
European Engineering Report - European Federation of ... · Institut der deutschen Wirtschaft Köln...
31
Postfach 10 19 42 · 50459 Köln Telefon: 0221 4981-749 · Fax: 0221 4981-99749 · [email protected] · www.iwkoeln.de Studie European Engineering Report an Herrn Dirk Manske VDI Verein Deutscher Ingenieure e. V. VDI-Platz 1 40468 Düsseldorf Ansprechpartner im IW Köln: Dr. Vera Erdmann Wissenschaftsbereich Bildungspolitik und Arbeitsmarktpolitik Köln, 26. Oktober 2009
Transcript of European Engineering Report - European Federation of ... · Institut der deutschen Wirtschaft Köln...
Postfach 10 19 42 · 50459 Köln Telefon: 0221 4981-749 · Fax: 0221 4981-99749 · [email protected] · www.iwkoeln.de
Studie
� � �
European Engineering Report
an Herrn Dirk Manske
VDI Verein Deutscher Ingenieure e. V.
VDI-Platz 1
40468 Düsseldorf
Ansprechpartner im IW Köln:
Dr. Vera Erdmann
Wissenschaftsbereich Bildungspolitik und Arbeitsmarktpolitik
Köln, 26. Oktober 2009
Institut der deutschen Wirtschaft Köln European Engineering Report
________________________________________________________________________________________
________________________________________________________________________________________
October 26th 2009 Page 2 of 31
Contents
Key Findings..................................................................................................................... 3
1 Introduction....................................................................................................................... 4
2 Indicators .......................................................................................................................... 6 2.1 Employed Engineering Workers ...................................................................................................6
2.2 Engineer Density ..........................................................................................................................8
2.3 Female Participation in Engineering...........................................................................................10
2.4 Part-time Engineers ....................................................................................................................12
2.5 Weekly Working Hours of Engineers..........................................................................................14
2.6 The Age Structure of Engineers .................................................................................................16
2.7 Employed Graduate Engineers...................................................................................................18
2.8 Graduations in Engineering ........................................................................................................23
2.9 Share of Graduations in Engineering .........................................................................................25
2.10 The Scientific Ability of 15-year-olds ..........................................................................................27
Literature ........................................................................................................................ 30
Institut der deutschen Wirtschaft Köln European Engineering Report
________________________________________________________________________________________
________________________________________________________________________________________
October 26th 2009 Page 3 of 31
Key Findings
Engineers play an important role in the innovative performance and the competitiveness of
European countries. The aim of this report is therefore to provide a comprehensive overview of
the most important indicators with respect to the European labour market for engineers and to
their education. The report covers the 27 European Union member states, the EU applicants
Croatia and Iceland as well as Norway and Switzerland. Generally, the indicators show a great
heterogeneity between the countries. The extent to which engineers are appreciated appears to
differ widely across Europe. The main findings of this report are as follows:
− The number of employed engineering workers, that is persons working in the engi-
neering profession regardless of their degree, ranges from more than 1.2 million in Ger-
many to only 1,700 in Malta.
− Finland and Germany, at more than 3 per cent, have the highest shares of employed
engineering workers among all employees. In contrast, in countries like the Slovak
Republic and Austria the proportion is less than half of the average.
− Female engineering workers are most common in Eastern European countries like
Latvia and Bulgaria, where they account for around 30 per cent of the total At about 9
per cent, the share of female engineering workers is lowest in the UK. On average,
every 6th engineer in Europe is female.
− The Netherlands and Switzerland have the highest proportions of engineering workers
employed part-time at around 23 and 15 per cent respectively. Less than 5 per cent of
the employed engineering workers in the Czech Republic, Poland and Spain work part-
time.
− The average weekly working hours of engineering workers vary between 37 hours 6
minutes and 45 hours 18 minutes. Engineering workers in Austria, Iceland and France
work the longest, whereas their counterparts in the Netherlands, Norway and Finland
work the shortest hours.
− Due to the fact that they have a large share of engineering workers below the age of 35,
Ireland and Spain are not likely to encounter replacement problems when their older en-
gineering workers leave the workforce. The age structure of employed engineering
workers in Germany, Bulgaria and Norway, however, indicates that these countries will
face such problems.
− In Europe, engineering workers do not necessarily hold an engineering degree. Nor do
all graduate engineers, that is people holding an engineering degree, work in the engi-
neering profession. On average, at least 28 per cent of graduate engineers work in a
profession other than engineering, indicating their great labour market flexibility.
− The number of graduations in engineering varies between more than 55,000 a year in
France and less than 50 in Cyprus.
− At 20 per cent, Finland has the highest share of graduations in engineering among all
graduations. At only about 4 per cent, Cyprus has the lowest share. On average, the
proportion of graduations in engineering is about 12 per cent.
− In view of their PISA score in science and the proportion reaching the highest PISA
level in science, Finnish 15-year-olds seem to be exceptionally well prepared for further
education and a career in engineering. This is in contrast to Romanian teenagers, who
lag far behind, with the consequence that Romania will most likely face a dearth of
young engineers in the future.
Institut der deutschen Wirtschaft Köln European Engineering Report
________________________________________________________________________________________
________________________________________________________________________________________
October 26th 2009 Page 4 of 31
1 Introduction
Engineers are particularly important for the economies of the countries of Europe. They develop
innovations that contribute to economic growth in two ways: On the one hand, innovations are
responsible for technical progress, which is a precondition of economic growth and prosperity.
On the other hand, innovations improve a country’s competitiveness in the global market, which
also fosters growth. Despite their prominent role in innovation and progress, the labour market
for engineers in Europe is far from homogeneous. This heterogeneity creates different condi-
tions for engineers in the respective labour markets that show the importance of engineers for
the industry and the economy of a country as a whole. The aim of this report is therefore to pro-
vide a comprehensive overview of the most important indicators with respect to the European
labour market for engineers and their education. The data allow a comparison of the European
countries and the conditions that engineers face there.
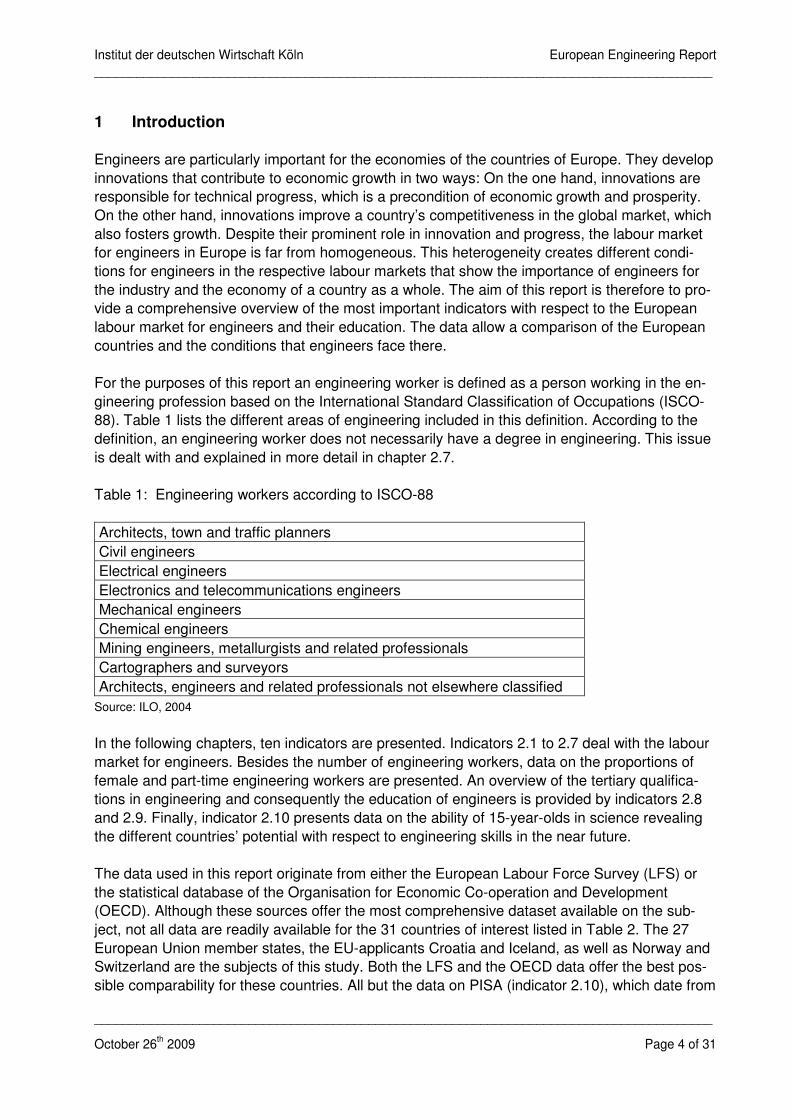
For the purposes of this report an engineering worker is defined as a person working in the en-
gineering profession based on the International Standard Classification of Occupations (ISCO-
88). Table 1 lists the different areas of engineering included in this definition. According to the
definition, an engineering worker does not necessarily have a degree in engineering. This issue
is dealt with and explained in more detail in chapter 2.7.
Table 1: Engineering workers according to ISCO-88
Architects, town and traffic planners
Civil engineers
Electrical engineers
Electronics and telecommunications engineers
Mechanical engineers
Chemical engineers
Mining engineers, metallurgists and related professionals
Cartographers and surveyors
Architects, engineers and related professionals not elsewhere classified
Source: ILO, 2004
In the following chapters, ten indicators are presented. Indicators 2.1 to 2.7 deal with the labour
market for engineers. Besides the number of engineering workers, data on the proportions of
female and part-time engineering workers are presented. An overview of the tertiary qualifica-
tions in engineering and consequently the education of engineers is provided by indicators 2.8
and 2.9. Finally, indicator 2.10 presents data on the ability of 15-year-olds in science revealing
the different countries’ potential with respect to engineering skills in the near future.
The data used in this report originate from either the European Labour Force Survey (LFS) or
the statistical database of the Organisation for Economic Co-operation and Development
(OECD). Although these sources offer the most comprehensive dataset available on the sub-
ject, not all data are readily available for the 31 countries of interest listed in Table 2. The 27
European Union member states, the EU-applicants Croatia and Iceland, as well as Norway and
Switzerland are the subjects of this study. Both the LFS and the OECD data offer the best pos-
sible comparability for these countries. All but the data on PISA (indicator 2.10), which date from
Institut der deutschen Wirtschaft Köln European Engineering Report
________________________________________________________________________________________
________________________________________________________________________________________
October 26th 2009 Page 5 of 31
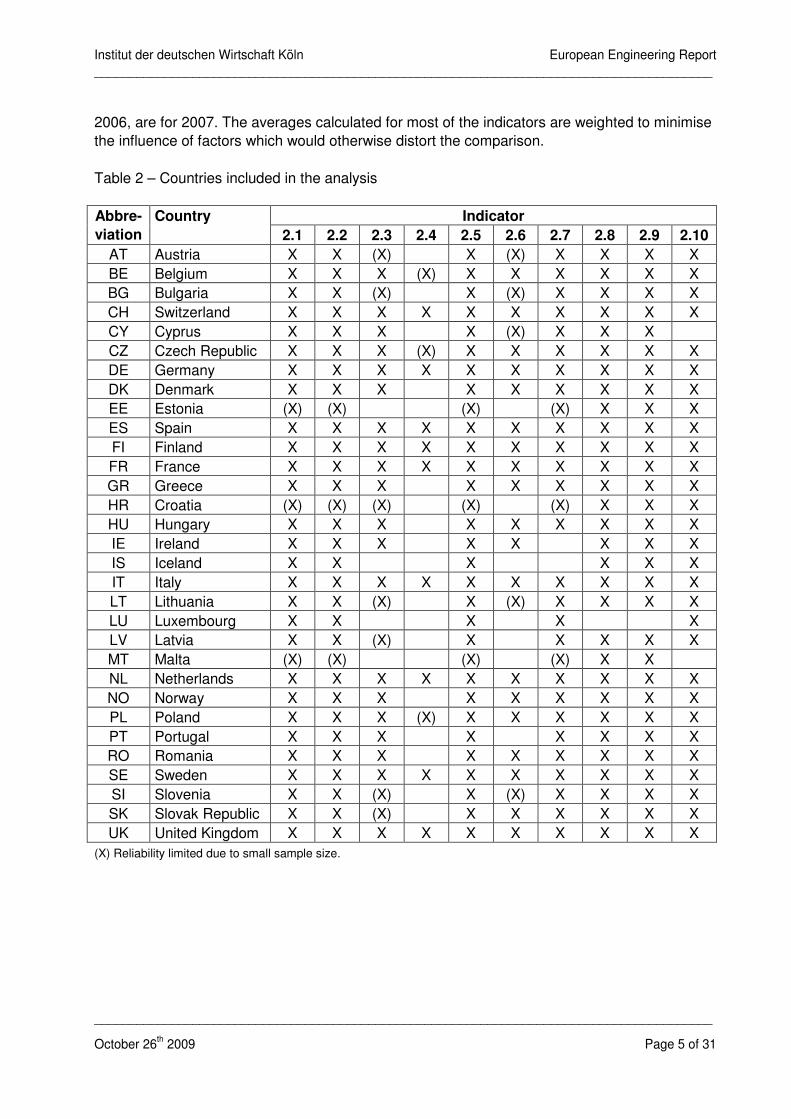
2006, are for 2007. The averages calculated for most of the indicators are weighted to minimise
the influence of factors which would otherwise distort the comparison.
Table 2 – Countries included in the analysis
Indicator Abbre-
viation
Country
2.1 2.2 2.3 2.4 2.5 2.6 2.7 2.8 2.9 2.10
AT Austria X X (X) X (X) X X X X
BE Belgium X X X (X) X X X X X X
BG Bulgaria X X (X) X (X) X X X X
CH Switzerland X X X X X X X X X X
CY Cyprus X X X X (X) X X X
CZ Czech Republic X X X (X) X X X X X X
DE Germany X X X X X X X X X X
DK Denmark X X X X X X X X X
EE Estonia (X) (X) (X) (X) X X X
ES Spain X X X X X X X X X X
FI Finland X X X X X X X X X X
FR France X X X X X X X X X X
GR Greece X X X X X X X X X
HR Croatia (X) (X) (X) (X) (X) X X X
HU Hungary X X X X X X X X X
IE Ireland X X X X X X X X
IS Iceland X X X X X X
IT Italy X X X X X X X X X X
LT Lithuania X X (X) X (X) X X X X
LU Luxembourg X X X X X
LV Latvia X X (X) X X X X X
MT Malta (X) (X) (X) (X) X X
NL Netherlands X X X X X X X X X X
NO Norway X X X X X X X X X
PL Poland X X X (X) X X X X X X
PT Portugal X X X X X X X X
RO Romania X X X X X X X X X
SE Sweden X X X X X X X X X X
SI Slovenia X X (X) X (X) X X X X
SK Slovak Republic X X (X) X X X X X X
UK United Kingdom X X X X X X X X X X
(X) Reliability limited due to small sample size.
Institut der deutschen Wirtschaft Köln European Engineering Report
________________________________________________________________________________________
________________________________________________________________________________________
October 26th 2009 Page 6 of 31
2 Indicators 2.1 Employed Engineering Workers
In the European Labour Force Survey, an employee is a person aged 15 years or more who,
during the reference week, performed paid work for at least one hour. People who had a job or
a business but were absent during the reference week due to illness, holidays or similar issues
are also included in this definition. Employed engineering workers are defined as employees
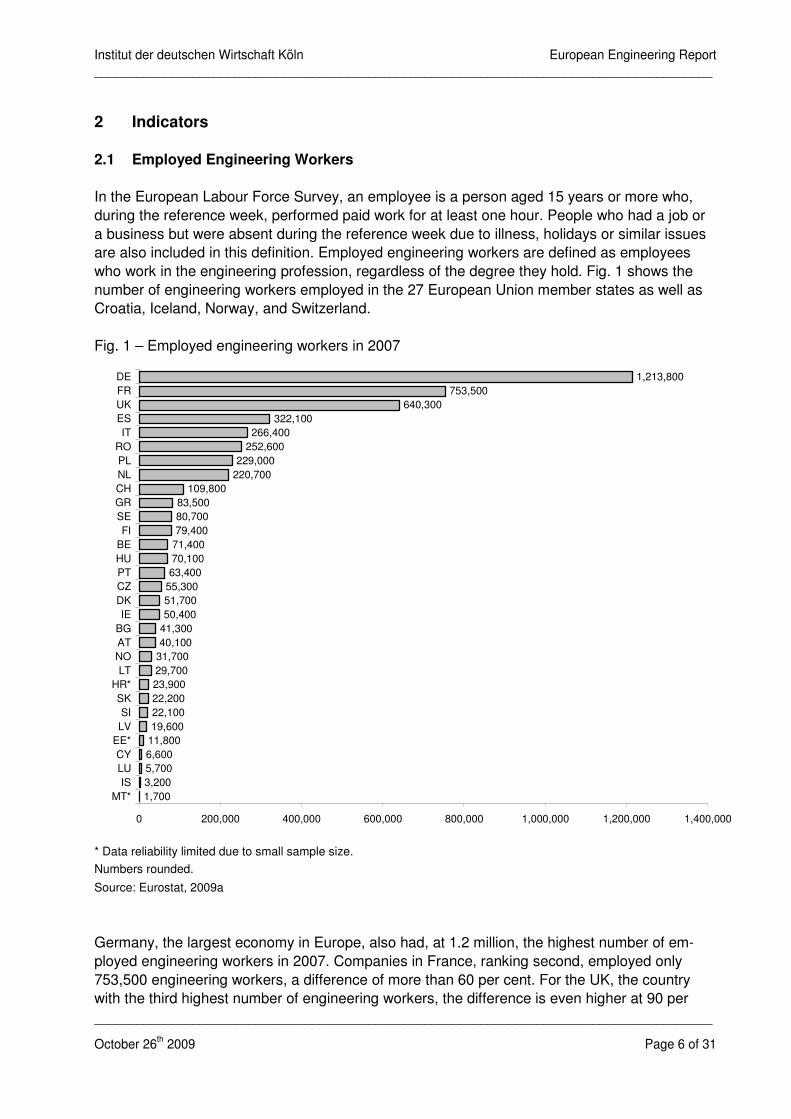
who work in the engineering profession, regardless of the degree they hold. Fig. 1 shows the
number of engineering workers employed in the 27 European Union member states as well as
Croatia, Iceland, Norway, and Switzerland.
Fig. 1 – Employed engineering workers in 2007
1,700
3,200
5,700
6,600
11,800
19,600
22,100
22,200
23,900
29,700
31,700
40,100
41,300
50,400
51,700
55,300
63,400
70,100
71,400
79,400
80,700
83,500
109,800
220,700
229,000
252,600
266,400
322,100
640,300
753,500
1,213,800
0 200,000 400,000 600,000 800,000 1,000,000 1,200,000 1,400,000
MT*
IS
LU
CY
EE*
LV
SI
SK
HR*
LT
NO
AT
BG
IE
DK
CZ
PT
HU
BE
FI
SE
GR
CH
NL
PL
RO
IT
ES
UK
FR
DE
* Data reliability limited due to small sample size.
Numbers rounded.
Source: Eurostat, 2009a
Germany, the largest economy in Europe, also had, at 1.2 million, the highest number of em-
ployed engineering workers in 2007. Companies in France, ranking second, employed only
753,500 engineering workers, a difference of more than 60 per cent. For the UK, the country
with the third highest number of engineering workers, the difference is even higher at 90 per
Institut der deutschen Wirtschaft Köln European Engineering Report
________________________________________________________________________________________
________________________________________________________________________________________
October 26th 2009 Page 7 of 31
cent. Together, the three largest employers of engineering workers, Germany, France and the
UK, accounted for more than half of Europe’s engineering workers in 2007.
The number of engineering workers in the 31 countries listed in Fig. 1 differs greatly from coun-
try to country. In 2007, companies in small European countries such as Malta, Iceland, Luxem-
bourg and Cyprus employed fewer than 10,000 engineering workers per country. At the same
time, companies in countries ranking in the top eight had more than 200,000 engineering work-
ers per country on their payroll; that is, 20 times as many.
Generally, the greater a country’s population, the more likely it is to have a large number of en-
gineering workers. The eight countries in Fig. 1 with the largest number of engineering workers
– Germany, France, the UK, Spain, Italy, Romania, Poland and the Netherlands – were also the
eight most populous European countries in 2007 (cf. Eurostat, 2009b), while the seven smallest
countries, Malta, Iceland, Luxembourg, Cyprus, Estonia, Latvia and Slovenia also had the few-
est engineering workers. Overall, the European countries are ranked very similarly with respect
to their population and to the number of employed engineering workers.
To sum up, in 2007 the number of engineering workers varied greatly among the 31 European
countries included in the analysis. Germany, with more than 1.2 million, had by far the largest
number of engineering workers, whereas Malta only employed 1,700, more than 700 times less.
The size of a country influences the number of its engineering workers significantly.
Institut der deutschen Wirtschaft Köln European Engineering Report
________________________________________________________________________________________
________________________________________________________________________________________
October 26th 2009 Page 8 of 31
2.2 Engineer Density
Using the absolute number of employed engineering workers in a country as the sole indicator
of their importance can be misleading, as it does not take into account the country’s size or in-
dustrial structure. In contrast, the number of employed engineering workers as a share of all
employed persons in a country permits a more useful comparison of the data. The higher this
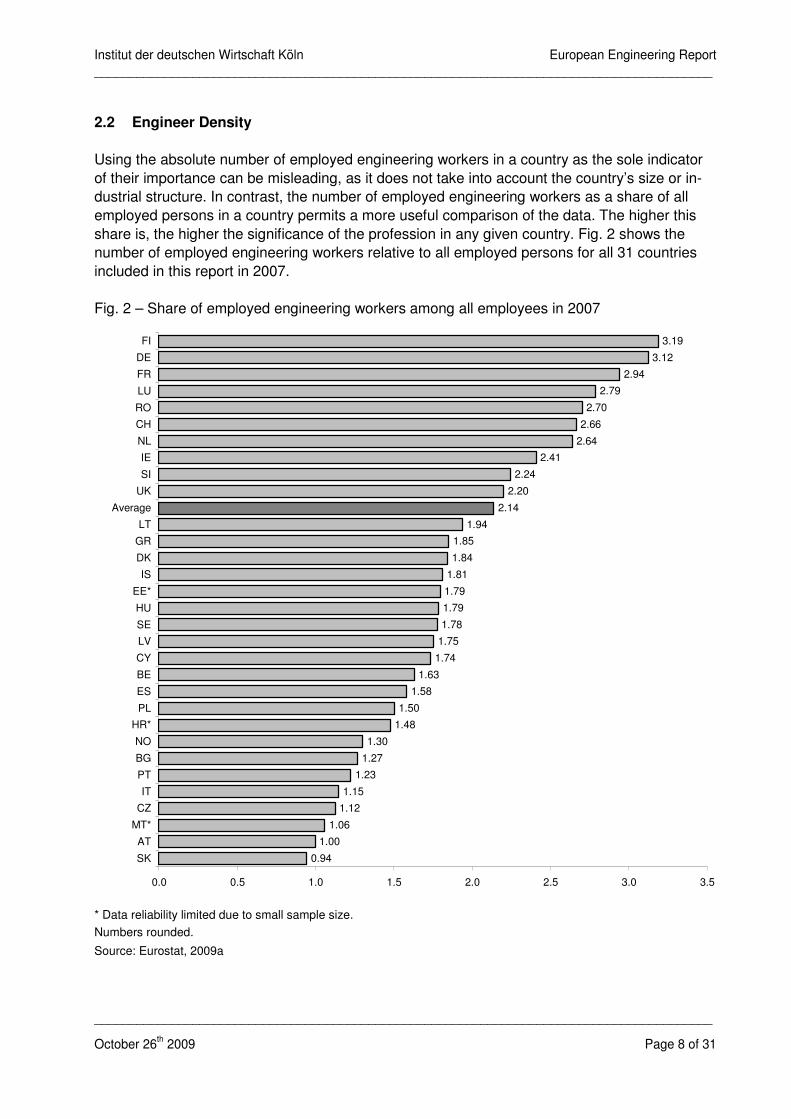
share is, the higher the significance of the profession in any given country. Fig. 2 shows the
number of employed engineering workers relative to all employed persons for all 31 countries
included in this report in 2007.
Fig. 2 – Share of employed engineering workers among all employees in 2007
0.94
1.00
1.06
1.12
1.15
1.23
1.27
1.30
1.48
1.50
1.58
1.63
1.74
1.75
1.78
1.79
1.79
1.81
1.84
1.85
1.94
2.14
2.20
2.24
2.41
2.64
2.66
2.70
2.79
2.94
3.12
3.19
0.0 0.5 1.0 1.5 2.0 2.5 3.0 3.5
SK
AT
MT*
CZ
IT
PT
BG
NO
HR*
PL
ES
BE
CY
LV
SE
HU
EE*
IS
DK
GR
LT
Average
UK
SI
IE
NL
CH
RO
LU
FR
DE
FI
* Data reliability limited due to small sample size.
Numbers rounded.
Source: Eurostat, 2009a
Institut der deutschen Wirtschaft Köln European Engineering Report
________________________________________________________________________________________
________________________________________________________________________________________
October 26th 2009 Page 9 of 31
In 2007, the average share of employed engineering workers among all employees in Europe
was 2.14 per cent. However, the range of values for the 31 different countries surveyed was
large: The difference between the highest share, 3.19 per cent in Finland, and the lowest, just
0.94 per cent in the Slovak Republic, was 2.25 percentage points. Hence, the highest share
was more than three times the lowest.
With more than 3 per cent of their employees being engineering workers, Finland and Germany
had the highest shares of all countries in 2007. These two countries place a particularly strong
emphasis on science and technology: For instance, both spent a comparatively high amount on
research and development (R&D) during the reference year: Finland’s expenditure represented
3.47 per cent of its gross domestic product (GDP), whereas Germany had an R&D expenditure
of 2.54 per cent in 2007. In contrast, the Slovak Republic, the country with the lowest share of
engineering workers, spent a mere 0.46 per cent of its GDP on developing new products or
processes (cf. Eurostat, 2009g). Engineering workers typically perform R&D-related tasks and
are thus a valuable asset for their countries. This connection is reflected in the exceptionally
high proportions of companies in high-tech industries engaging in innovation in both Finland and
Germany in 2006: more than half of such companies in Finland and nearly two thirds in Ger-
many (cf. Eurostat, 2009h).
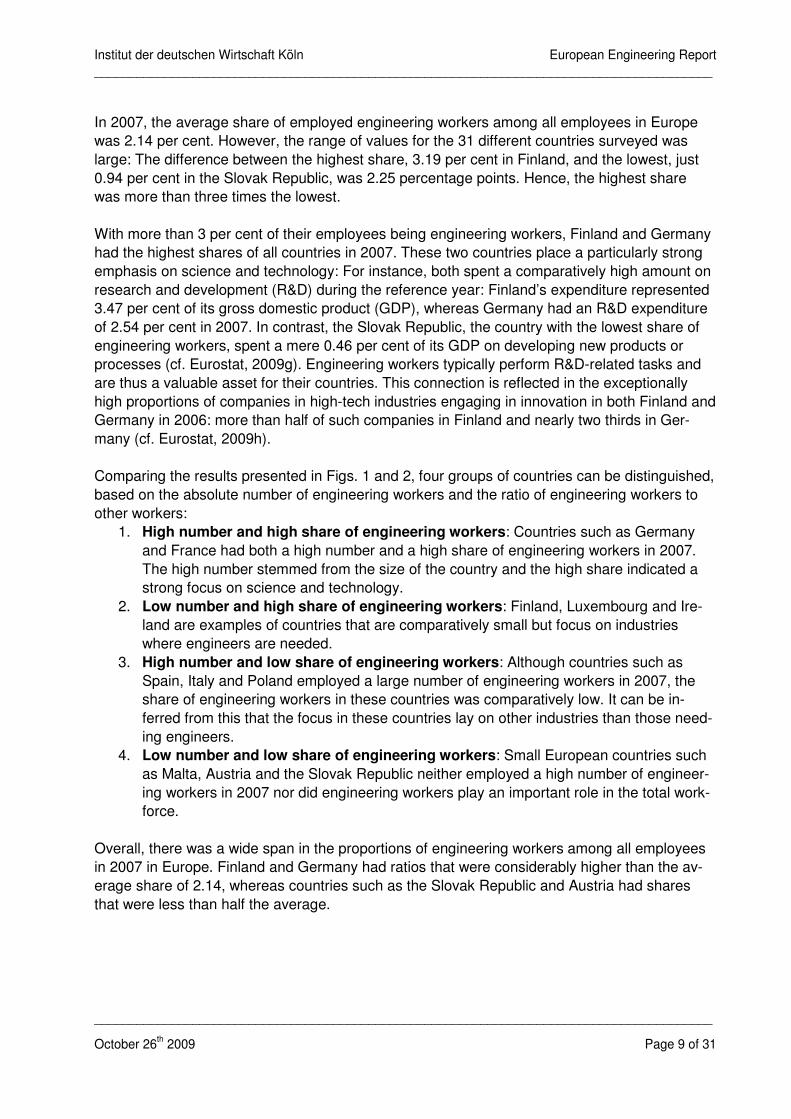
Comparing the results presented in Figs. 1 and 2, four groups of countries can be distinguished,
based on the absolute number of engineering workers and the ratio of engineering workers to
other workers:
1. High number and high share of engineering workers: Countries such as Germany
and France had both a high number and a high share of engineering workers in 2007.
The high number stemmed from the size of the country and the high share indicated a
strong focus on science and technology.
2. Low number and high share of engineering workers: Finland, Luxembourg and Ire-
land are examples of countries that are comparatively small but focus on industries
where engineers are needed.
3. High number and low share of engineering workers: Although countries such as
Spain, Italy and Poland employed a large number of engineering workers in 2007, the
share of engineering workers in these countries was comparatively low. It can be in-
ferred from this that the focus in these countries lay on other industries than those need-
ing engineers.
4. Low number and low share of engineering workers: Small European countries such
as Malta, Austria and the Slovak Republic neither employed a high number of engineer-
ing workers in 2007 nor did engineering workers play an important role in the total work-
force.
Overall, there was a wide span in the proportions of engineering workers among all employees
in 2007 in Europe. Finland and Germany had ratios that were considerably higher than the av-
erage share of 2.14, whereas countries such as the Slovak Republic and Austria had shares
that were less than half the average.
Institut der deutschen Wirtschaft Köln European Engineering Report
________________________________________________________________________________________
________________________________________________________________________________________
October 26th 2009 Page 10 of 31
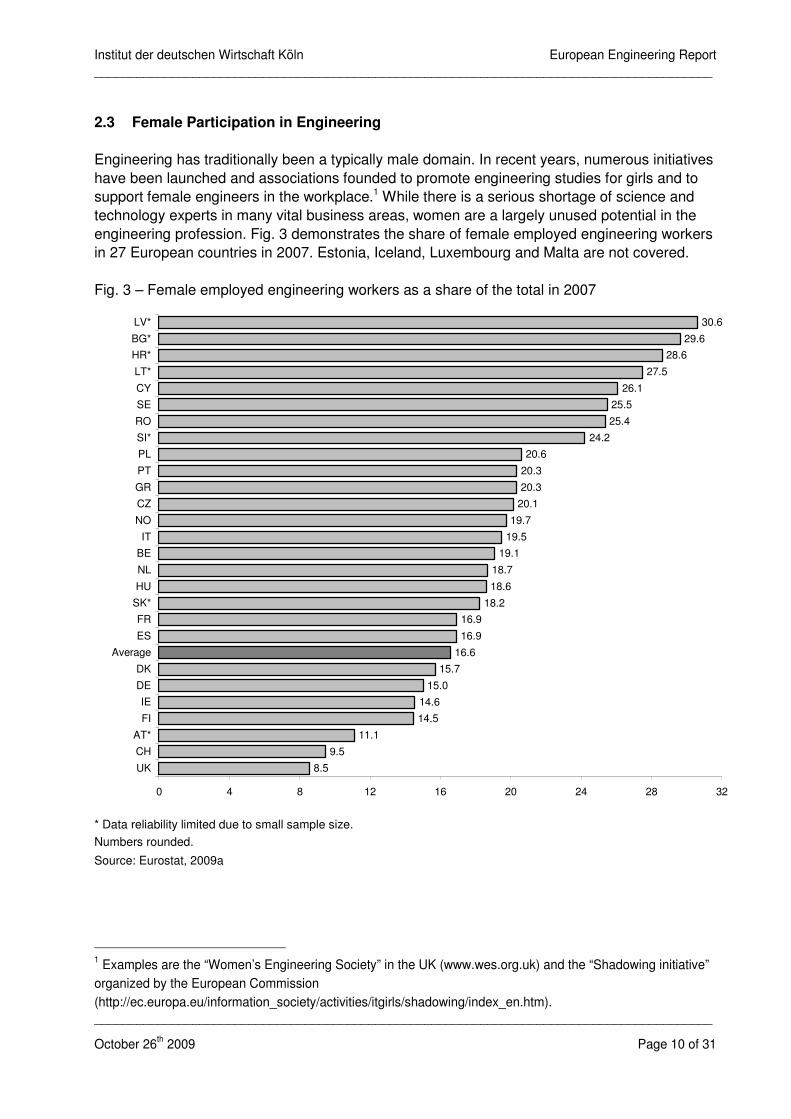
2.3 Female Participation in Engineering
Engineering has traditionally been a typically male domain. In recent years, numerous initiatives
have been launched and associations founded to promote engineering studies for girls and to
support female engineers in the workplace.1 While there is a serious shortage of science and
technology experts in many vital business areas, women are a largely unused potential in the
engineering profession. Fig. 3 demonstrates the share of female employed engineering workers
in 27 European countries in 2007. Estonia, Iceland, Luxembourg and Malta are not covered.
Fig. 3 – Female employed engineering workers as a share of the total in 2007
8.5
9.5
11.1
14.5
14.6
15.0
15.7
16.6
16.9
16.9
18.2
18.6
18.7
19.1
19.5
19.7
20.1
20.3
20.3
20.6
24.2
25.4
25.5
26.1
27.5
28.6
29.6
30.6
0 4 8 12 16 20 24 28 32
UK
CH
AT*
FI
IE
DE
DK
Average
ES
FR
SK*
HU
NL
BE
IT
NO
CZ
GR
PT
PL
SI*
RO
SE
CY
LT*
HR*
BG*
LV*
* Data reliability limited due to small sample size.
Numbers rounded.
Source: Eurostat, 2009a
1 Examples are the “Women’s Engineering Society” in the UK (www.wes.org.uk) and the “Shadowing initiative”
organized by the European Commission
(http://ec.europa.eu/information_society/activities/itgirls/shadowing/index_en.htm).
Institut der deutschen Wirtschaft Köln European Engineering Report
________________________________________________________________________________________
________________________________________________________________________________________
October 26th 2009 Page 11 of 31
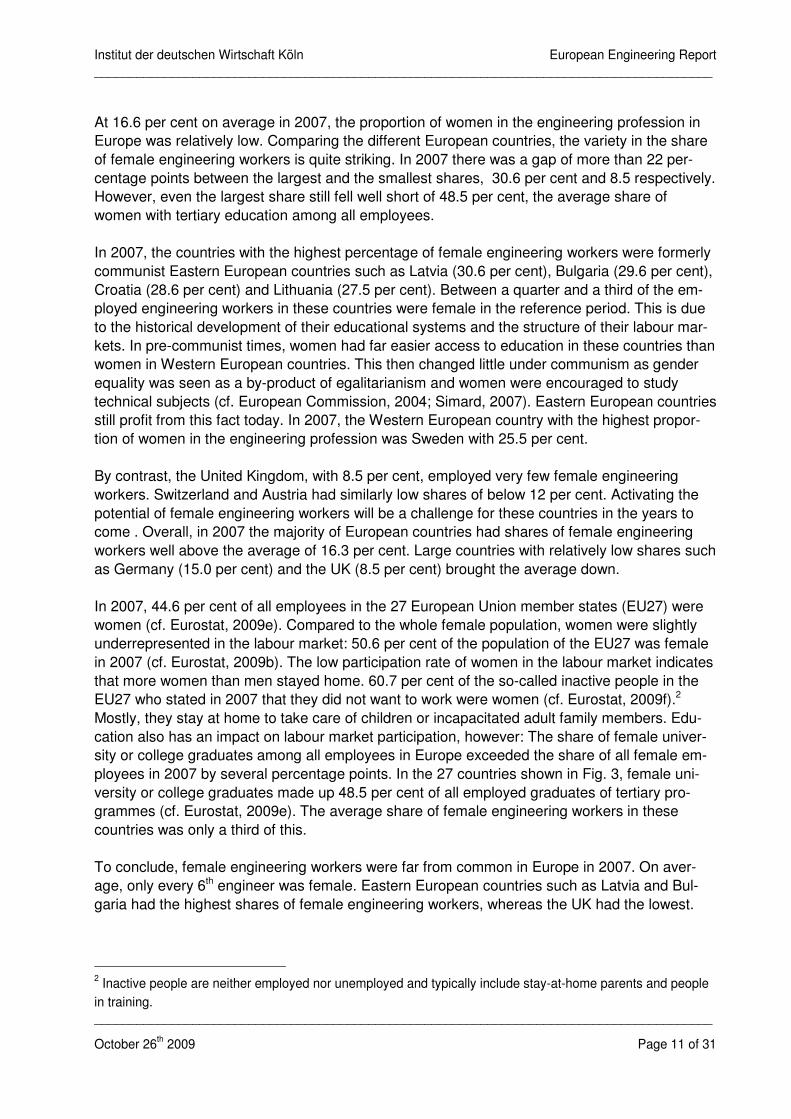
At 16.6 per cent on average in 2007, the proportion of women in the engineering profession in
Europe was relatively low. Comparing the different European countries, the variety in the share
of female engineering workers is quite striking. In 2007 there was a gap of more than 22 per-
centage points between the largest and the smallest shares, 30.6 per cent and 8.5 respectively.
However, even the largest share still fell well short of 48.5 per cent, the average share of
women with tertiary education among all employees.
In 2007, the countries with the highest percentage of female engineering workers were formerly
communist Eastern European countries such as Latvia (30.6 per cent), Bulgaria (29.6 per cent),
Croatia (28.6 per cent) and Lithuania (27.5 per cent). Between a quarter and a third of the em-
ployed engineering workers in these countries were female in the reference period. This is due
to the historical development of their educational systems and the structure of their labour mar-
kets. In pre-communist times, women had far easier access to education in these countries than
women in Western European countries. This then changed little under communism as gender
equality was seen as a by-product of egalitarianism and women were encouraged to study
technical subjects (cf. European Commission, 2004; Simard, 2007). Eastern European countries
still profit from this fact today. In 2007, the Western European country with the highest propor-
tion of women in the engineering profession was Sweden with 25.5 per cent.
By contrast, the United Kingdom, with 8.5 per cent, employed very few female engineering
workers. Switzerland and Austria had similarly low shares of below 12 per cent. Activating the
potential of female engineering workers will be a challenge for these countries in the years to
come . Overall, in 2007 the majority of European countries had shares of female engineering
workers well above the average of 16.3 per cent. Large countries with relatively low shares such
as Germany (15.0 per cent) and the UK (8.5 per cent) brought the average down.
In 2007, 44.6 per cent of all employees in the 27 European Union member states (EU27) were
women (cf. Eurostat, 2009e). Compared to the whole female population, women were slightly
underrepresented in the labour market: 50.6 per cent of the population of the EU27 was female
in 2007 (cf. Eurostat, 2009b). The low participation rate of women in the labour market indicates
that more women than men stayed home. 60.7 per cent of the so-called inactive people in the
EU27 who stated in 2007 that they did not want to work were women (cf. Eurostat, 2009f).2
Mostly, they stay at home to take care of children or incapacitated adult family members. Edu-
cation also has an impact on labour market participation, however: The share of female univer-
sity or college graduates among all employees in Europe exceeded the share of all female em-
ployees in 2007 by several percentage points. In the 27 countries shown in Fig. 3, female uni-
versity or college graduates made up 48.5 per cent of all employed graduates of tertiary pro-
grammes (cf. Eurostat, 2009e). The average share of female engineering workers in these
countries was only a third of this.
To conclude, female engineering workers were far from common in Europe in 2007. On aver-
age, only every 6th engineer was female. Eastern European countries such as Latvia and Bul-
garia had the highest shares of female engineering workers, whereas the UK had the lowest.
2 Inactive people are neither employed nor unemployed and typically include stay-at-home parents and people
in training.
Institut der deutschen Wirtschaft Köln European Engineering Report
________________________________________________________________________________________
________________________________________________________________________________________
October 26th 2009 Page 12 of 31
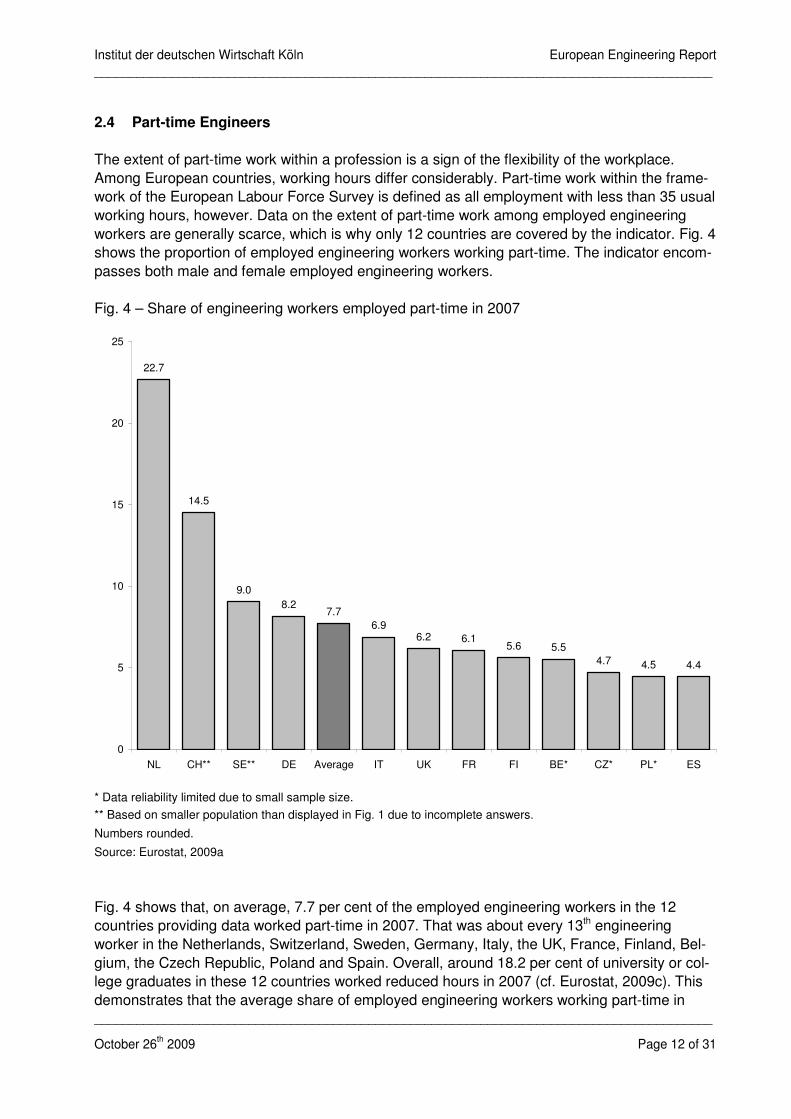
2.4 Part-time Engineers
The extent of part-time work within a profession is a sign of the flexibility of the workplace.
Among European countries, working hours differ considerably. Part-time work within the frame-
work of the European Labour Force Survey is defined as all employment with less than 35 usual
working hours, however. Data on the extent of part-time work among employed engineering
workers are generally scarce, which is why only 12 countries are covered by the indicator. Fig. 4
shows the proportion of employed engineering workers working part-time. The indicator encom-
passes both male and female employed engineering workers.
Fig. 4 – Share of engineering workers employed part-time in 2007
22.7
14.5
9.0
8.2
6.96.2 6.1
5.6 5.5
4.7 4.5 4.4
7.7
0
5
10
15
20
25
NL CH** SE** DE Average IT UK FR FI BE* CZ* PL* ES
* Data reliability limited due to small sample size.
** Based on smaller population than displayed in Fig. 1 due to incomplete answers.
Numbers rounded.
Source: Eurostat, 2009a
Fig. 4 shows that, on average, 7.7 per cent of the employed engineering workers in the 12
countries providing data worked part-time in 2007. That was about every 13th engineering
worker in the Netherlands, Switzerland, Sweden, Germany, Italy, the UK, France, Finland, Bel-
gium, the Czech Republic, Poland and Spain. Overall, around 18.2 per cent of university or col-
lege graduates in these 12 countries worked reduced hours in 2007 (cf. Eurostat, 2009c). This
demonstrates that the average share of employed engineering workers working part-time in
Institut der deutschen Wirtschaft Köln European Engineering Report
________________________________________________________________________________________
________________________________________________________________________________________
October 26th 2009 Page 13 of 31
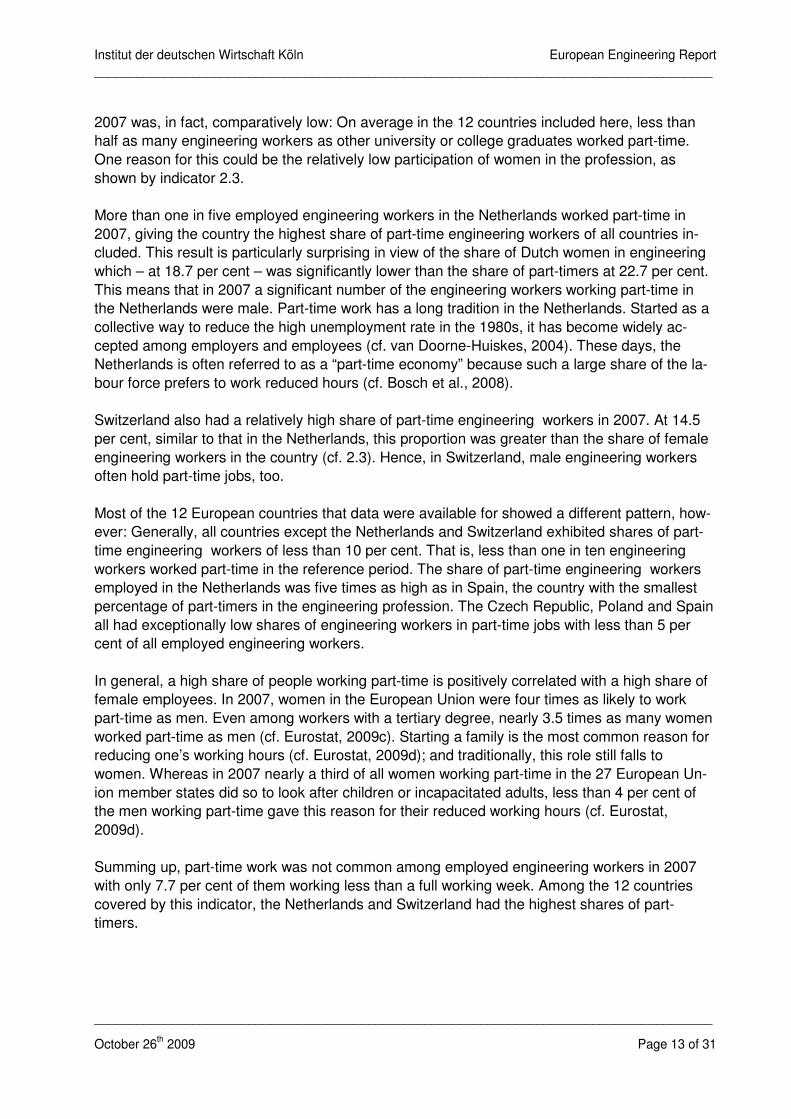
2007 was, in fact, comparatively low: On average in the 12 countries included here, less than
half as many engineering workers as other university or college graduates worked part-time.
One reason for this could be the relatively low participation of women in the profession, as
shown by indicator 2.3.
More than one in five employed engineering workers in the Netherlands worked part-time in
2007, giving the country the highest share of part-time engineering workers of all countries in-
cluded. This result is particularly surprising in view of the share of Dutch women in engineering
which – at 18.7 per cent – was significantly lower than the share of part-timers at 22.7 per cent.
This means that in 2007 a significant number of the engineering workers working part-time in
the Netherlands were male. Part-time work has a long tradition in the Netherlands. Started as a
collective way to reduce the high unemployment rate in the 1980s, it has become widely ac-
cepted among employers and employees (cf. van Doorne-Huiskes, 2004). These days, the
Netherlands is often referred to as a “part-time economy” because such a large share of the la-
bour force prefers to work reduced hours (cf. Bosch et al., 2008).
Switzerland also had a relatively high share of part-time engineering workers in 2007. At 14.5
per cent, similar to that in the Netherlands, this proportion was greater than the share of female
engineering workers in the country (cf. 2.3). Hence, in Switzerland, male engineering workers
often hold part-time jobs, too.
Most of the 12 European countries that data were available for showed a different pattern, how-
ever: Generally, all countries except the Netherlands and Switzerland exhibited shares of part-
time engineering workers of less than 10 per cent. That is, less than one in ten engineering
workers worked part-time in the reference period. The share of part-time engineering workers
employed in the Netherlands was five times as high as in Spain, the country with the smallest
percentage of part-timers in the engineering profession. The Czech Republic, Poland and Spain
all had exceptionally low shares of engineering workers in part-time jobs with less than 5 per
cent of all employed engineering workers.
In general, a high share of people working part-time is positively correlated with a high share of
female employees. In 2007, women in the European Union were four times as likely to work
part-time as men. Even among workers with a tertiary degree, nearly 3.5 times as many women
worked part-time as men (cf. Eurostat, 2009c). Starting a family is the most common reason for
reducing one’s working hours (cf. Eurostat, 2009d); and traditionally, this role still falls to
women. Whereas in 2007 nearly a third of all women working part-time in the 27 European Un-
ion member states did so to look after children or incapacitated adults, less than 4 per cent of
the men working part-time gave this reason for their reduced working hours (cf. Eurostat,
2009d).
Summing up, part-time work was not common among employed engineering workers in 2007
with only 7.7 per cent of them working less than a full working week. Among the 12 countries
covered by this indicator, the Netherlands and Switzerland had the highest shares of part-
timers.
Institut der deutschen Wirtschaft Köln European Engineering Report
________________________________________________________________________________________
________________________________________________________________________________________
October 26th 2009 Page 14 of 31
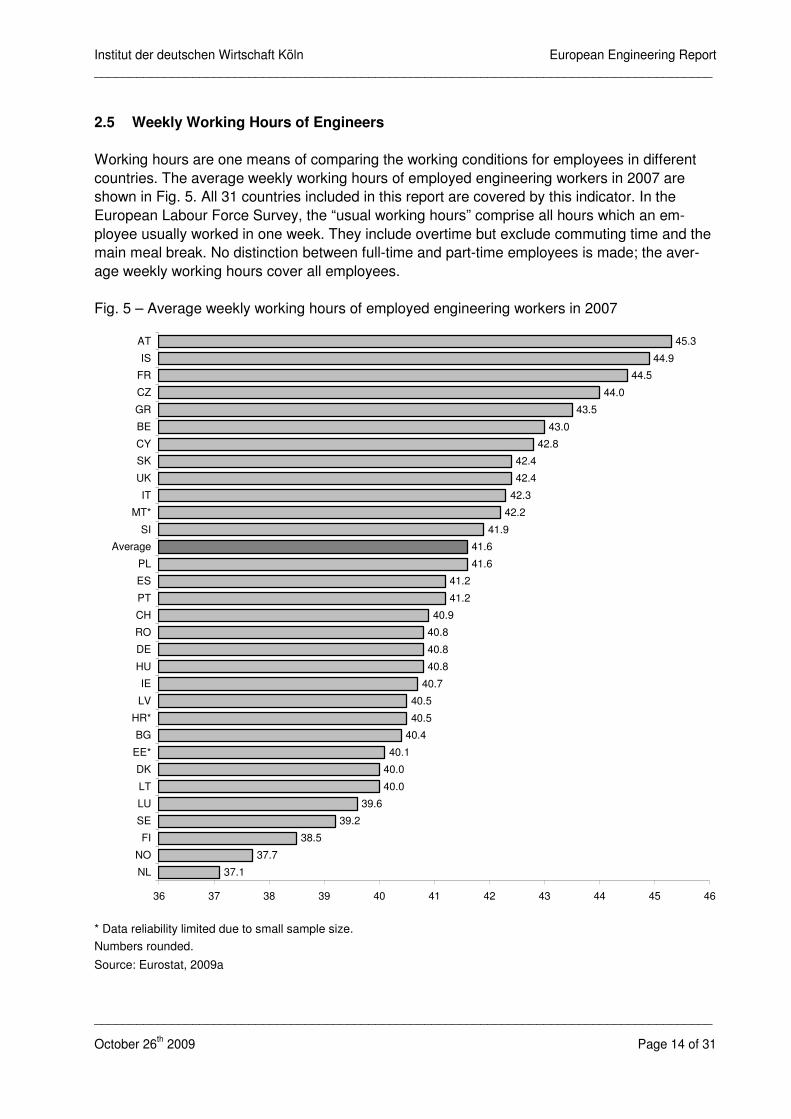
2.5 Weekly Working Hours of Engineers
Working hours are one means of comparing the working conditions for employees in different
countries. The average weekly working hours of employed engineering workers in 2007 are
shown in Fig. 5. All 31 countries included in this report are covered by this indicator. In the
European Labour Force Survey, the “usual working hours” comprise all hours which an em-
ployee usually worked in one week. They include overtime but exclude commuting time and the
main meal break. No distinction between full-time and part-time employees is made; the aver-
age weekly working hours cover all employees.
Fig. 5 – Average weekly working hours of employed engineering workers in 2007
37.1
37.7
38.5
39.2
39.6
40.0
40.0
40.1
40.4
40.5
40.5
40.7
40.8
40.8
40.8
40.9
41.2
41.2
41.6
41.9
42.2
42.3
42.4
42.4
42.8
43.0
43.5
44.0
44.5
44.9
45.3
41.6
36 37 38 39 40 41 42 43 44 45 46
NL
NO
FI
SE
LU
LT
DK
EE*
BG
HR*
LV
IE
HU
DE
RO
CH
PT
ES
PL
Average
SI
MT*
IT
UK
SK
CY
BE
GR
CZ
FR
IS
AT
* Data reliability limited due to small sample size.
Numbers rounded.
Source: Eurostat, 2009a
Institut der deutschen Wirtschaft Köln European Engineering Report
________________________________________________________________________________________
________________________________________________________________________________________
October 26th 2009 Page 15 of 31
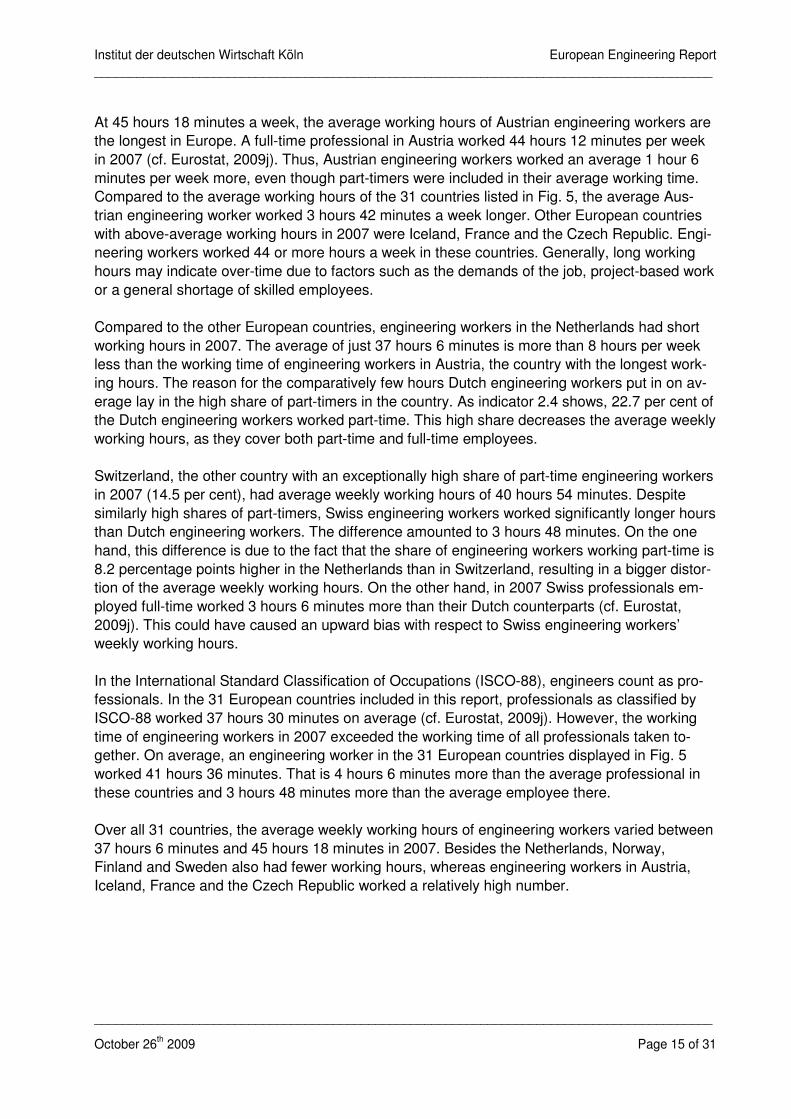
At 45 hours 18 minutes a week, the average working hours of Austrian engineering workers are
the longest in Europe. A full-time professional in Austria worked 44 hours 12 minutes per week
in 2007 (cf. Eurostat, 2009j). Thus, Austrian engineering workers worked an average 1 hour 6
minutes per week more, even though part-timers were included in their average working time.
Compared to the average working hours of the 31 countries listed in Fig. 5, the average Aus-
trian engineering worker worked 3 hours 42 minutes a week longer. Other European countries
with above-average working hours in 2007 were Iceland, France and the Czech Republic. Engi-
neering workers worked 44 or more hours a week in these countries. Generally, long working
hours may indicate over-time due to factors such as the demands of the job, project-based work
or a general shortage of skilled employees.
Compared to the other European countries, engineering workers in the Netherlands had short
working hours in 2007. The average of just 37 hours 6 minutes is more than 8 hours per week
less than the working time of engineering workers in Austria, the country with the longest work-
ing hours. The reason for the comparatively few hours Dutch engineering workers put in on av-
erage lay in the high share of part-timers in the country. As indicator 2.4 shows, 22.7 per cent of
the Dutch engineering workers worked part-time. This high share decreases the average weekly
working hours, as they cover both part-time and full-time employees.
Switzerland, the other country with an exceptionally high share of part-time engineering workers
in 2007 (14.5 per cent), had average weekly working hours of 40 hours 54 minutes. Despite
similarly high shares of part-timers, Swiss engineering workers worked significantly longer hours
than Dutch engineering workers. The difference amounted to 3 hours 48 minutes. On the one
hand, this difference is due to the fact that the share of engineering workers working part-time is
8.2 percentage points higher in the Netherlands than in Switzerland, resulting in a bigger distor-
tion of the average weekly working hours. On the other hand, in 2007 Swiss professionals em-
ployed full-time worked 3 hours 6 minutes more than their Dutch counterparts (cf. Eurostat,
2009j). This could have caused an upward bias with respect to Swiss engineering workers’
weekly working hours.
In the International Standard Classification of Occupations (ISCO-88), engineers count as pro-
fessionals. In the 31 European countries included in this report, professionals as classified by
ISCO-88 worked 37 hours 30 minutes on average (cf. Eurostat, 2009j). However, the working
time of engineering workers in 2007 exceeded the working time of all professionals taken to-
gether. On average, an engineering worker in the 31 European countries displayed in Fig. 5
worked 41 hours 36 minutes. That is 4 hours 6 minutes more than the average professional in
these countries and 3 hours 48 minutes more than the average employee there.
Over all 31 countries, the average weekly working hours of engineering workers varied between
37 hours 6 minutes and 45 hours 18 minutes in 2007. Besides the Netherlands, Norway,
Finland and Sweden also had fewer working hours, whereas engineering workers in Austria,
Iceland, France and the Czech Republic worked a relatively high number.
Institut der deutschen Wirtschaft Köln European Engineering Report
________________________________________________________________________________________
________________________________________________________________________________________
October 26th 2009 Page 16 of 31
2.6 The Age Structure of Engineers
Demographic change and the accompanying problems will continue to influence the European
labour market in the years to come. The current age structure of engineering workers is an indi-
cator of the impact that aging will have on the engineering profession in the future: Engineering
workers aged 55 years or older today will most likely leave the workforce within the next ten
years. Young engineers will then be required to fill the void and ensure the competitiveness of
companies employing engineers. A low share of young engineering workers – usually going
hand in hand with a comparatively low number of engineering graduates – is one of the major
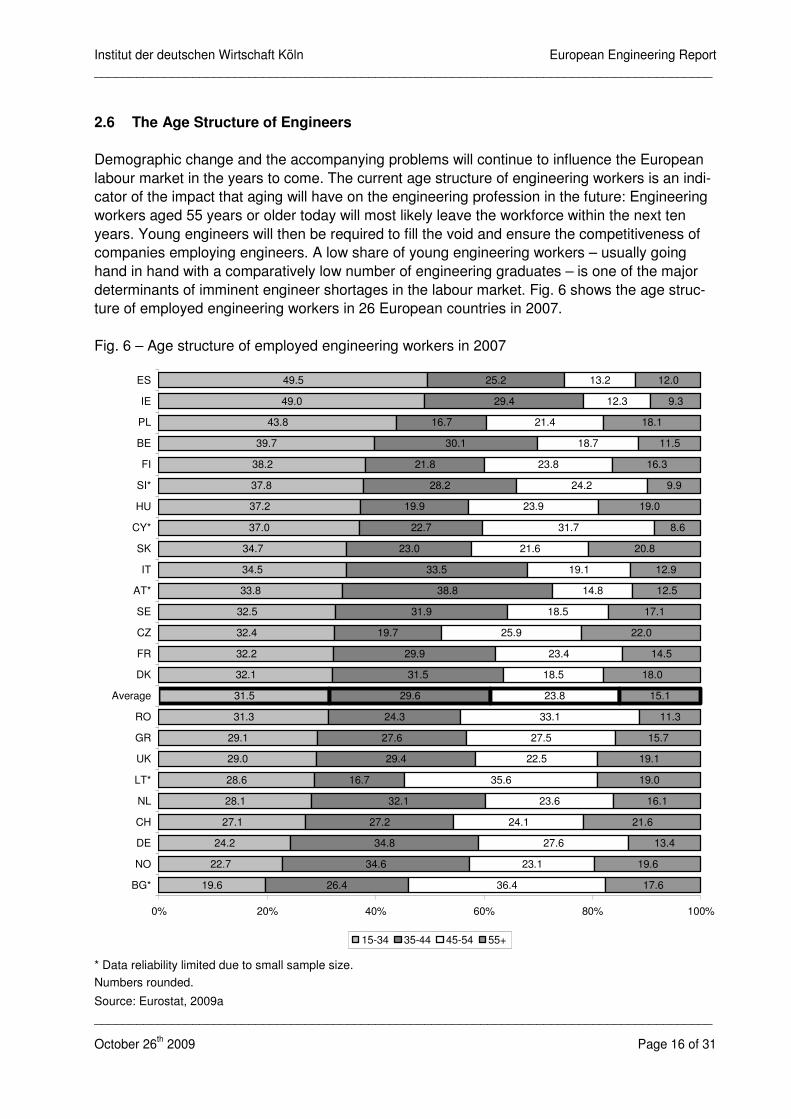
determinants of imminent engineer shortages in the labour market. Fig. 6 shows the age struc-
ture of employed engineering workers in 26 European countries in 2007.
Fig. 6 – Age structure of employed engineering workers in 2007
19.6
22.7
24.2
27.1
28.1
28.6
29.0
29.1
31.3
31.5
32.1
32.2
32.4
32.5
33.8
34.5
34.7
37.0
37.2
37.8
38.2
39.7
43.8
49.0
49.5
26.4
34.6
34.8
27.2
32.1
29.4
27.6
24.3
29.6
31.5
29.9
19.7
31.9
38.8
33.5
23.0
22.7
19.9
28.2
21.8
30.1
16.7
29.4
25.2
36.4
23.1
27.6
24.1
23.6
35.6
22.5
27.5
33.1
23.8
18.5
23.4
25.9
18.5
14.8
19.1
21.6
31.7
23.9
24.2
23.8
18.7
21.4
12.3
13.2
17.6
19.6
13.4
21.6
16.1
19.0
19.1
15.7
11.3
15.1
18.0
14.5
22.0
17.1
12.5
12.9
20.8
8.6
19.0
9.9
16.3
11.5
18.1
9.3
12.0
16.7
0% 20% 40% 60% 80% 100%
BG*
NO
DE
CH
NL
LT*
UK
GR
RO
Average
DK
FR
CZ
SE
AT*
IT
SK
CY*
HU
SI*
FI
BE
PL
IE
ES
15-34 35-44 45-54 55+
* Data reliability limited due to small sample size.
Numbers rounded.
Source: Eurostat, 2009a
Institut der deutschen Wirtschaft Köln European Engineering Report
________________________________________________________________________________________
________________________________________________________________________________________
October 26th 2009 Page 17 of 31
Fig. 6 demonstrates that 31.5 per cent of the employed engineering workers in the 26 European
countries were younger than 35 and 15.1 per cent were aged 55 or older. At the same time,
35.3 per cent of all employees with a tertiary degree were younger than 35 years, whereas 12.6
per cent were 55 years old or older in the EU27 (cf. Eurostat, 2009e). Given both the substan-
tially smaller share of young employees and the higher share of experienced employees, the
EU27 labour market for engineers is far more susceptible to the influence of demographic
change than the overall academic labour market.
With respect to their proportion of engineering workers younger than 35, two countries stick out:
Nearly half of the employed engineering workers in Spain and Ireland belonged to this age
group in 2007. Both countries also showed relatively low shares of engineering workers 55
years old or older. It can be concluded that these two countries are unlikely to encounter severe
problems replacing retiring engineering workers in the future.
Bulgaria, Norway and Germany exhibited comparatively low shares of engineering workers
younger than 35. In the latter two countries, less than 25 per cent, in the first fewer than 20 per
cent of the employed engineering workers were younger than 35. On top of the small proportion
of young engineering workers, Bulgaria and Norway also exhibited an above-average share of
engineering workers aged 55 or older. Hence, these countries in particular face problems with
regard to replacing retiring engineering workers. At 13.4 per cent, the German proportion of en-
gineering workers aged 55 or older was relatively low, but even today German companies face
severe recruiting problems with respect to engineers (cf. Erdmann/Koppel, 2009).
Most Eastern European countries showed relatively high shares of older engineering workers.
Around one fifth of the employed engineering workers in the Czech Republic, the Slovak Re-
public and Hungary were 55 years old or older. This is because in communist times, the promo-
tion of science and engineering was a focus of the governments in Eastern Europe and stu-
dents were encouraged to study engineering (cf. Simard, 2007; The Library of Congress, n. d).
However, the share of younger engineering workers in these countries also exceeded the aver-
age, implying that a sufficient number of replacements should be at hand in the future. A brain
drain towards western countries, though, might undermine this trend.
To sum up, countries such as Ireland and Spain, which had a very large share of engineering
workers below the age of 35 in 2007, are not likely to encounter replacement problems when
their older engineering workers leave the workforce. However, countries such as Germany, Bul-
garia and Norway, with a below-average share of young engineering workers, will face these
replacement problems.
Institut der deutschen Wirtschaft Köln European Engineering Report
________________________________________________________________________________________
________________________________________________________________________________________
October 26th 2009 Page 18 of 31
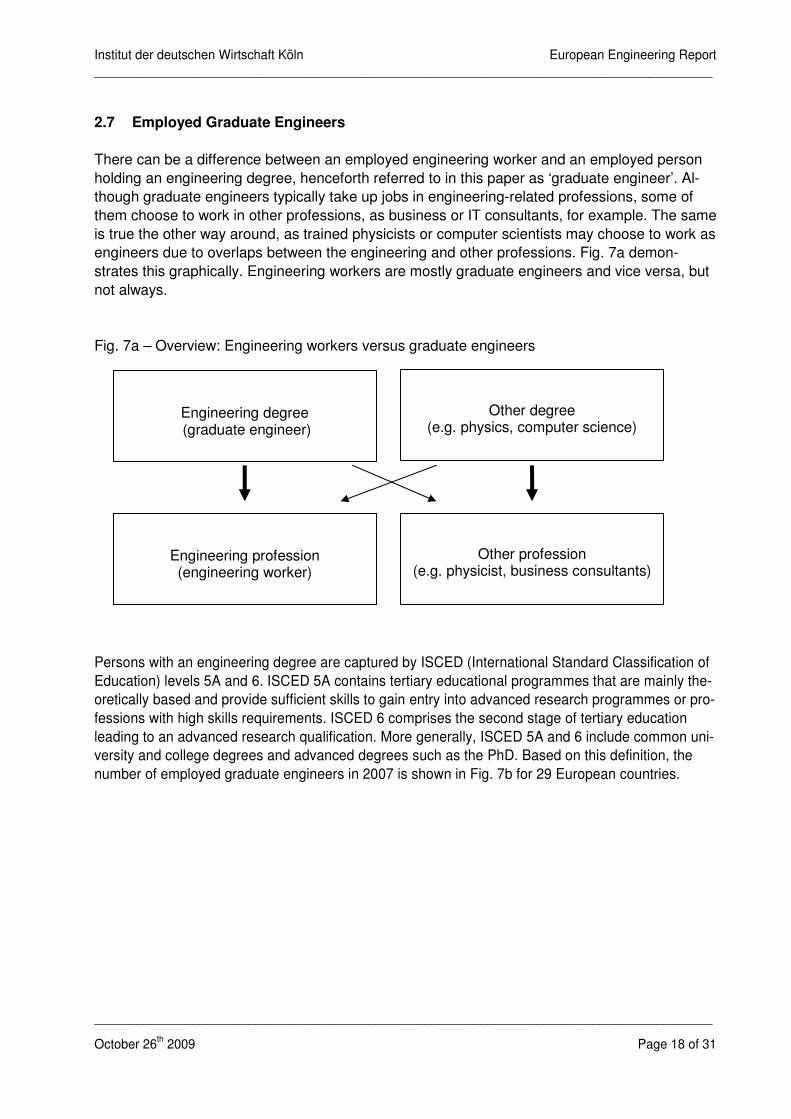
2.7 Employed Graduate Engineers
There can be a difference between an employed engineering worker and an employed person
holding an engineering degree, henceforth referred to in this paper as ‘graduate engineer’. Al-
though graduate engineers typically take up jobs in engineering-related professions, some of
them choose to work in other professions, as business or IT consultants, for example. The same
is true the other way around, as trained physicists or computer scientists may choose to work as
engineers due to overlaps between the engineering and other professions. Fig. 7a demon-
strates this graphically. Engineering workers are mostly graduate engineers and vice versa, but
not always.
Fig. 7a – Overview: Engineering workers versus graduate engineers
Persons with an engineering degree are captured by ISCED (International Standard Classification of
Education) levels 5A and 6. ISCED 5A contains tertiary educational programmes that are mainly the-
oretically based and provide sufficient skills to gain entry into advanced research programmes or pro-
fessions with high skills requirements. ISCED 6 comprises the second stage of tertiary education
leading to an advanced research qualification. More generally, ISCED 5A and 6 include common uni-
versity and college degrees and advanced degrees such as the PhD. Based on this definition, the
number of employed graduate engineers in 2007 is shown in Fig. 7b for 29 European countries.
Engineering profession (engineering worker)
Other profession (e.g. physicist, business consultants)
Other degree (e.g. physics, computer science)
Engineering degree (graduate engineer)
Institut der deutschen Wirtschaft Köln European Engineering Report
________________________________________________________________________________________
________________________________________________________________________________________
October 26th 2009 Page 19 of 31
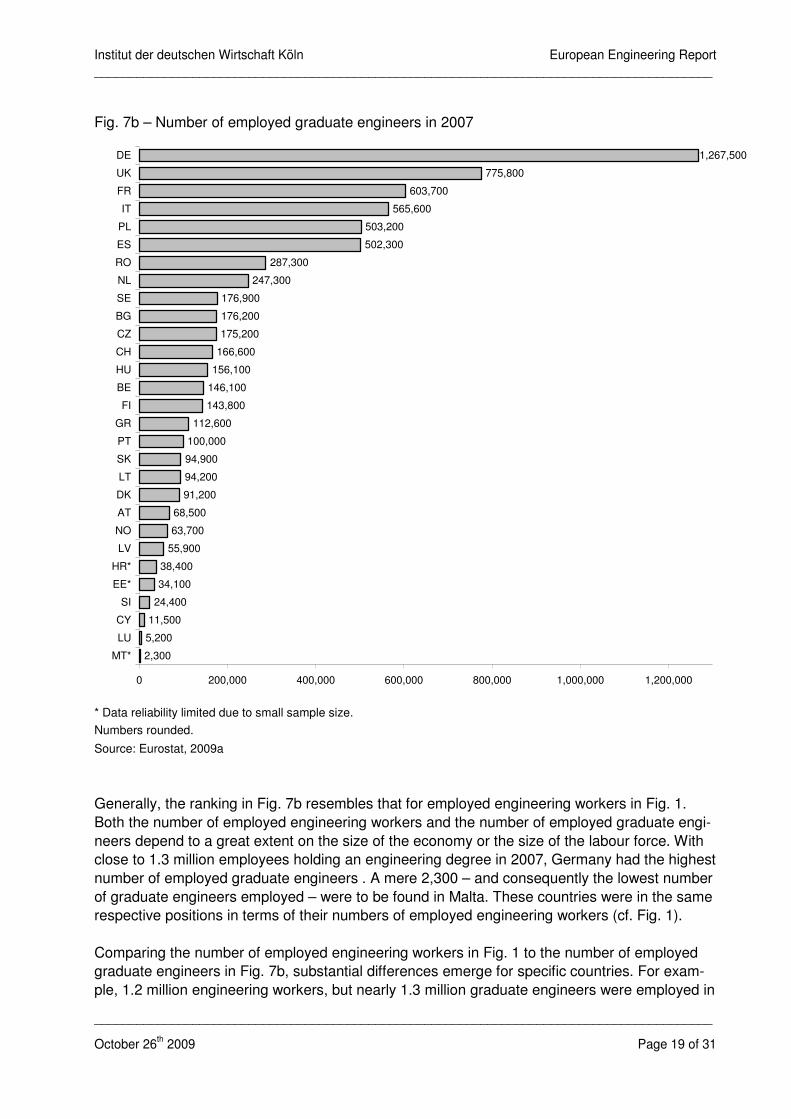
Fig. 7b – Number of employed graduate engineers in 2007
2,300
5,200
11,500
24,400
34,100
38,400
55,900
63,700
68,500
91,200
94,200
94,900
100,000
112,600
143,800
146,100
156,100
166,600
175,200
176,200
176,900
247,300
287,300
502,300
503,200
565,600
603,700
775,800
1,267,500
0 200,000 400,000 600,000 800,000 1,000,000 1,200,000
MT*
LU
CY
SI
EE*
HR*
LV
NO
AT
DK
LT
SK
PT
GR
FI
BE
HU
CH
CZ
BG
SE
NL
RO
ES
PL
IT
FR
UK
DE
* Data reliability limited due to small sample size.
Numbers rounded.
Source: Eurostat, 2009a
Generally, the ranking in Fig. 7b resembles that for employed engineering workers in Fig. 1.
Both the number of employed engineering workers and the number of employed graduate engi-
neers depend to a great extent on the size of the economy or the size of the labour force. With
close to 1.3 million employees holding an engineering degree in 2007, Germany had the highest
number of employed graduate engineers . A mere 2,300 – and consequently the lowest number
of graduate engineers employed – were to be found in Malta. These countries were in the same
respective positions in terms of their numbers of employed engineering workers (cf. Fig. 1).
Comparing the number of employed engineering workers in Fig. 1 to the number of employed
graduate engineers in Fig. 7b, substantial differences emerge for specific countries. For exam-
ple, 1.2 million engineering workers, but nearly 1.3 million graduate engineers were employed in
Institut der deutschen Wirtschaft Köln European Engineering Report
________________________________________________________________________________________
________________________________________________________________________________________
October 26th 2009 Page 20 of 31
Germany. By contrast, some countries exhibited a higher number of employed engineering
workers than employed graduate engineers. Luxembourg, for example, had 5,700 employed
engineering workers, but only 5,200 of its employees held an engineering degree.
The relation between engineering workers and graduate engineers in the labour force indicates
the country-specific composure of the engineering profession. If the number of employees hold-
ing an engineering degree exceeds the number of employed engineering workers, then at least
some engineering graduates are working in a job outside the engineering profession. For ex-
ample, the UK had 135,500 more graduate engineers than engineering workers. If all employed
engineering workers actually held an engineering degree, then 135,500 graduate engineers
were indeed working in non-engineering professions. Because it is possible that not all em-
ployed engineering workers actually held an engineering degree, the number of graduate engi-
neers working in a different profession could be even higher.
Fig. 7c visualizes this relationship. It displays the difference between employed graduate engi-
neers and employed engineering workers in relation to the employed graduate engineers. This
ratio – labelled x in the following formula – reveals the minimum percentage of employed
graduate engineers not working in the engineering profession.
engineersgraduateEmployed
workersgengineerinEmployedengineersgraduateEmployedx
−
=
Institut der deutschen Wirtschaft Köln European Engineering Report
________________________________________________________________________________________
________________________________________________________________________________________
October 26th 2009 Page 21 of 31
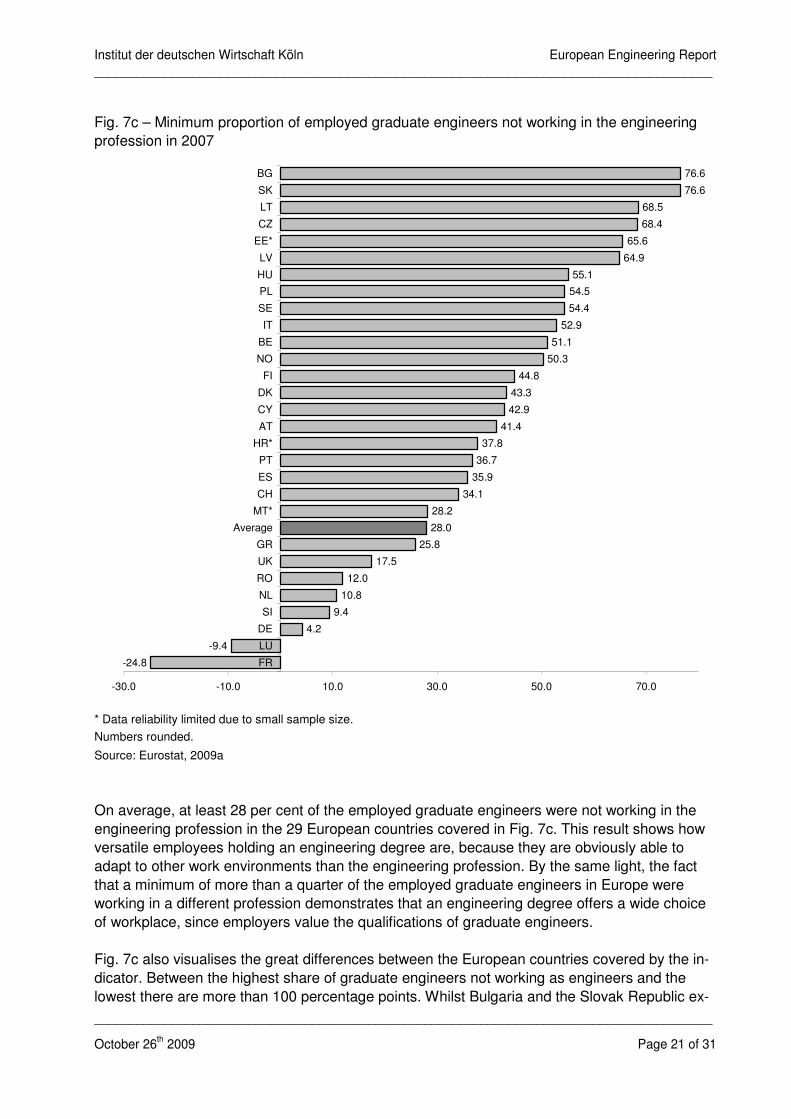
Fig. 7c – Minimum proportion of employed graduate engineers not working in the engineering
profession in 2007
-24.8
-9.4
4.2
9.4
10.8
12.0
17.5
25.8
28.0
28.2
34.1
35.9
36.7
37.8
41.4
42.9
43.3
44.8
50.3
51.1
52.9
54.4
54.5
55.1
64.9
65.6
68.4
68.5
76.6
76.6
-30.0 -10.0 10.0 30.0 50.0 70.0
FR
LU
DE
SI
NL
RO
UK
GR
Average
MT*
CH
ES
PT
HR*
AT
CY
DK
FI
NO
BE
IT
SE
PL
HU
LV
EE*
CZ
LT
SK
BG
* Data reliability limited due to small sample size.
Numbers rounded.
Source: Eurostat, 2009a
On average, at least 28 per cent of the employed graduate engineers were not working in the
engineering profession in the 29 European countries covered in Fig. 7c. This result shows how
versatile employees holding an engineering degree are, because they are obviously able to
adapt to other work environments than the engineering profession. By the same light, the fact
that a minimum of more than a quarter of the employed graduate engineers in Europe were
working in a different profession demonstrates that an engineering degree offers a wide choice
of workplace, since employers value the qualifications of graduate engineers.
Fig. 7c also visualises the great differences between the European countries covered by the in-
dicator. Between the highest share of graduate engineers not working as engineers and the
lowest there are more than 100 percentage points. Whilst Bulgaria and the Slovak Republic ex-
Institut der deutschen Wirtschaft Köln European Engineering Report
________________________________________________________________________________________
________________________________________________________________________________________
October 26th 2009 Page 22 of 31
hibited very high shares of about 77 per cent of graduate engineers not working in the engineer-
ing profession, around a quarter of French engineering workers actually did not hold an engi-
neering degree in 2007.
France is not the only country where the data indicate that not all employed engineering work-
ers hold a corresponding degree. At least one in ten engineering workers in Luxembourg had
not received an engineering degree from a college or university. This proportion could indicate
that these two countries are suffering a shortage of graduate engineers, thus having to fill va-
cancies with applicants with other degrees. However, this conclusion must be tentative. In
France, the job title “engineer” (ingénieur) is not defined by law (cf. VDI, 2002), with the result
that it can be used to describe jobs which do not require a graduate engineer. In consequence,
the number of employed engineering workers in France could be an overestimate if the French
definition of engineering worker was wider than in the European countries where the job title is
protected by law.
For some European countries, the low minimum proportion of graduate engineers not working in
their profession indicates a rather good match. Examples of this are Germany at 4.2 per cent,
Sweden at 9.4 per cent and Luxembourg at 9.4 per cent. This does not mean that all engineer-
ing positions in these countries have in fact been filled by engineering graduates but only that,
theoretically, they could have been.
Eastern European countries mostly exhibited large shares of graduate engineers not working in
the profession for which they were trained. More than 65 per cent of employees in Bulgaria, the
Slovak Republic, Lithuania, the Czech Republic and Estonia who had acquired an engineering
degree were not working in their profession. During communism, these countries encouraged
students to study engineering (cf. Simard, 2007). Hence, the number of engineering graduates
was exceptionally high during these times. This could explain the high percentage of graduate
engineers in the workforce working outside the engineering profession. The countries ranked
among the top 8 in Fig. 7c are all former communist countries, supporting this hypothesis.
In summary, whereas the majority of the European countries covered by the indicator exhibited
a much higher number of employed graduate engineers than employed engineering workers,
some of the engineering workers in Luxembourg and France did not hold an engineering degree
in 2007. On average, at least 28 per cent of the graduate engineers in the workforce were work-
ing in a different profession.
Institut der deutschen Wirtschaft Köln European Engineering Report
________________________________________________________________________________________
________________________________________________________________________________________
October 26th 2009 Page 23 of 31
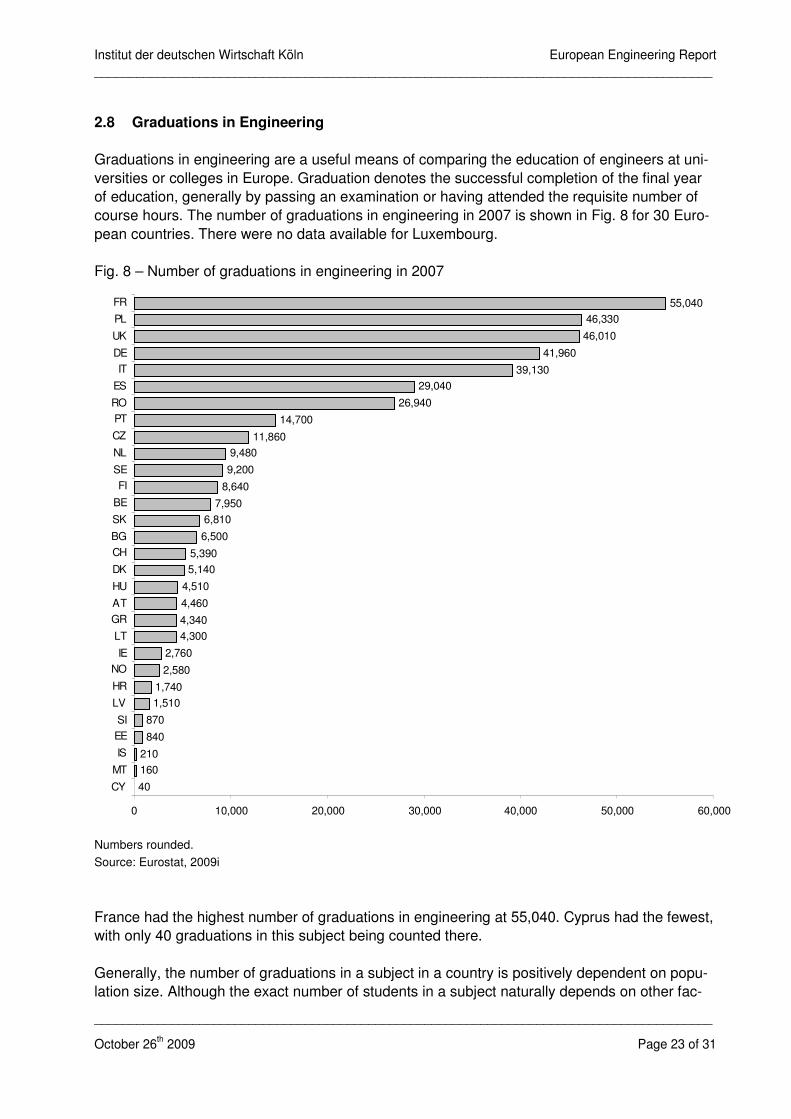
2.8 Graduations in Engineering
Graduations in engineering are a useful means of comparing the education of engineers at uni-
versities or colleges in Europe. Graduation denotes the successful completion of the final year
of education, generally by passing an examination or having attended the requisite number of
course hours. The number of graduations in engineering in 2007 is shown in Fig. 8 for 30 Euro-
pean countries. There were no data available for Luxembourg.
Fig. 8 – Number of graduations in engineering in 2007
40
160
210
840
870
1,510
1,740
2,580
2,760
4,300
4,340
4,460
4,510
5,140
5,390
6,500
6,810
7,950
8,640
9,200
9,480
11,860
14,700
26,940
29,040
39,130
41,960
46,010
46,330
55,040
0 10,000 20,000 30,000 40,000 50,000 60,000
CY
MT
IS
EE
SI
LV
HR
NO
IE
LT
GR
AT
HU
DK
CH
BG
SK
BE
FI
SE
NL
CZ
PT
RO
ES
IT
DE
UK
PL
FR
Numbers rounded.
Source: Eurostat, 2009i
France had the highest number of graduations in engineering at 55,040. Cyprus had the fewest,
with only 40 graduations in this subject being counted there.
Generally, the number of graduations in a subject in a country is positively dependent on popu-
lation size. Although the exact number of students in a subject naturally depends on other fac-
Institut der deutschen Wirtschaft Köln European Engineering Report
________________________________________________________________________________________
________________________________________________________________________________________
October 26th 2009 Page 24 of 31
tors as well, such as the proportion of high school graduates going on to study or the attractive-
ness of the subject, in most instances larger countries have more students. A higher number of
students then results in more graduations. The number of engineering workers in a country and
the number of graduations in engineering are also interdependent. The more engineering work-
ers are employed in a country, the more important a high number of graduations becomes if all
the vacancies due to retirement are to be filled. This is demonstrated in Fig. 8. The seven coun-
tries ranked highest with respect to their number of employed engineering workers (cf. Fig. 1)
also rank among the top 7 with respect to their number of graduations in engineering. Besides
France, Poland, the UK, Germany, Italy, Spain, and Romania exhibited the highest numbers of
graduations, with numbers varying between 26,940 and 55,040. The wide span in the number of
graduations in engineering is obvious even with respect to only the largest European econo-
mies.
A comparison of the absolute numbers for the European countries always reveals a wide range
due to different country size, for example. This is also true here and makes useful comparisons
difficult. Basically, Fig. 8 displays three bands of countries grouped according to the number of
their graduations in engineering. Each covers about a third of the European countries included.
The first band contains countries such as Ireland, Norway and Latvia that had relatively few
graduations in engineering, at most 2,760, in 2007. The second band features an intermediate
number of graduations in 2007. Countries such as the Netherlands, Sweden and Switzerland
mustered between 4,300 and 9,480 graduations in engineering. Finally, the last group includes
the top 7 countries together with Portugal and the Czech Republic, which all had more than
11,000 graduations in engineering.
The number of graduations in engineering is strongly dependent on factors such as population
size and number of students. Therefore, the results cannot be easily compared. France, with
more than 55,000 graduations, and Cyprus, with less than 50 in 2007, show how widely the
European countries differ in this respect.
Institut der deutschen Wirtschaft Köln European Engineering Report
________________________________________________________________________________________
________________________________________________________________________________________
October 26th 2009 Page 25 of 31
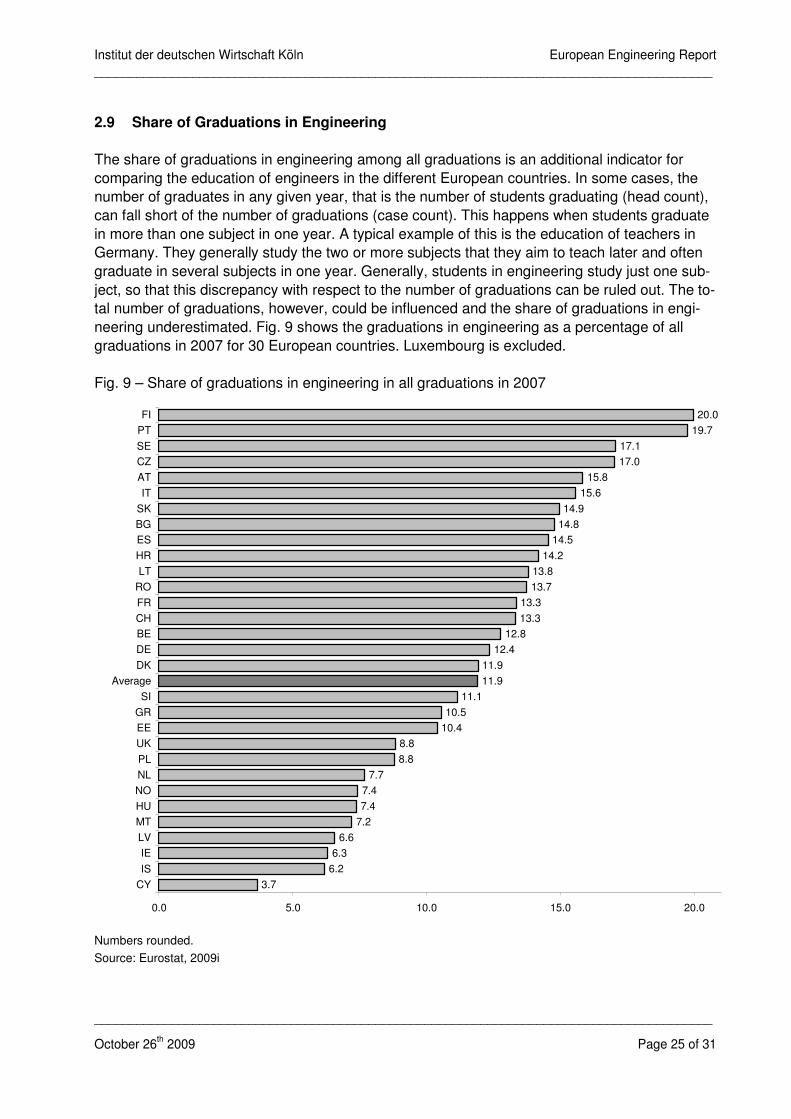
2.9 Share of Graduations in Engineering
The share of graduations in engineering among all graduations is an additional indicator for
comparing the education of engineers in the different European countries. In some cases, the
number of graduates in any given year, that is the number of students graduating (head count),
can fall short of the number of graduations (case count). This happens when students graduate
in more than one subject in one year. A typical example of this is the education of teachers in
Germany. They generally study the two or more subjects that they aim to teach later and often
graduate in several subjects in one year. Generally, students in engineering study just one sub-
ject, so that this discrepancy with respect to the number of graduations can be ruled out. The to-
tal number of graduations, however, could be influenced and the share of graduations in engi-
neering underestimated. Fig. 9 shows the graduations in engineering as a percentage of all
graduations in 2007 for 30 European countries. Luxembourg is excluded.
Fig. 9 – Share of graduations in engineering in all graduations in 2007
3.7
6.2
6.3
6.6
7.2
7.4
7.4
7.7
8.8
8.8
10.4
10.5
11.1
11.9
11.9
12.4
12.8
13.3
13.3
13.7
13.8
14.2
14.5
14.8
14.9
15.6
15.8
17.0
17.1
19.7
20.0
0.0 5.0 10.0 15.0 20.0
CY
IS
IE
LV
MT
HU
NO
NL
PL
UK
EE
GR
SI
Average
DK
DE
BE
CH
FR
RO
LT
HR
ES
BG
SK
IT
AT
CZ
SE
PT
FI
Numbers rounded.
Source: Eurostat, 2009i
Institut der deutschen Wirtschaft Köln European Engineering Report
________________________________________________________________________________________
________________________________________________________________________________________
October 26th 2009 Page 26 of 31
On average, around 12 out of every 100 graduations in the 30 countries covered by this indica-
tor were in engineering. More than half of these countries had an above average share. Only 13
countries exhibited a share of graduations in engineering below 11.9 per cent. The range of
shares covered was quite large: Between the highest share at 20 per cent and the lowest, at
just 3.7 per cent, were 16.3 percentage points. In other words, the highest share of graduations
in engineering among all graduations was more than five times the lowest.
At 20 per cent, Finland’s share of graduations in engineering was the highest in Europe. Simi-
larly high shares were to be found in Portugal at 19.7 per cent, Sweden at 17.1 per cent and the
Czech Republic at 17.0 per cent. In contrast, a mere 3.7 per cent of all graduations in Cyprus
were obtained in engineering, the lowest share of all European countries covered by the indica-
tor. Fig. 8 demonstrates that this country not only had the smallest share, but also the smallest
number, of graduations in this subject so that educating engineers seemed to play hardly any
role in Cyprus. Iceland (6.2 per cent), Ireland (6.3 per cent) and Latvia (6.6 per cent) had the
next highest shares of graduations in engineering, but these were still comparatively low.
The above-mentioned low share of graduations in engineering in Ireland (6.3 per cent) stands
out because the country had an exceptionally high share of young engineering workers in 2007
(cf. Fig. 6). Nearly half of all Irish engineering workers were younger than 35 years in 2007. The
low share of graduations in engineering seems to conflict with this. Around 25,000 employed
Irish engineering workers were younger than 35 in 2007. During that same year, there were
2,760 graduations in engineering in Ireland. Taking into account the fact that Irish tertiary
graduates are comparatively young (cf. OECD, 2009), this number of graduations in the past
few years would in fact have been more than sufficient to provide all those young engineering
workers that are part of the Irish workforce now. Still, Ireland actively promotes the study of en-
gineering through various initiatives aimed at young people in order to increase the number of
engineering students and graduations. Examples include “STEPS to engineering”
(www.steps.ie) and “Discover science + engineering” (www.discover-science.ie).
All in all, the share of graduations in engineering among all graduations in 2007 varied widely
between countries. Finland had the highest share at 20 per cent, whilst Cyprus’ share, at only
3.7 per cent, was negligible.
Institut der deutschen Wirtschaft Köln European Engineering Report
________________________________________________________________________________________
________________________________________________________________________________________
October 26th 2009 Page 27 of 31
2.10 The Scientific Ability of 15-year-olds
Besides the labour market for engineers in Europe and the young engineers being educated at
universities and colleges in Europe, the scientific abilities of high school students can also indi-
cate the future of engineering in any given country. The scientific abilities of 15-year-olds can
serve as a proxy for the importance attached to science in school and signal how well students
are prepared for studying engineering. Fig. 10 presents data on two respective items for 29
European countries: On the one hand, the chart shows the mean PISA (Programme for Interna-
tional Student Assessment) score of 15-year-olds in science. It measures how well students use
scientific knowledge, identify questions and draw evidence-based conclusions. On the other
hand, Fig. 10 shows the percentage of 15-year-olds at PISA level 6 in science. This is the high-
est proficiency level within the PISA framework and indicates that a student is able to handle
advanced scientific thinking and reasoning. To reach this level, students have to obtain at least
707.9 points in the science section of the PISA assessment. In general, each student is as-
signed to the highest proficiency level for which they would be expected to answer the majority
of assessment questions correctly (cf. OECD, 2007). All data are for 2006.
Institut der deutschen Wirtschaft Köln European Engineering Report
________________________________________________________________________________________
________________________________________________________________________________________
October 26th 2009 Page 28 of 31
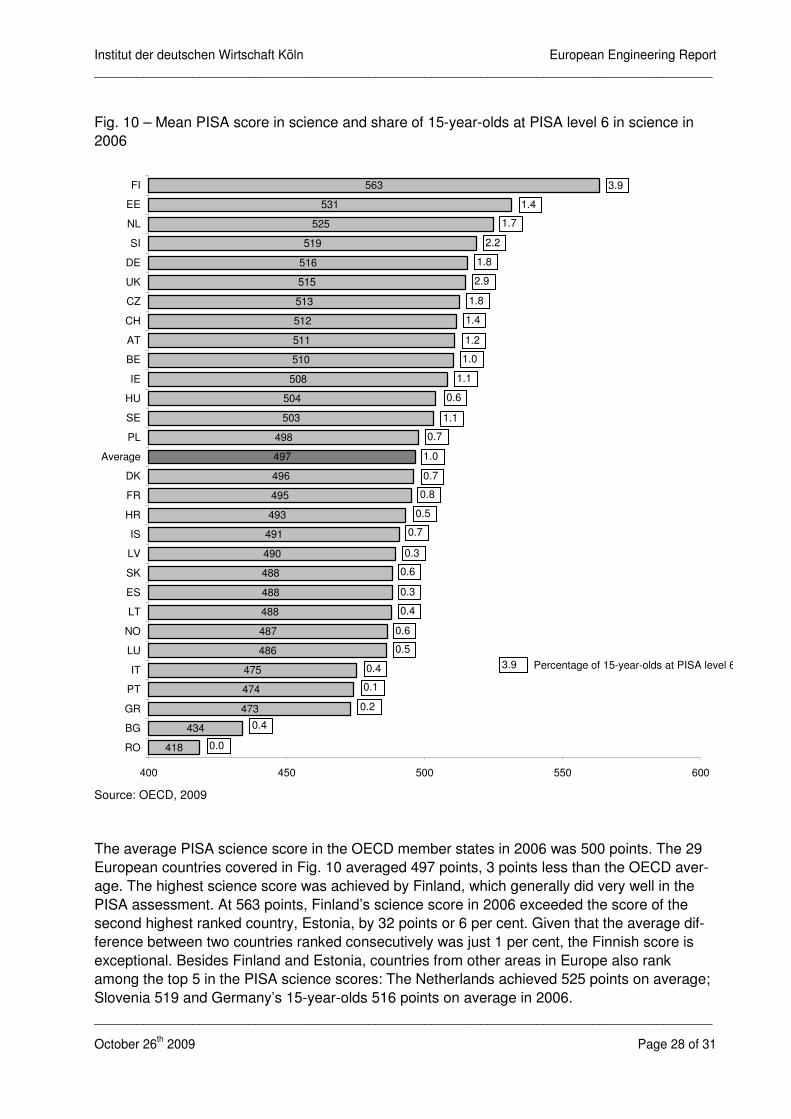
Fig. 10 – Mean PISA score in science and share of 15-year-olds at PISA level 6 in science in
2006
418
434
473
474
475
486
487
488
488
488
490
491
493
495
496
497
498
503
504
508
510
511
512
513
515
516
519
525
531
563
400 450 500 550 600
RO
BG
GR
PT
IT
LU
NO
LT
ES
SK
LV
IS
HR
FR
DK
Average
PL
SE
HU
IE
BE
AT
CH
CZ
UK
DE
SI
NL
EE
FI 3.9
1.4
%1.7
%2.2
%1.8
2.9
%1.8
%1.4
1.2
%1.0
%1.1
%0.6
1.1
%0.7
%1.0
%0.7
%0.8
%0.5
%0.7
%0.3
0.6
%0.3
%0.4
0.6
0.5
%0.4
0.1
%0.2
%0.4
%0.0
%
3.9
%
Percentage of 15-year-olds at PISA level 6
Source: OECD, 2009
The average PISA science score in the OECD member states in 2006 was 500 points. The 29
European countries covered in Fig. 10 averaged 497 points, 3 points less than the OECD aver-
age. The highest science score was achieved by Finland, which generally did very well in the
PISA assessment. At 563 points, Finland’s science score in 2006 exceeded the score of the
second highest ranked country, Estonia, by 32 points or 6 per cent. Given that the average dif-
ference between two countries ranked consecutively was just 1 per cent, the Finnish score is
exceptional. Besides Finland and Estonia, countries from other areas in Europe also rank
among the top 5 in the PISA science scores: The Netherlands achieved 525 points on average;
Slovenia 519 and Germany’s 15-year-olds 516 points on average in 2006.
Institut der deutschen Wirtschaft Köln European Engineering Report
________________________________________________________________________________________
________________________________________________________________________________________
October 26th 2009 Page 29 of 31
Romania scored lowest of all the countries included in the indicator. In 2006, its PISA science
score came to just 418 points. The second lowest score was Bulgaria’s at 434 points. These two
Eastern European countries are the most recent countries to have joined the European Union.
After years under communist regimes, their educational systems are still being reformed. The
Romanian PISA score was around a quarter lower than the Finnish one, which was the highest
score. The difference amounted to 145 points. Thus Romanian 15-year-olds were far worse
prepared for further education and a career in engineering than Finnish teenagers. The Roma-
nian PISA science score was just 84 per cent of the average score of the 29 European coun-
tries, whereas the Finnish score was 13 per cent higher than the average.
In the OECD member states, the average percentage of 15-year-olds at PISA level 6 in science
in 2006 was 1.3 per cent. Again, the European countries averaged slightly lower at 1.0 per cent,
although a high average PISA score in science and a high percentage of students at level 6 do
not necessarily go hand in hand. Nevertheless, in Finland the highest PISA science score and
the highest percentage of students at PISA level 6 in science coincided in 2006. 3.9 per cent of
the 15-year-olds in the country – and hence nearly four times as many as the average in Europe
– reached the highest proficiency level. Also, the Finnish percentage was around a third higher
than the percentage of 15-year-olds at level 6 in the UK, the country with the second highest
share in 2006 at 2.9 per cent. The five countries with the highest fraction of students reaching
level 6 in science were Finland, the UK, Slovenia (2.2 per cent), Germany and the Czech Re-
public (each at 1.8 per cent).
In 2006, Romania had both the lowest PISA score in science and the lowest percentage of 15-
year-olds at PISA level 6 in science. Indeed, no Romanian 15-year-olds reached this level. For
a country which employed a significant number of engineers in 2007 (cf. Fig. 1), this will pose a
serious problem in the future.
Also among the countries that featured relatively small percentages of 15-year-olds at PISA
level 6 in science were the Mediterranean countries Portugal (0.1 per cent), Greece (0.2 per
cent) and Spain (0.3 per cent). They only attained between 10 and 30 per cent of the average
percentage of teenagers at this proficiency level. Also, their shares were only between 3 and 8
per cent of the highest share. Here again, there was a wide range of results.
Overall, Finnish 15-year-olds seem to be exceptionally well prepared for further education and a
career in engineering. On the other hand, Romania, with its 15-year-olds lagging far behind, will
most likely face a dearth of young engineers in the future.
Institut der deutschen Wirtschaft Köln European Engineering Report
________________________________________________________________________________________
________________________________________________________________________________________
October 26th 2009 Page 30 of 31
Literature
Bosch, Nicole / Deelen, Anja / Euwals, Rob, 2008, Is Part-time Employment Here To Stay?
Evidence from the Dutch Labour Force Survey 1992-2005, IZA Discussion Paper No. 3367,
URL: http://www.iza.org [Status quo: 2009-08-28]
Erdmann, Vera / Koppel, Oliver, 2009, Ingenieurarbeitsmarkt 2008/09 – Fachkräftelücke, De-
mografie und Ingenieure 50Plus, URL:
http://www.vdi.de/fileadmin/vdi_de/redakteur_dateien/dps_dateien/2009-04-20-Studie%20VDI-
IW2.pdf [Status quo: 2009-09-24]
European Commission, 2004, Wasted talents: the situation of women scientists in Eastern
European countries, URL: http://ec.europa.eu/research/press/2004/pr3001en.html [Status quo:
2009-08-31]
Eurostat, 2009a, European Labour Force Survey 2007, Luxembourg
Eurostat, 2009b, Population by sex, age groups, nationality and labour status (1000), URL:
http://epp.eurostat.ec.europa.eu/portal/page/portal/employment_unemployment_lfs/data/databa
se [Status quo: 2009-09-03]
Eurostat, 2009c, Full-time and part-time employment by sex, age groups and highest level of
education attained (1000), URL:
http://epp.eurostat.ec.europa.eu/portal/page/portal/employment_unemployment_lfs/data/databa
se [Status quo: 2009-08-28]
Eurostat, 2009d, Main reason for part-time employment – Distribution for a given sex and age
group (%), URL:
http://epp.eurostat.ec.europa.eu/portal/page/portal/employment_unemployment_lfs/data/databa
se [Status quo: 2009-08-28]
Eurostat, 2009e, Employment by sex, age groups and highest level of education attained
(1000), URL:
http://epp.eurostat.ec.europa.eu/portal/page/portal/employment_unemployment_lfs/data/databa
se [Status quo: 2009-08-31]
Eurostat, 2009f, Inactive population by sex, age group and willingness to work (1000), URL:
http://epp.eurostat.ec.europa.eu/portal/page/portal/employment_unemployment_lfs/data/databa
se [Status quo: 2009-08-31]
Eurostat, 2009g, Total intramural R&D expenditure (GERD) by sectors of performance, URL:
http://epp.eurostat.ec.europa.eu/portal/page/portal/science_technology_innovation/data/databas
e [Status quo: 2009-09-02]
Eurostat, 2009h, Innovation in high-tech sectors (CIS 2006), EU Member States and selcted
countries, URL:
http://epp.eurostat.ec.europa.eu/portal/page/portal/science_technology_innovation/data/databas
e [Status quo: 2009-09-02]
Institut der deutschen Wirtschaft Köln European Engineering Report
________________________________________________________________________________________
________________________________________________________________________________________
October 26th 2009 Page 31 of 31
Eurostat, 2009i, Graduates in ISCED 3 to 6 by field of education and sex, URL:
http://epp.eurostat.ec.europa.eu/portal/page/portal/education/data/database [Status quo: 2009-
09-01]
Eurostat, 2009j, Average number of usual weekly working hours of work in main job, by sex,
professional status, full-time/part-time and occupation (hours), URL:
http://epp.eurostat.ec.europa.eu/portal/page/portal/employment_unemployment_lfs/data/databa
se [Status quo: 2009-09-24]
ILO – International Labour Organization, 2004, ISCO International Standard Classification of
Occupations, URL: http://www.ilo.org/public/english/bureau/stat/isco/isco88/index.htm [Status
quo: 2009-10-07]
Simard, Caroline, 2007, The state of Women and Technology Fields around the World, Anita
Borg Institute for Women and Technology, URL:
http://anitaborg.org/files/womenhightechworld.pdf [Status quo: 2009-08-27]
OECD – Organisation for Economic Co-operation and Development, 2007, PISA 2006, Science
Competencies for Tomorrow’s World, Volume 1: Analysis, URL: h
http://puck.sourceoecd.org/vl=2793935/cl=45/nw=1/rpsv/cgi-
bin/fulltextew.pl?prpsv=/ij/oecdthemes/99980029/v2007n18/s1/p1l.idx [Status Quo: 2009-09-29]
OECD – Organisation for Economic Co-operation and Development, 2009, Education at a
Glance 2009, URL: http://lysander.sourceoecd.org/vl=1238529/cl=48/nw=1/rpsv/cgi-
bin/fulltextew.pl?prpsv=/ij/oecdthemes/99980029/v2009n17/s1/p1l.idx [Status Quo: 2009-09-29]
The Library of Congress, n. d., A Country Study: Soviet Union (Former), Federal Research Di-
vision, URL: http://lcweb2.loc.gov/frd/cs/sutoc.html [Status quo: 2009-09-24]
van Doorne-Huiskes, Anneke, 2004, Working Time and Social Policy in the Netherlands,
Utrecht University, International Conference Working Time and Social Security in a Life-Long
Perspective, Berlin, URL: http://www.boeckler.de/pdf/wsi_2004_09_arbeitszeit_doorne.pdf
[Status quo: 2009-08-28]
VDI – Verein Deutscher Ingenieure, 2002, Ingenieurregister in europäischen Ländern, Frank-
reich – Großbritannien – Italien – Schweiz URL:
http://www.vdi.de/fileadmin/media/images/hauptgruppe/bg/Ingenieurregister_in_europaeischen_
Laendern.pdf [Status quo: 2009-09-25]