Evaluation of ecological benefits and risks of biochar systems fileGierig nimmt die Kohle aus Holz...
111
Institut für Agrar- und Ernährungswissenschaften der Naturwissenschaftlichen Fakultät III der Martin-Luther-Universität Halle-Wittenberg Evaluation of ecological benefits and risks of biochar systems Dissertation zur Erlangung des Doktorgrades der Agrarwissenschaften vorgelegt von Diplom-Wirtschaftsingenieur Sebastian Meyer geb. am 19.07.1980 in Starnberg Gutachter: Prof. Dr. Bruno Glaser Prof. Dr. - Ing. Peter Quicker Verteidigung am 30. Juni 2014
Transcript of Evaluation of ecological benefits and risks of biochar systems fileGierig nimmt die Kohle aus Holz...
Institut für Agrar- und Ernährungswissenschaften
der Naturwissenschaftlichen Fakultät III
der
Martin-Luther-Universität
Halle-Wittenberg
Evaluation of ecological benefits and risks of biochar systems
Dissertation
zur Erlangung des
Doktorgrades der Agrarwissenschaften
vorgelegt von
Diplom-Wirtschaftsingenieur Sebastian Meyer
geb. am 19.07.1980 in Starnberg
Gutachter:
Prof. Dr. Bruno Glaser
Prof. Dr. - Ing. Peter Quicker
Verteidigung am 30. Juni 2014

Gierig nimmt die Kohle aus Holz
Materie und Licht in sich auf
Großzügig stellt sie
Lebensraum und Wärme
Zur Verfügung
Doch das Wissen
Um ihr Wesen
Gibt sie
Nur widerstrebend preis
TABLE OF CONTENTS I
Table of Contents
Table of Contents ........................................................................................................................ I
Tables ........................................................................................................................................ IV
Figures ....................................................................................................................................... VI
Abbreviations and Symbols ...................................................................................................... VII
1 Introduction ...................................................................................................................... 11
1.1 General background .................................................................................................. 11
1.2 Objectives and structure of this thesis ...................................................................... 12
2 Technical, economical and climate related aspects of biochar production technologies:
A literature review.................................................................................................................... 15
2.1 Summary .................................................................................................................... 15
2.2 Introduction ............................................................................................................... 16
2.3 Methodology ............................................................................................................. 17
2.4 Overview on carbonization technologies .................................................................. 18
2.5 Technological maturity of carbonization technologies ............................................. 20
2.5.1 Pyrolysis technologies ........................................................................................ 21
2.5.2 Gasification ......................................................................................................... 21
2.5.3 Summary ............................................................................................................ 22
2.6 Profitability analyses of carbonization technologies ................................................. 23
2.6.1 Pyrolysis .............................................................................................................. 23
2.6.2 Gasification ......................................................................................................... 26
2.6.3 Flash Carbonization ............................................................................................ 27
2.6.4 Summary ............................................................................................................ 28
2.7 Greenhouse gas (GHG) balance of biochar production and application .................. 30
TABLE OF CONTENTS II
2.7.1 Pyrolysis technologies ........................................................................................ 33
2.7.2 Gasification ......................................................................................................... 35
2.7.3 Summary ............................................................................................................ 35
2.8 Outlook ...................................................................................................................... 36
3 Albedo impact on the suitability of biochar systems to mitigate global warming .......... 38
3.1 Summary .................................................................................................................... 38
3.2 Introduction ............................................................................................................... 39
3.3 Materials and methods.............................................................................................. 40
3.3.1 Overview of the modeled biochar system ......................................................... 40
3.3.2 Albedo impact of biochar application ................................................................ 41
3.3.3 The impact of biogenic and time-distributed emissions .................................... 49
3.4 Results ........................................................................................................................ 53
3.5 Discussion .................................................................................................................. 59
4 Thermal removal of polycyclic aromatic hydrocarbons from gasification biochars ........ 64
4.1 Introduction ............................................................................................................... 64
4.2 Materials and methods.............................................................................................. 65
4.2.1 Comparison of PAH analysis methods for gasification residues (1st experiment) .
............................................................................................................................ 65
4.2.2 Testing the functional efficiency of the PAH volatilization unit (2nd and 3rd
experiment) ...................................................................................................................... 66
4.2.3 Redesign of the PAH volatilization unit (4th experiment) ................................. 67
4.2.4 PAH volatilization in a laboratory scale experiment (5th experiment).............. 68
4.2.5 Statistical Analysis .............................................................................................. 68
4.3 Results ........................................................................................................................ 68
4.3.1 Comparison of PAH analysis methods for gasification residues (1st experiment)
............................................................................................................................ 68
4.3.2 Functional efficiency of the PAH volatilization unit (2nd and 3rd experiment) 70
TABLE OF CONTENTS III
4.3.3 Redesign of the PAH volatilization unit (4th experiment) .................................. 74
4.3.4 PAH volatilization in a laboratory scale experiment (5th experiment) ............... 75
4.4 Discussion .................................................................................................................. 76
4.5 Conclusion ................................................................................................................. 79
5 General Discussion ........................................................................................................... 81
5.1 The development status of carbonization technologies ........................................... 81
5.2 PAH levels in gasification biochars ............................................................................ 82
5.3 The overall climate impact of biochar systems ......................................................... 84
5.4 Expanding the point of view ...................................................................................... 86
6 Overall Conclusions .......................................................................................................... 87
7 Summary .......................................................................................................................... 90
8 Zusammenfassung ............................................................................................................ 93
9 References ........................................................................................................................ 96
10 Appendix ......................................................................................................................... 105
TABLES IV
Tables
Table 1: Publications identified and reviewed per category ................................................... 18
Table 2: Solid product yields, solid product carbon content and carbon yield of different
technologies ............................................................................................................................. 19
Table 3: Selection of technology-specific challenges ............................................................... 20
Table 4: Annual availability of electricity production systems ................................................ 22
Table 5: Productions costs for char and energy carriers as indicated in reviewed papers ..... 29
Table 6: Climate impacts of biochar production technologies ................................................ 31
Table 7: Donndorf field trial setup ........................................................................................... 42
Table 8: Pot trial setup ............................................................................................................. 42
Table 9: GWP characterization factors (for a TH of 20, 100 and 500 years) of a stand-alone
bioenergy system per kg biogenic CO2 emission from bioenergy production when 1-yr.
rotation and 50-yr. rotation biomass is used as feedstock ...................................................... 51
Table 10: GWP albedo characterization factors for a time horizon of 20, 100 and 500 years 56
Table 11: GWP characterization factors (for a TH of 20, 100 and 500 years) of the combined
biochar – bioenergy system per kg biogenic CO2 emission from bioenergy production when
50-yr. rotation is used as a feedstock ...................................................................................... 57
Table 12: GWP characterization factors (for a TH of 20, 100 and 500 years) of the combined
biochar – bioenergy system per kg biogenic CO2 emission from bioenergy production when
straw from an annual crop is used as a feedstock ................................................................... 57
Table 13: Overall climate impact of the biochar system for wheat cultivation (TH = 100). .... 58
Table 14: Overall climate impact of the stand-alone bioenergy system (TH = 100) ................ 59
Table 15: Comparison of the two PAH analysis methods using either acetone or toluene for
extraction (1st experiment). .................................................................................................... 69
Table 16: Comparison of the two PAH analysis methods using either acetone or toluene for
extraction (1st experiment). Detailed results. .......................................................................... 70
Table 17: PAH reduction in PAH volatilization unit (2nd experiment). ..................................... 71
Table 18: PAH reduction in PAH volatilization unit (2nd experiment). Detailed results. ........ 72
Table 19: PAH reduction in PAH volatilization unit (3rd experiment) ..................................... 72
Table 20: PAH reduction in PAH volatilization unit (3rd experiment). Detailed results. ......... 73

TABLES V
Table 21: PAH reduction in PAH volatilization (4th experiment). ............................................ 74
Table 22: PAH reduction in PAH volatilization (4th experiment). Detailed results. ................ 74
Table 23: PAH content in gasification residues from the laboratory scale experiment
(5th experiment)........................................................................................................................ 75
Table 24: PAH content in gasification residues from the laboratory scale experiment
(5th experiment). Detailed results. ........................................................................................... 75
FIGURES VI
Figures
Figure 1: Impact of biochar production on the natural carbon cycle ...................................... 32
Figure 2: Location of the field trial close to Donndorf near Bayreuth, Germany .................... 42
Figure 3: (Top) Albedo of FT soil samples before (black circles) and after (empty circles)
modest drying. (Bottom). Albedo of the PT series soil samples. ............................................. 54
Figure 4: (Top) Monthly changes in surface albedo in the first year after biochar application
to Wheat and Rapeseed fields near Donndorf, Germany. (Upper Middle) Monthly incoming
solar radiation at the top of the atmosphere (“TOA”). (Lower Middle) Monthly mean two-
way transmittance (“fatm”) of solar radiation throughout the atmosphere. (Bottom)
Instantaneous local radiative forcing (“RF”) associated with changes to surface albedo for the
two cases.. ................................................................................................................................ 55
Figure 5: Time-integrated radiative forcing (“iRF”) per 1 kg CO2 pulse emission of bioenergy
and biochar production compared to iRF per 1 kg CO2 from stand-alone bioenergy
production and to iRF per 1 kg CO2 from fossil CO2 emissions. ............................................... 57
Figure 6: Absolute Albedo Differences between control soil and (bio)char treatment from
Oguntunde et al. 2008 (left), Genesio et al. 2012 (middle) and field trial soil samples (right)
.................................................................................................................................................. 61
Figure 7: PAH volatilization unit (Source: Patent Specification) .............................................. 66
Figure 8: Boxplots indicating the median (central black bar), the minimum and maximum
(lower and upper whisker) and the lower and upper quartile (lower end upper end of the
box) of the Σ EPA16 PAH contents in mg/kg DM in three gasification residue samples after
application of the analysis method DIN 13877:A (left) and DIN 13877:B (right)..................... 69
Figure 9: Boxplots indicating the median (central black bar), the minimum and maximum
(lower and upper whisker) and the lower and upper quartile (lower end upper end of the
box) of the Σ EPA16 PAH contents in mg/kg DM in three gasification residue samples after
application of the analysis method DIN 13877:A (left) and DIN 13877:B (right)..................... 71
Figure 10: Boxplots indicating the median (central black bar), the minimum and maximum
(lower and upper whisker) and the lower and upper quartile (lower end upper end of the
box) of the Σ EPA16 PAH contents in mg/kg DM in three gasification residue samples from
the 1st experiment (left) and from the 3rd experiment (right). .............................................. 73
ABBREVIATIONS AND SYMBOLS VII
Abbreviations and Symbols
ANOVA analysis of variance
BAM biochar application mass
C carbon
CAM compost application mass
CBC share of carbon in oven dry biomass contained in biochar
CE oxidized carbon fraction of dry biomass during biochar production process
CH4 methane
Cl chlorine
CO2 carbon dioxide
CO2-C carbon content in carbon dioxide
CO2e carbon dioxide equivalent
DM dry mass
eq equation
Atmfɶ monthly average of two-way atmospheric transmittance parameter
gf fraction of green vegetation at a certain point in time
gfɶ average monthly fraction of green vegetation
scfɶ average monthly fraction of snow cover
FT field trial
g gram
GHG greenhouse gas
GWP Global Warming Potential
GWPalbedo Global Warming Potential characterization factor for albedo changes
GWPbio Global Warming Potential characterization factor for biogenic CO2 emissions
GWC gravimetric water content
ABBREVIATIONS AND SYMBOLS VIII
ISO International Organization for Standardization
h hour
ha hectare
htc hydrothermal carbonization
IEA International Energy Agency
iRF time-integrated radiative forcing
K potassium
kCO2 radiative efficiency of CO2
kg kilogram
kT monthly mean clearness index
kWel electrical kilowatt
kWth thermal kilowatt
kWh kilowatt-hour
LCA Life Cycle Analysis
MFS dry feedstock mass
Mg Megagram
MJ Megajoule
MODIS moderate-resolution imaging spectroradiometer
MPa Megapascal
MRT mean residence time
MWel electrical Megawatt
MWth thermal Megawatt
N nitrogen
N surface reflectance averaged over near-infrared regions
Ns surface reflectance of bare soil averaged over near-infrared regions
Nv surface reflectance of dense vegetation averaged over near-infrared regions
N2O Nitrous oxide
NASA National Aeronautics and Space Administration
min minute
ABBREVIATIONS AND SYMBOLS IX
m² square metre
n amount of samples
odt oven dry tonne
P phosphorus
p exceeding probability
PT pot trial
ppmv parts per million (volumetric)
R surface reflectance averaged over visible regions
Rs surface reflectance of bare soil averaged over visible regions
Rv surface reflectance of dense vegetation averaged over visible regions
RFα radiative forcing cause by an albedo change
�RFα monthly mean radiative forcing from a monthly mean surface albedo change
�TOAR monthly mean downward solar flux at the top of the atmosphere
RW roundwood
s second
SDVI scaled difference vegetation index
t (metric) tonne
Ta fraction of shortwave irradiation reaching TOA after reflection at the surface
TH time horizon
TOA top of the atmosphere
UBA Umweltbundesamt
US$2010 US-Dollar at the price level of the year 2010
W Watt
wt weight
yr year
�s∆ α monthly mean surface albedo change
�soil∆α albedo difference between different types of soil
λ wavelength
μm micrometer

INTRODUCTION 11
1 Introduction
1.1 General background
According to the Goddard Institute for Space Studies of the National Aeronautics and Space
Administration of the USA, the mean global temperature (combined land-surface air and
sea-surface water temperature) has increased by 0.58 °C between the base period 1951-
1980 and the year 2012 (Goddard Institute for Space Studies 2013). With the progression of
climate change, mitigation and adaptation efforts are being intensified to prevent already
perceived and expected negative impacts of changes in the biosphere. The latter include
adverse effects on the global food security (Wheeler and von Braun 2013).
Independent from the expected impacts of climate change on the global food security,
governmental and non-governmental organizations have already been struggling for a world
without hunger since decades. While the number of the world´s undernourished people
decreased from 980 million in the period 1990–92 to about 850 million in the period 2010–
2012 (Wheeler and von Braun 2013), this implies that the right to food in article 25c of the
Universal Declaration of Human Rights is still not guaranteed for a population substantially
larger than that of the entire European Union. The first of the four dimensions of food
security as defined by the United Nations’ Food and Agricultural Organization is “the
availability of sufficient quantities of food of appropriate quality” (Food and Agricultural
Organization of the United Nations 2006). The long-term availability of soils with a sufficient
fertility for food production is one of the main preconditions which have to be met to be
able to warrant that sufficient quantities of food of appropriate quality are available.
Climate change mitigation encompasses a wide range of options: among them are lifestyle
chances, energy use efficiency increases, the deployment of renewable energy sources, and
carbon sequestration methods. The concept of carbonizing biomass and using the obtained
product for soil amelioration and carbon sequestration – the so called “biochar system”
(Lehmann and Joseph 2009) - has gained much attention in the research community
(Lehmann 2007) as well as in the media in the last four years. The attractiveness of this
concept can be explained by its promise to contribute to climate change mitigation and to
foster food security at the same time (Glaser et al. 2001; Kimetu et al. 2008; Molina et al.
2009). Role model for this concept is the existence of Terra Preta in the Amazonian region of
INTRODUCTION 12
South America. Terra Preta (Portuguese for “black earth”) is a very dark, fertile
anthropogenic soil with an extraordinary high carbon content due to the presence of charred
organic matter.
It seems to be no coincidence that the interest in biochar systems rose in parallel to the
collapse of the popularity of biofuel production. A better understanding of the interactions
between biofuel use, energy crop provision, direct and indirect land use change (Panichelli
and Gnansounou 2008), food production and the resulting environmental impacts drastically
changed the public opinion on biofuels as well the support policy for biofuels in the
European Union in the recent years.
As both bioenergy and biochar systems are partly making use of the same resource basis and
are thus subject to multiple interactions with the agricultural environment, it is foreseeable
that an increase in biochar production will trigger critical questions on the realizable
ecological benefits and the potential negative environmental effects of biochar systems.
Answering these questions in an early stage of the market development might both help to
avoid steering into ecological dead ends and to optimize potential future support schemes
for biochar systems.
1.2 Objectives and structure of this thesis
The objective of this thesis is an evaluation of ecological benefits and risks of biochar
systems. The scope of the thesis was focused on impacts of biochar systems on the climate
system and on the potential impact of biochar systems on the polycyclic aromatic
hydrocarbons (PAH) level in soils. As basis for this evaluation, the technical and economic
development stage of different carbonization technologies was assessed.
Three studies, which build upon each other, were carried out to reach the objective of this
thesis:
Due to the absence of public support schemes for biochar systems, the biochar market
development in the recent years was solely driven by technological advancements of
carbonization systems and the resulting competitiveness of biochar systems on unregulated
markets. When this thesis was started in 2009, it was difficult to foresee the
commercialization speed of different carbonization technologies and their future market

INTRODUCTION 13
penetration. Both factors directly influence the type and extent of the environmental
impacts triggered by biochar systems. Accordingly, this thesis started with a literature review
dealing with the technical and economic development stage of four different carbonization
technologies (pyrolysis, gasification, hydrothermal carbonization, flash carbonization) and
their greenhouse gas balances:
• Meyer, Sebastian; Glaser, Bruno; Quicker, Peter (2011): Technical, Economical, and
Climate-Related Aspects of Biochar Production Technologies: A Literature Review. In:
ENVIRONMENTAL SCIENCE & TECHNOLOGY 45 (22), S. 9473–9483 (see chapter 2)
The article is online available at: http://pubs.acs.org/doi/abs/10.1021/es201792c
The article was cited 21 times in the ISI WEB of Knowledge and 39 times in Google Scholar
until 20.01.2014. The Journal impact factor of ES&T for the year 2012 was 5.257.
The literature review revealed that the impact of biochar application on the surface albedo
(the relation of reflected shortwave radiation to incoming shortwave radiation) had not yet
been accounted for in climate assessment of biochar systems. Changes in surface albedo
affect radiative forcing, thus large scale albedo changes directly influence the global climate.
Thus, it could not be ruled out that a decrease in the surface albedo caused by biochar field
application might overcompensate for the climate mitigation benefits of biochar systems. To
quantify this risk, the second study was carried out:
• Meyer, Sebastian; Bright, Ryan M.; Fischer, Daniel; Schulz, Hardy; Glaser, Bruno (2012):
Albedo Impact on the Suitability of Biochar Systems To Mitigate Global Warming. In:
ENVIRONMENTAL SCIENCE & TECHNOLOGY 46 (22), S. 12726–12734 (see chapter 3)
The article is online available at: http://pubs.acs.org/doi/abs/10.1021/es302302g
The article was cited 3 times in the ISI WEB of Knowledge and 7 times in Google Scholar until
20.01.2014. The Journal impact factor of ES&T for the year 2013 is not available yet.
In this study, the results of the albedo research were complemented by an analysis of the
temporal impacts of biogenic CO2 emissions on the climate and by a complete greenhouse
gas balance of a modeled biochar system to assess its overall climate impact.
INTRODUCTION 14
Since the results of the literature review highlighted the economic and climate related
advantages of using biogenic residues for biochar production, a critical evaluation of the
opportunity of utilizing wood gasification residues in biochar systems was set in the focus of
the third study. As wood gasification residues often contain large amounts of persistent and
carcinogenic polycyclic aromatic hydrocarbons (Bruno Veyrand et al. 2013), the third study
evaluated the efficiency of a thermal process designed to remove PAH from gasification
residues. The analyzed process aims at the provision of biochars with a minimal soil pollution
risk with regard to PAH:
• Meyer, Sebastian; Glaser, Bruno; Fischer, Daniel; Quicker, Peter; Noel, Yves; Kuffer, Georg
(2014): Thermal Removal of PAH from Gasification Biochars. Dr. Maria C. Hernandez Soriano
(Ed.), ISBN: 978-953-51-1235-8, InTech, DOI: 10.5772/57269 (see chapter 4)
This open access book chapter is online available without charge at:
http://www.intechopen.com/books/environmental-risk-assessment-of-soil-
contamination/thermal-removal-of-polycyclic-aromatic-hydrocarbons-from-gasification-
biochars
The mentioned three studies are presented in the following chapters. The main paper and
the supporting information to the article “Albedo Impact on the Suitability of Biochar
Systems to Mitigate Global Warming “ have been integrated in chapter 3 to ensure a better
readability. The discussion and the subsumption of the overall results of this thesis into the
current state of scientific knowledge are presented in chapter 5. The conclusions of the
entire thesis are presented in chapter 6. The results of the thesis are summarized in English
in chapter 7 and in German in chapter 8.

CHAPTER 2: A LITERATURE REVIEW 15
2 Technical, economical and climate related aspects of biochar production
technologies: A literature review
Sebastian Meyer, Bruno Glaser and Peter Quicker
published in:
Environmental Science & Technology 45 (22): pp 9473–9483, 2011
2.1 Summary
For the development of commercial biochar projects, reliable data on biochar production
technologies is needed. For this purpose, peer-reviewed scientific articles on carbonization
technologies (pyrolysis, gasification, hydrothermal carbonization, and flash carbonization)
have been analyzed. Valuable information is provided by papers on pyrolysis processes, less
information is available on gasification processes, and few papers about hydrothermal and
flash carbonization technologies were identified. A wide range of data on the costs of char
production (between 51 US$ per tonne pyrolysis biochar from yard waste and 386 US$ per
tonne retort charcoal) and on the GHG balance of biochar systems (between -1054 kg CO2e
and +123 kg CO2e per t dry biomass feedstock) have been published. More data from pilot
projects are needed to improve the evaluation of biochar production technologies.
Additional research on the influence of biochar application on surface albedo, atmospheric
soot concentration, and yield responses is necessary to assess the entire climate impact of
biochar systems. Above all, further field trials on the ability of different technologies to
produce chars for agricultural soils and carbon sequestration are essential for future
technology evaluation.
CHAPTER 2: A LITERATURE REVIEW 16
2.2 Introduction
In recent years, biochar application to soil has been put forward as a tool to mitigate global
warming and improve soil properties (Glaser et al. 2001; Kimetu et al. 2008; Molina et al.
2009). In spite of considerable scientific work on the effects of biochar application to soil
with respect to crop yields and stabilization of plant-derived carbon in agricultural soils, the
commercial production of biochar for soil improvement and C sequestration is still very
limited today. Parties interested in the development of commercial biochar need reliable
and comprehensive data on the different technologies available for biochar production. For
this reason, this paper summarizes the available peer-reviewed scientific literature (ISI Web
of Knowledge) about the technological, economical, and climate-relevant aspects of
carbonization technologies.
Biochar is defined as “charred organic matter applied to soil in a deliberate manner, with the
intent to improve soil properties” in (Lehmann and Joseph 2009). Although biomass-derived
char can be used as energy carrier, as adsorber, and for further applications, this paper
focuses on the production of chars for the improvement of soil properties.
Carbonized organic matter can have fundamentally different physical and chemical
properties depending on the technology (e.g., torrefaction (a pyrolysis process at low
temperature), slow pyrolysis, intermediate pyrolysis, fast pyrolysis, gasification,
hydrothermal carbonization (htc), or flash carbonization) used for its production. Research
on torrefied material as soil amendment has started only recently (Trifonova et al. 2009). In
contrast to considerable research which has already been carried out to assess the value of
charcoal as soil amendment (Iswaran et al. 1980; Lehmann et al. 2003; Yamato et al. 2006;
Steiner et al. 2007; Rajeev Jorapur and Anil K. Rajvanshi 1997), no publication was identified
which examines the use of chars from modern gasifiers as soil amendment. Charcoal can be
produced both in traditional earthen charcoal kilns where pyrolysis, gasification, and
combustion processes are carried out in parallel below the earthen kiln layer and in modern
charcoal retorts where pyrolysis and combustion processes are physically separated by a
metal barrier. Two papers have been published on the suitability of htc-char for the
stabilization of organic carbon (Steinbeiss et al. 2009; Libra et al. 2011), and another on the
suitability of htc-char for the improvement of soil properties (Rillig et al. 2010). Only one
publication is available today in the ISI Web of Knowledge on the suitability of the use of
CHAPTER 2: A LITERATURE REVIEW 17
carbonized material from flash carbonization as a soil amendment (Deenik et al. 2010). It is
important to be aware that the results of the indicated publications with carbonized material
from torrefaction, hydrothermal carbonization, and flash carbonization did not show an
improvement of plant growth after the addition of carbonized material.
As phytotoxic components have been found in torrefied material (Trifonova et al. 2009) and
torrefied material has hydrophobic properties, this technology is treated in less detail in this
review. Apart from that, all main technology routes already mentioned have been fully
included in this literature review as today’s knowledge on the suitability of carbonized
material from modern gasification, hydrothermal carbonization, and flash carbonization for
the improvement of soil properties is still very limited. However, it is indispensable to further
assess the ability of the different technologies to produce carbonized material suitable to
increase the fertility of agricultural soils and to store carbon over a long period of time. In
this context, special care has to be taken to avoid the use of chars contaminated with
polycyclic aromatic compounds or dioxins for agricultural purposes. A detailed discussion of
dioxin formation is presented by (McKay 2002) and limits for dioxin and polycyclic aromatic
hydrocarbon levels in compost and sewage sludge in European countries can be found in
(Libra et al. 2011).
It should be noted that in field trials, often mixtures of char and compost are used with the
aim to produce a soil amendment similar to the fertile Terra Preta soils in the Amazon region
(Glaser et al. 2001). Though char makes up a minor weight component of this soil
amendment, it is an essential part of the final product.
2.3 Methodology
To identify the relevant literature for this review, the ISI Web of Knowledge was explored
with the following method: By searching for articles containing the keywords “pyrolysis”,
“gasification”, “hydrothermal carbonization”, and “flash carbonization” in connection with
the keywords “reliability”, “availability”, “durability”, “development + hours”, and “scale
up”, the technological maturity of carbonization technologies was assessed. To retrieve
publications that analyze the economical profitability of carbonization technologies, the
keywords “profitability”, “economics”, “production costs + char”, and “return + char” were
CHAPTER 2: A LITERATURE REVIEW 18
used. Regarding the climate impact of carbonization technologies, the keywords “GHG
balance”, “LCA”, “albedo”, and “atmospheric soot” were selected.
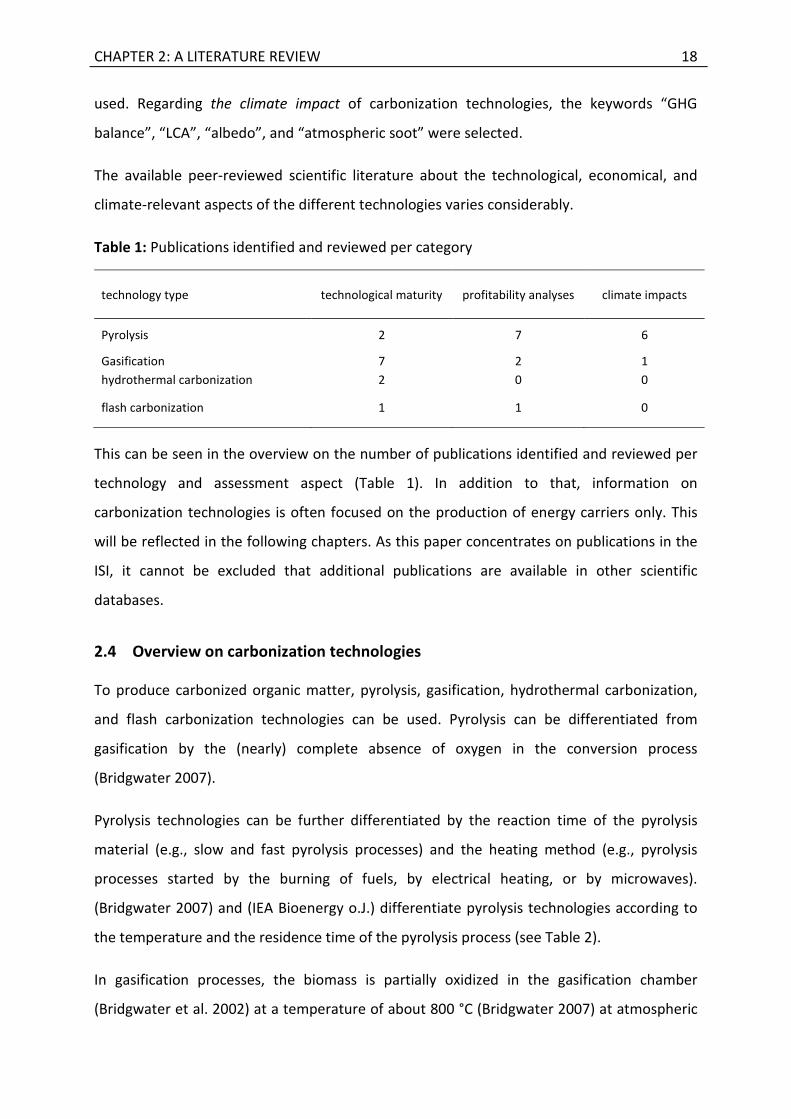
The available peer-reviewed scientific literature about the technological, economical, and
climate-relevant aspects of the different technologies varies considerably.
Table 1: Publications identified and reviewed per category
technology type technological maturity profitability analyses climate impacts
Pyrolysis 2 7 6
Gasification 7 2 1
hydrothermal carbonization 2 0 0
flash carbonization 1 1 0
This can be seen in the overview on the number of publications identified and reviewed per
technology and assessment aspect (Table 1). In addition to that, information on
carbonization technologies is often focused on the production of energy carriers only. This
will be reflected in the following chapters. As this paper concentrates on publications in the
ISI, it cannot be excluded that additional publications are available in other scientific
databases.
2.4 Overview on carbonization technologies
To produce carbonized organic matter, pyrolysis, gasification, hydrothermal carbonization,
and flash carbonization technologies can be used. Pyrolysis can be differentiated from
gasification by the (nearly) complete absence of oxygen in the conversion process
(Bridgwater 2007).
Pyrolysis technologies can be further differentiated by the reaction time of the pyrolysis
material (e.g., slow and fast pyrolysis processes) and the heating method (e.g., pyrolysis
processes started by the burning of fuels, by electrical heating, or by microwaves).
(Bridgwater 2007) and (IEA Bioenergy o.J.) differentiate pyrolysis technologies according to
the temperature and the residence time of the pyrolysis process (see Table 2).
In gasification processes, the biomass is partially oxidized in the gasification chamber
(Bridgwater et al. 2002) at a temperature of about 800 °C (Bridgwater 2007) at atmospheric
CHAPTER 2: A LITERATURE REVIEW 19
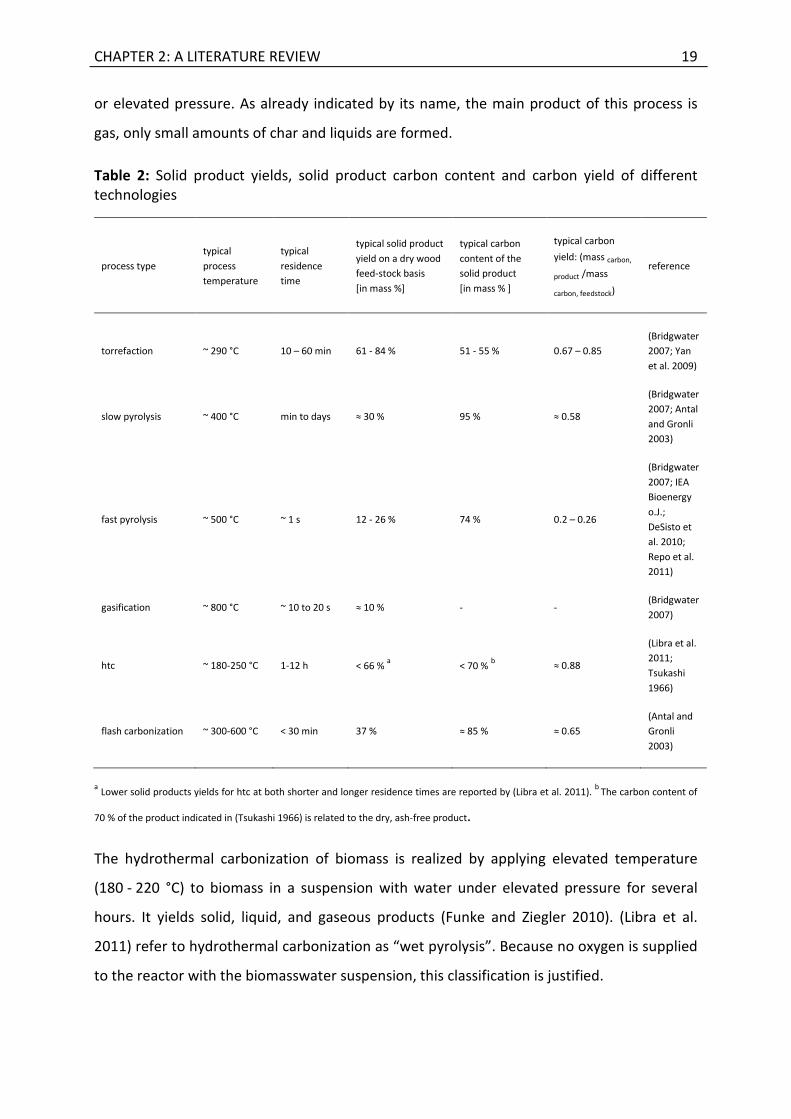
or elevated pressure. As already indicated by its name, the main product of this process is
gas, only small amounts of char and liquids are formed.
Table 2: Solid product yields, solid product carbon content and carbon yield of different technologies
process type
typical
process
temperature
typical
residence
time
typical solid product
yield on a dry wood
feed-stock basis
[in mass %]
typical carbon
content of the
solid product
[in mass % ]
typical carbon
yield: (mass carbon,
product /mass
carbon, feedstock)
reference
torrefaction ~ 290 °C 10 – 60 min 61 - 84 % 51 - 55 % 0.67 – 0.85
(Bridgwater
2007; Yan
et al. 2009)
slow pyrolysis ~ 400 °C min to days ≈ 30 % 95 % ≈ 0.58
(Bridgwater
2007; Antal
and Gronli
2003)
fast pyrolysis ~ 500 °C ~ 1 s 12 - 26 % 74 % 0.2 – 0.26
(Bridgwater
2007; IEA
Bioenergy
o.J.;
DeSisto et
al. 2010;
Repo et al.
2011)
gasification ~ 800 °C ~ 10 to 20 s ≈ 10 % - - (Bridgwater
2007)
htc ~ 180-250 °C 1-12 h < 66 % a < 70 %
b ≈ 0.88
(Libra et al.
2011;
Tsukashi
1966)
flash carbonization ~ 300-600 °C < 30 min 37 % ≈ 85 % ≈ 0.65
(Antal and
Gronli
2003)
a Lower solid products yields for htc at both shorter and longer residence times are reported by (Libra et al. 2011).
b The carbon content of
70 % of the product indicated in (Tsukashi 1966) is related to the dry, ash-free product.
The hydrothermal carbonization of biomass is realized by applying elevated temperature
(180 - 220 °C) to biomass in a suspension with water under elevated pressure for several
hours. It yields solid, liquid, and gaseous products (Funke and Ziegler 2010). (Libra et al.
2011) refer to hydrothermal carbonization as “wet pyrolysis”. Because no oxygen is supplied
to the reactor with the biomasswater suspension, this classification is justified.
CHAPTER 2: A LITERATURE REVIEW 20
For the flash carbonization of biomass, a flash fire is ignited at elevated pressure (at about
1 - 2 MPa) at the bottom of a packed bed of biomass. The fire moves upward through the
carbonization bed against the downward flow of air added to the process. In total about 0.8 -
1.5 kg of air per kg of biomass are delivered to the process. The reaction time of the process
is below 30 min, and the temperature in the reactor is in the range of 300 - 600 °C. The
process results mainly in gaseous and solid products. In addition to that, a limited amount of
condensate is formed. While the oxygen input into the carbonization process is a typical
feature of gasification technologies, both process temperature and the product spectrum
(distribution among solid, liquid, and gaseous outputs) of flash carbonization are uncommon
for gasification processes. It should be noted that typical solid product yields obtained by
gasification and fast pyrolysis processes are significantly lower as compared to the solid
product yields of slow pyrolysis, flash carbonization, hydrothermal carbonization and
torrefaction (see Table 2).
It is important to take into account that the development history of the different
technologies reviewed varies considerably: The development of coal gasification started
already a few centuries ago (Hamper 2006) whereas the development of charcoal kilns has
taken place over a time span of millennia (Antal and Gronli 2003).
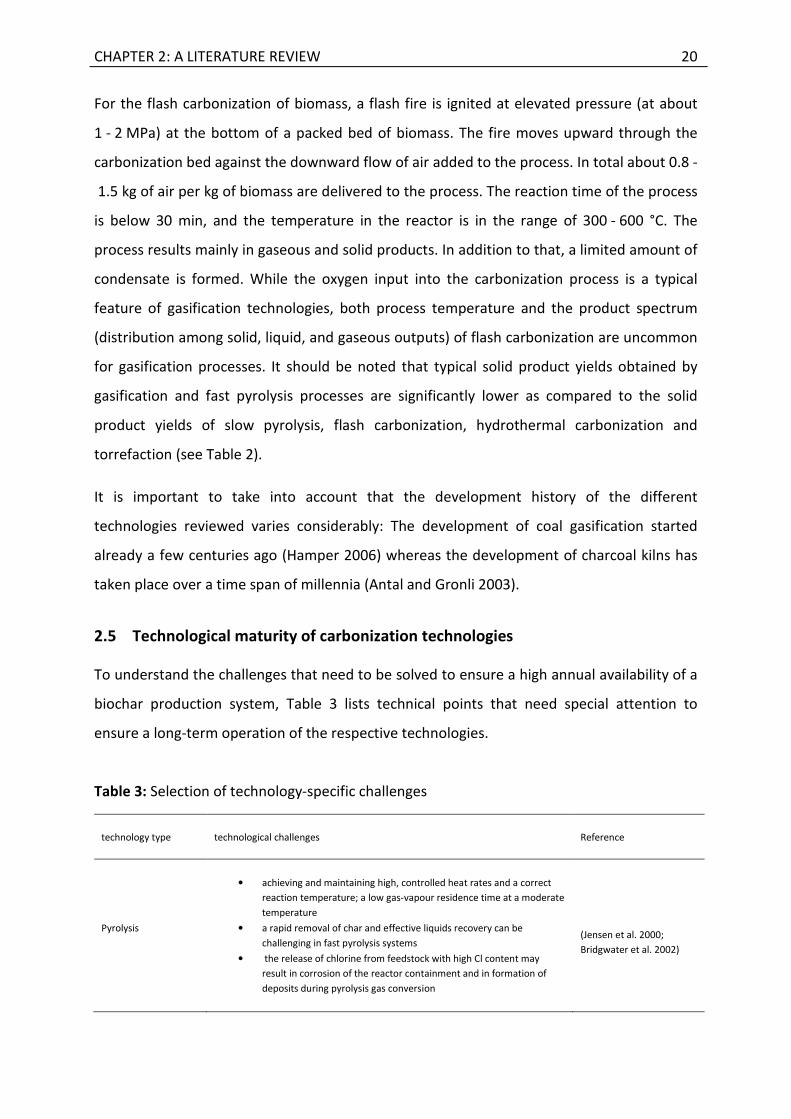
2.5 Technological maturity of carbonization technologies
To understand the challenges that need to be solved to ensure a high annual availability of a
biochar production system, Table 3 lists technical points that need special attention to
ensure a long-term operation of the respective technologies.
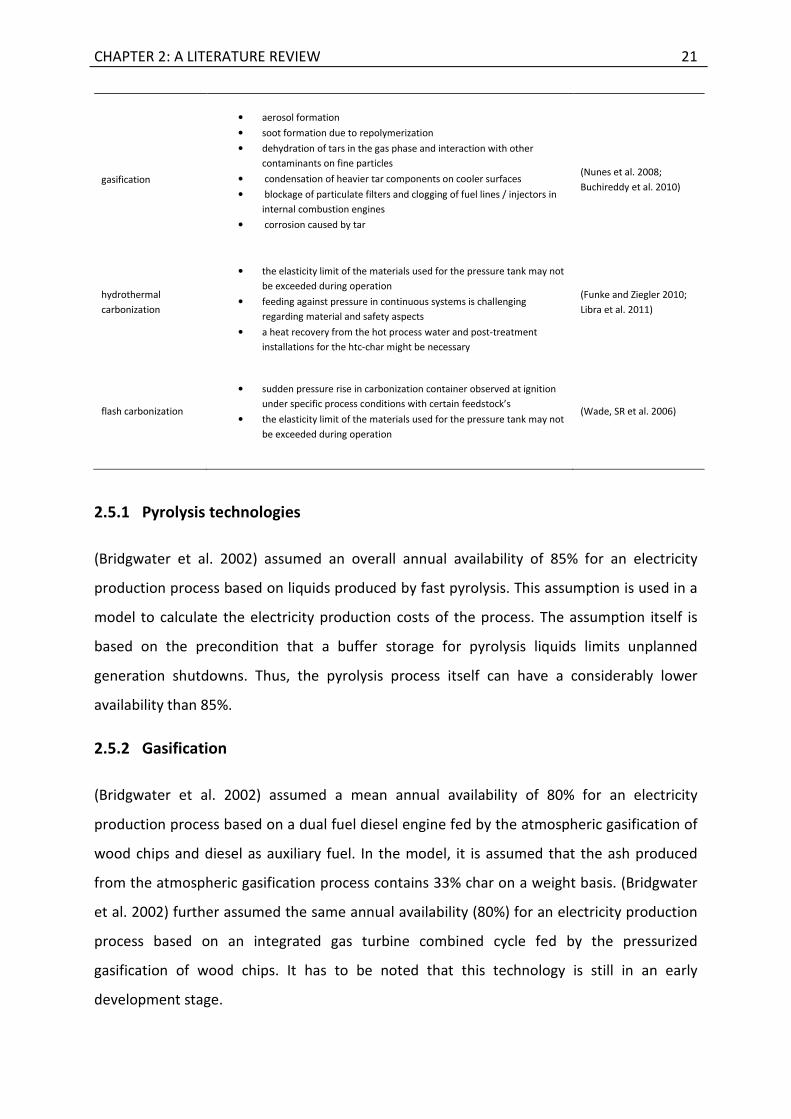
Table 3: Selection of technology-specific challenges
technology type technological challenges Reference
Pyrolysis
• achieving and maintaining high, controlled heat rates and a correct
reaction temperature; a low gas-vapour residence time at a moderate
temperature
• a rapid removal of char and effective liquids recovery can be
challenging in fast pyrolysis systems
• the release of chlorine from feedstock with high Cl content may
result in corrosion of the reactor containment and in formation of
deposits during pyrolysis gas conversion
(Jensen et al. 2000;
Bridgwater et al. 2002)
CHAPTER 2: A LITERATURE REVIEW 21
gasification
• aerosol formation
• soot formation due to repolymerization
• dehydration of tars in the gas phase and interaction with other
contaminants on fine particles
• condensation of heavier tar components on cooler surfaces
• blockage of particulate filters and clogging of fuel lines / injectors in
internal combustion engines
• corrosion caused by tar
(Nunes et al. 2008;
Buchireddy et al. 2010)
hydrothermal
carbonization
• the elasticity limit of the materials used for the pressure tank may not
be exceeded during operation
• feeding against pressure in continuous systems is challenging
regarding material and safety aspects
• a heat recovery from the hot process water and post-treatment
installations for the htc-char might be necessary
(Funke and Ziegler 2010;
Libra et al. 2011)
flash carbonization
• sudden pressure rise in carbonization container observed at ignition
under specific process conditions with certain feedstock’s
• the elasticity limit of the materials used for the pressure tank may not
be exceeded during operation
(Wade, SR et al. 2006)
2.5.1 Pyrolysis technologies
(Bridgwater et al. 2002) assumed an overall annual availability of 85% for an electricity
production process based on liquids produced by fast pyrolysis. This assumption is used in a
model to calculate the electricity production costs of the process. The assumption itself is
based on the precondition that a buffer storage for pyrolysis liquids limits unplanned
generation shutdowns. Thus, the pyrolysis process itself can have a considerably lower
availability than 85%.
2.5.2 Gasification
(Bridgwater et al. 2002) assumed a mean annual availability of 80% for an electricity
production process based on a dual fuel diesel engine fed by the atmospheric gasification of
wood chips and diesel as auxiliary fuel. In the model, it is assumed that the ash produced
from the atmospheric gasification process contains 33% char on a weight basis. (Bridgwater
et al. 2002) further assumed the same annual availability (80%) for an electricity production
process based on an integrated gas turbine combined cycle fed by the pressurized
gasification of wood chips. It has to be noted that this technology is still in an early
development stage.
CHAPTER 2: A LITERATURE REVIEW 22
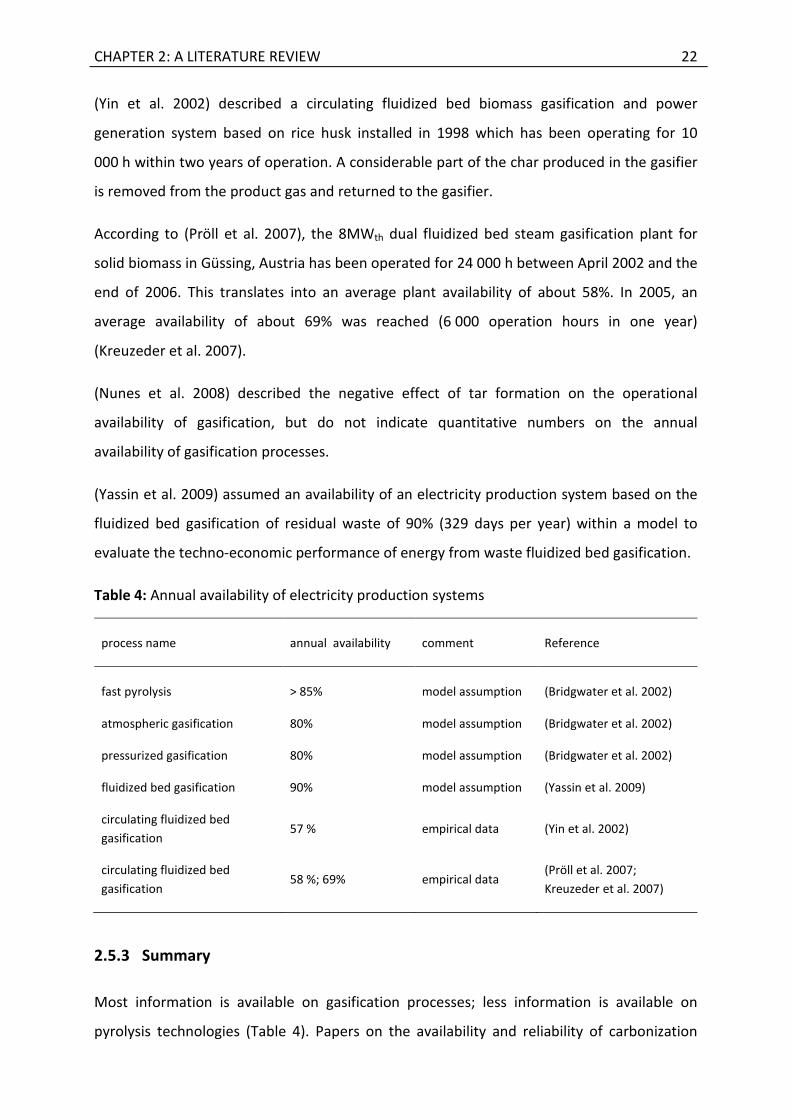
(Yin et al. 2002) described a circulating fluidized bed biomass gasification and power
generation system based on rice husk installed in 1998 which has been operating for 10
000 h within two years of operation. A considerable part of the char produced in the gasifier
is removed from the product gas and returned to the gasifier.
According to (Pröll et al. 2007), the 8MWth dual fluidized bed steam gasification plant for
solid biomass in Güssing, Austria has been operated for 24 000 h between April 2002 and the
end of 2006. This translates into an average plant availability of about 58%. In 2005, an
average availability of about 69% was reached (6 000 operation hours in one year)
(Kreuzeder et al. 2007).
(Nunes et al. 2008) described the negative effect of tar formation on the operational
availability of gasification, but do not indicate quantitative numbers on the annual
availability of gasification processes.
(Yassin et al. 2009) assumed an availability of an electricity production system based on the
fluidized bed gasification of residual waste of 90% (329 days per year) within a model to
evaluate the techno-economic performance of energy from waste fluidized bed gasification.
Table 4: Annual availability of electricity production systems
process name annual availability comment Reference
fast pyrolysis > 85% model assumption (Bridgwater et al. 2002)
atmospheric gasification 80% model assumption (Bridgwater et al. 2002)
pressurized gasification 80% model assumption (Bridgwater et al. 2002)
fluidized bed gasification 90% model assumption (Yassin et al. 2009)
circulating fluidized bed
gasification 57 % empirical data (Yin et al. 2002)
circulating fluidized bed
gasification 58 %; 69% empirical data
(Pröll et al. 2007;
Kreuzeder et al. 2007)
2.5.3 Summary
Most information is available on gasification processes; less information is available on
pyrolysis technologies (Table 4). Papers on the availability and reliability of carbonization
CHAPTER 2: A LITERATURE REVIEW 23
technologies are often not based on empirical data and do not cover hydrothermal and flash
carbonization technologies at all. The available knowledge is focused on systems for the
production of pyrolysis oil, synthesis gas, electricity, or heat. In summary, a comparison of
the technological maturity of biochar production technologies based on scientific literature
in not possible at the moment. In Table 4, data on the annual availability of production
processes as indicated in the reviewed papers are summarized. The difference between the
assumed availability rates and the empirical data is evident.
2.6 Profitability analyses of carbonization technologies
The focus of the literature review in this section was on publications issued not earlier than
the year 2000, since profitability analyses are subject to rapidly changing economic
framework conditions. Apart from that, they are often only valid for a specific project in a
specific region at a specific point in time. Depending on the type of technology used,
biogenic energy carriers (biogenic oil, synthesis gas), electricity, or heat are produced
together with the char and constitute the main product, byproduct, or residue of the
biomass conversion process. A considerable part of the described processes aim primarily at
the provision of bioenergy. In these cases, the indicated economic data cannot be directly
used to assess the profitability of the described technologies for biochar production.
However, the indicated economic data can be used as a benchmark to assess under which
conditions the production of biochar would be more (or less) profitable compared to the
production of a bioenergy carrier. It is important to be aware that the (bio)energy and the
biochar markets compete for the same feedstock, and that biochar-based soil amendments
compete with other products (e.g., peat, pure compost) and other methods used to improve
soil properties. To enable a direct comparison, the published economic data has been
converted to US $ at historical exchange rates and has been inflation-adjusted to the
reference year 2010 (US$2010).
2.6.1 Pyrolysis
(Islam and Ani 2000) carried out a techno – economic assessment of fluidized bed fast
pyrolysis systems with rice husk throughputs of 100 and 1000 kg/h. The systems were
assumed to be installed in Malaysia in a study carried out in 2000. Since the study focuses on
the production of the pyrolysis oil, production costs of 0.38 US$ (0.5 US$2010) per kg primary
CHAPTER 2: A LITERATURE REVIEW 24
pyrolysis oil [at 100 kg feed/hour] and 0.18 US$ (0.23 US$2010) per kg primary oil [at 1000 kg
feed/hour] have been calculated. Because solid char is coproduced by the fluidized bed fast
pyrolysis system, the sales price of the primary pyrolysis oil could be reduced if the char
would be sold. Unfortunately, production costs for the solid char cannot be derived from this
study. However, the energy value of char from fast pyrolysis within the process can be
calculated. Based on the higher heating value of char from fast pyrolysis (about 28 MJ/kg)
(DeSisto et al. 2010) and the price of wood pellets as an alternative biogenic heating fuel
(0.05 €2011/kWh; 0.0202 $2010/MJ), the energy value of the char is as high as 560 US$2010
/tonne. It should be noted here that the value of the char is considerably lower if a cheaper
conventional fuel is replaced. For example, (Badger et al. 2011) calculate with residual
heating oil as replacement at a price of 0.0109 US$2010/MJ.
(Bridgwater et al. 2002) calculated electricity production costs of 0.091 € (0.098
US$2010)/kWh at 20 MWel and 0.199 € (0.215 US$2010)/kWh at 1 MWel for a modeled
electricity production process in UK based on liquids produced by fast pyrolysis and diesel as
auxiliary fuel. Taking into account learning effects and assuming a 50% reduction of capital
costs of fast pyrolysis modules after 10 installations, they calculated electricity production
costs of 0.073 € (0.078 US$2010)/kWh at 20 MWel and of 0.146 € (0.157 US$2010)/kWh at 1
MWel. In their model it is assumed that char and off-gas produced during the pyrolysis are
burned to cover the internal heat demand of the installation. As calculated already above,
the energy value of the char can be as high as 560 US$2010/tonne.
(Lin and Hwang 2009) assessed the profitability of charcoal production from discarded
Cryptomeria branches and wood tops using a still-operational earthen kiln in Taiwan. This
analysis was based on empirical data combined with market research. Charcoal production
cost of 3707 US$ (3747 US$2010)/tonne can be derived from the analysis. If the revenues of
selling wood vinegar are subtracted from the sum of production cost, the char could be sold
at a whole-sale price of 1840 US$ (1860 US$2010) per tonne. Considering charcoal prices in
Taiwan amounted to 3030 US$ (3063 US$2010)/tonne at the time of the analysis according to
(Lin and Hwang 2009) the production process was judged to be economically feasible in their
publication. However, the charcoal sales price assumed in this calculation—it is not stated in
the mentioned publication if the indicated sales price is a retail price or an end customer
price—is extremely high and exceeds even the end customer price for retort barbecue
CHAPTER 2: A LITERATURE REVIEW 25
charcoal in Germany in 2011 (2,700 US$2010). Thus, it is doubtful whether the assumed sales
price can be realized for the total production volume indicated in the calculation (13,000 kg
charcoal / year). Whereas charcoal production might thus not be profitable in the described
example, charcoal production for energy applications— both in simple charcoal kilns and in
modern retort systems—is clearly profitable for many charcoal producers around the globe
(Brown et al. 2011). Thus, (Lin and Hwang 2009) might overestimate charcoal production
cost in earthen-kilns. For comparison, (Norgate and Langberg 2009) calculated charcoal
production cost of 373 US$ (386 US$2010)/tonne based on a continuous charcoal retort.
In a very detailed assessment, (Roberts et al. 2010) calculated the economic viability of a
modeled continuous drum kiln “slow” pyrolysis plant with a throughput of 10 tonnes dry
feedstock mass per hour at a temperature of 450 °C and a drum residence time of several
minutes in the United States. Aim of the process is to produce biochar for soil management
and synthesis gas for heat provision. Taking into account revenues from selling the biochar
(its value is calculated on basis of the potassium and phosphate content of the biochar and
an improved nitrogen fertilizer use efficiency caused by the application of the char), a tipping
fee for the disposal of yard waste, the sales of heat produced from the synthesis gas,
avoided composting costs, and the sales of GHG offset certificates (at a price of 20 US$ per
tonne CO2), biochar produced on the basis of yard waste yields a positive return of 16 US$
per tonne dry feedstock. This calculation takes into account the opportunity costs of
switching from yard waste based compost production to biochar production. Biochar
produced on the basis of corn stover and switch grass cannot be produced in a profitable
way under the same assumptions. For these types of feedstock, negative returns of 17 US$
to 30 US$ per tonne dry feedstock have been calculated. It should be noted here that the
costs for the transportation of feedstock from dispersed locations to the pyrolysis plant can
play a major role in the overall production costs of biochar. In this respect, the opportunity
of sourcing biochar feedstock from a single location—e.g., from a composting collection
station as assumed in the calculation cited above—can be a clear cost advantage.
Under these framework conditions, the direct production cost (not taking into account the
opportunity costs for not producing and selling compost) amount to 50 US$ per tonne dry
feedstock (or 172 US$ per tonne biochar at 29% wt biochar yield), while the total direct
revenues (not taking into account avoided costs for composting) amount to 112 US$ per
CHAPTER 2: A LITERATURE REVIEW 26
tonne dry feedstock (or 368 US$ per tonne biochar). Of the direct revenues, 35 US$ per
tonne dry feedstock (121 US$ per tonne biochar) are gained by sale of heat produced from
the synthesis gas of the pyrolysis process. Only 11 US$ per tonne dry feedstock (38 US$ per
tonne biochar) are associated with the agricultural value of biochar. Without the revenues
from the sales of GHG offset certificates, the pyrolysis process would be just at the edge of
profitability. Two aspects regarding the profitability analysis of the yard waste analysis need
further examination: Is it possible to create GHG offset certificates from a biochar project?
Since this is not possible on the market for legally binding GHG emission reductions, only the
voluntary market would offer chances to sell GHG offset certificates from biochar projects.
In addition to that, potential yield increases associated with the application of biochar—yet
not connected to its potassium and phosphorus content alone—have not been included yet
in the value of biochar and might improve the profitability of the analyzed system
substantially.
(Brown et al. 2011) reported total annual operating costs including fixed costs, capital
depreciation, and coproduct credits of about 71 million US$2010/year for a slow pyrolysis
facility with 262.000 tonnes of biochar production per year. From these figures, the
production costs for one tonne biochar can be calculated at 272 US$2010. For a fast pyrolysis
facility with an output of 172 million liters of biogenic gasoline from biooil, total annual
operating costs of 67,500,000 US$2010 and biogenic gasoline production costs of
0.39 US$2010/liter can be derived from the study. If the indicated production cost could be
realized, this facility would be highly profitable. The paper assumes that only 26% of the
coproduced char is used within the fast pyrolysis process to provide heat, the remaining char
is sold.
2.6.2 Gasification
(Yin et al. 2002) indicated a payback period of less than two years for a circulating fluidized
bed biomass gasification and power generation system installed in 1998 in the Fujian
Province of China. As already stated before, a considerable part of the char produced in the
gasifier is removed from the product gas and returned to the gasifier. For this system with a
throughput of 1500 kg rice husk/hour providing a power output of about 800 kW, total
investment costs of 510,000 US$ (625,000 US$2010) are necessary. However, the amount of
data provided in this article to underline the claimed payback period of two years is very
CHAPTER 2: A LITERATURE REVIEW 27
scarce. In addition to that, the indicated investment costs (about 640 US$ (784 US$2010)/kW)
are very low. The energy value of char from gasification within the process is calculated in
the last part of this subchapter.
(Bridgwater et al. 2002) calculated electricity production costs of 0.1 € (0.11 US$2010)/kWh at
20 MWel and 0.22 € (0.24 US$2010)/ kWh at 1 MWel installed capacity for an electricity
production process based on a dual fuel diesel engine fed by the atmospheric gasification of
wood chips and diesel as auxiliary fuel. They assumed electricity production costs of about
0.09 € (0.097 US $2010)/kWh at 20 MWel and of about 0.26 € (0.28 US$2010)/kWh at 1MWel for
an electricity production process based on an integrated gas turbine combined cycle fed by
the pressurized gasification of wood chips. In this model, it is assumed that the ash produced
from the atmospheric gasification process contains 33% wt char, resulting in an overall
carbon conversion efficiency of the system of 99.5%. Thus, nearly no char is left after the
biomass conversion process.
Peer-reviewed profitability analyses of gasification systems aiming at the sale of the char
produced in the process are not available in the ISI to the knowledge of the authors. This can
be partly explained by the development focus of this technology which is clearly set on the
provision of energy, and by the technical challenges still connected with the biomass
gasification technology. It is important to be aware that the operators of gasifiers will only
sell the coproduced char of the gasifiers if a char price is paid which at least covers the cost
for an alternative heating fuel for the gasification process. (Jorapur and Rajvanshi 1997)
indicate a higher heating value of 18.9 MJ for gasifier char. This would correspond to an
energy value of about 380 US$2010/tonne gasifier char if wood pellets would be used to
replace the char used as fuel in the gasifier.
2.6.3 Flash Carbonization
(Antal et al. 2007) stated that the actual capital investment incurred in the fabrication and
setup of a flash carbonization demonstration reactor (1.73 m diameter x 2.74 m height) at
the University of Hawaii were 270,000 US$ (290,000 US$2010). To these costs, US$ 30,000
(32,300 US$2010) have to be added in case a 1.27 MPa (12.7 bar) air compressor is installed to
provide pressure to the reactor. In case a 2.17 MPa (21.7 bar) air compressor would be used,
about US$ 120,000 (129,000 US$2010) has to be added to the costs of the reactor. According
CHAPTER 2: A LITERATURE REVIEW 28
to the authors, the 2.17 MPa systems have an output of 8.4 tonnes/day of fixed-carbon,
whereas the 1.27 MPa system has an output of 6.1 tonnes/day of fixed-carbon at 24 h of
operation. A rough profitability analysis is indicated in the paper with the aim to compare
the two systems from an economical point of view. This analysis—which resulted in very
short payback periods of 3.7 and 1.3 years for the 1.27 and the 2.17 MPa systems,
respectively—however cannot be used to assess the overall profitability of the two systems
due to the limited amount of cost data included in the calculation. It is possible that only
little economic information on this process has been published by the authors for
confidentiality reasons.
2.6.4 Summary
Most information is available on pyrolysis (especially slow pyrolysis) processes. Though the
information provided on the economics of a slow pyrolysis system aimed at the production
of heat and biochar is very detailed, it is only partly based on empirical data of an already
installed system. In summary, a thorough comparison of the profitability of biochar
production technologies based on scientific literature is not possible at the moment.
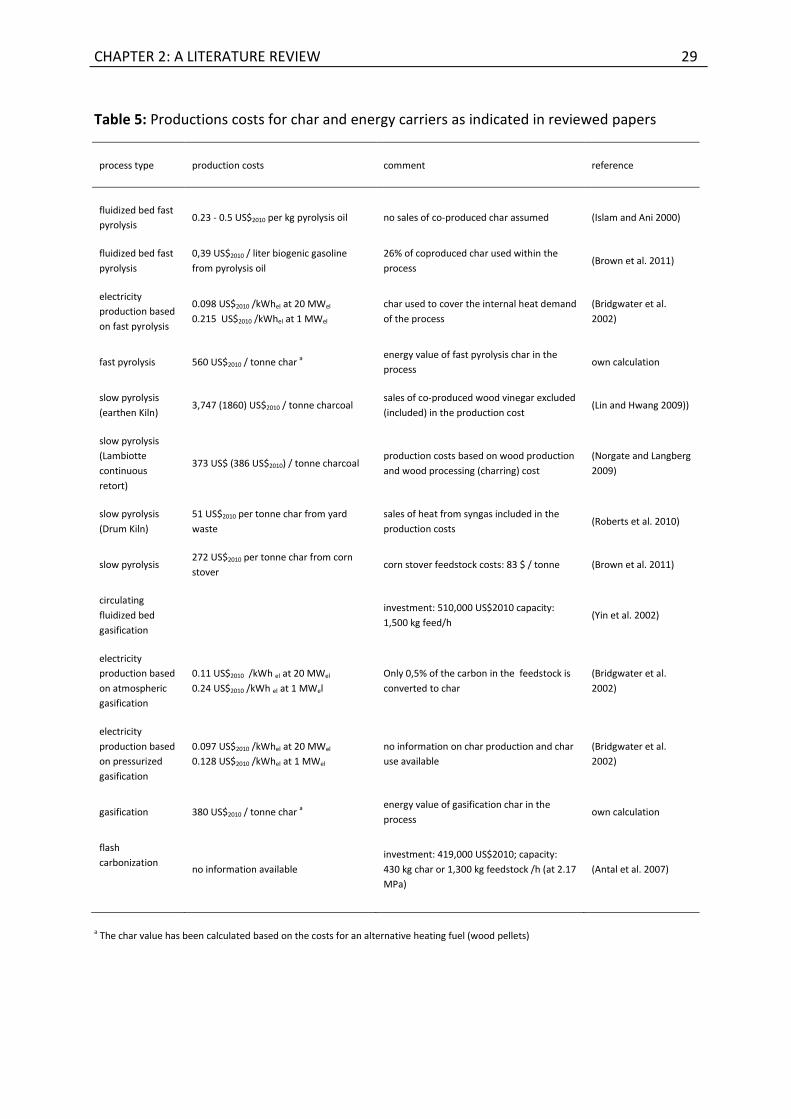
In Table 5, data on the economic viability of the different production processes as indicated
in the reviewed papers is summarized.
CHAPTER 2: A LITERATURE REVIEW 29
Table 5: Productions costs for char and energy carriers as indicated in reviewed papers
process type production costs comment reference
fluidized bed fast
pyrolysis 0.23 - 0.5 US$2010 per kg pyrolysis oil no sales of co-produced char assumed (Islam and Ani 2000)
fluidized bed fast
pyrolysis
0,39 US$2010 / liter biogenic gasoline
from pyrolysis oil
26% of coproduced char used within the
process (Brown et al. 2011)
electricity
production based
on fast pyrolysis
0.098 US$2010 /kWhel at 20 MWel
0.215 US$2010 /kWhel at 1 MWel
char used to cover the internal heat demand
of the process
(Bridgwater et al.
2002)
fast pyrolysis 560 US$2010 / tonne char a energy value of fast pyrolysis char in the
process own calculation
slow pyrolysis
(earthen Kiln) 3,747 (1860) US$2010 / tonne charcoal
sales of co-produced wood vinegar excluded
(included) in the production cost (Lin and Hwang 2009))
slow pyrolysis
(Lambiotte
continuous
retort)
373 US$ (386 US$2010) / tonne charcoal production costs based on wood production
and wood processing (charring) cost
(Norgate and Langberg
2009)
slow pyrolysis
(Drum Kiln)
51 US$2010 per tonne char from yard
waste
sales of heat from syngas included in the
production costs (Roberts et al. 2010)
slow pyrolysis 272 US$2010 per tonne char from corn
stover corn stover feedstock costs: 83 $ / tonne (Brown et al. 2011)
circulating
fluidized bed
gasification
investment: 510,000 US$2010 capacity:
1,500 kg feed/h (Yin et al. 2002)
electricity
production based
on atmospheric
gasification
0.11 US$2010 /kWh el at 20 MWel
0.24 US$2010 /kWh el at 1 MWel
Only 0,5% of the carbon in the feedstock is
converted to char
(Bridgwater et al.
2002)
electricity
production based
on pressurized
gasification
0.097 US$2010 /kWhel at 20 MWel
0.128 US$2010 /kWhel at 1 MWel
no information on char production and char
use available
(Bridgwater et al.
2002)
gasification 380 US$2010 / tonne char a energy value of gasification char in the
process own calculation
flash
carbonization
no information available
investment: 419,000 US$2010; capacity:
430 kg char or 1,300 kg feedstock /h (at 2.17
MPa)
(Antal et al. 2007)
a The char value has been calculated based on the costs for an alternative heating fuel (wood pellets)
CHAPTER 2: A LITERATURE REVIEW 30
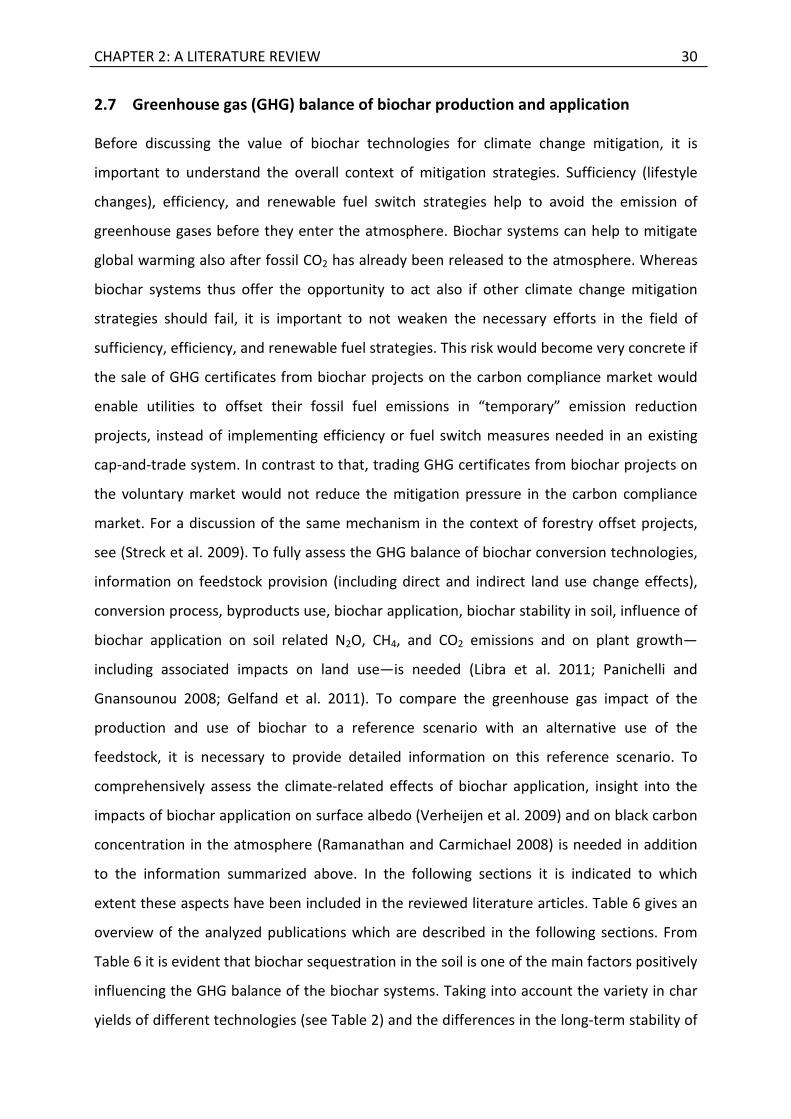
2.7 Greenhouse gas (GHG) balance of biochar production and application
Before discussing the value of biochar technologies for climate change mitigation, it is
important to understand the overall context of mitigation strategies. Sufficiency (lifestyle
changes), efficiency, and renewable fuel switch strategies help to avoid the emission of
greenhouse gases before they enter the atmosphere. Biochar systems can help to mitigate
global warming also after fossil CO2 has already been released to the atmosphere. Whereas
biochar systems thus offer the opportunity to act also if other climate change mitigation
strategies should fail, it is important to not weaken the necessary efforts in the field of
sufficiency, efficiency, and renewable fuel strategies. This risk would become very concrete if
the sale of GHG certificates from biochar projects on the carbon compliance market would
enable utilities to offset their fossil fuel emissions in “temporary” emission reduction
projects, instead of implementing efficiency or fuel switch measures needed in an existing
cap-and-trade system. In contrast to that, trading GHG certificates from biochar projects on
the voluntary market would not reduce the mitigation pressure in the carbon compliance
market. For a discussion of the same mechanism in the context of forestry offset projects,
see (Streck et al. 2009). To fully assess the GHG balance of biochar conversion technologies,
information on feedstock provision (including direct and indirect land use change effects),
conversion process, byproducts use, biochar application, biochar stability in soil, influence of
biochar application on soil related N2O, CH4, and CO2 emissions and on plant growth—
including associated impacts on land use—is needed (Libra et al. 2011; Panichelli and
Gnansounou 2008; Gelfand et al. 2011). To compare the greenhouse gas impact of the
production and use of biochar to a reference scenario with an alternative use of the
feedstock, it is necessary to provide detailed information on this reference scenario. To
comprehensively assess the climate-related effects of biochar application, insight into the
impacts of biochar application on surface albedo (Verheijen et al. 2009) and on black carbon
concentration in the atmosphere (Ramanathan and Carmichael 2008) is needed in addition
to the information summarized above. In the following sections it is indicated to which
extent these aspects have been included in the reviewed literature articles. Table 6 gives an
overview of the analyzed publications which are described in the following sections. From
Table 6 it is evident that biochar sequestration in the soil is one of the main factors positively
influencing the GHG balance of the biochar systems. Taking into account the variety in char
yields of different technologies (see Table 2) and the differences in the long-term stability of
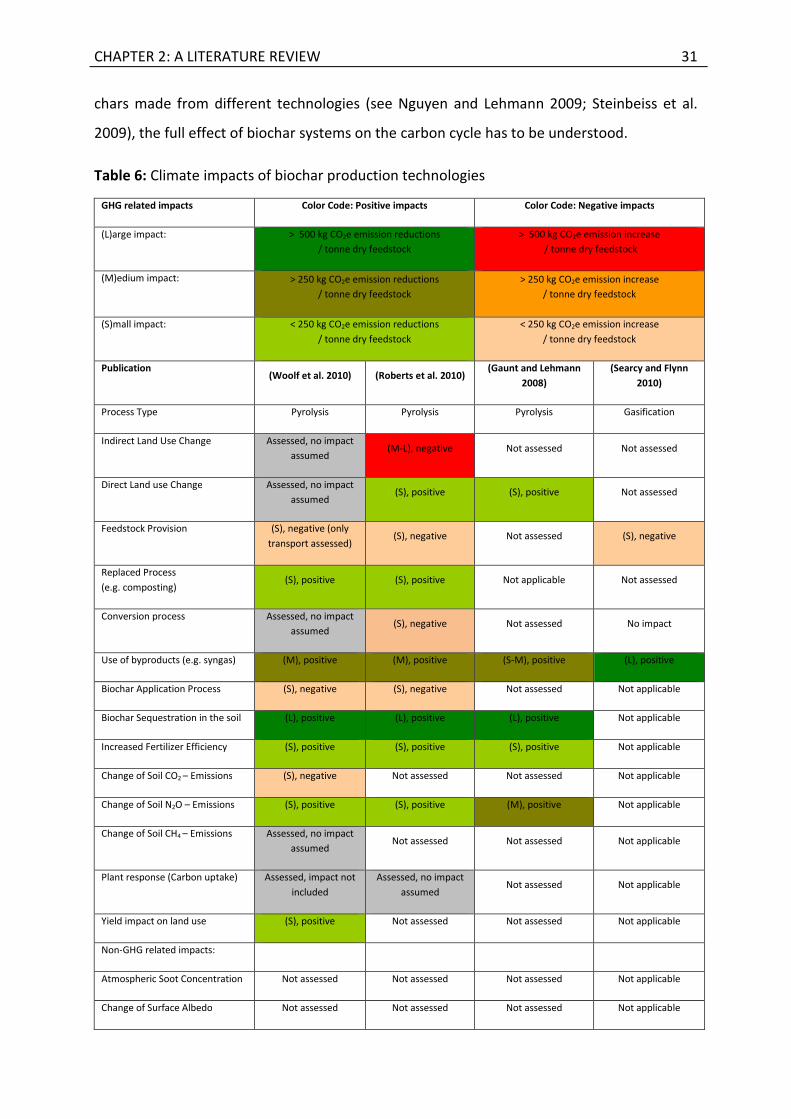
CHAPTER 2: A LITERATURE REVIEW 31
chars made from different technologies (see Nguyen and Lehmann 2009; Steinbeiss et al.
2009), the full effect of biochar systems on the carbon cycle has to be understood.
Table 6: Climate impacts of biochar production technologies
GHG related impacts Color Code: Positive impacts Color Code: Negative impacts
(L)arge impact: > 500 kg CO2e emission reductions
/ tonne dry feedstock
> 500 kg CO2e emission increase
/ tonne dry feedstock
(M)edium impact: > 250 kg CO2e emission reductions
/ tonne dry feedstock
> 250 kg CO2e emission increase
/ tonne dry feedstock
(S)mall impact: < 250 kg CO2e emission reductions
/ tonne dry feedstock
< 250 kg CO2e emission increase
/ tonne dry feedstock
Publication (Woolf et al. 2010) (Roberts et al. 2010)
(Gaunt and Lehmann
2008)
(Searcy and Flynn
2010)
Process Type Pyrolysis Pyrolysis Pyrolysis Gasification
Indirect Land Use Change Assessed, no impact
assumed (M-L), negative Not assessed Not assessed
Direct Land use Change Assessed, no impact
assumed (S), positive (S), positive Not assessed
Feedstock Provision (S), negative (only
transport assessed) (S), negative Not assessed (S), negative
Replaced Process
(e.g. composting) (S), positive (S), positive Not applicable Not assessed
Conversion process Assessed, no impact
assumed (S), negative Not assessed No impact
Use of byproducts (e.g. syngas) (M), positive (M), positive (S-M), positive (L), positive
Biochar Application Process (S), negative (S), negative Not assessed Not applicable
Biochar Sequestration in the soil (L), positive (L), positive (L), positive Not applicable
Increased Fertilizer Efficiency (S), positive (S), positive (S), positive Not applicable
Change of Soil CO2 – Emissions (S), negative Not assessed Not assessed Not applicable
Change of Soil N2O – Emissions (S), positive (S), positive (M), positive Not applicable
Change of Soil CH4 – Emissions Assessed, no impact
assumed Not assessed Not assessed Not applicable
Plant response (Carbon uptake) Assessed, impact not
included
Assessed, no impact
assumed Not assessed Not applicable
Yield impact on land use (S), positive Not assessed Not assessed Not applicable
Non-GHG related impacts:
Atmospheric Soot Concentration Not assessed Not assessed Not assessed Not applicable
Change of Surface Albedo Not assessed Not assessed Not assessed Not applicable
CHAPTER 2: A LITERATURE REVIEW 32
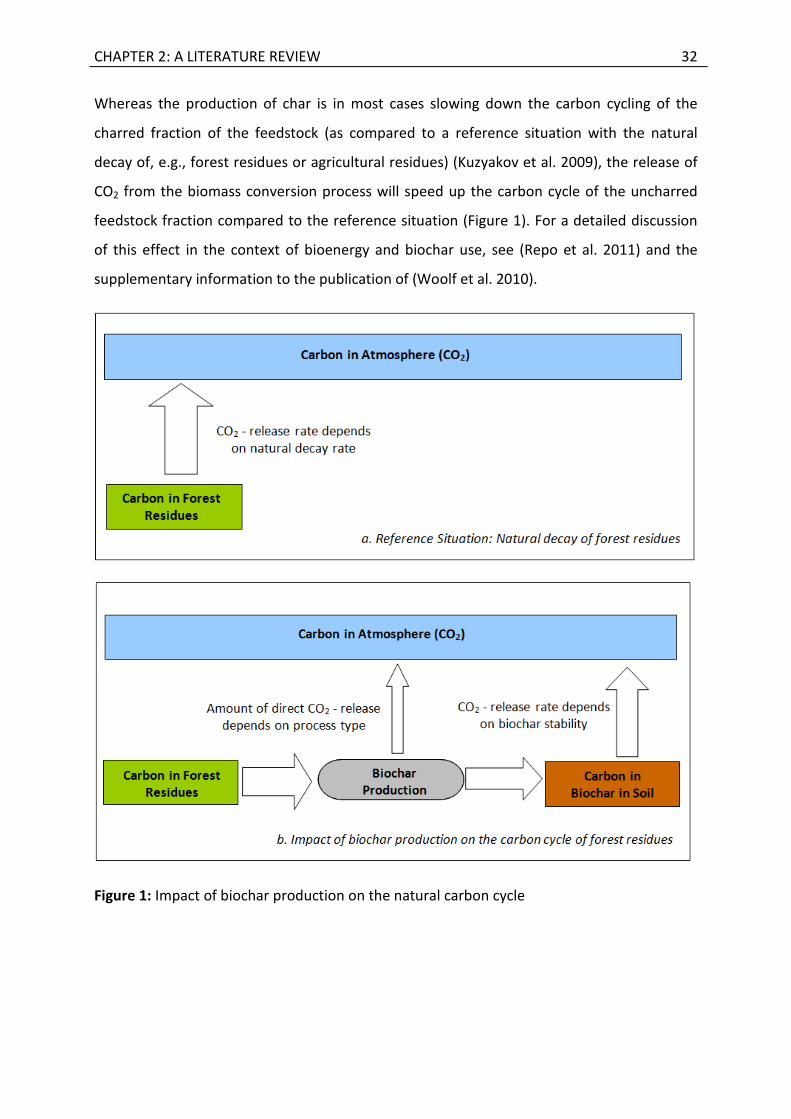
Whereas the production of char is in most cases slowing down the carbon cycling of the
charred fraction of the feedstock (as compared to a reference situation with the natural
decay of, e.g., forest residues or agricultural residues) (Kuzyakov et al. 2009), the release of
CO2 from the biomass conversion process will speed up the carbon cycle of the uncharred
feedstock fraction compared to the reference situation (Figure 1). For a detailed discussion
of this effect in the context of bioenergy and biochar use, see (Repo et al. 2011) and the
supplementary information to the publication of (Woolf et al. 2010).
Figure 1: Impact of biochar production on the natural carbon cycle
CHAPTER 2: A LITERATURE REVIEW 33
2.7.1 Pyrolysis technologies
(Woolf et al. 2010) calculated the maximum sustainable technical global potential for the
contribution of biochar systems to climate change mitigation. In this very comprehensive
paper, all GHG related impacts of pyrolysis biochar production and application have been
assessed. The potential impacts of biochar systems on the atmospheric soot concentration—
via biomass smoke and via black carbon dust becoming airborne—and on the surface albedo
are mentioned in the Supporting Information to the paper, but have not been examined in
detail. In the alpha scenario of the publication, 66 Gigatonnes CO2-C equivalent net avoided
GHG emissions have been calculated over a time period of 100 years for the production and
application of biochar derived from about 1.01 Gigatonnes biogenic carbon per year.
Assuming an average carbon content of 50% for dry biomass, 2.02 Gigatonnes of biomass
feedstock are used in the scenario for the production of biochar. As yield improvements are
assumed to be triggered by biochar application, the increment in biomass production is
reinvested into additional production of biochar in this scenario. Assuming a total
consumption of 2.3 Gigatonnes of dry biomass feedstock for the biochar production, this
scenario results in average net avoided GHG emissions of 1054 kg CO2e/tonne dry feedstock
and year.
The average avoided GHG emissions indicated above are in line with the results of a recent
publication of (Hammond et al. 2011): in this paper, a carbon abatement of 0.7-1.3 t CO2
equivalent per oven dry tonne of feedstock processed has been calculated. They also fit with
the calculations of (Roberts et al. 2010) in those of their scenarios which assume that
biochar is produced from unused residues.
(Roberts et al. 2010) calculated comprehensive greenhouse gas balances for the production
and application of biochar produced from different feedstock in a slow pyrolysis process. The
authors included most of the climate-relevant factors but did not account for impact of
biochar application on soil CH4 and soil CO2 emissions, on the surface albedo and the soot
concentration in the atmosphere. The latter two aspects do not impact on the GHG balance
of biochar production and application itself, but they influence the sum of climate relevant
effects of biochar application. To calculate the GHG impact of the production and use of
biochar, a reference scenario has to be taken into account to describe changes in emissions
when the biochar system is implemented. Under the assumption used by (Roberts et al.

CHAPTER 2: A LITERATURE REVIEW 34
2010), the following results have been calculated: Choosing a reference scenario in which
yard waste is used for composting, 885 kg CO2e per t dry biomass feedstock can be saved
when switching from yard waste composting to the production and application of biochar.
Choosing a reference scenario in which corn stover is left as residue on the field (thus not
used to provide bioenergy in the reference scenario), 793-864 kg CO2e per t dry biomass
feedstock can be saved when switching to the production and application of biochar. The
range of emission reduction depends on the moisture content of the corn stover used for
biochar production. However, if corn stover were used to produce electricity (thereby
replacing natural gas based electricity generation) in the reference scenario, GHG emissions
would increase by 123 kg CO2e per t dry biomass feedstock when switching to use the stover
in a biochar system. Switching from a reference scenario with agricultural crop production to
the cultivation of switch grass and the subsequent use of this feedstock for biochar
production might either reduce GHG emission by 442 kg CO2e per t dry biomass or increase
GHG emissions by 32 kgCO2e per t dry biomass, depending on the amount of GHG emissions
assumed to be triggered via indirect land use change effects. Indirect land-use change
effects are caused when an existing production of agricultural goods is displaced by the
cultivation of energy crops on the same plot of land. As an effect of that, other land areas,
e.g., primary rain forest might be converted to arable land to compensate for the decrease in
the previous production of agricultural goods.
In contrast to (Roberts et al. 2010), (Hammond et al. 2011) do not account for indirect land
use change effects when assessing the GHG balance of biochar systems. Thus, the latter
calculate substantial carbon abatements for biochar systems even in the case of wood chips
from short rotation coppice being used for biochar production.
A less comprehensive GHG balance for a slow pyrolysis-based biochar system has been
carried out by (Gaunt and Lehmann 2008). The authors did not account for indirect land-use
change impacts triggered by the production of energy crops, the emissions connected to the
provision and the conversion of the biomass feedstock, the energy use necessary for biochar
application, the impact of biochar application on plant growth and associated land use
effects, soil CH4 and soil CO2 emissions, the impacts on the surface albedo, and the soot
concentration in the atmosphere. Based on their assumptions, they calculated GHG emission
reductions of 10.7 t CO2 ha-1 yr-1 for corn stover. For direct comparison, (Roberts et al. 2010)
CHAPTER 2: A LITERATURE REVIEW 35
calculated emissions reductions of 7 t CO2 ha-1 yr-1 in a similar scenario for corn stover if this
feedstock would have remained a field residue in the reference scenario. If corn stover and
switch grass were used for pyrolysis based electricity production in the reference scenario
(thereby replacing natural gas-derived electricity), switching to a pyrolysis system optimized
for biochar production would reduce GHG emissions by 8.5 t CO2 ha-1 yr-1 in the case of using
corn stover as feedstock and by 7.6 t CO2 ha-1 yr-1 in the case of using wheat straw as
feedstock according to (Gaunt and Lehmann 2008). Because direct and indirect land-use
change effects were not taken into account for using energy crops as feedstock, the
calculated emission reductions for energy crop scenarios are not indicated here.
Whereas (Libra et al. 2011) did not calculate a complete GHG assessment of biochar
systems, they observed both a reduction in soil N2O emission and CO2 efflux four weeks after
mixing sandy loam brown earth mixed with pyrolysis biochar.
2.7.2 Gasification
(Searcy and Flynn 2010) calculated emission reductions of switching from coal-based
electricity production to a straw-based integrated gasification and combined cycle electricity
production system at 839 g CO2e per kWh of produced electricity (1680 kg CO2e/tonne dry
feedstock). It should be noted that this technology is still in an early development stage.
Apart from that, no extraction of biochar out of the integrated gasification and combined
cycle was assumed in this study.
2.7.3 Summary
Peer-reviewed greenhouse gas balances on the production and application of biochar were
identified for pyrolysis technologies only. The more recent publications in this field—(Woolf
et al. 2010) and (Roberts et al. 2010)—are far more comprehensive compared to older
papers since they cover more GHG related impacts of the biochar systems. Depending on the
types and previous use of the biomass feedstock, both reductions and increases of GHGs
have been calculated for biochar systems (Woolf et al. 2010; Roberts et al. 2010; Gaunt and
Lehmann 2008). GHG reductions are often not achieved if dedicated energy crops are used
as feedstock for the production of biochar or if biomass residues are already used for the
provision of bioenergy in the reference scenario. From a GHG perspective alone, the most
recent studies give a clear indication under which conditions biochar systems can contribute
CHAPTER 2: A LITERATURE REVIEW 36
to mitigate climate change. However, as explained above, the calculations do not yet take
into account all relevant climate impacts of biochar systems: Insights into the impacts of
biochar application on the surface albedo and on the black carbon (soot) concentration in
the atmosphere have not been added yet to the GHG balances of the biochar systems in the
publications reviewed. In this context, it should be noted that (Vaccari et al. 2011) reported
positive soil temperature anomalies up to 2 °C in open field biochar plots during the initial
phases of durum wheat production. These aspects should also be taken into account when
comparing the full climate benefit of bioenergy vs biochar systems (see also Woolf et al.
2010). Last but not least - as already indicated - it is important to use biochar-based
mitigation options complementary to existing mitigation strategies instead of replacing the
latter.
2.8 Outlook
The peer-reviewed papers analyzed provided valuable insights into technical reliability,
economic feasibility, and climate impact of different carbonization technologies. Most
papers focus on pyrolysis technologies, less information is available on gasification
processes. Publications on gasification processes often do not take into account the
potential suitability of the char as a product for soil improvement. Very little information
about hydrothermal and flash carbonization technologies with relevance for this review has
been published yet. Two comprehensive studies on the economic profitability and the GHG
balance of a slow pyrolysis process have been identified which point at economic and
environmental chances of biochar systems (Roberts et al. 2010; Woolf et al. 2010). Data
from pilot projects would be essential to further improve assessments on the technical
reliability and economic profitability of biochar production technologies. To complement the
assessments on the climate impact of biochar production technologies, additional
information on the impact of biochar application on surface albedo, atmospheric soot
concentration, and yield responses would be needed. The GHG balance of biochar systems
itself has been already quite well examined in recent papers with promising results regarding
climate mitigation opportunities.
In most of the studies, only one assessment dimension of a technology is analyzed.
Comparisons between different technologies—see for example the papers of (Bridgwater et
al. 2002) or (Brown et al. 2011)—are rare as well. Empirical data on the annual availability of
CHAPTER 2: A LITERATURE REVIEW 37
technologies which (co)produce biogenic chars has only been published from gasification
systems aimed at the production of electricity (in this sector, annual availability rates of 60-
70% were measured). A wide range of data on the costs of char production (between
51 $2010 per tonne pyrolysis biochar from yard waste and 386 US$2010 per tonne retort
charcoal) and on the GHG balance of biochar systems (between -1,054 kg CO2e and +123 kg
CO2e per t dry biomass feedstock) can be retrieved from the literature. A comprehensive
assessment of the technical, economic, and environmental strength and weakness of biochar
production technologies is unfortunately still not possible yet on the basis of the available
scientific peer-reviewed literature. This is at least partly explainable by the fact that the
production of biomass-based chars for the improvement of agricultural soils is still a
relatively new topic of scientific interest. Further research of both the public and the private
sector on the indicated knowledge gaps and its publication is necessary to support project
developers, technology developers, and policy makers with a comprehensive and detailed
picture on the different options to produce biochar for soil improvement and climate change
mitigation.
CHAPTER 3: ALBEDO IMPACT 38
3 Albedo impact on the suitability of biochar systems to mitigate global
warming
Sebastian Meyer, Ryan Bright, Daniel Fischer, Hardy Schulz and Bruno Glaser
published in:
Environmental Science & Technology 46 (22): pp 12726–12734, 2012
3.1 Summary
Biochar application to agricultural soils can change the surface albedo which could
counteract the climate mitigation benefit of biochar systems. However, the size of this
impact has not yet been quantified. Based on empirical albedo measurements and literature
data of arable soils mixed with biochar, a model for annual vegetation cover development
based on satellite data and an assessment of the annual development of surface humidity,
an average mean annual albedo reduction of 0.05 has been calculated for applying
30−32 Mg ha−1 biochar on a test field near Bayreuth, Germany. The impact of biochar
production and application on the carbon cycle and on the soil albedo was integrated into
the greenhouse gas (GHG) balance of a modeled pyrolysis based biochar system via the
computation of global warming potential (GWP) characterization factors. The analysis
resulted in a reduction of the overall climate mitigation benefit of biochar systems by
13−22% due to the albedo change as compared to an analysis which disregards the albedo
effect. Comparing the use of the same quantity of biomass in a biochar system to a
bioenergy district heating system which replaces natural gas combustion, bioenergy heating
systems achieve 99−119% of the climate benefit of biochar systems according to the model
calculation.
CHAPTER 3: ALBEDO IMPACT 39
3.2 Introduction
The charring of organic matter and its application to soil with the intent to improve soil
properties is known as biochar technology and commonly seen as an opportunity to mitigate
global warming (Glaser and Birk 2012). The carbon cycling of the charred material is slowed
down compared to uncharred organic matter. In addition, the production of biochar often
yields bioenergy as a coproduct which can substitute fossil fuels. Further, it was observed
that the application of biochar to soil can - at least in the short term - decrease soil
greenhouse gas emissions (Libra et al. 2011; Kammann et al. 2012; Singh et al. 2010) and
increase fertilizer use efficiency (Steiner et al. 2008). Under certain conditions, there is
evidence that black carbon (predominantly condensed aromatic and graphitic carbon
structures which are, for example, formed during biochar production (Glaser und Knorr
2008) in soil can reduce the carbon mineralization of organic matter added to the soil; for
example, in the form of harvest residues (Biqing Liang et al. 2010). While all of these impacts
serve to reduce radiative forcings from greenhouse gases (GHGs), there are also GHG
emissions during the whole lifecycle of a biochar system starting with feedstock production
up to the final degradation of the biochar in the soil (see also Meyer et al. 2011). The
application of biochar to soil can induce a radiative forcing (Genesio et al. 2012) by changing
the surface albedo (the dimensionless relation of reflected shortwave radiation to incoming
shortwave radiation) and the black carbon (soot) concentration in the atmosphere
(Ramanathan and Carmichael 2008). Thus, there is also a risk that biochar systems might
accelerate global warming.
This paper integrates the albedo impact caused by biochar application in the overall climate
impact assessment of a pyrolysis-based biochar system to assess the effect of biochar
systems on the climate more comprehensively. An existing, partly adapted GHG balance of a
pyrolysis based biochar system compiled by (Hammond et al. 2011) was used as basis to
assess the overall climate impact of a biochar system after the integration of the albedo
impact assessment. Quantifications of direct radiative forcing impacts of albedo changes
when biochar is applied to soil (i.e., the increase in absorbed short-wave radiation) were
based on empirical measurements and literature data. Since albedo measurements of soils
mixed with biochar are still rare (Genesio et al. 2012; Oguntunde et al. 2008), additional soil
albedo measurements were carried out to strengthen the basis of the analysis. Indirect
radiative forcing impacts of albedo changes (caused by changes in water vapor
CHAPTER 3: ALBEDO IMPACT 40
concentration in the atmosphere and changes in cloud cover due to changes in
evapotranspiration rates resulting from changes in the ratio of latent to sensible heat fluxes)
are not analyzed in this article (see also Figure 1 in Kirschbaum et al. 2011). These indirect
effects are difficult to assess and were not included in the scope of the present study,
although they may be, under certain conditions, quantitatively as important as the direct
effect of albedo changes (Bala et al. 2007). To stay in line with GHG metrics that integrate
instantaneous radiative forcing - the instantaneous perturbation of the earth energy balance
at the top of the atmosphere - caused by pulse emissions of greenhouse gases over a
common time horizon, this analysis adapts a methodology applied by (Bright et al. 2012) to
express the climate impact of albedo changes in the same unit (i.e., in Megagram of CO2
equivalent emissions [Mg CO2e]).
This paper also accounts for the climate impact caused by the temporal shift between pulse
emissions of biogenic CO2 during biochar production and the subsequent carbon
sequestration via the regrowing biomass feedstock. A comprehensive literature review
reveals that this dynamic impact has not yet been accounted for in global warming impact
assessments of biochar systems (Meyer et al. 2011). In line with (Cherubini et al. 2012c),
suitable GWP characterization factors for biogenic and time-distributed CO2 emissions of the
biochar system under study are developed.
Results are benchmarked to the climate impact of a standalone bioenergy heating system
which substitutes the use of fossil fuels and consumes the same amount of dry biomass
feedstock as the biochar system.
3.3 Materials and methods
3.3.1 Overview of the modeled biochar system
As mentioned, we are making use of existing lifecycle GHG data of (Hammond et al. 2011) to
model the GHG balance of a biochar system consisting of a pyrolysis plant with an annual
feedstock consumption of 2,000 Mg biomass (25% water content) and biochar application
on a wheat field. Since the results presented in chapter 3.4 are related to biochar production
via slow pyrolysis, they cannot be generalized to other carbonization technologies such as
fast pyrolysis, gasification, hydrothermal-, or flash carbonization. We modeled two scenarios
based on two types of feedstock with different regrowth periods: Wood chips from small
CHAPTER 3: ALBEDO IMPACT 41
forestry roundwood and wheat straw. Data on GHG emissions per type of feedstock
connected to the provision of biomass feedstock (including transport to the pyrolysis plants),
the production of the pyrolysis plant, char transport to the field, and its application to the
soil are taken directly from (Hammond et al. 2011). Wood chips were treated as a main
product, wheat straw as byproduct in the LCA inventory of this publication. We deviate from
the publication in the assumptions that 55% of the energy in the synthesis gas and waste
heat of the process can be supplied into a district heating system with a high annual
utilization factor of 75%, that transport heat losses are 5% (see also Cholewa and Siuta-Olcha
2010) and that resulting emissions saving are 0.252 kg CO2e/kWh final energy (see
Umweltbundesamt 2012) due to the replacement of natural gas heating systems. Due to the
limited scientific knowledge on a discussed positive impact of biochar application on soil
inherent organic matter stabilization, such an effect was not accounted for. In addition, the
impact of a potential increase in biomass production after biochar application on soil humus
formation was not taken into account.
To model the biochar system, it is assumed that biochar is applied to an arable field near
Donndorf close to Bayreuth in Bavaria/Germany and used for wheat and rapeseed
cultivation. The simulation of the albedo impact of biochar application at this location is
dealt with in chapter 3.3.2. The impact of biogenic and time-distributed emissions and
removal fluxes caused by the oxidation and stabilization of biochar, increases in fertilizer use
efficiency, and soil N2O reduction are discussed in chapter 3.3.3.
3.3.2 Albedo impact of biochar application
3.3.2.1 Laboratory soil albedo measurements
The following study was carried out: 16 wet soil samples (four treatments with four
replicates of each treatment) were taken from a biochar field trial near Donndorf in
Northern Bavaria [49°56′0.02″N, 11°31′15.77″E, World Geodetic System 1984 coordinates]
on January 26, 2012 (see Figure 2). The A horizon of the field site consists mainly of sandy silt
(Us) and of very sandy clay (Ls4). On the East side of the test field, the parent material is
sand stone. In Table 7, the different treatment volumes which had been already tilled 10 cm
deep into the arable soil in July 2010 are described.
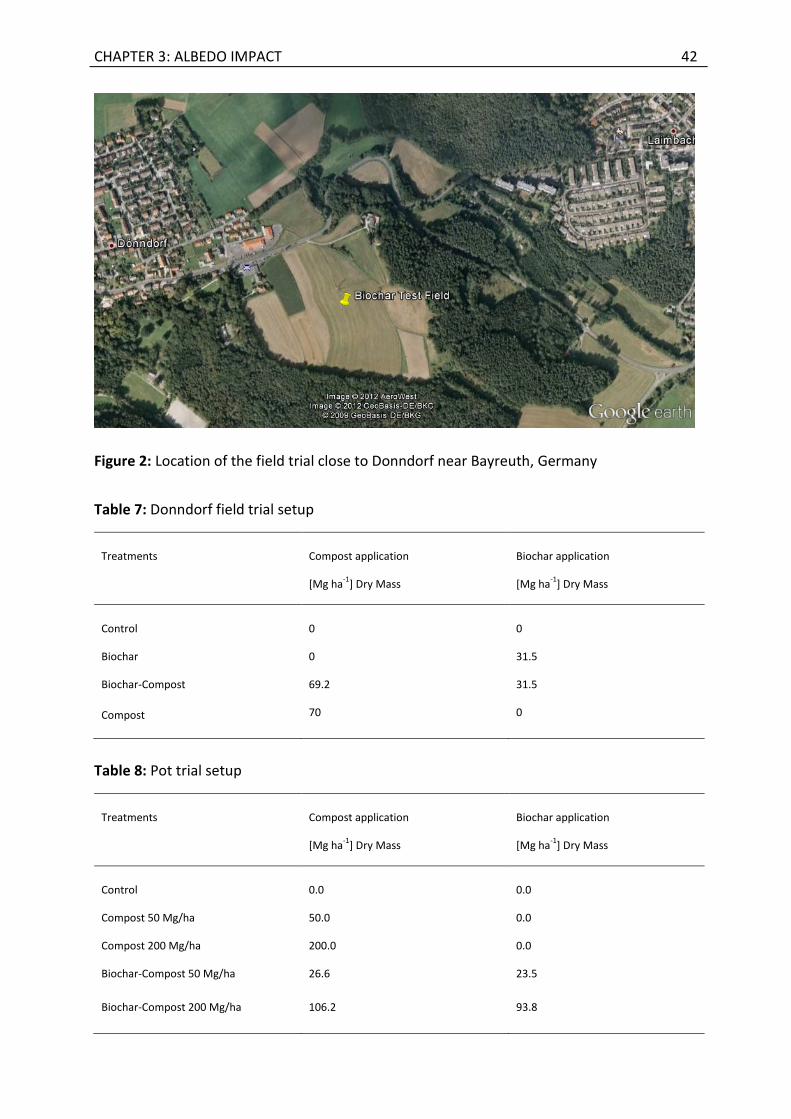
CHAPTER 3: ALBEDO IMPACT 42
Figure 2: Location of the field trial close to Donndorf near Bayreuth, Germany
Table 7: Donndorf field trial setup
Treatments Compost application
[Mg ha-1
] Dry Mass
Biochar application
[Mg ha-1
] Dry Mass
Control 0 0
Biochar 0 31.5
Biochar-Compost 69.2 31.5
Compost 70 0
Table 8: Pot trial setup
Treatments Compost application
[Mg ha-1
] Dry Mass
Biochar application
[Mg ha-1
] Dry Mass
Control 0.0 0.0
Compost 50 Mg/ha 50.0 0.0
Compost 200 Mg/ha 200.0 0.0
Biochar-Compost 50 Mg/ha 26.6 23.5
Biochar-Compost 200 Mg/ha 106.2 93.8
CHAPTER 3: ALBEDO IMPACT 43
For a detailed description of this field trial set up in 2010, see (Fischer 2010). Two 10 cm
deep tilling operations in preparation for corn and triticale cultivation were carried out in the
time period between field trial setup and soil sample extraction.
The biochar used in the treatments of the field trial (application rate 31.5 Mg ha−1) was
produced from wood in a slow pyrolysis plant by the company CarbonTerra in Duttenstein,
Germany. The soil samples were taken from the soil surface (0−5 cm) of four randomly
chosen sample sites of the respective treatments forming 4-fold replications, filled in plastic
bags and transported to the micrometeorological laboratory of the University of Bayreuth.
The albedo of the field trial soils samples was measured twice: One measurement per
sample was carried out at the original water content of the soil samples. Subsequently, these
soil samples were modestly dried in a drying oven at a temperature around 60 °C for 90 min,
followed by a second soil albedo measurement of each sample. In addition to the albedo
measurements, the gravimetric water content of each soil sample was analyzed.
The albedo of a second series of dry soil samples from a pot trial set up in the year 2009 (see
Schulz et al. 2013) was analyzed in the laboratory as well to study the impact of very high
biochar and compost applications on the soil albedo. The control treatment of this series
consists of washed sand from the Kiesgrube ZAPF, Weidenberg, Germany. Three further
treatments are based on very high biochar and compost amendments to the washed sand as
described in
Table 8. The char used in the washed sand samples (application rates 23.5 and 93.8 Mg ha-1
in two different treatments) was produced from hardwood by the charcoal producer
Köhlerei Wiesener in Rohr, Austria in a traditional charcoal kiln. For a detailed description of
the pot trial set up in 2009, see (Schulz et al. 2013). The treatments of the pot trial had been
used for greenhouse cultivation experiments for a period of two years before they were
used for the albedo measurements.
In the laboratory, each of the soil samples was evenly distributed on an open flat plastic
plate of 60 cm x 2 cm x 40 cm (width x height x depth)) size. A 500 Watt flood light with a
halide lamp (Manufacturer: düwi) was installed 50 cm above the plastic plate. Albedo
measurements of all soil samples were carried out in the lab with an ISO Second Class Kipp &
Zonen Double-Pyranometer CM 3 which was installed centrally 13 cm above the respective
soil samples. The albedo of the soils samples of the field trial in Bayreuth was measured
CHAPTER 3: ALBEDO IMPACT 44
twice: The first measurement was carried out with the original water content of the soil
samples. After that, these soil samples were modestly dried in a drying oven at a
temperature around 60 °C for 90 minutes, followed by a second soil albedo measurement. In
addition to the albedo measurements, the gravimetric water content of each soil sample
was analyzed.
To account for the measurement response time of the albedometer, the albedo of the soil
samples and the temperature of the albedometer were measured after lighting the soil
samples for 40 seconds with the halide lamp. Since the laboratory installation did not allow
for preventing that 15% of the soil sample area was covered by the shadow of the
albedometer, the values of reflected shortwave radiation measured were corrected
accordingly to account for the loss in reflected shortwave radiation. The albedo of a
reference soil sample (white sand) was measured together with the temperature of the
albedometer after every 10 albedo measurements to analyze the impact of the albedometer
temperature on the measured albedometer data. Since a clear linear correlation between
the albedometer temperature and the measured albedo of the white sand was observed (for
each degree of instrument temperature warming above 21.7 °C, the measured albedo value
increased by 0.0053), the detected albedo data was temperature-corrected for this thermal
measurement error.
One way analyses of variance (ANOVA) were carried out to compare the treatment effects
on the surface albedo values with Tukey's HSD as post-hoc test at a significance level of 0.05.
In addition, a regression analysis with the data of the FT soil samples was carried out with
the independent variables Gravimetric water content GWC, Compost Application Mass CAM,
and Biochar application Mass BAM and the dependent variable Surface Albedo.
3.3.2.2 Impact of vegetation cover, snow cover, and soil humidity on the surface albedo
change
The development of mean monthly surface albedo difference � s∆ α between arable land with
and without biochar application within a year is influenced by the average monthly surface
water content, the average monthly vegetation cover, and the average monthly snow cover.
We derive � s∆ α in our simulation according to the following formula:
CHAPTER 3: ALBEDO IMPACT 45
� �g scs soil1 f – f ∆α = − ∆α ɶ ɶ (1)
gfɶ is the average monthly fraction of green vegetation and scfɶ is the average monthly
fraction of snow cover. �soil∆α - the albedo difference between different types of soil –is
dependent on the surface properties of the soil treatments which depend on the type of
treatment, the change in surface properties over time, and the soil humidity (since water
enforces irradiation absorption).
To model the annual development of the vegetation cover of wheat and rapeseed fields at
our model location near Donndorf, the correlation between the fraction of green vegetation
at a certain point in time gf and the scaled difference vegetation index (SDVI) as suggested
by (Zhangyan Jiang et al. 2006) was applied:
s sg
v v s s
N R (N R )f SDVI
N R (N R )
− − −= =
− − − (2)
R represents the surface reflectance averaged over visible regions (λ ∼ 0.6 μm) and N the
surface reflectance averaged over near-infrared regions (λ ∼ 0.8 μm) of the spectrum. Ns and
Rs represent the reflectance of bare soil, Nv and Rv represent the reflectance of dense
vegetation. The bands 1 (0.62−0.67 μm) and 2 (0.84−0.87 μm) of the surface reflectance
product MOD09A1 produced every 8 days by the moderate-resolution imaging
spectroradiometer (MODIS) on the Terra satellite of (NASA) over the years 2010 and 2011
was used to derive gf and gfɶ . Since the data set has a resolution of 500 × 500 m, the
surface reflectance data from an agricultural field large enough to provide a homogeneous
surface was needed to calculate gf and gfɶ . For this purpose, surface reflectance data of an
agricultural field close to Penkun/Germany [53° 19′ 23.46″ N, 14° 15′48.35″ E, World
Geodetic System 1984 coordinates) with wheat cultivation in 2010 and rapeseed cultivation
in 2011 (no intertillage crops were cultivated in both years) was obtained. The data was used
to simulate the development of green vegetation cover on the modeled field site near
Donndorf without taking into account differences in the vegetation phenology between
fields in Donndorf and Penkun.
CHAPTER 3: ALBEDO IMPACT 46
According to the snow cover period map of (Hochschule für Angewandte Wissenschaften FH
München 2012) there were 40−60 snow cover days per year in the region of Bayreuth in the
average of the years 2005−2009. Based on this information, a total of 50 days with snow
cover was evenly distributed over the months from December to February in the intra-
annual delta albedo simulation. The impact of surface albedo changes on the snow cover
period due to increased radiation absorption (Ramanathan and Carmichael 2008) was not
accounted for in our assessment.
To account for the intra-annual variation in soil humidity and its impact on �soil∆α , it was
necessary to know how the humidity in the first millimeters of the soil surface of the field
trial site near Donndorf develops over the year. Due to a lack of empirical data, we assumed
in a simplified approach that dry surface conditions dominate on days without rainfall and
wet surface conditions dominate on day with rainfall. Continuously measured rainfalls
records (10 min measurement interval) for the years 2008−2011 in the Ökologisch-
Botanischer Garten in Bayreuth provided by the Micrometeorological Department of the
University of Bayreuth were used to derive the average amount of days with and without
rainfall per month in the region of Bayreuth. For wet days, a ∆αsoil of 0.027 between control
and biochar treatments (directly after biochar incorporation in soil) was used in our annual
delta albedo simulation for the field near Donndorf in line with the result from the Donndorf
field trial (see Figure 3) and our assumption on the development of ∆αsoil in time (see eq 4).
In line with the results from the albedo measurements of (Genesio et al. 2012) in Pistoia,
Italy (see Figure 6), a ∆αsoil of 0.15 between control and biochar treatments (directly after
biochar incorporation in soil) was used for dry days in the same simulation.
3.3.2.3 Radiative Forcing and GWP from albedo change
Methods for estimating GWP characterization factors from surface albedo changes are
thoroughly discussed in (Bright et al. 2012; Cherubini et al. 2012a) and (Muñoz et al. 2010).
Thus only a brief description is presented here. Monthly mean instantaneous forcing from
the monthly mean surface albedo change when biochar is applied can be described by the
following equation:
(3) � � � �
.TOA sAtmRF R fα α= − ∆
CHAPTER 3: ALBEDO IMPACT 47
�TOAR is the monthly mean downward solar flux at the top of the atmosphere (TOA) for our
region (in W/m2), Atmfɶ is a two-way atmospheric transmittance parameter accounting for the
monthly mean reflection and absorption of solar radiation (downward and upward)
throughout the atmosphere for the same region, and �s∆ α is the monthly mean surface
albedo change of the sample area scaled to 1 m2. � TOAR is a function of latitude, sunset hour
angle, and solar declination angle and is calculated following the methodology outlined in
(Duffie and Beckman 1991) and (Kalogirou 2009). Atmfɶ is the product of two factors: The
monthly mean clearness index, KT, or the fraction of TOA irradiance reaching Earth’s surface,
and, Ta the monthly fraction reaching TOA after reflection at the surface. 22-year mean
monthly clearness index data for our specific region are obtained from (NASA). There is no
empirical data on Ta. Since KT and Ta are subject to equal atmospheric conditions, we
estimated Ta based on a one layer atmosphere model and the following assumptions: For
each transition of the atmosphere (upwards and downwards), we assume that the fraction
of shortwave radiation transmitted is equal to KT. In addition to that, we assume that 50% of
the upwelling radiation not transmitted to the top of the atmosphere is reflected back to the
surface (and that the remaining 50% are being absorbed by the atmosphere) in line with the
global annual mean Earth’s energy budget of (Trenberth et al. 2009). After accounting for
the reduction of the reflected radiation by surface albedo, the fraction KT of the remaining
shortwave radiation is assumed to be transmitted again to the top of the atmosphere, 50%
of the radiation not transmitted to the top of the atmosphere is assumed to be reflected
back to the surface and so forth. To calculate Ta, we add all the fractions of short wave
radiation (reflected on the surface) reaching the top of the atmosphere. Averaged over 22
years, KT was 0.41 over the test field near Donndorf. According to the calculation based on
our assumptions described above, Ta was 0.44 over the same site in the same time period.
This value was used for the radiative forcing calculation. Since the value for the amount of
upwelling radiation not transmitted to the top of the atmosphere taken from (Trenberth et
al. 2009) describes a global average, the local conditions over the test field near Donndorf
might deviate substantially. To test the sensitivity or our result against a second, very
conservative scenario, we assumed that 90% of the upwelling radiation not transmitted to
the top of the atmosphere would be reflected back to the surface (and that the remaining
10% are being absorbed by the atmosphere). Under this assumption, Ta would be 0.45. Thus,
our result would change only very modestly. Monthly mean local instantaneous forcing is
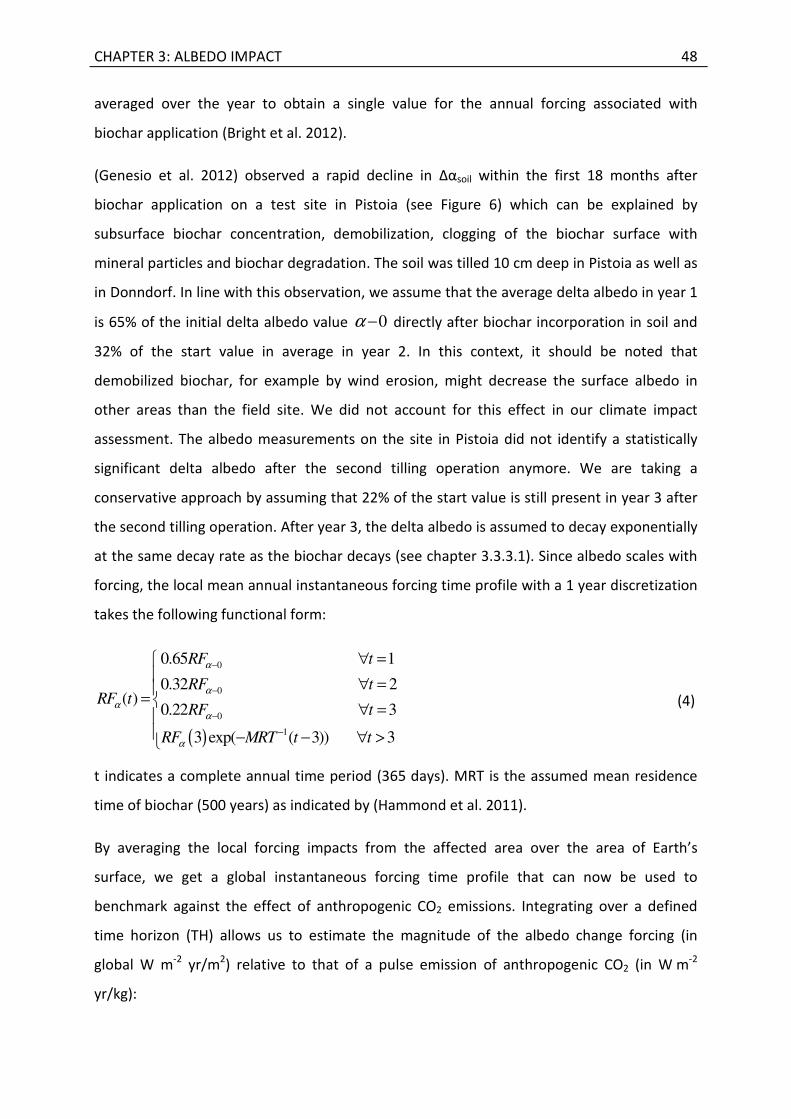
CHAPTER 3: ALBEDO IMPACT 48
averaged over the year to obtain a single value for the annual forcing associated with
biochar application (Bright et al. 2012).
(Genesio et al. 2012) observed a rapid decline in ∆αsoil within the first 18 months after
biochar application on a test site in Pistoia (see Figure 6) which can be explained by
subsurface biochar concentration, demobilization, clogging of the biochar surface with
mineral particles and biochar degradation. The soil was tilled 10 cm deep in Pistoia as well as
in Donndorf. In line with this observation, we assume that the average delta albedo in year 1
is 65% of the initial delta albedo value 0−α directly after biochar incorporation in soil and
32% of the start value in average in year 2. In this context, it should be noted that
demobilized biochar, for example by wind erosion, might decrease the surface albedo in
other areas than the field site. We did not account for this effect in our climate impact
assessment. The albedo measurements on the site in Pistoia did not identify a statistically
significant delta albedo after the second tilling operation anymore. We are taking a
conservative approach by assuming that 22% of the start value is still present in year 3 after
the second tilling operation. After year 3, the delta albedo is assumed to decay exponentially
at the same decay rate as the biochar decays (see chapter 3.3.3.1). Since albedo scales with
forcing, the local mean annual instantaneous forcing time profile with a 1 year discretization
takes the following functional form:
( )
0
0
0
1
0.65 1
0.32 2( )
0.22 3
3 exp( ( 3)) 3
−
−
−
−
∀ =
∀ ==
∀ = − − ∀ >
RF t
RF tRF t
RF t
RF MRT t t
α
α
αα
α
(4)
t indicates a complete annual time period (365 days). MRT is the assumed mean residence
time of biochar (500 years) as indicated by (Hammond et al. 2011).
By averaging the local forcing impacts from the affected area over the area of Earth’s
surface, we get a global instantaneous forcing time profile that can now be used to
benchmark against the effect of anthropogenic CO2 emissions. Integrating over a defined
time horizon (TH) allows us to estimate the magnitude of the albedo change forcing (in
global W m-2 yr/m2) relative to that of a pulse emission of anthropogenic CO2 (in W m-2
yr/kg):
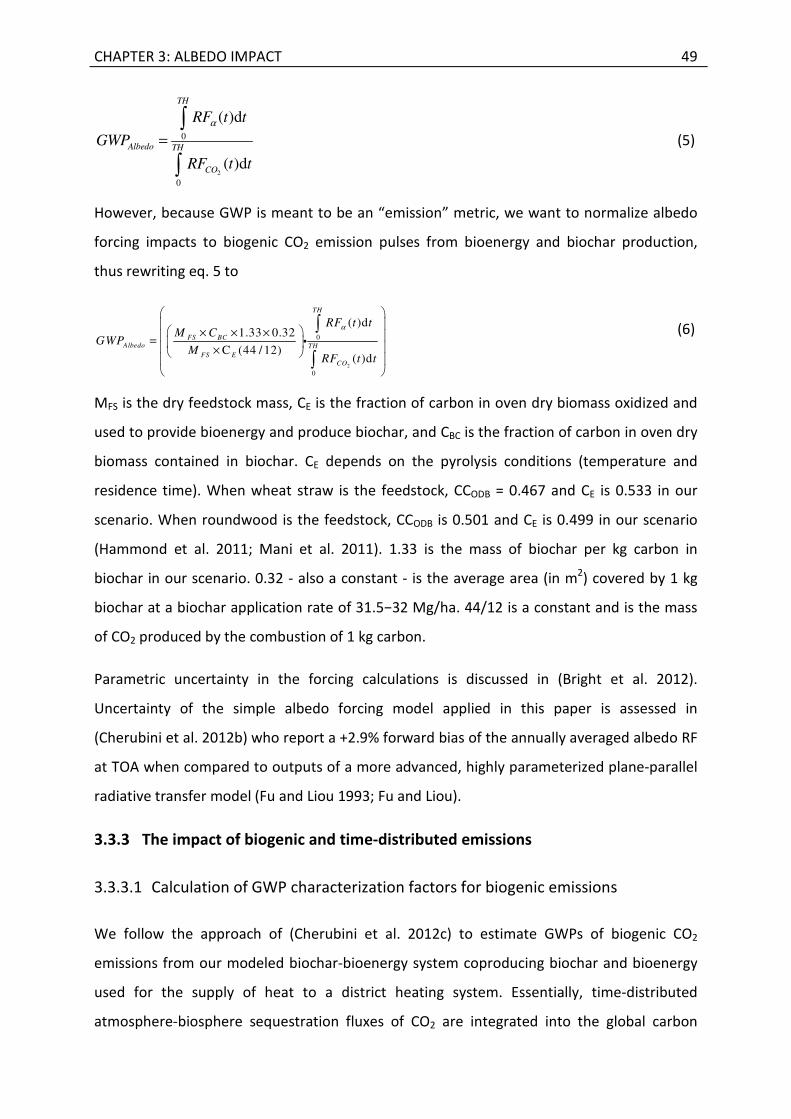
CHAPTER 3: ALBEDO IMPACT 49
2
0
0
( )d
( )d
=∫
∫
TH
Albedo TH
CO
RF t t
GWP
RF t t
α
(5)
However, because GWP is meant to be an “emission” metric, we want to normalize albedo
forcing impacts to biogenic CO2 emission pulses from bioenergy and biochar production,
thus rewriting eq. 5 to
2
0
0
( )d1.33 0.32
C (44 / 12)( )d
× × × = ×
∫
∫i
TH
FS BC
Albedo TH
FS E
CO
RF t tM C
GWPM
RF t t
α
(6)
MFS is the dry feedstock mass, CE is the fraction of carbon in oven dry biomass oxidized and
used to provide bioenergy and produce biochar, and CBC is the fraction of carbon in oven dry
biomass contained in biochar. CE depends on the pyrolysis conditions (temperature and
residence time). When wheat straw is the feedstock, CCODB = 0.467 and CE is 0.533 in our
scenario. When roundwood is the feedstock, CCODB is 0.501 and CE is 0.499 in our scenario
(Hammond et al. 2011; Mani et al. 2011). 1.33 is the mass of biochar per kg carbon in
biochar in our scenario. 0.32 - also a constant - is the average area (in m2) covered by 1 kg
biochar at a biochar application rate of 31.5−32 Mg/ha. 44/12 is a constant and is the mass
of CO2 produced by the combustion of 1 kg carbon.
Parametric uncertainty in the forcing calculations is discussed in (Bright et al. 2012).
Uncertainty of the simple albedo forcing model applied in this paper is assessed in
(Cherubini et al. 2012b) who report a +2.9% forward bias of the annually averaged albedo RF
at TOA when compared to outputs of a more advanced, highly parameterized plane-parallel
radiative transfer model (Fu and Liou 1993; Fu and Liou).
3.3.3 The impact of biogenic and time-distributed emissions
3.3.3.1 Calculation of GWP characterization factors for biogenic emissions
We follow the approach of (Cherubini et al. 2012c) to estimate GWPs of biogenic CO2
emissions from our modeled biochar-bioenergy system coproducing biochar and bioenergy
used for the supply of heat to a district heating system. Essentially, time-distributed
atmosphere-biosphere sequestration fluxes of CO2 are integrated into the global carbon
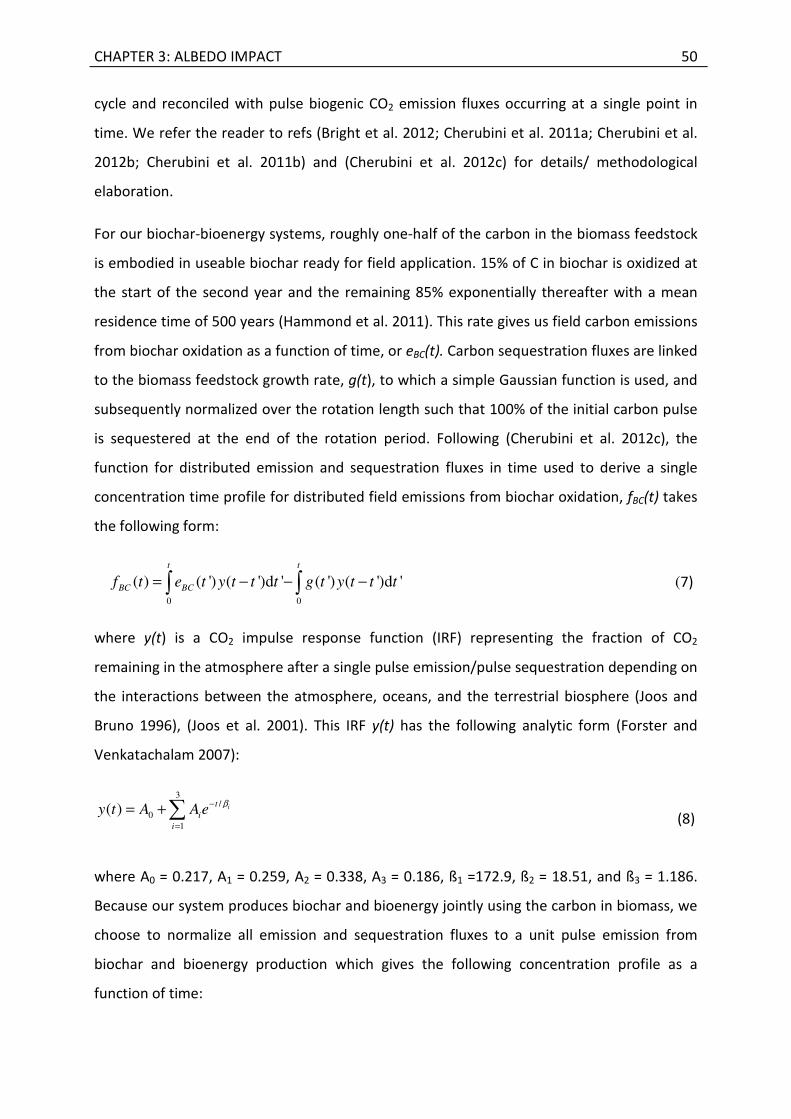
CHAPTER 3: ALBEDO IMPACT 50
cycle and reconciled with pulse biogenic CO2 emission fluxes occurring at a single point in
time. We refer the reader to refs (Bright et al. 2012; Cherubini et al. 2011a; Cherubini et al.
2012b; Cherubini et al. 2011b) and (Cherubini et al. 2012c) for details/ methodological
elaboration.
For our biochar-bioenergy systems, roughly one-half of the carbon in the biomass feedstock
is embodied in useable biochar ready for field application. 15% of C in biochar is oxidized at
the start of the second year and the remaining 85% exponentially thereafter with a mean
residence time of 500 years (Hammond et al. 2011). This rate gives us field carbon emissions
from biochar oxidation as a function of time, or eBC(t). Carbon sequestration fluxes are linked
to the biomass feedstock growth rate, g(t), to which a simple Gaussian function is used, and
subsequently normalized over the rotation length such that 100% of the initial carbon pulse
is sequestered at the end of the rotation period. Following (Cherubini et al. 2012c), the
function for distributed emission and sequestration fluxes in time used to derive a single
concentration time profile for distributed field emissions from biochar oxidation, fBC(t) takes
the following form:
0 0
( ) ( ') ( ')d ' ( ') ( ')d '= − − −∫ ∫t t
BC BCf t e t y t t t g t y t t t
(7)
where y(t) is a CO2 impulse response function (IRF) representing the fraction of CO2
remaining in the atmosphere after a single pulse emission/pulse sequestration depending on
the interactions between the atmosphere, oceans, and the terrestrial biosphere (Joos and
Bruno 1996), (Joos et al. 2001). This IRF y(t) has the following analytic form (Forster and
Venkatachalam 2007):
3/
0
1
( )−
=
= +∑ it
i
i
y t A A eβ
(8)
where A0 = 0.217, A1 = 0.259, A2 = 0.338, A3 = 0.186, ß1 =172.9, ß2 = 18.51, and ß3 = 1.186.
Because our system produces biochar and bioenergy jointly using the carbon in biomass, we
choose to normalize all emission and sequestration fluxes to a unit pulse emission from
biochar and bioenergy production which gives the following concentration profile as a
function of time:
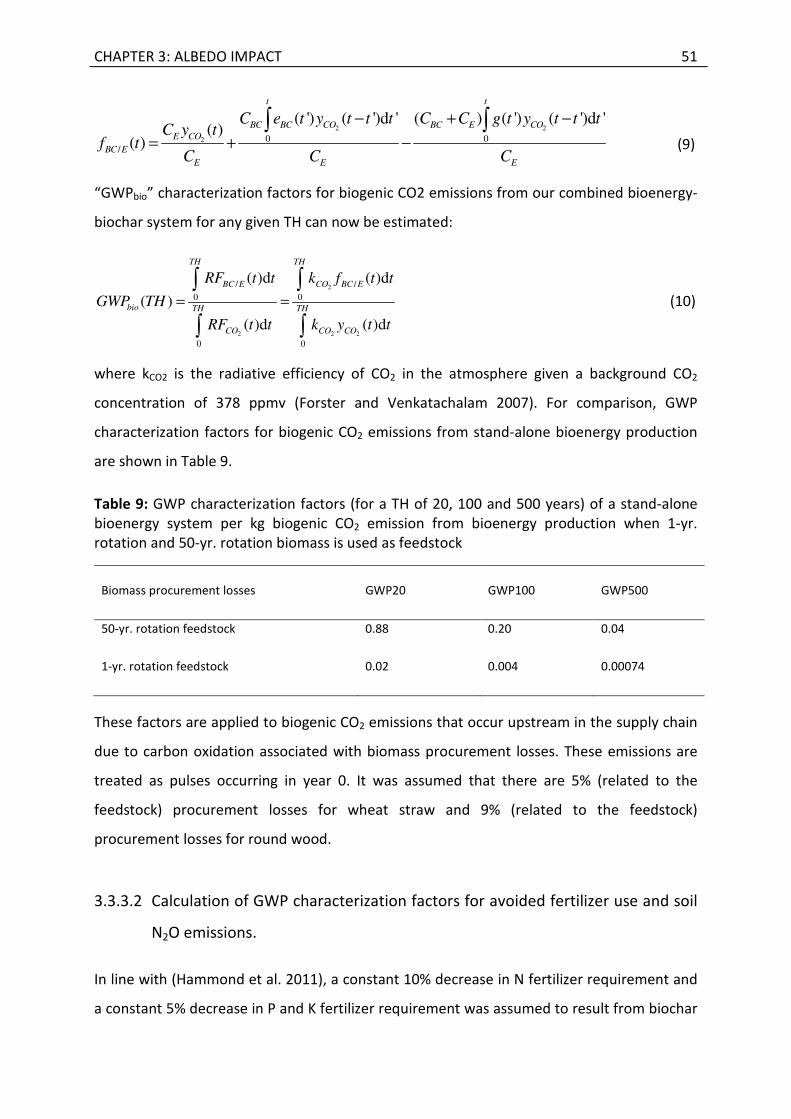
CHAPTER 3: ALBEDO IMPACT 51
2 2
2 0 0/
( ') ( ')d ' ( ) ( ') ( ')d '( )
( )
− + −
= + −∫ ∫t t
BC BC CO BC E CO
E CO
BC E
E E E
C e t y t t t C C g t y t t tC y t
f tC C C
(9)
“GWPbio” characterization factors for biogenic CO2 emissions from our combined bioenergy-
biochar system for any given TH can now be estimated:
2
2 2 2
/ /
0 0
0 0
( )d ( )d
( )
( )d ( )d
TH TH
BC E CO BC E
bio TH TH
CO CO CO
RF t t k f t t
GWP TH
RF t t k y t t
= =∫ ∫
∫ ∫
(10)
where kCO2 is the radiative efficiency of CO2 in the atmosphere given a background CO2
concentration of 378 ppmv (Forster and Venkatachalam 2007). For comparison, GWP
characterization factors for biogenic CO2 emissions from stand-alone bioenergy production
are shown in Table 9.
Table 9: GWP characterization factors (for a TH of 20, 100 and 500 years) of a stand-alone bioenergy system per kg biogenic CO2 emission from bioenergy production when 1-yr. rotation and 50-yr. rotation biomass is used as feedstock
Biomass procurement losses GWP20 GWP100 GWP500
50-yr. rotation feedstock 0.88 0.20 0.04
1-yr. rotation feedstock 0.02 0.004 0.00074
These factors are applied to biogenic CO2 emissions that occur upstream in the supply chain
due to carbon oxidation associated with biomass procurement losses. These emissions are
treated as pulses occurring in year 0. It was assumed that there are 5% (related to the
feedstock) procurement losses for wheat straw and 9% (related to the feedstock)
procurement losses for round wood.
3.3.3.2 Calculation of GWP characterization factors for avoided fertilizer use and soil
N2O emissions.
In line with (Hammond et al. 2011), a constant 10% decrease in N fertilizer requirement and
a constant 5% decrease in P and K fertilizer requirement was assumed to result from biochar
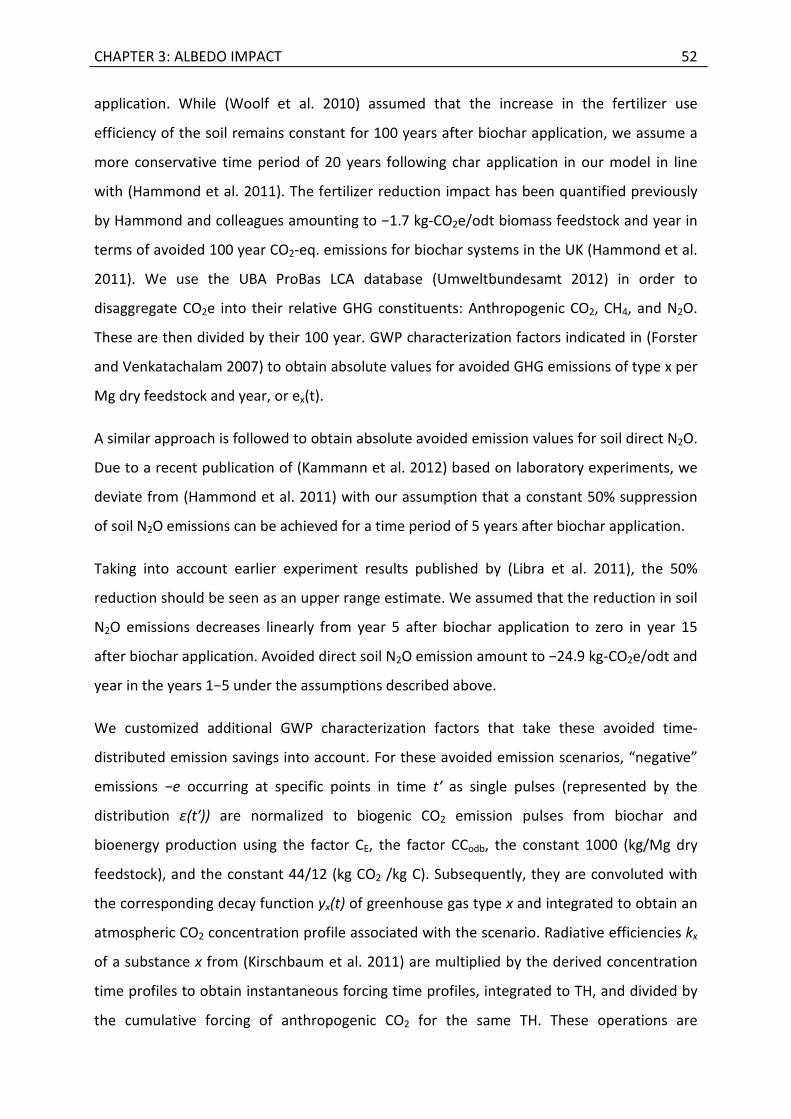
CHAPTER 3: ALBEDO IMPACT 52
application. While (Woolf et al. 2010) assumed that the increase in the fertilizer use
efficiency of the soil remains constant for 100 years after biochar application, we assume a
more conservative time period of 20 years following char application in our model in line
with (Hammond et al. 2011). The fertilizer reduction impact has been quantified previously
by Hammond and colleagues amounting to −1.7 kg-CO2e/odt biomass feedstock and year in
terms of avoided 100 year CO2-eq. emissions for biochar systems in the UK (Hammond et al.
2011). We use the UBA ProBas LCA database (Umweltbundesamt 2012) in order to
disaggregate CO2e into their relative GHG constituents: Anthropogenic CO2, CH4, and N2O.
These are then divided by their 100 year. GWP characterization factors indicated in (Forster
and Venkatachalam 2007) to obtain absolute values for avoided GHG emissions of type x per
Mg dry feedstock and year, or ex(t).
A similar approach is followed to obtain absolute avoided emission values for soil direct N2O.
Due to a recent publication of (Kammann et al. 2012) based on laboratory experiments, we
deviate from (Hammond et al. 2011) with our assumption that a constant 50% suppression
of soil N2O emissions can be achieved for a time period of 5 years after biochar application.
Taking into account earlier experiment results published by (Libra et al. 2011), the 50%
reduction should be seen as an upper range estimate. We assumed that the reduction in soil
N2O emissions decreases linearly from year 5 after biochar application to zero in year 15
after biochar application. Avoided direct soil N2O emission amount to −24.9 kg-CO2e/odt and
year in the years 1−5 under the assumpoons described above.
We customized additional GWP characterization factors that take these avoided time-
distributed emission savings into account. For these avoided emission scenarios, “negative”
emissions −e occurring at specific points in time t′ as single pulses (represented by the
distribution ε(t′)) are normalized to biogenic CO2 emission pulses from biochar and
bioenergy production using the factor CE, the factor CCodb, the constant 1000 (kg/Mg dry
feedstock), and the constant 44/12 (kg CO2 /kg C). Subsequently, they are convoluted with
the corresponding decay function yx(t) of greenhouse gas type x and integrated to obtain an
atmospheric CO2 concentration profile associated with the scenario. Radiative efficiencies kx
of a substance x from (Kirschbaum et al. 2011) are multiplied by the derived concentration
time profiles to obtain instantaneous forcing time profiles, integrated to TH, and divided by
the cumulative forcing of anthropogenic CO2 for the same TH. These operations are
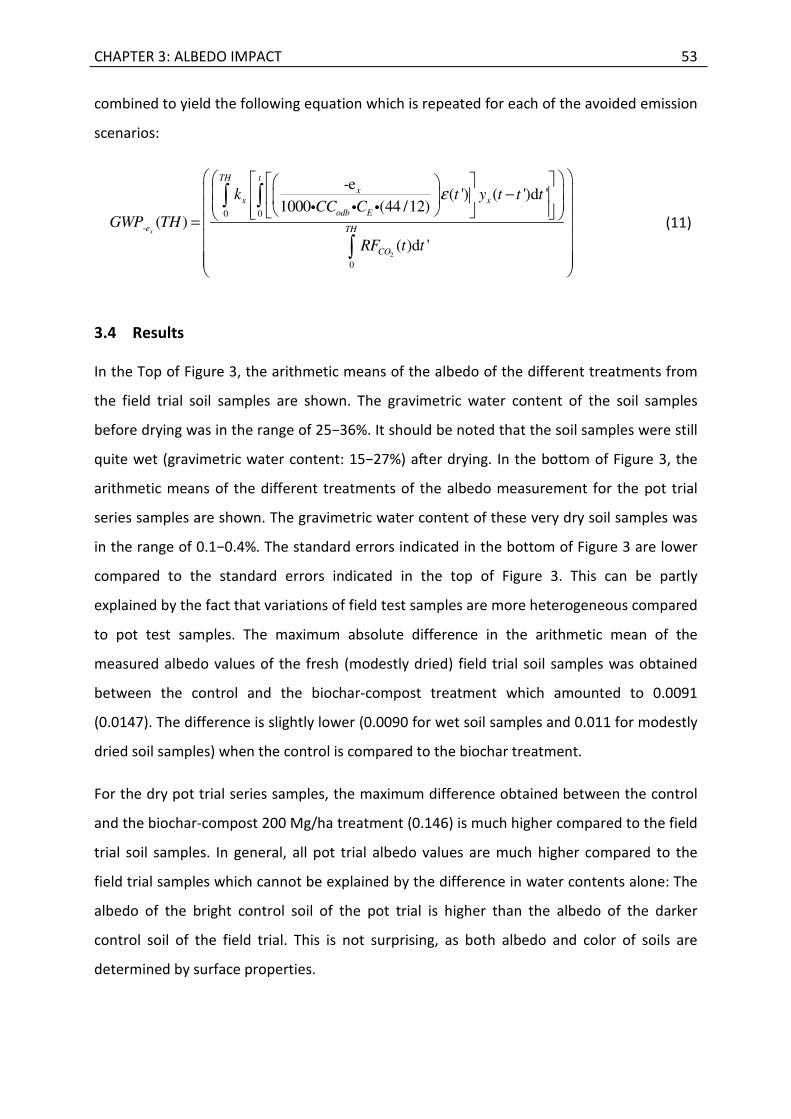
CHAPTER 3: ALBEDO IMPACT 53
combined to yield the following equation which is repeated for each of the avoided emission
scenarios:
2
0 0
-
0
-e ( ') ( ')d '
1000 (44 /12)( )
( )d 'x
TH t
xx x
odb E
e TH
CO
k t y t t tCC C
GWP TH
RF t t
ε − =
∫ ∫
∫
i i i
(11)
3.4 Results
In the Top of Figure 3, the arithmetic means of the albedo of the different treatments from
the field trial soil samples are shown. The gravimetric water content of the soil samples
before drying was in the range of 25−36%. It should be noted that the soil samples were still
quite wet (gravimetric water content: 15−27%) aper drying. In the boqom of Figure 3, the
arithmetic means of the different treatments of the albedo measurement for the pot trial
series samples are shown. The gravimetric water content of these very dry soil samples was
in the range of 0.1−0.4%. The standard errors indicated in the bottom of Figure 3 are lower
compared to the standard errors indicated in the top of Figure 3. This can be partly
explained by the fact that variations of field test samples are more heterogeneous compared
to pot test samples. The maximum absolute difference in the arithmetic mean of the
measured albedo values of the fresh (modestly dried) field trial soil samples was obtained
between the control and the biochar-compost treatment which amounted to 0.0091
(0.0147). The difference is slightly lower (0.0090 for wet soil samples and 0.011 for modestly
dried soil samples) when the control is compared to the biochar treatment.
For the dry pot trial series samples, the maximum difference obtained between the control
and the biochar-compost 200 Mg/ha treatment (0.146) is much higher compared to the field
trial soil samples. In general, all pot trial albedo values are much higher compared to the
field trial samples which cannot be explained by the difference in water contents alone: The
albedo of the bright control soil of the pot trial is higher than the albedo of the darker
control soil of the field trial. This is not surprising, as both albedo and color of soils are
determined by surface properties.
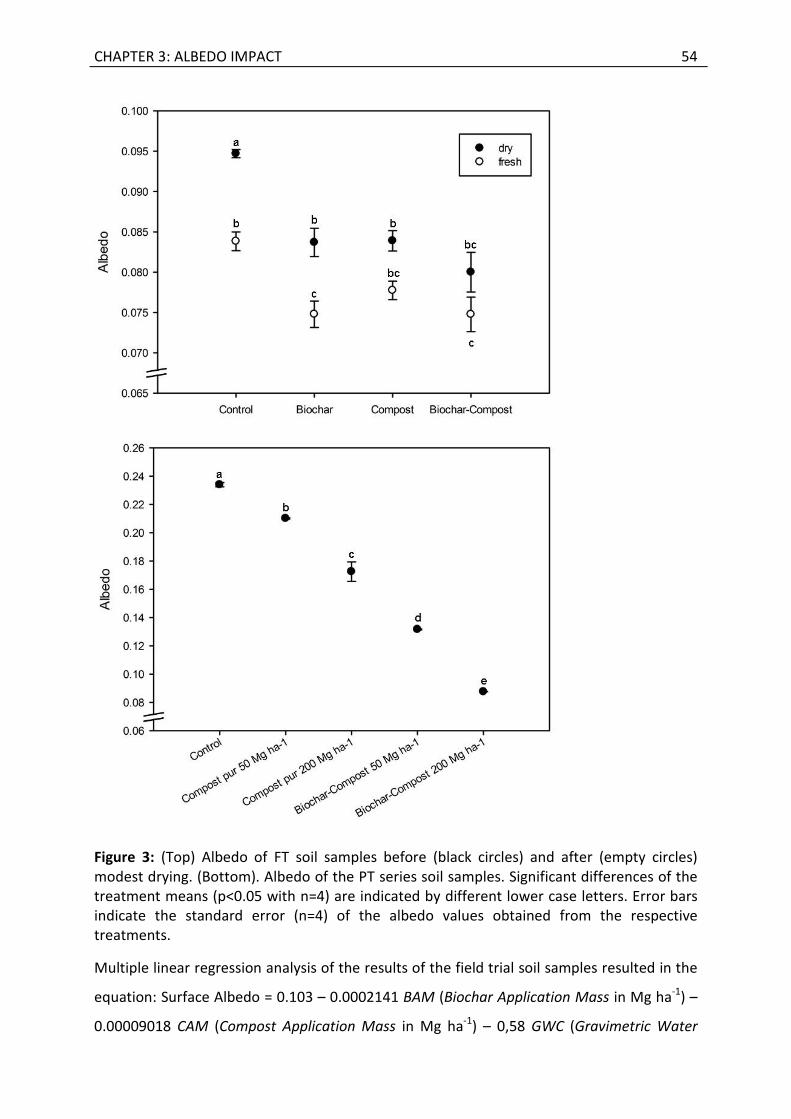
CHAPTER 3: ALBEDO IMPACT 54
Figure 3: (Top) Albedo of FT soil samples before (black circles) and after (empty circles) modest drying. (Bottom). Albedo of the PT series soil samples. Significant differences of the treatment means (p<0.05 with n=4) are indicated by different lower case letters. Error bars indicate the standard error (n=4) of the albedo values obtained from the respective treatments.
Multiple linear regression analysis of the results of the field trial soil samples resulted in the
equation: Surface Albedo = 0.103 – 0.0002141 BAM (Biochar Application Mass in Mg ha-1) –
0.00009018 CAM (Compost Application Mass in Mg ha-1) – 0,58 GWC (Gravimetric Water
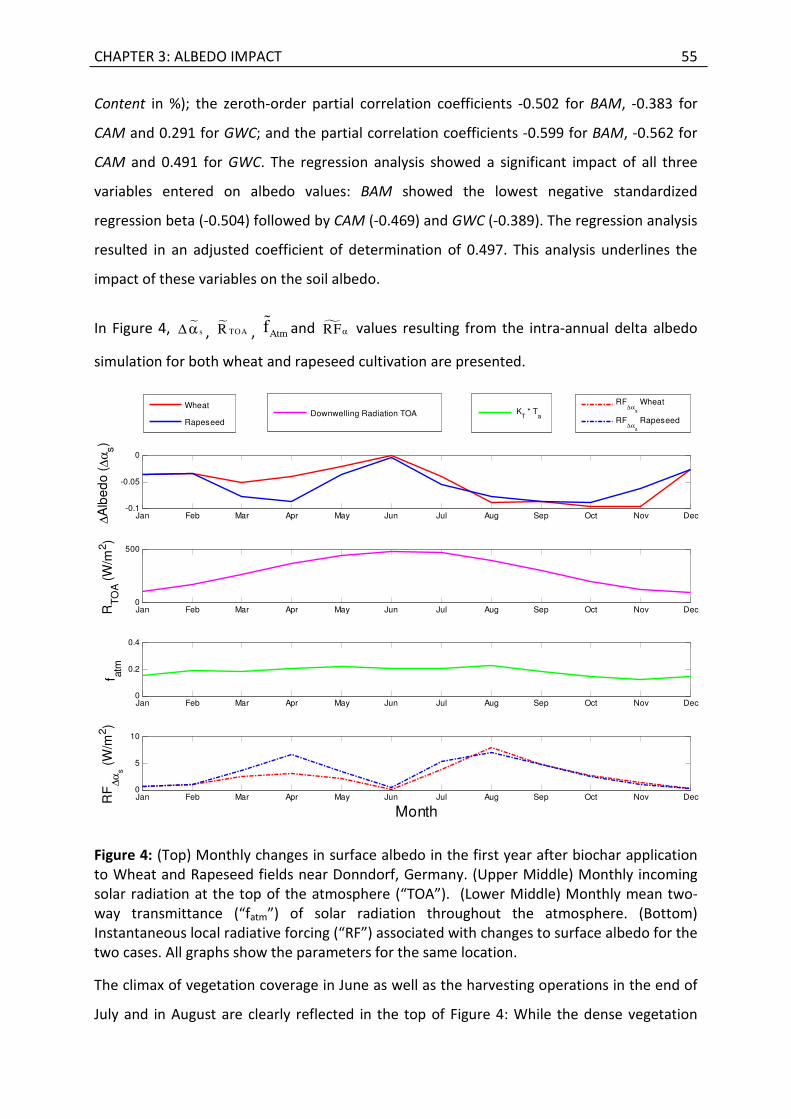
CHAPTER 3: ALBEDO IMPACT 55
Content in %); the zeroth-order partial correlation coefficients -0.502 for BAM, -0.383 for
CAM and 0.291 for GWC; and the partial correlation coefficients -0.599 for BAM, -0.562 for
CAM and 0.491 for GWC. The regression analysis showed a significant impact of all three
variables entered on albedo values: BAM showed the lowest negative standardized
regression beta (-0.504) followed by CAM (-0.469) and GWC (-0.389). The regression analysis
resulted in an adjusted coefficient of determination of 0.497. This analysis underlines the
impact of these variables on the soil albedo.
In Figure 4, �s∆ α , � TOAR , Atmfɶ and �RFα values resulting from the intra-annual delta albedo
simulation for both wheat and rapeseed cultivation are presented.
Figure 4: (Top) Monthly changes in surface albedo in the first year after biochar application to Wheat and Rapeseed fields near Donndorf, Germany. (Upper Middle) Monthly incoming solar radiation at the top of the atmosphere (“TOA”). (Lower Middle) Monthly mean two-way transmittance (“fatm”) of solar radiation throughout the atmosphere. (Bottom) Instantaneous local radiative forcing (“RF”) associated with changes to surface albedo for the two cases. All graphs show the parameters for the same location.
The climax of vegetation coverage in June as well as the harvesting operations in the end of
July and in August are clearly reflected in the top of Figure 4: While the dense vegetation
Jan Feb Mar Apr May Jun Jul Aug Sep Oct Nov Dec-0.1
-0.05
0
∆A
lbe
do
(∆
αs)
Wheat
Rapeseed
Jan Feb Mar Apr May Jun Jul Aug Sep Oct Nov Dec0
500
RT
OA (
W/m
2)
Downwelling Radiation TOA
Jan Feb Mar Apr May Jun Jul Aug Sep Oct Nov Dec0
0.2
0.4
f atm
KT * T
a
Jan Feb Mar Apr May Jun Jul Aug Sep Oct Nov Dec0
5
10
Month
RF
∆α
s
(W
/m2)
RF∆α
s
Wheat
RF∆α
s
Rapeseed
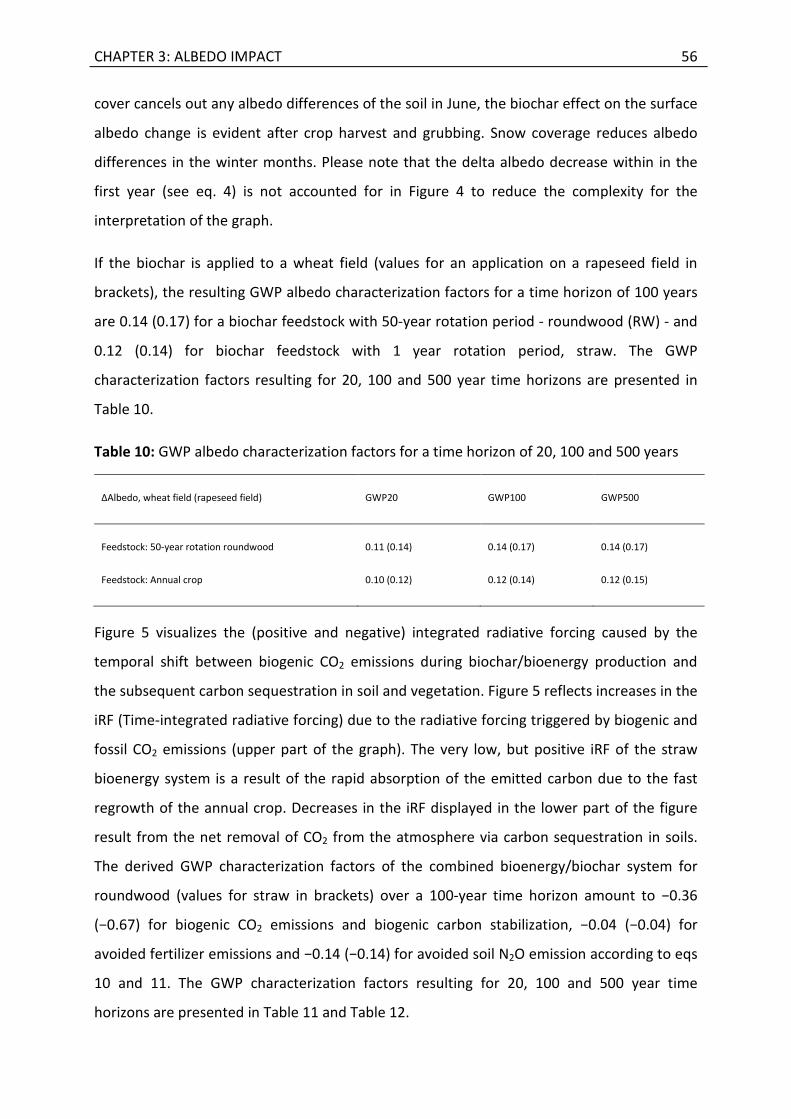
CHAPTER 3: ALBEDO IMPACT 56
cover cancels out any albedo differences of the soil in June, the biochar effect on the surface
albedo change is evident after crop harvest and grubbing. Snow coverage reduces albedo
differences in the winter months. Please note that the delta albedo decrease within in the
first year (see eq. 4) is not accounted for in Figure 4 to reduce the complexity for the
interpretation of the graph.
If the biochar is applied to a wheat field (values for an application on a rapeseed field in
brackets), the resulting GWP albedo characterization factors for a time horizon of 100 years
are 0.14 (0.17) for a biochar feedstock with 50-year rotation period - roundwood (RW) - and
0.12 (0.14) for biochar feedstock with 1 year rotation period, straw. The GWP
characterization factors resulting for 20, 100 and 500 year time horizons are presented in
Table 10.
Table 10: GWP albedo characterization factors for a time horizon of 20, 100 and 500 years
∆Albedo, wheat field (rapeseed field) GWP20 GWP100 GWP500
Feedstock: 50-year rotation roundwood 0.11 (0.14) 0.14 (0.17) 0.14 (0.17)
Feedstock: Annual crop 0.10 (0.12) 0.12 (0.14) 0.12 (0.15)
Figure 5 visualizes the (positive and negative) integrated radiative forcing caused by the
temporal shift between biogenic CO2 emissions during biochar/bioenergy production and
the subsequent carbon sequestration in soil and vegetation. Figure 5 reflects increases in the
iRF (Time-integrated radiative forcing) due to the radiative forcing triggered by biogenic and
fossil CO2 emissions (upper part of the graph). The very low, but positive iRF of the straw
bioenergy system is a result of the rapid absorption of the emitted carbon due to the fast
regrowth of the annual crop. Decreases in the iRF displayed in the lower part of the figure
result from the net removal of CO2 from the atmosphere via carbon sequestration in soils.
The derived GWP characterization factors of the combined bioenergy/biochar system for
roundwood (values for straw in brackets) over a 100-year time horizon amount to −0.36
(−0.67) for biogenic CO2 emissions and biogenic carbon stabilization, −0.04 (−0.04) for
avoided fertilizer emissions and −0.14 (−0.14) for avoided soil N2O emission according to eqs
10 and 11. The GWP characterization factors resulting for 20, 100 and 500 year time
horizons are presented in Table 11 and Table 12.
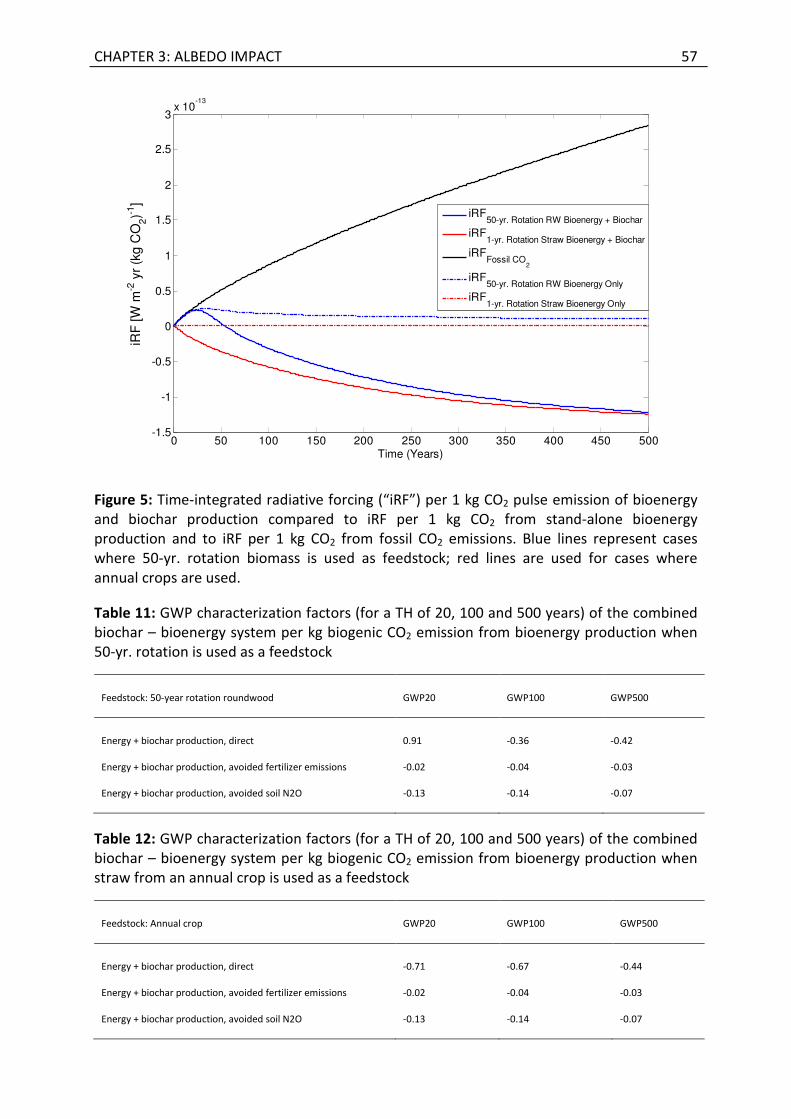
CHAPTER 3: ALBEDO IMPACT 57
Figure 5: Time-integrated radiative forcing (“iRF”) per 1 kg CO2 pulse emission of bioenergy and biochar production compared to iRF per 1 kg CO2 from stand-alone bioenergy production and to iRF per 1 kg CO2 from fossil CO2 emissions. Blue lines represent cases where 50-yr. rotation biomass is used as feedstock; red lines are used for cases where annual crops are used.
Table 11: GWP characterization factors (for a TH of 20, 100 and 500 years) of the combined biochar – bioenergy system per kg biogenic CO2 emission from bioenergy production when 50-yr. rotation is used as a feedstock
Feedstock: 50-year rotation roundwood GWP20 GWP100 GWP500
Energy + biochar production, direct 0.91 -0.36 -0.42
Energy + biochar production, avoided fertilizer emissions -0.02 -0.04 -0.03
Energy + biochar production, avoided soil N2O -0.13 -0.14 -0.07
Table 12: GWP characterization factors (for a TH of 20, 100 and 500 years) of the combined biochar – bioenergy system per kg biogenic CO2 emission from bioenergy production when straw from an annual crop is used as a feedstock
Feedstock: Annual crop GWP20 GWP100 GWP500
Energy + biochar production, direct -0.71 -0.67 -0.44
Energy + biochar production, avoided fertilizer emissions -0.02 -0.04 -0.03
Energy + biochar production, avoided soil N2O -0.13 -0.14 -0.07
0 50 100 150 200 250 300 350 400 450 500-1.5
-1
-0.5
0
0.5
1
1.5
2
2.5
3x 10
-13
iRF
[W
m-2
yr
(kg C
O2)-1
]
Time (Years)
iRF50-yr. Rotation RW Bioenergy + Biochar
iRF1-yr. Rotation Straw Bioenergy + Biochar
iRFFossil CO
2
iRF50-yr. Rotation RW Bioenergy Only
iRF1-yr. Rotation Straw Bioenergy Only
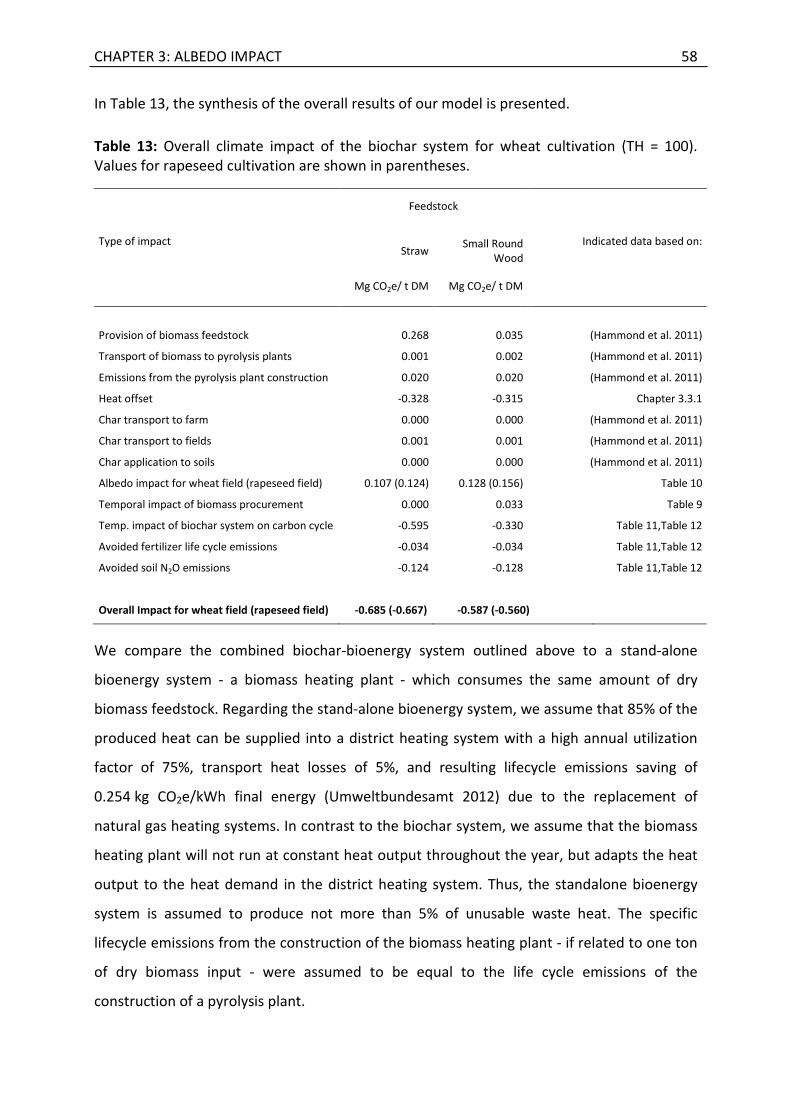
CHAPTER 3: ALBEDO IMPACT 58
In Table 13, the synthesis of the overall results of our model is presented.
Table 13: Overall climate impact of the biochar system for wheat cultivation (TH = 100). Values for rapeseed cultivation are shown in parentheses.
Type of impact
Feedstock
Indicated data based on: Straw
Small Round Wood
Mg CO2e/ t DM Mg CO2e/ t DM
Provision of biomass feedstock 0.268 0.035 (Hammond et al. 2011)
Transport of biomass to pyrolysis plants 0.001 0.002 (Hammond et al. 2011)
Emissions from the pyrolysis plant construction 0.020 0.020 (Hammond et al. 2011)
Heat offset -0.328 -0.315 Chapter 3.3.1
Char transport to farm 0.000 0.000 (Hammond et al. 2011)
Char transport to fields 0.001 0.001 (Hammond et al. 2011)
Char application to soils 0.000 0.000 (Hammond et al. 2011)
Albedo impact for wheat field (rapeseed field) 0.107 (0.124) 0.128 (0.156) Table 10
Temporal impact of biomass procurement 0.000 0.033 Table 9
Temp. impact of biochar system on carbon cycle -0.595 -0.330 Table 11,Table 12
Avoided fertilizer life cycle emissions -0.034 -0.034 Table 11,Table 12
Avoided soil N2O emissions -0.124 -0.128 Table 11,Table 12
Overall Impact for wheat field (rapeseed field) -0.685 (-0.667) -0.587 (-0.560)
We compare the combined biochar-bioenergy system outlined above to a stand-alone
bioenergy system - a biomass heating plant - which consumes the same amount of dry
biomass feedstock. Regarding the stand-alone bioenergy system, we assume that 85% of the
produced heat can be supplied into a district heating system with a high annual utilization
factor of 75%, transport heat losses of 5%, and resulting lifecycle emissions saving of
0.254 kg CO2e/kWh final energy (Umweltbundesamt 2012) due to the replacement of
natural gas heating systems. In contrast to the biochar system, we assume that the biomass
heating plant will not run at constant heat output throughout the year, but adapts the heat
output to the heat demand in the district heating system. Thus, the standalone bioenergy
system is assumed to produce not more than 5% of unusable waste heat. The specific
lifecycle emissions from the construction of the biomass heating plant - if related to one ton
of dry biomass input - were assumed to be equal to the life cycle emissions of the
construction of a pyrolysis plant.
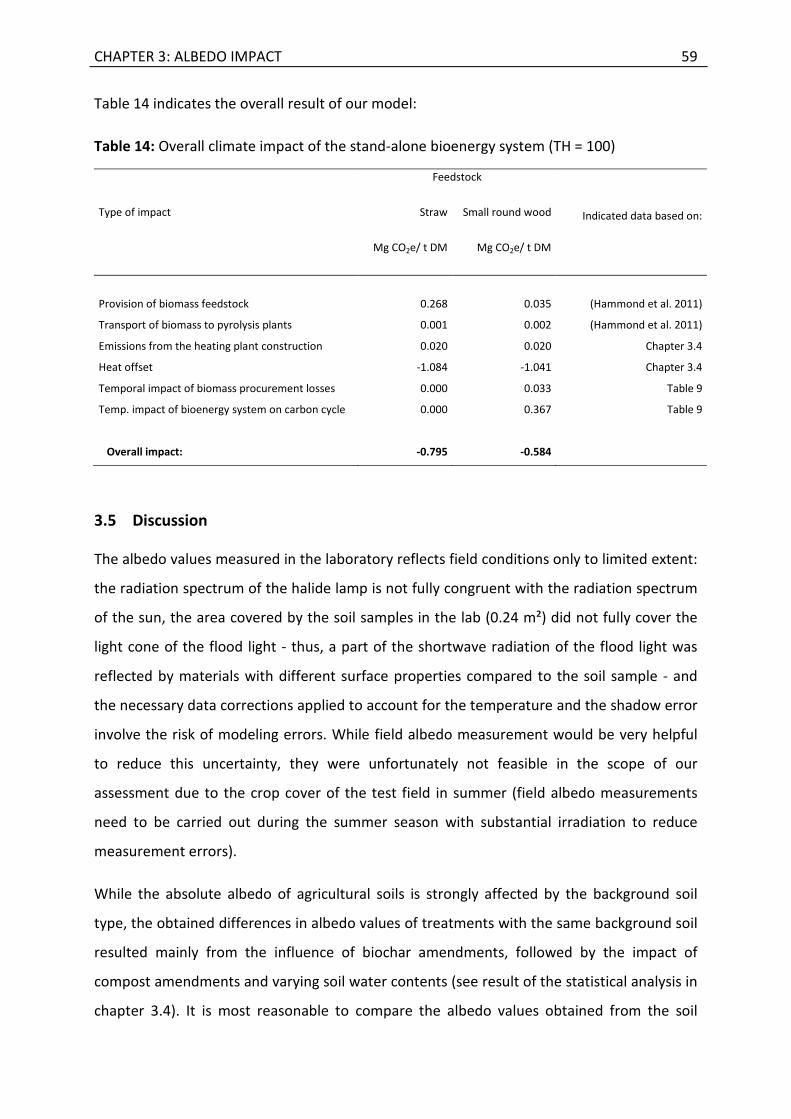
CHAPTER 3: ALBEDO IMPACT 59
Table 14 indicates the overall result of our model:
Table 14: Overall climate impact of the stand-alone bioenergy system (TH = 100)
Type of impact
Feedstock
Indicated data based on: Straw Small round wood
Mg CO2e/ t DM Mg CO2e/ t DM
Provision of biomass feedstock 0.268 0.035 (Hammond et al. 2011)
Transport of biomass to pyrolysis plants 0.001 0.002 (Hammond et al. 2011)
Emissions from the heating plant construction 0.020 0.020 Chapter 3.4
Heat offset -1.084 -1.041 Chapter 3.4
Temporal impact of biomass procurement losses 0.000 0.033 Table 9
Temp. impact of bioenergy system on carbon cycle 0.000 0.367 Table 9
Overall impact: -0.795 -0.584
3.5 Discussion
The albedo values measured in the laboratory reflects field conditions only to limited extent:
the radiation spectrum of the halide lamp is not fully congruent with the radiation spectrum
of the sun, the area covered by the soil samples in the lab (0.24 m²) did not fully cover the
light cone of the flood light - thus, a part of the shortwave radiation of the flood light was
reflected by materials with different surface properties compared to the soil sample - and
the necessary data corrections applied to account for the temperature and the shadow error
involve the risk of modeling errors. While field albedo measurement would be very helpful
to reduce this uncertainty, they were unfortunately not feasible in the scope of our
assessment due to the crop cover of the test field in summer (field albedo measurements
need to be carried out during the summer season with substantial irradiation to reduce
measurement errors).
While the absolute albedo of agricultural soils is strongly affected by the background soil
type, the obtained differences in albedo values of treatments with the same background soil
resulted mainly from the influence of biochar amendments, followed by the impact of
compost amendments and varying soil water contents (see result of the statistical analysis in
chapter 3.4). It is most reasonable to compare the albedo values obtained from the soil
CHAPTER 3: ALBEDO IMPACT 60
samples from Donndorf with the values measured in Pistoia (18 months after biochar
application) due to a similar amount of biochar application, similar background soils, same
tilling depth and equal time period between biochar application and albedo measurement in
both trials. However, the soils measured in Pistoia were very dry when analyzed as
compared to the wet soils analyzed in Donndorf. The measurements of soil samples in
Bayreuth resulted in larger absolute albedo differences when drier soil samples were
compared. This is in line with the higher absolute soil albedo difference (Δαsoil) measured on
the dry soils in Pistoia as compared to the values obtained from the wet soil samples of
Donndorf. The measured albedo differences are compared to published literature about
biochar impacts on soil albedo and are discussed in greater detail in the following section:
(Oguntunde et al. 2008) measured an absolute albedo difference between wet soils
previously situated under charcoal kilns in Ghana and wet soils of adjacent field areas of
0.032. The absolute difference in albedo between the same soil samples increased to 0.062
under dry conditions. The area where the measurements were carried out is dominated by
Haplic Acrisols with a high sand content (mean value of about 72%) in the topsoil (0–15 cm).
As already mentioned, (Genesio et al. 2012) measured an absolute albedo difference
between treatments with (at a rate of 30 [Mg ha-1]) and without biochar application of about
0.15 in December 2009 shortly after biochar application on dry arable silty loam soils near
Pistoia, Italy. The biochar was tilled 10 cm deep into the arable soil. The absolute albedo
difference between dry treatments with and without biochar application decreased to 0.08
seven months after application. On a parallel field trial at the same location, the authors
measured an absolute albedo difference of only 0.05 around 18 months after biochar
application. They were not able anymore to identify a statistically significant albedo
difference between the same treatments after the second tillage (which was carried out only
a few weeks after latest measurement described above). In Figure 6, the measured absolute
soil albedo differences are summarized.
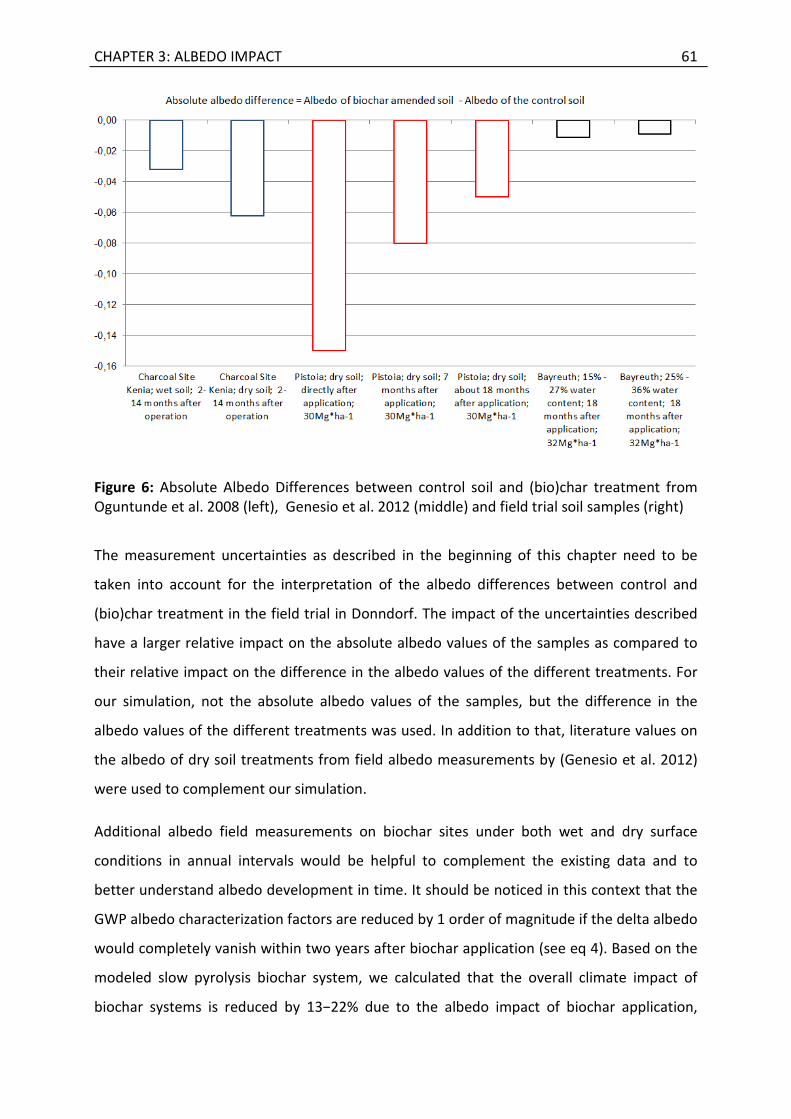
CHAPTER 3: ALBEDO IMPACT 61
Figure 6: Absolute Albedo Differences between control soil and (bio)char treatment from Oguntunde et al. 2008 (left), Genesio et al. 2012 (middle) and field trial soil samples (right)
The measurement uncertainties as described in the beginning of this chapter need to be
taken into account for the interpretation of the albedo differences between control and
(bio)char treatment in the field trial in Donndorf. The impact of the uncertainties described
have a larger relative impact on the absolute albedo values of the samples as compared to
their relative impact on the difference in the albedo values of the different treatments. For
our simulation, not the absolute albedo values of the samples, but the difference in the
albedo values of the different treatments was used. In addition to that, literature values on
the albedo of dry soil treatments from field albedo measurements by (Genesio et al. 2012)
were used to complement our simulation.
Additional albedo field measurements on biochar sites under both wet and dry surface
conditions in annual intervals would be helpful to complement the existing data and to
better understand albedo development in time. It should be noticed in this context that the
GWP albedo characterization factors are reduced by 1 order of magnitude if the delta albedo
would completely vanish within two years after biochar application (see eq 4). Based on the
modeled slow pyrolysis biochar system, we calculated that the overall climate impact of
biochar systems is reduced by 13−22% due to the albedo impact of biochar application,
CHAPTER 3: ALBEDO IMPACT 62
depending on the type of biochar feedstock and crop cultivated on the soil. Since the albedo
impact is linearly correlated to the field vegetation cover, agricultural systems with a large
share of dense and year-round vegetation cover can minimize this impact. The albedo
impact is also reduced when dark background soils are amended with biochar. To minimize
the uncertainty connected to the modeling of the annual development of vegetation cover
on basis of satellite data as carried out in this assessment, further field validations of the
applied SDVI- methodology over heterogeneous surfaces divided into very small sections are
necessary. In addition, further research should focus on the indirect impacts of albedo
changes and the impacts of biochar application on the annual development of vegetation
cover and near surface exchanges of water and energy. As GWPalbedo is directly proportional
to Ta, the monthly fraction of short wave radiation reaching TOA after reflection at the
surface, it is very important to know realistic local Ta values. Due to a lack of empirical
measurements available, we estimated Ta based on a simple one layer atmosphere model
and average global values for short wave radiation absorption. If achievable, empirical
measurements of Ta would be very helpful to improve the assessment of GWPalbedo.
Due to the scarcity in globally available biomass (if biomass is used for biochar production, it
cannot be used in standalone bioenergy systems to save fossil fuel emissions), we compared
the climate impact of using one ton of dry wood (and straw respectively) in biochar systems
and in stand-alone bioenergy systems. While we calculated overall CO2e emission savings
with our model for both systems and feedstock types, bioenergy systems achieve 99−119%
of the climate benefit of biochar systems according to our analysis. This can be mainly
explained by the lower energy provision of the pyrolysis plant due to the lost energy
contained in the biochar, the lower energy efficiency, and the lower heat use efficiency
caused by the continuous operation of the pyrolysis plant. According to our assessment, a
considerable fraction (23−29%) of the emissions savings of the biochar system is a result of
avoided soil N2O emissions and avoided fertilizer life cycle emissions. Long-term
measurements of avoided soil N2O emissions and more practical experience on the
achievable fertilizer reductions after biochar application are necessary to reduce the
uncertainty connected to this part of our assessment. The need to account for the climate
impact of temporal shifts of the carbon cycle was clearly demonstrated by the assessment of
both systems. Since we did not account for the impact of biochar application on biomass
yields, soil methane emissions, soil inherent organic carbon content, and atmospheric soot

CHAPTER 3: ALBEDO IMPACT 63
concentration, additional research is necessary to complement the current assessment. If
the biomass provision was to trigger indirect land use change via displacement effects, the
resulting climate impact would have to be accounted for in the overall climate impact
assessment. While this analysis focuses on a climate impact assessment, one should not
loose sight of the opportunities of biochar application for soil amelioration (Fischer and
Glaser 2012).
CHAPTER 4: THERMAL REMOVAL OF PAH 64
4 Thermal removal of polycyclic aromatic hydrocarbons from gasification
biochars
Sebastian Meyer, Bruno Glaser, Daniel Fischer, Peter Quicker, Yves Noel and Georg Kuffer
published as book chapter in:
Environmental Risk Assessment of Soil Contamination, Dr. Maria C. Hernandez Soriano (Ed.),
ISBN: 978-953-51-1235-8, InTech, 2014
4.1 Introduction
The number of small-scale (< 200 kW electrical capacity) wood gasifiers used for electricity
and heat provision in Central Europe is increasing. After the wood gasification process, about
10% of the dry-mass of the wood feedstock input are left in form of wood gasification
residues (Meyer et al. 2011) consisting of a mixture of char and ash. Inspired by the Terra
preta phenomenon and the intention to generate own humus rich black earths (Glaser et al.
2001), especially farmers are interested in the opportunity to use the carbonaceous and
nutrient-rich gasification residues produced by their own gasifiers for farm fertilizer
production, soil amelioration and for carbon sequestration (Kuzyakov et al. 2009).
However, gasification residues are known for their high content in polycyclic aromatic
hydrocarbons (PAH) (Schimmelpfennig and Glaser 2012). PAH are carcinogenic, persistent,
accumulate in organisms and partly inhibit reproduction (Bruno Veyrand et al. 2013). Due to
that, gasification residues with very high PAH contents need to be classified as hazardous
waste. As a moderate increase in temperature substantially increases the vapor pressure of
PAH, thermal processes can be used to volatize and subsequently remove PAH from
background matrixes (Harmon et al. 2001). To reduce the PAH content in gasification
residues, a thermal process – the so called PAH volatilization unit - has been developed by a
CHAPTER 4: THERMAL REMOVAL OF PAH 65
German wood gasifier manufacturer. In the following, a critical assessment of the functional
efficiency of this patented process is described.
The research work was carried out with the objective to evaluate the effectiveness of the
PAH volatilization unit in reducing the PAH content in gasification residues. This objective
was chosen to better assess the environmental suitability of using gasification residues as
soil amendment. Our working hypothesis was that it is possible to technically reduce the
PAH content in gasification residues to a level which allows for an agricultural use of the
gasification residues in line with the soil protection regulations in Germany. As a
precondition for this evaluation, the suitability of the analysis methods DIN 13877:A and DIN
13877:B for the determination of the PAH content in wood gasification residues had to be
checked. Based on the results of (Hilber et al. 2012), our working hypothesis in this regard
was that analysis method DIN 13877:B would be more suitable for the analysis task as
compared to analysis method DIN 13877:A.
4.2 Materials and methods
4.2.1 Comparison of PAH analysis methods for gasification residues
(1st
experiment)
(Hilber et al. 2012) demonstrated that the selection of an appropriate solvent is crucial to
determine the PAH content in biochars. They recommend a Soxhlet-extraction with toluene
for the PAH analysis of biochars. To complement and to reassess this work, the PAH content
(sum of the 16 PAH defined by the US Environmental Protection Agency EPA) of three
samples of the same production batch of gasification residues was determined using two
different extraction methods (cold extraction with acetone according to DIN 13877:A and
Soxhlet extraction with toluene for 5 hours according to DIN 13877:B). The gasification
residues had been produced from poplar wood chips in a commercially operated fixed-bed
Joos-Spanner biomass gasifier (30 kW electrical capacity) of the German manufacturer
Spanner Re² GmbH. The PAH analyses of all experiments described on the following pages
were carried out by the commercial laboratory Görtler Analytical Services GmbH in
Vaterstetten, Germany.
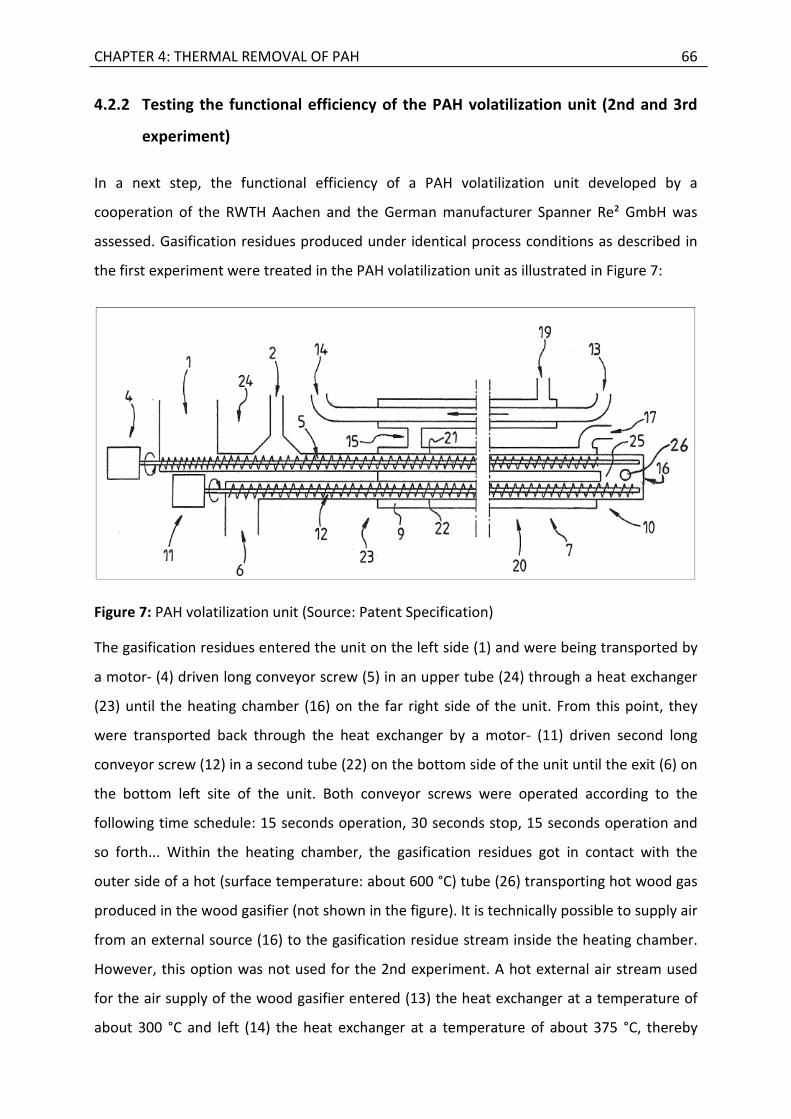
CHAPTER 4: THERMAL REMOVAL OF PAH 66
4.2.2 Testing the functional efficiency of the PAH volatilization unit (2nd and 3rd
experiment)
In a next step, the functional efficiency of a PAH volatilization unit developed by a
cooperation of the RWTH Aachen and the German manufacturer Spanner Re² GmbH was
assessed. Gasification residues produced under identical process conditions as described in
the first experiment were treated in the PAH volatilization unit as illustrated in Figure 7:
Figure 7: PAH volatilization unit (Source: Patent Specification)
The gasification residues entered the unit on the left side (1) and were being transported by
a motor- (4) driven long conveyor screw (5) in an upper tube (24) through a heat exchanger
(23) until the heating chamber (16) on the far right side of the unit. From this point, they
were transported back through the heat exchanger by a motor- (11) driven second long
conveyor screw (12) in a second tube (22) on the bottom side of the unit until the exit (6) on
the bottom left site of the unit. Both conveyor screws were operated according to the
following time schedule: 15 seconds operation, 30 seconds stop, 15 seconds operation and
so forth... Within the heating chamber, the gasification residues got in contact with the
outer side of a hot (surface temperature: about 600 °C) tube (26) transporting hot wood gas
produced in the wood gasifier (not shown in the figure). It is technically possible to supply air
from an external source (16) to the gasification residue stream inside the heating chamber.
However, this option was not used for the 2nd experiment. A hot external air stream used
for the air supply of the wood gasifier entered (13) the heat exchanger at a temperature of
about 300 °C and left (14) the heat exchanger at a temperature of about 375 °C, thereby
CHAPTER 4: THERMAL REMOVAL OF PAH 67
effectively cooling the wood gasification residues on their way through the heat exchanger.
Sealing air from the same external source as the heating chamber air stream was blown into
the left side (6) of the bottom tube of the PAH volatilization unit in counter flow principle
and left the unit on the top left side (1) of the unit. This counter current air flow was
introduced to prevent volatized PAH from leaving the PAH volatilization unit through the exit
for the processed gasification residues. In this technical design version of the process, about
5% of the air leaving the unit through was recirculated back into the sealing air stream.
This experimental setting was slightly modified for a 3rd experiment: The sealing air stream
was reduced. In addition to that, air from the external source (17) was intermittently (within
the standstill periods of the conveyor screws) blown into the gasification residue stream
within the heating chamber to supply oxygen to the hot gasification residues. In this
technical design version of the process, about 4% of the flue gas from the PAH volatilization
unit was recirculated back into the air stream which supplied both the combustion chamber
and the sealing air stream.
The PAH content of three samples of the processed batches of gasification residues was
analyzed according to DIN 13877:B in both experiments.
4.2.3 Redesign of the PAH volatilization unit (4th experiment)
In a redesigned version of the PAH volatilization unit, the manufacturer prevented the
recirculation of PAH into the PAH volatilization unit by blowing clean air from an external
source in the sealing air nozzle and by discharging the airstream with the volatized PAH in
the gas engine where the wood gas of the gasifier was burned. Further modifications of the
redesigned PAH volatilization unit included larger conveyor screw diameters and conveyor
screw tube diameters. Gasification residues from a 45 kWel wood gasifier fed by a mixture of
chips from different sort of woods were treated in this modified PAH volatilization unit in a
4th experiment. The sealing air stream and the heating chamber air stream volumes were
increased as compared to the 2nd and 3rd experiment. The PAH content of one sample of
the processed batch of gasification residues was analyzed according to DIN 13877:B.
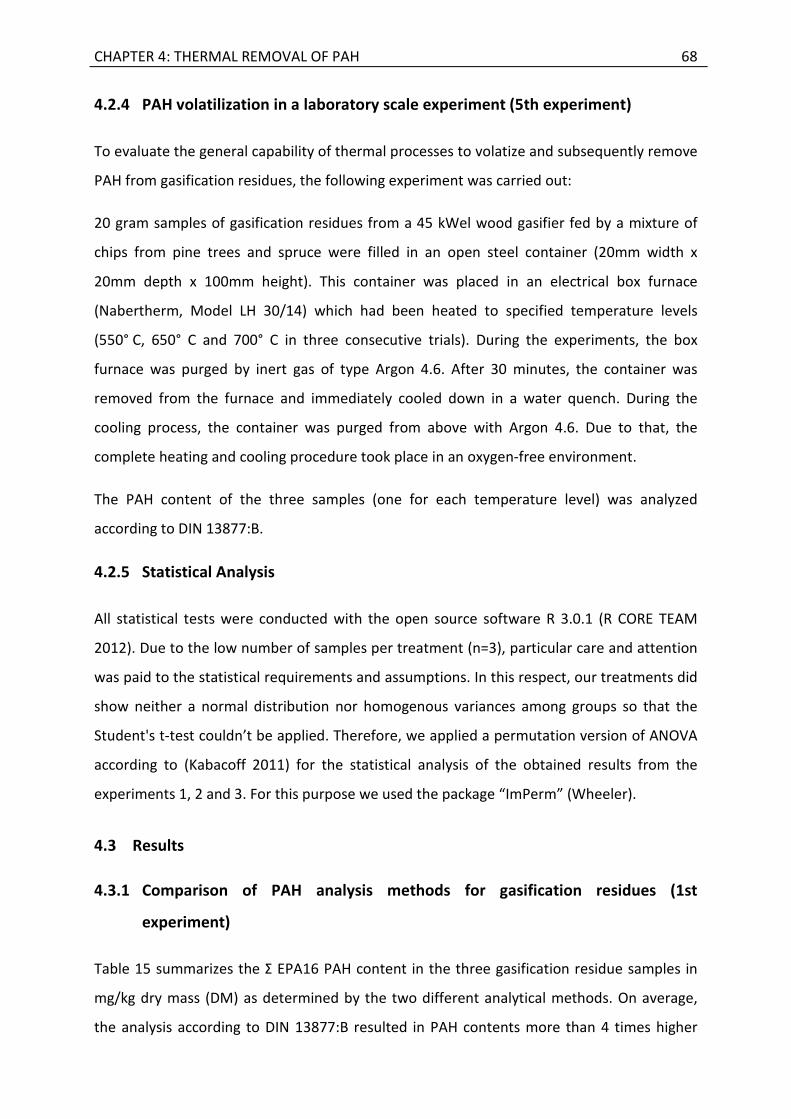
CHAPTER 4: THERMAL REMOVAL OF PAH 68
4.2.4 PAH volatilization in a laboratory scale experiment (5th experiment)
To evaluate the general capability of thermal processes to volatize and subsequently remove
PAH from gasification residues, the following experiment was carried out:
20 gram samples of gasification residues from a 45 kWel wood gasifier fed by a mixture of
chips from pine trees and spruce were filled in an open steel container (20mm width x
20mm depth x 100mm height). This container was placed in an electrical box furnace
(Nabertherm, Model LH 30/14) which had been heated to specified temperature levels
(550° C, 650° C and 700° C in three consecutive trials). During the experiments, the box
furnace was purged by inert gas of type Argon 4.6. After 30 minutes, the container was
removed from the furnace and immediately cooled down in a water quench. During the
cooling process, the container was purged from above with Argon 4.6. Due to that, the
complete heating and cooling procedure took place in an oxygen-free environment.
The PAH content of the three samples (one for each temperature level) was analyzed
according to DIN 13877:B.
4.2.5 Statistical Analysis
All statistical tests were conducted with the open source software R 3.0.1 (R CORE TEAM
2012). Due to the low number of samples per treatment (n=3), particular care and attention
was paid to the statistical requirements and assumptions. In this respect, our treatments did
show neither a normal distribution nor homogenous variances among groups so that the
Student's t-test couldn’t be applied. Therefore, we applied a permutation version of ANOVA
according to (Kabacoff 2011) for the statistical analysis of the obtained results from the
experiments 1, 2 and 3. For this purpose we used the package “ImPerm” (Wheeler).
4.3 Results
4.3.1 Comparison of PAH analysis methods for gasification residues (1st
experiment)
Table 15 summarizes the Σ EPA16 PAH content in the three gasification residue samples in
mg/kg dry mass (DM) as determined by the two different analytical methods. On average,
the analysis according to DIN 13877:B resulted in PAH contents more than 4 times higher
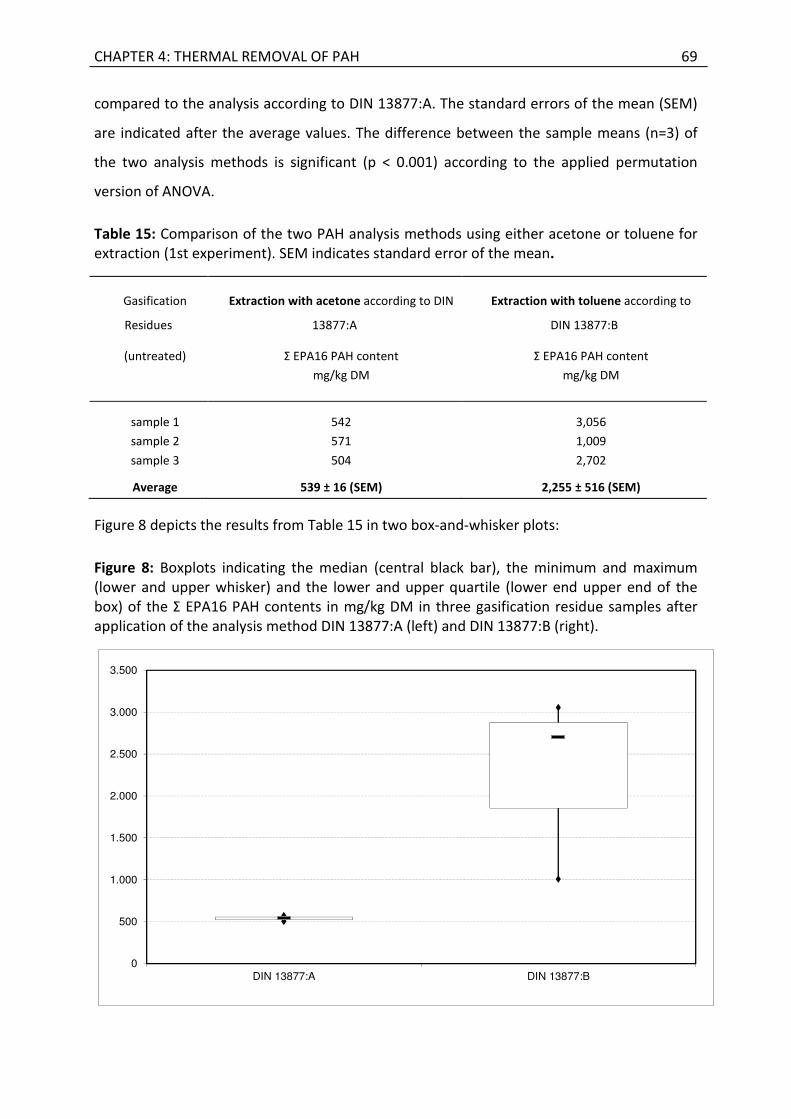
CHAPTER 4: THERMAL REMOVAL OF PAH 69
compared to the analysis according to DIN 13877:A. The standard errors of the mean (SEM)
are indicated after the average values. The difference between the sample means (n=3) of
the two analysis methods is significant (p < 0.001) according to the applied permutation
version of ANOVA.
Table 15: Comparison of the two PAH analysis methods using either acetone or toluene for extraction (1st experiment). SEM indicates standard error of the mean.
Gasification
Residues
Extraction with acetone according to DIN
13877:A
Extraction with toluene according to
DIN 13877:B
(untreated) Σ EPA16 PAH content Σ EPA16 PAH content
mg/kg DM mg/kg DM
sample 1 542 3,056
sample 2 571 1,009
sample 3 504 2,702
Average 539 ± 16 (SEM) 2,255 ± 516 (SEM)
Figure 8 depicts the results from Table 15 in two box-and-whisker plots:
Figure 8: Boxplots indicating the median (central black bar), the minimum and maximum (lower and upper whisker) and the lower and upper quartile (lower end upper end of the box) of the Σ EPA16 PAH contents in mg/kg DM in three gasification residue samples after application of the analysis method DIN 13877:A (left) and DIN 13877:B (right).
0
500
1.000
1.500
2.000
2.500
3.000
3.500
DIN 13877:A DIN 13877:B
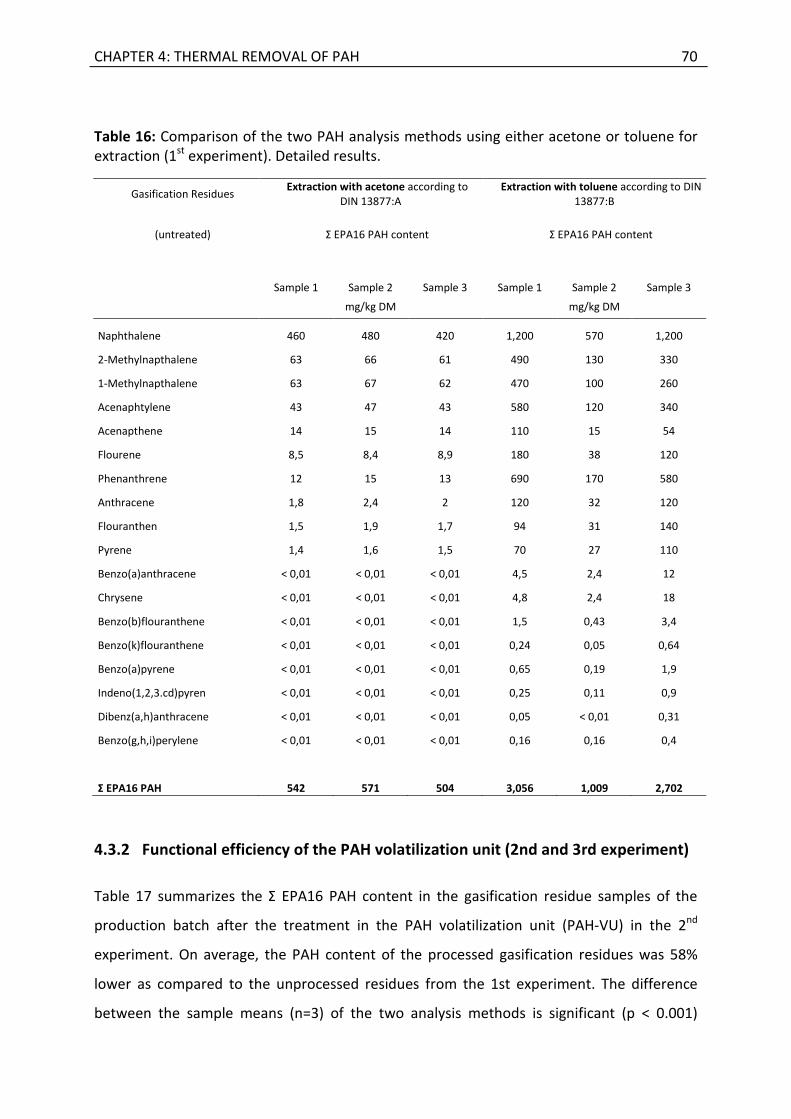
CHAPTER 4: THERMAL REMOVAL OF PAH 70
Table 16: Comparison of the two PAH analysis methods using either acetone or toluene for extraction (1st experiment). Detailed results.
Gasification Residues Extraction with acetone according to
DIN 13877:A Extraction with toluene according to DIN
13877:B
(untreated) Σ EPA16 PAH content Σ EPA16 PAH content
Sample 1 Sample 2 Sample 3 Sample 1 Sample 2 Sample 3
mg/kg DM mg/kg DM
Naphthalene 460 480 420 1,200 570 1,200
2-Methylnapthalene 63 66 61 490 130 330
1-Methylnapthalene 63 67 62 470 100 260
Acenaphtylene 43 47 43 580 120 340
Acenapthene 14 15 14 110 15 54
Flourene 8,5 8,4 8,9 180 38 120
Phenanthrene 12 15 13 690 170 580
Anthracene 1,8 2,4 2 120 32 120
Flouranthen 1,5 1,9 1,7 94 31 140
Pyrene 1,4 1,6 1,5 70 27 110
Benzo(a)anthracene < 0,01 < 0,01 < 0,01 4,5 2,4 12
Chrysene < 0,01 < 0,01 < 0,01 4,8 2,4 18
Benzo(b)flouranthene < 0,01 < 0,01 < 0,01 1,5 0,43 3,4
Benzo(k)flouranthene < 0,01 < 0,01 < 0,01 0,24 0,05 0,64
Benzo(a)pyrene < 0,01 < 0,01 < 0,01 0,65 0,19 1,9
Indeno(1,2,3.cd)pyren < 0,01 < 0,01 < 0,01 0,25 0,11 0,9
Dibenz(a,h)anthracene < 0,01 < 0,01 < 0,01 0,05 < 0,01 0,31
Benzo(g,h,i)perylene < 0,01 < 0,01 < 0,01 0,16 0,16 0,4
Σ EPA16 PAH 542 571 504 3,056 1,009 2,702
4.3.2 Functional efficiency of the PAH volatilization unit (2nd and 3rd experiment)
Table 17 summarizes the Σ EPA16 PAH content in the gasification residue samples of the
production batch after the treatment in the PAH volatilization unit (PAH-VU) in the 2nd
experiment. On average, the PAH content of the processed gasification residues was 58%
lower as compared to the unprocessed residues from the 1st experiment. The difference
between the sample means (n=3) of the two analysis methods is significant (p < 0.001)
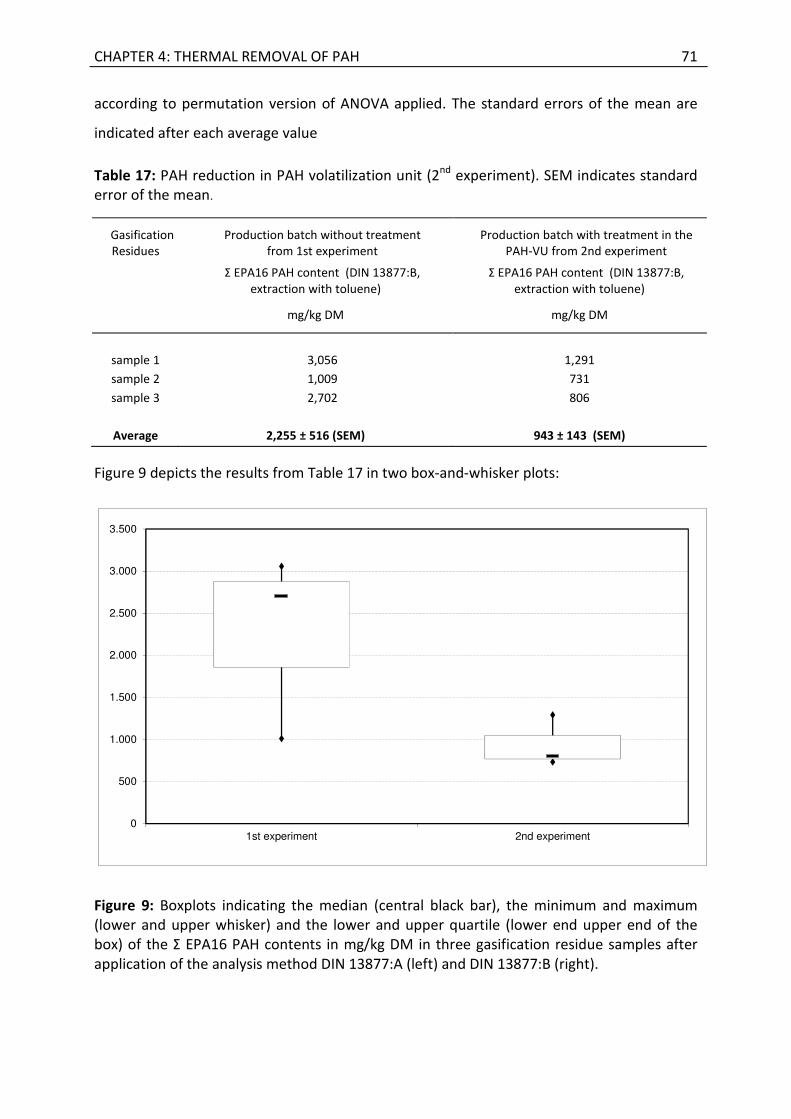
CHAPTER 4: THERMAL REMOVAL OF PAH 71
according to permutation version of ANOVA applied. The standard errors of the mean are
indicated after each average value
Table 17: PAH reduction in PAH volatilization unit (2nd experiment). SEM indicates standard error of the mean.
Gasification Residues
Production batch without treatment from 1st experiment
Production batch with treatment in the PAH-VU from 2nd experiment
Σ EPA16 PAH content (DIN 13877:B, extraction with toluene)
Σ EPA16 PAH content (DIN 13877:B, extraction with toluene)
mg/kg DM mg/kg DM
sample 1 3,056 1,291
sample 2 1,009 731
sample 3 2,702 806
Average 2,255 ± 516 (SEM) 943 ± 143 (SEM)
Figure 9 depicts the results from Table 17 in two box-and-whisker plots:
Figure 9: Boxplots indicating the median (central black bar), the minimum and maximum (lower and upper whisker) and the lower and upper quartile (lower end upper end of the box) of the Σ EPA16 PAH contents in mg/kg DM in three gasification residue samples after application of the analysis method DIN 13877:A (left) and DIN 13877:B (right).
0
500
1.000
1.500
2.000
2.500
3.000
3.500
1st experiment 2nd experiment
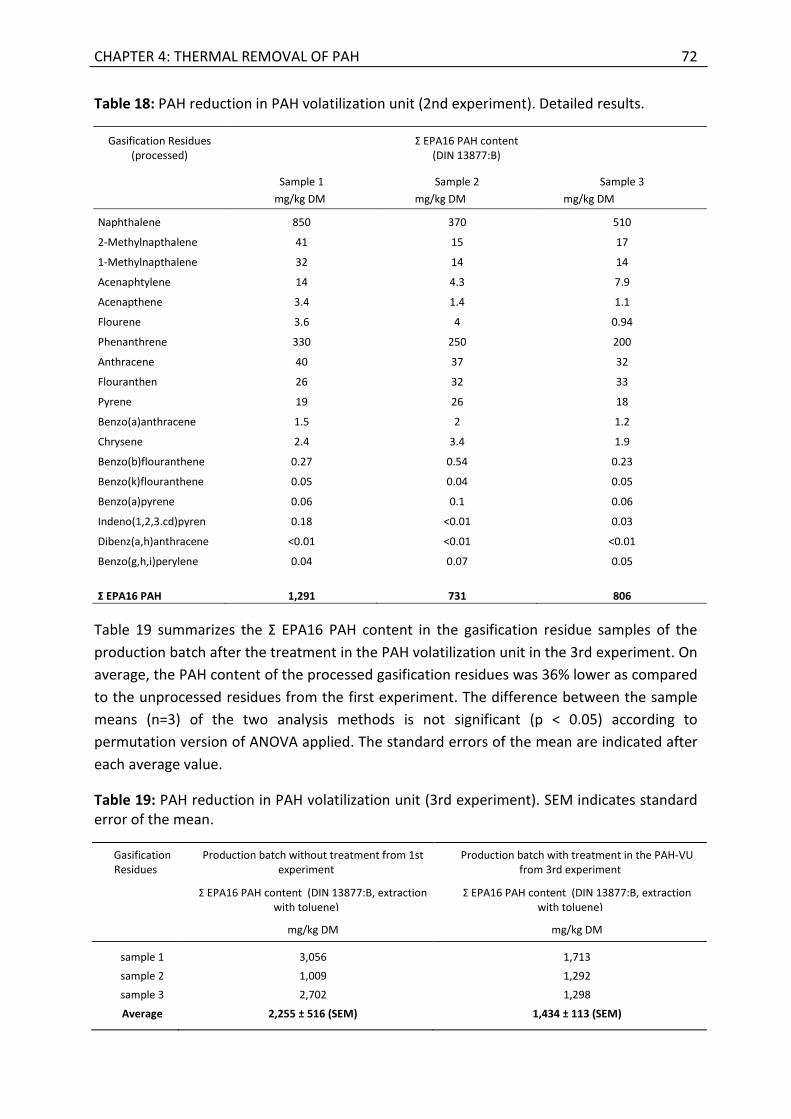
CHAPTER 4: THERMAL REMOVAL OF PAH 72
Table 18: PAH reduction in PAH volatilization unit (2nd experiment). Detailed results.
Gasification Residues (processed)
Σ EPA16 PAH content (DIN 13877:B)
Sample 1 Sample 2 Sample 3
mg/kg DM mg/kg DM mg/kg DM
Naphthalene 850 370 510
2-Methylnapthalene 41 15 17
1-Methylnapthalene 32 14 14
Acenaphtylene 14 4.3 7.9
Acenapthene 3.4 1.4 1.1
Flourene 3.6 4 0.94
Phenanthrene 330 250 200
Anthracene 40 37 32
Flouranthen 26 32 33
Pyrene 19 26 18
Benzo(a)anthracene 1.5 2 1.2
Chrysene 2.4 3.4 1.9
Benzo(b)flouranthene 0.27 0.54 0.23
Benzo(k)flouranthene 0.05 0.04 0.05
Benzo(a)pyrene 0.06 0.1 0.06
Indeno(1,2,3.cd)pyren 0.18 <0.01 0.03
Dibenz(a,h)anthracene <0.01 <0.01 <0.01
Benzo(g,h,i)perylene 0.04 0.07 0.05
Σ EPA16 PAH 1,291 731 806
Table 19 summarizes the Σ EPA16 PAH content in the gasification residue samples of the
production batch after the treatment in the PAH volatilization unit in the 3rd experiment. On
average, the PAH content of the processed gasification residues was 36% lower as compared
to the unprocessed residues from the first experiment. The difference between the sample
means (n=3) of the two analysis methods is not significant (p < 0.05) according to
permutation version of ANOVA applied. The standard errors of the mean are indicated after
each average value.
Table 19: PAH reduction in PAH volatilization unit (3rd experiment). SEM indicates standard error of the mean.
Gasification Residues
Production batch without treatment from 1st experiment
Production batch with treatment in the PAH-VU from 3rd experiment
Σ EPA16 PAH content (DIN 13877:B, extraction with toluene)
Σ EPA16 PAH content (DIN 13877:B, extraction with toluene)
mg/kg DM mg/kg DM
sample 1 3,056 1,713
sample 2 1,009 1,292
sample 3 2,702 1,298
Average 2,255 ± 516 (SEM) 1,434 ± 113 (SEM)
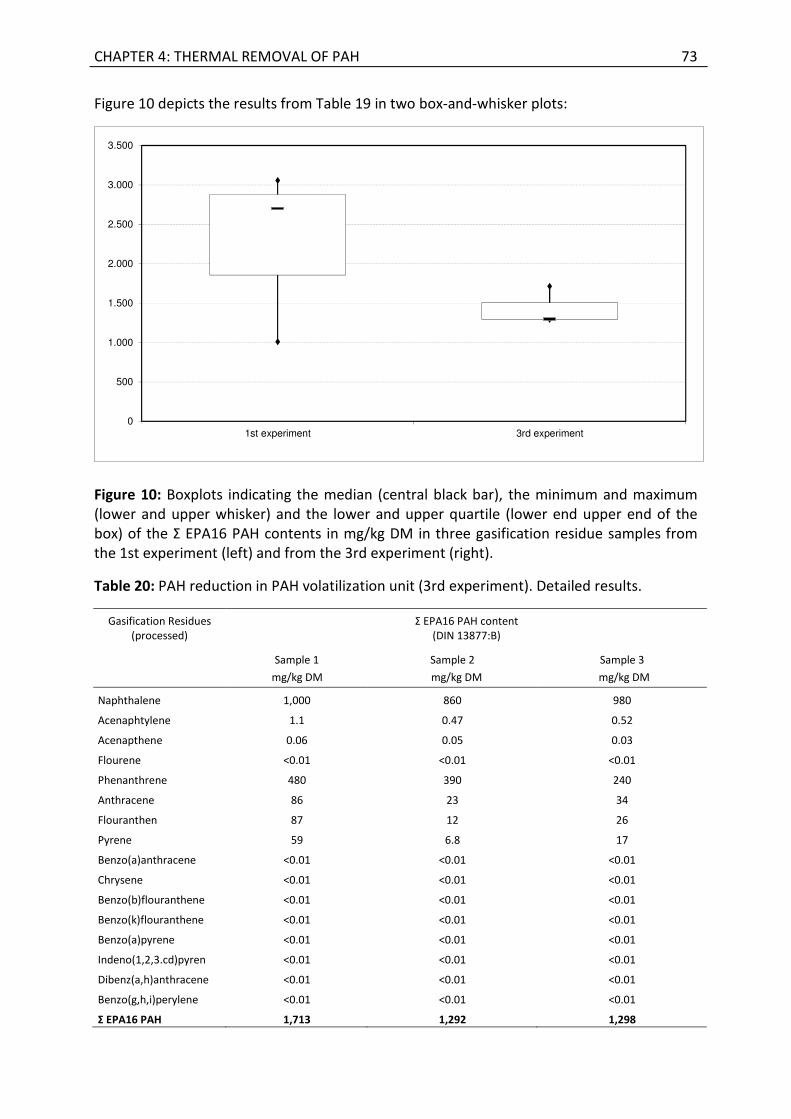
CHAPTER 4: THERMAL REMOVAL OF PAH 73
Figure 10 depicts the results from Table 19 in two box-and-whisker plots:
Figure 10: Boxplots indicating the median (central black bar), the minimum and maximum (lower and upper whisker) and the lower and upper quartile (lower end upper end of the box) of the Σ EPA16 PAH contents in mg/kg DM in three gasification residue samples from the 1st experiment (left) and from the 3rd experiment (right).
Table 20: PAH reduction in PAH volatilization unit (3rd experiment). Detailed results.
Gasification Residues (processed)
Σ EPA16 PAH content (DIN 13877:B)
Sample 1 Sample 2 Sample 3
mg/kg DM mg/kg DM mg/kg DM
Naphthalene 1,000 860 980
Acenaphtylene 1.1 0.47 0.52
Acenapthene 0.06 0.05 0.03
Flourene <0.01 <0.01 <0.01
Phenanthrene 480 390 240
Anthracene 86 23 34
Flouranthen 87 12 26
Pyrene 59 6.8 17
Benzo(a)anthracene <0.01 <0.01 <0.01
Chrysene <0.01 <0.01 <0.01
Benzo(b)flouranthene <0.01 <0.01 <0.01
Benzo(k)flouranthene <0.01 <0.01 <0.01
Benzo(a)pyrene <0.01 <0.01 <0.01
Indeno(1,2,3.cd)pyren <0.01 <0.01 <0.01
Dibenz(a,h)anthracene <0.01 <0.01 <0.01
Benzo(g,h,i)perylene <0.01 <0.01 <0.01
Σ EPA16 PAH 1,713 1,292 1,298
0
500
1.000
1.500
2.000
2.500
3.000
3.500
1st experiment 3rd experiment
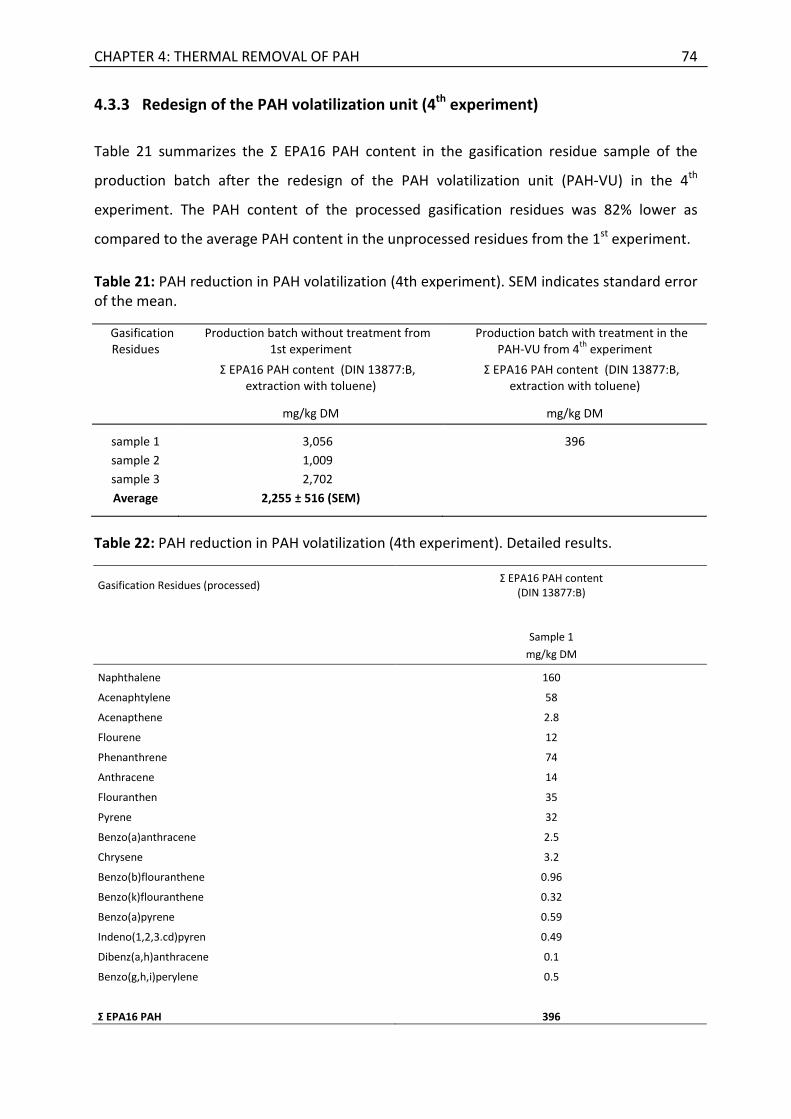
CHAPTER 4: THERMAL REMOVAL OF PAH 74
4.3.3 Redesign of the PAH volatilization unit (4th
experiment)
Table 21 summarizes the Σ EPA16 PAH content in the gasification residue sample of the
production batch after the redesign of the PAH volatilization unit (PAH-VU) in the 4th
experiment. The PAH content of the processed gasification residues was 82% lower as
compared to the average PAH content in the unprocessed residues from the 1st experiment.
Table 21: PAH reduction in PAH volatilization (4th experiment). SEM indicates standard error of the mean.
Gasification Residues
Production batch without treatment from 1st experiment
Production batch with treatment in the PAH-VU from 4
th experiment
Σ EPA16 PAH content (DIN 13877:B, extraction with toluene)
Σ EPA16 PAH content (DIN 13877:B, extraction with toluene)
mg/kg DM mg/kg DM
sample 1 3,056 396
sample 2 1,009
sample 3 2,702
Average 2,255 ± 516 (SEM)
Table 22: PAH reduction in PAH volatilization (4th experiment). Detailed results.
Gasification Residues (processed) Σ EPA16 PAH content
(DIN 13877:B)
Sample 1
mg/kg DM
Naphthalene 160
Acenaphtylene 58
Acenapthene 2.8
Flourene 12
Phenanthrene 74
Anthracene 14
Flouranthen 35
Pyrene 32
Benzo(a)anthracene 2.5
Chrysene 3.2
Benzo(b)flouranthene 0.96
Benzo(k)flouranthene 0.32
Benzo(a)pyrene 0.59
Indeno(1,2,3.cd)pyren 0.49
Dibenz(a,h)anthracene 0.1
Benzo(g,h,i)perylene 0.5
Σ EPA16 PAH 396
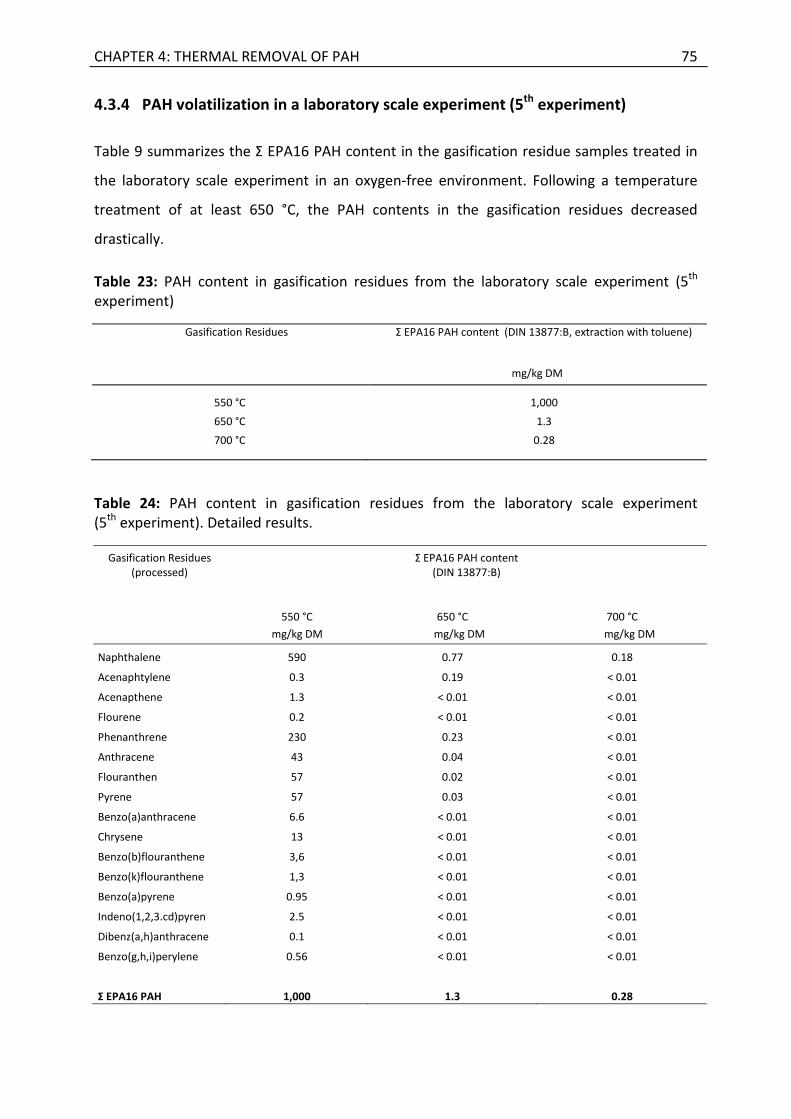
CHAPTER 4: THERMAL REMOVAL OF PAH 75
4.3.4 PAH volatilization in a laboratory scale experiment (5th
experiment)
Table 9 summarizes the Σ EPA16 PAH content in the gasification residue samples treated in
the laboratory scale experiment in an oxygen-free environment. Following a temperature
treatment of at least 650 °C, the PAH contents in the gasification residues decreased
drastically.
Table 23: PAH content in gasification residues from the laboratory scale experiment (5th experiment)
Gasification Residues
Σ EPA16 PAH content (DIN 13877:B, extraction with toluene)
mg/kg DM
550 °C 1,000
650 °C 1.3
700 °C 0.28
Table 24: PAH content in gasification residues from the laboratory scale experiment (5th experiment). Detailed results.
Gasification Residues (processed)
Σ EPA16 PAH content (DIN 13877:B)
550 °C 650 °C 700 °C
mg/kg DM mg/kg DM mg/kg DM
Naphthalene 590 0.77 0.18
Acenaphtylene 0.3 0.19 < 0.01
Acenapthene 1.3 < 0.01 < 0.01
Flourene 0.2 < 0.01 < 0.01
Phenanthrene 230 0.23 < 0.01
Anthracene 43 0.04 < 0.01
Flouranthen 57 0.02 < 0.01
Pyrene 57 0.03 < 0.01
Benzo(a)anthracene 6.6 < 0.01 < 0.01
Chrysene 13 < 0.01 < 0.01
Benzo(b)flouranthene 3,6 < 0.01 < 0.01
Benzo(k)flouranthene 1,3 < 0.01 < 0.01
Benzo(a)pyrene 0.95 < 0.01 < 0.01
Indeno(1,2,3.cd)pyren 2.5 < 0.01 < 0.01
Dibenz(a,h)anthracene 0.1 < 0.01 < 0.01
Benzo(g,h,i)perylene 0.56 < 0.01 < 0.01
Σ EPA16 PAH 1,000 1.3 0.28
CHAPTER 4: THERMAL REMOVAL OF PAH 76
4.4 Discussion
The comparison of the PAH analysis methods described in section 4.3.1 confirms the
recommendation of (Hilber et al. 2012): Soxhlet extraction with toluene resulted in a much
higher extraction of PAH from the gasification residues as compared to the extraction with
acetone (see Table 15). Thus, analysis method DIN 13877:B was applied for the PAH analysis
in the subsequent experiments 2-5.
(Min Wu et al. 2013) observed a positive correlation between the pyrolysis temperature
(between 200 °C and 500 °C in the experiment carried out) applied for the production of
biochars from lake sediments and the sorption of Phenanthrene to these biochars. As
gasification temperatures are higher (see Meyer et al. 2011) than the pyrolysis temperatures
applied in this experiment, we explain our analysis results by a strong sorption of PAH to the
carbonaceous matrix of the gasification residues.
(Fabbri et al. 2013) recently compared recovery rates after reflux extraction with toluene
and a 1:1 acetone/cyclohexane mixture of the three surrogate PAH Acenaphtene-d10,
Phenanthrene-d10 and Chrysene-d10 which had been previously added to a pyrolysis char
made form orchard pruning. The experiment resulted in higher recovery rates with the
solvent toluene as compared to the solvent mixture acetone/cyclohexane for the high
molecular weight PAH Phenanthrene-d10 (68% compared to 41%) and Chrysene-d10 (58%
compared to 7%). The recovery rate with the solvent toluene was though lower as compared
to the acetone/cyclohexane mixture for the low molecular weight PAH Acenaphtene-d10
(68% compared to 80%).
The differences in the recovery rates stated above are yet small if compared to our analysis
results (see Table 15). Reflux extractions are usually carried out at temperatures close to the
boiling point of the solvent applied. We thus presume that the strong difference in our
analysis results after applying the analysis methods DIN 13877:A (low temperature
extraction) and 13877:B (high temperature extraction) can be mainly explained by the
temperature difference between the two extraction methods. We recommend to directly
compare Soxhlet extractions with the solvents toluene and a 1:1 acetone/cyclohexane
mixture for the determination of the Σ EPA16 PAH content of gasification residues for future
research.
CHAPTER 4: THERMAL REMOVAL OF PAH 77
Based on the results described above, the effectiveness of the legal provisions of the
German Federal Soil Protection Act (Bundesbodenschutzgesetz [BBodSchG,
(Bundesministeriums der Justiz 1998)], and the German Federal Soil Protection and
Contaminated Sites Ordinance (Bundesbodenschutzverordnung [BBodSchV],
Bundesministeriums der Justiz 1999) for the protection of agricultural soils against PAH
pollution in Germany was analyzed. Special attention was paid to the suitability of the PAH
analysis methods specified in these regulations. The German Federal Soil Protection and
Contaminated Sites Ordinance defines precautionary values for the PAH content of soils.
These precautionary values are set at 10 mg/kg DM for the Σ EPA16 PAH content in the finely
granulated part of soils with humus contents larger than 8% and at 3 mg/kg DM for the Σ
EPA16 PAH content of soils with humus contents of less or equal 8%. The German Federal
Soil Protection and Contaminated Sites Ordinance specifies a number of analysis methods
which may be used to determine the PAH content of soils in accordance with this ordinance.
Among them are the analysis methods DIN 13877:A (cold extraction with acetone) and DIN
13877:B (Soxhlet extraction with toluene). However, our analysis results in chapter 4.3.1
have clearly shown that DIN 13877:A is not suitable to determine the PAH content in
gasification residues. Thus, the regulations of the German Federal Soil Protection Act and the
German Federal Soil Protection and Contaminated Sites Ordinance currently cannot prevent
the application of gasification residues with high PAH contents to agricultural soils, if the
cold extraction with acetone is applied for their characterization. It is recommended to close
this legislative loophole. Apart from that, it should be noted that there is no boundary value
for PAH loads added to soil (however for the PAH content in the soil) in the German soil
legislation.
While thermal processes are already used to remove PAH from contaminated soils (Harmon
et al. 2001), this principle was applied for the PAH removal from wood gasification residues
for the first time to our knowledge. The results displayed in Table 17, Table 19 and Table 21
indicate a reduction of the Σ EPA16 PAH content of the gasification residues by 36% to 82%
after the treatment in the PAH volatilization unit. Still, the residual PAH contents in the
gasification residues are too high to allow for an agricultural use.
The residual PAH content in the gasification residues was higher in the third experiment as
compared to the second experiment. This result might be explained by a difference in the
CHAPTER 4: THERMAL REMOVAL OF PAH 78
PAH content of the untreated gasification residues (although these were produced under the
same production conditions) or by a change in the airflow conditions within the PAH
volatilization unit caused by modifications of the sealing air stream and the heating chamber
air stream volumes. As already mentioned, gasification residues which had already passed
through the hot heating chamber got in contact with the volatilized PAH contained in the
sealing air which was blown into the lower conveyor screw. We assume that this is one of
the reasons for the high residual PAH content of the gasification residues in the 2nd and 3rd
experiment.
This hypothesis is supported by the comparably low PAH content of 396 mg/kg DM which
was reached after the redesign of the PAH volatilization unit which prevented the
recirculation of volatized PAH. Independent from the avoided recirculation effect, the
increase in the air supply to the heating chamber in the 4th experiment has with high
probability promoted the oxidation (combustion) of gasification residues in the heating
chamber. The resulting temperature increase might have supported a more complete
volatilization of the PAH from the gasification residues as compared to the 2nd and 3rd
experiment.
The 5th experiment proves that thermal volatilization processes are capable in reducing the
PAH content of gasification chars to levels which are acceptable for agricultural applications.
It can be derived from the data presented in Table 23, that minimum process temperatures
of about 650 °C are necessary for an effective removal of PAH from gasification residues.
Based on the laboratory scale experiment, the following additional technical design
modifications are suggested to further improve the functional efficiency of the PAH
volatilization unit:
• The gasification residues need to be sufficiently hot to allow for a complete
volatilization of the PAH sorbed to the residue surfaces. In a modified heat
exchanger, the hot wood gas should be used to heat the gasification residues in
counter-flow principle. It should be noted in this context that the boiling
temperatures of the analyzed PAH are in the range of 218 °C (naphthalene) to 536 °C
(Indeno(1,2,3-cd)pyrene) (Harmon et al. 2001), (A.K. Haritash and C.P. Kaushik 2009).
CHAPTER 4: THERMAL REMOVAL OF PAH 79
• The aim of the PAH volatilization unit is to reduce the PAH content in the gasification
residues. If the gasification residues can be sufficiently heated in the heat exchanger,
it is not necessary anymore to supply oxygen into the PAH volatilization unit to burn a
part of the residues. In this case, cheating chamber air (and perhaps sealing air as
well) would not be needed anymore.
• The volatilized PAH need to be efficiently removed from the gasification residues
before condensing again to the surface of the residues. If the sealing air stream is
removed, there is a need for another transport method to remove the volatized PAH.
It is suggested to vacuum the volatized PAH through a heat-resistant filter installed at
the hottest point of the heat exchanger and thus separate them from the hot
gasification residues.
Since the use of biochars in agriculture promises beneficial effects for soil amelioration and
climate change mitigation (see Fischer and Glaser 2012, Meyer et al. 2012), it is
recommended to continue the technical development to obtain gasifier residues with low
PAH contents which might subsequently be used as soil amendment. The joint composting
of gasification residues and organic feedstock sources could help to further reduce any
remaining PAH in the gasification residues via biodegradation (A.K. Haritash and C.P. Kaushik
2009) and to prevent nutrient losses in the composting process. In case further experiments
would affirm the viability of the preparation of gasification residues with very low PAH
contents which also meet all other applicable environmental standards for soil amendments,
a disposal problem could be turned into the valuable resource supply option for the
agricultural sector.
4.5 Conclusion
The results endorse the suitability of PAH analysis method DIN 13877:B for the
determination of the PAH content in gasification residues. Related to that, our findings give
evidence that DIN 13877:A is not suitable to determine the PAH content in gasification
residues. Thus, the regulations of the German Federal Soil Protection Act and the German
Federal Soil Protection and Contaminated Sites Ordinance currently cannot prevent the
application of gasification residue with high PAH contents to agricultural soils. It is
recommended to close this legislative loophole.

CHAPTER 4: THERMAL REMOVAL OF PAH 80
A reduction of the Σ EPA16 PAH content in gasification residues by 36% to 82% was achieved
by the tested PAH volatilization unit. However, the residual Σ EPA16 PAH content in the
gasification residues (between 396 and 1,713 mg/kg DM) is still far too high to allow for an
agricultural use of the residues. There are though promising technical redesign options
available to further improve the effectiveness of the examined thermal process. In a
laboratory scale experiment, the Σ EPA16 PAH content of gasification residues was reduced
to values below 2 mg/kg DM following thermal processing at temperatures of 650 °C and
more.
GENERAL DISCUSSION 81
5 General Discussion
For the presented three studies, the used materials and methods and the gained results
have already been discussed separately in the following chapters:
• Technical, Economical and Climate Related Aspects of Biochar Production Technologies:
A Literature Review (see chapters 2.5.3, 2.6.4, 2.7.3 and 2.8)
• Albedo Impact on the Suitability of Biochar Systems to Mitigate Global Warming (see
chapter 3.5)
• Thermal Removal of PAH from Gasification Biochars (see chapter 4.4)
In the following subchapters, the discussion and the subsumption of the overall results of
this thesis into the current state of scientific knowledge is presented.
5.1 The development status of carbonization technologies
It is inevitable that the information presented in the literature review on the technical,
economic and climate related development status of a new and rapidly evolving technology
sector (see chapter 2) is limited to the identified and analyzed literature sources and that the
collected information has a short half live time. For this reason, the findings of the literature
review published in 2011 are compared to the most recent information published in the field
in the ISI Web of Knowledge.
(Eberhardt et al. 2011) concluded that the production of HTC coal from straw and wood for
energy applications is not profitable 33er the assumptions used in their ex-ante evaluation of
the production cost of HTC coal in Brandenburg.
In a Taiwanese case study, (Chih-Chun Kung et al. 2013) calculated negative net margins for
the operation of slow and fast pyrolysis plants fed by wood from poplar grown on set aside
land when taking into account revenues from electricity sales and the agricultural value of
the produced biochar.
In line with the results presented in chapter 2.6.4, (Field et al. 2013) draw the conclusion
that the use of char for energy provision yields higher revenues as compared to its use as soil
amendment under the assumptions used in their model calculation. As prices for fossil
GENERAL DISCUSSION 82
energy carriers are expected to further increase in future and bioenergy and biochar
producers in many cases depend on the same resource basis, the bioenergy sector thus will
with high probability remain a strong competitor for the biochar production sector.
(Wiedner et al. 2013) presents principal technical parameters about commercial pyrolysis
units, gasifiers and htc units of five different European technology providers which aim at
the production of chars for agricultural applications. This publication stresses the lower black
carbon content of chars from hydrothermal carbonization (hydrochars) as compared to the
chars from pyrolysis and gasification processes. As the black carbon content of char
correlates with the stability of the chars, it is expected that the hydrochars examined are less
stable compared to the chars from pyrolysis and gasification. This was confirmed by a direct
comparison between the 13CO2 efflux of soils added with pyrolysis biochar and hydrochar
(both made from Miscanthus) as carried out by (Bai et al. 2013). Similar results regarding the
stability difference between pyrolysis chars and chars from hydrothermal carbonization have
been obtained by (Malghani et al. 2013).
Since the publication of the literature review in 2009 (see chapter 2), no additional scientific
information on the flash carbonization technology has been published. It is not clear
whether this technology is still being further developed.
In summary, published scientific information on the technical maturity and the economical
probability of carbonization technologies is still scarce. This can be partly explained by the
interest of technology manufactures to protect their technology expertise. The information
presented in scientific case studies is only valid for the selected assumptions and cannot be
generalized over regions, technologies and time. While the number of commercial
installations for biochar production in Central Europe has been increasing over the last three
years, the biochar market expansion is still substantially limited by the technical maturity
and the economic competitiveness of biochar production technologies.
5.2 PAH levels in gasification biochars
(Wiedner et al. 2013) found comparably low PAH contents (up to 15 mg/kg Σ EPA16-PAH) in
gasification biochars. As the analysis method DIN 13877:A (cold extraction with a mixture of
acetone and cyclohexane) was used for this assessment, this fits with the results presented
in chapter 4.3. It is expected that higher PAH contents would have been found in the same
GENERAL DISCUSSION 83
gasification biochar samples, if analysis method DIN 13877:B (Soxhlet extraction with
toluene) would have been applied.
In a Tradescantia genotoxicity assay, (Busch et al. 2013) observed a highly significant
increase in the mean percentage of micronuclei from Tradescantia pollen cells after exposing
Tradescantia flowers to a filtrate from the mixture of distilled water and a pyrolysis biochar
produced at a temperature of ∼450 °C with a high PAH content (62,7 mg/kg Σ EPA16-PAH,
PAH analysis method: Soxhlet extraction with toluene, Hilber et al. 2012). While the
observed genotoxic effects of the pyrolysis biochar on the Trandescantia plants cannot be
attributed to the high PAH content of the biochar with certainty, this test clearly indicates
the presence of mutagenic pollutants in the filtrate. In the same study, no statistically
significant increase in the mean percentage of micronuclei was observed after exposing
Tradescantia flowers to a filtrate from the mixture of distilled water and gasification residues
(from gasifiers of the company A.G.T. in Arioso, Italy). The PAH contents of these gasification
residues have not been examined in this publication, but they have been published in
(Wiedner et al. 2013): The gasification residues contained up to 2 mg/kg Σ EPA16-PAH (PAH
analysis method: cold extraction with a mixture of acetone and cyclohexane according to
DIN 13877:A). As already stated above, the low identified PAH contents in the gasification
residues might partly result from the application of the cold extraction method.
(Patryk Oleszczuk et al. 2014) discovered high PAH contents (between 1.8 and 101.3
mg Σ EPA16-PAH / kg soil) in soils close (5-10m distance) to portable charcoal ring kilns
without exhaust gas combustion / cleaning unit. Due to a large variation in the PAH contents
of the soil sample, the authors assume that at least a part of the soil samples might have
gotten in direct contact with charcoal particles or the liquid byproducts of the pyrolysis
process.
The cited publication underline the necessity to choose appropriate methods for the analysis
of the PAH content in carbonaceous analysis samples and to be aware of all potential PAH
emissions streams of biochars systems. With respect to the PAH volatilization unit examined
in chapter 4, this implies that the gas stream with the volatized PAH need to be fed into a
high temperature zone to enable a complete break-up / combustion of these PAH.
GENERAL DISCUSSION 84
5.3 The overall climate impact of biochar systems
(Jorge Laine 2012) proposes to use coke by-products from the refinement of
nonconventional fossil hydrocarbon reserves to change the surface albedo in arid regions in
the hope that a large scale regional albedo change would increase the annual precipitation
over this area. While the effectiveness of the presented concept with regard to the local
climate shall not be discussed here, the suggested approach would have an adverse effect
on the global climate: The decrease in the surface albedo would increase the radiative
forcing (see chapter 3.3.2.3), thereby directly enforcing climate change. Besides of that, the
use of the coke might provide additional financial returns to fossil fuel industry. This
underlines the necessity to take into account albedo changes if the climate impact of large
scale surfaces changes shall be assessed.
The climate impact of the albedo change associated with biochar application is not yet
sufficiently reflected in the sustainability discussion of biochar systems. In a recent
publication with the title “Biochar as a Geoengineering Climate Solution: Hazard
Identification and Risk Management” by (Downie et al. 2012), the albedo impact of biochar
systems is not even mentioned. It seems that the current focus on the GHG balance of
biochar systems obstructs the perception of the other radiative forcing impacts of biochar
systems. In this respect, the scientific understanding of the climate impacts of bioenergy
systems is already more advanced (see Bright et al. 2012).
It should however be mentioned that the very recently published work of (Verheijen et al.
2013) confirms the (negative) impact of albedo changes on the climate mitigation potential
of biochar systems: In this article, the authors calculated a reduction of the negative
radiative forcing impact of biochar systems by 5 to 95% after accounting for the albedo
impact of the biochar application.
The work of (Geoffrey Guest et al. 2013) underlines the need to take the rotation period of
the biomass crops used for biochar production into consideration when the climate impact
of biochar systems is evaluated (see the approach as taken in chapter 3.3.3.1):
Carbon neutrality does not equal climate neutrality in case there is a longer time period
between the emission and the sequestration of biogenic carbon.
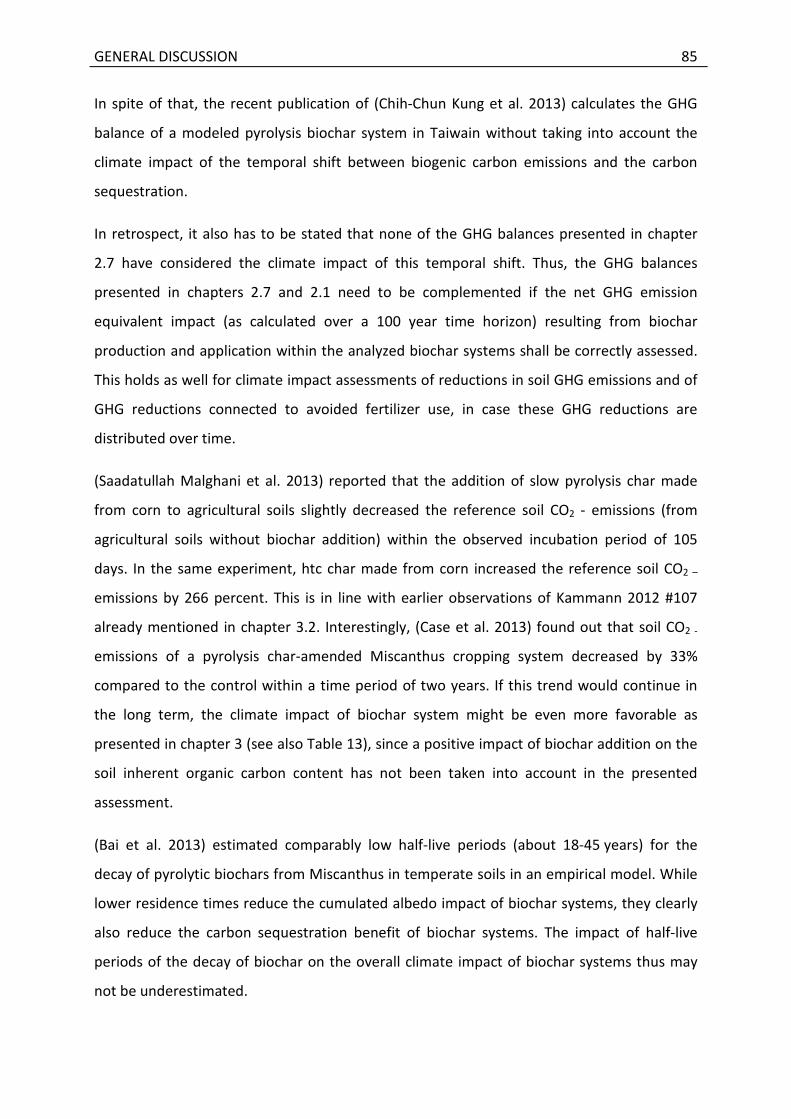
GENERAL DISCUSSION 85
In spite of that, the recent publication of (Chih-Chun Kung et al. 2013) calculates the GHG
balance of a modeled pyrolysis biochar system in Taiwain without taking into account the
climate impact of the temporal shift between biogenic carbon emissions and the carbon
sequestration.
In retrospect, it also has to be stated that none of the GHG balances presented in chapter
2.7 have considered the climate impact of this temporal shift. Thus, the GHG balances
presented in chapters 2.7 and 2.1 need to be complemented if the net GHG emission
equivalent impact (as calculated over a 100 year time horizon) resulting from biochar
production and application within the analyzed biochar systems shall be correctly assessed.
This holds as well for climate impact assessments of reductions in soil GHG emissions and of
GHG reductions connected to avoided fertilizer use, in case these GHG reductions are
distributed over time.
(Saadatullah Malghani et al. 2013) reported that the addition of slow pyrolysis char made
from corn to agricultural soils slightly decreased the reference soil CO2 - emissions (from
agricultural soils without biochar addition) within the observed incubation period of 105
days. In the same experiment, htc char made from corn increased the reference soil CO2 –
emissions by 266 percent. This is in line with earlier observations of Kammann 2012 #107
already mentioned in chapter 3.2. Interestingly, (Case et al. 2013) found out that soil CO2 -
emissions of a pyrolysis char-amended Miscanthus cropping system decreased by 33%
compared to the control within a time period of two years. If this trend would continue in
the long term, the climate impact of biochar system might be even more favorable as
presented in chapter 3 (see also Table 13), since a positive impact of biochar addition on the
soil inherent organic carbon content has not been taken into account in the presented
assessment.
(Bai et al. 2013) estimated comparably low half-live periods (about 18-45 years) for the
decay of pyrolytic biochars from Miscanthus in temperate soils in an empirical model. While
lower residence times reduce the cumulated albedo impact of biochar systems, they clearly
also reduce the carbon sequestration benefit of biochar systems. The impact of half-live
periods of the decay of biochar on the overall climate impact of biochar systems thus may
not be underestimated.
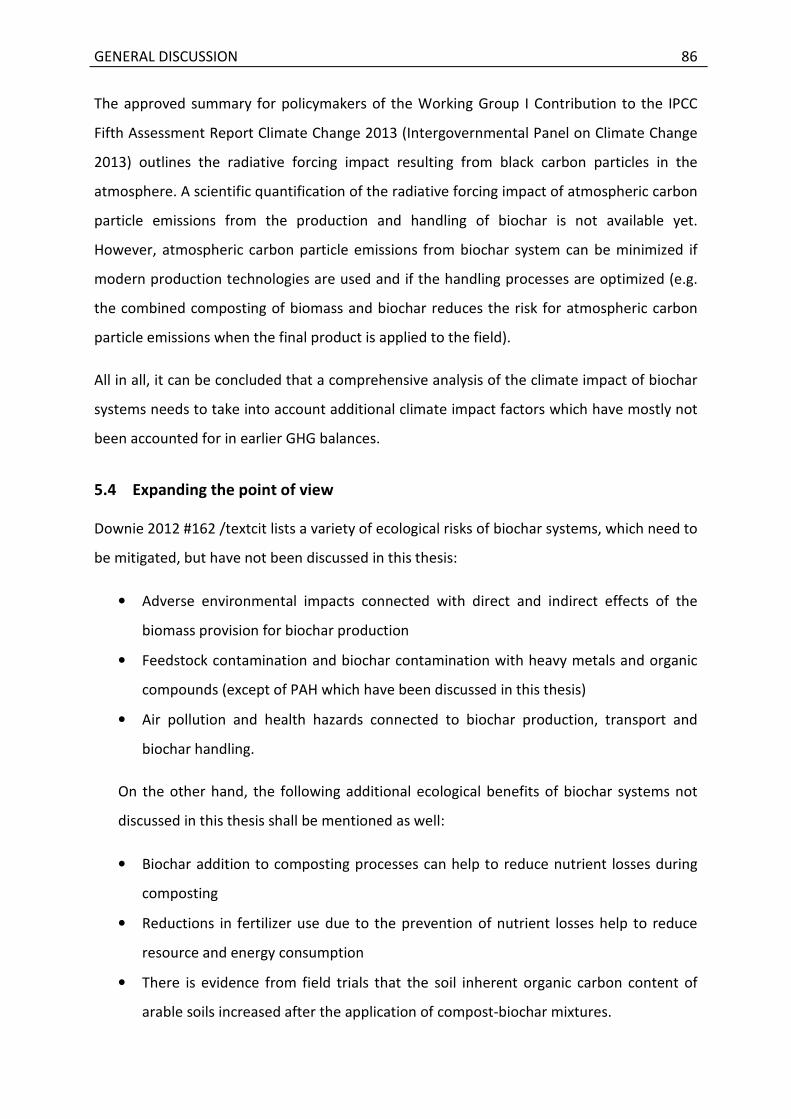
GENERAL DISCUSSION 86
The approved summary for policymakers of the Working Group I Contribution to the IPCC
Fifth Assessment Report Climate Change 2013 (Intergovernmental Panel on Climate Change
2013) outlines the radiative forcing impact resulting from black carbon particles in the
atmosphere. A scientific quantification of the radiative forcing impact of atmospheric carbon
particle emissions from the production and handling of biochar is not available yet.
However, atmospheric carbon particle emissions from biochar system can be minimized if
modern production technologies are used and if the handling processes are optimized (e.g.
the combined composting of biomass and biochar reduces the risk for atmospheric carbon
particle emissions when the final product is applied to the field).
All in all, it can be concluded that a comprehensive analysis of the climate impact of biochar
systems needs to take into account additional climate impact factors which have mostly not
been accounted for in earlier GHG balances.
5.4 Expanding the point of view
Downie 2012 #162 /textcit lists a variety of ecological risks of biochar systems, which need to
be mitigated, but have not been discussed in this thesis:
• Adverse environmental impacts connected with direct and indirect effects of the
biomass provision for biochar production
• Feedstock contamination and biochar contamination with heavy metals and organic
compounds (except of PAH which have been discussed in this thesis)
• Air pollution and health hazards connected to biochar production, transport and
biochar handling.
On the other hand, the following additional ecological benefits of biochar systems not
discussed in this thesis shall be mentioned as well:
• Biochar addition to composting processes can help to reduce nutrient losses during
composting
• Reductions in fertilizer use due to the prevention of nutrient losses help to reduce
resource and energy consumption
• There is evidence from field trials that the soil inherent organic carbon content of
arable soils increased after the application of compost-biochar mixtures.
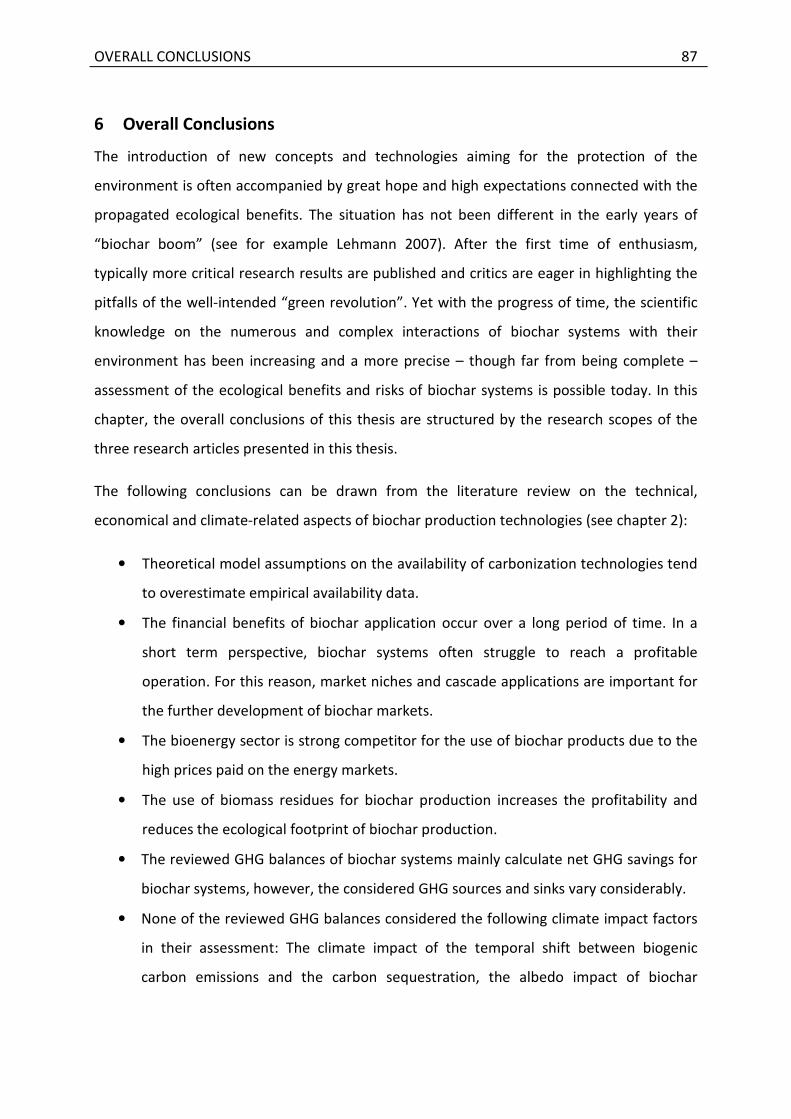
OVERALL CONCLUSIONS 87
6 Overall Conclusions
The introduction of new concepts and technologies aiming for the protection of the
environment is often accompanied by great hope and high expectations connected with the
propagated ecological benefits. The situation has not been different in the early years of
“biochar boom” (see for example Lehmann 2007). After the first time of enthusiasm,
typically more critical research results are published and critics are eager in highlighting the
pitfalls of the well-intended “green revolution”. Yet with the progress of time, the scientific
knowledge on the numerous and complex interactions of biochar systems with their
environment has been increasing and a more precise – though far from being complete –
assessment of the ecological benefits and risks of biochar systems is possible today. In this
chapter, the overall conclusions of this thesis are structured by the research scopes of the
three research articles presented in this thesis.
The following conclusions can be drawn from the literature review on the technical,
economical and climate-related aspects of biochar production technologies (see chapter 2):
• Theoretical model assumptions on the availability of carbonization technologies tend
to overestimate empirical availability data.
• The financial benefits of biochar application occur over a long period of time. In a
short term perspective, biochar systems often struggle to reach a profitable
operation. For this reason, market niches and cascade applications are important for
the further development of biochar markets.
• The bioenergy sector is strong competitor for the use of biochar products due to the
high prices paid on the energy markets.
• The use of biomass residues for biochar production increases the profitability and
reduces the ecological footprint of biochar production.
• The reviewed GHG balances of biochar systems mainly calculate net GHG savings for
biochar systems, however, the considered GHG sources and sinks vary considerably.
• None of the reviewed GHG balances considered the following climate impact factors
in their assessment: The climate impact of the temporal shift between biogenic
carbon emissions and the carbon sequestration, the albedo impact of biochar
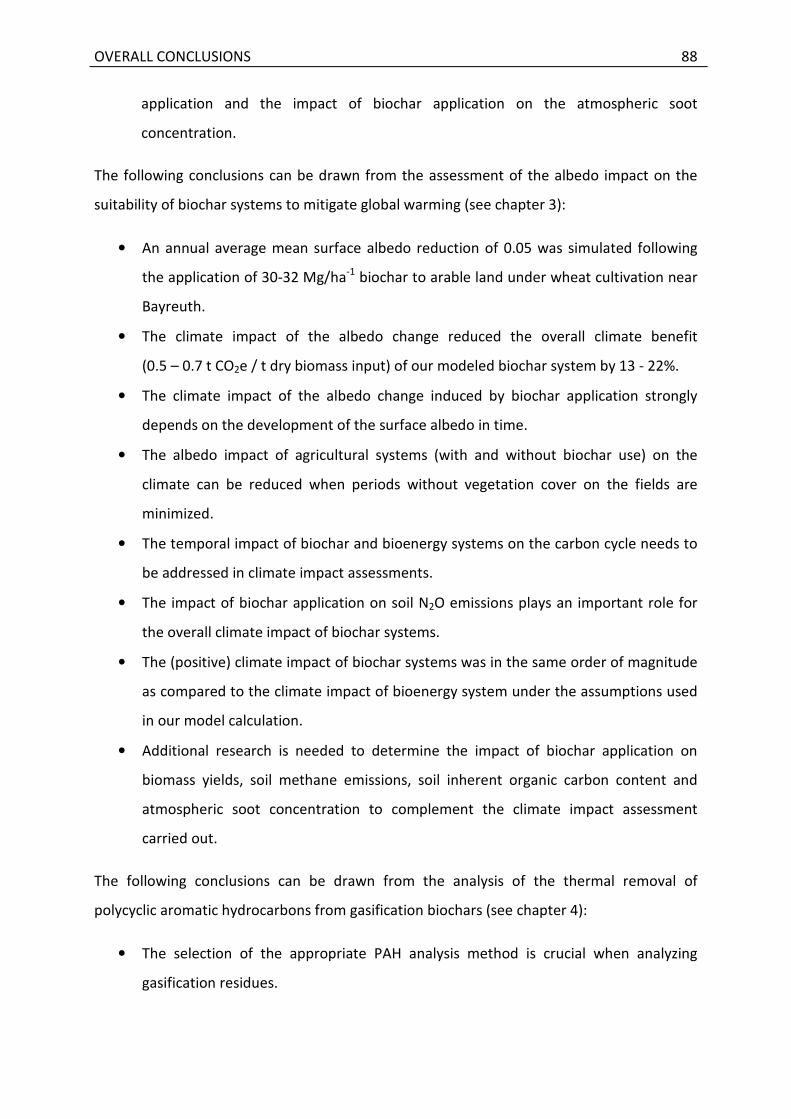
OVERALL CONCLUSIONS 88
application and the impact of biochar application on the atmospheric soot
concentration.
The following conclusions can be drawn from the assessment of the albedo impact on the
suitability of biochar systems to mitigate global warming (see chapter 3):
• An annual average mean surface albedo reduction of 0.05 was simulated following
the application of 30-32 Mg/ha-1 biochar to arable land under wheat cultivation near
Bayreuth.
• The climate impact of the albedo change reduced the overall climate benefit
(0.5 – 0.7 t CO2e / t dry biomass input) of our modeled biochar system by 13 - 22%.
• The climate impact of the albedo change induced by biochar application strongly
depends on the development of the surface albedo in time.
• The albedo impact of agricultural systems (with and without biochar use) on the
climate can be reduced when periods without vegetation cover on the fields are
minimized.
• The temporal impact of biochar and bioenergy systems on the carbon cycle needs to
be addressed in climate impact assessments.
• The impact of biochar application on soil N2O emissions plays an important role for
the overall climate impact of biochar systems.
• The (positive) climate impact of biochar systems was in the same order of magnitude
as compared to the climate impact of bioenergy system under the assumptions used
in our model calculation.
• Additional research is needed to determine the impact of biochar application on
biomass yields, soil methane emissions, soil inherent organic carbon content and
atmospheric soot concentration to complement the climate impact assessment
carried out.
The following conclusions can be drawn from the analysis of the thermal removal of
polycyclic aromatic hydrocarbons from gasification biochars (see chapter 4):
• The selection of the appropriate PAH analysis method is crucial when analyzing
gasification residues.
OVERALL CONCLUSIONS 89
• DIN 13877:A (cold extraction with acetone) is not suitable to comprehensively
determine the PAH content in gasification residues. The hot Soxhlet extraction
method (as applied in DIN 13877:B) is better suited for PAH analysis of gasification
residues.
• There is a loophole in the German soil protection legislation with regard to the
permitted PAH analysis methods which needs to be closed.
• PAH contents in wood gasification residues can be very high (up to a Σ EPA16-PAH
content of more than 3 000 mg/kg dry mass.
• Wood gasification residues are available at negative costs, if they have to be disposed
due to their PAH contamination.
• In laboratory experiments, it was proven that the PAH content of heavily polluted
gasification residues can be reduced to Σ EPA16-PAH values below 1 mg/kg dry mass
by a thermal volatilization process.
• This process has not yet been successfully scaled up to be implemented as an add-up
to commercial wood gasifiers. However, there are promising technical redesign
option available for this purpose.
• If a standardized PAH volatilization unit in form of an add-up for small-scale wood
gasifiers is developed, special care has to be taken to guarantee the effectiveness of
the PAH cleaning process under a broad range of operation conditions.
To draw a single main conclusion of this thesis: biochar systems can play a very helpful role
for the management of the environment if its risks are mitigated and if the application of
biochar systems is not abused as an excuse for delayed action in other areas.
Due to the diversity of interactions between biochars systems and the environment and due
the limitations of this thesis with regard to its scope and with regard to the present state of
scientific knowledge, future research activities are necessary to continuously re-evaluate and
complement the conclusions presented here.
SUMMARY 90
7 Summary
The concept of carbonizing biomass and using the obtained product for soil amelioration and
carbon sequestration – the so called “biochar system” - has gained much attention in the
research community as well as in the media in the last years. The attractiveness of this
concept can be explained by its promise to contribute to climate change mitigation and to
foster food security at the same time. It is though foreseeable that an increase in biochar
production will trigger critical questions on the realizable ecological benefits and the
potential negative environmental effects of biochar systems. Answering these questions in
an early stage of the market development might both help to avoid steering into an
ecological dead-end and to optimize potential future support schemes for biochar systems.
The objective of this thesis is thus an evaluation of ecological benefits and risks of biochar
systems. The scope of the thesis was limited to impacts of biochar systems on the climate
system and on the potential impact of biochar systems on the polycyclic aromatic
hydrocarbons (PAH) level in soils. This thesis contains three separate studies which are
summarized below.
In the first study, peer-reviewed scientific articles on carbonization technologies (pyrolysis,
gasification, hydrothermal carbonization, and flash carbonization) have been analyzed. It is
evident that theoretical model assumptions on the technical availability of carbonization
technologies stated in the reviewed articles tend to overestimate empirical availability data.
A wide range of data on the costs of char production (between 51 US$ per tonne pyrolysis
biochar from yard waste and 386 US$ per tonne retort charcoal) has been published. The
financial benefits of biochar application generally occur over a long period of time. When
evaluated on a short term perspective, biochar systems thus often struggle to reach a
profitable operation. In addition to that, the bioenergy sector is strong competitor for the
use of biochar products due to the high prices paid on the energy markets. For this reason,
market niches and cascade applications are important for the further development of
biochar markets. Besides of that, the use of biomass residues for biochar production
increases the profitability and reduces the ecological footprint of biochar production. The
reviewed greenhouse gas (GHG) balances of biochar systems mainly calculate net GHG
savings for biochar systems, however, the considered GHG sources and sinks vary
considerably. The reviewed results are in a range of 1,054 kg CO2e emission savings per t dry
SUMMARY 91
biomass feedstock up to an emission increase of +123 kg CO2e per t dry biomass feedstock.
However, none of the reviewed GHG balances has considered the factors in their
assessment: the climate impact of the temporal shift between biogenic carbon emissions
and carbon sequestration, the albedo impact of biochar application and the impact of
biochar application on the atmospheric soot concentration. Thus, at the time of publication
of the first study, it could not be ruled out that a decrease in the surface albedo caused by
biochar field application might overcompensate the climate mitigation benefits of biochar
systems.
To quantify this risk, the second study was carried out: Based on empirical albedo
measurements and literature data of arable soils mixed with biochar, a model for annual
vegetation cover development (wheat cultivation) based on satellite data and an assessment
of the annual development of surface humidity, an average mean annual albedo reduction
of 0.05 has been calculated for applying 30−32 Mg ha−1 biochar on a test field near Bayreuth,
Germany. The impact of biochar production and application on the carbon cycle and on the
soil albedo was integrated into the greenhouse gas balance of a modeled pyrolysis-based
biochar system via the computation of global warming potential (GWP) characterization
factors. The analysis resulted in a reduction of the overall climate mitigation benefit of
biochar systems by 13−22% due to the albedo change as compared to an analysis which
disregards the albedo effect. Comparing the use of the same quantity of biomass in a biochar
system to a bioenergy district heating system which replaces natural gas combustion,
bioenergy heating systems achieve 99−119% of the climate benefit of biochar systems
according to the model calculation. It was found out that the climate impact of the albedo
change induced by biochar application strongly depends on the development of the surface
albedo in time. In general, the albedo impact of agricultural systems (with and without
biochar use) on the climate can be reduced when periods without vegetation cover on the
fields are minimized. It also can be concluded from the model calculation that the impact of
biochar application on soil N2O emissions plays a decisive role for the overall climate impact
of biochar systems. While a comprehensive consideration of temporal impact of biochar
systems on the carbon cycle is essential to assess the overall climate impact of these
systems, this impact is still very insufficiently reflected in the present scientific sustainability
literature about biochar systems. Additional research is needed to determine the impact of
biochar application on biomass yields, soil methane emissions, soil inherent organic carbon
SUMMARY 92
content and atmospheric soot concentration to complement the climate impact assessment
carried out.
Since the results of the literature review highlighted the economic and climate-related
advantages of using biogenic residues for biochar production, a critical evaluation of the
opportunity of utilizing carbonaceous wood gasification residues as soil amendment was set
in the focus of the third study. Since wood gasification residues often contain large amounts
of persistent and carcinogenic polycyclic aromatic hydrocarbons, this study evaluated the
efficiency of a recently developed thermal process (called PAH volatilization unit) designed
to remove PAH from gasification residues. As a precondition for this evaluation, the
suitability of the PAH analysis methods DIN 13877:A and DIN 13877:B for the determination
of the PAH content in wood gasification residues had to be checked. The results endorse the
suitability of PAH analysis method DIN 13877:B for the determination of the PAH content in
gasification residues. Related to that, the findings gave evidence that DIN 13877:A is not
suitable to determine the PAH content in gasification residues. As the latter analysis method
is legally applicable under the German Federal Soil Protection and Contaminated Sites
Ordinance, this regulation cannot prevent the application of gasification residue with high
PAH contents to agricultural soils. It is thus recommended to close this legislative loophole. A
reduction of the Σ EPA16 PAH content in gasification residues by 36% to 82% was achieved
by the tested PAH volatilization unit. However, the residual Σ EPA16 PAH content in the
gasification residues (between 396 and 1,713 mg/kg DM) is still far too high to allow for an
agricultural use of the residues. There are though promising technical redesign options
available to further improve the effectiveness of the examined thermal process. In a
laboratory scale experiment, the Σ EPA16 PAH content of gasification residues was reduced
to values below 2 mg/kg DM following thermal processing at temperatures of 650 °C and
more.
The overall results of this thesis suggest that biochar systems can play a very helpful role for
the management of the environment if its risks are mitigated and if the application of
biochar systems is not abused as an excuse for delayed action in other areas.
ZUSAMMENFASSSUNG 93
8 Zusammenfassung
Die Herstellung von biogener Kohle und ihr Einsatz zur Aufwertung landwirtschaftlicher
Böden sowie zur Kohlenstoffsequestrierung im Rahmen sogenannter Biokohle-Systeme hat
in den letzten Jahren viel Aufmerksamkeit in der wissenschaftlichen Forschung und in den
Medien erhalten. Die Attraktivität dieses Konzepts lässt sich damit erklären, dass Biokohle-
Systemen die Fähigkeit zugeschrieben wird, dem anthropogenen Klimawandel
entgegenzuwirken und zugleich einen Beitrag zur Ernährungssicherheit zu leisten. Schon
heute ist jedoch absehbar, dass ein Anstieg der Biokohleproduktion kritische Fragen zu dem
dadurch tatsächlich erzielbaren ökologischen Nutzen sowie zu den möglichen ökologischen
Nebenwirkungen von Biokohlesystem hervorrufen wird. Eine frühzeitige Beantwortung
dieser Fragen kann dazu beitragen, ökologische Sackgassen zu vermeiden und mögliche
zukünftige Förderprogramme für Biokohle-System optimal auszugestalten.
Die Bewertung der ökologischen Chancen und Risiken von Biokohle-Systemen ist daher
Forschungsgegenstand dieser Dissertation. Der Forschungsfokus wurde hierbei auf die
Auswirkungen von Biokohlesystemen auf den Treibhauseffekt und auf die Akkumulierung
von polyzyklischen aromatischen Kohlenwasserstoffen in landwirtschaftlichen Böden
gesetzt. Diese Dissertation besteht aus drei Einzelstudien, die aufeinander aufbauen und im
Folgenden zusammengefasst werden.
Im Rahmen der ersten Studie wurden wissenschaftliche Peer-Review-Veröffentlichungen zu
den Karbonisierungsverfahren Pyrolyse, Vergasung, Hydrothermale Karbonisierung und
Flash-Karbonisierung systematisch ausgewertet. Die in den Veröffentlichungen dargestellten
Treibhausgasbilanzen des Einsatzes der Biokohlesysteme resultieren (insbesondere beim
Einsatz von biogenen Reststoffen) meist in einer Nettominderung der Treibhausgas-
konzentration in der Atmosphäre. Hierbei ist jedoch anzumerken, dass zwischen den Studien
eklatante Unterschiede in Bezug auf die berücksichtigten Treibhausgasquellen und
Treibhausgassenken bestehen. Die Bandbreite der analysierten Treibhausgasbilanzen reicht
von einer Nettoemissionsminderung in Höhe von 1054 kg CO2e pro Tonne biogener (Input)-
Trockenmasse bis zu einer Nettoemissionssteigerung in Höhe von 123 kg CO2e pro Tonne
biogener (Input)-Trockenmasse. Es muss allerdings konstatiert werden, dass keine der
analysierten Treibhausgasbilanzen die folgenden klimarelevanten Faktoren in die Bewertung
der Biokohlesysteme mit einbezogen hat: Die klimatischen Auswirkungen der zeitlichen
ZUSAMMENFASSSUNG 94
Differenz zwischen der Emission und der Sequestrierung biogenen Kohlenstoffs, die
Auswirkungen von Albedoänderungen, die durch die Biokohleapplikation hervorgerufen
werden; sowie den Einfluss der Biokohleanwendung auf den atmosphärischen Gehalt an
Black Carbon. Zum Zeitpunkt der Veröffentlichung der ersten Studie konnte daher nicht
ausgeschlossen werden, dass der positive Effekt von Biokohle-System auf die
Treibhausgaskonzentration (und damit auf den Treibhauseffekt) nicht durch die (den
Klimawandel verstärkende) Abnahme der Oberflächenalbedo aufgrund von
Biokohleapplikationen ins Gegenteil verkehrt wird.
Um dieses Risiko quantifizieren zu können, wurde die zweite Studie durchgeführt. Anhand
von eigenen Albedomessungen und von Literaturdaten zu Ackerflächen, die mit Biokohle
vermischt worden waren, wurde eine durchschnittliche jährliche Minderung der
Oberflächenalbedo in Höhe von 0,05 auf einem Versuchsfeld (nach einer Biokohleapplikation
in Höhe von 30-32 Mg ha−1) nahe Bayreuth in Deutschland berechnet. Hierbei wurden der
jährliche Verlauf der Vegetationsentwicklung (Weizenanbau) anhand einer Auswertung von
Satellitendaten und der Jahresverlauf der Entwicklung der Bodenfeuchtigkeit anhand von
meteorologischen Messdaten berücksichtigt. Der Einfluss der Biokohleproduktion auf den
Kohlenstoffkreislauf sowie auf die Oberflächenalbedo wurde in die Treibhausgasbilanz eines
modellierten Pyrolyse-Biokohle-Systems anhand der Berechnung von Treibhausgas-
Charakterisierungsfaktoren mit einbezogen. Diese Analyse ergab eine Reduktion des
Treibhausgasminderungspotenzials von Biokohlesystemen um 13-22%, wenn der Albedo-
Effekt in die Berechnung mit einbezogen wurde. Bei einem direkten Vergleich zwischen der
Produktion von Biokohle und der Bereitstellung von Bioenergie für ein Erdgas-befeuertes
Fernwärmenetz erzielte das Bioenergiesystem unter den gewählten Annahmen 99−119% des
Treibhausgasminderungspotenzials des Biokohlesystems. Es zeigte sich, dass die
Klimawirkung von Albedominderungen aufgrund von Biokohleapplikationen sehr stark von
der langfristigen Entwicklung der Oberflächenalbedo abhängig ist. Allgemein gilt, dass die
Klimawirkung der (oftmals niedrigen) Albedo landwirtschaftlichen Böden durch
Bewirtschaftungsverfahren mit ganzjähriger Bodenbedeckung optimiert werden kann. Die
Berechnungen ergaben weiterhin, dass der Einfluss von Biokohlegaben auf die
Lachgasemissionen der Böden eine entscheidende Rolle für Gesamtklimabilanz von
Biokohlesystemen spielt. Obwohl die Berücksichtigung der klimatischen Auswirkungen der
zeitlichen Differenz zwischen der Emission und der Sequestrierung biogenen Kohlenstoffs
ZUSAMMENFASSSUNG 95
(„CO2-neutral ist nicht zwingend auch klimaneutral“) essentiell für die Bewertung der
Klimawirksamkeit von Biokohlesystemen ist, findet dieser Einflussfaktor bislang nur eine
unzureichende Berücksichtigung in der derzeit veröffentlichten wissenschaftlichen Literatur
zu diesem Themenkomplex.
Da die Ergebnisse der Literaturauswertung die ökonomischen und ökologischen Vorteile
einer Biokohleproduktion auf Basis biogener Reststoffe in den Vordergrund gerückt hatten,
wurde der Fokus der dritten Studie auf eine kritische Bewertung der Option des Einsatzes
von Holzvergaserrückständen als Bodenhilfsstoff gesetzt. Da Holzvergaserkohlen oftmals
hohe Gehalte an persistenten und krebserregenden PAK aufweisen, wurde in dieser
Untersuchung die Effektivität eines kürzlich entwickelten thermischen Verfahrens zur
Reinigung von Vergaserkohlen untersucht. Im Vorfeld für diese Bewertung wurde die
Eignung der PAK-Analysemethoden DIN 13877:A und DIN 13877:B für die Bestimmung der
PAK-Gehalte in Vergaserkohlen untersucht. Hierbei zeigte sich, dass DIN 13877:A für diesen
Zweck nicht geeignet ist. Da diese Methode derzeit jedoch noch für Analysen gemäß der
Bundesbodenschutzverordnung zulässig ist, wird empfohlen, diese Gesetzeslücke zu
schließen. Durch das getestete thermische Verfahren konnte eine Minderung des Σ EPA16
PAK - Gehaltes in Vergasungsrückständen um 36 - 82% erzielt werden. Die verbleibenden
PAK-Gehalte in den Vergasungsrückständen waren jedoch immer noch viel zu hoch
(zwischen 396 und 1.713 mg/kg Trockenmasse), um eine landwirtschaftliche Verwertung der
Rückstände zuzulassen. Allerdings sind vielversprechende technische
Verfahrensanpassungen verfügbar, um die Effektivität des Prozesses weiter zu steigern. Im
Labormaßstab ist es durch eine thermische Behandlung der Vergasungsrückstände bei
Temperaturen über 650 °C gelungen, den Σ EPA16 PAK – Gehalt in den Rückständen auf
Werte unter 2 mg/kg Trockenmasse zu reduzieren.
Die Forschungsergebnisse dieser Dissertation deuten darauf hin, dass der Einsatz von
Biokohle-Systemen eine hilfreiche Rolle bei der Bewältigung drängender ökologischer
Herausforderungen spielen kann, wenn die Umweltrisiken der Biokohleproduktion minimiert
werden und der Einsatz von Biokohlesystemen nicht als Vorwand für die Verschleppung der
ökologischen Transformation in anderen Handlungsfeldern verwendet wird.
REFERENCES 96
9 References
A.K. Haritash; C.P. Kaushik (2009): Biodegradation aspects of Polycyclic Aromatic Hydrocarbons (PAHs): A review. In: Journal of Hazardous Materials 169 (1–3), S. 1–15.
Antal, Jr Michael Jerry; Wade, Samuel Robert; Nunoura, Teppei (2007): Biocarbon production from Hungarian sunflower shells. In: Journal of Analytical and Applied Pyrolysis
79 (1-2), S. 86–90.
Antal, M. J.; Gronli, M. (2003): The art, science, and technology of charcoal production. In: industrial & Engineering Chemistry Research 42 (8), S. 1619–1640.
Badger, Phil; Badger, Scott; Puettmann, Maureen; Steele, Philip; Cooper, Jerome (2011): Techno-Economic Analysis: Preliminary assessment of pyrolysis oil production costs and material energy balance associated with a transportable fast pyrolysis system. In: Bioresources 6 (1), S. 34–47.
Bai, Mo; Wilske, Burkhard; Buegger, Franz; Esperschuetz, Juergen; Kammann, Claudia Irene; Eckhardt, Christian et al. (2013a): Degradation kinetics of biochar from pyrolysis and hydrothermal carbonization in temperate soils. In: Plant and Soil 372 (1-2), S. 375–387.
Bala, G.; Caldeira, K.; Wickett, M.; Phillips, T. J.; Lobell, D. B.; Delire, C.; Mirin, A. (2007): Combined climate and carbon-cycle effects of large-scale deforestation. In: Proceedings of
the National Academy of Sciences 104 (16), S. 6550–6555.
Biqing Liang; Johannes Lehmann; Saran P. Sohi; Janice E. Thies; Brendan O’Neill; Lucerina Trujillo et al. (2010): Black carbon affects the cycling of non-black carbon in soil. In: Organic
Geochemistry 41 (2), S. 206–213.
Bridgwater, A. V. (2007): The production of biofuels and renewable chemicals by fast pyrolysis of biomass. In: International Journal of Global Energy Issues 27 (2), S. 160-203.
Bridgwater, A. V.; Toft, A. J.; Brammer, J. G. (2002): A techno-economic comparison of power production by biomass fast pyrolysis with gasification and combustion. In: Renewable &
Sustainable Energy Reviews 6 (3), S. 181–248.
Bright, Ryan M.; Cherubini, Francesco; Strømman, Anders H. (2012): Climate impacts of bioenergy: Inclusion of carbon cycle and albedo dynamics in life cycle impact assessment. In: Environmental Impact Assessment Review
Brown, Tristan R.; Wright, Mark M.; Brown, Robert C. (2011): Estimating profitability of two biochar production scenarios: slow pyrolysis vs fast pyrolysis. In: Biofuels, Bioproducts and
Biorefining 5 (1), S. 54-68.
Bruno Veyrand; Véronique Sirot; Sophie Durand; Charles Pollono; Philippe Marchand; Gaud Dervilly-Pinel et al. (2013): Human dietary exposure to polycyclic aromatic hydrocarbons: Results of the second French Total Diet Study. In: Environment International 54 (0), S. 11–17.
Buchireddy, Prashanth Reddy; Bricka, R. Mark; Rodriguez, Jose; Holmes, William (2010): Biomass Gasification: Catalytic Removal of Tars over Zeolites and Nickel Supported Zeolites. In: Energy & Fuels 24, S. 2707–2715.
REFERENCES 97
Bundesministeriums der Justiz (Hg.) (1998): Gesetz zum Schutz vor schädlichen Bodenveränderungen und zur Sanierung von Altlasten (Bundes-Bodenschutzgesetz -BBodSchG). Online verfügbar unter www.gesetze-im-internet.de/bundesrecht/bbodschg/gesamt.pdf, zuletzt geprüft am 15.03.2013.
Bundesministeriums der Justiz (Hg.) (1999): Bundes-Bodenschutz- und Altlastenverordnung (BBodSchV). Online verfügbar unter http://www.gesetze-im-internet.de/bundesrecht/bbodschv/gesamt.pdf, zuletzt geprüft am 15.03.2013.
Busch; Arne Stark; Claudia I. Kammann; Bruno Glaser (2013): Genotoxic and phytotoxic risk assessment of fresh and treated hydrochar from hydrothermal carbonization compared to biochar from pyrolysis. In: Ecotoxicology and Environmental Safety 97 (0), S. 59–66.
Case, Sean D. C.; McNamara, Niall P.; Reay, David S.; Whitaker, Jeanette (2013): Can biochar reduce soil greenhouse gas emissions from a Miscanthus bioenergy crop? In: GCB Bioenergy
Cherubini, F.; Bright, R. M.; Strømman, A. H. (2012a): Bioenergy and global warming: Contributions from biogenic CO2 fluxes and albedo changes. In: Nature Climate Change.
Cherubini, Francesco; Bright, Ryan M.; Strømman, Anders H. (2012b): Site-specific global warming potentials of biogenic CO 2 for bioenergy: contributions from carbon fluxes and albedo dynamics. In: Environmental Research Letters 7 (4), S. 45902.
Cherubini, Francesco; Guest, Geoffrey; Strømman, Anders H. (2012c): Application of probability distributions to the modeling of biogenic CO2 fluxes in life cycle assessment. In: GCB Bioenergy
Cherubini, Francesco; Peters, Glen P.; Berntsen, Terje; Strømman, Anders H.; Hertwich, Edgar (2011a): CO2 emissions from biomass combustion for bioenergy: atmospheric decay and contribution to global warming. In: GCB Bioenergy 3 (5), S. 413-426.
Cherubini, Francesco; Strømman, Anders H.; Hertwich, Edgar (2011b): Effects of boreal forest management practices on the climate impact of CO2 emissions from bioenergy. In: Ecological Modelling 223 (1), S. 59–66.
Chih-Chun Kung; Bruce A. McCarl; Xiaoyong Cao (2013): Economics of pyrolysis-based energy production and biochar utilization: A case study in Taiwan. In: Energy Policy 60 (0), S. 317–323.
Cholewa, T.; Siuta-Olcha, A. (2010): Comparison of heat losses in channel and preinsulated district heating networks. In: L. Pawlowski, Dudzinska und A. Pawlowski (Hg.): Environmental Engineering III. 6000 Broken Sound Parkway NW, STE 300, Boca Raton, FL 33487-2742 USA: CRC Press-Taylor & Francis Group, S. 569–574.
Deenik, Jonathan L.; McClellan, Tai; Uehara, Goro; Antal, Jr Michael J.; Campbell, Sonia (2010): Charcoal Volatile Matter Content Influences Plant Growth and Soil Nitrogen Transformations. In: Soil Science Society of America Journal 74 (4), S. 1259–1270.
DeSisto, William J.; Hill, I. NathanI; Beis, Sedat H.; Mukkamala, Saikrishna; Joseph, Jincy; Baker, Cirila et al. (2010): Fast Pyrolysis of Pine Sawdust in a Fluidized-Bed Reactor. In: Energy & Fuels 24, S. 2642–2651.
Downie, Adriana; Munroe, Paul; Cowie, Annette; van Zwieten, Lukas; Lau, David M. S. (2012): Biochar as a Geoengineering Climate Solution: Hazard Identification and Risk Management. In: Critical Reviews in Environmental Science and Technology 42 (3), S. 225–250.
REFERENCES 98
Duffie, J. A.; Beckman, A. (1991): Solar Engineering of Thermal Processes. 2nd ed. New York, USA: John Wiley and Sons, Inc.
Eberhardt, Gerd; Odening, Martin; Lotze-Campen, Hermann; Erlach, Berit; Rolinski, Susanne; Rothe, Pia; Wirth, Benjamin (2011): The impact of transportation costs on the profitability of industrial hydrothermal carbonisation. In: Berichte über Landwirtschaft 89 (3), S. 400–424.
Fabbri, Daniele; Rombola, Alessandro G.; Torri, Cristian; Spokas, Kurt A. (2013): Determination of polycyclic aromatic hydrocarbons in biochar and biochar amended soil. In: Journal of Analytical and Applied Pyrolysis 103 (SI), S. 60–67.
Field, John L.; Keske, Catherine M. H.; Birch, Greta L.; Defoort, Morgan W.; Cotrufo, M. Francesca (2013): Distributed biochar and bioenergy coproduction: a regionally specific case study of environmental benefits and economic impacts. In: Global Change Biology Bioenergy
5 (2, SI), S. 177–191.
Fischer, Daniel (2010): Bericht über einen Kompostierungs- und Feldversuchs mit und ohne Biokohle von dem Institut der Agrar- und Ernährungswissenschaften der Martin-Luther-Universität Halle-Wittenberg, Abteilung Bodenbiogeochemie in Zusammenarbeit mit der BKE Bio-Kompost und Entsorgung / GmbH & Co. und den landwirtschaftlichen Lehranstalten Bayreuth. Hg. v. Daniel Fischer.
Fischer, Daniel; Glaser, Bruno (2012): Synergisms between Compost and Biochar for Sustainable Soil Amelioration. Hg. v. Sumil Kunar. In-Tech. Online verfügbar unter http://www.intechopen.com/books/management-of-organic-waste/synergism-between-biochar-and-compost-for-sustainable-soil-amelioration, zuletzt geprüft am 20.04.2012.
Food and Agricultural Organization of the United Nations (2006): Policy Brief June 2006, Issue 2. Food Security. Online verfügbar unter ftp://ftp.fao.org/es/ESA/policybriefs/pb_02.pdf, zuletzt geprüft am 20.09.2013.
Forster, Piers; Venkatachalam, Ramaswamy (2007): Changes in Atmospheric Constituents and in Radiative Forcing. Fourth Assessment Report: Climate Change 2007: Working Group I Report: The Physical Science Basis, Chapter 2: Geneva: IPCC. Online verfügbar unter http://www.ipcc.ch/ipccreports/ar4-wg1.htm.
Fu, Qiang; Liou, K. N. (1993): Parameterization of the radiative properties of cirrus clouds. In: Journal of the Atmospheric Sciences 50 (13), S. 2008-2025.
Fu, Quiang; Liou, K. N.: Fu-Liou online 200507 (Diurnal Simulation). Hg. v. NASA. Online verfügbar unter http://snowdog.larc.nasa.gov/cgi-bin/rose/flp200503/sun/flsun.cgi, zuletzt geprüft am 19-04.2012.
Funke, Axel; Ziegler, Felix (2010): Hydrothermal carbonization of biomass: A summary and discussion of chemical mechanisms for process engineering. In: Biofuels Bioproducts &
Biorefining-BIOFPR 4 (2), S. 160–177.
Gaunt, J. L.; Lehmann, J. (2008): Energy balance and emissions associated with biochar sequestration and pyrolysis bioenergy production. In: Environ. Sci. Technol 42 (11), S. 4152-4158.
Gelfand, Ilya; Zenone, Terenzio; Jasrotia, Poonam; Chen, Jiquan; Hamilton, Stephen K.; Robertson, G. Philip (2011): Carbon debt of Conservation Reserve Program (CRP) grasslands converted to bioenergy production. In: Proceedings of the National Academy of Sciences of
the United States of America 108 (33), S. 13864–13869.
REFERENCES 99
Genesio, L.; Miglietta, F.; Lugato, E.; Baronti, S.; Pieri, M.; Vaccari, F. P. (2012): Surface albedo following biochar application in durum wheat. In: Environmental Research Letters 7 (1), S. 14025.
Geoffrey Guest; Ryan M. Bright; Francesco Cherubini; Anders H. Strømman (2013): Consistent quantification of climate impacts due to biogenic carbon storage across a range of bio-product systems. In: Environmental Impact Assessment Review 43 (0), S. 21–30.
Glaser, B.; Haumaier, L.; Guggenberger, G.; Zech, W. (2001): The‘Terra Preta‘phenomenon: a model for sustainable agriculture in the humid tropics. In: Naturwissenschaften 88 (1), S. 37-41.
Glaser, Bruno; Birk, Jago Jonathan (2012): State of the scientific knowledge on properties and genesis of Anthropogenic Dark Earths in Central Amazonia (terra preta de Índio). In: Geochimica et Cosmochimica Acta 82 (0), S. 39–51.
Glaser, Bruno; Knorr, Klaus-Holger (2008): Isotopic evidence for condensed aromatics from non-pyrogenic sources in soils – implications for current methods for quantifying soil black carbon. In: Rapid Communications in Mass Spectrometry 22 (7), S. 935-942.
Goddard Institute for Space Studies, National Aeronautics and Space Administration (2013): GLOBAL Land-Ocean Temperature Index in 0.01 degrees Celsius. Online verfügbar unter http://data.giss.nasa.gov/gistemp/tabledata_v3/GLB.Ts+dSST.txt, zuletzt geprüft am 20.09.2013.
Hammond, Jim; Shackley, Simon; Sohi, Saran; Brownsort, Peter (2011): Prospective life cycle carbon abatement for pyrolysis biochar systems in the UK. In: Energy Policy 39 (5), S. 2646–2655.
Hamper, M. J. (2006): Manufactured gas history and processes. In: Environmental Forensics 7 (1), S. 55–64.
Harmon, Thomas C.; Burks, Glenn A.; Aycaguer, Anne-Christine; Jackson, Kevin (2001): Thermally enhanced vapor extraction for removing PAHs from lampblack-contaminated soils. In: Journal of Environmental Engineering 127 (11), S. 986.
Hilber, Isabel; Blum, Franziska; Leifeld, Jens; Schmidt, Hans-Peter; Bucheli, Thomas D. (2012): Quantitative Determination of PAHs in Biochar: A Prerequisite To Ensure Its Quality and Safe Application. In: Journal of Agricultural and Food Chemistry 60 (12), S. 3042–3050.
Hochschule für Angewandte Wissenschaften FH München (Hg.) (2012): Schneebedeckungsdauer zur Ertragsabschätzung und Auslegung von PV-Systemen basierend auf Satellitendaten von 2005 bis 2009. Online verfügbar unter www-lse.ee.hm.edu/download/schneekarten_dach.pdf, zuletzt aktualisiert am 13.03.2012.
IEA Bioenergy (Hg.) (o.J.): IEA Bioenergy Task 34: Pyrolysis. Online verfügbar unter http://www.pyne.co.uk/?_id=76, zuletzt geprüft am 06.05.2010.
Intergovernmental Panel on Climate Change (2013): Working Group I Contribution to the IPCC Fifth Assessment Report Climate Change 2013: The Physical Science Basis Summary for Policymakers. Hg. v. Intergovernmental Panel on Climate Change. Intergovernmental Panel on Climate Change. Online verfügbar unter www.climatechange2013.org/images/uploads/WGIAR5-SPM_Approved27Sep2013.pdf, zuletzt geprüft am 25.10.2013.
REFERENCES 100
Islam, M. N.; Ani, F. N. (2000): Techno-economics of rice husk pyrolysis, conversion with catalytic treatment to produce liquid fuel. In: Bioresource Technology 73 (1), S. 67-75.
Iswaran, V.; Jauhri, K. S.; Sen, A. (1980): Effect of charcoal, coal and peat on the yield of moong, soybean and pea. In: Soil Biology & Biochemistry 12 (2), S. 191–192.
Jensen, P. A.; Frandsen, F. J.; Dam-Johansen, K.; Sander, B. (2000): Experimental investigation of the transformation. and release to gas phase of potassium and chlorine during straw pyrolysis. In: Energy & Fuels 14 (6), S. 1280–1285.
Joos, F.; Bruno, M. (1996): Pulse response functions are cost-efficient tools to model the link between carbon emissions, atmospheric CO2 and global warming. In: Physics and Chemistry
of The Earth 21 (5–6), S. 471–476..
Joos, Fortunat; Prentice, I. Colin; Sitch, Stephen; Meyer, Robert; Hooss, Georg; Plattner, Gian-Kasper et al. (2001): Global warming feedbacks on terrestrial carbon uptake under the Intergovernmental Panel on Climate Change (IPCC) Emission Scenarios. In: Global
Biogeochem. Cycles 15 (4), S. 891–907.
Jorapur, R.; Rajvanshi, A. K. (1997): Sugarcane leaf-bagasse gasifiers for industrial heating applications. In: Biomass & Bioenergy 13 (3), S. 141–146.
Jorge Laine (2012): Perspective of the preparation of agrichars using fossil hydrocarbon coke. In: Renewable and Sustainable Energy Reviews 16 (8), S. 5597–5602.
Kabacoff, Robert I (2011): R in Action. Data analysis and graphics with R. Shelter Island, NY 11964: Manning Publications Co.
Kalogirou, S. A. (2009): Solar Energy Engineering Processes and Systems. Burlington, MA, USA; San Diego, CA, USA, London, UK: Elsevier, Academic Press.
Kammann, Claudia; Ratering, Stefan; Eckhardt, Christian; Müller, Christoph (2012): Biochar and Hydrochar Effects on Greenhouse Gas (Carbon Dioxide, Nitrous Oxide, and Methane) Fluxes from Soils. In: Journal of Environmental Quality.
Kimetu, Joseph M.; Lehmann, Johannes; Ngoze, Solomon O.; Mugendi, Daniel N.; Kinyangi, James M.; Riha, Susan et al. (2008): Reversibility of soil productivity decline with organic matter of differing quality along a degradation gradient. In: ECOSYSTEMS 11 (5), S. 726–739.
Kirschbaum, M. U. F.; Whitehead, D.; Dean, S. M.; Beets, P. N.; Shepherd, J. D.; Ausseil, A.-G E. (2011): Implications of albedo changes following afforestation on the benefits of forests as carbon sinks. In: Biogeosciences 8 (12), S. 3687-3696.
Kreuzeder, Andreas; Pfeifer, Christoph; Hofbauer, Hermann (2007): Fluid-Dynamic Investigations in a Scaled Cold Model for a Dual Fluidized Bed Biomass Steam Gasification Process: Solid Flux Measurements and Optimization of the Cyclone. In: International Journal
of Chemical Reactor Engineering (Vol. 5, Article A 31).
Kuzyakov, Y.; Subbotina, I.; Chen, H.; Bogomolova, I.; Xu, X. (2009): Black carbon decomposition and incorporation into soil microbial biomass estimated by 14C labeling. In: Soil Biology and Biochemistry 41 (2), S. 210-219.
Lehmann, Johannes (2007): A handful of carbon. In: Nature 447 (7141), S. 143–144.
Lehmann, Johannes; Joseph, Stephen (Hg.) (2009): Biochar for Environmental Management. Science and Technology. 1 Band. London: Earthscan.
REFERENCES 101
Lehmann, Johannes; Pereira da Silva, Jose; Steiner, Christoph; Nehls, Thomas; Zech, Wolfgang; Glaser, Bruno (2003): Nutrient availability and leaching in an archaeological Anthrosol and a Ferralsol of the Central Amazon basin: fertilizer, manure and charcoal amendments. In: Plant and Soil 249, S. 343–357.
Libra, Judy A.; Ro, Kyoung S.; Kammann, Claudia; Funke, Axel; Berge, Nicole D.; Neubauer, York et al. (2011): Hydrothermal carbonization of biomass residuals: a comparative review of the chemistry, processes and applications of wet and dry pyrolysis. In: Biofuels 2 (1), S. 71–106.
Lin, Yu-Jen; Hwang, Gwo-Shyong (2009): Charcoal from biomass residues of a Cryptomeria plantation and analysis of its carbon fixation benefit in Taiwan. In: Biomass & Bioenergy 33 (9), S. 1289–1294.
Malghani, Saadatullah; Gleixner, Gerd; Trumbore, Susan E. (2013): Chars produced by slow pyrolysis and hydrothermal carbonization vary in carbon sequestration potential and greenhouse gases emissions. In: Soil Biology & Biochemistry 62, S. 137–146.
Mani, Thilakavathi; Murugan, Pulikesi; Mahinpey, Nader (2011): Pyrolysis of Oat Straw and the Comparison of the Product Yield to Wheat and Flax Straw Pyrolysis. In: ENERGY & FUELS
25 (7, SI), S. 2803–2807.
McKay, Gordon (2002): Dioxin characterisation, formation and minimisation during municipal solid waste (MSW) incineration: review. In: Chemical Engineering Journal 2002 (86), S. 343–368.
Meyer, Sebastian; Bright, Ryan M.; Fischer, Daniel; Schulz, Hardy; Glaser, Bruno (2012): Albedo Impact on the Suitability of Biochar Systems To Mitigate Global Warming. In: Environmental Science & Technology 46 (22), S. 12726–12734.
Meyer, Sebastian; Glaser, Bruno; Quicker, Peter (2011): Technical, Economical, and Climate-Related Aspects of Biochar Production Technologies: A Literature Review. In: Environmental
Science & Technology 45 (22), S. 9473–9483.
Min Wu; Bo Pan; Di Zhang; Di Xiao; Hao Li; Chi Wang; Ping Ning (2013): The sorption of organic contaminants on biochars derived from sediments with high organic carbon content. In: Chemosphere 90 (2), S. 782–788..
Molina, Mario; Zaelke, Durwood; Sarma, K. Madhava; Andersen, Stephen O.; Ramanathan, Veerabhadran; Kaniaru, Donald (2009): Reducing abrupt climate change risk using the Montreal Protocol and other regulatory actions to complement cuts in CO2 emissions. In: Proceedings of the National Academy of Sciences of the United States of America 106 (49), S. 20616–20621.
Muñoz, Ivan; Campra, Pablo; Fernández-Alba, Amadeo R. (2010): Including CO2-emission equivalence of changes in land surface albedo in life cycle assessment. Methodology and case study on greenhouse agriculture. In: The International Journal of Life Cycle Assessment
15 (7), S. 672-681.
NASA: Surface Meteorology and Solar Energy (SSE) Release v.6.0. Hg. v. NASA Langly Atmospheric Science Data Center. Online verfügbar unter http://eosweb.larc.nasa.gov/cgi-bin/sse/sse.cgi, zuletzt geprüft am 27.03.2012.
Nguyen, Binh Thanh; Lehmann, Johannes (2009): Black carbon decomposition under varying water regimes. In: Organic Geochemistry 40 (8), S. 846–853.
REFERENCES 102
Norgate, Terry; Langberg, David (2009): Environmental and Economic Aspects of Charcoal Use Environmental and Economic Aspects of Charcoal Use in Steelmaking. In: ISIJ
International 2009 (49), S. 587–595.
Nunes, S. Monteiro; Paterson, N.; Herod, A. A.; Dugwell, D. R.; Kandiyoti, R. (2008): Tar formation and destruction in a fixed bed reactor simulating downdraft gasification: Optimization of conditions. In: Energy & Fuels 22 (3), S. 1955–1964.
Oguntunde, Philip G.; Abiodun, Babatunde J.; Ajayi, Ayodele E.; van de Giesen, Nick (2008): Effects of charcoal production on soil physical properties in Ghana. In: Journal of Plant
Nutrition and Soil Science 171 (4), S. 591-596.
Panichelli, Luis; Gnansounou, Edgard (2008): Estimating greenhouse gas emissions from indirect land-use change in biofuels production: concepts and exploratory analysis for soybean-based biodiesel. In: Journal of Scientific & Industrial Research 67 (11), S. 1017–1030.
Patryk Oleszczuk; Izabela Jośko; Marcin Kuśmierz; Barbara Futa; Elżbieta Wielgosz; Sławomir Ligęza; Jacek Pranagal (2014): Microbiological, biochemical and ecotoxicological evaluation of soils in the area of biochar production in relation to polycyclic aromatic hydrocarbon content. In: Geoderma 213 (0), S. 502–511.
Pröll, Tobias; Rauch, Reinhard; Aichernig, Christian; Hofbauer, Hermann (2007): Fluidized Bed Steam Gasification of Solid Biomass - Performance Characteristics of an 8 MWth Combined Heat and Power Plant. In: International Journal of Chemical Reactor Engineering
2007 (Vol. 5, Article A 54).
Rajeev Jorapur; Anil K. Rajvanshi (1997): Sugarcane leaf-bagasse gasifiers for industrial heating applications. In: Biomass and Bioenergy 13 (3), S. 141–146.
Ramanathan, V.; Carmichael, G. (2008): Global and regional climate changes due to black carbon. In: NATURE GEOSCIENCE 1 (4), S. 221–227. Online verfügbar unter doi:10.1038/ngeo156.
Repo, Anna; Tuomi, Mikko; Liski, Jari (2011): Indirect carbon dioxide emissions from producing bioenergy from forest harvest residues. In: GCB Bioenergy 3 (2), S. 107-115.
Rillig, Matthias C.; Wagner, Marcel; Salem, Mohamed; Antunes, Pedro M.; George, Carmen; Ramke, Hans-Guenter et al. (2010): Material derived from hydrothermal carbonization: Effects on plant growth and arbuscular mycorrhiza. In: Applied Soil Ecology 45 (3), S. 238–242.
Roberts, Kelli G.; Gloy, Brent A.; Joseph, Stephen; Scott, Norman R.; Lehmann, Johannes (2010): Life Cycle Assessment of Biochar Systems: Estimating the Energetic, Economic, and Climate Change Potential. In: Environmental Science & Technology 44 (2), S. 827–833.
Saadatullah Malghani; Gerd Gleixner; Susan E. Trumbore (2013): Chars produced by slow pyrolysis and hydrothermal carbonization vary in carbon sequestration potential and greenhouse gases emissions. In: Soil Biology and Biochemistry 62 (0), S. 137–146..
Schimmelpfennig, Sonja; Glaser, Bruno (2012): One Step Forward toward Characterization: Some Important Material Properties to Distinguish Biochars. In: Journal of Environmental
Quality 41, S. 1001–1013.
Schulz, Hardy; Dunst, Gerald; Glaser, Bruno (2013): Positive effects of composted biochar on plant growth and soil fertility. In: Agronomy for Sustainable Development 33 (4), S. 817–827.
REFERENCES 103
Searcy, Erin; Flynn, Peter C. (2010): A criterion for selecting renewable energy processes. In: Biomass & Bioenergy 34 (5), S. 798–804.
Singh, B.P; Hatton, B.J; Singh, B.; A. Cowie; Kathuria, A. (2010): Influence of biochars on nitrous oxide emission and nitrogen leaching from two contrasting soils. In: J.Environ.Qual.
Steinbeiss, S.; Gleixner, G.; Antonietti, M. (2009): Effect of biochar amendment on soil carbon balance and soil microbial activity. In: Soil Biology & Biochemistry 2009 (41), S. 1301–1310.
Steiner, Christoph; Glaser, Bruno; Geraldes Teixeira, Wenceslau; Lehmann, Johannes; Blum, Winfried E.H; Zech, Wolfgang (2008): Nitrogen retention and plant uptake on a highly weathered central Amazonian Ferralsol amended with compost and charcoal. In: Journal of
Plant Nutrition and Soil Science 171 (6), S. 893-899.
Steiner, Christoph; Teixeira, Wenceslau; Lehmann, Johannes; Nehls, Thomas; Macêdo, Jeferson de; Blum, Winfried; Zech, Wolfgang (2007): Long term effects of manure, charcoal and mineral fertilization on crop production and fertility on a highly weathered Central Amazonian upland soil. In: Plant and Soil 291, S. 275–290.
Streck, C.; Tuerk, A.; Schlamadinger, B. (2009): Foresty offsets in emissions trading systems: a link between systems? In: Mitigation and Adaptation Strategies for Global Change 14, S. 455–463.
Trenberth, K. E.; Fasullo, J.; Kiehl, J. T. (2009): Earth´s Global Energy Budget. In: American
Meteorological Society, S. 311–323.
Trifonova, R.; Postma, J.; Schilder, M. T.; van Elsas, J. D. (2009): Microbial Enrichment of a Novel Growing Substrate and its Effect on Plant Growth. In: Microbial ecology 58 (3), S. 632-641.
Tsukashi, H. (1966): Infrared Spectra of artificial coal made form submerged wood at Uozu Toyama Prefecture Japan. In: Bulletin of the ChemicaL Society of Japan 39 (3), S. 460-&.
Umweltbundesamt, Ökoinstitut e.V (2012): ProBas: Prozessorientierte Basisdaten für Umweltmanagement-Instrumente. Hg. v. Umweltbundesamt. Online verfügbar unter http://www.probas.umweltbundesamt.de/, zuletzt geprüft am 04.04.2012.
Vaccari, F.P; Baronti, S.; Lugato, E.; Genesio, L.; Castaldi, S.; Fornasier, F.; Miglietta, F. (2011): Biochar as a strategy to sequester carbon and increase yield in durum wheat.
Verheijen, F.G.A.; Jeffery, S.; Bastos, A.C.; van der Velde, M.; Diafas, I. (2009): Biochar Application to Soils - A Critical Scientific Review of Effects on Soil Properties, Processes and Functions. Hg. v. Office for the Official Publications of the European Communities EUR 24099 EN.
Verheijen, Frank G.A.; Jeffery, Simon; van der Velde, Marijn; Penizek, Vit; Beland, Martin; Bastos, Ana Catarina; Keizer, Jan Jacob (2013): Reductions in soil surface albedo as a function of biochar application rate: implications for global radiative forcing. In: Environ. Res. Lett. 8,
IOP Publishing Ltd 2013 (044008).
Wade, SR; Nunoura, T.; Antal, M. J. (2006): Studies of the flash carbonization process. 2. Violent ignition behavior of pressurized packed beds of biomass: A factorial study. In: Industrial & Engineering Chemistry Research 45 (10), S. 3512–3519.
Wheeler, B.: lmPerm. Permutation tests for linear models. Online verfügbar unter http://cran.r-project.org/web/packages/lmPerm/index.html, zuletzt geprüft am 02.08.2013.
REFERENCES 104
Wheeler, Tim; Braun, Joachim von (2013): Climate Change Impacts on Global Food Security. In: Science 341 (6145), S. 508–513.
Wiedner, Katja; Rumpel, Cornelia; Steiner, Christoph; Pozzi, Alessandro; Maas, Robert; Glaser, Bruno (2013): Chemical evaluation of chars produced by thermochemical conversion (gasification, pyrolysis and hydrothermal carbonization) of agro-industrial biomass on a commercial scale. In: Biomass and Bioenergy 59 (0), S. 264–278.
Woolf, Dominic; Amonette, James E.; Street-Perrott, F. Alayne; Lehmann, Johannes; Joseph, Stephen (2010): Sustainable biochar to mitigate global climate change. In: Nat Commun 1, S. 56.
Yamato, M.; Okimori, Y.; Wibowo, I. F.; Anshori, S.; Ogawa, M. (2006): Effects of the application of charred bark of Acacia mangium on the yield of maize, cowpea and peanut, and soil chemical properties in South Sumatra, Indonesia. In: Soil Science & Plant Nutrition
52 (4), S. 489–495.
Yan, Wei; Acharjee, Tapas C.; Coronella, Charles J.; Vasquez, Victor R. (2009): Thermal Pretreatment of Lignocellulosic Biomass. In: Environmental Progress & Sustainable Energy 28 (3), S. 435–440.
Yassin, Liban; Lettieri, Paola; Simons, Stefaan J.R.; Germanà, Antonino (2009): Techno-economic performance of energy-from-waste fluidized bed combustion and gasification processes in the UK context. In: Chemical Engineering Journal 2009 (146), S. 315–327.
Yin, Xiu Li; Wu, Chuang Zhi; Zheng, Shun Peng; Chen, Yong (2002): Design and operation of a CFB gasification and power generation system for rice husk. In: Biomass & Bioenergy 2002 (Vol. 23, No. 3), S. pp. 181-187.
Zhangyan Jiang; Alfredo R. Huete; Jin Chen; Yunhao Chen; Jing Li; Guangjian Yan; Xiaoyu Zhang (2006): Analysis of NDVI and scaled difference vegetation index retrievals of vegetation fraction. In: Remote Sensing of Environment 101 (3), S. 366–378.

APPENDIX 105
10 Appendix

APPENDIX 106
Erklärung
Hiermit erkläre ich, dass ich meine Arbeit selbständig und ohne fremde Hilfe verfasst habe,
keine anderen als die von mir angegebenen Quellen und Hilfsmittel benutzt habe und die
den benutzten Werke wörtlich oder inhaltlich entnommenen Stellen als solche kenntlich
gemacht habe.
Ich habe weder vergebliche Promotionsversuche unternommen noch die Dissertation in der
gegenwärtigen bzw. in einer anderen Fassung bereits einer anderen Fakultät vorgelegt.
Des Weiteren erkläre ich, dass keine Strafverfahren gegen mich anhängig sind.
Sebastian Meyer
München, den 23.01.2014
APPENDIX 107
Wissenschaftlicher Werdegang
Promotion
2010 - 2014 Promotion zum Doktor der Agrarwissenschaften an der
Martin-Luther-Universität Halle-Wittenberg
Naturwissenschaftliche Fakultät III, Institut für Agrar- und
Ernährungswissenschaften, Professur für Bodenbiogeochemie,
Betreuer: Prof. Dr. Bruno Glaser
2009 - 2010 Externer Doktorand an der Universität Bayreuth
Fakultät für Biologie, Chemie und Geowissenschaften,
Abteilung Bodenphysik
Betreuer: PD Dr. Bruno Glaser
Studium
2001 - 2006 Studium an der Universität Flensburg
Studiengang Wirtschaftsingenieurwesen
Schwerpunkt Energie- und Umweltmanagement
Abschluss: Diplom

APPENDIX 108
Danksagung
Hiermit möchte ich mich bei allen bedanken, ohne deren Mitwirkung die Anfertigung dieser
Arbeit nicht möglich gewesen wäre. Mein besonderer Dank gilt:
• Den beiden Betreuern der Arbeit, Professor Bruno Glaser und Professor Peter
Quicker, für Ihre Bereitschaft zur Begleitung dieser Arbeit und für ihr stets schnelles
direktes, und hilfreiches Feedback zu meinen Arbeitsergebnissen
• Den Doktoranden Daniel Fischer, Yves Noel und Hardy Schulz sowie Dr. Ryan Bright
und Georg Kuffer für die gute Zusammenarbeit und die konstruktive Kritik
• Den Mitarbeitern der Firmen Spanner Re², PYREG und Sonnenerde für ihr Vertrauen
und die Bereitstellung von Informationen aus der Praxis
• Prof. Thomas Foken, Johannes Olesch, Sascha Döring, Lydia Funke, Josef Braun und
Matthias Wanderwitz sowie der Landwirtschaftlichen Lehranstalt Bayreuth für die
Unterstützung der Experimente
• Der NASA für die frei verfügbare Bereitstellung von globalen Fernerkundungsdaten
• Den anonymen Gutachern der drei Publikationen
• Meinen Arbeitskollegen und -Kolleginnen bei Ecofys, dem Landratsamt München und
Evergy, die mir die Zeit für die Arbeit an der Promotion gewährt haben
• Meinem Freund Uli für die erste Einführung in MATLAB
• Meinen Eltern Elke und Jörg, die mich immer darin unterstützt haben, Neues zu
lernen und
• Meiner Frau Anne, die auch diesen Weg mit mir gegangen ist.