
Evaluation of the increased pre-harvest forecasting ...
75
Department of Forest Biomaterials and Technology Evaluation of the increased pre-harvest forecasting precision of sawlog supply by use of historical harvester data and wood properties models - A case study on Scots pine in northern Sweden Sara Holappa Jonsson Master´s thesis • 60 credits Forest Science programme Rapport från Institutionen för skogens biomaterial och teknologi, 2018:9 Umeå 2018
Transcript of Evaluation of the increased pre-harvest forecasting ...

Department of Forest Biomaterials and Technology
Evaluation of the increased pre-harvest forecasting precision of sawlog supply by use of historical harvester data and wood properties models - A case study on Scots pine in northern Sweden
Sara Holappa Jonsson
Master´s thesis • 60 credits Forest Science programme Rapport från Institutionen för skogens biomaterial och teknologi, 2018:9 Umeå 2018


Evaluation of the increased pre-harvest forecasting precision of sawlog supply by use of historical harvester data and wood properties models – A case study on Scots pine in northern Sweden Utvärdering av nyttjande av skördardata och egenskapsmodeller för ökad precision i utbytes- och egenskapsprognoser för sågtimmer av svensk tall – En fallstudie i norra Sverige
Sara Holappa Jonsson
Supervisor: Emanuel Erlandsson, Swedish University of Agricultural Sciences, Department of Forest Biomaterials and Technology
Co-supervisor Ola Lindroos, Swedish University of Agricultural Sciences,
Department of Forest Biomaterials and Technology Johan Möller, Skogforsk Lars Wilhelmsson, Skogforsk Examiner: Dimitris Athanassiadis, Swedish University of Agricultural Sciences,
Department of Forest Biomaterials and Technology
Credits: 60 credits Level: Second cycle, A2E Course title: Master thesis in Forest Management at the Department of Forest
Biomaterials and Technology Course code: EX0832 Programme/education: Forest Science programme
Place of publication: Umeå Year of publication: 2018 Cover image: Anette Bruus Series: Rapport från Institutionen för skogens biomaterial och teknologi Part number: 2018:9 Online publication: https://stud.epsilon.slu.se
Keywords: forecasting, wood characteristics, imputation, value chain, wood procurement, heartwood diameter, big data
Swedish University of Agricultural Sciences Faculty of Forest Sciences Department of Forest Biomaterials and Technology


Nordic wood procurement is customer-oriented and involves real-time steering of the procurement according to products and markets. The development of better products and increased process efficiency is important for industrial customers. Sawmills’ demand usually covers total volume, species, lengths, diameter, time of delivery and stock levels, but the development is moving towards a more specific demand targeting also wood characteristics. Thanks to StanForD2010 it is possible to store detailed data of harvested trees through harvester files from previously harvested stands in a standardized manner. Skogforsk has developed the tool hprImputation, which uses kMSN imputation to make yield forecasting of planned harvesting stands based on the known outcome from stored harvester data of similar stands. It is possible to combine the imputation tool with earlier developed models for forecasting wood characteristics, thereby en-abling forecasts on both stand- and log level. With the possibilities to measure qual-ity with 3D/X-ray scanners in sawmills, the forecasting precision on log level can be evaluated. The aim of this masters’ thesis was firstly to evaluate the perceived benefits of in-creased precision in yield forecasting from a value chain perspective and identify key forecasting variables for different perspectives of the value chain. Secondly, the aim was to evaluate the influence of applying the imputation method based on har-vester data and wood properties models on the forecasting precision for key varia-bles at the case company SCA. The study showed that there is a considerable need and value potential for more accurate and detailed forecasting, which would improve the management along the whole value chain from forest to sales of sawmill products. However, there is a need for development of analytical tools that enable a more standardised and transparent handling of the data. The imputation method developed by Skogforsk provided higher accuracy of fore-casting on stand level compared to traditional methods at SCA but is dependent on accurate input data which was best provided by airborne laser scanning data among currently available data sources. The wood properties model developed by Skog-forsk could provide accurate forecasts on mean heartwood diameter, but further studies should evaluate whether the models should be adjusted to varying stand age as is indicated in this study.
Abstract

This development could provide the missing link between stand characteristics and a sawmill’s outcome of specific products, which combined with high data transpar-ency and integrated analytical tools could boost the abilities of integrated forecast-ing along the value chain.
Keywords: forecasting, wood characteristics, imputation, value chain, wood pro-curement, heartwood diameter, big data

Dagens skogsindustri är kundinriktad och styrs av produkter och marknader. Trad-itionellt har sågverkens önskemål berört totalvolym, trädslag, längder, diameter, le-veranstider och lagernivåer, men utvecklingen går mot mer specifika önskemål in-riktade på inre virkeskvaliteter. Tack vare standarden StanForD2010 är det idag möjligt att samla detaljerad inform-ation om avverkade träd genom skördardata från avverkade bestånd. Skogforsk har utvecklat verktyget hprImputation, som genom kMSN-imputering skapar utbytes-prognoser för planerade avverkningsbestånd baserat på kända utfall från historiskt skördardata för liknande bestånd. Imputeringsverktyget går att kombinera med tidi-gare utvecklade modeller för trädegenskaper, vilket möjliggör prognoser på både bestånds- och stocknivå. Med dagens möjligheter att mäta inre virkesegenskaper genom 3D/röntgenmätramar kan prognoskvaliteten från imputering och trädegen-skapsmodellerna utvärderas för en stor datamängd och därmed bana vägen för en framtida praktisk implementering av prognoser på stocknivå. Syftet med studien var att utvärdera de upplevda fördelarna av en ökad precision av utbytesprognoser ur ett värdekedjeperspektiv och identifiera önskvärda variabler att prognostisera, samt att utvärdera noggrannheten i prognoser på bestånds- och stock-nivå skapade med Skogforsks verktyg. Resultatet visade ett stort behov av ökad precision i utbytesprognoser jämfört med nuvarande metoder vid värdföretaget SCA. Detta skulle underlätta planeringen ge-nom hela värdekedjan från bestånd till färdig produkt. Dock finns ett övergripande behov av att utveckla analysverktyg för en mer standardiserad och transparent data-hantering. Tillämpningen av Skogforsks imputeringverktyg genererade tillförlitliga prognoser på beståndsnivå, men resultaten påverkas av kvaliteten på ingångsdata. Bland da-gens tillgängliga datakällor var laserdata det bästa alternativet för SCA. Egenskaps-modellerna kan med säkerhet generera prognoser på medelkärnvedsdiameter för stora datamängder.
Nyckelord: utbytesprognoser, vedegenskaper, imputering, värdekedja, virkesför-sörjning, kärnvedsdiameter, big data
Sammanfattning

This master’s thesis is initialised by Skogforsk, the Forestry Research Institute of Sweden.
I would like to express my greatest appreciation to Johan Möller and Lars Wil-helmsson, my supervisors at Skogforsk, who with talent, experience, dedication and humility made this possible, and most importantly, a fun and educating experi-ence.
Thank you Ingemar Eriksson (Forbis), John Arlinger (Skogforsk) and Jon Söder-berg (Skogforsk) for all expertise and talent, and for enabling the imputation and wood properties forecast.
I would also like to thank Emanuel Erlandsson, who has supervised me through the writing process with great dedication.
Last but not least I would like to thank Henrik Sjölander, my supervisor at SCA, and all of those from SCA who has contributed as respondents.
Preface

Abbreviations 2
1 Introduction 3 1.1 Planning of forest operations and wood supply 3 1.2 Wood properties and products 5 1.3 Data collection methods and accuracy 7 1.4 The kMSN (Most Similar Neighbour) method 8 1.5 Aim 10 1.6 Delimitations 10
2 Material and method 11 2.1 The case industry 11 2.2 Study design 13 2.3 Part I: Evaluation of perceived benefits of increased
precision in yield forecasting from a value chain perspective 13 2.4 Part II: Evaluation of the influence of applying the
imputation method and wood property models on the forecasting precision of key variables 16
2.5 Stand level forecasting 17 2.5.1 Segmentation and key figure calculation 19 2.5.2 Imputation 20
2.6 Log level forecasting 23 2.6.1 Heartwood diameter forecast 23
2.7 Model validation 25
3 Results 27 3.1 Current planning- and forecasting procedure 27
3.1.1 Forest Department 29 3.1.2 Wood Supply Department 31 3.1.3 Wood department and Bollsta sawmill 34
3.2 Potential benefits followed by more detailed- and accurate forecasts 35 3.2.1 Forest department 37 3.2.2 Wood supply department 38 3.2.3 Wood department and Bollsta sawmill 39
3.3 Evaluation of the influence of applying the imputation method and wood properties on the precision of forecasts of key variables 40
Table of contents

3.3.1 Stand level forecasts 40 3.3.2 Log level forecasts 45
4 Discussion 52 4.1 Part I: Evaluation of perceived benefits of increased
precision in yield forecasting from a value chain perspective 52 4.2 Part II: Evaluation of the influence of applying the
imputation method and wood properties models on the forecasting precision of key variables 54 4.2.1 Stand level forecasts 54 4.2.2 Log level forecasts 55
4.3 Strengths and weaknesses in the study 57 4.3.1 Interviews 57 4.3.2 Data and model validation 58
4.4 Implementation challenges and potentials 58 4.5 Conclusions 60
References 61 Personal communication 65


2
ALS Airborne laser scanning BA Basal area (m2 of stem coverage at breast height per hectare) BWH Basal area weighted height (m) DBH Diameter at breast height (1.3 m above ground level) (cm) m3sub/ha Cubic meter solid wood under bark per hectare kMSN k-Most Similar Neighbour kNN k-Nearest Neighbour StanForD2010 Standard for Forest Data CTL harvesting Cut to length harvesting Hpr-files Harvester production files Pri-files Production, individual files hprYield Calculation module which analyses harvester data and clusters of har-
vested areas in calculation units hprCM Module to calculate tree heights by re-creating stems based on harvester
data, based on functions by Kiljunen (2002) hprDemo A display-software for yield forecasts based on imputation, which is con-
nected to the harvester database. Register data can be imported and used for imputation and bucking simulation
hprImputation R-script to create data models and call imputations functions in the statis-tical software R (2006). Uses the method kMSN
hprProp Module that enables forecasting of wood properties htg Distinction of upper- and lower stem section dbhb Sets breast height diameters above 590 mm to 590 mm db Double bark thickness (mm) Head Heartwood diameter (mm) i Log number i Dh Diameter over bark (mm) at height h dh Diameter under bark (mm) for height h Dh/Dbh Relative diameter h Height from ground to cross-section (m) Htot Total tree height (m) cbh Number of annual rings at breast height (1.3 m above ground level) ch Number of annual rings (cambial age) in cross-section at height h m3sub_impharv Volume (m3sub/ha) forecast for the imputed harvester data m3sub_impALS Volume (m3sub/ha) forecast for the imputed ALS data m3sub_impreg Volume (m3sub/ha) forecast for the imputed register data m3sub_reg Current volume (m3sub/ha) forecast (register data)
Abbreviations
3
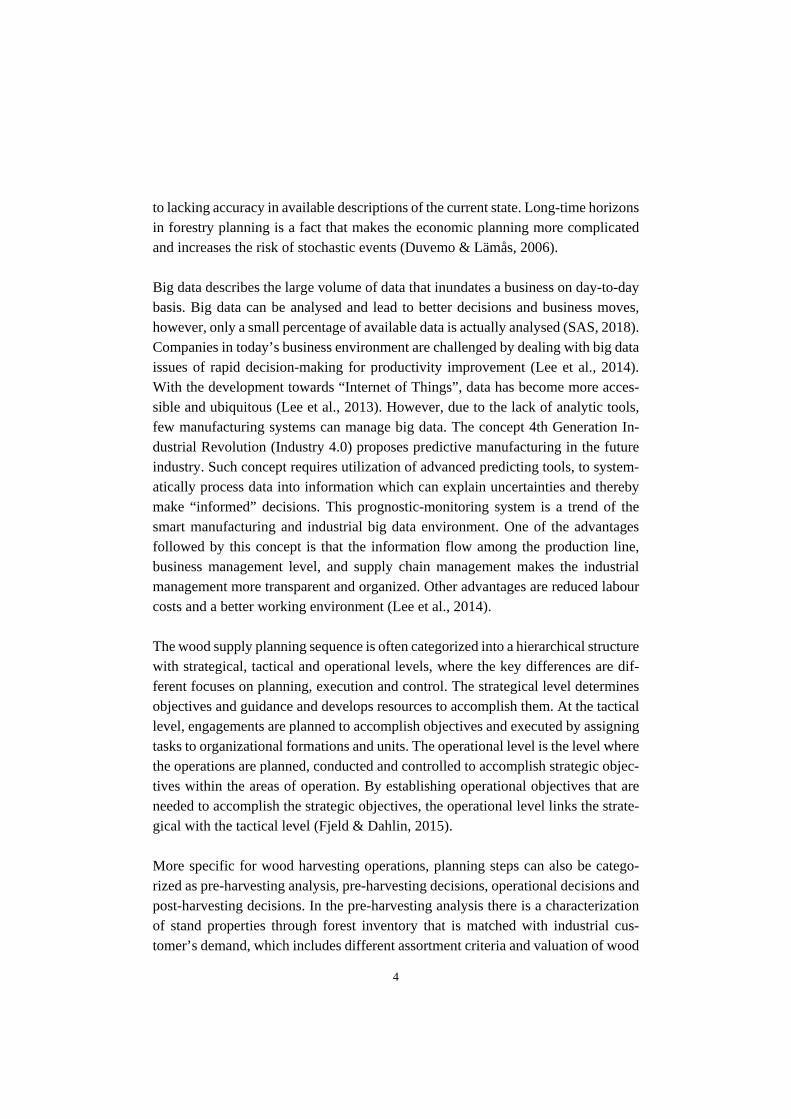
1.1 Planning of forest operations and wood supply During 2016, products from the forest industry were the third largest export products in Sweden (SCB, 2017). The forest resource is national, which means that there is only a negligible need for import within the forest industry. This makes the forest industry important for the Swedish gross domestic product (Skogsindustrierna, 2017). Being dependent on the export market, it is essential for the forest industry to ensure competitive costs and revenues (Carlsson & Rönnqvist, 2005). Since the forest resource is limited as well as associated with both ecological and economical aspects to consider, there is a fair amount of complexity in managing forests in a sustainable way that ensures timber production today and in future (Jonsson et al., 1993; Duvemo & Lämås, 2006). Facing such complexity makes the forest manage-ment planning an essential part of forest companies’ efficiency. From an industrial perspective, a key goal for wood supply is high precision in meeting the demands of the forest industry (Fjeld & Dahlin, 2008).
According to the rational theory of planning, the decision-maker should be able to envision the consequences of different actions before making decisions (Simon, 1976). In accordance to decision theory, decision making requires that there are op-tions to choose between in a goal-directed way. Further, the outcome of different options should have a specific value and it should be possible to rank the options. For this to be efficient, it is favourable that the values of the options are accurate. However, decision making is often affected by uncertainty which translates into un-reliability of the expected outcome from different options. Uncertainties in forestry can be related to unforeseen events, such as storm or changes in the market, but also
1 Introduction
4
to lacking accuracy in available descriptions of the current state. Long-time horizons in forestry planning is a fact that makes the economic planning more complicated and increases the risk of stochastic events (Duvemo & Lämås, 2006). Big data describes the large volume of data that inundates a business on day-to-day basis. Big data can be analysed and lead to better decisions and business moves, however, only a small percentage of available data is actually analysed (SAS, 2018). Companies in today’s business environment are challenged by dealing with big data issues of rapid decision-making for productivity improvement (Lee et al., 2014). With the development towards “Internet of Things”, data has become more acces-sible and ubiquitous (Lee et al., 2013). However, due to the lack of analytic tools, few manufacturing systems can manage big data. The concept 4th Generation In-dustrial Revolution (Industry 4.0) proposes predictive manufacturing in the future industry. Such concept requires utilization of advanced predicting tools, to system-atically process data into information which can explain uncertainties and thereby make “informed” decisions. This prognostic-monitoring system is a trend of the smart manufacturing and industrial big data environment. One of the advantages followed by this concept is that the information flow among the production line, business management level, and supply chain management makes the industrial management more transparent and organized. Other advantages are reduced labour costs and a better working environment (Lee et al., 2014). The wood supply planning sequence is often categorized into a hierarchical structure with strategical, tactical and operational levels, where the key differences are dif-ferent focuses on planning, execution and control. The strategical level determines objectives and guidance and develops resources to accomplish them. At the tactical level, engagements are planned to accomplish objectives and executed by assigning tasks to organizational formations and units. The operational level is the level where the operations are planned, conducted and controlled to accomplish strategic objec-tives within the areas of operation. By establishing operational objectives that are needed to accomplish the strategic objectives, the operational level links the strate-gical with the tactical level (Fjeld & Dahlin, 2015). More specific for wood harvesting operations, planning steps can also be catego-rized as pre-harvesting analysis, pre-harvesting decisions, operational decisions and post-harvesting decisions. In the pre-harvesting analysis there is a characterization of stand properties through forest inventory that is matched with industrial cus-tomer’s demand, which includes different assortment criteria and valuation of wood

5
properties by indexing methods. Often, a general index for stem price is used to calculate an offer to the wood selling forest owner while other analyses will predict both the demand and possible shares of different assortments in the harvesting sites. Index values of log properties within the assortments are based on present customer demands. Estimations of costs from harvesting, forwarding and haulage of different options can then be carried out with different simulation models. Sawmills and pulpmills with specific requirements for delivery volumes, assortments and other log properties need high accuracy in the available pre-harvesting information. Pre-harvesting decisions include selection of harvesting sites, wood destination, bucking instructions and choice of logging system, which can be facilitated with an efficient characterization of available forest stands. In this step it is crucial to have a valuation of alternative assortments and properties within different assortments. Operational decisions are selection of trees to harvest (in selective thinning operations) and bucking and sorting into different assortments according to the demands in the pre-vious steps. The decisions for bucking and positioning of main forwarding roads and landings should be decided beforehand. Post-harvesting decisions could be changes in destination or redefinition of assortment. With flexible operation these corrections should be small (Wilhelmsson et al., 2007).
1.2 Wood properties and products Nordic wood procurement with mechanized cut-to-length harvesting is customer-oriented and involves real-time steering of the procurement according to the product markets (Carlsson & Rönnqvist 2005; Malinen et al., 2014). The development of better products and increased process efficiency is important for industrial custom-ers. Raw material is the most important and the most expensive component in wood and paper products, but at the same time it is the most variable and least controlled one. With a better understanding of the origin, it is easier to control and take ad-vantage of the variation. With knowledge of the potential value in the forest resource and the cost of adapted forest operation to utilize stands, trees and logs economi-cally, the ability to meet the customers’ demands will be more profitable. To im-prove the value chain, the dialog between customer and the forest operation should be more knowledge-based in terms of benefits and costs of different processes di-rected to specific final products (Wilhelmsson et al., 2007).
6
The stem and log properties, techniques for characterizing, selecting, felling, buck-ing, forwarding, piling, loading, transporting, unloading and stockpiling at sawmill are all directly or indirectly related to process efficiency and/or product quality (Wil-helmsson et al., 2011). To use the approach of assuming fixed values of logs within predefined assortments has been efficient for cost minimization in wood flow opti-mization (Wilhelmsson et al., 2007; Barth et al. 2014). However, fixed quality clas-ses do not reflect the industrial needs properly. The recent trend to abandon the fixed quality classes makes it meaningful to introduce standardized characterization of wood and fibre properties to fit wood raw material to different customer’s prefer-ences (Wilhelmsson et al., 2007). The demands from different customers’ can be of varying specificity, depending on the products. Usually sawmill demands cover total volume, species, lengths, diam-eters, time of delivery and stock levels. The development is moving towards more specific demands with wood qualities, such as heartwood content, amount of sound knot and other variables. There are numerous of studies examining the correlation between different properties. For example, diameter growth has a large impact on density, latewood, heartwood and knot content (Wilhelmsson et al., 2002). To enable the sorting and follow-up of inner wood qualities, a special technique is required. During the recent years some Swedish sawmills have installed 3D/X-rays to measure the characteristics and quality of the logs before sorting them to different products (Möller et al., 2017). Studies have showed that combining 3D and X-ray techniques for wood properties measurement provides a higher accuracy than using the techniques separately (Oja et al., 2007; Skog & Oja, 2009) A study on heartwood diameter measurements of pine (Pinus sylvestris) shows that combining 3D and X-ray techniques provides an accuracy of a root square mean error of 9.3 mm com-pared to 17 mm only using X-ray, which is primarily due to the increased contrast between heartwood and sapwood (Skog & Oja, 2009). The better communication and transparency between the forest operation and the customers, the higher poten-tial there is to find the best solutions to match the product requirements from the sawmill with the available forest resources in the supply area (Wilhelmsson et al., 2011). The availability of sufficient information is fundamental for the management and optimization of wood procurement. Pre-harvesting information on standing stock should include volumes and qualities of timber assortments and the distribu-tion of length and diameter (Malinen et al., 2014).
7
1.3 Data collection methods and accuracy There are different methods of collecting data for forest stands, mostly through field inventory, photointerpretation or remote sensing with airborne laser scanning (ALS). The data typically contains information about standing volumes, species, and mean values for breast height diameter, stem size, age and height. The different methods can be either subjective or objective. Subjective field inventory is depend-ing on the skills of the surveyor, who estimates a variable directly by ocular assess-ment that might be supported by measurement in areas that she or he thinks are representative. In this type of data there are often both systematically and random errors and it is difficult to calculate the size of the errors. Objective methods are, on the other hand, based on statistical sampling theories. The areas or objects for the measurements are selected in advance through random sampling procedures and this method should not be dependent on the skills of the surveyor. Another advantage with objective methods is that the precision can be estimated based on the data ac-quired. Depending on which method that has been used, the data will have different properties. Properties such as bias and standard deviation in estimated forest varia-bles are used for comparing forest data from different sources (Barth et al., 2014). The development of using ALS has provided possibilities to increase the accuracy in descriptions of the standing tree stock, which includes both tree- and area based plot level approaches (Maltamo et al., 2009). ALS data has proven to be more ac-curate than field inventory and/or photointerpretation (Næsset, 2004; Eid et al., 2004). Even though the cost for ALS is relatively high, studies have shown that the increased accuracy in the data can make up for the inventory cost which still makes it more profitable to use ALS than photointerpretation (Eid et al., 2004). Comparing data from remote sensing with data from field inventory has also shown that the prediction of product recovery is more accurate with data acquired by remote sens-ing (Barth et al., 2014). With ALS data it is however difficult to accurately recognize tree species within mixed forest stands, and therefore it is necessary to use other data sources to complement ALS data. Since inventory plot size often vary between inventories, it is important to somehow overcome the problems related to the varia-tion when combining data from different inventory methods (Næsset, 2004). One alternative to using generalized information is to use non-parametric methods, which can be used for building and calibrating parametric models. Both parametric and non-parametric methods assume that observations are independent (except when paired). The difference between the methods is that non-parametric methods do not require that the population of the values are normally distributed (Vickers,
8
2005). A frequently used non-parametric method is the kMSN (Most Similar Neigh-bour) Method (Maltamo et al., 2006).
1.4 The kMSN (Most Similar Neighbour) method As earlier presented, it is expensive to collect data that satisfies the preference for detail level of pre-harvesting information. Instead, to produce the desired infor-mation with sufficient detail is it possible to use k-nearest neighbour (kNN) impu-tation, which exploits the association between inexpensive supporting variables that are measured on all stands and the variables of interest that are measured on merely a subset of stands (Crookston & Finley, 2007). The method for imputing data is called kMSN (Most Similar Neighbour), where numerous (k) of the most similar neighbours (of variables) are chosen. The average values of these most similar ob-jects are then transferred to one prognosis object (Moeur & Stage, 1995). Malinen et al. (2001) proposed a method to predict timber assortment yield based on har-vester-collected stem data-bases, non-parametric regression and bucking simula-tion. Cut-to-length harvester computers register a large amount of data, which can be utilized by stem databases to a small excess cost (Malinen et al., 2014). Thanks to the ability to use hpr-files (harvester production files) created according to the Standard for Forest Data (StanForD2010), which enables harvesters to communi-cate with the user, it is now possible to register data on a more detailed level (Arlinger et al., 2012). Hpr-files are successors to pri-files (production, individual files) and Skogforsk has developed a module that makes it possible to convert pri-files to hpr-files (Bhuyian et al., 2013). For every log that is bucked, data of tree species, volume, quality, dimensions (length and diameter) and the GPS-coordinates of the harvester are registered. Modern harvester computers can simulate a recon-struction of every single tree by adding the logs and estimate the length and the shape of the stem (Arlinger et al., 2012). Söderberg (2015) showed that there are potentials in using ALS data and historical harvester data for the kMSN-method to produce yield forecasts in forthcoming harvesting objects.
Finnish researchers have done projects evaluating the kMSN method for forecasting purposes (Malinen et al., 2006; Maltamo et al., 2009; Malinen et al., 2014). Most projects have focused on yield forecast, but some have also focused on tree charac-teristics such as crown height, height of the lowest dry branch and sawlog proportion of tree volume (Maltamo et al., 2009). During “The Scots Pine Resource Project”, funded by EU’s Northern Periphery Programme, a work package called Timber Re-covery Simulator for Wood Procurement Planning was launched (Malinen et al.,

9
2014). Finnish researchers have developed a software named Prehas-Finland, which is used for predicting timber assortment recovery when considering the technical quality of the stems and applying different bucking instructions. Prehas-Finland includes a bucking-to-value simulator which uses dynamic pro-gramming to maximize the value of each tree, given a certain diameter- and length distribution and prices for different products (timber assortment and diameter/length class). The software has been compared to earlier developed timber assortment re-covery regression models (Malinen et al., 2014). Skogforsk, the Forestry Research Institute of Sweden, has together with the Swedish forest companies SCA, Sveaskog and Södra recently finished a project with the aim to improve yield forecasts and evaluate future potential and requests from the dif-ferent stakeholders in the project. Skogforsk has developed the tool hprImputation, using imputation to simulate yield forecasts that can predict the number of logs in a specific assortment and dimension (length and diameter) that will be harvested from a forest stand with specific characteristics connected to geographical parameters. Technically, hprImputation is implemented as a script for the statistical program R (R Core Team). The model assumes that forests within a geographical area that have the same average height, basal area and species mixture will have similar character-istics when predicting dimension class and assortment/product. The method de-pends on segmented forest areas (Möller et al., 2017). With the module hprYield it is possible to segment the forest according to the measured stem data and create more homogenous units, which is useful for areas with a lot of variation within the stand (Bhuyian et al., unpubl.). Regional variation has showed to have an impact on factors related to yield; such variation could be shape of stems, historical manage-ment of stands and frequencies of root rot. Imputing data of known tree character-istics from historical harvester data within the same geographical area could thus be used to increase the accuracy of predictions based on inventory data. Using this imputation model, there are many potentials for creating greater value in the forest management planning, involving better allocation of resources, lower costs for warehousing, and a more efficient preparation of logs. A specific potential lies within the new possibilities to measure quality characteristics with 3D/X-ray scan-ners in sawmill, enabling a connection to be made between the measured (true) wood characteristics with the forecasts made by the imputation tool (using historical harvester data as reference) and tree characteristics models (Wilhelmsson et al., 2011). This way, the forecasts can be even better calibrated, which should enable a

10
better allocation of resources from the planning step to product. In order to fully use the potential of better forecasts, the importance has however been emphasized of imputing stand data on local geographical basis has been emphasized by Möller et al. (2017). The development of using the imputation tool and wood property models is continuing within Skogforsk (Söderberg et al., 2017).
With the new possibilities to measure the quality of logs with 3D/X-ray, the meas-ured wood characteristics can now be compared to the forecasts made by the impu-tation tool and tree characteristics model. This has however not been done yet. Stud-ying and evaluating this is an important next step towards applying big data (ALS- and harvester data) to create prognoses of yield and wood characteristics, and thereby potentially improve the allocation of resources from the planning step to product.
1.5 Aim The aim of this master’s thesis is to
• evaluate the perceived benefits of increased precision in yield forecasting from a value chain perspective,
• identify key forecasting variables for different perspectives of the value chain, • evaluate the influence of applying the imputation method based on harvester
data and wood property models on the forecasting precision for key variables at a case company
1.6 Delimitations The study is delimited to the case industry SCA, Bollsta sawmill and sawlogs of Scots pine (Pinus sylvestris). The methods for forecasting yield and properties are based on implementations of kMSN Imputation for R-script combined with an ex-ample of wood property models developed by Skogforsk.

11
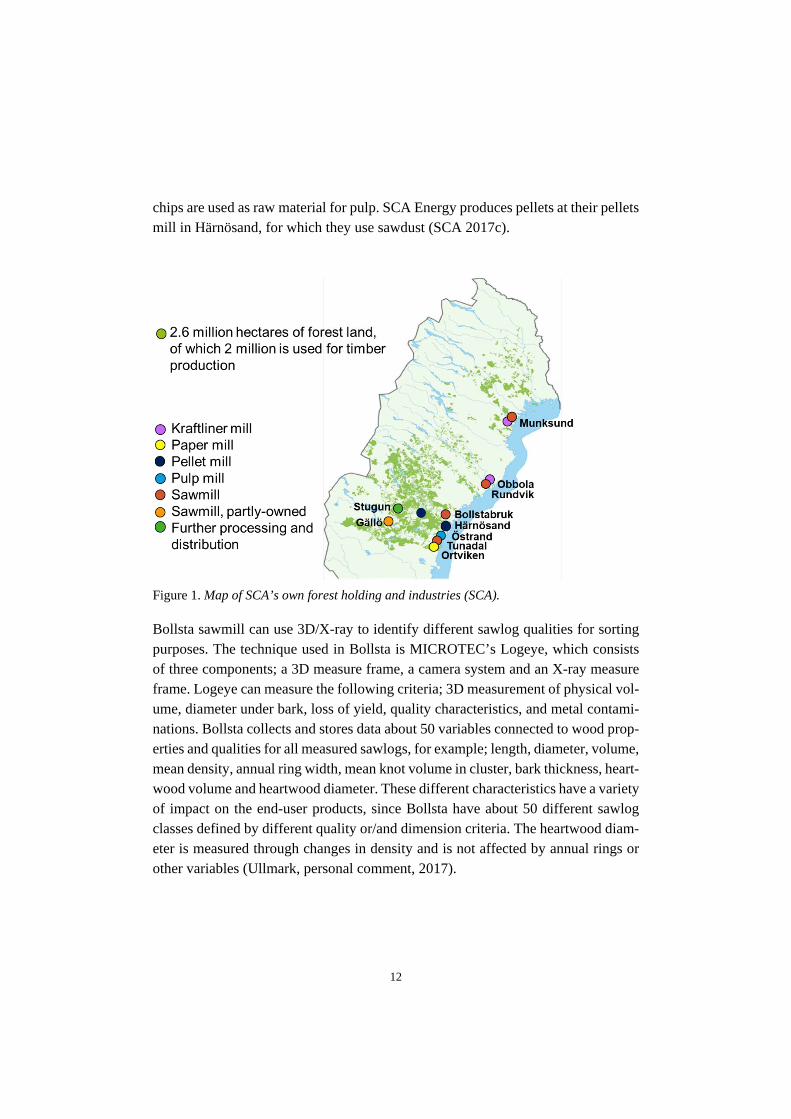
2.1 The case industry SCA is Sweden’s largest private forest owning company with 2 million hectares used for timber production, located in the northern part of Sweden (Figure 1) (SCA 2017a). SCA has five forest management areas. The total yearly harvested volume from the own forest holding is approximately 4.1 million cubic meters solid under bark (m3sub), corresponding to 60 % of the total harvested volume, and 2.7 m3sub (40 %) from private forest owners. External purchases and wood exchanges cover an additional 3.9 million m3sub. The sawlog volumes are 4.2 million m3sub, where half of the volumes are from the own forest holding and the other half from internal and external purchases.
The sawmilling unit of SCA, SCA Wood, has the total production capacity of 2.1 million m3 of solid-wood products. The range of products is supplemented with distribution solutions for customers in the wood industry and builders’ merchant sector, for example furniture material, window material, solid-wood flooring mate-rial, panelling, decking/garden timber and construction timber. SCA is a large actor on the global market and aims to offer not only high-quality wood products but also supplier concepts such as expert knowledge, complementary service solutions and efficient technology (SCA 2017b). Bollsta is the largest sawmill for pine in Sweden with the capacity of 560 000 cubic meters sawn goods produced per year. The sawmill uses only pine sawlogs as raw material, and refines them into different high-quality wood products. The bark from the logs is used for energy production and the
2 Material and method
12
chips are used as raw material for pulp. SCA Energy produces pellets at their pellets mill in Härnösand, for which they use sawdust (SCA 2017c).
Figure 1. Map of SCA’s own forest holding and industries (SCA). Bollsta sawmill can use 3D/X-ray to identify different sawlog qualities for sorting purposes. The technique used in Bollsta is MICROTEC’s Logeye, which consists of three components; a 3D measure frame, a camera system and an X-ray measure frame. Logeye can measure the following criteria; 3D measurement of physical vol-ume, diameter under bark, loss of yield, quality characteristics, and metal contami-nations. Bollsta collects and stores data about 50 variables connected to wood prop-erties and qualities for all measured sawlogs, for example; length, diameter, volume, mean density, annual ring width, mean knot volume in cluster, bark thickness, heart-wood volume and heartwood diameter. These different characteristics have a variety of impact on the end-user products, since Bollsta have about 50 different sawlog classes defined by different quality or/and dimension criteria. The heartwood diam-eter is measured through changes in density and is not affected by annual rings or other variables (Ullmark, personal comment, 2017).

13
Bollsta sawmill has three main product segments; 1. Finished products; for example, decking and the IKEA shelf “Gorm”.
2. Industry products; panels, glued wood and special qualities adapted for the industrial customers’ products.
3. Standard- and bulk products.
The main resource is the centre board, but for numerous products the side board is also used. Industry products often require early sorting and raw wood material of high quality, since the special dimensions make these products unlikely to sell to other customers than for whom the products were originally destined for (Lundgren, personal comment, 2017).
2.2 Study design The study was performed as two parts, conducted in parallel to each other. In part I, a workshop was first held to identify key forecasting variables. Afterwards, detailed interviews were conducted for evaluating perceived benefits of increased precision in yield forecasting from a value chain perspective. In part II, stand data from different sources was compiled and statistically analysed for measuring the influence of using Skogforsk’s implementation of kMSN impu-tation and wood properties models on the precision of yield and wood properties forecasts. The key forecasting variables, identified through the workshop in part I, were used for the analysis.
2.3 Part I: Evaluation of perceived benefits of increased precision in yield forecasting from a value chain perspective
To identify key forecasting variables, a workshop was held together with represent-atives from Skogforsk and SCA. The representatives from SCA were from the wood supply department, Bollsta sawmill and the wood department. The workshop was held through Skype for Business where the established project plan was presented and discussed to agree on what were the most important variables to include in the

14
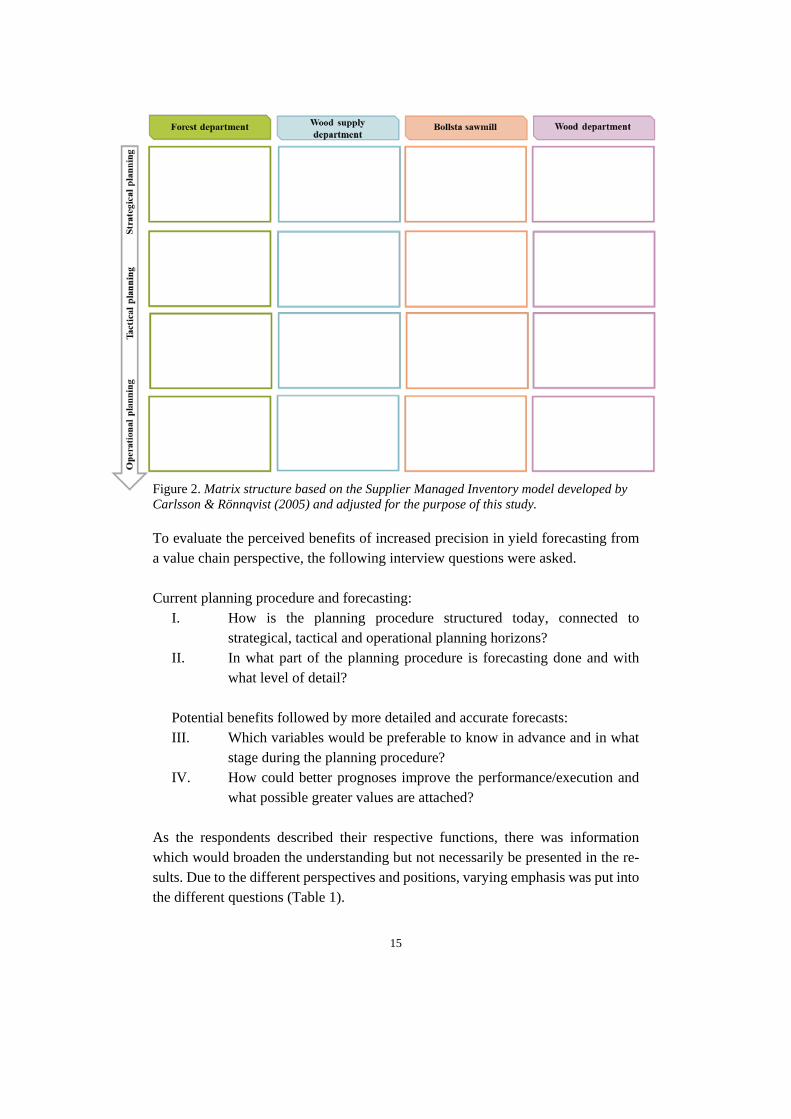
analysis. Each representative had the opportunity to present requests or suggestions on which variables to study. The session lasted for approximately two hours. Detailed semi-structured interviews were held with respondents from different key positions, covering all perspectives of the value chain from forest to market (Table 1). This method is used to gather focused, qualitative textual data. Semi-structured interviews provide a balance between the flexibility of an open-ended interview and the focus of a structured ethnographic survey. Semi-structured interviews com-monly start with non-sensitive, overall questions and then shifts focus to more spe-cific questions, using an interview guide (Design Research Techniques, 2018). Some of the respondents were suggested through a judgement selection by the in-terviewed supply chain manager, while others were added afterwards to cover parts that had not been discussed during the first interviews. The interviews were held separately, in person and lasted for approximately one up to two and a half hours. The answers were recorded and listened to for complementary answers to questions. The total recorded time was approximately fifteen hours and the notes taken while listening to the recordings were approximately twelve thousand words. After pro-cessing the answers from the respondents, each of the respondents had the chance to read the results to correct any misinterpretations. The structure used for Supplier Managed Inventory developed by Carlsson & Rönnqvist (2005) was adjusted to cover all planning procedures within the whole value chain (Figure 2). By using this structure during interviews, it was ensured to cover the planning system in a uniform approach for all links of the value chain. The forest department handles for example planning and management of silvicultural and harvesting operations, wood purchasing, and transportation. The wood supply department handles the overall wood flow and functions as the coordinating link between the forest department and the industry. The wood department (earlier called SCA Timber) handles tasks mainly related to sawmills and market sales of their products but is also partly functioning as a link between the wood supply department and the sawmills (Figure 2).
15
Figure 2. Matrix structure based on the Supplier Managed Inventory model developed by Carlsson & Rönnqvist (2005) and adjusted for the purpose of this study. To evaluate the perceived benefits of increased precision in yield forecasting from a value chain perspective, the following interview questions were asked. Current planning procedure and forecasting:
I. How is the planning procedure structured today, connected to strategical, tactical and operational planning horizons?
II. In what part of the planning procedure is forecasting done and with what level of detail?
Potential benefits followed by more detailed and accurate forecasts: III. Which variables would be preferable to know in advance and in what
stage during the planning procedure? IV. How could better prognoses improve the performance/execution and
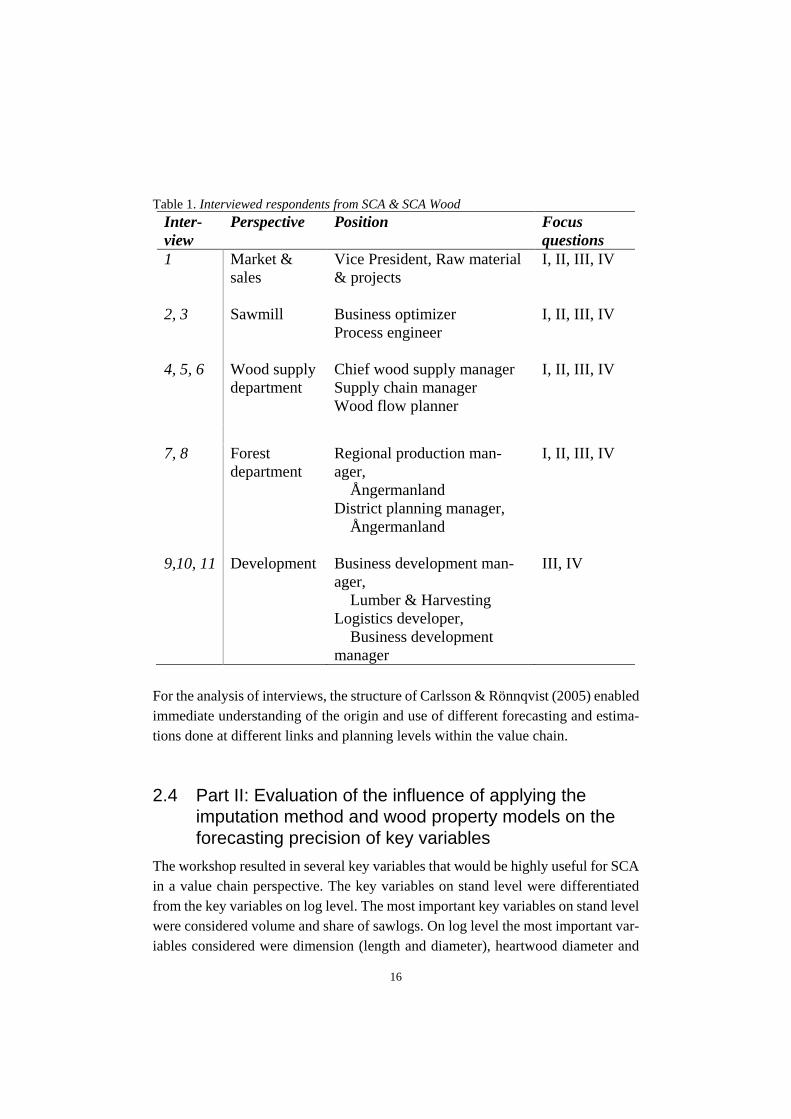
what possible greater values are attached? As the respondents described their respective functions, there was information which would broaden the understanding but not necessarily be presented in the re-sults. Due to the different perspectives and positions, varying emphasis was put into the different questions (Table 1).
16
Table 1. Interviewed respondents from SCA & SCA Wood Inter-view
Perspective Position Focus questions
1 2, 3 4, 5, 6
Market & sales Sawmill Wood supply department
Vice President, Raw material & projects Business optimizer Process engineer Chief wood supply manager Supply chain manager Wood flow planner
I, II, III, IV I, II, III, IV I, II, III, IV
7, 8 9,10, 11
Forest department Development
Regional production man-ager, Ångermanland District planning manager, Ångermanland Business development man-ager, Lumber & Harvesting Logistics developer, Business development manager
I, II, III, IV III, IV
For the analysis of interviews, the structure of Carlsson & Rönnqvist (2005) enabled immediate understanding of the origin and use of different forecasting and estima-tions done at different links and planning levels within the value chain.
2.4 Part II: Evaluation of the influence of applying the imputation method and wood property models on the forecasting precision of key variables
The workshop resulted in several key variables that would be highly useful for SCA in a value chain perspective. The key variables on stand level were differentiated from the key variables on log level. The most important key variables on stand level were considered volume and share of sawlogs. On log level the most important var-iables considered were dimension (length and diameter), heartwood diameter and

17
mean knot cluster. In the latter case, the analysis needed to be restrained in order to limit the study within the available time frame. Therefore, only heartwood diameter was chosen as forecasting variable. Heartwood diameter was considered of main importance for product value and the models for predicting heartwood diameter are also well developed and were relatively easy to adapt for this study. Also, the rep-resentatives from Bollsta sawmill described the heartwood diameter measurement with the 3D/X-ray scanner to be on a satisfying level of detail and accuracy, and therefore believed it to be a comparable variable above others. As forecasting of heartwood diameter provides simulated logs, it was considered meaningful to also forecast the number of logs per top diameter class in order to make the forecasts comparable with the actual measured heartwood diameter in the 3D/X-ray scanner.
2.5 Stand level forecasting To enable the yield forecasts by applying Skogforsk’s tool hprImputation, the input data from the studied stands had to contain given variables; species mixture, basal area (BA), basal area weighted mean diameter (BWD), basal area weighted mean height (BWH), stand area and stand age, and type of harvesting (final felling or thinning). The register data was delivered by SCA and is a mixture of field inventory data, ALS data that has been complemented with species mixture and age, and data from Trestima which is a smartphone application used for sample plot inventory. The ALS data was obtained through the Swedish Forest Agency. The national laser scanning performed by Swedish Land Surveying Agency started at year 2009, hence the description of the forest stands are approximately eight years old (Skogsstyrel-sen, 2017a). Since the ALS data does not provide accurate species mixture or age, this data was complemented from the stand register (field inventory data). To enable the model validation of imputation, the same variables were contained from har-vester data files (hpr-files) as for the included research stands. Thanks to the ability to store information from executed harvests through hpr-files in the harvester database developed by Skogforsk, 85 279 calculation units from historical harvester data could be used as potential most similar neighbours for the imputation. The hpr-files contain information about every tree that has been cut.
18
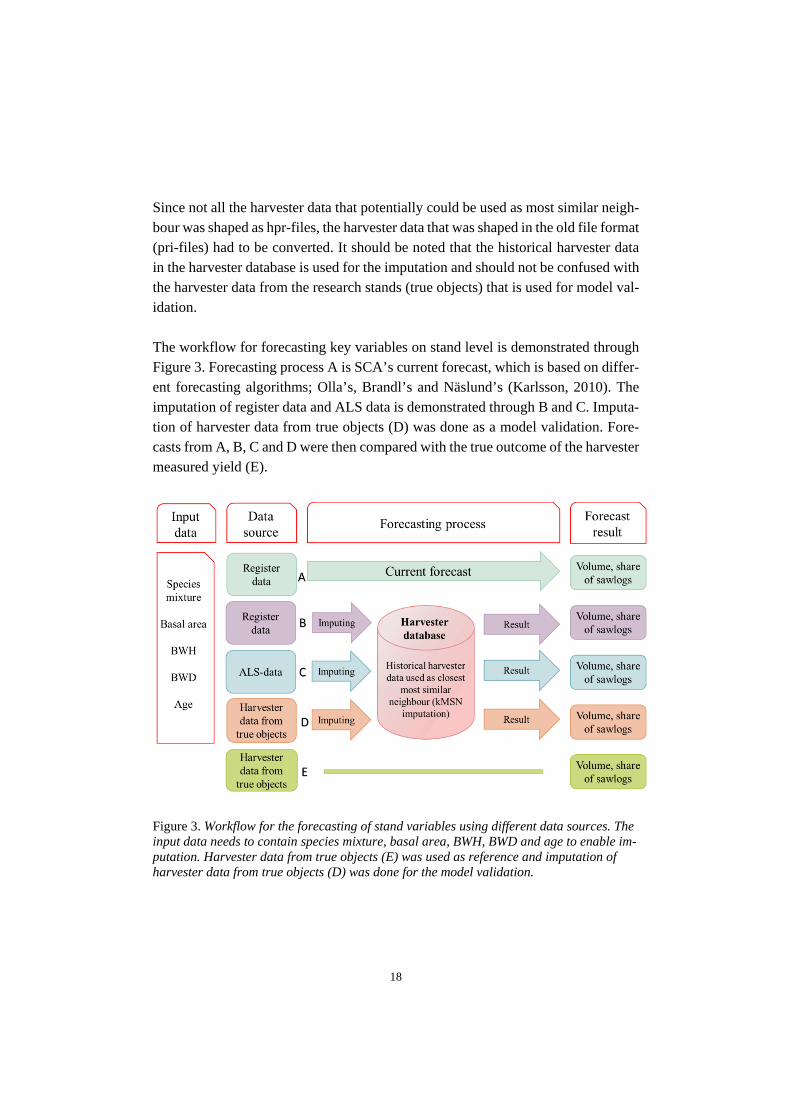
Since not all the harvester data that potentially could be used as most similar neigh-bour was shaped as hpr-files, the harvester data that was shaped in the old file format (pri-files) had to be converted. It should be noted that the historical harvester data in the harvester database is used for the imputation and should not be confused with the harvester data from the research stands (true objects) that is used for model val-idation. The workflow for forecasting key variables on stand level is demonstrated through Figure 3. Forecasting process A is SCA’s current forecast, which is based on differ-ent forecasting algorithms; Olla’s, Brandl’s and Näslund’s (Karlsson, 2010). The imputation of register data and ALS data is demonstrated through B and C. Imputa-tion of harvester data from true objects (D) was done as a model validation. Fore-casts from A, B, C and D were then compared with the true outcome of the harvester measured yield (E).
Figure 3. Workflow for the forecasting of stand variables using different data sources. The input data needs to contain species mixture, basal area, BWH, BWD and age to enable im-putation. Harvester data from true objects (E) was used as reference and imputation of harvester data from true objects (D) was done for the model validation.

19
The original number of the studied stands was 200 but since there was no registered coordinates for some of these stands, approximately half of them had to be removed. There was a deviation between the geometric size of the study stands from field inventory data and harvester data. Even though the evaluation of the yield forecasts was done per hectare, the deviation between the area stated in the field inventory and the actual harvested area was not allowed to be more than fifteen percent. This criteria was chosen to not risk more than marginally erroneous values for tree size and species mixture, which are important variables for the yield forecast, and also for stand age which is an important variable for the wood properties forecasting. It is also desirable to create forecasts for stands with relatively uniform stand age. Other criteria that was set was that each stand had to contain at least 50 m3sub of pine sawlogs which had been both bucked specifically for Bollsta and actually de-livered to Bollsta. There were stands that had to be removed due to the fact that the major part of these particular stands were delivered to other pine sawmills. Due to the given criteria the final number of studied stands was 61, of which 40 were final felling stands and 21 were thinning stands. The concept of imputation builds on managing big data in a structured and efficient way, and for that purpose Skogforsk has developed the harvester database consisting of historical harvester data. The harvester database contains raw data (hpr-files), calculated data from hprCM and hprYield (Table 2), ALS data, company register data and calculated data from hprProp (Arlinger, 2018, personal comment).
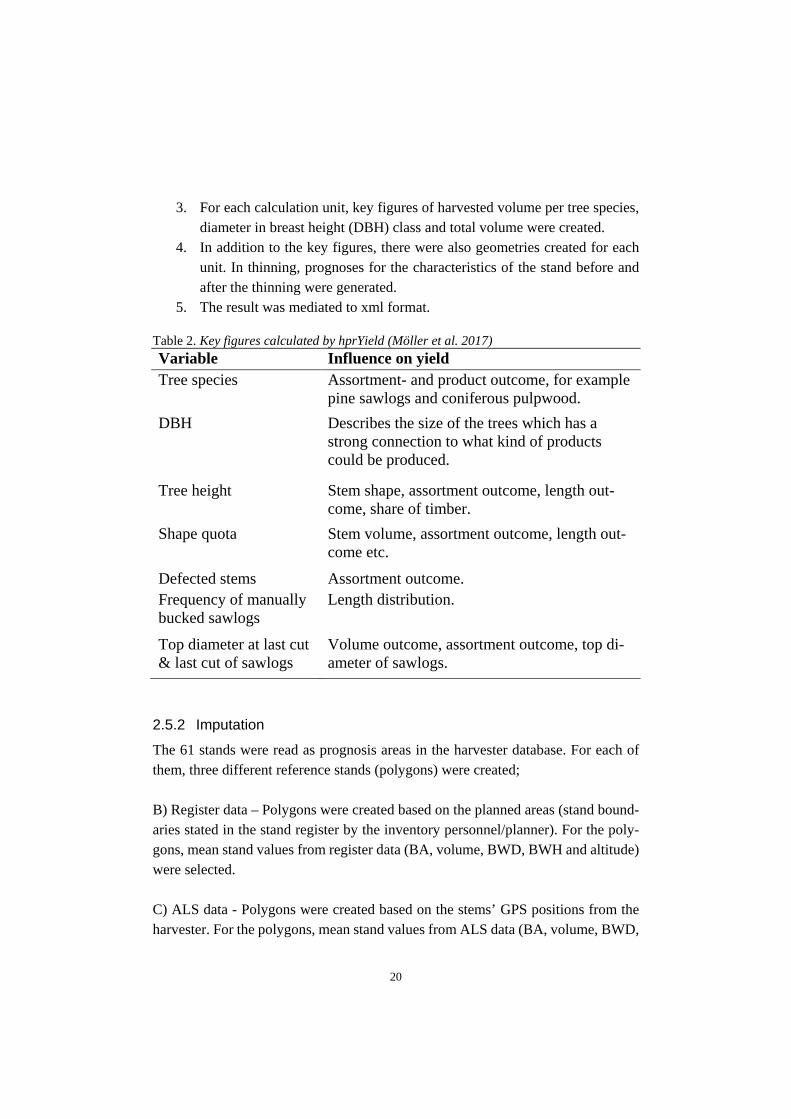
2.5.1 Segmentation and key figure calculation To calculate key figures from the harvester data, hprYield calculated key figures for each calculation unit (Table 2). This process is divided into five steps (Möller et al., 2017):
1. The module reads files that have been run through hprCM, which also esti-mated the top size on each stem (the part of the stem which is often not measured by the harvester as it is too short and with a relatively small di-ameter) according to a function developed by Kiljunen (2002). Unrealistic values of the stems were also corrected or filtered.
2. For harvested stands larger than 1 hectare, the module separates the stands into calculation units that are 0.5 – 1 hectares large with the purpose to cre-ate homogenous calculation units.
20
3. For each calculation unit, key figures of harvested volume per tree species, diameter in breast height (DBH) class and total volume were created.
4. In addition to the key figures, there were also geometries created for each unit. In thinning, prognoses for the characteristics of the stand before and after the thinning were generated.
5. The result was mediated to xml format. Table 2. Key figures calculated by hprYield (Möller et al. 2017) Variable Influence on yield Tree species Assortment- and product outcome, for example
pine sawlogs and coniferous pulpwood. DBH Describes the size of the trees which has a
strong connection to what kind of products could be produced.
Tree height Stem shape, assortment outcome, length out-come, share of timber.
Shape quota Stem volume, assortment outcome, length out-come etc.
Defected stems Assortment outcome. Frequency of manually bucked sawlogs
Length distribution.
Top diameter at last cut & last cut of sawlogs
Volume outcome, assortment outcome, top di-ameter of sawlogs.
2.5.2 Imputation
The 61 stands were read as prognosis areas in the harvester database. For each of them, three different reference stands (polygons) were created; B) Register data – Polygons were created based on the planned areas (stand bound-aries stated in the stand register by the inventory personnel/planner). For the poly-gons, mean stand values from register data (BA, volume, BWD, BWH and altitude) were selected. C) ALS data - Polygons were created based on the stems’ GPS positions from the harvester. For the polygons, mean stand values from ALS data (BA, volume, BWD,

21
BWH and altitude) were selected. Then, species mixture was collected from register data. D) Harvester data – Polygons were created by copying the harvested trees from the hpr-files (containing information of BA, BWH, BWD, species mixture, volume and stand boundaries through coordinates). Imputation could then be executed through hprImputation based on type of harvest-ing, BA, BWH, BWD and species mixture for the different prognosis areas (one from the stand register and one from the harvester data) (Figure 4) (Möller et al., 2017).
Figure 4. Visualisation of study objects in hprDemo.

22
HprImputation is an R-script based on the implementation of kMSN by Crookston et al. (2007), originally developed by Moeur and Stage (1995). In HprImputation, the five most similar neighbours to target observation i is defined as the reference observation j (over all reference observations) that minimizes the weighted Euclid-ean distance on the set of X-variables. The used set of variables included BA, BWH, BWD and species mixture. Thus: 𝑀𝑀𝑀𝑀𝑀𝑀(𝑖𝑖) = 𝑟𝑟𝑟𝑟𝑟𝑟𝑟𝑟𝑟𝑟𝑟𝑟𝑟𝑟𝑟𝑟𝑟𝑟 𝑜𝑜𝑜𝑜𝑜𝑜𝑟𝑟𝑟𝑟𝑜𝑜𝑜𝑜𝑜𝑜𝑖𝑖𝑜𝑜𝑟𝑟 𝑗𝑗 𝑤𝑤𝑖𝑖𝑜𝑜ℎ 𝑚𝑚𝑖𝑖𝑟𝑟𝑖𝑖𝑚𝑚𝑚𝑚𝑚𝑚 𝑑𝑑2𝑖𝑖𝑖𝑖 = (𝑋𝑋𝑖𝑖 − 𝑋𝑋𝑖𝑖) 𝑊𝑊 (𝑋𝑋𝑖𝑖 − 𝑋𝑋𝑖𝑖) 𝑟𝑟𝑜𝑜𝑟𝑟 𝑜𝑜𝑎𝑎𝑎𝑎 𝑗𝑗 = 1, . . . ,𝑟𝑟 (1) where; MSN(i) is the most similar neighbour to the ith target observation, d2ij is the squared distance between the ith target observation and the jth observation, for n reference observations, Xi is the vector of normalized X-variables for the ith target observation, Xj is the vector of normalized X-variables for the jth reference obser-vation, and W is a weight matrix (Crookston et al., 2007). 𝑊𝑊 = 𝛤𝛤 𝛬𝛬2 𝛤𝛤’ (2) where; Γ, are the recognized vectors and Λ^2 the squared recognized correlations. The weight matrix summarizes the best linear relationship between the sets of mul-tivariate Y and multivariate X taken simultaneously, while incorporating the covar-iance between the elements of X and elements of Y (Crookston et al., 2007). Since the imputation tool was unable to find any most similar neighbours for two thinned stands these two were removed from the data set. One explanation to this might be that the stands were unusually late conducted first-thinnings and that the imputation model was unable to find similar stands. The final number of stands that met all the criteria and had been successfully imputed was 59. Each imputation resulted in forecasts for each stand of its BA (m2/ha), BWH (m), BWD (cm), volume m3 solid over bark (m3sob/ha), volume (m3sub/ha), share of sawlogs per stand and species (%) and species mixture (through share of BA per species). Each stand was also assigned an identification number.
23
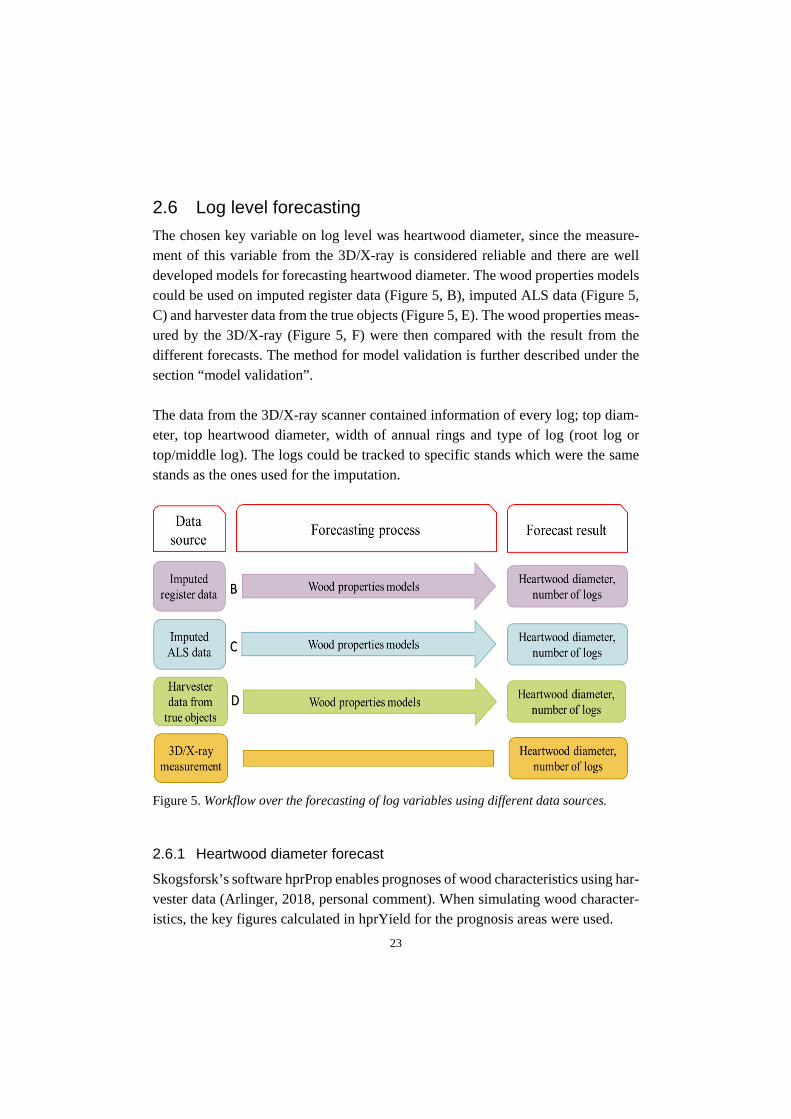
2.6 Log level forecasting The chosen key variable on log level was heartwood diameter, since the measure-ment of this variable from the 3D/X-ray is considered reliable and there are well developed models for forecasting heartwood diameter. The wood properties models could be used on imputed register data (Figure 5, B), imputed ALS data (Figure 5, C) and harvester data from the true objects (Figure 5, E). The wood properties meas-ured by the 3D/X-ray (Figure 5, F) were then compared with the result from the different forecasts. The method for model validation is further described under the section “model validation”. The data from the 3D/X-ray scanner contained information of every log; top diam-eter, top heartwood diameter, width of annual rings and type of log (root log or top/middle log). The logs could be tracked to specific stands which were the same stands as the ones used for the imputation.
Figure 5. Workflow over the forecasting of log variables using different data sources.
2.6.1 Heartwood diameter forecast
Skogsforsk’s software hprProp enables prognoses of wood characteristics using har-vester data (Arlinger, 2018, personal comment). When simulating wood character-istics, the key figures calculated in hprYield for the prognosis areas were used.

24
The software hprProp uses earlier developed models for predicting the number of annual rings (Wilhelmsson, 2006) and models for predicting heartwood diameter (Wilhelmsson et al., 2002). Thus, the independent variables used for predicting heartwood diameter of a cross-sectional wood sample at a specified height (h) are the number of annual rings (Ch) and diameter over bark (Dh) at this height. The diameter was contained from the harvester data and imputation outcome (diameter and length measurements) and the number of annual rings was predicted through the following equation;
𝑟𝑟ℎ = 𝑟𝑟𝑏𝑏ℎ� 𝐷𝐷ℎ𝐷𝐷𝑏𝑏ℎ
�0,3392−0,0289 ∗ 𝐷𝐷ℎ𝐷𝐷𝑏𝑏ℎ
(3)
Since the model for predicting number of annual rings (Equation 3) uses the diam-eter over bark and the model for predicting heartwood diameter uses the diameter under bark (Equation 5), the models developed by Hannrup (2004) for predicting bark thickness were used. The model distinguishes the upper and lower stem sec-tions, which should correspond to the sawlog frontier. The distinguishing was made by the following equation:
ℎ𝑡𝑡𝑡𝑡 = − ln (0.12/(72.1814+0.0789∗𝑑𝑑𝑏𝑏ℎ𝑏𝑏−0.09868∗𝑙𝑙𝑙𝑙𝑡𝑡))0.0078557−0.0000132∗𝑑𝑑𝑏𝑏ℎ𝑏𝑏
(4)
where; dbhb = min (dbh, 590), which sets breast height diameters above 590 mm to 590 mm. For the lower stem section, the double bark thickness (db, measured in mm) equa-tion is expressed as: 𝑑𝑑𝑜𝑜 = 3.5808 + 0.0109 ∗ 𝑑𝑑𝑜𝑜ℎ𝑏𝑏 + (72.1814 + 0.0789 ∗ 𝑑𝑑𝑜𝑜ℎ𝑏𝑏 − 0.9868 ∗𝑎𝑎𝑜𝑜𝑜𝑜) ∗ 𝑟𝑟𝑒𝑒𝑒𝑒(−(0.0078557 − 0.0000132 ∗ 𝑑𝑑𝑜𝑜ℎ𝑏𝑏) ∗ ℎ) (5) For the upper stem section, h>htg the equation follows: 𝑑𝑑𝑜𝑜 = 3.5808 + 0.0109 ∗ 𝑑𝑑𝑜𝑜ℎ𝑏𝑏 + 0.12 − 0.005 ∗ (ℎ − ℎ𝑜𝑜𝑡𝑡) (6) where; db = max(db, 2), which ensures that the double bark thickness under 2 mm is set to 2 mm.
25
With the prediction of number of annual rings at breast height and the bark thickness the diameter under bark was set as; dℎ = 𝐷𝐷ℎ − 𝑑𝑑𝑜𝑜 (7) from which the prediction of heartwood diameter could be done (Equation 8); 𝐻𝐻𝑟𝑟𝑜𝑜𝑑𝑑 = −15.4 + 0.1580 ∗ 𝑑𝑑ℎ ∗ 𝑎𝑎𝑟𝑟 𝑟𝑟ℎ + 𝑎𝑎𝑜𝑜𝑡𝑡𝑖𝑖 (8) The forecast of properties generated information about object identification number, type of log (butt-log or top/middle log), top heartwood diameter, top log diameter, age of stands, type of harvesting (final felling or thinning), species and assortments info (sawlogs or pulpwood). To enable comparison of the actual trees measured in the 3D/X-ray frame and simulated trees, a cluster of sawlogs had to be made. All logs were grouped into top diameter class groups (minimum 140 mm and maximum 400 mm with a 20 mm gap between the groups). This was made for each forecasting type (Figure 4 and 5) and stand. Each stand and top diameter group had to contain at least three logs per imputation type. For those stands and methods with three logs or more per diameter group, the mean heartwood diameter could be compared. Sawmills generally use the top heartwood diameter for sorting, therefore it was more suitable to compare top heartwood. From the imputation of ALS data, one of the stands (final felling) could not generate the base parameters to use in the R-script and had to be removed. The final number of stands from which it was possible to obtain forecasts of heartwood diameter was 58 (38 final fellings and 20 thinnings).
2.7 Model validation The accuracy of the results was measured and compared by root mean square error (RMSE) (Equation 8), and relative root mean square error (RMSE %) (Equation 9). The validation of any systematic errors within the predictions was done through calculation of bias (Equation 10) and relative bias (Equation 11). To evaluate how well the predictions fit the measured values, R2 was calculated by applying linear regression analysis (Equation 12).

26
𝑅𝑅𝑀𝑀𝑀𝑀𝑅𝑅 = �∑ (𝑦𝑦�𝑖𝑖𝑗𝑗−𝑦𝑦𝑖𝑖𝑗𝑗)
2𝑟𝑟𝑖𝑖=1
𝑛𝑛 (8)
𝑅𝑅𝑀𝑀𝑀𝑀𝑅𝑅 % = 100 ∗ 𝑅𝑅𝑅𝑅𝑅𝑅𝑅𝑅
𝑦𝑦� (9)
𝐵𝐵𝑖𝑖𝑜𝑜𝑜𝑜 =
∑ 𝑦𝑦�𝑖𝑖𝑖𝑖−𝑦𝑦𝑖𝑖𝑖𝑖𝑛𝑛𝑖𝑖=1
𝑛𝑛 (10)
𝐵𝐵𝑖𝑖𝑜𝑜𝑜𝑜 % = 100 ∗ 𝐵𝐵𝑖𝑖𝑙𝑙𝐵𝐵
𝑦𝑦� (11)
𝑅𝑅2 = 1 −
∑ (𝑦𝑦𝑖𝑖𝑖𝑖 − 𝑦𝑦�𝑖𝑖𝑖𝑖 )2 𝑖𝑖
∑ (𝑦𝑦𝑖𝑖𝑖𝑖 − 𝑦𝑦�𝑖𝑖𝑖𝑖)2 𝑖𝑖 (12)
where; n is the number of observations, y�𝑖𝑖j is the real value for the variable i for observation j, 𝑦𝑦𝑖𝑖j is the forecasted value for the variable i for observation j, 𝑦𝑦�� is the mean of real values and 𝑦𝑦� is the mean of the forecasted values. Both input variables and outcome from the forecast were tested for the forecast on stand level. However, BA, BWH, BWD for the thinning stands were not compared due to the different state in the prognoses: the imputation provides the state after harvesting while the input variables describe the state before harvesting. As the in-put variables BA, BWH and BWD are important for producing accurate forecasts, these were tested for final fellings (both register and ALS data). By applying the Mixed Effects Model in the statistical software Minitab (Minitab, 2017) it was possible to evaluate the influence of impacts not explained by the model. The random factor tested was stand identification number and the covariates were predicted mean share of heartwood, BWH, BWD, stand age, logarithmic stand age, predicted log age calculated through number of annual rings and diameter and predicted mean diameter through harvester data.

27
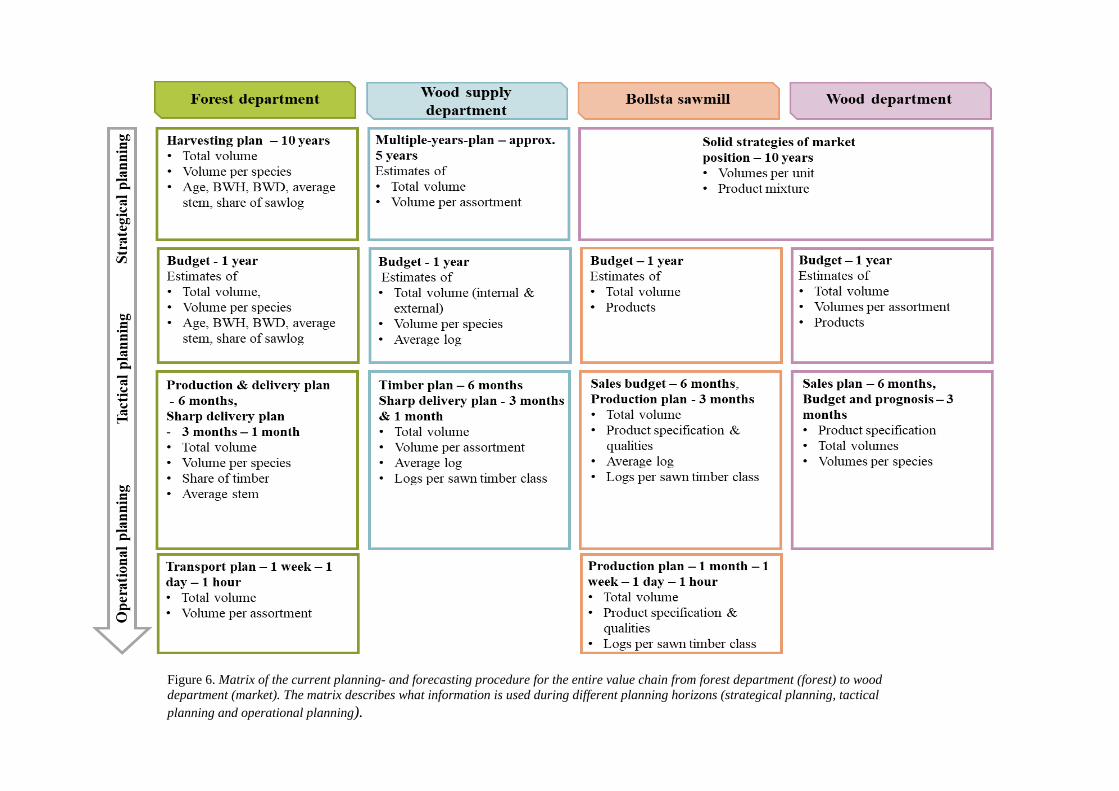
3.1 Current planning- and forecasting procedure The most fundamental strategy for SCA is described to have become clearer since the recent division of the company where the remaining parts of SCA is focused on forests, sawmilling and pulp production in mainly northern Sweden. The strategy includes value creation for the northern Swedish forests and especially for the own forest holding. Related to this, is to develop a well-functioning industry to ensure a balanced competition of the raw material and in return increase the value of the forest resource. To reach a certain market share it is important for SCA to screen the market and estimate possibilities, from which SCA strives for a market balance and optimum of procured volume and the cost for it. The current planning- and forecasting procedure as described by the respondents within the different departments (links) of the value chain is summarised in Figure 6. The matrix shows different levels of detail in the information on the different planning stages: strategical, tactical and operational. A more detailed description follows beneath, which includes some of the perceived challenges associated with unreliable forecasts and inaccurate data.
3 Results
28
Figure 6. Matrix of the current planning- and forecasting procedure for the entire value chain from forest department (forest) to wood department (market). The matrix describes what information is used during different planning horizons (strategical planning, tactical planning and operational planning).

29
3.1.1 Forest Department
Based on the interview with one of the respondents from the forest department, the long-term (strategical) planning horizon can be defined as ten years. The described planning procedure starts by creating a harvesting plan for volume per species and type of felling, which is made using their GIS program and field inventory of ran-domly chosen objects. The randomly chosen objects are then representative for the entire own forest holding. However, this data is only used for the ten-year-harvest-ing plan.
During the 20th century, a full inventory of the own forest holding was conducted, and this data is the core of what SCA calls their stand register. Whenever silvicul-tural measures are to be executed in a stand, the data in the register is updated. The field inventory is done using sample plots, ALS data that has been recounted and Trestima. The respondent considered that using ALS data is not sufficient, since the ALS data does not give accurate information of species mixture. The instructions for the field inventory is to use circular sample plots, but some of the respondents suspected that these instructions are sometimes forgotten or ignored, which could impact the inventory data quality. One of the respondents also emphasized the prob-lem of deciduous species being more inaccurate in outcome prognoses than other species, since the field inventory staff tend to under- or overestimate the share of deciduous species. The harvesting plan is renewed every five or six years, but still continuously updated every year. It is common that the share between species is the same for the whole ten-year period planned, even though the respondent pointed out that it can vary between years – in these cases year 2 might compensate for a shortfall of an assort-ment year 1. The one-year plan consists of volume per tree species, planning of roads and ensuring an equal share of spring- and summer stands and availability. The planned units that are ready for harvesting, whether it is thinning stands or final felling stands, are added to the stand register. One of the respondents from the forest department described that the stand register currently contains volume equal to two years of harvesting, but that it would be preferable to reach the goal of three years

30
or more. However, planning of such large volumes is considered resource demand-ing. Information in the stand register today is for example volume per species, mean stem volume, seasonal availability, age, and diameter in breast height. The variation is however large within the individual units, which makes the data unreliable. There is a monthly follow-up meeting regarding the tract bank and harvested vol-umes, assortments, species mixture and harvesting type. Wood purchasers, the dis-trict planning manager and production managers also discuss what is next to be har-vested, deficiency assortments and prioritized stands (related to road conditions or seasonal availability). In purchasing meetings there is a monthly follow up on what kind of stands are bought, volumes, costs and available volume. If there is a need to increase the share of for example spruce or spring stands, these questions are dis-cussed. Production Unit The respondent from the production unit described that the unit receives a figure of the yearly harvesting volume from the regional forest department. From this, the production unit makes a budget for the upcoming year. The budget contains availa-ble volumes, but also volumes not yet purchased or are unavailable for other rea-sons. Before finalizing the budget, reconciliation with the wood supply department is made to ensure that the budget and yearly volume corresponds to the demand from the industry. According to the respondent, the yearly budget is broken down to monthly plans, but the budget is adjusted after six months and every third month if needed. In cases of unforeseen events, such as fire, broken harvesters or unplanned mill production changes, the plans can change in one day. The regions engage in follow-up meetings every second week to plan responses to disturbances. A typically described response was the rescheduling of harvesting groups. In these cases, the respondent described the importance of carefully selecting to move the harvesting teams that will cause the least harmful consequences for the overall wood flow. A management meeting is held once a month. The production manager, production supervisors, the wood flow manager and the transport manager then discuss monthly performances regarding for example total volume, volume per assortments, costs, and productivity.
31
The transport managers follow a monthly delivery plan. Within the transport unit, the delivery plan is broken down to a weekly transport plan. Incoming import ves-sels, train volumes, available roadside stock and industry stock, available resources and other variables are taken into consideration. Day-to-day follow-ups are con-ducted to ensure that the wood flow is operated according to the need from the in-dustry with the right assortments and volume.
3.1.2 Wood Supply Department
The foundation of the wood procurement planning is the fundamental strategy for SCA – to create value for the northern forest. Within this strategy there are decisions of growth, which affects the procurement strategy in long term and from year to year. One of the respondents described the overall procurement planning as multi-ple-year-plans. Not long ago, these were one-year plans but in accordance with the decisions of industrial growth, it has seemed necessary to use longer planning hori-zons than one year.
The multiple-year-plan was described to be estimations based on historical out-comes. The foundation of the raw material source is the own forest holding, with the ten-year harvesting plan. The ten-year harvesting plan was described as static, meaning that there is not much room to make changes, since the volumes within the own forest basically “are what they are”. Other sources; purchases from private for-est owners, central affairs and import are more flexible. The wood supply depart-ment base their multiple-year-plan on recent last-year demand and production esti-mations from the different units and industries, from which total volumes and vol-umes per assortment for up-coming years are estimated. One of the respondents de-scribed the use of historical data as necessary, since the estimations are rough in this stage and historical data is better than what the respondents called “a plain sheet”. The wood supply department receives a suggested yearly harvesting volume from the five regions. For every six months, they also receive a request from the wood department and sawmills. The main role of the wood supply department is to pro-vide the industry with raw material so that the supply corresponds to the demand. To enable this, adjustments are made in the yearly volumes suggested by the forest- and wood departments. Together with the forest- and wood departments, the wood supply department agrees on a yearly budget and a six-month production plan. In this plan, the external sales, purchases and trades are also considered.

32
The current forecasts are based on historical data, harvester data and experience. Since the harvester data is only available for harvested stands, the historical data constitutes the base of these forecasts done in longer terms. However, to rely only on the historical data would not give the appropriate forecast due to the frequent fluctuations. The fluctuations are the reason that the supply chain manager and the wood specialist at every region need to search the data for unreliability. Communi-cation between the departments is essential for meeting the demands, and the fore-casts require monitoring. The wood department and sawmills plan and follow up mean log (in litres), as a measure of dimension. The wood supply department there-fore also relate to mean log in planning and follow-up. Even though the forest de-partment usually delivers the agreed-upon mean log for a six-month period, the fluc-tuations of the mean log between months can be up to twenty percent. This can be costly for the entire value chain, but especially costly for sawmills due to the devi-ations requiring management to enable the production of the ordered products. The planning process is subdivided into half year one (H1), half year two (H2), Quarter one to quarter four (Q1, Q2, Q3, and Q4) (Figure 7). The first forecast of the sawlog content is presented in August/September. This is an estimation of whether the content of the volumes will follow the normal trend from previous years or if there is any divergence. In October the content budget is set, with mean log, number of logs within sawlog classes and diameter distribution. Depending on sawmill, the level of detail in the order is relatively low or high. When an agreement is met in October, the products are often sold in December, which is why changes need to be negligible. In December, the forecasts are updated. There are three up-dates of the forecasts for one year;
1. Forecast for full year – total volume for internal and external affairs,
rough estimation of mean log. 2. Forecast for half year – timber plans; volume, mean log, number of logs
per sawn timber class. 3. Forecast for quarter – diameter distribution, estimation of different prod-
ucts, number of logs.

33
Figure 7. The planning and forecasting process during a one-year cycle, divided into half years (H1-2) and quarters (Q1-4) (SCA).
Every week there is an operational raw material meeting where representa-tives from sawmills, forest management, wood flow planning, transport management and the vice president of raw material and projects participate. Discussions include total volume, specific content (distribution ratio be-tween dimensions, quality classification precision, mean log, and mean log length), quality (share of rejects according to the Swedish Wood Measure-ment association, and stains) and stock levels at mill. The distribution ratio from the harvesters and the distribution ratio measured at sawmills often vary, which is a consequence of stock levels and lead time. However, the distribution ratio measured by the harvesters provides information of what sawmills could expect within the next weeks/month. According to one of the respondents from the development perspective, SCA does not have any software application to perform forward-aimed op-timizations of the wood flow. Instead, it is possible to evaluate how the wood flow has been performed connected to geographic supply areas. Vari-ables that are considered are assortment and transportation distance. The wood flow optimization software is under development in a newly started project that aims to create a software application that enables forward-aimed optimizations for supply areas of different assortments.

34
3.1.3 Wood department and Bollsta sawmill
The most strategical and long-term decisions within the wood department have a time horizon of ten to thirty years. These decisions often concern long term invest-ments. The wood department has a solid strategy over a five-year period where all five of SCA’s sawmills are considered. One of the respondents described that the strategy covers decisions such as market position, concept and choice of customers but also volumes, productivity and non-tangible values such as leadership. Geo-graphical conditions as well as technical aspects are considered, in order to find a strategy that can make use of the full potential. The strategy often intends to invest heavily in some of the units, for instance by installing a new saw line, while others are kept running with smaller investments. The five-year strategy needs to be well-established with the wood supply department. The respondent explains that the five-year strategy that is set in collaboration between the wood- and wood supply depart-ments is communicated to the management at Bollsta sawmill, who then plan the production accordingly.
The wood department and sawmills at SCA make their operational planning in a six-month period. The sales team starts by screening the market and suggests all possible volumes and products that they consider sellable within the next six-month period. The sales team’s suggestion is communicated to the wood supply depart-ment. According to the respondents at Bollsta sawmill the sales potential typically corresponds to 125 - 150 percent of the production capacity. The departments of wood supply, forest and wood, discuss how to match production- and sales volumes. The result of the discussions is normally that SCA Wood chooses approximately 80 percent of the products and volumes suggested by the sales team. The product spec-ification is then translated into a distribution matrix of desired amounts of logs in different length- and diameter classes, to be used for guiding the cut-to-length (CTL) harvesting and making price lists promoting bucking of logs in accordance to the desired distribution. This distribution matrix gives an idea of the mean log. If the forest department can deliver the mean log according to the distribution matrix, Bollsta should be able to produce the products in the product specification. The agreed variation of the mean log is 5 % per month. Thus, the respondents think that this way of planning and following-up the incoming raw material is too robust in the sense of detail level. Instead, it would be preferable to be able to follow the product specification, which would require higher accuracy in forecasts. This mind-set is confirmed by the wood supply department, and the common thoughts are to have a solution that would focus on products and different stock levels; at mill, in forest, by road and at terminals.
35
The timber plan extends over six months. For this whole period, knowing possible fluctuations in the customers’ monthly demands is advantageous. If the customers are unable to give these prognoses, the sales team estimates a monthly demand. The monthly demands are then compared with the sawmills’ ability to produce. In De-cember a contract until March is set and if the forest department then is unable to deliver the appropriate raw material needed for these already sold products, the sawmill has to produce these products by in-optimal processing of logs causing higher costs and lower productivity – for example by using large dimension logs for sawn goods that optimally should have been produced from small dimension logs. Something considered by respondents as a greater challenge to handle is when the mean log drops during a month: if, for example, the mean log is 170 litres instead of the expected 180 litres, a consequence could be that the sawmill is unable to produce the largest dimension products and that there is an unwanted excess of the smaller dimensions. For one month, a deviation of 10 litres on the mean log could translate into a loss of millions (SEK) for the wood department. In these cases, the most important issue is communication. The wood department accepts changes in the plans but the sooner they are informed, the less of a loss it is. Minimizing loss is easier if the deviations are handled early in the value chain. The production planning is monthly, weekly, on day-to-day basis and even hourly. In the short-term production planning, the focus is products and logs per sawlog class but also total volumes. This planning is important to maintain a high produc-tivity and as low costs as possible.
3.2 Potential benefits followed by more detailed- and accurate forecasts
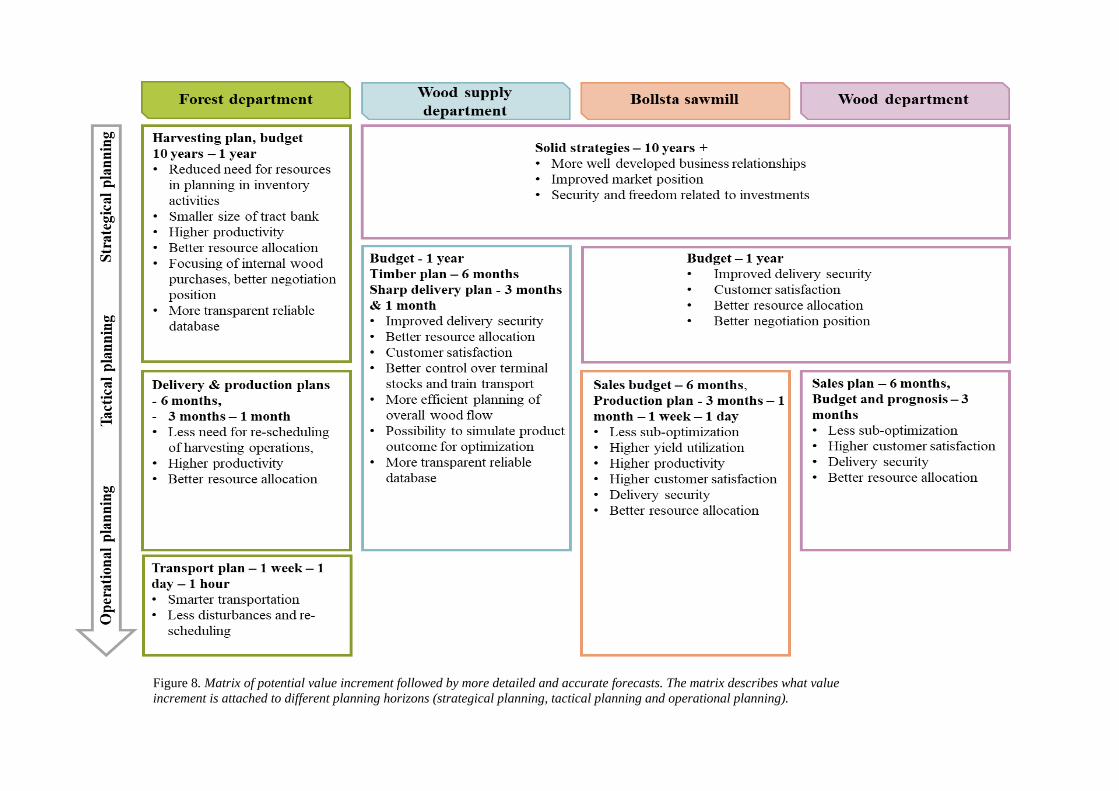
Figure 8 summarises the perceived potential benefits that respondents considered would follow by more detailed and accurate forecasts. More detailed descriptions are given in the following text.
36
).
Figure 8. Matrix of potential value increment followed by more detailed and accurate forecasts. The matrix describes what value increment is attached to different planning horizons (strategical planning, tactical planning and operational planning).

37
3.2.1 Forest department
The respondents from the forest department agreed on that more accurate data would improve the planning, since it would reduce the needed resources and thereby re-duce costs. Even though one of the respondents described that it would be preferable to have a larger stand register than two years of harvesting volume, the respondent also described that planned stands are perishable; for example, ribbons used for marking boarders are often not visible after more than five years after planning. With more reliable data it would be favourable to keep the stand register small and thereby improve the resource allocation. Both respondents explained that it is im-portant to have knowledge of the standing tree stock, roadside stock and terminal stock – “what is available now and what should wood purchasing focus on”? The challenge described is to maintain an even wood flow over the year, with the right content and availability. More accurate and detailed information would provide the opportunity to pay more for wood with desired characteristics and thereby improve the negotiation position.
SCA uses terminals for stock piling in a large extent. The respondents explained that this is a way to ensure volumes during changes in production at mills and en-suring that there is seasonal availability during the entire year. A described problem connected to the terminal stocks is the unreliability of their content. This can have implications for the mean log, because during periods when SCA needs to use large volumes from the terminal stock the mean log frequently varies. One of the respond-ents from the development perspective explained that given a certain demand during a certain time horizon, better prognoses should enable decision support systems of what in-stand logging units (homogenous parts of stands) should be stocked – not only volume but also their content and availability. All the respondents agreed on that the lack of accurate data from field inventory has implications for the entire value chain, for example when allocating harvesting and transportation resources. The mean stem volume and share of sawlogs have impact on harvester productivity, which in turn has consequences for balancing harvesting and forwarding activities. It is inefficient for the forwarder to wait for the harvester, which it decreases productivity and thus increases costs. In the worst-case scenario, an improper mean stem volume could lead to a situation where the harvesters must move and start on a new object before finishing the first one. In this scenario the transportation management, the wood supply management and the wood department are all negatively affected.

38
Another problem frequently described is that there are numerous of different data-bases and software with different forecasting formulas, and also different persons who change the numbers differently depending on role, experience and perception. This causes a lack of consistency in the handling of data. According to the respond-ents, this affects the quality of the data and makes it difficult to track changes. This is essential for follow-up of forecasts and improvement of data quality, for which the respondents requested a standardised database and software.
3.2.2 Wood supply department
At the wood supply department, one of the respondents described the use of histor-ical data as necessary, since the estimations are rough in this stage and historical data is better than, what the respondent called “a plain sheet”, as described before. However, the respondent also pointed out that using historical data sometimes can be repressive for development, which is why experience and communication are key factors for success. The respondent was under the perception that the strategical plans are too rough to benefit from high precision forecasts, and used the expression “plans are worthless, but planning is essential”. The respondent explained that the plan is just a base for re-planning and that the operational part of the wood procure-ment planning has higher value of accurate data and forecasts. However, other re-spondents considered that there would indeed be fruitful to use high precision fore-casts for the strategical planning when deciding where in the geographical area to invest resources, for example the employment of staff for purchasing wood from private forest owners. One of the respondents described that if it would be possible to know where there is a good mixture of pulpwood and timber that suits the demand from the industry, these geographies would be of higher value for investments. The main request from one of the respondents was to have a geographical predicta-bility, meaning where, when and what volumes are produced in the different geog-raphies. This information would be helpful when planning the handling of terminals and the train transports from terminals to industry and for the overall wood flow. For the supply chain manager who specializes on delivering the right content within the volumes, it would be preferable to have better information of species mixture, share of sawlogs and site conditions. With this information, there are expectations that it would be possible to simulate product outcome using the different price lists and distribution matrices for different mills. Assuming that the wood department would be able to create higher value

39
from better information of the wood characteristics and quality, respondents from the development perspective had reason to believe that future wood optimization software would take these variables into account. One of the respondents empha-sized the importance of new systems to be compatible with future development which is also related to industry standards. With the upgrade from VIOL (The Swe-dish branch standard system for businesses and real-time information of deliveries within the supply chain from forest to industry) 2 to VIOL 3, which is the forest industry’s common system for administrating and exchanging business information of wood deliveries within the value chain from forest to mill, a step towards such industry standard is considered to have been made. The respondent explained that standards enable different actors within the forest industry to communicate with each other. This way, in future scenarios, it should be possible to follow a product specification for a certain mill using the same distribution matrix for all suppliers and thereby achieve a higher delivery precision and lower costs. The respondent also thought that VIOL 3 should enable a default setting for the harvesters to pro-duce the assortment that is most suitable for the entire logistic solution. One of the respondents from the development perspective however pointed out that these pos-sible future development ideas rely on the ability to continue using CTL harvesting. The respondents explained that today’s software systems are not developed to pro-vide forecast information, even if accurate data would be available. To develop this kind of systems, the respondents think that it is important to discuss the benefits and possible challenges of such systems. It would affect the bucking of sawlogs, since the price list could be better adapted to different site conditions. In the long term, one of the respondents believed that better forecasts would enable the production management to choose objects with suitable site conditions when planning which objects should be destined to a certain mill. Most of the respondents agreed on that better forecast should first affect the tactical and operational management but in the long term it would also improve the strategical planning. This could be applied in external purchases and trades, since different mills specialize on different wood characteristics.
3.2.3 Wood department and Bollsta sawmill
The most strategical benefit from more accurate and detailed forecasts considered from the industry perspective was the “rasion d’être” (right to exist) on the market, which entails freedom and better possibilities for investments. However, the most direct value increment was described to be found within the operations on the oper-

40
ational level. The ability to forecast volumes, share of sawlogs and wood character-istics with high certainty would enable also high delivery certainty and customer satisfaction, and thereby increase revenue which is fundamental for the more strate-gical benefits.
Since most of the sawlog products are sold before production, the respondents em-phasized the importance of procuring the raw material that is needed for these prod-ucts. To meet the required volume is seldom a problem, but to also meet the desired specific contents of these volumes can be challenging. Sawmills and the wood de-partment order a total volume per species and mean log, measured in litres. As men-tioned before, respondents described the mean log as too general/undetailed for fol-low-up, given the criteria of the wood content for their products, and considered it preferable to follow the actual product specification in a more dynamic manner. This would however require higher accuracy in forecasts. Mentioned examples of varia-bles that would then be favourable to forecast are heartwood diameter, knot distance, fresh- vs. dry knots, and density. The main issue considered for Bollsta sawmill today is the fluctuations of the mean log. Since the production planning is focusing on products that are already sold, the entire operation is adapted accordingly. The largest value loss is obviously the loss of yield in the raw material when producing products from wood that is of unsuitable dimensions, but this also affects the productivity at the mill. For example, if the production would not match the planning, the capacity of the dryers would in turn not match the production and consequently the saw line must be stopped while awaiting the dryers to process the sawn goods. There are numerous productivity consequences of not receiving the requested raw material and the re-planning and re-scheduling of the operation is costly.
3.3 Evaluation of the influence of applying the imputation method and wood properties on the precision of forecasts of key variables
3.3.1 Stand level forecasts
The first part of the statistical analyses was on stand level, for the 59 stands that were imputed. Harvester data from the true objects (the actual harvested stands) was used as the reference values which were compared with both the results from the forecast and the input variables that were used for the imputation.
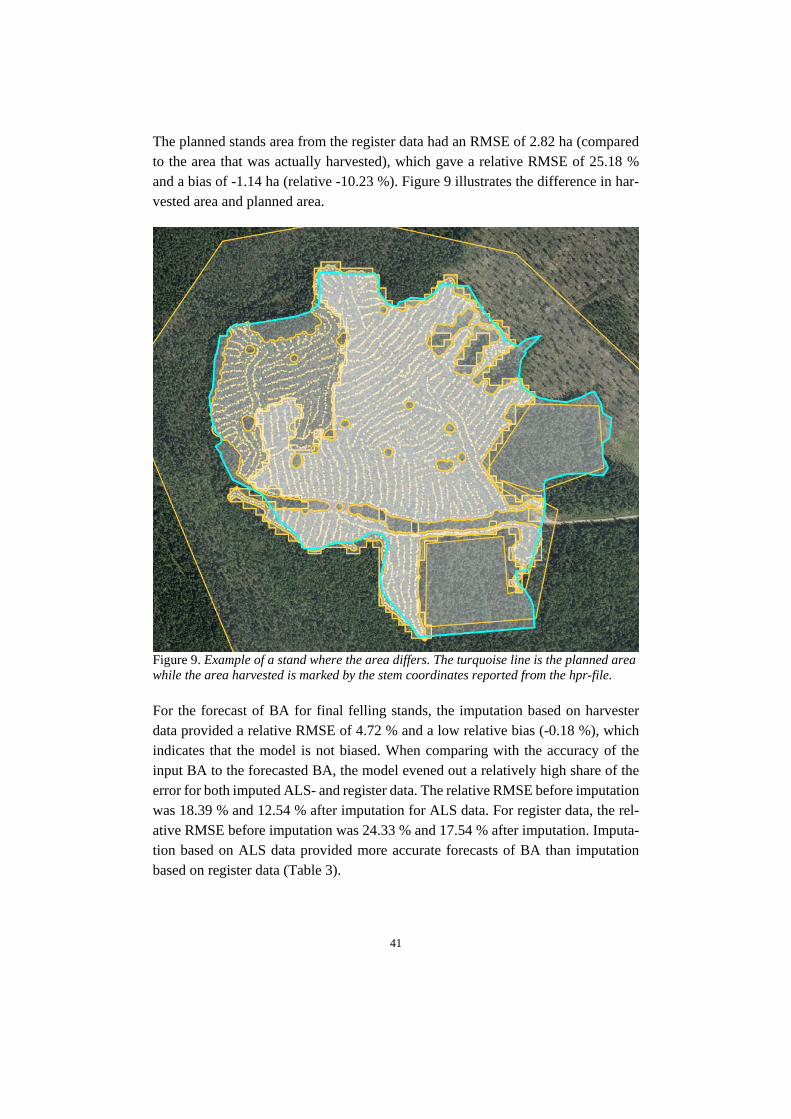
41
The planned stands area from the register data had an RMSE of 2.82 ha (compared to the area that was actually harvested), which gave a relative RMSE of 25.18 % and a bias of -1.14 ha (relative -10.23 %). Figure 9 illustrates the difference in har-vested area and planned area.
Figure 9. Example of a stand where the area differs. The turquoise line is the planned area while the area harvested is marked by the stem coordinates reported from the hpr-file. For the forecast of BA for final felling stands, the imputation based on harvester data provided a relative RMSE of 4.72 % and a low relative bias (-0.18 %), which indicates that the model is not biased. When comparing with the accuracy of the input BA to the forecasted BA, the model evened out a relatively high share of the error for both imputed ALS- and register data. The relative RMSE before imputation was 18.39 % and 12.54 % after imputation for ALS data. For register data, the rel-ative RMSE before imputation was 24.33 % and 17.54 % after imputation. Imputa-tion based on ALS data provided more accurate forecasts of BA than imputation based on register data (Table 3).
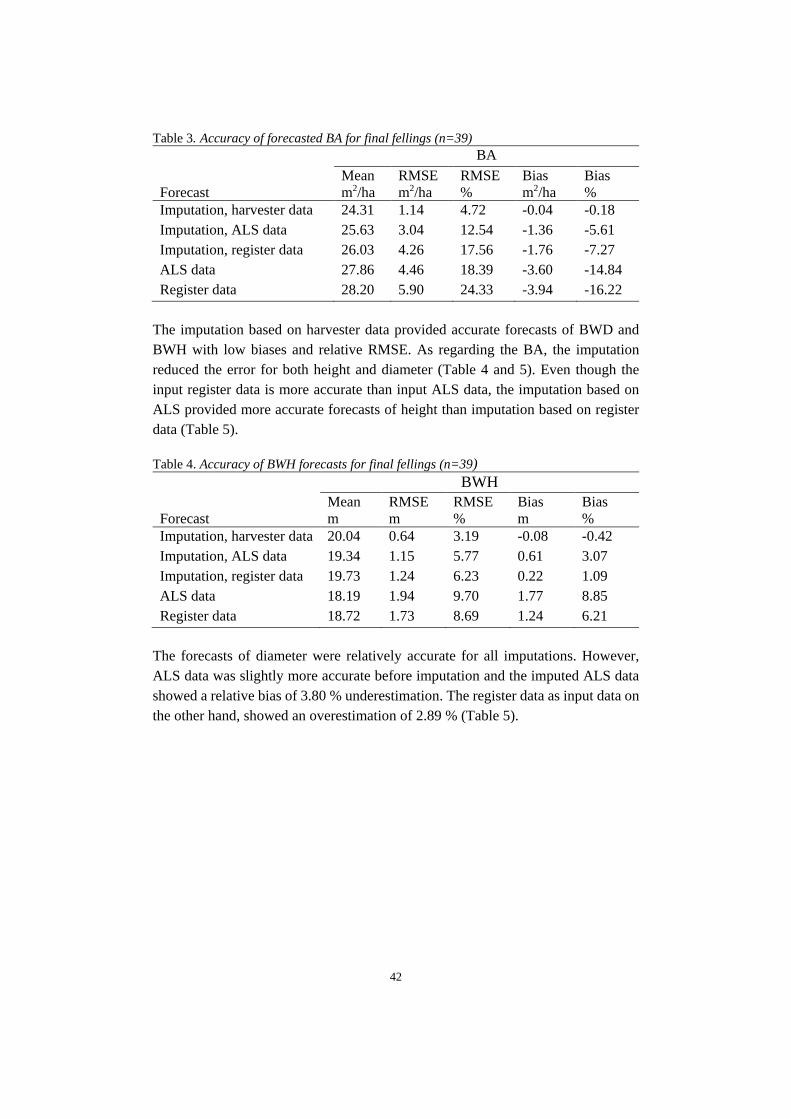
42
Table 3. Accuracy of forecasted BA for final fellings (n=39) BA
Forecast
Mean m2/ha
RMSE m2/ha
RMSE %
Bias m2/ha
Bias %
Imputation, harvester data 24.31 1.14 4.72 -0.04 -0.18 Imputation, ALS data 25.63 3.04 12.54 -1.36 -5.61 Imputation, register data 26.03 4.26 17.56 -1.76 -7.27 ALS data 27.86 4.46 18.39 -3.60 -14.84 Register data 28.20 5.90 24.33 -3.94 -16.22
The imputation based on harvester data provided accurate forecasts of BWD and BWH with low biases and relative RMSE. As regarding the BA, the imputation reduced the error for both height and diameter (Table 4 and 5). Even though the input register data is more accurate than input ALS data, the imputation based on ALS provided more accurate forecasts of height than imputation based on register data (Table 5). Table 4. Accuracy of BWH forecasts for final fellings (n=39) BWH Forecast
Mean m
RMSE m
RMSE %
Bias m
Bias %
Imputation, harvester data 20.04 0.64 3.19 -0.08 -0.42 Imputation, ALS data 19.34 1.15 5.77 0.61 3.07 Imputation, register data 19.73 1.24 6.23 0.22 1.09 ALS data 18.19 1.94 9.70 1.77 8.85 Register data 18.72 1.73 8.69 1.24 6.21
The forecasts of diameter were relatively accurate for all imputations. However, ALS data was slightly more accurate before imputation and the imputed ALS data showed a relative bias of 3.80 % underestimation. The register data as input data on the other hand, showed an overestimation of 2.89 % (Table 5).
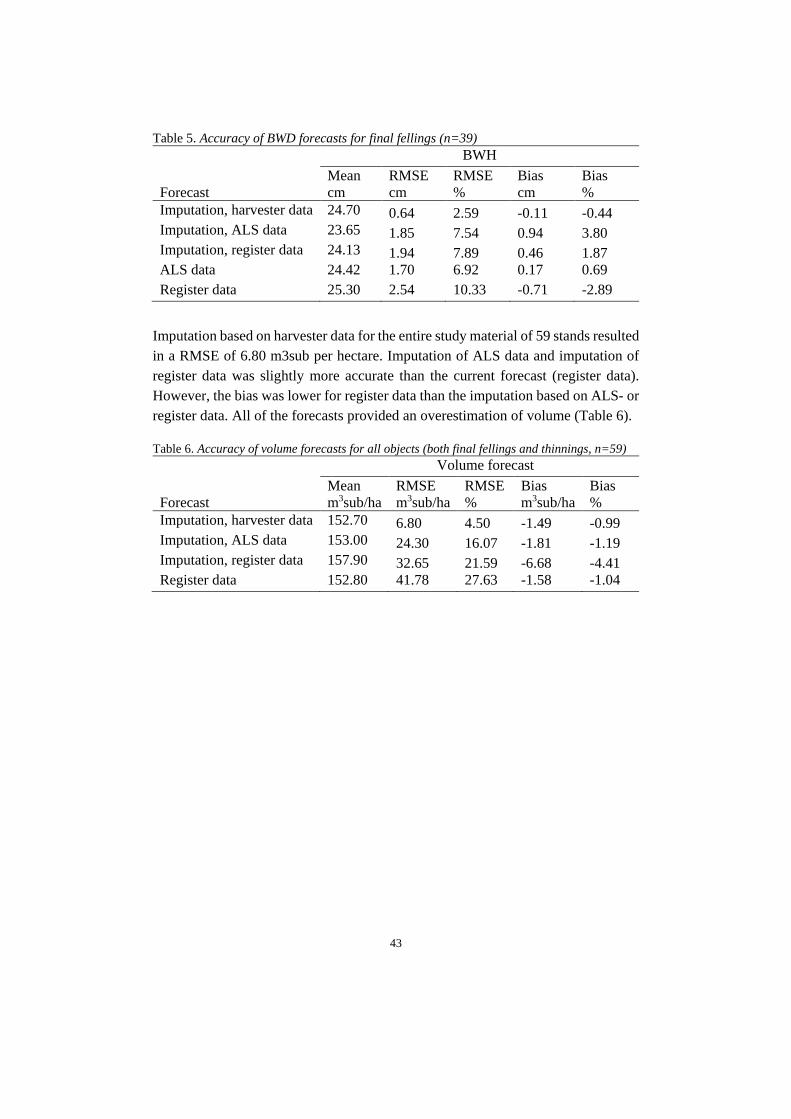
43
Table 5. Accuracy of BWD forecasts for final fellings (n=39) BWH Forecast
Mean cm
RMSE cm
RMSE %
Bias cm
Bias %
Imputation, harvester data 24.70 0.64 2.59 -0.11 -0.44 Imputation, ALS data 23.65 1.85 7.54 0.94 3.80 Imputation, register data 24.13 1.94 7.89 0.46 1.87 ALS data 24.42 1.70 6.92 0.17 0.69 Register data 25.30 2.54 10.33 -0.71 -2.89
Imputation based on harvester data for the entire study material of 59 stands resulted in a RMSE of 6.80 m3sub per hectare. Imputation of ALS data and imputation of register data was slightly more accurate than the current forecast (register data). However, the bias was lower for register data than the imputation based on ALS- or register data. All of the forecasts provided an overestimation of volume (Table 6). Table 6. Accuracy of volume forecasts for all objects (both final fellings and thinnings, n=59) Volume forecast Forecast
Mean m3sub/ha
RMSE m3sub/ha
RMSE %
Bias m3sub/ha
Bias %
Imputation, harvester data 152.70 6.80 4.50 -1.49 -0.99 Imputation, ALS data 153.00 24.30 16.07 -1.81 -1.19 Imputation, register data 157.90 32.65 21.59 -6.68 -4.41 Register data 152.80 41.78 27.63 -1.58 -1.04
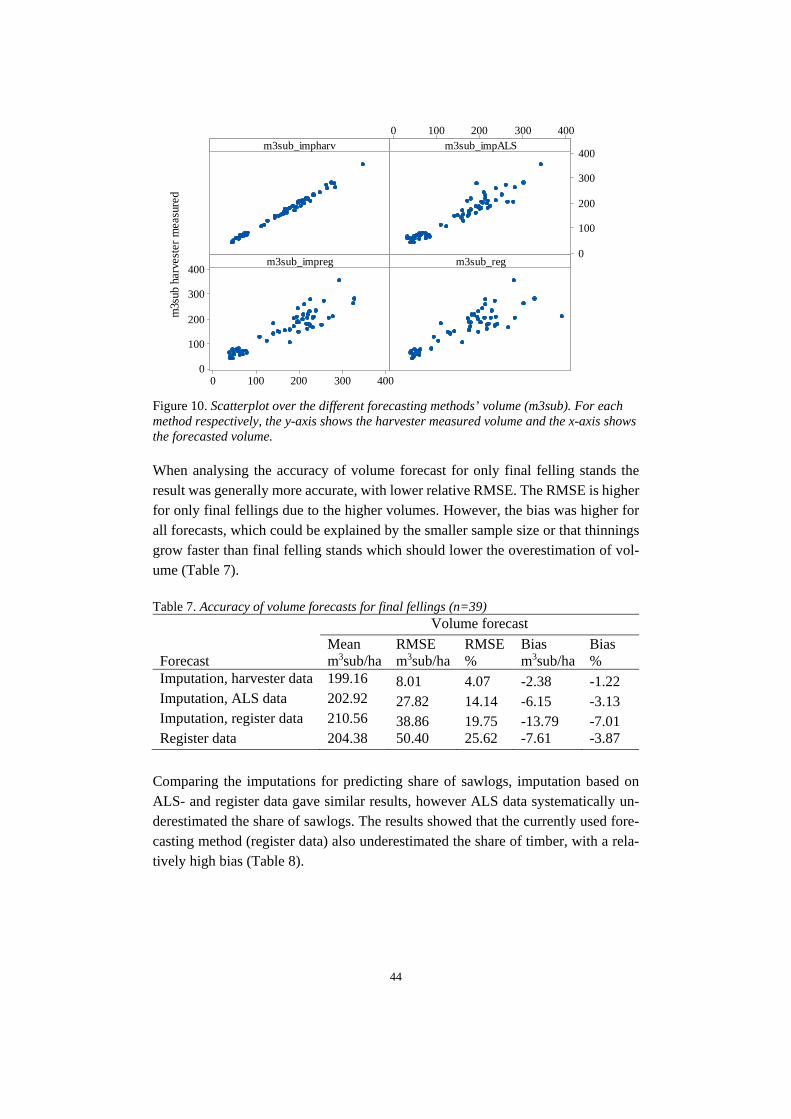
44
Figure 10. Scatterplot over the different forecasting methods’ volume (m3sub). For each method respectively, the y-axis shows the harvester measured volume and the x-axis shows the forecasted volume. When analysing the accuracy of volume forecast for only final felling stands the result was generally more accurate, with lower relative RMSE. The RMSE is higher for only final fellings due to the higher volumes. However, the bias was higher for all forecasts, which could be explained by the smaller sample size or that thinnings grow faster than final felling stands which should lower the overestimation of vol-ume (Table 7).
Table 7. Accuracy of volume forecasts for final fellings (n=39) Volume forecast Forecast
Mean m3sub/ha
RMSE m3sub/ha
RMSE %
Bias m3sub/ha
Bias %
Imputation, harvester data 199.16 8.01 4.07 -2.38 -1.22 Imputation, ALS data 202.92 27.82 14.14 -6.15 -3.13 Imputation, register data 210.56 38.86 19.75 -13.79 -7.01 Register data 204.38 50.40 25.62 -7.61 -3.87
Comparing the imputations for predicting share of sawlogs, imputation based on ALS- and register data gave similar results, however ALS data systematically un-derestimated the share of sawlogs. The results showed that the currently used fore-casting method (register data) also underestimated the share of timber, with a rela-tively high bias (Table 8).
4003002001000
400
300
200
100
0
4003002001000
400
300
200
100
0
m3sub_impharv
m3s
ub h
arve
ster
mea
sure
d
m3sub_impALS
m3sub_impreg m3sub_reg
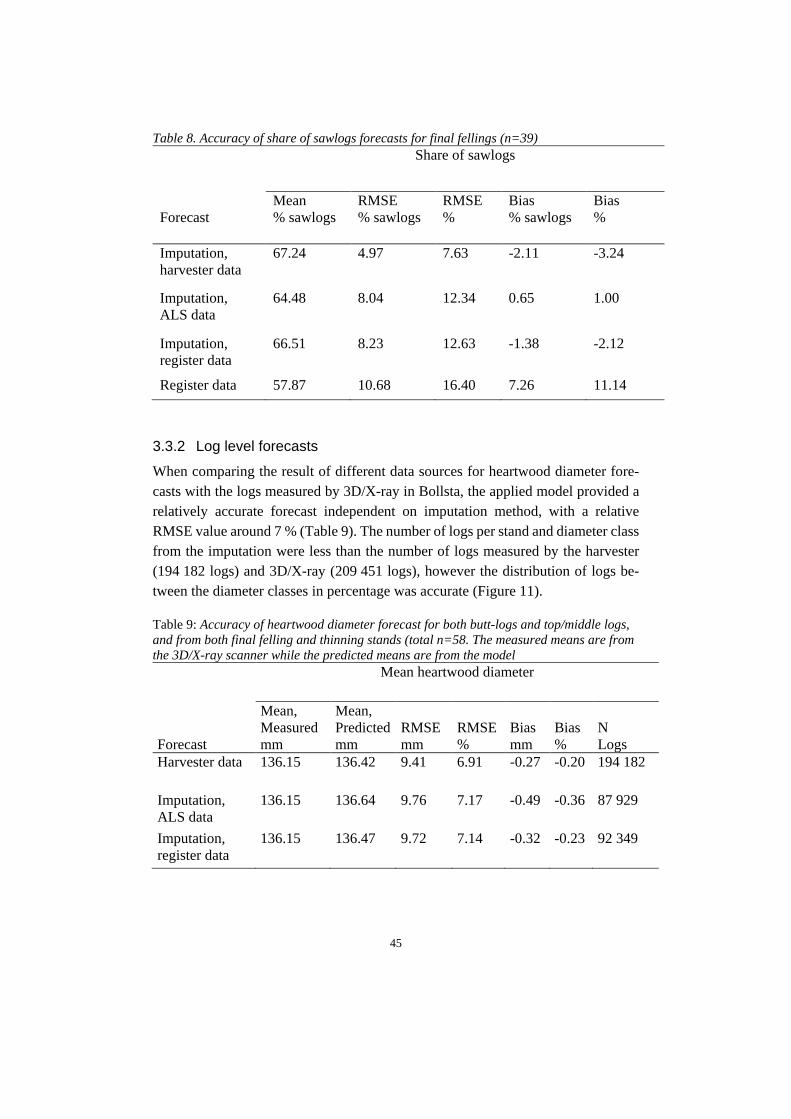
45
Table 8. Accuracy of share of sawlogs forecasts for final fellings (n=39) Share of sawlogs
Forecast
Mean % sawlogs
RMSE % sawlogs
RMSE %
Bias % sawlogs
Bias %
Imputation, harvester data
67.24 4.97 7.63
-2.11
-3.24
Imputation, ALS data
64.48 8.04
12.34
0.65
1.00
Imputation, register data
66.51 8.23
12.63
-1.38
-2.12
Register data 57.87
10.68
16.40
7.26
11.14
3.3.2 Log level forecasts
When comparing the result of different data sources for heartwood diameter fore-casts with the logs measured by 3D/X-ray in Bollsta, the applied model provided a relatively accurate forecast independent on imputation method, with a relative RMSE value around 7 % (Table 9). The number of logs per stand and diameter class from the imputation were less than the number of logs measured by the harvester (194 182 logs) and 3D/X-ray (209 451 logs), however the distribution of logs be-tween the diameter classes in percentage was accurate (Figure 11). Table 9: Accuracy of heartwood diameter forecast for both butt-logs and top/middle logs, and from both final felling and thinning stands (total n=58. The measured means are from the 3D/X-ray scanner while the predicted means are from the model
Mean heartwood diameter
Forecast
Mean, Measured mm
Mean, Predicted mm
RMSE mm
RMSE %
Bias mm
Bias %
N Logs
Harvester data 136.15 136.42 9.41 6.91 -0.27 -0.20 194 182
Imputation, ALS data
136.15 136.64 9.76 7.17 -0.49 -0.36 87 929
Imputation, register data
136.15 136.47 9.72 7.14 -0.32 -0.23 92 349
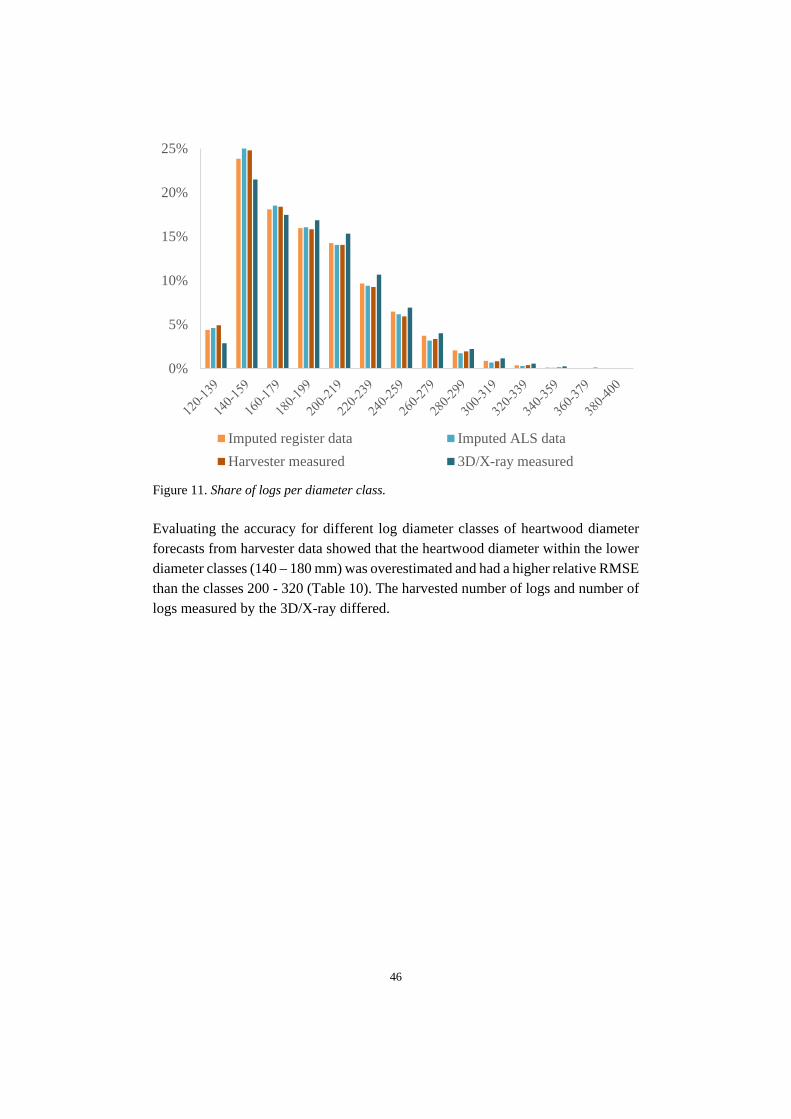
46
Figure 11. Share of logs per diameter class. Evaluating the accuracy for different log diameter classes of heartwood diameter forecasts from harvester data showed that the heartwood diameter within the lower diameter classes (140 – 180 mm) was overestimated and had a higher relative RMSE than the classes 200 - 320 (Table 10). The harvested number of logs and number of logs measured by the 3D/X-ray differed.
0%
5%
10%
15%
20%
25%
Imputed register data Imputed ALS dataHarvester measured 3D/X-ray measured
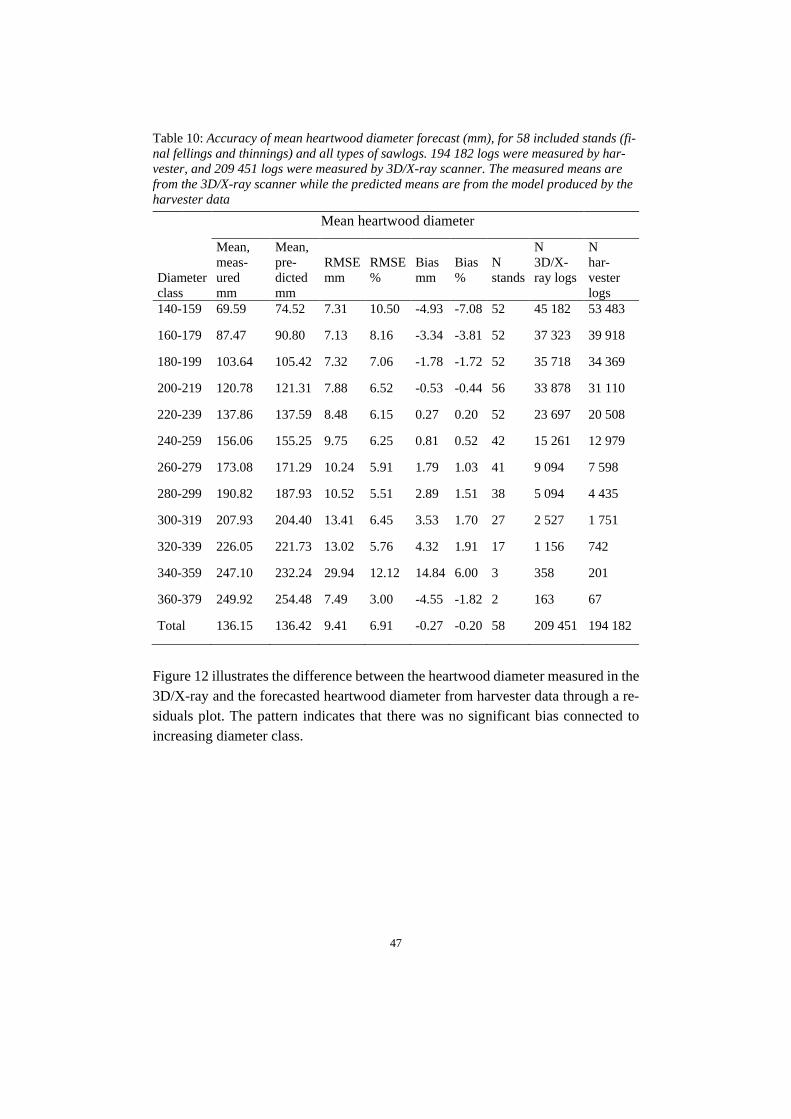
47
Table 10: Accuracy of mean heartwood diameter forecast (mm), for 58 included stands (fi-nal fellings and thinnings) and all types of sawlogs. 194 182 logs were measured by har-vester, and 209 451 logs were measured by 3D/X-ray scanner. The measured means are from the 3D/X-ray scanner while the predicted means are from the model produced by the harvester data
Figure 12 illustrates the difference between the heartwood diameter measured in the 3D/X-ray and the forecasted heartwood diameter from harvester data through a re-siduals plot. The pattern indicates that there was no significant bias connected to increasing diameter class.
Mean heartwood diameter
Diameter class
Mean, meas-ured mm
Mean, pre-dicted mm
RMSE mm
RMSE %
Bias mm
Bias %
N stands
N 3D/X-ray logs
N har-vester logs
140-159 69.59 74.52 7.31 10.50 -4.93 -7.08 52 45 182 53 483
160-179 87.47 90.80 7.13 8.16 -3.34 -3.81 52 37 323 39 918
180-199 103.64 105.42 7.32 7.06 -1.78 -1.72 52 35 718 34 369
200-219 120.78 121.31 7.88 6.52 -0.53 -0.44 56 33 878 31 110
220-239 137.86 137.59 8.48 6.15 0.27 0.20 52 23 697 20 508
240-259 156.06 155.25 9.75 6.25 0.81 0.52 42 15 261 12 979
260-279 173.08 171.29 10.24 5.91 1.79 1.03 41 9 094 7 598
280-299 190.82 187.93 10.52 5.51 2.89 1.51 38 5 094 4 435
300-319 207.93 204.40 13.41 6.45 3.53 1.70 27 2 527 1 751
320-339 226.05 221.73 13.02 5.76 4.32 1.91 17 1 156 742
340-359 247.10 232.24 29.94 12.12 14.84 6.00 3 358 201
360-379 249.92 254.48 7.49 3.00 -4.55 -1.82 2 163 67
Total 136.15 136.42 9.41 6.91 -0.27 -0.20 58 209 451 194 182
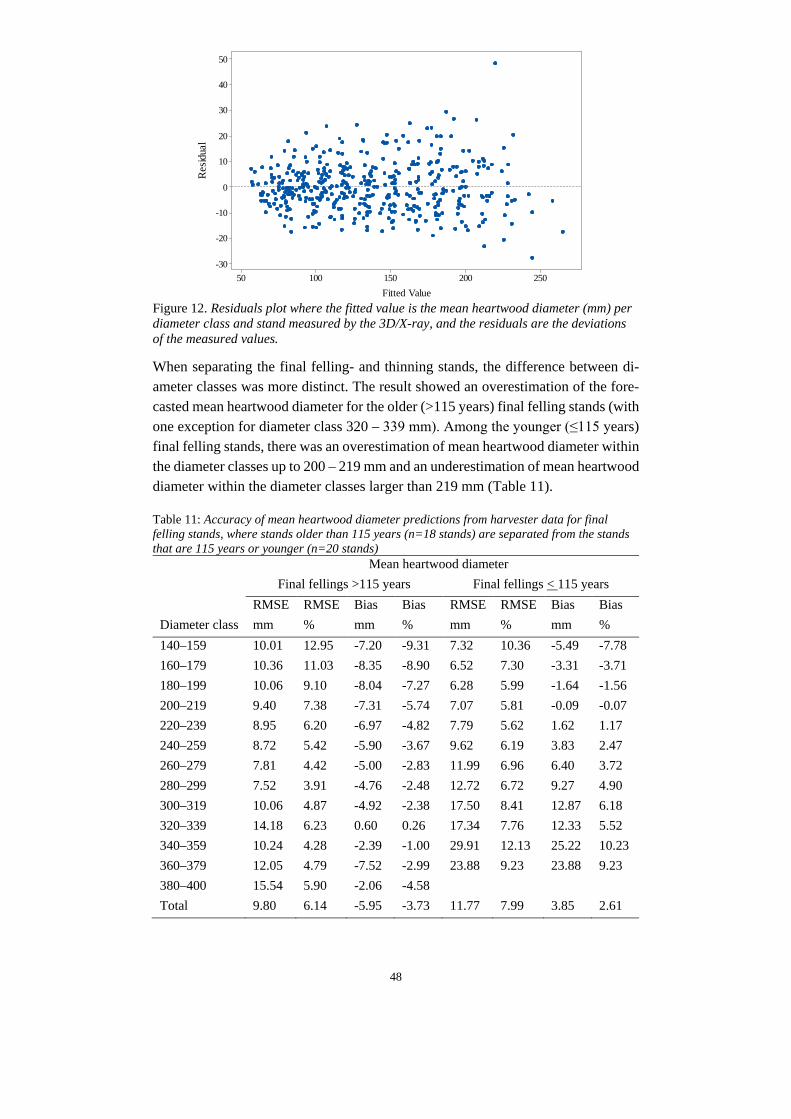
48
25020015010050
50
40
30
20
10
0
-10
-20
-30
Fitted Value
Res
idua
l Figure 12. Residuals plot where the fitted value is the mean heartwood diameter (mm) per diameter class and stand measured by the 3D/X-ray, and the residuals are the deviations of the measured values.
When separating the final felling- and thinning stands, the difference between di-ameter classes was more distinct. The result showed an overestimation of the fore-casted mean heartwood diameter for the older (>115 years) final felling stands (with one exception for diameter class 320 – 339 mm). Among the younger (≤115 years) final felling stands, there was an overestimation of mean heartwood diameter within the diameter classes up to 200 – 219 mm and an underestimation of mean heartwood diameter within the diameter classes larger than 219 mm (Table 11). Table 11: Accuracy of mean heartwood diameter predictions from harvester data for final felling stands, where stands older than 115 years (n=18 stands) are separated from the stands that are 115 years or younger (n=20 stands)
Mean heartwood diameter Final fellings >115 years Final fellings < 115 years
RMSE RMSE Bias Bias RMSE RMSE Bias Bias Diameter class mm % mm % mm % mm % 140–159 10.01 12.95 -7.20 -9.31 7.32 10.36 -5.49 -7.78 160–179 10.36 11.03 -8.35 -8.90 6.52 7.30 -3.31 -3.71 180–199 10.06 9.10 -8.04 -7.27 6.28 5.99 -1.64 -1.56 200–219 9.40 7.38 -7.31 -5.74 7.07 5.81 -0.09 -0.07 220–239 8.95 6.20 -6.97 -4.82 7.79 5.62 1.62 1.17 240–259 8.72 5.42 -5.90 -3.67 9.62 6.19 3.83 2.47 260–279 7.81 4.42 -5.00 -2.83 11.99 6.96 6.40 3.72 280–299 7.52 3.91 -4.76 -2.48 12.72 6.72 9.27 4.90 300–319 10.06 4.87 -4.92 -2.38 17.50 8.41 12.87 6.18 320–339 14.18 6.23 0.60 0.26 17.34 7.76 12.33 5.52 340–359 10.24 4.28 -2.39 -1.00 29.91 12.13 25.22 10.23 360–379 12.05 4.79 -7.52 -2.99 23.88 9.23 23.88 9.23 380–400 15.54 5.90 -2.06 -4.58
Total 9.80 6.14 -5.95 -3.73 11.77 7.99 3.85 2.61
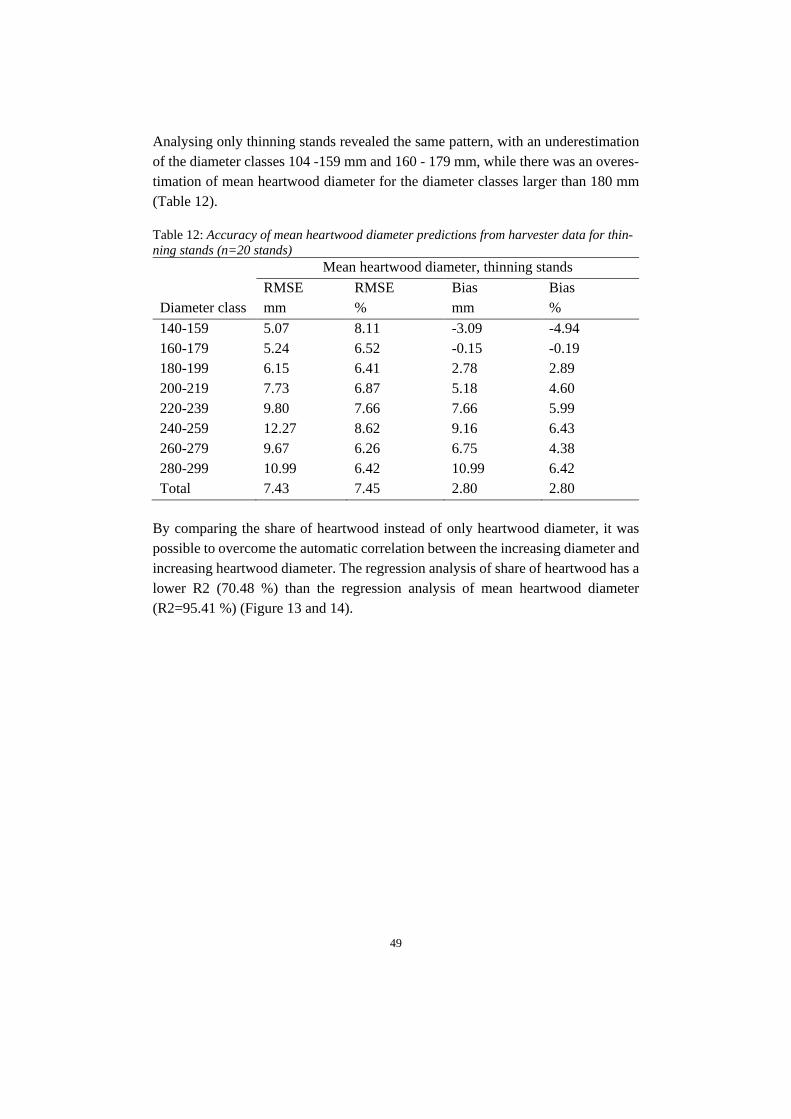
49
Analysing only thinning stands revealed the same pattern, with an underestimation of the diameter classes 104 -159 mm and 160 - 179 mm, while there was an overes-timation of mean heartwood diameter for the diameter classes larger than 180 mm (Table 12). Table 12: Accuracy of mean heartwood diameter predictions from harvester data for thin-ning stands (n=20 stands) Mean heartwood diameter, thinning stands
RMSE RMSE Bias Bias Diameter class mm % mm % 140-159 5.07 8.11 -3.09 -4.94 160-179 5.24 6.52 -0.15 -0.19 180-199 6.15 6.41 2.78 2.89 200-219 7.73 6.87 5.18 4.60 220-239 9.80 7.66 7.66 5.99 240-259 12.27 8.62 9.16 6.43 260-279 9.67 6.26 6.75 4.38 280-299 10.99 6.42 10.99 6.42 Total 7.43 7.45 2.80 2.80
By comparing the share of heartwood instead of only heartwood diameter, it was possible to overcome the automatic correlation between the increasing diameter and increasing heartwood diameter. The regression analysis of share of heartwood has a lower R2 (70.48 %) than the regression analysis of mean heartwood diameter (R2=95.41 %) (Figure 13 and 14).
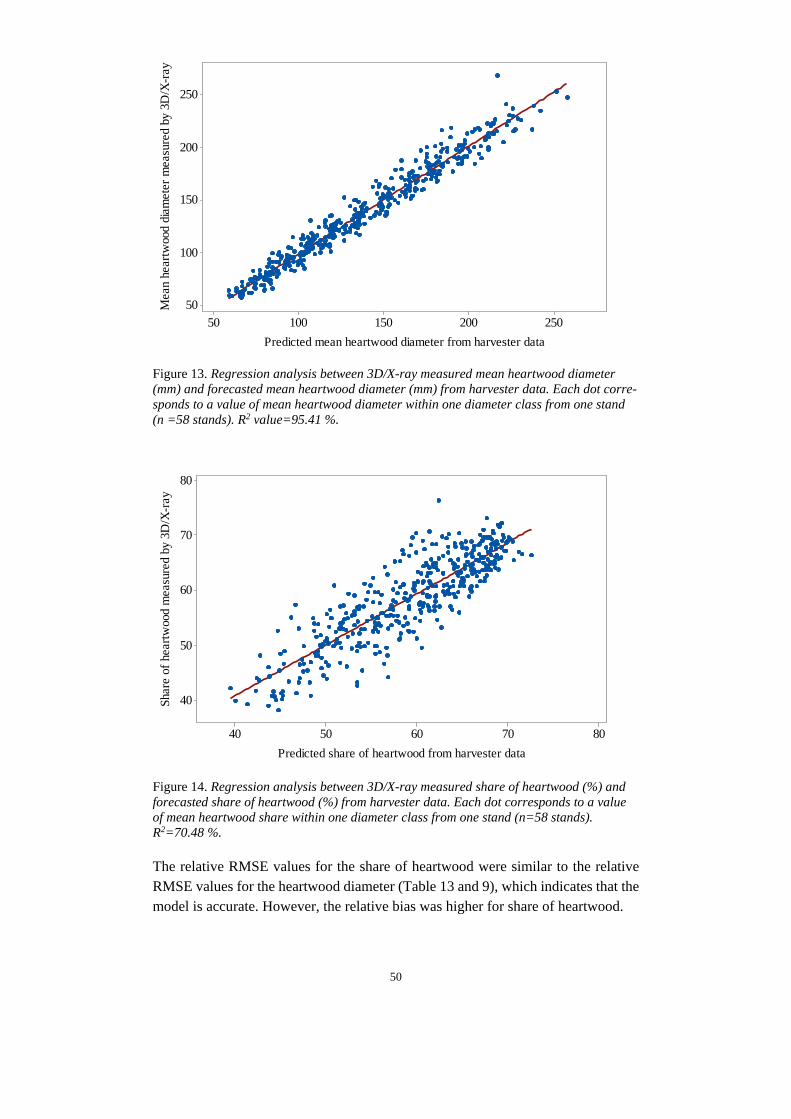
50
Figure 13. Regression analysis between 3D/X-ray measured mean heartwood diameter (mm) and forecasted mean heartwood diameter (mm) from harvester data. Each dot corre-sponds to a value of mean heartwood diameter within one diameter class from one stand (n =58 stands). R2 value=95.41 %. Figure 14. Regression analysis between 3D/X-ray measured share of heartwood (%) and forecasted share of heartwood (%) from harvester data. Each dot corresponds to a value of mean heartwood share within one diameter class from one stand (n=58 stands). R2=70.48 %. The relative RMSE values for the share of heartwood were similar to the relative RMSE values for the heartwood diameter (Table 13 and 9), which indicates that the model is accurate. However, the relative bias was higher for share of heartwood.
25020015010050
250
200
150
100
50
Predicted mean heartwood diameter from harvester data
Mea
n he
artw
ood
diam
eter
mea
sure
d by
3D
/X-r
ay
8070605040
80
70
60
50
40
Predicted share of heartwood from harvester data
Shar
e of
hea
rtwoo
d m
easu
red
by 3
D/X
-ray

51
Table 13: Share of heartwood diameter (n =58 stands) Share of heartwood, %
Forecast
RMSE %
RMSE %
Bias %
Bias %
Harvester data 4.04 6.90 -0.51 -0.86 Imputed ALS data 4.27 7.28 -0.66 -1.13 Imputed register data 4.25 7.26 -0.61 -1.05
Analysing the correlation between mean share of heartwood measured by the 3D/X-ray and the forecasted mean share of heartwood (from harvester data) gave a R2-value of 70.48 %. By using the Mixed Effects Model on the mean share of heartwood, it was possible to evaluate the influence of impacts not explained by the model. The random factor tested was stand identification number, while the covariates were BWD, BWH, stand age, log age, logarithmic stand age and mean diameter measured by harvester. No significant effect could be recognised from BWH or BWD, and not from log age (higher p-value than 0.05). However, stand age, logarithmic stand age and the har-vester mean diameter showed significant effect with P-values lower than 0.05. As the logarithmic stand age is used in the model, it was chosen before stand age as covariate (Table 14). Table 14: Covariates used for the Mixed Effects Model and their significance for the model fit
Term P-Value
Predicted mean heartwood share 0.000
Logarithmic stand age 0.000
Mean diameter measured by harvester 0.002
The results showed that out of the 29.52 % not explained by the model, 68.68 % could be explained by the variation between stands (P-values <0.05) (Table 15). Table 15: Influence of variables not explained by the model
Source Variance % of Total P-Value
Stands 0.000744 68.68 % 0.000
Error 0.000339 31.32 % 0.000
Total 0.001083
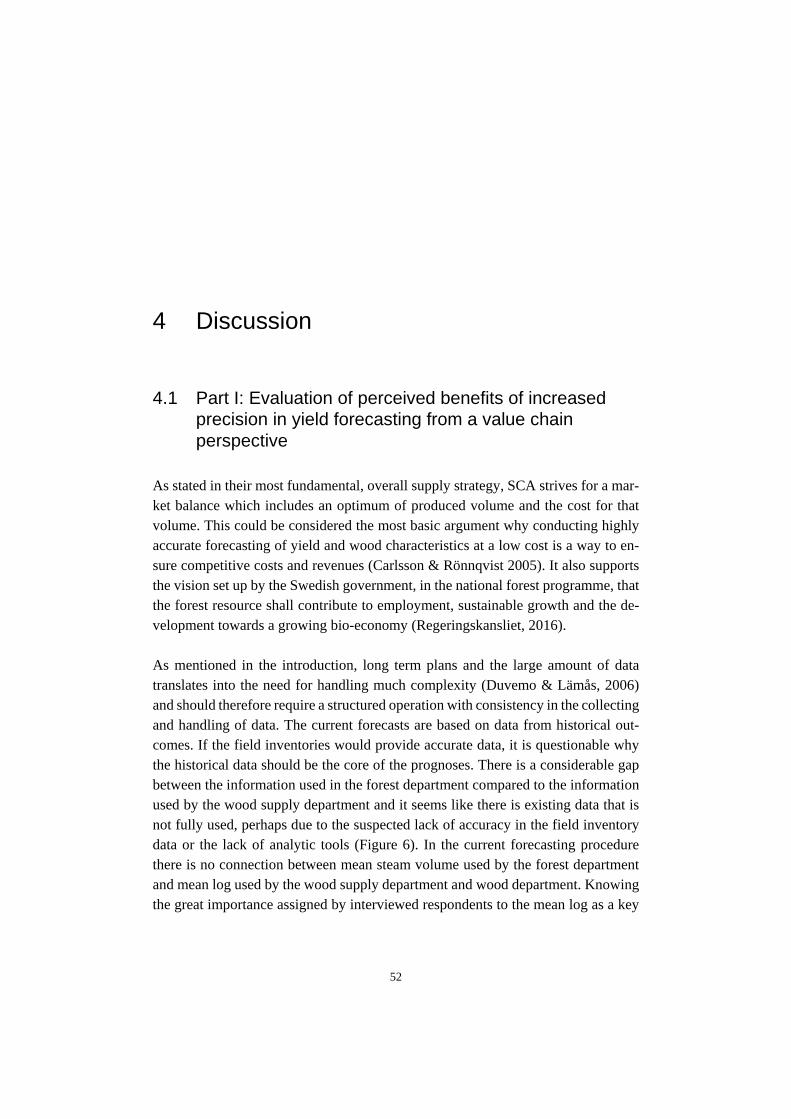
52
4.1 Part I: Evaluation of perceived benefits of increased precision in yield forecasting from a value chain perspective
As stated in their most fundamental, overall supply strategy, SCA strives for a mar-ket balance which includes an optimum of produced volume and the cost for that volume. This could be considered the most basic argument why conducting highly accurate forecasting of yield and wood characteristics at a low cost is a way to en-sure competitive costs and revenues (Carlsson & Rönnqvist 2005). It also supports the vision set up by the Swedish government, in the national forest programme, that the forest resource shall contribute to employment, sustainable growth and the de-velopment towards a growing bio-economy (Regeringskansliet, 2016).
As mentioned in the introduction, long term plans and the large amount of data translates into the need for handling much complexity (Duvemo & Lämås, 2006) and should therefore require a structured operation with consistency in the collecting and handling of data. The current forecasts are based on data from historical out-comes. If the field inventories would provide accurate data, it is questionable why the historical data should be the core of the prognoses. There is a considerable gap between the information used in the forest department compared to the information used by the wood supply department and it seems like there is existing data that is not fully used, perhaps due to the suspected lack of accuracy in the field inventory data or the lack of analytic tools (Figure 6). In the current forecasting procedure there is no connection between mean steam volume used by the forest department and mean log used by the wood supply department and wood department. Knowing the great importance assigned by interviewed respondents to the mean log as a key
4 Discussion

53
planning and follow-up variable, mean log could have been included among the key variables forecasted and analysed in this study. However, the mean log was not mentioned as a key variable during the workshop, due to the fact that future forecasts need to be more detailed than log dimensions, which was also emphasized during the interviews. Thus, both wood department and sawmill would benefit from future forecasts of wood properties that fulfils the product specifications and not only di-mensions.
The main benefits from more accurate data discussed were on the operational plan-ning level (Figure 8). However, the reduced costs related to operational management improvement directly connect to goal fulfilment of the tactical- and strategical plan-ning levels (Fjeld & Dahlin, 2015). With more accurate information, pre-harvesting analysis and decisions should be more informed and thereby decrease the needs for costly post-harvesting planning adjustments (Wilhelmsson et al., 2007). This argu-ment might be even more relevant for Bollsta sawmill, since the value increment of SCA’s forest resources largely depends on the value of products made at SCA’s sawmills. By the improved communication between the different parts of the value chain that is developing within SCA, the knowledge of potential value in the forest resource and costs will increase the ability to meet customers’ demands and add value for the entire value chain (Wilhelmsson et al., 2007). Digitalisation and automation are general trends that will affect the forest industry’s ability to increase value-creation and competitiveness, and thereby also increase customer value (Andrén et al., 2016). The need for better analytical tools to improve the workflow was frequently emphasized by interviewed respondents. By extensive use of big data such as historical harvester data, it should be possible to improve the information flow among production line, business management and the supply chain management. This should make the industrial management more transparent and organized and lead to reduced costs (Lee & Yang, 2014). With new projects and the renewal of VIOL, SCA is moving towards a more standardized management of in-formation, which seems to be highly relevant to enable the use of big data in a more optimal way. However, the input data for imputation needs to be of a certain quality to make the forecasts reliable.
54
4.2 Part II: Evaluation of the influence of applying the imputation method and wood properties models on the forecasting precision of key variables
4.2.1 Stand level forecasts
The areal deviations between the planned- and harvested area are problematic (Fig-ure 9). The relative bias implies that there is a systematic overestimation of the planned area in field inventories. In practice, this has an obvious impact on the esti-mated total volume and could potentially represent the largest error source for field inventories. During field inventory, the staff is responsible for marking nature con-sideration areas that exceeds 0.1 hectares. However, the harvester operators some-times need to make own decisions and leave areas due to inabilities to pass certain grounds (Kårén, 2018, personal comment). It is common that stands consist of more than one logging unit when the stand properties differ too much. In these cases, it is also common that not all logging units are harvested at the same time, which affects the follow-up of forecasts (Kårén, 2018, personal comment). Independent of what data source is chosen as input for the forecasts the error due to area deviation will remain since the planned area would be used for both register- and ALS data in forecasting purposes, even though the harvested areas was used for the ALS data in this case. One likely explanation to the areal deviations could also be that the hpr-files from the harvesters were not reported for the entire harvested area, which could be due to technical issues or affected by the harvester operator. In any case, it relates to the handling of data.
As the BA is considered the most important variable to predict volume (Möller, 2018, personal comment), the quality of the BA as an input variable is very im-portant (Table 3). Compared to BWH and BWD, the BA has larger relative errors in terms of overestimations for both ALS- and register data which clearly affects the volume forecasts (Table 6). This could have several explanations, for example there has been events of wind throws in the area after the ALS data (and likely also reg-ister data) was collected (Alamaa & Lunneborg, 2013), which naturally could have reduced the amount of trees and thus lowered the BA. Another reason could be that the harvested areas and the planned areas differ which, as mentioned in the methods section, could mean that parts of stands with large properties deviations has been compared (Figure 9). Input data from both ALS and the stand register underestimated height (Table 4). The height from ALS data was less accurate than from register data, which could be

55
explained by the fact that the ALS data was older than register data. For register data the overestimation of diameter in final felling stands (Table 5) is probably due to the human factor, which can be strengthened by the literature (Barth et al., 2014).
The volume was compared per hectare instead of total volume in order to reduce the impact of errors due to areal deviations. Imputation of harvester data indicates that the model was accurate in its forecasts, by showing both a low relative RMSE and a low bias (Table 6). However, it seems that the BA has influence of the results from imputations of ALS- and register data, thus the volumes per hectare were overesti-mated. Still, both the imputations provided more accurate forecasts than the current forecasting method. The volume forecast using ALS data was of similar accuracy as in an earlier study performed by Skogforsk (Söderberg et al., 2017). However, the earlier studies have shown that forecasts performed in the south part of Sweden were more accurate than in northern Sweden, which could be due to the smaller stands/logging units in the south. With smaller areas the logging units are often more homogenous, which is an advantage when using the imputation tool (Möller, 2018, personal comment). If the ALS data would have been up-to-date it is likely that ALS data would provide more accurate volume forecasts, since it then would be less af-fected by wind throws that has occurred. Wind throws are one of the reasons to why the time horizons in forestry have implications for the planning procedure (Duvemo & Lämås, 2006). The volume forecast for only final felling stands was more accurate compared to when combining both thinning stands and final felling stands, which could be due to the faster growth of the younger thinning stands. The higher bias could probably be explained by the smaller sample size (Table 7).
4.2.2 Log level forecasts
The forecasting of heartwood diameter was accurate independent of input data for the imputation. The number of logs per diameter class differed since the logs from the imputation are simulated logs, while the logs measured by harvester and 3D/X-ray are actual logs. However, the share of logs per diameter class was similar for all forecasts, which indicates that the means should be comparable (Figure 11). In an earlier study on prediction of heartwood by Wilhelmsson et al. (2006), values for all individual logs were used. However, in that study the measurements had to be re-stricted to very limited numbers of logs due to the manually conducted work without any access to big data. In this study, almost 200 0000 logs were possible to include thanks to the extensive databases of harvester data and automated measurements at

56
the mill, thereby providing a credible outcome. Thus, despite using mean values and not specific values for all individual logs, the result clearly indicates that it is possi-ble to forecast heartwood diameter using big data with confidence of achieving the forecasted mean heartwood diameter (Table 9).
Since the results were more or less equivalent independent of input data for the im-putation and properties forecast, it seemed motivated to only compare the heartwood forecasts from harvester data (with actual logs) in the further analysis. Reasons for the deviation between the number of logs measured by harvester and by 3D/X-ray, measured within different diameter classes, could be the different measurement techniques. Loss of bark in the forest operation or at the mill could also affect the diameter, which affects the sorting. However, the difference in total number of logs could potentially be explained by changes in delivery, meaning that some stands or parts of stands that were destined to other pine mills were delivered to Bollsta. If the number of logs measured at the mill would have been less than the harvested logs, this could potentially have been explained by the fact that parts of stands some-times go via terminals where the sawlogs are mixed with sawlogs from other stands which affects the follow-up (as emphasised by the respondents). Comparing the accuracy of heartwood diameter forecast per diameter class showed that the lower diameter classes were less accurate (Table 10). In practice however, low dimension logs (< 240 mm) are not used for products requiring large heartwood diameters. The exception for diameter class 340 - 359 mm with relatively large error and bias could potentially be explained by the few samples, constituted of mean heartwood diameter values from only three stands. The number of logs for this top diameter class that were measured by the 3D/X-ray were also almost twice as many as the number of harvested logs, which could have affected the result. The residuals plot (Figure 12) showed that the model did not seem to be biased for any diameter class when analysing the entire sample. However, the difference be-tween final felling stands equal to or younger than 115 years and final felling stands older than 115 years implies a need to adjust the model further to varying stand age (Table 11). The comparison of mean heartwood diameter per top diameter class with only thinning stands shows the same trend, which strengthens the need for adjust-ment (Table 12).
The regression analysis over forecasted mean heartwood diameter and measured mean heartwood diameter indicates that there is an autocorrelation between increas-ing heartwood diameter and increasing diameter (Figure 13). This autocorrelation

57
could be overcome by analysing the share of heartwood (Figure 14). Even though the bias was higher when analysing the share of heartwood (Table 13) compared to mean heartwood diameter (Table 9) the relative RMSE values were similar, which indicates that the model is trustworthy even with the autocorrelation. To describe the stands there could be a potential in analysing the share of heartwood, but in practice sawmills need the mean heartwood diameter to enable forecasts of product outcome of certain diameters.
There was a remaining deviation between stands not explained by stand age or mean diameter (Table 14 and 15). Further studies need to be done to know the actual rea-sons, but one possible reason is that stands often are unevenly aged, even though only one age is set to describe the stand. This would affect the heartwood forecasts since the calculation units in these cases would receive an age that would not be suitable for the stand properties.
4.3 Strengths and weaknesses in the study
4.3.1 Interviews
The interviews were of key importance to obtain an understanding of the overall function of the value chain’s planning system. However, the information gathered during the interviews was extensive and therefore information not relating to the aim of this study was not considered in the analysis or reported in results. The semi-structural approach was useful for naturally and smooth-going interviews, but it also caused difficulties to sort out the relevant information. In hindsight, the number of respondents could have been reduced to cover only the most important details. Due to the different roles in the management, some of the questions also turned out to be not properly adapted to the respondents; however, in these cases the focus of the questions could be adjusted.
All of the respondents had a chance to validate all answers, and it became evident that there were different perspectives on some of the answers. This might be yet another argument why the transparency and communication between different de-partments is necessary, even if it is natural that different perspectives of the value chain have different perceptions.

58
4.3.2 Data and model validation
Stand level forecasts As mentioned in the methods section, there were difficulties to acquire suitable data to enable the imputation. The data used for the current forecasting was gathered from different databases and analytical tools, which should be considered as an un-certainty, as it was impossible to ensure that no adjustments of the data had been made after the forecasting formulas had been applied. Changes that have been made in the data are often legitimate and made for a good reason (Österberg, 2018, per-sonal comment), but when evaluating and comparing the accuracy of the currently available forecasting tools it is an undesired disturbance. Neither is it of any ad-vantage for the internal follow-up.
Log level forecasts There were several variables on log level that would have been useful for SCA to forecast. However, heartwood diameter could be measured in the 3D/X-ray with high accuracy (Ullmark, 2018, personal comment) and was therefore a more certain variable, compared to other wood properties. The wood department would prefer to forecast products outcome, and their products are naturally sorted by a combination of different variables. Such combinations of variables are however considered as business secrets and could therefore not be included in this report. The time limita-tion of the study is another reason to why only one key variable (heartwood diame-ter) was studied. As it was impossible to compare individual logs, the mean heartwood diameter per log diameter class and stand was compared which naturally reduces errors. In order to evaluate the accuracy of the wood properties models for individual logs, it would have been meaningful to apply the model on the logs measured by the 3D/X-ray. This can be recommended for future studies and would also provide more certainty of the suspected needs of adjusting the model to varying stand age (as mentioned before).
4.4 Implementation challenges and potentials ALS data was identified as the most suitable input data when implementing the im-putation method. ALS data should be used not only because it can be provided to a relatively low cost, but also because it shows high accuracy and is not affected by the human factor. However, as both stated from respondents and attested by the literature (Maltamo et al 2006; Næsset 2004), ALS data does not provide accurate

59
species mixture. Another disadvantage regarding ALS data is that it eventually be-comes outdated, which manly affects BA (Table 3) and height (Table 4). With the new ALS data gathering which will be conducted during 2018 (Skogsstyrelsen, 2017), there will be an opportunity to combine the new and old ALS data to calculate the growth of stands and that way resolve the difficulties related to forecasting height and diameter with outdated ALS data.
For SCA, and potentially also other forest companies, to enable good use of the benefits of the imputation method, it is of high importance to resolve problems re-lated to deviations between planned- and harvested area. This relates to the need of a more standardized data handling, since the reasons for areal deviations probably will remain, while handling the deviation could be developed. As mentioned before, the area deviations affect the BA, which is important for stand forecasting. How-ever, it also affects age, which is essential for log forecasting. As the wood department requests forecasts on a product level, a logical step in the further development would be to use imputation methodology also for forecasting the outcome of logs (in terms of products) based on the properties measured by the 3D/X-ray frames. If the trend of installing 3D/X-rays continues, log data from nu-merous sawmills could be available within a near future to compile into a database in a similar manner as harvesting data. It could then be advantageous to distribute the log data through SDC (Swedish Forest Industry Data Central), since it would help establishing an industry standard of data handling. This development of the imputation methodology would enable linking the forecasting of final sawmill prod-ucts all the way to the unharvested forest stands and thus make full use of the po-tential of using available big data for increasing efficiency and precision of the value chain planning on the levels desired by interviewed respondents. However, as a first step towards a more detailed level of forecasting, the results from this study show that the imputation tool combined with wood properties models could already be implemented for practical use and increase forecasting precision of sawlog supply.

60
4.5 Conclusions Based on the results of this study, several conclusions can be made.
• There is a considerable need and value potential for more accurate and de-tailed forecasting, which would improve the management along the whole value chain from forest to sales of sawmill products. However, there is also a need for development of analytical tools that enable a more standardised and transparent handling of data along the different links of the value chain.
• The imputation method developed by Skogforsk can provide higher accu-
racy of forecasting on stand level compared to traditional methods but is dependent on accurate input data which is best provided by ALS among currently available data sources. The deviation in cut area estimations seems to be the most important issue to resolve in order to create accurate forecasts on both stand- and log level.
• The wood properties model developed by Skogforsk can provide accurate
forecasts on mean heartwood diameter, but further studies should evaluate whether the models should be adjusted to varying stand age as is indicated in this study.
• There could be large potential for future forecasting of sawmill products by
developing imputation models based on 3D/X-ray data of log properties. This development could also provide the missing link between stand char-acteristics and sawmill’s outcome of specific products, which combined with high data transparency and integrated analytical tools could boost the abilities of integrated forecasting along the value chain.

61
Alamaa, H. & Lunneborg, R. (2013) Ivar fällde miljoner kubikmeter skog https://www.svt.se/nyheter/lokalt/vasternorrland/ivar-fallde-miljoner-kubikmeter-skog [Retrieved 2018-04-06] Arlinger, J., Nordström, M. & Möller, J.J. (2012) StanForD 2010. Modern kommunikation med skogsmaskiner. - StanForD 2010. Modern communication With forest machines. Arbetsrapport 784, Skogforsk. Uppsala, Sweden. Andrén, H., Arvonen, H., Badman, D., Dasoson, Y., Dotzauer, E., Furness, A., Hol-lander, M., Larsson, M., Läkeryd, P., Nilsson, S., Olsson, O., Olsson, T., Pettersson, A., Rogerstedt, L., Thor, M. & Wintzell, J. (2016) Främjande av biobaserade pro-dukter och energy, smarta transport, en skogsindustri i världsklass och ökad export. Underlagsrapport från arbetsgrupp 3 inom nationellt skogsprogram. The Swedish Government. Stockholm, Sweden. http://www.regeringen.se/4a6128/contetas-sets/0b71b3ef7dbf49dab19bf7a15a8da07c/3_slutligbak.pdf [Retrieved 2018-04-05] Barth, A., Möller, J J., Wilhelmsson, L., Arlinger, J., Hedberg, R. & Söderman, U. (2014) A Swedish case study on the prediction of detailed product recovery from individual stem profiles based on airborne laser scanning. Annals of Forest Science, 72, 47–56. Bhuiyan, N., Möller J.J., Arlinger, J. (Unpublished) hprYield – beräkningsmodul för generering av geografiskt uppdelade nyckeltal baserat på skördardata. Skog-forsk, Uppsala, Sweden. Bhuiyan, N., Arlinger, J. & Möller, J. J. (2013) Kvalitetssäkring av beräkningsre-sultat från hprCM och konvertering av pri- till hpr-filer = Quality assurance of cal-culation results from hprCM and conversion of pri files to hpr files. Arbetsrapport 798, Skogforsk, Uppsala, Sweden. Carlsson, D. & Rönnqvist, M. (2005) Supply chain management in forestry––case studies at Södra Cell AB. European Journal of Operational Research 163, 589–616.
References

62
Crookston, N.L. & Finley, A.O. (2007) yaImpute: An R Package for k-NN Imputa-tion. Journal of Statistical Software. 23(10):1–16. Crookston, N.L., Moeur, M. & Renner, D. (2002) Users guide to the Most Similar Neighbor Imputation Program Version 2. Gen. Tech. Rep. RMRS-GTR-96. Ogden, UT: U.S. Department of Agriculture, Forest Service, Rocky Mountain Research Station. Design Research Techniques. (2018) Semi-Structured Interviews. http://designresearchtechniques.com/casestudies/semi-structured-interviews/ [Retrieved 2018-05-15] Duvemo, K. & Lämås, T. (2006) The influence of forest data quality on planning processes in forestry. Scandinavian Journal of Forest Research, 21(4), 327–339. Eid, T., Gobakken, T. & Næsset, E. (2004) Comparing stand inventories for large areas based on photo-interpretation and laser scanning by means of cost-plus-loss analyses, Scandinavian Journal of Forest Research, 19:6, 512-523. Oja, J., Grundberg, S., Fredriksson, J. & Berg, P. (2007) Automatic grading of saw-logs: A comparison between X-ray scanning, optical three-dimensional scanning and combinations of both methods, Scandinavian Journal of Forest Research, 19:1, 89-95. Fjeld, D. & Dahlin, B. (2015) Nordic logistics handbook: forest operations in wood supply. Swedish Agricultural University. Umeå, Sweden. Hannrup, B. (2004) Funktioner för skattning av barkens tjocklek hos tall och gran vid avverkning med skördare. Arbetsrapport 575, Skogforsk. Uppsala, Sweden. Jonsson, B., Jacobsson, J. & Kallur, H. (1993) The forest management planning package. Theory and application. Studia forestalia Suecica; 189 Karlsson, M. (2010) Data and methodology for yield forecast: A study at Medelpads forest district. Swe-dish Agricultural University: Department of Forest Resource Management. Umeå, Sweden. Kiljunen, N. (2002) Estimating dry mass of logging residues from final cuttings using a harvester data management system. International Journal of Forest Engi-neering. 13:1, 17-25. Lee, J., Lapira, E., Bagheri, B., & Kao, H. (2013) Recent advances and trends in predictive manufacturing systems in big data environment. NSF Industry/University Cooperative Research Center on Intelligent Maintenance Systems (IMS), University of Cincinnati, United States. Lee, J., Kao, H-A. & Yang, S. (2014) Service innovation and smart analytics for Industry 4.0 and big data environment. NSF I/UCRC Center for Intelligent

63
Maintenance Systems (IMS), University of Cincinnati, Cincinnati, OH 45221-0072, USA Malinen, J., Kilpeläinen, H. & Ylisirniö, K. (2014) Description and evaluation of Prehas software for pre-harvest assessment of timber assortments, International Journal of Forest Engineering, 25:1, 66-74. Malinen J., Maltamo M. & Harstela P. (2001) Application of most similar neigh-bour inference for estimating marked stand characteristics using harvester and in-ventory generated stem databases. Int J For Eng. 12:33–41. Maltamo, M., Peuhkurinen, J., Malinen, J., Vauhkonen, J., Packalén, P. & Tokola, T. (2009) Predicting tree attributes and quality characteristics of Scots pine using airborne laser scanning data. Silva Fennica 43(3): 507–521. Maltamo, M., Malinen, J., Packalén, P., Suvanto, A. & Kangas, J. (2006) Nonpara-metric estimation of stem volume using airborne laser scanning, aerial photog-raphy, and stand-register data. Canadian Journal of Forest Research 36(2), 426-436. Martell, D L., Gunn, E A. & Weintraub, A. (1998) Forest Management Challenges for Operational Researchers. European Journal of Operational Research 104, 1-16. Minitab. (2017) Overview for Mixed Effects Model. https://sup-port.minitab.com/en-us/minitab/18/help-and-how-to/modeling-statis-tics/anova/how-to/mixed-effects-model/before-you-start/overview/ [Retrieved 2018-03-08] Moeur, M. & Stage, A.R. (1995) Most Similar Neighbor: An improved sampling inference procedure for natural resource planning. Forest Science 41. Möller, J J., Arlinger, J., Nazmul, B., Eriksson, I. & Söderberg, J. (2017) Utbytes-prognoser baserade på skogs- och skördardata - Modell- och systembeskrivning för skapande av stambanker och imputerat utbyte. Forecasting of log product yield based on forest and harvester data – A description of models and system for creat-ing stem-files and imputation of product yield Arbetsrapport 691. Skogforsk. Upp-sala, Sweden. Möller, J.J., Nordström, M. & Arlinger, J. (2015) Förbättrade utbytesprognoser – en förstudie av gemensamma utvecklingsbehov hos SCA, Sveaskog och Södra skogsägarna. Improved yield forecassts – a pilot study by SCA, Sveaskog and Södra. Arbetsrapport 880, Skogforsk. Uppsala, Sweden. Næsset, E. (2004) Practical large-scale forest stand inventory using a small air-borne scanning laser. Scand. J. For. Res. 19: 164–179.

64
Regeringskansliet. (2016) Ett nationellt skogsprogram för Sverige http://www.re-geringen.se/regeringens-politik/ett-nationellt-skogsprogram-for-sverige/ [Retrie-ved 2018-04-05] SCA. (2017a) SCA i korthet https://www.sca.com/sv/om-sca/sca-i-korthet/ [Re-trieved 2017-09-19] SCA. (2017b) Om timber - Våra sågverk. https://www.sca.com/sv/tra/om-timber/ [Retrieved 2017-09-19] SCA. (2017c) Timber - Våra sågverk. https://www.sca.com/sv/tra/om-timber/vara-sagverk/ [Retrieved 2017-09-19] SCB. (2017) Svensk ekonomi är beroende av exporten. http://www.sverigeisif-fror.scb.se/hitta-statistik/sverige-i-siffror/samhallets-ekonomi/export-och-import-av-varor-och-tjanster/ [Retrieved 2017-09-29] Simon, H.A. (1976) Administrative behavior, 3rd edition. USA, New York: The MacMillan Company. SAS. (2018) Big Data – What it is and why it matters. https://www.sas.com/en_us/insights/big-data/what-is-big-data.html [Retrieved 2018-04-20] Skog, J. & Oja, J. (2009) Heartwood diameter measurements in Pinus sylvestris sawlogs combining X-ray and three-dimensional scanning, Scandinavian Journal of Forest Research, 24:2, 182-188. Skogsindustrierna. (2017) Skogsindustrins betydelse http://www.skogsindustri-erna.se/skogsindustrin/skogsindustrin-i-korthet/skogsindustrins-betydelse/ [Retrie-ved 2017-09-29] Skogsstyrelsen. (2017a) Viktigt att tänka på när du ska använda skogliga grund-data https://skogsstyrelsen.se/sjalvservice/karttjanster/skogliga-grunddata/viktigt-nar-du-ska-anvanda-skogliga-grunddata/ [Retrieved 2018-02-22] Skogsstyrelsen. (2017b) Ny laserscanning av svenska skogar https://www.skogs-styrelsen.se/nyhetslista/nu-ska-sveriges-skogar-laserskannas/ [Retrieved 2018-02-20] Söderberg, J. (2015) A method for using harvester data in airborne laser prediction of Forest variables in mature coniferous stands. Swedish Agricultural University: Dept. of Forest Resource Management. Umeå, Sweden.

65
Söderberg, J., Willén, E., Möller, J.J., Arlinger, J. & Bhuiyan, N. (2017) Utvärde-ring av utbytesprognoser med skogliga laserskattningar och skördardata - Resultat från tre fallstudier. Arbetsrapport 937, Skogforsk. Uppsala, Sweden. Vickers, A. (2005) Parametric versus non-parametric statistics in the analysis of randomized trials with non-normally distributed data. BMC Medical Research Methodology, 5:35. Wilhelmsson, L. (2006) Two models for predicting the number of annual rings in cross-sections of tree stems. Scandinavian Journal of Forest Research. Wilhelmsson, L., Arlinger, J., Hannrup, B., Nordström, M., Øvrum, A. & Gjerdrum, P. (2011) Methods and models for relating wood properties and storage conditions to process efæciency and product quality. Work report 750. Skogforsk. Uppsala, Sweden. Wilhelmsson, L., Arlinger, J., Spångberg, K., Lundqvist, S-O., Grahn, T., Heden-berg, Ö. & Olsson, L. (2002) Models for Predicting Wood Properties in Stems of Picea abies and Pinus sylvestris in Sweden. Scandinavian Journal of Forest Re-search, 17:4, 330-350. Wilhelmsson, L. Arlinger, J. Moberg, L. Möller, J. (2007) Intelligent CTL harvest-ing based on cost-benefit analyses for value chain optimization. 3rd Forest Engi-neering Conference, Sustainable Forest Operations: The future is now. Mont-Trem-blant, Canada.
Personal communication Arlinger, John. Researcher, Skogforsk, Uppsala, Sweden (2018). Kårén, Ola. Chief silviculture, SCA, Sundsvall, Sweden. (2018). Möller, Johan. Researcher, Skogforsk, Uppsala, Sweden. (2018). Robert, Lundgren. Business optimizer, SCA, Bollsta, Sweden. (2017). Ullmark, Gunilla. Process engineer, SCA, Bollsta, Sweden. (2017). Österberg, Per. Business development manager, SCA, Sundsvall, Sweden. (2017).