Evaluierung von monomerem und trimerem …€¦ · Evaluierung von monomerem und trimerem...
143
Evaluierung von monomerem und trimerem Photosystem 1 in nativen Systemen sowie in semiartifiziellen Systemen zur Biowasserstofferzeugung Dissertation zur Erlangung des Grades eines Doktors der Naturwissenschaften der Fakultät für Biologie und Biotechnologie an der Ruhr-Universität Bochum Angefertigt am Lehrstuhl für Biochemie der Pflanzen vorgelegt von Eithar Abdel Rashid El-Mohsnawy aus El-Mahalla El-Kubra, Ägypten Bochum 2007
Transcript of Evaluierung von monomerem und trimerem …€¦ · Evaluierung von monomerem und trimerem...
Evaluierung von monomerem und trimerem Photosystem 1 in nativen Systemen sowie in semiartifiziellen
Systemen zur Biowasserstofferzeugung
Dissertation zur Erlangung des Grades eines Doktors der Naturwissenschaften
der Fakultät für Biologie und Biotechnologie an der Ruhr-Universität Bochum
Angefertigt am Lehrstuhl für Biochemie der Pflanzen
vorgelegt von
Eithar Abdel Rashid El-Mohsnawy
aus El-Mahalla El-Kubra, Ägypten
Bochum 2007
Contents __________________________________________________________________________________________________
II
Evaluation of monomeric and trimeric PS1 in native systems and in semiartificial systems
for biohydrogen production
Submitted in Partial Fulfillment of the Requirements for Ph.D Degree from
Faculty of Biology and Biotechnology, Ruhr-University Bochum
Achieved in the Department of Plant Biochemistry
Submitted by Eithar Abdel Rashid El-Mohsnawy
Form El-Mahalla El-Kubra, Egypt
Bochum 2007
Contents __________________________________________________________________________________________________
III
Parts of this work have been published 1) Prodöhl, A.; Ambill, M.; El-Mohsnawy, E.; Lax, J.; Nowaczyk, M.; Oworah-Nkruma, R.; Volkmer, T.;
Wenk, S.-O.; Rögner, M., Modular Device For Hydrogen Production: Optimization of (Individual) Components. In Biohydrogen III, Miyake, J., et al., Eds. Elsevier: Oxford, 2004; pp 171-179.
2) Schlodder E, Shubin Vladimir, El-Mohsnawy E, Rögner M, Karapetyan N (2007): Steady-state and transient polarized absorption spectroscopy of photosystem I complexes from the cyanobacteria Arthrospira platensis and Thermosynechococcus elongatus.
Manuscript to be submitted 1) Chavdar Slavov, Eithar El-Mohsnawy, Matthias Rögner, Afred R. Holzwarth. Energy trapping
kinetics in Photosystem I monomers and trimers from Thermosynechoccocus elongatus
Referent: Prof. Dr. Matthias Rögner, Lehrstuhl für Biochemie der Pflanzen
Koreferent: PD Dr. Mathias Lübben, Lehrstuhl für Biophysik
Tag der Abgabe: 01. Juli 2007

Contents __________________________________________________________________________________________________
IV
For my Parent
Contents __________________________________________________________________________________________________
V
1) Introduction……………………………………………………… …………… ………….1 1.1) Cyanobacteria……………………………………………………………… ……………………… ……..1
1.1.1) Thermosynechococcus elongatus…………………………………………… ……………… …….1 1.2) Photosynthesis……………………………………………………………………… …………… ……….2
1.2.1) State transition…………………………………………………………………… …………………...3 1.2.2) Photosynthetic electron transport chain (PETC)………………………………… ………………..4 1.2.3) Thylakoid membrane………………………………………………………………………………….6
1.3) Photosystem 2……………………………………………………………………………………………...6. 1.4) Photosystem 1……………………………………………………………………………………………...8
1.4.1) Photosystem 1 in cyanobacteria and higher plants………………………………………………..8 1.4.2) Structure of cyanobacterial PS1……………………………………………………………………..9 1.4.3) Electron transport within PS1………………………………………………………………………..10 1.4.4) Long-wavelength chlorophyll (LWC)………………………………………………………………..15
1.5) Cytochrome c6 (Cyt c6)…………………..………………………………………………………………..16 1.6) Energy………………………………………………………………………………………………………17
1.6.1) Hydrogen………………………………………………………………………………………………17 1.6.2) Semiartificial system………………………………………………………………………………….18
1.7) Aim of the work…………………………………………………………………………………………….19
2) Materials and Methods………………………………………………………………… 21 2.1) Biochemical methods………………………………………………………………………………………21
2.1.2) Sterilization………………………………………………………………………………………….…21 2.1.2)Growth media…………………………………………………………………………………………..21 2.1.3) Buffers………………………………………………………………………………………………….22 2.1.4) Cytochrome c6………………………………………………………………………………………...23
2.1.4.1) Overexpression of Cyt. c6…………………………………………………………………..………….23 2.1.4.2) Extraction and purification of Cyt c6……………………………………………………………24
2.1.5) Extraction and Isolation of Photosystem 1…………………………………………………………24 2.1.5.1) Cultivation of T. elongatus cells………………………………………………………………...24 2.1.5.2) Harvesting and preparation of thylakoid membrane……………………… …………………24 2.1.5.3) Extraction of trimeric PS1……………………………………………………………… ………25
2.1.6) Chromatographic purification……………………………………………………… ……………….25 2.1.6.1) Immobilised metal affinity chromatography (IMAC)………………………… ……………….25 2.1.6.2) Hydrophobic Interaction Chromatography (HIC)…………………………… ………………..25 2.1.6.3) Ion Exchange Chromatography (IEC)……………………………………… …………………26 2.1.6.4) Size Exclusion Chromatography………………………………………… …………………….26
2.1.7) Sucrose gradient ……………………………………………………………………… …………….26 2.1.8) Protein precipitation………………………………………………………… ……………………….26 2.1.9) SDS-polyacrylamide gel electrophoresis (SDS-PAGE)………………… ……………………….27 2.1.10) Immuno-blot analysis ………………………………………………… …………………………...28 2.1.11) Lyophilization………………………………………………………………….. …………………..29 2.1.12) Amphipol trapping……………………………………………………………………… ………….29
2.2) Biophysical methods…………………………………………………… ………………………………..30 2.2.1) Chlorophyll determination………………………………………… ………………………………..30 2.2.2) Absorption spectra…………………………………………………………… ……………………..30 2.2.3) Transient Absorption Spectroscopy (light minus dark)………………… ………………………..31 2.2.4) Chl a/P700 ratio………………………………………………………… …………………………... 31 2.2.5) Carotenoid content estimation………………………………………… ………………………… ..32
Contents __________________________________________________________________________________________________
VI
2.2.6) CD-spectra…………………………………………………………………………………………...32 2.2.7) Fluorescence emission spectra at 77 K…………………………………………………………...33 2.2.8) Fluorescence emission spectra at RT……………………………………………………………..33 2.2.9) Fluorescence excitation spectra at 77 K…………………………………………………………..33 2.2.10) LD-spectra…………………………………………………………………………………………..33 2.2.11) Redox titration ……………………………………………………………………………………...34 2.2.12) Stability of PS1……………………………………………………………………………………...34
2.2.12.1) Photostability……………… .………………………………………………………………....34 2.2.12.2) Thermostability…………………………………………………………………………………35 2.2.12.3) Stability against ß-DM…………………………………………………………………………35
2.2.13) Time resolved fluorescence measurements……… …………………………………………….35 2.2.14) MALDI-TOF of intact protein complexes ………………………………………………………...36 2.2.15) Activity measurements (Oxygen-uptake)…………………………………………………………37
2.3) Electrochemical methods…………………………………………………...……………………………38
3) Results……………………………………………………………………………………..40 3.1) Isolation, Purification and Biochemical Characterization of PS1…………………………………….40
3.1.1) Isolation and purification of PS1 trimers…………………………………………………………...42 3.1.1.1) Purification of PS1 WT with IEC as 1st and HIC as 2nd column……………………………. 42 3.1.1.2) Purification of PS1 WT with HIC as 1st and IEC as 2nd column……………………………..42 3.1.1.3) His-tag PS1 purification by IMAC as 1st and IEC or HIC as 2nd chromatographic steps…44 3.1.1.4) Characterization of purified trimeric PS1……………………………………………………...45
3.1.2) Method development for quantitative production of PS1 monomers by dissociation of PS1 rimers………………………………………………………………………………………………...46 3.1.3) Detailed biochemical characterizations of purified PS1 monomers and trimers…………….. 55 3.1.4) Method for quantitative production of PS1 monomers without salt treatment (-SE)………… 58
3.2) Spectroscopical Characterization of PS1 complexes…………………………………..…………….62 3.2.1) Polypeptides Characterization (MALDI-TOF analysis)…………………………………………..62 3.2.2) Pigments Characterization………………………………………………………………………….64
3.2.2.1) Absorption Spectra…………………………………………………………………………….. 64 3.2.2.1.1) 5 K absorption spectra………………………………………………………………………..64 3.2.2.1.2) Carotenoid contents…………………………………………………………………………..67 3.2.2.1.3) Chl a content per P700 ratio…………………………………………………………………69 3.2.2.1.4) Redox potential………………………………………………………………………………. 71 3.2.2.2) LD-Spectra……………………………………………………………………………………….71 3.2.2.3) CD-Spectra ……………………………………………………………………………………...73 3.2.2.4) Fluorescence Spectra…………………………………………………………………………..75 3.2.2.4.1) Fluorescence emission Spectra …………………………………………………………….75 3.2.2.4.2) Fluorescence excitation Spectra…………………………………………………………….76
3.2.3) Kinetics measurements of monomeric and trimeric PS1………………………………………..79 3.3) Biotechnology……………………………………………………………………………………………..83
3.3.1) Cytochrome c6…………………………………………………………………………... ………….83 3.3.2) Stability of photosystem 1…………………………………………………………………………..87
3.3.2.1) Photostability…………………………………………………………………………………….87 3.3.2.2) Thermostability…………………………………………………………………………………. 89 3.3.2.3) Stability against detergent (ß-DM)…………………………………………………………….91
3.3.3) Lyophilization………………………………………………………………………………………...92 3.3.4) Long term stability using Amphipol L…………………………………………………………… 94
Contents __________________________________________________________________________________________________
VII
3.3.5) Photocurrent of PS1 immobilized on Bead electrodes………………………………………….94
4) Discussion……………………………………………………………………………….98 4.1) Modified preparations of PS1 monomers and trimers: Are monomers an artifact?.....................98
4.1.1) New insight into trimeric PS1 preparations…………………………………………………….......98 4.1.2) Dissociation of trimeric PS1 within the membrane……………………………………………..100 4.1.2) Untreated monomeric PS1………………………………………………………………………..103
4.2) Composition of PS1 pigments in monomers and trimers: New clues on LWCs!........................ 104 4.2.1) Co-factor structure and function………………………………………………………………….104 4.2.2) Far-red chlorophyll…………………………………………………………………………………107
4.3) Biotechnological applications of designed PS1 complexes ……………………………………….110 4.3.1) Stability……………………………………………………………………………………………...110 4.3.2) Lyophilization and amphipol trapping……………………………………………………………111 4.3.3) Photocurrent of immobilized PS 1 complexes…………………………………………………. 112 4.3.4) Biohydrogen device………………………………………………………………………………..113
4.4) Outlook…………………………………………………………………………………………………...116
5) Summary………………………………………………………………………………...117
6) Zusammenfassung…………………………………………………………………….118
7) References………………………………………………………………………………119
8) Abbreviations…………………………………………………………………………...130
9) Acknowledgement……………………………………………………………………...132
10) CV………………………………………………………………………………………..134
11) Erklärung.............................................................................................................135
Introduction __________________________________________________________________________________________________
1
1) Introduction
1.1) Cyanobacteria
“Cyanobacteria” is a general term for bacteria capable of oxygenic photosynthesis, which comprises over
1500 species with various morphologies and species-specific characteristics (including unicellular, colonial
and filamentous forms), (Nakamura et al. 2002). They are among the oldest known fossils (Schopf
2000), having been present on the earth for more than 3.5 billion years. Some filamentous cyanophytes
form differentiated cells, called heterocysts that are specialized for nitrogen fixation and resting or spore
cells called akinetes. Each individual cell typically has a thick, gelatinous cell wall, which stains gram-
negative. The cyanophytes lack flagella, but may move by gliding along surfaces. Most are found in fresh
water, while others are marines, in damp soil, or even temporarily moistened rocks in deserts. Also,
thermophilic species exist (Thermosynechococcus), which are able to grow in hot springs. A few are
endosymbionts in lichens, plants or sponges and provide energy for the host. Some live in the fur of
sloths, providing a form of camouflage. As cyanobacteria are among the most widely distributed micro-
organisms in the biosphere, they play a dominant role in the global nitrogen (Berman-Frank et al 2003)
and carbon cycles (Field et al 1998). They are the simplest organisms to perform oxygenic
photosynthesis, which differ from higher plants with respect to their thylakoid membrane structure and the
antenna system used to capture the light (Bald et al 1996).
The endosymbiontic theory explains the relationship between the chloroplasts of eukaryotic organisms
(higher plants and green algae), and prokaryotes such as cyanobacteria. According to this theory,
approximately 1.5 billion years ago, organisms similar to cyanobacteria entered into an endosymbiotic
relationship with anaerobic eukaryotic cells and became the ancestors of modern chloroplasts. For this
reason, plant and cyanobacterial photosystems share a common origin and perform very similar functions,
although they exist in different biological environments (Margulis 1970 and Ben-Shem et al. 2004).
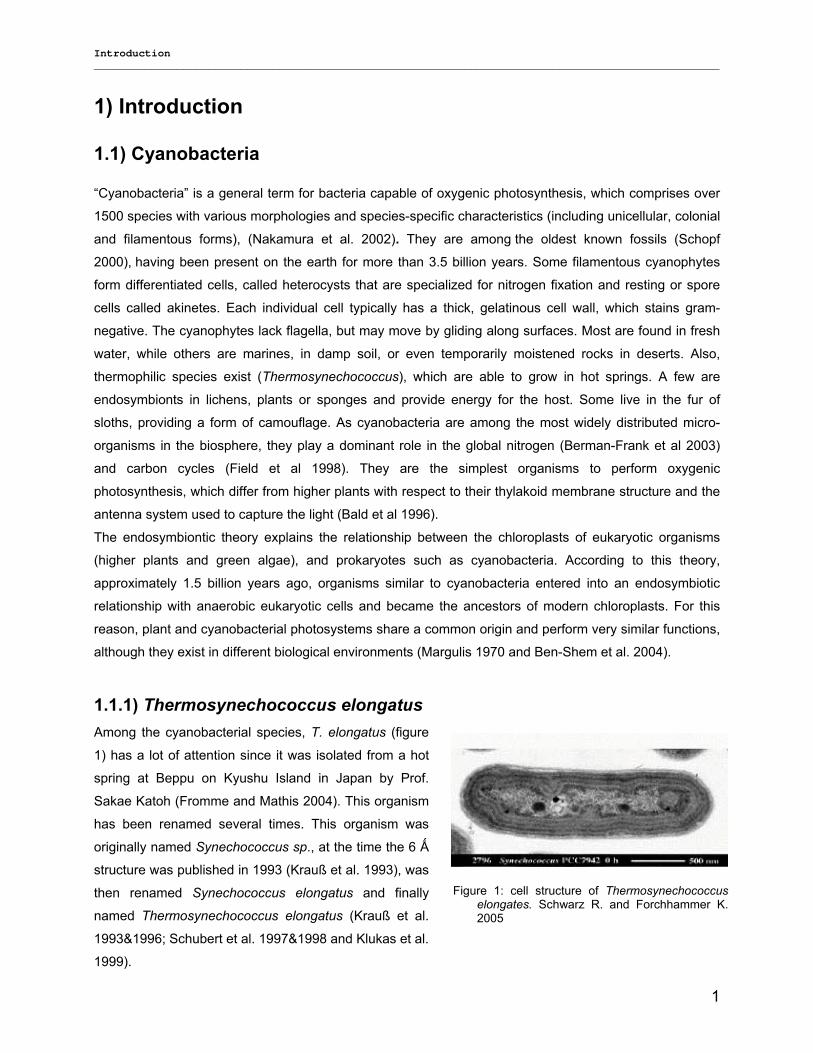
1.1.1) Thermosynechococcus elongatus Among the cyanobacterial species, T. elongatus (figure
1) has a lot of attention since it was isolated from a hot
spring at Beppu on Kyushu Island in Japan by Prof.
Sakae Katoh (Fromme and Mathis 2004). This organism
has been renamed several times. This organism was
originally named Synechococcus sp., at the time the 6 Ǻ
structure was published in 1993 (Krauß et al. 1993), was
then renamed Synechococcus elongatus and finally
named Thermosynechococcus elongatus (Krauß et al.
1993&1996; Schubert et al. 1997&1998 and Klukas et al.
1999).
Figure 1: cell structure of Thermosynechococcus elongates. Schwarz R. and Forchhammer K. 2005
Introduction __________________________________________________________________________________________________
2
T. elongatus is an obligate photoautotrophic organism, pigmented with chlorophyll a, carotenoids and
phycobilins, and has often been used as model organism for the study of photosynthesis: i.e. X-ray
structure of PS1 and PS2. (Zouni, A. et al. 2001; Jordan, P. et al 2001; Sonoike, K. and Katoh, S. 1989
and Katoh, H. et al 2001).
1.2) Photosynthesis Energy, water and oxygen are the sources of life on earth. Water exists on earth but how can energy and
oxygen be served?
The answer is photosynthesis. Photosynthesis is the most important energy converting biological process
on earth converting solar energy into chemical energy and sustaining nearly all living matter. Total
photosynthetic energy of the biosphere consumes 2 – 4 x 10¹⁸ kJ/year of light energy. This is only a small
fraction (0.1 %) of the total light energy arriving on the surface of the earth (about 24 x1020 kJ/year). From
this energy input about 200 billion tons biomass are produced by photosynthetic organisms per year,
thereby fixing more than 10 % of the total atmospheric CO2 per year to produce oxygen, and the
carbohydrates formed by this process serve as food for all living organisms. (Ke B., 2002; Whitmarsh J.
and Govindjee.1999).
Photosynthesis is carried out in two separate reactions: Light reaction and dark reaction. In the light
reaction, a photon is absorbed by photosynthetic molecules, and this excitation energy is channeled to a
special chlorophyll pair followed by water splitting, charge separation and charge stabilization producing
ATP and NAD(P)H. In the dark reaction, the ATP and NADPH generated by the light reactions are used to
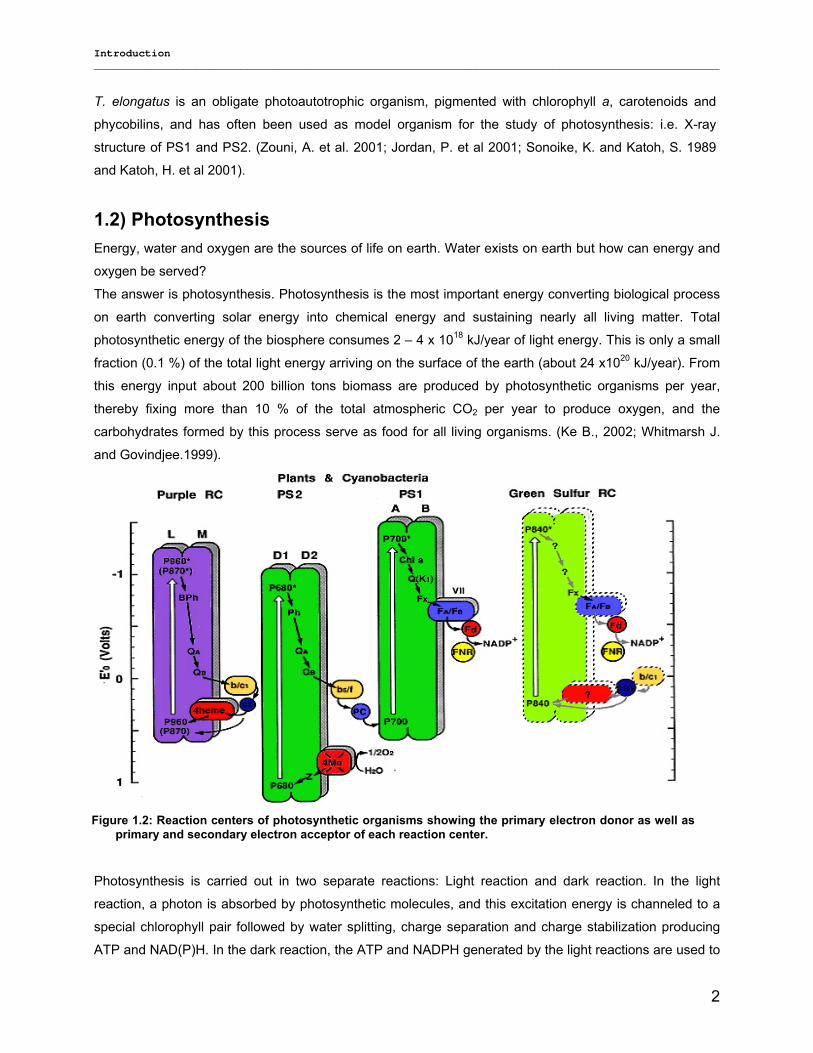
Figure 1.2: Reaction centers of photosynthetic organisms showing the primary electron donor as well asprimary and secondary electron acceptor of each reaction center.
Introduction __________________________________________________________________________________________________
3
synthesize organic molecules from carbon dioxide, which then yields sugar as the primary energy source
of plants (Jones and Fyfe, 2001).
Two different groups of photosynthetic organisms can be distinguished. The first group contains
anoxygenic photosynthetic organisms such as purple bacteria, green bacteria and heliobacteria which
contain one photosystem using inorganic reduced compound as electron donor (Drews and Imhoff, 1991).
The second group contains oxygenic photosynthetic organisms like cyanobacteria, green algae and higher
plants which have two photosystems and use water as electron donor that leads to the evolution of
molecular oxygen (Teuber et al., 2001).
Photosynthetic organisms can also be classified by the type of photochemical reaction centre which they
contain (see Figure 1.2) into type I reaction centers (RCs) using iron-sulfur as terminal electron acceptor,
(green sulfur bacteria and heliobacteria), and type II RCs using a quinone as terminal electron acceptor
(EA), such as the filamentous bacteria. Cyanobacteria, algae and higher plants contain both types, PS1
(photosystem 1) and PS2 (photosystem 2), i.e. they are capable of photosynthetic oxygen evolution; while
all other photosynthetic prokaryotes only conduct anoxygenic photosynthesis (Ke, B., 2002; Olson, 1970,
2001).
1.2.1) State transition The effective absorption of sunlight by antenna pigments is the critical first step in photosynthesis. All
oxygenic photosynthetic organisms share a common core antenna pigment complement of about 36
chlorophyll (Chl) a per PS2 and about 96 Chl a per PS1. Energy transfer and mutant studies have shown
that phycobilisomes in cyanobacteria can transfer energy directly to PS1 as well as to PS2 (Mullineaux,
1994; Rakhimberdieva et al., 2001). State transitions change the relative energy transfer from
phycobilisomes to PS2 and PS1, and also the distribution of chlorophyll-absorbed energy (van Thor et al.,
1998). Although the two effects normally occur together, the phycobilisome effect can be specifically
inhibited by mutagenesis (Emlyn-Jones et al., 1999; McConnell et al., 2002). In cyanobacteria grown
under ‘standard’ conditions, the phycobilisomes are the major accessory light-harvesting complexes, and
the phycobilisome effect is quantitatively more significant than the chlorophyll effect. Studies using
fluorescence recovery after photobleaching (FRAP) have shown that the phycobilisomes are mobile
complexes, diffusing rapidly on the surface of the thylakoid membrane. In contrast, PS2 is completely
immobile under normal conditions (Mullineaux et al., 1997; Sarcina et al., 2001). This indicates that the
association between phycobilisomes and reaction centers is transient and unstable. Recently a direct
connection between phycobilisome mobility and state transitions has been established. When
cyanobacterial cells are immersed in buffers of high osmotic strength, phycobilisome diffusion is strongly
inhibited (Joshua and Mullineaux, 2004). Under these conditions, cells are ‘locked’ in either State 1 or
State 2, depending on how they were adapted prior to addition of the buffer (see figure 1.3). This indicates
that the diffusion of phycobilisomes from reaction centre to reaction centre is required for state transitions.
The results suggested a ‘dynamic equilibrium’ model for state transitions, in which the signal transduction
pathway leads to a change in the binding constant of phycobilisomes for PS2 and/or PS1, leading to a
Introduction __________________________________________________________________________________________________
4
change in the steady-state populations of phycobilisomes coupled to each type of reaction centre. From
time-resolved fluorescence kinetics it can be estimated that up to about 50–60% of phycobilisomes are
decoupled from PS2 on transition to State 2 and energy storage studies indicate that these
phycobilisomes must then be functionally coupled to PS1 (Mullineaux and Allen., 1990).
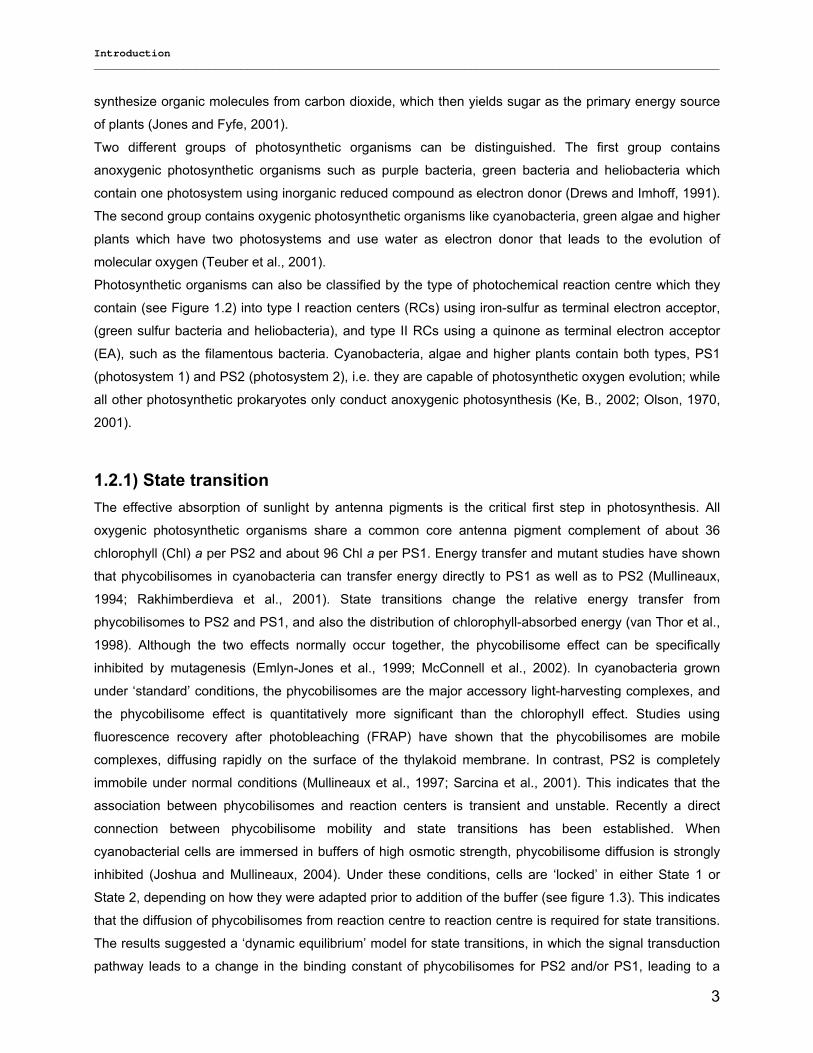
Several models have postulated the state transition in cyanobacteria. Figure 1.3 shows a model
suggested by Rögner et al (1996), which proposes transition of PBS from PS2 to PS1 upon going from
light to dark condition. This transition should be accompanied with a change in the oligomerization state of
both complexes.
1.2.2) Photosynthetic electron transport chain (PETC) The thylakoid membrane contains two main photosynthetic electron transport chains, the linear and the
cyclic transport chains. Upon light excitation and charge separation, the primary donor of PS2 (P680+) is
reduced via a redox active Tyr. and the nearby Mn-cluster located at the lumenal side. This cluster in turn
catalyses the oxidative cleavage of water into four protons, four electrons and molecular oxygen. The final
electron acceptor of PS2, a plastoquinone molecule (QB), leaves the complex at the cytoplasmic side as
plastoquinol after uptake of two protons and two electrons. Therefore, PS2 can be described as a water-
plastoquinone-oxidoreductase that catalyzes the following reaction:
Figure 1.3: Model of state transition (Rögner et al. 1996). At state 1 the phycobilins bind to dimeric PS2 and PS1 exists in monomeric form. At state 2, phycobilins bind to trimeric PS1 and PS2 exists in monomeric form.
Introduction __________________________________________________________________________________________________
5
2 H2O 4e- + 4H+ + O2
The plastoquinol is cycling electrons between PS2 and the cytochrome b6f (cyt b6f) which passes the
electron onto PC or Cyt c6 bound on the lumenal side cyt b6f. These soluble electron carriers in turn
transfer the electrons to PS1.
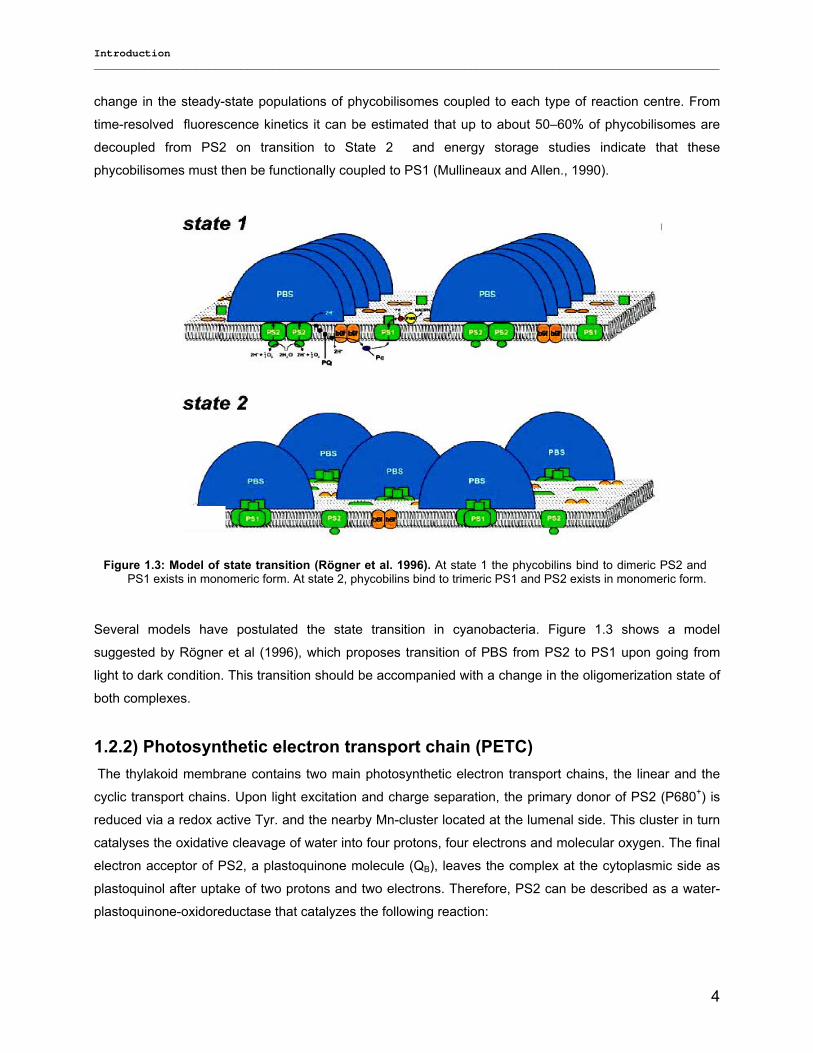
In the linear electron transport all three complexes (PS1, PS2, cyt b6f) are connected in series and the
electron transfer processes in and between the three complexes can be visualized in the so called Z-
scheme of oxygenic photosynthesis (Figure 1.4).
In the overall process light energy is used to transfer electrons from water to NADP+, yielding molecular
oxygen and NADPH. Additionally a proton concentration difference across the thylakoid membrane is
generated. The resulting electrochemical transmembrane potential in turn is used by the ATP synthase,
embedded in the thylakoid membrane, to generate ATP from ADP and Pi. The chemical free energy, in
form of NADPH and ATP, is utilized in the "dark" reactions, which perform in the cytosol of cyanobacteria
(Lengeler et al., 1999, Heinecke, 2001).
In addition to the described linear electron transfer pathway, an alternative pathway exists (cyclic electron
transport). It occurs when PS2 is not active and / or the stromal NADP+ concentration is too low to accept
electrons from reduced ferredoxin (Scheller, H., 1996, Michel, 2003). In this case, the electrons are
transferred back to plastocyanin or cyt c6 via the Cyt b6f complex. It does not require the input energy by
PS2 and thus it does not involve the production of O2. In cyclic electron transport the energy is used only
PS2 / light energy
Figure 1.4: Schematic view of the thylakoid membrane, showing the organization of the protein complexes for oxygenic photosynthesis and linear and cyclic photosynthetic electron transport. The flow of electrons is indicated by black arrows, and light excitation by red arrows. Ferredoxin (Fd) can be replaced by flavodoxin, plastocyanin (PC) by cytochrome C6.
Introduction __________________________________________________________________________________________________
6
for the generation of a proton motive force and NADPH is not formed; this is termed cyclic
photophosphorylation. The overall flow of electrons in cyclic electron transport is described in the following
equation; however, the number of pathways and components involved, besides PS1 is unknown (Michel,
2003).
1.2.3) Thylakoid membrane The photosynthetic membrane of cyanobacteria and higher plants is called thylakoid membrane. It is
composed of four main lipids: monogalactosyldiacylglycerol (MGDG), digalactosyldiacylglycerol (DGDG),
sulphoquinoldiacylglycerol (SQDG), and phosphatidylglycerol (PG). These lipids contribute about 50% to
the thylakoid mass. The rest of the mass can be ascribed to the incorporated protein complexes. The
thylakoid membrane forms a continuous membrane system separating the lumenal (inner) space from the
stromal (cytoplasmic) space. In comparison to higher plants, cyanobacteria show less differentiation and
more uniform distribution of the protein complexes (Staehelin and van der Staay 1996 and Irrgang K.,
1999). In the cyanobacterial thylakoid membrane, all components responsible for the photosynthetic light
reactions and photophosphorylation are embedded: PS1, PS2, cyt b6f complex and ATP synthase. In
addition, the soluble electron carriers ferredoxin and ferredoxin- NADP+-reductase (FNR) are present on
the stromal (cytosolic) side, and plastocyanin (PC) or cytochrome C6 (Cyt C6) as electron carriers on the
lumenal side. The membrane phase contains the mobile lipophilic electron carrier plastoquinone (PQ),
which cycles electrons between PS2 and cyt b6f. (See figure 1.4).
1.3) Photosystem 2 PS2 is one of the two large photosynthetic protein complexes; it is embedded in the thylakoid membrane
and catalyzes one of the most thermodynamically demanding reactions in biology: The photoinduced
oxidation of water. This reaction finally results in reduction of bound quinones and release of molecular
oxygen (Ferreira et al. 2004). FTIR measurements of higher plant and cyanobacterial PS2 showed no
significant difference (Remy et al. 2004). The structure of PS2 from cyanobacteria has recently been
determined by X-ray diffraction to a resolution of 3.8-3.2 Å (Zouni et al 2001 and Biesiadka et al. 2004,
respectively) and 3 Å of water oxidation complex (Kern et al. 2007).
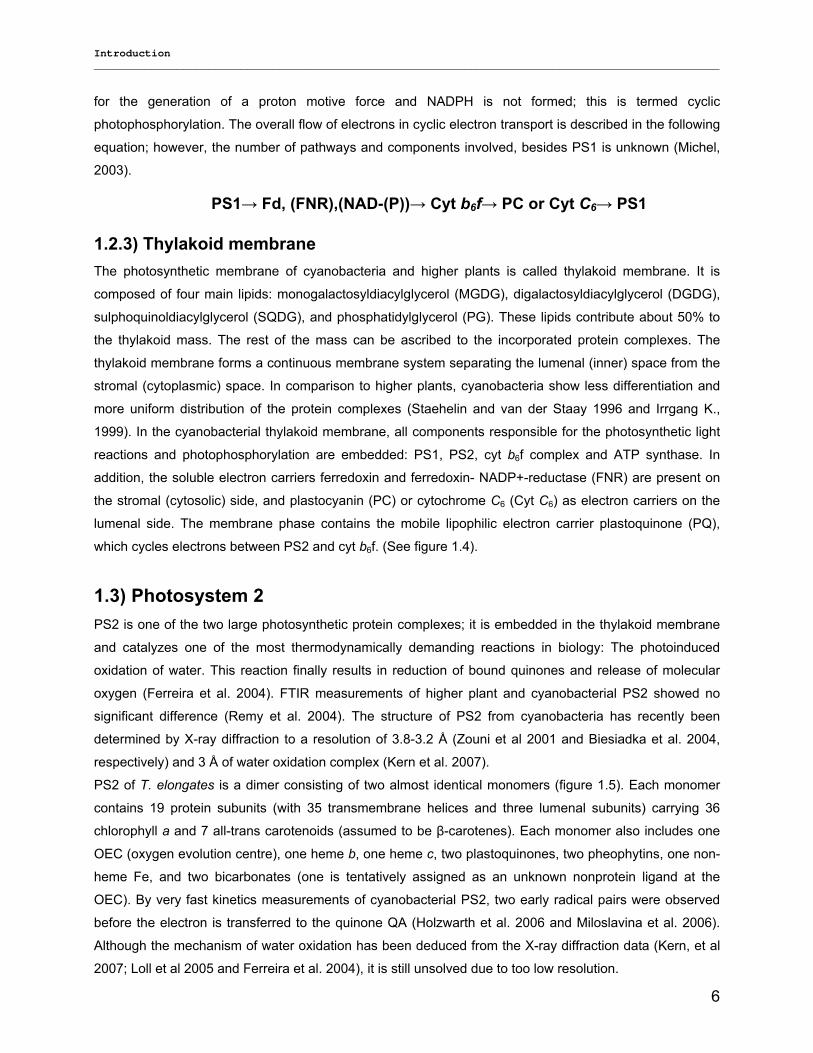
PS2 of T. elongates is a dimer consisting of two almost identical monomers (figure 1.5). Each monomer
contains 19 protein subunits (with 35 transmembrane helices and three lumenal subunits) carrying 36
chlorophyll a and 7 all-trans carotenoids (assumed to be β-carotenes). Each monomer also includes one
OEC (oxygen evolution centre), one heme b, one heme c, two plastoquinones, two pheophytins, one non-
heme Fe, and two bicarbonates (one is tentatively assigned as an unknown nonprotein ligand at the
OEC). By very fast kinetics measurements of cyanobacterial PS2, two early radical pairs were observed
before the electron is transferred to the quinone QA (Holzwarth et al. 2006 and Miloslavina et al. 2006).
Although the mechanism of water oxidation has been deduced from the X-ray diffraction data (Kern, et al
2007; Loll et al 2005 and Ferreira et al. 2004), it is still unsolved due to too low resolution.
PS1→ Fd, (FNR),(NAD-(P))→ Cyt b6f→ PC or Cyt C6→ PS1
Introduction __________________________________________________________________________________________________
7
Figure 1.5 Overall structure of PS2. (A) View of the PS2 dimer perpendicular to the membrane normal.Helices are represented as cylinders with D1 in yellow; D2 in orange; CP47 in red; CP43 in green; cyt b559 in wine red; PsbL, PsbM, and PsbT in medium blue; and PsbH, PsbI, PsbJ, PsbK, PsbX, PsbZ, and the putative PsbN in gray. The extrinsic proteins are PsbO in blue, PsbU in magenta, and PsbV in cyan. Chlorophylls of the D1/D2 reaction center are light green, pheophytins are blue, chlorophylls of the antenna complexes are dark green, ß-carotenes are in orange, hemes are in red, nonheme Fe is red, QA and QB are purple. The oxygen-evolving center (OEC) is shown as red (oxygen atoms), magenta (Mn ions), and cyan (Ca2_) balls. (B) View of the PS2 monomer along the membrane normal from the lumenal side. A part of the other monomer in the dimer is shown to emphasize the region of monomer/monomer interaction along the dotted line. The pseudo-twofold axis perpendicular to the membrane plane passing through the nonheme Fe relates the transmembrane helices of the D1/D2 heterodimer, the low molecular subunits, PsbI and PsbX, and CP43 and CP47 as emphasized by the black lines encircling these subunits. Coloring is identical to (A). Ferreira et al. 2004
Introduction __________________________________________________________________________________________________
8
1.4) Photosystem 1
1.4.1) Photosystem 1 in cyanobacteria and higher plants
Photosystem 1 functions as a bio-solar energy converter, catalyzing one of the first steps of oxygenic
photosynthesis. It captures sun-light by a large antenna system, consisting of chlorophylls and
carotenoids, and transfers this energy to the reaction centre, where it catalyzes the light driven electron
transfer from plastocyanin or cytochrome C6 (on lumen side) to ferredoxin (on the stromal side/
cytoplasimic side).
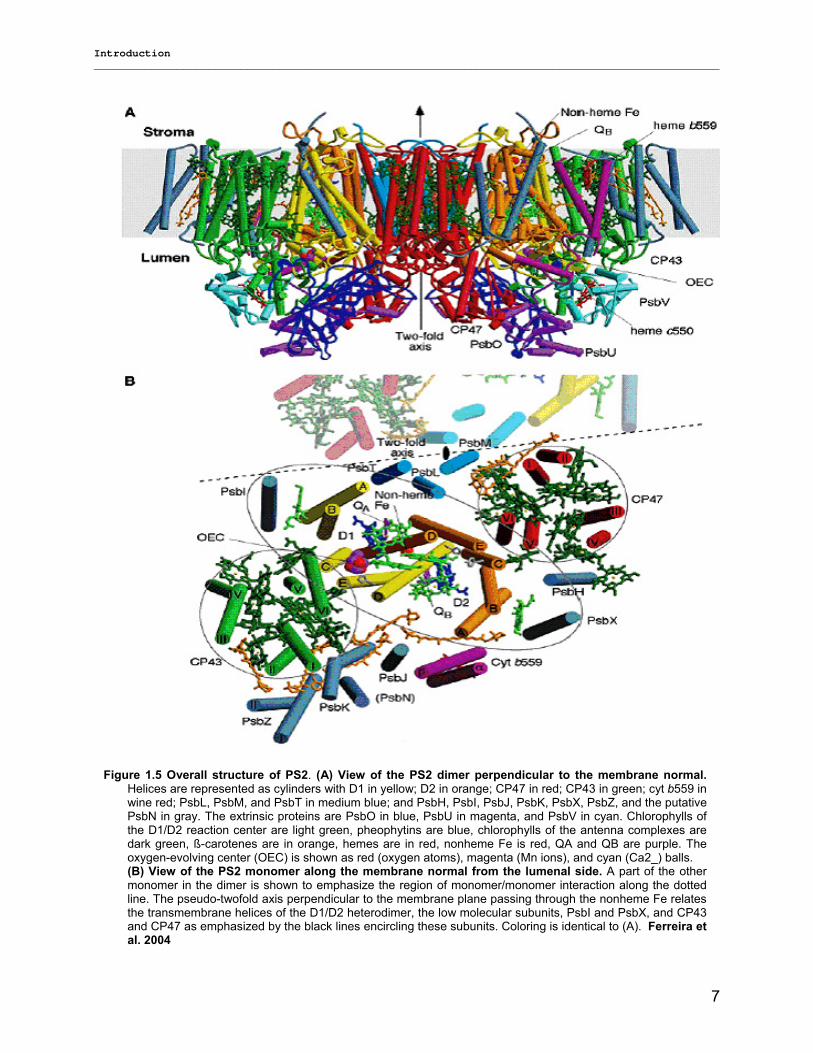
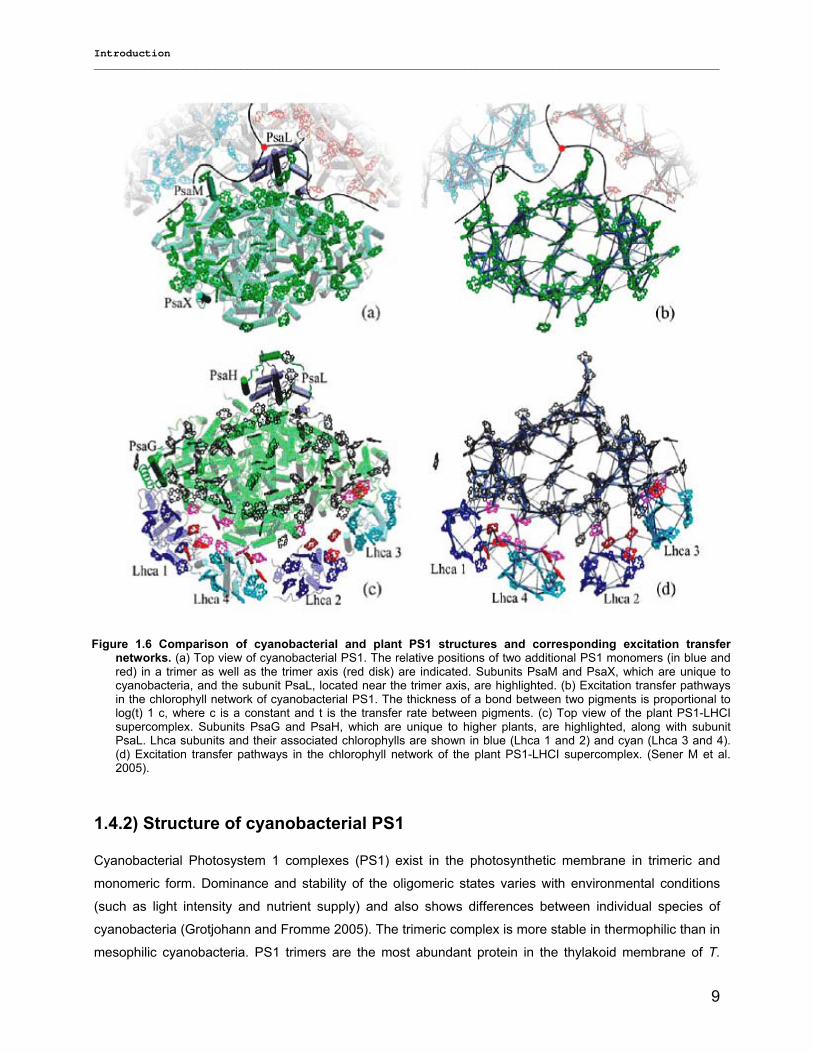
The chlorophyll a binding PS1 core complexes from cyanobacteria and plants show great structural
similarity, with differences appearing mostly in the outer protein subunits (Sener et al. 2005). Specifically,
the PS1 subunits PsaG and PsaH are present only in plants but not in cyanobacteria; whereas the
subunits PsaX and PsaM are found only in cyanobacteria but not in plants (figure 1.6). Furthermore, the
subunit PsaL displays important structural differences between plants and cyanobacteria. These
differences in the outer subunits facilitate two major variations in terms of the supramolecular organization
of the PS1 complex in cyanobacteria and plants. First, PS1 in cyanobacteria is known to form trimers
under certain physiological conditions, whereas plant PS1 was never observed as trimer up to now (Sener
et al. 2005, 2004; Ben-Shem et al. 2003; Fromme et al. 2003a and Fromme 1998). The subunits PsaM
and PsaL are responsible for the trimer formation and its stabilization in cyanobacteria (Jordan et al.
2001), while the absence of PsaM, the structural changes of PsaL, on the other hand, the presence of
PsaH prevents the trimer formation in plant PS1 (Grotjohann and Fromme 2005).
As second major structural difference between cyanobacteria and plants, plant PS1 typically forms a
supercomplex consisting of the core complex and an external antenna array of four peripheral chlorophyll
a/b binding LHCI complexes (Ben-Shem et al. 2003 and Klimmek et al. 2005); they are named Lhca1-
Lhca4 after their encoding genes and the PsaG subunit found in plant PS1 provides an anchoring point for
Lhca subunits.
Another difference in the supramolecular organization of the PS1 complex between plants and
cyanobacteria is revealed under iron-stress conditions, where cyanobacteria develop a ring of iron-stress
induced (IsiA) subunits surrounding a trimeric PS1 core. This nearly doubles the light harvesting cross-
section of the core complex (Bibby et al. 2001 (A&B), Boekema et al. 2001 and Kouril et al. 2005).
Trimeric PS1 is likely a new invention of cyanobacteria to adapt to lower light intensities at a time when
cyanobacteria had to compete with plants and algae for light (Nelson and Ben-Shem 2004; and Chitnis
2001).
Introduction __________________________________________________________________________________________________
9
1.4.2) Structure of cyanobacterial PS1
Cyanobacterial Photosystem 1 complexes (PS1) exist in the photosynthetic membrane in trimeric and
monomeric form. Dominance and stability of the oligomeric states varies with environmental conditions
(such as light intensity and nutrient supply) and also shows differences between individual species of
cyanobacteria (Grotjohann and Fromme 2005). The trimeric complex is more stable in thermophilic than in
mesophilic cyanobacteria. PS1 trimers are the most abundant protein in the thylakoid membrane of T.
Figure 1.6 Comparison of cyanobacterial and plant PS1 structures and corresponding excitation transfer networks. (a) Top view of cyanobacterial PS1. The relative positions of two additional PS1 monomers (in blue and red) in a trimer as well as the trimer axis (red disk) are indicated. Subunits PsaM and PsaX, which are unique to cyanobacteria, and the subunit PsaL, located near the trimer axis, are highlighted. (b) Excitation transfer pathways in the chlorophyll network of cyanobacterial PS1. The thickness of a bond between two pigments is proportional to log(t) 1 c, where c is a constant and t is the transfer rate between pigments. (c) Top view of the plant PS1-LHCI supercomplex. Subunits PsaG and PsaH, which are unique to higher plants, are highlighted, along with subunit PsaL. Lhca subunits and their associated chlorophylls are shown in blue (Lhca 1 and 2) and cyan (Lhca 3 and 4). (d) Excitation transfer pathways in the chlorophyll network of the plant PS1-LHCI supercomplex. (Sener M et al. 2005).
Introduction __________________________________________________________________________________________________
10
elongatus and the formation of intact trimers is essential for the growth of the cells at low light intensity
(Fromme et al. 2003b). Trimeric PS1 has a molecular weight of 1,068,000 Da as revealed from its protein
and cofactor composition (Jordan et al. 2001); it is the most complex membrane protein for which a
structure has been determined. Most remarkable feature is the large content of cofactors that provide
more than 30 % of the total mass of PS1. They are not only important for the function of the protein but
also play an essential role in the assembly and structural integrity of PS1.
Figure 1.7a shows the structure of trimeric PS1 as view from the cytoplasmic side onto the membrane
plane. Trimeric PS1 forms a clover-leaf-structure with a diameter of 220 A˚. It extends into the stroma by
90 A˚. The stromal hump is formed by subunits PsaC, PsaD and PsaE (figure 1.7 b&c). Each monomeric
PS1 consists of 12 proteins (PsaA, PsaB, PsaC, PsaD, PsaE, PsaF, PsaI, PsaJ, PsaK, PsaL, PsaM and
PsaX) to which 127 cofactors are non-covalently bound. These cofactors are 96 chlorophylls, 22
carotenoids, 3 (4Fe4S) clusters, two phylloquinone molecules and 4 lipids (figure 1.7 a, b and c). It is
known that most of the main proteins, including all cofactor-binding sites, are well conserved between
plants and cyanobacteria, whereas PsaM is unique to cyanobacteria and PsaX has so far only been
identified in thermophilic cyanobacteria. The large subunits PsaA and PsaB are the most important
subunits; they are located in the center of the PS1 monomers and harbor the majority of chlorophylls and
carotenoids of the antenna system as well as most of the cofactors of the electron transport chain from
P700 to the first FeS cluster (FX). The small hydrophobic subunits are located peripherally to PsaA and
PsaB. PsaL, PsaI and PsaM are located at the interface between the monomers, with PsaL forming the
connection domain that structurally and functionally links the monomers. The subunits PsaF, PsaJ, PsaK
and PsaX are located at the distal side of the PS1, with contacts to the membrane bilayer (Fromme et al.
2001, Jordan et al 2001, Grotjohann and Fromme 2005). The subunits PsaC, PsaD and PsaE are
extrinsic subunits that form a stromal hump, which extends beyond the membrane by 90 A˚. PsaC carries
the two terminal FeS clusters, FA and FB. All three subunits together form the docking site for
ferredoxin/flavodoxin, with PsaC carrying the terminal FeS clusters FA and FB.
1.4.3) Electron transport within PS1 The electron transport chain of PS1 consists of six chlorophylls, two phylloquinones and three 4Fe4S
clusters. Most of the cofactors have been identified spectroscopically; they are identical in photosystem 1
from cyanobacteria, algae and higher plants. Processes catalyzed by PS1 can be divided into the process
of light capturing, excitation energy transfer and electron transfer. Although charge separation was thought
to be initiated from P700, recently Holzwarth et al. (2006) reported that P700 are not oxidized in the first
electron transfer process, but rather only in the secondary electron transfer step and the new electron
transfer mechanism for PS1 where the accessory Chl(s) function as the primary electron donor(s) and the
A0 Chl(s) are the primary electron acceptor(s). The oxidized P700 are reduced by Cyt C6 or plastocyanin
and the electron is transferred stepwise to A0, A1 and from there subsequently to the three 4Fe4S clusters,
named FX, FA and FB.
Introduction __________________________________________________________________________________________________
11
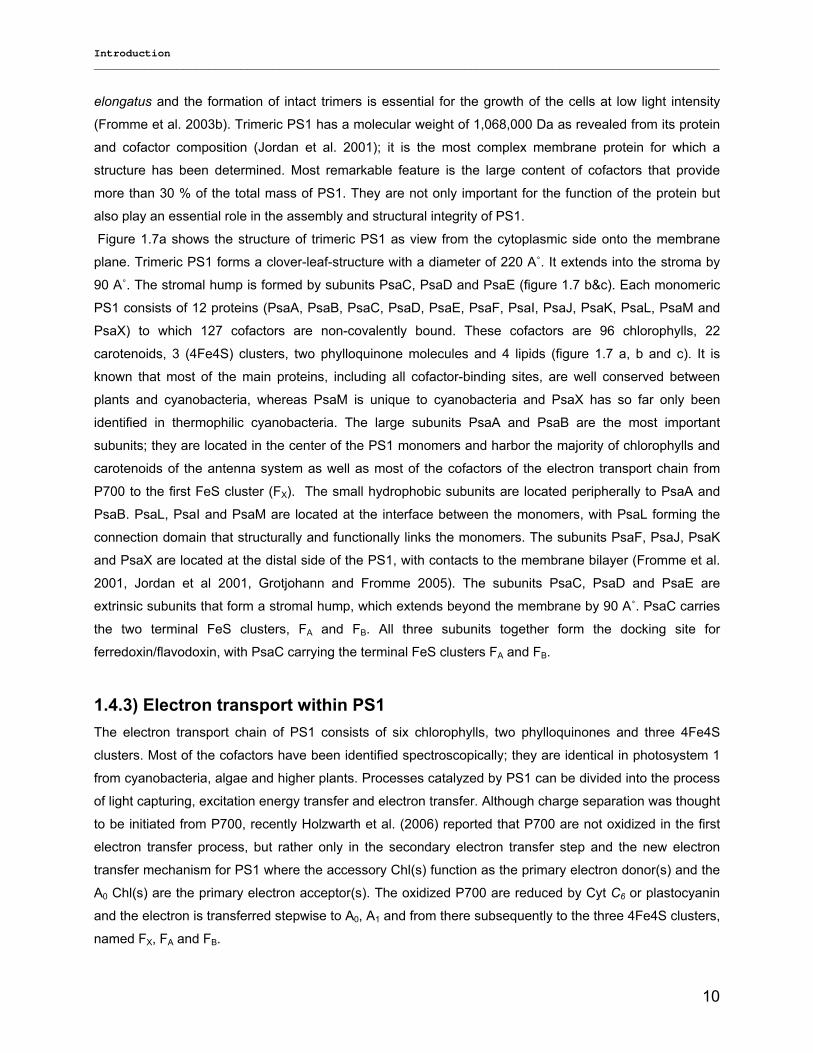
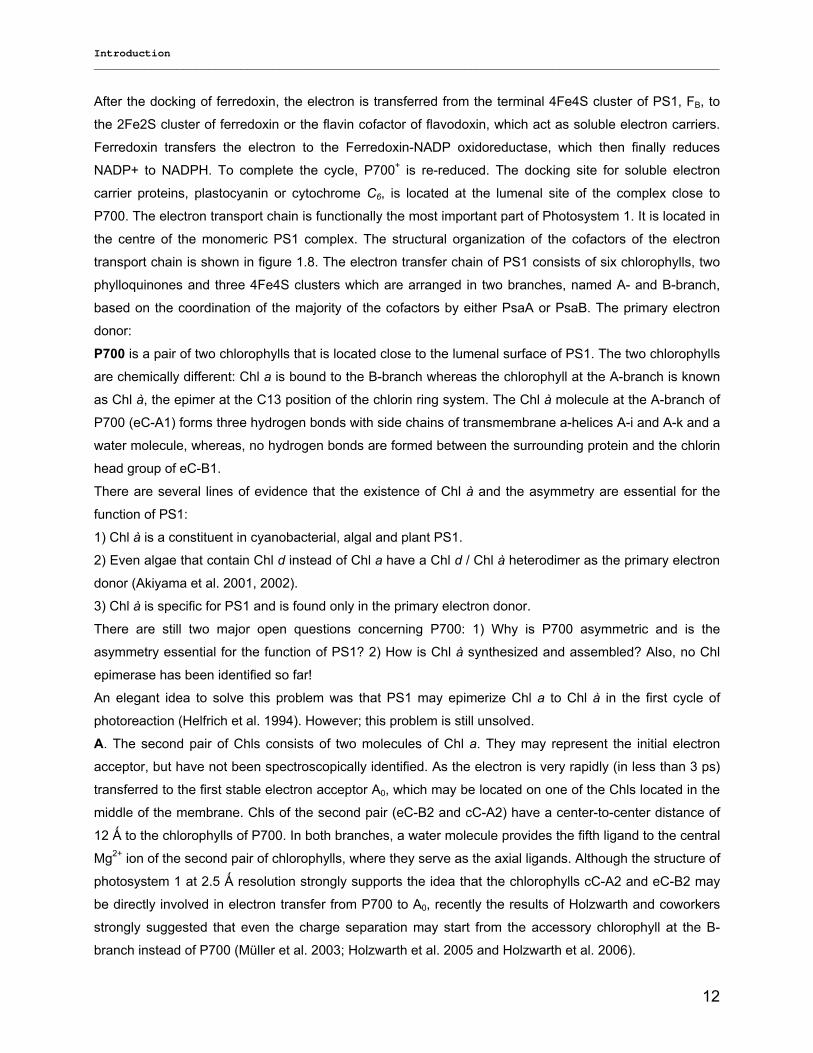
Figure 1.7 Structural model of PS1 trimer at 2.5 Ǻ resolution.
a) View along the membrane normal from the stromal side. For clarity, stromal subunits have been omitted. Different structural elements are shown in each of the three monomers (I, II and III).
I, arrangement of the transmembrane α-helices (cylinders). All subunits are labelled. The transmembrane α-helices of PsaA (blue) and PsaB (red) are named A-a to A-k (B-a to B-k) from the N to the C terminus (capital letters omitted). All loop regions of PsaA and PsaB are named according to the transmembrane helices which they connect. For all other subunits the α--helices and ß-sheets are numbered in alphabetical order from the N to the C terminus. Six helices in extra-membranous loop regions are drawn as spirals.
II, membrane-intrinsic subunits. In addition to the transmembrane α-helices, the stromal and lumenal loop regions are shown in ribbon representation.
III, complete set of cofactors shown with the transmembrane α-helices (the side chains of the antenna Chl a molecules have been omitted). ETC: quinones and chlorophylls in blue, iron and sulphur atoms of the three Fe4S4 clusters as orange and yellow spheres, respectively. Antenna system: chlorophylls in yellow, carotenoids in black, lipids in turquoise. (Jordan et al. 2001)
b) Zoom in to illustrate the arrangement of protein subunits and cofactors in one monomer. Transmembrane K-helices of the subunits PsaF, PsaK and PsaL are labeled. (Fromme P. et al. 2001)
c) Side view of the PS1 monomer. View direction parallel to the membrane plane. The crystallographic three-fold axis (C3) is indicated by the black vertical line. The three stromal subunits PsaE, PsaC and PsaD are located on top of the transmembrane K-helices. Structural regions corresponding to insertions in PsaC with respect to bacterial ferredoxins are colored green. (Fromme et al. 2001)
Introduction __________________________________________________________________________________________________
12
After the docking of ferredoxin, the electron is transferred from the terminal 4Fe4S cluster of PS1, FB, to
the 2Fe2S cluster of ferredoxin or the flavin cofactor of flavodoxin, which act as soluble electron carriers.
Ferredoxin transfers the electron to the Ferredoxin-NADP oxidoreductase, which then finally reduces
NADP+ to NADPH. To complete the cycle, P700+ is re-reduced. The docking site for soluble electron
carrier proteins, plastocyanin or cytochrome C6, is located at the lumenal site of the complex close to
P700. The electron transport chain is functionally the most important part of Photosystem 1. It is located in
the centre of the monomeric PS1 complex. The structural organization of the cofactors of the electron
transport chain is shown in figure 1.8. The electron transfer chain of PS1 consists of six chlorophylls, two
phylloquinones and three 4Fe4S clusters which are arranged in two branches, named A- and B-branch,
based on the coordination of the majority of the cofactors by either PsaA or PsaB. The primary electron
donor:
P700 is a pair of two chlorophylls that is located close to the lumenal surface of PS1. The two chlorophylls
are chemically different: Chl a is bound to the B-branch whereas the chlorophyll at the A-branch is known
as Chl à, the epimer at the C13 position of the chlorin ring system. The Chl à molecule at the A-branch of
P700 (eC-A1) forms three hydrogen bonds with side chains of transmembrane a-helices A-i and A-k and a
water molecule, whereas, no hydrogen bonds are formed between the surrounding protein and the chlorin
head group of eC-B1.
There are several lines of evidence that the existence of Chl à and the asymmetry are essential for the
function of PS1:
1) Chl à is a constituent in cyanobacterial, algal and plant PS1.
2) Even algae that contain Chl d instead of Chl a have a Chl d / Chl à heterodimer as the primary electron
donor (Akiyama et al. 2001, 2002).
3) Chl à is specific for PS1 and is found only in the primary electron donor.
There are still two major open questions concerning P700: 1) Why is P700 asymmetric and is the
asymmetry essential for the function of PS1? 2) How is Chl à synthesized and assembled? Also, no Chl
epimerase has been identified so far!
An elegant idea to solve this problem was that PS1 may epimerize Chl a to Chl à in the first cycle of
photoreaction (Helfrich et al. 1994). However; this problem is still unsolved.
A. The second pair of Chls consists of two molecules of Chl a. They may represent the initial electron
acceptor, but have not been spectroscopically identified. As the electron is very rapidly (in less than 3 ps)
transferred to the first stable electron acceptor A0, which may be located on one of the Chls located in the
middle of the membrane. Chls of the second pair (eC-B2 and cC-A2) have a center-to-center distance of
12 Ǻ to the chlorophylls of P700. In both branches, a water molecule provides the fifth ligand to the central
Mg2+ ion of the second pair of chlorophylls, where they serve as the axial ligands. Although the structure of
photosystem 1 at 2.5 Ǻ resolution strongly supports the idea that the chlorophylls cC-A2 and eC-B2 may
be directly involved in electron transfer from P700 to A0, recently the results of Holzwarth and coworkers
strongly suggested that even the charge separation may start from the accessory chlorophyll at the B-
branch instead of P700 (Müller et al. 2003; Holzwarth et al. 2005 and Holzwarth et al. 2006).
Introduction __________________________________________________________________________________________________
13
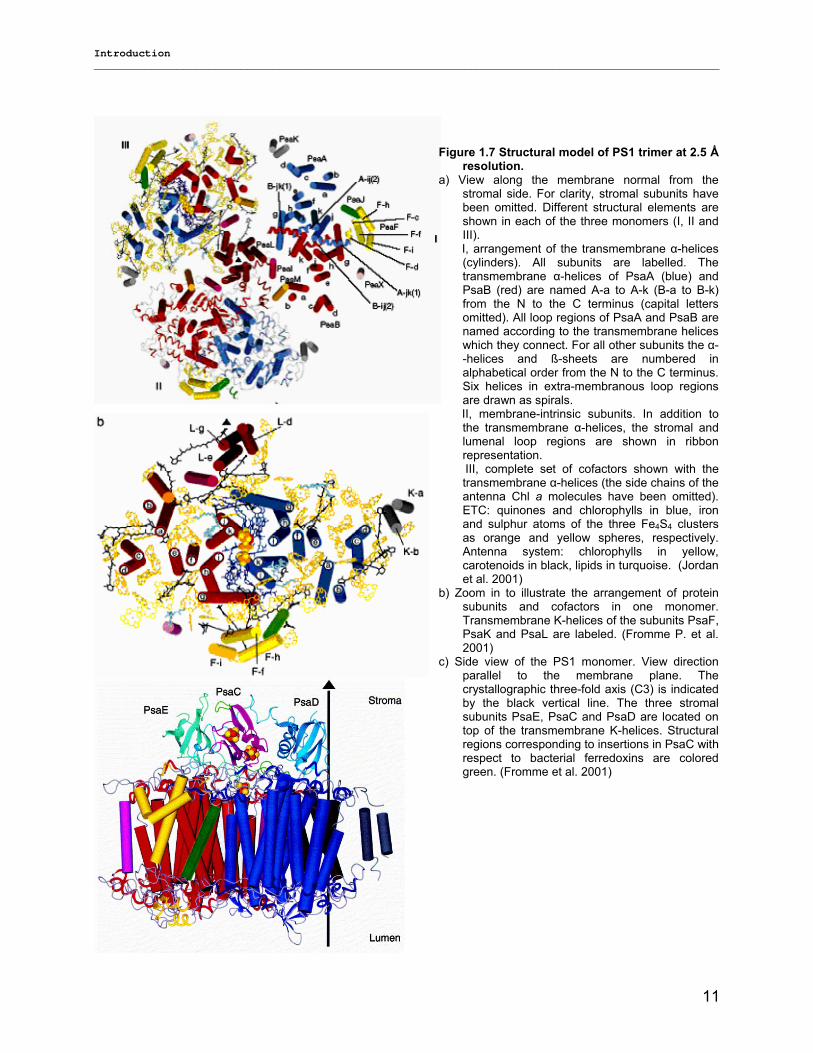
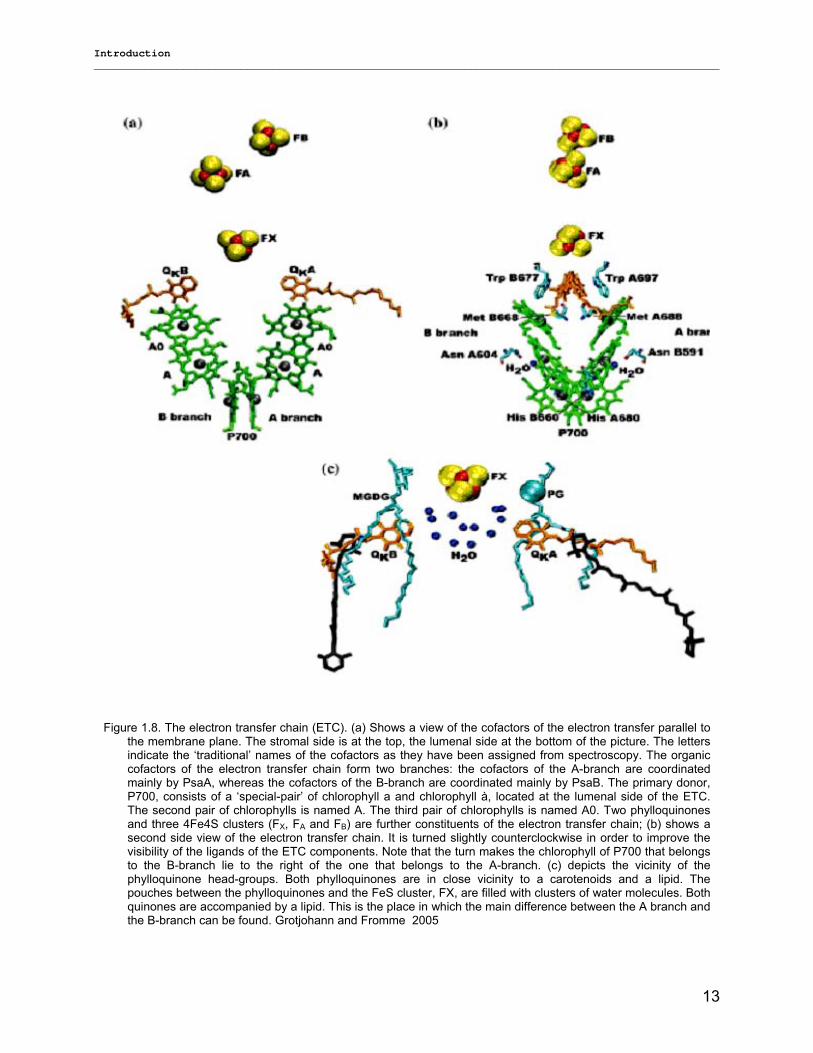
Figure 1.8. The electron transfer chain (ETC). (a) Shows a view of the cofactors of the electron transfer parallel to the membrane plane. The stromal side is at the top, the lumenal side at the bottom of the picture. The letters indicate the ‘traditional’ names of the cofactors as they have been assigned from spectroscopy. The organic cofactors of the electron transfer chain form two branches: the cofactors of the A-branch are coordinated mainly by PsaA, whereas the cofactors of the B-branch are coordinated mainly by PsaB. The primary donor, P700, consists of a ‘special-pair’ of chlorophyll a and chlorophyll à, located at the lumenal side of the ETC. The second pair of chlorophylls is named A. The third pair of chlorophylls is named A0. Two phylloquinones and three 4Fe4S clusters (FX, FA and FB) are further constituents of the electron transfer chain; (b) shows a second side view of the electron transfer chain. It is turned slightly counterclockwise in order to improve the visibility of the ligands of the ETC components. Note that the turn makes the chlorophyll of P700 that belongs to the B-branch lie to the right of the one that belongs to the A-branch. (c) depicts the vicinity of the phylloquinone head-groups. Both phylloquinones are in close vicinity to a carotenoids and a lipid. The pouches between the phylloquinones and the FeS cluster, FX, are filled with clusters of water molecules. Both quinones are accompanied by a lipid. This is the place in which the main difference between the A branch and the B-branch can be found. Grotjohann and Fromme 2005
Introduction __________________________________________________________________________________________________
14
A0. The third pair of Chls named ec-A3 and ec-B3, are located in the middle of the membrane. It is very
likely that the spectroscopic and redox properties of eC-A3 and eC-B3 are influenced by eC-B2 and eC-
A2, respectively. Both Chls have very unusual axial ligands as the sulfur atoms of methionine residues
A688 and B668 provide the fifth ‘ligands’ of the Mg2+ ions. Since the interaction between Mg2+ and
methionine sulfur is only very weak, this led to the hypothesis that the weak ligand may play an important
role in the tuning of the redox potential of A0, which is with -1.1 V very negative (Fromme et al. 2001;
Jordan et al. 2001).
A1 represents the two phylloquinones, named QKA and QKB, which are spectroscopically identified
electron acceptors. They are located at the cytoplasmic side of the membrane, in close vicinity to the
membrane surface. The protein ligands of both phylloquinones are identical on the A- and B-branch but
differ significantly from all other quinone binding pockets found in proteins. The asymmetric ligandation
may be one of the factors that cause the very negative redox potential (-770 mV) of A1 (Semenov et al.
2000).
FX is the rate limiting step of the electron transfer in PS1 and the question whether one or both branches
are active concentrates on this electron transfer step. There is experimental evidence that the electron
transfer can proceed along both branches, but with different rates. In the green algae Chlamydomonas
reinhardtii, the electron transfer is about a factor of 50 slower on the A- than on the B-branch (Boudreaux
et al. 2001; Guergova-Kuras et al. 2001 and Holzwarth et al. 2006). A recent study calculated the redox
potentials of the two electron transfer through the two active quinones in PS1 by evaluating the
electrostatic energies from the solution of the Poisson-Boltzmann equation based on the crystal structure.
The calculated redox potentials are -531 mV for QKA and -686 mV for QKB, which would lead to an uphill
electron transfer from QKA to FX (Ishikita and Knapp 2003). Two lipid molecules are located close to the
pathway from QKA and QKB to FX that could be a main factor in the establishment of the asymmetry.
FX plays an important structural and functional role in Photosystem 1. It transfers electrons from the
quinones to the terminal FeS clusters FA and FB. Electron transfer to FA is faster than electron transfer
from the phylloquinones to FX, therefore the FX intermediate is difficult to detect spectroscopically in intact
PS1 complexes. In addition to its functional role in electron transfer, FX also plays an important role in the
stabilization and assembly of the PS1 complex. Recent studies have shown that assembly of FX is critical
for the attachment of PsaC, PsaD and PsaE and that additional assembly proteins as rubredoxin (rebA)
are necessary for the assembly of FX (Shen et al. 2002). The physical chemical parameters of FX may also
be influenced by the presence of PsaC as the electron transfer to FX is blocked in mutants lacking PsaC
(Gong et al. 2003).
FA and FB are the two terminal FeS clusters bound to the extrinsic subunit PsaC. This supports a
sequential electron transport from FX to FA to FB as it was suggested by spectroscopic and biochemical
studies (Fischer et al. 1999; and Golbeck 1999). Antonkine et al. (2002 and 2003) found that the C-
terminus of PsaC is the main asymmetric element that causing the favorable incorporation of PsaC in a
specific orientation with FX. However, the extrinsic subunit PsaD plays also an important role in correct
Introduction __________________________________________________________________________________________________
15
docking of PsaC, as reconstitution of the PS1 core with PsaC in absence of PsaD and PsaE leads to an
equivalent reduction of FA and FB (Li et al. 1991).
As FB is the terminal FeS cluster mediating the electron transfer to ferredoxin, one would expect that most
of the electron transfer directly proceeds from FX to FB, with FA being only a short-lived intermediate. In
contrast, more than 80% of the electrons are found on FA, caused by the more negatively redox potential
of FA than FB. The stop of the electron transfer at FA may provide some protection from the waste of
energy by electron transfer to other molecules than ferredoxin, such as oxygen (Badger et al. 2000).
1.4.4) Long-wavelength chlorophyll (LWC) A unique property of PS1 from cyanobacteria, algae and higher plants is the relatively high content of the
so called long-wavelength chlorophylls (LWC). This red-, or low energy chlorophylls (Chls) are located on
the PS1 core complex and/or the peripheral light-harvesting complex (LHCI). LWC are defined on the
basis of their spectral properties: They absorb light at wavelengths longer than P700, i.e., the lowest
excited state of LWC are below P700. The presence of LWC in almost all types of PS1 complexes
indicates their functional importance. Since a concentrated solution of Chl a shows a low temperature
fluorescence band at 715 nm, it was suggested that a Chl aggregate (dimer) is responsible for the long
wavelength emission (Brody, 1958). Until now, the origin of red-shifted Chls in photosynthetic organisms is
not clear. Possibility, an aggregation of pigments is involved both in the red shift and the fluorescence
quenching of Chls in vivo (Karapetyan et al. 2006).
The fact that water molecules have been found close to antenna Chl dimers or trimers in the X-ray
structure of PS1 (Jordan et al., 2001) may help to establish the possible role of water in LWC. The
fluorescence yield of LWC strongly increases at low temperatures because excitation energy not utilized
by the reaction center (RC) migrates predominantly to LWC. Similar to P700, the LWC serve as terminal
energy trap and therefore have a pronounced effect on energy transfer and trapping. It was expected that
LWC serve to increase the trapping time and decrease the quantum yield of charge separation. However,
the decrease in the quantum yield of primary photochemistry by LWC is compensated by the efficient
uphill energy transfer from LWC to bulk Chls at physiological temperatures, and by the increase of the
absorption cross-section (Karapetyan et al. 2006). Notably, the mechanism of efficient uphill energy
transfer in the PS1 antenna is not yet clear. Probably, even a small overlap between the emission band of
the LWC and the absorption band of the primary electron donor is enough for efficient energy transfer.
LWC of PS1 may play various roles in photosynthesis depending on their location in the antenna, and
therefore on the distance between the red Chls and P700 (Karapetyan et al., 1999a). It was suggested
that LWC may concentrate energy on P700 by decreasing the amount of energy transfer in bulk Chls
(Holzwarth et al., 1993; White et al., 1996); however, recent data have shown that LWC slow down the
trapping rate (Gobets et al., 2001). Red Chls may increase the absorption cross-section under conditions
of low-intensity light in the course of cyanobacteria cultivation (Trissl, 1993; Shubin et al., 1995) and plant
growth (Rivadossi et al., 1999), or protect RC against excess energy (Mukerji and Sauer, 1989;
Introduction __________________________________________________________________________________________________
16
Karapetyan et al., 1999a,b). LWCs compete with P700 for excitation energy (especially at low
temperature), thus affecting the efficiency of charge separation (Pålsson et al., 1998).
PS1 trimers contain usually more LWC than monomers. Spectral properties of the LWC of several
cyanobacterial PS1 have been reported in several studies (Shubin et al., 1991, 1993; van der Lee et al.,
1993; Gobets et al., 1994, 2001a,b; Woolf et al., 1994; Pålsson et al., 1996, 1998; Karapetyan et al., 1997,
1999a; Wittmershaus et al., 1998; Kruip et al., 1999; Cometta et al., 2000; Hayes et al., 2000;
Melkozernov, 2001; Zazubovich et al., 2002; and Gobets and van Grondelle, 2001).
The maximal fluorescrnce emission at low temperature is about 730 nm for monomeric and 732 nm for
trimeric PS1 complexes from T. elongatus. PS1 monomers from T. elongatus, prepared either from a
psaL− strain or by dissociation of trimers, lack the PsaL subunit (Karapetyan et al. 2006), which forms
most of the contact sites within the trimerization domain and coordinates three antenna chlorophylls
(Jordan et al., 2001). For this reason, a location of some of the C719 pigments might be close to the
connecting domain of the monomeric PS1 complexes within the trimer (Pålsson et al., 1998).
1.5) Cytochrome c6 (Cyt c6) Cytochrome c6 is a small (about 10 kDa) monoheme protein which serves as soluble redox carrier in
oxygenic photosynthetic bacteria and eukaryotic algae (Sandmann et al., 1983; Kerfeld and Krogmann,
1998). It originated when iron was more abundant than copper in the anoxygenic seas prior to oxygenic
photosynthesis. After the appearance of oxygen in the atmosphere, iron became a rare element with
copper taking the lead over iron (De la Rosa et al. 2002).
Cytochrome c6 is located in the thylakoid lumen and transfers electrons from Cyt f of the Cyt b6f complex
to PS1 (Merchant and Dreyfuss, 1998). In oxygenic photosynthetic prokaryotes, where the photosynthetic
membranes also contain a cytochrome oxidase, Cyt c6 also serves as an electron donor to this complex
(Obinger et al., 1990; Moser et al., 1991; Nicholls et al., 1992). The mature Cyt c6 polypeptide typically
comprises 83–90 residues, with a single haem, and has a midpoint redox potential of -335 to -390 mV.
Under copper- starvation, many cyanobacteria and green algae such as Chlamydomonas use Cyt c6 as
electron donor for PS1, as the synthesis is repressed under copper starvation (Wood, 1978; Ho and
Krogmann, 1984). Although the structures of the two proteins are different, they are similar in size and
midpoint redox potential, reflecting their similar functions. There is a considerable variation among species
in the pI of both Cyt c6 and plastocyanin. However, in any one species, the pI of both proteins is similar,
again reflecting their similar functional interactions with other proteins (Ho and Krogmann, 1984; De la
Rosa et al., 2002). It was widely accepted that the land plants replace Cyt c6 with plastocyanin (Kerfeld
and Krogmann, 1998). Nevertheless, recent studies have shown that plants do have a form of Cyt c6 (Cyt
c6A). It is also now clear that Cyt c6A is not restricted to higher plants, as searching of the complete
genome sequence of the green alga Chlamydomonas reinhardtii showed a gene (designated CYC4) for
Cyt C6A (Wastl et al., 2004). Whereas plastocyanin is a ß-sheet protein with copper as the central ion, C-
type cytochromes are highly α-helical heme-containing proteins. Cyt c6 was shown to be the only electron
carrier in T. elongatus (Sutter et al., 1995) representing primordial form in the evolutionary line of proteins.
Introduction __________________________________________________________________________________________________
17
Previously, Cyt c6 from T. elongatus have been overexpressed in E coli in order use as natural electron
donor in our electrochemical device (M. Ambill 2004).
1.6) Energy Energy is the lifeblood of technological and economic development and has severe impact on economic
growth (Jeffrey chow et al 2003).
Although estimates vary, the world’s; economically recoverable fossil fuel reserves include almost 1 trillion
metric tons of coal, more than 1 trillion barrels of petroleum and over 150 trillion cubic meters of natural
gas (International Energy Annual 2001). In addition to fossil fuels, mineral resources important to energy
generation include over 3 million metric tons of uranium reserves (International Atomic Energy Agency,
Vienna, 2001). Conventional energy sources based on oil, coal, and natural gas have proven to be highly
effective drivers of economic progress, but at the same time damage the environment and human health.
In contrast, the potential of renewable energy sources is enormous as they can in principle meet many
times the world’s energy demand. Renewable energy sources can provide sustainable energy, based on
the use of routinely available resources (Herzog A. 2000 and Herzog et al. 2001).
1.6.1) Hydrogen The future hydrogen economy will feature hydrogen as an energy carrier in a reliable and sustainable
energy supply system. In today’s system, electricity serves as an energy carrier. Electricity made by the
conversion of primary energy sources is easily transported and delivered to end-users. Building an
infrastructure that allows for easy and cost-effective transportation and delivery of hydrogen energy is a
critical step toward a future hydrogen economy.
All hydrogen production processes are based on the separation of hydrogen from hydrogen-containing
feedstocks. The feedstock dictates the selection of the separation method. Today, two primary methods
are performed to separate hydrogen: thermal and chemical. A third method, biological, is in the
exploratory research and development phase.
Today, up to 95 % of the hydrogen is produced in the U.S., roughly 9 million tons per year, using a thermal
process with natural gas as feedstock, which is called steam methan reformation (SMR). Disadvantages of
this method are the highly costive as well as the natural gas used in this process increases the carbon
gases in the atmosphere. An advantage is the production of hydrogen from water using biological
catalysts that have been optimized by nature: the process of water-splitting photosynthesis on the one
hand and hydrogen production via the catalyst hydrogenase on the other hand (Esper et al. 2006).
Some cyanobacteria and green algae can also evolve hydrogen as a by-product of photosynthesis, with
some species such as Chlamydomonas realizing a direct transfer of photosynthetic electrons via
Ferredoxin (Fd) to a hydrogenase under sulfur deprivation (Melis A. 2002 and Happe T. and Kaminski A.
2001). There are three known types of hydrogenase in nature: [Fe-only]-type, [NiFe]-type and Fe-S-
cluster-free hydrogenase (Lyon E. et al. 2004), they differ in their activity and their O2-sensetivity. Fe-
hydrogenase is present in Chlamydomonas. It is the simplest one (only one subunit) and highly active
Introduction __________________________________________________________________________________________________
18
(2000 H2 s-1) (Happe T. et al. 2002 and Girbal L. et al. 2005). The problem is; the coupling of
photosynthesis and hydrogen production is highly inefficient because it occurs only under extremely
reduced PS2 water-splitting activity combined with anaerobiosis and finally leads to the degradation of the
culture (Melis A. and Happe T. 2001).
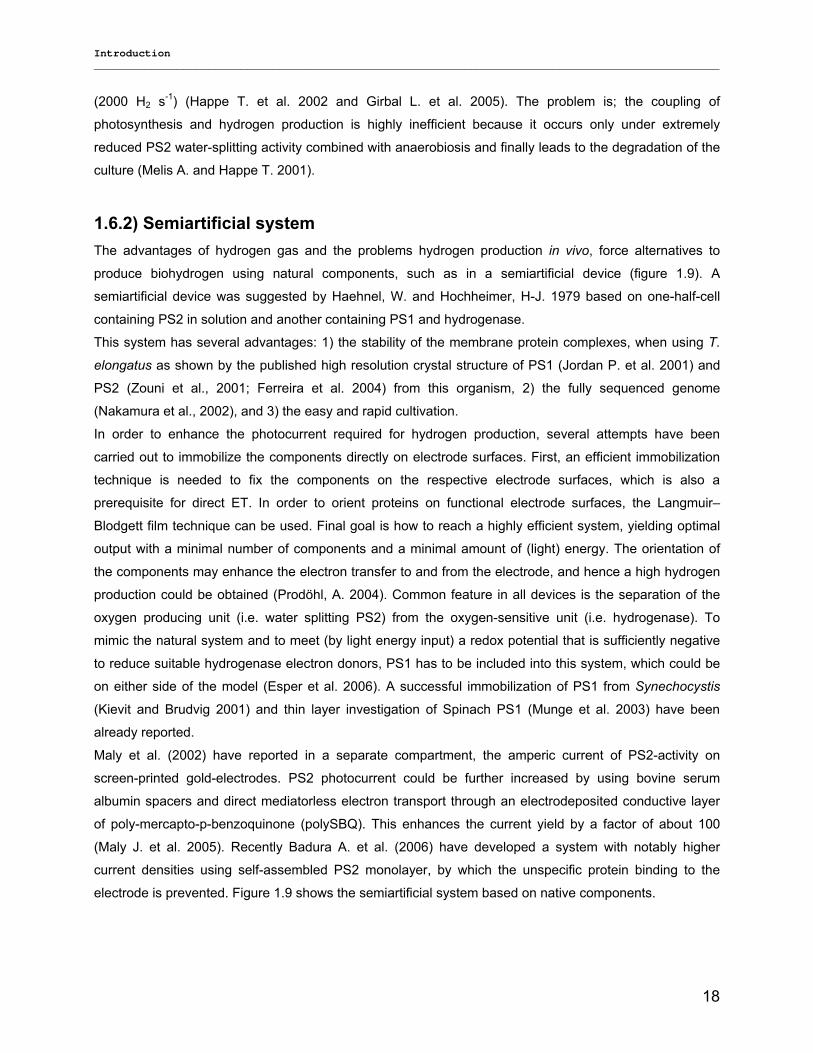
1.6.2) Semiartificial system The advantages of hydrogen gas and the problems hydrogen production in vivo, force alternatives to
produce biohydrogen using natural components, such as in a semiartificial device (figure 1.9). A
semiartificial device was suggested by Haehnel, W. and Hochheimer, H-J. 1979 based on one-half-cell
containing PS2 in solution and another containing PS1 and hydrogenase.
This system has several advantages: 1) the stability of the membrane protein complexes, when using T.
elongatus as shown by the published high resolution crystal structure of PS1 (Jordan P. et al. 2001) and
PS2 (Zouni et al., 2001; Ferreira et al. 2004) from this organism, 2) the fully sequenced genome
(Nakamura et al., 2002), and 3) the easy and rapid cultivation.
In order to enhance the photocurrent required for hydrogen production, several attempts have been
carried out to immobilize the components directly on electrode surfaces. First, an efficient immobilization
technique is needed to fix the components on the respective electrode surfaces, which is also a
prerequisite for direct ET. In order to orient proteins on functional electrode surfaces, the Langmuir–
Blodgett film technique can be used. Final goal is how to reach a highly efficient system, yielding optimal
output with a minimal number of components and a minimal amount of (light) energy. The orientation of
the components may enhance the electron transfer to and from the electrode, and hence a high hydrogen
production could be obtained (Prodöhl, A. 2004). Common feature in all devices is the separation of the
oxygen producing unit (i.e. water splitting PS2) from the oxygen-sensitive unit (i.e. hydrogenase). To
mimic the natural system and to meet (by light energy input) a redox potential that is sufficiently negative
to reduce suitable hydrogenase electron donors, PS1 has to be included into this system, which could be
on either side of the model (Esper et al. 2006). A successful immobilization of PS1 from Synechocystis
(Kievit and Brudvig 2001) and thin layer investigation of Spinach PS1 (Munge et al. 2003) have been
already reported.
Maly et al. (2002) have reported in a separate compartment, the amperic current of PS2-activity on
screen-printed gold-electrodes. PS2 photocurrent could be further increased by using bovine serum
albumin spacers and direct mediatorless electron transport through an electrodeposited conductive layer
of poly-mercapto-p-benzoquinone (polySBQ). This enhances the current yield by a factor of about 100
(Maly J. et al. 2005). Recently Badura A. et al. (2006) have developed a system with notably higher
current densities using self-assembled PS2 monolayer, by which the unspecific protein binding to the
electrode is prevented. Figure 1.9 shows the semiartificial system based on native components.
Introduction __________________________________________________________________________________________________
19
The aim of our device is to immobilize both Photosystems (PS1 and PS2) onto two electrodes connected
by a bridge wire. In this system, electrons which are used in natural system for metabolism (calvin cycle)
are oriented now to be used for hydrogen production.
Suitable electron mediator between PS2 and gold electrode, gold electrode and PS1 and PS1 and
hydrogenase are examined and optimized.
1.7) Aim of the work To produce biohydrogen in vitro from native components, highly stable complexes from T. elongatus were
chosen as electrons source (PS2) and intermediator (PS1) to transfer these electrons to the hydrogenase
that consequently reduces protons into molecular hydrogen. The presented project should design several
PS1 forms (monomers, trimers, WT and his-tagged) from T. elongatus in which the most efficient form
should be used in the biohydrogen device.
As the isolated monomeric PS1 from T. elongatus is limited, a comparative spectroscopical
characterization of isolated PS1 complexes (monomers and trimers) is important not only for the
optimization of the biohydrogen device but also for the elucidation of the role of both PS1 complexes in
native cells.
To achieve the above mentioned aims, the following strategy is used:
1) Improve methods for isolation and purification of PS1 trimers WT and his-tagged mutant by
which highly efficient complexes are quantitatively produced in a short time.
2) Develop suitable methods for the quantitative purification of mild PS1 monomers.
3) Characterize the purified complexes by sensitive biochemical and biophysical techniques to
find out the characteristic properties of monomeric and trimeric PS1.
Figure 1.9: Model of natural and artificial semisystem Prodöhl et al. (2004).

Introduction __________________________________________________________________________________________________
20
4) Determine the long-wavelength chlorophylls (LWCs) content, verify their function and
investigate their origin by modeling the very fast kinetics of both PS1 complexes.
5) Evaluate the stability of PS1 complexes by exposing them to physical and chemical stress
conditions.
6) Immobilize PS1 complexes on the gold electrode surface and optimize their activity (O2-
uptake and photocurrent) by selecting the efficient redox components (native (Cyt C6) and
artificial) for in vitro use.
Materials & Methods __________________________________________________________________________________________________
21
2) Materials and Methods Chemicals suppliers Reagents and other chemicals are parchsed from the following providers: Amersham Biosciences Europe
GmbH, AppliChem GmbH, Fluka, Sigma-Aldrich Chemie GmbH, J.T. Baker, Mallinckrodt Baker.
2.1) Biochemical methods
2.1.1) Sterilization Growth media, solutions and materials (glass, metals, etc…) were sterilised in an autoclave (Varioklav H-P
Labortechnik, Oberschleissheim, Germany) at 121˚ C for 45 min. Heat sensitive solutions were sterilized
by filtrating through 0.2 µm sterilized filters.
2.1.2) Growth Media - BG-11 medium BG-11 medium was prepared according to Rippka et al. (1979).
5 mM HEPES·NaOH pH 8.2 1 % (v/v) BG-FPC 100x 6 x 10-4 % (w/v) ferric ammonium citrate 0.19 mM sodium carbonate 0.175 mM potassium phosphate BG-FPC (100x) 1.76 M sodium nitrate 30.39 mM magnesium sulfate 24.49 mM calcium chloride 3.14 mM citric acid 0.28 mM Na-EDTA 10 % (v/v) trace elements Trace elements 46.26 mM boric acid 9.15 mM manganese chloride 0.77 mM zinc sulfate 1.61 mM sodium molybdate 0.32 mM copper sulfate 0.17 mM cobalt nitrate
- LB-medium Trypton (10 g/L), yeast extract (5 g/L) and NaCl (5 g/L) were mixed and adjusted to final pH was of 7.2.
For solid plates 15 g/L agar was added. 50 µg/L chloroamphenicol and/or 100 g/L ampicillin were added
after sterlization.
For LB-medium*, (1 mM) KNO3 and (20 mM) glucose were also added to LB-medium.
- TB-medium 12 g/L tryptone, 24 g/L yeast extract and 0.4 % (v/v) glycerol were mixed up. After autoclaving, potassium
phosphate buffer was added to a final concentration of 89 mM (17 mM KH2PO4, 72 mM K2HPO4).
Materials & Methods __________________________________________________________________________________________________
22
- TSB-medium Each in 100 ml medium contains 10 % (v/v) PEG 4000, 5 % (v/v) DMSO, 20 mM MgCl2, 1 % (w/v)
trypton, 0.5 % (w/v) yeast extract, 0.5 % (w/v) NaCl.
2.1.3) Buffers For all aqueous solutions were dissolved or diluted in filtrated and sterlized Millipore MilliQ.
1 M stock solutions of each component were prepared and followed by dilution to the final used
concentration.
- Shock buffer 50 mM Tris-HCl pH 8. 2 mM EDTA-Na and 20 % (w/v) sucrose.
- Buffer A MES 20 mM MES pH 7.5, 10 mM MgCl2, 10 mM CaCl2
- Buffer B 20 mM HEPES pH 7.5, 10 mM MgCl2, 10 mM CaCl2, 0.5 M mannitol.
- Buffer B1 20 mM MES pH 6.5, 10 mM MgCl2, 10 mM CaCl2, 0.5 M mannitol.
- Buffer C 20 mM MES pH 6.5, 10 mM MgCl2, 10 mM CaCl2, 20 % glycerol, 0.5 M mannitol.
- Extraction buffer1 20 mM HEPES pH 7.5, 10 mM MgCl2, 10 mM CaCl2 and (200 mM ammonium sulfate or different
concentrations as shown in results chapter) .
- Extraction buffer2 20 mM HEPES pH 7.5, 10 mM MgCl2, 10 mM CaCl2, 0.5 M mannitol, 0.1 % ß-DM.
- IMAC Equilibration buffer 50 mM MES 6.5, 10 mM MgCl2, 10m M CaCl2, 0.3 M NaCl, 0.25 M mannitol, 0.025 % ß-DM.
- IMAC, Elution buffer IMAC equilibration buffer + 0.1 M histidine.
- NiCl2 solution 0.1 M NiCl2 + 10 % CH3COOH in H2O.
- IEC Equilibration buffer 20 mM HEPES pH 7.5, 10 mM MgCl2, 10 mM CaCl2, 0.5 M mannitol, 0.03 % ß-DM.
- IEC Elution buffer IEC Equi. buffer + 0.2 M MgSO4.
Materials & Methods __________________________________________________________________________________________________
23
- HIC low salt buffer (Elution) 20 mM HEPES pH 7.5, 10 mM MgCl2, 10 mM CaCl2, 0.5 M mannitol, 0.03 % ß-DM.
- HIC high salt buffer (Equilibration) HIC Equilibration buffer + 1.5 M ammonium sulfate.
- Dialysis buffer 20 mM HEPES pH 7.5, 10 mM MgCl2, 10 mM CaCl2, 0.5 M mannitol, 0.025 % ß-DM.
- SEC buffer 20 mM MES pH 6.5, 30 mM CaCl2, 10 mM MgCl2, 0.02 % β-DM
- Washing buffer 20 mM HEPES pH 7.5, 10 mM MgCl2, 10 mM CaCl2, 0.5 M mannitol, 0.05 % ß-DM.
- Immobilizing buffer 30 mM HEPES pH 7.5, 50 mM KCl, 3 mM MgCl2, 10 µM PMS, 5 mM MV and 0.03 % (w/v) β-DM.
2.1.4) Cytochrome c6 2.1.4.1) Overexpression of Cyt c6 The transformation of the plasmids PEC86 and PUCPL in E. coli was performed according to Inoue et al.,
(1990) and Sambroock et al. (1989). The PUCPL plasmid containing the Cyt c6 gene (PetJ) was
constructed by Ambill (2004). The bacterial cells (DH5α and JM83) were grown on LB-solid medium for 60
hours at room temperature. Three germinated colonies were suspended into 200 µl TSB medium followed
by incubation on ice for 10 minutes. 1 µg of each plasmid (PEC86 and PUCPL-PetJ) were mixed with
bacterial suspension and incubated on ice for 30 minutes. Then, a mixture of 750 µl TSB medium and 20
µl of 20 % glucose was added to the bacteria-plasmid suspension before incubation at 37 °C for two
hours. After incubation, the culture was centrifuged at 6000 g for 3 min. 100 µl of supernatant was left to
be used for resuspending the sediment in order to be spread on solid LB-medium containing 100 µg/ml
ampicillin and 50 µg/ml chloroamphenicol. After overnight incubation at 37 °C, the bacterial cells
containing the vectors were grown up and used for overexpression.
About three well grown colonies were suspended in 120 ml LB-medium* containing 100 µg/ml ampicillin
and 50 µg/ml chloroamphenicol and incubated at 37 °C for 6-8 hours. Culture was centrifuged at 2500 g
for 15 minutes. The sediment was re-suspended in 20 ml LB-medium and used for inoculation. 1.8 L of
LB-medium was inoculated by the preculture and incubated at 37 °C with 150 rpm shaking for 4-8 hours.
At OD595 nm = 1, the bacterial culture was inducted by adding 0.3 mM IPTG, 100 mg/L ferrous sulfate and
0.1 mM α-aminoleonelic acid hydrochloride. The conical flask was well kept in anaerobic condition and
incubated at 37 °C for additional 20-44 hours.
Materials & Methods __________________________________________________________________________________________________
24
2.1.4.2) Extraction and purification of Cyt c6 After incubation period, the bacterial cultures were harvested by a centrifugation at 3000 g for 15 minutes.
The sediment was suspended in 30 ml shock buffer and kept on ice for 10 min. The same volume of
shock buffer containing 0.1 mg/ml lysozyme was added and the mixture was kept on ice for 30 min.
Bacterial cells were precipitated by centrifugation at 8000 g for 30 min and Cyt c6 (supernatant) was mixed
with 4 volume of cold acetone (-20 °C) followed by incubation at -20 °C for four hours at least. Cyt c6 was
precipitated by centrifugation at 11600 g for 20 min. Cyt c6 was suspended in 1.5 ml of 10 mM Tris pH 7
containing 0.1 % deriphat 160.
Purification of Cyt c6 was performed according to the protocols of Agalidis et al. (1999) with some
modifications. The concentrated Cyt c6 was diluted in 20 mM Tris-acetate buffer (pH 9) containing 0.1 %
deriphat 160 (disodium N-lauryl iminodipropionate). The UnoQ6 column was equilibrated with 20 mM Tris-
acetate buffer pH 9 containing 0.1 % deriphat 160 before loading the diluted sample. Elution was
proceeded by 2 CV gradient of sodium chloride (from 0 to 0.25 M) followed by 2 CV step at the same salt
concentration. Cytochrome c6 was detected by OD at 280 and 408 nm. The purified Cyt c6 was
precipitated by cold acetone (-20 ˚C) followed by suspending in 10 mM Tris-HCl buffer (pH 7) and stored
at -70 ˚C.
2.1.5) Extraction and Isolation of Photosystem 1
2.1.5.1) Cultivation of T. elongatus cells T. elongatus WT and mutant cells were cultivated in BG-11 medium at 45-50 ˚C in a stream of 5 % (v/v)
CO2 in air. The 20 L cultures of T. elongatus were grown in photobioreactors (Airlift Visual Safety
Fermenter, Bioengineering AG, Wald, Switzerland). Polyamide foil was used as light-permeable reactor
material. After autoclaving the 20 L of BG-11 medium and cooling down to 45 ˚C, 10 µg/L chloramphenicol
was added in case of mutant cells. 1 L preculture cells were inoculated into 20 L culture. White light was
provided at about 100 µE m-2s-1 and increased gradually according to cultural optical density to reach 150 -
200 µE m-2s-1. After about 3 days, cells were harvested in exponential growth phase at OD750nm of 2.5-3.
2.1.5.2) Harvesting and preparation of thylakoid membrane The growth phase of cyanobacterial culture was monitored by a sensor connected to the system. Cultures
at OD750nm 2.5-3 were harvested during the exponential growth phase. The cyanobacterial cells were
concentrated by filtration through AMICON filtration cells (Amicon DC10 LA) to reach a final volume of 2 L.
Cells were pelleted by centrifugation at 2000 g for 15 minutes (GSA-Rotor, Sorvall). The supernatant was
discarded and the cells were washed once with buffer A (MES) and recentrifuged as mentioned before.
Washed cells were suspended in 200 ml buffer B1 containing 0.2 % (w/v) lysozyme and stirred at 37 ˚C for
90 minute in dark condition. Cells were disrupted by applied pressure using Parr bomb at 2000 psi at 4 ˚C
for 20 minute. The most of phycobilins were removed by washing the thylakoid membrane with buffer A
and centrifugation at 3000 g at 4 ˚C for 18 min. An additional one washing step with buffer B1 was

Materials & Methods __________________________________________________________________________________________________
25
necessary before suspending the thylakoid membranes in buffer C. The thylakoid membranes were frozen
using liquid nitrogen at a chlorophyll concentration of about 2.5 mg/ml and stored at -70 ˚C for further
experiments.
2.1.5.3) Extraction of trimeric PS1 Extraction of trimeric PS1 was performed according to the protocols of Rögner et al. (1990) and Wenk and
Kruip (2000). About 30 ml of thylakoid membrane (chlorophyll concentration of 2.5 mg/ml) was slowly
thawed overnight at 10 °C. The thylakoid membrane was brought to volume of 100 ml with wash buffer,
homogenized for 5 times and centrifuged at 9000 g for 20 min. Pelleted thylakoid membrane was
resuspended in the washing buffer and centrifuged as mentioned before. The pellet was resuspended in
the extraction buffer1 to reach a chlorophyll concentration of about 1 µg/µl. The thylakoid membrane was
stirred for 15-20 min followed by adding different concentrations of ß-DM (see results chapter). Stirring for
20 minutes at room temperature was found to be enough for extraction of PS1 complexes. The
unsolubilized cell components were sedimented by ultracentrifugation (Ti70-Rotor, 60 min, 50000 rpm, 4
˚C, ultracentrifuge, Beckman).
2.1.6) Chromatographic purification The chromatographic purification steps were performed with a PerSeptive Biocad 700 E chromatography
system (Applied Biosystems, BioRad), using the following columns; UNOQ6; and POROS HQ/M for IEC;
POROS 50OH for HIC; Chelating Sepharose Fast Flow, Amersham Biosciences for IMAC and TSK 4000
SWXL or TSK 3000 SWXL, Tosoh Haas column for SEC.
2.1.6.1) Immobilised metal affinity chromatography (IMAC)
IMAC column was used for the purification of his-tagged PS1 by affinity binding of histidine chains to
nickel ions. Column was saturated by Ni ions, before equilibration with 4 CV (99:1 % equilibration to
elution buffer, respectively). The solubilized thylakoid membranes were filtrated and loaded onto the
column in a flow rate of 0.5-1 ml/min followed by 4 CV washing step before elution of PS1-his by a linear
gradient 1-100 mM histidine.
2.1.6.2) Hydrophobic Interaction Chromatography (HIC)
POROS 50OH column was equilibrated with 5 CV HIC equilibrated buffer. The extracted PS1 complex or
the purified PS1 (WT or his-tag) was mixed with 3 M ammonium sulfate to reach a final concentration of
1.5 M ammonium sulfate (150 mS) before loading onto the equilibrated column. After washing step (4 CV),
a linear gradient 1.5-0 ammonium sulfate was used for elution. For purification of untreated PS1, two
gradient steps were performed (1.5 -1.1 and 1.1 – 0 M ammonium sulfate). A flow rate of 5 ml/min was
used during equilibration and elution steps, whereas 3-4 ml/min was used for loading step. Purified PS1
was dialysed overnight at 10 ˚C using dialysis buffer. The buffer was replaced with some fresh one after 2
Materials & Methods __________________________________________________________________________________________________
26
hours. Purified PS1 was either concentrated and kept at -70 ˚C for further characterization or loaded onto
an IEC as 2nd purification step.
2.1.6.3) Ion Exchange Chromatography (IEC)
POROS HQ/M column was used as IEC for purification step. It was equilibrated with 4 CV of IEC
equilibration buffer before loading the lower bands (green and blue green) of SG or dialyzed PS1 after 1st
chromatographic step. After loading the samples, washing was occurred for 4 CV. The gradient step 0 –
200 mM MgSO4 was carried out for elution of PS1 complexes. Without special treatment, PS1 was eluted
as trimeric form. Desalting was performed either by dialysis or size exclusion chromatography column (10
DG, BioRad) with buffer B containing 0.03 % β-DM after concentrating the purified PS1. The desalted PS1
was concentrated and kept at -70 ˚C for further uses. In case of using POROS HQ/M as 1st purification
step, the eluted PS1 was mixed directly with 3 M ammonium sulfate and loaded to POROS 50OH column
to be used as 2nd purification step.
2.1.6.4) Size Exclusion Chromatography Size exclusion chromatography were performed on a Waters chromatographic system (two pumps, model
510 fitted with preparative pump heads and Rheodyne injector, Model 9125i and one analytically pump
model 510 for size exclusion chromatography) connected to a diode array detector (PDA 996, Waters,
Milford, MA, USA). TSK 4000 or 3000 gel filtration columns were used for testing the homogeneity of the
purified PS1 complexes. TSK column was equilibrated by 3 CV SEC buffer (M&M 2.1.3), followed by
loading 5 µg chlorophyll sample in 100 µl (SEC buffer) in flow rate of 0.3 - 0.5 µl/min.
2.1.7) Sucrose gradient Sucrose gradient was used for: i) The separating of the photosynthetic complexes, ii) displaying the effect
of salt treatment or iii) monitoring the homogeneity of purified complexes. 20 % sucrose in buffer A
containing 0.03 % ß-DM. The sucrose solution was frozen and slowly thawed overnight at 10 ˚C. In case
of identification purpose, 50 µl of each tested complex was added on the top of the defrozen sucrose
gradient, while about 6 ml of supernatants after UC were added onto the top surface of 30 ml sucrose
gradient in case of the separation of the photosynthetic complexes. After centrifugation at 25000 rpm for
about 18 hours at 4˚C (SW28-Rotor ultracentrifuge, Beckman), the top bands (colourless, orange and
blue) were discard and the bottom bands (green and blue green bands) were collected for further
purification steps.
2.1.8) Protein precipitation
Cyt c6 was precipitated by acetone (Ambill 2004). 1:4 V/V Cyt c6 to cold 100 % acetone (-20 ˚C) was
mixed and incubated for at least 4 hours at -20 ˚C. The mixture was centrifuged at 11600 g at 4 ˚C for 30
min. Precipitated Cyt c6 was dissolved in tris-buffer containing 0.1 % deriphat 160 for further uses.
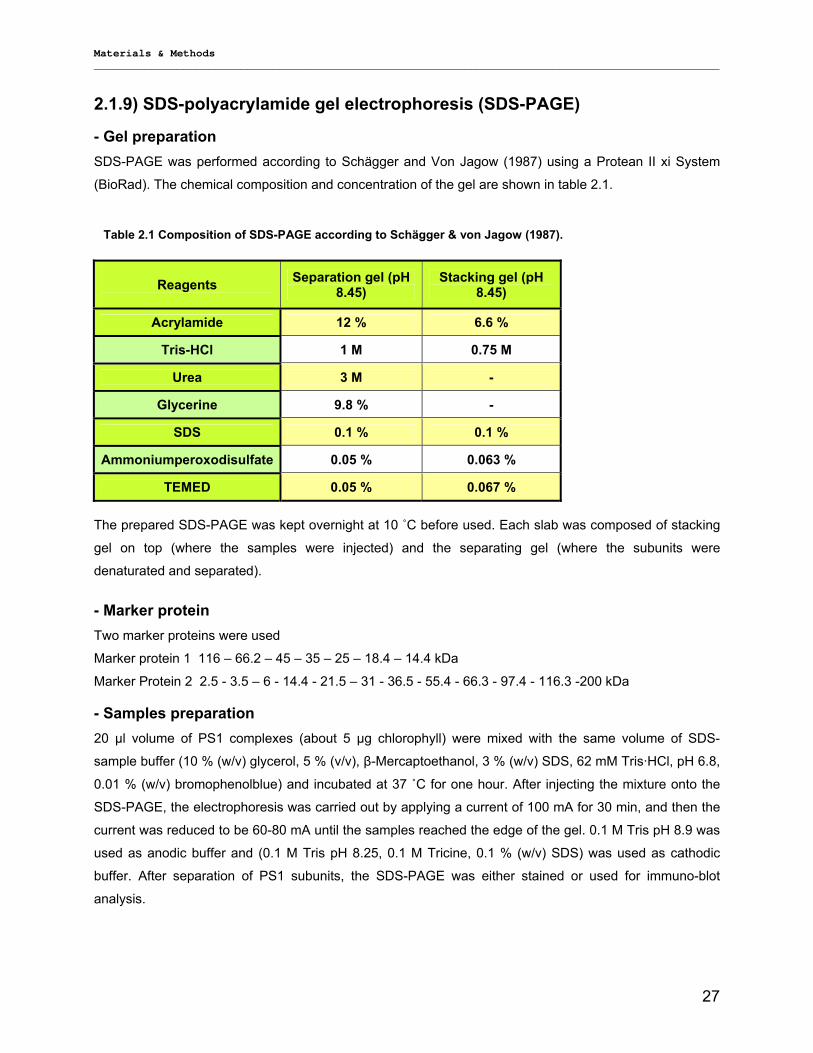
Materials & Methods __________________________________________________________________________________________________
27
2.1.9) SDS-polyacrylamide gel electrophoresis (SDS-PAGE)
- Gel preparation SDS-PAGE was performed according to Schägger and Von Jagow (1987) using a Protean II xi System
(BioRad). The chemical composition and concentration of the gel are shown in table 2.1.
Reagents
Separation gel (pH
8.45) Stacking gel (pH
8.45)
Acrylamide 12 % 6.6 %
Tris-HCl 1 M 0.75 M
Urea 3 M -
Glycerine 9.8 % -
SDS 0.1 % 0.1 %
Ammoniumperoxodisulfate 0.05 % 0.063 %
TEMED 0.05 % 0.067 % The prepared SDS-PAGE was kept overnight at 10 ˚C before used. Each slab was composed of stacking
gel on top (where the samples were injected) and the separating gel (where the subunits were
denaturated and separated).
- Marker protein Two marker proteins were used
Marker protein 1 116 – 66.2 – 45 – 35 – 25 – 18.4 – 14.4 kDa
Marker Protein 2 2.5 - 3.5 – 6 - 14.4 - 21.5 – 31 - 36.5 - 55.4 - 66.3 - 97.4 - 116.3 -200 kDa
- Samples preparation 20 µl volume of PS1 complexes (about 5 µg chlorophyll) were mixed with the same volume of SDS-
sample buffer (10 % (w/v) glycerol, 5 % (v/v), β-Mercaptoethanol, 3 % (w/v) SDS, 62 mM Tris·HCl, pH 6.8,
0.01 % (w/v) bromophenolblue) and incubated at 37 ˚C for one hour. After injecting the mixture onto the
SDS-PAGE, the electrophoresis was carried out by applying a current of 100 mA for 30 min, and then the
current was reduced to be 60-80 mA until the samples reached the edge of the gel. 0.1 M Tris pH 8.9 was
used as anodic buffer and (0.1 M Tris pH 8.25, 0.1 M Tricine, 0.1 % (w/v) SDS) was used as cathodic
buffer. After separation of PS1 subunits, the SDS-PAGE was either stained or used for immuno-blot
analysis.
Table 2.1 Composition of SDS-PAGE according to Schägger & von Jagow (1987).

Materials & Methods __________________________________________________________________________________________________
28
- Polypeptides visualization
After electrophoresis, SDS-PAGE was fixed by incubation in a mixture of 50 % methanol and 10 % acetic
acid for 20 min. The gel was stained with Coomassie Brilliant Blue reagent (0.2 % (w/v) Coomassie
Brilliant Blue R, 40 % (v/v) methanol, 7 % (v/v) acetic acid) for additional 20 min.
The gel was destained by immersing the gel in a mixture of 30 % (v/v) methanol and 10 % (v/v) acetic acid
for 8 – 12 hours.
2.1.10) Immuno-blot analysis Western-blot analysis was used for identification and position detection of Psa-D, -F, -L and -his-tag. The
antibodies against Psa-C, -D, -E and –F were provided as kindly gifts from Prof. Dr. Roland Lill and PsaL
subunit was provided as a kindly gift from Dr. Wade. Anti-histag, anti-rabbit and anti-mouse were bought
from Sigma.
The prestained protein marker (peqGOLD Protein-Marker (peqlab) was used:
116 kDa (β-Galactosidase;E. coli), 66.2 kDa (Bovine Serum-Albumine; Cow), 45 kDa (Ovalbumine
Chicken), 35 kDa (Lactat-Dehydrogenase Pig), 25 kDa (RE Bsp981 E. coli), 18.4 kDa (β-Lactoglobuline
Cow) and 14.4 kDa (Lysozyme Chicken).
The proteins were blotted onto a PVDF
membrane (Immobilon-P, Millipore, Bedford, MA,
USA) that have previously been incubated in 100
% methanol for 15 seconds followed by washing
with distilled water and incubating for 10 min in
transfer-buffer (25 mM Tris base, 192 mM
glycerol, 0.1% (w/v) SDS and 10 % methanol).
PAGE containing the protein blots was
surrounded by 2 PVDF layers followed by
sandwiching by 4 blotting paper layers.
Then, the sandwich was packed between two glass plates inside a plastic bag and kept overnight at room
temperature under press (about 2 kg weight; figure 2.1).
After transferring the protein blots onto the PVDF membrane, PVDF membrane was washed three times
with PBST-buffer (137 mM NaCl, 2.7 mM KCL, 7.9 mM Na2HPO4, 1.5 mM KH2PO4 and 0.5 % Tween-20)
before blocking the membrane by incubation in blocking buffer (PBS-buffer containing 1.5 % (w/v) skimmed
milk powder) for 1 hour at room temperature.
The membrane was washed three times with PBST buffer followed by incubation for three hours with the
1st antibody Psa-D, -F, -L or his-tagged was diluted in PBST buffer according to table 2.4.
The 2nd antibody was added after additional three times washing steps. The second antibody: i.e. Anti-
rabbit for Psa-D, -f and –L and anti-mouse for 10 histidine chains (horseradish peroxidase conjugate, Sigma) in dilution of 1:30000 by PBST-buffer was added to washed PVDF membrane and shaked at room
temperature for three hours.
4 layers filter papers
4 layers filter papers PVDF membrane
PVDF membrane SDS-gel PAGE
Glass sheet
Transfer solution
Glass sheet
Figure 2.1 Diagram showing the layers sandwiched the PVDF membrane.
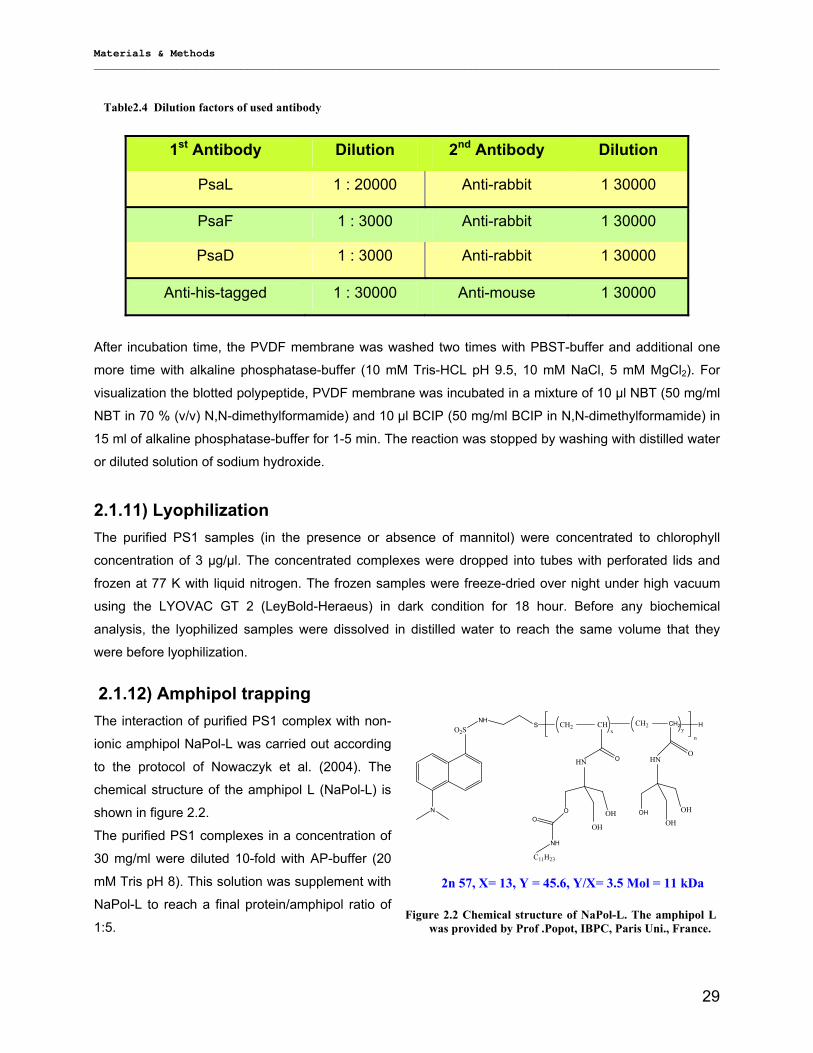
Materials & Methods __________________________________________________________________________________________________
29
After incubation time, the PVDF membrane was washed two times with PBST-buffer and additional one
more time with alkaline phosphatase-buffer (10 mM Tris-HCL pH 9.5, 10 mM NaCl, 5 mM MgCl2). For
visualization the blotted polypeptide, PVDF membrane was incubated in a mixture of 10 µl NBT (50 mg/ml
NBT in 70 % (v/v) N,N-dimethylformamide) and 10 µl BCIP (50 mg/ml BCIP in N,N-dimethylformamide) in
15 ml of alkaline phosphatase-buffer for 1-5 min. The reaction was stopped by washing with distilled water
or diluted solution of sodium hydroxide.
2.1.11) Lyophilization The purified PS1 samples (in the presence or absence of mannitol) were concentrated to chlorophyll
concentration of 3 µg/µl. The concentrated complexes were dropped into tubes with perforated lids and
frozen at 77 K with liquid nitrogen. The frozen samples were freeze-dried over night under high vacuum
using the LYOVAC GT 2 (LeyBold-Heraeus) in dark condition for 18 hour. Before any biochemical
analysis, the lyophilized samples were dissolved in distilled water to reach the same volume that they
were before lyophilization.
2.1.12) Amphipol trapping The interaction of purified PS1 complex with non-
ionic amphipol NaPol-L was carried out according
to the protocol of Nowaczyk et al. (2004). The
chemical structure of the amphipol L (NaPol-L) is
shown in figure 2.2.
The purified PS1 complexes in a concentration of
30 mg/ml were diluted 10-fold with AP-buffer (20
mM Tris pH 8). This solution was supplement with
NaPol-L to reach a final protein/amphipol ratio of
1:5.
1st Antibody Dilution 2nd Antibody Dilution
PsaL 1 : 20000 Anti-rabbit 1 30000
PsaF 1 : 3000 Anti-rabbit 1 30000
PsaD 1 : 3000 Anti-rabbit 1 30000
Anti-his-tagged 1 : 30000 Anti-mouse 1 30000
N
O2SNH
S CH2 CHx
CH2 CH2y
H
n
OHN
O
OH
OHO
NH
C11H23
OHN
OH
OH
OH
2n 57, X= 13, Y = 45.6, Y/X= 3.5 Mol = 11 kDa
Figure 2.2 Chemical structure of NaPol-L. The amphipol L was provided by Prof .Popot, IBPC, Paris Uni., France.
Table2.4 Dilution factors of used antibody
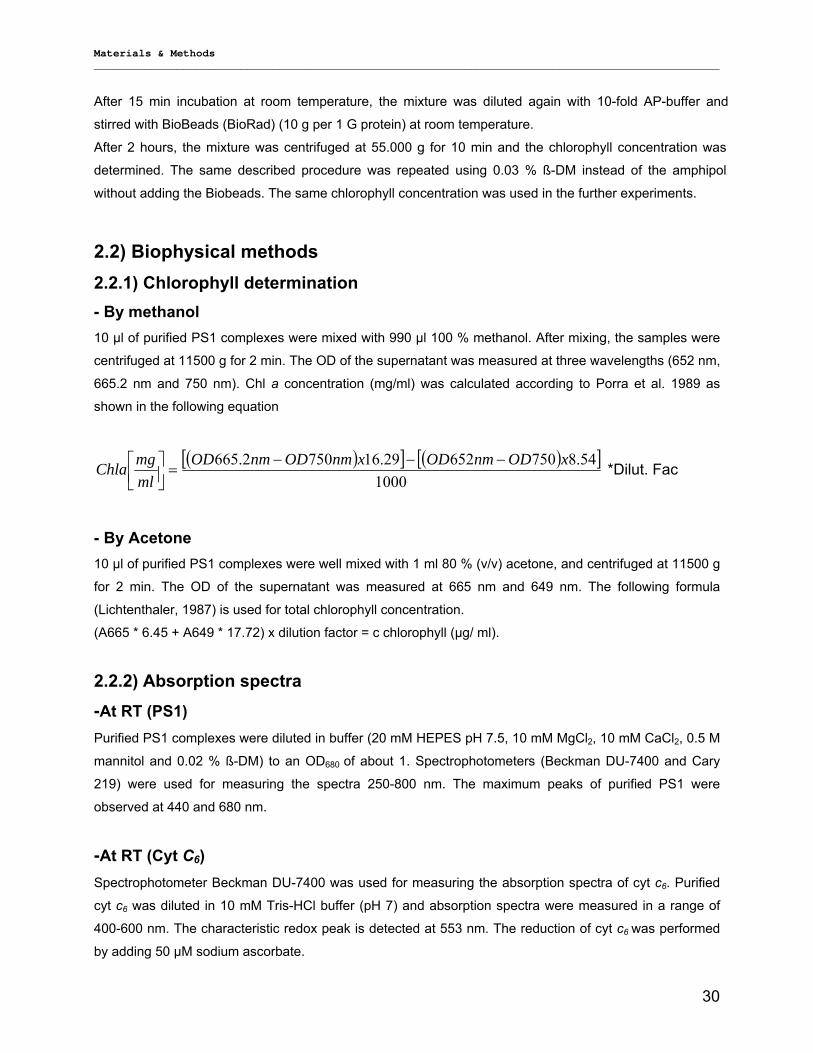
Materials & Methods __________________________________________________________________________________________________
30
After 15 min incubation at room temperature, the mixture was diluted again with 10-fold AP-buffer and
stirred with BioBeads (BioRad) (10 g per 1 G protein) at room temperature.
After 2 hours, the mixture was centrifuged at 55.000 g for 10 min and the chlorophyll concentration was
determined. The same described procedure was repeated using 0.03 % ß-DM instead of the amphipol
without adding the Biobeads. The same chlorophyll concentration was used in the further experiments.
2.2) Biophysical methods 2.2.1) Chlorophyll determination - By methanol 10 µl of purified PS1 complexes were mixed with 990 µl 100 % methanol. After mixing, the samples were
centrifuged at 11500 g for 2 min. The OD of the supernatant was measured at three wavelengths (652 nm,
665.2 nm and 750 nm). Chl a concentration (mg/ml) was calculated according to Porra et al. 1989 as
shown in the following equation
( )[ ] ( )[ ]1000
54.875065229.167502.665 xODnmODxnmODnmODmlmgChla −−−
=⎥⎦⎤
⎢⎣⎡ *Dilut. Fac
- By Acetone 10 µl of purified PS1 complexes were well mixed with 1 ml 80 % (v/v) acetone, and centrifuged at 11500 g
for 2 min. The OD of the supernatant was measured at 665 nm and 649 nm. The following formula
(Lichtenthaler, 1987) is used for total chlorophyll concentration.
(A665 * 6.45 + A649 * 17.72) x dilution factor = c chlorophyll (µg/ ml).
2.2.2) Absorption spectra -At RT (PS1) Purified PS1 complexes were diluted in buffer (20 mM HEPES pH 7.5, 10 mM MgCl2, 10 mM CaCl2, 0.5 M
mannitol and 0.02 % ß-DM) to an OD680 of about 1. Spectrophotometers (Beckman DU-7400 and Cary
219) were used for measuring the spectra 250-800 nm. The maximum peaks of purified PS1 were
observed at 440 and 680 nm.
-At RT (Cyt C6) Spectrophotometer Beckman DU-7400 was used for measuring the absorption spectra of cyt c6. Purified
cyt c6 was diluted in 10 mM Tris-HCl buffer (pH 7) and absorption spectra were measured in a range of
400-600 nm. The characteristic redox peak is detected at 553 nm. The reduction of cyt c6 was performed
by adding 50 µM sodium ascorbate.
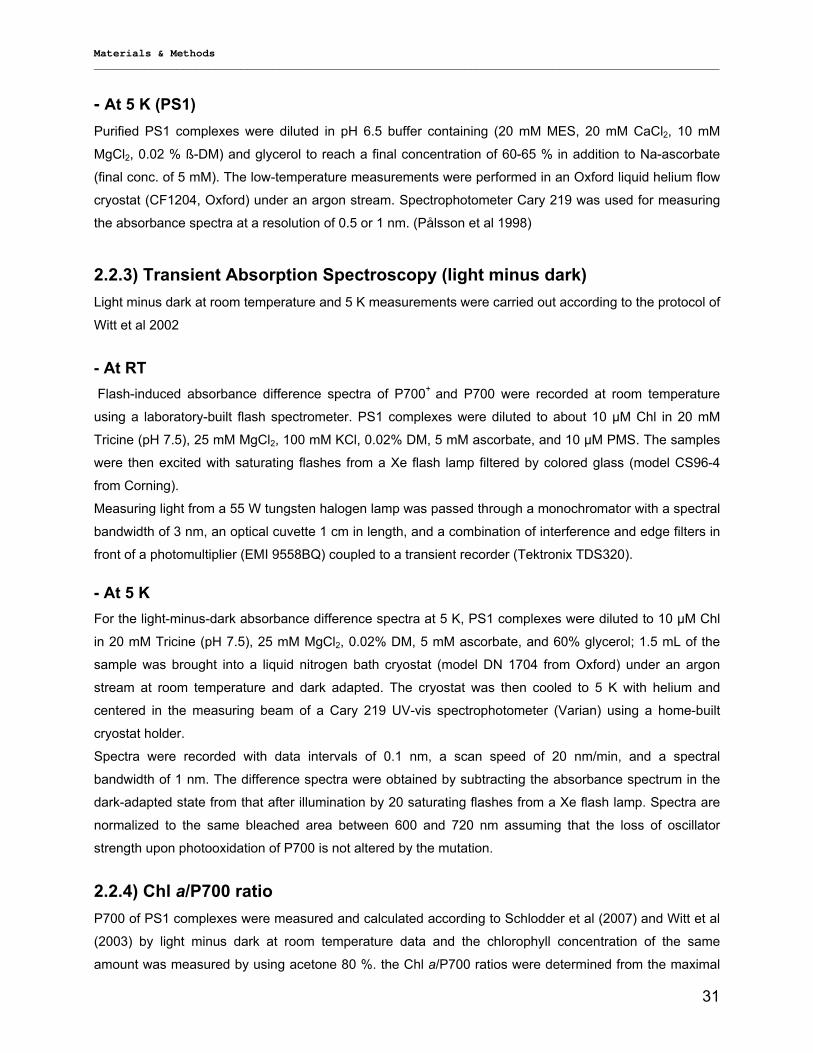
Materials & Methods __________________________________________________________________________________________________
31
- At 5 K (PS1) Purified PS1 complexes were diluted in pH 6.5 buffer containing (20 mM MES, 20 mM CaCl2, 10 mM
MgCl2, 0.02 % ß-DM) and glycerol to reach a final concentration of 60-65 % in addition to Na-ascorbate
(final conc. of 5 mM). The low-temperature measurements were performed in an Oxford liquid helium flow
cryostat (CF1204, Oxford) under an argon stream. Spectrophotometer Cary 219 was used for measuring
the absorbance spectra at a resolution of 0.5 or 1 nm. (Pålsson et al 1998)
2.2.3) Transient Absorption Spectroscopy (light minus dark) Light minus dark at room temperature and 5 K measurements were carried out according to the protocol of
Witt et al 2002
- At RT Flash-induced absorbance difference spectra of P700+ and P700 were recorded at room temperature
using a laboratory-built flash spectrometer. PS1 complexes were diluted to about 10 µM Chl in 20 mM
Tricine (pH 7.5), 25 mM MgCl2, 100 mM KCl, 0.02% DM, 5 mM ascorbate, and 10 µM PMS. The samples
were then excited with saturating flashes from a Xe flash lamp filtered by colored glass (model CS96-4
from Corning).
Measuring light from a 55 W tungsten halogen lamp was passed through a monochromator with a spectral
bandwidth of 3 nm, an optical cuvette 1 cm in length, and a combination of interference and edge filters in
front of a photomultiplier (EMI 9558BQ) coupled to a transient recorder (Tektronix TDS320).
- At 5 K For the light-minus-dark absorbance difference spectra at 5 K, PS1 complexes were diluted to 10 µM Chl
in 20 mM Tricine (pH 7.5), 25 mM MgCl2, 0.02% DM, 5 mM ascorbate, and 60% glycerol; 1.5 mL of the
sample was brought into a liquid nitrogen bath cryostat (model DN 1704 from Oxford) under an argon
stream at room temperature and dark adapted. The cryostat was then cooled to 5 K with helium and
centered in the measuring beam of a Cary 219 UV-vis spectrophotometer (Varian) using a home-built
cryostat holder.
Spectra were recorded with data intervals of 0.1 nm, a scan speed of 20 nm/min, and a spectral
bandwidth of 1 nm. The difference spectra were obtained by subtracting the absorbance spectrum in the
dark-adapted state from that after illumination by 20 saturating flashes from a Xe flash lamp. Spectra are
normalized to the same bleached area between 600 and 720 nm assuming that the loss of oscillator
strength upon photooxidation of P700 is not altered by the mutation.
2.2.4) Chl a/P700 ratio P700 of PS1 complexes were measured and calculated according to Schlodder et al (2007) and Witt et al
(2003) by light minus dark at room temperature data and the chlorophyll concentration of the same
amount was measured by using acetone 80 %. the Chl a/P700 ratios were determined from the maximal
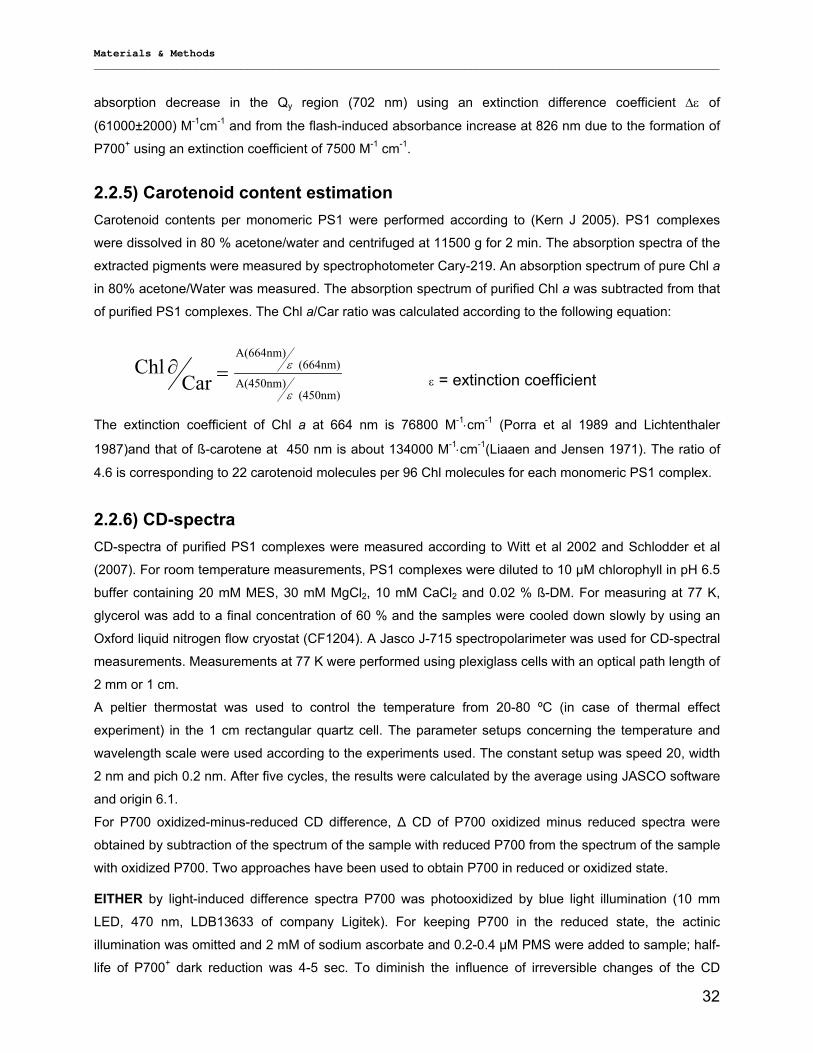
Materials & Methods __________________________________________________________________________________________________
32
absorption decrease in the Qy region (702 nm) using an extinction difference coefficient ∆ε of
(61000±2000) M-1cm-1 and from the flash-induced absorbance increase at 826 nm due to the formation of
P700+ using an extinction coefficient of 7500 M-1 cm-1.
2.2.5) Carotenoid content estimation Carotenoid contents per monomeric PS1 were performed according to (Kern J 2005). PS1 complexes
were dissolved in 80 % acetone/water and centrifuged at 11500 g for 2 min. The absorption spectra of the
extracted pigments were measured by spectrophotometer Cary-219. An absorption spectrum of pure Chl a
in 80% acetone/Water was measured. The absorption spectrum of purified Chl a was subtracted from that
of purified PS1 complexes. The Chl a/Car ratio was calculated according to the following equation:
(450nm) A(450nm)
(664nm) A(664nm)
Car Chl
ε
ε=∂ ε = extinction coefficient
The extinction coefficient of Chl a at 664 nm is 76800 M-1⋅cm-1 (Porra et al 1989 and Lichtenthaler
1987)and that of ß-carotene at 450 nm is about 134000 M-1⋅cm-1(Liaaen and Jensen 1971). The ratio of
4.6 is corresponding to 22 carotenoid molecules per 96 Chl molecules for each monomeric PS1 complex.
2.2.6) CD-spectra CD-spectra of purified PS1 complexes were measured according to Witt et al 2002 and Schlodder et al
(2007). For room temperature measurements, PS1 complexes were diluted to 10 µM chlorophyll in pH 6.5
buffer containing 20 mM MES, 30 mM MgCl2, 10 mM CaCl2 and 0.02 % ß-DM. For measuring at 77 K,
glycerol was add to a final concentration of 60 % and the samples were cooled down slowly by using an
Oxford liquid nitrogen flow cryostat (CF1204). A Jasco J-715 spectropolarimeter was used for CD-spectral
measurements. Measurements at 77 K were performed using plexiglass cells with an optical path length of
2 mm or 1 cm.
A peltier thermostat was used to control the temperature from 20-80 ºC (in case of thermal effect
experiment) in the 1 cm rectangular quartz cell. The parameter setups concerning the temperature and
wavelength scale were used according to the experiments used. The constant setup was speed 20, width
2 nm and pich 0.2 nm. After five cycles, the results were calculated by the average using JASCO software
and origin 6.1.
For P700 oxidized-minus-reduced CD difference, ∆ CD of P700 oxidized minus reduced spectra were
obtained by subtraction of the spectrum of the sample with reduced P700 from the spectrum of the sample
with oxidized P700. Two approaches have been used to obtain P700 in reduced or oxidized state.
EITHER by light-induced difference spectra P700 was photooxidized by blue light illumination (10 mm
LED, 470 nm, LDB13633 of company Ligitek). For keeping P700 in the reduced state, the actinic
illumination was omitted and 2 mM of sodium ascorbate and 0.2-0.4 µM PMS were added to sample; half-
life of P700+ dark reduction was 4-5 sec. To diminish the influence of irreversible changes of the CD
Materials & Methods __________________________________________________________________________________________________
33
spectra the measurements under illumination were performed alternately with measurements in the dark.
Difference spectra were calculated every cycle of 10 cycles. The calculated difference spectra have been
averaged.
OR chemically induced difference spectra,as the sample was divided in two parts. In one part P700 was
oxidized by 1 mM FeCN and several CD spectra were measured immediately without changing the
sample. In the second part 1 mM of ascorbate and 1 µM PMS were added to the sample and several CD
spectra were recorded.
2.2.7) Fluorescence emission spectra at 77 K Fluorescence emission spectra were performed in SLM-AMINCO Bauman, Series 2 Luminescence
spectrometer. PS1 complexes were diluted to a chlorophyll concentration of 3 µg/ml in buffer containing
(20 mM HEPES pH 7.5, 10 mM MgCl2, 10 mM CaCl2 and 0.02 % ß-DM) and glycerol in a final
concentration of 60 %. The diluted samples were frozen to 77 K by immersing in liquid nitrogen. 440 nm
actinic light was used for excitation. Fluorescence emission spectra were measured from 600 to 800 nm
with a stepsize of 1 nm and a bandpass filter of 4 nm. Maximum emission of PS1 was observed at 727-
728 nm for monomers and 733-734 for trimers. Origin 6.1 program was used for calculations.
2.2.8) Fluorescence emission spectra at RT Fluorescence emission spectra were carried out using SLM-AMINCO Bauman, Series 2 Luminescence
spectrometer. PS1 complexes were diluted in HEPES buffer pH 7.5 containing (20 mM HEPES, 10 mM
MgCl2, 10 mM CaCl2 and 0.02 % ß-DM) to reach final chlorophyll concentration of 5-8 µg/ml. Samples
were excited by 440 nm light and the fluorescence emission spectra were measured in a range from 400
to 800 nm with a step size of 1 nm and a bandpass filter of 8 nm.
2.2.9) Fluorescence excitation spectra at 77K The samples were prepared as 2.2.7. Excitation fluorescence spectra were measured in a range from 400 to 800 nm was measured with a step
size of 1 nm and a bandpass filter of 4 nm at emission fluorescence band at 745 nm, 750 nm and 755 nm.
Origin 6.1 was used for calculations.
2.2.10) LD-spectra Linear dichroism (LD) measurements were carried out according to Schlodder et al. 2005 and 2007. The
samples were oriented by embedding the monomeric and trimeric PS1 complexes in a gelatin gel which
subsequently was squeezed by a compression factor n in the x-direction.
The gel expands in the z-direction with the same factor n maintaining the y-dimension constant. The
measuring light beam is propagating parallel to the y-axis. The composition of the gel was 60% (v/v)
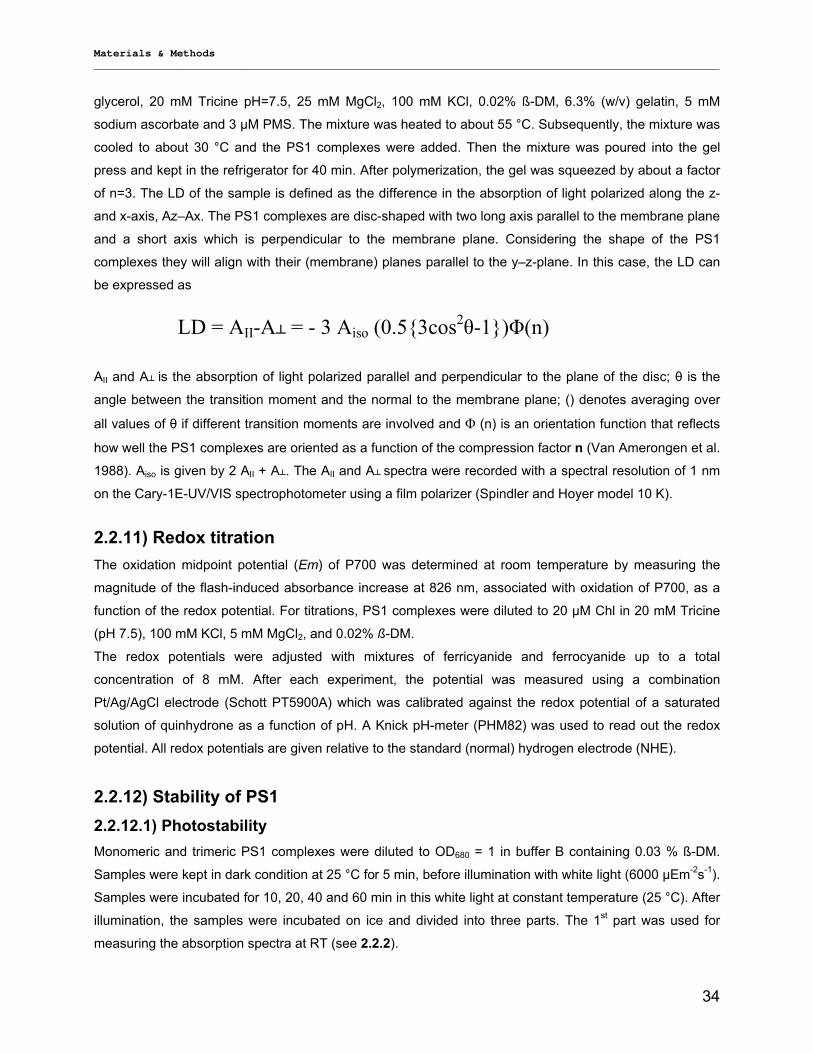
Materials & Methods __________________________________________________________________________________________________
34
glycerol, 20 mM Tricine pH=7.5, 25 mM MgCl2, 100 mM KCl, 0.02% ß-DM, 6.3% (w/v) gelatin, 5 mM
sodium ascorbate and 3 µM PMS. The mixture was heated to about 55 °C. Subsequently, the mixture was
cooled to about 30 °C and the PS1 complexes were added. Then the mixture was poured into the gel
press and kept in the refrigerator for 40 min. After polymerization, the gel was squeezed by about a factor
of n=3. The LD of the sample is defined as the difference in the absorption of light polarized along the z-
and x-axis, Az–Ax. The PS1 complexes are disc-shaped with two long axis parallel to the membrane plane
and a short axis which is perpendicular to the membrane plane. Considering the shape of the PS1
complexes they will align with their (membrane) planes parallel to the y–z-plane. In this case, the LD can
be expressed as
AII and A┴ is the absorption of light polarized parallel and perpendicular to the plane of the disc; θ is the
angle between the transition moment and the normal to the membrane plane; () denotes averaging over
all values of θ if different transition moments are involved and Φ (n) is an orientation function that reflects
how well the PS1 complexes are oriented as a function of the compression factor n (Van Amerongen et al.
1988). Aiso is given by 2 AII + A┴. The AII and A┴ spectra were recorded with a spectral resolution of 1 nm
on the Cary-1E-UV/VIS spectrophotometer using a film polarizer (Spindler and Hoyer model 10 K).
2.2.11) Redox titration The oxidation midpoint potential (Em) of P700 was determined at room temperature by measuring the
magnitude of the flash-induced absorbance increase at 826 nm, associated with oxidation of P700, as a
function of the redox potential. For titrations, PS1 complexes were diluted to 20 µM Chl in 20 mM Tricine
(pH 7.5), 100 mM KCl, 5 mM MgCl2, and 0.02% ß-DM.
The redox potentials were adjusted with mixtures of ferricyanide and ferrocyanide up to a total
concentration of 8 mM. After each experiment, the potential was measured using a combination
Pt/Ag/AgCl electrode (Schott PT5900A) which was calibrated against the redox potential of a saturated
solution of quinhydrone as a function of pH. A Knick pH-meter (PHM82) was used to read out the redox
potential. All redox potentials are given relative to the standard (normal) hydrogen electrode (NHE).
2.2.12) Stability of PS1 2.2.12.1) Photostability Monomeric and trimeric PS1 complexes were diluted to OD680 = 1 in buffer B containing 0.03 % ß-DM.
Samples were kept in dark condition at 25 °C for 5 min, before illumination with white light (6000 µEm-2s-1).
Samples were incubated for 10, 20, 40 and 60 min in this white light at constant temperature (25 °C). After
illumination, the samples were incubated on ice and divided into three parts. The 1st part was used for
measuring the absorption spectra at RT (see 2.2.2).
LD = AII-A┴ = - 3 Aiso (0.5{3cos2θ-1})Φ(n)
Materials & Methods __________________________________________________________________________________________________
35
The 2nd part was diluted in buffer pH 7.5 (20 mM HEPES, 10 mM MgCl2, 10 mM CaCl2 and 0.02 % ß-DM)
to reach final chlorophyll concentration of 5-8 µg/ml before measuring the emission fluorescence spectra
at RT (see 2.2.8).
The 3rd part was diluted to be 3 µg Chl/ml in buffer pH 7.5 containing (20 mM HEPES, 10 mM MgCl2, 10
mM CaCl2 and 0.02 % ß-DM) and glycerol (final concentration of 60 %). Diluted samples were frozen in
liquid nitrogen before measuring the fluorescence emission spectra at 77 K (see 2.2.7).
2.2.12.2) Thermostability PS1 complexes were diluted to OD680 = 1 in buffer B containing 0.03 % ß-DM and divided into three parts.
The 1st part was used for measuring the changes of CD-spectra 350-800 nm at constant temperature (RT,
40, 60 and 80 °C) according to description 2.2.6.
The 2nd part was used for measuring the CD-absorption at fixed wavelength (positive and negative band of
Chl. in red region; 682.8 nm & 668.8 nm for trimers and 682.8 nm & 668.4 nm for monomers) at
temperature gradient 20-80 °C. The values were recorded each 0.5 °C. The system setup was shown in
the CD-Spectra measurement (See 2.2.6).
The 3rd part was incubated at 80 °C for 10 min followed by cooling down to room temperature before
measuring the absorption spectra at RT (See 2.2.2) and comparing to non-heated samples.
2.2.12.3) Stability against ß-DM For investigation the effect of ß-DM, concentrated PS1 complexes (about 2 µg Chl/µl) were diluted to 5-8
µg Chl/ml in HEPES-buffer pH 7.5 (0.5 M mannitol, 20 mM HEPES pH 7.5, 10 mM MgCl2, 10 mM MgCl2
and Xß-DM). 10 % slandered solution of ß-DM was diluted in HEPES-buffer and mixed with PS1
complexes to reach the final ß-DM concentrations as shown in the results chapter. Diluted PS1 complexes
were incubated on dark for 5 min before measuring the fluorescence emission spectra at RT. The system
set up was described in 2.2.8 of this chapter
2.2.13) Time resolved fluorescence measurements This work was performed in corporation with AG. Holzwarth
Max-Planck-Institut of Bioorganic Chemistry, Mülheim a.d. Ruhr, Germany - Sample preparation PS1 complexes were diluted to an OD676 of 0.25 – 0.5 in 30 mM HEPES-NaOH (pH 7.5); 10 mM MgCl2;
10 mM CaCl2; 200 mM Mannitol and 0.009 % ß-DM. In order to keep the reaction centre in open state, a
combination of 40 mM Na-ascorbate and 60 µM PMS was added to the diluted PS1 complexes. All
measurements were carried out at room temperature (around 22 °C).
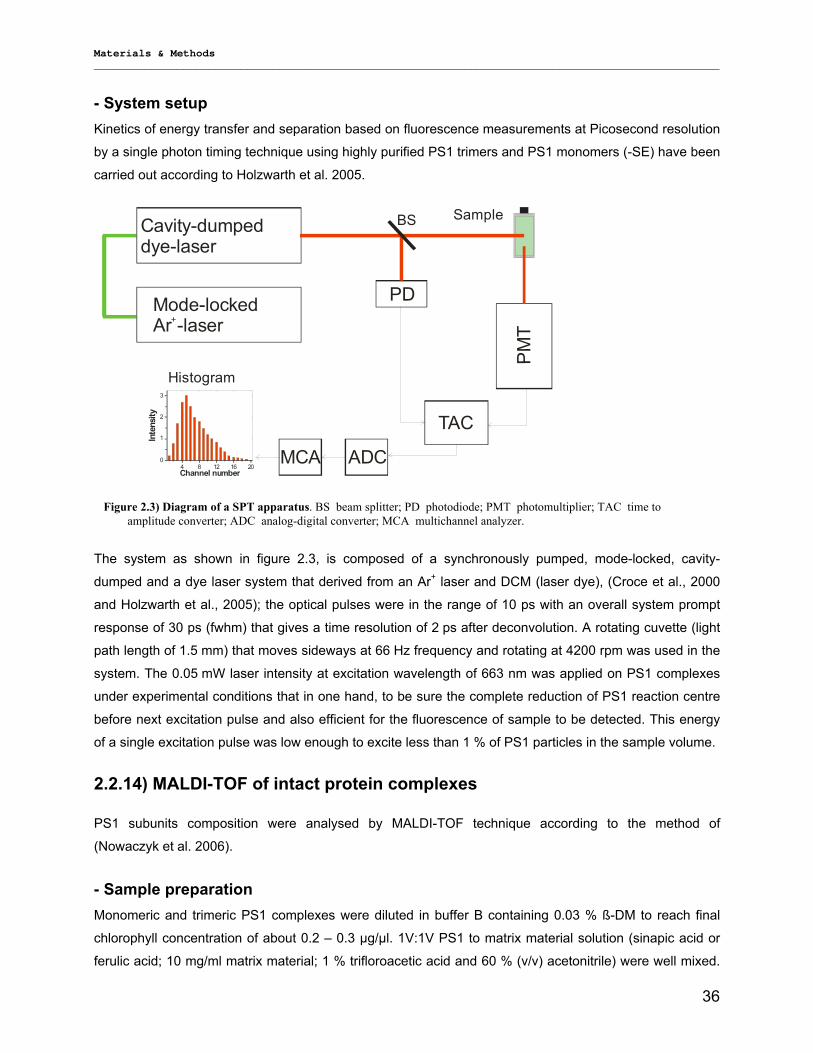
Materials & Methods __________________________________________________________________________________________________
36
- System setup Kinetics of energy transfer and separation based on fluorescence measurements at Picosecond resolution
by a single photon timing technique using highly purified PS1 trimers and PS1 monomers (-SE) have been
carried out according to Holzwarth et al. 2005.
4 8 12 16 200
1
2
3
Inte
nsity
Channel number
Mode-lockedAr -laser+
Cavity-dumpeddye-laser
PM
T
Sample
PD
TAC
BS
ADCMCA
Histogram
Fig. 2 Diagram of a SPT apparatus. BS - beam splitter; PD - photodiod; PMT - photomultiplier; TAC - time-to-amplitude converter; ADC - analog-digital converter; MCA - multichannel anlyzer
The system as shown in figure 2.3, is composed of a synchronously pumped, mode-locked, cavity-
dumped and a dye laser system that derived from an Ar+ laser and DCM (laser dye), (Croce et al., 2000
and Holzwarth et al., 2005); the optical pulses were in the range of 10 ps with an overall system prompt
response of 30 ps (fwhm) that gives a time resolution of 2 ps after deconvolution. A rotating cuvette (light
path length of 1.5 mm) that moves sideways at 66 Hz frequency and rotating at 4200 rpm was used in the
system. The 0.05 mW laser intensity at excitation wavelength of 663 nm was applied on PS1 complexes
under experimental conditions that in one hand, to be sure the complete reduction of PS1 reaction centre
before next excitation pulse and also efficient for the fluorescence of sample to be detected. This energy
of a single excitation pulse was low enough to excite less than 1 % of PS1 particles in the sample volume.
2.2.14) MALDI-TOF of intact protein complexes PS1 subunits composition were analysed by MALDI-TOF technique according to the method of
(Nowaczyk et al. 2006).
- Sample preparation Monomeric and trimeric PS1 complexes were diluted in buffer B containing 0.03 % ß-DM to reach final
chlorophyll concentration of about 0.2 – 0.3 µg/µl. 1V:1V PS1 to matrix material solution (sinapic acid or
ferulic acid; 10 mg/ml matrix material; 1 % trifloroacetic acid and 60 % (v/v) acetonitrile) were well mixed.
Figure 2.3) Diagram of a SPT apparatus. BS beam splitter; PD photodiode; PMT photomultiplier; TAC time to amplitude converter; ADC analog-digital converter; MCA multichannel analyzer.
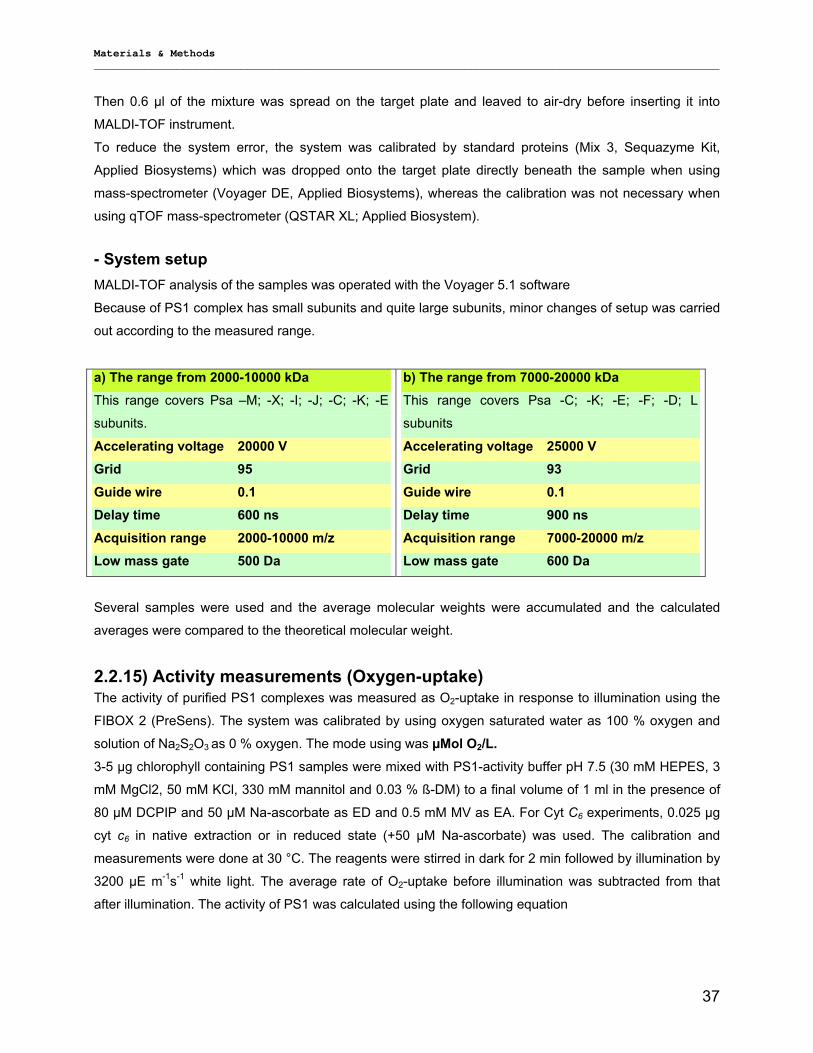
Materials & Methods __________________________________________________________________________________________________
37
Then 0.6 µl of the mixture was spread on the target plate and leaved to air-dry before inserting it into
MALDI-TOF instrument.
To reduce the system error, the system was calibrated by standard proteins (Mix 3, Sequazyme Kit,
Applied Biosystems) which was dropped onto the target plate directly beneath the sample when using
mass-spectrometer (Voyager DE, Applied Biosystems), whereas the calibration was not necessary when
using qTOF mass-spectrometer (QSTAR XL; Applied Biosystem).
- System setup MALDI-TOF analysis of the samples was operated with the Voyager 5.1 software
Because of PS1 complex has small subunits and quite large subunits, minor changes of setup was carried
out according to the measured range.
a) The range from 2000-10000 kDa This range covers Psa –M; -X; -I; -J; -C; -K; -E
subunits.
Accelerating voltage 20000 V Grid 95 Guide wire 0.1 Delay time 600 ns Acquisition range 2000-10000 m/z Low mass gate 500 Da
b) The range from 7000-20000 kDa This range covers Psa -C; -K; -E; -F; -D; L
subunits
Accelerating voltage 25000 V Grid 93 Guide wire 0.1 Delay time 900 ns Acquisition range 7000-20000 m/z Low mass gate 600 Da
Several samples were used and the average molecular weights were accumulated and the calculated
averages were compared to the theoretical molecular weight.
2.2.15) Activity measurements (Oxygen-uptake) The activity of purified PS1 complexes was measured as O2-uptake in response to illumination using the
FIBOX 2 (PreSens). The system was calibrated by using oxygen saturated water as 100 % oxygen and
solution of Na2S2O3 as 0 % oxygen. The mode using was µMol O2/L. 3-5 µg chlorophyll containing PS1 samples were mixed with PS1-activity buffer pH 7.5 (30 mM HEPES, 3
mM MgCl2, 50 mM KCl, 330 mM mannitol and 0.03 % ß-DM) to a final volume of 1 ml in the presence of
80 µM DCPIP and 50 µM Na-ascorbate as ED and 0.5 mM MV as EA. For Cyt C6 experiments, 0.025 µg
cyt c6 in native extraction or in reduced state (+50 µM Na-ascorbate) was used. The calibration and
measurements were done at 30 °C. The reagents were stirred in dark for 2 min followed by illumination by
3200 µE m-1s-1 white light. The average rate of O2-uptake before illumination was subtracted from that
after illumination. The activity of PS1 was calculated using the following equation
Materials & Methods __________________________________________________________________________________________________
38
Activity = ∆Sx60x1000/Cx1000 = µMol O2 mg-Chl-1 h-1
∆S difference of the average of the change of O2-uptake in light – the average of the change of O2-uptake in dark. 60 to change the rate from per minutes to per hours. C Chlorophyll concentrations µg. 1000 dilution factor of O2 and Chl
2.3) Electrochemical methods - Electrode preparation PS1 immobilization and photochemical current measurements were carried out according to Badura et al
2006 and Esper 2007).
The bead electrodes were self made by Esper B. (2007). The surface of gold bead electrodes were
modified prior to the immobilization of PS1 by overnight immersing in a mixture of 10 mM 1-octanethiol
(Sigma-Aldrich, Germany) and 0.1 mM 16-mercaptohexadecanoic acid (Sigma-Aldrich) dissolved in
dimethyl-sulfoxide (DMSO). After removal from the solution, the modified surface was rinsed several times
with DMSO and finally dried under a nitrogen stream.
To activate the carboxy-groups of 16-mercaptohexadecanoic acid, the modified surface was kept in a
mixture solution of 10 mM N-hydroxysuccinimide (Sigma-Aldrich) and 10 mM 1-ethyl-3-[3-
(dimethylamino)propyl]carbodiimide (Sigma-Aldrich) diluted in ultrapure water (Seralpur Pro 90 CN, Seral)
for 1 h followed by water washing to remove unreacted traces. Binding of the NTA group was induced by
incubation of the bead electrode within 150 mM Nα,Nα-bis(carboxymethyl)-lysine (Fluka, Switzerland),
dissolved in 0.5 M K2CO3 buffer, pH 9.8, for 90 min, followed by washing with water. For the complexation
of Ni ions, the surface was kept in 100 mM NiSO4 for 30 min and finally rinsed with water.
The adsorption process of PS1 onto the modified surface was performed by incubating the prepared
electrode in purified PS1 samples for three hours at least in the dark followed by 3 times washing with
immobilization-buffer, before connecting to the potentiostat.
- PS1 complexes preparation The mannitol existing in PS1 samples was removed either by dialysis the complexes for 6-8 hours in
HEPES buffer pH 7.5 free from mannitol (20 mM HEPES pH 7.5, 10 mM MgCl2, 10 mM MgCl2 and 0.03 %
ß-DM), or by 3-4 washing by the same buffer followed by centrifugation in 100,000 shortcut tube. After
removing the mannitol, PS1 samples were diluted in immobilized buffer (30 mM HEPES pH 7.5; 50 mM
KCl; 3 mM MgCl2; 10 µM PMS 5 mM MV and 0.03 % (w/v) β-DM) to final protein concentration 0.25
mg/ml.
Materials & Methods __________________________________________________________________________________________________
39
- System set-up For electrochemical measurements, a three-electrode system was used consisting of a Pt-counter
electrode, a gold bead working electrode (self made; Esper 2007) and an Ag/AgCl reference electrode
(WPI, USA) with 3 M KCl as electrolyte. The amperometric measurements were performed with an
AUTOLAB PGSTAT 12 potentiostat (Metrohm, Switzerland).
Prior to the experiments, recording of a cyclovoltammogram in 0.5 M H2SO4 was used to check the
cleanness of the surface.
Electrochemical experiments with immobilized PS1 complexes were carried out at 30 °C in buffered
electrolyte containing 10 µM PMS as electron donor for PS1 and 5 mM MV as electron acceptor. A
potential of -0.3 V was applied for 250 s to complete reducing the electron donor existed.
Immobilized PS1 was illuminated with a halogen cold light reflex-ion lamp using a 680 nm interference
filter (Schott, Germany) and a cold light filter Calflex 3000 and (Balzers, Liechtenstein) to protect the
sample from excessive heat. The applied light intensity was about 3000 µE m-2 s-1. For illumination with
red light and far-red light RG-645 and RG-715 nm were used respectively. The GPES software was used
and the method (Chrono method > 0.1 / amperometry) was applied.
Origin 6.1 was used for calculations.
Results __________________________________________________________________________________________________
40
3) Results 3.1) Isolation, Purification and Biochemical Characterization of PS1 3.1.1) Isolation and purification of PS1 trimers For reaching our aim to produce different forms of PS1 complexes, the traditional published methods
were modified to reduce the required preparation time as well as to produce high amount of pure PS1
complexes that are needed for the biohydrogen device.
To achieve this purpose, 10 histidine chains in N-terminus of PsaF (donor side of PS1) were
constructed (Prodöhl A. 2002 and Prodöhl A. et al 2004) to give the opportunity for purifying the trimeric
PS1 in two forms (wild type and his-tag mutant). As the trimeric PS1 complex is the most abundant
complex in T. elongatus (Jekow et al. 1995), most of the available publications are interested in the
purification and characterization PS1 trimers (Rögner et al. 1990, Kruip et al. 1993, Shen at al. 2002,
Fromme et al. 2001). These published methods were the guide to modify our method.
Diagram 3.1 summarizes the performed steps which were used for the isolation and purification of PS1
WT and his tagged mutant. According to the traditional methods, cells are harvested as described in
materials and methods. 15-20 minutes incubation in extraction-buffer pH 7.5 containing 0.6-1.6 % ß-DM
was used for isolation of PS1 trimers followed by 2 centrifugation steps, of which the 2nd one is a
sucrose gradient (figure 3.1). Sucrose gradient is necessary for the separation of PS1 from other
photosynthetic complexes as well as reducing the salt concentration of the extraction buffer. The
traditional method has two disadvantages;
1) Separation of the PS1 complex from other photosynthetic complexes by sucrose gradient is efficient
for low concentrated samples whereas in preparative level, the photosynthetic complexes are not well
separated.
2) Long preparation time, as the sucrose gradient step needs at least 18 hours for separation. Notably,
all published methods used IEC as 1st chromatographic step followed by HIC as 2nd chromatography
step (Diagram 3.1 red color).
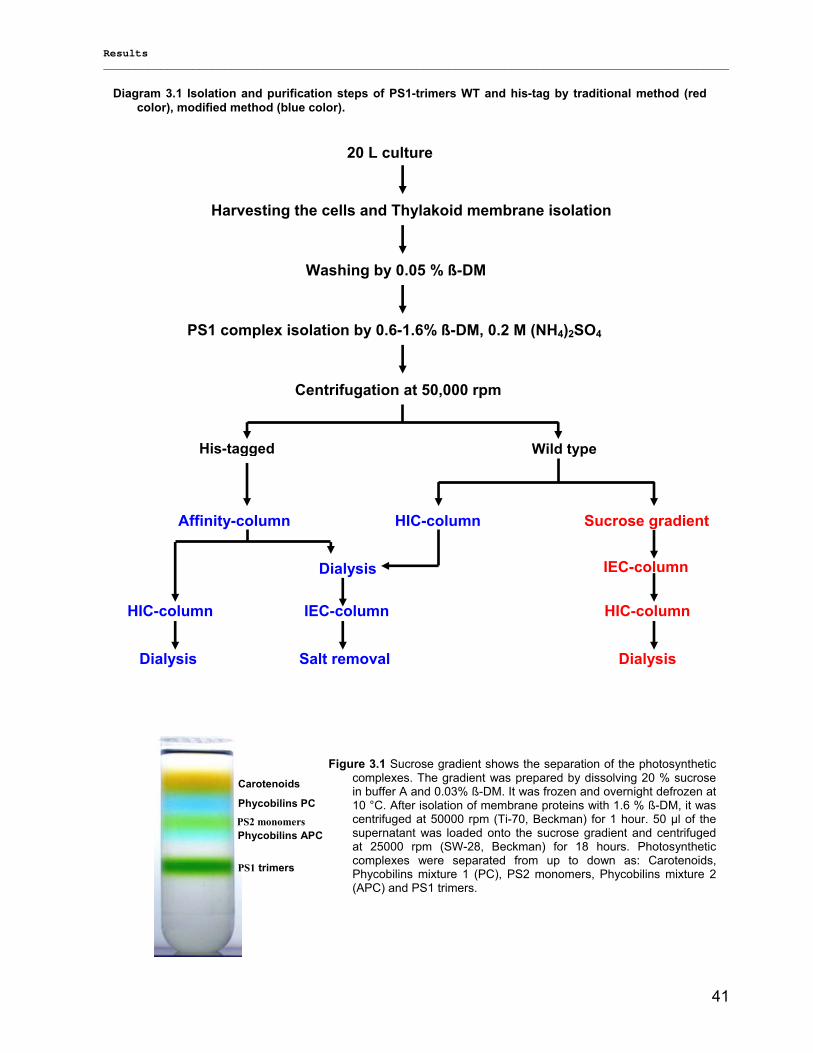
Results __________________________________________________________________________________________________
41
PS1 trimers
PS2 monomers Phycobilins APC
Phycobilins PC
Carotenoids
Figure 3.1 Sucrose gradient shows the separation of the photosynthetic complexes. The gradient was prepared by dissolving 20 % sucrose in buffer A and 0.03% ß-DM. It was frozen and overnight defrozen at 10 °C. After isolation of membrane proteins with 1.6 % ß-DM, it was centrifuged at 50000 rpm (Ti-70, Beckman) for 1 hour. 50 µl of the supernatant was loaded onto the sucrose gradient and centrifuged at 25000 rpm (SW-28, Beckman) for 18 hours. Photosynthetic complexes were separated from up to down as: Carotenoids, Phycobilins mixture 1 (PC), PS2 monomers, Phycobilins mixture 2 (APC) and PS1 trimers.
20 L culture
Harvesting the cells and Thylakoid membrane isolation
Washing by 0.05 % ß-DM
PS1 complex isolation by 0.6-1.6% ß-DM, 0.2 M (NH4)2SO4
Centrifugation at 50,000 rpm
His-tagged Wild type
Affinity-column HIC-column Sucrose gradient
Dialysis
IEC-column
Salt removal
HIC-column
Dialysis
IEC-column
HIC-column
Dialysis
Diagram 3.1 Isolation and purification steps of PS1-trimers WT and his-tag by traditional method (red color), modified method (blue color).
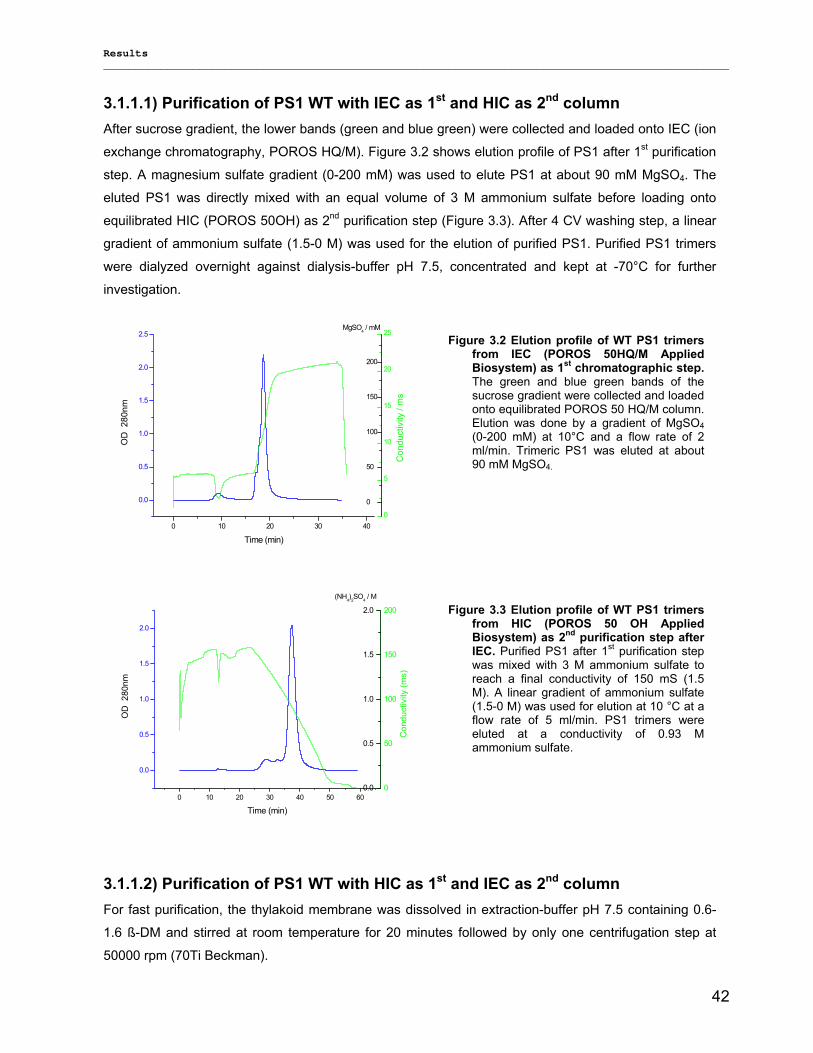
Results __________________________________________________________________________________________________
42
3.1.1.1) Purification of PS1 WT with IEC as 1st and HIC as 2nd column After sucrose gradient, the lower bands (green and blue green) were collected and loaded onto IEC (ion
exchange chromatography, POROS HQ/M). Figure 3.2 shows elution profile of PS1 after 1st purification
step. A magnesium sulfate gradient (0-200 mM) was used to elute PS1 at about 90 mM MgSO4. The
eluted PS1 was directly mixed with an equal volume of 3 M ammonium sulfate before loading onto
equilibrated HIC (POROS 50OH) as 2nd purification step (Figure 3.3). After 4 CV washing step, a linear
gradient of ammonium sulfate (1.5-0 M) was used for the elution of purified PS1. Purified PS1 trimers
were dialyzed overnight against dialysis-buffer pH 7.5, concentrated and kept at -70°C for further
investigation.
0 10 20 30 40
0.0
0.5
1.0
1.5
2.0
2.5
OD
280
nm
Time (min)
0
5
10
15
20
25MgSO4 / mM
Con
duct
ivity
/ m
s
0
50
100
150
200
0 10 20 30 40 50 60
0.0
0.5
1.0
1.5
2.0
OD
280
nm
Time (min)
0
50
100
150
200
(NH4)2SO4 / M
Con
duct
ivity
(ms)
0.0
0.5
1.0
1.5
2.0
3.1.1.2) Purification of PS1 WT with HIC as 1st and IEC as 2nd column For fast purification, the thylakoid membrane was dissolved in extraction-buffer pH 7.5 containing 0.6-
1.6 ß-DM and stirred at room temperature for 20 minutes followed by only one centrifugation step at
50000 rpm (70Ti Beckman).
Figure 3.2 Elution profile of WT PS1 trimers from IEC (POROS 50HQ/M Applied Biosystem) as 1st chromatographic step. The green and blue green bands of the sucrose gradient were collected and loaded onto equilibrated POROS 50 HQ/M column. Elution was done by a gradient of MgSO4(0-200 mM) at 10°C and a flow rate of 2 ml/min. Trimeric PS1 was eluted at about 90 mM MgSO4.
Figure 3.3 Elution profile of WT PS1 trimers from HIC (POROS 50 OH Applied Biosystem) as 2nd purification step after IEC. Purified PS1 after 1st purification step was mixed with 3 M ammonium sulfate to reach a final conductivity of 150 mS (1.5 M). A linear gradient of ammonium sulfate (1.5-0 M) was used for elution at 10 °C at a flow rate of 5 ml/min. PS1 trimers were eluted at a conductivity of 0.93 M ammonium sulfate.
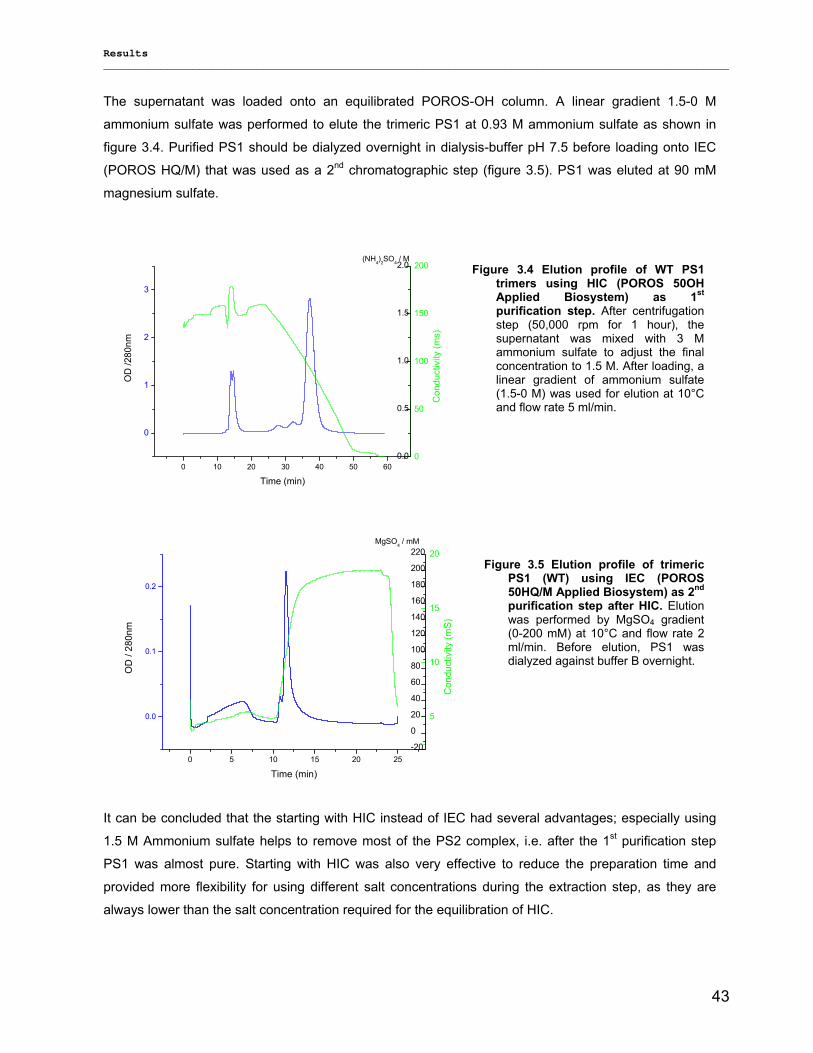
Results __________________________________________________________________________________________________
43
The supernatant was loaded onto an equilibrated POROS-OH column. A linear gradient 1.5-0 M
ammonium sulfate was performed to elute the trimeric PS1 at 0.93 M ammonium sulfate as shown in
figure 3.4. Purified PS1 should be dialyzed overnight in dialysis-buffer pH 7.5 before loading onto IEC
(POROS HQ/M) that was used as a 2nd chromatographic step (figure 3.5). PS1 was eluted at 90 mM
magnesium sulfate.
0 10 20 30 40 50 60
0
1
2
3
OD
/280
nm
Time (min)
0
50
100
150
200(NH4)2SO4 / M
Con
duct
ivity
(ms)
0.0
0.5
1.0
1.5
2.0
0 5 10 15 20 25
0.0
0.1
0.2
OD
/ 28
0nm
Time (min)
5
10
15
20
Con
duct
ivity
(mS)
-20
0
20
40
60
80
100
120
140
160
180
200
220MgSO4 / mM
It can be concluded that the starting with HIC instead of IEC had several advantages; especially using
1.5 M Ammonium sulfate helps to remove most of the PS2 complex, i.e. after the 1st purification step
PS1 was almost pure. Starting with HIC was also very effective to reduce the preparation time and
provided more flexibility for using different salt concentrations during the extraction step, as they are
always lower than the salt concentration required for the equilibration of HIC.
Figure 3.4 Elution profile of WT PS1 trimers using HIC (POROS 50OH Applied Biosystem) as 1st
purification step. After centrifugation step (50,000 rpm for 1 hour), the supernatant was mixed with 3 M ammonium sulfate to adjust the final concentration to 1.5 M. After loading, a linear gradient of ammonium sulfate (1.5-0 M) was used for elution at 10°C and flow rate 5 ml/min.
Figure 3.5 Elution profile of trimeric PS1 (WT) using IEC (POROS 50HQ/M Applied Biosystem) as 2nd
purification step after HIC. Elution was performed by MgSO4 gradient (0-200 mM) at 10°C and flow rate 2 ml/min. Before elution, PS1 was dialyzed against buffer B overnight.
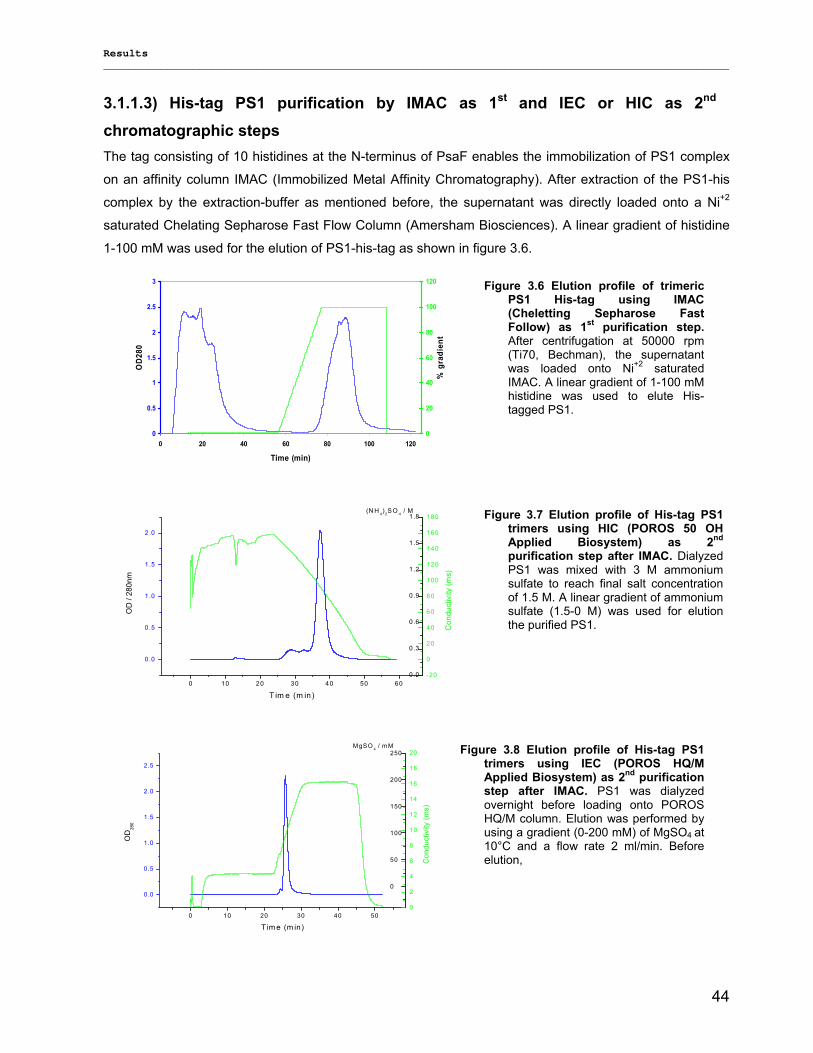
Results __________________________________________________________________________________________________
44
3.1.1.3) His-tag PS1 purification by IMAC as 1st and IEC or HIC as 2nd chromatographic steps The tag consisting of 10 histidines at the N-terminus of PsaF enables the immobilization of PS1 complex
on an affinity column IMAC (Immobilized Metal Affinity Chromatography). After extraction of the PS1-his
complex by the extraction-buffer as mentioned before, the supernatant was directly loaded onto a Ni+2
saturated Chelating Sepharose Fast Flow Column (Amersham Biosciences). A linear gradient of histidine
1-100 mM was used for the elution of PS1-his-tag as shown in figure 3.6.
0
0.5
1
1.5
2
2.5
3
0 20 40 60 80 100 120
Time (min)
OD
280
0
20
40
60
80
100
120
% g
radi
ent
0 10 20 30 40 50 60
0.0
0.5
1 .0
1 .5
2 .0
OD
/ 28
0nm
T im e (m in)
-20
0
20
40
60
80
100
120
140
160
180(N H 4)2S O 4 / M
Con
duct
ivity
(ms)
0 .0
0.3
0.6
0.9
1.2
1.5
1.8
0 10 20 30 40 50
0.0
0.5
1.0
1.5
2.0
2.5
OD
280
T im e (m in)
0
2
4
6
8
10
12
14
16
18
20
Con
duct
ivity
(ms)
0
50
100
150
200
250M gSO 4 / m M
Figure 3.6 Elution profile of trimeric PS1 His-tag using IMAC (Cheletting Sepharose Fast Follow) as 1st purification step. After centrifugation at 50000 rpm (Ti70, Bechman), the supernatant was loaded onto Ni+2 saturated IMAC. A linear gradient of 1-100 mM histidine was used to elute His-tagged PS1.
Figure 3.8 Elution profile of His-tag PS1 trimers using IEC (POROS HQ/M Applied Biosystem) as 2nd purification step after IMAC. PS1 was dialyzed overnight before loading onto POROS HQ/M column. Elution was performed by using a gradient (0-200 mM) of MgSO4 at 10°C and a flow rate 2 ml/min. Before elution,
Figure 3.7 Elution profile of His-tag PS1 trimers using HIC (POROS 50 OH Applied Biosystem) as 2nd purification step after IMAC. Dialyzed PS1 was mixed with 3 M ammonium sulfate to reach final salt concentration of 1.5 M. A linear gradient of ammonium sulfate (1.5-0 M) was used for elution the purified PS1.
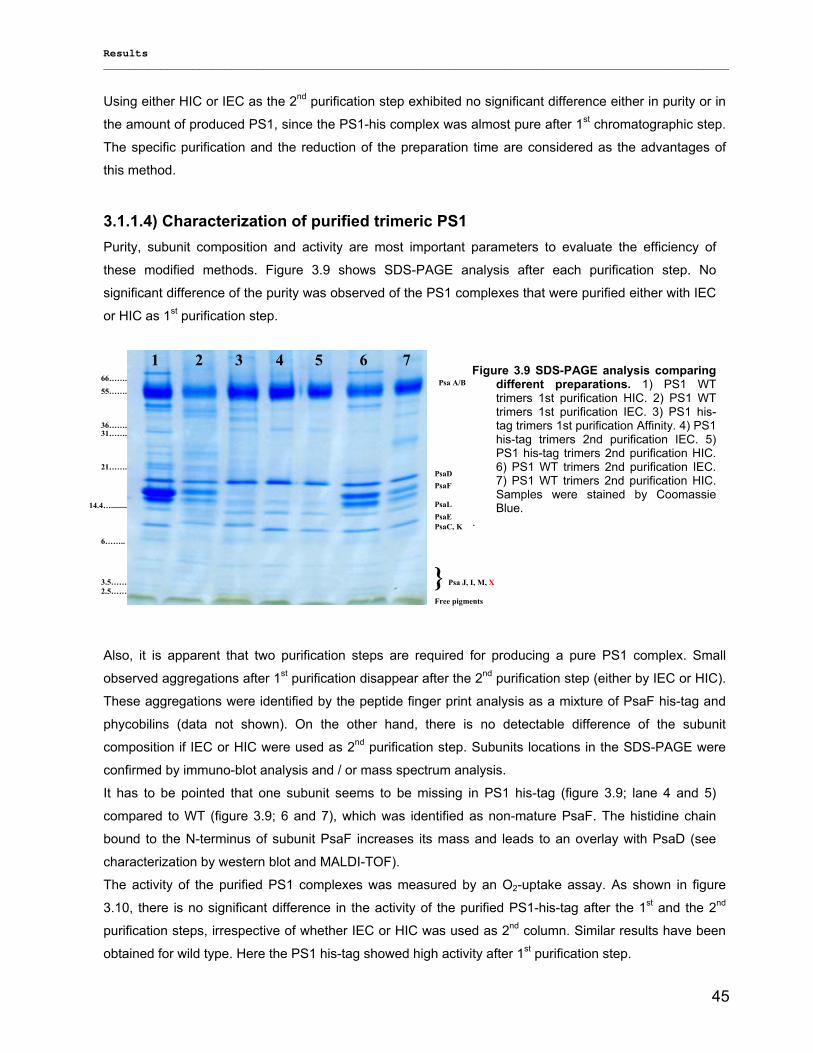
Results __________________________________________________________________________________________________
45
Using either HIC or IEC as the 2nd purification step exhibited no significant difference either in purity or in
the amount of produced PS1, since the PS1-his complex was almost pure after 1st chromatographic step.
The specific purification and the reduction of the preparation time are considered as the advantages of
this method.
3.1.1.4) Characterization of purified trimeric PS1 Purity, subunit composition and activity are most important parameters to evaluate the efficiency of
these modified methods. Figure 3.9 shows SDS-PAGE analysis after each purification step. No
significant difference of the purity was observed of the PS1 complexes that were purified either with IEC
or HIC as 1st purification step.
Also, it is apparent that two purification steps are required for producing a pure PS1 complex. Small
observed aggregations after 1st purification disappear after the 2nd purification step (either by IEC or HIC).
These aggregations were identified by the peptide finger print analysis as a mixture of PsaF his-tag and
phycobilins (data not shown). On the other hand, there is no detectable difference of the subunit
composition if IEC or HIC were used as 2nd purification step. Subunits locations in the SDS-PAGE were
confirmed by immuno-blot analysis and / or mass spectrum analysis.
It has to be pointed that one subunit seems to be missing in PS1 his-tag (figure 3.9; lane 4 and 5)
compared to WT (figure 3.9; 6 and 7), which was identified as non-mature PsaF. The histidine chain
bound to the N-terminus of subunit PsaF increases its mass and leads to an overlay with PsaD (see
characterization by western blot and MALDI-TOF).
The activity of the purified PS1 complexes was measured by an O2-uptake assay. As shown in figure
3.10, there is no significant difference in the activity of the purified PS1-his-tag after the 1st and the 2nd
purification steps, irrespective of whether IEC or HIC was used as 2nd column. Similar results have been
obtained for wild type. Here the PS1 his-tag showed high activity after 1st purification step.
76 5 4 3 2 1 Figure 3.9 SDS-PAGE analysis comparing
different preparations. 1) PS1 WT trimers 1st purification HIC. 2) PS1 WT trimers 1st purification IEC. 3) PS1 his-tag trimers 1st purification Affinity. 4) PS1 his-tag trimers 2nd purification IEC. 5) PS1 his-tag trimers 2nd purification HIC. 6) PS1 WT trimers 2nd purification IEC. 7) PS1 WT trimers 2nd purification HIC. Samples were stained by Coomassie Blue.
.
55…….
36……. 31…….
14.4…........
21…….
6……..
2.5…… 3.5……
Psa A/B
PsaD PsaF
PsaL PsaE PsaC, K
} Psa J, I, M, X
Free pigments
66…….
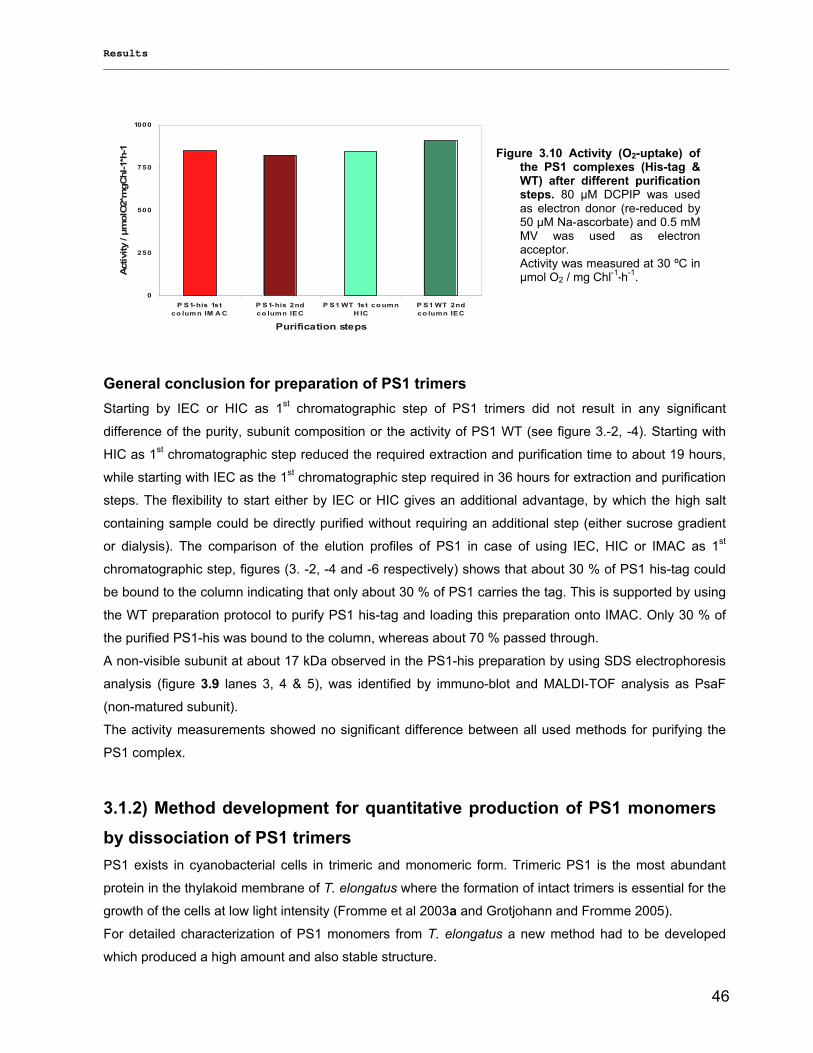
Results __________________________________________________________________________________________________
46
0
250
500
750
1000
P S1-his 1stco lumn IM A C
P S1-his 2ndco lumn IEC
P S1 WT 1st co umnH IC
P S1 WT 2ndco lumn IEC
Purification steps
Activ
ity /
µmol
O2*
mgC
hl-1
*h-1
General conclusion for preparation of PS1 trimers Starting by IEC or HIC as 1st chromatographic step of PS1 trimers did not result in any significant
difference of the purity, subunit composition or the activity of PS1 WT (see figure 3.-2, -4). Starting with
HIC as 1st chromatographic step reduced the required extraction and purification time to about 19 hours,
while starting with IEC as the 1st chromatographic step required in 36 hours for extraction and purification
steps. The flexibility to start either by IEC or HIC gives an additional advantage, by which the high salt
containing sample could be directly purified without requiring an additional step (either sucrose gradient
or dialysis). The comparison of the elution profiles of PS1 in case of using IEC, HIC or IMAC as 1st
chromatographic step, figures (3. -2, -4 and -6 respectively) shows that about 30 % of PS1 his-tag could
be bound to the column indicating that only about 30 % of PS1 carries the tag. This is supported by using
the WT preparation protocol to purify PS1 his-tag and loading this preparation onto IMAC. Only 30 % of
the purified PS1-his was bound to the column, whereas about 70 % passed through.
A non-visible subunit at about 17 kDa observed in the PS1-his preparation by using SDS electrophoresis
analysis (figure 3.9 lanes 3, 4 & 5), was identified by immuno-blot and MALDI-TOF analysis as PsaF
(non-matured subunit).
The activity measurements showed no significant difference between all used methods for purifying the
PS1 complex.
3.1.2) Method development for quantitative production of PS1 monomers by dissociation of PS1 trimers PS1 exists in cyanobacterial cells in trimeric and monomeric form. Trimeric PS1 is the most abundant
protein in the thylakoid membrane of T. elongatus where the formation of intact trimers is essential for the
growth of the cells at low light intensity (Fromme et al 2003a and Grotjohann and Fromme 2005).
For detailed characterization of PS1 monomers from T. elongatus a new method had to be developed
which produced a high amount and also stable structure.
Figure 3.10 Activity (O2-uptake) of the PS1 complexes (His-tag & WT) after different purification steps. 80 µM DCPIP was used as electron donor (re-reduced by 50 µM Na-ascorbate) and 0.5 mM MV was used as electron acceptor. Activity was measured at 30 ºC in µmol O2 / mg Chl-1*h-1.
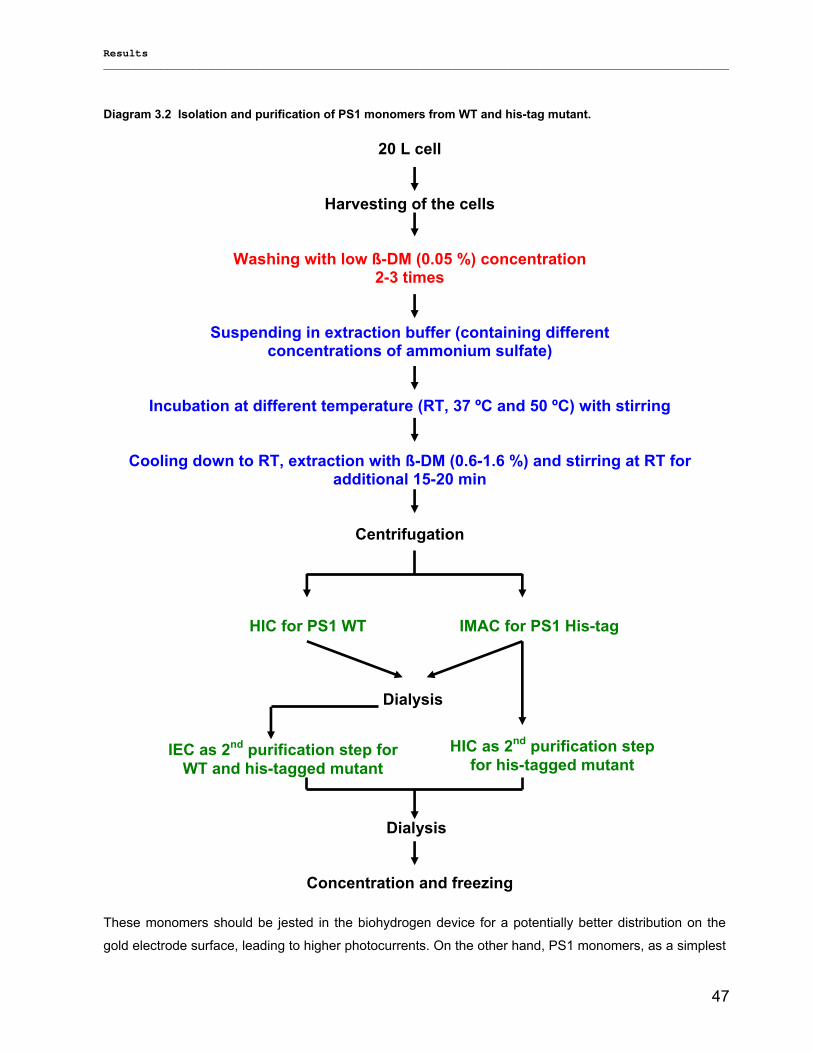
Results __________________________________________________________________________________________________
47
Diagram 3.2 Isolation and purification of PS1 monomers from WT and his-tag mutant.
20 L cell
Harvesting of the cells
Washing with low ß-DM (0.05 %) concentration 2-3 times
Suspending in extraction buffer (containing different concentrations of ammonium sulfate)
Incubation at different temperature (RT, 37 ºC and 50 ºC) with stirring
Cooling down to RT, extraction with ß-DM (0.6-1.6 %) and stirring at RT for additional 15-20 min
Centrifugation
HIC for PS1 WT IMAC for PS1 His-tag
Dialysis
Dialysis
Concentration and freezing
These monomers should be jested in the biohydrogen device for a potentially better distribution on the
gold electrode surface, leading to higher photocurrents. On the other hand, PS1 monomers, as a simplest
IEC as 2nd purification step for WT and his-tagged mutant
HIC as 2nd purification step for his-tagged mutant
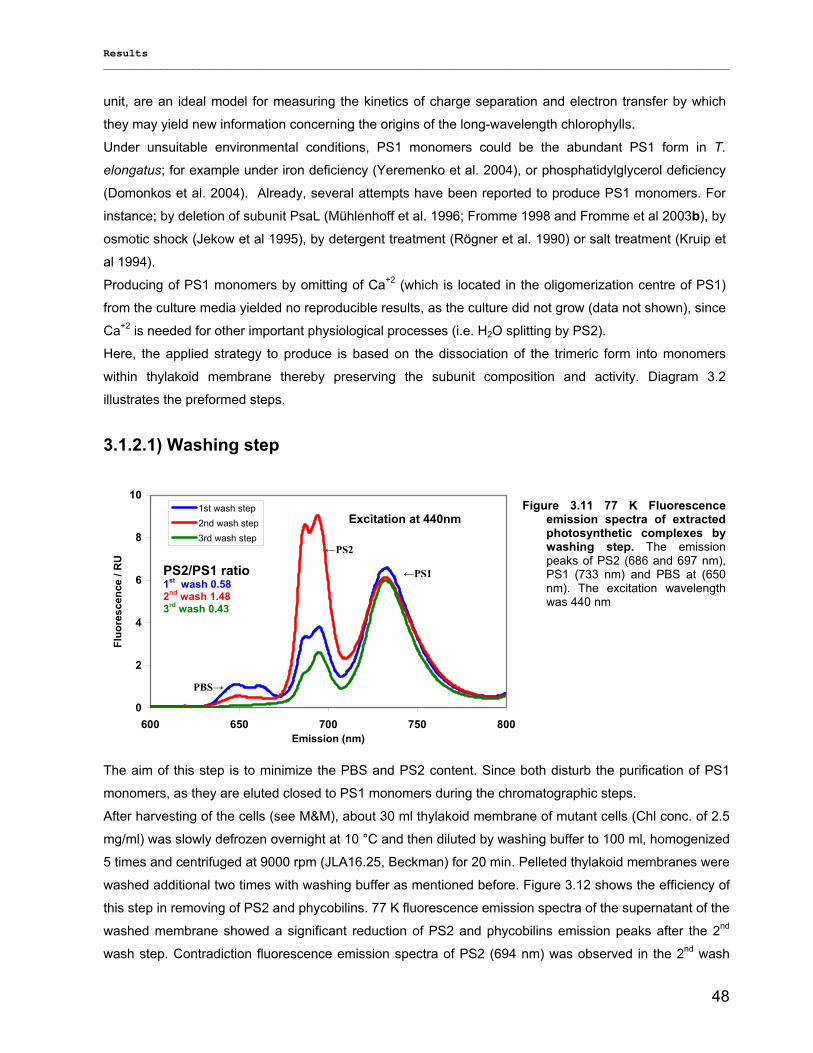
Results __________________________________________________________________________________________________
48
unit, are an ideal model for measuring the kinetics of charge separation and electron transfer by which
they may yield new information concerning the origins of the long-wavelength chlorophylls.
Under unsuitable environmental conditions, PS1 monomers could be the abundant PS1 form in T.
elongatus; for example under iron deficiency (Yeremenko et al. 2004), or phosphatidylglycerol deficiency
(Domonkos et al. 2004). Already, several attempts have been reported to produce PS1 monomers. For
instance; by deletion of subunit PsaL (Mühlenhoff et al. 1996; Fromme 1998 and Fromme et al 2003b), by
osmotic shock (Jekow et al 1995), by detergent treatment (Rögner et al. 1990) or salt treatment (Kruip et
al 1994).
Producing of PS1 monomers by omitting of Ca+2 (which is located in the oligomerization centre of PS1)
from the culture media yielded no reproducible results, as the culture did not grow (data not shown), since
Ca+2 is needed for other important physiological processes (i.e. H2O splitting by PS2).
Here, the applied strategy to produce is based on the dissociation of the trimeric form into monomers
within thylakoid membrane thereby preserving the subunit composition and activity. Diagram 3.2
illustrates the preformed steps.
3.1.2.1) Washing step
0
2
4
6
8
10
600 650 700 750 800Emission (nm)
Fluo
resc
ence
/ R
U
1st wash step2nd wash step3rd wash step
Excitation at 440nm
The aim of this step is to minimize the PBS and PS2 content. Since both disturb the purification of PS1
monomers, as they are eluted closed to PS1 monomers during the chromatographic steps.
After harvesting of the cells (see M&M), about 30 ml thylakoid membrane of mutant cells (Chl conc. of 2.5
mg/ml) was slowly defrozen overnight at 10 °C and then diluted by washing buffer to 100 ml, homogenized
5 times and centrifuged at 9000 rpm (JLA16.25, Beckman) for 20 min. Pelleted thylakoid membranes were
washed additional two times with washing buffer as mentioned before. Figure 3.12 shows the efficiency of
this step in removing of PS2 and phycobilins. 77 K fluorescence emission spectra of the supernatant of the
washed membrane showed a significant reduction of PS2 and phycobilins emission peaks after the 2nd
wash step. Contradiction fluorescence emission spectra of PS2 (694 nm) was observed in the 2nd wash
Figure 3.11 77 K Fluorescence emission spectra of extracted photosynthetic complexes by washing step. The emission peaks of PS2 (686 and 697 nm), PS1 (733 nm) and PBS at (650 nm). The excitation wavelength was 440 nm
←PS1
←PS2
PBS→
PS2/PS1 ratio 1st wash 0.58 2nd wash 1.48 3rd wash 0.43
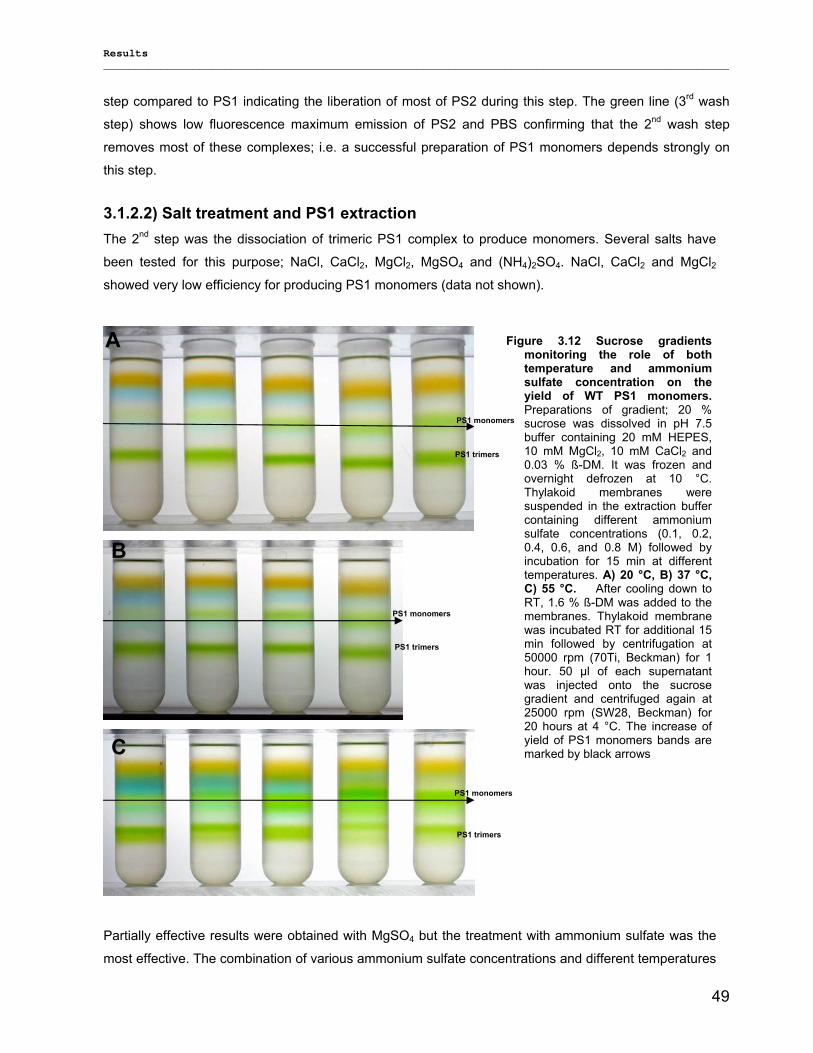
Results __________________________________________________________________________________________________
49
step compared to PS1 indicating the liberation of most of PS2 during this step. The green line (3rd wash
step) shows low fluorescence maximum emission of PS2 and PBS confirming that the 2nd wash step
removes most of these complexes; i.e. a successful preparation of PS1 monomers depends strongly on
this step.
3.1.2.2) Salt treatment and PS1 extraction The 2nd step was the dissociation of trimeric PS1 complex to produce monomers. Several salts have
been tested for this purpose; NaCl, CaCl2, MgCl2, MgSO4 and (NH4)2SO4. NaCl, CaCl2 and MgCl2
showed very low efficiency for producing PS1 monomers (data not shown).
Partially effective results were obtained with MgSO4 but the treatment with ammonium sulfate was the
most effective. The combination of various ammonium sulfate concentrations and different temperatures
C
PS1 monomers
PS1 monomers
PS1 monomers
PS1 trimers
PS1 trimers
PS1 trimers
A
B
Figure 3.12 Sucrose gradients monitoring the role of both temperature and ammonium sulfate concentration on the yield of WT PS1 monomers.Preparations of gradient; 20 % sucrose was dissolved in pH 7.5 buffer containing 20 mM HEPES, 10 mM MgCl2, 10 mM CaCl2 and 0.03 % ß-DM. It was frozen and overnight defrozen at 10 °C. Thylakoid membranes were suspended in the extraction buffer containing different ammonium sulfate concentrations (0.1, 0.2, 0.4, 0.6, and 0.8 M) followed byincubation for 15 min at different temperatures. A) 20 °C, B) 37 °C, C) 55 °C. After cooling down to RT, 1.6 % ß-DM was added to the membranes. Thylakoid membrane was incubated RT for additional 15 min followed by centrifugation at 50000 rpm (70Ti, Beckman) for 1 hour. 50 µl of each supernatant was injected onto the sucrose gradient and centrifuged again at 25000 rpm (SW28, Beckman) for 20 hours at 4 °C. The increase of yield of PS1 monomers bands are marked by black arrows
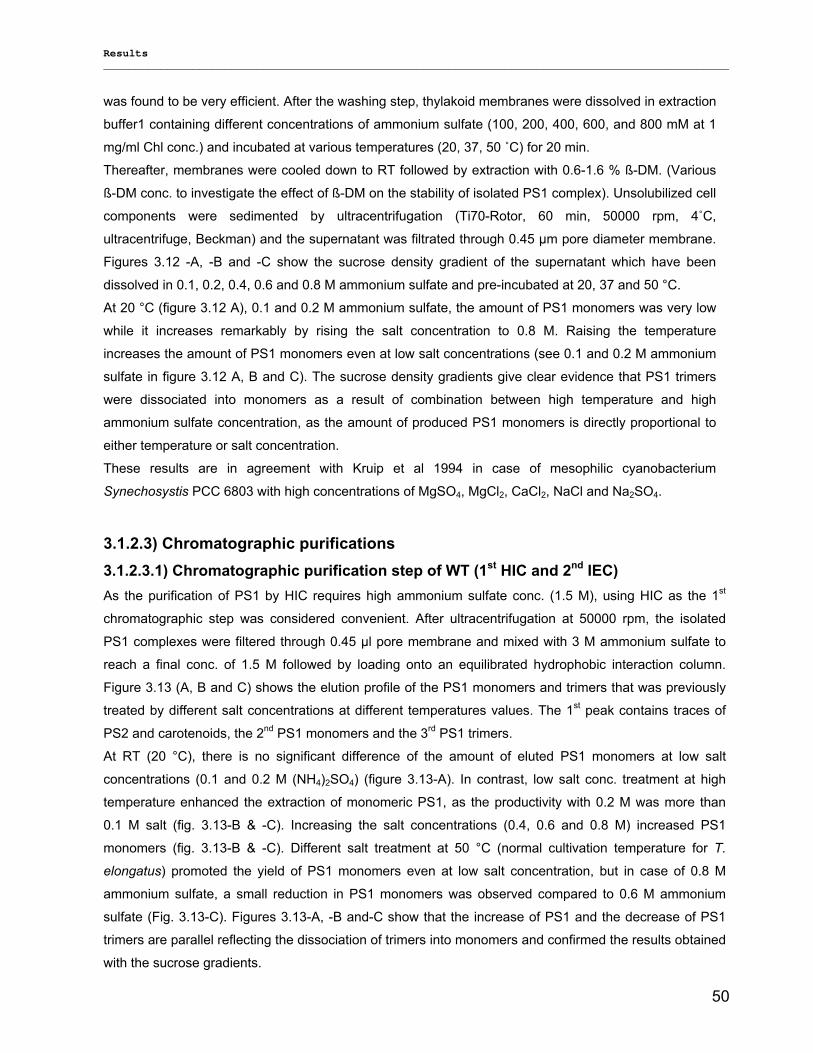
Results __________________________________________________________________________________________________
50
was found to be very efficient. After the washing step, thylakoid membranes were dissolved in extraction
buffer1 containing different concentrations of ammonium sulfate (100, 200, 400, 600, and 800 mM at 1
mg/ml Chl conc.) and incubated at various temperatures (20, 37, 50 ˚C) for 20 min. Thereafter, membranes were cooled down to RT followed by extraction with 0.6-1.6 % ß-DM. (Various
ß-DM conc. to investigate the effect of ß-DM on the stability of isolated PS1 complex). Unsolubilized cell
components were sedimented by ultracentrifugation (Ti70-Rotor, 60 min, 50000 rpm, 4˚C,
ultracentrifuge, Beckman) and the supernatant was filtrated through 0.45 µm pore diameter membrane.
Figures 3.12 -A, -B and -C show the sucrose density gradient of the supernatant which have been
dissolved in 0.1, 0.2, 0.4, 0.6 and 0.8 M ammonium sulfate and pre-incubated at 20, 37 and 50 °C.
At 20 °C (figure 3.12 A), 0.1 and 0.2 M ammonium sulfate, the amount of PS1 monomers was very low
while it increases remarkably by rising the salt concentration to 0.8 M. Raising the temperature
increases the amount of PS1 monomers even at low salt concentrations (see 0.1 and 0.2 M ammonium
sulfate in figure 3.12 A, B and C). The sucrose density gradients give clear evidence that PS1 trimers
were dissociated into monomers as a result of combination between high temperature and high
ammonium sulfate concentration, as the amount of produced PS1 monomers is directly proportional to
either temperature or salt concentration. These results are in agreement with Kruip et al 1994 in case of mesophilic cyanobacterium
Synechosystis PCC 6803 with high concentrations of MgSO4, MgCl2, CaCl2, NaCl and Na2SO4.
3.1.2.3) Chromatographic purifications 3.1.2.3.1) Chromatographic purification step of WT (1st HIC and 2nd IEC) As the purification of PS1 by HIC requires high ammonium sulfate conc. (1.5 M), using HIC as the 1st
chromatographic step was considered convenient. After ultracentrifugation at 50000 rpm, the isolated
PS1 complexes were filtered through 0.45 µl pore membrane and mixed with 3 M ammonium sulfate to
reach a final conc. of 1.5 M followed by loading onto an equilibrated hydrophobic interaction column.
Figure 3.13 (A, B and C) shows the elution profile of the PS1 monomers and trimers that was previously
treated by different salt concentrations at different temperatures values. The 1st peak contains traces of
PS2 and carotenoids, the 2nd PS1 monomers and the 3rd PS1 trimers.
At RT (20 °C), there is no significant difference of the amount of eluted PS1 monomers at low salt
concentrations (0.1 and 0.2 M (NH4)2SO4) (figure 3.13-A). In contrast, low salt conc. treatment at high
temperature enhanced the extraction of monomeric PS1, as the productivity with 0.2 M was more than
0.1 M salt (fig. 3.13-B & -C). Increasing the salt concentrations (0.4, 0.6 and 0.8 M) increased PS1
monomers (fig. 3.13-B & -C). Different salt treatment at 50 °C (normal cultivation temperature for T.
elongatus) promoted the yield of PS1 monomers even at low salt concentration, but in case of 0.8 M
ammonium sulfate, a small reduction in PS1 monomers was observed compared to 0.6 M ammonium
sulfate (Fig. 3.13-C). Figures 3.13-A, -B and-C show that the increase of PS1 and the decrease of PS1
trimers are parallel reflecting the dissociation of trimers into monomers and confirmed the results obtained
with the sucrose gradients.
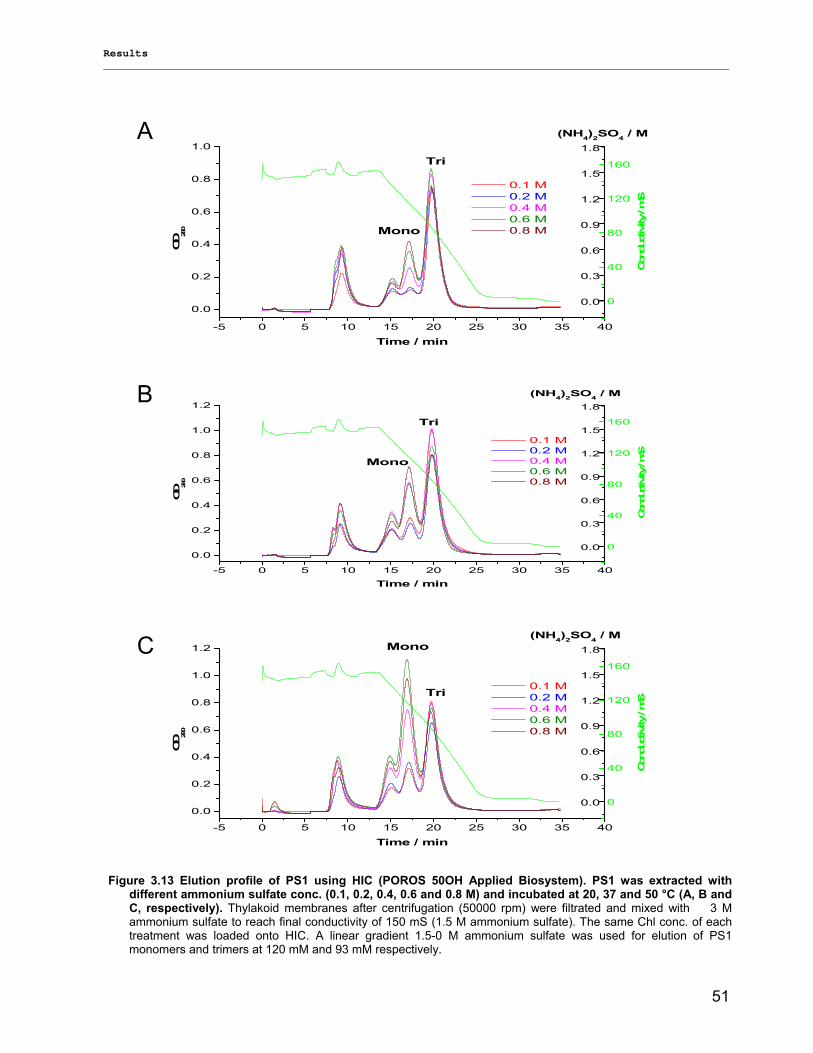
Results __________________________________________________________________________________________________
51
-5 0 5 10 15 20 25 30 35 40
0.0
0.2
0.4
0.6
0.8
1.0(NH4)2SO4 / M
Mono
Tri
Cond
uctiv
ity / mS
OD 28
0
Time / min
0.1 M 0.2 M 0.4 M 0.6 M 0.8 M
0
40
80
120
160
0.0
0.3
0.6
0.9
1.2
1.5
1.8
-5 0 5 10 15 20 25 30 35 40
0.0
0.2
0.4
0.6
0.8
1.0
1.2(NH4)2SO4 / M
Mono
Tri
Cond
uctiv
ity / mS
OD 28
0
Time / min
0.1 M 0.2 M 0.4 M 0.6 M 0.8 M
0
40
80
120
160
0.0
0.3
0.6
0.9
1.2
1.5
1.8
-5 0 5 10 15 20 25 30 35 40
0.0
0.2
0.4
0.6
0.8
1.0
1.2(NH4)2SO4 / M
Mono
Tri
Con
ductivity
/ mS
OD 28
0
Time / min
0.1 M 0.2 M 0.4 M 0.6 M 0.8 M
0
40
80
120
160
0.0
0.3
0.6
0.9
1.2
1.5
1.8
A
B
C
Figure 3.13 Elution profile of PS1 using HIC (POROS 50OH Applied Biosystem). PS1 was extracted with different ammonium sulfate conc. (0.1, 0.2, 0.4, 0.6 and 0.8 M) and incubated at 20, 37 and 50 °C (A, B and C, respectively). Thylakoid membranes after centrifugation (50000 rpm) were filtrated and mixed with 3 M ammonium sulfate to reach final conductivity of 150 mS (1.5 M ammonium sulfate). The same Chl conc. of each treatment was loaded onto HIC. A linear gradient 1.5-0 M ammonium sulfate was used for elution of PS1 monomers and trimers at 120 mM and 93 mM respectively.
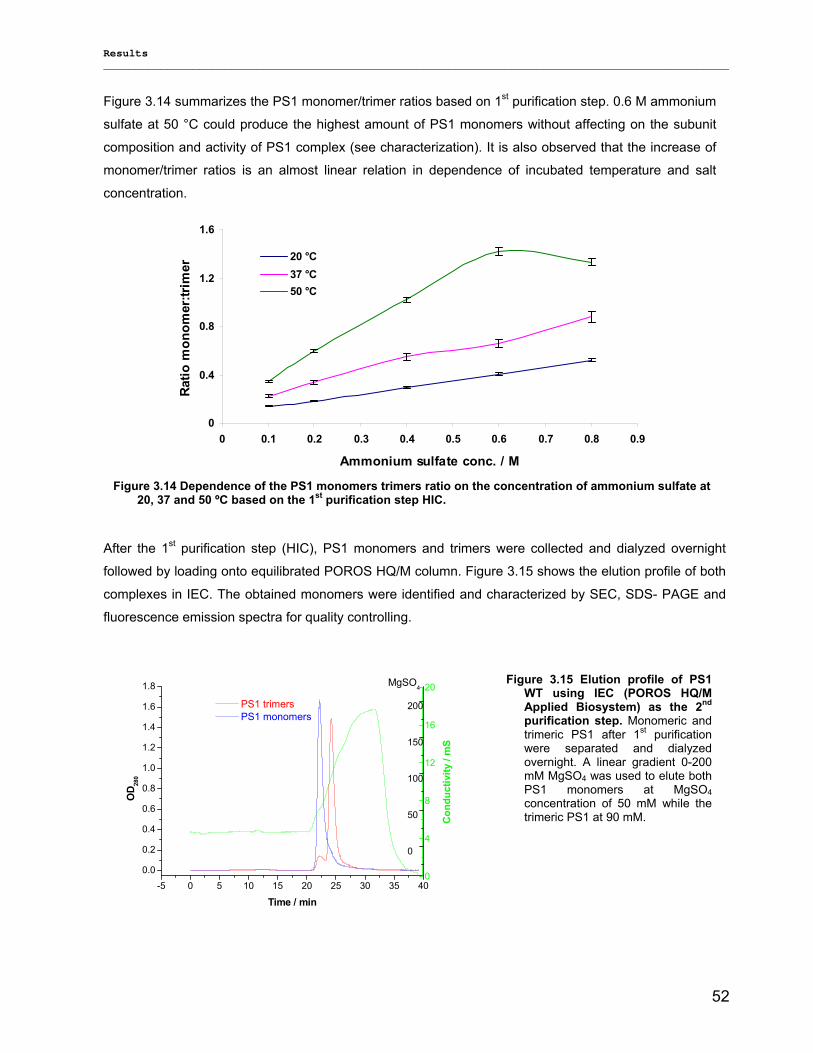
Results __________________________________________________________________________________________________
52
Figure 3.14 summarizes the PS1 monomer/trimer ratios based on 1st purification step. 0.6 M ammonium
sulfate at 50 °C could produce the highest amount of PS1 monomers without affecting on the subunit
composition and activity of PS1 complex (see characterization). It is also observed that the increase of
monomer/trimer ratios is an almost linear relation in dependence of incubated temperature and salt
concentration.
0
0.4
0.8
1.2
1.6
0 0.1 0.2 0.3 0.4 0.5 0.6 0.7 0.8 0.9
Ammonium sulfate conc. / M
Ratio
mon
omer
:trim
er
20 °C37 °C50 °C
After the 1st purification step (HIC), PS1 monomers and trimers were collected and dialyzed overnight
followed by loading onto equilibrated POROS HQ/M column. Figure 3.15 shows the elution profile of both
complexes in IEC. The obtained monomers were identified and characterized by SEC, SDS- PAGE and
fluorescence emission spectra for quality controlling.
-5 0 5 10 15 20 25 30 35 400.0
0.2
0.4
0.6
0.8
1.0
1.2
1.4
1.6
1.8 MgSO4
Cond
uctiv
ity /
mS
OD 28
0
Time / min
PS1 trimers PS1 monomers
0
4
8
12
16
20
0
50
100
150
200
Figure 3.15 Elution profile of PS1 WT using IEC (POROS HQ/M Applied Biosystem) as the 2nd
purification step. Monomeric and trimeric PS1 after 1st purification were separated and dialyzed overnight. A linear gradient 0-200 mM MgSO4 was used to elute both PS1 monomers at MgSO4concentration of 50 mM while the trimeric PS1 at 90 mM.
Figure 3.14 Dependence of the PS1 monomers trimers ratio on the concentration of ammonium sulfate at 20, 37 and 50 ºC based on the 1st purification step HIC.
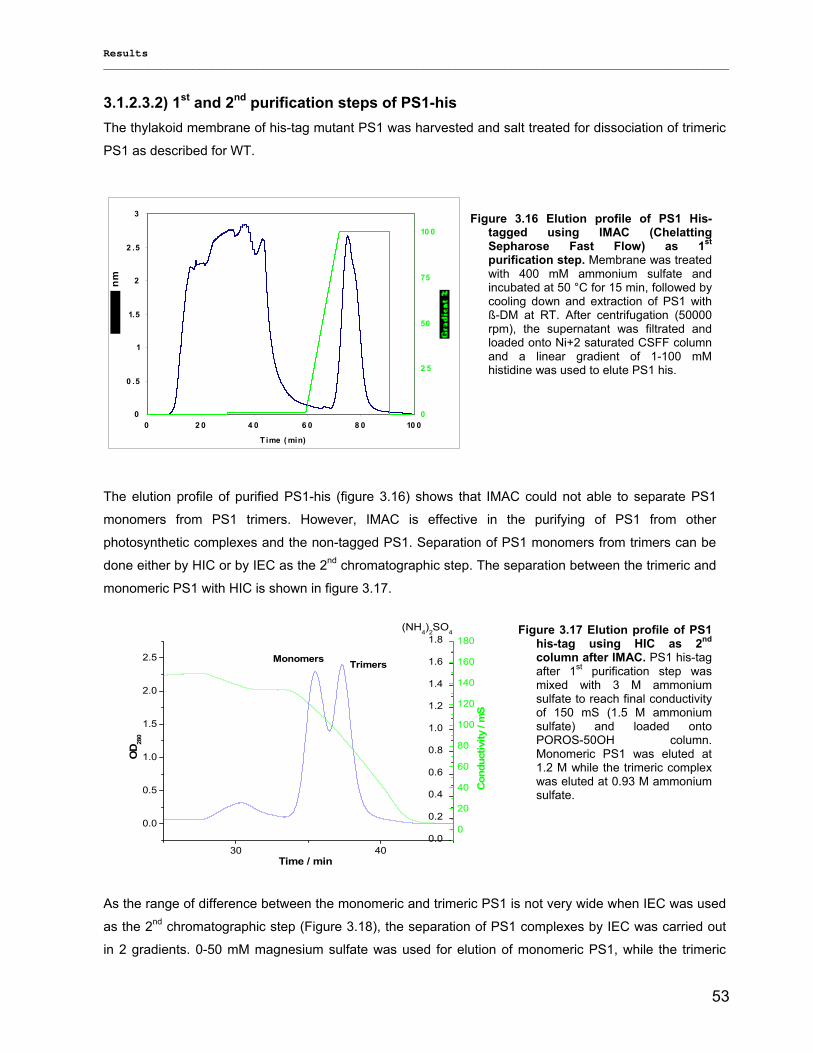
Results __________________________________________________________________________________________________
53
3.1.2.3.2) 1st and 2nd purification steps of PS1-his The thylakoid membrane of his-tag mutant PS1 was harvested and salt treated for dissociation of trimeric
PS1 as described for WT.
0
0 .5
1
1.5
2
2 .5
3
0 2 0 4 0 6 0 8 0 10 0
T ime ( min)
0
2 5
50
75
10 0
The elution profile of purified PS1-his (figure 3.16) shows that IMAC could not able to separate PS1
monomers from PS1 trimers. However, IMAC is effective in the purifying of PS1 from other
photosynthetic complexes and the non-tagged PS1. Separation of PS1 monomers from trimers can be
done either by HIC or by IEC as the 2nd chromatographic step. The separation between the trimeric and
monomeric PS1 with HIC is shown in figure 3.17.
30 40
0.0
0.5
1.0
1.5
2.0
2.5
Cond
uctiv
ity /
mS
OD 28
0
Time / min
0.0
0.2
0.4
0.6
0.8
1.0
1.2
1.4
1.6
1.8
Monomers Trimers
(NH4)2SO4
0
20
40
60
80
100
120
140
160
180
As the range of difference between the monomeric and trimeric PS1 is not very wide when IEC was used
as the 2nd chromatographic step (Figure 3.18), the separation of PS1 complexes by IEC was carried out
in 2 gradients. 0-50 mM magnesium sulfate was used for elution of monomeric PS1, while the trimeric
Figure 3.16 Elution profile of PS1 His-tagged using IMAC (Chelatting Sepharose Fast Flow) as 1st
purification step. Membrane was treated with 400 mM ammonium sulfate and incubated at 50 °C for 15 min, followed by cooling down and extraction of PS1 with ß-DM at RT. After centrifugation (50000 rpm), the supernatant was filtrated and loaded onto Ni+2 saturated CSFF column and a linear gradient of 1-100 mM histidine was used to elute PS1 his.
Figure 3.17 Elution profile of PS1 his-tag using HIC as 2nd
column after IMAC. PS1 his-tag after 1st purification step was mixed with 3 M ammonium sulfate to reach final conductivity of 150 mS (1.5 M ammonium sulfate) and loaded onto POROS-50OH column. Monomeric PS1 was eluted at 1.2 M while the trimeric complex was eluted at 0.93 M ammonium sulfate.
nm
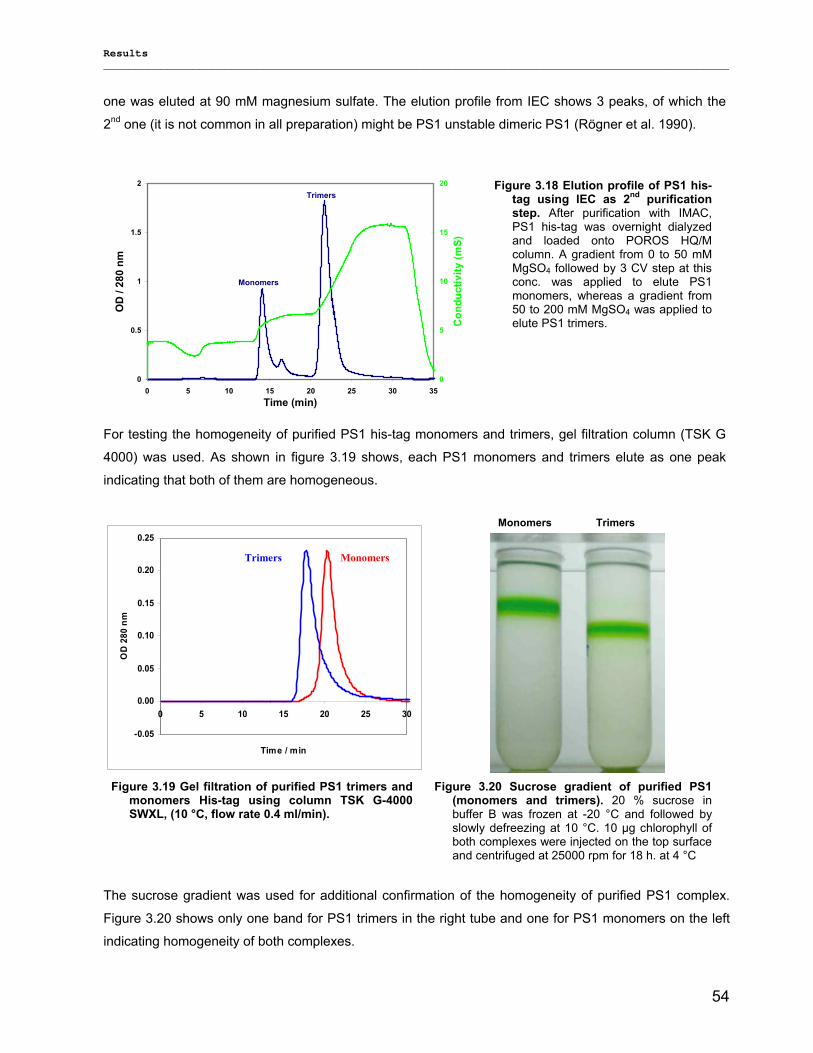
Results __________________________________________________________________________________________________
54
one was eluted at 90 mM magnesium sulfate. The elution profile from IEC shows 3 peaks, of which the
2nd one (it is not common in all preparation) might be PS1 unstable dimeric PS1 (Rögner et al. 1990).
0
0.5
1
1.5
2
0 5 10 15 20 25 30 35Time (min)
OD
/ 28
0 nm
0
5
10
15
20
Con
duct
ivity
(mS)
Monomers
Trimers
For testing the homogeneity of purified PS1 his-tag monomers and trimers, gel filtration column (TSK G
4000) was used. As shown in figure 3.19 shows, each PS1 monomers and trimers elute as one peak
indicating that both of them are homogeneous.
-0.05
0.00
0.05
0.10
0.15
0.20
0.25
0 5 10 15 20 25 30
Time / min
OD
280
nm
The sucrose gradient was used for additional confirmation of the homogeneity of purified PS1 complex.
Figure 3.20 shows only one band for PS1 trimers in the right tube and one for PS1 monomers on the left
indicating homogeneity of both complexes.
Figure 3.18 Elution profile of PS1 his-tag using IEC as 2nd purification step. After purification with IMAC, PS1 his-tag was overnight dialyzed and loaded onto POROS HQ/M column. A gradient from 0 to 50 mM MgSO4 followed by 3 CV step at this conc. was applied to elute PS1 monomers, whereas a gradient from 50 to 200 mM MgSO4 was applied to elute PS1 trimers.
Figure 3.19 Gel filtration of purified PS1 trimers and monomers His-tag using column TSK G-4000 SWXL, (10 °C, flow rate 0.4 ml/min).
MonomersTrimers
Figure 3.20 Sucrose gradient of purified PS1 (monomers and trimers). 20 % sucrose in buffer B was frozen at -20 °C and followed by slowly defreezing at 10 °C. 10 µg chlorophyll of both complexes were injected on the top surface and centrifuged at 25000 rpm for 18 h. at 4 °C
Monomers Trimers
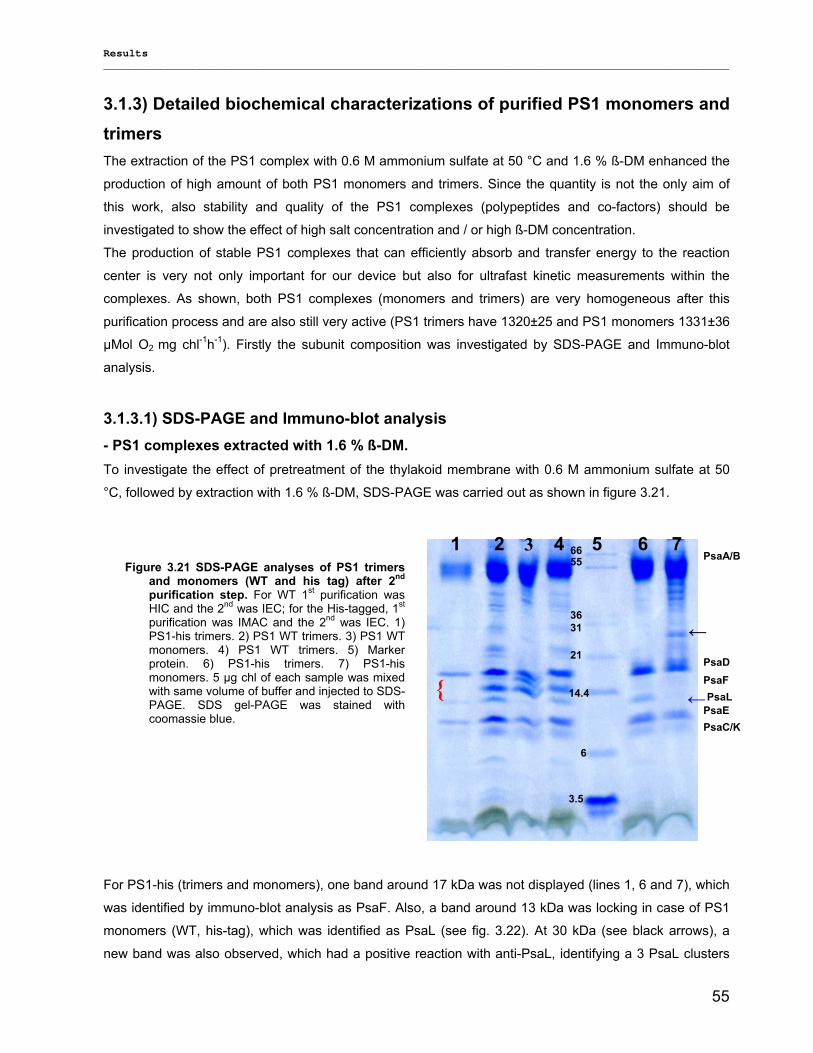
Results __________________________________________________________________________________________________
55
3.1.3) Detailed biochemical characterizations of purified PS1 monomers and trimers The extraction of the PS1 complex with 0.6 M ammonium sulfate at 50 °C and 1.6 % ß-DM enhanced the
production of high amount of both PS1 monomers and trimers. Since the quantity is not the only aim of
this work, also stability and quality of the PS1 complexes (polypeptides and co-factors) should be
investigated to show the effect of high salt concentration and / or high ß-DM concentration.
The production of stable PS1 complexes that can efficiently absorb and transfer energy to the reaction
center is very not only important for our device but also for ultrafast kinetic measurements within the
complexes. As shown, both PS1 complexes (monomers and trimers) are very homogeneous after this
purification process and are also still very active (PS1 trimers have 1320±25 and PS1 monomers 1331±36
µMol O2 mg chl-1h-1). Firstly the subunit composition was investigated by SDS-PAGE and Immuno-blot
analysis.
3.1.3.1) SDS-PAGE and Immuno-blot analysis - PS1 complexes extracted with 1.6 % ß-DM. To investigate the effect of pretreatment of the thylakoid membrane with 0.6 M ammonium sulfate at 50
°C, followed by extraction with 1.6 % ß-DM, SDS-PAGE was carried out as shown in figure 3.21.
For PS1-his (trimers and monomers), one band around 17 kDa was not displayed (lines 1, 6 and 7), which
was identified by immuno-blot analysis as PsaF. Also, a band around 13 kDa was locking in case of PS1
monomers (WT, his-tag), which was identified as PsaL (see fig. 3.22). At 30 kDa (see black arrows), a
new band was also observed, which had a positive reaction with anti-PsaL, identifying a 3 PsaL clusters
Figure 3.21 SDS-PAGE analyses of PS1 trimers and monomers (WT and his tag) after 2nd
purification step. For WT 1st purification was HIC and the 2nd was IEC; for the His-tagged, 1st
purification was IMAC and the 2nd was IEC. 1) PS1-his trimers. 2) PS1 WT trimers. 3) PS1 WT monomers. 4) PS1 WT trimers. 5) Marker protein. 6) PS1-his trimers. 7) PS1-his monomers. 5 µg chl of each sample was mixed with same volume of buffer and injected to SDS-PAGE. SDS gel-PAGE was stained with coomassie blue.
{ ←
←
6
3.5
21
14.4
31 36
55 66 1 2 3 4 5 6 7
PsaA/B
PsaD PsaF PsaL PsaE PsaC/K
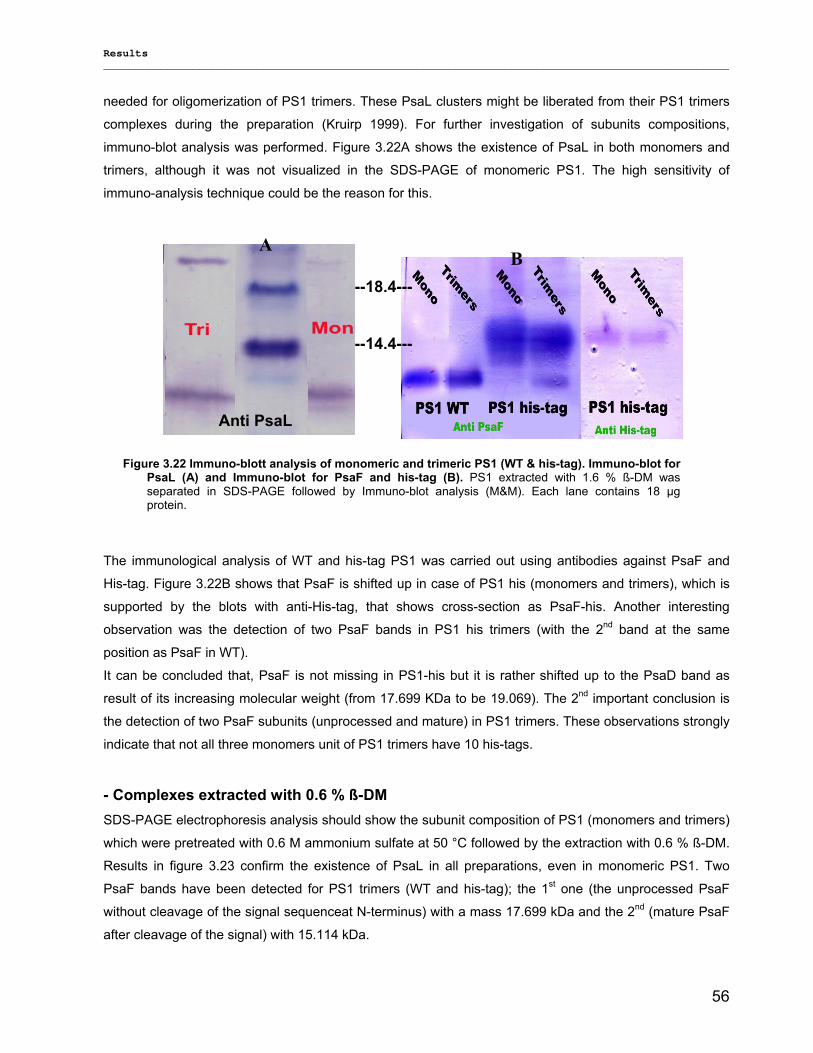
Results __________________________________________________________________________________________________
56
needed for oligomerization of PS1 trimers. These PsaL clusters might be liberated from their PS1 trimers
complexes during the preparation (Kruirp 1999). For further investigation of subunits compositions,
immuno-blot analysis was performed. Figure 3.22A shows the existence of PsaL in both monomers and
trimers, although it was not visualized in the SDS-PAGE of monomeric PS1. The high sensitivity of
immuno-analysis technique could be the reason for this.
The immunological analysis of WT and his-tag PS1 was carried out using antibodies against PsaF and
His-tag. Figure 3.22B shows that PsaF is shifted up in case of PS1 his (monomers and trimers), which is
supported by the blots with anti-His-tag, that shows cross-section as PsaF-his. Another interesting
observation was the detection of two PsaF bands in PS1 his trimers (with the 2nd band at the same
position as PsaF in WT).
It can be concluded that, PsaF is not missing in PS1-his but it is rather shifted up to the PsaD band as
result of its increasing molecular weight (from 17.699 KDa to be 19.069). The 2nd important conclusion is
the detection of two PsaF subunits (unprocessed and mature) in PS1 trimers. These observations strongly
indicate that not all three monomers unit of PS1 trimers have 10 his-tags.
- Complexes extracted with 0.6 % ß-DM SDS-PAGE electrophoresis analysis should show the subunit composition of PS1 (monomers and trimers)
which were pretreated with 0.6 M ammonium sulfate at 50 °C followed by the extraction with 0.6 % ß-DM.
Results in figure 3.23 confirm the existence of PsaL in all preparations, even in monomeric PS1. Two
PsaF bands have been detected for PS1 trimers (WT and his-tag); the 1st one (the unprocessed PsaF
without cleavage of the signal sequenceat N-terminus) with a mass 17.699 kDa and the 2nd (mature PsaF
after cleavage of the signal) with 15.114 kDa.
Figure 3.22 Immuno-blott analysis of monomeric and trimeric PS1 (WT & his-tag). Immuno-blot for PsaL (A) and Immuno-blot for PsaF and his-tag (B). PS1 extracted with 1.6 % ß-DM was separated in SDS-PAGE followed by Immuno-blot analysis (M&M). Each lane contains 18 µg protein.
A B
Anti PsaL
--14.4---
--18.4---
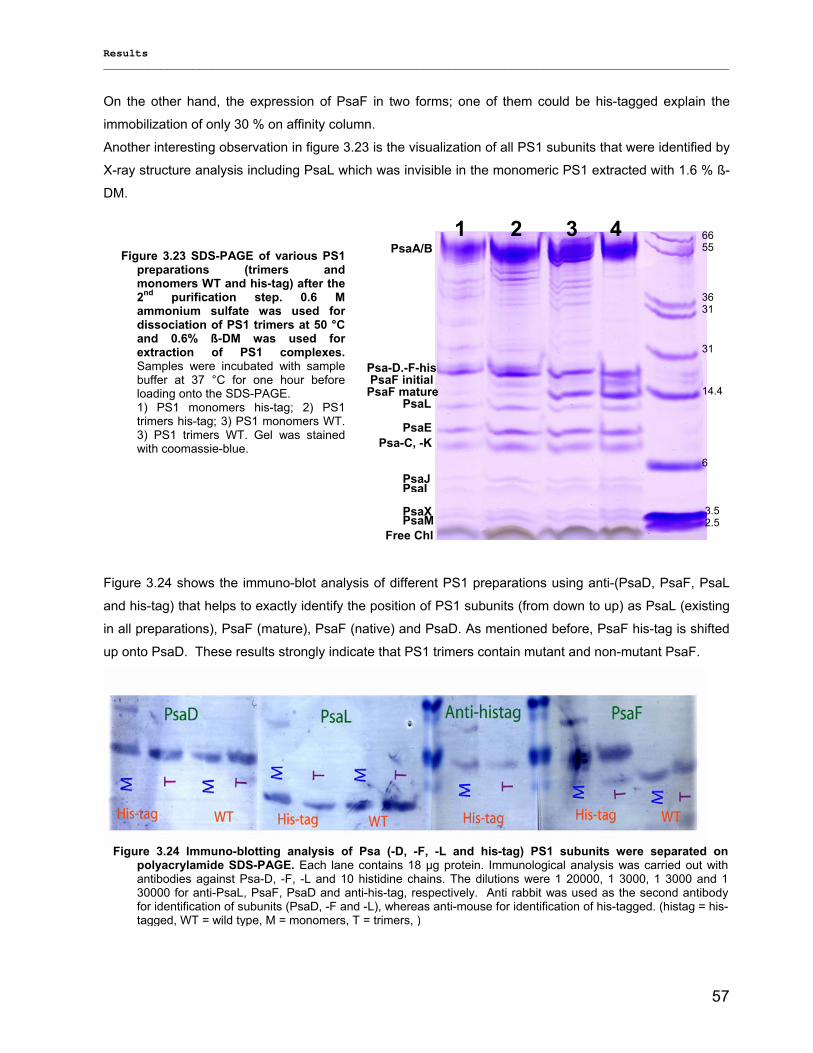
Results __________________________________________________________________________________________________
57
On the other hand, the expression of PsaF in two forms; one of them could be his-tagged explain the
immobilization of only 30 % on affinity column.
Another interesting observation in figure 3.23 is the visualization of all PS1 subunits that were identified by
X-ray structure analysis including PsaL which was invisible in the monomeric PS1 extracted with 1.6 % ß-
DM.
Figure 3.24 shows the immuno-blot analysis of different PS1 preparations using anti-(PsaD, PsaF, PsaL
and his-tag) that helps to exactly identify the position of PS1 subunits (from down to up) as PsaL (existing
in all preparations), PsaF (mature), PsaF (native) and PsaD. As mentioned before, PsaF his-tag is shifted
up onto PsaD. These results strongly indicate that PS1 trimers contain mutant and non-mutant PsaF.
Figure 3.23 SDS-PAGE of various PS1 preparations (trimers and monomers WT and his-tag) after the 2nd purification step. 0.6 M ammonium sulfate was used for dissociation of PS1 trimers at 50 °C and 0.6% ß-DM was used for extraction of PS1 complexes.Samples were incubated with sample buffer at 37 °C for one hour before loading onto the SDS-PAGE. 1) PS1 monomers his-tag; 2) PS1 trimers his-tag; 3) PS1 monomers WT. 3) PS1 trimers WT. Gel was stained with coomassie-blue.
Figure 3.24 Immuno-blotting analysis of Psa (-D, -F, -L and his-tag) PS1 subunits were separated on polyacrylamide SDS-PAGE. Each lane contains 18 µg protein. Immunological analysis was carried out with antibodies against Psa-D, -F, -L and 10 histidine chains. The dilutions were 1 20000, 1 3000, 1 3000 and 1 30000 for anti-PsaL, PsaF, PsaD and anti-his-tag, respectively. Anti rabbit was used as the second antibody for identification of subunits (PsaD, -F and -L), whereas anti-mouse for identification of his-tagged. (histag = his-tagged, WT = wild type, M = monomers, T = trimers, )
6655
36 31
31
14.4
6
3.52.5
PsaA/B
Psa-D,-F-hisPsaF initial
PsaF maturePsaL
PsaEPsa-C, -K
PsaJ PsaI
PsaXPsaM
Free Chl
1 2 3 4
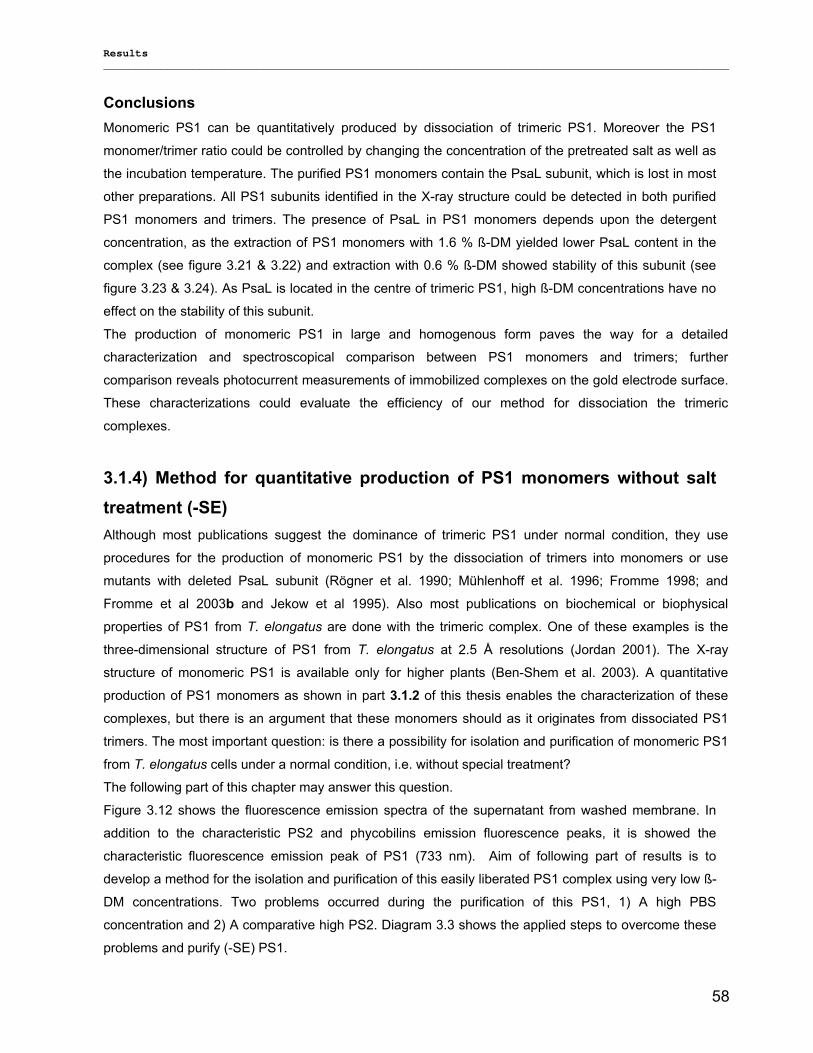
Results __________________________________________________________________________________________________
58
Conclusions Monomeric PS1 can be quantitatively produced by dissociation of trimeric PS1. Moreover the PS1
monomer/trimer ratio could be controlled by changing the concentration of the pretreated salt as well as
the incubation temperature. The purified PS1 monomers contain the PsaL subunit, which is lost in most
other preparations. All PS1 subunits identified in the X-ray structure could be detected in both purified
PS1 monomers and trimers. The presence of PsaL in PS1 monomers depends upon the detergent
concentration, as the extraction of PS1 monomers with 1.6 % ß-DM yielded lower PsaL content in the
complex (see figure 3.21 & 3.22) and extraction with 0.6 % ß-DM showed stability of this subunit (see
figure 3.23 & 3.24). As PsaL is located in the centre of trimeric PS1, high ß-DM concentrations have no
effect on the stability of this subunit.
The production of monomeric PS1 in large and homogenous form paves the way for a detailed
characterization and spectroscopical comparison between PS1 monomers and trimers; further
comparison reveals photocurrent measurements of immobilized complexes on the gold electrode surface.
These characterizations could evaluate the efficiency of our method for dissociation the trimeric
complexes.
3.1.4) Method for quantitative production of PS1 monomers without salt treatment (-SE) Although most publications suggest the dominance of trimeric PS1 under normal condition, they use
procedures for the production of monomeric PS1 by the dissociation of trimers into monomers or use
mutants with deleted PsaL subunit (Rögner et al. 1990; Mühlenhoff et al. 1996; Fromme 1998; and
Fromme et al 2003b and Jekow et al 1995). Also most publications on biochemical or biophysical
properties of PS1 from T. elongatus are done with the trimeric complex. One of these examples is the
three-dimensional structure of PS1 from T. elongatus at 2.5 Å resolutions (Jordan 2001). The X-ray
structure of monomeric PS1 is available only for higher plants (Ben-Shem et al. 2003). A quantitative
production of PS1 monomers as shown in part 3.1.2 of this thesis enables the characterization of these
complexes, but there is an argument that these monomers should as it originates from dissociated PS1
trimers. The most important question: is there a possibility for isolation and purification of monomeric PS1
from T. elongatus cells under a normal condition, i.e. without special treatment?
The following part of this chapter may answer this question.
Figure 3.12 shows the fluorescence emission spectra of the supernatant from washed membrane. In
addition to the characteristic PS2 and phycobilins emission fluorescence peaks, it is showed the
characteristic fluorescence emission peak of PS1 (733 nm). Aim of following part of results is to
develop a method for the isolation and purification of this easily liberated PS1 complex using very low ß-
DM concentrations. Two problems occurred during the purification of this PS1, 1) A high PBS
concentration and 2) A comparative high PS2. Diagram 3.3 shows the applied steps to overcome these
problems and purify (-SE) PS1.
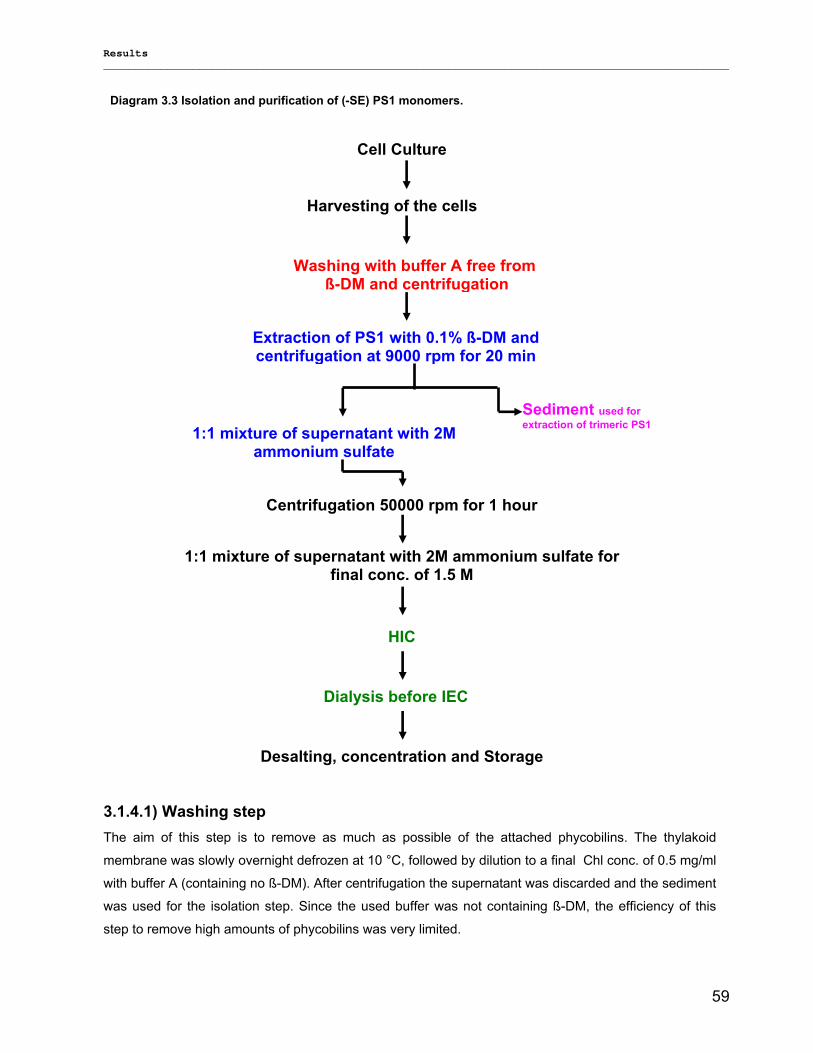
Results __________________________________________________________________________________________________
59
Diagram 3.3 Isolation and purification of (-SE) PS1 monomers.
3.1.4.1) Washing step The aim of this step is to remove as much as possible of the attached phycobilins. The thylakoid
membrane was slowly overnight defrozen at 10 °C, followed by dilution to a final Chl conc. of 0.5 mg/ml
with buffer A (containing no ß-DM). After centrifugation the supernatant was discarded and the sediment
was used for the isolation step. Since the used buffer was not containing ß-DM, the efficiency of this
step to remove high amounts of phycobilins was very limited.
Cell Culture
Harvesting of the cells
Washing with buffer A free from ß-DM and centrifugation
Extraction of PS1 with 0.1% ß-DM and centrifugation at 9000 rpm for 20 min
Sediment used for extraction of trimeric PS1 1:1 mixture of supernatant with 2M
ammonium sulfate
Centrifugation 50000 rpm for 1 hour
1:1 mixture of supernatant with 2M ammonium sulfate for final conc. of 1.5 M
HIC
Dialysis before IEC
Desalting, concentration and Storage
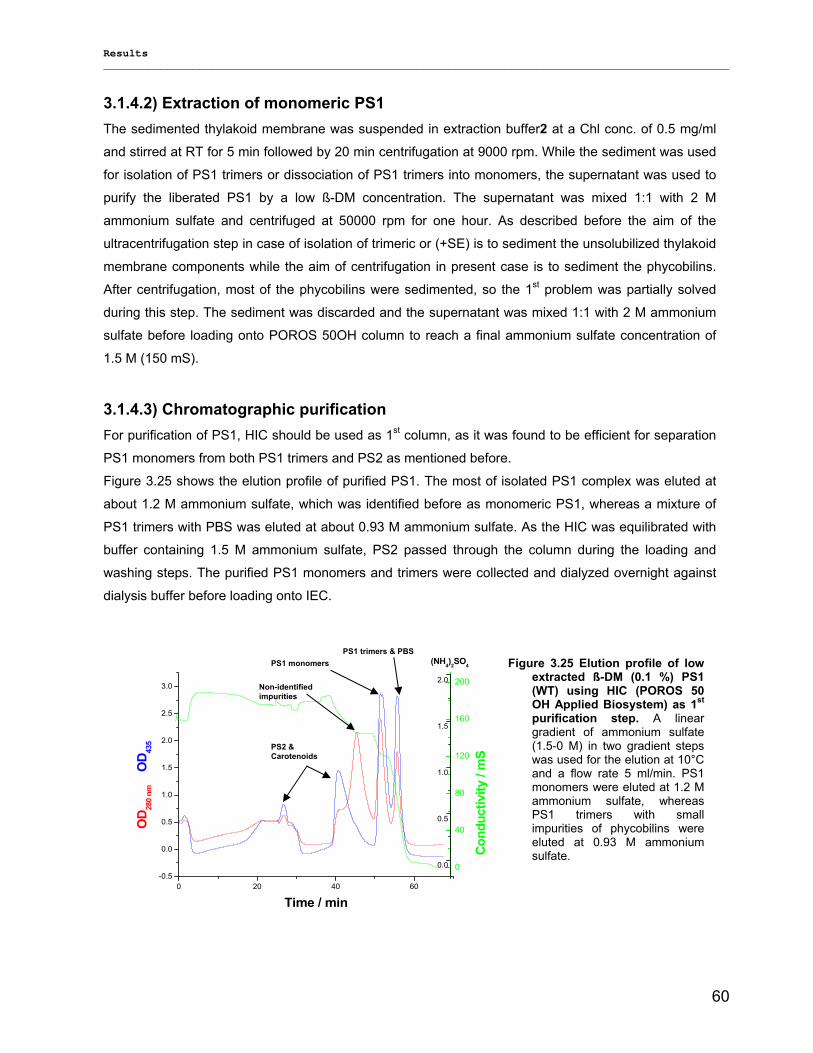
Results __________________________________________________________________________________________________
60
3.1.4.2) Extraction of monomeric PS1 The sedimented thylakoid membrane was suspended in extraction buffer2 at a Chl conc. of 0.5 mg/ml
and stirred at RT for 5 min followed by 20 min centrifugation at 9000 rpm. While the sediment was used
for isolation of PS1 trimers or dissociation of PS1 trimers into monomers, the supernatant was used to
purify the liberated PS1 by a low ß-DM concentration. The supernatant was mixed 1:1 with 2 M
ammonium sulfate and centrifuged at 50000 rpm for one hour. As described before the aim of the
ultracentrifugation step in case of isolation of trimeric or (+SE) is to sediment the unsolubilized thylakoid
membrane components while the aim of centrifugation in present case is to sediment the phycobilins.
After centrifugation, most of the phycobilins were sedimented, so the 1st problem was partially solved
during this step. The sediment was discarded and the supernatant was mixed 1:1 with 2 M ammonium
sulfate before loading onto POROS 50OH column to reach a final ammonium sulfate concentration of
1.5 M (150 mS).
3.1.4.3) Chromatographic purification For purification of PS1, HIC should be used as 1st column, as it was found to be efficient for separation
PS1 monomers from both PS1 trimers and PS2 as mentioned before.
Figure 3.25 shows the elution profile of purified PS1. The most of isolated PS1 complex was eluted at
about 1.2 M ammonium sulfate, which was identified before as monomeric PS1, whereas a mixture of
PS1 trimers with PBS was eluted at about 0.93 M ammonium sulfate. As the HIC was equilibrated with
buffer containing 1.5 M ammonium sulfate, PS2 passed through the column during the loading and
washing steps. The purified PS1 monomers and trimers were collected and dialyzed overnight against
dialysis buffer before loading onto IEC.
0 20 40 60-0.5
0.0
0.5
1.0
1.5
2.0
2.5
3.0
(NH4)2SO4
Con
duct
ivity
/ m
S
OD
280
nm
OD 43
5
Time / min
0
40
80
120
160
200
0.0
0.5
1.0
1.5
2.0
Figure 3.25 Elution profile of low extracted ß-DM (0.1 %) PS1 (WT) using HIC (POROS 50 OH Applied Biosystem) as 1st
purification step. A linear gradient of ammonium sulfate (1.5-0 M) in two gradient steps was used for the elution at 10°C and a flow rate 5 ml/min. PS1 monomers were eluted at 1.2 M ammonium sulfate, whereas PS1 trimers with small impurities of phycobilins were eluted at 0.93 M ammonium sulfate.
PS1 trimers & PBSPS1 monomers
PS2 & Carotenoids
Non-identified impurities
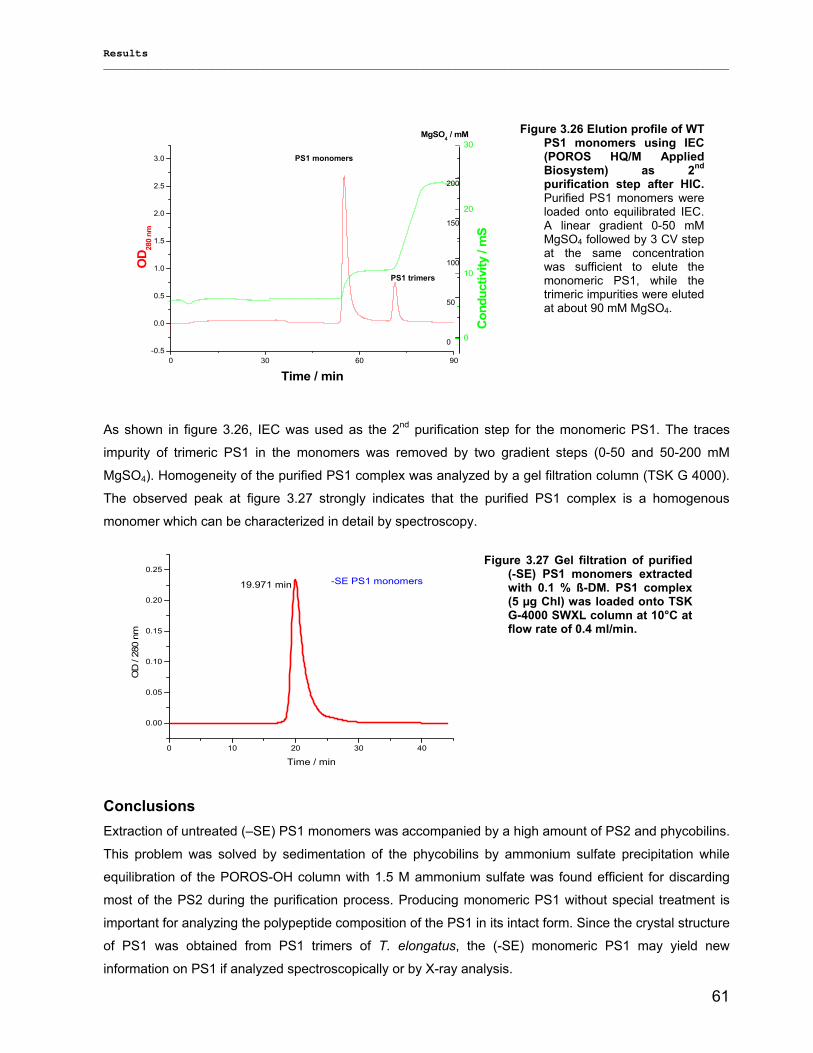
Results __________________________________________________________________________________________________
61
0 30 60 90-0.5
0.0
0.5
1.0
1.5
2.0
2.5
3.0
OD 28
0 nm
MgSO4 / mM
Con
duct
ivity
/ m
S
Time / min
0
10
20
30
0
50
100
150
200
As shown in figure 3.26, IEC was used as the 2nd purification step for the monomeric PS1. The traces
impurity of trimeric PS1 in the monomers was removed by two gradient steps (0-50 and 50-200 mM
MgSO4). Homogeneity of the purified PS1 complex was analyzed by a gel filtration column (TSK G 4000).
The observed peak at figure 3.27 strongly indicates that the purified PS1 complex is a homogenous
monomer which can be characterized in detail by spectroscopy.
0 10 20 30 40
0.00
0.05
0.10
0.15
0.20
0.25
19.971 min
OD
/ 28
0 nm
Time / min
-SE PS1 monomers
Conclusions Extraction of untreated (–SE) PS1 monomers was accompanied by a high amount of PS2 and phycobilins.
This problem was solved by sedimentation of the phycobilins by ammonium sulfate precipitation while
equilibration of the POROS-OH column with 1.5 M ammonium sulfate was found efficient for discarding
most of the PS2 during the purification process. Producing monomeric PS1 without special treatment is
important for analyzing the polypeptide composition of the PS1 in its intact form. Since the crystal structure
of PS1 was obtained from PS1 trimers of T. elongatus, the (-SE) monomeric PS1 may yield new
information on PS1 if analyzed spectroscopically or by X-ray analysis.
Figure 3.26 Elution profile of WT PS1 monomers using IEC (POROS HQ/M Applied Biosystem) as 2nd
purification step after HIC. Purified PS1 monomers were loaded onto equilibrated IEC. A linear gradient 0-50 mM MgSO4 followed by 3 CV step at the same concentration was sufficient to elute the monomeric PS1, while the trimeric impurities were eluted at about 90 mM MgSO4.
Figure 3.27 Gel filtration of purified (-SE) PS1 monomers extracted with 0.1 % ß-DM. PS1 complex (5 µg Chl) was loaded onto TSK G-4000 SWXL column at 10°C at flow rate of 0.4 ml/min.
PS1 monomers
PS1 trimers
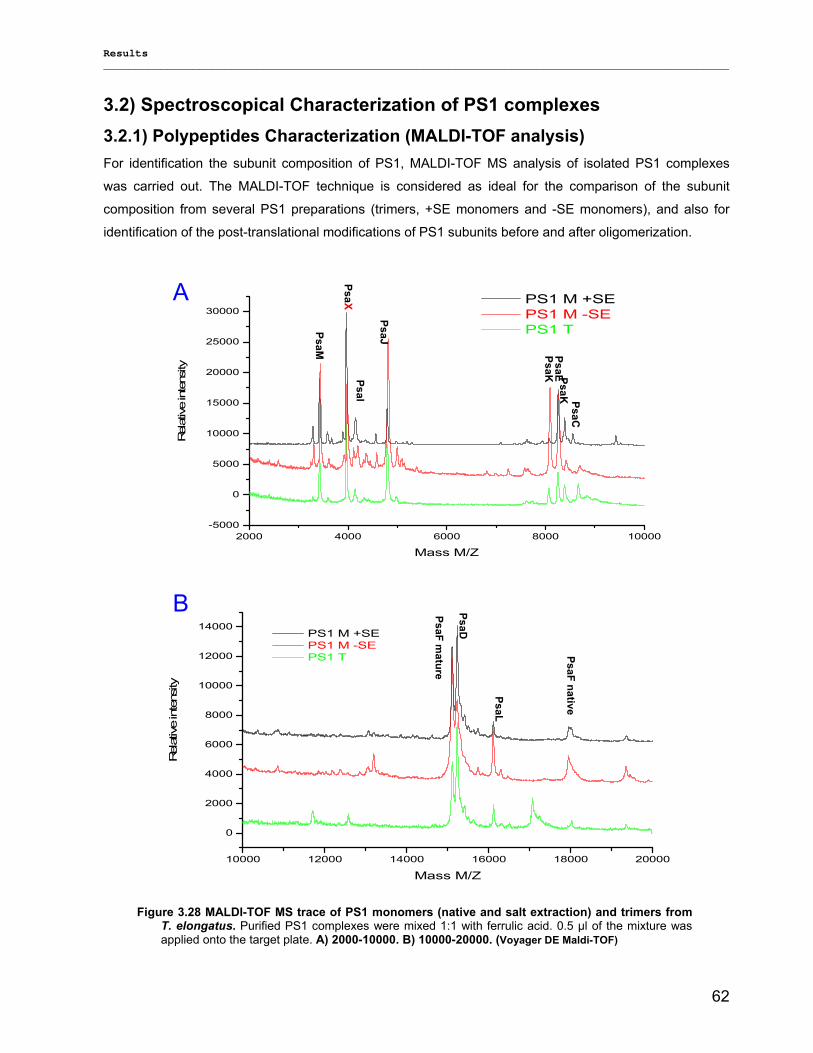
Results __________________________________________________________________________________________________
62
3.2) Spectroscopical Characterization of PS1 complexes 3.2.1) Polypeptides Characterization (MALDI-TOF analysis) For identification the subunit composition of PS1, MALDI-TOF MS analysis of isolated PS1 complexes
was carried out. The MALDI-TOF technique is considered as ideal for the comparison of the subunit
composition from several PS1 preparations (trimers, +SE monomers and -SE monomers), and also for
identification of the post-translational modifications of PS1 subunits before and after oligomerization.
2000 4000 6000 8000 10000-5000
0
5000
10000
15000
20000
25000
30000
Relat
ive
inte
nsity
Mass M/Z
PS1 M +SE PS1 M -SE PS1 T
10000 12000 14000 16000 18000 20000
0
2000
4000
6000
8000
10000
12000
14000
Relat
ive
inte
nsity
Mass M/Z
PS1 M +SE PS1 M -SE PS1 T
PsaI
PsaJ
PsaK PsaK PsaC
PsaE
Figure 3.28 MALDI-TOF MS trace of PS1 monomers (native and salt extraction) and trimers from T. elongatus. Purified PS1 complexes were mixed 1:1 with ferrulic acid. 0.5 µl of the mixture wasapplied onto the target plate. A) 2000-10000. B) 10000-20000. (Voyager DE Maldi-TOF)
PsaM
PsaX
PsaF mature
PsaD
PsaL
PsaF native
A
B
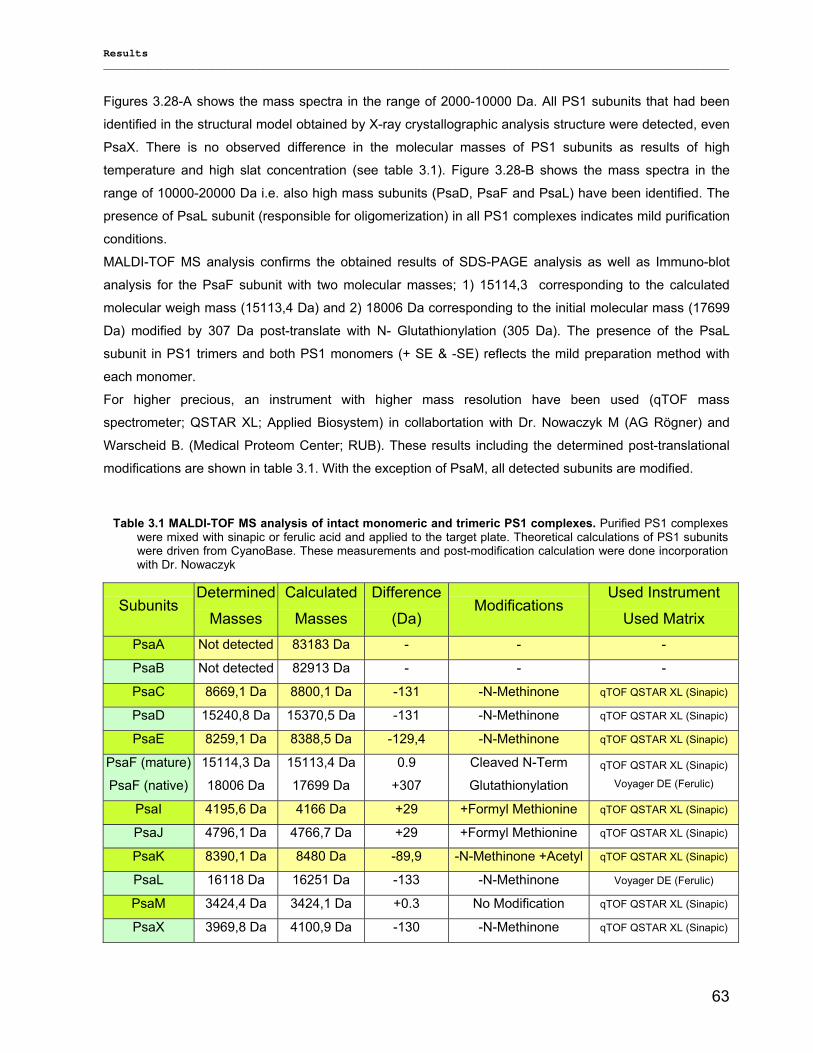
Results __________________________________________________________________________________________________
63
Figures 3.28-A shows the mass spectra in the range of 2000-10000 Da. All PS1 subunits that had been
identified in the structural model obtained by X-ray crystallographic analysis structure were detected, even
PsaX. There is no observed difference in the molecular masses of PS1 subunits as results of high
temperature and high slat concentration (see table 3.1). Figure 3.28-B shows the mass spectra in the
range of 10000-20000 Da i.e. also high mass subunits (PsaD, PsaF and PsaL) have been identified. The
presence of PsaL subunit (responsible for oligomerization) in all PS1 complexes indicates mild purification
conditions.
MALDI-TOF MS analysis confirms the obtained results of SDS-PAGE analysis as well as Immuno-blot
analysis for the PsaF subunit with two molecular masses; 1) 15114,3 corresponding to the calculated
molecular weigh mass (15113,4 Da) and 2) 18006 Da corresponding to the initial molecular mass (17699
Da) modified by 307 Da post-translate with N- Glutathionylation (305 Da). The presence of the PsaL
subunit in PS1 trimers and both PS1 monomers (+ SE & -SE) reflects the mild preparation method with
each monomer.
For higher precious, an instrument with higher mass resolution have been used (qTOF mass
spectrometer; QSTAR XL; Applied Biosystem) in collabortation with Dr. Nowaczyk M (AG Rögner) and
Warscheid B. (Medical Proteom Center; RUB). These results including the determined post-translational
modifications are shown in table 3.1. With the exception of PsaM, all detected subunits are modified.
Subunits Determined
Masses
Calculated
Masses
Difference
(Da) Modifications
Used Instrument
Used Matrix PsaA Not detected 83183 Da - - -
PsaB Not detected 82913 Da - - -
PsaC 8669,1 Da 8800,1 Da -131 -N-Methinone qTOF QSTAR XL (Sinapic)
PsaD 15240,8 Da 15370,5 Da -131 -N-Methinone qTOF QSTAR XL (Sinapic)
PsaE 8259,1 Da 8388,5 Da -129,4 -N-Methinone qTOF QSTAR XL (Sinapic)
PsaF (mature)
PsaF (native)
15114,3 Da
18006 Da
15113,4 Da
17699 Da
0.9
+307
Cleaved N-Term
Glutathionylation qTOF QSTAR XL (Sinapic)
Voyager DE (Ferulic)
PsaI 4195,6 Da 4166 Da +29 +Formyl Methionine qTOF QSTAR XL (Sinapic)
PsaJ 4796,1 Da 4766,7 Da +29 +Formyl Methionine qTOF QSTAR XL (Sinapic)
PsaK 8390,1 Da 8480 Da -89,9 -N-Methinone +Acetyl qTOF QSTAR XL (Sinapic)
PsaL 16118 Da 16251 Da -133 -N-Methinone Voyager DE (Ferulic)
PsaM 3424,4 Da 3424,1 Da +0.3 No Modification qTOF QSTAR XL (Sinapic)
PsaX 3969,8 Da 4100,9 Da -130 -N-Methinone qTOF QSTAR XL (Sinapic)
Table 3.1 MALDI-TOF MS analysis of intact monomeric and trimeric PS1 complexes. Purified PS1 complexes were mixed with sinapic or ferulic acid and applied to the target plate. Theoretical calculations of PS1 subunits were driven from CyanoBase. These measurements and post-modification calculation were done incorporation with Dr. Nowaczyk
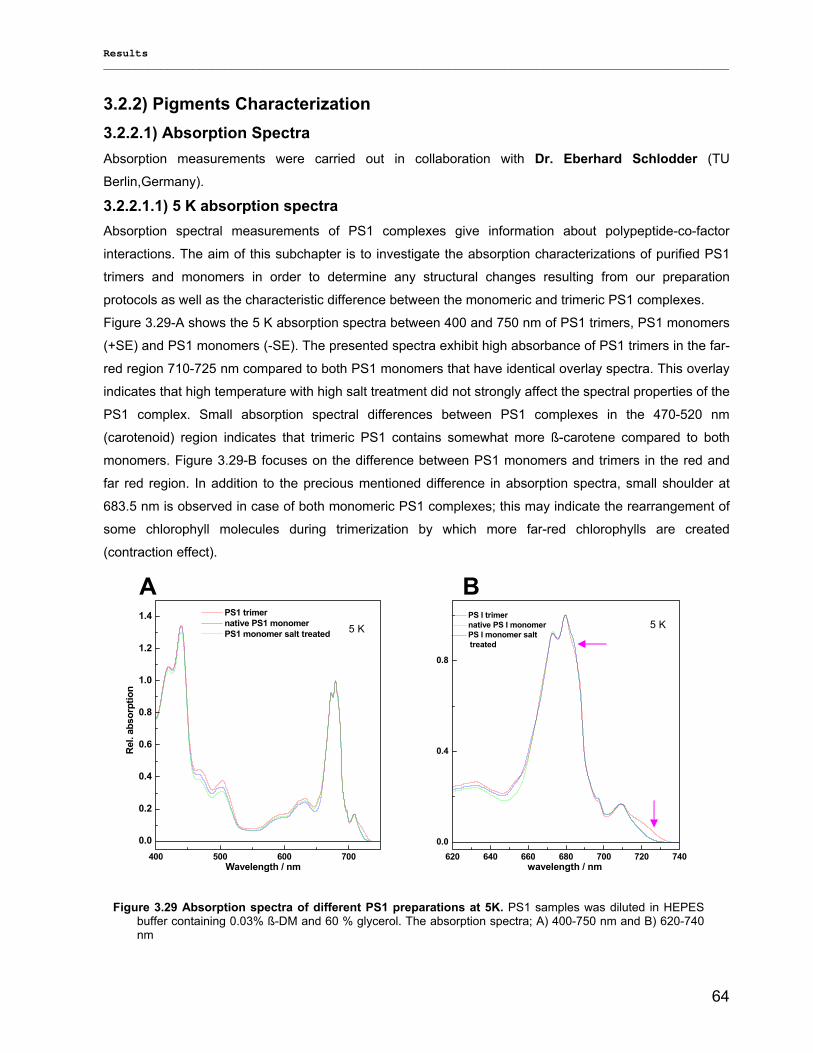
Results __________________________________________________________________________________________________
64
3.2.2) Pigments Characterization 3.2.2.1) Absorption Spectra Absorption measurements were carried out in collaboration with Dr. Eberhard Schlodder (TU
Berlin,Germany).
3.2.2.1.1) 5 K absorption spectra Absorption spectral measurements of PS1 complexes give information about polypeptide-co-factor
interactions. The aim of this subchapter is to investigate the absorption characterizations of purified PS1
trimers and monomers in order to determine any structural changes resulting from our preparation
protocols as well as the characteristic difference between the monomeric and trimeric PS1 complexes.
Figure 3.29-A shows the 5 K absorption spectra between 400 and 750 nm of PS1 trimers, PS1 monomers
(+SE) and PS1 monomers (-SE). The presented spectra exhibit high absorbance of PS1 trimers in the far-
red region 710-725 nm compared to both PS1 monomers that have identical overlay spectra. This overlay
indicates that high temperature with high salt treatment did not strongly affect the spectral properties of the
PS1 complex. Small absorption spectral differences between PS1 complexes in the 470-520 nm
(carotenoid) region indicates that trimeric PS1 contains somewhat more ß-carotene compared to both
monomers. Figure 3.29-B focuses on the difference between PS1 monomers and trimers in the red and
far red region. In addition to the precious mentioned difference in absorption spectra, small shoulder at
683.5 nm is observed in case of both monomeric PS1 complexes; this may indicate the rearrangement of
some chlorophyll molecules during trimerization by which more far-red chlorophylls are created
(contraction effect).
400 500 600 700
0.0
0.2
0.4
0.6
0.8
1.0
1.2
1.4
Rel
. abs
orpt
ion
Wavelength / nm
PS1 trimer native PS1 monomer PS1 monomer salt treated 5 K
620 640 660 680 700 720 7400.0
0.4
0.8
wavelength / nm
PS I trimer native PS I monomer PS I monomer salt
treated
5 K
Figure 3.29 Absorption spectra of different PS1 preparations at 5K. PS1 samples was diluted in HEPES buffer containing 0.03% ß-DM and 60 % glycerol. The absorption spectra; A) 400-750 nm and B) 620-740 nm
A B
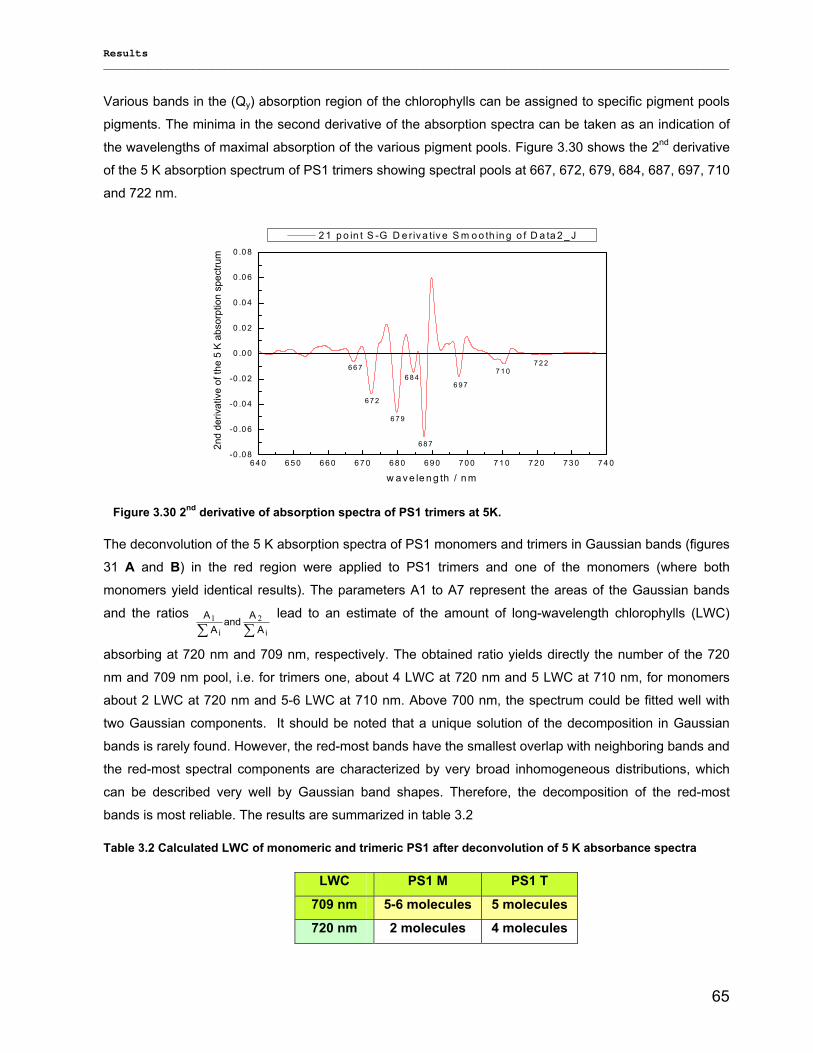
Results __________________________________________________________________________________________________
65
Various bands in the (Qy) absorption region of the chlorophylls can be assigned to specific pigment pools
pigments. The minima in the second derivative of the absorption spectra can be taken as an indication of
the wavelengths of maximal absorption of the various pigment pools. Figure 3.30 shows the 2nd derivative
of the 5 K absorption spectrum of PS1 trimers showing spectral pools at 667, 672, 679, 684, 687, 697, 710
and 722 nm.
6 4 0 6 5 0 6 6 0 6 7 0 6 8 0 6 9 0 7 0 0 7 1 0 7 2 0 7 3 0 7 4 0-0 .0 8
-0 .0 6
-0 .0 4
-0 .0 2
0 .0 0
0 .0 2
0 .0 4
0 .0 6
0 .0 8
2nd
deriv
ativ
e of
the
5 K
abso
rptio
n sp
ectru
m
w a v e le n g th / n m
2 1 p o in t S -G D e riv a tiv e S m o o th in g o f D a ta 2 _ J
7 2 27 1 0
6 9 7
6 8 7
6 8 4
6 7 9
6 7 2
6 6 7
The deconvolution of the 5 K absorption spectra of PS1 monomers and trimers in Gaussian bands (figures
31 A and B) in the red region were applied to PS1 trimers and one of the monomers (where both
monomers yield identical results). The parameters A1 to A7 represent the areas of the Gaussian bands
and the ratios ∑∑ ii AAand
AA 21 lead to an estimate of the amount of long-wavelength chlorophylls (LWC)
absorbing at 720 nm and 709 nm, respectively. The obtained ratio yields directly the number of the 720
nm and 709 nm pool, i.e. for trimers one, about 4 LWC at 720 nm and 5 LWC at 710 nm, for monomers
about 2 LWC at 720 nm and 5-6 LWC at 710 nm. Above 700 nm, the spectrum could be fitted well with
two Gaussian components. It should be noted that a unique solution of the decomposition in Gaussian
bands is rarely found. However, the red-most bands have the smallest overlap with neighboring bands and
the red-most spectral components are characterized by very broad inhomogeneous distributions, which
can be described very well by Gaussian band shapes. Therefore, the decomposition of the red-most
bands is most reliable. The results are summarized in table 3.2
LWC PS1 M PS1 T
709 nm 5-6 molecules 5 molecules
720 nm 2 molecules 4 molecules
Figure 3.30 2nd derivative of absorption spectra of PS1 trimers at 5K.
Table 3.2 Calculated LWC of monomeric and trimeric PS1 after deconvolution of 5 K absorbance spectra
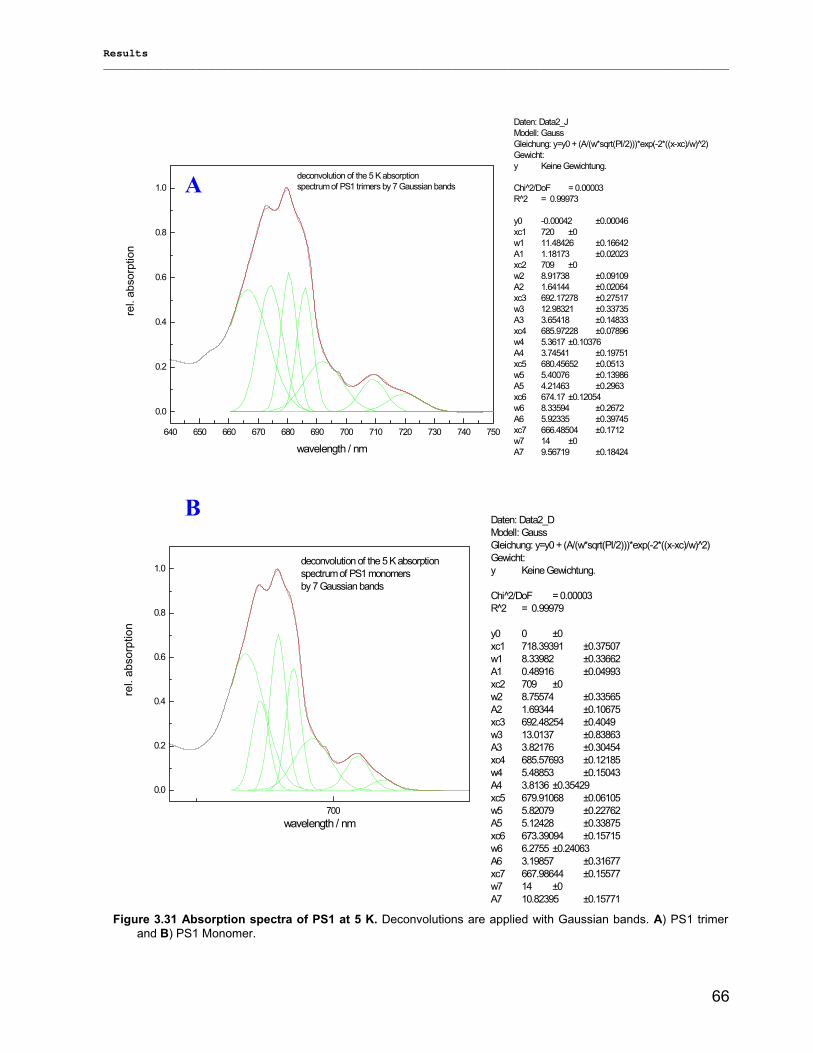
Results __________________________________________________________________________________________________
66
640 650 660 670 680 690 700 710 720 730 740 750
0.0
0.2
0.4
0.6
0.8
1.0
Daten: Data2_JModell: GaussGleichung: y=y0 + (A/(w*sqrt(PI/2)))*exp(-2*((x-xc)/w) 2)Gewicht:y Keine Gewichtung. Chi 2/DoF = 0.00003R^2 = 0.99973 y0 -0.00042 ±0.00046xc1 720 ±0w1 11.48426 ±0.16642A1 1.18173 ±0.02023xc2 709 ±0w2 8.91738 ±0.09109A2 1.64144 ±0.02064xc3 692.17278 ±0.27517w3 12.98321 ±0.33735A3 3.65418 ±0.14833xc4 685.97228 ±0.07896w4 5.3617 ±0.10376A4 3.74541 ±0.19751xc5 680.45652 ±0.0513w5 5.40076 ±0.13986A5 4.21463 ±0.2963xc6 674.17 ±0.12054w6 8.33594 ±0.2672A6 5.92335 ±0.39745xc7 666.48504 ±0.1712w7 14 ±0A7 9.56719 ±0.18424
rel.
abso
rptio
n
wavelength / nm
deconvolution of the 5 K absorptionspectrum of PS1 trimers by 7 Gaussian bands
700
0.0
0.2
0.4
0.6
0.8
1.0
Daten: Data2_DModell: GaussGleichung: y=y0 + (A/(w*sqrt(PI/2)))*exp(-2*((x-xc)/w)^2)Gewicht:y Keine Gewichtung. Chi 2/DoF = 0.00003R 2 = 0.99979 y0 0 ±0xc1 718.39391 ±0.37507w1 8.33982 ±0.33662A1 0.48916 ±0.04993xc2 709 ±0w2 8.75574 ±0.33565A2 1.69344 ±0.10675xc3 692.48254 ±0.4049w3 13.0137 ±0.83863A3 3.82176 ±0.30454xc4 685.57693 ±0.12185w4 5.48853 ±0.15043A4 3.8136 ±0.35429xc5 679.91068 ±0.06105w5 5.82079 ±0.22762A5 5.12428 ±0.33875xc6 673.39094 ±0.15715w6 6.2755 ±0.24063A6 3.19857 ±0.31677xc7 667.98644 ±0.15577w7 14 ±0A7 10.82395 ±0.15771
rel.
abso
rptio
n
wavelength / nm
deconvolution of the 5 K absorptionspectrum of PS1 monomersby 7 Gaussian bands
Figure 3.31 Absorption spectra of PS1 at 5 K. Deconvolutions are applied with Gaussian bands. A) PS1 trimer and B) PS1 Monomer.
B
A
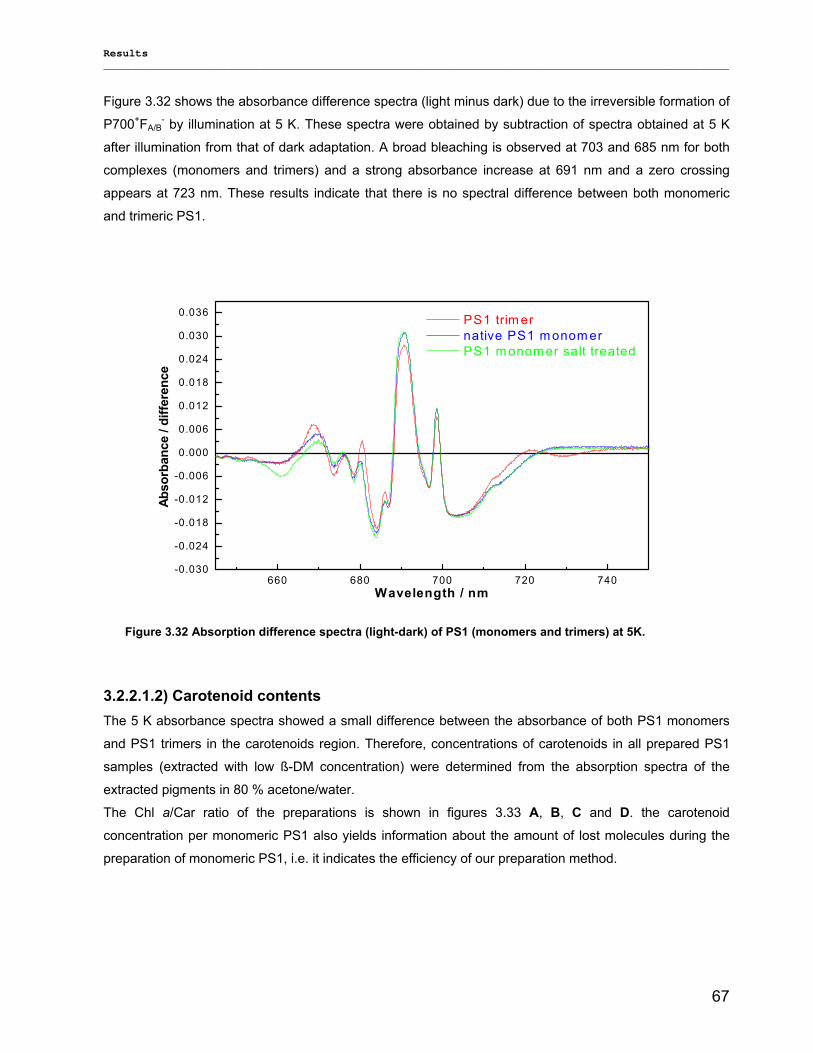
Results __________________________________________________________________________________________________
67
Figure 3.32 shows the absorbance difference spectra (light minus dark) due to the irreversible formation of
P700+FA/B- by illumination at 5 K. These spectra were obtained by subtraction of spectra obtained at 5 K
after illumination from that of dark adaptation. A broad bleaching is observed at 703 and 685 nm for both
complexes (monomers and trimers) and a strong absorbance increase at 691 nm and a zero crossing
appears at 723 nm. These results indicate that there is no spectral difference between both monomeric
and trimeric PS1.
660 680 700 720 740-0.030
-0.024
-0.018
-0.012
-0.006
0.000
0.006
0.012
0.018
0.024
0.030
0.036
Abso
rban
ce /
diffe
renc
e
Wavelength / nm
PS1 trim er native PS1 m onom er PS1 m onom er salt treated
3.2.2.1.2) Carotenoid contents The 5 K absorbance spectra showed a small difference between the absorbance of both PS1 monomers
and PS1 trimers in the carotenoids region. Therefore, concentrations of carotenoids in all prepared PS1
samples (extracted with low ß-DM concentration) were determined from the absorption spectra of the
extracted pigments in 80 % acetone/water.
The Chl a/Car ratio of the preparations is shown in figures 3.33 A, B, C and D. the carotenoid
concentration per monomeric PS1 also yields information about the amount of lost molecules during the
preparation of monomeric PS1, i.e. it indicates the efficiency of our preparation method.
Figure 3.32 Absorption difference spectra (light-dark) of PS1 (monomers and trimers) at 5K.
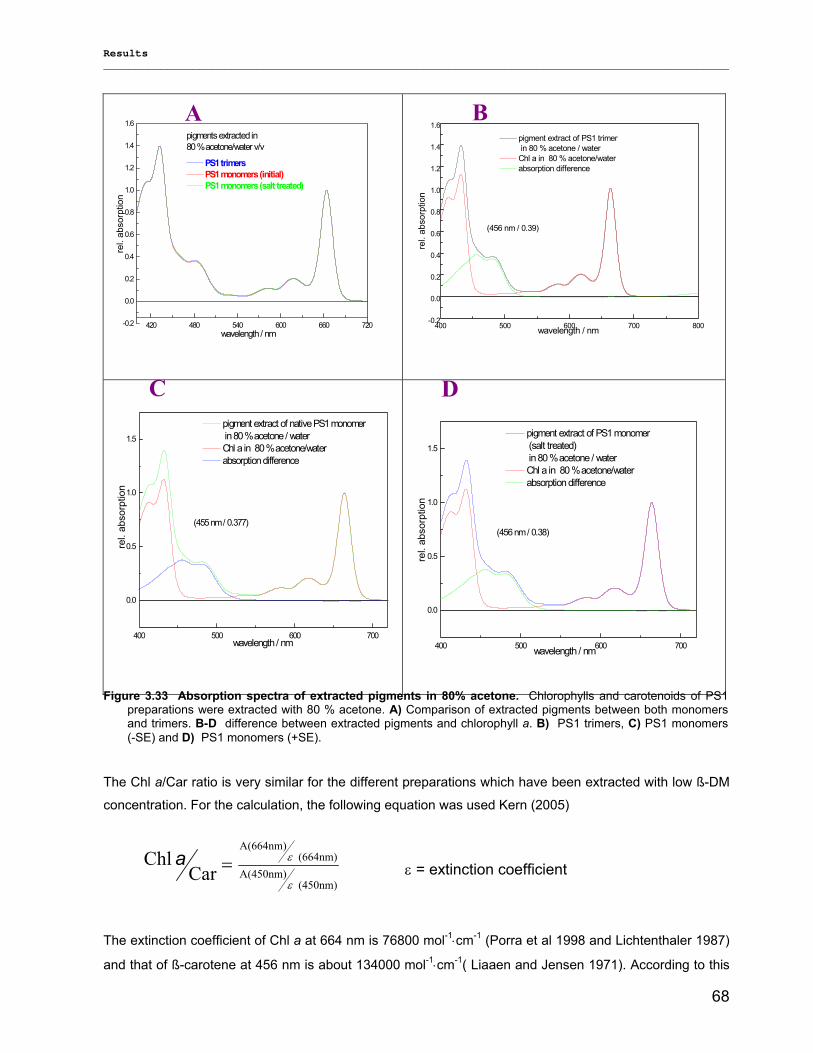
Results __________________________________________________________________________________________________
68
420 480 540 600 660 720-0.2
0.0
0.2
0.4
0.6
0.8
1.0
1.2
1.4
1.6
re
l. ab
sorp
tion
wavelength / nm
PS1 trimers PS1 monomers (initial) PS1 monomers (salt treated)
pigments extracted in 80 % acetone/water v/v
400 500 600 700 800-0.2
0.0
0.2
0.4
0.6
0.8
1.0
1.2
1.4
1.6
rel.
abso
rptio
n
wavelength / nm
pigment extract of PS1 trimer in 80 % acetone / water
Chl a in 80 % acetone/water absorption difference
(456 nm / 0.39)
400 500 600 700
0.0
0.5
1.0
1.5
rel.
abso
rptio
n
wavelength / nm
pigment extract of native PS1 monomer in 80 % acetone / water
Chl a in 80 % acetone/water absorption difference
(455 nm / 0.377)
400 500 600 700
0.0
0.5
1.0
1.5
rel.
abso
rptio
n
wavelength / nm
pigment extract of PS1 monomer (salt treated) in 80 % acetone / water
Chl a in 80 % acetone/water absorption difference
(456 nm / 0.38)
The Chl a/Car ratio is very similar for the different preparations which have been extracted with low ß-DM
concentration. For the calculation, the following equation was used Kern (2005)
(450nm) A(450nm)
(664nm) A(664nm)
Car Chl
ε
ε=a ε = extinction coefficient
The extinction coefficient of Chl a at 664 nm is 76800 mol-1⋅cm-1 (Porra et al 1998 and Lichtenthaler 1987)
and that of ß-carotene at 456 nm is about 134000 mol-1⋅cm-1( Liaaen and Jensen 1971). According to this
BA
C D
Figure 3.33 Absorption spectra of extracted pigments in 80% acetone. Chlorophylls and carotenoids of PS1 preparations were extracted with 80 % acetone. A) Comparison of extracted pigments between both monomers and trimers. B-D difference between extracted pigments and chlorophyll a. B) PS1 trimers, C) PS1 monomers (-SE) and D) PS1 monomers (+SE).
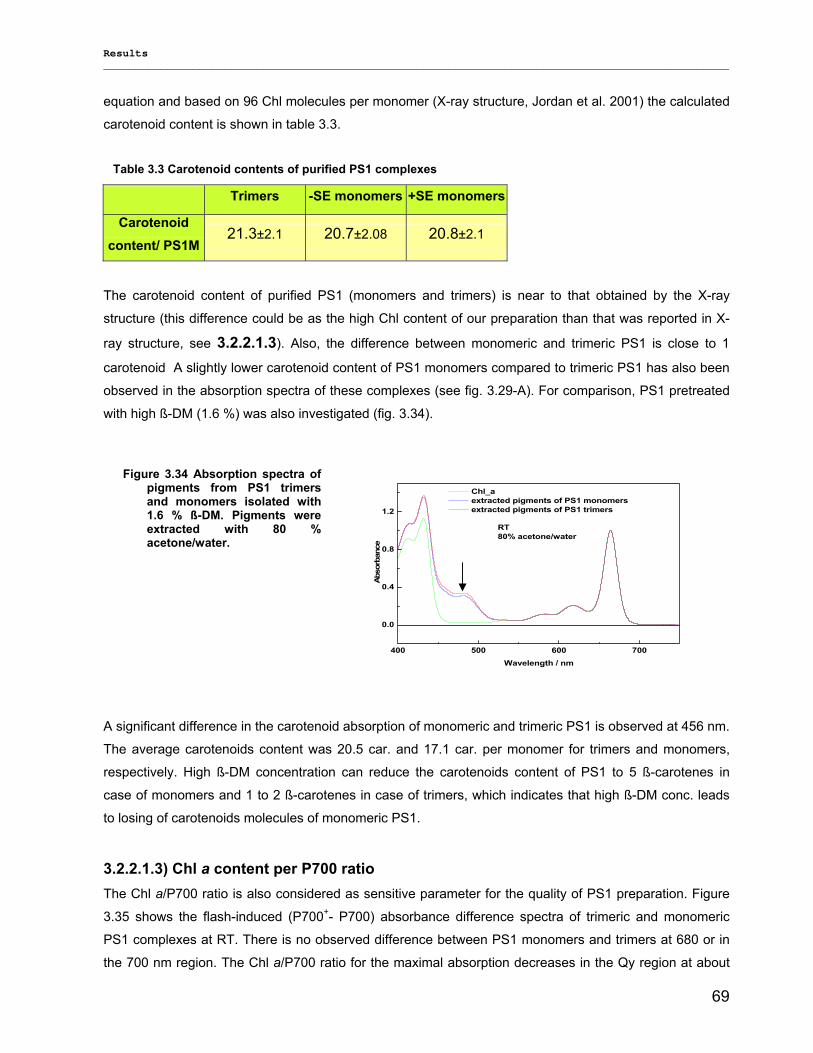
Results __________________________________________________________________________________________________
69
equation and based on 96 Chl molecules per monomer (X-ray structure, Jordan et al. 2001) the calculated
carotenoid content is shown in table 3.3.
Trimers -SE monomers +SE monomers
Carotenoid content/ PS1M
21.3±2.1 20.7±2.08 20.8±2.1
The carotenoid content of purified PS1 (monomers and trimers) is near to that obtained by the X-ray
structure (this difference could be as the high Chl content of our preparation than that was reported in X-
ray structure, see 3.2.2.1.3). Also, the difference between monomeric and trimeric PS1 is close to 1
carotenoid A slightly lower carotenoid content of PS1 monomers compared to trimeric PS1 has also been
observed in the absorption spectra of these complexes (see fig. 3.29-A). For comparison, PS1 pretreated
with high ß-DM (1.6 %) was also investigated (fig. 3.34).
400 500 600 700
0.0
0.4
0.8
1.2
Abso
rban
ce
Wavelength / nm
Chl_a extracted pigments of PS1 monomers extracted pigments of PS1 trimers
RT80% acetone/water
A significant difference in the carotenoid absorption of monomeric and trimeric PS1 is observed at 456 nm.
The average carotenoids content was 20.5 car. and 17.1 car. per monomer for trimers and monomers,
respectively. High ß-DM concentration can reduce the carotenoids content of PS1 to 5 ß-carotenes in
case of monomers and 1 to 2 ß-carotenes in case of trimers, which indicates that high ß-DM conc. leads
to losing of carotenoids molecules of monomeric PS1.
3.2.2.1.3) Chl a content per P700 ratio The Chl a/P700 ratio is also considered as sensitive parameter for the quality of PS1 preparation. Figure
3.35 shows the flash-induced (P700+- P700) absorbance difference spectra of trimeric and monomeric
PS1 complexes at RT. There is no observed difference between PS1 monomers and trimers at 680 or in
the 700 nm region. The Chl a/P700 ratio for the maximal absorption decreases in the Qy region at about
Figure 3.34 Absorption spectra of pigments from PS1 trimers and monomers isolated with 1.6 % ß-DM. Pigments were extracted with 80 % acetone/water.
Table 3.3 Carotenoid contents of purified PS1 complexes
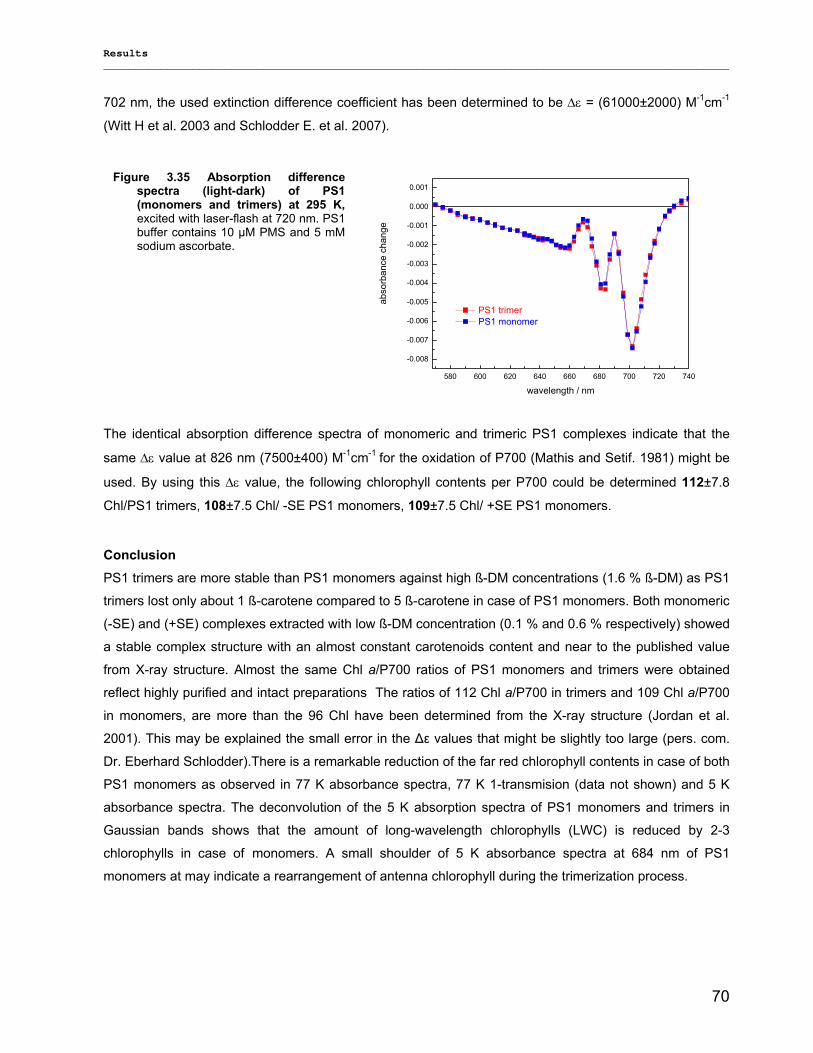
Results __________________________________________________________________________________________________
70
702 nm, the used extinction difference coefficient has been determined to be ∆ε = (61000±2000) M-1cm-1
(Witt H et al. 2003 and Schlodder E. et al. 2007).
580 600 620 640 660 680 700 720 740
-0.008
-0.007
-0.006
-0.005
-0.004
-0.003
-0.002
-0.001
0.000
0.001
abso
rban
ce c
hang
ewavelength / nm
PS1 trimer PS1 monomer
The identical absorption difference spectra of monomeric and trimeric PS1 complexes indicate that the
same ∆ε value at 826 nm (7500±400) M-1cm-1 for the oxidation of P700 (Mathis and Setif. 1981) might be
used. By using this ∆ε value, the following chlorophyll contents per P700 could be determined 112±7.8
Chl/PS1 trimers, 108±7.5 Chl/ -SE PS1 monomers, 109±7.5 Chl/ +SE PS1 monomers.
Conclusion PS1 trimers are more stable than PS1 monomers against high ß-DM concentrations (1.6 % ß-DM) as PS1
trimers lost only about 1 ß-carotene compared to 5 ß-carotene in case of PS1 monomers. Both monomeric
(-SE) and (+SE) complexes extracted with low ß-DM concentration (0.1 % and 0.6 % respectively) showed
a stable complex structure with an almost constant carotenoids content and near to the published value
from X-ray structure. Almost the same Chl a/P700 ratios of PS1 monomers and trimers were obtained
reflect highly purified and intact preparations The ratios of 112 Chl a/P700 in trimers and 109 Chl a/P700
in monomers, are more than the 96 Chl have been determined from the X-ray structure (Jordan et al.
2001). This may be explained the small error in the ∆ε values that might be slightly too large (pers. com.
Dr. Eberhard Schlodder).There is a remarkable reduction of the far red chlorophyll contents in case of both
PS1 monomers as observed in 77 K absorbance spectra, 77 K 1-transmision (data not shown) and 5 K
absorbance spectra. The deconvolution of the 5 K absorption spectra of PS1 monomers and trimers in
Gaussian bands shows that the amount of long-wavelength chlorophylls (LWC) is reduced by 2-3
chlorophylls in case of monomers. A small shoulder of 5 K absorbance spectra at 684 nm of PS1
monomers at may indicate a rearrangement of antenna chlorophyll during the trimerization process.
Figure 3.35 Absorption difference spectra (light-dark) of PS1 (monomers and trimers) at 295 K,excited with laser-flash at 720 nm. PS1 buffer contains 10 µM PMS and 5 mM sodium ascorbate.
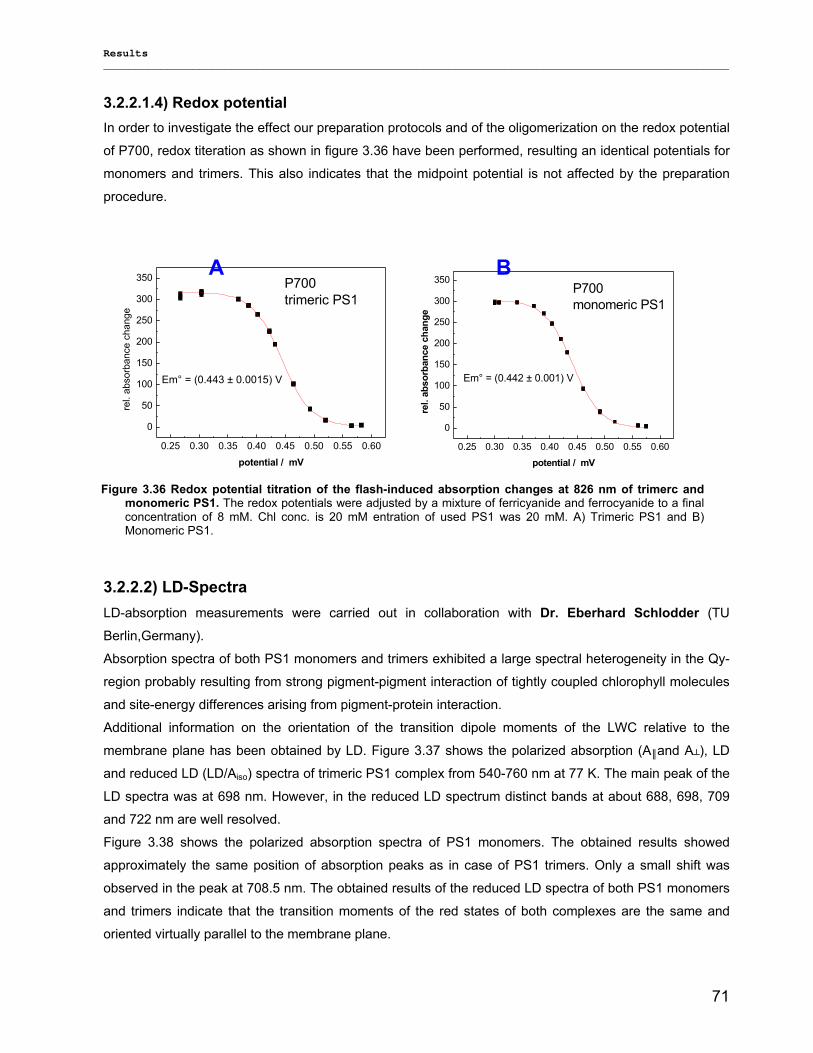
Results __________________________________________________________________________________________________
71
3.2.2.1.4) Redox potential In order to investigate the effect our preparation protocols and of the oligomerization on the redox potential
of P700, redox titeration as shown in figure 3.36 have been performed, resulting an identical potentials for
monomers and trimers. This also indicates that the midpoint potential is not affected by the preparation
procedure.
0.25 0.30 0.35 0.40 0.45 0.50 0.55 0.60
0
50
100
150
200
250
300
350 P700trimeric PS1
Em° = (0.443 ± 0.0015) V
rel.
abso
rban
ce c
hang
e
potential / mV0.25 0.30 0.35 0.40 0.45 0.50 0.55 0.60
0
50
100
150
200
250
300
350
Em° = (0.442 ± 0.001) V
P700monomeric PS1
rel.
abso
rban
ce c
hang
e
potential / mV
3.2.2.2) LD-Spectra LD-absorption measurements were carried out in collaboration with Dr. Eberhard Schlodder (TU
Berlin,Germany).
Absorption spectra of both PS1 monomers and trimers exhibited a large spectral heterogeneity in the Qy-
region probably resulting from strong pigment-pigment interaction of tightly coupled chlorophyll molecules
and site-energy differences arising from pigment-protein interaction.
Additional information on the orientation of the transition dipole moments of the LWC relative to the
membrane plane has been obtained by LD. Figure 3.37 shows the polarized absorption (A║and A┴), LD
and reduced LD (LD/Aiso) spectra of trimeric PS1 complex from 540-760 nm at 77 K. The main peak of the
LD spectra was at 698 nm. However, in the reduced LD spectrum distinct bands at about 688, 698, 709
and 722 nm are well resolved.
Figure 3.38 shows the polarized absorption spectra of PS1 monomers. The obtained results showed
approximately the same position of absorption peaks as in case of PS1 trimers. Only a small shift was
observed in the peak at 708.5 nm. The obtained results of the reduced LD spectra of both PS1 monomers
and trimers indicate that the transition moments of the red states of both complexes are the same and
oriented virtually parallel to the membrane plane.
Figure 3.36 Redox potential titration of the flash-induced absorption changes at 826 nm of trimerc and monomeric PS1. The redox potentials were adjusted by a mixture of ferricyanide and ferrocyanide to a final concentration of 8 mM. Chl conc. is 20 mM entration of used PS1 was 20 mM. A) Trimeric PS1 and B) Monomeric PS1.
A B
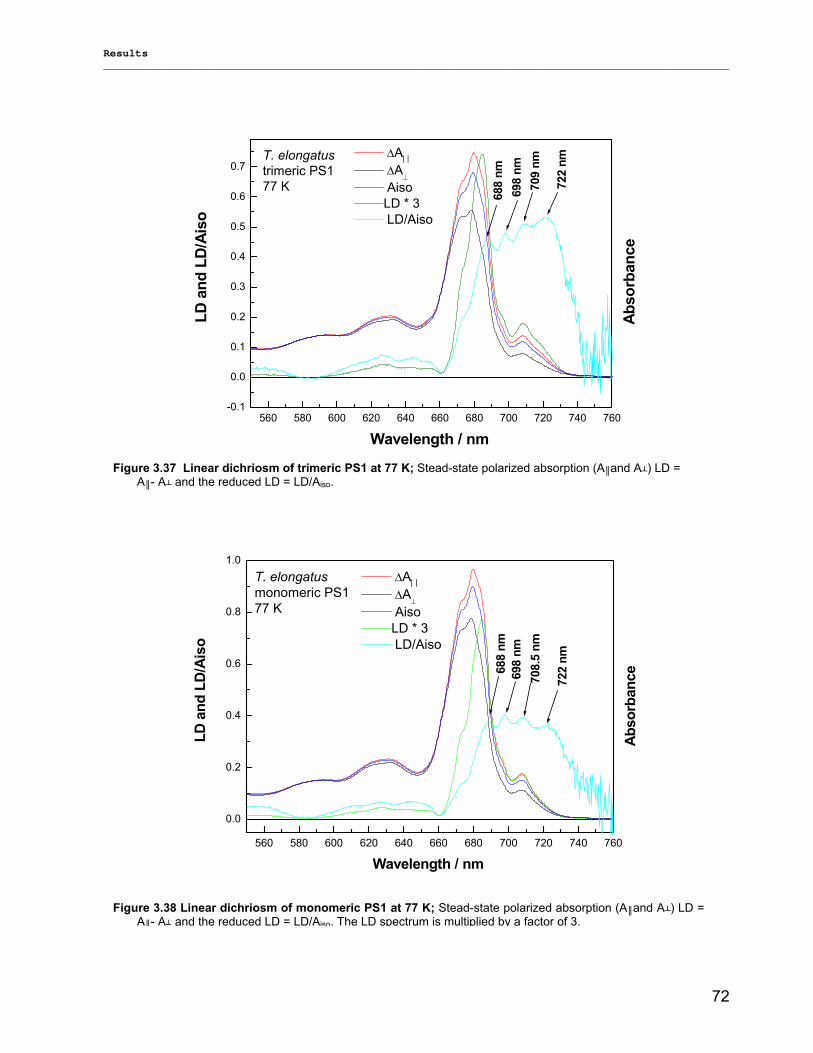
Results __________________________________________________________________________________________________
72
560 580 600 620 640 660 680 700 720 740 760-0.1
0.0
0.1
0.2
0.3
0.4
0.5
0.6
0.7
688
nm69
8 nm
709
nm
722
nmT. elongatustrimeric PS177 K
Abs
orba
nce
LD a
nd L
D/A
iso
Wavelength / nm
∆A⎮⎮
∆A⊥
AisoLD * 3 LD/Aiso
560 580 600 620 640 660 680 700 720 740 760
0.0
0.2
0.4
0.6
0.8
1.0
688
nm69
8 nm
708.
5 nm
722
nm
Abso
rban
ce
LD a
nd L
D/A
iso
Wavelength / nm
∆A⎮⎮
∆A⊥
AisoLD * 3 LD/Aiso
T. elongatusmonomeric PS177 K
Figure 3.37 Linear dichriosm of trimeric PS1 at 77 K; Stead-state polarized absorption (A║and A┴) LD = A║- A┴ and the reduced LD = LD/Aiso.
Figure 3.38 Linear dichriosm of monomeric PS1 at 77 K; Stead-state polarized absorption (A║and A┴) LD = A║- A┴ and the reduced LD = LD/Aiso. The LD spectrum is multiplied by a factor of 3.
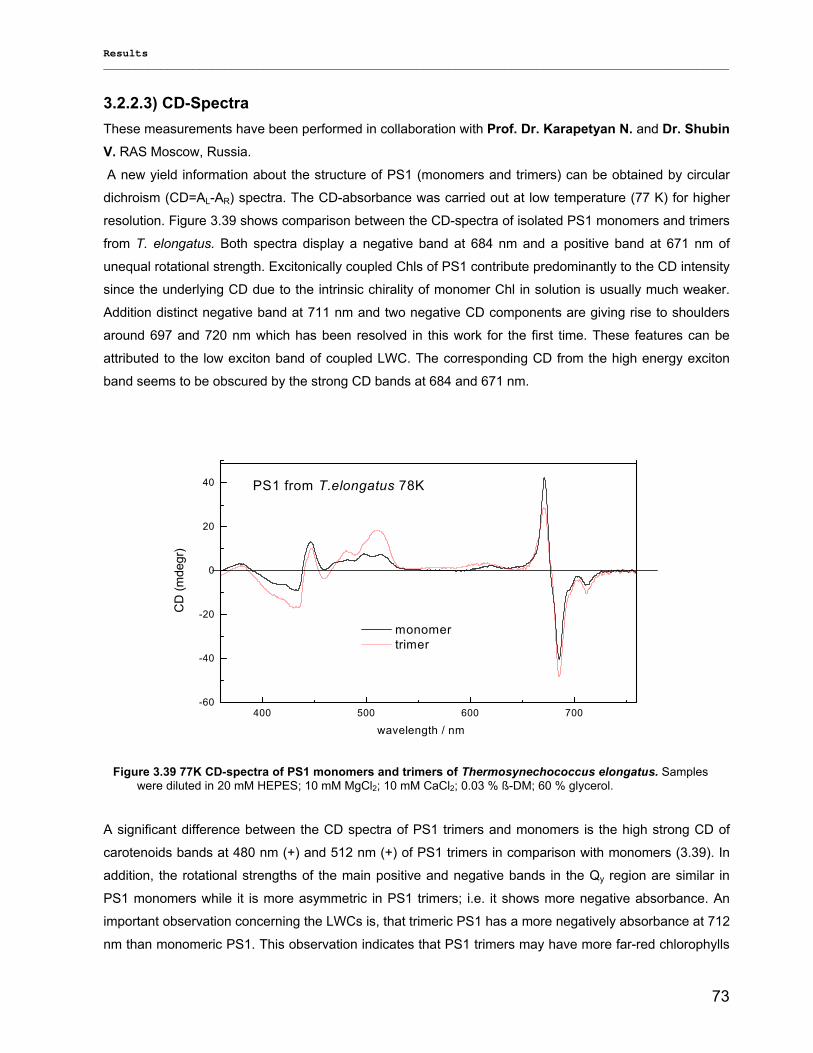
Results __________________________________________________________________________________________________
73
3.2.2.3) CD-Spectra These measurements have been performed in collaboration with Prof. Dr. Karapetyan N. and Dr. Shubin V. RAS Moscow, Russia.
A new yield information about the structure of PS1 (monomers and trimers) can be obtained by circular
dichroism (CD=AL-AR) spectra. The CD-absorbance was carried out at low temperature (77 K) for higher
resolution. Figure 3.39 shows comparison between the CD-spectra of isolated PS1 monomers and trimers
from T. elongatus. Both spectra display a negative band at 684 nm and a positive band at 671 nm of
unequal rotational strength. Excitonically coupled Chls of PS1 contribute predominantly to the CD intensity
since the underlying CD due to the intrinsic chirality of monomer Chl in solution is usually much weaker.
Addition distinct negative band at 711 nm and two negative CD components are giving rise to shoulders
around 697 and 720 nm which has been resolved in this work for the first time. These features can be
attributed to the low exciton band of coupled LWC. The corresponding CD from the high energy exciton
band seems to be obscured by the strong CD bands at 684 and 671 nm.
400 500 600 700-60
-40
-20
0
20
40
wavelength / nm
PS1 from T.elongatus 78K
CD
(mde
gr)
monomer trimer
A significant difference between the CD spectra of PS1 trimers and monomers is the high strong CD of
carotenoids bands at 480 nm (+) and 512 nm (+) of PS1 trimers in comparison with monomers (3.39). In
addition, the rotational strengths of the main positive and negative bands in the Qy region are similar in
PS1 monomers while it is more asymmetric in PS1 trimers; i.e. it shows more negative absorbance. An
important observation concerning the LWCs is, that trimeric PS1 has a more negatively absorbance at 712
nm than monomeric PS1. This observation indicates that PS1 trimers may have more far-red chlorophylls
Figure 3.39 77K CD-spectra of PS1 monomers and trimers of Thermosynechococcus elongatus. Samples were diluted in 20 mM HEPES; 10 mM MgCl2; 10 mM CaCl2; 0.03 % ß-DM; 60 % glycerol.
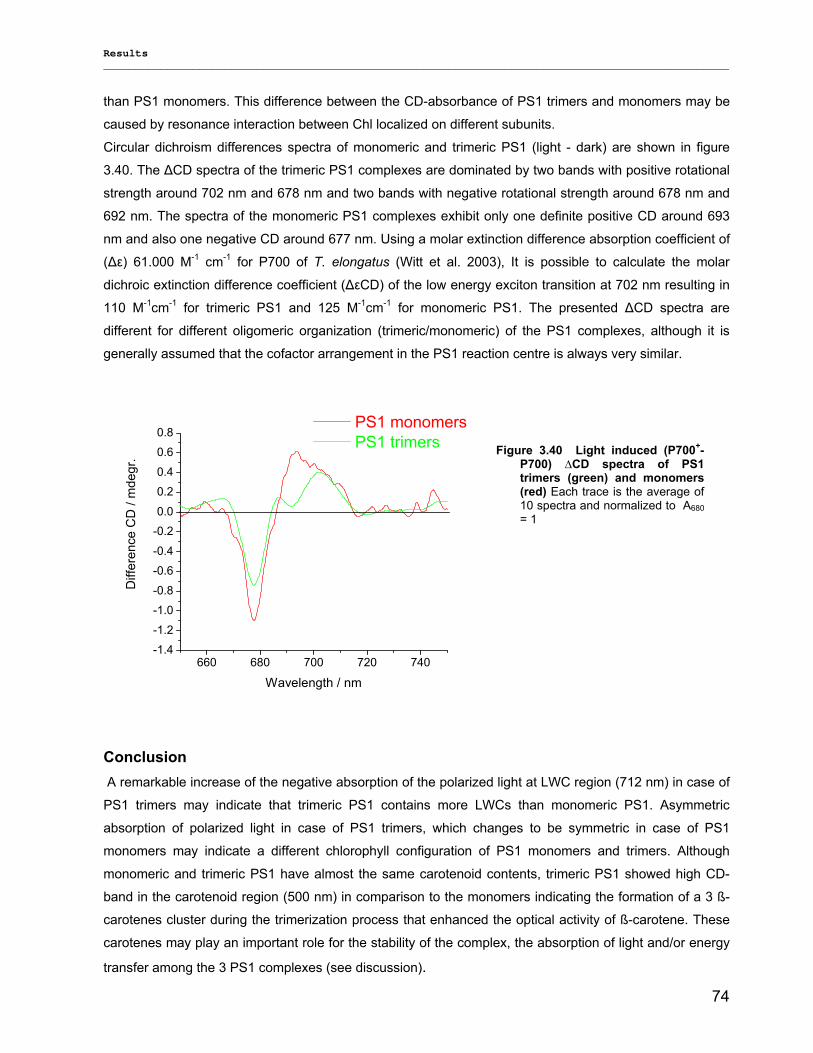
Results __________________________________________________________________________________________________
74
than PS1 monomers. This difference between the CD-absorbance of PS1 trimers and monomers may be
caused by resonance interaction between Chl localized on different subunits.
Circular dichroism differences spectra of monomeric and trimeric PS1 (light - dark) are shown in figure
3.40. The ∆CD spectra of the trimeric PS1 complexes are dominated by two bands with positive rotational
strength around 702 nm and 678 nm and two bands with negative rotational strength around 678 nm and
692 nm. The spectra of the monomeric PS1 complexes exhibit only one definite positive CD around 693
nm and also one negative CD around 677 nm. Using a molar extinction difference absorption coefficient of
(∆ε) 61.000 M-1 cm-1 for P700 of T. elongatus (Witt et al. 2003), It is possible to calculate the molar
dichroic extinction difference coefficient (∆εCD) of the low energy exciton transition at 702 nm resulting in
110 M-1cm-1 for trimeric PS1 and 125 M-1cm-1 for monomeric PS1. The presented ∆CD spectra are
different for different oligomeric organization (trimeric/monomeric) of the PS1 complexes, although it is
generally assumed that the cofactor arrangement in the PS1 reaction centre is always very similar.
660 680 700 720 740-1.4
-1.2
-1.0
-0.8
-0.6
-0.4
-0.2
0.0
0.2
0.4
0.6
0.8
Diff
eren
ce C
D /
mde
gr.
Wavelength / nm
PS1 monomers PS1 trimers
Conclusion A remarkable increase of the negative absorption of the polarized light at LWC region (712 nm) in case of
PS1 trimers may indicate that trimeric PS1 contains more LWCs than monomeric PS1. Asymmetric
absorption of polarized light in case of PS1 trimers, which changes to be symmetric in case of PS1
monomers may indicate a different chlorophyll configuration of PS1 monomers and trimers. Although
monomeric and trimeric PS1 have almost the same carotenoid contents, trimeric PS1 showed high CD-
band in the carotenoid region (500 nm) in comparison to the monomers indicating the formation of a 3 ß-
carotenes cluster during the trimerization process that enhanced the optical activity of ß-carotene. These
carotenes may play an important role for the stability of the complex, the absorption of light and/or energy
transfer among the 3 PS1 complexes (see discussion).
Figure 3.40 Light induced (P700+-P700) ∆CD spectra of PS1 trimers (green) and monomers (red) Each trace is the average of 10 spectra and normalized to A680= 1
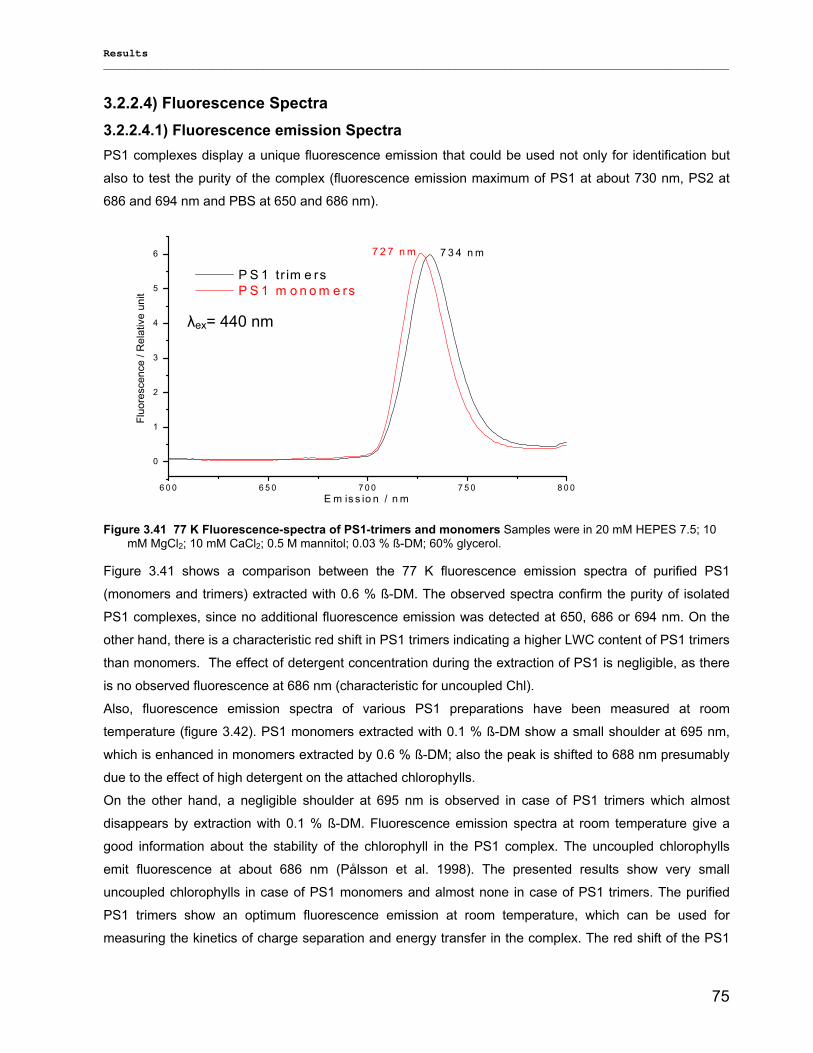
Results __________________________________________________________________________________________________
75
3.2.2.4) Fluorescence Spectra
3.2.2.4.1) Fluorescence emission Spectra PS1 complexes display a unique fluorescence emission that could be used not only for identification but
also to test the purity of the complex (fluorescence emission maximum of PS1 at about 730 nm, PS2 at
686 and 694 nm and PBS at 650 and 686 nm).
6 0 0 6 5 0 7 0 0 7 5 0 8 0 0
0
1
2
3
4
5
6 7 3 4 n m
Fluo
resc
ence
/ R
elat
ive
unit
E m is s io n / n m
P S 1 tr im e rs P S 1 m o n o m e rs
7 2 7 n m
Figure 3.41 shows a comparison between the 77 K fluorescence emission spectra of purified PS1
(monomers and trimers) extracted with 0.6 % ß-DM. The observed spectra confirm the purity of isolated
PS1 complexes, since no additional fluorescence emission was detected at 650, 686 or 694 nm. On the
other hand, there is a characteristic red shift in PS1 trimers indicating a higher LWC content of PS1 trimers
than monomers. The effect of detergent concentration during the extraction of PS1 is negligible, as there
is no observed fluorescence at 686 nm (characteristic for uncoupled Chl).
Also, fluorescence emission spectra of various PS1 preparations have been measured at room
temperature (figure 3.42). PS1 monomers extracted with 0.1 % ß-DM show a small shoulder at 695 nm,
which is enhanced in monomers extracted by 0.6 % ß-DM; also the peak is shifted to 688 nm presumably
due to the effect of high detergent on the attached chlorophylls.
On the other hand, a negligible shoulder at 695 nm is observed in case of PS1 trimers which almost
disappears by extraction with 0.1 % ß-DM. Fluorescence emission spectra at room temperature give a
good information about the stability of the chlorophyll in the PS1 complex. The uncoupled chlorophylls
emit fluorescence at about 686 nm (Pålsson et al. 1998). The presented results show very small
uncoupled chlorophylls in case of PS1 monomers and almost none in case of PS1 trimers. The purified
PS1 trimers show an optimum fluorescence emission at room temperature, which can be used for
measuring the kinetics of charge separation and energy transfer in the complex. The red shift of the PS1
Figure 3.41 77 K Fluorescence-spectra of PS1-trimers and monomers Samples were in 20 mM HEPES 7.5; 10 mM MgCl2; 10 mM CaCl2; 0.5 M mannitol; 0.03 % ß-DM; 60% glycerol.
λex= 440 nm
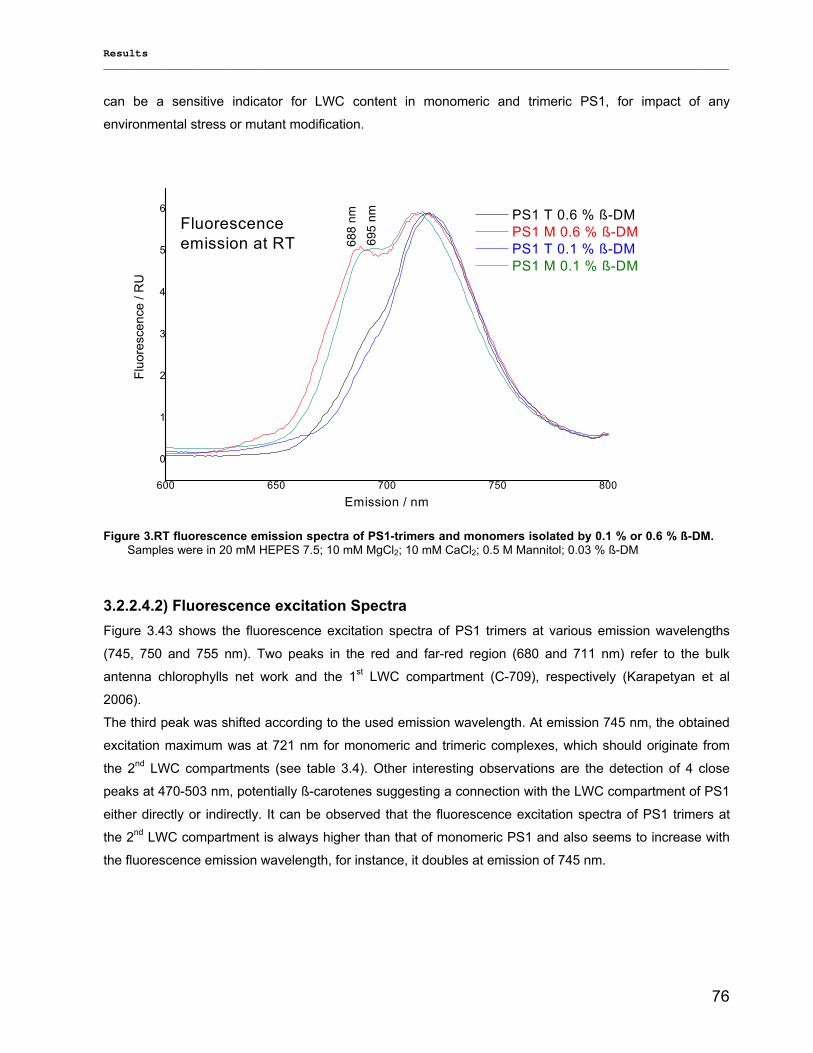
Results __________________________________________________________________________________________________
76
can be a sensitive indicator for LWC content in monomeric and trimeric PS1, for impact of any
environmental stress or mutant modification.
600 650 700 750 800
0
1
2
3
4
5
6
695
nm
Fluo
resc
ence
/ R
U
Emission / nm
PS1 T 0.6 % ß-DM PS1 M 0.6 % ß-DM PS1 T 0.1 % ß-DM PS1 M 0.1 % ß-DM
Fluorescence emission at RT 68
8 nm
3.2.2.4.2) Fluorescence excitation Spectra Figure 3.43 shows the fluorescence excitation spectra of PS1 trimers at various emission wavelengths
(745, 750 and 755 nm). Two peaks in the red and far-red region (680 and 711 nm) refer to the bulk
antenna chlorophylls net work and the 1st LWC compartment (C-709), respectively (Karapetyan et al
2006).
The third peak was shifted according to the used emission wavelength. At emission 745 nm, the obtained
excitation maximum was at 721 nm for monomeric and trimeric complexes, which should originate from
the 2nd LWC compartments (see table 3.4). Other interesting observations are the detection of 4 close
peaks at 470-503 nm, potentially ß-carotenes suggesting a connection with the LWC compartment of PS1
either directly or indirectly. It can be observed that the fluorescence excitation spectra of PS1 trimers at
the 2nd LWC compartment is always higher than that of monomeric PS1 and also seems to increase with
the fluorescence emission wavelength, for instance, it doubles at emission of 745 nm.
Figure 3.RT fluorescence emission spectra of PS1-trimers and monomers isolated by 0.1 % or 0.6 % ß-DM. Samples were in 20 mM HEPES 7.5; 10 mM MgCl2; 10 mM CaCl2; 0.5 M Mannitol; 0.03 % ß-DM
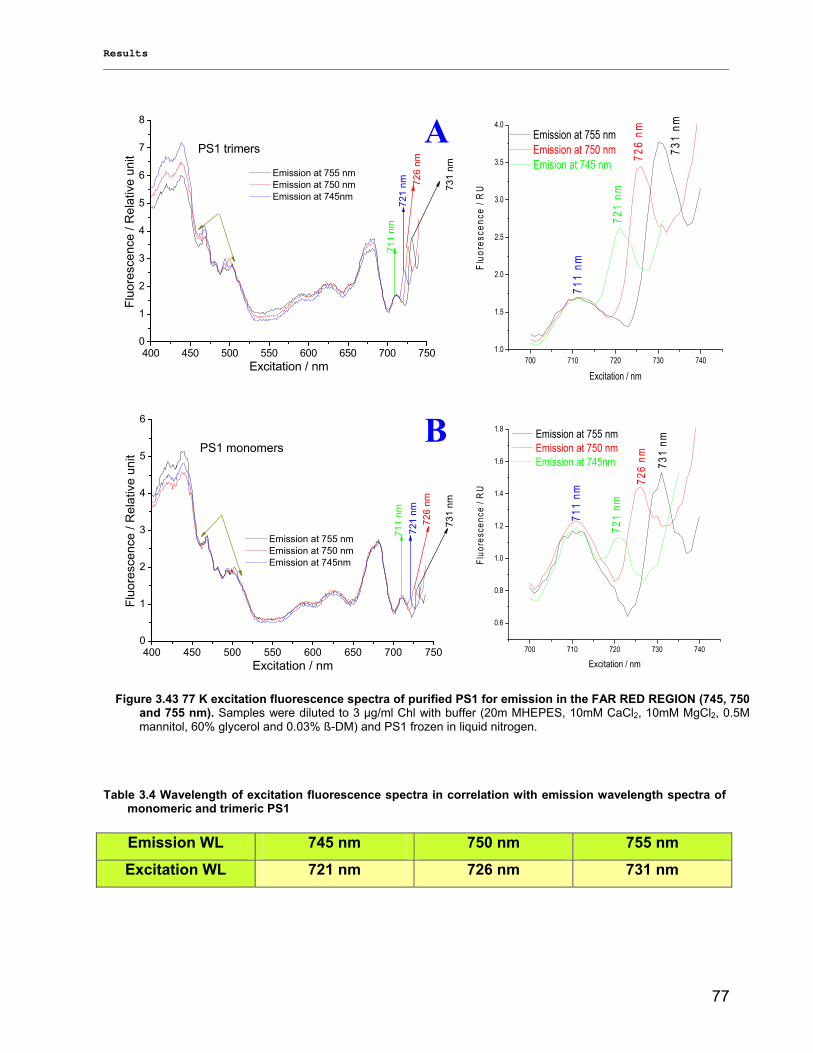
Results __________________________________________________________________________________________________
77
400 450 500 550 600 650 700 7500
1
2
3
4
5
6
7
8
731
nm
726
nm72
1 nm
Fluo
resc
ence
/ R
elat
ive
unit
Excitation / nm
Emission at 755 nm Emission at 750 nm Emission at 745nm
PS1 trimers
711
nm
400 450 500 550 600 650 700 7500
1
2
3
4
5
6
731
nm
726
nm72
1 nm
Fluo
resc
ence
/ R
elat
ive
unit
Excitation / nm
Emission at 755 nm Emission at 750 nm Emission at 745nm
PS1 monomers
711
nm
Emission WL 745 nm 750 nm 755 nm
Excitation WL 721 nm 726 nm 731 nm
Figure 3.43 77 K excitation fluorescence spectra of purified PS1 for emission in the FAR RED REGION (745, 750 and 755 nm). Samples were diluted to 3 µg/ml Chl with buffer (20m MHEPES, 10mM CaCl2, 10mM MgCl2, 0.5M mannitol, 60% glycerol and 0.03% ß-DM) and PS1 frozen in liquid nitrogen.
A
B
700 710 720 730 7401.0
1.5
2.0
2.5
3.0
3.5
4.0
731
nm
726
nm
721
nm
711
nmFluo
resc
ence
/ R
U
Excitation / nm
Emission at 755 nm Emission at 750 nm Emision at 745 nm
700 710 720 730 740
0.6
0.8
1.0
1.2
1.4
1.6
1.8
731
nm
726
nm
721
nm
711
nm
Fluo
resc
ence
/ R
U
Excitation / nm
Emission at 755 nm Emission at 750 nm Emission at 745nm
Table 3.4 Wavelength of excitation fluorescence spectra in correlation with emission wavelength spectra of monomeric and trimeric PS1
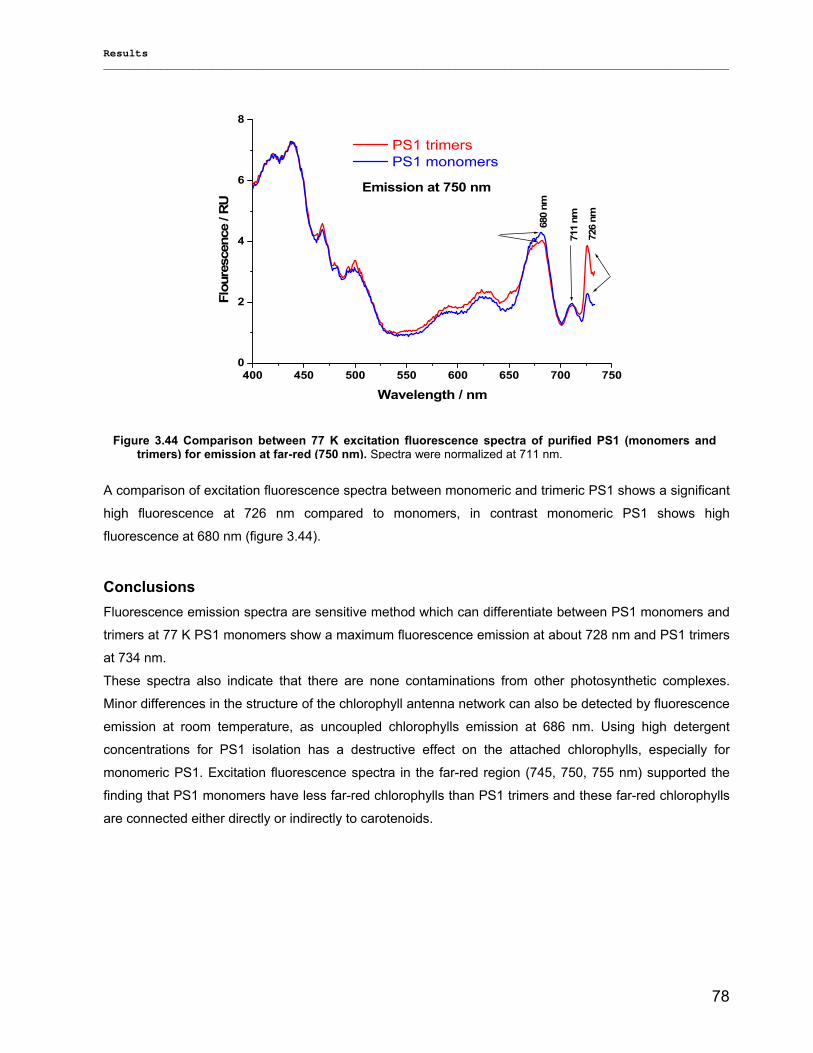
Results __________________________________________________________________________________________________
78
400 450 500 550 600 650 700 7500
2
4
6
8
680
nm
711
nm
726
nm
Emission at 750 nm
Flou
resc
ence
/ R
U
Wavelength / nm
PS1 trimers PS1 monomers
A comparison of excitation fluorescence spectra between monomeric and trimeric PS1 shows a significant
high fluorescence at 726 nm compared to monomers, in contrast monomeric PS1 shows high
fluorescence at 680 nm (figure 3.44). Conclusions Fluorescence emission spectra are sensitive method which can differentiate between PS1 monomers and
trimers at 77 K PS1 monomers show a maximum fluorescence emission at about 728 nm and PS1 trimers
at 734 nm.
These spectra also indicate that there are none contaminations from other photosynthetic complexes.
Minor differences in the structure of the chlorophyll antenna network can also be detected by fluorescence
emission at room temperature, as uncoupled chlorophylls emission at 686 nm. Using high detergent
concentrations for PS1 isolation has a destructive effect on the attached chlorophylls, especially for
monomeric PS1. Excitation fluorescence spectra in the far-red region (745, 750, 755 nm) supported the
finding that PS1 monomers have less far-red chlorophylls than PS1 trimers and these far-red chlorophylls
are connected either directly or indirectly to carotenoids.
Figure 3.44 Comparison between 77 K excitation fluorescence spectra of purified PS1 (monomers and trimers) for emission at far-red (750 nm). Spectra were normalized at 711 nm.
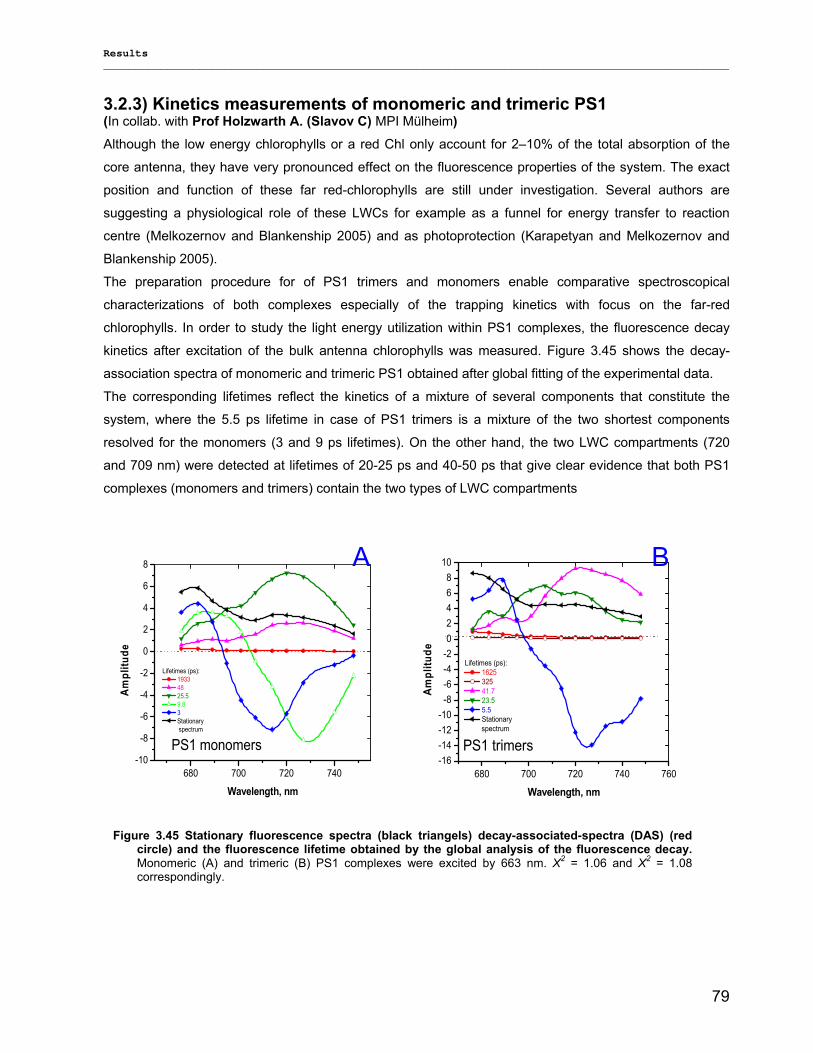
Results __________________________________________________________________________________________________
79
3.2.3) Kinetics measurements of monomeric and trimeric PS1 (In collab. with Prof Holzwarth A. (Slavov C) MPI Mülheim) Although the low energy chlorophylls or a red Chl only account for 2–10% of the total absorption of the
core antenna, they have very pronounced effect on the fluorescence properties of the system. The exact
position and function of these far red-chlorophylls are still under investigation. Several authors are
suggesting a physiological role of these LWCs for example as a funnel for energy transfer to reaction
centre (Melkozernov and Blankenship 2005) and as photoprotection (Karapetyan and Melkozernov and
Blankenship 2005).
The preparation procedure for of PS1 trimers and monomers enable comparative spectroscopical
characterizations of both complexes especially of the trapping kinetics with focus on the far-red
chlorophylls. In order to study the light energy utilization within PS1 complexes, the fluorescence decay
kinetics after excitation of the bulk antenna chlorophylls was measured. Figure 3.45 shows the decay-
association spectra of monomeric and trimeric PS1 obtained after global fitting of the experimental data.
The corresponding lifetimes reflect the kinetics of a mixture of several components that constitute the
system, where the 5.5 ps lifetime in case of PS1 trimers is a mixture of the two shortest components
resolved for the monomers (3 and 9 ps lifetimes). On the other hand, the two LWC compartments (720
and 709 nm) were detected at lifetimes of 20-25 ps and 40-50 ps that give clear evidence that both PS1
complexes (monomers and trimers) contain the two types of LWC compartments
680 700 720 740-10
-8
-6
-4
-2
0
2
4
6
8
PS1 monomers
Ampl
itude
Wavelength, nm
Lifetimes (ps): 1933 48 25.5 9.8 3 Stationary
spectrum
680 700 720 740 760-16-14-12-10-8-6-4-202468
10
PS1 trimers
Ampl
itude
Wavelength, nm
Lifetimes (ps): 1625 325 41.7 23.5 5.5 Stationary
spectrum
Figure 3.45 Stationary fluorescence spectra (black triangels) decay-associated-spectra (DAS) (red circle) and the fluorescence lifetime obtained by the global analysis of the fluorescence decay. Monomeric (A) and trimeric (B) PS1 complexes were excited by 663 nm. X2 = 1.06 and X2 = 1.08 correspondingly.
A B
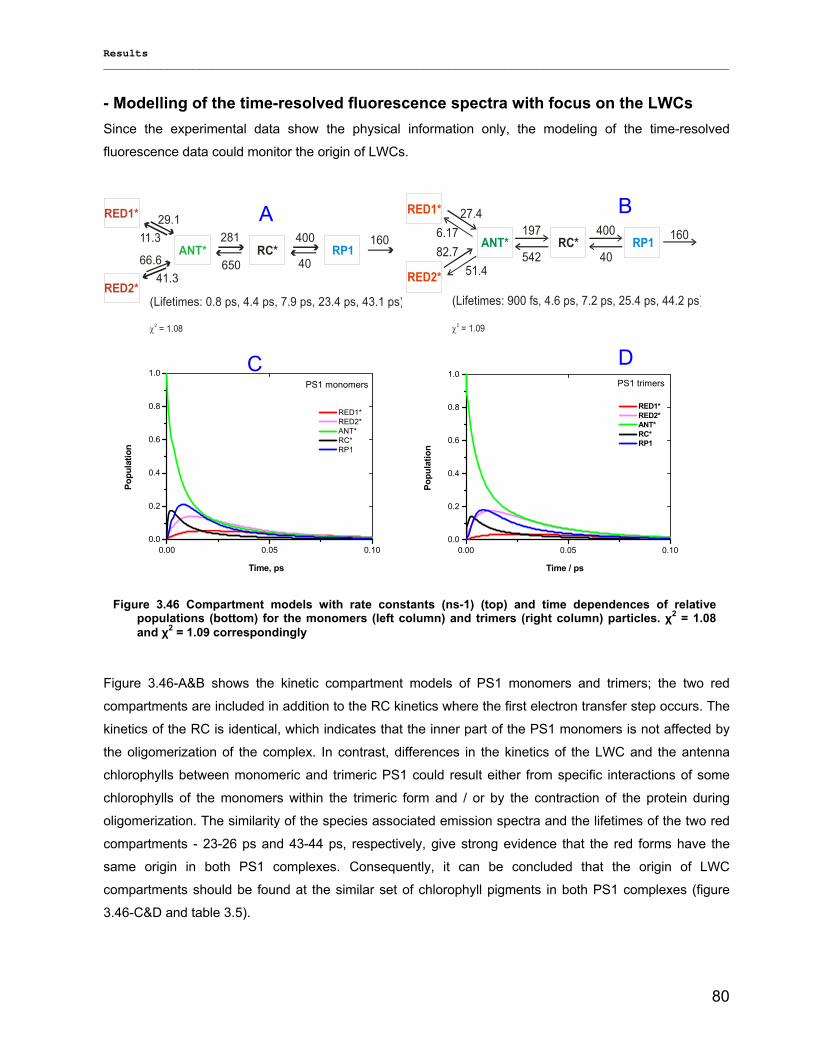
Results __________________________________________________________________________________________________
80
- Modelling of the time-resolved fluorescence spectra with focus on the LWCs Since the experimental data show the physical information only, the modeling of the time-resolved
fluorescence data could monitor the origin of LWCs.
281
650
400
40
160
RED1*
RC* RP1
RED2*
29.111.3
66.641.3
ANT*
(Lifetimes: 0.8 ps, 4.4 ps, 7.9 ps, 23.4 ps, 43.1 ps)
χ2 = 1.08
542
197 400
40
160
RED1*
RC* RP1
RED2*
27.46.1782.7
51.4
ANT*
(Lifetimes: 900 fs, 4.6 ps, 7.2 ps, 25.4 ps, 44.2 ps)
χ2 = 1.09
0.00 0.05 0.100.0
0.2
0.4
0.6
0.8
1.0
Popu
latio
n
Time, ps
RED1* RED2* ANT* RC* RP1
PS1 monomers
0.00 0.05 0.100.0
0.2
0.4
0.6
0.8
1.0
Popu
latio
n
Time / ps
RED1* RED2* ANT* RC* RP1
PS1 trimers
Figure 3.46-A&B shows the kinetic compartment models of PS1 monomers and trimers; the two red
compartments are included in addition to the RC kinetics where the first electron transfer step occurs. The
kinetics of the RC is identical, which indicates that the inner part of the PS1 monomers is not affected by
the oligomerization of the complex. In contrast, differences in the kinetics of the LWC and the antenna
chlorophylls between monomeric and trimeric PS1 could result either from specific interactions of some
chlorophylls of the monomers within the trimeric form and / or by the contraction of the protein during
oligomerization. The similarity of the species associated emission spectra and the lifetimes of the two red
compartments - 23-26 ps and 43-44 ps, respectively, give strong evidence that the red forms have the
same origin in both PS1 complexes. Consequently, it can be concluded that the origin of LWC
compartments should be found at the similar set of chlorophyll pigments in both PS1 complexes (figure
3.46-C&D and table 3.5).
B
Figure 3.46 Compartment models with rate constants (ns-1) (top) and time dependences of relative populations (bottom) for the monomers (left column) and trimers (right column) particles. χ2 = 1.08 and χ2 = 1.09 correspondingly
C D
A
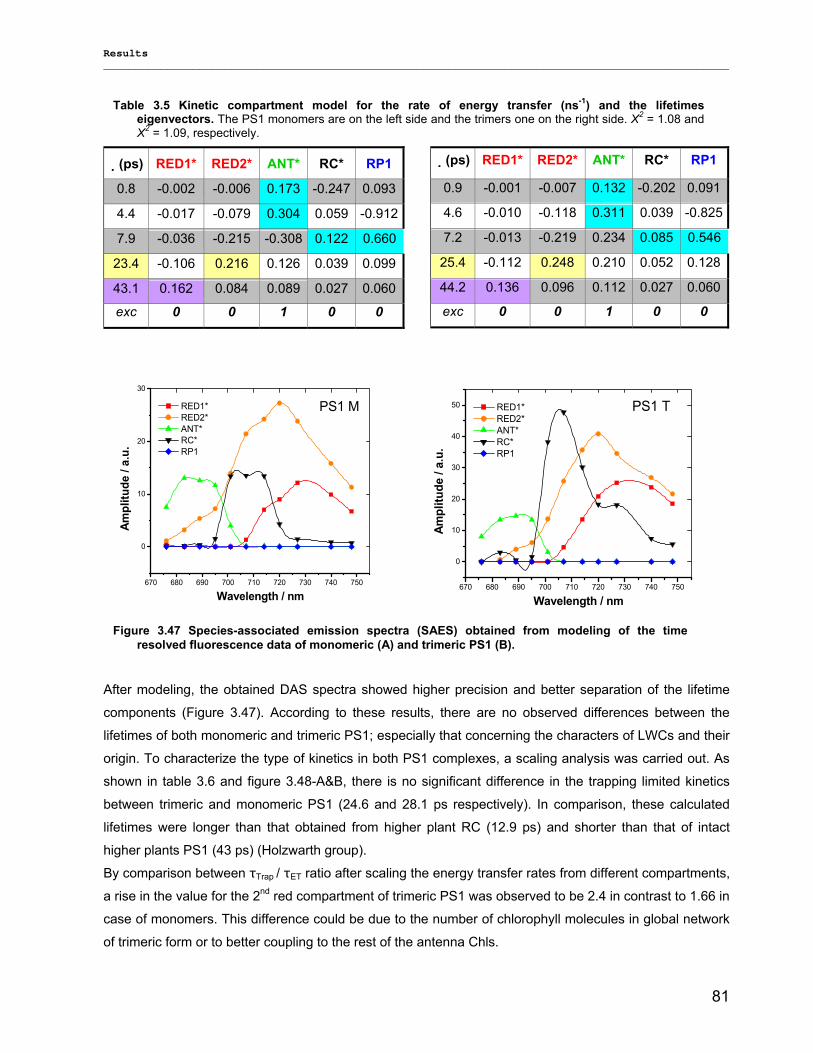
Results __________________________________________________________________________________________________
81
�(ps) RED1* RED2* ANT* RC* RP1
0.8 -0.002 -0.006 0.173 -0.247 0.093
4.4 -0.017 -0.079 0.304 0.059 -0.912
7.9 -0.036 -0.215 -0.308 0.122 0.660
23.4 -0.106 0.216 0.126 0.039 0.099
43.1 0.162 0.084 0.089 0.027 0.060
exc 0 0 1 0 0
�(ps) RED1* RED2* ANT* RC* RP1
0.9 -0.001 -0.007 0.132 -0.202 0.091
4.6 -0.010 -0.118 0.311 0.039 -0.825
7.2 -0.013 -0.219 0.234 0.085 0.546
25.4 -0.112 0.248 0.210 0.052 0.128
44.2 0.136 0.096 0.112 0.027 0.060
exc 0 0 1 0 0
670 680 690 700 710 720 730 740 750
0
10
20
30
PS1 M
Ampl
itude
/ a.
u.
Wavelength / nm
RED1* RED2* ANT* RC* RP1
670 680 690 700 710 720 730 740 750
0
10
20
30
40
50 PS1 T
Ampl
itude
/ a.
u.
Wavelength / nm
RED1* RED2* ANT* RC* RP1
After modeling, the obtained DAS spectra showed higher precision and better separation of the lifetime
components (Figure 3.47). According to these results, there are no observed differences between the
lifetimes of both monomeric and trimeric PS1; especially that concerning the characters of LWCs and their
origin. To characterize the type of kinetics in both PS1 complexes, a scaling analysis was carried out. As
shown in table 3.6 and figure 3.48-A&B, there is no significant difference in the trapping limited kinetics
between trimeric and monomeric PS1 (24.6 and 28.1 ps respectively). In comparison, these calculated
lifetimes were longer than that obtained from higher plant RC (12.9 ps) and shorter than that of intact
higher plants PS1 (43 ps) (Holzwarth group).
By comparison between τTrap / τET ratio after scaling the energy transfer rates from different compartments,
a rise in the value for the 2nd red compartment of trimeric PS1 was observed to be 2.4 in contrast to 1.66 in
case of monomers. This difference could be due to the number of chlorophyll molecules in global network
of trimeric form or to better coupling to the rest of the antenna Chls.
Table 3.5 Kinetic compartment model for the rate of energy transfer (ns-1) and the lifetimes eigenvectors. The PS1 monomers are on the left side and the trimers one on the right side. X2 = 1.08 and X2 = 1.09, respectively.
Figure 3.47 Species-associated emission spectra (SAES) obtained from modeling of the time resolved fluorescence data of monomeric (A) and trimeric PS1 (B).
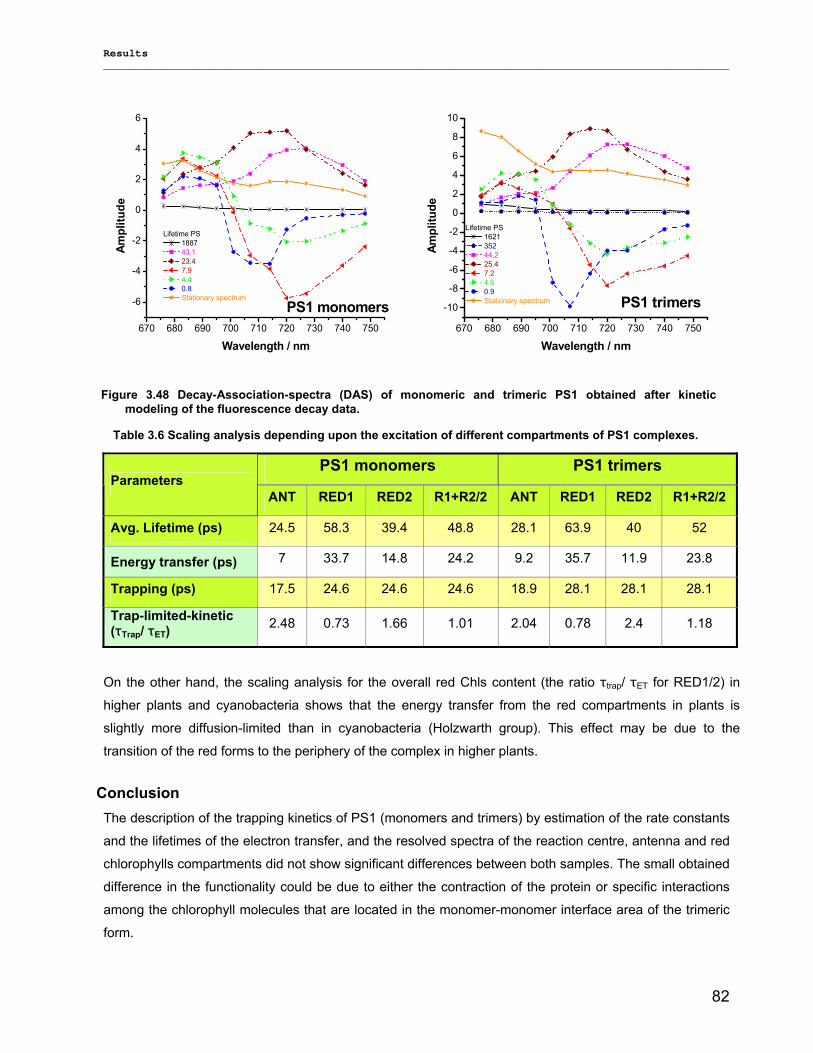
Results __________________________________________________________________________________________________
82
670 680 690 700 710 720 730 740 750
-6
-4
-2
0
2
4
6
PS1 monomers
Ampl
itude
Wavelength / nm
Lifetime PS 1887 43.1 23.4 7.9 4.4 0.8 Stationary spectrum
670 680 690 700 710 720 730 740 750
-10
-8
-6
-4
-2
0
2
4
6
8
10
PS1 trimers
Ampl
itude
Wavelength / nm
Lifetime PS 1621 352 44.2 25.4 7.2 4.6 0.9 Stationary spectrum
PS1 trimers PS1 monomers
R1+R2/2 RED2 RED1 ANT R1+R2/2 RED2 RED1 ANT Parameters
52 40 63.9 28.1 48.8 39.4 58.3 24.5 Avg. Lifetime (ps)
23.8 11.9 35.7 9.2 24.2 14.8 33.7 7 Energy transfer (ps)
28.1 28.1 28.1 18.9 24.6 24.6 24.6 17.5 Trapping (ps)
1.18 2.4 0.78 2.04 1.01 1.66 0.73 2.48 Trap-limited-kinetic (τTrap/ τET)
On the other hand, the scaling analysis for the overall red Chls content (the ratio τtrap/ τET for RED1/2) in
higher plants and cyanobacteria shows that the energy transfer from the red compartments in plants is
slightly more diffusion-limited than in cyanobacteria (Holzwarth group). This effect may be due to the
transition of the red forms to the periphery of the complex in higher plants.
Conclusion The description of the trapping kinetics of PS1 (monomers and trimers) by estimation of the rate constants
and the lifetimes of the electron transfer, and the resolved spectra of the reaction centre, antenna and red
chlorophylls compartments did not show significant differences between both samples. The small obtained
difference in the functionality could be due to either the contraction of the protein or specific interactions
among the chlorophyll molecules that are located in the monomer-monomer interface area of the trimeric
form.
Figure 3.48 Decay-Association-spectra (DAS) of monomeric and trimeric PS1 obtained after kinetic modeling of the fluorescence decay data.
Table 3.6 Scaling analysis depending upon the excitation of different compartments of PS1 complexes.
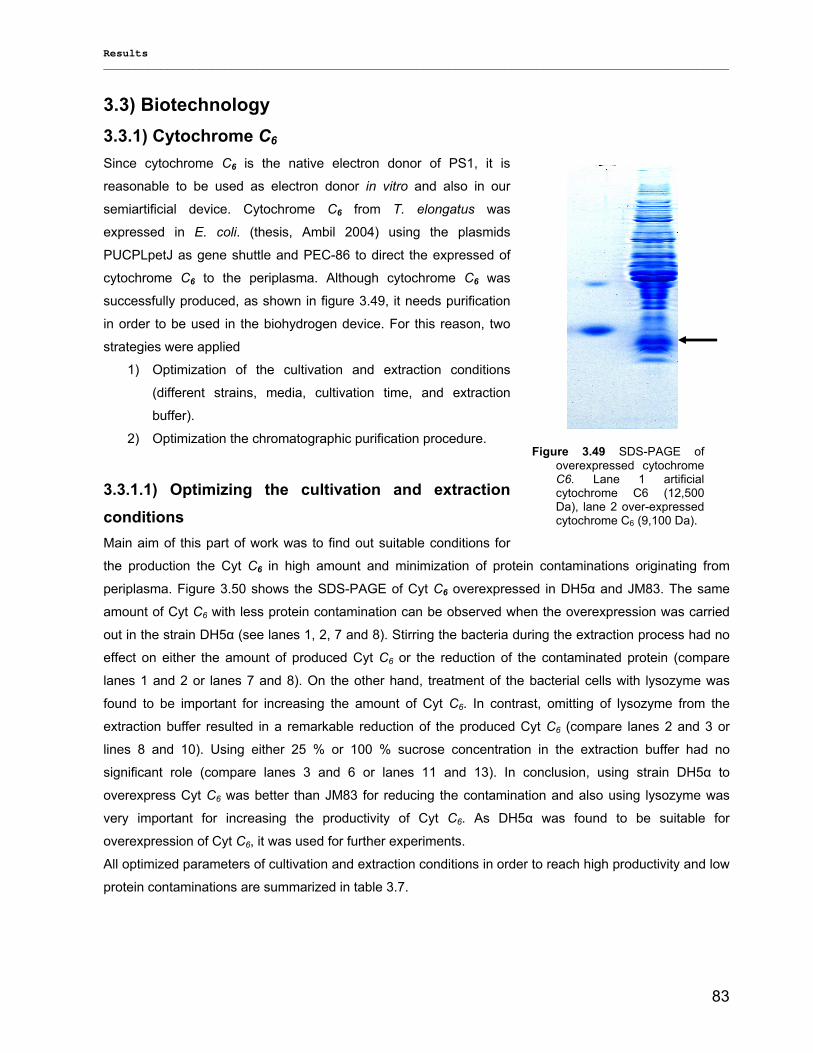
Results __________________________________________________________________________________________________
83
3.3) Biotechnology 3.3.1) Cytochrome C6 Since cytochrome C6 is the native electron donor of PS1, it is
reasonable to be used as electron donor in vitro and also in our
semiartificial device. Cytochrome C6 from T. elongatus was
expressed in E. coli. (thesis, Ambil 2004) using the plasmids
PUCPLpetJ as gene shuttle and PEC-86 to direct the expressed of
cytochrome C6 to the periplasma. Although cytochrome C6 was
successfully produced, as shown in figure 3.49, it needs purification
in order to be used in the biohydrogen device. For this reason, two
strategies were applied
1) Optimization of the cultivation and extraction conditions
(different strains, media, cultivation time, and extraction
buffer).
2) Optimization the chromatographic purification procedure.
3.3.1.1) Optimizing the cultivation and extraction conditions Main aim of this part of work was to find out suitable conditions for
the production the Cyt C6 in high amount and minimization of protein contaminations originating from
periplasma. Figure 3.50 shows the SDS-PAGE of Cyt C6 overexpressed in DH5α and JM83. The same
amount of Cyt C6 with less protein contamination can be observed when the overexpression was carried
out in the strain DH5α (see lanes 1, 2, 7 and 8). Stirring the bacteria during the extraction process had no
effect on either the amount of produced Cyt C6 or the reduction of the contaminated protein (compare
lanes 1 and 2 or lanes 7 and 8). On the other hand, treatment of the bacterial cells with lysozyme was
found to be important for increasing the amount of Cyt C6. In contrast, omitting of lysozyme from the
extraction buffer resulted in a remarkable reduction of the produced Cyt C6 (compare lanes 2 and 3 or
lines 8 and 10). Using either 25 % or 100 % sucrose concentration in the extraction buffer had no
significant role (compare lanes 3 and 6 or lanes 11 and 13). In conclusion, using strain DH5α to
overexpress Cyt C6 was better than JM83 for reducing the contamination and also using lysozyme was
very important for increasing the productivity of Cyt C6. As DH5α was found to be suitable for
overexpression of Cyt C6, it was used for further experiments.
All optimized parameters of cultivation and extraction conditions in order to reach high productivity and low
protein contaminations are summarized in table 3.7.
Figure 3.49 SDS-PAGE of
overexpressed cytochrome C6. Lane 1 artificial cytochrome C6 (12,500 Da), lane 2 over-expressed cytochrome C6 (9,100 Da).
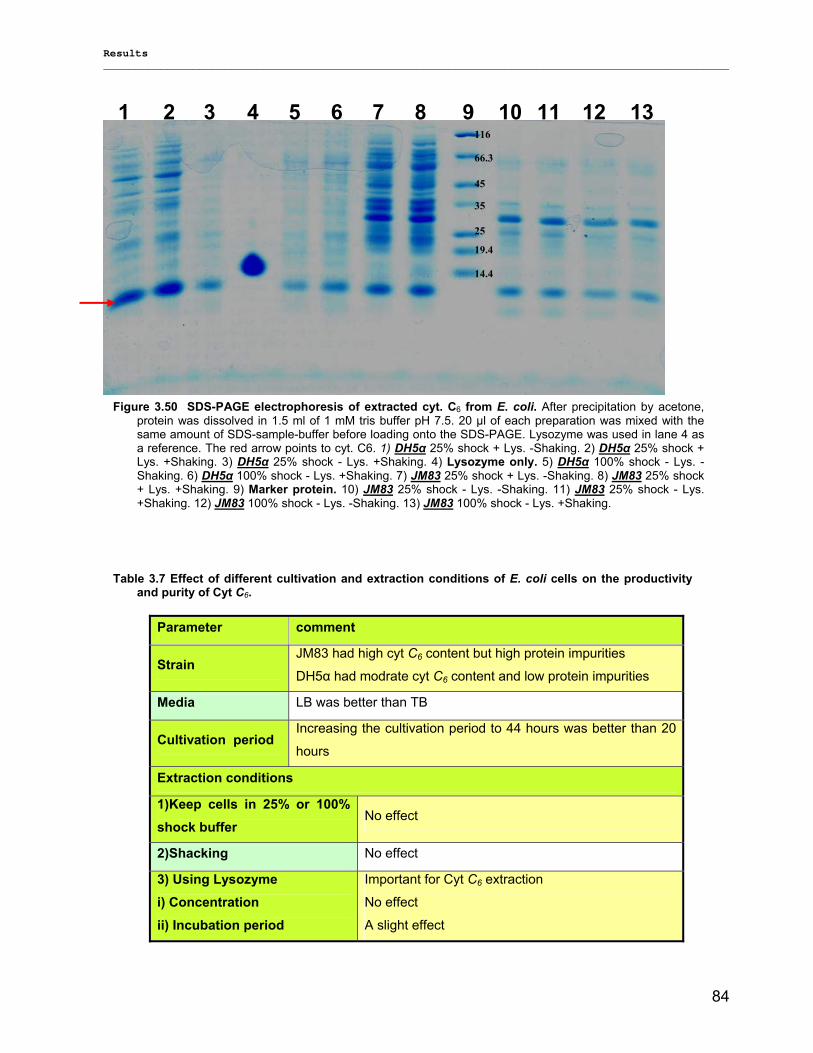
Results __________________________________________________________________________________________________
84
Parameter comment
Strain JM83 had high cyt C6 content but high protein impurities
DH5α had modrate cyt C6 content and low protein impurities
Media LB was better than TB
Cultivation period Increasing the cultivation period to 44 hours was better than 20
hours
Extraction conditions 1)Keep cells in 25% or 100% shock buffer
No effect
2)Shacking No effect
3) Using Lysozyme
i) Concentration
ii) Incubation period
Important for Cyt C6 extraction
No effect
A slight effect
Figure 3.50 SDS-PAGE electrophoresis of extracted cyt. C6 from E. coli. After precipitation by acetone, protein was dissolved in 1.5 ml of 1 mM tris buffer pH 7.5. 20 µl of each preparation was mixed with the same amount of SDS-sample-buffer before loading onto the SDS-PAGE. Lysozyme was used in lane 4 as a reference. The red arrow points to cyt. C6. 1) DH5α 25% shock + Lys. -Shaking. 2) DH5α 25% shock + Lys. +Shaking. 3) DH5α 25% shock - Lys. +Shaking. 4) Lysozyme only. 5) DH5α 100% shock - Lys. -Shaking. 6) DH5α 100% shock - Lys. +Shaking. 7) JM83 25% shock + Lys. -Shaking. 8) JM83 25% shock + Lys. +Shaking. 9) Marker protein. 10) JM83 25% shock - Lys. -Shaking. 11) JM83 25% shock - Lys. +Shaking. 12) JM83 100% shock - Lys. -Shaking. 13) JM83 100% shock - Lys. +Shaking.
1 2 3 4 5 6 7 8 9 10 11 12 13 116
66.3
45
35
25
19.4
14.4
Table 3.7 Effect of different cultivation and extraction conditions of E. coli cells on the productivity and purity of Cyt C6.
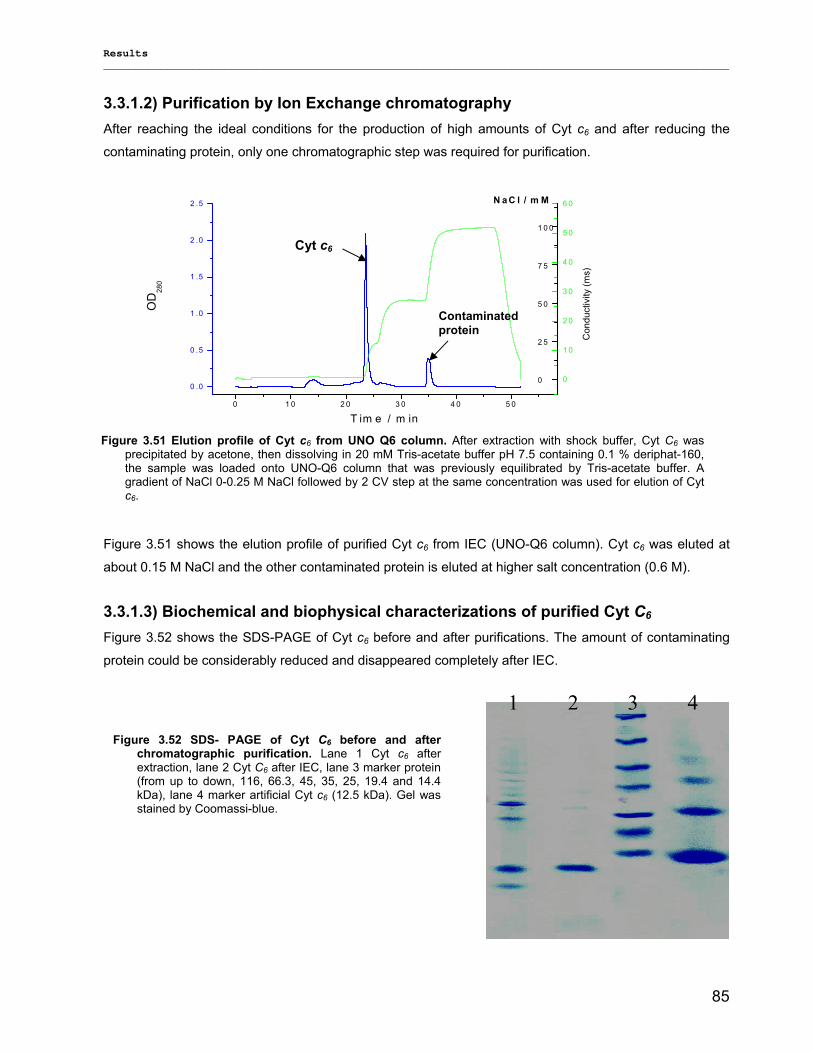
Results __________________________________________________________________________________________________
85
3.3.1.2) Purification by Ion Exchange chromatography After reaching the ideal conditions for the production of high amounts of Cyt c6 and after reducing the
contaminating protein, only one chromatographic step was required for purification.
Figure 3.51 shows the elution profile of purified Cyt c6 from IEC (UNO-Q6 column). Cyt c6 was eluted at
about 0.15 M NaCl and the other contaminated protein is eluted at higher salt concentration (0.6 M).
3.3.1.3) Biochemical and biophysical characterizations of purified Cyt C6 Figure 3.52 shows the SDS-PAGE of Cyt c6 before and after purifications. The amount of contaminating
protein could be considerably reduced and disappeared completely after IEC.
0 1 0 2 0 3 0 4 0 5 0
0 .0
0 .5
1 .0
1 .5
2 .0
2 .5
OD
280
T im e / m in
0
1 0
2 0
3 0
4 0
5 0
6 0
Con
duct
ivity
(ms)
0
2 5
5 0
7 5
1 0 0
N a C l / m M
Figure 3.52 SDS- PAGE of Cyt C6 before and after chromatographic purification. Lane 1 Cyt c6 after extraction, lane 2 Cyt C6 after IEC, lane 3 marker protein (from up to down, 116, 66.3, 45, 35, 25, 19.4 and 14.4 kDa), lane 4 marker artificial Cyt c6 (12.5 kDa). Gel was stained by Coomassi-blue.
Figure 3.51 Elution profile of Cyt c6 from UNO Q6 column. After extraction with shock buffer, Cyt C6 was precipitated by acetone, then dissolving in 20 mM Tris-acetate buffer pH 7.5 containing 0.1 % deriphat-160, the sample was loaded onto UNO-Q6 column that was previously equilibrated by Tris-acetate buffer. A gradient of NaCl 0-0.25 M NaCl followed by 2 CV step at the same concentration was used for elution of Cyt c6.
1 2 3 4
Cyt c6
Contaminated protein
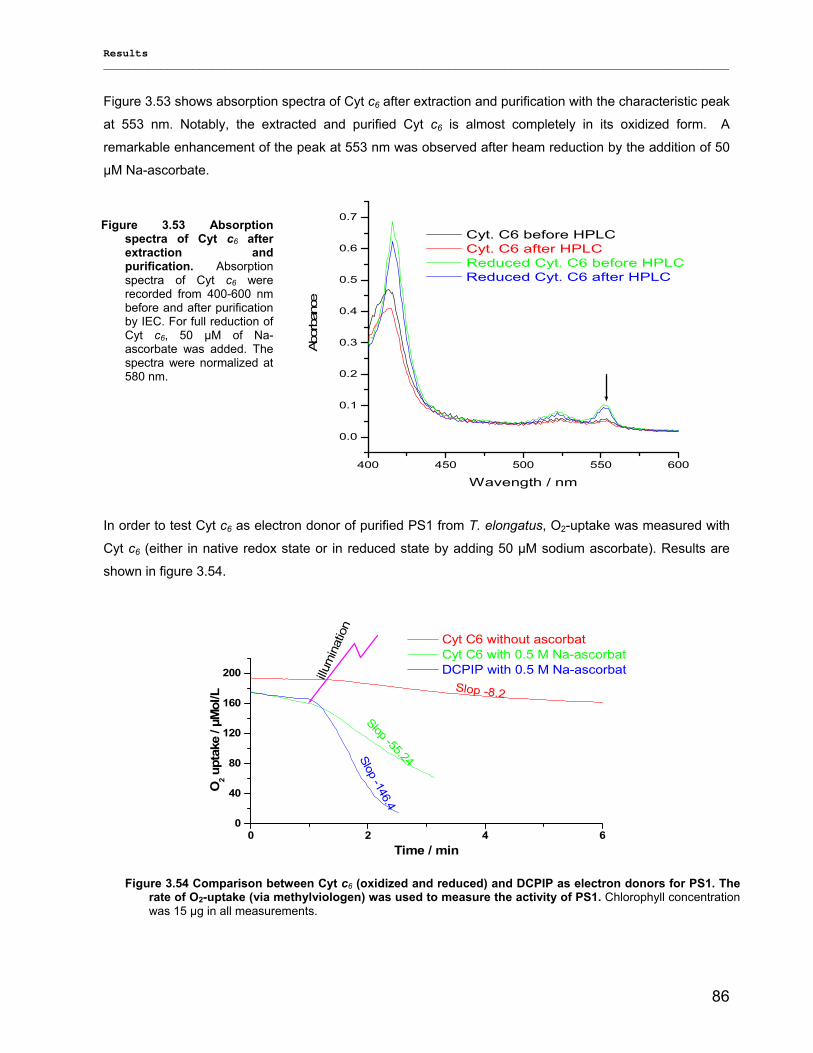
Results __________________________________________________________________________________________________
86
Figure 3.53 shows absorption spectra of Cyt c6 after extraction and purification with the characteristic peak
at 553 nm. Notably, the extracted and purified Cyt c6 is almost completely in its oxidized form. A
remarkable enhancement of the peak at 553 nm was observed after heam reduction by the addition of 50
µM Na-ascorbate.
400 450 500 550 600
0.0
0.1
0.2
0.3
0.4
0.5
0.6
0.7
Abor
banc
e
Wavength / nm
Cyt. C6 before HPLC Cyt. C6 after HPLC Reduced Cyt. C6 before HPLC Reduced Cyt. C6 after HPLC
In order to test Cyt c6 as electron donor of purified PS1 from T. elongatus, O2-uptake was measured with
Cyt c6 (either in native redox state or in reduced state by adding 50 µM sodium ascorbate). Results are
shown in figure 3.54.
0 2 4 60
40
80
120
160
200
Slop -146.4
Slop -55.24
Slop -8.2
illum
inat
ion
O2 u
ptak
e / µ
Mol
/L
Time / min
Cyt C6 without ascorbat Cyt C6 with 0.5 M Na-ascorbat DCPIP with 0.5 M Na-ascorbat
Figure 3.54 Comparison between Cyt c6 (oxidized and reduced) and DCPIP as electron donors for PS1. The rate of O2-uptake (via methylviologen) was used to measure the activity of PS1. Chlorophyll concentration was 15 µg in all measurements.
Figure 3.53 Absorption spectra of Cyt c6 after extraction and purification. Absorption spectra of Cyt c6 were recorded from 400-600 nm before and after purification by IEC. For full reduction of Cyt c6, 50 µM of Na-ascorbate was added. The spectra were normalized at 580 nm.
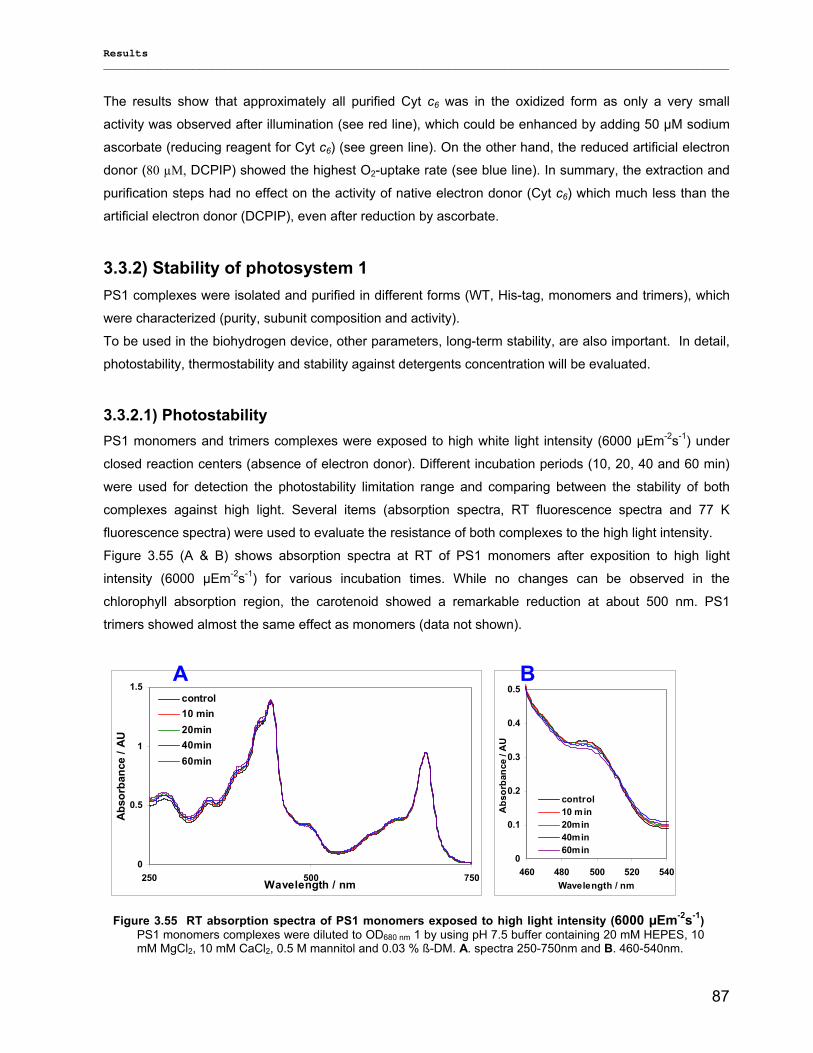
Results __________________________________________________________________________________________________
87
The results show that approximately all purified Cyt c6 was in the oxidized form as only a very small
activity was observed after illumination (see red line), which could be enhanced by adding 50 µM sodium
ascorbate (reducing reagent for Cyt c6) (see green line). On the other hand, the reduced artificial electron
donor (80 µM, DCPIP) showed the highest O2-uptake rate (see blue line). In summary, the extraction and
purification steps had no effect on the activity of native electron donor (Cyt c6) which much less than the
artificial electron donor (DCPIP), even after reduction by ascorbate.
3.3.2) Stability of photosystem 1 PS1 complexes were isolated and purified in different forms (WT, His-tag, monomers and trimers), which
were characterized (purity, subunit composition and activity).
To be used in the biohydrogen device, other parameters, long-term stability, are also important. In detail,
photostability, thermostability and stability against detergents concentration will be evaluated.
3.3.2.1) Photostability PS1 monomers and trimers complexes were exposed to high white light intensity (6000 µEm-2s-1) under
closed reaction centers (absence of electron donor). Different incubation periods (10, 20, 40 and 60 min)
were used for detection the photostability limitation range and comparing between the stability of both
complexes against high light. Several items (absorption spectra, RT fluorescence spectra and 77 K
fluorescence spectra) were used to evaluate the resistance of both complexes to the high light intensity.
Figure 3.55 (A & B) shows absorption spectra at RT of PS1 monomers after exposition to high light
intensity (6000 µEm-2s-1) for various incubation times. While no changes can be observed in the
chlorophyll absorption region, the carotenoid showed a remarkable reduction at about 500 nm. PS1
trimers showed almost the same effect as monomers (data not shown).
0
0.5
1
1.5
250 500 750Wavelength / nm
Abs
orba
nce
/ AU
control10 min20min40min60min
0
0.1
0.2
0.3
0.4
0.5
460 480 500 520 540Wavelength / nm
Abs
orba
nce
/ AU
control10 min20min40min60min
A B
Figure 3.55 RT absorption spectra of PS1 monomers exposed to high light intensity (6000 µEm-2s-1)PS1 monomers complexes were diluted to OD680 nm 1 by using pH 7.5 buffer containing 20 mM HEPES, 10 mM MgCl2, 10 mM CaCl2, 0.5 M mannitol and 0.03 % ß-DM. A. spectra 250-750nm and B. 460-540nm.
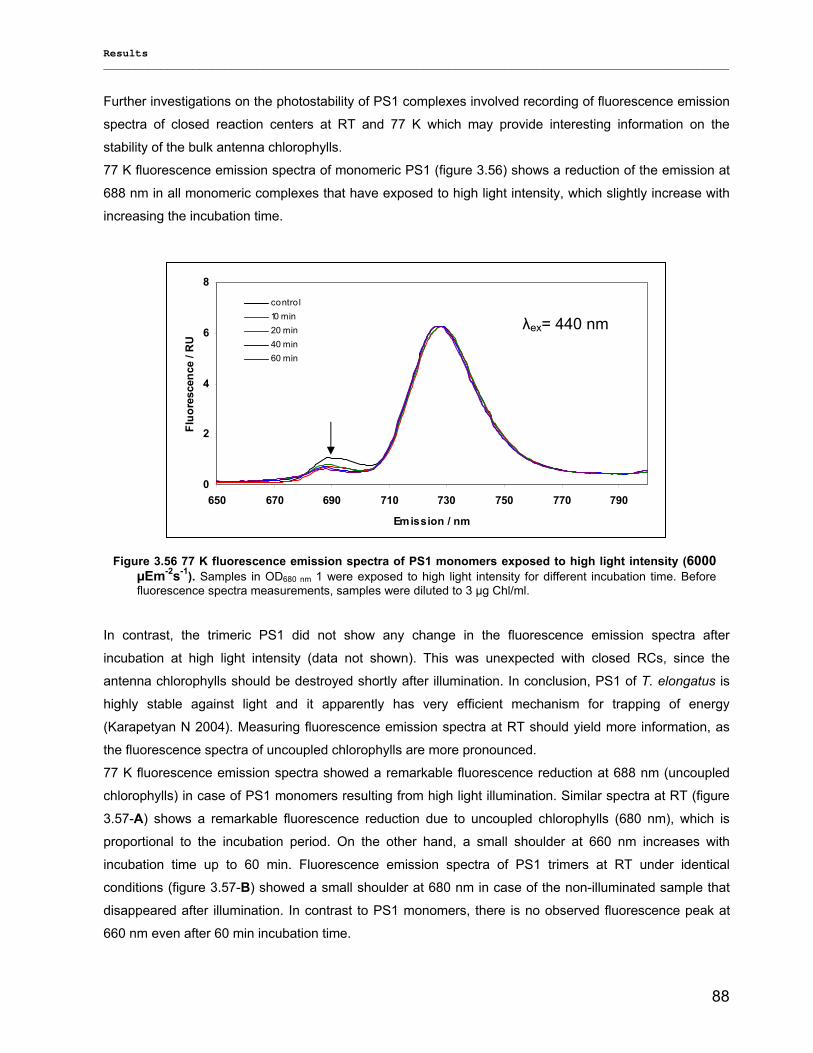
Results __________________________________________________________________________________________________
88
Further investigations on the photostability of PS1 complexes involved recording of fluorescence emission
spectra of closed reaction centers at RT and 77 K which may provide interesting information on the
stability of the bulk antenna chlorophylls.
77 K fluorescence emission spectra of monomeric PS1 (figure 3.56) shows a reduction of the emission at
688 nm in all monomeric complexes that have exposed to high light intensity, which slightly increase with
increasing the incubation time.
0
2
4
6
8
650 670 690 710 730 750 770 790
Emission / nm
Fluo
resc
ence
/ R
U
contro l10 min20 min40 min60 min
In contrast, the trimeric PS1 did not show any change in the fluorescence emission spectra after
incubation at high light intensity (data not shown). This was unexpected with closed RCs, since the
antenna chlorophylls should be destroyed shortly after illumination. In conclusion, PS1 of T. elongatus is
highly stable against light and it apparently has very efficient mechanism for trapping of energy
(Karapetyan N 2004). Measuring fluorescence emission spectra at RT should yield more information, as
the fluorescence spectra of uncoupled chlorophylls are more pronounced. 77 K fluorescence emission spectra showed a remarkable fluorescence reduction at 688 nm (uncoupled
chlorophylls) in case of PS1 monomers resulting from high light illumination. Similar spectra at RT (figure
3.57-A) shows a remarkable fluorescence reduction due to uncoupled chlorophylls (680 nm), which is
proportional to the incubation period. On the other hand, a small shoulder at 660 nm increases with
incubation time up to 60 min. Fluorescence emission spectra of PS1 trimers at RT under identical
conditions (figure 3.57-B) showed a small shoulder at 680 nm in case of the non-illuminated sample that
disappeared after illumination. In contrast to PS1 monomers, there is no observed fluorescence peak at
660 nm even after 60 min incubation time.
Figure 3.56 77 K fluorescence emission spectra of PS1 monomers exposed to high light intensity (6000 µEm-2s-1). Samples in OD680 nm 1 were exposed to high light intensity for different incubation time. Before fluorescence spectra measurements, samples were diluted to 3 µg Chl/ml.
λex= 440 nm
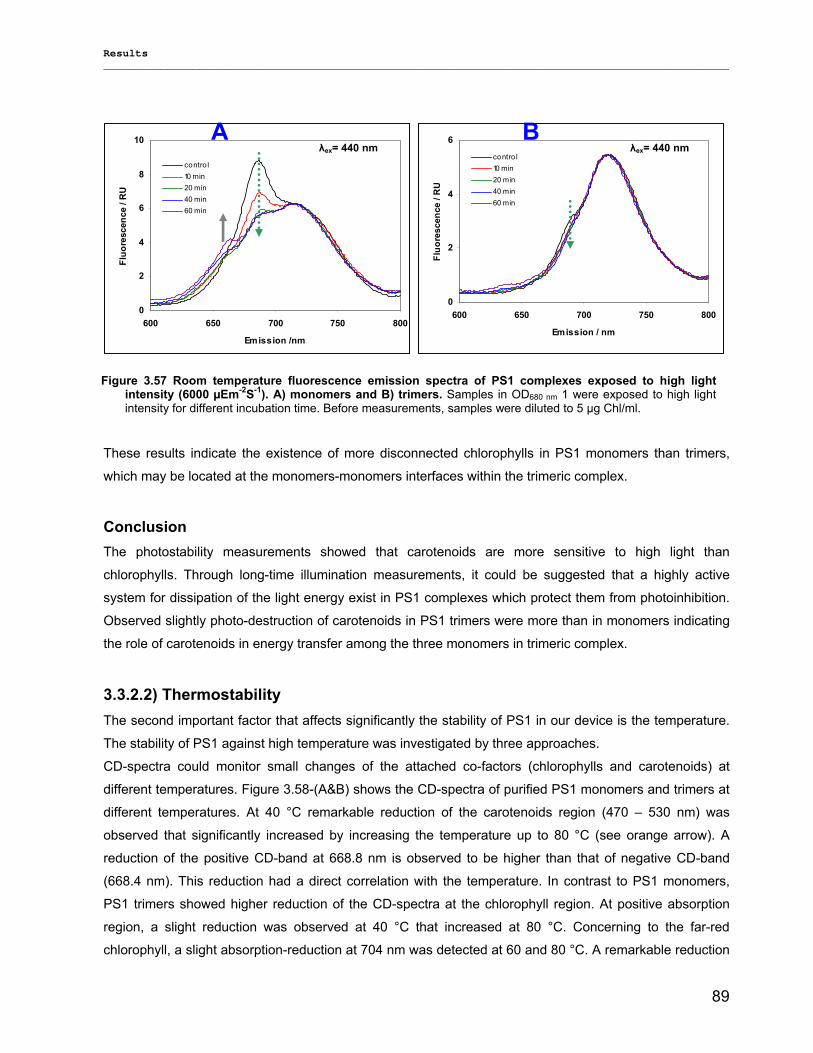
Results __________________________________________________________________________________________________
89
0
2
4
6
8
10
600 650 700 750 800
Emission /nm
Fluo
resc
ence
/ R
U
contro l10 min20 min40 min60 min
0
2
4
6
600 650 700 750 800
Emission / nm
Fluo
resc
ence
/ R
U
contro l10 min20 min40 min60 min
These results indicate the existence of more disconnected chlorophylls in PS1 monomers than trimers,
which may be located at the monomers-monomers interfaces within the trimeric complex.
Conclusion The photostability measurements showed that carotenoids are more sensitive to high light than
chlorophylls. Through long-time illumination measurements, it could be suggested that a highly active
system for dissipation of the light energy exist in PS1 complexes which protect them from photoinhibition.
Observed slightly photo-destruction of carotenoids in PS1 trimers were more than in monomers indicating
the role of carotenoids in energy transfer among the three monomers in trimeric complex.
3.3.2.2) Thermostability The second important factor that affects significantly the stability of PS1 in our device is the temperature.
The stability of PS1 against high temperature was investigated by three approaches.
CD-spectra could monitor small changes of the attached co-factors (chlorophylls and carotenoids) at
different temperatures. Figure 3.58-(A&B) shows the CD-spectra of purified PS1 monomers and trimers at
different temperatures. At 40 °C remarkable reduction of the carotenoids region (470 – 530 nm) was
observed that significantly increased by increasing the temperature up to 80 °C (see orange arrow). A
reduction of the positive CD-band at 668.8 nm is observed to be higher than that of negative CD-band
(668.4 nm). This reduction had a direct correlation with the temperature. In contrast to PS1 monomers,
PS1 trimers showed higher reduction of the CD-spectra at the chlorophyll region. At positive absorption
region, a slight reduction was observed at 40 °C that increased at 80 °C. Concerning to the far-red
chlorophyll, a slight absorption-reduction at 704 nm was detected at 60 and 80 °C. A remarkable reduction
Figure 3.57 Room temperature fluorescence emission spectra of PS1 complexes exposed to high light intensity (6000 µEm-2S-1). A) monomers and B) trimers. Samples in OD680 nm 1 were exposed to high light intensity for different incubation time. Before measurements, samples were diluted to 5 µg Chl/ml.
λex= 440 nm λex= 440 nm A B
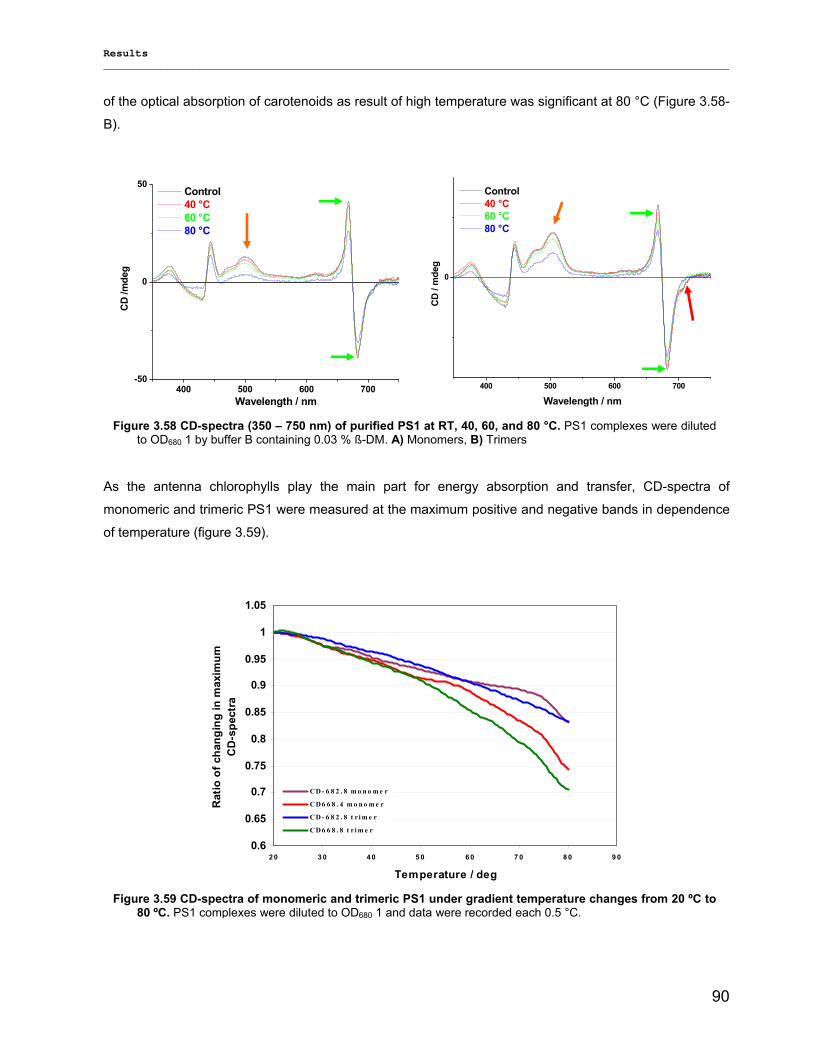
Results __________________________________________________________________________________________________
90
of the optical absorption of carotenoids as result of high temperature was significant at 80 °C (Figure 3.58-
B).
400 500 600 700-50
0
50
CD
/mde
g
Wavelength / nm
Control 40 °C 60 °C 80 °C
400 500 600 700
0
Control 40 °C 60 °C 80 °C
CD
/ m
deg
Wavelength / nm
As the antenna chlorophylls play the main part for energy absorption and transfer, CD-spectra of
monomeric and trimeric PS1 were measured at the maximum positive and negative bands in dependence
of temperature (figure 3.59).
0.6
0.65
0.7
0.75
0.8
0.85
0.9
0.95
1
1.05
2 0 3 0 4 0 5 0 6 0 7 0 8 0 9 0
Temperature / deg
Rat
io o
f cha
ngin
g in
max
imum
C
D-s
pect
ra
C D - 6 8 2 . 8 m o n o m e r
C D 6 6 8 . 4 m o n o m e r
C D - 6 8 2 . 8 t r i m e r
C D 6 6 8 . 8 t r i m e r
Figure 3.59 CD-spectra of monomeric and trimeric PS1 under gradient temperature changes from 20 ºC to 80 ºC. PS1 complexes were diluted to OD680 1 and data were recorded each 0.5 °C.
Figure 3.58 CD-spectra (350 – 750 nm) of purified PS1 at RT, 40, 60, and 80 °C. PS1 complexes were diluted to OD680 1 by buffer B containing 0.03 % ß-DM. A) Monomers, B) Trimers
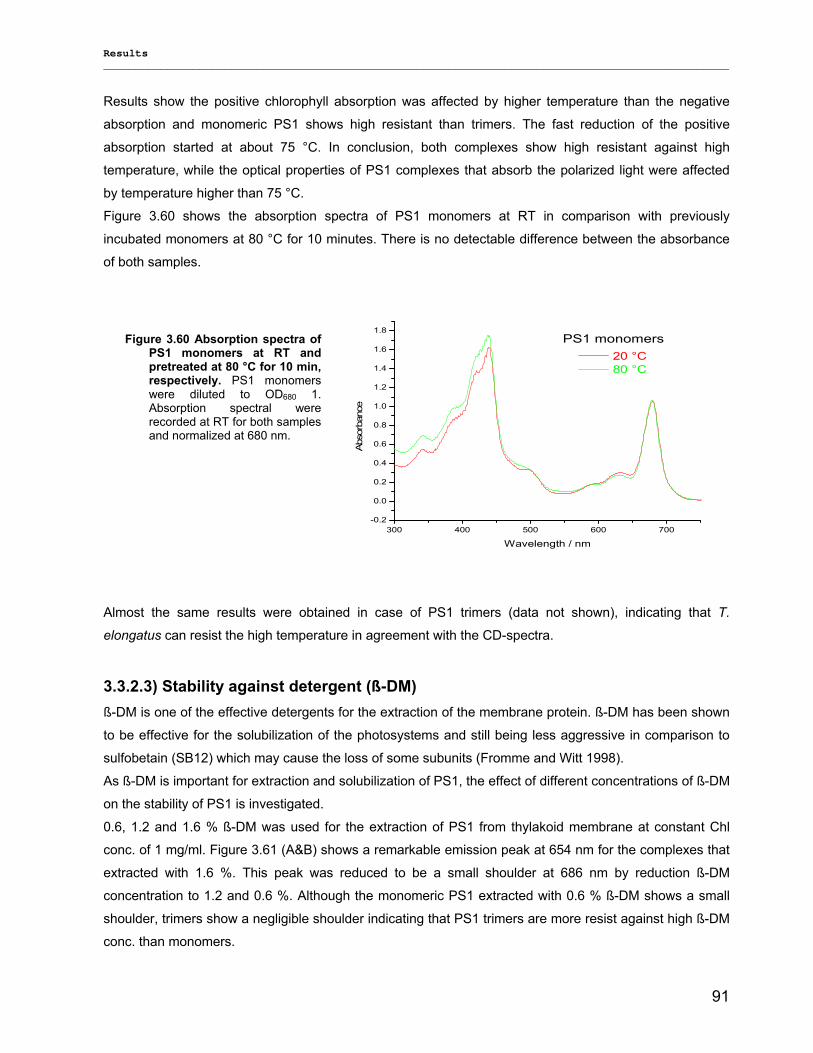
Results __________________________________________________________________________________________________
91
Results show the positive chlorophyll absorption was affected by higher temperature than the negative
absorption and monomeric PS1 shows high resistant than trimers. The fast reduction of the positive
absorption started at about 75 °C. In conclusion, both complexes show high resistant against high
temperature, while the optical properties of PS1 complexes that absorb the polarized light were affected
by temperature higher than 75 °C. Figure 3.60 shows the absorption spectra of PS1 monomers at RT in comparison with previously
incubated monomers at 80 °C for 10 minutes. There is no detectable difference between the absorbance
of both samples.
300 400 500 600 700-0.2
0.0
0.2
0.4
0.6
0.8
1.0
1.2
1.4
1.6
1.8PS1 monomers
Abso
rban
ce
Wavelength / nm
20 °C 80 °C
Almost the same results were obtained in case of PS1 trimers (data not shown), indicating that T.
elongatus can resist the high temperature in agreement with the CD-spectra.
3.3.2.3) Stability against detergent (ß-DM) ß-DM is one of the effective detergents for the extraction of the membrane protein. ß-DM has been shown
to be effective for the solubilization of the photosystems and still being less aggressive in comparison to
sulfobetain (SB12) which may cause the loss of some subunits (Fromme and Witt 1998).
As ß-DM is important for extraction and solubilization of PS1, the effect of different concentrations of ß-DM
on the stability of PS1 is investigated.
0.6, 1.2 and 1.6 % ß-DM was used for the extraction of PS1 from thylakoid membrane at constant Chl
conc. of 1 mg/ml. Figure 3.61 (A&B) shows a remarkable emission peak at 654 nm for the complexes that
extracted with 1.6 %. This peak was reduced to be a small shoulder at 686 nm by reduction ß-DM
concentration to 1.2 and 0.6 %. Although the monomeric PS1 extracted with 0.6 % ß-DM shows a small
shoulder, trimers show a negligible shoulder indicating that PS1 trimers are more resist against high ß-DM
conc. than monomers.
Figure 3.60 Absorption spectra of PS1 monomers at RT and pretreated at 80 °C for 10 min, respectively. PS1 monomers were diluted to OD680 1. Absorption spectral were recorded at RT for both samples and normalized at 680 nm.
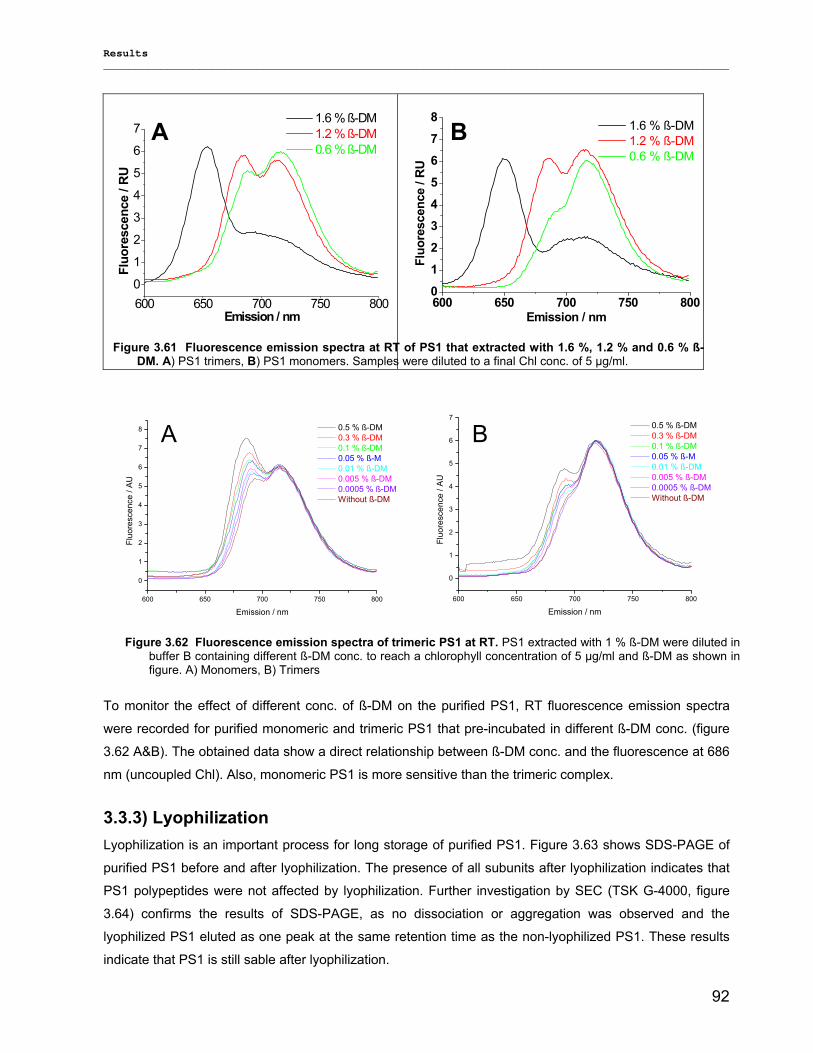
Results __________________________________________________________________________________________________
92
600 650 700 750 8000
1
2
3
4
5
6
7Fl
uore
scen
ce /
RU
Emission / nm
1.6 % ß-DM 1.2 % ß-DM 0.6 % ß-DM
600 650 700 750 8000
1
2
3
4
5
6
7
8
Fluo
resc
ence
/ R
U
Emission / nm
1.6 % ß-DM 1.2 % ß-DM 0.6 % ß-DM
600 650 700 750 800
0
1
2
3
4
5
6
7
8
Fluo
resc
ence
/ A
U
Emission / nm
0.5 % ß-DM 0.3 % ß-DM 0.1 % ß-DM 0.05 % ß-M 0.01 % ß-DM 0.005 % ß-DM 0.0005 % ß-DM Without ß-DM
600 650 700 750 800
0
1
2
3
4
5
6
7
Fluo
resc
ence
/ A
U
Emission / nm
0.5 % ß-DM 0.3 % ß-DM 0.1 % ß-DM 0.05 % ß-M 0.01 % ß-DM 0.005 % ß-DM 0.0005 % ß-DM Without ß-DM
To monitor the effect of different conc. of ß-DM on the purified PS1, RT fluorescence emission spectra
were recorded for purified monomeric and trimeric PS1 that pre-incubated in different ß-DM conc. (figure
3.62 A&B). The obtained data show a direct relationship between ß-DM conc. and the fluorescence at 686
nm (uncoupled Chl). Also, monomeric PS1 is more sensitive than the trimeric complex. 3.3.3) Lyophilization Lyophilization is an important process for long storage of purified PS1. Figure 3.63 shows SDS-PAGE of
purified PS1 before and after lyophilization. The presence of all subunits after lyophilization indicates that
PS1 polypeptides were not affected by lyophilization. Further investigation by SEC (TSK G-4000, figure
3.64) confirms the results of SDS-PAGE, as no dissociation or aggregation was observed and the
lyophilized PS1 eluted as one peak at the same retention time as the non-lyophilized PS1. These results
indicate that PS1 is still sable after lyophilization.
Figure 3.61 Fluorescence emission spectra at RT of PS1 that extracted with 1.6 %, 1.2 % and 0.6 % ß-DM. A) PS1 trimers, B) PS1 monomers. Samples were diluted to a final Chl conc. of 5 µg/ml.
Figure 3.62 Fluorescence emission spectra of trimeric PS1 at RT. PS1 extracted with 1 % ß-DM were diluted in buffer B containing different ß-DM conc. to reach a chlorophyll concentration of 5 µg/ml and ß-DM as shown in figure. A) Monomers, B) Trimers
A B
A B
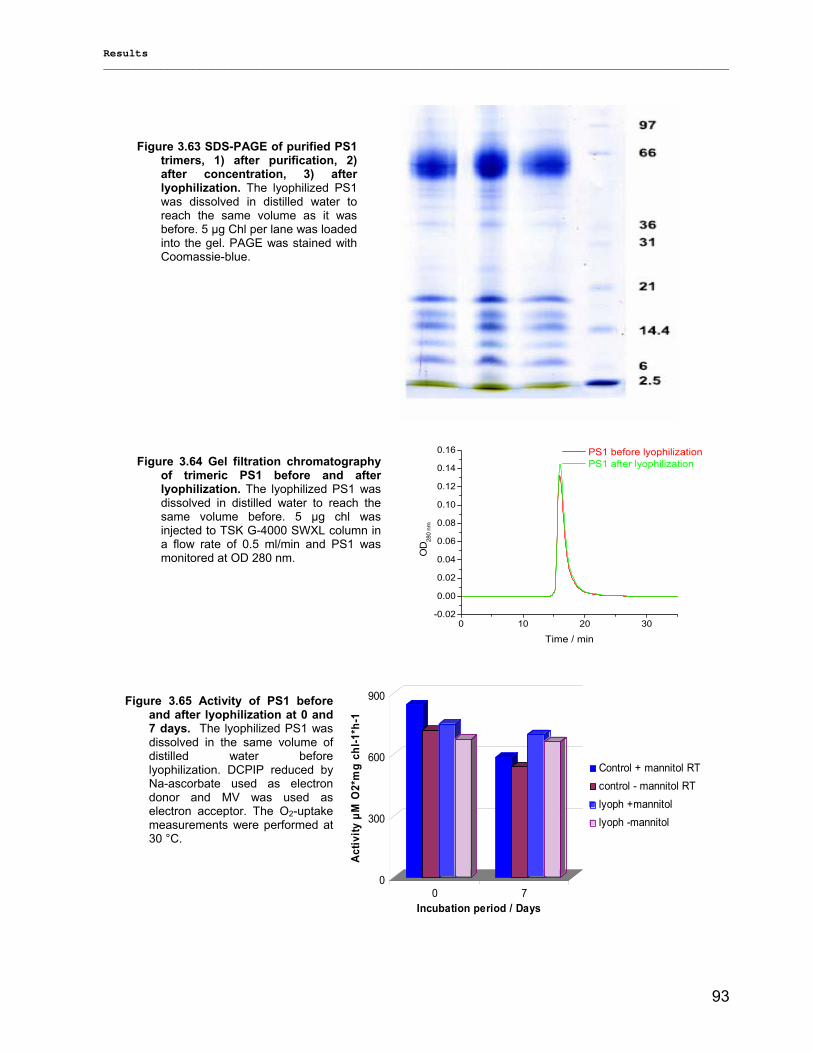
Results __________________________________________________________________________________________________
93
0 10 20 30-0.02
0.00
0.02
0.04
0.06
0.08
0.10
0.12
0.14
0.16
OD
280
nm
Time / min
PS1 before lyophilization PS1 after lyophilization
0
300
600
900
Activ
ity µ
M O
2*m
g ch
l-1*h
-1
0 7Incubation period / Days
Control + mannitol RTcontrol - mannitol RTlyoph +mannitollyoph -mannitol
Figure 3.63 SDS-PAGE of purified PS1 trimers, 1) after purification, 2) after concentration, 3) after lyophilization. The lyophilized PS1 was dissolved in distilled water to reach the same volume as it was before. 5 µg Chl per lane was loaded into the gel. PAGE was stained with Coomassie-blue.
Figure 3.64 Gel filtration chromatography of trimeric PS1 before and after lyophilization. The lyophilized PS1 was dissolved in distilled water to reach the same volume before. 5 µg chl was injected to TSK G-4000 SWXL column in a flow rate of 0.5 ml/min and PS1 was monitored at OD 280 nm.
Figure 3.65 Activity of PS1 before and after lyophilization at 0 and 7 days. The lyophilized PS1 was dissolved in the same volume of distilled water before lyophilization. DCPIP reduced by Na-ascorbate used as electron donor and MV was used as electron acceptor. The O2-uptake measurements were performed at 30 °C.
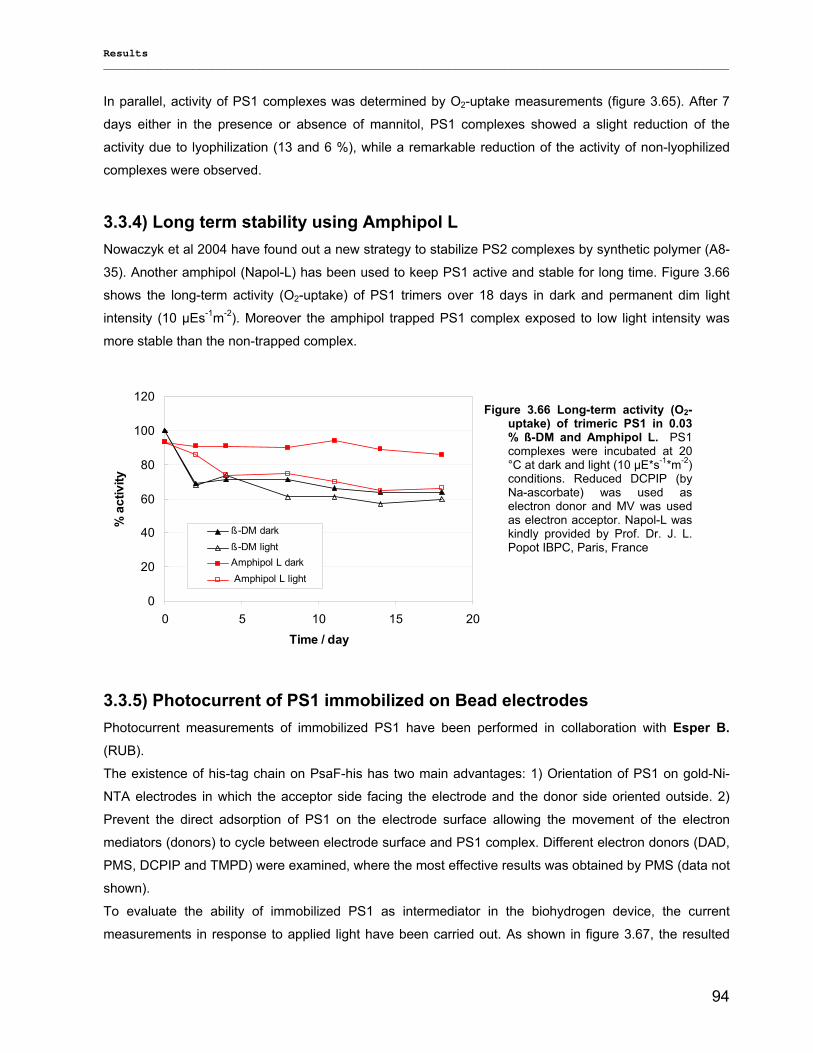
Results __________________________________________________________________________________________________
94
In parallel, activity of PS1 complexes was determined by O2-uptake measurements (figure 3.65). After 7
days either in the presence or absence of mannitol, PS1 complexes showed a slight reduction of the
activity due to lyophilization (13 and 6 %), while a remarkable reduction of the activity of non-lyophilized
complexes were observed.
3.3.4) Long term stability using Amphipol L Nowaczyk et al 2004 have found out a new strategy to stabilize PS2 complexes by synthetic polymer (A8-
35). Another amphipol (Napol-L) has been used to keep PS1 active and stable for long time. Figure 3.66
shows the long-term activity (O2-uptake) of PS1 trimers over 18 days in dark and permanent dim light
intensity (10 µEs-1m-2). Moreover the amphipol trapped PS1 complex exposed to low light intensity was
more stable than the non-trapped complex.
0
20
40
60
80
100
120
0 5 10 15 20Time / day
% a
ctiv
ity
ß-DM dark ß-DM lightAmphipol L dark Amphipol L light
3.3.5) Photocurrent of PS1 immobilized on Bead electrodes Photocurrent measurements of immobilized PS1 have been performed in collaboration with Esper B. (RUB). The existence of his-tag chain on PsaF-his has two main advantages: 1) Orientation of PS1 on gold-Ni-
NTA electrodes in which the acceptor side facing the electrode and the donor side oriented outside. 2)
Prevent the direct adsorption of PS1 on the electrode surface allowing the movement of the electron
mediators (donors) to cycle between electrode surface and PS1 complex. Different electron donors (DAD,
PMS, DCPIP and TMPD) were examined, where the most effective results was obtained by PMS (data not
shown).
To evaluate the ability of immobilized PS1 as intermediator in the biohydrogen device, the current
measurements in response to applied light have been carried out. As shown in figure 3.67, the resulted
Figure 3.66 Long-term activity (O2-uptake) of trimeric PS1 in 0.03 % ß-DM and Amphipol L. PS1 complexes were incubated at 20 °C at dark and light (10 µE*s-1*m-2) conditions. Reduced DCPIP (by Na-ascorbate) was used as electron donor and MV was used as electron acceptor. Napol-L was kindly provided by Prof. Dr. J. L. Popot IBPC, Paris, France
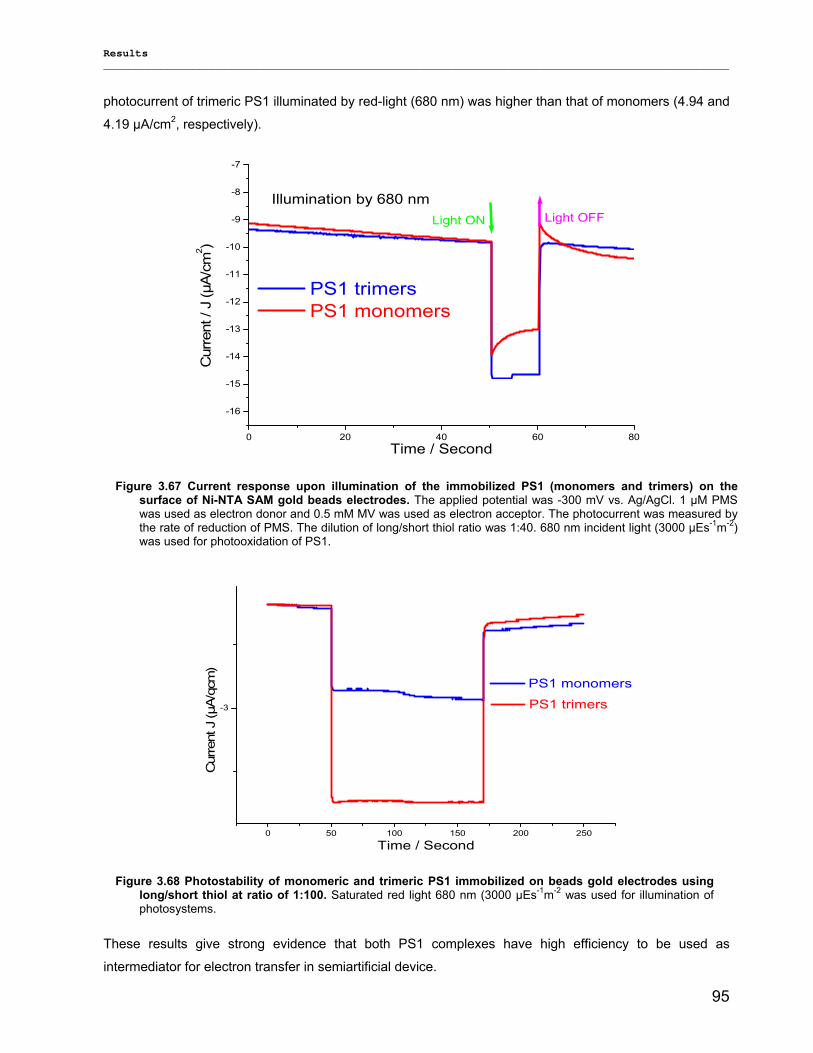
Results __________________________________________________________________________________________________
95
photocurrent of trimeric PS1 illuminated by red-light (680 nm) was higher than that of monomers (4.94 and
4.19 µA/cm2, respectively).
0 20 40 60 80
-16
-15
-14
-13
-12
-11
-10
-9
-8
-7
Illumination by 680 nmLight OFFLight ON
Cur
rent
/ J
(µA
/cm
2 )
Time / Second
PS1 trimers PS1 monomers
0 50 100 150 200 250
-3
PS1 monomers
Cur
rent
J (µ
A/q
cm)
Time / Second
PS1 trimers
These results give strong evidence that both PS1 complexes have high efficiency to be used as
intermediator for electron transfer in semiartificial device.
Figure 3.68 Photostability of monomeric and trimeric PS1 immobilized on beads gold electrodes using long/short thiol at ratio of 1:100. Saturated red light 680 nm (3000 µEs-1m-2 was used for illumination of photosystems.
Figure 3.67 Current response upon illumination of the immobilized PS1 (monomers and trimers) on the surface of Ni-NTA SAM gold beads electrodes. The applied potential was -300 mV vs. Ag/AgCl. 1 µM PMS was used as electron donor and 0.5 mM MV was used as electron acceptor. The photocurrent was measured by the rate of reduction of PMS. The dilution of long/short thiol ratio was 1:40. 680 nm incident light (3000 µEs-1m-2) was used for photooxidation of PS1.
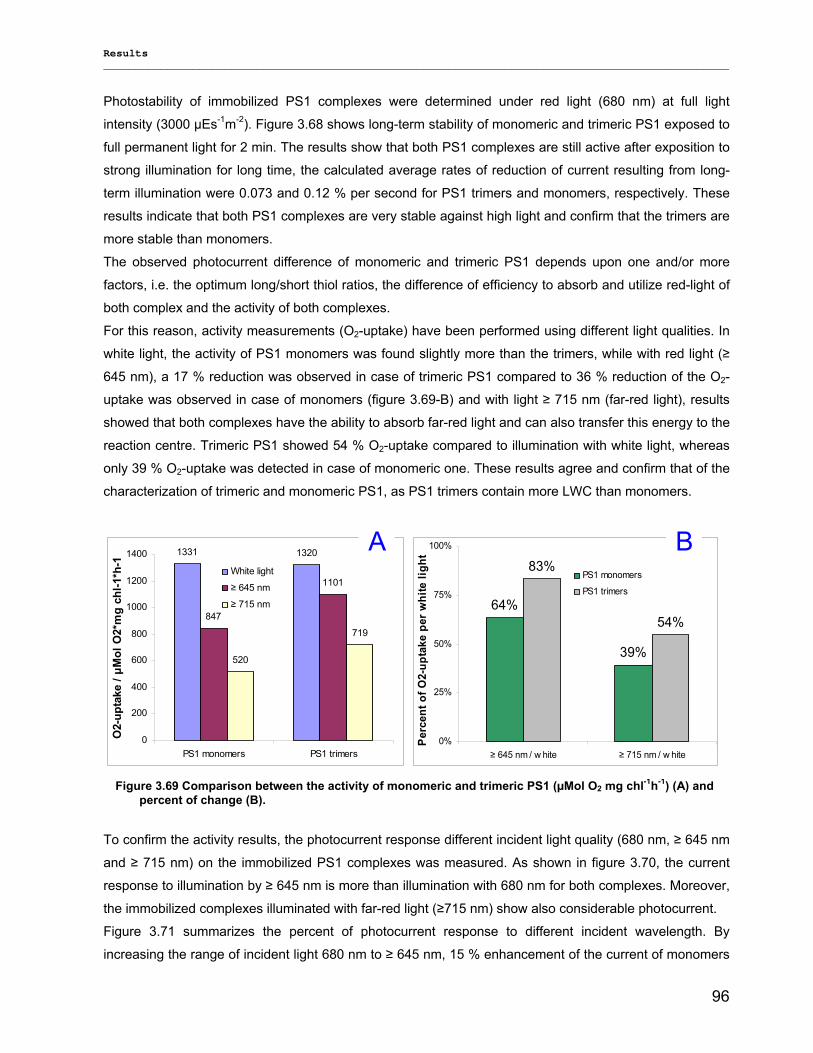
Results __________________________________________________________________________________________________
96
Photostability of immobilized PS1 complexes were determined under red light (680 nm) at full light
intensity (3000 µEs-1m-2). Figure 3.68 shows long-term stability of monomeric and trimeric PS1 exposed to
full permanent light for 2 min. The results show that both PS1 complexes are still active after exposition to
strong illumination for long time, the calculated average rates of reduction of current resulting from long-
term illumination were 0.073 and 0.12 % per second for PS1 trimers and monomers, respectively. These
results indicate that both PS1 complexes are very stable against high light and confirm that the trimers are
more stable than monomers.
The observed photocurrent difference of monomeric and trimeric PS1 depends upon one and/or more
factors, i.e. the optimum long/short thiol ratios, the difference of efficiency to absorb and utilize red-light of
both complex and the activity of both complexes.
For this reason, activity measurements (O2-uptake) have been performed using different light qualities. In
white light, the activity of PS1 monomers was found slightly more than the trimers, while with red light (≥
645 nm), a 17 % reduction was observed in case of trimeric PS1 compared to 36 % reduction of the O2-
uptake was observed in case of monomers (figure 3.69-B) and with light ≥ 715 nm (far-red light), results
showed that both complexes have the ability to absorb far-red light and can also transfer this energy to the
reaction centre. Trimeric PS1 showed 54 % O2-uptake compared to illumination with white light, whereas
only 39 % O2-uptake was detected in case of monomeric one. These results agree and confirm that of the
characterization of trimeric and monomeric PS1, as PS1 trimers contain more LWC than monomers.
1331 1320
847
1101
520
719
0
200
400
600
800
1000
1200
1400
PS1 monomers PS1 trimers
O2-
upta
ke /
µMol
O2*
mg
chl-1
*h-1
White light
≥ 645 nm
≥ 715 nm 64%
39%
83%
54%
0%
25%
50%
75%
100%
≥ 645 nm / w hite ≥ 715 nm / w hite
Perc
ent o
f O2-
upta
ke p
er w
hite
ligh
t
PS1 monomers
PS1 trimers
To confirm the activity results, the photocurrent response different incident light quality (680 nm, ≥ 645 nm
and ≥ 715 nm) on the immobilized PS1 complexes was measured. As shown in figure 3.70, the current
response to illumination by ≥ 645 nm is more than illumination with 680 nm for both complexes. Moreover,
the immobilized complexes illuminated with far-red light (≥715 nm) show also considerable photocurrent.
Figure 3.71 summarizes the percent of photocurrent response to different incident wavelength. By
increasing the range of incident light 680 nm to ≥ 645 nm, 15 % enhancement of the current of monomers
A B
Figure 3.69 Comparison between the activity of monomeric and trimeric PS1 (µMol O2 mg chl-1h-1) (A) and percent of change (B).
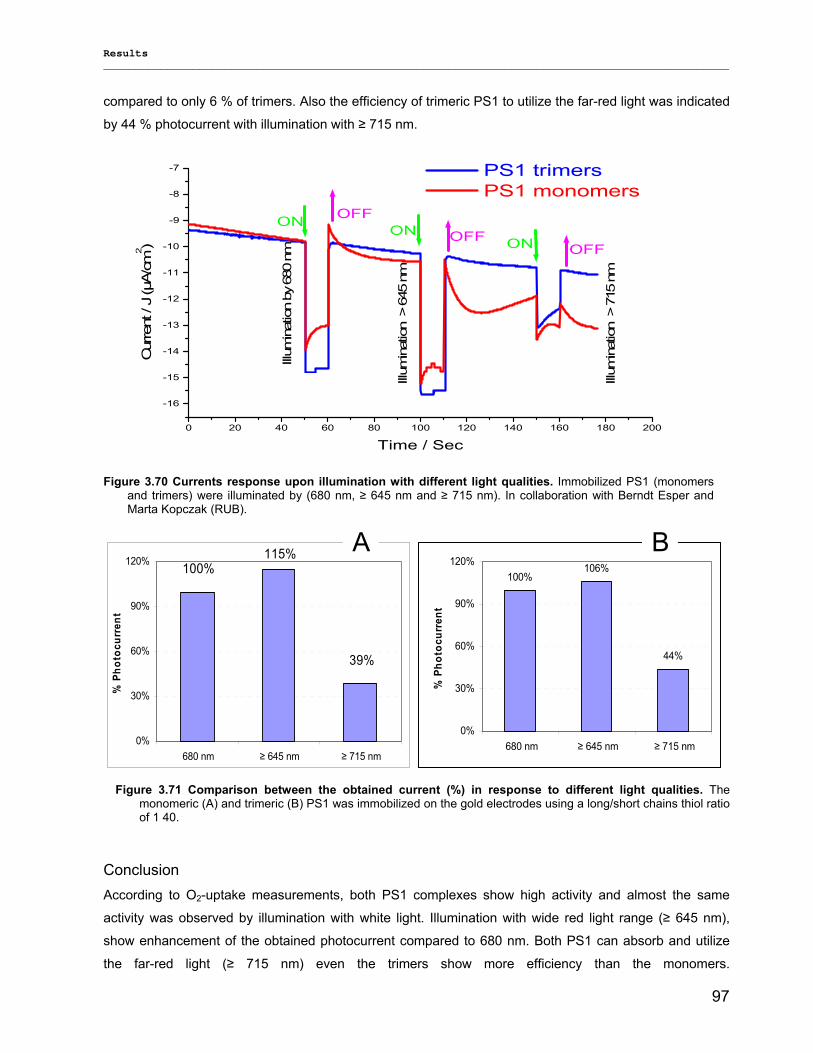
Results __________________________________________________________________________________________________
97
compared to only 6 % of trimers. Also the efficiency of trimeric PS1 to utilize the far-red light was indicated
by 44 % photocurrent with illumination with ≥ 715 nm.
0 20 40 60 80 100 120 140 160 180 200
-16
-15
-14
-13
-12
-11
-10
-9
-8
-7
OFF
OFFOFFON
ONON
Illum
inat
ion
> 7
15 n
m
Illum
inat
ion
> 6
45 n
m
Illum
inat
ion
by 6
80 n
m
Cur
rent
/ J
(µA/c
m2 )
Time / Sec
PS1 trimers PS1 monomers
39%
115%100%
0%
30%
60%
90%
120%
680 nm ≥ 645 nm ≥ 715 nm
% P
hoto
curr
ent
100%106%
44%
0%
30%
60%
90%
120%
680 nm ≥ 645 nm ≥ 715 nm
% P
hoto
curr
ent
Conclusion According to O2-uptake measurements, both PS1 complexes show high activity and almost the same
activity was observed by illumination with white light. Illumination with wide red light range (≥ 645 nm),
show enhancement of the obtained photocurrent compared to 680 nm. Both PS1 can absorb and utilize
the far-red light (≥ 715 nm) even the trimers show more efficiency than the monomers.
Figure 3.70 Currents response upon illumination with different light qualities. Immobilized PS1 (monomers and trimers) were illuminated by (680 nm, ≥ 645 nm and ≥ 715 nm). In collaboration with Berndt Esper and Marta Kopczak (RUB).
A B
Figure 3.71 Comparison between the obtained current (%) in response to different light qualities. The monomeric (A) and trimeric (B) PS1 was immobilized on the gold electrodes using a long/short chains thiol ratio of 1 40.
Discussion __________________________________________________________________________________________________
98
4) Discussion 4.1) Modified preparations of PS1 monomers and trimers: Are monomers an artifact? 4.1.1) New insight into trimeric PS1 preparations Photosystem 1 exists in vivo in both trimeric and monomeric form. The dominance and stability of the
oligomeric state varies with the environmental conditions (light and nutrition supply). Karapetyan and co-
workers gave the first direct evidence that trimeric PS1 is not an artifact (Shubin et al. 1992 & 1993).
The stability of trimeric PS1 is established through the interaction of constituent polypeptides of each
monomer with each other and with the attached co-factors that explains why PS1 from T. elongatus is
mainly isolated as trimers.
Biochemical and biophysical investigations of trimeric PS1 pointed to the importance of the electrostatic
force generated in the monomer-monomer interface and the attached cofactors on stabilization of trimeric
complexes. Three hydrophobic subunits (PsaL, PsaM and PsaI) were found to be the main requirements
for the trimerization process (figure 4.1) (Fromme and Grotjohann 2006; Grotjohann & Fromme 2005;
Fromme et al. 2003a; Jordan P. et al. 2001; Schluchter et al. 1996 and Xu et al. 1995).
A confirmation for the role of carotenoids in the stability of trimeric PS1 was investigated by Hladik et al.
1982, who reported that extraction of carotenoids with n-heptan resulted in isolation of PS1 only in
monomeric form.
In 1966, the first efficient separation of PS1 by various methods like sonication, or by detergent such as
digitonin (Anderson and Boardman 1966 and Wessels 1966), Triton X-100 (Vernon et al. 1966) and SDS
(Ogawa et al. 1966) has been reported. The problem of these preparations was their enrichment with
cytb6f.
Relatively, well purified PS1 complex from higher plants (100 Chl a per P700) was reported by Bengis &
Nelson (1975) and Nelson & Ben-Shem (2002). Pure and stable PS1 trimers from cyanobacteria,
especially S. elongatus (T. elongatus) and Synechocystis were published by Newman and Sherman
(1978); Wynn et al. (1978) and Rögner et al. (1990 a&b); which give the conclusion that ß-DM is the best
detergent for extraction and solubilization of PS1.
Rögner and co-workers were the first who used the high-performance liquid chromatography (HPLC) as
final purification step (Boekema et al. 1987; Rögner et at. 1990 a&b; and Wenk and Kruip 2000). Further
improvement towards crystallization was achieved by Fromme and Witt (1998); Fromme (1998) and
Jordan et al. (2001). While most protocols depend on sucrose gradient (18-22 hours) for pre-separation of
the photosynthetic complexes (PS2 and PBS) from PS1 (Kruip et al. 1997 & 1993; Shen et al. 2002 and
Jekow et al. 1995), omitting this step was reported by Wenk and Kruip (2000) for Synechocystis. Strategy
of this work depends on the reduction of PS2 and phycobilin content by two washing steps before the
extraction of PS1, followed by HIC as the first chromatographic step, which enabled to reduce the
purification time to about 15 hours (compared to 32-36 hours of the traditional methods).
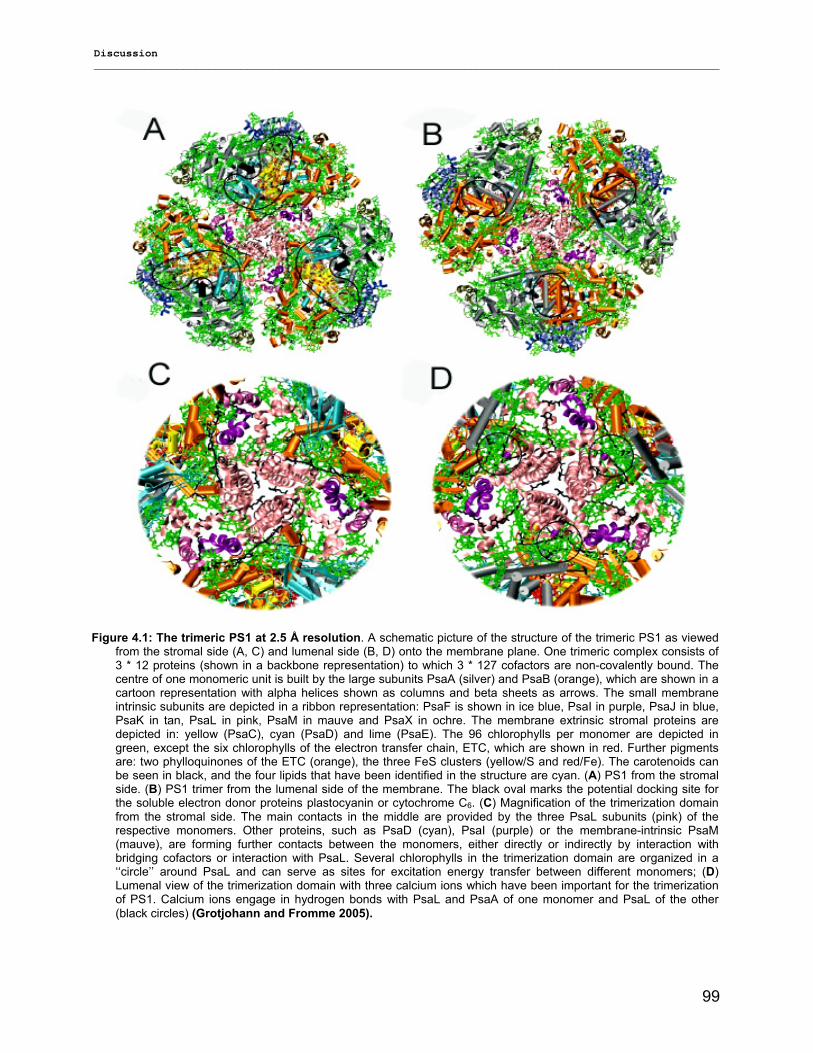
Discussion __________________________________________________________________________________________________
99
Figure 4.1: The trimeric PS1 at 2.5 Å resolution. A schematic picture of the structure of the trimeric PS1 as viewed from the stromal side (A, C) and lumenal side (B, D) onto the membrane plane. One trimeric complex consists of 3 * 12 proteins (shown in a backbone representation) to which 3 * 127 cofactors are non-covalently bound. The centre of one monomeric unit is built by the large subunits PsaA (silver) and PsaB (orange), which are shown in a cartoon representation with alpha helices shown as columns and beta sheets as arrows. The small membrane intrinsic subunits are depicted in a ribbon representation: PsaF is shown in ice blue, PsaI in purple, PsaJ in blue, PsaK in tan, PsaL in pink, PsaM in mauve and PsaX in ochre. The membrane extrinsic stromal proteins are depicted in: yellow (PsaC), cyan (PsaD) and lime (PsaE). The 96 chlorophylls per monomer are depicted in green, except the six chlorophylls of the electron transfer chain, ETC, which are shown in red. Further pigments are: two phylloquinones of the ETC (orange), the three FeS clusters (yellow/S and red/Fe). The carotenoids can be seen in black, and the four lipids that have been identified in the structure are cyan. (A) PS1 from the stromal side. (B) PS1 trimer from the lumenal side of the membrane. The black oval marks the potential docking site for the soluble electron donor proteins plastocyanin or cytochrome C6. (C) Magnification of the trimerization domain from the stromal side. The main contacts in the middle are provided by the three PsaL subunits (pink) of the respective monomers. Other proteins, such as PsaD (cyan), PsaI (purple) or the membrane-intrinsic PsaM (mauve), are forming further contacts between the monomers, either directly or indirectly by interaction with bridging cofactors or interaction with PsaL. Several chlorophylls in the trimerization domain are organized in a ‘‘circle’’ around PsaL and can serve as sites for excitation energy transfer between different monomers; (D) Lumenal view of the trimerization domain with three calcium ions which have been important for the trimerization of PS1. Calcium ions engage in hydrogen bonds with PsaL and PsaA of one monomer and PsaL of the other (black circles) (Grotjohann and Fromme 2005).
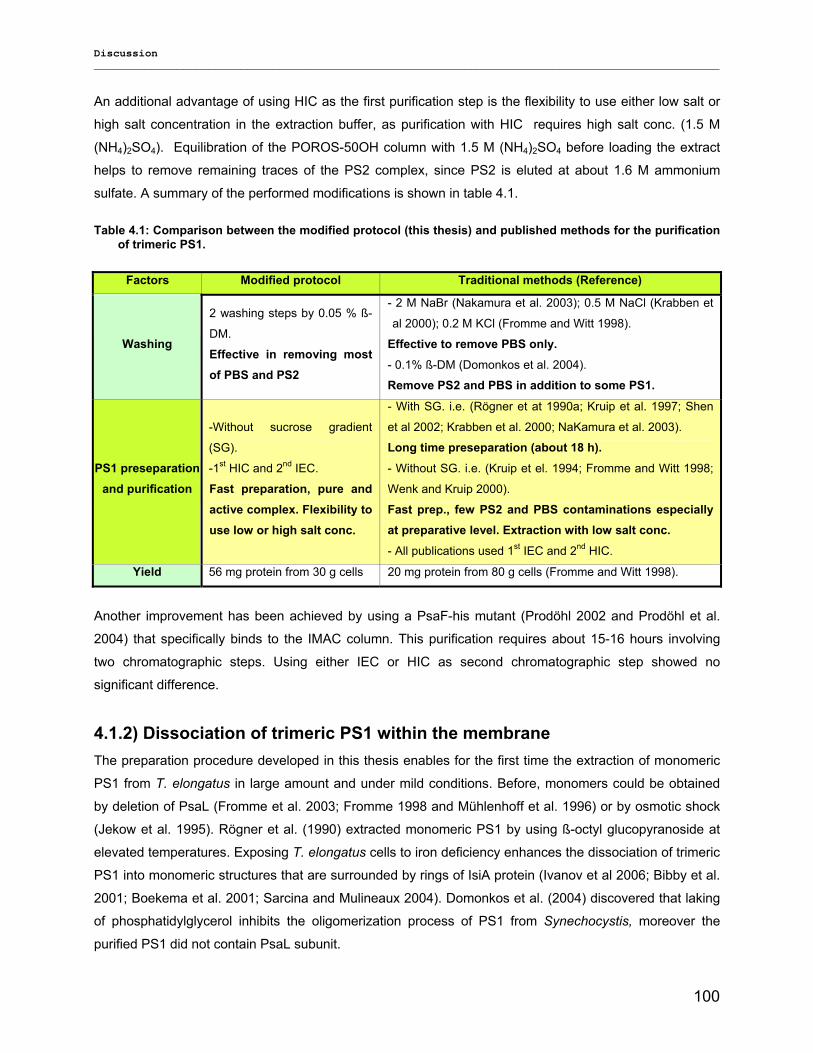
Discussion __________________________________________________________________________________________________
100
An additional advantage of using HIC as the first purification step is the flexibility to use either low salt or
high salt concentration in the extraction buffer, as purification with HIC requires high salt conc. (1.5 M
(NH4)2SO4). Equilibration of the POROS-50OH column with 1.5 M (NH4)2SO4 before loading the extract
helps to remove remaining traces of the PS2 complex, since PS2 is eluted at about 1.6 M ammonium
sulfate. A summary of the performed modifications is shown in table 4.1.
Factors Modified protocol Traditional methods (Reference)
Washing
2 washing steps by 0.05 % ß-
DM.
Effective in removing most of PBS and PS2
- 2 M NaBr (Nakamura et al. 2003); 0.5 M NaCl (Krabben et
al 2000); 0.2 M KCl (Fromme and Witt 1998). Effective to remove PBS only.
- 0.1% ß-DM (Domonkos et al. 2004).
Remove PS2 and PBS in addition to some PS1.
PS1 preseparation and purification
-Without sucrose gradient
(SG).
-1st HIC and 2nd IEC.
Fast preparation, pure and active complex. Flexibility to use low or high salt conc.
- With SG. i.e. (Rögner et at 1990a; Kruip et al. 1997; Shen
et al 2002; Krabben et al. 2000; NaKamura et al. 2003).
Long time preseparation (about 18 h).
- Without SG. i.e. (Kruip et el. 1994; Fromme and Witt 1998;
Wenk and Kruip 2000).
Fast prep., few PS2 and PBS contaminations especially at preparative level. Extraction with low salt conc.
- All publications used 1st IEC and 2nd HIC.
Yield 56 mg protein from 30 g cells 20 mg protein from 80 g cells (Fromme and Witt 1998).
Another improvement has been achieved by using a PsaF-his mutant (Prodöhl 2002 and Prodöhl et al.
2004) that specifically binds to the IMAC column. This purification requires about 15-16 hours involving
two chromatographic steps. Using either IEC or HIC as second chromatographic step showed no
significant difference.
4.1.2) Dissociation of trimeric PS1 within the membrane The preparation procedure developed in this thesis enables for the first time the extraction of monomeric
PS1 from T. elongatus in large amount and under mild conditions. Before, monomers could be obtained
by deletion of PsaL (Fromme et al. 2003; Fromme 1998 and Mühlenhoff et al. 1996) or by osmotic shock
(Jekow et al. 1995). Rögner et al. (1990) extracted monomeric PS1 by using ß-octyl glucopyranoside at
elevated temperatures. Exposing T. elongatus cells to iron deficiency enhances the dissociation of trimeric
PS1 into monomeric structures that are surrounded by rings of IsiA protein (Ivanov et al 2006; Bibby et al.
2001; Boekema et al. 2001; Sarcina and Mulineaux 2004). Domonkos et al. (2004) discovered that laking
of phosphatidylglycerol inhibits the oligomerization process of PS1 from Synechocystis, moreover the
purified PS1 did not contain PsaL subunit.
Table 4.1: Comparison between the modified protocol (this thesis) and published methods for the purification of trimeric PS1.
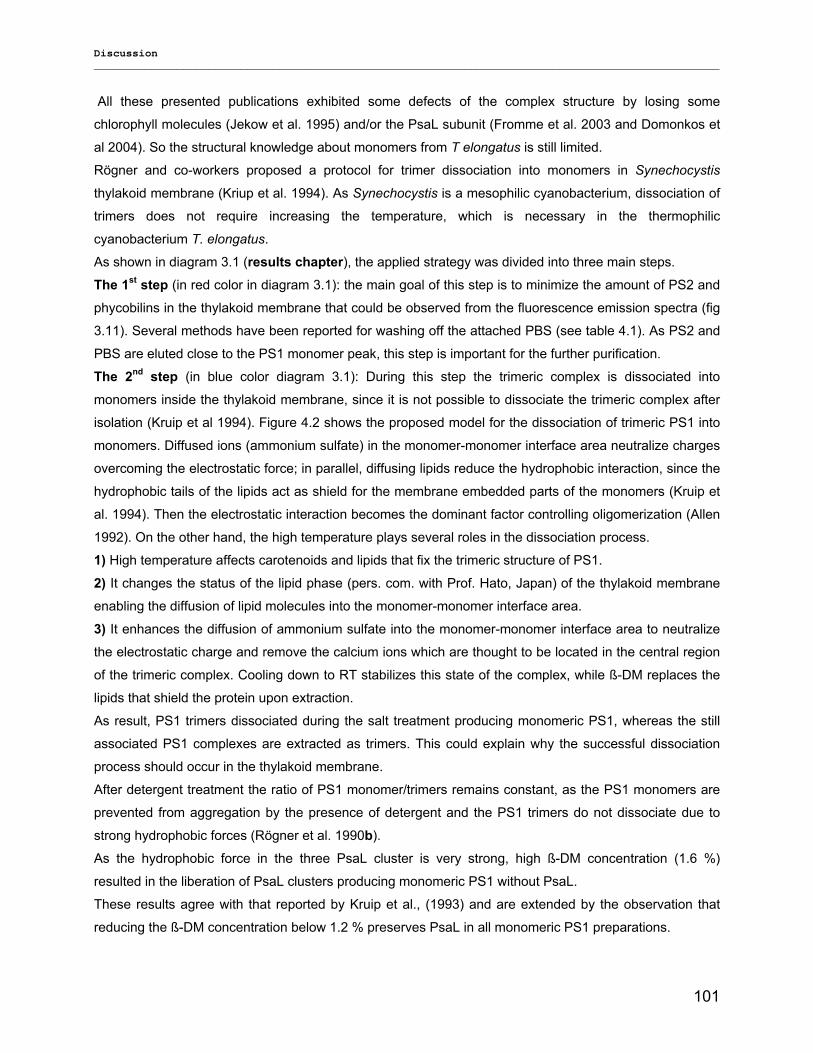
Discussion __________________________________________________________________________________________________
101
All these presented publications exhibited some defects of the complex structure by losing some
chlorophyll molecules (Jekow et al. 1995) and/or the PsaL subunit (Fromme et al. 2003 and Domonkos et
al 2004). So the structural knowledge about monomers from T elongatus is still limited.
Rögner and co-workers proposed a protocol for trimer dissociation into monomers in Synechocystis
thylakoid membrane (Kriup et al. 1994). As Synechocystis is a mesophilic cyanobacterium, dissociation of
trimers does not require increasing the temperature, which is necessary in the thermophilic
cyanobacterium T. elongatus.
As shown in diagram 3.1 (results chapter), the applied strategy was divided into three main steps.
The 1st step (in red color in diagram 3.1): the main goal of this step is to minimize the amount of PS2 and
phycobilins in the thylakoid membrane that could be observed from the fluorescence emission spectra (fig
3.11). Several methods have been reported for washing off the attached PBS (see table 4.1). As PS2 and
PBS are eluted close to the PS1 monomer peak, this step is important for the further purification.
The 2nd step (in blue color diagram 3.1): During this step the trimeric complex is dissociated into
monomers inside the thylakoid membrane, since it is not possible to dissociate the trimeric complex after
isolation (Kruip et al 1994). Figure 4.2 shows the proposed model for the dissociation of trimeric PS1 into
monomers. Diffused ions (ammonium sulfate) in the monomer-monomer interface area neutralize charges
overcoming the electrostatic force; in parallel, diffusing lipids reduce the hydrophobic interaction, since the
hydrophobic tails of the lipids act as shield for the membrane embedded parts of the monomers (Kruip et
al. 1994). Then the electrostatic interaction becomes the dominant factor controlling oligomerization (Allen
1992). On the other hand, the high temperature plays several roles in the dissociation process. 1) High temperature affects carotenoids and lipids that fix the trimeric structure of PS1.
2) It changes the status of the lipid phase (pers. com. with Prof. Hato, Japan) of the thylakoid membrane
enabling the diffusion of lipid molecules into the monomer-monomer interface area.
3) It enhances the diffusion of ammonium sulfate into the monomer-monomer interface area to neutralize
the electrostatic charge and remove the calcium ions which are thought to be located in the central region
of the trimeric complex. Cooling down to RT stabilizes this state of the complex, while ß-DM replaces the
lipids that shield the protein upon extraction.
As result, PS1 trimers dissociated during the salt treatment producing monomeric PS1, whereas the still
associated PS1 complexes are extracted as trimers. This could explain why the successful dissociation
process should occur in the thylakoid membrane.
After detergent treatment the ratio of PS1 monomer/trimers remains constant, as the PS1 monomers are
prevented from aggregation by the presence of detergent and the PS1 trimers do not dissociate due to
strong hydrophobic forces (Rögner et al. 1990b).
As the hydrophobic force in the three PsaL cluster is very strong, high ß-DM concentration (1.6 %)
resulted in the liberation of PsaL clusters producing monomeric PS1 without PsaL.
These results agree with that reported by Kruip et al., (1993) and are extended by the observation that
reducing the ß-DM concentration below 1.2 % preserves PsaL in all monomeric PS1 preparations.
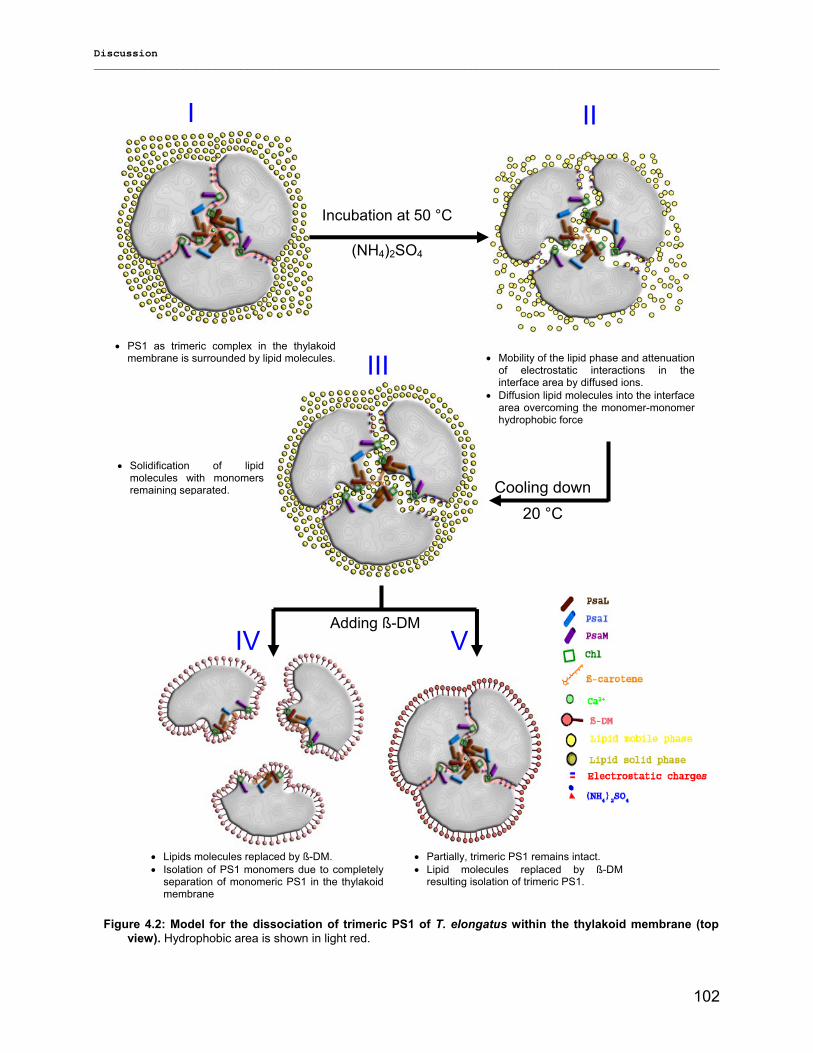
Discussion __________________________________________________________________________________________________
102
I II
III
IV V
Incubation at 50 °C
(NH4)2SO4
Cooling down 20 °C
Adding ß-DM
• PS1 as trimeric complex in the thylakoid membrane is surrounded by lipid molecules. • Mobility of the lipid phase and attenuation
of electrostatic interactions in the interface area by diffused ions.
• Diffusion lipid molecules into the interface area overcoming the monomer-monomer hydrophobic force
• Solidification of lipid molecules with monomers remaining separated.
• Lipids molecules replaced by ß-DM. • Isolation of PS1 monomers due to completely
separation of monomeric PS1 in the thylakoid membrane
• Partially, trimeric PS1 remains intact. • Lipid molecules replaced by ß-DM
resulting isolation of trimeric PS1.
Figure 4.2: Model for the dissociation of trimeric PS1 of T. elongatus within the thylakoid membrane (top view). Hydrophobic area is shown in light red.
Discussion __________________________________________________________________________________________________
103
The 3rd step (in green color, diagram 3.1) i.e., by the presence of detergent chromatographic purification.
Starting with HIC yields optimal conditions for the purification of +SE PS1, as a reduction of the high salt
concentration (0.6-0.8 M ammonium sulfate) is not required. Although, HIC as first chromatographic step
for PS1 purification has not been reported before, it was very efficient for the separation of monomers and
trimers from WT and his-tagged mutant after IMAC.
As controlled by sucrose gradient and estimated by HIC, the monomer/trimer ratio depends directly on the
concentration of ammonium sulfate in combination with temperature effect.
4.1.2) Untreated monomeric PS1 An additional strategy for purification of monomeric PS1 without any special treatment is very important for
the investigation of its native structure in the cells. Although the extraction of untreated (–SE) PS1 is
accompanied by a high amount of PS2 and phycobilins, this problem was overcome by the ammonium
sulfate precipitation of phycobilins and the equilibration of the HIC column with 1.5 M ammonium sulfate;
this was the best strategy to remove remaining PS2. The most probable reasons for the previously very
limited publications of untreated monomeric PS1 from T. elongatus are its existence in low amount in the
cells (Grotjohann and Fromme 2005), its loss by washing with 0.1 % ß-DM (Domonkos et al. 2004) and /
or the overlay of monomeric PS1 with the PS2 band in the sucrose gradient (traditional protocols).
Not only speed up of the preparation time or the production of monomeric complex is important, but also
the fact that these complexes are in high quality and activity. For this reason, an evaluation of the
prepared complexes is necessary.
The polypeptides composition of our purified PS1 monomers (-SE & +SE) and trimers was investigated by
several techniques (SDS-PAGE, immuno-blot and mass-spectrometry). All PS1 subunits known from the
X-ray structure were identified. The obtained identical mass-spectra of monomers (+SE and -SE) confirm
the efficiency of our modified and developed methods and indicate that the complete biosynthesis of PS1
should occur before the oligomerization process.
Although PsaL is highly hydrophobic with a quite high molecular weight (16.251 kDa) and although it was
lost in most monomer preparations from T. elongatus (Rögner et al., 1990b and Fromme and Witt 1998), it
was detected in all our monomeric complexes. The existence of all PS1 subunits is a prerequisite for the
incorporation of monomers (either –SE or +SE) into proteoliposomes in order to form PS1 trimers in vitro
(Kruip et al 1999).
The identification of two molecular masses of PsaF (initial and mature) explains why only 30 % of PsaF
was his-tagged mutated, since the histidine chain binds only to the N-terminus of unprocessed PsaF. On
the other hand, the existence of both unprocessed and mature PsaF within trimers poses the question: is
it genetically or environmentally induced?
Also, are the post-translation modifications in all PS1 subunits except PsaM, processed physiologically
important?
These two questions can not be answered here, but they are very important for future investigations.
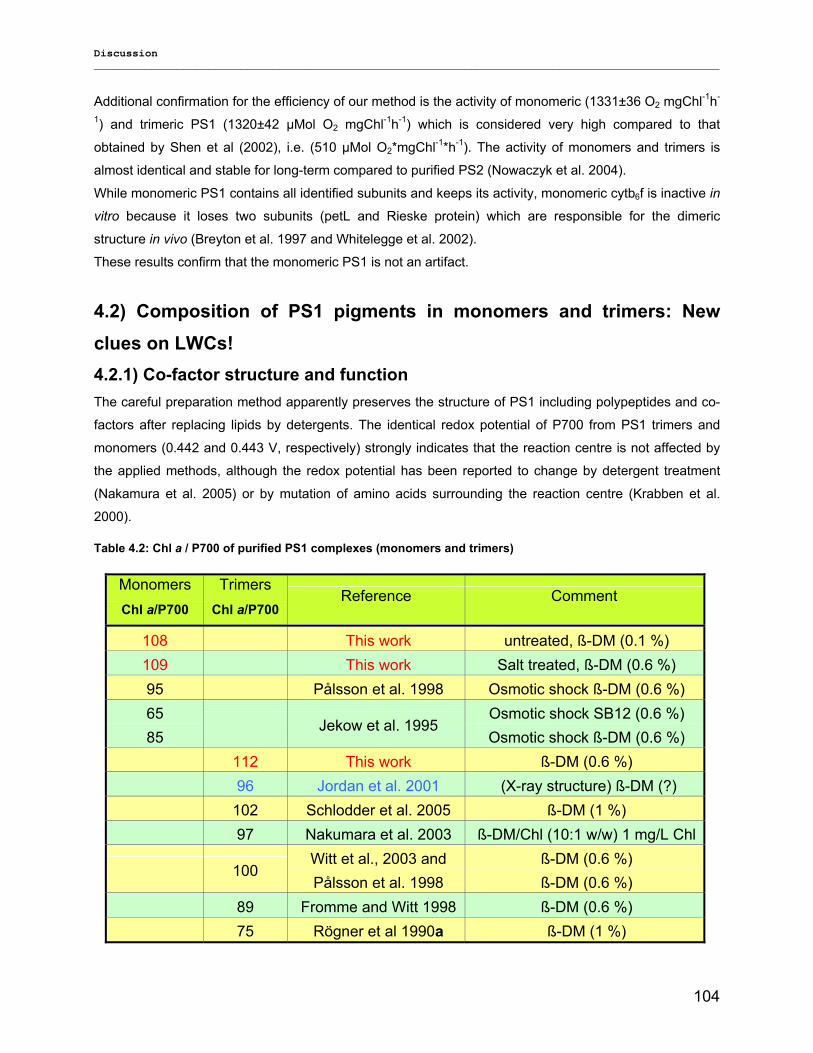
Discussion __________________________________________________________________________________________________
104
Additional confirmation for the efficiency of our method is the activity of monomeric (1331±36 O2 mgChl-1h-
1) and trimeric PS1 (1320±42 µMol O2 mgChl-1h-1) which is considered very high compared to that
obtained by Shen et al (2002), i.e. (510 µMol O2*mgChl-1*h-1). The activity of monomers and trimers is
almost identical and stable for long-term compared to purified PS2 (Nowaczyk et al. 2004).
While monomeric PS1 contains all identified subunits and keeps its activity, monomeric cytb6f is inactive in
vitro because it loses two subunits (petL and Rieske protein) which are responsible for the dimeric
structure in vivo (Breyton et al. 1997 and Whitelegge et al. 2002).
These results confirm that the monomeric PS1 is not an artifact.
4.2) Composition of PS1 pigments in monomers and trimers: New clues on LWCs! 4.2.1) Co-factor structure and function The careful preparation method apparently preserves the structure of PS1 including polypeptides and co-
factors after replacing lipids by detergents. The identical redox potential of P700 from PS1 trimers and
monomers (0.442 and 0.443 V, respectively) strongly indicates that the reaction centre is not affected by
the applied methods, although the redox potential has been reported to change by detergent treatment
(Nakamura et al. 2005) or by mutation of amino acids surrounding the reaction centre (Krabben et al.
2000).
Monomers Chl a/P700
Trimers Chl a/P700
Reference Comment
108 This work untreated, ß-DM (0.1 %) 109 This work Salt treated, ß-DM (0.6 %) 95 Pålsson et al. 1998 Osmotic shock ß-DM (0.6 %) 65 85
Jekow et al. 1995 Osmotic shock SB12 (0.6 %) Osmotic shock ß-DM (0.6 %)
112 This work ß-DM (0.6 %) 96 Jordan et al. 2001 (X-ray structure) ß-DM (?) 102 Schlodder et al. 2005 ß-DM (1 %) 97 Nakumara et al. 2003 ß-DM/Chl (10:1 w/w) 1 mg/L Chl
100 Witt et al., 2003 and Pålsson et al. 1998
ß-DM (0.6 %) ß-DM (0.6 %)
89 Fromme and Witt 1998 ß-DM (0.6 %) 75 Rögner et al 1990a ß-DM (1 %)
Table 4.2: Chl a / P700 of purified PS1 complexes (monomers and trimers)
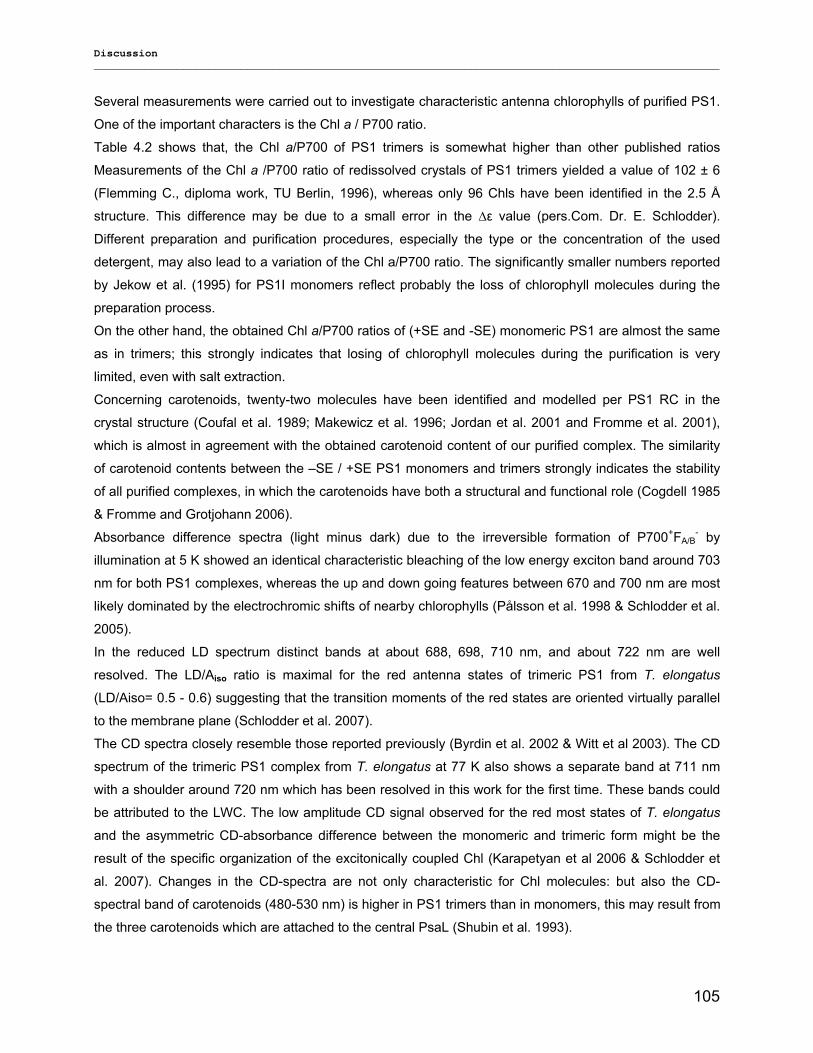
Discussion __________________________________________________________________________________________________
105
Several measurements were carried out to investigate characteristic antenna chlorophylls of purified PS1.
One of the important characters is the Chl a / P700 ratio.
Table 4.2 shows that, the Chl a/P700 of PS1 trimers is somewhat higher than other published ratios
Measurements of the Chl a /P700 ratio of redissolved crystals of PS1 trimers yielded a value of 102 ± 6
(Flemming C., diploma work, TU Berlin, 1996), whereas only 96 Chls have been identified in the 2.5 Å
structure. This difference may be due to a small error in the ∆ε value (pers.Com. Dr. E. Schlodder).
Different preparation and purification procedures, especially the type or the concentration of the used
detergent, may also lead to a variation of the Chl a/P700 ratio. The significantly smaller numbers reported
by Jekow et al. (1995) for PS1I monomers reflect probably the loss of chlorophyll molecules during the
preparation process.
On the other hand, the obtained Chl a/P700 ratios of (+SE and -SE) monomeric PS1 are almost the same
as in trimers; this strongly indicates that losing of chlorophyll molecules during the purification is very
limited, even with salt extraction.
Concerning carotenoids, twenty-two molecules have been identified and modelled per PS1 RC in the
crystal structure (Coufal et al. 1989; Makewicz et al. 1996; Jordan et al. 2001 and Fromme et al. 2001),
which is almost in agreement with the obtained carotenoid content of our purified complex. The similarity
of carotenoid contents between the –SE / +SE PS1 monomers and trimers strongly indicates the stability
of all purified complexes, in which the carotenoids have both a structural and functional role (Cogdell 1985
& Fromme and Grotjohann 2006). Absorbance difference spectra (light minus dark) due to the irreversible formation of P700+FA/B
- by
illumination at 5 K showed an identical characteristic bleaching of the low energy exciton band around 703
nm for both PS1 complexes, whereas the up and down going features between 670 and 700 nm are most
likely dominated by the electrochromic shifts of nearby chlorophylls (Pålsson et al. 1998 & Schlodder et al.
2005).
In the reduced LD spectrum distinct bands at about 688, 698, 710 nm, and about 722 nm are well
resolved. The LD/Aiso ratio is maximal for the red antenna states of trimeric PS1 from T. elongatus
(LD/Aiso= 0.5 - 0.6) suggesting that the transition moments of the red states are oriented virtually parallel
to the membrane plane (Schlodder et al. 2007).
The CD spectra closely resemble those reported previously (Byrdin et al. 2002 & Witt et al 2003). The CD
spectrum of the trimeric PS1 complex from T. elongatus at 77 K also shows a separate band at 711 nm
with a shoulder around 720 nm which has been resolved in this work for the first time. These bands could
be attributed to the LWC. The low amplitude CD signal observed for the red most states of T. elongatus
and the asymmetric CD-absorbance difference between the monomeric and trimeric form might be the
result of the specific organization of the excitonically coupled Chl (Karapetyan et al 2006 & Schlodder et
al. 2007). Changes in the CD-spectra are not only characteristic for Chl molecules: but also the CD-
spectral band of carotenoids (480-530 nm) is higher in PS1 trimers than in monomers, this may result from
the three carotenoids which are attached to the central PsaL (Shubin et al. 1993).
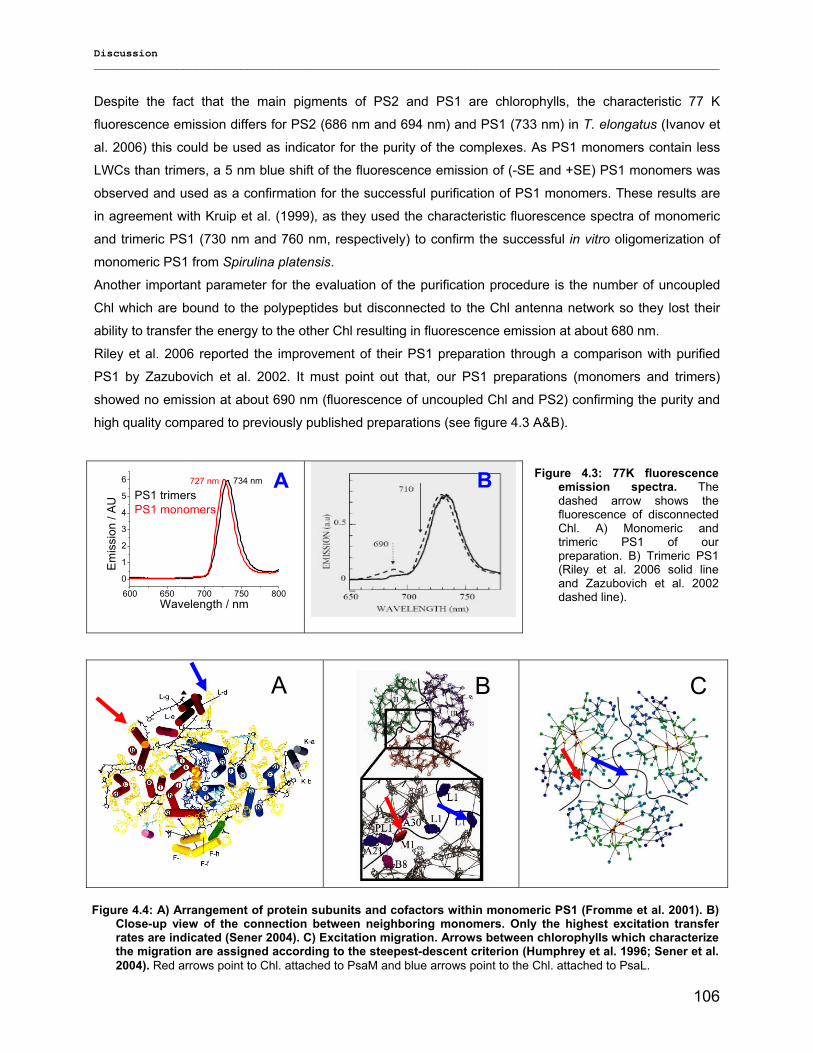
Discussion __________________________________________________________________________________________________
106
Despite the fact that the main pigments of PS2 and PS1 are chlorophylls, the characteristic 77 K
fluorescence emission differs for PS2 (686 nm and 694 nm) and PS1 (733 nm) in T. elongatus (Ivanov et
al. 2006) this could be used as indicator for the purity of the complexes. As PS1 monomers contain less
LWCs than trimers, a 5 nm blue shift of the fluorescence emission of (-SE and +SE) PS1 monomers was
observed and used as a confirmation for the successful purification of PS1 monomers. These results are
in agreement with Kruip et al. (1999), as they used the characteristic fluorescence spectra of monomeric
and trimeric PS1 (730 nm and 760 nm, respectively) to confirm the successful in vitro oligomerization of
monomeric PS1 from Spirulina platensis.
Another important parameter for the evaluation of the purification procedure is the number of uncoupled
Chl which are bound to the polypeptides but disconnected to the Chl antenna network so they lost their
ability to transfer the energy to the other Chl resulting in fluorescence emission at about 680 nm.
Riley et al. 2006 reported the improvement of their PS1 preparation through a comparison with purified
PS1 by Zazubovich et al. 2002. It must point out that, our PS1 preparations (monomers and trimers)
showed no emission at about 690 nm (fluorescence of uncoupled Chl and PS2) confirming the purity and
high quality compared to previously published preparations (see figure 4.3 A&B).
600 650 700 750 800
0
1
2
3
4
5
6 734 nm
Em
issi
on /
AU
Wavelength / nm
PS1 trimers PS1 monomers
727 nm
Figure 4.3: 77K fluorescence emission spectra. The dashed arrow shows the fluorescence of disconnected Chl. A) Monomeric and trimeric PS1 of our preparation. B) Trimeric PS1 (Riley et al. 2006 solid line and Zazubovich et al. 2002 dashed line).
Figure 4.4: A) Arrangement of protein subunits and cofactors within monomeric PS1 (Fromme et al. 2001). B) Close-up view of the connection between neighboring monomers. Only the highest excitation transfer rates are indicated (Sener 2004). C) Excitation migration. Arrows between chlorophylls which characterize the migration are assigned according to the steepest-descent criterion (Humphrey et al. 1996; Sener et al. 2004). Red arrows point to Chl. attached to PsaM and blue arrows point to the Chl. attached to PsaL.
A B C
A B
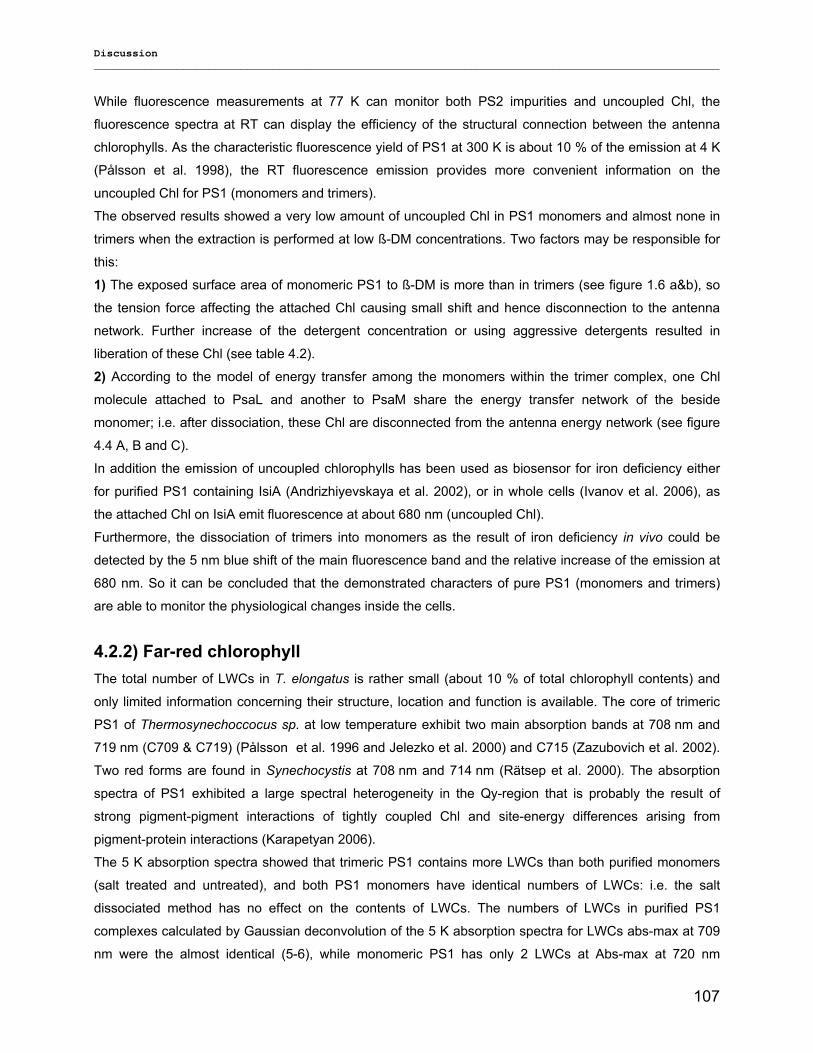
Discussion __________________________________________________________________________________________________
107
While fluorescence measurements at 77 K can monitor both PS2 impurities and uncoupled Chl, the
fluorescence spectra at RT can display the efficiency of the structural connection between the antenna
chlorophylls. As the characteristic fluorescence yield of PS1 at 300 K is about 10 % of the emission at 4 K
(Pålsson et al. 1998), the RT fluorescence emission provides more convenient information on the
uncoupled Chl for PS1 (monomers and trimers).
The observed results showed a very low amount of uncoupled Chl in PS1 monomers and almost none in
trimers when the extraction is performed at low ß-DM concentrations. Two factors may be responsible for
this:
1) The exposed surface area of monomeric PS1 to ß-DM is more than in trimers (see figure 1.6 a&b), so
the tension force affecting the attached Chl causing small shift and hence disconnection to the antenna
network. Further increase of the detergent concentration or using aggressive detergents resulted in
liberation of these Chl (see table 4.2).
2) According to the model of energy transfer among the monomers within the trimer complex, one Chl
molecule attached to PsaL and another to PsaM share the energy transfer network of the beside
monomer; i.e. after dissociation, these Chl are disconnected from the antenna energy network (see figure
4.4 A, B and C).
In addition the emission of uncoupled chlorophylls has been used as biosensor for iron deficiency either
for purified PS1 containing IsiA (Andrizhiyevskaya et al. 2002), or in whole cells (Ivanov et al. 2006), as
the attached Chl on IsiA emit fluorescence at about 680 nm (uncoupled Chl).
Furthermore, the dissociation of trimers into monomers as the result of iron deficiency in vivo could be
detected by the 5 nm blue shift of the main fluorescence band and the relative increase of the emission at
680 nm. So it can be concluded that the demonstrated characters of pure PS1 (monomers and trimers)
are able to monitor the physiological changes inside the cells.
4.2.2) Far-red chlorophyll The total number of LWCs in T. elongatus is rather small (about 10 % of total chlorophyll contents) and
only limited information concerning their structure, location and function is available. The core of trimeric
PS1 of Thermosynechoccocus sp. at low temperature exhibit two main absorption bands at 708 nm and
719 nm (C709 & C719) (Pålsson et al. 1996 and Jelezko et al. 2000) and C715 (Zazubovich et al. 2002).
Two red forms are found in Synechocystis at 708 nm and 714 nm (Rätsep et al. 2000). The absorption
spectra of PS1 exhibited a large spectral heterogeneity in the Qy-region that is probably the result of
strong pigment-pigment interactions of tightly coupled Chl and site-energy differences arising from
pigment-protein interactions (Karapetyan 2006).
The 5 K absorption spectra showed that trimeric PS1 contains more LWCs than both purified monomers
(salt treated and untreated), and both PS1 monomers have identical numbers of LWCs: i.e. the salt
dissociated method has no effect on the contents of LWCs. The numbers of LWCs in purified PS1
complexes calculated by Gaussian deconvolution of the 5 K absorption spectra for LWCs abs-max at 709
nm were the almost identical (5-6), while monomeric PS1 has only 2 LWCs at Abs-max at 720 nm
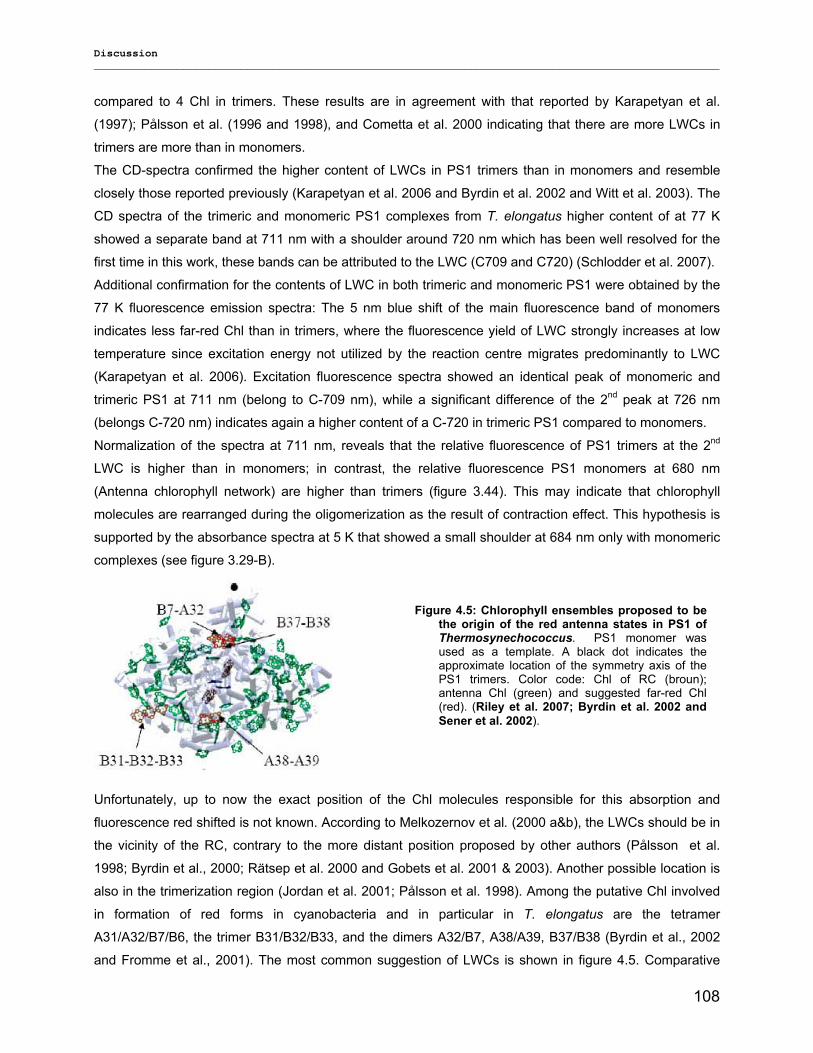
Discussion __________________________________________________________________________________________________
108
compared to 4 Chl in trimers. These results are in agreement with that reported by Karapetyan et al.
(1997); Pålsson et al. (1996 and 1998), and Cometta et al. 2000 indicating that there are more LWCs in
trimers are more than in monomers.
The CD-spectra confirmed the higher content of LWCs in PS1 trimers than in monomers and resemble
closely those reported previously (Karapetyan et al. 2006 and Byrdin et al. 2002 and Witt et al. 2003). The
CD spectra of the trimeric and monomeric PS1 complexes from T. elongatus higher content of at 77 K
showed a separate band at 711 nm with a shoulder around 720 nm which has been well resolved for the
first time in this work, these bands can be attributed to the LWC (C709 and C720) (Schlodder et al. 2007).
Additional confirmation for the contents of LWC in both trimeric and monomeric PS1 were obtained by the
77 K fluorescence emission spectra: The 5 nm blue shift of the main fluorescence band of monomers
indicates less far-red Chl than in trimers, where the fluorescence yield of LWC strongly increases at low
temperature since excitation energy not utilized by the reaction centre migrates predominantly to LWC
(Karapetyan et al. 2006). Excitation fluorescence spectra showed an identical peak of monomeric and
trimeric PS1 at 711 nm (belong to C-709 nm), while a significant difference of the 2nd peak at 726 nm
(belongs C-720 nm) indicates again a higher content of a C-720 in trimeric PS1 compared to monomers.
Normalization of the spectra at 711 nm, reveals that the relative fluorescence of PS1 trimers at the 2nd
LWC is higher than in monomers; in contrast, the relative fluorescence PS1 monomers at 680 nm
(Antenna chlorophyll network) are higher than trimers (figure 3.44). This may indicate that chlorophyll
molecules are rearranged during the oligomerization as the result of contraction effect. This hypothesis is
supported by the absorbance spectra at 5 K that showed a small shoulder at 684 nm only with monomeric
complexes (see figure 3.29-B).
Unfortunately, up to now the exact position of the Chl molecules responsible for this absorption and
fluorescence red shifted is not known. According to Melkozernov et al. (2000 a&b), the LWCs should be in
the vicinity of the RC, contrary to the more distant position proposed by other authors (Pålsson et al.
1998; Byrdin et al., 2000; Rätsep et al. 2000 and Gobets et al. 2001 & 2003). Another possible location is
also in the trimerization region (Jordan et al. 2001; Pålsson et al. 1998). Among the putative Chl involved
in formation of red forms in cyanobacteria and in particular in T. elongatus are the tetramer
A31/A32/B7/B6, the trimer B31/B32/B33, and the dimers A32/B7, A38/A39, B37/B38 (Byrdin et al., 2002
and Fromme et al., 2001). The most common suggestion of LWCs is shown in figure 4.5. Comparative
Figure 4.5: Chlorophyll ensembles proposed to be the origin of the red antenna states in PS1 of Thermosynechococcus. PS1 monomer was used as a template. A black dot indicates the approximate location of the symmetry axis of the PS1 trimers. Color code: Chl of RC (broun); antenna Chl (green) and suggested far-red Chl (red). (Riley et al. 2007; Byrdin et al. 2002 and Sener et al. 2002).
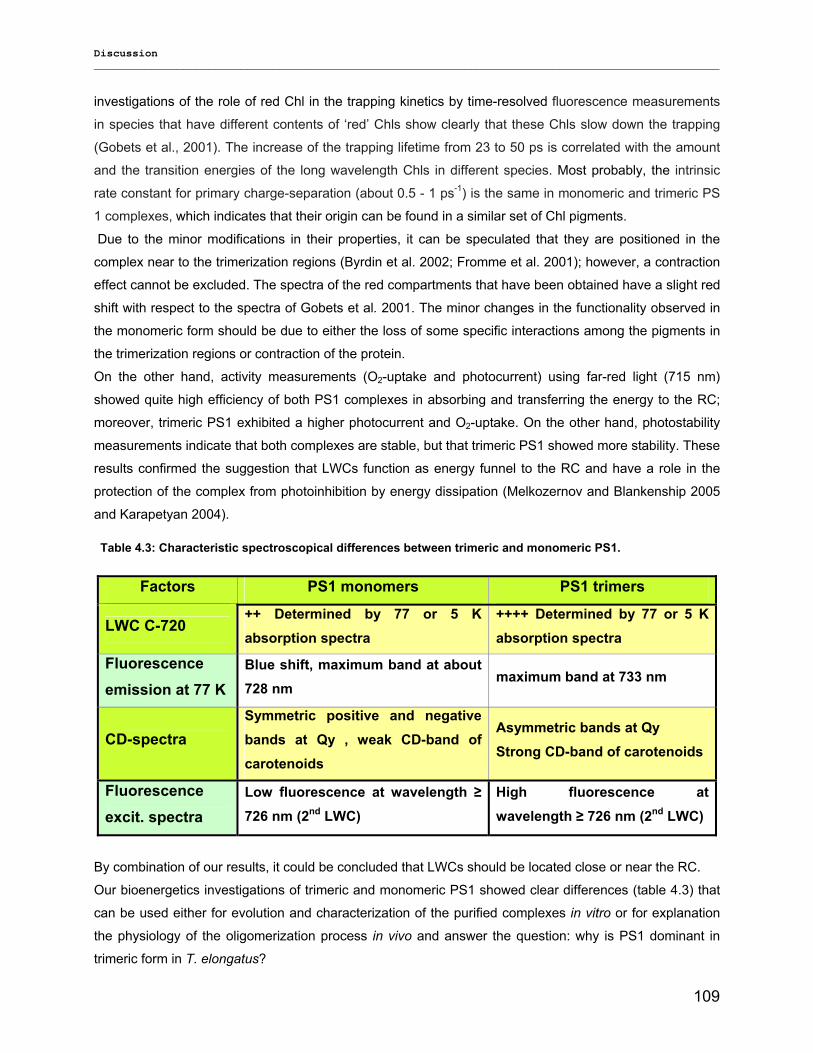
Discussion __________________________________________________________________________________________________
109
investigations of the role of red Chl in the trapping kinetics by time-resolved fluorescence measurements
in species that have different contents of ‘red’ Chls show clearly that these Chls slow down the trapping
(Gobets et al., 2001). The increase of the trapping lifetime from 23 to 50 ps is correlated with the amount
and the transition energies of the long wavelength Chls in different species. Most probably, the intrinsic
rate constant for primary charge-separation (about 0.5 - 1 ps-1) is the same in monomeric and trimeric PS
1 complexes, which indicates that their origin can be found in a similar set of Chl pigments. Due to the minor modifications in their properties, it can be speculated that they are positioned in the
complex near to the trimerization regions (Byrdin et al. 2002; Fromme et al. 2001); however, a contraction
effect cannot be excluded. The spectra of the red compartments that have been obtained have a slight red
shift with respect to the spectra of Gobets et al. 2001. The minor changes in the functionality observed in
the monomeric form should be due to either the loss of some specific interactions among the pigments in
the trimerization regions or contraction of the protein.
On the other hand, activity measurements (O2-uptake and photocurrent) using far-red light (715 nm)
showed quite high efficiency of both PS1 complexes in absorbing and transferring the energy to the RC;
moreover, trimeric PS1 exhibited a higher photocurrent and O2-uptake. On the other hand, photostability
measurements indicate that both complexes are stable, but that trimeric PS1 showed more stability. These
results confirmed the suggestion that LWCs function as energy funnel to the RC and have a role in the
protection of the complex from photoinhibition by energy dissipation (Melkozernov and Blankenship 2005
and Karapetyan 2004).
Factors PS1 monomers PS1 trimers
LWC C-720 ++ Determined by 77 or 5 K absorption spectra
++++ Determined by 77 or 5 K absorption spectra
Fluorescence emission at 77 K
Blue shift, maximum band at about 728 nm
maximum band at 733 nm
CD-spectra Symmetric positive and negative bands at Qy , weak CD-band of carotenoids
Asymmetric bands at Qy Strong CD-band of carotenoids
Fluorescence excit. spectra
Low fluorescence at wavelength ≥ 726 nm (2nd LWC)
High fluorescence at wavelength ≥ 726 nm (2nd LWC)
By combination of our results, it could be concluded that LWCs should be located close or near the RC.
Our bioenergetics investigations of trimeric and monomeric PS1 showed clear differences (table 4.3) that
can be used either for evolution and characterization of the purified complexes in vitro or for explanation
the physiology of the oligomerization process in vivo and answer the question: why is PS1 dominant in
trimeric form in T. elongatus?
Table 4.3: Characteristic spectroscopical differences between trimeric and monomeric PS1.
Discussion __________________________________________________________________________________________________
110
4.3) Biotechnological applications of designed PS1 complexes 4.3.1) Stability A) High light The absorption spectra of both complexes (PS1 monomers and trimers) did not show any absorption
maximum-shift even after 60 min illumination with high light intensity (6000 µEm-2s-1). In contrast, PS1 of
Spanich showed a blue shift after only 10 min illumination with 2300 µEm-2s-1 indicating the destruction
(liberation) of some chlorophyll molecules (Hui et al. 2000). Since RT fluorescence emission could monitor
the uncoupled chlorophylls (Pålsson et al. 1998), it was used to illustrate the effect of high light illumination
on the PS1 complex. The reduction of the characteristic fluorescence of uncoupled chlorophylls was
unexpected. There are two interpretations:
1) Uncoupled chlorophylls as observed in PS1 monomers (see 4.2.1 and fig. 4.4) may re-connect to the
energy transfer network so that this emission disappears.
2) The antenna chlorophyll network has a protection system (dissipation of excess energy; Karapetyan
2004), which is laking in the uncoupled chlorophylls, i.e. the accumulated light energy destroys them
leading to disappearance of the fluorescence at 680 nm. The fluorescence emission band of uncoupled
Chl after 60 min illumination strongly indicates that PS1 trimers are more stable than PS1 monomers. The
trimeric PS1 could also dissipate the energy via the energy distribution balance between the 3 monomers.
These results have been expected and are in agreement with others previously discussed concerning the
LWC contents of trimers and monomers (Karapetyan et al. 2006 and Karapetyan 2004).
On the other hand, carotenoids play an important role in the protection of PS1 against photodamage
through quenching of the highly damaging triplet state (Chl3) (Fromme & Grotjohann 2005; Grotjohann &
Fromme 2006 and Richard et al. 2000) i.e. the stability of PS1 complexes is due to their enrichment with
carotenoids.
B) High temperature As T. elongatus is a thermophilic cyanobacterium with growth and physiological processes being in
optimum at 45-55 ºC, the isolated PS1 complex can resist high temperatures. Moreover, the extracted
PS1 showed a high thermal stability and activity at high temperature.
The CD-spectra showed changes of the absorption properties of the attached co-factors depending on the
temperature. At high temperature (80 ºC), changing of the CD-band of the carotenoids and positive band
of the chlorophylls of both PS1 complexes may indicate the start of the partial denaturation of the protein
structure which leads to partially disconnection of some carotenoid molecules followed by losing their
optical activity. This effect seems to be reversible, as a slight difference in the carotenoid absorption was
observed in both complexes exposed to 80 ºC for 10 min followed by cooling to RT, while no detectable
difference was observed in the Chl absorption.
CD-spectral changes of PS1 trimers did not reflect the dissociation into monomers, as the characteristic
CD-spectra of monomers was not observed. High temperature may cause a partial disconnection of co-
factors and also slight changes of the CD-spectra in the far-red region of trimeric PS1 at 60 & 80 ºC which
Discussion __________________________________________________________________________________________________
111
strongly supports our hypothesis. A confirmation for starting the denaturation of PS1 complex at 85 ºC was
observed through changes of the P700 stability of T. elongatus (Koike et al. 1982).
On the other hand, the purified PS1 showed the highest photocurrent activity at 37 °C; even it could be
active up to 70 ºC (Esper 2007).
C) Detergents: Detergents play an important role in the isolation and solubilization of membrane protein complexes.
Almost all recent publications concerning isolation of photosynthetic complexes use ß-DM for the isolation
at a concentration 0.6-1.2 %. Rögner et al. (1990b) pointed out the importance of ß-DM in keeping
preparations in their native and active state. The purity of ß-DM (free of α-isomer) is very important for
successful purification (Fromme and Witt 1998). Although ß-DM was found to be the best detergent for
PS1 isolation, incubation of monomeric PS1 in ß-DM containing buffer in the absence of lipid phase
resulted in denaturation of the pigment-protein complex (Kruip et al. 1999). The obtained results of this
thesis strongly indicate that using ß-DM concentration ≥ 1.6 % affects the complex structure permanently,
as reduction of the ß-DM concentration to 0.03 % after extraction with 1.6 % ß-DM has no effect on the
fluorescence of the uncoupled Chl.
A high ß-DM concentration affects the polypeptide interaction through penetration between them, resulting
in a small shift which is enough to disconnect the attached Chl from the antenna chlorophyll network. Two
evidences support this hypothesis:
1) Observation of a characteristic fluorescence of uncoupled Chl even after reducing the ß-DM
concentration to 0.03 %.
2) Liberation of PsaL from the monomeric PS1 complex as result of the extraction with 1.6 % ß-DM. In
contrast, ß-DM concentration ≤ 1.2 % during the extraction causes no changes in the pigment-pigment or
the pigment-protein structure. Since the surface exposed to outer atmosphere is larger in monomers than
in trimers (see figure 4.1 and 4.2), the observed effect of ß-DM on PS1 is also more pronounced in
monomers.
4.3.2) Lyophilization and amphipol trapping
Lyophilization of PS1 helps to keep its activity for a long time and paves the way for commercial
applications. The advantages of lyophilization to keep the structure and function of pharmaceutical
compounds were reported by Wang (2000). Subunit composition, homogeneity and activity of lyophilized
PS1 strongly indicate that it is the ideal way for storage and safe transportation of the complex.
Amphipols are amphipathic polymers designed for making membrane proteins hydrophilic (Tribet et al
1996 and 1997). Amphipols keep the membrane protein soluble without denaturation, so it is optimum for
our membrane protein (figure 4.6). Trapping of PS1 in amphipol (A8-35) did not show a significant
difference in long-term stability compared to the non-trapped complex (data not shown), however, trapping
in amphipol (Napol-L) slightly enhanced the stability of PS1 even under low light intensity. Amphipol was
found to be an effective method for keeping the activity of PS2 for quite long time, even under low light
intensity.
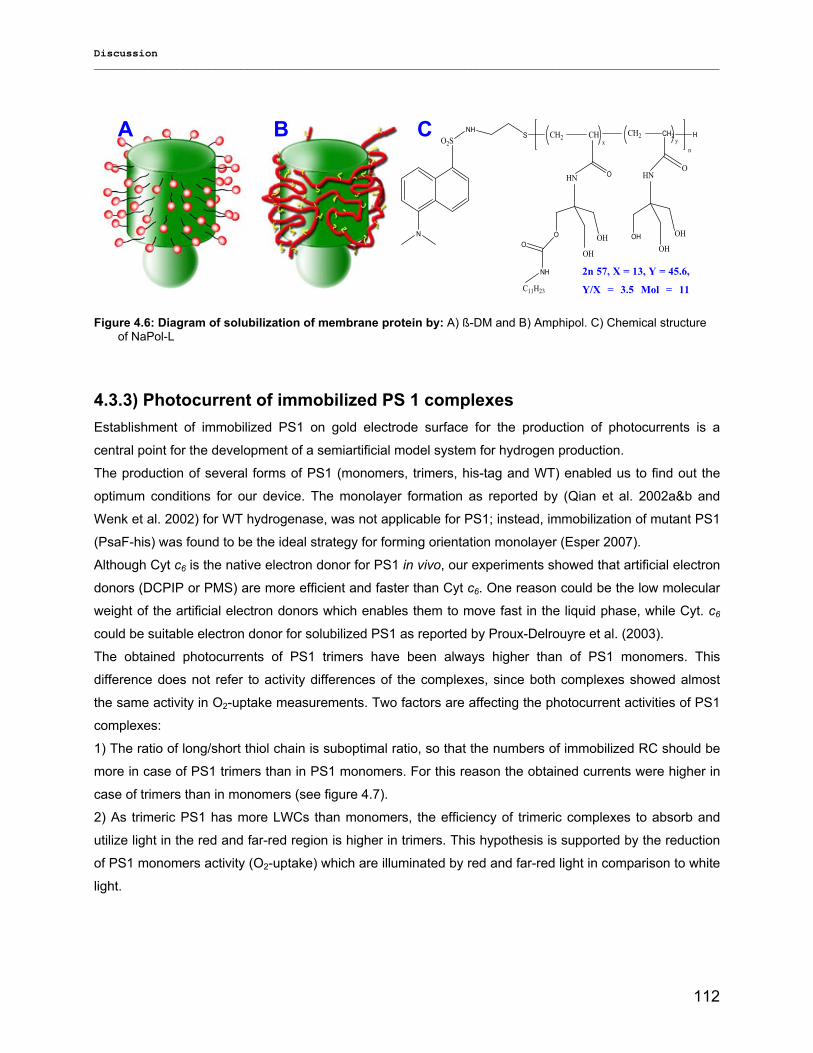
Discussion __________________________________________________________________________________________________
112
N
O2SNH
S CH2 CHx
CH2 CH2y
H
n
OHN
O
OH
OHO
NH
C11H23
OHN
OH
OH
OH
4.3.3) Photocurrent of immobilized PS 1 complexes Establishment of immobilized PS1 on gold electrode surface for the production of photocurrents is a
central point for the development of a semiartificial model system for hydrogen production.
The production of several forms of PS1 (monomers, trimers, his-tag and WT) enabled us to find out the
optimum conditions for our device. The monolayer formation as reported by (Qian et al. 2002a&b and
Wenk et al. 2002) for WT hydrogenase, was not applicable for PS1; instead, immobilization of mutant PS1
(PsaF-his) was found to be the ideal strategy for forming orientation monolayer (Esper 2007).
Although Cyt c6 is the native electron donor for PS1 in vivo, our experiments showed that artificial electron
donors (DCPIP or PMS) are more efficient and faster than Cyt c6. One reason could be the low molecular
weight of the artificial electron donors which enables them to move fast in the liquid phase, while Cyt. c6
could be suitable electron donor for solubilized PS1 as reported by Proux-Delrouyre et al. (2003).
The obtained photocurrents of PS1 trimers have been always higher than of PS1 monomers. This
difference does not refer to activity differences of the complexes, since both complexes showed almost
the same activity in O2-uptake measurements. Two factors are affecting the photocurrent activities of PS1
complexes:
1) The ratio of long/short thiol chain is suboptimal ratio, so that the numbers of immobilized RC should be
more in case of PS1 trimers than in PS1 monomers. For this reason the obtained currents were higher in
case of trimers than in monomers (see figure 4.7).
2) As trimeric PS1 has more LWCs than monomers, the efficiency of trimeric complexes to absorb and
utilize light in the red and far-red region is higher in trimers. This hypothesis is supported by the reduction
of PS1 monomers activity (O2-uptake) which are illuminated by red and far-red light in comparison to white
light.
2n 57, X = 13, Y = 45.6,
Y/X = 3.5 Mol = 11
Figure 4.6: Diagram of solubilization of membrane protein by: A) ß-DM and B) Amphipol. C) Chemical structure of NaPol-L
A B C
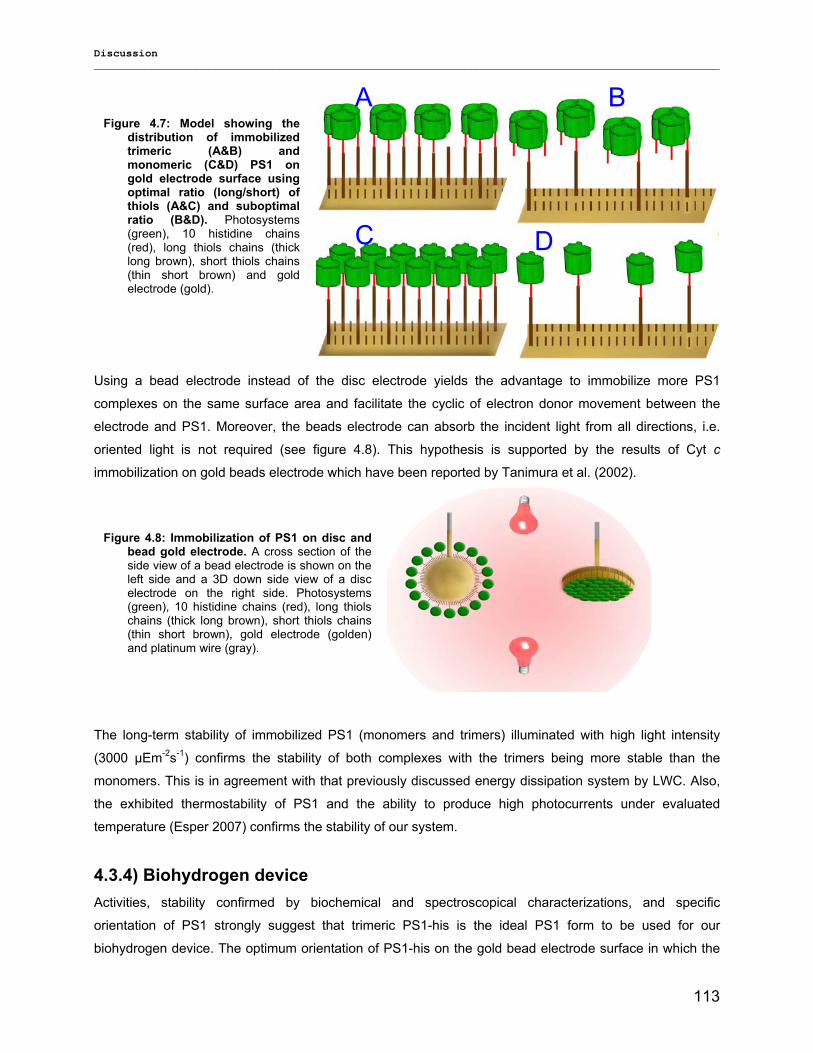
Discussion __________________________________________________________________________________________________
113
Using a bead electrode instead of the disc electrode yields the advantage to immobilize more PS1
complexes on the same surface area and facilitate the cyclic of electron donor movement between the
electrode and PS1. Moreover, the beads electrode can absorb the incident light from all directions, i.e.
oriented light is not required (see figure 4.8). This hypothesis is supported by the results of Cyt c
immobilization on gold beads electrode which have been reported by Tanimura et al. (2002).
The long-term stability of immobilized PS1 (monomers and trimers) illuminated with high light intensity
(3000 µEm-2s-1) confirms the stability of both complexes with the trimers being more stable than the
monomers. This is in agreement with that previously discussed energy dissipation system by LWC. Also,
the exhibited thermostability of PS1 and the ability to produce high photocurrents under evaluated
temperature (Esper 2007) confirms the stability of our system.
4.3.4) Biohydrogen device Activities, stability confirmed by biochemical and spectroscopical characterizations, and specific
orientation of PS1 strongly suggest that trimeric PS1-his is the ideal PS1 form to be used for our
biohydrogen device. The optimum orientation of PS1-his on the gold bead electrode surface in which the
Figure 4.7: Model showing the distribution of immobilized trimeric (A&B) and monomeric (C&D) PS1 on gold electrode surface using optimal ratio (long/short) of thiols (A&C) and suboptimal ratio (B&D). Photosystems (green), 10 histidine chains (red), long thiols chains (thick long brown), short thiols chains (thin short brown) and gold electrode (gold).
B
DC
A
Figure 4.8: Immobilization of PS1 on disc and bead gold electrode. A cross section of the side view of a bead electrode is shown on the left side and a 3D down side view of a disc electrode on the right side. Photosystems (green), 10 histidine chains (red), long thiols chains (thick long brown), short thiols chains (thin short brown), gold electrode (golden) and platinum wire (gray).
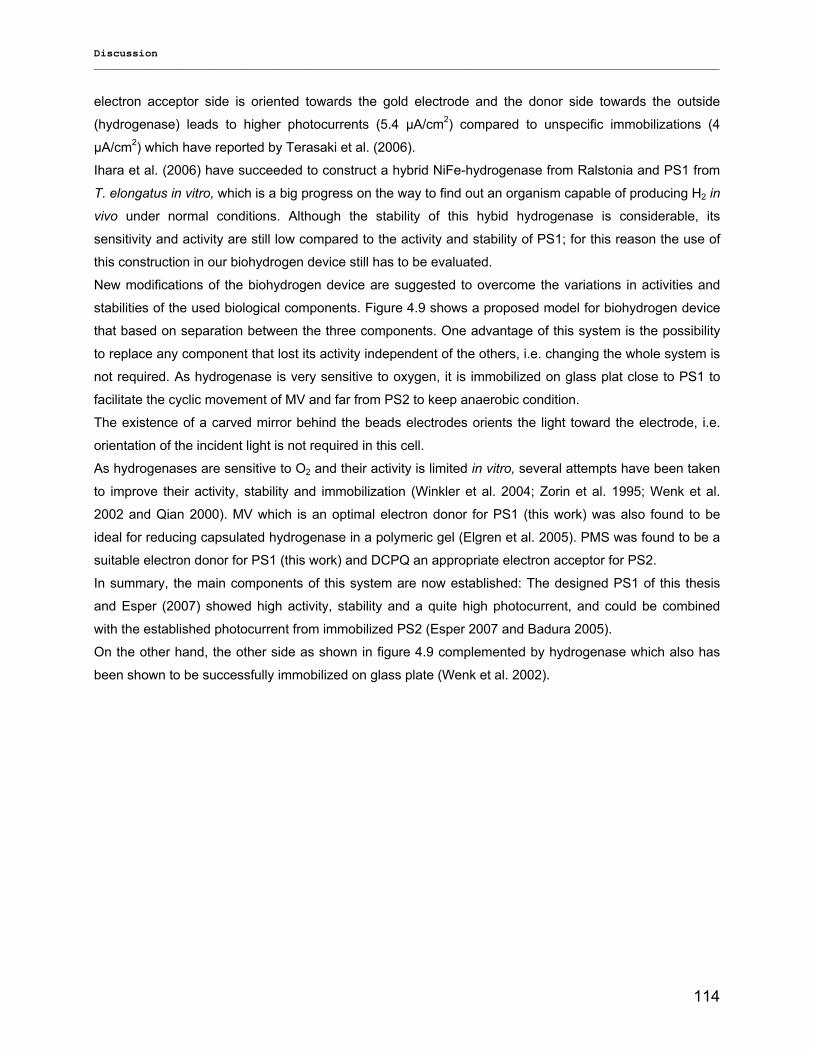
Discussion __________________________________________________________________________________________________
114
electron acceptor side is oriented towards the gold electrode and the donor side towards the outside
(hydrogenase) leads to higher photocurrents (5.4 µA/cm2) compared to unspecific immobilizations (4
µA/cm2) which have reported by Terasaki et al. (2006).
Ihara et al. (2006) have succeeded to construct a hybrid NiFe-hydrogenase from Ralstonia and PS1 from
T. elongatus in vitro, which is a big progress on the way to find out an organism capable of producing H2 in
vivo under normal conditions. Although the stability of this hybid hydrogenase is considerable, its
sensitivity and activity are still low compared to the activity and stability of PS1; for this reason the use of
this construction in our biohydrogen device still has to be evaluated.
New modifications of the biohydrogen device are suggested to overcome the variations in activities and
stabilities of the used biological components. Figure 4.9 shows a proposed model for biohydrogen device
that based on separation between the three components. One advantage of this system is the possibility
to replace any component that lost its activity independent of the others, i.e. changing the whole system is
not required. As hydrogenase is very sensitive to oxygen, it is immobilized on glass plat close to PS1 to
facilitate the cyclic movement of MV and far from PS2 to keep anaerobic condition.
The existence of a carved mirror behind the beads electrodes orients the light toward the electrode, i.e.
orientation of the incident light is not required in this cell.
As hydrogenases are sensitive to O2 and their activity is limited in vitro, several attempts have been taken
to improve their activity, stability and immobilization (Winkler et al. 2004; Zorin et al. 1995; Wenk et al.
2002 and Qian 2000). MV which is an optimal electron donor for PS1 (this work) was also found to be
ideal for reducing capsulated hydrogenase in a polymeric gel (Elgren et al. 2005). PMS was found to be a
suitable electron donor for PS1 (this work) and DCPQ an appropriate electron acceptor for PS2.
In summary, the main components of this system are now established: The designed PS1 of this thesis
and Esper (2007) showed high activity, stability and a quite high photocurrent, and could be combined
with the established photocurrent from immobilized PS2 (Esper 2007 and Badura 2005).
On the other hand, the other side as shown in figure 4.9 complemented by hydrogenase which also has
been shown to be successfully immobilized on glass plate (Wenk et al. 2002).
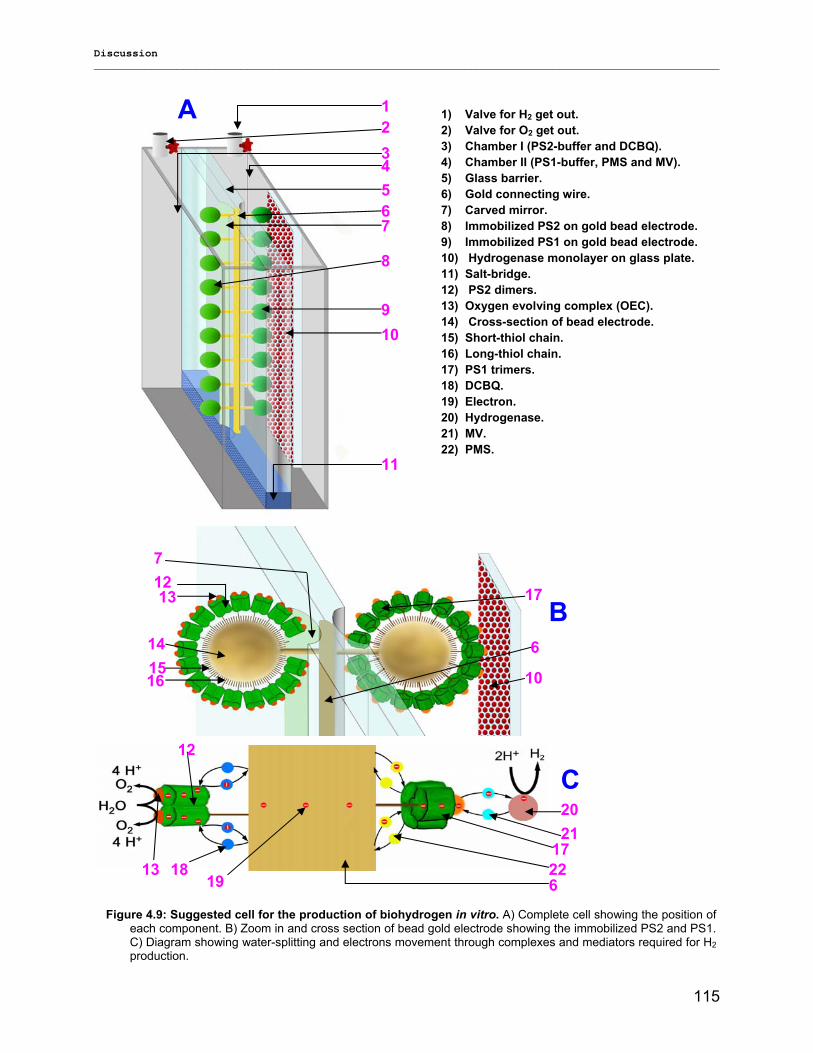
Discussion __________________________________________________________________________________________________
115
1234567
Figure 4.9: Suggested cell for the production of biohydrogen in vitro. A) Complete cell showing the position of each component. B) Zoom in and cross section of bead gold electrode showing the immobilized PS2 and PS1. C) Diagram showing water-splitting and electrons movement through complexes and mediators required for H2production.
13 12
11
10 9
8
14 15
6
7
16
17
10
21
19
20
18
12
13 6 22 17
1) Valve for H2 get out. 2) Valve for O2 get out. 3) Chamber I (PS2-buffer and DCBQ). 4) Chamber II (PS1-buffer, PMS and MV). 5) Glass barrier. 6) Gold connecting wire. 7) Carved mirror. 8) Immobilized PS2 on gold bead electrode. 9) Immobilized PS1 on gold bead electrode. 10) Hydrogenase monolayer on glass plate. 11) Salt-bridge. 12) PS2 dimers. 13) Oxygen evolving complex (OEC). 14) Cross-section of bead electrode. 15) Short-thiol chain. 16) Long-thiol chain. 17) PS1 trimers. 18) DCBQ. 19) Electron. 20) Hydrogenase. 21) MV. 22) PMS.
A
B
C
Discussion __________________________________________________________________________________________________
116
4.4) Outlook After optimization and establishment of the components and electron transfer steps of our device, the next
step is to engineer this presented system (4.9). Although the successful hybridization of PS1 and
hydrogenase (Ihara et al. 2006) has bee achieved, the next step is to stabilize this construction into a cell
creating an organism capable to produce hydrogen in vivo.
Another strategy, which may be more reproducible for producing H2 in vitro, is to construct a hybrid
between the hydrogenase and ferredoxine (Fd) the native electron acceptor of PS1. In this case, electrons
are transferred from PS1 to hydrogenase via Fd and hydrogenase is not required to be immobilized, i.e. it
could be solubilized in the buffer.
A potential application of our results could be to use PS1 as biosensor, i.e. to use its ability to absorb and
utilize the far-red light for producing a photocurrent.
At the physiological level, the spectral characters of PS1 (monomers and trimers) could be used as
indicator for physiological changes due to environmental effects or induced mutations which was already
shown for the effect of iron deficiency on oligomerization of PS1 (Ivanove et al. 2006; Bibby et al. 2001;
and Sarcina and Mulineaux 2004).
As this is the 1st time to purify large quantities of monomeric PS1 under mild condition (untreated and salt
dissociation), this offers the unique opportunity to crystallize monomeric PS1 from T. elongatus and
characterized its structure at even higher resolution than possible up to now.
Summary __________________________________________________________________________________________________
117
5) Summary Biohydrogen is considered as an important future renewable energy source. In order to develop a model
system for its production, we designed a device which is based on three biological components:
Photosystem 2 (PS2), Photosystem 1 (PS1) and Hydrogenase. In this device, PS1 functions as electron
intermediator between PS2 (water splitting) and hydrogenase (hydrogen production). For a routine use in
this system, purification of highly active trimeric PS1 was optimized and speeded up from 32 to 15 hours.
In order to evaluate which PS1 is best suited for our device, new and mild methods were developed for
the qualitative and quantitative production of monomeric PS1. This enabled for the first time a detailed
analysis in comparison with the trimeric form in terms of pigment/cofactor contents, subunit composition,
photosynthetic electron transport and photocurrent of immobilized PS1. Both complexes showed almost
identical spectroscopic characteristics of LD-spectra, redox potential, Chl a/P700 ratio, carotenoid
contents, subunit composition and activity. Modeling of kinetics measurements (time resolved
fluorescence in the lower ps range) indicated the same origin of the long wavelength chlorophylls (LWCs)
in both complexes. It could also be shown, that monomers can be reversibly transformed into trimers by
changing the salt concentration of the medium and that this effect depends on the fluidity of the membrane
phase. In summary, these results indicate that monomeric PS1 is not a purification artifact and acts as the
smallest fully functional PS1 unit.
On the other hand, PS1 monomers and trimers differ in the following characteristics:
1) Blue-shifted fluorescence emission of monomeric PS1
2) Higher (LWC) contents of trimeric PS1
3) Higher CD-band of carotenoids in trimeric PS1
4) Higher excitation fluorescence spectrum in the far-red region of PS1 trimers
Optimization of photocurrent measurements of PS1, which had been immobilized on a gold surfaces by a
His-tag, showed the higher efficiency of the artificial electron donor PMS in comparison with the native Cyt
c6. Also, immobilized trimeric PS1 yielded higher photocurrents (5.4 µA/cm2) than monomers. Due to its
high photo- and thermostability, the high light absorbance and transfer efficiency and the high
photocurrent in immobilized state, trimeric PS1-His-tag qualifies as ideal component of the semiarticial
device for hydrogen production.
Zusammenfassung __________________________________________________________________________________________________
118
6) Zusammenfassung Biowasserstoff wird als wichtige erneuerbare Energiequelle der Zukunft angesehen. Um ein Modellsystem
für dessen Produktion zu entwickeln haben wir ein System entworfen, das aus drei biologischen
Komponenten besteht: Photosystem 2 (PS2), Photosystem 1 (PS1) und Hydrogenase. In diesem System
vermittelt PS1 Elektronen zwischen PS2 (Wasserspaltung) und der Hydrogenase (Wasserstoffproduktion).
Für die routinemäßige Verwendung in unserem System wurde die Isolierung von hoch aktivem PS1-
Trimer optimiert und die Dauer der Isolierung von 32 auf 15 Stunden verringert. Um herauszufinden
welches PS1 am besten für unser System geeignet ist, wurden neue, schonende Methoden für die
qualitative und quantitative Produktion von monomerem PS1 entwickelt. Dies ermöglichte erstmals einen
detaillierten Vergleich mit trimerem PS1 bezüglich Pigment/Kofaktor-Gehalt, der
Untereinheitenzusammensetzung, dem photosynthetischen Elektronentransport und der Photoströme von
immobilisiertem PS1. Beide Komplexe wiesen weitestgehend identische Eigenschaften auf (LD-Spektren,
Redoxpotential, Chl a/P700-Verhältnis, Karotinoidgehalt, Untereinheitenzusammensetzung und Aktivität).
Die Modellierung kinetischer Messungen (zeitaufgelöste Fluoreszenzmessungen im unteren ps-Bereich)
zeigt, dass die roten Chlorophylle (long wavelength chlorophylls, LWC) in beiden Komplexen denselben
Ursprung haben. Ferner konnte gezeigt werden, dass durch Veränderung der Salzkonzentration des
Mediums Monomere reversibel in Trimere überführt werden können und dass dieser Vorgang von der
Fluidität der Membranphase abhängt. Zusammenfassend zeigen diese Ergebnisse, dass monomeres PS1
kein Artefakt der Aufreinigung ist und als kleinste voll funktionsfähige PS1-Einheit betrachtet werden
muss.
Andererseits unterscheiden sich PS1 Monomere und Trimere in den folgenden Eigenschaften:
1.) Blauverschiebung der Fluoreszenz-Emissionsspektren des monomeren PS1
2.) Höherer LWC-Gehalt im PS1 Trimer
3.) Höhere CD-Bande der Karotinoide im PS1 Trimer
4.) Höheres Anregungs-Fluoreszenzspektrum in dem fernroten Bereich des PS1 Trimers
Optimierung der Photostrom-Messungen an PS1, welches mittels His-tag an Goldoberflächen
immobilisiert wurde, zeigte eine höhere Effizienz des artifiziellen PS1-Elektronendonors PMS im Vergleich
zum natürlichen Donor Cyt. c6. Aufgrund seiner hohen Licht- und Thermostabilität, seiner hohen
Lichtabsorption und Transfereffizienz sowie seiner hohen Photoströme (5.4 µA/cm2) im immobilisierten
Zustand ist trimeres His-tag PS1 daher besonders für die Verwendung im semiartifiziellen System zur
Wasserstoffproduktion geeignet.
References __________________________________________________________________________________________________
119
7) References 2) Agalidis I., Othman S., Boussac A., Reiss-Husson F., and Desbois A. (1999): Purification, redox and
spectroscopic properties of the tetraheme cytochrome c isolated from Rubrivivax gelatinosus. Eur. J. Biochem.; 261: 325.
3) Akiyama M, Miyashita H, Kise H, Watanabe T, Mimuro M, Miyachi S and Kobayashi M (2002) Quest for minor but key chlorophyll molecules in photosynthetic reaction centers–unusual pigment composition in the reaction centers of the chlorophyll d-dominated cyanobacterium Acaryochloris marina. Photosyn Res 74: 97–107
4) Akiyama M, Miyashita H, Kise H, Watanabe T, Miyachi S and Kobayashi M (2001) Detection of chlorophyll d’ and pheophytin a in a chlorophyll d-dominating oxygenic photosynthetic prokaryote Acaryochloris marina. Anal Sci 17: 205–208
5) Allen JF (1992): Protein phosphorylation in regulation of photosynthesis. BBA 1098: 275-335.
6) Ambill M. Struktur - Funktionsbeziehungen am cyanobakteriellen Cytochrom b6f-Komplex unter Verwendung neuer Reinigungsstrategien. Ph. Thesis 2004.
7) Anderson JM, Boardman NK. Fractionation of the photochemical systems of photosynthesis (1966): Chlorophyll contents and photochemical activities of particles isolated from spinach chloroplasts. Bibl Laeger. 14;112(3):403–421.
8) Andrizhiyevskaya EG, Schwabe TME, Germano M, D’Haene S, Kruip J, van Grondelle R and Dekker JP (2002) Spectroscopic properties of PS I–IsiA supercomplexes of the cyanobacterium Synechococcus PCC 7942. Biochim Biophys Acta 1556: 265–272
9) Antonkine ML, Jordan P, Fromme P, Krauss N, Golbeck JH, Stehlik D. Assembly of protein subunits within the stromal ridge of photosystem I. Structural changes between unbound and sequentially PS I-bound polypeptides and correlated changes of the magnetic properties of the terminal iron sulfur clusters. J Mol Biol. 2003 Mar 28;327(3):671-97.
10) Antonkine ML, Liu G, Bentrop D, Bryant DA, Bertini I, Luchinat C, Golbeck JH, Stehlik D. Solution structure of the unbound, oxidized Photosystem I subunit PsaC, containing [4Fe-4S] clusters F(A) and F(B): a conformational change occurs upon binding to photosystem I. J Biol Inorg Chem. 2002 Apr;7(4-5):461-72. Epub 2002 Jan 11.
11) Badger MR, Caemmerer Svon, Ruuska S and Nakano H (2000) Electron flow to oxygen in higher plants and algae: rates and control of direct photoreduction (Mehler reaction) and rubisco oxygenase. Phil Trans R Soc Lond B Biol Sci 355: 1433–1446
12) Badura, A.; Esper, B.; Ataka, K.; Grunwald, C.; Wöll, C.; Kuhlmann, J.; Heberle, J.; Rögner, M. (2006) Light Driven Water Splitting for (Bio-hydrogen Production: Photosystem 2 as Central Part of a Bioelectrochemical Device. Photochem Photobiol 82, 1385-1390.
13) Bald Dirk, Kruip Jochen and Rögner Matthias (1996): Supramolecular architecture of cyanobacterial thylakoid membranes: How is the phycobilisome connected with the photosystems? Photosynthesis Research 49 (2) 103-118.
14) Bengis C, Nelson N. Purification and properties of the photosystem I reaction center from chloroplasts. (1975) J Biol Chem. 25;250(8):2783–2788.
15) Ben-Shem A, Frolow F and Nelson N (2003) Crystal structure of plant Photosystem I. Nature 426: 630–635
16) Ben-Shem A, Frolow F and Nelson N (2004) Evolution of Photosystem I – from symmetry through pseudo-symmetry to asymmetry. FEBS Lett 564: 274–280
17) Berman-Frank I, Chen Y, Gerchman Y, Dismukes G, and Falkowski P (2003): Inhibition of nitrogenase by oxygen in marine cyanobacteria controls the global nitrogen and oxygen cycles. Biogeosciences Discussions, 2, 261–273
18) Bibby TS, Nield J, Barber J. Three-dimensional model and characterization of the iron stress-induced CP43’-photosystem I supercomplex isolated from the cyanobacterium Synechocystis PCC 6803. J Biol Chem. 2001a Nov 16;276(46):43246-52. Epub 2001a Aug 22.
19) Bibby TS, Nield J, Partensky F, Barber J. Oxyphotobacteria. Antenna ring around photosystem I. Nature. 2001b Oct 11;413(6856):590.
20) Biesiadka J., Loll B., Kern J, Irrgang K. D.and Zouni A., Crystal structure of cyanobacterial photosystem II at 3.2 Å resolution: a closer look at the Mn-cluster, Phys. Chem. Chem. Phys. 6 (2004) 4733-4736.
References __________________________________________________________________________________________________
120
21) Boekema EJ, Dekker JP, van Heel M, Rögner M, Saenger W, Witt I and Witt HT (1987) Evidence for a trimeric organization of the Photosystem I complex from the thermophilic cyanobacterium Synechococcus sp. FEBS Lett 217: 283–286
22) Boekema, E. J., Hifney, A., Yakushevska, A. E., Piotrowski, M., Keegstra, W., Berry, S., Michel, K. P., Pistorius, E. K. and Kruip, J. (2001), A giant chlorophyll-protein complex induced by iron deficiency in cyanobacteria. Nature. 412 (6848):745-748
23) Boudreaux B, MacMillan F, Teutloff C, Agalarov R, Gu F, Grimaldi S, Bittl R, Brettel K and Redding K (2001) Mutations in both sides of the Photosystem I reaction center identify the phylloquinone observed by electron paramagnetic resonance spectroscopy. J Biol Chem 276: 37299–37306.
24) Breyton C, Tribet C, Olive J, Dubacq JP and Popot JL (1997): Dimer to monomer conversion of the cytochrome b6f complex. Causes and consequences. JBC 272: 21892-21900.
25) Brody SS (1958): New excited state of chlorophyll. Science 128: 838–839
26) Byrdin M, Jordan P, Krauss N, Fromme P, Stehlik D and Schlodder E (2002) Light harvesting in photosystem I: modeling based on 2.5 °A structure of photosystem I from Synechococcus elongatus. Biophys J 83: 433–457
27) Byrdin M, Rimke I, Schlodder E, Stehlik D and Roelofs TA (2000) Decay kinetics and quantum yields of fluorescence in photosystem I from Synechococcus elongatus with P700 reduced and oxidized state: are the kinetics of excited state decay trap-limited or transfer-limited? Biophys J 79: 992–1007
28) Chitnis PR 2001 Photosystem I: function and physiology. Annu. Rev. Plant Physiol. Plant Mol. Biol. 52: 593-626
29) Cogdell, R. J. 1985. Carotenoids in photosynthesis.Pure Appl. Chem. 57: 723-728.
30) Cometta A, Zucchelli G, Karapetyan NV, Engelmann E, Garlashi FM and Jennings RC (2000) Thermal behavior of long wavelength absorption transitions in Spirulina platensis photosystem I trimers. Biophys J 79: 3235–3243
31) Coufal, J., Hladik, J. & Sofrova, D. (1998) The carotenoid content of photosystem I-pigment-protein-complexes of the Cyanobacterium Synechococcus elongatus. Photosynthetica 23, 603-616.
32) Christopher B. Field, Michael J. Behrenfeld, James T. Randerson, and Paul Falkowski (1998): Primary Production of the Biosphere: Integrating Terrestrial and Oceanic Components. Science, 281: 237.
33) Croce R, Dorra D, Holzwarth AR and Jennings RC. (2000) Fluorescence decay and spectral evolution in intact photosystem I of higher plants. Biochemistry 39: 6341–6348
34) De la Rosa MA, Navarro JA, Dı´ az-Quintana A, De la Cerda B, Molina-Heredia FP, Balme A, Murdoch P del S, Dı´ az-Moreno I, Dura´ n RV and Herva´ s M (2002) An evolutionary analysis of the reaction mechanisms of Photosystem I reduction by cytochrome c(6) and plastocyanin. Bioelectrochemistry 55: 41–45
35) Domonkos I, Malec P, Sallai A, Kova´ cs L, Itoh K, Shen G, Ughy B, Bogos B, Sakurai I, Kis M, Strzalka K, Wada H, Itoh S, Farkas T and Gombos Z (2004) Phosphatidylglycerol is essential for oligomerization of Photosystem I reaction center. Plant Physiol 134: 1471–1478
36) Drews, G. and Imhoff, J. F. (1991), Phototrophic purple bacteria. In: Shively, J.M. & Barton, L.L. (eds.) Cariations in autotrophic Life. Academic Press, London, San Diego, New York, Boston, Sydney, Tokyo, Toronto. 51-97.
37) Elgren E., Zadvorny O., Brecht E., Douglas T., Zorin N., Maroney M., and Peters J. (2005), "Immobilization of Active Hydrogenases by Encapsulation in Polymeric Porous Gels ." Nanoletters 5, 2085-2087.
38) Emlyn-Jones D, Ashby MK, Mullineaux CW. 1999. A gene required for the regulation of photosynthetic light-harvesting in the cyanobacterium Synechocystis 6803. Molecular Microbiology 33,1050–1058.
39) Esper Berndt (2007) Photosysteme aus Thermosynechococcus elongatus als Komponenten eines bioelektronischen Modellsystems zur Biowasserstoffproduktion. Dissertation, Ruhr-Universität, Bochum.
40) Esper, B.; Badura, A.; Rögner, M. (2006) Photosynthesis as a power supply for (bio-) hydrogen production. Trends Plant Sci. 11, 11, 543.
41) Ferreira, K. N.; Iverson, T. M.; Maghlaoui, K.; Barber, J.; Iwata, S. (2004) Architecture of the Photosynthetic Oxygen-Evolving Center. Science 303, 5665, 1831-1838.
42) Fischer N, Se´ tif P and Rochaix JD (1999) Site-directed mutagenesis of the PsaC subunit of Photosystem I. F(b) is the cluster interacting with soluble ferredoxin. J Biol Chem 274: 23333–23340.
43) Flemming Cornelia, Charakterisierung der Antennensysteme von monomeren und trimeren Photosystem I Komplexen (diploma work, TU Berlin, 1996)
References __________________________________________________________________________________________________
121
44) Fromme P (1998) Crystallization of Photosystem I for Structural Analysis. Habilitation, Technical University Berlin, Berlin, Germany
45) Fromme P and Mathis P (2004): Unraveling the Photosystem I reaction center: a history, or the sum of many efforts. Photosynthetic research 80: 109-124
46) Fromme P, Jordan P and Krauß N (2001) Structure of photosystem I. Biochim Biophys Acta 1507: 5–31
47) Fromme P, Melkozernov A, Jordan P and Krauß N (2003a) Structure and function of Photosystem I: interaction with its soluble electron carriers and external antenna systems. FEBS Lett 555: 40–4
48) Fromme P, Schlodder E, Jansson S (2003b) Structure and Function of the antenna system in Photosystem I. In: Green BR and Parson WW (ed) Light-Harvesting Antennas in Photosynthesis, pp 253–279. Kluwer Academic Publishers, Dordrecht, The Netherlands
49) Fromme Petra, Grotjohann Ingo (2006): Structural analysis of cyanobacterial PS1. Advanced in photosynthesis and respiration Spring USA (24) 47-69.
50) Fromme, P. and Witt, H. T. (1998). Improved Isolation and Crystallization of Photosystem I for Structural Analysis. Biochim. Biophys. Acta 1365, 175-184.
51) Girbal, L. et al. (2005) Homologous/heterologous over-expression in Clostridium acetobutylicum and characterization of purified clostridial and algal Fe-only hydrogenases with high specific activity. Appl.Environ. Microbiol. 71, 2777–2781
52) Gobets B, Valkunas L and van Grondelle R (2003) Bridging the gap between structural and lattice-models: a parametrization of energy transfer and trapping in photosystem I. Biophys J 85: 3872–3882
53) Gobets B, van Amerongen H, Monshower R, Kruip J, Rögner M, van Grondelle R and Dekker JP (1994) Polarized site-selected fluorescence spectroscopy of isolated photosystem I particles. Biochim Biophys Acta 1188: 75–85.
54) Gobets B and van Grondelle R (2001) Energy transfer and trapping in photosystem I. Biochim Biophys Acta 1507: 80–99
55) Gobets B, van Stokkum IHM, Rögner M, Kruip J, Schlodder E, Karapetyan NV, Dekker JP and van Grondelle R (2001): Time resolved fluorescence emission measurements of photosystem I particles of various cyanobacteria: a unified compartmental model. Biophys J 81: 407–424
56) Golbeck JH (1999) A comparative analysis of the spin state distribution of in vitro and in vivo mutants of PsaC. Photosynth Res 61: 107–144
57) Gong X.-M., Agalarov R., Brettel K., and Carmeli C. (2003): Control of Electron Transport in Photosystem I by the Iron-Sulfur Cluster FX in Response to Intra- and Intersubunit Interactions J. Biol. Chem 278(21): 19141 - 19150.
58) Grotjohann Ingo and Fromme Petra (2005): Structure of cyanobacterial Photosystem I Photosynthesis Research 85: 51–72
59) Guergova-Kuras M, Boudreaux B, Joliot A, Joliot P and Redding K (2001) Evidence for two active branches for electron transfer in Photosystem I. Proc Natl Acad Sci USA 98: 4437–4442
60) Haehnel, W. and Hochheimer, H-J. (1979) 303 – On the current generated by a galvanic cell driven by electron transport. Bioelectrochem. Bioenerg. 6, 563–574
61) Happe, T. and Kaminski, A. (2002) Differential regulation of the [Fe]-hydrogenase during anaerobic adaptation in the green alga Chlamydomonas reinhardtii. Eur. J. Biochem. 269, 1022–1032
62) Happe, T. et al. (2002) Hydrogenases in green algae: do they save the algae’s life and solve our energy problems? Trends Plant Sci. 7, 246–250.
63) Hayes JM, Matsuzaki S, Raetsep M and Small GJ (2000) Red chlorophyll a antenna states of photosystem I of the cyanobacterium Synechocystis sp. PCC 6803. J Phys Chem B 104: 5625–5633.
64) Heinecke, D. (2001), Photosynthesis: Dark reactions. In: Encyclopedia of Life Sciences, Nature Publishing group, London pp. 1-4
65) Helfrich M, Schoch S, Lempert U, Cmiel E and Rudiger W (1994) Chlorophyll synthetase cannot synthesize chlorophyll a’. Eur J Biochem 219: 267–275
66) Herzog A. (2000)“Federal Funding of Energy R&D and its Implications,” Invited Speaker, Symposium on Energy in the 21st Century, American Chemical Society Northwest/Rocky Mountain Regional Meeting, Idaho Falls, ID, June 15, 2000.
References __________________________________________________________________________________________________
122
67) Herzog A. (2001) “Energy R&D Funding, Trends, and Implications,” Invited Speaker, Symposium on Energy in the 21st Century, 222nd American Chemical Society National Meeting, Chicago, Illinois, August 26-30, 2001.
68) Herzog A.V., Lipman T.E., and Kammen D.M., “Renewable Energy Sources,” in, OUR FRAGILE WORLD: Challenges and Opportunities for Sustainable Development, forerunner to the Encyclopedia of Life Support Systems (EOLSS), Volume 1, Section 1 (UNESCOEOLSS Secretariat, EOLSS Publishers Co. Ltd.), May 2001.
69) Hladik J, Pancoska P, Safrova D (1982). The influence of carotenoids on the conformation of chlorophyll-protein complexes isolated from the Cyanobacterium Plectonema boryanum. Absorption and circular dichroism study. Biochim Biophys Acta 681:263–272
70) Ho KK, Krogmann DW. 1984. Electron donors to P700 in cyanobacteria and algae. An instance of unusual genetic variability. Biochim Biophys Acta 766:310–316.
71) Holzwarth AR, Muller MG, Niklas J, Lubitz W. (2005): Charge recombination fluorescence in photosystem I reaction centers from Chlamydomonas reinhardtii. J Phys Chem B. 31;109(12):5903-11.
72) Holzwarth, A. R.; Müller, M. G.; Reus, M.; Nowaczyk, M.; Sander, J.; Rögner, M. (2006) Kinetics and mechanism of electron transfer in intact photosystem II and in the isolated reaction center: Pheophytin is the primary electron acceptor. Proc. Natl. Acad. Sci. 103, 18, 6895-6900.
73) Holzwarth AR, Schatz G, Brock H and Bittersmann E (1993): Energy transfer and charge separation kinetics in photosystem I. 1. Picosecond transient absorption and fluorescence study of cyanobacterial photosystem I particles. Biophys J 64: 1813–1826
74) Hui Y, Jie W, and Carpentier R (2000) Degradation of the Photosystem I Complex During Photoinhibition. Photochemistry and Photobiology 72 (4) 508–512.
75) Ihara, M.; Nishihara, H.; Yoon, K. S.; Lenz, O.; Friedrich, B.; Nakamoto, H.; Kojima, K.; Honma, D.; Kamachi, T.; Okura, I. (2006) Light-driven hydrogen production by a hybrid complex of a [NiFe]-hydrogenase and the cyanobacterial photosystem I. Photochem Photobiol 82, 3, 676-82.
76) Inoue, H., Nojima, H. and Okayama, H. (1990) High efficiency transformation of Escherichia coli with plasmids. Gene, 96, 23-28.
77) International Atomic Energy Agency, Vienna, 2001 78) International Energy Annual 2001 79) Ishikita H and Knapp EW (2003) Redox potential of quinines in both electron transfer branches of Photosystem I.
J Biol Chem 278: 52002–52011
80) Irrgang, K.-D. (1999) Chapter 6: The Architecture of the Thylakoid Membrane In: Concepts in Photobiology: Photosynthesis and Photomorphogenesis (eds. Singhal, G. S., Renger, G., Sopory, S. K., Irrgang, K.-D. & Govindjee) pp. 139-180, Kluwer Publ. Co. and Narosa Publ. House.
81) Hiroshi Ishikita and Ernst-Walter Knapp (2003): “Redox potential of quinones in both electron transfer branches of photosystem I” J. Biol. Chem. 278 - 52002-52011.
82) Ivanov AG, Krol M, Sveshnikov D, Selstam E, Sandstrom S, Koochek M, Park YI, Vasil’ev S, Bruce D, Oquist G, and Huner NP. (2006): Iron deficiency in cyanobacteria causes monomerization of photosystem I trimers and reduces the capacity for state transitions and the effective absorption cross section of photosystem I in vivo. Plant Physiol. 141(4):1436-45.
83) Jeffrey Chow, Raymond J. Kopp, Paul R. Portney (2003): Energy Resources and Global Development. Science 302 1528-1531
84) Jekow, P., Fromme, P., Witt, H.T. & Saenger, W. Photosystem I from Synechococcus elongatus (1995): preparation and crystallization of monomers with varying subunit compositions. Biochim. Biophys. Acta 1229, 115−1120
85) Jelezko, F.; Tietz, C.; Gerken, U.; Wrachtrup, J.; Bittl, R. J. Phys.Chem. B 2000, 104, 8093 Jelezko F, Tietz C, Gerken U, Wrachtrup J and Bittl R (2000) Single-Molecule Spectroscopy on Photosystem I Pigment-Protein Complexes, J. Phys. Chem. B 104, 8093-8096
86) Jones MR, Fyfe PK. (2001): Photosynthesis: new light on biological oxygen production. Curr Biol. 17;11(8):R318-21
87) Jordan P, Fromme P, Klukas O, Witt HT, Saenger W and Krauß N (2001) Three-dimensional structure of cyanobacterial photosystem I at 2.5 °A resolution. Nature 411: 909–917
88) Joshua Sarah and Mullineaux Conrad (2004): Phycobilisome Diffusion Is Required for Light-State Transitions in Cyanobacteria. Plant Physiology,; 135: 2112 – 2119
References __________________________________________________________________________________________________
123
89) Karapetyan NV (2004) The dynamics of excitation energy in Photosystem I of cyanobacteria: transfer in the antenna, capture by the reaction site, and dissipation. Biofizika 49:212–226
90) Karapetyan NV, Dorra D, Schweitzer G, Bezsmertnaya IN and Holzwarth AR (1997) Fluorescence spectroscopy of the longwave chlorophylls in trimeric and monomeric photosystem I core complexes from the cyanobacterium Spirulina platensis. Biochemistry 36: 13830–13837.
91) Karapetyan NV, Holzwarth AR and R¨ognerM(1999a) The photosystem I trimer of cyanobacteria: molecular organization, excitation dynamics and physiological significance.FEBSLett 460: 395–400.
92) Karapetyan N., Schlodder E., Grondelle R. And Dekker J (2006): The long wavelength chlorophylls of photosystem I. Advanced in photosynthesis and respiration Spring USA (24) 177-192.
93) Karapetyan NV, Shubin VV and Strasser RJ (1999b) Energy exchange between the chlorophyll antenna of monomeric subunits within the photosystem I trimeric complex of the cyanobacterium Spirulina. Photosynth Res 61: 291–301
94) Katoh, H., N. Hagino, A. R. Grossmann and T. Ogawa (2001). “Genes essential to iron transport in the cyanobacterium Synechocystis sp. strain PCC 6803.” J Bacteriol 183: 2279-2784.
95) Ke B., 2002; The spectral species P430 and its spectral and kinetic properties are briefly reviewed. Currently available evidence shows P430 to be the optic-spectral representation of FeS-A/B, the electron acceptor(s) of Photosystem I (PS I). Photosynth Res. 2002;73(1-3):207-14.
96) Kerfeld CA and Krogmann DW. (1998): Photosynthetic Cytochrome C in cyanobacteria, algae and plants. Annu Rev Plant Physiol Plant Mol Biol. 49:397-425.
97) Kern, J. (2005), Structural and functional investigations of Photosystem II from Thermosynechococcus elongatus. Technische Universität zu Berlin, Dissertation.
98) Kern J, Biesiadka J, Loll B, Saenger W, Zouni A (2007): Structure of the Mn(4)-Ca cluster as derived from X-ray diffraction. Photosynth Res. In press
99) Kievit Olaf and Brudvig W. Gary (2001): Direct electrochemistry of photosystem I. Electroana. Chem 497: 139-149.
100) Klimmek F, Ganeteg U, Ihalainen JA, van Roon H, Jensen PE, Scheller HV, Dekker JP, Jansson S. (2005): Structure of the higher plant light harvesting complex I: in vivo characterization and structural interdependence of the Lhca proteins. Biochemistry. 1;44(8):3065-73
101) Klukas O, Schubert WD, Jordan P, Krauß N, Fromme P, Witt HT and Saenger W (1999) Localization of two phylloquinones, QK and QK’, in an improved electron density map of Photosystem I at 4 A ˚ resolution. J Biol Chem 274: 7361–7367
102) Klukas O, Schubert WD, Jordan P, Krauß N, Fromme P, Witt HT and Saenger W (1999) Photosystem I, an improved model of the stromal subunits PsaC, PsaD, and PsaE. J Biol Chem 274: 7351–7360
103) Kouril R, van Oosterwijk N, Yakushevska AE, Boekema EJ. Photosystem I: a search for green plant trimers. Photochem Photobiol Sci. 2005 Dec;4(12):1091-4. Epub
104) Krabben L, Schlodder E, Jordan R, Carbonera D, Giacometti G, Lee H, Webber AN, Lubitz W. (2000): Influence of the axial ligands on the spectral properties of P700 of photosystem I: a study of site-directed mutants. Biochemistry. 24;39(42):13012-25.
105) Krauß N, Hinrichs W, Witt I, Fromme P, Pritzkow W, Dauter Z, Betzel C, Wilson KS, Witt HT and Saenger W (1993) Three-dimesional structure of system I of photosynthesis at 6 A˚ resolution. Nature 361: 326–361
106) Krauß N, Schubert WD, Klukas O, Fromme P, Witt HT and Saenger W (1996) Photosystem I at 4 A ˚ resolution represents the first structural model of a joint photosynthetic reaction centre and core antenna system. Nat Struct Biol 3: 965–973
107) Kruip J, Boekema EJ, Bald D, Boonstra AF, Rogner M. (1993): Isolation and structural characterization of monomeric and trimeric photosystem I complexes (P700.FA/FB and P700.FX) from the cyanobacterium Synechocystis PCC 6803. J Biol Chem. 5;268(31):23353-60.
108) Kruip J, Karapetyan NV, Terekhova IV and Rögner M (1999) In vitro oligomerization of a membrane protein complex. Liposome-based reconstitution of trimeric photosystem I from isolated monomers. J Biol Chem 274: 18181–18188
109) Kruip, J., Boekema, E. J., Bald, D., and Rögner, M. (1994) Evidence for the existence of trimeric and monomeric Photosystem I complexes in thylakoid membranes from cyanobacteria Photosynth. Res. 40, 279–286
References __________________________________________________________________________________________________
124
110) Kruip J, Chitnis PR, Lagoutte B, Rögner M, Boekema EJ. (1997): Structural organization of the major subunits in cyanobacterial photosystem 1. Localization of subunits PsaC, -D, -E, -F, and -J. J Biol Chem. 4;272(27):17061-9
111) Lengeler, J. W., Drews, G. and Schlegel, H. G. (1999),Biology of the Prokaryotes. Thieme-Verlag, Stuttgart
112) Liaaen S., Jensen A., Quantitative determination of carotenoids in photosynthetic tissues, Methods in Enzymol. 23A, 586-602, 1971.
113) Li N, Zhao JD, Warren PV, Warden JT, Bryant DA and Golbeck JH (1991) PsaD is required for the stable binding of PsaC to the Photosystem I core protein of Synechococcus sp. PCC 6301.. Biochemistry 30: 7863–7872
114) Lichtenthaler, H. K. (1987). Chlorophylls and carotenoids: pigments of photosynthetic biomembranes. Meth Enzymol. 148: 350-382.
115) Loll B, Kern J, Saenger W, Zouni A, Biesiadka J. (2005): Towards complete cofactor arrangement in the 3.0 A resolution structure of photosystem II. Nature. 15;438(7070):1040-4.
116) Lyon EJ, Shima S, Boecher R, Thauer RK, Grevels FW, Bill E, Roseboom W, Albracht SP (2004): Carbon monoxide as an intrinsic ligand to iron in the active site of the iron-sulfur-cluster-free hydrogenase H2-forming methylenetetrahydromethanopterin dehydrogenase as revealed by infrared spectroscopy. J Am Chem Soc. 3;126(43):14239-48
117) Makewicz A, Radunz A, Schmid GH. (1996): Comparative immunological detection of lipids and carotenoids on peptides of photosystem I from higher plants and cyanobacteria. Z Naturforsch [C]. 1996 May-Jun;51(5-6):319-28.
118) Maly, J.; Illiano, E.; Sabato, M.; De Francesco, M.; Pinto, V.; Masci, A.; Masci, D.; Masojidek, J.; Sugiura, M.; Franconi, R.; Pilloton, R. (2002) Immobilisation of engineered molecules on electrodes and optical surfaces. Mater. Sci. Eng. C22, 257-261.
119) Maly, J.; Krejci, J.; Ilie, M.; Jakubka, L.; Masojidek, J.; Pilloton, R.; Sameh, K.; Steffan, P.; Stryhal, Z.; Sugiura, M. (2005) Monolayers of photosystem II on gold electrodes with enhanced sensor response - effect of porosity and protein layer arrangement. Anal Bioanal Chem 381, 8, 1558-67. Epub 2005 Apr 9.
120) Margulis, L. (1970), Origin of eukaryotic cells. Yale University Press. New Haven, Conneticut.
121) McConnell MD, Koop R, Vasil’ev S, Bruce D (2002) Regulation of the distribution of chlorophyll and phycobilin-absorbed excitation energy in cyanobacteria. A structure-based model for the light state transition. Plant Physiol 130: 1201–1212
122) Melis, A. (2002) Green Alga Hydrogen Production: Progress, Challenges and Prospects. Int. J. Hydrogen Energy 27, 1217-1228.
123) Melis, A.; Happe, T. (2001) Hydrogen Production. Green Algae as a Source of Energy. Plant Physiol. 127, 3, 740-748. 57.
124) Melkozernov AN, Blankenship RE. (2005): Structural and functional organization of the peripheral light-harvesting system in photosystem I. Photosynth Res. 85(1):33-50.
125) Melkozernov AN, Lin S, Blankenship RE. (2000a): Excitation dynamics and heterogeneity of energy equilibration in the core antenna of photosystem I from the cyanobacterium Synechocystis sp. PCC 6803. Biochemistry. 15;39(6):1489-98
126) Melkozernov AN, Lin S, Blankenship RE. (2000b): Femtosecond transient spectroscopy and excitonic interactions in Photosystem I. J Phys Chem B. 24;104(7):1651-6.
127) Melkozernov AN, Lin S, Blankenship RE, Valkunas L. (2001) Spectral inhomogeneity of photosystem I and its influence on excitation equilibration and trapping in the cyanobacterium Synechocystis sp. PCC6803 at 77 K. Biophys J. 2001 Aug;81(2):1144-54
128) Merchant S, Dreyfuss BW. (1998): Posttranslation assembly of photosynthetic metalloproteins. Annu Rev Plant Physiol Plant Mol Biol. 49:25-51.
129) Michel, K. P. (2003),Adaptation of the photosynthetic electron transport chain in cyanobacteria to iron deficiency and oxidative stress: The function of IdiA and IsiA. Universität Bielefeld, Habilitation.
130) Miloslavina, Y., Szczepaniak, M., Müller, G., Sander, J., Nowaczyk, M., Rögner, M., Holzwarth, A. R. (2006); Charge Separation Kinetics in Intact Photosystem II Core Particles Is Trap-Limited. A Picosecond Fluorescence Study; Biochemistry 45, 2436-2442
References __________________________________________________________________________________________________
125
131) Moser D, Nicholls P, Wastyn M, Peschek G. (1991): Acidic cytochrome c6 of unicellular cyanobacteria is an indispensable and kinetically competent electron donor to cytochrome oxidase in plasma and thylakoid membranes. Biochem Int. 24(4):757-68
132) Mühlenhoff U, Zhao J and Bryant DA (1996) Interaction between Photosystem I and flavodoxin from the cyanobacterium Synechococcus sp. PCC 7002 as revealed by chemical cross-linking. Eur J Biochem 235: 324–331.
133) Mukerji I, Sauer K (1989) Temperature dependent steady-state and picosecond kinetic fluorescence measurements of a Photosystem I preparation from spinach. In W Briggs, ed, Progress in Photosynthesis, Vol 8. Alan R Liss, New York, pp 105–122
134) Müller MG, Niklas J, Lubitz W and Holzwarth AR (2003) Ultrafast transient absorption studies on Photosystem Ireaction centers from Chlamydomonas reinhardtii. 1. A new interpretation of the energy trapping and early electron transfer steps in Photosystem I. Biophys J 85: 3899–3922.
135) Mullineaux CW (1994) Excitation energy transfer from phycobilisomes to photosystem I in a cyanobacterial mutant lacking photosystem II. Biochim Biophys Acta 1184: 71–77
136) Mullineaux CW (2004) FRAP analysis of photosynthetic membranes. J Exp Bot 55: 1207–1211
137) Mullineaux CW, Allen JF (1990) State 1-state 2 transitions in the cyanobacterium Synechococcus 6301 are controlled by the redox state of electron carriers between photosystems I and II. Photosynth Res 22: 157–166
138) Mullineaux CW, Tobin MJ, Jones GR (1997) Mobility of photosynthetic complexes in thylakoid membranes. Nature 390: 421–4
139) Munge, B.; Das, S. K.; Ilagan, R.; Pendon, Z.; Yang, J.; Frank, H. A.; Rusling, J. F. (2003) Electron Transfer Reactions of Redox Cofactors in Spinach Photosystem I Reaction Center Protein in Lipid Films on Electrodes. J. Am. Chem. Soc. 125, 12457-12463.
140) Nakamura Y, Kaneko T, Sato S, Ikeuchi M, Katoh H, Sasamoto S, Watanabe A, Iriguchi M, Kawashima K, Kimura T, Kishida Y, Kiyokawa C, Kohara M, Matsumoto, Sayaka Shimpo , Hisae Tsuruoka , Tsuyuko Wada , Manabu Yamada , Satoshi Tabata (2002): Complete genomic sequence of nitrogen-fixing symbiotic bacterium Bradyrhizobium japonicum USDA110. DNA Res. 31;9 (6):189-97 12597275
141) Nakamura Akimasa ; SUZAWA Tomoyuki ; KATO Yuki ; WATANABE Tadashi (2005): Significant species-dependence of P700 redox potential as verified by spectroelectrochemistry : Comparison of spinach and TheromoSynechococcus elongatus. FEBS letters 579, no11, pp. 2273-2276
142) Nakamura, A., Akai M., Yoshida E., Taki T. and Watanabe T. (2003). “Reversed-phase HPLC determination of chlorophyll a’ and phylloquinone in Photosystem I of oxygenic photosynthetic organisms. Universal existence of one chlorophyll a’ molecule in Photosystem I.” Eur J Biochem 270(11): 2446-58.
143) Nelson N, Ben-Shem A. (2002): Photosystem I reaction center: past and future. Photosynth Res. 73(1-3):193-206
144) Nelson, N.; Ben-Shem, A. (2004): The complex architecture of oxygenic photosynthesis. Nat. Rev. Mol. Cell. Biol. 5, 12, 971-82.
145) Newman PJ, Sherman LA. (1978): Isolation and characterization of photosystem I and II membrane particles from the blue-green alga, Synechococcus cedrorum. Biochim Biophys Acta. 8;503(2):343-61
146) Nicholls P, Rand RP, Fuller N, Butko P. (1992): Water, ions and membrane proteins: how would Darwin look at cytochromes and channels? Biochem Soc Trans.;20(3):583-9.
147) Nowaczyk, M. M.; Hebeler, R.; Schlodder, E.; Meyer, H. E.; Warscheid, B.; Rögner, M. (2006) Psb27, a Cyanobacterial Lipoprotein, Is Involved in the Repair Cycle of Photosystem II. Plant Cell 18, 11, 3121-31.
148) Nowaczyk, M., Oworah-Nkruma, R., Zoonens, M., Rögner, M., Popot, J. L. (2004) Amphipols: Strategies for an improved PS2 environment in detergent-free aqueous solution,In: Biohydrogen III (J. Miyake, ed.), 151-160, Elsevier, Niederlande
149) Obinger C, Knepper JC, Zimmermann U, Peschek GA. (1990): Identification of a periplasmic C-type cytochrome as electron donor to the plasma membrane-bound cytochrome oxidase of the cyanobacterium Nostoc mac. Biochem Biophys Res Commun. 15;169(2):492-501
150) Ogawa, T., F. Obata and K. Shibata (1966): Two pigment proteins in spinach chloroplast. Biochim. Biophys. Ada 112: 223-234.
151) Olson, J.M. 1970, J.M. Olson, ‘Evolution of Photosynthesis’ (1970),
152) Olson, J.M. 2001 re-examined thirty years later, Photosynth. Res. 68 (2001) 95-112.
References __________________________________________________________________________________________________
126
153) Palsson L-O, Dekker JP, Schlodder E, Monshouwer R and van Grondelle R (1996) Polarized site-selective fluorescence spectroscopy of the long-wavelength emitting chlorophylls in isolated photosystem I particles of Synechococcus elongatus. Photosynth Res 48: 239–262
154) Palsson L-O, Flemming C, GobetsB, van Grondelle R, Dekker JP and Schlodder E (1998) Energy transfer and charge separation in photosystem I: P700 oxidation upon selective excitation of the long-wavelength antenna chlorophylls of Synechococcus elongatus. Biophys J 74: 2611–2622
155) Porra, R. J.; Thompson, W. A.; Kriedemann, P. E. (1989) Determination of accurate extinction coefficients and simultaneous equations for assaying chlorophyll a and b extracted with four different solvents: verification of the concentration of chlorophyll standards by atomic absorption spectroscopy. Biochim. Biophys. Act. 975, 384-394.
156) Prodöhl, A. Photosynthetische Erzeugung von Biowasserstoff mit natürlichen und semiartifiziellen Systemen. Diplomarbeit, Ruhr-Universität, Bochum, 2002.
157) Prodöhl, A.; Ambill, M.; El-Mohsnawy, E.; Lax, J.; Nowaczyk, M.; Oworah-Nkruma, R.; Volkmer, T.; Wenk, S.-O.; Rögner, M., Modular Device For Hydrogen Production: Optimization of (Individual) Components. In Biohydrogen III, Miyake, J., et al., Eds. Elsevier: Oxford, 2004; pp 171-179.
158) Proux-Delrouyre, V.; Demaille, C.; Leibl, W.; Setif, P.; Bottin, H.; Bourdillon, C. (2003) : Electrocatalytic Investigation of Light-Induced Electron Transfer between Cytochrome c6 and Photosystem I. J. Am. Chem. Soc. 125, 45, 13686-13692.
159) Qian D. J., Nakamura C., Zorin N. and Miyake J. (2002a) Hydrogenase–poly(viologen) complex monolayers and electrochemical properties in Langmuir–Blodgett films. Colloids Surf. A.198-200: 663-669
160) Qian DJ, Nakamura C, Noda K, Zorin NA, Miyake J. (2000): Fabrication of an electrode-viologen-hydrogenase heterogeneous system and the electrochemical hydrogen evolution. Appl Biochem Biotechnol. Spring;84-86:409-18.
161) Qian DJ, Nakamura C, Wenk SO, Ishikawa H, Zorin N, Miyake J. (2002b) A hydrogen biosensor made of clay, poly(butylviologen), and hydrogenase sandwiched on a glass carbon electrode. Biosens Bioelectron. 17(9):789-96.
162) Raetsep M, Johnson TW, Chitnis PR and Small GJ (2000) The red-absorbing chlorophyll a antenna states of photosystem I: a hole-burning study of Synechocystis sp. PCC 6803 and its mutants. J Phys Chem 104B: 836–847
163) Rakhimberdieva MG, Boichenko VA, Karapetyan NV and Stadnichuk IN (2001) Interaction of phycobilisomes with photosystem II dimers and photosystem I monomers and trimers in the cyanobacterium Spirulina platensis. Biochemistry 40: 15780–15788
164) Remy A, Niklas J, Kuhl H, Kellers P, Schott T, Rogner M, Gerwert K (2004): FTIR spectroscopy shows structural similarities between photosystems II from cyanobacteria and spinach. Eur J Biochem.;271(3):563-7
165) Richard S, Morency MJ, Drevet C, Jouanin L, Seguin A. (2000): Isolation and characterization of a dehydrin gene from white spruce induced upon wounding, drought and cold stresses. Plant Mol Biol.;43(1):1-10
166) Riley K, Reinot T, Jankowiak R, Fromme P, and Zazubovich F (2007): Red Antenna States of Photosystem I from Cyanobacteria Synechocystis PCC 6803 and Thermosynechococcus elongatus: Single-Complex Spectroscopy and Spectral Hole-Burning Study. J. Phys. Chem. B 111, 286-292
167) Riley KJ, Zazubovich V, Jankowiak R (2006): Frequency-domain spectroscopic study of the PS I-CP43’ supercomplex from the cyanobacterium Synechocystis PCC 6803 grown under iron stress conditions. J Phys Chem B. 16;110(45):22436-46
168) Rippka, R., J. Deruelles, J. Waterbury, M. Herdman and R. Stanier (1979). “Generic assignments, strain histories and properties of pure cultures of cyanobacteria.” J Gen Microbiol 111: 1-61.
169) Rivadossi A, Zucchelli G, Garlaschi FM and Jennings RC (1999) The importance of PSI chlorophyll red forms in lightharvesting by leaves. Photosynth Res 60: 209–215
170) Rögner M, Boekema JE and Barber J (1996): How does photosystem 2 split water? The structural basis of efficient energy conversion Trends in Biochemical Sciences, 21-2 44-49.
171) Rögner M., Mühlenhoff U., Boekema E. and Witt H. (1990b): Mono-, di- and trimeric PS I reaction center complexes isolated from the thermophilic cyanobacterium Synechococcus sp. Size, shape and activity. Biochimica et Biophysica Acta (BBA) - Bioenergetics 1015, Issue 3, 22 415-424.
172) Rögner M, Nixon PJ, Diner BA. (1990a): Purification and characterization of photosystem I and photosystem II core complexes from wild-type and phycocyanin-deficient strains of the cyanobacterium Synechocystis PCC 6803. J Biol Chem. 15;265(11):6189-96.
References __________________________________________________________________________________________________
127
173) Sambroock, J., Fritsch, E.F. and Maniatis, T. (1989) Molecular cloning: A laboratory manual 2nd Edition. Cold Spring Habour Laboratory Press, USA.
174) Sandmann G, Reck H, Kessler E, Böger P (1983) Distribution of plastocyanin and soluble plastidic cytochrome c in various classes of algae. Arch Microbiol 134:23–27
175) Sarcina M and Mullineaux CW. (2004): Mobility of the IsiA chlorophyll-binding protein in cyanobacterial thylakoid membranes. J Biol Chem. 27;279(35):36514-8.
176) Sarcina M, Tobin M, and Mullineaux C (2001): Diffusion of Phycobilisomes on the Thylakoid Membranes of theCyanobacterium Synechococcus 7942 Vol. 276, No. 50, Issue of December 14, pp. 46830–46834, 2001
177) Schägger, H. and von Jagow, G. (1987), Tricine-sodium dodecyl sulfate-polyacrylamide gel electrophoresis for the separation of proteins in the range from 1 to 100 kDa. Analyt Biochem 166: 368-79
178) Scheller H. V., In vitro cyclic electron transport in barley thylakoids follows two independent pathways, Plant Physiol. 110 (1996) 187-194
179) Schlodder E, Cetin M, Byrdin M, Terekhova V, Karapetyan N.V., P700+- and 3P700-induced quenching of the fluorescence at 760 nm in trimeric photosytem I complexes from the cyanobacterium Arthrospira platensis, Biochim. Biophys. Acta 1706 (2005) 53-67.
180) Schlodder E, Shubin Vladimir, El-Mohsnawy E, Rögner M, Karapetyan N (2007): Steady-state and transient polarized absorption spectroscopy of photosystem I complexes from the cyanobacteria Arthrospira platensis and Thermosynechococcus elongatus.
181) Schluchter WM, Shen G, Zhao J and Bryant DA (1996) Characterization of psaI and psaL mutants of Synechococcus sp. strain PCC 7002: a new model for state transitions in cyanobacteria. Photochem Photobiol 64: 53–66
182) Schopf JW. (2000): Solution to Darwin’s dilemma: discovery of the missing Precambrian record of life. Proc Natl Acad Sci U S A. 20;97(13):6947-53
183) Schubert WD, Klukas O, Krauß N, Saenger W, Fromme P and Witt HT (1997) Photosystem I of Synechococcus elongatus at 4 A˚ resolution: comprehensive structure analysis. J Mol Biol 272: 741–769
184) Schubert WD, Klukas O, Saenger W, Witt HT, Fromme P and Krauß N (1998) A common ancestor for oxygenic and anoxygenic photosynthetic systems: a comparison based on the structural model of Photosystem I. J Mol Biol 280: 297–314
185) Schwarz R and Forchhammer K (2005): Acclimation of unicellular cyanobacteria to macronutrient deficiency: emergence of a complex network of cellular responses. Microbiology.151(Pt 8):2503-14.
186) Semenov A., Vassiliev I., Van der Est A., Mamedov M., Zybailov B., Shen G., Stehlik D., Diner B., Chitnis P., and Golbeck J. (2001) Recruitment of a Foreign Quinone into the A1 Site of Photosystem I. III. Altered Kinetics of Electron Transfer in Phylloquinone Biosynthetic Pathway Mutants Studied by Time-Resolved Optical, EPR and Electrometric Techniques J Biol. Chem 4; 275 (31): 23429-38.
187) Sener M, Jolley C, Ben-Shem A, Fromme P, Nelson N, Croce R, and Schulten K (2005) Comparison of the Light-Harvesting Networks of Plant and Cyanobacterial Photosystem I Biophysical Journal, 89 1630–1642
188) Sener MK, Lu DY, Ritz T, Park S, Fromme P and Schulten K (2002) Robustness and optimality of light harvesting in cyanobacterial photosystem I. J Phys ChemB106: 7948–7960
189) Sener MK, Park S, Lu D, Damjanovic A, Ritz T, Fromme P, Schulten K. (2004): Excitation migration in trimeric cyanobacterial photosystem I. J Chem Phys. 15;120(23):11183-95.
190) Shen G., Antonkine M., der Est A., Vassiliev I., Brettel K., Bittl R., Zech S., Zhao J., Stehlik D., Bryant D., and Golbeck J. (2002) Assembly of Photosystem I. J. Biol. Chem., Vol. 277, Issue 23, 20355-20366, June 7, 2
191) Shubin V, Bezsmertnaya I and Karapetyan N (1992): Isolation from Spirulina membranes of two photosystem I-type complexes, one of which contains chlorophyll responsible for the 77 K fluorescence band at 760 nm. 309, 3, ;t40-342
192) Shubin VV, Bezsmertnaya IN and Karapetyan NV (1995) Efficient energy transfer from the long-wavelength antenna chlorophylls to P700 in photosystem I complexes from Spirulina platensis. J Photochem Photobiol B 30: 153–160.
193) Shubin VV, Murthy SDS, Karapetyan NV and Mohanty P (1991) Origin of the 77 K variable fluorescence at 758 nm in the cyanobacterium Spirulina platensis. Biochim Biophys Acta 1060: 28–36
194) Shubin VV, Tsuprun VL, Bezsmertnaya IN and Karapetyan NV (1993) Trimeric forms of the photosystem I reaction center complex pre-exist in the membranes of the cyanobacteriun Spirulina platensis. FEBS Lett 334: 79–82
References __________________________________________________________________________________________________
128
195) Sonoike K, Katoh S. Simple estimation of the differential absorption coefficient of P-700 in detergent-treated preparations. Biochim Biophys Acta. 1989;976:210–213.
196) Staehelin LA and van der Staay GWM (1996) Structure, composition, functional organization and dynamic properties of thylakoid membranes. In: Ort DR and Yocum CF (eds) Oxygenic Photosynthesis: The Light Reactions. Advances in Photosynthesis and Respiration, vol 4. Springer, Dordrecht, pp 11-30
197) Sutter M, Sticht H, Schmid R, Hörth P, Rösch P and Haehnel W (1995) Cytochrome c6 from the thermophilic Synechococcus elongatus. In Mathis,P. (ed.), Photosynthesis: From Light to Biosphere. Kluwer Academic Publishers, The Netherlands, Vol. II, pp. 563–566.
198) Takahashi Y, Katoh S. (1982): Functional subunit structure of photosystem 1 reaction center in Synechococcus sp. Arch Biochem Biophys. 1982 Nov;219(1):219-27.
199) Tanimura R., Hill M., Margoliash E., Niki K., Ohno H., and Gray H. (2002) Active Carboxylic Acid-Terminated Alkanethiol Self-Assembled Monolayers on Gold Bead Electrodes for Immobilization of Cytochromes c. Electrochem. Solid-State Lett., 5, Issue 12, pp. E67-E70
200) Terasaki N, Yamamoto N, Tamada K, Hattori M, Hiraga T, Tohri A, Sato I, Iwai M, Iwai M, Taguchi S, Enami I, Inoue Y, Yamanoi Y, Yonezawa T, Mizuno K, Murata M, Nishihara H, Yoneyama S, Minakata M, Ohmori T, Sakai M, Fujii M. (2006): Bio-photosensor: Cyanobacterial photosystem I coupled with transistor via molecular wire. Biochim Biophys Acta. 2006 Nov 15; [Epub ahead of print].
201) Teuber M, Rögner M, Berry S (2001) Fluorescent probes for non-invasive bioenergetic studies of whole cyanobacterial cells. Biochim Biophys Acta 1506: 31-46.
202) Tribet C.; Audebert R and Popot J.-L. (1996) Amphipols: Polymers that keep membrane proteins soluble in aqueous solutions. Proc. Natl. Acad. Sci. USA 93: 15047-15050.
203) Tribet C.; Audebert R and Popot J.-L. (1997) Stabilization of hydrophobic colloidal dispersions in water with amphiphilic polymers: application to integral membrane proteins. Langmuir, 13: 5570-5576.
204) Trissl H-W (1993) Long-wavelength absorbing antenna pigments and heterogeneous absorption bands concentrate excitons and increase absorption cross-section. Photosynth Res 35: 247–263.
205) Van Amerongen H, Kuil ME, van Mourik F, van Grondelle R. (1988): Linear dichroism of the complex between the gene 32 protein of bacteriophage T4 and poly(1,N6-ethenoadenylic acid). J Mol Biol. 20;204(2):397-405.
206) Van der Lee J, Bald D, Kwa S, van Grondelle R, Rögner M and Dekker JP (1993) Steady-state polarized-light spectroscopy of isolated photosystem I complex. Photosynth Res 35: 311–321.
207) Van Thor, J. J., Mullineaux, C. W., Matthijs, H. C. P., and Hellingwert, K. J. (1998) Light harvesting and state transitions in cyanobacteria. Botanica Acta 111, 430-443.
208) Vernon LP, Shaw ER, Ke B. (1966): A photochemically active particle derived from chloroplasts by the action of the detergent Triton X-100. J Biol Chem. 10;241(17):4101-9.
209) Wang, J., Analytical Electrochemistry. Second ed.; Wiley-VCH: 2000.
210) Wenk, S.-O.; Qian, D.-J.; Wakayama, T.; Nakamura, C.; Zorin, N.; Rögner, M.; Miyake, J. (2002) Biomolecular device for photoinduced hydrogen production. Int. J. Hydrogen Energy 27, 1489-1493.
211) Wessels JS. (1968): Isolation and properties of two digitonin-soluble pigment-protein complexes from spinach. Biochim Biophys Acta. 1968 Feb 12;153(2):497-500.
212) Whitelegge J, Zahng H, Aguilera R, Taylor R and Cramer W (2002): Full subunit Coverage Liquid Chromatography Electrospray Ionization Mass Spectrometry (LCMS+) of an Oligomeric Membrane Protein. Mol. Cellu. Proteom. 1.10 816-827.
213) Whitmarsh J. and Govindjee J.. The photosynthetic process in (Singhal, G.S., Renger, G., Sopory, S.K., Irrgang, K.-D. and Govindjee, eds.) Concepts in Photobiology: Photosynthesis and Photomorphogenesis, Narosa Publishing House, New Dehli, India 1999, pp. 11-51
214) Winkler, M., Maeurer, C., Hemschemeier, A. and Happe T. (2004) The isolation of green algal strains with outstanding H2-productivity. Biohydrogen III, (Miyake J, Igarashi Y, Rögner M., eds), Elsevier Science, Oxford, 103-115.
215) White NTH, Beddard GS, Thorne JR, Feeban TM, Keyes TA, Heathcote P (1996) Primary charge separation and energy transfer in the photosystem I reaction center of higher plants. J Phys Chem B 100: 12086–12099.
216) Wittmershaus BP, Tran TD and Panaia B (1998) Fluorescence from low-energy chlorophylls in photosystem I of Synechocystis sp. PCC 6803 at physiological temperatures. Photosynth Res 57: 29–39
References __________________________________________________________________________________________________
129
217) Witt H, Bordignon E, Carbonera D, Dekker JP, Karapetyan NV, Teutloff C, Webber A, Lubitz W and Schlodder E (2003) Species-specific differences of the spectroscopic properties of P700: analysis of the influence of non-conserved amino acid residues by site-directed mutagenesis of photosystem I from Chlamydomonas reinhardtii. J Biol Chem 278: 46760–46771
218) Witt, H., Schlodder, E., Teutloff, C., Niklas, J., Bordignon, E., Carbonera, D., Kohler, S., Labahn, A., and Lubitz, W. (2002): Hydrogen Bonding to P700: Site-Directed Mutagenesis of Threonine A739 of Photosystem I in Chlamydomonas reinhardtii. Biochemistry 41, 8557–8569
219) Wood PM 1978. Interchangeable copper and iron proteins in algal photosynthesis. Studies on plastocyanin and cytochrome c-552 in Chlamydomonas. Eur J Biochem 87:9–19.
220) Woolf VM,Wittmershaus BP,Vermaas WFJ and Tran TD (1994) Resolution of low-energy chlorophylls in photosystem I of Synechocystis sp. PCC 6803 at 77 and 295 K through fluorescence excitation anisotropy. Photosynth Res 40: 21–34
221) Wynn RM, Omaha J and Malkin R (1989): Structural and functional properties of the cyanobacterial Photosystem I complex. Biochemistry 28 5554-5560.
222) Xu Q, Hoppe D, Chitnis VP, Odom WR, Guikema JA and Chitnis PR (1995) Mutational analysis of Photosystem I polypeptides in the cyanobacterium Synechocystis sp. PCC 6803. Targeted inactivation of psaI reveals the function of psaI in the structural organization of psaL. J Biol Chem 270: 16243–16250
223) Xu W, Chitnis P, Valieva A, Est Avan der, Pushkar YN, Krzystyniak M, Teutloff C, Zech SG, Bittl R, Stehlik D, Zybailov B, Shen G and Golbeck JH (2003) Electron transfer in cyanobacterial Photosystem I: I. Physiological and spectroscopic characterization of site-directed mutants in a putative electron transfer pathway from A0 through A1 to FX. J Biol Chem 278: 27864–27875
224) Zazubovich V, Matsuzaki S, Johnson TW, Hayes JM, Chitnis PR and Small GJ (2002) Red antenna states of photosystem I from cyanobacterium Synechococcus elongatus: a spectral hole-burning study. Chem. Physics 275: 47–59
225) Zorin, N. A.; Pashkova, O. N.; Gogotov, I. N. (1995) Isolation and characterization of two forms of hydrogenase from Thiocapsa roseopersicina. Biochemistry (Moscow) 60, 379-384.
226) Zouni A, Witt HT, Kern J, Fromme P, Krauß N, Saenger W and Orth P (2001) Crystal structure of Photosystem II from Synechococcus elongatus at 3.8 A ˚ resolution. Nature 409: 739–743
Abbreviations __________________________________________________________________________________________________
130
8) Abbreviations (m)A (milli) Ampere A Absorbance Å Ångström AB Antibody APC Allophycocyanin ATP Adenosintriphosphate APS Ammoniumperoxidosulfate ß-DM β-dodecyl maltoside ß-car β-carotene BPB Bromophenolblue,3,3’,5,5’-tetrabromophenolsulfophtalein BSA Bovine serum albumin CD Circular dichroism. CHAPS 3-((3-Cholamidopropyl)-dimethylammonio)-1-propane-sulfonate Chl Chlorophyll CM Cytoplasmic membrane CS Charge separation Cytc6 Cytochromec6 (k)Da (kilo) Dalton DMF Dimethylformamide DMSO Dimethylsulfoxide DNA Desoxyribonucleic acid DCBQ 2,6 dichloro-p-benzoquinone DTT 1,4-Dithiothreitol (µ)E (micro) Einstein E coli Escherichia coli EDTA Ethylenediamietetraacetate Fd Ferredoxin FNR Ferredoxin NADP Oxidoreductase GRIP Groningen Image Processing h Hour HEPES 2-[4-(2-Hydroxyethyl)1-1 piperazinyl] ethansulfonic acid HIC Hydrophobic interaction chromatography His his-tag HPLC High pressure liquid chromatography HTG Heptyl β-D thioglucoside IEC Ion exchange chromatography IdiA Iron deficiency Protein A IMAC Immobilised metall affinity chromatography IMT Intact mass tag IPTG Isopropyl-ß-D-thiogalactopyranoside IsiA Iron stress induced Protein A (k)J (kilo) Joule K Kelvin L Litre LC Liquid chromatography LD Linear dichroism LWC Low wavelength chlorophyll M Mol MALDI Matrix-assisted-laserdesorption-ionisation MES 2-(N-Morpholino) ethane-sulfonic acid MS Mass spectroscopy MSP Manganese stabilising protein MudPIT Multidimensional Protein identification technology MV Methylviologen, (1,1'-Dimethyl-4,4'-bipyridinium-dichlorid) NAD Nicotinamidadenindinucleotid NADP Nicotinamidadenindinucleotidphosphate NDH NAD(P)H dehydrogenase nm Nanometer OD Optical density PAGE Polyacrylamide gel electrophoresis P680 Reaction centre of Photosystem 2
Abbreviations __________________________________________________________________________________________________
131
P700 Reaction centre of Photosystem 1 Pc Plastocyanin PC Phycocyanin PE Phycoerythrin PDA Photo diode array PDB Protein data bank pH Pondus hydrogen Pheo Pheophytine PMF Peptide mass fingerprint PMS phenazine methosulphate PQ Plastoquinone PS I, 1 Photosystem 1 PS II, 2 Photosystem 2 PVDF Polyvinylidenfluoride Q Quinone RB radical pair RPM Round per minute RT Room temperature SEC Size exclusion chromatography -SE Without salt extraction +SE With salt extraction SMCC 4-(N-Maleimidomethyl)cyclohexancarboxylsäure-Nhydroxysuccinimidylester (m)S (milli) Siemens s Second SDH Succinate dehydrogenase SDS Sodium dodecyl sulfate T. elongatus Thermosynechococcus elongatus TCA Trichloro acetic acid TEMED (N,N,N’,N’-Tetramethylethylendiamin) ToF Time of flight Tris Tris-(hydroxymethyl)-aminomethan Triton X100 Octylphenoxy poly (8-10) ethyleneglycol Tween Polyoxyethylene sorbitan monolaureate v Volume (k)V (kilo) Volt w Weight WT Wild type

Acknowledgement __________________________________________________________________________________________________
132
9) Acknowledgement I would like to express my ultimate gratitude to Prof. Dr. Matthias Rögner for giving me the opportunity to
be one of his working group, his guidance in my research projects, his patience and support the
completion of this dissertation and his interesting to solve the problems that face us (my family and me)
during our staying in Germany.
I would like to thank PD Dr. Mathias Lübben for his kindly acceptance to be the second examinator for this
work.
I would like also to thank the Egyptian Ministry of Higher Education and Suez Canal University for their
financial support.
My special thanks go to the Department of Biological and Geological Sciences and faculty of Education in
Al-Arish for offering me this scholarship.
I would like to thank PD Dr. Eberhard Schlodder for his kindly contact and good hospitality for me during
visiting his lab, reviewing and correcting my thesis and fruit discussions.
Special thanks to Prof. Dr. Navassard Karapetyan for his important advices and discussions, his
encouragement and reviewing my thesis. I would also thank Dr. Vladimir Shubin (AG Karapetyan) for our
collaboration.
I would like to thank Prof. Dr. Alfred Holzwarth for collaboration and giving me the opportunity to measure
very fast kinetics of my prep. Special thanks sure for Chavdar Slavov (AG Holzwarth) for collaboration,
good hospitality, interested ideas and friendly contact.
I would like to thank Dr. Berndt Esper for our good team-work, measuring the photocurrent, solving the
computer troubles and optimize the net system in our lab.
Special huge thanks for Dieter Wunsch and Dr. Thomas Schott for helping me too much and giving me a
feeling that I am around my family as well as their interesting to my work.
I would also like to thank and acknowledge my lab and group members; Regina, Berndt, Stefan Wenk,
Julia Sander, Doro, Adrian, Marta, Julia Lax, Anika, Yuichi, Gábor and Kieske for saving an optimum
working conditions in the lab and familiar atmosphere in the office. I would like to extend my appreciation
to Regina, Berndt and J Sander for helping me to achieve most of the official documents.
My thanks go to Claudia and Ulrike for caring the cultures and their help to apply my experimental
designs.
My Acknowledgments go also to Dr. Nowaczyk for interested discussions, collaboration in measuring
mass-spectra of my sample in protein centre.
I would also to thank Thomas Schott, Julia Sander, Doro, Gábor and Adrian for saving some time to
correct some parts of my thesis.
I would thank each one in Gene-lab, AG Nowaczyk and AG Poetsch for kindly contact.
I would thank Dr. Wade for kindly gift (Anti PsaL), Prof Rolan Lill for kindly gift (Anti PsaD, F, E, C) and
Prof J. Popot for providing us Napol-L.

Acknowledgement __________________________________________________________________________________________________
133
Sure I can not forget my family (my wife, Ahmed, and Moemen) who are saving an ideal and quite
atmosphere for working and writing, and special thanks go to my family in Egypt especially my parent,
Ehab, Egab and Enass. whose unconditional love, unwavering support and always asking for me.

Curriculum vitae __________________________________________________________________________________________________
134
10) Curriculum vitae Personal data:
o Name: Eithar Abdel Rashid Abd Rabboh El-Mohsnawy o Date of birth:03.07.1970 o Place of birth: El-Mahalla El-Kubra, Gharbia, Egypt o Nationality: Egyptian o Marital status: Married
Educations: o Primary school: 1976-1981 o Prep school: 1981-1984 o Secondary school: 1984-1987 o (Abitur): 1987
Languages: o Native Language: Arabic o Foreign Languages: English, German
Professional studies: o B.Sc.: in Botany, Faculty of Science, Tanta Uni (1991) o Primaster: In Phycology, Faculty of Science, Tanta Uni (1993) o M.Sc.: In Phycology, Faculty of Science, Tanta Uni (1994-1997). o PhD student: Plant Biochemistry, Ruhr Uni Bochum, Germany (2003-up to now)
Courses and practical training: o Molecular Biology: Alexandria Uni (1998). o Lecturer profession: Suez Canal Uni. (1999). o German courses (G1-G3) (2000). o German courses (M1-M3) (2002). o ZMP (2002)
Positions: o Researcher assistant: Department of Biological and Geological Sciences, Faculty of Education
(Kafr El-Sheikh), Tanta Uni (1993-1996). o Demonstrator: Department of Biological and Geological Sciences, Faculty of Education (El-Arish),
Suez Canal Uni (1996-1997). o Assistant Lecturer: Department of Biological and Geological Sciences, Faculty of Education (El-
Arish), Suez Canal Uni (1997-up to now)
Fields of work o Effect of heavy metals on the growth and physiological activities of cyanobacteria in industrial
cities in Egypt (1993-1997, Botany Department, Tanta Uni). o Role of algae on the production of pharmaceutical compounds in North Sinai (2000-2001, Botany
Department, Tanta Uni). o Photosystem 1 in native and semiartificial system (2003-2007, Plant Biochemistry, Faculty of
Biology and Biotechnology, Ruhr-Uni Bochum)

Curriculum vitae __________________________________________________________________________________________________
135
11) Erklärung Hiermit erkläre ich, dass ich die Arbeit selbständig verfasst und bei keiner anderen
Fakultät eingereicht und dass ich keine anderen als die angegebenen Hilfsmittel
verwendet habe. Es handelt sich bei der heute von mir eingereichten Dissertation um
fünf in Wort und Bild völlig übereinstimmende Exemplare.
Weiterhin erkläre ich, dass digitale Abbildungen nur die originalen Daten enthalten und
in keinem Fall inhaltsverändernde Bildbearbeitung vorgenommen wurde
Bochum, den 01.07.07
___________________
Eithar El-Mohsnawy

Filename: My final thesis-A1 Directory: C:\Documents and Settings\mmm\Desktop Template: C:\Documents and Settings\mmm\Application
Data\Microsoft\Templates\Normal.dot Title: Cyanobacteria: Subject: Author: Eithar1 Keywords: Comments: Creation Date: 6/27/2007 10:45 AM Change Number: 45 Last Saved On: 8/27/2007 3:17 PM Last Saved By: Eithar1 Total Editing Time: 2,580 Minutes Last Printed On: 8/31/2007 9:30 AM As of Last Complete Printing Number of Pages: 142 Number of Words: 47,311 (approx.) Number of Characters: 269,678 (approx.)