Fiji technical report, river aggregate assessment in ...
88
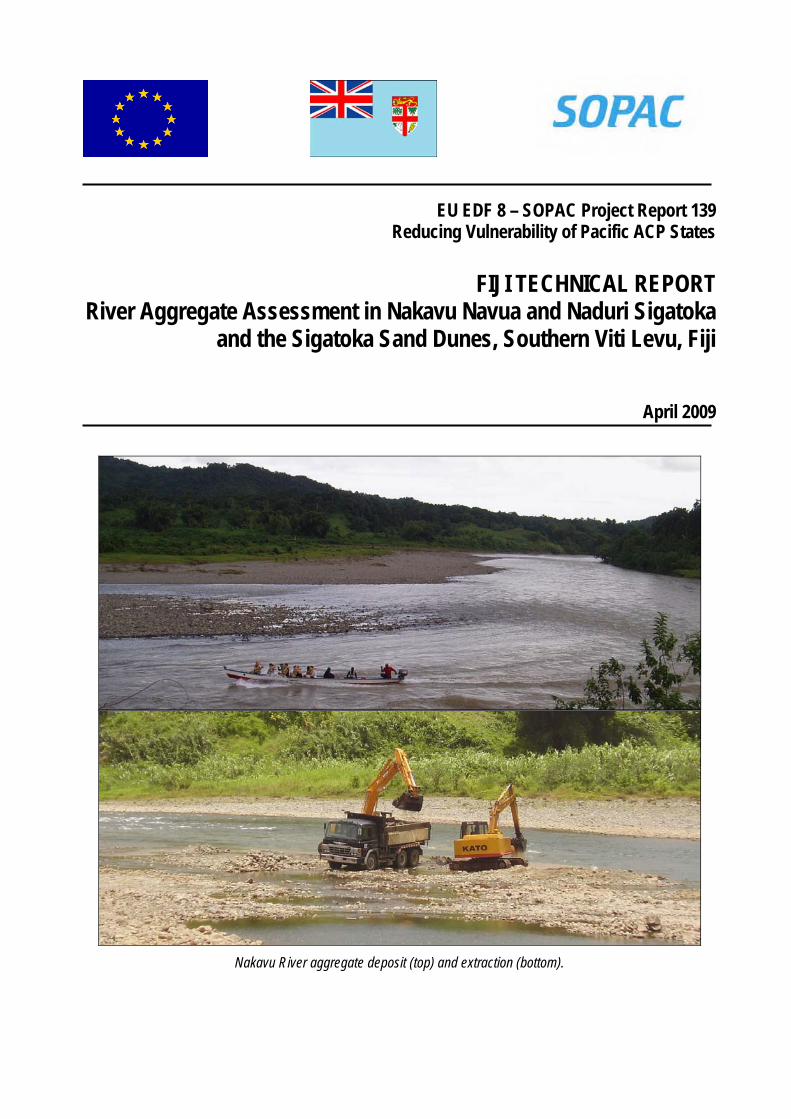
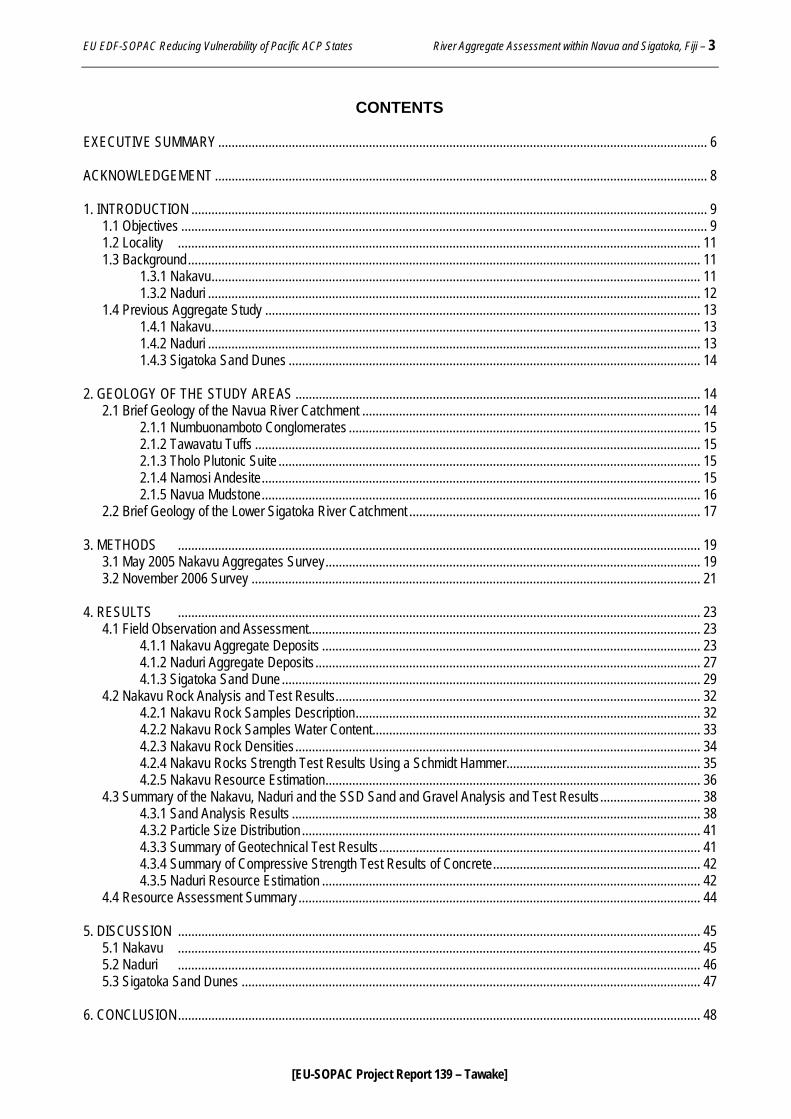
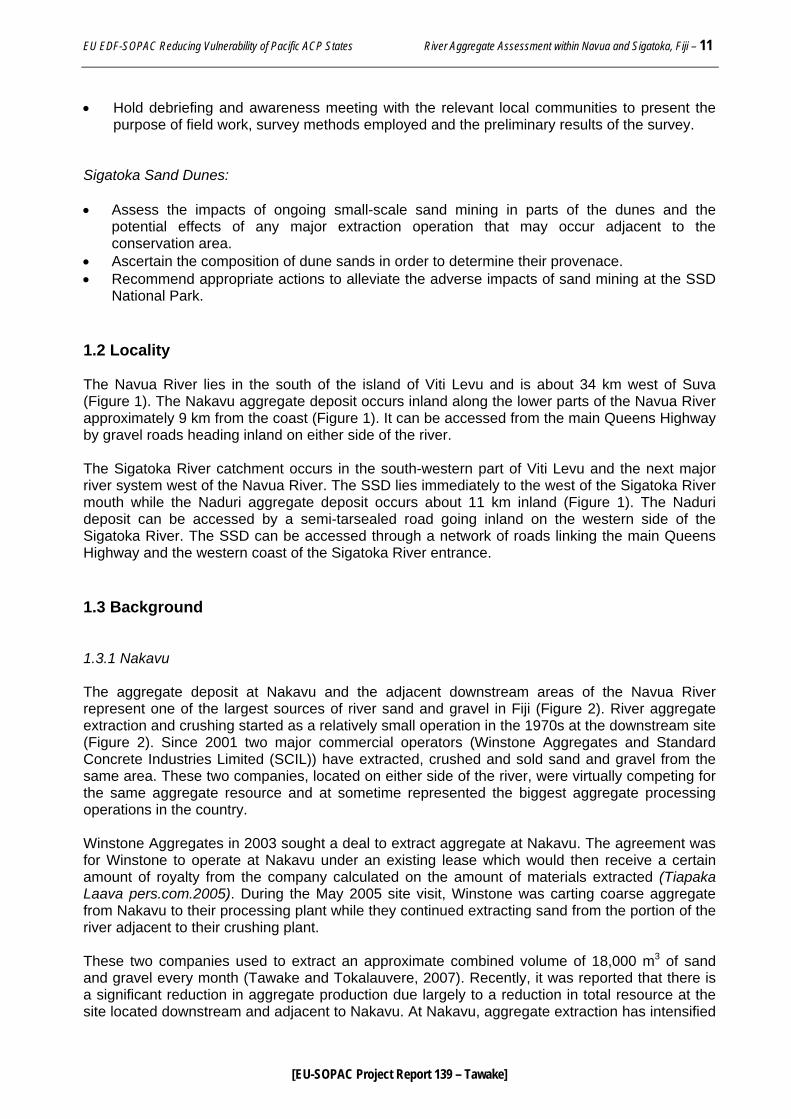
EU EDF 8 – SOPAC Project Report 139 Reducing Vulnerability of Pacific ACP States FIJI TECHNICAL REPORT River Aggregate Assessment in Nakavu Navua and Naduri Sigatoka and the Sigatoka Sand Dunes, Southern Viti Levu, Fiji April 2009 Nakavu River aggregate deposit (top) and extraction (bottom).
Transcript of Fiji technical report, river aggregate assessment in ...
EU EDF 8 – SOPAC Project Report 139 Reducing Vulnerability of Pacific ACP States
FIJI TECHNICAL REPORT River Aggregate Assessment in Nakavu Navua and Naduri Sigatoka
and the Sigatoka Sand Dunes, Southern Viti Levu, Fiji
April 2009
Nakavu River aggregate deposit (top) and extraction (bottom).
EU EDF-SOPAC Reducing Vulnerability of Pacific ACP States River Aggregate Assessment within Navua and Sigatoka, Fiji – 2
[EU-SOPAC Project Report 139 – Tawake]
Author:
Akuila K. Tawake SOPAC Secretariat
April 2009
PACIFIC ISLANDS APPLIED GEOSCIENCE COMMISSION c/o SOPAC Secretariat
Private Mail Bag GPO, Suva
FIJI ISLANDS http://www.sopac.org
Phone: +679 338 1377 Fax: +679 337 0040
www.sopac.org [email protected]
Important Notice
This report has been produced with the financial assistance of the European Community; however, the views expressed herein must never be taken to reflect the official opinion of the
European Community.
EU EDF-SOPAC Reducing Vulnerability of Pacific ACP States River Aggregate Assessment within Navua and Sigatoka, Fiji – 3
[EU-SOPAC Project Report 139 – Tawake]
CONTENTS EXECUTIVE SUMMARY .................................................................................................................................................. 6 ACKNOWLEDGEMENT ................................................................................................................................................... 8 1. INTRODUCTION .......................................................................................................................................................... 9 1.1 Objectives ............................................................................................................................................................. 9 1.2 Locality ............................................................................................................................................................ 11 1.3 Background......................................................................................................................................................... 11 1.3.1 Nakavu.................................................................................................................................................. 11 1.3.2 Naduri ................................................................................................................................................... 12 1.4 Previous Aggregate Study .................................................................................................................................. 13 1.4.1 Nakavu.................................................................................................................................................. 13 1.4.2 Naduri ................................................................................................................................................... 13 1.4.3 Sigatoka Sand Dunes ........................................................................................................................... 14 2. GEOLOGY OF THE STUDY AREAS ......................................................................................................................... 14 2.1 Brief Geology of the Navua River Catchment ..................................................................................................... 14 2.1.1 Numbuonamboto Conglomerates ......................................................................................................... 15 2.1.2 Tawavatu Tuffs ..................................................................................................................................... 15 2.1.3 Tholo Plutonic Suite .............................................................................................................................. 15 2.1.4 Namosi Andesite................................................................................................................................... 15 2.1.5 Navua Mudstone................................................................................................................................... 16 2.2 Brief Geology of the Lower Sigatoka River Catchment ....................................................................................... 17 3. METHODS ............................................................................................................................................................ 19 3.1 May 2005 Nakavu Aggregates Survey................................................................................................................ 19 3.2 November 2006 Survey ...................................................................................................................................... 21 4. RESULTS ............................................................................................................................................................ 23 4.1 Field Observation and Assessment..................................................................................................................... 23 4.1.1 Nakavu Aggregate Deposits ................................................................................................................. 23 4.1.2 Naduri Aggregate Deposits................................................................................................................... 27 4.1.3 Sigatoka Sand Dune ............................................................................................................................. 29 4.2 Nakavu Rock Analysis and Test Results............................................................................................................. 32 4.2.1 Nakavu Rock Samples Description....................................................................................................... 32 4.2.2 Nakavu Rock Samples Water Content.................................................................................................. 33 4.2.3 Nakavu Rock Densities......................................................................................................................... 34 4.2.4 Nakavu Rocks Strength Test Results Using a Schmidt Hammer.......................................................... 35 4.2.5 Nakavu Resource Estimation................................................................................................................ 36 4.3 Summary of the Nakavu, Naduri and the SSD Sand and Gravel Analysis and Test Results.............................. 38 4.3.1 Sand Analysis Results .......................................................................................................................... 38 4.3.2 Particle Size Distribution ....................................................................................................................... 41 4.3.3 Summary of Geotechnical Test Results................................................................................................ 41 4.3.4 Summary of Compressive Strength Test Results of Concrete.............................................................. 42 4.3.5 Naduri Resource Estimation ................................................................................................................. 42 4.4 Resource Assessment Summary ........................................................................................................................ 44 5. DISCUSSION ............................................................................................................................................................ 45 5.1 Nakavu ............................................................................................................................................................ 45 5.2 Naduri ............................................................................................................................................................ 46 5.3 Sigatoka Sand Dunes ......................................................................................................................................... 47 6. CONCLUSION ............................................................................................................................................................ 48
EU EDF-SOPAC Reducing Vulnerability of Pacific ACP States River Aggregate Assessment within Navua and Sigatoka, Fiji – 4
[EU-SOPAC Project Report 139 – Tawake]
7. RECOMMENDATIONS .............................................................................................................................................. 48 7.1 Nakavu ............................................................................................................................................................ 48 7.2 Naduri ............................................................................................................................................................ 49 7.3 Sigatoka Sand Dunes ......................................................................................................................................... 49 8. REFERENCES ........................................................................................................................................................... 50 LIST OF FIGURES 1 Locality map of the survey sites in south Viti Levu, Fiji ................................................................................. .10 2 The 2002 IKONOS satellite image of the Nakavu Study Site ........................................................................ 12 3 Geology map of the Navua River catchment ................................................................................................. 17 4 Geology map of the lower Sigatoka River...................................................................................................... 18 5 Map of the Nakavu Aggregate Deposit ......................................................................................................... 20 6 Facets of field investigations at Nakavu........................................................................................................ .20 7 Aggregate study sites and sand sampling sites near Naduri Village............................................................. .21 8 Fieldwork in the Sigatoka Area ..................................................................................................................... .22 9 The SSD sand sampling locality map ........................................................................................................... .23 10 Maps and photos of the mid-section of the Navua River catchment ............................................................. .24 11 Aggregate extraction and its impact at Nakavu............................................................................................. .25 12 Photos capturing the level of aggregate extraction at Nakavu at different times .......................................... .27 13 The Naduri sand and gravel deposits ........................................................................................................... .28 14 The map and photos of the SSD................................................................................................................... .31 15 Photos of the concrete post of the SSD rest house ...................................................................................... .32 16 The histogram of the water content values of Nakavu rock hand specimens ............................................... .33 17 The histogram of the water content values of Sabata and Nukusere rock hand specimens......................... .34 18 The rock density histogram of the Nakavu rock specimens.......................................................................... .34 19 The rock density histogram of the Sabata and Nukusere rock specimens. ................................................... 35 20 The compressive strength histogram of the Nakavu rocks ........................................................................... .35 21 The compressive strength histogram of the Sabata and Nukusere rocks..................................................... .36 22 The three GPS-mapped Nakavu aggregate deposits ................................................................................... .37 23 The histogram of the Naduri sand grading results ........................................................................................ .38 24 The histogram of the percentage composition of the Naduri sand................................................................ .39 25 The histogram of the SSD sand grading results ........................................................................................... .40 26 The histogram of the percentage composition of the SSD sand................................................................... .40 27 Graphs showing the Nakavu and Naduri percentage passing of mixed sand and gravel samples................ 41 28 The histogram showing the compressive strengths of concrete cylinders .................................................... .42 29 The GPS- mapped Naduri aggregate deposits ............................................................................................. .43 LIST OF TABLES 1 Description of the Nakavu rock hand specimens ........................................................................................... 32 2 Summary of the Nakavu aggregate resource figures..................................................................................... 38 3 Summary of the Nakavu and Naduri aggregates geotechnical test results.................................................... 41 4 Summary of the compressive strength test results of concrete cylinders ...................................................... 42 5 Summary of the Naduri aggregate resource figures ...................................................................................... 43 6 Summary of results for Nakavu, Naduri and the SSD.................................................................................... 44
EU EDF-SOPAC Reducing Vulnerability of Pacific ACP States River Aggregate Assessment within Navua and Sigatoka, Fiji – 5
[EU-SOPAC Project Report 139 – Tawake]
LIST OF APPENDICES 1 Navua and Sigatoka Climatic Conditions between 1971 and 2000 ............................................................... 52 2 Nakavu Rock Samples Weight, Volume and Water Content ......................................................................... 53 3 Nakavu Rock Sample Densities..................................................................................................................... 54 4 Nakavu Schmidt Hammer Compressive Strength Test Results..................................................................... 55 5 Nakavu Resistivity Sounding Data................................................................................................................. 57 6 Naduri Resistivity Sounding Data .................................................................................................................. 66 7 Aggregate Particle Size Distribution Data ...................................................................................................... 70 8 Coarse Aggregate Particle Density and Water Absorption ............................................................................ 74 9 Aggregate Crushing Value of Coarse Aggregate .......................................................................................... 78 10 SCIL Aggregate Test Report.......................................................................................................................... 82 11 Los Angeles Abrasion Test Results ............................................................................................................... 86 ACRONYMS AND TECHNICAL TERMS
ACV Aggregate Crushing Value
Aggregates Granular materials used in construction. They may be natural (e.g. deposits of sand and gravel), manufactured (e.g. quarried rock) or recycled (e.g. demolition waste). Aggregate in this report, is referring to natural deposits of sand and gravel.
AS Australia Standards DE Department of Environment EIA Environment Impact Assessment EU European Union GPS Global Positioning System LA Los Angeles MPa Mega Pascals MRD Mineral Resources Department NDR Naduri NKS Nukusere NKV Nakavu NLTB Native Lands Trust Board NTF National Trust of Fiji NZS New Zealand Standards OD Oven Dry PWD Public Works Department SBT Sabata SCIL Standard Concrete Industries Limited SOPAC Pacific Islands Applied Geoscience Commission SSD Sigatoka Sand Dunes SSD1 Surface Saturated Dry Turaga ni Koro Village Headman
EU EDF-SOPAC Reducing Vulnerability of Pacific ACP States River Aggregate Assessment within Navua and Sigatoka, Fiji – 6
[EU-SOPAC Project Report 139 – Tawake]
ACKNOWLEDGEMENT This study was financially supported by the European Union, under the 8th European Development Funds, as part of the SOPAC-EU Reducing Vulnerability of Pacific ACP States Project. The support of Mr Ifereimi Dau, the former Director of the Mineral Resources Department; and that of the former Acting Director of the MRD, Mr Kemueli Masikerei, are recognised. The assistance and contribution of a number of MRD staff in all facets of the survey are gratefully acknowledged. The author is indebted in particular to Jerry Taganesia and Jonati Railala, for their respective assistance in GPS mapping, and in conducting the resistivity survey and the subsequent data interpretation. Additionally, appreciation goes to Mr Josefa Vakasukavono (Turaga ni Koro, Nakavu Village), Mr Sakiusa Neisaroi (Turaga ni Koro, Naduri Village), and Mr Aropiame Cavalevu (Senior Ranger, National Trust of Fiji) for their assistance and support during the survey. Further, the assistance of Amrit Raj in the analysis of the sand samples is acknowledged.
EU EDF-SOPAC Reducing Vulnerability of Pacific ACP States River Aggregate Assessment within Navua and Sigatoka, Fiji – 7
[EU-SOPAC Project Report 139 – Tawake]
EXECUTIVE SUMMARY In an endeavour to assist rural communities through reducing vulnerability initiatives, the SOPAC-EU Project has responded to the request of a number of communities by carrying out and supporting aggregate resources assessment in selected parts of the Navua and Sigatoka rivers, namely Nakavu (Navua River) and Naduri (Sigatoka River) and the Sigatoka Sand Dunes (SSD). In doing so, the Project has implemented an integrated resources assessment and management strategy that ensures social, environmental and economic issues are investigated, reported and actioned prior to resource development. Further, the outcomes of the study were presented to stakeholders including the impacted communities. This report compiles the results of aggregate assessments that were carried out at the aforementioned study sites May 2005 and November 2006. This report must be considered together with Naiova (2007) and Tawake and Tokalauvere (2007) in order to understand how integrated aggregate resource assessment and management is being practised through the SOPAC-EU Project initiative in Fiji. Aggregate surveys involved geologically assessing the resource area utilising resistivity soundings to determine depth to bedrock and thickness of unconsolidated strata, and rock sampling for test purposes. All samples collected were tested for specific gravity and water content. Compressive strength was determined using a Schmidt Hammer. Socio-economic surveys and project awareness/debriefing was undertaken at both Nakavu and Naduri. Situated at the downstream end of the Navua River gorge, the Nakavu site receives significant amounts of aggregate material that are being flushed down the river channel, particularly during periods of heavy rain. The test results for both volcanic and plutonic rock specimens have exhibited fresh, strong, compact and heavy aggregate material. This is supported by the low measures for the Aggregate Crushing Value and the Los Angeles Abrasion tests that are indicative of strong and durable coarse aggregate. The Nakavu aggregate deposits contain significant amount of coarse aggregate. Resource estimation confirms that significant aggregate resources occur at the Nakavu site that can supply the Nausori-Navua corridor and nearby areas. These resource figures are based on in-situ studies of the time of survey and do not take into account recharge, during times of flood and removal from continuing extraction that is bound to happen from time to time. Consequently, the resource figures are expected to be higher than what is reported in this study; however, the aggregate resource has been significantly reduced due to recent intensive extraction of sand and gravel at Nakavu. The two surveyed aggregate deposits at Naduri are relatively smaller in size. Generally, they comprise more sand and fine gravel rather than coarse gravel with coarser gravel becoming progressively dominant further upstream. The Naduri sand deposit is made largely of coarse- and medium-grained sand with minor fine gravel and fine sand, and is predominantly composed of mafic and felsic mineral fragments. The Naduri sands are almost entirely made up of minerals derived from volcanic and plutonic rock material. Apart from the significant occurrence of silt and clay in some parts of the deposit, the Naduri sands when clean are a good source of construction sand. The Naduri mixed aggregate samples generally exhibit high quality geotechnical performance. The resource estimation confirms that the combined aggregate resource is relatively small with an estimated extractable resource of 171,840 m3. Any large-scale aggregate extraction operation can potentially deplete the resource within two years. With reduced sediment replenishment being predicted at Naduri, it can be deduced that there will be no significant increase in resource in the near future. Based on the findings of this study, it is recommended that only small- medium-scale aggregate extraction be granted at Naduri to ensure resource sustainability. The
EU EDF-SOPAC Reducing Vulnerability of Pacific ACP States River Aggregate Assessment within Navua and Sigatoka, Fiji – 8
[EU-SOPAC Project Report 139 – Tawake]
sand and gravel deposits at Naduri are of reasonably good quality but relatively small in size. They can only support a small-medium-scale aggregate extraction operation. With the absence of oversize boulders, the Naduri aggregate resource would be less attractive to potential developers. Despite the minimal impact of the ongoing small-scale sand extraction at the SSD on the environment and the nearby communities, it would have been better to prohibit sand mining altogether. Considering the current uses of the sand dunes, especially for sightseeing and recreation, it is more beneficial in the long term to preserve the natural beauty and the uniqueness of the site rather than exploiting the sand resources for construction purposes. The sand grain sizes of the SSD range largely between coarse and fine-grained sand with medium-grained sand scoring the highest percentage in terms of abundance. Additionally, the SSD sand is a small portion of the sand consists of the other grain sizes predominantly composed of mafic and felsic mineral fragments with minor volcanic glass. This is similar to the composition of the Naduri sand that occurs about 11 km inland. Due to the significant volume of high quality aggregate resource that occurs at Nakavu coupled with its accessibility and locality at the downstream end of a gorge, it is considered the best site for extraction in the Navua River. This large resource can continue to provide significant supply of sand and gravel for the Nausori-Navua corridor.
EU EDF-SOPAC Reducing Vulnerability of Pacific ACP States River Aggregate Assessment within Navua and Sigatoka, Fiji – 9
[EU-SOPAC Project Report 139 – Tawake]
1. INTRODUCTION Construction aggregate is extracted from river sand and gravel deposits in many parts of Viti Levu. In the last two decades, the construction industry in Fiji has grown significantly hence the increasing demand for raw construction material including sand and gravel. River aggregate are always targeted by domestic excavator and commercial operators due to the fact that they are accessible, relatively easy to extract and rock fragments are naturally washed by the action of the flowing water. Commercial aggregate extraction operations in rivers are a major contributing factor to resource over-exploitation, intense and prolonged siltation in the water column, riverbank erosion, decreasing water level and the overall degradation of the river system. This has recently been witnessed at Nakavu along the Navua River after increasing extraction in the last three years. Prolonged and continuous extraction activities may also put pressure on freshwater resources such as fish, prawn and mussels, which the local population rely on for their major sources of protein. In an endeavour to assist rural communities through reducing vulnerability initiatives, the SOPAC-EU Project has responded to the request of a number of communities by undertaking and aggregate resources assessments in selected parts of the Navua and Sigatoka rivers, namely Nakavu (Navua River) and Naduri (Sigatoka River) and at the Sigatoka Sand Dunes (SSD) (Figure 1). In doing so, the Project has implemented an integrated resources assessment and management strategy that ensures social, environmental and economic issues are investigated, reported and actioned prior to resource development. 1.1 Objectives The principal objectives of the assessments at each study site are given below: Nakavu and Naduri: • Geologically assess river aggregate deposits and the immediate surrounding of the resource
area. • GPS survey to capture the aerial coverage of river aggregate deposits. • When necessary conduct geophysical survey: resistivity and seismic. • Determine the quality of sand and gravel that occur at Nakavu/Naduri and their suitability for
construction purposes. • Collect sand and gravel samples for characterisation analysis and geo-technical testing
purposes. • Assist the environmental consultant in conducting field scientific studies for the EIA. • Assist in consultations with the local communities on their views about river aggregate
extraction and determine local uses of the river and its surroundings (e.g. domestic, agriculture, fishery).
EU EDF-SOPAC Reducing Vulnerability of Pacific ACP States River Aggregate Assessment within Navua and Sigatoka, Fiji – 10
[EU-SOPAC Project Report 139 – Tawake]
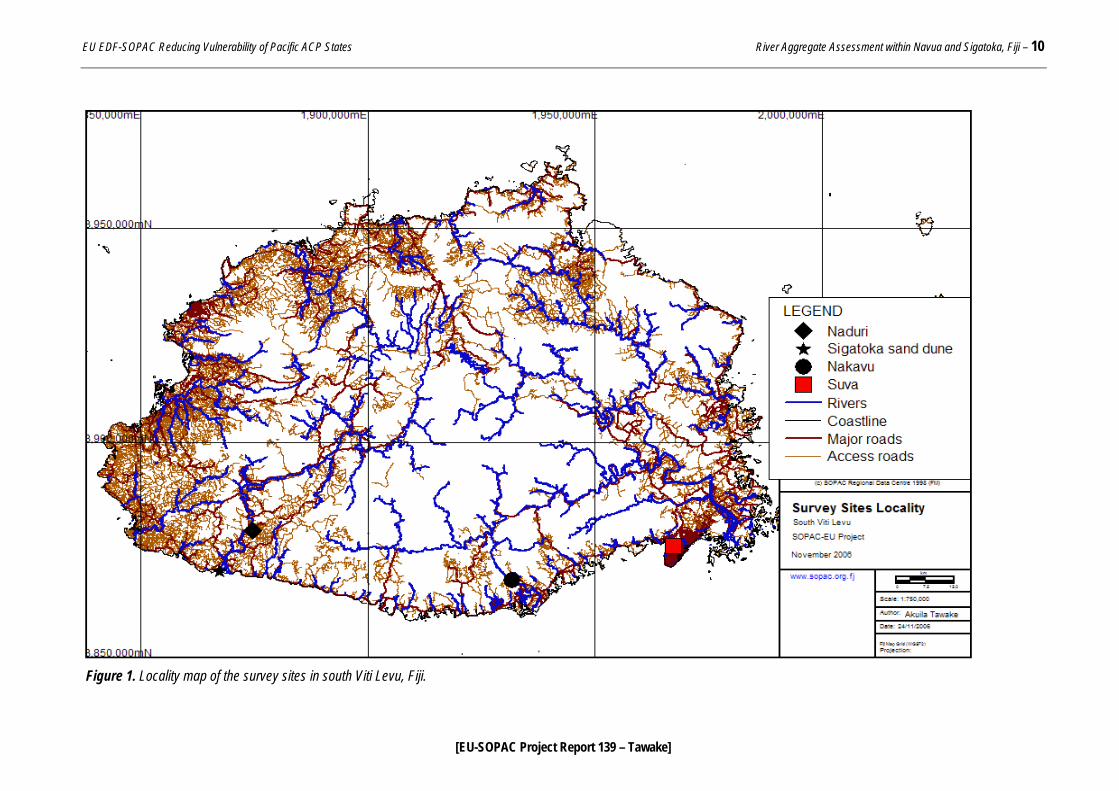
Figure 1. Locality map of the survey sites in south Viti Levu, Fiji.
EU EDF-SOPAC Reducing Vulnerability of Pacific ACP States River Aggregate Assessment within Navua and Sigatoka, Fiji – 11
[EU-SOPAC Project Report 139 – Tawake]
• Hold debriefing and awareness meeting with the relevant local communities to present the purpose of field work, survey methods employed and the preliminary results of the survey.
Sigatoka Sand Dunes: • Assess the impacts of ongoing small-scale sand mining in parts of the dunes and the
potential effects of any major extraction operation that may occur adjacent to the conservation area.
• Ascertain the composition of dune sands in order to determine their provenace. • Recommend appropriate actions to alleviate the adverse impacts of sand mining at the SSD
National Park. 1.2 Locality The Navua River lies in the south of the island of Viti Levu and is about 34 km west of Suva (Figure 1). The Nakavu aggregate deposit occurs inland along the lower parts of the Navua River approximately 9 km from the coast (Figure 1). It can be accessed from the main Queens Highway by gravel roads heading inland on either side of the river. The Sigatoka River catchment occurs in the south-western part of Viti Levu and the next major river system west of the Navua River. The SSD lies immediately to the west of the Sigatoka River mouth while the Naduri aggregate deposit occurs about 11 km inland (Figure 1). The Naduri deposit can be accessed by a semi-tarsealed road going inland on the western side of the Sigatoka River. The SSD can be accessed through a network of roads linking the main Queens Highway and the western coast of the Sigatoka River entrance. 1.3 Background 1.3.1 Nakavu The aggregate deposit at Nakavu and the adjacent downstream areas of the Navua River represent one of the largest sources of river sand and gravel in Fiji (Figure 2). River aggregate extraction and crushing started as a relatively small operation in the 1970s at the downstream site (Figure 2). Since 2001 two major commercial operators (Winstone Aggregates and Standard Concrete Industries Limited (SCIL)) have extracted, crushed and sold sand and gravel from the same area. These two companies, located on either side of the river, were virtually competing for the same aggregate resource and at sometime represented the biggest aggregate processing operations in the country. Winstone Aggregates in 2003 sought a deal to extract aggregate at Nakavu. The agreement was for Winstone to operate at Nakavu under an existing lease which would then receive a certain amount of royalty from the company calculated on the amount of materials extracted (Tiapaka Laava pers.com.2005). During the May 2005 site visit, Winstone was carting coarse aggregate from Nakavu to their processing plant while they continued extracting sand from the portion of the river adjacent to their crushing plant. These two companies used to extract an approximate combined volume of 18,000 m3 of sand and gravel every month (Tawake and Tokalauvere, 2007). Recently, it was reported that there is a significant reduction in aggregate production due largely to a reduction in total resource at the site located downstream and adjacent to Nakavu. At Nakavu, aggregate extraction has intensified
EU EDF-SOPAC Reducing Vulnerability of Pacific ACP States River Aggregate Assessment within Navua and Sigatoka, Fiji – 12
[EU-SOPAC Project Report 139 – Tawake]
in the last three years in which a number of small-to large-scale operators were active in the area including Highway Stabilizer. This was possible with the approval of the Nakavu landowners. Towards the end of 2007, SCIL had reportedly signed an agreement with the Nakavu landowners giving the company exclusive rights to extract, process and sell river aggregate extracted from the Nakavu land (Jiujiua Leca pers. Com.2007).
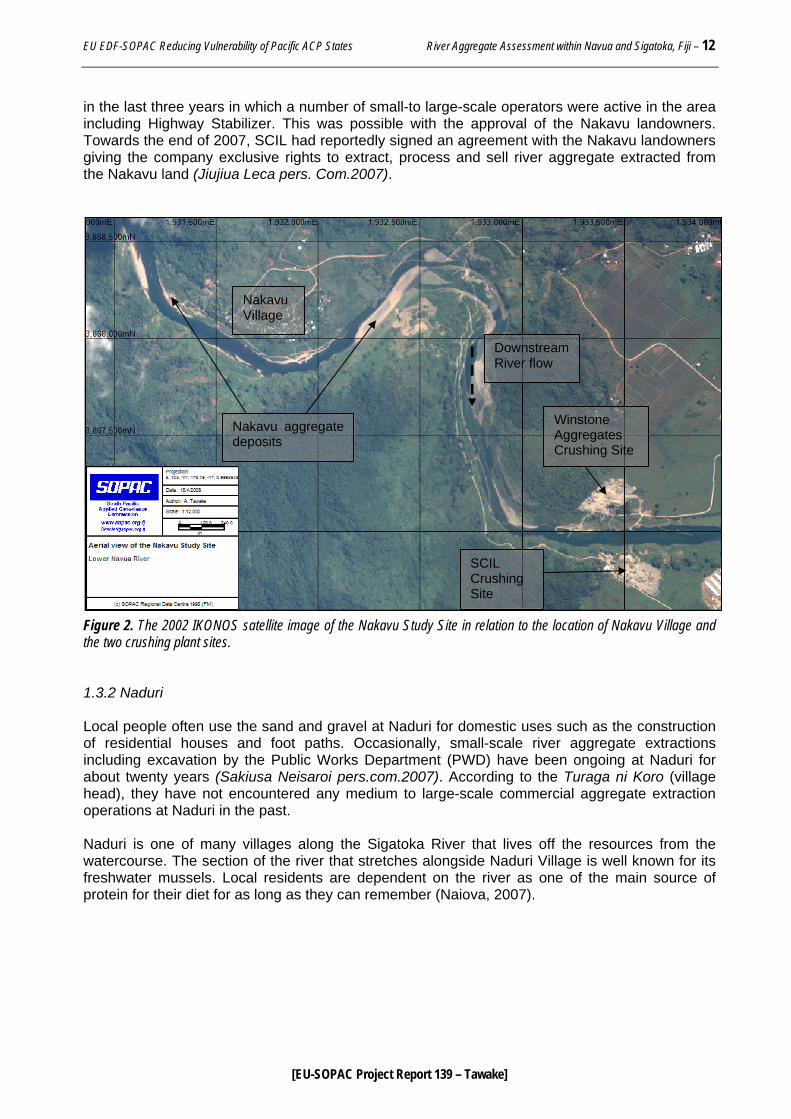
Figure 2. The 2002 IKONOS satellite image of the Nakavu Study Site in relation to the location of Nakavu Village and the two crushing plant sites. 1.3.2 Naduri Local people often use the sand and gravel at Naduri for domestic uses such as the construction of residential houses and foot paths. Occasionally, small-scale river aggregate extractions including excavation by the Public Works Department (PWD) have been ongoing at Naduri for about twenty years (Sakiusa Neisaroi pers.com.2007). According to the Turaga ni Koro (village head), they have not encountered any medium to large-scale commercial aggregate extraction operations at Naduri in the past. Naduri is one of many villages along the Sigatoka River that lives off the resources from the watercourse. The section of the river that stretches alongside Naduri Village is well known for its freshwater mussels. Local residents are dependent on the river as one of the main source of protein for their diet for as long as they can remember (Naiova, 2007).
Downstream River flow
Nakavu Village
Nakavu aggregate deposits
SCIL Crushing Site
Winstone Aggregates Crushing Site
EU EDF-SOPAC Reducing Vulnerability of Pacific ACP States River Aggregate Assessment within Navua and Sigatoka, Fiji – 13
[EU-SOPAC Project Report 139 – Tawake]
1.3.3 Sigatoka Sand Dunes (SSD) The SSD are of national and historical significance to Fiji for the following reasons: • In July 1989, the SSD was designated as Fiji's first National Park and its management was
handed over to the National Trust of Fiji (http://nationaltrust.org.fj). • The dunes are unique in their natural beauty, and have long been an attraction for people
both locally and from overseas. • Sigatoka Sand Dunes are also rich in ancient pottery artefacts that continue to surface as the
processes of sediment erosion and accretion continue. About two thirds of the entire sand dune area is registered under crown land and this has been declared a National Park. The conservation area is on the western part of the SSD and comes under the responsibility of the National Trust of Fiji. The other one third of the dune area fall under native and freehold land categories (Aropiame Cavalevu pers.com.2006). According to the National Trust of Fiji (NTF), illegal small-scale sand mining has been taking place in various parts of the area; hence the need to assess the impacts of such activity on the sand dunes. The NTF, a statutory body funded jointly by the Fiji Government, independent donors and multi-lateral projects, was established in 1970 to provide for the protection of Fiji’s natural, cultural and national heritage. It is the only national trust in the South Pacific region and specialises in both the natural and cultural aspects of heritage conservation. The NTF currently protects a total of 14 heritage sites within the Fiji Islands, including the SSD National Park (http://nationaltrust.org.fj). 1.4 Previous Studies This section of the report summarises previous relevant studies that were carried out in the three study areas, a number of which are described in Naiova (2007). 1.4.1 Nakavu A study on an aggregate deposit adjacent to the Nakavu aggregate resource was conducted by the MRD in 2001 and reported in two separate technical notes. The first survey was carried out at the request of SCIL in order to determine the thickness of the river bank gravel deposit (Rahiman, 2002a). Secondly, crushed coarse aggregate and naturally-occurring sand collected from the SCIL Navua extraction site were delivered to the MRD for petrographic assessment (Rahiman, 2002b). Seismic refraction and resistivity sounding were carried out at the then SCIL aggregate extraction site. The seismic results indicated that the thickness of the gravel bed varied between 5 and 10 metres whilst the resistivity profile showed an average depth of 10 metres. Additionally, the petrographic examination results revealed that the rocks appear to be free of deleterious minerals that may trigger alkali-silica reaction; however, due to unrepresentative sampling and the insignificant amount of rocks being represented in the petrographic study, the results may not be fully representative of the rock types that occur in the study area. 1.4.2 Naduri Apart from Naiova (2007) and Houtz (1960), no other previous study report was available for the Naduri Area (Figure 4). A brief extraction from Houtz (1960) on the geology of the lower part of the Sigatoka River catchment will be highlighted in Section 2.2 below.
EU EDF-SOPAC Reducing Vulnerability of Pacific ACP States River Aggregate Assessment within Navua and Sigatoka, Fiji – 14
[EU-SOPAC Project Report 139 – Tawake]
1.4.3 Sigatoka Sand Dunes (SSD) A number of studies at the SSD (Figure 4) have provided extensive reviews of geology, dune formation processes, human occupancy, degradation and past research projects (Simon Fraser University, 1998). In addition, a study on the Vegetation of the Sigatoka Sand Dunes was carried out by Kirkpatrick and Hassall in 1978 (Kirkpatrick and Hassall, 1981). Further, a detailed investigation on the geomorphic evolution of the Sigatoka Delta was undertaken by de Biran (2001). The most relevant study was conducted by Hirst and Kennedy (1962) in which they investigated the economic potential of the SSD iron sand. The potential of the sand dune as a source of magnetite has been recognised for several years but previously there had been no overall assessment. In order to obtain an estimate of the iron ore potential of the dunes, the Geological Survey and the Department of Mines in conjunction with Banno Oceania Limited, conducted systematic sampling of the dunes between January and March 1962. Sand samples were obtained from drill holes located at theodolite survey controlled sites within the dune. A total of 24 drill holes were drilled with an average depth of 31 feet. The survey results confirmed an estimated 32.5 million tonnes of sand at the SSD representing about half the total volume of sand above sea level. About 5 percent of this volume (i.e. 1.8 million tonnes) is estimated to contain magnetic minerals. Over the whole of the dunes there is a relative concentration of magnetic minerals on the higher ground. In the eastern dunes, although a sharp decline in magnetic minerals becomes apparent as sea level is approached, an area of 135 acres has an average of 9.1 percent magnetic mineral to a depth of 25 feet. In the west an area of 330 acres contains some 1,100,000 tonnes of magnetic minerals (i.e. 6.5 percent) to a depth of 31 feet. The dunes material ranges in size from clay to 1 mm sand, with a minor amount of coarse material. Sieve analysis has shown that general variation in grain size do not conform to any simple areal pattern. The strongly magnetic grains are of relatively small size and they tend to be relatively concentrated in sand finer than 0.25 mm. 2. GEOLOGY OF THE STUDY AREAS 2.1 Brief Geology of the Navua River Catchment This account of the geology of the Navua River catchment is extracted from Band (1968) and the geology map (Figure 3) was compiled by Rodda and Band (1966). Only major occurrences of rock formation / member in the Navua River catchment will be further described in this section to highlight the sources of aggregate deposits that occur in the river channel and terraces particularly in the Nakavu study area. The oldest rocks belong to the Wainimala Group, which is sub-divided into the Mount Gordon sub-Group and the Matailobau sub-Group. The Mount Gordon sub-Group represents the lower tertiary rocks and is composed of basic to acidic volcanoclastic rocks such as the Numbuonamboto Conglomerate, Lokalevu Keratophyre and the Tawavatu Tuff. The Matailobau sub-Group, on the other hand, consists only of sedimentary rocks known as the Tuvutau Greywacke. The Wainimala Group has been intruded by the Tholo Plutonic Suite ranging from early gabbro to later and more extensive tonalite and minor diorite. The upper Tertiary volcanic and sedimentary group lie with marked unconformity on an eroded surface of Waininmala and Tholo rocks. The oldest of these groups is the Savura Volcanic Group and is composed predominantly of andesitic volcanoclastic rocks known as the Vango Formation. The most widespread of the upper Tertiary Groups is the Mendrausuthu Group, which consists of
EU EDF-SOPAC Reducing Vulnerability of Pacific ACP States River Aggregate Assessment within Navua and Sigatoka, Fiji – 15
[EU-SOPAC Project Report 139 – Tawake]
(a) andesitic epiclastic rocks accompanied by some flows, known as the Namosi Andesite, and (b) marine sediments like the Navua Mudstone, Waidina Sandstone, Suva Marl and Serua Conglomerate. Low-grade regional metamorphism to the greenschist facies affected the rocks of the Wainimala Group during the Tholo orogeny. 2.1.1 Numbuonamboto Conglomerate Mainly basaltic and spilitic in composition, this Formation occurs extensively to the north and west of the Navua River (Figure 3) and is composed of coarse volcanoclastic rocks. The clasts are frequently subrounded and volcanic conglomerate is the most common rock type with minor volcanic breccia and tuff. The matrix of the conglomerate is either dark grey basic sandstone or green lithic sandstone. The Navutulevu Member consists of polymict conglomerate with interbedded sandstone and has a total thickness of about 1,000 feet. It is regarded generally as marking the boundary between the Numbuonamboto Conglomerate and the Tawavatu Tuff. 2.1.2 Tawavatu Tuff In the main channel of the Navua River, the Tawavatu Tuff occurs between Nakavu and Nukusere villages (Figure 3). This formation consists of lithic tuff with intercalated horizons of lapilli tuff. The finer-grained tuff are well bedded and commonly show an alteration of lithic tuff with fine-grained green to dark-grey vitric tuff. 2.1.3 Tholo Plutonic Suite The Tholo Plutonic Suite is found within a broad zone trending east-north-east across the southern half of Viti Levu. Two distinct phases of plutonic activity are represented. There is an early suite of hypersthene and olivine gabbro and a more extensive diorite-tonalite suite (Figure 3). The gabbro occurs in isolated stocks and also larger masses within composite intrusions where age relationship may be demonstrated. The diorite-tonalite suite is inferred to have arisen by differentiation from an intermediate magma and there is a clear gradation from early quartz diorite through to tonalite to trondhjemite. Petrographic evidence also points to two distinct magma types, and it is likely that the early gabbroic magma was derived from a deeper level than that which produced the diorite-tonalite suite. 2.1.4 Namosi Andesite The Namosi Andesites (Figure 3) are largely made up of volcanic conglomerate, with augite andesite as the prominent rock-type. This formation lies with marked unconformity on steeply dipping tuff and volcanic conglomerate of the Mount Gordon sub-Group. The basal part of the succession consists mainly of rudite and arenite, but andesite flows occur locally and evidence indicates a marine environment deposition. Several sub-divisions are distinguished as follows: Hornblende andesite flow, Hornblende andesite volcanic conglomerate, Augite andesite volcanic conglomerate, Augite andesite flow, and Sandstone and conglomerate. The change from the augite andesite to the hornblende
EU EDF-SOPAC Reducing Vulnerability of Pacific ACP States River Aggregate Assessment within Navua and Sigatoka, Fiji – 16
[EU-SOPAC Project Report 139 – Tawake]
andesite type of volcanic conglomerate is gradational. Thin hornblende andesite flows are interlayered with the volcanic conglomerate in the Wainikoroiluva River – a major tributary of the Navua River. The flows consist of greyish andesite with phenocrysts of plagioclase and hornblende. 2.1.5 Navua Mudstone The Navua Mudstone is a westerly lateral equivalent of the Namosi Andesite (Figure 3). Rocks of this Formation crop out in a narrow basin, some 20 miles in length along the east-west trending upper part of the Navua River. This basin has a maximum width of 7 miles in the east where the Navua Mudstone abuts against the Namosi Andesite, but it narrows rapidly westwards to a width of 4 miles. In the east of the basin andesitic detritus contributed much of the sedimentary material. Further west and away from the volcanic source, andesitic detritus is subordinate to material derived from the weathering and erosion of the Lower Tertiary rocks. Throughout most of the basin the Navua Mudstone lies with pronounced unconformity on Lower Tertiary volcanic and plutonic rocks, the unconformity being marked in most places by a thin basal conglomerate. Throughout most of the basin the Navua Mudstone consists of a uniform sequence of well-bedded medium-grey mudstones, marls and fine-grained sandstones. 2.2 Brief Geology of the Lower Sigatoka River Catchment This brief geology of the lower Sigatoka River catchment is extracted from Houtz (1960) but the geology map in Figure 4 is adopted from Rodda and Band (1966). These, on some occasions, have resulted in the same rock member / formation being identified with different names in these two documents. Only major occurrences of rock formation / member in the lower Sigatoka River catchment will be further explained in this section to highlight potential sources of sand and gravel deposits that occur in the Naduri and the SSD study areas. Similar to the Navua Area, the Wainimala Group represents the oldest rocks and forms the basal part of the Sigatoka Area. The Wainimala Group rocks occur quite extensively and they are at least 13,000 feet thick. They are sub-divided into four Formations namely (i) Fresh to Altered basic Flow; (ii) Breccia; (iii) Altered Argillite; and (iv) Limestone. The foraminiferal limestone in the Wainimala has been consistently dated as Lower Miocene and are generally referred to as volcanic with minor mudstone and limestone in Figure 4. The Sigatoka Series is at least 17,000 feet thick and composed of Limestone, Argillite and Sandstone, Andesite Intrusive, and Breccia-Agglomerate and flows. Although the Sigatoka is in many ways similar to the Wainimala, there is a pronounced division between the lower beds which are about 90 percent igneous and the relatively unaltered upper sequence which is about 90 percent sedimentary. In Figure 4, the Sigatoka Series is identified as sandstone, mudstone, limestone and various volcanic rocks. In Houtz (1960), the Tamanua conglomerate and sandstone is part of the Sigatoka Series while the same member is part of the Navosa Sedimentary Group in Rodda and Band (1966). Plutonics of the Tholo Plutonic Suite are not presented as a discrete event in the stratigraphic column because waning plutonic intrusion extended upward into the younger beds after the bulk of the material had already intruded the basement. Basic and acidic plutonics are clearly intrusive into the Wainimala, whereas the only intrusive into the Sigatoka are andesite plugs and occasionally minor diorite. These later stage intrusives are quite possibly contemporaneous and are considered to represent the waning stage of Tholo activity.
EU EDF-SOPAC Reducing Vulnerability of Pacific ACP States River Aggregate Assessment within Navua and Sigatoka, Fiji – 17
[EU-SOPAC Project Report 139 – Tawake]
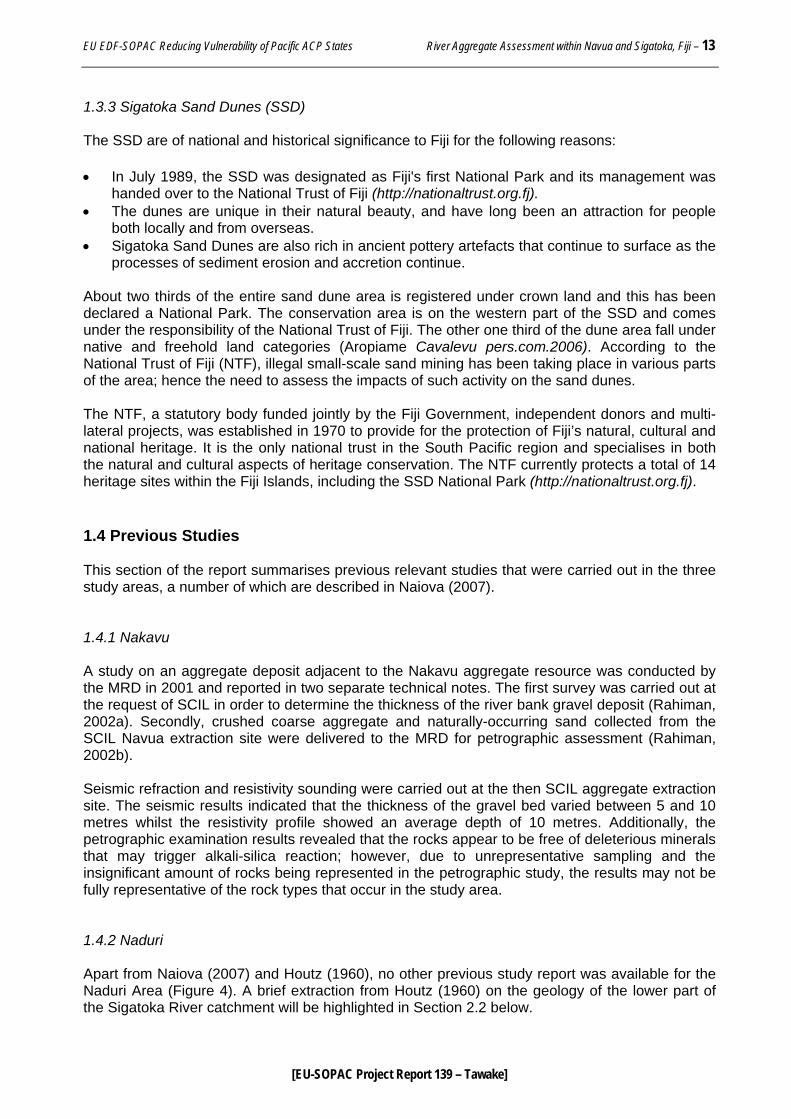
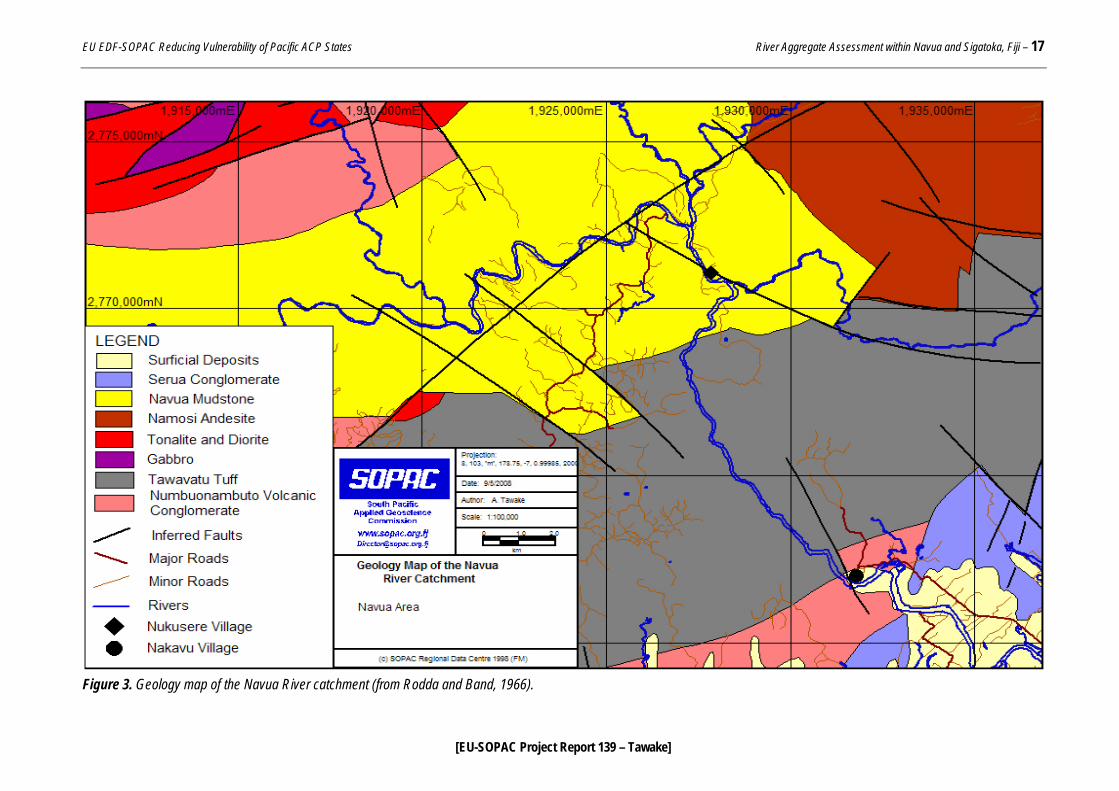
Figure 3. Geology map of the Navua River catchment (from Rodda and Band, 1966).
EU EDF-SOPAC Reducing Vulnerability of Pacific ACP States River Aggregate Assessment within Navua and Sigatoka, Fiji – 18
[EU-SOPAC Project Report 139 – Tawake]
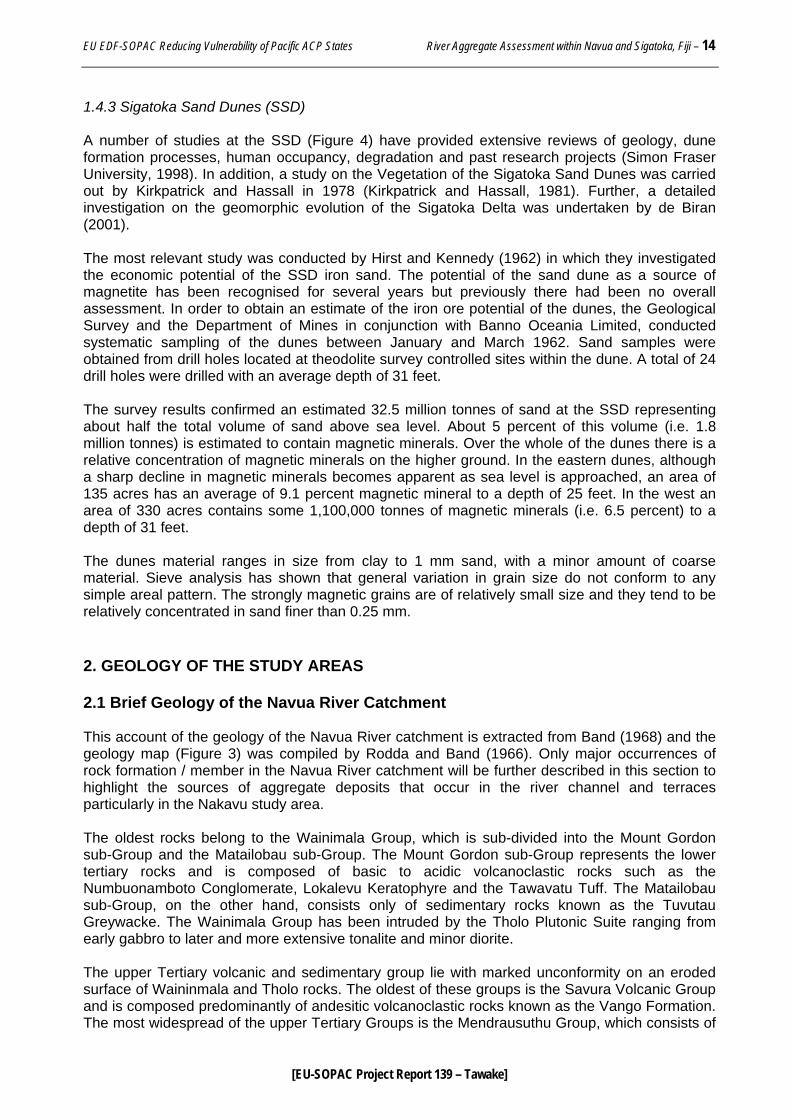
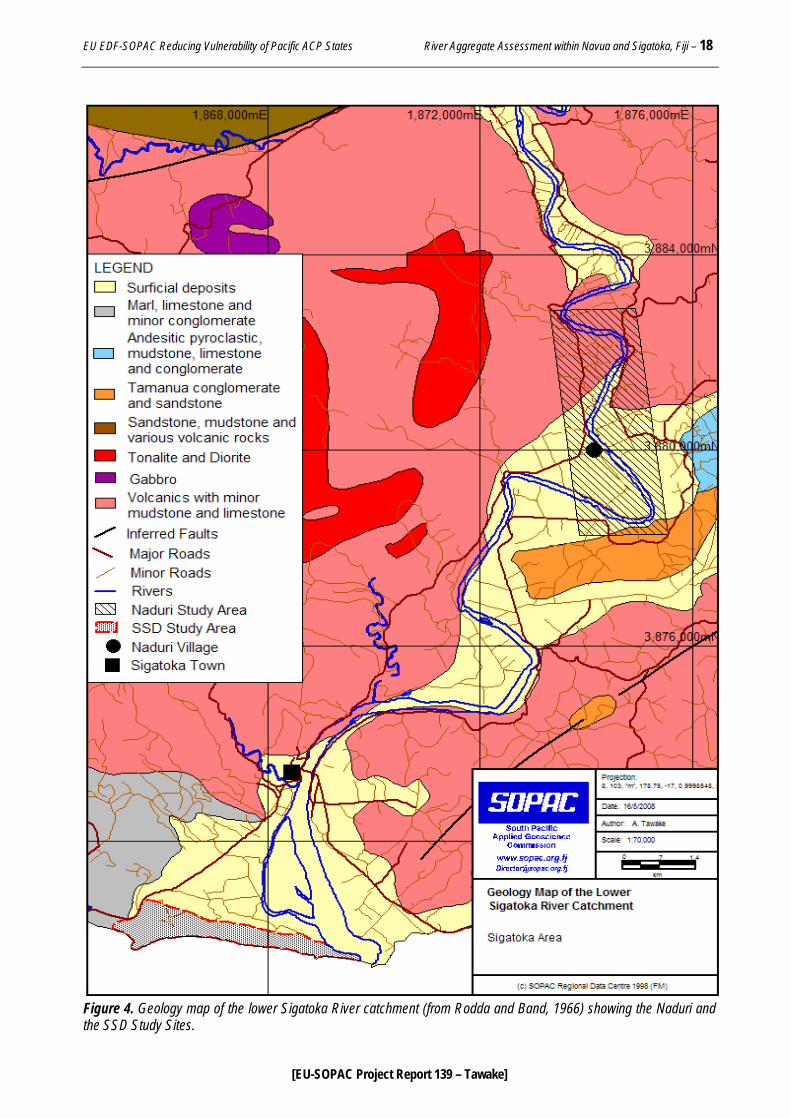
Figure 4. Geology map of the lower Sigatoka River catchment (from Rodda and Band, 1966) showing the Naduri and the SSD Study Sites.
EU EDF-SOPAC Reducing Vulnerability of Pacific ACP States River Aggregate Assessment within Navua and Sigatoka, Fiji – 19
[EU-SOPAC Project Report 139 – Tawake]
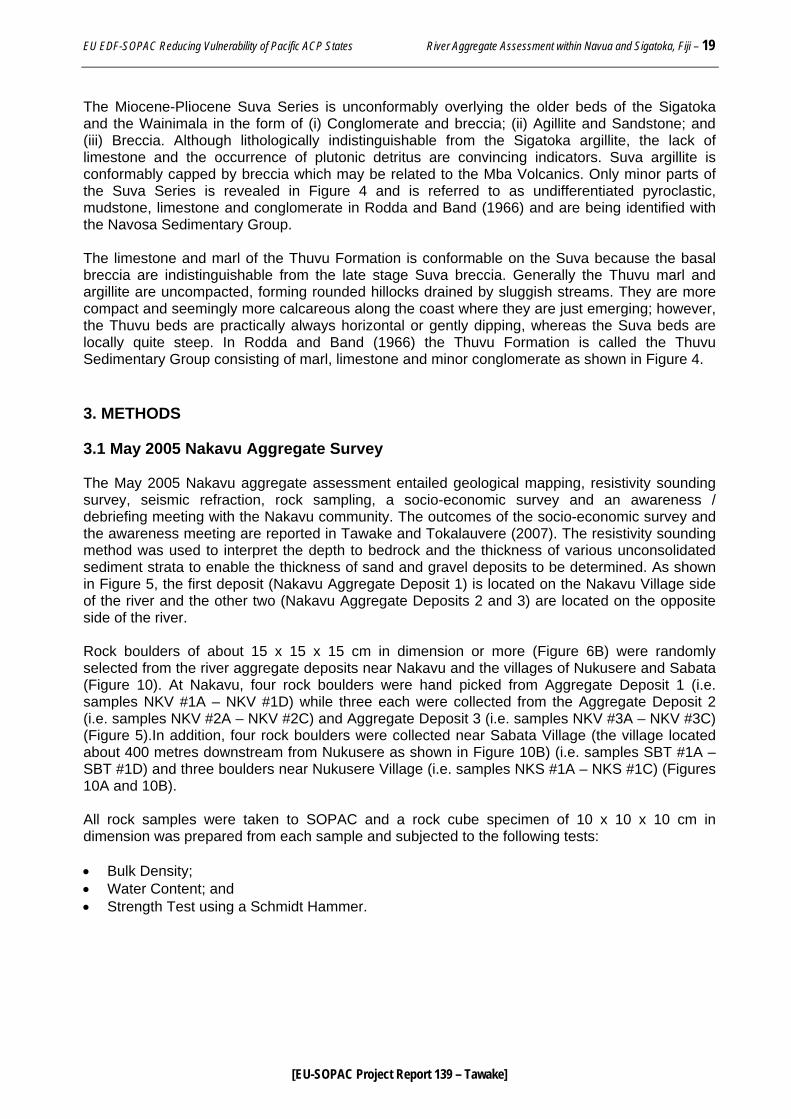
The Miocene-Pliocene Suva Series is unconformably overlying the older beds of the Sigatoka and the Wainimala in the form of (i) Conglomerate and breccia; (ii) Agillite and Sandstone; and (iii) Breccia. Although lithologically indistinguishable from the Sigatoka argillite, the lack of limestone and the occurrence of plutonic detritus are convincing indicators. Suva argillite is conformably capped by breccia which may be related to the Mba Volcanics. Only minor parts of the Suva Series is revealed in Figure 4 and is referred to as undifferentiated pyroclastic, mudstone, limestone and conglomerate in Rodda and Band (1966) and are being identified with the Navosa Sedimentary Group. The limestone and marl of the Thuvu Formation is conformable on the Suva because the basal breccia are indistinguishable from the late stage Suva breccia. Generally the Thuvu marl and argillite are uncompacted, forming rounded hillocks drained by sluggish streams. They are more compact and seemingly more calcareous along the coast where they are just emerging; however, the Thuvu beds are practically always horizontal or gently dipping, whereas the Suva beds are locally quite steep. In Rodda and Band (1966) the Thuvu Formation is called the Thuvu Sedimentary Group consisting of marl, limestone and minor conglomerate as shown in Figure 4. 3. METHODS 3.1 May 2005 Nakavu Aggregate Survey The May 2005 Nakavu aggregate assessment entailed geological mapping, resistivity sounding survey, seismic refraction, rock sampling, a socio-economic survey and an awareness / debriefing meeting with the Nakavu community. The outcomes of the socio-economic survey and the awareness meeting are reported in Tawake and Tokalauvere (2007). The resistivity sounding method was used to interpret the depth to bedrock and the thickness of various unconsolidated sediment strata to enable the thickness of sand and gravel deposits to be determined. As shown in Figure 5, the first deposit (Nakavu Aggregate Deposit 1) is located on the Nakavu Village side of the river and the other two (Nakavu Aggregate Deposits 2 and 3) are located on the opposite side of the river. Rock boulders of about 15 x 15 x 15 cm in dimension or more (Figure 6B) were randomly selected from the river aggregate deposits near Nakavu and the villages of Nukusere and Sabata (Figure 10). At Nakavu, four rock boulders were hand picked from Aggregate Deposit 1 (i.e. samples NKV #1A – NKV #1D) while three each were collected from the Aggregate Deposit 2 (i.e. samples NKV #2A – NKV #2C) and Aggregate Deposit 3 (i.e. samples NKV #3A – NKV #3C) (Figure 5).In addition, four rock boulders were collected near Sabata Village (the village located about 400 metres downstream from Nukusere as shown in Figure 10B) (i.e. samples SBT #1A – SBT #1D) and three boulders near Nukusere Village (i.e. samples NKS #1A – NKS #1C) (Figures 10A and 10B). All rock samples were taken to SOPAC and a rock cube specimen of 10 x 10 x 10 cm in dimension was prepared from each sample and subjected to the following tests: • Bulk Density; • Water Content; and • Strength Test using a Schmidt Hammer.
EU EDF-SOPAC Reducing Vulnerability of Pacific ACP States River Aggregate Assessment within Navua and Sigatoka, Fiji – 20
[EU-SOPAC Project Report 139 – Tawake]
Figure 5. Map of the Nakavu Aggregate Deposits showing the geophysical survey sites and the mixed aggregate sample locality. Additionally, a seismic survey was conducted at all the resistivity survey sites shown in Figure 5. The OYO McSEIS-170 seismograph was used together with a hammer and a plate to generate seismic energy. Unfortunately, the seismic data collected could not be processed due to the corrupted SeisREFA software that was normally used for data processing and interpretation, hence a seismic analysis will not be part of this report.
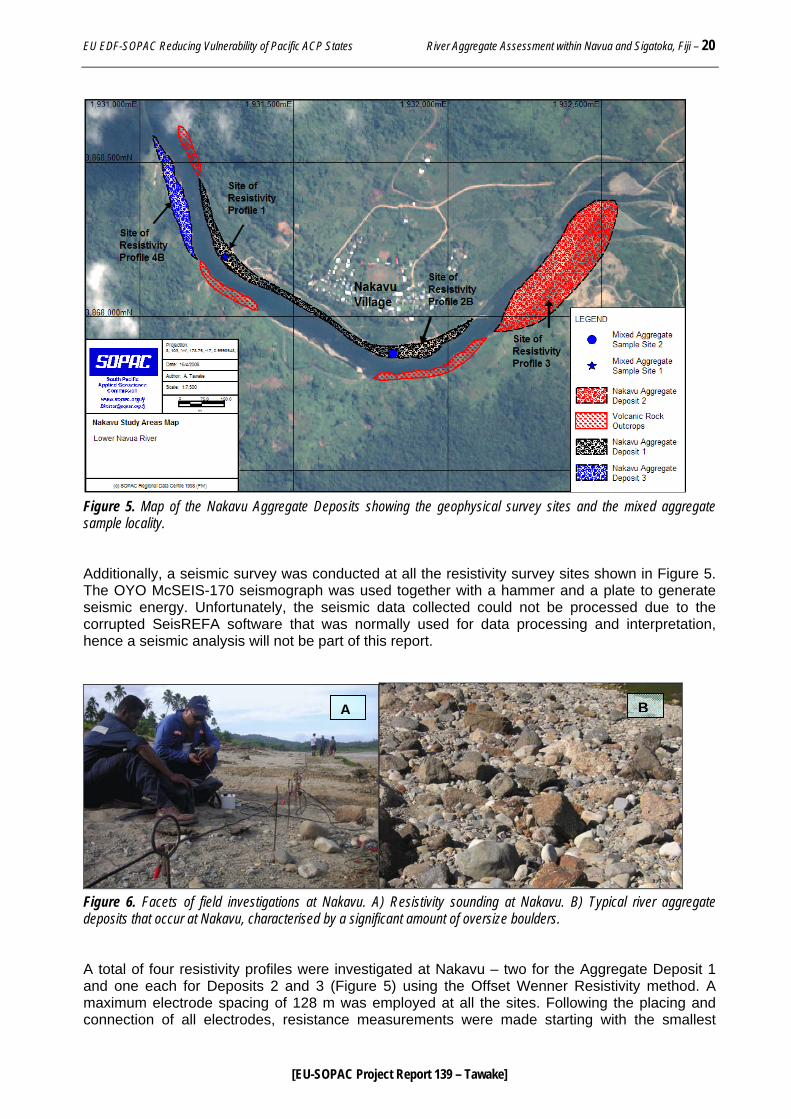
Figure 6. Facets of field investigations at Nakavu. A) Resistivity sounding at Nakavu. B) Typical river aggregate deposits that occur at Nakavu, characterised by a significant amount of oversize boulders. A total of four resistivity profiles were investigated at Nakavu – two for the Aggregate Deposit 1 and one each for Deposits 2 and 3 (Figure 5) using the Offset Wenner Resistivity method. A maximum electrode spacing of 128 m was employed at all the sites. Following the placing and connection of all electrodes, resistance measurements were made starting with the smallest
A B
EU EDF-SOPAC Reducing Vulnerability of Pacific ACP States River Aggregate Assessment within Navua and Sigatoka, Fiji – 21
[EU-SOPAC Project Report 139 – Tawake]
spacings and progressing outward (Figure 6A). In this case it started with 0.5 m and continued right to 128 m; however, whenever an error was recorded, the survey was prematurely terminated, for example at 32 m or 64 m electrode spacing rather than having to go right to 128 m. The derived resistivity was processed and interpreted using the REINVERT software. A hand-held Trimble GeoExplorer 3 GPS was used to locate the sampling and the survey sites. It was also used to map the surficial coverage of the three aggregate deposits. 3.2 November 2006 Survey Geological mapping, resistivity sounding survey, sediment sampling, socio-economic survey and an awareness / debriefing meeting with the Naduri community were part of the November 2006 field investigation. The results of the socio-economic survey and the outcome of the awareness meeting are reported in Naiova (2007).
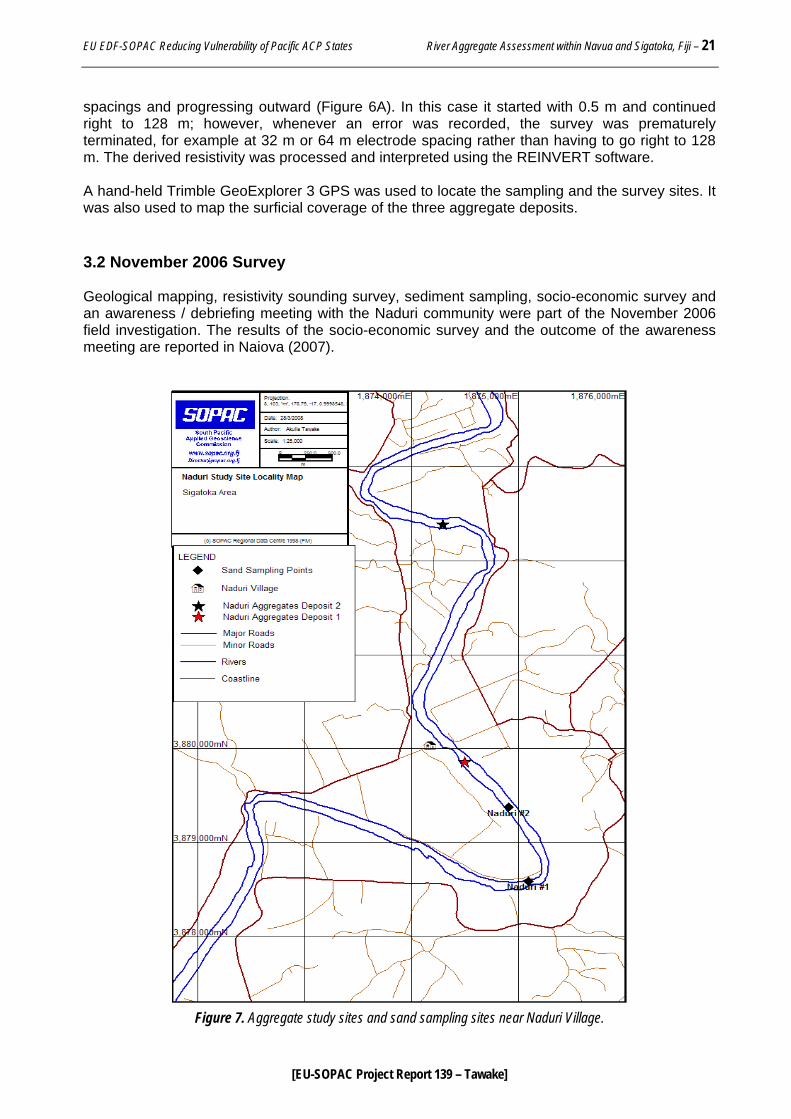
Figure 7. Aggregate study sites and sand sampling sites near Naduri Village.
EU EDF-SOPAC Reducing Vulnerability of Pacific ACP States River Aggregate Assessment within Navua and Sigatoka, Fiji – 22
[EU-SOPAC Project Report 139 – Tawake]
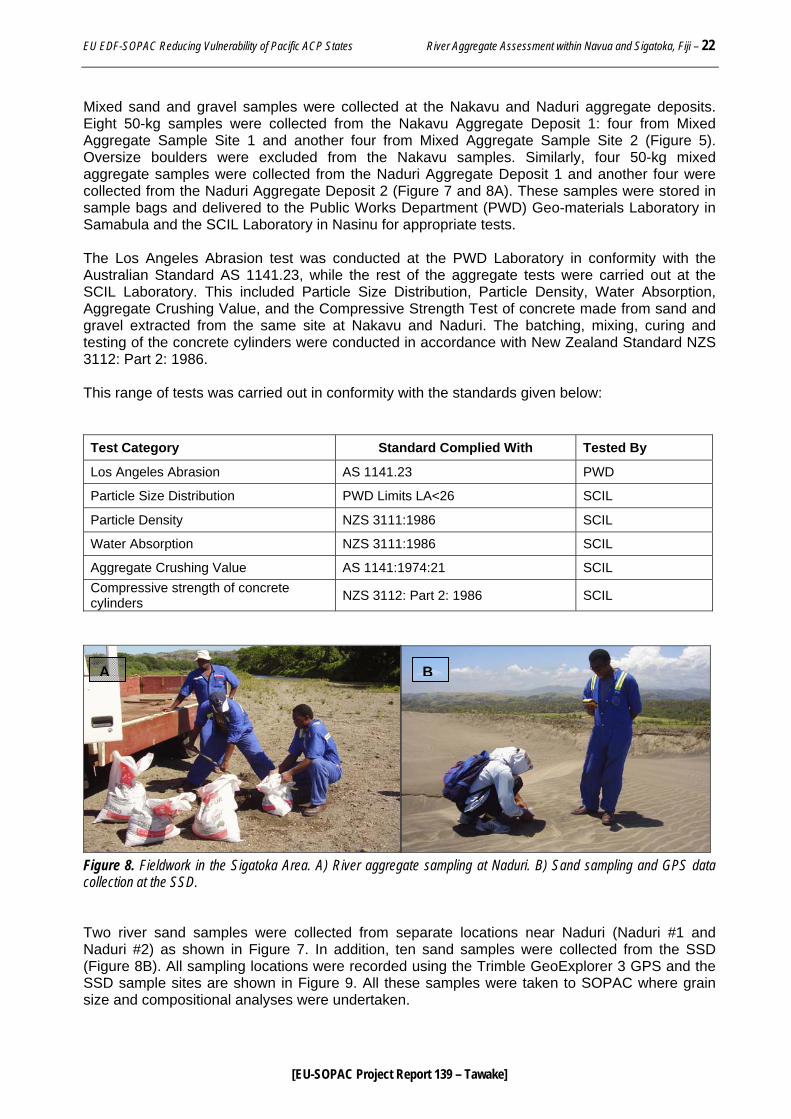
Mixed sand and gravel samples were collected at the Nakavu and Naduri aggregate deposits. Eight 50-kg samples were collected from the Nakavu Aggregate Deposit 1: four from Mixed Aggregate Sample Site 1 and another four from Mixed Aggregate Sample Site 2 (Figure 5). Oversize boulders were excluded from the Nakavu samples. Similarly, four 50-kg mixed aggregate samples were collected from the Naduri Aggregate Deposit 1 and another four were collected from the Naduri Aggregate Deposit 2 (Figure 7 and 8A). These samples were stored in sample bags and delivered to the Public Works Department (PWD) Geo-materials Laboratory in Samabula and the SCIL Laboratory in Nasinu for appropriate tests. The Los Angeles Abrasion test was conducted at the PWD Laboratory in conformity with the Australian Standard AS 1141.23, while the rest of the aggregate tests were carried out at the SCIL Laboratory. This included Particle Size Distribution, Particle Density, Water Absorption, Aggregate Crushing Value, and the Compressive Strength Test of concrete made from sand and gravel extracted from the same site at Nakavu and Naduri. The batching, mixing, curing and testing of the concrete cylinders were conducted in accordance with New Zealand Standard NZS 3112: Part 2: 1986. This range of tests was carried out in conformity with the standards given below: Test Category Standard Complied With Tested By
Los Angeles Abrasion AS 1141.23 PWD
Particle Size Distribution PWD Limits LA<26 SCIL
Particle Density NZS 3111:1986 SCIL
Water Absorption NZS 3111:1986 SCIL
Aggregate Crushing Value AS 1141:1974:21 SCIL Compressive strength of concrete cylinders NZS 3112: Part 2: 1986 SCIL
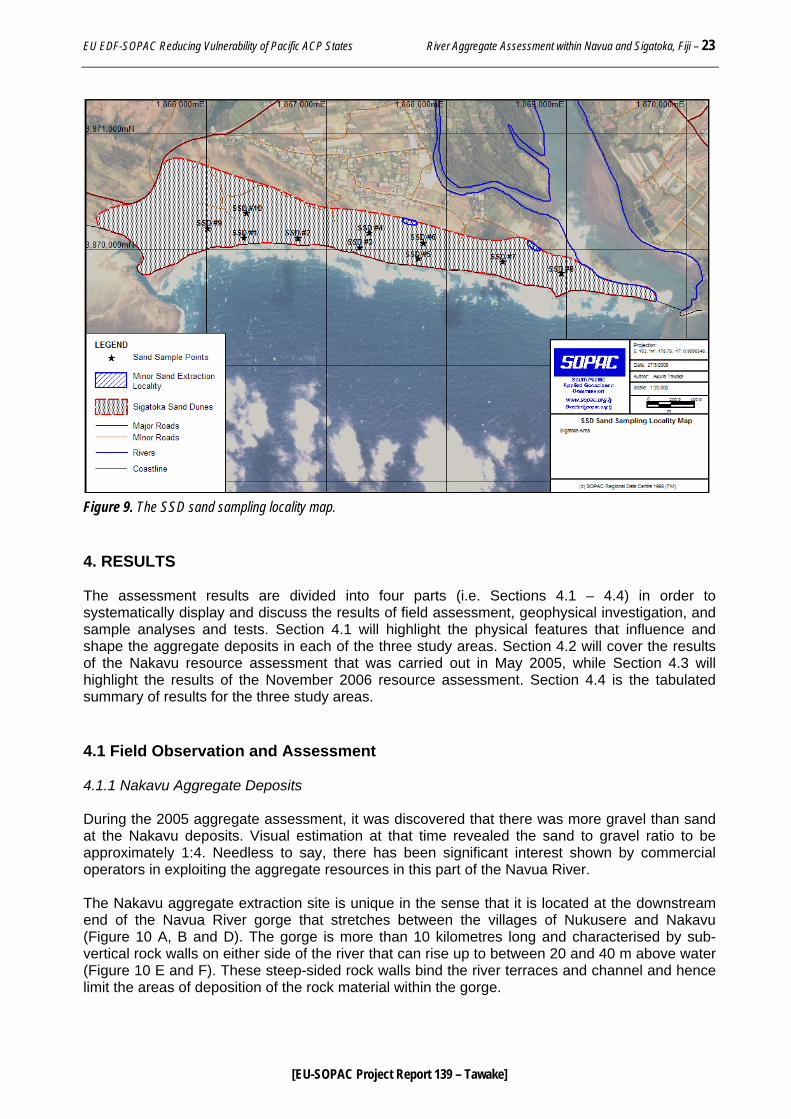
Figure 8. Fieldwork in the Sigatoka Area. A) River aggregate sampling at Naduri. B) Sand sampling and GPS data collection at the SSD. Two river sand samples were collected from separate locations near Naduri (Naduri #1 and Naduri #2) as shown in Figure 7. In addition, ten sand samples were collected from the SSD (Figure 8B). All sampling locations were recorded using the Trimble GeoExplorer 3 GPS and the SSD sample sites are shown in Figure 9. All these samples were taken to SOPAC where grain size and compositional analyses were undertaken.
A B
EU EDF-SOPAC Reducing Vulnerability of Pacific ACP States River Aggregate Assessment within Navua and Sigatoka, Fiji – 23
[EU-SOPAC Project Report 139 – Tawake]
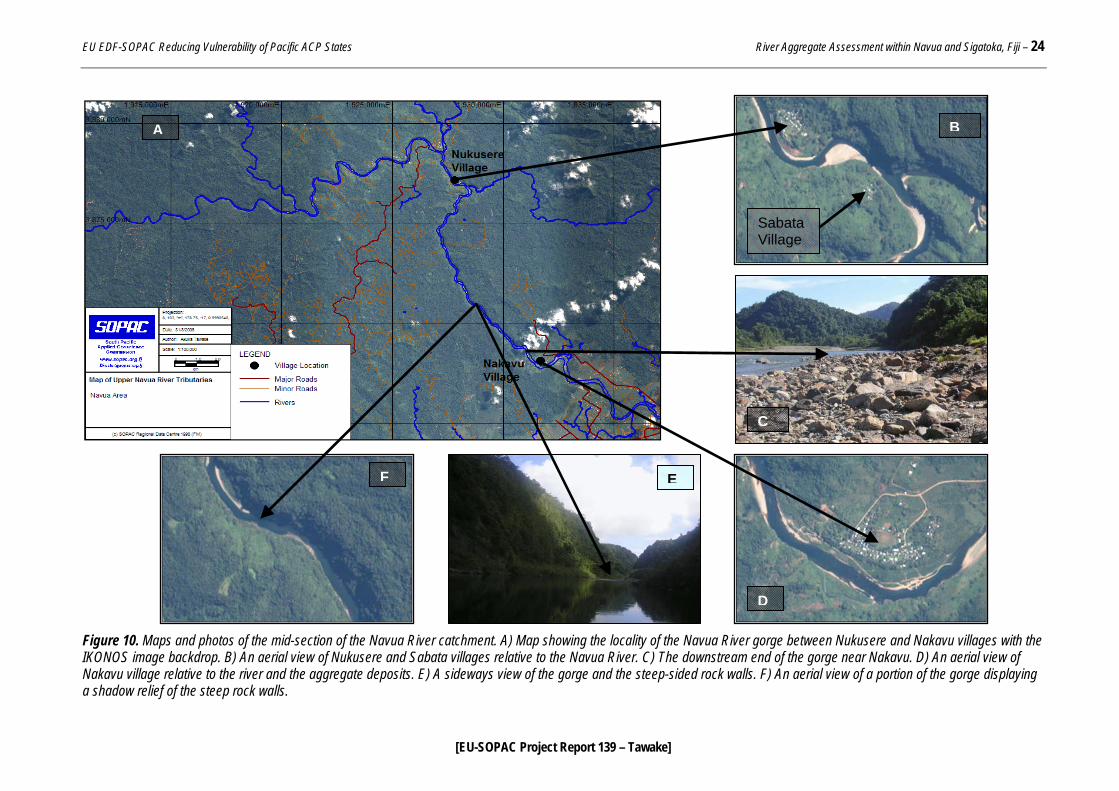
Figure 9. The SSD sand sampling locality map. 4. RESULTS The assessment results are divided into four parts (i.e. Sections 4.1 – 4.4) in order to systematically display and discuss the results of field assessment, geophysical investigation, and sample analyses and tests. Section 4.1 will highlight the physical features that influence and shape the aggregate deposits in each of the three study areas. Section 4.2 will cover the results of the Nakavu resource assessment that was carried out in May 2005, while Section 4.3 will highlight the results of the November 2006 resource assessment. Section 4.4 is the tabulated summary of results for the three study areas. 4.1 Field Observation and Assessment 4.1.1 Nakavu Aggregate Deposits During the 2005 aggregate assessment, it was discovered that there was more gravel than sand at the Nakavu deposits. Visual estimation at that time revealed the sand to gravel ratio to be approximately 1:4. Needless to say, there has been significant interest shown by commercial operators in exploiting the aggregate resources in this part of the Navua River. The Nakavu aggregate extraction site is unique in the sense that it is located at the downstream end of the Navua River gorge that stretches between the villages of Nukusere and Nakavu (Figure 10 A, B and D). The gorge is more than 10 kilometres long and characterised by sub-vertical rock walls on either side of the river that can rise up to between 20 and 40 m above water (Figure 10 E and F). These steep-sided rock walls bind the river terraces and channel and hence limit the areas of deposition of the rock material within the gorge.
EU EDF-SOPAC Reducing Vulnerability of Pacific ACP States River Aggregate Assessment within Navua and Sigatoka, Fiji – 24
[EU-SOPAC Project Report 139 – Tawake]
Figure 10. Maps and photos of the mid-section of the Navua River catchment. A) Map showing the locality of the Navua River gorge between Nukusere and Nakavu villages with the IKONOS image backdrop. B) An aerial view of Nukusere and Sabata villages relative to the Navua River. C) The downstream end of the gorge near Nakavu. D) An aerial view of Nakavu village relative to the river and the aggregate deposits. E) A sideways view of the gorge and the steep-sided rock walls. F) An aerial view of a portion of the gorge displaying a shadow relief of the steep rock walls.
A B
C
D
F E
Sabata Village
EU EDF-SOPAC Reducing Vulnerability of Pacific ACP States River Aggregate Assessment within Navua and Sigatoka, Fiji – 25
[EU-SOPAC Project Report 139 – Tawake]
With the aid of flood waters during periods of heavy rain in the Navua River catchment, rock and sediment material are transported downstream in large volumes and deposited at Nakavu, where the gorge terminates (Figure 10C). Additionally, two major tributaries of the Navua River drain into the main river channel near the upper end of the gorge. The Navua-Wainikoroiluva River junction occurs at about 1.5 kilometres to the north of Nukusere Village whereas the Navua-Wainikovu River junction is located downstream at approximately 0.5 km to the southeast of Nukusere Village (Figure 10A). They not only contribute to the high volume of water that flows downstream but also to elevated bedload and suspended load. According to the Fiji Meteorological Services records, the average annual rainfall in Navua over 30 years (between 1971 and 2000) was 3573 mm. This is twice the amount of rainfall in Sigatoka for the same period. The details of the climatic conditions of Navua and Sigatoka during the said period are given in Appendix 1. The scenario described above is quite critical during prolonged heavy rain in which flash floods had been previously experienced in the Navua area. In such cases, huge volumes of water that come from all the tributaries of the Navua River are channelled through this narrow and steep-sided gorge. With nowhere to escape the water builds up in the gorge and gains momentum in the process. This fast flowing flood water releases its energy when it reaches the downstream end of the gorge at Nakavu, where the water gets dispersed rapidly to the neighbouring flat areas causing flash floods.
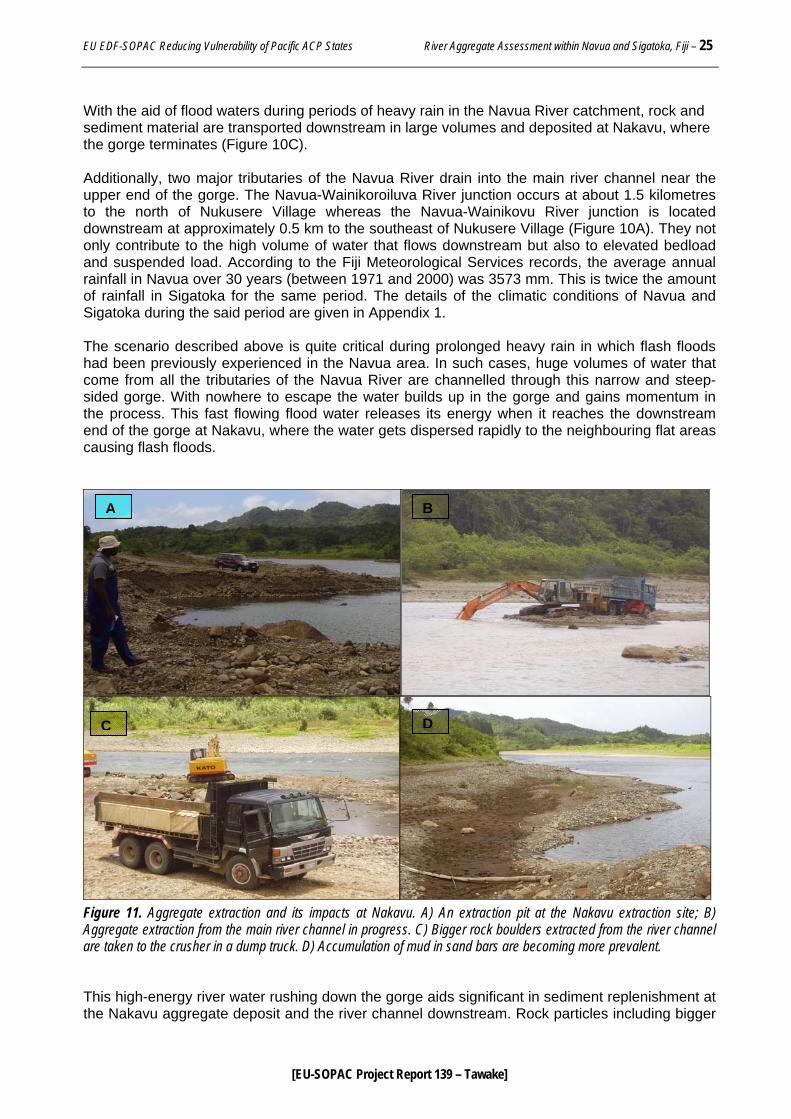
Figure 11. Aggregate extraction and its impacts at Nakavu. A) An extraction pit at the Nakavu extraction site; B) Aggregate extraction from the main river channel in progress. C) Bigger rock boulders extracted from the river channel are taken to the crusher in a dump truck. D) Accumulation of mud in sand bars are becoming more prevalent. This high-energy river water rushing down the gorge aids significant in sediment replenishment at the Nakavu aggregate deposit and the river channel downstream. Rock particles including bigger
A B
C D
EU EDF-SOPAC Reducing Vulnerability of Pacific ACP States River Aggregate Assessment within Navua and Sigatoka, Fiji – 26
[EU-SOPAC Project Report 139 – Tawake]
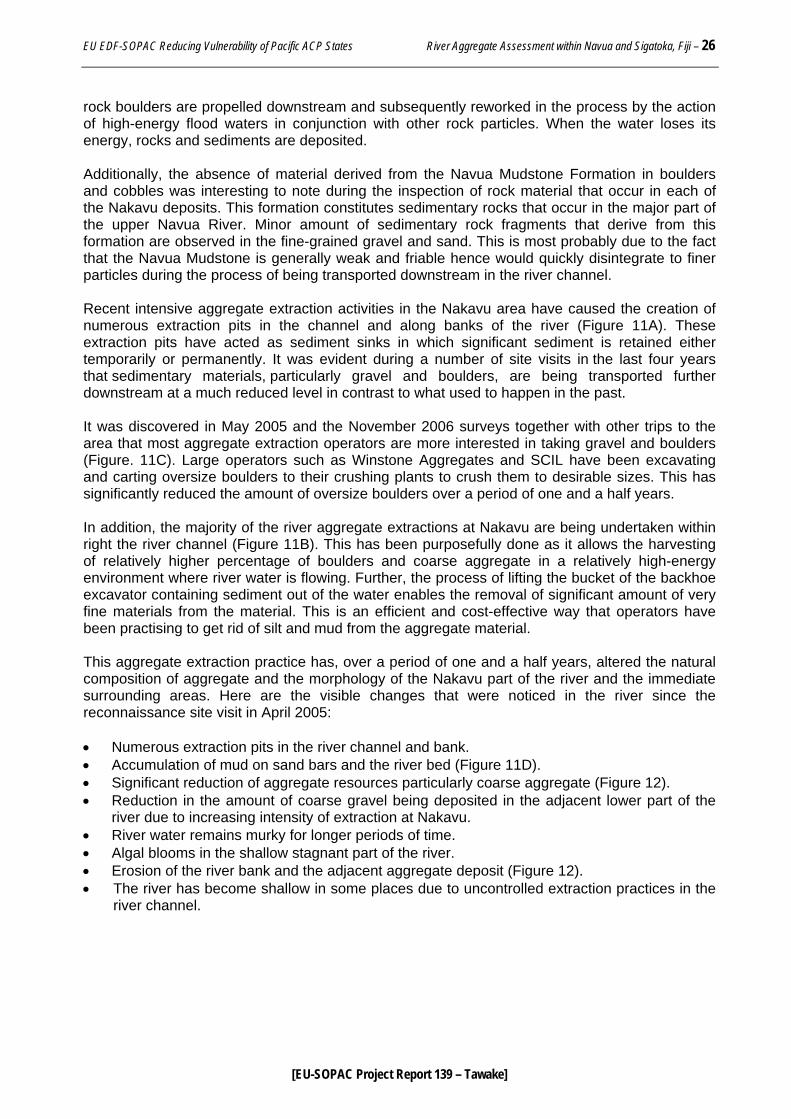
rock boulders are propelled downstream and subsequently reworked in the process by the action of high-energy flood waters in conjunction with other rock particles. When the water loses its energy, rocks and sediments are deposited. Additionally, the absence of material derived from the Navua Mudstone Formation in boulders and cobbles was interesting to note during the inspection of rock material that occur in each of the Nakavu deposits. This formation constitutes sedimentary rocks that occur in the major part of the upper Navua River. Minor amount of sedimentary rock fragments that derive from this formation are observed in the fine-grained gravel and sand. This is most probably due to the fact that the Navua Mudstone is generally weak and friable hence would quickly disintegrate to finer particles during the process of being transported downstream in the river channel. Recent intensive aggregate extraction activities in the Nakavu area have caused the creation of numerous extraction pits in the channel and along banks of the river (Figure 11A). These extraction pits have acted as sediment sinks in which significant sediment is retained either temporarily or permanently. It was evident during a number of site visits in the last four years that sedimentary materials, particularly gravel and boulders, are being transported further downstream at a much reduced level in contrast to what used to happen in the past. It was discovered in May 2005 and the November 2006 surveys together with other trips to the area that most aggregate extraction operators are more interested in taking gravel and boulders (Figure. 11C). Large operators such as Winstone Aggregates and SCIL have been excavating and carting oversize boulders to their crushing plants to crush them to desirable sizes. This has significantly reduced the amount of oversize boulders over a period of one and a half years. In addition, the majority of the river aggregate extractions at Nakavu are being undertaken within right the river channel (Figure 11B). This has been purposefully done as it allows the harvesting of relatively higher percentage of boulders and coarse aggregate in a relatively high-energy environment where river water is flowing. Further, the process of lifting the bucket of the backhoe excavator containing sediment out of the water enables the removal of significant amount of very fine materials from the material. This is an efficient and cost-effective way that operators have been practising to get rid of silt and mud from the aggregate material. This aggregate extraction practice has, over a period of one and a half years, altered the natural composition of aggregate and the morphology of the Nakavu part of the river and the immediate surrounding areas. Here are the visible changes that were noticed in the river since the reconnaissance site visit in April 2005: • Numerous extraction pits in the river channel and bank. • Accumulation of mud on sand bars and the river bed (Figure 11D). • Significant reduction of aggregate resources particularly coarse aggregate (Figure 12). • Reduction in the amount of coarse gravel being deposited in the adjacent lower part of the
river due to increasing intensity of extraction at Nakavu. • River water remains murky for longer periods of time. • Algal blooms in the shallow stagnant part of the river. • Erosion of the river bank and the adjacent aggregate deposit (Figure 12). • The river has become shallow in some places due to uncontrolled extraction practices in the
river channel.
EU EDF-SOPAC Reducing Vulnerability of Pacific ACP States River Aggregate Assessment within Navua and Sigatoka, Fiji – 27
[EU-SOPAC Project Report 139 – Tawake]
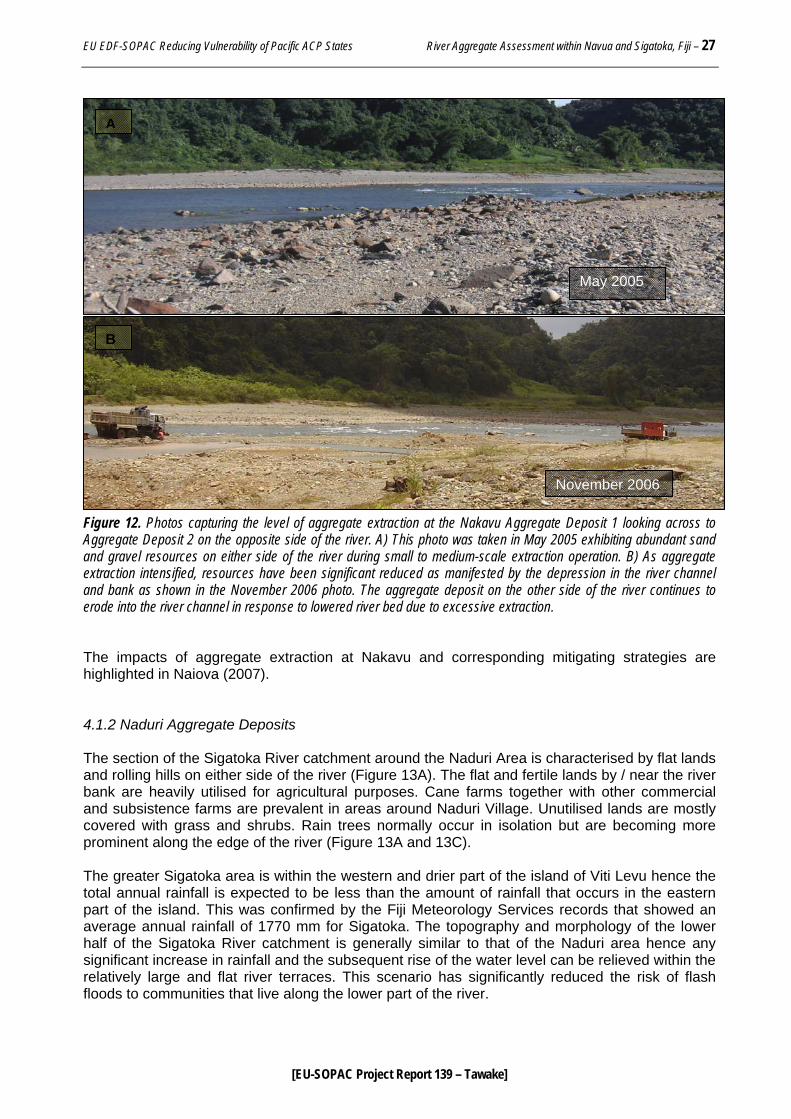
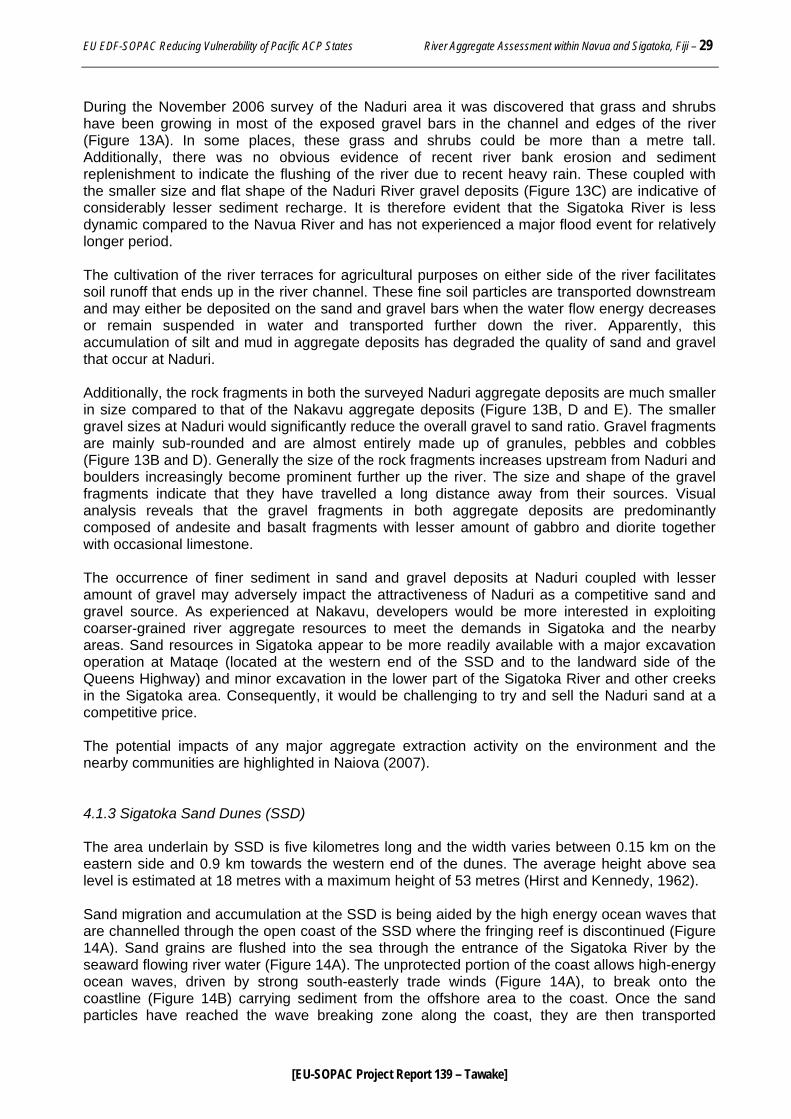
Figure 12. Photos capturing the level of aggregate extraction at the Nakavu Aggregate Deposit 1 looking across to Aggregate Deposit 2 on the opposite side of the river. A) This photo was taken in May 2005 exhibiting abundant sand and gravel resources on either side of the river during small to medium-scale extraction operation. B) As aggregate extraction intensified, resources have been significant reduced as manifested by the depression in the river channel and bank as shown in the November 2006 photo. The aggregate deposit on the other side of the river continues to erode into the river channel in response to lowered river bed due to excessive extraction. The impacts of aggregate extraction at Nakavu and corresponding mitigating strategies are highlighted in Naiova (2007). 4.1.2 Naduri Aggregate Deposits The section of the Sigatoka River catchment around the Naduri Area is characterised by flat lands and rolling hills on either side of the river (Figure 13A). The flat and fertile lands by / near the river bank are heavily utilised for agricultural purposes. Cane farms together with other commercial and subsistence farms are prevalent in areas around Naduri Village. Unutilised lands are mostly covered with grass and shrubs. Rain trees normally occur in isolation but are becoming more prominent along the edge of the river (Figure 13A and 13C). The greater Sigatoka area is within the western and drier part of the island of Viti Levu hence the total annual rainfall is expected to be less than the amount of rainfall that occurs in the eastern part of the island. This was confirmed by the Fiji Meteorology Services records that showed an average annual rainfall of 1770 mm for Sigatoka. The topography and morphology of the lower half of the Sigatoka River catchment is generally similar to that of the Naduri area hence any significant increase in rainfall and the subsequent rise of the water level can be relieved within the relatively large and flat river terraces. This scenario has significantly reduced the risk of flash floods to communities that live along the lower part of the river.
May 2005
November 2006
A
B
EU EDF-SOPAC Reducing Vulnerability of Pacific ACP States River Aggregate Assessment within Navua and Sigatoka, Fiji – 28
[EU-SOPAC Project Report 139 – Tawake]
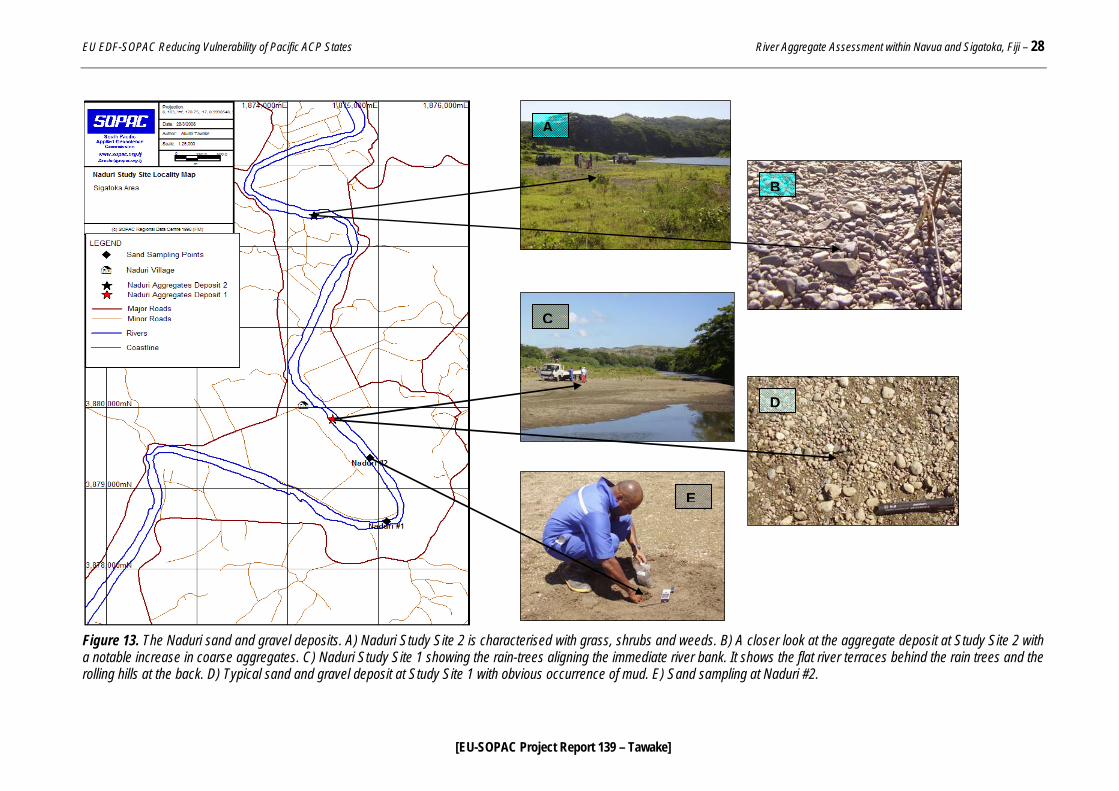
Figure 13. The Naduri sand and gravel deposits. A) Naduri Study Site 2 is characterised with grass, shrubs and weeds. B) A closer look at the aggregate deposit at Study Site 2 with a notable increase in coarse aggregates. C) Naduri Study Site 1 showing the rain-trees aligning the immediate river bank. It shows the flat river terraces behind the rain trees and the rolling hills at the back. D) Typical sand and gravel deposit at Study Site 1 with obvious occurrence of mud. E) Sand sampling at Naduri #2.
B
C
D
A
E
EU EDF-SOPAC Reducing Vulnerability of Pacific ACP States River Aggregate Assessment within Navua and Sigatoka, Fiji – 29
[EU-SOPAC Project Report 139 – Tawake]
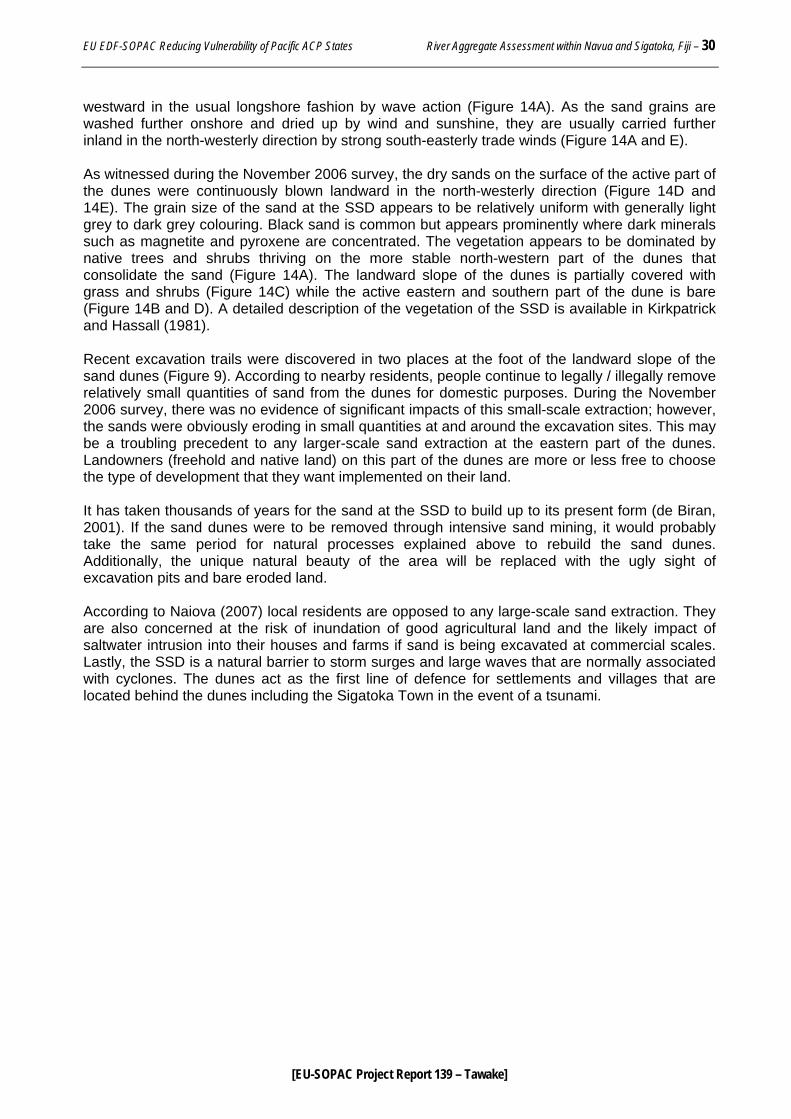
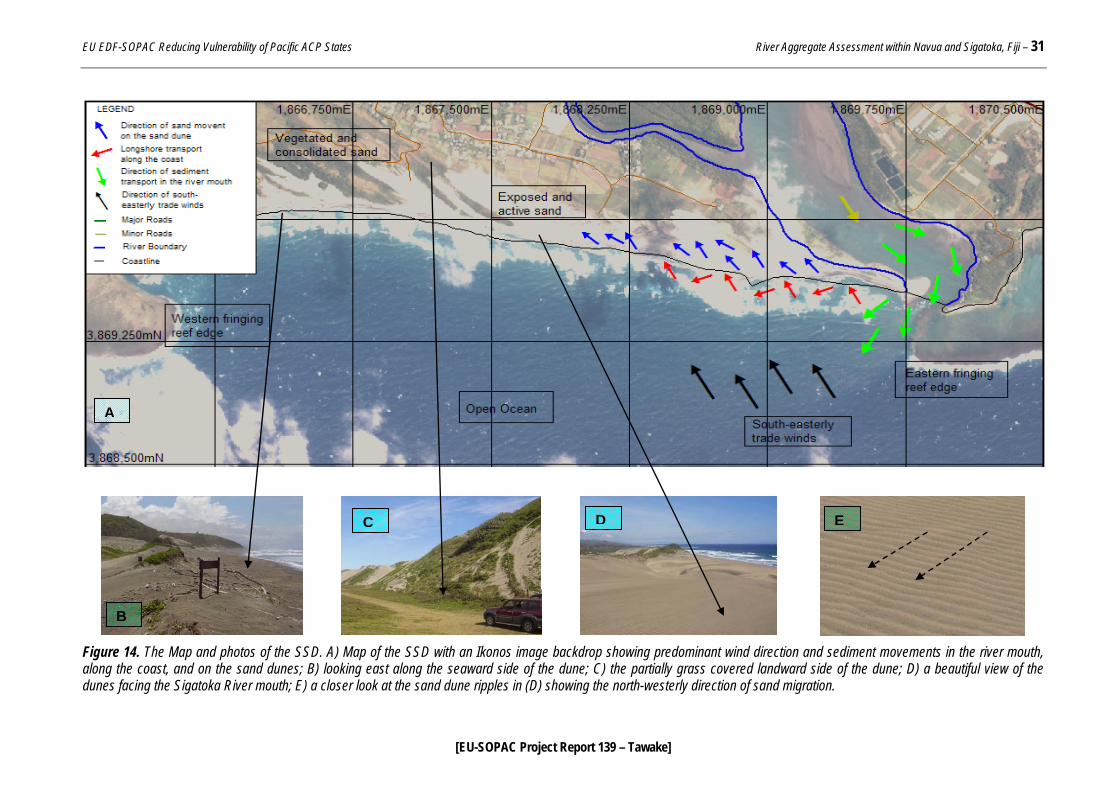
During the November 2006 survey of the Naduri area it was discovered that grass and shrubs have been growing in most of the exposed gravel bars in the channel and edges of the river (Figure 13A). In some places, these grass and shrubs could be more than a metre tall. Additionally, there was no obvious evidence of recent river bank erosion and sediment replenishment to indicate the flushing of the river due to recent heavy rain. These coupled with the smaller size and flat shape of the Naduri River gravel deposits (Figure 13C) are indicative of considerably lesser sediment recharge. It is therefore evident that the Sigatoka River is less dynamic compared to the Navua River and has not experienced a major flood event for relatively longer period. The cultivation of the river terraces for agricultural purposes on either side of the river facilitates soil runoff that ends up in the river channel. These fine soil particles are transported downstream and may either be deposited on the sand and gravel bars when the water flow energy decreases or remain suspended in water and transported further down the river. Apparently, this accumulation of silt and mud in aggregate deposits has degraded the quality of sand and gravel that occur at Naduri. Additionally, the rock fragments in both the surveyed Naduri aggregate deposits are much smaller in size compared to that of the Nakavu aggregate deposits (Figure 13B, D and E). The smaller gravel sizes at Naduri would significantly reduce the overall gravel to sand ratio. Gravel fragments are mainly sub-rounded and are almost entirely made up of granules, pebbles and cobbles (Figure 13B and D). Generally the size of the rock fragments increases upstream from Naduri and boulders increasingly become prominent further up the river. The size and shape of the gravel fragments indicate that they have travelled a long distance away from their sources. Visual analysis reveals that the gravel fragments in both aggregate deposits are predominantly composed of andesite and basalt fragments with lesser amount of gabbro and diorite together with occasional limestone. The occurrence of finer sediment in sand and gravel deposits at Naduri coupled with lesser amount of gravel may adversely impact the attractiveness of Naduri as a competitive sand and gravel source. As experienced at Nakavu, developers would be more interested in exploiting coarser-grained river aggregate resources to meet the demands in Sigatoka and the nearby areas. Sand resources in Sigatoka appear to be more readily available with a major excavation operation at Mataqe (located at the western end of the SSD and to the landward side of the Queens Highway) and minor excavation in the lower part of the Sigatoka River and other creeks in the Sigatoka area. Consequently, it would be challenging to try and sell the Naduri sand at a competitive price. The potential impacts of any major aggregate extraction activity on the environment and the nearby communities are highlighted in Naiova (2007). 4.1.3 Sigatoka Sand Dunes (SSD) The area underlain by SSD is five kilometres long and the width varies between 0.15 km on the eastern side and 0.9 km towards the western end of the dunes. The average height above sea level is estimated at 18 metres with a maximum height of 53 metres (Hirst and Kennedy, 1962). Sand migration and accumulation at the SSD is being aided by the high energy ocean waves that are channelled through the open coast of the SSD where the fringing reef is discontinued (Figure 14A). Sand grains are flushed into the sea through the entrance of the Sigatoka River by the seaward flowing river water (Figure 14A). The unprotected portion of the coast allows high-energy ocean waves, driven by strong south-easterly trade winds (Figure 14A), to break onto the coastline (Figure 14B) carrying sediment from the offshore area to the coast. Once the sand particles have reached the wave breaking zone along the coast, they are then transported
EU EDF-SOPAC Reducing Vulnerability of Pacific ACP States River Aggregate Assessment within Navua and Sigatoka, Fiji – 30
[EU-SOPAC Project Report 139 – Tawake]
westward in the usual longshore fashion by wave action (Figure 14A). As the sand grains are washed further onshore and dried up by wind and sunshine, they are usually carried further inland in the north-westerly direction by strong south-easterly trade winds (Figure 14A and E). As witnessed during the November 2006 survey, the dry sands on the surface of the active part of the dunes were continuously blown landward in the north-westerly direction (Figure 14D and 14E). The grain size of the sand at the SSD appears to be relatively uniform with generally light grey to dark grey colouring. Black sand is common but appears prominently where dark minerals such as magnetite and pyroxene are concentrated. The vegetation appears to be dominated by native trees and shrubs thriving on the more stable north-western part of the dunes that consolidate the sand (Figure 14A). The landward slope of the dunes is partially covered with grass and shrubs (Figure 14C) while the active eastern and southern part of the dune is bare (Figure 14B and D). A detailed description of the vegetation of the SSD is available in Kirkpatrick and Hassall (1981). Recent excavation trails were discovered in two places at the foot of the landward slope of the sand dunes (Figure 9). According to nearby residents, people continue to legally / illegally remove relatively small quantities of sand from the dunes for domestic purposes. During the November 2006 survey, there was no evidence of significant impacts of this small-scale extraction; however, the sands were obviously eroding in small quantities at and around the excavation sites. This may be a troubling precedent to any larger-scale sand extraction at the eastern part of the dunes. Landowners (freehold and native land) on this part of the dunes are more or less free to choose the type of development that they want implemented on their land. It has taken thousands of years for the sand at the SSD to build up to its present form (de Biran, 2001). If the sand dunes were to be removed through intensive sand mining, it would probably take the same period for natural processes explained above to rebuild the sand dunes. Additionally, the unique natural beauty of the area will be replaced with the ugly sight of excavation pits and bare eroded land. According to Naiova (2007) local residents are opposed to any large-scale sand extraction. They are also concerned at the risk of inundation of good agricultural land and the likely impact of saltwater intrusion into their houses and farms if sand is being excavated at commercial scales. Lastly, the SSD is a natural barrier to storm surges and large waves that are normally associated with cyclones. The dunes act as the first line of defence for settlements and villages that are located behind the dunes including the Sigatoka Town in the event of a tsunami.
EU EDF-SOPAC Reducing Vulnerability of Pacific ACP States River Aggregate Assessment within Navua and Sigatoka, Fiji – 31
[EU-SOPAC Project Report 139 – Tawake]
Figure 14. The Map and photos of the SSD. A) Map of the SSD with an Ikonos image backdrop showing predominant wind direction and sediment movements in the river mouth, along the coast, and on the sand dunes; B) looking east along the seaward side of the dune; C) the partially grass covered landward side of the dune; D) a beautiful view of the dunes facing the Sigatoka River mouth; E) a closer look at the sand dune ripples in (D) showing the north-westerly direction of sand migration.
A
B
C D E
EU EDF-SOPAC Reducing Vulnerability of Pacific ACP States River Aggregate Assessment within Navua and Sigatoka, Fiji – 32
[EU-SOPAC Project Report 139 – Tawake]
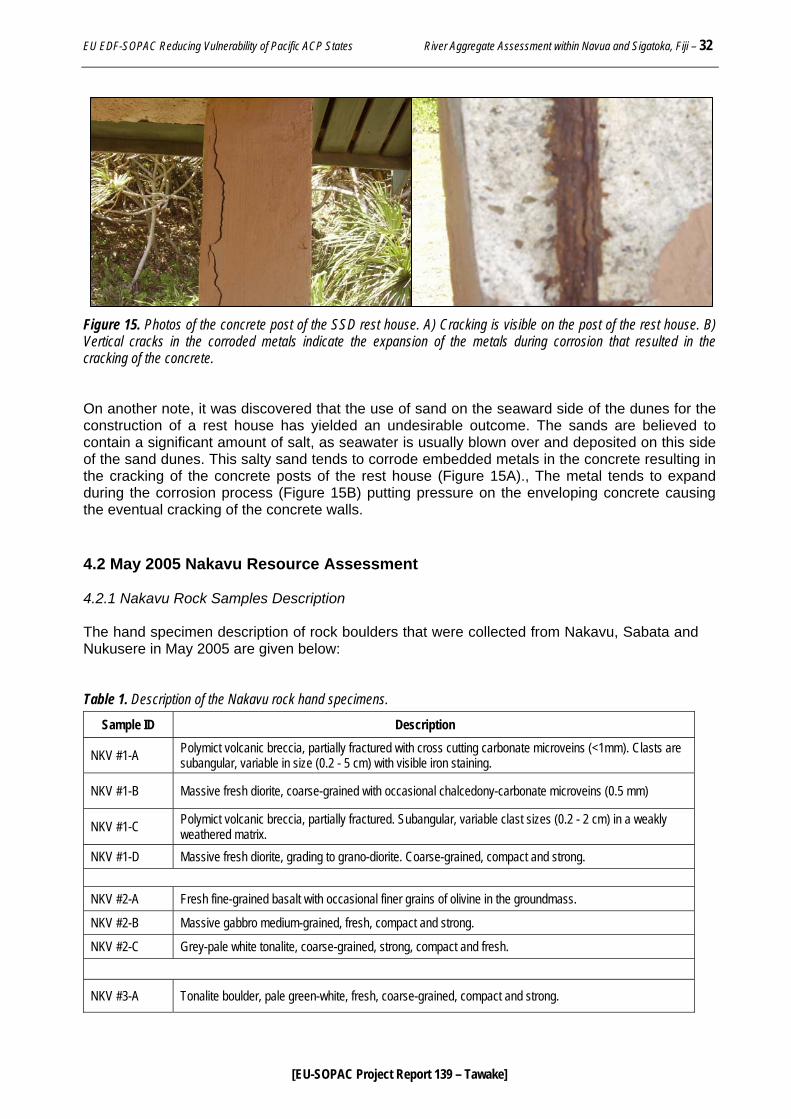
Figure 15. Photos of the concrete post of the SSD rest house. A) Cracking is visible on the post of the rest house. B) Vertical cracks in the corroded metals indicate the expansion of the metals during corrosion that resulted in the cracking of the concrete. On another note, it was discovered that the use of sand on the seaward side of the dunes for the construction of a rest house has yielded an undesirable outcome. The sands are believed to contain a significant amount of salt, as seawater is usually blown over and deposited on this side of the sand dunes. This salty sand tends to corrode embedded metals in the concrete resulting in the cracking of the concrete posts of the rest house (Figure 15A)., The metal tends to expand during the corrosion process (Figure 15B) putting pressure on the enveloping concrete causing the eventual cracking of the concrete walls. 4.2 May 2005 Nakavu Resource Assessment 4.2.1 Nakavu Rock Samples Description The hand specimen description of rock boulders that were collected from Nakavu, Sabata and Nukusere in May 2005 are given below: Table 1. Description of the Nakavu rock hand specimens.
Sample ID Description
NKV #1-A Polymict volcanic breccia, partially fractured with cross cutting carbonate microveins (<1mm). Clasts are subangular, variable in size (0.2 - 5 cm) with visible iron staining.
NKV #1-B Massive fresh diorite, coarse-grained with occasional chalcedony-carbonate microveins (0.5 mm)
NKV #1-C Polymict volcanic breccia, partially fractured. Subangular, variable clast sizes (0.2 - 2 cm) in a weakly weathered matrix.
NKV #1-D Massive fresh diorite, grading to grano-diorite. Coarse-grained, compact and strong. NKV #2-A Fresh fine-grained basalt with occasional finer grains of olivine in the groundmass.
NKV #2-B Massive gabbro medium-grained, fresh, compact and strong.
NKV #2-C Grey-pale white tonalite, coarse-grained, strong, compact and fresh.
NKV #3-A Tonalite boulder, pale green-white, fresh, coarse-grained, compact and strong.
EU EDF-SOPAC Reducing Vulnerability of Pacific ACP States River Aggregate Assessment within Navua and Sigatoka, Fiji – 33
[EU-SOPAC Project Report 139 – Tawake]
NKV #3-B Iron-stained polymict volcanic breccia, fractured with subangular, variable clasts (0.2 - 2 cm).
NKV #3-C Fresh fine-grained basalt, compact and strong.
SBT #1 Fine-grained basalt with some carbonate microveins, fresh, strong but vesicular in some places.
SBT #2 Medium-grained gabbro, fresh, compact, and strong with occasional vughs.
SBT #3 Massive and strong gabbro. Fresh, compact and medium-grained.
SBT #4 Fresh massive diorite, compact, coarse-grained and strong. NKS #1 Very fine-grained basalt, fresh and compact.
NKS #2 Fresh, compact, massive and coarse-grained diorite with occasional microveins (0.5 mm).
NKS #3 Bedded, fine medium-grained sandstone. Belongs of the Navua Mudstone Formation.
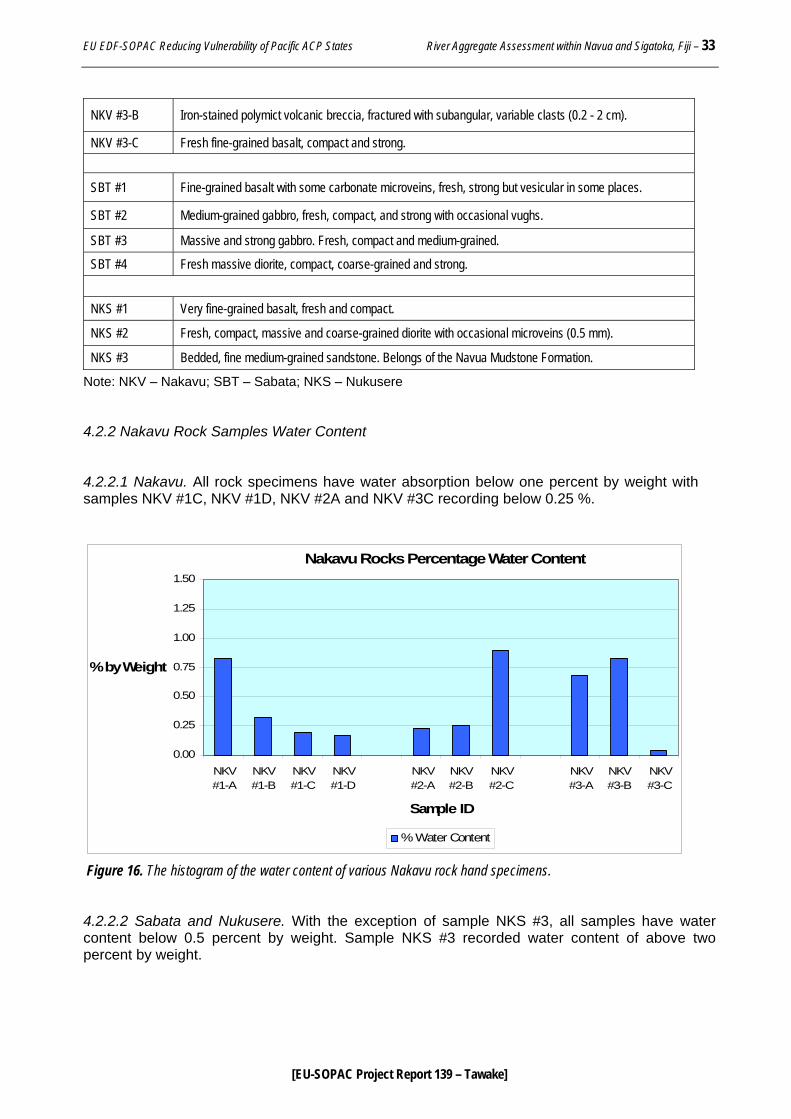
Note: NKV – Nakavu; SBT – Sabata; NKS – Nukusere 4.2.2 Nakavu Rock Samples Water Content 4.2.2.1 Nakavu. All rock specimens have water absorption below one percent by weight with samples NKV #1C, NKV #1D, NKV #2A and NKV #3C recording below 0.25 %.
Nakavu Rocks Percentage Water Content
0.00
0.25
0.50
0.75
1.00
1.25
1.50
NKV#1-A
NKV#1-B
NKV#1-C
NKV#1-D
NKV#2-A
NKV#2-B
NKV#2-C
NKV#3-A
NKV#3-B
NKV#3-C
Sample ID
% by Weight
% Water Content
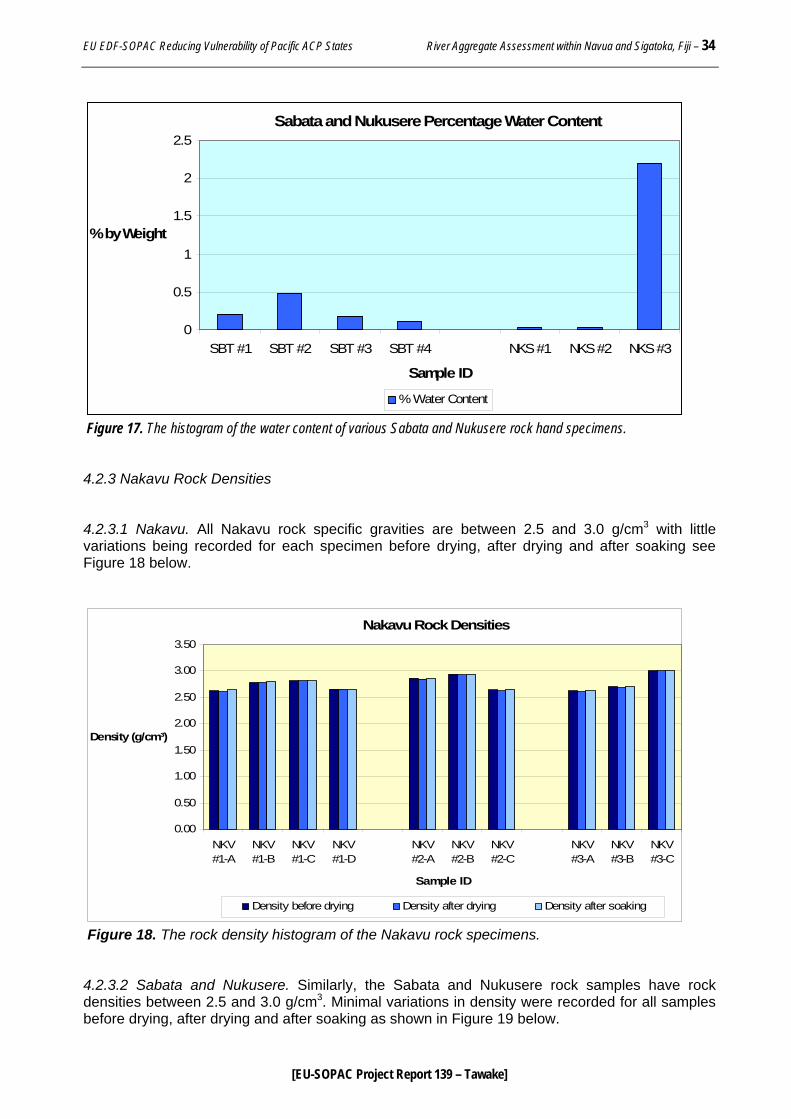
Figure 16. The histogram of the water content of various Nakavu rock hand specimens. 4.2.2.2 Sabata and Nukusere. With the exception of sample NKS #3, all samples have water content below 0.5 percent by weight. Sample NKS #3 recorded water content of above two percent by weight.
EU EDF-SOPAC Reducing Vulnerability of Pacific ACP States River Aggregate Assessment within Navua and Sigatoka, Fiji – 34
[EU-SOPAC Project Report 139 – Tawake]
Sabata and Nukusere Percentage Water Content
0
0.5
1
1.5
2
2.5
SBT #1 SBT #2 SBT #3 SBT #4 NKS #1 NKS #2 NKS #3
Sample ID
% by Weight
% Water Content
Figure 17. The histogram of the water content of various Sabata and Nukusere rock hand specimens. 4.2.3 Nakavu Rock Densities 4.2.3.1 Nakavu. All Nakavu rock specific gravities are between 2.5 and 3.0 g/cm3 with little variations being recorded for each specimen before drying, after drying and after soaking see Figure 18 below.
Nakavu Rock Densities
0.00
0.50
1.00
1.50
2.00
2.50
3.00
3.50
NKV#1-A
NKV#1-B
NKV#1-C
NKV#1-D
NKV#2-A
NKV#2-B
NKV#2-C
NKV#3-A
NKV#3-B
NKV#3-C
Sample ID
Density (g/cm³)
Density before drying Density after drying Density after soaking
Figure 18. The rock density histogram of the Nakavu rock specimens. 4.2.3.2 Sabata and Nukusere. Similarly, the Sabata and Nukusere rock samples have rock densities between 2.5 and 3.0 g/cm3. Minimal variations in density were recorded for all samples before drying, after drying and after soaking as shown in Figure 19 below.
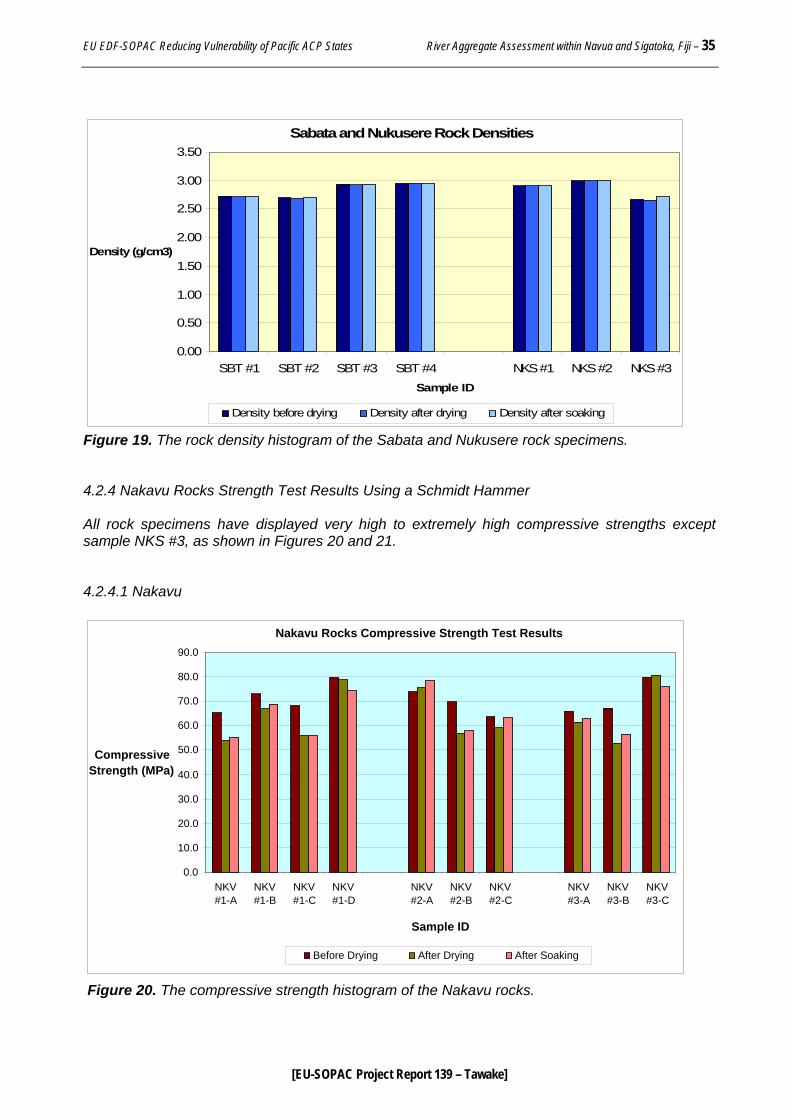
EU EDF-SOPAC Reducing Vulnerability of Pacific ACP States River Aggregate Assessment within Navua and Sigatoka, Fiji – 35
[EU-SOPAC Project Report 139 – Tawake]
Sabata and Nukusere Rock Densities
0.00
0.50
1.00
1.50
2.00
2.50
3.00
3.50
SBT #1 SBT #2 SBT #3 SBT #4 NKS #1 NKS #2 NKS #3Sample ID
Density (g/cm3)
Density before drying Density after drying Density after soaking
Figure 19. The rock density histogram of the Sabata and Nukusere rock specimens. 4.2.4 Nakavu Rocks Strength Test Results Using a Schmidt Hammer All rock specimens have displayed very high to extremely high compressive strengths except sample NKS #3, as shown in Figures 20 and 21. 4.2.4.1 Nakavu
Figure 20. The compressive strength histogram of the Nakavu rocks.
Nakavu Rocks Compressive Strength Test Results
0.0
10.0
20.0
30.0
40.0
50.0
60.0
70.0 80.0
90.0
NKV#1-A
NKV#1-B
NKV#1-C
NKV#1-D
NKV#2-A
NKV#2-B
NKV#2-C
NKV #3-A
NKV#3-B
NKV#3-C
Sample ID
Compressive Strength (MPa)
Before Drying After Drying After Soaking
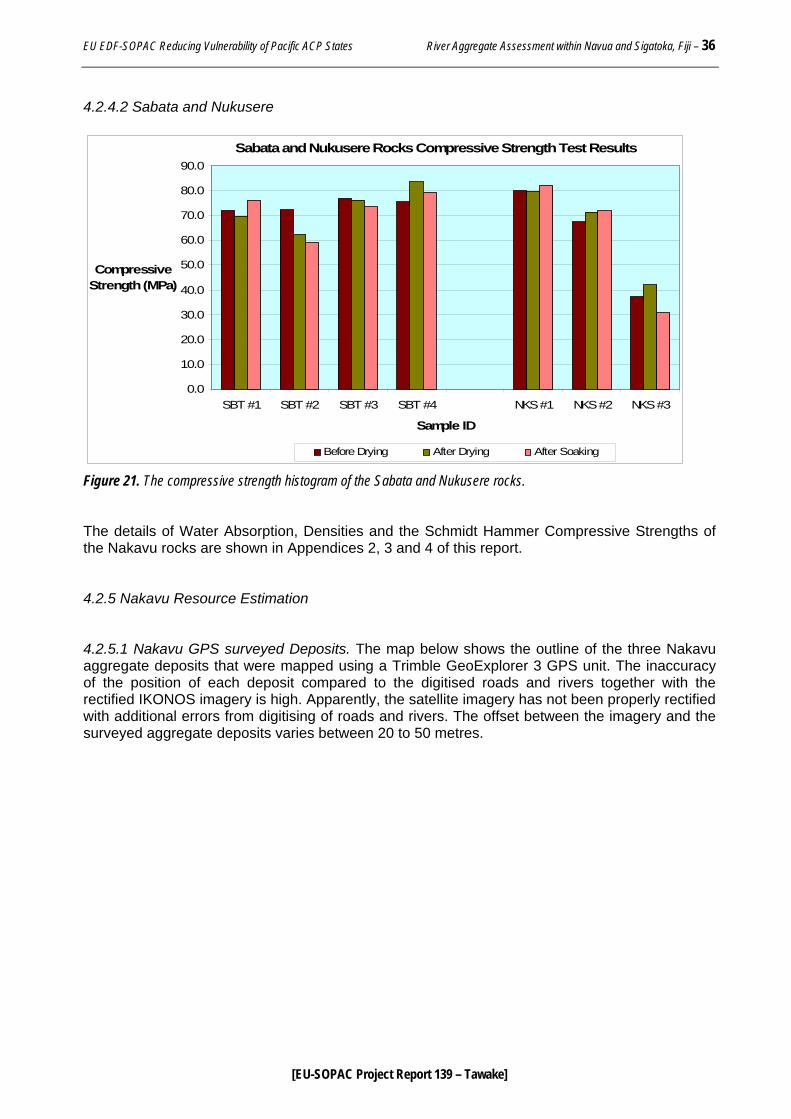
EU EDF-SOPAC Reducing Vulnerability of Pacific ACP States River Aggregate Assessment within Navua and Sigatoka, Fiji – 36
[EU-SOPAC Project Report 139 – Tawake]
4.2.4.2 Sabata and Nukusere
Sabata and Nukusere Rocks Compressive Strength Test Results
0.0
10.0
20.0
30.0
40.0
50.0
60.0
70.0
80.0
90.0
SBT #1 SBT #2 SBT #3 SBT #4 NKS #1 NKS #2 NKS #3
Sample ID
CompressiveStrength (MPa)
Before Drying After Drying After Soaking
Figure 21. The compressive strength histogram of the Sabata and Nukusere rocks. The details of Water Absorption, Densities and the Schmidt Hammer Compressive Strengths of the Nakavu rocks are shown in Appendices 2, 3 and 4 of this report. 4.2.5 Nakavu Resource Estimation 4.2.5.1 Nakavu GPS surveyed Deposits. The map below shows the outline of the three Nakavu aggregate deposits that were mapped using a Trimble GeoExplorer 3 GPS unit. The inaccuracy of the position of each deposit compared to the digitised roads and rivers together with the rectified IKONOS imagery is high. Apparently, the satellite imagery has not been properly rectified with additional errors from digitising of roads and rivers. The offset between the imagery and the surveyed aggregate deposits varies between 20 to 50 metres.
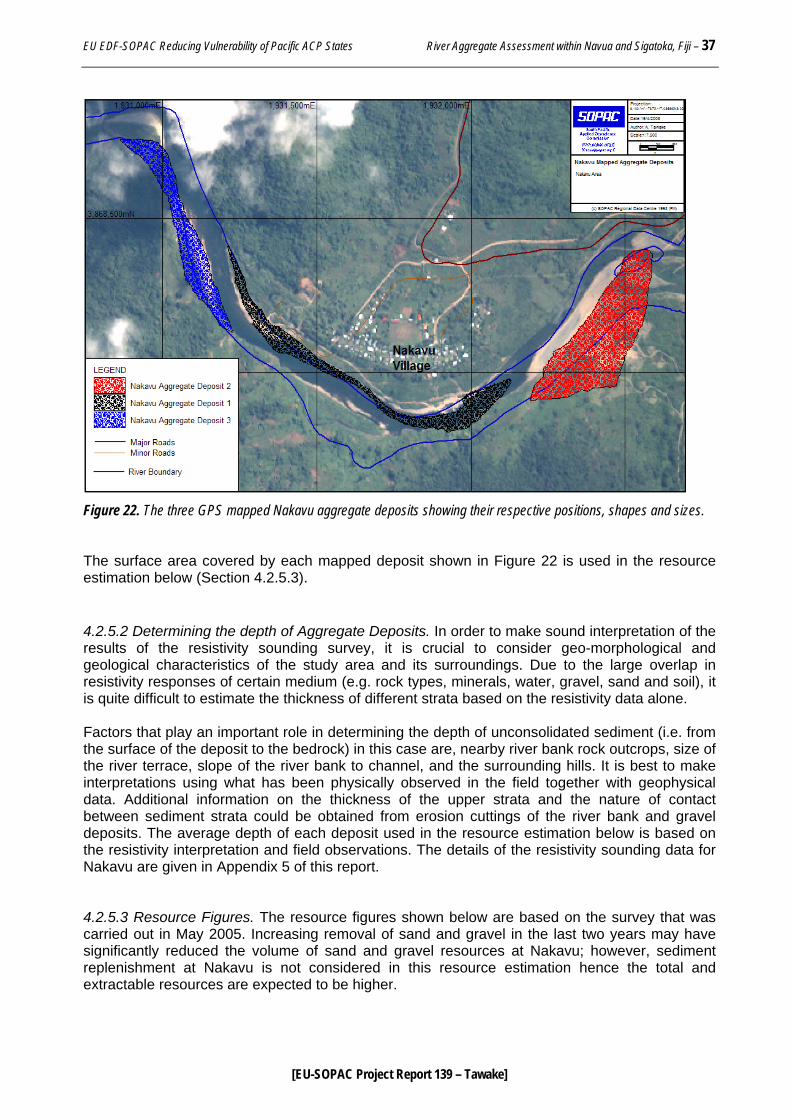
EU EDF-SOPAC Reducing Vulnerability of Pacific ACP States River Aggregate Assessment within Navua and Sigatoka, Fiji – 37
[EU-SOPAC Project Report 139 – Tawake]
Figure 22. The three GPS mapped Nakavu aggregate deposits showing their respective positions, shapes and sizes. The surface area covered by each mapped deposit shown in Figure 22 is used in the resource estimation below (Section 4.2.5.3). 4.2.5.2 Determining the depth of Aggregate Deposits. In order to make sound interpretation of the results of the resistivity sounding survey, it is crucial to consider geo-morphological and geological characteristics of the study area and its surroundings. Due to the large overlap in resistivity responses of certain medium (e.g. rock types, minerals, water, gravel, sand and soil), it is quite difficult to estimate the thickness of different strata based on the resistivity data alone. Factors that play an important role in determining the depth of unconsolidated sediment (i.e. from the surface of the deposit to the bedrock) in this case are, nearby river bank rock outcrops, size of the river terrace, slope of the river bank to channel, and the surrounding hills. It is best to make interpretations using what has been physically observed in the field together with geophysical data. Additional information on the thickness of the upper strata and the nature of contact between sediment strata could be obtained from erosion cuttings of the river bank and gravel deposits. The average depth of each deposit used in the resource estimation below is based on the resistivity interpretation and field observations. The details of the resistivity sounding data for Nakavu are given in Appendix 5 of this report. 4.2.5.3 Resource Figures. The resource figures shown below are based on the survey that was carried out in May 2005. Increasing removal of sand and gravel in the last two years may have significantly reduced the volume of sand and gravel resources at Nakavu; however, sediment replenishment at Nakavu is not considered in this resource estimation hence the total and extractable resources are expected to be higher.
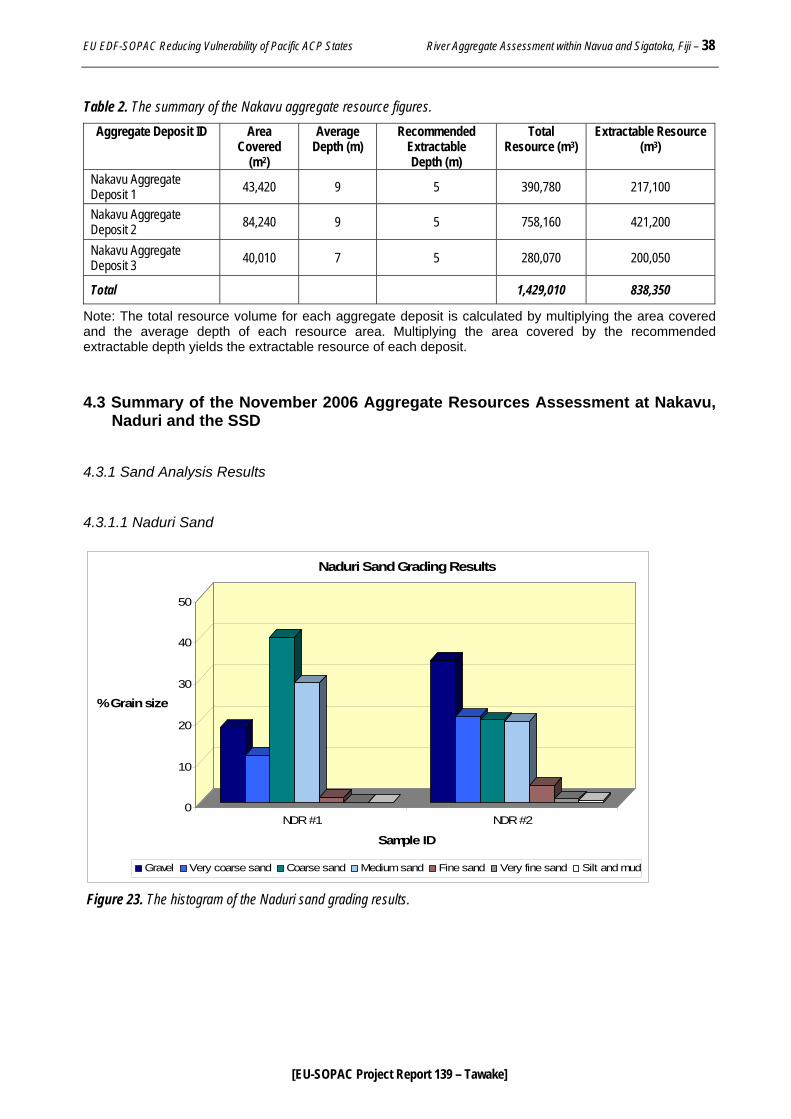
EU EDF-SOPAC Reducing Vulnerability of Pacific ACP States River Aggregate Assessment within Navua and Sigatoka, Fiji – 38
[EU-SOPAC Project Report 139 – Tawake]
Table 2. The summary of the Nakavu aggregate resource figures. Aggregate Deposit ID Area
Covered (m2)
Average Depth (m)
Recommended Extractable Depth (m)
Total Resource (m3)
Extractable Resource (m3)
Nakavu Aggregate Deposit 1 43,420 9 5 390,780 217,100
Nakavu Aggregate Deposit 2 84,240 9 5 758,160 421,200
Nakavu Aggregate Deposit 3 40,010 7 5 280,070 200,050
Total 1,429,010 838,350
Note: The total resource volume for each aggregate deposit is calculated by multiplying the area covered and the average depth of each resource area. Multiplying the area covered by the recommended extractable depth yields the extractable resource of each deposit. 4.3 Summary of the November 2006 Aggregate Resources Assessment at Nakavu,
Naduri and the SSD 4.3.1 Sand Analysis Results 4.3.1.1 Naduri Sand
0
10
20
30
40
50
% Grain size
NDR #1 NDR #2
Sample ID
Naduri Sand Grading Results
Gravel Very coarse sand Coarse sand Medium sand Fine sand Very fine sand Silt and mud
Figure 23. The histogram of the Naduri sand grading results.
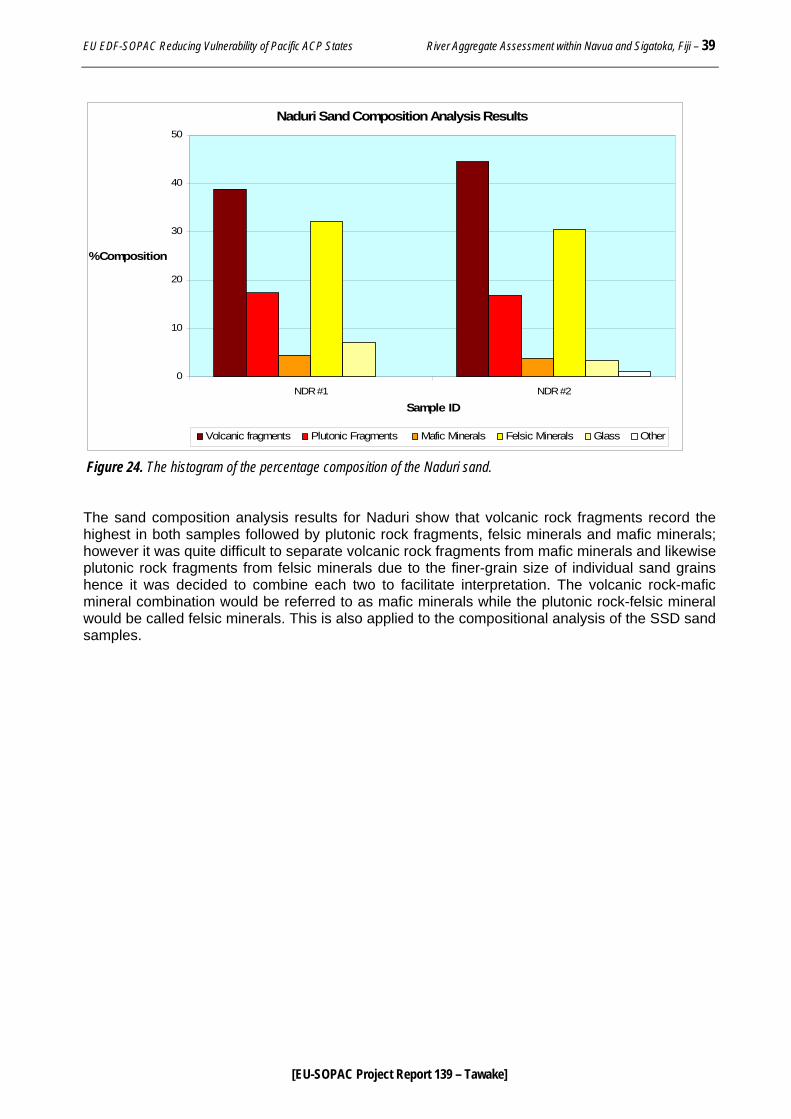
EU EDF-SOPAC Reducing Vulnerability of Pacific ACP States River Aggregate Assessment within Navua and Sigatoka, Fiji – 39
[EU-SOPAC Project Report 139 – Tawake]
Naduri Sand Composition Analysis Results
0
10
20
30
40
50
NDR #1 NDR #2
Sample ID
% Composition
Volcanic fragments Plutonic Fragments Mafic Minerals Felsic Minerals Glass Other
Figure 24. The histogram of the percentage composition of the Naduri sand. The sand composition analysis results for Naduri show that volcanic rock fragments record the highest in both samples followed by plutonic rock fragments, felsic minerals and mafic minerals; however it was quite difficult to separate volcanic rock fragments from mafic minerals and likewise plutonic rock fragments from felsic minerals due to the finer-grain size of individual sand grains hence it was decided to combine each two to facilitate interpretation. The volcanic rock-mafic mineral combination would be referred to as mafic minerals while the plutonic rock-felsic mineral would be called felsic minerals. This is also applied to the compositional analysis of the SSD sand samples.
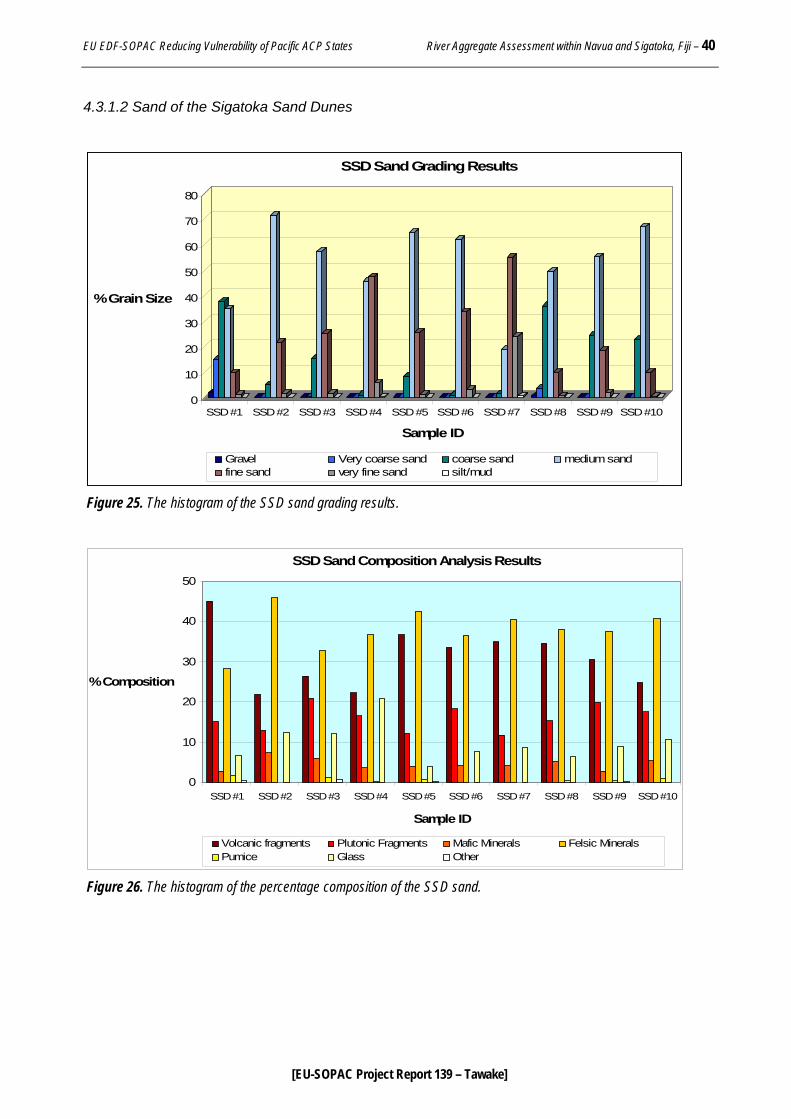
EU EDF-SOPAC Reducing Vulnerability of Pacific ACP States River Aggregate Assessment within Navua and Sigatoka, Fiji – 40
[EU-SOPAC Project Report 139 – Tawake]
4.3.1.2 Sand of the Sigatoka Sand Dunes
0
10
20
30
40
50
60
70
80
% Grain Size
SSD #1 SSD #2 SSD #3 SSD #4 SSD #5 SSD #6 SSD #7 SSD #8 SSD #9 SSD #10
Sample ID
SSD Sand Grading Results
Gravel Very coarse sand coarse sand medium sandfine sand very fine sand silt/mud
Figure 25. The histogram of the SSD sand grading results.
SSD Sand Composition Analysis Results
0
10
20
30
40
50
SSD #1 SSD #2 SSD #3 SSD #4 SSD #5 SSD #6 SSD #7 SSD #8 SSD #9 SSD #10
Sample ID
% Composition
Volcanic fragments Plutonic Fragments Mafic Minerals Felsic MineralsPumice Glass Other
Figure 26. The histogram of the percentage composition of the SSD sand.
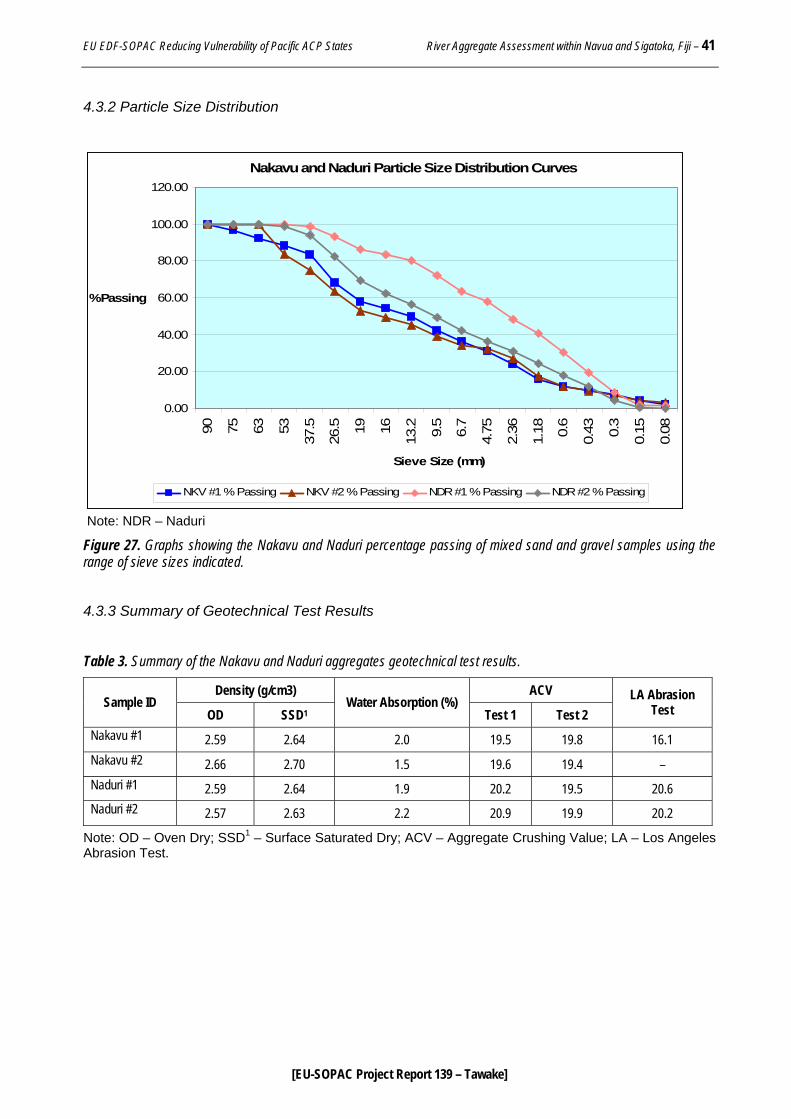
EU EDF-SOPAC Reducing Vulnerability of Pacific ACP States River Aggregate Assessment within Navua and Sigatoka, Fiji – 41
[EU-SOPAC Project Report 139 – Tawake]
4.3.2 Particle Size Distribution
Nakavu and Naduri Particle Size Distribution Curves
0.00
20.00
40.00
60.00
80.00
100.00
120.00
90 75 63 53
37.5
26.5 19 16
13.2 9.5
6.7
4.75
2.36
1.18 0.6
0.43 0.3
0.15
0.08
Sieve Size (mm)
% Passing
NKV #1 % Passing NKV #2 % Passing NDR #1 % Passing NDR #2 % Passing
Note: NDR – Naduri Figure 27. Graphs showing the Nakavu and Naduri percentage passing of mixed sand and gravel samples using the range of sieve sizes indicated. 4.3.3 Summary of Geotechnical Test Results Table 3. Summary of the Nakavu and Naduri aggregates geotechnical test results.
Density (g/cm3) ACV Sample ID
OD SSD1 Water Absorption (%)
Test 1 Test 2 LA Abrasion
Test
Nakavu #1 2.59 2.64 2.0 19.5 19.8 16.1 Nakavu #2 2.66 2.70 1.5 19.6 19.4 – Naduri #1 2.59 2.64 1.9 20.2 19.5 20.6 Naduri #2 2.57 2.63 2.2 20.9 19.9 20.2
Note: OD – Oven Dry; SSD1 – Surface Saturated Dry; ACV – Aggregate Crushing Value; LA – Los Angeles Abrasion Test.
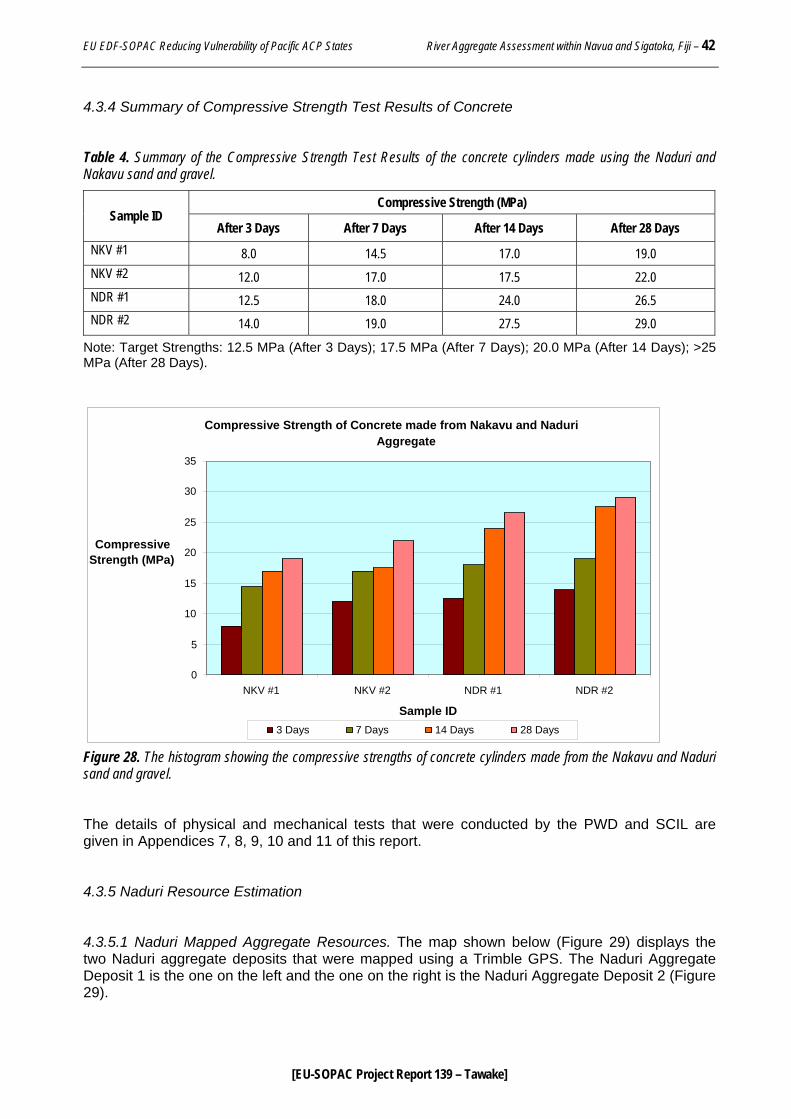
EU EDF-SOPAC Reducing Vulnerability of Pacific ACP States River Aggregate Assessment within Navua and Sigatoka, Fiji – 42
[EU-SOPAC Project Report 139 – Tawake]
4.3.4 Summary of Compressive Strength Test Results of Concrete Table 4. Summary of the Compressive Strength Test Results of the concrete cylinders made using the Naduri and Nakavu sand and gravel.
Compressive Strength (MPa) Sample ID
After 3 Days After 7 Days After 14 Days After 28 Days NKV #1 8.0 14.5 17.0 19.0 NKV #2 12.0 17.0 17.5 22.0 NDR #1 12.5 18.0 24.0 26.5 NDR #2 14.0 19.0 27.5 29.0
Note: Target Strengths: 12.5 MPa (After 3 Days); 17.5 MPa (After 7 Days); 20.0 MPa (After 14 Days); >25 MPa (After 28 Days).
Figure 28. The histogram showing the compressive strengths of concrete cylinders made from the Nakavu and Naduri sand and gravel. The details of physical and mechanical tests that were conducted by the PWD and SCIL are given in Appendices 7, 8, 9, 10 and 11 of this report. 4.3.5 Naduri Resource Estimation 4.3.5.1 Naduri Mapped Aggregate Resources. The map shown below (Figure 29) displays the two Naduri aggregate deposits that were mapped using a Trimble GPS. The Naduri Aggregate Deposit 1 is the one on the left and the one on the right is the Naduri Aggregate Deposit 2 (Figure 29).
Compressive Strength of Concrete made from Nakavu and NaduriAggregate
0
5
10
15
20
25
30
35
NKV #1 NKV #2 NDR #1 NDR #2 Sample ID
Compressive Strength (MPa)
3 Days 7 Days 14 Days 28 Days
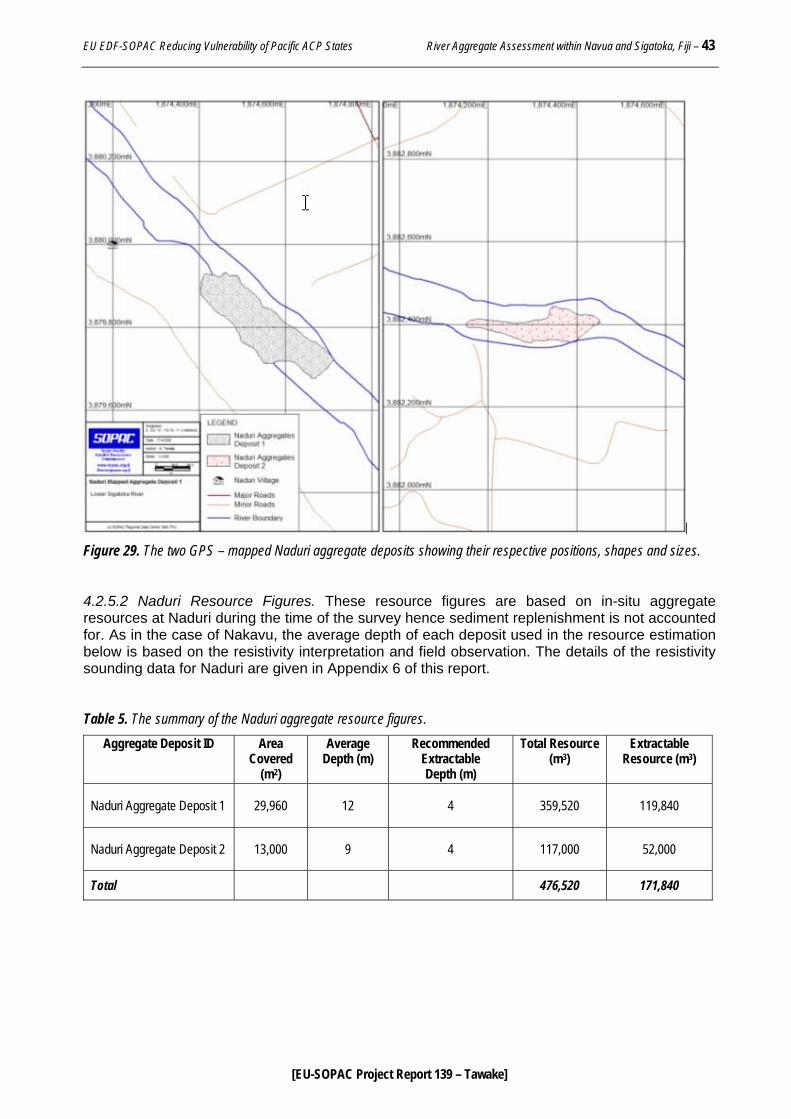
EU EDF-SOPAC Reducing Vulnerability of Pacific ACP States River Aggregate Assessment within Navua and Sigatoka, Fiji – 43
[EU-SOPAC Project Report 139 – Tawake]
Figure 29. The two GPS – mapped Naduri aggregate deposits showing their respective positions, shapes and sizes. 4.2.5.2 Naduri Resource Figures. These resource figures are based on in-situ aggregate resources at Naduri during the time of the survey hence sediment replenishment is not accounted for. As in the case of Nakavu, the average depth of each deposit used in the resource estimation below is based on the resistivity interpretation and field observation. The details of the resistivity sounding data for Naduri are given in Appendix 6 of this report. Table 5. The summary of the Naduri aggregate resource figures.
Aggregate Deposit ID Area Covered
(m2)
Average Depth (m)
Recommended Extractable Depth (m)
Total Resource (m3)
Extractable Resource (m3)
Naduri Aggregate Deposit 1 29,960 12 4 359,520 119,840
Naduri Aggregate Deposit 2 13,000 9 4 117,000 52,000
Total 476,520 171,840
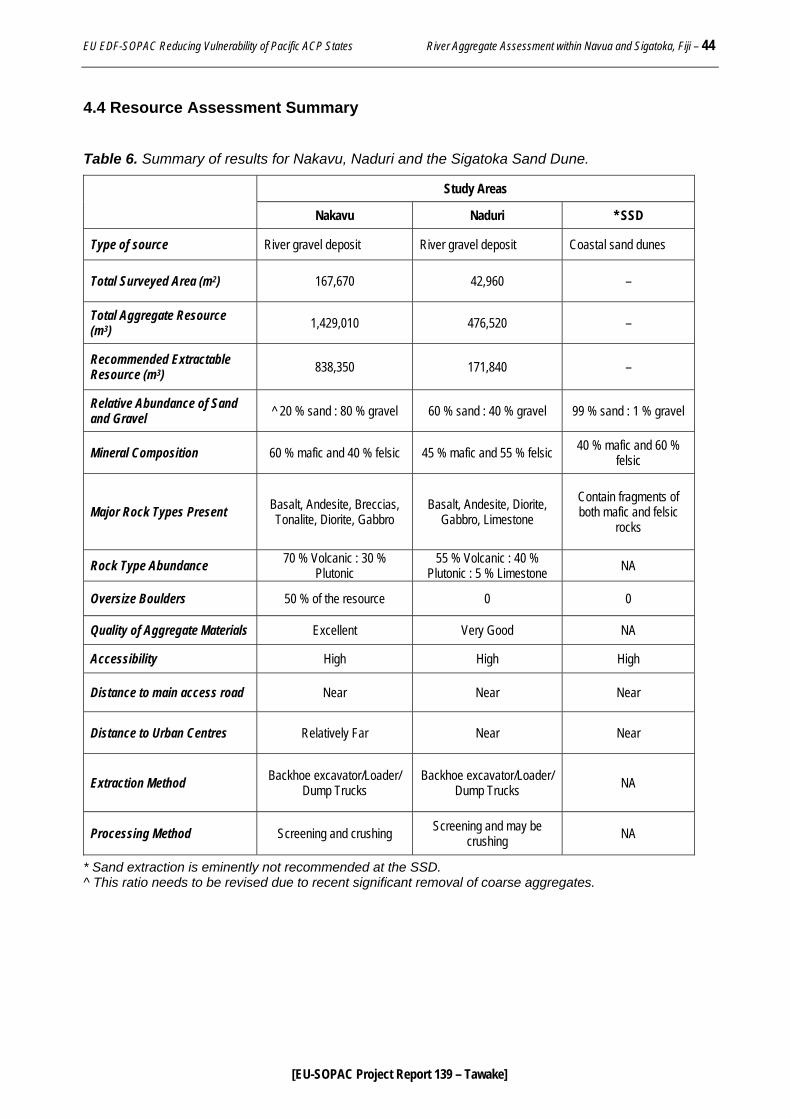
EU EDF-SOPAC Reducing Vulnerability of Pacific ACP States River Aggregate Assessment within Navua and Sigatoka, Fiji – 44
[EU-SOPAC Project Report 139 – Tawake]
4.4 Resource Assessment Summary Table 6. Summary of results for Nakavu, Naduri and the Sigatoka Sand Dune.
Study Areas
Nakavu Naduri * SSD
Type of source River gravel deposit River gravel deposit Coastal sand dunes
Total Surveyed Area (m2) 167,670 42,960 –
Total Aggregate Resource (m3) 1,429,010 476,520 –
Recommended Extractable Resource (m3) 838,350 171,840 –
Relative Abundance of Sand and Gravel ^ 20 % sand : 80 % gravel 60 % sand : 40 % gravel 99 % sand : 1 % gravel
Mineral Composition 60 % mafic and 40 % felsic 45 % mafic and 55 % felsic 40 % mafic and 60 % felsic
Major Rock Types Present Basalt, Andesite, Breccias, Tonalite, Diorite, Gabbro
Basalt, Andesite, Diorite, Gabbro, Limestone
Contain fragments of both mafic and felsic
rocks
Rock Type Abundance 70 % Volcanic : 30 % Plutonic
55 % Volcanic : 40 % Plutonic : 5 % Limestone NA
Oversize Boulders 50 % of the resource 0 0
Quality of Aggregate Materials Excellent Very Good NA
Accessibility High High High
Distance to main access road Near Near Near
Distance to Urban Centres Relatively Far Near Near
Extraction Method Backhoe excavator/Loader/ Dump Trucks
Backhoe excavator/Loader/ Dump Trucks NA
Processing Method Screening and crushing Screening and may be crushing NA
* Sand extraction is eminently not recommended at the SSD. ^ This ratio needs to be revised due to recent significant removal of coarse aggregates.
EU EDF-SOPAC Reducing Vulnerability of Pacific ACP States River Aggregate Assessment within Navua and Sigatoka, Fiji – 45
[EU-SOPAC Project Report 139 – Tawake]
5. DISCUSSION 5.1 Nakavu The Nakavu site contains significant coarse aggregate resources with very high quality that can supply the Suva-Navua corridor and the nearby areas. Sand occurs as a minor component. Situated at the downstream end of the Navua River gorge, Nakavu receives huge volumes of aggregate material that are flushed down the river channel. While the determination of the sediment replenishment rate is beyond the scope of this study; what can be deduced from certain important features of the upper Navua River catchment such as the geology of the catchment, amount of rainfall, and presence of the river gorge, is that the level of sediment recharge is expected to be high. On occasions of lengthy and heavy downpour in the Navua River catchment, the Nakavu site is expected to receive significant sediment recharge. The occurrence of huge resources of sub-angular coarse aggregate at Nakavu does indicate that the sources are not too far away. This has been confirmed by the rare presence of sedimentary material of the Navua Mudstone Formation that occur further upstream from the Nakavu site. Commercial operators who were extracting aggregate at Nakavu in the last three years had shown great interest in the place due to the significant occurrence of bigger rock boulders. Extraction of coarse river gravel is the safest and most viable option as operators need only to haul this material to their crushing site and crush them to desirable sizes. The increasing level of aggregate extraction at Nakavu in the last few years is becoming a matter of concern, especially the uncontrolled manner in which the resources have been exploited. Apparently, the resources are being overexploited and there are indications that environmental damage has occurred (Naiova, 2007). The rate of sediment replenishment is exceeded by the harvesting rate. In addition, other river users especially tourist operators and Nakavu villagers are concerned with the alteration of the river channel and the absence of fish, eels and prawns in the river. These river species are the main source of protein for the villagers. With the exception of sample NKS #3, the results of the physical and strength tests on the Nakavu, Sabata and Nukusere rocks have revealed sound geotechnical performance. The results for both volcanic and plutonic rock specimens have exhibited fresh, strong, compact and heavy rocks. In contrast, the test results on the fine, medium-grained sandstone sample (NKS #3) exhibited high water absorption and moderate compressive strength. Further, the compressive strength of the dry sandstone is higher than when the sample is soaked in water suggesting that the sample can be hard and brittle when dry but turns softer when soaked in water. This sandstone unit is a member of the Navua Mudstone Formation that occurs in the upper Navua River catchment. . The notion that the Nakavu aggregate resources are generally of good quality, is supported by the test results conducted on the November 2006 samples as shown in Table 3. In the Particle Size Distribution Curves (Figure 27), the Nakavu mixed aggregate samples showed relatively higher coarse aggregate contents than that of Naduri. The results of the Aggregate Crushing Value and the Los Angeles Abrasion tests are quite low indicating that the samples are strong and durable, respectively. Additionally, the specimens are heavy as exhibited by the Oven Dry (OD) and Surface Saturated Dry (SSD) densities. The relatively higher water absorption is expected due to the increase in surface area of numerous coarse aggregate particles being tested. In contrast, the test results of concrete cylinders (Table 4) made from the Nakavu sand and gravel samples revealed inferior compressive strengths. After 28 days, both concrete samples (NKV #1 and NKV #2) attained optimum strengths below the minimum target strength. The report reveals good flowage and workable mix but the below expectation results can be attributed to
EU EDF-SOPAC Reducing Vulnerability of Pacific ACP States River Aggregate Assessment within Navua and Sigatoka, Fiji – 46
[EU-SOPAC Project Report 139 – Tawake]
poor bonding between aggregate particles and cement paste. This poor bonding is due to the high clay surface coating on both fine and coarse aggregates for both samples. The report further reveals that the sand equivalent value (cleanliness value) was beyond the maximum allowed in the standard requirement. Further, there were hardly any coarse aggregate broken during the compression but the paste had failed to hold the fine and coarse aggregates together resulting in failed lower strength. This indicates that the aggregate must have contained significant amount of dirt that weakens the bonding of the cement paste and the fine and coarse aggregate resulting in lower compressive strength of the concrete. Finally, the resource figures shown in Table 2 confirm that the Nakavu aggregate deposit is significant in size. Also, additional resources due to natural sediment recharge were not taken into account in this resource estimation hence the figures given in Table 2 are based on in-situ aggregate resources that occur onsite during the time of the survey. With significant sediment replenishment reported to have occurred at Nakavu in the past together with the scenario explained in Section 4.1.1 of this report, it can be safely concluded that the actual resource is expected to be higher than the estimated total resource given in Table 2; however, the aggregate resource has been significantly reduced due to recent intense extraction of sand and gravel at Nakavu. 5.2 Naduri The Naduri aggregate resource has some unique characteristics that distinguish it from the one at Nakavu. Firstly, the two aggregate deposits surveyed are relatively smaller in size. Generally, there are more sand and fine gravel than coarse gravel at Naduri with coarser gravel becoming progressively dominant further upstream. Apart from the quality of aggregate and the distance to major markets, developers are more interested in coarser-grained gravel due to their wider applications and higher demand in the construction industry. In addition, there are abundant freshwater fish and mussels in the river where the surveyed resources occur. Villages and nearby settlements are heavily dependent on the river not only as a source of food but also for other domestic uses such as washing and bathing. The current sporadic fashion of extraction for domestic building purposes has not affected these river resources in any significant way; however, any medium- to large-scale aggregate extraction operation is most likely to inflict adverse impacts on the surrounding environment including these freshwater species. The grading results of the two Naduri sand samples revealed that they are made largely of coarse- and medium-grained sand with minor fine gravel and fine sand. The composition analysis results have shown that the Naduri sand is predominantly composed of mafic and felsic mineral fragments. These two major mineral categories have about the same abundance with a trace amount of glass. The analysis results indicate that the Naduri sands are almost entirely made up of minerals derived from volcanic and plutonic rock material. Apart from the concern on the occurrence of silt and clay in some places, the Naduri sands when clean are a good source of construction sand. The geotechnical test results of the Naduri mixed aggregate samples (Table 3) indicated that the Naduri aggregate resource is of good quality. In the Particle Size Distribution Curves (Figure 27), the bulk of material in the Naduri mixed aggregate samples consist of sand and fine gravel while the coarse gravel is a minor component. This has confirmed what had been observed in the field. The results of the Aggregate Crushing Value and the Los Angeles Abrasion tests exhibited strong and durable coarse aggregate respectively. Additionally, the Oven Dry (OD) and Surface Saturated Dry (SSD1) densities revealed heavy and compact aggregate specimens. As in the case of the Nakavu aggregate, the relative higher water absorption of the Naduri coarse
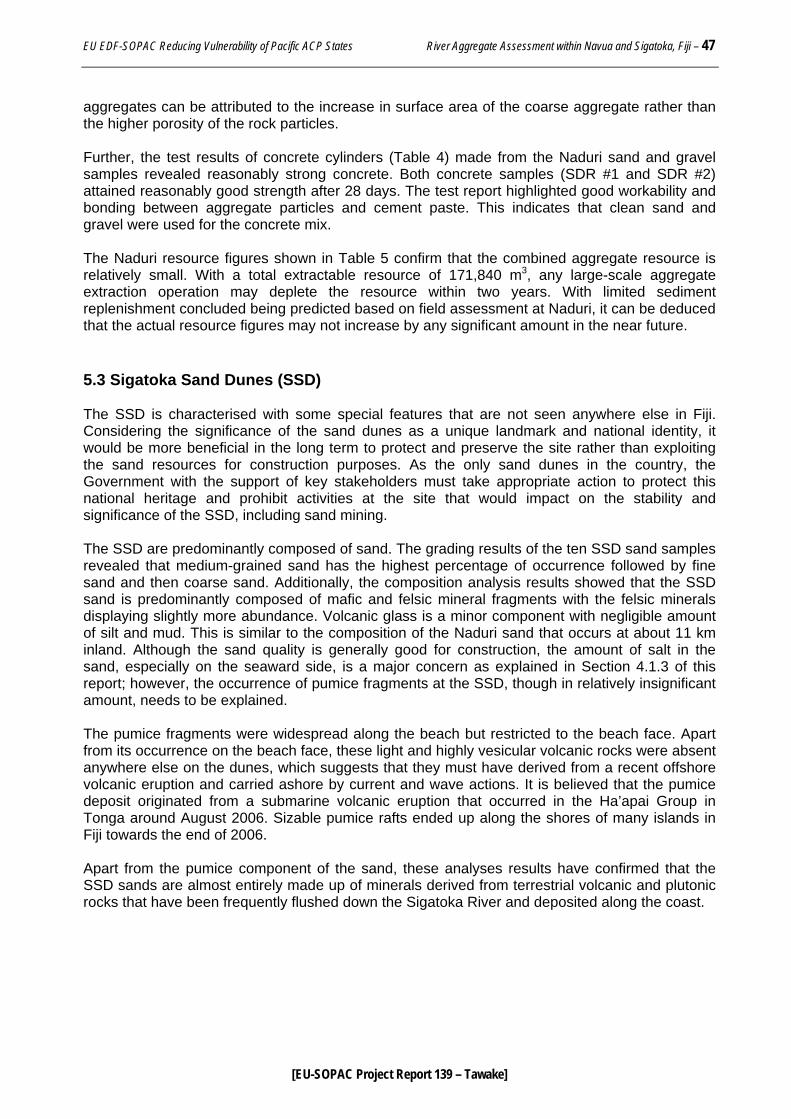
EU EDF-SOPAC Reducing Vulnerability of Pacific ACP States River Aggregate Assessment within Navua and Sigatoka, Fiji – 47
[EU-SOPAC Project Report 139 – Tawake]
aggregates can be attributed to the increase in surface area of the coarse aggregate rather than the higher porosity of the rock particles. Further, the test results of concrete cylinders (Table 4) made from the Naduri sand and gravel samples revealed reasonably strong concrete. Both concrete samples (SDR #1 and SDR #2) attained reasonably good strength after 28 days. The test report highlighted good workability and bonding between aggregate particles and cement paste. This indicates that clean sand and gravel were used for the concrete mix. The Naduri resource figures shown in Table 5 confirm that the combined aggregate resource is relatively small. With a total extractable resource of 171,840 m3, any large-scale aggregate extraction operation may deplete the resource within two years. With limited sediment replenishment concluded being predicted based on field assessment at Naduri, it can be deduced that the actual resource figures may not increase by any significant amount in the near future. 5.3 Sigatoka Sand Dunes (SSD) The SSD is characterised with some special features that are not seen anywhere else in Fiji. Considering the significance of the sand dunes as a unique landmark and national identity, it would be more beneficial in the long term to protect and preserve the site rather than exploiting the sand resources for construction purposes. As the only sand dunes in the country, the Government with the support of key stakeholders must take appropriate action to protect this national heritage and prohibit activities at the site that would impact on the stability and significance of the SSD, including sand mining. The SSD are predominantly composed of sand. The grading results of the ten SSD sand samples revealed that medium-grained sand has the highest percentage of occurrence followed by fine sand and then coarse sand. Additionally, the composition analysis results showed that the SSD sand is predominantly composed of mafic and felsic mineral fragments with the felsic minerals displaying slightly more abundance. Volcanic glass is a minor component with negligible amount of silt and mud. This is similar to the composition of the Naduri sand that occurs at about 11 km inland. Although the sand quality is generally good for construction, the amount of salt in the sand, especially on the seaward side, is a major concern as explained in Section 4.1.3 of this report; however, the occurrence of pumice fragments at the SSD, though in relatively insignificant amount, needs to be explained. The pumice fragments were widespread along the beach but restricted to the beach face. Apart from its occurrence on the beach face, these light and highly vesicular volcanic rocks were absent anywhere else on the dunes, which suggests that they must have derived from a recent offshore volcanic eruption and carried ashore by current and wave actions. It is believed that the pumice deposit originated from a submarine volcanic eruption that occurred in the Ha’apai Group in Tonga around August 2006. Sizable pumice rafts ended up along the shores of many islands in Fiji towards the end of 2006. Apart from the pumice component of the sand, these analyses results have confirmed that the SSD sands are almost entirely made up of minerals derived from terrestrial volcanic and plutonic rocks that have been frequently flushed down the Sigatoka River and deposited along the coast.
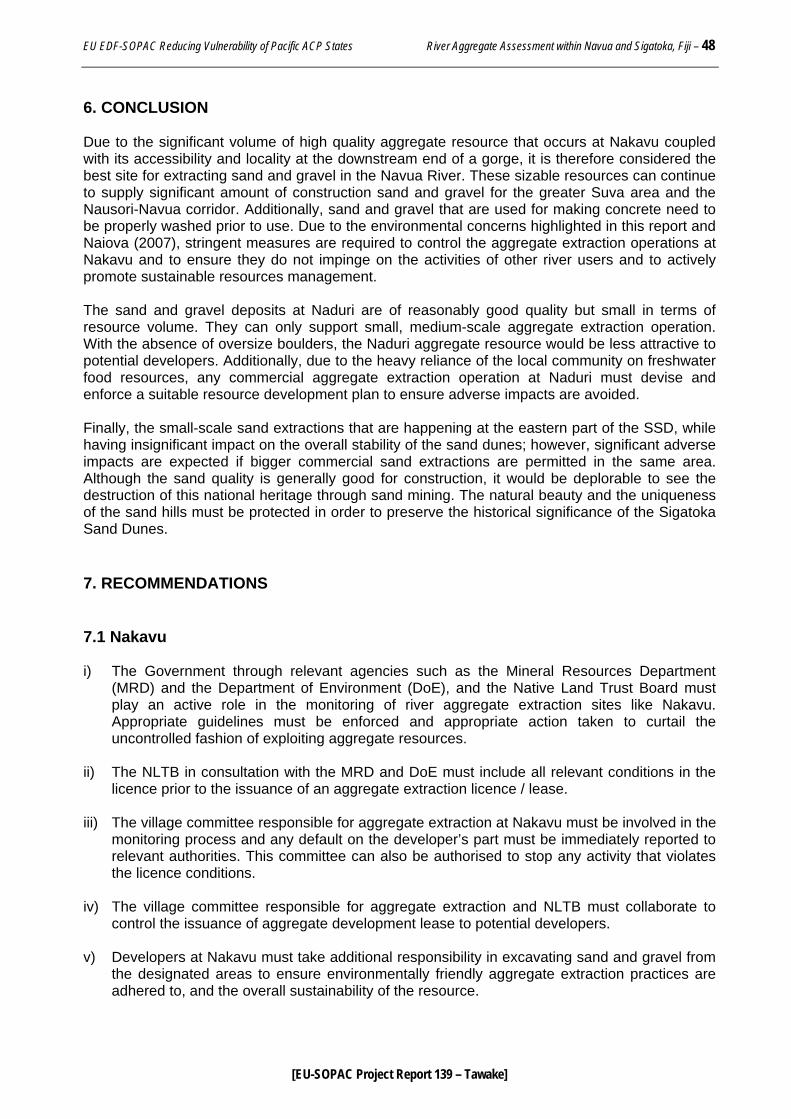
EU EDF-SOPAC Reducing Vulnerability of Pacific ACP States River Aggregate Assessment within Navua and Sigatoka, Fiji – 48
[EU-SOPAC Project Report 139 – Tawake]
6. CONCLUSION Due to the significant volume of high quality aggregate resource that occurs at Nakavu coupled with its accessibility and locality at the downstream end of a gorge, it is therefore considered the best site for extracting sand and gravel in the Navua River. These sizable resources can continue to supply significant amount of construction sand and gravel for the greater Suva area and the Nausori-Navua corridor. Additionally, sand and gravel that are used for making concrete need to be properly washed prior to use. Due to the environmental concerns highlighted in this report and Naiova (2007), stringent measures are required to control the aggregate extraction operations at Nakavu and to ensure they do not impinge on the activities of other river users and to actively promote sustainable resources management. The sand and gravel deposits at Naduri are of reasonably good quality but small in terms of resource volume. They can only support small, medium-scale aggregate extraction operation. With the absence of oversize boulders, the Naduri aggregate resource would be less attractive to potential developers. Additionally, due to the heavy reliance of the local community on freshwater food resources, any commercial aggregate extraction operation at Naduri must devise and enforce a suitable resource development plan to ensure adverse impacts are avoided. Finally, the small-scale sand extractions that are happening at the eastern part of the SSD, while having insignificant impact on the overall stability of the sand dunes; however, significant adverse impacts are expected if bigger commercial sand extractions are permitted in the same area. Although the sand quality is generally good for construction, it would be deplorable to see the destruction of this national heritage through sand mining. The natural beauty and the uniqueness of the sand hills must be protected in order to preserve the historical significance of the Sigatoka Sand Dunes. 7. RECOMMENDATIONS 7.1 Nakavu i) The Government through relevant agencies such as the Mineral Resources Department
(MRD) and the Department of Environment (DoE), and the Native Land Trust Board must play an active role in the monitoring of river aggregate extraction sites like Nakavu. Appropriate guidelines must be enforced and appropriate action taken to curtail the uncontrolled fashion of exploiting aggregate resources.
ii) The NLTB in consultation with the MRD and DoE must include all relevant conditions in the
licence prior to the issuance of an aggregate extraction licence / lease. iii) The village committee responsible for aggregate extraction at Nakavu must be involved in the
monitoring process and any default on the developer’s part must be immediately reported to relevant authorities. This committee can also be authorised to stop any activity that violates the licence conditions.
iv) The village committee responsible for aggregate extraction and NLTB must collaborate to
control the issuance of aggregate development lease to potential developers. v) Developers at Nakavu must take additional responsibility in excavating sand and gravel from
the designated areas to ensure environmentally friendly aggregate extraction practices are adhered to, and the overall sustainability of the resource.
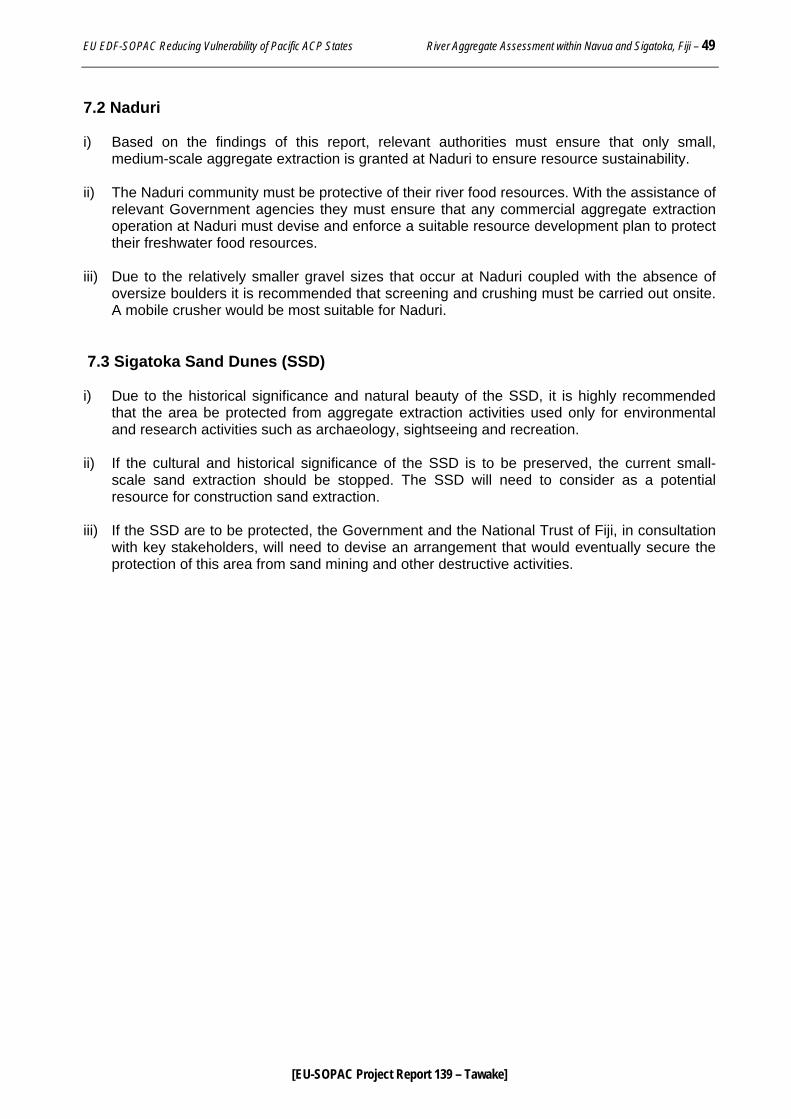
EU EDF-SOPAC Reducing Vulnerability of Pacific ACP States River Aggregate Assessment within Navua and Sigatoka, Fiji – 49
[EU-SOPAC Project Report 139 – Tawake]
7.2 Naduri i) Based on the findings of this report, relevant authorities must ensure that only small,
medium-scale aggregate extraction is granted at Naduri to ensure resource sustainability. ii) The Naduri community must be protective of their river food resources. With the assistance of
relevant Government agencies they must ensure that any commercial aggregate extraction operation at Naduri must devise and enforce a suitable resource development plan to protect their freshwater food resources.
iii) Due to the relatively smaller gravel sizes that occur at Naduri coupled with the absence of
oversize boulders it is recommended that screening and crushing must be carried out onsite. A mobile crusher would be most suitable for Naduri.
7.3 Sigatoka Sand Dunes (SSD) i) Due to the historical significance and natural beauty of the SSD, it is highly recommended
that the area be protected from aggregate extraction activities used only for environmental and research activities such as archaeology, sightseeing and recreation.
ii) If the cultural and historical significance of the SSD is to be preserved, the current small-
scale sand extraction should be stopped. The SSD will need to consider as a potential resource for construction sand extraction.
iii) If the SSD are to be protected, the Government and the National Trust of Fiji, in consultation
with key stakeholders, will need to devise an arrangement that would eventually secure the protection of this area from sand mining and other destructive activities.
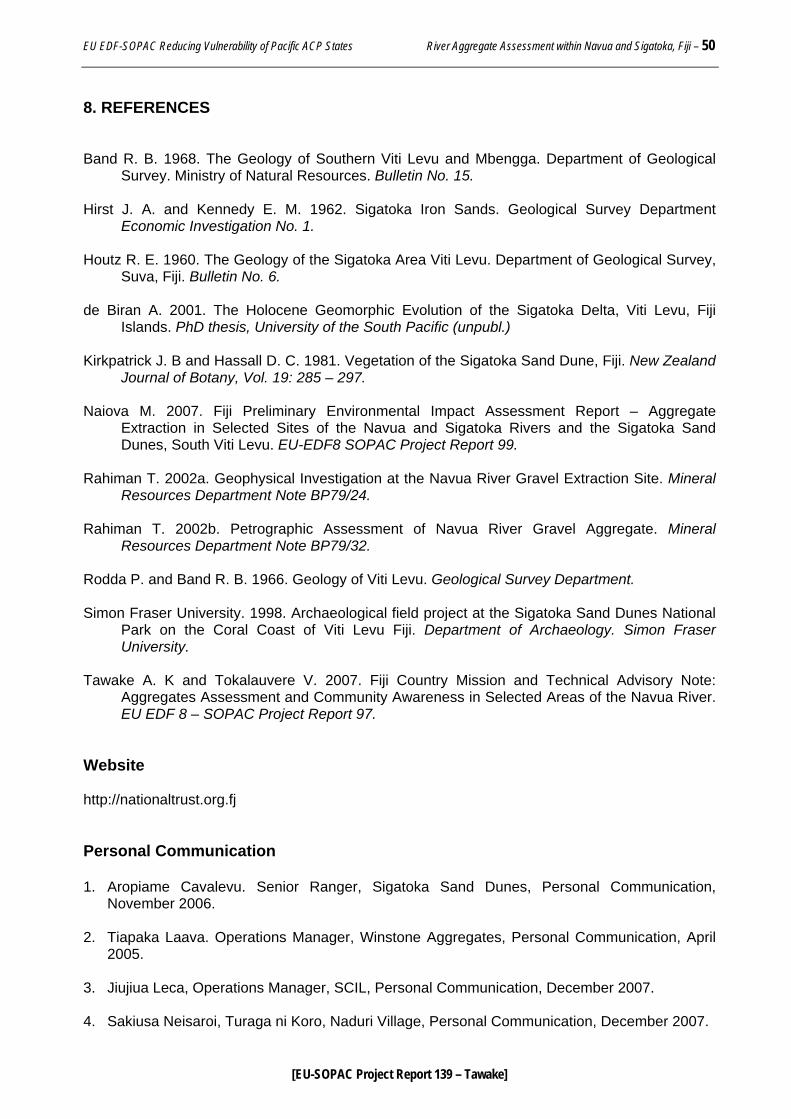
EU EDF-SOPAC Reducing Vulnerability of Pacific ACP States River Aggregate Assessment within Navua and Sigatoka, Fiji – 50
[EU-SOPAC Project Report 139 – Tawake]
8. REFERENCES Band R. B. 1968. The Geology of Southern Viti Levu and Mbengga. Department of Geological
Survey. Ministry of Natural Resources. Bulletin No. 15. Hirst J. A. and Kennedy E. M. 1962. Sigatoka Iron Sands. Geological Survey Department
Economic Investigation No. 1. Houtz R. E. 1960. The Geology of the Sigatoka Area Viti Levu. Department of Geological Survey,
Suva, Fiji. Bulletin No. 6. de Biran A. 2001. The Holocene Geomorphic Evolution of the Sigatoka Delta, Viti Levu, Fiji
Islands. PhD thesis, University of the South Pacific (unpubl.) Kirkpatrick J. B and Hassall D. C. 1981. Vegetation of the Sigatoka Sand Dune, Fiji. New Zealand
Journal of Botany, Vol. 19: 285 – 297. Naiova M. 2007. Fiji Preliminary Environmental Impact Assessment Report – Aggregate
Extraction in Selected Sites of the Navua and Sigatoka Rivers and the Sigatoka Sand Dunes, South Viti Levu. EU-EDF8 SOPAC Project Report 99.
Rahiman T. 2002a. Geophysical Investigation at the Navua River Gravel Extraction Site. Mineral
Resources Department Note BP79/24. Rahiman T. 2002b. Petrographic Assessment of Navua River Gravel Aggregate. Mineral
Resources Department Note BP79/32. Rodda P. and Band R. B. 1966. Geology of Viti Levu. Geological Survey Department. Simon Fraser University. 1998. Archaeological field project at the Sigatoka Sand Dunes National
Park on the Coral Coast of Viti Levu Fiji. Department of Archaeology. Simon Fraser University.
Tawake A. K and Tokalauvere V. 2007. Fiji Country Mission and Technical Advisory Note:
Aggregates Assessment and Community Awareness in Selected Areas of the Navua River. EU EDF 8 – SOPAC Project Report 97.
Website http://nationaltrust.org.fj Personal Communication 1. Aropiame Cavalevu. Senior Ranger, Sigatoka Sand Dunes, Personal Communication,
November 2006. 2. Tiapaka Laava. Operations Manager, Winstone Aggregates, Personal Communication, April
2005. 3. Jiujiua Leca, Operations Manager, SCIL, Personal Communication, December 2007. 4. Sakiusa Neisaroi, Turaga ni Koro, Naduri Village, Personal Communication, December 2007.
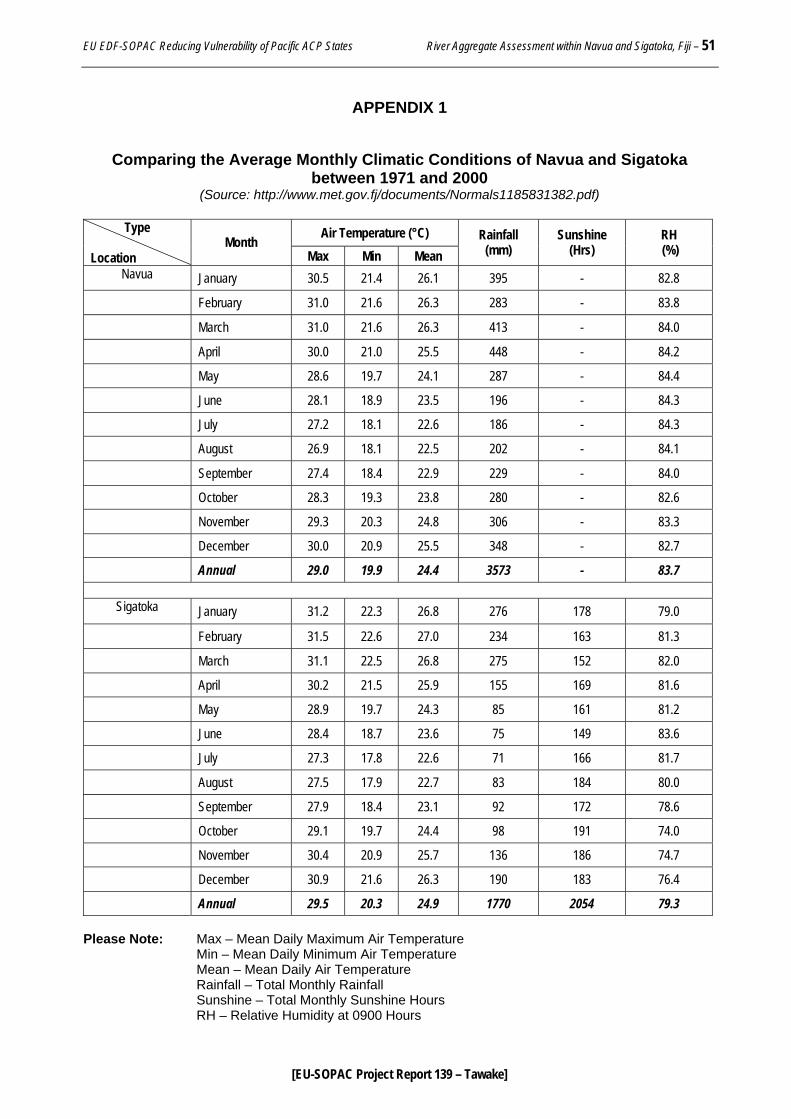
EU EDF-SOPAC Reducing Vulnerability of Pacific ACP States River Aggregate Assessment within Navua and Sigatoka, Fiji – 51
[EU-SOPAC Project Report 139 – Tawake]
APPENDIX 1
Comparing the Average Monthly Climatic Conditions of Navua and Sigatoka between 1971 and 2000
(Source: http://www.met.gov.fj/documents/Normals1185831382.pdf)
Air Temperature (°C) Type Location
Month Max Min Mean
Rainfall (mm)
Sunshine (Hrs)
RH (%)
Navua January 30.5 21.4 26.1 395 - 82.8 February 31.0 21.6 26.3 283 - 83.8 March 31.0 21.6 26.3 413 - 84.0 April 30.0 21.0 25.5 448 - 84.2 May 28.6 19.7 24.1 287 - 84.4 June 28.1 18.9 23.5 196 - 84.3 July 27.2 18.1 22.6 186 - 84.3 August 26.9 18.1 22.5 202 - 84.1 September 27.4 18.4 22.9 229 - 84.0 October 28.3 19.3 23.8 280 - 82.6 November 29.3 20.3 24.8 306 - 83.3 December 30.0 20.9 25.5 348 - 82.7 Annual 29.0 19.9 24.4 3573 - 83.7
Sigatoka January 31.2 22.3 26.8 276 178 79.0
February 31.5 22.6 27.0 234 163 81.3 March 31.1 22.5 26.8 275 152 82.0 April 30.2 21.5 25.9 155 169 81.6 May 28.9 19.7 24.3 85 161 81.2 June 28.4 18.7 23.6 75 149 83.6 July 27.3 17.8 22.6 71 166 81.7 August 27.5 17.9 22.7 83 184 80.0 September 27.9 18.4 23.1 92 172 78.6 October 29.1 19.7 24.4 98 191 74.0 November 30.4 20.9 25.7 136 186 74.7 December 30.9 21.6 26.3 190 183 76.4 Annual 29.5 20.3 24.9 1770 2054 79.3
Please Note: Max – Mean Daily Maximum Air Temperature Min – Mean Daily Minimum Air Temperature Mean – Mean Daily Air Temperature Rainfall – Total Monthly Rainfall Sunshine – Total Monthly Sunshine Hours RH – Relative Humidity at 0900 Hours
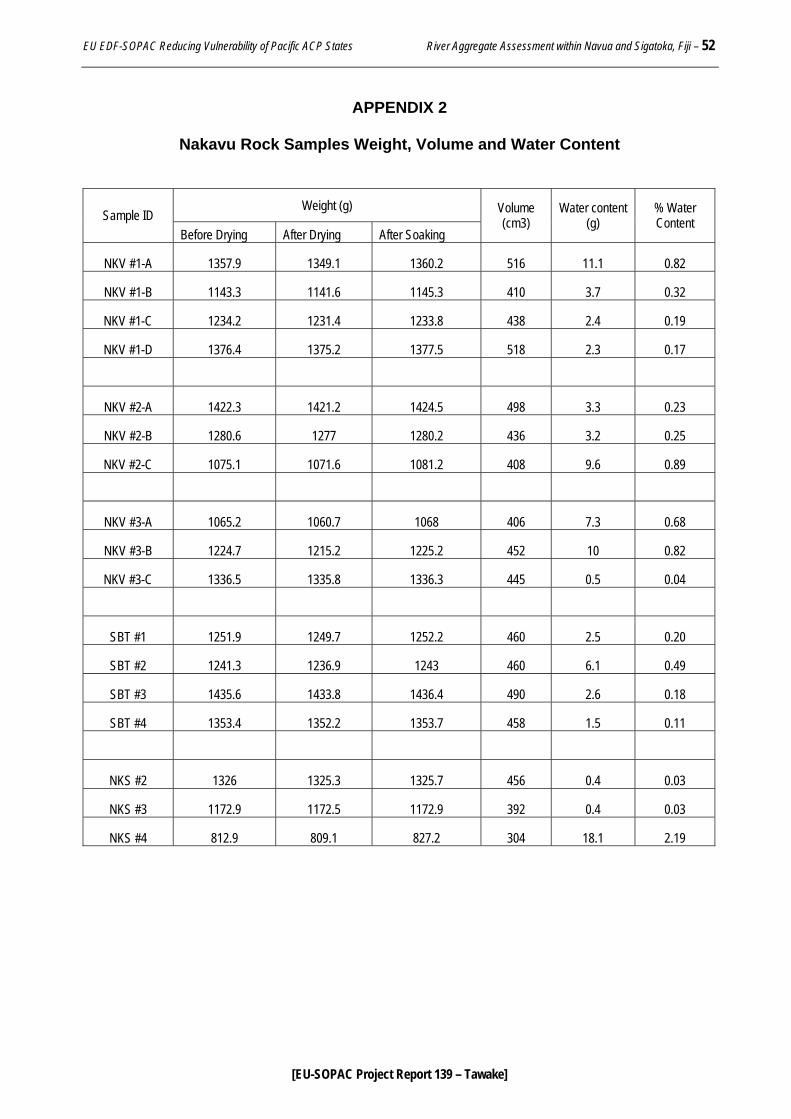
EU EDF-SOPAC Reducing Vulnerability of Pacific ACP States River Aggregate Assessment within Navua and Sigatoka, Fiji – 52
[EU-SOPAC Project Report 139 – Tawake]
APPENDIX 2
Nakavu Rock Samples Weight, Volume and Water Content
Weight (g)
Sample ID Before Drying After Drying After Soaking
Volume (cm3)
Water content (g)
% Water Content
NKV #1-A 1357.9 1349.1 1360.2 516 11.1 0.82
NKV #1-B 1143.3 1141.6 1145.3 410 3.7 0.32
NKV #1-C 1234.2 1231.4 1233.8 438 2.4 0.19
NKV #1-D 1376.4 1375.2 1377.5 518 2.3 0.17
NKV #2-A 1422.3 1421.2 1424.5 498 3.3 0.23
NKV #2-B 1280.6 1277 1280.2 436 3.2 0.25
NKV #2-C 1075.1 1071.6 1081.2 408 9.6 0.89
NKV #3-A 1065.2 1060.7 1068 406 7.3 0.68
NKV #3-B 1224.7 1215.2 1225.2 452 10 0.82
NKV #3-C 1336.5 1335.8 1336.3 445 0.5 0.04
SBT #1 1251.9 1249.7 1252.2 460 2.5 0.20
SBT #2 1241.3 1236.9 1243 460 6.1 0.49
SBT #3 1435.6 1433.8 1436.4 490 2.6 0.18
SBT #4 1353.4 1352.2 1353.7 458 1.5 0.11
NKS #2 1326 1325.3 1325.7 456 0.4 0.03
NKS #3 1172.9 1172.5 1172.9 392 0.4 0.03
NKS #4 812.9 809.1 827.2 304 18.1 2.19
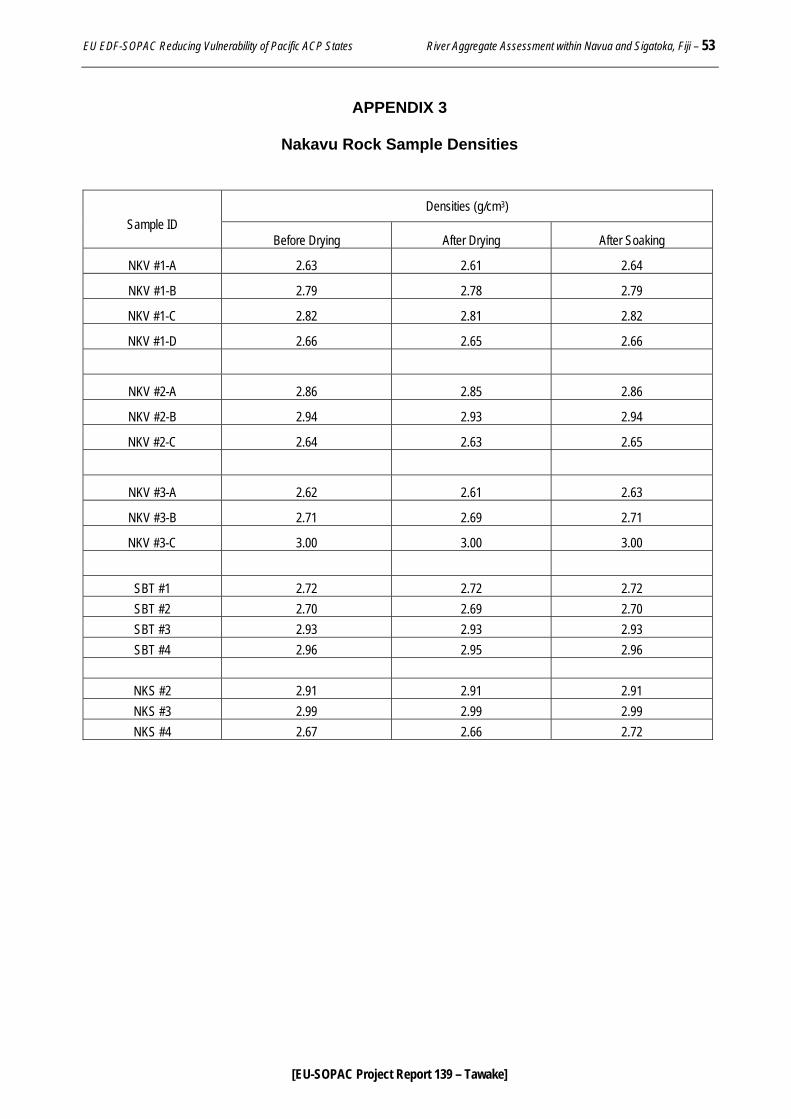
EU EDF-SOPAC Reducing Vulnerability of Pacific ACP States River Aggregate Assessment within Navua and Sigatoka, Fiji – 53
[EU-SOPAC Project Report 139 – Tawake]
APPENDIX 3
Nakavu Rock Sample Densities
Densities (g/cm3) Sample ID
Before Drying After Drying After Soaking
NKV #1-A 2.63 2.61 2.64
NKV #1-B 2.79 2.78 2.79
NKV #1-C 2.82 2.81 2.82
NKV #1-D 2.66 2.65 2.66
NKV #2-A 2.86 2.85 2.86
NKV #2-B 2.94 2.93 2.94
NKV #2-C 2.64 2.63 2.65
NKV #3-A 2.62 2.61 2.63
NKV #3-B 2.71 2.69 2.71
NKV #3-C 3.00 3.00 3.00
SBT #1 2.72 2.72 2.72 SBT #2 2.70 2.69 2.70 SBT #3 2.93 2.93 2.93 SBT #4 2.96 2.95 2.96
NKS #2 2.91 2.91 2.91 NKS #3 2.99 2.99 2.99 NKS #4 2.67 2.66 2.72
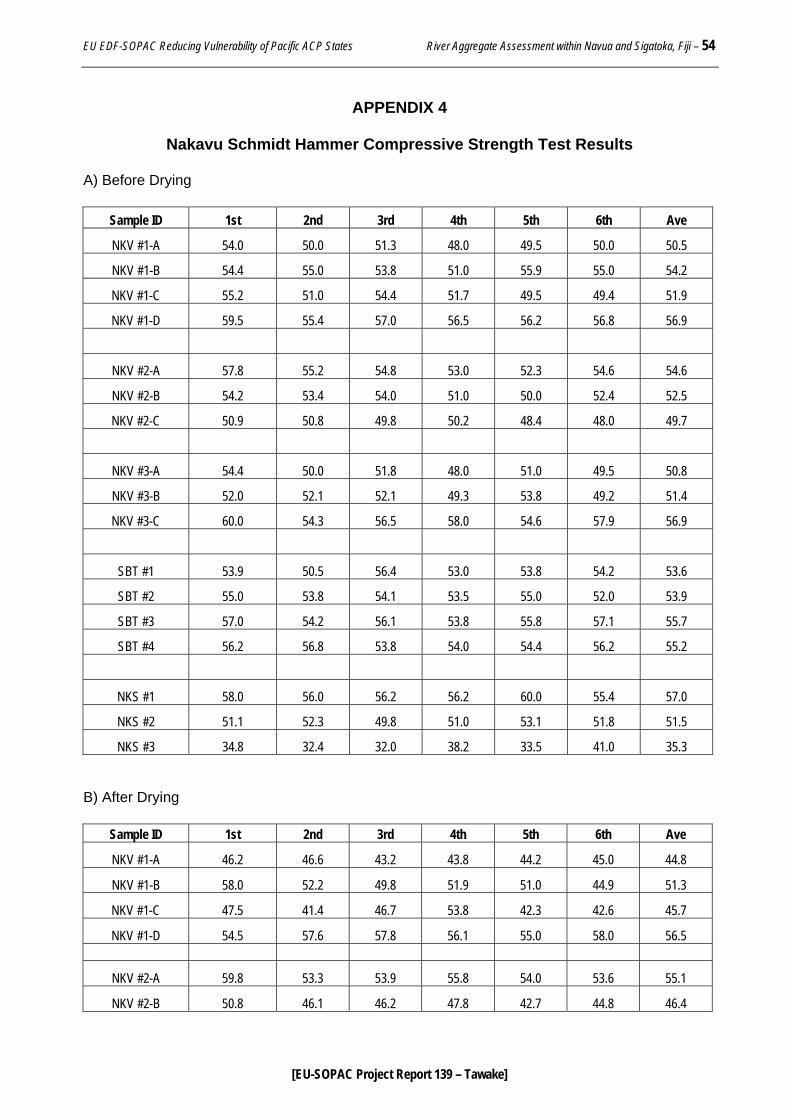
EU EDF-SOPAC Reducing Vulnerability of Pacific ACP States River Aggregate Assessment within Navua and Sigatoka, Fiji – 54
[EU-SOPAC Project Report 139 – Tawake]
APPENDIX 4
Nakavu Schmidt Hammer Compressive Strength Test Results A) Before Drying
Sample ID 1st 2nd 3rd 4th 5th 6th Ave
NKV #1-A 54.0 50.0 51.3 48.0 49.5 50.0 50.5
NKV #1-B 54.4 55.0 53.8 51.0 55.9 55.0 54.2
NKV #1-C 55.2 51.0 54.4 51.7 49.5 49.4 51.9
NKV #1-D 59.5 55.4 57.0 56.5 56.2 56.8 56.9
NKV #2-A 57.8 55.2 54.8 53.0 52.3 54.6 54.6
NKV #2-B 54.2 53.4 54.0 51.0 50.0 52.4 52.5
NKV #2-C 50.9 50.8 49.8 50.2 48.4 48.0 49.7
NKV #3-A 54.4 50.0 51.8 48.0 51.0 49.5 50.8
NKV #3-B 52.0 52.1 52.1 49.3 53.8 49.2 51.4
NKV #3-C 60.0 54.3 56.5 58.0 54.6 57.9 56.9
SBT #1 53.9 50.5 56.4 53.0 53.8 54.2 53.6
SBT #2 55.0 53.8 54.1 53.5 55.0 52.0 53.9
SBT #3 57.0 54.2 56.1 53.8 55.8 57.1 55.7
SBT #4 56.2 56.8 53.8 54.0 54.4 56.2 55.2
NKS #1 58.0 56.0 56.2 56.2 60.0 55.4 57.0
NKS #2 51.1 52.3 49.8 51.0 53.1 51.8 51.5
NKS #3 34.8 32.4 32.0 38.2 33.5 41.0 35.3 B) After Drying
Sample ID 1st 2nd 3rd 4th 5th 6th Ave
NKV #1-A 46.2 46.6 43.2 43.8 44.2 45.0 44.8
NKV #1-B 58.0 52.2 49.8 51.9 51.0 44.9 51.3
NKV #1-C 47.5 41.4 46.7 53.8 42.3 42.6 45.7
NKV #1-D 54.5 57.6 57.8 56.1 55.0 58.0 56.5
NKV #2-A 59.8 53.3 53.9 55.8 54.0 53.6 55.1
NKV #2-B 50.8 46.1 46.2 47.8 42.7 44.8 46.4
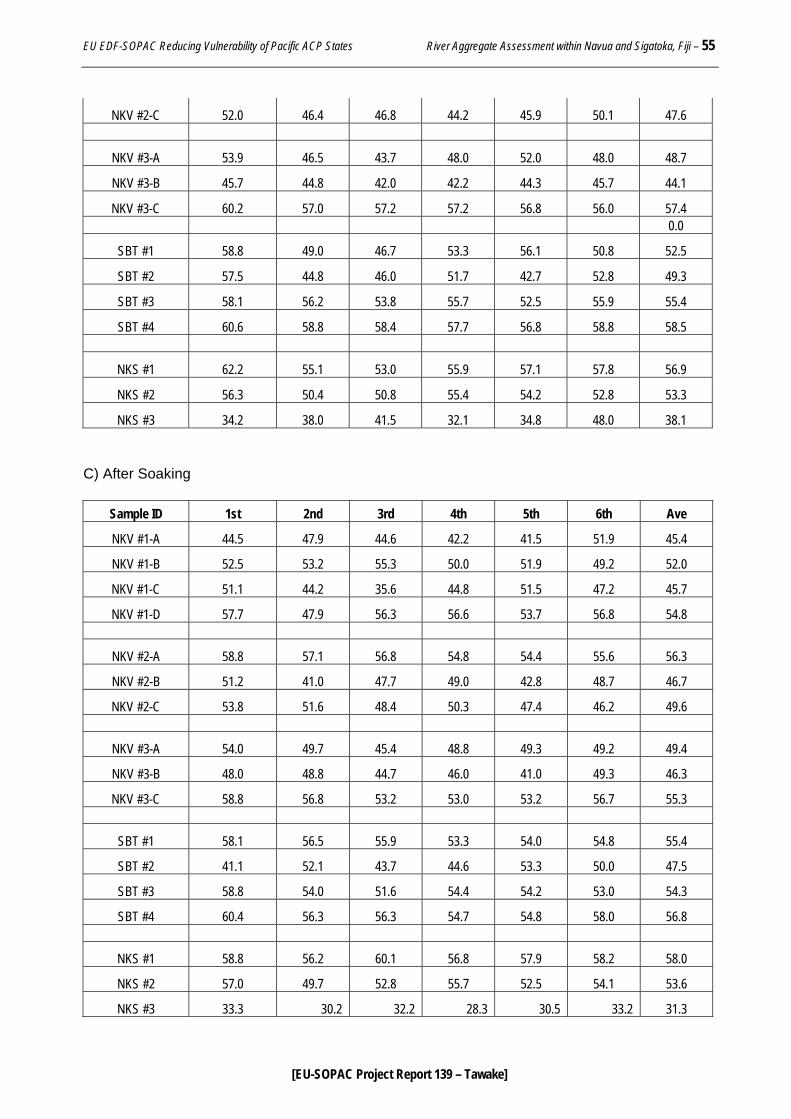
EU EDF-SOPAC Reducing Vulnerability of Pacific ACP States River Aggregate Assessment within Navua and Sigatoka, Fiji – 55
[EU-SOPAC Project Report 139 – Tawake]
NKV #2-C 52.0 46.4 46.8 44.2 45.9 50.1 47.6
NKV #3-A 53.9 46.5 43.7 48.0 52.0 48.0 48.7
NKV #3-B 45.7 44.8 42.0 42.2 44.3 45.7 44.1
NKV #3-C 60.2 57.0 57.2 57.2 56.8 56.0 57.4 0.0
SBT #1 58.8 49.0 46.7 53.3 56.1 50.8 52.5
SBT #2 57.5 44.8 46.0 51.7 42.7 52.8 49.3
SBT #3 58.1 56.2 53.8 55.7 52.5 55.9 55.4
SBT #4 60.6 58.8 58.4 57.7 56.8 58.8 58.5
NKS #1 62.2 55.1 53.0 55.9 57.1 57.8 56.9
NKS #2 56.3 50.4 50.8 55.4 54.2 52.8 53.3
NKS #3 34.2 38.0 41.5 32.1 34.8 48.0 38.1 C) After Soaking
Sample ID 1st 2nd 3rd 4th 5th 6th Ave
NKV #1-A 44.5 47.9 44.6 42.2 41.5 51.9 45.4
NKV #1-B 52.5 53.2 55.3 50.0 51.9 49.2 52.0
NKV #1-C 51.1 44.2 35.6 44.8 51.5 47.2 45.7
NKV #1-D 57.7 47.9 56.3 56.6 53.7 56.8 54.8
NKV #2-A 58.8 57.1 56.8 54.8 54.4 55.6 56.3
NKV #2-B 51.2 41.0 47.7 49.0 42.8 48.7 46.7
NKV #2-C 53.8 51.6 48.4 50.3 47.4 46.2 49.6
NKV #3-A 54.0 49.7 45.4 48.8 49.3 49.2 49.4
NKV #3-B 48.0 48.8 44.7 46.0 41.0 49.3 46.3
NKV #3-C 58.8 56.8 53.2 53.0 53.2 56.7 55.3
SBT #1 58.1 56.5 55.9 53.3 54.0 54.8 55.4
SBT #2 41.1 52.1 43.7 44.6 53.3 50.0 47.5
SBT #3 58.8 54.0 51.6 54.4 54.2 53.0 54.3
SBT #4 60.4 56.3 56.3 54.7 54.8 58.0 56.8
NKS #1 58.8 56.2 60.1 56.8 57.9 58.2 58.0
NKS #2 57.0 49.7 52.8 55.7 52.5 54.1 53.6
NKS #3 33.3 30.2 32.2 28.3 30.5 33.2 31.3
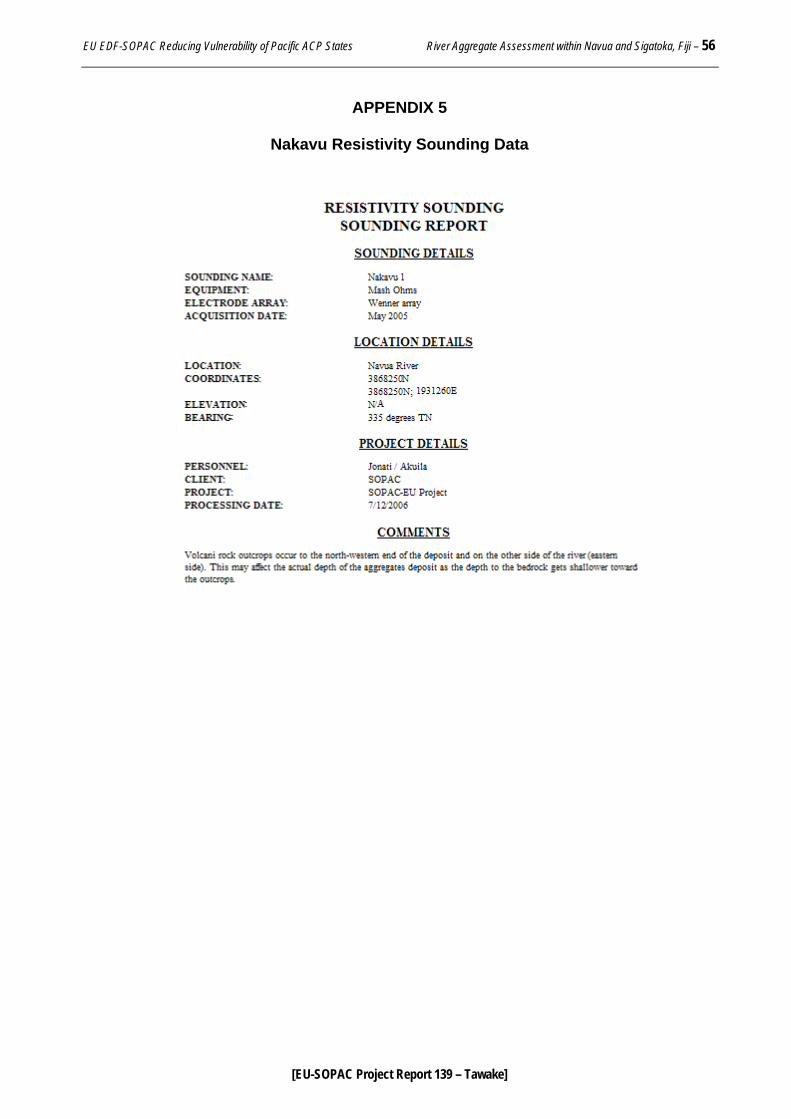
EU EDF-SOPAC Reducing Vulnerability of Pacific ACP States River Aggregate Assessment within Navua and Sigatoka, Fiji – 56
[EU-SOPAC Project Report 139 – Tawake]
APPENDIX 5
Nakavu Resistivity Sounding Data
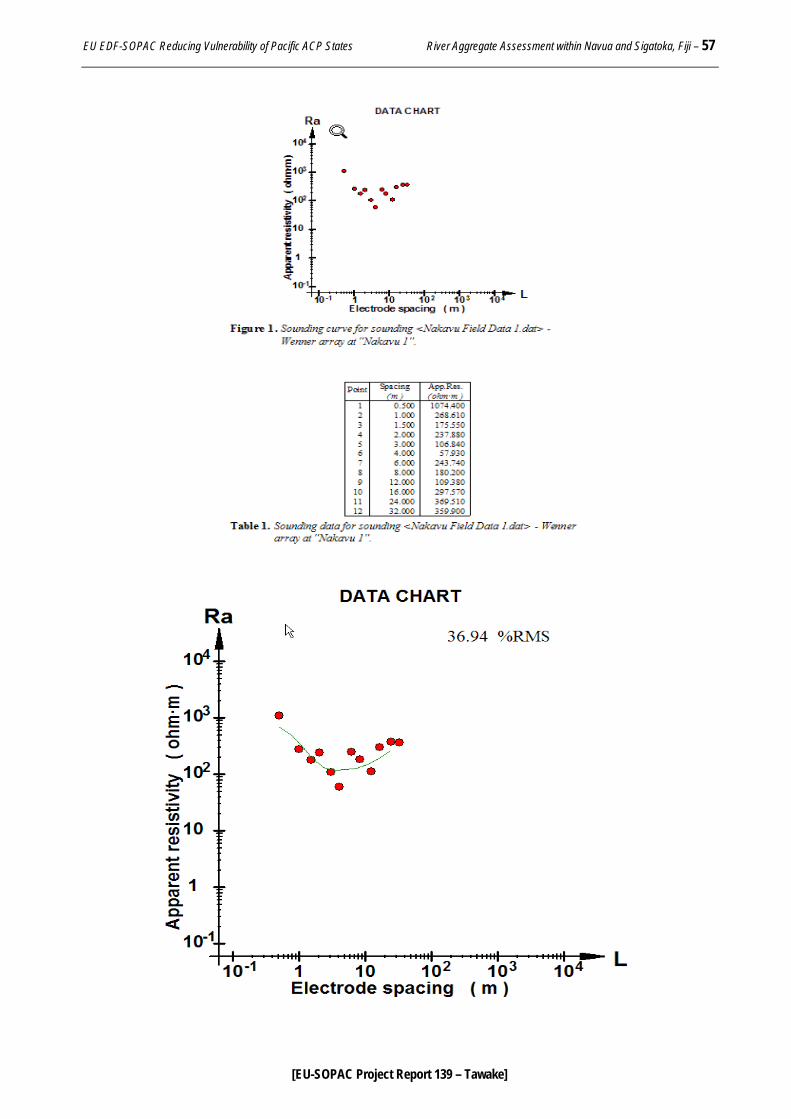
EU EDF-SOPAC Reducing Vulnerability of Pacific ACP States River Aggregate Assessment within Navua and Sigatoka, Fiji – 57
[EU-SOPAC Project Report 139 – Tawake]
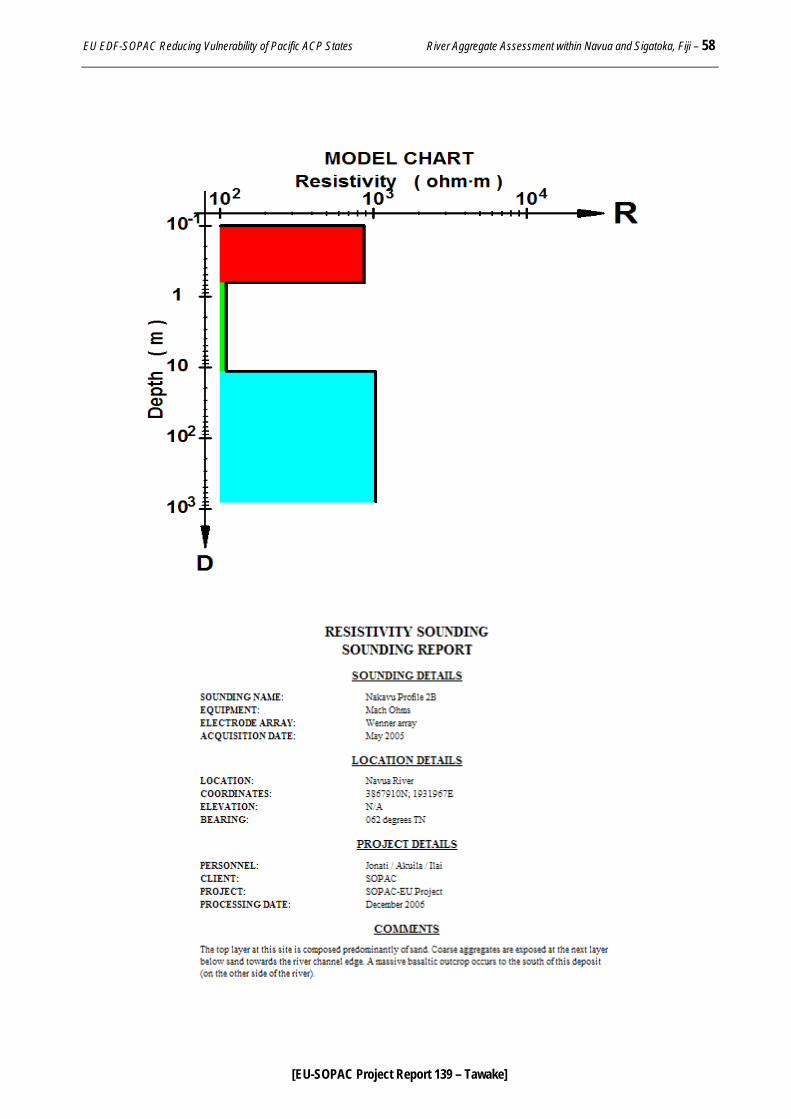
EU EDF-SOPAC Reducing Vulnerability of Pacific ACP States River Aggregate Assessment within Navua and Sigatoka, Fiji – 58
[EU-SOPAC Project Report 139 – Tawake]
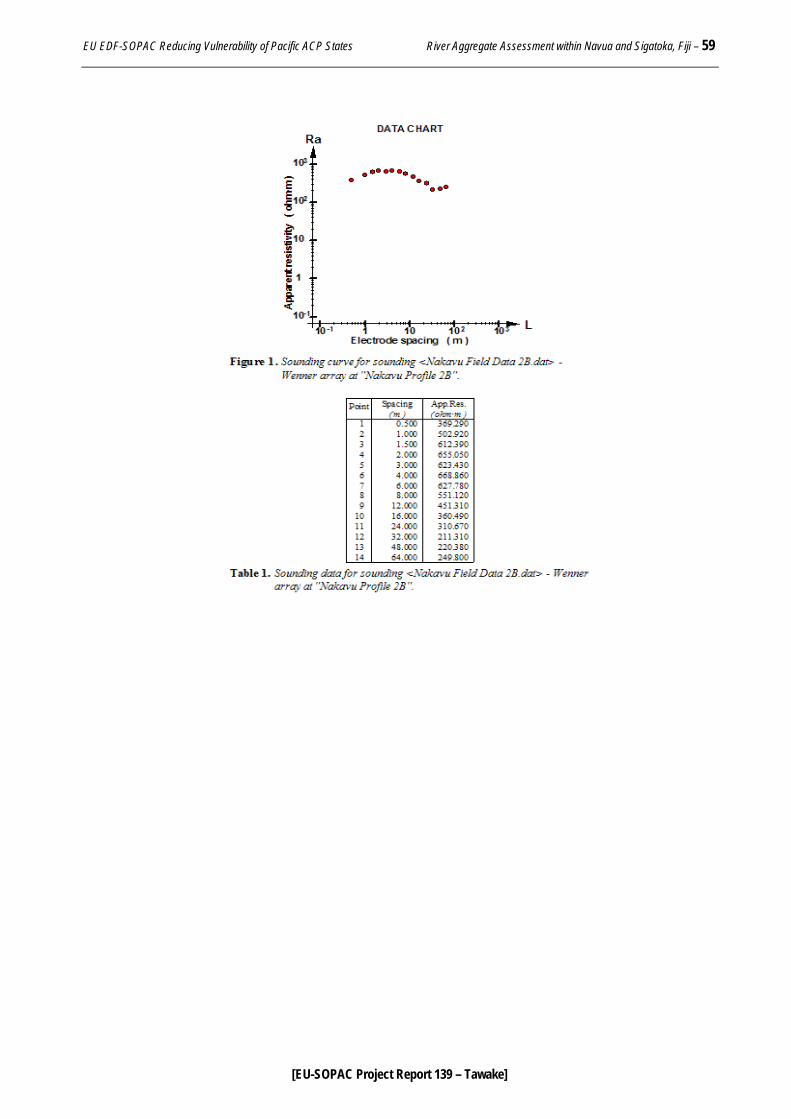
EU EDF-SOPAC Reducing Vulnerability of Pacific ACP States River Aggregate Assessment within Navua and Sigatoka, Fiji – 59
[EU-SOPAC Project Report 139 – Tawake]
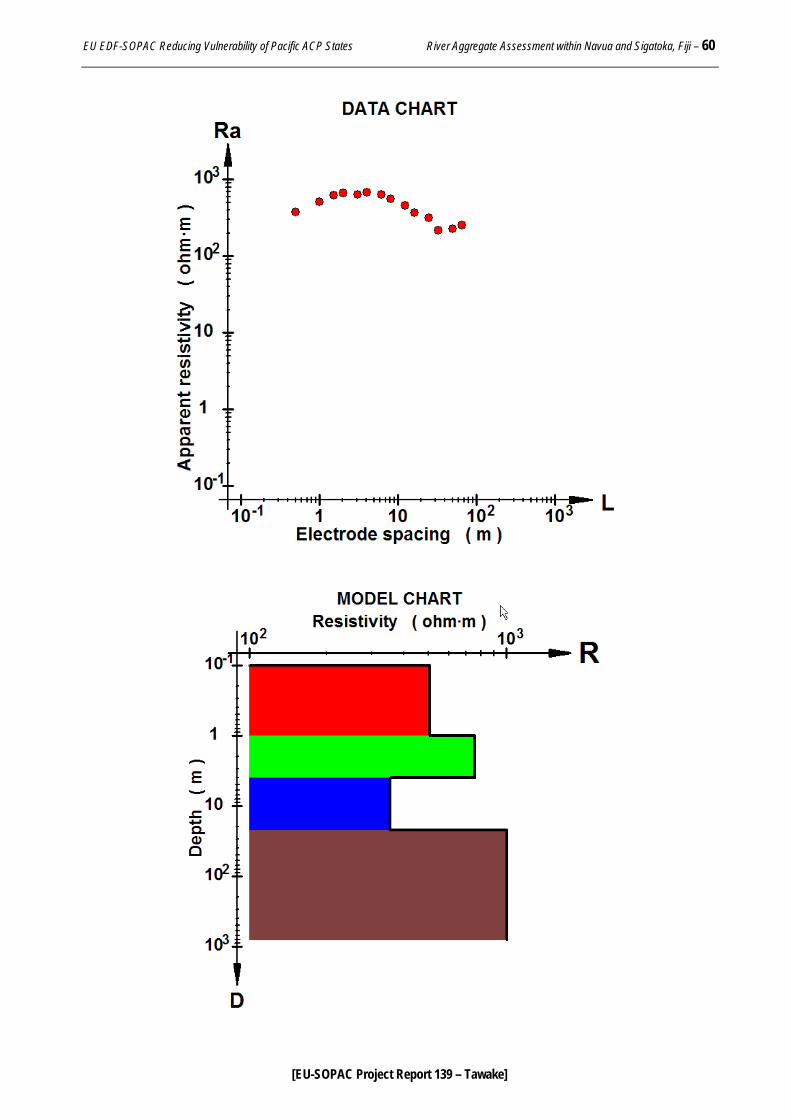
EU EDF-SOPAC Reducing Vulnerability of Pacific ACP States River Aggregate Assessment within Navua and Sigatoka, Fiji – 60
[EU-SOPAC Project Report 139 – Tawake]
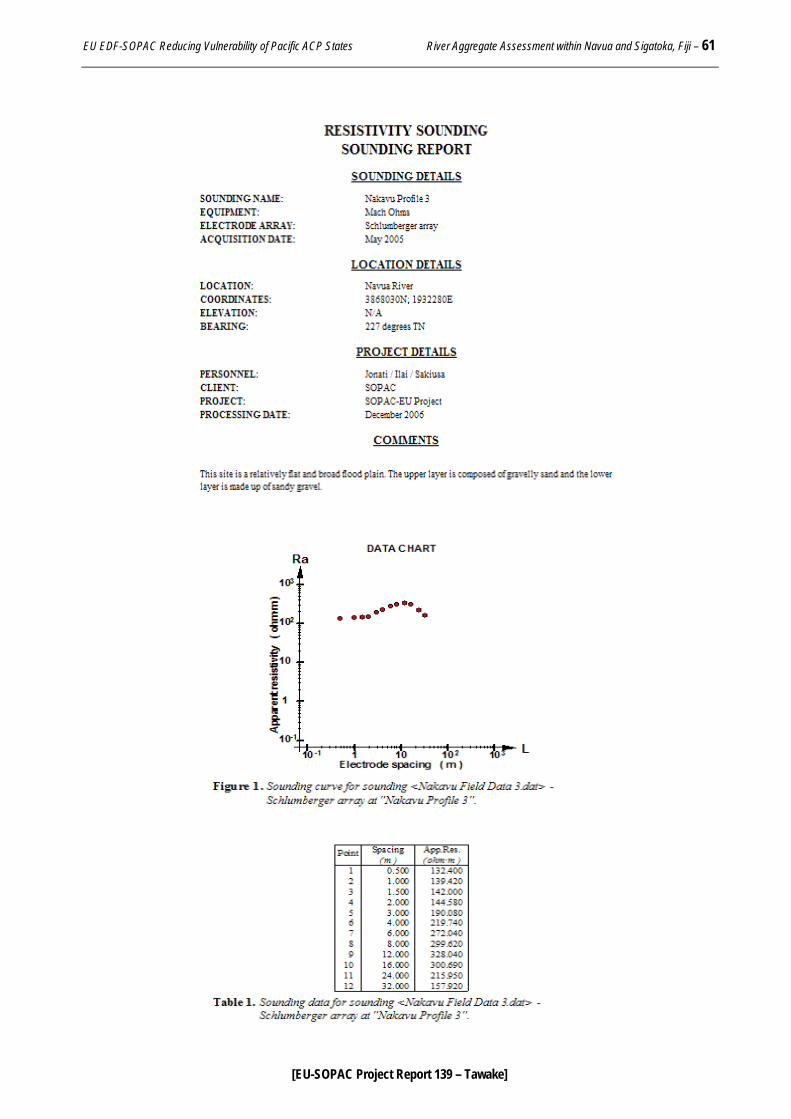
EU EDF-SOPAC Reducing Vulnerability of Pacific ACP States River Aggregate Assessment within Navua and Sigatoka, Fiji – 61
[EU-SOPAC Project Report 139 – Tawake]
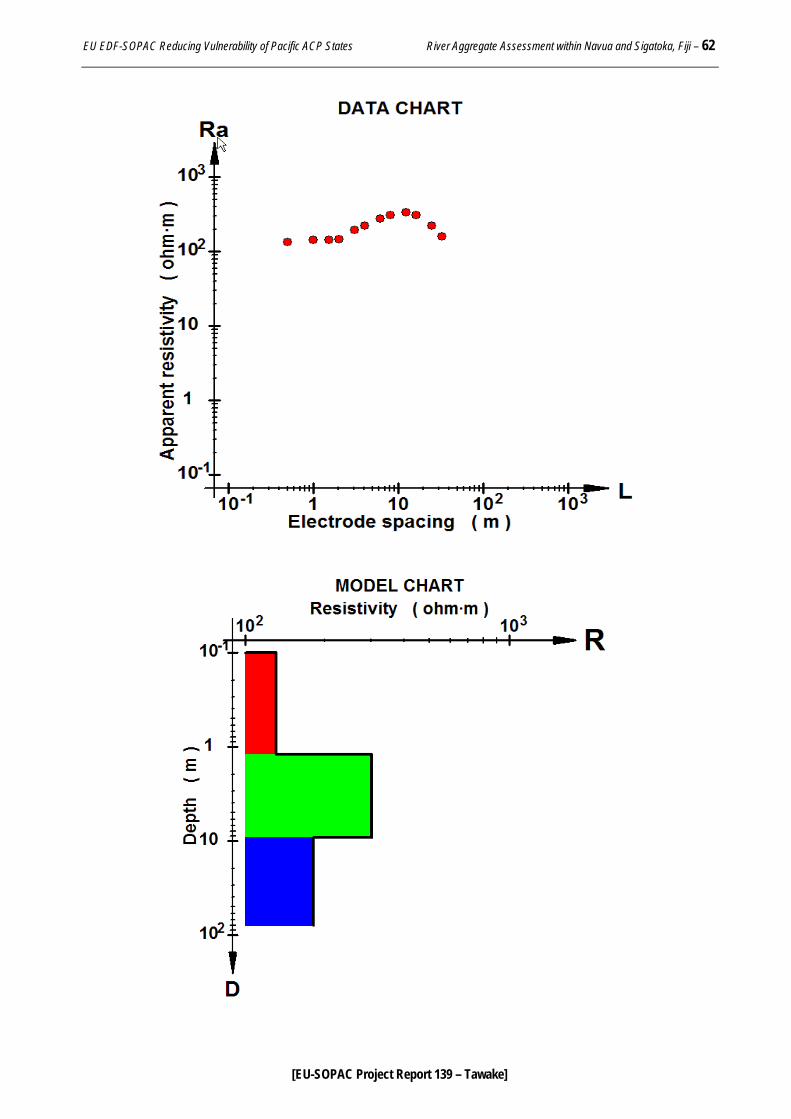
EU EDF-SOPAC Reducing Vulnerability of Pacific ACP States River Aggregate Assessment within Navua and Sigatoka, Fiji – 62
[EU-SOPAC Project Report 139 – Tawake]
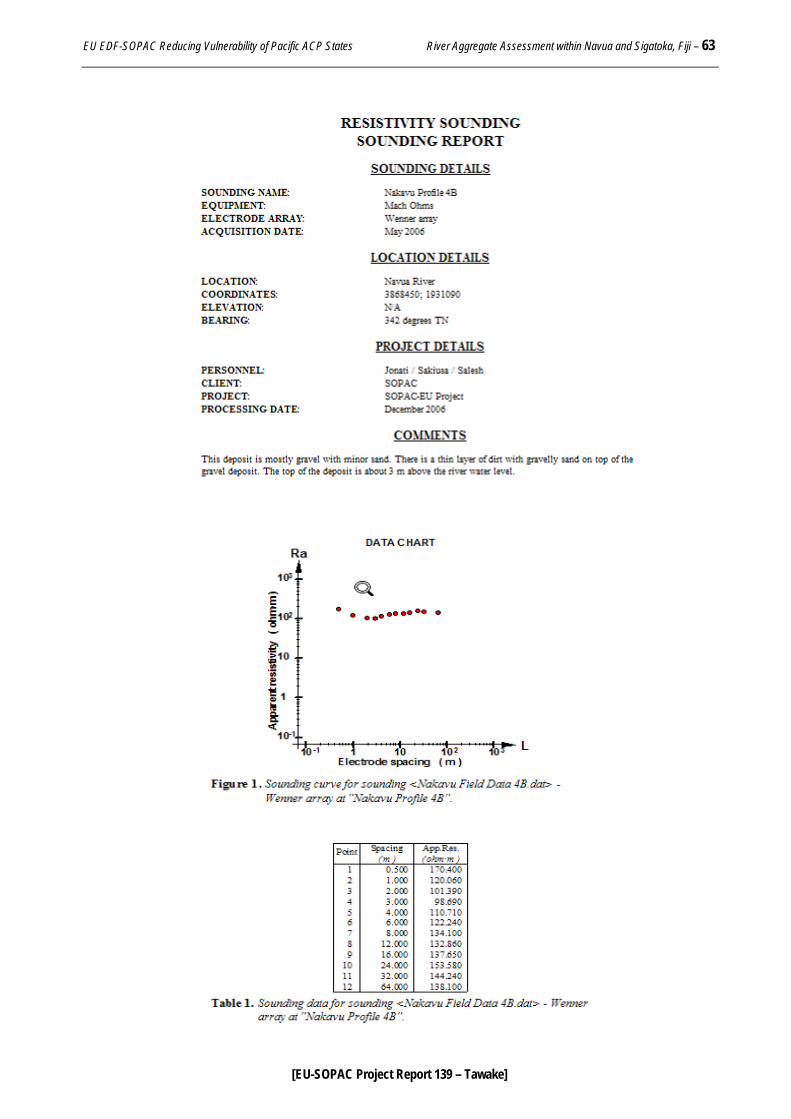
EU EDF-SOPAC Reducing Vulnerability of Pacific ACP States River Aggregate Assessment within Navua and Sigatoka, Fiji – 63
[EU-SOPAC Project Report 139 – Tawake]
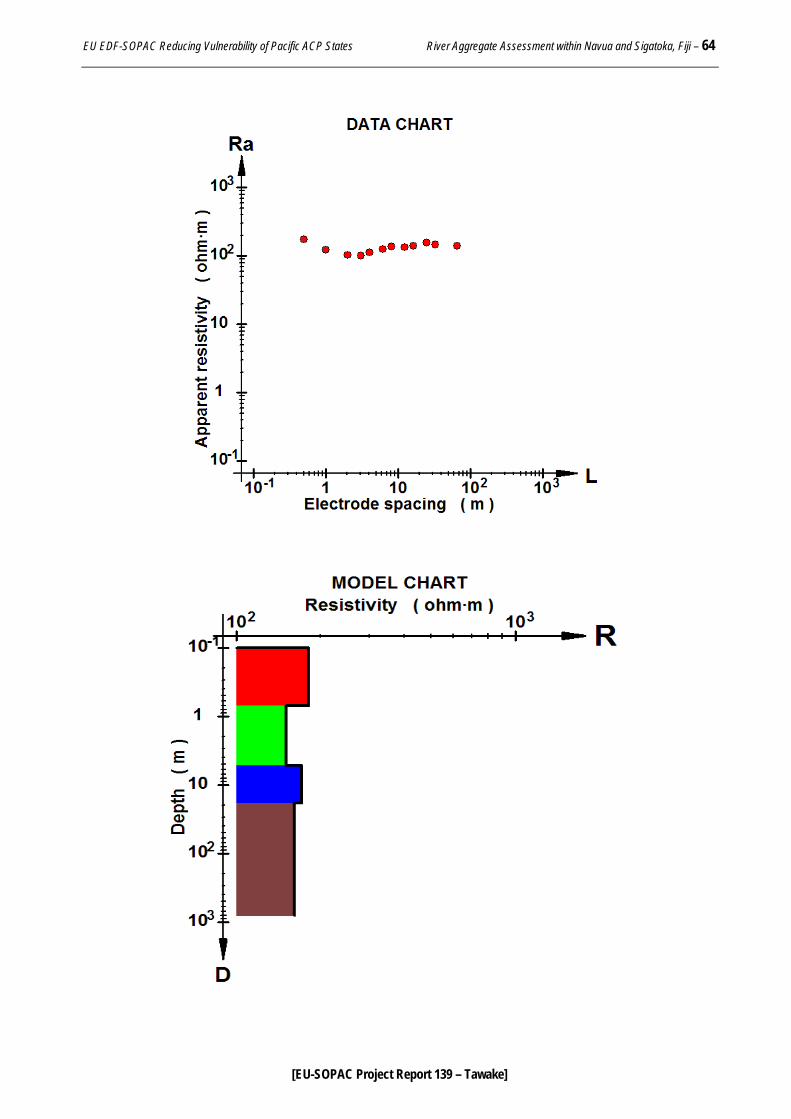
EU EDF-SOPAC Reducing Vulnerability of Pacific ACP States River Aggregate Assessment within Navua and Sigatoka, Fiji – 64
[EU-SOPAC Project Report 139 – Tawake]
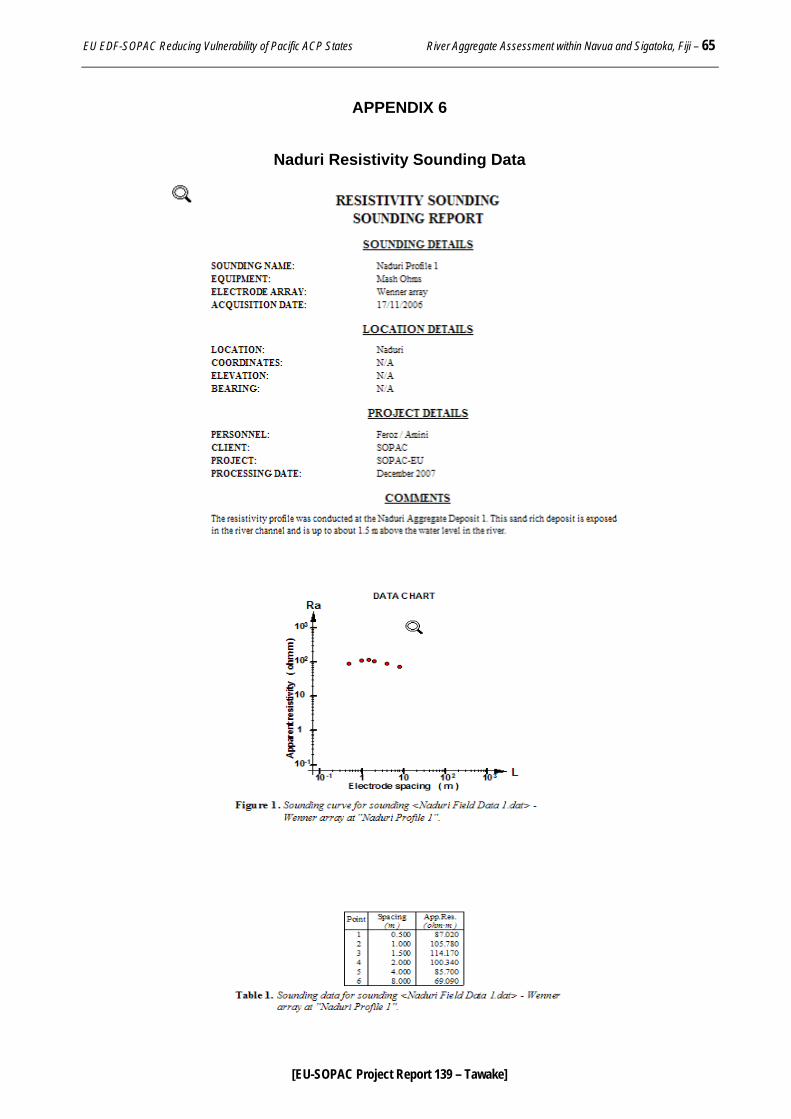
EU EDF-SOPAC Reducing Vulnerability of Pacific ACP States River Aggregate Assessment within Navua and Sigatoka, Fiji – 65
[EU-SOPAC Project Report 139 – Tawake]
APPENDIX 6
Naduri Resistivity Sounding Data
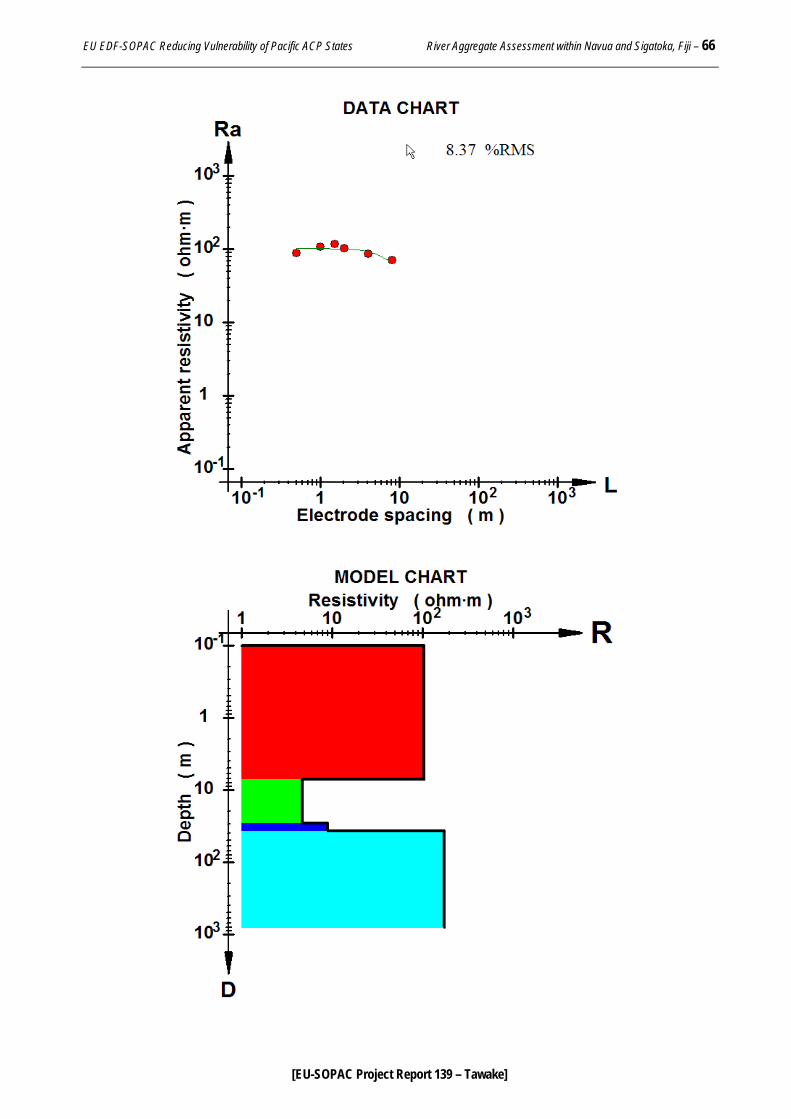
EU EDF-SOPAC Reducing Vulnerability of Pacific ACP States River Aggregate Assessment within Navua and Sigatoka, Fiji – 66
[EU-SOPAC Project Report 139 – Tawake]
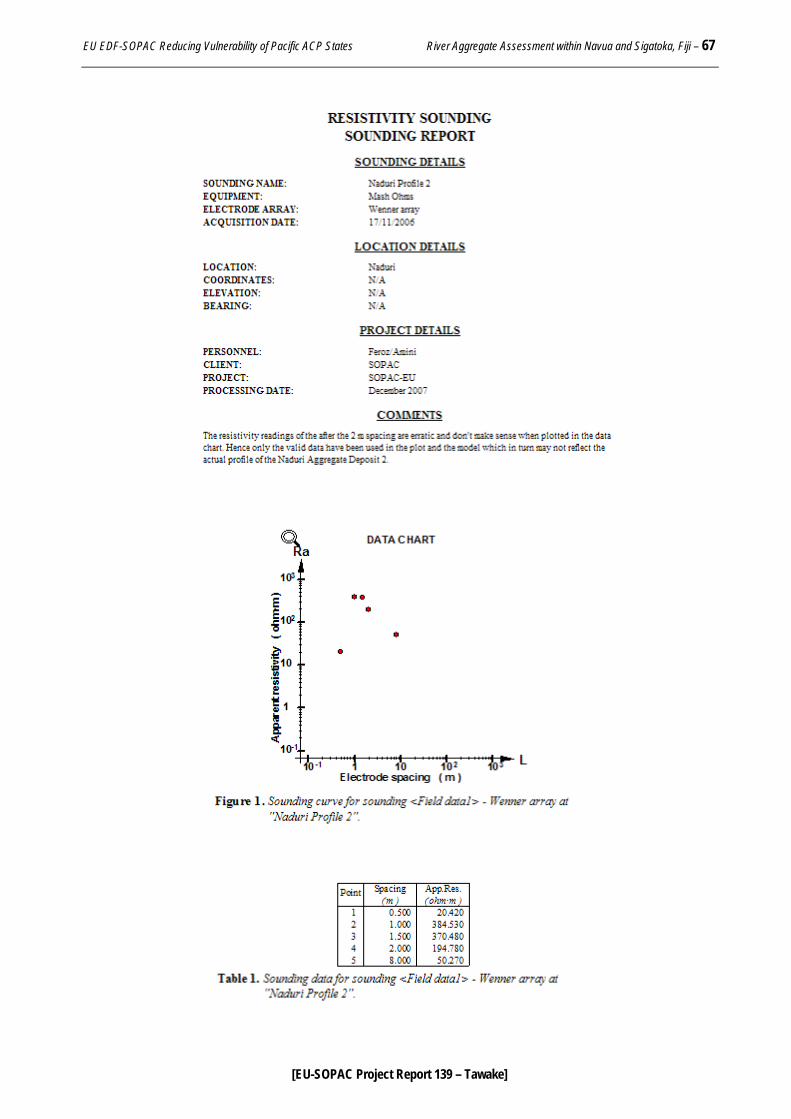
EU EDF-SOPAC Reducing Vulnerability of Pacific ACP States River Aggregate Assessment within Navua and Sigatoka, Fiji – 67
[EU-SOPAC Project Report 139 – Tawake]
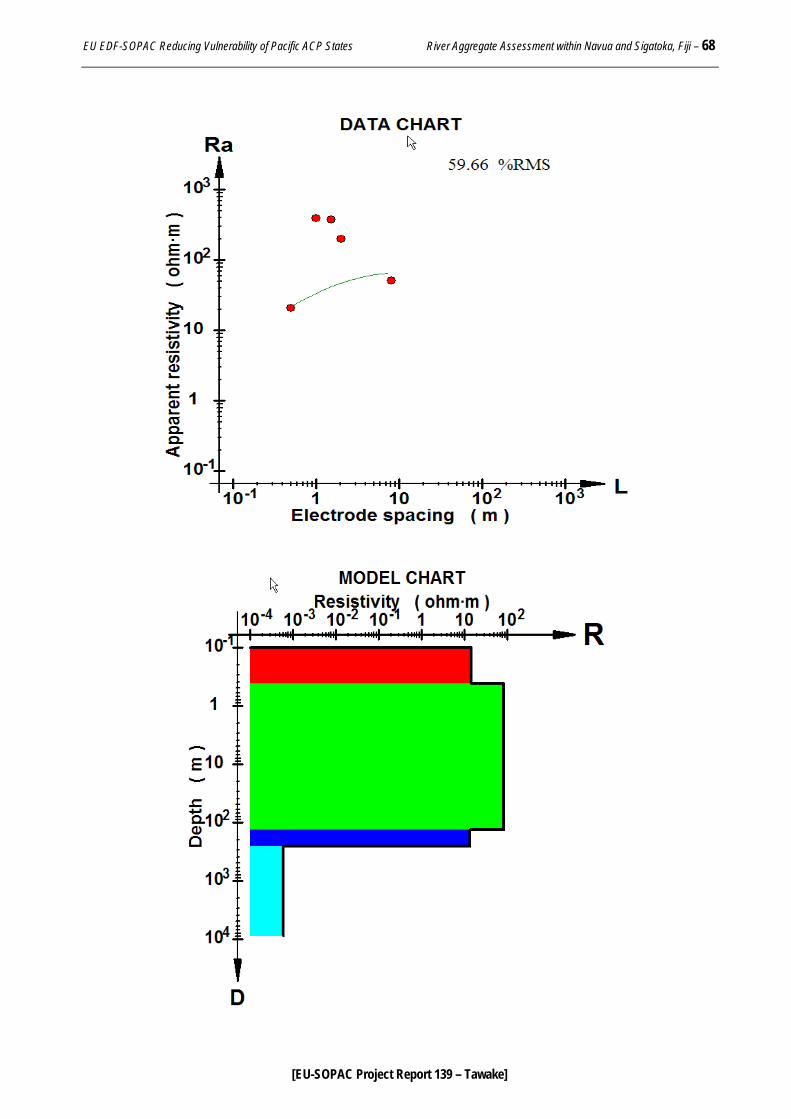
EU EDF-SOPAC Reducing Vulnerability of Pacific ACP States River Aggregate Assessment within Navua and Sigatoka, Fiji – 68
[EU-SOPAC Project Report 139 – Tawake]
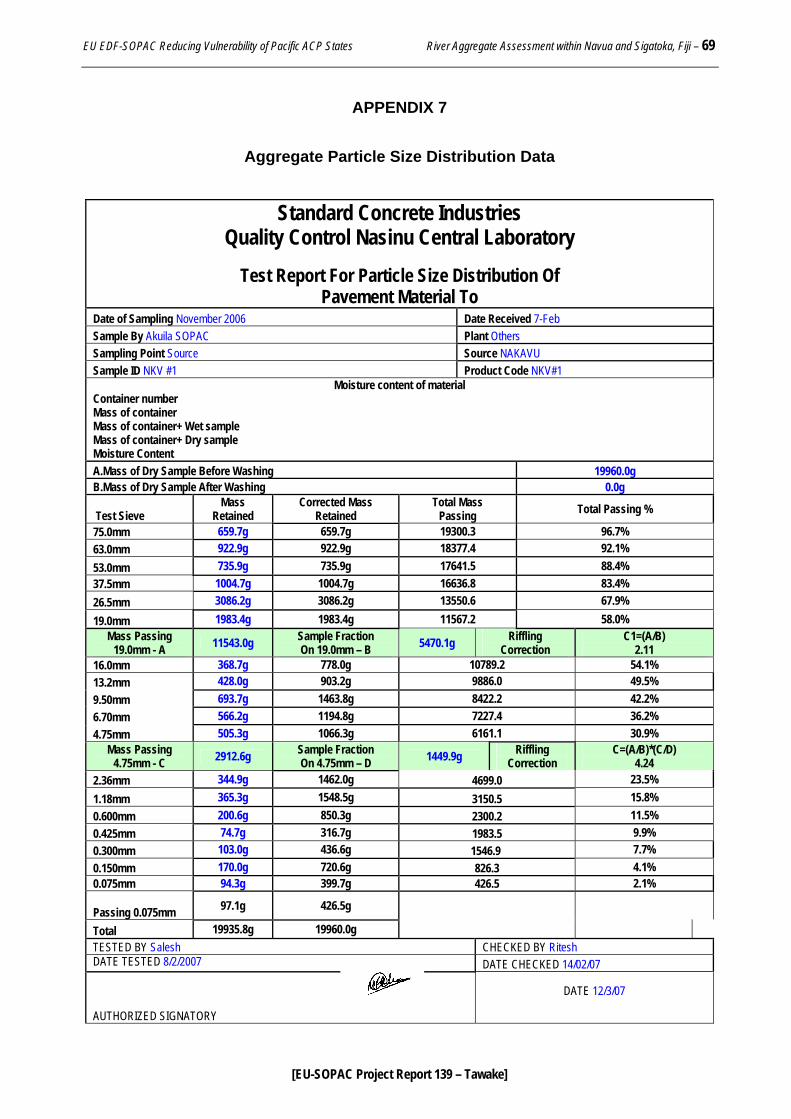
EU EDF-SOPAC Reducing Vulnerability of Pacific ACP States River Aggregate Assessment within Navua and Sigatoka, Fiji – 69
[EU-SOPAC Project Report 139 – Tawake]
APPENDIX 7
Aggregate Particle Size Distribution Data
Standard Concrete Industries Quality Control Nasinu Central Laboratory
Test Report For Particle Size Distribution Of
Pavement Material To Date of Sampling November 2006 Date Received 7-Feb Sample By Akuila SOPAC Plant Others Sampling Point Source Source NAKAVU Sample ID NKV #1 Product Code NKV#1
Moisture content of material Container number Mass of container Mass of container+ Wet sample Mass of container+ Dry sample Moisture Content A.Mass of Dry Sample Before Washing 19960.0g B.Mass of Dry Sample After Washing 0.0g
Test Sieve Mass
Retained Corrected Mass
Retained Total Mass
Passing Total Passing %
75.0mm 659.7g 659.7g 19300.3 96.7% 63.0mm 922.9g 922.9g 18377.4 92.1% 53.0mm 735.9g 735.9g 17641.5 88.4% 37.5mm 1004.7g 1004.7g 16636.8 83.4% 26.5mm 3086.2g 3086.2g 13550.6 67.9% 19.0mm 1983.4g 1983.4g 11567.2 58.0%
Mass Passing 19.0mm - A 11543.0g Sample Fraction
On 19.0mm – B 5470.1g Riffling Correction
C1=(A/B) 2.11
16.0mm 368.7g 778.0g 10789.2 54.1% 13.2mm 428.0g 903.2g 9886.0 49.5% 9.50mm 693.7g 1463.8g 8422.2 42.2% 6.70mm 566.2g 1194.8g 7227.4 36.2% 4.75mm 505.3g 1066.3g 6161.1 30.9%
Mass Passing 4.75mm - C 2912.6g Sample Fraction
On 4.75mm – D 1449.9g Riffling Correction
C=(A/B)*(C/D) 4.24
2.36mm 344.9g 1462.0g 4699.0 23.5% 1.18mm 365.3g 1548.5g 3150.5 15.8% 0.600mm 200.6g 850.3g 2300.2 11.5% 0.425mm 74.7g 316.7g 1983.5 9.9% 0.300mm 103.0g 436.6g 1546.9 7.7% 0.150mm 170.0g 720.6g 826.3 4.1% 0.075mm 94.3g 399.7g 426.5 2.1%
Passing 0.075mm 97.1g 426.5g
Total 19935.8g 19960.0g TESTED BY Salesh CHECKED BY Ritesh DATE TESTED 8/2/2007 DATE CHECKED 14/02/07
AUTHORIZED SIGNATORY
DATE 12/3/07
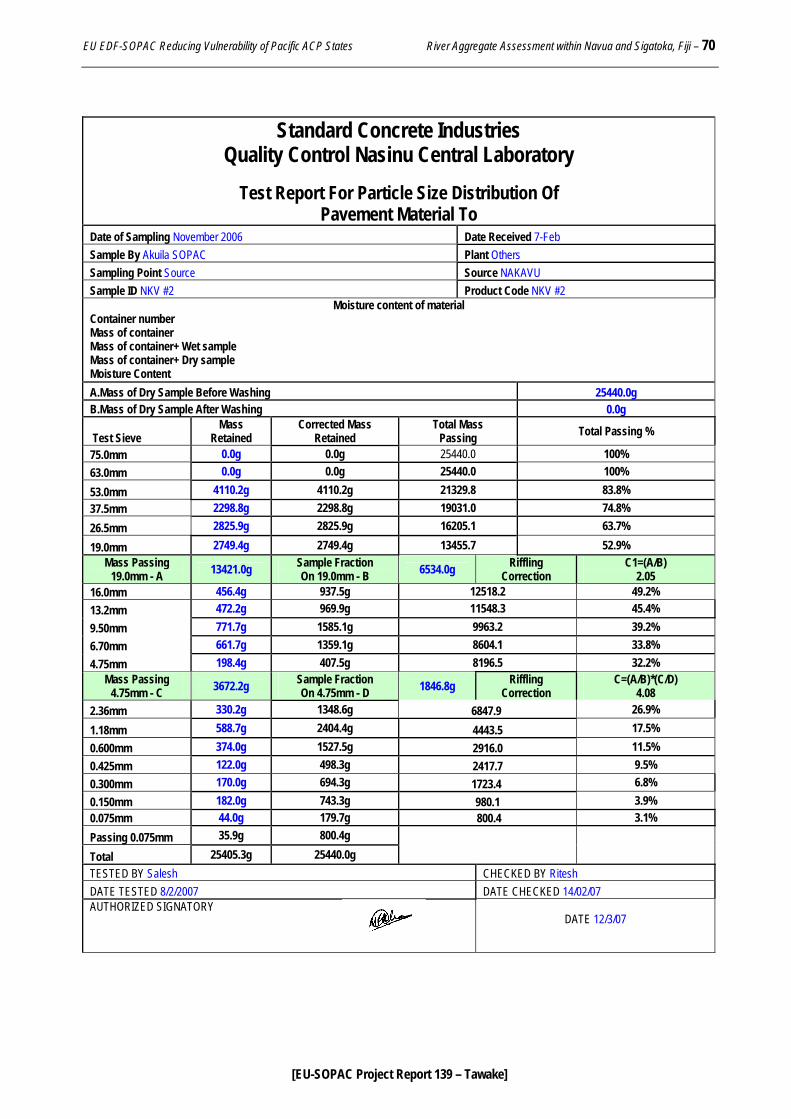
EU EDF-SOPAC Reducing Vulnerability of Pacific ACP States River Aggregate Assessment within Navua and Sigatoka, Fiji – 70
[EU-SOPAC Project Report 139 – Tawake]
Standard Concrete Industries
Quality Control Nasinu Central Laboratory
Test Report For Particle Size Distribution Of Pavement Material To
Date of Sampling November 2006 Date Received 7-Feb Sample By Akuila SOPAC Plant Others Sampling Point Source Source NAKAVU Sample ID NKV #2 Product Code NKV #2
Moisture content of material Container number Mass of container Mass of container+ Wet sample Mass of container+ Dry sample Moisture Content A.Mass of Dry Sample Before Washing 25440.0g B.Mass of Dry Sample After Washing 0.0g
Test Sieve Mass
Retained Corrected Mass
Retained Total Mass
Passing Total Passing %
75.0mm 0.0g 0.0g 25440.0 100% 63.0mm 0.0g 0.0g 25440.0 100% 53.0mm 4110.2g 4110.2g 21329.8 83.8% 37.5mm 2298.8g 2298.8g 19031.0 74.8% 26.5mm 2825.9g 2825.9g 16205.1 63.7%
19.0mm 2749.4g 2749.4g 13455.7 52.9% Mass Passing
19.0mm - A 13421.0g Sample Fraction On 19.0mm - B 6534.0g Riffling
Correction C1=(A/B)
2.05 16.0mm 456.4g 937.5g 12518.2 49.2% 13.2mm 472.2g 969.9g 11548.3 45.4% 9.50mm 771.7g 1585.1g 9963.2 39.2% 6.70mm 661.7g 1359.1g 8604.1 33.8% 4.75mm 198.4g 407.5g 8196.5 32.2%
Mass Passing 4.75mm - C 3672.2g Sample Fraction
On 4.75mm - D 1846.8g Riffling Correction
C=(A/B)*(C/D) 4.08
2.36mm 330.2g 1348.6g 6847.9 26.9% 1.18mm 588.7g 2404.4g 4443.5 17.5% 0.600mm 374.0g 1527.5g 2916.0 11.5% 0.425mm 122.0g 498.3g 2417.7 9.5% 0.300mm 170.0g 694.3g 1723.4 6.8% 0.150mm 182.0g 743.3g 980.1 3.9% 0.075mm 44.0g 179.7g 800.4 3.1% Passing 0.075mm 35.9g 800.4g
Total 25405.3g 25440.0g
TESTED BY Salesh CHECKED BY Ritesh DATE TESTED 8/2/2007 DATE CHECKED 14/02/07 AUTHORIZED SIGNATORY
DATE 12/3/07
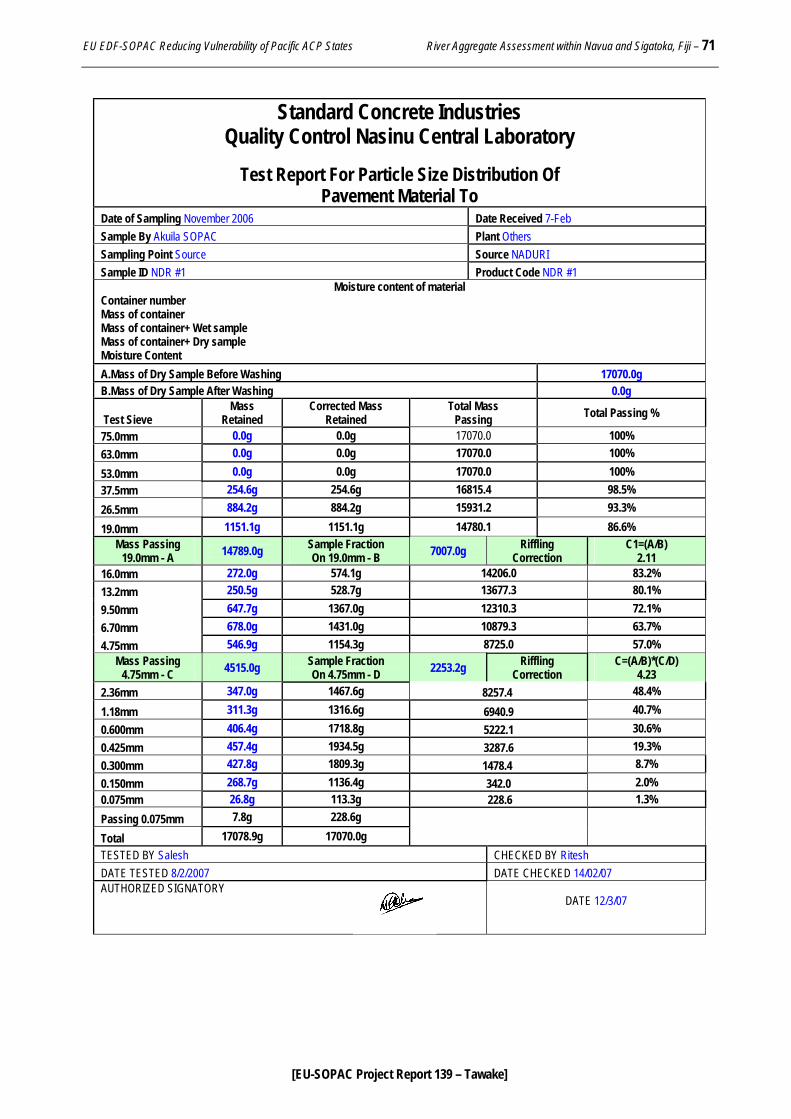
EU EDF-SOPAC Reducing Vulnerability of Pacific ACP States River Aggregate Assessment within Navua and Sigatoka, Fiji – 71
[EU-SOPAC Project Report 139 – Tawake]
Standard Concrete Industries Quality Control Nasinu Central Laboratory
Test Report For Particle Size Distribution Of
Pavement Material To Date of Sampling November 2006 Date Received 7-Feb Sample By Akuila SOPAC Plant Others Sampling Point Source Source NADURI Sample ID NDR #1 Product Code NDR #1
Moisture content of material Container number Mass of container Mass of container+ Wet sample Mass of container+ Dry sample Moisture Content A.Mass of Dry Sample Before Washing 17070.0g B.Mass of Dry Sample After Washing 0.0g
Test Sieve Mass
Retained Corrected Mass
Retained Total Mass
Passing Total Passing %
75.0mm 0.0g 0.0g 17070.0 100% 63.0mm 0.0g 0.0g 17070.0 100% 53.0mm 0.0g 0.0g 17070.0 100% 37.5mm 254.6g 254.6g 16815.4 98.5% 26.5mm 884.2g 884.2g 15931.2 93.3%
19.0mm 1151.1g 1151.1g 14780.1 86.6% Mass Passing
19.0mm - A 14789.0g Sample Fraction On 19.0mm - B 7007.0g Riffling
Correction C1=(A/B)
2.11 16.0mm 272.0g 574.1g 14206.0 83.2% 13.2mm 250.5g 528.7g 13677.3 80.1% 9.50mm 647.7g 1367.0g 12310.3 72.1% 6.70mm 678.0g 1431.0g 10879.3 63.7% 4.75mm 546.9g 1154.3g 8725.0 57.0%
Mass Passing 4.75mm - C 4515.0g Sample Fraction
On 4.75mm - D 2253.2g Riffling Correction
C=(A/B)*(C/D) 4.23
2.36mm 347.0g 1467.6g 8257.4 48.4% 1.18mm 311.3g 1316.6g 6940.9 40.7% 0.600mm 406.4g 1718.8g 5222.1 30.6% 0.425mm 457.4g 1934.5g 3287.6 19.3% 0.300mm 427.8g 1809.3g 1478.4 8.7% 0.150mm 268.7g 1136.4g 342.0 2.0% 0.075mm 26.8g 113.3g 228.6 1.3% Passing 0.075mm 7.8g 228.6g
Total 17078.9g 17070.0g
TESTED BY Salesh CHECKED BY Ritesh DATE TESTED 8/2/2007 DATE CHECKED 14/02/07 AUTHORIZED SIGNATORY
DATE 12/3/07
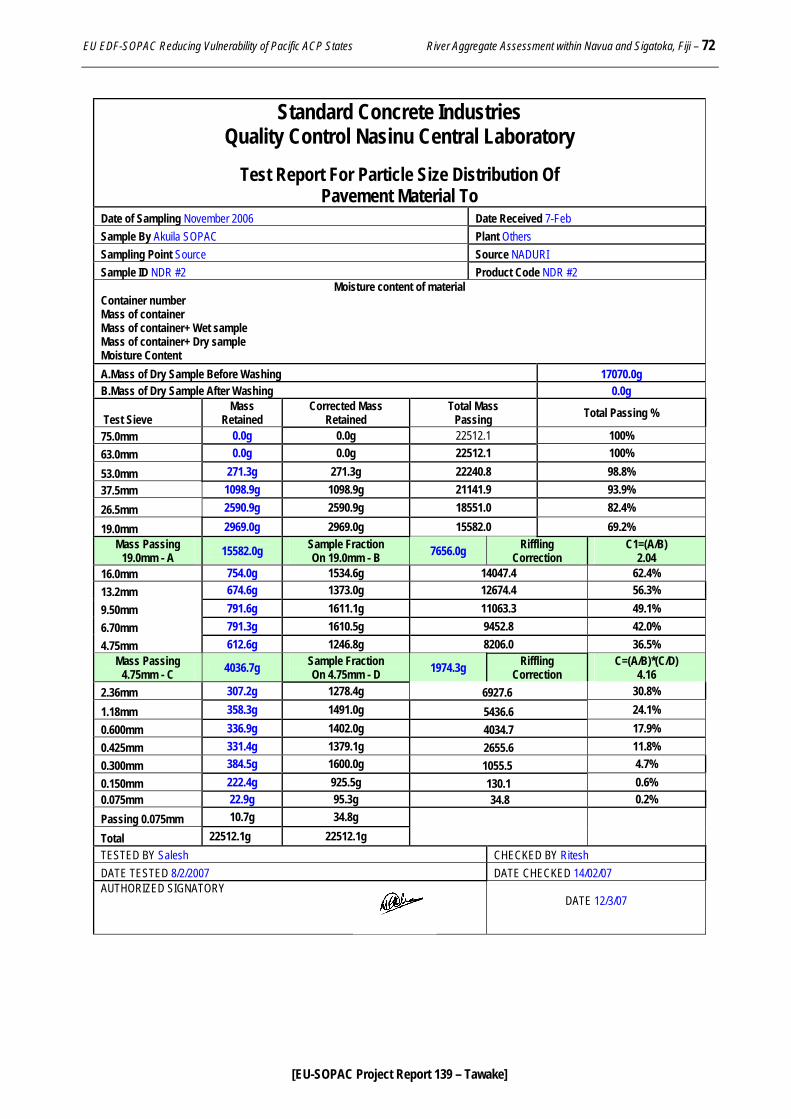
EU EDF-SOPAC Reducing Vulnerability of Pacific ACP States River Aggregate Assessment within Navua and Sigatoka, Fiji – 72
[EU-SOPAC Project Report 139 – Tawake]
Standard Concrete Industries Quality Control Nasinu Central Laboratory
Test Report For Particle Size Distribution Of
Pavement Material To Date of Sampling November 2006 Date Received 7-Feb Sample By Akuila SOPAC Plant Others Sampling Point Source Source NADURI Sample ID NDR #2 Product Code NDR #2
Moisture content of material Container number Mass of container Mass of container+ Wet sample Mass of container+ Dry sample Moisture Content A.Mass of Dry Sample Before Washing 17070.0g B.Mass of Dry Sample After Washing 0.0g
Test Sieve Mass
Retained Corrected Mass
Retained Total Mass
Passing Total Passing %
75.0mm 0.0g 0.0g 22512.1 100% 63.0mm 0.0g 0.0g 22512.1 100% 53.0mm 271.3g 271.3g 22240.8 98.8% 37.5mm 1098.9g 1098.9g 21141.9 93.9% 26.5mm 2590.9g 2590.9g 18551.0 82.4%
19.0mm 2969.0g 2969.0g 15582.0 69.2% Mass Passing
19.0mm - A 15582.0g Sample Fraction On 19.0mm - B 7656.0g Riffling
Correction C1=(A/B)
2.04 16.0mm 754.0g 1534.6g 14047.4 62.4% 13.2mm 674.6g 1373.0g 12674.4 56.3% 9.50mm 791.6g 1611.1g 11063.3 49.1% 6.70mm 791.3g 1610.5g 9452.8 42.0% 4.75mm 612.6g 1246.8g 8206.0 36.5%
Mass Passing 4.75mm - C 4036.7g Sample Fraction
On 4.75mm - D 1974.3g Riffling Correction
C=(A/B)*(C/D) 4.16
2.36mm 307.2g 1278.4g 6927.6 30.8% 1.18mm 358.3g 1491.0g 5436.6 24.1% 0.600mm 336.9g 1402.0g 4034.7 17.9% 0.425mm 331.4g 1379.1g 2655.6 11.8% 0.300mm 384.5g 1600.0g 1055.5 4.7% 0.150mm 222.4g 925.5g 130.1 0.6% 0.075mm 22.9g 95.3g 34.8 0.2% Passing 0.075mm 10.7g 34.8g
Total 22512.1g 22512.1g
TESTED BY Salesh CHECKED BY Ritesh DATE TESTED 8/2/2007 DATE CHECKED 14/02/07 AUTHORIZED SIGNATORY
DATE 12/3/07
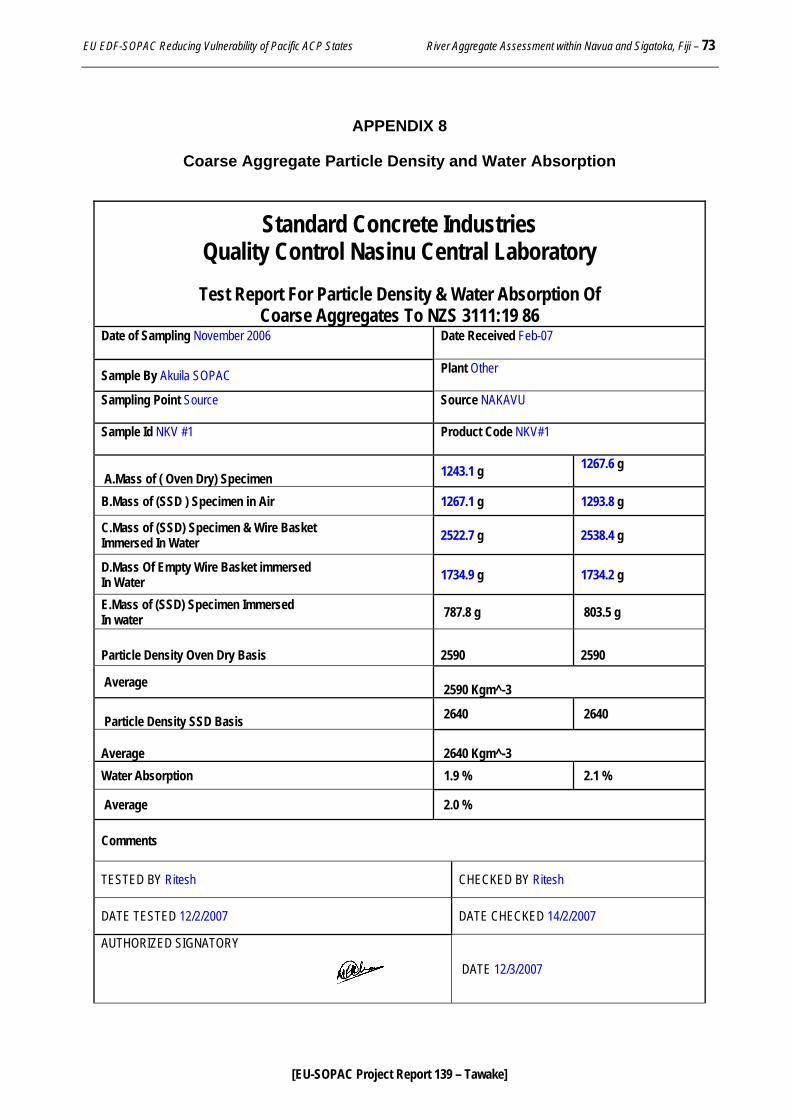
EU EDF-SOPAC Reducing Vulnerability of Pacific ACP States River Aggregate Assessment within Navua and Sigatoka, Fiji – 73
[EU-SOPAC Project Report 139 – Tawake]
APPENDIX 8
Coarse Aggregate Particle Density and Water Absorption
Standard Concrete Industries Quality Control Nasinu Central Laboratory
Test Report For Particle Density & Water Absorption Of
Coarse Aggregates To NZS 3111:19 86 Date of Sampling November 2006
Date Received Feb-07
Sample By Akuila SOPAC Plant Other
Sampling Point Source
Source NAKAVU
Sample Id NKV #1
Product Code NKV#1
A.Mass of ( Oven Dry) Specimen 1243.1 g 1267.6 g
B.Mass of (SSD ) Specimen in Air 1267.1 g 1293.8 g
C.Mass of (SSD) Specimen & Wire Basket Immersed In Water 2522.7 g 2538.4 g
D.Mass Of Empty Wire Basket immersed In Water 1734.9 g 1734.2 g
E.Mass of (SSD) Specimen Immersed In water 787.8 g 803.5 g
Particle Density Oven Dry Basis
2590
2590
Average 2590 Kgm^-3
Particle Density SSD Basis 2640 2640
Average
2640 Kgm^-3
Water Absorption 1.9 % 2.1 %
Average 2.0 %
Comments
TESTED BY Ritesh CHECKED BY Ritesh
DATE TESTED 12/2/2007 DATE CHECKED 14/2/2007
AUTHORIZED SIGNATORY
DATE 12/3/2007
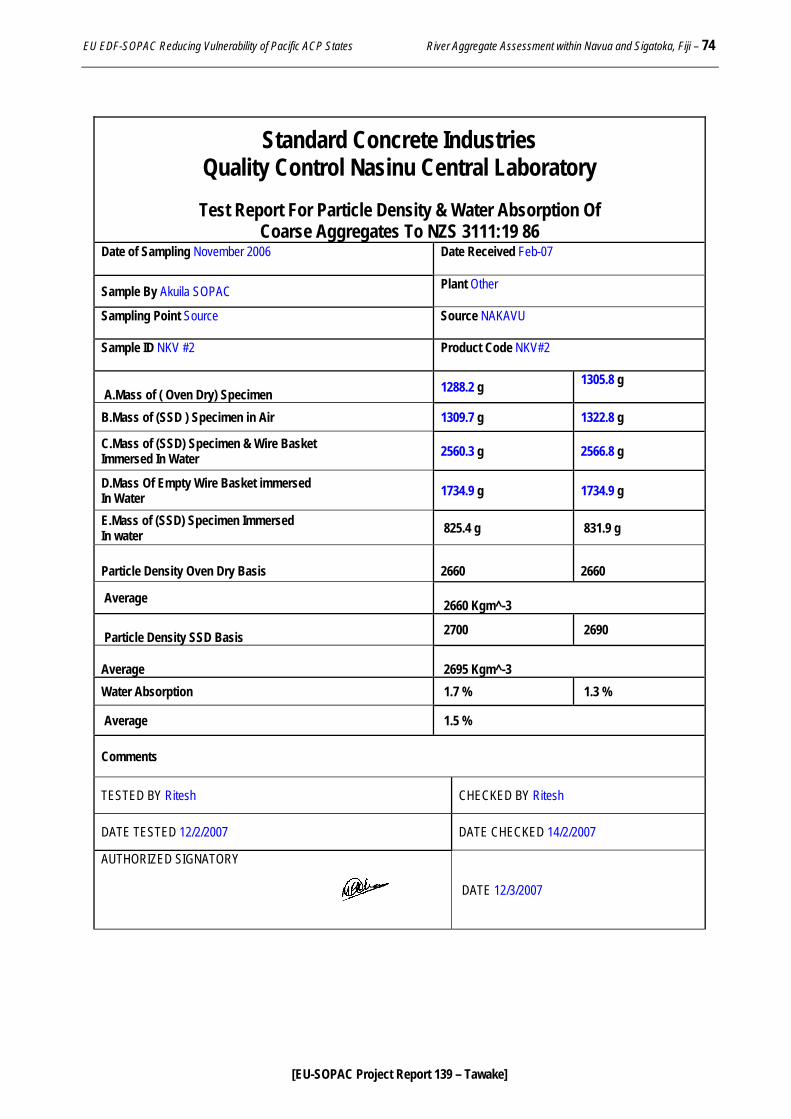
EU EDF-SOPAC Reducing Vulnerability of Pacific ACP States River Aggregate Assessment within Navua and Sigatoka, Fiji – 74
[EU-SOPAC Project Report 139 – Tawake]
Standard Concrete Industries Quality Control Nasinu Central Laboratory
Test Report For Particle Density & Water Absorption Of
Coarse Aggregates To NZS 3111:19 86 Date of Sampling November 2006
Date Received Feb-07
Sample By Akuila SOPAC Plant Other
Sampling Point Source
Source NAKAVU
Sample ID NKV #2
Product Code NKV#2
A.Mass of ( Oven Dry) Specimen 1288.2 g 1305.8 g
B.Mass of (SSD ) Specimen in Air 1309.7 g 1322.8 g
C.Mass of (SSD) Specimen & Wire Basket Immersed In Water 2560.3 g 2566.8 g
D.Mass Of Empty Wire Basket immersed In Water 1734.9 g 1734.9 g
E.Mass of (SSD) Specimen Immersed In water 825.4 g 831.9 g
Particle Density Oven Dry Basis
2660
2660
Average 2660 Kgm^-3
Particle Density SSD Basis 2700 2690
Average
2695 Kgm^-3
Water Absorption 1.7 % 1.3 %
Average 1.5 %
Comments
TESTED BY Ritesh CHECKED BY Ritesh
DATE TESTED 12/2/2007 DATE CHECKED 14/2/2007
AUTHORIZED SIGNATORY
DATE 12/3/2007
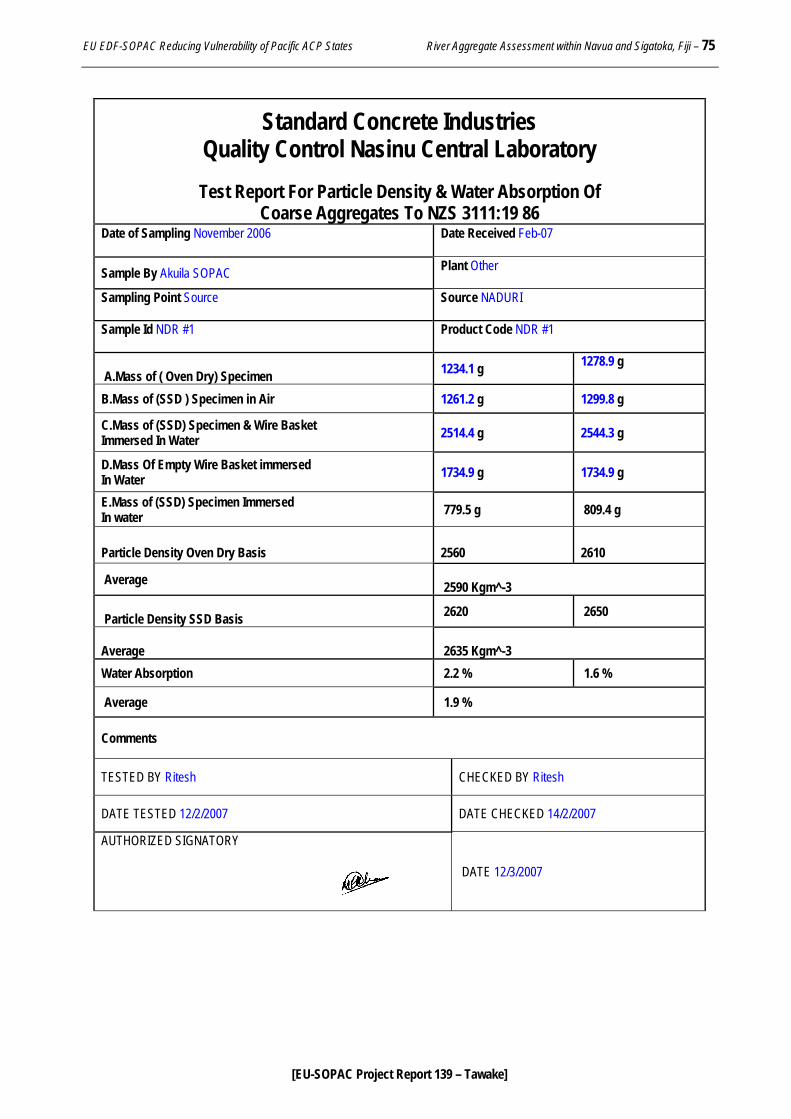
EU EDF-SOPAC Reducing Vulnerability of Pacific ACP States River Aggregate Assessment within Navua and Sigatoka, Fiji – 75
[EU-SOPAC Project Report 139 – Tawake]
Standard Concrete Industries Quality Control Nasinu Central Laboratory
Test Report For Particle Density & Water Absorption Of
Coarse Aggregates To NZS 3111:19 86 Date of Sampling November 2006
Date Received Feb-07
Sample By Akuila SOPAC Plant Other
Sampling Point Source
Source NADURI
Sample Id NDR #1
Product Code NDR #1
A.Mass of ( Oven Dry) Specimen 1234.1 g 1278.9 g
B.Mass of (SSD ) Specimen in Air 1261.2 g 1299.8 g
C.Mass of (SSD) Specimen & Wire Basket Immersed In Water 2514.4 g 2544.3 g
D.Mass Of Empty Wire Basket immersed In Water 1734.9 g 1734.9 g
E.Mass of (SSD) Specimen Immersed In water 779.5 g 809.4 g
Particle Density Oven Dry Basis
2560
2610
Average 2590 Kgm^-3
Particle Density SSD Basis 2620 2650
Average
2635 Kgm^-3
Water Absorption 2.2 % 1.6 %
Average 1.9 %
Comments
TESTED BY Ritesh CHECKED BY Ritesh
DATE TESTED 12/2/2007 DATE CHECKED 14/2/2007
AUTHORIZED SIGNATORY
DATE 12/3/2007
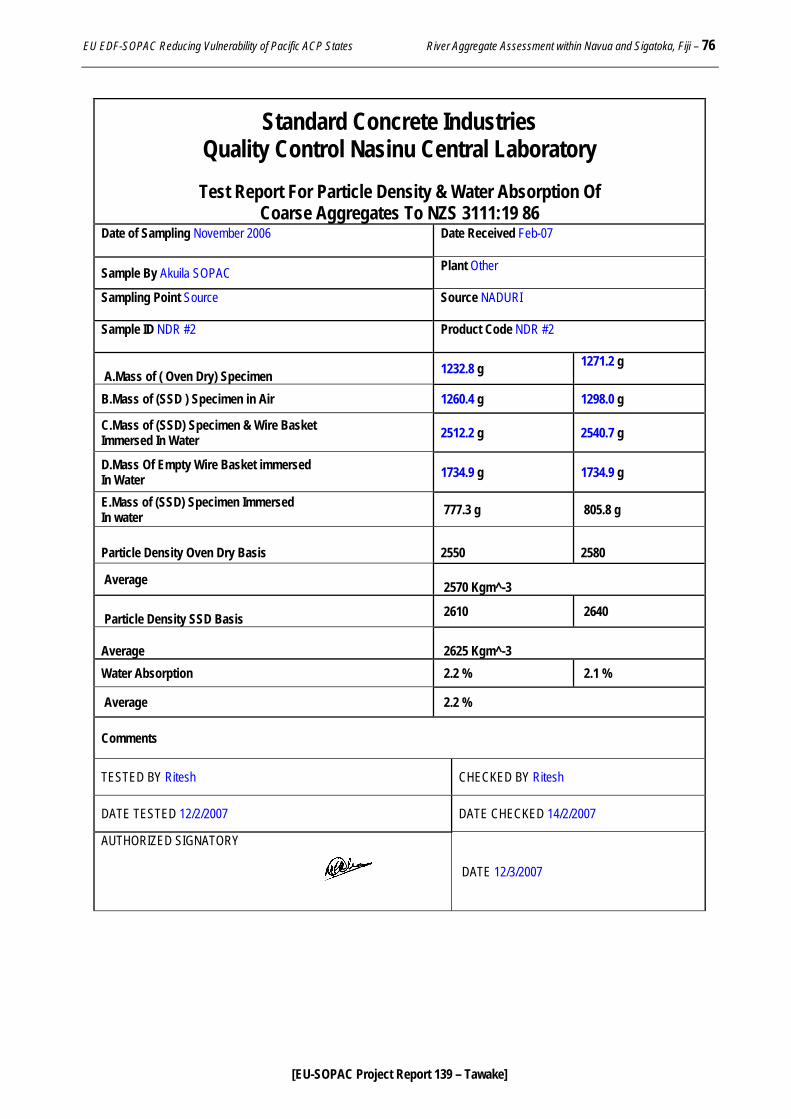
EU EDF-SOPAC Reducing Vulnerability of Pacific ACP States River Aggregate Assessment within Navua and Sigatoka, Fiji – 76
[EU-SOPAC Project Report 139 – Tawake]
Standard Concrete Industries Quality Control Nasinu Central Laboratory
Test Report For Particle Density & Water Absorption Of
Coarse Aggregates To NZS 3111:19 86 Date of Sampling November 2006
Date Received Feb-07
Sample By Akuila SOPAC Plant Other
Sampling Point Source
Source NADURI
Sample ID NDR #2
Product Code NDR #2
A.Mass of ( Oven Dry) Specimen 1232.8 g 1271.2 g
B.Mass of (SSD ) Specimen in Air 1260.4 g 1298.0 g
C.Mass of (SSD) Specimen & Wire Basket Immersed In Water 2512.2 g 2540.7 g
D.Mass Of Empty Wire Basket immersed In Water 1734.9 g 1734.9 g
E.Mass of (SSD) Specimen Immersed In water 777.3 g 805.8 g
Particle Density Oven Dry Basis
2550
2580
Average 2570 Kgm^-3
Particle Density SSD Basis 2610 2640
Average
2625 Kgm^-3
Water Absorption 2.2 % 2.1 %
Average 2.2 %
Comments
TESTED BY Ritesh CHECKED BY Ritesh
DATE TESTED 12/2/2007 DATE CHECKED 14/2/2007
AUTHORIZED SIGNATORY
DATE 12/3/2007
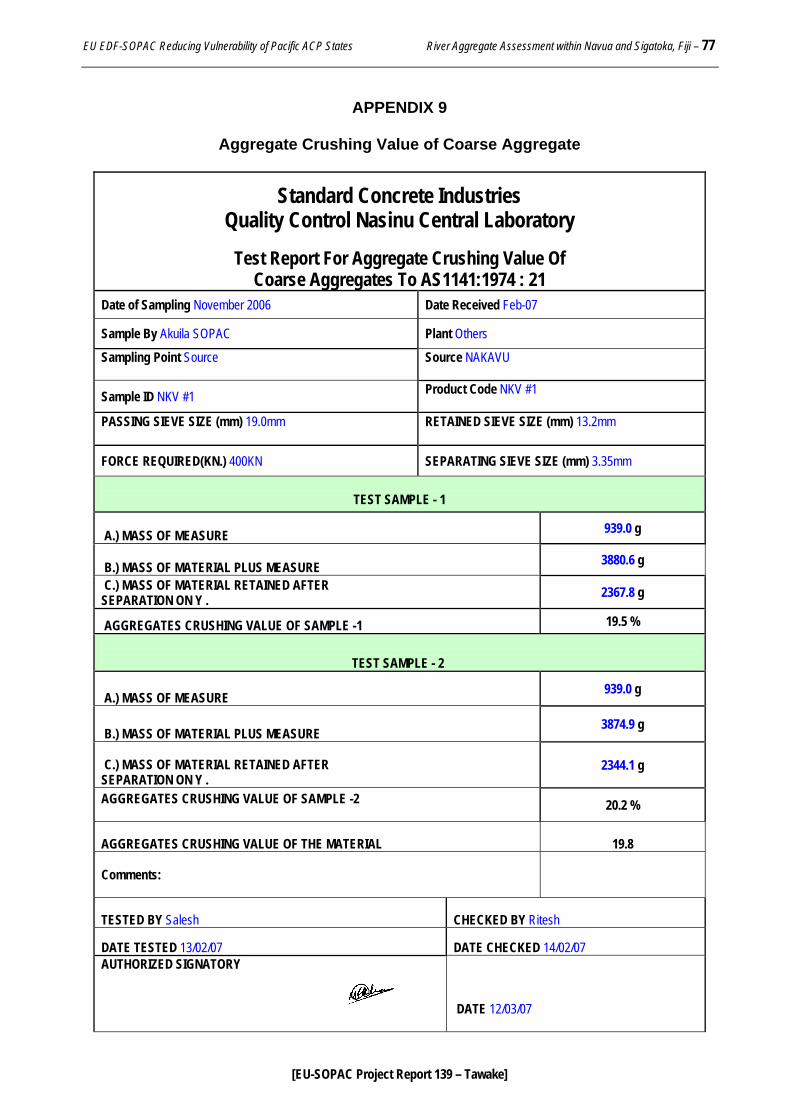
EU EDF-SOPAC Reducing Vulnerability of Pacific ACP States River Aggregate Assessment within Navua and Sigatoka, Fiji – 77
[EU-SOPAC Project Report 139 – Tawake]
APPENDIX 9
Aggregate Crushing Value of Coarse Aggregate
Standard Concrete Industries
Quality Control Nasinu Central Laboratory
Test Report For Aggregate Crushing Value Of Coarse Aggregates To AS1141:1974 : 21
Date of Sampling November 2006 Date Received Feb-07
Sample By Akuila SOPAC Plant Others
Sampling Point Source
Source NAKAVU
Sample ID NKV #1 Product Code NKV #1
PASSING SIEVE SIZE (mm) 19.0mm
RETAINED SIEVE SIZE (mm) 13.2mm
FORCE REQUIRED(KN.) 400KN SEPARATING SIEVE SIZE (mm) 3.35mm
TEST SAMPLE - 1
A.) MASS OF MEASURE 939.0 g
B.) MASS OF MATERIAL PLUS MEASURE 3880.6 g
C.) MASS OF MATERIAL RETAINED AFTER SEPARATION ON Y . 2367.8 g
AGGREGATES CRUSHING VALUE OF SAMPLE -1 19.5 %
TEST SAMPLE - 2
A.) MASS OF MEASURE 939.0 g
B.) MASS OF MATERIAL PLUS MEASURE
3874.9 g
C.) MASS OF MATERIAL RETAINED AFTER SEPARATION ON Y .
2344.1 g
AGGREGATES CRUSHING VALUE OF SAMPLE -2 20.2 %
AGGREGATES CRUSHING VALUE OF THE MATERIAL 19.8
Comments:
TESTED BY Salesh CHECKED BY Ritesh
DATE TESTED 13/02/07 DATE CHECKED 14/02/07 AUTHORIZED SIGNATORY
DATE 12/03/07
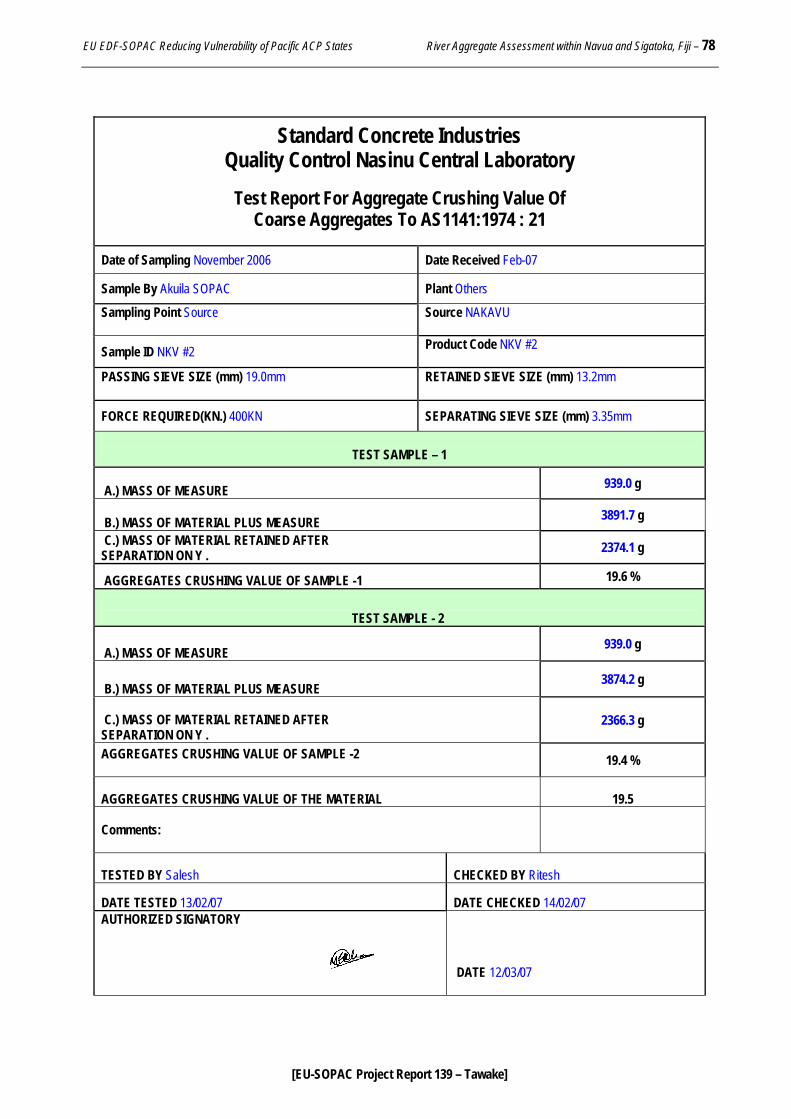
EU EDF-SOPAC Reducing Vulnerability of Pacific ACP States River Aggregate Assessment within Navua and Sigatoka, Fiji – 78
[EU-SOPAC Project Report 139 – Tawake]
Standard Concrete Industries
Quality Control Nasinu Central Laboratory
Test Report For Aggregate Crushing Value Of Coarse Aggregates To AS1141:1974 : 21
Date of Sampling November 2006 Date Received Feb-07
Sample By Akuila SOPAC Plant Others
Sampling Point Source
Source NAKAVU
Sample ID NKV #2 Product Code NKV #2
PASSING SIEVE SIZE (mm) 19.0mm
RETAINED SIEVE SIZE (mm) 13.2mm
FORCE REQUIRED(KN.) 400KN SEPARATING SIEVE SIZE (mm) 3.35mm
TEST SAMPLE – 1
A.) MASS OF MEASURE 939.0 g
B.) MASS OF MATERIAL PLUS MEASURE 3891.7 g
C.) MASS OF MATERIAL RETAINED AFTER SEPARATION ON Y . 2374.1 g
AGGREGATES CRUSHING VALUE OF SAMPLE -1 19.6 %
TEST SAMPLE - 2
A.) MASS OF MEASURE 939.0 g
B.) MASS OF MATERIAL PLUS MEASURE
3874.2 g
C.) MASS OF MATERIAL RETAINED AFTER SEPARATION ON Y .
2366.3 g
AGGREGATES CRUSHING VALUE OF SAMPLE -2 19.4 %
AGGREGATES CRUSHING VALUE OF THE MATERIAL 19.5
Comments:
TESTED BY Salesh CHECKED BY Ritesh
DATE TESTED 13/02/07 DATE CHECKED 14/02/07 AUTHORIZED SIGNATORY
DATE 12/03/07
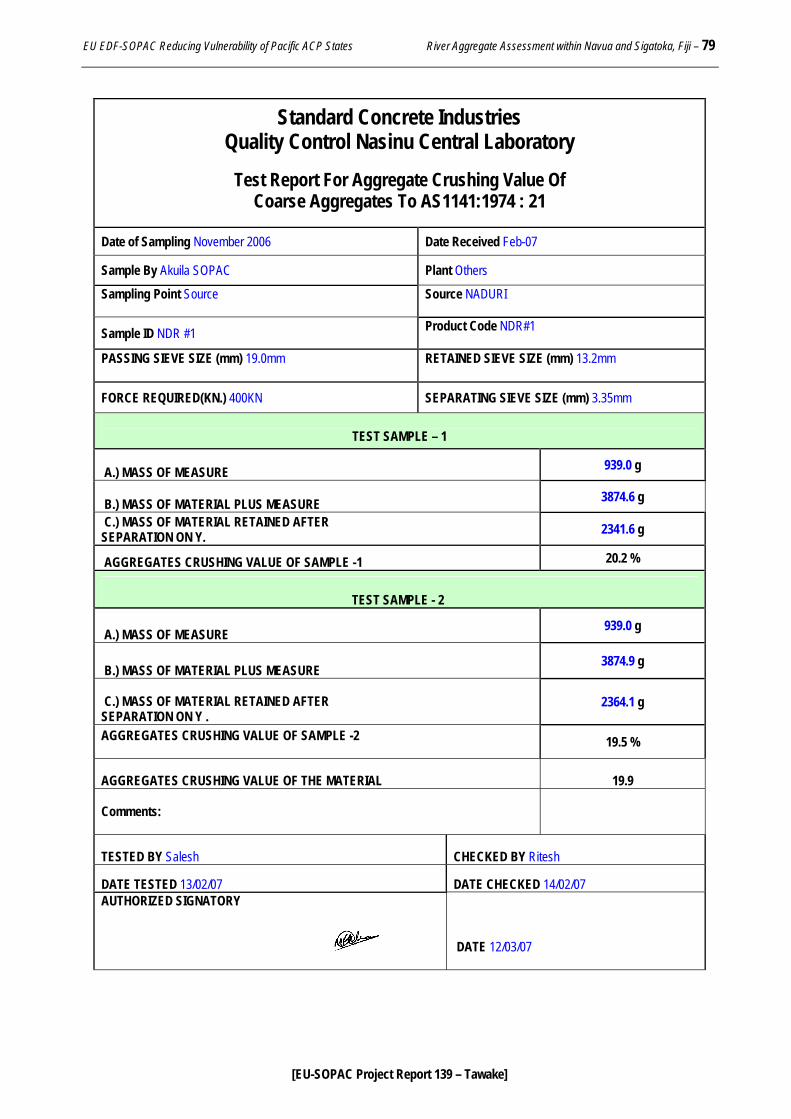
EU EDF-SOPAC Reducing Vulnerability of Pacific ACP States River Aggregate Assessment within Navua and Sigatoka, Fiji – 79
[EU-SOPAC Project Report 139 – Tawake]
Standard Concrete Industries
Quality Control Nasinu Central Laboratory
Test Report For Aggregate Crushing Value Of Coarse Aggregates To AS1141:1974 : 21
Date of Sampling November 2006 Date Received Feb-07
Sample By Akuila SOPAC Plant Others
Sampling Point Source
Source NADURI
Sample ID NDR #1 Product Code NDR#1
PASSING SIEVE SIZE (mm) 19.0mm
RETAINED SIEVE SIZE (mm) 13.2mm
FORCE REQUIRED(KN.) 400KN SEPARATING SIEVE SIZE (mm) 3.35mm
TEST SAMPLE – 1
A.) MASS OF MEASURE 939.0 g
B.) MASS OF MATERIAL PLUS MEASURE 3874.6 g
C.) MASS OF MATERIAL RETAINED AFTER SEPARATION ON Y. 2341.6 g
AGGREGATES CRUSHING VALUE OF SAMPLE -1 20.2 %
TEST SAMPLE - 2
A.) MASS OF MEASURE 939.0 g
B.) MASS OF MATERIAL PLUS MEASURE
3874.9 g
C.) MASS OF MATERIAL RETAINED AFTER SEPARATION ON Y .
2364.1 g
AGGREGATES CRUSHING VALUE OF SAMPLE -2 19.5 %
AGGREGATES CRUSHING VALUE OF THE MATERIAL 19.9
Comments:
TESTED BY Salesh CHECKED BY Ritesh
DATE TESTED 13/02/07 DATE CHECKED 14/02/07 AUTHORIZED SIGNATORY
DATE 12/03/07
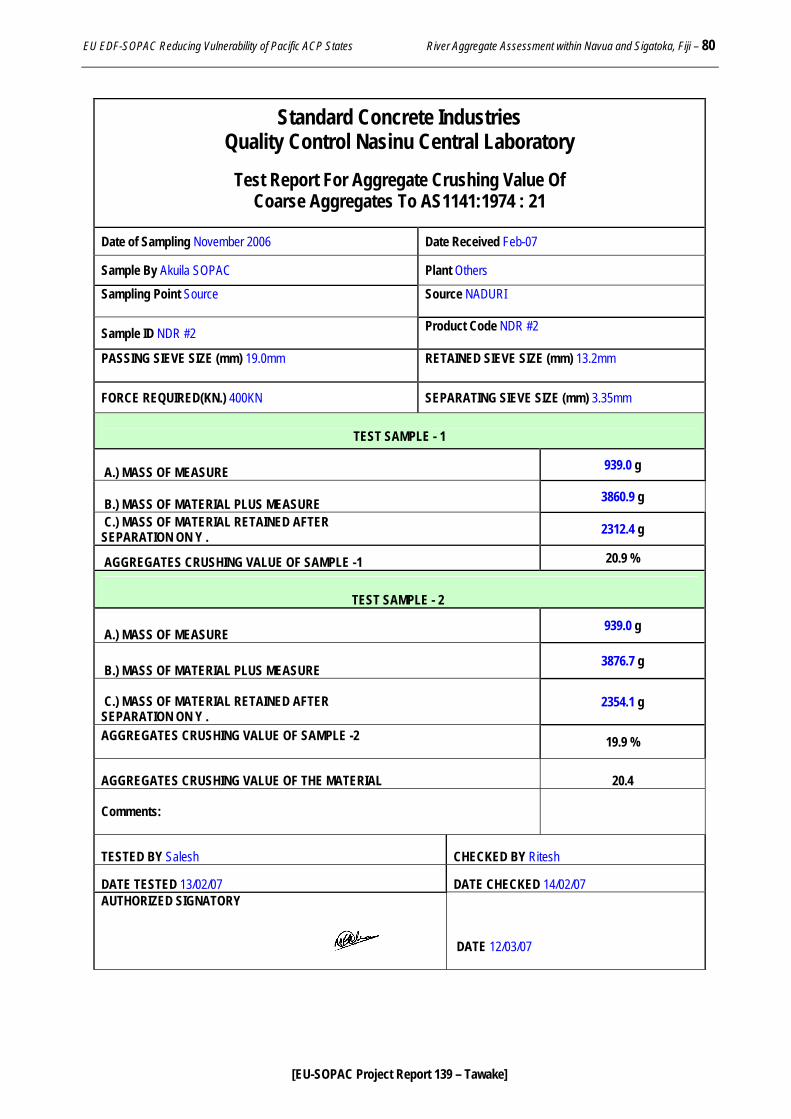
EU EDF-SOPAC Reducing Vulnerability of Pacific ACP States River Aggregate Assessment within Navua and Sigatoka, Fiji – 80
[EU-SOPAC Project Report 139 – Tawake]
Standard Concrete Industries
Quality Control Nasinu Central Laboratory
Test Report For Aggregate Crushing Value Of Coarse Aggregates To AS1141:1974 : 21
Date of Sampling November 2006 Date Received Feb-07
Sample By Akuila SOPAC Plant Others
Sampling Point Source
Source NADURI
Sample ID NDR #2 Product Code NDR #2
PASSING SIEVE SIZE (mm) 19.0mm
RETAINED SIEVE SIZE (mm) 13.2mm
FORCE REQUIRED(KN.) 400KN SEPARATING SIEVE SIZE (mm) 3.35mm
TEST SAMPLE - 1
A.) MASS OF MEASURE 939.0 g
B.) MASS OF MATERIAL PLUS MEASURE 3860.9 g
C.) MASS OF MATERIAL RETAINED AFTER SEPARATION ON Y . 2312.4 g
AGGREGATES CRUSHING VALUE OF SAMPLE -1 20.9 %
TEST SAMPLE - 2
A.) MASS OF MEASURE 939.0 g
B.) MASS OF MATERIAL PLUS MEASURE
3876.7 g
C.) MASS OF MATERIAL RETAINED AFTER SEPARATION ON Y .
2354.1 g
AGGREGATES CRUSHING VALUE OF SAMPLE -2 19.9 %
AGGREGATES CRUSHING VALUE OF THE MATERIAL 20.4
Comments:
TESTED BY Salesh CHECKED BY Ritesh
DATE TESTED 13/02/07 DATE CHECKED 14/02/07 AUTHORIZED SIGNATORY
DATE 12/03/07
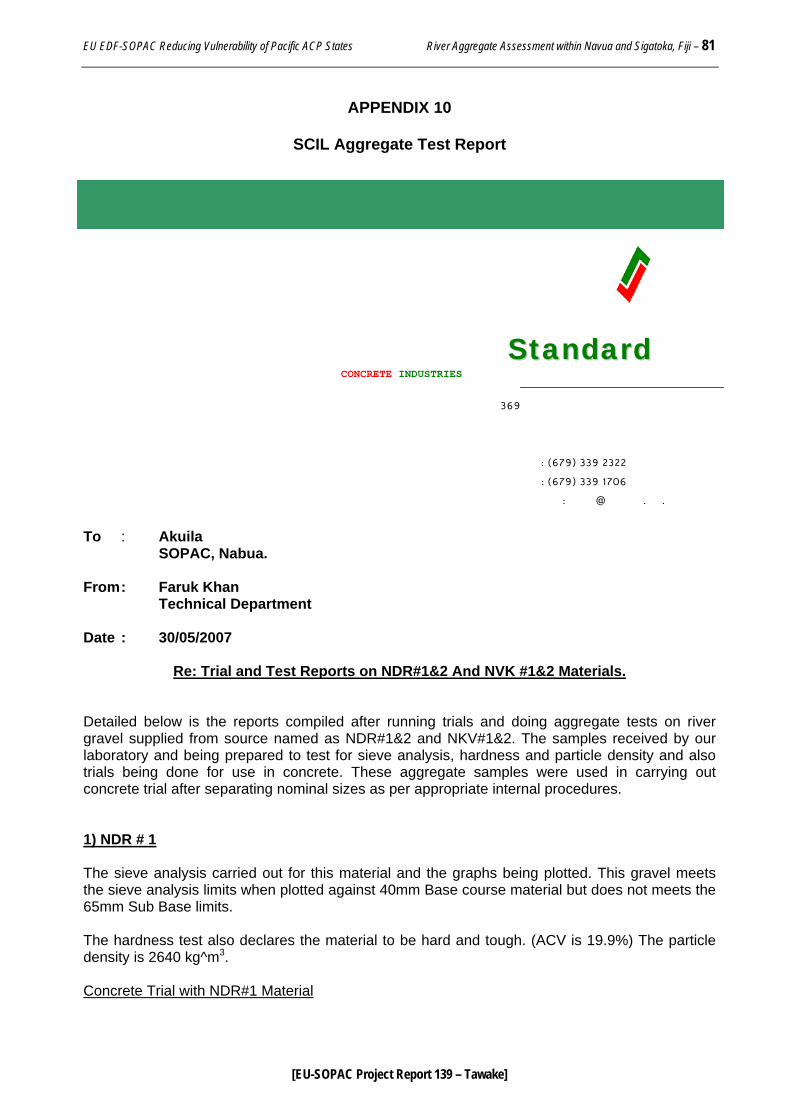
EU EDF-SOPAC Reducing Vulnerability of Pacific ACP States River Aggregate Assessment within Navua and Sigatoka, Fiji – 81
[EU-SOPAC Project Report 139 – Tawake]
APPENDIX 10
SCIL Aggregate Test Report
SSttaannddaarrdd CONCRETE INDUSTRIES
� � ��� 369 ���� ���� ������� �: (679) 339 2322 �: (679) 339 1706 �����: �����@�������.���.�� To : Akuila SOPAC, Nabua. From : Faruk Khan Technical Department Date : 30/05/2007
Re: Trial and Test Reports on NDR#1&2 And NVK #1&2 Materials. Detailed below is the reports compiled after running trials and doing aggregate tests on river gravel supplied from source named as NDR#1&2 and NKV#1&2. The samples received by our laboratory and being prepared to test for sieve analysis, hardness and particle density and also trials being done for use in concrete. These aggregate samples were used in carrying out concrete trial after separating nominal sizes as per appropriate internal procedures. 1) NDR # 1 The sieve analysis carried out for this material and the graphs being plotted. This gravel meets the sieve analysis limits when plotted against 40mm Base course material but does not meets the 65mm Sub Base limits. The hardness test also declares the material to be hard and tough. (ACV is 19.9%) The particle density is 2640 kg^m3. Concrete Trial with NDR#1 Material
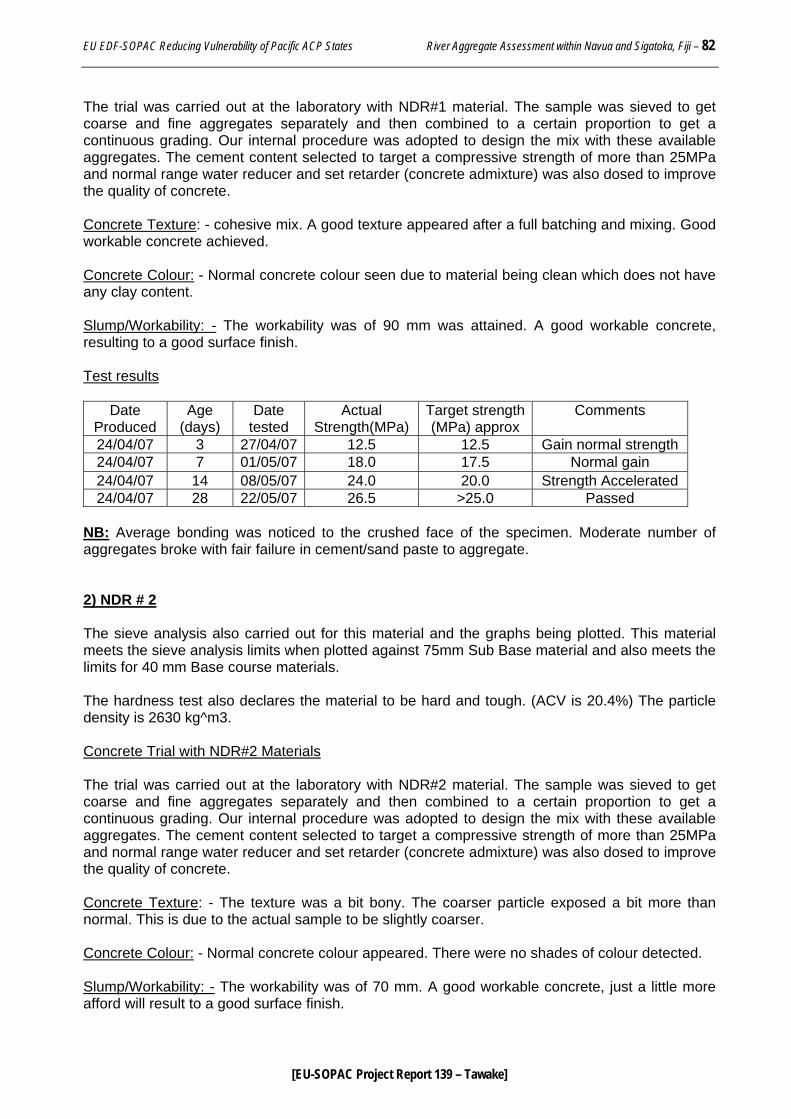
EU EDF-SOPAC Reducing Vulnerability of Pacific ACP States River Aggregate Assessment within Navua and Sigatoka, Fiji – 82
[EU-SOPAC Project Report 139 – Tawake]
The trial was carried out at the laboratory with NDR#1 material. The sample was sieved to get coarse and fine aggregates separately and then combined to a certain proportion to get a continuous grading. Our internal procedure was adopted to design the mix with these available aggregates. The cement content selected to target a compressive strength of more than 25MPa and normal range water reducer and set retarder (concrete admixture) was also dosed to improve the quality of concrete. Concrete Texture: - cohesive mix. A good texture appeared after a full batching and mixing. Good workable concrete achieved. Concrete Colour: - Normal concrete colour seen due to material being clean which does not have any clay content. Slump/Workability: - The workability was of 90 mm was attained. A good workable concrete, resulting to a good surface finish. Test results
Date Produced
Age (days)
Date tested
Actual Strength(MPa)
Target strength(MPa) approx
Comments
24/04/07 3 27/04/07 12.5 12.5 Gain normal strength 24/04/07 7 01/05/07 18.0 17.5 Normal gain 24/04/07 14 08/05/07 24.0 20.0 Strength Accelerated 24/04/07 28 22/05/07 26.5 >25.0 Passed
NB: Average bonding was noticed to the crushed face of the specimen. Moderate number of aggregates broke with fair failure in cement/sand paste to aggregate. 2) NDR # 2 The sieve analysis also carried out for this material and the graphs being plotted. This material meets the sieve analysis limits when plotted against 75mm Sub Base material and also meets the limits for 40 mm Base course materials. The hardness test also declares the material to be hard and tough. (ACV is 20.4%) The particle density is 2630 kg^m3. Concrete Trial with NDR#2 Materials The trial was carried out at the laboratory with NDR#2 material. The sample was sieved to get coarse and fine aggregates separately and then combined to a certain proportion to get a continuous grading. Our internal procedure was adopted to design the mix with these available aggregates. The cement content selected to target a compressive strength of more than 25MPa and normal range water reducer and set retarder (concrete admixture) was also dosed to improve the quality of concrete. Concrete Texture: - The texture was a bit bony. The coarser particle exposed a bit more than normal. This is due to the actual sample to be slightly coarser. Concrete Colour: - Normal concrete colour appeared. There were no shades of colour detected. Slump/Workability: - The workability was of 70 mm. A good workable concrete, just a little more afford will result to a good surface finish.
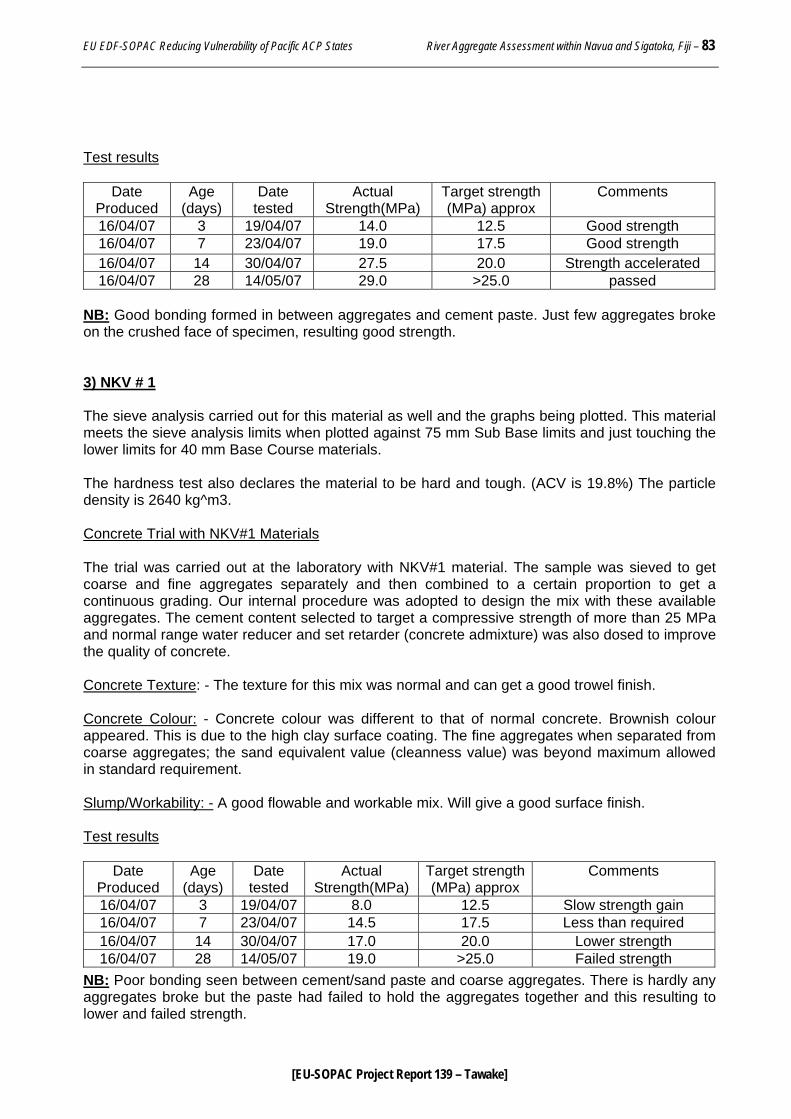
EU EDF-SOPAC Reducing Vulnerability of Pacific ACP States River Aggregate Assessment within Navua and Sigatoka, Fiji – 83
[EU-SOPAC Project Report 139 – Tawake]
Test results
Date Produced
Age (days)
Date tested
Actual Strength(MPa)
Target strength (MPa) approx
Comments
16/04/07 3 19/04/07 14.0 12.5 Good strength 16/04/07 7 23/04/07 19.0 17.5 Good strength 16/04/07 14 30/04/07 27.5 20.0 Strength accelerated 16/04/07 28 14/05/07 29.0 >25.0 passed
NB: Good bonding formed in between aggregates and cement paste. Just few aggregates broke on the crushed face of specimen, resulting good strength. 3) NKV # 1 The sieve analysis carried out for this material as well and the graphs being plotted. This material meets the sieve analysis limits when plotted against 75 mm Sub Base limits and just touching the lower limits for 40 mm Base Course materials. The hardness test also declares the material to be hard and tough. (ACV is 19.8%) The particle density is 2640 kg^m3. Concrete Trial with NKV#1 Materials The trial was carried out at the laboratory with NKV#1 material. The sample was sieved to get coarse and fine aggregates separately and then combined to a certain proportion to get a continuous grading. Our internal procedure was adopted to design the mix with these available aggregates. The cement content selected to target a compressive strength of more than 25 MPa and normal range water reducer and set retarder (concrete admixture) was also dosed to improve the quality of concrete. Concrete Texture: - The texture for this mix was normal and can get a good trowel finish. Concrete Colour: - Concrete colour was different to that of normal concrete. Brownish colour appeared. This is due to the high clay surface coating. The fine aggregates when separated from coarse aggregates; the sand equivalent value (cleanness value) was beyond maximum allowed in standard requirement. Slump/Workability: - A good flowable and workable mix. Will give a good surface finish. Test results
Date Produced
Age (days)
Date tested
Actual Strength(MPa)
Target strength(MPa) approx
Comments
16/04/07 3 19/04/07 8.0 12.5 Slow strength gain 16/04/07 7 23/04/07 14.5 17.5 Less than required 16/04/07 14 30/04/07 17.0 20.0 Lower strength 16/04/07 28 14/05/07 19.0 >25.0 Failed strength
NB: Poor bonding seen between cement/sand paste and coarse aggregates. There is hardly any aggregates broke but the paste had failed to hold the aggregates together and this resulting to lower and failed strength.
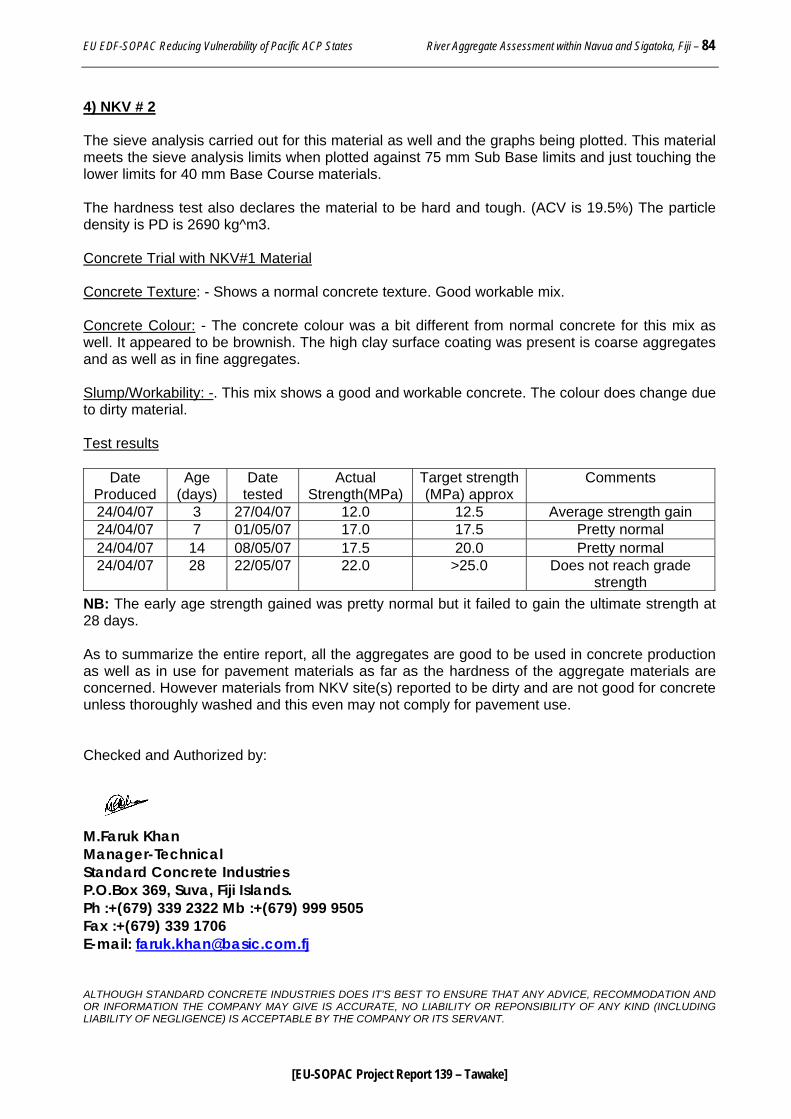
EU EDF-SOPAC Reducing Vulnerability of Pacific ACP States River Aggregate Assessment within Navua and Sigatoka, Fiji – 84
[EU-SOPAC Project Report 139 – Tawake]
4) NKV # 2 The sieve analysis carried out for this material as well and the graphs being plotted. This material meets the sieve analysis limits when plotted against 75 mm Sub Base limits and just touching the lower limits for 40 mm Base Course materials. The hardness test also declares the material to be hard and tough. (ACV is 19.5%) The particle density is PD is 2690 kg^m3. Concrete Trial with NKV#1 Material Concrete Texture: - Shows a normal concrete texture. Good workable mix. Concrete Colour: - The concrete colour was a bit different from normal concrete for this mix as well. It appeared to be brownish. The high clay surface coating was present is coarse aggregates and as well as in fine aggregates. Slump/Workability: -. This mix shows a good and workable concrete. The colour does change due to dirty material. Test results
Date Produced
Age (days)
Date tested
Actual Strength(MPa)
Target strength(MPa) approx
Comments
24/04/07 3 27/04/07 12.0 12.5 Average strength gain 24/04/07 7 01/05/07 17.0 17.5 Pretty normal 24/04/07 14 08/05/07 17.5 20.0 Pretty normal 24/04/07 28 22/05/07 22.0 >25.0 Does not reach grade
strength NB: The early age strength gained was pretty normal but it failed to gain the ultimate strength at 28 days. As to summarize the entire report, all the aggregates are good to be used in concrete production as well as in use for pavement materials as far as the hardness of the aggregate materials are concerned. However materials from NKV site(s) reported to be dirty and are not good for concrete unless thoroughly washed and this even may not comply for pavement use. Checked and Authorized by:
M.Faruk Khan Manager-Technical Standard Concrete Industries P.O.Box 369, Suva, Fiji Islands. Ph :+(679) 339 2322 Mb :+(679) 999 9505 Fax :+(679) 339 1706 E-mail: [email protected] ALTHOUGH STANDARD CONCRETE INDUSTRIES DOES IT’S BEST TO ENSURE THAT ANY ADVICE, RECOMMODATION AND OR INFORMATION THE COMPANY MAY GIVE IS ACCURATE, NO LIABILITY OR REPONSIBILITY OF ANY KIND (INCLUDING LIABILITY OF NEGLIGENCE) IS ACCEPTABLE BY THE COMPANY OR ITS SERVANT.

EU EDF-SOPAC Reducing Vulnerability of Pacific ACP States River Aggregate Assessment within Navua and Sigatoka, Fiji – 85
[EU-SOPAC Project Report 139 – Tawake]
APPENDIX 11
Los Angeles Abrasion Test Results
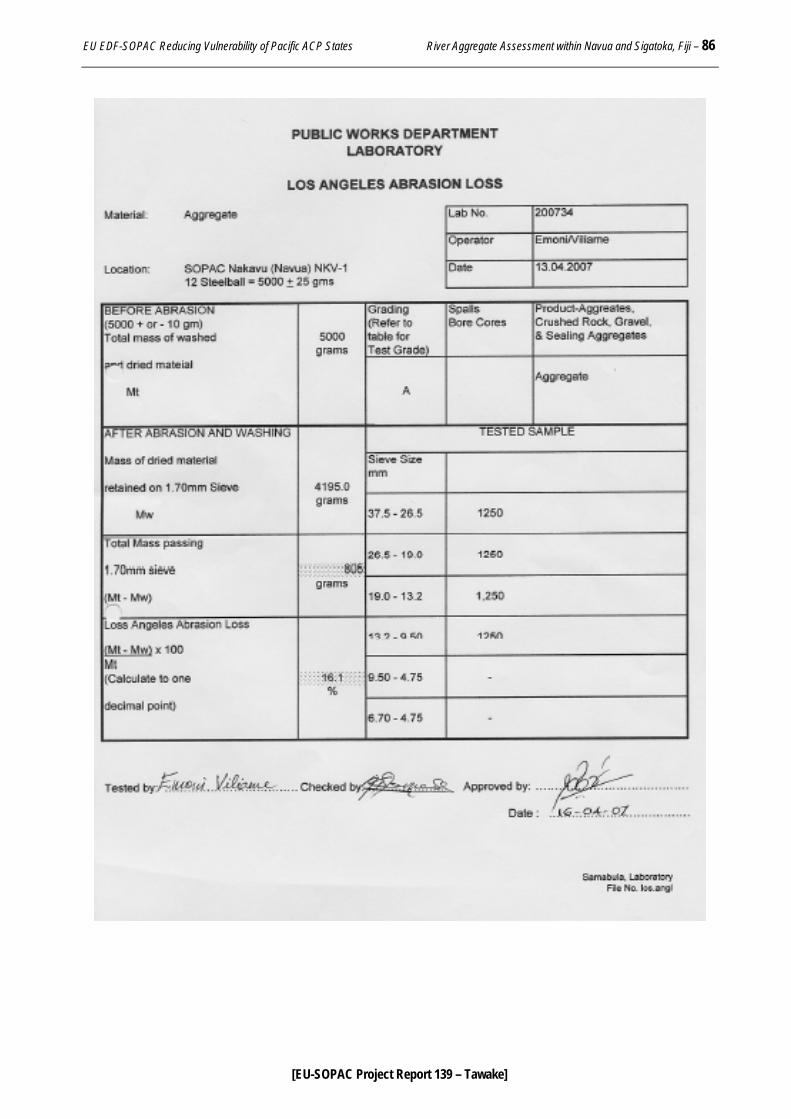
EU EDF-SOPAC Reducing Vulnerability of Pacific ACP States River Aggregate Assessment within Navua and Sigatoka, Fiji – 86
[EU-SOPAC Project Report 139 – Tawake]
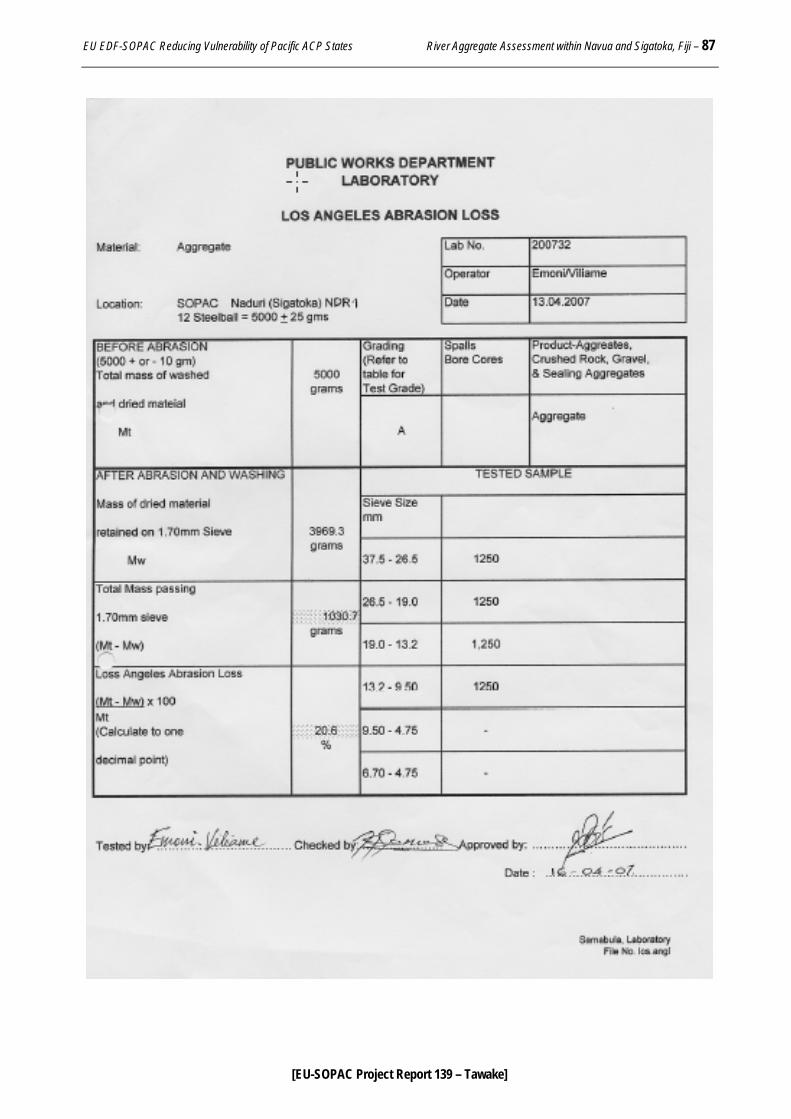
EU EDF-SOPAC Reducing Vulnerability of Pacific ACP States River Aggregate Assessment within Navua and Sigatoka, Fiji – 87
[EU-SOPAC Project Report 139 – Tawake]
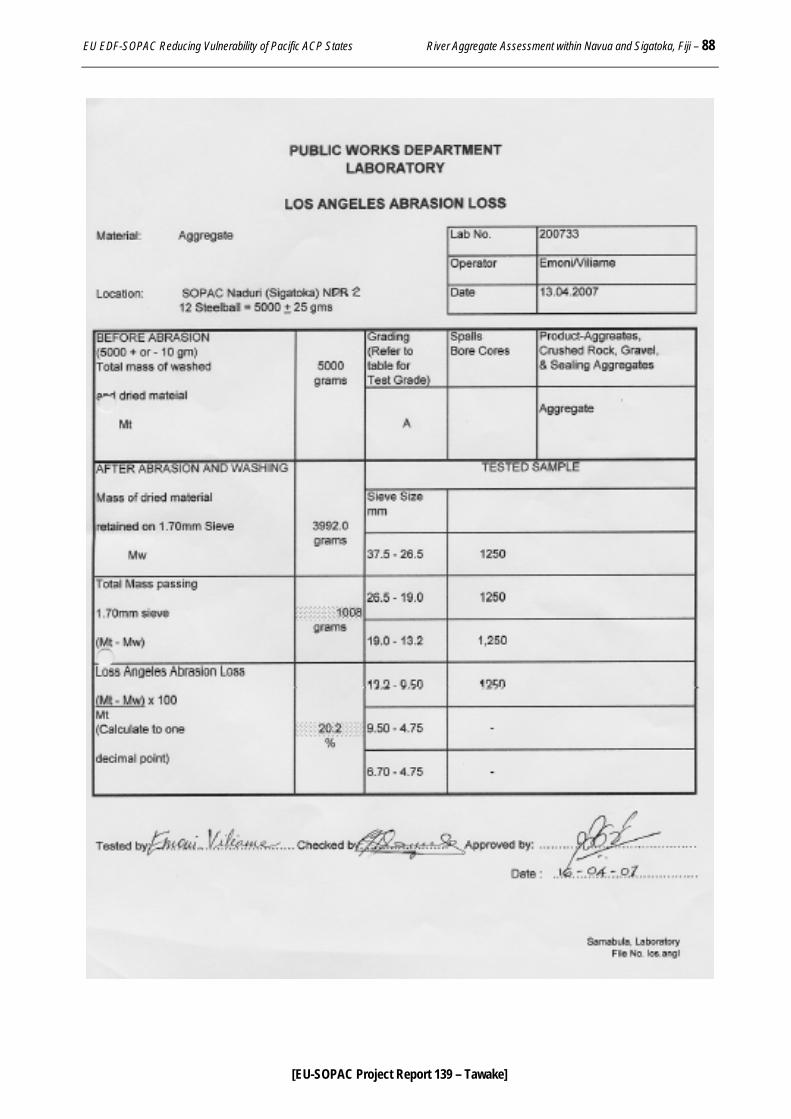
EU EDF-SOPAC Reducing Vulnerability of Pacific ACP States River Aggregate Assessment within Navua and Sigatoka, Fiji – 88
[EU-SOPAC Project Report 139 – Tawake]