Flavonolignan Biosynthesis in Silybum marianum · 2017-10-11 · Biosynthesis of silymarin...
179
Flavonolignan Biosynthesis in Silybum marianum – Potential Regulatory Mechanisms and Candidate Genes Dissertation zur Erlangung des Doktorgrades der Naturwissenschaften (Dr. rer. nat.) dem Fachbereich der Pharmazie der Philipps-Universität Marburg vorgelegt von Lennart Poppe aus Lüdenscheid/Germany Marburg/Lahn 2017
Transcript of Flavonolignan Biosynthesis in Silybum marianum · 2017-10-11 · Biosynthesis of silymarin...
Flavonolignan Biosynthesis in Silybum marianum –
Potential Regulatory Mechanisms and Candidate Genes
Dissertation zur Erlangung des
Doktorgrades der Naturwissenschaften
(Dr. rer. nat.)
dem Fachbereich der Pharmazie
der Philipps-Universität Marburg
vorgelegt von
Lennart Poppe
aus Lüdenscheid/Germany
Marburg/Lahn 2017
2
Vom Fachbereich Pharmazie der Philipps‐Universität Marburg
als Dissertation am 04.10.2017 angenommen.
Erstgutachterin: Prof. Dr. Maike Petersen
Zweitgutachter: Prof. Dr. Arnold Grünweller
Tag der mündlichen Prüfung: 04.10.2017
Hochschulkennziffer: 1180
3
Originaldokument gespeichert auf dem Publikationsserver der
Philipps-Universität Marburg
http://archiv.ub.uni-marburg.de
Dieses Werk bzw. Inhalt steht unter einer
Creative Commons Namensnennung
Keine kommerzielle Nutzung
Keine Bearbeitung
4.0 Deutschland Lizenz.
Die vollständige Lizenz finden Sie unter:
https://creativecommons.org/licenses/by-nc-nd/4.0/
4
Eidesstaatliche Erklärung
Ich versichere, dass ich meine Dissertation
Flavonolignan Biosynthesis in Silybum marianum – Potential Regulatory Mechanisms and
Candidate Genes
selbständig ohne unerlaubte Hilfe angefertigt und mich dabei keiner anderen als der von mir
ausdrücklich bezeichneten Quellen bedient habe. Alle vollständig oder sinngemäß
übernommenen Zitate sind als solche gekennzeichnet.
Die Dissertation wurde in der jetzigen oder einer ähnlichen Form noch bei keiner anderen
Hochschule eingereicht und hat noch keinen sonstigen Prüfungszwecken gedient.
Marburg, den 11.10.2017
5
Acknowledgments
After five years of exciting research and joyful moments I have reached the end of my time
preparing for my PhD.
I hereby like to thank my PhD supervisor Prof. Dr. Maike Petersen for her support during this
thesis. I will miss the many pleasant conversations about pharmaceutical and biological topics
which could broaden my scientific horizon and mostly satisfy my natural curiosity. Her guidance,
encouragement and advice throughout this research are greatly appreciated.
I am very grateful to Prof. Dr. Arnold Grünweller for being the co-examiner of my thesis.
Furthermore, I would like to thank the current and former colleagues in the Petersen working
group for their support and help, including Marie-Claire Badouin, Elke Bauerbach, Tobias Busch,
Agus Chahyadi, Sandra Dietzler, Olga Haag, Simona Riedel, Jennifer Robinson, Thanh Son Ta,
Victoria Werner, Stefan Wolters and especially Dr. Soheil Pezeshki for his friendship and
inspiring conversations and also my life partner Julia Wohl.
While not directly involved in my projects, I would also like to express my thanks to the
employees of the Institute of Pharmaceutical Biology and the former and current colleagues of
the Li working group for the good companionship and joyful atmosphere. I will miss all the fun
times together.
Special thanks go to my family, especially my parents, who have always supported me and
particularly invested so much time and efforts in my education over so many years. I am truly
grateful that I could pursue my scientific goals. This would not have been possible without you.
6
Publications and Presentations
Publication Poppe, L., Petersen, M.
Variation in the flavonolignan composition of fruits from different
Silybum marianum chemotypes and suspension cultures derived
therefrom. Phytochemistry 2016, 131, 68–75.
Scientific lectures Flavonolignan biosynthesis in Silybum marianum – potential
regulatory mechanisms and candidate genes.
PhD student and postdoc conference of the Deutsche
Pharmazeutische Gesellschaft (DPhG), Sanofi-Aventis, Frankfurt,
2017.
Candidate genes involved in flavonolignan biosynthesis in Silybum
marianum.
Section of Natural Products of the Deutsche Botanische
Gesellschaft (DBG), Meisdorf, 2016.
Poster presentations Candidate genes involved in flavonolignan biosynthesis in Silybum
marianum.
International Plant Science Conference, Botanikertagung, Freising,
2015.
Identification of candidate genes involved in flavonolignan
biosynthesis in Silybum marianum. International Plant Science
Conference, Botanikertagung, Tübingen, 2013.
7
I. Table of contents
Eidesstaatliche Erklärung .............................................................................................................................. 4
Acknowledgments ......................................................................................................................................... 5
Publications and Presentations ..................................................................................................................... 6
I. Table of contents .............................................................................................................................. 7
II. Abbreviations ................................................................................................................................. 11
III. Introduction .................................................................................................................................... 14
1. Classification, morphology and etymology of Silybum marianum ................................................. 14
2. Specialised compounds from Silybum marianum .......................................................................... 16
3. Medicinal application and clinical research ................................................................................... 18
4. Biosynthesis of silymarin components ........................................................................................... 20
Phenolic compounds (phenylpropanoids) ........................................................................... 20 4.1
Flavonolignans (silymarin) ................................................................................................... 23 4.2
5. Cell cultures .................................................................................................................................... 29
6. Working objectives ......................................................................................................................... 30
IV. Material and Methods .................................................................................................................... 31
1. Plant cell cultures ........................................................................................................................... 31
1.1 Establishment of callus and suspension cultures ................................................................ 31
2. Culture characterisation ................................................................................................................. 32
2.1 Determination of growth parameters ................................................................................. 32
2.2 Enzyme extraction from cells and medium ......................................................................... 33
2.3 Determination of dry weight and flavonolignan components ............................................ 33
2.4 Determination of protein concentrations ........................................................................... 34
2.5 Enzyme activity .................................................................................................................... 34
3. Elicitation of a suspension culture ................................................................................................. 34
3.1 Sterile inoculation and elicitation of cultures ...................................................................... 35
3.2 Determination of flavonolignan components ..................................................................... 36
3.3 Accumulation and release of silymarin to medium ............................................................. 36
3.4 Degradation of silymarin...................................................................................................... 37
4. Flavonolignan composition from varying milk thistle chemotypes ............................................... 37
Origin of milk thistle fruits ................................................................................................... 38 4.1
Extraction method for silymarin from fruits ....................................................................... 38 4.2
8
Establishment and cultivation of in vitro cultures ............................................................... 39 4.3
Determination of flavonolignan composition ..................................................................... 39 4.4
Enzyme preparation and purification .................................................................................. 40 4.5
Enzyme assays ..................................................................................................................... 41 4.6
5. Enzymology .................................................................................................................................... 42
5.1 Plant enzyme sources .......................................................................................................... 42
5.2 Fast protein liquid chromatography (FPLC) ......................................................................... 44
5.3 Concentration of protein solutions ...................................................................................... 47
5.4 Desalting via PD-10 columns ................................................................................................ 49
5.5 Isolation of recombinant proteins ....................................................................................... 49
5.6 Determination of protein concentration ............................................................................. 50
5.7 Protoplast isolation .............................................................................................................. 51
5.8 Sodium dodecyl sulphate polyacrylamide gel electrophoresis (SDS-PAGE) .................... 52
5.9 Western Blot ........................................................................................................................ 54
5.10 Enzyme assays ..................................................................................................................... 56
5.11 Spectrophotometrical detection of silymarin ..................................................................... 61
5.12 Thin-layer chromatography (TLC) ........................................................................................ 62
5.13 High-performance liquid chromatography (HPLC) .............................................................. 63
6. Molecular biology ........................................................................................................................... 64
6.1 RNA extraction ..................................................................................................................... 64
6.2 cDNA synthesis ..................................................................................................................... 65
6.3 Polymerase chain reaction (PCR) ......................................................................................... 65
6.4 Agarose gel electrophoresis ................................................................................................. 71
6.5 Purification of DNA fragments from agarose gels ............................................................... 72
6.6 Ligation ................................................................................................................................. 72
6.7 Restriction enzyme digest .................................................................................................... 74
7. Genetic engineering ....................................................................................................................... 75
7.1 Chemically competent E. coli cells ....................................................................................... 75
7.2 Transformation of pro- and eukaryotic cell lines ................................................................. 76
7.3 Overnight cultures ............................................................................................................... 78
7.4 Plasmid preparation ............................................................................................................. 78
7.5 Sample verification and pre-expression measures .............................................................. 79
7.6 Glycerol stocks ..................................................................................................................... 80
9
7.7 Expression of recombinant proteins .................................................................................... 80
8. Culture media ................................................................................................................................. 82
8.1 B5 medium (Gamborg et al., 1968)...................................................................................... 82
8.2 CB-2 (Gertlowski and Petersen, 1993) ................................................................................. 83
8.3 MS-Li (Empt et al., 2000)...................................................................................................... 83
8.4 Lysogeny Broth (LB) ............................................................................................................. 83
8.5 Super Optimal broth with Catabolite repression (SOC) ....................................................... 84
8.6 Yeast extract Peptone Dextrose medium ± Sorbitol (YPD/YPDS) .................................... 84
8.7 Minimal Dextrose/Methanol medium (MD/MM) ............................................................... 85
8.8 Buffered Glycerol/Methanol-complex medium (BMGY/BMMY) ..................................... 86
8.9 Synthetic Complete minimal defined medium (SC) ............................................................. 86
9. Primer list ....................................................................................................................................... 88
9.1 Degenerate primers ............................................................................................................. 88
9.2 RACE PCR primer .................................................................................................................. 88
9.3 Full length primers / gene expression primers .................................................................... 90
9.4 Sequencing primers ............................................................................................................. 92
10. Vector sequences, maps and features ........................................................................................... 93
10.1 pDrive (Qiagen) .................................................................................................................... 93
10.2 pET-15b (Novagen) .............................................................................................................. 94
10.3 pRACE (Clontech) ................................................................................................................. 95
10.4 pPICZα A (Invitrogen, provided by Prof. Dr. A. Schaller, Hohenheim) ................................ 96
10.5 pYES2/NT C (Invitrogen) ...................................................................................................... 97
11. Genotypes of laboratory strains (bacteria and yeast) .................................................................... 98
12. Reagents and kits ........................................................................................................................... 99
13. List of chemicals ........................................................................................................................... 100
14. Instruments and materials ........................................................................................................... 103
V. Results and Discussion ................................................................................................................. 105
1. Culture characterisation ............................................................................................................... 105
1.1 Medium parameters .......................................................................................................... 106
1.2 Growth parameters ........................................................................................................... 107
1.3 Flavonolignan content ....................................................................................................... 109
1.4 Enzyme activities................................................................................................................ 110
2. Culture elicitation ......................................................................................................................... 112
10
2.1 Flavonolignan content ....................................................................................................... 112
2.2 Silymarin degradation ........................................................................................................ 114
3. Flavonolignan composition from different milk thistle chemotypes ........................................... 115
3.1 Extraction method ............................................................................................................. 116
3.2 Silymarin content and composition in fruits ...................................................................... 117
3.3 Silymarin composition in suspension-cultured cells and medium .................................... 122
4. Enzymatic formation of silymarin components ........................................................................... 125
4.1 Qualitative peroxidase activity assays ............................................................................... 126
4.2 Enzymatic silymarin formation .......................................................................................... 127
4.3 Modified assays for silymarin formation ........................................................................... 129
4.4 Optimal buffer and pH for reaction ................................................................................... 130
4.5 Inhibitor studies ................................................................................................................. 131
4.6 Electron donor ................................................................................................................... 134
5. Cell wall protein extraction (CWPE) ............................................................................................. 135
6. Protoplast isolation ...................................................................................................................... 136
7. Spectrophotometrical detection of silymarin in enzyme assays.................................................. 137
8. Analysis of plant samples by thin-layer chromatography (TLC) ................................................... 138
9. Separation and identification of silymarin compounds by high-performance-liquid
chromatography (HPLC) ........................................................................................................................ 141
10. Purification of peroxidase by fast protein liquid chromatography (FPLC) ................................... 143
11. Molecular cloning of genes putatively involved in silymarin formation ...................................... 147
11.1 PCR with degenerate primers ............................................................................................ 147
11.2 RACE PCR ........................................................................................................................... 148
11.3 Full length sequences ........................................................................................................ 149
12. Expression studies for peroxidases, laccases and dirigent proteins ............................................ 157
12.1 Prokaryotic cell lines (E. coli) ............................................................................................. 157
12.2 Eukaryotic cell lines (yeast) ............................................................................................... 158
VI. Closing Discussion and Outlook.................................................................................................... 162
VII. Summary ...................................................................................................................................... 164
VIII. Zusammenfassung ........................................................................................................................ 166
IX. References .................................................................................................................................... 169
11
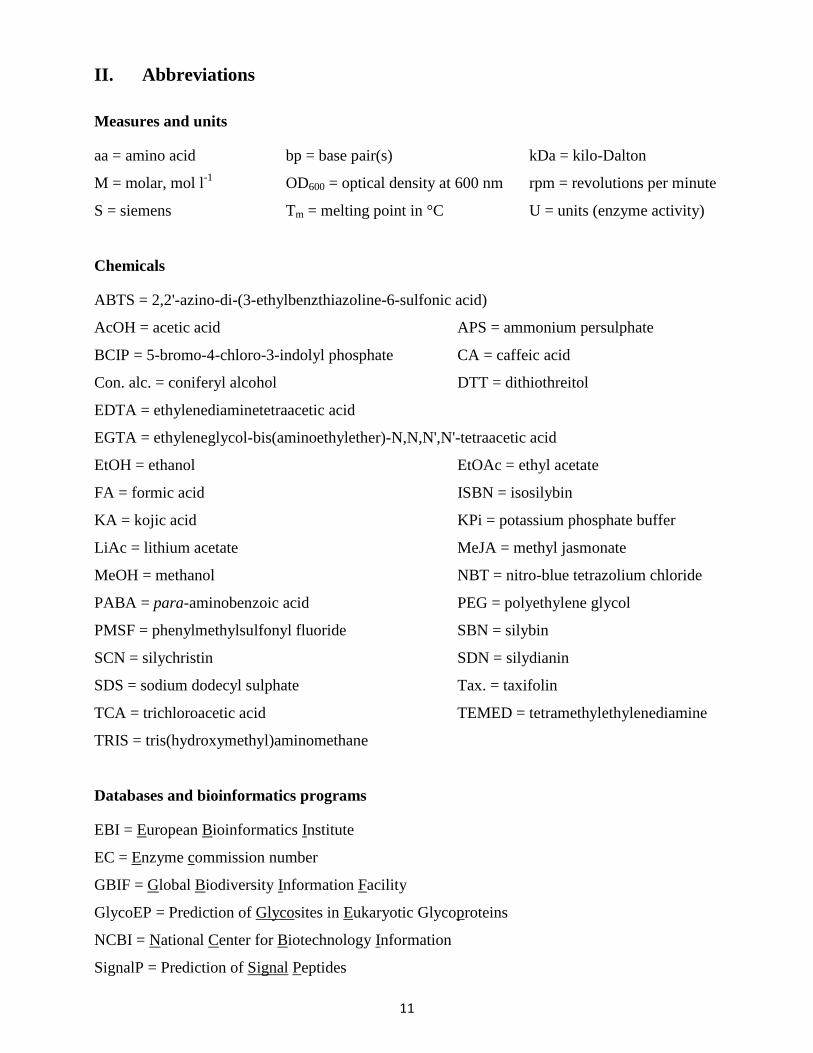
II. Abbreviations
Measures and units
aa = amino acid bp = base pair(s) kDa = kilo-Dalton
M = molar, mol l-1
OD600 = optical density at 600 nm rpm = revolutions per minute
S = siemens Tm = melting point in °C U = units (enzyme activity)
Chemicals
ABTS = 2,2'-azino-di-(3-ethylbenzthiazoline-6-sulfonic acid)
AcOH = acetic acid APS = ammonium persulphate
BCIP = 5-bromo-4-chloro-3-indolyl phosphate CA = caffeic acid
Con. alc. = coniferyl alcohol DTT = dithiothreitol
EDTA = ethylenediaminetetraacetic acid
EGTA = ethyleneglycol-bis(aminoethylether)-N,N,N',N'-tetraacetic acid
EtOH = ethanol EtOAc = ethyl acetate
FA = formic acid ISBN = isosilybin
KA = kojic acid KPi = potassium phosphate buffer
LiAc = lithium acetate MeJA = methyl jasmonate
MeOH = methanol NBT = nitro-blue tetrazolium chloride
PABA = para-aminobenzoic acid PEG = polyethylene glycol
PMSF = phenylmethylsulfonyl fluoride SBN = silybin
SCN = silychristin SDN = silydianin
SDS = sodium dodecyl sulphate Tax. = taxifolin
TCA = trichloroacetic acid TEMED = tetramethylethylenediamine
TRIS = tris(hydroxymethyl)aminomethane
Databases and bioinformatics programs
EBI = European Bioinformatics Institute
EC = Enzyme commission number
GBIF = Global Biodiversity Information Facility
GlycoEP = Prediction of Glycosites in Eukaryotic Glycoproteins
NCBI = National Center for Biotechnology Information
SignalP = Prediction of Signal Peptides
12
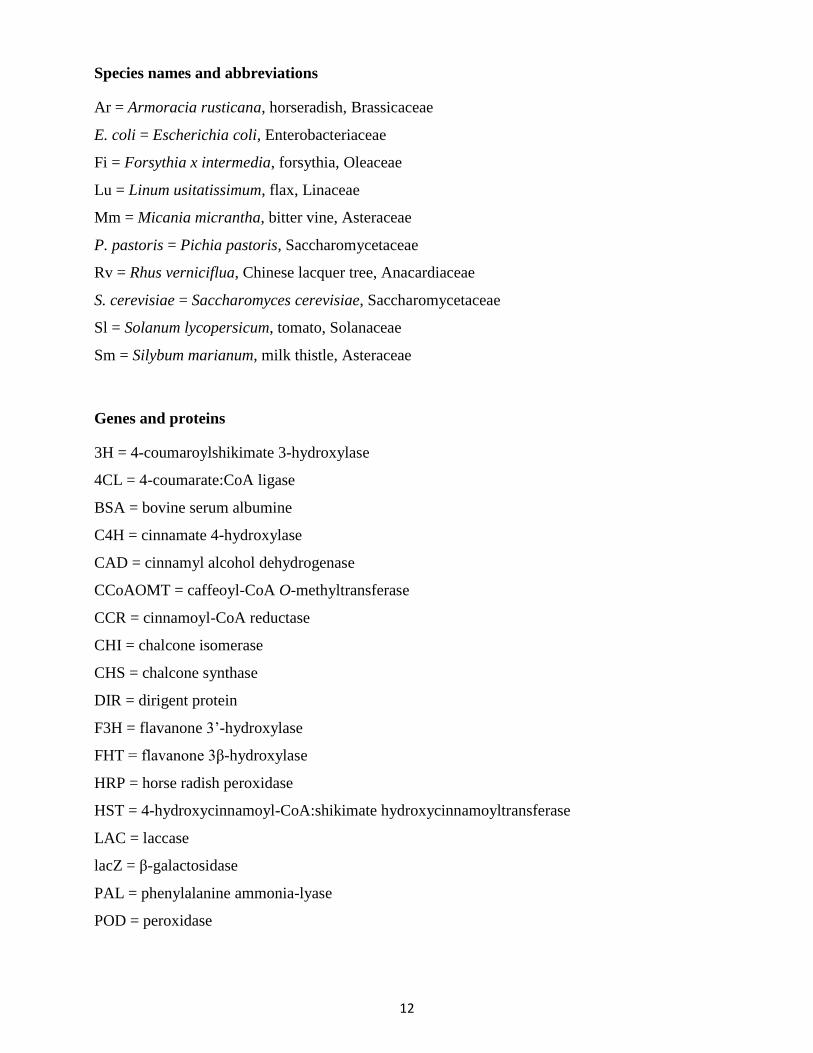
Species names and abbreviations
Ar = Armoracia rusticana, horseradish, Brassicaceae
E. coli = Escherichia coli, Enterobacteriaceae
Fi = Forsythia x intermedia, forsythia, Oleaceae
Lu = Linum usitatissimum, flax, Linaceae
Mm = Micania micrantha, bitter vine, Asteraceae
P. pastoris = Pichia pastoris, Saccharomycetaceae
Rv = Rhus verniciflua, Chinese lacquer tree, Anacardiaceae
S. cerevisiae = Saccharomyces cerevisiae, Saccharomycetaceae
Sl = Solanum lycopersicum, tomato, Solanaceae
Sm = Silybum marianum, milk thistle, Asteraceae
Genes and proteins
3H = 4-coumaroylshikimate 3-hydroxylase
4CL = 4-coumarate:CoA ligase
BSA = bovine serum albumine
C4H = cinnamate 4-hydroxylase
CAD = cinnamyl alcohol dehydrogenase
CCoAOMT = caffeoyl-CoA O-methyltransferase
CCR = cinnamoyl-CoA reductase
CHI = chalcone isomerase
CHS = chalcone synthase
DIR = dirigent protein
F3H = flavanone 3’-hydroxylase
FHT = flavanone 3β-hydroxylase
HRP = horse radish peroxidase
HST = 4-hydroxycinnamoyl-CoA:shikimate hydroxycinnamoyltransferase
LAC = laccase
lacZ = β-galactosidase
PAL = phenylalanine ammonia-lyase
POD = peroxidase
13
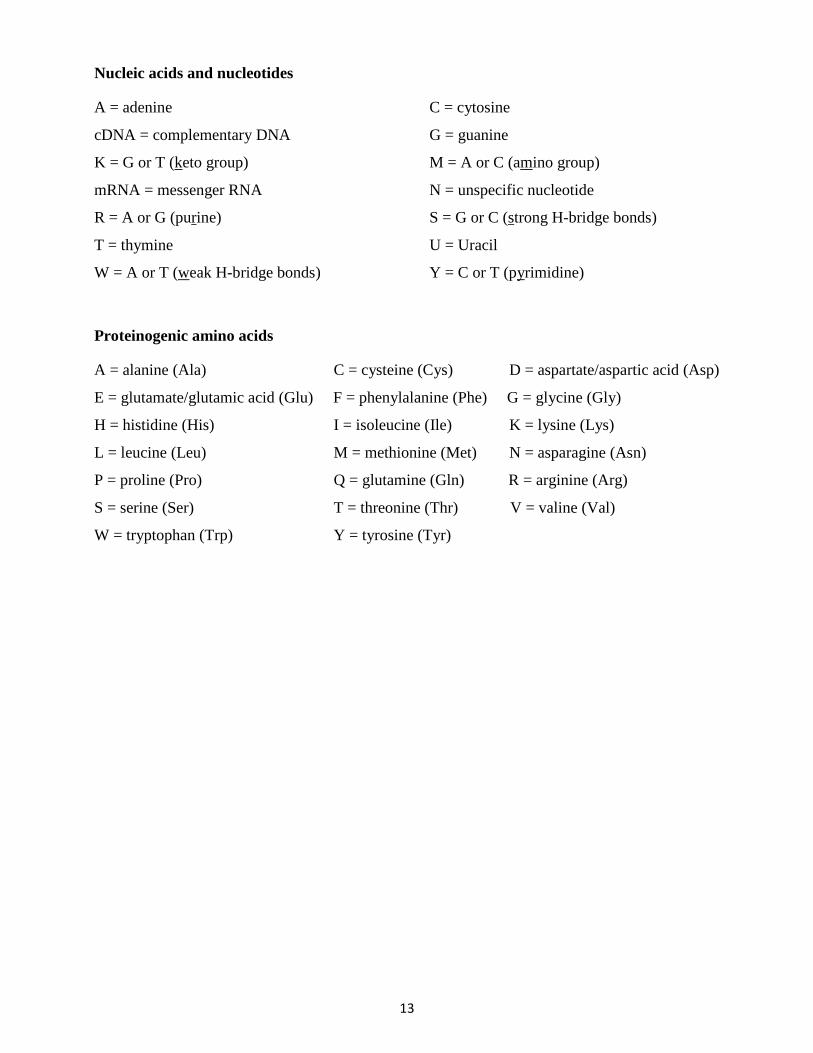
Nucleic acids and nucleotides
A = adenine C = cytosine
cDNA = complementary DNA G = guanine
K = G or T (keto group) M = A or C (amino group)
mRNA = messenger RNA N = unspecific nucleotide
R = A or G (purine) S = G or C (strong H-bridge bonds)
T = thymine U = Uracil
W = A or T (weak H-bridge bonds) Y = C or T (pyrimidine)
Proteinogenic amino acids
A = alanine (Ala) C = cysteine (Cys) D = aspartate/aspartic acid (Asp)
E = glutamate/glutamic acid (Glu) F = phenylalanine (Phe) G = glycine (Gly)
H = histidine (His) I = isoleucine (Ile) K = lysine (Lys)
L = leucine (Leu) M = methionine (Met) N = asparagine (Asn)
P = proline (Pro) Q = glutamine (Gln) R = arginine (Arg)
S = serine (Ser) T = threonine (Thr) V = valine (Val)
W = tryptophan (Trp) Y = tyrosine (Tyr)
14
III. Introduction
1. Classification, morphology and etymology of Silybum marianum
Silybum marianum (L.) Gaertn. belongs to the family Asteraceae (Compositae) or daisy family,
an extremely large and widespread family of flowering plants (Angiospermae) - more precisely,
the magnoliopsida (dicotyledons) with its subclasses of asterids and further on the order Asterales
(Angiosperm Phylogeny Website; GBIF Backbone Taxonomy).
Milk thistle is a native of Southern Europe through to Asia (Fuchs, 1543), but it also occurs in the
Canaries, the Azores and Madeira and extends eastward to South Russia and Iran. It is as well
naturalised in the Americas and in South Australia as an invasive plant (Popay, 2013). For
medicinal supply Silybum marianum is cultivated on large fields in Austria, Hungary, Germany,
China and Argentina. The presence in botanical gardens throughout the world, because of its
pharmaceutical interest, is noteworthy as well.
There are many common names given to milk thistle, including Our Lady's thistle, Marian thistle,
St. Mary's thistle, Sow thistle, variegated thistle or Wild artichoke and many more (Quattrocchi,
1999). Its botanical name Silybum marianum is prioritised by most scientific sources, in contrast
to the uncommonly used name Carduus marianus.
Milk thistle usually is an annual or biannual plant with relatively typical purple thistle flower-
heads and shiny green leaves with white lines/marbling. According to an old legend these milky-
white veins of the leaves originated from the milk of the Virgin Mary which once dropped upon a
plant and led to the names St. Mary' thistle and Our Lady's thistle, as well as the names marianus
and marianum. Its genus name “Silybum” is originally derived from the Greek word “silybon“
meaning tassel. The spherical purple flower-heads are supposed to look like tassels.
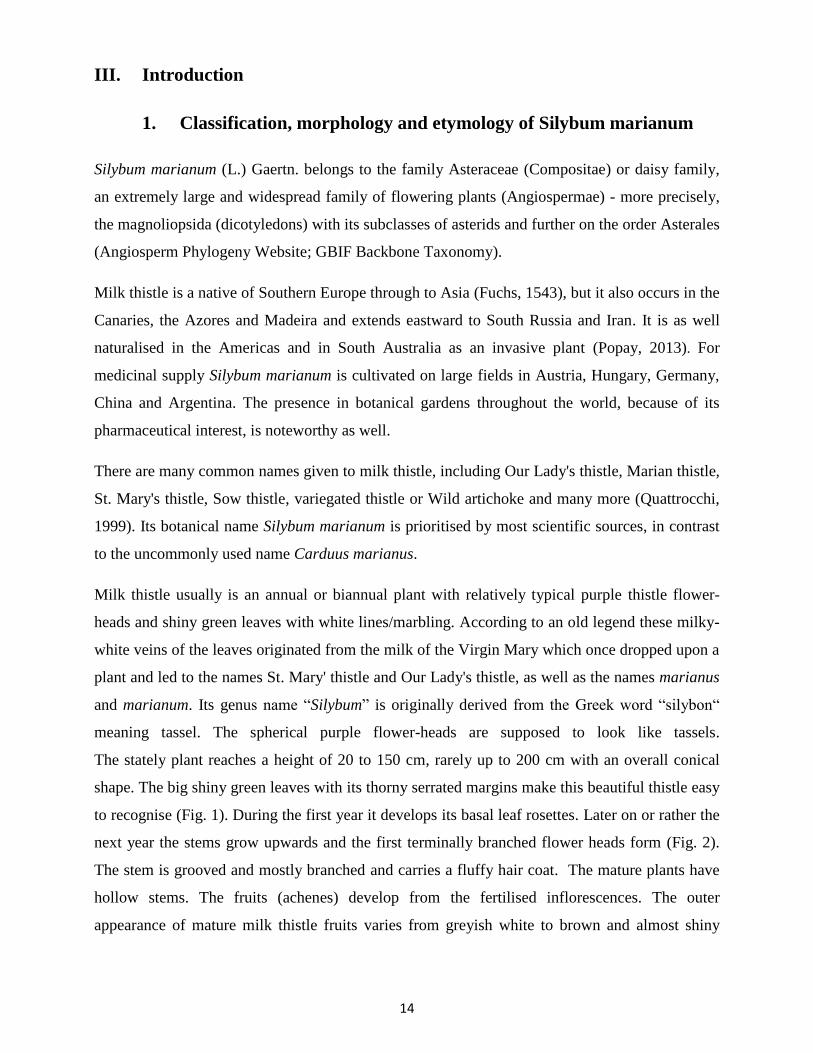
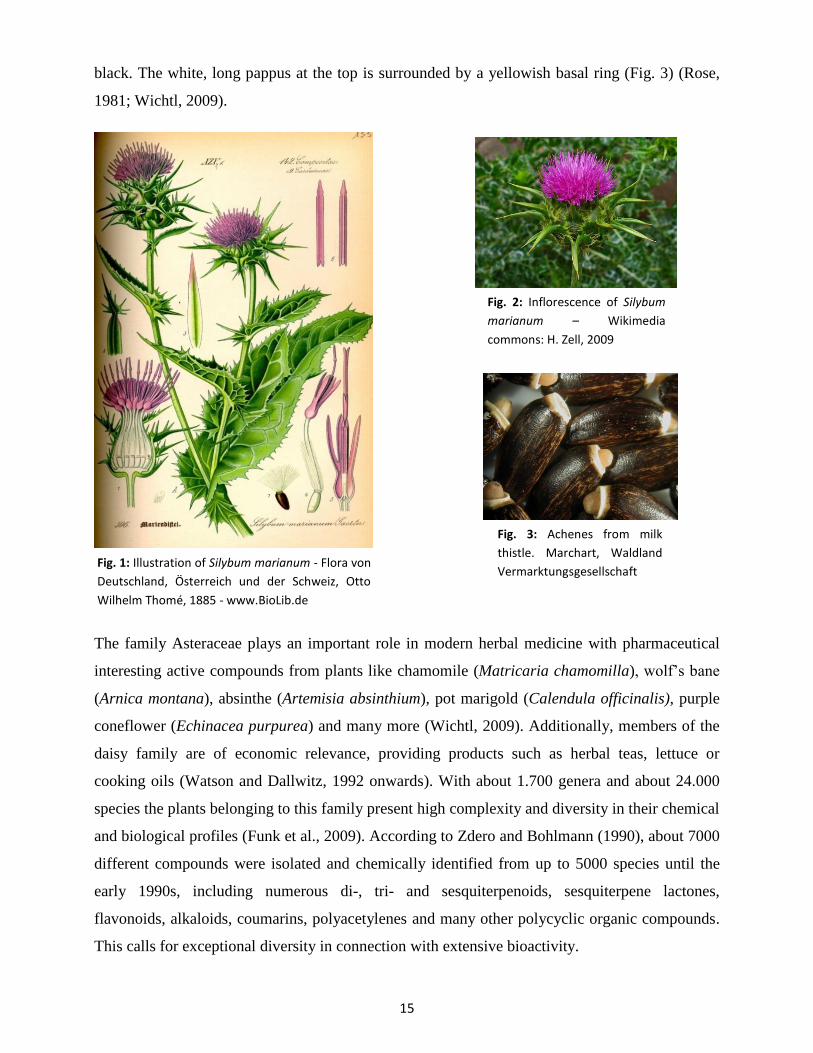
The stately plant reaches a height of 20 to 150 cm, rarely up to 200 cm with an overall conical
shape. The big shiny green leaves with its thorny serrated margins make this beautiful thistle easy
to recognise (Fig. 1). During the first year it develops its basal leaf rosettes. Later on or rather the
next year the stems grow upwards and the first terminally branched flower heads form (Fig. 2).
The stem is grooved and mostly branched and carries a fluffy hair coat. The mature plants have
hollow stems. The fruits (achenes) develop from the fertilised inflorescences. The outer
appearance of mature milk thistle fruits varies from greyish white to brown and almost shiny
15
black. The white, long pappus at the top is surrounded by a yellowish basal ring (Fig. 3) (Rose,
1981; Wichtl, 2009).
The family Asteraceae plays an important role in modern herbal medicine with pharmaceutical
interesting active compounds from plants like chamomile (Matricaria chamomilla), wolf’s bane
(Arnica montana), absinthe (Artemisia absinthium), pot marigold (Calendula officinalis), purple
coneflower (Echinacea purpurea) and many more (Wichtl, 2009). Additionally, members of the
daisy family are of economic relevance, providing products such as herbal teas, lettuce or
cooking oils (Watson and Dallwitz, 1992 onwards). With about 1.700 genera and about 24.000
species the plants belonging to this family present high complexity and diversity in their chemical
and biological profiles (Funk et al., 2009). According to Zdero and Bohlmann (1990), about 7000
different compounds were isolated and chemically identified from up to 5000 species until the
early 1990s, including numerous di-, tri- and sesquiterpenoids, sesquiterpene lactones,
flavonoids, alkaloids, coumarins, polyacetylenes and many other polycyclic organic compounds.
This calls for exceptional diversity in connection with extensive bioactivity.
Fig. 1: Illustration of Silybum marianum - Flora von
Deutschland, Österreich und der Schweiz, Otto
Wilhelm Thomé, 1885 - www.BioLib.de
Fig. 3: Achenes from milk
thistle. Marchart, Waldland
Vermarktungsgesellschaft
mbH, 2008
Fig. 2: Inflorescence of Silybum
marianum – Wikimedia
commons: H. Zell, 2009
16
Almost all higher plants have in common that they produce a broad spectrum of specialised
metabolites. Although these substances are not directly involved in the development or growth of
the organism like primary metabolites, they play a crucial role in increasing the plants’ chances
of long-term survival, persistence and fertility. Among other functions they are essential for
defence against herbivores and pathogens and communication with other organisms. They further
support in enduring abiotic stress such as increased UV-radiation or environmental challenges.
Furthermore, these organic compounds are of special pharmaceutical interest since they can serve
as medicines. Therefore they should be referred to as specialised metabolites/compounds,
because they are anything but secondary. On account of their pharmaceutical potential, the
specialised compounds identified from Asteraceae species can be regarded as promising natural
substances for future medicinal discoveries. More specifically, their anti-inflammatory and
antitumoral properties could be an interesting approach for further potential applications in case
of cardiovascular disorders or in cancer therapy (Lajter, 2016).
2. Specialised compounds from Silybum marianum
The fruit wall of the achenes of Silybum marianum contains the largest amount of the
pharmaceutically interesting flavonolignan mixture silymarin (3-6%). In addition, flavonoids like
quercetin, kaempferol, taxifolin as well as fatty oils (20-30%) with linoleic acid, tocopherols and
sterols have been identified in the fruits (Hohmann et al., 2001). Silymarin has low water
solubility and bioavailability, as well as poor intestinal absorption. Therefore, new soluble silybin
derivatives (e.g. silybin-N-methyl-glucamine, silybin bis-hemisuccinate or a β-cyclodextrin
complex) have been designed (Loguercio and Festi, 2011). Silymarin itself represents a mixture
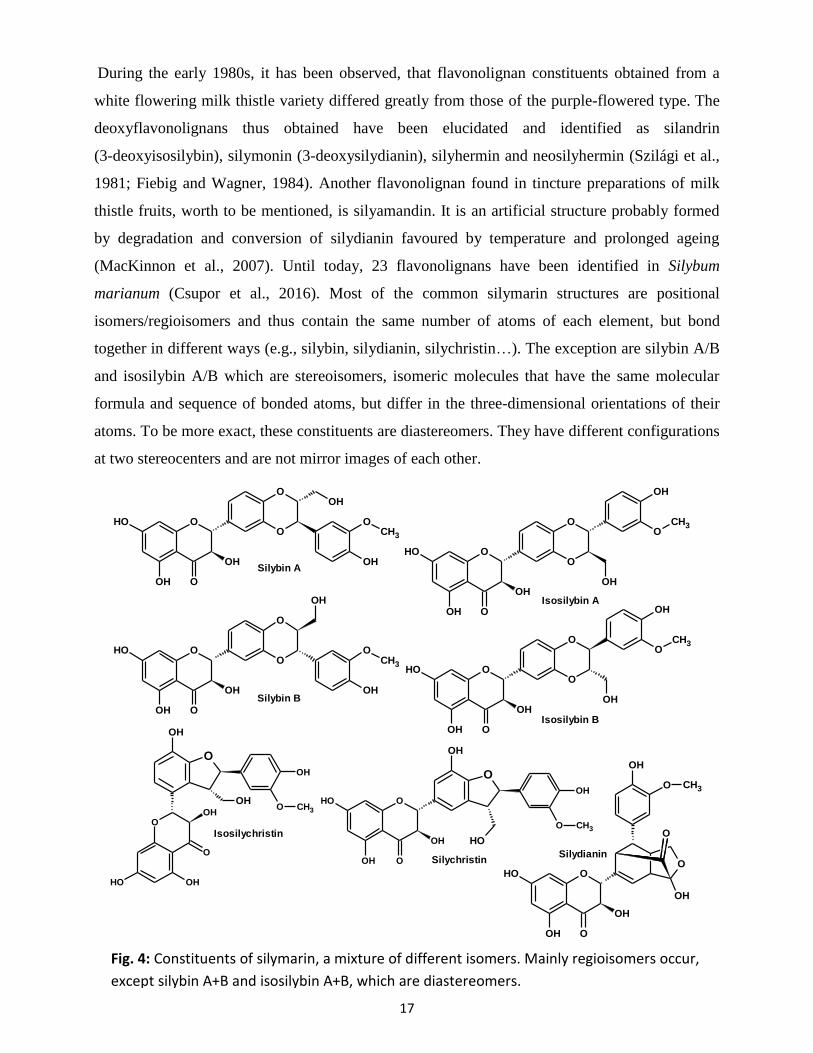
of polyphenolic molecules of more than seven different compounds (silybin A/B, isosilybin A/B,
silydianin, silychristin, isosilychristin and others), among which silybin represents the major
compound of the extract (Fig. 4; Kuki et al., 2012; Lee and Liu, 2003). All silymarin components
are derived from the precursors taxifolin and coniferyl alcohol. However, Silybum marianum is
not the only species that can synthesise these special types of flavonolignans. A Chinese group
identified several identical substances in Euonymus acanthocarpus (Celastraceae), congeneric to
our indigenous European spindle (Euonymus europaeus). Silybin A+B, isosilybin A+B and
silychristin could be isolated from bark material and positively confirmed by analytical methods
(Zhu et al., 2012).
17
OH
OH
O CH3
O
OHOH
OOH
OH O
OH
OCH3
O
OH
OH
O
OH
O
O
OH
OH
OCH3
O
OH
OH
O
OH
O
O
OH
OH
CH3O
OH
O
OH
OH
O
OH
O
O
OH
CH3O
OH
O
OH
OH
O
OH
O
O
Silybin A
Silybin B
Isosilybin A
Isosilybin B
SilydianinSilychristin
O
OH
O
O
OH
OH
OH O
O
OH
CH3
OH
OH
O CH3
O
OHOH
O
OHOH
O
Isosilychristin
During the early 1980s, it has been observed, that flavonolignan constituents obtained from a
white flowering milk thistle variety differed greatly from those of the purple-flowered type. The
deoxyflavonolignans thus obtained have been elucidated and identified as silandrin
(3-deoxyisosilybin), silymonin (3-deoxysilydianin), silyhermin and neosilyhermin (Szilági et al.,
1981; Fiebig and Wagner, 1984). Another flavonolignan found in tincture preparations of milk
thistle fruits, worth to be mentioned, is silyamandin. It is an artificial structure probably formed
by degradation and conversion of silydianin favoured by temperature and prolonged ageing
(MacKinnon et al., 2007). Until today, 23 flavonolignans have been identified in Silybum
marianum (Csupor et al., 2016). Most of the common silymarin structures are positional
isomers/regioisomers and thus contain the same number of atoms of each element, but bond
together in different ways (e.g., silybin, silydianin, silychristin…). The exception are silybin A/B
and isosilybin A/B which are stereoisomers, isomeric molecules that have the same molecular
formula and sequence of bonded atoms, but differ in the three-dimensional orientations of their
atoms. To be more exact, these constituents are diastereomers. They have different configurations
at two stereocenters and are not mirror images of each other.
Fig. 4: Constituents of silymarin, a mixture of different isomers. Mainly regioisomers occur,
except silybin A+B and isosilybin A+B, which are diastereomers.
18
3. Medicinal application and clinical research
Milk thistle has been used in traditional medicine for centuries mainly for the treatment of hepatic
disorders (Benedum et al., 2000). This dates back to the first century when the Roman naturalist,
Pliny the Elder, wrote about the plant's juice stimulating the bile flow and Dioscorides, who used
the seeds as a remedy for poisoning from snake bites. The 16th
century physician and botanist
Leonhart Fuchs praised its effectiveness against poisons in his book “New Kreüterbuch” (1543).
One century later, Nicholas Culpeper, a famous British botanist and herbalist, recommended its
use in the treatment of disorders affecting the liver and other bodily fluids (Grieve, 1971). In the
beginning of the 19th
century milk thistle was recommended and used for the treatment of blood
and liver problems as well as for intestinal cleansing. It was found that the fruits contain the
active principle that has the protective effects on the liver. The formula "Tinctura Cardui Mariae
Rademacher" still is listed in some pharmacopoeias and the German “Synonymverzeichnis”.
More recently, with the evidence of its hepatoprotective effects in animal experiments (1949) and
the isolation of the flavonolignan mixture silymarin (1969) as well as the systematic research of
ingredients and preparations of milk thistle fruits, the first finished medicinal product called
Legalon® was commercially produced (Schadewaldt, 1969).
Nowadays the application of silymarin mainly is focused on oral treatment of toxic liver damage
and for supportive therapy in chronic inflammatory liver diseases and in case of liver cirrhosis
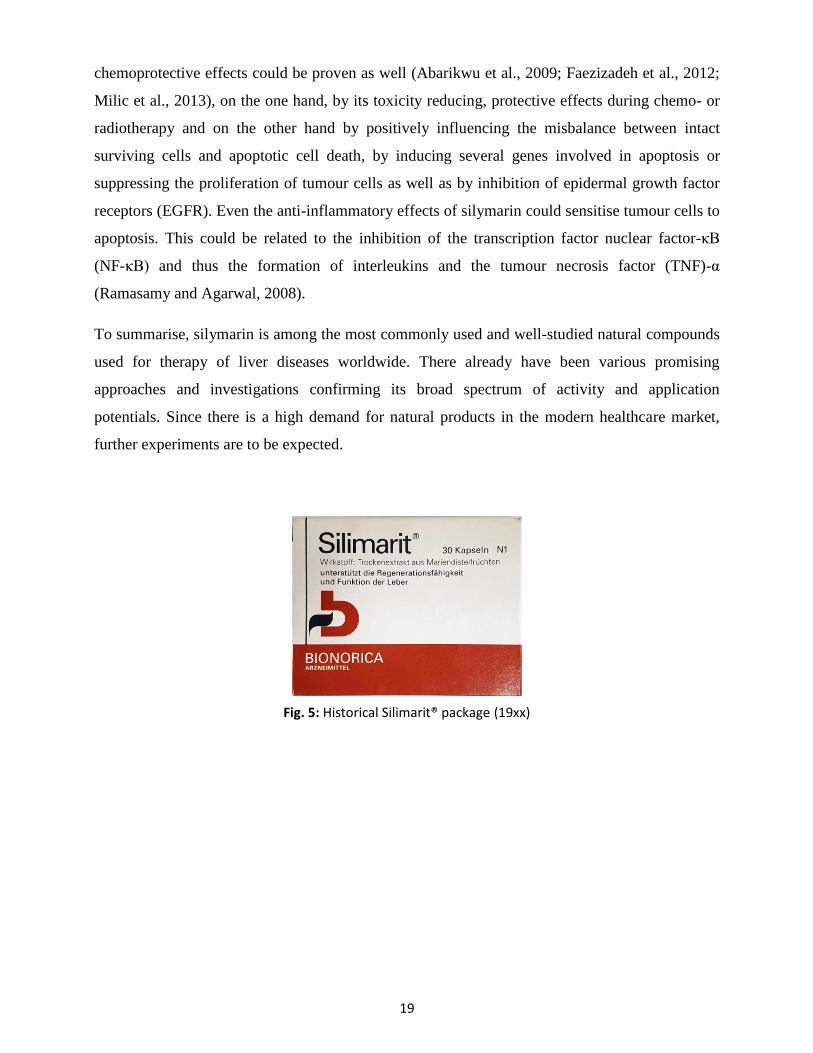
(Leng-Peschlow, 1996; Wellington and Blair, 2001). In most instances, adjusted dry extracts
come to use [e.g. Legalon® Madaus or Silimarit
® Bionorica (Fig. 5)]. There is evidence, that
silymarin increases protein synthesis in hepatocytes by stimulating RNA polymerase I activity.
This leads to increased stability of biological membranes and increased protein biosynthesis
(Vargas-Mendoza, 2014). Furthermore, due to its phenolic structure, silymarin functions as a
scavenger of radicals that can be formed during metabolisation of toxic substances (e.g. ethanol
or xenobiotics) and it has been shown to positively enhance the hepatic glutathione system
(Karimi et al., 2011; Bergheim et al., 2005; Kwon et al., 2013). In addition, intravenously given
high doses of the constituent silybin can serve as a first “antidote” in case of mushroom
poisoning with death cap (Amanita phalloides). It prevents the uptake of amatoxins by liver cells
and thus protects undamaged liver tissue (Leschert et al., 2006). Its antioxidative, antifibrotic,
anti-inflammatory, immunomodulatory, antiviral and lipid peroxidation preventive properties
have been the subject of various investigations in recent years (Dixit et al., 2010; Ghosh et al.,
2010; Parmar and Gandhi, 2008). Recently, beneficial effects in cancer therapy and
19
Fig. 5: Historical Silimarit® package (19xx)
chemoprotective effects could be proven as well (Abarikwu et al., 2009; Faezizadeh et al., 2012;
Milic et al., 2013), on the one hand, by its toxicity reducing, protective effects during chemo- or
radiotherapy and on the other hand by positively influencing the misbalance between intact
surviving cells and apoptotic cell death, by inducing several genes involved in apoptosis or
suppressing the proliferation of tumour cells as well as by inhibition of epidermal growth factor
receptors (EGFR). Even the anti-inflammatory effects of silymarin could sensitise tumour cells to
apoptosis. This could be related to the inhibition of the transcription factor nuclear factor-κB
(NF-κB) and thus the formation of interleukins and the tumour necrosis factor (TNF)-α
(Ramasamy and Agarwal, 2008).
To summarise, silymarin is among the most commonly used and well-studied natural compounds
used for therapy of liver diseases worldwide. There already have been various promising
approaches and investigations confirming its broad spectrum of activity and application
potentials. Since there is a high demand for natural products in the modern healthcare market,
further experiments are to be expected.
20
4. Biosynthesis of silymarin components
Phenolic compounds (phenylpropanoids) 4.1
In addition to the terpenoid metabolism the polyphenolic pathway ranks among the most
widespread secondary metabolic pathways of plants (Emiliani et al., 2009). The starting
compounds of the phenolic pathway are the two aromatic amino acids phenylalanine and
tyrosine. These emerge from the shikimate pathway starting with the coupling of erythose-4-
phosphate and phosphoenolpyruvate and leading via the intermediary shikimic acid to chorismic
acid. Chorismate is then transformed to L-phenylalanine and L-tyrosine (Herrmann and Weaver,
1999).
The structures and properties of polyphenols are very diverse. Among them range all compounds
with two or more hydroxyl groups or hydroxy derivatives linked to a benzene ring. Consequently,
the group includes specialised metabolites like anthocyanins, catechins, coumarins, flavonoids,
isoflavonoids, lignans and other phenylpropanoids. As lignin, which consists of polymerised
monolignol monomers (coniferyl alcohol, 4-coumaryl alcohol and sinapyl alcohol), they are
crucially involved in the process of lignification. Lignin is one of the most frequently occurring
biopolymers along with cellulose (Freudenberg and Nash, 1968). Phenylpropanoids are named
after their six-carbon, aromatic phenyl group substituted with a three-carbon propene side chain.
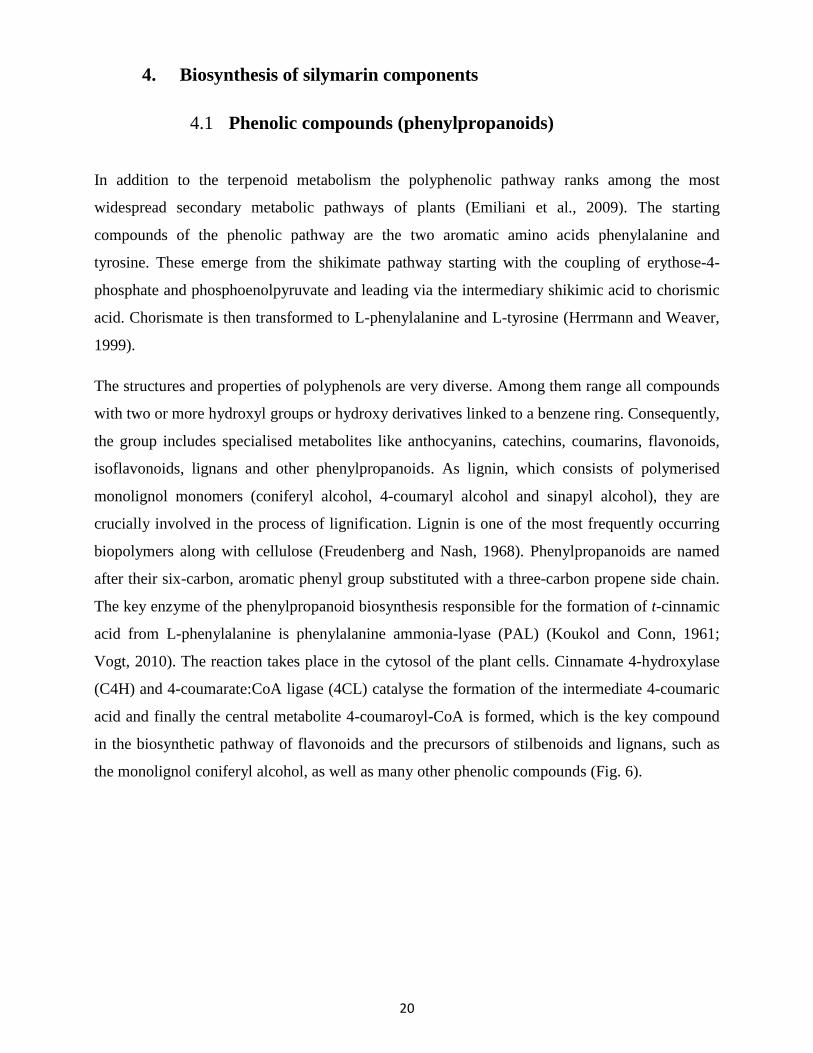
The key enzyme of the phenylpropanoid biosynthesis responsible for the formation of t-cinnamic
acid from L-phenylalanine is phenylalanine ammonia-lyase (PAL) (Koukol and Conn, 1961;
Vogt, 2010). The reaction takes place in the cytosol of the plant cells. Cinnamate 4-hydroxylase
(C4H) and 4-coumarate:CoA ligase (4CL) catalyse the formation of the intermediate 4-coumaric
acid and finally the central metabolite 4-coumaroyl-CoA is formed, which is the key compound
in the biosynthetic pathway of flavonoids and the precursors of stilbenoids and lignans, such as
the monolignol coniferyl alcohol, as well as many other phenolic compounds (Fig. 6).
21
COOH
NH2
COOH COOH
HO HO
C
O
SCoA
HO
Shikimic acid
C
O
O
HO
OH
COOH
HOCaffeoylshikimic acid
C
O
O
HO
OH
COOH
HO
HO
C
O
SCoAHO
4-Coumaroylshikimic acidCaffeoyl-CoAShikimic acid
4-Coumaroyl-CoA4-Coumaric acidt-Cinnamic acidL-Phenylalanine
HO
C
O
SCoA
Feruloyl-CoA
H3CO
HO
C
O
Coniferaldehyde
H3CO
HOConiferyl alcohol
H3COH
CH2OH
PALPAL C4H 4CL
HST
3H
CCoAOMT
CCR CAD
HST
Fig. 6: The main biosynthetic pathway towards the monolignol coniferyl alcohol. PAL = phenylalanine
ammonia-lyase, C4H = cinnamate 4-hydroxylase, 4CL = 4-coumarate:CoA ligase, HST = 4-hydroxycinnamoyl-
CoA:shikimate hydroxycinnamoyltransferase, 3H = 4-coumaroylshikimate 3-hydroxylase, CCoAOMT =
caffeoyl-CoA O-methyltransferase, CCR = cinnamoyl-CoA reductase, CAD = cinnamyl alcohol dehydrogenase.
a) The flavanonol 2,3-dihydroquercetin (taxifolin)
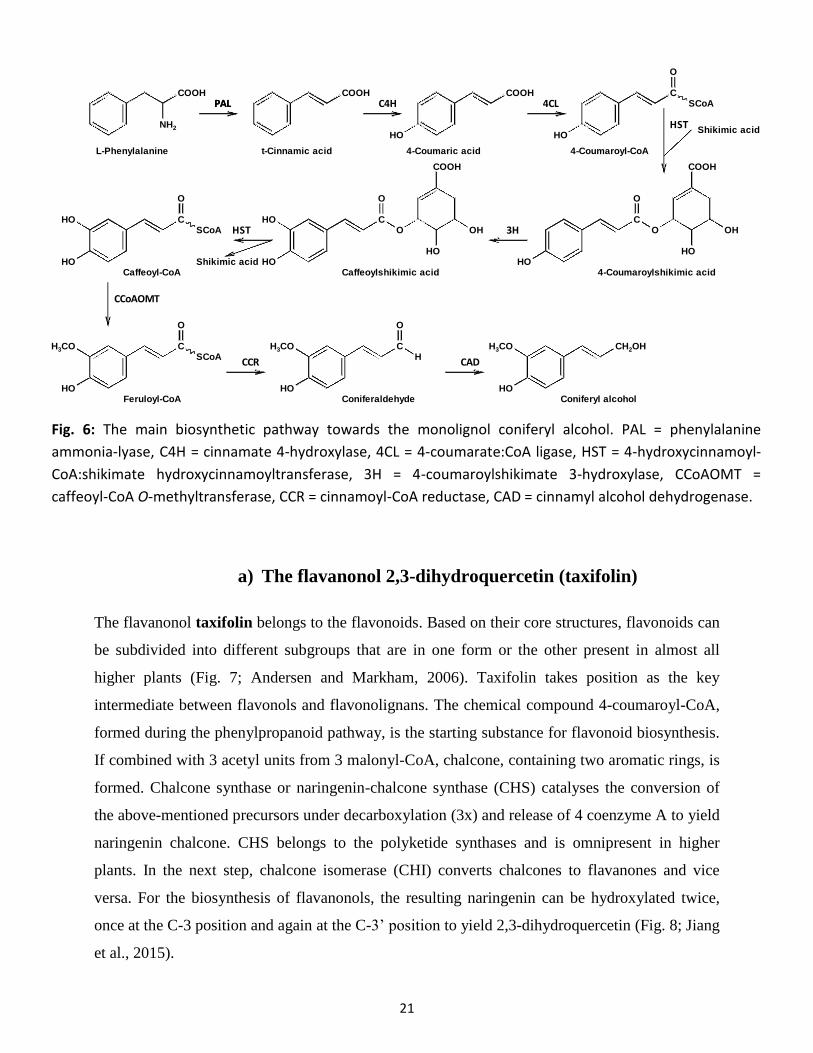
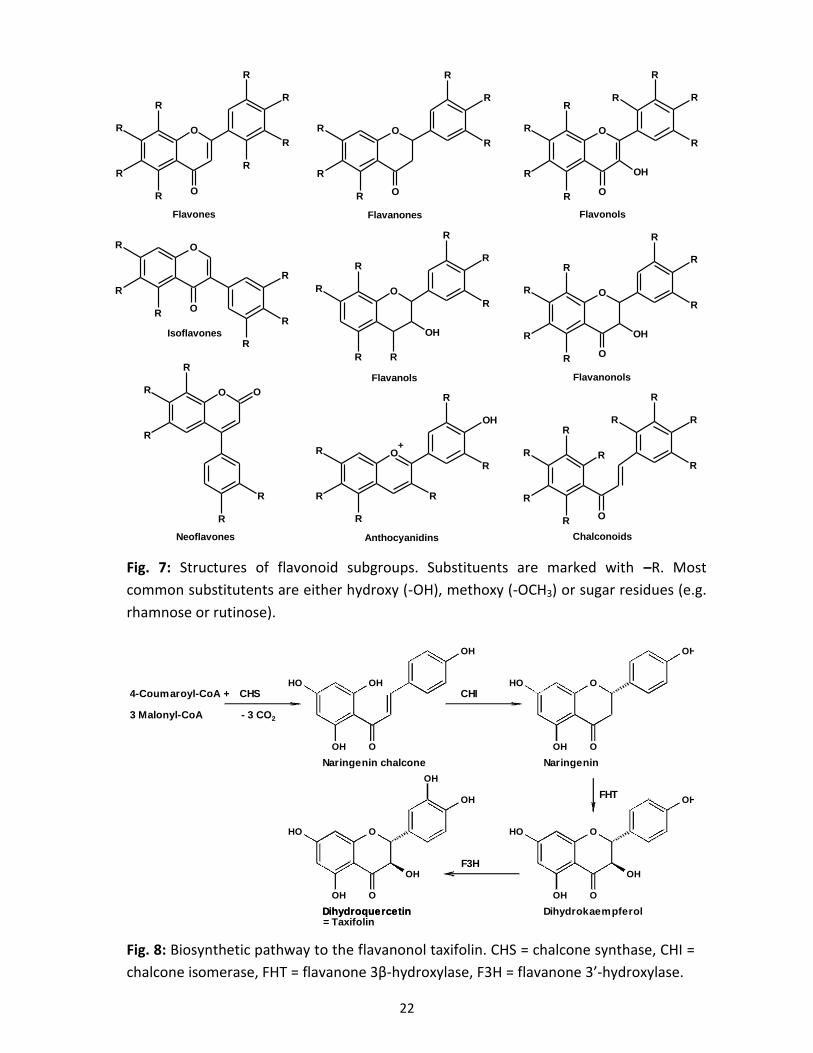
The flavanonol taxifolin belongs to the flavonoids. Based on their core structures, flavonoids can
be subdivided into different subgroups that are in one form or the other present in almost all
higher plants (Fig. 7; Andersen and Markham, 2006). Taxifolin takes position as the key
intermediate between flavonols and flavonolignans. The chemical compound 4-coumaroyl-CoA,
formed during the phenylpropanoid pathway, is the starting substance for flavonoid biosynthesis.
If combined with 3 acetyl units from 3 malonyl-CoA, chalcone, containing two aromatic rings, is
formed. Chalcone synthase or naringenin-chalcone synthase (CHS) catalyses the conversion of
the above-mentioned precursors under decarboxylation (3x) and release of 4 coenzyme A to yield
naringenin chalcone. CHS belongs to the polyketide synthases and is omnipresent in higher
plants. In the next step, chalcone isomerase (CHI) converts chalcones to flavanones and vice
versa. For the biosynthesis of flavanonols, the resulting naringenin can be hydroxylated twice,
once at the C-3 position and again at the C-3’ position to yield 2,3-dihydroquercetin (Fig. 8; Jiang
et al., 2015).
22
Fig. 7: Structures of flavonoid subgroups. Substituents are marked with –R. Most
common substitutents are either hydroxy (-OH), methoxy (-OCH3) or sugar residues (e.g.
rhamnose or rutinose).
O
O
R
R
R
R
R
R
R
R
O
OR
R
R
R
R
R
O
OH
R
R
R
R
R
R
R
O
O
R
R
R
R
R
R
O+
OH
R
R
R
R
R
R
Flavones Flavanones
Isoflavones
Flavanols
Neoflavones Anthocyanidins Chalconoids
O
O
OH
R
R
R
RR
R
R
R
O
O
OH
R
R
R
R
R
R
R
Flavonols
Flavanonols
O
R
R
R
R
RR
R
R
R
OO
R
R
R
R
R
OH
OH
O
OH
O
O
OH
O
O
OH
Naringenin
Dihydrokaempferol
FHT
Naringenin chalcone
CHICHS
- 3 CO2
4-Coumaroyl-CoA +
3 Malonyl-CoA
OH
HO
OH
HO
OH
HO
OH
O
O
OH
Dihydroquercetin
OH
HO
OH
F3H
Dihydroquercetin= Taxifolin
Fig. 8: Biosynthetic pathway to the flavanonol taxifolin. CHS = chalcone synthase, CHI =
chalcone isomerase, FHT = flavanone 3β-hydroxylase, F3H = flavanone 3’-hydroxylase.
23
Flavonolignans (silymarin) 4.2
Flavonolignans are natural phenols composed of a flavonoid and a phenylpropanoid part. In case
of the more popular compounds extracted from the purple flowering milk thistle varieties these
are taxifolin and coniferyl alcohol. The biosynthesis of the deoxy forms, like silandrin and
silyhermin, however, should involve eriodictyol or naringenin and the biosynthesis of the two
2,3-deoxy compounds apigenin or chrysoeriol instead of taxifolin (Fiebig and Wagner, 1984).
Moreover, more “non-taxifolin-based” flavonolignans like hydnocarpin and hydnowightin from
Hydnocarpus wightiana seeds, scutellaprostin from Scutellaria prostrata or flavonolignans
derived from the flavone tricin have been isolated and described as well (Chambers et al., 2015).
Most studies focus on the pharmacological use and the chemistry of silymarin, whereas the
biosynthesis has been poorly investigated. The protein(s) responsible for the coupling and thus
the formation of the typical flavonolignan components have yet to be identified. The reaction is
supposed to take place via a radical coupling mechanism by radical-forming oxidative enzymes
like peroxidases or laccases, similar to the formation of monolignol radicals and polymerisation
during lignification (Poppe and Petersen, 2016).
Lignin peroxidases (EC 1.11.1.14; diarylpropane:O2,H2O2 oxidoreductase) have molecular
weights between 38 and 43 kDa and manganese peroxidases (EC 1.11.1.13; Mn(II):H2O2
oxidoreductases) molecular weights between 45 and 47 kDa (Gold and Alic, 1993). Both are
heme-containing glycoproteins with one protoporphyrin IX as a prosthetic group and two
conserved calcium-binding sites as well as four conserved disulphide bridges. While lignin
peroxidases are better known for lignin degradation, special focus is given to the class III heme
peroxidases, which consist of the secretory higher plant peroxidases (Passardi et al., 2005). These
display much discussed functions and reactive capacity. This includes tissue-specific functions
comprising cell wall biosynthesis (lignification), cell elongation, participation in plant defence
mechanisms, detoxification and seed germination (Almagro et al., 2008; Shigeto and Tsutsumi,
2015). A peroxidase potentially involved in the formation of flavonolignans could be similar
structured as class III secretory peroxidases like the commonly used horseradish peroxidase
(HRP, EC 1.11.1.7). In that case, post-translational modification and extended glycosylation
patterns would be highly probable and should contribute to its function and activity (Wuhrer et
al., 2005; Palm et al., 2014; Baker et al., 2016).
24
Laccases (EC 1.10.3.2; benzenediol:O2 oxidoreductases) are commonly extracellular copper-
containing glycoproteins with molecular weights between 60 and 80 kDa (Thurston, 1994). The
active site of laccases contains four copper ions, from which one is a mononuclear “blue” copper
ion. Therefore they are referred to as “blue” laccases (Morozova et al., 2007). They play a role in
the degradation, but also the formation of lignin polymers, by promoting the oxidative coupling
of monolignol units. In addition to the obvious differences in structure, laccases are generally
considered to have a lower oxidation potential (Heinzkill et al., 1998).
Both types of enzymes catalyse one-electron oxidations of phenolic substrates leading to radical
formation (Kersten et al., 1990). Peroxidases use hydrogen peroxide, laccases molecular oxygen
as the electron donor. In the special case of silymarin biosynthesis, the radicals formed by the
oxidising enzymes will couple in a non-stereospecific way (Becker and Schrall, 1977; Gavezzotti
et al., 2014) leading to regioisomers and diastereomers as disparate mixtures. Furthermore, both
enzyme classes are known to have multiple isoforms which vary in enzymatic activity, substrate
specificity, functions, stability or other biochemical properties (Krainer et al., 2014; He et al.,
2014; Sergio et al., 2007). For instance, with regard to milk thistle, Greimel and Koch (1977)
discovered several peroxidase isoenzymes and divided them into four groups, based on their
charge and migration speed during discontinuous electrophoresis. They concluded that the
different activity distribution of the peroxidases is closely related to the organ specificity of its
isoenzymes.
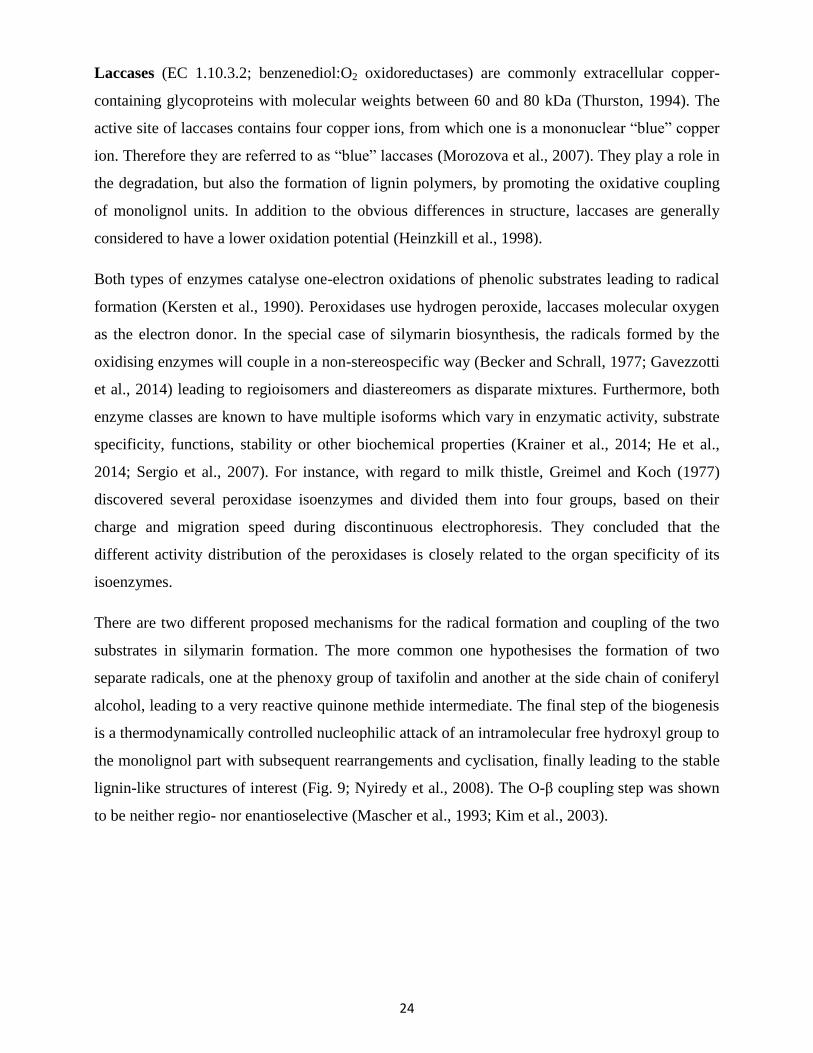
There are two different proposed mechanisms for the radical formation and coupling of the two
substrates in silymarin formation. The more common one hypothesises the formation of two
separate radicals, one at the phenoxy group of taxifolin and another at the side chain of coniferyl
alcohol, leading to a very reactive quinone methide intermediate. The final step of the biogenesis
is a thermodynamically controlled nucleophilic attack of an intramolecular free hydroxyl group to
the monolignol part with subsequent rearrangements and cyclisation, finally leading to the stable
lignin-like structures of interest (Fig. 9; Nyiredy et al., 2008). The O-β coupling step was shown
to be neither regio- nor enantioselective (Mascher et al., 1993; Kim et al., 2003).
25
- [O]
Coniferyl alcohol
CHOH
OCH3
O
OH
OOH
OH
OH
OH O
Taxifolin
H
OH
O
CH3
OH
- [O]H
OH
OOH
O
OH
OH O
O- coupling
+
OH
O
CH3
O
OOH
O
OH
OH
OH
O
Quinone methide
intermediate
OH
OCH3
O
OH
OH
O
OH
O
O
OHSilybin
Fig. 9: Biosynthesis of silymarin constituents (e.g. silybin)
according to Nyiredy et al. (2008). [O] = oxidation.
26
OH
OCH3 OH
- [O]
Coniferyl alcohol
CHOH
OCH3
O
H
OH
O
O
OH
OH
OH
O
CH
OH
O
CH3
OH
[O]
[O]
OH
OCH3
O
OH
OH
O
OH
O
O
OH
OH
O CH3O
OH
OH
O OH
O
O
OH
Isosilybin
Silybin
CH
OH
O CH3
OH
O
OH
O
OH
OH
OH
O
+ Taxifolin
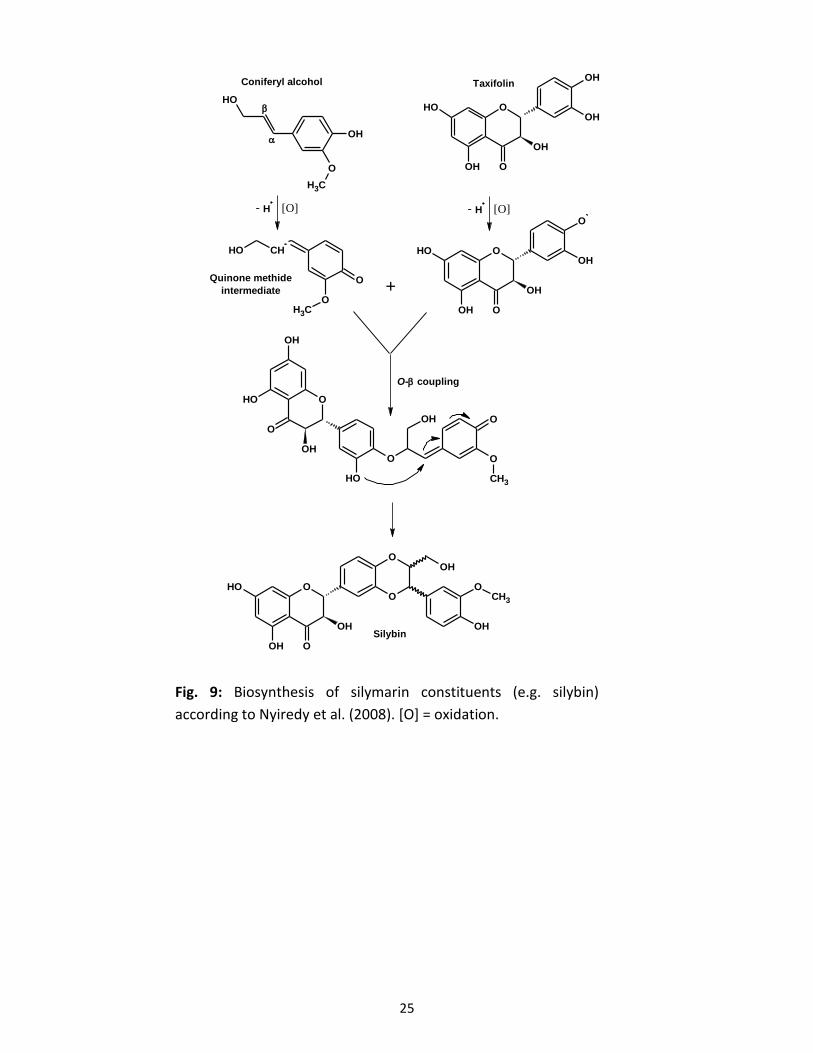
Fig. 10: Biosynthesis of silymarin constituents (e.g. silybin/isosilybin) according to
Althagafy et al. (2013). [O] = oxidation.
Another possibility is the formation of only one radical by single electron oxidation of coniferyl
alcohol with subsequent addition to one of the hydroxy groups of taxifolin’s catechol part, and
finally a second oxidation to yield silybin or isosilybin (Fig. 10; Althagafy et al., 2013).
However, the study only presented oxidative coupling with silver(I)oxide (Ag2O) instead of
enzymes to form the silymarin constituents. Nevertheless, a similar reaction mechanism could
also take place in flavonolignan biogenesis in vivo.
A further important question arises by looking into the relative amounts of the different
constituents of flavonolignans, particularly in fruits of milk thistle plants harvested from different
origins. It can be observed that there are distinct chemotypic variations in different
ecotypes/cultivars and genotypes (Hasanloo et al., 2005; Hetz et al., 1995; Martin et al., 2006;
Shokrpour et al., 2007; Poppe and Petersen, 2016). It could thereby be commercially profitable,
to increase and stabilise specific fruit yields and genotypic varieties with a preferred regioisomer
profile. From a scientific perspective, clarifying the underlying mechanism behind the
distribution of the positional isomers is particularly interesting. So far, very little is known about
why these distinctions in positional isomer proportions occur and how the plant discriminates
between them. Possible causes could be on the proteomic and genomic levels, the stage of fruit
development, transport systems or environmental influences.
27
At this point it is worth considering whether the occurrence of varying regioisomer and
diastereomer ratios might be due to the presence of specialised proteins driving the formation of
specific compounds of the silymarin mixture. So-called specifier or dirigent proteins might
direct regio- and/or stereoselectivity and thus play an active role in coupling the phenoxy radicals
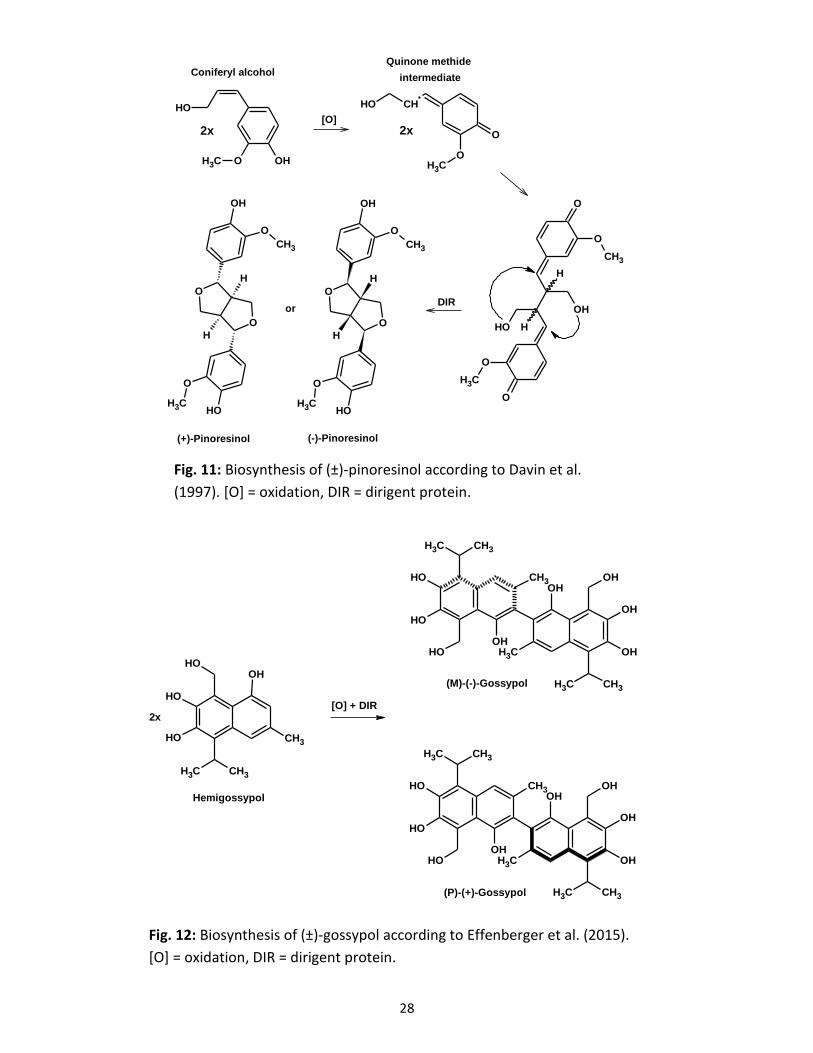
during flavonolignan biogenesis. Around 1995, the group of Davin and Lewis was the first who
discovered this new type of proteins which could determine precisely the biochemical outcome of
phenoxy radical coupling of monolignols during lignan biosynthesis and lignification without
having an own catalytic activity (Davin and Lewis, 2000). These specialised proteins could direct
the stereoselective biosynthesis of (+)-pinoresinol from coniferyl alcohol monomers (Fig. 11;
Davin et al., 1997). Recently, however, due to extensive mutational analysis, the thesis about no
catalytic activity was challenged. The group of Schaller et al. proposed a catalytic function for
dirigent proteins in the cyclisation step of the quinone methide intermediate. This was attributed
to active proton donation by hydrogen bond formation or acid catalysis (Gasper et al., 2016).
Another dirigent protein was identified in Arabidopsis thaliana, responsible for enantioselective
synthesis of (-)-pinoresinol (Pickel et al., 2010). The first 3D structure of a dirigent protein
resulted in a trimeric structure with an eight stranded β-barrel topology for each monomer (Kim
et al., 2007); the molecular mass of the monomers is about 20 kDa, rarely up to 40 kDa.
Meanwhile, more dirigent proteins involved in lignan/lignin biosyntheses, for instance from
Arabidopsis and Schisandra species (Kim et al., 2012; Pickel et al., 2010) or Isatis indigotica
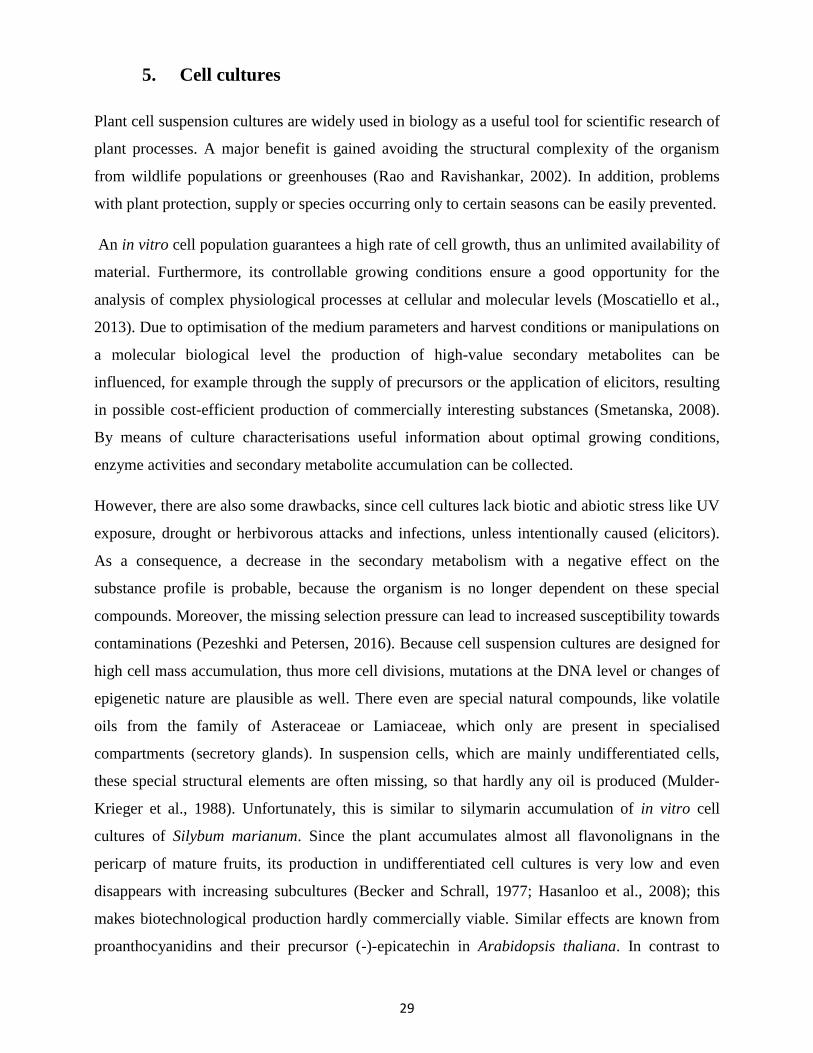
plants (Li et al., 2014) have been described. Other dirigent proteins are involved in gossypol
biogenesis in cotton species (Fig. 12; Effenberger et al., 2015). Since the reaction mechanism
between the phenoxy radical of taxifolin and the monolignol part (coniferyl alcohol) might take
place in a similar way, the assumption of the involvement of dirigent proteins in silymarin
formation seems reasonable.
Often proteins with a similar structure are also referred to as disease resistance-responsive or
dirigent-like proteins. These mostly serve as a plant defence mechanism by inducing a set of
responses that can help against the effects of invading pathogens (Martin et al., 2003). In many
cases, their direct biochemical functions or a possible dirigent activity have not yet been fully
investigated (Seneviratne et al., 2014).
28
Fig. 11: Biosynthesis of (±)-pinoresinol according to Davin et al.
(1997). [O] = oxidation, DIR = dirigent protein.
CH3
CH3CH3
OHOH
OH
OH
[O] + DIR2x
Hemigossypol
CH3
CH3 CH3
OHOH
OH
OH
CH3
CH3 CH3
OHOH
OH
OH
CH3
CH3 CH3
OHOH
OH
OH
CH3
CH3 CH3
OHOH
OH
OH
(M)-(-)-Gossypol
(P)-(+)-Gossypol
Fig. 12: Biosynthesis of (±)-gossypol according to Effenberger et al. (2015).
[O] = oxidation, DIR = dirigent protein.
OH
OCH3 OH
2x[O]
CHOH
OCH3
O2x
OH
O
CH3
O
OH
O
CH3
O
H
H
O
O
CH3
OH
O
O
CH3 OH
H
H
O
O
CH3
OH
O
O
CH3 OH
H
H
DIRor
(-)-Pinoresinol(+)-Pinoresinol
Coniferyl alcoholQuinone methide
intermediate
29
5. Cell cultures
Plant cell suspension cultures are widely used in biology as a useful tool for scientific research of
plant processes. A major benefit is gained avoiding the structural complexity of the organism
from wildlife populations or greenhouses (Rao and Ravishankar, 2002). In addition, problems
with plant protection, supply or species occurring only to certain seasons can be easily prevented.
An in vitro cell population guarantees a high rate of cell growth, thus an unlimited availability of
material. Furthermore, its controllable growing conditions ensure a good opportunity for the
analysis of complex physiological processes at cellular and molecular levels (Moscatiello et al.,
2013). Due to optimisation of the medium parameters and harvest conditions or manipulations on
a molecular biological level the production of high-value secondary metabolites can be
influenced, for example through the supply of precursors or the application of elicitors, resulting
in possible cost-efficient production of commercially interesting substances (Smetanska, 2008).
By means of culture characterisations useful information about optimal growing conditions,
enzyme activities and secondary metabolite accumulation can be collected.
However, there are also some drawbacks, since cell cultures lack biotic and abiotic stress like UV
exposure, drought or herbivorous attacks and infections, unless intentionally caused (elicitors).
As a consequence, a decrease in the secondary metabolism with a negative effect on the
substance profile is probable, because the organism is no longer dependent on these special
compounds. Moreover, the missing selection pressure can lead to increased susceptibility towards
contaminations (Pezeshki and Petersen, 2016). Because cell suspension cultures are designed for
high cell mass accumulation, thus more cell divisions, mutations at the DNA level or changes of
epigenetic nature are plausible as well. There even are special natural compounds, like volatile
oils from the family of Asteraceae or Lamiaceae, which only are present in specialised
compartments (secretory glands). In suspension cells, which are mainly undifferentiated cells,
these special structural elements are often missing, so that hardly any oil is produced (Mulder-
Krieger et al., 1988). Unfortunately, this is similar to silymarin accumulation of in vitro cell
cultures of Silybum marianum. Since the plant accumulates almost all flavonolignans in the
pericarp of mature fruits, its production in undifferentiated cell cultures is very low and even
disappears with increasing subcultures (Becker and Schrall, 1977; Hasanloo et al., 2008); this
makes biotechnological production hardly commercially viable. Similar effects are known from
proanthocyanidins and their precursor (-)-epicatechin in Arabidopsis thaliana. In contrast to
30
flavonols and anthocyanins, which for the most part are present in all plant organs except the
seeds, these compounds are specifically accumulated in the seed coats (Lepiniec et al., 2006;
Routaboul et al., 2006). Several transport proteins are involved and responsible for subcellular
translocation of flavonoids and accumulation of specific substances in different plant storage
locations (Saito et al., 2013).
Another important aspect worth pointing out is the extracellular accumulation and secretion of
silymarin and other flavonoid compounds due to active transport systems (Prieto and Corchete,
2014; Sánchez-Sampedro et al., 2005). Additionally, the release of proteins into the culture
medium, especially proven for extracellular peroxidases (Quiroz-Figueroa and Loyola-Vargas,
2001; Ravi et al., 1986), along with the precursors of flavonolignans, can lead to active formation
of the characteristic silymarin components. If now one considers the suspension cell culture
medium as apoplastic space, thus resembling the missing fruit wall, interesting relations and
possibilities for further scientific investigations, concerning the biosynthesis, distribution and
final storage location of silymarin, come to mind.
6. Working objectives
The overall objective of this dissertation was to provide further insight into the final step of
flavonolignan biosynthesis and its underlying mechanisms responsible for the formation of the
active substance mixture silymarin in Silybum marianum. For this purpose, special focus was set
on two types of enzymes; proteins catalysing one-electron oxidations of phenolic substrates
leading to radical formation, like peroxidases (PODs) and laccases (LACs), and dirigent proteins
(DIRs), potentially involved in regulating the stereo- and/or regioselectivity leading to distinct
characteristic distributions of the individual silymarin components. By means of molecular
methods, full length sequences coding for putatively involved genes, have been identified. In
order to evaluate the function of the encoded proteins attempts to actively express these in
various host cells were undertaken.
In another approach, suspension cell cultures of different Silybum marianum cultivars varying in
the composition of their flavonolignan mixture have been established to get useful information
about enzyme activities, growing parameters and possible plant processes taking effect in
flavonolignan biosynthesis. This includes an attempt to enhance the in vitro silymarin production
via elicitation.
31
IV. Material and Methods
1. Plant cell cultures
In the focus of this PhD thesis were plant cell cultures from Silybum marianum (milk thistle).
Plants from different origins and ecotypes were of special interest. Initially, we started with plant
material collected from the Old Botanical Garden in Marburg. The mature achenes of milk thistle
plants were the starting material for callus and cell suspension cultures (see below). These
cultures were characterised first and an attempt to increase the silymarin content by means of
elicitation was undertaken. Later on, cell cultures from two more varieties of Silybum marianum
(fruits from milk thistle plants collected in the Botanical Garden in Frankfurt and fruits obtained
from a pharmaceutical wholesaler, harvested from cultivation areas in Poland) with differing
flavonolignan distribution were established and investigated as well.
1.1 Establishment of callus and suspension cultures
The mature achenes were washed with 70% EtOH for 1-2 min, followed by treatment in 5%
chlorine disinfectant solution for 20 min and three subsequent washing steps in sterile dist. H2O.
After this sterilisation step the fruits were germinated on MSOH (MS-medium without addition
of hormones; Murashige and Skoog, 1962) agar plates. After germination, parts of the developed
cotyledons were placed on MS-Li, B5 (Gamborg et al., 1968) and CB-2 (Gertlowski and
Petersen, 1993) medium with agar. For composition of media see IV.8.
Two weeks later callus grown on B5 and CB-2 medium was immersed in 50 ml liquid B5
medium (without agar); additionally some callus was always retained as a safe stock and
transferred to fresh medium once per month. The suspension cultures were transferred into fresh
medium (50 ml) once every week, using 5.0 g cell wet weight, and shaken at 220 rpm and 26 °C
in the dark. Cells grown in B5 medium showed better growth parameters and were chosen for
future experiments. On MS-Li medium small roots could be excised from the leaf margin and
were cultivated in liquid MS-Li medium, transferred into fresh medium every 3 weeks using
0.4 g root tips (~1 cm).
32
2. Culture characterisation
A culture characterisation serves to determine the optimal growth conditions. This includes
various growth parameters, enzyme activities and expression levels or the accumulation of
secondary metabolites, which were of particular interest in our case. The experiment was carried
out with established suspension cultures from milk thistle fruits harvested in the late summer of
2012 in the Old Botanical Garden Marburg. At the start of this experiment, the suspension
cultures were in their 5th
subculture. At first, 5.0 g cells (wet weight) of Silybum marianum
suspension cultures grown for seven days were transferred into fresh sterile culture medium (B5)
with a heat-sterilised perforated spoon in a laminar flow workbench. This corresponds to day 0.
In total, 15 flasks were inoculated. Every day for 13 consecutive days, 1 flask was taken for the
determination of cell fresh and dry weight, silymarin and protein content plus enzyme activities
and medium parameters. Harvesting and processing of the cells preferably took place at the same
time of day. With help of a suction filter and a water-jet vacuum pump cells and medium were
separated. 3 ml medium were filled in two 1.5 ml reaction tubes immediately and placed on ice or
frozen at -20 °C. Remaining medium was preserved for further determinations. The cells were
weighed (fresh weight per flask), 2 x 0.5 g of the moist cells were filled in pre-weighed plastic
centrifuge tubes and frozen at -20 °C for later determinations of dry weight and silymarin
content. The remaining cells were saved for preparation of enzyme crude extracts (IV.5.1.a) and
determination of enzyme activities.
2.1 Determination of growth parameters
The following medium parameters were determined:
a. pH value
After calibration with adequate buffer solutions the pH value of the medium was determined at
room temperature with a pH-electrode.
33
b. Conductivity
For the determination of the conductivity the medium was diluted with dist. H2O in a 1:4 ratio.
The electrode was first calibrated and the measurement took place at room temperature.
c. Sugar content
The total sugar content was measured with a refractometer after calibration with H2O.
2.2 Enzyme extraction from cells and medium
Crude extracts from plant suspension cells can be used as a source for enzymes. The cells must
first be shredded in a suitable buffer system and possible oxidation prevented. This procedure is
explained in detail in IV.5.1.a.
Since the necessary enzyme(s) for the coupling reaction between taxifolin and coniferyl alcohol
are also released to the medium of milk thistle suspension cells a specific preparation took place
here, as well. For a detailed explanation see IV.5.1.b.
2.3 Determination of dry weight and flavonolignan components
Frozen cells prepared for this step were lyophilised for 48 h, followed by weighing and
subtraction of the tare weight of the plastic tubes. Cell dry weight per 0.5 g moist cells also
enables calculation of dry weight per flask. Further on these cells were used for determination of
the silymarin content. In addition, 0.5 g of the root cultures developed on solid MS-Li medium
were analysed for their silymarin content once.
The lyophilised cells or roots in the plastic tubes were squelched with a stirring rod and 5 ml of
MeOH added, the tubes sealed with a perforated lid and shaken vigorously. Subsequently, tubes
were placed in a 70 °C pre-heated ultrasonic bath for 10 min. After shaking once more the
ultrasonic treatment was repeated. Tubes were centrifuged at 3.000 g for 10 min and supernatants
carefully collected. The solvent was evaporated with help of a rotary evaporator. Residues were
re-dissolved in 0.5 ml MeOH each and transferred to 1.5 ml reaction tubes.
34
Before HPLC measurement 100 µl of these samples were diluted with 100 µl of eluent (47.5%
MeOH, 52.5% H2O, 0.01% phosphoric acid) and centrifuged at 16.000 g for 10 min.
2.4 Determination of protein concentrations
To determine the protein content of the samples, they were measured photometrically using the
assay according to Bradford (1976) (IV.5.6).
2.5 Enzyme activity
The activity of crude protein extracts and medium samples were determined by performing
enzyme assays as described in IV.5.10. After desalting via PD-10 column 20 µl of the gained
sample were added to a mixture of the educts taxifolin and coniferyl alcohol. With subsequent
HPLC measurement the formed flavonolignan products could be determined qualitatively and
quantitatively.
3. Elicitation of a suspension culture
Although the best culture conditions were determined before, some secondary metabolites are
produced in low concentrations and in some cases not at all, for which it is necessary to develop
strategies such as elicitation to stimulate the production of the desired component (Zhao et al.,
2005). Compared with the whole fruit, silymarin production in plant cell cultures is very low
(0.01-0.04% of the dry weight versus 1-5% in fruits) (Cacho et al., 1999; Andrzejewska and
Sadowska, 2008; Hasanloo et al., 2008).
An elicitor is a compound (natural or synthetic) that can simulate a stress condition in the culture,
triggering the same response in the cells that would be induced in the natural environment,
usually resulting in the accumulation of secondary metabolites (Zhao et al., 2005; Vasconsuelo
and Boland, 2007). Additionally recent results suggest that excretion of silymarin and its
precursors is a transporter-dependent active transport and that yet another mechanism involving a
vesicle trafficking system seems to participate in driving this class of secondary metabolites to
the extracellular compartment (Prieto and Corchete, 2013).
35
In this experiment a suspension culture of milk thistle was tested whether it can be induced with
an elicitor to produce more components of the flavonolignan mixture silymarin. Cultures were
treated with either methyl jasmonate (MeJA), a known elicitor for secondary metabolites in
plants, or EtOH as a control.
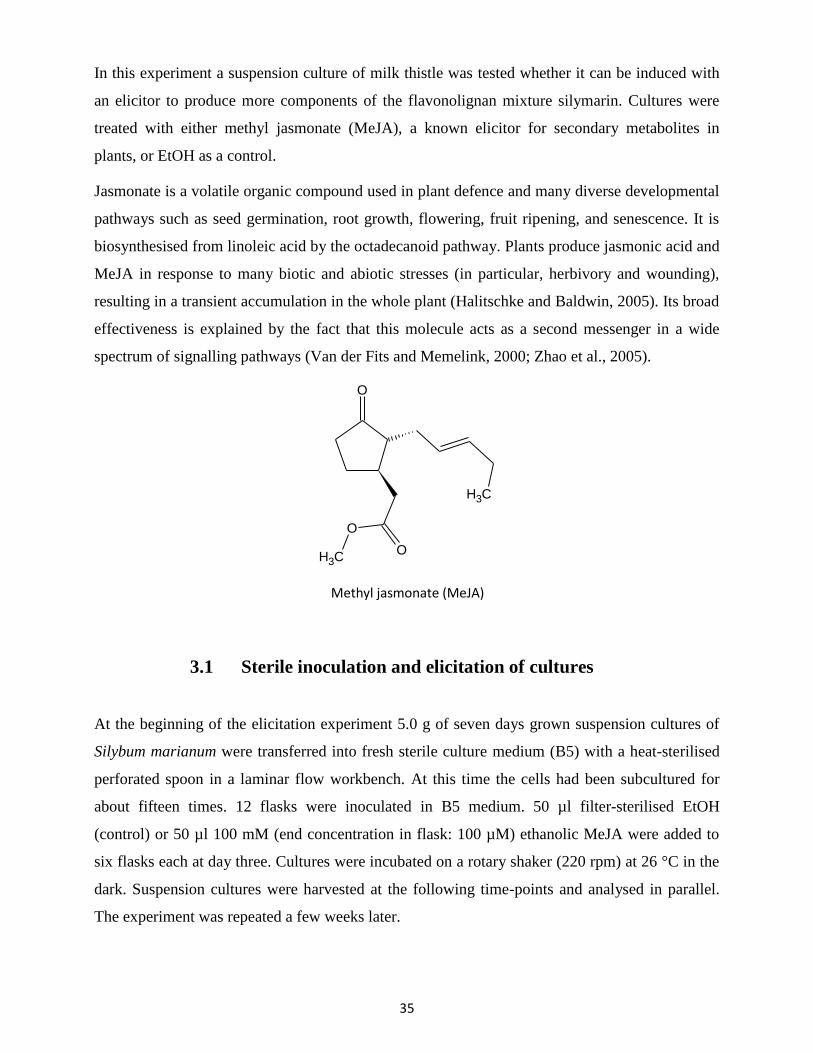
Jasmonate is a volatile organic compound used in plant defence and many diverse developmental
pathways such as seed germination, root growth, flowering, fruit ripening, and senescence. It is
biosynthesised from linoleic acid by the octadecanoid pathway. Plants produce jasmonic acid and
MeJA in response to many biotic and abiotic stresses (in particular, herbivory and wounding),
resulting in a transient accumulation in the whole plant (Halitschke and Baldwin, 2005). Its broad
effectiveness is explained by the fact that this molecule acts as a second messenger in a wide
spectrum of signalling pathways (Van der Fits and Memelink, 2000; Zhao et al., 2005).
CH3
O
O
O
CH3
3.1 Sterile inoculation and elicitation of cultures
At the beginning of the elicitation experiment 5.0 g of seven days grown suspension cultures of
Silybum marianum were transferred into fresh sterile culture medium (B5) with a heat-sterilised
perforated spoon in a laminar flow workbench. At this time the cells had been subcultured for
about fifteen times. 12 flasks were inoculated in B5 medium. 50 µl filter-sterilised EtOH
(control) or 50 µl 100 mM (end concentration in flask: 100 µM) ethanolic MeJA were added to
six flasks each at day three. Cultures were incubated on a rotary shaker (220 rpm) at 26 °C in the
dark. Suspension cultures were harvested at the following time-points and analysed in parallel.
The experiment was repeated a few weeks later.
Methyl jasmonate (MeJA)
36
3.2 Determination of flavonolignan components
After 0/12/24/48/96/216 h cells and medium were separated with a suction filter and a water-jet
vacuum pump. Remaining medium was kept for further determinations. 2.0 g of these moist cells
were filled in pre-weighed plastic centrifuge tubes and frozen at -20 °C for later determination of
the silymarin content.
The extraction method was as described in IV.3.3. However this time, 100 µl of the samples were
diluted with 400 µl HPLC eluent before measurement via HPLC. Unfortunately, the cell samples
for the first test series got unusable due to a technical problem in the lyophilisation system.
3.3 Accumulation and release of silymarin to medium
In addition to its enzymatic activity, medium of suspension cultures of Silybum marianum
contains small amounts of silymarin and its precursors taxifolin and coniferyl alcohol. They
could be released through some passive or active mechanisms or silymarin formation takes place
there due to the presence of secreted peroxidases. It was investigated whether more silymarin
products could be found in the medium after elicitation with MeJA. The extent of this
“accumulation” was determined by extracting the whole culture medium with EtOAc.
The cell-free medium was first filtered through filter paper, sucked through a membrane filter
(0.8 mm pore size) and centrifuged for 5 min at 3.000 g in order to remove all particulate cell
residues. Afterwards it was extracted twice with an equal volume of EtOAc. After merging of the
two organic extracts it was evaporated with a rotary evaporator. Residues were re-dissolved in
0.15 ml (1st experiment) or 0.25 ml (2
nd experiment) MeOH each and transferred to 1.5 ml
reaction tubes. The elicitation experiment was repeated under almost the same conditions.
Measurement and evaluation was done via HPLC without further dilution steps.
37
3.4 Degradation of silymarin
It was also tested whether the silymarin components are stable in the medium of the suspension
cells or whether degradation occurs. Degradation due to temperature, the medium pH and
potentially present enzymes could influence flavonolignan stability to a certain extent.
In a first experiment, medium, in which Silybum marianum suspension cells had grown for seven
days, was compared to TRIS-HCl buffer. Both were adjusted to pH 10 and the medium was
additionally filtered and desalted with a PD-10 column (IV.5.4). Then 200 μl of the
medium/buffer were mixed with 50 µl of a 10 mM silymarin standard (~240 µg). In each case
three samples were shaken at 26 °C at 120 rpm for 24 h in the dark and two more samples were
directly (0 h) extracted with EtOAc to serve as a reference.
The second experiment was very similar. However, fresh medium at two different pH values was
compared to adjusted TRIS-HCl buffers. The extraction method and incubation time were the
same.
All samples were extracted with 250 µl EtOAc three times each. The combined extracts were
then evaporated under the hood overnight, re-dissolved in 250 μl HPLC eluent and measured via
HPLC (IV.5.13).
4. Flavonolignan composition from varying milk thistle chemotypes
While looking for factors possibly regulating the positional isomer or diastereomer ratio of the
flavonolignans in Silybum marianum, the investigation of milk thistle fruits collected from plants
grown in various habitats in Europe, should provide further new insights. For this purpose,
mature fruits from two different German and Polish cultivars each, as well as fruits from Hungary
and Bulgaria have been compared with respect to their ratio of flavonolignans. Furthermore,
callus and suspension cultures have been established (IV.1.1) from the varieties with clear
distinctions in their regioisomer distribution. These were then as well analysed for silymarin
content, especially the positional isomer ratios, in cells and released to the outer compartment.
Additionally, crude enzyme extracts and concentrated cell culture media were fractionated and
purified via FPLC for further investigation of proteins involved in silymarin formation. Enzyme
assays for dirigent proteins and possible differences in the enzyme(s) responsible for radical
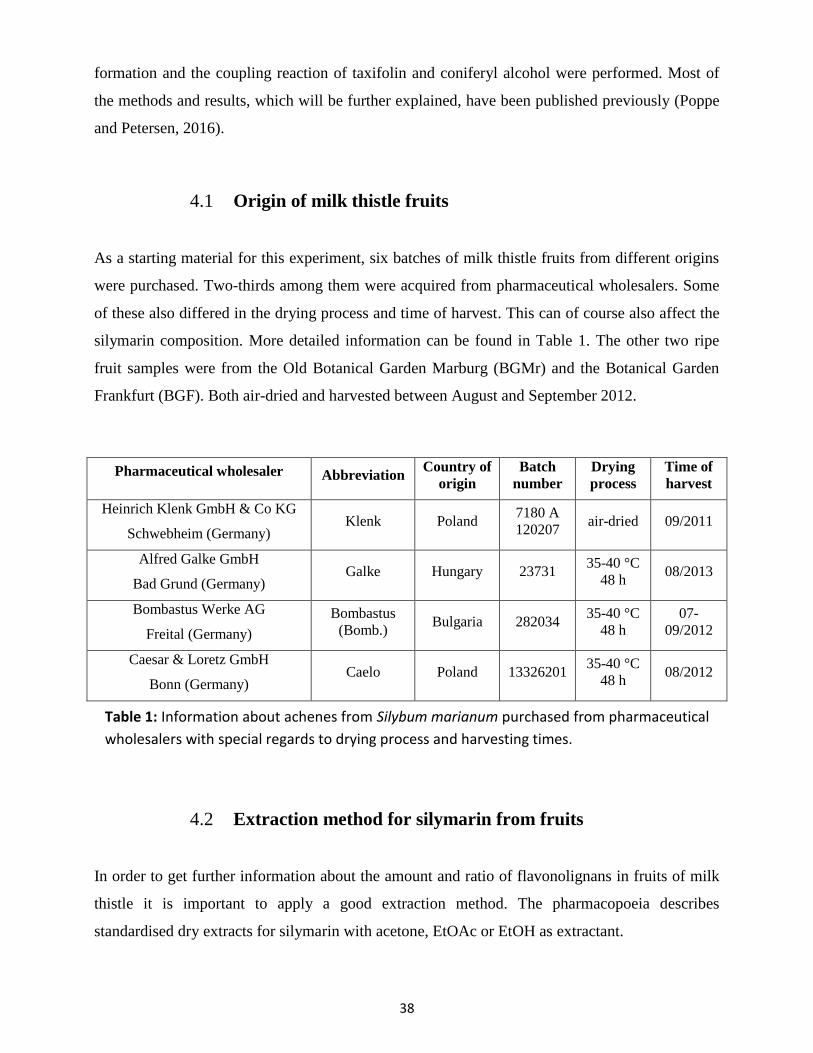
38
formation and the coupling reaction of taxifolin and coniferyl alcohol were performed. Most of
the methods and results, which will be further explained, have been published previously (Poppe
and Petersen, 2016).
Origin of milk thistle fruits 4.1
As a starting material for this experiment, six batches of milk thistle fruits from different origins
were purchased. Two-thirds among them were acquired from pharmaceutical wholesalers. Some
of these also differed in the drying process and time of harvest. This can of course also affect the
silymarin composition. More detailed information can be found in Table 1. The other two ripe
fruit samples were from the Old Botanical Garden Marburg (BGMr) and the Botanical Garden
Frankfurt (BGF). Both air-dried and harvested between August and September 2012.
Pharmaceutical wholesaler Abbreviation Country of
origin
Batch
number
Drying
process
Time of
harvest
Heinrich Klenk GmbH & Co KG
Schwebheim (Germany) Klenk Poland
7180 A
120207 air-dried 09/2011
Alfred Galke GmbH
Bad Grund (Germany) Galke Hungary 23731
35-40 °C
48 h 08/2013
Bombastus Werke AG
Freital (Germany)
Bombastus
(Bomb.) Bulgaria 282034
35-40 °C
48 h
07-
09/2012
Caesar & Loretz GmbH
Bonn (Germany) Caelo Poland 13326201
35-40 °C
48 h 08/2012
Extraction method for silymarin from fruits 4.2
In order to get further information about the amount and ratio of flavonolignans in fruits of milk
thistle it is important to apply a good extraction method. The pharmacopoeia describes
standardised dry extracts for silymarin with acetone, EtOAc or EtOH as extractant.
Table 1: Information about achenes from Silybum marianum purchased from pharmaceutical
wholesalers with special regards to drying process and harvesting times.
39
To test the effectivity of varying extractants, exactly 1 g fruits of a batch of Silybum marianum
(Galke / Hungary) were pulverised in liquid N2 and the powder suspended in 10 ml acetone,
EtOAc or MeOH in duplicate samples. After 2 x 10 min in an ultrasonic bath at 70 °C and
temporary shaking followed by centrifugation at 3.000 g for 10 min the supernatants were
collected and evaporated to dryness. The residue was re-dissolved in 0.5 ml MeOH. Finally,
samples were prepared for analysis via TLC (IV.5.12) and HPLC (IV.5.13). Before evaluation by
HPLC, 100 µl of the obtained samples were diluted with 400 µl eluent, followed by
centrifugation at 16.000 g for 5 min. Samples were analysed twice.
Two further extraction steps were added in order to find out whether the single extraction is
quantitative. All three extracts were then analysed separately by HPLC.
Establishment and cultivation of in vitro cultures 4.3
As described in IV.1.1, callus and suspensions cultures were then established from seedlings of
the fruit samples with the most striking differences in their regioisomer pattern. In addition to the
already existing cultures from the Marburg variety, the decision was done in favour of the variant
from Poland (Klenk) and the one received from Frankfurt, which shared its pattern with the
remaining, not further used, fruit samples.
Determination of flavonolignan composition 4.4
a. Suspension cells
After 7 days of growth in B5 medium, cells and medium were separated with a suction filter and
a vacuum pump, the medium was kept for further analyses. 2.0 g medium-free cells were filled in
pre-weighed plastic centrifuge tubes and frozen at -20 °C.
The extraction was performed as described in IV.2.3. Before HPLC analysis 100 µl of each
sample was diluted with 400 µl eluent and centrifuged at 16.000 g for 5 min.
40
b. Cell culture medium
Extraction of flavonolignans from the cell culture medium was done as described in IV.3.3. In
this case, however, the volumes of two culture flasks were combined (60-80 ml) and extracted
two times with an equal volume of EtOAc in order to obtain higher flavonolignan amounts. The
organic solvent phases were combined and evaporated with a rotary evaporator. Residues were
re-dissolved in 0.5 ml MeOH each and transferred to 1.5 ml reaction tubes. After addition of the
same volume eluent and centrifugation at 16.000 g for 5 min the extracts were analysed by HPLC
(IV.5.13).
Enzyme preparation and purification 4.5
a. Crude extracts
Crude protein extracts were prepared as described in IV.5.1.a. 7 day old suspension cultures from
all three varieties served as starting material. After successful extraction, samples were desalted
with a PD-10 column (IV.5.4) and stored at -20 °C until they were tested in enzyme assays. In
case of further purification steps via FPLC, the desalting step was omitted. Protein concentration
was determined according to IV.5.6.
b. Concentrated medium
Cell-free media were kept for further concentrating steps as described in IV.5.3.c. This time the
medium was purified even more carefully by means of three additional filtration steps through
membrane filters with a pore size of 0.8 (1x) and 0.2 (2x) μm. During this process the medium
was kept around 0 °C. Each medium was concentrated via Centricon® centrifugal devices at
8.000 g and 4 °C until the desired concentration was reached. The media were concentrated by
10-fold, based on the starting volume from two mixed suspension cultures. The concentrated
media were stored at -20 ° C until purification by FPLC.
41
c. Fractionation, purification and identification
For fractionation and purification, the protein extracts from suspension cells of the three varieties
with different regioisomer patterns in the fruits, were loaded into a super loop connected to an
ÄKTA purifier system with a column for anion exchange chromatography (IV.5.2.a) after
filtration to remove particles. After successful fractionation and storage on ice, a test for
peroxidase activity was performed (IV.5.10.f). The active fractions then were pooled for further
concentration steps. The remaining fractions were stored at -20 °C. These were tested later for
dirigent proteins (IV.5.10.c).
The pooled peroxidase-positive fractions were concentrated with Centricon® tubes. Afterwards,
the concentrated protein solution (250-500 µl) was loaded to a capillary loop connected to the
ÄKTA purifier system. The proteins were separated by molecular mass with help of a gel
filtration column (IV.5.2.b). The resulting fractions were again tested for peroxidase activity
(IV.5.10.f). The active fraction(s) were stored on ice. With help of the established calibration
curve the approximate molecular mass of the protein could be determined. Determination of the
protein concentration was carried out in a modified form of the Bradford assay (IV.5.6).
Enzyme assays 4.6
Initially, the purified peroxidases of the three respective types of suspension cultures, extracted
from either the cells or the corresponding medium, were tested in standard enzyme assays
(IV.5.10.a) for possible differences in their activity or even regiospecificity.
Afterwards, the fractions gained during the separation with the anion exchange column were
tested for dirigent proteins, possibly regulating the coupling reaction between taxifolin and
coniferyl alcohol. This might manifest in either quantity shifts of the individual flavonolignan
regioisomers or even only changes in the diastereomeric distribution of silybin or isosilybin. With
this in mind, several enzyme assays were carried out as described in IV.5.10.c.
42
5. Enzymology
5.1 Plant enzyme sources
a. Crude extracts
An easy way to gain active protein is the extraction from shredded fresh plant suspension cells,
even though naturally a mixture of all present enzymes and proteins is the result. For that purpose
5 g fresh, medium-free cells were weighed into a plastic centrifuge tube and 5 ml
Tris(hydroxymethyl)aminomethane-HCl buffer (0.05 mol l-1
pH 10.0 with 1 mmol l-1
DTT) and
1 g Polyclar 10 (1/5 of the cell weight) were added. These quantities could also be adjusted by the
amount of available cells. The mixture was stirred and homogenised three times with a blender
(UltraTurrax), using a protocol of 30 sec of blending, followed by 30 sec of cooling on ice. This
homogenate was centrifuged at 10.000 g at 4 °C for 20 min. The supernatant was decanted and
desalted with help of PD-10 columns (IV.5.4). Most analyses of enzyme parameters were
performed with protein preparations from cultures, which were grown in B5 medium until day 7.
In case of the culture characterisation a sample was prepared every day (IV.2.2). Since fewer
cells were available in the first few days and the determination of the silymarin content had
priority, this also could have negative effects on the respective activity of the crude extract.
Otherwise, exactly 5 g cells were used.
b. Medium
In order to use the medium from the same B5 cell cultures as an enzyme source it had to be
properly cleaned up. For this purpose, all cells were separated from the medium in the first step.
This was done by repeated vacuum filtration through a membrane filter with 0.8 µm pore size
and subsequent centrifugation at 4 °C and 8.000 g for 5 min. This was followed by a desalting
step with PD-10 columns (IV.5.4). Afterwards, the samples could be used as an enzyme source
for assays (IV.5.10).
43
Frequently, the obtained samples were further concentrated for increased enzyme activity via
Centricon® tubes (IV.5.3.c). Most medium samples were concentrated 10-fold. This also enabled
the visualisation of enzymes after additional TCA precipitation (IV.5.3.b) and SDS-PAGE
separation. In addition, the entire medium from two combined flasks could be loaded into the
super loop of the FPLC system in one go for further fractionation and purification (IV.5.2).
c. Cell wall protein extraction (CWPE)
In order to obtain typically secreted proteins that are still attached to the cell walls, suspension
cells of the three different origins (IV.4.3) were treated successively with increasing
concentrations of an ionic solution according to Pickel (2011). For this purpose, the cells were
first separated completely from the medium by sucking off through a membrane filter with
0.8 µm pore size. About 40 g cell fresh weight from two flasks per cultivar was thus obtained as
starting material. Then shaking at 4 °C and 200 rpm in extraction buffer A (half of the culture
volume) for 15 min and repeated separation bz vacuum filtration followed. The aqueous solution
was saved and the remaining cells were extracted again in buffer B under the same conditions for
quantitative extraction. Both cell free solutions then were combined and 10-fold concentrated
with the help of Centricon® tubes (IV.5.3.c) before application in enzyme assays or additional
concentration by TCA precipitation (IV.5.3.b) for SDS gel electrophoresis.
In the further course a hybrid extraction method according to Printz et al. (2015), has been tried
as well. In this protocol, adapted from Verdonk et al. (2012) and Feiz et al. (2006), a sequential
three-step extraction based on low ionic strength buffers with additional CaCl2, EGTA, and LiCl
is described. Using this procedure should lead to good purity of the wall fraction and a high yield
of protein extraction. In our special case, however, since this method did not lead to particularly
good results, a further detailed explanation of the experiment will be omitted.
Extraction buffer A
0.1 M KPi (pH 6.0)
75 mM KCl
Extraction buffer B
0.1 M KPi (pH 6.0)
150 mM KCl
0.5 M KPi (pH 6.0, 100 ml)
87.7 ml 0.5 M KH2PO4
12.3 ml 0.5 M K2HPO4
44
5.2 Fast protein liquid chromatography (FPLC)
Another option to gain high recovery rates of the protein(s) of choice is the additional purification
and separation by chromatographic methods, e.g. ion exchange chromatography, followed by size
exclusion chromatography. Ideally, a chromatography system like ÄKTA, designed for increased
productivity and reliable results, is used for that purpose. This chromatography system functions
according to similar principles as in high-performance liquid chromatography (HPLC). Different
affinities of various components for two materials enable focused separation. Here as well, a
mobile phase (buffer) and a stationary phase (column packing material) ensure fractionation.
a. Ion exchange chromatography (IEC)
Ion exchange chromatography belongs to the most common chromatographic methods for protein
purification. The proteins of interest, dissolved in the running buffer, will bind to the resin due to
their charge. Non-binding components will be washed out. The elution buffer then increases in its
ionic strength (e.g. salt concentration, gradient), slowly displacing the bound proteins. Depending
on the ionic strength of the protein, they dissociate sooner or later and can be collected in
fractions in the eluent. Conductivity (salt concentration), pH and UV-absorption at 280 nm
(protein concentration) can be monitored by appropriate detectors.
For membrane-bound or secretory peroxidases, fractionation by anion exchange chromatography
(AEC) seemed appropriate. Other groups already achieved good results with this kind of
separation (Al-Senaidy and Ismael, 2011; Pérez-Galende et al., 2014). All runs with the ÄKTA-
purifier system were carried out at room temperature. Buffers were also brought to room
temperature beforehand and filtered particle-free.
The sterile-filtered protein extracts (IV.5.1) were applied to a Q-Sepharose column (1.6 cm x
11 cm) equilibrated with equilibration buffer (0.05 M TRIS–HCl, pH 8.0) at a flow rate of 1 ml
min-1
. Q-Sepharose is a strong anion exchange material. Protein samples were loaded to the
system with help of a super loop (max. 10 ml) at a flow rate of 0.5 ml min-1
. Subsequently, the
column was washed with one column volume of equilibration buffer. Proteins were eluted with
two column volumes of a linear gradient of 0-0.5 M NaCl in equilibration buffer. 2 ml fractions
were collected and placed on ice for activity tests.
45
b. Size exclusion chromatography (SEC)
Size exclusion chromatography separates proteins almost only by their size or rather molecular
weight. In addition, form factors such as the three-dimensional structure and glycosylations can
make slight differences. The column (stationary phase), usually consists of very small porous
polymer beads. Typically the proteins are transported through an aqueous phase (gel filtration
chromatography). Whereas smaller proteins get entangled in the pores, bigger molecules cannot
enter and simply pass by. The larger the protein, the shorter its retention time and vice versa.
In addition to its short and clearly defined separation times another benefit is the possibility to
determine the approximate molecular weight of the protein of interest with help of calibration
proteins.
For further purification, the peroxidase-positive protein samples from AEC were pooled and
concentrated by ultrafiltration (Centricon®
). Concentrated enzyme solutions were loaded onto a
gel filtration column (Superdex™
200 Increase, 10/300) previously equilibrated with 0.01 M
NaH2PO4, 0.14 M NaCl buffer, pH 7.4 at a flow rate of 0.75 ml min-1
via capillary loop (200-
500 µl). Elution was carried out in the same buffer and at the same flow rate. Fractionation
started after 0.3 column volumes. Fractions (2 ml) were collected, placed on ice and tested for
peroxidase activity. Only the most active fraction was used as enzyme source for further
experiments.
The approximate molecular weight of the protein was determined with the aid of a previously
established calibration curve with proteins of known mass. For this purpose, proteins of different
molecular weights are loaded to the gel filtration column under the same running conditions as
described in the size exclusion method above. The calibration proteins were transferrin (80 kDa),
bovine serum albumin (67 kDa), egg albumin (45 kDa), carbonic anhydrase (26 kDa) and
cytochrome c (12.3 kDa). These were adjusted to 1 mg ml-1
each and 200 μl of the mixed
solution was loaded to the gel filtration column via capillary loop. The individual substances can
then be assigned to a respective fraction by UV-absorption. The molecular weight of the
unknown protein can then be determined by its elution time.
46
c. Purification of histidine-tagged proteins
The purification of histidine-tagged recombinant proteins can also be performed by FPLC. It is
also known as immobilised metal ion affinity chromatography (IMAC). The polyhistidine tag of
the protein, usually consisting of six histidine residues (His) linked to the N- or C-terminus of the
protein, forms a reversible complex with immobilised nickel atoms of a Ni-Sepharose column.
With increasing imidazole concentration of the elution buffer, it is displaced and washed out.
This leads to a selective separation of the target protein from non-tagged proteins. After detection
via UV-absorption it can be easily fractionated and collected for further studies.
The sterile-filtered protein solution in His-binding buffer (3 ml) was injected to the column
(HisTrap™
FF, bed volume 1 ml) via a capillary loop (500 µl) in several steps at a flow rate of
0.25 ml min-1
. The flow-through was collected. Before, the column had been equilibrated with
binding buffer (0.02 M NaPi, 0.5 M NaCl, 0.02 M imidazole, pH 7.4) at a flow rate of 1 ml min-1
until conductivity and absorption were constant. After repeated washing with binding buffer until
constant values were reached the elution step was initiated. This was done with a linear gradient
of increasing concentration of the elution buffer (0.02 M NaPi, 0.5 M NaCl, 0.25 M imidazole,
pH 7.4) at a flow rate of 1 ml min-1
. At the same time, 2 ml fractions were collected. Eluting
protein was detected by UV-absorption (280 nm) and subjected to activity assays (IV.5.10).
Purification of His-tagged proteins can also be done by gravity elution from self-packed columns.
0.5-1.0 ml of a suspension of nickel-NTA(nitrilotriacetic acid) material were loaded into an
empty disposable column and washed with H2O several times. 1 ml of His-Tag binding buffer
(50 mM KPi, 300 mM NaCl, 10 mM imidazole pH 8.0) was added and the nickel-NTA
equilibrated for 30 min and then drained. 500 mM KPi, 3 M NaCl, 100 mM imidazole pH 8.0 in a
1:10 ratio was added to the protein sample and mixed with the column material. The column was
sealed tightly, placed in ice and rocked gently for 1 h. Afterwards the fluid was drained, mixed
and 200 µl kept for SDS-PAGE (flow-through). The column material was washed eight times
with 2 ml His-Tag washing buffer 1 (50 mM KPi, 300 mM NaCl, 20 mM imidazole pH 8.0) in
order to remove unbound proteins. If required, two additional washing steps with 1 ml washing
buffer 2 (50 mM KPi, 300 mM NaCl, 50 mM imidazole pH 8.0) were added. Aliquots of the
washing fractions were saved for SDS-PAGE analysis. The elution of bound proteins was done in
three steps with 1 ml elution buffer (50 mM KPi, 300 mM NaCl, 250 mM imidazole pH 8.0)
each. These fractions were combined and desalted with PD-10 columns. The nickel-NTA-column
47
was cleaned with 1 ml 10% AcOH and washed with H2O several times. Until further use, the
columns were stored at 4 °C in 1 ml 20% EtOH.
5.3 Concentration of protein solutions
a. Ammonium sulphate precipitation
An ammonium sulphate precipitation is an effective and simple method for enrichment and
partial purification of proteins (Cooper, 1981). In this process, salt ions compete with the
hydration shell of the hydrated protein. The ammonium sulphate concentration affects the protein
surface charge at which the protein is dehydrated to a sufficient degree for precipitation.
Hydrophobic proteins precipitate faster (earlier) than hydrophilic ones. This method can either be
used for the precipitation of all proteins present in the solution or for fractionation by using
different ammonium sulphate saturation steps. This can result in a partial purification of the
protein of interest.
An ice-cold saturated ammonium sulphate solution is needed. The pH of the solution should
correspond to the sample pH in order to prevent pH change during the salting-out process. In
these experiments pH 10 was used. At first, the volume of the crude protein extract was defined
to determine the required amount of saturated ammonium sulphate solution. The sample was
stirred on ice. Within 20 min the required volume of ammonium sulphate solution was added
dropwise to the crude extract. After mixing another 20 min on ice, centrifugation at 4 °C 30.000 g
for 20 min followed. Pellet and supernatant were separated. The pellet was dissolved in 3.0 ml
0.05 M TRIS-HCl buffer pH 10 and stored at -20 °C. The supernatant could be used for further
precipitations.
The following precipitation steps have been performed:
Saturation of ammonium sulphate: 0 – 20%
20 – 40%
40 – 60%
60 – 80%
48
The obtained fractions were desalted with a PD-10 column (IV.5.4). For total precipitation of all
proteins at once the ammonium sulphate concentration was adjusted to 80% saturation.
b. Trichloroacetic acid (TCA) precipitation
Precipitation with trichloroacetic acid (TCA) is a simple and quick way to gain concentrated
denatured proteins. This can be useful for SDS gel electrophoresis or sample preparation prior to
mass spectrometry.
The sample solution was mixed with the same volume of 40% TCA (final concentration 20%)
and incubated on ice for 1 h. After centrifugation at 4 °C and 13.000 g for 20 min, the pellet was
washed with ice-cold 80% acetone and the solvent evaporated. Finally, the pellet was dissolved
in 0.1 M NaHCO3 with 10% sucrose or another suitable buffer for further investigations.
c. Concentration by centrifugal filters
Centrifugal filters (e.g. Centricon®) can be used for protein purification. On the one hand these
filter systems reduce the volume of protein solutions while increasing the protein concentration
and on the other hand can remove or replace buffer ingredients.
For example, 5 day old habituated medium (B5) from suspension cultures of Silybum marianum
was concentrated. For this, two Centricons® were washed with 14 ml dist. H2O and repeatedly
filled with the same amount of particle-free medium (IV.5.1.b), whirling up the liquid with a
pipette from time to time. In the end, the media samples were concentrated to 5 ml, aliquoted,
desalted with a PD-10 column and stored at -20 °C. All centrifugation steps were performed at
4 °C for 15-30 min at 8.000 g. The concentrated protein samples could be applied in enzyme
assays.
Furtermore, these concentrated protein samples could also be used for further purification and
fractionation steps by means of FPLC (IV.5.2). In doing so, the desalting step was omitted.
49
5.4 Desalting via PD-10 columns
All protein extracts, except the ones purified with the FPLC system, were desalted with PD-10
columns. It was done based on the manufacturer’s instructions (GE Healthcare). 25 ml TRIS-HCl
pH 8-10 buffer with 1 mM DTT were used to equilibrate the column with elution buffer,
followed by addition of 2.5 ml protein sample and discarding the flow-through. In the last step
the PD-10 column was eluted with 3.5 ml buffer, while collecting the flow-through. Afterwards
the columns were washed with 25 ml H2O and stored at 4 °C until further usage. The collected
protein fractions were aliquoted and stored at -20 °C.
5.5 Isolation of recombinant proteins
a. E. coli strains (genetically modified)
Proteins were expressed overnight in E. coli BL21(DE3)pLysS and BL21-CodonPlus (DE3)-
RIPL strains (IV.7.7.a). The bacterial cultures were transferred in portions into 50 ml falcon tubes
and centrifuged at 4 °C for 5 min at 3.000 g. The supernatant was discarded, the pellet frozen in
liquid N2 and stored at -80 °C. The cells were suspended in TRIS-HCl buffer pH 8.5 (4 ml per 1 g
pellet), in case of the second strain mixed with lysozyme (1 mg ml-1
), and thawed on ice for about
30 min. Homogenisation was done on ice with a sonifier with an intensity setting of 100% and
0.3 amplitude for 60 sec each. Afterwards the homogenates were centrifuged at 4 °C and 6.000 g
for 10 min. The supernatant was used for purification with His-Tag columns (IV.5.2.c). In each
case a sample of the pellet (after soluble protein extraction) was re-dissolved in H2O and used as
the insoluble fraction for SDS-PAGE (IV.5.8), likewise 20 µl of the supernatant was used as the
soluble fraction in SDS-PAGE.
50
b. Pichia pastoris / Saccharomyces cerevisiae strains
(genetically modified)
Proteins were synthesised in either P. pastoris X-33 or S. cerevisiae (CB018, InvSc1) for 12-
72 h. The cultures were transferred in portions into 50 ml Falcon tubes and centrifuged at 4 °C
for 5 min at 1.500 g. The cell pellet was frozen in liquid N2 and stored at -80 °C. In case of
P. pastoris the supernatant was saved for precipitation with ammonium sulphate with subsequent
PD-10 desalting. For disintegration the cells were resuspended in 1 ml breaking buffer (50 mM
Na3PO4, 1 mM EDTA, 5% glycerol, 10 mM imidazole and 1 mM PMSF, pH 8.5) per 1 g cell
pellet, thawed on ice and centrifuged at 4 °C for 5 min at 1.500 g. After decanting the supernatant
the pellet was resuspended in breaking buffer (1 µl mg-1
) and the same volume acid-washed glass
beads (~0.5 mm ø) added. Disintegration was done by vigorously shaking in a benchtop
homogeniser (Minilys®
) at 4.000 rpm for 30 sec, followed by cooling on ice for 30 sec and 2-3
repetitions. Afterwards the suspensions were centrifuged at 4 °C and 13.000 g for 10 min and the
supernatant transferred to new tubes. In each case a sample of the pellet was resuspended in H2O
and used as the insoluble fraction for SDS-PAGE. Likewise 20 µl of the supernatant was used as
the soluble fraction.
5.6 Determination of protein concentration
Protein concentration was measured by using an assay according to Bradford (1972). It serves for
the photometric quantification of a protein solution using calibration with a protein of known
concentration. The Bradford solution is composed as follows:
Coomassie Brilliant Blue G250 100 mg
96% ethanol 50 ml
85% o-phosphoric acid 100 ml
Dist. H2O 850 ml
The solution was filtered twice and stored at 4 °C until used. 20 µl of a 1:1 diluted sample (with
TRIS-HCl buffer pH 10.0) was incubated with 2 ml Bradford reagent in disposable macro
cuvettes for 15 min. Absorbance was measured at 595 nm against Bradford reagent with 20 µl
51
buffer as reference value. Calibration was performed with standard samples of 0.25, 0.5 and 1 mg
ml-1
bovine serum albumin (BSA) measured in duplicate. The protein concentration of the
unknown sample was calculated with help of the straight calibration line.
In the case of very small amounts of protein (e.g. proteins purified by FPLC), the test had to be
slightly modified. Here 50 µl of the protein sample were used. Accordingly, the calibration curve
had to be adjusted with appropriately diluted BSA standards (1:50).
5.7 Protoplast isolation
Protoplasts are cells whose cell wall has been removed with the help of enzymes. In case of
plants, cellulase digests the cellulose of the cell walls and pectinase decomposes the pectin of the
middle lamella. Without cell wall the resulting protoplasts are of spherical shape. To prove the
hypothesis that silymarin mostly is stored in the intact cell walls of suspension cells and not the
protoplast, a complete digestion of the outer layer should lead to increased amounts of silymarin
in the corresponding medium, whereas the protoplasts should be largely free of silymarin.
Otherwise the result would indicate a presence of flavonolignans and precursors in the interior of
the cells.
For protoplast isolation suspensions cells of Silybum marianum (5-8 days old) were filtered and
squeezed through a tea strainer. 5 g drained cells were weighed and suspended in 50 ml
protoplast medium “P5” [B5 with extra 0.5 M mannitol (4.57 g) and 1.4 times the amount of Ca2+
(210 mg l-1
CaCl2 . 2 H2O)] with 2% cellulase “Rohament CT” (1 g) and 0.8% pectinase
“Rohament P” (0.4 g). Cell wall digestion proceeded in darkness at 25 °C on a shaker (100 rpm).
After 24 h the suspension was filtered through nylon tissue for removal of possible cell
aggregates. All further steps were performed at 4 °C. Protoplasts were sedimented by
centrifugation at 100 g for 5 min. The supernatant was carefully removed with a glass pipette.
The sediment was resuspended in enzyme-free protoplast medium. This washing process was
repeated three times. Finally protoplasts were suspended in 1-2 ml “P5”.
Protoplasts were examined with a microscope and looked similar to plant protoplasts isolated by
other groups.
52
5.8 Sodium dodecyl sulphate polyacrylamide gel electrophoresis
(SDS-PAGE)
SDS-PAGE separates proteins according to their molecular weight, based on their differential
rates of migration through a sieving matrix (a gel) under the influence of an applied electrical
field. SDS (sodium dodecyl sulphate) is a detergent that is present in the SDS-PAGE sample
where, after boiling in presence of a reducing agent (β-mercaptoethanol), it disrupts the tertiary
structure of proteins. This brings the folded proteins down to linear molecules. It also coats the
protein with a uniform negative charge, which masks the intrinsic charges of the protein. SDS
binds fairly uniformly to the linear proteins (around 1.4 g SDS per 1 g protein), meaning that the
charge of the protein is now approximately proportional to its molecular weight. SDS is also
present in the gel and the electrophoresis buffer.
The system consisted of a lower separating gel and an upper stacking gel layer, called a
discontinuous system (Laemmli, 1970). The gel formation takes place by a radical reaction
mechanism. The polymerisation starter ammonium persulphate (APS), together with
tetramethylethylenediamine (TEMED) as a catalyst, leads to polymerisation of the
acrylamide/bisacrylamide (37.5:1) mixture.
First, the glass plates were thoroughly cleaned with 70% EtOH and placed into the gadget with an
appropriate spacer in between. Subsequently the separating gel was mixed and quickly poured
between the glass plates (see table for composition). This was directly overlaid with a small layer
of n-butanol to straighten the line between separating and stacking gel. This was removed after
polymerisation of the separating gel. Then the stacking gel was mixed and poured on top of the
separating gel layer and a comb for ten pockets added. After complete polymerisation the gel was
fixed in the electrophoresis chamber and the buffer reservoir filled with running buffer (192 mM
glycine, 25 mM TRIS und 0.1% SDS, pH 5.3). The comb was removed carefully and the pockets
repeatedly cleaned with running buffer to remove gel residues or air bubbles.
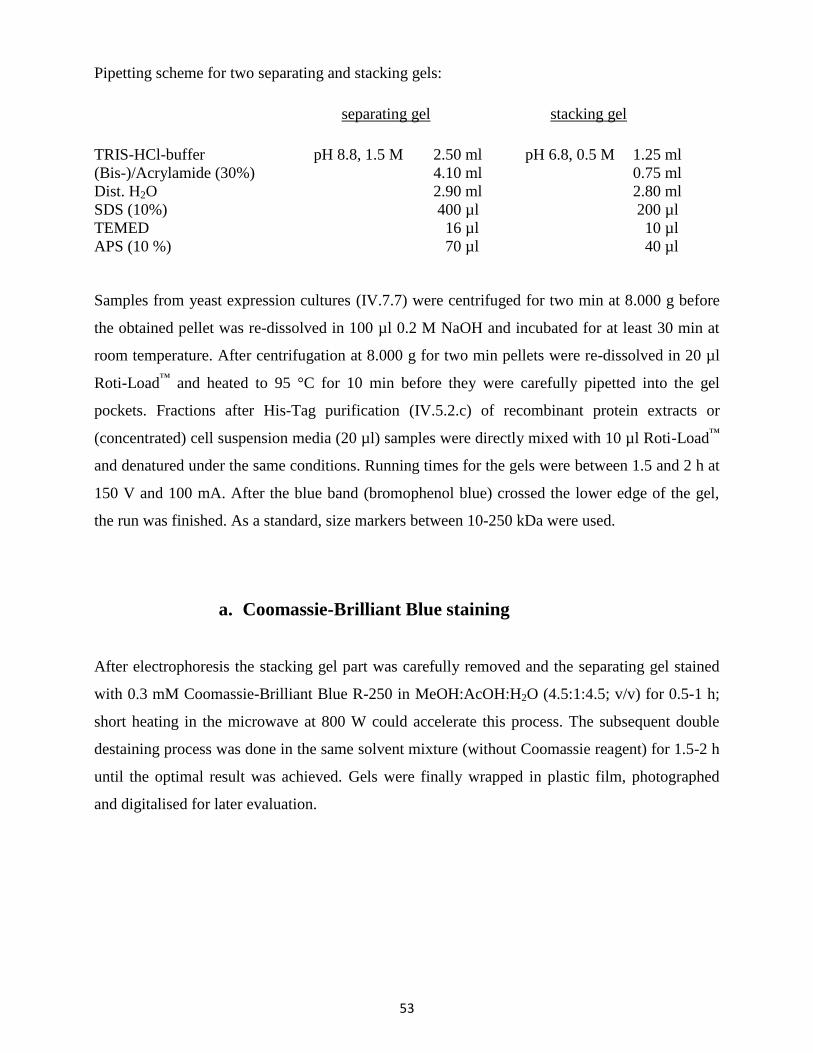
53
Pipetting scheme for two separating and stacking gels:
separating gel stacking gel
TRIS-HCl-buffer pH 8.8, 1.5 M 2.50 ml pH 6.8, 0.5 M 1.25 ml
(Bis-)/Acrylamide (30%) 4.10 ml 0.75 ml
Dist. H2O 2.90 ml 2.80 ml
SDS (10%) 400 µl 200 µl
TEMED 16 µl 10 µl
APS (10 %) 70 µl 40 µl
Samples from yeast expression cultures (IV.7.7) were centrifuged for two min at 8.000 g before
the obtained pellet was re-dissolved in 100 µl 0.2 M NaOH and incubated for at least 30 min at
room temperature. After centrifugation at 8.000 g for two min pellets were re-dissolved in 20 µl
Roti-Load™
and heated to 95 °C for 10 min before they were carefully pipetted into the gel
pockets. Fractions after His-Tag purification (IV.5.2.c) of recombinant protein extracts or
(concentrated) cell suspension media (20 µl) samples were directly mixed with 10 µl Roti-Load™
and denatured under the same conditions. Running times for the gels were between 1.5 and 2 h at
150 V and 100 mA. After the blue band (bromophenol blue) crossed the lower edge of the gel,
the run was finished. As a standard, size markers between 10-250 kDa were used.
a. Coomassie-Brilliant Blue staining
After electrophoresis the stacking gel part was carefully removed and the separating gel stained
with 0.3 mM Coomassie-Brilliant Blue R-250 in MeOH:AcOH:H2O (4.5:1:4.5; v/v) for 0.5-1 h;
short heating in the microwave at 800 W could accelerate this process. The subsequent double
destaining process was done in the same solvent mixture (without Coomassie reagent) for 1.5-2 h
until the optimal result was achieved. Gels were finally wrapped in plastic film, photographed
and digitalised for later evaluation.
54
b. Silver staining
If staining with Coomassie reagent was not sensitive enough, the gels were additionally stained
with silver.
After completely destaining the Coomassie stained gel in MeOH-AcOH-H2O (4:1:5; v/v), silver
staining was done according to the Silver Stain Plus™
kit manual from Bio-Rad. It describes a
simple four-step process, starting with fixation in an enhancer solution for 20 min with
subsequent washing in frequently renewed dist. H2O for 20-30 min. The following staining and
developing step was done in a freshly prepared staining solution, containing the silver complex, a
reduction moderator, an image development reagent and Na2CO3 as an accelerator. As soon as the
desired staining intensity was reached, usually after 10-20 min, the reaction was stopped in 5%
AcOH for at least 15 min and then washed in dist. H2O. Silver stained gels then were wrapped in
plastic film, photographed and digitalised for later evaluation. In some cases, bands were cut out
accurately and used for protein identification after tryptic digestion. The determination was done
by mass spectrometry.
5.9 Western Blot
Western blotting, also known as protein immunoblot, is a core technique in cell and molecular
biology. It is used to detect the presence of a specific protein in a complex mixture extracted from
cells. The separation by size using gel electrophoresis, efficient transfer to the surface of a
membrane and the specific detection of a target protein by specific antibodies belongs to the three
key elements of this technique. The target protein can be visualised as band on the blotting
membrane with help of colour or chemoluminescence detection systems.
After successful SDS-PAGE the gel was removed from the chamber and the stacking gel part
detached, followed by equilibration in transfer buffer (Towbin buffer; 25 mM TRIS, 192 mM
glycine, pH 8.3, 20% MeOH) for 10-30 min.
Pre-cut filter paper and the sponge material for the blotting chamber were briefly wetted in
transfer buffer. The membrane (PVDF, Immobilion™
-P from Millipore; 0.45 µm pore size) was
put in MeOH for about 15 sec, washed in dist. H2O for 2 min and equilibrated in transfer buffer
for at least 5 min. The single layers were assembled in the correct order, air pockets removed and
55
installed in a tank blotting system filled with transfer buffer. After blotting for 1.5 h at 100 V the
membrane was carefully removed and analysed by immunodetection. In the later course of this
work, a semi-dry blotting system was used. For this, blotting was done with a constant current,
depending on the membrane size (length*width
*2 mA), for about 1 h.
The membrane was washed three times in TBS buffer (10 mM TRIS-HCl, 0.9% NaCl, pH 7.4)
for 5 min. The used SDS-gel was dyed as described in IV.5.8, to check for transfer efficiency.
Blocking of the membrane was achieved in TBS-T buffer (10 mM TRIS-HCl, 0.9% NaCl, 0.05%
Tween 20, pH 7.4) with 5% milk powder for 1.5 h, followed by two washing steps in TBS-T for
5 min. After that the membrane was incubated with the first antibody (Pierce™
6x-His Epitope
Tag Antibody), diluted 1:10000 in TBS-T with 1% milk powder overnight at 4 °C. The next day
the membrane was washed eight times for 5 min in TBS-T and then incubated with the second
antibody (anti-mouse IgG alkaline phosphatase), diluted 1:20000 in TBS-T for 1 h at room
temperature. Finally the membrane was washed five times in TBS-T for 5 min and was dyed with
freshly prepared NBT-BCIP solution. The membrane was equilibrated in substrate buffer (100 M
TRIS-HCl, 100 mM NaCl, 5 mM MgCl2, pH 9.5) for 5 min and then dyed in 10 ml substrate
buffer mixed with 80 µl BCIP (20 mg/ml in 100% dimethylformamide) and 60 µl NBT
(50 mg/ml in 70% dimethylformamide) for 15-30 min and finally stopped by washing in dist.
H2O for three times. This detection method leads to an intense deep purple coloration when it
reacts with alkaline phosphatase. The alkaline phosphatase catalyses the cleavage of a
phosphatase group of BCIP to yield an indigo dye. In turn, the indoxyl group reduces a
tetrazolium salt (NBT) to produce an insoluble formazan that combines with the indigo dye to
form a colored precipitate (Altmann, 1976).
In order to check the protein transfer the membrane was dyed with amido black staining solution
(0.1% in MeOH:AcOH:H2O, 4:1:5) for 10 sec with subsequent destaining in MeOH:AcOH:H2O
(4.5:1:4.5) for 10-15 min.
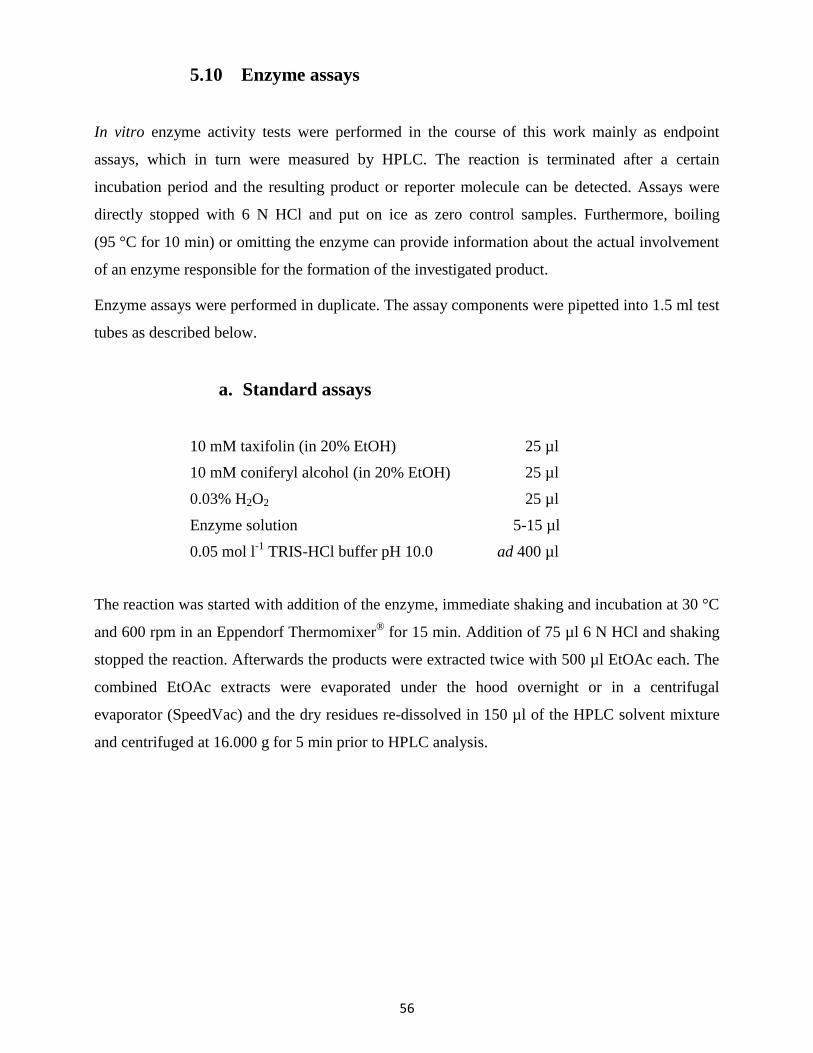
56
5.10 Enzyme assays
In vitro enzyme activity tests were performed in the course of this work mainly as endpoint
assays, which in turn were measured by HPLC. The reaction is terminated after a certain
incubation period and the resulting product or reporter molecule can be detected. Assays were
directly stopped with 6 N HCl and put on ice as zero control samples. Furthermore, boiling
(95 °C for 10 min) or omitting the enzyme can provide information about the actual involvement
of an enzyme responsible for the formation of the investigated product.
Enzyme assays were performed in duplicate. The assay components were pipetted into 1.5 ml test
tubes as described below.
a. Standard assays
10 mM taxifolin (in 20% EtOH) 25 µl
10 mM coniferyl alcohol (in 20% EtOH) 25 µl
0.03% H2O2 25 µl
Enzyme solution 5-15 µl
0.05 mol l-1
TRIS-HCl buffer pH 10.0 ad 400 µl
The reaction was started with addition of the enzyme, immediate shaking and incubation at 30 °C
and 600 rpm in an Eppendorf Thermomixer® for 15 min. Addition of 75 µl 6 N HCl and shaking
stopped the reaction. Afterwards the products were extracted twice with 500 µl EtOAc each. The
combined EtOAc extracts were evaporated under the hood overnight or in a centrifugal
evaporator (SpeedVac) and the dry residues re-dissolved in 150 µl of the HPLC solvent mixture
and centrifuged at 16.000 g for 5 min prior to HPLC analysis.
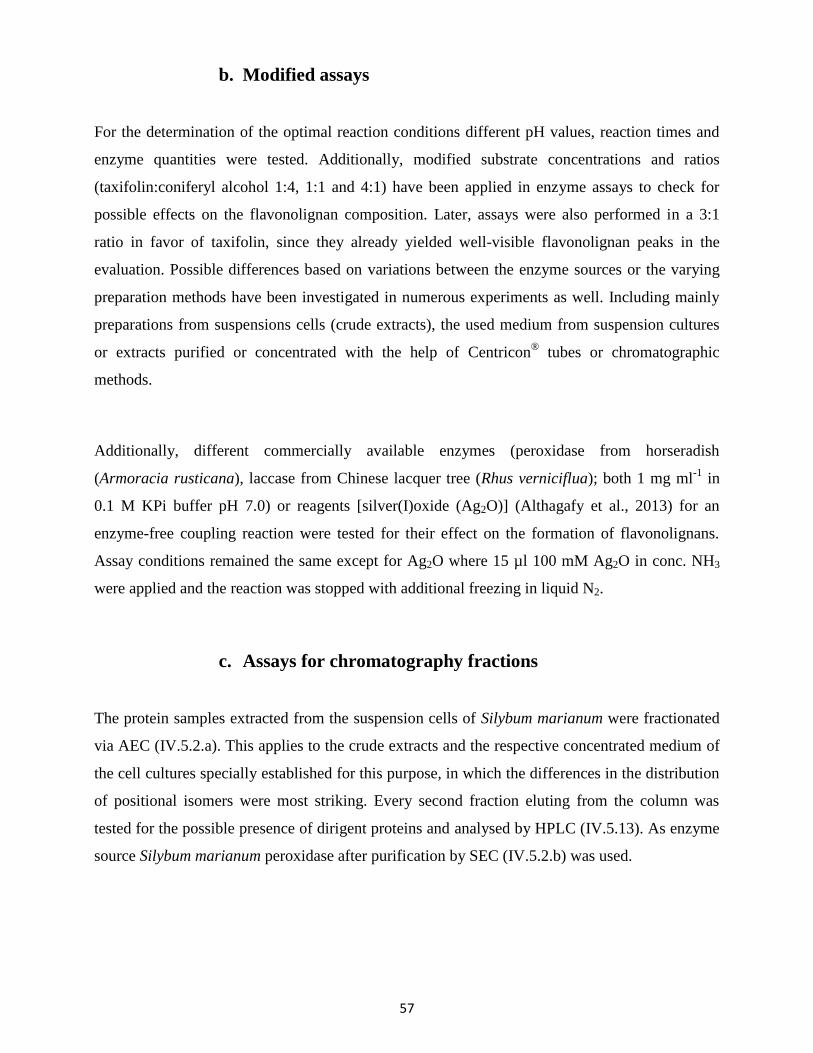
57
b. Modified assays
For the determination of the optimal reaction conditions different pH values, reaction times and
enzyme quantities were tested. Additionally, modified substrate concentrations and ratios
(taxifolin:coniferyl alcohol 1:4, 1:1 and 4:1) have been applied in enzyme assays to check for
possible effects on the flavonolignan composition. Later, assays were also performed in a 3:1
ratio in favor of taxifolin, since they already yielded well-visible flavonolignan peaks in the
evaluation. Possible differences based on variations between the enzyme sources or the varying
preparation methods have been investigated in numerous experiments as well. Including mainly
preparations from suspensions cells (crude extracts), the used medium from suspension cultures
or extracts purified or concentrated with the help of Centricon® tubes or chromatographic
methods.
Additionally, different commercially available enzymes (peroxidase from horseradish
(Armoracia rusticana), laccase from Chinese lacquer tree (Rhus verniciflua); both 1 mg ml-1
in
0.1 M KPi buffer pH 7.0) or reagents [silver(I)oxide (Ag2O)] (Althagafy et al., 2013) for an
enzyme-free coupling reaction were tested for their effect on the formation of flavonolignans.
Assay conditions remained the same except for Ag2O where 15 µl 100 mM Ag2O in conc. NH3
were applied and the reaction was stopped with additional freezing in liquid N2.
c. Assays for chromatography fractions
The protein samples extracted from the suspension cells of Silybum marianum were fractionated
via AEC (IV.5.2.a). This applies to the crude extracts and the respective concentrated medium of
the cell cultures specially established for this purpose, in which the differences in the distribution
of positional isomers were most striking. Every second fraction eluting from the column was
tested for the possible presence of dirigent proteins and analysed by HPLC (IV.5.13). As enzyme
source Silybum marianum peroxidase after purification by SEC (IV.5.2.b) was used.
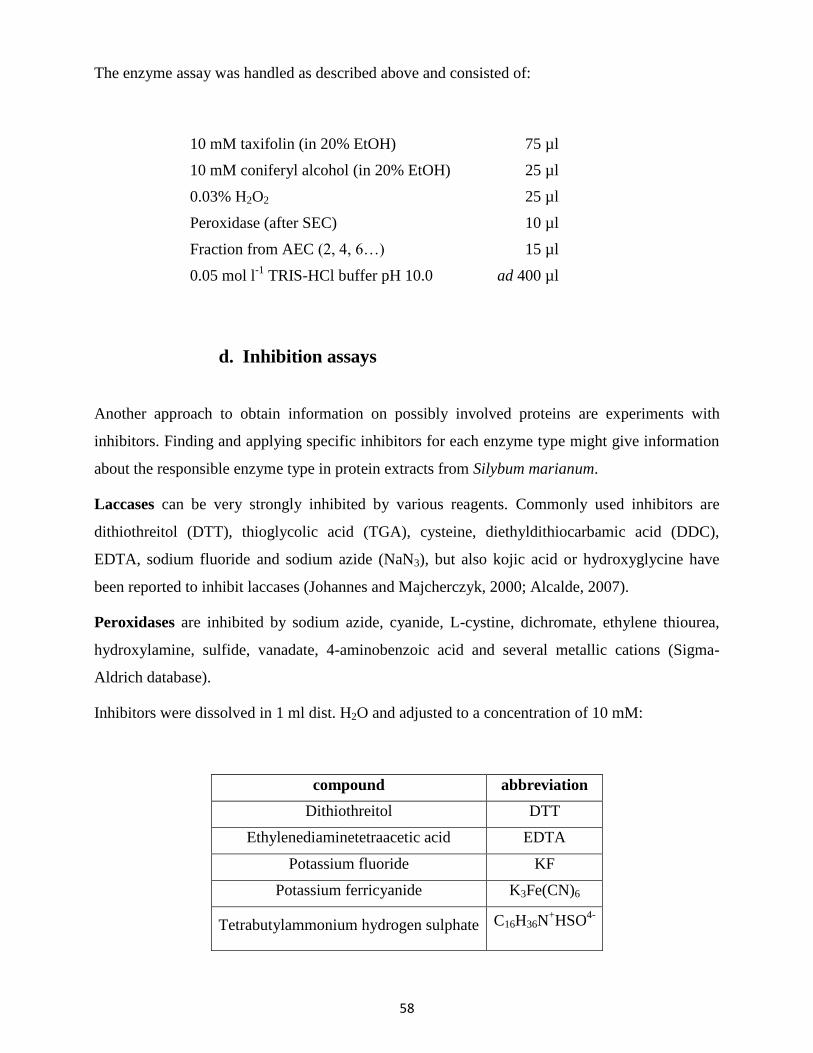
58
The enzyme assay was handled as described above and consisted of:
10 mM taxifolin (in 20% EtOH) 75 µl
10 mM coniferyl alcohol (in 20% EtOH) 25 µl
0.03% H2O2 25 µl
Peroxidase (after SEC) 10 µl
Fraction from AEC (2, 4, 6…) 15 µl
0.05 mol l-1
TRIS-HCl buffer pH 10.0 ad 400 µl
d. Inhibition assays
Another approach to obtain information on possibly involved proteins are experiments with
inhibitors. Finding and applying specific inhibitors for each enzyme type might give information
about the responsible enzyme type in protein extracts from Silybum marianum.
Laccases can be very strongly inhibited by various reagents. Commonly used inhibitors are
dithiothreitol (DTT), thioglycolic acid (TGA), cysteine, diethyldithiocarbamic acid (DDC),
EDTA, sodium fluoride and sodium azide (NaN3), but also kojic acid or hydroxyglycine have
been reported to inhibit laccases (Johannes and Majcherczyk, 2000; Alcalde, 2007).
Peroxidases are inhibited by sodium azide, cyanide, L-cystine, dichromate, ethylene thiourea,
hydroxylamine, sulfide, vanadate, 4-aminobenzoic acid and several metallic cations (Sigma-
Aldrich database).
Inhibitors were dissolved in 1 ml dist. H2O and adjusted to a concentration of 10 mM:
compound abbreviation
Dithiothreitol DTT
Ethylenediaminetetraacetic acid EDTA
Potassium fluoride KF
Potassium ferricyanide K3Fe(CN)6
Tetrabutylammonium hydrogen sulphate C16H36N+HSO
4-
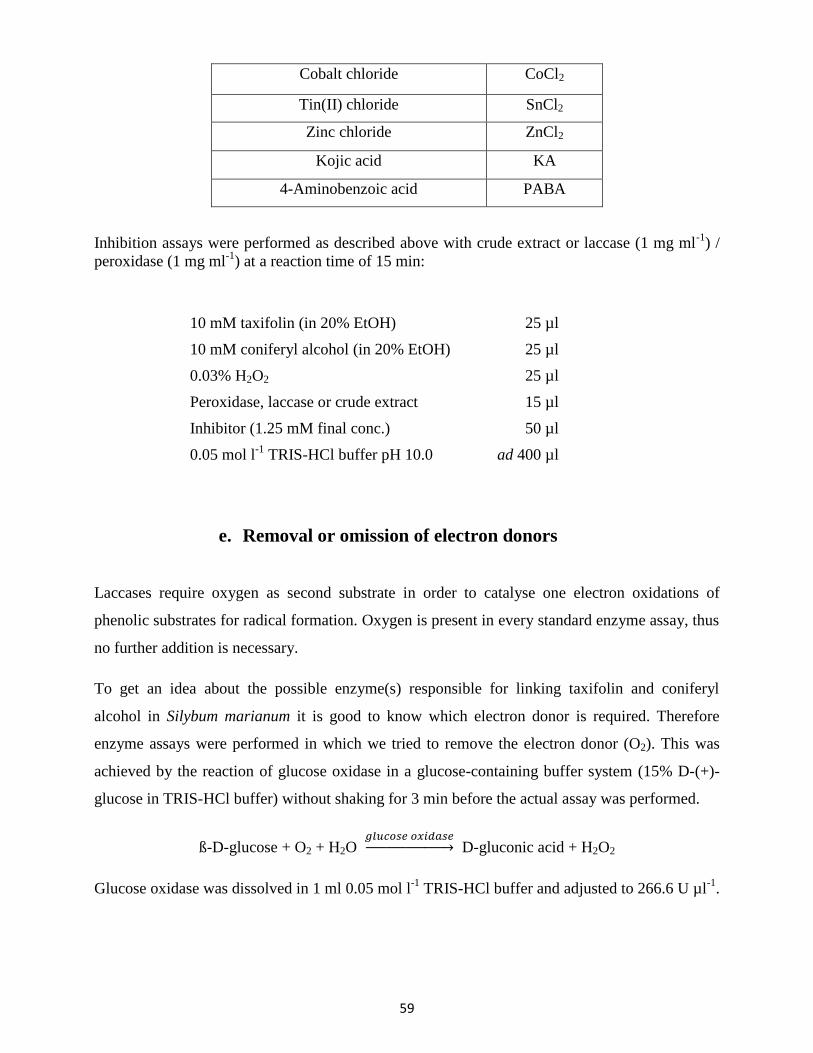
59
Cobalt chloride CoCl2
Tin(II) chloride SnCl2
Zinc chloride ZnCl2
Kojic acid KA
4-Aminobenzoic acid PABA
Inhibition assays were performed as described above with crude extract or laccase (1 mg ml-1
) /
peroxidase (1 mg ml-1
) at a reaction time of 15 min:
10 mM taxifolin (in 20% EtOH) 25 µl
10 mM coniferyl alcohol (in 20% EtOH) 25 µl
0.03% H2O2 25 µl
Peroxidase, laccase or crude extract 15 µl
Inhibitor (1.25 mM final conc.) 50 µl
0.05 mol l-1
TRIS-HCl buffer pH 10.0 ad 400 µl
e. Removal or omission of electron donors
Laccases require oxygen as second substrate in order to catalyse one electron oxidations of
phenolic substrates for radical formation. Oxygen is present in every standard enzyme assay, thus
no further addition is necessary.
To get an idea about the possible enzyme(s) responsible for linking taxifolin and coniferyl
alcohol in Silybum marianum it is good to know which electron donor is required. Therefore
enzyme assays were performed in which we tried to remove the electron donor (O2). This was
achieved by the reaction of glucose oxidase in a glucose-containing buffer system (15% D-(+)-
glucose in TRIS-HCl buffer) without shaking for 3 min before the actual assay was performed.
ß-D-glucose + O2 + H2O 𝑔𝑙𝑢𝑐𝑜𝑠𝑒 𝑜𝑥𝑖𝑑𝑎𝑠𝑒→ D-gluconic acid + H2O2
Glucose oxidase was dissolved in 1 ml 0.05 mol l-1
TRIS-HCl buffer and adjusted to 266.6 U µl-1
.
60
Assays were performed as described above with a reaction time of 20 min:
10 mM taxifolin (in 20% EtOH) 25 µl
10 mM coniferyl alcohol (in 20% EtOH) 25 µl
0.03% H2O2 25 µl
Laccase or crude extract 15 µl
Glucose oxidase (10 U final conc.) 15 µl
0.05 mol l-1
TRIS-HCl buffer pH 10.0
(+ 15% D-(+)-glucose) ad 400 µl
In the case of the reaction with a peroxidase no special pretreatment was necessary. Assays were
done as always with one change: By omitting H2O2 the electron donor crucial for a peroxidase
reaction was removed.
Additionally, substitution experiments with NADPH have been tried.
10 mM taxifolin (in 20% EtOH) 25 µl
10 mM coniferyl alcohol (in 20% EtOH) 25 µl
50 mM NADPH (5 mM final conc.) 40 µl
Peroxidase or crude extract 15 µl
0.05 mol l-1
TRIS-HCl buffer pH 10.0 ad 400 µl
f. Peroxidase activity assay
Oxidative enzymes like peroxidases can be easily identified and tested for their activity using
colour reactions. In the presence of an electron donor (e.g. H2O2), these react with a specific
substance, which leads to the change of colour due to shifts in its wavelength. Substances like
DAB (3,3'-diaminobenzidine) or ABTS (2,2'-azino-di-(3-ethylbenzthiazoline-6-sulfonic acid) are
well suited for that purpose. In the case of ABTS, its oxidation leads to a color change from a
bright transparent green to a deep dark green. This can then be measured photometrically and
thus the activity can be determined. In our case, it usually was only important whether peroxidase
activity could be detected at all, specific activity was rather incidental.
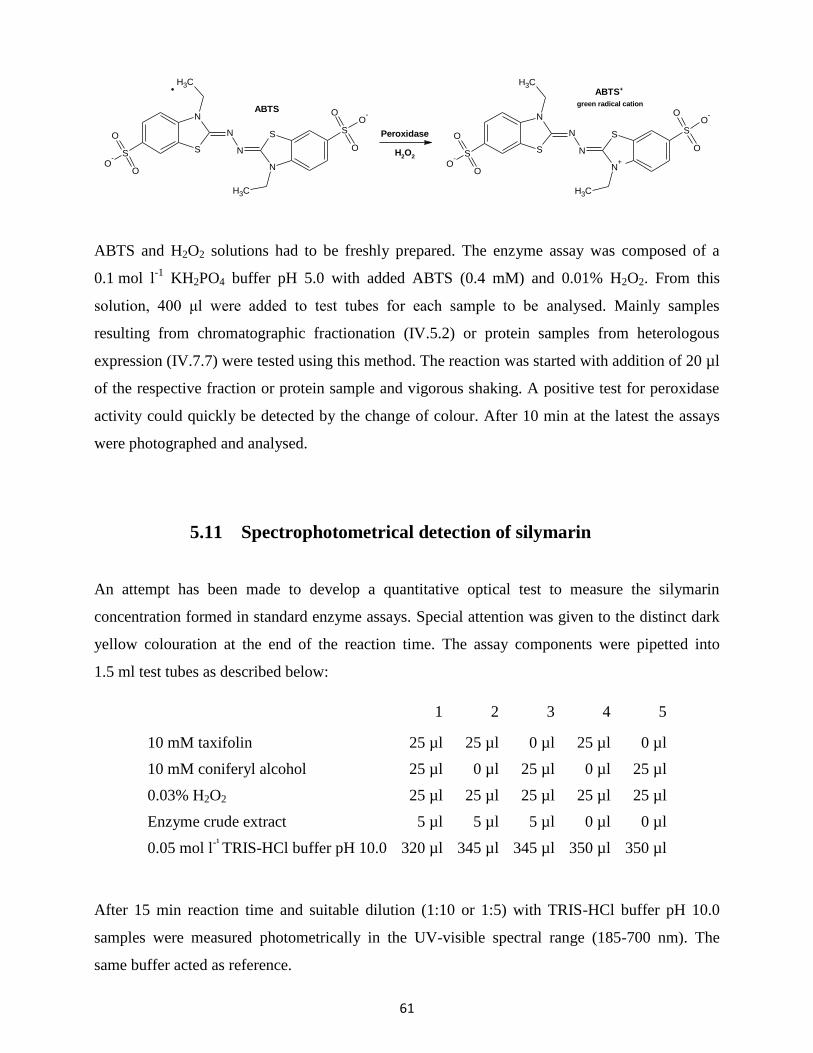
61
ABTS and H2O2 solutions had to be freshly prepared. The enzyme assay was composed of a
0.1 mol l-1
KH2PO4 buffer pH 5.0 with added ABTS (0.4 mM) and 0.01% H2O2. From this
solution, 400 μl were added to test tubes for each sample to be analysed. Mainly samples
resulting from chromatographic fractionation (IV.5.2) or protein samples from heterologous
expression (IV.7.7) were tested using this method. The reaction was started with addition of 20 µl
of the respective fraction or protein sample and vigorous shaking. A positive test for peroxidase
activity could quickly be detected by the change of colour. After 10 min at the latest the assays
were photographed and analysed.
5.11 Spectrophotometrical detection of silymarin
An attempt has been made to develop a quantitative optical test to measure the silymarin
concentration formed in standard enzyme assays. Special attention was given to the distinct dark
yellow colouration at the end of the reaction time. The assay components were pipetted into
1.5 ml test tubes as described below:
1 2 3 4 5
10 mM taxifolin 25 µl 25 µl 0 µl 25 µl 0 µl
10 mM coniferyl alcohol 25 µl 0 µl 25 µl 0 µl 25 µl
0.03% H2O2 25 µl 25 µl 25 µl 25 µl 25 µl
Enzyme crude extract 5 µl 5 µl 5 µl 0 µl 0 µl
0.05 mol l-¹
TRIS-HCl buffer pH 10.0 320 µl 345 µl 345 µl 350 µl 350 µl
After 15 min reaction time and suitable dilution (1:10 or 1:5) with TRIS-HCl buffer pH 10.0
samples were measured photometrically in the UV-visible spectral range (185-700 nm). The
same buffer acted as reference.
O
CH3
S
N
CH3
N
S
N
N S
S
OO
-
O
OO
-
Peroxidase
H2O
2
O
CH3
S
N
CH3
N+
S
N
N S
S
OO
-
O
OO
-
ABTS
ABTS+· green radical cation
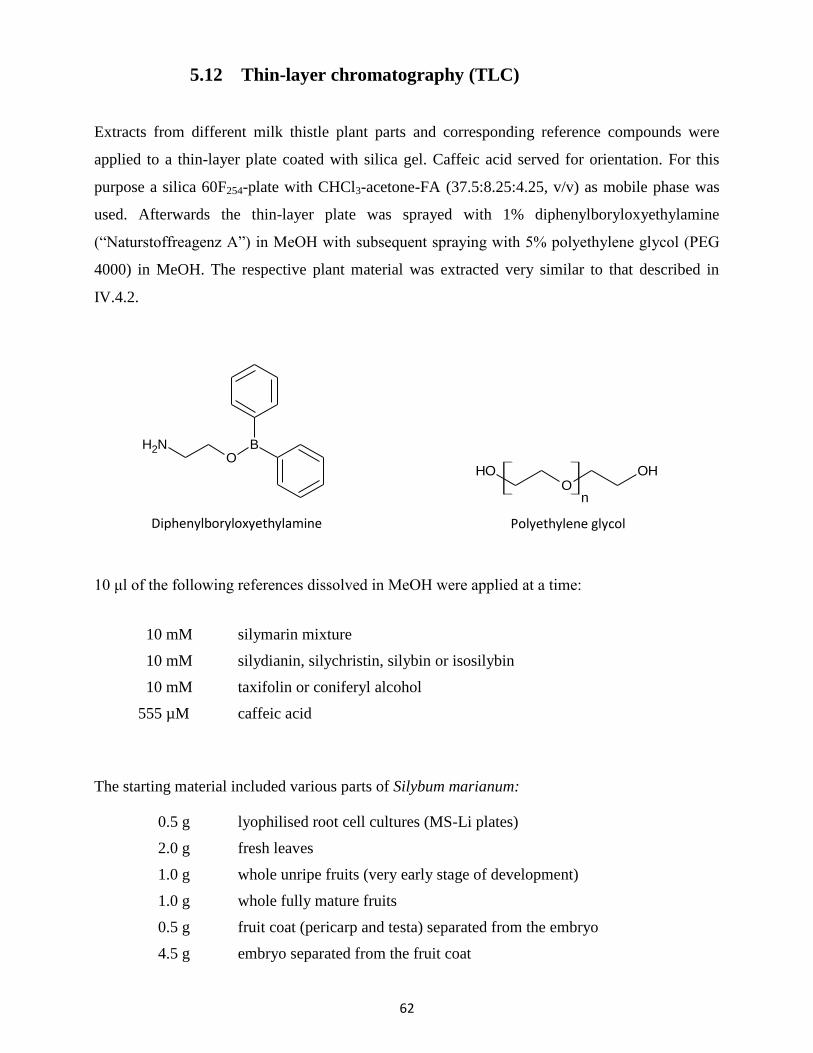
62
5.12 Thin-layer chromatography (TLC)
Extracts from different milk thistle plant parts and corresponding reference compounds were
applied to a thin-layer plate coated with silica gel. Caffeic acid served for orientation. For this
purpose a silica 60F254-plate with CHCl3-acetone-FA (37.5:8.25:4.25, v/v) as mobile phase was
used. Afterwards the thin-layer plate was sprayed with 1% diphenylboryloxyethylamine
(“Naturstoffreagenz A”) in MeOH with subsequent spraying with 5% polyethylene glycol (PEG
4000) in MeOH. The respective plant material was extracted very similar to that described in
IV.4.2.
OBNH2
OHO
OH
n
10 μl of the following references dissolved in MeOH were applied at a time:
10 mM silymarin mixture
10 mM silydianin, silychristin, silybin or isosilybin
10 mM taxifolin or coniferyl alcohol
555 µM caffeic acid
The starting material included various parts of Silybum marianum:
0.5 g lyophilised root cell cultures (MS-Li plates)
2.0 g fresh leaves
1.0 g whole unripe fruits (very early stage of development)
1.0 g whole fully mature fruits
0.5 g fruit coat (pericarp and testa) separated from the embryo
4.5 g embryo separated from the fruit coat
Diphenylboryloxyethylamine Polyethylene glycol
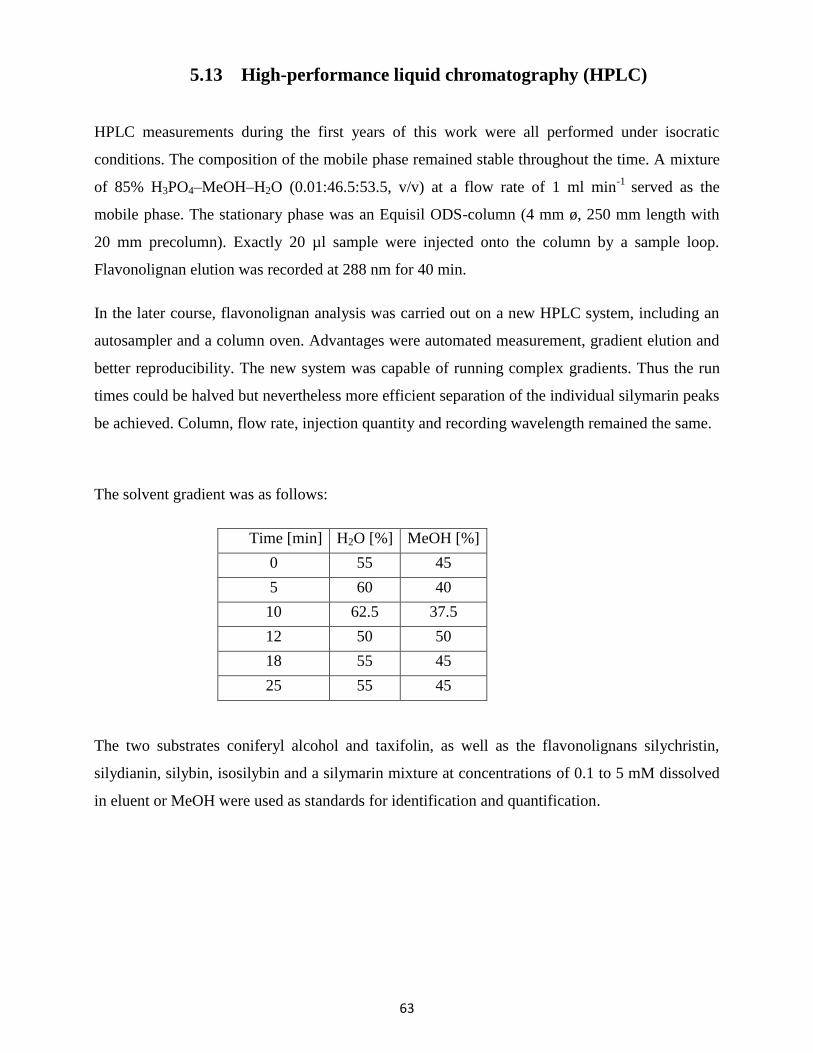
63
5.13 High-performance liquid chromatography (HPLC)
HPLC measurements during the first years of this work were all performed under isocratic
conditions. The composition of the mobile phase remained stable throughout the time. A mixture
of 85% H3PO4–MeOH–H2O (0.01:46.5:53.5, v/v) at a flow rate of 1 ml min-1
served as the
mobile phase. The stationary phase was an Equisil ODS-column (4 mm ø, 250 mm length with
20 mm precolumn). Exactly 20 µl sample were injected onto the column by a sample loop.
Flavonolignan elution was recorded at 288 nm for 40 min.
In the later course, flavonolignan analysis was carried out on a new HPLC system, including an
autosampler and a column oven. Advantages were automated measurement, gradient elution and
better reproducibility. The new system was capable of running complex gradients. Thus the run
times could be halved but nevertheless more efficient separation of the individual silymarin peaks
be achieved. Column, flow rate, injection quantity and recording wavelength remained the same.
The solvent gradient was as follows:
Time [min] H2O [%] MeOH [%]
0 55 45
5 60 40
10 62.5 37.5
12 50 50
18 55 45
25 55 45
The two substrates coniferyl alcohol and taxifolin, as well as the flavonolignans silychristin,
silydianin, silybin, isosilybin and a silymarin mixture at concentrations of 0.1 to 5 mM dissolved
in eluent or MeOH were used as standards for identification and quantification.
64
6. Molecular biology
Molecular biological techniques were applied to isolate three types of cDNAs/genes: peroxidase
(POD), laccase (LAC) and dirigent proteins (DIRs).
6.1 RNA extraction
Total RNA extracts from fresh fruits of Silybum marianum were prepared using a phenol-
chloroform extraction essentially according to Chomczynski and Sacchi (1987).
All materials needed for RNA extraction were autoclaved twice or heated at 200 °C for 2 h. In
addition, all working steps with RNA were performed with gloves. Unripe fruits collected and
separated from the inflorescence of the plant growing in the old botanical garden of Marburg
were frozen and pulverised in liquid N2 in a mortar. It was crucial to keep all material cold to
prevent any enzymatic activity, which could destroy the RNA. Approximately 50 mg of this
powder was mixed and incubated at room temperature with 500 µl “Solution D”, a 4 M
guanidinium thiocyanate solution in 25 mM citrate buffer pH 7.0 and 0.5% laurylsarcosine. After
adding 50 µl 2 M sodium acetate pH 4, the solution was mixed gently. In the next step 500 µl of
phenol saturated with citrate buffer pH 2 was added. The content of the tube was mixed gently
and 100 µl ice-cold chloroform were added. The reaction tube was vigorously mixed for 10 sec,
incubated on ice for 15 min and centrifuged for 15 min at 12.000 g and 4 °C. 400 µl of the
aqueous supernatant were transferred to a new tube and 400 µl ice-cold 2-propanol (1x volume)
were added. The RNA was precipitated for 15 min at -20 °C with subsequent centrifugation for
10 min at 12.000 g and 4 °C. The supernatant was collected. 400 µl 70% EtOH (1x volume) were
added to wash the pellet and the tube was centrifuged for 5 min at 7.500 g and 4 °C. After
removing the supernatant, 400 µl 100% EtOH were added. Again the tube was centrifuged for
5 min at 7.500 g and 4 °C. The supernatant was removed and the remaining pellet was dried at
37 °C.
The RNA was dissolved in 20 µl dist. H2O at 50 °C. The amount and purity of RNA was
determined photometrically and the integrity was controlled on an agarose gel. Samples with high
amount (> 3.000 ng µl-1
) of pure RNA (ratio of 260/280 nm > 1.6) were chosen for further
experiments.
65
6.2 cDNA synthesis
The cDNA was synthesised with the RevertAid First Strand cDNA Synthesis Kit.
1 µg RNA and 1 µl oligo(dT)18 primer were adjusted to a total volume of 12 µl with sterile H2O
in an Eppendorf® tube. The content of the tube was mixed gently and centrifuged for a few sec. It
was heated in a water bath for 5 min at 70 °C and then cooled on ice. After short centrifugation,
4 µl 5x reaction buffer, 1 µl RiboLock RNAse inhibitor and 2 µl 10 mM dNTP mix were added.
After gentle mixing and centrifugation, the tube was incubated at 37 °C for 5 min. 1 µl RevertAid
reverse transcriptase was added and the tube was incubated for 1 h at 42 °C. The reaction was
stopped by heating for 5 min at 70 °C.
6.3 Polymerase chain reaction (PCR)
a. PCR with degenerate primers
Since the genome of Silybum marianum is not sequenced yet, genes had to be identified by PCR
(Mullis et al., 1987; Saiki et al., 1988). Initially degenerate primers were used for this purpose.
They allow the recovery of genes from organisms where genomic information is not available.
The primers were designed by aligning homologous gene sequences of other organisms from the
NCBI database with help of a bioinformatics tool (CLC sequence viewer 7.6). Therefore, (partial)
DNA sequences of similar proteins from preferably closely or distantly related organisms are
listed vertically and compared with each other. When using enough sequences, regions with very
high similarity can be identified. Assuming that the nucleic acid to be amplified also contains
these conserved regions, it is possible to generate primer pairs that bind with a high probability to
the unknown sequence.
In the case of the reference sequences, attention was first paid to as high as possible species
relationship. Thus, all sequences coding for peroxidases originate from the family Asteraceae.
For the laccase and dirigent protein sequences this was not feasible. Due to lack of sequences of
closely related species, the required primers relied on distinct families with even some
gymnosperms among them. All primers necessary for this work were ordered from Eurofins
Genomics and can be found in the specific list (IV.9).
66
The gene library numbers of sequences used for the design of degenerate primers are as follows:
Peroxidase (POD): Dirigent proteins (DIRs)
Artemisia annua (AY208699) Dysosma tsayuensis (DQ418765)
Cynara scolymus (ADP37429; GU145301) Forsythia x intermedia (AF210061; AF210062)
Helianthus annuus (DQ889869) Podophyllum peltatum (AAK38666)
Mikania micrantha (FJ872511) Schisandra chinensis (ADR30610)
Senecio squalidus (AJ810531) Sesamum indicum (AY560651)
Zinnia elegans (AB023959; AJ880395) Sinopodophyllum hexandrum (DQ414685)
Thuja plicata (AAL92120; AF210064)
Laccase (LAC):
Glycine max (AAM54731)
Medicago truncatula (AES71245)
Pisum sativum (ABC59623)
Rosa hybrid cultivar (ACC78283)
A standard PCR protocol was used for a final volume of 25 µl:
cDNA 1.0 µl
GoTaq® buffer (5x) 5.0 µl
10 mM dNTP mix 0.5 µl
25 mM MgCl2 3.0 µl
Primer 1 (10 or 100 mM) 0.5 µl
Primer 2 (10 or 100 mM) 0.5 µl
GoTaq® polymerase 0.1 µl
Dist. H2O 14.4 µl
Usually a master mix was prepared for up to 5 samples. In some instances other polymerases
were used as well, such as DreamTaq, PhusionTaq or HotStart/TrueStart Taq. Buffer and total
volume were then adjusted accordingly. These ensured lower error rates due to advantages such
as proofreading, high fidelity and good PCR specificity. The PCR cycles were the following:
1st cycle: 94 °C, 120 sec / GSP Tm -5 °C, 60 sec / 70 °C, 90 sec
2nd
- 39th
cycle: 94 °C, 30 sec / GSP Tm -5 °C, 60 sec / 70 °C, 90 sec
40th
cycle: 94 °C, 60 sec / GSP Tm -5 °C, 60 sec / 70 °C, 10 min
End: cooling at 6 °C.
67
TM is the temperature at which binding of the primer to the melted template sequence is expected
(primer hybridisation, "annealing"). Usually, the melting temperature Tm -5 °C was chosen as
starting point with a gradient of up to 6 °C with steps of 1-2 °C above and below. The melting
point of primers was calculated with a tool on the Eurofins website. In case of additional method-
specific overhangs, these additional nucleotides were omitted in the calculation. Touchdown
PCRs were performed as well. Here, a temperature just above TM is chosen and the annealing
temperature is reduced by 0.5 °C per cycle. This is repeated 10-15 cycles, followed by a further
20-30 cycles at a fixed annealing temperature Tm -5 °C. By doing this, a highly specific primer
bonding to the sequence and efficient amplification could be expected.
The product of the PCR was analysed by agarose gel electrophoresis (IV.6.4). Products of the
expected size were cut out and purified by gel extraction (IV.6.5).
b. RACE PCR
RACE (rapid amplification of cDNA ends) PCR is a complex method that allows identifying full-
length sequences of a partially known gene with nontranslated regions. The 3' end is often
generated via the poly(A) tail of the mRNA. For the usually more challenging 5' RACE, an
adapter must be ligated to the 5' end of the mRNA.
Classical RACE PCR was performed according to a modified protocol of Scotto-Lavino et al.
(2006a, 2006b). Unfortunately, this method only resulted in two incomplete 3’ ends without stop
codon. The 5’ RACE method led to no results at all. Therefore, this method is only described
briefly and will not be mentioned further.
To generate 3' end partial cDNA clones, mRNA is reverse transcribed using a 'hybrid' primer
(Qtotal; QT) that consists of two mixed bases (GATC or GAC followed by (T)17 followed by a
unique 35-base oligonucleotide sequence (QI-QO). Amplification is then performed using a
primer containing part of this sequence (Qouter; QO), which now binds to each cDNA at its 3' end,
and using a primer derived from the gene of interest (GSP1). A second set of amplification cycles
is then carried out using 'nested' primers (Qinner; QI) and GSP2 to quench the amplification of
non-specific products.
68
To generate 5' end partial cDNA clones, reverse transcription (primer extension) is carried out by
using a gene-specific primer (GSP-RT) to generate first-strand products. Following this, a
poly(A) tail is appended using terminal deoxynucleotidyl transferase (TdT) and dATP.
Amplification is then achieved using the hybrid primer QT to form the second strand of cDNA,
the QO primer, and a GSP upstream of the one used for reverse transcription. Finally, a second set
of PCR cycles is carried out using nested primers (QI and GSP2) to increase the yield of specific
product.
SMART-RACE PCR is an important modification of the classic RACE PCR, whereas SMART
stands for "switching mechanism at 5' end of RNA transcript". The experiments were carried out
using the SMARTer® RACE 5'/3' Kit from Clontech (Chenchik et al., 1998; Bower and Johnston,
2010). A supplied special modified oligonucleotide and a reverse transcriptase should ensure
better sensitivity and higher specificity.
The principle behind this is that the reverse transcriptase used, attaches a poly(C) tail to the 3' end
of the cDNA (corresponding to the 5' end of the template RNA), which then serves as a template
for a G-rich second primer. This second primer contains an adapter sequence, which is also used
by the reverse transcriptase as a template for the same cDNA ("switching mechanism"). Thus, the
completed cDNA contains two adapter regions, at the 3' and 5' ends. 5’ and 3’ gene-specific
primers can then be used in long-distance PCR to generate full-length cDNA. Additionally, the
gene specific primers of the kit contain an adapter sequence for easy incorporation into the
included pRACE vector.
According to the SMARTer® RACE Kit protocol, 4 μl 5x First-Strand Buffer, 0.5 μl 100 mM
DTT and 1 μl 20 mM dNTP mix were pipetted into a reaction tube (solution A). In another tube,
1 μl RNA, 1 μl 5' CDS primer A and 9 μl water were mixed. The reaction tube was incubated at
72 °C for 3 min, cooled for 2 min at 42 °C and finally put on ice. To this sample 1 μl SMARTER
II A oligonucleotide was added (solution B). Solution A was mixed with 0.5 μl of RNase
inhibitor and 2 μl SMARTScribe™
reverse transcriptase and then completely added to solution B.
The reaction tube was incubated for 90 min at 42 °C and heated to 70 °C for 10 min afterwards.
The 5' cDNA was diluted with 90 μl TE buffer.
69
The subsequent PCR had a total volume of 50 μl and was composed as follows:
SeqAmp buffer (2x) 25.0 µl
SeqAmp DNA Polymerase 1.0 µl
SMARTer RACE cDNA 2.5 µl
Universal Primer Mix (10x) [UPM] 5.0 µl
10 μM 5’ or 3’ GSP 1.0 µl
Dist. H2O 15.5 μl
The gene specific primers (GSPs) had preferably a TM ˃ 70 °C, which enabled the use of
touchdown PCR, but at least ≥ 65 °C. Furthermore, they had 15 bp overlaps with vector
sequences at their 5’ ends, necessary for successful In-Fusion cloning. The PCR cycles were the
following:
Touchdown PCR (if GSP TM > 70 °C):
1st - 5
th cycle: 94 °C, 30 sec / 72 °C, 3min
6th
- 10th
cycle: 94 °C, 30 sec / 70 °C, 30 sec / 72 °C, 3 min
11th
- 40th
cycle: 94 °C, 30 sec / 68 °C, 30 sec / 73 °C, 3 min
End: cooling at 6 °C.
Normal PCR (if GSP TM between 60-70 °C)
1st - 39
th cycle: 94 °C, 30 sec / GSP Tm - 5 °C, 30 sec / 72 °C, 3 min
40th
cycle: 94 °C, 30 sec / GSP Tm - 5 °C, 30 sec / 72 °C, 10 min
End: cooling at 6 °C.
If necessary, the PCR product was diluted 1:100 with dist. H2O or TE buffer and a nested PCR
was performed. This method was used to generate the 5’ ends of the DIRs. Otherwise difficulties
in distinction would have been likely because of a high similarity of gene sequences. In that case,
the included Nested Universal Primer (NUP) was used during PCR instead of the Universal
primer mix (UPM). Furthermore, a second 5’ GSP, binding further inside in the sequence, was
applied. For amplification, the simpler PCR protocol was chosen.
70
The resulting promising PCR products of appropriate sizes were not inserted into the pRACE
vector by simple ligation, but by a recombination. This In-Fusion cloning was carried out with
specific enzymes included in the kit. The manufacturer's instructions were followed, but in half of
the indicated volumes:
Linearised pRACE vector 0.5 µl
Gel-purified RACE product 3.5 µl
In-Fusion HD Master Mix 1.0 µl
Samples were incubated for 15 min at 50 °C and transferred to ice until transformation of frozen
Stellar™
competent cells (IV.7.2.a).
c. PCR for amplification of full length sequences
After successful generation of the complete coding sequence by assembly of the 5 'and 3' end,
full length primers were used for expression experiments in different pro- and eukaryotic cell
lines. For this purpose, the necessary primer restriction sites were matched to those also present
in the plasmids. The complete primer list can be found in chapter IV.9. The necessary PCR was
performed with a polymerase with proofreading activity to obtain a high accuracy of replication.
Two different enzymes were used:
High Fidelity PCR Polymerase Mix: Phusion®
High Fidelity DNA Polymerase:
HiFi buffer + MgCl2 (10x) 5 µl HF buffer + MgCl2 (10x) 10 µl
2 mM dNTP Mix 5 µl 2 mM dNTP Mix 5 µl
10 mM primer f 0.25 µl 10 mM primer f 0.5 µl
10 mM primer r 0.25 µl 10 mM primer r 0.5 µl
cDNA (template) 1.5 µl cDNA (template) 0.5 µl
HiFi Polymerase 0.25 µl Phusion® Polymerase 0.25 µl
Dist. H2O ad 50 µl Dist. H2O ad 50 µl
71
The PCR cycles were the following:
1st cycle: 94 °C, 120 sec / GSP Tm -5 °C, 60 sec / 72 °C, 90 sec
2nd
- 39th
cycle: 94 °C, 30 sec / GSP Tm -5 °C, 60 sec / 72 °C, 90 sec
40th
cycle: 94 °C, 60 sec / GSP Tm -5 °C, 60 sec / 72 °C, 10 min
End: cooling at 6 °C.
The PCR products were analysed by agarose gel electrophoresis. Matching products were cut out,
purified via gel extraction and ligated into pDrive until further transformation of E. coli and
confirmation by sequencing.
d. Colony PCR
Colony PCR is a convenient method for determination of the presence or absence of insert DNA
in plasmid constructs introduced into organisms (E. coli, Saccharomyces cerevisiae). This
method was mainly used for the conformation of successful transformation of yeast expression
cell lines. The respective colony, which was used for expression later on, was picked from the
agar plate and suspended in 100 µl 200 mM LiAc, 1% SDS solution and incubated for 5 min at
70 °C. This heating step causes the release of the plasmid DNA from the cell, after which it can
serve as template for a PCR reaction. For further purification 300 µl of 100% EtOH were added
and mixed vigorously. The DNA and cell debris were sedimented by centrifugation at 15.000 g
for 3 min and the resulting pellet washed in 70% EtOH. It was re-dissolved in 100 µl dist. H2O
and centrifuged again at 15.000 g for 15 sec. 1 µl of the resulting supernatant was used as
template for a standard PCR reaction with specific primers for the respective protein. Colonies
verified in this way can then be re-inoculated, multiplied and stored at 4 °C until further
expression analysis.
6.4 Agarose gel electrophoresis
For the separation of DNA and RNA samples agarose gels were used as a matrix. 1.4 g agarose
were dissolved in 200 ml of either 0.5x TBE-buffer (44.5 mM boric acid, 1 mM Na2-EDTA and
44.5 mM TRIS) or in 1x TAE-buffer (20 mM acetic acid, 1 mM Na2-EDTA, 40 mM TRIS), by
heating in a microwave (0.7% agarose gel). Approximately 50 ml were used to prepare a gel.
72
While still hot, 0.7 µl of 1% ethidium bromide solution were added and mixed well. Accordingly,
the electrophoresis chamber contained either 0.5x TBE-buffer or 1x TAE-buffer. The slots of the
gel were loaded with a mixture of RNA or DNA with 6x loading dye (0.03% bromophenol blue,
0.03% xylene cyanol, 60 mM EDTA in 60% glycerol). Usually, 8 µl sample were mixed with
2 µl dye when using PCR products and 3 µl sample and 3 µl dye when using RNA. As a marker,
3 µl of a DNA ladder mix (GeneRuler™
) was used. The DNA was separated with 110 V for about
45 min until the lower blue band (bromophenol blue) had reached two thirds of the gel. The gels
were then checked under UV at 254 nm or digitally by means of blue-green LED light and an
amber filter.
6.5 Purification of DNA fragments from agarose gels
Once a DNA fragment with the correct calculated length (given as base pairs, bp) was obtained,
all PCR samples, which contained this band, were separated completely by agarose gel
electrophoresis and the respective bands were cut out of the gel. For gel extraction and
purification a NucleoSpin Extract II kit was used.
Firstly, the gel matrix was dissolved, using the binding buffer NT in a ratio of 200 µl
buffer/100 mg gel matrix. The tube was incubated at 50 °C until the gel was liquefied (5-
10 min.). The solution was centrifuged through a NucleoSpin silica filter for 1 min at 11.000 g.
The flow-through was discarded. 600 µl of the wash buffer (NT3) was added and again the flow-
through was discarded after centrifugation at 11.000 g for 1 min. The silica membrane was then
centrifuged for 2 min at 11.000 g to dry the silica membrane. Finally 15 µl of dist. H2O were
added into the centre of the silica filter. After an incubation time of 5 min, the flow-through was
centrifuged into a reaction tube and the silica filter was cleaned with dist. H2O for further use.
The DNA concentration of the sample was measured photometrically.
6.6 Ligation
Ligation is the covalent linkage of an insert sequence with a vector.
73
a. TA-ligation
TA-ligation is a simple way of inserting DNA fragments into vectors. It is based on the
attachment of an adenosine nucleotide (A) at the end of the PCR reaction of the DNA polymerase
type A to the finished strand. This A can interact with an overhanging thymidine nucleotide (T)
of the linear plasmid, thus facilitating the incorporation of the insert into the vector. Since both
ends of the insert as well as the vector are identical, half of the vectors result in a reverse
incorporation of the insert. Ligation reactions into the TA-cloning vector pDrive were performed
with the Qiagen PCR cloning kit.
0.25-1.0 µl DNA fragment solution and 0.5 µl pDrive cloning vector were pipetted to 2.5 µl 2x
ligation buffer with ligase in a total volume of 5 µl. The mixture was incubated overnight at
4-10 °C in the refrigerator or at least for half an hour at 16 °C. Then the ligase was denatured for
5-10 minutes at 65 °C, prior to transformation.
b. Ligation into restriction sites
The second applied method is ligation with T4 DNA ligase into the sticky ends of DNA
fragments previously cut with restriction endonucleases. For this ligation, a DNA fragment
digested with restriction enzymes is introduced into a plasmid. This was also pre-digested with
the respective enzymes and, if necessary, additionally purified. Thus, a directed incorporation of
the insert can occur if different restriction endonucleases have been used for the two restriction
sites. Insert and plasmid were used in a ratio of 5-10:1 in favour of the insert. The respective
amounts were determined photometrically and the quantities to be used calculated accordingly. In
addition, the concentration of the DNA fragment could previously be increased by evaporation.
The ligation mix had a total volume of 10 μl. First the insert was re-dissolved in the required
volume of water.
Plasmid 1.0 μl
T4 Ligase buffer (10x) 1.0 μl
T4 DNA Ligase 1.0 μl
DNA fragment solution 7.0 μl
74
The mixture was incubated for 20 h at 4 °C and the reaction stopped at 65 °C for 10 min. The
cooled solution was used for the transformation of pro- and eukaryotic expression strains.
6.7 Restriction enzyme digest
Digestion with restriction endonucleases is an important method of molecular biology. The
restriction digest is used to characterise DNA on the basis of the resulting characteristic DNA
fragments and to prepare DNA for cloning attempts. The standard digestion assays were
performed in a total volume of 15 μl. The choice of the final buffer concentration was dependent
on the enzyme(s) used. The aim was to obtain maximum enzyme activity with simultaneous
suppression of unspecific digestion (star activity). The choice of the enzyme(s) was directed to
the restriction sites in the gene and/or the plasmid. If there were variations in the pipetting
scheme, it is explicitly pointed out in the respective method.
Otherwise the assays were composed as follows:
2x yellow buffer (10x) or 3.0 µl EcoRI buffer (10x) 1.5 µl
1x orange buffer (10x) or 1.5 µl EcoRI 0.5 µl
1x red buffer (10x) 1.5 µl Plasmid 3.0 µl
NdeI | EcoRI | HindIII | HindIII 0.5 µl Dist. H2O 10.0 µl
XhoI | NotI | XhoI | EcoRI 0.5 µl
Plasmid 3.0 µl
Dist. H2O ad 15.0 µl
For digestion of high amounts of DNA the final volume was extended to 20 µl. In addition, the
concentration of restriction enzymes was tripled (1.5 µl each) and only plasmid DNA sample
used instead of further dilution with dist. H2O. Samples were incubated overnight (~16 h) or at
least for 3 h at 37 °C. If only information about the actual presence of an insert had to be gathered
quickly, short heating in the microwave (30 sec) was enough to detect bands by agarose gel
electrophoresis.
75
7. Genetic engineering
7.1 Chemically competent E. coli cells
For the genetic engineering work safety strains of E. coli were used: EZ from Qiagen,
BL21(DE3)pLysS from Novagen, BL21-CodonPlus (DE3)-RIPL from Agilent and Stellar™
from
Clontech. The EZ and BL21 strains were multiplied and made chemically competent in the
laboratory. The EZ cells were used for plasmid multiplication and verification, whereas the BL21
strains were used solely for expression studies. Competent Stellar™
cells were only used for
transformation with pRACE constructs (IV.6.3.b).
In order to get competent bacteria, cells of a stock culture were picked with a sterile toothpick
and inoculated in a test tube containing 2 ml liquid LB medium and 2 μl tetracycline (12.5 mg
ml-1
Tet in EtOH). In case of the BL21-CodonPlus (DE3)-RIPL cells, tetracycline was replaced
with chloramphenicol (50 mg ml-1
Cam in EtOH). The test tubes were closed with a lid and
shaken overnight at 220 rpm and 37 °C. The next morning, 0.75 ml of fresh sterile LB was taken
from a 250 ml Erlenmeyer flask, acting as a reference for the determination of the optical density
at 600 nm (OD600). The rest (~100 ml) was mixed with 90 μl of the tetracycline solution. 2 ml of
the overnight culture were then added to the flask and cultivated at 220 rpm and 37 °C until an
optical density (OD600) of 0.6 was reached. The suspensions were then centrifuged in two sterile
50 ml tubes at 3.000 g and 4 °C for 10 min. The supernatant was discarded and the pellet
resuspended in 10 ml cold 100 mM CaCl2. The suspensions were combined and centrifuged at
2.500 g and 4 °C for 12 min. Again, the supernatant was discarded and the pellet resuspended in
10 ml cold 100 mM CaCl2, followed by incubation on ice for 20 min and centrifugation under the
same conditions once more. Finally, the supernatant was discarded and the cells resuspended in
2 ml 100 mM CaCl2 with 15% glycerol. The bacteria were distributed in aliquots of 150 μl in
sterile 1.5 ml reaction tubes, frozen in liquid N2 and stored at -80 °C.
76
7.2 Transformation of pro- and eukaryotic cell lines
a. E. coli strains (heat shock transformation)
Tubes with 150 µl frozen competent E. coli cells were thawed on ice. 5 µl of ligation mix
(IV.6.6.a) were added to 70 µl of these, mixed very carefully and put back on ice for 30 min. The
tubes were then incubated in a water bath at 42 °C for exactly 90 sec and cooled again on ice for
2 min. 150 µl SOC medium were added and incubated at 37 °C for 45 min with gentle shaking in
an Eppendorf Thermomixer (650 rpm). The mixture was added to a pre-warmed LB agar plate
(containing the appropriate amount of antibiotic) in a Petri dish and plated with a sterile Drigalski
scoopula. Clones containing pDrive could additionally be selected for integrated DNA fragments
via blue-white screening. For this purpose, X-Gal (80 µg ml-1
) and IPTG (12 µg ml-1
) were added
to the LB medium for plates. After drying of the liquid film, the dishes were closed, sealed and
incubated overnight (~18 h) at 37 °C.
b. Pichia pastoris (electroporation)
To promote integration, the pPICZα constructs were linearised in the 5’ AOX1 promoter region.
In case of the laccase and both dirigent proteins SacI was used for this purpose (overnight at
37 °C). The peroxidase construct was linearised with BstXI overnight at 55 °C. Both restriction
enzymes were heat-inactivated after complete linearisation (SacI at 65 °C and BstXI at 80 °C for
20 min).
Enzyme buffer (10x) 2.0 µl
SacI | BstXI 5.0 µl
Plasmid 10.0 µl
Dist. H2O 3.0 µl
The constructs were purified by phenol/chloroform extraction (Sambrook and Russell, 2006)
once. The sample was added to an equal volume of phenol and vortexed vigorously. After
centrifugation (16.000 g; 3 min) the upper phase (containing the DNA) was transferred to a new
Eppendorf tube. An equal volume of CHCl3 was added, vortexed and centrifuged again. The
aqueous phase was transferred into a new Eppendorf tube with 1/10 volume 3 M sodium acetate
77
and 2.5 volumes of 100% ice-cold EtOH, vortexed and kept at -20 °C for 15 min. After
centrifugation at 16.000 g and 4 °C for 3 min the DNA pellet was washed with 80% EtOH, air-
dried, resuspended in 10 µl dist. H2O and finally stored at -20 °C until further use.
Transformation of P. pastoris was done by means of electroporation. 4 ml of the P. pastoris X-33
strain were grown in YPD medium in a small tube at 30 °C overnight. The next day 250 ml of
fresh medium were inoculated with 1 ml of the overnight culture in a 1 liter flask and grown
overnight again to an OD600 of ~1.5. The cells were centrifuged at 1.500 g for 5 min at 4 °C and
resuspended in 250 ml ice-cold sterile H2O. This step was repeated twice, but cells were
resuspended in 125 ml ice-cold sterile H2O the second time and in 10 ml ice-cold 1 M sorbitol
after the third centrifugation step. Finally the cells were centrifuged as described above, the pellet
resuspended in 1 ml ice-cold 1 M sorbitol in a final volume of approximately 1.5 ml. Cells were
kept on ice and used the same day.
80 µl of these P. pastoris X-33 cells were mixed with 10 µg of the linearised pPICZα A
constructs and transferred to an ice-cold 0.2 cm electroporation cuvette. The cuvette was
incubated with the cells on ice for 5 min. They were pulsed with a BioRad MicroPulser™
according to the parameters for yeast (P. pastoris) as suggested by the manufacturer. Afterwards
1 ml ice-cold 1 M sorbitol was added immediately and the cuvette contents transferred to a sterile
1.5 ml Eppendorf tube. This was incubated at 30 °C without shaking for 1-2 h. 200 µl of the
content were spread on YPDS plates containing the appropriate concentration of Zeocin™
(100 µg ml-1
) and incubated for 2-3 days at 30 °C.
c. Saccharomyces cerevisiae
Transformation of S. cerevisiae strains was done with the lithium acetate method according to
Gietz and Schiestl (2002). All steps were done with autoclaved buffers and toothpicks. At first,
carrier DNA (fish sperm) was dissolved in TE buffer (10 mM TRIS-HCl, 1 mM Na2EDTA pH
8.0) by stirring at 4 °C for 1-2 h and then heated to 99 °C for 5 min and stored on ice until further
use. The plasmid DNA was diluted with dist. H2O to a concentration of 50 ng µl-1
. An amount of
yeast cells about as large as a pinhead was picked from a fresh YPD plate and resuspended in
1 ml dist. H2O. The suspension was centrifuged at 16.000 g for 30 sec and the supernatant
removed. The following was pipetted on the cell pellet in the given order and mixed afterwards.
78
Polyethylene glycol (50% w/v) 240 µl
1 M lithium acetate 36 µl
Carrier DNA (2 mg ml-1
) 50 µl
Plasmid (50 ng µl-1
) 34 µl
The samples were incubated for at least 1 h at 42 °C, subsequently centrifuged at 16.000 g and
resuspended in 1 ml dist. H2O. Finally, 200 µl of these were spread on SCD plates and incubated
at 30 °C for 3-4 days.
After formation of successfully transformed S. cerevisiae cells, colonies were streaked out on
fresh SCD plates and checked for the correct insert via colony PCR (IV.6.3.d).
7.3 Overnight cultures
After successful transformation of E. coli EZ cells and streaking on solid media plates, colonies
were picked with the help of sterile toothpicks and placed in a tube containing 4 ml LB medium
with ampicillin (0.1 mg ml-1
). The tubes were closed, sealed and put into an incubator at 37 °C
with 220 rpm rotation for 18 h. The next day, the cells were centrifuged, plasmids extracted by
plasmid preparation (IV.7.4) and a control digest performed, before further sequencing or
recloning steps.
7.4 Plasmid preparation
Plasmid preparation is a simple method to separate and extract plasmids from bacteria. These
were then either sequenced for verification, or the insert was cut by restriction enzymes and
ligated into another vector. Also, multiplied empty vectors could be obtained this way.
1.5 ml of the cell suspension from overnight cultures were pipetted into test tubes followed by
centrifugation at 1.500 g for 5 min. The supernatant was discarded and the procedure was
repeated with another 1.5 ml cell suspension. After the second centrifugation step the supernatant
was removed quantitatively with a pipette and the protocol from the QIAprep® Spin Miniprep Kit
by Qiagen was followed:
79
The pellets were resuspended in 250 µl buffer P1 (50 mM TRIS-HCl pH 8.0, 10 mM EDTA,
100 μg ml-1
RNase A). 250 µl buffer P2 (200 mM NaOH, 1% SDS) were added and the tubes
were mixed by inverting them 5 times. 350 µl buffer N3 (4.2 M guanidinium-HCl, 0.9 M
CH3CO2K, pH 4.8) were added and the tubes were again mixed by inverting them a few times.
Afterwards, the tubes were centrifuged for 10 min at 16.000 g. The supernatants were pipetted
carefully to QIAprep®
spin columns and centrifuged for 1 min at 16.000 g. The flow-through was
discarded and the columns were washed with 500 µl buffer PB (5 M guanidinium-HCl, 30%
2-propanol) by centrifugation at 16.000 g for 1 min. After discarding the flow-through the
columns were washed again with 750 µl buffer PE (10 mM TRIS-HCl pH 7.5, 80% EtOH) by
centrifugation at the same conditions. The flow-through was discarded again and the columns
were dried by short centrifugation. To elute the DNA, 50 µl sterile water were applied to the
column. After incubation for 5 min at room temperature, the columns were centrifuged for 1 min
at 11.000 g and the flow-through containing the plasmid-DNA collected in 1.5 ml test tubes.
7.5 Sample verification and pre-expression measures
The vectors were subjected to a restriction digest (IV.6.7) and the product was examined by gel
electrophoresis. For the sequencing, 20 μl were added to new reaction tubes and send to Eurofins
Genomics or adjusted to a concentration of ~80 ng μl-1
with a total volume of 12 μl and sent to
Seqlab. From colonies with correct sequences, glycerol stocks were prepared. Full-length
sequences were used for cloning into expression vectors.
For cloning into an expression vector after successful sequencing, correspondingly more plasmid
DNA sample was digested, to generate more insert. The inserts were ligated to the plasmid with
T4 DNA ligase (IV.6.6.b) and then brought into the strain E. coli EZ first. After verification of
correct clones, transformation of the appropriate expression strain followed.
80
7.6 Glycerol stocks
When the sequencing results of plasmids were satisfying, glycerol stocks for cryopreservation
were prepared. For this 75 µl sterile glycerol and 425 µl liquid bacteria culture (overnight
cultures) were thoroughly mixed. Subsequently, these were frozen in liquid N2 and stored
at -80 °C for stable long-term storage. Additionally, crucial constructs were stored at -20 °C in
form of plasmids dissolved in dist. H2O.
7.7 Expression of recombinant proteins
a. E. coli BL21 strains
For synthesis of heterologous proteins expression vectors were used, that contained the gene in
the correct reading direction. These were introduced into E. coli BL21(DE3)pLysS or
BL21-CodonPlus (DE3)-RIPL by transformation. For this 2 ml LB medium with 10 µl ampicillin
(20 mg ml-1
) were inoculated with a bacterial colony and incubated over night at 37 °C and
220 rpm. The next day, the overnight culture was added to 100 ml LB medium (0.75 ml were
saved for the photometrical reference) and cultivated at 37 °C and 220 rpm to an OD600 of about
0.4. With addition of 100 µl 1 M IPTG (final concentration 1 mM) induction of protein
expression was started. After cultivation overnight at 37 °C cells were collected by centrifugation
for 5 min at 5.000 g in 50 ml tubes. Finally they were frozen in liquid N2 and stored at -80 °C
until further homogenisation and purification steps (IV.6.5.a).
b. P. pastoris X-33 strain
For expression of recombinant proteins in Pichia strains special media were used
(BMGY/BMMY). Because adequate aeration during MeOH induction is an important parameter
for efficient expression in P. pastoris baffled flasks covered with cheesecloth were used.
Furthermore cultures were never allowed to be more than 30% of the total flask volume. All
expression studies were done at 28-30 °C in an incubation shaker.
81
For this 25 ml BMGY was inoculated with a single colony of the respective Pichia clone in a 500
ml baffled flask. It grew at 230 rpm at 30 °C until the culture reached an OD600 ~10 (18 h). The
cells were harvested by centrifugation at 1.500 g for 5 min at room temperature. The cell pellet
was resuspended in 200 ml BMMY in a 1 l baffled flask to an OD600 of 1.0 to induce expression.
To maintain induction 100% MeOH was added every 24 h to a final concentration of 0.5-1%.
After 0, 12, 24, 48 and 72 h at 28 °C and 160-180 rpm 1 ml of the expression culture was
transferred to a 1.5 ml tube and centrifuged shortly for expression level analysis later on. For
expression of secreted proteins the supernatant was transferred to a separate tube. All samples
were frozen quickly in liquid N2 and stored at -20 °C. Supernatants (extracellular) and cell pellets
(intracellular) were analysed for protein expression via SDS-PAGE and Western blot. Cell
disruption and protein extraction were performed as described in section IV.5.5.b.
c. S. cerevisiae CB018 and InvSc1 strains
In the case of the successfully transformed yeast cells mainly two different media were used for
expression of recombinant proteins. SCD medium was used for cell mass accumulation and SCG
medium for induction. Each time a single colony of the CB018 or InvSc1 strain containing the
correct pYES2/NT C construct was inoculated and grown overnight at 30 °C in 3 ml SCD as the
pre-culture. It was further transferred to a 500 ml baffled flask and shaken at 200 rpm at 30 °C
overnight in about 100 ml total volume of SCD. The next day the cells were harvested by
centrifugation at 1.500 g for 5 min at room temperature. The resulting cell pellet was resuspended
in 200 ml SCG medium to an OD600 of ~1.5 in a 1 l baffled flask to induce expression. Flasks
were covered with 2 sterile layers of cheesecloth.
After 0, 6, 12 and 24 h at 30 °C and 200 rpm 1 ml of the expression culture was transferred to a
1.5 ml tube, its OD600 measured and centrifuged shortly for expression level analysis later on.
Finally cells were harvested after 24 h (OD600 ~2.75) by centrifugation at 1.500 g for 5 min at
4 °C. To test for secretion of expressed proteins 1.5 ml of the supernatant was transferred to a
separate tube. All samples were frozen quickly in liquid N2 and stored at -20 °C until further
homogenisation and purification steps (IV.6.5.b). Cell pellets were analysed for protein
expression by SDS-PAGE and Western blot.
82
8. Culture media
8.1 B5 medium (Gamborg et al., 1968)
As a standard medium for the cultivation of callus and suspensions cells of Silybum marianum,
B5 was used. It was composed as follows:
Macroelements: Microelements:
KNO3 2500.0 mg l-1
H3BO3 3.00 mg l-1
MgSO4 . 7 H2O 250.0 mg l
-1 ZnSO4
. 7 H2O 3.00 mg l
-1
NaH2PO4 . H2O 172.0 mg l
-1 MnSO4
. H2O 1.00 mg l
-1
CaCl2 . 2 H2O 150.0 mg l
-1 KI 0.75 mg l
-1
(NH4)2SO4 134.0 mg l-1
Na2MoO4 . 2 H2O 0.25 mg l
-1
FeSO4 . 7 H2O* 25.6 mg l
-1 CuSO4
. 5 H2O 0.25 mg l
-1
Na2-EDTA* 34.3 mg l-1
CoCl2 . 6 H2O 0.25 mg l
-1
These two components were combined in a solution which was
autoclaved before use in order to obtain the Fe-EDTA complex.
Vitamins: Hormones:
Thiamine-HCl 10 mg l-1
2,4-D (final conc. 1 mg l-1
; stock sol. 0.5 mg ml-1
)
Pyridoxine-HCl 1 mg l-1
Kinetin (final conc. 0.1 mg l-1
; stock sol. 0.2 mg ml-1
)
Nicotinic acid 1 mg l-1
Further components:
Myo-inositol 100 mg l-1
Sucrose 20 g l-1
Macro- and microelements were each prepared as 10x stock solutions. Vitamins were aliquoted
into portions according to 1-2 l medium and stored at -20 °C. Stock solutions for hormones were
stored at 4 °C. After mixing all components the missing volume was adjusted with dist. H2O and
the pH value was adjusted to 5.8 with 0.5 M HCl. Finally, 50 ml medium were filled into 250 ml
Erlenmeyer flasks each, closed with cellulose stoppers and autoclaved.
*
83
8.2 CB-2 (Gertlowski and Petersen, 1993)
The medium CB-2 differs from B5 almost only in terms of added hormones. A highly soluble
source of peptides and amino acids in the form of N-Z-amines® is also added (2 g l
-1).
Hormones:
2,4-D (final conc. 2.0 mg l-1
; stock sol. 200 mg l-1
)
IAA (final conc. 0.5 mg l-1
; stock sol. 50 mg l-1
)
Kinetin (final conc. 0.2 mg l-1
; stock sol. 20 mg l-1
)
NAA (final conc. 0.5 mg l-1
; stock sol. 50 mg l-1
)
8.3 MS-Li (Empt et al., 2000)
MS-Li medium is a variant of the popular MS medium (Murashige and Skoog, 1962) with
additional 0.4 mg l-1
NAA specially adapted to cell cultures of Linum (flax) species.
8.4 Lysogeny Broth (LB)
The standard medium for the cultivation of bacteria like Escherichia coli is LB (Sezonov et al.,
2007):
Tryptone / peptone 10 g l-1
Yeast extract 5 g l-1
NaCl 10 g l-1
± Agar 10 g l-1
The solution was adjusted to pH 7.0 with 0.5 M NaOH and autoclaved. Solid medium for plates
additionally contained 1% agar. If a selection marker for antibiotic resistance was present on the
plasmid, the medium was adapted accordingly, by adding ampicillin (100 mg l-1
) or other suitable
antibiotics after cooling to ~55 °C.
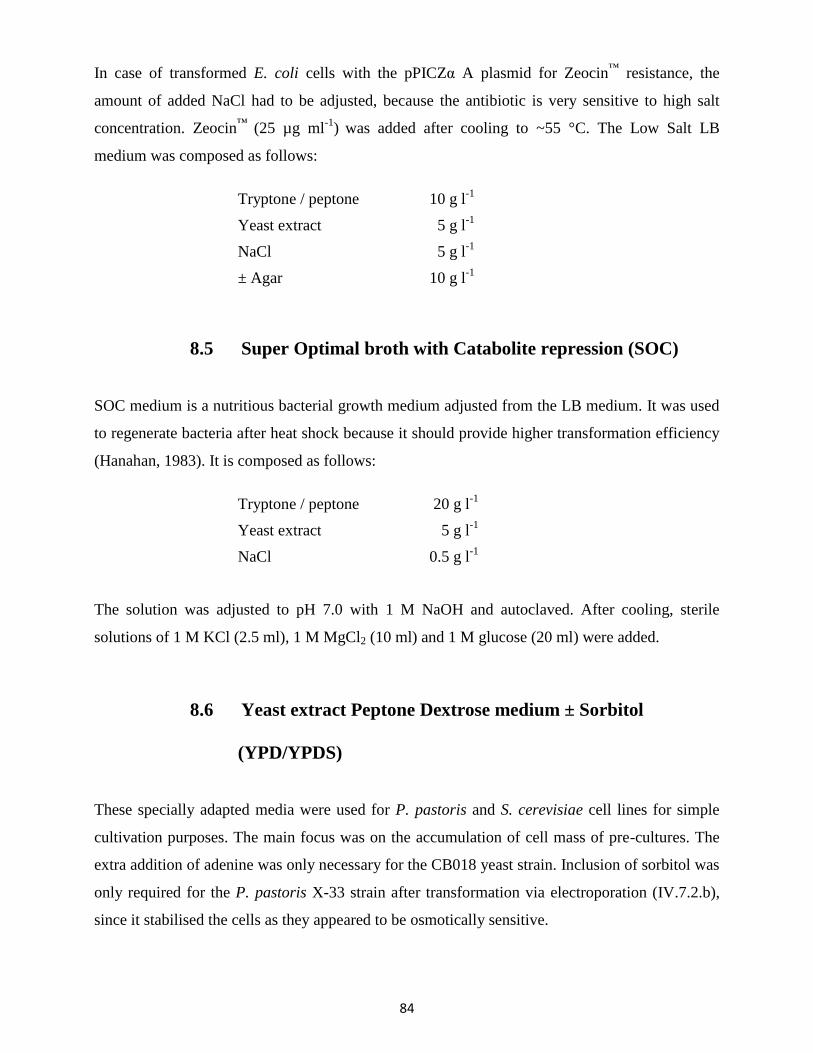
84
In case of transformed E. coli cells with the pPICZα A plasmid for Zeocin™
resistance, the
amount of added NaCl had to be adjusted, because the antibiotic is very sensitive to high salt
concentration. Zeocin™
(25 µg ml-1
) was added after cooling to ~55 °C. The Low Salt LB
medium was composed as follows:
Tryptone / peptone 10 g l-1
Yeast extract 5 g l-1
NaCl 5 g l-1
± Agar 10 g l-1
8.5 Super Optimal broth with Catabolite repression (SOC)
SOC medium is a nutritious bacterial growth medium adjusted from the LB medium. It was used
to regenerate bacteria after heat shock because it should provide higher transformation efficiency
(Hanahan, 1983). It is composed as follows:
Tryptone / peptone 20 g l-1
Yeast extract 5 g l-1
NaCl 0.5 g l-1
The solution was adjusted to pH 7.0 with 1 M NaOH and autoclaved. After cooling, sterile
solutions of 1 M KCl (2.5 ml), 1 M MgCl2 (10 ml) and 1 M glucose (20 ml) were added.
8.6 Yeast extract Peptone Dextrose medium ± Sorbitol
(YPD/YPDS)
These specially adapted media were used for P. pastoris and S. cerevisiae cell lines for simple
cultivation purposes. The main focus was on the accumulation of cell mass of pre-cultures. The
extra addition of adenine was only necessary for the CB018 yeast strain. Inclusion of sorbitol was
only required for the P. pastoris X-33 strain after transformation via electroporation (IV.7.2.b),
since it stabilised the cells as they appeared to be osmotically sensitive.
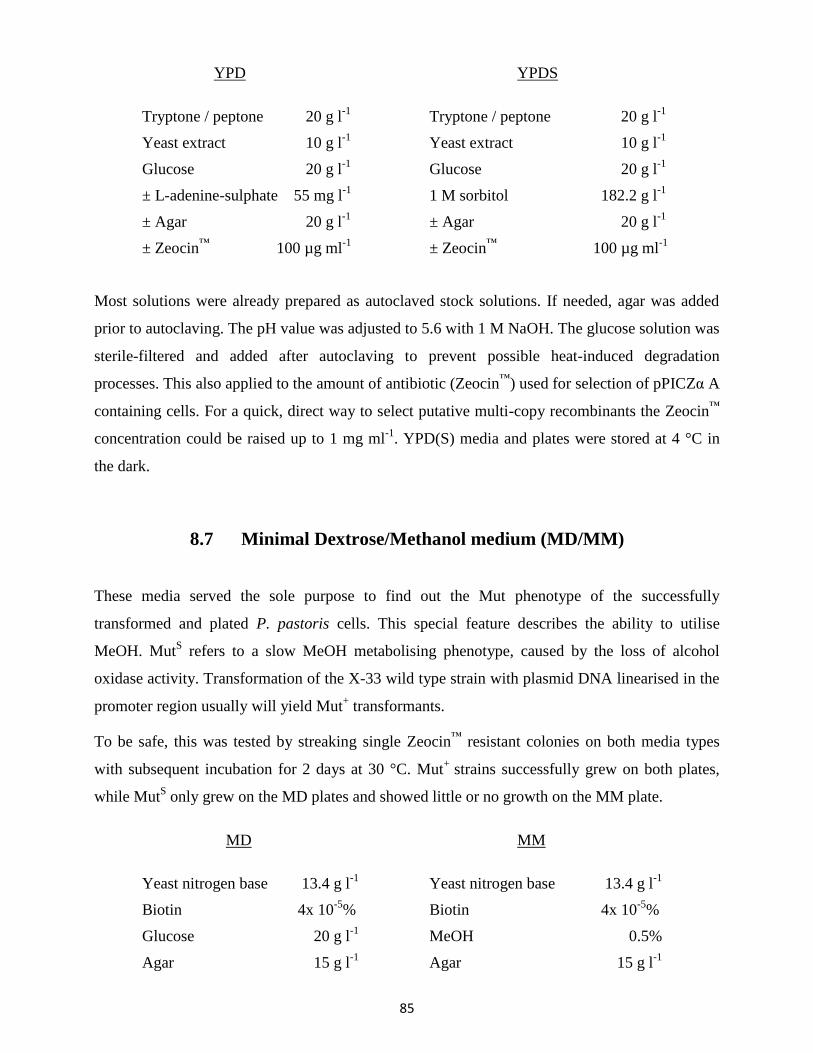
85
YPD YPDS
Tryptone / peptone 20 g l-1
Tryptone / peptone 20 g l-1
Yeast extract 10 g l-1
Yeast extract 10 g l-1
Glucose 20 g l-1
Glucose 20 g l-1
± L-adenine-sulphate 55 mg l-1
1 M sorbitol 182.2 g l-1
± Agar 20 g l-1
± Agar 20 g l-1
± Zeocin™
100 µg ml-1
± Zeocin™
100 µg ml-1
Most solutions were already prepared as autoclaved stock solutions. If needed, agar was added
prior to autoclaving. The pH value was adjusted to 5.6 with 1 M NaOH. The glucose solution was
sterile-filtered and added after autoclaving to prevent possible heat-induced degradation
processes. This also applied to the amount of antibiotic (Zeocin™
) used for selection of pPICZα A
containing cells. For a quick, direct way to select putative multi-copy recombinants the Zeocin™
concentration could be raised up to 1 mg ml-1
. YPD(S) media and plates were stored at 4 °C in
the dark.
8.7 Minimal Dextrose/Methanol medium (MD/MM)
These media served the sole purpose to find out the Mut phenotype of the successfully
transformed and plated P. pastoris cells. This special feature describes the ability to utilise
MeOH. MutS refers to a slow MeOH metabolising phenotype, caused by the loss of alcohol
oxidase activity. Transformation of the X-33 wild type strain with plasmid DNA linearised in the
promoter region usually will yield Mut+ transformants.
To be safe, this was tested by streaking single Zeocin™
resistant colonies on both media types
with subsequent incubation for 2 days at 30 °C. Mut+
strains successfully grew on both plates,
while MutS only grew on the MD plates and showed little or no growth on the MM plate.
MD MM
Yeast nitrogen base 13.4 g l-1
Yeast nitrogen base 13.4 g l-1
Biotin 4x 10⁻⁵
%
Biotin 4x 10⁻⁵
%
Glucose 20 g l-1
MeOH 0.5%
Agar 15 g l-1
Agar 15 g l-1
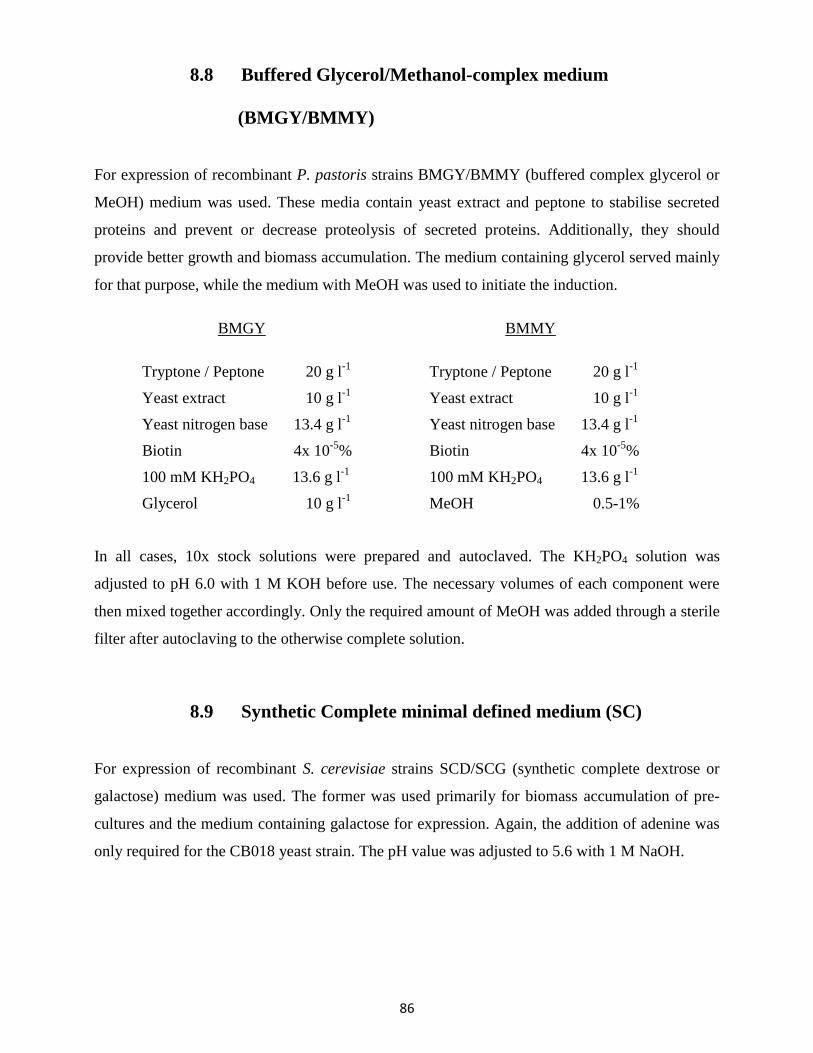
86
8.8 Buffered Glycerol/Methanol-complex medium
(BMGY/BMMY)
For expression of recombinant P. pastoris strains BMGY/BMMY (buffered complex glycerol or
MeOH) medium was used. These media contain yeast extract and peptone to stabilise secreted
proteins and prevent or decrease proteolysis of secreted proteins. Additionally, they should
provide better growth and biomass accumulation. The medium containing glycerol served mainly
for that purpose, while the medium with MeOH was used to initiate the induction.
BMGY BMMY
Tryptone / Peptone 20 g l-1
Tryptone / Peptone 20 g l-1
Yeast extract 10 g l-1
Yeast extract 10 g l-1
Yeast nitrogen base 13.4 g l-1
Yeast nitrogen base 13.4 g l-1
Biotin 4x 10⁻⁵
% Biotin 4x 10⁻⁵
%
100 mM KH2PO4 13.6 g l-1
100 mM KH2PO4 13.6 g l-1
Glycerol 10 g l-1
MeOH 0.5-1%
In all cases, 10x stock solutions were prepared and autoclaved. The KH2PO4 solution was
adjusted to pH 6.0 with 1 M KOH before use. The necessary volumes of each component were
then mixed together accordingly. Only the required amount of MeOH was added through a sterile
filter after autoclaving to the otherwise complete solution.
8.9 Synthetic Complete minimal defined medium (SC)
For expression of recombinant S. cerevisiae strains SCD/SCG (synthetic complete dextrose or
galactose) medium was used. The former was used primarily for biomass accumulation of pre-
cultures and the medium containing galactose for expression. Again, the addition of adenine was
only required for the CB018 yeast strain. The pH value was adjusted to 5.6 with 1 M NaOH.
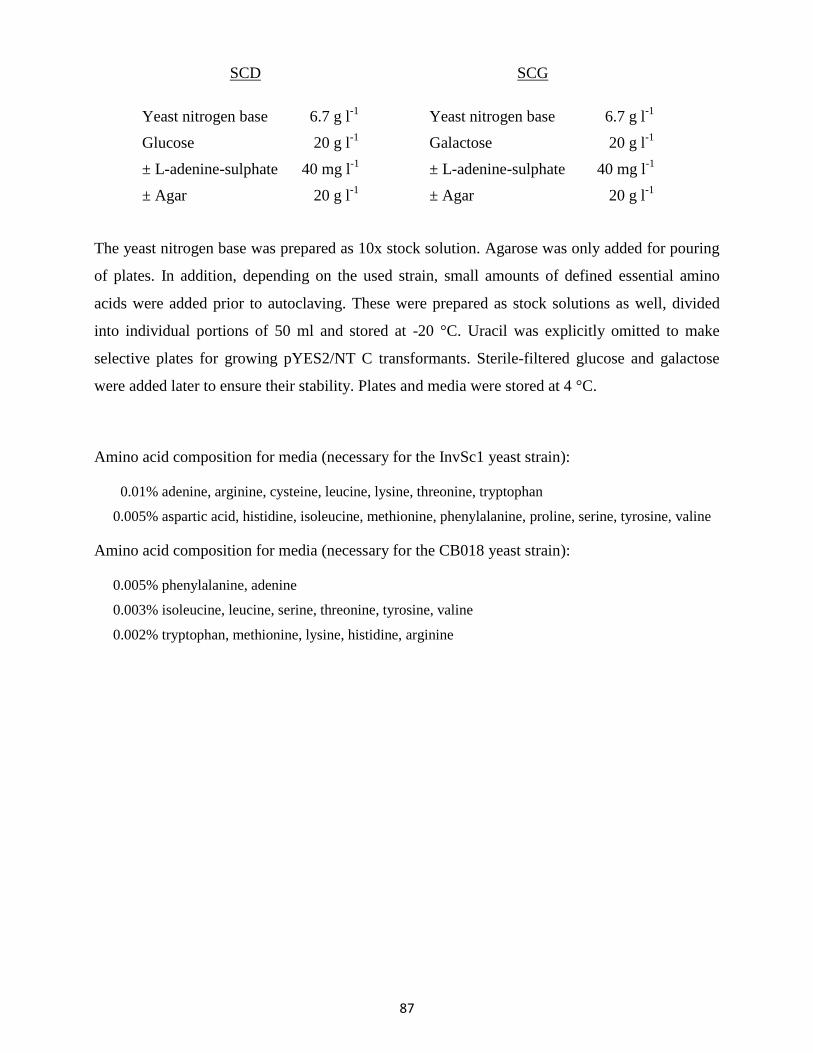
87
SCD SCG
Yeast nitrogen base 6.7 g l-1
Yeast nitrogen base 6.7 g l-1
Glucose 20 g l-1
Galactose 20 g l-1
± L-adenine-sulphate 40 mg l-1
± L-adenine-sulphate 40 mg l-1
± Agar 20 g l-1
± Agar 20 g l-1
The yeast nitrogen base was prepared as 10x stock solution. Agarose was only added for pouring
of plates. In addition, depending on the used strain, small amounts of defined essential amino
acids were added prior to autoclaving. These were prepared as stock solutions as well, divided
into individual portions of 50 ml and stored at -20 °C. Uracil was explicitly omitted to make
selective plates for growing pYES2/NT C transformants. Sterile-filtered glucose and galactose
were added later to ensure their stability. Plates and media were stored at 4 °C.
Amino acid composition for media (necessary for the InvSc1 yeast strain):
0.01% adenine, arginine, cysteine, leucine, lysine, threonine, tryptophan
0.005% aspartic acid, histidine, isoleucine, methionine, phenylalanine, proline, serine, tyrosine, valine
Amino acid composition for media (necessary for the CB018 yeast strain):
0.005% phenylalanine, adenine
0.003% isoleucine, leucine, serine, threonine, tyrosine, valine
0.002% tryptophan, methionine, lysine, histidine, arginine
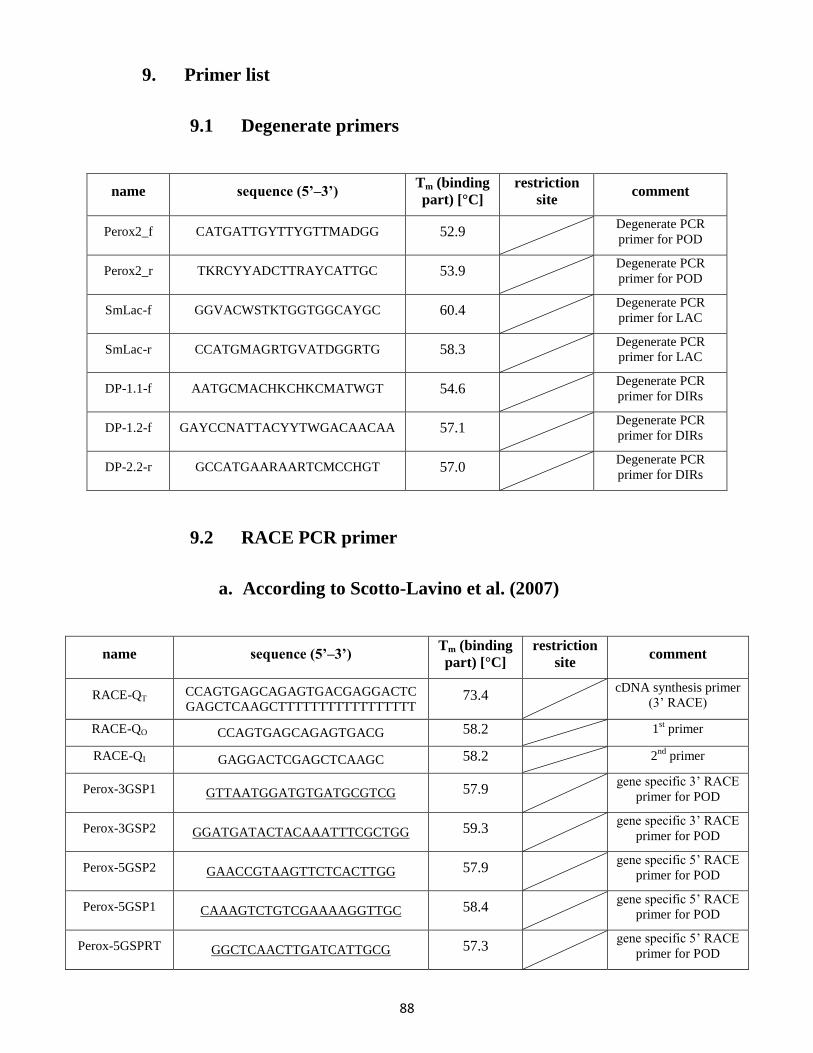
88
9. Primer list
9.1 Degenerate primers
name sequence (5’–3’) Tm (binding
part) [°C]
restriction
site comment
Perox2_f CATGATTGYTTYGTTMADGG 52.9 Degenerate PCR
primer for POD
Perox2_r TKRCYYADCTTRAYCATTGC 53.9 Degenerate PCR
primer for POD
SmLac-f GGVACWSTKTGGTGGCAYGC 60.4 Degenerate PCR
primer for LAC
SmLac-r CCATGMAGRTGVATDGGRTG 58.3 Degenerate PCR
primer for LAC
DP-1.1-f AATGCMACHKCHKCMATWGT 54.6 Degenerate PCR
primer for DIRs
DP-1.2-f GAYCCNATTACYYTWGACAACAA 57.1 Degenerate PCR
primer for DIRs
DP-2.2-r GCCATGAARAARTCMCCHGT 57.0 Degenerate PCR
primer for DIRs
9.2 RACE PCR primer
a. According to Scotto-Lavino et al. (2007)
name sequence (5’–3’) Tm (binding
part) [°C]
restriction
site comment
RACE-QT CCAGTGAGCAGAGTGACGAGGACTC
GAGCTCAAGCTTTTTTTTTTTTTTTTT 73.4
cDNA synthesis primer
(3’ RACE)
RACE-QO CCAGTGAGCAGAGTGACG 58.2 1st primer
RACE-QI GAGGACTCGAGCTCAAGC 58.2 2nd
primer
Perox-3GSP1 GTTAATGGATGTGATGCGTCG 57.9 gene specific 3’ RACE
primer for POD
Perox-3GSP2 GGATGATACTACAAATTTCGCTGG 59.3 gene specific 3’ RACE
primer for POD
Perox-5GSP2 GAACCGTAAGTTCTCACTTGG 57.9 gene specific 5’ RACE
primer for POD
Perox-5GSP1 CAAAGTCTGTCGAAAAGGTTGC 58.4 gene specific 5’ RACE
primer for POD
Perox-5GSPRT GGCTCAACTTGATCATTGCG 57.3 gene specific 5’ RACE
primer for POD
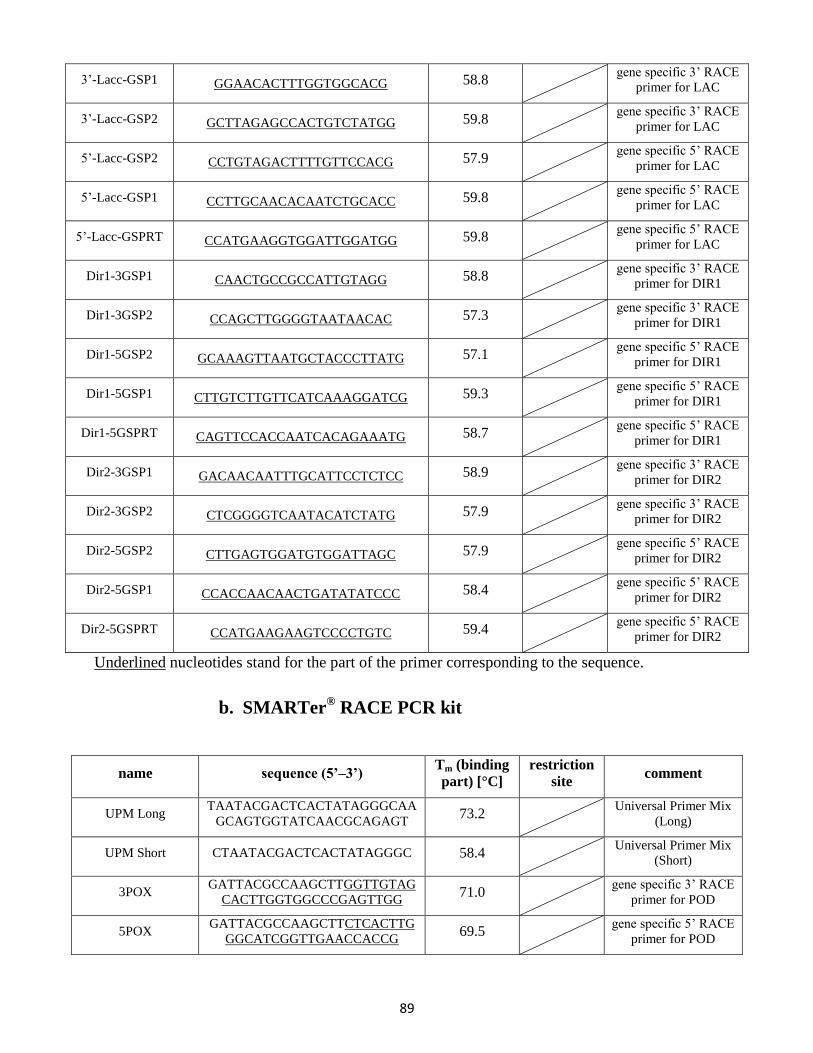
89
3’-Lacc-GSP1 GGAACACTTTGGTGGCACG 58.8 gene specific 3’ RACE
primer for LAC
3’-Lacc-GSP2 GCTTAGAGCCACTGTCTATGG 59.8 gene specific 3’ RACE
primer for LAC
5’-Lacc-GSP2 CCTGTAGACTTTTGTTCCACG 57.9 gene specific 5’ RACE
primer for LAC
5’-Lacc-GSP1 CCTTGCAACACAATCTGCACC 59.8 gene specific 5’ RACE
primer for LAC
5’-Lacc-GSPRT CCATGAAGGTGGATTGGATGG 59.8 gene specific 5’ RACE
primer for LAC
Dir1-3GSP1 CAACTGCCGCCATTGTAGG 58.8 gene specific 3’ RACE
primer for DIR1
Dir1-3GSP2 CCAGCTTGGGGTAATAACAC 57.3 gene specific 3’ RACE
primer for DIR1
Dir1-5GSP2 GCAAAGTTAATGCTACCCTTATG 57.1 gene specific 5’ RACE
primer for DIR1
Dir1-5GSP1 CTTGTCTTGTTCATCAAAGGATCG 59.3 gene specific 5’ RACE
primer for DIR1
Dir1-5GSPRT CAGTTCCACCAATCACAGAAATG 58.7 gene specific 5’ RACE
primer for DIR1
Dir2-3GSP1 GACAACAATTTGCATTCCTCTCC 58.9 gene specific 3’ RACE
primer for DIR2
Dir2-3GSP2 CTCGGGGTCAATACATCTATG 57.9 gene specific 3’ RACE
primer for DIR2
Dir2-5GSP2 CTTGAGTGGATGTGGATTAGC 57.9 gene specific 5’ RACE
primer for DIR2
Dir2-5GSP1 CCACCAACAACTGATATATCCC 58.4 gene specific 5’ RACE
primer for DIR2
Dir2-5GSPRT CCATGAAGAAGTCCCCTGTC 59.4 gene specific 5’ RACE
primer for DIR2
Underlined nucleotides stand for the part of the primer corresponding to the sequence.
b. SMARTer® RACE PCR kit
name sequence (5’–3’) Tm (binding
part) [°C]
restriction
site comment
UPM Long TAATACGACTCACTATAGGGCAA
GCAGTGGTATCAACGCAGAGT 73.2
Universal Primer Mix
(Long)
UPM Short CTAATACGACTCACTATAGGGC 58.4 Universal Primer Mix
(Short)
3POX GATTACGCCAAGCTTGGTTGTAG
CACTTGGTGGCCCGAGTTGG 71.0
gene specific 3’ RACE
primer for POD
5POX GATTACGCCAAGCTTCTCACTTG
GGCATCGGTTGAACCACCG 69.5
gene specific 5’ RACE
primer for POD
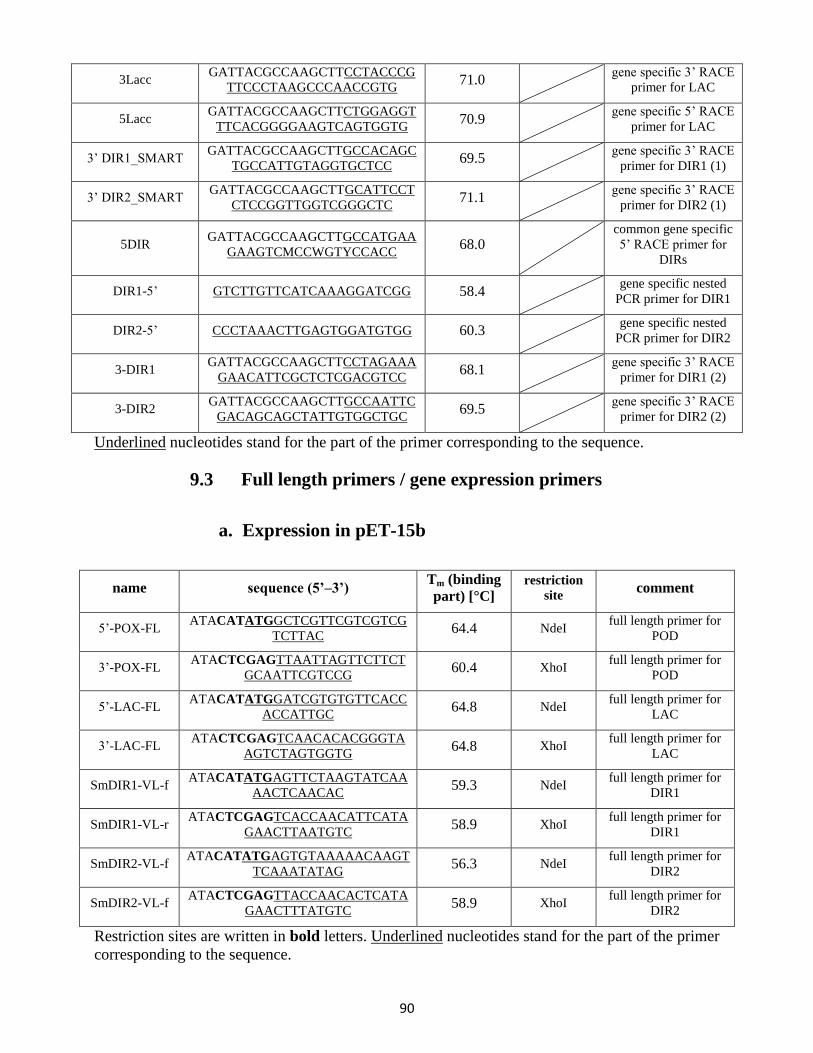
90
3Lacc GATTACGCCAAGCTTCCTACCCG
TTCCCTAAGCCCAACCGTG 71.0 gene specific 3’ RACE
primer for LAC
5Lacc GATTACGCCAAGCTTCTGGAGGT
TTCACGGGGAAGTCAGTGGTG 70.9 gene specific 5’ RACE
primer for LAC
3’ DIR1_SMART GATTACGCCAAGCTTGCCACAGC
TGCCATTGTAGGTGCTCC 69.5
gene specific 3’ RACE
primer for DIR1 (1)
3’ DIR2_SMART GATTACGCCAAGCTTGCATTCCT
CTCCGGTTGGTCGGGCTC 71.1
gene specific 3’ RACE
primer for DIR2 (1)
5DIR GATTACGCCAAGCTTGCCATGAA
GAAGTCMCCWGTYCCACC 68.0 common gene specific
5’ RACE primer for
DIRs
DIR1-5’ GTCTTGTTCATCAAAGGATCGG 58.4 gene specific nested
PCR primer for DIR1
DIR2-5’ CCCTAAACTTGAGTGGATGTGG 60.3 gene specific nested
PCR primer for DIR2
3-DIR1 GATTACGCCAAGCTTCCTAGAAA
GAACATTCGCTCTCGACGTCC 68.1
gene specific 3’ RACE
primer for DIR1 (2)
3-DIR2 GATTACGCCAAGCTTGCCAATTC
GACAGCAGCTATTGTGGCTGC 69.5
gene specific 3’ RACE
primer for DIR2 (2)
Underlined nucleotides stand for the part of the primer corresponding to the sequence.
9.3 Full length primers / gene expression primers
a. Expression in pET-15b
name sequence (5’–3’) Tm (binding
part) [°C]
restriction
site comment
5’-POX-FL ATACATATGGCTCGTTCGTCGTCG
TCTTAC 64.4 NdeI
full length primer for
POD
3’-POX-FL ATACTCGAGTTAATTAGTTCTTCT
GCAATTCGTCCG 60.4 XhoI
full length primer for
POD
5’-LAC-FL ATACATATGGATCGTGTGTTCACC
ACCATTGC 64.8 NdeI
full length primer for
LAC
3’-LAC-FL ATACTCGAGTCAACACACGGGTA
AGTCTAGTGGTG 64.8 XhoI
full length primer for
LAC
SmDIR1-VL-f ATACATATGAGTTCTAAGTATCAA
AACTCAACAC 59.3 NdeI
full length primer for
DIR1
SmDIR1-VL-r ATACTCGAGTCACCAACATTCATA
GAACTTAATGTC 58.9 XhoI
full length primer for
DIR1
SmDIR2-VL-f ATACATATGAGTGTAAAAACAAGT
TCAAATATAG 56.3 NdeI
full length primer for
DIR2
SmDIR2-VL-f ATACTCGAGTTACCAACACTCATA
GAACTTTATGTC 58.9 XhoI
full length primer for
DIR2
Restriction sites are written in bold letters. Underlined nucleotides stand for the part of the primer
corresponding to the sequence.
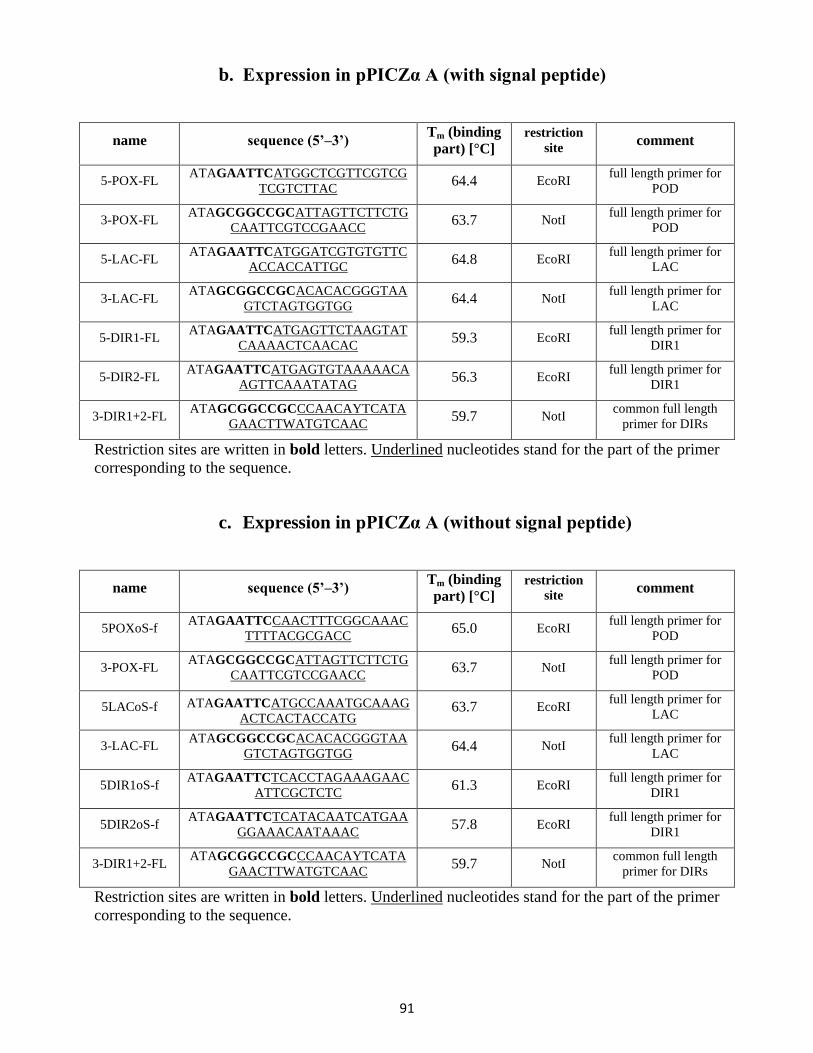
91
b. Expression in pPICZα A (with signal peptide)
name sequence (5’–3’) Tm (binding
part) [°C]
restriction
site comment
5-POX-FL ATAGAATTCATGGCTCGTTCGTCG
TCGTCTTAC 64.4 EcoRI
full length primer for
POD
3-POX-FL ATAGCGGCCGCATTAGTTCTTCTG
CAATTCGTCCGAACC 63.7 NotI
full length primer for
POD
5-LAC-FL ATAGAATTCATGGATCGTGTGTTC
ACCACCATTGC 64.8 EcoRI
full length primer for
LAC
3-LAC-FL ATAGCGGCCGCACACACGGGTAA
GTCTAGTGGTGG 64.4 NotI
full length primer for
LAC
5-DIR1-FL ATAGAATTCATGAGTTCTAAGTAT
CAAAACTCAACAC 59.3 EcoRI
full length primer for
DIR1
5-DIR2-FL ATAGAATTCATGAGTGTAAAAACA
AGTTCAAATATAG 56.3 EcoRI
full length primer for
DIR1
3-DIR1+2-FL ATAGCGGCCGCCCAACAYTCATA
GAACTTWATGTCAAC 59.7 NotI
common full length
primer for DIRs
Restriction sites are written in bold letters. Underlined nucleotides stand for the part of the primer
corresponding to the sequence.
c. Expression in pPICZα A (without signal peptide)
name sequence (5’–3’) Tm (binding
part) [°C]
restriction
site comment
5POXoS-f ATAGAATTCCAACTTTCGGCAAAC
TTTTACGCGACC 65.0 EcoRI
full length primer for
POD
3-POX-FL ATAGCGGCCGCATTAGTTCTTCTG
CAATTCGTCCGAACC 63.7 NotI
full length primer for
POD
5LACoS-f ATAGAATTCATGCCAAATGCAAAG
ACTCACTACCATG 63.7 EcoRI
full length primer for
LAC
3-LAC-FL ATAGCGGCCGCACACACGGGTAA
GTCTAGTGGTGG 64.4 NotI
full length primer for
LAC
5DIR1oS-f ATAGAATTCTCACCTAGAAAGAAC
ATTCGCTCTC 61.3 EcoRI
full length primer for
DIR1
5DIR2oS-f ATAGAATTCTCATACAATCATGAA
GGAAACAATAAAC 57.8 EcoRI
full length primer for
DIR1
3-DIR1+2-FL ATAGCGGCCGCCCAACAYTCATA
GAACTTWATGTCAAC 59.7 NotI
common full length
primer for DIRs
Restriction sites are written in bold letters. Underlined nucleotides stand for the part of the primer
corresponding to the sequence.
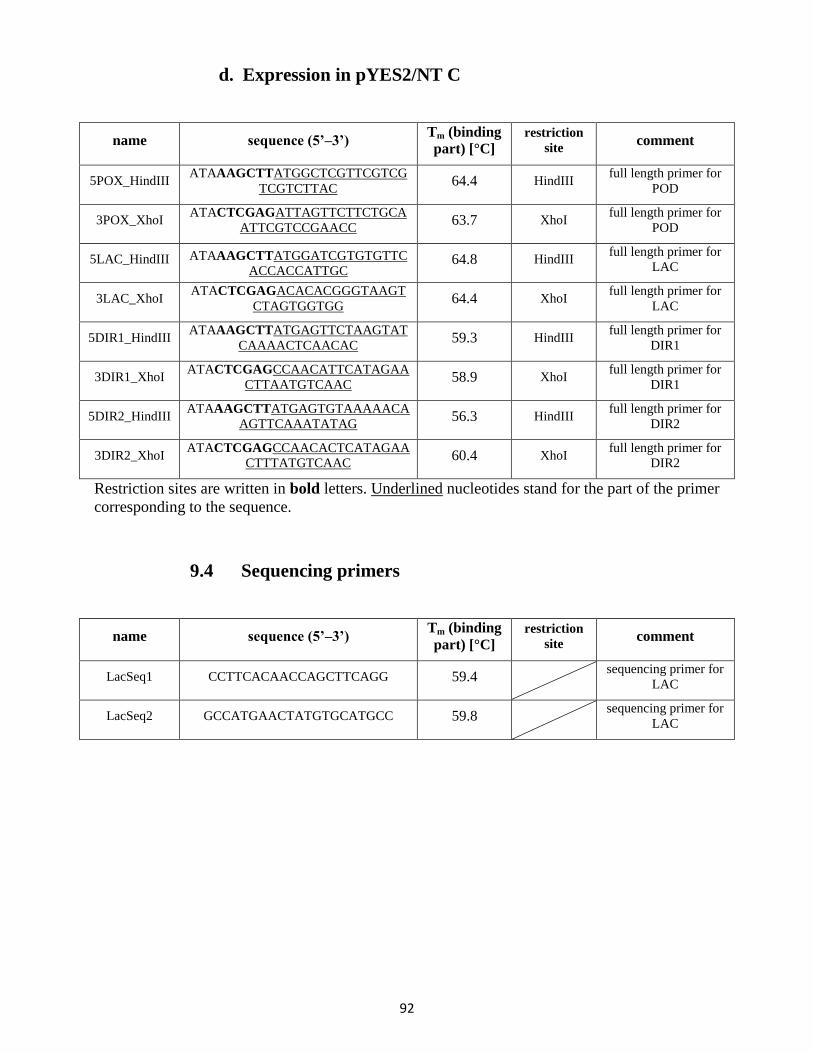
92
d. Expression in pYES2/NT C
name sequence (5’–3’) Tm (binding
part) [°C]
restriction
site comment
5POX_HindIII ATAAAGCTTATGGCTCGTTCGTCG
TCGTCTTAC 64.4 HindIII
full length primer for
POD
3POX_XhoI ATACTCGAGATTAGTTCTTCTGCA
ATTCGTCCGAACC 63.7 XhoI
full length primer for
POD
5LAC_HindIII ATAAAGCTTATGGATCGTGTGTTC
ACCACCATTGC 64.8 HindIII
full length primer for
LAC
3LAC_XhoI ATACTCGAGACACACGGGTAAGT
CTAGTGGTGG 64.4 XhoI
full length primer for
LAC
5DIR1_HindIII ATAAAGCTTATGAGTTCTAAGTAT
CAAAACTCAACAC 59.3 HindIII
full length primer for
DIR1
3DIR1_XhoI ATACTCGAGCCAACATTCATAGAA
CTTAATGTCAAC 58.9 XhoI
full length primer for
DIR1
5DIR2_HindIII ATAAAGCTTATGAGTGTAAAAACA
AGTTCAAATATAG 56.3 HindIII
full length primer for
DIR2
3DIR2_XhoI ATACTCGAGCCAACACTCATAGAA
CTTTATGTCAAC 60.4 XhoI
full length primer for
DIR2
Restriction sites are written in bold letters. Underlined nucleotides stand for the part of the primer
corresponding to the sequence.
9.4 Sequencing primers
name sequence (5’–3’) Tm (binding
part) [°C]
restriction
site comment
LacSeq1 CCTTCACAACCAGCTTCAGG 59.4 sequencing primer for
LAC
LacSeq2 GCCATGAACTATGTGCATGCC 59.8 sequencing primer for
LAC
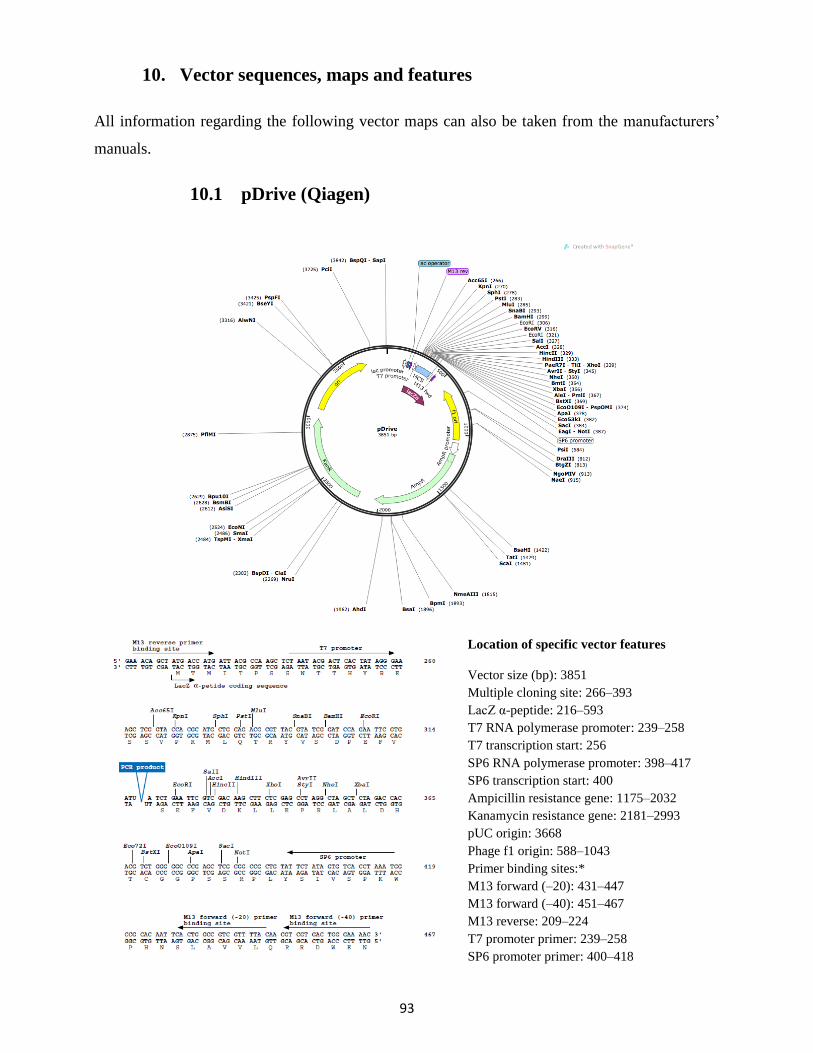
93
10. Vector sequences, maps and features
All information regarding the following vector maps can also be taken from the manufacturers’
manuals.
10.1 pDrive (Qiagen)
Location of specific vector features
Vector size (bp): 3851
Multiple cloning site: 266–393
LacZ α-peptide: 216–593
T7 RNA polymerase promoter: 239–258
T7 transcription start: 256
SP6 RNA polymerase promoter: 398–417
SP6 transcription start: 400
Ampicillin resistance gene: 1175–2032
Kanamycin resistance gene: 2181–2993
pUC origin: 3668
Phage f1 origin: 588–1043
Primer binding sites:*
M13 forward (–20): 431–447
M13 forward (–40): 451–467
M13 reverse: 209–224
T7 promoter primer: 239–258
SP6 promoter primer: 400–418
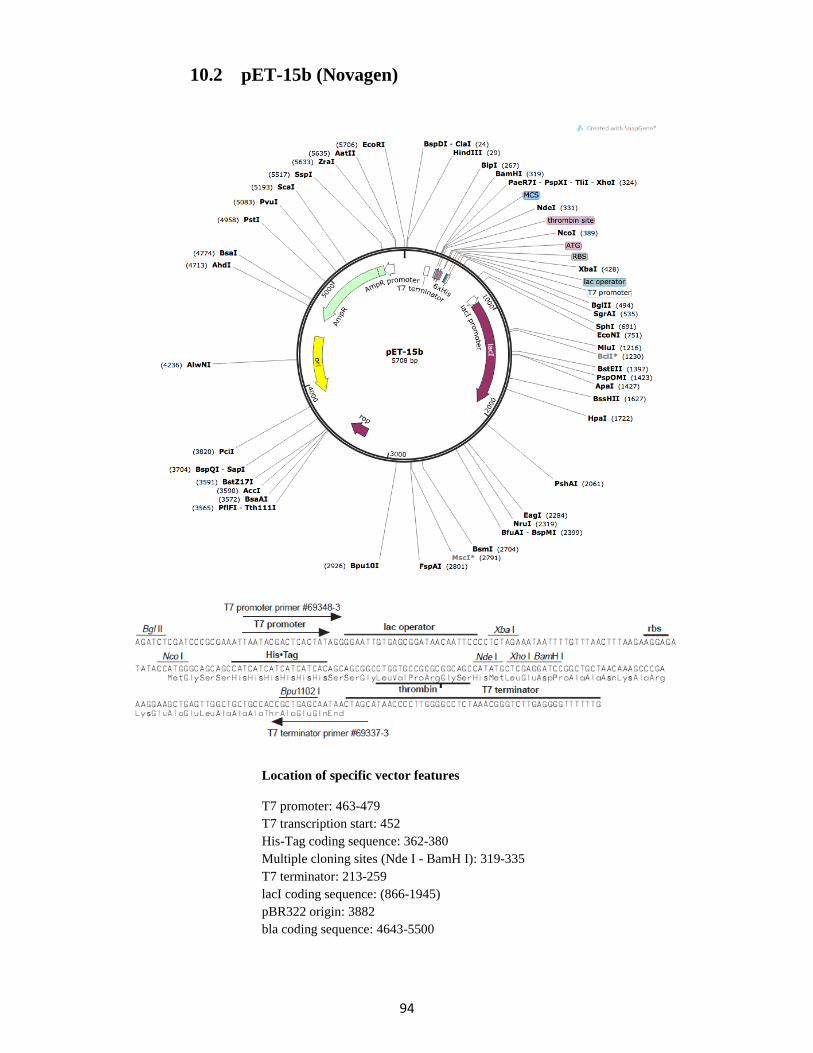
94
10.2 pET-15b (Novagen)
Location of specific vector features
T7 promoter: 463-479
T7 transcription start: 452
His-Tag coding sequence: 362-380
Multiple cloning sites (Nde I - BamH I): 319-335
T7 terminator: 213-259
lacI coding sequence: (866-1945)
pBR322 origin: 3882
bla coding sequence: 4643-5500
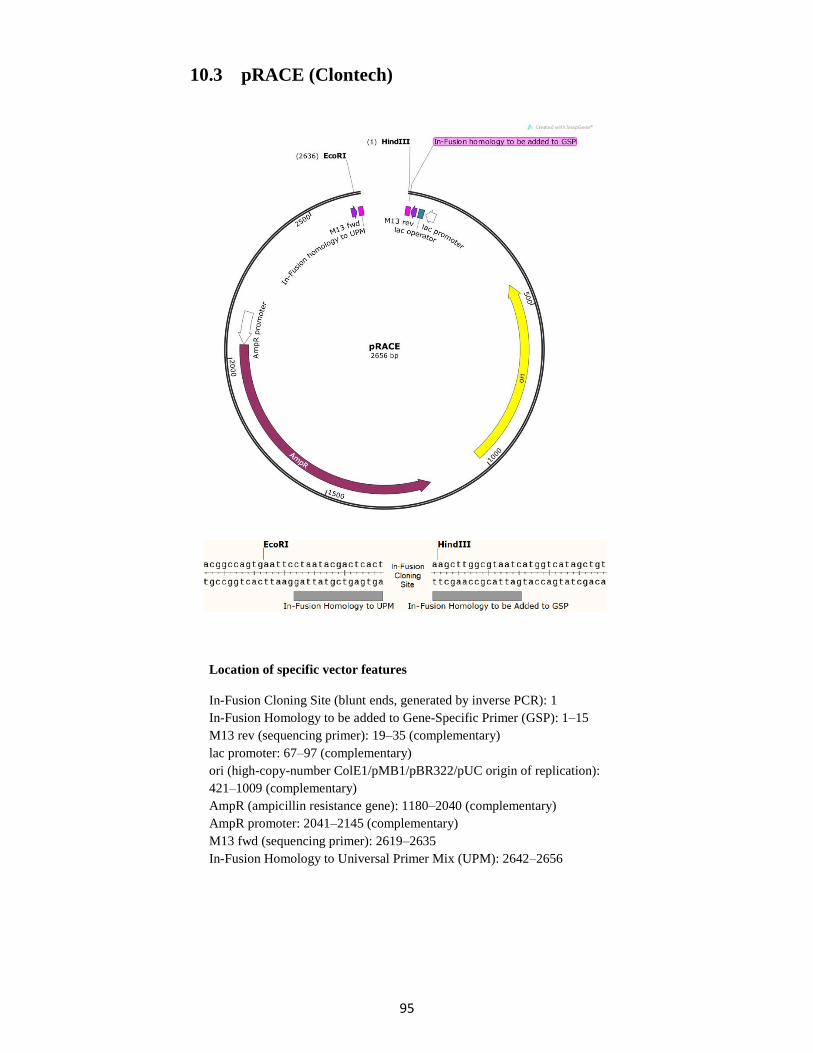
95
10.3 pRACE (Clontech)
Location of specific vector features
In-Fusion Cloning Site (blunt ends, generated by inverse PCR): 1
In-Fusion Homology to be added to Gene-Specific Primer (GSP): 1–15
M13 rev (sequencing primer): 19–35 (complementary)
lac promoter: 67–97 (complementary)
ori (high-copy-number ColE1/pMB1/pBR322/pUC origin of replication):
421–1009 (complementary)
AmpR (ampicillin resistance gene): 1180–2040 (complementary)
AmpR promoter: 2041–2145 (complementary)
M13 fwd (sequencing primer): 2619–2635
In-Fusion Homology to Universal Primer Mix (UPM): 2642–2656
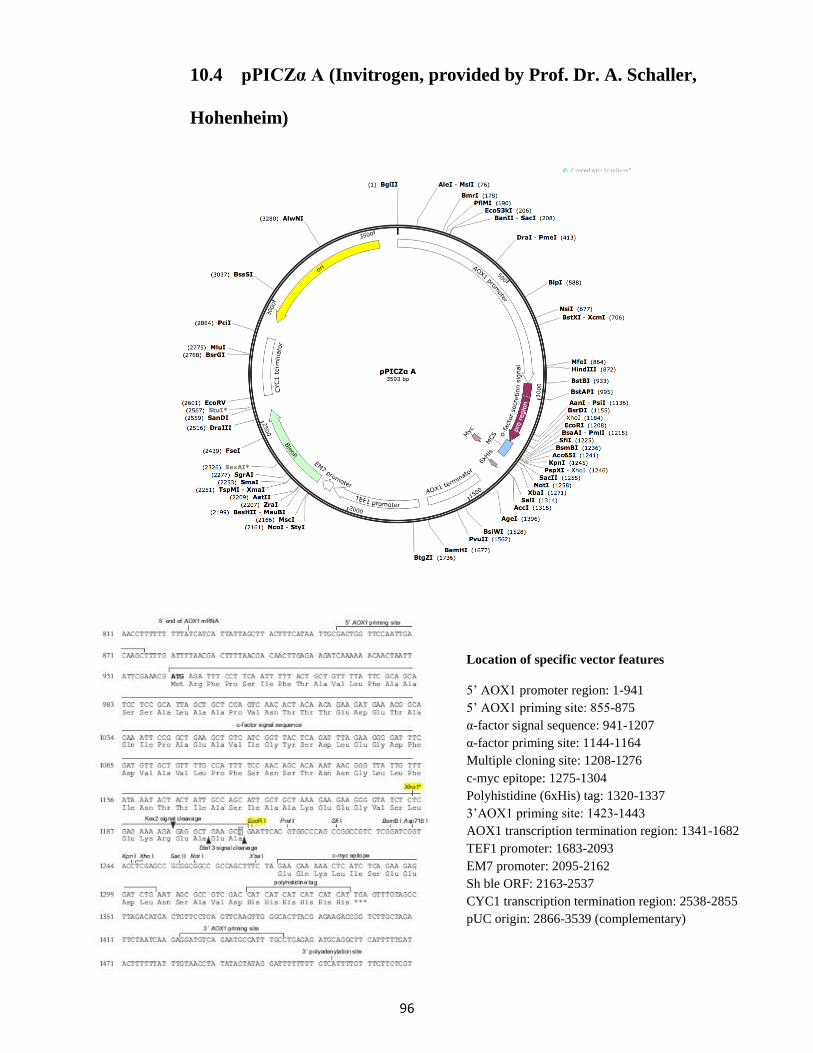
96
10.4 pPICZα A (Invitrogen, provided by Prof. Dr. A. Schaller,
Hohenheim)
Location of specific vector features
5’ AOX1 promoter region: 1-941
5’ AOX1 priming site: 855-875
α-factor signal sequence: 941-1207
α-factor priming site: 1144-1164
Multiple cloning site: 1208-1276
c-myc epitope: 1275-1304
Polyhistidine (6xHis) tag: 1320-1337
3’AOX1 priming site: 1423-1443
AOX1 transcription termination region: 1341-1682
TEF1 promoter: 1683-2093
EM7 promoter: 2095-2162
Sh ble ORF: 2163-2537
CYC1 transcription termination region: 2538-2855
pUC origin: 2866-3539 (complementary)
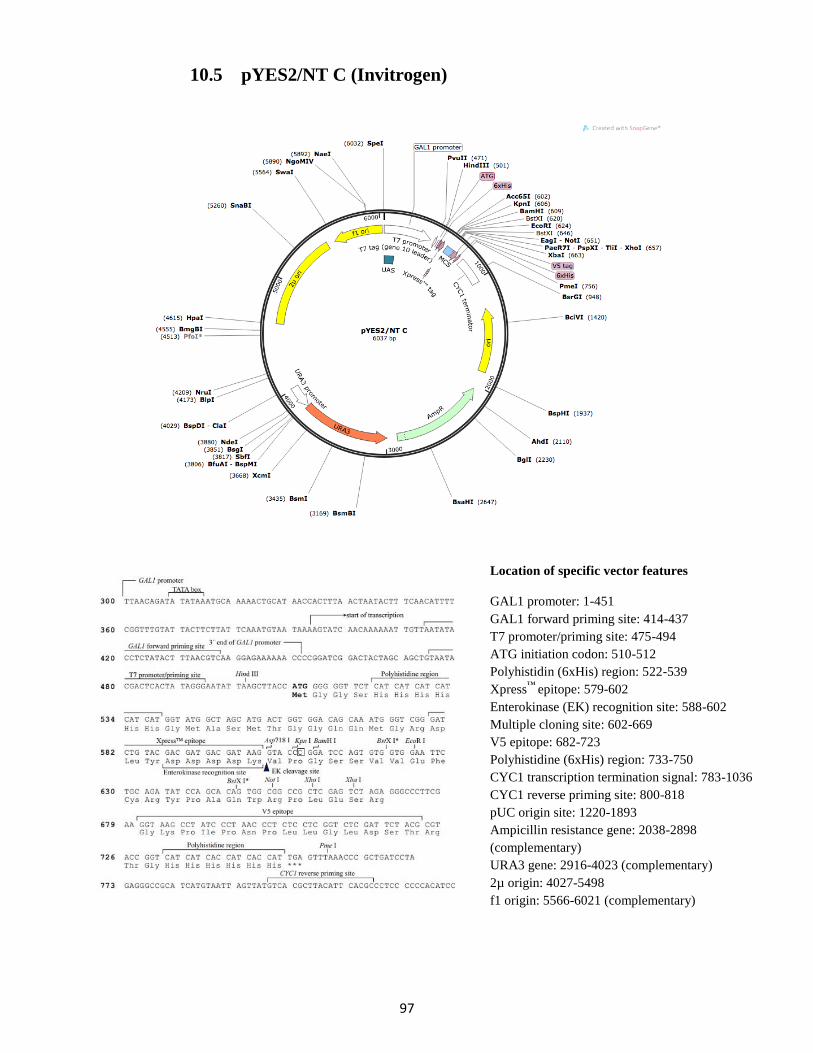
97
10.5 pYES2/NT C (Invitrogen)
Location of specific vector features
GAL1 promoter: 1-451
GAL1 forward priming site: 414-437
T7 promoter/priming site: 475-494
ATG initiation codon: 510-512
Polyhistidin (6xHis) region: 522-539
Xpress™
epitope: 579-602
Enterokinase (EK) recognition site: 588-602
Multiple cloning site: 602-669
V5 epitope: 682-723
Polyhistidine (6xHis) region: 733-750
CYC1 transcription termination signal: 783-1036
CYC1 reverse priming site: 800-818
pUC origin site: 1220-1893
Ampicillin resistance gene: 2038-2898
(complementary)
URA3 gene: 2916-4023 (complementary)
2µ origin: 4027-5498
f1 origin: 5566-6021 (complementary)
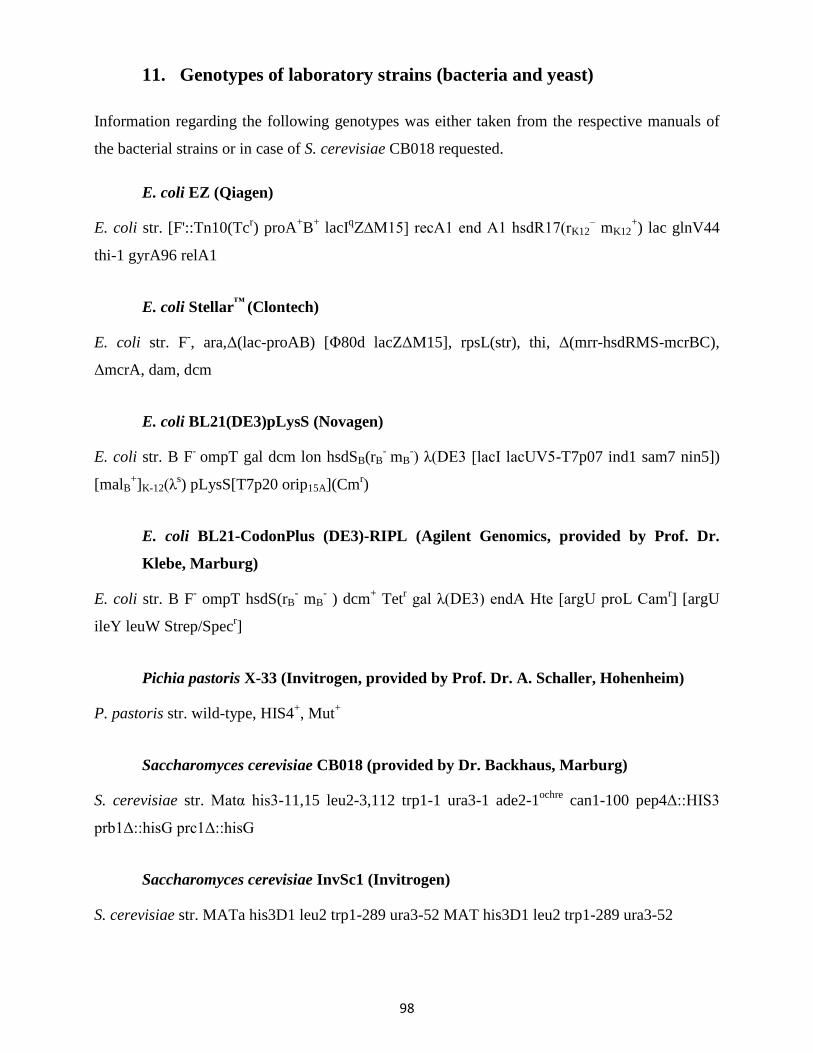
98
11. Genotypes of laboratory strains (bacteria and yeast)
Information regarding the following genotypes was either taken from the respective manuals of
the bacterial strains or in case of S. cerevisiae CB018 requested.
E. coli EZ (Qiagen)
E. coli str. [F'::Tn10(Tcr) proA
+B
+ lacI
qZ∆M15] recA1 end A1 hsdR17(rK12
– mK12
+) lac glnV44
thi-1 gyrA96 relA1
E. coli Stellar™
(Clontech)
E. coli str. F-, ara,Δ(lac-proAB) [Φ80d lacZΔM15], rpsL(str), thi, Δ(mrr-hsdRMS-mcrBC),
ΔmcrA, dam, dcm
E. coli BL21(DE3)pLysS (Novagen)
E. coli str. B F- ompT gal dcm lon hsdSB(rB
- mB
-) λ(DE3 [lacI lacUV5-T7p07 ind1 sam7 nin5])
[malB+]K-12(λ
s) pLysS[T7p20 orip15A](Cm
r)
E. coli BL21-CodonPlus (DE3)-RIPL (Agilent Genomics, provided by Prof. Dr.
Klebe, Marburg)
E. coli str. B F- ompT hsdS(rB
- mB
- ) dcm
+ Tet
r gal λ(DE3) endA Hte [argU proL Cam
r] [argU
ileY leuW Strep/Specr]
Pichia pastoris X-33 (Invitrogen, provided by Prof. Dr. A. Schaller, Hohenheim)
P. pastoris str. wild-type, HIS4+, Mut
+
Saccharomyces cerevisiae CB018 (provided by Dr. Backhaus, Marburg)
S. cerevisiae str. Matα his3-11,15 leu2-3,112 trp1-1 ura3-1 ade2-1ochre
can1-100 pep4Δ::HIS3
prb1Δ::hisG prc1Δ::hisG
Saccharomyces cerevisiae InvSc1 (Invitrogen)
S. cerevisiae str. MATa his3D1 leu2 trp1-289 ura3-52 MAT his3D1 leu2 trp1-289 ura3-52
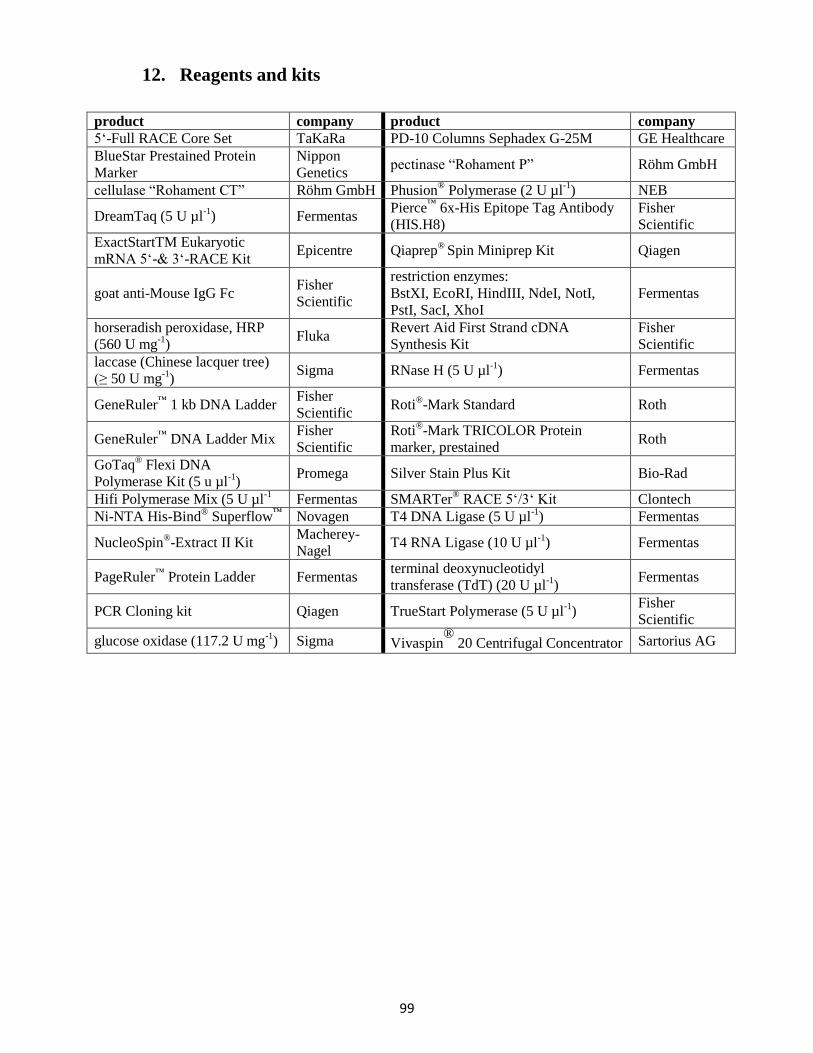
99
12. Reagents and kits
product company product company
5‘-Full RACE Core Set TaKaRa PD-10 Columns Sephadex G-25M GE Healthcare
BlueStar Prestained Protein
Marker
Nippon
Genetics pectinase “Rohament P” Röhm GmbH
cellulase “Rohament CT” Röhm GmbH Phusion® Polymerase (2 U µl
-1) NEB
DreamTaq (5 U µl-1
) Fermentas Pierce
™ 6x-His Epitope Tag Antibody
(HIS.H8)
Fisher
Scientific
ExactStartTM Eukaryotic
mRNA 5‘-& 3‘-RACE Kit Epicentre Qiaprep
® Spin Miniprep Kit Qiagen
goat anti-Mouse IgG Fc Fisher
Scientific
restriction enzymes:
BstXI, EcoRI, HindIII, NdeI, NotI,
PstI, SacI, XhoI
Fermentas
horseradish peroxidase, HRP
(560 U mg-1
) Fluka
Revert Aid First Strand cDNA
Synthesis Kit
Fisher
Scientific
laccase (Chinese lacquer tree)
(≥ 50 U mg-1
) Sigma RNase H (5 U µl
-1) Fermentas
GeneRuler™
1 kb DNA Ladder Fisher
Scientific Roti
®-Mark Standard Roth
GeneRuler™
DNA Ladder Mix Fisher
Scientific
Roti®-Mark TRICOLOR Protein
marker, prestained Roth
GoTaq® Flexi DNA
Polymerase Kit (5 u µl-1
) Promega Silver Stain Plus Kit Bio-Rad
Hifi Polymerase Mix (5 U µl-1
Fermentas SMARTer® RACE 5‘/3‘ Kit Clontech
Ni-NTA His-Bind® Superflow
™ Novagen T4 DNA Ligase (5 U µl
-1) Fermentas
NucleoSpin®-Extract II Kit
Macherey-
Nagel T4 RNA Ligase (10 U µl
-1) Fermentas
PageRuler™
Protein Ladder Fermentas terminal deoxynucleotidyl
transferase (TdT) (20 U µl-1
) Fermentas
PCR Cloning kit Qiagen TrueStart Polymerase (5 U µl-1
) Fisher
Scientific
glucose oxidase (117.2 U mg-1
) Sigma Vivaspin®
20 Centrifugal Concentrator Sartorius AG
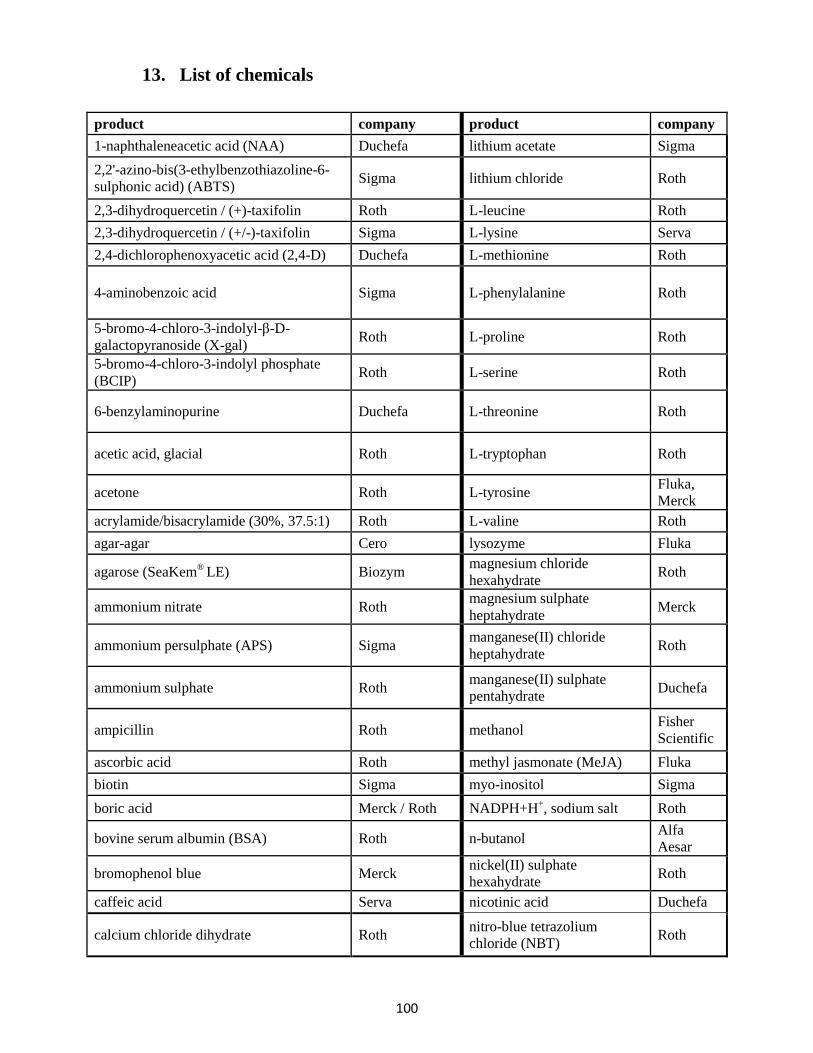
100
13. List of chemicals
product company product company
1-naphthaleneacetic acid (NAA) Duchefa lithium acetate Sigma
2,2'-azino-bis(3-ethylbenzothiazoline-6-
sulphonic acid) (ABTS) Sigma lithium chloride Roth
2,3-dihydroquercetin / (+)-taxifolin Roth L-leucine Roth
2,3-dihydroquercetin / (+/-)-taxifolin Sigma L-lysine Serva
2,4-dichlorophenoxyacetic acid (2,4-D) Duchefa L-methionine Roth
4-aminobenzoic acid Sigma L-phenylalanine Roth
5-bromo-4-chloro-3-indolyl-β-D-
galactopyranoside (X-gal) Roth L-proline Roth
5-bromo-4-chloro-3-indolyl phosphate
(BCIP) Roth L-serine Roth
6-benzylaminopurine Duchefa L-threonine Roth
acetic acid, glacial Roth L-tryptophan Roth
acetone Roth L-tyrosine Fluka,
Merck
acrylamide/bisacrylamide (30%, 37.5:1) Roth L-valine Roth
agar-agar Cero lysozyme Fluka
agarose (SeaKem®
LE) Biozym magnesium chloride
hexahydrate Roth
ammonium nitrate Roth magnesium sulphate
heptahydrate Merck
ammonium persulphate (APS) Sigma manganese(II) chloride
heptahydrate Roth
ammonium sulphate Roth manganese(II) sulphate
pentahydrate Duchefa
ampicillin Roth methanol Fisher
Scientific
ascorbic acid Roth methyl jasmonate (MeJA) Fluka
biotin Sigma myo-inositol Sigma
boric acid Merck / Roth NADPH+H+, sodium salt Roth
bovine serum albumin (BSA) Roth n-butanol Alfa
Aesar
bromophenol blue Merck nickel(II) sulphate
hexahydrate Roth
caffeic acid Serva nicotinic acid Duchefa
calcium chloride dihydrate Roth nitro-blue tetrazolium
chloride (NBT) Roth
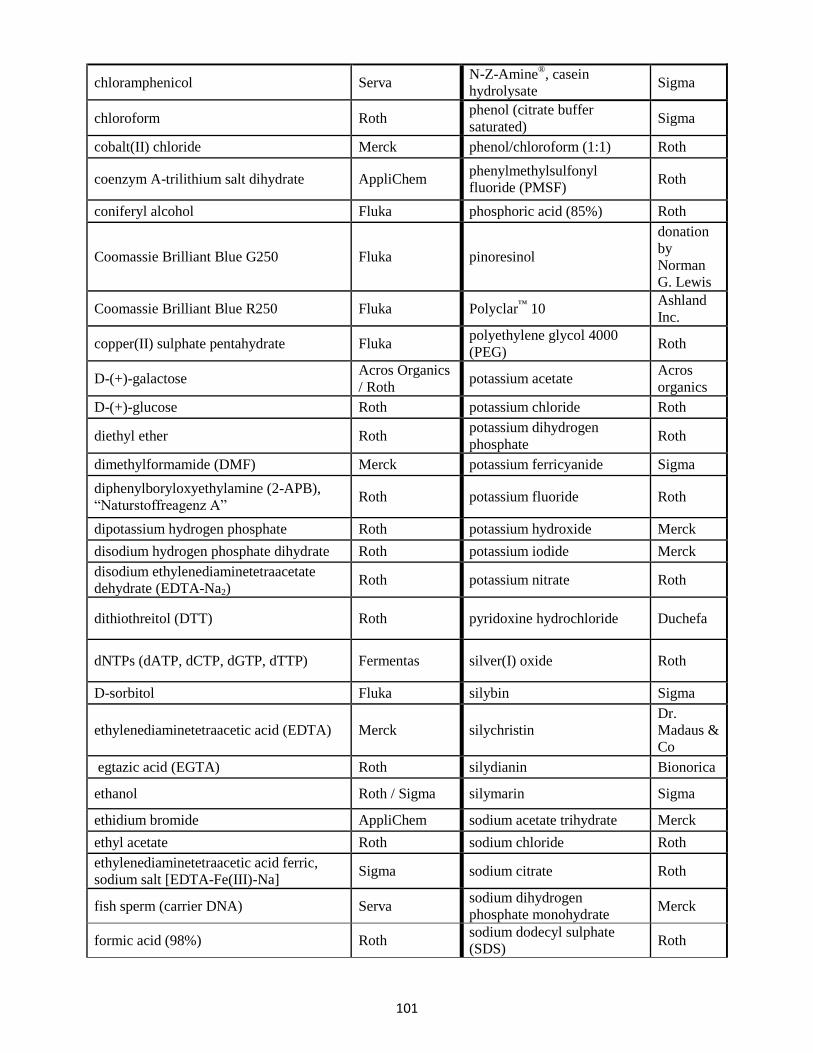
101
chloramphenicol Serva N-Z-Amine
®, casein
hydrolysate Sigma
chloroform Roth phenol (citrate buffer
saturated) Sigma
cobalt(II) chloride Merck phenol/chloroform (1:1) Roth
coenzym A-trilithium salt dihydrate AppliChem phenylmethylsulfonyl
fluoride (PMSF) Roth
coniferyl alcohol Fluka phosphoric acid (85%) Roth
Coomassie Brilliant Blue G250 Fluka pinoresinol
donation
by
Norman
G. Lewis
Coomassie Brilliant Blue R250 Fluka Polyclar™
10 Ashland
Inc.
copper(II) sulphate pentahydrate Fluka polyethylene glycol 4000
(PEG) Roth
D-(+)-galactose Acros Organics
/ Roth potassium acetate
Acros
organics
D-(+)-glucose Roth potassium chloride Roth
diethyl ether Roth potassium dihydrogen
phosphate Roth
dimethylformamide (DMF) Merck potassium ferricyanide Sigma
diphenylboryloxyethylamine (2-APB),
“Naturstoffreagenz A” Roth potassium fluoride Roth
dipotassium hydrogen phosphate Roth potassium hydroxide Merck
disodium hydrogen phosphate dihydrate Roth potassium iodide Merck
disodium ethylenediaminetetraacetate
dehydrate (EDTA-Na2) Roth potassium nitrate Roth
dithiothreitol (DTT) Roth pyridoxine hydrochloride Duchefa
dNTPs (dATP, dCTP, dGTP, dTTP) Fermentas silver(I) oxide Roth
D-sorbitol Fluka silybin Sigma
ethylenediaminetetraacetic acid (EDTA) Merck silychristin
Dr.
Madaus &
Co
egtazic acid (EGTA) Roth silydianin Bionorica
ethanol Roth / Sigma silymarin Sigma
ethidium bromide AppliChem sodium acetate trihydrate Merck
ethyl acetate Roth sodium chloride Roth
ethylenediaminetetraacetic acid ferric,
sodium salt [EDTA-Fe(III)-Na] Sigma sodium citrate Roth
fish sperm (carrier DNA) Serva sodium dihydrogen
phosphate monohydrate Merck
formic acid (98%) Roth sodium dodecyl sulphate
(SDS) Roth
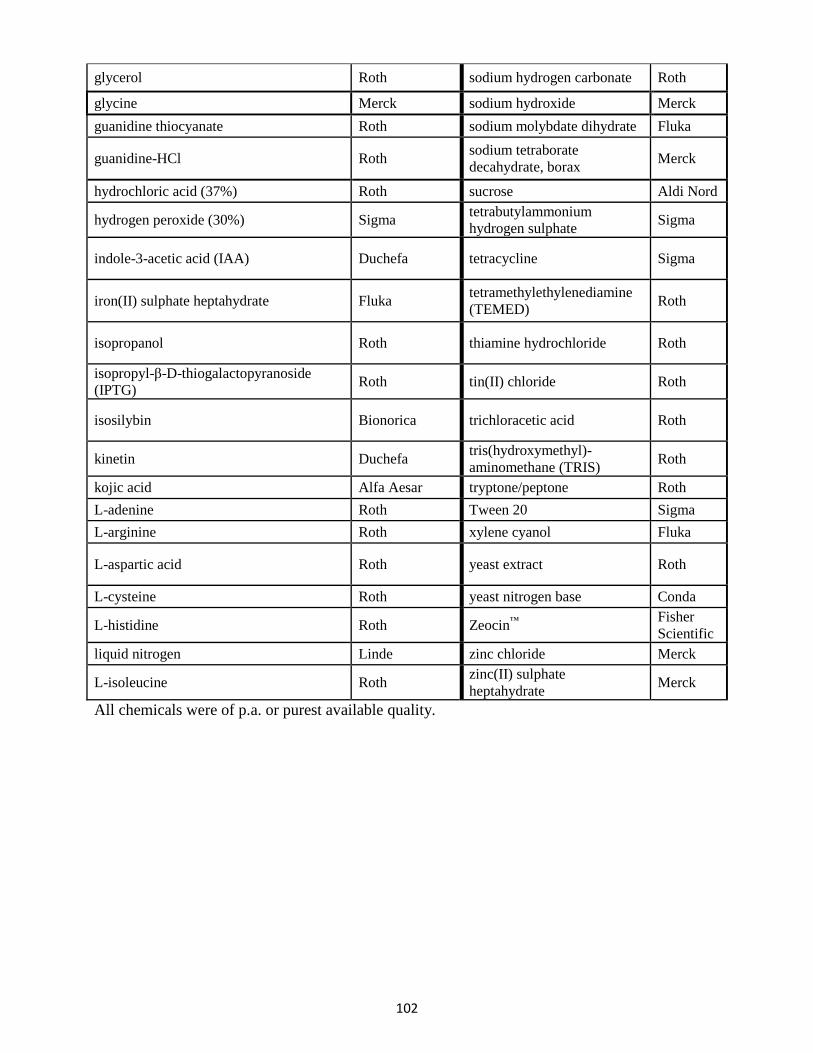
102
glycerol Roth sodium hydrogen carbonate Roth
glycine Merck sodium hydroxide Merck
guanidine thiocyanate Roth sodium molybdate dihydrate Fluka
guanidine-HCl Roth sodium tetraborate
decahydrate, borax Merck
hydrochloric acid (37%) Roth sucrose Aldi Nord
hydrogen peroxide (30%) Sigma tetrabutylammonium
hydrogen sulphate Sigma
indole-3-acetic acid (IAA) Duchefa tetracycline Sigma
iron(II) sulphate heptahydrate Fluka tetramethylethylenediamine
(TEMED) Roth
isopropanol Roth thiamine hydrochloride Roth
isopropyl-β-D-thiogalactopyranoside
(IPTG) Roth tin(II) chloride Roth
isosilybin Bionorica trichloracetic acid Roth
kinetin Duchefa tris(hydroxymethyl)-
aminomethane (TRIS) Roth
kojic acid Alfa Aesar tryptone/peptone Roth
L-adenine Roth Tween 20 Sigma
L-arginine Roth xylene cyanol Fluka
L-aspartic acid Roth yeast extract Roth
L-cysteine Roth yeast nitrogen base Conda
L-histidine Roth Zeocin™
Fisher
Scientific
liquid nitrogen Linde zinc chloride Merck
L-isoleucine Roth zinc(II) sulphate
heptahydrate Merck
All chemicals were of p.a. or purest available quality.
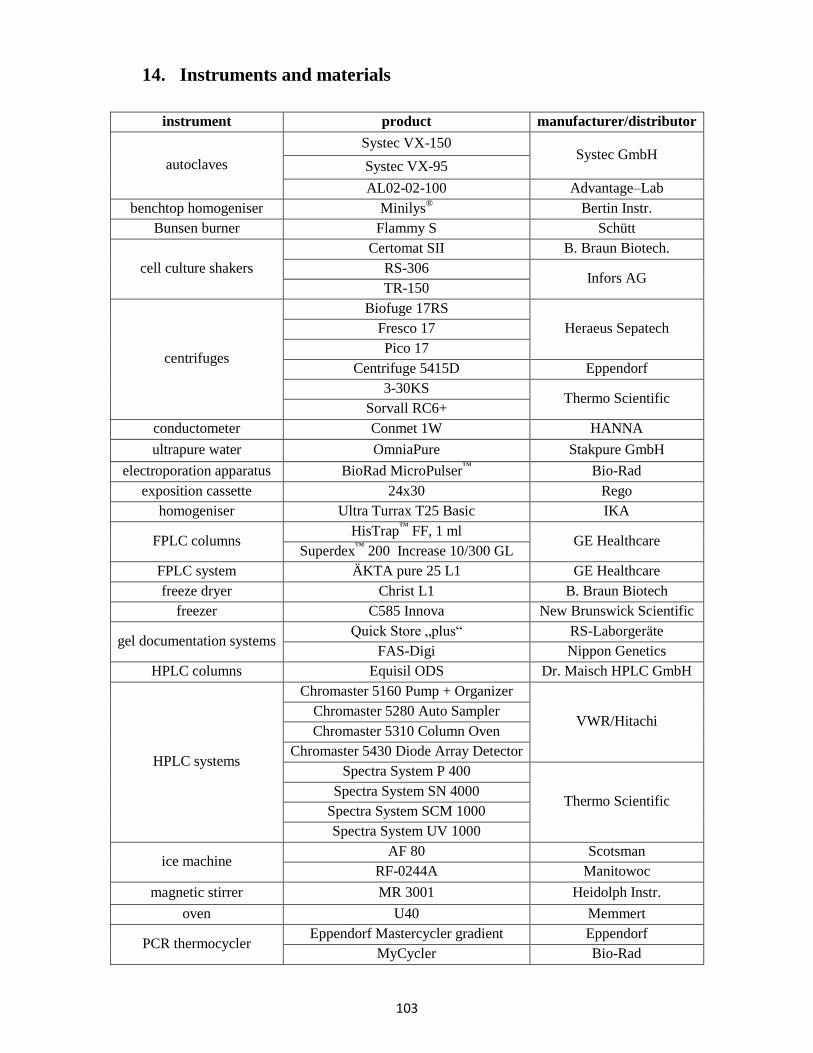
103
14. Instruments and materials
instrument product manufacturer/distributor
autoclaves
Systec VX-150 Systec GmbH
Systec VX-95
AL02-02-100 Advantage–Lab
benchtop homogeniser Minilys® Bertin Instr.
Bunsen burner Flammy S Schütt
cell culture shakers
Certomat SII B. Braun Biotech.
RS-306 Infors AG
TR-150
centrifuges
Biofuge 17RS
Heraeus Sepatech Fresco 17
Pico 17
Centrifuge 5415D Eppendorf
3-30KS Thermo Scientific
Sorvall RC6+
conductometer Conmet 1W HANNA
ultrapure water OmniaPure Stakpure GmbH
electroporation apparatus BioRad MicroPulser™
Bio-Rad
exposition cassette 24x30 Rego
homogeniser Ultra Turrax T25 Basic IKA
FPLC columns HisTrap
™ FF, 1 ml
GE Healthcare Superdex
™ 200 Increase 10/300 GL
FPLC system ÄKTA pure 25 L1 GE Healthcare
freeze dryer Christ L1 B. Braun Biotech
freezer C585 Innova New Brunswick Scientific
gel documentation systems Quick Store „plus“ RS-Laborgeräte
FAS-Digi Nippon Genetics
HPLC columns Equisil ODS Dr. Maisch HPLC GmbH
HPLC systems
Chromaster 5160 Pump + Organizer
VWR/Hitachi Chromaster 5280 Auto Sampler
Chromaster 5310 Column Oven
Chromaster 5430 Diode Array Detector
Spectra System P 400
Thermo Scientific Spectra System SN 4000
Spectra System SCM 1000
Spectra System UV 1000
ice machine AF 80 Scotsman
RF-0244A Manitowoc
magnetic stirrer MR 3001 Heidolph Instr.
oven U40 Memmert
PCR thermocycler Eppendorf Mastercycler gradient Eppendorf
MyCycler Bio-Rad
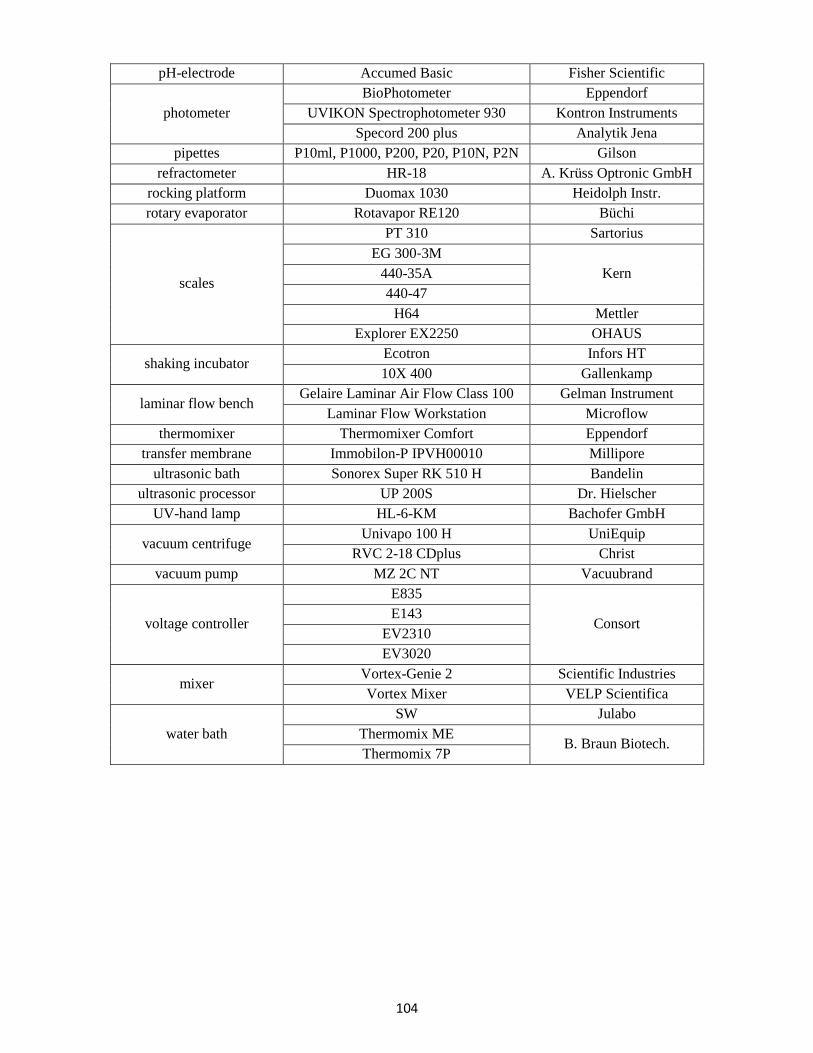
104
pH-electrode Accumed Basic Fisher Scientific
photometer
BioPhotometer Eppendorf
UVIKON Spectrophotometer 930 Kontron Instruments
Specord 200 plus Analytik Jena
pipettes P10ml, P1000, P200, P20, P10N, P2N Gilson
refractometer HR-18 A. Krüss Optronic GmbH
rocking platform Duomax 1030 Heidolph Instr.
rotary evaporator Rotavapor RE120 Büchi
scales
PT 310 Sartorius
EG 300‐3M
Kern 440-35A
440-47
H64 Mettler
Explorer EX2250 OHAUS
shaking incubator Ecotron Infors HT
10X 400 Gallenkamp
laminar flow bench Gelaire Laminar Air Flow Class 100 Gelman Instrument
Laminar Flow Workstation Microflow
thermomixer Thermomixer Comfort Eppendorf
transfer membrane Immobilon-P IPVH00010 Millipore
ultrasonic bath Sonorex Super RK 510 H Bandelin
ultrasonic processor UP 200S Dr. Hielscher
UV-hand lamp HL-6-KM Bachofer GmbH
vacuum centrifuge Univapo 100 H UniEquip
RVC 2-18 CDplus Christ
vacuum pump MZ 2C NT Vacuubrand
voltage controller
E835
Consort E143
EV2310
EV3020
mixer Vortex-Genie 2 Scientific Industries
Vortex Mixer VELP Scientifica
water bath
SW Julabo
Thermomix ME B. Braun Biotech.
Thermomix 7P
105
V. Results and Discussion
1. Culture characterisation
The aim of the characterisation of a suspension culture during a cultivation period is to determine
growth phases for optimal harvesting times. Of particular interest was the accumulation of the
flavonolignan mixture silymarin as well as enzyme activities of proteins involved in the
biosynthesis. In addition, parameters regarding growth and nutrient consumption, such as protein
or sugar content, can provide useful information about possible adjustments to the nutrient
content of the medium. Furthermore, the accumulation of secondary substances after elicitation,
possible commercial utilisation or just simplified handling of ongoing working processes can be
discussed.
Since the medium itself is a kind of apoplastic space for cell cultures, many interesting aspects
also arise here. Metabolites and enzymes can be secreted to the apoplastic space and reactions
can take place here. Conductivity measurement of the medium allows a direct, rough insight into
possible changes and physiological processes of the suspension cultures. More detailed
investigations of enzyme activities and determination of secondary metabolites can provide
further information on similar processes taking place in the natural plant.
For observations during the culture characterisation, it should be noted that natural fluctuations
can occur in the individual samples. These can appear in the form of "outliers" in the evaluation
and are therefore inconclusive in critical evaluation. In addition to natural fluctuations, minor
errors or differences in the processing of the samples are unavoidable. The age of the suspension
cultures also plays an important role, since it is known that the metabolism of suspension cultures
changes in the long term.
106
1.1 Medium parameters
In the following, the observed changes of medium parameters like pH-value, conductivity and
sugar content will be described. In addition a small change in colour of the medium from light
yellow to brownish could be discovered. It can be assumed that this occurs because phenol
oxidases and phenolic compounds are released into the medium, also by increasing cell lysis.
The initial pH-value of the culture medium is about 6.0. Within 14 days it increases up to a
maximum of pH 7.7 on day 11 and then decreases again to a relatively constant level of pH 7.3.
Towards the end of the characterisation period beginning cell lysis and thus increased release of
cell plasma and organelles to the medium led to a higher pH-value.
The conductivity represents the amount of dissolved charged compounds. A clear trend could be
observed. At the start of the cultivation period values around 900 µS cm-1
could be measured,
descending towards the end to values about 500 µS cm-1
. Since plant cell growth depends, inter
alia, on ions from micro and macro elements of the medium to maintain their primary and
secondary metabolism, the decrease in conductivity could be explained by this.
The daily measured sugar content followed this downward trend. Before autoclaving, 2% sucrose
where added to the B5-medium. Measured values were between 2.3% and 0.2%. However, it
should be noted that the sugar content was recorded by refractive index and thus other dissolved
substances with light-refracting properties could influence the total value. The added sugar from
the medium was consumed as nutrient, from which the plant cells gained their necessary energy.
This addition was necessary, because the cell cultures were cultivated in the dark, thus cannot
live photoautotrophically. The outlier at day 10 can be seen as a minor exception.
The change of the parameters pH, conductivity and sugar content over time proceeded mostly as
expected. After inoculation of plant cell cultures in fresh medium and a small familiarisation
phase (lag phase), the cells could adjust to their particular conditions and pass into a strong
growth phase. As a result, conductivity and sugar content decreased almost linearly and can be
seen as a sign of active metabolism. After a week of growth most essential nutrients were
consumed. This lack of resources led to the start of upcoming cell lysis (dying-off phase),
resulting in continuously rising pH values. Similar processes have also been described for an in
vitro culture of Coleus blumei (Petersen, 1994) or a Forsythia × intermedia cell suspension
culture (Schmitt and Petersen, 2002).
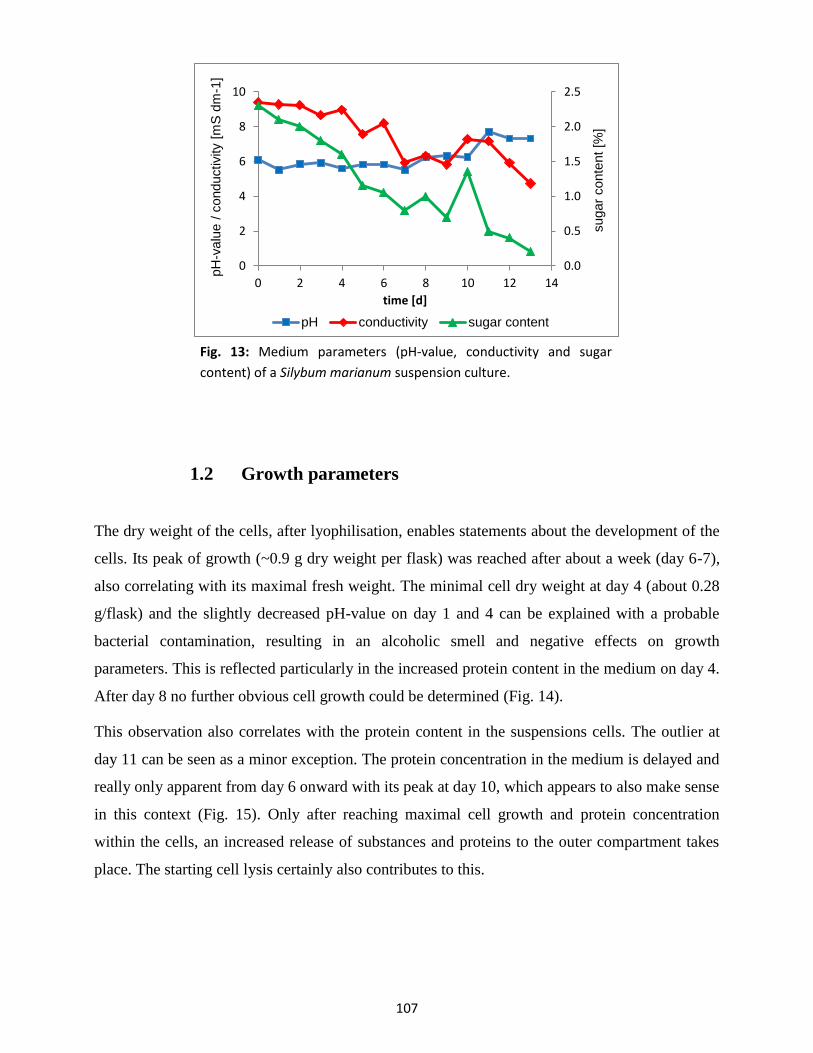
107
1.2 Growth parameters
The dry weight of the cells, after lyophilisation, enables statements about the development of the
cells. Its peak of growth (~0.9 g dry weight per flask) was reached after about a week (day 6-7),
also correlating with its maximal fresh weight. The minimal cell dry weight at day 4 (about 0.28
g/flask) and the slightly decreased pH-value on day 1 and 4 can be explained with a probable
bacterial contamination, resulting in an alcoholic smell and negative effects on growth
parameters. This is reflected particularly in the increased protein content in the medium on day 4.
After day 8 no further obvious cell growth could be determined (Fig. 14).
This observation also correlates with the protein content in the suspensions cells. The outlier at
day 11 can be seen as a minor exception. The protein concentration in the medium is delayed and
really only apparent from day 6 onward with its peak at day 10, which appears to also make sense
in this context (Fig. 15). Only after reaching maximal cell growth and protein concentration
within the cells, an increased release of substances and proteins to the outer compartment takes
place. The starting cell lysis certainly also contributes to this.
0.0
0.5
1.0
1.5
2.0
2.5
0
2
4
6
8
10
0 2 4 6 8 10 12 14
sugar
conte
nt
[%]
pH
-valu
e /
conductivity
[mS
dm
-1]
time [d]
pH conductivity sugar content
Fig. 13: Medium parameters (pH-value, conductivity and sugar
content) of a Silybum marianum suspension culture.
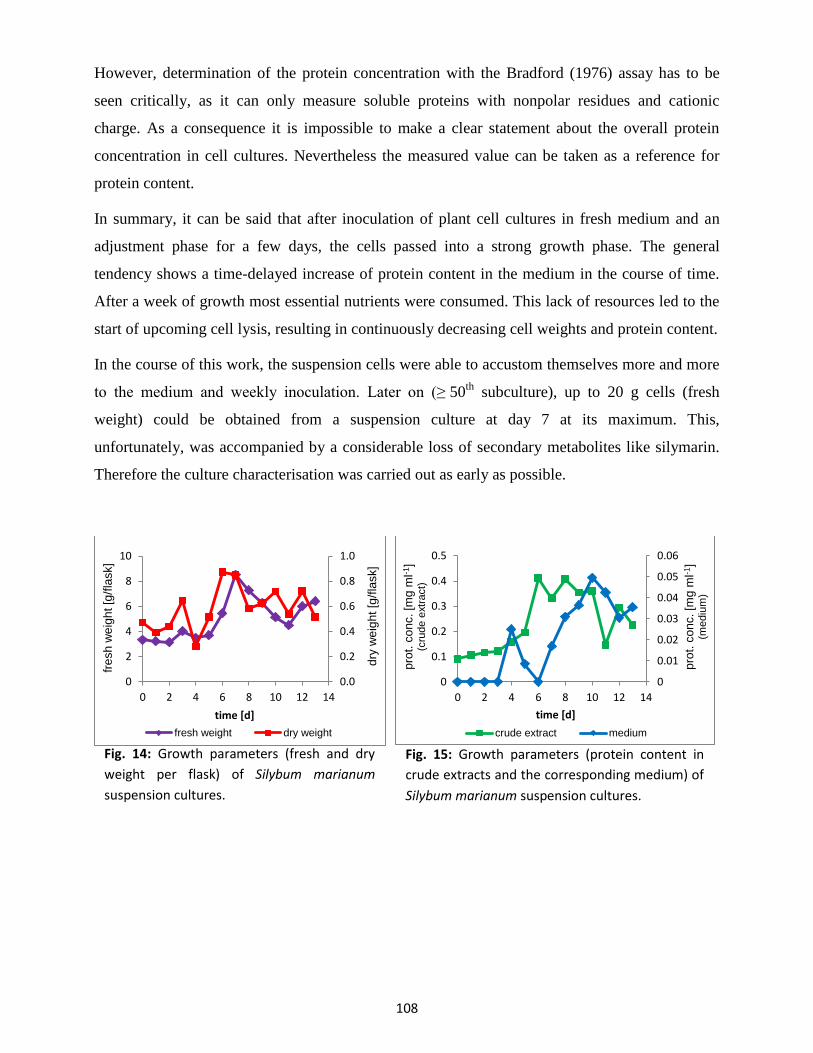
108
However, determination of the protein concentration with the Bradford (1976) assay has to be
seen critically, as it can only measure soluble proteins with nonpolar residues and cationic
charge. As a consequence it is impossible to make a clear statement about the overall protein
concentration in cell cultures. Nevertheless the measured value can be taken as a reference for
protein content.
In summary, it can be said that after inoculation of plant cell cultures in fresh medium and an
adjustment phase for a few days, the cells passed into a strong growth phase. The general
tendency shows a time-delayed increase of protein content in the medium in the course of time.
After a week of growth most essential nutrients were consumed. This lack of resources led to the
start of upcoming cell lysis, resulting in continuously decreasing cell weights and protein content.
In the course of this work, the suspension cells were able to accustom themselves more and more
to the medium and weekly inoculation. Later on (≥ 50th
subculture), up to 20 g cells (fresh
weight) could be obtained from a suspension culture at day 7 at its maximum. This,
unfortunately, was accompanied by a considerable loss of secondary metabolites like silymarin.
Therefore the culture characterisation was carried out as early as possible.
0.0
0.2
0.4
0.6
0.8
1.0
0
2
4
6
8
10
0 2 4 6 8 10 12 14
dry
we
igh
t [g
/fla
sk]
fre
sh
we
igh
t [g
/fla
sk]
time [d]
fresh weight dry weight
0
0.01
0.02
0.03
0.04
0.05
0.06
0
0.1
0.2
0.3
0.4
0.5
0 2 4 6 8 10 12 14p
rot.
co
nc. [m
g m
l-1]
(mediu
m)
pro
t. c
on
c. [m
g m
l-1]
(cru
de e
xtr
act)
time [d]
crude extract medium
Fig. 14: Growth parameters (fresh and dry
weight per flask) of Silybum marianum
suspension cultures.
Fig. 15: Growth parameters (protein content in
crude extracts and the corresponding medium) of
Silybum marianum suspension cultures.
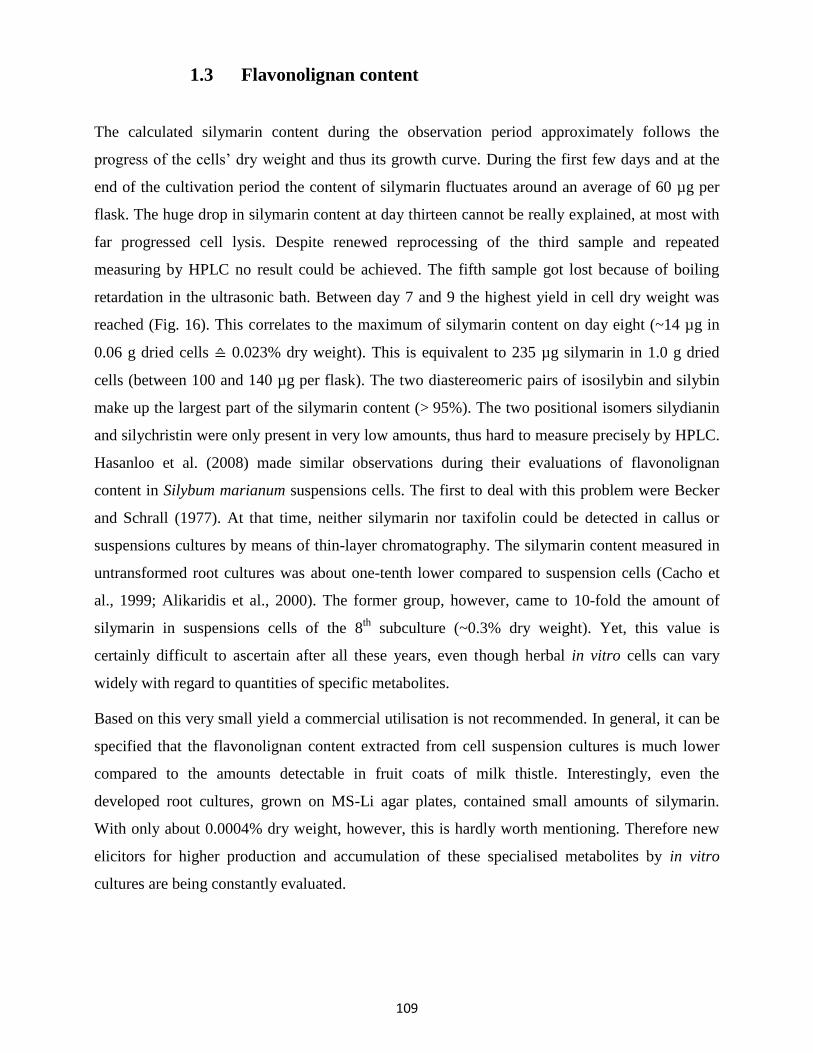
109
1.3 Flavonolignan content
The calculated silymarin content during the observation period approximately follows the
progress of the cells’ dry weight and thus its growth curve. During the first few days and at the
end of the cultivation period the content of silymarin fluctuates around an average of 60 µg per
flask. The huge drop in silymarin content at day thirteen cannot be really explained, at most with
far progressed cell lysis. Despite renewed reprocessing of the third sample and repeated
measuring by HPLC no result could be achieved. The fifth sample got lost because of boiling
retardation in the ultrasonic bath. Between day 7 and 9 the highest yield in cell dry weight was
reached (Fig. 16). This correlates to the maximum of silymarin content on day eight (~14 µg in
0.06 g dried cells ≙ 0.023% dry weight). This is equivalent to 235 µg silymarin in 1.0 g dried
cells (between 100 and 140 µg per flask). The two diastereomeric pairs of isosilybin and silybin
make up the largest part of the silymarin content (> 95%). The two positional isomers silydianin
and silychristin were only present in very low amounts, thus hard to measure precisely by HPLC.
Hasanloo et al. (2008) made similar observations during their evaluations of flavonolignan
content in Silybum marianum suspensions cells. The first to deal with this problem were Becker
and Schrall (1977). At that time, neither silymarin nor taxifolin could be detected in callus or
suspensions cultures by means of thin-layer chromatography. The silymarin content measured in
untransformed root cultures was about one-tenth lower compared to suspension cells (Cacho et
al., 1999; Alikaridis et al., 2000). The former group, however, came to 10-fold the amount of
silymarin in suspensions cells of the 8th
subculture (~0.3% dry weight). Yet, this value is
certainly difficult to ascertain after all these years, even though herbal in vitro cells can vary
widely with regard to quantities of specific metabolites.
Based on this very small yield a commercial utilisation is not recommended. In general, it can be
specified that the flavonolignan content extracted from cell suspension cultures is much lower
compared to the amounts detectable in fruit coats of milk thistle. Interestingly, even the
developed root cultures, grown on MS-Li agar plates, contained small amounts of silymarin.
With only about 0.0004% dry weight, however, this is hardly worth mentioning. Therefore new
elicitors for higher production and accumulation of these specialised metabolites by in vitro
cultures are being constantly evaluated.
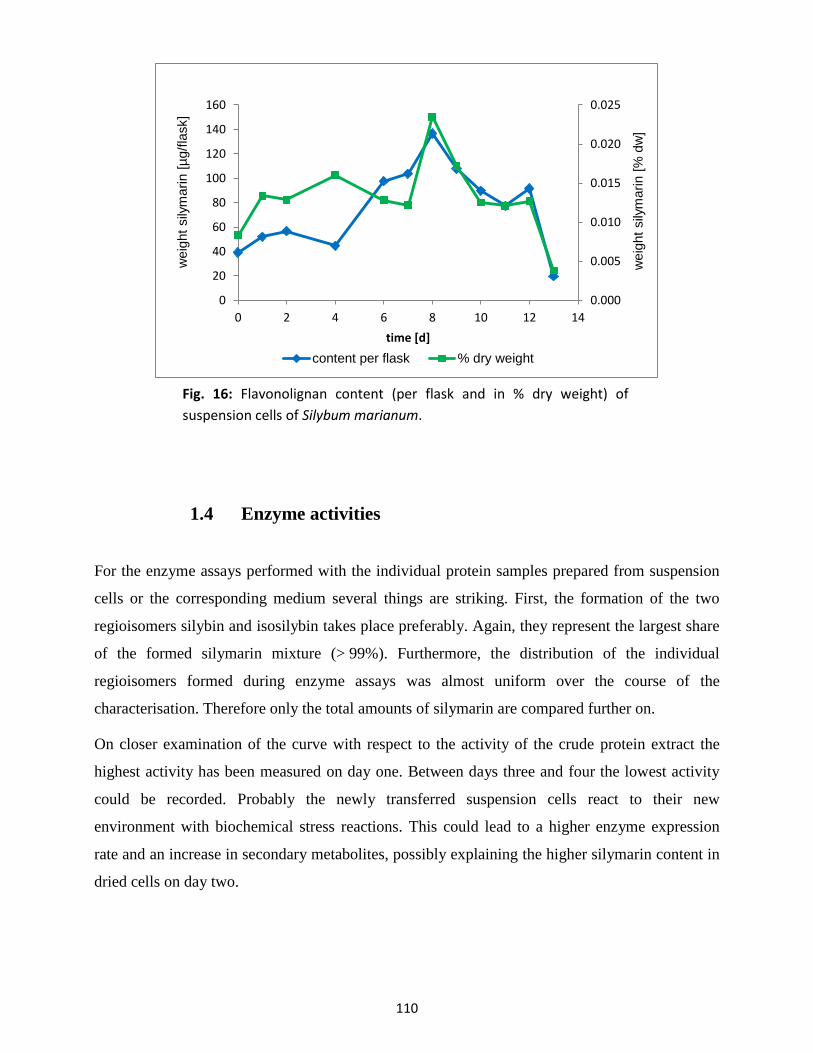
110
1.4 Enzyme activities
For the enzyme assays performed with the individual protein samples prepared from suspension
cells or the corresponding medium several things are striking. First, the formation of the two
regioisomers silybin and isosilybin takes place preferably. Again, they represent the largest share
of the formed silymarin mixture (> 99%). Furthermore, the distribution of the individual
regioisomers formed during enzyme assays was almost uniform over the course of the
characterisation. Therefore only the total amounts of silymarin are compared further on.
On closer examination of the curve with respect to the activity of the crude protein extract the
highest activity has been measured on day one. Between days three and four the lowest activity
could be recorded. Probably the newly transferred suspension cells react to their new
environment with biochemical stress reactions. This could lead to a higher enzyme expression
rate and an increase in secondary metabolites, possibly explaining the higher silymarin content in
dried cells on day two.
0.000
0.005
0.010
0.015
0.020
0.025
0
20
40
60
80
100
120
140
160
0 2 4 6 8 10 12 14
weig
ht
sily
marin [
% d
w]
weig
ht
sily
marin [
µg/f
lask]
time [d]
content per flask % dry weight
Fig. 16: Flavonolignan content (per flask and in % dry weight) of
suspension cells of Silybum marianum.
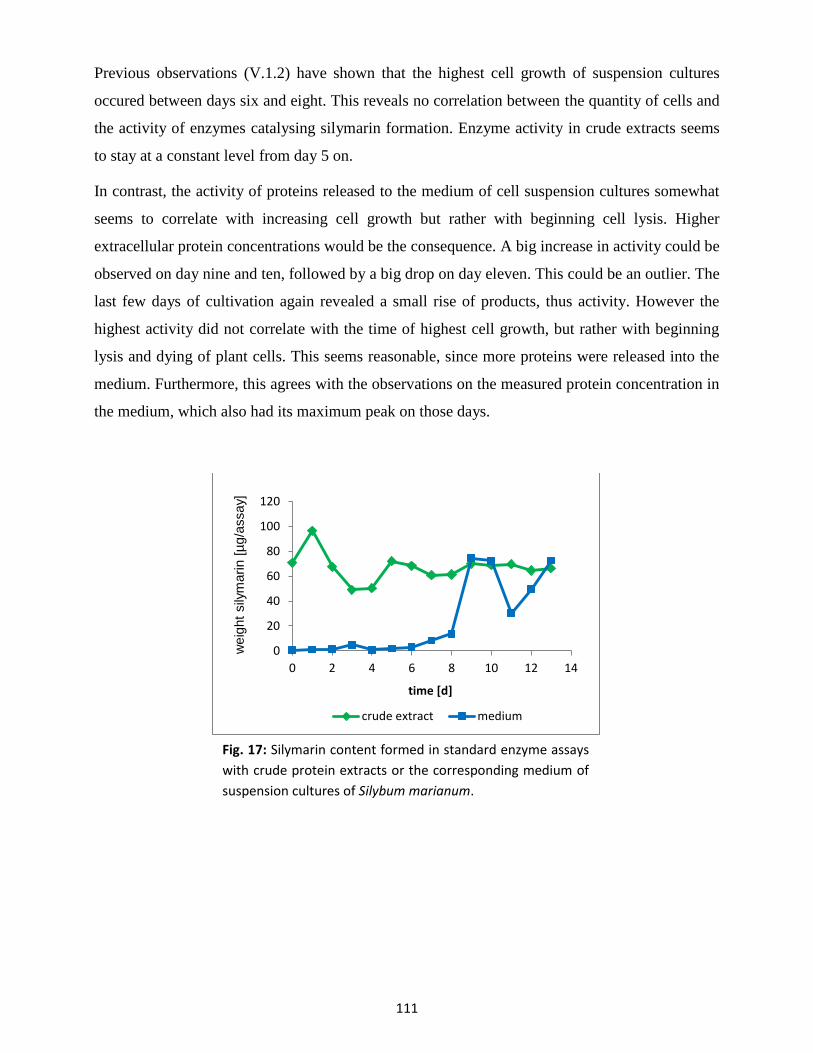
111
Previous observations (V.1.2) have shown that the highest cell growth of suspension cultures
occured between days six and eight. This reveals no correlation between the quantity of cells and
the activity of enzymes catalysing silymarin formation. Enzyme activity in crude extracts seems
to stay at a constant level from day 5 on.
In contrast, the activity of proteins released to the medium of cell suspension cultures somewhat
seems to correlate with increasing cell growth but rather with beginning cell lysis. Higher
extracellular protein concentrations would be the consequence. A big increase in activity could be
observed on day nine and ten, followed by a big drop on day eleven. This could be an outlier. The
last few days of cultivation again revealed a small rise of products, thus activity. However the
highest activity did not correlate with the time of highest cell growth, but rather with beginning
lysis and dying of plant cells. This seems reasonable, since more proteins were released into the
medium. Furthermore, this agrees with the observations on the measured protein concentration in
the medium, which also had its maximum peak on those days.
0
20
40
60
80
100
120
0 2 4 6 8 10 12 14
weig
ht
sily
marin [
µg/a
ssay]
time [d]
crude extract medium
Fig. 17: Silymarin content formed in standard enzyme assays
with crude protein extracts or the corresponding medium of
suspension cultures of Silybum marianum.
112
2. Culture elicitation
In previous studies it was reported that methyl jasmonate (MeJA) or cyclodextrins can induce the
release of taxifolin, coniferyl alcohol and all of the isomers of the silymarin mixture to the
extracellular medium (Sánchez-Sampedro et al., 2005; Belchi-Navarro et al., 2011). Many other
substances have also proven their effectiveness as elicitors in various studies. These include, for
example, picloram (Hasanloo et al., 2008), salicylic acid (Khalili et al., 2009), chitosan (Hasanloo
et al., 2014), synthetic pyrazinecarboxamide derivatives (Tůmová et al., 2011) or silver ions
(Vildová et al., 2014). In the course of this work the choice yet fell on MeJA, a known elicitor for
secondary metabolites in plants, because other groups achieved good results with this elicitor.
2.1 Flavonolignan content
In order to increase the silymarin formation and study possible effects on its release into the outer
compartments in vitro cells of Silybum marianum were treated with either MeJA or EtOH as
control. The addition was made on day three of freshly inoculated suspensions cells in B5
medium. Every 12 h, starting with 0 h, a flask was taken and analysed for its flavonolignan
content.
Comparing the silymarin content in the suspension cells, no big differences could be detected
between control and samples. The trend of the curves is very similar. The flavonolignan content
increases slowly until reaching its maximum with about 0.028% dry weight after three days of
incubation, and then decreases steadily in the following days. Merely cell samples obtained after
12-24 h of elicitation showed a small increase of silymarin content (~0.005% dry weight) (Fig.
18). This effect seems to correlate with the amount of silymarin released into the medium, shifted
for about 12 h. A higher biosynthesis of flavonolignans in suspension cells also could have an
enhancing effect on transport systems.
Flavonolignans were released into the medium in a similar amount in the control group and in
elicited samples. Only marginal differences could be detected during the first 12 h of elicitation.
After 24 h the effect of the elicitor showed its full impact on putative transport systems. Elicited
samples showed about 70% more silymarin in the medium at that time. The control group with
EtOH nearly catches up with a delay of 12 h showing a parallel curve from that time onwards
(Fig. 19). Yet the amount stays about 15-20% lower.
113
In general, increased flavonolignan formation started after 12 h, peaked between 24 and 48 h and
slightly decreased afterwards. These observations are in agreement to other studies (Sánchez-
Sampedro et al., 2005). Conversely, Belchi-Navarro et al. (2011) found that MeJA only markedly
influenced silymarin production if combined with cyclodextrins and only after delayed addition.
It is also reported that flavonolignan accumulation in the medium of suspension cells treated with
MeJA is closely related to an increased activity of the enzyme phospholipase D (Madrid and
Corchete, 2010). In 2013, Prieto and Corchete demonstrated that extracellular accumulation of
flavonolignans in Silybum marianum cultures is dominated by ATP-dependent primary transport
that involves ATP-binding cassette-like transporters. Their results suggest that the elicitor-
induced secondary metabolite release from cells into the medium could also be regarded as an
induced excretion via activation of specific transport systems. They postulated that a Ras-related
protein of the Rab family, usually involved in transmitting signals within cells, as well as an
ATP-binding cassette transporter (ABC transporter) is upregulated in cultures elicited with
MeJA. Both enzymes could play an important role in secretion and/or recycling of cell wall
components (Prieto and Corchete, 2014).
Nevertheless, even after successful elicitation of milk thistle suspension cells, flavonolignan
quantities are still far too low for an economic benefit. Extraction from mature achenes is still
significantly more profitable. A far more interesting topic would be to clarify how silymarin is
released to the medium, which mechanisms are involved and if so, as a result, whether this could
affect the flavonolignan regioisomer distributions. This in turn could be a possible indication of
similar processes for silymarin accumulation in the mature fruits of the plants. Even though this
has been investigated a lot in recent years it is certainly an interesting topic for new insights into
plant processes in the future.
Recent studies predict vesicles or specialised organelles transporting newly synthesised
compounds to other storage compartments or to the plasma membrane for efflux (Weston et al.,
2012), thus vesicle-associated pathways for the delivery of silymarin and/or their precursors to
the extracellular medium are conceivable. “Taken into account that the extracellular medium of
suspension cultures could be considered as an apoplastic space, thus resembling the fruit wall, it
could be postulated that coniferyl alcohol and taxifolin could be exported independently and
radical coupling of these precursors would take part extracellularly by apoplastic proteins.
Concerning flavonoids, the enzymes for their biosynthesis are believed to be localised on the
cytosolic side of the endoplasmic reticulum (ER), and efficient flavonoid transport systems
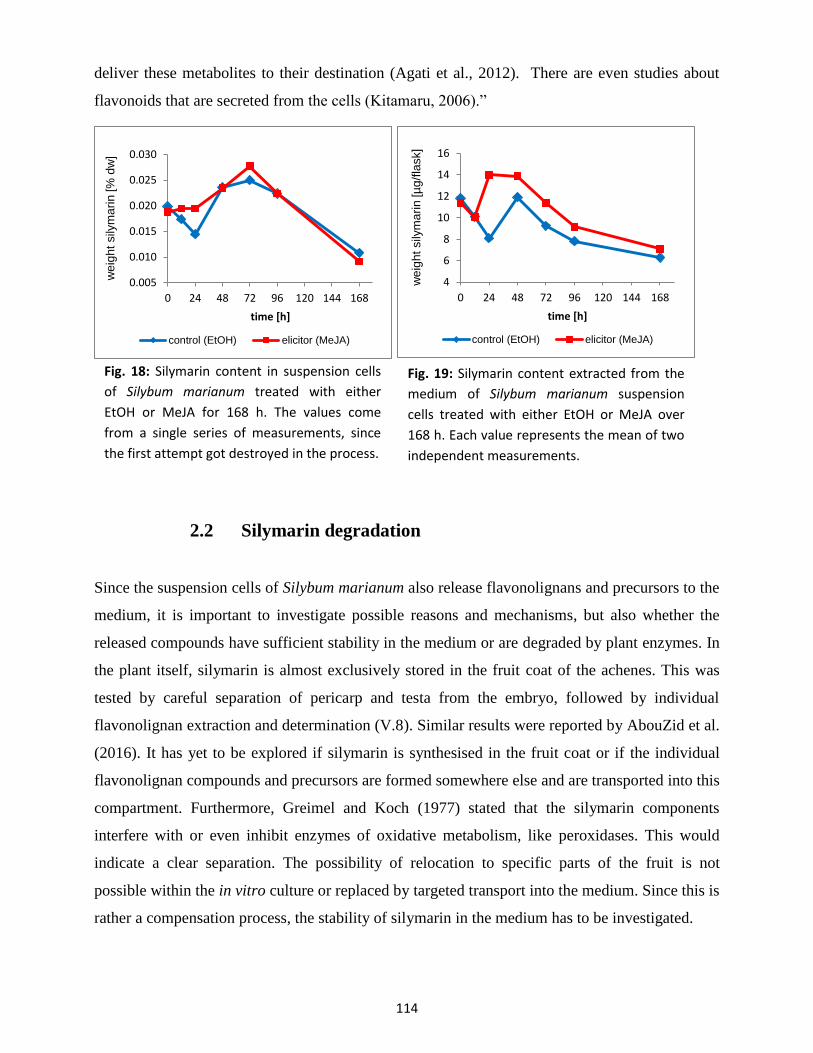
114
deliver these metabolites to their destination (Agati et al., 2012). There are even studies about
flavonoids that are secreted from the cells (Kitamaru, 2006).”
2.2 Silymarin degradation
Since the suspension cells of Silybum marianum also release flavonolignans and precursors to the
medium, it is important to investigate possible reasons and mechanisms, but also whether the
released compounds have sufficient stability in the medium or are degraded by plant enzymes. In
the plant itself, silymarin is almost exclusively stored in the fruit coat of the achenes. This was
tested by careful separation of pericarp and testa from the embryo, followed by individual
flavonolignan extraction and determination (V.8). Similar results were reported by AbouZid et al.
(2016). It has yet to be explored if silymarin is synthesised in the fruit coat or if the individual
flavonolignan compounds and precursors are formed somewhere else and are transported into this
compartment. Furthermore, Greimel and Koch (1977) stated that the silymarin components
interfere with or even inhibit enzymes of oxidative metabolism, like peroxidases. This would
indicate a clear separation. The possibility of relocation to specific parts of the fruit is not
possible within the in vitro culture or replaced by targeted transport into the medium. Since this is
rather a compensation process, the stability of silymarin in the medium has to be investigated.
0.005
0.010
0.015
0.020
0.025
0.030
0 24 48 72 96 120 144 168
we
igh
t sily
ma
rin
[%
dw
]
time [h]
control (EtOH) elicitor (MeJA)
4
6
8
10
12
14
16
0 24 48 72 96 120 144 168
we
igh
t sily
ma
rin
[µ
g/f
lask]
time [h]
control (EtOH) elicitor (MeJA)
Fig. 18: Silymarin content in suspension cells
of Silybum marianum treated with either
EtOH or MeJA for 168 h. The values come
from a single series of measurements, since
the first attempt got destroyed in the process.
Fig. 19: Silymarin content extracted from the
medium of Silybum marianum suspension
cells treated with either EtOH or MeJA over
168 h. Each value represents the mean of two
independent measurements.
115
The stability of silymarin and its possible degradation was tested by incubating a specific amount
of silymarin standard (~240 µg) in 50 µl purified medium for 24 h under normal culture
conditions (IV.3.4). Different pH conditions, as well as simple TRIS-HCl buffer as a reference,
were tested.
In the evaluation of the collected data it is striking, that there was about 12% less silymarin after
shaking it in habituated medium in the dark at 26 °C for 24 h. Compared to simple TRIS-HCl
buffer of the same pH this was even 7% more degradation. The effect increased with rising pH
values particularly for the positional isomer silydianin. About 50% less silydianin and 20% less
of the other regioisomers could be detected after incubation at pH 10.0 for 24 h.
The results show that released flavonolignans are rather unstable in the culture medium.
Temperature and pH probably play the major role, but degradation by enzymes cannot be
excluded. In 2007, Sánchez-Sampedro et al. reported that even though peroxidases from cell
extracts and, to a higher degree from the spent medium, promote flavonolignan formation,
silymarin compounds were also degraded by suspension culture peroxidases. Although a higher
pH (~9.5) for the formation of silymarin in enzyme assays is very favourable, a rising pH in the
culture medium, as observed at the end of the culture period, shows rather opposite effects. This
is reflected particularly in the stability of the positional isomer silydianin. This shows that an in
vitro culture is only an attempted imitation and is inferior to the plant in many ways. This is
especially true for storage of specialised metabolites in special compartments of the plant.
3. Flavonolignan composition from different milk thistle chemotypes
Since the middle of the 1990s, Hetz et al. (1995) found that there are different lines of Silybum
marianum plants with a varying silymarin composition. A decade later, more research groups
took up this topic and discovered distinct chemotypic variations, particularly in the fruits, from
plants grown and harvested in different areas (Hasanloo et al., 1995; Martin et al., 2006;
Shokrpour et al., 2007). However, very little is known about why these differences occur and
how the plant discriminates between the individual silymarin regioisomers.
Simple seasonal differences due to environmental factors, harvesting times or also further
processing methods, for example the drying processes could affect the silymarin composition.
Much more interesting, however, could also be factors on the enzymatic and genomic level of the
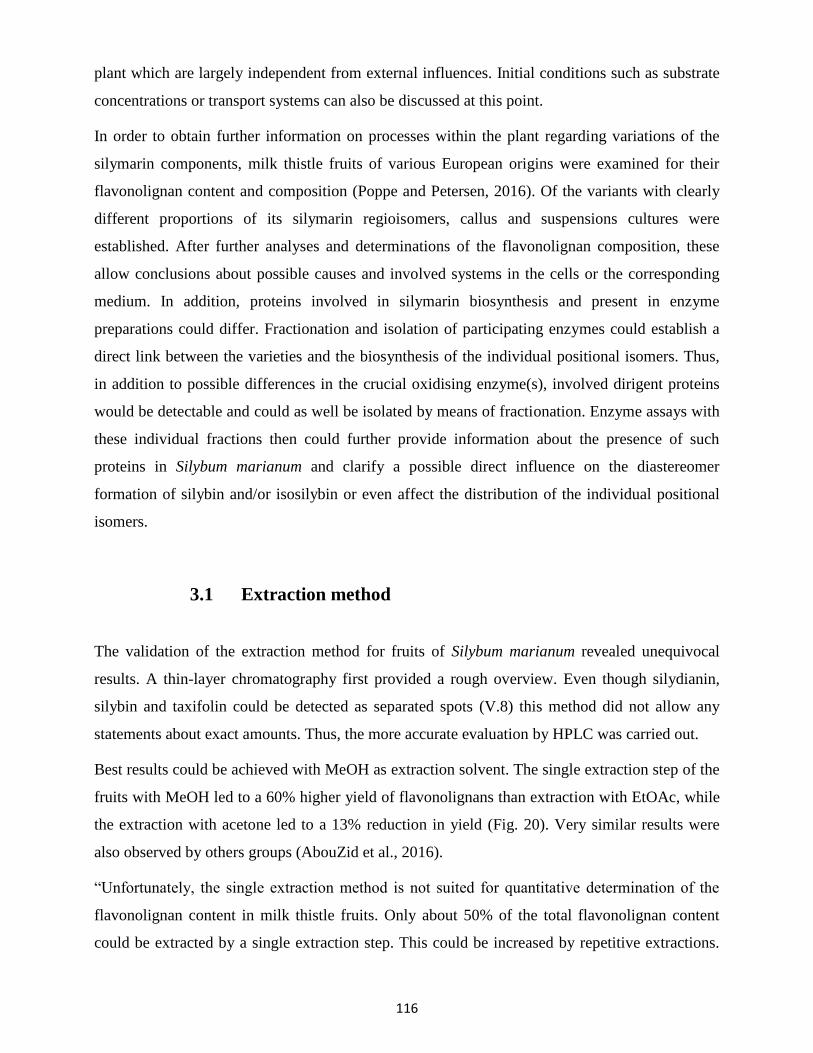
116
plant which are largely independent from external influences. Initial conditions such as substrate
concentrations or transport systems can also be discussed at this point.
In order to obtain further information on processes within the plant regarding variations of the
silymarin components, milk thistle fruits of various European origins were examined for their
flavonolignan content and composition (Poppe and Petersen, 2016). Of the variants with clearly
different proportions of its silymarin regioisomers, callus and suspensions cultures were
established. After further analyses and determinations of the flavonolignan composition, these
allow conclusions about possible causes and involved systems in the cells or the corresponding
medium. In addition, proteins involved in silymarin biosynthesis and present in enzyme
preparations could differ. Fractionation and isolation of participating enzymes could establish a
direct link between the varieties and the biosynthesis of the individual positional isomers. Thus,
in addition to possible differences in the crucial oxidising enzyme(s), involved dirigent proteins
would be detectable and could as well be isolated by means of fractionation. Enzyme assays with
these individual fractions then could further provide information about the presence of such
proteins in Silybum marianum and clarify a possible direct influence on the diastereomer
formation of silybin and/or isosilybin or even affect the distribution of the individual positional
isomers.
3.1 Extraction method
The validation of the extraction method for fruits of Silybum marianum revealed unequivocal
results. A thin-layer chromatography first provided a rough overview. Even though silydianin,
silybin and taxifolin could be detected as separated spots (V.8) this method did not allow any
statements about exact amounts. Thus, the more accurate evaluation by HPLC was carried out.
Best results could be achieved with MeOH as extraction solvent. The single extraction step of the
fruits with MeOH led to a 60% higher yield of flavonolignans than extraction with EtOAc, while
the extraction with acetone led to a 13% reduction in yield (Fig. 20). Very similar results were
also observed by others groups (AbouZid et al., 2016).
“Unfortunately, the single extraction method is not suited for quantitative determination of the
flavonolignan content in milk thistle fruits. Only about 50% of the total flavonolignan content
could be extracted by a single extraction step. This could be increased by repetitive extractions.
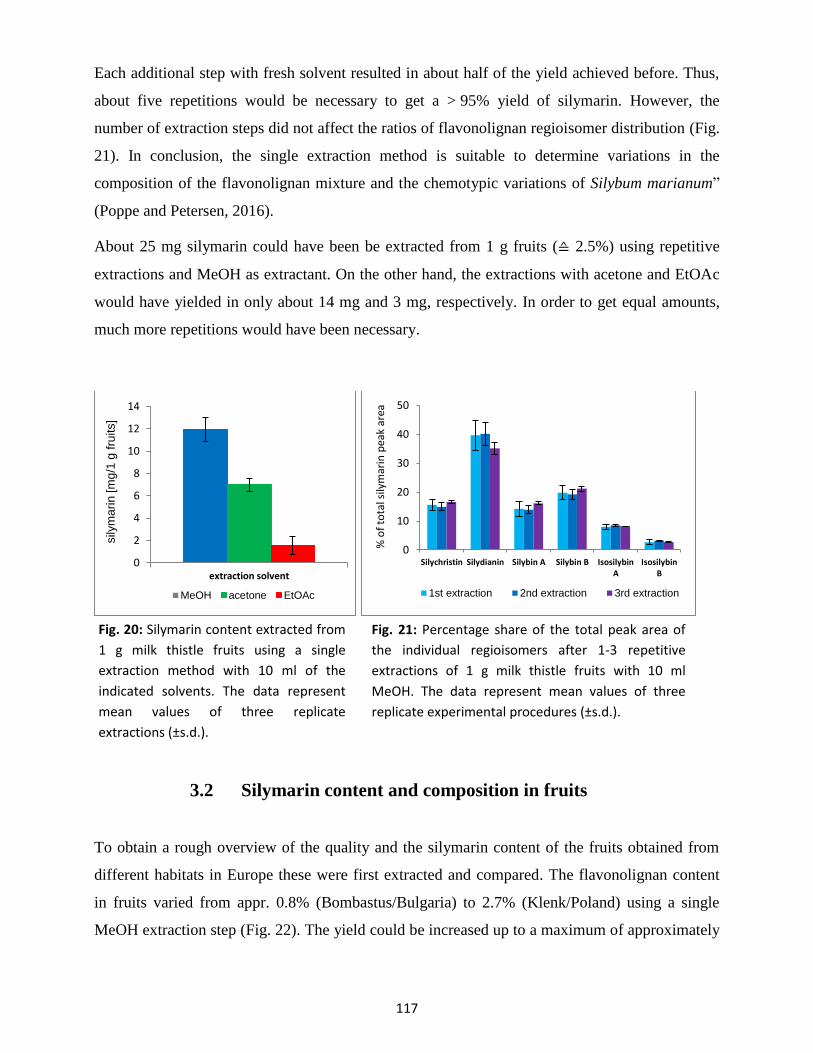
117
Each additional step with fresh solvent resulted in about half of the yield achieved before. Thus,
about five repetitions would be necessary to get a > 95% yield of silymarin. However, the
number of extraction steps did not affect the ratios of flavonolignan regioisomer distribution (Fig.
21). In conclusion, the single extraction method is suitable to determine variations in the
composition of the flavonolignan mixture and the chemotypic variations of Silybum marianum”
(Poppe and Petersen, 2016).
About 25 mg silymarin could have been be extracted from 1 g fruits (≙ 2.5%) using repetitive
extractions and MeOH as extractant. On the other hand, the extractions with acetone and EtOAc
would have yielded in only about 14 mg and 3 mg, respectively. In order to get equal amounts,
much more repetitions would have been necessary.
3.2 Silymarin content and composition in fruits
To obtain a rough overview of the quality and the silymarin content of the fruits obtained from
different habitats in Europe these were first extracted and compared. The flavonolignan content
in fruits varied from appr. 0.8% (Bombastus/Bulgaria) to 2.7% (Klenk/Poland) using a single
MeOH extraction step (Fig. 22). The yield could be increased up to a maximum of approximately
0
2
4
6
8
10
12
14
sily
ma
rin
[m
g/1
g f
ruits]
extraction solvent
MeOH acetone EtOAc
0
10
20
30
40
50
Silychristin Silydianin Silybin A Silybin B IsosilybinA
IsosilybinB
% o
f to
tal s
ilym
arin
pea
k ar
ea
1st extraction 2nd extraction 3rd extraction
Fig. 20: Silymarin content extracted from
1 g milk thistle fruits using a single
extraction method with 10 ml of the
indicated solvents. The data represent
mean values of three replicate
extractions (±s.d.).
Fig. 21: Percentage share of the total peak area of
the individual regioisomers after 1-3 repetitive
extractions of 1 g milk thistle fruits with 10 ml
MeOH. The data represent mean values of three
replicate experimental procedures (±s.d.).
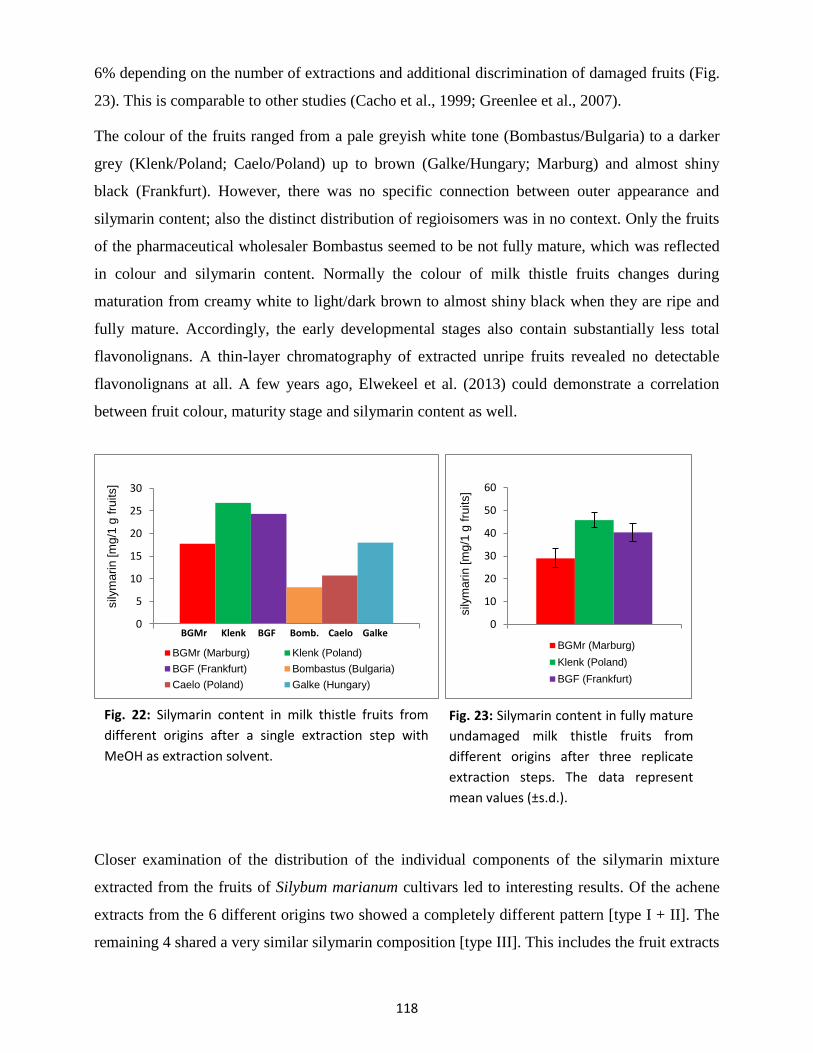
118
6% depending on the number of extractions and additional discrimination of damaged fruits (Fig.
23). This is comparable to other studies (Cacho et al., 1999; Greenlee et al., 2007).
The colour of the fruits ranged from a pale greyish white tone (Bombastus/Bulgaria) to a darker
grey (Klenk/Poland; Caelo/Poland) up to brown (Galke/Hungary; Marburg) and almost shiny
black (Frankfurt). However, there was no specific connection between outer appearance and
silymarin content; also the distinct distribution of regioisomers was in no context. Only the fruits
of the pharmaceutical wholesaler Bombastus seemed to be not fully mature, which was reflected
in colour and silymarin content. Normally the colour of milk thistle fruits changes during
maturation from creamy white to light/dark brown to almost shiny black when they are ripe and
fully mature. Accordingly, the early developmental stages also contain substantially less total
flavonolignans. A thin-layer chromatography of extracted unripe fruits revealed no detectable
flavonolignans at all. A few years ago, Elwekeel et al. (2013) could demonstrate a correlation
between fruit colour, maturity stage and silymarin content as well.
Closer examination of the distribution of the individual components of the silymarin mixture
extracted from the fruits of Silybum marianum cultivars led to interesting results. Of the achene
extracts from the 6 different origins two showed a completely different pattern [type I + II]. The
remaining 4 shared a very similar silymarin composition [type III]. This includes the fruit extracts
0
5
10
15
20
25
30
sily
ma
rin
[m
g/1
g f
ruits]
BGMr Klenk BGF Bomb. Caelo Galke
BGMr (Marburg) Klenk (Poland)
BGF (Frankfurt) Bombastus (Bulgaria)
Caelo (Poland) Galke (Hungary)
0
10
20
30
40
50
60
sily
ma
rin
[m
g/1
g f
ruits]
BGMr (Marburg)
Klenk (Poland)
BGF (Frankfurt)
Fig. 22: Silymarin content in milk thistle fruits from
different origins after a single extraction step with
MeOH as extraction solvent.
Fig. 23: Silymarin content in fully mature
undamaged milk thistle fruits from
different origins after three replicate
extraction steps. The data represent
mean values (±s.d.).
119
from Frankfurt, Hungary, Poland (Caelo) and Bulgaria. In this milk thistle chemotype the
amounts of silychristin, silybin A and B and isosilybin A each were between 10 and 20%,
calculated as the share of the total silymarin peak area, while isosilybin B amounts only to about
5%. The dominant positional isomer was silydianin with about 40%. The achenes from Poland
(Klenk) contained between 25-35% each of the total silymarin peak area as silychristin, silybin A
and silybin B, while the silydianin content was extremely low (< 10%) [type II]. Compared to
these, the Marburg line (BGMr) revealed the highest amount of the regioisomer silydianin with
about 70% of the total silymarin peak area, but on the other hand, the lowest silychristin and
silybin amounts [type I]. The percentage share of the positional isomer isosilybin was roughly
comparable in all samples (Fig. 24).
Representatives of the three lines with the most striking differences in their regioisomeric pattern
of silymarin were chosen for a second comparison to validate the results. The Frankfurt line was
chosen for the type III cultivar for further experiments. Additionally, only fully mature and
undamaged fruits were selected. The above-mentioned results could be reproduced. This was also
true when comparing absolute quantities of the individual flavonolignans. The characteristic
patterns of the regioisomer distribution of the three types are easily recognisable. Again, the
silychristin (0.4 mg/1 g fruits) and silybin (0.9 mg/1 g fruits) quantities of the Marburg cultivar
[type I] were very low compared to the other two. The value of silydianin is the highest
(2.65 mg/1 g fruits), whereas the Klenk line revealed very low silydianin amounts (0.5 mg/1 g
fruits). In turn, this is characterised by a high proportion of silychristin (4.2 mg/1 g fruits) and
silybin (10 mg/1 g fruits) [type II]. To some extent, one could label these two cultivars as lines
with opposite distribution of the proportions of regioisomers in the total silymarin mixture.
Solely, the share of isosilybin is very similar for all three cultivars with values between 3-
4 mg/1 g fruits. Compared with type I+II, the proportions of the positional isomers of the
Frankfurt line almost have an average character [type III] (Fig. 25).
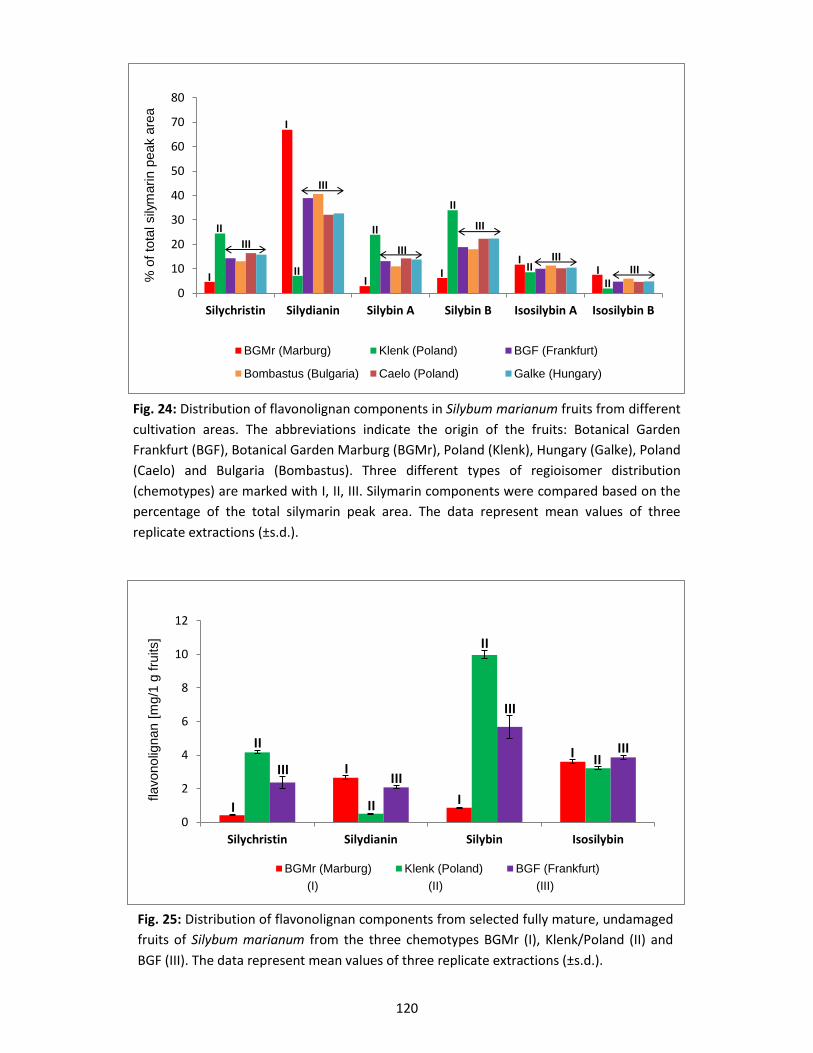
120
0
10
20
30
40
50
60
70
80
Silychristin Silydianin Silybin A Silybin B Isosilybin A Isosilybin B
% o
f to
tal sily
marin p
eak a
rea
BGMr (Marburg) Klenk (Poland) BGF (Frankfurt)
Bombastus (Bulgaria) Caelo (Poland) Galke (Hungary)
0
2
4
6
8
10
12
Silychristin Silydianin Silybin Isosilybin
flavonolig
nan [
mg/1
g f
ruits]
BGMr (Marburg) Klenk (Poland) BGF (Frankfurt)
I
I
I I
I I
II
II
II
II
II
II
III
III
III
III III
III
II
III
I
I
I
I
II
II
II
III
III
III
(I) (II) (III)
Fig. 24: Distribution of flavonolignan components in Silybum marianum fruits from different
cultivation areas. The abbreviations indicate the origin of the fruits: Botanical Garden
Frankfurt (BGF), Botanical Garden Marburg (BGMr), Poland (Klenk), Hungary (Galke), Poland
(Caelo) and Bulgaria (Bombastus). Three different types of regioisomer distribution
(chemotypes) are marked with I, II, III. Silymarin components were compared based on the
percentage of the total silymarin peak area. The data represent mean values of three
replicate extractions (±s.d.).
Fig. 25: Distribution of flavonolignan components from selected fully mature, undamaged
fruits of Silybum marianum from the three chemotypes BGMr (I), Klenk/Poland (II) and
BGF (III). The data represent mean values of three replicate extractions (±s.d.).
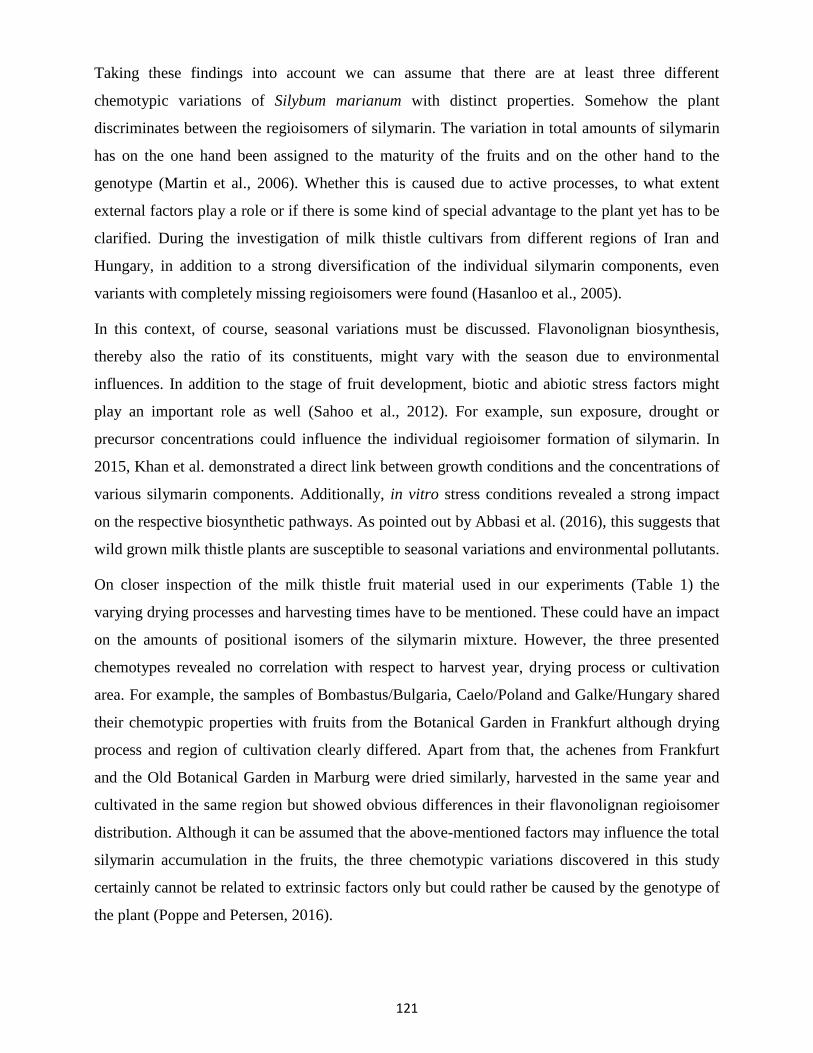
121
Taking these findings into account we can assume that there are at least three different
chemotypic variations of Silybum marianum with distinct properties. Somehow the plant
discriminates between the regioisomers of silymarin. The variation in total amounts of silymarin
has on the one hand been assigned to the maturity of the fruits and on the other hand to the
genotype (Martin et al., 2006). Whether this is caused due to active processes, to what extent
external factors play a role or if there is some kind of special advantage to the plant yet has to be
clarified. During the investigation of milk thistle cultivars from different regions of Iran and
Hungary, in addition to a strong diversification of the individual silymarin components, even
variants with completely missing regioisomers were found (Hasanloo et al., 2005).
In this context, of course, seasonal variations must be discussed. Flavonolignan biosynthesis,
thereby also the ratio of its constituents, might vary with the season due to environmental
influences. In addition to the stage of fruit development, biotic and abiotic stress factors might
play an important role as well (Sahoo et al., 2012). For example, sun exposure, drought or
precursor concentrations could influence the individual regioisomer formation of silymarin. In
2015, Khan et al. demonstrated a direct link between growth conditions and the concentrations of
various silymarin components. Additionally, in vitro stress conditions revealed a strong impact
on the respective biosynthetic pathways. As pointed out by Abbasi et al. (2016), this suggests that
wild grown milk thistle plants are susceptible to seasonal variations and environmental pollutants.
On closer inspection of the milk thistle fruit material used in our experiments (Table 1) the
varying drying processes and harvesting times have to be mentioned. These could have an impact
on the amounts of positional isomers of the silymarin mixture. However, the three presented
chemotypes revealed no correlation with respect to harvest year, drying process or cultivation
area. For example, the samples of Bombastus/Bulgaria, Caelo/Poland and Galke/Hungary shared
their chemotypic properties with fruits from the Botanical Garden in Frankfurt although drying
process and region of cultivation clearly differed. Apart from that, the achenes from Frankfurt
and the Old Botanical Garden in Marburg were dried similarly, harvested in the same year and
cultivated in the same region but showed obvious differences in their flavonolignan regioisomer
distribution. Although it can be assumed that the above-mentioned factors may influence the total
silymarin accumulation in the fruits, the three chemotypic variations discovered in this study
certainly cannot be related to extrinsic factors only but could rather be caused by the genotype of
the plant (Poppe and Petersen, 2016).
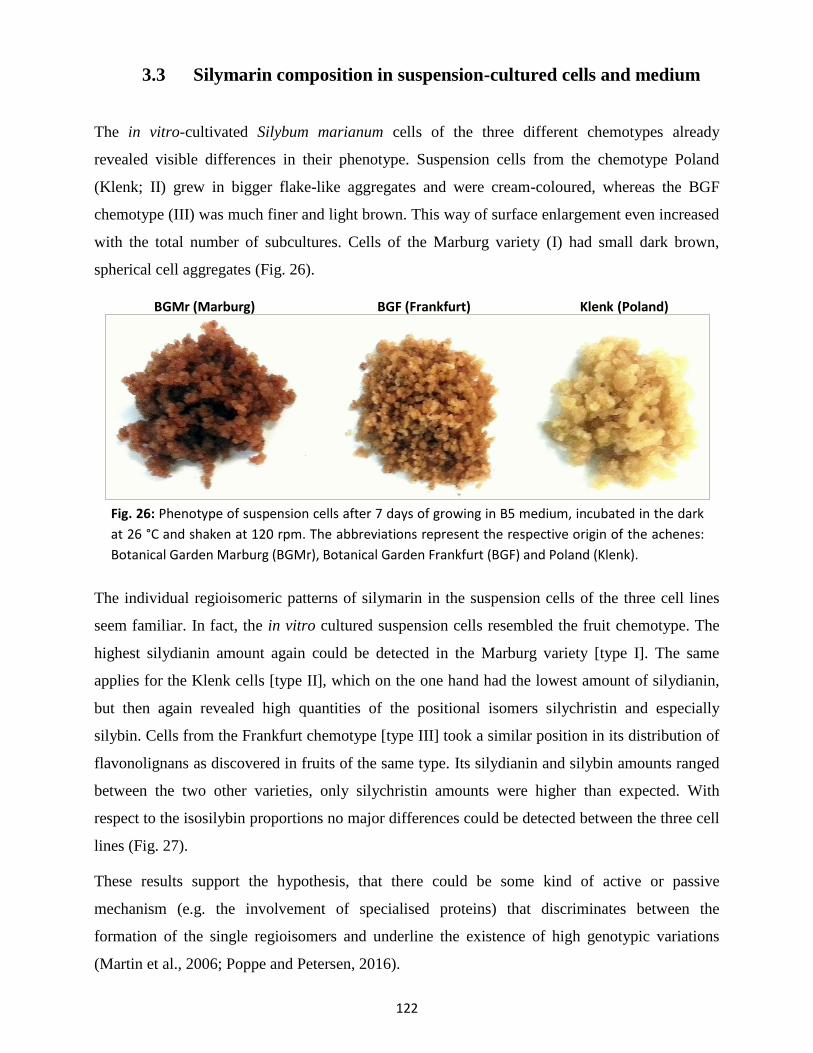
122
3.3 Silymarin composition in suspension-cultured cells and medium
The in vitro-cultivated Silybum marianum cells of the three different chemotypes already
revealed visible differences in their phenotype. Suspension cells from the chemotype Poland
(Klenk; II) grew in bigger flake-like aggregates and were cream-coloured, whereas the BGF
chemotype (III) was much finer and light brown. This way of surface enlargement even increased
with the total number of subcultures. Cells of the Marburg variety (I) had small dark brown,
spherical cell aggregates (Fig. 26).
The individual regioisomeric patterns of silymarin in the suspension cells of the three cell lines
seem familiar. In fact, the in vitro cultured suspension cells resembled the fruit chemotype. The
highest silydianin amount again could be detected in the Marburg variety [type I]. The same
applies for the Klenk cells [type II], which on the one hand had the lowest amount of silydianin,
but then again revealed high quantities of the positional isomers silychristin and especially
silybin. Cells from the Frankfurt chemotype [type III] took a similar position in its distribution of
flavonolignans as discovered in fruits of the same type. Its silydianin and silybin amounts ranged
between the two other varieties, only silychristin amounts were higher than expected. With
respect to the isosilybin proportions no major differences could be detected between the three cell
lines (Fig. 27).
These results support the hypothesis, that there could be some kind of active or passive
mechanism (e.g. the involvement of specialised proteins) that discriminates between the
formation of the single regioisomers and underline the existence of high genotypic variations
(Martin et al., 2006; Poppe and Petersen, 2016).
Fig. 26: Phenotype of suspension cells after 7 days of growing in B5 medium, incubated in the dark
at 26 °C and shaken at 120 rpm. The abbreviations represent the respective origin of the achenes:
Botanical Garden Marburg (BGMr), Botanical Garden Frankfurt (BGF) and Poland (Klenk).
BGMr (Marburg) BGF (Frankfurt) Klenk (Poland)
123
The analysis of the cell culture media revealed clear distinctions in the isomeric flavonolignan
ratios. Especially the very low amount of silydianin and silychristin are striking. Both compounds
made up for the dominant silymarin components in cell extracts. The remarkable divergence
between the diastereomers of silybin and isosilybin even within a cell line is particularly
interesting as well. These were always very uniformly spread in the fruits, suspension cells or
even enzyme assays. Although the cells of the Marburg variety [type I] revealed the lowest
amount of silybin in the cells, more was released to the medium compared to the other two types.
The isosilybin B value of the Klenk line [type II] seems peculiarly high. In summary, it can be
said that the respective medium does not resemble the fruit chemotype and no real correlation is
recognisable (Fig. 28).
Certainly, a large influence on the distribution of the individual silymarin components in the
medium could be its stability as mentioned in V.2.2. Degradation due to rising pH values or
extracellular enzymes can be expected but cannot solely explain this diverse distribution. In case
of the regioisomers silychristin and silydianin these could either be retained inside the cells or
may be tightly linked to the cell well. Selective transport mechanisms for silymarin components
and/or its precursors have been proposed by Prieto and Corchete (2014) who, however, did not
analyse a possible variation in the ratio of different silymarin components.
0
1
2
3
4
Silychristin Silydianin Silybin Isosilybin
fla
vo
no
lign
an
[µ
g/1
00
mg
of ce
ll d
ry w
eig
ht]
BGMr (Marburg) Klenk (Poland) BGF (Frankfurt)
(I) (II) (III)
II III
I
III III
III
I
I I
II
II
II
Fig. 27: Distribution of flavonolignan components extracted after 5, 20
and 50 subcultures of suspension cell lines of three different
chemotypes. The data represent mean values of three extractions.
Standard deviations were omitted due to the fact that the individual
flavonolignan content decreases with the number of subcultures.
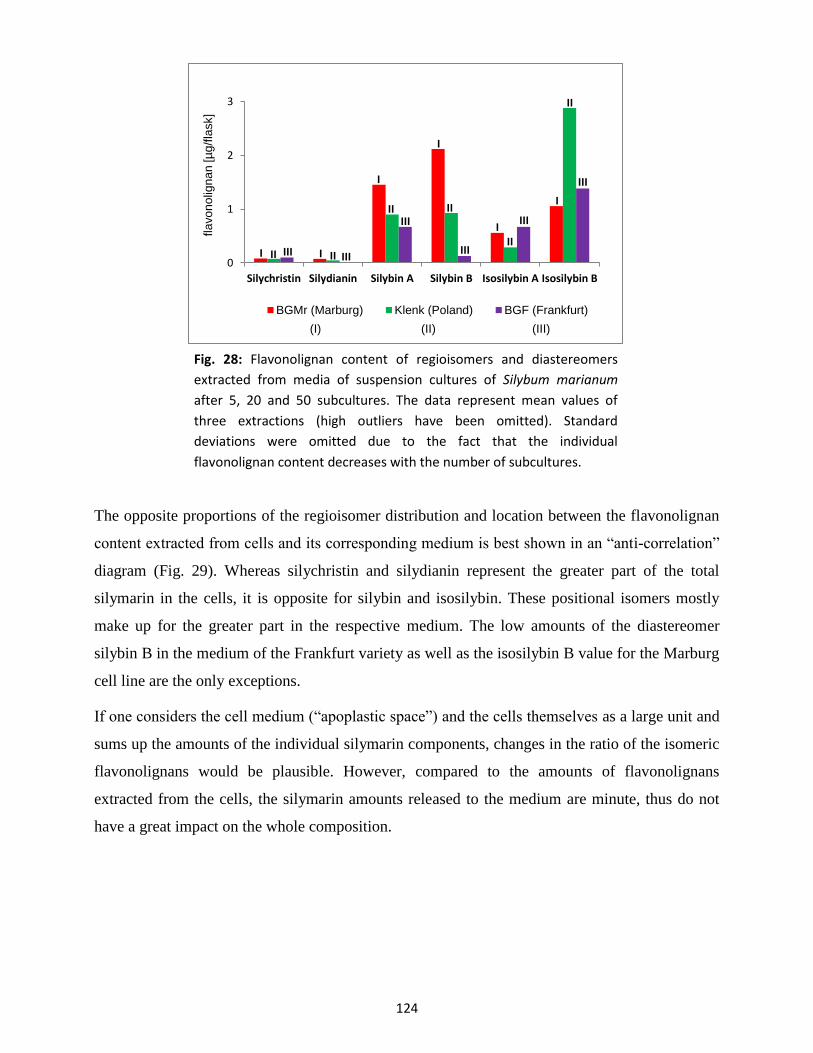
124
The opposite proportions of the regioisomer distribution and location between the flavonolignan
content extracted from cells and its corresponding medium is best shown in an “anti-correlation”
diagram (Fig. 29). Whereas silychristin and silydianin represent the greater part of the total
silymarin in the cells, it is opposite for silybin and isosilybin. These positional isomers mostly
make up for the greater part in the respective medium. The low amounts of the diastereomer
silybin B in the medium of the Frankfurt variety as well as the isosilybin B value for the Marburg
cell line are the only exceptions.
If one considers the cell medium (“apoplastic space”) and the cells themselves as a large unit and
sums up the amounts of the individual silymarin components, changes in the ratio of the isomeric
flavonolignans would be plausible. However, compared to the amounts of flavonolignans
extracted from the cells, the silymarin amounts released to the medium are minute, thus do not
have a great impact on the whole composition.
0
1
2
3
Silychristin Silydianin Silybin A Silybin B Isosilybin A Isosilybin B
fla
vo
no
lign
an
[µ
g/f
lask]
BGMr (Marburg) Klenk (Poland) BGF (Frankfurt)
(I) (II) (III)
Fig. 28: Flavonolignan content of regioisomers and diastereomers
extracted from media of suspension cultures of Silybum marianum
after 5, 20 and 50 subcultures. The data represent mean values of
three extractions (high outliers have been omitted). Standard
deviations were omitted due to the fact that the individual
flavonolignan content decreases with the number of subcultures.
I
I
I
I
I
I
II II
II II
II
II
III III III
III III
III
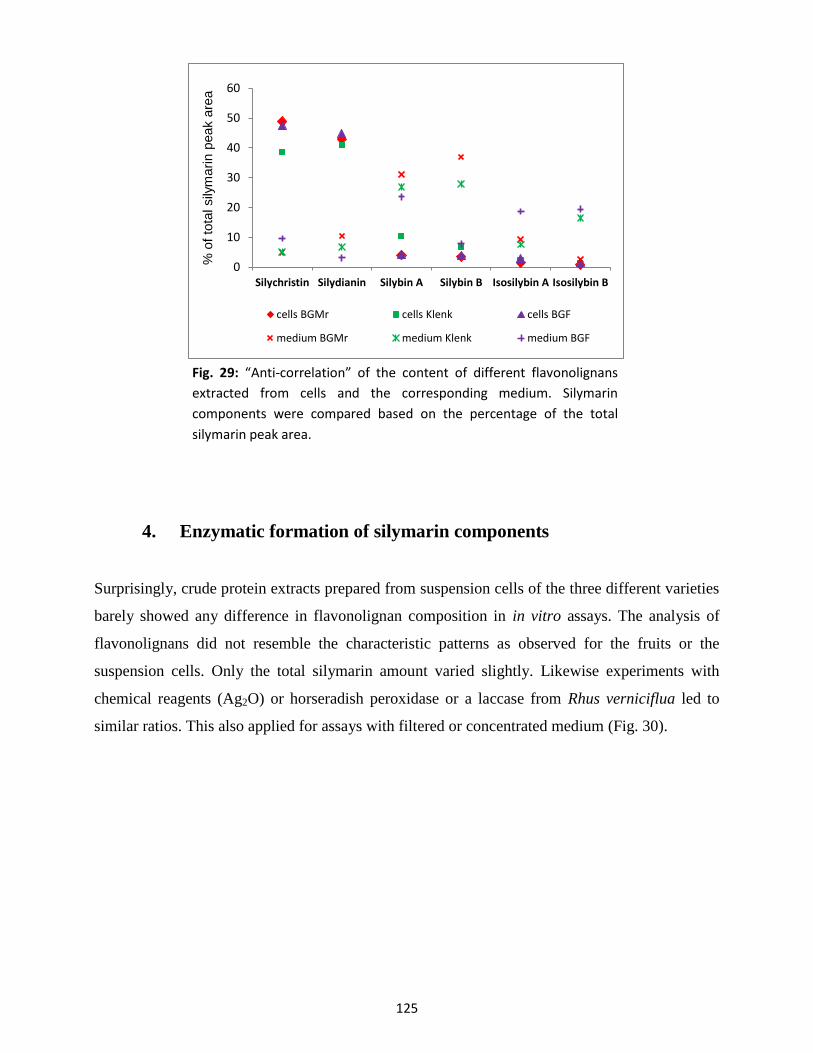
125
4. Enzymatic formation of silymarin components
Surprisingly, crude protein extracts prepared from suspension cells of the three different varieties
barely showed any difference in flavonolignan composition in in vitro assays. The analysis of
flavonolignans did not resemble the characteristic patterns as observed for the fruits or the
suspension cells. Only the total silymarin amount varied slightly. Likewise experiments with
chemical reagents (Ag2O) or horseradish peroxidase or a laccase from Rhus verniciflua led to
similar ratios. This also applied for assays with filtered or concentrated medium (Fig. 30).
0
10
20
30
40
50
60
Silychristin Silydianin Silybin A Silybin B Isosilybin A Isosilybin B
% o
f to
tal sily
marin p
eak a
rea
cells BGMr cells Klenk cells BGF
medium BGMr medium Klenk medium BGF
Fig. 29: “Anti-correlation” of the content of different flavonolignans
extracted from cells and the corresponding medium. Silymarin
components were compared based on the percentage of the total
silymarin peak area.
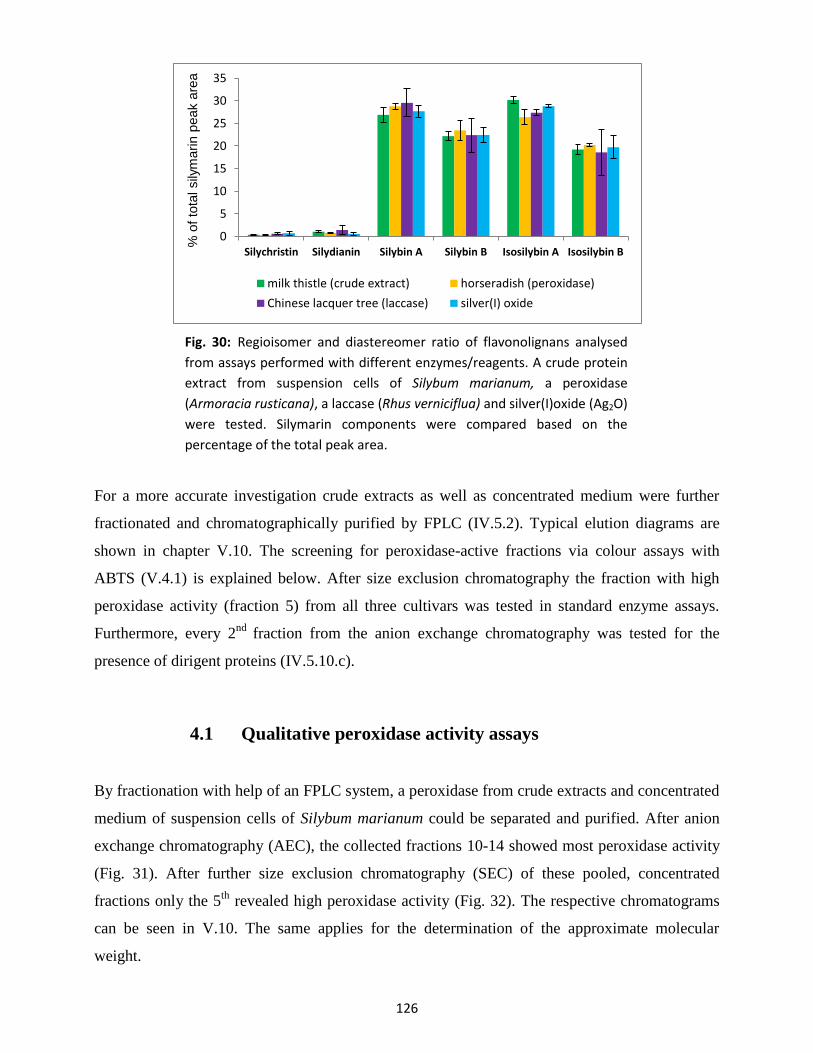
126
For a more accurate investigation crude extracts as well as concentrated medium were further
fractionated and chromatographically purified by FPLC (IV.5.2). Typical elution diagrams are
shown in chapter V.10. The screening for peroxidase-active fractions via colour assays with
ABTS (V.4.1) is explained below. After size exclusion chromatography the fraction with high
peroxidase activity (fraction 5) from all three cultivars was tested in standard enzyme assays.
Furthermore, every 2nd
fraction from the anion exchange chromatography was tested for the
presence of dirigent proteins (IV.5.10.c).
4.1 Qualitative peroxidase activity assays
By fractionation with help of an FPLC system, a peroxidase from crude extracts and concentrated
medium of suspension cells of Silybum marianum could be separated and purified. After anion
exchange chromatography (AEC), the collected fractions 10-14 showed most peroxidase activity
(Fig. 31). After further size exclusion chromatography (SEC) of these pooled, concentrated
fractions only the 5th
revealed high peroxidase activity (Fig. 32). The respective chromatograms
can be seen in V.10. The same applies for the determination of the approximate molecular
weight.
0
5
10
15
20
25
30
35
Silychristin Silydianin Silybin A Silybin B Isosilybin A Isosilybin B
% o
f to
tal sily
marin p
eak a
rea
milk thistle (crude extract) horseradish (peroxidase)
Chinese lacquer tree (laccase) silver(I) oxide
Fig. 30: Regioisomer and diastereomer ratio of flavonolignans analysed
from assays performed with different enzymes/reagents. A crude protein
extract from suspension cells of Silybum marianum, a peroxidase
(Armoracia rusticana), a laccase (Rhus verniciflua) and silver(I)oxide (Ag2O)
were tested. Silymarin components were compared based on the
percentage of the total peak area.
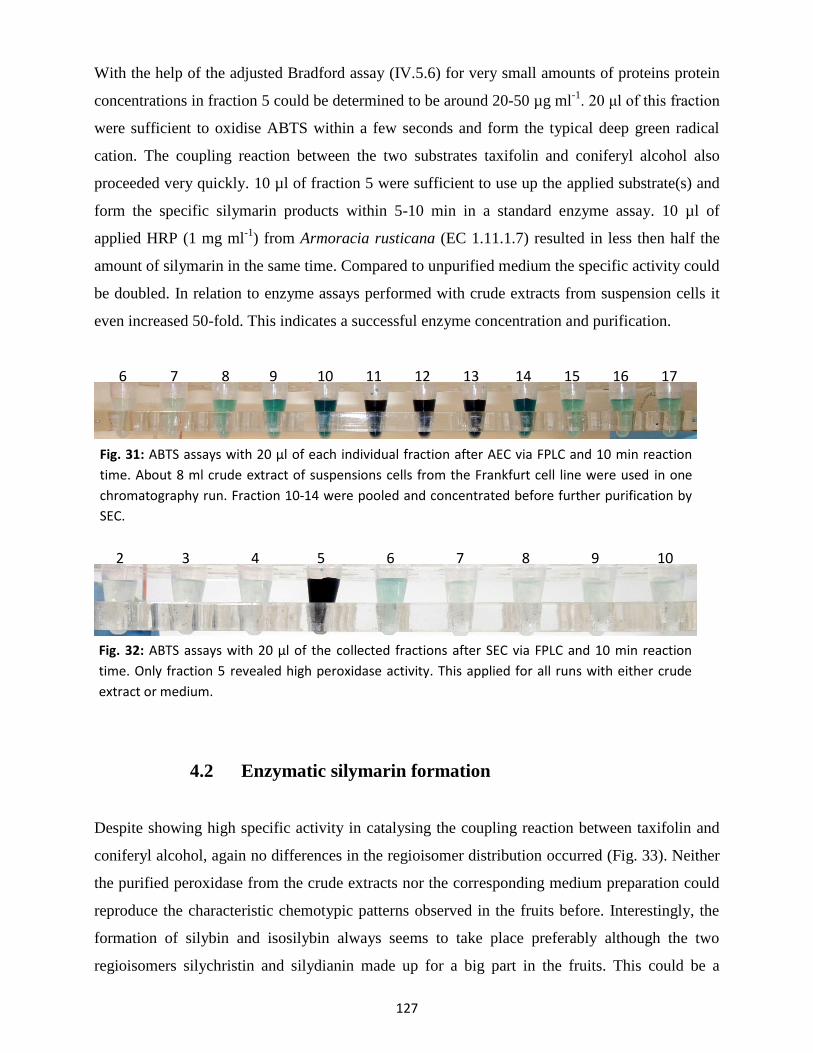
127
With the help of the adjusted Bradford assay (IV.5.6) for very small amounts of proteins protein
concentrations in fraction 5 could be determined to be around 20-50 µg ml-1
. 20 μl of this fraction
were sufficient to oxidise ABTS within a few seconds and form the typical deep green radical
cation. The coupling reaction between the two substrates taxifolin and coniferyl alcohol also
proceeded very quickly. 10 µl of fraction 5 were sufficient to use up the applied substrate(s) and
form the specific silymarin products within 5-10 min in a standard enzyme assay. 10 µl of
applied HRP (1 mg ml-1
) from Armoracia rusticana (EC 1.11.1.7) resulted in less then half the
amount of silymarin in the same time. Compared to unpurified medium the specific activity could
be doubled. In relation to enzyme assays performed with crude extracts from suspension cells it
even increased 50-fold. This indicates a successful enzyme concentration and purification.
4.2 Enzymatic silymarin formation
Despite showing high specific activity in catalysing the coupling reaction between taxifolin and
coniferyl alcohol, again no differences in the regioisomer distribution occurred (Fig. 33). Neither
the purified peroxidase from the crude extracts nor the corresponding medium preparation could
reproduce the characteristic chemotypic patterns observed in the fruits before. Interestingly, the
formation of silybin and isosilybin always seems to take place preferably although the two
regioisomers silychristin and silydianin made up for a big part in the fruits. This could be a
6 7 8 9 10 11 12 13 14 15 16 17
2 3 4 5 6 7 8 9 10
Fig. 31: ABTS assays with 20 µl of each individual fraction after AEC via FPLC and 10 min reaction
time. About 8 ml crude extract of suspensions cells from the Frankfurt cell line were used in one
chromatography run. Fraction 10-14 were pooled and concentrated before further purification by
SEC.
Fig. 32: ABTS assays with 20 µl of the collected fractions after SEC via FPLC and 10 min reaction
time. Only fraction 5 revealed high peroxidase activity. This applied for all runs with either crude
extract or medium.
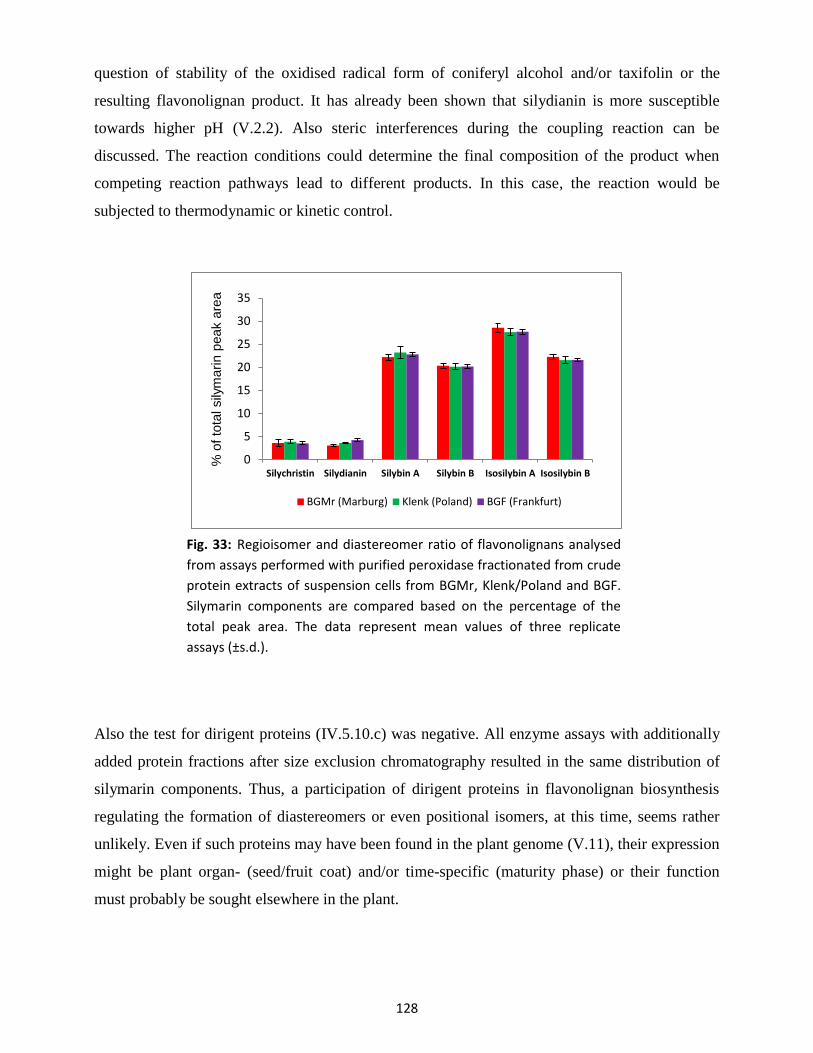
128
question of stability of the oxidised radical form of coniferyl alcohol and/or taxifolin or the
resulting flavonolignan product. It has already been shown that silydianin is more susceptible
towards higher pH (V.2.2). Also steric interferences during the coupling reaction can be
discussed. The reaction conditions could determine the final composition of the product when
competing reaction pathways lead to different products. In this case, the reaction would be
subjected to thermodynamic or kinetic control.
Also the test for dirigent proteins (IV.5.10.c) was negative. All enzyme assays with additionally
added protein fractions after size exclusion chromatography resulted in the same distribution of
silymarin components. Thus, a participation of dirigent proteins in flavonolignan biosynthesis
regulating the formation of diastereomers or even positional isomers, at this time, seems rather
unlikely. Even if such proteins may have been found in the plant genome (V.11), their expression
might be plant organ- (seed/fruit coat) and/or time-specific (maturity phase) or their function
must probably be sought elsewhere in the plant.
0
5
10
15
20
25
30
35
Silychristin Silydianin Silybin A Silybin B Isosilybin A Isosilybin B
% o
f to
tal sily
marin p
eak a
rea
BGMr (Marburg) Klenk (Poland) BGF (Frankfurt)
Fig. 33: Regioisomer and diastereomer ratio of flavonolignans analysed
from assays performed with purified peroxidase fractionated from crude
protein extracts of suspension cells from BGMr, Klenk/Poland and BGF.
Silymarin components are compared based on the percentage of the
total peak area. The data represent mean values of three replicate
assays (±s.d.).
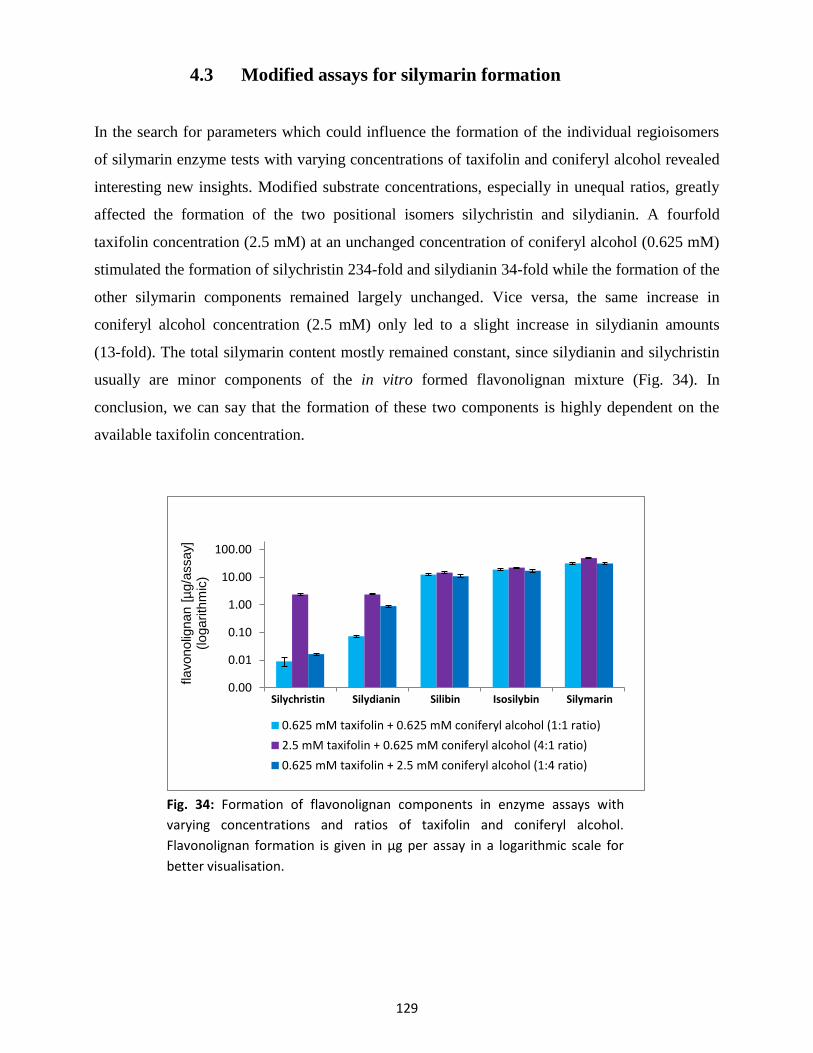
129
4.3 Modified assays for silymarin formation
In the search for parameters which could influence the formation of the individual regioisomers
of silymarin enzyme tests with varying concentrations of taxifolin and coniferyl alcohol revealed
interesting new insights. Modified substrate concentrations, especially in unequal ratios, greatly
affected the formation of the two positional isomers silychristin and silydianin. A fourfold
taxifolin concentration (2.5 mM) at an unchanged concentration of coniferyl alcohol (0.625 mM)
stimulated the formation of silychristin 234-fold and silydianin 34-fold while the formation of the
other silymarin components remained largely unchanged. Vice versa, the same increase in
coniferyl alcohol concentration (2.5 mM) only led to a slight increase in silydianin amounts
(13-fold). The total silymarin content mostly remained constant, since silydianin and silychristin
usually are minor components of the in vitro formed flavonolignan mixture (Fig. 34). In
conclusion, we can say that the formation of these two components is highly dependent on the
available taxifolin concentration.
0.00
0.01
0.10
1.00
10.00
100.00
flavonolig
nan [
µg/a
ssay]
(logarith
mic
)
Silychristin Silydianin Silibin Isosilybin Silymarin
0.625 mM taxifolin + 0.625 mM coniferyl alcohol (1:1 ratio)
2.5 mM taxifolin + 0.625 mM coniferyl alcohol (4:1 ratio)
0.625 mM taxifolin + 2.5 mM coniferyl alcohol (1:4 ratio)
Fig. 34: Formation of flavonolignan components in enzyme assays with
varying concentrations and ratios of taxifolin and coniferyl alcohol.
Flavonolignan formation is given in µg per assay in a logarithmic scale for
better visualisation.
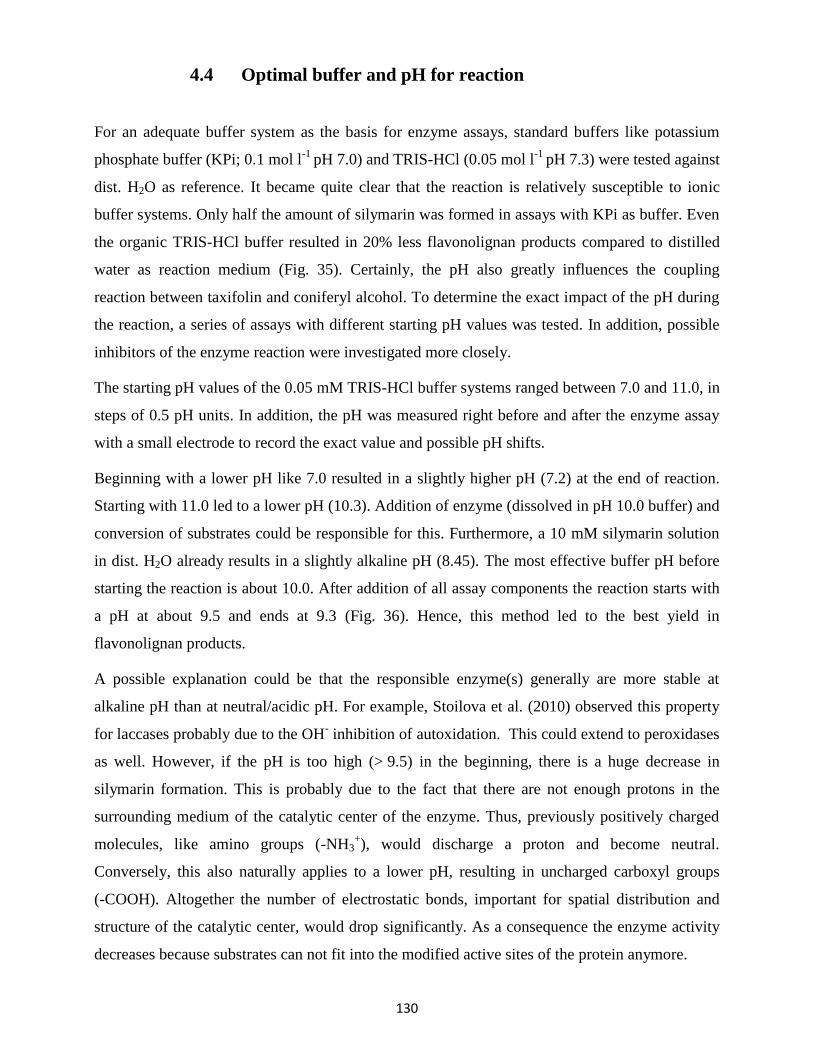
130
4.4 Optimal buffer and pH for reaction
For an adequate buffer system as the basis for enzyme assays, standard buffers like potassium
phosphate buffer (KPi; 0.1 mol l-1
pH 7.0) and TRIS-HCl (0.05 mol l-1
pH 7.3) were tested against
dist. H2O as reference. It became quite clear that the reaction is relatively susceptible to ionic
buffer systems. Only half the amount of silymarin was formed in assays with KPi as buffer. Even
the organic TRIS-HCl buffer resulted in 20% less flavonolignan products compared to distilled
water as reaction medium (Fig. 35). Certainly, the pH also greatly influences the coupling
reaction between taxifolin and coniferyl alcohol. To determine the exact impact of the pH during
the reaction, a series of assays with different starting pH values was tested. In addition, possible
inhibitors of the enzyme reaction were investigated more closely.
The starting pH values of the 0.05 mM TRIS-HCl buffer systems ranged between 7.0 and 11.0, in
steps of 0.5 pH units. In addition, the pH was measured right before and after the enzyme assay
with a small electrode to record the exact value and possible pH shifts.
Beginning with a lower pH like 7.0 resulted in a slightly higher pH (7.2) at the end of reaction.
Starting with 11.0 led to a lower pH (10.3). Addition of enzyme (dissolved in pH 10.0 buffer) and
conversion of substrates could be responsible for this. Furthermore, a 10 mM silymarin solution
in dist. H2O already results in a slightly alkaline pH (8.45). The most effective buffer pH before
starting the reaction is about 10.0. After addition of all assay components the reaction starts with
a pH at about 9.5 and ends at 9.3 (Fig. 36). Hence, this method led to the best yield in
flavonolignan products.
A possible explanation could be that the responsible enzyme(s) generally are more stable at
alkaline pH than at neutral/acidic pH. For example, Stoilova et al. (2010) observed this property
for laccases probably due to the OH- inhibition of autoxidation. This could extend to peroxidases
as well. However, if the pH is too high (> 9.5) in the beginning, there is a huge decrease in
silymarin formation. This is probably due to the fact that there are not enough protons in the
surrounding medium of the catalytic center of the enzyme. Thus, previously positively charged
molecules, like amino groups (-NH3+), would discharge a proton and become neutral.
Conversely, this also naturally applies to a lower pH, resulting in uncharged carboxyl groups
(-COOH). Altogether the number of electrostatic bonds, important for spatial distribution and
structure of the catalytic center, would drop significantly. As a consequence the enzyme activity
decreases because substrates can not fit into the modified active sites of the protein anymore.
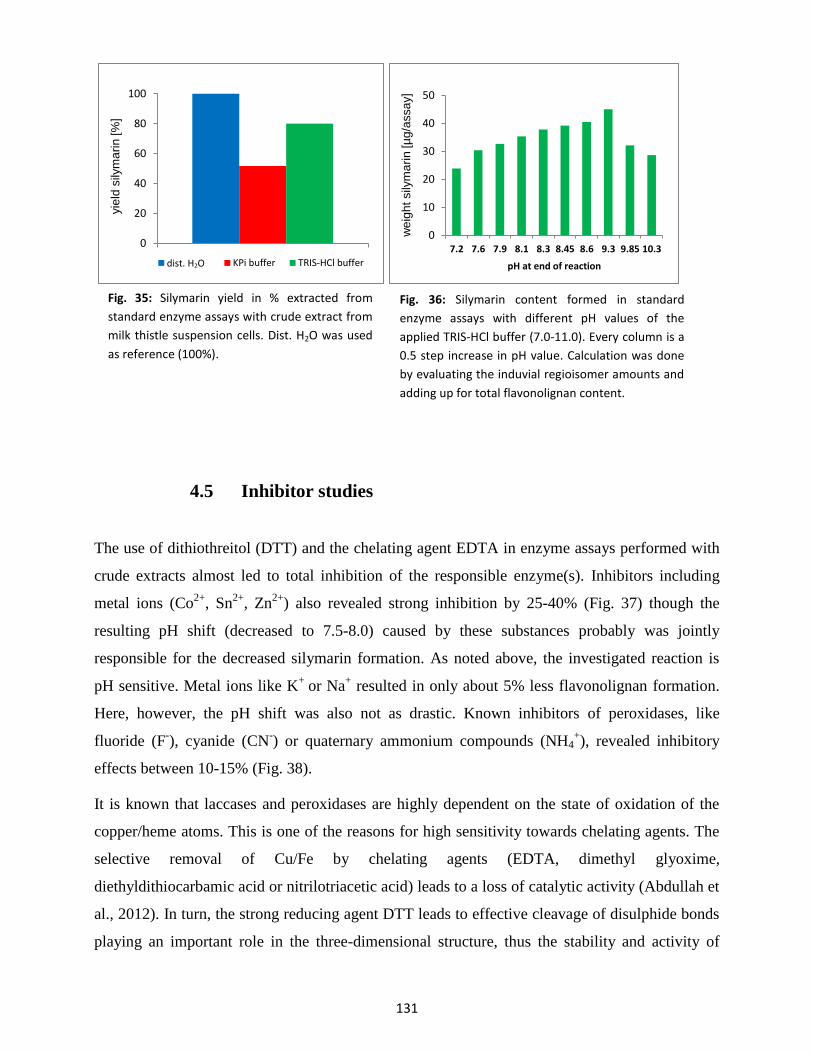
131
4.5 Inhibitor studies
The use of dithiothreitol (DTT) and the chelating agent EDTA in enzyme assays performed with
crude extracts almost led to total inhibition of the responsible enzyme(s). Inhibitors including
metal ions (Co2+
, Sn2+
, Zn2+
) also revealed strong inhibition by 25-40% (Fig. 37) though the
resulting pH shift (decreased to 7.5-8.0) caused by these substances probably was jointly
responsible for the decreased silymarin formation. As noted above, the investigated reaction is
pH sensitive. Metal ions like K+
or Na+ resulted in only about 5% less flavonolignan formation.
Here, however, the pH shift was also not as drastic. Known inhibitors of peroxidases, like
fluoride (F-), cyanide (CN
-) or quaternary ammonium compounds (NH4
+), revealed inhibitory
effects between 10-15% (Fig. 38).
It is known that laccases and peroxidases are highly dependent on the state of oxidation of the
copper/heme atoms. This is one of the reasons for high sensitivity towards chelating agents. The
selective removal of Cu/Fe by chelating agents (EDTA, dimethyl glyoxime,
diethyldithiocarbamic acid or nitrilotriacetic acid) leads to a loss of catalytic activity (Abdullah et
al., 2012). In turn, the strong reducing agent DTT leads to effective cleavage of disulphide bonds
playing an important role in the three-dimensional structure, thus the stability and activity of
0
20
40
60
80
100
yie
ld s
ilym
ari
n [%
]
KPi buffer TRIS-HCl buffer
0
10
20
30
40
50
7.2 7.6 7.9 8.1 8.3 8.45 8.6 9.3 9.85 10.3
we
igh
t sily
ma
rin
[µ
g/a
ssa
y]
pH at end of reaction
Fig. 35: Silymarin yield in % extracted from
standard enzyme assays with crude extract from
milk thistle suspension cells. Dist. H2O was used
as reference (100%).
dist. H2O
Fig. 36: Silymarin content formed in standard
enzyme assays with different pH values of the
applied TRIS-HCl buffer (7.0-11.0). Every column is a
0.5 step increase in pH value. Calculation was done
by evaluating the induvial regioisomer amounts and
adding up for total flavonolignan content.
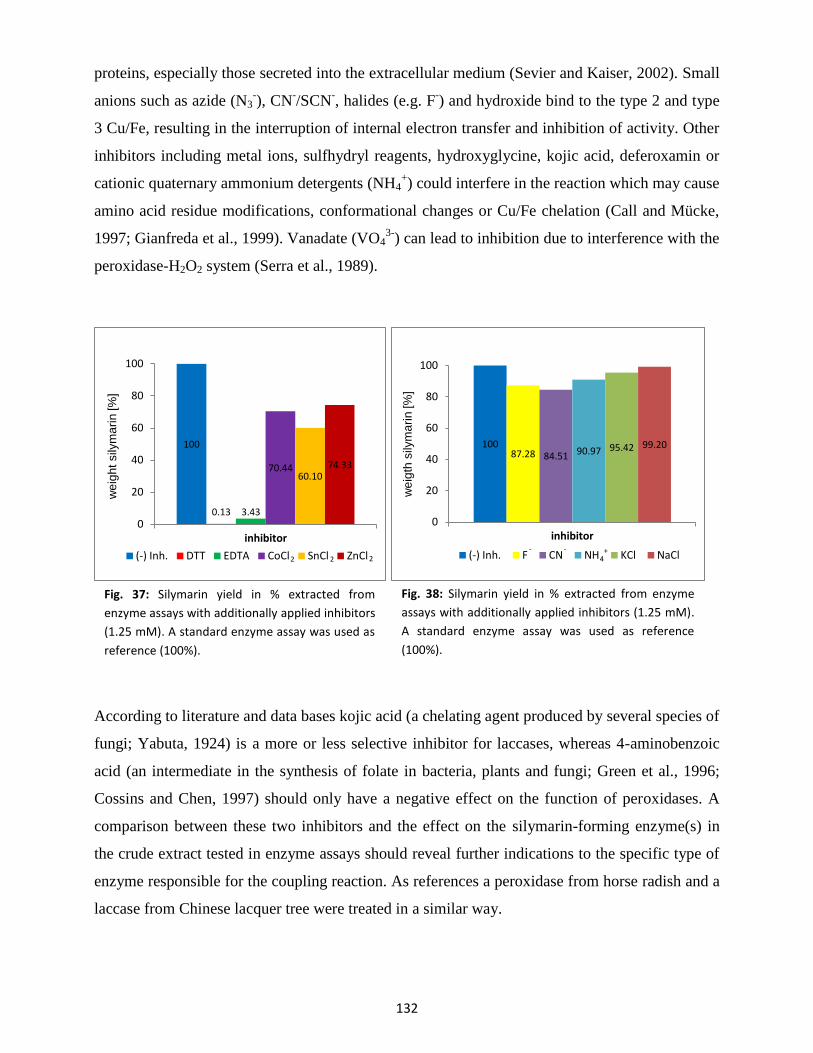
132
proteins, especially those secreted into the extracellular medium (Sevier and Kaiser, 2002). Small
anions such as azide (N3-), CN
-/SCN
-, halides (e.g. F
-) and hydroxide bind to the type 2 and type
3 Cu/Fe, resulting in the interruption of internal electron transfer and inhibition of activity. Other
inhibitors including metal ions, sulfhydryl reagents, hydroxyglycine, kojic acid, deferoxamin or
cationic quaternary ammonium detergents (NH4+) could interfere in the reaction which may cause
amino acid residue modifications, conformational changes or Cu/Fe chelation (Call and Mücke,
1997; Gianfreda et al., 1999). Vanadate (VO43-
) can lead to inhibition due to interference with the
peroxidase-H2O2 system (Serra et al., 1989).
According to literature and data bases kojic acid (a chelating agent produced by several species of
fungi; Yabuta, 1924) is a more or less selective inhibitor for laccases, whereas 4-aminobenzoic
acid (an intermediate in the synthesis of folate in bacteria, plants and fungi; Green et al., 1996;
Cossins and Chen, 1997) should only have a negative effect on the function of peroxidases. A
comparison between these two inhibitors and the effect on the silymarin-forming enzyme(s) in
the crude extract tested in enzyme assays should reveal further indications to the specific type of
enzyme responsible for the coupling reaction. As references a peroxidase from horse radish and a
laccase from Chinese lacquer tree were treated in a similar way.
100
0.13 3.43
70.44 60.10
74.33
0
20
40
60
80
100
we
igh
t sily
ma
rin
[%
]
inhibitor
(-) Inh. DTT EDTA CoCl SnCl ZnCl
100 87.28 84.51 90.97 95.42 99.20
0
20
40
60
80
100
we
igth
sily
ma
rin
[%
]
inhibitor
(-) Inh. F CN NH KCl NaCl
Fig. 38: Silymarin yield in % extracted from enzyme
assays with additionally applied inhibitors (1.25 mM).
A standard enzyme assay was used as reference
(100%).
Fig. 37: Silymarin yield in % extracted from
enzyme assays with additionally applied inhibitors
(1.25 mM). A standard enzyme assay was used as
reference (100%).
2 2 2 - -
4+
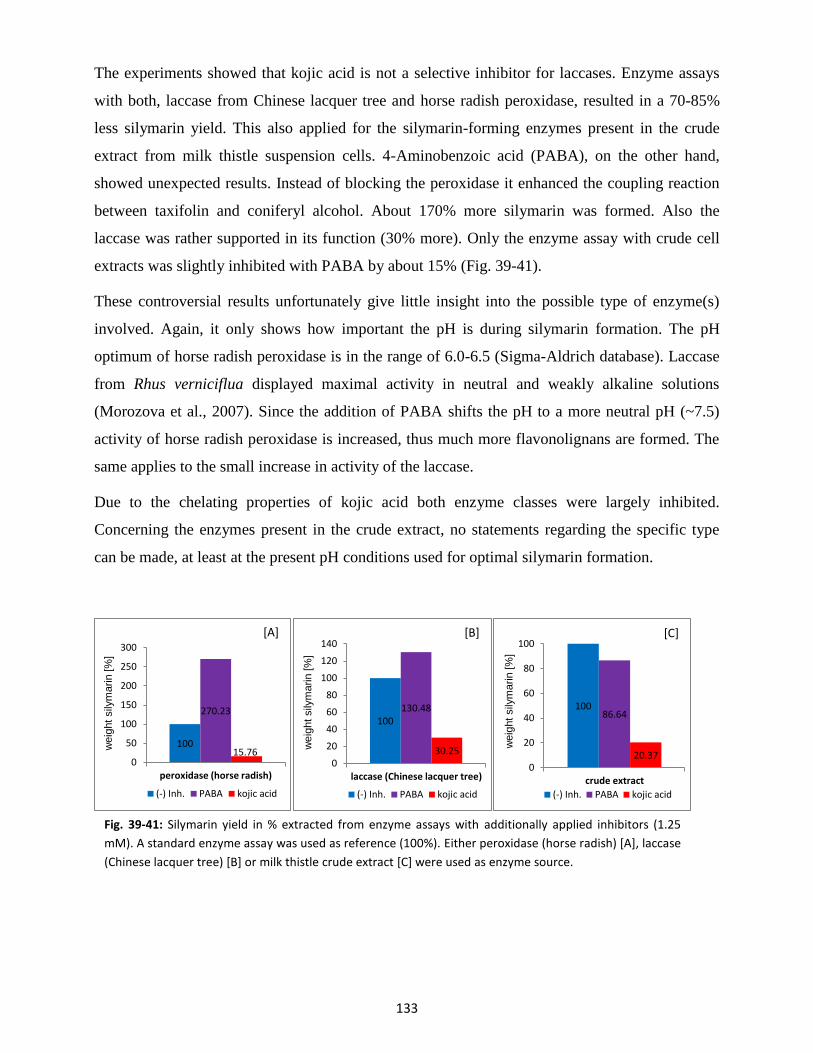
133
The experiments showed that kojic acid is not a selective inhibitor for laccases. Enzyme assays
with both, laccase from Chinese lacquer tree and horse radish peroxidase, resulted in a 70-85%
less silymarin yield. This also applied for the silymarin-forming enzymes present in the crude
extract from milk thistle suspension cells. 4-Aminobenzoic acid (PABA), on the other hand,
showed unexpected results. Instead of blocking the peroxidase it enhanced the coupling reaction
between taxifolin and coniferyl alcohol. About 170% more silymarin was formed. Also the
laccase was rather supported in its function (30% more). Only the enzyme assay with crude cell
extracts was slightly inhibited with PABA by about 15% (Fig. 39-41).
These controversial results unfortunately give little insight into the possible type of enzyme(s)
involved. Again, it only shows how important the pH is during silymarin formation. The pH
optimum of horse radish peroxidase is in the range of 6.0-6.5 (Sigma-Aldrich database). Laccase
from Rhus verniciflua displayed maximal activity in neutral and weakly alkaline solutions
(Morozova et al., 2007). Since the addition of PABA shifts the pH to a more neutral pH (~7.5)
activity of horse radish peroxidase is increased, thus much more flavonolignans are formed. The
same applies to the small increase in activity of the laccase.
Due to the chelating properties of kojic acid both enzyme classes were largely inhibited.
Concerning the enzymes present in the crude extract, no statements regarding the specific type
can be made, at least at the present pH conditions used for optimal silymarin formation.
100
270.23
15.76 0
50
100
150
200
250
300
weig
ht
sily
marin
[%
]
peroxidase (horse radish)
(-) Inh. PABA kojic acid
100 130.48
30.25 0
20
40
60
80
100
120
140
weig
ht
sily
marin
[%
]
laccase (Chinese lacquer tree)
(-) Inh. PABA kojic acid
100 86.64
20.37 0
20
40
60
80
100
weig
ht
sily
marin
[%
]
crude extract
(-) Inh. PABA kojic acid
Fig. 39-41: Silymarin yield in % extracted from enzyme assays with additionally applied inhibitors (1.25
mM). A standard enzyme assay was used as reference (100%). Either peroxidase (horse radish) [A], laccase
(Chinese lacquer tree) [B] or milk thistle crude extract [C] were used as enzyme source.
[A] [B] [C]
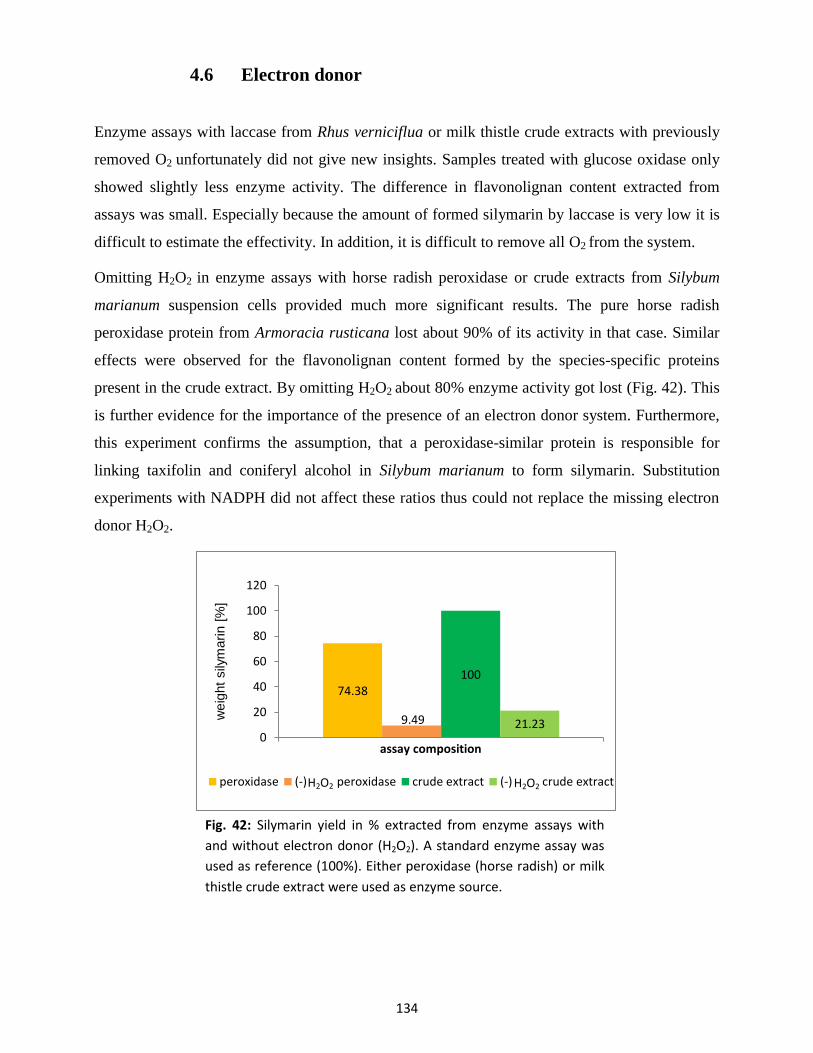
134
4.6 Electron donor
Enzyme assays with laccase from Rhus verniciflua or milk thistle crude extracts with previously
removed O2 unfortunately did not give new insights. Samples treated with glucose oxidase only
showed slightly less enzyme activity. The difference in flavonolignan content extracted from
assays was small. Especially because the amount of formed silymarin by laccase is very low it is
difficult to estimate the effectivity. In addition, it is difficult to remove all O2 from the system.
Omitting H2O2 in enzyme assays with horse radish peroxidase or crude extracts from Silybum
marianum suspension cells provided much more significant results. The pure horse radish
peroxidase protein from Armoracia rusticana lost about 90% of its activity in that case. Similar
effects were observed for the flavonolignan content formed by the species-specific proteins
present in the crude extract. By omitting H2O2 about 80% enzyme activity got lost (Fig. 42). This
is further evidence for the importance of the presence of an electron donor system. Furthermore,
this experiment confirms the assumption, that a peroxidase-similar protein is responsible for
linking taxifolin and coniferyl alcohol in Silybum marianum to form silymarin. Substitution
experiments with NADPH did not affect these ratios thus could not replace the missing electron
donor H2O2.
74.38
9.49
100
21.23 0
20
40
60
80
100
120
weig
ht
sily
marin [
%]
assay composition
peroxidase (-) peroxidase crude extract (-) crude extractH2O2 H2O2
Fig. 42: Silymarin yield in % extracted from enzyme assays with
and without electron donor (H2O2). A standard enzyme assay was
used as reference (100%). Either peroxidase (horse radish) or milk
thistle crude extract were used as enzyme source.
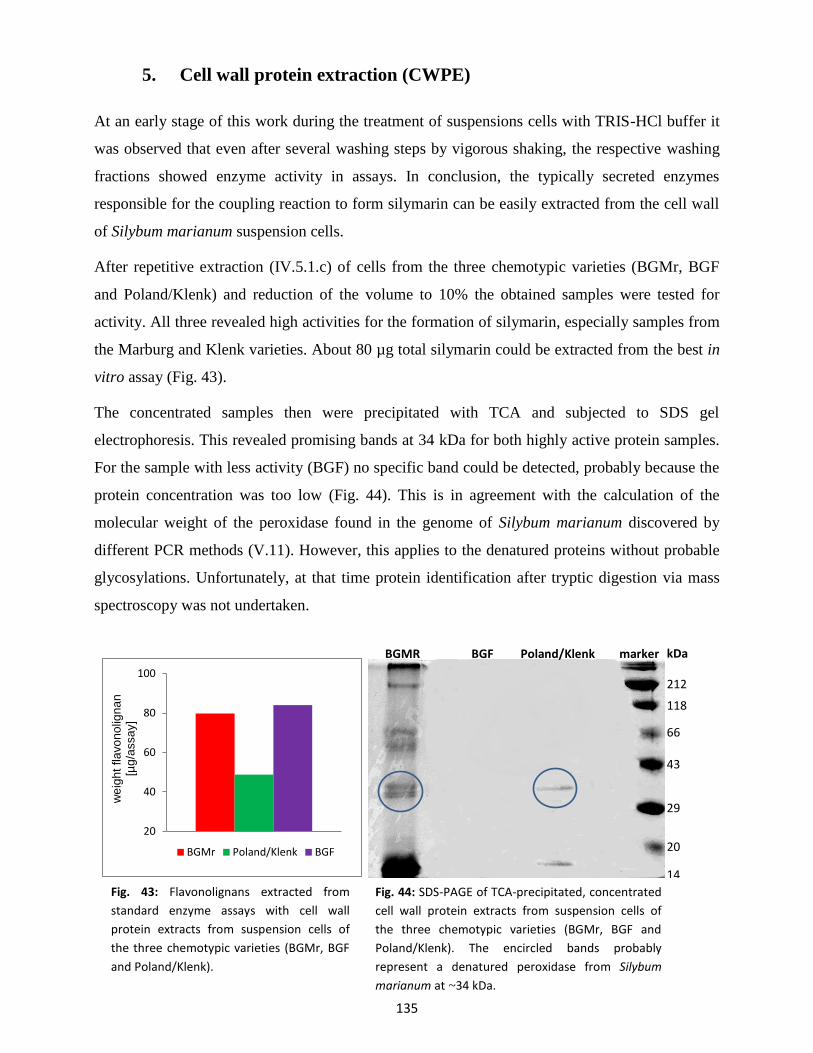
135
5. Cell wall protein extraction (CWPE)
At an early stage of this work during the treatment of suspensions cells with TRIS-HCl buffer it
was observed that even after several washing steps by vigorous shaking, the respective washing
fractions showed enzyme activity in assays. In conclusion, the typically secreted enzymes
responsible for the coupling reaction to form silymarin can be easily extracted from the cell wall
of Silybum marianum suspension cells.
After repetitive extraction (IV.5.1.c) of cells from the three chemotypic varieties (BGMr, BGF
and Poland/Klenk) and reduction of the volume to 10% the obtained samples were tested for
activity. All three revealed high activities for the formation of silymarin, especially samples from
the Marburg and Klenk varieties. About 80 µg total silymarin could be extracted from the best in
vitro assay (Fig. 43).
The concentrated samples then were precipitated with TCA and subjected to SDS gel
electrophoresis. This revealed promising bands at 34 kDa for both highly active protein samples.
For the sample with less activity (BGF) no specific band could be detected, probably because the
protein concentration was too low (Fig. 44). This is in agreement with the calculation of the
molecular weight of the peroxidase found in the genome of Silybum marianum discovered by
different PCR methods (V.11). However, this applies to the denatured proteins without probable
glycosylations. Unfortunately, at that time protein identification after tryptic digestion via mass
spectroscopy was not undertaken.
20
40
60
80
100
we
igh
t fla
vo
no
lign
an
[µ
g/a
ssa
y]
BGMr Poland/Klenk BGF
BGMR BGF Poland/Klenk marker kDa
212
118
66
43
29
20
14
Fig. 43: Flavonolignans extracted from
standard enzyme assays with cell wall
protein extracts from suspension cells of
the three chemotypic varieties (BGMr, BGF
and Poland/Klenk).
Fig. 44: SDS-PAGE of TCA-precipitated, concentrated
cell wall protein extracts from suspension cells of
the three chemotypic varieties (BGMr, BGF and
Poland/Klenk). The encircled bands probably
represent a denatured peroxidase from Silybum
marianum at ~34 kDa.
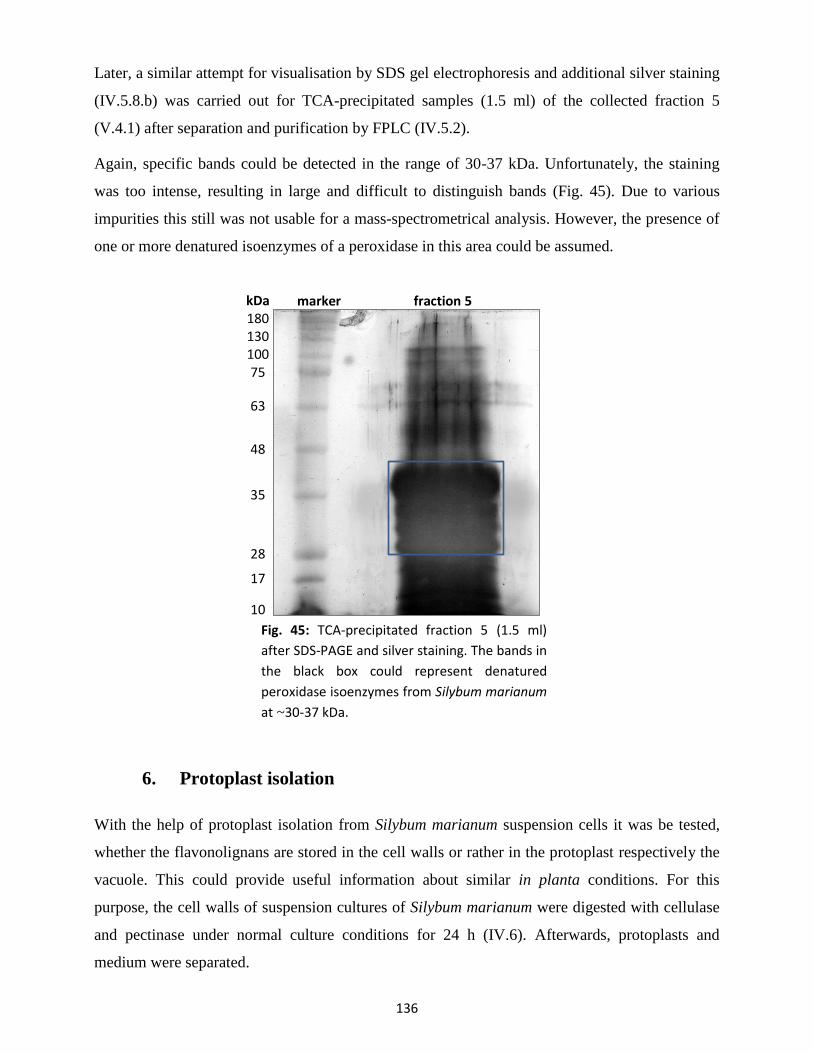
136
Later, a similar attempt for visualisation by SDS gel electrophoresis and additional silver staining
(IV.5.8.b) was carried out for TCA-precipitated samples (1.5 ml) of the collected fraction 5
(V.4.1) after separation and purification by FPLC (IV.5.2).
Again, specific bands could be detected in the range of 30-37 kDa. Unfortunately, the staining
was too intense, resulting in large and difficult to distinguish bands (Fig. 45). Due to various
impurities this still was not usable for a mass-spectrometrical analysis. However, the presence of
one or more denatured isoenzymes of a peroxidase in this area could be assumed.
6. Protoplast isolation
With the help of protoplast isolation from Silybum marianum suspension cells it was be tested,
whether the flavonolignans are stored in the cell walls or rather in the protoplast respectively the
vacuole. This could provide useful information about similar in planta conditions. For this
purpose, the cell walls of suspension cultures of Silybum marianum were digested with cellulase
and pectinase under normal culture conditions for 24 h (IV.6). Afterwards, protoplasts and
medium were separated.
Fig. 45: TCA-precipitated fraction 5 (1.5 ml)
after SDS-PAGE and silver staining. The bands in
the black box could represent denatured
peroxidase isoenzymes from Silybum marianum
at ~30-37 kDa.
marker fraction 5 kDa 180 130 100 75
63
48
35
28
17
10
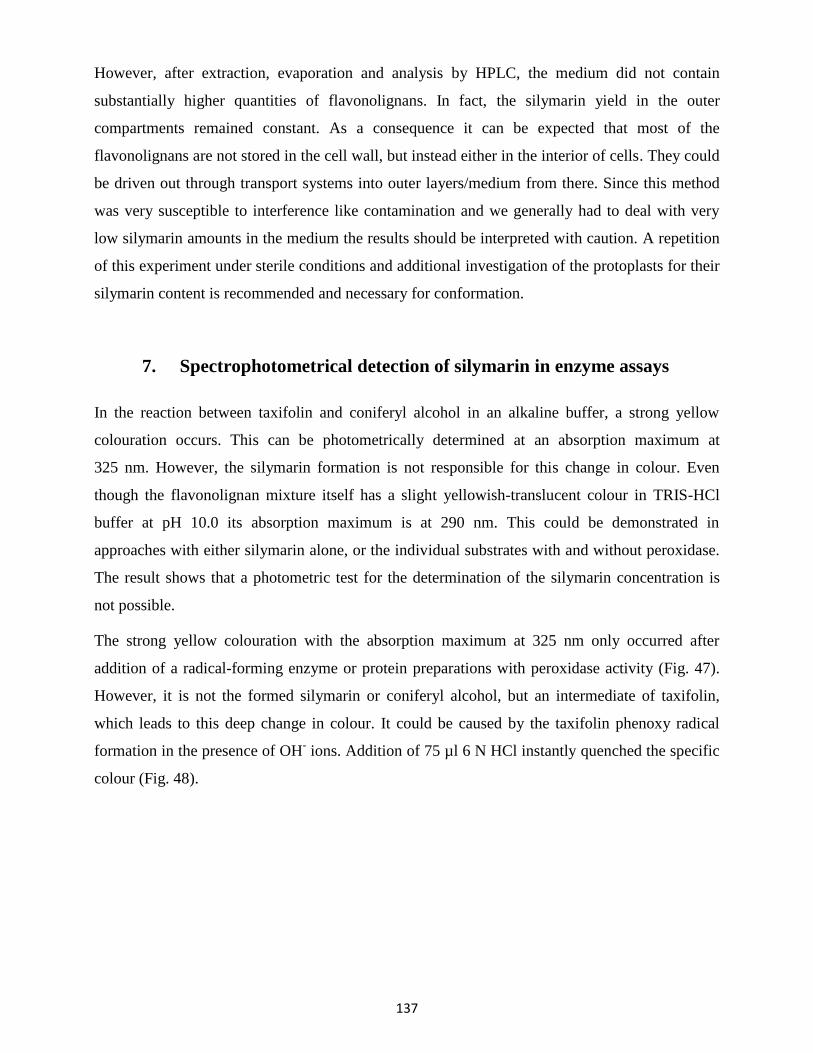
137
However, after extraction, evaporation and analysis by HPLC, the medium did not contain
substantially higher quantities of flavonolignans. In fact, the silymarin yield in the outer
compartments remained constant. As a consequence it can be expected that most of the
flavonolignans are not stored in the cell wall, but instead either in the interior of cells. They could
be driven out through transport systems into outer layers/medium from there. Since this method
was very susceptible to interference like contamination and we generally had to deal with very
low silymarin amounts in the medium the results should be interpreted with caution. A repetition
of this experiment under sterile conditions and additional investigation of the protoplasts for their
silymarin content is recommended and necessary for conformation.
7. Spectrophotometrical detection of silymarin in enzyme assays
In the reaction between taxifolin and coniferyl alcohol in an alkaline buffer, a strong yellow
colouration occurs. This can be photometrically determined at an absorption maximum at
325 nm. However, the silymarin formation is not responsible for this change in colour. Even
though the flavonolignan mixture itself has a slight yellowish-translucent colour in TRIS-HCl
buffer at pH 10.0 its absorption maximum is at 290 nm. This could be demonstrated in
approaches with either silymarin alone, or the individual substrates with and without peroxidase.
The result shows that a photometric test for the determination of the silymarin concentration is
not possible.
The strong yellow colouration with the absorption maximum at 325 nm only occurred after
addition of a radical-forming enzyme or protein preparations with peroxidase activity (Fig. 47).
However, it is not the formed silymarin or coniferyl alcohol, but an intermediate of taxifolin,
which leads to this deep change in colour. It could be caused by the taxifolin phenoxy radical
formation in the presence of OH- ions. Addition of 75 µl 6 N HCl instantly quenched the specific
colour (Fig. 48).
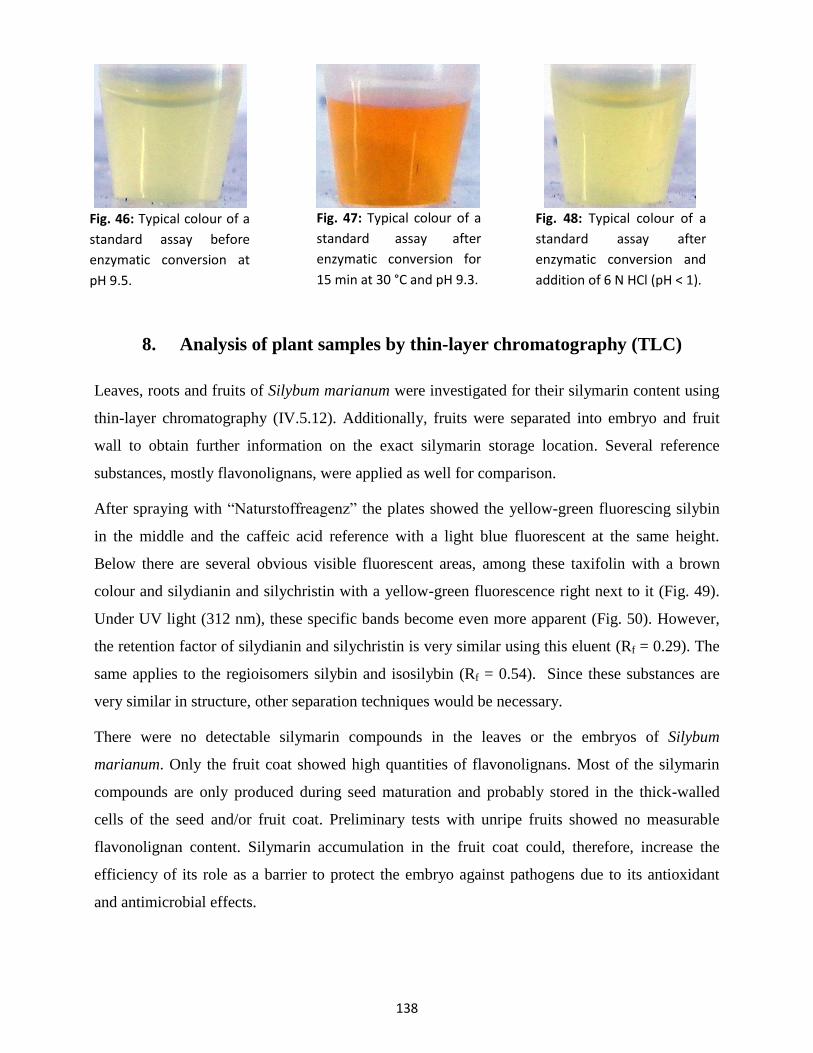
138
8. Analysis of plant samples by thin-layer chromatography (TLC)
Leaves, roots and fruits of Silybum marianum were investigated for their silymarin content using
thin-layer chromatography (IV.5.12). Additionally, fruits were separated into embryo and fruit
wall to obtain further information on the exact silymarin storage location. Several reference
substances, mostly flavonolignans, were applied as well for comparison.
After spraying with “Naturstoffreagenz” the plates showed the yellow-green fluorescing silybin
in the middle and the caffeic acid reference with a light blue fluorescent at the same height.
Below there are several obvious visible fluorescent areas, among these taxifolin with a brown
colour and silydianin and silychristin with a yellow-green fluorescence right next to it (Fig. 49).
Under UV light (312 nm), these specific bands become even more apparent (Fig. 50). However,
the retention factor of silydianin and silychristin is very similar using this eluent (Rf = 0.29). The
same applies to the regioisomers silybin and isosilybin (Rf = 0.54). Since these substances are
very similar in structure, other separation techniques would be necessary.
There were no detectable silymarin compounds in the leaves or the embryos of Silybum
marianum. Only the fruit coat showed high quantities of flavonolignans. Most of the silymarin
compounds are only produced during seed maturation and probably stored in the thick-walled
cells of the seed and/or fruit coat. Preliminary tests with unripe fruits showed no measurable
flavonolignan content. Silymarin accumulation in the fruit coat could, therefore, increase the
efficiency of its role as a barrier to protect the embryo against pathogens due to its antioxidant
and antimicrobial effects.
Fig. 46: Typical colour of a
standard assay before
enzymatic conversion at
pH 9.5.
Fig. 47: Typical colour of a
standard assay after
enzymatic conversion for
15 min at 30 °C and pH 9.3.
Fig. 48: Typical colour of a
standard assay after
enzymatic conversion and
addition of 6 N HCl (pH < 1).
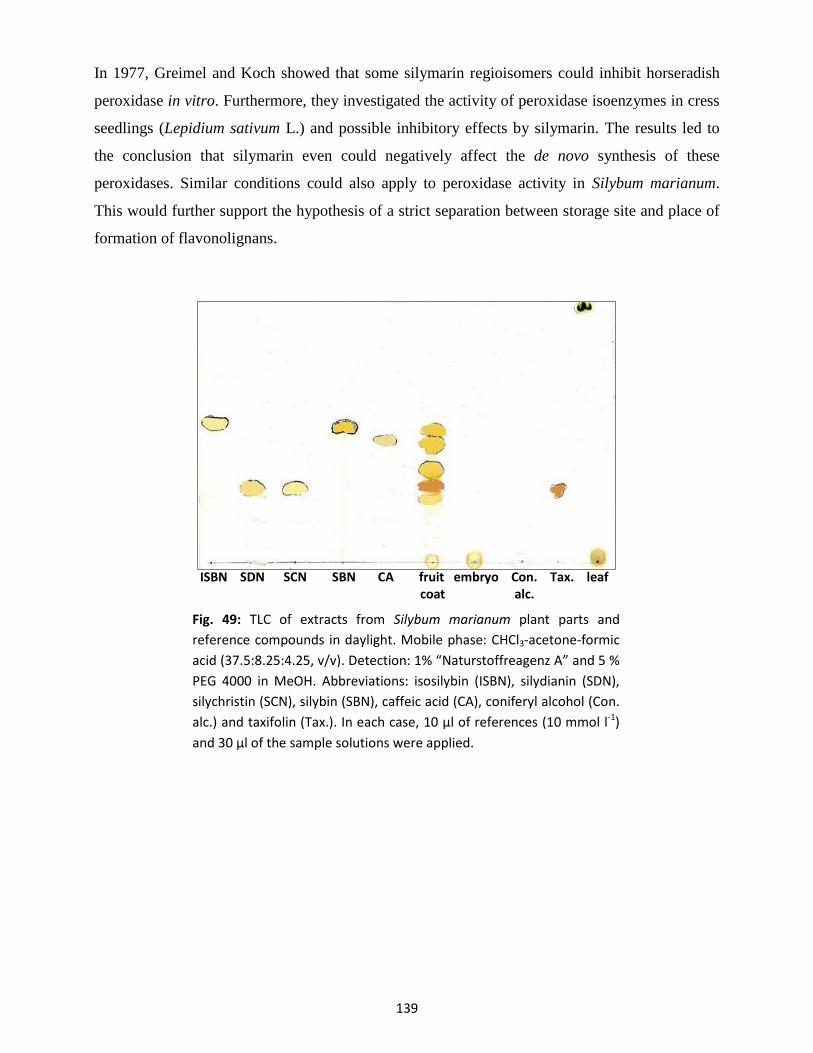
139
In 1977, Greimel and Koch showed that some silymarin regioisomers could inhibit horseradish
peroxidase in vitro. Furthermore, they investigated the activity of peroxidase isoenzymes in cress
seedlings (Lepidium sativum L.) and possible inhibitory effects by silymarin. The results led to
the conclusion that silymarin even could negatively affect the de novo synthesis of these
peroxidases. Similar conditions could also apply to peroxidase activity in Silybum marianum.
This would further support the hypothesis of a strict separation between storage site and place of
formation of flavonolignans.
Fig. 49: TLC of extracts from Silybum marianum plant parts and
reference compounds in daylight. Mobile phase: CHCl3-acetone-formic
acid (37.5:8.25:4.25, v/v). Detection: 1% “Naturstoffreagenz A” and 5 %
PEG 4000 in MeOH. Abbreviations: isosilybin (ISBN), silydianin (SDN),
silychristin (SCN), silybin (SBN), caffeic acid (CA), coniferyl alcohol (Con.
alc.) and taxifolin (Tax.). In each case, 10 µl of references (10 mmol l-1)
and 30 µl of the sample solutions were applied.
ISBN SDN SCN SBN CA fruit embryo Con. Tax. leaf coat alc.
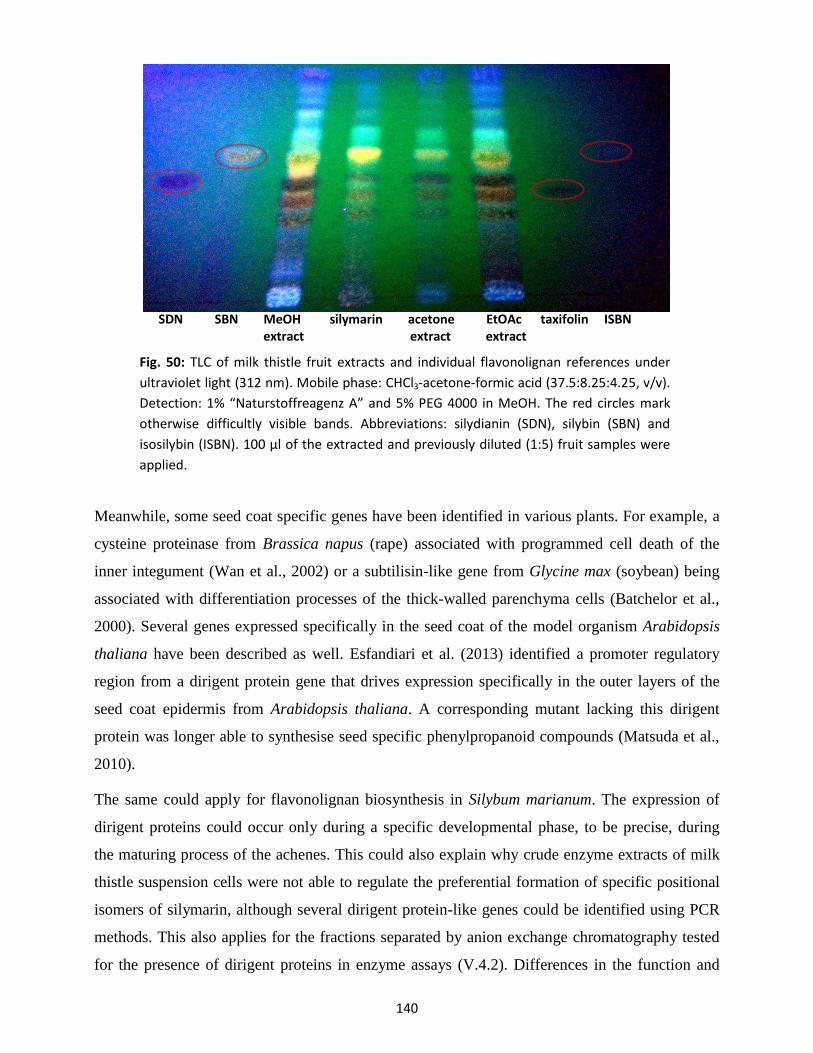
140
Meanwhile, some seed coat specific genes have been identified in various plants. For example, a
cysteine proteinase from Brassica napus (rape) associated with programmed cell death of the
inner integument (Wan et al., 2002) or a subtilisin-like gene from Glycine max (soybean) being
associated with differentiation processes of the thick-walled parenchyma cells (Batchelor et al.,
2000). Several genes expressed specifically in the seed coat of the model organism Arabidopsis
thaliana have been described as well. Esfandiari et al. (2013) identified a promoter regulatory
region from a dirigent protein gene that drives expression specifically in the outer layers of the
seed coat epidermis from Arabidopsis thaliana. A corresponding mutant lacking this dirigent
protein was longer able to synthesise seed specific phenylpropanoid compounds (Matsuda et al.,
2010).
The same could apply for flavonolignan biosynthesis in Silybum marianum. The expression of
dirigent proteins could occur only during a specific developmental phase, to be precise, during
the maturing process of the achenes. This could also explain why crude enzyme extracts of milk
thistle suspension cells were not able to regulate the preferential formation of specific positional
isomers of silymarin, although several dirigent protein-like genes could be identified using PCR
methods. This also applies for the fractions separated by anion exchange chromatography tested
for the presence of dirigent proteins in enzyme assays (V.4.2). Differences in the function and
Fig. 50: TLC of milk thistle fruit extracts and individual flavonolignan references under
ultraviolet light (312 nm). Mobile phase: CHCl3-acetone-formic acid (37.5:8.25:4.25, v/v).
Detection: 1% “Naturstoffreagenz A” and 5% PEG 4000 in MeOH. The red circles mark
otherwise difficultly visible bands. Abbreviations: silydianin (SDN), silybin (SBN) and
isosilybin (ISBN). 100 µl of the extracted and previously diluted (1:5) fruit samples were
applied.
SDN SBN MeOH silymarin acetone EtOAc taxifolin ISBN extract extract extract
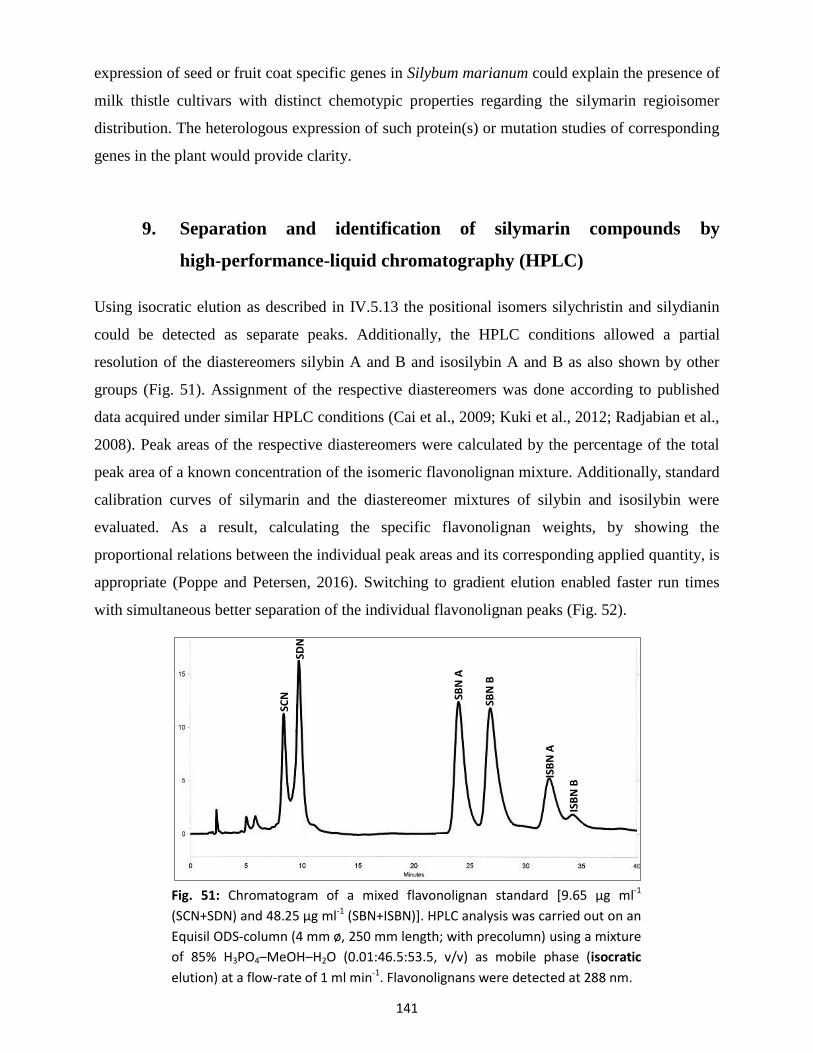
141
expression of seed or fruit coat specific genes in Silybum marianum could explain the presence of
milk thistle cultivars with distinct chemotypic properties regarding the silymarin regioisomer
distribution. The heterologous expression of such protein(s) or mutation studies of corresponding
genes in the plant would provide clarity.
9. Separation and identification of silymarin compounds by
high-performance-liquid chromatography (HPLC)
Using isocratic elution as described in IV.5.13 the positional isomers silychristin and silydianin
could be detected as separate peaks. Additionally, the HPLC conditions allowed a partial
resolution of the diastereomers silybin A and B and isosilybin A and B as also shown by other
groups (Fig. 51). Assignment of the respective diastereomers was done according to published
data acquired under similar HPLC conditions (Cai et al., 2009; Kuki et al., 2012; Radjabian et al.,
2008). Peak areas of the respective diastereomers were calculated by the percentage of the total
peak area of a known concentration of the isomeric flavonolignan mixture. Additionally, standard
calibration curves of silymarin and the diastereomer mixtures of silybin and isosilybin were
evaluated. As a result, calculating the specific flavonolignan weights, by showing the
proportional relations between the individual peak areas and its corresponding applied quantity, is
appropriate (Poppe and Petersen, 2016). Switching to gradient elution enabled faster run times
with simultaneous better separation of the individual flavonolignan peaks (Fig. 52).
Fig. 51: Chromatogram of a mixed flavonolignan standard [9.65 µg ml-1
(SCN+SDN) and 48.25 µg ml-1 (SBN+ISBN)]. HPLC analysis was carried out on an
Equisil ODS-column (4 mm ø, 250 mm length; with precolumn) using a mixture
of 85% H3PO4–MeOH–H2O (0.01:46.5:53.5, v/v) as mobile phase (isocratic
elution) at a flow-rate of 1 ml min-1. Flavonolignans were detected at 288 nm.
SCN
SDN
SBN
A
SBN
B
ISB
N A
ISB
N B
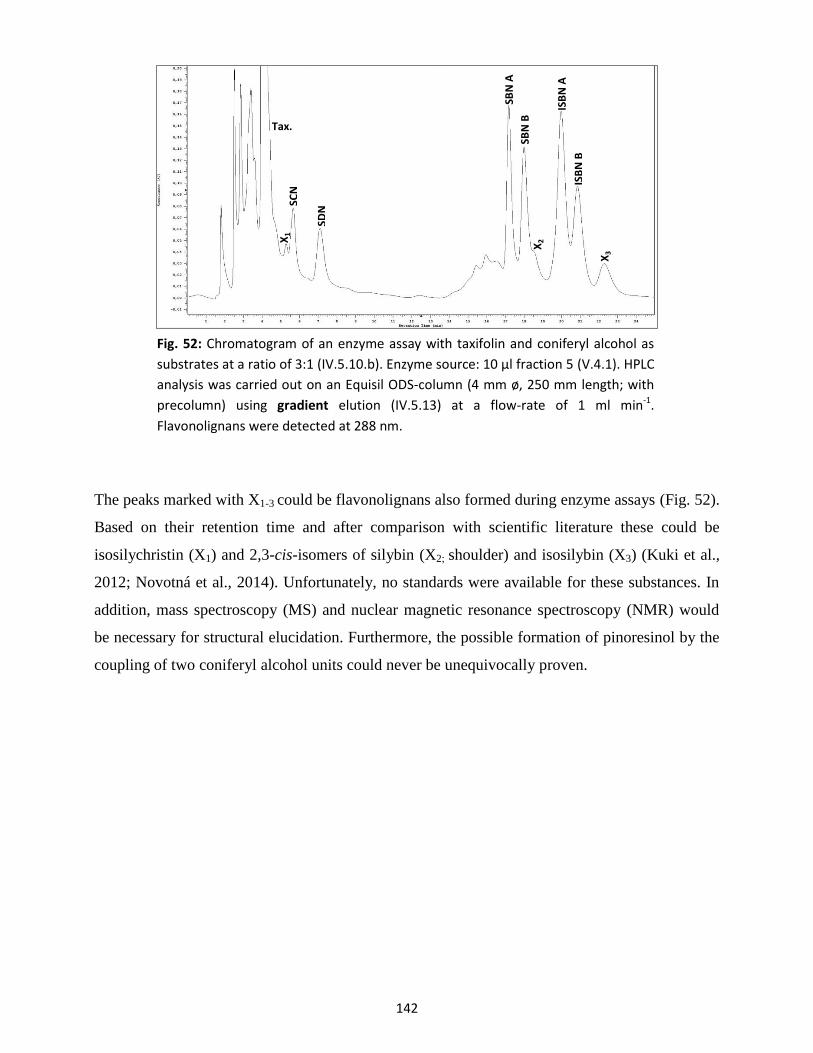
142
The peaks marked with X1-3 could be flavonolignans also formed during enzyme assays (Fig. 52).
Based on their retention time and after comparison with scientific literature these could be
isosilychristin (X1) and 2,3-cis-isomers of silybin (X2; shoulder) and isosilybin (X3) (Kuki et al.,
2012; Novotná et al., 2014). Unfortunately, no standards were available for these substances. In
addition, mass spectroscopy (MS) and nuclear magnetic resonance spectroscopy (NMR) would
be necessary for structural elucidation. Furthermore, the possible formation of pinoresinol by the
coupling of two coniferyl alcohol units could never be unequivocally proven.
Fig. 52: Chromatogram of an enzyme assay with taxifolin and coniferyl alcohol as
substrates at a ratio of 3:1 (IV.5.10.b). Enzyme source: 10 µl fraction 5 (V.4.1). HPLC
analysis was carried out on an Equisil ODS-column (4 mm ø, 250 mm length; with
precolumn) using gradient elution (IV.5.13) at a flow-rate of 1 ml min-1.
Flavonolignans were detected at 288 nm.
Tax.
SCN
SDN
SBN
A
SBN
B IS
BN
A
ISB
N B
X1
X2
X3
143
10. Purification of peroxidase by fast protein liquid chromatography
(FPLC)
Crude extracts and medium of suspension cells of Silybum marianum were fractionated and
enriched by anion exchange chromatography (AEC). Run times and conditions as well as buffers
are explained in IV.5.2.a.
The chromatogram was obtained with help of the UNICORN™
Control Software of the ÄKTA
pure system. It shows all important parameters (Fig. 53). Whereas the precolumn pressure should
always remain constant, conductivity increases with rising concentration of the elution buffer. In
case of purified medium NaCl concentrations between 0.2-0.3 mol l-1
were sufficient to elute
most protein(s) from the column resulting in a clear peak with an UV maximum at about
125 mAU (Fig. 53). These fractions (10-14) also showed the highest peroxidase activity (V.4.1;
Fig. 31). Accordingly, fractionated crude extracts resulted in more peaks with higher absorptions,
since these also contained significantly higher amounts of diverse cellular proteins (Fig. 54).
Furthermore, fractions with highest peroxidase activity could slightly shift.
The pooled enzyme fractions positive for high peroxidase activity were concentrated with help of
centrifugal ultrafiltration and fractionated by means of size exclusion chromatography (SEC).
Details on the running conditions are explained in IV.5.2.b. The highest peak (absorption) in the
UV chromatogram of the fractionated medium can be seen in fraction 5 (Fig. 55), only this
fraction showed peroxidase activity (V.4.1). This was also true for fractionated enzyme crude
extracts but with lower absorption values, thus peroxidase yields (Fig. 56). Therefore it can be
assumed that the purification of the peroxidase from milk thistle suspension cells was successful.
Yet, purification and fractionation of the medium seems more profitable, since yields are higher
and far less side products/proteins have to be removed. These results further confirm that high
amounts of peroxidase are secreted to the outer compartments.
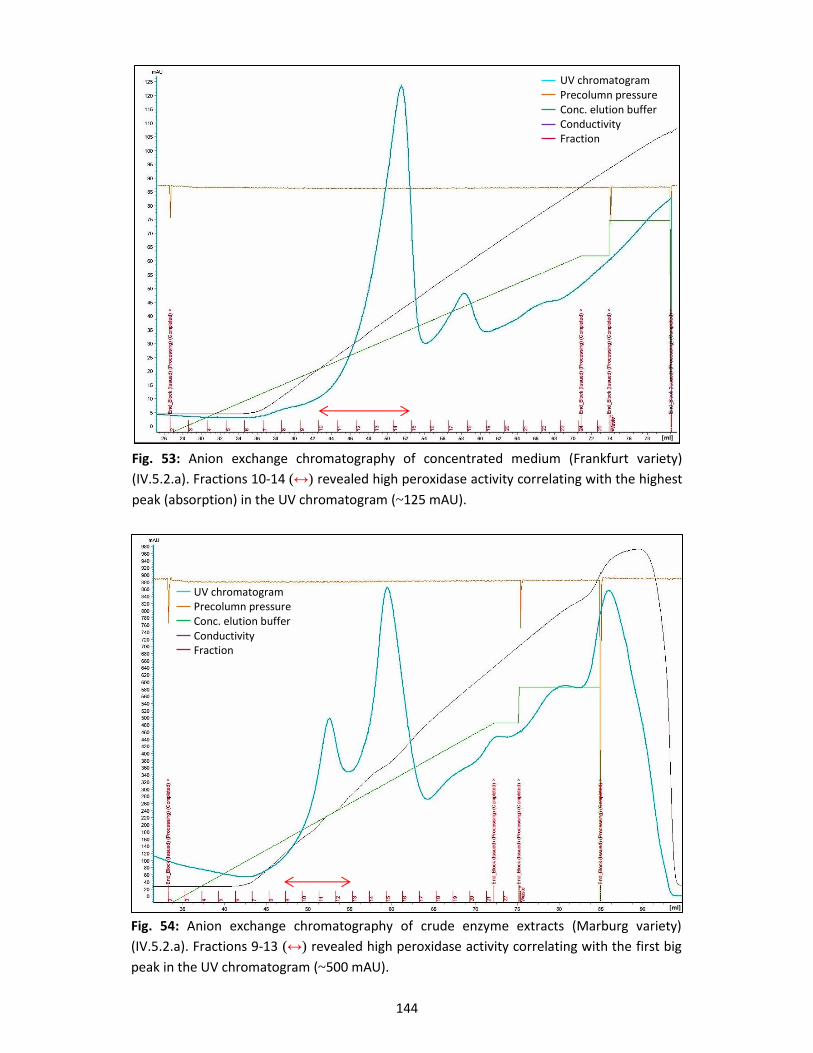
144
Fig. 53: Anion exchange chromatography of concentrated medium (Frankfurt variety)
(IV.5.2.a). Fractions 10-14 (↔) revealed high peroxidase activity correlating with the highest
peak (absorption) in the UV chromatogram (~125 mAU).
[ml]
UV chromatogram Precolumn pressure Conc. elution buffer Conductivity Fraction
Fig. 54: Anion exchange chromatography of crude enzyme extracts (Marburg variety)
(IV.5.2.a). Fractions 9-13 (↔) revealed high peroxidase activity correlating with the first big
peak in the UV chromatogram (~500 mAU).
[ml]
UV chromatogram Precolumn pressure Conc. elution buffer Conductivity Fraction
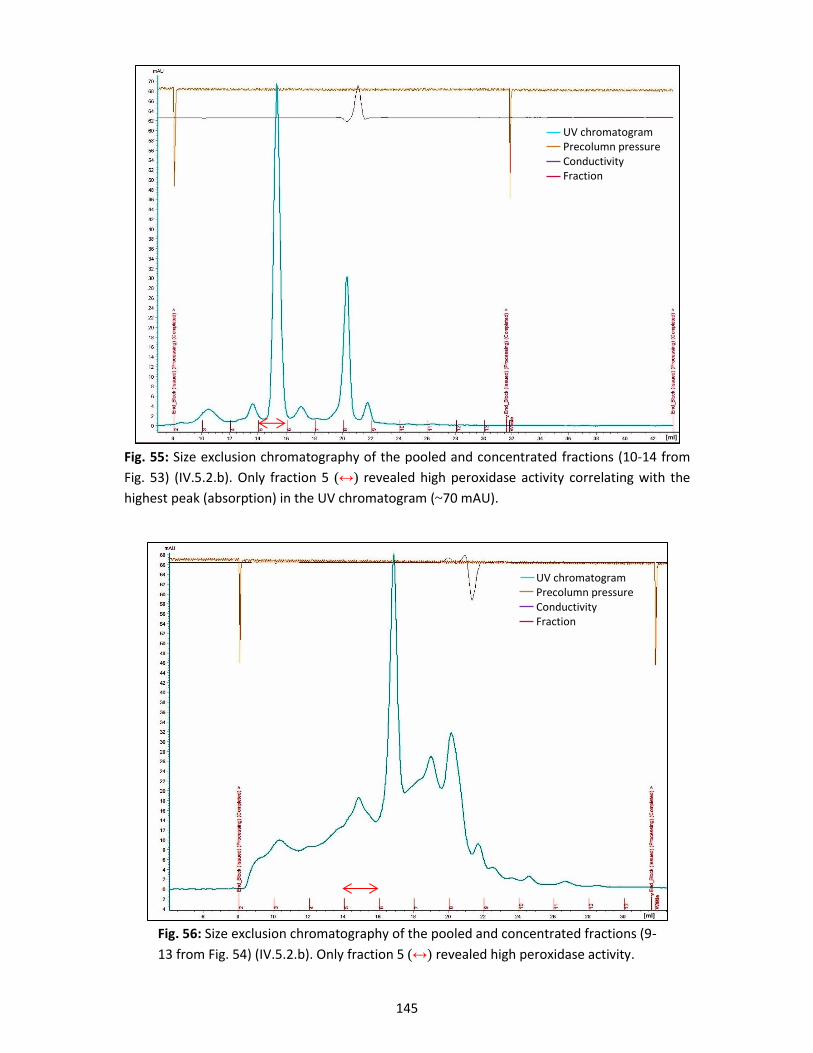
145
Fig. 55: Size exclusion chromatography of the pooled and concentrated fractions (10-14 from
Fig. 53) (IV.5.2.b). Only fraction 5 (↔) revealed high peroxidase activity correlating with the
highest peak (absorption) in the UV chromatogram (~70 mAU).
UV chromatogram Precolumn pressure Conductivity Fraction
[ml]
Fig. 56: Size exclusion chromatography of the pooled and concentrated fractions (9-
13 from Fig. 54) (IV.5.2.b). Only fraction 5 (↔) revealed high peroxidase activity.
[ml]
UV chromatogram Precolumn pressure Conductivity Fraction
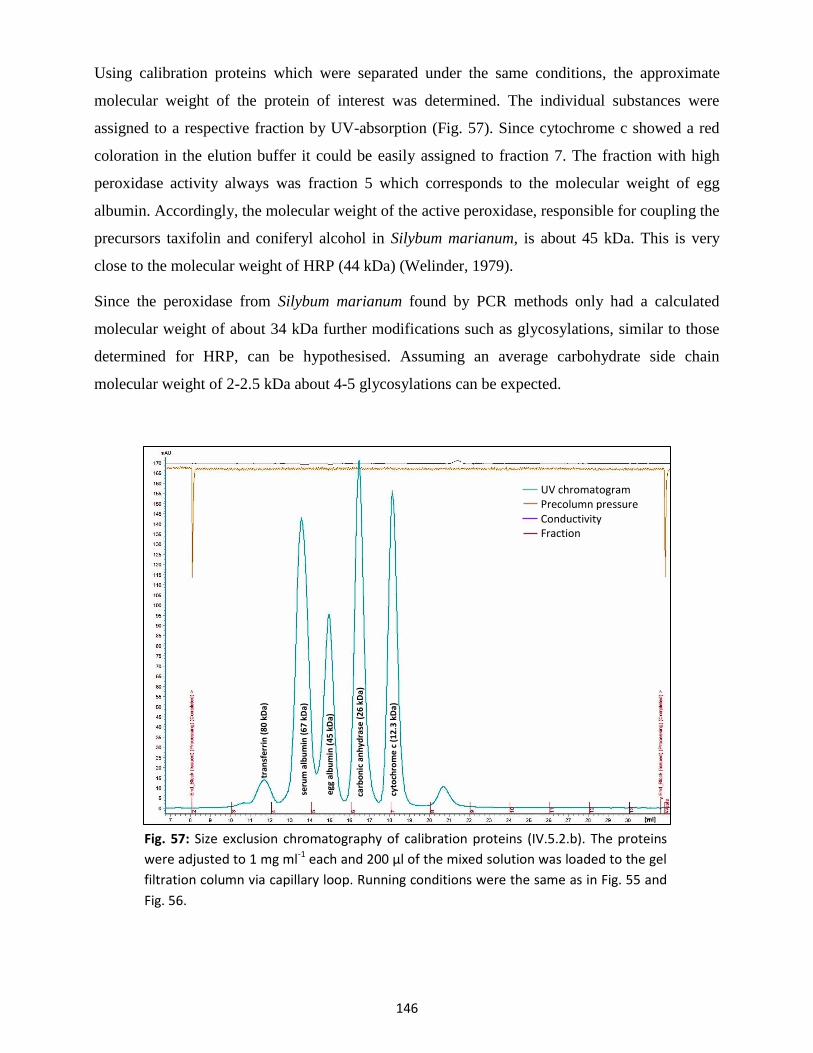
146
Using calibration proteins which were separated under the same conditions, the approximate
molecular weight of the protein of interest was determined. The individual substances were
assigned to a respective fraction by UV-absorption (Fig. 57). Since cytochrome c showed a red
coloration in the elution buffer it could be easily assigned to fraction 7. The fraction with high
peroxidase activity always was fraction 5 which corresponds to the molecular weight of egg
albumin. Accordingly, the molecular weight of the active peroxidase, responsible for coupling the
precursors taxifolin and coniferyl alcohol in Silybum marianum, is about 45 kDa. This is very
close to the molecular weight of HRP (44 kDa) (Welinder, 1979).
Since the peroxidase from Silybum marianum found by PCR methods only had a calculated
molecular weight of about 34 kDa further modifications such as glycosylations, similar to those
determined for HRP, can be hypothesised. Assuming an average carbohydrate side chain
molecular weight of 2-2.5 kDa about 4-5 glycosylations can be expected.
Fig. 57: Size exclusion chromatography of calibration proteins (IV.5.2.b). The proteins
were adjusted to 1 mg ml-1 each and 200 μl of the mixed solution was loaded to the gel
filtration column via capillary loop. Running conditions were the same as in Fig. 55 and
Fig. 56.
[ml]
UV chromatogram Precolumn pressure Conductivity Fraction
cyto
chro
me
c (1
2.3
kDa)
carb
on
ic a
nh
ydra
se (
26
kDa)
seru
m a
lbu
min
(6
7 kD
a)
egg
alb
um
in (
45
kDa)
tran
sfe
rrin
(8
0 k
Da)
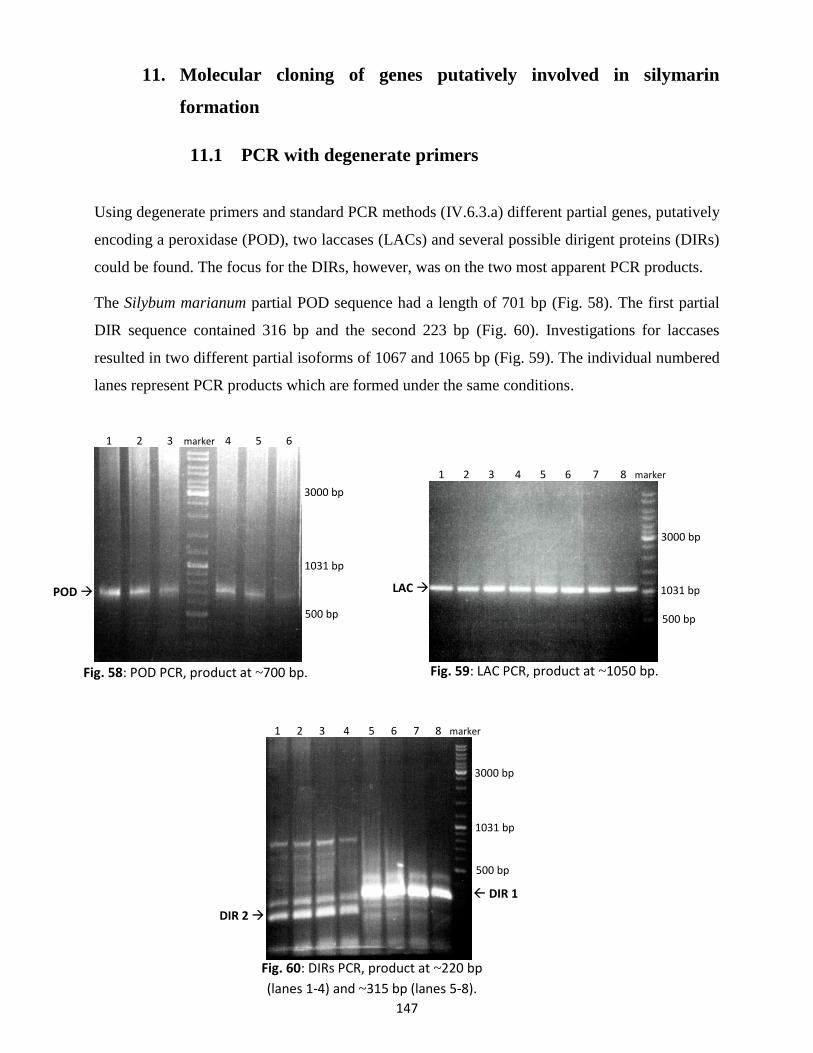
147
11. Molecular cloning of genes putatively involved in silymarin
formation
11.1 PCR with degenerate primers
Using degenerate primers and standard PCR methods (IV.6.3.a) different partial genes, putatively
encoding a peroxidase (POD), two laccases (LACs) and several possible dirigent proteins (DIRs)
could be found. The focus for the DIRs, however, was on the two most apparent PCR products.
The Silybum marianum partial POD sequence had a length of 701 bp (Fig. 58). The first partial
DIR sequence contained 316 bp and the second 223 bp (Fig. 60). Investigations for laccases
resulted in two different partial isoforms of 1067 and 1065 bp (Fig. 59). The individual numbered
lanes represent PCR products which are formed under the same conditions.
1 2 3 marker 4 5 6
POD
Fig. 58: POD PCR, product at ~700 bp.
3000 bp
1031 bp
500 bp
1 2 3 4 5 6 7 8 marker
LAC
3000 bp
1031 bp
500 bp
Fig. 59: LAC PCR, product at ~1050 bp.
1 2 3 4 5 6 7 8 marker
Fig. 60: DIRs PCR, product at ~220 bp
(lanes 1-4) and ~315 bp (lanes 5-8).
DIR 1
DIR 2
3000 bp
1031 bp
500 bp
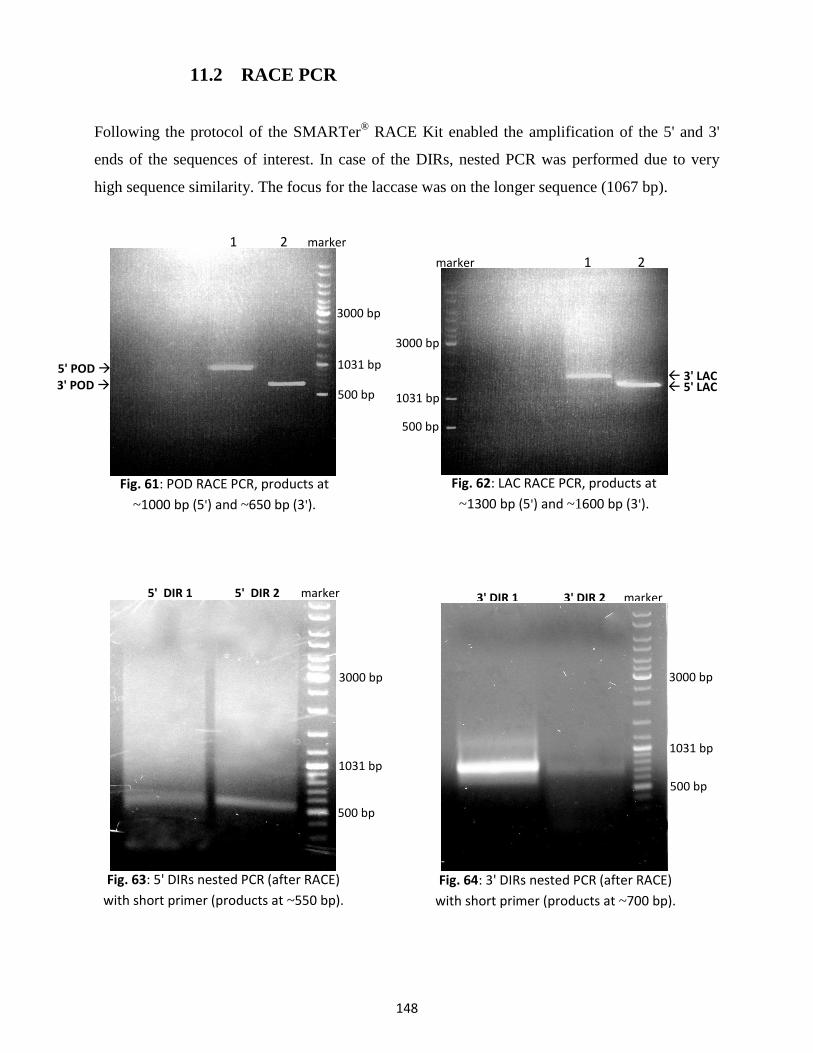
148
5' DIR 1 5' DIR 2 marker 3' DIR 1 3' DIR 2 marker
11.2 RACE PCR
Following the protocol of the SMARTer® RACE Kit enabled the amplification of the 5' and 3'
ends of the sequences of interest. In case of the DIRs, nested PCR was performed due to very
high sequence similarity. The focus for the laccase was on the longer sequence (1067 bp).
1 2 marker
marker 1 2
500 bp
500 bp 1031 bp
1031 bp
3000 bp
3000 bp
5' POD
3' POD 3' LAC 5' LAC
Fig. 61: POD RACE PCR, products at
~1000 bp (5') and ~650 bp (3').
Fig. 62: LAC RACE PCR, products at
~1300 bp (5') and ~1600 bp (3').
500 bp
500 bp
1031 bp
1031 bp
3000 bp 3000 bp
Fig. 63: 5' DIRs nested PCR (after RACE)
with short primer (products at ~550 bp).
Fig. 64: 3' DIRs nested PCR (after RACE)
with short primer (products at ~700 bp).
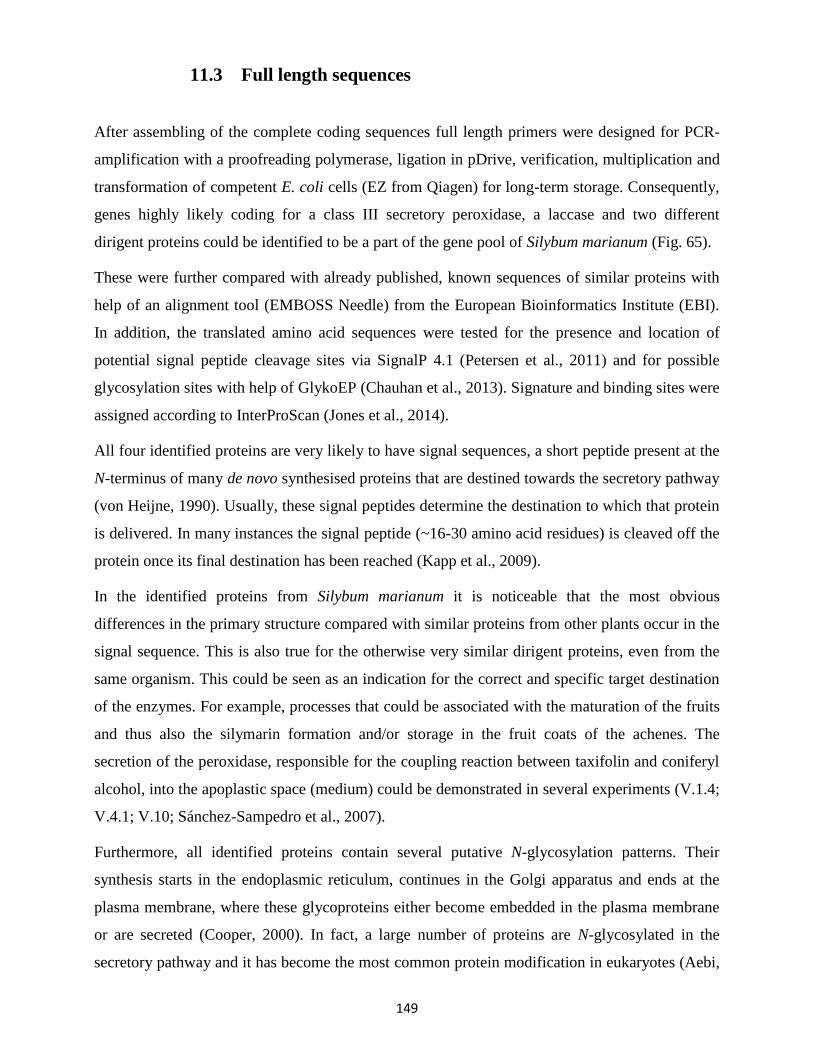
149
11.3 Full length sequences
After assembling of the complete coding sequences full length primers were designed for PCR-
amplification with a proofreading polymerase, ligation in pDrive, verification, multiplication and
transformation of competent E. coli cells (EZ from Qiagen) for long-term storage. Consequently,
genes highly likely coding for a class III secretory peroxidase, a laccase and two different
dirigent proteins could be identified to be a part of the gene pool of Silybum marianum (Fig. 65).
These were further compared with already published, known sequences of similar proteins with
help of an alignment tool (EMBOSS Needle) from the European Bioinformatics Institute (EBI).
In addition, the translated amino acid sequences were tested for the presence and location of
potential signal peptide cleavage sites via SignalP 4.1 (Petersen et al., 2011) and for possible
glycosylation sites with help of GlykoEP (Chauhan et al., 2013). Signature and binding sites were
assigned according to InterProScan (Jones et al., 2014).
All four identified proteins are very likely to have signal sequences, a short peptide present at the
N-terminus of many de novo synthesised proteins that are destined towards the secretory pathway
(von Heijne, 1990). Usually, these signal peptides determine the destination to which that protein
is delivered. In many instances the signal peptide (~16-30 amino acid residues) is cleaved off the
protein once its final destination has been reached (Kapp et al., 2009).
In the identified proteins from Silybum marianum it is noticeable that the most obvious
differences in the primary structure compared with similar proteins from other plants occur in the
signal sequence. This is also true for the otherwise very similar dirigent proteins, even from the
same organism. This could be seen as an indication for the correct and specific target destination
of the enzymes. For example, processes that could be associated with the maturation of the fruits
and thus also the silymarin formation and/or storage in the fruit coats of the achenes. The
secretion of the peroxidase, responsible for the coupling reaction between taxifolin and coniferyl
alcohol, into the apoplastic space (medium) could be demonstrated in several experiments (V.1.4;
V.4.1; V.10; Sánchez-Sampedro et al., 2007).
Furthermore, all identified proteins contain several putative N-glycosylation patterns. Their
synthesis starts in the endoplasmic reticulum, continues in the Golgi apparatus and ends at the
plasma membrane, where these glycoproteins either become embedded in the plasma membrane
or are secreted (Cooper, 2000). In fact, a large number of proteins are N-glycosylated in the
secretory pathway and it has become the most common protein modification in eukaryotes (Aebi,
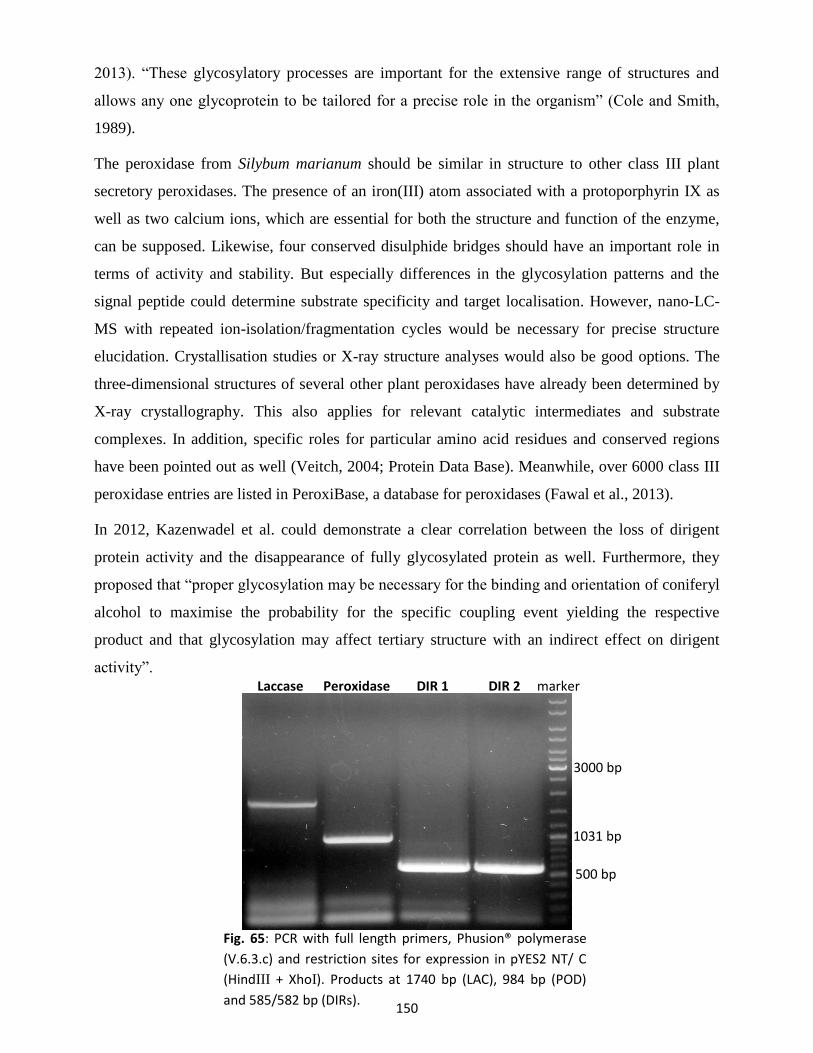
150
Laccase Peroxidase DIR 1 DIR 2 marker
2013). “These glycosylatory processes are important for the extensive range of structures and
allows any one glycoprotein to be tailored for a precise role in the organism” (Cole and Smith,
1989).
The peroxidase from Silybum marianum should be similar in structure to other class III plant
secretory peroxidases. The presence of an iron(III) atom associated with a protoporphyrin IX as
well as two calcium ions, which are essential for both the structure and function of the enzyme,
can be supposed. Likewise, four conserved disulphide bridges should have an important role in
terms of activity and stability. But especially differences in the glycosylation patterns and the
signal peptide could determine substrate specificity and target localisation. However, nano-LC-
MS with repeated ion-isolation/fragmentation cycles would be necessary for precise structure
elucidation. Crystallisation studies or X-ray structure analyses would also be good options. The
three-dimensional structures of several other plant peroxidases have already been determined by
X-ray crystallography. This also applies for relevant catalytic intermediates and substrate
complexes. In addition, specific roles for particular amino acid residues and conserved regions
have been pointed out as well (Veitch, 2004; Protein Data Base). Meanwhile, over 6000 class III
peroxidase entries are listed in PeroxiBase, a database for peroxidases (Fawal et al., 2013).
In 2012, Kazenwadel et al. could demonstrate a clear correlation between the loss of dirigent
protein activity and the disappearance of fully glycosylated protein as well. Furthermore, they
proposed that “proper glycosylation may be necessary for the binding and orientation of coniferyl
alcohol to maximise the probability for the specific coupling event yielding the respective
product and that glycosylation may affect tertiary structure with an indirect effect on dirigent
activity”.
3000 bp
1031 bp
500 bp
Fig. 65: PCR with full length primers, Phusion® polymerase
(V.6.3.c) and restriction sites for expression in pYES2 NT/ C
(HindIII + XhoI). Products at 1740 bp (LAC), 984 bp (POD)
and 585/582 bp (DIRs).
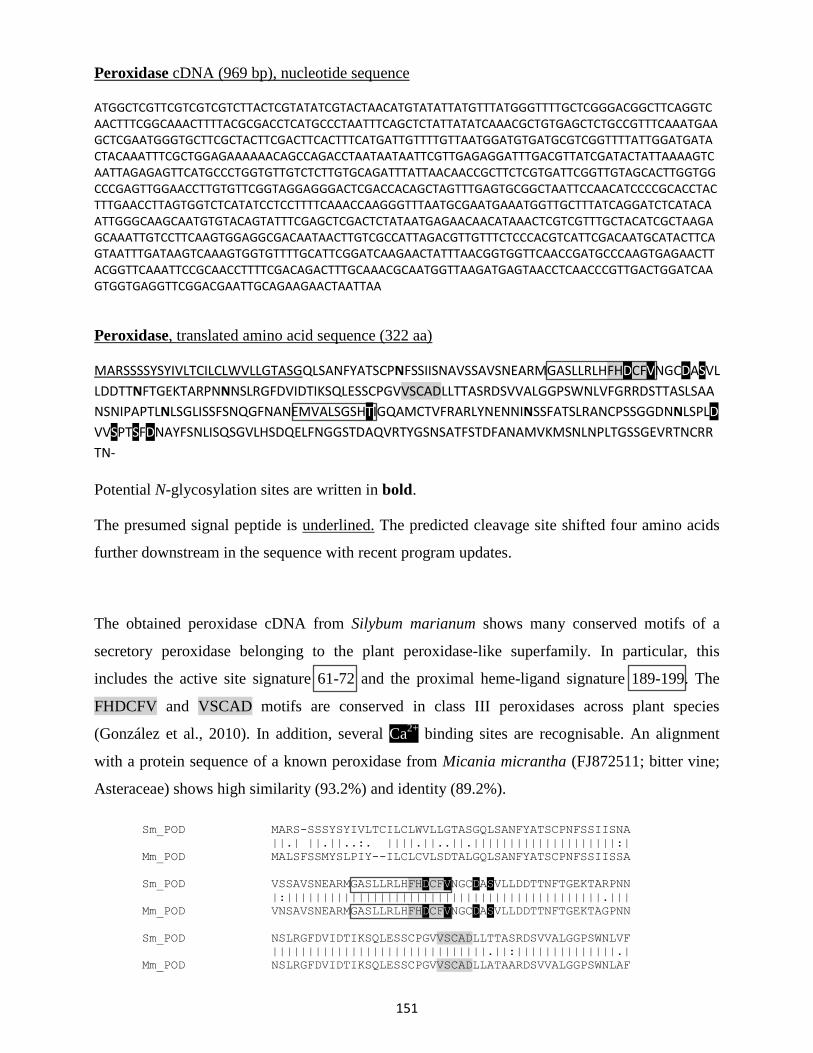
151
Peroxidase cDNA (969 bp), nucleotide sequence
ATGGCTCGTTCGTCGTCGTCTTACTCGTATATCGTACTAACATGTATATTATGTTTATGGGTTTTGCTCGGGACGGCTTCAGGTCAACTTTCGGCAAACTTTTACGCGACCTCATGCCCTAATTTCAGCTCTATTATATCAAACGCTGTGAGCTCTGCCGTTTCAAATGAAGCTCGAATGGGTGCTTCGCTACTTCGACTTCACTTTCATGATTGTTTTGTTAATGGATGTGATGCGTCGGTTTTATTGGATGATACTACAAATTTCGCTGGAGAAAAAACAGCCAGACCTAATAATAATTCGTTGAGAGGATTTGACGTTATCGATACTATTAAAAGTCAATTAGAGAGTTCATGCCCTGGTGTTGTCTCTTGTGCAGATTTATTAACAACCGCTTCTCGTGATTCGGTTGTAGCACTTGGTGGCCCGAGTTGGAACCTTGTGTTCGGTAGGAGGGACTCGACCACAGCTAGTTTGAGTGCGGCTAATTCCAACATCCCCGCACCTACTTTGAACCTTAGTGGTCTCATATCCTCCTTTTCAAACCAAGGGTTTAATGCGAATGAAATGGTTGCTTTATCAGGATCTCATACAATTGGGCAAGCAATGTGTACAGTATTTCGAGCTCGACTCTATAATGAGAACAACATAAACTCGTCGTTTGCTACATCGCTAAGAGCAAATTGTCCTTCAAGTGGAGGCGACAATAACTTGTCGCCATTAGACGTTGTTTCTCCCACGTCATTCGACAATGCATACTTCAGTAATTTGATAAGTCAAAGTGGTGTTTTGCATTCGGATCAAGAACTATTTAACGGTGGTTCAACCGATGCCCAAGTGAGAACTTACGGTTCAAATTCCGCAACCTTTTCGACAGACTTTGCAAACGCAATGGTTAAGATGAGTAACCTCAACCCGTTGACTGGATCAAGTGGTGAGGTTCGGACGAATTGCAGAAGAACTAATTAA
Peroxidase, translated amino acid sequence (322 aa)
MARSSSSYSYIVLTCILCLWVLLGTASGQLSANFYATSCPNFSSIISNAVSSAVSNEARMGASLLRLHFHDCFVNGCDASVL
LDDTTNFTGEKTARPNNNSLRGFDVIDTIKSQLESSCPGVVSCADLLTTASRDSVVALGGPSWNLVFGRRDSTTASLSAA
NSNIPAPTLNLSGLISSFSNQGFNANEMVALSGSHTIGQAMCTVFRARLYNENNINSSFATSLRANCPSSGGDNNLSPLD
VVSPTSFDNAYFSNLISQSGVLHSDQELFNGGSTDAQVRTYGSNSATFSTDFANAMVKMSNLNPLTGSSGEVRTNCRR
TN-
Potential N-glycosylation sites are written in bold.
The presumed signal peptide is underlined. The predicted cleavage site shifted four amino acids
further downstream in the sequence with recent program updates.
The obtained peroxidase cDNA from Silybum marianum shows many conserved motifs of a
secretory peroxidase belonging to the plant peroxidase-like superfamily. In particular, this
includes the active site signature 61-72 and the proximal heme-ligand signature 189-199. The
FHDCFV and VSCAD motifs are conserved in class III peroxidases across plant species
(González et al., 2010). In addition, several Ca2+
binding sites are recognisable. An alignment
with a protein sequence of a known peroxidase from Micania micrantha (FJ872511; bitter vine;
Asteraceae) shows high similarity (93.2%) and identity (89.2%).
Sm_POD MARS-SSSYSYIVLTCILCLWVLLGTASGQLSANFYATSCPNFSSIISNA
||.| ||.||..:. ||||.||..||.||||||||||||||||||||:|
Mm_POD MALSFSSMYSLPIY--ILCLCVLSDTALGQLSANFYATSCPNFSSIISSA
Sm_POD VSSAVSNEARMGASLLRLHFHDCFVNGCDASVLLDDTTNFTGEKTARPNN
|:||||||||||||||||||||||||||||||||||||||||||||.|||
Mm_POD VNSAVSNEARMGASLLRLHFHDCFVNGCDASVLLDDTTNFTGEKTAGPNN
Sm_POD NSLRGFDVIDTIKSQLESSCPGVVSCADLLTTASRDSVVALGGPSWNLVF
||||||||||||||||||||||||||||||.||:||||||||||||||.|
Mm_POD NSLRGFDVIDTIKSQLESSCPGVVSCADLLATAARDSVVALGGPSWNLAF
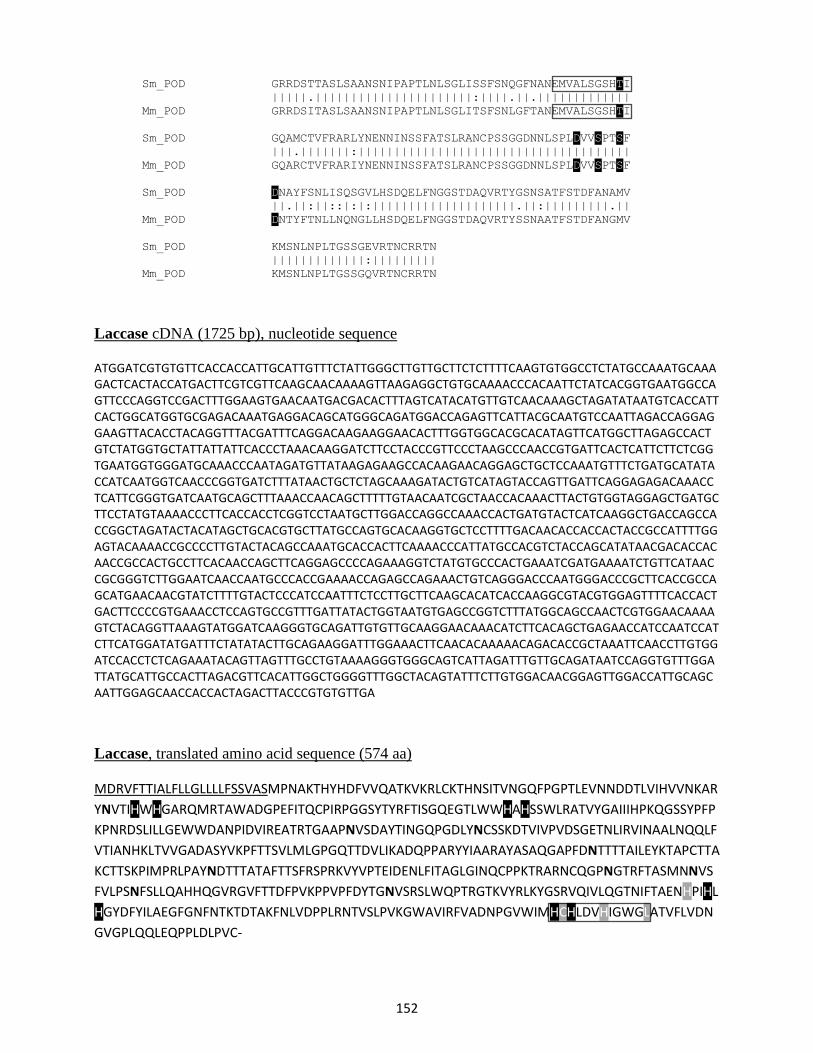
152
Sm_POD GRRDSTTASLSAANSNIPAPTLNLSGLISSFSNQGFNANEMVALSGSHTI
|||||.||||||||||||||||||||||:||||.||.|||||||||||||
Mm_POD GRRDSITASLSAANSNIPAPTLNLSGLITSFSNLGFTANEMVALSGSHTI
Sm_POD GQAMCTVFRARLYNENNINSSFATSLRANCPSSGGDNNLSPLDVVSPTSF
|||.|||||||:||||||||||||||||||||||||||||||||||||||
Mm_POD GQARCTVFRARIYNENNINSSFATSLRANCPSSGGDNNLSPLDVVSPTSF
Sm_POD DNAYFSNLISQSGVLHSDQELFNGGSTDAQVRTYGSNSATFSTDFANAMV
||.||:||::|:|:||||||||||||||||||||.||:|||||||||.||
Mm_POD DNTYFTNLLNQNGLLHSDQELFNGGSTDAQVRTYSSNAATFSTDFANGMV
Sm_POD KMSNLNPLTGSSGEVRTNCRRTN
|||||||||||||:|||||||||
Mm_POD KMSNLNPLTGSSGQVRTNCRRTN
Laccase cDNA (1725 bp), nucleotide sequence
ATGGATCGTGTGTTCACCACCATTGCATTGTTTCTATTGGGCTTGTTGCTTCTCTTTTCAAGTGTGGCCTCTATGCCAAATGCAAAGACTCACTACCATGACTTCGTCGTTCAAGCAACAAAAGTTAAGAGGCTGTGCAAAACCCACAATTCTATCACGGTGAATGGCCAGTTCCCAGGTCCGACTTTGGAAGTGAACAATGACGACACTTTAGTCATACATGTTGTCAACAAAGCTAGATATAATGTCACCATTCACTGGCATGGTGCGAGACAAATGAGGACAGCATGGGCAGATGGACCAGAGTTCATTACGCAATGTCCAATTAGACCAGGAGGAAGTTACACCTACAGGTTTACGATTTCAGGACAAGAAGGAACACTTTGGTGGCACGCACATAGTTCATGGCTTAGAGCCACTGTCTATGGTGCTATTATTATTCACCCTAAACAAGGATCTTCCTACCCGTTCCCTAAGCCCAACCGTGATTCACTCATTCTTCTCGGTGAATGGTGGGATGCAAACCCAATAGATGTTATAAGAGAAGCCACAAGAACAGGAGCTGCTCCAAATGTTTCTGATGCATATACCATCAATGGTCAACCCGGTGATCTTTATAACTGCTCTAGCAAAGATACTGTCATAGTACCAGTTGATTCAGGAGAGACAAACCTCATTCGGGTGATCAATGCAGCTTTAAACCAACAGCTTTTTGTAACAATCGCTAACCACAAACTTACTGTGGTAGGAGCTGATGCTTCCTATGTAAAACCCTTCACCACCTCGGTCCTAATGCTTGGACCAGGCCAAACCACTGATGTACTCATCAAGGCTGACCAGCCACCGGCTAGATACTACATAGCTGCACGTGCTTATGCCAGTGCACAAGGTGCTCCTTTTGACAACACCACCACTACCGCCATTTTGGAGTACAAAACCGCCCCTTGTACTACAGCCAAATGCACCACTTCAAAACCCATTATGCCACGTCTACCAGCATATAACGACACCACAACCGCCACTGCCTTCACAACCAGCTTCAGGAGCCCCAGAAAGGTCTATGTGCCCACTGAAATCGATGAAAATCTGTTCATAACCGCGGGTCTTGGAATCAACCAATGCCCACCGAAAACCAGAGCCAGAAACTGTCAGGGACCCAATGGGACCCGCTTCACCGCCAGCATGAACAACGTATCTTTTGTACTCCCATCCAATTTCTCCTTGCTTCAAGCACATCACCAAGGCGTACGTGGAGTTTTCACCACTGACTTCCCCGTGAAACCTCCAGTGCCGTTTGATTATACTGGTAATGTGAGCCGGTCTTTATGGCAGCCAACTCGTGGAACAAAAGTCTACAGGTTAAAGTATGGATCAAGGGTGCAGATTGTGTTGCAAGGAACAAACATCTTCACAGCTGAGAACCATCCAATCCATCTTCATGGATATGATTTCTATATACTTGCAGAAGGATTTGGAAACTTCAACACAAAAACAGACACCGCTAAATTCAACCTTGTGGATCCACCTCTCAGAAATACAGTTAGTTTGCCTGTAAAAGGGTGGGCAGTCATTAGATTTGTTGCAGATAATCCAGGTGTTTGGATTATGCATTGCCACTTAGACGTTCACATTGGCTGGGGTTTGGCTACAGTATTTCTTGTGGACAACGGAGTTGGACCATTGCAGCAATTGGAGCAACCACCACTAGACTTACCCGTGTGTTGA
Laccase, translated amino acid sequence (574 aa)
MDRVFTTIALFLLGLLLLFSSVASMPNAKTHYHDFVVQATKVKRLCKTHNSITVNGQFPGPTLEVNNDDTLVIHVVNKAR
YNVTIHWHGARQMRTAWADGPEFITQCPIRPGGSYTYRFTISGQEGTLWWHAHSSWLRATVYGAIIIHPKQGSSYPFP
KPNRDSLILLGEWWDANPIDVIREATRTGAAPNVSDAYTINGQPGDLYNCSSKDTVIVPVDSGETNLIRVINAALNQQLF
VTIANHKLTVVGADASYVKPFTTSVLMLGPGQTTDVLIKADQPPARYYIAARAYASAQGAPFDNTTTTAILEYKTAPCTTA
KCTTSKPIMPRLPAYNDTTTATAFTTSFRSPRKVYVPTEIDENLFITAGLGINQCPPKTRARNCQGPNGTRFTASMNNVS
FVLPSNFSLLQAHHQGVRGVFTTDFPVKPPVPFDYTGNVSRSLWQPTRGTKVYRLKYGSRVQIVLQGTNIFTAENHPIHL
HGYDFYILAEGFGNFNTKTDTAKFNLVDPPLRNTVSLPVKGWAVIRFVADNPGVWIMHCHLDVHIGWGLATVFLVDN
GVGPLQQLEQPPLDLPVC-
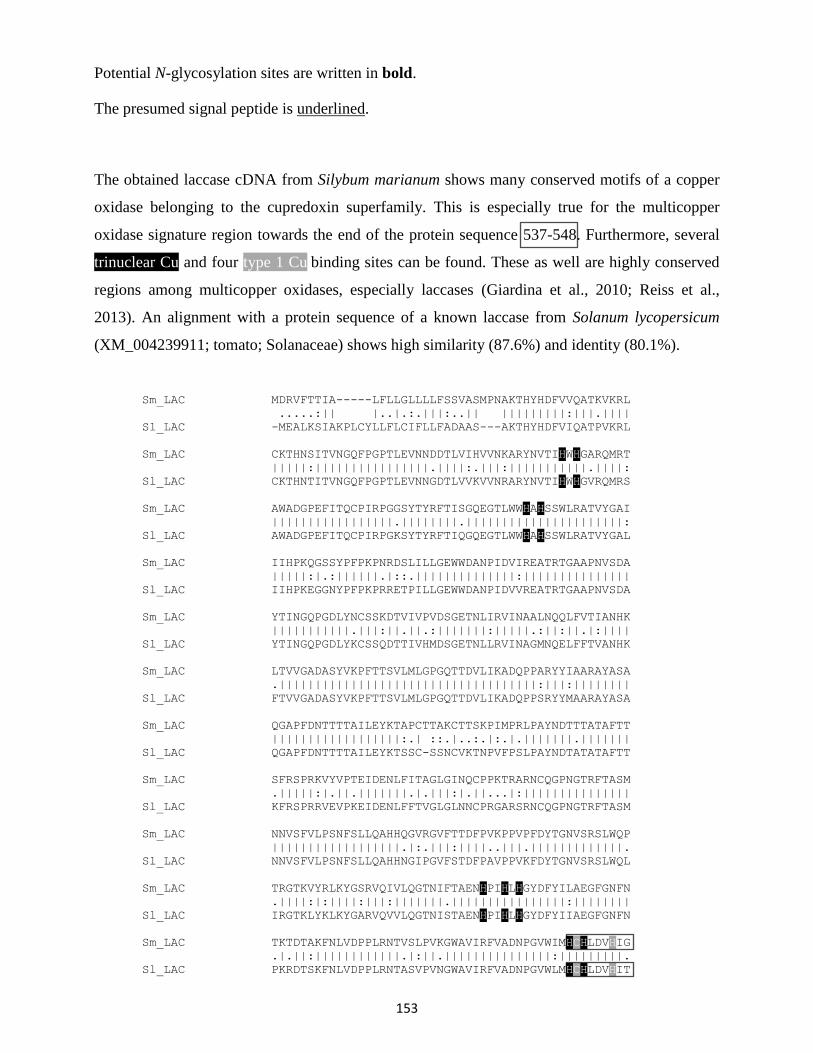
153
Potential N-glycosylation sites are written in bold.
The presumed signal peptide is underlined.
The obtained laccase cDNA from Silybum marianum shows many conserved motifs of a copper
oxidase belonging to the cupredoxin superfamily. This is especially true for the multicopper
oxidase signature region towards the end of the protein sequence 537-548. Furthermore, several
trinuclear Cu and four type 1 Cu binding sites can be found. These as well are highly conserved
regions among multicopper oxidases, especially laccases (Giardina et al., 2010; Reiss et al.,
2013). An alignment with a protein sequence of a known laccase from Solanum lycopersicum
(XM_004239911; tomato; Solanaceae) shows high similarity (87.6%) and identity (80.1%).
Sm_LAC MDRVFTTIA-----LFLLGLLLLFSSVASMPNAKTHYHDFVVQATKVKRL
.....:|| |..|.:.|||:..|| |||||||||:|||.||||
Sl_LAC -MEALKSIAKPLCYLLFLCIFLLFADAAS---AKTHYHDFVIQATPVKRL
Sm_LAC CKTHNSITVNGQFPGPTLEVNNDDTLVIHVVNKARYNVTIHWHGARQMRT
|||||:||||||||||||||||.||||:.|||:|||||||||||.||||:
Sl_LAC CKTHNTITVNGQFPGPTLEVNNGDTLVVKVVNRARYNVTIHWHGVRQMRS
Sm_LAC AWADGPEFITQCPIRPGGSYTYRFTISGQEGTLWWHAHSSWLRATVYGAI
|||||||||||||||||.||||||||.||||||||||||||||||||||:
Sl_LAC AWADGPEFITQCPIRPGKSYTYRFTIQGQEGTLWWHAHSSWLRATVYGAL
Sm_LAC IIHPKQGSSYPFPKPNRDSLILLGEWWDANPIDVIREATRTGAAPNVSDA
|||||:|.:||||||.|::.||||||||||||||:|||||||||||||||
Sl_LAC IIHPKEGGNYPFPKPRRETPILLGEWWDANPIDVVREATRTGAAPNVSDA
Sm_LAC YTINGQPGDLYNCSSKDTVIVPVDSGETNLIRVINAALNQQLFVTIANHK
|||||||||||.|||:||.||.:|||||||:|||||.:||:||.|:||||
Sl_LAC YTINGQPGDLYKCSSQDTTIVHMDSGETNLLRVINAGMNQELFFTVANHK
Sm_LAC LTVVGADASYVKPFTTSVLMLGPGQTTDVLIKADQPPARYYIAARAYASA
.||||||||||||||||||||||||||||||||||||:|||:||||||||
Sl_LAC FTVVGADASYVKPFTTSVLMLGPGQTTDVLIKADQPPSRYYMAARAYASA
Sm_LAC QGAPFDNTTTTAILEYKTAPCTTAKCTTSKPIMPRLPAYNDTTTATAFTT
||||||||||||||||||:.| ::.|..:.|:.|.|||||||.|||||||
Sl_LAC QGAPFDNTTTTAILEYKTSSC-SSNCVKTNPVFPSLPAYNDTATATAFTT
Sm_LAC SFRSPRKVYVPTEIDENLFITAGLGINQCPPKTRARNCQGPNGTRFTASM
.|||||:|.||.|||||||.|.|||:|.||...|:|||||||||||||||
Sl_LAC KFRSPRRVEVPKEIDENLFFTVGLGLNNCPRGARSRNCQGPNGTRFTASM
Sm_LAC NNVSFVLPSNFSLLQAHHQGVRGVFTTDFPVKPPVPFDYTGNVSRSLWQP
||||||||||||||||||.|:.|||:||||..|||.|||||||||||||.
Sl_LAC NNVSFVLPSNFSLLQAHHNGIPGVFSTDFPAVPPVKFDYTGNVSRSLWQL
Sm_LAC TRGTKVYRLKYGSRVQIVLQGTNIFTAENHPIHLHGYDFYILAEGFGNFN
.||||:|:||||:|||:|||||||.||||||||||||||||:||||||||
Sl_LAC IRGTKLYKLKYGARVQVVLQGTNISTAENHPIHLHGYDFYIIAEGFGNFN
Sm_LAC TKTDTAKFNLVDPPLRNTVSLPVKGWAVIRFVADNPGVWIMHCHLDVHIG
.|.||:||||||||||||.|:||.|||||||||||||||:|||||||||.
Sl_LAC PKRDTSKFNLVDPPLRNTASVPVNGWAVIRFVADNPGVWLMHCHLDVHIT
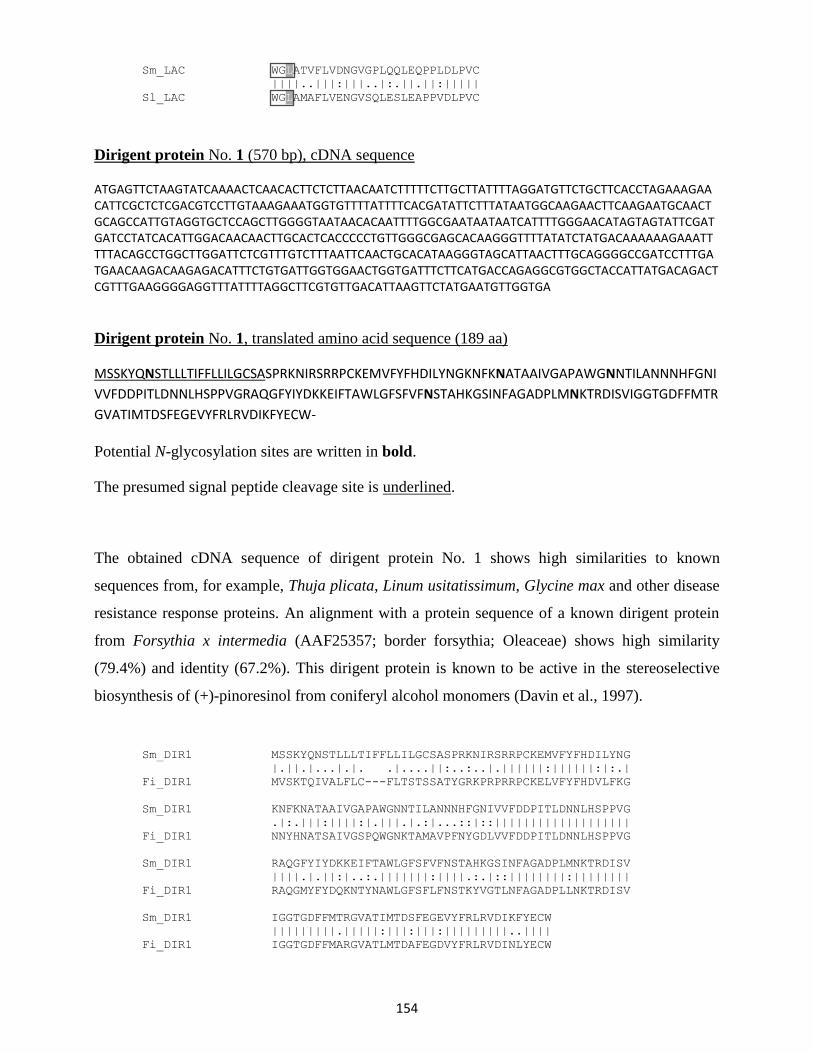
154
Sm_LAC WGLATVFLVDNGVGPLQQLEQPPLDLPVC
||||..|||:|||..|:.||.||:|||||
Sl_LAC WGLAMAFLVENGVSQLESLEAPPVDLPVC
Dirigent protein No. 1 (570 bp), cDNA sequence
ATGAGTTCTAAGTATCAAAACTCAACACTTCTCTTAACAATCTTTTTCTTGCTTATTTTAGGATGTTCTGCTTCACCTAGAAAGAACATTCGCTCTCGACGTCCTTGTAAAGAAATGGTGTTTTATTTTCACGATATTCTTTATAATGGCAAGAACTTCAAGAATGCAACTGCAGCCATTGTAGGTGCTCCAGCTTGGGGTAATAACACAATTTTGGCGAATAATAATCATTTTGGGAACATAGTAGTATTCGATGATCCTATCACATTGGACAACAACTTGCACTCACCCCCTGTTGGGCGAGCACAAGGGTTTTATATCTATGACAAAAAAGAAATTTTTACAGCCTGGCTTGGATTCTCGTTTGTCTTTAATTCAACTGCACATAAGGGTAGCATTAACTTTGCAGGGGCCGATCCTTTGATGAACAAGACAAGAGACATTTCTGTGATTGGTGGAACTGGTGATTTCTTCATGACCAGAGGCGTGGCTACCATTATGACAGACTCGTTTGAAGGGGAGGTTTATTTTAGGCTTCGTGTTGACATTAAGTTCTATGAATGTTGGTGA
Dirigent protein No. 1, translated amino acid sequence (189 aa)
MSSKYQNSTLLLTIFFLLILGCSASPRKNIRSRRPCKEMVFYFHDILYNGKNFKNATAAIVGAPAWGNNTILANNNHFGNI
VVFDDPITLDNNLHSPPVGRAQGFYIYDKKEIFTAWLGFSFVFNSTAHKGSINFAGADPLMNKTRDISVIGGTGDFFMTR
GVATIMTDSFEGEVYFRLRVDIKFYECW-
Potential N-glycosylation sites are written in bold.
The presumed signal peptide cleavage site is underlined.
The obtained cDNA sequence of dirigent protein No. 1 shows high similarities to known
sequences from, for example, Thuja plicata, Linum usitatissimum, Glycine max and other disease
resistance response proteins. An alignment with a protein sequence of a known dirigent protein
from Forsythia x intermedia (AAF25357; border forsythia; Oleaceae) shows high similarity
(79.4%) and identity (67.2%). This dirigent protein is known to be active in the stereoselective
biosynthesis of (+)-pinoresinol from coniferyl alcohol monomers (Davin et al., 1997).
Sm_DIR1 MSSKYQNSTLLLTIFFLLILGCSASPRKNIRSRRPCKEMVFYFHDILYNG
|.||.|...|.|. .|....||:..:..|.||||||:||||||:|:.|
Fi_DIR1 MVSKTQIVALFLC---FLTSTSSATYGRKPRPRRPCKELVFYFHDVLFKG
Sm_DIR1 KNFKNATAAIVGAPAWGNNTILANNNHFGNIVVFDDPITLDNNLHSPPVG
.|:.|||:||||:|.|||.|.:|...::|::|||||||||||||||||||
Fi_DIR1 NNYHNATSAIVGSPQWGNKTAMAVPFNYGDLVVFDDPITLDNNLHSPPVG
Sm_DIR1 RAQGFYIYDKKEIFTAWLGFSFVFNSTAHKGSINFAGADPLMNKTRDISV
||||.|.||:|..:.|||||||:||||.:.|::||||||||:||||||||
Fi_DIR1 RAQGMYFYDQKNTYNAWLGFSFLFNSTKYVGTLNFAGADPLLNKTRDISV
Sm_DIR1 IGGTGDFFMTRGVATIMTDSFEGEVYFRLRVDIKFYECW
|||||||||.|||||:|||:|||:|||||||||..||||
Fi_DIR1 IGGTGDFFMARGVATLMTDAFEGDVYFRLRVDINLYECW
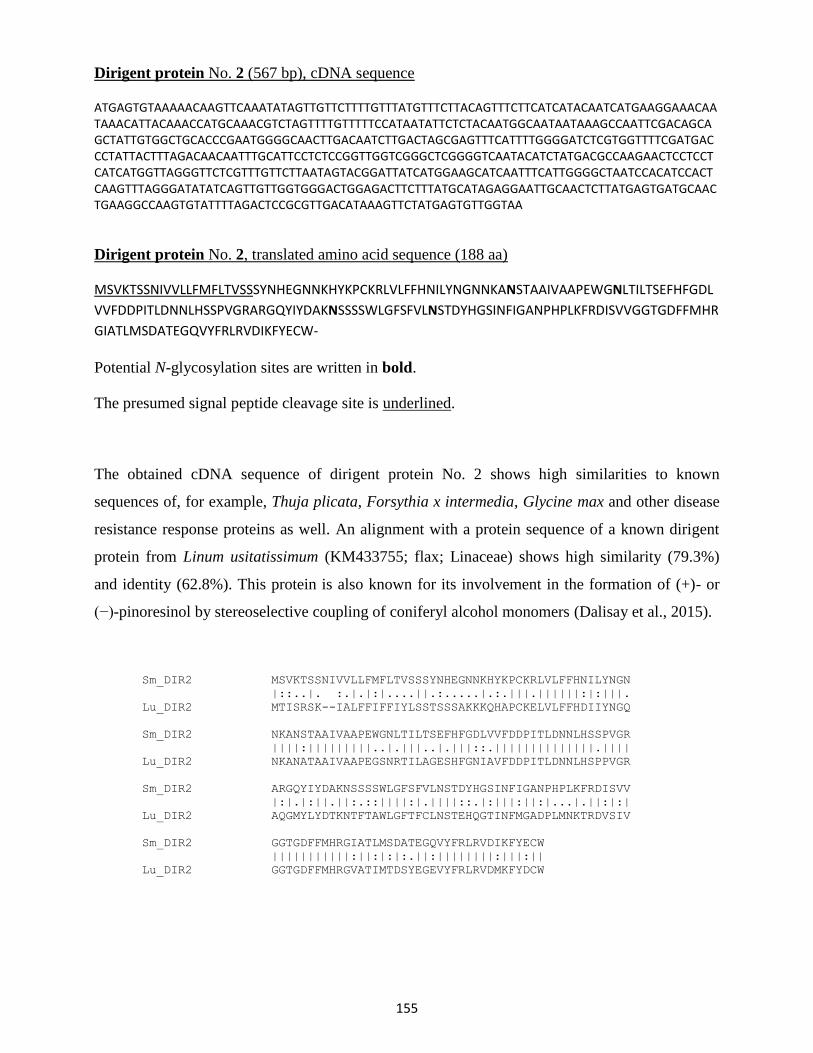
155
Dirigent protein No. 2 (567 bp), cDNA sequence
ATGAGTGTAAAAACAAGTTCAAATATAGTTGTTCTTTTGTTTATGTTTCTTACAGTTTCTTCATCATACAATCATGAAGGAAACAATAAACATTACAAACCATGCAAACGTCTAGTTTTGTTTTTCCATAATATTCTCTACAATGGCAATAATAAAGCCAATTCGACAGCAGCTATTGTGGCTGCACCCGAATGGGGCAACTTGACAATCTTGACTAGCGAGTTTCATTTTGGGGATCTCGTGGTTTTCGATGACCCTATTACTTTAGACAACAATTTGCATTCCTCTCCGGTTGGTCGGGCTCGGGGTCAATACATCTATGACGCCAAGAACTCCTCCTCATCATGGTTAGGGTTCTCGTTTGTTCTTAATAGTACGGATTATCATGGAAGCATCAATTTCATTGGGGCTAATCCACATCCACTCAAGTTTAGGGATATATCAGTTGTTGGTGGGACTGGAGACTTCTTTATGCATAGAGGAATTGCAACTCTTATGAGTGATGCAACTGAAGGCCAAGTGTATTTTAGACTCCGCGTTGACATAAAGTTCTATGAGTGTTGGTAA
Dirigent protein No. 2, translated amino acid sequence (188 aa)
MSVKTSSNIVVLLFMFLTVSSSYNHEGNNKHYKPCKRLVLFFHNILYNGNNKANSTAAIVAAPEWGNLTILTSEFHFGDL
VVFDDPITLDNNLHSSPVGRARGQYIYDAKNSSSSWLGFSFVLNSTDYHGSINFIGANPHPLKFRDISVVGGTGDFFMHR
GIATLMSDATEGQVYFRLRVDIKFYECW-
Potential N-glycosylation sites are written in bold.
The presumed signal peptide cleavage site is underlined.
The obtained cDNA sequence of dirigent protein No. 2 shows high similarities to known
sequences of, for example, Thuja plicata, Forsythia x intermedia, Glycine max and other disease
resistance response proteins as well. An alignment with a protein sequence of a known dirigent
protein from Linum usitatissimum (KM433755; flax; Linaceae) shows high similarity (79.3%)
and identity (62.8%). This protein is also known for its involvement in the formation of (+)- or
(−)-pinoresinol by stereoselective coupling of coniferyl alcohol monomers (Dalisay et al., 2015).
Sm_DIR2 MSVKTSSNIVVLLFMFLTVSSSYNHEGNNKHYKPCKRLVLFFHNILYNGN
|::..|. :.|.|:|....||.:.....|.:.|||.||||||:|:|||.
Lu_DIR2 MTISRSK--IALFFIFFIYLSSTSSSAKKKQHAPCKELVLFFHDIIYNGQ
Sm_DIR2 NKANSTAAIVAAPEWGNLTILTSEFHFGDLVVFDDPITLDNNLHSSPVGR
||||:|||||||||..|.|||..|.|||::.||||||||||||||.||||
Lu_DIR2 NKANATAAIVAAPEGSNRTILAGESHFGNIAVFDDPITLDNNLHSPPVGR
Sm_DIR2 ARGQYIYDAKNSSSSWLGFSFVLNSTDYHGSINFIGANPHPLKFRDISVV
|:|.|:||.||:.::||||:|.||||::.|:|||:||:|...|.||:|:|
Lu_DIR2 AQGMYLYDTKNTFTAWLGFTFCLNSTEHQGTINFMGADPLMNKTRDVSIV
Sm_DIR2 GGTGDFFMHRGIATLMSDATEGQVYFRLRVDIKFYECW
|||||||||||:||:|:|:.||:||||||||:|||:||
Lu_DIR2 GGTGDFFMHRGVATIMTDSYEGEVYFRLRVDMKFYDCW
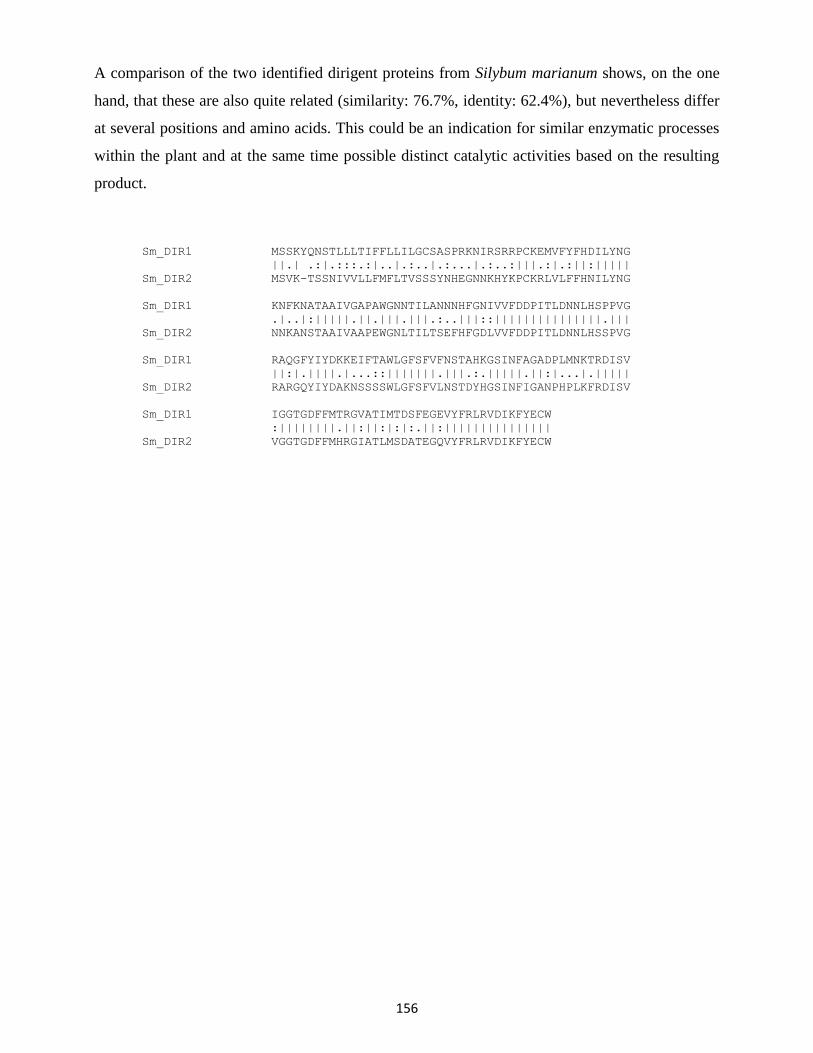
156
A comparison of the two identified dirigent proteins from Silybum marianum shows, on the one
hand, that these are also quite related (similarity: 76.7%, identity: 62.4%), but nevertheless differ
at several positions and amino acids. This could be an indication for similar enzymatic processes
within the plant and at the same time possible distinct catalytic activities based on the resulting
product.
Sm_DIR1 MSSKYQNSTLLLTIFFLLILGCSASPRKNIRSRRPCKEMVFYFHDILYNG
||.| .:|.:::.:|..|.:..|.:...|.:..:|||.:|.:||:|||||
Sm_DIR2 MSVK-TSSNIVVLLFMFLTVSSSYNHEGNNKHYKPCKRLVLFFHNILYNG
Sm_DIR1 KNFKNATAAIVGAPAWGNNTILANNNHFGNIVVFDDPITLDNNLHSPPVG
.|..|:|||||.||.|||.|||.:..|||::|||||||||||||||.|||
Sm_DIR2 NNKANSTAAIVAAPEWGNLTILTSEFHFGDLVVFDDPITLDNNLHSSPVG
Sm_DIR1 RAQGFYIYDKKEIFTAWLGFSFVFNSTAHKGSINFAGADPLMNKTRDISV
||:|.||||.|...::|||||||.|||.:.|||||.||:|...|.|||||
Sm_DIR2 RARGQYIYDAKNSSSSWLGFSFVLNSTDYHGSINFIGANPHPLKFRDISV
Sm_DIR1 IGGTGDFFMTRGVATIMTDSFEGEVYFRLRVDIKFYECW
:||||||||.||:||:|:|:.||:|||||||||||||||
Sm_DIR2 VGGTGDFFMHRGIATLMSDATEGQVYFRLRVDIKFYECW
157
12. Expression studies for peroxidases, laccases and dirigent proteins
12.1 Prokaryotic cell lines (E. coli)
Initially, the discovered sequences were expressed in E. coli cell lines in order to obtain large
protein quantities in short time. For this purpose, they were ligated into the expression vector
pET-15b and introduced in either BL21(DE3)pLysS or BL21-CodonPlus (DE3)-RIPL cells. A
polyhistidine-tag for purification, already present on the plasmid, was attached to the N-terminus.
Expression was done as described in IV.7.7.a.
The formation of the desired proteins, however, could not be detected. SDS-PAGE after affinity
chromatography for proteins containing a polyhistidine tag showed no gene-specific bands in the
expected size ranges. Likewise, enzyme activity tests with insoluble and soluble protein fractions
were negative. Therefore, the structure of the proteins could be too complex for expression in
prokaryotic systems.
A possible approach to this problem would be the removal or replacement of the signal sequences
since prokaryotes do not have a membrane-enclosed secretion system analogous to the
eukaryotes. Even then, problems such as insoluble protein inclusion bodies could be expected.
Extensive refolding techniques of intracellularly produced proteins would be the consequence. In
2011, Pickel came to a similar result and conclusion during his PhD thesis. An approach would
be the co-expression of chaperones possibly resulting in a higher expression level of the soluble
protein complex which, for example, was the case for a dirigent protein from Arabidopsis
thaliana (Kazenwadel 2013).
Furthermore, the expected glycosylations, probably responsible for the correct structure and
function of these proteins, tend to be major problems for E. coli-based expression systems
because of its limited post-translational machinery function (Khow and Suntrarachun, 2012).
Meanwhile, problem-solving approaches by a succesful transfer of a gene cluster encoding a
complete N-linked protein glycosylation pathway from subdivisions of Proteobacteria into E. coli
were presented (Fisher et al., 2011; Nothaft and Szymanski, 2013).
According to Krainer and Glieder (2015) it has to be pointed out that the production of, for
example, secreted class III peroxidases in E. coli is still by far not suitable for biotechnological
applications due to the extremely low yields. The maximum achievable yields from E. coli for
HRP did not surpass 10 mg l-1
so far (Grigorenko et al., 1999).
158
12.2 Eukaryotic cell lines (yeast)
a. Pichia pastoris X-33 strain
In the further course of this work the decision for the next expression attempt fell to a methanol-
inducible system known for the high-level secretion of recombinant proteins (Ahmad et al.,
2014). For example, the group of Kazenwadel et al. (2012) could achieve good results for high
glycosylated proteins containing signal peptides. A fed batch fermentation process yielded about
47 mg l-1
of a dirigent protein.
This time the cDNA sequences of the proteins were inserted into the expression vector once with
signal sequence and once without signal peptides in order to cover both possibilities for
expression of active enzyme. After ligating into the expression vector pPICZα A and
conformation of the correct insert within the reading frame the constructs were linearised and
P. pastoris cells transformed by electroporation (IV.7.2.b). In each case, the His-Tag present on
the plasmid was attached to the C-terminal end of the sequence for easier detection and
purification.
The ability to utilise MeOH (Mut phenotype) was tested using Zeocin™
-resistant transformants
on MD and MM plates (IV.8.7). Mut+ colonies with possible multiple gene insertions were used
for further isolation of pure clonal isolates. Putative multi-copy recombinants were selected by
picking well growing clones from YPD plates with adjusted high Zeocin™
concentration (1 mg
ml-1
). The presence of the insert was confirmed via colony PCR (IV.6.3.d). Expression
experiments were undertaken as described in IV.7.7.b.
The supernatants and cell pellets were analysed for protein expression by SDS-PAGE and the
more sensitive Western blot or enzyme assays. Unfortunately, neither the inserts with nor those
without signal peptide resulted in any detectable expressed protein. No recombinant protein could
be detected at any time between 0 and 72 h of expression, neither secreted nor on the intracellular
level. Concentrating the supernatant by ammonium sulphate precipitation (IV.5.3.a) did not result
in the desired success either. Variation of the temperature (28-30 °C) during expression or the
regularly added MeOH concentration (0.5-1%) also led to no improvement. Since no
recombinant protein could be found within the cells as well it can be assumed that the expression
in P. pastoris did not work properly and would have to be optimised on many levels.
159
Following Pichia protocols, the biggest hurdle seems to be generating initial success, meaning
expression of recombinant protein at any level (Higgins and Cregg, 1998). The secreted protein
might also be susceptible to neutral pH proteases which could be circumvented by expressing in
unbuffered medium. The addition of 1% casamino acids with buffered medium could inhibit
extracellular proteases (Werten et al., 1999). In addition, heavily glycosylated proteins with
possible interchain disulphide bonds would probably not go through the secretion pathway and
therefore not be modified (Gasser et al., 2006). Then again, intended or casual deglycosylation
could likely lead to loss of activity. A class III peroxidase mutant for HRP that contained
mutations in all N-glycosylation sites showed a 300-fold reduction in catalytic activity (Capone et
al., 2014). Even the number of glycosylations per isoenzyme could affect both purification factor
and recovery yield as reported for isoenzymes of HRP (Krainer et al., 2014).
Another very important aspect could be the α-mating factor secretion signal sequence of the P.
pastoris strains used for expression. Extensive site-directed mutagenesis of the respective prepro
region led to interesting results. Though some mutations clearly dampened protein expression,
deletion of specific amino acids led to about 50% increased secretion of reporter proteins
(Lin-Cereghino et al., 2013).
b. Saccharomyces cerevisiae CB018 and InvSc1 strains
As an alternative to the P. pastoris system optimised for the secretion of recombinant proteins a
simpler strategic approach was undertaken. The full length sequences were ligated into the vector
pYES2/NT C and again a His-Tag was attached to the C-terminal end of the proteins. After
verification of the inserts within the correct reading frame transformation of the Saccharomyces
cerevisiae strains CB018 and InvSc1 followed by using the lithium acetate method (IV.7.2.c).
InvSc1 is a common fast-growing S. cerevisiae strain; CB018 was established in the W303 strain
background with deficiencies for major vacuolar proteases (Pep-). Again, successful
transformation was confirmed by colony PCR (IV.6.3.d). Both strains should theoretically be
able to produce the proteins intracellularly. For expression conditions see IV.7.7.c.
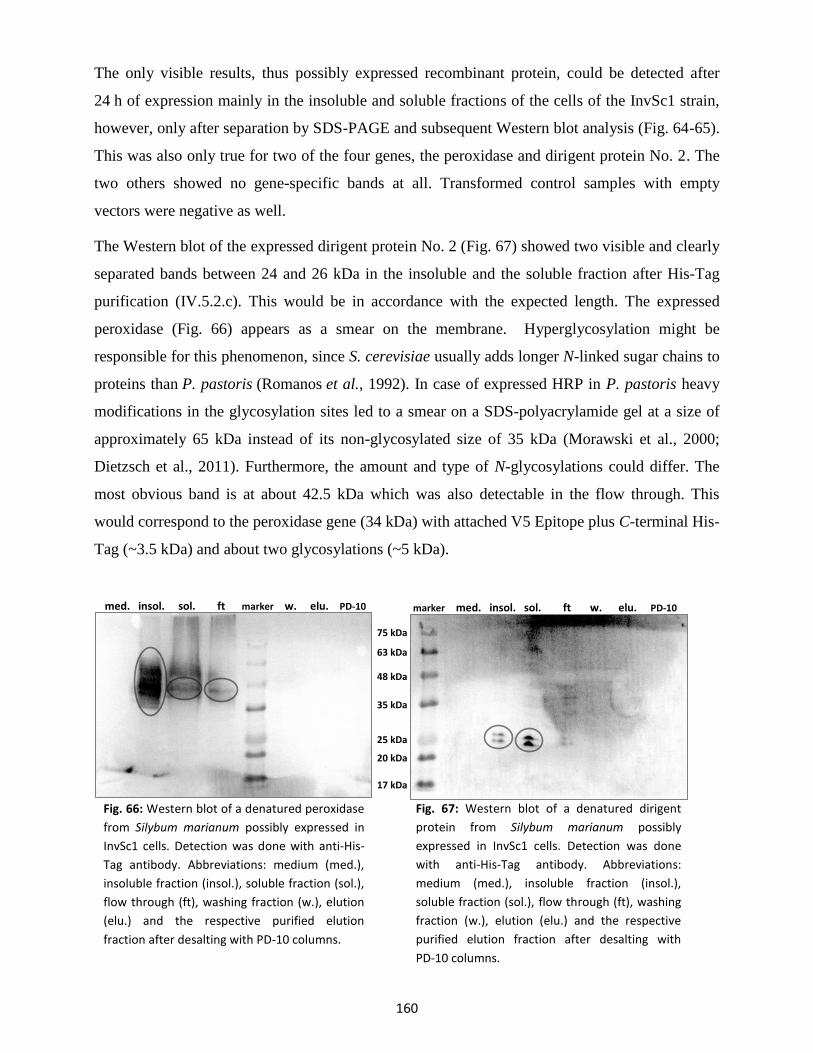
160
The only visible results, thus possibly expressed recombinant protein, could be detected after
24 h of expression mainly in the insoluble and soluble fractions of the cells of the InvSc1 strain,
however, only after separation by SDS-PAGE and subsequent Western blot analysis (Fig. 64-65).
This was also only true for two of the four genes, the peroxidase and dirigent protein No. 2. The
two others showed no gene-specific bands at all. Transformed control samples with empty
vectors were negative as well.
The Western blot of the expressed dirigent protein No. 2 (Fig. 67) showed two visible and clearly
separated bands between 24 and 26 kDa in the insoluble and the soluble fraction after His-Tag
purification (IV.5.2.c). This would be in accordance with the expected length. The expressed
peroxidase (Fig. 66) appears as a smear on the membrane. Hyperglycosylation might be
responsible for this phenomenon, since S. cerevisiae usually adds longer N-linked sugar chains to
proteins than P. pastoris (Romanos et al., 1992). In case of expressed HRP in P. pastoris heavy
modifications in the glycosylation sites led to a smear on a SDS-polyacrylamide gel at a size of
approximately 65 kDa instead of its non-glycosylated size of 35 kDa (Morawski et al., 2000;
Dietzsch et al., 2011). Furthermore, the amount and type of N-glycosylations could differ. The
most obvious band is at about 42.5 kDa which was also detectable in the flow through. This
would correspond to the peroxidase gene (34 kDa) with attached V5 Epitope plus C-terminal His-
Tag (~3.5 kDa) and about two glycosylations (~5 kDa).
med. insol. sol. ft marker w. elu. PD-10 marker med. insol. sol. ft w. elu. PD-10
75 kDa
63 kDa
48 kDa
35 kDa
25 kDa
20 kDa
17 kDa
Fig. 66: Western blot of a denatured peroxidase
from Silybum marianum possibly expressed in
InvSc1 cells. Detection was done with anti-His-
Tag antibody. Abbreviations: medium (med.),
insoluble fraction (insol.), soluble fraction (sol.),
flow through (ft), washing fraction (w.), elution
(elu.) and the respective purified elution
fraction after desalting with PD-10 columns.
Fig. 67: Western blot of a denatured dirigent
protein from Silybum marianum possibly
expressed in InvSc1 cells. Detection was done
with anti-His-Tag antibody. Abbreviations:
medium (med.), insoluble fraction (insol.),
soluble fraction (sol.), flow through (ft), washing
fraction (w.), elution (elu.) and the respective
purified elution fraction after desalting with
PD-10 columns.
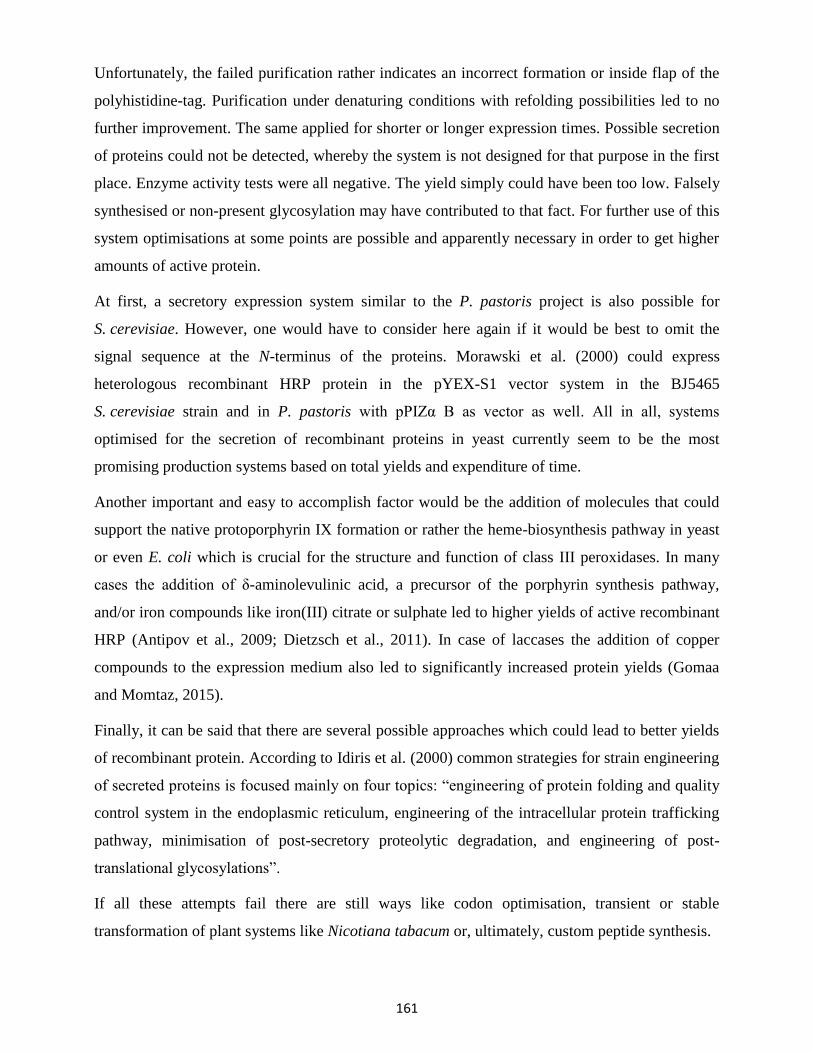
161
Unfortunately, the failed purification rather indicates an incorrect formation or inside flap of the
polyhistidine-tag. Purification under denaturing conditions with refolding possibilities led to no
further improvement. The same applied for shorter or longer expression times. Possible secretion
of proteins could not be detected, whereby the system is not designed for that purpose in the first
place. Enzyme activity tests were all negative. The yield simply could have been too low. Falsely
synthesised or non-present glycosylation may have contributed to that fact. For further use of this
system optimisations at some points are possible and apparently necessary in order to get higher
amounts of active protein.
At first, a secretory expression system similar to the P. pastoris project is also possible for
S. cerevisiae. However, one would have to consider here again if it would be best to omit the
signal sequence at the N-terminus of the proteins. Morawski et al. (2000) could express
heterologous recombinant HRP protein in the pYEX-S1 vector system in the BJ5465
S. cerevisiae strain and in P. pastoris with pPIZα B as vector as well. All in all, systems
optimised for the secretion of recombinant proteins in yeast currently seem to be the most
promising production systems based on total yields and expenditure of time.
Another important and easy to accomplish factor would be the addition of molecules that could
support the native protoporphyrin IX formation or rather the heme-biosynthesis pathway in yeast
or even E. coli which is crucial for the structure and function of class III peroxidases. In many
cases the addition of δ-aminolevulinic acid, a precursor of the porphyrin synthesis pathway,
and/or iron compounds like iron(III) citrate or sulphate led to higher yields of active recombinant
HRP (Antipov et al., 2009; Dietzsch et al., 2011). In case of laccases the addition of copper
compounds to the expression medium also led to significantly increased protein yields (Gomaa
and Momtaz, 2015).
Finally, it can be said that there are several possible approaches which could lead to better yields
of recombinant protein. According to Idiris et al. (2000) common strategies for strain engineering
of secreted proteins is focused mainly on four topics: “engineering of protein folding and quality
control system in the endoplasmic reticulum, engineering of the intracellular protein trafficking
pathway, minimisation of post-secretory proteolytic degradation, and engineering of post-
translational glycosylations”.
If all these attempts fail there are still ways like codon optimisation, transient or stable
transformation of plant systems like Nicotiana tabacum or, ultimately, custom peptide synthesis.
162
VI. Closing Discussion and Outlook
In the course of this work eligible enzymes and several factors possibly involved in flavonolignan
biosynthesis in Silybum marianum have been investigted. A secretory class III heme peroxidase
could be identified and isolated from established cell suspension cultures. This enzyme and
propable isoforms may be responsible for the radical formation and coupling reaction between
taxifolin and coniferyl alcohol. However, peroxidases and other oxidative enzymes or substances
alone could not regulate the formation of flavonolignan diastereomers or even regioisomers
present in the silymarin mixture. In fruits of distinct milk thistle ecotypes/cultivars the
distribution of these flavonolignans can clearly differ. Interestingly, the regioisomer composition
in suspension cells resembled the chemotype of these plant origins.
Since solely extrinsic factors, like seasonal variations, could be excluded to be responsible for
this phenomenon high genotypic variations with distinct chemotypic properties can be assumed.
The plant must have ways to regulate the formation of its individual flavonolignan structures. It
could be shown, that changing concentrations of the substrates could contribute to this to a small
extent. Yet, additional active mechanisms seem probable. Precursors and/or flavonolignans could
be transported individually to their destination in the testa/pericarp and also discriminated in the
same process. The search for transport proteins possibly involved and responsible for
translocation of flavonolignans and accumulation of these substances in specific plant parts
seems an interesting approach. Extensive characterisation by functional genomic efforts, like
metabolic profiling followed by reverse genetic experimentation, would be necessary for further
information.
Another possibility would be that silymarin is mostly only formed at its storage location. This
would indicate a participation of further enzymes involved in flavonolignan biosynthesis. At this
point, dirigent proteins have been hypothesised. An involvement in regulating the individual
flavonolignan structures in Silybum marianum seems possible. Two different dirigent proteins
could be identified to be part of the gene pool. Since these share high similarity with proteins
from non related plant families also regulating the formation of diastereomeric structures a
similar function in milk thistle seems plausible. Even new types of dirigent proteins, playing an
active role in coupling the phenoxy radicals and thus possibly regulate the biosynthesis of
specific positional isomers of silymarin, are possible and would certainly be a major discovery.
163
Enzyme preparations from Silybum marianum cells provided no further information regarding the
presence and involvement of dirigent proteins. The expression of these proteins might be plant
organ and/or time specific. With help of quantitiative real-time PCR (qPCR) with isolated RNA
from distinct plant parts at different stages of plant development it could be tested, whether
involved proteins are active only during the fruit development and maturation phase. This could
further indicate fruit coat specific dirigent proteins possibly involved in flavonolignan
biosynthesis.
The main focus for further clarification of this topic should be the expression and characterisation
of the proteins found by means of PCR methods from Silybum marianum plant material. Since
the laccase, peroxidase and the two dirigent proteins all contain a signal peptide and show many
glycosylation patterns, most likely crucial for structure and activity, this has to be considered
when choosing a suitable expression system. For this purpose, yeast systems optimised for the
secretion of recombinant proteins could be used first. The signal sequence should be omitted.
Furthermore, molecules supporting the native protoporphyrin IX formation should be added.
δ-aminolevulinic acid is particularly well suited for that purpose. Depending on the ion contained
in the centre of the protoporphyrin, addition of Fe2+
/Cu2+
to the medium could also have a
positive impact on expression.
Even better would be the expression in High Five™
insect cell lines specialised for secreted
expression of recombinant proteins. Also stable transformation of plant-based systems could be
considered. An expression of active protein by modified Gateway cloning strategies for tagged
proteins should certainly be possible. Especially with regard to heavily glycosylated proteins with
signal peptides these represent promising alternatives. The expression rate as well could be
increased by performing codon optimisation. Only those amino acids which are most strongly
expressed in the respective species would be used for the synthesis of a recombinant protein.
Ultimately, the expressed peroxidase and laccase should be tested in enzyme assays for their
radical formation potential and their ability to form silymarin. Especially the possible
involvement of the two dirigent proteins should be clarified, but also whether they differ in their
function. In case the laccase and both dirigent proteins are not involved in silymarin biogenesis
the participation in other enzymatic reactions can not be excluded. Lignification processes, like
the formation of monolignol radicals and the stereoselective coupling of monolignol units should
be considered and investigated. X-ray christallography would clarify post-translational
modifications and extended glycosylation patterns.
164
VII. Summary
Flavonolignan Biosynthesis in Silybum marianum – Potential Regulatory Mechanisms and
Candidate Genes
Lennart Poppe
Silymarin, a flavonolignan mixture from milk thistle (Silybum marianum, Asteraceae), is mainly
used for the supportive therapy of chronic liver diseases or to prevent toxic liver damage. In
addition, beneficial effects for human health like tumor inhibition and immunomodulatory
mechanisms have been reported. The plant produces and accumulates silymarin mainly in the
testa and pericarp for protection of its sporophytic embryo against plant herbivores and to limit or
prevent bacterial, fungal or viral infections.
The final step in the biosynthetic pathway of silymarin is not yet fully elucidated. Starting point is
the amino acid L-phenylalanine which is converted to 4-coumaroyl-CoA which is the essential
precursor for flavonoids and monolignols. A flavonoid (taxifolin) and a monolignol (coniferyl
alcohol) then are transformed to silymarin by radical formation (oxidation), coupling,
rearrangement and subsequent cyclisation. Several positional isomers (mainly silychristin,
silydianin, silybin and isosilybin) occur, the latter two being present as diastereomeric pairs. The
distribution of these regioisomers differs in ecotypes/cultivars and genotypes. Whereas a
peroxidase (POD) is probably responsible for the radical formation, very little is known about
how the plant discriminates between its regioisomers and diastereomers. A potential involvement
of dirigent proteins (DIRs), controlling the formation, has been investigated.
In vitro cultures have been established from seedlings of three Silybum marianum varieties for
further insights into flavonolignan content and composition in suspension cultures and the release
of flavonolignans to the outer compartments. Additionally, over a period of two weeks, one
culture line was characterised based on various medium parameters, silymarin formation and
corresponding enzyme activities. The same culture line was also subjected to an elicitation
attempt. However, despite a slight increase in the quantities of the specialised metabolites of the
silymarin mixture, the amounts of flavonolignans produced in suspension cells of Silybum
marianum are very low.
165
Interestingly, a connection between the individual positional isomer amounts of silymarin
extracted from the mature fruit skins and the respective in vitro cells could be determined. The
regioisomer composition in suspension cells resembled the chemotype of the plant origin. This
underlined the assumption of the existence of high genotypic variations and the possible presence
of involved regulatory mechanisms. Higher taxifolin concentrations increased the formation of
two specific regioisomers in enzyme assays but no further direct mechanism for discrimination
could be found. Since enzyme activity and flavonolignans could also be detected in the medium
of suspension cells, transport systems might play a role as well.
A class III secretory peroxidase, a laccase of the cupredoxin superfamily and two different
dirigent proteins could be identified to be a part of the gene pool of Silybum marianum.
Unfortunately, the expression of these genes in different E. coli and yeast strains turned out to be
a big hurdle. Signal peptides and several glycosylation sites, crucial for structure and activity,
greatly contribute to this. Optimisation at some points would be necessary in order to yield
recombinant proteins.
On the other hand, the enzyme(s) involved in the coupling reaction between taxifolin and
coniferyl alcohol could be extracted from in vitro cells and the respective medium. The radical-
forming protein could successfully be identified as a peroxidase with a molecular weight of about
45 kDa using chromatographical methods. In general, structure and function should be similar to
the versatile used horseradish peroxidase (HRP). However, this protein alone could not
specifically regulate the formation of individual silymarin regioisomers. Even though dirigent
proteins could be identified on the genomic level their presence in enzyme preparations or an
actual involvement could never be proven. Their expression and utilisation could be plant organ-
and/or time-specific, namely active only during the fruit development and maturation phase.
In summary, in the scope of this thesis, enzymes probably involved in the final step of the
silymarin biosynthesis and numerous factors possibly regulating the positional isomer ratios were
discussed and highlighted. While issues concerning the expression of recombinant proteins
remained to be challenging, reasonable solutions were presented. A continuation of this project
seems promising and very interesting for further clarification of this subject.
166
VIII. Zusammenfassung
Flavonolignan Biosynthese in Silybum marianum – Mögliche Regulationsmechanismen und
Kandidatengene
Lennart Poppe
Silymarin, ein Flavonolignangemisch aus der Mariendistel (Silybum marianum, Asteraceae), wird
überwiegend zur unterstützenden Therapie von chronischen Lebererkrankungen sowie zur
Prävention toxischer Leberschäden genutzt. Zusätzlich werden positive Effekte wie
Tumorhemmung und immunmodulatorische Mechanismen beschrieben. Die Pflanze reichert
Silymarin hauptsächlich in der Samenschale und Fruchtwand an. Dies dient zum Schutz des
Keimlings gegen Pflanzenfresser und um Bakterien-, Pilz- oder Virusinfektionen einzudämmen
oder zu verhindern.
Der letzte Schritt im Biosyntheseweg von Silymarin ist noch nicht vollständig aufgeklärt.
Ausgangssubstrat ist die Aminosäure L-Phenylalanin, die zu 4-Cumaroyl-CoA umgewandelt
wird, welches eine essentielle Vorstufe für die Synthese von Flavonoiden und Monolignolen ist.
Ein Flavonoid (Taxifolin) und ein Monolignol (Coniferylalkohol) reagieren dann über
Radikalbildung, Verknüpfung, Umlagerung und anschließendem Ringschluss zu Silymarin.
Dabei entstehen mehrere Positionsisomere (hauptsächlich Silychristin, Silydianin, Silybin und
Isosilybin), wobei die beiden zuletzt genannten als Diastereomerenpaare vorliegen. Die
Verteilung der Regioisomere unterscheidet sich in Ökotypen/Kultursorten und Genotypen. Für
die Radikalbildung ist sehr wahrscheinlich eine Peroxidase (POD) verantwortlich. Es ist nur sehr
wenig darüber bekannt, wie die Differenzierung zwischen den Regioisomeren und
Diastereomeren in der Pflanze abläuft, deshalb wurde eine mögliche Beteiligung von
dirigierenden Proteinen (DIRs) untersucht.
Aus Keimlingen dreier Silybum marianum Varianten wurden in-vitro Kulturen angelegt, um
zusätzliche Erkenntnisse über Gehalt und Zusammensetzung der Flavonolignane zu erhalten.
Weiterhin wurde die Sekretion der Sekundärstoffe in Zellwand und Medium von
Suspensionskulturen untersucht. Eine Kulturlinie wurde über einen zweiwöchigen Zeitraum in
Bezug auf verschiedene Mediumskenngrößen, Silymarinbildung und entsprechende
Enzymaktivitäten charakterisiert. Mit der gleichen Kulturlinie wurde auch eine Elicitierung
durchgeführt. Obwohl eine geringe Zunahme an Silymarinkomponenten beobachtet werden
167
konnte, sind die in Suspensionszellen von Silybum marianum produzierten Mengen an
Flavonolignanen leider sehr gering.
Bemerkenswert dabei war ein Zusammenhang zwischen den einzelnen Positionsisomeren des
Silymarins, extrahiert aus den reifen Fruchtschalen, und den entsprechenden in-vitro Kulturen.
Die Zusammensetzung der Regioisomere in den Suspensionszellen hat Ähnlichkeit mit dem
Chemotyp der Pflanzenherkunft. Dies untermauert die Annahme von genotypischen Variationen
und eine mögliche Beteiligung regulatorischer Mechanismen. Erhöhte Taxifolinkonzentrationen
in Enzymassays steigerten zwar die Bildung von zwei spezifischen Regioisomeren, weitere
direkte Wege der Differenzierung konnten jedoch nicht gefunden werden. Da auch das Medium
der Suspensionszellen Enzymaktivität und Flavonolignane aufwies, spielen vermutlich auch
Transportsysteme eine Rolle.
Durch molekularbiologische Methoden konnten eine sekretorische Peroxidase (Klasse III), eine
Laccase der Cupredoxin-Familie und zwei dirigierende Proteine im Genpool von
Silybum marianum identifiziert werden. Die Expression dieser Gene in verschiedenen E. coli und
Hefestämmen erwies sich leider als sehr schwierig. Diese Problematik wurde verstärkt durch die
Anwesenheit von Signalpeptiden und mehreren Glykosylierungsstellen, welche wichtig für
Aufbau und Funktion der Proteine sind. Für die Gewinnung rekombinanter Proteine wäre eine
weitere Optimierung notwendig.
Die an der Kopplungsreaktion zwischen Taxifolin und Coniferylalkohol beteiligen Enzyme
konnten auch aus in-vitro Zellen und dem Medium gewonnen werden. Das verantwortliche
Enzym konnte durch chromatographische Trennverfahren erfolgreich als Peroxidase mit einem
Molekulargewicht von etwa 45 kDa bestimmt werden. Im Allgemeinen sollte sie in Struktur und
Funktion der Meerrettich-Peroxidase (HRP) ähneln. Allerdings konnte dieses Protein allein nicht
die Bildung einzelner Regioisomere des Silymarins gezielt steuern. Obwohl dirigierende Proteine
auf genomischer Ebene nachgewiesen wurden, konnte ihre Gegenwart in Enzymextrakten oder
ihre tatsächliche Beteiligung an der Bildung unterschiedlicher Silymarinkomponenten nicht
belegt werden. Sie könnten organspezifisch oder zu verschiedenen Entwicklungstadien der
Pflanze exprimiert werden. Eine Beteiligung nur während der Fruchtentwicklung und
Reifungsphase wäre denkbar.
Zusammenfassend lässt sich sagen, dass im Rahmen dieser Arbeit Enzyme untersucht wurden,
die vermutlich den letzten Schritt der Silymarin-Biosynthese katalysieren. Zahlreiche Faktoren
wurden angesprochen, die möglicherweise die Zusammensetzung der Positionsisomere

168
regulieren. Während die Expression der rekombinanten Proteine eine Herausforderung bleibt,
wurden weitere Lösungsvorschläge vorgestellt. Eine Fortsetzung dieses Projektes scheint
vielversprechend und hinsichtlich einer weiteren Aufklärung dieses Themas sehr interessant.
169
IX. References
Abarikwu, S.O., Adedara, I.A., Owoeye, O., Tanaka, T., Farombi, E.O., 2009. Silibinin and silymarin from
milk thistle: bioefficacy, hepatoprotection and chemopreventive potentials. In: Nutritional Antioxidants in
Cancer and Degenerative Diseases 167–183. Farombi, E.O. (Ed.). Transworld Research Network, Kerala.
Abbasi, B.H., Ali, H., Yücesan, B., Saeed, S., Rehman, K., Khan, M.A., 2016. Evaluation of biochemical
markers during somatic embryogenesis in Silybum marianum L. 3 Biotech. 6, 71, 1–8.
Abdullah, N.A., Osman N., Hasan, S., Hassan, O.H., 2012. Chelating Agents Role on Thermal
Characteristics and Phase Formation of Modified Cerate-Zirconate via Sol-gel Synthesis Route. Int. J.
Electrochem. Sci. 7, 9401–9409.
AbouZid, S.F., Chen, S-N., McAlpine, J.B., Friesen, J.B., Pauli, G.F., 2016. Silybum marianum pericarp
yields enhanced silymarin products. Fitoterapia 112, 136–142.
Aebi, M., 2013. N-linked protein glycosylation in the ER. Biochim. Biophys. Acta 1833, 2430–2437.
Agati, G., Azzarello, E., Pollastri, S., Tattini, M., 2012. Flavonoids as antioxidants in plants: location and
functional significance. Plant Sci. 196, 67–76.
Ahmad, M., Hirz, M., Pichler, H., Schwab, H., 2014. Protein expression in Pichia pastoris: recent
achievements and perspectives for heterologous protein production. Appl. Microbiol. Biotechnol. 98, 5301–
5317.
Alcalde, M., 2007. Laccases: Biological functions, molecular structure and industrial applications. In:
Industrial Enzymes. Structure, Function and Applications 26, 461–476. Polaina, J., MacCabe, A.P. (Eds.).
Springer, Dordrecht, The Netherlands.
Alikaridis, F., Papadakis, D., Pantelia, K., Kephalas, K., 2000. Flavonolignan production from Silybum
marianum transformed and untransformed root cultures. Fitoterapia 71, 379–384.
Almagro, L., Gómez Ros, L.V., Belchi-Navarro, S., Bru, R., Ros Barceló, A., Pedreño, M.A., 2009. Class
III peroxidases in plant defence reactions. J. Exp. Bot. 60, 377–390.
Al-Senaidy, A.M., Ismael, M.A., 2011. Purification and characterization of membrane-bound peroxidase
from date palm leaves (Phoenix dactylifera L.). Saudi J. Biol. Sci. 18, 293–298.
Althagafy, H.S., Meza-Aviña, M.E., Oberlies, N.H., Croatt, M.P., 2013. Mechanistic study of the
biomimetic synthesis of flavonolignan diastereoisomers in milk thistle. J. Org. Chem. 78, 7594–7600.
Altman, F.P., 1976. Tetrazolium salts and formazans. Prog. Histochem. Cytochem. 9, 1–56.
Andersen, O.M., Markham, K.R., 2006. Flavonoids: Chemistry, Biochemistry and Applications. CRC
Press, Boca Raton, Florida.
Angiosperm Phylogeny Group (APG). Angiosperm Phylogeny Website. Accessed via
http://www.mobot.org/MOBOT/research/APweb/ on 2016-11-25.
Antipov, E., Cho, A.E., Klibanov, A.M., 2009. How a single-point mutation in horseradish peroxidase
markedly enhances enantioselectivity. J. Am. Chem. Soc. 131, 11155–11160.
Baker, M.R., Tabb, D.L., Ching, T., Zimmerman, L.J., Sakharov I.Y., Li, Q.X., 2016. Site-Specific N-
Glycosylation Characterization of Windmill Palm Tree Peroxidase Using Novel Tools for Analysis of Plant
Glycopeptide Mass Spectrometry Data. J. Proteome Res. 15, 2026–2038.
170
Batchelor, A.K., Boutilier, K., Miller, S.S., Labbé, H., Bowman, L., Hu, M., Johnson, D.A., Gijzen, M.,
Miki, B.L., 2000. The seed coat-specific expression of a subtilisin-like gene, SCS1, from soybean. Planta
211, 484–492.
Becker, H., Schrall, R., 1977. Tissue and suspension cultures of Silybum marianum. II. Communication:
The formation of flavonolignans by feeding suspension cultures with flavonoids and coniferyl alcohol.
Planta Med. 32, 27–32.
Belchi-Navarro, S., Pedreño, M.A., Corchete P., 2011. Methyl jasmonate increases silymarin production in
Silybum marianum (L.) Gaernt. cell cultures treated with β-cyclodextrins. Biotechnol. Lett. 33, 179–184.
Benedum, J., Loew, D., Schilcher, H., 2000. Arzneipflanzen in der Traditionellen Medizin, 98. 3. Auflage.
Kooperation Phytopharmaka, Bonn.
Bergheim, I., McClain, C.J., Arteel, G.E., 2005. Treatment of alcoholic liver disease. Dig. Dis. 23, 275–284.
Bower, N.I., Johnston, I.A., 2010. Targeted rapid amplification of cDNA ends (T-RACE) - an improved
RACE reaction through degradation of non-target sequences. Nucleic Acids Res. 38, e194.
Bradford, M.M., 1976. A rapid and sensitive method for the quantication of microgram quantities of protein
utilizing the principle of protein-dye binding. Anal. Biochem. 72, 248–254.
Cacho, M., Morán, M., Corchete, P., Fernández-Tárrago, J., 1999. Influence of medium composition on the
accumulation of flavonolignans in cultured cells of Silybum marianum (L.) Gaertn. Plant Sci. 144, 63–68.
Cai, X.L., Li, D.N., Qiao, J.Q., Lian, H.Z., Wang, S.K., 2009. Determination of silymarin flavonoids by
HPLC and LC-MS and investigation of extraction rate of silymarin in Silybum marianum fruits by boiling
water. Asian J. Chem. 21, 63–74.
Call, H.P., Mücke, I., 1997. History, overview and applications of mediated lignolytic systems, especially
laccase-mediator-systems (Lignozym®-process). J. Biotechnol. 53, 163–202.
Capone, S., Pletzenauer, R., Maresch, D., Metzger, K., Altmann, F., Herwig, C., Spadiut, O., 2014. Glyco-
variant library of the versatile enzyme horseradish peroxidase. Glycobiology 24, 852–863.
Chambers, C.S., Valentova, K., Kren, V., 2015. “Non-Taxifolin” Derived Flavonolignans: Phytochemistry
and Biology. Curr. Pharm. Des. 21, 5489–5500.
Chauhan, J.S., Rao, A., Raghava, G.P.S., 2013. In silico Platform for Prediction of N-, O- and C-Glycosites
in Eukaryotic Protein Sequences. PLoS One 8, e67008.
Chenchik, A., Zhu, Y.Y., Diatchenko, L., Li, R., Hill, J., Siebert, P.D., 1998. Generation and use of high-
quality cDNA from small amounts of total RNA by SMART PCR. In Gene Cloning and Analysis by RT-
PCR 1, 305–319. Siebert, P., Larrick, J. (Eds.). Eaton Publishing Company, Biotechniques Books, Madison.
Chomczynski, P., Sacchi, N., 1987. Single-step method of RNA isolation by acid guanidinium thiocyanate-
phenol-chloroform extraction. Anal. Biochem. 162, 156–159.
Cole, C.R., Smith, C.A., 1989. Glycoprotein biochemistry (structure and function) - a vehicle for teaching
many aspects of biochemistry and molecular biology. Biochem. Educ. 17, 169–224.
Cooper, G.M., 2000. The Endoplasmic Reticulum. In the Cell: A Molecular Approach. 2nd
edition. Sinauer
Associates, Sunderland, Massachusetts.
Cooper, T.G., 1981. Biochemische Arbeitsmethoden 1, 76. W. de Gruyter, Berlin.
171
Cossins, E.A., Chen, L., 1997. Folates and one-carbon metabolism in plants and fungi. Phytochemistry 45,
437–452.
Csupor, D., Csorba, A., Hohmann, J., 2016. Recent advances in the analysis of flavonolignans of Silybum
marianum. J. Pharm. Biomed. Anal. 130, 301–317.
Dalisay, D.S., Kim, K.W., Lee, C., Yang, H., Rübel, O., Bowen, B.P., Davin, L.B., Lewis, N.G., 2015.
Dirigent Protein-Mediated Lignan and Cyanogenic Glucoside Formation in Flax Seed: Integrated Omics
and MALDI Mass Spectrometry Imaging. J. Nat. Prod. 78, 1231–1242.
Davin, L.B., Lewis, N.G., 2000. Dirigent Proteins and Dirigent Sites Explain the Mystery of Specificity of
Radical Precursor Coupling in Lignan and Lignin Biosynthesis. Plant Physiol. 123, 453–461.
Davin, L.B., Wang, H.B., Crowell, A.L., Bedgar, D.L., Martin, D.M., Sarkanen, S., Lewis, N.G., 1997.
Stereoselective bimolecular phenoxy radical coupling by an auxiliary (dirigent) protein without an active
center. Science 275, 362–366.
Dietzsch, C., Spadiut, O., Herwig, C., 2011. A dynamic method based on the specific substrate uptake rate
to set up a feeding strategy for Pichia pastoris. Microb. Cell Fact. 10, 14–22.
Dixit, N., Baboota, S., Kohli, K., Ahmad, S., Ali, J., 2010. Silymarin: a review of pharmacological aspects
and bioavailability enhancement approaches. Indian J. Pharmacol. 42, 38–45.
Effenberger, I., Zhang, B., Li, L., Wang, Q., Liu, Y., Klaiber, I., Pfannstiel, J., Wang, Q., Schaller, A., 2015.
Dirigent Proteins from Cotton (Gossypium sp.) for the Atropselective Synthesis of Gossypol. Angew.
Chem. Int. Ed. Engl. 54, 14660–14663.
Elwekeel, A., Elfishawy, A., AbouZid, S., 2013. Silymarin content in Silybum marianum fruits at different
maturity stages. J. Med. Plant Res. 7, 1665–1669.
Emiliani, G., Fondi, M., Fani, R., Gribaldo, S., 2009. A horizontal gene transfer at the origin of
phenylpropanoid metabolism: a key adaptation of plants to land. Biol. Direct 4, 7, 1–12.
Empt, U., Alfermann, A.W., Pras, N., Petersen, M., 2000. The use of plant cell cultures for the production
of podophyllotoxin and related lignans. J. Appl. Bot. 74, 145–150.
Esfandiari, E., Jin, Z., Abdeen, A., Griffiths, J.S., Western, T.L., Haughn, G.W., 2013. Identification and
analysis of an outer-seed-coat-specific promoter from Arabidopsis thaliana. Plant Mol. Biol. 81, 93–104.
Faezizadeh, Z., Mesbah-Namin, S.A., Allameh, A., 2012. The effect of silymarin on telomerase activity in
the human leukemia cell line K562. Planta Med. 78, 899–902.
Fawal, N., Li, Q., Savelli, B., Brette, M., Passaia, G., Fabre, M., Mathé, C., Dunand, D., 2013. PeroxiBase:
a database for large-scale evolutionary analysis of peroxidases. Nucleic Acids Res. 41, D441–D444.
Feiz, L., Irshad, M., Pont-Lezica, R.F., Canut, H., Jamet, E., 2006. Evaluation of cell wall preparations for
proteomics: a new procedure for purifying cell walls from Arabidopsis hypocotyls. Plant Methods 2, 10, 1–
13.
Fiebig, M., Wagner, H., 1984. New antihepatotoxically active flavonolignans from a white flowering
variety of Silybum. Planta Med. 50, 310–313.
Fisher, A.C., Haitjema, C.H., Guarino, C., Çelik, E., Endicott, C.E., Reading, C.A., Merritt, J.H., Ptak,
A.C., Zhang, S., DeLisa, M.P., 2011. Production of secretory and extracellular N-linked glycoproteins in
Escherichia coli. Appl. Environ. Microbiol. 77, 871–881.
Freudenberg, K., Nash, A.C., 1968. Constitution and Biosynthesis of Lignin. Springer, Berlin.
172
Fuchs, L., 1543. The New Herbal of 1543. New Kreüterbuch XXXI (31). Taschen GmbH Köln, 2001.
Funk, V.A., Susanna, A., Stuessy, T., Robinson, H., 2009. Classification of Compositae. In Systematics,
Evolution, and Biogeography of Compositae 171–189. Funk, V.A., A. Susanna, A., Stuessy, T., R. Bayer,
R. (Eds.). International Association for Plant Taxonomy, Vienna.
Gamborg, O.L., Miller, R.A., Ojima, K., 1968. Nutrient requirements of suspension cultures of soybean root
cells. Exp. Cell Res. 50, 151–158.
Gasper, R., Effenberger, I., Kolesinski, P., Terlecka, B., Hofmann, E., Schaller, A., 2016. Dirigent Protein
Mode of Action Revealed by the Crystal Structure of AtDIR6. Plant Physiol. 172, 2165–2175.
Gasser, B., Maurer, M., Gach, J., Kunert, R., Mattanovich, D., 2006. Engineering of Pichia pastoris for
improved production of antibody fragments. Biotechnol. Bioeng. 94, 353–361.
Gavezzotti, P., Vavrikova, E., Valentova, K., Fronza, G., Kudanga, T., Kuzma, M., Riva, S., Biedermann,
D., Kren, V., 2014. Enzymatic oxidative dimerization of silymarin flavonolignans. J. Mol. Catal. B-Enzym.
109, 24–30.
Gertlowski, C., Petersen, M., 1993. Influence of carbon source on growth and rosmarinic acid production in
suspension cultures of Coleus blumei. Plant Cell Tiss. Org. Cult. 34, 183–190.
Ghosh, A., Ghosh, T., Jain, S., 2010. Silymarin - a review on the pharmacodynamics and bioavailability
enhancement approaches. J. Pharm. Sci. Technol. 2, 348–355.
Gianfreda, L., Xu, F., Bollag, J.M., 1999. Laccases: A Useful Group of Oxidoreductive Enzymes.
Bioremediat. J. 3, 1–26.
Giardina, P., Faraco, V., Pezzella, C., Piscitelli, A., Vanhulle, S., Sannia, G., 2010. Laccases: a never-
ending story. Cell. Mol. Life Sci. 67, 369–385.
Gietz, R.D., Schiestl, R.H., 2007. High-efficiency yeast transformation using the LiAc/SS carrier
DNA/PEG method. Nat. Protoc. 2, 31–34.
Global Biodiversity Information Facility (GBIF). GBIF Backbone Taxonomy. Accessed via
http://www.gbif.org/species/3145214 on 2016-11-09.
Gold, M.H., Alic, M., 1993. Molecular biology of the lignin-degrading basidiomycete Phanerochaete
chrysosporium. Microbiol Rev. 57, 605–622.
Gomaa, O.M., Momtaz, O.A., 2015. Copper induction and differential expression of laccase in Aspergillus
flavus. Braz. J. Microbiol. 46, 285–292.
González, A.M., Marcel, T.C., Kohutova, Z., Stam, P., van der Linden, C.G., Niks, R.E., 2010. Peroxidase
profiling reveals genetic linkage between peroxidase gene clusters and basal host and non-host resistance to
rusts and mildew in barley. PLoS One 5, e10495.
Green, J.M., Nichols, B.P., Matthews, R.G., 1996. Folate biosynthesis, reduction, and polyglutamylation.
In: Escherichia coli and Salmonella. Cellular and Molecular Biology, 665–673. Neidhardt, F.C. (Ed.).
Washington, ASM Press, USA.
Greenlee, H., Abascal, K., Yarnell, E., Ladas, E., 2007. Clinical applications of Silybum marianum in
oncology. Integr. Cancer Ther. 6, 158–165.
Greimel, A., Koch, H., 1977. Peroxidase-isoenzyme in Silybum marianum. Planta Med. 32, 323–330.
173
Greimel, A., Koch, H., 1977. Silymarin - an inhibitor of horseradish peroxidase. Experientia 33, 1417–
1418.
Grieve, M., 1971. A Modern Herbal 2, 797. Dover Publications, New York, USA.
Grigorenko, V., Chubar, T., Kapeliuch, Y., Börchers, T., Spener, F., Egorov, A., 1999. New approaches for
functional expression of recombinant horseradish peroxidase C in Escherichia coli. Biocatal. Biotransform.
17, 359–379.
Halitschke, R, Baldwin, I.T., 2005. Jasmonates and related compounds in plant-insect interactions. J. Plant
Growth Regul. 23, 238–245.
Hanahan, D., 1983. Studies on transformation of Escherichia coli with plasmids. J. Mol. Biol. 166, 557–
580.
Hasanloo, T., Eskandari, S., Najafi, F., 2014. Chitosan (middle-viscous) as an effective elicitor for silymarin
production in Silybum marianum hairy root cultures. Res. J. Pharmacogn. 1, 9–13.
Hasanloo, T., Khavari-Nejab, R.A., Majidi, E., Ardekani, M.R.S., 2005. Analysis of flavonolignans in dried
fruits of Silybum marianum (L.) Gaertn. from Iran. Pakistan J. Biol. Sci. 8, 1778–1782.
Hasanloo, T., Khavari-Nejad, R.A., Majidi, E., Ardakani, M.R.S., 2008. Flavonolignan production in cell
suspension culture of Silybum marianum. Pharm. Biol. 46, 876–882.
He, F., Qin, X., Zhang, H., Yang, Y., Zhang, X., Yang, Y., 2014. Characterization of laccase isoenzymes
from the white-rot fungus Ganoderma sp.En3 and synergistic action of isoenzymes for dye decolorization.
J. Chem. Tech. Bio. 90, 2265–2279.
Heinzkill, M., Bech, L., Halkier, T., Schneider, P., Anke, T., 1998. Characterization of Laccases and
Peroxidases from Wood-Rotting Fungi (Family Coprinaceae). Appl. Environ. Microbiol. 64, 1601–1606.
Herrmann, K.M., Weaver, L.M., 1999. The Shikimate Pathway. Annu. Rev. Plant Physiol. Plant Mol. Biol.
50, 473–503.
Hetz, E., Liersch, R., Schieder, O., 1995. Genetic investigations on Silybum marianum and S. eburneum
with respect to leaf colour, outcrossing ratio, and flavonolignan composition. Planta Med. 61, 54c57.
Higgins, D.R., Cregg, J.M., 1998. Introduction to Pichia pastoris. In Pichia Protocols. Methods in
Molecular Biology 103, 1–15. Humana Press, Totowa, New Jersey.
Hohmann, B., Reher, G., Stahl-Biskup, E., 2001. Mikroskopische Drogenmonographien, Pharmazeutische
Biologie 3, 120. Wissenschaftliche Verlagsgesellschaft mbH, Stuttgart.
Idiris, A., Tohda, H., Kumagai, H., Takegawa, K., 2010. Engineering of protein secretion in yeast: strategies
and impact on protein production. Appl. Microbiol. Biotechnol. 86, 403–417.
Jiang, W., Yin, Q., Wu, R., Zheng, G., Liu, J., Dixon, R.A., Pang, Y., 2015. Role of a chalcone isomerase-
like protein in flavonoid biosynthesis in Arabidopsis thaliana. J. Exp. Bot. 66, 7165–7179.
Johannes, C., Majcherczyk, A., 2000. Laccase activity tests and laccase inhibitors. J. Biotechnol. 78, 193–
199.
Jones, P., Binns, D., Chang, H.Y., Fraser, M., Li, W., McAnulla, C., McWilliam, H., Maslen, J., Mitchell,
A., Nuka, G., Pesseat, S., Quinn, A.F., Sangrador-Vegas, A., Scheremetjew, M., Yong, S.Y., Lopez, R.,
Hunter, S., 2014. InterProScan 5: genome-scale protein function classification. Bioinformatics 30, 1236–
1240.
174
Kapp, K., Schrempf, S., Lemberg, M.K., Dobberstein, B., 2009. Post-Targeting Functions of Signal
Peptides. In: Madame Curie Bioscience Database. Austin, Texas, Landes Bioscience.
Karimi, G., Vahabzadeh, M., Lari, P., Rashedinia, M., Moshiri, M., 2011. “Silymarin”, a promising
pharmacological agent for treatment of diseases. Iran J. Basic. Med. Sci. 14, 308–317.
Kazenwadel, C., 2013. Challenges in Biocatalysis – Case Studies on Protein Expression, Engineering and
Application. PhD Dissertation. University of Stuttgart.
Kazenwadel, C., Klebensberger, J., Richter, S., Pfannstiel, J., Gerken, U., Pickel, B., Schaller, A., Hauer,
B., 2012. Optimized expression of the dirigent protein AtDIR6 in Pichia pastoris and impact of
glycosylation on protein structure and function. Appl. Microbiol. Biotechnol. 97, 7215–7227.
Kersten, P.J., Kalyanaraman, B., Hammel, K.E., Reinhammar, B., Kirk, T.K., 1990. Comparison of lignin
peroxidase, horseradish peroxidase and laccase in the oxidation of methoxybenzenes. Biochem. J. 268, 475–
480.
Khalili, M., Hasanloo, T., Kazemi Tabar, S.K., Rahnama, H., 2009. Chitosan (middle-viscous) as an
effective elicitor for silymarin production in Silybum marianum hairy root cultures. Cell Biol. Int. 33, 988–
994.
Khan, M.A., Abbasi, B.H., Shah, N.A., Yücesan, B., Ali, H., 2015. Analysis of metabolic variations
throughout growth and development of adventitious roots in Silybum marianum L. (Milk thistle), a
medicinal plant. Plant Cell Tiss. Org. Cult. 123, 501–510.
Khow, O., Suntrarachun, S., 2012. Strategies for production of active eukaryotic proteins in bacterial
expression system. Asian Pac. J. Trop. Biomed. 2, 159–162.
Kim, K.W., Moinuddin, S.G., Atwell, K.M., Costa, M.A., Davin, L.B., Lewis, N.G., 2012. Opposite
Stereoselectivities of Dirigent Proteins in Arabidopsis and Schizandra Species. J. Biol. Chem. 287, 33957–
33972.
Kim, K.W., Smith, C.A., Daily, M.D., Cort, J.R., Davin, L.B., Lewis, N.G., 2007. Trimeric structure of (+)-
pinoresinol forming dirigent protein at 1.95 Å resolution with three isolated active sites. J. Biol. Chem. 290,
1308–1318.
Kim, N.C., Graf, T.N., Sparacino, C.M., Wani, M.C., Wall, M.E., 2003. Complete isolation and
characterization of silybins and isosilybins from milk thistle (Silybum marianum). Org. Biomol. Chem. 1,
1684–1689.
Kitamura, S., Shikazono, N., Tanaka, A., 2006. Transport of flavonoids: from cytosolic synthesis to
vacuolar accumulation. In: The Science of Flavonoids 123–146. Grotewold, E. (Ed.). Springer, New York.
Koukol, J., Conn, E.E., 1961. Metabolism of aromatic compounds in higher plants. IV. Purification and
properties of phenylalanine deaminase of Hordeum vulgare. J. Biol. Chem. 236, 2692–2698.
Krainer, F.W., Glieder, A., 2015. An updated view on horseradish peroxidases: recombinant production and
biotechnological applications. Appl. Microbiol. Biotechnol. 99, 1611–1625.
Krainer, F.W., Pletzenauer, R., Rossetti, L., Herwig, C., Glieder, A., Spadiut, O., 2014. Purification and
basic biochemical characterization of 19 recombinant plant peroxidase isoenzymes produced in Pichia
pastoris. Protein Expr. Purif. 95, 104–112.
Kuki, A., Nagy, L., Deak, G., Nagy, M., Zsuga, M., Keki, S., 2012. Identification of silymarin constituents:
An improved HPLC-MS method. Chromatographia 75, 175–180.
175
Kwon, D.Y., Jung, Y.S., Kim, S.J., Kim, Y.S., Choi, D.W., Kim, Y.C., 2013. Alterations in sulfur amino
acid metabolism in mice treated with silymarin: a novel mechanism of its action involved in enhancement
of the antioxidant defense in liver. Planta Med. 79, 997–1002.
Laemmli, U.K., 1970. Cleavage of Structural Proteins during Assembly of the Head of Bacteriophage T4.
Nature 227, 680–685.
Lajter, I., 2016. Biologically active secondary metabolites from Asteraceae and Polygonaceae species. PhD
Dissertation. University of Szeged, Hungary.
Lee, D.Y., Liu, Y., 2003. Molecular structure and stereochemistry of silybin A, silybin B, isosilybin A, and
isosilybin B, isolated from Silybum marianum (milk thistle). J. Nat. Prod. 66, 1171–1174.
Leng-Peschlow, E., 1996. Properties and medical use of flavonolignans (silymarin) from Silybum
marianum. Phytother. Res. 10, 25–26.
Lepiniec, L., Debeaujon, I., Routaboul, J.M., Baudry, A., Pourcel, L., Nesi, N., Caboche, M., 2006.
Genetics and biochemistry of seed flavonoids. Annu. Rev. Plant Biol. 57, 405–430.
Letschert, K., Faulstich, H., Keller, D., Keppler, D., 2006. Molecular Characterization and Inhibition of
Amanitin Uptake into Human Hepatocytes. Toxicol. Sci. 91, 140–149.
Li, Q., Chen, J., Xiao, Y., Di, P., Zhang, L., Chen, W., 2014. The dirigent multigene family in Isatis
indigotica: gene discovery and differential transcript abundance. BMC Genomics 15, 388.
Lin-Cereghino, G.P., Stark, C.M., Kim, D., Chang, J., Shaheen, N., Poerwanto, H., Agari, K., Moua, P.,
Low, L.K., Tran, N., Huang, A.D., Nattestad, M., Oshiro, K.T., Chang, J.W., Chavan, A., Tsai, J.W., 2013.
The effect of α-mating factor secretion signal mutations on recombinant protein expression in Pichia
pastoris. Gene 519, 311–317.
Loguercio, C., Festi, D., 2011. Silybin and the liver: from basic research to clinical practice. World J.
Gastroenterol. 17, 2288–2301.
MacKinnon, S.L., Hodder, M., Craft, C., Simmons-Boyce, J., 2007. Silyamandin, a new flavonolignan
isolated from milk thistle tinctures. Planta Med. 73, 1214–1216.
Madrid, E., Corchete, P., 2010. Silymarin secretion and its elicitation by methyl jasmonate in cell cultures
of Silybum marianum is mediated by phospholipase D-phosphatidic acid. J. Exp. Bot. 61, 747–754.
Martin, G.B., Bogdanove, A.J., Sessa, G., 2003. Understanding the functions of plant disease resistance
proteins. Annu. Rev. Plant Biol. 54, 23–61.
Martin, R.J., Lauren, D.R., Smith, W.A., Jensen, D.J., Deo, B., Douglas, J.A., 2006. Factors influencing
silymarin content and composition in variegated thistle (Silybum marianum). New Zeal. J. Crop. Hort. 34,
239–245.
Mascher, H., Kikuta, C., Weyhenmeyer, R., 1993. Diastereomeric separation of free and conjugated silibin
in plasma by reversed-phase HPLC after specific extraction. J. Liquid Chromatogr. 16, 2777–2789.
Matsuda, F., Hirai, M.Y., Sasaki, E., Akiyama, K., Yonekura-Sakakibara, K., Provart, N.J., Sakurai, T.,
Shimada, Y., Saito, K., 2010. AtMetExpress development: a phytochemical atlas of Arabidopsis
development. Plant Physiol. 552, 576–578.
Milic, N., Milosevic, N., Suvajdzic, L., Zarkov, M., Abenavoli, L., 2013. New therapeutic potentials of milk
thistle (Silybum marianum). Nat. Prod. Commun. 8, 1801–1810.
176
Morawski, B., Lin, Z.L., Cirino, P.C., Joo, H., Bandara, G., Arnold, F.H., 2000. Functional expression of
horseradish peroxidase in Saccharomyces cerevisiae and Pichia pastoris. Protein Eng. 13, 377–384.
Morozova, O.V., Shumakovich, G.P., Gorbacheva, M.A., Shleev, S.V., Yaropolov, A.I., 2007. “Blue”
laccases. Biochemistry (Mosc.) 72, 1136–1150.
Moscatiello, R., Baldan, B., Navazio, L., 2013. Plant cell suspension cultures. Methods Mol. Biol. 953, 77–
93.
Mulder-Krieger, T., Verpoorte, R., Svendsen, A.B., Scheffer, J.J.C., 1988. Production of essential oils and
flavours in plant cell and tissue cultures. A review. Plant Cell Tiss. Organ Cult. 13, 85–154.
Mullis, K.B., Erlich, H.A., Arnheim, N., Horn, G.T., Saiki, R.K., Scharf, S.J., 1987. Process for amplifying,
detecting, and/or-cloning nucleic acid sequences. U.S. Patent # 4.683.195.
Murashige, T., Skoog, F., 1962. A Revised Medium for Rapid Growth and Bio Assays with Tobacco Tissue
Cultures. Physiologia Plantarum 15, 473–497.
Nothaft, H., Szymanski, M., 2013. Bacterial Protein N-Glycosylation: New Perspectives and Applications. J
Biol Chem. 288, 6912–6920.
Novotná, M., Gažák, R., Biedermann, D., Di Meo, F., Marhol, P., Kuzma, M., Bednárová, L., Fuksová, K.,
Trouillas, P., Křen, V., 2014. cis–trans Isomerization of silybins A and B. Beilstein J. Org. Chem. 10,
1047–1063.
Nyiredy, S., Samu, Z., Szücs, Z., Gulácsi, K., Kurtán, T., Antus, S., 2008. New Insight into the Biosynthesis
of Flavanolignans in the White-Flowered Variant of Silybum marianum. J. Chromatogr. Sci. 46, 93–96.
Palm, G.J., Sharma, A., Kumari, M., Panjikar, S., Albrecht, D., Jagannadham, M.V., Hinrichs, W., 2014.
Post-translational modification and extended glycosylation pattern of a plant latex peroxidase of native
source characterized by X-ray crystallography. FEBS J. 281, 4319–4333.
Parmar, M.Y., Gandhi, T.R., 2008. From hepatoprotective herbal drug, silymarin from experimental
pharmacology to clinical medicine – a review. Pharmacogn. Rev. 2, 102–109.
Passardi, F., Cosio, C., Penel, C., Dunand, C., 2005. Peroxidases have more functions than a swiss army
knife. Plant Cell Rep. 24, 255–265.
Perez Galende, P., Hidalgo Cuadrado, N., Arellano, J.B., Gavilanes, F., Kostetsky, E.Y., Zhadan, G.G.,
Villar, E., Roig, M.G., Kennedy, J.F., Shnyrov, V.L., 2015. Purification and structural stability of white
Spanish broom (Cytisus multiflorus) peroxidase. Int. J. Biol. Macromol. 72, 718–723
Petersen, M., 1994. Coleus spp.: in vitro culture and the production of forskolin and rosmarinic acid. In
Biotechnology in Agriculture and Forestry VI, 69–92. Y.P.S. Bajaj (Ed.). Springer, Berlin, Heidelberg.
Petersen, T.N., Brunak, S., von Heijne, G., Henrik Nielsen, H., 2011. SignalP 4.0: discriminating signal
peptides from transmembrane regions. Nat. Methods 8, 785–786.
Pezeshki, S., 2016. Biosynthese von Kaffeesäuremetaboliten im Ackerhornmoos Anthoceros agrestis und
im Kleinen Blasenmützenmoos Physcomitrella patens. PhD Thesis, Philipps-Universität Marburg.
Pickel, B., 2011. Heterologe Expression und molekulare Charakterisierung des Dirigentproteins AtDIR6
aus A. thaliana. PhD Thesis, Universität Hohenheim.
Pickel, B., Constantin, M.A., Pfannstiel, J., Conrad, J., Beifuss, U., Schaller, A., 2010. An
Enantiocomplementary Dirigent Protein for the Enantioselective Laccase-Catalyzed Oxidative Coupling of
Phenols. Angew. Chem. Int. Ed. Engl. 49, 202–204.
177
Popay, I., 2013. Silybum marianum (variegated thistle). Invasive Species Compendium. Accessed via
http://www.cabi.org/isc/datasheet/50304 on 2016-11-08.
Poppe, L., Petersen, M., 2016. Variation in the flavonolignan composition of fruits from different Silybum
marianum chemotypes and suspension cultures derived therefrom. Phytochemistry 131, 68–75.
Prieto, D., Corchete, P., 2014. Transport of flavonolignans to the culture medium of elicited cell
suspensions of Silybum marianum. J. Plant. Physiol. 171, 63–68.
Printz, B., Morais R.D.S., Wienkoop, S., Seargent, K., Lutts, S., Hausman, J.F., Renaut, J., 2015. An
improved protocol to study the plant cell proteome. Front. Plant Sci. 6, 237.
Quattrocchi, U., 1999. CRC World Dictionary of Plant Names: Common Names, Scientific Names,
Eponyms, Synonyms, and Etymology 4, 3452. CRC Press, Boca Raton, Florida.
Quiroz-Figueroa, F.R., Loyola-Vargas, V., 2001. Characterization of extracellular peroxidases released by
coffee suspension cell cultures. Colloq. Sci. Int. Café 19, 840–846.
Radjabian, T., Rezazadeh, S.H., Huseini, H.F., 2008. Analysis of silymarin components in the seed extracts
of some milk thistle ecotypes from Iran by HPLC. Iran. J. Sci. Technol. Trans. A Sci. 32, 141–146.
Ramasamy, K., Agarwal, R., 2008. Multitargeted therapy of cancer by silymarin. Cancer Lett. 269, 352–
362.
Rao, S.R., Ravishankar, G.A., 2002. Plant cell cultures: Chemical factories of secondary metabolites.
Biotechnol. Adv. 20, 101–153.
Ravi, K., Hu, C., Reddi, P.S., van Huystee, R.B., 1986. Effect of tunicamycin on peroxidase release by
cultured peanut suspension cells. J. Exp. Bot. 37, 1708–1715.
Reiss, R., Ihssen, J., Richter, M., Eichhorn, E., Schilling, B., Thöny-Meyer, L., 2013. Laccase versus
laccase-like multi-copper oxidase: a comparative study of similar enzymes with diverse substrate spectra.
PLoS One 8, e65633.
Romanos, M.A., Scorer, C.A., Clare, J.J., 1992. Foreign gene expression in yeast: a review. Yeast 8, 423–
488.
Rose, F., 1981. The Wild Flower Key. British Isles and North West Europe. A Guide to Plant Identification
in the Field, with and Without Flowers, 388–389. Frederick Warne, Penguin Books, London.
Routaboul, J.M., Kerhoas, L., Debeaujon, I., Pourcel, L., Caboche, M., Einhorn, J., Lepiniec, L., 2006.
Flavonoid diversity and biosynthesis in seed of Arabidopsis thaliana. Planta 224, 96–107.
Sahoo, K.P., Kasera, P.K., Mohammed, S., 2012. Secondary metabolites produced during different seasons
in some arid medicinal plants. Asian J. Plant Sci. 2, 650–652.
Saiki, R.K., Gelfand, D.H., Stoffel, S., Scharf, S.J., Higuchi, R., Horn, G.T., Mullis, K.B., Erlich, H.A.,
1988. Primer-directed enzymatic amplification of DNA with a thermostable DNA polymerase. Science 239,
487–491.
Saito, K., Yonekura-Sakakibara, K., Nakabayashi, R., Higashi, Y., Yamazaki, M., Tohge, T., Fernie, A.R.,
2013. The flavonoid biosynthetic pathway in Arabidopsis: structural and genetic diversity. Plant Physiol.
Biochem. 72, 21–34.
Sambrook, J., Russell, D.W., 2006. Purification of nucleic acids by extraction with phenol:chloroform. Cold
Spring Harb. Protoc..
178
Sánchez-Sampedro, M.A., Fernández-Tárrago, J., Corchete, P., 2005. Yeast extract and methyl jasmonate-
induced silymarin production in cell cultures of Silybum marianum (L.) Gaertn.. J. Biotechnol. 119, 60–69.
Sánchez-Sampedro, M.A., Fernández-Tárrago, J., Corchete, P., 2007. Silymarin synthesis and degradation
by peroxidases of cell suspension cultures of Silybum marianum. J. Plant Physiol. 164, 669–674.
Schadewaldt, H., 1969. The history of Silymarin. Contribution to the history of liver therapy. Med. Welt 20,
902–914.
Schmitt, J., Petersen, M., 2002. Pinoresinol and matairesinol accumulation in a Forsythia × intermedia cell
suspension culture. Plant Cell Tissue Organ Cult. 68, 91–98.
Scotto-Lavino, E., Du, G., Frohman, M.A., 2006a. 5′-end cDNA amplification using classic RACE. Nat.
Protoc. 1, 2555–2562.
Scotto-Lavino, E., Du, G., Frohman, M.A., 2006b. 3′-end cDNA amplification using classic RACE. Nat.
Protoc. 1, 2742–2745.
Seneviratne, H.K., Dalisay, D.S., Kim, K.W., Moinuddin, S.G., Yang, H., Hartshorn, C.M., Davin, L.B.,
Lewis, N.G., 2014. Non-host disease resistance response in pea (Pisum sativum) pods: Biochemical
function of DRR206 and phytoalexin pathway localization. Phytochemistry 113, 140–148.
Sergio, L., Pieralice, M., Di Venere, D., Cardinali, A., 2007. Thermostability of soluble and bound
peroxidases from artichoke and a mathematical model of its inactivation kinetics. Food Technol.
Biotechnol. 45, 367–373.
Serra, M.A., Sabbioni, E., Marchesini, A., Pintar, A., Valoti, M., 1989. Vanadate as an inhibitor of plant and
mammalian peroxidases. Biol. Trace. Elem. Res. 23, 151–164.
Sevier, C.S., Kaiser, C.A., 2002. Formation and transfer of disulphide bonds in living cells. Nat. Rev. Mol.
Cell Bio. 3, 836–847.
Sezonov, G., Joseleau-Petit, D., D’Ari, R., 2007. Escherichia coli Physiology in Luria-Bertani Broth. J.
Bacteriol. 189, 8746–8749.
Shigeto, J., Tsutsumi, Y., 2015. Diverse functions and reactions of class III peroxidases. New Phytol. 209,
1395–1402.
Shokrpour, M., Mohammadi, S.A., Moghaddam, M., Ziai, S.A., Javanshir, A., 2007. Variation in
flavonolignan concentration of milk thistle (Silybum marianum) fruits grown in Iran. J. Herbs Spices Med.
Plants. 13, 55–69.
Sigma-Aldrich. Peroxidase enzymes. EC 1.11.1.7. Accessed via http://www.sigmaaldrich.com/life-
science/metabolomics/enzyme-explorer/analytical-enzymes/peroxidase-enzymes.html on 2017-3-24.
Smetanska, I., 2008. Production of secondary metabolites using plant cell cultures. Adv. Biochem. Eng.
Biotechnol. 111, 187–228.
Stoilova, I., Krastanov, A., Stanchev, V., 2010. Properties of crude laccase from Trametes versicolor
produced by solid-substrate fermentation. J. Adv. Res. BioSci. Biotechnol. 1, 208–215.
Szilági, I., Tétényi, P., Antus, S., Seligmann, O., Chari, V.M., Seitz, M., Wagner, H., 1981. Structure of
silandrin and silymonin, two new flavanolignans from a white blooming Silybum marianum variety. Planta
Med. 43, 121–127.
Thurston, C.F., 1994. The structure and function of fungal laccases. Microbiology. 140, 19–26.
179
Tůmová, L., Tůma, J., Doležal, M., 2011. Pyrazinecarboxamides as potential elicitors of flavonolignan and
flavonoid production in Silybum marianum and Ononis arvensis cultures in vitro. Molecules 16, 9142–
9152.
Vargas-Mendoza, N., Madrigal-Santillán, E., Morales-González, A., Esquivel-Soto, J., Esquivel-Chirino,
C., García-Luna, Y., González-Rubio, M., Gayosso-de-Lucio, J.A., Morales-González, J.A., 2014.
Hepatoprotective Effect of Silymarin. World J. Hepatol. 6, 144–149.
Veitch, N.C., 2004. Structural determinants of plant peroxidase function. Phytochem. Rev. 3, 3–18.
Verdonk, J.C., Hatfield, R.D., Sullivan, M.L., 2012. Proteomic analysis of cell walls of two developmental
stages of alfalfa stems. Front. Plant Sci. 3, 279, 1–9.
Vildová, A., Hendrychová, H., Kubeš, J., Tůmová, L., 2014. Influence of AgNO3 Treatment on the
Flavonolignan Production in Cell Suspension Culture of Silybum marianum (L.) Gaertn. Int. J. Biol.
Biomol. Agric. Food Biotechnol. Eng. 8, 959–962.
Vogt, T., 2010. Phenylpropanoid Biosynthesis. Mol. Plant 3, 2–20.
von Heijne, G., 1990. The Signal Peptide. J. Membr. Biol. 115, 195–201.
Wan, L., Xia, Q., Qiu, X., Selvaraj, G., 2002. Early stages of seed development in Brassica napus: a seed
coat-specific cysteine proteinase associated with programmed cell death of the inner integument. Plant J.
30, 1–10.
Watson, L., Dallwitz, M.J., 1992 onwards. The families of flowering plants: descriptions, illustrations,
identification and information retrieval. Version: 19th October 2016. Accessed via http://delta-
intkey.com/angio/www/composit.htm on 2016-11-28.
Welinder, K.G., 1979. Amino Acid Sequence Studies of Horseradish Peroxidase. FEBS J. 96, 483–502.
Wellington, K., Blair, J., 2001. Silymarin: A review of its clinical properties in the management of hepatic
disorders. BioDrugs 15, 465–489.
Werten, M.W., van den Bosch, T.J., Wind, R.D., Mooibroek, H., de Wolf, F.A., 1999. High-yield secretion
of recombinant gelatins by Pichia pastoris. Yeast 15, 1087–1096.
Weston, L.A., Ryan, P.R., Watt, M., 2012. Mechanisms for cellular transport and release of allelochemicals
from plant roots into the rhizosphere. J. Exp. Bot. 63, 3445–3454.
Wichtl, M., 2009. Teedrogen und Phytopharmaka. Ein Handbuch für die Praxis auf wissenschaftlicher
Grundlage. 5. Auflage. Wissenschaftliche Verlagsgesellschaft mbH, Stuttgart.
Wuhrer, M., Balog, C.I, Koeleman, C.A., Deelder, A.M., Hokke, C.H, 2005. New features of site-specific
horseradish peroxidase (HRP) glycosylation uncovered by nano-LC-MS with repeated ion-
isolation/fragmentation cycles. Biochim. Biophys. Acta. 1732, 229–239.
Yabuta, T., 1924. The constitution of kojic acid, a gamma-pyrone derivative formed by Aspergillus oryzae
from carbohydrates. J. Chem. Soc. 125, 575–587.
Zdero, C., Bohlmann, F., 1990. Systematics and evolution within the Compositae, seen with the eyes of a
chemist. Plant Syst. Evol. 171, 1–14.
Zhu, J.X., Ren, J., Qin, J.J., Cheng, X.R., Zeng, Q., Zhang, F., Yan, S.K., Jin, H.Z., Zhang, W.D., 2012.
Phenylpropanoids and Lignanoids from Euonymus acanthocarpus. Arch. Pharm. Res. 35, 1739–1747.