FORSCHUNGSBERICHT AGRARTECHNIK - Uni...
92
FORSCHUNGSBERICHT AGRARTECHNIK des Fachausschusses Forschung und Lehre der Max-Eyth-Gesellschaft Agrartechnik im VDI (VDI-MEG) Johannes Hagen Krümpel Demand-Driven Biogas Production in Anaerobic Filters 580 Dissertation Hohenheim 2017
Transcript of FORSCHUNGSBERICHT AGRARTECHNIK - Uni...
FORSCHUNGSBERICHT AGRARTECHNIK des Fachausschusses Forschung und Lehre der Max-Eyth-Gesellschaft Agrartechnik im VDI (VDI-MEG)
Johannes Hagen Krümpel
Demand-Driven Biogas Production in Anaerobic Filters
580
Dissertation Hohenheim 2017


University of Hohenheim
Institute of Agricultural Engineering
Livestock Systems Engineering (440b)
Prof. Dr. T. Jungbluth
State Institute of Agricultural Engineering and Bioenergy (740)
Dr. Hans Oechsner
Demand-Driven Biogas Production in Anaerobic Filters
Cumulative Doctoral Thesis
Submitted in ful�llment of the requirements for the degree
"Doktor der Agrarwissenschaften"
(Dr. sc. agr. / Ph. D. in Agricultural Sciences)
to the
Faculty of Agricultural Sciences
presented by
M. Sc. Johannes Hagen Krümpel
from Bad Camberg
Stuttgart-Hohenheim
2016
This thesis was accepted as a doctoral dissertation in ful�llment of the requirements for
the degree "Doktor der Agrarwissenschaften" (Dr. sc. agr. / Ph. D. in Agricultural
Sciences) by the Faculty of Agricultural Sciences at the University of Hohenheim, on Oc-
tober 5th, 2016.
Dean: Prof. Dr. Ralf T. Vögele
Reviewer: Prof. Dr. Thomas Jungbluth
Co-Reviewer: Prof. Dr. Martin Kranert
Oral examination: Prof. Dr. Thomas Jungbluth
Prof. Dr. Martin Kranert
Prof. Dr. Joachim Müller
Head of the Committee: Prof. Dr. Markus Rodehutscord
Date of oral examination: January 12th 2017
All rights reserved. This book or any portion thereof may not be reproduced or used in
any manner whatsoever without the express written permission of the publisher.
Alle Rechte vorbehalten. Die Verwendung von Texten und Bildern, auch auszugsweise, ist
ohne Zustimmung des Autors urheberrechtswidrig und strafbar. Das gilt insbesondere für
Vervielfältigung, Übersetzung, Mikrover�lmung sowie die Einspeicherung und Verarbei-
tung in elektronischen Systemen.
©2017 Johannes Krümpel.
self publishing: Johannes Krümpel
supply source: University of Hohenheim
State Institute of Agricultural Engineering
and Bioenergy (LA 740)
D - 70599 Stuttgart
Acknowledgments
First and foremost I would like to express my sincere gratitude to Prof. Dr. Thomas Jun-
gbluth for giving me the opportunity to prove myself as a doctoral candidate, for the
possibility of conducting the research as freely as I could and for the support throughout
the last years.
I would like to thank the other members of the examination committee:
Prof. Dr. Joachim Müller, Prof. Dr. Martin Kranert and Prof. Dr. Markus Rode-
hutscord, for evaluating my thesis and their insightful comments and hard questions
during the examination as well as for the encouraging and inspiring words afterwards.
Thankfully Dr. Hans Oechsner has provided access to laboratory and research facilities
of the state institute and established an always healthy climate amongst colleagues.
My sincere thanks goes especially to Dr. Simon Zielonka and Dr. Andreas Lemmer who
accompanied my career progression since the early days of my studies at the University of
Hohenheim. Their expertise, long and critical discussions and also their personal advice
during times of distress were making this experience a whole lot more worthwhile.
Not to forget are the other members within the team of the State Institute of Agricul-
tural Engineering and Bioenergy, who were all very supporting. The research had not
been possible without them. The results of my research have been signi�cantly improved
by them by giving advice, sharing their knowledge and o�ering a helping hand wherever
possible.
I thank my fellow labmates for the countless hours providing a helping hand, no matter
what the occasion. For the fun and athletic social intercourse after work.
Last but not least, I would like to thank my family and friends for supporting me spir-
itually throughout writing this thesis and my life in general.
Contents
Contents
List of Figures vi
List of Tables viii
1 Introduction 1
1.1 Framework . . . . . . . . . . . . . . . . . . . . . . . . . . . . . . . . . . . . 1
1.2 Flexible Biogas Production . . . . . . . . . . . . . . . . . . . . . . . . . . . 1
1.3 Two-Staged Anaerobic Digestion . . . . . . . . . . . . . . . . . . . . . . . . 3
1.3.1 Anaerobic Filters . . . . . . . . . . . . . . . . . . . . . . . . . . . . 6
2 Problem and Objective 7
3 Kinetics of Biogasproduction in Anaerobic Filters 8
3.1 Introduction . . . . . . . . . . . . . . . . . . . . . . . . . . . . . . . . . . . 9
3.2 Methods . . . . . . . . . . . . . . . . . . . . . . . . . . . . . . . . . . . . . 10
3.2.1 Experimental Setup . . . . . . . . . . . . . . . . . . . . . . . . . . . 10
3.2.2 Analytical . . . . . . . . . . . . . . . . . . . . . . . . . . . . . . . . 11
3.2.3 Analysis . . . . . . . . . . . . . . . . . . . . . . . . . . . . . . . . . 12
3.3 Results and Discussion . . . . . . . . . . . . . . . . . . . . . . . . . . . . . 13
3.4 Conclusions . . . . . . . . . . . . . . . . . . . . . . . . . . . . . . . . . . . 17
3.5 References . . . . . . . . . . . . . . . . . . . . . . . . . . . . . . . . . . . . 18
4 Intrinsic Gas Production Kinetics of Selected Intermediates in Anaer-
obic Filters for Demand Orientated Energy Supply 21
4.1 Introduction . . . . . . . . . . . . . . . . . . . . . . . . . . . . . . . . . . . 22
4.2 Material and Methods . . . . . . . . . . . . . . . . . . . . . . . . . . . . . 22
4.2.1 Experimental Setup . . . . . . . . . . . . . . . . . . . . . . . . . . . 22
4.2.2 Analytical . . . . . . . . . . . . . . . . . . . . . . . . . . . . . . . . 24
4.2.3 Analysis . . . . . . . . . . . . . . . . . . . . . . . . . . . . . . . . . 24
4.3 Results and Discussion . . . . . . . . . . . . . . . . . . . . . . . . . . . . . 25
4.4 Conclusion . . . . . . . . . . . . . . . . . . . . . . . . . . . . . . . . . . . . 32
4.5 References . . . . . . . . . . . . . . . . . . . . . . . . . . . . . . . . . . . . 32
5 Demand-Driven Biogas Production in Anaerobic Filters 35
5.1 Introduction . . . . . . . . . . . . . . . . . . . . . . . . . . . . . . . . . . . 36
5.2 Material and Methods . . . . . . . . . . . . . . . . . . . . . . . . . . . . . 38
5.2.1 Experimental Setup . . . . . . . . . . . . . . . . . . . . . . . . . . . 38
iv
Contents
5.2.2 Analytical . . . . . . . . . . . . . . . . . . . . . . . . . . . . . . . . 40
5.2.3 Analysis . . . . . . . . . . . . . . . . . . . . . . . . . . . . . . . . . 41
5.3 Results . . . . . . . . . . . . . . . . . . . . . . . . . . . . . . . . . . . . . . 42
5.3.1 Flexible Gas Production . . . . . . . . . . . . . . . . . . . . . . . . 42
5.3.2 Variability of Gas Concentrations . . . . . . . . . . . . . . . . . . . 46
5.3.3 Carbon Balance . . . . . . . . . . . . . . . . . . . . . . . . . . . . . 48
5.4 Conclusion . . . . . . . . . . . . . . . . . . . . . . . . . . . . . . . . . . . . 52
5.5 References . . . . . . . . . . . . . . . . . . . . . . . . . . . . . . . . . . . . 54
6 General Discussion 58
6.1 Methane Production Kinetics . . . . . . . . . . . . . . . . . . . . . . . . . 58
6.2 Flexible Biogas Production . . . . . . . . . . . . . . . . . . . . . . . . . . . 61
6.2.1 Cause and E�ect of VFA Accumulation . . . . . . . . . . . . . . . 62
6.2.2 Variability of Gas Concentrations . . . . . . . . . . . . . . . . . . . 63
6.2.3 Degradation Degree . . . . . . . . . . . . . . . . . . . . . . . . . . . 64
6.3 Reactor-Design for Demand-Driven Biogas Production . . . . . . . . . . . 65
6.4 Concluding Remarks . . . . . . . . . . . . . . . . . . . . . . . . . . . . . . 66
7 Summary 68
8 Zusammenfassung 70
Bibliography 72
v
Contents
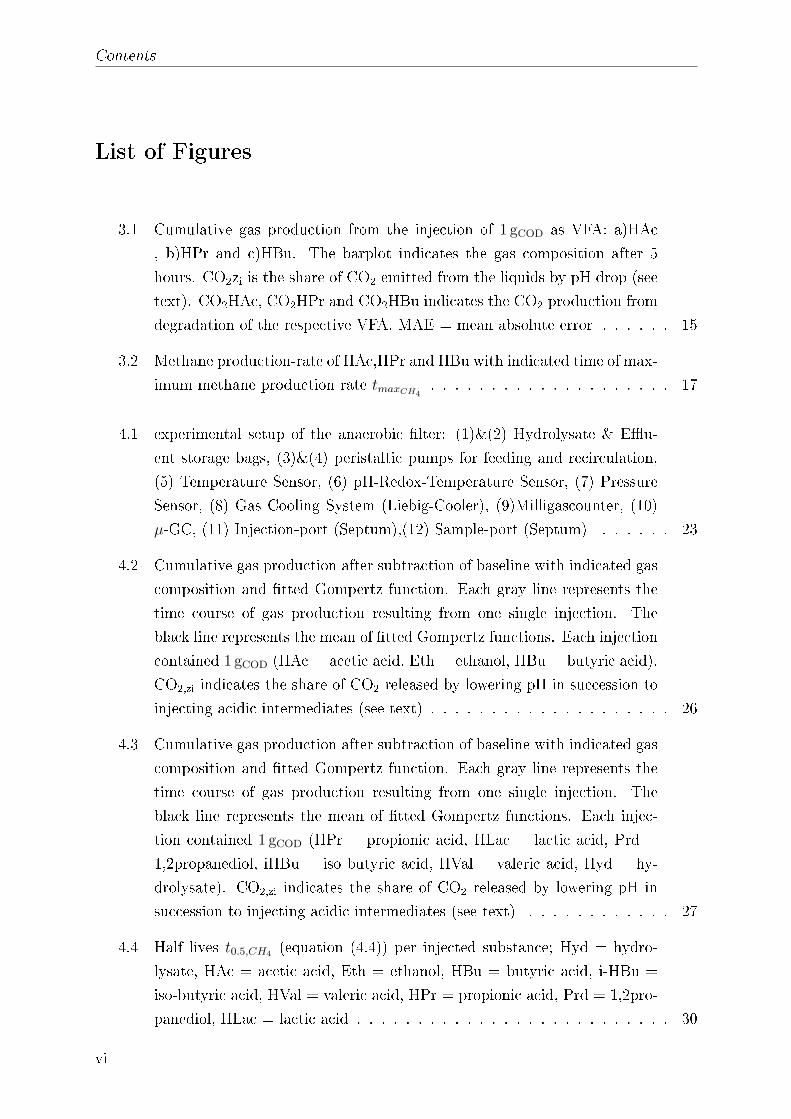
List of Figures
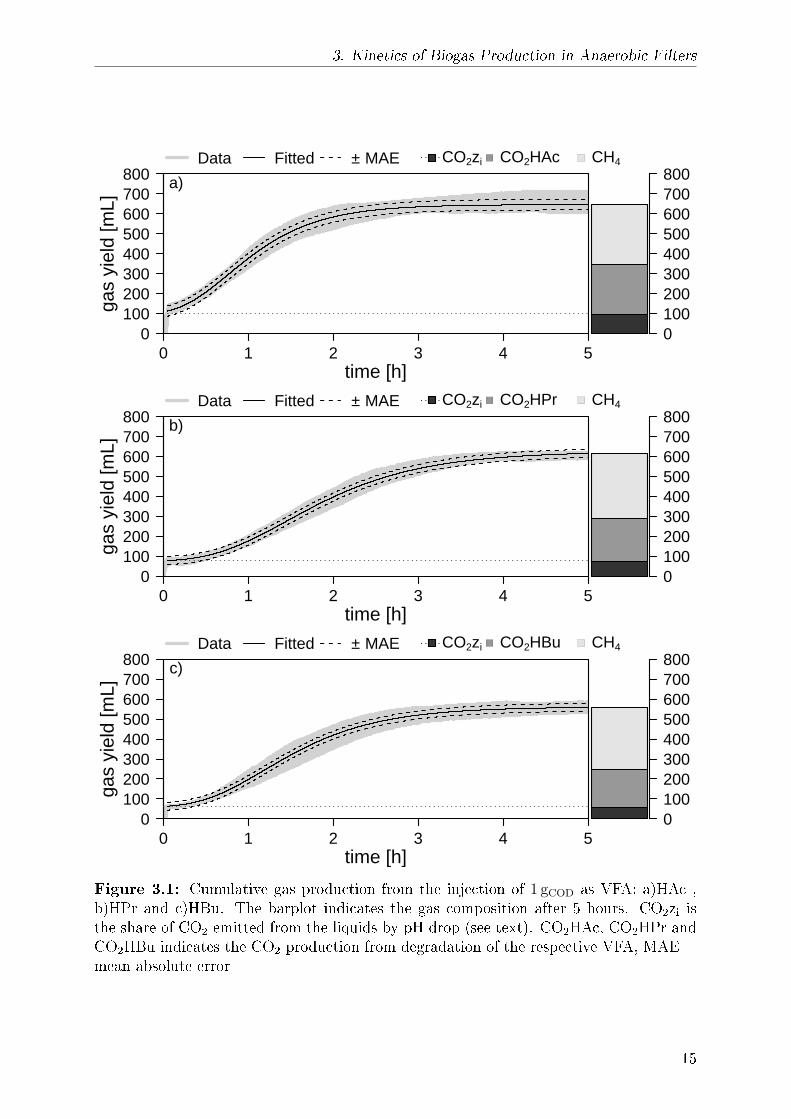
3.1 Cumulative gas production from the injection of 1 gCOD as VFA: a)HAc
, b)HPr and c)HBu. The barplot indicates the gas composition after 5
hours. CO2zi is the share of CO2 emitted from the liquids by pH drop (see
text). CO2HAc, CO2HPr and CO2HBu indicates the CO2 production from
degradation of the respective VFA, MAE = mean absolute error . . . . . . 15
3.2 Methane production-rate of HAc,HPr and HBu with indicated time of max-
imum methane production rate tmaxCH4. . . . . . . . . . . . . . . . . . . . 17
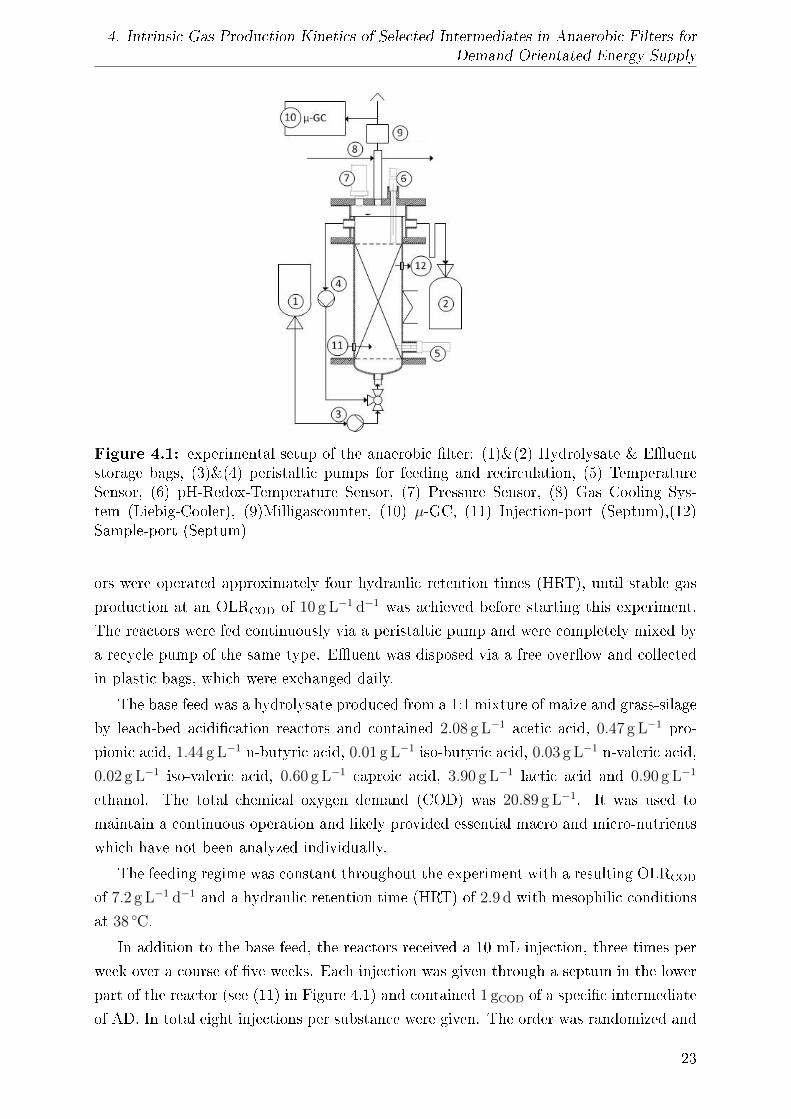
4.1 experimental setup of the anaerobic �lter: (1)&(2) Hydrolysate & E�u-
ent storage bags, (3)&(4) peristaltic pumps for feeding and recirculation,
(5) Temperature Sensor, (6) pH-Redox-Temperature Sensor, (7) Pressure
Sensor, (8) Gas Cooling System (Liebig-Cooler), (9)Milligascounter, (10)
µ-GC, (11) Injection-port (Septum),(12) Sample-port (Septum) . . . . . . 23
4.2 Cumulative gas production after subtraction of baseline with indicated gas
composition and �tted Gompertz function. Each gray line represents the
time course of gas production resulting from one single injection. The
black line represents the mean of �tted Gompertz functions. Each injection
contained 1 gCOD (HAc = acetic acid, Eth = ethanol, HBu = butyric acid).
CO2,zi indicates the share of CO2 released by lowering pH in succession to
injecting acidic intermediates (see text) . . . . . . . . . . . . . . . . . . . . 26
4.3 Cumulative gas production after subtraction of baseline with indicated gas
composition and �tted Gompertz function. Each gray line represents the
time course of gas production resulting from one single injection. The
black line represents the mean of �tted Gompertz functions. Each injec-
tion contained 1 gCOD (HPr = propionic acid, HLac = lactic acid, Prd =
1,2propanediol, iHBu = iso butyric acid, HVal = valeric acid, Hyd = hy-
drolysate). CO2,zi indicates the share of CO2 released by lowering pH in
succession to injecting acidic intermediates (see text) . . . . . . . . . . . . 27
4.4 Half lives t0.5,CH4 (equation (4.4)) per injected substance; Hyd = hydro-
lysate, HAc = acetic acid, Eth = ethanol, HBu = butyric acid, i-HBu =
iso-butyric acid, HVal = valeric acid, HPr = propionic acid, Prd = 1,2pro-
panediol, HLac = lactic acid . . . . . . . . . . . . . . . . . . . . . . . . . . 30
vi
Contents
5.1 Experimental setup of the anaerobic �lter: (1)&(2) hydrolysate & e�uent
storage bags, (3)&(4) peristaltic pumps for feeding and recirculation, (5)
temperature sensor, (6) pH-temperature sensor, (7) pressure sensor, (8) gas
cooling system (Liebig-cooler), (9)gas meter, (10) µ-GC . . . . . . . . . . . 38
5.2 Compiled data of OLR-mode 'demand' for both substrates A and B with
daily gas and methane production: a), rate of increase in methane produc-
tion rCH4 : b), applied OLR: c) . . . . . . . . . . . . . . . . . . . . . . . . . 43
5.3 Compiled data of OLR-mode 'peak' for both substrates A and B with daily
biogas and methane production: a), rate of increase in methane production
rCH4 : b), applied OLR: c) . . . . . . . . . . . . . . . . . . . . . . . . . . . 45
5.4 OLR-mode 'demand' for both substrates 'A' and 'B' with mean CH4 and
CO2 concentrations: a), H2 concentrations: b) and applied OLR: c) . . . . 46
5.5 OLR-mode 'peak' for both substrates 'A' and 'B' with mean CH4 and CO2
concentrations: a), H2 concentrations: b) and applied OLR: c) . . . . . . . 47
5.6 Carbon balance based on total carbon (TC) input per phase of the ex-
periment. Conversion of TC to inorganic carbon (IC): a), conversion of
TC to total organic carbon (TOC) separated into dissolved organic carbon
(DOC) and particulate carbon (pC): b), conversion of TC to methane: c)
and conversion of TC to carbon dioxide: d) . . . . . . . . . . . . . . . . . . 49
5.7 Mean di�erence of total nitrogen-input and total nitrogen-output per day
over the course of the experiment . . . . . . . . . . . . . . . . . . . . . . . 50
vii
Contents
List of Tables
3.1 Overview of theoretical and experimental methane yields from the injec-
tion of 1 gCOD as VFA and �tted parameters of the Gompertz function of
equation (3.4) for methane. Signi�cant di�erences in the mean are marked
by di�erent letters . . . . . . . . . . . . . . . . . . . . . . . . . . . . . . . 16
4.1 Fitted parameters of the Gompertz function for methane (equation (4.1)&(4.3))
after injection of 1 gCOD as well as calculated half lives (equation (4.4)). Sig-
ni�cant di�erences in the mean are marked by di�erent letters (only �rst
set of injections)) . . . . . . . . . . . . . . . . . . . . . . . . . . . . . . . . 29
5.1 Mean composition of Substrate A and B . . . . . . . . . . . . . . . . . . . 39
viii
1. Introduction
1 Introduction
1.1 Framework
Within the EU-28 the share of renewable energy (RE) in primary energy production has
increased to 24.3 % in 2013, signifying a 84.4 % increase between the years 2003 and 2013
(EU, 2016). Guidelines for the transformation of the energy supply in Germany aim
at increasing the share of RE to 35 % in 2020 and to more than 80 % in 2050 (BMWi,
2010). The European Union predicts the share of renewable energy in gross �nal energy
consumption to achieve 55 % to 97 % in 2050 (EU, 2012).
Fluctuating energy sources, namely wind turbines and photovoltaic, will be the mayor
contributors to this increase (Steinke et al., 2013). The intermittent energy supply by
these sources poses challenges for the electricity grid and needs to be counter balanced.
Balancing power, positive or negative, can be categorized by their response time into
primary, secondary and tertiary balancing power with reaction times <30 s, <15 min and
>15 min, respectively (Hirth and Ziegenhagen, 2015). A demand-driven energy supply
by weather independent biomass conversion can o�er these grid services (BMWi, 2010;
Thrän et al., 2015). Flexible energy production from biogas has been identi�ed as a
vital approach to provide the grid with positive and negative balancing power. It can
either be achieved by increasing gas storage capacity, a demand-driven biogas production
or a combination of both (Hahn et al., 2014b). Recent research in demand-driven biogas
production focuses on traditional continuously stirred tank reactor (CSTR) plant designs,
demonstrating its feasibility, opportunities and limitations (Mauky et al., 2015, 2016;
Mulat et al., 2016).
1.2 Flexible Biogas Production
In recent years the interest in �exible biogas production has increased. Bekkering et al.
(2013) investigated a seasonal gas supply on a theoretical basis, since at the time no
relevant literature was available concerning actively controlling the gas output quantity
of a digester. Modeling three scenarios, the research group found that gas storage is by
far the most expensive option, whereas a �exible gas production was revealed as the most
cost e�ective.
Changing the focus towards �exible power generation, Hahn et al. (2014b) reviewed
concepts to achieve �exibility by a demand-driven biogas supply. The concepts discussed
were (1) biogas storing or (2) �exible biogas production. The latter accomplished either by
variable substrate feeding using CSTRs or adapted biogas plant con�gurations, including
1
1. Introduction
two-staged anaerobic digestion. It was concluded that on-site gas storage can provide the
shortest reaction times in terms of power generation, albeit long term balancing power is
limited, due to the size of gas storage and potential permissions under law. Furthermore
it was concluded that a �exible biogas production can provide long term balancing power,
but in order to provide tertiary and secondary balancing power a gas storage is needed.
Primary balancing power was not considered speci�cally. Though, explicitly mentioned is
the lower risk of process disturbance and enhanced �exibility of biogas production when
adapted plant con�gurations such as two-staged anaerobic digestion are utilized.
The above �ndings are in line with Grim et al. (2015) who modeled �exible biogas
production of a CSTR by using the anaerobic digestion model one (ADM1). Under the
Swedish conditions presented herein, �exible biogas production could increase income by
6 % to 10 % for simple electricity production strategies. For more advanced �exibility
concepts, the monetary framework needs to be adapted. Higher �uctuations in the elec-
tricity price as well as subsidies or system optimization would be necessary for �exible
biogas production.
A �rst experimental study on �exible biogas production was executed by Mauky et al.
(2015), using lab-scale CSTRs with organic loading rates on volatile solid base (OLRVS)
ranging between 1 kg m−3 d−1 to 7 kg m−3 d−1. The feeding regime was changed to less
feedings per day. Easily degradable substrates like sugar beet were used in the mix to
produce peaks in gas production. It was demonstrated that biogas can be produced highly
�exible, minimizing the necessary gas storage system. No process disturbances could be
detected, although the diurnal variation lead to a daily alternation of gas concentration,
pH and acid concentrations.
Taking a deeper look into the dynamics of the process Mulat et al. (2016) compared the
feeding regimes 'once per day' or 'once every second day' to 'once every 2 h'. It was found
that less frequent feeding, while keeping the same overall OLR, leads to improved process
stability and changes the bacterial community composition, whereas the methanogenic
community remains stable. A sudden increase in volatile fatty acid (VFA) concentrations
after feeding could be detected, but returned to normal levels in the periods when no
substrate addition took place. The overall e�ciency of the process could be improved,
leading to a 14 % increase in methane yield. Feeding high amounts at certain points in
time may prevent shortcut �ows, ensuring recalcitrant components of the substrate to
remain in the reactor. The higher diversity of the bacterial community in less frequently
fed systems supports this suggestion.
In a trial by Mauky et al. (2016), not only the feasibility of a �exible biogas production,
but also the prediction of gas production by means of simpli�ed dynamic models was
demonstrated in full scale. In addition a 42 % to 45 % saving in gas storage capacity
could be achieved compared to constant gas production.
So far all of the published literature on demand-driven gas production focuses on
2
1. Introduction
single-staged anaerobic digestion using CSTRs. There are possible advantages for �exible
gas production in using a two-staged approach, which have not been examined yet.
1.3 Two-Staged Anaerobic Digestion
Anaerobic digestion (AD) of complex organic material is a sequence of processes with
di�erent microorganisms involved in each step. Based on substrate and produced inter-
mediates, the overall process is divided into (1)hydrolysis, (2)acidogenesis, (3)acetogenesis
and (4)methanogenesis (Bischofsberger, 2005). The initial breakdown of complex organics
into soluble products is achieved by secretion of exo-enzymes by fermentative bacteria and
is described as the rate limiting step in the anaerobic treatment of complex substrates
(Pavlostathis and Giraldo-Gomez, 1991). Membrane permeable products of hydrolysis
such as monosaccharides, amino acids and long chain fatty acids are further degraded to
volatile fatty acids (VFA), hydrogen gas (H2) and carbon dioxide (CO2) during acidogen-
esis.
Acetogenesis is termed after its main product acetic acid (HAc) and is achieved either
by oxidation of VFAs or by homoacetogenesis, the reduction of carbon dioxide with hydro-
gen gas. The latter does seem to play only a minor role in anaerobic treatment (Gehring
et al., 2015).
For acetate production i.e. oxidation of VFAs, a low H2 partial pressure needs to be
maintained. In anaerobic environments this is mainly accomplished by the close interac-
tion of fermentative bacteria and H2 consuming methanogenic archea. This syntrophic
cooperation enables otherwise thermodynamically unfavorable reactions to be performed.
The overall reaction becomes exergonic through the work of hydrogenotrophic meth-
anogens, reducing CO2 with H2 to methane (CH4). Under the low H2 partial pressure
(<10 Pa) the energy yield of fatty acid oxidation is then su�cient to form ATP from
the oxidizing reaction (Schink, 1997). About one third of total methane production in
anaerobic treatment is attributed to hydrogenotrophic methanogenesis (John S. Jeris,
1965). However, this share changes with substrate type and was found to be the dom-
inant pathway in the studies of Mulat et al. (2016) for �exible gas production. In an
anaerobic �lter of a two-staged system Gehring et al. (2015) determined a share of hydro-
genotrophic methanogenesis in the range of 28 % to 44 % of total methane production and
it was positively correlated to OLR. The second mayor pathway of methane formation
is accomplished by acetate cleavage, which forms 1 mol of CH4 from the methyl group
and 1 mol of CO2 from the carboxylic group of 1 mol HAc and thereby completing the
anaerobic digestion.
In traditional one-staged AD all these steps take place in one reaction vessel, where
a delicate balance between acid forming and methane forming microorganisms is main-
tained. A lack of stability in the anaerobic process is often due to imbalances between
3
1. Introduction
these groups of microorganisms(Cohen et al., 1979; Demirel and Yenigün, 2002). Both
groups di�er widely in their physiology, nutritional demand, growth kinetics, sensitivity
to environmental changes and optimum growth conditions (Pohland and Ghosh, 1971).
To take account of these di�erences and to provide optimal conditions for both groups,
Pohland and Ghosh (1971) proposed a system to physically divide the process into two
reactors, increasing process stability and control.
Throughout the last years the two-staged AD has been applied to treat a wide vari-
ety of substrates, ranging from liquid model substances like glucose over highly complex
industrial wastewaters and animal products to solid organic waste or purposefully grown
energy crops (Ghosh et al., 1985; Verrier et al., 1987; Raynal et al., 1998; Ince, 1998;
Demirel and Yenigün, 2002; Yu et al., 2002; Demirer and Chen, 2005; Cysneiros et al.,
2012; Zielonka et al., 2010; Lindner et al., 2016). The reactor con�guration employed is
tailored to the primary substrates of the system. Most commonly it is put into prac-
tice as a combination of CSTR or leach-bed reactor (LBR) as acidi�cation stage and an
anaerobic �lter (AF) or up�ow anaerobic sludge blanket reactor (UASB) as the second-
ary methanation stage. The spatio-temporal separation of hydrolysis/acidogenesis and
acetogenesis/methanogenesis yields a liquid rich in easily degradable intermediates in the
acidi�cation recator (AR) and is subsequently degraded to biogas in the methane reactor
(MR).
Recent developments show that the composition of produced hydrolysate in the AR
can be in�uenced towards certain main products by controlling pH and redox-potential
(Eh). In studies by Ren et al. (1997, 2007) treating molasses from sugar beet re�nery an
ethanol-type fermentation occurred at pH<4.5. Higher butyric acid (HBu) concentrations
were achieved at pH>6 and propionic acid (HPr) was the main product under conditions
of pH 5.5 and Eh>−278 mV. A complex medium containing glucose and yeast extract
was the substrate used by Horiuchi et al. (2002). A change in composition of produced
hydrolysate from mainly butyric to propionic and acetic acid was observed, when increas-
ing the pH of the AR from 5.0 to 8.0. Highest HBu concentration were measured at pH
6.0. In experiments using maize silage, the hydrolysate composition changed with the
pH, reducing the butyric acid concentration by >90 % while going from pH 5.5 to 7.5
Lindner et al. (2015). Here propionic acid concentrations increased accordingly until its
highest values at pH 7.0, displacing acetate as the main VFA. Total acids measured in
the hydrolysate were reduced, due to the onset of methanogenesis at pH 6.0.
Two-staged AD o�ers several advantages over single-staged AD and can be summarized
as follows:
� provision of optimal conditions for the microorganism consortia taking part in the
respective step (Pohland and Ghosh, 1971; Cohen et al., 1979),
� thereby increasing turnover rates and enabling a reduction in total reactor volume
4
1. Introduction
(Cohen et al., 1979),
� disposal of slugde from the AR without loss of slowly growing methanogens (Cohen
et al., 1979),
� a fractionation of produced biogas (Muha et al., 2013), enabling high methane
concentrations in the MR and
� higher overall methane yields for speci�c substrates (Ghosh, 1987).
Further advantages, possibly improving demand-driven gas production and thereby en-
hancing the scale of �exibility compared to single- stage AD, are that
� the hydrolysis as rate limiting step (Pavlostathis and Giraldo-Gomez, 1991) is de-
coupled from methanogenesis, thereby enabling a shift of the gas production into
times of higher demand,
� selective production of certain intermediates in the AR by controlling pH and redox-
potential (Ren et al., 1997, 2007; Lindner et al., 2015),
� generally higher process stability and ruggedness against shock loads (Rajeshwari
et al., 2000),
� operation of the MR at much higher OLRs than CSTRs (Rajeshwari et al., 2000)
and
� the possibility to keep the MR in dormancy (Tauseef et al., 2013).
The above advantages come at the expense of a decreased overall degradation degree
when treating lignocellulosic material. Lindner et al. (2016) determined a decrease in
methane yield using a two-staged AD system in comparison to the methane potential
determined by batch tests. Methane yields were reduced by 70.6 %, 31.3 % and 7.8 % for
hay/straw, maize silage and sugar beet, respectively. It was concluded from this study
that only easily degradable substrates with low lignocellulosic components should be used
in two-staged AD. Supporting evidence of a decreased hydrolysis rate of cellulose under
slightly acidic conditions were presented by Koeck et al. (2015), who found the highest
degradation rates for cellulose �lter paper by di�erent clostridia strains at a starting
pH between 7.19-7.51. At lower and higher starting pH the time needed for complete
degradation was extended. Other disadvantages of two-staged AD are the need for well-
trained plant operators and possibly higher investment and maintenance cost due to a
more complex plant design.
5
1. Introduction
1.3.1 Anaerobic Filters
In two-staged AD the majority of methane is produced in the MR, accounting for approx-
imately 80 % of total methane production when treating agricultural crops like sugarbeet,
hay/straw or maize silage (Lindner et al., 2016). Therefore the focus for demand-driven
energy production is the MR, as it is the key for a �exible biogas production in two-staged
AD. Anaerobic Filters marked the �rst step towards the so called "second generation an-
aerobic digesters" and their potentially high e�ciency was �rst demonstrated by Young
and McCarty (1969). Anaerobic Filters can be operated in up�ow or down�ow and they
use the ability of the microorganisms to form a bio�lm and attach to support media -
the packing bed (Bischofsberger, 2005). The immobilization of the biomass prevents the
loss of slowly growing methanogens and thereby enables high organic loading rates with
a mean OLRCOD of 9.6 g L−1 d−1 for installed industrial anaerobic �lters (Bischofsberger,
2005) and maximum OLRsCOD up to ≈ 40 g L−1 d−1 (Tauseef et al., 2013; Bischofsberger,
2005). These high OLRs are combined with short HRTs as low as <1 d (Tauseef et al.,
2013) and maintaining high degradation degrees.
The media surface texture, media pore size and porosity of the packing bed have a
signi�cant in�uence on biomass retention of attached biomass as well as on suspended
biomass trapped in the interstitial void spaces, both increasing the e�ciency of the AF
(Tay et al., 1997; Show and Tay, 1999). Speci�c surface area seems to be of importance
only if the amount of attached biomass is large relative to the suspended biomass (Tay
et al., 1997). In packing beds with a porosity of 90 % the majority (56 %) of methane
production in the AF could be attributed to the suspended biomass. In contrast 56 % to
58 % of methane production was attributed to attached biomass in the packing bed with
a porosity of 75 % (Show and Tay, 1999). During development of the bio�lm the void
volume is reduced markedly by 43 % to 57 % (Show and Tay, 1999; Jawed and Tare, 2000)
and thus decreasing the e�ective HRT. Bio�lm development can be partitioned into at
least four distinct stages: (1)reversible attachment, (2)"irreversible" attachment, (2)mat-
uration and (4)detachment. Each of the stages is accompanied by a profound change in
phenotype of the microorganisms (Stoodley et al., 2002) and the average di�erence in
protein production between phases is as high as 35 % for Pseudomonas aeruginosa (Sauer
et al., 2002). Mature bio�lms are complex structures with matrix-enclosed microcolon-
ies interspersed between channels which deliver nutrients into the deeper levels of thick
bio�lms. The bio�lm structure is largely determined by production of slime-like extracel-
lular polymeric substances (EPS) which make up 10 % to 90 % of total organic matter in
bio�lms (Nielsen et al., 1997). But also the physical environment plays an important role
to develop density and strength (Stoodley et al., 2002). Bio�lms grown under high shear
forces seem to exhibit a smoother and denser matrix than those grown under low shear
forces (Liu and Tay, 2001).
6
2. Problem and Objective
2 Problem and Objective
Two-staged AD is a viable option for demand-driven biogas production (Hahn et al.,
2014b). It is known that anaerobic �lters are characterized by high process stability and
enable the operation at very high OLRs, compared to single-staged AD (Ghosh, 1991;
Tauseef et al., 2013). Yet, gas production pro�les matching sudden increases and decreases
in energy demand haven't been examined in literature.
Quick adaptions within a timeframe <15 min could open new marketing opportunities
for plant operators and provide decentralized balancing services for grid integrity. The
advantages of two-staged AD over traditional CSTRs could enhance the range of �ex-
ibility in a large scale. Therefore a major question is how fast the methane production
can be adapted to sudden changes in demand and to what extent these adaptions are
reproducible.
The ability to react might be in�uenced by substrate composition and controlled hy-
drolysis towards certain intermediates could improve the reaction times towards increased
demand. It is therefore another focus of this research to examine intrinsic methane produc-
tion kinetics of common intermediates of AD. A reliable prediction of methane provision
is needed and the groundwork for future prediction models is laid out in this research.
From the above the following research objectives are deduced:
� Determine the intrinsic kinetics of gas production in Anaerobic Filters for the most
common intermediates found in hydrolysate,
� demonstrate the feasibility, reproducibility and the possible extent of demand-driven
biogas production in Anaerobic Filters with respect to changing substrate compos-
ition and
� evaluate the process e�ciency based on carbon �uxes to unfold e�ects resulting from
changing operational conditions.
7
3. Kinetics of Biogas Production in Anaerobic Filters
3 Kinetics of Biogasproduction in Anaerobic Filters
Johannes Krümpela, Friedrich Schäufeleb, Johannes Schneiderb, Thomas
Jungbluthc, Simon Zielonkaa, Andreas Lemmera
aState Institute of Agricultural Engineering and Bioenergy,
University of Hohenheim, Garbenstraÿe 9, 70599, Stuttgart, Germany
bGoethe Center for Scieinti�c Computing,
Goethe University, Kettenhofweg 139, 60325, Frankfurt am Main, Germany
cInstitute for Agricultural Engineering,
University of Hohenheim, Garbenstraÿe 9, 70599 Stuttgart, Germany
Article Information:
Published: Bioresource Technology 200 (2016) 230�234
Received: August 21st 2015
Revised: October 2nd 2015
Accepted: October 3rd 2015
Available online: October 19th2015
DOI: 10.1016/j.biortech.2015.10.030
Abstract
This study investigates methane production kinetics from individual volatile fatty
acids (VFA) in an Up�ow Anaerobic Filter (AF). 1 gCOD in the form of acetic (HAc),
propionic (HPr) or butyric acid (HBu) was injected into the AF while operating at an
organic loading rate (OLRCOD) of 3.5 g L−1 d−1. A methodology is introduced to separ-
ate gas production of the baseload from the product formation of VFA degradation after
the injection. The lag phase, fractional rate of gas production and half-life has been de-
termined for the methane generation of the three VFAs. The half-lifes were in the order
HAc<HBu<HPr showing a slower gas production from the C-3 acid than from the C-4
acid. The results can be used for prediction models for on-demand biogas production
which has been identi�ed as a vital approach to provide balancing power for a transform-
ing energy market.
Keywords: on demand, two-staged, anaerobic digestion, volatile fatty acids, biogas
8
3. Kinetics of Biogas Production in Anaerobic Filters
3.1 Introduction
The growing share of renewable energy worldwide demands for balancing power to com-
pensate its �uctuating energy supply. On-demand biogas production and its subsequent
electri�cation or its implementation in Power to Gas strategies has been identi�ed by
several researchers as a vital approach to provide short and long term as well as second-
ary and tertiary, positive and negative balancing power (Hahn et al., 2014; Mauky et al.,
2015; Ahern et al., 2015; Linke et al., 2015). In micro gas grids the biogas production
can avoid the necessity of large gas reservoirs by following demand curves and provide
gas when needed. In particular two-staged anaerobic digestion has several advantages
emphasizing its suitability to meet the requirements imposed by a transforming energy
market and several special applications.
Two-staged AD systems are mostly realized by a continuously stirred tank reactor
(CSTR) or leach-bed reactor (LBR) as acidi�cation-stage in combination with a high
rate methanation stage i.e. Up�ow sludge blanket reactor (UASB) or anaerobic �lter
(AF) where the majority of biogas production takes place (Linke et al., 2015; Nizami and
Murphy, 2010; Demirel and Yenigün, 2002). In the acidi�cation stage a hydrolysate rich
in organic acids and other intermediary products such as alcohols, sugars, and amino acids
is produced. The methanation stage completes the AD and degrades the intermediary
products to methane and carbon dioxide as its main products.
The advantages of two-staged AD are rooted in the spatial separation of the hy-
drolysis and acidogenesis from the acetogenesis and methanogenesis, thus facilitating an
enhancement of AD by optimizing the environment for the microorganisms involved in
the respective step (Fox and Pohland, 1994), enabling shorter retention times, higher
loading rates and an overall more robust process (Nizami and Murphy, 2010; Demirel
and Yenigün, 2002). Due to the selection towards faster growing microorganisms in the
�rst stage, two-staged systems can accomplish higher substrate �exibility and withstand
changes in operational control (Fox and Pohland, 1994; Lindner et al., 2015). Provided
that the composition of the hydrolysate is known, the timed feeding to the AF could be
used to produce gas when needed and cover peaks in demand.
From degradation kinetic studies it is known that individual organic substances show
di�erent rates of degradation (Wang et al., 1999; Aguilar et al., 1995; Öztürk, 1991;
Rebac et al., 1999) resulting in di�erent rates of product formation, in particular biogas
production rates. However the rate of biogas production in this respect has not been a
main focus of research yet. In anaerobic digestion for energy production (as opposed to
waste treatment) the main product is methane and the time needed for its production
from di�erent substances is of special interest for demand driven biogas production.
Since the interactions of operational conditions are versatile and complex, this study is
taking a step towards elucidating methane production kinetics from individual substances
9
3. Kinetics of Biogas Production in Anaerobic Filters
in the AF. A detailed look into the gas production is provided after injecting VFAs into
the AF while under normal operation. The aquired data can be used to develop prediction
models of methane formation which is essential for demand driven biogas production using
AFs. In the following a new methodology is described to determine the methane yield as
well as its production kinetics from individual intermediates.
3.2 Methods
3.2.1 Experimental Setup
Three up�ow Anaerobic Filters (AF) of identical construction with an internal free volume
of 2801± 16 mL (measured before inocculation) were used. The packed bed consists of
Type HX-9 (Christian Stöhr GmbH & Co.KG) with a surface area of 940 m2m−3. Each of
the three AF is equipped with two peristaltic pumps (Watson Marlow, 114FDC/DC) for
feeding and recirculation, a combined pH/redox electrode (Endress & Hauser, CPS16D),
temperature- (Endress & Hauser, Easytemp TMR31) and pressure sensor- (Endress &
Hauser, Cerabar T PMC131), electrical heating (thermo GmbH) and gas cooling with
integrated condensate re�ux into the reactor. The produced biogas is measured volumet-
rically with a Milligascounter (Ritter, MGC10) and recalculated to STP conditions (0 ◦C
and 1013.25 hPa). Gas samples are drawn via a multipositioning valve connecting through
the three reactors to analyse the gas quality by gas chromatography (In�con, 3000 µ-GC)
every 20 min for each reactor. An interpolated value of the gas quality is assigned to each
count of the Milligascounter depending on the time di�erence between the count and the
two gas quality measurements before and after the volume count.
Start up was completed using seed sludge from similar reactors in our laboratory
and the reactors have been in operation for eight month. Prior to this experiment the
packed beds have been removed, mixed and were then redistributed to each reactor to
provide same conditions and to level e�ects of previous experiments. After mixing the
packed beds, the reactors were operated for three weeks while increasing the OLRCOD
to 15 g L−1 d−1 with COD degradation degrees of 94.2± 1.5 % which was considered as
stable operation.
The reactors were then operated at 38.8± 0.5 ◦C and the OLRCOD was set to
3.5 g L−1 d−1 with hydraulic retention times (HRT) of 9.33 d over the whole course of
the experiment. The applied OLR is below the actual capacity of the reactors, as men-
tioned above. For the base-feed a hydrolysate, produced from 1:1 maize and grass silage
was used to provide essential macro- and micronutrients as well as simulating a base load
for the reactors.LBRs were used to produce the hydrolysate similar to Chen et al. (2013).
The hydrolysate has a total COD of 33 574 mg L−1 and is composed by 3546 mg L−1 Acetic
Acid, 381 mg L−1 Propionic Acid, 2213 mg L−1 n-Butyric Acid, 8053 mg L−1 Lactic Acid,
10
3. Kinetics of Biogas Production in Anaerobic Filters
1878 mg L−1 Ethanol, 1516 mg L−1 Propanediol, 693 mg L−1 Fructose and 513 mg L−1 par-
ticulate matter. Concentrations are given on a COD-basis. The remaining share is not
detected by the applied methods for single component analysis.
Twice a week (Tuesdays and Thursdays) a 10 mL dilution was injected into the lower
part of the reactor via a septum, containing a COD of 1 g in the form of acetic acid (HAc),
propionic acid (HPr) or butyric acid (HBu). Dilutions were prepared by calculating the
theoretical COD using formula 3.1, weighing 10 gCOD into a 100 mL �ask and �lling to
the mark with distilled water.
CODt =8(4x+ y − 2z)
12x+ y + 16z[gCODg
−1CxHyOz] (3.1)
The chronological order of the injected VFA was randomised for each reactor. Each
reactor received three replicates of each VFA. Data recording started three hours prior to
injection and lasted for eight hours in total. The e�uent was collected in plastic sample
vials which were attached to the free over�ow of the reactor and were exchanged hourly.
The e�uent samples were analyzed for soluble chemical oxygen demand (SCOD) to check
for VFAs which were not degraded.
3.2.2 Analytical
SCOD is measured using Hach Lange cuvette test (LCK014) after �ltering (0.2 µm) the
samples with a syringe �lter holder.
Volatile fatty acids are analyzed by adding 1 ml of 17 % ortho-phosphoric-acid and
1 ml of n-methyl-valeric-acid to 1 ml of sample. By adding distilled water a 1:10 dilution
is prepared which is then transferred into vials for the autosampler of the Varian CP-
3800 gas chromatograph. It operates with FID-detector and a WCOT fused silica column
(50 m, 0.32 mm) at 60 ◦C for two minutes, then increasing the temperature to 150 ◦C with
30 ◦C min−1 and �nally increasing to 240 ◦C with 8 ◦C min−1.The carrier gas is Helium.
Alcohols, sugars and lactic acid are analyzed with a Bischo� HPLC with RI-detector
and a BioRad Aminex HPX-87H column (7.8 x 300 mm, part size 5 µm) operated at a �ow
rate of 0.6 ml min−1,35 ◦C,6.0 MPa and 0.02 N H2SO4 eluent. The samples are prepared
by adding 1 ml of 0.2 N H2SO4 to 5 ml of sample and �lling up with bi-distilled water to
10 ml in order to yield a 1:2 dilution. It is then transferred into vials for the autosampler
of the HPLC-system.
Gas quality is analyzed by the In�con3000 µ-GC with two columns. H2, N2, O2
and CH4 is analyzed by channel A with back�ush-injector, �x and variable sample loop
and a 5Å Molsieve column (30µm �lm, 320µm diameter, 14 m length) and a Poraplot
U pre column (30µm �lm, 320µm diameter, 2 m length). Back�ush is activated after
10 s, Injection-time of the variable sample loop is set to 0 ms. Column A is operated at
2.0 bar and 80 ◦C. The carrier gas is Argon. Channel B, for the analysis of CO2 and
11
3. Kinetics of Biogas Production in Anaerobic Filters
H2S, is equipped with a variable sample loop and a Pora Plot Q column (20µm �lm,
320µm diameter, 8 m length). Injection-time is set to 30 ms. It is operated at 1.4 bar
and 50 ◦C. The carriergas is Helium. Both channels are connected to an individual TCD-
sensor. Injector temperature as well as sample inlet for both channels are set to 60 ◦C.
To purge the line from the sample point to the µ-GC the internal pump operates for 45 s
at approximately 15 ml min−1 to 30 ml min−1.
3.2.3 Analysis
To separate the gas production of the continuous base-feed from the gas production of VFA
injection a baseline is determined for each injection. Therefore a linear regression using
the method of least squares has been �tted to the cumulative gas production of methane
and carbon dioxide starting from three hours prior to injection. Let i ∈ {CH4, CO2},then the base gas production Bi is given by
Bi(t) = αi + ri · t (3.2)
where t is the time[h], t ∈ [−3, 0], t0 = 0, αi is the approximated intercept at t0 and
ri is the approximated rate of the respective gas production.
To determine the gas production resulting from the actual injection, the baseline
determined by equation (3.2) is subtracted from the cumulative sum of the respective gas
component, giving the gas yield curve of VFA degradation
X̃i(t) = Xi(t)−Bi(t) (3.3)
where Xi(t) is the measured cumulative sum of gas produced at t, t ∈ [−3, 5] and X̃i(t)
is the resulting gas production from VFA degradation. To given X̃i(t) within the interval
t ∈ [0.05, 5], a modi�ed Gompertz-function (equation (3.4)) is approximated via non-
linear regression using the Gauss-Newton Algorithm. The classical Gompertz function
was modi�ed by adding a parameter zi. This restriction and modi�cation is done to take
account of the initial gas ejection after VFA addition.
Vi(t) = ai · exp(−exp(1− ki · (t− λi))) + zi (3.4)
with Vi(t) for the approximated sum of produced gas from the injection at time t.
ai + zi [mL] is the �nal asymptotic gas volume, zi [mL] is the intercept at t = 0.05, λiindicates the lag-phase [h] and ki [h−1] is the fractional rate of gas production.
To �nd the point in time of maximum methane-production-rate equation (3.4) is
rearranged to equation (3.5) using the parameters aCH4 , λCH4 , kCH4 and zCH4 . This is
done to correct for the displacement caused by the initial gas ejection.
12
3. Kinetics of Biogas Production in Anaerobic Filters
VCH4(t) =(aCH4 + zCH4)
· exp(−exp(1− kCH4 · (t− λCH4)))(3.5)
The �rst derivative of equation (3.5) will give the methane production rate over time
and enables to �nd the point in time of maximum methane production rate (t = tmaxCH4).
The half-life of CH4 production t0.5CH4is found in analogy to Wang et al. (2011) by
t0.5CH4= λCH4 +
1− ln(ln(2))
kCH4
(3.6)
For a statistical analysis the �tted parameters λCH4 , kCH4 and the points in time for
t0.5CH4and tmaxCH4
of individual runs have been analyzed. These variables have been
tested by an ANOVA and a consequent Tukey HSD test to determine di�erences between
means.
3.3 Results and Discussion
The injection of VFAs into the AF showed a complex interaction of several mechanisms.
Due to the injection a pH drop could be observed immediately after injection, causing
an ejection of large quantities of gas. This rapid ejection is completed in the �rst three
minutes after injection. For this reason the �tting of the Gompertz function is restricted
to the data from 3 min after injection and parameter zi in formula (3.4) is introduced,
which is re�ecting the amount of gas ejected in the �rst three minutes. Due to the very low
solubility of CH4 compared to CO2, assuming zi to be CO2 only, is reasonable. Thus, the
overall CO2 production caused by the injection can be divided into two separate fractions:
CO2 ejected by the pH drop and CO2 produced by the degradation of the injected VFA.
The fraction of CO2 determined as parameter zi are 99.30± 23.23 mL, 77.02± 13.46 mL
and 62.35± 5.10 mL for acetic, propionic and butyric acid respectively. The decrease in
zi can be explained by the higher Mol-concentration added, the shorter the carbon chain
of the VFA. Thus providing more H+ for lowering the pH in the vicinity of the septum
and causing a transition from HCO3- to CO2. The immediate CO2 release leads to a
lower CH4 concentration of the gas composition (data not shown) directly after injection.
The initial concentration levels are reached after 5 hours when the gas production from
VFA degradation is �nished and the head space of the reactors is purged by the produced
gas. This is in contrast to the �ndings of Pind et al. (2003) who observed an increase
in CH4 concentration as well as in pH after injecting VFAs. The reason for the converse
reactions may be attributed to the neutralization with NaOH of the VFAs by Pind et al.
(2003). This way excess OH- after the degradation of the VFA is present to increase the
pH and in turn providing a higher solubility for CO2 and a transformation to HCO3- in
13
3. Kinetics of Biogas Production in Anaerobic Filters
the liquids.
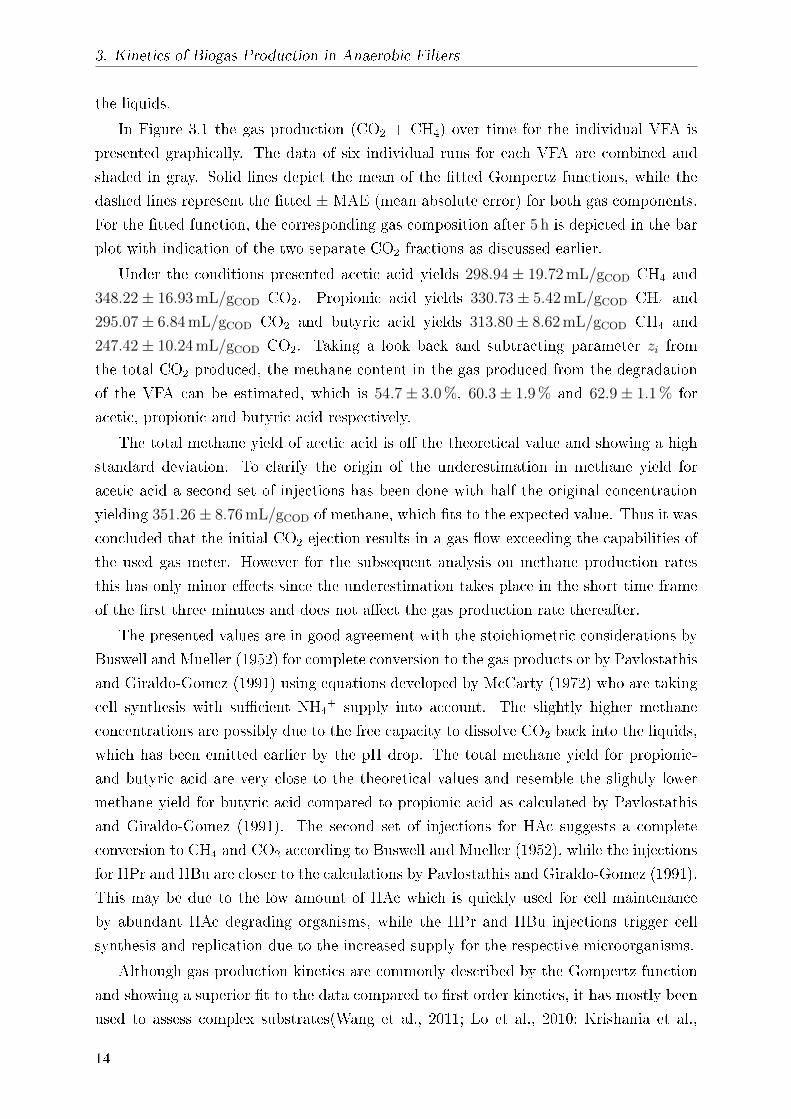
In Figure 3.1 the gas production (CO2 + CH4) over time for the individual VFA is
presented graphically. The data of six individual runs for each VFA are combined and
shaded in gray. Solid lines depict the mean of the �tted Gompertz functions, while the
dashed lines represent the �tted ± MAE (mean absolute error) for both gas components.
For the �tted function, the corresponding gas composition after 5 h is depicted in the bar
plot with indication of the two separate CO2-fractions as discussed earlier.
Under the conditions presented acetic acid yields 298.94± 19.72 mL/gCOD CH4 and
348.22± 16.93 mL/gCOD CO2. Propionic acid yields 330.73± 5.42 mL/gCOD CH4 and
295.07± 6.84 mL/gCOD CO2 and butyric acid yields 313.80± 8.62 mL/gCOD CH4 and
247.42± 10.24 mL/gCOD CO2. Taking a look back and subtracting parameter zi from
the total CO2 produced, the methane content in the gas produced from the degradation
of the VFA can be estimated, which is 54.7± 3.0 %, 60.3± 1.9 % and 62.9± 1.1 % for
acetic, propionic and butyric acid respectively.
The total methane yield of acetic acid is o� the theoretical value and showing a high
standard deviation. To clarify the origin of the underestimation in methane yield for
acetic acid a second set of injections has been done with half the original concentration
yielding 351.26± 8.76 mL/gCOD of methane, which �ts to the expected value. Thus it was
concluded that the initial CO2 ejection results in a gas �ow exceeding the capabilities of
the used gas meter. However for the subsequent analysis on methane production rates
this has only minor e�ects since the underestimation takes place in the short time frame
of the �rst three minutes and does not a�ect the gas production rate thereafter.
The presented values are in good agreement with the stoichiometric considerations by
Buswell and Mueller (1952) for complete conversion to the gas products or by Pavlostathis
and Giraldo-Gomez (1991) using equations developed by McCarty (1972) who are taking
cell synthesis with su�cient NH4+ supply into account. The slightly higher methane
concentrations are possibly due to the free capacity to dissolve CO2 back into the liquids,
which has been emitted earlier by the pH drop. The total methane yield for propionic-
and butyric acid are very close to the theoretical values and resemble the slightly lower
methane yield for butyric acid compared to propionic acid as calculated by Pavlostathis
and Giraldo-Gomez (1991). The second set of injections for HAc suggests a complete
conversion to CH4 and CO2 according to Buswell and Mueller (1952), while the injections
for HPr and HBu are closer to the calculations by Pavlostathis and Giraldo-Gomez (1991).
This may be due to the low amount of HAc which is quickly used for cell maintenance
by abundant HAc degrading organisms, while the HPr and HBu injections trigger cell
synthesis and replication due to the increased supply for the respective microorganisms.
Although gas production kinetics are commonly described by the Gompertz function
and showing a superior �t to the data compared to �rst order kinetics, it has mostly been
used to assess complex substrates(Wang et al., 2011; Lo et al., 2010; Krishania et al.,
14
3. Kinetics of Biogas Production in Anaerobic Filters
0 1 2 3 4 50
100200300400500600700800 a)
gas
yiel
d [m
L]
time [h]
Data Fitted ± MAE CO2zi CO2HAc CH4
0100200300400500600700800
0 1 2 3 4 50
100200300400500600700800 b)
gas
yiel
d [m
L]
time [h]
Data Fitted ± MAE CO2zi CO2HPr CH4
0100200300400500600700800
0 1 2 3 4 50
100200300400500600700800 c)
gas
yiel
d [m
L]
time [h]
Data Fitted ± MAE CO2zi CO2HBu CH4
0100200300400500600700800
Figure 3.1: Cumulative gas production from the injection of 1 gCOD as VFA: a)HAc ,b)HPr and c)HBu. The barplot indicates the gas composition after 5 hours. CO2zi isthe share of CO2 emitted from the liquids by pH drop (see text). CO2HAc, CO2HPr andCO2HBu indicates the CO2 production from degradation of the respective VFA, MAE =mean absolute error
15
3. Kinetics of Biogas Production in Anaerobic Filters
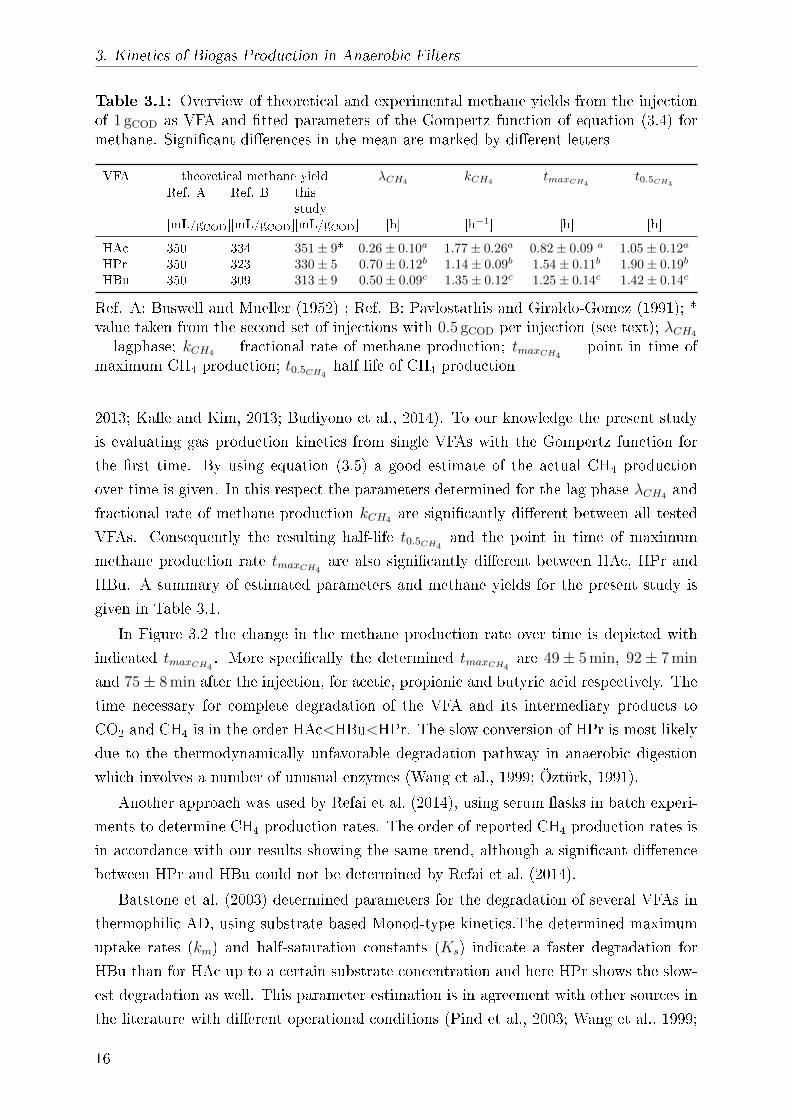
Table 3.1: Overview of theoretical and experimental methane yields from the injectionof 1 gCOD as VFA and �tted parameters of the Gompertz function of equation (3.4) formethane. Signi�cant di�erences in the mean are marked by di�erent letters
VFA theoretical methane yield λCH4kCH4
tmaxCH4t0.5CH4
Ref. A Ref. B thisstudy
[mL/gCOD][mL/gCOD][mL/gCOD] [h] [h−1] [h] [h]
HAc 350 334 351± 9* 0.26± 0.10a 1.77± 0.26a 0.82± 0.09 a 1.05± 0.12a
HPr 350 323 330± 5 0.70± 0.12b 1.14± 0.09b 1.54± 0.11b 1.90± 0.19b
HBu 350 309 313± 9 0.50± 0.09c 1.35± 0.12c 1.25± 0.14c 1.42± 0.14c
Ref. A: Buswell and Mueller (1952) ; Ref. B: Pavlostathis and Giraldo-Gomez (1991); *value taken from the second set of injections with 0.5 gCOD per injection (see text); λCH4
= lagphase; kCH4 = fractional rate of methane production; tmaxCH4= point in time of
maximum CH4 production; t0.5CH4half life of CH4 production
2013; Ka�e and Kim, 2013; Budiyono et al., 2014). To our knowledge the present study
is evaluating gas production kinetics from single VFAs with the Gompertz function for
the �rst time. By using equation (3.5) a good estimate of the actual CH4 production
over time is given. In this respect the parameters determined for the lag phase λCH4 and
fractional rate of methane production kCH4 are signi�cantly di�erent between all tested
VFAs. Consequently the resulting half-life t0.5CH4and the point in time of maximum
methane production rate tmaxCH4are also signi�cantly di�erent between HAc, HPr and
HBu. A summary of estimated parameters and methane yields for the present study is
given in Table 3.1.
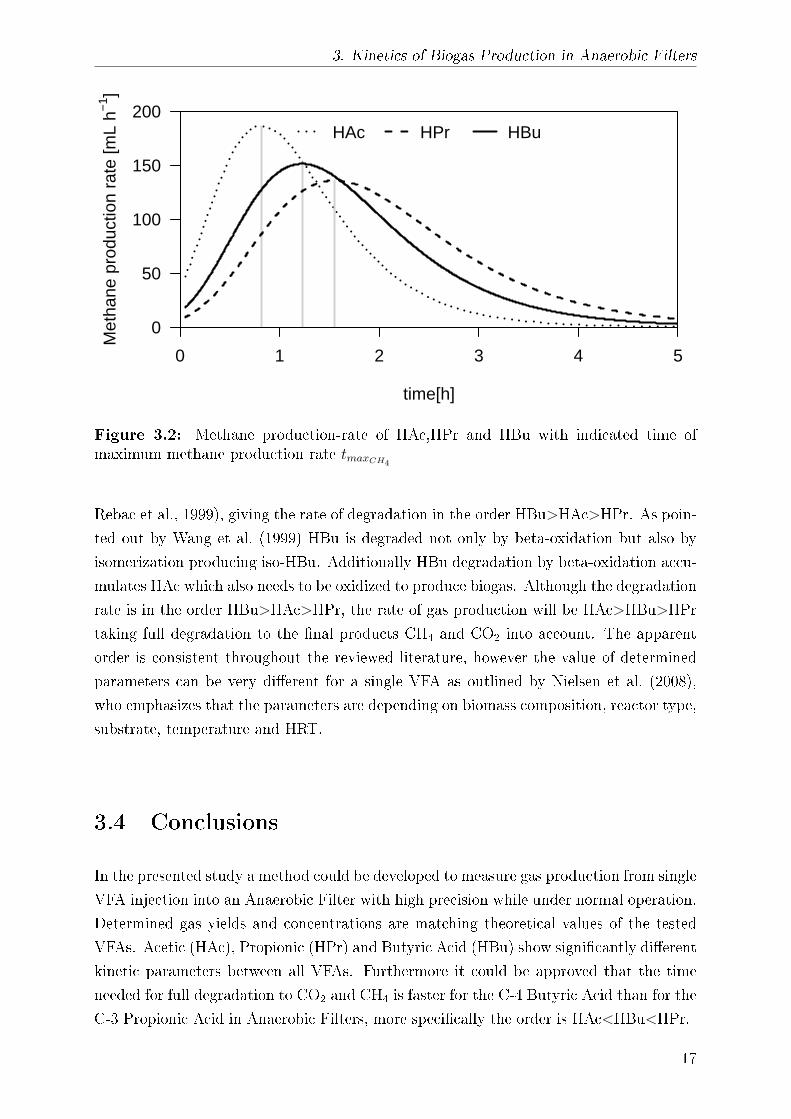
In Figure 3.2 the change in the methane production rate over time is depicted with
indicated tmaxCH4. More speci�cally the determined tmaxCH4
are 49± 5 min, 92± 7 min
and 75± 8 min after the injection, for acetic, propionic and butyric acid respectively. The
time necessary for complete degradation of the VFA and its intermediary products to
CO2 and CH4 is in the order HAc<HBu<HPr. The slow conversion of HPr is most likely
due to the thermodynamically unfavorable degradation pathway in anaerobic digestion
which involves a number of unusual enzymes (Wang et al., 1999; Öztürk, 1991).
Another approach was used by Refai et al. (2014), using serum �asks in batch experi-
ments to determine CH4 production rates. The order of reported CH4 production rates is
in accordance with our results showing the same trend, although a signi�cant di�erence
between HPr and HBu could not be determined by Refai et al. (2014).
Batstone et al. (2003) determined parameters for the degradation of several VFAs in
thermophilic AD, using substrate based Monod-type kinetics.The determined maximum
uptake rates (km) and half-saturation constants (Ks) indicate a faster degradation for
HBu than for HAc up to a certain substrate concentration and here HPr shows the slow-
est degradation as well. This parameter estimation is in agreement with other sources in
the literature with di�erent operational conditions (Pind et al., 2003; Wang et al., 1999;
16
3. Kinetics of Biogas Production in Anaerobic Filters
0 1 2 3 4 5
0
50
100
150
200
time[h]
Met
hane
pro
duct
ion
rate
[mL
h−1 ]
HAc HPr HBu
Figure 3.2: Methane production-rate of HAc,HPr and HBu with indicated time ofmaximum methane production rate tmaxCH4
Rebac et al., 1999), giving the rate of degradation in the order HBu>HAc>HPr. As poin-
ted out by Wang et al. (1999) HBu is degraded not only by beta-oxidation but also by
isomerization producing iso-HBu. Additionally HBu degradation by beta-oxidation accu-
mulates HAc which also needs to be oxidized to produce biogas. Although the degradation
rate is in the order HBu>HAc>HPr, the rate of gas production will be HAc>HBu>HPr
taking full degradation to the �nal products CH4 and CO2 into account. The apparent
order is consistent throughout the reviewed literature, however the value of determined
parameters can be very di�erent for a single VFA as outlined by Nielsen et al. (2008),
who emphasizes that the parameters are depending on biomass composition, reactor type,
substrate, temperature and HRT.
3.4 Conclusions
In the presented study a method could be developed to measure gas production from single
VFA injection into an Anaerobic Filter with high precision while under normal operation.
Determined gas yields and concentrations are matching theoretical values of the tested
VFAs. Acetic (HAc), Propionic (HPr) and Butyric Acid (HBu) show signi�cantly di�erent
kinetic parameters between all VFAs. Furthermore it could be approved that the time
needed for full degradation to CO2 and CH4 is faster for the C-4 Butyric Acid than for the
C-3 Propionic Acid in Anaerobic Filters, more speci�cally the order is HAc<HBu<HPr.
17
3. Kinetics of Biogas Production in Anaerobic Filters
Acknowledgements
This study orginates from the project "Methanoquant" (FKZ 03SF0423B) and is sup-
ported by the german Federal Ministry of Education and Research (BMBF) and the
Projektträger Jülich (PtJ).
3.5 References
Aguilar, A., Casas, C., Lema, J., 1995. Degradation of volatile fatty acids by di�erently
enriched methanogenic cultures: Kinetics and inhibition. Water Research 29, 505�509.
Ahern, E., Deane, P., Persson, T., Gallachoir, B., Murphy, J., 2015. A perspective on the
potential role of renewable gas in a smart energy island system. Renewable Energy 78,
648�656.
Batstone, D., Pind, P., Angelidaki, I., 2003. Kinetics of thermophilic, anaerobic oxidation
of straight and branched chain butyrate and valerate. Biotechnology and Bioengineering
84, 195�204.
Budiyono, Syaichurrozi, I., Sumardiono, S., 2014. Kinetic model of biogas yield produc-
tion from vinasse at various initial ph: Comparison between modi�ed gompertz model
and �rst order kinetic model. Research Journal of Applied Sciences, Engineering and
Technology 7, 2798�2805.
Buswell, A.M., Mueller, H.F., 1952. Mechanism of methane fermentation. Industrial &
Engineering Chemistry 44, 550�552.
Chen, Y., Röÿler, B., Zielonka, S., Lemmer, A., Wonneberger, A.M., Jungbluth, T., 2013.
The pressure e�ects on two-phase anaerobic digestion. Applied Energy .
Demirel, B., Yenigün, O., 2002. Two-phase anaerobic digestion processes: A review.
Journal of Chemical Technology and Biotechnology 77, 743�755.
Fox, P., Pohland, F., 1994. Anaerobic treatment applications and fundamentals: Sub-
strate speci�city during phase separation. Water Environment Research 66, 716�724.
Hahn, H., Krautkremer, B., Hartmann, K., Wachendorf, M., 2014. Review of concepts
for a demand-driven biogas supply for �exible power generation. Renewable and Sus-
tainable Energy Reviews 29, 383�393.
Ka�e, G., Kim, S., 2013. Anaerobic treatment of apple waste with swine manure for
biogas production: Batch and continuous operation. Applied Energy 103, 61�72.
18
3. Kinetics of Biogas Production in Anaerobic Filters
Krishania, M., Vijay, V., Chandra, R., 2013. Methane fermentation and kinetics of wheat
straw pretreated substrates co-digested with cattle manure in batch assay. Energy 57,
359�367.
Lindner, J., Zielonka, S., Oechsner, H., Lemmer, A., 2015. E�ect of di�erent ph-values
on process parameters in two-phase anaerobic digestion of high-solid substrates. En-
vironmental Technology (United Kingdom) 36, 198�207.
Linke, B., Rodriguez-Abalde, A., Jost, C., Krieg, A., 2015. Performance of a novel two-
phase continuously fed leach bed reactor for demand-based biogas production from
maize silage. Bioresource Technology 177, 34�40.
Lo, H., Kurniawan, T., Sillanpää, M., Pai, T., Chiang, C., Chao, K., Liu, M., Chuang,
S., Banks, C., Wang, S., Lin, K., Lin, C., Liu, W., Cheng, P., Chen, C., Chiu, H., Wu,
H., 2010. Modeling biogas production from organic fraction of msw co-digested with
mswi ashes in anaerobic bioreactors. Bioresource Technology 101, 6329�6335.
Mauky, E., Jacobi, H., Liebetrau, J., Nelles, M., 2015. Flexible biogas production for
demand-driven energy supply - feeding strategies and types of substrates. Bioresource
Technology 178, 262�269.
McCarty, P., 1972. Energetics of organic matter degradation, in: Mitchell, R. (Ed.),
Water Pollution Microbiology. Wiley-Interscience. chapter 5, pp. 91�118.
Nielsen, H., Mladenovska, Z., Ahring, B., 2008. Kinetics of propionate conversion in
anaerobic continuously stirred tank reactors. Environmental Technology 29, 151�160.
Nizami, A.S., Murphy, J., 2010. What type of digester con�gurations should be employed
to produce biomethane from grass silage? Renewable and Sustainable Energy Reviews
14, 1558�1568.
Öztürk, M., 1991. Conversion of acetate, propionate and butyrate to methane under
thermophilic conditions in batch reactors. Water Research 25, 1509�1513.
Pavlostathis, S., Giraldo-Gomez, E., 1991. Kinetics of anaerobic treatment: A critical
review. Critical Reviews in Environmental Control 21, 411�490.
Pind, P., Angelidaki, I., Ahring, B., 2003. Dynamics of the anaerobic process: E�ects of
volatile fatty acids. Biotechnology and Bioengineering 82, 791�801.
Rebac, S., Gerbens, S., Lens, P., Van Lier, J., Stams, A., Keesman, K., Lettinga, G.,
1999. Kinetics of fatty acid degradation by psychrophilically grown anaerobic granular
sludge. Bioresource Technology 69, 241�248.
19
3. Kinetics of Biogas Production in Anaerobic Filters
Refai, S., Wassmann, K., Deppenmeier, U., 2014. Short-term e�ect of acetate and ethanol
on methane formation in biogas sludge. Applied Microbiology and Biotechnology 98,
7271�7280.
Wang, M., Tang, S., Tan, Z., 2011. Modeling in vitro gas production kinetics: Derivation
of logistic-exponential (le) equations and comparison of models. Animal Feed Science
and Technology 165, 137�150.
Wang, Q., Kuninobu, M., Ogawa, H., Kato, Y., 1999. Degradation of volatile fatty acids
in highly e�cient anaerobic digestion. Biomass and Bioenergy 16, 407�416.
20
4. Intrinsic Gas Production Kinetics of Selected Intermediates in Anaerobic Filters for
Demand Orientated Energy Supply
4 Intrinsic Gas Production Kinetics of Selected
Intermediates in Anaerobic Filters for Demand
Orientated Energy Supply
Johannes Krümpel, Lukas Illi, Andreas Lemmer
State Institute of Agricultural Engineering and Bioenergy,
University of Hohenheim, Garbenstraÿe 9, 70599, Stuttgart, Germany
Article Information:
Published online: April 11th Environmental Technology (2017)
Received: June 24th 2016
Revised: January 18th 2017
Accepted: February 28th 2017
DOI: 10.1080/09593330.2017.1308439
Abstract
In consequence of a growing share of solar and wind power, recent research on biogas
production highlighted a need in demand-orientated, �exible gas production to provide
grid services and enable a decentralized stabilization of the electricity infrastructure. Two-
staged anaerobic digestion is particularly suitable for shifting the methane production into
times of higher demand due to the spatio-temporal separation of hydrolysis and methano-
genesis. To provide a basis for predicting gas production in an Anaerobic Filter, kinetic
parameters of gas production have been determined experimentally in this study. A new
methodology is used, enabling their determination during continuous operation. An order
in methane production rate could be established by comparing the half lives of methane
production. The order was, beginning with the fastest: acetic acid>ethanol>butyric
acid>iso-butyric acid>valeric acid>propionic acid>1,2propanediol>lactic acid. However
the mixture of a natural hydrolysate from the acidi�cation tank appeared to produce
methane faster than all single components tested.
Keywords: anaerobic digestion, VFA degradation, biogas, two stage, two phase
21
4. Intrinsic Gas Production Kinetics of Selected Intermediates in Anaerobic Filters for
Demand Orientated Energy Supply
4.1 Introduction
In consequence of a growing share of solar and wind power, recent research on biogas pro-
duction highlighted a need in demand-orientated, �exible gas production to provide grid
services and enable a decentralized stabilization of the electricity infrastructure (Thrän
et al., 2015; Hahn et al., 2014; Mauky et al., 2015). In the traditional CSTR biogas
plant, treating energy crops or agricultural wastes, all four steps of anaerobic digestion
(hydrolysis, acidogenesis, acetogenesis, methanogenesis) take place in one reaction cham-
ber. The initial breakdown of lignocellulosic substrates to soluble products is described
as the rate-limiting step in anaerobic digestion (AD) (Pavlostathis and Giraldo-Gomez,
1991), de�ning the boundaries in organic loading rate (OLR) and therefore the adap-
tion to possible demand-curves. In a two-staged plant setup with acidi�cation reactor
and a subsequent high rate methanation reactor, the hydrolysis and methanogenesis are
separated into two reaction vessels, as described extensively in the literature (Fox and
Pohland, 1994; Demirel and Yenigün, 2002; Yu et al., 2002; Lehtomäki and Björnsson,
2006; Parawira et al., 2007; Zhang and He, 2014; Lindner et al., 2015, 2016). With this
spatio-temporal separation, the two staged AD system is particularly suitable for shift-
ing the methane production into times of higher demand and could open new marketing
opportunities for plant operators.
To produce biogas on point in such a system a supporting model is desirable to provide
future plant operators with reliable predictions for their gas production. Yet, current
modeling approaches in the literature focus on degradation kinetics (Yang et al., 2015),
rather than gas production kinetics. To provide a basis to predict gas production from
hydrolysate in a high rate methanation reactor, kinetic parameters of gas production for
individual intermediates have been determined experimentally in this study.
4.2 Material and Methods
4.2.1 Experimental Setup
The experiments were conducted in three Anaerobic Filters (AF) of identical construc-
tion. The mean free volume of the reactors was 2.8 L. A schematic representation of the
reactors is given in Figure 4.1. The reactors were in operation for approximately two years
after inoculation with separated liquid digestate from the research biogas plant "Unterer
Lindenhof, University of Hohenheim". Previous experiments included the one described
in Krümpel et al. (2016) as well as feeding similar substrates as the base feed used in this
experiment at various organic loading rates (OLR) up to OLRCOD of 20 g L−1 d−1.
The preparation of the reactors for the experiment at hand included removal, mixing
and redistribution of the packed beds to level e�ects of previous experiments. The react-
22
4. Intrinsic Gas Production Kinetics of Selected Intermediates in Anaerobic Filters for
Demand Orientated Energy Supply
Figure 4.1: experimental setup of the anaerobic �lter: (1)&(2) Hydrolysate & E�uentstorage bags, (3)&(4) peristaltic pumps for feeding and recirculation, (5) TemperatureSensor, (6) pH-Redox-Temperature Sensor, (7) Pressure Sensor, (8) Gas Cooling Sys-tem (Liebig-Cooler), (9)Milligascounter, (10) µ-GC, (11) Injection-port (Septum),(12)Sample-port (Septum)
ors were operated approximately four hydraulic retention times (HRT), until stable gas
production at an OLRCOD of 10 g L−1 d−1 was achieved before starting this experiment.
The reactors were fed continuously via a peristaltic pump and were completely mixed by
a recycle pump of the same type. E�uent was disposed via a free over�ow and collected
in plastic bags, which were exchanged daily.
The base feed was a hydrolysate produced from a 1:1 mixture of maize and grass-silage
by leach-bed acidi�cation reactors and contained 2.08 g L−1 acetic acid, 0.47 g L−1 pro-
pionic acid, 1.44 g L−1 n-butyric acid, 0.01 g L−1 iso-butyric acid, 0.03 g L−1 n-valeric acid,
0.02 g L−1 iso-valeric acid, 0.60 g L−1 caproic acid, 3.90 g L−1 lactic acid and 0.90 g L−1
ethanol. The total chemical oxygen demand (COD) was 20.89 g L−1. It was used to
maintain a continuous operation and likely provided essential macro and micro-nutrients
which have not been analyzed individually.
The feeding regime was constant throughout the experiment with a resulting OLRCOD
of 7.2 g L−1 d−1 and a hydraulic retention time (HRT) of 2.9 d with mesophilic conditions
at 38 ◦C.
In addition to the base feed, the reactors received a 10 mL injection, three times per
week over a course of �ve weeks. Each injection was given through a septum in the lower
part of the reactor (see (11) in Figure 4.1) and contained 1 gCOD of a speci�c intermediate
of AD. In total eight injections per substance were given. The order was randomized and
23
4. Intrinsic Gas Production Kinetics of Selected Intermediates in Anaerobic Filters for
Demand Orientated Energy Supply
contained one of the following substances: acetic acid (HAc), propionic acid (HPr), lactic
acid (HLac), butyric acid (HBu), ethanol (Eth) or 1,2propanediol (Prd).
After completing this set of injections a second set was prepared. This time it was not
randomized. Each reactor received two injections of valeric acid (HVal), followed by three
injections of the base-hydrolysate (Hyd) and �nally receiving two injections of iso-butyric
acid (i-HBu) over a course of three weeks. The acquired data of this set is reported, but
not taken into account for the statistical analysis.
4.2.2 Analytical
Liquid samples from hydrolysate and samples taken from the reactor were analyzed by a
combination of gas chromatography (GC) and high performance liquid chromatography
(HPLC) to detect volatile fatty acids (VFAs), lactic acid, alcohols and sugars. The GC
was equipped with a WCOT fused silica column and FID-detector with the carrier gas
helium. The HPLC-system was operated with 0.02 N H2SO4 eluent, a Biorad Aminex
HPX87-H column and a refractory index detector. COD was measured using Hach Lange
cuvette tests (LCK 014).
Produced biogas volume was measured online by Ritter Milligascounters and was
recalculated to STP conditions (0 ◦C, 1013.25 hPa). Gas quality was analyzed by gas
chromatography every 20 minutes with a two-channel In�con 3000 µ-GC. Channel A was
equipped with a Molsieve 5Å column and channel B with a Poraplot Q column. Carrier
gases were Argon and Helium respectively. Both channels were equipped with a thermal
conductivity detector (TCD). To each count of the Milligascounter an interpolated value
of the gas quality was assigned, depending on the time di�erence between the quality
measurements and the volume-count.
The exact operating conditions of GC, HPLC and µ-GC are described elsewhere
(Krümpel et al., 2016).
4.2.3 Analysis
To determine wether tested intermediates show di�erences in methane production kinetics
the following procedure was applied: A baseline of gas production was recorded during the
three hours prior to injection. The baseline was a simple linear �t to the data of cumulative
gas production. The baseline was then subtracted from the cumulative gas production
over the time period from three hours prior injection to six hours after injection. The
resulting curve represented the cumulative gas production resulting from the injection. In
order to describe the observed gas production from the injected intermediate, a nonlinear
�t using a modi�ed Gompertz equation (after Wang et al. (2011)) was �tted to the
resulting curve. The �t was accomplished by a method of least squares using the built in
`NL2SOL'-Algorithm of the free R-statistical software (R Development Core Team, 2008).
24
4. Intrinsic Gas Production Kinetics of Selected Intermediates in Anaerobic Filters for
Demand Orientated Energy Supply
The Gompertz equation (4.1) given below includes three parameters, giving the �nal gas
yield ai [mL], the lag phase λi [h] and the fractional rate of gas production ki [h−1] with
i ∈ {CH4, CO2}.
Vi(t) = ai · exp(−exp(1− ki · (t− λi))) (4.1)
In case of acidic intermediates the above equation is extended by a fourth parameter
zi [mL]. It is introduced to correct for initial CO2 ejections due to lowered pH as described
in Krümpel et al. (2016):
Vi(t) = ai · exp(−exp(1− ki · (t− λi))) + zi (4.2)
The �nal yield in this case changes to ai + zi and the corrected methane production
kinetic is therefore (Krümpel et al., 2016):
VCH4(t) =(aCH4 + zCH4)
· exp(−exp(1− kCH4 · (t− λCH4)))(4.3)
A detailed description of this method is given in Krümpel et al. (2016). The parameters
have been estimated for every injection. To establish an order of methane production rates
the half lives for each injection were calculated with the following formula, according to
Wang et al. (2011):
t0.5,CH4 = λCH4 +1− ln(ln(2))
kCH4
(4.4)
Where t0.5,CH4 is the point in time where half of the �nal methane yield is reached.
4.3 Results and Discussion
Due to technical di�culties one of the three reactors had to be taken out of analysis.
Nevertheless the remaining injections were analyzed as described. After subtracting the
baseline for each individual injection, all gas production curves showed a sigmoid shape
which is shown in Figure 4.2 and 4.3.
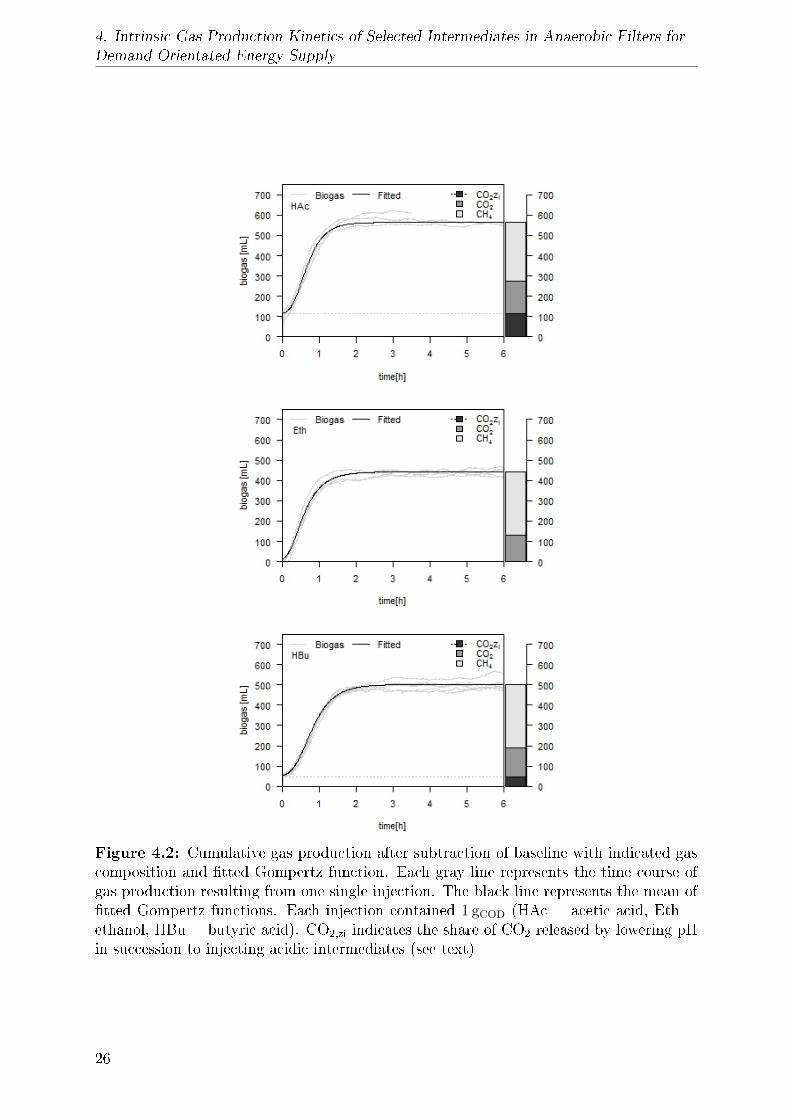
The Gompertz function shown is constructed from the mean of parameter estimations
for each substance and aggregates the resulting CO2 and CH4 production curves. After
the injection of acidic intermediates, the pH dropped as expected. In consequence CO2
was ejected as dissolved carbon in the form of HCO3- transformed to gaseous CO2. The
amount of immediate gas ejection was highest for acetic acid with 40± 11 % of total
CO2 release after injection. This share decreased roughly with lower molar concentration
of the injected intermediate. The speci�c shares of immediate ejection in total CO2
25
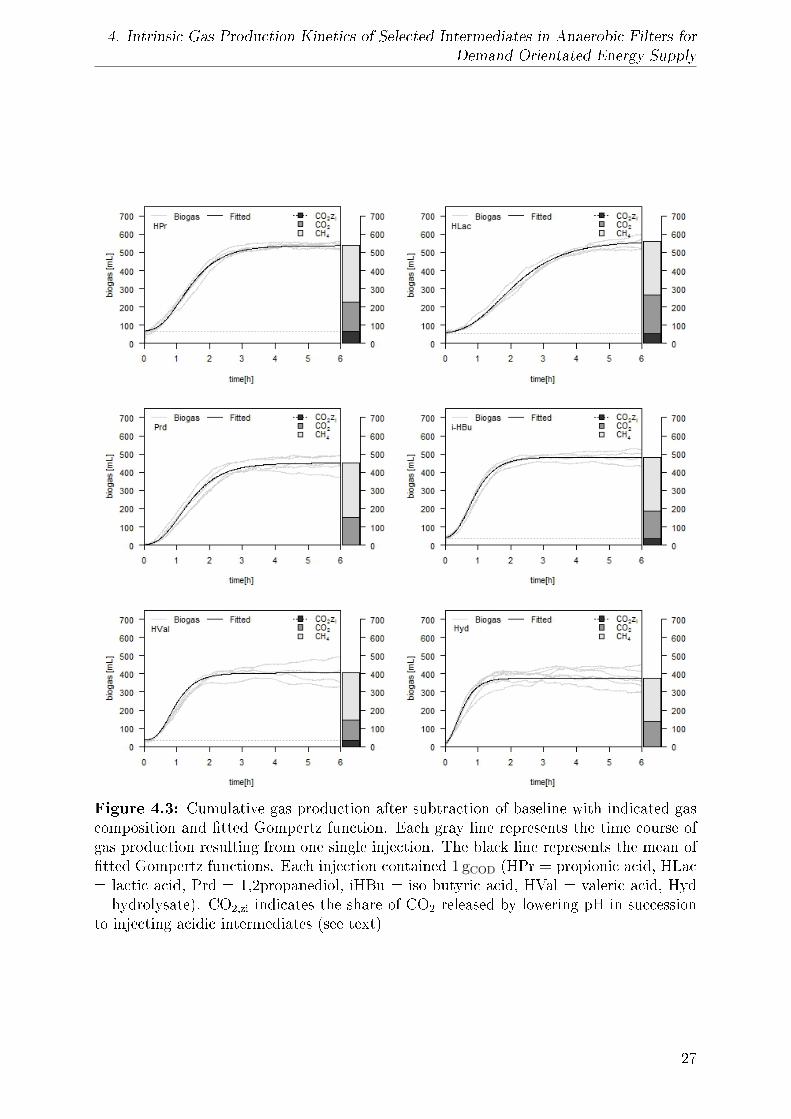
4. Intrinsic Gas Production Kinetics of Selected Intermediates in Anaerobic Filters for
Demand Orientated Energy Supply
Figure 4.2: Cumulative gas production after subtraction of baseline with indicated gascomposition and �tted Gompertz function. Each gray line represents the time course ofgas production resulting from one single injection. The black line represents the mean of�tted Gompertz functions. Each injection contained 1 gCOD (HAc = acetic acid, Eth =ethanol, HBu = butyric acid). CO2,zi indicates the share of CO2 released by lowering pHin succession to injecting acidic intermediates (see text)
26
4. Intrinsic Gas Production Kinetics of Selected Intermediates in Anaerobic Filters for
Demand Orientated Energy Supply
Figure 4.3: Cumulative gas production after subtraction of baseline with indicated gascomposition and �tted Gompertz function. Each gray line represents the time course ofgas production resulting from one single injection. The black line represents the mean of�tted Gompertz functions. Each injection contained 1 gCOD (HPr = propionic acid, HLac= lactic acid, Prd = 1,2propanediol, iHBu = iso butyric acid, HVal = valeric acid, Hyd= hydrolysate). CO2,zi indicates the share of CO2 released by lowering pH in successionto injecting acidic intermediates (see text)
27
4. Intrinsic Gas Production Kinetics of Selected Intermediates in Anaerobic Filters for
Demand Orientated Energy Supply
release were 29± 12 %, 25± 10 %, 25± 14 %, 20± 8 % and 20± 9 % for HPr, HBu, HVal,
HLac and i-HBu respectively. For the non-acidic intermediates, namely ethanol and 1,2-
propanediol, this immediate gas ejection did not take place (see Figure 4.2 and 4.3).
The gas composition indicated in the accompanying barplot was calculated as the mean
of individual parameter estimations from each repetition. The split CO2 bars illustrate
the aforementioned gas ejection as CO2,zi and the remainder which was released from
degradation of the injected intermediate. After the CO2 ejection and the proceeding
degradation of the intermediate, the pH recovers and free capacity to solubilize CO2
emerges. These processes lead to a gas composition, which is o� the stoichiometrical
values predicted by Buswell and Mueller (1952). The methane yield however is not biased
by this, since its solubility is very low compared to that of CO2.
None of the injected intermediates reached the methane yield of 350 mL which is pre-
dicted by stoichiometry assuming complete degradation Khanal (2008). Under the condi-
tions presented, the methane yields for the tested substances in the �rst set of injections
were 287± 13 mL, 310± 19 mL, 311± 33 mL, 296± 39 mL, 312± 16 mL and 300± 38 mL
for acetic acid, propionic acid, butyric acid, lactic acid, ethanol and 1,2-propanediol, re-
spectively. In the second set of injections the yields were 298± 30 mL, 257± 54 mL and
239± 37 mL for iso-butyric acid, valeric acid and the hydrolysate, respectively.
The actual methane yield is a�ected by microbial growth during degradation as well
as possible side routes with inorganic electron acceptors in the reactor liquid, resulting
in other products, predominantly H2S. The microbial growth is particularly pronounced
in the studies of Yang et al. (2015), who studied methane formation kinetics of selected
C1 to C5 organic acids in batch serum bottles. Here the methane yields were between
0.17 gCOD/gCOD for lactic acid and 0.58 gCOD/gCOD for acetic acid. This stresses the
distinctive di�erences between batch and continuous operation or in other words between
a growing micro organism (MO) population and a steady state population.
In Table 4.1
the estimated parameters of the Gompertz functions are summarized for CH4. Herein
signi�cant di�erences are only indicated between substances of the �rst set of injections.
By calculating the half lives of methane production according to formula (4.4) an order
of methane production rates could be established and is depicted in Figure 4.4.
The order determined, beginning with the fastest is HAc >Eth >HBu >HiBu >HVal
>HPr >Prd >HLac. At this point it should be noted that intermediates with an odd-
numbered C chain are more likely to be found on the lower rates end. This is most
commonly explained by the thermodynamically unfavorable conversion of propionic acid
to acetate, CO2 and hydrogen (Öztürk, 1991). Straight chain VFAs with odd-numbered C-
atoms will mostly be degraded by beta oxidation and eventually yield propionic acid as an
intermediate. Odd-numbered straight chain VFAs will therefore include this unfavorable
pathway and are thus more likely to be found at the lower end of methane production
28
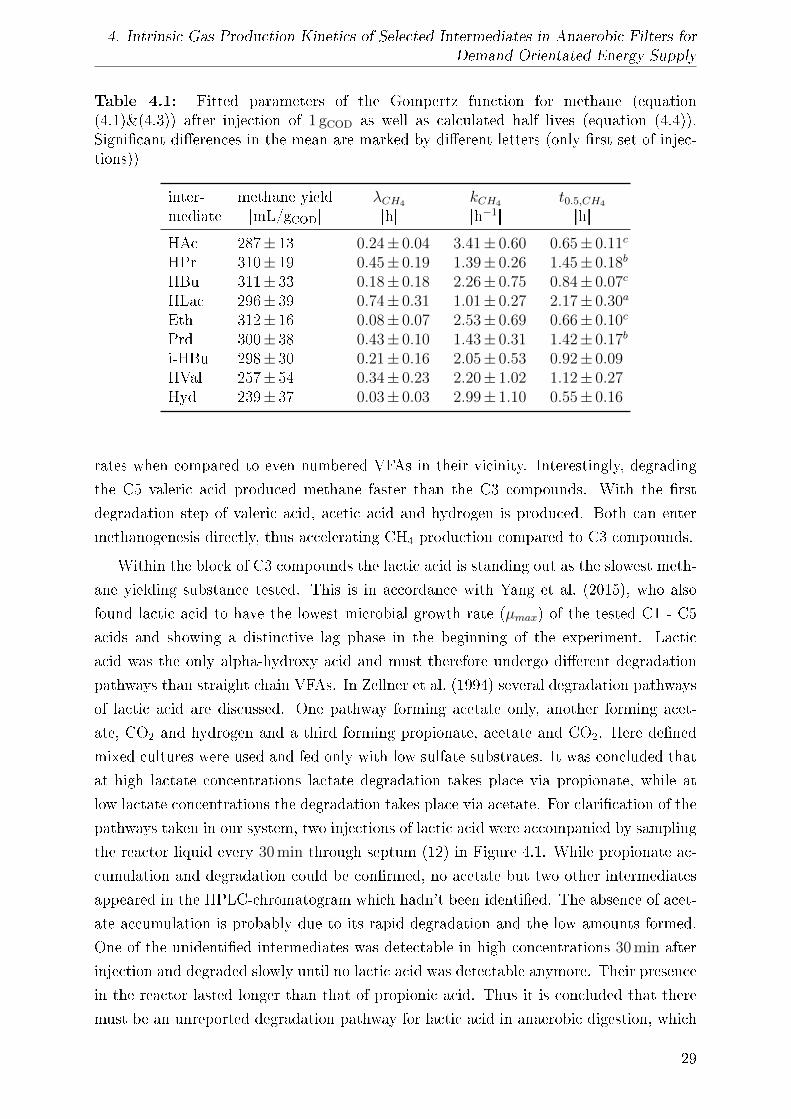
4. Intrinsic Gas Production Kinetics of Selected Intermediates in Anaerobic Filters for
Demand Orientated Energy Supply
Table 4.1: Fitted parameters of the Gompertz function for methane (equation(4.1)&(4.3)) after injection of 1 gCOD as well as calculated half lives (equation (4.4)).Signi�cant di�erences in the mean are marked by di�erent letters (only �rst set of injec-tions))
inter- methane yield λCH4 kCH4 t0.5,CH4
mediate [mL/gCOD] [h] [h−1] [h]
HAc 287± 13 0.24± 0.04 3.41± 0.60 0.65± 0.11c
HPr 310± 19 0.45± 0.19 1.39± 0.26 1.45± 0.18b
HBu 311± 33 0.18± 0.18 2.26± 0.75 0.84± 0.07c
HLac 296± 39 0.74± 0.31 1.01± 0.27 2.17± 0.30a
Eth 312± 16 0.08± 0.07 2.53± 0.69 0.66± 0.10c
Prd 300± 38 0.43± 0.10 1.43± 0.31 1.42± 0.17b
i-HBu 298± 30 0.21± 0.16 2.05± 0.53 0.92± 0.09HVal 257± 54 0.34± 0.23 2.20± 1.02 1.12± 0.27Hyd 239± 37 0.03± 0.03 2.99± 1.10 0.55± 0.16
rates when compared to even numbered VFAs in their vicinity. Interestingly, degrading
the C5 valeric acid produced methane faster than the C3 compounds. With the �rst
degradation step of valeric acid, acetic acid and hydrogen is produced. Both can enter
methanogenesis directly, thus accelerating CH4 production compared to C3 compounds.
Within the block of C3 compounds the lactic acid is standing out as the slowest meth-
ane yielding substance tested. This is in accordance with Yang et al. (2015), who also
found lactic acid to have the lowest microbial growth rate (µmax) of the tested C1 - C5
acids and showing a distinctive lag phase in the beginning of the experiment. Lactic
acid was the only alpha-hydroxy acid and must therefore undergo di�erent degradation
pathways than straight chain VFAs. In Zellner et al. (1994) several degradation pathways
of lactic acid are discussed. One pathway forming acetate only, another forming acet-
ate, CO2 and hydrogen and a third forming propionate, acetate and CO2. Here de�ned
mixed cultures were used and fed only with low sulfate substrates. It was concluded that
at high lactate concentrations lactate degradation takes place via propionate, while at
low lactate concentrations the degradation takes place via acetate. For clari�cation of the
pathways taken in our system, two injections of lactic acid were accompanied by sampling
the reactor liquid every 30 min through septum (12) in Figure 4.1. While propionate ac-
cumulation and degradation could be con�rmed, no acetate but two other intermediates
appeared in the HPLC-chromatogram which hadn't been identi�ed. The absence of acet-
ate accumulation is probably due to its rapid degradation and the low amounts formed.
One of the unidenti�ed intermediates was detectable in high concentrations 30 min after
injection and degraded slowly until no lactic acid was detectable anymore. Their presence
in the reactor lasted longer than that of propionic acid. Thus it is concluded that there
must be an unreported degradation pathway for lactic acid in anaerobic digestion, which
29
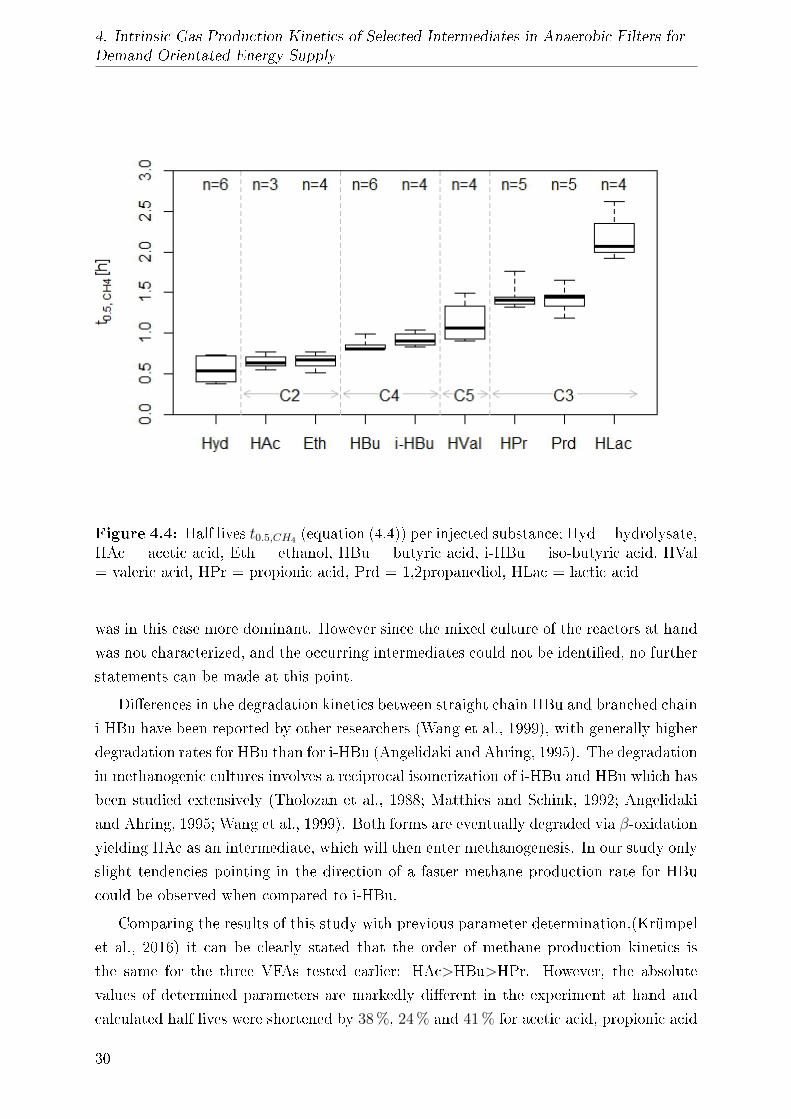
4. Intrinsic Gas Production Kinetics of Selected Intermediates in Anaerobic Filters for
Demand Orientated Energy Supply
Figure 4.4: Half lives t0.5,CH4 (equation (4.4)) per injected substance; Hyd = hydrolysate,HAc = acetic acid, Eth = ethanol, HBu = butyric acid, i-HBu = iso-butyric acid, HVal= valeric acid, HPr = propionic acid, Prd = 1,2propanediol, HLac = lactic acid
was in this case more dominant. However since the mixed culture of the reactors at hand
was not characterized, and the occurring intermediates could not be identi�ed, no further
statements can be made at this point.
Di�erences in the degradation kinetics between straight chain HBu and branched chain
i-HBu have been reported by other researchers (Wang et al., 1999), with generally higher
degradation rates for HBu than for i-HBu (Angelidaki and Ahring, 1995). The degradation
in methanogenic cultures involves a reciprocal isomerization of i-HBu and HBu which has
been studied extensively (Tholozan et al., 1988; Matthies and Schink, 1992; Angelidaki
and Ahring, 1995; Wang et al., 1999). Both forms are eventually degraded via β-oxidation
yielding HAc as an intermediate, which will then enter methanogenesis. In our study only
slight tendencies pointing in the direction of a faster methane production rate for HBu
could be observed when compared to i-HBu.
Comparing the results of this study with previous parameter determination,(Krümpel
et al., 2016) it can be clearly stated that the order of methane production kinetics is
the same for the three VFAs tested earlier: HAc>HBu>HPr. However, the absolute
values of determined parameters are markedly di�erent in the experiment at hand and
calculated half lives were shortened by 38 %, 24 % and 41 % for acetic acid, propionic acid
30
4. Intrinsic Gas Production Kinetics of Selected Intermediates in Anaerobic Filters for
Demand Orientated Energy Supply
and butyric acid, respectively, although the same digesters and methods were used. The
main di�erence between the two experiments was the base-OLRCOD, with 3.5 g L−1 d−1
in (Krümpel et al., 2016) and 7.2 g L−1 d−1 in this study. Therefore the OLR applied has
most likely a major impact on the results of this method. That is actually not surprising
as the Monod Kinetic, the most widely used kinetic model for AD, expressed in terms of
speci�c utilization rate U is (Pavlostathis and Giraldo-Gomez, 1991):
U =kS
KS + S(4.5)
where: k is the maximum speci�c utilization rate, S is the concentration of the growth
limiting substrate and KS is the half velocity coe�cient (i.e. substrate concentration
at one half maximum speci�c growth rate). This implies that the speci�c utilization
rate is dependent on substrate concentration. It stands to reason that at a higher OLR
the substrate concentrations are higher and therefore a faster methane production was
observed in this experiment. Other factors in�uencing the level of estimated parameters
in kinetic studies outlined by Nielsen et al. (2008) are a more adapted microorganism
(MO) population, reactor type, substrate, temperature and HRT.
As a surprising result, hydrolysate produced methane faster than all other tested
substances, even faster than acetic acid, which can be readily converted to CH4 and CO2
by acetoclastic methanogens. That is particularly unexpected because a major portion
of the COD in the hydrolysate is comprised by lactic acid, the slowest methane forming
intermediate in the trial. The hydrolysate has the lowest lag-phase (λCH4) determined
in the trials, but only the second highest fractional rate of gas production (kCH4) after
HAc. The higher lag-phase of HAc could be governed by the higher acidity of the injected
solution. When HAc was injected, the pH in the vicinity of the injection port may
have been decreased to inhibitory levels for a short period of time and thus delaying the
methane production. The half lives as the frame of reference could therefore be slightly
biased by this e�ect.
However when providing several intermediates at once, they are degraded simultan-
eously by di�erent specialized MOs releasing H2, CO2 and acetate. While acetate is
evidently producing methane very quickly, hydrogenotrophic methanogenesis as a sub-
sequent reaction to interspecies hydrogen transfer is possibly a main driving force for
faster methane production in the case of hydrolysate. This is in agreement with Wieg-
ant et al. (1986) who found the highest microbial speci�c growth rates of 0.330 h−1 when
H2/CO2 was the substrate compared to 0.040 h−1, 0.030 h−1 and 0.109 h−1 for acetate, pro-
pionate and butyrate respectively. Following the argument that propionate degradation is
a slow process, one could argue that due to the thermodynamically favorable conversion
of H2 and CO2 to CH4 hydrogenotrophic methanogenesis is a very fast conversion step.
This argumentation has its �aws since it is known that thermodynamic constants such as
31
4. Intrinsic Gas Production Kinetics of Selected Intermediates in Anaerobic Filters for
Demand Orientated Energy Supply
∆G′◦ do not state how fast equilibrium is reached in a certain reaction.Nelson and Cox
(2013) This is rather the �eld of enzyme kinetics. But the higher growth rates found in
the literature for thermodynamically favorable reactions lead to a denser population of
MOs speci�cally performing the reaction of interest. This is supported by the fact that
MO populations can adapt to substrates and increase the degradation rates as shown by
several studies (Öztürk, 1991; Wang et al., 1999; Aguilar et al., 1995) for various VFAs.
Thus the higher microbial biomass in the �xed bed performing the speci�c reaction are
likely to be the underpinning reason for faster reactions.
4.4 Conclusion
Kinetic parameters of gas production can be determined during continuous operation of
a high rate methanation reactor. The gas production rates of tested single intermediates
can be ordered by determining their half lives of gas production. The order determined
after injection of 1 gCOD, beginning with the fastest is HAc >Eth >HBu >HiBu >HVal
>HPr >Prd >HLac. Odd-numbered C-chains of the speci�c intermediate lead to a slow
gas production due to the thermodynamically unfavorable degradation of propionate in
the process of complete breakdown to CH4 and CO2. However, the mixture used as a base
feed (hydrolysate) has shown to have the fastest methane production rate, even though
it was comprised of lactic acid to a large extent. This is due to multiple factors such as
the parallel degradation of the compounds by di�erent microorganisms, the inter-species
hydrogen transfer and following hydrogenotrophic methanogenesis, the possibly perfectly
adapted MO population to the hydrolysate or the low acidity compared to other acidic
injections. The �ndings can be used for modeling and point towards the possibility to
lump gas production kinetics of several intermediates into one simple parameter describing
the hydrolysate. Further research on this is recommended. Especially with an eye on more
extreme situations and �uctuating gas production over the course of the day to meet the
requirements of �exible gas production.
Acknowledgments
This study originates from the project "Methanoquant" (FKZ 03SF0423B) and is sup-
ported by the german Federal Ministry of Education and Research (BMBF) and the
Projektträger Jülich (PtJ).
4.5 References
Aguilar, A., Casas, C., Lema, J., 1995. Degradation of volatile fatty acids by di�erently
enriched methanogenic cultures: Kinetics and inhibition. Water Research 29, 505�509.
32
4. Intrinsic Gas Production Kinetics of Selected Intermediates in Anaerobic Filters for
Demand Orientated Energy Supply
Angelidaki, I., Ahring, B., 1995. Isomerization of n- and i-butyrate in anaerobic meth-
anogenic systems. Antonie van Leeuwenhoek 68, 285�291.
Buswell, A.M., Mueller, H.F., 1952. Mechanism of methane fermentation. Industrial &
Engineering Chemistry 44, 550�552.
Demirel, B., Yenigün, O., 2002. Two-phase anaerobic digestion processes: A review.
Journal of Chemical Technology and Biotechnology 77, 743�755.
Fox, P., Pohland, F., 1994. Anaerobic treatment applications and fundamentals: Sub-
strate speci�city during phase separation. Water Environment Research 66, 716�724.
Hahn, H., Krautkremer, B., Hartmann, K., Wachendorf, M., 2014. Review of concepts
for a demand-driven biogas supply for �exible power generation. Renewable and Sus-
tainable Energy Reviews 29, 383�393.
Khanal, S.K. (Ed.), 2008. Anaerobic biotechnology for bioenergy production: principles
and applications. Wiley-Blackwell, Ames, Iowa.
Krümpel, J., Schäufele, F., Schneider, J., Jungbluth, T., Zielonka, S., Lemmer, A., 2016.
Kinetics of biogas production in anaerobic �lters. Bioresource Technology 200, 230�234.
Lehtomäki, A.b., Björnsson, L., 2006. Two-stage anaerobic digestion of energy crops:
Methane production, nitrogen mineralisation and heavy metal mobilisation. Environ-
mental Technology 27, 209�218.
Lindner, J., Zielonka, S., Oechsner, H., Lemmer, A., 2015. E�ect of di�erent ph-values
on process parameters in two-phase anaerobic digestion of high-solid substrates. En-
vironmental Technology (United Kingdom) 36, 198�207.
Lindner, J., Zielonka, S., Oechsner, H., Lemmer, A., 2016. Is the continuous two-stage
anaerobic digestion process well suited for all substrates? Bioresource Technology 200,
470�476.
Matthies, C., Schink, B., 1992. Reciprocal isomerization of butyrate and isobutyrate by
the strictly anaerobic bacterium strain wog13 and methanogenic isobutyrate degrada-
tion by a de�ned triculture. Applied and Environmental Microbiology 58, 1435�1439.
Mauky, E., Jacobi, H., Liebetrau, J., Nelles, M., 2015. Flexible biogas production for
demand-driven energy supply - feeding strategies and types of substrates. Bioresource
Technology 178, 262�269.
Nelson, D.L., Cox, M.M., 2013. Lehninger principles of biochemistry. Freeman, New
York, NY. 6. ed., [international ed.] edition.
33
4. Intrinsic Gas Production Kinetics of Selected Intermediates in Anaerobic Filters for
Demand Orientated Energy Supply
Nielsen, H., Mladenovska, Z., Ahring, B., 2008. Kinetics of propionate conversion in
anaerobic continuously stirred tank reactors. Environmental Technology 29, 151�160.
Öztürk, M., 1991. Conversion of acetate, propionate and butyrate to methane under
thermophilic conditions in batch reactors. Water Research 25, 1509�1513.
Parawira, W.b., Murto, M., Read, J., Mattiasson, B., 2007. A study of two-stage anaer-
obic digestion of solid potato waste using reactors under mesophilic and thermophilic
conditions. Environmental Technology 28, 1205�1216.
Pavlostathis, S., Giraldo-Gomez, E., 1991. Kinetics of anaerobic treatment: A critical
review. Critical Reviews in Environmental Control 21, 411�490.
R Development Core Team, 2008. R: A Language and Environment for Statistical Com-
puting. R Foundation for Statistical Computing. Vienna, Austria. ISBN 3-900051-07-0.
Tholozan, J.L., Samain, E., Grivet, J.P., 1988. Isomerization between n-butyrate and
isobutyrate in enrichment cultures. FEMS Microbiology Letters 53, 187�191.
Thrän, D., Dotzauer, M., Lenz, V., Liebetrau, J., Ortwein, A., 2015. Flexible bioenergy
supply for balancing �uctuating renewables in the heat and power sector a review of
technologies and concepts. Energy, Sustainability and Society 5, 1�15.
Wang, M., Tang, S., Tan, Z., 2011. Modeling in vitro gas production kinetics: Derivation
of logistic-exponential (le) equations and comparison of models. Animal Feed Science
and Technology 165, 137�150.
Wang, Q., Kuninobu, M., Ogawa, H., Kato, Y., 1999. Degradation of volatile fatty acids
in highly e�cient anaerobic digestion. Biomass and Bioenergy 16, 407�416.
Wiegant, W., Hennink, M., Lettinga, G., 1986. Separation of the propionate degradation
to improve the e�ciency of thermophilic anaerobic treatment of acidi�ed wastewaters.
Water Research 20, 517�524.
Yang, Y., Chen, Q., Guo, J., Hu, Z., 2015. Kinetics and methane gas yields of selected
c1 to c5 organic acids in anaerobic digestion. Water Research 87, 112�118.
Yu, H., Samani, Z., Hanson, A., Smith, G., 2002. Energy recovery from grass using
two-phase anaerobic digestion. Waste Management 22, 1�5.
Zellner, G., Neudörfer, F., Diekmann, H., 1994. Degradation of lactate by an anaerobic
mixed culture in a �uidized-bed reactor. Water Research 28, 1337�1340.
Zhang, B., He, P.J., 2014. Performance assessment of two-stage anaerobic digestion of
kitchen wastes. Environmental Technology (United Kingdom) 35, 1277�1285.
34
5. Demand-Driven Biogas Production in Anaerobic Filters
5 Demand-Driven Biogas Production in Anaerobic
Filters
Andreas Lemmer, Johannes Krümpel
State Institute of Agricultural Engineering and Bioenergy,
University of Hohenheim, Garbenstraÿe 9, 70599, Stuttgart, Germany
Article Information:
Published: Applied Energy 185 (2017) 885-894
Received: September 6th 2016
Revised: October 21st 2016
Accepted: October 23rd 2016
Available online: November 9th 2016
DOI : 10.1016/j.apenergy.2016.10.073
Abstract
The growth in electricity generated from renewable energy sources is posing challenges
for grid integrity and the need to counter balance the intermittent power supply by these
sources. Biogas technology can o�er such grid services by adapting the biogas production
to the balancing demand and subsequent electricity production of the combined heat and
power unit. Innovative plant designs such as two-staged anaerobic digestion could pos-
sibly adapt to imbalances in the electricity grid in shorter time frames than traditional
completely mixed tank reactors (CSTR). Scope of this research paper is to demonstrate
the feasibility of operating an anaerobic �lter for highly �exible gas production. The re-
peatability of this type of operation is examined to demonstrate its predictability. Based
on gas production pro�les a measure of responsiveness is introduced to determine how
quick adaptions in gas production can be made. Furthermore the in�uence of substrate
composition is tested and �nally a carbon balance is derived to evaluate the performance
of this approach of operation. The results indicate that anaerobic �lters are well suited
for �exible gas production and show a good reproducibility under the conditions presen-
ted. From the comparison of rate of increases in methane production it was found that
the composition of the two substrates tested, does not have an in�uence on the rate of
increase in methane production. The pH a�ects the solubility of CO2 and HCO3- and
therefore marks an important parameter determining the gas composition, especially un-
der varying OLRs. The carbon balance showed that the largest output fraction is CH4,
followed by CO2, inorganic carbon, dissolved organic carbon and particulate carbon with
varying shares depending on the experimental phase.
35
5. Demand-Driven Biogas Production in Anaerobic Filters
Keywords: balancing power, anaerobic digestion, two-staged, �exibility, carbon balance
5.1 Introduction
As a result of greenhouse gas(GHG) emission reduction policies, the share of renewable
energy (RE) in energy production has seen a considerable increase in the last decade.
Within the EU-28, the share had increased by 84.4 % between 2003 and 2013. Electricity
generated from renewable energy sources contributed to more than one quarter (25.4 %)
of the EU-28's gross electricity consumption. The growth in electricity generated from
renewable energy sources during the period 2003 to 2013 largely re�ects an expansion
in three renewable energy sources, namely, wind turbines, solar power and biomass (EU,
2016).
Scenarios developed by the EU predict a signi�cant share of 55 % to 97 % renewable
energy supply in gross energy production by th year 2050 (EU, 2012). As outlined by
Steinke et al. (2013), the increase will mainly be provided by solar and wind, thereby
posing challenges for grid stability and the need to counter balance the intermittent
power supply by these sources.
Biogas technology not only reduces GHG emissions when compared to fossil fuel elec-
tricity production (Bacenetti et al., 2016), but can o�er grid services by making electricity
production of the combined heat and power unit (CHP) more �exible. With enhanced
�exibility in energy production the biogas technology could play a signi�cant role in
smart grid applications such as the models presented in (Brouwer et al., 2015; Calvillo
et al., 2016; Zamani et al., 2016), and help increase the revenues for future aggregated
distributed energy resources or virtual power plants.
Shifting the electricity output into times of higher demand or alternatively lowering
the power production to amend excess supply by other sources can be achieved by several
adjustments to biogas technology. One frequently discussed option is to adapt the biogas
production to the electricity demand, thereby opening new marketing options for plant
operators (Thrän et al., 2015; Hahn et al., 2014b; Grim et al., 2015; Mulat et al., 2016).
Existing biogas plants in Germany are currently increasing gas storage volumes and
expanding CHP capacity to achieve higher �exibility (Hahn et al., 2014a). Current reac-
tion times are approximately one day and weekend shutdowns are not the usual practice at
the moment. Improvements in �exibility could be achieved by altering the feeding regime
to adapt gas production within several hours. Mauky et al. (2015) not only demonstrated
the general feasibility but also determined savings in biogas storage capacity of 42 % to
45 % and found a more stable overall performance for continuously stirred tank reactors
(CSTR) when operated in a �exible feeding regime.
Innovative plant designs such as two-staged anaerobic digestion (AD) with separ-
36
5. Demand-Driven Biogas Production in Anaerobic Filters
ated hydrolysis/acidogenesis and acetogenesis/methanogenesis could possibly adapt to
imbalances in the electricity grid in even shorter time frames. Two-staged AD systems
commonly consist of a CSTR or leach-bed reactor to produce a liquid that is rich in volat-
ile fatty acids and alcohols. The acidi�cation reactor (AR) is coupled to a methanation
reactor (MR) where the soluble organics can be quickly degraded to yield biogas. The
second stage is often put into practice as an anaerobic �lter (AF), up�ow sludge blanket
reactor (UASB) or more sophisticated versions thereof (Lindner et al., 2015; Zielonka
et al., 2010; Nizami and Murphy, 2010; Cysneiros et al., 2012; Tauseef et al., 2013; Chen
et al., 2013). The advantages of two-staged setups found in literature are:
� Providing optimal conditions for the microorganism consortia taking part in the
respective step of AD(Pohland and Ghosh, 1971; Cohen et al., 1979),
� thereby increasing turnover rates and enabling a reduction in total reactor volume
(Cohen et al., 1979),
� disposal of slugde from the AR without loss of slowly growing methanogens (Cohen
et al., 1979),
� fractionating the produced biogas (Muha et al., 2013) and enabling high methane
concentrations in the MR and
� higher overall methane yields for speci�c substrates (Ghosh, 1987).
Further advantages of two-staged AD over single-staged AD, potentially improving
demand-driven gas production, are that the hydrolysis as rate limiting step (Pavlostathis
and Giraldo-Gomez, 1991) is decoupled from methanogenesis and thereby enables a shift
of the gas production into times of higher demand. It could furthermore be shown that
selectively producing certain intermediates in the AR is possible by controlling pH and
redox-potential (Ren et al., 1997, 2007; Lindner et al., 2015), which may be used for a tar-
geted production of a hydrolysate with a high methane production rate. It is also known
that attached biomass reactors have a generally higher process stability and ruggedness
towards shock loads and can operate at much higher organic loading rates (OLR) than
CSTRs (Rajeshwari et al., 2000). Moreover, maintaining dormancy in the MR is also
possible (Tauseef et al., 2013).
The scope of this research paper was to demonstrate the feasibility of operating an
anaerobic �lter for highly �exible gas production. The replicability of this type of oper-
ation was examined to demonstrate its predictability. Based on gas production pro�les,
a measure of responsiveness was introduced to determine whether and how rapidly ad-
aptions to the production process are possible. Furthermore, the in�uence of substrate
composition was tested and �nally a carbon balance was derived to evaluate operation
performance.
37
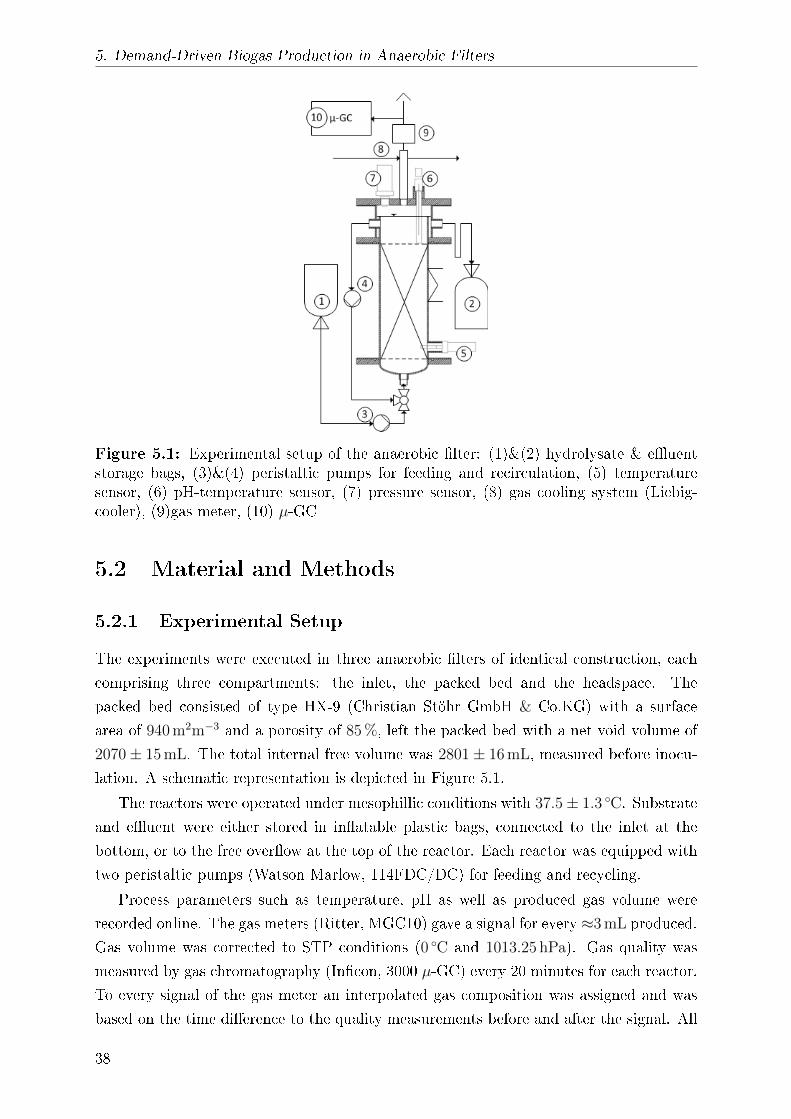
5. Demand-Driven Biogas Production in Anaerobic Filters
Figure 5.1: Experimental setup of the anaerobic �lter: (1)&(2) hydrolysate & e�uentstorage bags, (3)&(4) peristaltic pumps for feeding and recirculation, (5) temperaturesensor, (6) pH-temperature sensor, (7) pressure sensor, (8) gas cooling system (Liebig-cooler), (9)gas meter, (10) µ-GC
5.2 Material and Methods
5.2.1 Experimental Setup
The experiments were executed in three anaerobic �lters of identical construction, each
comprising three compartments: the inlet, the packed bed and the headspace. The
packed bed consisted of type HX-9 (Christian Stöhr GmbH & Co.KG) with a surface
area of 940 m2m−3 and a porosity of 85 %, left the packed bed with a net void volume of
2070± 15 mL. The total internal free volume was 2801± 16 mL, measured before inocu-
lation. A schematic representation is depicted in Figure 5.1.
The reactors were operated under mesophillic conditions with 37.5± 1.3 ◦C. Substrate
and e�uent were either stored in in�atable plastic bags, connected to the inlet at the
bottom, or to the free over�ow at the top of the reactor. Each reactor was equipped with
two peristaltic pumps (Watson Marlow, 114FDC/DC) for feeding and recycling.
Process parameters such as temperature, pH as well as produced gas volume were
recorded online. The gas meters (Ritter, MGC10) gave a signal for every ≈3 mL produced.
Gas volume was corrected to STP conditions (0 ◦C and 1013.25 hPa). Gas quality was
measured by gas chromatography (In�con, 3000 µ-GC) every 20 minutes for each reactor.
To every signal of the gas meter an interpolated gas composition was assigned and was
based on the time di�erence to the quality measurements before and after the signal. All
38
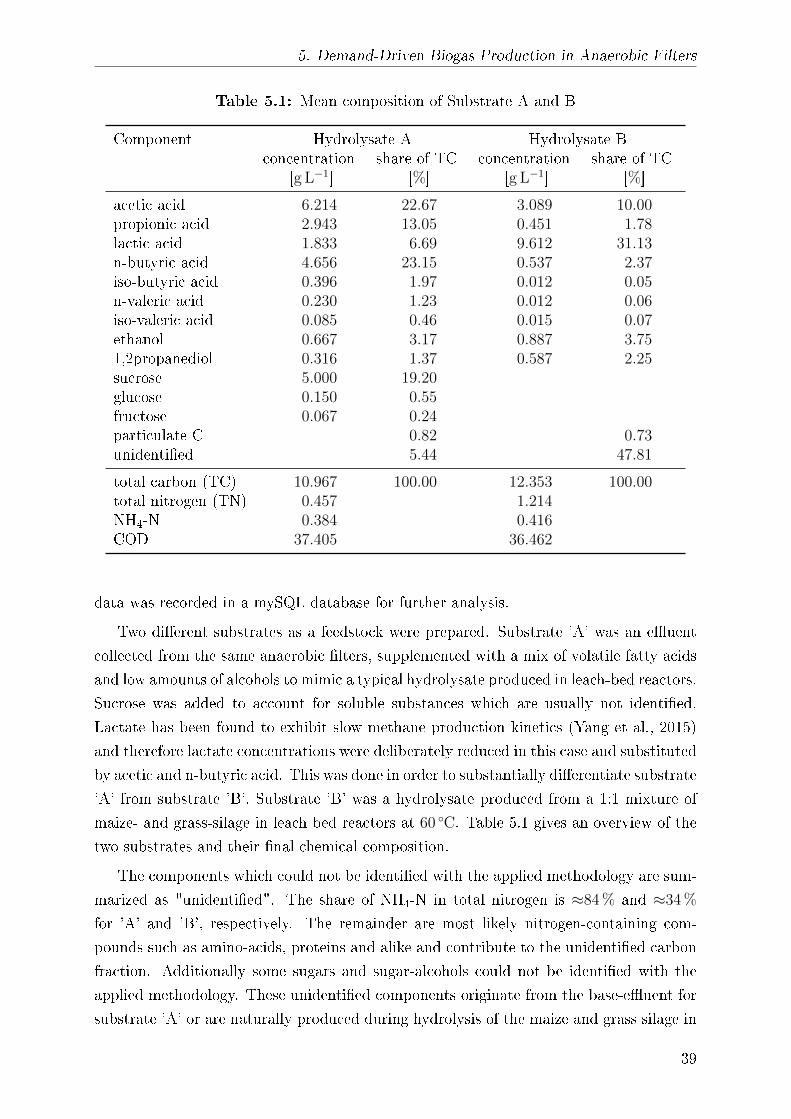
5. Demand-Driven Biogas Production in Anaerobic Filters
Table 5.1: Mean composition of Substrate A and B
Component Hydrolysate A Hydrolysate Bconcentration share of TC concentration share of TC
[g L−1] [%] [g L−1] [%]
acetic acid 6.214 22.67 3.089 10.00propionic acid 2.943 13.05 0.451 1.78lactic acid 1.833 6.69 9.612 31.13n-butyric acid 4.656 23.15 0.537 2.37iso-butyric acid 0.396 1.97 0.012 0.05n-valeric acid 0.230 1.23 0.012 0.06iso-valeric acid 0.085 0.46 0.015 0.07ethanol 0.667 3.17 0.887 3.751,2propanediol 0.316 1.37 0.587 2.25sucrose 5.000 19.20glucose 0.150 0.55fructose 0.067 0.24particulate C 0.82 0.73unidenti�ed 5.44 47.81
total carbon (TC) 10.967 100.00 12.353 100.00total nitrogen (TN) 0.457 1.214NH4-N 0.384 0.416COD 37.405 36.462
data was recorded in a mySQL database for further analysis.
Two di�erent substrates as a feedstock were prepared. Substrate 'A' was an e�uent
collected from the same anaerobic �lters, supplemented with a mix of volatile fatty acids
and low amounts of alcohols to mimic a typical hydrolysate produced in leach-bed reactors.
Sucrose was added to account for soluble substances which are usually not identi�ed.
Lactate has been found to exhibit slow methane production kinetics (Yang et al., 2015)
and therefore lactate concentrations were deliberately reduced in this case and substituted
by acetic and n-butyric acid. This was done in order to substantially di�erentiate substrate
'A' from substrate 'B'. Substrate 'B' was a hydrolysate produced from a 1:1 mixture of
maize- and grass-silage in leach bed reactors at 60 ◦C. Table 5.1 gives an overview of the
two substrates and their �nal chemical composition.
The components which could not be identi�ed with the applied methodology are sum-
marized as "unidenti�ed". The share of NH4-N in total nitrogen is ≈84 % and ≈34 %
for 'A' and 'B', respectively. The remainder are most likely nitrogen-containing com-
pounds such as amino-acids, proteins and alike and contribute to the unidenti�ed carbon
fraction. Additionally some sugars and sugar-alcohols could not be identi�ed with the
applied methodology. These unidenti�ed components originate from the base-e�uent for
substrate 'A' or are naturally produced during hydrolysis of the maize and grass silage in
39
5. Demand-Driven Biogas Production in Anaerobic Filters
the case of substrate 'B'.
In addition to the two substrates, two OLR-modes of operation were tested. The �rst
OLR-mode featured characteristics of a diurnal "double peak"-pattern of electricity-price
development (Li and Flynn, 2004). These characteristics are de�ned by starting low and
shooting up quickly in the early morning hours, continuing with a mid-day depression and
a second increase in the later evening hours, to �nally come back to a low level during
the night. The second mode of operation featured two extreme increases in OLR per day
for three hours to simulate peak-production. In the following these two OLR-modes of
operation will be referred to as 'demand' and 'peak', respectively.
The AFs were operated in parallel, processing the substrate and OLR-mode com-
binations in the sequence: 'demand.A' → 'peak.A' → 'demand.B' → 'peak.B'. Each
combination was planned to last four days. The corresponding mean hydraulic retention
times (HRT), based on the measured free volume of the packing bed were 2.4 d and 3.6 d
for 'demand' and 'peak', respectively. The true HRT is lower due to the establishment
of the bio�lm. A change of HRT due to biomass accumulation during the experiment is
thought to be negligible since a fully grown bio�lm was established beforehand.
Changes to the OLR during the day were realized by increasing or decreasing the
pause-intervals between feeding events. Each feeding event lasted 15 seconds throughout
the experiment and equaled the amount of ≈3.8 mL.
Hydrolysate samples were drawn once a week during bag �lling. The prepared bags
were stored at 4 ◦C for a maximum of one week. No gas production could be observed in
the feed bags while storing. The low pH of the hydrolysate (between 3-4) hindered any
signi�cant gas development during the time when the bags were attached to the plants.
The substrate and e�uent bags connected to the AFs were exchanged daily and weight
losses and gains were recorded with a weighing scale. E�uent samples were drawn each
day after disconnecting and weighing the bags.
5.2.2 Analytical
Liquid samples were analyzed by gas chromatography (GC) to determine volatile fatty
acids (VFA). The Shimadzu GC-2010plus was equipped with a SGE 25 m × 0.32 mm
column with a Bonded Polyethylene Glycol BP21 0.25µm �lm, a �ame ionization de-
tector and helium as a carrier gas. The temperature program started at 60 ◦C for two
minutes, then the temperature increased to 150 ◦C at 30 ◦C min−1 and �nally to 240 ◦C at
8 ◦C min−1. The injector temperature was set to 80 ◦C.
A supplementary analysis was performed to determine sugars, alcohols, formic acid
and lactic acid with a Bischo�-HPLC system, equipped with a BioRad Aminex HPX-
87H column (7.8 × 300 mm, part size 5 µm), refractory index detector and 0.02 N H2SO4
eluent. The system was operated at a �ow rate of 0.6 mL min−1, 35 ◦C and 6.0 MPa.
40
5. Demand-Driven Biogas Production in Anaerobic Filters
Total carbon (TC), inorganic carbon (IC) and total nitrogen (TN) were analyzed by
the Analytik Jena multi N/C 2100 S (ChD) BU. Herein the sample is catalytically oxidized
within an oxygen atmosphere at 850 ◦C. The gas stream is carried towards an nondis-
persive infrared adsorption (NDIR) detector to detect CO2. An inline electrochemical
detector was used to detect nitric oxides. The resulting area under the curve is correlated
to the TC or TN content, respectively. A second injection into another reaction vessel
was performed to analyze IC by acidifying the sample with H3PO4 and purging the CO2
towards the detector. The total organic carbon (TOC) was calculated by the di�erence
between TC and IC. By �ltering with a 0.25µm syringe �lter holder prior to analysis,
the dissolved carbon (DC) and dissolved organic carbon (DOC) were determined with
the same procedure. Chemical oxygen demand (COD) was measured using cuvette tests
(Hach Lange, LCK014).
NH4-N was analyzed by using the automatic distillation system Gerhardt Vapodest50s.
Herein the ammonium was distilled as ammonia by adding 32 %-NaOH to a 5 mL sample
and was collected in a 2 % boric acid (H3BO3) condenser. After completed distillation the
pH of the condenser liquid is titrated back to its initial pH with 0.1 molar HCl. The HCl
consumption was correlated to the ammonium content of the sample. The Vapodest50s
was set to 90 % steam power and 5 min distillation time. Added reactants were 74 mL
water, 86 mL NaOH and 86 mL H3BO3.
Gas quality was analyzed by the In�con3000 µ-GC with two separate analytical chan-
nels. Both channels were equipped with a thermal conductivity detector (TCD). Channel
A was characterized by having a variable and �xed sample loop, 5Å molsieve column
(30µm �lm, 320µm diameter, 14 m length), a Poraplot U pre column (30µm �lm, 320µm
diameter, 2 m length) and argon as a carrier gas to analyze concentrations of H2, N2, O2
and CH4. Column A was operated at 2.0 bar and 80 ◦C. Back�ush was activated after
10 s and the injection time of the variable sample loop was set to 0 s. Channel B, for the
analysis of CO2 and H2S, was equipped with a Pora Plot Q column (20µm �lm, 320µm
diameter, 8 m length) operating at 1.4 bar and 50 ◦C. The injection-time was set to 30 ms
and the carrier gas was helium.
5.2.3 Analysis
The recorded gas production data were compiled into 20 min intervals for each day. The
mean gas �ow and the standard deviation (SD) per interval was calculated over all three
reactors and four days of operation, equaling n=12 days per substrate×OLR combination.
As a measure of responsiveness to changes in OLR, the rate of increase in methane
production (rCH4) was calculated for each 20 minute interval. This was done by using
the mean of the produced methane in each interval and determining the slope by linear
regression in a moving window of three consecutive intervals.
41
5. Demand-Driven Biogas Production in Anaerobic Filters
Intra-daily variations were calculated as the span of measured values during one day
according to equation 5.1:
∆(i)d = max(i)d −min(i)d, (5.1)
Where i is the value measured, i.e. pH on day d.
The carbon balance was calculated on a daily basis with the start and end point marked
by the exchange of feed and e�uent bags. The produced gas was assigned to the same
period and was recalculated to the respective carbon mass. The analyzed concentrations
of individual components in the process-liquids by GC and HPLC were also recalculated to
their respective carbon mass. In combination with the data from the carbon analyzer, the
following carbon pools could be established: TC, IC, particulate carbon (pC), unidenti�ed
dissolved organic carbon (uDOC) and carbon by component i (Cci). Wherein the sum
of Cci and uDOC gave DOC, DOC + pC gave TOC and TOC + IC gave TC. The
degradation degree was calculated based on TOC by equation 5.2 to evaluate the process
performance:
ηTOC =TOCin[g/d]− TOCout[g/d]
TOCin[g/d]× 100%, (5.2)
where ηTOC is the degradation degree, TOCin is the TOC fed into the AF and TOCout
is the TOC leaving the system via the e�uent during the same time period.
All carbon fractions have been directly measured with the exception of dissolved meth-
ane. The solubility of methane at atmospheric pressure is extremely low and therefore
thought to be negligible.
5.3 Results
5.3.1 Flexible Gas Production
Figure 5.2 depicts the phases 'demand.A' and 'demand.B', individual methane as well
as total biogas production. The mean SD per 20 min interval for biogas production
were as low as ±12.6 mL for 'A', and ±13.1 mL for 'B'. The according mean SD for
methane production were±7.5 mL and±8.6 mL, respectively. The highest deviations were
reached within the hour after the steep increase in OLR during the morning hours, with
a maximum SD of ±27.4 mL and ±28.9 mL. This demonstrated an excellent replicability,
considering that three independent reactors were involved in the analysis.
Notably, the gas production followed the changes in OLR immediately and every
increase or decrease in OLR found its expression in the gas production pro�le. The two
instances per day, when the OLRCOD had increased to its highest value of ≈ 20 g L−1 d−1,
are worth taking a closer look. Although the applied OLR was the same for both instances,
42
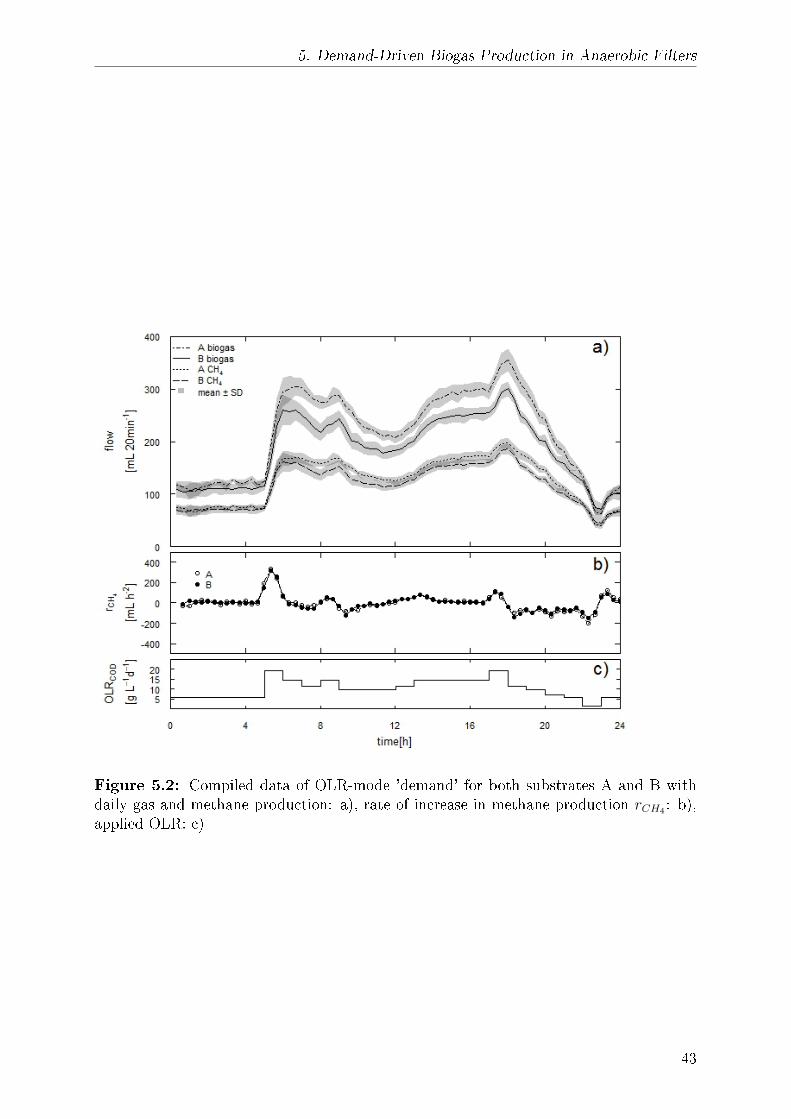
5. Demand-Driven Biogas Production in Anaerobic Filters
Figure 5.2: Compiled data of OLR-mode 'demand' for both substrates A and B withdaily gas and methane production: a), rate of increase in methane production rCH4 : b),applied OLR: c)
43
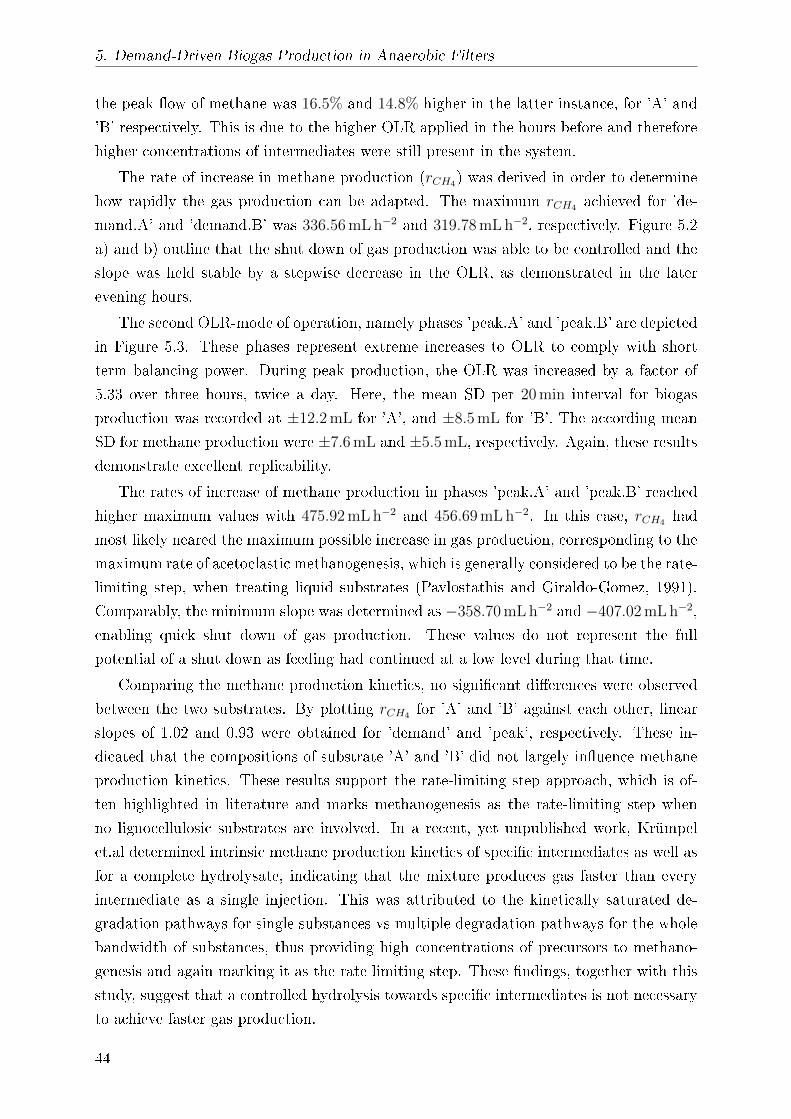
5. Demand-Driven Biogas Production in Anaerobic Filters
the peak �ow of methane was 16.5% and 14.8% higher in the latter instance, for 'A' and
'B' respectively. This is due to the higher OLR applied in the hours before and therefore
higher concentrations of intermediates were still present in the system.
The rate of increase in methane production (rCH4) was derived in order to determine
how rapidly the gas production can be adapted. The maximum rCH4 achieved for 'de-
mand.A' and 'demand.B' was 336.56 mL h−2 and 319.78 mL h−2, respectively. Figure 5.2
a) and b) outline that the shut down of gas production was able to be controlled and the
slope was held stable by a stepwise decrease in the OLR, as demonstrated in the later
evening hours.
The second OLR-mode of operation, namely phases 'peak.A' and 'peak.B' are depicted
in Figure 5.3. These phases represent extreme increases to OLR to comply with short
term balancing power. During peak production, the OLR was increased by a factor of
5.33 over three hours, twice a day. Here, the mean SD per 20 min interval for biogas
production was recorded at ±12.2 mL for 'A', and ±8.5 mL for 'B'. The according mean
SD for methane production were ±7.6 mL and ±5.5 mL, respectively. Again, these results
demonstrate excellent replicability.
The rates of increase of methane production in phases 'peak.A' and 'peak.B' reached
higher maximum values with 475.92 mL h−2 and 456.69 mL h−2. In this case, rCH4 had
most likely neared the maximum possible increase in gas production, corresponding to the
maximum rate of acetoclastic methanogenesis, which is generally considered to be the rate-
limiting step, when treating liquid substrates (Pavlostathis and Giraldo-Gomez, 1991).
Comparably, the minimum slope was determined as −358.70 mL h−2 and −407.02 mL h−2,
enabling quick shut down of gas production. These values do not represent the full
potential of a shut down as feeding had continued at a low level during that time.
Comparing the methane production kinetics, no signi�cant di�erences were observed
between the two substrates. By plotting rCH4 for 'A' and 'B' against each other, linear
slopes of 1.02 and 0.93 were obtained for 'demand' and 'peak', respectively. These in-
dicated that the compositions of substrate 'A' and 'B' did not largely in�uence methane
production kinetics. These results support the rate-limiting step approach, which is of-
ten highlighted in literature and marks methanogenesis as the rate-limiting step when
no lignocellulosic substrates are involved. In a recent, yet unpublished work, Krümpel
et.al determined intrinsic methane production kinetics of speci�c intermediates as well as
for a complete hydrolysate, indicating that the mixture produces gas faster than every
intermediate as a single injection. This was attributed to the kinetically saturated de-
gradation pathways for single substances vs multiple degradation pathways for the whole
bandwidth of substances, thus providing high concentrations of precursors to methano-
genesis and again marking it as the rate limiting step. These �ndings, together with this
study, suggest that a controlled hydrolysis towards speci�c intermediates is not necessary
to achieve faster gas production.
44
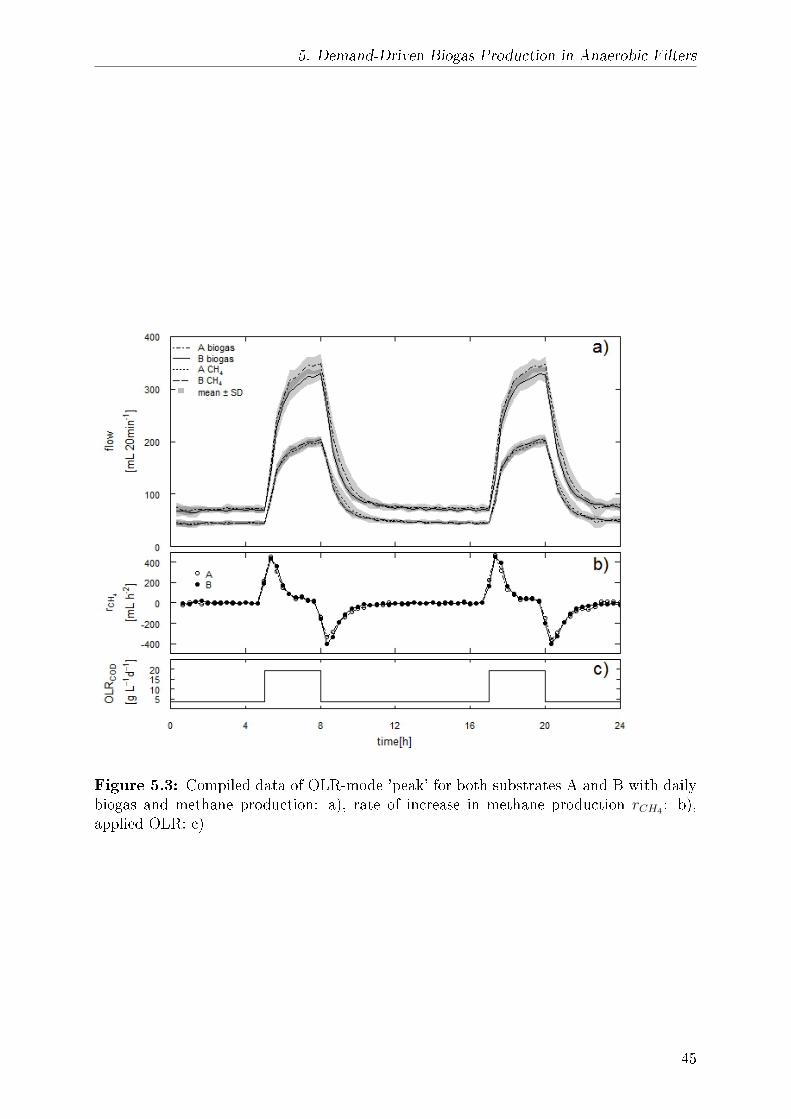
5. Demand-Driven Biogas Production in Anaerobic Filters
Figure 5.3: Compiled data of OLR-mode 'peak' for both substrates A and B with dailybiogas and methane production: a), rate of increase in methane production rCH4 : b),applied OLR: c)
45
5. Demand-Driven Biogas Production in Anaerobic Filters
Figure 5.4: OLR-mode 'demand' for both substrates 'A' and 'B' with mean CH4 andCO2 concentrations: a), H2 concentrations: b) and applied OLR: c)
5.3.2 Variability of Gas Concentrations
Not only the produced gas volume but also the gas composition had varied with changing
OLR. During times of increased OLR, elevated CO2 concentrations could be measured
while CH4 concentrations reacted conversely. A mean CH4 concentration was recorded at
57.56± 2.03 % for 'demand.A'.
Intra-daily variations were in the order of 6.16± 0.99 %-points, excluding day one of
'demand.A', where the intra-daily variation was highest with 10.29 %-points. In phase
'demand.B', the CH4 concentrations were generally higher with a recorded 61.05± 0.85 %
and showed smaller intra-daily variations to 'demand.A' of 3.00± 0.77 %-points. The
course of mean gas concentrations during the phases 'demand.A' and 'demand.B' is shown
in Figure 5.4. The gas concentrations during 'peak.A' and 'peak.B' responded similarly to
increasing OLR. The mean CH4 concentrations were 59.02± 2.39 % and 61.74± 1.06 %
for 'A' and 'B', respectively. The according intra-daily variations were slightly higher than
those in the OLR-mode demand, with 7.26± 2.05 %-points and 3.58± 0.37 %-points. The
course of mean gas concentrations during the phases 'peak.A' and 'peak.B' is shown in
46
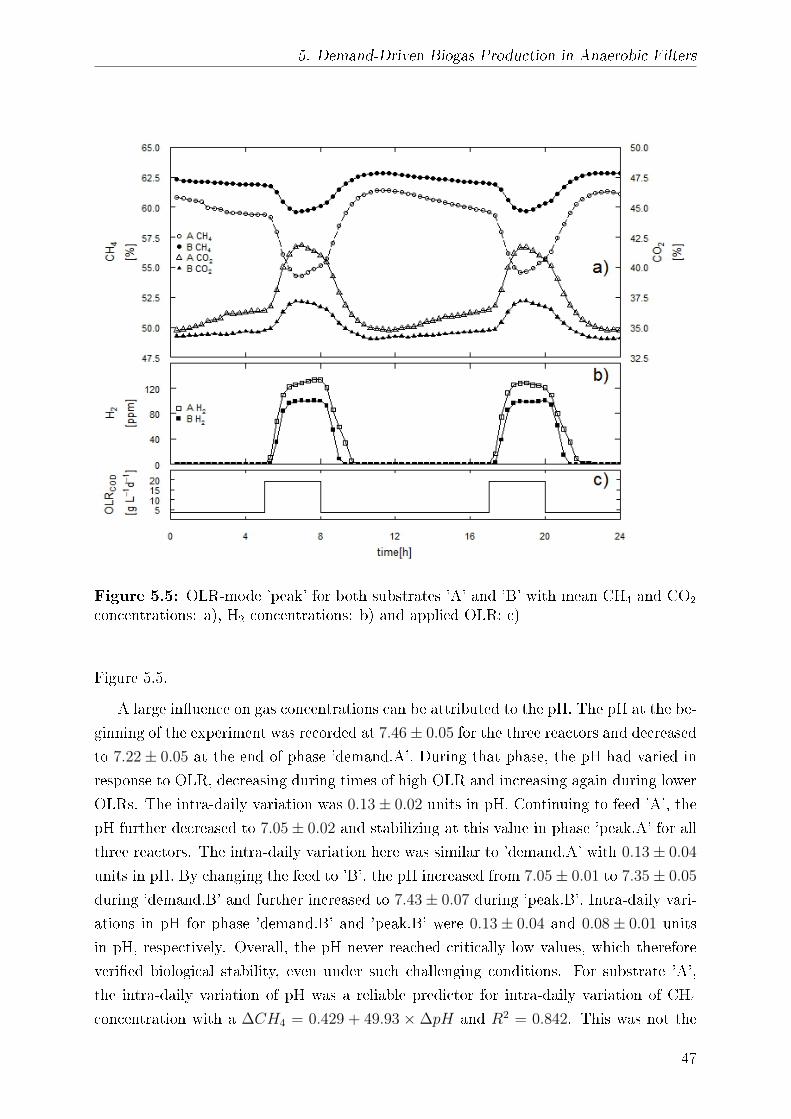
5. Demand-Driven Biogas Production in Anaerobic Filters
Figure 5.5: OLR-mode 'peak' for both substrates 'A' and 'B' with mean CH4 and CO2
concentrations: a), H2 concentrations: b) and applied OLR: c)
Figure 5.5.
A large in�uence on gas concentrations can be attributed to the pH. The pH at the be-
ginning of the experiment was recorded at 7.46± 0.05 for the three reactors and decreased
to 7.22± 0.05 at the end of phase 'demand.A'. During that phase, the pH had varied in
response to OLR, decreasing during times of high OLR and increasing again during lower
OLRs. The intra-daily variation was 0.13± 0.02 units in pH. Continuing to feed 'A', the
pH further decreased to 7.05± 0.02 and stabilizing at this value in phase 'peak.A' for all
three reactors. The intra-daily variation here was similar to 'demand.A' with 0.13± 0.04
units in pH. By changing the feed to 'B', the pH increased from 7.05± 0.01 to 7.35± 0.05
during 'demand.B' and further increased to 7.43± 0.07 during 'peak.B'. Intra-daily vari-
ations in pH for phase 'demand.B' and 'peak.B' were 0.13± 0.04 and 0.08± 0.01 units
in pH, respectively. Overall, the pH never reached critically low values, which therefore
veri�ed biological stability, even under such challenging conditions. For substrate 'A',
the intra-daily variation of pH was a reliable predictor for intra-daily variation of CH4
concentration with a ∆CH4 = 0.429 + 49.93 ×∆pH and R2 = 0.842. This was not the
47
5. Demand-Driven Biogas Production in Anaerobic Filters
case for substrate 'B' with ∆CH4 = 3.13 + 3.04×∆pH and R2 = 0.036.
The reasoning behind the di�erent responses to a changing pH was found in the bu�er
system acting in anaerobic digestion, which is mainly the carbonate bu�er. This system
could be labeled as open bu�er system since a decreasing pH causes CO2 to leave the
system via the gas stream. Thus it is not available anymore for bu�ering.
In contrast, the NH3 / NH4+ bu�er could be termed as closed bu�er, since both
species will remain in the liquid phase of the system. Taking a look at the substrate
composition, substrate 'B' featured higher nitrogen contents, whether it is in the form of
proteins or ammonia. In the pH range where the experiments were conducted, all nitrogen
contributing to the NH3 / NH4+ bu�er would be in the state of NH4
+. By introducing
nitrogenous compounds through the feed stream, accumulated VFAs were immediately
neutralized and reduced the extent of action by the carbonate bu�er and thus smaller
variations in gas composition were observed. Therefore the NH3 / NH4+ bu�er could
be valued higher as it prevented extreme variations in gas quality. While nitrogenous
compounds help to stabilize the gas quality under these conditions, it must be assured
that nitrogen levels will not reach inhibitory levels.
Similarly to CO2 and CH4, the measured mean H2 concentration varied with changing
OLR. A maximum in H2 concentration was reached during the second increase in OLR
during the evening hours with 130 ppm and 90 ppm for 'demand.A' and 'demand.B',
respectively. During 'peak.A' and 'peak.B', H2 could only be measured at increased OLR
and reached 130 ppm and 100 ppm.
About one third of total methane production in anaerobic treatment is attributed
to hydrogenotrophic methanogenesis (John S. Jeris, 1965). However, this share changes
with substrate type and was found to be the dominant pathway for �exible gas production
(Mulat et al., 2016). In an anaerobic �lter of a two-staged AD system a share of hydro-
genotrophic methanogenesis in the range of 28 % to 44 % of total methane production
was found and it was positively correlated to OLR (Gehring et al., 2015). Due to the
sensitive response of H2 concentrations to changing OLR shown here (see Figure 5.4 and
5.5) and the apparent increased share of hydrogenotrophic methanogenesis in �exibly fed
AD systems, it may serve as a controlling measure to prevent overloading.
5.3.3 Carbon Balance
All reactors performed in a stable manner throughout the experiment. The TOC degrad-
ation degree was high and ranged between 92.35 % and 95.42 %. During the OLR-mode
'demand', the degradation degree was the lowest for both substrates, as it re�ects the
higher mean OLR. Herein the degradation degree for 'A' was 92.84± 1.11 %, whereas 'B'
was 93.63± 0.59 %. Applying the OLR-mode 'peak', the degradation degree for 'A' and
'B' were 94.39± 0.68 % and 94.17± 0.39 %, respectively. A graphical representation of
48
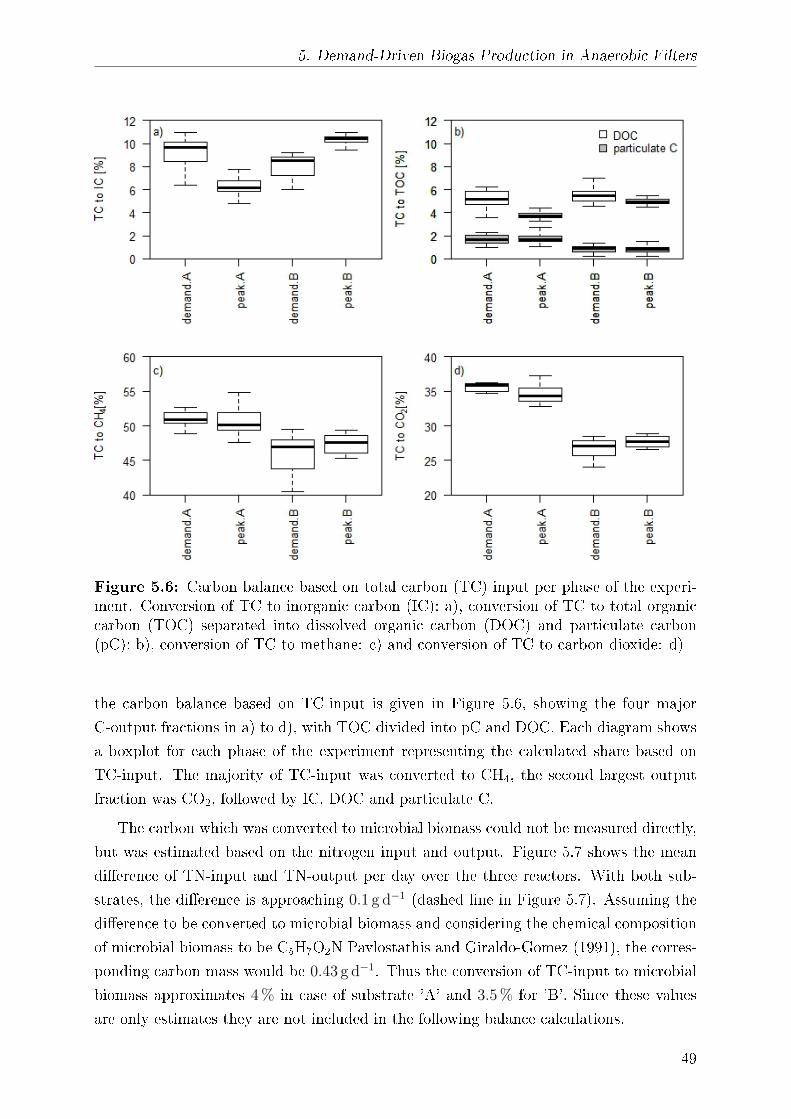
5. Demand-Driven Biogas Production in Anaerobic Filters
Figure 5.6: Carbon balance based on total carbon (TC) input per phase of the experi-ment. Conversion of TC to inorganic carbon (IC): a), conversion of TC to total organiccarbon (TOC) separated into dissolved organic carbon (DOC) and particulate carbon(pC): b), conversion of TC to methane: c) and conversion of TC to carbon dioxide: d)
the carbon balance based on TC-input is given in Figure 5.6, showing the four major
C-output fractions in a) to d), with TOC divided into pC and DOC. Each diagram shows
a boxplot for each phase of the experiment representing the calculated share based on
TC-input. The majority of TC-input was converted to CH4, the second largest output
fraction was CO2, followed by IC, DOC and particulate C.
The carbon which was converted to microbial biomass could not be measured directly,
but was estimated based on the nitrogen input and output. Figure 5.7 shows the mean
di�erence of TN-input and TN-output per day over the three reactors. With both sub-
strates, the di�erence is approaching 0.1 g d−1 (dashed line in Figure 5.7). Assuming the
di�erence to be converted to microbial biomass and considering the chemical composition
of microbial biomass to be C5H7O2N Pavlostathis and Giraldo-Gomez (1991), the corres-
ponding carbon mass would be 0.43 g d−1. Thus the conversion of TC-input to microbial
biomass approximates 4 % in case of substrate 'A' and 3.5 % for 'B'. Since these values
are only estimates they are not included in the following balance calculations.
49
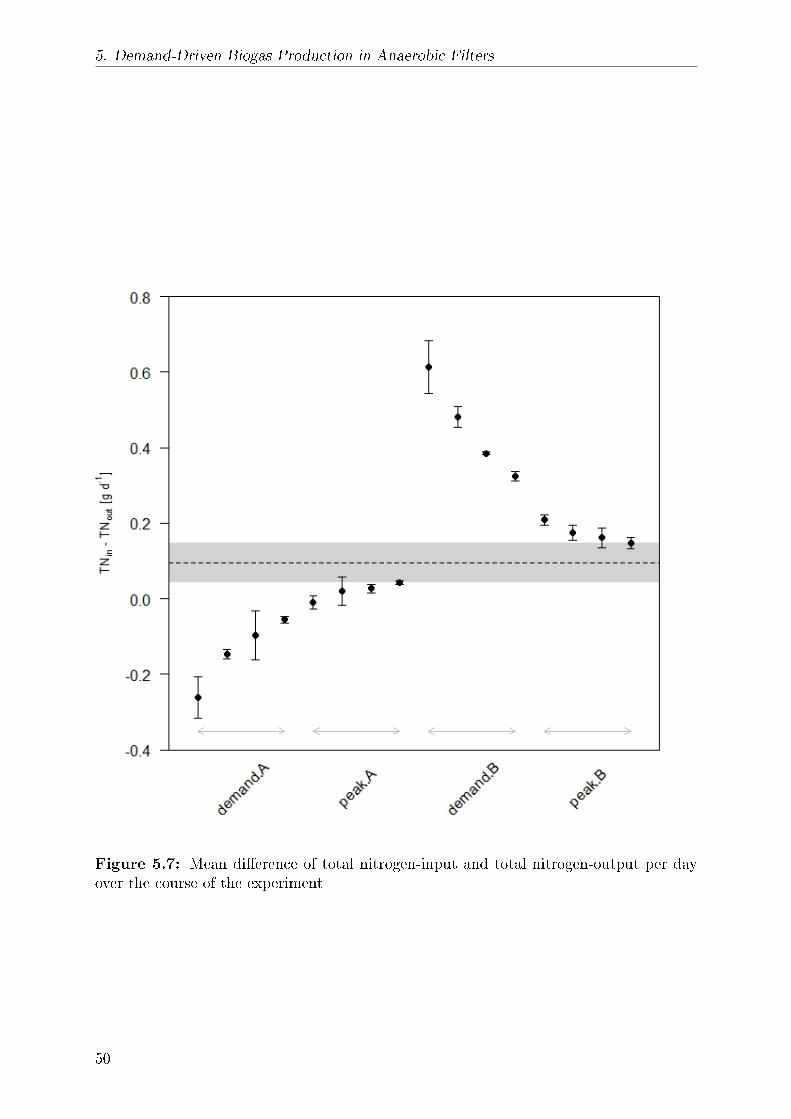
5. Demand-Driven Biogas Production in Anaerobic Filters
Figure 5.7: Mean di�erence of total nitrogen-input and total nitrogen-output per dayover the course of the experiment
50
5. Demand-Driven Biogas Production in Anaerobic Filters
As a whole, the daily carbon balances based on TC-input were closed by 93.48± 6.91 %.
The individual balance closures for each OLR-mode×substrate combination ordered chro-nologically were 103.16± 2.82 % for 'demand.A', 95.39± 7.00 % for 'peak.A', 86.89± 5.50 %
for 'demand.B' and 91.31± 2.45 % for 'peak.B'. The di�erences in balance closure are
mainly due to changes in pH over the course of the experiment which in�uenced the sol-
ubility for inorganic carbon. Initially, the carbon-saturated reactor liquid responded to
the newly introduced substrate 'A' by a decrease in pH. HCO3- was therefore transformed
to CO2 which could then leave the reactor via the gas stream. During 'peak.A', the pH
remained at the lower level and inorganic carbon remained stable. With the introduction
of substrate 'B', pH had began to rise, therefore providing a higher solubility for inor-
ganic carbon. Due to the enrichment of the liquid during that phase, the carbon balance
closure was reduced until saturation was reached again in phase 'peak.B'. This dynamic is
supported by the measured IC concentrations, which follow the pH progression described
earlier. Starting at 1.173± 0.057 g L−1 for the three reactors, the IC concentration de-
creased over the course of 'demand.A' down to 0.850± 0.113 g L−1. During 'peak.A' it
further decreased to 0.680± 0.004 g L−1. In 'demand.B' and 'peak.B', it increased to
1.153± 0.020 g L−1and 1.402± 0.061 g L−1, respectively.
A closer look into the e�uent composition reveals that only a very small share of
substances was identi�ed. Substances in the e�uent which were analyzed by GC and
HPLC only accounted for 4.8± 5.5 % of organic carbon in the e�uent. These are most
prominently acetic acid followed by propionic acid and n-butyric acid. No accumulation
of VFAs could be detected which would instead have meant an imminent process failure.
The maximum concentration of acetic acid in the e�uent was <0.3 g L−1. The uniden-
ti�ed remainder was a mixture of a wide variety of soluble and particulate substances
including proteins, carbohydrates, polysaccharides, lipids, DNA, humic acid substances
and other substances secreted by cells, dead cells and their fragments, as well as active
biomass detaching from the bio�lm. While these components are classi�ed as soluble mi-
crobial products (SMP), extracellular polymeric substances (EPS) or subdivisions thereof,
their exact de�nition and properties are a controversially discussed �eld (Laspidou and
Rittmann, 2002; Ramesh et al., 2006). However, SMP are known to form the majority
of e�uent COD from biological treatment processes (Laspidou and Rittmann, 2002). For
clarity SMP and EPS are referred to as uDOC and pC in the following, since sharp bound-
aries are de�ned by the methodologies to determine these fractions. The uDOC makes
a share in relation to TC-input of 4.70± 1.03 % over the whole experiment. Within one
substrate-type the share of conversion from TC-input to uDOC-output decreases with
lower mean OLR. This trend could not be determined as signi�cant in this case, but is
described in the literature as a possible response to shock loading, i.e. increased OLR
and shortened HRT (Ketheesan and Stuckey, 2015). The share of pC in TOC of the e�u-
ent was distinctively di�erent between phases of di�ering substrate. During the feeding
51
5. Demand-Driven Biogas Production in Anaerobic Filters
of substrate 'A', it increased from 24.21± 8.11 % to 31.27± 6.67 %. Whereas in phase
'demand.B' and 'peak.B', it remained stable at 13.33± 5.01 % and 14.02± 5.09 %. Al-
though it was a major constituent of organic carbon in the e�uent, it only accounted
for 1.76± 0.44 % and 0.88± 0.32 % in relation to TC-input. Concerning the relation of
TC-input to pC output, signi�cant di�erences in the mean were observed between the
substrates. Within one substrate-type no di�erences were observed between operation
modes.
The interrelations here are complicated. During low OLR, biomass associated products
(BAP) increase as a share of SMP due to endogenous decay. The share of utilization as-
sociated products (UAP), which are formed in proportion to the substrate used, increase
at high OLRs (Schiener et al., 1998). Both are subdivisions of SMP. UAP are biodegrad-
able (Laspidou and Rittmann, 2002), but due to shortened HRT with higher OLR these
products may not be able to cycle back to become an electron-donor substrate for the
cells and are instead washed out prematurely. On the other hand, part of extracellular
polymeric substances (EPS), which are formed to stabilize the bio�lm and also in propor-
tion to substrate utilization, become inert biomass which is non biodegradable (Laspidou
and Rittmann, 2002). In a two-staged AD system with liquid recycle, this may lead to an
accumulation of inert biomass, thus increasing COD over time, which is not available for
gas production. In this case, a special treatment might be required to combat increasing
COD. This experiment has shown that EPS measured as pC are signi�cantly di�erent
between substrates, while uDOC are more in�uenced by the mode of operation. Fur-
ther research towards the e�ects of demand-driven biogas production on SMP and EPS
production could be bene�cial.
5.4 Conclusion
In this experiment, the suitability of anaerobic �lters for demand-driven gas production
was examined. The results indicate that anaerobic �lters are well suited for highly �exible
gas production. All three reactors showed degradation degrees over 90 % with no signi�c-
ant accumulation of intermediates. The replicability and therefore its predictability were
evaluated which led to the �nding that an excellent degree of replication can be achieved
under the presented conditions. Even by introducing abrupt changes in OLRCOD by a
factor >5 to 20 g L−1 d−1, the stability of the process was always guaranteed and high
degradation degrees were ensured. As a possible measure for responsiveness to increased
OLR, this study had introduced the rate of increase in methane production rCH4 . By
comparing rCH4 it was found that the substrate composition does not have an in�uence
on the rate of increase. The pH is vital for the solubility of CO2 and HCO3- and therefore
is an important parameter, especially under varying OLRs. When operating the AF for
demand-driven gas production, nitrogen supplementation helps avoiding large �uctuations
52
5. Demand-Driven Biogas Production in Anaerobic Filters
in gas composition, which could ultimately lead to the shut down of the CHP when the
methane content drops below 40 %. Preventing the action of the carbonate bu�er is also
important in order to maintain bio�lm stability, since large quantities of CO2 released
from the liquid would introduce high shear forces and lead to biomass washout. The
carbon balance shown here, together with pH observation supports the carbonate bu�er
dynamics and the importance of nitrogen supplementation. Further conclusions drawn
from the carbon balance are that ≈6 % to 8 % of the carbon input is leaving the reactor
in the form of DOC and particulate C. In a two-staged system with e�uent recycle into
an acidi�cation reactor, this may lead to an accumulation of recalcitrant or inert carbon
fractions, which result in increasing COD of the liquids over time. This is not limited to
demand-driven operation, but may be exaggerated due to changing HRT and OLRs.
The proposed system, as a stand-alone AF, is suitable for substrates in which the
hydrolysis rate does not play a signi�cant role. High strength waste waters with consider-
able requirements towards hydrolysis are not suited. It may be used for high solid waste
streams or energy crops in combination with a separated acidi�cation reactor. This will
ensure short reaction times concerning gas production.
In a full scale application several biogas plants would ideally be aggregated to a virtual
power plant as part of a micro-grid or smart grid. By scattering the plants geographically,
a decentralized tool for stabilizing the grid is established. Thereby local �uctuations in
demand could be met locally, without the need of transition lines from a central power
plant. It also spares large gas storage capacities which are restricted by law. Whenever
positive or negative balancing power is requested, the CHPs of the according biogas
plants are increasing or decreasing their power output and subsequently changing the
biogas volume used by the CHP. The biogas plant operating system would then adjust
the gas production accordingly by taking control over the feeding regime and produce the
gas just in time. Implementation of the proposed system would not be restricted to the
electricity sector. Gas production could also be guided by heat demand or a combination
of both to support Smart Energy Systems on a national level (Mathiesen et al., 2015) or
in a smaller scale like the Energy Hub approach (Orehounig et al., 2015).
Upcoming technologies, which aim at injecting into the natural gas grid, might also
pose new requirements to stabilize low pressure gas-grids locally. This has been invest-
igated by Abeysekera et al. (2016) and could be a future application for demand-driven
biogas production as well.
As a further step into this research, it is recommended to investigate the boundaries of
safe operation in a demand-driven feeding regime and its e�ects on the process to develop
adequate control strategies.
53
5. Demand-Driven Biogas Production in Anaerobic Filters
Acknowledgments
This study originates from the project "Methanoquant" (FKZ 03SF0423B) and is sup-
ported by the german Federal Ministry of Education and Research (BMBF) and the
Projekt-träger Jülich (PtJ).
5.5 References
Abeysekera, M., Wu, J., Jenkins, N., Rees, M., 2016. Steady state analysis of gas networks
with distributed injection of alternative gas. Applied Energy 164, 991�1002.
Bacenetti, J., Sala, C., Fusi, A., Fiala, M., 2016. Agricultural anaerobic digestion plants:
What lca studies pointed out and what can be done to make them more environmentally
sustainable. Applied Energy 179, 669�686.
Brouwer, A.b., van den Broek, M., Seebregts, A., Faaij, A.c., 2015. Operational �exibility
and economics of power plants in future low-carbon power systems. Applied Energy
156, 107�128.
Calvillo, C., Sýnchez-Miralles, A., Villar, J., MartÃn, F., 2016. Optimal planning and
operation of aggregated distributed energy resources with market participation. Applied
Energy 182, 340�357.
Chen, Y., Röÿler, B., Zielonka, S., Lemmer, A., Wonneberger, A.M., Jungbluth, T., 2013.
The pressure e�ects on two-phase anaerobic digestion. Applied Energy .
Cohen, A., Zoetemeyer, R., van Deursen, A., van Andel, J., 1979. Anaerobic digestion
of glucose with separated acid production and methane formation. Water Research 13,
571�580.
Cysneiros, D., Banks, C., Heaven, S., Karatzas, K., 2012. The role of phase separation
and feed cycle length in leach beds coupled to methanogenic reactors for digestion of a
solid substrate (part 1): Optimisation of reactors' performance. Bioresource Technology
103, 56�63.
EU, 2012. Energy roadmap 2050. https://ec.europa.eu/energy/sites/ener/files/
documents/2012_energy_roadmap_2050_en_0.pdf. [Online; accessed 19-Aug-2016].
EU, 2016. Renewable energy statistics. http://ec.europa.eu/eurostat/
statistics-explained/index.php/Renewable_energy_statistics. [Online; ac-
cessed 19-Aug-2016].
54
5. Demand-Driven Biogas Production in Anaerobic Filters
Gehring, T., Klang, J., Niedermayr, A., Berzio, S., Immenhauser, A., Klocke, M., Wich-
ern, M., Lübken, M., 2015. Determination of methanogenic pathways through carbon
isotope analysis for the two-stage anaerobic digestion of high-solids substrates. Envir-
onmental Science and Technology 49, 4705�4714.
Ghosh, S., 1987. Improved sludge gasi�cation by two-phase anaerobic digestion. Journal
of Environmental Engineering (United States) 113, 1265�1284.
Grim, J., Nilsson, D., Hansson, P.A., Nordberg, A., 2015. Demand-orientated power
production from biogas: Modeling and simulations under swedish conditions. Energy
and Fuels 29, 4066�4075.
Hahn, H., Ganagin, W., Hartmann, K., Wachendorf, M., 2014a. Cost analysis of con-
cepts for a demand oriented biogas supply for �exible power generation. Bioresource
Technology 170, 211�220.
Hahn, H., Krautkremer, B., Hartmann, K., Wachendorf, M., 2014b. Review of concepts
for a demand-driven biogas supply for �exible power generation. Renewable and Sus-
tainable Energy Reviews 29, 383�393.
John S. Jeris, P.L.M., 1965. The biochemistry of methane fermentation using c14 tracers.
Journal (Water Pollution Control Federation) 37, 178�192.
Ketheesan, B., Stuckey, D.b., 2015. E�ects of hydraulic/organic shock/transient loads in
anaerobic wastewater treatment: A review. Critical Reviews in Environmental Science
and Technology 45, 2693�2727.
Laspidou, C., Rittmann, B., 2002. A uni�ed theory for extracellular polymeric substances,
soluble microbial products, and active and inert biomass. Water Research 36, 2711�
2720.
Li, Y., Flynn, P., 2004. Deregulated power prices: Comparison of diurnal patterns. Energy
Policy 32, 657�672.
Lindner, J., Zielonka, S., Oechsner, H., Lemmer, A., 2015. E�ect of di�erent ph-values
on process parameters in two-phase anaerobic digestion of high-solid substrates. En-
vironmental Technology (United Kingdom) 36, 198�207.
Mathiesen, B., Lund, H., Connolly, D., Wenzel, H., Ostergaard, P., Müller, B., Nielsen,
S., Ridjan, I., KarnOe, P., Sperling, K., Hvelplund, F., 2015. Smart energy systems for
coherent 100energy and transport solutions. Applied Energy 145, 139�154.
Mauky, E., Jacobi, H., Liebetrau, J., Nelles, M., 2015. Flexible biogas production for
demand-driven energy supply - feeding strategies and types of substrates. Bioresource
Technology 178, 262�269.
55
5. Demand-Driven Biogas Production in Anaerobic Filters
Muha, I., Zielonka, S., Lemmer, A., Schönberg, M., Linke, B., Grillo, A., Wittum, G.,
2013. Do two-phase biogas plants separate anaerobic digestion phases? - a mathem-
atical model for the distribution of anaerobic digestion phases among reactor stages.
Bioresource Technology 132, 414�418.
Mulat, D., Fabian Jacobi, H., Feilberg, A., Adamsen, A., Richnow, H.H., Nikolausz, M.,
2016. Changing feeding regimes to demonstrate �exible biogas production: E�ects on
process performance, microbial community structure, and methanogenesis pathways.
Applied and Environmental Microbiology 82, 438�449.
Nizami, A.S., Murphy, J., 2010. What type of digester con�gurations should be employed
to produce biomethane from grass silage? Renewable and Sustainable Energy Reviews
14, 1558�1568.
Orehounig, K.b., Evins, R.b., Dorer, V., 2015. Integration of decentralized energy systems
in neighbourhoods using the energy hub approach. Applied Energy 154, 277�289.
Pavlostathis, S., Giraldo-Gomez, E., 1991. Kinetics of anaerobic treatment: A critical
review. Critical Reviews in Environmental Control 21, 411�490.
Pohland, F., Ghosh, S., 1971. Developments in anaerobic stabilization of organic wastes
- the two-phase concept. Environmental Letters 1, 255�266.
Rajeshwari, K., Balakrishnan, M., Kansal, A., Lata, K., Kishore, V., 2000. State-of-the-
art of anaerobic digestion technology for industrial wastewater treatment. Renewable
& sustainable energy reviews 4, 135�156.
Ramesh, A., Lee, D.J., Hong, S., 2006. Soluble microbial products (smp) and soluble
extracellular polymeric substances (eps) from wastewater sludge. Applied Microbiology
and Biotechnology 73, 219�225.
Ren, N., Chua, H., Chan, S., Tsang, Y., Wang, Y., Sin, N., 2007. Assessing optimal
fermentation type for bio-hydrogen production in continuous-�ow acidogenic reactors.
Bioresource Technology 98, 1774�1780.
Ren, N., Wang, B., Huang, J.C., 1997. Ethanol-type fermentation from carbohydrate in
high rate acidogenic reactor. Biotechnology and Bioengineering 54, 428�433.
Schiener, P., Nachaiyasit, S., Stuckey, D., 1998. Production of soluble microbial products
(smp) in an anaerobic ba�ed reactor: Composition, biodegradability, and the e�ect of
process parameters. Environmental Technology 19, 391�399.
Steinke, F., Wolfrum, P., Ho�mann, C., 2013. Grid vs. storage in a 100 percent renewable
europe. Renewable Energy 50, 826�832.
56
5. Demand-Driven Biogas Production in Anaerobic Filters
Tauseef, S., Abbasi, T., Abbasi, S., 2013. Energy recovery from wastewaters with high-
rate anaerobic digesters. Renewable and Sustainable Energy Reviews 19, 704�741.
Thrän, D., Dotzauer, M., Lenz, V., Liebetrau, J., Ortwein, A., 2015. Flexible bioenergy
supply for balancing �uctuating renewables in the heat and power sector a review of
technologies and concepts. Energy, Sustainability and Society 5, 1�15.
Yang, Y., Chen, Q., Guo, J., Hu, Z., 2015. Kinetics and methane gas yields of selected
c1 to c5 organic acids in anaerobic digestion. Water Research 87, 112�118.
Zamani, A., Zakariazadeh, A., Jadid, S., 2016. Day-ahead resource scheduling of a re-
newable energy based virtual power plant. Applied Energy 169, 324�340.
Zielonka, S., Lemmer, A., Oechsner, H., Jungbluth, T., 2010. Energy balance of a two-
phase anaerobic digestion process for energy crops. Engineering in Life Sciences 10,
515�519.
57
6. General Discussion
6 General Discussion
6.1 Methane Production Kinetics
In the literature several factors in�uencing the kinetics of methane production can be
found. These include adaption of microorganisms to the substrate and nutrient supply.
Since di�erent microorganisms grow on speci�c substrates, the abundance of the respective
organisms play an important role and determine the maximum rates of degradation, as
well as the actual degradation pathway. These e�ects have been studied by Aguilar
et al. (1995) using two di�erently enriched methanogenic cultures. The glucose pre-grown
culture displayed an almost nine-fold higher utilization rate of propionic acid than the
culture pre-grown with acetate as the sole carbon source. Similarly, n-butyric and iso-
butyric acid were degraded faster by the glucose pre-grown culture as opposed to acetic
acid degradation which was the same for both cultures. While this experiment was a long
term selection over three years, changing the consortium of microorganisms to a large
extent, Öztürk (1991) observed similar e�ects in a short time frame, using batch cultures
which were fed twice. As a result of adaption of the sludge and its propionate-degrading
bacteria, the second feeding showed a 2.5 times faster degradation of propionic acid and
1.45 to 1.75 times higher methanogenic activities.
Besides adaption to certain substrates, there are numerous other factors in�uencing
the rate of degradation and ultimately the rate of methane production. In a study by
Moestedt et al. (2015), the addition of Nickel increased the methanogenesis rate constants
km by 98 % to 220 % compared to the test runs where Nickel was omitted. Nickel is an
important metal in key-enzymes of methanogenesis, such as methyl-coenzyme-M cofactor
F430, and its su�cient supply is essential to maintain high rates of methane production.
Alongside nickel the anaerobic process is reliant on appropriate supply of other nu-
trients to perform e�ciently. These nutrients include nitrogen, phosphorous and several
minor or micro nutrients such as cobalt, selenium, iron, manganese, molybdenum, po-
tassium, calcium, and magnesium. Lack of certain nutrients deteriorates the performance
of AD and may change the degradation pathways leading to a build up of intermediary
products such as propionate. Results by Vintiloiu et al. (2012) showed strong statistically
signi�cant e�ects of macro- and micro-nutrients on the stability of the anaerobic process
of agricultural biogas plants in Germany. Nickel, molybdenum, and sulfur showed the
strongest e�ects, followed by selenium, whereas iron, cobalt and sodium only showed ef-
fects in combination with other elements. These �ndings emphasize the importance of a
balanced macro and micro-nutrient supply to ensure a stable process.
In order to exclude e�ects of nutrient de�ciencies, the produced hydrolysates used in
58
6. General Discussion
all experiments presented in the work at hand, were supplemented with su�cient amounts
of trace elements. The aforementioned e�ects regarding the adaption of microorganisms
to certain substrates was minimized by providing a base-OLR containing all kinds of in-
termediates. This procedure should enable the microorganisms to adapt to all substrates
found in practice, speci�cally the ones tested in the experiments conducted in the publica-
tions "Kinetics of Biogas Production in Anaerobic Filters" and "Intrinsic Gas Production
Kinetics of Selected Intermediates in Anaerobic Filters for Demand Orientated Energy
Supply".
In these two publications the methane production kinetics for various components of
hydrolysate have been determined. With the method presented, all injections were given
as 1 gCOD, which stoichiometrically should yield the same amount of methane gas, assum-
ing complete conversion to methane. From the determined kinetic parameters the half
lives of methane production were calculated to order the tested substances according to
their intrinsic gas production velocities. Signi�cant di�erences in the methane production
kinetics could be determined for individual substances with acetic acid representing the
fastest intermediate and lactic acid as the slowest. The underpinning mechanisms which
lead to these di�erences are complex. Concerning single substance injections, acetic acid
represents the only direct precursor to methanogenesis, and therefore exhibits the fastest
methane production in both experimental runs. However, the absolute values of determ-
ined parameters are markedly di�erent in the second experiment and calculated half lives
were shortened by 38 %, 24 % and 41 % for acetic acid, propionic acid and butyric acid,
respectively, although the same digesters and methods were used. The relative order of
the three substances remained the same. The main di�erence between the two experi-
ments was the base-OLRCOD, with 3.5 g L−1 d−1 in the �rst experiment and 7.2 g L−1 d−1
in the latter. Therefore the OLR applied has most likely a major impact on the results of
this method. That is actually not surprising as the Monod Kinetic, the most widely used
kinetic model for AD, expressed in terms of speci�c utilization rate U is (Pavlostathis
and Giraldo-Gomez, 1991):
U =kS
KS + S(6.1)
where: k is the maximum speci�c utilization rate, S is the concentration of the growth
limiting substrate and KS is the half velocity coe�cient (i.e. substrate concentration
at one half maximum speci�c growth rate). This implies that the speci�c utilization
rate is dependent on substrate concentration. It stands to reason that at a higher OLR
the substrate concentrations are higher and therefore a faster methane production was
observed in the second experiment.
The complexity is underpinned by experiments by Wang et al. (1999), who found
that the rate of propionic acid degradation was markedly decreased when acetic acid
59
6. General Discussion
concentrations were greater than 1400 mg L−1. Conversely the rate of degradation of
acetic acid was not altered by increased propionic acid concentrations. This relationship is
con�rmed by Kus and Wiesmann (1995), going even further and establishing the relation
between unionized HAc and the HPr removal rate. That means that the dissociation
state of the inhibitor is the actual player in that game and thus the 'true' substrate
concentration is governed by pH. The stronger the acid i.e. the lower the pKA value of
the respective acid, the lower the 'true' substrate concentration at elevated pH. This is
considered in an extension of the Monod Kinetic and referred to as Haldane Kinetics.
Not only acetic acid has an in�uence on propionic acid degradation, but additionally
the concentration of unionized propionic acid itself acts as inhibitor for its removal (Kus
and Wiesmann, 1995). Furthermore unionized HAc inhibits the degradation of HAc and
thus presenting a two sided optimization problem. For lower pH values the proportion
of unionized HAc is high, thus substrate inhibition is induced, whereas at higher pH the
concentration of unionized HAc is low and substrate limitation leads to lower degradation
rates. Thus if VFA concentrations are su�ciently high they are self inhibitory to their
degradation. Mawson et al. (1991) determined 50 % inhibition of acetic and propionate
degradation at 14 mg L−1 of undissociated VFA.
Apart from the unexplained degradation pathway discussed in chapter 4, this could be
another reason for lactic acid to show such a low methane production rate. The pKA of
lactic acid is considerably lower than that for the other substances tested, thus rendering
unionized lactate as a scarce substrate, diminishing its degradation rate.
Other factors determining the kinetics of anaerobic digestion are discussed in the
review by Pavlostathis and Giraldo-Gomez (1991) devoting separate chapters to the in-
�uences of bioenergetics, temperature, inhibition and mass transfer.
Nevertheless, the order of methane production rates for individual substances determ-
ined in chapter 3 and 4 is in agreement with most studies concerning VFA degradation
(Wang et al., 1999; Aguilar et al., 1995; Öztürk, 1991), although with the exception of
Yang et al. (2015) only the three major VFAs HAc, HPr and HBu were in the focus of
interest. Lin et al. (1986) con�rms the �ndings that a mixture of VFAs (2:1:1 mixture of
HAc, HPr and HBu) increases the overall degradation rates compared to single VFA sup-
plementation, without explicitly giving an explanation. As already suggested in chapter
4, the parallel degradation by many di�erent organisms of the various substrates in the
hydrolysate-mix and the concomitant production of precursors to methanogenesis are pos-
sibly the main factor of the positioning in the determined order of methane production
rates.
The two hydrolysates tested in chapter 5 were relatively di�erent in composition,
substrate 'B' containing more than 30 % of TC as lactic acid, which was determined as
the slowest methane producing intermediate tested in chapter 4. Yet, both substrates
exhibited almost exactly the same methane production pro�les for both OLR-modes of
60
6. General Discussion
operation. On the one hand this reinforces the �ndings that the mixture of intermediates
inherits the highest methane production rates and on the other hand that acetoclastic
methanogenesis is the rate limiting step in the Anaerobic Filters. This is most likely the
reason that for both substrates the same methane production rates were observed.
It is obvious that all the above factors cannot be determined at once in an experimental
run, and are thus not included in a number of kinetic studies. This also leads to high
variations in reported kinetic constants for VFA degradation in the order of 1 - 30 fold
(Yang et al., 2015) and make comparisons of those di�cult, even when the same method
is used.
6.2 Flexible Biogas Production
In order to operate an anaerobic digester with the aim of demand-driven or �exible biogas
production, a highly stable process is required, which is characterized by
� low VFA concentrations,
� stable gas concentrations and
� high degradation degrees.
The attention towards demand-driven biogas production is relatively new and the
literature on this quite limited. However there is another term that shares some key fea-
tures, although the actual aims of these studies are di�erent. These studies were published
under the term hydraulic/organic shock/transient loads. Instantaneous changes in OLR
can be de�ned as organic shock loading, while a gradual or stepwise variation in OLR
over a speci�c time interval can be regarded as organic transient loading (Ketheesan and
Stuckey, 2015). Hydraulic shock or hydraulic transient loading is termed similarly. Dur-
ing demand orientated biogas production, shock and transient loading occur on purpose
and the �ndings on this matter are therefore relevant for this kind of operation.
It must be noted though that in the experiment conducted in chapter 5, the maximum
OLRCOD applied was 20 g L−1 d−1. Although this is more than the doubled mean OLR for
industrial anaerobic �lters, it was only applied for a maximum of three hours in the OLR-
mode 'peak'. The mean OLRCOD over the day in the experiments conducted here was
10.14 g L−1 d−1 and 7.38 g L−1 d−1 for the OLR modes 'demand' and 'peak', respectively.
Thus no extreme scenario compared to studies concerning shock loads was investigated
here. The reason was the aim to achieve a gas production pro�le featuring characteristics
of typical demand curves and not overloading the reactors. Additionally, the maximum
OLR was limited to some extent by the used gas meter, which could only measure gas
�ows up to 1000 mL h−1.
61
6. General Discussion
6.2.1 Cause and E�ect of VFA Accumulation
The most reported response to shock loading is the decrease of degradation degree due to
accumulation of VFAs and concomitant decrease in speci�c methane yield (Cohen et al.,
1982; Grobicki and Stuckey, 1991; Borja and Banks, 1995; Chua et al., 1997; Angenent
et al., 2002; Masse and Masse, 2005; Ketheesan and Stuckey, 2015). The accumulation
is the consequence of kinetically saturated acetoclastic methanogenesis, the rate limit-
ing step when liquid substrates are subjected to AD (Pavlostathis and Giraldo-Gomez,
1991) and thus controlling the maximum OLR that can be safely applied (Ketheesan and
Stuckey, 2015). Acidogens on the other end seem to exhibit the most rapid conversion
step and thus precursors to acetogenesis like propionate and butyrate accumulate. Acet-
ogenetic organisms degrade the VFAs at a rate somewhere in between, while obligatory
forming H2. In order for these microorganisms to gain energy from H2 forming reac-
tions, a low H2 partial pressure is mandatory and therefore live in syntrophic relation
with H2-consuming organisms like methanogens. Ultimately, kinetic di�erences between
acidogenic, acetogenic and methanogenic microorganisms result in the accumulation of
intermediates such as VFAs, H2 and CO2 (Ketheesan and Stuckey, 2015). Further accu-
mulation leads to a drop in pH, depending on alkalinity of the system. The proportion
of undissociated VFAs increases at lower pH and the uptake of undissociated VFAs is ac-
celerated (Fukuzaki et al., 1990). In order to maintain intracellular pH and a functional
gradient the excess protons need to be channeled out of the cell, amplifying the decrease
in pH and the toxicity of undissociated VFAs (Fukuzaki et al., 1990). The accumulation
of intermediary products such as formate, acetic acid and H2 �nally lead to the acetogenic
pathway becoming thermodynamically unfavorable, completely blocking the degradation
of precursors to acetogenesis with system failure as the result.
VFA accumulation likely occurred in the trials of chapter 5 after applying high OLRs.
The e�uent composition was analyzed only once per day and VFA dynamics could there-
fore not be pictured in detail. Nevertheless the lowest degradation degree accompanied by
slightly higher VFA concentrations was reached in the OLR-mode 'demand', which repres-
ented the higher mean OLR of the two modes of operation. However, the measured VFA
concentrations in the e�uent never came close to any problematic values and renders
evidence of a highly stable process, even under the challenging operational conditions
applied in the trials.
When operating anaerobic �lters for �exible biogas production they need to operate
within the boundaries of the discussed self inhibitory VFA accumulation. The results
presented in the study at hand suggest that anaerobic �lters are well suited to handle
variations in OLR throughout the day with quick responses in gas production. As demon-
strated the gas production follows the applied OLR, with a distinctive expression of each
change in the OLR. That marks the process as highly predictable and de�ned boundaries
62
6. General Discussion
within safe operation of AD in terms of VFA accumulation can possibly be satis�ed by
process control. The inclusion of three reactors in the analysis emphasize the repeatability
and therefore predictability of such an approach of operation.
6.2.2 Variability of Gas Concentrations
The methane concentrations of the produced biogas changed in response to the variations
of the OLR in the study presented here and has been reported throughout the literature
for shock loading (Kennedy and van den Berg, 1982; Chua et al., 1997; Masse and Masse,
2005; Senturk et al., 2013). In all cases the CO2 concentration increased in response to
increased OLR, with the CH4 concentration reacting conversely. This e�ect can be at-
tributed to di�erent mechanisms. First the accumulation of VFAs prevents the formation
of their respective product gases. Secondly, depending on alkalinity, the accumulation of
VFAs may cause a drop in pH and subsequently releasing CO2 from the process liquid.
Ultimately, high VFA concentrations or low pH would inhibit the methanogenic process.
In the experiment at hand substrate 'A' caused the gas quality to change by a max-
imum of >10 % during day one of the experiment and >7 % thereafter, presumably due
to the release of large quantities of CO2 after increasing the OLR to its maximum value.
For substrate 'B' however, the gas concentrations only changed by ≈ 3 %, although the
intra-daily pH variations were similar for both substrates.
The main bu�er acting in anaerobic digestion is the carbonate bu�er. This system
could be labeled as open bu�er system since a decreasing pH causes CO2 to leave the
system via the gas stream, as could be shown in all the experiments conducted in this
work. Thus it is not available anymore for bu�ering.
In contrast the NH3 / NH4+ bu�er could be termed as closed bu�er, since both
species will remain in the liquid phase of the system. Taking a look at the substrate
composition, Substrate 'B' featured higher nitrogen contents, whether it is in the form
of proteins or ammonia. In the pH range where the experiments were conducted all
nitrogen contributing to the NH3 / NH4+ bu�er would be in the state of NH4
+. By
introducing nitrogenous compounds through the feed stream, the accumulated VFAs were
immediately neutralized, reducing the extent of action by the carbonate bu�er, and thus
smaller variations in gas composition were observed. Therefore the NH3 / NH4+ bu�er
could be valued higher as it prevents extreme variations in gas quality.
The converse reactions, i.e. higher methane and lower carbon dioxide concentrations
can be observed during recovery from organic shock loading. Excess VFAs will be de-
graded and pH reaches pre-shock levels. The free capacity to dissolve CO2 leads to an
increased methane content since newly produced carbon dioxide partly remains in the
liquid.
Recalling that the applied increases in OLR were somewhat limited by the gas meter
63
6. General Discussion
in this study, more extreme cases are imaginable in practice. If the gas quality dropped
below a methane content of 40 %, the shutdown of the CHP would be initiated, destroying
the revenue of demand orientated power supply. Hence the observation and control of
alkalinity presents itself as crucial when demand orientated biogas/power production is
targeted. The minimum observed CH4 concentration during the whole experiment was
51.76 %, thus remaining in an area of safe operation. Again the AF proved itself to be well
suited to handle these challenging operational conditions and its suitability for �exible
biogas production.
6.2.3 Degradation Degree
The degradation degrees, based on TOC (see 5.2) during the trials remained high at
>90 % under all substrate ×OLR-mode combinations tested. Thus it can be concluded
that the anaerobic process in the AF was very stable under these �exible operational
conditions. Yet, slight di�erences in degradation degree between the experimental phases
could be observed and since VFA concentrations in the e�uent were negligible, the cause
of altered degradation degrees mus be rooted elsewhere.
Apart from VFA accumulation, other products summarized under the term 'soluble
microbial products' (SMP) are a�ected by organic/hydraulic shock loads (Ketheesan and
Stuckey, 2015). SMP can be further subdivided into utilization associated products
(UAP) and biomass associated products (BAP). UAP are a direct result of substrate
utilization, while BAP are formed from biomass, presumably as part of decay (Laspidou
and Rittmann, 2002). A second large category of products is termed extracellular poly-
meric substances (EPS) and are largely associated with the solid phase and are therefore
insoluble. EPS are bio-polymers in which bio�lm microorganisms are embedded (Flem-
ming et al., 2007). Laspidou and Rittmann (2002) presented a uni�cation of the two
schools of SMP and EPS, yet the exact de�nition of SMP, EPS and their subdivisions is
still controversially debated (Ramesh et al., 2006). However three important remarks with
respect to demand orientated biogas production can be made here. Firstly the bio�lm
structure is a�ected by shear stress induced for example by decreases in HRT, thus al-
tering EPS composition and bio�lm architecture Liu and Tay (2001). Secondly, partly
degradation of EPS leads to BAP which can recycle to become electron donor substrate
(Laspidou and Rittmann, 2002), but may be washed out prematurely when the HRT is
low. Thirdly, true dead cell residuals as part of EPS are non-biodegradable (Laspidou
and Rittmann, 2002) and thus could accumulate in a two-staged AD system with liquid
recycling. This may lead to an increase in COD concentration of reactor liquids over
time, with error of judgement regarding expected methane yields as the consequence. In
chapter 5 the DOC measured in the e�uent in deed decreased with lower mean OLR,
thus pointing towards UAP. EPS measured as particulate C were not a�ected by the
64
6. General Discussion
OLR-mode but was altered slightly by the substrate type. Further research on this topic
and its implication for two-staged AD, in particular demand-driven biogas production is
desirable.
6.3 Reactor-Design for Demand-Driven Biogas Produc-
tion
The extent to withstand organic/hydraulic shock loadings and therefore the feasibility
of demand-orientated biogas production is governed by several factors. First and fore-
most the e�ciency of acetoclastic methanogenesis determines the maximum OLR which
can be applied without accumulation of VFAs. The bu�er-capacity prevents the system
from inhibitory low pH after shock loading. Other factors in�uencing the capability and
e�ciency of withstanding shock loads are mass transfer limitations, biomass washout,
nutrient limitations and microbial diversity.
The appearance of the methanogenic aggregates, usually found in the form of �ocs or
bio�lms with certain solid-/gas-/liquid-interfaces, in�uences the rate at which substrates
can be degraded. The available surface area to volume ratio of such aggregates promotes or
demotes the in and out�ux of substrates and products. Thus a key factor for withstanding
shock loads is the reactor design. Considering attached biomass reactors opposed to
suspended biomass reactors, the suspended biomass may be more susceptible to washout
of microorganisms than attached biomass.
Purposefully introduced organic shock loads for �exible biogas production could be
achieved through higher substrate concentrations in combination with maintained HRT,
as well as shortened HRT in combination with maintained substrate concentration. Yet,
their e�ects can be very di�erent. Shortened HRT may increase liquid velocities and
shortening contact time for substrate metabolism, thus decreasing mass transfer into the
aggregate. Di�erently, higher substrate concentrations lead to larger gradients in sub-
strate concentration between the bulk liquid and the inward of the aggregate, increasing
the mass transfer driving force. For �exible biogas production the shortened HRT with
maintained substrate concentration are far more likely.
Higher shear forces during shock load may cause a loss of biomass due to increased
liquid velocities, but even more due to increased gas production. A rapid drop in pH
and concomitant CO2evolution can cause extremely high shear forces and entrain large
amounts of bio�lm from the carrier material in anaerobic �lters as observed during HAc
injection in the experiments of chapter 3 and 4. Loss of active biomass from the reactor
could cause serious problems and ultimately induce a chain reaction leading to system
failure.
Kennedy and van den Berg (1982) examined anaerobic �lters operating at 60 % to 70 %
65
6. General Discussion
of the maximum steady state OLR. These were overloaded for 24 h with loading rates 2-
9 times higher than the control rate and a maximum OLRCOD of 94.2 g L−1 d−1. Their
conclusions were that the reactors were durable and regained stable operation quickly
after overloading within 12 h to 48 h and that anaerobic �lters were not prone to some of
the operating instabilities associated with conventional anaerobic reactors. Other reactor
types may be similarly suitable to variations in OLR, such as anaerobic migrating blanket
reactors. In the studies of Angenent et al. (2002) these were subjected to a doubled
OLRCOD from 25 g L−1 d−1 to 50 g L−1 d−1 within six HRTs (42 h). Pre-shock conditions
were reached "immediately" after the OLR was restored (Angenent et al., 2002). A
�uidized bed reactor operated by Borja and Banks (1995) recovered within 11 h to 14 h
after doubling the OLRCOD from 15.6 g L−1 d−1 to 31.2 g L−1 d−1 for 6 h or 12 h. Anaerobic
Ba�ed Reactors in the study of Grobicki and Stuckey (1991) were subjected to shock
loads, increasing from an OLRCOD 4.8 g L−1 d−1 to 96 g L−1 d−1 for 3 h, while decreasing
the HRT from 20 h to 1 h. Here the biomass washout has been quanti�ed and was less than
15 %. The recovery here was rapid and pre-shock degradation degrees were reached within
24 h. Masse and Masse (2005) also observed increased biomass loss during shock loads
using anaerobic sequencing batch reactors, but without e�ect on performance, probably
because initial biomass concentrations were high. Regarding biomass washout, �xed �lm,
expanded and �uidized bed reactors withstand higher loading rates and have shown better
stability compared to CSTR systems (Rajeshwari et al., 2000). For demand-driven biogas
production this feature enhances stability and therefore marks attached biomass reactor
designs as especially suitable.
6.4 Concluding Remarks
In the studies conducted in this work, di�erences in gas production kinetics for several
important intermediates found in hydrolysate could be determined. In conclusion this
demonstrated that:
� di�erent intermediates formed in the AR have di�erent methane production rates,
� extrapolating from individual methane production rates to the methane production
rate of a mixture is questionable,
� the mixture of many di�erent intermediates exhibits the fastest methane production
rates and thus
� the control of the hydrolysis towards speci�c intermediates is not necessary.
Operation of anaerobic �lters with the aim of �exible biogas production has proven its
feasibility and reproducibility. Methane production immediately followed changes in OLR
66
6. General Discussion
when liquid substrates were used. A key factor in order to prevent large �uctuation in gas
composition is the alkalinity of the process liquid, speci�cally the provision of nitrogenous
compounds is vital to maintain stable gas concentrations. Anaerobic Filters or attached
biomass reactors in general seem to exhibit superior performance towards shock loading
and are therefore especially suited for demand orientated gas production as they recover
quickly from overloading. Formation of soluble and particular C may be in�uenced or
exaggerated by changing HRT and OLR. Further research in order to evaluate the limits
of safe operation is recommended as more extreme scenarios are imaginable in practice.
In order to predict methane production or adjust operational conditions for demand
orientated gas production mechanistic models picturing each degradation step and chemo-
physical reactions seem too complex. A possible solution may be Autoregressive-Moving
Average (ARMA) models which can be validated based on empiric data, such as the ones
gathered in this work and are especially used in order to make short term forecasts.
67
7. Summary
7 Summary
Fluctuating energy sources, namely wind turbines and photovoltaic, will be the mayor
contributors to the increase in share of renewable energies. The intermittent energy supply
by these sources poses challenges for the power grid and need to be counter balanced.
A demand-driven energy supply by weather independent biomass conversion can o�er
these grid services. Flexible energy production from biogas has been identi�ed as a vital
approach to provide the grid with positive and negative balancing power. The two-staged
anaerobic digestion may be especially suitable for demand orientated gas production due
to the advantages of the anaerobic �lters to withstand high organic loading rates and
shock loading. Two staged anaerobic digestion is characterized by a spatio-temporal
separation of acidi�cation and methane production. A liquid rich in soluble products,
such as volatile fatty acids, alcohols and sugars is produced in the �rst stage and and is
subsequently converted to biogas in the second stage. The methanation stage as the main
gas producing unit in such a system is in the focus of this research.
The ability to react to sudden changes in demand might be in�uenced by substrate
composition and controlled hydrolysis towards certain intermediates could improve the
reaction times towards increased demand. It is therefore one focus of this research work
to examine intrinsic methane production kinetics of common intermediates of anaerobic
digestion. Other major questions are how fast the methane production can be adapted
to sudden changes in demand and to what extent these adaptions are reproducible. It
was therefore of interest to demonstrate the feasibility, reproducibility and the possible
extent of demand-driven biogas production in anaerobic �lters, with respect to changing
substrate composition. Furthermore the evaluation of the process e�ciency based on
carbon �uxes should be examined to unfold e�ects resulting from changing operational
conditions.
With a newly developed methodology, introduced in the publication "Kinetics of Bio-
gas Production in Anaerobic Filters" kinetic parameters of methane production for indi-
vidual volatile fatty acids (VFA) could be determined. The bandwidth of tested interme-
diates was broadened in the second research paper "Intrinsic Gas Production Kinetics of
Selected Intermediates in Anaerobic Filters for Demand Orientated Energy Supply". It
has been found that intermediates could be ordered according to their half-lives of meth-
ane production. The apparent order, beginning with the fastest was acetic acid >ethanol
>butyric acid >iso-butyric acid> valeric acid> propionic acid> propanediol> lactic acid.
However the mixture of these individual components administered as a naturally produced
hydrolysate revealed the fastest methane production kinetics.
Di�erences in the absolute values of determined kinetic parameters between the two
68
7. Summary
experiments can be attributed to variations in organic loading rate (OLR), since degrada-
tion rates of a speci�c substrate are determined by substrate concentration. But also other
parameters in�uence the absolute rate at which methane is produced, such as the concen-
tration of products or unionized substrate itself, pH, nutrient availability, bioenergetics,
temperature, inhibition, mass transfer and microbial population.
In the third research paper �Demand-Driven Biogas Production in Anaerobic Filters�
the previous �ndings have been put to the test by applying changes in OLR through-
out the day and examining di�erent substrate compositions with respect to the methane
production rates. As demonstrated, the gas production followed the applied OLR with
a distinctive expression of each change in the OLR. That marks the process as highly
predictable and de�ned boundaries within safe operation of AD, in terms of VFA accu-
mulation, can possibly be satis�ed by process control. The inclusion of three reactors in
the analysis emphasizes the repeatability and therefore the predictability of such an ap-
proach of operation. Feasibility and reproducibility of demand-driven biogas production
by anaerobic �lters could thus be demonstrated. It has been found that the hydrolys-
ate composition has no signi�cant in�uence on methane production kinetics for demand
orientated gas production, since the maximum rate is limited by acetoclastic methano-
genesis. The control of the hydrolysis should focus on high overall degradation, rather
than towards the production of speci�c intermediates.
A key factor in order to prevent large �uctuation in gas composition is alkalinity, spe-
ci�cally the provision of nitrogenous compounds is vital to maintain stable conditions.
Anaerobic �lters or attached biomass reactors in general seem to exhibit superior per-
formance towards shock loading and are therefore especially suited for demand orientated
gas production as they recover quickly from overloading.
Formation of soluble microbial products (SMP) and extracellular polymeric substances
(EPS) may be in�uenced or exaggerated by constantly changing HRT and OLR. Further
research in order to evaluate the limits of safe operation is recommended as more extreme
scenarios than the ones examined in this work are imaginable in practice.
69
8. Zusammenfassung
8 Zusammenfassung
Fluktuierende Energiequellen, vornehmlich in Form von Windturbinen und Photo-
voltaik-Anlagen werden den Groÿteil des Wachstums an Erneuerbaren Energien ausma-
chen. Die unstetige Energieversorgung dieser Quellen stellt eine Herausforderung für die
Elektrizitätsnetze dar und muss mit entsprechender Regelenergie ausgeglichen werden.
Eine bedarfsgerechte Energieversorgung durch wetterunabhängige Biomasse-Konversion
kann diese Netzdienstleistungen erbringen. Flexible Energiebereitstellung durch Biogas
wurde als wichtiger Ansatz erkannt, um Netze mit positiver und negativer Regelenergie
zu stabilisieren. Die zwei-stu�ge anaerobe Vergärung, die aufgrund der hohen biologi-
schen Stabilität des Anaerob�lters gegenüber Lastwechseln besonders für bedarfsgerechte
Biogasproduktion geeignet ist, wird charakterisiert durch die räumlich-, zeitliche Tren-
nung der Versäuerung von der Methanproduktion. Aus der zugeführten Biomasse wird
in der ersten Stufe eine Prozess�üssigkeit, reich an organischen Säuren, Zuckern und Al-
koholen produziert, die anschlieÿend in der zweiten Stufe zu Biogas umgewandelt wird.
Die Methan-Stufe, als maÿgeblich gasproduzierende Einheit steht dabei im Fokus dieser
Arbeit.
Im Rahmen dieser Arbeit sollte die Machbarkeit, Reproduzierbarkeit und das Aus-
maÿ der bedarfsgerechten Biogasproduktion im Anaerob�lter begutachtet werden, auch
im Hinblick auf den Ein�uss der Substratzusammensetzung. Die Beurteilung der Pro-
zesse�zienz soll anhand einer Kohlensto�bilanz erfolgen um eventuelle E�ekte der sich
ändernden Betriebsparameter aufzudecken.
Mit einer neuen Methode, eingeführt in der Publikation �Kinetics of Biogas Production
in Anaerobic Filters�, konnten kinetische Parameter der Methanbildung einzeler Fettsäu-
ren bestimmt werden. Die Bandbreite der getesteten Intermediate wurde mit der zweiten
Publikation �Intrinsic Gas Production Kinetics of Selected Intermediates in Anaerobic
Filters for Demand Orientated Energy Supply� erweitert. Anhand der �Halbwertszeiten
der Methan Produktion� konnte eine Reihenfolge der Gasbildungsgeschwindigkeiten eta-
bliert werden. Die Reihenfolge der getesteten Intermediate, beginnend mit dem schnell-
sten, wurde wie folgt bestimmt: Essigsäure> Ethanol> Buttersäure> iso-Buttersäure>
Valeriansäure> Propioinsäure> Milchsäure. Am schnellsten wurde Methan jedoch nach
der Zugabe eines natürlich produzierten Hydrolysates, also eine Mischung aller einzelnen
Intermediate, erzielt.
Unterschiede in den absoluten Werten der Kinetik-Parameter zwischen den beiden Ex-
perimenten können dem Ein�uss der angelegten Raumbelastung zugeordnet werden, da
Abbauraten spezi�scher Substrate im Allgemeinen von der Substratkonzentration abhän-
gig sind. Andere Faktoren, die für die absoluten Raten der Methanproduktion verantwort-
70
8. Zusammenfassung
lich stehen, sind Produktkonzentrationen, unionisierte Substratkonzentration, pH-Wert,
Nährsto�verfügbarkeit, Temperatur, Massetransfer und die mikrobielle Population.
In der dritten Publikation �Demand-Driven Biogas Production in Anaerobic Filters�
wurden die vorherigen Erkenntnisse überprüft, indem im laufe eines Tages wechselnde
Raumbelastungen angelegt wurden und Methanproduktionsraten im Hinblick auf Sub-
stratzusammensetzung untersucht wurden. Die Gasproduktion folgte jeder Änderung der
Raumbelastung mit einer sehr kurzen zeitlichen Verzögerung. Der Prozess zeichnet sich
durch eine gute Voraussagbarkeit innerhalb der Grenzen des stabilen Betriebs der anaero-
ben Vergärung aus. Das Einbeziehen dreier Reaktoren in die Analyse unterstreicht die gute
Reproduzierbarkeit und die damit einhergehenden Vorhersagemöglichkeiten eines solchen
Ansatzes des Anlagenbetriebs. Die Machbarkeit und Reproduzierarkeit konnten demnach
demonstriert werden. Die Substratzusammensetzung scheint in diesem Zusammenhang
keinen signi�kanten Ein�uss auf die Gasbildungskinetik zu haben, da der Geschwindig-
keitslimitierende Faktor die acetoklastische Methanogenese ist. Die Prozesskontrolle der
Hydrolyse sollte daher in Richtung des Gesamtabbaugrades optimiert werden, anstatt
gezielte Intermediate zu produzieren.
Die Produktion von gelösten mikrobiellen Produkten (SMP) und extrazellulären po-
lymeren Substanzen (EPS) ist möglicherweise beein�usst oder sogar verstärkt durch sich
ständig ändernde Raumbelastung und Verweilzeit. Weitergehende Untersuchungen sind
nötig um die Grenzen der sicheren Betriebsweise festzulegen, da in der Praxis durchaus
extremere Szenarios denkbar sind.
Ein Schlüsselelement um starke Schwankungen in der Gaszusammensetzung zu ver-
meiden ist die Pu�erkapazität der Flüssigkeiten im Fermenter. Insgesamt eignen sich
Anaerob�lter oder Reaktoren mit entsprechendem Biomasserückhalt besser als klassische
volldurchmischte Systeme, da sie eine deutlich bessere Wiederstandsfähigkeit gegenüber
Stoÿbelastungen aufzeigen und sich schnell von Überlastungen erholen. Sie sind daher
besonders für die bedarfsgerechte Biogasproduktion geeignet.
71
Bibliography
Bibliography
Abeysekera, M., Wu, J., Jenkins, N., Rees, M., 2016. Steady state analysis of gas networks
with distributed injection of alternative gas. Applied Energy 164, 991�1002.
Aguilar, A., Casas, C., Lema, J., 1995. Degradation of volatile fatty acids by di�erently
enriched methanogenic cultures: Kinetics and inhibition. Water Research 29, 505�509.
Ahern, E., Deane, P., Persson, T., Gallachoir, B., Murphy, J., 2015. A perspective on the
potential role of renewable gas in a smart energy island system. Renewable Energy 78,
648�656.
Angelidaki, I., Ahring, B., 1995. Isomerization of n- and i-butyrate in anaerobic meth-
anogenic systems. Antonie van Leeuwenhoek 68, 285�291.
Angenent, L., Abel, S., Sung, S., 2002. E�ect of an organic shock load on the stability
of an anaerobic migrating blanket reactor. Journal of Environmental Engineering 128,
1109�1120.
Bacenetti, J., Sala, C., Fusi, A., Fiala, M., 2016. Agricultural anaerobic digestion plants:
What lca studies pointed out and what can be done to make them more environmentally
sustainable. Applied Energy 179, 669�686.
Batstone, D., Pind, P., Angelidaki, I., 2003. Kinetics of thermophilic, anaerobic oxidation
of straight and branched chain butyrate and valerate. Biotechnology and Bioengineering
84, 195�204.
Bekkering, J., Broekhuis, A., van Gemert, W., Hengeveld, E., 2013. Balancing gas supply
and demand with a sustainable gas supply chain - a study based on �eld data. Applied
Energy 111, 842�852.
Bischofsberger, W. (Ed.), 2005. Anaerobtechnik. Springer, Berlin; Heidelberg [u.a.]. 2.
edition.
BMWi, 2010. German federal ministry of economics and technology (bmwi), energy
concept for an environmentally sound, reliable and a�ordable energy supply. http://
www.bmwi.de/English/Redaktion/Pdf/energy-concept. [Online; accessed 19-Aug-
2016].
Borja, R., Banks, C., 1995. Response of an anaerobic �uidized bed reactor treating
ice-cream wastewater to organic, hydraulic, temperature and ph shocks. Journal of
Biotechnology 39, 251�259.
72
Bibliography
Brouwer, A.b., van den Broek, M., Seebregts, A., Faaij, A.c., 2015. Operational �exibility
and economics of power plants in future low-carbon power systems. Applied Energy
156, 107�128.
Budiyono, Syaichurrozi, I., Sumardiono, S., 2014. Kinetic model of biogas yield produc-
tion from vinasse at various initial ph: Comparison between modi�ed gompertz model
and �rst order kinetic model. Research Journal of Applied Sciences, Engineering and
Technology 7, 2798�2805.
Buswell, A.M., Mueller, H.F., 1952. Mechanism of methane fermentation. Industrial &
Engineering Chemistry 44, 550�552.
Calvillo, C., Sýnchez-Miralles, A., Villar, J., MartÃn, F., 2016. Optimal planning and
operation of aggregated distributed energy resources with market participation. Applied
Energy 182, 340�357.
Chen, Y., Röÿler, B., Zielonka, S., Lemmer, A., Wonneberger, A.M., Jungbluth, T., 2013.
The pressure e�ects on two-phase anaerobic digestion. Applied Energy .
Chua, H., Hu, W., Yu, P., Cheung, M., 1997. Responses of an anaerobic �xed-�lm reactor
to hydraulic shock loadings. Bioresource Technology 61, 79�83.
Cohen, A., Breure, A., van Andel, J., van Deursen, A., 1982. In�uence of phase separ-
ation on the anaerobic digestion of glucose-ii. stability, and kinetic responses to shock
loadings. Water Research 16, 449�455.
Cohen, A., Zoetemeyer, R., van Deursen, A., van Andel, J., 1979. Anaerobic digestion
of glucose with separated acid production and methane formation. Water Research 13,
571�580.
Cysneiros, D., Banks, C., Heaven, S., Karatzas, K., 2012. The role of phase separation
and feed cycle length in leach beds coupled to methanogenic reactors for digestion of a
solid substrate (part 1): Optimisation of reactors' performance. Bioresource Technology
103, 56�63.
Demirel, B., Yenigün, O., 2002. Two-phase anaerobic digestion processes: A review.
Journal of Chemical Technology and Biotechnology 77, 743�755.
Demirer, G., Chen, S., 2005. Two-phase anaerobic digestion of unscreened dairy manure.
Process Biochemistry 40, 3542�3549.
EU, 2012. Energy roadmap 2050. https://ec.europa.eu/energy/sites/ener/files/
documents/2012_energy_roadmap_2050_en_0.pdf. [Online; accessed 19-Aug-2016].
73
Bibliography
EU, 2016. Renewable energy statistics. http://ec.europa.eu/eurostat/
statistics-explained/index.php/Renewable_energy_statistics. [Online; ac-
cessed 19-Aug-2016].
Flemming, H.C., Neu, T., Wozniak, D.d., 2007. The eps matrix: The "house of bio�lm
cells". Journal of Bacteriology 189, 7945�7947.
Fox, P., Pohland, F., 1994. Anaerobic treatment applications and fundamentals: Sub-
strate speci�city during phase separation. Water Environment Research 66, 716�724.
Fukuzaki, S., Nishio, N., Shobayashi, M., Nagai, S., 1990. Inhibition of the ferment-
ation of propionate to methane by hydrogen, acetate, and propionate. Applied and
Environmental Microbiology 56, 719�723.
Gehring, T., Klang, J., Niedermayr, A., Berzio, S., Immenhauser, A., Klocke, M., Wich-
ern, M., Lübken, M., 2015. Determination of methanogenic pathways through carbon
isotope analysis for the two-stage anaerobic digestion of high-solids substrates. Envir-
onmental Science and Technology 49, 4705�4714.
Ghosh, S., 1987. Improved sludge gasi�cation by two-phase anaerobic digestion. Journal
of Environmental Engineering (United States) 113, 1265�1284.
Ghosh, S., 1991. Pilot-scale demonstration of two-phase anaerobic digestion of activated
sludge. Water Science and Technology 23, 1179�1188.
Ghosh, S., Ombregt, J., Pipyn, P., 1985. Methane production from industrial wastes by
two-phase anaerobic digestion. Water Research 19, 1083�1088.
Grim, J., Nilsson, D., Hansson, P.A., Nordberg, A., 2015. Demand-orientated power
production from biogas: Modeling and simulations under swedish conditions. Energy
and Fuels 29, 4066�4075.
Grobicki, A., Stuckey, D., 1991. Performance of the anaerobic ba�ed reactor under
steady-state and shock loading conditions. Biotechnology and Bioengineering 37, 344�
355.
Hahn, H., Ganagin, W., Hartmann, K., Wachendorf, M., 2014a. Cost analysis of con-
cepts for a demand oriented biogas supply for �exible power generation. Bioresource
Technology 170, 211�220.
Hahn, H., Krautkremer, B., Hartmann, K., Wachendorf, M., 2014b. Review of concepts
for a demand-driven biogas supply for �exible power generation. Renewable and Sus-
tainable Energy Reviews 29, 383�393.
74
Bibliography
Hirth, L., Ziegenhagen, I., 2015. Balancing power and variable renewables: Three links.
Renewable and Sustainable Energy Reviews 50, 1035�1051.
Horiuchi, J.I., Shimizu, T., Tada, K., Kanno, T., Kobayashi, M., 2002. Selective produc-
tion of organic acids in anaerobic acid reactor by ph control. Bioresource Technology
82, 209�213.
Ince, O., 1998. Performance of a two-phase anaerobic digestion system when treating
dairy wastewater. Water Research 32, 2707�2713.
Jawed, M., Tare, V., 2000. Post-mortem examination and analysis of anaerobic �lters.
Bioresource Technology 72, 75�84.
John S. Jeris, P.L.M., 1965. The biochemistry of methane fermentation using c14 tracers.
Journal (Water Pollution Control Federation) 37, 178�192.
Ka�e, G., Kim, S., 2013. Anaerobic treatment of apple waste with swine manure for
biogas production: Batch and continuous operation. Applied Energy 103, 61�72.
Kennedy, K., van den Berg, L., 1982. Stability and performance of anaerobic �xed �lm
reactors during hydraulic overloading at 10-35C. Water Research 16, 1391�1398.
Ketheesan, B., Stuckey, D.b., 2015. E�ects of hydraulic/organic shock/transient loads in
anaerobic wastewater treatment: A review. Critical Reviews in Environmental Science
and Technology 45, 2693�2727.
Khanal, S.K. (Ed.), 2008. Anaerobic biotechnology for bioenergy production: principles
and applications. Wiley-Blackwell, Ames, Iowa.
Koeck, D., Koellmeier, T., Zverlov, V., Liebl, W., Schwarz, W., 2015. Di�erences in
biomass degradation between newly isolated environmental strains of clostridium ther-
mocellum and heterogeneity in the size of the cellulosomal sca�oldin. Systematic and
Applied Microbiology 38, 424�432.
Krishania, M., Vijay, V., Chandra, R., 2013. Methane fermentation and kinetics of wheat
straw pretreated substrates co-digested with cattle manure in batch assay. Energy 57,
359�367.
Krümpel, J., Schäufele, F., Schneider, J., Jungbluth, T., Zielonka, S., Lemmer, A., 2016.
Kinetics of biogas production in anaerobic �lters. Bioresource Technology 200, 230�234.
Kus, F., Wiesmann, U., 1995. Degradation kinetics of acetate and propionate by immob-
ilized anaerobic mixed cultures. Water Research 29, 1437�1443.
75
Bibliography
Laspidou, C., Rittmann, B., 2002. A uni�ed theory for extracellular polymeric substances,
soluble microbial products, and active and inert biomass. Water Research 36, 2711�
2720.
Li, Y., Flynn, P., 2004. Deregulated power prices: Comparison of diurnal patterns. Energy
Policy 32, 657�672.
Lin, C.Y., Sato, K., Noike, T., Matsumoto, J., 1986. Methanogenic digestion using mixed
substrate of acetic, propionic and butyric acids. Water Research 20, 385�394.
Lindner, J., Zielonka, S., Oechsner, H., Lemmer, A., 2015. E�ect of di�erent ph-values
on process parameters in two-phase anaerobic digestion of high-solid substrates. En-
vironmental Technology (United Kingdom) 36, 198�207.
Lindner, J., Zielonka, S., Oechsner, H., Lemmer, A., 2016. Is the continuous two-stage
anaerobic digestion process well suited for all substrates? Bioresource Technology 200,
470�476.
Linke, B., Rodriguez-Abalde, A., Jost, C., Krieg, A., 2015. Performance of a novel two-
phase continuously fed leach bed reactor for demand-based biogas production from
maize silage. Bioresource Technology 177, 34�40.
Liu, Y., Tay, J.H., 2001. Metabolic response of bio�lm to shear stress in �xed-�lm culture.
Journal of Applied Microbiology 90, 337�342.
Lo, H., Kurniawan, T., Sillanpää, M., Pai, T., Chiang, C., Chao, K., Liu, M., Chuang,
S., Banks, C., Wang, S., Lin, K., Lin, C., Liu, W., Cheng, P., Chen, C., Chiu, H., Wu,
H., 2010. Modeling biogas production from organic fraction of msw co-digested with
mswi ashes in anaerobic bioreactors. Bioresource Technology 101, 6329�6335.
Masse, L., Masse, D., 2005. E�ect of soluble organic, particulate organic, and hydraulic
shock loads on anaerobic sequencing batch reactors treating slaughterhouse wastewater
at 20 C. Process Biochemistry 40, 1225�1232.
Mathiesen, B., Lund, H., Connolly, D., Wenzel, H., Ostergaard, P., Müller, B., Nielsen,
S., Ridjan, I., KarnOe, P., Sperling, K., Hvelplund, F., 2015. Smart energy systems for
coherent 100energy and transport solutions. Applied Energy 145, 139�154.
Matthies, C., Schink, B., 1992. Reciprocal isomerization of butyrate and isobutyrate by
the strictly anaerobic bacterium strain wog13 and methanogenic isobutyrate degrada-
tion by a de�ned triculture. Applied and Environmental Microbiology 58, 1435�1439.
Mauky, E., Jacobi, H., Liebetrau, J., Nelles, M., 2015. Flexible biogas production for
demand-driven energy supply - feeding strategies and types of substrates. Bioresource
Technology 178, 262�269.
76
Bibliography
Mauky, E., Weinrich, S., Nägele, H.J., Jacobi, H., Liebetrau, J., Nelles, M., 2016. Model
predictive control for demand-driven biogas production in full scale. Chemical Engin-
eering and Technology 39, 652�664.
Mawson, A., Earle, R., Larsen, V., 1991. Degradation of acetic and propionic acids in the
methane fermentation. Water Research 25, 1549�1554.
McCarty, P., 1972. Energetics of organic matter degradation, in: Mitchell, R. (Ed.),
Water Pollution Microbiology. Wiley-Interscience. chapter 5, pp. 91�118.
Moestedt, J.b., Malmborg, J.c., Nordell, E., 2015. Determination of methane and carbon
dioxide formation rate constants for semi-continuously fed anaerobic digesters. Energies
8, 645�655.
Muha, I., Zielonka, S., Lemmer, A., Schönberg, M., Linke, B., Grillo, A., Wittum, G.,
2013. Do two-phase biogas plants separate anaerobic digestion phases? - a mathem-
atical model for the distribution of anaerobic digestion phases among reactor stages.
Bioresource Technology 132, 414�418.
Mulat, D., Fabian Jacobi, H., Feilberg, A., Adamsen, A., Richnow, H.H., Nikolausz, M.,
2016. Changing feeding regimes to demonstrate �exible biogas production: E�ects on
process performance, microbial community structure, and methanogenesis pathways.
Applied and Environmental Microbiology 82, 438�449.
Nelson, D.L., Cox, M.M., 2013. Lehninger principles of biochemistry. Freeman, New
York, NY. 6. ed., [international ed.] edition.
Nielsen, H., Mladenovska, Z., Ahring, B., 2008. Kinetics of propionate conversion in
anaerobic continuously stirred tank reactors. Environmental Technology 29, 151�160.
Nielsen, P., Jahn, A., Palmgren, R., 1997. Conceptual model for production and compos-
ition of exopolymers in bio�lms. Water Science and Technology 36, 11�19.
Nizami, A.S., Murphy, J., 2010. What type of digester con�gurations should be employed
to produce biomethane from grass silage? Renewable and Sustainable Energy Reviews
14, 1558�1568.
Orehounig, K.b., Evins, R.b., Dorer, V., 2015. Integration of decentralized energy systems
in neighbourhoods using the energy hub approach. Applied Energy 154, 277�289.
Öztürk, M., 1991. Conversion of acetate, propionate and butyrate to methane under
thermophilic conditions in batch reactors. Water Research 25, 1509�1513.
Pavlostathis, S., Giraldo-Gomez, E., 1991. Kinetics of anaerobic treatment: A critical
review. Critical Reviews in Environmental Control 21, 411�490.
77
Bibliography
Pind, P., Angelidaki, I., Ahring, B., 2003. Dynamics of the anaerobic process: E�ects of
volatile fatty acids. Biotechnology and Bioengineering 82, 791�801.
Pohland, F., Ghosh, S., 1971. Developments in anaerobic stabilization of organic wastes
- the two-phase concept. Environmental Letters 1, 255�266.
R Development Core Team, 2008. R: A Language and Environment for Statistical Com-
puting. R Foundation for Statistical Computing. Vienna, Austria. ISBN 3-900051-07-0.
Rajeshwari, K., Balakrishnan, M., Kansal, A., Lata, K., Kishore, V., 2000. State-of-the-
art of anaerobic digestion technology for industrial wastewater treatment. Renewable
& sustainable energy reviews 4, 135�156.
Ramesh, A., Lee, D.J., Hong, S., 2006. Soluble microbial products (smp) and soluble
extracellular polymeric substances (eps) from wastewater sludge. Applied Microbiology
and Biotechnology 73, 219�225.
Raynal, J., Delgenes, J., Moletta, R., 1998. Two-phase anaerobic digestion of solid wastes
by a multiple liquefaction reactors process. Bioresource Technology 65, 97�103.
Rebac, S., Gerbens, S., Lens, P., Van Lier, J., Stams, A., Keesman, K., Lettinga, G.,
1999. Kinetics of fatty acid degradation by psychrophilically grown anaerobic granular
sludge. Bioresource Technology 69, 241�248.
Refai, S., Wassmann, K., Deppenmeier, U., 2014. Short-term e�ect of acetate and ethanol
on methane formation in biogas sludge. Applied Microbiology and Biotechnology 98,
7271�7280.
Ren, N., Chua, H., Chan, S., Tsang, Y., Wang, Y., Sin, N., 2007. Assessing optimal
fermentation type for bio-hydrogen production in continuous-�ow acidogenic reactors.
Bioresource Technology 98, 1774�1780.
Ren, N., Wang, B., Huang, J.C., 1997. Ethanol-type fermentation from carbohydrate in
high rate acidogenic reactor. Biotechnology and Bioengineering 54, 428�433.
Sauer, K., Camper, A., Ehrlich, G., Costerton, J., Davies, D., 2002. Pseudomonas aer-
uginosa displays multiple phenotypes during development as a bio�lm. Journal of
Bacteriology 184, 1140�1154.
Schiener, P., Nachaiyasit, S., Stuckey, D., 1998. Production of soluble microbial products
(smp) in an anaerobic ba�ed reactor: Composition, biodegradability, and the e�ect of
process parameters. Environmental Technology 19, 391�399.
Schink, B., 1997. Energetics of syntrophic cooperation in methanogenic degradation.
Microbiology and Molecular Biology Reviews 61, 262�280.
78
Bibliography
Senturk, E., Ince, M., Engin, G., 2013. The e�ect of transient loading on the perform-
ance of a mesophilic anaerobic contact reactor at constant feed strength. Journal of
Biotechnology 164, 232�237.
Show, K.Y., Tay, J.H., 1999. In�uence of support media on biomass growth and retention
in anaerobic �lters. Water Research 33, 1471�1481.
Steinke, F., Wolfrum, P., Ho�mann, C., 2013. Grid vs. storage in a 100 percent renewable
europe. Renewable Energy 50, 826�832.
Stoodley, P., Sauer, K., Davies, D., Costerton, J., 2002. Bio�lms as complex di�erentiated
communities. Annual Review of Microbiology 56, 187�209.
Tauseef, S., Abbasi, T., Abbasi, S., 2013. Energy recovery from wastewaters with high-
rate anaerobic digesters. Renewable and Sustainable Energy Reviews 19, 704�741.
Tay, J.H., Show, K.Y., Jeyaseelan, S., 1997. Media factors a�ecting the performance of
up�ow anaerobic packed-bed reactors. Environmental Monitoring and Assessment 44,
249�261.
Tholozan, J.L., Samain, E., Grivet, J.P., 1988. Isomerization between n-butyrate and
isobutyrate in enrichment cultures. FEMS Microbiology Letters 53, 187�191.
Thrän, D., Dotzauer, M., Lenz, V., Liebetrau, J., Ortwein, A., 2015. Flexible bioenergy
supply for balancing �uctuating renewables in the heat and power sector a review of
technologies and concepts. Energy, Sustainability and Society 5, 1�15.
Verrier, D., Roy, F., Albagnac, G., 1987. Two-phase methanization of solid vegetable
wastes. Biological Wastes 22, 163�177.
Vintiloiu, A., Lemmer, A., Oechsner, H., Jungbluth, T., 2012. Mineral substances and
macronutrients in the anaerobic conversion of biomass: An impact evaluation. Engin-
eering in Life Sciences 12, 287�294.
Wang, M., Tang, S., Tan, Z., 2011. Modeling in vitro gas production kinetics: Derivation
of logistic-exponential (le) equations and comparison of models. Animal Feed Science
and Technology 165, 137�150.
Wang, Q., Kuninobu, M., Ogawa, H., Kato, Y., 1999. Degradation of volatile fatty acids
in highly e�cient anaerobic digestion. Biomass and Bioenergy 16, 407�416.
Wiegant, W., Hennink, M., Lettinga, G., 1986. Separation of the propionate degradation
to improve the e�ciency of thermophilic anaerobic treatment of acidi�ed wastewaters.
Water Research 20, 517�524.
79
Bibliography
Yang, Y., Chen, Q., Guo, J., Hu, Z., 2015. Kinetics and methane gas yields of selected
c1 to c5 organic acids in anaerobic digestion. Water Research 87, 112�118.
Young, J., McCarty, P., 1969. The anaerobic �lter for waste treatment. Journal of the
Water Pollution Control Federation 41, Suppl:R160+.
Yu, H., Samani, Z., Hanson, A., Smith, G., 2002. Energy recovery from grass using
two-phase anaerobic digestion. Waste Management 22, 1�5.
Zamani, A., Zakariazadeh, A., Jadid, S., 2016. Day-ahead resource scheduling of a re-
newable energy based virtual power plant. Applied Energy 169, 324�340.
Zellner, G., Neudörfer, F., Diekmann, H., 1994. Degradation of lactate by an anaerobic
mixed culture in a �uidized-bed reactor. Water Research 28, 1337�1340.
Zielonka, S., Lemmer, A., Oechsner, H., Jungbluth, T., 2010. Energy balance of a two-
phase anaerobic digestion process for energy crops. Engineering in Life Sciences 10,
515�519.
80

ISSN 0931-6264