GeoPLASMA-CE: Assessment of methods for geothermal closed ...
90
K. HOFMANN 1 , P.RIEDEL 1 , I. GÖRZ 1 & THE GEOPLASMA-CE TEAM. 1 Saxon State Office for Environment, Agriculture and Geology (Sächsisches Landesamt für Umwelt, Landwirtschaft und Geologie) Deliverable D.T2.2.2 Synopsis of geothermal mapping methods 06 2017 GeoPLASMA-CE: Assessment of methods for geothermal closed loop systems
Transcript of GeoPLASMA-CE: Assessment of methods for geothermal closed ...
K. HOFMANN1, P.RIEDEL
1, I. GÖRZ1 & THE GEOPLASMA-CE TEAM.
1 Saxon State Office for Environment, Agriculture and Geology (Sächsisches Landesamt für Umwelt, Landwirtschaft und Geologie)
Deliverable D.T2.2.2 Synopsis of geothermal mapping methods
06 2017
GeoPLASMA-CE: Assessment of methods for geothermal closed loop systems

Page 1
Contact details of author: [email protected]
The involved GeoPLASMA-CE team
Geological Survey of Austria (LP) G. Goetzl, C. Steiner
Page 2
Content
Glossary ........................................................................................................................ 3
1. Introduction ............................................................................................................... 5
2. General workflow for geothermal mapping based on a 3D model ............................................ 6
3. Geothermal potential mapping for closed loop systems ......................................................... 7
3.1. Research of existing geothermal mapping methods ........................................................... 7
3.2. Input data ............................................................................................................... 9
3.3. Data processing and modelled objects ............................................................................ 9
3.4. Modelling workflows for closed loop systems .................................................................. 11
3.4.1. Maps of geothermal heat extraction and geothermal conductivity .................................... 11
3.4.2. Temperature maps ................................................................................................ 14
3.5. Interpreted information and visualization ...................................................................... 16
4. Summary and Conclusions ............................................................................................. 20
5. References ................................................................................................................ 22
Annex 1: methodical assessment sheets .............................................................................. 28
Page 3
Glossary
description
Geothermal energy Energy stored below the surface of the solid earth in the form of heat
Shallow geothermal use The use of geothermal energy until a depth of 400 m
geothermal potential The useful accessible resource — that part of geothermal energy of a given area that could be extracted economically and legally at some specified time in the future
Risk and land-use conflicts
direct or indirect negative impact on the environment which geothermal exploitation affects to the compartments (water, soil, air, nature) and on other land uses nearby
3D structural model describes the geometry, spatial distribution and neighborhood relationship of geological units in the modelling domain
Suitability The possibility to use shallow geothermal energy by a specific method
Parameter model Assigns physical or chemical parameters to the geological units specified in the 3D structural model. It can be used for calculations or predictions.
COP The coefficient of performance of an electric heat pump for a certain working point is the momentary ratio of the thermal output emitted to the consumed electrical power.
Map is a projection of a high-dimensional object on a plane. Usually, it is a scaled, simplified and generalized model of the earth.
Geothermal mapping Calculation and visualisation of geothermal potential by specific thematic output parameters (e.g. thermal conductivity, extraction rates)
Conflict mapping Calculation and visualisation of land-use conflicts and risk areas due to geothermal utilisation (e.g. traffic light maps, specific conflict layers)
Metadata Provides information about the data itself. It summarizes basic properties of the data and makes working with the data easier. E.g. metadata of a book are its author and year of publication.
Closed loop system (borehole heat exchanger) In a closed loop system the heat carrier fluid is not transferred in or out of the system boundaries, only heat is exchanged. They are vertically or inclined installed in the subsurface. Mostly these are U-shaped plastic pipes installed in boreholes, or arranged concentrically as an inner or outer pipe. Heat transport within the borehole heat exchangers takes place mostly through the pumping of a working fluid.
Open loop system In an open loop system, the heat carrier fluid is groundwater. It is
Page 4
withdrawn from an extraction well, passes through a heat exchanger and a heat pump, if necessary, afterwards it is returned to the aquifer via the injection well.
Extraction well Withdraws groundwater from an aquifer. It consists of a plastic filter tube, which is implemented in a borehole. It is part of a geothermal application using groundwater as heat source.
Injection well: Is the second well - aside from the extraction well – needed for a geothermal application using groundwater as heat source. A well through which geothermal water is returned to an subsurface reservoir after use. Geothermal production and injection wells are constructed of pipes layered inside one another and cemented into the earth and to each other.
Hydraulic conductivity Quantifies the capacity of rock and unconsolidated sediments to transmit a fluid, taking density and viscosity of the fluid into account. The unit is [m/s].
Aquifer a large permeable body of rock capable of yielding quantities of water to springs or wells.
Geothermal gradient the rate of temperature increase in the Earth as a function of depth.
Geothermal heat pumps devices that take advantage of the relatively constant temperature of the Earth’s subsurface, using it as a source and sink of heat for both heating and cooling. In cooling mode heat is dissipated into the Earth; when heating, heat is extracted from the Earth resulting in a temporary temperature decrease in the subsurface surrounded by the application.
Permeability: capacity of a substance (such as rock) to transmit a fluid. The degree of permeability depends on the number, size, and shape of the pores and/or fractures in the rock and their interconnections. It is measured by the time it takes a fluid of standard viscosity to move a given distance. The unit of permeability is Darcy [m²].
Porosity: ratio of the aggregate volume of pore spaces in rock or soil to its total volume, usually stated as a percentage.
Page 5
1. Introduction
The aim of the GeoPLASMA-CE project is to develop new management strategies for shallow geothermal use of urban and non-urban regions. The project intends to create a standardized data base and a web-based platform including the geothermal potential as well as factors of risk and land-use conflicts. The data comprises geological and structural data, petrophysical and technical parameters as well as the model data produced during different stages of the project. The geothermal potential modelling and the risk-factor validation will be based on a 3D structural model of the shallow geological subsurface which will be used to quantify the spatial distribution of physical and technical parameters and of risk factors.
To elaborate a compilation and assessment of existing methods a literature study was conducted as first step to establish a workflow for geothermal modelling in GeoPLASMA-CE. Information about existing methods for geothermal mapping of current and previous projects for 3D-modelling, open loop and closed loop systems as well as land-use-conflict mapping was gathered. The applicability of the methods used in the projects for GeoPLASMA-CE was investigated in a next step. The project team created a template to summarize the most important information about the methods regarding the topics mentioned (3D-modelling, open loop and closed loop systems, land-use-conflict mapping). Summaries of all methods and lessons learned from the projects, which provide important inputs, were established for four separate reports, based on these standardized assessment sheets:
� Synopsis of geological 3D-modelling methods,
� Synopsis of geothermal mapping methods - open loop systems,
� Synopsis of geothermal mapping methods - closed loop systems,
� Synopsis of mapping methods of land-use conflicts and environmental impact assessment.
All assessment sheets are added in annex 1 for further information. The publications concerning the analysed projects were collected and are available for further research and use in the database “knowledge repository”.
This process generated important knowledge about how to develop workflows of geothermal mapping for GeoPLASMA-CE, which will be accomplished within the next steps.
The delivered four reports and the knowledge repository will be available online at the project’s website (http://www.interreg-central.eu/Content.Node/GeoPLASMA-CE.html).
Page 6
2. General workflow for geothermal mapping based on a 3D model
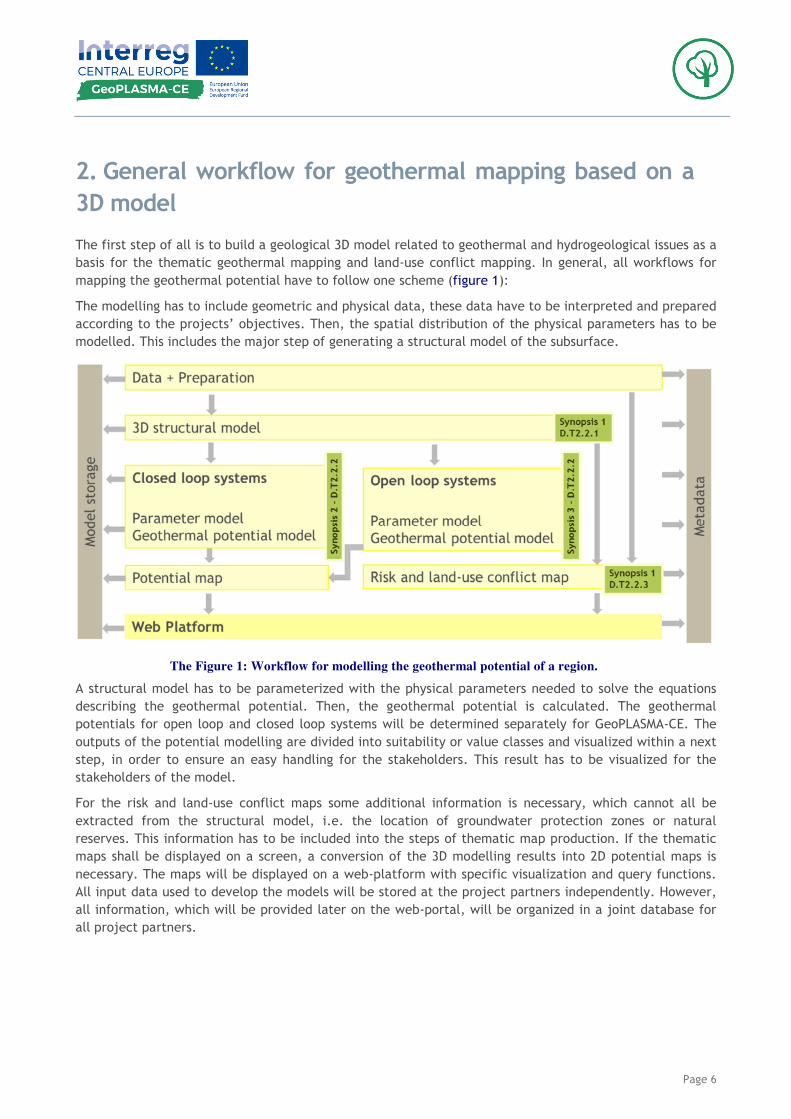
The first step of all is to build a geological 3D model related to geothermal and hydrogeological issues as a basis for the thematic geothermal mapping and land-use conflict mapping. In general, all workflows for mapping the geothermal potential have to follow one scheme (figure 1):
The modelling has to include geometric and physical data, these data have to be interpreted and prepared according to the projects’ objectives. Then, the spatial distribution of the physical parameters has to be modelled. This includes the major step of generating a structural model of the subsurface.
The Figure 1: Workflow for modelling the geothermal potential of a region.
A structural model has to be parameterized with the physical parameters needed to solve the equations describing the geothermal potential. Then, the geothermal potential is calculated. The geothermal potentials for open loop and closed loop systems will be determined separately for GeoPLASMA-CE. The outputs of the potential modelling are divided into suitability or value classes and visualized within a next step, in order to ensure an easy handling for the stakeholders. This result has to be visualized for the stakeholders of the model.
For the risk and land-use conflict maps some additional information is necessary, which cannot all be extracted from the structural model, i.e. the location of groundwater protection zones or natural reserves. This information has to be included into the steps of thematic map production. If the thematic maps shall be displayed on a screen, a conversion of the 3D modelling results into 2D potential maps is necessary. The maps will be displayed on a web-platform with specific visualization and query functions. All input data used to develop the models will be stored at the project partners independently. However, all information, which will be provided later on the web-portal, will be organized in a joint database for all project partners.
Page 7
3. Geothermal potential mapping for closed loop systems
3.1. Research of existing geothermal mapping methods
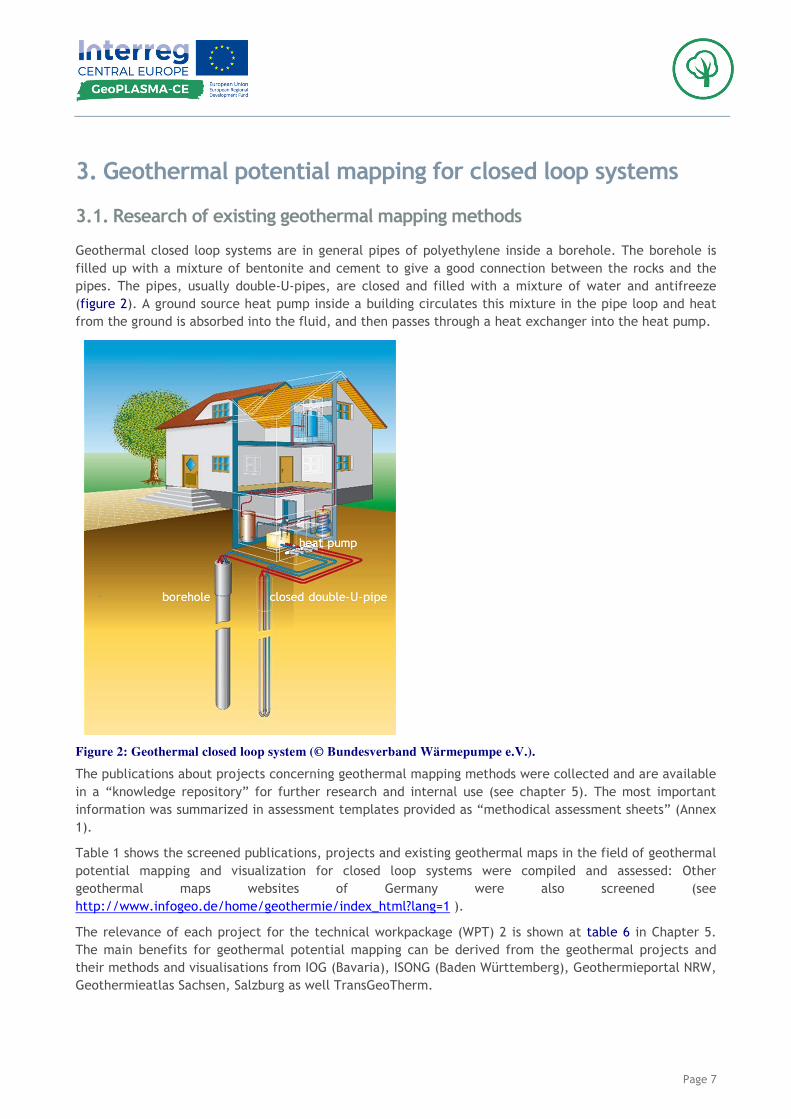
Geothermal closed loop systems are in general pipes of polyethylene inside a borehole. The borehole is filled up with a mixture of bentonite and cement to give a good connection between the rocks and the pipes. The pipes, usually double-U-pipes, are closed and filled with a mixture of water and antifreeze (figure 2). A ground source heat pump inside a building circulates this mixture in the pipe loop and heat from the ground is absorbed into the fluid, and then passes through a heat exchanger into the heat pump.
Figure 2: Geothermal closed loop system (© Bundesverband Wärmepumpe e.V.).
The publications about projects concerning geothermal mapping methods were collected and are available in a “knowledge repository” for further research and internal use (see chapter 5). The most important information was summarized in assessment templates provided as “methodical assessment sheets” (Annex 1).
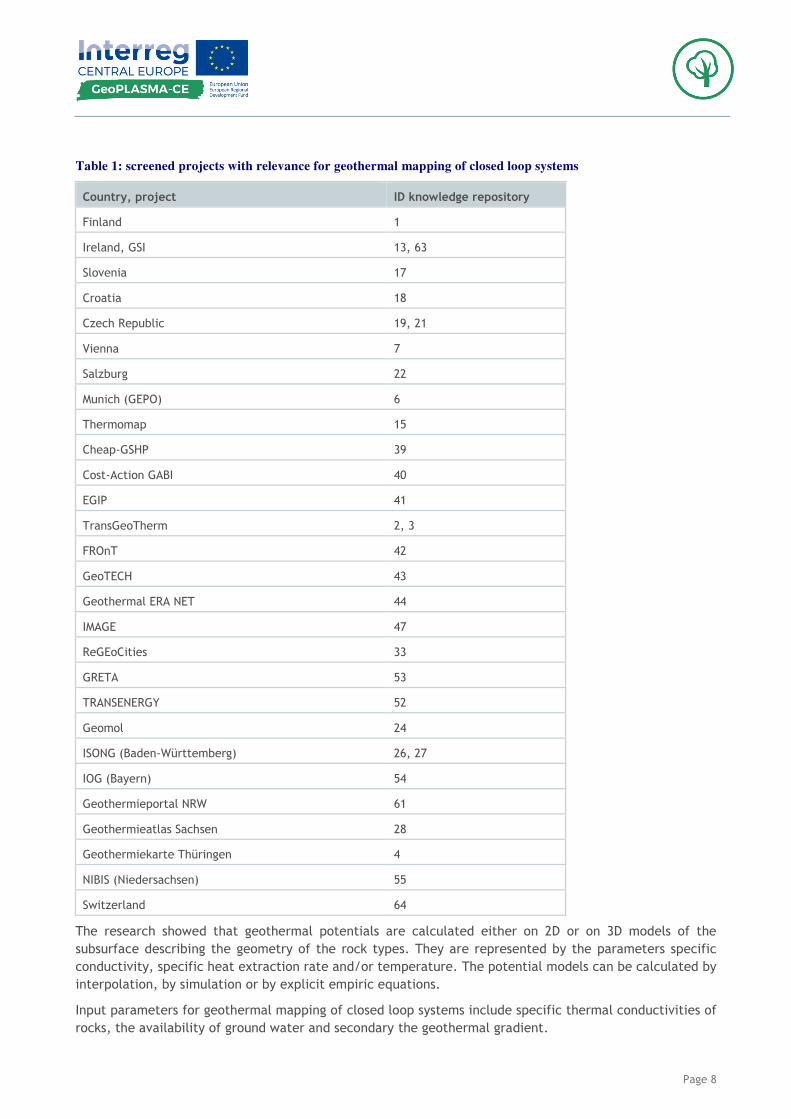
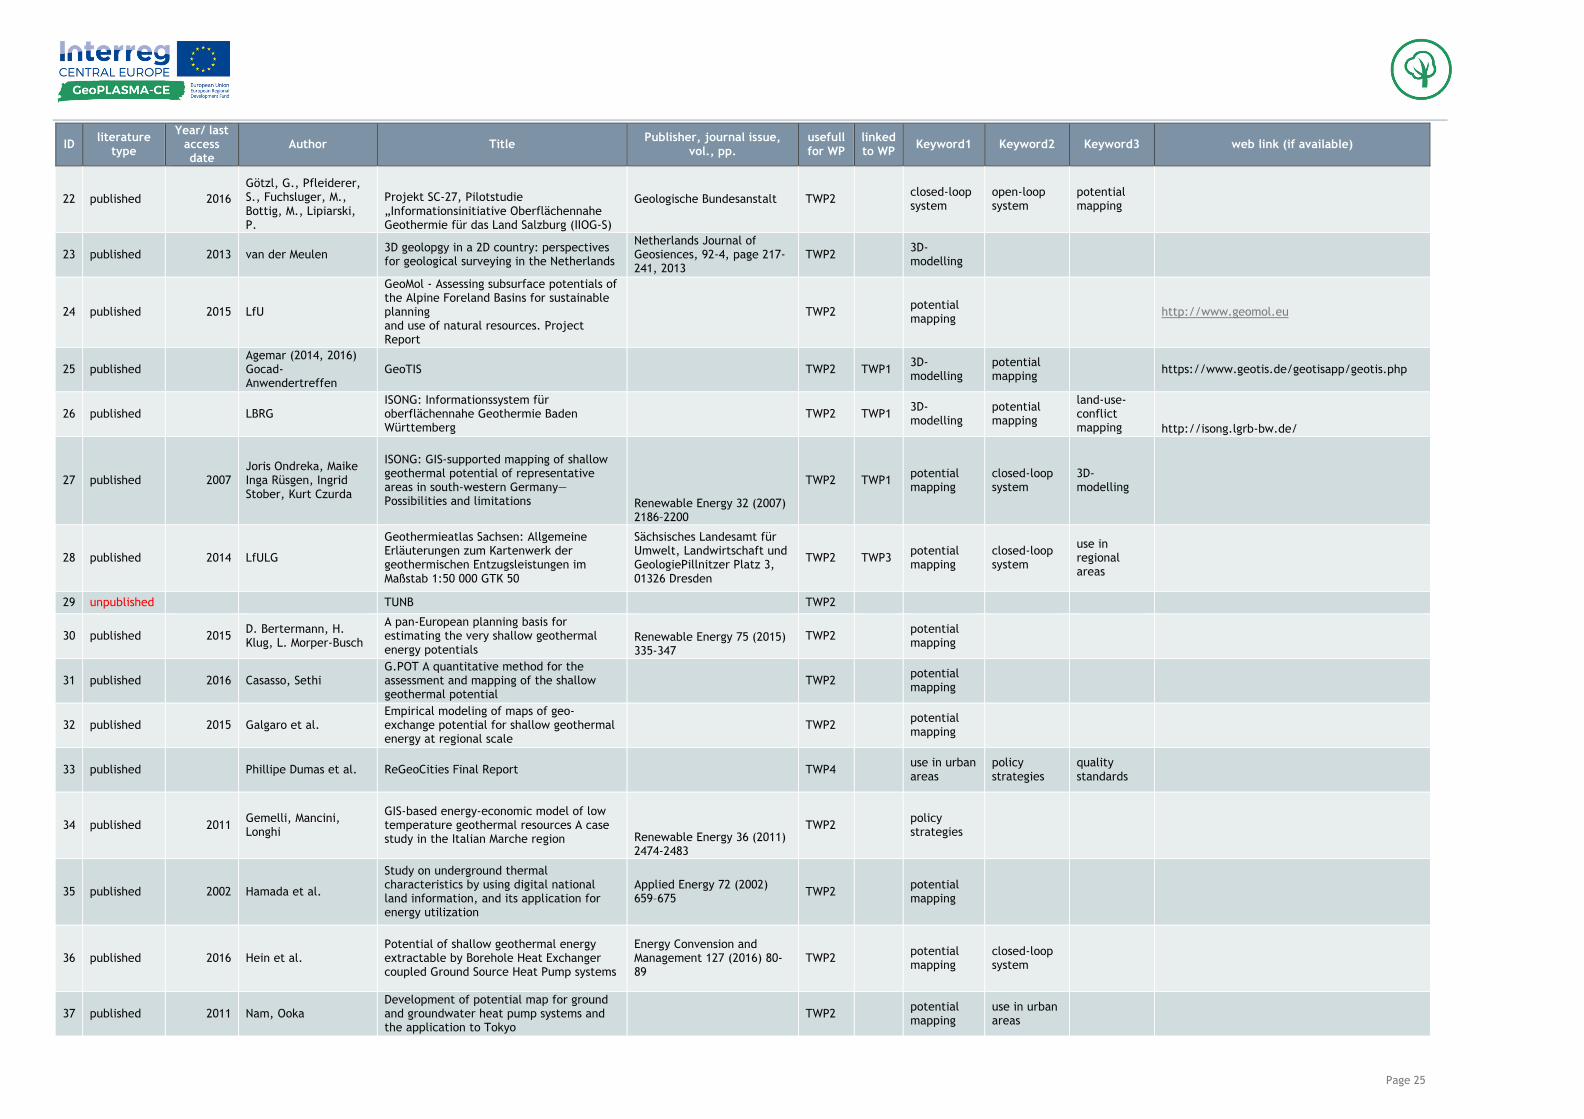
Table 1 shows the screened publications, projects and existing geothermal maps in the field of geothermal potential mapping and visualization for closed loop systems were compiled and assessed: Other geothermal maps websites of Germany were also screened (see http://www.infogeo.de/home/geothermie/index_html?lang=1 ).
The relevance of each project for the technical workpackage (WPT) 2 is shown at table 6 in Chapter 5. The main benefits for geothermal potential mapping can be derived from the geothermal projects and their methods and visualisations from IOG (Bavaria), ISONG (Baden Württemberg), Geothermieportal NRW, Geothermieatlas Sachsen, Salzburg as well TransGeoTherm.
Page 8
Table 1: screened projects with relevance for geothermal mapping of closed loop systems
Country, project ID knowledge repository
Finland 1
Ireland, GSI 13, 63
Slovenia 17
Croatia 18
Czech Republic 19, 21
Vienna 7
Salzburg 22
Munich (GEPO) 6
Thermomap 15
Cheap-GSHP 39
Cost-Action GABI 40
EGIP 41
TransGeoTherm 2, 3
FROnT 42
GeoTECH 43
Geothermal ERA NET 44
IMAGE 47
ReGEoCities 33
GRETA 53
TRANSENERGY 52
Geomol 24
ISONG (Baden-Württemberg) 26, 27
IOG (Bayern) 54
Geothermieportal NRW 61
Geothermieatlas Sachsen 28
Geothermiekarte Thüringen 4
NIBIS (Niedersachsen) 55
Switzerland 64
The research showed that geothermal potentials are calculated either on 2D or on 3D models of the subsurface describing the geometry of the rock types. They are represented by the parameters specific conductivity, specific heat extraction rate and/or temperature. The potential models can be calculated by interpolation, by simulation or by explicit empiric equations.
Input parameters for geothermal mapping of closed loop systems include specific thermal conductivities of rocks, the availability of ground water and secondary the geothermal gradient.
Page 9
The specific thermal conductivity maps show only rock related geothermal conditions for different depths. The petrographic differences influence the capability to conduct heat to a borehole heat exchanger. This property of a defined rock body is represented by the specific thermal conductivity maps.
In difference to that the maps of specific heat extraction rate in Watts per Meter are additional influenced by technical conditions of the geothermal heat pump, e.g. the annual operation hours, the heat power and the COP of the heat pump. The maps of heat extraction rate give interval values for different depths and are an estimation of the possible heat that can be extracted by a borehole heat exchanger (closed loop system). These values are defined for one specific type of use, usually a standardized single family house. This implies that information about other installation types, e.g. borehole heat exchanger fields, cannot be provided. Furthermore, the maps cannot replace any real planning and dimensioning of a geothermal plant. Nevertheless they give a good overview of geothermal potential and a possible quick estimation for public users.
The third way to present geothermal potential conditions is the mapping of temperatures. These data give an overview of for example annual mean values of the surface temperatures. Additional they can show the temperature gradient. Together with the thermal conductivity maps, the temperature data provide a base for professional planning of a specific geothermal plant.
The approach of producing geothermal potential maps in non-urban and urban scale is very diverse in different countries. Good examples of this diversity are the geothermal potential maps of the individual federal states of Germany. These maps are developed by the federal states and represent different mapping or modelling methods, different scales and different physical parameters called “geothermal potential”.
3.2. Input data
Depending on the calculation and mapping method, different kinds of input data are used in the investigated projects to calculate geothermal potential maps for closed loop systems:
� geologic 3D-model (with hydro- and petrologic aspects)
� top of geologic units as grid (e.g. 50 m x 50 m, 10 m x 10 m grids),
� digital borehole strata information,
� groundwater table, groundwater thickness,
� specific thermal conductivities related to specific rock types (petrology) determined on rock samples, drilling cores and/or literature studies,
� temperature measurements in boreholes,
� thermal response tests ,
� surface heat fluxes.
According to the workflow chosen for GeoPLASMA-CE the availability of the parameters needed has to be assessed and compiled for every project partner and pilot area. This has been achieved in form of a parameter list, developed in WPT3.
3.3. Data processing and modelled objects
If the potential is described by thermal conductivities, this is usually calculated by interpolation, i.e. by the methods of inverse distances or Kriging. The data are derived from laboratory measurements of rock samples (e.g. cores) or via literature values. It is mostly distinguished between saturated and dry rock
Page 10
samples because the thermal conductivity differs mainly if a soft rock sample like sand is dry or water saturated.
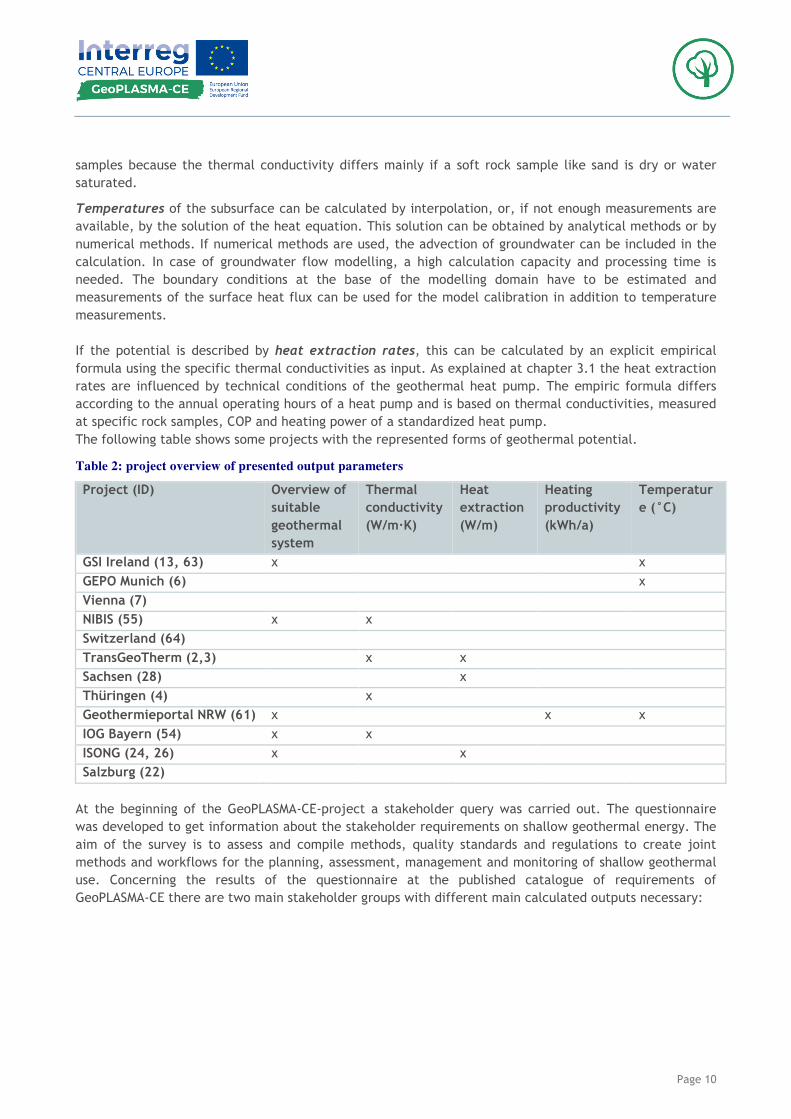
Temperatures of the subsurface can be calculated by interpolation, or, if not enough measurements are available, by the solution of the heat equation. This solution can be obtained by analytical methods or by numerical methods. If numerical methods are used, the advection of groundwater can be included in the calculation. In case of groundwater flow modelling, a high calculation capacity and processing time is needed. The boundary conditions at the base of the modelling domain have to be estimated and measurements of the surface heat flux can be used for the model calibration in addition to temperature measurements. If the potential is described by heat extraction rates, this can be calculated by an explicit empirical formula using the specific thermal conductivities as input. As explained at chapter 3.1 the heat extraction rates are influenced by technical conditions of the geothermal heat pump. The empiric formula differs according to the annual operating hours of a heat pump and is based on thermal conductivities, measured at specific rock samples, COP and heating power of a standardized heat pump. The following table shows some projects with the represented forms of geothermal potential.
Table 2: project overview of presented output parameters
Project (ID) Overview of suitable geothermal system
Thermal conductivity (W/m·K)
Heat extraction (W/m)
Heating productivity (kWh/a)
Temperature (°C)
GSI Ireland (13, 63) x x
GEPO Munich (6) x
Vienna (7)
NIBIS (55) x x
Switzerland (64)
TransGeoTherm (2,3) x x
Sachsen (28) x
Thüringen (4) x
Geothermieportal NRW (61) x x x
IOG Bayern (54) x x
ISONG (24, 26) x x
Salzburg (22)
At the beginning of the GeoPLASMA-CE-project a stakeholder query was carried out. The questionnaire was developed to get information about the stakeholder requirements on shallow geothermal energy. The aim of the survey is to assess and compile methods, quality standards and regulations to create joint methods and workflows for the planning, assessment, management and monitoring of shallow geothermal use. Concerning the results of the questionnaire at the published catalogue of requirements of GeoPLASMA-CE there are two main stakeholder groups with different main calculated outputs necessary:
Page 11
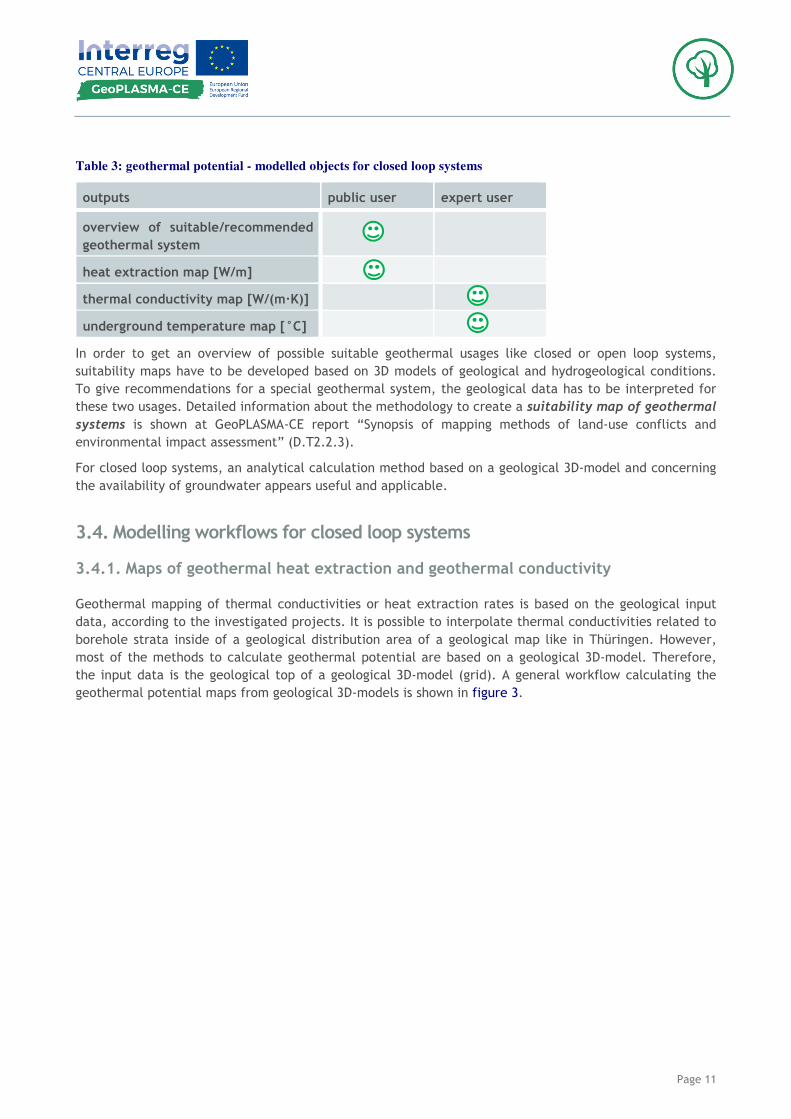
Table 3: geothermal potential - modelled objects for closed loop systems
outputs public user expert user
overview of suitable/recommended geothermal system
heat extraction map [W/m]
thermal conductivity map [W/(m·K)]
underground temperature map [°C]
In order to get an overview of possible suitable geothermal usages like closed or open loop systems, suitability maps have to be developed based on 3D models of geological and hydrogeological conditions. To give recommendations for a special geothermal system, the geological data has to be interpreted for these two usages. Detailed information about the methodology to create a suitability map of geothermal
systems is shown at GeoPLASMA-CE report “Synopsis of mapping methods of land-use conflicts and environmental impact assessment” (D.T2.2.3).
For closed loop systems, an analytical calculation method based on a geological 3D-model and concerning the availability of groundwater appears useful and applicable.
3.4. Modelling workflows for closed loop systems
3.4.1. Maps of geothermal heat extraction and geothermal conductivity
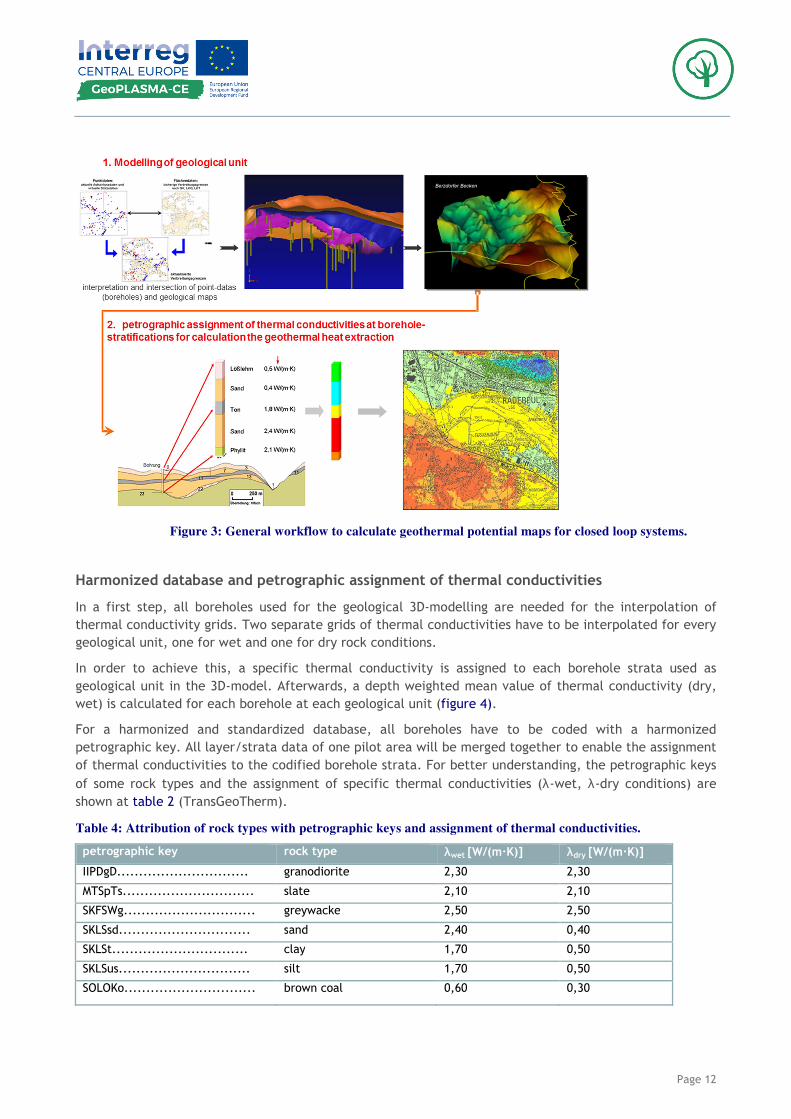
Geothermal mapping of thermal conductivities or heat extraction rates is based on the geological input data, according to the investigated projects. It is possible to interpolate thermal conductivities related to borehole strata inside of a geological distribution area of a geological map like in Thüringen. However, most of the methods to calculate geothermal potential are based on a geological 3D-model. Therefore, the input data is the geological top of a geological 3D-model (grid). A general workflow calculating the geothermal potential maps from geological 3D-models is shown in figure 3.
Page 12
Figure 3: General workflow to calculate geothermal potential maps for closed loop systems.
Harmonized database and petrographic assignment of thermal conductivities
In a first step, all boreholes used for the geological 3D-modelling are needed for the interpolation of thermal conductivity grids. Two separate grids of thermal conductivities have to be interpolated for every geological unit, one for wet and one for dry rock conditions.
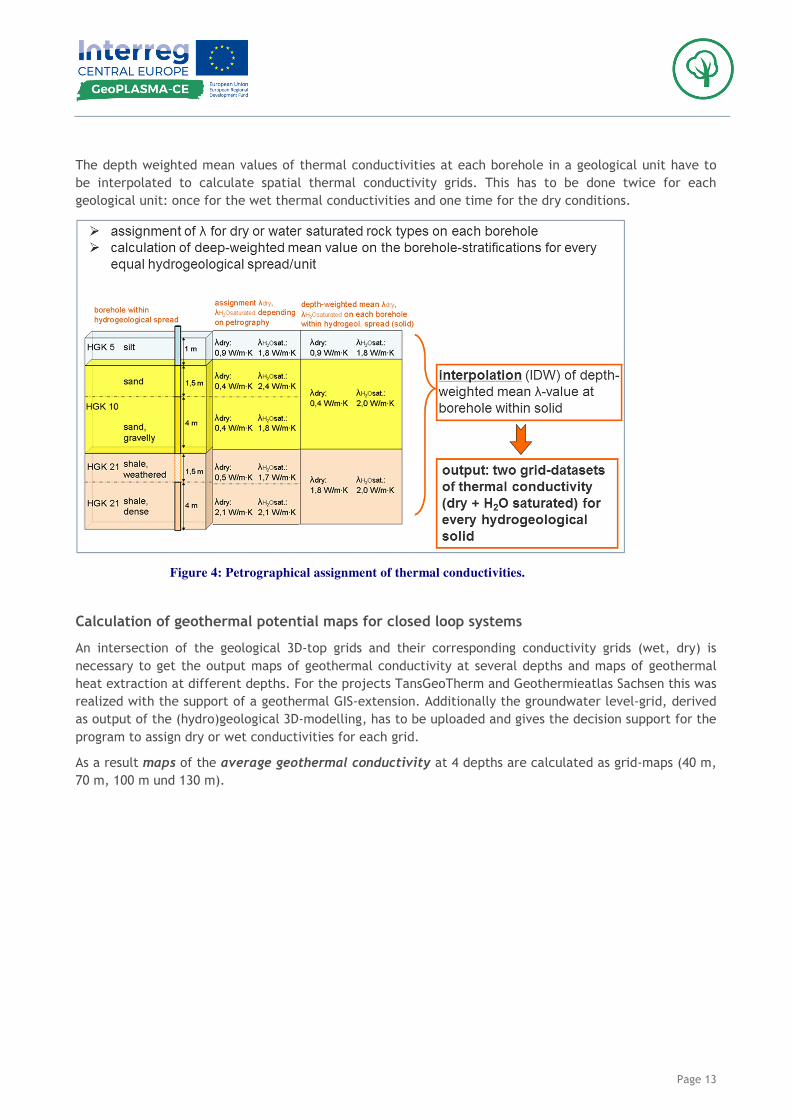
In order to achieve this, a specific thermal conductivity is assigned to each borehole strata used as geological unit in the 3D-model. Afterwards, a depth weighted mean value of thermal conductivity (dry, wet) is calculated for each borehole at each geological unit (figure 4).
For a harmonized and standardized database, all boreholes have to be coded with a harmonized petrographic key. All layer/strata data of one pilot area will be merged together to enable the assignment of thermal conductivities to the codified borehole strata. For better understanding, the petrographic keys of some rock types and the assignment of specific thermal conductivities (λ-wet, λ-dry conditions) are shown at table 2 (TransGeoTherm).
Table 4: Attribution of rock types with petrographic keys and assignment of thermal conductivities.
petrographic key rock type λwet [W/(m·K)] λdry [W/(m·K)]
IIPDgD.............................. granodiorite 2,30 2,30
MTSpTs.............................. slate 2,10 2,10
SKFSWg.............................. greywacke 2,50 2,50
SKLSsd.............................. sand 2,40 0,40
SKLSt............................... clay 1,70 0,50
SKLSus.............................. silt 1,70 0,50
SOLOKo.............................. brown coal 0,60 0,30
Page 13
The depth weighted mean values of thermal conductivities at each borehole in a geological unit have to be interpolated to calculate spatial thermal conductivity grids. This has to be done twice for each geological unit: once for the wet thermal conductivities and one time for the dry conditions.
Figure 4: Petrographical assignment of thermal conductivities.
Calculation of geothermal potential maps for closed loop systems
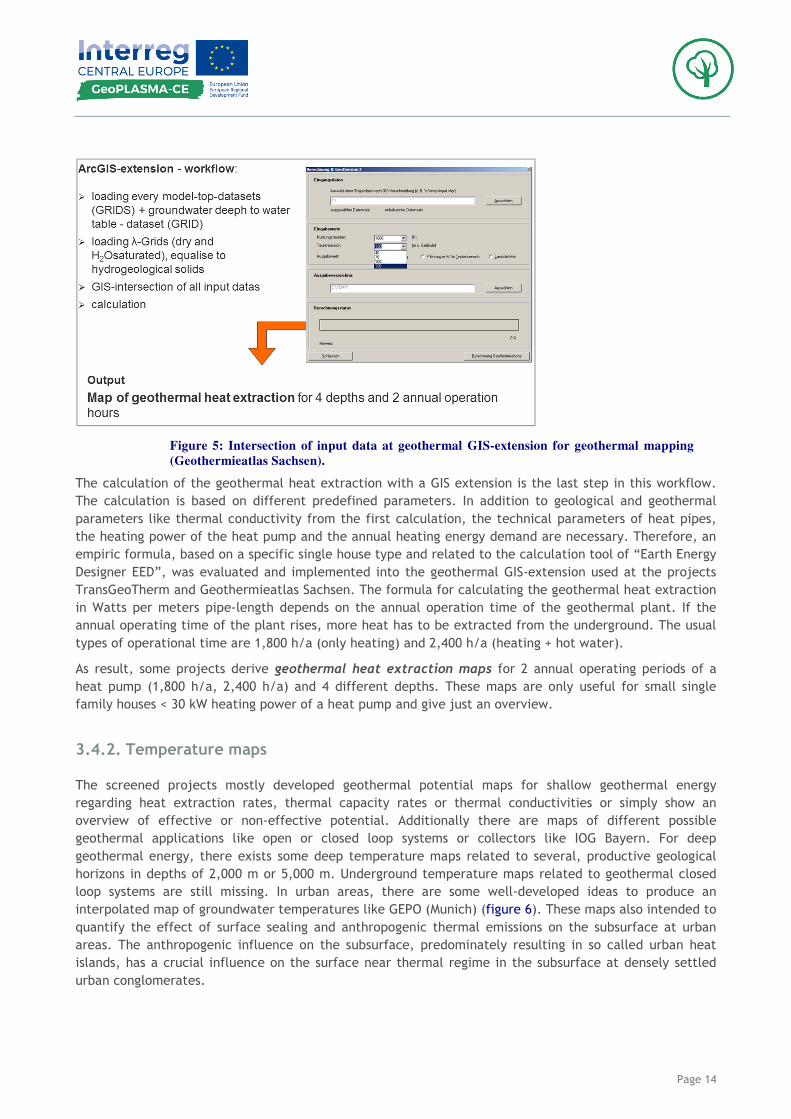
An intersection of the geological 3D-top grids and their corresponding conductivity grids (wet, dry) is necessary to get the output maps of geothermal conductivity at several depths and maps of geothermal heat extraction at different depths. For the projects TansGeoTherm and Geothermieatlas Sachsen this was realized with the support of a geothermal GIS-extension. Additionally the groundwater level-grid, derived as output of the (hydro)geological 3D-modelling, has to be uploaded and gives the decision support for the program to assign dry or wet conductivities for each grid.
As a result maps of the average geothermal conductivity at 4 depths are calculated as grid-maps (40 m, 70 m, 100 m und 130 m).
Page 14
Figure 5: Intersection of input data at geothermal GIS-extension for geothermal mapping
(Geothermieatlas Sachsen).
The calculation of the geothermal heat extraction with a GIS extension is the last step in this workflow. The calculation is based on different predefined parameters. In addition to geological and geothermal parameters like thermal conductivity from the first calculation, the technical parameters of heat pipes, the heating power of the heat pump and the annual heating energy demand are necessary. Therefore, an empiric formula, based on a specific single house type and related to the calculation tool of “Earth Energy Designer EED”, was evaluated and implemented into the geothermal GIS-extension used at the projects TransGeoTherm and Geothermieatlas Sachsen. The formula for calculating the geothermal heat extraction in Watts per meters pipe-length depends on the annual operation time of the geothermal plant. If the annual operating time of the plant rises, more heat has to be extracted from the underground. The usual types of operational time are 1,800 h/a (only heating) and 2,400 h/a (heating + hot water).
As result, some projects derive geothermal heat extraction maps for 2 annual operating periods of a heat pump (1,800 h/a, 2,400 h/a) and 4 different depths. These maps are only useful for small single family houses < 30 kW heating power of a heat pump and give just an overview.
3.4.2. Temperature maps
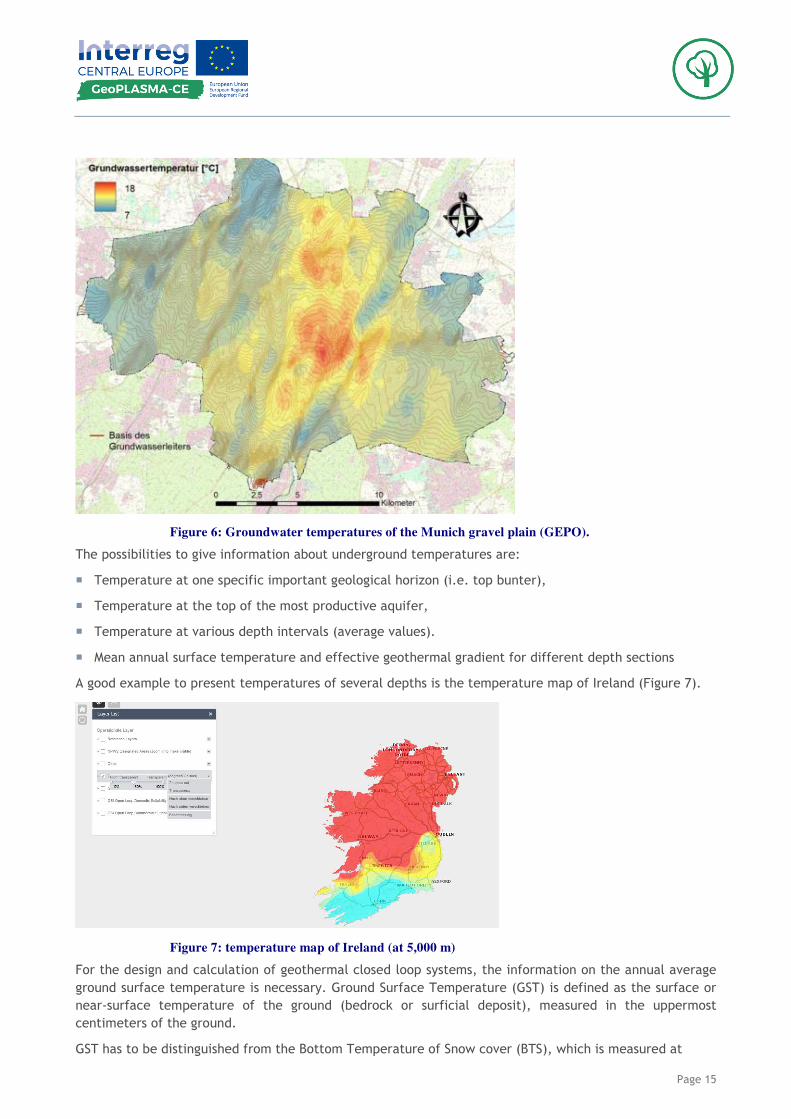
The screened projects mostly developed geothermal potential maps for shallow geothermal energy regarding heat extraction rates, thermal capacity rates or thermal conductivities or simply show an overview of effective or non-effective potential. Additionally there are maps of different possible geothermal applications like open or closed loop systems or collectors like IOG Bayern. For deep geothermal energy, there exists some deep temperature maps related to several, productive geological horizons in depths of 2,000 m or 5,000 m. Underground temperature maps related to geothermal closed loop systems are still missing. In urban areas, there are some well-developed ideas to produce an interpolated map of groundwater temperatures like GEPO (Munich) (figure 6). These maps also intended to quantify the effect of surface sealing and anthropogenic thermal emissions on the subsurface at urban areas. The anthropogenic influence on the subsurface, predominately resulting in so called urban heat islands, has a crucial influence on the surface near thermal regime in the subsurface at densely settled urban conglomerates.
Page 15
Figure 6: Groundwater temperatures of the Munich gravel plain (GEPO).
The possibilities to give information about underground temperatures are:
� Temperature at one specific important geological horizon (i.e. top bunter),
� Temperature at the top of the most productive aquifer,
� Temperature at various depth intervals (average values).
� Mean annual surface temperature and effective geothermal gradient for different depth sections
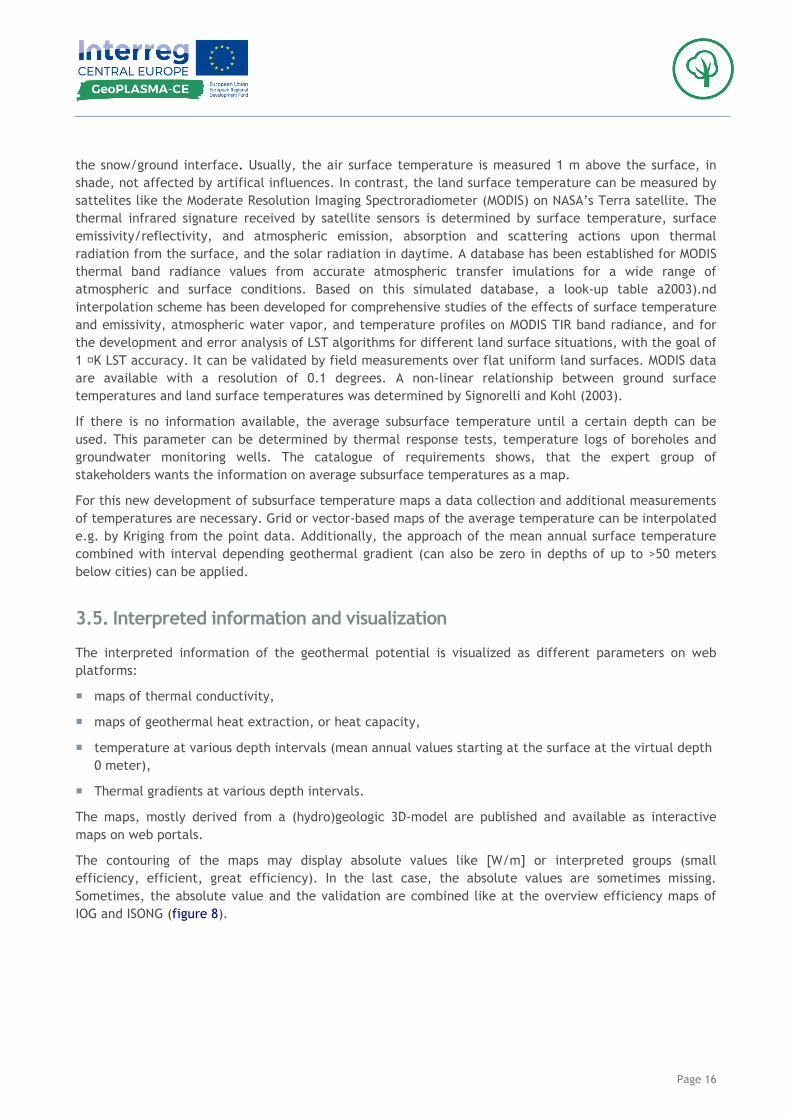
A good example to present temperatures of several depths is the temperature map of Ireland (Figure 7).
Figure 7: temperature map of Ireland (at 5,000 m)
For the design and calculation of geothermal closed loop systems, the information on the annual average ground surface temperature is necessary. Ground Surface Temperature (GST) is defined as the surface or near-surface temperature of the ground (bedrock or surficial deposit), measured in the uppermost centimeters of the ground.
GST has to be distinguished from the Bottom Temperature of Snow cover (BTS), which is measured at
Page 16
the snow/ground interface. Usually, the air surface temperature is measured 1 m above the surface, in shade, not affected by artifical influences. In contrast, the land surface temperature can be measured by sattelites like the Moderate Resolution Imaging Spectroradiometer (MODIS) on NASA’s Terra satellite. The thermal infrared signature received by satellite sensors is determined by surface temperature, surface emissivity/reflectivity, and atmospheric emission, absorption and scattering actions upon thermal radiation from the surface, and the solar radiation in daytime. A database has been established for MODIS thermal band radiance values from accurate atmospheric transfer imulations for a wide range of atmospheric and surface conditions. Based on this simulated database, a look-up table a2003).nd interpolation scheme has been developed for comprehensive studies of the effects of surface temperature and emissivity, atmospheric water vapor, and temperature profiles on MODIS TIR band radiance, and for the development and error analysis of LST algorithms for different land surface situations, with the goal of 1 K LST accuracy. It can be validated by field measurements over flat uniform land surfaces. MODIS data are available with a resolution of 0.1 degrees. A non-linear relationship between ground surface temperatures and land surface temperatures was determined by Signorelli and Kohl (2003).
If there is no information available, the average subsurface temperature until a certain depth can be used. This parameter can be determined by thermal response tests, temperature logs of boreholes and groundwater monitoring wells. The catalogue of requirements shows, that the expert group of stakeholders wants the information on average subsurface temperatures as a map.
For this new development of subsurface temperature maps a data collection and additional measurements of temperatures are necessary. Grid or vector-based maps of the average temperature can be interpolated e.g. by Kriging from the point data. Additionally, the approach of the mean annual surface temperature combined with interval depending geothermal gradient (can also be zero in depths of up to >50 meters below cities) can be applied.
3.5. Interpreted information and visualization
The interpreted information of the geothermal potential is visualized as different parameters on web platforms:
� maps of thermal conductivity,
� maps of geothermal heat extraction, or heat capacity,
� temperature at various depth intervals (mean annual values starting at the surface at the virtual depth 0 meter),
� Thermal gradients at various depth intervals.
The maps, mostly derived from a (hydro)geologic 3D-model are published and available as interactive maps on web portals.
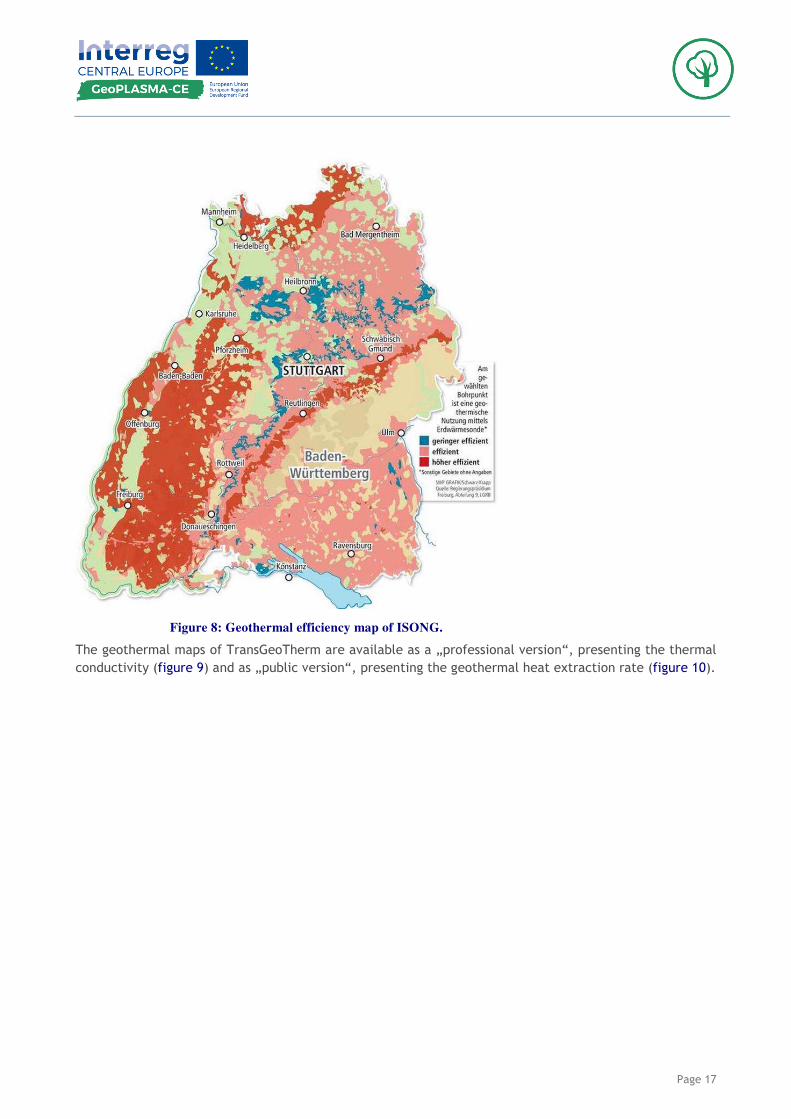
The contouring of the maps may display absolute values like [W/m] or interpreted groups (small efficiency, efficient, great efficiency). In the last case, the absolute values are sometimes missing. Sometimes, the absolute value and the validation are combined like at the overview efficiency maps of IOG and ISONG (figure 8).
Page 17
Figure 8: Geothermal efficiency map of ISONG.
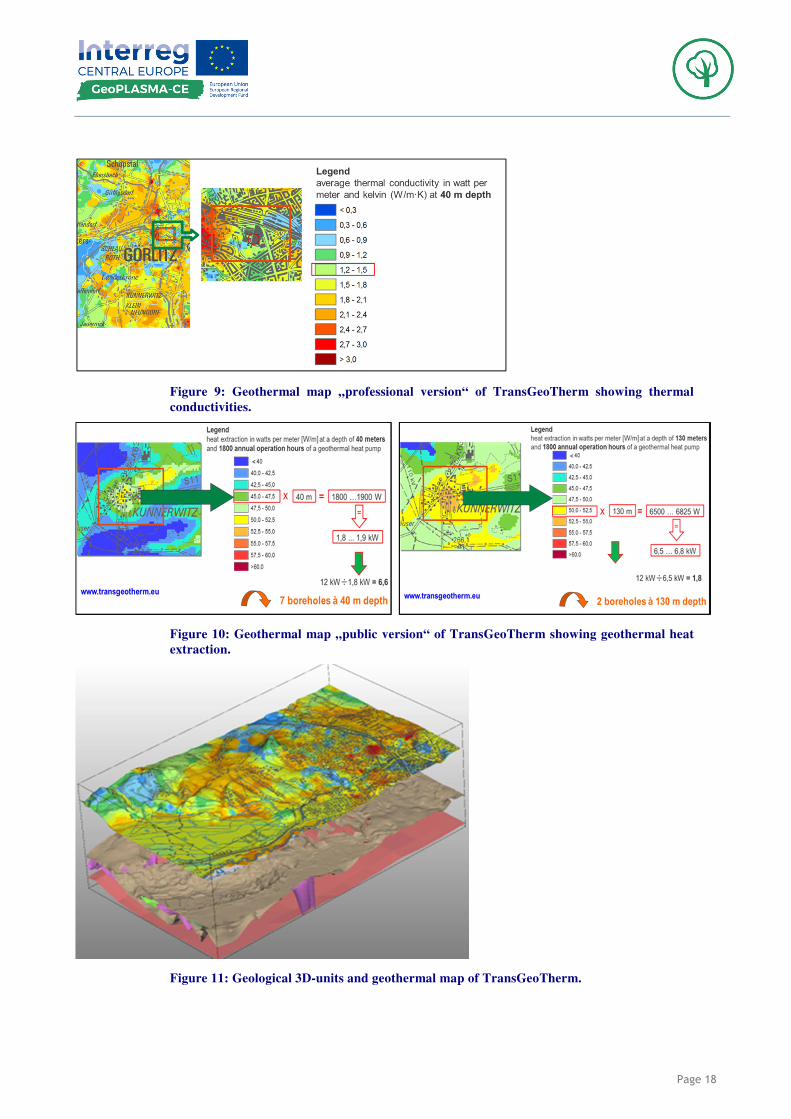
The geothermal maps of TransGeoTherm are available as a „professional version“, presenting the thermal conductivity (figure 9) and as „public version“, presenting the geothermal heat extraction rate (figure 10).
Page 18
Figure 9: Geothermal map „professional version“ of TransGeoTherm showing thermal
conductivities.
Figure 10: Geothermal map „public version“ of TransGeoTherm showing geothermal heat
extraction.
Figure 11: Geological 3D-units and geothermal map of TransGeoTherm.
Page 19
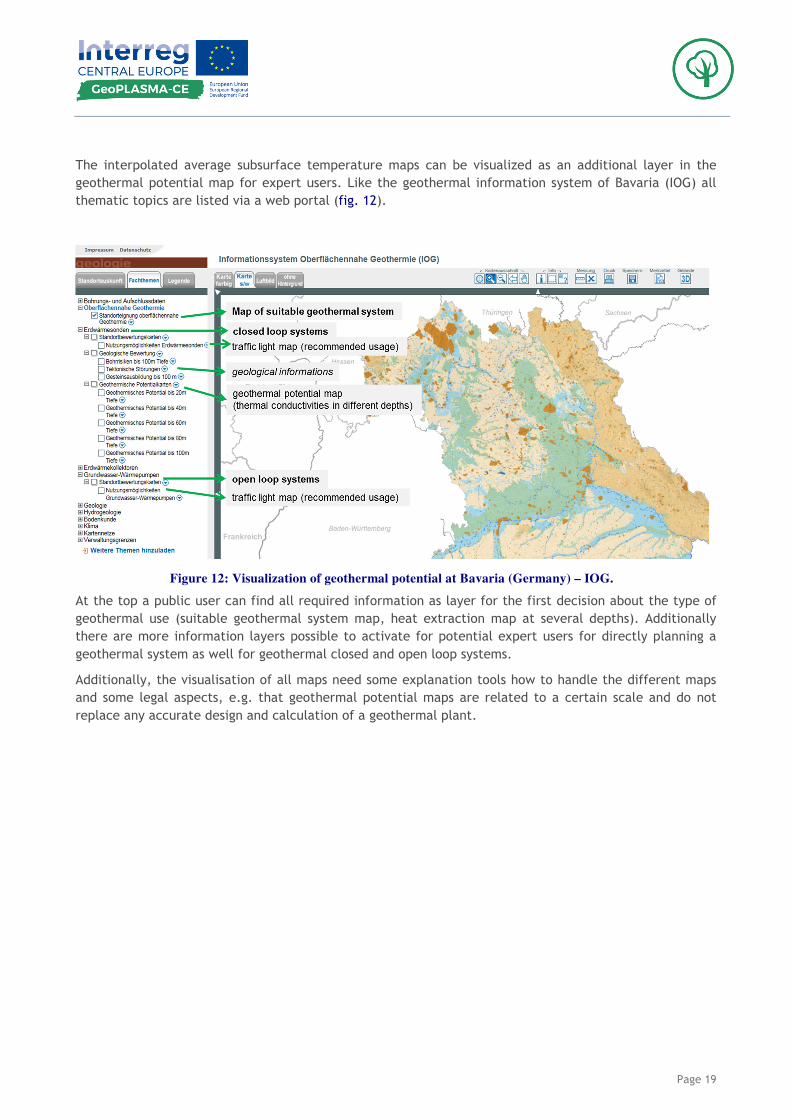
The interpolated average subsurface temperature maps can be visualized as an additional layer in the geothermal potential map for expert users. Like the geothermal information system of Bavaria (IOG) all thematic topics are listed via a web portal (fig. 12).
Figure 12: Visualization of geothermal potential at Bavaria (Germany) – IOG.
At the top a public user can find all required information as layer for the first decision about the type of geothermal use (suitable geothermal system map, heat extraction map at several depths). Additionally there are more information layers possible to activate for potential expert users for directly planning a geothermal system as well for geothermal closed and open loop systems.
Additionally, the visualisation of all maps need some explanation tools how to handle the different maps and some legal aspects, e.g. that geothermal potential maps are related to a certain scale and do not replace any accurate design and calculation of a geothermal plant.
Page 20
4. Summary and Conclusions
The approaches of geothermal potential mapping in non-urban and urban scale are very diverse in different countries. For closed loop systems, an analytical calculation method based on a geological 3D-model and concerning the availability of groundwater appears useful and applicable. Experiences and methodical know-how of the transboundary EU-project TransGeoTherm and the mapping and visualisation of ISONG and IOG can give a big benefit and input for the methodology and visualisation of geothermal maps of closed loop systems for GeoPLASMA-CE.
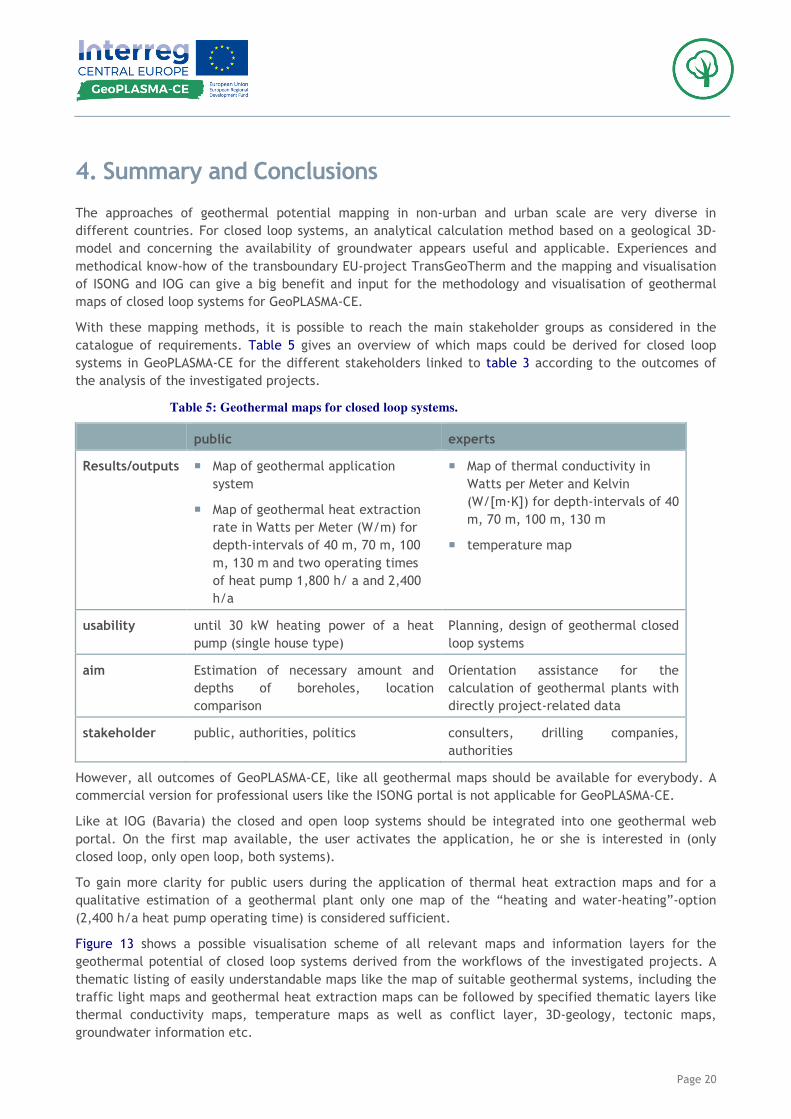
With these mapping methods, it is possible to reach the main stakeholder groups as considered in the catalogue of requirements. Table 5 gives an overview of which maps could be derived for closed loop systems in GeoPLASMA-CE for the different stakeholders linked to table 3 according to the outcomes of the analysis of the investigated projects.
Table 5: Geothermal maps for closed loop systems.
public experts
Results/outputs � Map of geothermal application system
� Map of geothermal heat extraction rate in Watts per Meter (W/m) for depth-intervals of 40 m, 70 m, 100 m, 130 m and two operating times of heat pump 1,800 h/ a and 2,400 h/a
� Map of thermal conductivity in Watts per Meter and Kelvin (W/[m·K]) for depth-intervals of 40 m, 70 m, 100 m, 130 m
� temperature map
usability until 30 kW heating power of a heat pump (single house type)
Planning, design of geothermal closed loop systems
aim Estimation of necessary amount and depths of boreholes, location comparison
Orientation assistance for the calculation of geothermal plants with directly project-related data
stakeholder public, authorities, politics consulters, drilling companies, authorities
However, all outcomes of GeoPLASMA-CE, like all geothermal maps should be available for everybody. A commercial version for professional users like the ISONG portal is not applicable for GeoPLASMA-CE.
Like at IOG (Bavaria) the closed and open loop systems should be integrated into one geothermal web portal. On the first map available, the user activates the application, he or she is interested in (only closed loop, only open loop, both systems).
To gain more clarity for public users during the application of thermal heat extraction maps and for a qualitative estimation of a geothermal plant only one map of the “heating and water-heating”-option (2,400 h/a heat pump operating time) is considered sufficient.
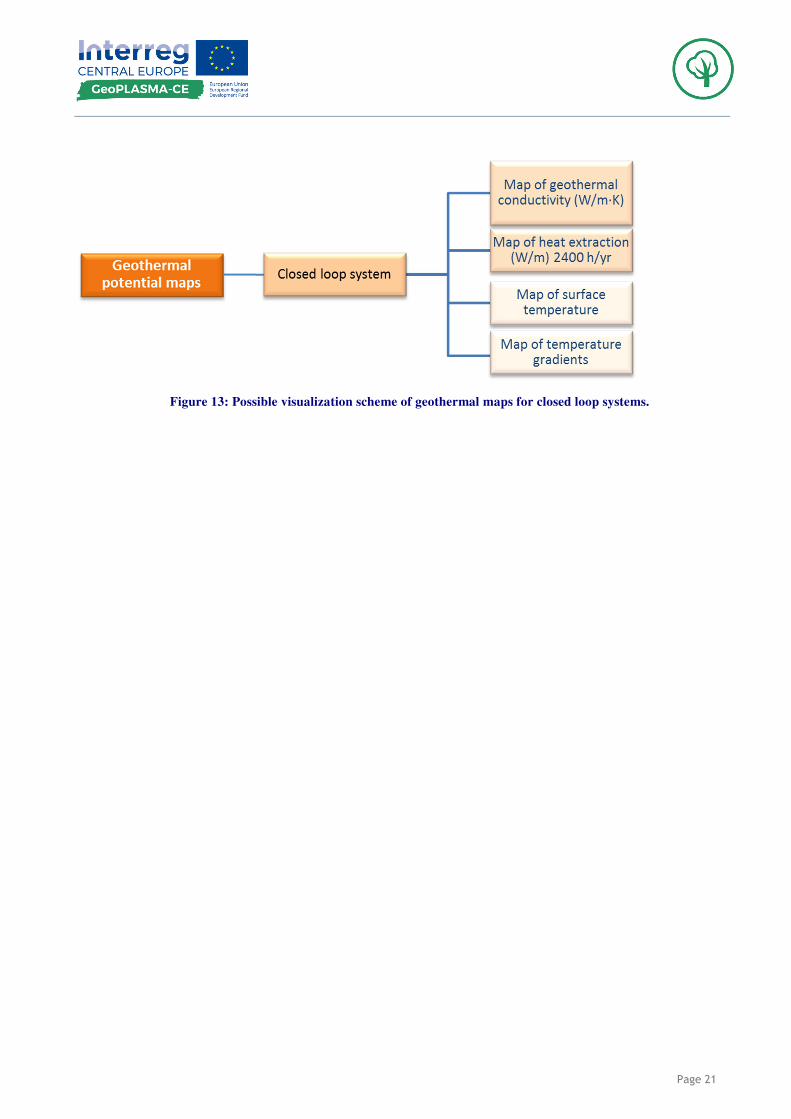
Figure 13 shows a possible visualisation scheme of all relevant maps and information layers for the geothermal potential of closed loop systems derived from the workflows of the investigated projects. A thematic listing of easily understandable maps like the map of suitable geothermal systems, including the traffic light maps and geothermal heat extraction maps can be followed by specified thematic layers like thermal conductivity maps, temperature maps as well as conflict layer, 3D-geology, tectonic maps, groundwater information etc.
Page 21
Figure 13: Possible visualization scheme of geothermal maps for closed loop systems.
Page 22
5. References
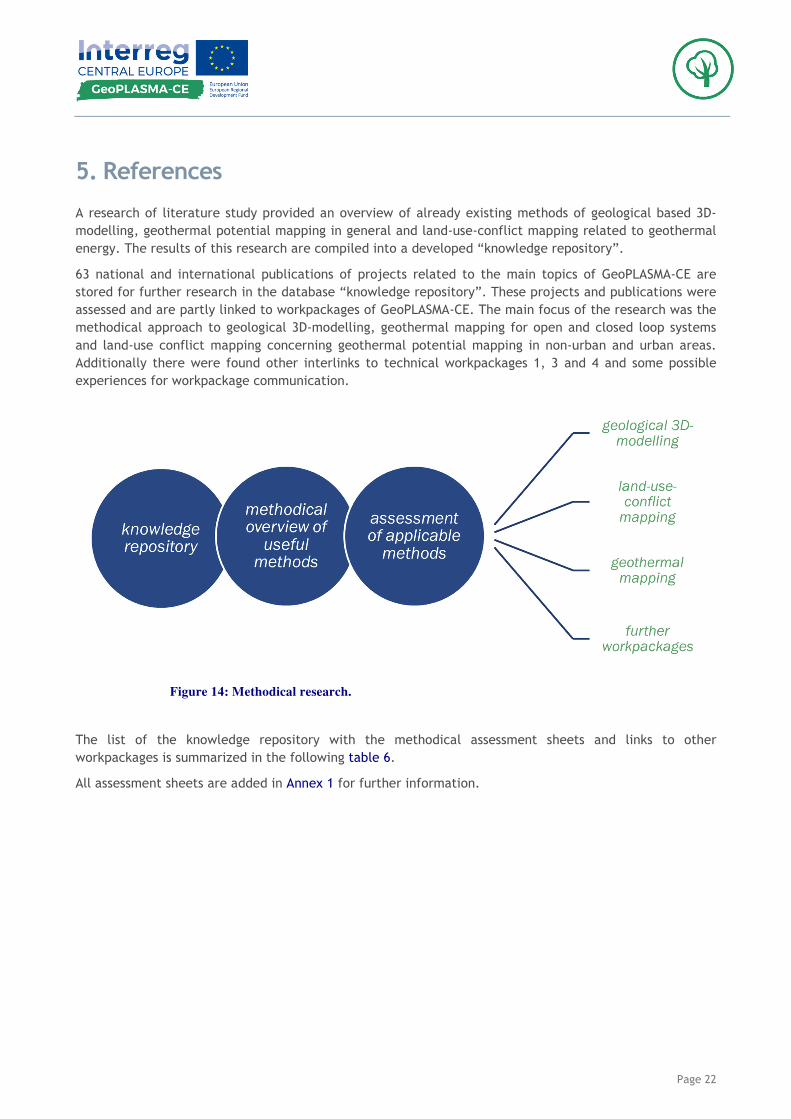
A research of literature study provided an overview of already existing methods of geological based 3D-modelling, geothermal potential mapping in general and land-use-conflict mapping related to geothermal energy. The results of this research are compiled into a developed “knowledge repository”.
63 national and international publications of projects related to the main topics of GeoPLASMA-CE are stored for further research in the database “knowledge repository”. These projects and publications were assessed and are partly linked to workpackages of GeoPLASMA-CE. The main focus of the research was the methodical approach to geological 3D-modelling, geothermal mapping for open and closed loop systems and land-use conflict mapping concerning geothermal potential mapping in non-urban and urban areas. Additionally there were found other interlinks to technical workpackages 1, 3 and 4 and some possible experiences for workpackage communication.
Figure 14: Methodical research.
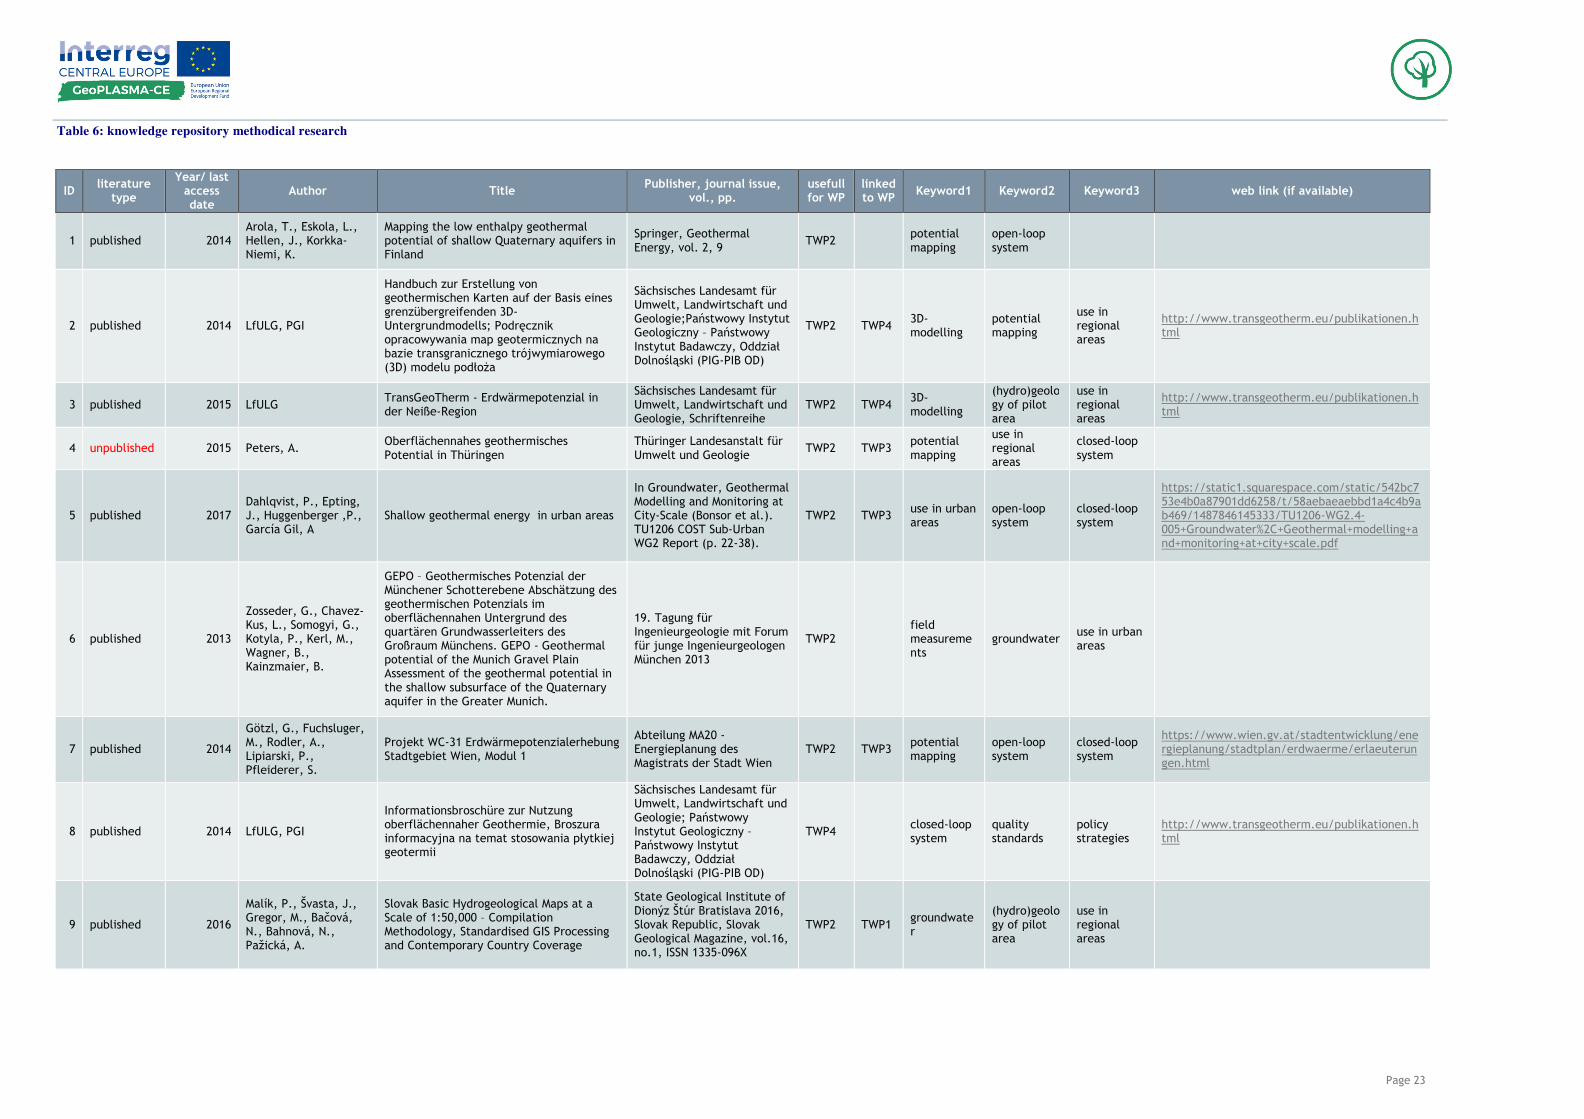
The list of the knowledge repository with the methodical assessment sheets and links to other workpackages is summarized in the following table 6.
All assessment sheets are added in Annex 1 for further information.
Page 23
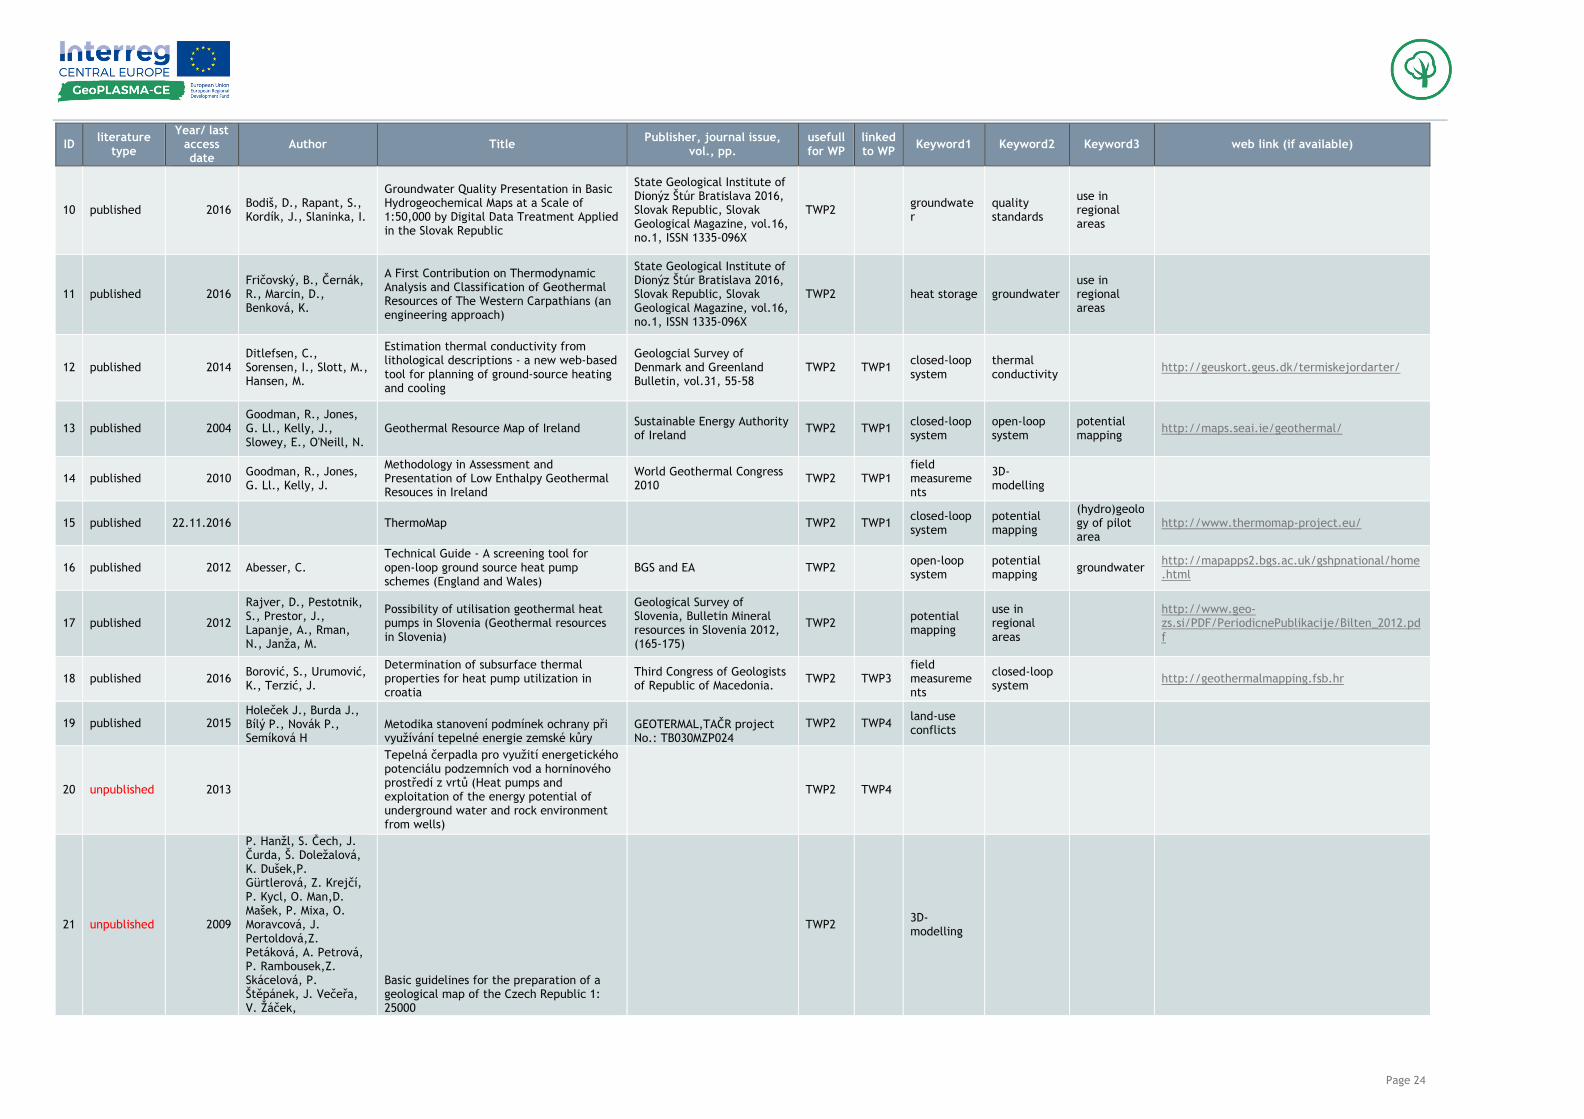
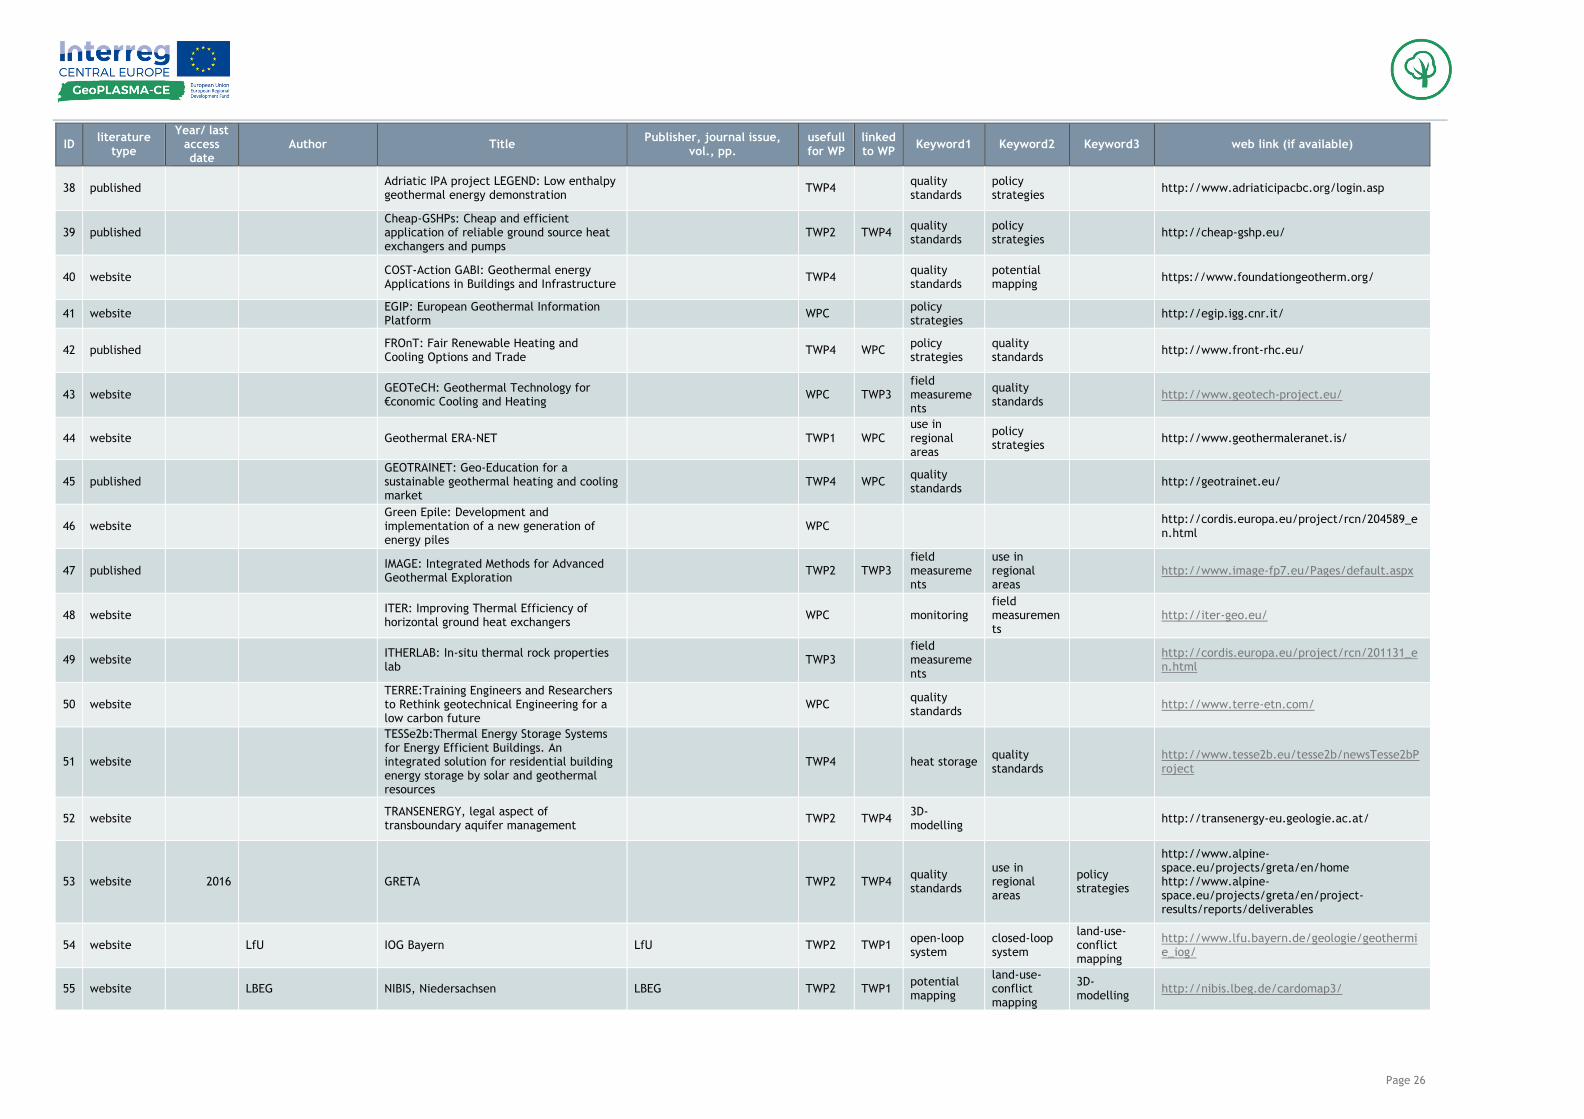
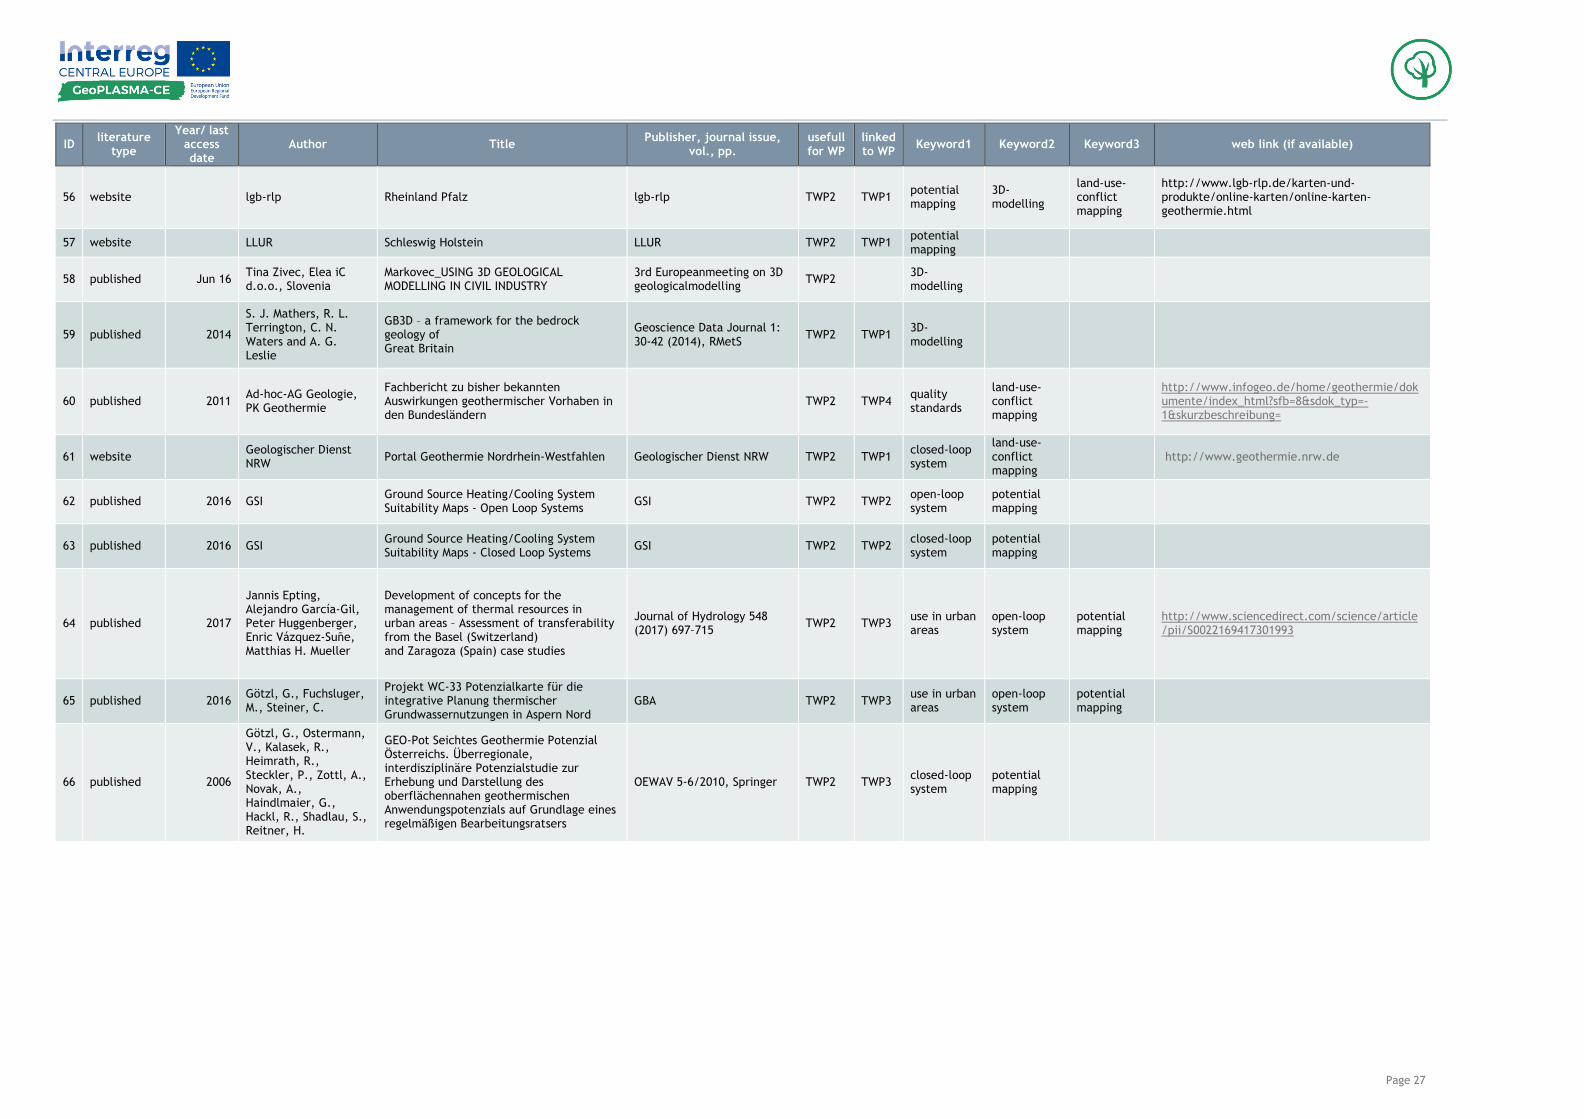
Table 6: knowledge repository methodical research
ID literature
type
Year/ last access date
Author Title Publisher, journal issue,
vol., pp. usefull for WP
linked to WP
Keyword1 Keyword2 Keyword3 web link (if available)
1 published 2014 Arola, T., Eskola, L., Hellen, J., Korkka-Niemi, K.
Mapping the low enthalpy geothermal potential of shallow Quaternary aquifers in Finland
Springer, Geothermal Energy, vol. 2, 9
TWP2
potential mapping
open-loop system
2 published 2014 LfULG, PGI
Handbuch zur Erstellung von geothermischen Karten auf der Basis eines grenzübergreifenden 3D-Untergrundmodells; Podręcznik opracowywania map geotermicznych na bazie transgranicznego trójwymiarowego (3D) modelu podłoża
Sächsisches Landesamt für Umwelt, Landwirtschaft und Geologie;Państwowy Instytut Geologiczny – Państwowy Instytut Badawczy, Oddział Dolnośląski (PIG-PIB OD)
TWP2 TWP4 3D-modelling
potential mapping
use in regional areas
http://www.transgeotherm.eu/publikationen.html
3 published 2015 LfULG TransGeoTherm - Erdwärmepotenzial in der Neiße-Region
Sächsisches Landesamt für Umwelt, Landwirtschaft und Geologie, Schriftenreihe
TWP2 TWP4 3D-modelling
(hydro)geology of pilot area
use in regional areas
http://www.transgeotherm.eu/publikationen.html
4 unpublished 2015 Peters, A. Oberflächennahes geothermisches Potential in Thüringen
Thüringer Landesanstalt für Umwelt und Geologie
TWP2 TWP3 potential mapping
use in regional areas
closed-loop system
5 published 2017 Dahlqvist, P., Epting, J., Huggenberger ,P., García Gil, A
Shallow geothermal energy in urban areas
In Groundwater, Geothermal Modelling and Monitoring at City-Scale (Bonsor et al.). TU1206 COST Sub-Urban WG2 Report (p. 22-38).
TWP2 TWP3 use in urban areas
open-loop system
closed-loop system
https://static1.squarespace.com/static/542bc753e4b0a87901dd6258/t/58aebaeaebbd1a4c4b9ab469/1487846145333/TU1206-WG2.4-005+Groundwater%2C+Geothermal+modelling+and+monitoring+at+city+scale.pdf
6 published 2013
Zosseder, G., Chavez-Kus, L., Somogyi, G., Kotyla, P., Kerl, M., Wagner, B., Kainzmaier, B.
GEPO – Geothermisches Potenzial der Münchener Schotterebene Abschätzung des geothermischen Potenzials im oberflächennahen Untergrund des quartären Grundwasserleiters des Großraum Münchens. GEPO - Geothermal potential of the Munich Gravel Plain Assessment of the geothermal potential in the shallow subsurface of the Quaternary aquifer in the Greater Munich.
19. Tagung für Ingenieurgeologie mit Forum für junge Ingenieurgeologen München 2013
TWP2
field measurements
groundwater use in urban areas
7 published 2014
Götzl, G., Fuchsluger, M., Rodler, A., Lipiarski, P., Pfleiderer, S.
Projekt WC-31 Erdwärmepotenzialerhebung Stadtgebiet Wien, Modul 1
Abteilung MA20 - Energieplanung des Magistrats der Stadt Wien
TWP2 TWP3 potential mapping
open-loop system
closed-loop system
https://www.wien.gv.at/stadtentwicklung/energieplanung/stadtplan/erdwaerme/erlaeuterungen.html
8 published 2014 LfULG, PGI
Informationsbroschüre zur Nutzung oberflächennaher Geothermie, Broszura informacyjna na temat stosowania płytkiej geotermii
Sächsisches Landesamt für Umwelt, Landwirtschaft und Geologie; Państwowy Instytut Geologiczny – Państwowy Instytut Badawczy, Oddział Dolnośląski (PIG-PIB OD)
TWP4
closed-loop system
quality standards
policy strategies
http://www.transgeotherm.eu/publikationen.html
9 published 2016
Malík, P., Švasta, J., Gregor, M., Bačová, N., Bahnová, N., Pažická, A.
Slovak Basic Hydrogeological Maps at a Scale of 1:50,000 – Compilation Methodology, Standardised GIS Processing and Contemporary Country Coverage
State Geological Institute of Dionýz Štúr Bratislava 2016, Slovak Republic, Slovak Geological Magazine, vol.16, no.1, ISSN 1335-096X
TWP2 TWP1 groundwater
(hydro)geology of pilot area
use in regional areas
Page 24
ID literature
type
Year/ last access date
Author Title Publisher, journal issue,
vol., pp. usefull for WP
linked to WP
Keyword1 Keyword2 Keyword3 web link (if available)
10 published 2016 Bodiš, D., Rapant, S., Kordík, J., Slaninka, I.
Groundwater Quality Presentation in Basic Hydrogeochemical Maps at a Scale of 1:50,000 by Digital Data Treatment Applied in the Slovak Republic
State Geological Institute of Dionýz Štúr Bratislava 2016, Slovak Republic, Slovak Geological Magazine, vol.16, no.1, ISSN 1335-096X
TWP2
groundwater
quality standards
use in regional areas
11 published 2016 Fričovský, B., Černák, R., Marcin, D., Benková, K.
A First Contribution on Thermodynamic Analysis and Classification of Geothermal Resources of The Western Carpathians (an engineering approach)
State Geological Institute of Dionýz Štúr Bratislava 2016, Slovak Republic, Slovak Geological Magazine, vol.16, no.1, ISSN 1335-096X
TWP2
heat storage groundwater use in regional areas
12 published 2014 Ditlefsen, C., Sorensen, I., Slott, M., Hansen, M.
Estimation thermal conductivity from lithological descriptions - a new web-based tool for planning of ground-source heating and cooling
Geologcial Survey of Denmark and Greenland Bulletin, vol.31, 55-58
TWP2 TWP1 closed-loop system
thermal conductivity
http://geuskort.geus.dk/termiskejordarter/
13 published 2004 Goodman, R., Jones, G. Ll., Kelly, J., Slowey, E., O'Neill, N.
Geothermal Resource Map of Ireland Sustainable Energy Authority of Ireland
TWP2 TWP1 closed-loop system
open-loop system
potential mapping
http://maps.seai.ie/geothermal/
14 published 2010 Goodman, R., Jones, G. Ll., Kelly, J.
Methodology in Assessment and Presentation of Low Enthalpy Geothermal Resouces in Ireland
World Geothermal Congress 2010
TWP2 TWP1 field measurements
3D-modelling
15 published 22.11.2016
ThermoMap
TWP2 TWP1 closed-loop system
potential mapping
(hydro)geology of pilot area
http://www.thermomap-project.eu/
16 published 2012 Abesser, C. Technical Guide - A screening tool for open-loop ground source heat pump schemes (England and Wales)
BGS and EA TWP2
open-loop system
potential mapping
groundwater http://mapapps2.bgs.ac.uk/gshpnational/home.html
17 published 2012
Rajver, D., Pestotnik, S., Prestor, J., Lapanje, A., Rman, N., Janža, M.
Possibility of utilisation geothermal heat pumps in Slovenia (Geothermal resources in Slovenia)
Geological Survey of Slovenia, Bulletin Mineral resources in Slovenia 2012, (165-175)
TWP2
potential mapping
use in regional areas
http://www.geo-zs.si/PDF/PeriodicnePublikacije/Bilten_2012.pdf
18 published 2016 Borović, S., Urumović, K., Terzić, J.
Determination of subsurface thermal properties for heat pump utilization in croatia
Third Congress of Geologists of Republic of Macedonia.
TWP2 TWP3 field measurements
closed-loop system
http://geothermalmapping.fsb.hr
19 published 2015 Holeček J., Burda J., Bílý P., Novák P., Semíková H
Metodika stanovení podmínek ochrany při využívání tepelné energie zemské kůry
GEOTERMAL,TAČR project No.: TB030MZP024
TWP2 TWP4 land-use conflicts
20 unpublished 2013
Tepelná čerpadla pro využití energetického potenciálu podzemních vod a horninového prostředí z vrtů (Heat pumps and exploitation of the energy potential of underground water and rock environment from wells)
TWP2 TWP4
21 unpublished 2009
P. Hanžl, S. Čech, J. Čurda, Š. Doležalová, K. Dušek,P. Gürtlerová, Z. Krejčí, P. Kycl, O. Man,D. Mašek, P. Mixa, O. Moravcová, J. Pertoldová,Z. Petáková, A. Petrová, P. Rambousek,Z. Skácelová, P. Štěpánek, J. Večeřa, V. Žáček,
Basic guidelines for the preparation of a geological map of the Czech Republic 1: 25000
TWP2
3D-modelling
Page 25
ID literature
type
Year/ last access date
Author Title Publisher, journal issue,
vol., pp. usefull for WP
linked to WP
Keyword1 Keyword2 Keyword3 web link (if available)
22 published 2016 Götzl, G., Pfleiderer, S., Fuchsluger, M., Bottig, M., Lipiarski, P.
Projekt SC-27, Pilotstudie „Informationsinitiative Oberflächennahe Geothermie für das Land Salzburg (IIOG-S)
Geologische Bundesanstalt TWP2
closed-loop system
open-loop system
potential mapping
23 published 2013 van der Meulen 3D geolopgy in a 2D country: perspectives for geological surveying in the Netherlands
Netherlands Journal of Geosiences, 92-4, page 217-241, 2013
TWP2
3D-modelling
24 published 2015 LfU
GeoMol - Assessing subsurface potentials of the Alpine Foreland Basins for sustainable planning and use of natural resources. Project Report
TWP2
potential mapping
http://www.geomol.eu
25 published
Agemar (2014, 2016) Gocad-Anwendertreffen
GeoTIS
TWP2 TWP1 3D-modelling
potential mapping
https://www.geotis.de/geotisapp/geotis.php
26 published
LBRG ISONG: Informationssystem für oberflächennahe Geothermie Baden Württemberg
TWP2 TWP1
3D-modelling
potential mapping
land-use-conflict mapping http://isong.lgrb-bw.de/
27 published 2007 Joris Ondreka, Maike Inga Rüsgen, Ingrid Stober, Kurt Czurda
ISONG: GIS-supported mapping of shallow geothermal potential of representative areas in south-western Germany—Possibilities and limitations Renewable Energy 32 (2007)
2186–2200
TWP2 TWP1 potential mapping
closed-loop system
3D-modelling
28 published 2014 LfULG
Geothermieatlas Sachsen: Allgemeine Erläuterungen zum Kartenwerk der geothermischen Entzugsleistungen im Maßstab 1:50 000 GTK 50
Sächsisches Landesamt für Umwelt, Landwirtschaft und GeologiePillnitzer Platz 3, 01326 Dresden
TWP2 TWP3 potential mapping
closed-loop system
use in regional areas
29 unpublished
TUNB
TWP2
30 published 2015 D. Bertermann, H. Klug, L. Morper-Busch
A pan-European planning basis for estimating the very shallow geothermal energy potentials
Renewable Energy 75 (2015) 335-347
TWP2
potential mapping
31 published 2016 Casasso, Sethi G.POT A quantitative method for the assessment and mapping of the shallow geothermal potential
TWP2
potential mapping
32 published 2015 Galgaro et al. Empirical modeling of maps of geo-exchange potential for shallow geothermal energy at regional scale
TWP2
potential mapping
33 published
Phillipe Dumas et al. ReGeoCities Final Report
TWP4
use in urban areas
policy strategies
quality standards
34 published 2011 Gemelli, Mancini, Longhi
GIS-based energy-economic model of low temperature geothermal resources A case study in the Italian Marche region Renewable Energy 36 (2011)
2474-2483
TWP2
policy strategies
35 published 2002 Hamada et al.
Study on underground thermal characteristics by using digital national land information, and its application for energy utilization
Applied Energy 72 (2002) 659–675
TWP2
potential mapping
36 published 2016 Hein et al. Potential of shallow geothermal energy extractable by Borehole Heat Exchanger coupled Ground Source Heat Pump systems
Energy Convension and Management 127 (2016) 80-89
TWP2
potential mapping
closed-loop system
37 published 2011 Nam, Ooka Development of potential map for ground and groundwater heat pump systems and the application to Tokyo
TWP2
potential mapping
use in urban areas
Page 26
ID literature
type
Year/ last access date
Author Title Publisher, journal issue,
vol., pp. usefull for WP
linked to WP
Keyword1 Keyword2 Keyword3 web link (if available)
38 published
Adriatic IPA project LEGEND: Low enthalpy geothermal energy demonstration
TWP4
quality standards
policy strategies
http://www.adriaticipacbc.org/login.asp
39 published
Cheap-GSHPs: Cheap and efficient application of reliable ground source heat exchangers and pumps
TWP2 TWP4
quality standards
policy strategies
http://cheap-gshp.eu/
40 website
COST-Action GABI: Geothermal energy Applications in Buildings and Infrastructure
TWP4
quality standards
potential mapping
https://www.foundationgeotherm.org/
41 website
EGIP: European Geothermal Information Platform
WPC
policy strategies
http://egip.igg.cnr.it/
42 published
FROnT: Fair Renewable Heating and Cooling Options and Trade
TWP4 WPC policy strategies
quality standards
http://www.front-rhc.eu/
43 website
GEOTeCH: Geothermal Technology for €conomic Cooling and Heating
WPC TWP3 field measurements
quality standards
http://www.geotech-project.eu/
44 website
Geothermal ERA-NET
TWP1 WPC use in regional areas
policy strategies
http://www.geothermaleranet.is/
45 published
GEOTRAINET: Geo-Education for a sustainable geothermal heating and cooling market
TWP4 WPC
quality standards
http://geotrainet.eu/
46 website
Green Epile: Development and implementation of a new generation of energy piles
WPC
http://cordis.europa.eu/project/rcn/204589_en.html
47 published
IMAGE: Integrated Methods for Advanced Geothermal Exploration
TWP2 TWP3 field measurements
use in regional areas
http://www.image-fp7.eu/Pages/default.aspx
48 website
ITER: Improving Thermal Efficiency of horizontal ground heat exchangers
WPC
monitoring field measurements
http://iter-geo.eu/
49 website
ITHERLAB: In-situ thermal rock properties lab
TWP3
field measurements
http://cordis.europa.eu/project/rcn/201131_en.html
50 website
TERRE:Training Engineers and Researchers to Rethink geotechnical Engineering for a low carbon future
WPC
quality standards
http://www.terre-etn.com/
51 website
TESSe2b:Thermal Energy Storage Systems for Energy Efficient Buildings. An integrated solution for residential building energy storage by solar and geothermal resources
TWP4
heat storage
quality standards
http://www.tesse2b.eu/tesse2b/newsTesse2bProject
52 website
TRANSENERGY, legal aspect of transboundary aquifer management
TWP2 TWP4 3D-modelling
http://transenergy-eu.geologie.ac.at/
53 website 2016
GRETA
TWP2 TWP4 quality standards
use in regional areas
policy strategies
http://www.alpine-space.eu/projects/greta/en/home http://www.alpine-space.eu/projects/greta/en/project-results/reports/deliverables
54 website
LfU IOG Bayern LfU TWP2 TWP1 open-loop system
closed-loop system
land-use-conflict mapping
http://www.lfu.bayern.de/geologie/geothermie_iog/
55 website
LBEG NIBIS, Niedersachsen LBEG TWP2 TWP1 potential mapping
land-use-conflict mapping
3D-modelling
http://nibis.lbeg.de/cardomap3/
Page 27
ID literature
type
Year/ last access date
Author Title Publisher, journal issue,
vol., pp. usefull for WP
linked to WP
Keyword1 Keyword2 Keyword3 web link (if available)
56 website
lgb-rlp Rheinland Pfalz lgb-rlp TWP2 TWP1 potential mapping
3D-modelling
land-use-conflict mapping
http://www.lgb-rlp.de/karten-und-produkte/online-karten/online-karten-geothermie.html
57 website
LLUR Schleswig Holstein LLUR TWP2 TWP1 potential mapping
58 published Jun 16 Tina Zivec, Elea iC d.o.o., Slovenia
Markovec_USING 3D GEOLOGICAL MODELLING IN CIVIL INDUSTRY
3rd Europeanmeeting on 3D geologicalmodelling
TWP2
3D-modelling
59 published 2014
S. J. Mathers, R. L. Terrington, C. N. Waters and A. G. Leslie
GB3D – a framework for the bedrock geology of Great Britain
Geoscience Data Journal 1: 30-42 (2014), RMetS
TWP2 TWP1 3D-modelling
60 published 2011 Ad-hoc-AG Geologie, PK Geothermie
Fachbericht zu bisher bekannten Auswirkungen geothermischer Vorhaben in den Bundesländern
TWP2 TWP4
quality standards
land-use-conflict mapping
http://www.infogeo.de/home/geothermie/dokumente/index_html?sfb=8&sdok_typ=-1&skurzbeschreibung=
61 website
Geologischer Dienst NRW
Portal Geothermie Nordrhein-Westfahlen Geologischer Dienst NRW TWP2 TWP1 closed-loop system
land-use-conflict mapping
http://www.geothermie.nrw.de
62 published 2016 GSI Ground Source Heating/Cooling System Suitability Maps - Open Loop Systems
GSI TWP2 TWP2 open-loop system
potential mapping
63 published 2016 GSI Ground Source Heating/Cooling System Suitability Maps - Closed Loop Systems
GSI TWP2 TWP2 closed-loop system
potential mapping
64 published 2017
Jannis Epting, Alejandro García-Gil, Peter Huggenberger, Enric Vázquez-Suñe, Matthias H. Mueller
Development of concepts for the management of thermal resources in urban areas – Assessment of transferability from the Basel (Switzerland) and Zaragoza (Spain) case studies
Journal of Hydrology 548 (2017) 697–715
TWP2 TWP3 use in urban areas
open-loop system
potential mapping
http://www.sciencedirect.com/science/article/pii/S0022169417301993
65 published 2016 Götzl, G., Fuchsluger, M., Steiner, C.
Projekt WC-33 Potenzialkarte für die integrative Planung thermischer Grundwassernutzungen in Aspern Nord
GBA TWP2 TWP3 use in urban areas
open-loop system
potential mapping
66 published 2006
Götzl, G., Ostermann, V., Kalasek, R., Heimrath, R., Steckler, P., Zottl, A., Novak, A., Haindlmaier, G., Hackl, R., Shadlau, S., Reitner, H.
GEO-Pot Seichtes Geothermie Potenzial Österreichs. Überregionale, interdisziplinäre Potenzialstudie zur Erhebung und Darstellung des oberflächennahen geothermischen Anwendungspotenzials auf Grundlage eines regelmäßigen Bearbeitungsratsers
OEWAV 5-6/2010, Springer TWP2 TWP3 closed-loop system
potential mapping

Page 28
Annex 1: methodical assessment sheets
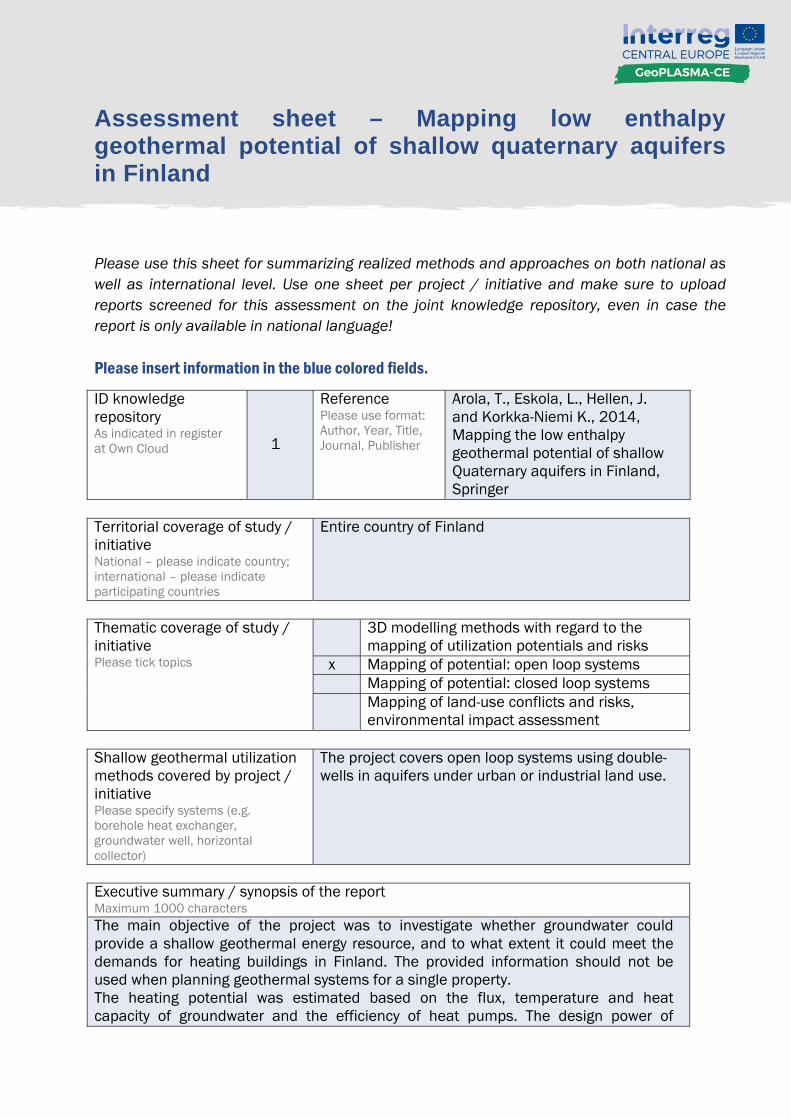
Assessment sheet – Mapping low enthalpy geothermal potential of shallow quaternary aquifers in Finland
Please use this sheet for summarizing realized methods and approaches on both national as well as international level. Use one sheet per project / initiative and make sure to upload reports screened for this assessment on the joint knowledge repository, even in case the report is only available in national language! Please insert information in the blue colored fields.
ID knowledge repository As indicated in register at Own Cloud 1
Reference Please use format: Author, Year, Title, Journal, Publisher
Arola, T., Eskola, L., Hellen, J. and Korkka-Niemi K., 2014, Mapping the low enthalpy geothermal potential of shallow Quaternary aquifers in Finland, Springer
Territorial coverage of study / initiative National – please indicate country; international – please indicate participating countries
Entire country of Finland
Thematic coverage of study / initiative Please tick topics
3D modelling methods with regard to the mapping of utilization potentials and risks
x Mapping of potential: open loop systems Mapping of potential: closed loop systems Mapping of land-use conflicts and risks,
environmental impact assessment Shallow geothermal utilization methods covered by project / initiative Please specify systems (e.g. borehole heat exchanger, groundwater well, horizontal collector)
The project covers open loop systems using double-wells in aquifers under urban or industrial land use.
Executive summary / synopsis of the report Maximum 1000 characters The main objective of the project was to investigate whether groundwater could provide a shallow geothermal energy resource, and to what extent it could meet the demands for heating buildings in Finland. The provided information should not be used when planning geothermal systems for a single property. The heating potential was estimated based on the flux, temperature and heat capacity of groundwater and the efficiency of heat pumps. The design power of
residential buildings was divided by the groundwater power to determine the ability of groundwater to heat buildings. Approximately 56500 ha of Finnish aquifers are zoned for urban or industrial land use. In total 55 to 60 MW of the heat load could be utilised with heat pumps, meaning that 25% to 40% of annually constructed residential buildings could be heated utilising groundwater in Finland. Description of applied approach (methods and workflow) for mapping A novel groundwater energy database, combining the groundwater area and land use information was created using ArcGIS software. To estimate the groundwater flux of the portion of an aquifer with urban or industrial land use, the aquifer’s proportional land use ratio was calculated. Energy calculations were performed for each mapped urban and industrial area located inside a groundwater area in three phases:
1) Potential heat power that Finnish aquifers under urban or industrial land use can produce (G) G [W] = F · ΔT · SCwat F = groundwater flux [kg/s] = total recharge; ΔT = temperature difference between inlet and outlet in the heat pump [K]; SCwat = heat capacity of water [J/kg · K] Used values: ΔT = 3 [K], SCwat = 4200 [J/kg · K] 3 K groundwater will usually not freeze if 3 K is extracted, is a conservative figure.
2) Amount of heating power (H) that can be delivered to heat distribution systems by utilising heat pumps Assumptions: 100 % of the amount of heat is exploitable, no heat loss occurs in the evaporator of the heat exchanger and heat from the compressor is delivered efficiently. Since E = H/COP and H ≈ G+E with E = electric power [W], G can also be expressed as G ≈ H(1-(1/COP)). Using the last equation and equation from 1), H can be calculated. H [W] = F · ΔT · SCwat/(1-(1/COP)) Value used for COP = 3.5 based on literature
3) Surface area of buildings that could be heated using groundwater heating power (A) The design power Ed [W/m²] of detached houses and apartment buildings was simulated with the IDA Indoor Climate and Energy dynamic simulation tool. The heat demands of different locations were simulated based on the four climatic zones in Finland. A [m²] = H/Ed
Description of input data used for mapping Please make a general sketch, no detailed data lists (e.g. hydrogeological maps scale 1:50.000)
- Groundwater areas with an estimated yield of 100 m³/day or more - Land use data above aquifers - Map of climatic zones, mainly based on 30 years of data on annual average air
temperatures
Description of output parameters and data-formats of results e.g. printed maps including the scale, GIS based maps, interactive web-systems
- Map with aquifers represented as dots. Colours of dots indicate the categorised amount of heat (G) exploitable. Classes of heat exploitable are: 1 – 100; 100 – 200, 200 – 500, >500 kW
- Table of selected groundwater areas ranked according to the amount of heat (G) exploitable
Description of the suitability of the chosen approach for GeoPLASMA-CE Please write a short review about the pros and cons of the chosen approach! Is that approach suitable for GeoPLASMA-CE? Suitable for GeoPLASMA-CE: Standardized workflow to calculate the heat exploitable from aquifers depending on their land use and the amount of heating power that can be delivered to heat distribution systems.
Assessment sheet – TransGeoTherm, geothermal energy for the transborder development of the Neisse region
Please use this sheet for summarizing realized methods and approaches on both national as well as international level. Use one sheet per project / initiative and make sure to upload reports screened for this assessment on the joint knowledge repository, even in case the report is only available in national language! Please insert information in the blue colored fields.
Project
TransGeoTherm
ID knowledge repository As indicated in register at Own Cloud
2
Reference Please use format: Author, Year, Title, Journal, Publisher
Handbuch zur Erstellung von geothermischen Karten auf der Basis eines grenzübergreifenden 3D-Untergrundmodells
Territorial coverage of study / initiative National – please indicate country; international – please indicate participating countries
Region Odra-Neisse in Germany and Poland
Thematic coverage of study / initiative Please tick topics
x 3D modelling methods with regard to the mapping of utilization potentials and risks
Mapping of potential: open loop systems x Mapping of potential: closed loop systems Mapping of land-use conflicts and risks,
environmental impact assessment Shallow geothermal utilization methods covered by project / initiative
Public version for location queries private builders With heat extraction capacity Professional version for planning consultant and drilling companies contains additionally the heat specific conductivity
Executive summary / synopsis of the report Maximum 1000 characters
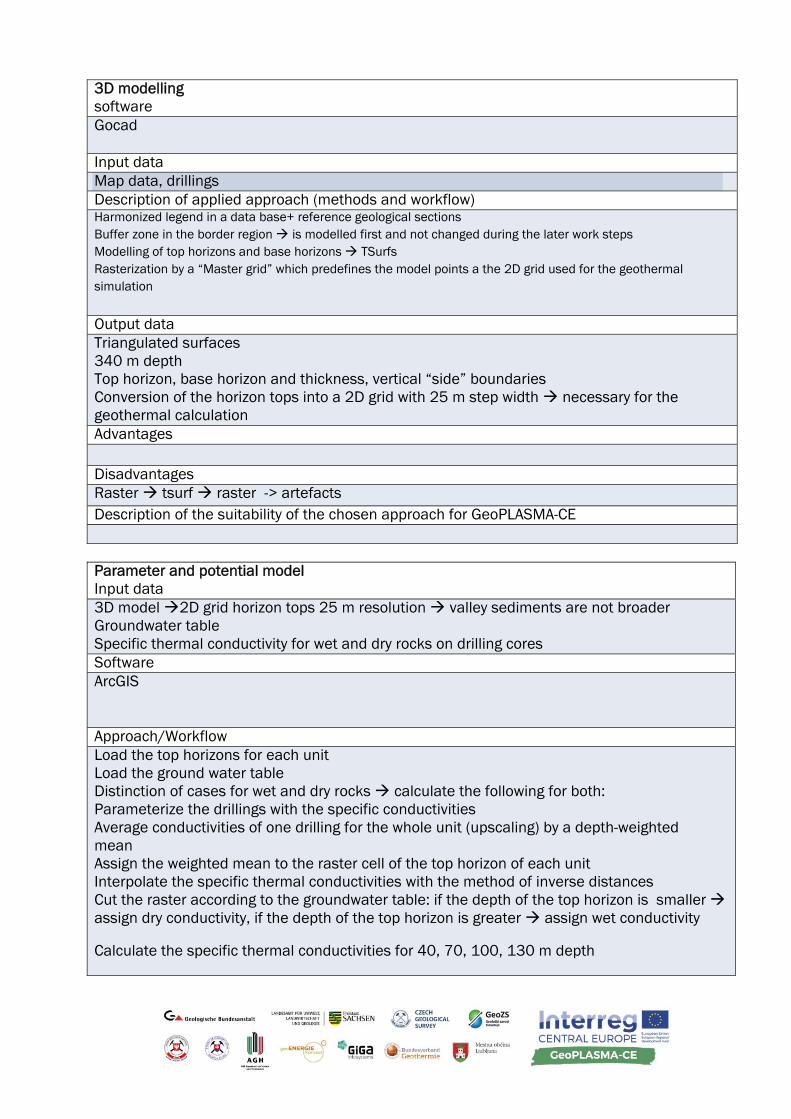
3D modelling software Gocad Input data Map data, drillings Description of applied approach (methods and workflow) Harmonized legend in a data base+ reference geological sections Buffer zone in the border region is modelled first and not changed during the later work steps Modelling of top horizons and base horizons TSurfs Rasterization by a “Master grid” which predefines the model points a the 2D grid used for the geothermal simulation
Output data Triangulated surfaces 340 m depth Top horizon, base horizon and thickness, vertical “side” boundaries Conversion of the horizon tops into a 2D grid with 25 m step width necessary for the geothermal calculation Advantages Disadvantages Raster tsurf raster -> artefacts Description of the suitability of the chosen approach for GeoPLASMA-CE Parameter and potential model Input data 3D model 2D grid horizon tops 25 m resolution valley sediments are not broader Groundwater table Specific thermal conductivity for wet and dry rocks on drilling cores Software ArcGIS Approach/Workflow Load the top horizons for each unit Load the ground water table Distinction of cases for wet and dry rocks calculate the following for both: Parameterize the drillings with the specific conductivities Average conductivities of one drilling for the whole unit (upscaling) by a depth-weighted mean Assign the weighted mean to the raster cell of the top horizon of each unit Interpolate the specific thermal conductivities with the method of inverse distances Cut the raster according to the groundwater table: if the depth of the top horizon is smaller assign dry conductivity, if the depth of the top horizon is greater assign wet conductivity
Calculate the specific thermal conductivities for 40, 70, 100, 130 m depth
Output data 25 m 2D Grid with specific heat conduction for 4 depth levels: 40, 70, 100, 130 m Advantages Disadvantages Suitability for Geoplasma Potential maps Input data 2D grid with specific thermal conductivity and depth of the top horizon Software ArcGIS ID Geothermal extension Approach/Workflow Calculate the specific heat extraction capacity by a empiric formula using the specific thermal conductivity:
Entzugsleistung = -0,96 * λ2 + 13,00 * λ + 29,60 (for 1800 h/a)
Output data 25 m 2D Grid with specific heat extraction capacity Advantages Disadvantages Suitability for Geoplasma
Assessment sheet - UK3d
Please use this sheet for summarizing realized methods and approaches on both national as well as international level. Use one sheet per project / initiative and make sure to upload reports screened for this assessment on the joint knowledge repository, even in case the report is only available in national language! Please insert information in the blue colored fields.
ID knowledge repository As indicated in register at Own Cloud
3 Reference Please use format: Author, Year, Title, Journal, Publisher
Mathers et al. 2012
Territorial coverage of study / initiative National – please indicate country; international – please indicate participating countries
England, Wales and Scotland
Thematic coverage of study / initiative Please tick topics
x 3D modelling methods with regard to the mapping of utilization potentials and risks
Mapping of potential: open loop systems Mapping of potential: closed loop systems Mapping of land-use conflicts and risks,
environmental impact assessment Shallow geothermal utilization methods covered by project / initiative Please specify systems (e.g. borehole heat exchanger, groundwater well, horizontal collector)
Executive summary / synopsis of the report Maximum 1000 characters Consistent state 3d state model with major geological units and faults Detailed models are included stepwise Description of input data used for mapping Please make a general sketch, no detailed data lists (e.g. hydrogeological maps scale 1:50.000) Geological maps, drilling data, seismic data Description of applied approach (methods and workflow) for mapping Construction of lines representing major horizons in fence diagrams Connection of the lines to horizon surfaces by bilinear interpolation
Description of output parameters and data-formats of results e.g. printed maps including the scale, GIS based maps, interactive web-systems Triangulated surfaces, processing required for volumetric parameterization Description of the suitability of the chosen approach for GeoPLASMA-CE Please write a short review about the pros and cons of the chosen approach! Is that approach suitable for GeoPLASMA-CE? Advanced project with interesting tools for querying and visualization in the www
Assessment sheet – WC 31, Shallow geothermal potential maps, City of Vienna
Please use this sheet for summarizing realized methods and approaches on both national as well as international level. Use one sheet per project / initiative and make sure to upload reports screened for this assessment on the joint knowledge repository, even in case the report is only available in national language! Please insert information in the blue colored fields.
ID knowledge repository As indicated in register at Own Cloud
7
Reference Please use format: Author, Year, Title, Journal, Publisher
Götzl, G., Fuchsluger M., Rodler F.A., Lipiarski P., Pfleiderer S., 2014, Projekt WC-31, Erdwärmepotenzialerhebung Stadtgebiet Wien, Modul 1
Territorial coverage of study / initiative National – please indicate country; international – please indicate participating countries
City of Vienna
Thematic coverage of study / initiative Please tick topics
3D modelling methods with regard to the mapping of utilization potentials and risks
x Mapping of potential: open loop systems x Mapping of potential: closed loop systems
Mapping of land-use conflicts and risks, environmental impact assessment
Shallow geothermal utilization methods covered by project / initiative Please specify systems (e.g. borehole heat exchanger, groundwater well, horizontal collector)
Closed loop systems: - Borehole heat exchangers (max. depth 300 m) - thermically enhanced construction parts Open loop systems: - Applications using heat pumps or free cooling
Executive summary / synopsis of the report Maximum 1000 characters The objective of this project, funded by the Municipal Department 20 of the Vienna City Administration, was to analyse the shallow geothermal potential of Vienna and provide shallow geothermal potential maps. The heat conductivity was determined as the crucial parameter for the determination of the potential for closed loop systems. The potential was determined for 3 different depth intervals. The investigation of the shallow geothermal potential for open loop systems included only the uppermost aquifer. The crucial parameter to determine this potential was the
maximum thermal power of a well doublet, depending on the hydrogeological situation. Description of applied approach (methods and workflow) for mapping Workflow closed loop systems:
- Derivation of thermal rock properties for existing borehole profiles from literature studies. Borehole profiles were changed into heat conductivity and heat capacity profiles.
- The city area was divided into 22 geologically homogenous areas, based on existing geological maps.
- Pointed information about thermal properties was extrapolated into a citywide map using statistical average. The heat conductivity profile for each homogenous area was determined using statistical average.
Workflow open loop systems:
- A hydrogeological map, scale 1: 25 000, was divided into 14 hydrogeolocially homogenous areas
- The maximum thermal power for virtual well doublets on locations with existing hydrogeolocial information was calculated within the homogenous areas using the following equation: P [W] = ΔT · ⟨ср · ρ⟩ · Q ΔT = Difference of temperature between extraction and injection well ср · ρ = Volumetric heat capacity of ground water [J/m³/K] Q = Discharge of well doublet [m³/s] ΔT was set to 5K in a first step. The value was decreased, if the target value of the Rulesheet RB207 had been breached, according to given groundwater temperature time series. RB207 demands a maximum and minimum injection temperature of 20 °C and 5 °C, respectively. The maximum admissible discharge (Q) was calculated using the approach of Thiem (1906): Q = kf · (mNGW – 1) · mMGW Kf = hydraulic conductivity [m/s] mNGW = thickness of ground water body at low water level mMGW = thickness of ground water body at average water level
- The mean average of the maximum thermal power is calculated for each homogenous area.
Description of input data used for mapping Please make a general sketch, no detailed data lists (e.g. hydrogeological maps scale 1:50.000)
- Geological maps - Thermal Response Tests - Characteristic thermal properties according to literature studies (ÖWAV, VDI) - Borehole profiles - User data of existing shallow geothermal applications
- Groundwater isolines - Top Aquifer - Thickness of “Wienerwaldschotter” (=Aquifer) - Soil temperatures - Groundwater Temperatures
Description of output parameters and data-formats of results e.g. printed maps including the scale, GIS based maps, interactive web-systems All potential maps are accessible via the webviewer of the city of Vienna. A report in a new window opens by clicking on the map. It includes the suitability/power class of the location and provides information whether or not a license for the closed loop systems is necessary. Closed Loop systems
- 3 Potential maps for different depth intervals: 30 m, 100 m, 200 m Classification of the potential maps depends on the average heat conductivity: < 1.6 W/m/K Low suitability 1.6 - < 1.9 W/m/K Medium suitability > 1.9 W/m/K High suitability
Open Loop systems
- Potential map, scale 1:25 000 Classification of the potential map depends on maximum thermal power for well doublets: < 1 kW Open loop systems not recommended 1 kW - < 5 kW Small sized applications after evaluation of local situation possible 5 kW - < 20 kW Medium sized applications after evaluation of local situation possible > 20 kW Large sized applications and local grids after evaluation of local situation possible Water protection areas are included in the map
Description of the suitability of the chosen approach for GeoPLASMA-CE Please write a short review about the pros and cons of the chosen approach! Is that approach suitable for GeoPLASMA-CE? PROs: The approaches and workflows for closed and open loop systems are considered to be suitable for GeoPLASMA-CE. The project report describes the developed approach in small detail. In order to successfully apply the methodology to GeoPLASMA-CE, detailed (hydro)geological information about the pilot areas has to be accessible.
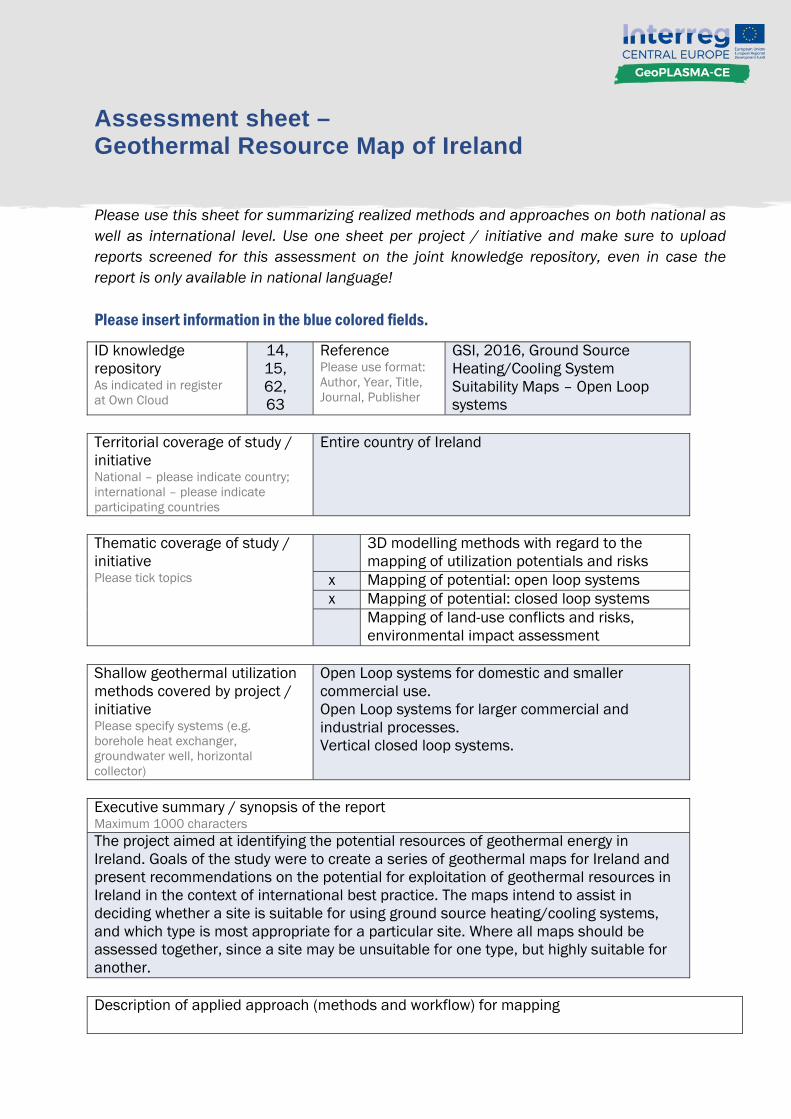
Assessment sheet – Geothermal Resource Map of Ireland
Please use this sheet for summarizing realized methods and approaches on both national as well as international level. Use one sheet per project / initiative and make sure to upload reports screened for this assessment on the joint knowledge repository, even in case the report is only available in national language! Please insert information in the blue colored fields.
ID knowledge repository As indicated in register at Own Cloud
14, 15, 62, 63
Reference Please use format: Author, Year, Title, Journal, Publisher
GSI, 2016, Ground Source Heating/Cooling System Suitability Maps – Open Loop systems
Territorial coverage of study / initiative National – please indicate country; international – please indicate participating countries
Entire country of Ireland
Thematic coverage of study / initiative Please tick topics
3D modelling methods with regard to the mapping of utilization potentials and risks
x Mapping of potential: open loop systems x Mapping of potential: closed loop systems
Mapping of land-use conflicts and risks, environmental impact assessment
Shallow geothermal utilization methods covered by project / initiative Please specify systems (e.g. borehole heat exchanger, groundwater well, horizontal collector)
Open Loop systems for domestic and smaller commercial use. Open Loop systems for larger commercial and industrial processes. Vertical closed loop systems.
Executive summary / synopsis of the report Maximum 1000 characters The project aimed at identifying the potential resources of geothermal energy in Ireland. Goals of the study were to create a series of geothermal maps for Ireland and present recommendations on the potential for exploitation of geothermal resources in Ireland in the context of international best practice. The maps intend to assist in deciding whether a site is suitable for using ground source heating/cooling systems, and which type is most appropriate for a particular site. Where all maps should be assessed together, since a site may be unsuitable for one type, but highly suitable for another. Description of applied approach (methods and workflow) for mapping
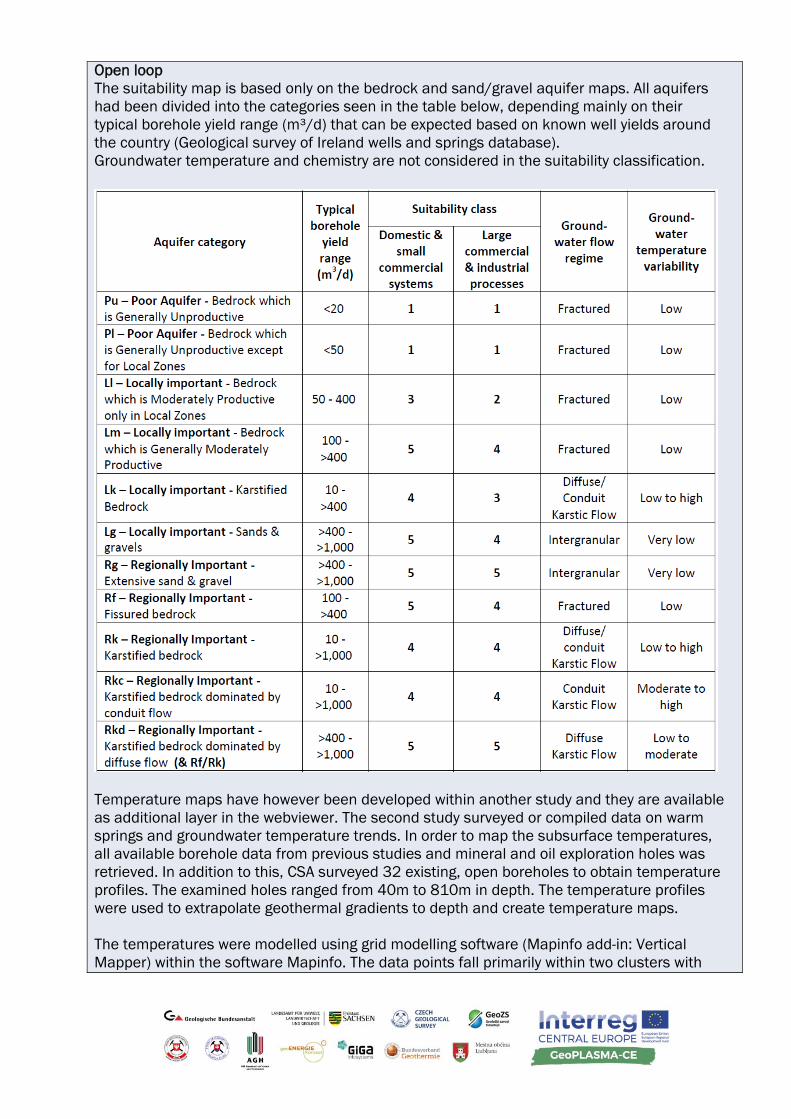
Open loop The suitability map is based only on the bedrock and sand/gravel aquifer maps. All aquifers had been divided into the categories seen in the table below, depending mainly on their typical borehole yield range (m³/d) that can be expected based on known well yields around the country (Geological survey of Ireland wells and springs database). Groundwater temperature and chemistry are not considered in the suitability classification.
Temperature maps have however been developed within another study and they are available as additional layer in the webviewer. The second study surveyed or compiled data on warm springs and groundwater temperature trends. In order to map the subsurface temperatures, all available borehole data from previous studies and mineral and oil exploration holes was retrieved. In addition to this, CSA surveyed 32 existing, open boreholes to obtain temperature profiles. The examined holes ranged from 40m to 810m in depth. The temperature profiles were used to extrapolate geothermal gradients to depth and create temperature maps. The temperatures were modelled using grid modelling software (Mapinfo add-in: Vertical Mapper) within the software Mapinfo. The data points fall primarily within two clusters with
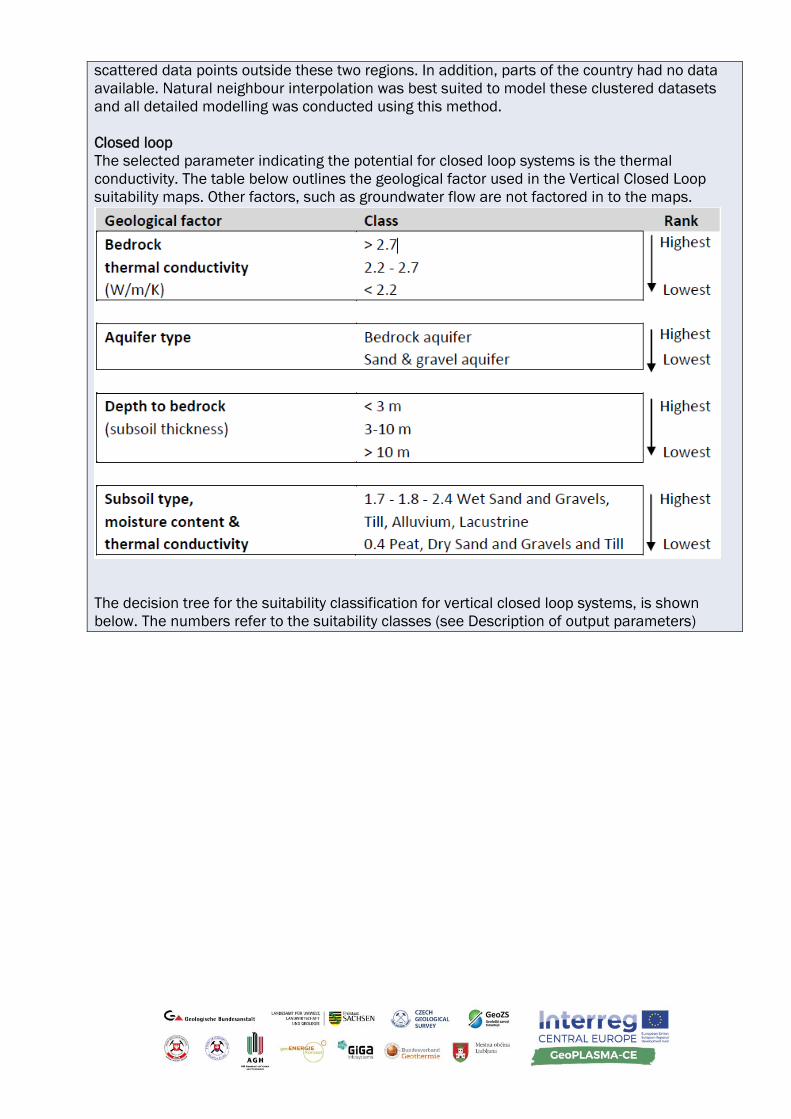
scattered data points outside these two regions. In addition, parts of the country had no data available. Natural neighbour interpolation was best suited to model these clustered datasets and all detailed modelling was conducted using this method. Closed loop The selected parameter indicating the potential for closed loop systems is the thermal conductivity. The table below outlines the geological factor used in the Vertical Closed Loop suitability maps. Other factors, such as groundwater flow are not factored in to the maps.
The decision tree for the suitability classification for vertical closed loop systems, is shown below. The numbers refer to the suitability classes (see Description of output parameters)
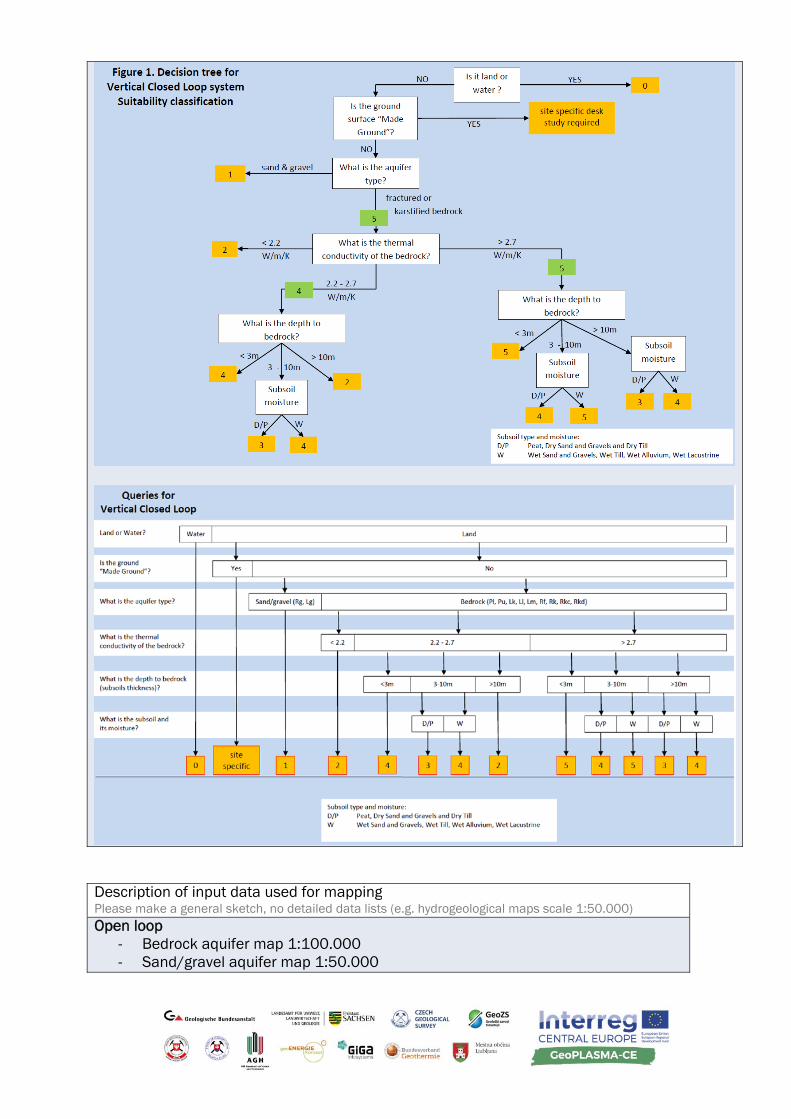
Description of input data used for mapping Please make a general sketch, no detailed data lists (e.g. hydrogeological maps scale 1:50.000) Open loop
- Bedrock aquifer map 1:100.000 - Sand/gravel aquifer map 1:50.000
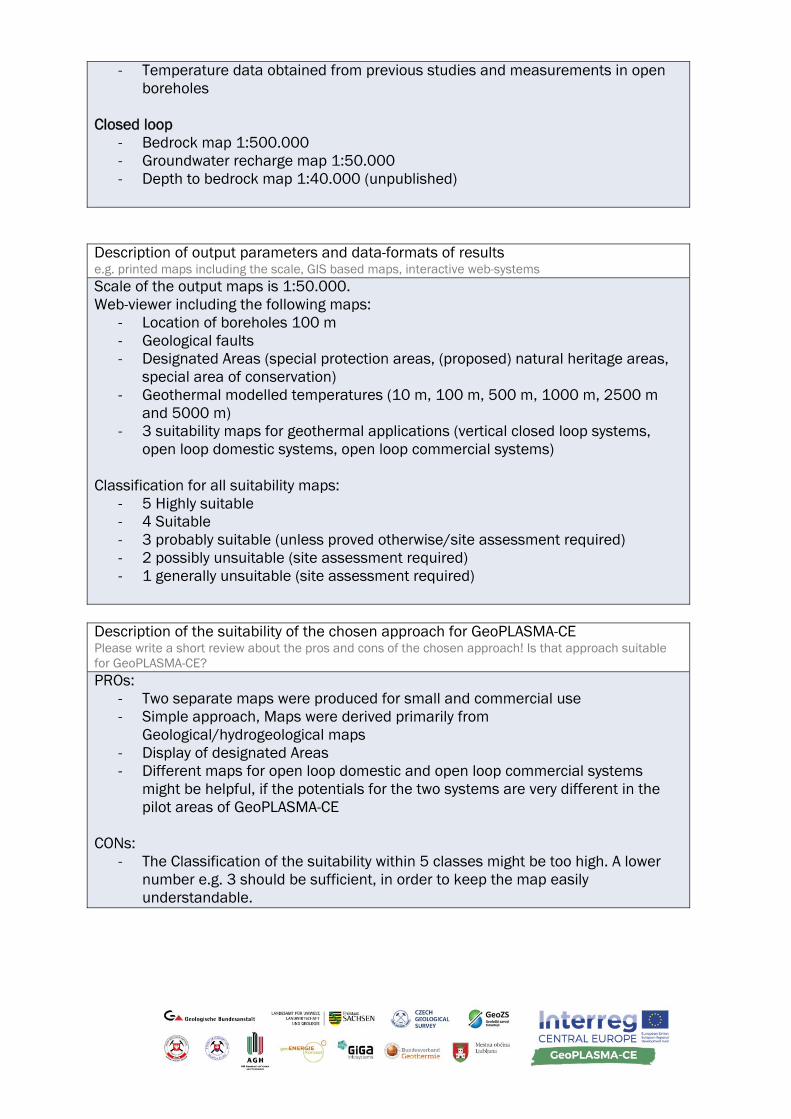
- Temperature data obtained from previous studies and measurements in open boreholes
Closed loop - Bedrock map 1:500.000 - Groundwater recharge map 1:50.000 - Depth to bedrock map 1:40.000 (unpublished)
Description of output parameters and data-formats of results e.g. printed maps including the scale, GIS based maps, interactive web-systems Scale of the output maps is 1:50.000. Web-viewer including the following maps:
- Location of boreholes 100 m - Geological faults - Designated Areas (special protection areas, (proposed) natural heritage areas,
special area of conservation) - Geothermal modelled temperatures (10 m, 100 m, 500 m, 1000 m, 2500 m
and 5000 m) - 3 suitability maps for geothermal applications (vertical closed loop systems,
open loop domestic systems, open loop commercial systems)
Classification for all suitability maps: - 5 Highly suitable - 4 Suitable - 3 probably suitable (unless proved otherwise/site assessment required) - 2 possibly unsuitable (site assessment required) - 1 generally unsuitable (site assessment required)
Description of the suitability of the chosen approach for GeoPLASMA-CE Please write a short review about the pros and cons of the chosen approach! Is that approach suitable for GeoPLASMA-CE? PROs:
- Two separate maps were produced for small and commercial use - Simple approach, Maps were derived primarily from
Geological/hydrogeological maps - Display of designated Areas - Different maps for open loop domestic and open loop commercial systems
might be helpful, if the potentials for the two systems are very different in the pilot areas of GeoPLASMA-CE
CONs:
- The Classification of the suitability within 5 classes might be too high. A lower number e.g. 3 should be sufficient, in order to keep the map easily understandable.
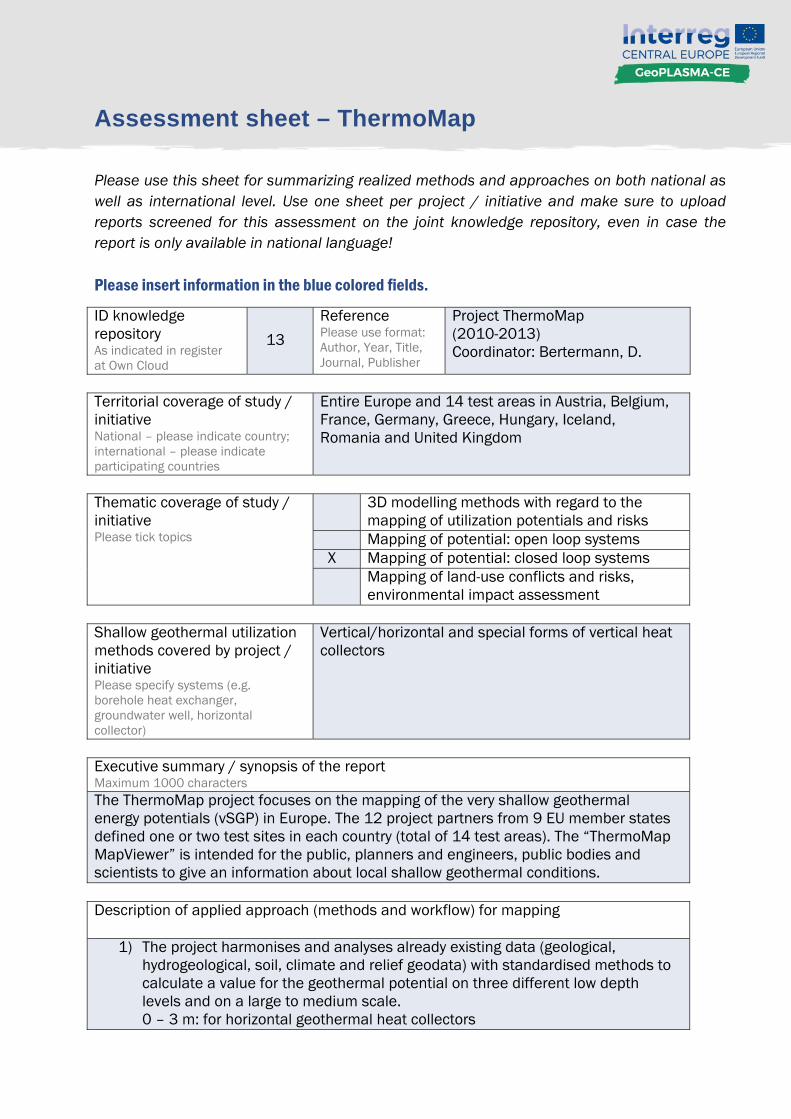
Assessment sheet – ThermoMap
Please use this sheet for summarizing realized methods and approaches on both national as well as international level. Use one sheet per project / initiative and make sure to upload reports screened for this assessment on the joint knowledge repository, even in case the report is only available in national language! Please insert information in the blue colored fields.
ID knowledge repository As indicated in register at Own Cloud
13
Reference Please use format: Author, Year, Title, Journal, Publisher
Project ThermoMap (2010-2013) Coordinator: Bertermann, D.
Territorial coverage of study / initiative National – please indicate country; international – please indicate participating countries
Entire Europe and 14 test areas in Austria, Belgium, France, Germany, Greece, Hungary, Iceland, Romania and United Kingdom
Thematic coverage of study / initiative Please tick topics
3D modelling methods with regard to the mapping of utilization potentials and risks
Mapping of potential: open loop systems X Mapping of potential: closed loop systems
Mapping of land-use conflicts and risks, environmental impact assessment
Shallow geothermal utilization methods covered by project / initiative Please specify systems (e.g. borehole heat exchanger, groundwater well, horizontal collector)
Vertical/horizontal and special forms of vertical heat collectors
Executive summary / synopsis of the report Maximum 1000 characters The ThermoMap project focuses on the mapping of the very shallow geothermal energy potentials (vSGP) in Europe. The 12 project partners from 9 EU member states defined one or two test sites in each country (total of 14 test areas). The “ThermoMap MapViewer” is intended for the public, planners and engineers, public bodies and scientists to give an information about local shallow geothermal conditions. Description of applied approach (methods and workflow) for mapping
1) The project harmonises and analyses already existing data (geological, hydrogeological, soil, climate and relief geodata) with standardised methods to calculate a value for the geothermal potential on three different low depth levels and on a large to medium scale. 0 – 3 m: for horizontal geothermal heat collectors
3 – 6 m: for vertical geothermal heat collectors 6 – 10 m: for special forms of vertical heat collectors The analysis of the geodata will be performed in a GIS-environment with standardised methods, valid for all participating countries. The heat conductivity is calculated based on the Kersten (1949) formula, using soil data (moisture state, grain size and density) and climate data (precipitation and air temperature). Classification of heat conductivity: - > 1.2 W/mK: High - 1.1 – 1.2 W/mK: Medium high - 1.0 – 1.1 W/mK: Medium - 0.9 – 1.0 W/mK: Medium low - < 0.9 W/mK: Low All areas with legal constraints (nature protection zone, water protection zone, flood area), a slope > 15°, permafrost or a certain soil type (e.g. planosol, gleysol) are classified to have limited usability. Map areas containing hard rock within the first depth layer are considered unsuitable for very shallow geothermal system.
2) “vSGP Calculator”: The calculation function loads all available data from the
European Outline Map for a specified map point to the calculator. The user can utilise the existing data or amend it with own data. Compared to the accuracy level of the European Outline Map, the calculator offers the possibility to reach an even greater level of accuracy as in the test areas for a single map location.
Description of input data used for mapping Please make a general sketch, no detailed data lists (e.g. hydrogeological maps scale 1:50.000)
- Slope - Annual temperature - Annual precipitation - Water table - Thickness of the softrock zone - Soil type (WRB classification) - Grain size at three depth levels (USDA classification) - Heat conductivity at three depth levels
Description of output parameters and data-formats of results e.g. printed maps including the scale, GIS based maps, interactive web-systems
1) “ThermoMap MapViewer” includes information for the suitability of very shallow geothermal systems for Europe (1:250000) and more detailed information in selected test areas on cadastral parcel level (from 1:5000 to 1:40000). Locations within the test areas are classified as limited usable, suitable and not suitable regarding the use of very shallow geothermal systems. Additionally layers with background information (protection zones, water bodies, softrock thickness, slope, annual mean temperature and annual precipitation) are available.
Different info tools display interpreted information in an info box, as a table or as a printed report enriched with map details and diagrams.
2) “Calculator” can be used to improve estimations for locations on the European
Outline Map and also outside of the MapViewer for calculating the vSGP in non-european countries.
Description of the suitability of the chosen approach for GeoPLASMA-CE Please write a short review about the pros and cons of the chosen approach! Is that approach suitable for GeoPLASMA-CE? PROs: Structure of the web viewer:
- different info tools - background parameters as layers - Only areas with suitable or limited usability are coloured.
CONs:
- The depths are too low for GeoPLASMA-CE. - Too many classes of heat conductivity (medium high and medium low
unnecessary) Overall this is a best practice example, with useful information about the processing of geodata and the structure of the webviewer.
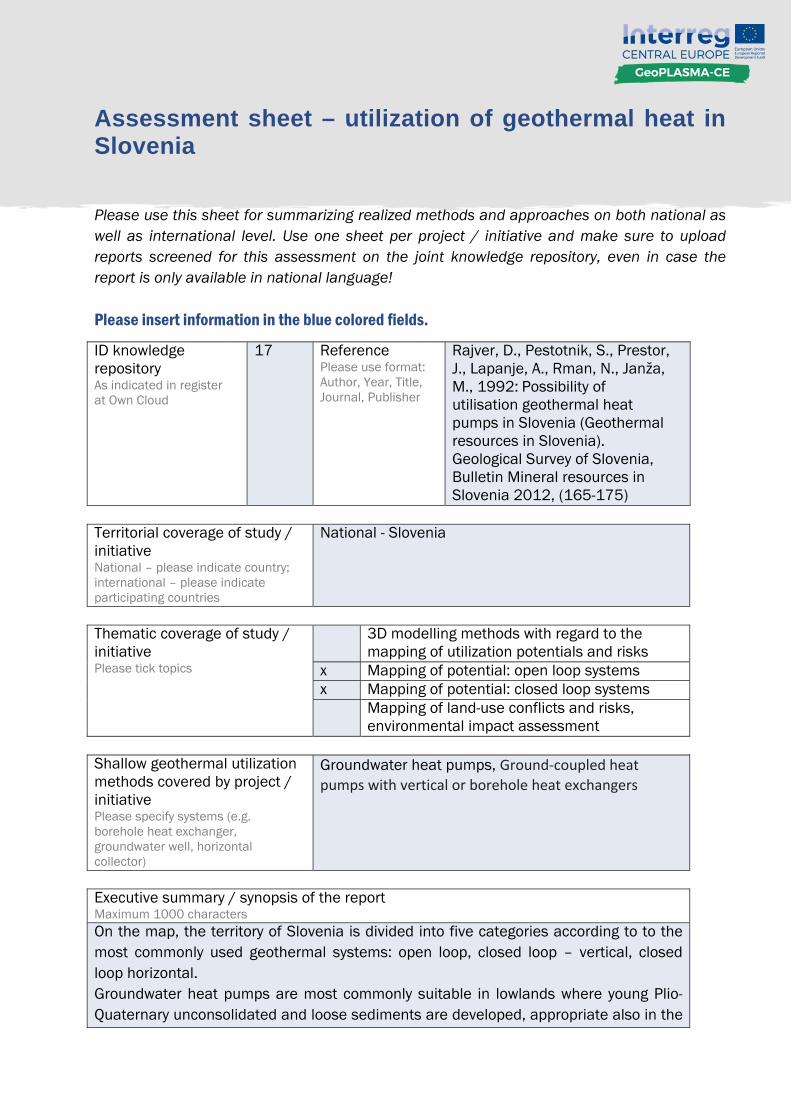
Assessment sheet – utilization of geothermal heat in Slovenia
Please use this sheet for summarizing realized methods and approaches on both national as well as international level. Use one sheet per project / initiative and make sure to upload reports screened for this assessment on the joint knowledge repository, even in case the report is only available in national language! Please insert information in the blue colored fields.
ID knowledge repository As indicated in register at Own Cloud
17 Reference Please use format: Author, Year, Title, Journal, Publisher
Rajver, D., Pestotnik, S., Prestor, J., Lapanje, A., Rman, N., Janža, M., 1992: Possibility of utilisation geothermal heat pumps in Slovenia (Geothermal resources in Slovenia). Geological Survey of Slovenia, Bulletin Mineral resources in Slovenia 2012, (165-175)
Territorial coverage of study / initiative National – please indicate country; international – please indicate participating countries
National - Slovenia
Thematic coverage of study / initiative Please tick topics
3D modelling methods with regard to the mapping of utilization potentials and risks
x Mapping of potential: open loop systems x Mapping of potential: closed loop systems Mapping of land-use conflicts and risks,
environmental impact assessment Shallow geothermal utilization methods covered by project / initiative Please specify systems (e.g. borehole heat exchanger, groundwater well, horizontal collector)
Groundwater heat pumps, Ground‐coupled heat pumps with vertical or borehole heat exchangers
Executive summary / synopsis of the report Maximum 1000 characters On the map, the territory of Slovenia is divided into five categories according to to the most commonly used geothermal systems: open loop, closed loop – vertical, closed loop horizontal. Groundwater heat pumps are most commonly suitable in lowlands where young Plio-Quaternary unconsolidated and loose sediments are developed, appropriate also in the
areas of terrestrial and deltaic sediments of Neogene and Plio-Quaternary age. Ground-coupled heat pumps with vertical or borehole heat exchangers (BHEs) are often the best choice in parts of central, southern, and western Slovenia that display a diverse range of rocks, either clastic (sandstone, silt) or carbonate (limestone, dolomite). Ground-coupled heat pumps with vertical and horizontal collectors are most often the best choice in areas with clastic or even metamorphic and igneous rocks, and also suitable in areas characterized by flysch and other deep marine. Carbonates as well as metamorphic and igneous rocks may be unsuitable for larger BHE fields. Description of applied approach (methods and workflow) for mapping Simple approach of estimating possibility of using geothermal heat pumps based on hydrogeological conditions of the territory of Slovenia. Based on geological and hydrogeological maps, the country was divided into the following 5 categories:
1. Most commonly vertical collectors 2. Most commonly groundwater heat pumps 3. Most commonly vertical/horizontal collectors 4. Often groundwater heat pumps 5. Most commonly unsuitable for larger BHE fields
Description of input data used for mapping Please make a general sketch, no detailed data lists (e.g. hydrogeological maps scale 1:50.000) Hydrogeological map of Slovenia, scale 1:250.000 Geological map of Slovenia Description of output parameters and data-formats of results e.g. printed maps including the scale, GIS based maps, interactive web-systems GIS based map Description of the suitability of the chosen approach for GeoPLASMA-CE Please write a short review about the pros and cons of the chosen approach! Is that approach suitable for GeoPLASMA-CE? Simple approach which could be used just in preliminary studies on national or regional level
Assessment sheet – utilization of heat pumps in Croatia
Please use this sheet for summarizing realized methods and approaches on both national as well as international level. Use one sheet per project / initiative and make sure to upload reports screened for this assessment on the joint knowledge repository, even in case the report is only available in national language! Please insert information in the blue colored fields.
ID knowledge repository As indicated in register at Own Cloud
18 Reference Please use format: Author, Year, Title, Journal, Publisher
Staša Borović, S., Urumović, K., Terzić, J. 2016: DETERMINATION OF SUBSURFACE THERMAL PROPERTIES FOR HEAT PUMP UTILIZATION IN CROATIA. Third Congress of Geologists of Republic of Macedonia. (http://geothermalmapping.fsb.hr)
Territorial coverage of study / initiative National – please indicate country; international – please indicate participating countries
Croatia
Thematic coverage of study / initiative Please tick topics
3D modelling methods with regard to the mapping of utilization potentials and risks
Mapping of potential: open loop systems x Mapping of potential: closed loop systems Mapping of land-use conflicts and risks,
environmental impact assessment Shallow geothermal utilization methods covered by project / initiative Please specify systems (e.g. borehole heat exchanger, groundwater well, horizontal collector)
borehole heat exchanger
Executive summary / synopsis of the report Maximum 1000 characters The project goal is the determination of the thermal properties of shallow geothermal potential in characteristic regions throughout the Republic of Croatia and promotion of application of ground source heat pump (GCHP) technology as renewable energy source. Research will investigate use of heat pumps, coupled with borehole exchangers and connected to ground, for heating and cooling of already built buildings. Experimental boreholes, that will be used for measuring ground thermal response (so called TRT – thermal response test), will be drilled along with geological supervision which includes soil sampling and soil properties determination. The mapping process of shallow geothermal potential will create the preconditions for more effective implementation of GCHP for heating and cooling of buildings in Croatia, as it is the
case in technologically most advanced countries. Description of applied approach (methods and workflow) for mapping Research includes drilling of experimental boreholes that will be used for measuring ground thermal response. Along with drilling procedure, the geological supervision will be carried with soil sampling and soil properties determination in order to fulfil main objective of the project and that is the determination of the thermal properties of shallow geothermal potential in characteristic regions throughout the Republic of Croatia. The results obtained by measurements are to be used for creating map of geothermal potential variation. Description of input data used for mapping Please make a general sketch, no detailed data lists (e.g. hydrogeological maps scale 1:50.000) Thermal properties of the subsurface were measured: Direct measurement of sediment thermal properties Distributed Thermal Response Test (DTRT) conventional Thermal Response Test (TRT) Description of output parameters and data-formats of results e.g. printed maps including the scale, GIS based maps, interactive web-systems Average thermal conductivities of sediments and rocks in selected locations Description of the suitability of the chosen approach for GeoPLASMA-CE Please write a short review about the pros and cons of the chosen approach! Is that approach suitable for GeoPLASMA-CE? For GeoPLASMA comparison of thermal parameters measured with different methods could be useful and also obtained average thermal conductivities of sediments and rocks.
Assessment sheet – utilization of geothermal energy in the Czech Republic
Please use this sheet for summarizing realized methods and approaches on both national as well as international level. Use one sheet per project / initiative and make sure to upload reports screened for this assessment on the joint knowledge repository, even in case the report is only available in national language! Please insert information in the blue colored fields.
ID knowledge repository As indicated in register at Own Cloud
19 Reference Please use format: Author, Year, Title, Journal, Publisher
Holeček J., Burda J., Bílý P., Novák P., Semíková H.: 2015, Metodika stanovení podmínek ochrany při využívání tepelné energie zemské kůry (GEOTERMAL),,TAČR project No.: TB030MZP024
Territorial coverage of study / initiative National – please indicate country; international – please indicate participating countries
Country of Czech Republic
Thematic coverage of study / initiative Please tick topics
3D modelling methods with regard to the mapping of utilization potentials and risks
Mapping of potential: open loop systems Mapping of potential: closed loop systems X Mapping of land-use conflicts and risks,
environmental impact assessment Shallow geothermal utilization methods covered by project / initiative Please specify systems (e.g. borehole heat exchanger, groundwater well, horizontal collector)
Not aimed for shallow geothermal utilization. The document includes certified methods for an establishment of conditions of deep geothermal energy utilization and protection of the rock environment.
Executive summary / synopsis of the report Maximum 1000 characters The aim of the project is a methodological study usable for legislative conditions processing, which include utilization and protection of the geothermal sources in the rock environment of the Czech Republic in the context of utilisation the Earth crust heat for industry purposes. The main part of the study will be a comprehensive definition and suggestion of methodology, principles and feasibility conditions for prospection, verification, exploitation and protection of geothermal resources. Principles of the documentation processing including a manual for technical-geological and land use documentation in frame of the valid CZ and EU legislation will be an important part. The study will also take local specification given by the variability of geological formation in CZ and geothermal source type into consideration. To fulfil the project’s aims, research works will cover the problematic of the Earth’s crust heat utilisation in complex. Particular objectives of the project as well as the methodological study
constituents will therefore be: suitability and exploitability determination of the geothermal energetic resources in CZ, analysis of the contemporary legal framework both in CZ and EU and its possibilities. Critical points will be also identified and adjustment in the Czech legislation proposed. Limiting geological conditions for the definition and determination of the areas for special encroachments into the crust will be defined. Conditions and objective criteria of the environment in the process of Earth crust heat usage as well as protection of the geothermal source and exploitation mechanism from negative natural and anthropogenic impact. Geothermal energy exploitation and requirements of groundwater protection and utilisation will be described both in legislative and objective level including their relationships implications particularly for industrial utilisation of the Earth crust heat. Description of applied approach (methods and workflow) for mapping Literature review of legal regulations in the Czech Republic and EU (selected resources). Description of the geological conditions from a geothermal point of view. Description of input data used for mapping Please make a general sketch, no detailed data lists (e.g. hydrogeological maps scale 1:50.000) No geological or geothermal mapping was conducted with this methodical instruction. Description of output parameters and data-formats of results e.g. printed maps including the scale, GIS based maps, interactive web-systems The document includes a general overview map of the geothermal potential for the whole area of the Czech Republic in scale 1: 500 000. Description of the suitability of the chosen approach for GeoPLASMA-CE Please write a short review about the pros and cons of the chosen approach! Is that approach suitable for GeoPLASMA-CE? This methodical instruction is mainly focused on deep geothermal energy utilisation from the legislation point of view. A part of described legislation procedures and steps are also obligatory for construction shallow geothermal boreholes deeper than 30 m.
Assessment sheet – heat pumps in the Czech Republic
Please use this sheet for summarizing realized methods and approaches on both national as well as international level. Use one sheet per project / initiative and make sure to upload reports screened for this assessment on the joint knowledge repository, even in case the report is only available in national language! Please insert information in the blue colored fields.
ID knowledge repository As indicated in register at Own Cloud
20 Reference Please use format: Author, Year, Title, Journal, Publisher
Team of authors (unknowns), 2013, Tepelná čerpadla pro využití energetického potenciálu podzemních vod a horninového prostředí z vrtů (Heat pumps and exploitation of the energy potential of underground water and rock environment from wells),,CZ Ministry of Regional Development
Territorial coverage of study / initiative National – please indicate country; international – please indicate participating countries
Country of Czech Republic
Thematic coverage of study / initiative Please tick topics
3D modelling methods with regard to the mapping of utilization potentials and risks
X Mapping of potential: open loop systems X Mapping of potential: closed loop systems X Mapping of land-use conflicts and risks,
environmental impact assessment Shallow geothermal utilization methods covered by project / initiative Please specify systems (e.g. borehole heat exchanger, groundwater well, horizontal collector)
borehole heat exchanger, groundwater wells
Executive summary / synopsis of the report Maximum 1000 characters Methodical recommendations for construction and water authorities relating to the permission for newly installed heat pumps. The document deals with open as well as closed loop geothermal systems. It contains recommendations and a summary of the Czech legislation related to the shallow geothermal energy.
Description of applied approach (methods and workflow) for mapping No information provided in the text Description of input data used for mapping Please make a general sketch, no detailed data lists (e.g. hydrogeological maps scale 1:50.000) No information provided in the text Description of output parameters and data-formats of results e.g. printed maps including the scale, GIS based maps, interactive web-systems No information provided in the text Description of the suitability of the chosen approach for GeoPLASMA-CE Please write a short review about the pros and cons of the chosen approach! Is that approach suitable for GeoPLASMA-CE? The document does not deal with any mapping strategies, but it describes needs and requested prospecting works for permitting new geothermal installations by legislation authorities. The document is partly applicable for GeoPlasma-CE mapping strategies (e.g. list of types of shallow geothermal utilisations and its legislation requirements). Cons It does not contain any measured data or methods.
Assessment sheet – Guideline for geological mapping in the Czech Republic
Please use this sheet for summarizing realized methods and approaches on both national as well as international level. Use one sheet per project / initiative and make sure to upload reports screened for this assessment on the joint knowledge repository, even in case the report is only available in national language! Please insert information in the blue colored fields.
ID knowledge repository As indicated in register at Own Cloud
21 Reference Please use format: Author, Year, Title, Journal, Publisher
P. Hanžl, S. Čech, J. Čurda, Š. Doležalová, K. Dušek,P. Gürtlerová, Z. Krejčí, P. Kycl, O. Man,D. Mašek, P. Mixa, O. Moravcová, J. Pertoldová,Z. Petáková, A. Petrová, P. Rambousek,Z. Skácelová, P. Štěpánek, J. Večeřa, V. Žáček, (2009): Basic guidelines for the preparation of a geological map of the Czech Republic 1: 25000, publicly unpublished, Czech Geological Survey
Territorial coverage of study / initiative National – please indicate country; international – please indicate participating countries
Country of Czech Republic
Thematic coverage of study / initiative Please tick topics
3D modelling methods with regard to the mapping of utilization potentials and risks
Mapping of potential: open loop systems Mapping of potential: closed loop systems X Mapping of land-use conflicts and risks,
environmental impact assessment Shallow geothermal utilization methods covered by project / initiative Please specify systems (e.g. borehole heat exchanger, groundwater well, horizontal collector)
Not aimed for shallow geothermal utilization - description of mapping methods, data processing (eg. GIS, symbol keys etc.) and construction of geological and hydrogeological maps.
Executive summary / synopsis of the report Maximum 1000 characters The guidelines for the preparation of a geological map consist of one main document (summary) and eleven supplements (methodical guidelines) dealing with individual
aspects (e.g. Basic geology, hydrogeology, raw materials, geophysics, geohazards… ) of mapping methods and map construction. Description of input data used for mapping Please make a general sketch, no detailed data lists (e.g. hydrogeological maps scale 1:50.000) Input data for mapping at scale 1:250000 are older geological maps with a scale of 1:500000 and large databases of literature archive and internal geological databases of document points. Description of output parameters and data-formats of results e.g. printed maps including the scale, GIS based maps, interactive web-systems
- printed thematic maps at scale 1:250000 - GIS based maps - online interactive web-system
Description of the suitability of the chosen approach for GeoPLASMA-CE Please write a short review about the pros and cons of the chosen approach! Is that approach suitable for GeoPLASMA-CE? Standardized methodology for whole area of the country. Some general mapping methods are suitable for GeoPlasma-CE project, but it is not focused on geothermal energy. Useful parts are in sections of basic geology and hydrogeology or land use hazards.
Assessment sheet – SC 27, Shallow geothermal potential, State of Salzburg
Please use this sheet for summarizing realized methods and approaches on both national as well as international level. Use one sheet per project / initiative and make sure to upload reports screened for this assessment on the joint knowledge repository, even in case the report is only available in national language! Please insert information in the blue colored fields.
ID knowledge repository As indicated in register at Own Cloud
22
Reference Please use format: Author, Year, Title, Journal, Publisher
Götzl, G., Pfleiderer, S., Fuchsluger, M., Bottig, M., Lipiarski, P., 2016, Projekt SC-27, Pilotstudie „Informationsinitiative Oberflächennahe Geothermie für das Land Salzburg (IIOG-S), GBA
Territorial coverage of study / initiative National – please indicate country; international – please indicate participating countries
State of Salzburg
Thematic coverage of study / initiative Please tick topics
3D modelling methods with regard to the mapping of utilization potentials and risks
x Mapping of potential: open loop systems x Mapping of potential: closed loop systems
Mapping of land-use conflicts and risks, environmental impact assessment
Shallow geothermal utilization methods covered by project / initiative Please specify systems (e.g. borehole heat exchanger, groundwater well, horizontal collector)
Closed loop systems: - Borehole heat exchangers
Open loop systems:
- Groundwater heat pumps
Executive summary / synopsis of the report Maximum 1000 characters This project is a pilot study for the development of a digital information system for shallow geothermal applications in the state of Salzburg, Austria. The objectives of the project were to create geothermal potential maps for ground water heat pumps and borehole heat exchangers in the areas of permanent settlement and to support the government of Salzburg to compile concepts for the practical application of this study’s products.
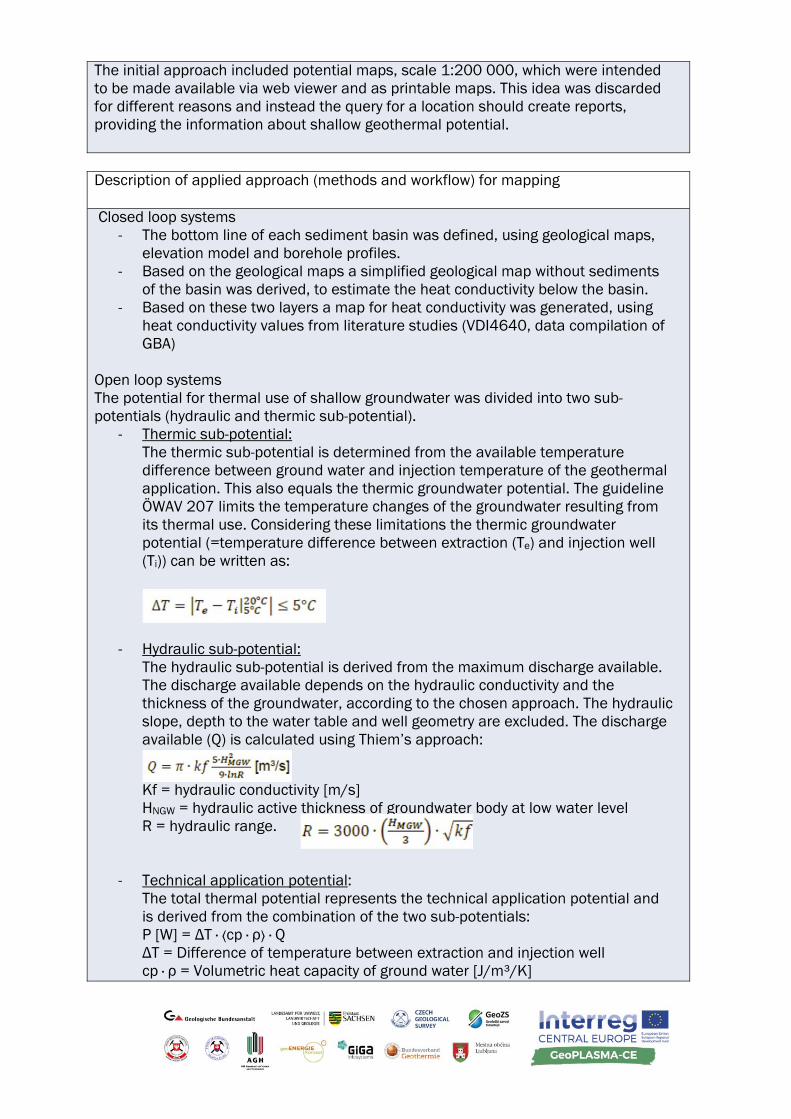
The initial approach included potential maps, scale 1:200 000, which were intended to be made available via web viewer and as printable maps. This idea was discarded for different reasons and instead the query for a location should create reports, providing the information about shallow geothermal potential. Description of applied approach (methods and workflow) for mapping Closed loop systems
- The bottom line of each sediment basin was defined, using geological maps, elevation model and borehole profiles.
- Based on the geological maps a simplified geological map without sediments of the basin was derived, to estimate the heat conductivity below the basin.
- Based on these two layers a map for heat conductivity was generated, using heat conductivity values from literature studies (VDI4640, data compilation of GBA)
Open loop systems The potential for thermal use of shallow groundwater was divided into two sub-potentials (hydraulic and thermic sub-potential).
- Thermic sub-potential: The thermic sub-potential is determined from the available temperature difference between ground water and injection temperature of the geothermal application. This also equals the thermic groundwater potential. The guideline ÖWAV 207 limits the temperature changes of the groundwater resulting from its thermal use. Considering these limitations the thermic groundwater potential (=temperature difference between extraction (Te) and injection well (Ti)) can be written as:
- Hydraulic sub-potential: The hydraulic sub-potential is derived from the maximum discharge available. The discharge available depends on the hydraulic conductivity and the thickness of the groundwater, according to the chosen approach. The hydraulic slope, depth to the water table and well geometry are excluded. The discharge available (Q) is calculated using Thiem’s approach:
Kf = hydraulic conductivity [m/s] HNGW = hydraulic active thickness of groundwater body at low water level R = hydraulic range.
- Technical application potential: The total thermal potential represents the technical application potential and is derived from the combination of the two sub-potentials: P [W] = ΔT · ⟨ср · ρ⟩ · Q ΔT = Difference of temperature between extraction and injection well ср · ρ = Volumetric heat capacity of ground water [J/m³/K]
Q = Discharge of well doublet [m³/s] The licensed discharges were used as auxiliary quantity to determine the technical application potential for locations where the hydraulic sub-potential could not be calculated due to missing data.
Description of input data used for mapping Please make a general sketch, no detailed data lists (e.g. hydrogeological maps scale 1:50.000) Closed loop systems
- Geological maps of Salzburg - Borehole profiles - Elevation model - Soil temperatures - Thermal Response Tests - Literature compilation of heat conductivities
Open loop systems
- Licensed discharges for peak loads of existing applications - Literature compilation of hydraulic conductivities - Hydrogeological maps
Description of output parameters and data-formats of results e.g. printed maps including the scale, GIS based maps, interactive web-systems The outputs of this project have not been implemented in a web based information system until now. Information about the following parameters, which are considered as crucial for the determination of the shallow geothermal potential, has been compiled on scale 1: 200 000. Closed loop systems
- Heat conductivity map (depth: 0 – 100 m) - Soil temperature map
Using this information and the geometry, material, and operation of method of the borehole heat exchanger, it is possible to determine the best design of the closed loop system. Open loop systems
- Outline of hydrogeologically suitable areas - Hydraulic sub-potential: Maximum discharge for well doublets - Thermic sub-potential: Maximum temperature difference for well doublets - Technical application potential: Maximum power for well doublets
Description of the suitability of the chosen approach for GeoPLASMA-CE Please write a short review about the pros and cons of the chosen approach! Is that approach suitable for GeoPLASMA-CE? PROs The developed approach of this project is considered to be very good for the creation of shallow geothermal potential maps. Heat conductivity values of different rock types are considered.
CONs Although the depth to 100 m is sufficient for standard BHEs, another map of the heat conductivity for an additional depth interval (eg. – 200m) would be good extension. The hydraulic conductivity is the most sensitive parameter for the developed approach for open loop systems. Therefore this approach is only suitable for pilot areas, where the hydraulic conductivity is known well.
Geomol – assessing subsurface potentials of the Alpine Foreland Basin for sustainable planning and use of natural resources
Please use this sheet for summarizing realized methods and approaches on both national as well as international level. Use one sheet per project / initiative and make sure to upload reports screened for this assessment on the joint knowledge repository, even in case the report is only available in national language! Please insert information in the blue colored fields.
ID knowledge repository As indicated in register at Own Cloud
24
Reference Please use format: Author, Year, Title, Journal, Publisher
Diepolder et al. Geomol project report
Territorial coverage of study / initiative National – please indicate country; international – please indicate participating countries
France, Switzerland, Germany, Baden-Württemberg, Bavaria, Austria, Slovenia, Italia
Thematic coverage of study / initiative Please tick topics
x 3D modelling methods with regard to the mapping of utilization potentials and risks
x Mapping of potential: open loop systems x Mapping of potential: closed loop systems Mapping of land-use conflicts and risks,
environmental impact assessment Shallow geothermal utilization methods covered by project / initiative
Temperature models
Executive summary / synopsis of the report Maximum 1000 characters Assemblage of a 3D model generated by different states with different softwares Unified workflow for data processing (seismic interpretation, drillings) Harmonized data base with uniform classification of lithostratigraphic units Internal consistency is obtained by the exchange of drilling data Common interpretation and modelling of bordering areas + finetuning Individual geothermal modelling with compöetely different methods 3D modelling software
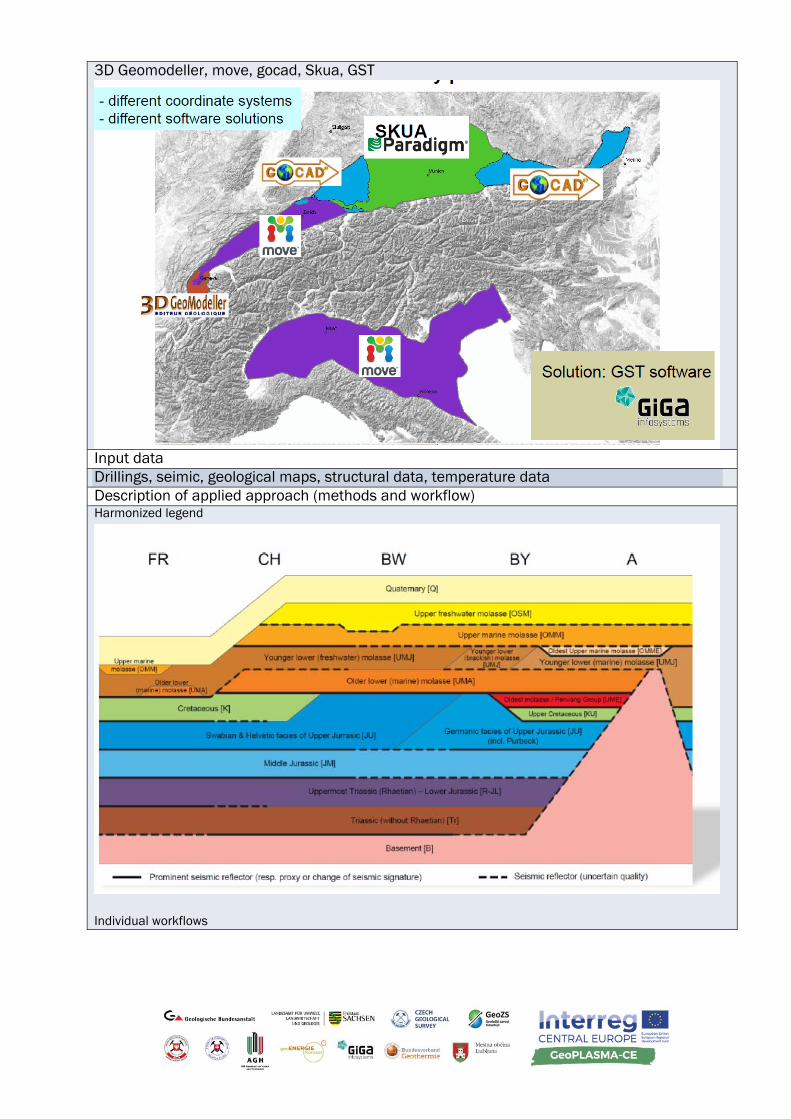
3D Geomodeller, move, gocad, Skua, GST
Input data Drillings, seimic, geological maps, structural data, temperature data Description of applied approach (methods and workflow) Harmonized legend
Individual workflows
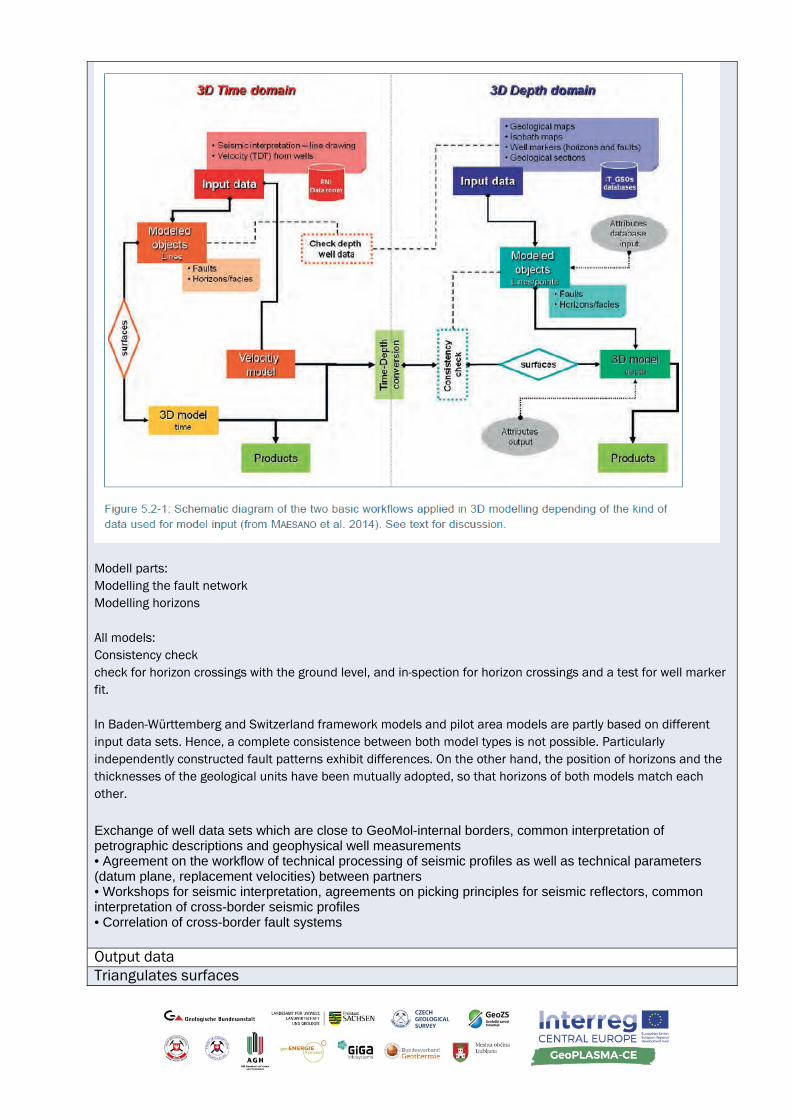
Modell parts: Modelling the fault network Modelling horizons All models: Consistency check check for horizon crossings with the ground level, and in-spection for horizon crossings and a test for well marker fit. In Baden-Württemberg and Switzerland framework models and pilot area models are partly based on different input data sets. Hence, a complete consistence between both model types is not possible. Particularly independently constructed fault patterns exhibit differences. On the other hand, the position of horizons and the thicknesses of the geological units have been mutually adopted, so that horizons of both models match each other.
Exchange of well data sets which are close to GeoMol-internal borders, common interpretation of petrographic descriptions and geophysical well measurements • Agreement on the workflow of technical processing of seismic profiles as well as technical parameters (datum plane, replacement velocities) between partners • Workshops for seismic interpretation, agreements on picking principles for seismic reflectors, common interpretation of cross-border seismic profiles • Correlation of cross-border fault systems Output data Triangulates surfaces
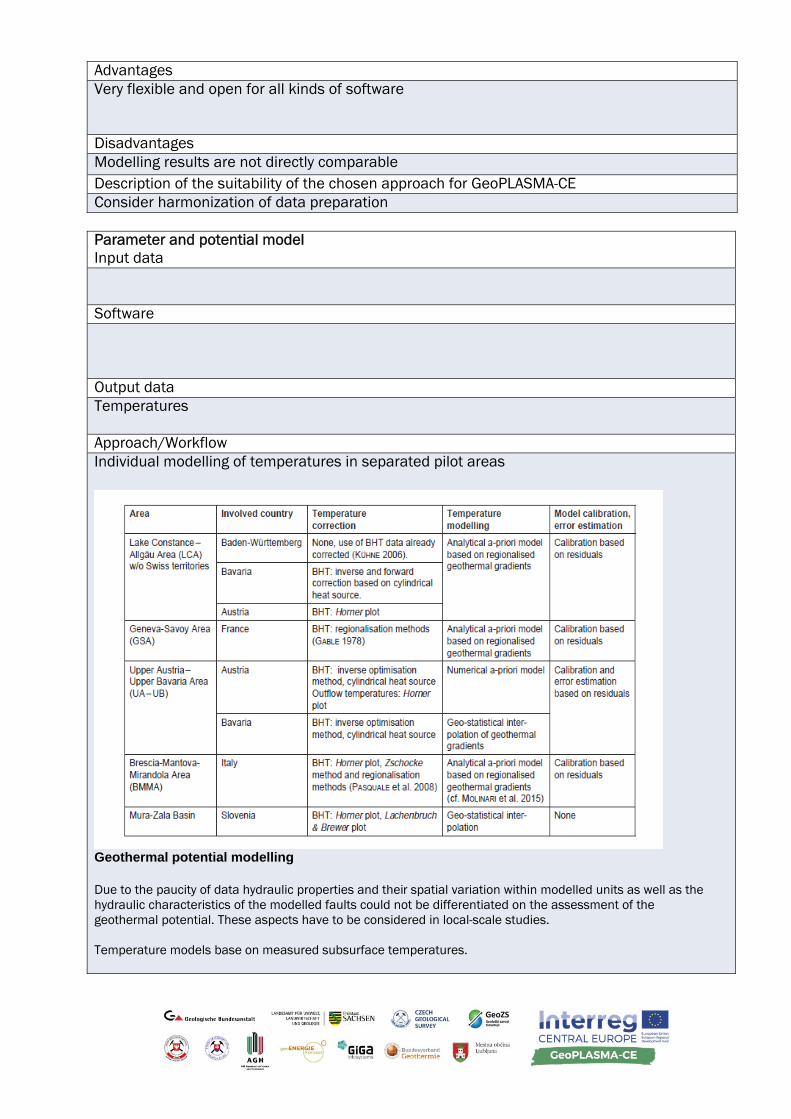
Advantages Very flexible and open for all kinds of software
Disadvantages Modelling results are not directly comparable Description of the suitability of the chosen approach for GeoPLASMA-CE Consider harmonization of data preparation Parameter and potential model Input data Software Output data Temperatures Approach/Workflow Individual modelling of temperatures in separated pilot areas
Geothermal potential modelling Due to the paucity of data hydraulic properties and their spatial variation within modelled units as well as the hydraulic characteristics of the modelled faults could not be differentiated on the assessment of the geothermal potential. These aspects have to be considered in local-scale studies. Temperature models base on measured subsurface temperatures.
Data processing includes the calculation of the true vertical as well as horizontal position of a single datum point at the subsurface as well as temperature correction. Temperature correction are only applied for BHT measurements as well as outflow temperatures at the wellhead in order to estimate the true formation temperature. All other available temperature sources are either estimated to reflect the true formation temperature (undisturbed temperature logs and DST measurements) or not able to be corrected (disturbed temperature logs). In a next step, the individual datum points may optionally be allocated to geological units in order to allow data filtering. This processing step has been applied for the UA – UB pilot area only. The final step of the data processing consists in a plausibility evaluation in order to eliminate temperature datum points affected by a large error. Temperature modelling (2D, 3D) has been achieved by either data interpolation or / and forward modelling. Pure data interpolation or extrapolation is only recommendable in case of a sufficiently high density of datum points.In contrast, numerical modelling requires more effort and a conceptional a-priori model, which will be translated into a temperature model. In many cases a combination of both approaches have been applied during GeoMol in order to achieve temperature models. Model calibration and estimation of error: Temperature models, which rely on any kind of numerical or analytical modelling, need to be calibrated based on processed temperature data. For that purpose, residuals between modelled and observed temperature values are calculated and superposed to the a-priori model in order to minimise the prediction error at observation points. These re-siduals, which are often interpolated to a regular grid, also reflect the prediction error of the a-priori model. In contrast, error estimation of data interpolated to a regular grid is reflected by the statistical error of variance associated to the chosen interpolation method (e. g. Kriging). geopotential map series of the pilot areas and the Mura-Zala Basin:
temperatures at the top of the most important productive aquifers, temperatures at 0.5 km, 1 km, 1.5 km, 2 km, 3 km and 4 km depths below surface, depths of the 60 °C, 100 °C and 120 °C or 150 °C isotherms, each combinable with the distribution of the geological units and the transection traces of the principal faults at the respective depth levels. Data and workflow harmonisation: Except for the SMA and BMMA, all pilot areas are covering at least two different countries. For that reason, harmonisation of data and workflows has been a crucial issue. Considering the evaluation of the quality of different data sources the quality coefficients proposed by Clauser et al. (2002) have been applied for the pilot areas UA – UB and LCA. These coefficients are a good tool for a harmonised evaluation of the quality of input data and can also be used for the creation of data density maps. However, these quality coefficient do not reflect the quality of the method chosen for BHT correction. As the coefficients are normalised, they may also be used as weighting factors for geo-statistical data interpolation. Data processing was executed individually by all project partners involved at a certain pilot area. At the early stage of data processing the individual methods for data processing have been assessed by questionnaires. The assessment of applied methods show, that in most cases well established, internationally published methods have been applied. Only for datum points having less than two BHT values regionally differing empiric methods have been used for data correction. In most cases these methods are not transferable to other regions as they are only derived from regional datasets.
Analytical as well as numerical a-priori models do not refer to measured subsurface data. For that reason, model calibration based on observation points is inevitable. In addition, the calculated residuals in most cases give valuable information about heat transport processes not included in the a-priori model (e. g. convective heat transport not included in a pure conductive heat transport model) and data errors. For the UA – UB pilot area the calculated residuals have also been used to identify erroneous observation points. In a second stage of quality control, all measured subsurface temperatures showing residuals of more than ± 20 °C have been once again checked for plausibility.
Based on the experiences gained from GeoMol, it is recommended to establish an a-priori temperature model, which is not directly derived from measured subsurface temperatures of varying data quality. A pure conductive numerical 3D model has, in addition, the advantage of allowing hydrogeological interpretation
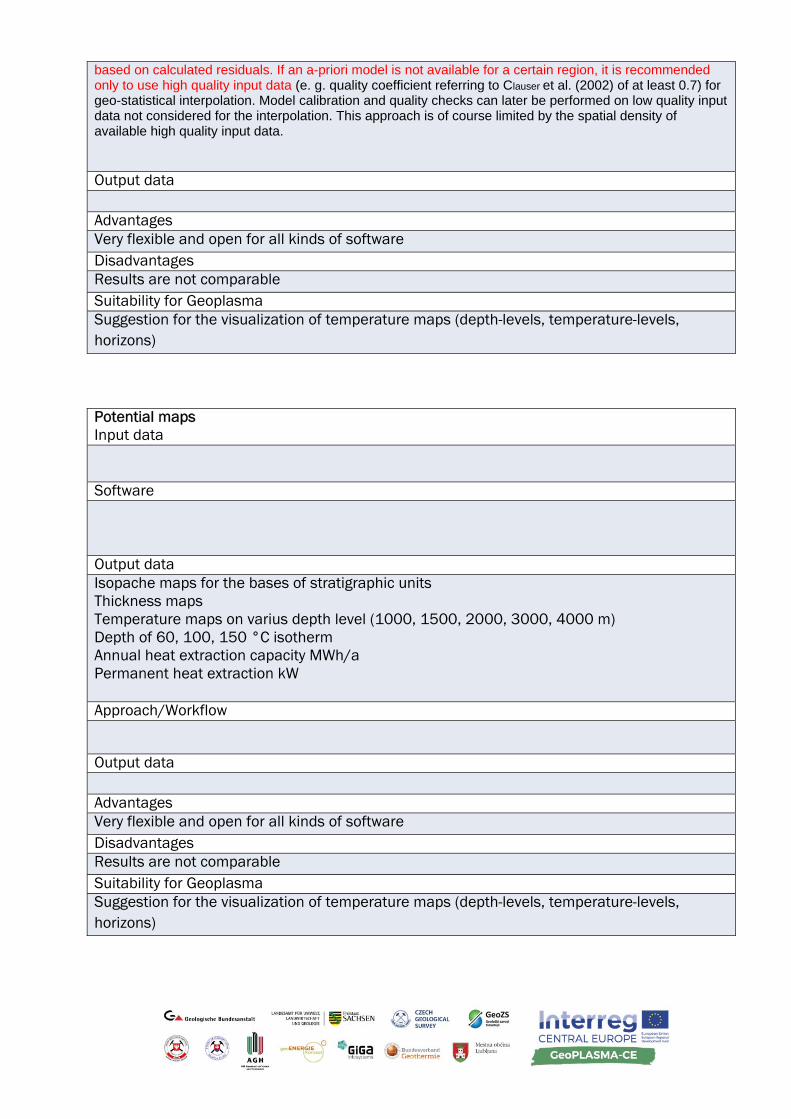
based on calculated residuals. If an a-priori model is not available for a certain region, it is recommended only to use high quality input data (e. g. quality coefficient referring to Clauser et al. (2002) of at least 0.7) for geo-statistical interpolation. Model calibration and quality checks can later be performed on low quality input data not considered for the interpolation. This approach is of course limited by the spatial density of available high quality input data.
Output data Advantages Very flexible and open for all kinds of software Disadvantages Results are not comparable Suitability for Geoplasma Suggestion for the visualization of temperature maps (depth-levels, temperature-levels, horizons) Potential maps Input data Software Output data Isopache maps for the bases of stratigraphic units Thickness maps Temperature maps on varius depth level (1000, 1500, 2000, 3000, 4000 m) Depth of 60, 100, 150 °C isotherm Annual heat extraction capacity MWh/a Permanent heat extraction kW Approach/Workflow
Output data Advantages Very flexible and open for all kinds of software Disadvantages Results are not comparable Suitability for Geoplasma Suggestion for the visualization of temperature maps (depth-levels, temperature-levels, horizons)

ISONG – information system surface near geothermal energy
Please use this sheet for summarizing realized methods and approaches on both national as well as international level. Use one sheet per project / initiative and make sure to upload reports screened for this assessment on the joint knowledge repository, even in case the report is only available in national language! Please insert information in the blue colored fields.
ID knowledge repository As indicated in register at Own Cloud
26 Reference Please use format: Author, Year, Title, Journal, Publisher
http://isong.lgrb-bw.de/
Territorial coverage of study / initiative National – please indicate country; international – please indicate participating countries
Baden-Württemberg 400 m depth
Thematic coverage of study / initiative Please tick topics
x 3D modelling methods with regard to the mapping of utilization potentials and risks
x Mapping of potential: open loop systems x Mapping of potential: closed loop systems x Mapping of land-use conflicts and risks,
environmental impact assessment Shallow geothermal utilization methods covered by project / initiative
Executive summary / synopsis of the report Maximum 1000 characters 3D modelling software Gocad Input data Drillings, geological maps, isopach maps Description of applied approach (methods and workflow) 3D model of major faults and horizons (TSURFS)
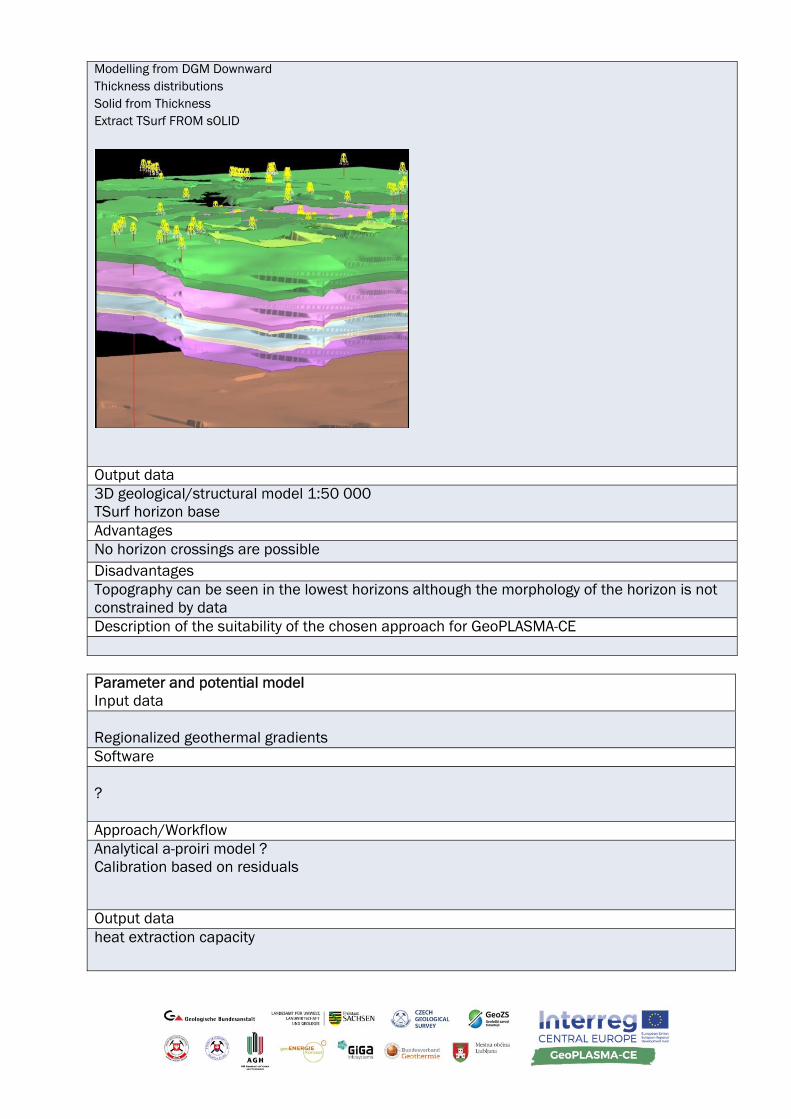
Modelling from DGM Downward Thickness distributions Solid from Thickness Extract TSurf FROM sOLID
Output data 3D geological/structural model 1:50 000 TSurf horizon base Advantages No horizon crossings are possible Disadvantages Topography can be seen in the lowest horizons although the morphology of the horizon is not constrained by data Description of the suitability of the chosen approach for GeoPLASMA-CE Parameter and potential model Input data Regionalized geothermal gradients Software ? Approach/Workflow Analytical a-proiri model ? Calibration based on residuals
Output data heat extraction capacity
Advantages Disadvantages Suitability for Geoplasma potential maps Input data Software Output data Specific heat extraction capacity for houses heating systems working 1800 h/a (only heating) or 2400 h/a (heating and hot water production) Approach/Workflow
Output data Advantages Disadvantages Suitability for Geoplasma Conflict maps maps Input data Maps for protection zones: drinking, mineral and curative water Information from 3D model: limitation of drilling depth (swellable rocks) Artesian springs and aquifers Software Output data Prognostic drilling profile Indicating the geological units, artesic groundwater, swellable rocks, limitation of drilling depth Approach/Workflow
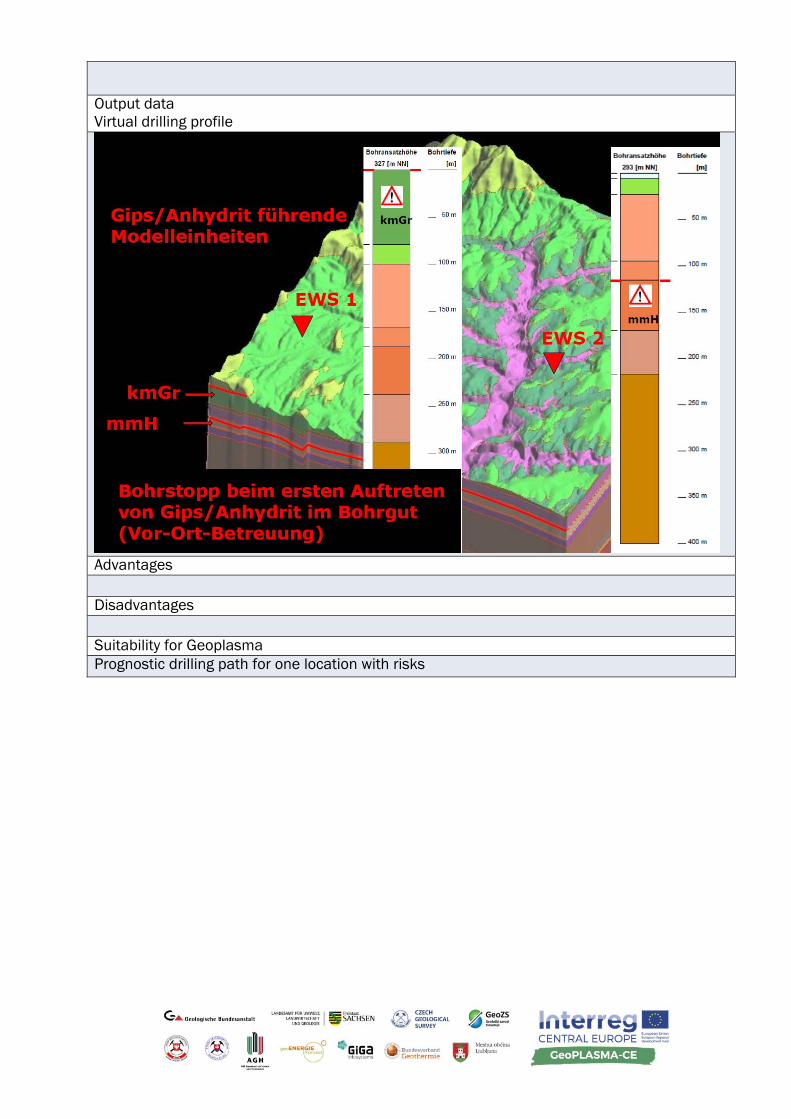
Output data Virtual drilling profile
Advantages Disadvantages Suitability for Geoplasma Prognostic drilling path for one location with risks
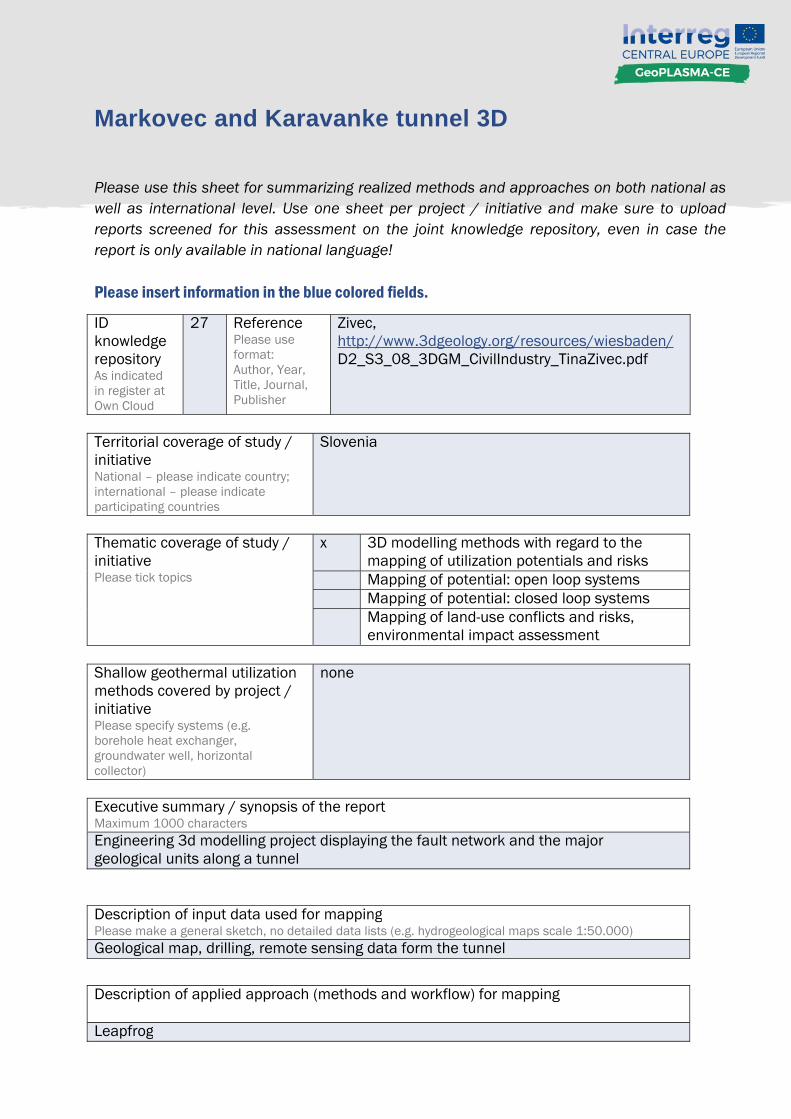
Markovec and Karavanke tunnel 3D
Please use this sheet for summarizing realized methods and approaches on both national as well as international level. Use one sheet per project / initiative and make sure to upload reports screened for this assessment on the joint knowledge repository, even in case the report is only available in national language! Please insert information in the blue colored fields.
ID knowledge repository As indicated in register at Own Cloud
27 Reference Please use format: Author, Year, Title, Journal, Publisher
Zivec, http://www.3dgeology.org/resources/wiesbaden/ D2_S3_08_3DGM_CivilIndustry_TinaZivec.pdf
Territorial coverage of study / initiative National – please indicate country; international – please indicate participating countries
Slovenia
Thematic coverage of study / initiative Please tick topics
x 3D modelling methods with regard to the mapping of utilization potentials and risks
Mapping of potential: open loop systems Mapping of potential: closed loop systems Mapping of land-use conflicts and risks,
environmental impact assessment Shallow geothermal utilization methods covered by project / initiative Please specify systems (e.g. borehole heat exchanger, groundwater well, horizontal collector)
none
Executive summary / synopsis of the report Maximum 1000 characters Engineering 3d modelling project displaying the fault network and the major geological units along a tunnel Description of input data used for mapping Please make a general sketch, no detailed data lists (e.g. hydrogeological maps scale 1:50.000) Geological map, drilling, remote sensing data form the tunnel
Description of applied approach (methods and workflow) for mapping Leapfrog
Description of the output Please make a general sketch, no detailed data lists (e.g. hydrogeological maps scale 1:50.000) Triangulated surfaces Description of the suitability of the chosen approach for GeoPLASMA-CE Please write a short review about the pros and cons of the chosen approach! Is that approach suitable for GeoPLASMA-CE? Consistent model for complex geological situation with faults, veins,…
Implicit modelling of the fault blocks, veins and metamorphic units Each unit is modelled individually The resulting bodies are cut by Boolean operations the lithology is modelled in each fault block
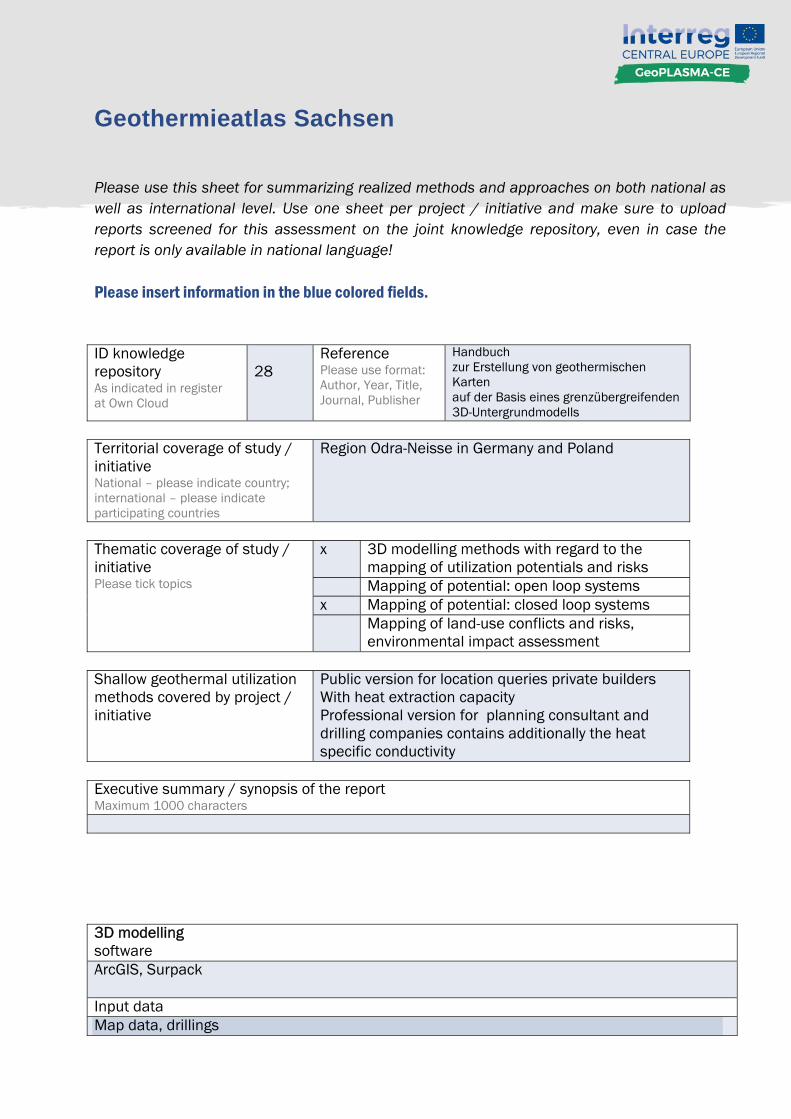
Geothermieatlas Sachsen
Please use this sheet for summarizing realized methods and approaches on both national as well as international level. Use one sheet per project / initiative and make sure to upload reports screened for this assessment on the joint knowledge repository, even in case the report is only available in national language! Please insert information in the blue colored fields.
ID knowledge repository As indicated in register at Own Cloud
28
Reference Please use format: Author, Year, Title, Journal, Publisher
Handbuch zur Erstellung von geothermischen Karten auf der Basis eines grenzübergreifenden 3D-Untergrundmodells
Territorial coverage of study / initiative National – please indicate country; international – please indicate participating countries
Region Odra-Neisse in Germany and Poland
Thematic coverage of study / initiative Please tick topics
x 3D modelling methods with regard to the mapping of utilization potentials and risks
Mapping of potential: open loop systems x Mapping of potential: closed loop systems Mapping of land-use conflicts and risks,
environmental impact assessment Shallow geothermal utilization methods covered by project / initiative
Public version for location queries private builders With heat extraction capacity Professional version for planning consultant and drilling companies contains additionally the heat specific conductivity
Executive summary / synopsis of the report Maximum 1000 characters 3D modelling software ArcGIS, Surpack Input data Map data, drillings
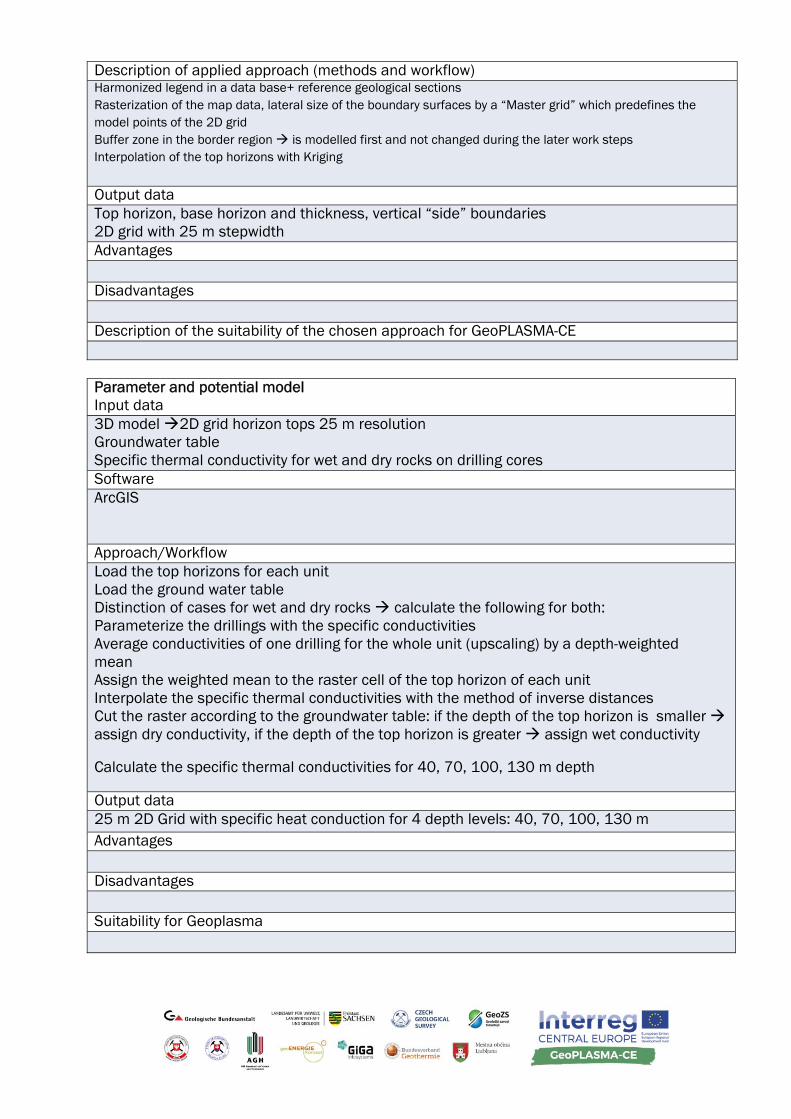
Description of applied approach (methods and workflow) Harmonized legend in a data base+ reference geological sections Rasterization of the map data, lateral size of the boundary surfaces by a “Master grid” which predefines the model points of the 2D grid Buffer zone in the border region is modelled first and not changed during the later work steps Interpolation of the top horizons with Kriging
Output data Top horizon, base horizon and thickness, vertical “side” boundaries 2D grid with 25 m stepwidth Advantages Disadvantages Description of the suitability of the chosen approach for GeoPLASMA-CE Parameter and potential model Input data 3D model 2D grid horizon tops 25 m resolution Groundwater table Specific thermal conductivity for wet and dry rocks on drilling cores Software ArcGIS Approach/Workflow Load the top horizons for each unit Load the ground water table Distinction of cases for wet and dry rocks calculate the following for both: Parameterize the drillings with the specific conductivities Average conductivities of one drilling for the whole unit (upscaling) by a depth-weighted mean Assign the weighted mean to the raster cell of the top horizon of each unit Interpolate the specific thermal conductivities with the method of inverse distances Cut the raster according to the groundwater table: if the depth of the top horizon is smaller assign dry conductivity, if the depth of the top horizon is greater assign wet conductivity
Calculate the specific thermal conductivities for 40, 70, 100, 130 m depth
Output data 25 m 2D Grid with specific heat conduction for 4 depth levels: 40, 70, 100, 130 m Advantages Disadvantages Suitability for Geoplasma
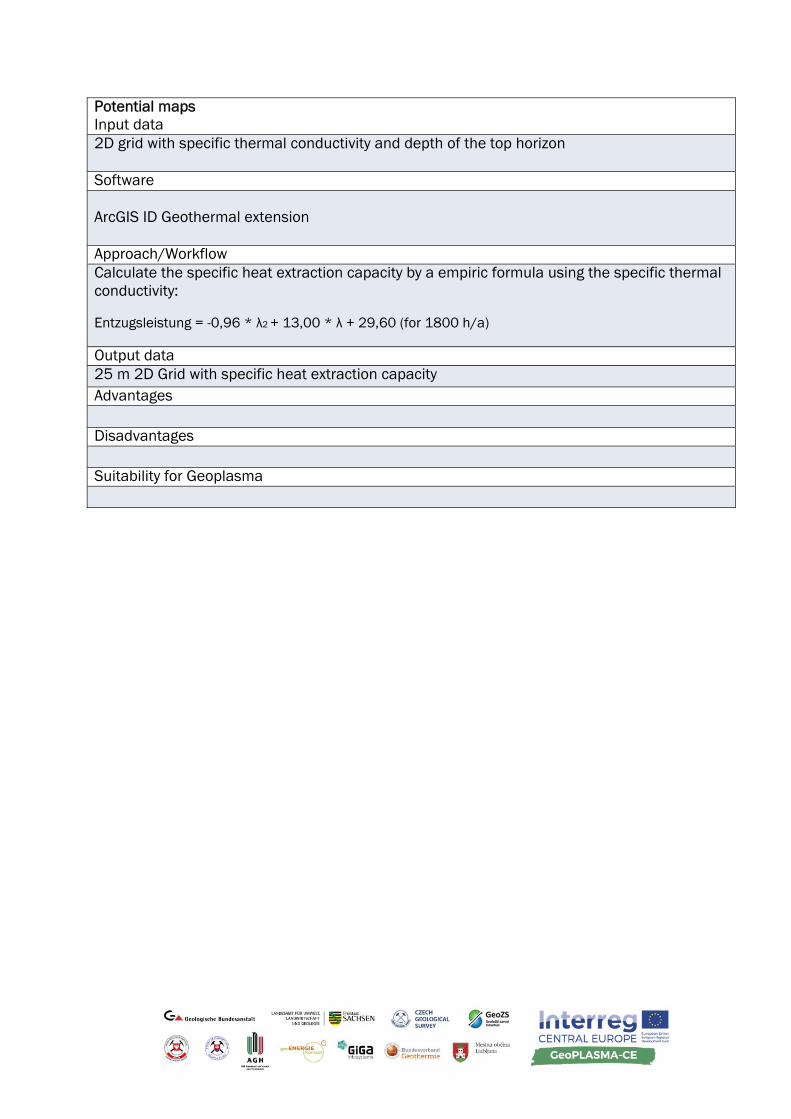
Potential maps Input data 2D grid with specific thermal conductivity and depth of the top horizon Software ArcGIS ID Geothermal extension Approach/Workflow Calculate the specific heat extraction capacity by a empiric formula using the specific thermal conductivity:
Entzugsleistung = -0,96 * λ2 + 13,00 * λ + 29,60 (for 1800 h/a)
Output data 25 m 2D Grid with specific heat extraction capacity Advantages Disadvantages Suitability for Geoplasma
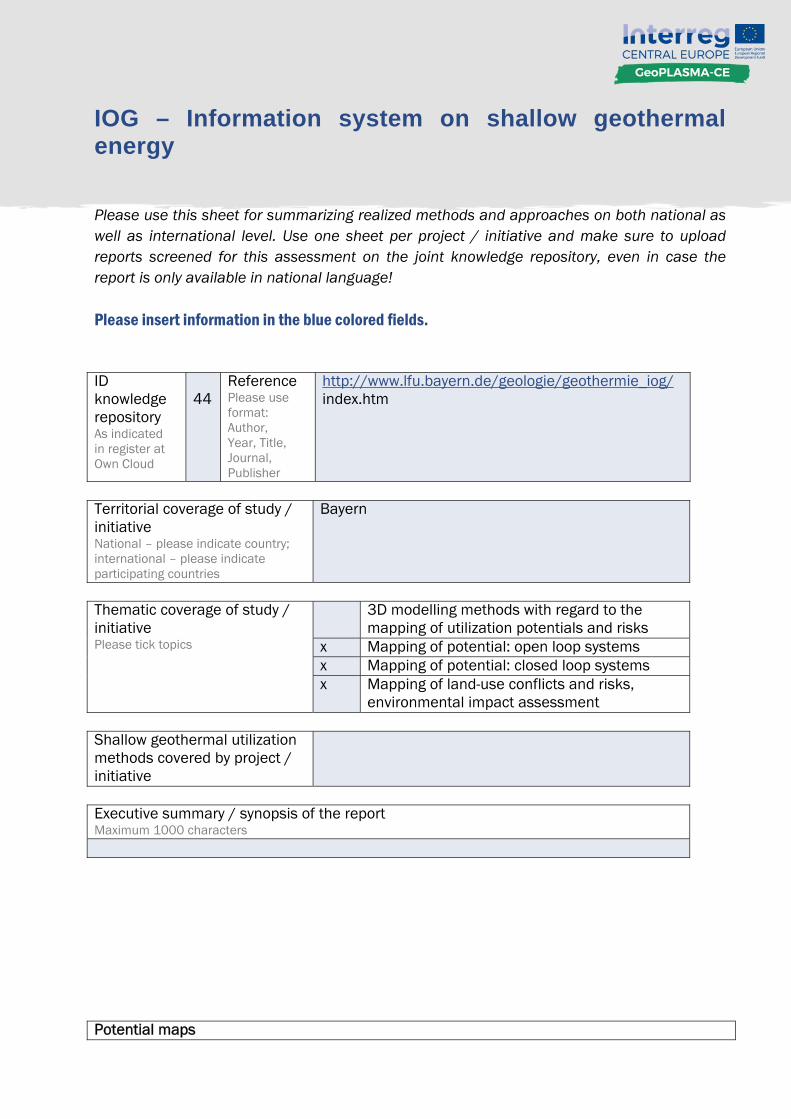
IOG – Information system on shallow geothermal energy
Please use this sheet for summarizing realized methods and approaches on both national as well as international level. Use one sheet per project / initiative and make sure to upload reports screened for this assessment on the joint knowledge repository, even in case the report is only available in national language! Please insert information in the blue colored fields.
ID knowledge repository As indicated in register at Own Cloud
44
Reference Please use format: Author, Year, Title, Journal, Publisher
http://www.lfu.bayern.de/geologie/geothermie_iog/ index.htm
Territorial coverage of study / initiative National – please indicate country; international – please indicate participating countries
Bayern
Thematic coverage of study / initiative Please tick topics
3D modelling methods with regard to the mapping of utilization potentials and risks
x Mapping of potential: open loop systems x Mapping of potential: closed loop systems x Mapping of land-use conflicts and risks,
environmental impact assessment Shallow geothermal utilization methods covered by project / initiative
Executive summary / synopsis of the report Maximum 1000 characters Potential maps
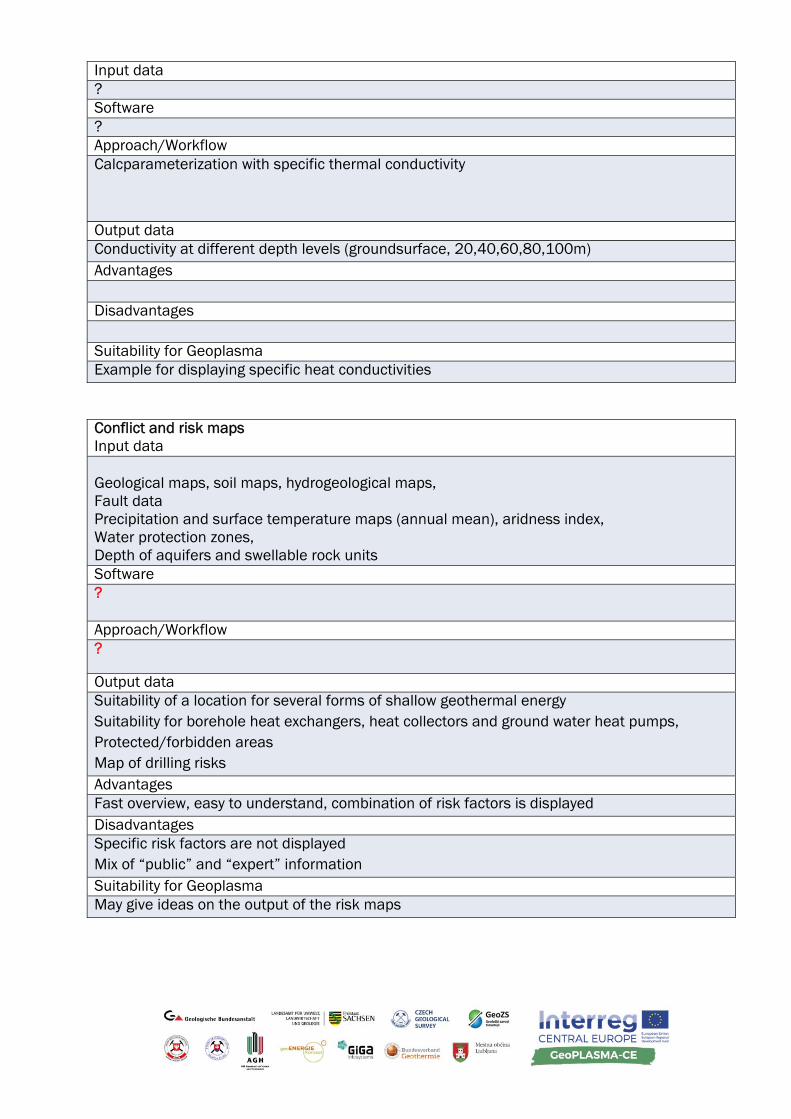
Input data ? Software ? Approach/Workflow Calcparameterization with specific thermal conductivity
Output data Conductivity at different depth levels (groundsurface, 20,40,60,80,100m) Advantages Disadvantages Suitability for Geoplasma Example for displaying specific heat conductivities Conflict and risk maps Input data Geological maps, soil maps, hydrogeological maps, Fault data Precipitation and surface temperature maps (annual mean), aridness index, Water protection zones, Depth of aquifers and swellable rock units Software ? Approach/Workflow ?
Output data Suitability of a location for several forms of shallow geothermal energy Suitability for borehole heat exchangers, heat collectors and ground water heat pumps, Protected/forbidden areas Map of drilling risks Advantages Fast overview, easy to understand, combination of risk factors is displayed Disadvantages Specific risk factors are not displayed Mix of “public” and “expert” information Suitability for Geoplasma May give ideas on the output of the risk maps

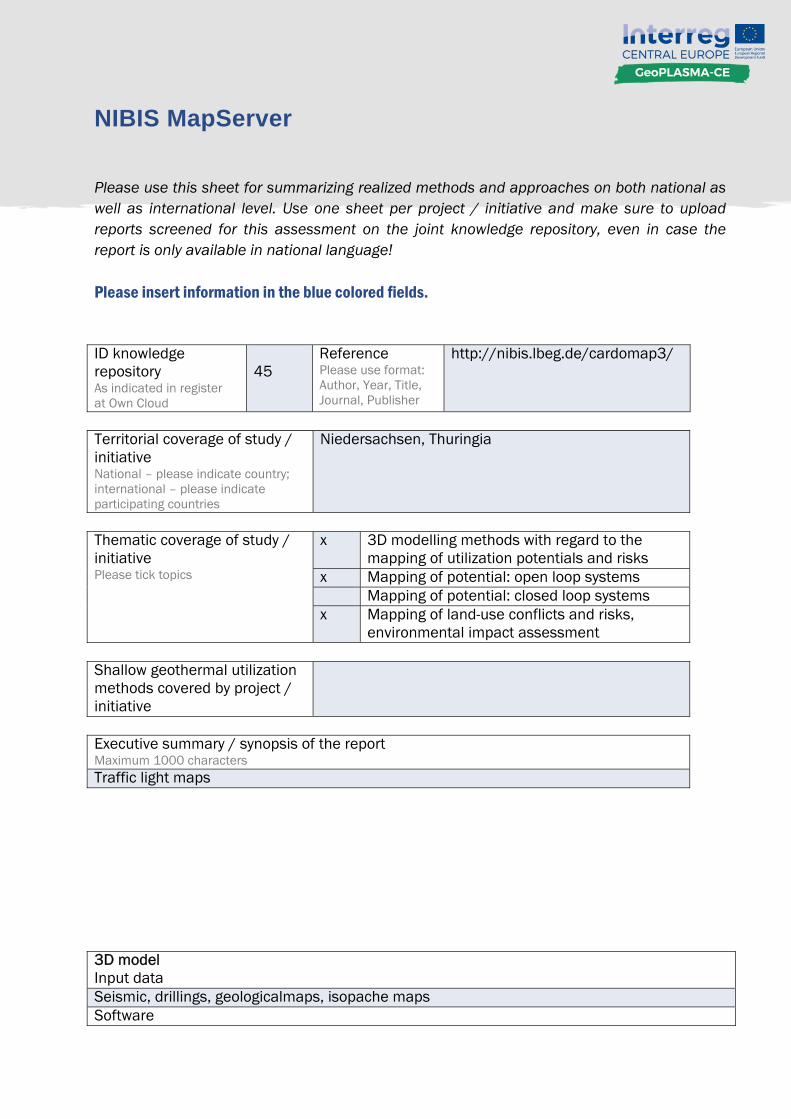
NIBIS MapServer
Please use this sheet for summarizing realized methods and approaches on both national as well as international level. Use one sheet per project / initiative and make sure to upload reports screened for this assessment on the joint knowledge repository, even in case the report is only available in national language! Please insert information in the blue colored fields.
ID knowledge repository As indicated in register at Own Cloud
45
Reference Please use format: Author, Year, Title, Journal, Publisher
http://nibis.lbeg.de/cardomap3/
Territorial coverage of study / initiative National – please indicate country; international – please indicate participating countries
Niedersachsen, Thuringia
Thematic coverage of study / initiative Please tick topics
x 3D modelling methods with regard to the mapping of utilization potentials and risks
x Mapping of potential: open loop systems Mapping of potential: closed loop systems x Mapping of land-use conflicts and risks,
environmental impact assessment Shallow geothermal utilization methods covered by project / initiative
Executive summary / synopsis of the report Maximum 1000 characters Traffic light maps 3D model Input data Seismic, drillings, geologicalmaps, isopache maps Software
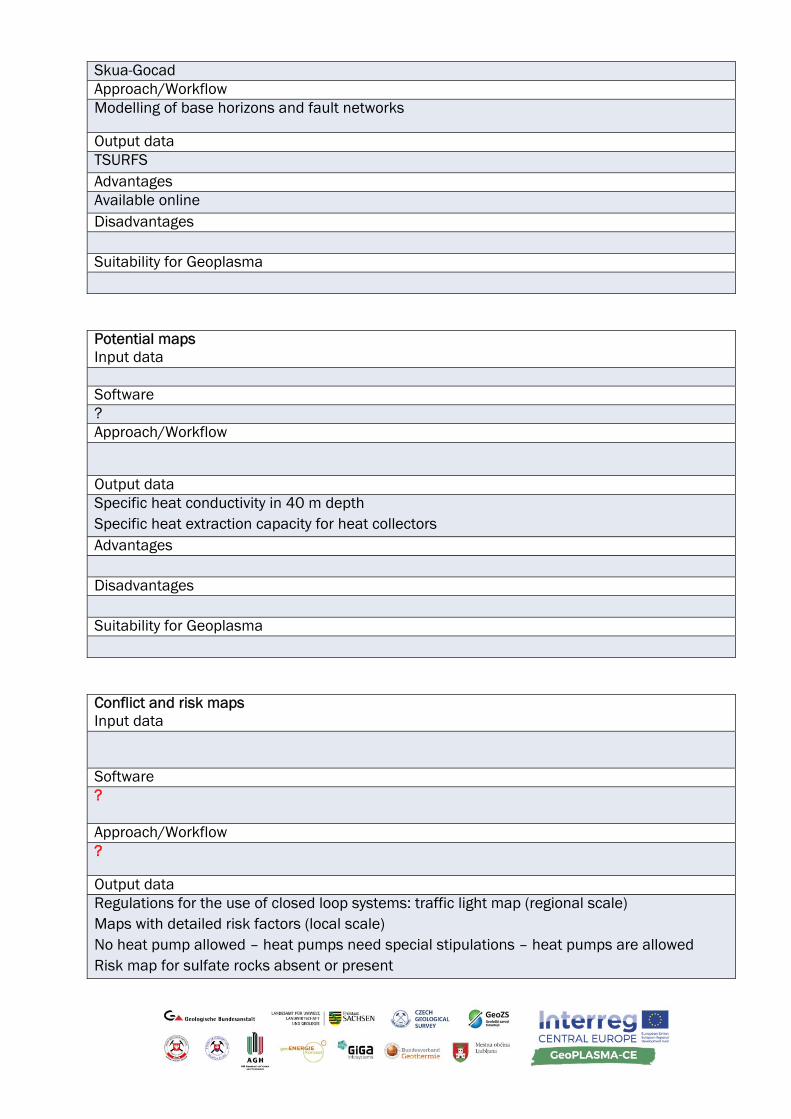
Skua-Gocad Approach/Workflow Modelling of base horizons and fault networks
Output data TSURFS Advantages Available online Disadvantages Suitability for Geoplasma Potential maps Input data Software ? Approach/Workflow
Output data Specific heat conductivity in 40 m depth Specific heat extraction capacity for heat collectors Advantages Disadvantages Suitability for Geoplasma Conflict and risk maps Input data Software ? Approach/Workflow ?
Output data Regulations for the use of closed loop systems: traffic light map (regional scale) Maps with detailed risk factors (local scale) No heat pump allowed – heat pumps need special stipulations – heat pumps are allowed Risk map for sulfate rocks absent or present
Advantages Disadvantages Suitability for Geoplasma
Geothermal Portal of Rheinland-Pfalz
Please use this sheet for summarizing realized methods and approaches on both national as well as international level. Use one sheet per project / initiative and make sure to upload reports screened for this assessment on the joint knowledge repository, even in case the report is only available in national language! Please insert information in the blue colored fields.
ID knowledge repository As indicated in register at Own Cloud
46
Reference Please use format: Author, Year, Title, Journal, Publisher
http://www.geothermieportal.de/geothermie_6.0/?Cmd =ShowMap&blCode=rp
Territorial coverage of study / initiative National – please indicate country; international – please indicate participating countries
Rheinland-Pfalz
Thematic coverage of study / initiative Please tick topics
3D modelling methods with regard to the mapping of utilization potentials and risks
Mapping of potential: open loop systems Mapping of potential: closed loop systems x Mapping of land-use conflicts and risks,
environmental impact assessment Shallow geothermal utilization methods covered by project / initiative
Heat collectors Heat pumps
Executive summary / synopsis of the report Maximum 1000 characters Traffic light maps Potential maps Input data
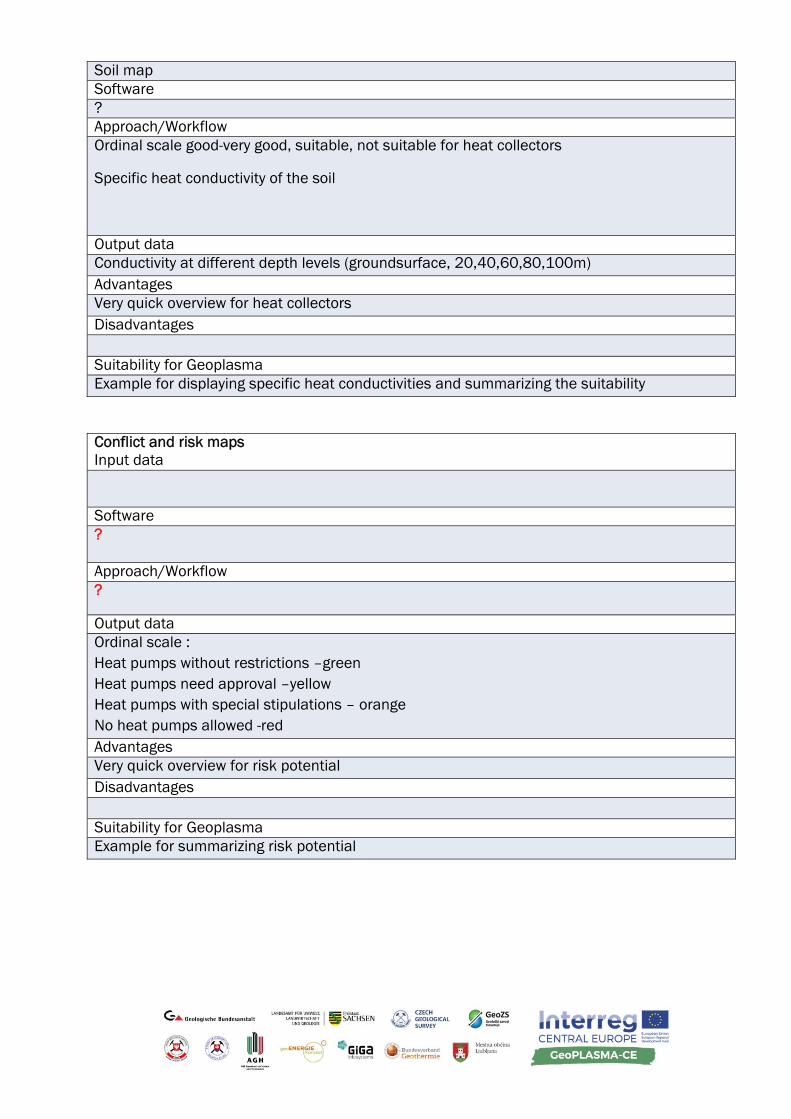
Soil map Software ? Approach/Workflow Ordinal scale good-very good, suitable, not suitable for heat collectors
Specific heat conductivity of the soil
Output data Conductivity at different depth levels (groundsurface, 20,40,60,80,100m) Advantages Very quick overview for heat collectors Disadvantages Suitability for Geoplasma Example for displaying specific heat conductivities and summarizing the suitability Conflict and risk maps Input data Software ? Approach/Workflow ?
Output data Ordinal scale : Heat pumps without restrictions –green Heat pumps need approval –yellow Heat pumps with special stipulations – orange No heat pumps allowed -red Advantages Very quick overview for risk potential Disadvantages Suitability for Geoplasma Example for summarizing risk potential
Assessment sheet for methods and approaches for potential and risk mapping on shallow geothermal use based on existing projects and initiatives
Please use this sheet for summarizing realized methods and approaches on both national as well as international level. Use one sheet per project / initiative and make sure to upload reports screened for this assessment on the joint knowledge repository, even in case the report is only available in national language! Please insert information in the blue colored fields.
ID knowledge repository As indicated in register at Own Cloud
66 Reference Please use format: Author, Year, Title, Journal, Publisher
G. Götzl, V. Ostermann, R. Kalasek, R. Heimrath, P. Steckler, A. Zottl, A. Novak, G. Haindlmaier, R. Hackl, S. Shadlau, H. Reitner, 2010, GEO-Pot Seichtes Geothermie Potenzial Österreichs. Überregionale, interdisziplinäre Potenzialstudie zur Erhebung und Darstellung des oberflächennahen geothermischen Anwendungspotenzials auf Grundlage eines regelmäßigen Bearbeitungsrasters; öwav 5-6/2010, Springer Verlag.
Territorial coverage of study / initiative National – please indicate country; international – please indicate participating countries
Austria
Thematic coverage of study / initiative Please tick topics
3D modelling methods with regard to the mapping of utilization potentials and risks
Mapping of potential: open loop systems X Mapping of potential: closed loop systems Mapping of land-use conflicts and risks,
environmental impact assessment Shallow geothermal utilization methods covered by project / initiative Please specify systems (e.g. borehole heat exchanger,
Borehole heat exchanger
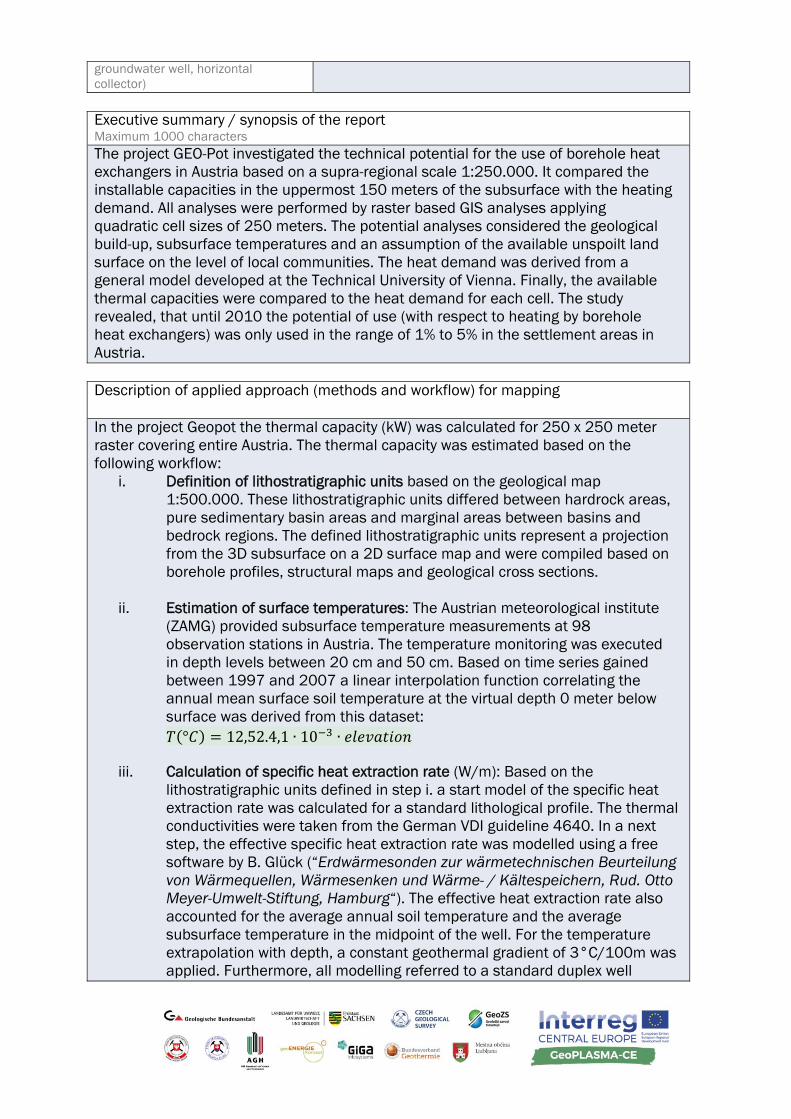
groundwater well, horizontal collector) Executive summary / synopsis of the report Maximum 1000 characters The project GEO-Pot investigated the technical potential for the use of borehole heat exchangers in Austria based on a supra-regional scale 1:250.000. It compared the installable capacities in the uppermost 150 meters of the subsurface with the heating demand. All analyses were performed by raster based GIS analyses applying quadratic cell sizes of 250 meters. The potential analyses considered the geological build-up, subsurface temperatures and an assumption of the available unspoilt land surface on the level of local communities. The heat demand was derived from a general model developed at the Technical University of Vienna. Finally, the available thermal capacities were compared to the heat demand for each cell. The study revealed, that until 2010 the potential of use (with respect to heating by borehole heat exchangers) was only used in the range of 1% to 5% in the settlement areas in Austria. Description of applied approach (methods and workflow) for mapping In the project Geopot the thermal capacity (kW) was calculated for 250 x 250 meter raster covering entire Austria. The thermal capacity was estimated based on the following workflow:
i. Definition of lithostratigraphic units based on the geological map 1:500.000. These lithostratigraphic units differed between hardrock areas, pure sedimentary basin areas and marginal areas between basins and bedrock regions. The defined lithostratigraphic units represent a projection from the 3D subsurface on a 2D surface map and were compiled based on borehole profiles, structural maps and geological cross sections.
ii. Estimation of surface temperatures: The Austrian meteorological institute (ZAMG) provided subsurface temperature measurements at 98 observation stations in Austria. The temperature monitoring was executed in depth levels between 20 cm and 50 cm. Based on time series gained between 1997 and 2007 a linear interpolation function correlating the annual mean surface soil temperature at the virtual depth 0 meter below surface was derived from this dataset: ° 12,52.4,1 ∙ 10 ∙
iii. Calculation of specific heat extraction rate (W/m): Based on the
lithostratigraphic units defined in step i. a start model of the specific heat extraction rate was calculated for a standard lithological profile. The thermal conductivities were taken from the German VDI guideline 4640. In a next step, the effective specific heat extraction rate was modelled using a free software by B. Glück (“Erdwärmesonden zur wärmetechnischen Beurteilung von Wärmequellen, Wärmesenken und Wärme- / Kältespeichern, Rud. Otto Meyer-Umwelt-Stiftung, Hamburg“). The effective heat extraction rate also accounted for the average annual soil temperature and the average subsurface temperature in the midpoint of the well. For the temperature extrapolation with depth, a constant geothermal gradient of 3°C/100m was applied. Furthermore, all modelling referred to a standard duplex well
geometry and a constant amount of 1996 operational hours per year. iv. GIS analyses and preparation of output datasets: The entire area of Austria
was covered by a quadratic grid of 250m size. For calculating the thermal capacity of cell, the following attributes have been added to the cells: lithostratigraphic unit and average elevation. The numerical simulations executed, based on the program developed by B. Glück, led to a matrix of thermal capacities referring to the standard well geometry and standard annual operational hours. The thermal capacity was furthermore set in dependency of the geological build-up (lithostratigraphic unit) and the average soil temperature (elevation). The total thermal capacity for each cell was afterwards calculated by linear interpolation of the matrix nodes with respect to the attributes of each cell. In a final step, the total thermal capacity installable at a cell was calculated by multiplying the unspoilt land surface areas, suitable for constructing boreholes, with the area consumed by each borehole. This led to a ratio, which was finally multiplied to the thermal capacity of each borehole heat exchanger. In a last step, the total thermal capacity per cell was compared to the heat demand of each cell.
v. Visualization: The output datasets were delivered in terms of a regular grid,
stored in a Esri GIS geodatabase. The results have been published in terms of printable maps.
Description of input data used for mapping Please make a general sketch, no detailed data lists (e.g. hydrogeological maps scale 1:50.000)
- Lithostratigraphic units, decribed by a reference lithological borehole profile (maximum depth 150 meters). Geological map of Austria 1:500.000.
- Thermal conductivity (water saturated only) for different rock types taken from the DVI 4640 guideline
- Annual soil temperature (depth 0 meter), derived from long term monitoring of the subsurface temperature (1997 – 2007) in 98 stations all over Austria.
- Constant geothermal gradient of 3°C/100m
Description of output parameters and data-formats of results e.g. printed maps including the scale, GIS based maps, interactive web-systems
- Map of specific heat extraction rate (W/m) based on the raster - Map of annual soil temperature based on the raster - Thermal capacity of a standard well (default geometry and operational hours
on the basis of the raster) - Total thermal capacity per cell
Description of the suitability of the chosen approach for GeoPLASMA-CE Please write a short review about the pros and cons of the chosen approach! Is that approach suitable for GeoPLASMA-CE? The approach chosen can be defined as supra-regional and therefore not very suitable for the aims of GeoPLASMA-CE. The handling with geodata based rasters was very easy and did not consume much of data storage capacities. The workflow to
estimate the annual soil temperatures based on monitoring station is commonly used and can also be applied in GeoPLASMA-CE. However, the correlation between the annual soil temperature and the surface elevation is also depending on the climatic constraints and may not be suited for areas with a high relief. One should consider to create interpolation functions for the soil temperature only for homogeneous regions from a climatic point of view.