Gregorio Francisco Canó ALmonte
134
Gregorio Francisco Canó ALmonte ASSESSMENT OF ROBUSTNESS FOR COMPOSITE STEEL-CONCRETE FRAME BUILDINGS Coimbra, September 2019 Dissertation of Master of Science in construction of Steel and Composite Structure Faculty advisor Professor Aldina Maria Cruz Santiago and Professor Ruis António Duarte Simões
Transcript of Gregorio Francisco Canó ALmonte

Gregorio Francisco Canó ALmonte
ASSESSMENT OF ROBUSTNESS FOR COMPOSITE STEEL-CONCRETE FRAME BUILDINGS
Coimbra, September 2019
Dissertation of Master of Science in construction of Steel and Composite Structure Faculty advisor Professor Aldina Maria Cruz Santiago and
Professor Ruis António Duarte Simões
Faculdade de Ciências e Tecnologia da Universidade de Coimbra
Departamento de Engenharia Civil
Gregorio Francisco Canó ALmonte
ASSESSMENT OF ROBUSTNESS FOR COMPOSITE STEEL-
CONCRETE FRAME BUILDINGS
AVALIAÇÃO DA ROBUSTEZ DE EDIFICIOS MISTOS AÇO-BETÃO EM ESTRUTURA PORTICADA
Dissertation of Master of Science in construction of Steel and Composite Structure
Faculty advisor Professor Aldina Maria Cruz Santiago and Professor Ruis António Duarte Simões
The author of this dissertation is full responsible for its content. The Civil Enginring Faculty of FCTUC declines any
responsibility; legal or other, in relation of errors or omission that it might have.
Coimbra, September 2019

Gregrorio Francisco Canó Almonte i
Summary
Robustness for buildings is a compilation of lessons learned from past experiences in the
engineering world. The main purpose is always the same: to avoid the progressive collapse on
buildings second to an accidental load like fire, explosion, impact or the consequence of a human
error. This is why the construction norms for Europe, EN 1991 part 1-7, is focused in that matter.
However, preparing a building to withstand the additional stress caused by these events, can make
the final cost of the structure out of reach for the investor. This is what motivated the research at
hand, so that we could design a structure, on top of the building, capable of redistributing the loads.
In order to reach this objective, a parametric numerical study was done, where two buildings
were designed under three different conditions. The first one was a simple structural design
following the consideration on the European norms for ultimate and serviceability limit state, used
as a refence point. On the second one, the buildings were designed following the Eurocode 1 part
1-7 for accidental load, making the structure with enough redundancy in order to tolerate the stress
applied. On the third one, the latter was applied by using a truss superstructure to redistribute the
load. The solutions were compared based on the final weight and connection rigidity of the
building. On both cases the building with the truss superstructure was verified for the accidental
combination loads. However, the shortest one, when checked for normal conditions for the ULS
and SLS, was not satisfactory, having to be redesigned for the additional weight of the truss
superstructure.
Making a comparison of the final solution for both buildings, we arrived at the conclusion that
the truss superstructure that was considered, helped the structural design. Even though for the
shorter building the solution was not lighter, the connection rotational stiffness was considerably
lower, whereas for the second building, both conditions were satisfactory.
Keyword
Robustness | Progressive collapse | Truss superstructure | Connections rigidity

Gregrorio Francisco Canó Almonte ii
Acknowledgement
First, I want to thank God for putting in me the will to learn new things, for His guidance and
for giving me enough strength to never give up. Without Him, none of this was possible. Second,
I would like to express my gratitude and appreciation for my advisors, Professor Aldina Maria Cruz
Santiago and Rui António Duarte Simões, for believing in me, their availability and for helping me
chose a topic that allowed me to flourish and put into practice the knowledge gathered in the past
two years, building on my confidence to do structural design.
Also, want to thank the group colleagues that quickly became friends, for welcoming this
foreign student as part of their circle, introducing me to their culture and sharing their experience
on the field, specially Emanuel Correia and Tiago Andrade, for been available to offer help when
I needed it the most, always helping me clarify my many doubts; and to the rest of the faculty staff,
professors and investigators, that became a special part of my everyday life, in particular Filip,
Nemanja, Damjan and Jorge. On the other hand, The CAD Coimbra Basket Club not only make
me feel like a part of a family, but also represented the perfect work-life balance, helping me
preserve my sanity in stressful moments. Moreover, to my friends of a lifetime, those back at home,
for having supported me in the distance and encouraged me to succeed and develop my carrier.
Finally, I want to thank my family for all the sacrifices made for me, so that I could be where I
am today, accomplishing this personal goal; for their unconditional love and support throughout
this master and my life. I will be forever grateful for the things that they have given me. And last
but not least, to my fiancé Anaymi Acosta, for believing in me, being there for me and not allowing
me to give up; definitely, without you I would not have been able to accomplish this, I will be
forever in debts.

Gregrorio Francisco Canó Almonte iii
Contents
Symbols .................................................................................................................................... vi
1. Introduction ....................................................................................................................... 1
1.1. Relevance and scope .................................................................................................. 1
2. Literature review: EN 1991-1-7 ........................................................................................ 7
2.1. Introduction ............................................................................................................... 7
2.2. Robustness design approach ...................................................................................... 7
2.2.1. Accidental design strategies for identified actions ........................................... 10
2.2.2. Accidental design strategies for unidentified actions ....................................... 11
2.2.3. Use of consequence classes .............................................................................. 11
2.2.4. Impact ............................................................................................................... 12
2.2.5. Internal explosions ........................................................................................... 13
2.2.6. Design for consequences of localized failure in buildings from an unspecified
cause (Annex A) .................................................................................................................... 14
2.2.6.1. Recommended strategies ............................................................................. 16
2.2.6.2. Horizontal ties .............................................................................................. 17
2.2.6.3. Vertical ties .................................................................................................. 19
2.2.6.4. Nominal section of load-bearing wall .......................................................... 20
2.2.6.5. Key elements ................................................................................................ 20
2.2.7. Information on risk assessment (Annex B) ...................................................... 20
2.2.7.1. Description of the scope of a risk analysis................................................... 22
2.2.7.2. Risk acceptance and mitigating measures .................................................... 24
2.2.7.3. Risk mitigation measures ............................................................................. 25
2.2.7.4. Application to buildings and civil engineering structures ........................... 25
2.2.8. Dynamic design for impact (Annex C) ............................................................ 27
2.2.9. Internal explosions (Annex D) ......................................................................... 27
3. Structural connections ..................................................................................................... 29

Gregrorio Francisco Canó Almonte iv
3.1. Beam-to-column and beam-to-beam connections ................................................... 29
3.1.1. Analysis, classification and modeling of joints ................................................ 30
3.1.1.1. Elastic global analysis .................................................................................. 31
3.1.1.2. Rigid-plastic global analysis ........................................................................ 33
3.1.1.3. Elastic-plastic global analysis ...................................................................... 35
3.1.1.4. Global analysis of lattice girders.................................................................. 35
3.1.2. Joint classification ............................................................................................ 35
3.1.3. Modeling beam-to-column connection ............................................................ 38
3.2. Steel-to-concrete connection ................................................................................... 41
3.2.1. Longitudinal shear stress between concrete and steel ...................................... 41
4. Structural design of buildings: two case studies ............................................................. 47
4.1. Parametric values and analysis case ........................................................................ 47
4.1.1. Parametric values ............................................................................................. 47
4.1.2. Analysis case .................................................................................................... 48
4.2. Actions ..................................................................................................................... 48
4.2.1. General actions for live load ............................................................................ 48
4.2.2. General action for permanent load ................................................................... 49
4.2.3. General action for permanent non-structural elements .................................... 50
4.2.4. Other permanent action considered .................................................................. 50
4.2.5. Snow load ......................................................................................................... 50
4.2.6. Wind load ......................................................................................................... 51
4.2.6.1. Building 1 wind load .................................................................................... 52
4.2.6.1. Building 2 wind load .................................................................................... 53
4.2.7. Load summary .................................................................................................. 55
4.2.8. Load combination ............................................................................................. 55
4.3. Design assumptions ................................................................................................. 56
4.3.1. Structural modeling .......................................................................................... 56
Gregrorio Francisco Canó Almonte v
4.3.2. Building characterization ................................................................................. 57
4.3.3. Composite slab ................................................................................................. 58
4.3.4. Secondary beam ............................................................................................... 61
4.3.5. Primary beam ................................................................................................... 66
4.3.6. Columns ........................................................................................................... 67
4.3.7. Beam-to-column connection ............................................................................ 71
4.3.8. Braces system ................................................................................................... 73
4.3.9. Final solution .................................................................................................... 74
5. Evaluation of robustness on the building ........................................................................ 76
5.1. Classification of the buildings ................................................................................. 76
5.2. Notional removal of supports .................................................................................. 76
5.3. Actions ..................................................................................................................... 78
5.3.1. Load combination ............................................................................................. 78
5.4. Design assumptions ................................................................................................. 80
5.4.1. First approach: Design without truss superstructure ........................................ 80
5.4.2. Second approach: Design with truss superstructure ......................................... 83
5.4.2.1. Trusses system ............................................................................................. 86
5.5. Connections ............................................................................................................. 87
5.6. Final solution ........................................................................................................... 93
6. Conclusion ...................................................................................................................... 95
7. Bibliography ................................................................................................................... 99
8. Annex ................................................................................................................................ 1

Gregrorio Francisco Canó Almonte vi
Symbols
" + " implies “to be combine with”
𝛴 implies “to be combine with”
Gkj are the characteristic values of the permanent actions
Ad is the design value of an accidental action
Qk,1 is the characteristic value of the leading variable actions
Qk,i are the characteristic values of the other variable actions
𝜓1,1 is the factor for the frequent value of the leading variable 𝑄𝑘, 1
𝜓2,I is the factor for the quasi-permanent value of the i-th variable action 𝑄𝑘, 𝑖
s is the spacing of ties.
L is the span of the tie.
𝜓 is the relevant factor in the expression for combination of action effects for the accidental
design situation.
Ft is 60𝑘𝑁𝑚𝑜𝑟20 + 4𝑛𝑠 𝑘𝑁𝑚, 𝑤ℎ𝑖𝑐ℎ 𝑒𝑣𝑒𝑟 𝑖𝑠 𝑙𝑒𝑠𝑠
ns is the number of stories
z is the lesser distance between ties
A The cross-sectional area in 𝑚𝑚2 of the wall measured on plan, excluding the non-load-
bearing leaf of a cavity wall.
H is the story height in meters.
ki The stiffness coefficient for basic joint component ⅈ.
𝑧 The lever arm see figure 6.15 EN 1993-1-8.
𝜇 The stiffness ration 𝑆𝑗, 𝑖𝑛𝑖/𝑆𝑗.
Ftr,Rd The effective design resistance of a bolt-row 𝑟.
hr The distance from bolt-row 𝑟 to the center of compression.
𝑟 The bolt-row number.
ⅆ is the nominal diameter of the bolt.
fub is the yield strength of the relevant basic component.
fy is the ultimate tensile strength of the bolt material.
hc The depth of the column
hb The depth of the beam
kb The mean value of 𝐼𝑏 ∕ 𝐿𝑏 for all the beam at the top of that story.
kc The mean value of 𝐼𝑐 ∕ 𝐿𝑐 for all the column in that story.
Ib The second moment of area of a beam.
Ic The second moment of area of a column.
Lb The spam of a beam (center-to-center of columns)
Gregrorio Francisco Canó Almonte vii
Lc The span of a column
Mb,Pl,Rd The design plastic moment resistance of the beam.
Mc,Pl,Rd The design plastic moment resistance of the column.
𝑧 The lever arm.
𝛽1 The value of transformation parameter 𝛽 for the right-hand side joint.
𝛽2 The value of transformation parameter 𝛽 for the left-hand side joint.
Mj,b1,Ed The moment at the intersection from the right-hand beam.
Mj,b2,Ed The moment at the intersection from the left-hand beam.
𝑉𝑥 Shear stress on the section
𝑆 Static moment of the homogenized concrete section in relation with the neutral elastic axis.
𝐼 The moment of inertia of the homogenized section.
𝑞 The longitudinal shear stresses.
γv Partial coefficient to consider material imperfections, use 1.25.
ⅆ Diameter of the shear stud.
fu Ultimate tensile stress of the shear stud, less than 500 𝑁 ∕ 𝑚𝑚2
fck Ultimate compression tension for concrete at 28 days.
hsc Total height of the shear stud
PB The force due to the flexion of the stud
Pz The force due to the inclination of the stud
hsc Total height of the shear stud
hp Total height of the steel sheet
nr The number of shear stud in the nerve, not higher than 2.
Where,
𝑛 The number of connectors
Lx Distance between the support and any point in the beam.
PRd Shera stud resistance.
Nc Force applied to the concrete.
VL,Rd Longitudinal shear design resistance.
Nc,f The compression force resisted by the concrete flange.
Rc The maximum compression resistance of the concrete flange.
Ra The maximum tensile resistance of the steel section.
Sk Characteristic value of snow on the ground at a relevant site.
Cz Coefficient depending on the zone.
H Altitude of the local in meters
𝑆 Snow load on the roof.

Gregrorio Francisco Canó Almonte viii
𝜇i Snow load shape coefficient.
ce Exposure coefficient.
ct Thermal coefficient.
qp The peak velocity pressures.
qp20 The peak velocity pressures at a height of 20 meters.
qp32 The peak velocity pressures at a height of 32 meters.
qp40 The peak velocity pressures at a height of 40 meters.
" + " Implies “to be combine with”.
𝛴 Implies “to be combine with”.
Gkj The characteristic values of the permanent actions.
𝛾G,j Partial factor for permanent action 𝑗.
𝑃 Relevant representative value of a prestressing action.
𝛾p Partial factor for prestressing actions.
Qk,1 The characteristic value of the leading variable actions.
𝛾Q,1 Partial value factor for the leading variable action.
Qk,i The characteristic values of the accompanying variable actions ⅈ.
𝛾Q,i Partial value factor for the accompanying variable actions ⅈ.
𝜓o,i The factor for combination for the accompanying variable action ⅈ.
ks Coefficient that allows to take into consideration the effect of the reduction of the normal
force of the concrete slab due to initial cracking and local slip of shear connection, which may be
taken as 0.9
kc Coefficient which considers of the stress distribution within the section immediately prior
to cracking and is given by:
hc The thickness of the concrete flange.
Z0 The vertical distance between the centroids of the un-cracked concrete flange and the un-
cracked composite section, calculated using the modular ration 𝑛0 for short term loading.
𝑘 Coefficient which allows for the effect of non-uniform self-equilibrating stress which may
be taken as 0.8.
Fct,eff The mean value of the tensile strength of the concrete effective at the time when cracks
may first be expected to occur. This value may be taken as 𝑓𝑐𝑡𝑚 from table 3.1 of NP EN 1992-1-
1.
Act The area of the tensile zone immediately prior of the cracking of the cross section
𝜎s The maximum stress permitted in the reinforcement immediately after cracking.
𝑀𝑃𝑙, 𝑅𝑑 The plastic resistance moment of the section.
𝑉𝑃𝑙, 𝑅𝑑 The plastic shear resistance of the section.
Gregrorio Francisco Canó Almonte ix
Av The shear area of the section.
fy The yield strength of the structural steel.
VEd The shear stress applied to the beam.
MEd,max The maximum moment applied to the beam.
𝑤 The combination load applied to the beam.
𝐿 The length of the beam.
b0 The distance between connectors.
bei The effective width of the concrete flange.
δmax Maximum deformation allowed
𝐿 Beam length
ui Overall horizontal displacement over the building height 𝐻
𝑢 Horizontal displacement over a story height 𝐻𝑖
Assessment of Robustness for Composite Steel-Concrete Frame Buildings Introduction
Gregrorio Francisco Canó Almonte 1
1. Introduction
1.1. Relevance and scope
The construction industry has witness various improvements based on the knowledge of the
materials, the construction method and the efficiency and cost of production of the structure. The
composite structures are a perfect example of this evolution, where different materials are
combined in order to take advantages of specific mechanical characteristics of each element. For
this reason, steel structures, thanks to their high resistance to tensile stress, are often combined with
concrete, which has high resistance to compression, allowing both materials to be used with a high
efficiency. As a result, there are lightweight structural elements that can super pass large span.
This, combined with other characteristics, has allowed the growth of steel structures use in the
world.
The construction process of steel structures is made from standardized elements. The
installation process is simple and has a big impact on the execution time and, furthermore, in the
final cost of the construction. Besides, the steel structure is 100% recyclable making it very suitable
to lessen the environmental impact.
For the structural design of a building, each country has established its own code. The European
Union (EU) has the Eurocodes, which give the parameters on how the design should be conducted
within the EU. This set of codes stablishes the Ultimate Limits States, when the structure is limited
by the stress experienced in all the materials involved; and the Serviceability Limits State, when
the condition of the structure is in service and involves other verifications like cracking, vibration,
deformation, durability and overall stability. These limits are verified after submitting the building
with different loads scenarios that are also summarized in the Eurocode.
The first part of the Eurocode EN 1990 makes a differentiation between the permanent load,
the variable loads and the accidental loads on a building. The permanent load refers to the self-
weight of structural and non-structural elements that are fixed in the building. The nominal density
used for the structural elements is defined on the codes for each material and in the case of the non-
structural elements, it can be defined by the provider.
The variable loads, according to Eurocode 0, are the ones whom the variation in magnitude
with time is neither negligible nor monotonic; for example, snow, wind, thermal, imposed variable
load. The imposed load varies according to the usage of the building. The environmental loads are

Assessment of Robustness for Composite Steel-Concrete Frame Buildings Introduction
Gregrorio Francisco Canó Almonte 2
defined in Eurocode 1 part 1-3, 1-4 and 1-5 and they depend on the shape, height and if is a
composite structure or not, among others.
The accidental loads are actions of short duration but of significant magnitude, that are unlikely
to occur on a given structure during the design working life; for example, fire, explosion, seismic
(CEN, 2009). These loads are more complex when taken into consideration, because, they may
never occur on the life span of the structure and there is not a way to determine the expected damage
or probability of occurrence. They are represented in Eurocode 1 part 1-2 for fire, part 1-7 for
impacts and explosion and Eurocode 8 part 1-1 for seismic action.
In this thesis, we will focus on the Eurocode 1 part 1-7 where “robustness” is defined as the
ability of a structure to withstand events like fire, explosions, impact or the consequence of human
error, without being damaged to an extent that is disproportionate to the original cause. This norm
proposes two different approaches for the structural design: one through the identification and
quantification of the accidental action (explosion, impact) and another one based on limiting the
damage. In the case at hand, the design is going to be based on limiting the damages, which has
three ways in which it can be achieved. The first one is to identify key elements in the structure on
which its stability depends on an accidental design situation and design. The second one is to design
the structure so that it’s stability won’t be affected in case there is a localized damage. The third
one is using design rules in order to get enough robustness (for example, ductility of the elements,
traditional tying to increase the integrity of the structure) (Way, 2011).
The study of robustness has been emphasized, revised and evolved due to a series of events
around the world. In the document “Best Practices for Reducing the Potential for Progressive
Collapse in Building” from the National Institute of Standards and Technology in the United States
of America (Technology, 2007), there are five maior cases presented where the result of not taking
into consideration this capacity on the structure lead to partial or total failure. These examples help
to understand and give an introduction on how robustness pretend to enhance structural design.
In May 16th, 1968, in a 22-story building in the east side of London known as the Ronan Point
Tower, an incident took place; the light of a match produced a gas explosion on the 18th floor caused
a partial structural collapse. Thanks to this occurrence, the prevention of disproportionate collapse
was introduced in the engineering world. In this event, one of the external walls was severely
damaged and, with this, the lack vertical support for the floors above caused everything from the
top to collapse and, due to the weight, all the floors underneath as well. According to investigations,
this was due to the new construction methodology implemented at the time. It could be shown that
it did not have structural integrity to withhold this type of situations. In other words, there was not

Assessment of Robustness for Composite Steel-Concrete Frame Buildings Introduction
Gregrorio Francisco Canó Almonte 3
an alternative path for the load to be distributed to other structural members of the building
(Technology, 2007).
Figure 1-1: Ronan Point Tower partial collapse (Cook, 2018)
In July 17th, 1981, the Hyatt Regency Hotel’s walkway collapse in Kansas City, Missouri, was
another case study for the lack redundancy in the structure. In the original drawings there where
two pavements, one on top of each other, hanging from the ceiling inside the lobby both using a
continuous rod as support. In this case, due to a lack of communication between the project designer
and the company in charge of the construction, this support was modified, and the lower pathway
was set to hang directly from the upper one with a different rod. This doubled the stress in the
structural element on the upper bridge causing a total collapse of the structure (Technology, 2007).
Figure 1-2 Hyatt Regency Hotel walkway collapse (MURPHY, 2014)
In April 23, 1987, the L’Ambiance Plaza in Bridgeport, Connecticut had a total collapse due to
the insufficient reinforcement of the slab. This structure was using a different technique for the
construction method known as the “Lift Slab Method”. This consisted on having the slab cast on
the ground one on top of each other and then they were lifted to its position with jacks installed on

Assessment of Robustness for Composite Steel-Concrete Frame Buildings Introduction
Gregrorio Francisco Canó Almonte 4
top of the columns. Many hypotheses exist of when and where the collapse started; however, it is
clear, that it started with a local failure of the structure and the lack of resistance of the slab due to
poor reinforcement for cracking, leading to the total collapse of the structure (Technology, 2007).
Figure 1-3 L’Ambiance Plaza total collapse (CARTER, 2018)
In April 19, 1995 a truck bomb was detonated on the north side of the Alfred P. Murrah
Building in Oklahoma City, Oklahoma, that caused the partial collapse of the building. This was a
terrorist attack aimed to harm a Unites Stated government office that was located there. This case,
as opposed to the other ones, the structural design and detailing was according to the constructions
codes that existed at the moment of erection; however, this building was not designed to sustain
accidental loads like earthquake, blast, or any type of extreme loading because it was not
mandatory. This was a nine-story reinforced concrete building with ordinary moment frames and,
according to investigations, just by modifying the structure, to a moment frames like the one used
in seismic design, would have limit the collapse to a 50% (Technology, 2007).
Figure 1-4 Alfred P. Murrah Federal Building partial collapse (Jenkins, 2019)

Assessment of Robustness for Composite Steel-Concrete Frame Buildings Introduction
Gregrorio Francisco Canó Almonte 5
In a heavy snowstorm in the winter of 1996 the Jackson Landing Skating Rink came to a
complete collapse in Durham, New Hampshire. This was a result of an unheated dome that, due to
the low angle of inclination, stored a large amount of snow. This resulted in a local failure, given
that one of the anchorages from one of the rods’bends failed suddenly. This was pre-engineered
rigid frame structure of 64 m by 30.5 m open on the laterals. The roof structure was a metal-deck
carried by Z-shape and C-shape purlins anchored to bents separated every 6.4 m, that resisted the
lateral forces by cross-bracing cable on three non-sequential spans. On this day, the progressive
collapse was due to overload of the purlin pulling down or by lateral instability of the structure.
This case study is different from the others, since is not the typical vertical progressive failure, but
a horizontal version of it, where open structure requires low resistance to lateral loads; therefore, it
was not prepared to resist the sudden increase of load causing the instability and, eventually, a
structure collapse.
Figure 1-5 Jackson Landing Skating Rink collapse (Technology, 2007)
These are five well documented and studied cases where the structural design did not took into
consideration the possibility of a rapid increase or change of loads, where the buildings had a lack
of structural integrity and there was not a redundancy in the structure or an alternative path for the
load in case of an extreme condition. As a result, there was loss of human life and large amounts
of money. Cases like the ones presented here have helped shape what is known today as robustness
in the structure.
The robustness in steel structures have different ways of being assessed. According to Eurocode
1 part 1-7, one of them is the instantaneous loss of a column that helps to design a structure capable
of having an internal redistribution of the loads to avoid a progressive collapse. The purpose of this
method is to simulate the column loss due to a car collision, gas explosion, fire or malicious intent.
Assessment of Robustness for Composite Steel-Concrete Frame Buildings Introduction
Gregrorio Francisco Canó Almonte 6
The main purpose of this thesis is the study of two different scenarios of a composite steel-
concrete building to evaluate robustness through European norms, with the objective to propose an
alternative load path due to the loss of a column. The first approach will be done by making the
sections of the buildings resist the stress applying EN 1991 part 1-7. The second approach will be
to use a truss superstructure to redistribute these loads. It will be done only by numerical
verification supported by the Eurocode. The solution will be validated according the structural
behavior of the building. To ensure the necessary redundancy of a structure, the cost becomes a
major factor on the final decision. With this thesis, a comparison of the final weight for two
different solutions will be presented, as well as the structural solutions and benefits.

Assessment of Robustness for Composite Steel-Concrete Frame Buildings Literature review: EN 1991-1-7
Gregrorio Francisco Canó Almonte 7
2. Literature review: EN 1991-1-7
2.1. Introduction
In this chapter will be describe in extension the use of the Eurocode 1 part 1-7, for this review
it will be necessary to outline other sections of the Eurocode (EN). It is important to point out that
in this project the study will focus an office building.
2.2. Robustness design approach
The Eurocode, as was stated before, dedicated to take into consideration the structural
robustness is the part 1-7 of the Eurocode 1. Where robustness is defined as “the ability of a
structure to withstand events like fire, explosions, impact, or the consequences of human error,
without being damaged to an extent disproportionate to the original cause” (CEN, 2006). This
term can also be found in the Eurocode 0 and Eurocode 3. Is important to point out that every
country may vary some of the parameters in this code through the National Annex; however,
Portugal has not made any.
Design for robustness involves considering an accidental load and, according to Eurocode 0
section 3.2, This situation refers to an “exceptional conditions applicable to the structure or to its
exposure, example to fire, explosion, impact or localized failure” (CEN, 2009). In other words,
the building should be designed to ensure that a disproportionate collapse will not occur.
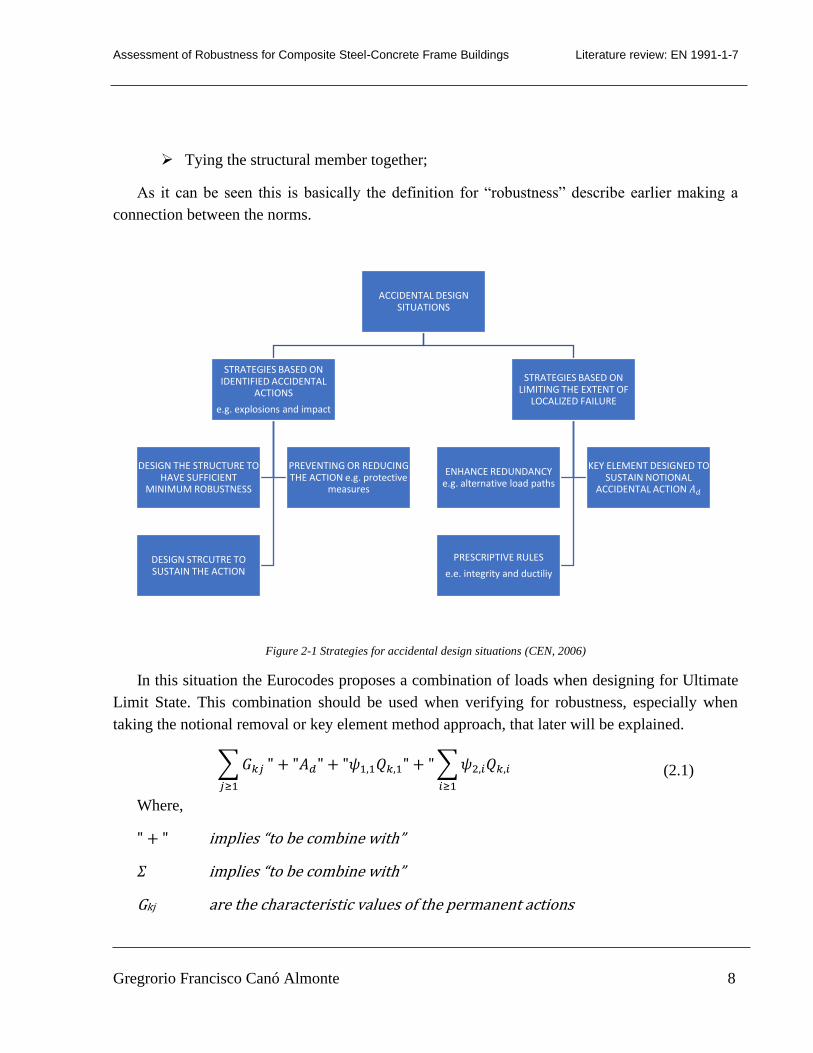
Figure 2-1 is a direct extraction from EN 1991 part 1-7 where the strategies for the structural
design in accidental situations are described. The consideration will be taken in accordance with
the client and relevant authority. The path should be chosen so the basis of structural projects are
accomplished; specially what is stated in Eurocode 0, in section 2.1, where it specifies that the
structure should be designed in a way that will not be damaged by explosion, impact, and the
consequence of human error. Also, that the potential damage of a structure should be avoided or
limited by appropriately selecting one of the following:
➢ Avoiding, eliminating or reducing the hazards to which the structure can be subjected;
➢ Selecting a structural form which has low sensitivity to the hazards considered;
➢ Selecting a structural form and design that can survive adequately the accidental
removal of an individual member or limited part of the structure, or the occurrence of
acceptable localized damage;
➢ Avoiding as far as possible structural systems that can collapse without warning;
Assessment of Robustness for Composite Steel-Concrete Frame Buildings Literature review: EN 1991-1-7
Gregrorio Francisco Canó Almonte 8
➢ Tying the structural member together;
As it can be seen this is basically the definition for “robustness” describe earlier making a
connection between the norms.
Figure 2-1 Strategies for accidental design situations (CEN, 2006)
In this situation the Eurocodes proposes a combination of loads when designing for Ultimate
Limit State. This combination should be used when verifying for robustness, especially when
taking the notional removal or key element method approach, that later will be explained.
∑ 𝐺𝑘𝑗
𝑗≥1
" + "𝐴𝑑" + "𝜓1,1𝑄𝑘,1" + " ∑ 𝜓2,𝑖𝑄𝑘,𝑖
𝑖≥1
(2.1)
Where,
" + " ⅈmplⅈes “to be combⅈne wⅈth”
𝛴 ⅈmplⅈes “to be combⅈne wⅈth”
Gkj are the characteristic values of the permanent actions
ACCIDENTAL DESIGN SITUATIONS
STRATEGIES BASED ON IDENTIFIED ACCIDENTAL
ACTIONS
e.g. explosions and impact
DESIGN THE STRUCTURE TO HAVE SUFFICIENT
MINIMUM ROBUSTNESS
PREVENTING OR REDUCING THE ACTION e.g. protective
measures
DESIGN STRCUTRE TO SUSTAIN THE ACTION
STRATEGIES BASED ON LIMITING THE EXTENT OF
LOCALIZED FAILURE
ENHANCE REDUNDANCY e.g. alternative load paths
KEY ELEMENT DESIGNED TO SUSTAIN NOTIONAL
ACCIDENTAL ACTION 𝐴𝑑
PRESCRIPTIVE RULES
e.e. integrity and ductiliy

Assessment of Robustness for Composite Steel-Concrete Frame Buildings Literature review: EN 1991-1-7
Gregrorio Francisco Canó Almonte 9
Ad is the design value of an accidental action
Qk,1 is the characteristic value of the leading variable actions
Qk,i are the characteristic values of the other variable actions
𝜓1,1 is the factor for the frequent value of the leading variable 𝑄𝑘,1
𝜓2,I is the factor for the quasi-permanent value of the i-th variable action 𝑄𝑘,𝑖
The value for the factor for the frequent and quasi-permanent value 𝜓 are taken form table A1.1
from the Eurocode 0, shown here in Table 2-1. This value will depend on the category of use for
the building and the type of load. Each country may vary this value in the National Annex, but,
once again, Portugal does not make any changes on this.
Table 2-1 Recommended values of 𝜓 factors for buildings (CEN, 2009)
The design rules and specific guidance analyzing steel structures are expressed in the Eurocode
3 part 1-1; however, there is no description for structural robustness. Here, in section 2.1.3, where
the title is “Design working life, durability and robustness”, the parameters for the durability and

Assessment of Robustness for Composite Steel-Concrete Frame Buildings Literature review: EN 1991-1-7
Gregrorio Francisco Canó Almonte 10
the design work life are stablished and it states that the structure should be resistant to accidental
action and then makes reference to the EN 1991 part 1-7.
2.2.1. Accidental design strategies for identified actions
The first strategy on Figure 2-1 is when the accidental load is identified. When starting to
consider which accidental action to use when choosing the strategy of approach, the Eurocode 1,
part 1-7 section 3.2, gives a pre-determine list of things to look for:
➢ the measures taken for preventing or reducing the severity of an accidental action;
➢ the probability of occurrence of the identified accidental action;
➢ the consequences of failure due to the identified accidental action;
➢ public perception;
➢ the level of acceptable risk.
These will help categorize the structure depending on the risk level. To design a building with
no accidental-load consequences, is impracticable; for this reason, and in most cases, a certain level
of risk will have to be accepted. It is important to emphasize that localized failure may be tolerable,
if this will not jeopardize the stability of the construction, and the overall load-bearing capacity is
maintained, allowing the necessary emergency measures to be taken.
Also, some actions should be considered to mitigate the risk of accidental actions. These can
be done while making the structural design or by adding some protection to the elements. In the
EN 1991 part 1-7 there are three considerations to select at least one when designing for robustness.
A. Prevent the action from occurring or reducing the probability and/or magnitude of the
action to an acceptable level through the structural design process (CEN, 2006). This
can be as simple as selecting a different paint for a steel structure to help the resistance
to a fire in a building or providing with enough space in a bridge between the trafficked
lanes and the structure.
B. Protecting the structure against the effects of an accidental action by reducing the effects
of the action on the structure (CEN, 2006). Some example for this will be barriers to
prevent car crashing on the structures when the construction is vulnerable.
C. Ensuring that the structure has enough robustness by adopting one or more of the
following approaches:
i. By designing certain components of the structure, upon which stability depends,
as key elements, to increase the likelihood of the structure’s survival following
an accidental event (CEN, 2006);
Assessment of Robustness for Composite Steel-Concrete Frame Buildings Literature review: EN 1991-1-7
Gregrorio Francisco Canó Almonte 11
ii. Designing structural members, and selecting materials, to have enough ductility
capable of absorbing significant strain energy without rupture (CEN, 2006);
iii. Incorporating enough redundancy in the structure to facilitate the transfer of
actions to alternative load paths following an accidental event (CEN, 2006).
These are the basis for a structural design when the action is known, the other approach is to
design to limit the extent of localized failure.
2.2.2. Accidental design strategies for unidentified actions
This path is taken when the action is unknown, and the potential failure of the structure should
be mitigated adopting one of the following methods:
A. Designing key elements, on which the stability of the structure depends, to sustain the
effects of model of accidental action 𝐴𝑑 (CEN, 2006);
B. Designing the structure so that in the event of a localized failure the stability of the
whole structure or a significant part of it would not be endangered (CEN, 2006); for
this, the norm imposes a limit of the minimum for acceptance of “localized failure”
to 100 m2 or 15% of the area of the floor, whichever is less.
C. Applying prescriptive design/detailing rules that provide acceptable robustness for
the structure (CEN, 2006).
When taking this approach, the norm gives some recommendation of how to proceed in the
Annex A of EN 1991 part 1-7. These recommendations are tied to the building consequences class
that is assessed by the engineer. For this reason, when starting a project and making the decision
of the strategy that will be adopted, all the entities involved should be part of it.
2.2.3. Use of consequence classes
In the EN 1990 gives each building a consequence class that it is used to design. This
classification is based on the human life that can be loss and the social, economic or environmental
consequence. This is resumed in table B1 of Annex B and it is represented in Table 2-2.

Assessment of Robustness for Composite Steel-Concrete Frame Buildings Literature review: EN 1991-1-7
Gregrorio Francisco Canó Almonte 12
Consequences
Class
Description Examples of buildings and
civil engineering works
CC3 High consequence for loss of human
life, or economic, social or
environmental consequences very great
Grandstands, public buildings
where consequences of failure
are high (e.g. a concert hall)
CC2 Medium consequences for loss of
human life, economic, social or
environmental consequences
considerable
Residential and offices
buildings, public buildings
where consequences of failure
are medium (e.g. an office
building)
CC1 Low consequences for loss of human
life, and economic, social or
environmental consequences small or
negligible
Agricultural buildings here
people do not normally enter
(e.g. storage buildings),
greenhouses
Table 2-2 Definition of consequence class (CEN, 2009)
It is possible to considered different consequence class on different parts of the construction.
Also, if some action is applied to minimize the risk of certain accidental load, for the design
purpose, it might be considered to lower the consequence class, but the most appropriate thing to
do is to reduce de forces applied to the structure. Therefore, when having the building
characterized:
➢ CC1: No specific consideration is necessary for accidental actions except to ensure that
the robustness and stability rules given in the norms, as applicable, are met (CEN,
2006);
➢ CC2: depending upon the specific circumstances of the structure, a simplified analysis
by static equivalent action models may be adopted or prescriptive design/detailing rules
may be applied (CEN, 2006);
➢ CC3: an examination of the specific case should be carried out to determine the level
of reliability and the depth of structural analyses required. This may require a risk
analysis to be carried out and the use of refined methods such as dynamic analyses,
non-linear models and interaction between the load and the structure (CEN, 2006).
2.2.4. Impact
Impacts are considered an accidental action that it could be used in buildings. In the EN 1991
part 1-7 the following events are defined as impact in a structure:

Assessment of Robustness for Composite Steel-Concrete Frame Buildings Literature review: EN 1991-1-7
Gregrorio Francisco Canó Almonte 13
➢ Impact from road vehicles (excluding collisions on lightweight structures);
➢ Impact from forklift trucks;
➢ Impact from trains (excluding collisions on lightweight structures);
➢ Impact from ships;
➢ The hard landing of helicopters on roof;
For buildings, action due to impact shall be considered for:
➢ Buildings used for car parking;
➢ Buildings in which vehicles or forklift trucks are permitted, and
➢ Buildings that are located adjacent to either road or railway traffic.
As it can be seen, the used of this type of load is very limited. This will be used in a higher
extend when designing a bridge or structures where the interactions with vehicles is more often.
As it was said before, for this project it is considered a conventional building and to elaborate on
this topic is not considered necessary.
2.2.5. Internal explosions
The internal explosions are considered for buildings design when there is a part of the building
exposed to gas, where there is any type of explosive materials, the possibility of any liquid forming
explosive vapor or gas is stored or transported. EN 1991-1-7 does not cover the effect of the
explosion or the cascade effects from several connected rooms filled with explosive gas, dust or
vapor and is limited to the effect of the internal explosions.
Explosion is defined as the consequence of a rapid chemical reaction of dust, gas or vapor in
air that results in a high temperature and overpressures response. The pressure created on structural
members should consider the forces transmitted by the non-structural member. When measuring
the pressure, there several parameters to contemplate, according to EN 1991 part 1-7:
➢ Type of dust, gas or vapor;
➢ The percentage of dust, gas or vapor in the air
➢ The uniformity of the dust, gas or vapor air mixture;
➢ The ignition source;
➢ The presence of obstacles in the enclosure;
➢ The size, shape and strength of the enclosure in which the explosion occurs;
➢ The amount of venting or pressure release that may be available.
Assessment of Robustness for Composite Steel-Concrete Frame Buildings Literature review: EN 1991-1-7
Gregrorio Francisco Canó Almonte 14
These bounds will help to have a better estimation of the load that needs to be applied when
designing. However, is very difficult to come with an exact number.
When analyzing a construction work classified as CC1, there is no specific consideration of the
effect of the explosion, other than complying with what is stated in the norms about connections
and interaction between components. However, for the ones classified as CC2 or CC3, one of the
methods applied in Annex A and D should be considered. Additionally, for CC3 structures a
dynamic analysis is required as well.
For the explosion, the design consideration, may allow the partial failure of the structure if it
does not include key element where the stability of the structure can be threatened. There are some
actions that can be taken in order to minimize the damage caused. Again, the Eurocode 1 part 1-7
in section 5.3 gives some measures that can be taken to control this:
➢ Designing the structure to resist the explosion peak pressure;
➢ Using venting panels with defined venting pressures;
➢ Separating adjacent sections of the structure that contain explosive materials;
➢ Limiting the area of structures that are exposed to explosion risks;
➢ Providing specific protective measures between adjacent structures exposed to
explosions risks avoiding propagation of pressures.
When using venting panels additional consideration are important for the well-functioning of
the system. For example, they should be located near the ignition sources, if known, or where
pressures are high. Also, put in a location where it will not cause the expansion of the explosion,
be restraint so it does not become a missile and threaten personnel. For these reasons, the
recommendations are that they should be design by an expert.
2.2.6. Design for consequences of localized failure in
buildings from an unspecified cause (Annex A)
This section gives all the design approaches for consequences of a localized failure in buildings
from an unspecified cause, with the main purpose of limiting the extent of damage or failure.
Making the structure sufficiently robust and avoiding disproportionate collapse. In this aspect, the
building is only required to survive minimum amount of time that is needed to ensure the safe
evacuation and rescue of personnel from the building and its surroundings. This may change for
buildings used for handling hazardous materials, provision of essential services, or for national
security reasons (CEN, 2006).

Assessment of Robustness for Composite Steel-Concrete Frame Buildings Literature review: EN 1991-1-7
Gregrorio Francisco Canó Almonte 15
Also, the EN1991-1-7 gives a categorization to the consequence class that relates to the
consequence class previously reviewed, see Table 2-3. At the same time, it states that a building
with multiple categorization should be classified with the more onerous type and that in the case
of a basement they may be included if they meet with the requirements of “Consequence Class 2
Upper Risk Group”. These will help to select the approach that should be taken when considering
robustness in buildings.
Consequences
Classes
Example of categorization of building type and occupancy
1 Single occupancy houses not exceeding 4 stories.
Agricultural buildings.
Buildings into which people rarely go, provided no part of the building is
closer to another building, or area where people do go, than a distance of
1 12⁄ time the building height.
2a
Lower Risk
Group
5 story single occupancy house.
Hotel not exceeding 4 stories.
Flats, apartments and other residential buildings no exceeding 4 stories.
Offices not exceeding 4 stories.
Retailing premises not exceeding 3 stories of less than 1,000 m2 floor area in
each story.
Single story educational buildings.
All buildings not exceeding two stories to which the public are admitted, and
which contain floor areas not exceeding 2,000 m2 at each story.
2b
Upper Risk
Group
Hotels, flats, apartments and other residential buildings greater than 4 stories
but not exceeding 15 stories.
Educational buildings greater than single story but not exceeding 15 stories.
Retailing premises greater than 3 stories but not exceeding 15 stories.
Hospital not exceeding 3 stories.
Offices greater than 4 stories but not exceeding 15 stories.
All buildings to which the public are admitted, and which contain floor areas
exceeding 2,000 m2 but not exceeding 5,000 m2 at each story.
Car parking not exceeding 6 stories.
Assessment of Robustness for Composite Steel-Concrete Frame Buildings Literature review: EN 1991-1-7
Gregrorio Francisco Canó Almonte 16
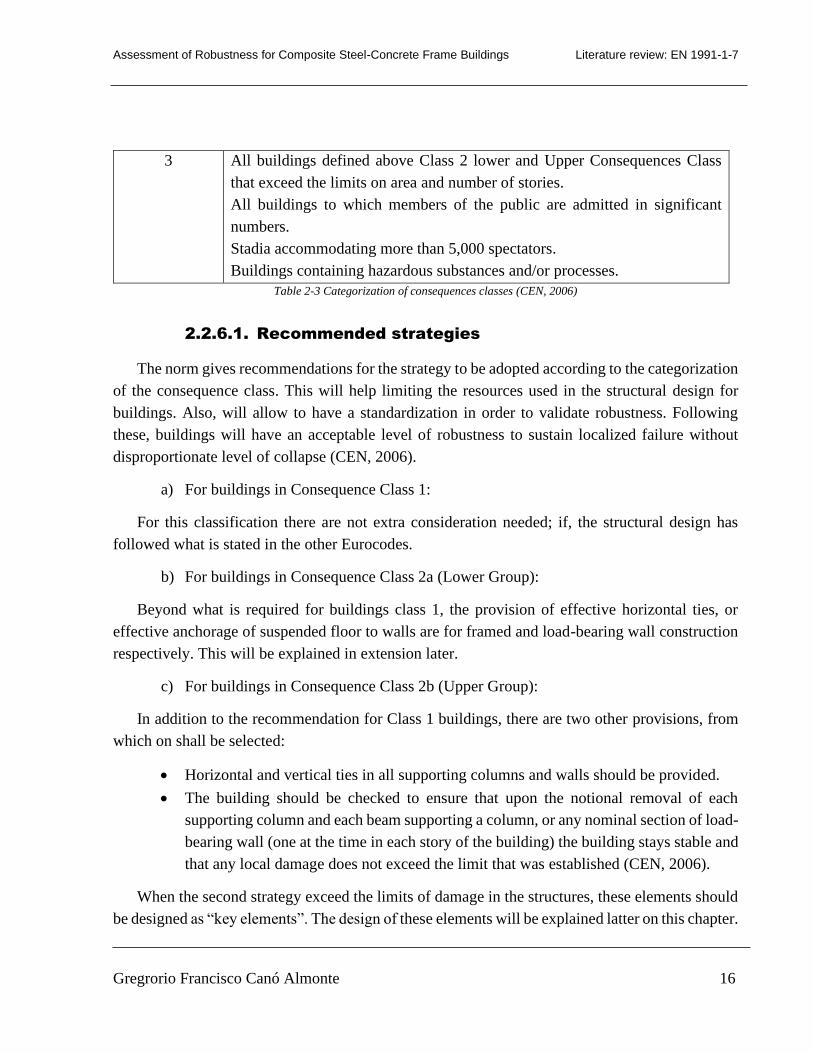
3 All buildings defined above Class 2 lower and Upper Consequences Class
that exceed the limits on area and number of stories.
All buildings to which members of the public are admitted in significant
numbers.
Stadia accommodating more than 5,000 spectators.
Buildings containing hazardous substances and/or processes.
Table 2-3 Categorization of consequences classes (CEN, 2006)
2.2.6.1. Recommended strategies
The norm gives recommendations for the strategy to be adopted according to the categorization
of the consequence class. This will help limiting the resources used in the structural design for
buildings. Also, will allow to have a standardization in order to validate robustness. Following
these, buildings will have an acceptable level of robustness to sustain localized failure without
disproportionate level of collapse (CEN, 2006).
a) For buildings in Consequence Class 1:
For this classification there are not extra consideration needed; if, the structural design has
followed what is stated in the other Eurocodes.
b) For buildings in Consequence Class 2a (Lower Group):
Beyond what is required for buildings class 1, the provision of effective horizontal ties, or
effective anchorage of suspended floor to walls are for framed and load-bearing wall construction
respectively. This will be explained in extension later.
c) For buildings in Consequence Class 2b (Upper Group):
In addition to the recommendation for Class 1 buildings, there are two other provisions, from
which on shall be selected:
• Horizontal and vertical ties in all supporting columns and walls should be provided.
• The building should be checked to ensure that upon the notional removal of each
supporting column and each beam supporting a column, or any nominal section of load-
bearing wall (one at the time in each story of the building) the building stays stable and
that any local damage does not exceed the limit that was established (CEN, 2006).
When the second strategy exceed the limits of damage in the structures, these elements should
be designed as “key elements”. The design of these elements will be explained latter on this chapter.

Assessment of Robustness for Composite Steel-Concrete Frame Buildings Literature review: EN 1991-1-7
Gregrorio Francisco Canó Almonte 17
d) For buildings in Consequence Class 3:
A systematic risk assessment of the building should be undertaken where foreseeable and
unforeseeable hazards should be taken into consideration.
2.2.6.2. Horizontal ties
Framed structures
The horizontal ties are rolled steel section, steel bar reinforcement in concrete slabs, or steel
mesh reinforcement and profiled steel sheeting in composite steel/concrete floors or a combination
of two or more of the previous. They should be provided in order that all structural load-bearing
section of the building are tied together and should be continuous and be arranged as closely as
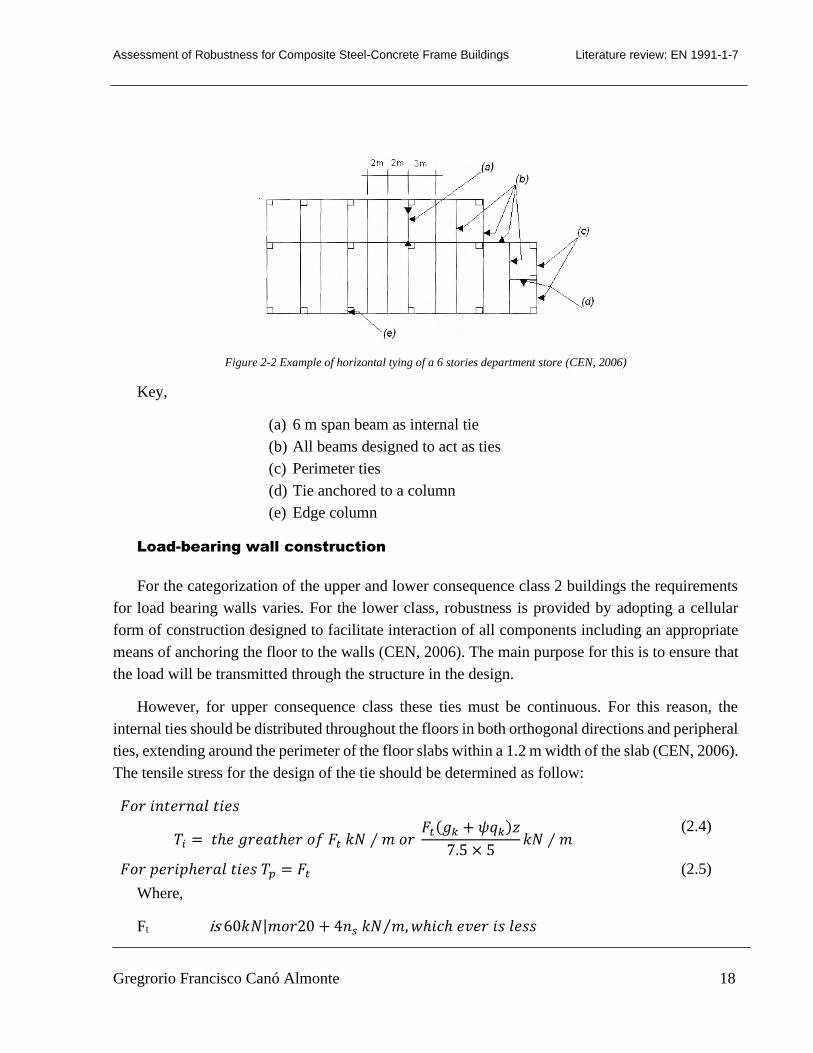
practicable to the edges of floors and lines of the column and walls, see Figure 2-2.
For the design of these ties and its end connections, should be able to absorb a tensile stress
load for the accidental limit state. The internal and perimeter ties will have different loads
depending on the following:
− 𝑓𝑜𝑟 𝑖𝑛𝑡𝑒𝑟𝑛𝑎𝑙 𝑡𝑖𝑒𝑠,
𝑇𝑖 = 0.8(𝑔𝑘 + 𝜓𝑞𝑘)𝑠𝐿 𝑜𝑟 75𝑘𝑁, 𝑤ℎ𝑖𝑐ℎ𝑒𝑣𝑒𝑟 𝑖𝑠 𝑔𝑟𝑒𝑎𝑡𝑒𝑟 (2.2)
− 𝑓𝑜𝑟 𝑝𝑒𝑟𝑖𝑚𝑒𝑡𝑒𝑟 𝑡𝑖𝑒𝑠,
𝑇𝑝 = 0.4(𝑔𝑘 + 𝜓𝑞𝑘)𝑠𝐿 𝑜𝑟 75𝑘𝑁, 𝑤ℎ𝑖𝑐ℎ𝑒𝑣𝑒𝑟 𝑖𝑠 𝑔𝑟𝑒𝑎𝑡𝑒𝑟 (2.3)
Where,
s is the spacing of ties.
L is the span of the tie.
𝜓 is the relevant factor in the expression for combination of action effects for the
accidental design situation.
Assessment of Robustness for Composite Steel-Concrete Frame Buildings Literature review: EN 1991-1-7
Gregrorio Francisco Canó Almonte 18
Figure 2-2 Example of horizontal tying of a 6 stories department store (CEN, 2006)
Key,
(a) 6 m span beam as internal tie
(b) All beams designed to act as ties
(c) Perimeter ties
(d) Tie anchored to a column
(e) Edge column
Load-bearing wall construction
For the categorization of the upper and lower consequence class 2 buildings the requirements
for load bearing walls varies. For the lower class, robustness is provided by adopting a cellular
form of construction designed to facilitate interaction of all components including an appropriate
means of anchoring the floor to the walls (CEN, 2006). The main purpose for this is to ensure that
the load will be transmitted through the structure in the design.
However, for upper consequence class these ties must be continuous. For this reason, the
internal ties should be distributed throughout the floors in both orthogonal directions and peripheral
ties, extending around the perimeter of the floor slabs within a 1.2 m width of the slab (CEN, 2006).
The tensile stress for the design of the tie should be determined as follow:
𝐹𝑜𝑟 𝑖𝑛𝑡𝑒𝑟𝑛𝑎𝑙 𝑡𝑖𝑒𝑠
𝑇𝑖 = 𝑡ℎ𝑒 𝑔𝑟𝑒𝑎𝑡ℎ𝑒𝑟 𝑜𝑓 𝐹𝑡 𝑘𝑁 ∕ 𝑚 𝑜𝑟 𝐹𝑡(𝑔𝑘 + 𝜓𝑞𝑘)𝑧
7.5 × 5𝑘𝑁 ∕ 𝑚
(2.4)
𝐹𝑜𝑟 𝑝𝑒𝑟𝑖𝑝ℎ𝑒𝑟𝑎𝑙 𝑡𝑖𝑒𝑠 𝑇𝑝 = 𝐹𝑡 (2.5)
Where,
Ft is 60𝑘𝑁|𝑚𝑜𝑟20 + 4𝑛𝑠 𝑘𝑁 𝑚, 𝑤ℎ𝑖𝑐ℎ 𝑒𝑣𝑒𝑟 𝑖𝑠 𝑙𝑒𝑠𝑠⁄

Assessment of Robustness for Composite Steel-Concrete Frame Buildings Literature review: EN 1991-1-7
Gregrorio Francisco Canó Almonte 19
ns is the number of stories
z is the lesser distance between ties
➢ 5 time the clear story height H, or
➢ The greatest distance in meters in the direction of the tie, between the centers of the
columns of other vertical load-bearing member whether this distance is spanned by:
o A single slab or
o By a system of beams and slabs.
Figure 2-3 Illustration of factors H and z (CEN, 2006)
Key,
a) Plan
b) Section: Flat slab
c) Section: Beam and slab
2.2.6.3. Vertical ties
For the vertical ties it is recommended that, each column and wall, to be continuously from the
foundations to the roof level. This is to guarantee a continuity of the path of the accidental load
throughout the structure. When considering a framed building, the load-bearing elements should
be able to sustain the accidental design tensile force that is equal to the largest design vertical
permanent and variable load reaction applied to the column from any one story. When calculating
the accidental design loading it should not be assumed to act simultaneously with permanent and
variable actions that may be acting on the structure (CEN, 2006).
For this consideration to be considered effective, EN 1991 part 1-7 has some parameters that
must be matched:

Assessment of Robustness for Composite Steel-Concrete Frame Buildings Literature review: EN 1991-1-7
Gregrorio Francisco Canó Almonte 20
a) For masonry wall their thickness is at least 150 mm and if they have a minimum
compressive strength of 5 𝑁 ∕ 𝑚𝑚2 in accordance to EN 199-1-1
b) The clear height of the wall, 𝐻, measured in meters between faces of floor or roof does
not exceed 20𝑡, where 𝑡 is the thickness of the wall in meters.
c) If they are designed to sustain the following vertical tie force 𝑇
𝑇 =34𝐴
8000(
𝐻
𝑇)
2
𝑁, 𝑜𝑟100𝐾𝑁 𝑚𝑜𝑓𝑤𝑎𝑙𝑙, 𝑤ℎ𝑖𝑐ℎ𝑒𝑣𝑒𝑟𝑖𝑠𝑔𝑟𝑒𝑎𝑡𝑒𝑟,⁄ (2.6)
Where,
A The cross-sectional area in 𝑚𝑚2 of the wall measured on plan, excluding the
non-load-bearing leaf of a cavity wall.
d) The vertical ties are grouped at 5 𝑚 maximum centers along the wall and occur no
greater than 2.5 𝑚 from an unrestrained end of the wall.
2.2.6.4. Nominal section of load-bearing wall
The length for the nominal section of a load-bearing wall has some limitations according to EN
1991 part 1-7 and are as follow;
➢ For a reinforced concrete wall, a length not exciding 2.25 𝐻.
➢ For an external masonry, timber or steel stud wall, the length measured between lateral
supports provided by the vertical building components.
➢ For an internal masonry, timber of steel stud wall, a length not exciding 2.25 𝐻.
Where,
H is the story height in meters.
2.2.6.5. Key elements
In this approach, the key elements, as it was stated for the strategy when designing for
consequence class 2.b, should be capable of resisting an additional accidental load, 𝐴𝑑, applied in
both direction to the element and any other attached, one at the time, taking into account the
connection between them. This load should be applied using the combination for accidental load.
The EN 1991 part 1-7 recommend the value of 𝐴𝑑 = 34 𝐾𝑁 ∕ 𝑚2 (CEN, 2006).
2.2.7. Information on risk assessment (Annex B)

Assessment of Robustness for Composite Steel-Concrete Frame Buildings Literature review: EN 1991-1-7
Gregrorio Francisco Canó Almonte 21
This section of the Eurocode 1 part 1-7 is dedicated to how to plan and execute risk assessment
for civil engineering structures, see Figure 2-4 Overview of risk analysis . This will be done along
with the design for consequences of localized failure for buildings that have a consequence class
of 3. To understand this topic is important to define some concept that will be used throughout its
development.
Figure 2-4 Overview of risk analysis (CEN, 2006)
These definitions are giving in the Annex B of the EN 1991 part 1-7 and are described next:
- Consequences: A possible result of an event. This can be express verbally or numerically
as the economic loss, human loss, injuries, environmental damage, among others.
- Hazard scenario: A critical situation at a particular time consisting of a leading hazard
together with one or more accompanying conditions which lead to an unwanted event. For
example, the complete collapse of the structure.
- Risk: A measure of the combination of the probability or frequency of occurrence of a
defined hazard and the magnitude of the consequences of the occurrence.
- Risk acceptance criteria: Acceptable limits to probabilities of certain consequences of an
undesired event and are expressed in terms of annual frequencies. These criteria are
normally determined by the authorities to reflect the level of risk considered to be
acceptable by people and society.

Assessment of Robustness for Composite Steel-Concrete Frame Buildings Literature review: EN 1991-1-7
Gregrorio Francisco Canó Almonte 22
- Risk analysis: A systematic approach for describing and/or calculating risk. Risk analysis
involves the identification of undesired events, and the causes, likelihoods and
consequences of these events.
- Risk evaluation: A comparison of the results of a risk analysis with the acceptance criteria
for risk and other decision criteria.
- Risk management: Systematic measures undertaken by an organization in order to attain
and maintain a level of safety that complies with defined objectives.
- Undesired event: An event of condition that can cause human injury, environmental or
material damage.
2.2.7.1. Description of the scope of a risk analysis
To start the risk analysis all technical, environmental, organizational and human circumstances
must be identified and detailed for further evaluation. Also, these tasks have a descriptive part,
known as qualitative; and may, where relevant and practicable, also have a numerical part, known
as quantitative.
Qualitative risk analysis
The most important task in the qualitative risk analysis is to identify all hazards and
corresponding hazard scenarios. It requires a detailed examination and understanding of the
system. For the importance of this step, some technics have been developed to help engineers when
making the analysis.
In structural risk analysis some conditions that can present hazards to the structures and that
have been listed in the Eurocode are:
➢ High values of ordinary actions.
➢ Low values of resistances, possibly due to errors or unforeseen deterioration.
➢ Ground and other environmental conditions different from those assumed in the design.
➢ Accidental actions like fire, explosion, flood, impact or earthquake.
➢ Unspecified accidental actions.
This list gives some specific cases to pay attention when doing a qualitive risk analysis in a
structural design. However, it is not limit to only this, there might be others, but every case is
different.
Assessment of Robustness for Composite Steel-Concrete Frame Buildings Literature review: EN 1991-1-7
Gregrorio Francisco Canó Almonte 23
Also, the norm gives a list of some hazard scenarios that should be considered in the risk
analysis, that are presented here; once again, in real life is not limit to only this.
➢ The anticipated or known variable actions on the structure.
➢ The environment surrounding the structure.
➢ The propose or known inspection regime of the structure.
➢ The concept of the structure, its detailed design, materials of constructions and possible
points of vulnerability to damage or deterioration.
➢ The consequences of type and degree of damage due to the identified hazard scenario.
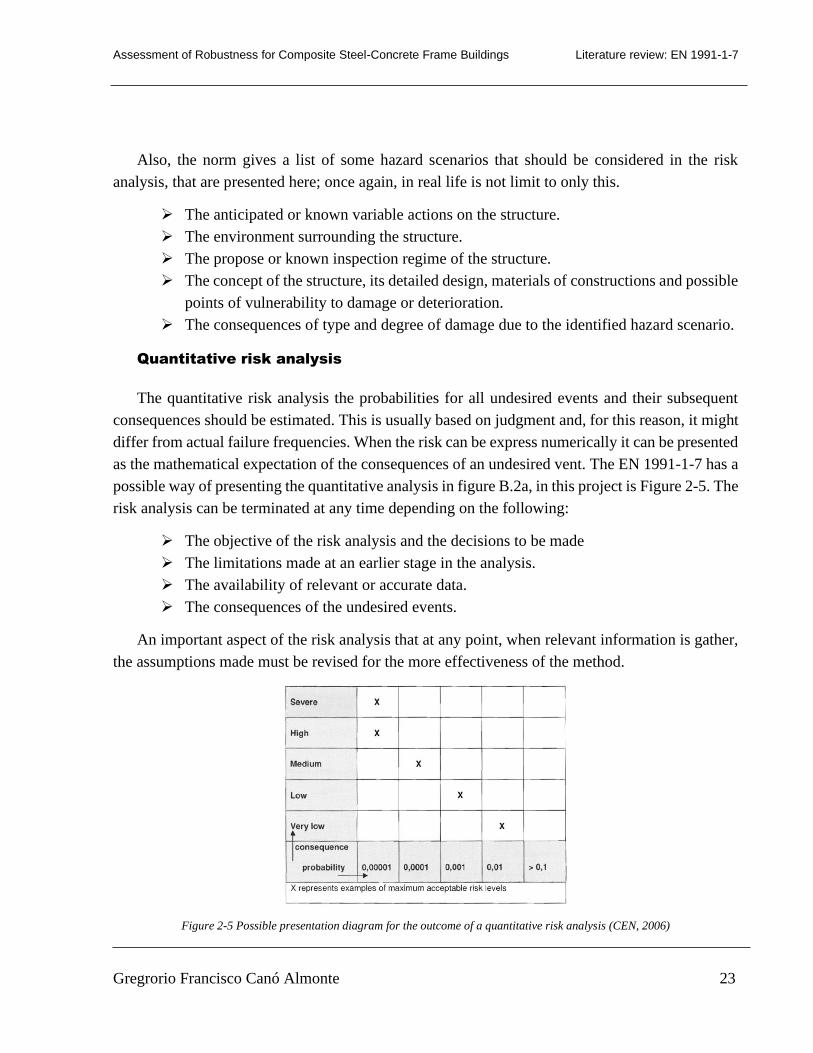
Quantitative risk analysis
The quantitative risk analysis the probabilities for all undesired events and their subsequent
consequences should be estimated. This is usually based on judgment and, for this reason, it might
differ from actual failure frequencies. When the risk can be express numerically it can be presented
as the mathematical expectation of the consequences of an undesired vent. The EN 1991-1-7 has a
possible way of presenting the quantitative analysis in figure B.2a, in this project is Figure 2-5. The
risk analysis can be terminated at any time depending on the following:
➢ The objective of the risk analysis and the decisions to be made
➢ The limitations made at an earlier stage in the analysis.
➢ The availability of relevant or accurate data.
➢ The consequences of the undesired events.
An important aspect of the risk analysis that at any point, when relevant information is gather,
the assumptions made must be revised for the more effectiveness of the method.
Figure 2-5 Possible presentation diagram for the outcome of a quantitative risk analysis (CEN, 2006)

Assessment of Robustness for Composite Steel-Concrete Frame Buildings Literature review: EN 1991-1-7
Gregrorio Francisco Canó Almonte 24
This diagram helps classify every hazard scenario into Severe, High, Medium, Low or Very
Low the potential of failure of the risk identified. Where Severe is that the building can have a
sudden collapse, resulting on the loss of life and injury and Very Low are local damages of small
importance. This will be done by estimations by the engineer.
2.2.7.2. Risk acceptance and mitigating measures
The next step, after identifying the level of risk, is deciding whether the risk is acceptable or
mitigating measures should be taken. For this, the ALARP (as low as reasonably practicable)
principle is used, where risk can be above or below the ALARP region. When the risk falls below
or the tolerable region no measures are need it, in the other hand, the risk most be mitigated. When
the risk is between these two boundaries an economical optimal solution should be sought.
When the risk is accepted, they should be classified by the following criteria:
➢ The individual acceptance of the risk, which is presented as fatal accident rates.
➢ The socially acceptable level of risk, which is presented as F-N curve, for probability
of F having an accident versus N the number of casualties.
The acceptance criteria may come from national regulation or requirements, certain codes and
standards, or from experience and/or theorical knowledge that may be used as a basis for decisions
on acceptable risk. They also can be expressed qualitatively or numerically.
The EN 1991 part 1-7 have some criteria that need to be meet for qualitative risk analysis:
a) The general aim should be to minimize the risk without incurring a substantial cost
penalty.
b) For the consequence within the vertically hatched area of Figure 2-6, the risks
associated with the scenario can normally be accepted.
c) For the consequences within the diagonally hatched area of Figure 2-6, a decision on
whether the risk of the scenario can be accepted and whether risk mitigation measures
can be adopted at an acceptable cost should be made.
d) For the consequence considered to be unacceptable, or the horizontally hatched area of
Figure 2-6, appropriate risk mitigation measures should be taken.

Assessment of Robustness for Composite Steel-Concrete Frame Buildings Literature review: EN 1991-1-7
Gregrorio Francisco Canó Almonte 25
Figure 2-6 Possible presentation diagram for the outcome of a qualitative risk analysis (CEN, 2006)
2.2.7.3. Risk mitigation measures
The norm, once again, gives a list of mitigating measures that might be used for the mitigation
measures and one or more can be used.
a) Elimination or reduction of the hazard.
b) By-passing the hazard by changing the design concepts or occupancy.
c) Controlling the hazard.
d) Overcome the hazard.
e) Permitting controlled collapse of the structure where the probability of injury or fatality
may be reduced.
2.2.7.4. Application to buildings and civil engineering
structures
This section gives a summary of the application for robustness for buildings and civil
engineering structures in order to mitigate risk for extreme events. For the structural measures,
recommends that the members are designed in a way to have reserves of strength or an alternative
load path in case of local failures. For non-structural measures, assorts the reduction of the
probability of the event occurring, the strength of the action or the chance of failure.
For the structural design the probabilities and effects of all accidental and extreme action
happening at the same time should be considered. In these cases, the consequences should be
presented in terms of number of casualties and economic losses. This approach has its complicity
when considering unforeseeable hazards. For this reason, the more global damage tolerance design

Assessment of Robustness for Composite Steel-Concrete Frame Buildings Literature review: EN 1991-1-7
Gregrorio Francisco Canó Almonte 26
previously described (key elements design, horizontal and vertical ties, notional removal) should
be used.
Structural risk analysis
The approach for the structural risk analysis due to accidental action can follow the sequences
in Figure 2-7.
Figure 2-7 Illustration of steps in risk analysis of structures subject to accidental actions (CEN, 2006)
Key,
- Step 1: Identification and modelling of relevant accidental hazards. Assessment of the
probability of occurrence of different hazards with different intensities.
- Step 2: Assessment of damage states to structures from different hazards. Assessment of
the probability of different states of damage and corresponding consequences for given
hazards.
- Step 3: Assessment of the performance of the damaged structure. Assessment of the
probability of inadequate performance of the damaged structure together with the
corresponding consequence.
The total risk R can be assessed by:
𝑅 = ∑ 𝑃(𝐻𝑖)
𝑁𝐻
𝑖=1
∑ ∑ 𝑃(𝐻𝑖)
𝑁𝑆
𝑘=1
𝑃(𝐷𝑗|𝐻𝑖)𝑃(𝑆𝑘|𝐷𝑗)𝐶(𝑆𝑘)
𝑁𝐷
𝑗
(2.7)
Where is assumed that the structure is subjected to 𝑁𝐻 different hazards, that the hazards may
damages the structure in 𝑁𝐷 different ways (can be dependent on the considered hazards) and that
the performance of the damages structure can be discretized into 𝑁𝑆 adverse states 𝑆𝐾 with
corresponding consequences 𝐶(𝑆𝑘). 𝑃(𝐻𝑖) is the probability of occurrence (within a reference time
interval) of the 𝑖𝑡ℎ hazard, 𝑃(𝐷𝑗|𝐻𝑖) is the conditional probability of 𝑗𝑡ℎ damage state of the

Assessment of Robustness for Composite Steel-Concrete Frame Buildings Literature review: EN 1991-1-7
Gregrorio Francisco Canó Almonte 27
structure given the 𝑖𝑡ℎ hazard and 𝑃(𝑆𝑘|𝐷𝑗) is the conditional probability of the 𝑘𝑡ℎ adverse
overall structural performance 𝑆 given the 𝑖𝑡ℎ damage state.
Also, when performing a risk analysis, different strategies for the risk control and the risk
reduction have to be investigated for economic feasibility:
- The risk may be reduced by reducing the probability that the hazards occurs, 𝑃(𝐻𝑖). For
example, removing explosive materials from buildings, can reduce the probability of an
explosion happening inside.
- The risk may be reduced by reducing the probability of significant damages for given
hazards, 𝑃(𝐷𝑗|𝐻𝑖). For example, using passive or active fire control for the structure.
- The risk may be reduced by reducing the probability of adverse structural performance
given structural damage, 𝑃(𝑆𝑘|𝐷𝑗). For example, designing the structure with enough
redundancy.
2.2.8. Dynamic design for impact (Annex C)
The EN 1991 part 1-7 dedicates Annex C to dynamic design for impact in structures. Where
impact is defined as an interaction between a moving object and a structure, in which the kinetic
energy of the object is suddenly transformed into energy of deformation. For this phenomenon to
be study, the mechanical properties of both elements must be determined. When designing for this
event, equivalent static forces are commonly used.
Advanced design of structures to sustain actions due to impact may include explicitly one or
several of the following aspects:
- Dynamic effects.
- Non-linear material behavior.
However, since this does not form part of the study that is been worked in this thesis, this will
not be detailed.
2.2.9. Internal explosions (Annex D)
When taking into consideration internal explosions, the Eurocode 1 part 1-7 annex D gives
recommendation for the opening area in dust explosions in rooms, vessels and bunkers. Also, helps
calculate the pressure caused by natural gas explosions in buildings and explosions in road and rail

Assessment of Robustness for Composite Steel-Concrete Frame Buildings Literature review: EN 1991-1-7
Gregrorio Francisco Canó Almonte 28
tunnels. Once again, this will not be the scoop of this investigation, for this reason, this will not be
expanded in this project.

Assessment of Robustness for Composite Steel-Concrete Frame Buildings Structural connections
Gregrorio Francisco Canó Almonte 29
3. Structural connections
In this section will be explained the relevant elements for structural connections. This will
include beam-to-beam, beam-to-column and concrete-to-steel connection, since all become
responsible for the re-distribution of the load when considering robustness in a structure. For these,
multiple sources will be used and referenced in this work.
3.1. Beam-to-column and beam-to-beam connections
According to Eurocode 3 part 1- 8, a connection is where two or more elements meet. This
represent the point where internal forces and moment are transfer and when considering robustness,
since the stress amplified, is a critical point when designing. There are multiples element that need
to be defined in order to have a better understanding of a connection.
In Figure 3-1, there are two type of beam-to-column configurations, single-sided and double-
sided joint. Also, it is point out the relevant part of the connection that represent the mechanical
and rotational resistance of the connection. Both of this drawing are joints in the strong axis of the
elements.
Figure 3-1 Parts of a beam to column joint configuration (CEN, 2005)
In a steel structures joints can be found in different places, see Figure 3-2. This can happen for
multiple reasons, for example: limits in the fabrication of the elements, transportation problems,
viability when erecting the structures, among others. For these reasons, in this project the focus
will be beam-to-column in the strong axis, as was shown before, and beam-to-beam in the weak

Assessment of Robustness for Composite Steel-Concrete Frame Buildings Structural connections
Gregrorio Francisco Canó Almonte 30
axis. The connection will be design to resist the strength of the forces applied and the rotational
capacity.
Figure 3-2 Joint configuration (CEN, 2005)
3.1.1. Analysis, classification and modeling of joints
There are three distinctions that need to be made when modeling a joint, to consider the effect
of its behavior on the distribution of internal forces and on the structure.
➢ Simple, in which the joint may be assumed not to transmit bending moments.
➢ Continuous, in which the behavior of the joint may be assumed to have no effect on the
analysis.
➢ Semi-continuous, in which the behavior of the joint need to be taken into account in the
analysis.

Assessment of Robustness for Composite Steel-Concrete Frame Buildings Structural connections
Gregrorio Francisco Canó Almonte 31
These peculiarities will have different implication in the structure depending on the global
analysis method used and the classification of the joint. The Eurocode 3 part 1-8, helps on the
selection of the modeling using Table 3-1. The will be explained latter in this chapter.
Table 3-1 Type of joint model (CEN, 2005)
3.1.1.1. Elastic global analysis
When using a global elastic analysis, the joints will have to be classified in function of its
rotational stiffness in nominally pinned, rigid or semi-rigid. Also, they will have to be able to resist
the nominal stress from the structural analysis (CEN, 2005).
If a semi-rigid joint is used, the rotational stiffness 𝑆𝑗 corresponding to the bending moment
𝑀𝑗,𝐸𝑑 should be used in the analysis. If 𝑀𝑗,𝐸𝑑 does not exceed 2 3⁄ 𝑀𝑗,𝑅𝑑 the initial rotational
stiffness 𝑆𝑗,𝑖𝑛𝑖 may be taken in the global analysis, see Figure 3-3 (a) (CEN, 2005).
However, the norm has a simplification where the rotational stiffness can be considered equal
to 𝑆𝑗,𝑖𝑛𝑖 ∕ 𝜂, for all the values of 𝑀𝑗,𝐸𝑑, as it can be seen in Figure 3-3 (b). The coefficient for the
stiffness modification 𝜂 can be found in Table 3-2 (CEN, 2005).
Figure 3-3 Rotational stiffness to be used in elastic global analysis (CEN, 2005)

Assessment of Robustness for Composite Steel-Concrete Frame Buildings Structural connections
Gregrorio Francisco Canó Almonte 32
Table 3-2 Stiffness modification coefficient (CEN, 2005)
For joint of element type H or I the value of 𝑆𝑗 is taken based on the flexibility of their basic
components, each one represented with an elastic stiffness coefficient, 𝑘𝑖, obtained in section 6.3.2,
table 6.11 in EN 1993 part 1-8. This does not apply for column base, since in this project this will
not be part of the study, column base connection will not be emphasized.
𝑆𝑗 =𝐸𝑧2
𝜇 ∑1𝑘𝑖𝑖
(3.1)
Where,
ki The stiffness coefficient for basic joint component 𝑖.
𝑧 The lever arm see figure 6.15 EN 1993-1-8.
𝜇 The stiffness ration 𝑆𝑗,𝑖𝑛𝑖/𝑆𝑗 .
The stiffness ratio 𝜇 should be determined as follow:
− 𝑖𝑓 𝑀𝑗,𝐸𝑑 ≤ 2 ∕ 3𝑀𝑗,𝑅𝑑
𝜇 = 1
(3.2)
− 𝑖𝑓 2 ∕ 3𝑀𝑗,𝑅𝑑 < 𝑀𝑗,𝐸𝑑 ≤ 𝑀𝑗,𝑅𝑑
𝜇 = (1.5𝑀𝑗,𝐸𝑑 ∕ 𝑀𝑗,𝑅𝑑)𝜓
(3.3)
Where 𝜓 is obtain from
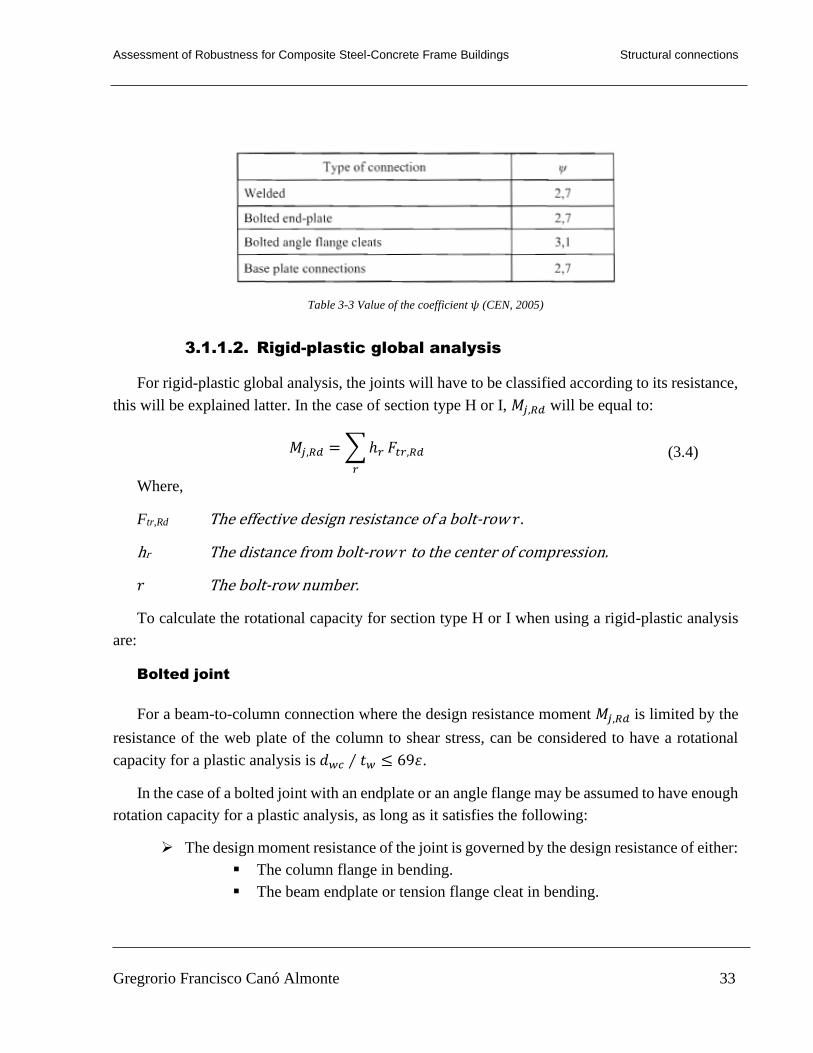
Assessment of Robustness for Composite Steel-Concrete Frame Buildings Structural connections
Gregrorio Francisco Canó Almonte 33
Table 3-3 Value of the coefficient 𝜓 (CEN, 2005)
3.1.1.2. Rigid-plastic global analysis
For rigid-plastic global analysis, the joints will have to be classified according to its resistance,
this will be explained latter. In the case of section type H or I, 𝑀𝑗,𝑅𝑑 will be equal to:
𝑀𝑗,𝑅𝑑 = ∑ ℎ𝑟
𝑟
𝐹𝑡𝑟,𝑅𝑑 (3.4)
Where,
Ftr,Rd The effective design resistance of a bolt-row 𝑟.
hr The distance from bolt-row 𝑟 to the center of compression.
𝑟 The bolt-row number.
To calculate the rotational capacity for section type H or I when using a rigid-plastic analysis
are:
Bolted joint
For a beam-to-column connection where the design resistance moment 𝑀𝑗,𝑅𝑑 is limited by the
resistance of the web plate of the column to shear stress, can be considered to have a rotational
capacity for a plastic analysis is 𝑑𝑤𝑐 ∕ 𝑡𝑤 ≤ 69휀.
In the case of a bolted joint with an endplate or an angle flange may be assumed to have enough
rotation capacity for a plastic analysis, as long as it satisfies the following:
➢ The design moment resistance of the joint is governed by the design resistance of either:
▪ The column flange in bending.
▪ The beam endplate or tension flange cleat in bending.

Assessment of Robustness for Composite Steel-Concrete Frame Buildings Structural connections
Gregrorio Francisco Canó Almonte 34
➢ The thickness 𝑡 of either the column flange or the beam endplate or tension flange cleat
(not necessarily the same basic component as in (a)) satisfies:
𝑡 ≤ 0.36 𝑑√𝑓𝑢𝑏 ∕ 𝑓𝑦 (3.5)
Where,
𝑑 is the nominal diameter of the bolt.
fub is the yield strength of the relevant basic component.
fy is the ultimate tensile strength of the bolt material.
For a joint where the design resistance moment 𝑀𝑗,𝑅𝑑 is limited by the shear resistance of the
bolt, can’t be considered as having enough rotational capacity for the plastic analysis.
Welded joints
For welded beam-to-column joints where the column web is reinforced for compression and
not for tension, and the resistant moment is not limited due to shear stress of the web of the column,
the rotational capacity of the joint can be considered not less than:
𝜙𝐶𝑑 = 0.025ℎ𝑐 ∕ ℎ𝑏 (3.6)
Where,
hc The depth of the column
hb The depth of the beam
Although, if the joint fulfills what is stated in this section and is welded but not reinforced, it
can be considered that it has a rotational capacity 𝜙𝐶𝑑 not less than 0.015 radian.
All these considerations are verified only for steel type S 235, S 275 and S 355 and for joints
where the design value of axial force 𝑁𝐸𝑑 in the connected members does not exceed 5% of the
design plastic resistance 𝑁𝑝𝑙,𝑅𝑑 of its cross section. Also, this verification is not necessary if 𝑀𝑗,𝑅𝑑
of the joint is at least 1.2 times the design plastic moment resistance 𝑀𝑝𝑙,𝑅𝑑 of the cross section of
the connected members.
In case of hollow section, it is necessary to review section 7 of the EN 1993 part 1-8. Since this
connection is not critical in the project, this will not be emphasized.

Assessment of Robustness for Composite Steel-Concrete Frame Buildings Structural connections
Gregrorio Francisco Canó Almonte 35
3.1.1.3. Elastic-plastic global analysis
When using an elastic-plastic global analysis for the structure, the joint will have to be classified
by their stiffness and resistance. In this case the same methods previously mentioned will be used,
for the 𝑀𝑗,𝑅𝑑 will be the same as it was mentioned in section 3.1.1.2 of this text, the value of 𝑆𝑗 will
be the same as mentioned in section 3.1.1.1 and 𝜙𝐶𝑑 will be found the same way as mention in
section 3.1.1.2. Also, for hollow section the method explained in section 7 of the Eurocode 3 part
1-8 will be used, this part will not be detailed since is not a critical part of the project.
The design of the joint for this type of analysis has a bi-linear simplification for the relation of
the moment and rotation of the joint represented in Figure 3-4. Where 𝜂 will be taken from Table
3-3.
Figure 3-4 Simplified bi-linear design moment-rotation characteristic (CEN, 2005)
3.1.1.4. Global analysis of lattice girders
3.1.2. Joint classification
As it was stated before, all joints can be classified according to their stiffness or to their
resistance and these joints must respect the assumptions made on the analysis method chosen,
without adversely affecting any other part of the structure.

Assessment of Robustness for Composite Steel-Concrete Frame Buildings Structural connections
Gregrorio Francisco Canó Almonte 36
Classification according to its stiffness
A joint will be classified as rigid, nominally pinned or semi-rigid according to its rotational
stiffness. For this, the initial rotational stiffness 𝑆𝑗,𝑖𝑛𝑖 must be compare with the limits indicated in
Figure 3-5. The joint can be catalogized by calculation as it was explained in the previous section
or by experimental results.
A nominally pinned joint should be capable to transmit the internal forces, without creating
significant moment that can adversely affect the structure. This type of joint should be able to
accept the rotation imposed by the load combination. For a rigid joint, should have enough
rotational stiffness to guarantee a full continuity for the analysis. If the joint cannot be qualified as
neither of these types, the joint will be considered semi-rigid.
Figure 3-5 Classification of joint by stiffness (CEN, 2005)
Zone 1: rigid, if 𝑆𝑗,𝑖𝑛𝑖 ≥𝑘𝑏𝐸𝐼𝑏
𝐿𝑏
Where,
𝑘𝑏 = 8 for frame where the bracing system reduces the horizontal displacement by at least
80%.
𝑘𝑏 = 25 for other frames, provided that in every story 𝑘𝑏 ∕ 𝑘𝑐 ≥ 0.1.
Zone 2: semi-rigid
All joints in zone 2 should be classified as semi-rigid. Joints in Zone 1 or 3 may optionally also
be treated as semi-rigid.

Assessment of Robustness for Composite Steel-Concrete Frame Buildings Structural connections
Gregrorio Francisco Canó Almonte 37
Zone:3 nominally pined, if 𝑆𝑗,𝑖𝑛𝑖 ≥0.5𝐸𝐼𝑏
𝐿𝑏
Where,
kb The mean value of 𝐼𝑏 ∕ 𝐿𝑏 for all the beam at the top of that story.
kc The mean value of 𝐼𝑐 ∕ 𝐿𝑐 for all the column in that story.
Ib The second moment of area of a beam.
Ic The second moment of area of a column.
Lb The spam of a beam (center-to-center of columns)
Lc The span of a column
The base of a column can be classified as well but since is not part of this investigation will not
be detailed.
Classification according to its resistance
When classifying a connection due to its resistance, it will be based on making a comparison
between is resistance moment, 𝑀𝑗,𝑅𝑑, with the resistance moment of the element joint. They can be
arranged into three main groups:
Nominally pined joints
This type of joints should be able to transmit the internal forces of the structure without creating
and adverse moment that can affect other members. Joints that its design resistance is not greater
than 25% of a full-strength joint and that has sufficiently rotation will be considered pin.
Full strength joints
For full strength joints, the design resistance cannot be less than the resistance of the element
connected. For a joint to be classified as full strength must meet the criteria stablished in Figure
3-6. Where the moment resistance of the connection, 𝑀𝑗,𝑅𝑑, should be greater than the moment
resistance of the beam, 𝑀𝑏,𝑃𝑙,𝑅𝑑, or the moment resistance of the column, 𝑀𝑐,𝑃𝑙,𝑅𝑑
, when the
connection is on the top of the column, or 2𝑀𝑐,𝑃𝑙,𝑅𝑑 when the connection is within the column
height.
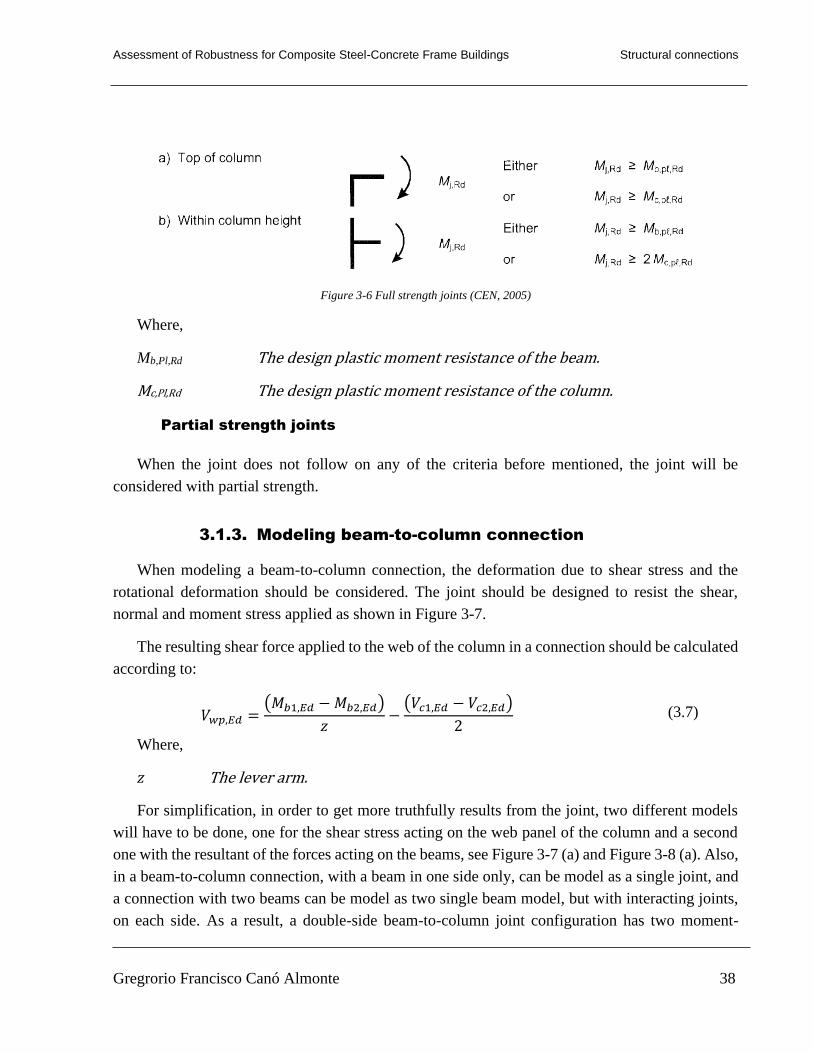
Assessment of Robustness for Composite Steel-Concrete Frame Buildings Structural connections
Gregrorio Francisco Canó Almonte 38
Figure 3-6 Full strength joints (CEN, 2005)
Where,
Mb,Pl,Rd The design plastic moment resistance of the beam.
Mc,Pl,Rd The design plastic moment resistance of the column.
Partial strength joints
When the joint does not follow on any of the criteria before mentioned, the joint will be
considered with partial strength.
3.1.3. Modeling beam-to-column connection
When modeling a beam-to-column connection, the deformation due to shear stress and the
rotational deformation should be considered. The joint should be designed to resist the shear,
normal and moment stress applied as shown in Figure 3-7.
The resulting shear force applied to the web of the column in a connection should be calculated
according to:
𝑉𝑤𝑝,𝐸𝑑 =(𝑀𝑏1,𝐸𝑑 − 𝑀𝑏2,𝐸𝑑)
𝑧−
(𝑉𝑐1,𝐸𝑑 − 𝑉𝑐2,𝐸𝑑)
2 (3.7)
Where,
𝑧 The lever arm.
For simplification, in order to get more truthfully results from the joint, two different models
will have to be done, one for the shear stress acting on the web panel of the column and a second
one with the resultant of the forces acting on the beams, see Figure 3-7 (a) and Figure 3-8 (a). Also,
in a beam-to-column connection, with a beam in one side only, can be model as a single joint, and
a connection with two beams can be model as two single beam model, but with interacting joints,
on each side. As a result, a double-side beam-to-column joint configuration has two moment-
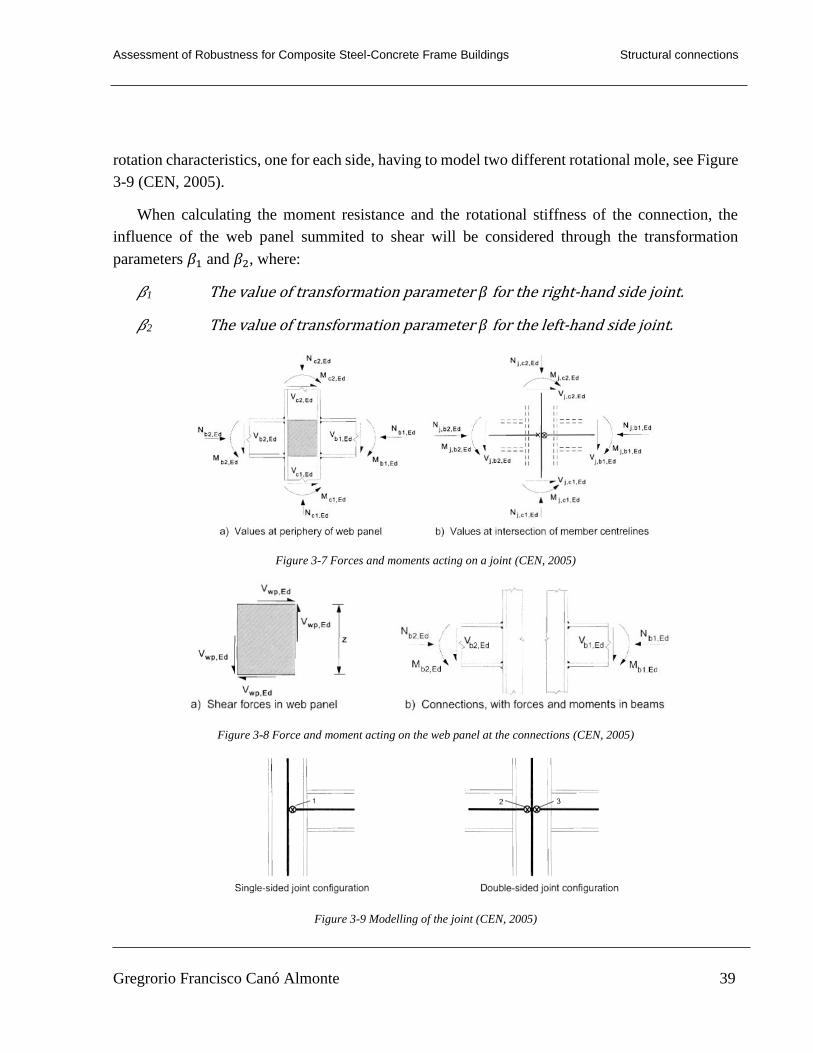
Assessment of Robustness for Composite Steel-Concrete Frame Buildings Structural connections
Gregrorio Francisco Canó Almonte 39
rotation characteristics, one for each side, having to model two different rotational mole, see Figure
3-9 (CEN, 2005).
When calculating the moment resistance and the rotational stiffness of the connection, the
influence of the web panel summited to shear will be considered through the transformation
parameters 𝛽1 and 𝛽2, where:
𝛽1 The value of transformation parameter 𝛽 for the right-hand side joint.
𝛽2 The value of transformation parameter 𝛽 for the left-hand side joint.
Figure 3-7 Forces and moments acting on a joint (CEN, 2005)
Figure 3-8 Force and moment acting on the web panel at the connections (CEN, 2005)
Figure 3-9 Modelling of the joint (CEN, 2005)

Assessment of Robustness for Composite Steel-Concrete Frame Buildings Structural connections
Gregrorio Francisco Canó Almonte 40
Where,
1. Joint
2. Joint 2: left side
3. Joint 2: right side
In Table 3-4 Approximate values for the transformation parameter 𝛽 there are approximate
values for 𝛽1 and 𝛽2. However, for more accurate values can be found following the next equations.
These equations will be mandatory in the case of joint where the beam do not have the same
designs.
𝛽1 = |1 −𝑀𝑗,𝑏2,𝐸𝑑
𝑀𝑗,𝑏1,𝐸 𝑑| ≤ 2 (3.8)
𝛽2 = |1 −𝑀𝑗,𝑏1,𝐸𝑑
𝑀𝑗,𝑏2,𝐸 𝑑| ≤ 2 (3.9)
Where,
Mj,b1,Ed The moment at the intersection from the right-hand beam.
Mj,b2,Ed The moment at the intersection from the left-hand beam.
3
Table 3-4 Approximate values for the transformation parameter 𝛽 (CEN, 2005)

Assessment of Robustness for Composite Steel-Concrete Frame Buildings Structural connections
Gregrorio Francisco Canó Almonte 41
After considering these, the resistance of the connection must be calculated taking into
consideration the bolts and the distribution. To do so, what is established in EN 1993 part 1-8
section 6 have to be followed, this will not be explain since what is important for this case study is
the rotational stiffness more than the plastic resistance of the connection.
3.2. Steel-to-concrete connection
The connection between the steel and the concrete is important to guarantee the re-distribution
of the forces in the structure. This connection can be ignored, where the two materials work
separately; partial, where only a percentage of the interaction is considered; or total, where the two
materials work together to create a composite element with better mechanical characteristics, see
Figure 3-10. For robustness this can be a method to tie the elements among each other and will
help with the deformation of the structure.
Figure 3-10 Composite beam deformation with full interaction and no interaction between materials (LUIS CALADO, 2015)
3.2.1. Longitudinal shear stress between concrete and steel
When calculating the longitudinal stress of the connection between the concrete and the steel,
and considering that it has a total interaction between the two materials has a lineal-elastic behavior,
the longitudinal shear stress, 𝑞, can be determine following:
𝑞(𝑥) =𝑉(𝑥)𝑆
𝐼 (3.10)
Where,

Assessment of Robustness for Composite Steel-Concrete Frame Buildings Structural connections
Gregrorio Francisco Canó Almonte 42
𝑉(𝑥) Shear stress on the section
𝑆 Static moment of the homogenized concrete section in relation with the neutral
elastic axis.
𝐼 The moment of inertia of the homogenized section.
𝑞 The longitudinal shear stresses.
However, this will be true if the beam does not exceed its elastic moment. When this happens,
the distribution of the longitudinal shear stress is no longer lineal-elastic and the beam develops
plasticity in the mid-span, where the forces applied to the connectors will increase (LUIS
CALADO, 2015).
Figure 3-11 Variation of the longitudinal shear stress, q, according to the span of the beam (LUIS CALADO, 2015).
When designing a building, it can be considered that the connectors are ductile and, because of
the capacity of the redistribution of the forces for the longitudinal shear, it can be admitted a
uniform shear force throughout the beam and equal spacing between connectors.
Shear stud connectors
The shear stud connectors have an ultimate tensile strength resistance between 450 𝑁 ∕ 𝑚𝑚2
and 600 𝑁 ∕ 𝑚𝑚2, even though the norm does not allow resistance higher than 500 𝑁 ∕ 𝑚𝑚2,
and a geometrical characteristics with diameters between 13 and 25 𝑚𝑚 and height between 75
and 150 𝑚𝑚. Using these values, the shear resistance on a solid slab for the stud can depend on

Assessment of Robustness for Composite Steel-Concrete Frame Buildings Structural connections
Gregrorio Francisco Canó Almonte 43
the resistance of the concrete or the resistance of the stud using the following equations (CEN,
2009):
𝑃𝑅𝑑 = mⅈn(𝑃𝑅𝑑,1; 𝑃𝑅𝑑,2) (3.11)
Where,
𝑃𝑅𝑑,1 =0.8𝑓𝑢𝜋
𝑑2
4𝛾𝑣
(3.12)
Or
𝑃𝑅𝑑,2 =0.29𝛼 𝑑 √𝑓𝑐𝑘𝐸𝑐𝑚
2
𝛾𝑣 (3.13)
Where,
γv Partial coefficient to consider material imperfections, use 1.25.
𝑑 Diameter of the shear stud.
fu Ultimate tensile stress of the shear stud, less than 500 𝑁 ∕ 𝑚𝑚2
fck Ultimate compression tension for concrete at 28 days.
hsc Total height of the shear stud
Where 𝛼 will be calculates as:
𝛼 = 0.2 (ℎ𝑠𝑐
𝑑+ 1) 𝑓𝑜𝑟 3 ≤
ℎ𝑠𝑐
𝑑≤ 4 (3.14)
𝛼 = 1 𝑓𝑜𝑟 ℎ𝑠𝑐
𝑑> 4 (3.15)
According to the Eurocode 4 part 1-1, the shear stud, when in between the parameters of height
and diameter before mentioned, can be considered ductile when their total height after the weld is
not smaller than 4 times its diameter. Also, sets a limit to the minimum height of the stud to be 3
times its diameter after the welding (CEN, 2009).
However, when a composite slab it’s considered with a profiled steel sheet, the resistance for
the shear stud will minimized depending on the geometry of the sheet, see Figure 3-12. On the
case of a trapezoidal steel sheet, the steel stud will present a behavior like the one presented in
Figure 3-13. Where the stud has its ultimate tensile strength when the material gets plasticized on

Assessment of Robustness for Composite Steel-Concrete Frame Buildings Structural connections
Gregrorio Francisco Canó Almonte 44
the core. This will only be possible if the stud is, at least two times its diameter, greater than the
height of the steel sheet.
Figure 3-12 Shear stud resistance according to the geometry of the steel sheet (LUIS CALADO, 2015)
Figure 3-13 Shear stud behavior in a trapezoidal steel sheet (LUIS CALADO, 2015)
Where,
PB The force due to the flexion of the stud
Pz The force due to the inclination of the stud
hsc Total height of the shear stud
hp Total height of the steel sheet
After several experimental tests for different type of steel sheet it was concluded that the
resistance of the shear stud considering the steel sheet profile, 𝑃𝑖,𝑅𝑑 , will be equal to the one
calculated for a solid slab, multiply for a reduction factor, 𝑘𝑖, that depends on orientation of the
nerves, parallel or transvers to the beam.

Assessment of Robustness for Composite Steel-Concrete Frame Buildings Structural connections
Gregrorio Francisco Canó Almonte 45
𝑃𝑖,𝑅𝑑 = 𝑘𝑖𝑃𝑅𝑑 (3.16)
Where,
• For the nerves are parallel to the beam
𝑘𝑙 = 0.6𝑏0
ℎ𝑃(
ℎ𝑠𝑐
ℎ𝑝− 1) ≤ 1.0 (3.17)
• For the nerves are transverse to the beam
𝑘𝑡 =0.7
√𝑛𝑟
𝑏0
ℎ𝑃(
𝑛𝑠𝑐
ℎ𝑝− 1) (3.18)
Where,
nr The number of shear stud in the nerve, not higher than 2.
Figure 3-14 Steel sheet geometrical components (CEN, 2009)
Partial/total shear force connection
When calculating the resistance moment of a composite section, 𝑀𝑅𝑑 , it is related to the
resistance force of the longitudinal shear, 𝑉𝐿,𝑅𝑑, and concomitant to the number of connector and
the respective force strength, 𝑃𝑅𝑑. In a composite beam the moment applied depends on the load
and the support condition, the resistance moment depends, among others, on the connection since
this will condition the force applied to the concrete, 𝑁𝑐. As a result, the longitudinal shear design
resistance will be equal to the number of connectors times the resistance force of the connector in
a distance in the bema, and this will have to be equal or greater than the compression force applied
to the concrete.
𝑁𝑐 ≤ 𝑉𝐿,𝑅𝑑 = 𝑛𝐿𝑥𝑃𝑅𝑑 (3.19)
Where,
𝑛 The number of connectors

Assessment of Robustness for Composite Steel-Concrete Frame Buildings Structural connections
Gregrorio Francisco Canó Almonte 46
Lx Distance between the support and any point in the beam.
PRd Shera stud resistance.
Nc Force applied to the concrete.
VL,Rd Longitudinal shear design resistance.
If the connection between the two materials, 𝑁𝑐,𝑓, is considered total and the neutral plastic
axis is in the concrete, means that 𝑅𝑐 ≥ 𝑅𝑎. In this case 𝑁𝑐,𝑓 = 𝑅𝑎. In the other hand, if the neutral
plastic axis is in the steel, 𝑅𝑎 > 𝑅𝑐 and 𝑁𝑐,𝑓 = 𝑅𝑐. As a result, the value for the compression force
on the concrete flange will be equal to (LUIS CALADO, 2015):
𝑁𝑐,𝑓 = mⅈn(𝑅𝑐; 𝑅𝑎) (3.20)
Where,
Nc,f The compression force resisted by the concrete flange.
Rc The maximum compression resistance of the concrete flange.
Ra The maximum tensile resistance of the steel section.
As a result, if 𝑁𝑐 = 𝑁𝑐,𝑓 the connection between the elements will be considered total, in the
other hand, if 𝑁𝑐 < 𝑁𝑐,𝑓 the connection will be considered partial. The ratio between these two
components will represent the degree of connection, 𝜂 (LUIS CALADO, 2015).

Assessment of Robustness for Composite Steel-Concrete Frame BuildingsStructural design of buildings: two case
studies
Gregrorio Francisco Canó Almonte 47
4. Structural design of buildings: two case studies
For this project, two different type of buildings where selected to be designed following what
it is described in the Eurocodes. For each case, there will be three situations so the results can be
compared at the end. On the first model, the building will be designed without taking into
consideration robustness. It will be a simple design to Ultimate Limited State and Serviceability
Limit State. The second model will be taking into consideration robustness with the removal of key
elements. In this case, the key elements considered will be the columns. The third model will use
the first solution and combine it with a truss structure in the top, that will allow it to resist the
notional removal of key elements.
This chapter will present the definition of the materials, structural layouts, actions, action
combinations and verification of the limit states and the linear elastic analysis.
4.1. Parametric values and analysis case
4.1.1. Parametric values
The parametric values where selected in order to have buildings with similar characteristics to
the everyday erected. For both situations the designs where set as seen in Table 4-1. To help make
a fair comparison with the final solutions, some parameters were set fixed in all cases.
The floor system was considered to have a composite response only for the secondary beams.
The primary beams where designed to be able to resist the loads during the construction phase,
without using any propping device. The column base connections where considered fixed allowing
rotation on the X direction on the global coordinates of the structure. The beam to column
connections that belong on the moment resistant frame where considered as totally rigid on the X
direction and the beam to column connection, on the Y direction, where considered perfectly
pinned. The building will be considered to have a moment resistance frame (MRF) on the X
direction and a braced system on the Y direction.
Each building will be designed three times, the first time following the normal regulation for a
project design, the second time using EN 1991 part 1-7 with the removal of the critical element and
a third time using a truss superstructure to withstand the additional stress from the removal of the
columns.

Assessment of Robustness for Composite Steel-Concrete Frame BuildingsStructural design of buildings: two case
studies
Gregrorio Francisco Canó Almonte 48
Parametric Building 1 Building 2
Floor height 4 m 4 m
Moment resistance frame span 6 x 8 m 4 x 8 m
Braced frame span 6 x 5 m 4 x 5 m
Lateral force design scenario Wind Wind
Concrete C30/37 C30/37
Steel S355 S355
Utilization Office Office
Nomenclator
Building Normal Condition
Building following EN 1991-1-7
Building with truss superstructure
1-1
1-2
1-3
2-1
2-2
2-3
Table 4-1 Parametric consideration for buildings type
4.1.2. Analysis case
The structures will be analyzed for the loss of the column taking only into considerations the
wind load for horizontal load. For each building, the most critical situation was identified by
removing one by one column on the first floor of the structure; since, here the elements had a
greater rate of utilization.
4.2. Actions
For the permanent action and the live load for the building it was used the parameters
established on the EN 1990 and the EN 1991 part 1-1. The snow and wind where considered
following the recommendations from EN 1991 part 1-3 and EN 1991 part 1-4 respectively.
Identified accidental loads where not taken into consideration and will not be part of this evaluation.
The primary beam was not considered to work as a composite member in order to be able to
resist the stresses for the construction phase, at ultimate limit state and serviceability state. This
will allow a faster construction process.
4.2.1. General actions for live load
Buildings with a utilization for office, fit in category type B. This will allow to select the
standardization load applicable for the design of this construction. A summary of table 6.1 from
the EN 1991 part 1-1 is given in this thesis in Table 4-2. Acknowledging this, the load used for this

Assessment of Robustness for Composite Steel-Concrete Frame BuildingsStructural design of buildings: two case
studies
Gregrorio Francisco Canó Almonte 49
categorization are summarized in Table 6.2 from the Eurocode and can also be seen in Table 4-2.
For the design a load due to the building utilization of 3 𝐾𝑁 ∕ 𝑚2 will be used.
Category Specific Use Load (KN/m2)
A Area for domestic and
residential activities
2 to 3
B Office areas 2 to 3
C Areas where people may
congragate
It has a sub category
2 to 7.5
D Shopping areas 4 to 5
Table 4-2 Category of use (CEN, 2009)
The roof of the building can be considered of three types according to the specific use that will
have. The first one, is for roofs that cannot be access except for normal maintenance and repair.
The second one is for roofs that are accessible with an occupancy that can be categorize along with
the other floors. The last classification is for roof that will have special used like the landing of a
helicopter, see Table 4-3. In this case a category type H was used where the recommendations from
the Eurocode is to use a load of 0.40 𝐾𝑁 ∕ 𝑚2.
Category of loaded area Specific use
H Roofs not accessible except for normal
maintenance and repair.
I Roof accessible with occupancy according to
categories A to G
J Roof accessible for special services, such as
helicopter landing areas.
Table 4-3 Categorization of roofs (CEN, 2009)
4.2.2. General action for permanent load
For the structural element, annex A for the EN 1991 part 1-1 stablish the recommended values.
As a result, we proceeded to select these values to take into consideration in the structural design
of the structure, see Table 4-4.
Materials Density 𝜸(𝑲𝑵 ∕ 𝒎𝟑)
Concrete 24.0
Structural steel 78.5
Table 4-4 Construction materials density (CEN, 2009)
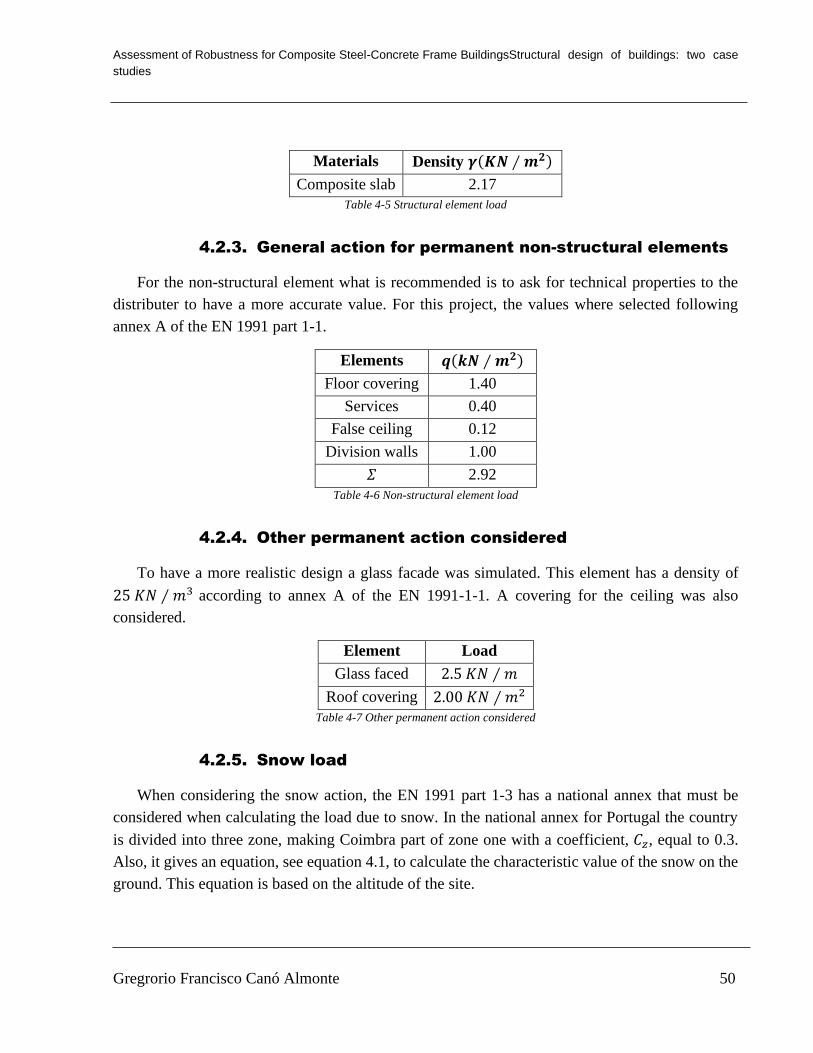
Assessment of Robustness for Composite Steel-Concrete Frame BuildingsStructural design of buildings: two case
studies
Gregrorio Francisco Canó Almonte 50
Materials Density 𝜸(𝑲𝑵 ∕ 𝒎𝟐)
Composite slab 2.17
Table 4-5 Structural element load
4.2.3. General action for permanent non-structural elements
For the non-structural element what is recommended is to ask for technical properties to the
distributer to have a more accurate value. For this project, the values where selected following
annex A of the EN 1991 part 1-1.
Elements 𝒒(𝒌𝑵 ∕ 𝒎𝟐)
Floor covering 1.40
Services 0.40
False ceiling 0.12
Division walls 1.00
𝛴 2.92
Table 4-6 Non-structural element load
4.2.4. Other permanent action considered
To have a more realistic design a glass facade was simulated. This element has a density of
25 𝐾𝑁 ∕ 𝑚3 according to annex A of the EN 1991-1-1. A covering for the ceiling was also
considered.
Element Load
Glass faced 2.5 𝐾𝑁 ∕ 𝑚
Roof covering 2.00 𝐾𝑁 ∕ 𝑚2
Table 4-7 Other permanent action considered
4.2.5. Snow load
When considering the snow action, the EN 1991 part 1-3 has a national annex that must be
considered when calculating the load due to snow. In the national annex for Portugal the country
is divided into three zone, making Coimbra part of zone one with a coefficient, 𝐶𝑧, equal to 0.3.
Also, it gives an equation, see equation 4.1, to calculate the characteristic value of the snow on the
ground. This equation is based on the altitude of the site.
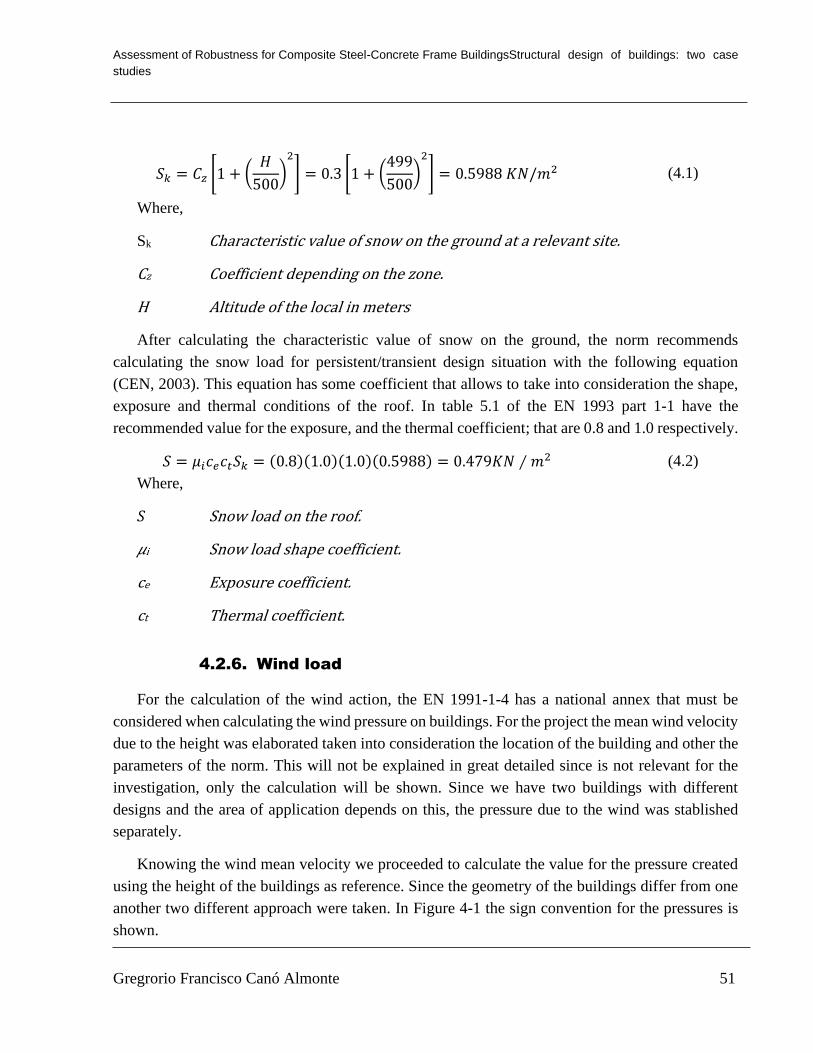
Assessment of Robustness for Composite Steel-Concrete Frame BuildingsStructural design of buildings: two case
studies
Gregrorio Francisco Canó Almonte 51
𝑆𝑘 = 𝐶𝑧 [1 + (𝐻
500)
2
] = 0.3 [1 + (499
500)
2
] = 0.5988 𝐾𝑁/𝑚2 (4.1)
Where,
Sk Characteristic value of snow on the ground at a relevant site.
Cz Coefficient depending on the zone.
H Altitude of the local in meters
After calculating the characteristic value of snow on the ground, the norm recommends
calculating the snow load for persistent/transient design situation with the following equation
(CEN, 2003). This equation has some coefficient that allows to take into consideration the shape,
exposure and thermal conditions of the roof. In table 5.1 of the EN 1993 part 1-1 have the
recommended value for the exposure, and the thermal coefficient; that are 0.8 and 1.0 respectively.
𝑆 = 𝜇𝑖𝑐𝑒𝑐𝑡𝑆𝑘 = (0.8)(1.0)(1.0)(0.5988) = 0.479𝐾𝑁 ∕ 𝑚2 (4.2)
Where,
𝑆 Snow load on the roof.
𝜇i Snow load shape coefficient.
ce Exposure coefficient.
ct Thermal coefficient.
4.2.6. Wind load
For the calculation of the wind action, the EN 1991-1-4 has a national annex that must be
considered when calculating the wind pressure on buildings. For the project the mean wind velocity
due to the height was elaborated taken into consideration the location of the building and other the
parameters of the norm. This will not be explained in great detailed since is not relevant for the
investigation, only the calculation will be shown. Since we have two buildings with different
designs and the area of application depends on this, the pressure due to the wind was stablished
separately.
Knowing the wind mean velocity we proceeded to calculate the value for the pressure created
using the height of the buildings as reference. Since the geometry of the buildings differ from one
another two different approach were taken. In Figure 4-1 the sign convention for the pressures is
shown.

Assessment of Robustness for Composite Steel-Concrete Frame BuildingsStructural design of buildings: two case
studies
Gregrorio Francisco Canó Almonte 52
Figure 4-1 Sing convention for pressure due to the wind load (CEN, 2010)
4.2.6.1. Building 1 wind load
Since this building height is less than any of the longitudinal or transversal dimensions, only
one pressure was needed it at the building height of 20 m, and this was used for both wind in the
X or Y direction. Using these parameters, the mean wind velocity graphic was developed, see
Figure 4-2. For modeling purpose, the wind in the X direction will be considered acting in the same
direction as the MFR and the Y will be acting perpendicular.
Table 4-8 Calculation for the wind pressure building 1 (CEN, 2010)
z0 = 0.30 m (Tabela 4.1)
vb,0 = 27.00 m/s zmin = 8.00 m (Tabela 4.1)
cdir = 1.00 (recommended) kr =
cseason = 1.00 (recommended)
ρ = 1.25 kg/m3
φ = 0 (figura A.1 or A.2)
S = 0 (figura A.2 or A.3)
vb = 27.00 m/s co = 1
qb = 455.63 N/m2
KI = 1 (Recommended)
Peak factor=
Category:
3.50
III
2.2-Roughness factor
0.215
3-Orography Coefficient
4-Wind turbulance
5-Exposure coefficeint
1-Wind pressures
1.1-Basic parameters acc. National Annex
1.2-Basic wind velocity EN 1991-1-4 (4.1)
1.3-Basic Velocity Pressure
2-Wind force
2.1-Terrain category (Table 4.1)

Assessment of Robustness for Composite Steel-Concrete Frame BuildingsStructural design of buildings: two case
studies
Gregrorio Francisco Canó Almonte 53
Figure 4-2 Wind mean velocity building 1
As a result, the pressure at a height of 16 meters was calculated.
𝑞𝑝 = 0.922𝑘 𝑁 𝑚2⁄ (4.3)
Where,
qp The peak velocity pressures.
Table 4-9 Wind pressure for each area building 1
4.2.6.1. Building 2 wind load
For this building, since the height is greater than both X and Y dimensions, a different approach
was needed. Following what is stated in the norms, three peak velocity pressures where needed
depending on the direction of the wind pressures that it was going to be calculated, see Figure 4-3.
Taking all these into consideration the pressures due to the wind where calculated.
0
2
4
6
8
10
12
14
16
18
18 19 20 21 22 23 24
Hei
ght
(m)
Velocity (m/s)
Mean Wind Velocity (m/s)
A B C D E F G H I
Wind X -1.11 -0.74 -0.46 0.66 -0.3 -1.66 -1.11 -0.65 -0.18
Wind Y -1.11 -0.74 0 0.68 -0.35 -1.66 -1.11 -0.65 -0.18
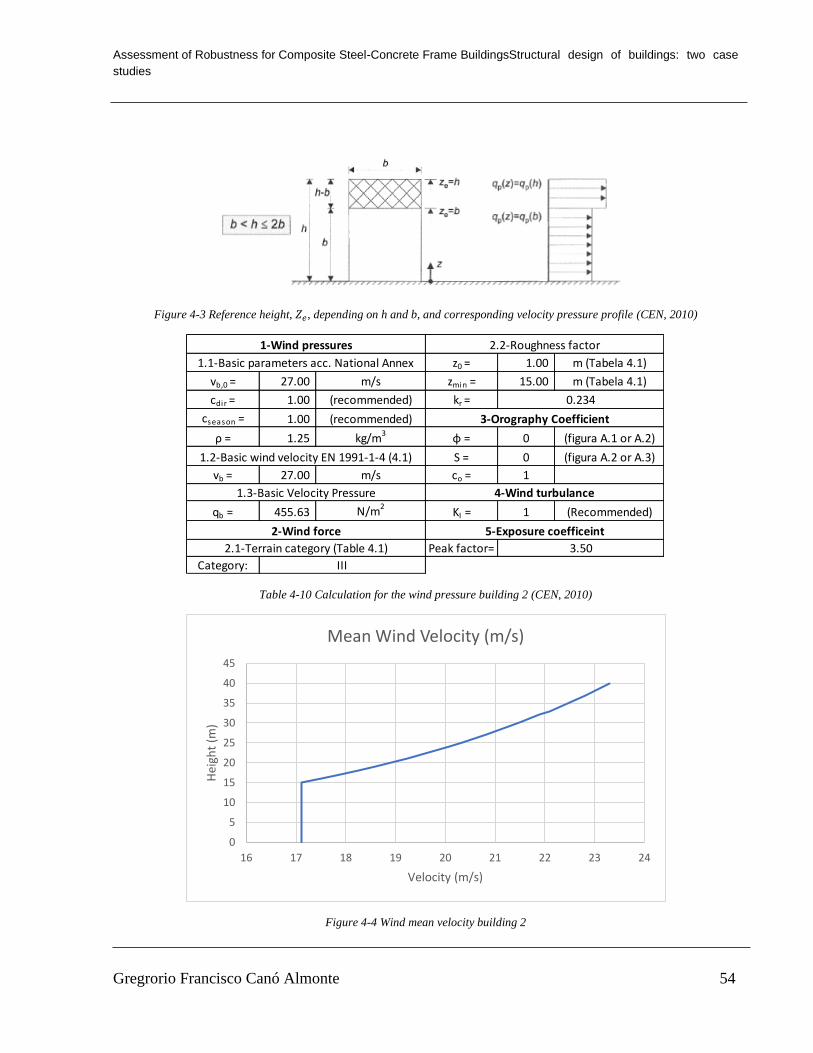
Assessment of Robustness for Composite Steel-Concrete Frame BuildingsStructural design of buildings: two case
studies
Gregrorio Francisco Canó Almonte 54
Figure 4-3 Reference height, 𝑍𝑒, depending on h and b, and corresponding velocity pressure profile (CEN, 2010)
Table 4-10 Calculation for the wind pressure building 2 (CEN, 2010)
Figure 4-4 Wind mean velocity building 2
z0 = 1.00 m (Tabela 4.1)
vb,0 = 27.00 m/s zmin = 15.00 m (Tabela 4.1)
cdir = 1.00 (recommended) kr =
cseason = 1.00 (recommended)
ρ = 1.25 kg/m3
φ = 0 (figura A.1 or A.2)
S = 0 (figura A.2 or A.3)
vb = 27.00 m/s co = 1
qb = 455.63 N/m2
KI = 1 (Recommended)
Peak factor=
Category:
3.50
2.2-Roughness factor
III
0.234
3-Orography Coefficient
4-Wind turbulance
5-Exposure coefficeint
1.1-Basic parameters acc. National Annex
1.2-Basic wind velocity EN 1991-1-4 (4.1)
1.3-Basic Velocity Pressure
2-Wind force
1-Wind pressures
2.1-Terrain category (Table 4.1)
0
5
10
15
20
25
30
35
40
45
16 17 18 19 20 21 22 23 24
Hei
ght
(m)
Velocity (m/s)
Mean Wind Velocity (m/s)

Assessment of Robustness for Composite Steel-Concrete Frame BuildingsStructural design of buildings: two case
studies
Gregrorio Francisco Canó Almonte 55
𝑞𝑝20 = 0.749𝑘 𝑁 𝑚2⁄ (4.4)
𝑞𝑝32 = 0.907𝑘 𝑁 𝑚2⁄ (4.5)
𝑞𝑝40 = 0.986 𝑁 𝑚2⁄ (4.6)
qp20 The peak velocity pressures at a height of 20 meters.
qp32 The peak velocity pressures at a height of 32 meters.
qp40 The peak velocity pressures at a height of 40 meters.
Table 4-11 Wind pressure for each area building 2
4.2.7. Load summary
In Table 4-12, we present a summary of the loads that will be applied to each building for
design purposes. These loads will be applied in the same way for all buildings, even when
considering robustness.
Load Unit
Self-weight Considered for each element
Rest of permanent load
Glass facade
Roof covering
2.92 𝐾𝑁 𝑚2⁄
2.00 𝐾𝑁 𝑚⁄
2.00 𝐾𝑁 𝑚2⁄
Live load 3.00 𝐾𝑁 𝑚2⁄
Wind load Table 4-9 and Table 4-11
Snow load 0.479 𝐾𝑁 𝑚2⁄
Roof load 0.40 𝐾𝑁 𝑚2⁄
Table 4-12 Applied load summary
4.2.8. Load combination
The load combinations that were considered for the ultimate limit states was the fundamental
combination.
∑ 𝛾𝐺,𝑗𝐺𝑘,𝑗
𝑗≥1
" + "𝛾𝑄,1𝑄𝑘,1" + " ∑ 𝛾𝑄,1𝜓0,𝑖𝑄𝑘,𝑖
𝑖>1
(4.7)
A20 A32 A40 B20 B32 B40 C20 C32 C40 D20 D32 D40 E20 E32 E40 F G H I
WIND X 0.00 -1.09 -1.18 0.00 -0.73 -0.79 0.00 -0.45 -0.49 0.00 0.73 0.79 0.00 -0.47 -0.51 -1.78 -1.18 -0.69 -0.20
WIND Y -0.90 0.00 -1.18 -0.60 0.00 -0.79 0.00 0.00 0.00 0.60 0.00 0.79 -0.41 0.00 -0.54 -1.80 -1.20 -0.70 -0.20

Assessment of Robustness for Composite Steel-Concrete Frame BuildingsStructural design of buildings: two case
studies
Gregrorio Francisco Canó Almonte 56
Where it must be verified:
• EQU – Lost of static equilibrium
Design
Situation
𝛾𝐺,sup
Unfavorable
𝛾𝐺,𝑖𝑛𝑓
Favorable
𝛾𝑄,1
Unfavorable
𝛾𝑄,1
Favorable
𝛾𝑄,𝑖
Unfavorable
𝛾𝑄,𝑖
Favorable
Persistent 1.10 0.90 1.50 0.00 1.50 0.00
Transient 1.10 0.90 1.50 0.00 1.50 0.00
Table 4-13 Design value for equation EQU
• STR – Structure collapse
Design
Situation
𝛾𝐺,sup
Unfavorable
𝛾𝐺,𝑖𝑛𝑓
Favorable
𝛾𝑄,1
Unfavorable
𝛾𝑄,1
Favorable
𝛾𝑄,𝑖
Unfavorable
𝛾𝑄,𝑖
Favorable
Persistent 1.35 1.00 1.50 0.00 1.50 0.00
Transient 1.35 1.00 1.50 0.00 1.50 0.00
Table 4-14 Design value for equation STR
• GTR – Excessive deformation or collapse of the foundations (in this investigation, the
foundations are not considered)
The combination factors that will be used where selected from Table 2-1 from this project.
4.3. Design assumptions
4.3.1. Structural modeling
For the structural modeling the column base were considered to be fixed only allowing rotation
on the global axis 𝑥, along the moment resistance frame (MRF), see Figure 4-5 Global modeling
considerations. The primary beam where considered continuous and where used to complete the
MRF and the secondary beam was idealized as perfectly pin at both ends. To simulate the rigidity
of the concrete slab and create a diaphragm effect, concrete beams were place in between the
secondary beams. These beams will not contribute to the final resistance of the structure or change
the distributions of the loads. These considerations where taken for both buildings.
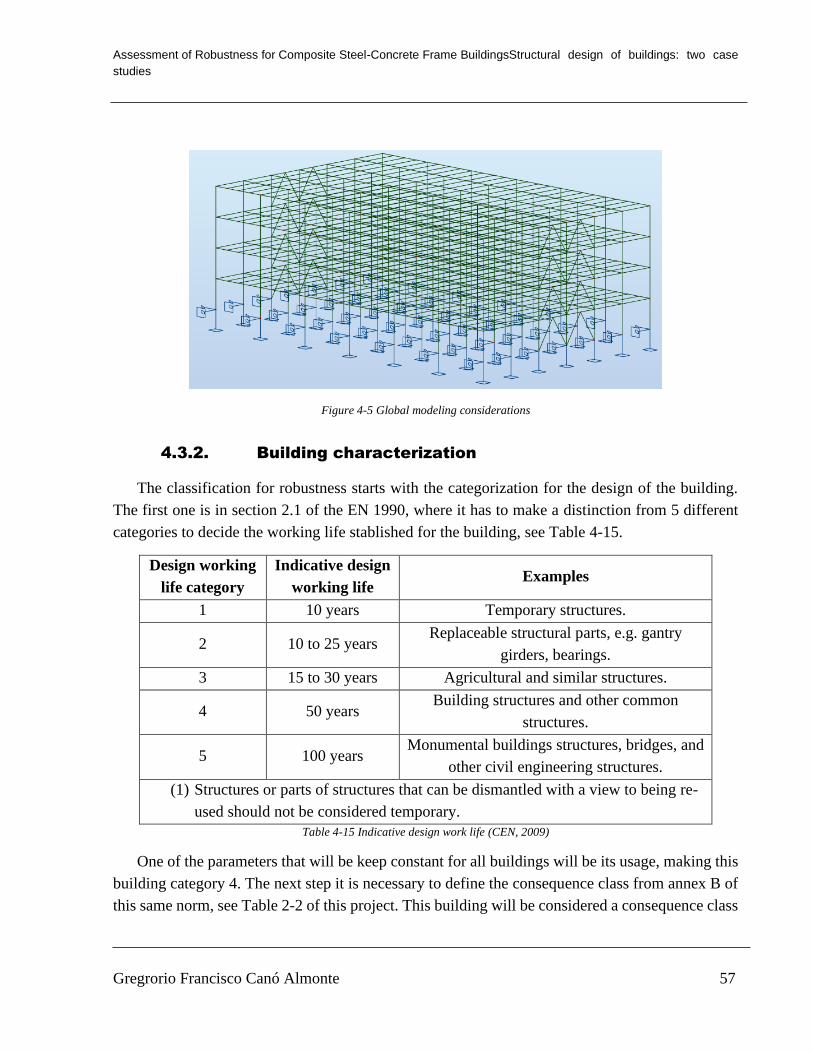
Assessment of Robustness for Composite Steel-Concrete Frame BuildingsStructural design of buildings: two case
studies
Gregrorio Francisco Canó Almonte 57
Figure 4-5 Global modeling considerations
4.3.2. Building characterization
The classification for robustness starts with the categorization for the design of the building.
The first one is in section 2.1 of the EN 1990, where it has to make a distinction from 5 different
categories to decide the working life stablished for the building, see Table 4-15.
Design working
life category
Indicative design
working life Examples
1 10 years Temporary structures.
2 10 to 25 years Replaceable structural parts, e.g. gantry
girders, bearings.
3 15 to 30 years Agricultural and similar structures.
4 50 years Building structures and other common
structures.
5 100 years Monumental buildings structures, bridges, and
other civil engineering structures.
(1) Structures or parts of structures that can be dismantled with a view to being re-
used should not be considered temporary.
Table 4-15 Indicative design work life (CEN, 2009)
One of the parameters that will be keep constant for all buildings will be its usage, making this
building category 4. The next step it is necessary to define the consequence class from annex B of
this same norm, see Table 2-2 of this project. This building will be considered a consequence class
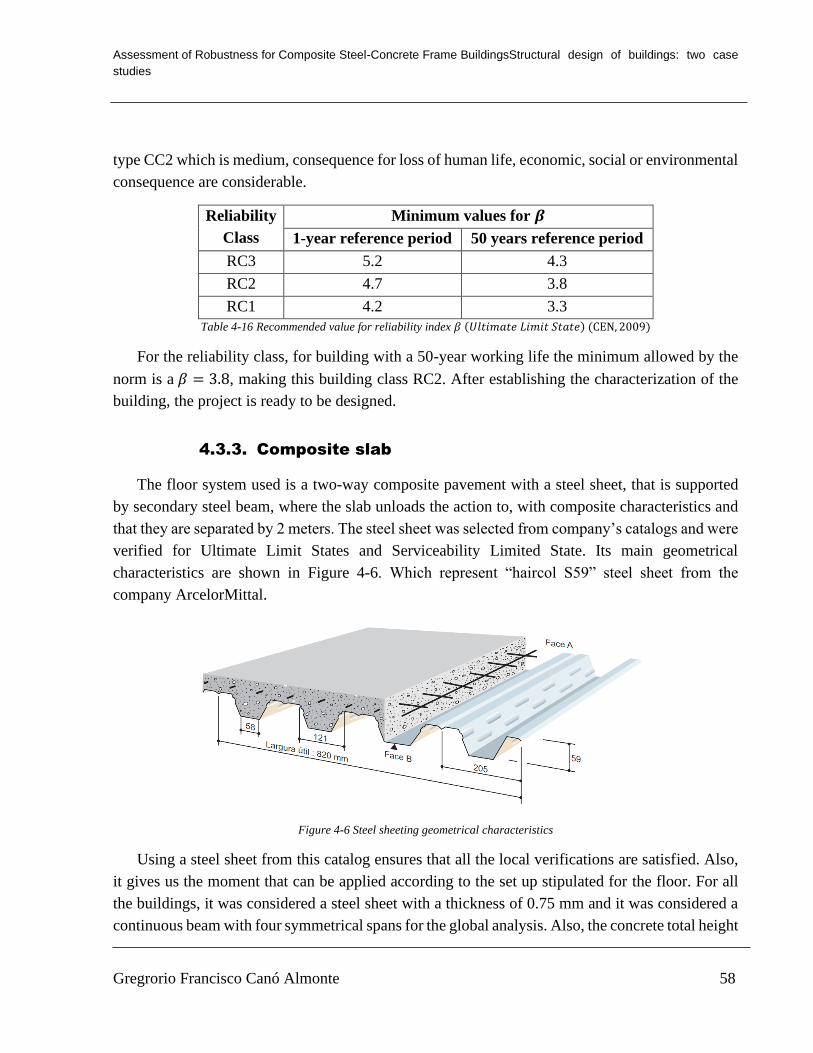
Assessment of Robustness for Composite Steel-Concrete Frame BuildingsStructural design of buildings: two case
studies
Gregrorio Francisco Canó Almonte 58
type CC2 which is medium, consequence for loss of human life, economic, social or environmental
consequence are considerable.
Reliability
Class
Minimum values for 𝜷
1-year reference period 50 years reference period
RC3 5.2 4.3
RC2 4.7 3.8
RC1 4.2 3.3
Table 4-16 Recommended value for reliability index 𝛽 (𝑈𝑙𝑡𝑖𝑚𝑎𝑡𝑒 𝐿𝑖𝑚𝑖𝑡 𝑆𝑡𝑎𝑡𝑒) (CEN, 2009)
For the reliability class, for building with a 50-year working life the minimum allowed by the
norm is a 𝛽 = 3.8, making this building class RC2. After establishing the characterization of the
building, the project is ready to be designed.
4.3.3. Composite slab
The floor system used is a two-way composite pavement with a steel sheet, that is supported
by secondary steel beam, where the slab unloads the action to, with composite characteristics and
that they are separated by 2 meters. The steel sheet was selected from company’s catalogs and were
verified for Ultimate Limit States and Serviceability Limited State. Its main geometrical
characteristics are shown in Figure 4-6. Which represent “haircol S59” steel sheet from the
company ArcelorMittal.
Figure 4-6 Steel sheeting geometrical characteristics
Using a steel sheet from this catalog ensures that all the local verifications are satisfied. Also,
it gives us the moment that can be applied according to the set up stipulated for the floor. For all
the buildings, it was considered a steel sheet with a thickness of 0.75 mm and it was considered a
continuous beam with four symmetrical spans for the global analysis. Also, the concrete total height

Assessment of Robustness for Composite Steel-Concrete Frame BuildingsStructural design of buildings: two case
studies
Gregrorio Francisco Canó Almonte 59
considered was 120 mm. As a result, the maximum load combination allowed is 13.26 𝐾𝑁 ∕ 𝑚2.
Using the characteristic combination for buildings the following load where used, see Table 4-17.
Loads 𝑲𝑵 ∕ 𝒎𝟐
Steel sheet self-weight 0.0851
Concrete slab self-weight 2.17
Other elements self-weight 2.92
Utilization load 3.00
Table 4-17 Load applied to concrete slab
∑ 𝛾𝐺,𝑗𝐺𝑘1𝑗
𝑗>1
" + "𝛾𝑝𝑃" + "𝛾𝑄,1𝑄𝑘,1" + " ∑ 𝛾𝑄,𝑖𝜓0,𝑖𝑄𝑘,𝑖
𝑖>1
(4.8)
Where,
" + " Implⅈes “to be combⅈne wⅈth”.
𝛴 Implⅈes “to be combⅈne wⅈth”.
Gkj The characteristic values of the permanent actions.
𝛾G,j Partial factor for permanent action 𝑗.
𝑃 Relevant representative value of a prestressing action.
𝛾p Partial factor for prestressing actions.
Qk,1 The characteristic value of the leading variable actions.
𝛾Q,1 Partial value factor for the leading variable action.
Qk,i The characteristic values of the accompanying variable actions 𝑖.
𝛾Q,i Partial value factor for the accompanying variable actions 𝑖.
𝜓o,i The factor for combination for the accompanying variable action 𝑖.
Using this equation, it can be verified, in equation 4.2, that the load applied is lower than the
resistance of the slab.
1.35(2.09 + 2.92) + 1.5(3) = 11.26𝑘𝑁 ∕ 𝑚2 < 13.26 𝐾𝑁 ∕ 𝑚2 (4.9)
For the cracking of the concrete, EN 1994-2 in section 7, gives the minimum area admissible
for reinforcement bar to control the cracks. This area can be found using different methods, one
controlling the spacing between the reinforcement bar and another one controlling the size of the
Assessment of Robustness for Composite Steel-Concrete Frame BuildingsStructural design of buildings: two case
studies
Gregrorio Francisco Canó Almonte 60
bars, the second approach was used. In this project a reinforcement welded mesh was used having
a longitudinal wire of 8 mm spaced 100 mm and cross wire of 8 mm separated 200 mm.
𝐴𝑠 =𝑘𝑠𝑘𝑐𝑘𝑓𝑐𝑡,𝑒𝑓𝑓𝐴𝑐𝑡
𝜎𝑠 (4.10)
ks Coefficient that allows to take into consideration the effect of the reduction of
the normal force of the concrete slab due to initial cracking and local slip of shear connection,
which may be taken as 0.9
kc Coefficient which considers of the stress distribution within the section
immediately prior to cracking and is given by:
𝑘𝑐 =1
1 +ℎ𝑐
2𝑧0
+ 0.3 ≤ 1.0 (4.11)
hc The thickness of the concrete flange.
Z0 The vertical distance between the centroids of the un-cracked concrete flange
and the un-cracked composite section, calculated using the modular ration 𝑛0 for short term
loading.
𝑘 Coefficient which allows for the effect of non-uniform self-equilibrating stress
which may be taken as 0.8.
Fct,eff The mean value of the tensile strength of the concrete effective at the time
when cracks may first be expected to occur. This value may be taken as 𝑓𝑐𝑡𝑚 from table 3.1 of
NP EN 1992-1-1.
Act The area of the tensile zone immediately prior of the cracking of the cross
section
𝜎s The maximum stress permitted in the reinforcement immediately after
cracking.
Where, 𝜎s was considered 360 𝑁 ∕ 𝑚𝑚2, from the table 7.1 in EN 1994-2 here represented in
Table 4-18, due to the size of the wire.

Assessment of Robustness for Composite Steel-Concrete Frame BuildingsStructural design of buildings: two case
studies
Gregrorio Francisco Canó Almonte 61
Table 4-18 Maximum bar diameter for high bond bars (CEN, 2005)
𝑘𝑐 =1
1 + (120
2(19.4))
+ 0.3 = 0.69 (4.12)
𝐴𝑠,𝑙 =(0.9)(0.8)(0.69)(2.9)(86,758.5)
360= 346.68 𝑚𝑚 2
𝑚⁄ (4.13)
𝐴𝑠,𝑡 =(0.9)(0.8)(0.69)(2.9)(61,000.0)
360= 243.75 𝑚𝑚 2
𝑚⁄ (4.14)
Making the welded mesh selected enough to control the crack as it can be seen in Table 4-19.
𝐴𝑠,𝐸𝑑 𝑚𝑚 2𝑚⁄ 𝐴𝑠,𝑅𝑑 𝑚𝑚 2
𝑚⁄
𝐴𝑠,𝑙 346.68 503
𝐴𝑠,𝑡 243.75 252
Table 4-19 Longitudinal reinforcement for cracking control
4.3.4. Secondary beam
The secondary beam was designed as a composite structure and the connection beam-to-beam
was considered as perfectly pin for calculation purpose, as it was mention before. The ribs of the
steel sheet where considered perpendicular to the beam. The layout for the beams can be seen in
Figure 4-7and Figure 4-8, where the secondary beams are separated by 2 meters.

Assessment of Robustness for Composite Steel-Concrete Frame BuildingsStructural design of buildings: two case
studies
Gregrorio Francisco Canó Almonte 62
Figure 4-7 Primary and secondary beam layout building 1
Figure 4-8 Primary and secondary beam layout building 2
For the design, the program known as ArcelorMittal Beam Calculation (ABC), which is a
software created by AcerlorMittal, was used to help with the structural verification for composite
beams. Since the same layout for the secondary beams were used for all buildings the verification
was done only once. Using the same loads applied for the slab verification, see Table 4-17, the
composite beam was design.
Figure 4-9 Composite beam design set up (ARCELORMITTAL)

Assessment of Robustness for Composite Steel-Concrete Frame BuildingsStructural design of buildings: two case
studies
Gregrorio Francisco Canó Almonte 63
For the verification, the section used was an IPE 140, see mechanical properties in Table 4-20.
This was selected since it was the beam capable of resisting the moment applied, in both under
construction and at the ultimate limited states stages, without the need of propping, as it was said
before. This section was critical for the resistance of the maximum moment applied for the
construction stage.
Table 4-20 Mechanical characteristics for the secondary beam (ARCELORMITTAL)
Using the verification for the Ultimate Limit State in EN 1993 part 1-1, for plastic shear and
moment, the beam was validated. First for the construction phase then as a composite member.
Also, this member does not have to be verified for the shear buckling of the web according to the
norm.
𝑉𝑃𝑙,𝑅𝑑 =𝐴𝑣(𝑓𝑦 ∕ √3)
𝛾𝑀0
= 156.64 𝐾𝑁 (4.15)
𝑀𝑃𝑙,𝑅𝑑 =𝑊𝑝𝑙𝑓𝑦
𝛾𝑀0
= 31.36 𝐾𝑁𝑚 (4.16)
Where,
𝑀𝑃𝑙,𝑅𝑑 The plastic resistance moment of the section.
𝑉𝑃𝑙,𝑅𝑑 The plastic shear resistance of the section.
Av The shear area of the section.
fy The yield strength of the structural steel.
In the construction phase, the moment and shear applied using the characteristic combination
for loads using a construction load of 1.5 𝑘𝑁 ∕ 𝑚2 was calculated to be 8.28 𝐾𝑁/𝑚, as it can be
seen in equation 4.16. Using this value, and applying the statics equation for equilibrium, the forces
A = 16.43 cm2
Av = 7.64 cm2
Iy = 541.22 cm4
Iz = 44.92 cm4
It = 2.45 cm4
Iw = 1,981.36 cm6
Wel ,y = 77.32 cm3
Wpl ,y = 88.34 cm3
IPE 140
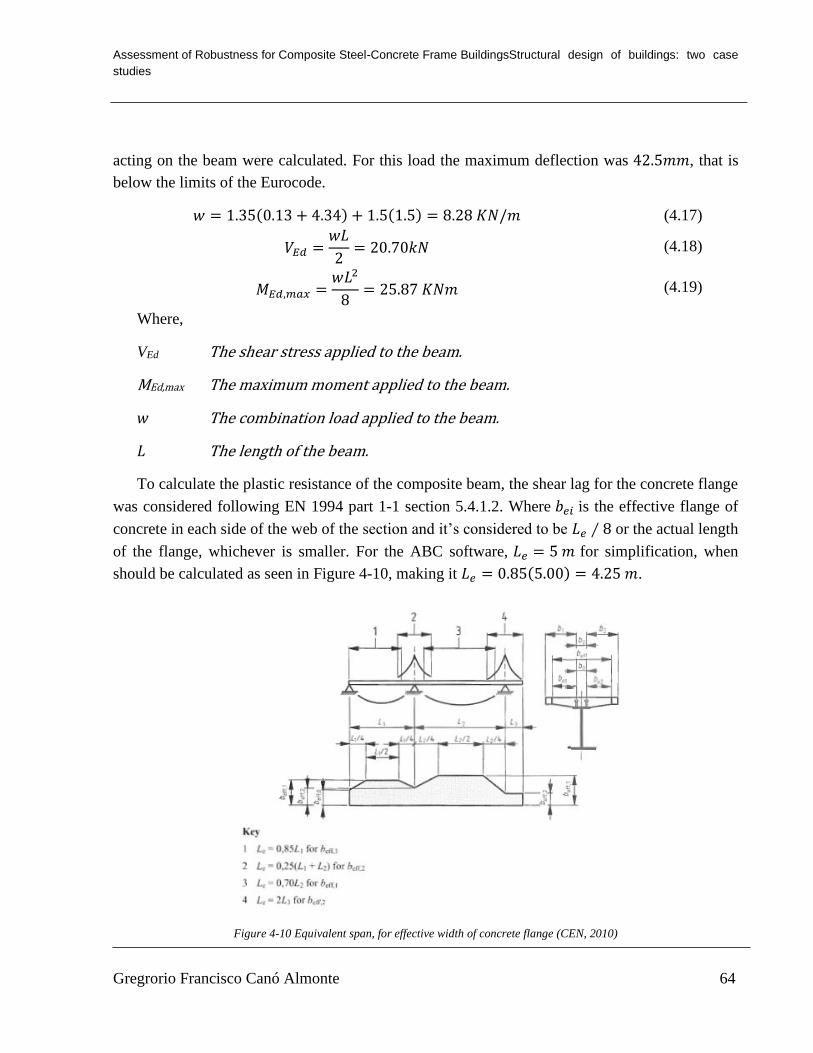
Assessment of Robustness for Composite Steel-Concrete Frame BuildingsStructural design of buildings: two case
studies
Gregrorio Francisco Canó Almonte 64
acting on the beam were calculated. For this load the maximum deflection was 42.5𝑚𝑚, that is
below the limits of the Eurocode.
𝑤 = 1.35(0.13 + 4.34) + 1.5(1.5) = 8.28 𝐾𝑁/𝑚 (4.17)
𝑉𝐸𝑑 =𝑤𝐿
2= 20.70𝑘𝑁 (4.18)
𝑀𝐸𝑑,𝑚𝑎𝑥 =𝑤𝐿2
8= 25.87 𝐾𝑁𝑚 (4.19)
Where,
VEd The shear stress applied to the beam.
MEd,max The maximum moment applied to the beam.
𝑤 The combination load applied to the beam.
𝐿 The length of the beam.
To calculate the plastic resistance of the composite beam, the shear lag for the concrete flange
was considered following EN 1994 part 1-1 section 5.4.1.2. Where 𝑏𝑒𝑖 is the effective flange of
concrete in each side of the web of the section and it’s considered to be 𝐿𝑒 ∕ 8 or the actual length
of the flange, whichever is smaller. For the ABC software, 𝐿𝑒 = 5 𝑚 for simplification, when
should be calculated as seen in Figure 4-10, making it 𝐿𝑒 = 0.85(5.00) = 4.25 𝑚.
Figure 4-10 Equivalent span, for effective width of concrete flange (CEN, 2010)
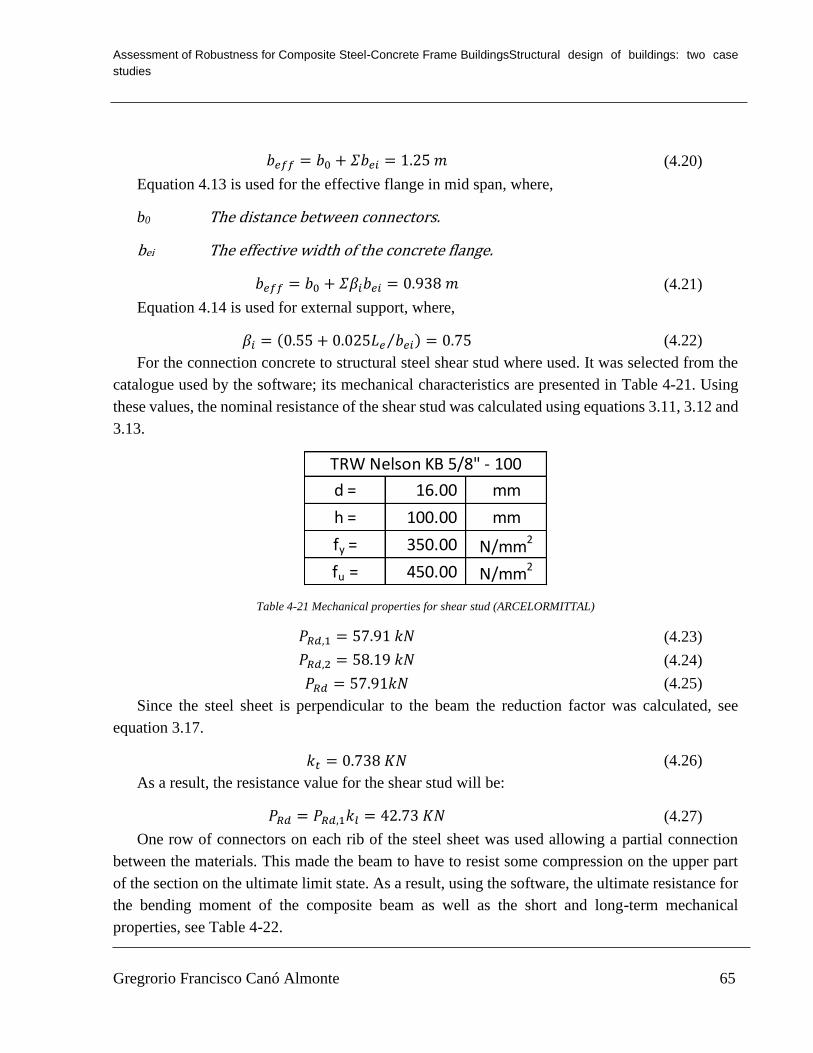
Assessment of Robustness for Composite Steel-Concrete Frame BuildingsStructural design of buildings: two case
studies
Gregrorio Francisco Canó Almonte 65
𝑏𝑒𝑓𝑓 = 𝑏0 + 𝛴𝑏𝑒𝑖 = 1.25 𝑚 (4.20)
Equation 4.13 is used for the effective flange in mid span, where,
b0 The distance between connectors.
bei The effective width of the concrete flange.
𝑏𝑒𝑓𝑓 = 𝑏0 + 𝛴𝛽𝑖𝑏𝑒𝑖 = 0.938 𝑚 (4.21)
Equation 4.14 is used for external support, where,
𝛽𝑖 = (0.55 + 0.025𝐿𝑒 𝑏𝑒𝑖⁄ ) = 0.75 (4.22)
For the connection concrete to structural steel shear stud where used. It was selected from the
catalogue used by the software; its mechanical characteristics are presented in Table 4-21. Using
these values, the nominal resistance of the shear stud was calculated using equations 3.11, 3.12 and
3.13.
Table 4-21 Mechanical properties for shear stud (ARCELORMITTAL)
𝑃𝑅𝑑,1 = 57.91 𝑘𝑁 (4.23)
𝑃𝑅𝑑,2 = 58.19 𝑘𝑁 (4.24)
𝑃𝑅𝑑 = 57.91𝑘𝑁 (4.25)
Since the steel sheet is perpendicular to the beam the reduction factor was calculated, see
equation 3.17.
𝑘𝑡 = 0.738 𝐾𝑁 (4.26)
As a result, the resistance value for the shear stud will be:
𝑃𝑅𝑑 = 𝑃𝑅𝑑,1𝑘𝑙 = 42.73 𝐾𝑁 (4.27)
One row of connectors on each rib of the steel sheet was used allowing a partial connection
between the materials. This made the beam to have to resist some compression on the upper part
of the section on the ultimate limit state. As a result, using the software, the ultimate resistance for
the bending moment of the composite beam as well as the short and long-term mechanical
properties, see Table 4-22.
d = 16.00 mm
h = 100.00 mm
fy = 350.00 N/mm2
fu = 450.00 N/mm2
TRW Nelson KB 5/8" - 100

Assessment of Robustness for Composite Steel-Concrete Frame BuildingsStructural design of buildings: two case
studies
Gregrorio Francisco Canó Almonte 66
𝑀𝑝𝑙,𝑅𝑑 = 96.11 𝐾𝑁𝑚
𝑉𝑃𝑙,𝑅𝑑 = 156.64 𝐾𝑁
𝐼𝑚,𝑠ℎ𝑜𝑟𝑡−𝑡𝑒𝑟𝑚 = 4573 𝑐𝑚4
𝐼𝑚,𝑙𝑜𝑛𝑔−𝑡𝑒𝑟𝑚 = 3681 𝑐𝑚4
Table 4-22 Composite beam mechanical characteristics (ARCELORMITTAL)
4.3.5. Primary beam
The primary beams were considered continuous along the X axis of the global coordinate of
the building. They were not considered as composite structure in order to have enough resistance
in both construction and utilization phase. This will allow to have a faster constructive process not
having to use propping, like it was done for the secondary beam. For optimization purposes, the
beams for the intermedium floors where design separately from the ones on the roof. The
verification for the ultimate limit state of these beams where done through the software ROBOT
Structural Analysis, se Annex, only for the utilization phase.
For the primary beams, it was considered that they do not have any connection to the concrete.
For analysis purposes, the beams were restricted by the secondary beam and that they applied the
load. As it was stated before, the slab is a two-way slab that unloads to the secondary beam. For
the serviceability limit state, it was considered the beam with the worst conditions to do a
deformation check.
𝛿𝑚𝑎𝑥 = 𝐿 ∕ 250 = 8,000𝑚𝑚 ∕ 250 = 40𝑚𝑚 (4.28)
Where,
δmax Maximum deformation allowed
𝐿 Beam length
Figure 4-11 Shear stress diagram for primary beam in KN

Assessment of Robustness for Composite Steel-Concrete Frame BuildingsStructural design of buildings: two case
studies
Gregrorio Francisco Canó Almonte 67
Figure 4-12 Bending moment diagram for primary beam in KNm
Figure 4-13 Maximum deformation for primary beam in mm
4.3.6. Columns
The columns were separated into two groups, according to its position, in order to try to
optimize as much possible the structure. The first group is the external column, which usually must
resist less stress and the internal column. For building 2, due to its height, each group was divided
into three sub section to enhance the design even more, see
Figure 4-15 and Figure 4-17. As it was mention before, in both cases, for the global analysis,
the column base where considered fixed allowing rotation on the 𝑥 direction for the global
coordinate.
The columns do not have any restraining in any direction making it mandatory to verify the
resistance to lateral buckling on both directions. They were also checked using the software Robot
Structural Analysis, in the same way it was done for the beams, following Eurocode 3 part 1-1, for
Ultimate Limited State, see Annex.
The serviceability state the building must be checked for local and global deformation. This
was done manually for each building following EN 1990. To do this verification, the set of columns
with the worst conditions were selected for each building and verify.
Table 4-23 Critical deformation for building 1
Column A4 UY (mm) u (mm) Column G4 UY (mm) u (mm)
100373 15.4732 1.4046 100379 15.4251 1.277
100320 14.0686 3.3653 100326 14.1481 3.3726
100267 10.7033 4.4969 100273 10.7755 4.4644
100059 6.2064 6.2064 100061 6.3111 6.3111
100058 0 100060 0

Assessment of Robustness for Composite Steel-Concrete Frame BuildingsStructural design of buildings: two case
studies
Gregrorio Francisco Canó Almonte 68
Table 4-24 Critical deformation for building 2
Figure 4-14 Definition of horizontal displacement (CEN, 2009)
𝑢𝑖 ≤ 𝐻𝑖 ∕ 150 (4.29)
𝑢 ≤ 𝐻 ∕ 500 (4.30)
Where,
ui Overall horizontal displacement over the building height 𝐻
𝑢 Horizontal displacement over a story height 𝐻𝑖
In Figure 4-16 and Figure 4-18 we can see the reaction to compression for all elements in the
structure. In both cases, it represents the result for the worst-case scenario for the building in ULS.
In these images, we can have a sense on what it was said before. At the same time, the exterior
columns had to resist to some moment as well.
Column A4 UY (mm) u (mm) Column G4 UY (mm) u (mm)
100009 77.23 8.41 106009 77.31 8.54
90009 68.82 9.11 96009 68.77 9.09
80009 59.71 9.31 86009 59.68 9.32
70009 50.40 9.36 76009 50.36 9.34
60009 41.03 9.22 66009 41.01 9.24
50009 31.81 8.66 56009 31.77 8.66
40009 23.15 7.62 46009 23.11 7.59
30009 15.53 6.60 36009 15.52 6.63
20009 8.93 5.19 26009 8.89 5.20
10009 3.73 3.73 16009 3.69 3.69
3 0.00 6003 0.00
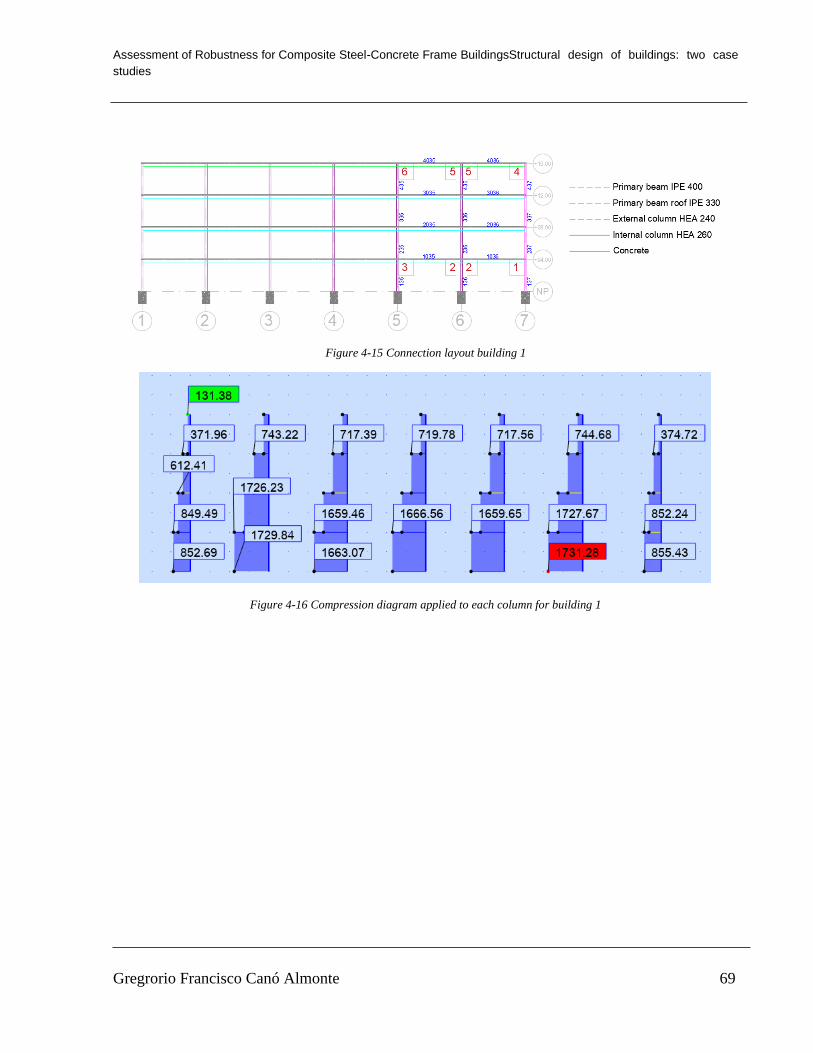
Assessment of Robustness for Composite Steel-Concrete Frame BuildingsStructural design of buildings: two case
studies
Gregrorio Francisco Canó Almonte 69
Figure 4-15 Connection layout building 1
Figure 4-16 Compression diagram applied to each column for building 1

Assessment of Robustness for Composite Steel-Concrete Frame BuildingsStructural design of buildings: two case
studies
Gregrorio Francisco Canó Almonte 70
Figure 4-17 Connection layout building 2
Figure 4-18 Compression diagram applied to each column for building 1

Assessment of Robustness for Composite Steel-Concrete Frame BuildingsStructural design of buildings: two case
studies
Gregrorio Francisco Canó Almonte 71
4.3.7. Beam-to-column connection
The design of the connection was done using the global analysis of the structure. Like the
column and the beam, the software Robot Structural Analysis was used following Eurocode 3 part
1-8. In the global model all connections where considered rigid, as a result, all the connection
where designed to fulfill this characteristic. For the building 1, six critical connection in B frame
where selected, they were all verified, ensuring to have a rigid connection, and that they satisfied
the requirements of the norms, in
Figure 4-15 it can be seen the layout of the connections considered.
Since connection two and three connect the same of elements, this connection where design
equal. The same approach was considered for connection five and six and, as it will see later, for
building 2 the same situation was presented.
Figure 4-19 Connection drawing building 1 - A) Connection 1 - B) Connection 2 – C) Connection 4 – D) Connection 5
A) B)
C) D)

Assessment of Robustness for Composite Steel-Concrete Frame BuildingsStructural design of buildings: two case
studies
Gregrorio Francisco Canó Almonte 72
Table 4-25 Connection rotational stiffness building 1-1 (𝑘𝑁𝑚)
Bolt Sj,rig Sj,pin Sj,ini Sj
Connection 1 M24 48,569.64 3,035.60 82,299.81 27,940.52
Connection 2 M27 48,569.64 3,035.60 170,811.84 57,406.96
Connection 3 M27 48,569.64 3,035.60 199,398.28 97,942.56
Connection 4 M24 21,484.68 1,342.79 21,925.29 13,768.92
Connection 5 M22 21,484.68 1,342.79 92,021.11 35,064.82
Connection 6 M22 21,484.68 1,342.79 98,056.68 46,974.64
A) B)
C) D)
E) F)

Assessment of Robustness for Composite Steel-Concrete Frame BuildingsStructural design of buildings: two case
studies
Gregrorio Francisco Canó Almonte 73
Figure 4-20 Connection drawing building 2 - A) Connection 1 - B) Connection 2 – C) Connection 4 – D) Connection 5 – E)
Connection 7 – F) Connection 8 – G) Connection 10 – H) Connection 11
Table 4-26 Connection rotational stiffness building 2-1 (𝑘𝑁𝑚)
4.3.8. Braces system
The braces system was used to control the building deformation due to the wind pressure. These
elements will only receive axial forces of tension or compression and will be considered pinned in
both extremities. They were used on the 𝑦 axis of the global coordinate of the structure as it can be
seen in Figure 4-7 and Figure 4-8. The beam where the braces connect to the building was not
considered as composite for simplification purpose.
Bolt Sj,rig Sj,pin Sj,ini Sj
Connection 1 M27 70,860.09 4,428.76 81,992.66 29,129.22
Connection 2 M27 70,860.09 4,428.76 60,917.45 28,618.48
Connection 3 M27 70,860.09 4,428.76 60,917.45 29,785.97
Connection 4 M27 70,860.09 4,428.76 106,629.51 37,346.29
Connection 5 M27 70,860.09 4,428.76 74,901.53 46,117.86
Connection 6 M27 70,860.09 4,428.76 75,976.43 75,976.43
Connection 7 M24 70,860.09 4,428.76 74,564.92 45,493.89
Connection 8 M27 70,860.09 4,428.76 74,564.92 29,657.89
Connection 9 M27 70,860.09 4,428.76 78,312.54 33,006.51
Connection 10 M24 48,569.64 3,035.60 77,988.74 31,091.51
Connection 11 M24 48,569.64 3,035.60 187,229.93 81,408.48
Connection 12 M24 48,569.64 3,035.60 180,997.80 73,471.38
G) H)
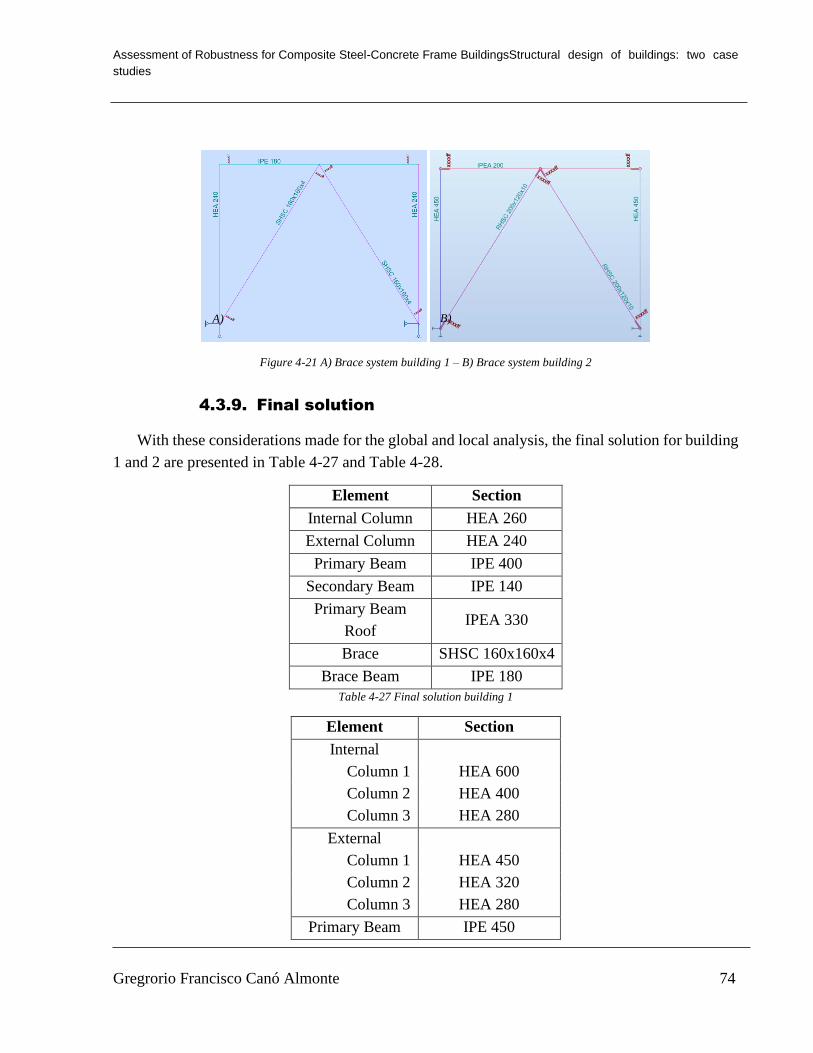
Assessment of Robustness for Composite Steel-Concrete Frame BuildingsStructural design of buildings: two case
studies
Gregrorio Francisco Canó Almonte 74
Figure 4-21 A) Brace system building 1 – B) Brace system building 2
4.3.9. Final solution
With these considerations made for the global and local analysis, the final solution for building
1 and 2 are presented in Table 4-27 and Table 4-28.
Element Section
Internal Column HEA 260
External Column HEA 240
Primary Beam IPE 400
Secondary Beam IPE 140
Primary Beam
Roof IPEA 330
Brace SHSC 160x160x4
Brace Beam IPE 180
Table 4-27 Final solution building 1
Element Section
Internal
Column 1 HEA 600
Column 2 HEA 400
Column 3 HEA 280
External
Column 1 HEA 450
Column 2 HEA 320
Column 3 HEA 280
Primary Beam IPE 450
A) B)
Assessment of Robustness for Composite Steel-Concrete Frame BuildingsStructural design of buildings: two case
studies
Gregrorio Francisco Canó Almonte 75
Secondary Beam IPE 140
Primary Beam
Roof IPE 400
Brace RHSC 200x120x10
Brace Beam IPEA 200
Table 4-28 Final solution building 2
The parameters used for the structural analysis of these buildings will be kept the same. The
only modification will be the removal of the column according to the Eurocodes to apply
robustness.

Assessment of Robustness for Composite Steel-Concrete Frame Buildings Evaluation of robustness on the building
Gregrorio Francisco Canó Almonte 76
5. Evaluation of robustness on the building
After both buildings were designed following the norm, we proceeded to apply EN 1991 part
1-7. The structural considerations for all elements will be the same as before explained, making
sure they can sustain the stresses of an accidental combination by removing a column while
applying robustness, and having the ultimate limited state and serviceability limited state for the
building under normal conditions verified.
5.1. Classification of the buildings
The first step, as it was seen in chapter 2, is to stablish the categorization for consequences
classes. This will help to minimize the cost for the required solution and it is based on what is was
done in section 4.3.2, which stated that both buildings are consequences class CC2, with a medium
risk of failure, following EN 1990. Using table A.1 from the EN 1991 part 1-7, represented in this
text in Table 2-3, we stablished the category for both buildings.
For building 1, we concluded that it belongs to the Lower Risk Group 2a, since is an office
building with four floors or less. For this building, it is only required to provide an effective
horizontal tie, or effective anchorage for suspended floors to walls. However, this building will be
designed for the notional removal of columns in order to maintain a pattern to make comparison
between solutions.
For building 2, we got to the conclusion that this belongs to the Upper Risk Group 2b, since is
an office building with more than four floors, but less than fifteen. For this group, the building must
be checked for the notional removal of each support, along with providing an alternative path for
the load to travel with horizontal and vertical ties.
5.2. Notional removal of supports
Since both buildings are bi-symmetrical, it reduced the number of columns that were needed to
be eliminated. We proceeded to remove the columns on by one and re-design the building,
identifying the two critical elements for both structures. For building 1, it was columns B-6 and B-
7; and for building 2, it was columns C-4 and C-5. This was done only for the first floor since it is
the segment that is withstanding greater stress.

Assessment of Robustness for Composite Steel-Concrete Frame Buildings Evaluation of robustness on the building
Gregrorio Francisco Canó Almonte 77
Figure 5-1 Critical column building 1
For building 1, the brace system was considered in the two-middle span of the y direction. This
set up represented the most efficient way to control de deformation of the building under normal
conditions for serviceability limit state. Also, it helped to alleviate the stresses on the columns
around it.
Figure 5-2 Critical column building 2
For building 2, the braces were considered on the outer spans in the y direction. As a result, the
most critical elements were in the middle frame. Once again, the braces help to ease the load that
are transmitted to the nearby columns. Making them as an alternative path for the load to be
redistributed throughout the building.

Assessment of Robustness for Composite Steel-Concrete Frame Buildings Evaluation of robustness on the building
Gregrorio Francisco Canó Almonte 78
5.3. Actions
To apply robustness in the structure, the accidental load combination will be used as it was
explained before. However, all the loads will be applied only modifying the 𝜓 factor.
5.3.1. Load combination
According to the EN 1991 part 1-7 and how it was explained before, robustness is considered
an accidental load. As a result, the load combination that is needed to be used is the accidental
combinations, see equation 5.1, to verify the structure at Ultimate Limited State for structural
stability. However, since the buildings will be fully constructed, an ULS and SLS verification, as
it was performed in chapter 4, most be performed.
∑ 𝐺𝑘𝑗
𝑗≥1
" + "𝐴𝑑" + "𝜓1,1𝑄𝑘,1" + " ∑ 𝜓2,𝑖𝑄𝑘,𝑖
𝑖≥1
(5.1)
This combination will minorize the imposed load by a factor of 𝜓2. In Table 5-1 we present
the various combinations used to asses robustness. The Eurocode works with probabilities and, it
assumes, that that the structure will not have to resist the loss of the column and the imposed load
at its peak at the same time.

Assessment of Robustness for Composite Steel-Concrete Frame Buildings Evaluation of robustness on the building
Gregrorio Francisco Canó Almonte 79
Table 5-1 Accidental load combinations
Name
Case
Coef
f.Ca
seCo
eff.
Case
Coef
f.Ca
seCo
eff.
Case
Coef
f.Ca
seCo
eff.
Case
Coef
f.Ca
seCo
eff.
Case
Coef
f.Ca
seCo
eff.
Case
Coef
f.Ca
seCo
eff.
Case
Coef
f.Ca
seCo
eff.
Case
Coef
f.
ACCI
DENT
AL_Q
sv_W
x_FA
VUL
S1
12
13
14
15
16
07
08
0.29
0.210
011
012
013
014
0.715
0
ACCI
DENT
AL_Q
sv_W
x_DE
SUL
S1
12
13
14
15
16
07
08
0.29
010
0.211
012
013
014
0.715
0
ACCI
DENT
AL_Q
sv_W
y_FA
VUL
S1
12
13
14
15
16
07
08
0.29
010
011
0.212
013
014
0.715
0
ACCI
DENT
AL_Q
sv_W
y_DE
SUL
S1
12
13
14
15
16
07
08
0.29
010
011
012
0.213
014
0.715
0
ACCI
DENT
AL_W
x_FA
VUL
S1
12
13
14
15
16
07
08
0.29
0.610
011
012
013
014
0.515
0
ACCI
DENT
AL_W
x_DE
SUL
S1
12
13
14
15
16
07
08
0.29
010
0.611
012
013
014
0.515
0
ACCI
DENT
AL_W
y_FA
VUL
S1
12
13
14
15
16
07
08
0.29
010
011
0.612
013
014
0.515
0
ACCI
DENT
AL_W
y_DE
SUL
S1
12
13
14
15
16
07
08
0.29
010
011
012
0.613
014
0.515
0
ACCI
DENT
AL_S
NOW
_Wx_
FAV
ULS
11
21
31
41
51
60
70
80.5
90.2
100
110
120
130
140.5
150
ACCI
DENT
AL_S
NOW
_Wx_
DES
ULS
11
21
31
41
51
60
70
80.5
90
100.2
110
120
130
140.5
150
ACCI
DENT
AL_S
NOW
_Wy_
FAV
ULS
11
21
31
41
51
60
70
80.5
90
100
110.2
120
130
140.5
150
ACCI
DENT
AL_S
NOW
_Wy_
DES
ULS
11
21
31
41
51
60
70
80.5
90
100
110
120.2
130
140.5
150
ACCI
DENT
AL_W
INTE
R_W
x_FA
VUL
S1
12
13
14
15
16
07
0.68
0.29
0.210
011
012
013
014
0.515
0
ACCI
DENT
AL_W
INTE
R_W
x_DE
SUL
S1
12
13
14
15
16
07
0.68
0.29
010
0.211
012
013
014
0.515
0
ACCI
DENT
AL_W
INTE
R_W
y_FA
VUL
S1
12
13
14
15
16
07
0.68
0.29
010
011
0.212
013
014
0.515
0
ACCI
DENT
AL_W
INTE
R_W
y_DE
SUL
S1
12
13
14
15
16
07
0.68
0.29
010
011
012
0.213
014
0.515
0
ACCI
DENT
AL_S
UMM
ER_W
x_FA
VUL
S1
12
13
14
15
16
0.67
08
0.29
0.210
011
012
013
014
0.515
0
ACCI
DENT
AL_S
UMM
ER_W
x_DE
SUL
S1
12
13
14
15
16
0.67
08
0.29
010
0.211
012
013
014
0.515
0
ACCI
DENT
AL_S
UMM
ER_W
y_FA
VUL
S1
12
13
14
15
16
0.67
08
0.29
010
011
0.212
013
014
0.515
0
ACCI
DENT
AL_S
UMM
ER_W
y_DE
SUL
S1
12
13
14
15
16
0.67
08
0.29
010
011
012
0.213
014
0.515
0
CONS
TRUC
UTILI
ZACA
OCO
BERT
URA
Dt W
INTE
RSN
OWW
IND
X FAV
WIN
D X D
ESW
IND
Y FAV
WIN
D Y D
ESPP
PP_L
AJE
RCP
PP_F
ACHA
DPP
_COB
ERT
Dt SU
MM
ER
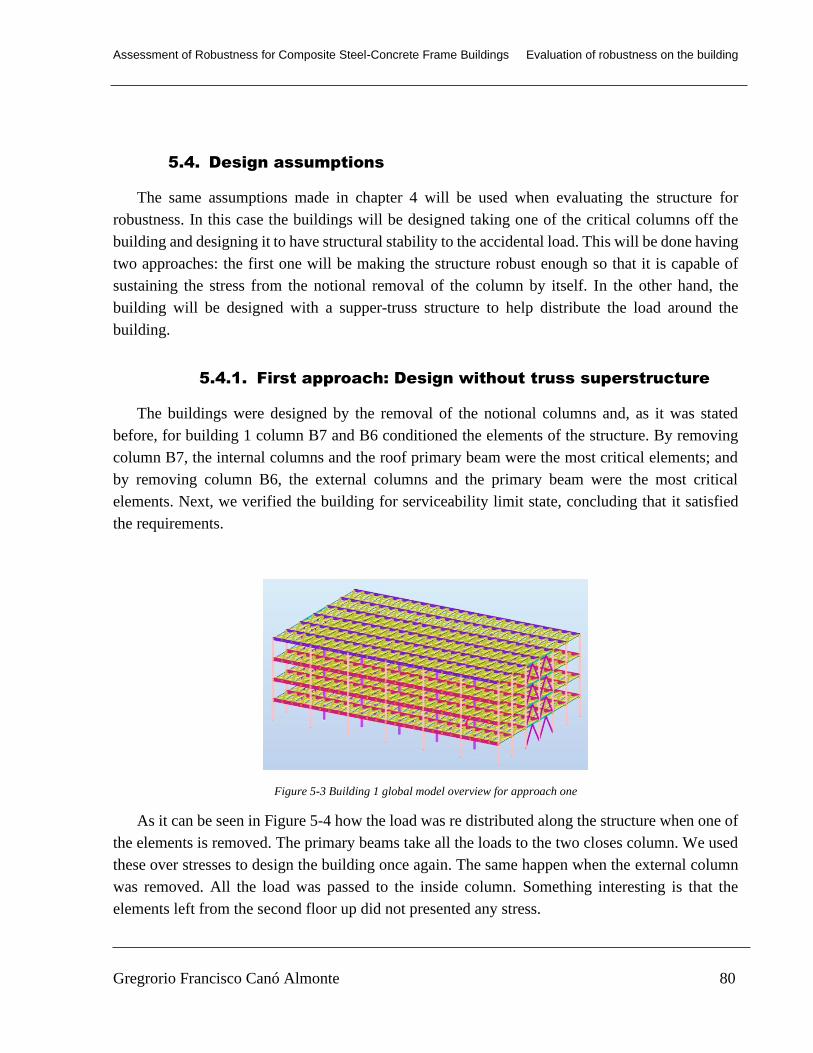
Assessment of Robustness for Composite Steel-Concrete Frame Buildings Evaluation of robustness on the building
Gregrorio Francisco Canó Almonte 80
5.4. Design assumptions
The same assumptions made in chapter 4 will be used when evaluating the structure for
robustness. In this case the buildings will be designed taking one of the critical columns off the
building and designing it to have structural stability to the accidental load. This will be done having
two approaches: the first one will be making the structure robust enough so that it is capable of
sustaining the stress from the notional removal of the column by itself. In the other hand, the
building will be designed with a supper-truss structure to help distribute the load around the
building.
5.4.1. First approach: Design without truss superstructure
The buildings were designed by the removal of the notional columns and, as it was stated
before, for building 1 column B7 and B6 conditioned the elements of the structure. By removing
column B7, the internal columns and the roof primary beam were the most critical elements; and
by removing column B6, the external columns and the primary beam were the most critical
elements. Next, we verified the building for serviceability limit state, concluding that it satisfied
the requirements.
Figure 5-3 Building 1 global model overview for approach one
As it can be seen in Figure 5-4 how the load was re distributed along the structure when one of
the elements is removed. The primary beams take all the loads to the two closes column. We used
these over stresses to design the building once again. The same happen when the external column
was removed. All the load was passed to the inside column. Something interesting is that the
elements left from the second floor up did not presented any stress.

Assessment of Robustness for Composite Steel-Concrete Frame Buildings Evaluation of robustness on the building
Gregrorio Francisco Canó Almonte 81
Figure 5-4 Compression diagram applied to each column for building 1
Figure 5-5 Moment diagram applied to each column for building 1
In building 2, by removing column C5, the internal columns were critical along with the
primary beam. By removing the C4 column, the external and the roof’s primary beams were
critical. Then, we verify the building for serviceability state in normal conditions and the brace
system needed to be reinforced.
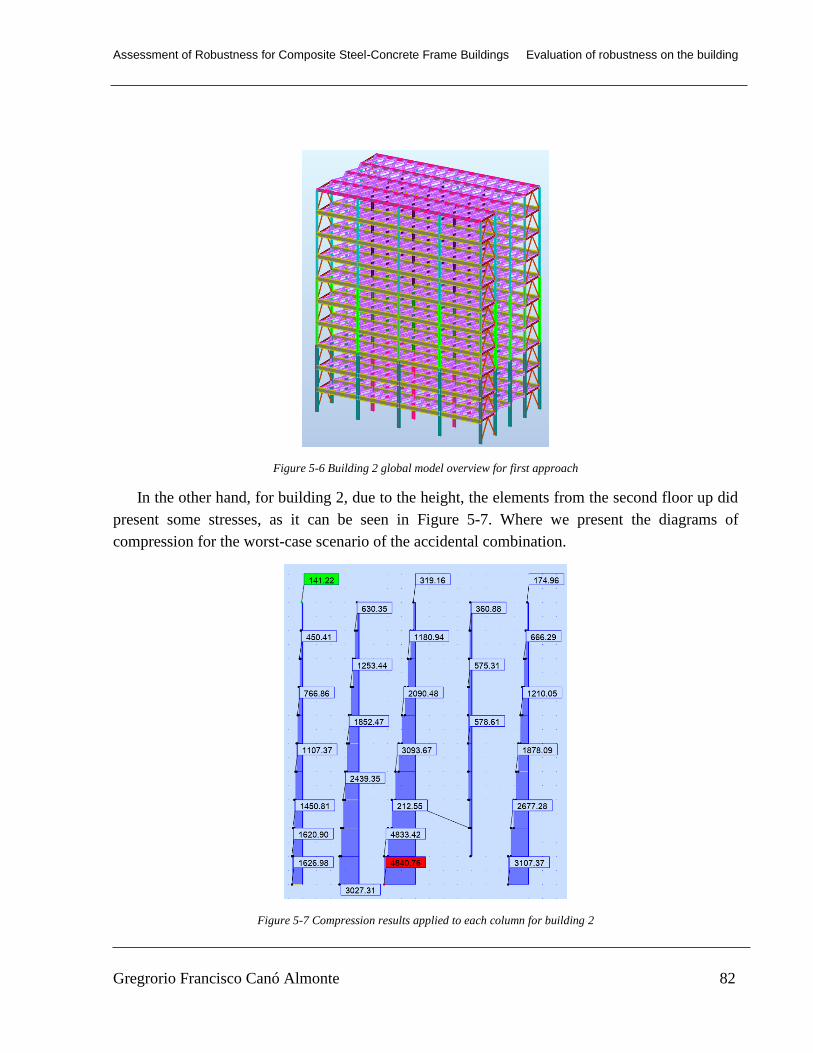
Assessment of Robustness for Composite Steel-Concrete Frame Buildings Evaluation of robustness on the building
Gregrorio Francisco Canó Almonte 82
Figure 5-6 Building 2 global model overview for first approach
In the other hand, for building 2, due to the height, the elements from the second floor up did
present some stresses, as it can be seen in Figure 5-7. Where we present the diagrams of
compression for the worst-case scenario of the accidental combination.
Figure 5-7 Compression results applied to each column for building 2

Assessment of Robustness for Composite Steel-Concrete Frame Buildings Evaluation of robustness on the building
Gregrorio Francisco Canó Almonte 83
Figure 5-8 Moment results applied to each column for building 2
5.4.2. Second approach: Design with truss superstructure
The main idea in this instance was to have a truss superstructure capable of redistribution of
the stresses, caused by the removal of the column, throughout the building. For building 1, column
B6 was the one that created the worst condition for the truss superstructure elements. After
designing the latter, we proceeded to verify the ultimate limit state and serviceability limit state,
since it added over forty thousand kilograms, forcing us to reinforce the structure in order to verify
this.
Figure 5-9 Building 1 global model overview for second approach
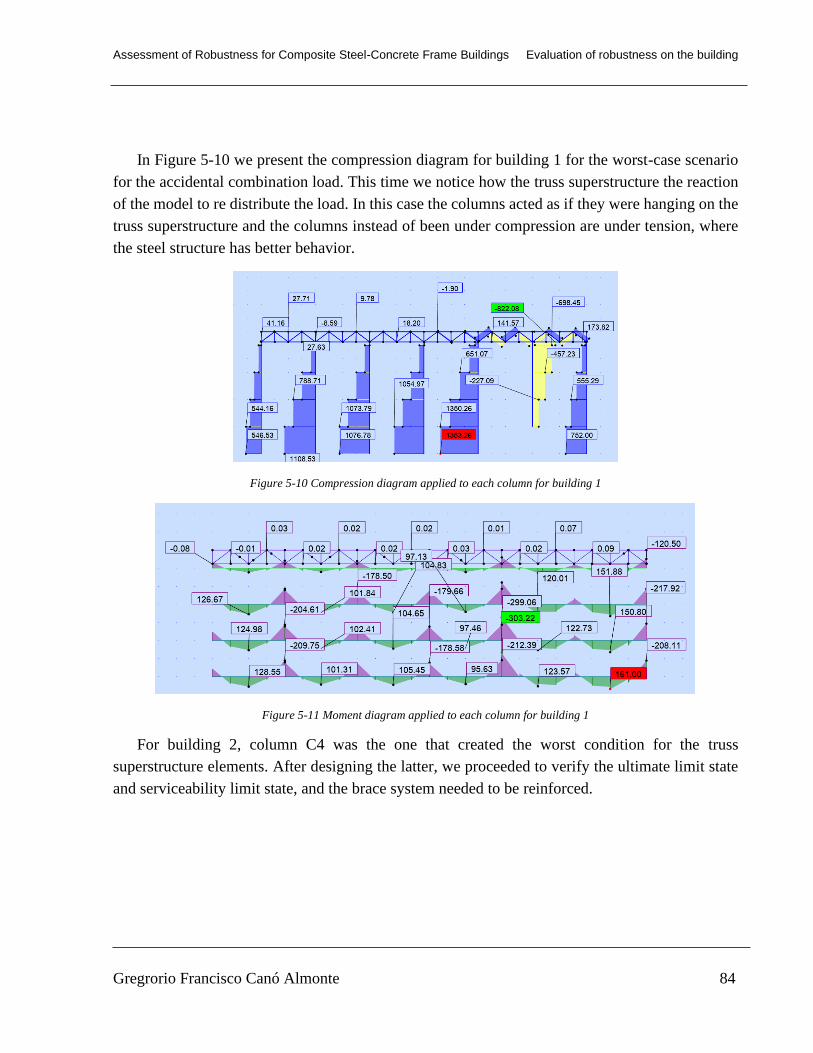
Assessment of Robustness for Composite Steel-Concrete Frame Buildings Evaluation of robustness on the building
Gregrorio Francisco Canó Almonte 84
In Figure 5-10 we present the compression diagram for building 1 for the worst-case scenario
for the accidental combination load. This time we notice how the truss superstructure the reaction
of the model to re distribute the load. In this case the columns acted as if they were hanging on the
truss superstructure and the columns instead of been under compression are under tension, where
the steel structure has better behavior.
Figure 5-10 Compression diagram applied to each column for building 1
Figure 5-11 Moment diagram applied to each column for building 1
For building 2, column C4 was the one that created the worst condition for the truss
superstructure elements. After designing the latter, we proceeded to verify the ultimate limit state
and serviceability limit state, and the brace system needed to be reinforced.

Assessment of Robustness for Composite Steel-Concrete Frame Buildings Evaluation of robustness on the building
Gregrorio Francisco Canó Almonte 85
Figure 5-12 Building 2 global model overview for second approach
The same situation was presented for the truss superstructure of building 2, see Figure 5-13.
Where we represent the compression diagram for the building. The same situation where the
columns seem to be hanging from the truss superstructure making them to work on tensile stress.
Figure 5-13 Compression results applied to each column for building 2

Assessment of Robustness for Composite Steel-Concrete Frame Buildings Evaluation of robustness on the building
Gregrorio Francisco Canó Almonte 86
Figure 5-14 Moment results applied to each column for building 2
5.4.2.1. Trusses system
For the truss superstructure, it was selected a truss system on the top because is the most
efficient solution, so that we could redistribute the load when removing an element. It can be seen
on Figure 5-15 and Figure 5-17 for both buildings how the element works. To come up with the
most accurate solution, the structure was modeled using different height for the truss. By doing so,
the usage of the elements on the truss varied allowing us to choose the lightest result.
Figure 5-15 Overview of trusses system for building 1

Assessment of Robustness for Composite Steel-Concrete Frame Buildings Evaluation of robustness on the building
Gregrorio Francisco Canó Almonte 87
Figure 5-16 Weight vs. Height chart for building 1 trusses
Figure 5-17 Overview of trusses system for building 2
Figure 5-18 Weight vs. Height chart for building 2 trusses
5.5. Connections
The connections were verified, once again, to be able to resist the stress for the accidental
combination, with the removal of the column, and the ULS in normal conditions. Also, they were
0
10000
20000
30000
40000
50000
60000
0 0.5 1 1.5 2 2.5 3
we
igh
t (k
g)
Height (m)
30,000.00
31,000.00
32,000.00
33,000.00
34,000.00
35,000.00
0 0.5 1 1.5 2 2.5 3
We
igh
t (k
g)
Height (m)
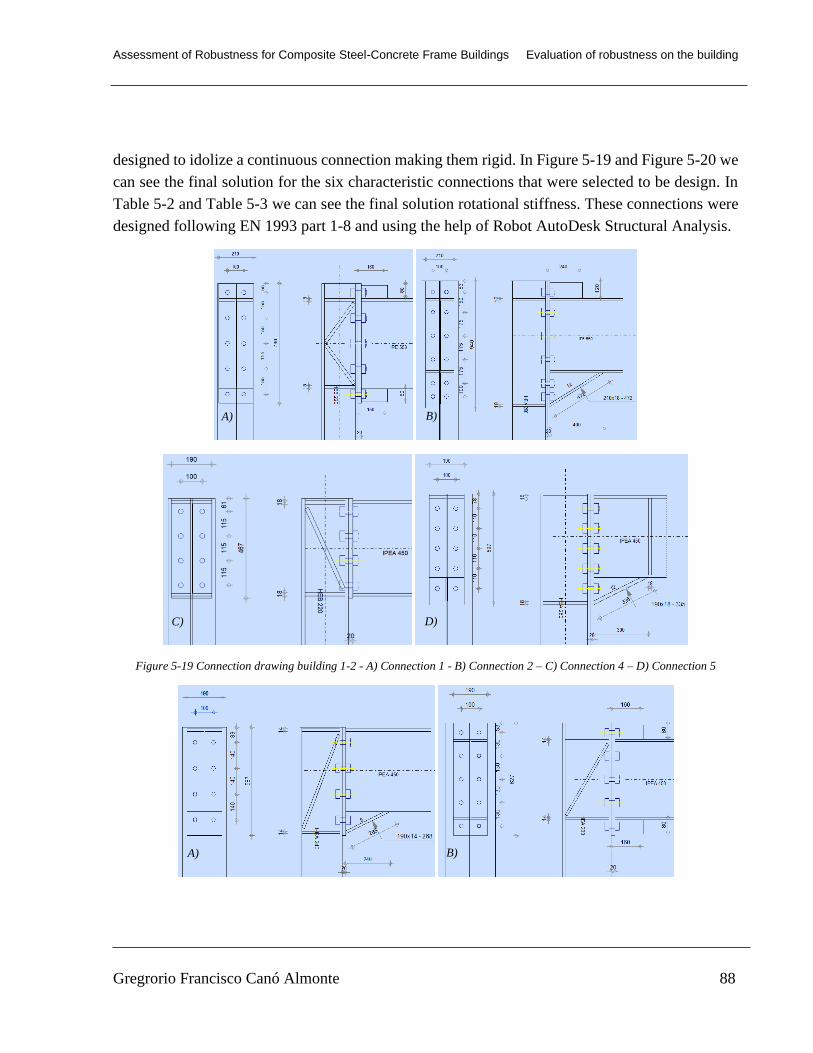
Assessment of Robustness for Composite Steel-Concrete Frame Buildings Evaluation of robustness on the building
Gregrorio Francisco Canó Almonte 88
designed to idolize a continuous connection making them rigid. In Figure 5-19 and Figure 5-20 we
can see the final solution for the six characteristic connections that were selected to be design. In
Table 5-2 and Table 5-3 we can see the final solution rotational stiffness. These connections were
designed following EN 1993 part 1-8 and using the help of Robot AutoDesk Structural Analysis.
Figure 5-19 Connection drawing building 1-2 - A) Connection 1 - B) Connection 2 – C) Connection 4 – D) Connection 5
A) B)
C) D)
A) B)

Assessment of Robustness for Composite Steel-Concrete Frame Buildings Evaluation of robustness on the building
Gregrorio Francisco Canó Almonte 89
Figure 5-20 Connection drawing building 1-3 - A) Connection 1 - B) Connection 2 – C) Connection 4 – D) Connection 5
Table 5-2 Connection rotational stiffness building 1-2 (𝑘𝑁𝑚)
Table 5-3 Connection rotational stiffness building 1-3 (𝑘𝑁𝑚)
For the second building, we did the same procedure. The solutions can be seen in Table 5-4
and Table 5-5. These values will be used to make comparisons in the conclusion.
Bolt Sj,rig Sj,pin Sj,ini Sj
Connection 1 M27 140,944.65 8,809.04 159,079.60 159,079.60
Connection 2 M30 140,944.65 8,809.04 282,478.47 282,478.47
Connection 3 M30 140,944.65 8,809.04 330,400.87 330,400.87
Connection 4 M24 62,493.48 3,905.84 136,456.80 136,456.80
Connection 5 M27 62,493.48 3,905.84 179,535.60 179,535.60
Connection 6 M27 62,493.48 3,905.84 199,286.69 199,286.69
Bolt Sj,rig Sj,pin Sj,ini Sj
Connection 1 M24 62,493.48 3,905.84 166,775.86 157,353.02
Connection 2 M24 62,493.48 3,905.84 73,154.28 33,481.41
Connection 3 M24 62,493.48 3,905.84 73,154.28 31,954.08
Connection 4 M24 17,547.83 1,096.74 23,779.72 23,779.72
Connection 5 M24 17,547.83 1,096.74 35,092.47 11,935.99
Connection 6 M24 17,547.83 1,096.74 73,671.73 73,671.73
C) D)
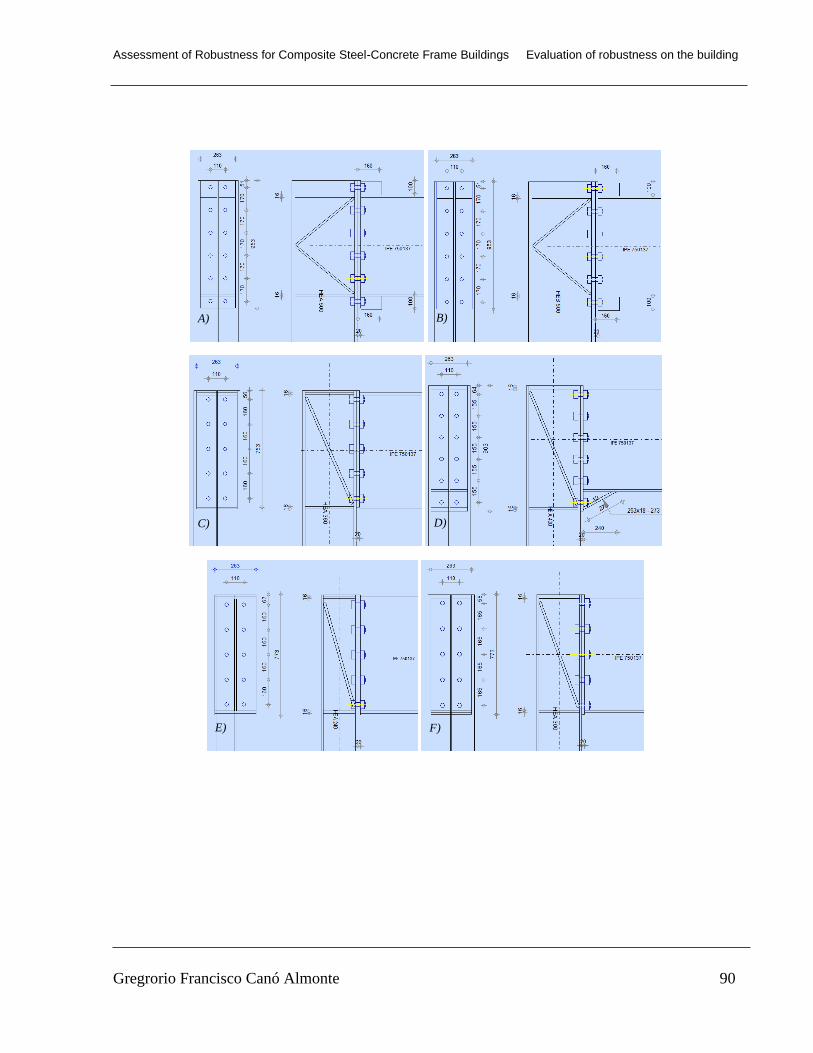
Assessment of Robustness for Composite Steel-Concrete Frame Buildings Evaluation of robustness on the building
Gregrorio Francisco Canó Almonte 90
B)
C) D)
E) F)
A)

Assessment of Robustness for Composite Steel-Concrete Frame Buildings Evaluation of robustness on the building
Gregrorio Francisco Canó Almonte 91
Figure 5-21 Connection drawing building 2-2 - A) Connection 1 - B) Connection 2 – C) Connection 4 – D) Connection 5 – E)
Connection 7 – F) Connection 8 – G) Connection 10 – H) Connection 11
G) H)
B)
C) D)
A)

Assessment of Robustness for Composite Steel-Concrete Frame Buildings Evaluation of robustness on the building
Gregrorio Francisco Canó Almonte 92
Figure 5-22 Connection drawing building 2-3 - A) Connection 1 - B) Connection 2 – C) Connection 4 – D) Connection 5 – E)
Connection 7 – F) Connection 8 – G) Connection 10 – H) Connection 11
Table 5-4 Connection rotational stiffness building 2-2 (𝑘𝑁𝑚)
Bolt Sj,rig Sj,pin Sj,ini Sj
Connection 1 M30 335,741.70 20,983.86 337,425.61 337,425.61
Connection 2 M30 335,741.70 20,983.86 372,792.26 372,792.26
Connection 3 M30 335,741.70 20,983.86 372,792.26 372,792.26
Connection 4 M27 335,741.70 20,983.86 475,297.82 475,297.82
Connection 5 M30 335,741.70 20,983.86 761,955.24 761,955.24
Connection 6 M30 335,741.70 20,983.86 761,955.24 761,955.24
Connection 7 M27 20,983.86 335,741.70 412,201.57 412,201.57
Connection 8 M30 20,983.86 335,741.70 487,049.50 487,049.50
Connection 9 M30 20,983.86 335,741.70 468,852.61 468,852.61
Connection 10 M27 70,860.09 4,428.76 29,392.84 38,149.26
Connection 11 M30 70,860.09 4,428.76 175,425.53 82,881.76
Connection 12 M30 70,860.09 4,428.76 180,778.90 93,209.31
G) H)
E) F)
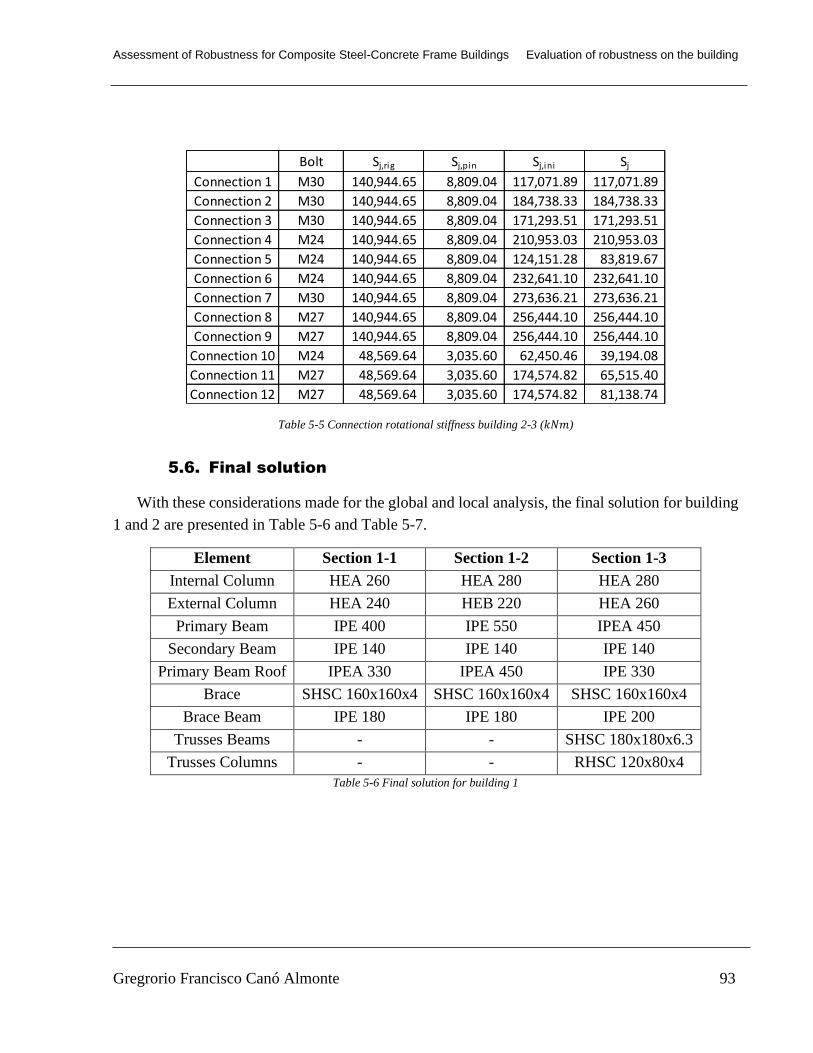
Assessment of Robustness for Composite Steel-Concrete Frame Buildings Evaluation of robustness on the building
Gregrorio Francisco Canó Almonte 93
Table 5-5 Connection rotational stiffness building 2-3 (𝑘𝑁𝑚)
5.6. Final solution
With these considerations made for the global and local analysis, the final solution for building
1 and 2 are presented in Table 5-6 and Table 5-7.
Element Section 1-1 Section 1-2 Section 1-3
Internal Column HEA 260 HEA 280 HEA 280
External Column HEA 240 HEB 220 HEA 260
Primary Beam IPE 400 IPE 550 IPEA 450
Secondary Beam IPE 140 IPE 140 IPE 140
Primary Beam Roof IPEA 330 IPEA 450 IPE 330
Brace SHSC 160x160x4 SHSC 160x160x4 SHSC 160x160x4
Brace Beam IPE 180 IPE 180 IPE 200
Trusses Beams - - SHSC 180x180x6.3
Trusses Columns - - RHSC 120x80x4
Table 5-6 Final solution for building 1
Bolt Sj,rig Sj,pin Sj,ini Sj
Connection 1 M30 140,944.65 8,809.04 117,071.89 117,071.89
Connection 2 M30 140,944.65 8,809.04 184,738.33 184,738.33
Connection 3 M30 140,944.65 8,809.04 171,293.51 171,293.51
Connection 4 M24 140,944.65 8,809.04 210,953.03 210,953.03
Connection 5 M24 140,944.65 8,809.04 124,151.28 83,819.67
Connection 6 M24 140,944.65 8,809.04 232,641.10 232,641.10
Connection 7 M30 140,944.65 8,809.04 273,636.21 273,636.21
Connection 8 M27 140,944.65 8,809.04 256,444.10 256,444.10
Connection 9 M27 140,944.65 8,809.04 256,444.10 256,444.10
Connection 10 M24 48,569.64 3,035.60 62,450.46 39,194.08
Connection 11 M27 48,569.64 3,035.60 174,574.82 65,515.40
Connection 12 M27 48,569.64 3,035.60 174,574.82 81,138.74

Assessment of Robustness for Composite Steel-Concrete Frame Buildings Evaluation of robustness on the building
Gregrorio Francisco Canó Almonte 94
Element Section 2-1 Section 2-2 Section 2-3
Internal
Column 1 HEA 600 HEB 500 HEA 600
Column 2 HEA 400 HEA 400 HEA 400
Column 3 HEA 280 HEA 300 HEA 280
External
Column 1 HEA 450 HEA 500 HEA 450
Column 2 HEA 320 HEA 340 HEA 320
Column 3 HEA 280 HEA 280 HEA 280
Primary Beam IPE 450 IPE 750x137 IPE 550
Secondary Beam IPE 140 IPE 140 IPE 140
Primary Beam Roof IPE 400 IPE 450 IPE 400
Brace RHSC 200x120x10 SHSC 120x120x8 RHSC 200x120x10
Brace Beam IPEA 200 IPEA 200 IPEA 200
Trusses Beams - - SHSC 220x220x6.4
Trusses Columns - - SHSC 120x120x5
Table 5-7 Final solution for building 2

Assessment of Robustness for Composite Steel-Concrete Frame Buildings Conclusion
Gregrorio Francisco Canó Almonte 95
6. Conclusion
Throughout the course of this study, we reviewed and designed two buildings separately
following EN 1993 part 1-1 and EN 1994 part 1-1. Each one of them was analyzed three times under
three different situations: one in normal conditions; another one applying the accidental loads
combination following EN 1991 part 1-7; and a third one applying the latter using a truss
superstructure to redistribute the loads. The purpose was to compare sections regarding the
structure weights, and compare the beam-to-column connections, as well as the rotational stiffness.
On building 1, regarding structural behavior, the first two conditions had nothing out of the
ordinary. This was not the case for the third situation, where the truss superstructure that was placed
in order to resist the accidental loads, verified for the accidental combination. However, when it
was verified for the ultimate limit state at normal conditions, the structure had to be reinforced due
to the added weight of the truss superstructure.
On the other hand, for building 2, the only hazard was to control its total vertical deformation.
We believe that using a different arrangement could have given a more efficient structure. In the
case of building 2-3, despite of adding weight due to the truss superstructure, it was not required
its reinforcement in order to resist the loads.
Figure 6-1 shows a summary of the total weight of the buildings in all three approaches. It can
be seen how the re-design of building 1-3 made its total solution the heavier one. For building 2,
not having the superstructure represented a heavier result.
Figure 6-1 Weight comparison between buildings
-
50,000.00
100,000.00
150,000.00
200,000.00
250,000.00
300,000.00
350,000.00
400,000.00
BUILDING 1 BUILDING 2
Wei
ght
(kg)
BUILDING WEIGHT
1 2 3

Assessment of Robustness for Composite Steel-Concrete Frame Buildings Conclusion
Gregrorio Francisco Canó Almonte 96
Regarding the connections, due to the deformation that occurs when a column is withdrawn
from building and the increase of the momentum happens, there needs to be a reinforcement in
order to be capable of redistributing the load, as well as maintaining its rigidity. In this regard for
building 1, as it can be seen in Figure 6-2, building 1-2 had to be the most reinforced one to
withstand the loads. In the other hand, due the truss superstructure and the re design of the structure,
building 1-3 was favored and the rigidity of the connection was lowered.
Figure 6-2 Rotational stiffness comparison for building 1
Figure 6-3 represents the third connection for all three approaches for building 1. This was the
one that presented the bigger change through the process, which is a vivid example of the impact
the removal of a column has on a connection. Making the connection more laborious and costly.
Figure 6-3 Connection 3 for building 1 - A) Building 1-1 B) Building 1-2 C) Building 1-3
For Figure 6-4, the same comparison for the connection rotational stiffness was made for
building 2. Once again, the connections for the second approach were the one with the highest
-
50,000.00
100,000.00
150,000.00
200,000.00
250,000.00
300,000.00
350,000.00
Connection1
Connection2
Connection3
Connection4
Connection5
Connection6
Fin
al R
ota
tio
nal
Sti
ffn
ess
(kN
m)
CONNECTION ROTATIONAL STIFFNESS
1-1 1-2 1-3
A) B) C)
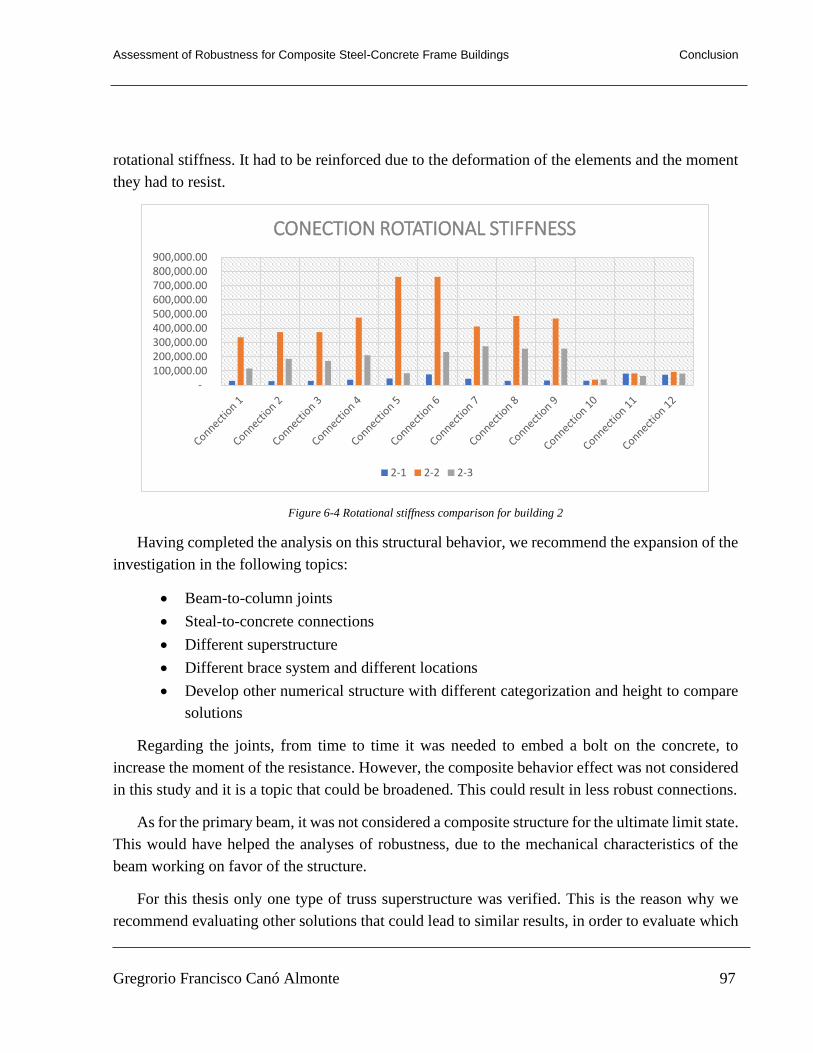
Assessment of Robustness for Composite Steel-Concrete Frame Buildings Conclusion
Gregrorio Francisco Canó Almonte 97
rotational stiffness. It had to be reinforced due to the deformation of the elements and the moment
they had to resist.
Figure 6-4 Rotational stiffness comparison for building 2
Having completed the analysis on this structural behavior, we recommend the expansion of the
investigation in the following topics:
• Beam-to-column joints
• Steal-to-concrete connections
• Different superstructure
• Different brace system and different locations
• Develop other numerical structure with different categorization and height to compare
solutions
Regarding the joints, from time to time it was needed to embed a bolt on the concrete, to
increase the moment of the resistance. However, the composite behavior effect was not considered
in this study and it is a topic that could be broadened. This could result in less robust connections.
As for the primary beam, it was not considered a composite structure for the ultimate limit state.
This would have helped the analyses of robustness, due to the mechanical characteristics of the
beam working on favor of the structure.
For this thesis only one type of truss superstructure was verified. This is the reason why we
recommend evaluating other solutions that could lead to similar results, in order to evaluate which
- 100,000.00 200,000.00 300,000.00 400,000.00 500,000.00 600,000.00 700,000.00 800,000.00 900,000.00
CONECTION ROTATIONAL STIFFNESS
2-1 2-2 2-3

Assessment of Robustness for Composite Steel-Concrete Frame Buildings Conclusion
Gregrorio Francisco Canó Almonte 98
of them has higher efficiency. This other solution can include horizontal ties that can minimize or
redistribute the loads in each floor. Even though the brace system did not have an important role
when designing for robustness, they did work as an alternative path for the load when a column
nearby was removed.
By increasing the number of studies or examples regarding this matter, it could bring up a
pattern to be used in other structural designs, allowing the addition of new details to the current
norms.

Assessment of Robustness for Composite Steel-Concrete Frame Buildings Bibliography
Gregrorio Francisco Canó Almonte 99
7. Bibliography
ARCELORMITTAL. ARCELORMITTAL BEAM CALCULATOR. LUXEMBOURG :
ARCELORMITTAL R&D. Vol. 3.47.
2019. AUTODESK ROBOT STRUCTURAL DESIGN PROFESSIONAL 2019. 2019.
CARTER, EBONG UDOMA, DAN KATZ, CASSANDRA BASLER AND CHRISTIAN.
2018. WSHU Public Radio. [Online] April 24, 2018. https://www.wshu.org/post/remembering-
bridgeports-lambiance-plaza-collapse-31-years-ago.
CASSIANO, DAVID JORGE ROCHETA. 2017. POST SEISMIC STRUCTURAL
ROBUSTNESS IN MOMENT RESISTING FRAME STEEL BUILDINGS. COIMBRA :
UNIVERSIDADE DE COIMBRA, 2017.
CEN. 2009. EN 1990 - EUROCODIGO 0 : BASIS OF STRUCTURAL DESIGN. BRUSSELS :
EUROPEAN COMMITTEE FOR STANDARDIZATION, 2009.
—. 2009. EN 1991-1-1 - EUROCODE 1 - ACTION ON STRUCTURES - PARTE 1-1 :
GENERAL ACTIONS. DENSITIES, SELF-WEIGHT, IMPOSED LOADS FOR BUILDINGS.
BRUSSELS : EUROPEAN COMMITTEE FOR STANDARDIZATION, 2009.
—. 2003. EN 1991-1-3 - EUROCODE 1 - ACTION ON STRUCTURES - PART 1-3: GENERAL
ACTION - SNOW LOADS. BRUSSELS : EUROPEAN COMMITTEE FOR
STANDARDIZATION, 2003.
—. 2010. EN 1991-1-4 - EUROCODE 1 - ACTION ON STRUCTURES - PARTE 1-4 :
GENERAL ACTIONS, WIND ACTIONS. BRUSSELS : EUROPEAN COMMITTEE FOR
STANDARDIZATION, 2010.
—. 2006. EN 1991-1-7 - EUROCODE 1 - ACTIONS ON STRUCTURES - PART 1-7:
GENERAL ACTIONS - ACCIDENTAL ACTIONS. BRUSSELS : EUROPEAN COMMITTEE
FOR STANDARDIZATION, 2006.
—. 2005. EN 1993-1-8 - EUROCODE 3 - DESIGN OF STEEL STRCUTRE - PARTE 1-8:
DESIGN OF JOINTS. BRUSSELS : EUROPEAN COMMITEE FOR STANDARIZATION,
2005.
—. 2009. EN 1994-1-1 - EUROCODE 4 - DESIGN OF COMPOSITE STRUCTURES - PART
1-1: GENERAL RULES AND RULES FOR BUILDINGS. BRUSSELS : EUROPEAN
COMMITEE FOR STANDARIZATION, 2009.

Assessment of Robustness for Composite Steel-Concrete Frame Buildings Bibliography
Gregrorio Francisco Canó Almonte 100
—. 2005. EN 1994-2 EUROCODE 4 - DESIGN OF COMPOSITE STEEL AND CONCRETE
STRUCTURES - PART 2: GENERAL RULES AND RULES FOR BRIDGES. BRUSSELS :
EUROPEAN COMMITTEE FOR STANDARDIZATION, 2005.
Cook, Chris. 2018. BBC News. [Online] June 15, 2018. https://www.bbc.com/news/uk-
politics-44498608.
JEAN-PIERRE JASPART, KLAUS WEYNAND. 2016. DESIGN OF JOINTS IN STEEL
AND COMPOSITE STRUCTURES. s.l. : ECCS - EUROPEAN CONVENTION FOR
CONSTRUCTIONAL STEELWORK, 2016.
Jenkins, John Philip. 2019. Encyclopedia Britannica. [Online] April 12, 2019.
https://www.britannica.com/event/Oklahoma-City-bombing.
LUIS CALADO, JOAO SANTOS. 2015. ESTRUTURAS MISTAS DE ACO E BETAO.
LISBOA : EUROPRESS, LDA, 2015.
MURPHY, KEVIN. 2014. The Kanses City Star. [Online] July 17, 2014.
https://www.kansascity.com/news/local/article748398.html.
Technology, National Institute of Standards and. 2007. Best Practices for Reducing the
Potential for Progressive Collapse in Buildings. s.l. : US Departmaent of Commerce, 2007.
Way, Andrew. 2011. STRUCTRUAL ROBUSTNESS OF STEEL FRAMED BUILDINGS.
Berkshire : The Steel Construction Institute, 2011.

Assessment of Robustness for Composite Steel-Concrete Frame Buildings Annex
Gregorio Francisco Cano Almonte A-1
8. Annex
Column calculation example
STEEL DESIGN ----------------------------------------------------------------------------------------------------------------------------- -----------
CODE: EN 1993-1:2005/A1:2014, Eurocode 3: Design of steel structures.
ANALYSIS TYPE: Member Verification
------------------------------------------------------------------------------------------------------------------------------------- ---
CODE GROUP:
MEMBER: 23 Column_23 POINT: 3 COORDINATE: x = 0.50 L = 2.00
m
----------------------------------------------------------------------------------------------------------------------------- -----------
LOADS:
Governing Load Case: 130 ACCIDENTAL_Qsv_Wy_DES (1+2+3+4+5)*1.00+(8+12)*0.20+14*0.70
----------------------------------------------------------------------------------------------------------------------------- -----------
MATERIAL:
S 355 ( S 355 ) fy = 355.00 MPa
----------------------------------------------------------------------------------------------------------------------------------------
SECTION PARAMETERS: HEA 600
h=59.0 cm gM0=1.00 gM1=1.00
b=30.0 cm Ay=163.28 cm2 Az=93.21 cm2 Ax=226.46 cm2
tw=1.3 cm Iy=141208.00 cm4 Iz=11271.30 cm4 Ix=440.00 cm4
tf=2.5 cm Wely=4786.71 cm3 Welz=751.42 cm3
----------------------------------------------------------------------------------------------------------------------------- -----------
INTERNAL FORCES AND CAPACITIES:
N,Ed = 4174.70 kN My,Ed = -43.69 kN*m
Nc,Rd = 8039.26 kN My,Ed,max = -232.06 kN*m
Nb,Rd = 6105.44 kN My,c,Rd = 1699.28 kN*m Vz,Ed = -94.19 kN
Vz,c,Rd = 1910.39 kN
Mb,Rd = 1634.13 kN*m
Class of section = 3
----------------------------------------------------------------------------------------------------------------------------------------
LATERAL BUCKLING PARAMETERS:
z = 0.00 Mcr = 12722.11 kN*m Curve,LT - a XLT = 0.96
Lcr,low=4.00 m Lam_LT = 0.37 fi,LT = 0.58
----------------------------------------------------------------------------------------------------------------------------- -----------
BUCKLING PARAMETERS:
About y axis: About z axis:
Ly = 4.00 m Lam_y = 0.21 Lz = 4.00 m Lam_z = 0.74
Lcr,y = 4.00 m Xy = 1.00 Lcr,z = 4.00 m Xz = 0.76
Lamy = 16.02 kyy = 0.96 Lamz = 56.70 kzy = 0.96
Torsional buckling: Flexural-torsional buckling
Curve,T=b alfa,T=0.34 Curve,TF=b alfa,TF=0.34
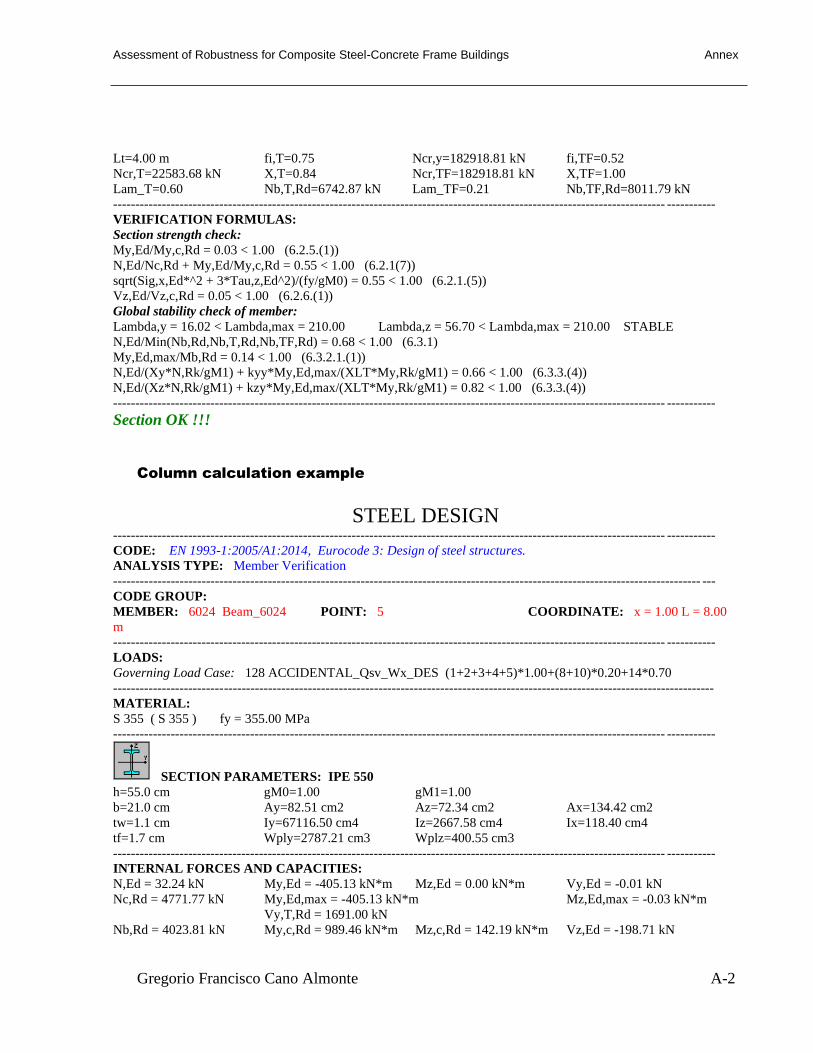
Assessment of Robustness for Composite Steel-Concrete Frame Buildings Annex
Gregorio Francisco Cano Almonte A-2
Lt=4.00 m fi,T=0.75 Ncr,y=182918.81 kN fi,TF=0.52
Ncr,T=22583.68 kN X,T=0.84 Ncr,TF=182918.81 kN X,TF=1.00
Lam_T=0.60 Nb,T,Rd=6742.87 kN Lam_TF=0.21 Nb,TF,Rd=8011.79 kN
----------------------------------------------------------------------------------------------------------------------------- -----------
VERIFICATION FORMULAS:
Section strength check:
My,Ed/My,c,Rd = 0.03 < 1.00 (6.2.5.(1))
N,Ed/Nc,Rd + My,Ed/My,c,Rd = 0.55 < 1.00 (6.2.1(7))
sqrt(Sig,x,Ed*^2 + 3*Tau,z,Ed^2)/(fy/gM0) = 0.55 < 1.00 (6.2.1.(5))
Vz,Ed/Vz,c,Rd = 0.05 < 1.00 (6.2.6.(1))
Global stability check of member:
Lambda,y = 16.02 < Lambda,max = 210.00 Lambda,z = 56.70 < Lambda,max = 210.00 STABLE
N,Ed/Min(Nb,Rd,Nb,T,Rd,Nb,TF,Rd) = 0.68 < 1.00 (6.3.1)
My,Ed,max/Mb,Rd = 0.14 < 1.00 (6.3.2.1.(1))
N,Ed/(Xy*N,Rk/gM1) + kyy*My,Ed,max/(XLT*My,Rk/gM1) = 0.66 < 1.00 (6.3.3.(4))
N,Ed/(Xz*N,Rk/gM1) + kzy*My,Ed,max/(XLT*My,Rk/gM1) = 0.82 < 1.00 (6.3.3.(4))
----------------------------------------------------------------------------------------------------------------------------- -----------
Section OK !!!
Column calculation example
STEEL DESIGN ----------------------------------------------------------------------------------------------------------------------------- -----------
CODE: EN 1993-1:2005/A1:2014, Eurocode 3: Design of steel structures.
ANALYSIS TYPE: Member Verification
------------------------------------------------------------------------------------------------------------------------------------- ---
CODE GROUP:
MEMBER: 6024 Beam_6024 POINT: 5 COORDINATE: x = 1.00 L = 8.00
m
----------------------------------------------------------------------------------------------------------------------------- -----------
LOADS:
Governing Load Case: 128 ACCIDENTAL_Qsv_Wx_DES (1+2+3+4+5)*1.00+(8+10)*0.20+14*0.70
----------------------------------------------------------------------------------------------------------------------------------------
MATERIAL:
S 355 ( S 355 ) fy = 355.00 MPa
----------------------------------------------------------------------------------------------------------------------------- -----------
SECTION PARAMETERS: IPE 550
h=55.0 cm gM0=1.00 gM1=1.00
b=21.0 cm Ay=82.51 cm2 Az=72.34 cm2 Ax=134.42 cm2
tw=1.1 cm Iy=67116.50 cm4 Iz=2667.58 cm4 Ix=118.40 cm4
tf=1.7 cm Wply=2787.21 cm3 Wplz=400.55 cm3
----------------------------------------------------------------------------------------------------------------------------- -----------
INTERNAL FORCES AND CAPACITIES:
N,Ed = 32.24 kN My,Ed = -405.13 kN*m Mz,Ed = 0.00 kN*m Vy,Ed = -0.01 kN
Nc,Rd = 4771.77 kN My,Ed,max = -405.13 kN*m Mz,Ed,max = -0.03 kN*m
Vy,T,Rd = 1691.00 kN
Nb,Rd = 4023.81 kN My,c,Rd = 989.46 kN*m Mz,c,Rd = 142.19 kN*m Vz,Ed = -198.71 kN

Assessment of Robustness for Composite Steel-Concrete Frame Buildings Annex
Gregorio Francisco Cano Almonte A-3
MN,y,Rd = 989.46 kN*m MN,z,Rd = 142.19 kN*m Vz,T,Rd = 1482.61 kN
Mb,Rd = 781.83 kN*m Tt,Ed = 0.00 kN*m
Class of section = 1
------------------------------------------------------------------------------------------------- ---------------------------------------
LATERAL BUCKLING PARAMETERS:
z = 1.00 Mcr = 1468.89 kN*m Curve,LT - c XLT = 0.75
Lcr,low=2.00 m Lam_LT = 0.82 fi,LT = 0.86 XLT,mod = 0.79
----------------------------------------------------------------------------------------------------------------------------- -----------
BUCKLING PARAMETERS:
About y axis: About z axis:
Ly = 8.00 m Lam_y = 0.47 Lz = 2.00 m Lam_z = 0.59
Lcr,y = 8.00 m Xy = 0.93 Lcr,z = 2.00 m Xz = 0.84
Lamy = 35.80 kzy = 1.00 Lamz = 44.89 kzz = 0.90
Torsional buckling: Flexural-torsional buckling
Curve,T=b alfa,T=0.34 Curve,TF=b alfa,TF=0.34
Lt=2.00 m fi,T=0.66 Ncr,y=21735.44 kN fi,TF=0.66
Ncr,T=20736.69 kN X,T=0.89 Ncr,TF=21735.44 kN X,TF=0.90
Lam_T=0.48 Nb,T,Rd=4261.66 kN Lam_TF=0.47 Nb,TF,Rd=4284.51 kN
----------------------------------------------------------------------------------------------------------------------------- -----------
VERIFICATION FORMULAS:
Section strength check:
N,Ed/Nc,Rd = 0.01 < 1.00 (6.2.4.(1))
(My,Ed/MN,y,Rd)^ 2.00 + (Mz,Ed/MN,z,Rd)^1.00 = 0.17 < 1.00 (6.2.9.1.(6))
Vy,Ed/Vy,T,Rd = 0.00 < 1.00 (6.2.6-7)
Vz,Ed/Vz,T,Rd = 0.13 < 1.00 (6.2.6-7)
Tau,ty,Ed/(fy/(sqrt(3)*gM0)) = 0.00 < 1.00 (6.2.6)
Tau,tz,Ed/(fy/(sqrt(3)*gM0)) = 0.00 < 1.00 (6.2.6)
Global stability check of member:
Lambda,y = 35.80 < Lambda,max = 210.00 Lambda,z = 44.89 < Lambda,max = 210.00 STABLE
N,Ed/Min(Nb,Rd,Nb,T,Rd,Nb,TF,Rd) = 0.01 < 1.00 (6.3.1)
My,Ed,max/Mb,Rd = 0.52 < 1.00 (6.3.2.1.(1))
N,Ed/(Xy*N,Rk/gM1) + kyy*My,Ed,max/(XLT*My,Rk/gM1) + kyz*Mz,Ed,max/(Mz,Rk/gM1) = 0.47 < 1.00
(6.3.3.(4))
N,Ed/(Xz*N,Rk/gM1) + kzy*My,Ed,max/(XLT*My,Rk/gM1) + kzz*Mz,Ed,max/(Mz,Rk/gM1) = 0.53 < 1.00
(6.3.3.(4))
----------------------------------------------------------------------------------------------------------------------------- -----------
Section OK !!!

Assessment of Robustness for Composite Steel-Concrete Frame Buildings Annex
Gregorio Francisco Cano Almonte A-4
Connection calculation example
Autodesk Robot Structural Analysis Professional 2019
Design of fixed beam-to-column connection
EN 1993-1-8:2005/AC:2009
Ratio
0.95
General
Connection no.: 1
Connection name: Frame knee
Structure node: 13017
Structure bars: 25, 1024
Geometry
Column

Assessment of Robustness for Composite Steel-Concrete Frame Buildings Annex
Gregorio Francisco Cano Almonte A-5
Section: HEA 450
Bar no.: 25
a = -90.0 [Deg] Inclination angle
hc = 440 [mm] Height of column section
bfc = 300 [mm] Width of column section
twc = 12 [mm] Thickness of the web of column section
tfc = 21 [mm] Thickness of the flange of column section
rc = 27 [mm] Radius of column section fillet
Ac = 178.03 [cm2] Cross-sectional area of a column
Ixc = 63721.60 [cm4] Moment of inertia of the column section
Material: S 355
fyc = 355.00 [MPa] Resistance
Beam
Section: IPE 550
Bar no.: 1024
a = -0.0 [Deg] Inclination angle
hb = 550 [mm] Height of beam section
bf = 210 [mm] Width of beam section
twb = 11 [mm] Thickness of the web of beam section
tfb = 17 [mm] Thickness of the flange of beam section
rb = 24 [mm] Radius of beam section fillet
rb = 24 [mm] Radius of beam section fillet

Assessment of Robustness for Composite Steel-Concrete Frame Buildings Annex
Gregorio Francisco Cano Almonte A-6
a = -0.0 [Deg] Inclination angle
Ab = 134.42 [cm2] Cross-sectional area of a beam
Ixb = 67116.50 [cm4] Moment of inertia of the beam section
Material: S 355
fyb = 355.00 [MPa] Resistance
Bolts
The shear plane passes through the UNTHREADED portion of the bolt.
d = 30 [mm] Bolt diameter
Class = 8.8 Bolt class
FtRd = 323.14 [kN] Tensile resistance of a bolt
nh = 2 Number of bolt columns
nv = 5 Number of bolt rows
h1 = 55 [mm] Distance between first bolt and upper edge of front plate
Horizontal spacing ei = 100 [mm]
Vertical spacing pi = 155;155;155;155 [mm]
Plate
hp = 730 [mm] Plate height
bp = 210 [mm] Plate width
tp = 25 [mm] Plate thickness
Material: S 355
fyp = 355.00 [MPa] Resistance
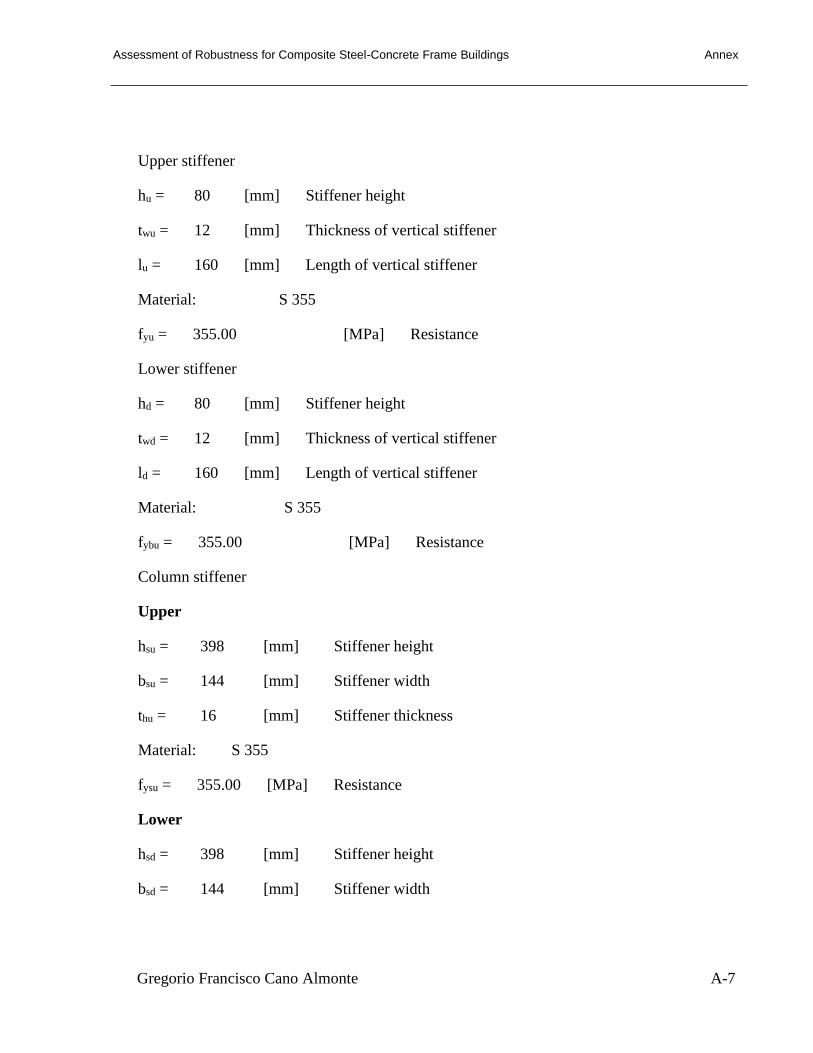
Assessment of Robustness for Composite Steel-Concrete Frame Buildings Annex
Gregorio Francisco Cano Almonte A-7
Upper stiffener
hu = 80 [mm] Stiffener height
twu = 12 [mm] Thickness of vertical stiffener
lu = 160 [mm] Length of vertical stiffener
Material: S 355
fyu = 355.00 [MPa] Resistance
Lower stiffener
hd = 80 [mm] Stiffener height
twd = 12 [mm] Thickness of vertical stiffener
ld = 160 [mm] Length of vertical stiffener
Material: S 355
fybu = 355.00 [MPa] Resistance
Column stiffener
Upper
hsu = 398 [mm] Stiffener height
bsu = 144 [mm] Stiffener width
thu = 16 [mm] Stiffener thickness
Material: S 355
fysu = 355.00 [MPa] Resistance
Lower
hsd = 398 [mm] Stiffener height
bsd = 144 [mm] Stiffener width

Assessment of Robustness for Composite Steel-Concrete Frame Buildings Annex
Gregorio Francisco Cano Almonte A-8
hsd = 398 [mm] Stiffener height
thd = 8 [mm] Stiffener thickness
Material: S 355
fysu = 355.00 [MPa] Resistance
Diagonal stiffener
Typ: Double
wa = 144 [mm] Width of diagonal stiffener
ta = 16 [mm] Thickness of diagonal stiffener
Material: S 355
fya = 355.00 [MPa] Resistance
Fillet welds
aw = 8 [mm] Web weld
af = 13 [mm] Flange weld
as = 8 [mm] Stiffener weld
Material factors
gM0 = 1.00 Partial safety factor [2.2]
gM1 = 1.00 Partial safety factor [2.2]
gM2 = 1.25 Partial safety factor [2.2]
gM3 = 1.25 Partial safety factor [2.2]
Loads
Ultimate limit state
Case: 128: ACCIDENTAL_Qsv_Wx_DES (1+2+3+4+5)*1.00+(8+10)*0.20+14*0.70

Assessment of Robustness for Composite Steel-Concrete Frame Buildings Annex
Gregorio Francisco Cano Almonte A-9
Mb1,Ed = 661.58 [kN*m] Bending moment in the right beam
Vb1,Ed = 265.35 [kN] Shear force in the right beam
Nb1,Ed = 55.72 [kN] Axial force in the right beam
Mc1,Ed = -284.62 [kN*m] Bending moment in the lower column
Vc1,Ed = -107.21 [kN] Shear force in the lower column
Nc1,Ed = -2540.59 [kN] Axial force in the lower column
Mc2,Ed = 368.25 [kN*m] Bending moment in the upper column
Vc2,Ed = 175.00 [kN] Shear force in the upper column
Nc2,Ed = -2225.46 [kN] Axial force in the upper column
Results
Beam resistances
TENSION
Ab = 134.42 [cm2] Area EN1993-1-1:[6.2.3]
Ntb,Rd = Ab fyb / gM0
Ntb,Rd
=
4771.7
7
[kN
] Design tensile resistance of the section
EN1993-1-
1:[6.2.3]
SHEAR
Avb = 91.54 [cm2] Shear area EN1993-1-1:[6.2.6.(3)]
Vcb,Rd = Avb (fyb / Ö3) / gM0
Vcb,Rd
=
1876.2
2
[kN
]
Design sectional resistance for
shear EN1993-1-1:[6.2.6.(2)]
Vb1,Ed / Vcb,Rd ≤ 1,0 0.14 < 1.00 verified (0.14
)

Assessment of Robustness for Composite Steel-Concrete Frame Buildings Annex
Gregorio Francisco Cano Almonte A-10
BENDING - PLASTIC MOMENT (WITHOUT BRACKETS)
Wplb = 2787.21 [cm3] Plastic section modulus EN1993-1-1:[6.2.5.(2)]
Mb,pl,Rd = Wplb fyb / gM0
Mb,pl,
Rd =
989
.46
[kN
*m]
Plastic resistance of the section for bending
(without stiffeners)
EN1993-1-
1:[6.2.5.(2)]
BENDING ON THE CONTACT SURFACE WITH PLATE OR CONNECTED
ELEMENT
Wpl = 2787.21 [cm3] Plastic section modulus EN1993-1-1:[6.2.5]
Mcb,Rd = Wpl fyb / gM0
Mcb,Rd
=
989.4
6
[kN*
m]
Design resistance of the section for
bending
EN1993-1-
1:[6.2.5]
FLANGE AND WEB - COMPRESSION
Mcb,Rd
=
989.4
6
[kN*
m]
Design resistance of the section for
bending
EN1993-1-
1:[6.2.5]
hf = 533 [mm] Distance between the centroids of
flanges [6.2.6.7.(1)]
Fc,fb,Rd = Mcb,Rd / hf
Fc,fb,Rd = 1857.0
9
[kN
] Resistance of the compressed flange and web
[6.2.6.7.(1)
]
Column resistances
WEB PANEL - SHEAR
Mb1,Ed = 661.58 [kN*m] Bending moment (right beam) [5.3.(3)]
Mb2,Ed = 0.00 [kN*m] Bending moment (left beam) [5.3.(3)]
Vc1,Ed = -107.21 [kN] Shear force (lower column) [5.3.(3)]

Assessment of Robustness for Composite Steel-Concrete Frame Buildings Annex
Gregorio Francisco Cano Almonte A-11
WEB PANEL - SHEAR
Mb1,Ed = 661.58 [kN*m] Bending moment (right beam) [5.3.(3)]
Vc2,Ed = 175.00 [kN] Shear force (upper column) [5.3.(3)]
z = 499 [mm] Lever arm [6.2.5]
Vwp,Ed = (Mb1,Ed - Mb2,Ed) / z - (Vc1,Ed - Vc2,Ed) / 2
Vwp,Ed = 1467.18 [kN] Shear force acting on the web panel [5.3.(3)]
Avs = 65.
78
[cm2
] Shear area of the column web
EN1993-1-
1:[6.2.6.(3)]
Avd = 39.
14
[cm2
]
Area of the diagonal stiffener subjected to
shear
EN1993-1-
1:[6.2.6.(3)]
Avc = 104
.93
[cm2
] Shear area
EN1993-1-
1:[6.2.6.(3)]
ds = 538 [mm
] Distance between the centroids of stiffeners [6.2.6.1.(4)]
Mpl,fc,
Rd =
11.
74
[kN
*m]
Plastic resistance of the column flange for
bending [6.2.6.1.(4)]
Mpl,stu,
Rd =
6.8
2
[kN
*m]
Plastic resistance of the upper transverse
stiffener for bending [6.2.6.1.(4)]
Mpl,stl,
Rd =
1.7
0
[kN
*m]
Plastic resistance of the lower transverse
stiffener for bending [6.2.6.1.(4)]
Vwp,Rd = 0.9 ( Avs*fy,wc+Avd*fya ) / (Ö3 gM0) + Min(4 Mpl,fc,Rd / ds , (2 Mpl,fc,Rd + Mpl,stu,Rd +
Mpl,stl,Rd) / ds)
Vwp,R
d =
1995.
00
[kN
]
Resistance of the column web panel
for shear [6.2.6.1]
Vwp,Ed / Vwp,Rd ≤ 1,0 0.74 < 1.00 verified (0.74)

Assessment of Robustness for Composite Steel-Concrete Frame Buildings Annex
Gregorio Francisco Cano Almonte A-12
WEB - TRANSVERSE COMPRESSION - LEVEL OF THE BEAM BOTTOM
FLANGE
Bearing:
twc = 12 [m
m] Effective thickness of the column web [6.2.6.2.(6)]
beff,c,w
c = 344
[m
m] Effective width of the web for compression [6.2.6.2.(1)]
Avc = 65.7
8
[cm2]
Shear area EN1993-1-
1:[6.2.6.(3)]
w = 0.82 Reduction factor for interaction with shear [6.2.6.2.(1)]
scom,Ed
=
224.
41
[MP
a] Maximum compressive stress in web [6.2.6.2.(2)]
kwc = 1.00 Reduction factor conditioned by
compressive stresses [6.2.6.2.(2)]
As = 17.3
1
[cm2]
Area of the web stiffener EN1993-1-
1:[6.2.4]
a = 32.0 [De
g] Inclination angle of a diagonal stiffener
Asd = 46.1
6
[cm2]
Diagonal stiffener area EN1993-1-
1:[6.2.4]
Fc,wc,Rd1 = w kwc beff,c,wc twc fyc / gM0 + As fys / gM0 + Asd cos(a) fya / gM0
Fc,wc,Rd1 = 3162.44 [kN] Column web resistance [6.2.6.2.(1)]

Assessment of Robustness for Composite Steel-Concrete Frame Buildings Annex
Gregorio Francisco Cano Almonte A-13
Buckling:
dwc
= 344
[mm
] Height of compressed web [6.2.6.2.(1)]
lp = 1.1
5 Plate slenderness of an element [6.2.6.2.(1)]
r = 0.7
2 Reduction factor for element buckling [6.2.6.2.(1)]
ls = 3.9
0 Stiffener slenderness
EN1993-1-
1:[6.3.1.2]
cs = 1.0
0 Buckling coefficient of the stiffener
EN1993-1-
1:[6.3.1.2]
lsd = 4.5
9 Diagonal stiffener slenderness
EN1993-1-
1:[6.3.1.2]
csd = 1.0
0
Buckling coefficient of a diagonal
stiffener
EN1993-1-
1:[6.3.1.2]
Fc,wc,Rd2 = w kwc r beff,c,wc twc fyc / gM1 + As cs fys / gM1 + Asd csd cos(a) fya / gM1
Fc,wc,Rd2 = 2838.39 [kN] Column web resistance [6.2.6.2.(1)]
Final resistance:
Fc,wc,Rd,low = Min (Fc,wc,Rd1 , Fc,wc,Rd2)
Fc,wc,Rd = 2838.39 [kN] Column web resistance [6.2.6.2.(1)]
Geometrical parameters of a connection
EFFECTIVE LENGTHS AND PARAMETERS - COLUMN FLANGE

Assessment of Robustness for Composite Steel-Concrete Frame Buildings Annex
Gregorio Francisco Cano Almonte A-14
N
r m
m
x e
e
x p
leff,
cp
leff,
nc
leff
,1
leff
,2
leff,c
p,g
leff,n
c,g
leff,
1,g
leff,
2,g
1 2
3 -
10
0 - 87
14
2
12
8
12
8
12
8 0 0 0 0
2 2
3 -
10
0 -
15
5
14
2
18
1
14
2
18
1 226 151 151 151
3 2
3 -
10
0 -
15
5
14
2
21
6
14
2
21
6 310 155 155 155
4 2
3 -
10
0 -
15
5
14
2
18
1
14
2
18
1 226 151 151 151
5 2
3 -
10
0 - 87
14
2
18
1
14
2
18
1 158 117 117 117
EFFECTIVE LENGTHS AND PARAMETERS - FRONT PLATE
N
r m
m
x e
e
x p
leff,
cp
leff,
nc
leff
,1
leff
,2
leff,c
p,g
leff,n
c,g
leff,1
,g
leff,2
,g
1 3
5 -
5
5 - 87
22
0
27
5
22
0
27
5 197 214 197 214
2 3
5 -
5
5 -
15
5
22
2
21
4
21
4
21
4 266 186 186 186
3 3
5 -
5
5 -
15
5
22
2
21
0
21
0
21
0 310 155 155 155
4 3
5 -
5
5 -
15
5
22
2
21
0
21
0
21
0 266 183 183 183
5 3
5 -
5
5 - 87
22
0
27
5
22
0
27
5 197 214 197 214

Assessment of Robustness for Composite Steel-Concrete Frame Buildings Annex
Gregorio Francisco Cano Almonte A-15
m – Bolt distance from the web
mx – Bolt distance from the beam flange
e – Bolt distance from the outer edge
ex – Bolt distance from the horizontal outer edge
p – Distance between bolts
leff,cp – Effective length for a single bolt in the circular failure mode
leff,nc – Effective length for a single bolt in the non-circular failure mode
leff,1 – Effective length for a single bolt for mode 1
leff,2 – Effective length for a single bolt for mode 2
leff,cp,g – Effective length for a group of bolts in the circular failure mode
leff,nc,g – Effective length for a group of bolts in the non-circular failure mode
leff,1,g – Effective length for a group of bolts for mode 1
leff,2,g – Effective length for a group of bolts for mode 2
Connection resistance for tension
Ft,Rd = 323.14 [kN] Bolt resistance for tension [Table 3.4]
Bp,Rd = 669.76 [kN] Punching shear resistance of a bolt [Table 3.4]
Nj,Rd = Min (Ntb,Rd , nv nh Ft,Rd , nv nh Bp,Rd)
Nj,Rd = 3231.36 [kN] Connection resistance for tension [6.2]
Nb1,Ed / Nj,Rd ≤ 1,0 0.02 < 1.00 verified (0.02)
Connection resistance for bending
Ft,Rd = 323.14 [kN] Bolt resistance for tension [Table 3.4]
Bp,Rd = 669.76 [kN] Punching shear resistance of a bolt [Table 3.4]

Assessment of Robustness for Composite Steel-Concrete Frame Buildings Annex
Gregorio Francisco Cano Almonte A-16
Ft,fc,Rd – column flange resistance due to bending
Ft,wc,Rd – column web resistance due to tension
Ft,ep,Rd – resistance of the front plate due to bending
Ft,wb,Rd – resistance of the web in tension
Ft,fc,Rd = Min (FT,1,fc,Rd , FT,2,fc,Rd , FT,3,fc,Rd) [6.2.6.4] , [Tab.6.2]
Ft,wc,Rd = w beff,t,wc twc fyc / gM0 [6.2.6.3.(1)]
Ft,ep,Rd = Min (FT,1,ep,Rd , FT,2,ep,Rd , FT,3,ep,Rd) [6.2.6.5] , [Tab.6.2]
Ft,wb,Rd = beff,t,wb twb fyb / gM0 [6.2.6.8.(1)]
RESISTANCE OF THE BOLT ROW NO. 1
Ft1,Rd,comp - Formula Ft1,Rd,comp Component
Ft1,Rd = Min (Ft1,Rd,comp) 507.83 Bolt row resistance
Ft,fc,Rd(1) = 556.26 556.26 Column flange - tension
Ft,wc,Rd(1) = 507.83 507.83 Column web - tension
Ft,ep,Rd(1) = 646.27 646.27 Front plate - tension
Bp,Rd = 1339.52 1339.52 Bolts due to shear punching
Vwp,Rd/b = 1995.00 1995.00 Web panel - shear
Fc,wc,Rd = 2838.39 2838.39 Column web - compression
Fc,fb,Rd = 1857.09 1857.09 Beam flange - compression
RESISTANCE OF THE BOLT ROW NO. 2
Ft2,Rd,comp - Formula Ft2,Rd,comp Component
Ft2,Rd = Min (Ft2,Rd,comp) 558.94 Bolt row resistance
Ft,fc,Rd(2) = 637.36 637.36 Column flange - tension

Assessment of Robustness for Composite Steel-Concrete Frame Buildings Annex
Gregorio Francisco Cano Almonte A-17
Ft2,Rd,comp - Formula Ft2,Rd,comp Component
Ft,wc,Rd(2) = 558.94 558.94 Column web - tension
Ft,ep,Rd(2) = 646.27 646.27 Front plate - tension
Ft,wb,Rd(2) = 843.51 843.51 Beam web - tension
Bp,Rd = 1339.52 1339.52 Bolts due to shear punching
Vwp,Rd/b - ∑11 Fti,Rd = 1995.00 - 507.83 1487.17 Web panel - shear
Fc,wc,Rd - ∑11 Ftj,Rd = 2838.39 - 507.83 2330.57 Column web - compression
Fc,fb,Rd - ∑11 Ftj,Rd = 1857.09 - 507.83 1349.27 Beam flange - compression
RESISTANCE OF THE BOLT ROW NO. 3
Ft3,Rd,comp - Formula Ft3,Rd,comp Component
Ft3,Rd = Min (Ft3,Rd,comp) 507.32 Bolt row resistance
Ft,fc,Rd(3) = 646.27 646.27 Column flange - tension
Ft,wc,Rd(3) = 558.94 558.94 Column web - tension
Ft,ep,Rd(3) = 646.27 646.27 Front plate - tension
Ft,wb,Rd(3) = 828.87 828.87 Beam web - tension
Bp,Rd = 1339.52 1339.52 Bolts due to shear punching
Vwp,Rd/b - ∑12 Fti,Rd = 1995.00 - 1066.77 928.23 Web panel - shear
Fc,wc,Rd - ∑12 Ftj,Rd = 2838.39 - 1066.77 1771.62 Column web - compression
Fc,fb,Rd - ∑12 Ftj,Rd = 1857.09 - 1066.77 790.32 Beam flange - compression
Ft,fc,Rd(3 + 2) - ∑22 Ftj,Rd = 1187.94 - 558.94 628.99 Column flange - tension - group
Ft,wc,Rd(3 + 2) - ∑22 Ftj,Rd = 1066.27 - 558.94 507.32 Column web - tension - group
Ft,fc,Rd(3 + 2) - ∑22 Ftj,Rd = 1187.94 - 558.94 628.99 Column flange - tension - group
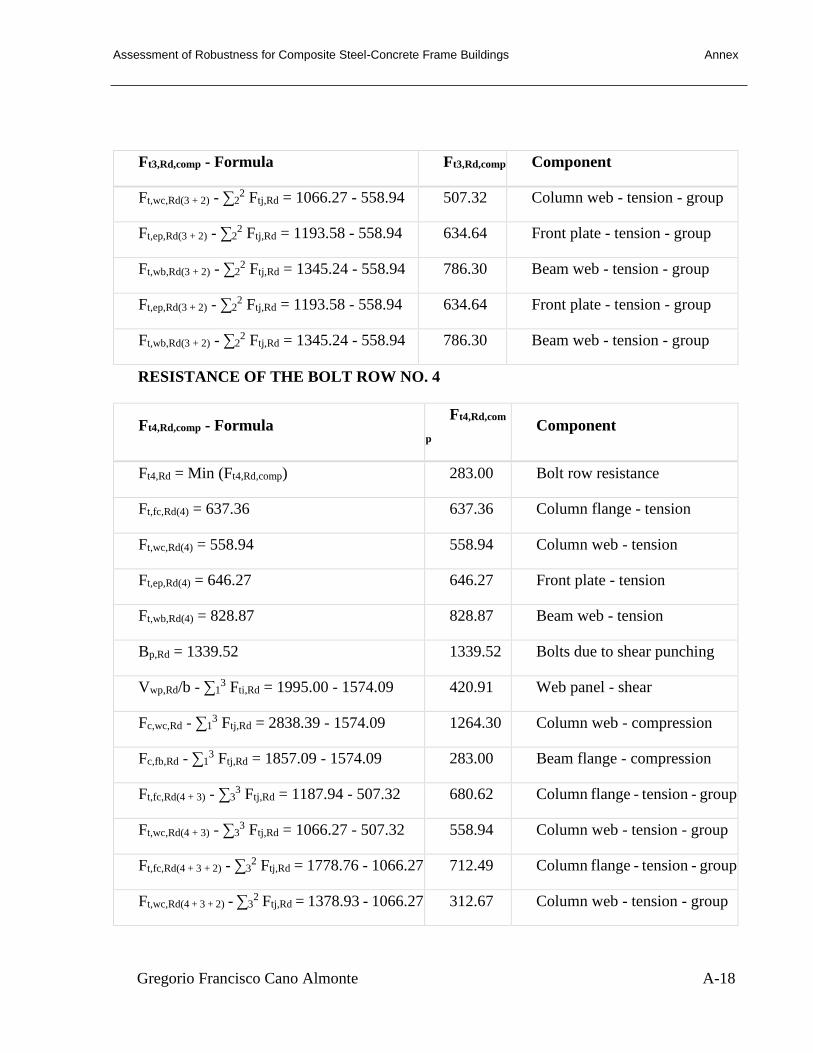
Assessment of Robustness for Composite Steel-Concrete Frame Buildings Annex
Gregorio Francisco Cano Almonte A-18
Ft3,Rd,comp - Formula Ft3,Rd,comp Component
Ft,wc,Rd(3 + 2) - ∑22 Ftj,Rd = 1066.27 - 558.94 507.32 Column web - tension - group
Ft,ep,Rd(3 + 2) - ∑22 Ftj,Rd = 1193.58 - 558.94 634.64 Front plate - tension - group
Ft,wb,Rd(3 + 2) - ∑22 Ftj,Rd = 1345.24 - 558.94 786.30 Beam web - tension - group
Ft,ep,Rd(3 + 2) - ∑22 Ftj,Rd = 1193.58 - 558.94 634.64 Front plate - tension - group
Ft,wb,Rd(3 + 2) - ∑22 Ftj,Rd = 1345.24 - 558.94 786.30 Beam web - tension - group
RESISTANCE OF THE BOLT ROW NO. 4
Ft4,Rd,comp - Formula Ft4,Rd,com
p Component
Ft4,Rd = Min (Ft4,Rd,comp) 283.00 Bolt row resistance
Ft,fc,Rd(4) = 637.36 637.36 Column flange - tension
Ft,wc,Rd(4) = 558.94 558.94 Column web - tension
Ft,ep,Rd(4) = 646.27 646.27 Front plate - tension
Ft,wb,Rd(4) = 828.87 828.87 Beam web - tension
Bp,Rd = 1339.52 1339.52 Bolts due to shear punching
Vwp,Rd/b - ∑13 Fti,Rd = 1995.00 - 1574.09 420.91 Web panel - shear
Fc,wc,Rd - ∑13 Ftj,Rd = 2838.39 - 1574.09 1264.30 Column web - compression
Fc,fb,Rd - ∑13 Ftj,Rd = 1857.09 - 1574.09 283.00 Beam flange - compression
Ft,fc,Rd(4 + 3) - ∑33 Ftj,Rd = 1187.94 - 507.32 680.62 Column flange - tension - group
Ft,wc,Rd(4 + 3) - ∑33 Ftj,Rd = 1066.27 - 507.32 558.94 Column web - tension - group
Ft,fc,Rd(4 + 3 + 2) - ∑32 Ftj,Rd = 1778.76 - 1066.27 712.49 Column flange - tension - group
Ft,wc,Rd(4 + 3 + 2) - ∑32 Ftj,Rd = 1378.93 - 1066.27 312.67 Column web - tension - group

Assessment of Robustness for Composite Steel-Concrete Frame Buildings Annex
Gregorio Francisco Cano Almonte A-19
Ft4,Rd,comp - Formula Ft4,Rd,com
p Component
Ft,ep,Rd(4 + 3) - ∑33 Ftj,Rd = 1188.41 - 507.32 681.09 Front plate - tension - group
Ft,wb,Rd(4 + 3) - ∑33 Ftj,Rd = 1330.60 - 507.32 823.28 Beam web - tension - group
Ft,ep,Rd(4 + 3 + 2) - ∑32 Ftj,Rd = 1807.06 - 1066.27 740.79 Front plate - tension - group
Ft,wb,Rd(4 + 3 + 2) - ∑32 Ftj,Rd = 2065.07 - 1066.27 998.80 Beam web - tension - group
The remaining bolts are inactive (they do not carry loads) because resistance of one of the
connection components has been used up or these bolts are positioned below the center of rotation.
SUMMARY TABLE OF FORCES
N
r hj Ftj,Rd Ft,fc,Rd Ft,wc,Rd Ft,ep,Rd Ft,wb,Rd Ft,Rd Bp,Rd
1 576 507.83 556.26 507.83 646.27 - 646.27 1339.5
2
2 421 558.94 637.36 558.94 646.27 843.51 646.27 1339.5
2
3 266 507.32 646.27 558.94 646.27 828.87 646.27 1339.5
2
4 111 283.00 637.36 558.94 646.27 828.87 646.27 1339.5
2
5 -44 - 637.36 558.94 646.27 - 646.27 1339.5
2
CONNECTION RESISTANCE FOR BENDING Mj,Rd
Mj,Rd = ∑ hj Ftj,Rd
Mj,Rd = 694.93 [kN*m] Connection resistance for bending [6.2]
Mb1,Ed / Mj,Rd ≤ 1,0 0.95 < 1.00 verified (0.95)

Assessment of Robustness for Composite Steel-Concrete Frame Buildings Annex
Gregorio Francisco Cano Almonte A-20
Connection resistance for shear
av = 0.60 Coefficient for calculation of Fv,Rd [Table 3.4]
bLf = 0.97 Reduction factor for long connections [3.8]
Fv,Rd = 263.74 [kN] Shear resistance of a single bolt [Table 3.4]
Ft,Rd,max = 323.14 [kN] Tensile resistance of a single bolt [Table 3.4]
Fb,Rd,int = 592.20 [kN] Bearing resistance of an intermediate bolt [Table 3.4]
Fb,Rd,ext = 329.00 [kN] Bearing resistance of an outermost bolt [Table 3.4]
Nr Ftj,Rd,N Ftj,Ed,N Ftj,Rd,M Ftj,Ed,M Ftj,Ed Fvj,Rd
1 646.27 11.14 507.83 483.46 494.60 239.13
2 646.27 11.14 558.94 532.12 543.27 210.76
3 646.27 11.14 507.32 482.98 494.12 239.41
4 646.27 11.14 283.00 269.42 280.57 363.92
5 646.27 11.14 0.00 0.00 11.14 520.99
Ftj,Rd,N – Bolt row resistance for simple tension
Ftj,Ed,N – Force due to axial force in a bolt row
Ftj,Rd,M – Bolt row resistance for simple bending
Ftj,Ed,M – Force due to moment in a bolt row
Ftj,Ed – Maximum tensile force in a bolt row
Fvj,Rd – Reduced bolt row resistance
Ftj,Ed,N = Nj,Ed Ftj,Rd,N / Nj,Rd
Ftj,Ed,M = Mj,Ed Ftj,Rd,M / Mj,Rd
Ftj,Ed = Ftj,Ed,N + Ftj,Ed,M

Assessment of Robustness for Composite Steel-Concrete Frame Buildings Annex
Gregorio Francisco Cano Almonte A-21
Ftj,Ed,N = Nj,Ed Ftj,Rd,N / Nj,Rd
Fvj,Rd = Min (nh Fv,Ed (1 - Ftj,Ed/ (1.4 nh Ft,Rd,max), nh Fv,Rd , nh Fb,Rd))
Vj,Rd = nh ∑1n Fvj,Rd [Table 3.4]
Vj,Rd = 1574.21 [kN] Connection resistance for shear [Table 3.4]
Vb1,Ed / Vj,Rd ≤ 1,0 0.17 < 1.00 verified (0.17)
Weld resistance
Aw = 186.9
7
[c
m2] Area of all welds
[4.5.3.
2(2)]
Awy = 86.55 [c
m2] Area of horizontal welds
[4.5.3.
2(2)]
Awz = 100.4
2
[c
m2] Area of vertical welds
[4.5.3.
2(2)]
Iwy = 10145
6.77
[c
m4]
Moment of inertia of the weld arrangement with
respect to the hor. axis
[4.5.3.
2(5)]
s^max=t^
max =
165.7
9
[M
Pa] Normal stress in a weld
[4.5.3.
2(6)]
s^=t^ = 165.7
9
[M
Pa] Stress in a vertical weld
[4.5.3.
2(5)]
tII = 26.43 [M
Pa] Tangent stress
[4.5.3.
2(5)]
bw = 0.90 Correlation coefficient [4.5.3.
2(7)]
Ö[s^max2 + 3*(t^max
2)] ≤ fu/(bw*gM2) 331.59 < 417.78 verified (0.79)
Ö[s^2 + 3*(t^
2+tII2)] ≤ fu/(bw*gM2) 334.73 < 417.78 verified (0.80)
s^ ≤ 0.9*fu/gM2 165.79 < 338.40 verified (0.49)

Assessment of Robustness for Composite Steel-Concrete Frame Buildings Annex
Gregorio Francisco Cano Almonte A-22
Connection stiffness
twash = 6 [mm] Washer thickness [6.2.6.3.(2)]
hhead = 21 [mm] Bolt head height [6.2.6.3.(2)]
hnut = 30 [mm] Bolt nut height [6.2.6.3.(2)]
Lb = 84 [mm] Bolt length [6.2.6.3.(2)]
k10 = 11 [mm] Stiffness coefficient of bolts [6.3.2.(1)]
STIFFNESSES OF BOLT ROWS
Nr hj k3 k4 k5 keff,j keff,j hj keff,j hj2
Sum 17.06 557.49
1 576 0 0 65 0 0.00 0.00
2 421 3 102 59 2 9.02 380.13
3 266 3 102 49 2 5.66 150.81
4 111 3 102 58 2 2.38 26.55
keff,j = 1 / (∑35 (1 / ki,j)) [6.3.3.1.(2)]
zeq = ∑j keff,j hj2 / ∑j keff,j hj
zeq = 327 [mm] Equivalent force arm [6.3.3.1.(3)]
keq = ∑j keff,j hj / zeq
keq = 5 [mm] Equivalent stiffness coefficient of a bolt arrangement [6.3.3.1.(1)]
k1 = ¥ Stiffness coefficient of the column web panel subjected to shear [6.3.2.(1)]
k2 = ¥ Stiffness coefficient of the compressed column web [6.3.2.(1)]
Sj,ini = E zeq2 / ∑i (1 / k1 + 1 / k2 + 1 / keq) [6.3.1.(4)]
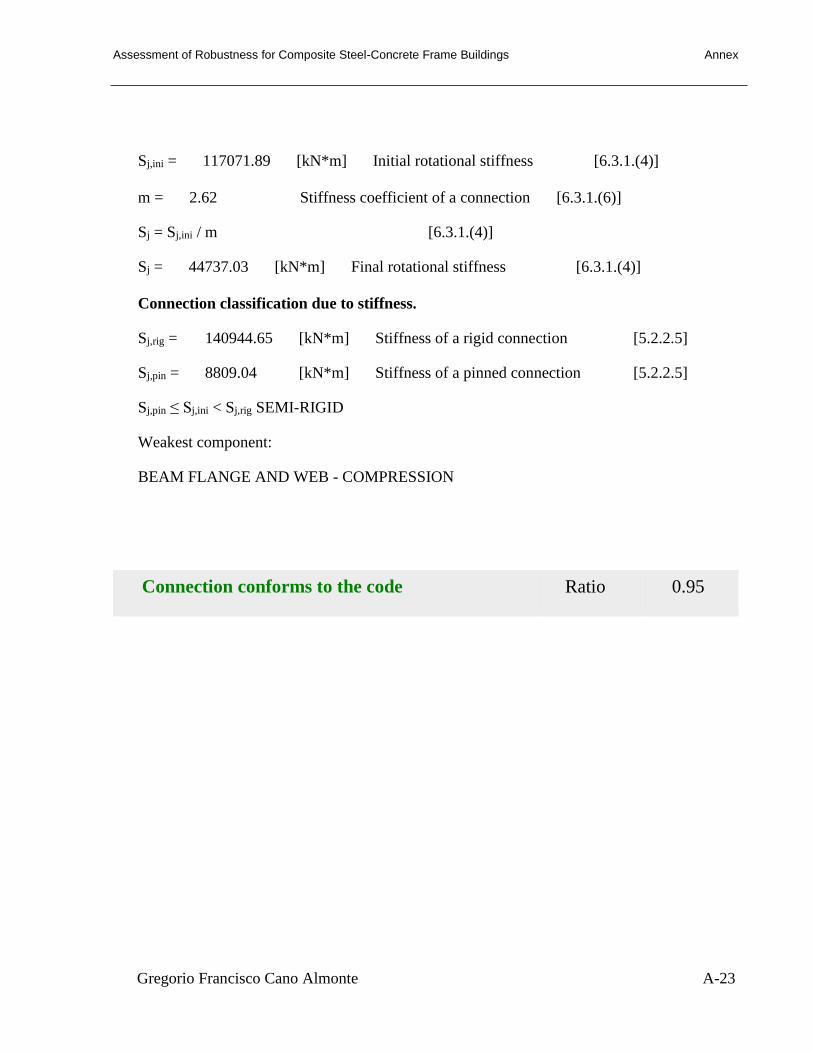
Assessment of Robustness for Composite Steel-Concrete Frame Buildings Annex
Gregorio Francisco Cano Almonte A-23
Sj,ini = 117071.89 [kN*m] Initial rotational stiffness [6.3.1.(4)]
m = 2.62 Stiffness coefficient of a connection [6.3.1.(6)]
Sj = Sj,ini / m [6.3.1.(4)]
Sj = 44737.03 [kN*m] Final rotational stiffness [6.3.1.(4)]
Connection classification due to stiffness.
Sj,rig = 140944.65 [kN*m] Stiffness of a rigid connection [5.2.2.5]
Sj,pin = 8809.04 [kN*m] Stiffness of a pinned connection [5.2.2.5]
Sj,pin ≤ Sj,ini < Sj,rig SEMI-RIGID
Weakest component:
BEAM FLANGE AND WEB - COMPRESSION
Connection conforms to the code Ratio 0.95