HCI Deepsea Oil Explorer Auf der Suche nach dem Gold der Meere.
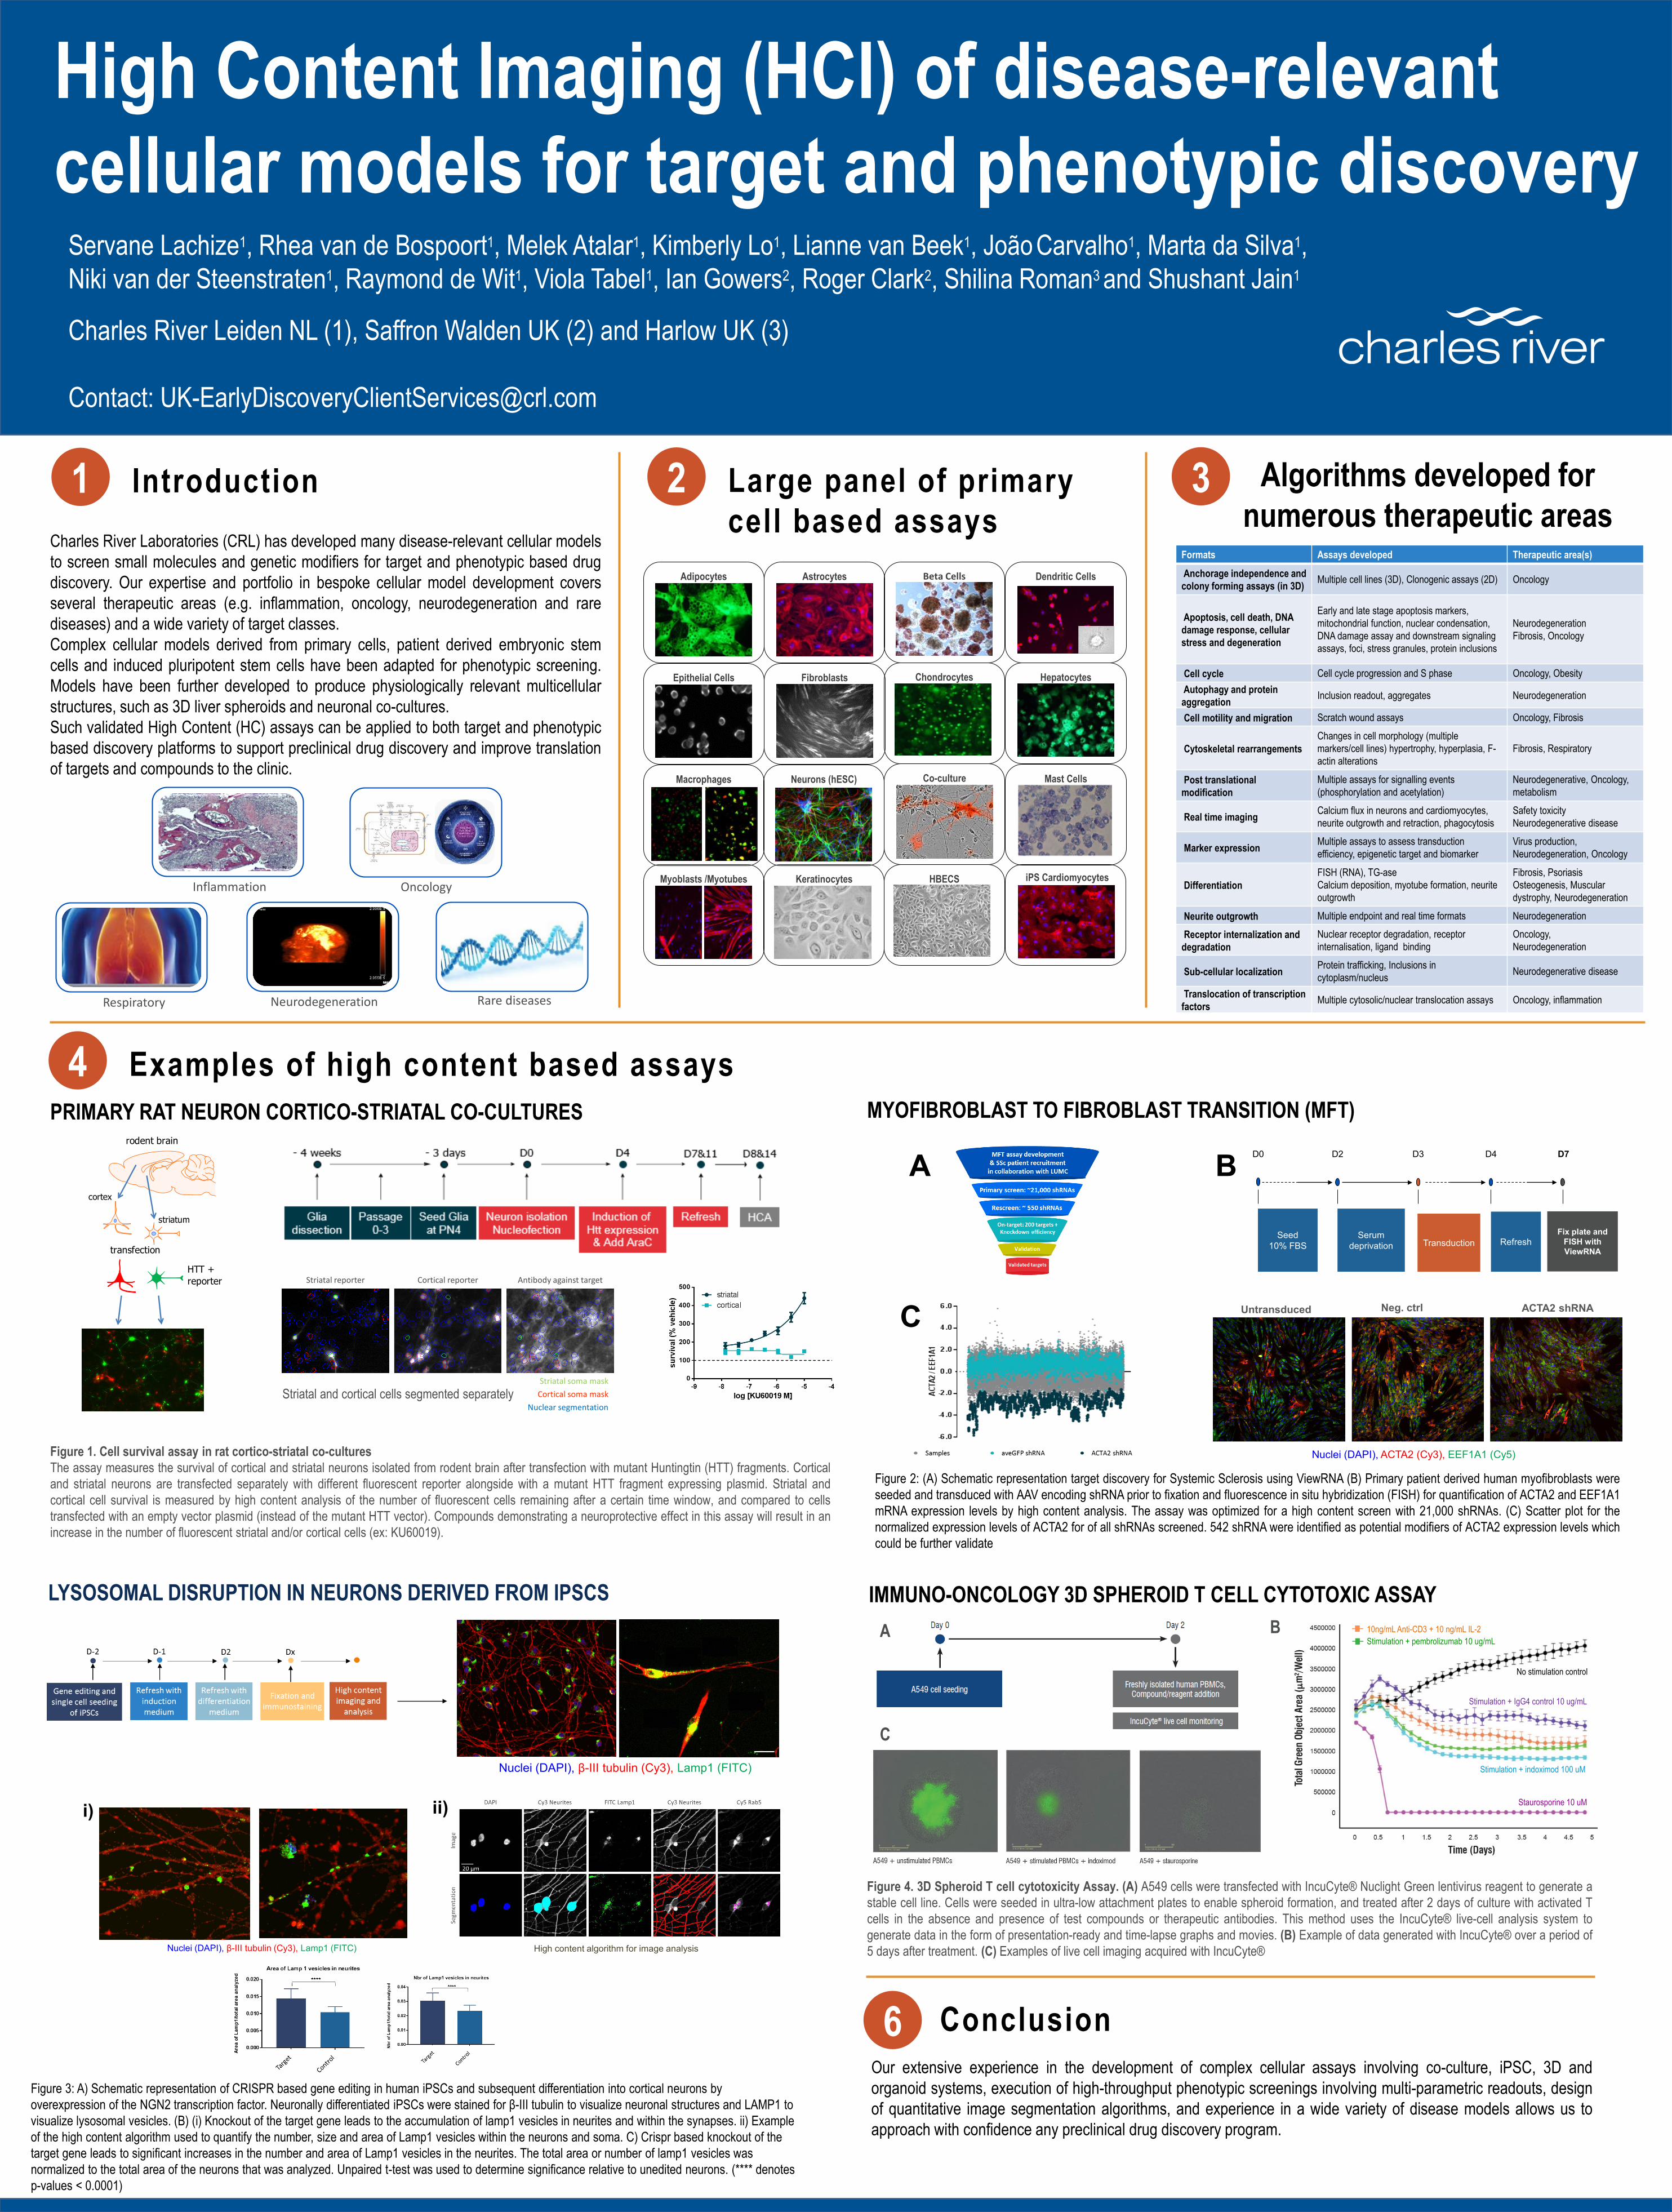
High Content Imaging (HCI) of disease-relevant cellular models for target and phenotypic discovery
Servane Lachize1, Rhea van de Bospoort1, Melek Atalar1, Kimberly Lo1, Lianne van Beek1, João Carvalho1, Marta da Silva1, Niki van der Steenstraten1, Raymond de Wit1, Viola Tabel1, Ian Gowers2, Roger Clark2, Shilina Roman3 and Shushant Jain1
Charles River Leiden NL (1), Saffron Walden UK (2) and Harlow UK (3)
Contact: [email protected]
1 IntroductionCharles River Laboratories (CRL) has developed many disease-relevant cellular modelsto screen small molecules and genetic modifiers for target and phenotypic based drugdiscovery. Our expertise and portfolio in bespoke cellular model development coversseveral therapeutic areas (e.g. inflammation, oncology, neurodegeneration and rarediseases) and a wide variety of target classes.Complex cellular models derived from primary cells, patient derived embryonic stemcells and induced pluripotent stem cells have been adapted for phenotypic screening.Models have been further developed to produce physiologically relevant multicellularstructures, such as 3D liver spheroids and neuronal co-cultures.Such validated High Content (HC) assays can be applied to both target and phenotypicbased discovery platforms to support preclinical drug discovery and improve translationof targets and compounds to the clinic.
2 Large panel of primary cell based assays
4 Examples of high content based assays
Rare diseasesRespiratory
Inflammation Oncology
Neurodegeneration
Epithelial Cells
Adipocytes Astrocytes Beta Cells
HBECS
Chondrocytes
Macrophages Neurons (hESC)
Hepatocytes
Keratinocytes
Mast CellsCo-culture
Fibroblasts
Myoblasts /Myotubes
Dendritic Cells
PRIMARY RAT NEURON CORTICO-STRIATAL CO-CULTURES
striatum
cortex
HTT + reporter
transfection
rodent brain
Striatal soma maskCortical soma mask
Nuclear segmentation
Striatal reporter Cortical reporter Antibody against target
Striatal and cortical cells segmented separately
MYOFIBROBLAST TO FIBROBLAST TRANSITION (MFT)
Algorithms developed for numerous therapeutic areas
Formats Assays developed Therapeutic area(s)
Anchorage independence and colony forming assays (in 3D) Multiple cell lines (3D), Clonogenic assays (2D) Oncology
Apoptosis, cell death, DNA damage response, cellular stress and degeneration
Early and late stage apoptosis markers, mitochondrial function, nuclear condensation, DNA damage assay and downstream signaling assays, foci, stress granules, protein inclusions
NeurodegenerationFibrosis, Oncology
Cell cycle Cell cycle progression and S phase Oncology, ObesityAutophagy and protein aggregation Inclusion readout, aggregates Neurodegeneration
Cell motility and migration Scratch wound assays Oncology, Fibrosis
Cytoskeletal rearrangementsChanges in cell morphology (multiple markers/cell lines) hypertrophy, hyperplasia, F-actin alterations
Fibrosis, Respiratory
Post translationalmodification
Multiple assays for signalling events (phosphorylation and acetylation)
Neurodegenerative, Oncology, metabolism
Real time imaging Calcium flux in neurons and cardiomyocytes, neurite outgrowth and retraction, phagocytosis
Safety toxicityNeurodegenerative disease
Marker expression Multiple assays to assess transduction efficiency, epigenetic target and biomarker
Virus production, Neurodegeneration, Oncology
DifferentiationFISH (RNA), TG-aseCalcium deposition, myotube formation, neurite outgrowth
Fibrosis, PsoriasisOsteogenesis, Muscular dystrophy, Neurodegeneration
Neurite outgrowth Multiple endpoint and real time formats Neurodegeneration
Receptor internalization and degradation
Nuclear receptor degradation, receptor internalisation, ligand binding
Oncology,Neurodegeneration
Sub-cellular localization Protein trafficking, Inclusions in cytoplasm/nucleus Neurodegenerative disease
Translocation of transcription factors Multiple cytosolic/nuclear translocation assays Oncology, inflammation
3
IMMUNO-ONCOLOGY 3D SPHEROID T CELL CYTOTOXIC ASSAY
Figure 4. 3D Spheroid T cell cytotoxicity Assay. (A) A549 cells were transfected with IncuCyte® Nuclight Green lentivirus reagent to generate astable cell line. Cells were seeded in ultra-low attachment plates to enable spheroid formation, and treated after 2 days of culture with activated Tcells in the absence and presence of test compounds or therapeutic antibodies. This method uses the IncuCyte® live-cell analysis system togenerate data in the form of presentation-ready and time-lapse graphs and movies. (B) Example of data generated with IncuCyte® over a period of5 days after treatment. (C) Examples of live cell imaging acquired with IncuCyte®
Figure 1. Cell survival assay in rat cortico-striatal co-culturesThe assay measures the survival of cortical and striatal neurons isolated from rodent brain after transfection with mutant Huntingtin (HTT) fragments. Corticaland striatal neurons are transfected separately with different fluorescent reporter alongside with a mutant HTT fragment expressing plasmid. Striatal andcortical cell survival is measured by high content analysis of the number of fluorescent cells remaining after a certain time window, and compared to cellstransfected with an empty vector plasmid (instead of the mutant HTT vector). Compounds demonstrating a neuroprotective effect in this assay will result in anincrease in the number of fluorescent striatal and/or cortical cells (ex: KU60019).
iPS Cardiomyocytes
Our extensive experience in the development of complex cellular assays involving co-culture, iPSC, 3D andorganoid systems, execution of high-throughput phenotypic screenings involving multi-parametric readouts, designof quantitative image segmentation algorithms, and experience in a wide variety of disease models allows us toapproach with confidence any preclinical drug discovery program.
6 Conclusion
No stimulation control
Staurosporine 10 uM
Stimulation + indoximod 100 uM
Stimulation + IgG4 control 10 ug/mL
10ng/mL Anti-CD3 + 10 ng/mL IL-2Stimulation + pembrolizumab 10 ug/mL
A B
C
Untransduced ACTA2 shRNANeg. ctrl
Nuclei (DAPI), ACTA2 (Cy3), EEF1A1 (Cy5)
BA
C
Figure 2: (A) Schematic representation target discovery for Systemic Sclerosis using ViewRNA (B) Primary patient derived human myofibroblasts wereseeded and transduced with AAV encoding shRNA prior to fixation and fluorescence in situ hybridization (FISH) for quantification of ACTA2 and EEF1A1mRNA expression levels by high content analysis. The assay was optimized for a high content screen with 21,000 shRNAs. (C) Scatter plot for thenormalized expression levels of ACTA2 for of all shRNAs screened. 542 shRNA were identified as potential modifiers of ACTA2 expression levels whichcould be further validate
LYSOSOMAL DISRUPTION IN NEURONS DERIVED FROM IPSCS
Nuclei (DAPI), β-III tubulin (Cy3), Lamp1 (FITC)
Nuclei (DAPI), β-III tubulin (Cy3), Lamp1 (FITC) High content algorithm for image analysis
i) ii)
Figure 3: A) Schematic representation of CRISPR based gene editing in human iPSCs and subsequent differentiation into cortical neurons by overexpression of the NGN2 transcription factor. Neuronally differentiated iPSCs were stained for β-III tubulin to visualize neuronal structures and LAMP1 to visualize lysosomal vesicles. (B) (i) Knockout of the target gene leads to the accumulation of lamp1 vesicles in neurites and within the synapses. ii) Example of the high content algorithm used to quantify the number, size and area of Lamp1 vesicles within the neurons and soma. C) Crispr based knockout of the target gene leads to significant increases in the number and area of Lamp1 vesicles in the neurites. The total area or number of lamp1 vesicles was normalized to the total area of the neurons that was analyzed. Unpaired t-test was used to determine significance relative to unedited neurons. (**** denotes p-values < 0.0001)
D0 D2
Serum deprivation
Seed10% FBS
D3
Transduction
D4
Refresh
D7
Fix plate and FISH with ViewRNA
![Sören Gröttrup - uni-muenster.de · called cellular senescence, recently discovered even for several single-celled organisms (see [82]). Cellular senescence is the phenomenon that](https://static.fdokument.com/doc/165x107/5eb87cf41188d05425591815/sren-grttrup-uni-called-cellular-senescence-recently-discovered-even-for.jpg)