High Interstitial Stainless Austenitic Steels - … · Die Online-Fachbuchhandlung beck-shop.de ist...
14
Engineering Materials High Interstitial Stainless Austenitic Steels Bearbeitet von Hans Berns, Valentin Gavriljuk, Sascha Riedner 1. Auflage 2012. Buch. x, 170 S. Hardcover ISBN 978 3 642 33700 0 Format (B x L): 15,5 x 23,5 cm Gewicht: 438 g Weitere Fachgebiete > Technik > Technologien diverser Werkstoffe > Metallurgie Zu Inhaltsverzeichnis schnell und portofrei erhältlich bei Die Online-Fachbuchhandlung beck-shop.de ist spezialisiert auf Fachbücher, insbesondere Recht, Steuern und Wirtschaft. Im Sortiment finden Sie alle Medien (Bücher, Zeitschriften, CDs, eBooks, etc.) aller Verlage. Ergänzt wird das Programm durch Services wie Neuerscheinungsdienst oder Zusammenstellungen von Büchern zu Sonderpreisen. Der Shop führt mehr als 8 Millionen Produkte.
Transcript of High Interstitial Stainless Austenitic Steels - … · Die Online-Fachbuchhandlung beck-shop.de ist...
Engineering Materials
High Interstitial Stainless Austenitic Steels
Bearbeitet vonHans Berns, Valentin Gavriljuk, Sascha Riedner
1. Auflage 2012. Buch. x, 170 S. HardcoverISBN 978 3 642 33700 0
Format (B x L): 15,5 x 23,5 cmGewicht: 438 g
Weitere Fachgebiete > Technik > Technologien diverser Werkstoffe > Metallurgie
Zu Inhaltsverzeichnis
schnell und portofrei erhältlich bei
Die Online-Fachbuchhandlung beck-shop.de ist spezialisiert auf Fachbücher, insbesondere Recht, Steuern und Wirtschaft.Im Sortiment finden Sie alle Medien (Bücher, Zeitschriften, CDs, eBooks, etc.) aller Verlage. Ergänzt wird das Programmdurch Services wie Neuerscheinungsdienst oder Zusammenstellungen von Büchern zu Sonderpreisen. Der Shop führt mehr
als 8 Millionen Produkte.
Chapter 2Constitution
2.1 General Remarks
The constitution of high interstitial steels describes the state of atomic order inthermodynamic equilibrium. It depends on the three variables of state: concen-tration of alloying elements in iron, temperature and pressure. A region that is inthe same state of order is known as a phase. Nitrogen is a volatile element andtherefore the gas phase and especially the partial pressure of N2 has to be takeninto account. The liquid phase appears during melting, solidification and welding.Of the solid state phases austenite, d-ferrite, carbides, nitrides and sigma phase areto be expected. To cope with such a complex alloy system the commercial soft-ware program THERMO-CALCTM, version R with TCFE4 database [1] was usedto calculate the constitution of multi-component HIS.
It depends on experimental data and theoretical models covering a wide rangeof steel compositions by minimizing the Gibb’s free energy [2]. The programprovides phase diagrams as isothermal or isoplethal sections through a system.Also the mole, mass or volume fraction of phases in a given steel may be plottedover the temperature. In addition the chemical composition of each phase isavailable. In the high temperature range from solidification to solution annealing,which are of practical importance, less deviation from the calculated equilibrium isto be expected than at lower temperatures. However during quenching the kineticsof precipitation are of interest only. It is shown in the next chapter that the atoms inhomogeneous austenite are not necessarily distributed evenly, but that microseg-regation (mm range) or short range atomic decomposition (clustering, nm range)may cause a chemical inhomogeneity which is not covered by the calculations.Tramp elements are not considered to reduce the computing time except formanufactured grades.
Limited experimental verification was in good agreement with the simulation.Therefore the calculated phase diagrams are taken as a reasonable guideline toreveal tendencies.
H. Berns et al., High Interstitial Stainless Austenitic Steels,Engineering Materials, DOI: 10.1007/978-3-642-33701-7_2,� Springer-Verlag Berlin Heidelberg 2013
7
2.2 Variation of Interstitial Content
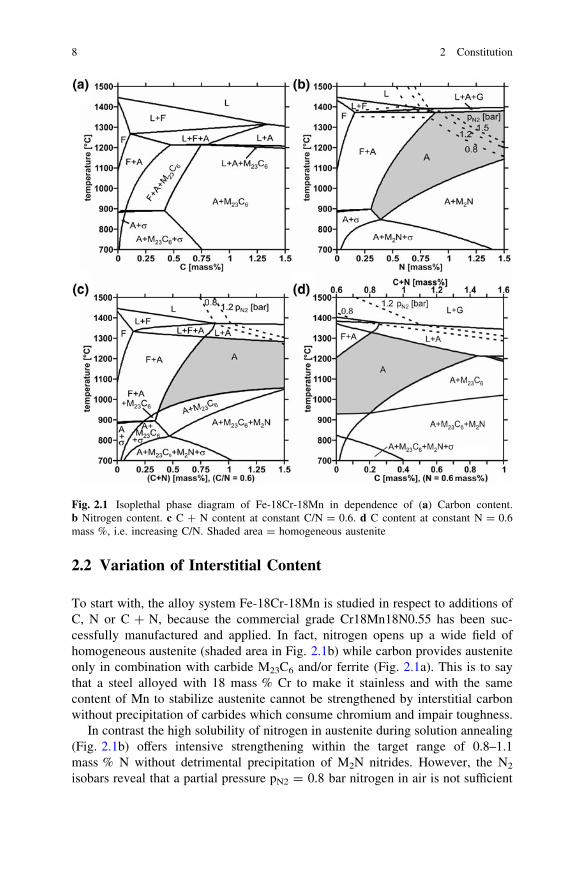
To start with, the alloy system Fe-18Cr-18Mn is studied in respect to additions ofC, N or C ? N, because the commercial grade Cr18Mn18N0.55 has been suc-cessfully manufactured and applied. In fact, nitrogen opens up a wide field ofhomogeneous austenite (shaded area in Fig. 2.1b) while carbon provides austeniteonly in combination with carbide M23C6 and/or ferrite (Fig. 2.1a). This is to saythat a steel alloyed with 18 mass % Cr to make it stainless and with the samecontent of Mn to stabilize austenite cannot be strengthened by interstitial carbonwithout precipitation of carbides which consume chromium and impair toughness.
In contrast the high solubility of nitrogen in austenite during solution annealing(Fig. 2.1b) offers intensive strengthening within the target range of 0.8–1.1mass % N without detrimental precipitation of M2N nitrides. However, the N2
isobars reveal that a partial pressure pN2 = 0.8 bar nitrogen in air is not sufficient
Fig. 2.1 Isoplethal phase diagram of Fe-18Cr-18Mn in dependence of (a) Carbon content.b Nitrogen content. c C ? N content at constant C/N = 0.6. d C content at constant N = 0.6mass %, i.e. increasing C/N. Shaded area = homogeneous austenite
8 2 Constitution
to dissolve 0.8–1.1 mass % N in the melt. At lower contents solidification passesthrough a regime of ferrite whose solubility for nitrogen is much lower than that ofaustenite. The resulting degassing may cause boiling or foaming of the solidifyingmelt or pores in the solid material. Pressure metallurgy is a means of raising thenitrogen content in the melt to a level which assures a fully austenitic solidifica-tion. It is important to note that pN2 governs the uptake of nitrogen to the equi-librium content, but that the formation of bubbles at the beginning of degassingdepends on the total pressure including the ferrostatic part of the melt whichsomewhat eases the problem in respect to the calculations.
The concept of alloying with C ? N is now applied to the basic composition ofsteel Cr18Mn18N0.55 to avoid pressure metallurgy (Fig. 2.1c). The C ? N con-tent is plotted along the abscissa at a selected C/N ratio in mass %. The atomicratio is smaller by [1-(12/14)] 100 & 14 %. The shaded phase field of homo-geneous austenite is sufficiently large to dissolve 0.8–1.1 mass % C ? N at asolution anneal temperature TSA of e.g. 1100 �C. As in Fig. 2.1b the L-F-A triplepoint remains just below 0.9 mass % of interstitials but the corresponding pN2 islowered from 1.5 to 0.8 bar and a fully austenitic solidification is to be expected(Fig. 2.1c). This means that the partial replacement of N by C is as effective infending off d-ferrite but comes with less volatility of the remaining nitrogen. Thesolidus temperature TS is lowered by carbon, but the temperature of beginningprecipitation TP is hardly changed within the interstitial range of interest. The typeof precipitate turns from M2N to M23C6 though, which is followed by M2N atlower temperatures.
The addition of carbon to commercial steel Cr18Mn18N0.55 will reduce thecontent of d-ferrite during solidification and allow of more nitrogen in the melt.Therefore Fig. 2.1d starts from 0.6 mass % N and directly demonstrates the effectof carbon implying an increase of the C/N ratio. The L-F-A triple point is locatedat about 0.25 mass % C and the corresponding temperatures TS and TP are about1320 and 950 �C respectively.
At higher carbon contents the range of homogeneous austenite between TS andTP is narrowed and with it the interval for hot working and solution annealing. Atthe example of the commercial grade Fig. 2.1c and d clearly demonstrate that theC/N concept is suited to increase the interstitial content by melting at normalpressure of air, but that there is a limit to the optimal carbon content.
2.3 Effect of C/N Ratio
An isothermal section through the Fe-18Cr-18Mn-C–N system at TSA = 1100 �Coutlines the shaded target area of homogeneous austenite (Fig. 2.2). It is encasedby ferrite to the left, M2N to the right and M23C6 above. The carbon content ofaustenite grows from (mass %) 0.3 at 0.2 N to almost 0.8 at 1.1 N. This underlinesthe beneficial effect of jointly alloying C ? N in respect to the intended increase ofthe interstitial content in austenite. It may be raised further by a higher TSA,
2.2 Variation of Interstitial Content 9
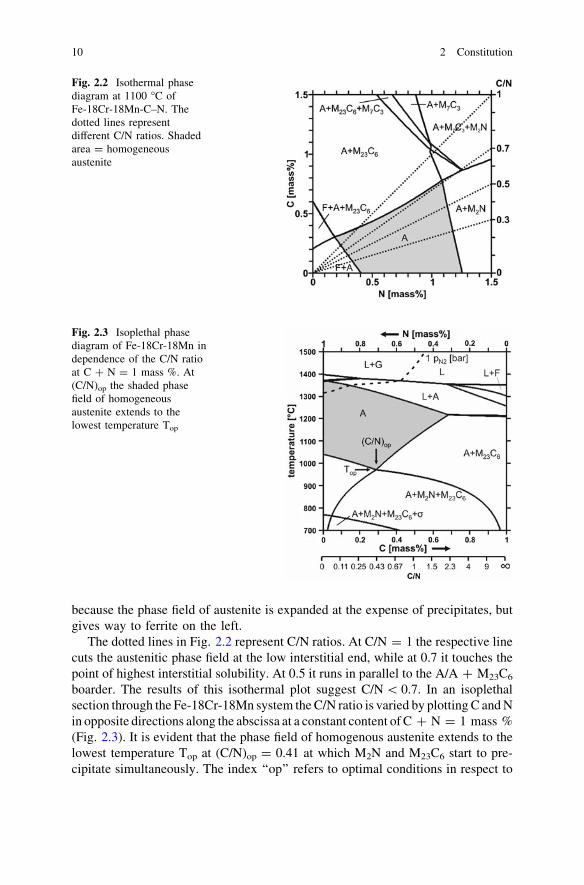
because the phase field of austenite is expanded at the expense of precipitates, butgives way to ferrite on the left.
The dotted lines in Fig. 2.2 represent C/N ratios. At C/N = 1 the respective linecuts the austenitic phase field at the low interstitial end, while at 0.7 it touches thepoint of highest interstitial solubility. At 0.5 it runs in parallel to the A/A ? M23C6
boarder. The results of this isothermal plot suggest C/N \ 0.7. In an isoplethalsection through the Fe-18Cr-18Mn system the C/N ratio is varied by plotting C and Nin opposite directions along the abscissa at a constant content of C ? N = 1 mass %(Fig. 2.3). It is evident that the phase field of homogenous austenite extends to thelowest temperature Top at (C/N)op = 0.41 at which M2N and M23C6 start to pre-cipitate simultaneously. The index ‘‘op’’ refers to optimal conditions in respect to
Fig. 2.2 Isothermal phasediagram at 1100 �C ofFe-18Cr-18Mn-C–N. Thedotted lines representdifferent C/N ratios. Shadedarea = homogeneousaustenite
Fig. 2.3 Isoplethal phasediagram of Fe-18Cr-18Mn independence of the C/N ratioat C ? N = 1 mass %. At(C/N)op the shaded phasefield of homogeneousaustenite extends to thelowest temperature Top
10 2 Constitution
retarding the begin of precipitation during quenching from TSA. To the left of (C/N)op
M2N starts to precipitate at TP [ Top and to right this holds true for M23C6. In themiddle part of the C/N range a fully austenitic solidification prevails.
2.4 Variation of Substitutional Content
The basic substitutional elements are chromium and manganese. Molybdenum andcopper are of interest in respect to corrosion resistance. Tramp elements can affectthe constitution.
2.4.1 Chromium and Manganese
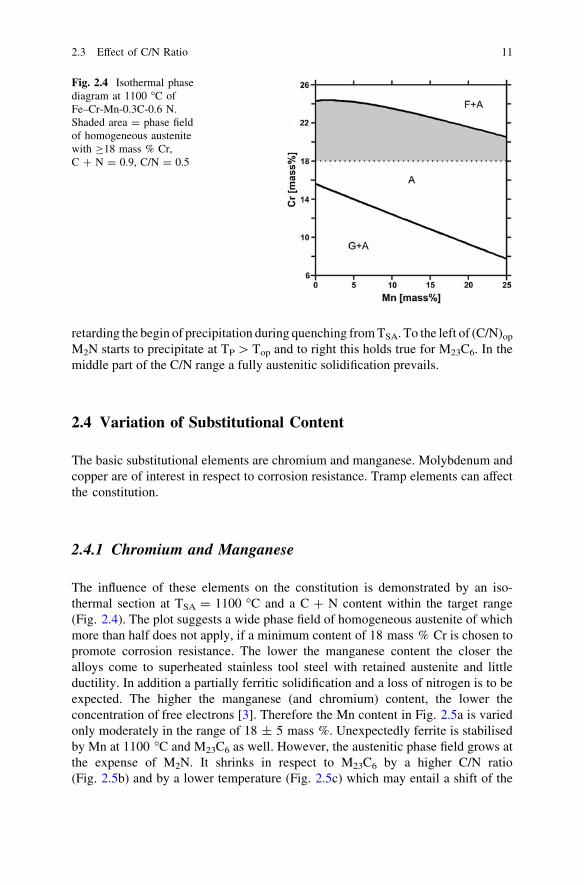
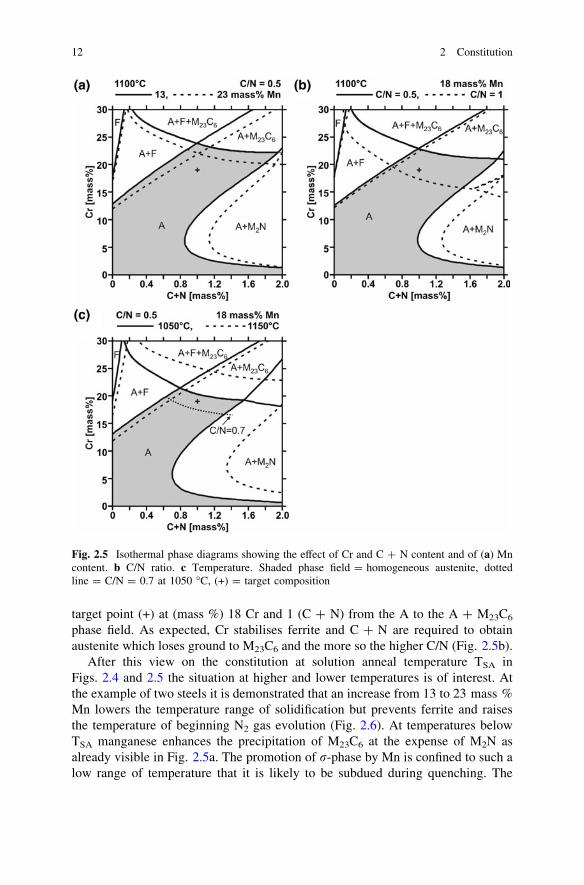
The influence of these elements on the constitution is demonstrated by an iso-thermal section at TSA = 1100 �C and a C ? N content within the target range(Fig. 2.4). The plot suggests a wide phase field of homogeneous austenite of whichmore than half does not apply, if a minimum content of 18 mass % Cr is chosen topromote corrosion resistance. The lower the manganese content the closer thealloys come to superheated stainless tool steel with retained austenite and littleductility. In addition a partially ferritic solidification and a loss of nitrogen is to beexpected. The higher the manganese (and chromium) content, the lower theconcentration of free electrons [3]. Therefore the Mn content in Fig. 2.5a is variedonly moderately in the range of 18 ± 5 mass %. Unexpectedly ferrite is stabilisedby Mn at 1100 �C and M23C6 as well. However, the austenitic phase field grows atthe expense of M2N. It shrinks in respect to M23C6 by a higher C/N ratio(Fig. 2.5b) and by a lower temperature (Fig. 2.5c) which may entail a shift of the
Fig. 2.4 Isothermal phasediagram at 1100 �C ofFe–Cr-Mn-0.3C-0.6 N.Shaded area = phase fieldof homogeneous austenitewith C18 mass % Cr,C ? N = 0.9, C/N = 0.5
2.3 Effect of C/N Ratio 11
target point (+) at (mass %) 18 Cr and 1 (C ? N) from the A to the A ? M23C6
phase field. As expected, Cr stabilises ferrite and C ? N are required to obtainaustenite which loses ground to M23C6 and the more so the higher C/N (Fig. 2.5b).
After this view on the constitution at solution anneal temperature TSA inFigs. 2.4 and 2.5 the situation at higher and lower temperatures is of interest. Atthe example of two steels it is demonstrated that an increase from 13 to 23 mass %Mn lowers the temperature range of solidification but prevents ferrite and raisesthe temperature of beginning N2 gas evolution (Fig. 2.6). At temperatures belowTSA manganese enhances the precipitation of M23C6 at the expense of M2N asalready visible in Fig. 2.5a. The promotion of r-phase by Mn is confined to such alow range of temperature that it is likely to be subdued during quenching. The
Fig. 2.5 Isothermal phase diagrams showing the effect of Cr and C ? N content and of (a) Mncontent. b C/N ratio. c Temperature. Shaded phase field = homogeneous austenite, dottedline = C/N = 0.7 at 1050 �C, (+) = target composition
12 2 Constitution
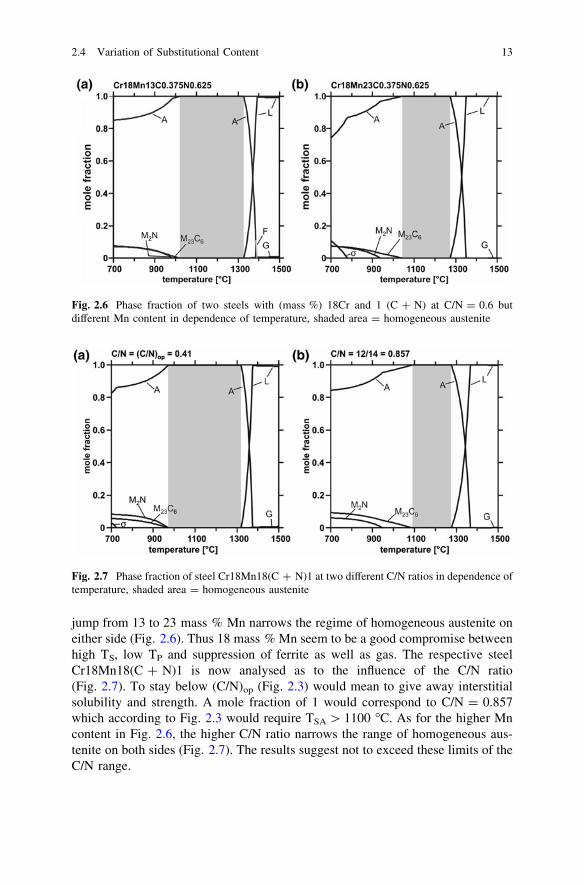
jump from 13 to 23 mass % Mn narrows the regime of homogeneous austenite oneither side (Fig. 2.6). Thus 18 mass % Mn seem to be a good compromise betweenhigh TS, low TP and suppression of ferrite as well as gas. The respective steelCr18Mn18(C ? N)1 is now analysed as to the influence of the C/N ratio(Fig. 2.7). To stay below (C/N)op (Fig. 2.3) would mean to give away interstitialsolubility and strength. A mole fraction of 1 would correspond to C/N = 0.857which according to Fig. 2.3 would require TSA [ 1100 �C. As for the higher Mncontent in Fig. 2.6, the higher C/N ratio narrows the range of homogeneous aus-tenite on both sides (Fig. 2.7). The results suggest not to exceed these limits of theC/N range.
Fig. 2.6 Phase fraction of two steels with (mass %) 18Cr and 1 (C ? N) at C/N = 0.6 butdifferent Mn content in dependence of temperature, shaded area = homogeneous austenite
Fig. 2.7 Phase fraction of steel Cr18Mn18(C ? N)1 at two different C/N ratios in dependence oftemperature, shaded area = homogeneous austenite
2.4 Variation of Substitutional Content 13
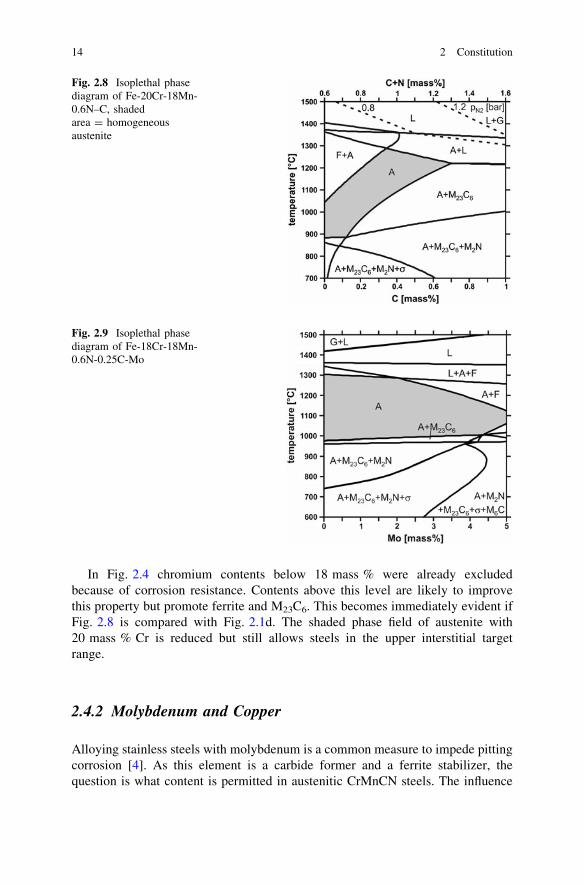
In Fig. 2.4 chromium contents below 18 mass % were already excludedbecause of corrosion resistance. Contents above this level are likely to improvethis property but promote ferrite and M23C6. This becomes immediately evident ifFig. 2.8 is compared with Fig. 2.1d. The shaded phase field of austenite with20 mass % Cr is reduced but still allows steels in the upper interstitial targetrange.
2.4.2 Molybdenum and Copper
Alloying stainless steels with molybdenum is a common measure to impede pittingcorrosion [4]. As this element is a carbide former and a ferrite stabilizer, thequestion is what content is permitted in austenitic CrMnCN steels. The influence
Fig. 2.8 Isoplethal phasediagram of Fe-20Cr-18Mn-0.6N–C, shadedarea = homogeneousaustenite
Fig. 2.9 Isoplethal phasediagram of Fe-18Cr-18Mn-0.6N-0.25C-Mo
14 2 Constitution
of Mo on the constitution is depicted in Fig. 2.9 at the example of steelCr18Mn18N0.6C0.25. The gas phase is shifted to higher temperatures as Molowers the activity of nitrogen in the melt. Ferrite is stabilised to lower temper-atures but—up to & 2 mass % Mo—not below &1300 �C which allows hotworking in the range of homogeneous austenite. The temperature TP of beginningprecipitation (M23C6 followed by M2N) is hardly raised and at 2 mass % Mo staysjust below 1000 �C. The temperature of r precipitation is raised, though. Theaddition of B2 mass % Mo to the above steel appears to be feasible.
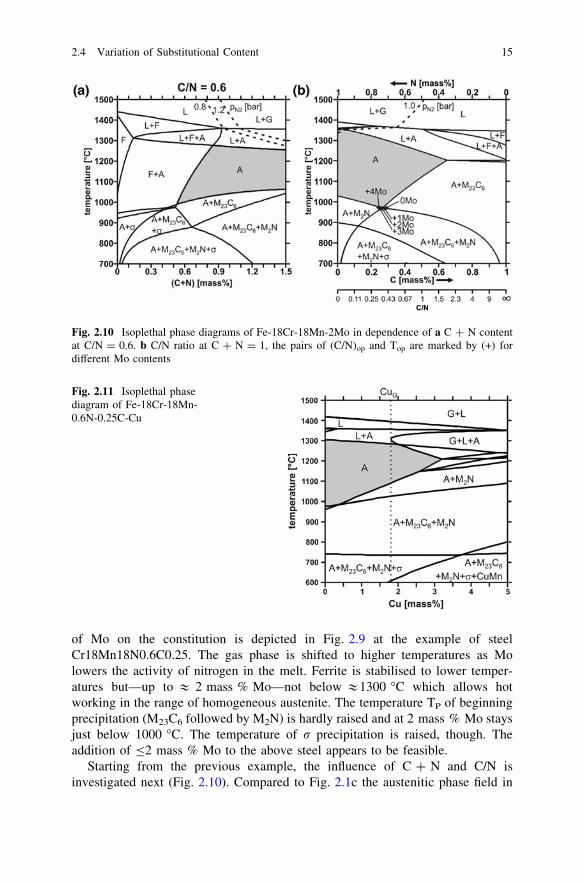
Starting from the previous example, the influence of C ? N and C/N isinvestigated next (Fig. 2.10). Compared to Fig. 2.1c the austenitic phase field in
Fig. 2.10 Isoplethal phase diagrams of Fe-18Cr-18Mn-2Mo in dependence of a C ? N contentat C/N = 0.6. b C/N ratio at C ? N = 1, the pairs of (C/N)op and Top are marked by (+) fordifferent Mo contents
Fig. 2.11 Isoplethal phasediagram of Fe-18Cr-18Mn-0.6N-0.25C-Cu
2.4 Variation of Substitutional Content 15
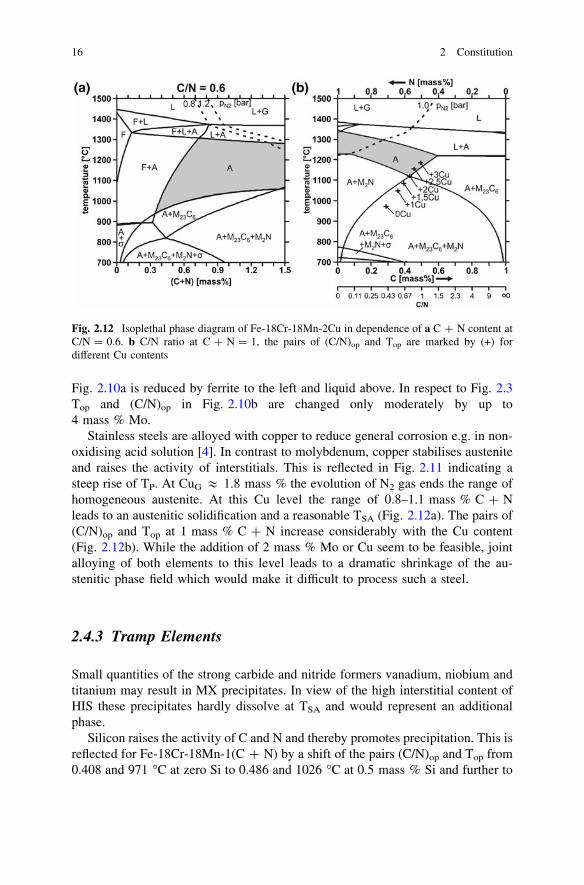
Fig. 2.10a is reduced by ferrite to the left and liquid above. In respect to Fig. 2.3Top and (C/N)op in Fig. 2.10b are changed only moderately by up to4 mass % Mo.
Stainless steels are alloyed with copper to reduce general corrosion e.g. in non-oxidising acid solution [4]. In contrast to molybdenum, copper stabilises austeniteand raises the activity of interstitials. This is reflected in Fig. 2.11 indicating asteep rise of TP. At CuG & 1.8 mass % the evolution of N2 gas ends the range ofhomogeneous austenite. At this Cu level the range of 0.8–1.1 mass % C ? Nleads to an austenitic solidification and a reasonable TSA (Fig. 2.12a). The pairs of(C/N)op and Top at 1 mass % C ? N increase considerably with the Cu content(Fig. 2.12b). While the addition of 2 mass % Mo or Cu seem to be feasible, jointalloying of both elements to this level leads to a dramatic shrinkage of the au-stenitic phase field which would make it difficult to process such a steel.
2.4.3 Tramp Elements
Small quantities of the strong carbide and nitride formers vanadium, niobium andtitanium may result in MX precipitates. In view of the high interstitial content ofHIS these precipitates hardly dissolve at TSA and would represent an additionalphase.
Silicon raises the activity of C and N and thereby promotes precipitation. This isreflected for Fe-18Cr-18Mn-1(C ? N) by a shift of the pairs (C/N)op and Top from0.408 and 971 �C at zero Si to 0.486 and 1026 �C at 0.5 mass % Si and further to
Fig. 2.12 Isoplethal phase diagram of Fe-18Cr-18Mn-2Cu in dependence of a C ? N content atC/N = 0.6. b C/N ratio at C ? N = 1, the pairs of (C/N)op and Top are marked by (+) fordifferent Cu contents
16 2 Constitution
0.560 and 1075 �C at 1 mass % Si. To avoid a detrimental increase of Top by up to100 �C it is recommend to not fully exploit the range of Si B 1 % given e.g. inEN10088 for austenitic steels, but to keep its content as low as possible.
2.5 Selection of Steels
The phase field of homogeneous austenite is the target area of HIS to be reachedby solution annealing and preserved by quenching. An austenitic solidification isdesirable to transfer nitrogen from the melt to the austenite without degassing. Tokeep the concentration of free electrons high and with it the ductile metalliccharacter of interatomic bonding a reduction of substitutional alloy content,namely of Cr, Mn, Mo, would be helpful (see Sect. 3.1.3). However, the experi-ence with HIS Mn17Cr15N0.43C0.39 and general knowledge on stainless steelspeak for 18 mass % Cr. As shown above, 18 mass % Mn are a reasonable matchto avoid ferrite during solidification.
The interstitial content is aimed at C0.8 mass % C ? N to boost strength. Inview of experience with HNS and the calculations above the envisaged upper limitof 1.1 mass % C ? N is confirmed to avoid problems during hot working and heattreatment. As to the C/N ratio, one has to start from the soluble content of nitrogenin alloys with 18 mass % of Cr and Mn each at normal pressure of air. It slightlydepends on the carbon content, but 0.6 mass % N seems to be a fair value to startwith. Combining the C ? N content and the C/N ratio in mass % we arrive atC ? N = N [(C/N) ? 1]. Inserting N = 0.6 and (C/N)op = 0.41 the C ? Ncontent is 0.85. Higher interstitial contents have to rely on more carbon whichentails C/N [ (C/N)op and TP [ Top.
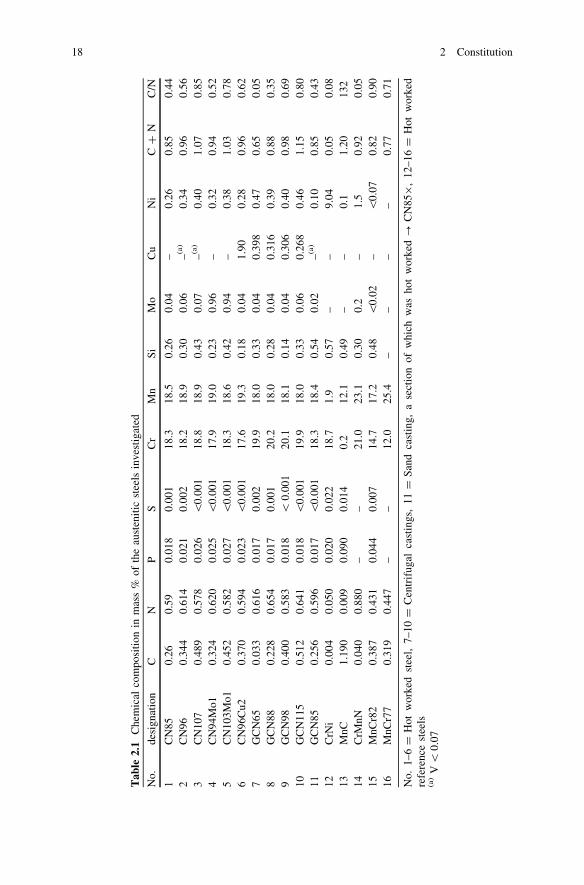
Based on these constitutional considerations three steels with 18 mass % of Crand Mn each were selected: one at the lower end of the C ? N target range, one atthe upper end and one in the middle. These three new HIS were molten and hotworked on an industrial scale and designated according to their C ? N content,times 100, i.e. CN85, CN96 and CN107 (Table 2.1).
To these Mo and Cu were added by remelting a smaller batch. A series of HISwith 0.65–1.15 mass % C ? N was produced as castings. In accordance withEuropean standards the designation is preceeded by ‘‘G’’. A few reference steelsare listed of which CrNi represents a standard low interstitial grade, MnC a highcarbon Hadfield steel and CrMnN a high nitrogen steel. The grades MnCr82 andMnCr70 are reference HIS of lower chromium and interstitial content. For theinvestigation of structure (Chap. 3) and properties (Chap. 4) premachined speci-mens were solution annealed, quenched and machined to final size. Details of HISmanufacture are given in Chap. 5.
2.4 Variation of Substitutional Content 17
Tab
le2.
1C
hem
ical
com
posi
tion
inm
ass
%of
the
aust
enit
icst
eels
inve
stig
ated
No.
desi
gnat
ion
CN
PS
Cr
Mn
Si
Mo
Cu
Ni
C?
NC
/N
1C
N85
0.26
0.59
0.01
80.
001
18.3
18.5
0.26
0.04
–0.
260.
850.
442
CN
960.
344
0.61
40.
021
0.00
218
.218
.90.
300.
06–(a
)0.
340.
960.
563
CN
107
0.48
90.
578
0.02
6\
0.00
118
.818
.90.
430.
07–(a
)0.
401.
070.
854
CN
94M
o10.
324
0.62
00.
025
\0.
001
17.9
19.0
0.23
0.96
–0.
320.
940.
525
CN
103M
o10.
452
0.58
20.
027
\0.
001
18.3
18.6
0.42
0.94
–0.
381.
030.
786
CN
96C
u20.
370
0.59
40.
023
\0.
001
17.6
19.3
0.18
0.04
1.90
0.28
0.96
0.62
7G
CN
650.
033
0.61
60.
017
0.00
219
.918
.00.
330.
040.
398
0.47
0.65
0.05
8G
CN
880.
228
0.65
40.
017
0.00
120
.218
.00.
280.
040.
316
0.39
0.88
0.35
9G
CN
980.
400
0.58
30.
018
\0.
001
20.1
18.1
0.14
0.04
0.30
60.
400.
980.
6910
GC
N11
50.
512
0.64
10.
018
\0.
001
19.9
18.0
0.33
0.06
0.26
80.
461.
150.
8011
GC
N85
0.25
60.
596
0.01
7\
0.00
118
.318
.40.
540.
02–(a
)0.
100.
850.
4312
CrN
i0.
004
0.05
00.
020
0.02
218
.71.
90.
57–
–9.
040.
050.
0813
MnC
1.19
00.
009
0.09
00.
014
0.2
12.1
0.49
––
0.1
1.20
132
14C
rMnN
0.04
00.
880
––
21.0
23.1
0.30
0.2
–1.
50.
920.
0515
MnC
r82
0.38
70.
431
0.04
40.
007
14.7
17.2
0.48
\0.
02–
\0.
070.
820.
9016
MnC
r77
0.31
90.
447
––
12.0
25.4
––
––
0.77
0.71
No.
1–6
=H
otw
orke
dst
eel,
7–10
=C
entr
ifug
alca
stin
gs,
11=
San
dca
stin
g,a
sect
ion
ofw
hich
was
hot
wor
ked?
CN
859
,12
–16
=H
otw
orke
dre
fere
nce
stee
ls(a
)V
\0.
07
18 2 Constitution

References
1. Software System and Users Guide (2008) Thermo-Calc Software AB SE- 11347 Stockholm2. Saunders N (1995) Phase diagram calculation for high-temperature structural materials. Phil
Trans Royal Soc London A351:543–5613. Shanina BD, Gavriljuk VG, Konchitz AA, Kolesnik SP (1998) The influence of substitutional
atoms upon the electron structure of the iron-based transition metal alloys. J Phys CondensedMatter 10:1825–1838
4. Heimann W, Oppenheim R, Wessling W (1993) Stainless steels. In: Steel, vol 2. Springer,Berlin, pp 382–422
References 19