Decentralized Throughput Optimization in Industrial - mediaTUM

High-throughput biodiversity assessment –
Powers and limitations of meta-barcoding
Hochdurchsatzerfassung von Biodiversität –
Stärken und Grenzen von Meta-barcoding
Doctoral thesis for a doctoral degree at the Graduate School of Life Sciences, Julius-Maximilians-Universität Würzburg,
Section Integrative Biology
submitted by
Wiebke Sickel
from
Oranienburg
Würzburg, 2016


Submitted on: …………………………………………………………..……..
Office stamp
Members of the Promotionskomitee:
Chairperson: Prof Dr Thomas Müller
Primary Supervisor: Dr Alexander Keller
Supervisor (Second): Prof Dr Ingolf Steffan-Dewenter
Supervisor (Third): Prof Dr Jörg Schultz
Date of Public Defence: …………………………………………….…………
Date of Receipt of Certificates: ……………………………………………….


Affidavit I hereby confirm that my thesis entitled 'High-throughput biodiversity assessment -
powers and limitations of meta-barcoding' is the result of my own work. I did not receive any help or support from commercial consultants. All sources and / or materials applied are listed and specified in the thesis. Furthermore, I confirm that this thesis has not yet been submitted as part of another examination process neither in identical nor in similar form. Würzburg, 07 October 2016 Place, Date Signature
Eidesstattliche Erklärung Hiermit erkläre ich an Eides statt, die Dissertation 'Hochdurchsatzerfassung von
Biodiversität - Stärken und Grenzen von Meta-barcoding' eigenständig, d.h. insbesondere selbständig und ohne Hilfe eines kommerziellen Promotionsberaters, angefertigt und keine anderen als die von mir angegebenen Quellen und Hilfsmittel verwendet zu haben. Ich erkläre außerdem, dass die Dissertation weder in gleicher noch in ähnlicher Form bereits in einem anderen Prüfungsverfahren vorgelegen hat. Würzburg, 07. Oktober 2016 Ort, Datum Unterschrift


Acknowledgements
I am highly grateful to my three supervisors, Dr Alexander Keller, Prof DrIngolf Steffan-Dewenter and Prof Dr Jorg Schultz. Firstly, for giving me theopportunity to pursue a PhD; secondly for encouraging me to develop andconduct my own research projects; and thirdly for their constant support andadvice during these last three years.
I would like to thank the rest of the Molecular Biodiversity Group for valuablediscussions, helping me out when needed and generally for creating a greatworking environment; thank you Gudrun Grimmer, Markus J. Ankenbrand,Anna Voulgari-Kokota, and the Bachelor and Master students Annette Bran-del, Mira Becker, Rebecca Balles and Jonas Stelz.
Many thanks go to my collaborators Dr Giulia Zancolli, Dr Ivonne Meuche,Dr Andrea Holzschuh, Dr Frank Forster, Prof Dr T. Ulmar Grafe, Dr DieterMahsberg, Dr Stephan Hartel and Jonathan Lanzen. I would also like tothank the staff of the Graduate School of Life Sciences.
Further thanks go to the following people who so far have not been named:Niklas Terhoeven of the Computational Evolutionary Biology Group withinthe Centre for Computational and Theoretical Biology, Dr Simone Rost andJens Graf of the Human Genetics Department, Janina Kay of the Depart-ment for Neurobiology and Genetics as well as my family and (other) friends.
vii

Summary
Traditional species identification based on morphological characters is labo-rious and requires expert knowledge. It is further complicated in the case ofspecies assemblages or degraded and processed material. DNA-barcoding,species identification based on genetic data, has become a suitable alterna-tive, yet species assemblages are still difficult to study. In the past decademeta-barcoding has widely been adopted for the study of species commu-nities, due to technological advances in modern sequencing platforms andbecause manual separation of individual specimen is not required. Here,meta-barcoding is put into context and applied to the study of bee-collectedpollen as well as bacterial communities. These studies provide the basisfor a critical evaluation of the powers and limitations of meta-barcoding. Ad-vantages identified include species identification without the need for expertknowledge as well as the high throughput of samples and sequences. Inmicrobiology, meta-barcoding can facilitate directed cultivation of taxa of in-terest identified with meta-barcoding data. Disadvantages include insuffi-cient species resolution due to short read lengths and incomplete referencedatabases, as well as limitations in abundance estimation of taxa and func-tional profiling. Despite these, meta-barcoding is a powerful method for theanalysis of species communities and holds high potential especially for au-tomated biomonitoring.
viii

Zusammenfassung
Traditionelle Methoden der Identifizierung von Organismen anhand von mor-phologischen Merkmalen sind arbeits- und zeitaufwendig und benotigen Ex-pertenkenntnisse der Morphologie. Weitere Probleme liegen in der Anal-yse von Artgemeinschaften und prozessiertem Material. DNA-barcoding,Artbestimmung anhand von genetischen Merkmalen, hat sich als Alterna-tive herausgebildet, jedoch sind Artgemeinschaften nach wie vor schwierigzu analysieren. Im vergangenen Jahrzehnt wurde meta-barcoding zur Anal-yse von Artgemeinschaften entwickelt; insbesondere durch die Weiteren-twicklung moderner Sequenziergerate und da eine Auftrennung der Organ-ismen innerhalb einer Gemeinschaft nicht mehr notwendig ist. In der vor-liegenden Arbeit wurde zunachst ein Uberblick uber meta-barcoding er-stellt. Die Methode wurde dann fur die Analyse von Bienen-gesammeltemPollen und Bakteriengemeinschaften angewandt. Diese Studien bilden einegute Basis, um die Vor- und Nachteile von meta-barcoding kritisch zu be-werten. Vorteile beinhalten unter anderem, dass Organismen bestimmtwerden konnen, ohne dass Expertenkenntnisse notwendig sind, sowie derhohe Durchsatz von Proben und Sequenzen. In der Mikrobiologie kannmeta-barcoding eine gerichtete Kultivierung von Bakterien erleichtern, diedurch meta-barcoding als Zielorganismen indentifiziert wurden. Nachteilefinden sich in der manchmal noch unzureichenden Unterscheidung nah ver-wandter Arten aufgrund von kurzen Sequenzlangen und luckenhaften Ref-erenzdatenbanken, sowie Einschrankungen in der Abschatzung von Abun-danzen und Funktionen der Organismen innerhalb der Artgemeinschaft.Trotz dieser Problematiken ist meta-barcoding eine leistungsstarke Methodefur die Analyse von Artgemeinschaften und ist besonders vielversprechendfur automatisiertes Bio-Monitoring.
ix

Table of contents
Acknowledgements vii
Summary viii
Zusammenfassung ix
I. Introduction 1
II. Publications 7
1. Metabarcoding put into context 10P.1. DNA-Metabarcoding - ein neuer Blick auf organismische Di-
versitat . . . . . . . . . . . . . . . . . . . . . . . . . . . . . . . 11
2. Pollen analysis 15P.2. Increased efficiency in identifying mixed pollen samples by
meta-barcoding with a dual-indexing approach . . . . . . . . 16P.3. Standard method for identification of bee pollen mixtures through
meta-barcoding . . . . . . . . . . . . . . . . . . . . . . . . . . 26
3. Bacterial communities 38P.4. Reptiles as Reservoirs of Bacterial Infections: Real Threat or
Methodological Bias? . . . . . . . . . . . . . . . . . . . . . . 39P.5. Bacterial Diversity and Community Structure in Two Bornean
Nepenthes Species with Differences in Nitrogen AcquisitionStrategies . . . . . . . . . . . . . . . . . . . . . . . . . . . . . 46
III. Discussion 63
x

Appendix 88
Bibliography 88
Abbreviations 89
List of Figures 91
List of Tables 92
Author Contributions 93
Curriculum Vitae 99
xi

Part I.
Introduction
1
Part I Introduction
Morphological species identification: A centralaspect of biology with limitations
The classification of a specimen to a species remains a central aspect ofbiology (Wiens and Servedio 2000). Its application ranges from system-atic biology and ecology to conservation biology (Wiens and Servedio 2000;Balakrishnan 2005). It can also become important in food safety (Woolfeand Primrose 2004) and law enforcement (Ogden et al. 2009). Tradition-ally, species identifications are based on morphological characters (Wiensand Servedio 2000; Balakrishnan 2005). Sometimes, other aspects are in-cluded, such as behaviour (Balakrishnan 2005). However, there are manysituations in which these aspects are not feasible or simply impossible, forexample, when the specimen has been processed in some way, which is thecase in gut contents (Soininen et al. 2009; Valentini et al. 2009; Pompanonet al. 2012) or in traditional Chinese medicine (Yip et al. 2007; Li et al. 2011;Coghlan et al. 2012).
One other example, where classification based on morphological charac-ters is not sufficient, is pollen analysis, which traditionally utilises light mi-croscopy (Mullins and Emberlin 1997). The pollen grains of closely-relatedplant species very closely resemble one another, so often the lowest taxo-nomic level that can be identified is plant family (Williams and Kremen 2007;Galimberti et al. 2014). In addition, pollen grain classification is very labori-ous (Galimberti et al. 2014) and requires expert knowledge of the respectivebioregion the pollen was collected in (Keller et al. 2015).
In the case of bacteria, species identification is further complicated by theneed to bring them into culture to study them in detail (Handelsman andSmalla 2003). However, cultivation in standard media only captures a lowamount of bacterial diversity to study (Handelsman and Smalla 2003). Ad-ditionally, diversity of morphological characters is limited in bacteria (Han-delsman and Smalla 2003), which means that numerous tests of bacterialmorphology and physiology are needed to describe a bacterial specimenfurther and to classify it (Gerner-Smidt et al. 1991; Mata et al. 2002; Ed-berg et al. 1986). This is very tedious and can become very costly. Al-though some rapid tests for certain groups of bacteria exist (Holmes et al.1994; Odumeru et al. 1999), these are often tailored for pathogen identifica-tion (Holmes et al. 1994; Odumeru et al. 1999) or are restricted to specificgroups of bacteria (Nord et al. 1974) and thus fail to detect, yet even classifyundescribed species.
2

Part I Introduction
DNA-barcoding: Species identification based ongenetic material
Thus, in the past decades, species identification based on genetic infor-mation, DNA-barcoding, has become an important tool. This is especiallythe case for organisms difficult to study otherwise, like bacteria, and pro-cessed or degraded material. DNA-barcoding relies on a simple compari-son of DNA sequences of an unclassified specimen to reference sequencesof known identity. It has been quickly adopted in microbiology (Woese andFox 1977; Fox et al. 1977) and is nowadays required in bacterial speciesdescriptions (Stackebrandt et al. 2002; Blaxter 2016). Since its invention ithas also been applied to higher eukaryotes (Hebert et al. 2003). In principle,DNA is isolated from an unknown specimen, a particular part of the genome,the marker gene, is amplified, sequenced and compared to a sequence ob-tained from a specimen of known identity. If the difference between twosequences is below a certain threshold, e.g. 97% in the case of bacteria(Stackebrandt and Goebel 1994), the unknown specimen is assigned to thesame species. If the difference is larger, the unknown specimen belongs toa different species. Usually, the query sequence is compared to a variety ofsequences of known identity, saved in a database, such as GenBank (Ben-son et al. 2013) or BOLD (Ratnasingham and Hebert 2007). If the databasecontains sequences similar to the query sequence, a species identificationcan be made. If not, the specimen remains unclassified, but it is still possibleto assign it to higher taxonomic levels, such as genus or family, by adjustingthe threshold.
The fragment of the genome used for DNA-barcoding is called the markergene. A good marker gene needs to fulfill various requirements. Firstly,DNA sequence dissimilarities between closely-related species need to belarge enough to tell the species apart, so species resolution of the markergene needs to be sufficient (Hollingsworth et al. 2011). At the same time, thedifferences within a single species should not be too large to avoid wrong-fully assigning specimens of the same species to separate species. In otherwords, a good marker gene exhibits a barcode gap, which means that thesequence variation within a single species is lower than and does not over-lap with the sequence variation between species (Chen et al. 2010; Schochet al. 2012). For correct classification at higher taxonomic levels, the markergene needs to represent the genetic disparity at these levels as well. Sec-ondly, the marker gene should also exhibit high amplification success ratesacross a variety of species (Chen et al. 2010). Ideally, the marker gene canbe successfully amplified from a large group of different organisms, such as
3

Part I Introduction
different families or even phyla, with a universal set of primers and still distin-guish organisms at the species level (Chen et al. 2010; Hollingsworth et al.2011; Coissac et al. 2012). Thirdly, the length of the fragment to be anal-ysed should be sufficient to cover enough sequence differences for speciesdistinction, but at the same time short enough for successful amplification indegraded material (Chen et al. 2010; Coissac et al. 2012).
For different groups of organisms, different marker genes have proven to besuitable for DNA-barcoding. In bacteria, the 16S ribosomoal RNA (rRNA)gene is most commonly used (Woese and Fox 1977; Fox et al. 1977; Stacke-brandt et al. 2002; Blaxter 2016). For animals, the mitochondrial cytochromeoxidase I (COI) gene (Hebert et al. 2003; Benson et al. 2013) and for fungithe internal transcribed spacer (ITS) within the ribosomal cistron (Schochet al. 2012) have been identified as suitable markers. In the case of plants,the choice of a marker gene is more complicated, and several genes havebeen proposed with very different success rates (Chen et al. 2010).
Although DNA-barcoding is commonly used for species identification, it isstill single specimens that are being dealt with and in the case of assem-blages, such as pollen from sediment cores, collected by bees or communi-ties of bacteria, the need to manually separate individuals from one anotherpersists. Again, this is laborious and taxa of low abundance might be missedout (Bent and Forney 2008; Pompanon et al. 2012). Especially in the caseof bacteria, the importance of studying complete assemblages rather thanfocusing on specific taxa has recently been recognised (Junker et al. 2011;Keller et al. 2013; Kueneman et al. 2013). It has become generally acceptedthat the study of bacterial communities as a whole bears novel and impor-tant findings concerning bacterial ecology (Keller et al. 2013; Kueneman etal. 2013). In host-microbe associations, for example, it is probably the bac-terial community as a whole rather than singular strains that contributes tothe interaction (Junker et al. 2011; Keller et al. 2013; Kueneman et al. 2013).
Thus, an alternative approach that would allow identifying all species withinan assemblage simultaneously and without prior separation would highlybenefit various research fields, such as agro-ecology (Williams and Kremen2007; Krupke et al. 2012), palaeo-ecology (Behling et al. 2004; Davies andTipping 2004; Gugerli et al. 2005), diet analysis (Valentini et al. 2010; Soini-nen et al. 2009) and community ecology (Peterson et al. 2008; Beil et al.2008; Loudon et al. 2014), but also applications such as food safety (Galim-berti et al. 2014; Bruni et al. 2015), allergen load assessment (Kraaijeveldet al. 2015) and safety issues with medicinal preparations (Coghlan et al.2012).
4

Part I Introduction
Meta-barcoding: Analysing speciescommunities
In the past decade, major advances have been made with high-throughputsequencing (HTS) platforms, improving sequence length and quality whilstdropping costs (Shokralla et al. 2012; Zinger et al. 2012). The ability to readmillions of DNA sequences simultaneously (Shokralla et al. 2012), allowsspecies identification of theoretically all species within a sample in parallel,which is termed meta-barcoding. In meta-barcoding, DNA is extracted froma mixture of organisms or specimens, such as soil, gut contents or pollen as-semblages. Next, the marker gene is amplified, similarly to DNA-barcoding.However, because the marker gene is amplified from a mixture of differentDNA sources, universal primers suitable for amplification from closely anddistantly related species at the same time is even more important than inDNA-barcoding. The universal primers need to be sufficient for successfulamplification of all organisms in the sample, but also with the same effi-ciency, so as not to introduce skews in the data (Coissac et al. 2012).
The immense throughput of modern sequencing platforms further allows theanalysis of multiple samples at the same time, called multiplexing. In thiscase, each sample is specifically labeled with a short sequence of knownbase composition, an index sequence, which is sequenced alongside theactual DNA barcode (Binladen et al. 2007; Kozich et al. 2013). The sam-ple indices allow mapping of obtained DNA sequences to individual sampleslater on in raw data processing. Multiplexing requires an an additional step insample processing, normalisation (Harris et al. 2010; Kozich et al. 2013), toaccount for differential amplification success between samples, which wouldskew the sequencing output per sample dramatically. Sample processingrequires some additional preparation based on the sequence platform cho-sen, the whole process is called library preparation. Once fully prepared forsequencing, the base composition of each sequence in the sample is readby the sequencer alongside the sample index, if multiplexing is performed.
Most sequencing platforms perform two sequencing runs, one forward andone reverse sequence read. These can be joined during raw data process-ing (Aronesty 2011), to cover a longer barcode sequence. Further commondata processing steps include quality filtering, since the data often containsequencing errors (Coissac et al. 2012; Kozich et al. 2013), demultiplexing,i.e. mapping sequences to samples, and chimera checking, which removesa common PCR artifact (Caporaso et al. 2010; Edgar et al. 2011). Taxo-nomic classification in meta-barcoding generally relies on the same princi-
5

Part I Introduction
ples as DNA-barcoding (see above). However, the vast amount of sequenc-ing data, with up to 600 Gigabases with the Illumina HiSeq 2000 (Coissac etal. 2012; Shokralla et al. 2012), requires some amendments. Running everysingle sequence against a database would be computationally very inten-sive, so sequences are clustered into operational taxonomics units (OTUs)before taxonomic classification (Caporaso et al. 2010; Edgar 2010; Edgar2013; Blaxter 2016). In bacteria, OTUs are commonly clustered based ona 97% sequence identity threshold (Cuesta-Zuluaga and Escobar 2016),other groups of organisms might require other thresholds. For actual tax-onomic identification, one representative sequence per OTU is run againstthe chosen reference database and taxonomy is assigned based on thisrepresentative (Ji et al. 2013).
In microbiology, meta-barcoding has been adopted rapidly, because it by-passes cultivation and subsequently the separation of individual strains be-fore community assembly (Zinger et al. 2012), but the potential for diet anal-ysis (Valentini et al. 2009; Soininen et al. 2009; Pompanon et al. 2012) andbiodiversity monitoring (Shokralla et al. 2012) has also been realised. Meta-barcoding has successfully been applied to a variety of higher organismsas well, including fungi (Balint et al. 2014), plants (Keller et al. 2015) andanimals (Yu et al. 2012).
Objectives
This thesis aims to critically analyse the powers and limitations of meta-barcoding. To achieve this, the first step is to create an overview of therole of meta-barcoding in biology (Publication P.1). Then, meta-barcodingwas applied to the analysis of bee-collected pollen with the aim to estab-lish a method for pollen meta-barcoding (Publications P.2 and P.3). In thethird instance, bacterial communities were analysed with meta-barcoding toinfer host-microbe associations (Publications P.4 and P.5). I then criticallyevaluated meta-barcoding with a focus on its application in biodiversity as-sessments.
6

Part II.
Publications
7

Part II Publications
Main findings of the publications
In the following, the main findings of the five publications are summarised.Publication P.1 is a mini-review of meta-barcoding in biological research andthus gives a short overview of this methodology. Publications P.2 and P.3introduce a method for pollen analysis using meta-barcoding. Afterwards,publications P.4 and P.5 apply meta-barcoding to bacterial communities inassociation with reptile (P.4) and plant (P.5) hosts.
Mini-review. The overview (Publication P.1) summarises the principle behindDNA-barcoding in general and the workflow of meta-barcoding in particular.It highlights some of the main advantages of meta-barcoding over other ap-proaches but also introduces the challenges associated with that method.These will be discussed in more detail later in the thesis.
Pollen analysis. Applying meta-barcoding to the analysis of pollen (Publica-tion P.2) constitutes in the first instance a proof of principle. It was possibleto establish a method for sequencing DNA extracted from pollen and to auto-matically identify the plant origin of the pollen with a bioinformatical pipeline.However, there are many different approaches for pollen meta-barcoding(Richardson et al. 2015; Kraaijeveld et al. 2015) and even slight differencesin protocols limit the comparability of studies. Thus, a detailed protocol for asuggested standard method for pollen meta-barcoding was developed (Pub-lication P.3). It contains step by step descriptions of both the laboratory andthe bioinformatic workflow.
The laboratory method was based on a previously published pipeline forbacterial community analysis Kozich et al. 2013 and was adapted to be suit-able for pollen analysis. Incorporated into the oligo scaffold provided byKozich et al. 2013 were primers amplifying the internal transcribed spacer2 (ITS2), a genetic marker, which has been reported suitable for plant bar-coding (Chen et al. 2010). Additionally, this marker was chosen becausea comprehensive database of ITS2 sequences was available (Schultz et al.2006).
The method cannot only be applied to pollen analysis but also to any otherquestion of plant species identification in mixed samples or samples wheretaxonomic identification is not possible otherwise.
Bacterial community analysis. Analysing bacterial communities constitutesthe most important application of meta-barcoding because it is difficult tostudy bacteria otherwise. Meta-barcoding was applied to the analysis of
8

Part II Publications
bacterial communities in two study systems: pet reptiles (Publication P.4)and Bornean pitcher plants (Publication P.5). It was possible to (i) refute thelong-held belief that pet reptiles carry human pathogens in their oral cavitiesand (ii) describe the bacterial community in two Nepenthes species. Themain rationale for applying meta-barcoding in these cases was to circumventthe methodological bias of bacterial isolation and cultivation on standardmedia and instead of this, describe the complete bacterial community.
9

CHAPTER 1
Metabarcoding put into context
10
Part II Publications
P.1 DNA-Metabarcoding - ein neuer Blick auforganismische Diversitat
Authors:
Alexander Keller, Gudrun Grimmer, Wiebke Sickel*, Markus J. Ankenbrand*Co-author
published: 2016
Journal: BIOspektrum
Volume: 22, Pages: 147-150
©Copyright by Springer; Permission for reuse granted with license number3903660116535
11

147
BIOspektrum | 02.16 | 22. Jahrgang
ALEXANDER KELLER, GUDRUN GRIMMER, WIEBKE SICKEL,
MARKUS J. ANKENBRAND
LEHRSTUHL FÜR TIERÖKOLOGIE UND TROPENBIOLOGIE, BIOZENTRUM,
UNIVERSITÄT WÜRZBURG
Taxon identification is one of the fundamental challenges in biologicalresearch. Usually, classifications are based on specimen morphology,sometimes supported by their behaviour, ecology or biochemistry. Tech-nological advances now allow using genomic fragments as a taxon bar-code. With the latest developments of high-throughput sequencers thiscan go even further: identifying complete assemblages simultaneously,with various applications in ecology, conservation, forensics and healthsecurity.
DOI: 10.1007/s12268-016-0669-0© Springer-Verlag 2016
ó Die Identifikation von Organismen stellteine der grundlegendsten und ältesten Her-ausforderungen in der biologischen For-schung dar. Traditionell wird diese Erken-nung und Abgrenzung von anderen Lebewe-sen über morphologische Merkmale durch-geführt, ggf. werden je nach taxonomischerGruppe auch ethologische, biochemische oderökologische Informationen zurate gezogen.Durch die technologischen Entwicklungen inden vergangenen Jahren stehen uns heutezusätzlich genomische Daten in Form vonDNA-Sequenzen zur Verfügung, die auch beider Klassifizierung und Unterscheidung vonOrganismen hilfreich sein können.
DNA-Barcoding unterstützt dietraditionelle ArterkennungIn der Diversitätsforschung wurde dieSequenzierung genomischer DNA-Fragmenteschon relativ früh eingesetzt, um die evolu tiveGeschichte von Organismen zu rekonstruieren[1]. Dabei werden Sequenzen unterschied-licher Organismen miteinander verglichen,Unterschiede ermittelt und diese zur Erstel-lung eines phylogenetischen Stammbaumsverwendet. Vor allem in der Mikrobiologieetablierte sich diese Methode schnell, da sienicht mehr auf die wenigen erfassbaren Merk-
male der Individuen angewiesen war [1].Dementsprechend verwundert es nicht, dasserste Schritte zur Katalogisierung von Orga-nismen anhand von Sequenzen auch in
mikrobiologischen Werken zu finden sind [2].Erst im Jahr 2003 wurde diese Methode unterdem Namen DNA-Barcoding auch für höhereEukaryoten etabliert [3]. Inzwischen ist dieMethode weit verbreitet und wird durch zahl-reiche Initiativen gestützt. Die grundlegen-den Ziele des DNA-Barcodings sind die flä-chendeckende Katalogisierung der organis-mischen Diversität und deren Nutzung alsReferenz für weiterführende Fragestellungen.
Das Prinzip des DNA-Barcodings bestehtdarin, ein kurzes Fragment der genomischenDNA zu analysieren, das repräsentativ füreine bestimmte Art ist und eindeutig auf die-se zurückgeführt werden kann. Über einenbioinformatischen Vergleich mittels einesSchwellenwertes (barcoding gap) kann dieIdentität einer unbekannten Sequenz anhandeiner Referenzdatenbank bestimmt werden(Abb. 1A). Dieser Schwellenwert wird so defi-niert, dass intraspezifische von interspezifi-scher genomischer Variation unterschiedenwird (Abb. 1B). Ein großer Vorteil dieser
Genetische Ökologie
DNA-Metabarcoding – ein neuer Blickauf organismische Diversität
˚ Abb. 1: Bioinformatischer Ablauf einer DNA-Barcoding-Studie. A, Sequenzidentitäten mit Refe-renzen kleiner dem Schwellenwert X gelten als erfolgreiche Artidentifizierung. B, X wird bestimmtdurch die barcode gap zwischen der Variation innerhalb einer Art und zu anderen Arten. C, Einord-nung ähnlicher Sequenzen in taxonomische Einheiten (OTU, operational taxonomic unit) einesMetabarcoding-Datensatzes; nur eine repräsentative Sequenz wird mit der Datenbank abge-glichen.
A
B C
Methode ist die Reproduzierbarkeit der Iden-tifikation. Eine erfolgreiche Arterkennungkann somit nicht nur von erfahrenen Taxo-nomen und Experten bestimmter Artengrup-pen durchgeführt werden. Für die taxonomi-schen Großgruppen werden meist unter-schiedliche genomische Bereiche verwendet:Für Bakterien ist die ribosomale 16S-RNA eta-bliert, für Pilze ITS(internal transcribed spa-cer)-Bereiche, für Pflanzen Abschnitte der ITSoder Plastid-Gene, wohingegen bei Tierendominant mitochondriale Marker eingesetztwerden. Neuere Studien setzen verschiedeneRegionen kombiniert ein, um die taxonomi-sche Sicherheit zu erhöhen [4].
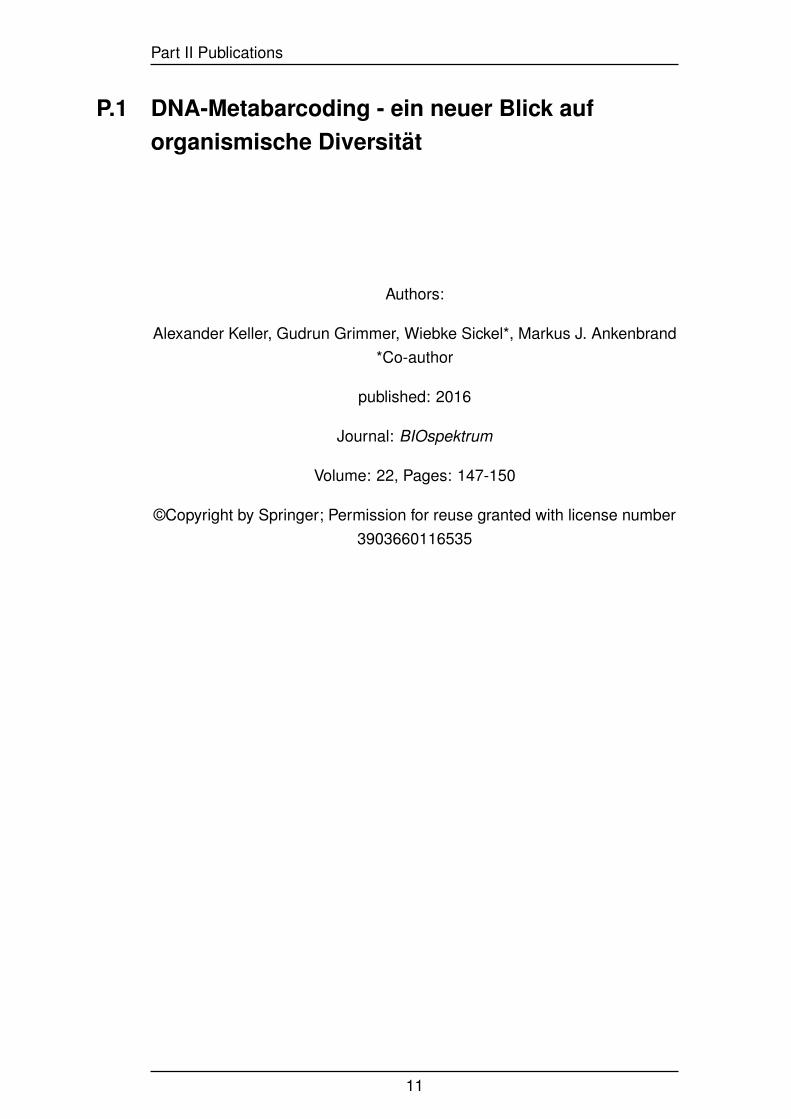
Erfassung komplexer Artge mein -schaften mit DNA-MetabarcodingNeue Hochdurchsatztechnologien erlaubenes nun, einen Schritt weiterzugehen. Es wirdeine Vielzahl von Sequenzen aus einer Aus-gangsprobe generiert; im Kontext der Diver-sitätsforschung kann dies eingesetzt werden,um nicht nur einzelne Individuen, sonderneine Vielzahl von Organismen simultan zuerfassen (Abb. 2, [5]). Moderne Plattformenerlauben hierbei außerdem, verschiedene Pro-ben gleichzeitig zu prozessieren (multiple-xing), dabei wird jede Probe spezifisch mar-kiert (Abb. 2C).
Je nach Technologie ergeben sich mehrereMillionen Sequenzen, sodass der direkte Ver-gleich mit Referenzdatenbanken unpraktika-bel wird. Man verwendet daher oft einenZwischenschritt: Über ein Clustering-Verfah-ren werden innerhalb eines DatensatzesSequenzen nach Ähnlichkeit in taxonomische
Einheiten (OTUs, operational taxonomic units)zusammengefasst (Abb. 1D). Aus diesen Ein-heiten wird jeweils nur eine repräsentativeSequenz mit der Referenzdatenbank ver-glichen. Da besonders im mikrobiellenBereich der Anteil an unbekannten Organis-men sehr groß werden kann, werden zudemAlgorithmen eingesetzt, die bei fehlendenReferenzsequenzen die unbekannte Sequenzso gut wie möglich in übergeordnete Grup-pen klassifizieren (z. B. Gattung, Familie, Ord-nung).
Auch das Metabarcoding etablierte sichzuerst in der bakteriellen Ökologie. Komplet-te Gemeinschaften werden hier auf einmalerfasst, ohne die einzelnen Organismen vor-her zu trennen [6]. Es bedarf auch keiner vor-herigen Kultivierung der einzelnen Bakte-rien, welche für einen Großteil nicht prakti-kabel ist. Obwohl diese Methode noch sehrjung ist, hat sie schon enorm zu einem neu-en Verständnis von mikrobieller Diversitätund der Strukturierung von Gemeinschaftenbeigetragen [6]. Die Etablierung des Meta-barcodings befindet sich derzeit auch fürEukaryoten im Aufwind und verspricht hierebenso eine gute Erfassung der Biodiversität.Artgemeinschaften von Pilzen [7], Pflanzen[8] und Tieren [9] konnten über die Hoch-durchsatzsequenzierung bereits erfolgreicherfasst werden und ermöglichen einen neuenBlick auf die Mechanismen der Etablierungund Strukturierung von Artgemeinschaftenund Ökosystemen.
Jedoch ergeben sich durch das Metabarco-ding auch neue Herausforderungen. DieAbundanzwerte stellen nicht unbedingt die
tatsächliche Abundanz einer erfassten Artdar. Da die zugrunde liegende Polymerase-kettenreaktion (PCR) kein linearer Prozessist, kann es zu einer Überschätzung oderUnterschätzung kommen [5]. Hinzu kommt,dass die Biomasse zwischen den Arten vari-ieren kann und dass diese auch unterschied-lich gut labortechnisch aufgeschlossen wer-den können. Beide Faktoren beeinträchtigendie Vergleichbarkeit von Abundanzen zwi-schen den Arten. Durch qualitativ schlechteSequenzierergebnisse können Sequenzenfehlklassifiziert werden und damit zu einerartifiziellen Überschätzung der tatsächlichenBiodiversität führen. Von entscheidenderBedeutung für jede taxonomische Klassifi-zierung eines Metabarcoding-Datensatzes istdie Quantität und Qualität der zugrunde lie-genden Referenzdatenbank, in welcher sichauch fehlerhafte Sequenzen befinden kön-nen, besonders bei nicht-kurierten Daten-banken [10]. Dem Großteil dieser neuenSchwierigkeiten kann durch eine akkuratebioinformatische Auswertung und diverseKorrekturmechanismen nach der Sequenzie-rung entgegengewirkt werden. Auch hier ver-spricht die Umstellung von einzelnen aufmehrere Marker Vorteile, ist derzeit jedochanalytisch schwerer umsetzbar als bei Ein-zelorganismen [11].
Anwendungsbereiche vonDNA-MetabarcodingBiodiversitätserfassung und Charakterisie-rung von Artgemeinschaften stellen einenessenziellen Bestandteil der ökologischen For-schung und des Naturschutzes dar. Die Mög-
˚ Abb. 2: Überblick über Metabarcoding. Ein Ökosystem (A) mit schwer unterscheidbaren Arten wird untersucht und die DNA aus verschiedenenStichproben isoliert (B) und sequenziert (C). Nach der Datenaufbereitung (OTU, operational taxonomic unit; D) und einem Datenbankabgleich (E) wirddie Artgemeinschaft für jede Stichprobe separat ermittelt (F).
A B C
F E D
148 WISSENSCHAFT · SPECIAL: SEQUENZIERUNG
BIOspektrum | 02.16 | 22. Jahrgang

lichkeit, Proben im Hochdurchsatz und ohneAuftrennung in einzelne Individuen prozes-sieren zu können, erlaubt generell eine Erhö-hung der Stichproben (und damit der statis-tischen Sicherheit) sowie der Anzahl andurchführbaren Experimenten [11]. Es kön-nen auch für taxonomisch schlecht erfassteGebiete und Artgruppen Studien durchge-führt werden. Zudem kann die Eingliederungin ökologische Nischen sehr feinskalig unter-sucht werden, da wenig Ausgangsmaterialnotwendig ist (Abb. 3, [6]). Es ergeben sichneue Möglichkeiten des Naturschutzes durchdas Metabarcoding von Umgebungs-DNA. Imaquatischen Bereich kann der Nachweisbedrohter oder invasiver Arten durch abge-stoßene Hautzellen, Exkremente oder andereKörperbestandteile direkt über das Wassererfolgen, ohne dass Individuen gefangen wer-den müssen. Durch die Beprobung von Erd-schichten können Rückschlüsse auf die Bio-diversität im Verlauf der Erdgeschichte gezo-gen werden [11].
Metabarcoding wird zudem sehr erfolgreichbei der Erfassung von zwischenartlichenInteraktionen sowie zur Identifikation vonPathogenen und Symbionten eingesetzt [6].Es können Netzwerke aus Pflanzen und derenBestäubern direkt über die Sequenzierungvon Pollen erfasst werden [8]. Die Bedeutungvon bakteriellen Gemeinschaften im Darm-trakt für die Immunabwehr und die Nähr-stoffversorgung ist bekannt, doch bietet dieneue Forschungsmethode nun die Möglich-keit, diese Gemeinschaften systematisch zuuntersuchen und im Kontext diverser Hinter-gründe (z. B. Ernährung und Krankheiten)auszuwerten.
Für die Sicherungdes Lebensqualitätder Menschen kanndas Metabarcodingin einer Vielzahl vonBereichen eingesetztwerden [11]. Die Nah-rungsqualität kanndurch die Erfassungder pflanzlichen undtierischen Bestand-
teile überprüft und gesichert werden. Aller-gene wie Pollen in der Luft sowie Blüteereig-nisse bei Algen können frühzeitig erfasst unddamit präventive Maßnahmen eingeleitet wer-den. Das Metabarcoding kann außerdem zurErfassung von Krankheitserregern verwen-det werden und damit zur Hygiene in Städtenund Verkehrszentren beitragen. Klinikensowie wissenschaftliche Labore können durchregelmäßige Prüfung auf Kontaminationenhin untersucht werden. Auch forensische Ana-lysen lassen sich durch die Methode verbes-sern, indem Algen, Pollen und weitere Pflan-zenbestandteile zur Ursprungsermittlung her-angezogen werden.
Die Bandbreite an Applikationen ist groß,und durch die anhaltenden technologischenWeiterentwicklungen wird sowohl die Qua-lität als auch die Quantität der Daten durchMetabarcoding ständig verbessert und kosten -effizienter gestaltet. Mit dieser Entwicklungzeigt sich auch ein Trend in der Ausbildungder Wissenschaftler, von taxonomischenExperten hin zu bioinformatischen Analyti-kern. Diese verschiedenen Blickwinkel, vonMetabarcoding und traditionellen Erfas-sungsmethoden zusammen, erlauben es,unser Wissen über Biodiversität und Artge-meinschaften deutlich zu erweitern und dieMechanismen hinter Ökosystemen zu ver -stehen. ó
Literatur[1] Woese CR, Fox GE (1977) Phylogenetic structure of theprokaryotic domain: the primary kingdoms.Proc Natl Acad Sci USA 74:5088–5090[2] Fox GE,Pechman KR, Woese CR (1977) Comparative cata-loging of 16S ribosomal ribonucleic acid: molecular approachto procaryotic systematics. Int J Syst Evol Microbiol 27:44–57
[3] Hebert PD, Cywinska A, Ball SL et al. (2003) Biologicalidentifications through DNA barcodes. Proc Biol Sci270:313–321[4] Dupuis J, Row A, Sperling F (2012) Multi-locus speciesdelimitation in closely related animals and fungi: one markeris not enough. Mol Ecol 21:4422–4436[5] Keller A, Danner N, Grimmer G et al. (2015) Evaluatingmultiplexed next-generation sequencing as a method in paly-nology for mixed pollen samples. Plant Biol 17:558–566[6] Junker RR, Keller A (2015) Microhabitat heterogeneityacross leaves and flower organs promotes bacterial diversity.FEMS Microbiol Ecol 91:fiv097 (doi: 10.1093/femsec/fiv097)[7] Bálint M, Schmidt P, Sharma R et al. (2014) An Illuminametabarcoding pipeline for fungi. Ecol Evol 4:2642–2653[8] Sickel W, Ankenbrand M, Grimmer G et al. (2015)Increased efficiency in identifying mixed pollen samples bymeta-barcoding with a dual-indexing approach. BMC Ecol15:20[9] Yu D, Ji Y, Emerson B et al. (2012) Biodiversity soup:metabarcoding of arthropods for rapid biodiversity assess-ment and biomonitoring. Methods Ecol Evol 3:613–623[10] Nilsson R, Ryberg M, Kristiansson E et al. (2006)Taxonomic reliability of DNA sequences in public sequencedatabases: a fungal perspective. PLoS One 1:e59[11] Bell K, de Vere N, Keller A et al. (2016) Pollen DNA bar-coding: current applications and future prospects. Genome(im Druck)
Korrespondenzadresse:Dr. Alexander KellerLehrstuhl für Tierökologie und Tropenbiologie,BiozentrumUniversität WürzburgAm HublandD-97074 WürzburgTel.: 0931-31-84427Fax: [email protected]
¯ Abb. 3: Feinskalige Analyse von Bakteriengemeinschaften auf Blüten.Die Datenpunkte entsprechen Einzelproben mit jeweils einer gesamtenArtgemeinschaft, aufgetragen nach Ihrer Ähnlichkeit zueinander mittelsDCA(detrended correspondence analysis)-Ordinationsanalyse. Mikrohabi-tate wie Griffel, Nektar- und Staubblätter einer Blüte sowie die Blätterstellen sehr unterschiedliche Voraussetzungen für Bakterien dar. Siebeherbergen dadurch mehrere verschiedene, diverse und gut unter-scheidbare Gemeinschaften, die ohne Metabarcoding bisher unterschätztwurden (nach [6]).
ARBEITSGRUPPE
Alexander Keller, Gudrun Grimmer, WiebkeSickel und Markus J. Ankenbrand (v. l. n. r.)
Die Molecular Biodiversity Group der UniversitätWürzburg ist eine Nachwuchsforscher-AG, diesich mit ökologischen Artgemeinschaften be-schäftigt. Wir analysieren Wirt-Mikroben-Inter -aktionen von Pflanzen und Insekten sowie Pflan-zen-Bestäuber-Interaktionen. Zudem sind wir inder Methodenentwicklung für Metabarcoding aktiv.
150 WISSENSCHAFT · SPECIAL: SEQUENZIERUNG
BIOspektrum | 02.16 | 22. Jahrgang

CHAPTER 2
Pollen analysis
15

Part II Publications
P.2 Increased efficiency in identifying mixed pollen
samples by meta-barcoding with a dual-indexing
approach
Authors:
Wiebke Sickel*, Markus J. Ankenbrand, Gudrun Grimmer, AndreaHolzschuh, Stephan Hartel, Jonathan Lanzen, Ingolf Steffan-Dewenter,
Alexander Keller
*First author
published: 2015
Journal: BMC Ecology
Volume: 15, Pages: 20
©Copyright by the authors
16

Sickel et al. BMC Ecol (2015) 15:20 DOI 10.1186/s12898-015-0051-y
METHODOLOGY ARTICLE
Increased efficiency in identifying mixed pollen samples by meta-barcoding with a dual-indexing approachWiebke Sickel, Markus J Ankenbrand, Gudrun Grimmer, Andrea Holzschuh, Stephan Härtel, Jonathan Lanzen, Ingolf Steffan‑Dewenter and Alexander Keller*
Abstract
Background: Meta‑barcoding of mixed pollen samples constitutes a suitable alternative to conventional pollen identification via light microscopy. Current approaches however have limitations in practicability due to low sample throughput and/or inefficient processing methods, e.g. separate steps for amplification and sample indexing.
Results: We thus developed a new primer‑adapter design for high throughput sequencing with the Illumina tech‑nology that remedies these issues. It uses a dual‑indexing strategy, where sample‑specific combinations of forward and reverse identifiers attached to the barcode marker allow high sample throughput with a single sequencing run. It does not require further adapter ligation steps after amplification. We applied this protocol to 384 pollen samples collected by solitary bees and sequenced all samples together on a single Illumina MiSeq v2 flow cell. According to rarefaction curves, 2,000–3,000 high quality reads per sample were sufficient to assess the complete diversity of 95% of the samples. We were able to detect 650 different plant taxa in total, of which 95% were classified at the species level. Together with the laboratory protocol, we also present an update of the reference database used by the classi‑fier software, which increases the total number of covered global plant species included in the database from 37,403 to 72,325 (93% increase).
Conclusions: This study thus offers improvements for the laboratory and bioinformatical workflow to existing approaches regarding data quantity and quality as well as processing effort and cost‑effectiveness. Although only tested for pollen samples, it is furthermore applicable to other research questions requiring plant identification in mixed and challenging samples.
Keywords: DNA barcoding, High throughput sequencing, Illumina MiSeq platform, ITS2, Next generation sequencing, NGS, Osmia, Palynology, Pollination ecology
© 2015 Sickel et al. This article is distributed under the terms of the Creative Commons Attribution 4.0 International License (http://creativecommons.org/licenses/by/4.0/), which permits unrestricted use, distribution, and reproduction in any medium, provided you give appropriate credit to the original author(s) and the source, provide a link to the Creative Commons license, and indicate if changes were made. The Creative Commons Public Domain Dedication waiver (http://creativecommons.org/publicdomain/zero/1.0/) applies to the data made available in this article, unless otherwise stated.
BackgroundIdentification of pollen origin is a central aspect in pol-lination ecology studies [1–3] and agro-ecological research [4, 5]. Conventional pollen identification utilises light microscopy and discriminates species according to morphological characteristics [6]. This requires expert knowledge for the bioregion and taxa of interest [7], is
time-consuming [8] and lacks discriminatory power at lower taxonomic levels [4, 8].
A promising approach to circumvent these issues has been to identify plant species in pollen samples by DNA sequence analysis. This can be done by, for example, clon-ing amplified PCR products into plasmids and sequenc-ing a subset of clones [8, 9] or sequencing pollen grains of interest [10, 11] or bee crop contents directly [12]. However, this often does not reflect the complete diver-sity of plant species present, since only a subset of DNA sequences are analysed or only dominant plant taxa can be detected. Recent studies [7, 13–15] have identified
Open Access
*Correspondence: [email protected]‑wuerzburg.de Department of Animal Ecology and Tropical Biology, Biocenter, University of Würzburg, Am Hubland, 97074 Würzburg, Germany

Page 2 of 9Sickel et al. BMC Ecol (2015) 15:20
high throughput sequencing (HTS) approaches based on meta-barcoding as a suitable alternative for existing methods. However, current protocols still suffer from a limited sample throughput [7, 14, 15] and/or practicabil-ity issues due to separate steps for PCR amplification and index labelling [13]. We here present a protocol for highly multiplexed pollen sequencing utilising a dual-indexing strategy [16]. An overview of existing methods along-side our new approach is given in Figure 1. We designed meta-barcoding primers suitable for plant identification using the internal transcribed spacer 2 (ITS2) that already incorporate Illumina-specific adapters for high-through-put sequencing as well as new sequencing primers that
are added to the sequencing flow cell. The rationale for using ITS2 rather than other genetic markers for plant DNA barcoding in general is provided elsewhere [17] and its applicability regarding meta-barcoding criteria has also been successfully demonstrated [7, 13]. We tested our new approach by sequencing 384 pollen samples collected by two solitary bees species with known different foraging strategies: polylectic Osmia bicornis [18] and oligolectic Osmia truncorum [19]. Alongside this enhancement of the laboratory method, we updated the reference database used for ITS2 meta-barcoding [7] and added compatibility for the UTAX classification software [20] as a second and alternative strategy beside the RDP classifier [7, 21].
Figure 1 Comparison of different approaches for plant species identification in mixed pollen samples.

Page 3 of 9Sickel et al. BMC Ecol (2015) 15:20
MethodsDual‑indexing designAs amplifying primers we used the well-established com-bination of plant barcoding primers ITS-S2F [17] and ITS4R [22]. These were already used for plant species identification based on meta-barcoding [7] and deliver a fragment of suitable size for MiSeq v2 sequencing using 500 cycles. For MiSeq-conformity, we expanded each of the primers according to the overall oligo scaffold described in Kozich et al. [16]. This scaffold consists of MiSeq-specific adapters, an 8nt index sequence, a 10nt pad as well as a 2nt linker sequence and lastly the amplify-ing primers. To successfully transfer the scaffold design to ITS2 sequencing, we ensured by minor modifications that the melting temperature (Tm) of the combined pad, linker and amplifying primer was ~65°C (see Additional file of Kozich et al. [16]) enabling the read primers to bind dur-ing the later sequencing procedure. In the forward scaf-fold, we adapted the pad sequence from 5′-TATGGTAATT-3′ to 5′-CCTGGTGCTG-3′ (adapted nucleotides in bold). The pad of the reverse scaffold remained unchanged. Complete sequences of the final oligos were forward: 5 ′ - AATGATACGGCGACCACCGAGATCTACACXXXXXXXXCCTGGTGCTGGTATGCGATACTTGGTGTGAAT-3′ and reverse: 5′-CAAGCAGAAGACGGCATACGAGAT XXXXXXXX AGTCAGTCAG CCTCCTCCGCTTATTGATATGC-3′, where adapted nucleotides are denoted in bold and XXXXXXXX indicates the index sequences used for multiplexing. Both primer sequences were thus 32nt long, had a Tm of 64.8°C, a 50% GC content and exhibited low self-com-plementarity (longest dimer complement: 4 bp). They amplify a total fragment of approximately 470–480 bp, including the complete ITS2 sequence. The actual sequenced part of this fragment covers 350–360 bp (tar-get only) and is thus within the range of 2 × 250 cycles sequencing, leaving some buffer for joining the paired end reads. We used 16 forward index sequences SA501–SB508 and 24 reverse indices SA701–SB712, allowing a total of 384 unique combinations for sample indexing (Additional file of Kozich et al. [16]). With ITS2-spe-cific modifications, it was also necessary to modify the sequencing primers that are added to the MiSeq flow cell. We thus changed read and index primers as follows (adapted nucleotides in bold): Read1: 5′-CCTGGTGCTGGTATGCGATACTTGGTGTGAAT-3′, Read2: 5′-AGTCAGTCAG CCTCCTCCGCTTATTGATATGC-3′, Index: 5′-GCATAT-CAATAAGCGGAGGAGG CTGACTGACT-3′.
Processing test samplesThe newly designed dual-indexing approach was evalu-ated with mixed pollen samples, collected from nests of the solitary bees Osmia bicornis (270 samples), Osmia truncorum (111 samples) and other Osmia spp. (3
samples) at various sites near Würzburg, Germany from April to September 2013. Different samples originated from pools of two different brood cells from the same nest (likely the same mother bee few days apart). We chose this study system because we wanted to demon-strate that different foraging strategies can be detected using pollen meta-barcoding. We documented flower resources available during the sample period within a 50 m radius (all plant species) and within a 600 m radius (mass-flowering plants only) around the nest sites. This was done to gain information on species identity of flower resources available for bee foraging at the time of sampling (Additional file 1) and to be able to compare them with our sequence data.
DNA from ~0.003 g pollen grains was isolated as described by Keller et al. [7] using the Macherey-Nagel Food Kit (Düren, Germany). PCR was performed in three separate 10 µL reactions in order to avoid PCR bias [23]. Each reaction contained 5 µL 2 × Phusion Master Mix (New England Biolabs, Ipswich, MA, USA), 0.33 µM each of the forward and reverse primers, 3.34 µL PCR grade water and 1 µL DNA template. PCR conditions were as follows: initial denaturation at 95°C for 4 min, 37 cycles of denaturation at 95°C for 40 s, annealing at 49°C for 40 s and elongation at 72°C for 40 s; followed by a final extension step at 72°C for 5 min. Each sample was assigned a different forward/reverse index combination for sample-specific labelling. Triplicate reactions of each sample were combined after PCR and further processed as described in Kozich et al. [16], including between-sample normalization using the SequalPrep™ Normaliza-tion Plate Kit (Invitrogen GmbH, Darmstadt, Germany) and pooling of 96 samples. These pools were quality con-trolled using a Bioanalyzer High Sensitivity DNA Chip (Agilent Technologies, Santa Clara, CA, USA), quanti-fied with the dsDNA High Sensitivity Assay (Life Tech-nologies GmbH, Darmstadt, Germany), and afterwards combined to a single pool containing all 384 samples. This was diluted to 8 pM, denatured and spiked with 5% Phix Control Kit v3 (Illumina Inc., San Diego, CA, USA) according to the Sample Preparation Guide (llumina Inc. 2013). Sequencing was performed on the Illumina MiSeq using 2 × 250 cycles v2 chemistry (Illumina Inc., San Diego, CA, USA).
Data analysisRaw sequence reads were obtained from the Illumina MiSeq output directly, which includes sample reads already demultiplexed by the MiSeq Reporter v. 2.5.1.3 with perfect index matches only. Forward and reverse reads were joined using the join_paired_ends.py com-mand in QIIME v.1.8.0 [24] using default parameters. Low quality reads were removed (<Q20, <150 bp,
Page 4 of 9Sickel et al. BMC Ecol (2015) 15:20
ambiguous base-pairs) with USEARCH v8.0.1477 [25]. Combined reads were taxonomically classified with the RDP classifier [21] as well as the UTAX algorithm and results compared to show that the data is compatible between both alternative analytical strategies. UTAX and RDP were executed for each sample separately.
In the following, we concentrate on UTAX, since the RDP classifier has been used previously for pollen taxo-nomic assignments [7]. A raw score cut-off at 20 was used, as the UTAX algorithm does currently not provide bootstrap comparable confidence values (but is expected to incorporate these soon, see http://drive5.com/usearch/manual/faq_taxconfs.html, accessed 2015/22/05). These assignment scores are however comparable between reads as long as subsequent analyses do base all upon the same database.
For data analysis, the raw UTAX output was parsed using a self-written perl script, which counts the number of assignments for each taxon and aggregates these into a single table (https://github.com/iimog/meta-barcod-ing-dual-indexing). This table is converted into a com-munity matrix format, with rows as species and columns representing samples, and a separate file with the taxo-nomic lineage of each species is also created. These files are directly importable into common statistical software, e.g. R v.3.1.2 [26] using the package phyloseq v.1.6.1 [27]. To assess sufficiency of the sequencing depth, we created species accumulation curves for each sample using the vegan package v2.2-0 [28] in R v.3.1.2 [26], excluding taxa accounting for less than 0.1% of sample reads. Addition-ally, we determined the ten most abundant plant families collected by O. bicornis and O. truncorum.
Reference database updateBeside the enhancement of the laboratory protocol, we considered it important to address also the actuality and completeness of the reference database. We thus per-formed an update according to the annotation pipeline described for the ITS2 database [29, 30]. For this, we extracted all available ITS2 sequences belonging to Vir-idiplantae from GenBank [31] (accessed on 2015/19/01) as described in detail in Koetschan et al. [30]. The tax-onomy follows the NCBI taxonomy database [32], which may not perfectly reflect evolutionary status, but is well usable for automatic procedures, due to its integration into the public NCBI framework. Taxonomy was assigned to the sequences by mapping the gi to the NCBI taxid. Taxonomic levels were selected at seven levels (kingdom, phylum, class, order, family, genus, species) using a cus-tom perl script utilizing the NCBI::Taxonomy module by courtesy of F. Förster (doi:10.5281/zenodo.17375). RDP training files, a UTAX database and taxtree were cre-ated with a custom perl script (https://github.com/iimog/
meta-barcoding-dual-indexing). The database update, scripts and information on how to use it with the RDP classifier or UTAX are provided at http://www.dna-ana-lytics.biozentrum.uni-wuerzburg.de.
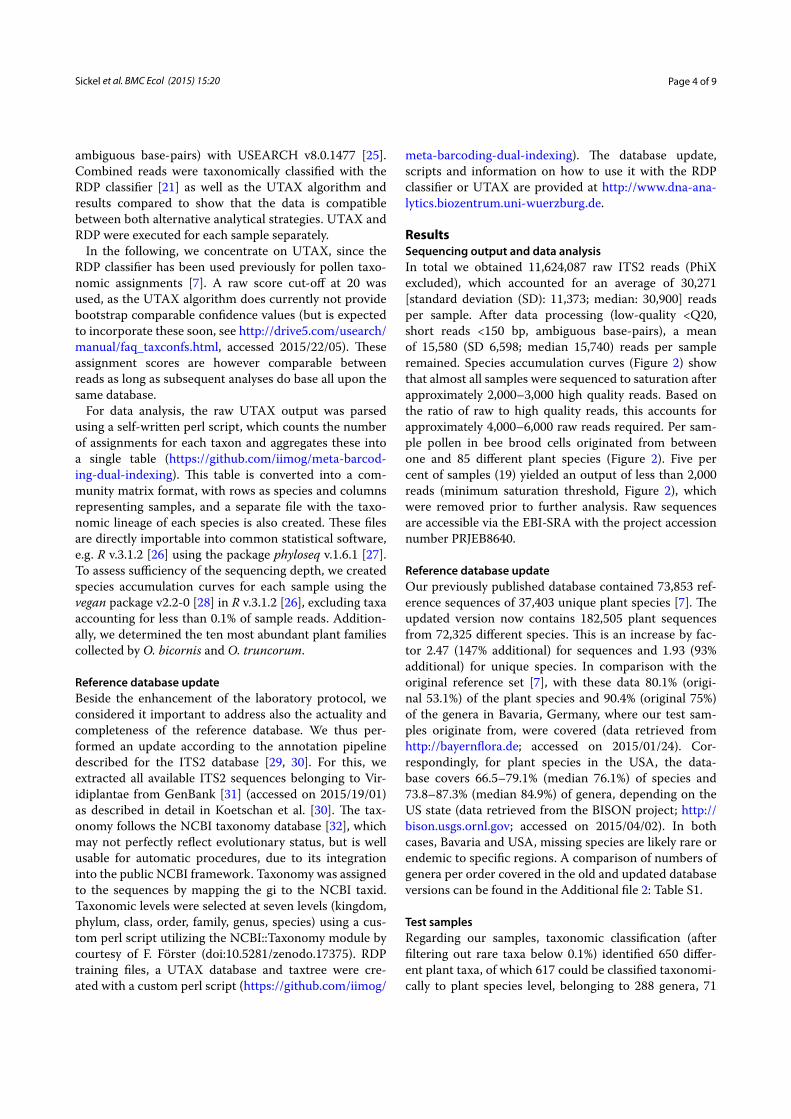
ResultsSequencing output and data analysisIn total we obtained 11,624,087 raw ITS2 reads (PhiX excluded), which accounted for an average of 30,271 [standard deviation (SD): 11,373; median: 30,900] reads per sample. After data processing (low-quality <Q20, short reads <150 bp, ambiguous base-pairs), a mean of 15,580 (SD 6,598; median 15,740) reads per sample remained. Species accumulation curves (Figure 2) show that almost all samples were sequenced to saturation after approximately 2,000–3,000 high quality reads. Based on the ratio of raw to high quality reads, this accounts for approximately 4,000–6,000 raw reads required. Per sam-ple pollen in bee brood cells originated from between one and 85 different plant species (Figure 2). Five per cent of samples (19) yielded an output of less than 2,000 reads (minimum saturation threshold, Figure 2), which were removed prior to further analysis. Raw sequences are accessible via the EBI-SRA with the project accession number PRJEB8640.
Reference database updateOur previously published database contained 73,853 ref-erence sequences of 37,403 unique plant species [7]. The updated version now contains 182,505 plant sequences from 72,325 different species. This is an increase by fac-tor 2.47 (147% additional) for sequences and 1.93 (93% additional) for unique species. In comparison with the original reference set [7], with these data 80.1% (origi-nal 53.1%) of the plant species and 90.4% (original 75%) of the genera in Bavaria, Germany, where our test sam-ples originate from, were covered (data retrieved from http://bayernflora.de; accessed on 2015/01/24). Cor-respondingly, for plant species in the USA, the data-base covers 66.5–79.1% (median 76.1%) of species and 73.8–87.3% (median 84.9%) of genera, depending on the US state (data retrieved from the BISON project; http://bison.usgs.ornl.gov; accessed on 2015/04/02). In both cases, Bavaria and USA, missing species are likely rare or endemic to specific regions. A comparison of numbers of genera per order covered in the old and updated database versions can be found in the Additional file 2: Table S1.
Test samplesRegarding our samples, taxonomic classification (after filtering out rare taxa below 0.1%) identified 650 differ-ent plant taxa, of which 617 could be classified taxonomi-cally to plant species level, belonging to 288 genera, 71
Page 5 of 9Sickel et al. BMC Ecol (2015) 15:20
families, 37 orders and nine classes. The remaining 33 taxa (5%) could not be classified at the species level. Of these, 17 taxa could still be classified at genus level and another seven at the family level. Nine taxa remained that could not be classified even to family level. These belonged to the Sapindales, Fagales and Microthamniales (one taxon each) or remained unclassified (six taxa). At the genus level, RDP and UTAX taxonomic assignments agreed in ~90% of all read classifications, thus both clas-sifiers yielded comparable results.
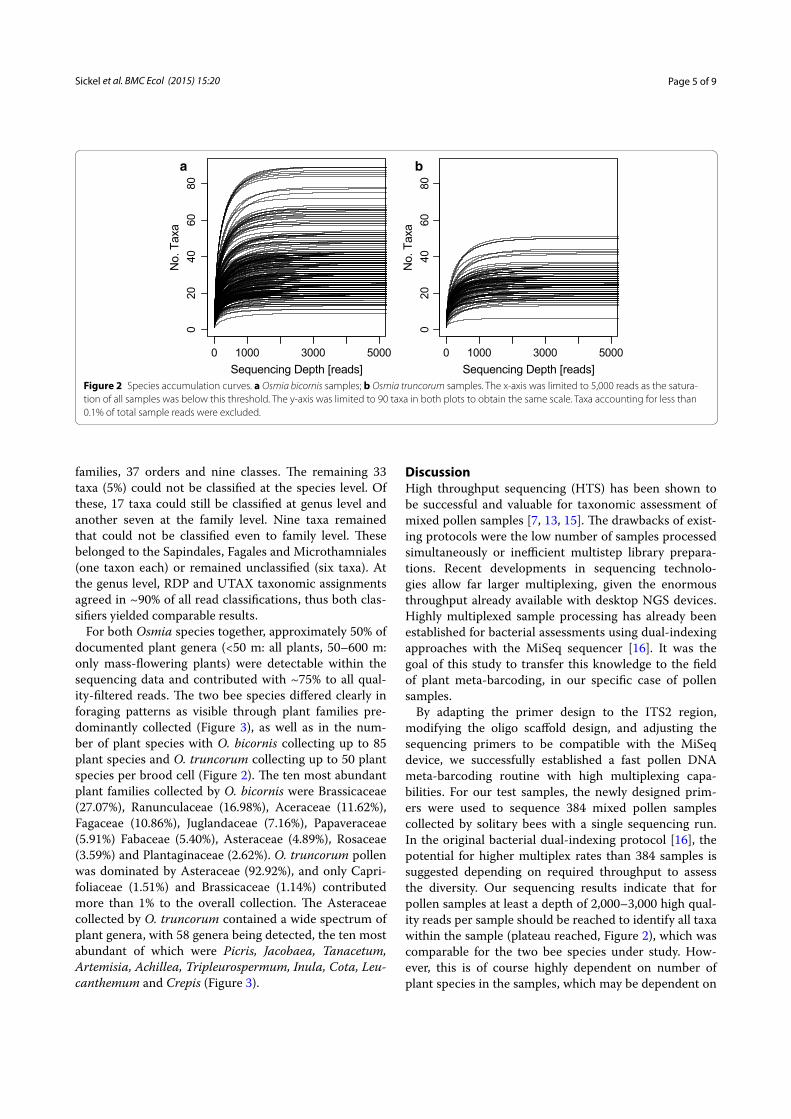
For both Osmia species together, approximately 50% of documented plant genera (<50 m: all plants, 50–600 m: only mass-flowering plants) were detectable within the sequencing data and contributed with ~75% to all qual-ity-filtered reads. The two bee species differed clearly in foraging patterns as visible through plant families pre-dominantly collected (Figure 3), as well as in the num-ber of plant species with O. bicornis collecting up to 85 plant species and O. truncorum collecting up to 50 plant species per brood cell (Figure 2). The ten most abundant plant families collected by O. bicornis were Brassicaceae (27.07%), Ranunculaceae (16.98%), Aceraceae (11.62%), Fagaceae (10.86%), Juglandaceae (7.16%), Papaveraceae (5.91%) Fabaceae (5.40%), Asteraceae (4.89%), Rosaceae (3.59%) and Plantaginaceae (2.62%). O. truncorum pollen was dominated by Asteraceae (92.92%), and only Capri-foliaceae (1.51%) and Brassicaceae (1.14%) contributed more than 1% to the overall collection. The Asteraceae collected by O. truncorum contained a wide spectrum of plant genera, with 58 genera being detected, the ten most abundant of which were Picris, Jacobaea, Tanacetum, Artemisia, Achillea, Tripleurospermum, Inula, Cota, Leu-canthemum and Crepis (Figure 3).
DiscussionHigh throughput sequencing (HTS) has been shown to be successful and valuable for taxonomic assessment of mixed pollen samples [7, 13, 15]. The drawbacks of exist-ing protocols were the low number of samples processed simultaneously or inefficient multistep library prepara-tions. Recent developments in sequencing technolo-gies allow far larger multiplexing, given the enormous throughput already available with desktop NGS devices. Highly multiplexed sample processing has already been established for bacterial assessments using dual-indexing approaches with the MiSeq sequencer [16]. It was the goal of this study to transfer this knowledge to the field of plant meta-barcoding, in our specific case of pollen samples.
By adapting the primer design to the ITS2 region, modifying the oligo scaffold design, and adjusting the sequencing primers to be compatible with the MiSeq device, we successfully established a fast pollen DNA meta-barcoding routine with high multiplexing capa-bilities. For our test samples, the newly designed prim-ers were used to sequence 384 mixed pollen samples collected by solitary bees with a single sequencing run. In the original bacterial dual-indexing protocol [16], the potential for higher multiplex rates than 384 samples is suggested depending on required throughput to assess the diversity. Our sequencing results indicate that for pollen samples at least a depth of 2,000–3,000 high qual-ity reads per sample should be reached to identify all taxa within the sample (plateau reached, Figure 2), which was comparable for the two bee species under study. How-ever, this is of course highly dependent on number of plant species in the samples, which may be dependent on
a b
Figure 2 Species accumulation curves. a Osmia bicornis samples; b Osmia truncorum samples. The x‑axis was limited to 5,000 reads as the satura‑tion of all samples was below this threshold. The y‑axis was limited to 90 taxa in both plots to obtain the same scale. Taxa accounting for less than 0.1% of total sample reads were excluded.
Page 6 of 9Sickel et al. BMC Ecol (2015) 15:20
sample origin, foraging behaviour and the biodiversity of the ecosystem of interest, but may serve nonetheless as a guideline for higher multiplex rates. Additional index combinations for more samples are provided in the Addi-tional files alongside the protocol for the bacterial dual-index approach [16].
Beside our dual-indexing strategy, another HTS-based approach has been recently proposed. There, PCR ampli-fication and index labelling were conducted in separate steps [13], which is time and labour-intensive and intro-duces a further step where errors may be introduced. In our protocol, PCR amplification and sample index-ing occur simultaneously, which is highly practical and requires no special reagents, such as additional expen-sive library preparation kits or adapter ligation chemi-cals. In our protocol, the complete workflow accounts for less than USD 20.00 for materials per sample, when processing 384 samples simultaneously. This is much lower than conventional pollen analysis under the light
microscope, which can reach several hundred USD per sample.
Most plant taxa detected could be successfully classi-fied using the already shown RDP classifier [7, 21], but also the recently developed UTAX algorithm [25]. Due to the missing confidence values for taxonomic assignments in UTAX version 8.0 (announced for version 8.1, http://drive5.com/usearch/manual/faq_taxconfs.html, accessed 2015/22/05), we compared the classifications to the RDP output as well as the documented flower resources. UTAX and RDP showed high agreement between taxo-nomic classifications, thus both may be used arbitrarily.
Approximately half of the genera found flowering near the nest sites were detected in the pollen samples. This is attributable to bee foraging preferences, where not all available resources might be used, especially for the oli-golectic O. truncorum. Secondly, about three quarters of the reads were assigned to plant genera documented near the nesting sites (<50 m: all plant species, 50–600 m:
a b
Figure 3 Pollen spectrum of the two bee species. a Ten most abundant families as collected by the bee species O. bicornis and O. truncorum. For O. truncorum ‘other’ include the families Apiaceae, Rosaceae, Fabaceae, Ranunculaceae, Plantaginaceae, Juglandaceae and Amaranthaceae. b Plant genera detected within the Asteraceae collected by O. truncorum. For visualisation reasons, only the eight most abundant genera are labelled. Please note that Aceraceae is now included within Sapindaceae.

Page 7 of 9Sickel et al. BMC Ecol (2015) 15:20
mass-flowering plants only). As bees are expected to for-age also further away, the remaining reads are attribut-able to pollen collected from undocumented plants or misclassifications.
According to our expectation, pollen composition pat-terns were very different for the oligolectic and the pol-ylectic bee species (Figure 3). O. truncorum samples were dominated by Asteraceae, whereas O. bicornis samples showed a wide pollen spectrum. Our data correspond to flower preferences and foraging strategies known for these species [18, 19]. This supports the high quality of information obtained by pollen meta-barcoding, as already intensively evaluated in another study [7]. It is noteworthy that even very rare taxa could be detected, which is of special interest in the oligolectic O. trunco-rum and might be overlooked in light microscopy assess-ment of pollen samples.
We would like to point out that abundance data obtained from molecular approaches should in general be inter-preted with care and only as relative abundance (divided by total number of reads in the sample to account for vary-ing library sizes). Contradicting results exist concerning the suitability of pollen meta-barcoding for quantification purposes, with Keller et al. [7] and Kraaijeveld et al. [14] finding a positive significant correlation between genera by light microscopy and meta-barcoding, whilst Richard-son et al. [13] were not able to find such a connection. Due to the different steps in the workflow, e.g. dilutions and PCR, biases can be introduced, leading to skewed data and over- or underrepresentation of certain taxa. PCR bias is considered to be a random process and can be accounted for by performing replicate PCR reactions for each sam-ple [23], which are pooled subsequently. We followed this approach in this study likewise to Keller et al. [7] to avoid PCR bias as far as possible. This may explain some of the discrepancy between studies, although a recent study indi-cated that PCR replicates might not be necessary in pollen meta-barcoding [14]. The reduced amount of individual processing steps of direct indexing, (as performed here and in both studies identifying positive correlation [7, 14]) further reduces additional risks to introduce unwanted effects in comparison with the study using adapter ligation that shows no correlation [13].
In this study, samples of the same bee species show high consistency in abundance patterns of major taxa, which are easily biologically explainable. A good com-promise for most studies investigating foraging patterns might be to not use direct count data, but conservatively categorising plant taxa into ‘abundant’ and ‘rare’ based on a threshold, as proposed by Keller et al. [7]. Where more detail is needed, a subset of samples may also be analysed in parallel by light microscopy for evaluation purposes [7, 13, 14].
One major advantage of pollen meta-barcoding is that no expert knowledge on pollen morphology is required for taxonomic assignment. Additionally, species level assignment is possible even for closely related plant taxa. However, successful taxonomic assignment criti-cally depends on the quality of the reference database. Our target marker was the ITS2 region, but other genetic markers might also be considered for plant species iden-tification using meta-barcoding, e.g. trnL [14, 15] or rbcL plus trnH-psbA [8, 9]. The described dual indexing approach [16] can also be applied to other genetic mark-ers, provided some considerations are taken into account as described for ITS2 in this study. On the laboratory side of the workflow, firstly target and thereby primer choice should be appropriate for universal amplification and plant species identification based on DNA sequence data. The amplified fragment should be of the appropriate size for the chosen MiSeq sequencing chemistry, e.g. no longer than ~480–490 bp for 2 × 250 v2 sequencing kits, allowing for some overlap between forward and reverse reads. Given these conditions are met, primer design can be performed following the guidelines from Kozich et al. [16] including the required modifications to the various oligonucleotides. However, as mentioned before, success-ful plant species identification relies to a large degree also on the underlying reference database and bioinformati-cal classification algorithm. For most alternative markers comprehensive reference databases are currently lacking and thus taxonomic classifications are mainly performed by a BLAST search [33] against sequences downloaded from GenBank [8, 9, 13–15], locally managed alterna-tive databases [9] and/or newly acquired DNA sequences [8, 9]. BLAST searches are based on local alignments that may only use parts of each sequence (e.g. conserved regions) for classification, lack a hierarchy classification procedure and results can be difficult to interpret [7, 17] especially when results show hits for multiple, different taxa. Setting up locally managed databases is time- and labour-intensive a well as costly and makes it difficult to compare independent studies with one another. In the case of the ITS2 region, we benefitted from the already established ITS2 database [30], which contains annotated and trimmed ITS2 sequences from species worldwide and can be publicly accessed, improving overall compara-bility across studies.
Although Chen et al. [17] reported high identifica-tion accuracies with ITS2 as a genetic marker, some plant taxa could not be identified in recent studies on pollen meta-barcoding [7, 13]. These included the fami-lies Salicaceae, Lamiaceae [13] and Vitaceae [7] and the genera Lonicera [13], Heracleum, Carduus, Phace-lia, Convolvulus and Helianthus [7], although they had been identified with microscopic pollen analysis. In

Page 8 of 9Sickel et al. BMC Ecol (2015) 15:20
this study, we could detect all of these taxa. Failure to detect these families and genera with DNA sequence data was most likely due to incompleteness of the ref-erence databases in these studies. Richardson et al. [13] used in total only 2,628 reference sequences, that described about half of the locally occurring plant spe-cies. In the case of Keller et al. [7], we were able to directly compare the database then (73,853 sequences) and now (182,505 sequences), which revealed that for each of those plant taxa more reference sequences were included after the database update presented here (Additional file 3: Table S2). This explains the positive detection for those plant taxa in this study in contrast to earlier studies and again highlights the importance of a current and comprehensive reference database for meta-barcoding purposes.
Our test samples comprised only pollen samples col-lected by bees, but in general ITS2 meta-barcoding can be applied to plant identification in other research fields where mixed samples are encountered, such as diet anal-ysis of herbivores [34, 35] and in palaeo-ecology [36–38]. Furthermore, high-throughput DNA analysis of mixed plant samples can also prove valuable in food safety issues [39], honey quality analysis [8, 9] as well as allergen load assessment [14]. For such applications, alteration of the provided protocol for library preparation and sequencing is not needed, although the DNA extraction process may require alternative kits or adapted protocols specific for the material of interest.
ConclusionsWe have successfully transferred a high-throughput technique for bacterial community sequencing to pol-len meta-barcoding, which now enables labour- and cost-effective analysis of up to 384 mixed pollen samples simultaneously, thereby omitting drawbacks of previously established methods. We furthermore enhanced the database used for plant taxa identification based on HTS data. Additionally, our method should be easily adaptable to sample analysis of mixed plant origin in other research fields.
Availability of supporting dataThe data set supporting the results of this article are in the EBI-SRA repository, under the project accession number PRJEB8640. Data on regional flora has been retrieved from http://bayernflora.de for Bavaria (accessed on: 2015/01/24) and from http://bison.usgs.ornl.gov/ for the USA (accessed on 2015/04/02). The database update, scripts and information on how to use it with the RDP classifier or UTAX are provided at http://www.dna-ana-lytics.biozentrum.uni-wuerzburg.de and https://github.com/iimog/meta-barcoding-dual-indexing.
AbbreviationsHTS: high throughput sequencing; ITS2: internal transcribed spacer 2; Tm: melting temperature.
Authors’ contributionsWS designed the new primers, participated in laboratory work, undertook data analysis and drafted the manuscript. MJA performed the database update, scripted the workflow with RDP classifier and UTAX and performed taxonomic classification. GG performed most of the laboratory work. AH, SH and ISD participated in the study design. AH and JL provided the pollen sam‑ples. AK conceived the study, performed bioinformatic processing and helped drafting the manuscript. All authors read and approved the final manuscript.
AcknowledgementsThis work was financially supported by the DFG Collaborative Research Center 1047, Insect Timing. MJA was further supported by a PhD fellowship from the Graduate School of Life Sciences of the University of Würzburg. We are highly grateful to the staff from the Department of Human Genetics (University of Würzburg, Germany), especially S. Rost for granting us access to the Illumina MiSeq device. Further thanks go to F. Förster (Department of Bioinformatics, University of Würzburg, Germany) for help with the ITS2 database update. We also thank P. Schloss (University of Michigan, USA) for initial advice on primer design.
Compliance with ethical guidelines
Competing interestsThe authors declare that they have no competing interests.
Received: 15 April 2015 Accepted: 25 June 2015
References 1. Carvell C, Westrich P, Meek WR, Pywell RF, Nowakowski M (2006) Assess‑
ing the value of annual and perennial forage mixtures for bumblebees by direct observation and pollen analysis. Apidologie 37:326–340
2. Köppler K, Vorwohl G, Koeniger N (2007) Comparison of pollen spectra collected by four different subspecies of the honey bee Apis mellifera. Apidologie 38:341–353
3. Behl M, Horn H, Schwabe A (2008) Analysis of pollen loads in a wild bee community (Hymenoptera: Apidae)—a method for elucidating habitat use and foraging distances. Apidologie 39:456–467
4. Williams NM, Kremen C (2007) Resource distributions among habitats determine solitary bee offspring production in a mosaic landscape. Ecol Appl 17:910–921
5. Krupke CH, Hunt GJ, Eitzer BD, Andino G, Given K (2012) Multiple routes of pesticide exposure for honey bees living near agricultural fields. PLoS One 7:e29268
6. Mullins J, Emberlin J (1997) Sampling pollens. J Aerosol Sci 28:365–370 7. Keller A, Danner N, Grimmer G, Ankenbrand M, von der Ohe K, von der
Ohe W et al (2015) Evaluating multiplexed next‑generation sequencing as a method in palynology for mixed pollen samples. Plant Biol 17:558–566
8. Galimberti A, De Mattia F, Bruni I, Scaccabarozzi D, Sandionigi A, Barbuto M et al (2014) A DNA barcoding approach to characterize pollen col‑lected by honeybees. PLoS One 9:e109363
Additional files
Additional file 1: Plant species documented near solitary bee nest sites.
Additional file 2: Table S1. Comparison of the number of genera per order for all orders.
Additional file 3: Table S2. Comparison of the number of sequences per group for selected taxonomic groups.

Page 9 of 9Sickel et al. BMC Ecol (2015) 15:20
9. Bruni I, Galimberti A, Caridi L, Scaccabarozzi D, De Mattia F, Casiraghi M et al (2015) A DNA barcoding approach to identify plant species in multiflower honey. Food Chem 170:308–315
10. Parducci L, Suyama Y, Lascoux M, Bennett KD (2005) Ancient DNA from pollen: a genetic record of population history in Scots pine. Mol Ecol 14:2873–2882
11. Bennett KD, Parducci L (2006) DNA from pollen: principles and potential. Holocene 16:1031–1034
12. Wilson EE, Sidhu CS, LeVan KE, Holway DA (2010) Pollen foraging behav‑iour of solitary Hawaiian bees revealed through molecular pollen analysis. Mol Ecol 19:4823–4829
13. Richardson RT, Lin C‑H, Sponsler DB, Quijia JO, Goodell K, Johnson RM (2015) Application of ITS2 metabarcoding to determine the provenance of pollen collected by honey bees in an agroecosystem. Appl Plant Sci 3:1400066
14. Kraaijeveld K, de Weger LA, Ventayol García M, Buermans H, Frank J, Hiem‑stra PS et al (2015) Efficient and sensitive identification and quantification of airborne pollen using next‑generation DNA sequencing. Mol Ecol Resour 15:8–16
15. Valentini A, Miquel C, Taberlet P (2010) DNA barcoding for honey biodi‑versity. Diversity 2:610–617
16. Kozich JJ, Westcott SL, Baxter NT, Highlander SK, Schloss PD (2013) Development of a dual‑index sequencing strategy and curation pipeline for analyzing amplicon sequence data on the MiSeq Illumina sequencing platform. Appl Environ Microbiol 79:5112–5120
17. Chen S, Yao H, Han J, Liu C, Song J, Shi L et al (2010) Validation of the ITS2 region as a novel DNA barcode for identifying medicinal plant species. PLoS One 5:e8613
18. Gathmann A, Tscharntke T (2002) Foraging ranges of solitary bees. J Anim Ecol 71:757–764
19. Praz CJ, Müller A, Dorn S (2008) Host recognition in a pollen‑specialist bee: evidence for a genetic basis. Apidologie 39:547–557
20. Edgar RC (2013) UPARSE: highly accurate OTU sequences from microbial amplicon reads. Nat Methods 10:996–998
21. Wang Q, Garrity GM, Tiedje JM, Cole JR (2007) Naive Bayesian classifier for rapid assignment of rRNA sequences into the new bacterial taxonomy. Appl Environ Microbiol 73:5261–5267
22. White TJ, Bruns T, Lee S, Taylor JW (1990) Amplification and direct sequencing of fungal ribosomal RNA genes for phylogenetics. In: Innis MA, Gelfand DH, Sninsky JJ, White TJ (eds) PCR protocols: a guide to methods and applications. Academic Press, New York, pp 315–322
23. Fierer N, Hamady M, Lauber CL, Knight R (2008) The influence of sex, handedness, and washing on the diversity of hand surface bacteria. Proc Natl Acad Sci USA 105:17994–17999
24. Caporaso JG, Kuczynski J, Stombaugh J, Bittinger K, Bushman FD, Costello EK et al (2010) QIIME allows analysis of high‑throughput community sequencing data. Nat Methods 7:335–336
25. Edgar RC (2010) Search and clustering orders of magnitude faster than BLAST. Bioinformatics 26:2460–2461
26. R Core Team (2014) R: A language and environment for statistical com‑puting. Vienna, Austria. http://www.R‑project.org/
27. McMurdie PJ, Holmes S (2013) Phyloseq: an R package for reproducible interactive analysis and graphics of microbiome census data. PLoS One 8:e61217
28. Dixon P (2003) VEGAN, a package of R functions for community ecology. J Veg Sci 14:927–930
29. Keller A, Schleicher T, Schultz J, Müller T, Dandekar T, Wolf M (2009) 5.8S‑28S rRNA interaction and HMM‑based ITS2 annotation. Gene 430:50–57
30. Koetschan C, Förster F, Keller A, Schleicher T, Ruderisch B, Schwarz R et al (2010) The ITS2 Database III–sequences and structures for phylogeny. Nucleic Acids Res 38(Database issue):D275–D279
31. Benson DA, Cavanaugh M, Clark K, Karsch‑Mizrachi I, Lipman DJ, Ostell J et al (2013) GenBank. Nucleic Acids Res 41(Database issue):D36–D42
32. Sayers EW, Barrett T, Benson DA, Bolton E, Bryant SH, Canese K et al (2011) Database resources of the national centre for biotechnology information. Nucleic Acids Res 39(suppl 1):D38–D51
33. Altschul SF, Gish W, Miller W, Myers EW, Lipman DJ (1990) Basic local alignment search tool. J Mol Biol 215:403–410
34. Soininen EM, Valentini A, Coissac E, Miquel C, Gielly L, Brochmann C et al (2009) Analysing diet of small herbivores: the efficiency of DNA barcod‑ing coupled with high‑throughput pyrosequencing for deciphering the composition of complex plant mixtures. Front Zool 6:16
35. Valentini A, Miquel C, Nawaz MA, Bellemain E, Coissac E, Pompanon F et al (2009) New perspectives in diet analysis based on DNA barcoding and parallel pyrosequencing: the trnL approach. Mol Ecol Resour 9:51–60
36. Gugerli F, Parducci L, Petit RJ (2004) Ancient plant DNA: review and pros‑pects. New Phytol 166:409–418
37. Behling H, Pillar VD, Orlóci L, Bauermann SG (2004) Late Quaternary Arau‑caria forest, grassland (Campos), fire and climate dynamics, studied by high‑resolution pollen, charcoal and multivariate analysis of the Cambará do Sul core in southern Brazil. Palaeogeogr Palaeoclimatol Palaeoecol 203:277–297
38. Davies AL, Tipping R (2004) Sensing small‑scale human activity in the palaeoecological record: fine spatial resolution pollen analyses from Glen Affric, northern Scotland. Holocene 14:233–245
39. Woolfe M, Primrose S (2004) Food forensics: using DNA technology to combat misdescription and fraud. Trends Biotechnol 22:222–226
Submit your next manuscript to BioMed Centraland take full advantage of:
• Convenient online submission
• Thorough peer review
• No space constraints or color figure charges
• Immediate publication on acceptance
• Inclusion in PubMed, CAS, Scopus and Google Scholar
• Research which is freely available for redistribution
Submit your manuscript at www.biomedcentral.com/submit

Part II Publications
P.3 Standard method for identification of bee pollen
mixtures through meta-barcoding
Authors:
Wiebke Sickel*, Markus J. Ankenbrand*, Gudrun Grimmer, Frank Forster,Ingolf Steffan-Dewenter, Alexander Keller
*Equally contributing first authors
in press
Book: COLOSS BeeBook
Volume: III
©Copyright by the authors
26

Standard method for identification of bee pollen mixtures through meta-barcoding Wiebke Sickel1,*, Markus J Ankenbrand1,*, Gudrun Grimmer1, Frank Förster2, Ingolf Steffan-Dewenter1, Alexander Keller1 1Department of Animal Ecology and Tropical Biology, Biocenter, University of Würzburg, Am Hubland, 97074 Würzburg, Germany 2Department of Bioinformatics, Biocenter, University of Würzburg, Am Hubland, 97074 Würzburg, Germany *equally contributing
Table of contents 1. Introduction 3. Bioinformatics 2. Meta-barcoding protocol 3.1. Required software 2.1 Required materials 3.2. Classification 2.1.1. Reagents 3.2.1. Reference database 2.1.2. Laboratory equipment 3.2.2. Preparation and classification
of sequencing data
2.2. Pollen acquisition 4. Data analysis 2.3. Laboratory workflow 4.1. Required software 2.3.1. DNA extraction 4.2. Prepare sample meta-data 2.3.2. Amplification 4.3. Importing data 2.3.2.1. 96-well PCR sample design 4.4. Recommended packages for
further analysis
2.3.3. Normalisation 5. Acknowledgments 2.3.4. Quality control and quantification 6. References 2.3.4.1. Bioanalyzer 2.3.4.2. Quantification 2.3.5. Sequencing 2.3.5.1. Sample library 2.3.5.2. PhiX control 2.3.5.3. Preparing reagent cassette and
loading the sample
Summary Traditional pollen analysis via light microscopy has limitations in sample throughput as well as taxonomic resolution. Recently, pollen meta-barcoding methods have been developed as alternative approaches, where plant species identification of pollen grains works via DNA sequencing. However, these utilise different genetic markers and sequencing platforms lessening study comparability. We here describe a detailed protocol of the latest development in this field as a standard method for pollen meta-barcoding. It is highly cost-efficient, requires no palynological knowledge, is performable in standard laboratories and profits from a well-established reference database. Key words Apis mellifera, BEEBOOK, COLOSS, honey bee, Illumina MiSeq platform, ITS2, laboratory protocol, next generation sequencing, palynology, pollination ecology
Short title: Pollen meta-barcoding
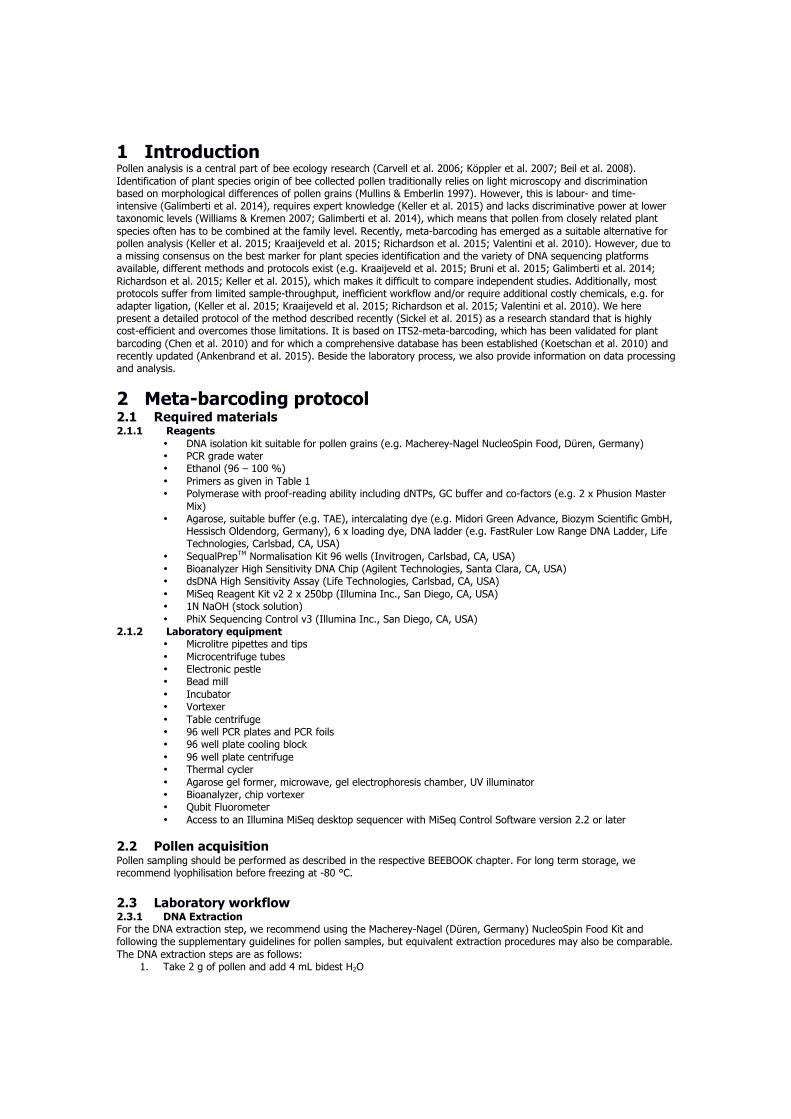
1 Introduction Pollen analysis is a central part of bee ecology research (Carvell et al. 2006; Köppler et al. 2007; Beil et al. 2008). Identification of plant species origin of bee collected pollen traditionally relies on light microscopy and discrimination based on morphological differences of pollen grains (Mullins & Emberlin 1997). However, this is labour- and time-intensive (Galimberti et al. 2014), requires expert knowledge (Keller et al. 2015) and lacks discriminative power at lower taxonomic levels (Williams & Kremen 2007; Galimberti et al. 2014), which means that pollen from closely related plant species often has to be combined at the family level. Recently, meta-barcoding has emerged as a suitable alternative for pollen analysis (Keller et al. 2015; Kraaijeveld et al. 2015; Richardson et al. 2015; Valentini et al. 2010). However, due to a missing consensus on the best marker for plant species identification and the variety of DNA sequencing platforms available, different methods and protocols exist (e.g. Kraaijeveld et al. 2015; Bruni et al. 2015; Galimberti et al. 2014; Richardson et al. 2015; Keller et al. 2015), which makes it difficult to compare independent studies. Additionally, most protocols suffer from limited sample-throughput, inefficient workflow and/or require additional costly chemicals, e.g. for adapter ligation, (Keller et al. 2015; Kraaijeveld et al. 2015; Richardson et al. 2015; Valentini et al. 2010). We here present a detailed protocol of the method described recently (Sickel et al. 2015) as a research standard that is highly cost-efficient and overcomes those limitations. It is based on ITS2-meta-barcoding, which has been validated for plant barcoding (Chen et al. 2010) and for which a comprehensive database has been established (Koetschan et al. 2010) and recently updated (Ankenbrand et al. 2015). Beside the laboratory process, we also provide information on data processing and analysis.
2 Meta-barcoding protocol 2.1 Required materials 2.1.1 Reagents
• DNA isolation kit suitable for pollen grains (e.g. Macherey-Nagel NucleoSpin Food, Düren, Germany) • PCR grade water • Ethanol (96 – 100 %) • Primers as given in Table 1 • Polymerase with proof-reading ability including dNTPs, GC buffer and co-factors (e.g. 2 x Phusion Master
Mix) • Agarose, suitable buffer (e.g. TAE), intercalating dye (e.g. Midori Green Advance, Biozym Scientific GmbH,
Hessisch Oldendorg, Germany), 6 x loading dye, DNA ladder (e.g. FastRuler Low Range DNA Ladder, Life Technologies, Carlsbad, CA, USA)
• SequalPrepTM Normalisation Kit 96 wells (Invitrogen, Carlsbad, CA, USA) • Bioanalyzer High Sensitivity DNA Chip (Agilent Technologies, Santa Clara, CA, USA) • dsDNA High Sensitivity Assay (Life Technologies, Carlsbad, CA, USA) • MiSeq Reagent Kit v2 2 x 250bp (Illumina Inc., San Diego, CA, USA) • 1N NaOH (stock solution) • PhiX Sequencing Control v3 (Illumina Inc., San Diego, CA, USA)
2.1.2 Laboratory equipment • Microlitre pipettes and tips • Microcentrifuge tubes • Electronic pestle • Bead mill • Incubator • Vortexer • Table centrifuge • 96 well PCR plates and PCR foils • 96 well plate cooling block • 96 well plate centrifuge • Thermal cycler • Agarose gel former, microwave, gel electrophoresis chamber, UV illuminator • Bioanalyzer, chip vortexer • Qubit Fluorometer • Access to an Illumina MiSeq desktop sequencer with MiSeq Control Software version 2.2 or later
2.2 Pollen acquisition Pollen sampling should be performed as described in the respective BEEBOOK chapter. For long term storage, we recommend lyophilisation before freezing at -80 °C. 2.3 Laboratory workflow 2.3.1 DNA Extraction For the DNA extraction step, we recommend using the Macherey-Nagel (Düren, Germany) NucleoSpin Food Kit and following the supplementary guidelines for pollen samples, but equivalent extraction procedures may also be comparable. The DNA extraction steps are as follows:
1. Take 2 g of pollen and add 4 mL bidest H2O

2. Homogenise the sample with an electronic pestle 3. Take 200 µL (~50 mg pollen) of the emulsion and grind it in a bead mill 4. Add 400 µL Buffer CF (preheated to 65 °C) and 10µL Proteinase K and mix carefully 5. Incubate at 65°C for 30 min 6. Centrifuge the mixture for 10 min (>10,000 x g) 7. Transfer the supernatant into a new microcentrifuge tube and add 1 vol Buffer C4 and 1 vol ethanol 8. Vortex for 30 s 9. Pipette 700 µL mixture onto a NucleoSpin Food Column placed in a Collection Tube 10. Centrifuge for 1 min at 11,000 x g 11. Discard the flow-through 12. Repeat steps 9-11 13. Add 400 µL Buffer CQW onto the spin column 14. Centrifuge for 1 min at 11,000 x g 15. Discard the flow-through 16. Add 700 µL Buffer C5 onto the spin column 17. Centrifuge for 1 min at 11,000 x g 18. Discard the flow-through 19. Add 200 µL Buffer C5 onto the spin column 20. Centrifuge for 2 min at 11,000 x g 21. Place the spin column into a new 1.5 mL microcentrifuge tube 22. Add 100 µL Elution Buffer CE (pre-heated to 70 °C) onto the membrane 23. Incubate for 5 min at room temperature (18-25 °C) 24. Centrifuge for 1 min a 11,000 x g 25. Proceed with amplification or keep frozen until further processing
2.3.2 Amplification This protocol utilises a dual-indexing strategy (Kozich et al. 2013) amplifying the ITS2 region, using the primers ITS-S2F (Chen et al. 2010) and ITS4R (White et al. 1990). The primer sequences are as follows: forward: 5’-AATGATACGGCGACCACCGAGATCTACAC XXXXXXXX CCTGGTGCTG GT ATGCGATACTTGGTGTGAAT-3’; reverse: 5’-CAAGCAGAAGACGGCATACGAGAT XXXXXXXX AGTCAGTCAG CC TCCTCCGCTTATTGATATGC-3’, where XXXXXX indicates the variable index sequences (Table 1). The detailed protocol is described below:
1. Sample index combinations should be planned beforehand according to the scheme in Figure 1 2. Prepare 3 x 10 µL reaction mixes for each sample containing (also see PCR sample design 2.3.2.1 below for
details): • 5 µL 2 x Phusion Master Mix (New England Biolabs, Ipswich, MA, USA) or equivalent • 0.33 µM each of the forward and reverse primers (sample-specific combinations of forward and reverse
index sequences) • 3.34 µL PCR grade water • 1 µL DNA template
3. Carry out the PCR with a programme of: • 95 °C for 4 min., then • 37 cycles of 95 °C for 40 sec.; • 49 °C for 40 sec.; • 72 °C for 40 sec. and • a final extension at 72°C for 5 min.
4. Combine the triplicate PCR reactions of each sample and mix well. For quality control purposes, successful amplification can be checked on a 1 % agarose gel using 5 µL of the combined PCR product. 2.3.2.1 96-well PCR sample design Design 1: Well-equipped laboratories with pipetting robots or 96-channel pipettes can directly fill each well with a different sample and generate three replicates of these. This will result in 4 x 3 replicate 96-well plates according to Figure 1 used for amplification. After amplification one can proceed with 2.3.3. Normalisation. Design 2: For laboratories with little equipment for automated pipetting, the workflow described above is impractical, since manual pipetting in that format is time-intensive and pipetting errors can be easily introduced. To facilitate the process, we recommend to work with all triplicates but only 24 samples on one 96 well plate (Figure 2). This way, 16 PCR plates will be produced, but pipetting effort is minimized. PCR plate labelling is therefore of utter importance, for example with roman numbers, I – XVI to be able to map the samples back to the scheme in Figure 1. The complete workflow is shown schematically in Figure 2 and described in the following:
1. Prepare two PCR master mixes, each containing one forward primer, corresponding to the samples you want to amplify; each master mix contains: • 200 µL 2 x Phusion Master Mix (New England Biolabs, Ipswich, MA, USA) or equivalent • 13.2 µL forward primer • 133.6 µL PCR grade water
2. Place a new PCR plate into a cooling block

3. Distribute 26 µL of the master mixes into row A (Master Mix 1) and F (Master Mix 2) 4. Add 1 µL of the correct reverse primer 5. Add 3 µL of the correct DNA template 6. Using a pipette set to 10 µL, pipette up and down to mix and distribute 10 µL each into the two rows below:
from row A into rows B + C; from row F into rows G +H 7. Seal with a foil, spin down briefly 8. Perform PCR 9. Prepare a 1 % agarose gel 10. After PCR, briefly spin down again 11. Lift the foil carefully and combine the triplicate reactions, pipette up and down to mix 12. For gel electrophoresis, add 1 µL of 6x loading buffer into the so far unused rows D + E 13. Add 5 µL PCR product to the loading buffer 14. Briefly spin down 15. Load the gel, add a DNA ladder 16. Run the gel (e.g. 25 min, 120 V) 17. Check under UV illuminator for successful PCR amplification 18. Freeze PCR product until further processing
2.3.3 Normalisation To ensure more equalised library sizes, DNA amounts in each PCR product are normalised using the SequalPrepTM Normalisation Kit (Invitrogen, Carlsbad, CA, USA). For 384 samples, four normalisation plates are needed. After normalisation, samples from each plate will be combined in ‘plate pools’ for the following quality control.
Design 1: Pool the samples of all three replicates together by keeping the sample scheme. Transfer 25 µL of PCR products onto the Normalisation plates. Proceed with the normalisation as described below. Design 2: For normalisation, PCR plates I – IV; V – VIII; IX – XII and XIII – XVI will be combined to Normalisation Plates 1, 2, 3 and 4. The pipetting scheme is as follows:
1. Thaw the PCR plates 2. Briefly spin down 3. Use four Normalisation plates and add 25 µL of PCR product into the wells following this scheme: • Normalisation Plate 1: PCR plates I –IV • PCR plate I: row A à row A; row F à row B • PCR plate II: row A à row C; row F à row D • PCR plate III: row A à row E; row F à row F • PCR plate IV: row A à row G; row F à row H
• Repeat analogous for the other three Normalisation Plates • Proceed with the normalisation as described below.
Design 1 & 2: Continue for both designs with the normalization:
1. Add 25 µL of Binding buffer 2. Mix by pipetting up and down or seal the plate with foil tape, vortex to mix and briefly centrifuge the plate 3. Incubate for 1 hour at room temperature; alternatively leave to incubate overnight 4. Aspirate liquid from wells, do not scrape the well sides 5. Add 50 µL Wash buffer, mix by pipetting up and down 6. Completely aspirate the buffer from wells, you may need to invert and tap the plate on paper towels 7. Add 20 µL of Elution buffer 8. Mix by pipetting up and down or seal the plate with foil tape, vortex and briefly spin down 9. Incubate for 5min at room temperature 10. Combine 5 µL of each sample (plate-wise) in a new microcentrifuge tube, mix well 11. Prepare 1:10 dilutions of each plate pool
2.3.4 Quality control and quantification Quality control is performed on a Bioanalyzer High Sensitivity DNA Chip (Agilent Technologies, Santa Clara, CA, USA) to ensure that the correct fragment size (peak at approximately 450bp; target plus adapters) has been amplified. Additionally, libraries are quantified using the dsDNA High Sensitivity Assay on the Qubit fluorometer (both Life Technologies GmbH, Darmstadt, Germany) in order to combine the four plate pools equimolarly to the final sequencing library. We recommend preparing three independent concentration measurements per plate pool. 2.3.4.1 Bioanalyzer
1. Prepare a Bioanalyzer Chip according to the protocol 2. Allow all reagents to equilibrate to room temperature 3. If not ready, prepare a gel-dye mix: 4. Add 15 µL of the dye concentrate (blue lid) to a gel matrix vial (red lid) 5. Vortex well and spin down, transfer to spin filter

6. Centrifuge at 2240 x g for 10 min 7. Protect solution from light, store at 4 °C, use within 6 weeks 8. Put a new chip on the chip priming station 9. Pipette 9 µL gel-dye mix into the well marked with a white ‘G’ 10. Close the chip priming station, with the plunger at position 1mL 11. Press plunger until held by the clip 12. Wait for 60 s then release clip 13. After 5 s slowly pull back the plunger to the 1mL position 14. Open the priming station, pipette 9 mL gel-dye mix in the wells marked with black ‘G’s 15. Pipette 5 µL marker (green lid) into all sample wells and the ladder wells 16. Pipette 1 µL of ladder (yellow lid) in the well marked with a ladder symbol 17. In each sample well, pipette 1 µL of sample (concentrated and diluted Plate pools) or 1 µL marker (unused
wells) 18. Put the chip horizontally in the adapter and vortex for 1 min at 2400 rpm 19. Run the chip within 5 min 20. The samples are of sufficient quality, if the electropherograms show a single peak at approximately 450bp; this
peak can be rather wide due to different lengths of the ITS2 region, a minor peak shortly after the lower marker is acceptable and corresponds to left-over primer dimers, which will not interfere with sequencing
2.3.4.2 Quantification 21. Measure concentrations of plate pools with the dsDNA High Sensitivity Assay on the Qubit Fluorometer 22. Mix 1 x n µL Qubit reagent with 199 x n µL Qubit buffer (working solution) 23. For each measurement, mix 180-199 µL working solution with 1-20 µL sample 24. Vortex and incubate at room temperature for 2 min 25. Combine plate pools to final library equimolarly, starting with the least concentrated library of which take 20 µL 26. Quantify the final pool and dilute to 2 nM, if final pool contains less than 2nM proceed without dilution
2.3.5 Sequencing For library dilution, we follow the Illumina Sample Preparation Guide for a 2 nM library, with some modifications. In order to increase read quality, 5 % PhiX control is added to the sample library. Additionally, the reagent cassette of the sequencing kit (e.g. Illumina MiSeq Reagent Kit v2 2x250bp) is spiked with the custom Read1, Read2 and index primers (for primer sequences, see Table 1). 2.3.5.1 Sample library
1. Remove Buffer HT1 from freezer 2. Prepare a fresh dilution of 0.15 N NaOH (less than a week old) 3. Mix 5µL of the sample library with 5 µL of 0.15 N NaOH 4. Vortex briefly and centrifuge at 280 x g for 1 min 5. Incubate at room temperature for 5 min 6. Add 990 µL Buffer HT1 (10 pM library) 7. Mix 480 µL of 10 pM library and 120 µL Buffer HT1 (8 pM library)
2.3.5.2 PhiX control
1. Thaw PhiX control at room temperature 2. Mix 2 µL 10 nM PhiX control with 3 µL H2O (4 nM PhiX) 3. Add 5 µL 0.15 N NaOH 4. Vortex briefly and centrifuge at 280 x g for 1 min 5. Incubate at room temperature for 5 min 6. Add 990 µL Buffer HT1 (20 pM PhiX) 7. Mix 375 µL of 20 pM PhiX and 225 µL Buffer HT1 (12.5 pM PhiX) 8. Mix 570 µL 8 pM library with 30 µL 12.5 pM PhiX
2.3.5.3 Preparing reagent cassette and loading the sample
1. Remove the reagent cassette from the freezer 2. Place in water bath, do not fill higher than maximum water line 3. Prepare 3 µL each of Read1, Read2 and index primers in new microcentrifuge tubes 4. Remove cassette from water bath, dry with paper towel 5. Invert the cassette several times to mix 6. Inspect wells, make sure all reagents are thawed and there are no precipitates 7. Gently tap the cassette on the bench to remove air bubbles 8. With a 1000 µL pipette tip, break the foils over wells 12-14 and well 17 9. With a 100 µL pipette set to 75 µL, transfer the read and index primers to the following wells of the reagent
cartridge: Read1 à Well 12; Index à Well 13; Read2 à Well14, mix well by pipetting up and down 10. Load 600 µL of the spiked library to well 17 11. Load the cassette, PR2 bottle and flow cell as prompted by the instrument 12. Sequence

3 Bioinformatics 3.1 Required software
• up to date Linux or Unix-based OS • fastq-join, version 1.01.759, (Aronesty 2011), if necessary add location to your system PATH • usearch, version 8.0.1477, (Edgar 2010), , if necessary add location to your system PATH • RDPclassifier, version 2.10.2, (Wang et al. 2007), installed to <path_to_RDPTools>
3.2 Classification 3.2.1 Reference database
1. Download reference datasets and training data of Viridiplantae for UTAX or RDPclassifier from http://www.dna-analytics.biozentrum.uni-wuerzburg.de/molecular_biodiversity_group/downloads or https://github.com/iimog/meta-barcoding-dual-indexing.
Alternatively a reference dataset can specifically created and used to train a classifier, if only a limited set of taxa is of interest (not recommended, but faster). Detailed instructions and scripts are available at: https://github.com/iimog/meta-barcoding-dual-indexing. The steps are:
1. Download/create a fasta file containing ITS2 sequences with gene identifier (gi) as header (e.g. from the ITS2-database (Schultz et al. 2006)
2. Assign taxonomy based on the NCBI TaxID (Federhen 2012) of the gi using the supplied scripts 3. Create specific training files for the classifier of choice using the supplied scripts
3.2.2 Preparation and classification of sequencing data The sequence reads created in step 2.3.5 have to be joined, quality filtered and classified. This can be automatically done with the script classify_reads.pl at https://github.com/iimog/meta-barcoding-dual-indexing. For this purpose
1. copy all R1 and R2 fastq files into a single folder 2. copy reference database folder (utax_trained and/or rdp_trained) from 3.2.1 to this folder 3. navigate on the shell to this folder 4.a execute UTAX based classification (fast): perl classify_reads.pl --out results *.fastq\ --utax-db utax_trained/viridiplantae_all_2014.utax.udb\ --utax-taxtree utax_trained/viridiplantae_all_2014.utax.tax
Alternatively you may: 4.b execute RDP based classification together (slow):
perl classify_reads.pl --out results *.fastq\ --noutax\ --rdp --rdp-jar <path_to_RDPTools>/classifier.jar\ --rdp-train-propfile rdp_trained/its2.properties
This performs the following steps in an automatic procedure:
1. Join the paired reads using fastq-join (Aronesty 2011) 2. Perform Q20 quality filtering and length filtering with usearch (Edgar 2010) and the fastq_filter subcommand
(-fastq_truncqual 19, -fastq_minlen 150) 3.a If specified, run usearch (Edgar 2010) with the utax subcommand and training data from step 3.2.1 3.b If specified, run RDPclassifier (Wang et al. 2007) with the training data from step 3.2.1 4. Discard assignments below a bootstrap/rawscore threshold 5. Count the number of reads per taxon of each sample 6. Aggregates the taxon counts for each sample in a common matrix 7. Separates the taxonomic information from the counts
This procedure will end with the following files: a otu_table.txt, a tax_table.txt (one out_table and one tax_table for rdp and utax each) and a mapfile.tsv file for further analysis with phyloseq (McMurdie & Holmes 2013). In addition also the results of the intermediate steps are retained in the subfolders joined, filtered, count and utax or rdp. Those can be used for troubleshooting, archiving or further analyses.
4. Data analysis 4.1 Required software
• up to date R distribution (R Core Team 2014) • R package: phyloseq (McMurdie & Holmes 2013); https://joey711.github.io/phyloseq

4.2 Prepare sample meta-data The generated “mapfile.tsv” is already structured in a format that is adequate to import the sample information into R. This is the file where sample meta-information must be deposited. For example continuous vectors like “altitude” or “temperature” or categorical factors as “bee species” or “site” can be used. For this, open the file with your preferred text-editor or spreadsheet application and add columns according to the sampling design. Save the file again in tab-separated format.
4.3 Importing data The data generated in 3. can be directly imported into R as a phyloseq class object. This allows a variety of analytical procedures and is recommended. However, other software tools handling community datasets may be equally well used for the task of analyses. The following are R scripts, that can be directly used on the console:
1. library(phyloseq) # load the package 2. setwd("<path_to_data>") # set the folder where data is located 3. data <- otu_table(read.table("utax_otu_table.txt"), taxa_are_rows=T)
# import community data, replace utax with rdp if adequate.
4. data.tax <- tax_table(as.matrix(read.table("utax_tax_table.txt", fill=T, header=T, sep="\t", row.names=1))) # import taxonomy information of pollen
5. data.map <- import_qiime_sample_data("mapfile.tsv") # import sample meta-data 6. data <- merge_phyloseq(data.otu, data.tax, data.map) # create phyloseq object
Relativize and filter rare taxa below 0.1 %. This is recommended but not necessary.
7. data.rel = transform_sample_counts(data, function(x) x/sum(x)) 8. otu_table(data)[otu_table(data.rel)<0.001]<-0 9. otu_table(data.rel)[otu_table(data.rel)<0.001]<-0 10. data = prune_taxa(taxa_sums(data)>0, data) 11. data = prune_taxa(taxa_sums(data)>0, data)
After completion of the tasks above, the dataset is in a condition where individual analyses can be started. The tutorials at the repository of phyloseq ((McMurdie & Holmes 2013); https://joey711.github.io/phyloseq) provide a good starting point for this.
4.4 Recommended packages for further analysis Whilst phylseq provides basic tools suited for most purposes, the modularity of R packages allows a variety of more and deeper analyses. It is not possible to discuss all the features here, yet we provide a list some of the major packages relevant for community ecology and pollination studies:
• vegan: comprehensive community ecology package • picante: phylogenetic diversity indices • bipartite: interaction network ecology • edgeR: tests and logFC to investigate differential distributions of taxa between samples
5. Acknowledgements This work was financially supported by the DFG Collaborative Research Center 1047, Insect Timing. MJA was further supported by a grant of the German Excellence Initiative to the Graduate School of Life Sciences of the University of Würzburg. We are grateful to the members of the Departments of Animal Ecology and Tropical Biology; Bioinformatics; and Human Genetics, University of Würzburg, for constructive input on the design of the workflow. We additionally thank the Department of Human Genetics, especially S. Rost, for granting us access to the Illumina MiSeq device.
6. References
Ankenbrand, M.J. et al., 2015. The ITS2 database V -- Twice as much. Molecular Biology and Evolution, doi: 10.1093/molbev/msv174.
Aronesty, E., 2011. ea-utils: “Command-line tools for processing biological sequencing data.” Available at: http://code.google.com/p/ea-utils.
Beil, M., Horn, H. & Schwabe, A., 2008. Analysis of pollen loads in a wild bee community (Hymenoptera : Apidae) – a method for elucidating habitat use and foraging distances. Apidologie, 39, pp.456–467.
Bruni, I. et al., 2015. A DNA barcoding approach to identify plant species in multiflower honey. Food Chemistry, 170, pp.308–315.
Carvell, C. et al., 2006. Assessing the value of annual and perennial forage mixtures for bumblebees by direct observation and pollen analysis. Apidologie, 37(3), pp.326–340.
Chen, S. et al., 2010. Validation of the ITS2 region as a novel DNA barcode for identifying medicinal plant species. PloS one, 5(1), p.e8613.
Edgar, R.C., 2010. Search and clustering orders of magnitude faster than BLAST. Bioinformatics, 26(19), pp.2460–2461.
Federhen, S., 2012. The NCBI Taxonomy database. Nucleic acids research, 40(Database issue), pp.D136–43.
Galimberti, A. et al., 2014. A DNA barcoding approach to characterize pollen collected by honeybees. PloS one, 9(10), p.e109363.
Keller, A. et al., 2015. Evaluating multiplexed next-generation sequencing as a method in palynology for mixed pollen samples. Plant Biology, 17(2), pp.558–566.
Koetschan, C. et al., 2010. The ITS2 Database III--sequences and structures for phylogeny. Nucleic Acids Research, 38(Database issue), pp.D275–D279.
Köppler, K., Vorwohl, G. & Koeniger, N., 2007. Comparison of pollen spectra collected by four different subspecies of the honey bee Apis mellifera. Apidologie, 38, pp.341–353.
Kozich, J.J. et al., 2013. Development of a dual-index sequencing strategy and curation pipeline for analyzing amplicon sequence data on the MiSeq Illumina sequencing platform. Applied and Environmental Microbiology, 79(17), pp.5112–5120.
Kraaijeveld, K. et al., 2015. Efficient and sensitive identification and quantification of airborne pollen using next-generation DNA sequencing. Molecular Ecology Resources, 15, pp.8–16.
McMurdie, P.J. & Holmes, S., 2013. phyloseq: an R package for reproducible interactive analysis and graphics of microbiome census data. PloS one, 8(4), p.e61217.
Mullins, J. & Emberlin, J., 1997. Sampling pollens. Journal of Aerosol Science, 28(3), pp.365–370.
R Core Team, 2014. R: A language and environment for statistical computing.
Richardson, R.T. et al., 2015. Application of ITS2 metabarcoding to determine the provenance of pollen collected by honey bees in an agroecosystem. Applications in Plant Sciences, 3(1), p.1400066.
Schultz, J. et al., 2006. The internal transcribed spacer 2 database--a web server for (not only) low level phylogenetic analyses. Nucleic acids research, 34(Web Server issue), pp.W704–7.
Sickel, W. et al., 2015. Increased efficiency in identifying mixed pollen samples by meta-barcoding with a dual-indexing approach. BMC Ecology, 15(20).
Valentini, A., Miquel, C. & Taberlet, P., 2010. DNA barcoding for honey biodiversity. Diversity, 2, pp.610–617.
Wang, Q. et al., 2007. Naive Bayesian classifier for rapid assignment of rRNA sequences into the new bacterial taxonomy. Applied and Environmental Microbiology, 73(16), pp.5261–5267.
White, T.J. et al., 1990. Amplification and direct sequencing of fungal ribosomal RNA genes for phylogenetics. In M. A. Innis et al., eds. PCR Protocols: A Guide to Methods and Applications. New York: Academic Press, pp. 315–322.
Williams, N.M. & Kremen, C., 2007. Resource distributions among habitats determine solitary bee offspring production in a mosaic landscape. Ecological Applications, 17, pp.910–921.

Table 1: Primer Sequences with indexes SA501 – SB712 (adapted from Kozich et al. 2013); index sequences indicated in bold Forward Name Sequence SA501 AATGATACGGCGACCACCGAGATCTACAC ATCGTACG CCTGGTGCTG GT ATGCGATACTTGGTGTGAAT SA502 AATGATACGGCGACCACCGAGATCTACAC ACTATCTG CCTGGTGCTG GT ATGCGATACTTGGTGTGAAT SA503 AATGATACGGCGACCACCGAGATCTACAC TAGCGAGT CCTGGTGCTG GT ATGCGATACTTGGTGTGAAT SA504 AATGATACGGCGACCACCGAGATCTACAC CTGCGTGT CCTGGTGCTG GT ATGCGATACTTGGTGTGAAT SA505 AATGATACGGCGACCACCGAGATCTACAC TCATCGAG CCTGGTGCTG GT ATGCGATACTTGGTGTGAAT SA506 AATGATACGGCGACCACCGAGATCTACAC CGTGAGTG CCTGGTGCTG GT ATGCGATACTTGGTGTGAAT SA507 AATGATACGGCGACCACCGAGATCTACAC GGATATCT CCTGGTGCTG GT ATGCGATACTTGGTGTGAAT SA508 AATGATACGGCGACCACCGAGATCTACAC GACACCGT CCTGGTGCTG GT ATGCGATACTTGGTGTGAAT SB501 AATGATACGGCGACCACCGAGATCTACAC CTACTATA CCTGGTGCTG GT ATGCGATACTTGGTGTGAAT SB502 AATGATACGGCGACCACCGAGATCTACAC CGTTACTA CCTGGTGCTG GT ATGCGATACTTGGTGTGAAT SB503 AATGATACGGCGACCACCGAGATCTACAC AGAGTCAC CCTGGTGCTG GT ATGCGATACTTGGTGTGAAT SB504 AATGATACGGCGACCACCGAGATCTACAC TACGAGAC CCTGGTGCTG GT ATGCGATACTTGGTGTGAAT SB505 AATGATACGGCGACCACCGAGATCTACAC ACGTCTCG CCTGGTGCTG GT ATGCGATACTTGGTGTGAAT SB506 AATGATACGGCGACCACCGAGATCTACAC TCGACGAG CCTGGTGCTG GT ATGCGATACTTGGTGTGAAT SB507 AATGATACGGCGACCACCGAGATCTACAC GATCGTGT CCTGGTGCTG GT ATGCGATACTTGGTGTGAAT SB508 AATGATACGGCGACCACCGAGATCTACAC GTCAGATA CCTGGTGCTG GT ATGCGATACTTGGTGTGAAT Reverse Name Sequence SA701 CAAGCAGAAGACGGCATACGAGAT AACTCTCG AGTCAGTCAG CC TCCTCCGCTTATTGATATGC SA702 CAAGCAGAAGACGGCATACGAGAT ACTATGTC AGTCAGTCAG CC TCCTCCGCTTATTGATATGC SA703 CAAGCAGAAGACGGCATACGAGAT AGTAGCGT AGTCAGTCAG CC TCCTCCGCTTATTGATATGC SA704 CAAGCAGAAGACGGCATACGAGAT CAGTGAGT AGTCAGTCAG CC TCCTCCGCTTATTGATATGC SA705 CAAGCAGAAGACGGCATACGAGAT CGTACTCA AGTCAGTCAG CC TCCTCCGCTTATTGATATGC SA706 CAAGCAGAAGACGGCATACGAGAT CTACGCAG AGTCAGTCAG CC TCCTCCGCTTATTGATATGC SA707 CAAGCAGAAGACGGCATACGAGAT GGAGACTA AGTCAGTCAG CC TCCTCCGCTTATTGATATGC SA708 CAAGCAGAAGACGGCATACGAGAT GTCGCTCG AGTCAGTCAG CC TCCTCCGCTTATTGATATGC SA709 CAAGCAGAAGACGGCATACGAGAT GTCGTAGT AGTCAGTCAG CC TCCTCCGCTTATTGATATGC SA710 CAAGCAGAAGACGGCATACGAGAT TAGCAGAC AGTCAGTCAG CC TCCTCCGCTTATTGATATGC SA711 CAAGCAGAAGACGGCATACGAGAT TCATAGAC AGTCAGTCAG CC TCCTCCGCTTATTGATATGC SA712 CAAGCAGAAGACGGCATACGAGAT TCGCTATA AGTCAGTCAG CC TCCTCCGCTTATTGATATGC SB701 CAAGCAGAAGACGGCATACGAGAT AAGTCGAG AGTCAGTCAG CC TCCTCCGCTTATTGATATGC SB702 CAAGCAGAAGACGGCATACGAGAT ATACTTCG AGTCAGTCAG CC TCCTCCGCTTATTGATATGC SB703 CAAGCAGAAGACGGCATACGAGAT AGCTGCTA AGTCAGTCAG CC TCCTCCGCTTATTGATATGC SB704 CAAGCAGAAGACGGCATACGAGAT CATAGAGA AGTCAGTCAG CC TCCTCCGCTTATTGATATGC SB705 CAAGCAGAAGACGGCATACGAGAT CGTAGATC AGTCAGTCAG CC TCCTCCGCTTATTGATATGC SB706 CAAGCAGAAGACGGCATACGAGAT CTCGTTAC AGTCAGTCAG CC TCCTCCGCTTATTGATATGC SB707 CAAGCAGAAGACGGCATACGAGAT GCGCACGT AGTCAGTCAG CC TCCTCCGCTTATTGATATGC SB708 CAAGCAGAAGACGGCATACGAGAT GGTACTAT AGTCAGTCAG CC TCCTCCGCTTATTGATATGC SB709 CAAGCAGAAGACGGCATACGAGAT GTATACGC AGTCAGTCAG CC TCCTCCGCTTATTGATATGC SB710 CAAGCAGAAGACGGCATACGAGAT TACGAGCA AGTCAGTCAG CC TCCTCCGCTTATTGATATGC SB711 CAAGCAGAAGACGGCATACGAGAT TCAGCGTT AGTCAGTCAG CC TCCTCCGCTTATTGATATGC SB712 CAAGCAGAAGACGGCATACGAGAT TCGCTACG AGTCAGTCAG CC TCCTCCGCTTATTGATATGC Index and Read Name Sequence Read1 CCTGGTGCTG GT ATGCGATACTTGGTGTGAAT Read2 AGTCAGTCAG CC TCCTCCGCTTATTGATATGC Index GCATATCAATAAGCGGAGGA GG CTGACTGACT
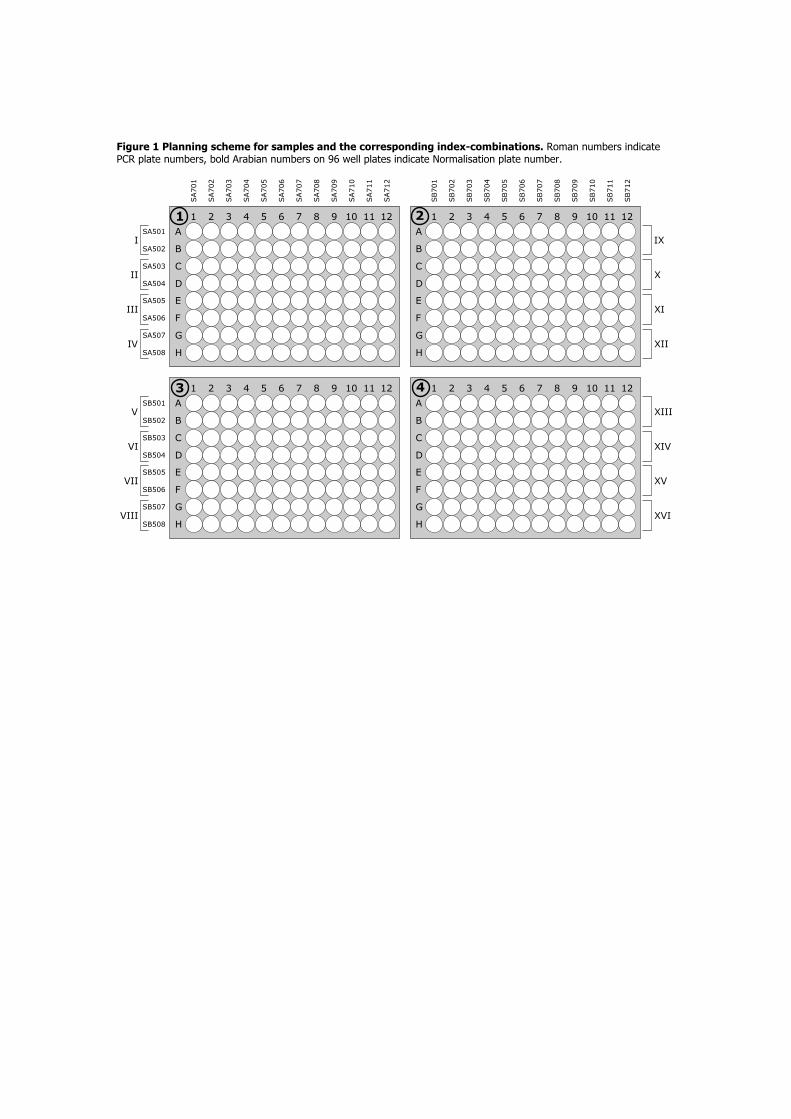
Figure 1 Planning scheme for samples and the corresponding index-combinations. Roman numbers indicate PCR plate numbers, bold Arabian numbers on 96 well plates indicate Normalisation plate number.
1 2 3 4 5 6 7 8 9 10 11 12A
B
C
D
E
F
G
H
1 2 3 4 5 6 7 8 9 10 11 12A
B
C
D
E
F
G
H
1 2 3 4 5 6 7 8 9 10 11 12A
B
C
D
E
F
G
H
1 2 3 4 5 6 7 8 9 10 11 12A
B
C
D
E
F
G
H
ISA501
SA502
SA503
SA504
SA505
SA506
SA507
SA508
SB501
SB502
SB503
SB504
SB505
SB506
SB507
SB508
SB712
SB711
SB710
SB709
SB708
SB707
SB706
SB705
SB704
SB703
SB702
SA711
SA710
SA709
SA708
SA707
SA706
SA705
SA704
SA703
SA702
SA701
SB701
SA712
1 2
43
II
III
IV
V
VI
VII
VIII XVI
XV
XIV
XIII
XII
XI
X
IX

Figure 2 Detailed workflow (schematic), suitable for laboratories with limited access to equipment for automated pipetting. Bold numbers indicated step number of Design 2 in sub-chapter 2.3.2.1
12
34
56
78
910
1112
A B C D E F G H12
)D
istr
ibut
e lo
adin
g dy
e
LDLD
LDLD
LDLD
LDLD
LDLD
LDLD LD
LDLD
LDLD
LDLD
LDLD
LDLD
LD12
34
56
78
910
1112
A B C D E F G H11
)Re-
com
bine
rep
licat
es
12
34
56
78
910
1112
A B C D E F G H13
)Add
P5µ
L CR p
rodu
ct for
ele
ctro
phor
esis
;le
ave
25µL
oin
reo
ws
A a
nd F
+5
µL+
5 µL
+5
µL+
5 µL
+5
µL+
5 µL
+5
µL+
5 µL
+5
µL+
5 µL
+5
µL+
5 µL
+5
µL+
5 µL
+5
µL+
5 µL
+5
µL+
5 µL
+5
µL+
5 µL
+5
µL+
5 µL
+5
µL+
5 µL
4)
Add
rev
erse
prim
ers
12
34
56
78
910
1112
A B C D E F G H
Rev11
Rev10
Rev9
Rev8
Rev7
Rev6
Rev5
Rev4
Rev3
Rev2
Rev1
Rev12
+1
µL+
1 µL
+1
µL+
1 µL
+1
µL+
1 µL
+1
µL+
1 µL
+1
µL+
1 µL
+1
µL+
1 µL
+1
µL+
1 µL
+1
µL+
1 µL
+1
µL+
1 µL
+1
µL+
1 µL
+1
µL+
1 µL
+1
µL+
1 µL1
23
45
67
89
1011
12A B C D E F G H
Fwd1
Fwd2
3)
Dis
trib
ute
Mas
ter
Mix
es
+26
µL+
26µL
+26
µL+
26µL
+26
µL+
26µL
+26
µL+
26µL
+26
µL+
26µL
+26
µL+
26µL
+26
µL+
26µL
+26
µL+
26µL
+26
µL+
26µL
+26
µL+
26µL
+26
µL+
26µL
+26
µL+
26µL
1-2
)2
Mas
ter
mix
es (
Fwd1
+ F
wd2
)20
0 µL
Phu
aion
13.2
µL
Fwd
prim
er13
3.6
µL w
ater
Plac
e PC
R p
late
in c
oolin
g bo
xla
bel w
ith r
oman
num
ber
(e.g
. IV
for
fw
d pr
imer
s SA50
7 an
d SA50
8)
12
34
56
78
910
1112
A B C D E F G H5)
Add
DN
A t
empl
ate
+3
µL+
3 µL
+3
µL+
3 µL
+3
µL+
3 µL
+3
µL+
3 µL
+3
µL+
3 µL
+3
µL+
3 µL
+3
µL+
3 µL
+3
µL+
3 µL
+3
µL+
3 µL
+3
µL+
3 µL
+3
µL+
3 µL
+3
µL+
3 µL 1
23
45
67
89
1011
12A B C D E F G H6)
Div
ide
into
rep
licat
es
7-1
0)
PCR a
nd G
el P
repa
ratio
n
Prog
ram
me:
95°C
; 4
min
37 c
ycle
s of
9
5°C;
40 s
ec 4
9°C;
40 s
ec 7
2°C;
40 s
ec72
°C;
5 m
in

CHAPTER 3
Bacterial communities
38

Part II Publications
P.4 Reptiles as Reservoirs of Bacterial Infections:
Real Threat or Methodological Bias?
Authors:
Giulia Zancolli, Dieter Mahsberg, Wiebke Sickel*, Alexander Keller
*Co-author
published: 2015
Journal: Microbial Ecology
Volume: 70, Pages: 759-584
©Copyright by Springer; Permission for reuse granted with license number3903570604909
39

NOTES AND SHORT COMMUNICATIONS
Reptiles as Reservoirs of Bacterial Infections: Real Threator Methodological Bias?
Giulia Zancolli1,3 & Dieter Mahsberg1 & Wiebke Sickel1,2 & Alexander Keller1,2
Received: 25 February 2015 /Accepted: 16 April 2015# Springer Science+Business Media New York 2015
Abstract Bacterial infections secondary to snakebites andhuman pathogens (e.g., Salmonella) have been linked to theoral microbiota of snakes and pet reptiles. Based on culture-dependent studies, it is speculated that snakes’ oral microbiotareflects the fecal flora of their ingested preys. However,cultured-based techniques have been shown to be limited asthey fail to identify unculturable microorganisms which rep-resent the vast majority of the microbial diversity. Here, weused culture-independent high-throughput sequencing toidentify reptile-associated pathogens and to characterize theoral microbial community of five snakes, one gecko, andtwo terrapins. Few potential human pathogens were detectedat extremely low frequencies. Moreover, bacterial taxa repre-sented in the snake’s oral cavity bore little resemblance to theirpreys’ fecal microbiota. Overall, we found distinct, highlydiverse microbial communities with consistent, species-specific patterns contrary to previous culture-based studies.Our study does not support the widely held assumption thatreptiles’ oral cavity acts as pathogen reservoir and providesimportant insights for future research.
Keywords 16S rDNA .Oral microbiota . Snakebite .Woundinfection . Zoonosis
Short Note
Bacterial infections are common complications of woundssecondary to animal bites, and it is established that pathogenicmicroorganisms recovered from bite wounds reflect the oralflora of the biting animal [1]. It is also determined that the oralflora of the biting animal is influenced by the microbiome oftheir ingested prey and other foods [1]. Thus, snakes’ oralmicrobiota has been suggested to be fecal in nature, as preyanimals often defecate upon being ingested [2]. Microbes fre-quently identified in the oral cavity of snakes have includedClostridium species, pathogenic and non-pathogenic Entero-bacteriaceae such as Salmonella, Morganella morganii,Proteus, Providencia, and Escherichia coli [3–6]. Zoonoseshave also been linked to pet reptiles [7]. Nonetheless, thosestudies were based on culture-dependent techniques, whichrestrict microbial identification to those bacteria able to growin cultures, thus providing a biased picture of microbial diver-sity. However, advances in sequencing technologies have dra-matically expanded our ability to profile bacterial communi-ties, revealing an astonishing majority of unculturable micro-organisms [8].
In this study, we characterized the oral microbiota of com-mon pet reptiles by means of 16S amplicon sequencing. Inparticular, we aimed to (i) identify potential pathogens causingbite wound infections and bacteria previously cultured fromsnakes’ mouth cavities and (ii) explore the similarity betweenthe oral microbiota of snakes and the fecal flora of their preyby comparing our results with recently published data frommouse stool samples [9, 10]. We used multiple datasets fromdifferent mouse strains [9, 10] to account for potential vari-ability between the fecal microbiota of the mice used to feedthe snakes in the present study and that from literature.
We collected swab samples from the oral cavity of thefollowing reptiles: four royal pythons (Python regius), one
* Giulia [email protected]
1 Department of Animal Ecology and Tropical Biology, Biocentre,University of Würzburg, Würzburg, Germany
2 DNA Analytics Core Facility, Biocentre, University of Würzburg,Würzburg, Germany
3 School of Biological Sciences, Environment Centre Wales, BangorUniversity, Bangor LL57 2UW, UK
Microb EcolDOI 10.1007/s00248-015-0618-3
Author's personal copy

Table1
Relativeabundances
ofim
portant
bacteriafrom
theoralcavity
ofcaptivereptilesandthesubstrateof
thevivaria.S
equences
wereblastedto
search
forb
acterialtaxaidentifiedin
pastcultu
re-
basedstudies(referencesintext)isolatedfrom
themouthof
snakes
andwound
infections
secondarytosnakebitesandlistedhereinwith
GenBanksequence
identificationnumbers(G
I),B
LAST
percentage
ofidentity,andassigned
scientificname.Taxonomicassignmento
fthemostabundantO
TUsdetected
inthisstudyarealso
reported
GI
Percentage
identity
Scientificname
Substrate
Python
regius
1Py
thon
regius
2Py
thon
regius
3Py
thon
regius
4Acrantophis
dumerili
Eublepharis
macularius
Trachemys
s.scrip
ta1
Trachemys
s.scrip
ta2
Bacteria
know
nfrom
literature
Achromobacterdenitrificans
Not
detected
Acinetobacter
spp.
343206383
100
Acinetobacter
johnsonii
1.821
0.064
0.117
0.074
0.036
0.553
0.097
13.323
3.532
631252876
99.21
Acinetobacter
radioresistens
0.605
0.008
0.125
0.020
0.159
Acinetobacter
calcoaceticus
507148019
100
Acinetobacter
calcoaceticus
PHEA-2
0.253
0.008
0.059
0.845
0.072
Acinetobacter
lwoffii
631252148
97.63
Acinetobacter
lwoffii
0.007
0.003
0.005
Actinom
yces
spp.
636560534
95.65
Actinom
yces
naturae
0.021
0.006
Aerom
onas
spp.
507147982
100
Aerom
onas
veroniiB
565
0.016
0.338
Arcobacterbutzleri
Not
detected
Bacillus
spp.
444439662
99.6
Bacillus
pumilu
sSA
FR-032
0.027
0.006
485099110
100
Bacillus
thuringiensisBt407
0.239
0.005
0.003
0.032
Bacteroides
fragilis
444439524
99.6
Bacteroides
fragilisYCH46
0.183
Bacteroides
spp.
631251741
99.6
Bacteroides
nordii
1.744
631251997
100
Bacteroides
sartorii
0.049
0.084
Bordetella
avium
Not
detected
Bordetella
trem
atum
Not
detected
Bulkolderia
spp.
Not
detected
Cedecea
neteri
Not
detected
Cetobacterium
somerae
Not
detected
Chryseobacteriumindologenes
Not
detected
Chryseobacteriummassiliae
Not
detected
Chryseobacterium
meningosepticum
Not
detected
Citrobacterdiversus
Not
detected
Citrobacterfreundii
631253147
100
Citrobacterfreundii
0.555
0.016
0.004
0.006
0.731
0.309
Clostridium
spp.
219846899
99.6
Clostridium
disporicum
0.106
219857201
94.47
Clostridium
straminisolvens
0.285
310975204
98.02
Clostridium
xylanolyticum
0.274
0.004
0.005
Corynebacterium
spp.
265678646
100
Corynebacterium
appendicis
0.024
0.122
343201299
100
Corynebacterium
freneyi
0.176
0.449
0.071
0.376
0.016
0.219
0.034
343201411
100
Corynebacterium
pseudodiphtheriticum
0.012
219846842
100
Corynebacterium
riegelii
0.012
0.609
265678670
100
Corynebacterium
tuberculostearicum
0.005
0.008
0.021
0.071
0.058
Diphtheroid
bacillu
sNot
detected
Edw
ardsiella
tarda
Not
detected
Enterobacterspp.
Not
detected
G. Zancolli et al.
Author's personal copy
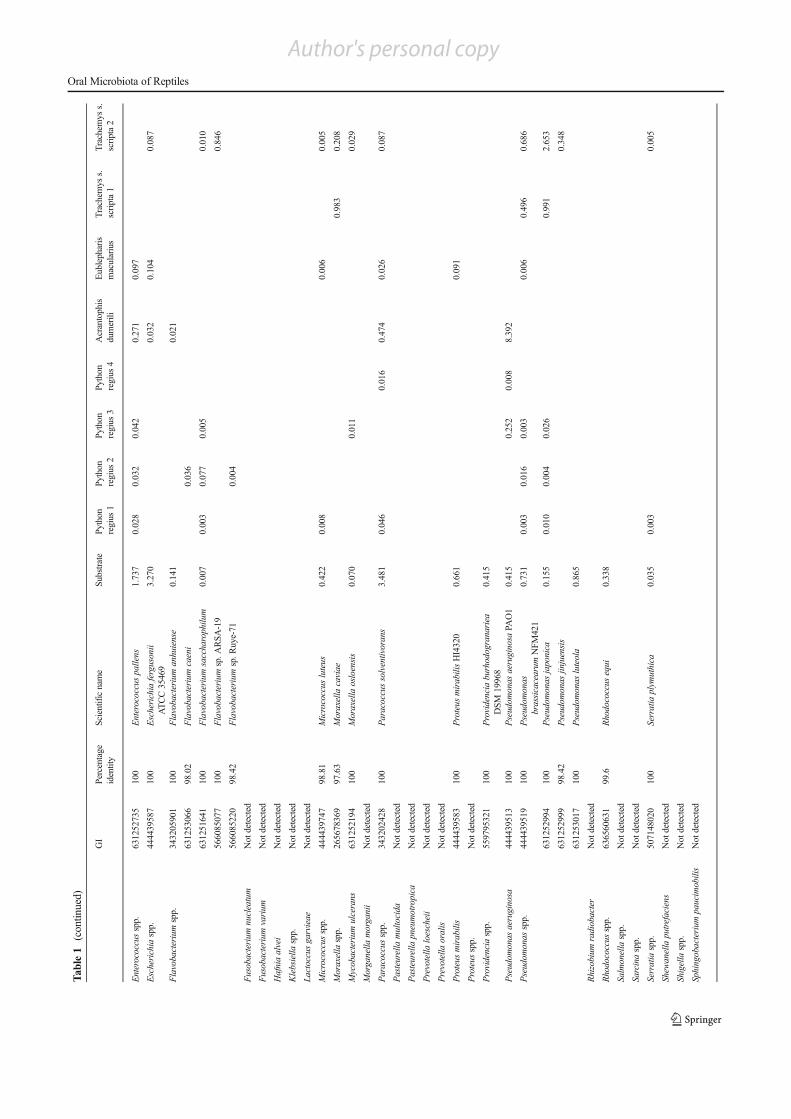
Table1
(contin
ued)
GI
Percentage
identity
Scientificname
Substrate
Python
regius
1Py
thon
regius
2Py
thon
regius
3Py
thon
regius
4Acrantophis
dumerili
Eublepharis
macularius
Trachemys
s.scrip
ta1
Trachemys
s.scrip
ta2
Enterococcusspp.
631252735
100
Enterococcuspallens
1.737
0.028
0.032
0.042
0.271
0.097
Escherichia
spp.
444439587
100
Escherichia
fergusonii
ATCC35469
3.270
0.032
0.104
0.087
Flavobacteriumspp.
343205901
100
Flavobacteriumanhuiense
0.141
0.021
631253066
98.02
Flavobacteriumcaeni
0.036
631251641
100
Flavobacteriumsaccharophilum
0.007
0.003
0.077
0.005
0.010
566085077
100
Flavobacteriumsp.A
RSA
-19
0.846
566085220
98.42
Flavobacteriumsp.R
uye-71
0.004
Fusobacterium
nucleatum
Not
detected
Fusobacterium
varium
Not
detected
Hafniaalvei
Not
detected
Klebsiella
spp.
Not
detected
Lactoccusgarvieae
Not
detected
Micrococcus
spp.
444439747
98.81
Micrococcus
luteus
0.422
0.008
0.006
0.005
Moraxella
spp.
265678369
97.63
Moraxella
caviae
0.983
0.208
Mycobacterium
ulcerans
631252194
100
Moraxella
osloensis
0.070
0.011
0.029
Morganella
morganii
Not
detected
Paracoccusspp.
343202428
100
Paracoccussolventivorans
3.481
0.046
0.016
0.474
0.026
0.087
Pasteurella
multocida
Not
detected
Pasteurella
pneumotropica
Not
detected
Prevotella
loescheii
Not
detected
Prevotella
oralis
Not
detected
Proteus
mirabilis
444439583
100
Proteus
mirabilisHI4320
0.661
0.091
Proteus
spp.
Not
detected
Providencia
spp.
559795321
100
Providencia
burhodogranariea
DSM
19968
0.415
Pseudom
onas
aeruginosa
444439513
100
Pseudom
onas
aeruginosa
PAO1
0.415
0.252
0.008
8.392
Pseudom
onas
spp.
444439519
100
Pseudom
onas
brassicacearum
NFM
421
0.731
0.003
0.016
0.003
0.006
0.496
0.686
631252994
100
Pseudom
onas
japonica
0.155
0.010
0.004
0.026
0.991
2.653
631252999
98.42
Pseudom
onas
jinjuensis
0.348
631253017
100
Pseudom
onas
luteola
0.865
Rhizobium
radiobacter
Not
detected
Rhodococcus
spp.
636560631
99.6
Rhodococcus
equi
0.338
Salmonella
spp.
Not
detected
Sarcinaspp.
Not
detected
Serratia
spp.
507148020
100
Serratia
plym
uthica
0.035
0.003
0.005
Shew
anella
putrefaciens
Not
detected
Shigella
spp.
Not
detected
Sphingobacterium
paucimobilis
Not
detected
Oral Microbiota of Reptiles
Author's personal copy

Table1
(contin
ued)
GI
Percentage
identity
Scientificname
Substrate
Python
regius
1Py
thon
regius
2Py
thon
regius
3Py
thon
regius
4Acrantophis
dumerili
Eublepharis
macularius
Trachemys
s.scrip
ta1
Trachemys
s.scrip
ta2
Sphingobacterium
spiritivorum
631252509
99.21
Sphingobacterium
spiritivorum
0.690
Staphylococcus
spp.
485099103
100
Staphylococcus
warneriSG
10.928
0.089
0.039
0.069
0.165
0.155
0.211
0.271
Stenotrophom
onas
maltophilia
343200117
100
Stenotrophom
onas
maltophilia
0.049
0.028
0.105
0.012
0.117
1.795
0.077
Streptococcusspp.
Not
detected
Tatumella
ptyseos
Not
detected
Tsukam
urella
spp.
444304034
98.82
Tsukam
urella
paurom
etabola
DSM
20162
0.580
Vagococcus
spp.
636560558
84.43
Vagococcus
penaei
0.028
Xanthom
onas
spp.
444439622
100
Xanthom
onas
axonopodispv.
citristr.
306
1.392
0.003
0.065
0.049
Yersinia
enterocolitica
Not
detected
MostabundantO
TUsfoundin
thisstudy
OTU_237
444304263
100
Polynucleobacter
necessariussubsp.
asym
bioticus
28.646
1.125
1.761
1.485
1.313
8.509
3.880
5.045
0.416
OTU_26
219846259
99.21
Acidocella
aminolytica
9.077
0.358
0.295
0.315
0.158
0.878
0.589
0.065
0.164
OTU_1
343200563
90.91
Terrimonas
lutea
0.056
35.175
25.110
50.636
35.135
0.011
0.006
0.111
OTU_2
566085498
92.09
Chryseobacteriumsp.T
HMBM1
0.105
34.203
35.872
36.909
36.966
0.021
0.013
0.135
OTU_4
566085064
98.42
Chryseobacteriumsp.T
HG15
0.956
8.107
0.004
61.979
0.006
0.005
OTU_23
265678797
97.63
Hydrocarboniphaga
effusa
0.429
0.015
10.148
0.136
OTU_9
631253014
92.09
Chryseobacteriummarinum
0.028
41.780
0.005
OTU_10
636560426
90.51
Niastella
populi
0.007
0.003
39.662
0.010
OTU_17
343201778
97.63
Chryseobacteriumpallidum
0.007
0.003
0.020
0.005
17.141
16.858
OTU_8
253680759
95.26
Collim
onas
fungivorans
0.014
0.005
9.773
15.650
G. Zancolli et al.
Author's personal copy
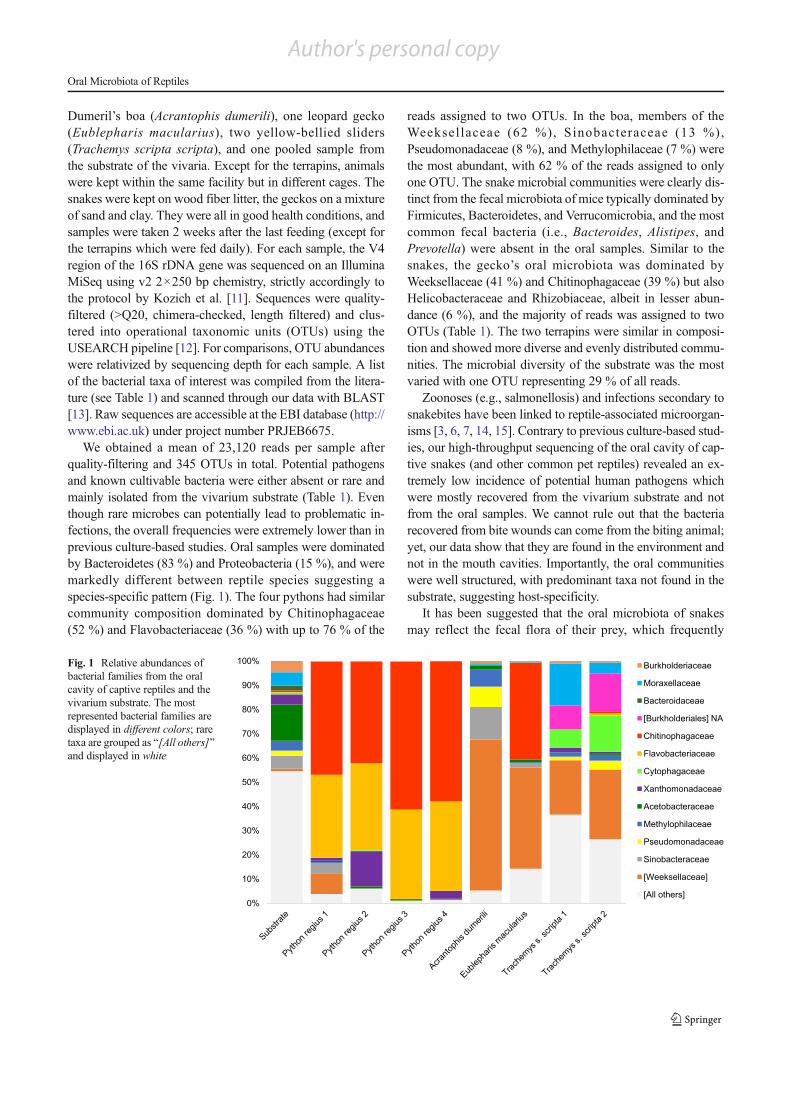
Dumeril’s boa (Acrantophis dumerili), one leopard gecko(Eublepharis macularius), two yellow-bellied sliders(Trachemys scripta scripta), and one pooled sample fromthe substrate of the vivaria. Except for the terrapins, animalswere kept within the same facility but in different cages. Thesnakes were kept on wood fiber litter, the geckos on a mixtureof sand and clay. They were all in good health conditions, andsamples were taken 2 weeks after the last feeding (except forthe terrapins which were fed daily). For each sample, the V4region of the 16S rDNA gene was sequenced on an IlluminaMiSeq using v2 2×250 bp chemistry, strictly accordingly tothe protocol by Kozich et al. [11]. Sequences were quality-filtered (>Q20, chimera-checked, length filtered) and clus-tered into operational taxonomic units (OTUs) using theUSEARCH pipeline [12]. For comparisons, OTU abundanceswere relativized by sequencing depth for each sample. A listof the bacterial taxa of interest was compiled from the litera-ture (see Table 1) and scanned through our data with BLAST[13]. Raw sequences are accessible at the EBI database (http://www.ebi.ac.uk) under project number PRJEB6675.
We obtained a mean of 23,120 reads per sample afterquality-filtering and 345 OTUs in total. Potential pathogensand known cultivable bacteria were either absent or rare andmainly isolated from the vivarium substrate (Table 1). Eventhough rare microbes can potentially lead to problematic in-fections, the overall frequencies were extremely lower than inprevious culture-based studies. Oral samples were dominatedby Bacteroidetes (83 %) and Proteobacteria (15 %), and weremarkedly different between reptile species suggesting aspecies-specific pattern (Fig. 1). The four pythons had similarcommunity composition dominated by Chitinophagaceae(52 %) and Flavobacteriaceae (36 %) with up to 76 % of the
reads assigned to two OTUs. In the boa, members of theWeeksel laceae (62 %), Sinobacteraceae (13 %),Pseudomonadaceae (8 %), and Methylophilaceae (7 %) werethe most abundant, with 62 % of the reads assigned to onlyone OTU. The snake microbial communities were clearly dis-tinct from the fecal microbiota of mice typically dominated byFirmicutes, Bacteroidetes, and Verrucomicrobia, and the mostcommon fecal bacteria (i.e., Bacteroides, Alistipes, andPrevotella) were absent in the oral samples. Similar to thesnakes, the gecko’s oral microbiota was dominated byWeeksellaceae (41 %) and Chitinophagaceae (39 %) but alsoHelicobacteraceae and Rhizobiaceae, albeit in lesser abun-dance (6 %), and the majority of reads was assigned to twoOTUs (Table 1). The two terrapins were similar in composi-tion and showed more diverse and evenly distributed commu-nities. The microbial diversity of the substrate was the mostvaried with one OTU representing 29 % of all reads.
Zoonoses (e.g., salmonellosis) and infections secondary tosnakebites have been linked to reptile-associated microorgan-isms [3, 6, 7, 14, 15]. Contrary to previous culture-based stud-ies, our high-throughput sequencing of the oral cavity of cap-tive snakes (and other common pet reptiles) revealed an ex-tremely low incidence of potential human pathogens whichwere mostly recovered from the vivarium substrate and notfrom the oral samples. We cannot rule out that the bacteriarecovered from bite wounds can come from the biting animal;yet, our data show that they are found in the environment andnot in the mouth cavities. Importantly, the oral communitieswere well structured, with predominant taxa not found in thesubstrate, suggesting host-specificity.
It has been suggested that the oral microbiota of snakesmay reflect the fecal flora of their prey, which frequently
0%
10%
20%
30%
40%
50%
60%
70%
80%
90%
100%Burkholderiaceae
Moraxellaceae
Bacteroidaceae
[Burkholderiales] NA
Chitinophagaceae
Flavobacteriaceae
Cytophagaceae
Xanthomonadaceae
Acetobacteraceae
Methylophilaceae
Pseudomonadaceae
Sinobacteraceae
[Weeksellaceae]
[All others]
Fig. 1 Relative abundances ofbacterial families from the oralcavity of captive reptiles and thevivarium substrate. The mostrepresented bacterial families aredisplayed in different colors; raretaxa are grouped as B[All others]^and displayed in white
Oral Microbiota of Reptiles
Author's personal copy
defecate upon being ingested [2]. However, the microbialcommunities in the mouth cavities of our snakes were mark-edly distinct from those identified in mouse stool samplesusing similar molecular techniques [9, 10]. In particular, themost abundant genera found in mouse stool were completelyabsent. It is worth noting that our snakes were fed upon deadmice.
Other studies also contradict the suggestion that snake oralfloras are a result of fecal contamination from prey. For in-stance, no differences were observed between wild snakes(which feed on live prey) and captive snakes (fed with frozenmice) [4, 16]. Similarly, Goldstein et al. [3] did not find obvi-ous differences between the oral microbiota of adult gartersnakes and neonates before their first meal. Ecological com-munities are dynamic systems, which respond to different en-vironmental conditions by modifying their species composi-tion and population [17]. Oral microbial communities in par-ticular are constantly altered by the host activities, e.g., eatingand tongue movements inside and outside the buccal cavity.Saliva and other oral secretions, including snake venom [18],possess antimicrobial activities, and the microbial commen-sals in the oral cavity can limit the growth of invasive species,including pathogens [19]. It is thus unlikely that snakes’ oralmicrobiota reflects that of their preys’ feces, and our datastrongly support this.
Our data also suggest that the vivarium substrate is not amajor source of oral microbiota, as most of the taxa recoveredfrom the oral samples were restricted to this habitat. Interest-ingly, the pythons, albeit in separate cages, showed a stronglyuniform pattern, which however differed largely from the boadespite being kept within the same room and fed with thesame food. Overall, we observed large and consistent differ-ences between reptile taxonomic groups suggesting a role ofhost phylogeny and/or diet (snakes: carnivores, gecko: insec-tivore, terrapins: omnivores) in shaping the host-associatedmicrobial community.
This pilot study offers relevant insights for future investi-gations for better understanding to which extent host phylog-eny and diet play a role in determining the assembly of the oralmicrobiota using reptiles as a model taxon. Furthermore, ex-tending the analysis to venomous snakes will be of uttermostinterest considering that venom can exert antibacterial activity[18]. Metagenomic sequencing could also elucidate the bio-logical functions of the oral microbiota, especially in snakeswhere bacteria may play a central role in producing enzymesand biomolecules for aid in prey digestion.
Acknowledgments This work was supported by the University ofWürzburg, Land Bavaria, and a Career Development Fellowship by theGraduate School of Life Sciences, University of Würzburg (to GZ). We
thank Martin Llewellyn and Wolfgang Wüster for the constructive com-ments on an earlier version of the manuscript.
References
1. Abrahamian FM, Goldstein EJC (2011) Microbiology of animalbite wound infections. Clin Microbiol Rev 24:231–246
2. Goldstein EJC, Citron DM, Gonzalez H, Russell FE, Finegold SM(1979) Bacteriology of rattlesnake venom and implications for ther-apy. J Infect Dis 140:818–821
3. Goldstein EJC, Agyare EO, Vagvolgyi AE, Halpern M (1981)Aerobic bacterial oral flora of garter snakes: development of normalflora and pathogenic potential for snakes and humans. J ClinMicrobiol 13:954–956
4. Blaylock RSM (2001) Normal oral bacterial flora from some south-ern African snakes. Onderstepoort J Vet Res 68:175–182
5. Ferreira Junior RS, Siqueira AK, Campagner MV, Salerno T,Soares TCS, Lucheis SB, Paes AC, Barraviera B (2009)Comparison of wildlife and captivity rattlesnakes (Crotalusdurissus terrificus) microbiota. Pesq Vet Bras 29:999–1003
6. LamKK, Crow P, Ng KHL, Shek KC, Fung HT, Ades G, Grioni A,Tan KS, Yip KT, Lung DC, Que TL, Lam TSK, Simpson ID, TsuiKL, Kam CW (2010) A cross-sectional survey of snake oral bacte-rial flora from Hong Kong, SAR, China. Emerg Med J 28:107–114
7. Warwick C, Lambiris AJL, Westwood D, Steedman C (2001)Reptile-related salmonellosis. J R Soc Med 94:124–126
8. Rappé MS, Giovannoni SJ (2003) The uncultured microbial major-ity. Annu Rev Microbiol 57:369–394
9. Gu S, Chen D, Zhang JN, Lv X, Wang K, Duan LP, Nie Y, Wu XL(2013) Bacterial community mapping of the mouse gastrointestinaltract. PLoS One 8:e74957
10. Krych L, Hansen CHF, van den Berg FWJ, Nielsen DS (2013)Quantitatively different, yet qualitatively alike: a meta-analysis ofthe mouse core gut microbiome with a view towards the human gutmicrobiome. PLoS One 8:e62578
11. Kozich JJ, Westcott SL, Baxter NT, Highlander SK, Schloss PD(2013) Development of a dual-index sequencing strategy andcuration pipeline for analyzing amplicon sequence data on theMiSeq Illumina sequencing platform. Appl Environ Microbiol 79:5112–5120
12. Edgar RC (2010) Search and clustering orders of magnitude fasterthan BLAST. Bioinformatics 26:2460–2461
13. Altschul SF, Gish W, Miller W, Myers EW, Lipman DJ (1990)Basic local alignment search tool. J Mol Biol 215:403–410
14. Arroyo O, Bolaños R, Muñoz G (1980) The bacterial flora ofvenoms and mouth cavities of Costa Rican snakes. Bull Pan AmHealth Organ 14:280–285
15. Garg A, Sujatha S, Garg J, Acharya NS, Chandra Parija S (2009)Wound infections secondary to snakebite. J Infect Dev Ctries 3:221–223
16. Fonseca MG, Moreira WMQ, Cunha KC, Ribeiro ACMG,Almeida MTG (2009) Oral microbiota of Brazilian captive snakes.J Venom Anim Toxins incl Trop Dis 15:54–60
17. Morin PJ (1999) Community ecology. Blackwell Science, Malden18. Shebl RI, Mohamed AF, Ali AE, Amin MA (2012) Antimicrobial
profile of selected snake venoms and their associated enzymaticactivities. Br Microbiol Res J 2:251–263
19. Avila M, Ojcius DM, Yilmaz Ö (2009) The oral microbiota: livingwith a permanent guest. DNA Cell Biol 28:405–411
G. Zancolli et al.
Author's personal copy

Part II Publications
P.5 Bacterial Diversity and Community Structure in
Two Bornean Nepenthes Species with
Differences in Nitrogen Acquisition Strategies
Authors:
Wiebke Sickel*, T. Ulmar Grafe, Ivonne Meuche, Ingolf Steffan-Dewenter,Alexander Keller
*First author
published: 2016
Journal: Microbial Ecology
Volume: 71, Pages: 938-953
©Copyright by Springer; Permission for reuse granted with license number3903551229675
46
PLANT MICROBE INTERACTIONS
Bacterial Diversity and Community Structure in Two BorneanNepenthes Species with Differences in NitrogenAcquisition Strategies
Wiebke Sickel1 & T. Ulmar Grafe2 & Ivonne Meuche2 & Ingolf Steffan-Dewenter1 &
Alexander Keller1
Received: 20 December 2014 /Accepted: 21 December 2015# Springer Science+Business Media New York 2016
Abstract Carnivorous plants of the genus Nepenthes havebeen studied for over a century, but surprisingly little is knownabout associations with microorganisms. The two species Ne-penthes rafflesiana and Nepenthes hemsleyana differ in theirpitcher-mediated nutrient sources, sequestering nitrogen fromarthropod prey and arthropods as well as bat faeces, respec-tively. We expected bacterial communities living in thepitchers to resemble this diet difference. Samples were takenfrom different parts of the pitchers (leaf, peristome, inside,outside, digestive fluid) of both species. Bacterial communi-ties were determined using culture-independent high-through-put amplicon sequencing. Bacterial richness and communitystructure were similar in leaves, peristomes, inside and outsidewalls of both plant species. Regarding digestive fluids, bacte-rial richness was higher in N. hemsleyana than inN. rafflesiana. Additionally, digestive fluid communities werehighly variable in structure, with strain-specific differences incommunity composition between replicates. Acidophilic taxawere mostly of low abundance, except the genus Acidocella,which strikingly reached extremely high levels in twoN. rafflesiana fluids. In N. hemsleyana fluid, some taxa clas-sified as vertebrate gut symbionts as well as saprophytes wereenriched compared to N. rafflesiana, with saprophytes
constituting potential competitors for nutrients. The high var-iation in community structure might be caused by a number ofbiotic and abiotic factors. Nitrogen-fixing bacteria were pres-ent in both study species, which might provide essential nu-trients to the plant at times of low prey capture and/or rareencounters with bats.
Keywords Nepenthes . Carnivorous plants . Next-generationsequencing . 16s rDNA . Plant-microbe interactions
Introduction
Carnivorous plants of the species-rich genus Nepenthes(Nepenthaceae, Caryophyllales) grow in nutrient-depleted,acidic soils across South East Asia [1] with centres of diversityin Borneo, Sumatra and the Philippines [2, 3]. These tropicalplants derive nutrients, e.g. nitrogen, usually from arthropodprey, which they catch and digest in highly adapted pitchertraps [1]. The traps consist of the pitcher lid, the peristome, i.e.the rim of the pitcher, and the digestive zone, filled with anacidic and often viscous fluid [4, 5]. The inner pitcher wallabove the digestive fluid is commonly referred to as the waxyzone, as it is often covered with epicuticular wax [6–8]. Thedifferent parts have distinct functions in prey attraction, cap-ture and retention, for example, extra-floral nectar productionin the lid and peristome [9, 10] or anisotropic orientation of theinner walls together with easily detachable wax crystals whichclog insect adhesive pads [6, 11]. The fluid is involved in preyretention due to viscoelasticity in some Nepenthes species [5,12] and prey digestion, which involves low pH and secretionof digestive enzymes [13, 14]. Prey introduction has beenfound to trigger fluid acidification [14], digestive enzyme ex-pression [15] and nutrient uptake via the activation of ammo-nium transporter genes [4]. Fluid acidification is thought to be
Electronic supplementary material The online version of this article(doi:10.1007/s00248-015-0723-3) contains supplementary material,which is available to authorized users.
* Alexander [email protected]
1 Department of Animal Ecology and Tropical Biology, Biocenter,University of Würzburg, 97074 Würzburg, Germany
2 Faculty of Science, University Brunei Darussalam, Tungku Link,Gadong, BE 1410, Brunei
Microb EcolDOI 10.1007/s00248-015-0723-3
Author's personal copy

induced by ammonium, since introduction of ammonium-containing substances activates proton secretion [13] as wellas the expression of plasma-membrane H+ -ATPase [14].However, there seem to exist different mechanisms in differ-ent Nepenthes species, especially for pH decrease in pitchers,as demonstrated forNepenthes rafflesiana by Bauer et al. [16].
The two Nepenthes species, N. rafflesiana and Nepentheshemsleyana, differ in their nutrient sequestration strategy, withthe former being a ‘typical’ pitcher plant relying on arthropodcapture and the latter having a dual strategy of obtaining nu-trients both from arthropod capture and the faeces ofHardwicke’s Woolly Bats, Kerivoula hardwickii, which roostin the pitchers during daytime [17]. This bat-plant mutualismhas only recently been reported [17] and up to now remains tobe studied inmore detail. However, it seems that, in parts of itsrange, K. hardwickii bats are quite dependent onN. hemsleyana as day roosts and only occasionally chooseless suitable pitchers of other Nepenthes species, for exampleNepenthes bicalcarata [18]. Preliminary genetic data indicatethat N. hemsleyana and N. rafflesiana (the typical form) aredirect sister taxa (M. Scharmann, pers. communication). Thetwo species have only recently been recognised as separate,with N. hemsleyana previously being referred to as the elon-gate form of N. rafflesiana [19, 20]. The two species differ inpitcher morphology and subsequently in prey capture, reten-tion strategies and suitability as roosting sites for bats [17, 19,21–24]. Prey attraction mechanisms are often retarded inN. hemsleyana [19], although it retains the ability to digestinsect prey [17, 22].
Despite Nepenthes plants having been studied for over acentury [25], surprisingly little is known about any associa-tions with microorganisms [26]. Regarding the role of mi-crobes in the digestion process, it has been proposed that bac-teria might support prey digestion [13, 27, 28], but some re-ports seem to refute that idea. For example, a recent study hasfound that the fluid of closed and newly opened pitchers issterile and does not support microbial growth [29]. Further-more, Nepenthes species are equipped with a variety of en-dogenous digestive enzymes, including aspartic proteases [15]and chitinases [30], indicating that pitcher plants do not re-quire microbial support in prey breakdown. Other endogenousproteins secreted into the pitcher fluid, such as plumbaginderivatives, have antimicrobial activities [31–33], whichmight inhibit bacterial growth in the fluid. However, the pres-ence of endogenous enzymes in the plant does not precludesupportive action from bacterial enzymes. Higashi et al. [13]suggested that enzymes from both the plant and bacteria oc-curring in the pitchers are involved in prey breakdown. Addi-tionally, there is strong evidence supporting a diverse andfunctional microbial community in mature pitchers with po-tential to provide services for the plant. Firstly, high bacterialdiversity [13, 34], complex bacterial profiles [35] as well asactive bacterial enzymes [26, 36, 37] have been reported in the
fluid. Secondly, Chou et al. [38] analysed bacterial communi-ties in three Nepenthes species—Nepenthes ampullaria, Ne-penthes gracilis and Nepenthes mirabilis—in their naturalhabitat and found that even unopened pitchers harbour bacte-rial assemblages, but that the community structure differedbetween closed and opened pitchers. They concluded thatbacterial communities in Nepenthes pitchers can be endoge-nous or introduced, with introduced taxa being potential com-petitors for nutrients. In the study on Nepenthes fluid bacteria[38], only 900 bacterial 16s ribosomal DNA (rDNA) se-quences (30 per sample) were analysed; thus, their resultslikely did not represent the complete bacterial community.Introduction of bacteria by prey has also been proposed forthe convergent, but phylogenetically very distantly relatedNorthern pitcher plants (Sarracenia spp., Sarraceniaceae,Ericales) [39–41], which also capture prey in pitcher traps[25]. However, it was proposed that the identified bacteriacould also be beneficial to the plant host through fixation ofatmospheric nitrogen and subsequent provision of additionalnitrogenous compounds [39], which is also supported bymodelling studies [42].
In this study, we analysed complete bacterial communitiesin two Nepenthes species by applying culture-independenthigh-throughput sequencing technology. We collected sam-ples from natural field sites and analysed bacterial diversity,community structure and taxa distribution. Since the variousparts of a pitcher can be considered to be very different withregard to morphological surface structure, exposure to thesurroundings and chemical properties, we were interestedwhether these properties also affect bacterial assemblages.Additionally, we expected distinct bacterial communities inthe digestive fluids of the two species, mainly affected by theirdifferent diets. We hypothesised that the microbiota ofN. rafflesiana would contain large proportions of insect-associated taxa. In contrast, vertebrate gut symbionts wereexpected to be present in N. hemsleyana fluid, introduced bythe faeces of K. hardwickii.
Materials and Methods
Sample Design
Samples were collected near Labi, Brunei Darussalam, Bor-neo in June 2013. One aerial pitcher of five different plantseach of N. rafflesiana (the typical form) and N. hemsleyanawere sampled (Table 1). Each pitcher was fully developed,open for approximately 4–6 weeks and contained capturedprey, which was not characterised further. N. rafflesiana grewin an open disturbed lowland heath forest (4° 38’ 50.55 N,114° 30’ 31.38 E), and N. hemsleyana grew in a peat swampwith heath forest mosaic along a small open stream valley (4°35’ 06.92 N, 114° 30’ 35.10 E). The two sites were 6.7 km
W. Sickel et al.
Author's personal copy
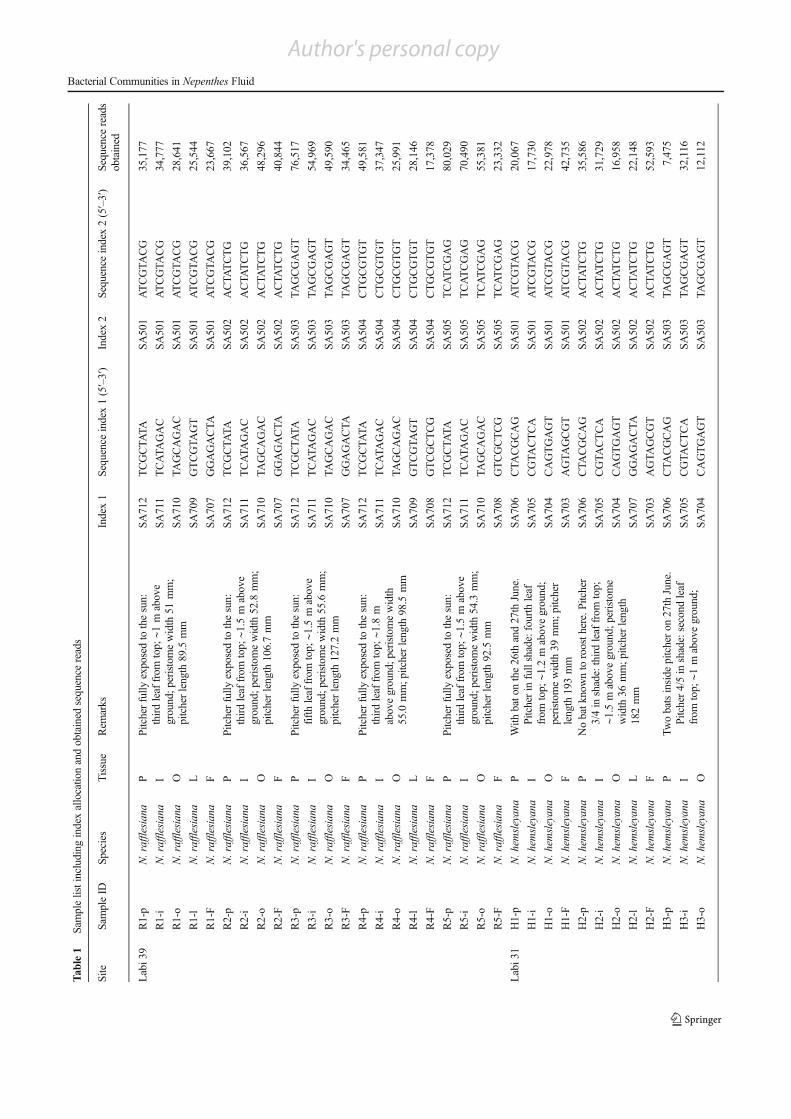
Table1
Samplelistincluding
indexallocatio
nandobtained
sequence
reads
Site
SampleID
Species
Tissue
Rem
arks
Index1
Sequence
index1(5′–3′)
Index2
Sequence
index2(5′–3′)
Sequence
reads
obtained
Labi3
9R1-p
N.rafflesiana
PPitcherfully
exposedto
thesun:
third
leaffrom
top;
∼1m
above
ground;p
eristomewidth
51mm;
pitcherlength
89.5
mm
SA712
TCGCTA
TASA
501
ATCGTA
CG
35,177
R1-i
N.rafflesiana
ISA
711
TCATA
GAC
SA501
ATCGTA
CG
34,777
R1-o
N.rafflesiana
OSA
710
TAGCAGAC
SA501
ATCGTA
CG
28,641
R1-l
N.rafflesiana
LSA
709
GTCGTA
GT
SA501
ATCGTA
CG
25,544
R1-F
N.rafflesiana
FSA
707
GGAGACTA
SA501
ATCGTA
CG
23,667
R2-p
N.rafflesiana
PPitcherfully
exposedto
thesun:
third
leaffrom
top;
∼1.5
mabove
ground;p
eristomewidth
52.8
mm;
pitcherlength
106.7mm
SA712
TCGCTA
TASA
502
ACTA
TCTG
39,102
R2-i
N.rafflesiana
ISA
711
TCATA
GAC
SA502
ACTA
TCTG
36,567
R2-o
N.rafflesiana
OSA
710
TAGCAGAC
SA502
ACTA
TCTG
48,296
R2-F
N.rafflesiana
FSA
707
GGAGACTA
SA502
ACTA
TCTG
40,844
R3-p
N.rafflesiana
PPitcherfully
exposedto
thesun:
fifth
leaffrom
top;
∼1.5
mabove
ground;p
eristomewidth
55.6
mm;
pitcherlength
127.2mm
SA712
TCGCTA
TASA
503
TAGCGAGT
76,517
R3-i
N.rafflesiana
ISA
711
TCATA
GAC
SA503
TAGCGAGT
54,969
R3-o
N.rafflesiana
OSA
710
TAGCAGAC
SA503
TAGCGAGT
49,590
R3-F
N.rafflesiana
FSA
707
GGAGACTA
SA503
TAGCGAGT
34,465
R4-p
N.rafflesiana
PPitcherfully
exposedto
thesun:
third
leaffrom
top;
∼1.8
maboveground;p
eristomewidth
55.0
mm;p
itcherlength
98.5
mm
SA712
TCGCTA
TASA
504
CTGCGTGT
49,581
R4-i
N.rafflesiana
ISA
711
TCATA
GAC
SA504
CTGCGTGT
37,347
R4-o
N.rafflesiana
OSA
710
TAGCAGAC
SA504
CTGCGTGT
25,991
R4-l
N.rafflesiana
LSA
709
GTCGTA
GT
SA504
CTGCGTGT
28,146
R4-F
N.rafflesiana
FSA
708
GTCGCTCG
SA504
CTGCGTGT
17,378
R5-p
N.rafflesiana
PPitcherfully
exposedto
thesun:
third
leaffrom
top;
∼1.5
mabove
ground;p
eristomewidth
54.3
mm;
pitcherlength
92.5
mm
SA712
TCGCTA
TASA
505
TCATCGAG
80,029
R5-i
N.rafflesiana
ISA
711
TCATA
GAC
SA505
TCATCGAG
70,490
R5-o
N.rafflesiana
OSA
710
TAGCAGAC
SA505
TCATCGAG
55,381
R5-F
N.rafflesiana
FSA
708
GTCGCTCG
SA505
TCATCGAG
23,332
Labi3
1H1-p
N.hem
sleyana
PWith
bato
nthe26th
and27th
June.
Pitcherin
fullshade:fourth
leaf
from
top;
∼1.2
maboveground;
peristomewidth
39mm;p
itcher
length
193mm
SA706
CTA
CGCAG
SA501
ATCGTA
CG
20,067
H1-i
N.hem
sleyana
ISA
705
CGTA
CTCA
SA501
ATCGTA
CG
17,730
H1-o
N.hem
sleyana
OSA
704
CAGTGAGT
SA501
ATCGTA
CG
22,978
H1-F
N.hem
sleyana
FSA
703
AGTA
GCGT
SA501
ATCGTA
CG
42,735
H2-p
N.hem
sleyana
PNobatk
nownto
roosth
ere.Pitcher
3/4in
shade:third
leaffrom
top;
∼1.5
maboveground;p
eristome
width
36mm;p
itcherlength
182mm
SA706
CTA
CGCAG
SA502
ACTA
TCTG
35,586
H2-i
N.hem
sleyana
ISA
705
CGTA
CTCA
SA502
ACTA
TCTG
31,729
H2-o
N.hem
sleyana
OSA
704
CAGTGAGT
SA502
ACTA
TCTG
16,958
H2-l
N.hem
sleyana
LSA
707
GGAGACTA
SA502
ACTA
TCTG
22,148
H2-F
N.hem
sleyana
FSA
703
AGTA
GCGT
SA502
ACTA
TCTG
52,593
H3-p
N.hem
sleyana
PTw
obatsinside
pitcheron
27th
June.
Pitcher4/5in
shade:second
leaf
from
top;
∼1m
aboveground;
SA706
CTA
CGCAG
SA503
TAGCGAGT
7,475
H3-i
N.hem
sleyana
ISA
705
CGTA
CTCA
SA503
TAGCGAGT
32,116
H3-o
N.hem
sleyana
OSA
704
CAGTGAGT
SA503
TAGCGAGT
12,112
Bacterial Communities in Nepenthes Fluid
Author's personal copy

apart. Two pitchers of N. hemsleyana were observed to har-bour bats at the time of sampling (Table 1). For sample col-lection, sterile swabs wet with sterilised water were used toswab the peristome (P), inside (I) and outside (O) of the pitch-er, as well as the leaf the pitcher was connected to (L). Fluid(F) was taken with a sterile disposable syringe. Swab headswere cut off to fall into a sterile microcentrifuge tube, andsamples were frozen immediately until processing.
DNA Extraction, PCR and Library Preparationfor Sequencing
Swab heads were covered in phosphate-buffered saline (PBS,pH 7.4), shaken horizontally for 10 min, swabs removed andcentrifuged for 10 min (twice, pellet carried over). For fluids,up to 600 μL were used for DNA extraction. DNAwas thenisolated using the PowerSoil® DNA Isolation Kit (MoBioLaboratories, Carlsbad, CA, USA) following the manufac-turer’s instructions, but adding a 5-min incubation step atroom temperature after applying the elution buffer. Alongsidethe actual samples, we processed a laboratory control, whichconsisted of an empty tube of the DNA extraction kit, to which60 μL PCR grade water were added and which was thenfurther processed in the exact same way as all other samples.
PCR and library preparation were performed according to apreviously published dual indexing approach [43]. This meth-od uses modular primers, consisting of MiSeq specificadapters, 8 nt index sequences, 10 nt pad sequences, 2 ntlinker sequences and 16s rDNA amplifying primers [43].The incorporated amplifying primers were 515f and 806r[44]. The MiSeq adapters ensure sequencing platform confor-mity; the pad sequence is designed to reach a melting temper-ature of approximately 65 °C for the pad-linker-primer se-quence; the linker lowers self-complementarity and differentcombinations of forward and reverse index sequences allowsample-specific labelling [43]. The complete primer se-quences were, forward: 5′-AATGATACGGCGACCACCGAGATCTACAC XXXXXXXX TATGGTAATT GTGTGCCAGCMGCCGCGGTAA-3′ and reverse: 5′-CAAGCAGAAGACGGCATACGAGAT XXXXXXXXAGTCAGTCAG CC GGACTACHVGGGTWTCTAAT-3′[43], where XXXXXXXX indicates the index sequences,which were selected as shown in Table 1.
PCR was performed in triplicate for each sample [45] in10-μL reactions, each containing 5 μL 2× Phusion® HighFidelity PCR Master Mix (New England Biolabs, Ipswich,MA, USA), 0.33 μM each of forward and reverse primer(Eurofins MWG Operon, Huntsville, AL, USA), 3.34 μLPCR grade water and 1 μL template DNA. PCR conditionscomprised an initial denaturation step at 95 °C for 4 min,35 cycles of denaturation at 95 °C for 40 s, annealing at55 °C for 30 s and elongation at 72 °C for 1 min, followedby final extension at 72 °C for 5 min. Triplicates of a sampleTa
ble1
(contin
ued)
Site
SampleID
Species
Tissue
Rem
arks
Index1
Sequence
index1(5′–3′)
Index2
Sequence
index2(5′–3′)
Sequence
reads
obtained
peristomewidth
42.5
mm;p
itcher
length
160mm
H3-F
N.hem
sleyana
FSA
703
AGTA
GCGT
SA503
TAGCGAGT
5,581
H4-p
N.hem
sleyana
PNobatk
nownto
roosth
ere.Pitcher5/6
inshade:fourth
leaffrom
top;
∼2.2
maboveground;p
eristomewidth
50mm;
pitcherlength
218mm
SA706
CTA
CGCAG
SA504
CTGCGTGT
13,242
H4-i
N.hem
sleyana
ISA
705
CGTA
CTCA
SA504
CTGCGTGT
22,111
H4-o
N.hem
sleyana
OSA
704
CAGTGAGT
SA504
CTGCGTGT
18,215
H4-F
N.hem
sleyana
FSA
703
AGTA
GCGT
SA504
CTGCGTGT
27,065
H5-p
N.hem
sleyana
PNobatk
nownto
roosth
ere.Pitcher2/3in
shade:fifth
leaffrom
top;
∼1m
above
ground;p
eristomewidth
39mm;p
itcher
length
136mm
SA706
CTA
CGCAG
SA505
TCATCGAG
9,315
H5-i
N.hem
sleyana
ISA
705
CGTA
CTCA
SA505
TCATCGAG
20,748
H5-o
N.hem
sleyana
OSA
704
CAGTGAGT
SA505
TCATCGAG
8,927
H5-l
N.hem
sleyana
LSA
707
GGAGACTA
SA505
TCATCGAG
27,718
H5-F
N.hem
sleyana
FSA
703
AGTA
GCGT
SA505
TCATCGAG
41,924
Pperistome,Iinside,O
outside,Lleaf,F
fluid
W. Sickel et al.
Author's personal copy
were pooled, and successful amplification was verified withan agarose gel, using 5 μL of the pool.
The remaining 25 μL were further processed using theSequalPrepTM Normalization Plate Kit (Invitrogen, Carlsbad,CA, USA), eluting in 20 μL, which works both as a PCRproduct clean-up removing excess primers and nucleotidesas well as normalising DNA quantities to 25 ng for each sam-ple. Of the eluate, 5 μL normalised DNA was taken forpooling with samples of other projects and laboratory controlsamples (pure extraction kit) according to Kozich et al. [43].This pool was verified for library fragment size with aBioanalyzer High Sensitivity DNA Chip (Agilent Technolo-gies, Santa Clara, CA, USA) and quantified with the dsDNAHigh Sensitivity Assay (Life Technologies GmbH, Darmstadt,Germany). The final pool was diluted to 2 nM and furtherprepared for sequencing following the Illumina Guide forDNA library preparation [46], obtaining a final library of10 pM. PhiX Control Kit v3 (Illumina Inc., San Diego, CA,USA) was added as a spike-in to ensure high-quality reads.Sequencing was performed on the Illumina MiSeq® Platform(Illumina Inc., San Diego, CA, USA) using 2×250 bp v2MiSeq® chemistry. The cartridge of the reagent kit was addi-tionally supplied with 3 μL each of the custom sequencingand index primers [43].
Bioinformatics and Statistics
Quality control was performed using FastQC v0.11.2 (http://www.bioinformatics.babraham.ac.uk/projects/fastqc/).Forward and reverse reads were joined together with fastq-join v.1.8.0 (https://code.google.com/p/ea-utils/wiki/FastqJoin). Demultiplexing was performed in QIIME v. 1.8.0 [47], which included quality filtering (Phred score>Q20,sequence length > 200 bp). In this step, only reads withcomplete index sequences were kept. Clusters of operationaltaxonomic units (OTUs) were built, chimaeras removed andtaxonomically classified using the UCLUST [48] andUCHIME [49] algorithms, as implemented in USEARCH v.7.0.1090 [48]. Chloroplast and mitochondrial 16S rDNAwerefiltered out. Additionally, overall laboratory control samplessuggested Moraxellaceae, Brucellaceae, Oxalobacteraceae,Comamonadaceae and the order Caulobacterales to originatefrom kits, plasticware and laboratory contamination, whichwere removed prior to follow-up analyses. Although we can-not rule out that some of these might also be part of the naturalmicrobiota of Nepenthes, we applied this conservative filter-ing, as presence of these taxa as well as their abundance wouldbe highly overestimated in the results and thus not comparablewith other bacteria.
The data set was imported into R v.3.0.3 [50] and analysedusing the phyloseq [51] and vegan [52] packages. Sequencingdepth was assessed using rarefaction curves. Samples notreaching saturation in the rarefaction were removed from
further analyses, as they likely do not represent the wholecommunity present (six leaves). Observed richness andShannon’s H species diversity index [53] were determinedwith respect to species and tissue. Sample counts wererelativised for each sample in subsequent data analysis. Wedetermined the most dominant taxa within the system usingthe summarize_taxa_through_plots.py command implement-ed in QIIME [47]. We used detrended correspondence analy-sis (DCA) [54] based on UniFrac distance [55] to infer simi-larities in community structure between samples visually.DCA eliminates two common artefacts of other multivariateanalyses, such as the arch effect and compression of the endsof the axes, complicating interpretation and producing skewedpatterns [54]. We performed environmental fitting of sampledata, i.e. plant species and pitcher tissue to infer which vari-able explained data clustering. Further, we determined OTUsand their relative abundance that co-localised with fluid sam-ples away from the centre to determine bacterial taxa associ-ated with differences in community structure. Additionally,we determined how much of each fluid community was rep-resented by the OTUs of each cluster. Variability in commu-nity structure within tissue replicates was further evaluatedusing analysis of similarity (ANOSIM) [56] with 999 permu-tations, based on the Bray-Curtis dissimilarity index [57] andgrouped by tissue. This was accompanied by looking at thedistribution of bacterial families within fluid samples.
Occurrence of certain pre-selected taxa with potential func-tions (see below) was explored by sub-setting the dataset foreach group. These taxa included nitrogen-fixing bacteria:Burkholderiales [41], Rhizobiales [58, 59]; acidophilic taxa:Acidobacteriaceae [60], Acetobacteriaceae [61, 62]; verte-brate gut symbionts:Mobiluncus, Clostridium, Anaerococcus[63], Enterobacteriaceae [64], Lactobacillus [65],Streptococcus [66]; insect gut symbionts: Serratia, Pantoea,other Enterobacteriaceae, Rhodococcus [39], Lactococcus[40], Chryseobacterium [41] and bacteria previously identi-fied in Nepenthes species: Xanthobacter, Sphingomonas,Novosphingobium, Kaistia, Enterobacter, Dyella, Acidocella,Acidisoma [38]. For identification of closely related bacterialreference species, OTUs classified as Enterobacteriaceae wereadditionally run against the NCBI microbial 16s database [67]using the BLASTn option [68] for better resolution betweeninsect and vertebrate gut symbionts. For fluid samples of bothNepenthes species, we determined common bacterial OTUspresent in at least 90 % of the fluid samples using thecompute_core_microbiome.py command in QIIME [47]. Al-so, we inferred differences in taxa distributions with statisticalpairwise comparisons between the two Nepenthes species forfluids by calculating the logarithmic fold change and applyingthe exact test between groups of count libraries, as implement-ed in the package edgeR [69]. The fold change is the ratio of afinal value to an initial value. It is usually transformed to thelogarithmic fold change (logFC) with the base of 2, so that a
Bacterial Communities in Nepenthes Fluid
Author's personal copy

twofold decrease has the logFC value of 1, a twofold decreasesubsequently has the logFC value of −1. In our case, the finalvalue corresponds to abundance inN. rafflesiana, whereas theinitial value corresponds to abundance in N. hemsleyana. Weonly reported genera with statistically significant logFCvalues, which was determined by fitting negative binomialmodels to the raw sequence reads and estimating dispersionusing the quantile adjusted conditional maximum likelihoodmethod. Then, the exact test was used to determine statistical-ly significant logFCs [69]. This approach has been recom-mended for microbiome data when analysing differentialabundance [70].
Results
Sequencing Output
In total, we obtained 1,611,942 raw reads with quality aboveQ20 (probability of erroneous base calls within sequencereads 1 in 100), including a laboratory control. This accountedfor 30,777±18,581 reads per sample. Reads clustered into1407 OTUs excluding mitochondria, chloroplasts and labora-tory contamination. Most rarefaction curves reached an as-ymptote (Supplemental File 1), indicating that sequencing ef-fort was sufficient for most samples to characterise the bacte-rial diversity. Raw sequence data has been deposited at theEBI-SRAwith the project accession number PRJEB7957.
Community Structure
Summarised over both species and tissues, Proteobacteria dom-inated the bacterial community with 49.6 % of all reads, butActinobacteria (15.8 %), Bacteroidetes (17.2 %) andFirmicutes (8.8 %) were also of considerable abundance. With-in Proteobacteria, Alphaproteobacteria were most abundant(31.0 %), followed by Gammaproteobacteria (14.2 %). Beta-and Deltaproteobacteria were rare with 3.8 and 0.5 %, respec-tively. The most abundant orders of the Proteobacteria wereRhizobiales (14.6 %) and Rhodospirillales (9.8 %), followedby Sphingomonadales (4.8 %, all Alphaproteobacteria),Enterobacteriales (4.7 %), Pseudomonadales (3.6 %),Xanthomonadales (4.2 %, all Gammaproteobacteria) andBurkholderiales (3.2 %, Betaproteobacteria). Within the otherphyla, Actinomycetales (13.0 %, Actinobacteria),Sediminibacterium (8.6 %, Bacteroidetes) and Bacilli (6.9 %,Firmicutes) were most abundant. A complete list of all detectedtaxa can be found in Supplemental File 2.
Bacterial Diversity
Alpha-diversity analysis revealed medium bacterial species rich-ness averaging around 100 observed OTUs per sample, which
was more or less similar across species and tissues (Fig. 1). Forboth species, some samples of the pitcher’s outer surface showedan exceptional high number of OTUs present resembling the soilcontrol (approximately 750 OTUs, data not shown).N. hemsleyana fluids showed higher diversity (Shannon’s Hindex) compared to the other samples of the same species.N. rafflesiana fluids showed a slight decrease in diversity com-pared to the other tissues, but it was not significant (pairwiseWilcox test, uncorrected p values: pinside=0.151, pleaf =0.857,poutside=0.095, pperistome=0.056). The bacterial richness in thefluid of N. rafflesiana was significantly lower than inN. hemsleyana fluid (Fig. 1a; Wilcoxon rank sum test: W=22,p=0.032); bacterial diversity showed the same trend (Fig. 1b),but was not significantly different (W=19, p=0.222). The out-sides of the plant species also seemed to differ in richness anddiversity (Fig. 1), but this was not significant (richness: W=20,p=0.151; diversity: W=18, p=0.309). In DCA based onUniFrac distance, 32 and 24.4 % of the total variability betweensamples were explained on the first two axes (Fig. 2). Mostsamples clustered closely together, except some fluid and leafsamples, which clustered further away. Pitcher tissue explainedsample clustering (p=0.001, 999 permutations), but plant spe-cies did not (p=0.813). Fluid samples of both species generallyshowed high variability between replicates, as inferred by remoteclustering of fluid replicates in DCA (Fig. 2). For both plantspecies, two fluid replicates could be observed that clusteredclosely together, but far away from the other samples (Fig. 2,marked with # forN. hemsleyana and a forN. rafflesiana). In thecase of N. hemsleyana these two replicates corresponded to thepitchers with observed bat roosting (Table 1). OtherN. hemsleyana fluid replicates were located outside the centre(b in Fig. 2) or at the bottom left together with one outsidereplicate (c in Fig. 2). The species ordination (data not shown)revealed no clear picture as to which lineages or groups of eco-logically similar bacteria (e.g. gut bacteria, nitrogen-fixing taxa)were associated with the respective fluid communities. Thus, wedetermined all OTUs that co-localised with those samples andcombined them in clusters (Table 2 and Supplemental File 3).There were two types of OTUs associated with those samples.Firstly, taxa that could be detected in fluid as well as other sam-ples, but reached higher levels in fluids (e.g. Acidocella spp. incluster 2), and secondly, taxa that were exclusive to fluid samples(e.g. most Chitinophagaceae in cluster 1 and Treponema spp. incluster 2), with the second type occurring more often(Supplemental File 3). Combining all OTUs within their re-spective clusters showed that these clusters made up a ma-jority of the respective fluid communities (Table 2). Takentogether, ordination analysis implied that bacterial communi-ties in Nepenthes fluid could be extremely variable. Wefurther assessed this by ANOSIM (Fig. 3), where fluidsshowed increased dissimilarity ranks compared to all othertissues except leaves (Nemenyi’s test, uncorrected p values:pbetween<0.001, pinside<0.001, pleaf = 0.766, poutside<0.001,
W. Sickel et al.
Author's personal copy

pperistome<0.001). This was also evident by comparing thedistribution of bacterial families within fluid samples, whichclearly differed between the different fluid samples (Fig. 4a).
Regarding the taxonomic identities of OTUs within the clus-ters, some taxa stood out. For example, in cluster 1 (correspond-ing samples marked with # in Fig. 2), one OTU dominated thefluid community of one of those pitcher replicates. There, itaccounted for 93.9 % of all reads and was also moderatelyabundant in its neighbouring fluid replicate (13.2 %). This taxoncould also be detected in other samples, includingN. rafflesiana,but never at such high levels (6.5 % for two N. rafflesiana fluidreplicates, but less than 5 % in all other cases). This particulartaxon belonged to the Enterobacteriaceae and was identified asbeing closely related to Klebsiella spp. by BLASTn [68], whichis found in gastrointestinal tracts [71]. Furthermore, nine OTUsof this cluster belonged to the Chitinophagaceae. Although onlydetected at low abundance, these OTUs were almost completelyexclusive to N. hemsleyana fluid (Supplemental File 3). OtherChitinophagaceae in the data set belonged to the genusSediminibacterium, which was quite abundant and could bedetected in most of the samples, or were detected almost exclu-sively in other samples of N. hemsleyana. Other OTUs of thatcluster belonged to several different lineages, but none stoodout. It should be noted that OTUs of other clusters also occurredin these two N. hemsleyana fluids.
For the second cluster (corresponding samples marked witha in Fig. 2), we found two OTUs of extremely high abundancelevels as well as several low abundance OTUs belonging to the
same taxonomic lineage. The OTUs with high abundance bothbelonged to the genus Acidocella (Order: Rhodospirillales),were closely related to one another and together accounted for66.7 and 72.6% of all reads in the two fluid communities of thiscluster. Including other OTUs belonging to this genus raisedthese numbers to 74 % in both cases. Generally, Acidocellacould be detected in six fluid samples as well as all other pitchertissues except leaves, albeit with highly variable abundancelevels (Fig. 4b) and mostly belonging to N. rafflesiana. At thesame time, it was absent from several samples, also includingtwo N. rafflesiana fluid samples. There were several OTUswithin cluster 2 that belonged to the genus Treponema, all ofwhich were exclusive to oneN. rafflesiana fluid replicate, with-in that accounted for 0.7 % of the community. In the whole dataset, there was one more OTU assigned to the genus Treponema,which was detected on the outside of one N. hemsleyana pitch-er, accounting for 0.4 % of the community. Some OTUsassigned to Treponema were also significantly enriched inN rafflesiana fluid, compared to N. hemsleyana (Fig. 5d). Addi-tionally, OTUs from cluster 1 contributed to 6.5 % of both fluidcommunities of those N. rafflesiana fluid replicates (a in Fig. 2).
In the other two clusters, no such OTUs or lineages werefound. However, OTUs from cluster 3 made up 36.7 % of therespective fluid community of this cluster’s N. hemsleyanareplicate (b in Fig. 2), but that OTUs from cluster 1 and 2contributed 5.1 and 5.8 % to that community as well. Forcluster 4, we found that only 12 out of 55 OTUs belongingto that cluster could be detected in any of the other samples.
50
100
200
Obs
erve
d ric
hnes
sn=5 n=5 n=5 n=5 n=2 n=2 n=5 n=5 n=5 n=5
*
N. hemsleyanaN.rafflesiana
N. hemsleyanaN.rafflesiana
#
#
#
#
Fluid Inside Leaf Outside Peristome
Tissue
a) b)
Fluid Inside Leaf Outside Peristome
Tissue
0
1
2
3
4
5
Sha
nnon
's H
div
ersi
ty
n=5 n=5 n=5 n=5 n=2 n=2 n=5 n=5 n=5 n=5
Fig. 1 Bacterial diversity with respect to plant species and tissue.Diversity indices were determined after filtering raw data, but beforerelativising abundance. a Observed species richness, plotted on alogarithmic y-axis for visualisation reasons, b Shannon’s H diversity.White N. hemsleyana, grey N. rafflesiana. Order of tissues from left to
right: Fluid, Inside, Leaf, Outside, Peristome. Single dots indicate outlierslying outside +/−1.5 of the interquartile range. *p value < 0.05 (Wilcoxonrank sum test), number sign indicates N. hemsleyana fluid replicates withobserved bat roosting, unspecified comparisons were not significant
Bacterial Communities in Nepenthes Fluid
Author's personal copy

Screening Taxa of Interest
Nitrogen-fixing bacteria, such as Rhizobiales andBurkholderiales were detected in all tissues of both plant spe-cies. In the Rhizobiales, Bradyrhizobium and Methylosinuswere most abundant in most samples. Within theBurkholderiales, Burkholderia were also occasionally abun-dant, especially on the inside of N. hemsleyana. Of the pre-selected gut symbionts, OTUs belonging to the Enterobacte-riaceae were most abundant in the fluids of both Nepenthesspecies. These were identified as being closely related toKlebsiella, Pragia, Morganella, Escherichia, Providencia,Pantoea and Arsenophonus spp. using BLASTn [68]. Othergut symbionts could also be recovered in fluids and the othertissues, albeit with low abundances. These included both ver-tebrate and insect gut symbionts, e.g. Streptococcus andChryseobacterium. Clostridium occurred on the inside of bothNepenthes species, as well as on the outside and the leaf ofN. hemsleyana, but not in the fluids. Other pre-selected taxa(Xanthobacter, Sphingomonas, Novosphingobium, Kaistia,
Enterobacter and Dyella) were extremely rare or absent. Theonly exception was Sphingomonas, which occurred on alltissues of bothNepenthes species. Acidophilic taxa were over-all quite rare (Fig. 4b) with the exception of the genusAcidocella (Order: Rhodospirillales), which was significantlyenriched inN. rafflesiana fluid compared toN. hemsleyana, asrevealed by the logFC (Fig. 5a). Taxa that were significantly
Fluid
Inside
Leaf
OutsidePeristome
-2
-1
0
1
2
-2 -1 0 1 2 3DCA1 [32 %]
DC
A2 [2
4.4
%]
SpeciesN. hemsleyanaN. rafflesiana
TissueFluidInside
LeafOutsidePeristome
##
aa
b
c
c
Fig. 2 Detrended correspondence analysis (DCA) based on UniFracdistance. Ordination was performed on filtered and relativised data.Open symbols N. hemsleyana, closed symbols N. rafflesiana; shapesindicate tissue. Tissue had a significant effect on data point location (pvalue = 0.001, 999 permutations). Tissue designation within the plottingarea indicates the centroid of the respective tissue. Number sign indicatesN. hemsleyana fluid replicates with observed bat roosting. Lower caseletters (a–c) indicate samples for which co-localising taxa wereinvestigated
Fig. 3 Analysis of similarity (ANOSIM) for tissues based onBray-Curtisdissimilarity. From left to right: Between, Fluid, Inside, Leaf, Outside,Peristome. Single dots indicate outliers lying outside +/−1.5 of theinterquartile range. Please note that these do not correspond to samplereplicates but to pairwise comparisons between dissimilarity ranks ofreplicates. Tissues sharing the same lowercase letter are not statisticallydifferent from one another (Nemenyi’s test). Fluids and leaves showincreased variability between pitcher replicates
Table 2 Relative amounts of OTUs in clusters contributing to fluidcommunities
SampleID
Cluster 1DCA1> 2.5DCA2< 1.5(%)
Cluster 2DCA1> 2.5DCA2<−1.5(%)
Cluster 32 <DCA1<30 <DCA2<1(%)
Cluster 4DCA1<−1.5DCA2<−1.5(%)
H1-F (#) 73.8 0.1 1.5 <0.1
H2-F (b) 5.1 5.8 36.8 <0.1
H3-F (#) 95.5 0.4 <0.1 0
H4-F (c) <0.1 0.5 <0.1 71.3
H5-F 0.3 0.4 0 0.1
R1-F (a) 6.5 71.7 0 0
R2-F (a) 6.5 90.4 0 <0.1
R3-F 3.0 1.7 0 0.3
R4-F 0.3 <0.1 0 0.8
R5-F 1.2 1.3 0 0.4
Symbols and lower case letters in brackets indicate where the samples arelocated in Fig. 2
H N. hemsleyana, R N. rafflesiana, F fluid
W. Sickel et al.
Author's personal copy

more abundant in N. hemsleyana fluid belonged to vertebrategut symbionts, such as Lactobacillus, Mobiluncus andAnaerococcus , but also nitrogen-fixing taxa, e.g.Mesorhizobium, Methylosinus and Burkholderia (Fig. 5b).Some saprophytic taxa, such as Corynebacterium,Sphingobacterium and Mycobacterium were also enriched inN. hemsleyana fluid (Fig. 5d). Despite those differences, eight
OTUs were common to 90 % of the fluid samples of bothNepenthes species. Two of those belonged to theBradyrhizobiaceae with one OTU further classified asBradyrhizobium, two OTUs belonged to the Enterobacteria-ceae (closely related to Klebsiella and Escherichia) and oneOTU each was classified as Rhodococcus, Sphingomonas,Methylobacterium and Sediminibacterium.
0.00
0.25
0.50
0.75
1.00
H1.F# H2.Fb H3.F# H4.Fc H5.F R1.Fa R2.Fa R3.F R4.F R5.F
Sample ID
Rel
ativ
e ab
unda
nce
[Chthonio-bacteriaceae]
Chitino-phagaceae
Entero-bacteriaceae
Myco-bacteriaceae
Rhodo-cyclaceae
Sphingo-bacteriaceae
Aceto-bacteraceae
Chitino-phagaceae
Cryo-morphaceae
Cyto-phagaceae
Sphingo-bacteriaceae
Entero-bacteriaceae
Brevi-bacteriaceae
Derma-bacteraceae
Dietziaceae
Rhodo-cyclaceae
Sphingo-bacteriaceae
[Week-sellaceae]
Coryne-bacteriaceae
Entero-bacteriaceae
Staphylo-coccaceae
Strepto-coccaceae
Xantho-monadaceae
Aceto-bacteraceae
Entero-bacteriaceae
Aceto-bacteraceae
Entero-bacteriaceae
Aceto-bacteracae
Bacillaceae
Brady-rhizobiaceae
Burkhol-deriaceae
Chitino-phagaceae
Entero-bacteriaceae
Pseudo-monadaceae
Sphingo-bacteriaceae
Brady-rhizobiaceae
Chitino-phagaceae
Coryne-bacteriaceae
Sphingo-monadaceae
Staphylo-coccaceae
Brady-rhizobiaceae
Chitino-phagaceae
Nanno-cystaceaePseudo-
monadaceaeRhizo-
biaceae
N. hemsleyana N. rafflesiana
otherother
otherother other other other other other other
a)
0.00
0.25
0.50
0.75
1.00
H1.F
#H
1.I
H1.O
H1.P
H2.F
bH
2.I
H2.L
H2.O
H2.P
H3.F
#H
3.I
H3.O
H3.P
H4.F
cH
4.I
H4.O
H4.P
H5.F
H5.I
H5.L
H5.O
H5.P
R1.F
aR
1.I
R1.L
R1.O
R1.P
R2.F
aR
2.I
R2.O
R2.P
R3.F
R3.I
R3.O
R3.P
R4.F
R4.I
R4.L
R4.O
R4.P
R5.F
R5.I
R5.O
R5.P
Rel
ativ
e ab
unda
nce
N. hemsleyana N. rafflesiana
b)
Sample ID
Group
other
Acidocella
Gut Symbionts
Nitrogen fixersSaprophytesOther acidophiles
Fig. 4 Community composition. a Relative abundance of bacterialfamilies in fluid samples. ‘Other’ includes families representing lessthan 5 % of the sample communities. b Relative abundance of taxagrouped into ecologically similar groups (see ‘Materials and Methods’).Abbreviations in sample IDs: H N. hemsleyana, R N. rafflesiana, F fluid,
I inside, L leaf,O outside, P peristome. Symbols and lower case letters inthe Sample IDs indicate where the samples are located in the ordinationplot (Fig. 2), number sign N. hemsleyana fluid associated with batroosting, a–c = fluid samples for which co-localising taxa wereinvestigated
Bacterial Communities in Nepenthes Fluid
Author's personal copy

ChryseobacteriumEnterococcusAnaerococcusStreptococcus
ErwiniaMobiluncus
Lactobacillus c
NannocystisSediminibacterium
ThermomonasPhaeospirillum
WautersiellaPseudomonas
LeuconostocBacillus
AlcanivoraxKaistobacter
MarinomonasTreponema
TG5Candidatus Nitrososphaera
VeillonellaDesemzia
FlavobacteriumSkermanellaBdellovibrio
BrevibacillusAquimonas
RubellimicrobiumGW-34
Catonella*Mycobacterium
ParacoccusPrevotella
Actinomycetospora1-68
JonquetellaSphingomonas
AnaerosporaCampylobacter
PedobacterAerococcus
KingellaEllin506
CoprococcusGemmata
KytococcusRunella
*CorynebacteriumRhodobacter
DialisterConexibacter
FlavihumibacterMethylotenera
SpirosomaTsukamurellaHyphomonas
Jeotgalicoccus*Microbacterium
TelmatospirillumNevskia
ZoogloeaBacteroides
MegasphaeraCellulosimicrobium
WAL_1855DElizabethkingia
NiabellaPlanctomycesLuteolibacter
RathayibacterRhodanobacter
GordoniaSphingobium
SphingobacteriumCandidatus Rhabdochlamydia
BrachybacteriumEthanoligenensLeadbetterella
FluviicolaPropionivibrioDyadobacter
Chthoniobacter
-10
-5 0 5
Logarithmic Fold Change
Gen
us
0.01
0.02
0.03
0.04
p-Value
d
AgrobacteriumRhodoplanes
MethylobacteriumBurkholderia
KaistiaDevosia
AchromobacterPandoraea
Mesorhizobiumb
AcidocellaRoseococcusAcidiphilium
GluconobacterAcidisoma
TerriglobusEdaphobacter
N. hemsleyana N. rafflesiana
a
W. Sickel et al.
Author's personal copy

Discussion
We analysed bacterial communities associated with twoNepenthes species, N. rafflesiana and N. hemsleyana, whichdiffer in their nutrient sequestration strategies. We comparedbacterial diversity and community structure between the twoNepenthes species as well as different parts of the pitchers. Wefurther inferred potential functional roles of specific bacterialtaxa by comparing taxa distribution within the fluids of thetwo Nepenthes species.
Tissue Comparison
Regarding pitcher tissues, we found high similarities in bac-terial diversity as well as community structure between mosttissues. The outsides showed a somewhat increased bacterialrichness and diversity in N. hemsleyana, and the leavesseemed rather variable in their community structure. Sincethese two tissues were exposed to the environment, those dif-ferences might be applicable to random colonisation events byenvironmental bacteria. This indicates that bacteria colonisingthese pitcher parts do not form a functional association withthe plant and thus passively accumulate over time, as previ-ously proposed [34]. The general similarity between the dif-ferent pitcher parts was unexpected because each pitcher tis-sue exhibits distinct morphological and chemical surface char-acteristics, which we expected to affect bacterial communitycomposition, as previously proposed for leaves of differenttree species [72]. Within the pitchers, bacterial diversity waslower than in the environmental soil controls, similarly to arecent study on three other Nepenthes species [73]. This indi-cates that some selection mechanisms may exist to controlcertain groups of bacteria, for example plant pathogens.Nepenthes plants produce antimicrobial substances, such asplumbagin and its derivatives, in its fluid and leaves [74]. This
substance is probably also expressed in other parts of thepitcher, which might be a mechanism of pathogen defence.
Nepenthes Species Comparison
In contrast to the tissue types discussed above, the digestivefluids showed more striking differences. Here, N. hemsleyanashowed higher bacterial richness than N. rafflesiana. Thecommunity structure was highly variable between pitcher rep-licates of both species. This is in line with the findings of Chouet al. [38]. The difference in richness might be attributed totwo opposing mechanisms: introduction of additional taxa inN. hemsleyana and suppression of various taxa inN. rafflesiana. We have indications for both, as fluid diversityof N. hemsleyana was probably increased due to bacteria in-troduced by bat faeces, which would not occur inN. rafflesiana. The two fluid replicates of N. hemsleyanawithobserved bat roosting showed a difference in communitystructure compared to the other replicates (Fig. 2), indicatingthat bat faeces introduction alters the bacterial community.Our results show that faeces might introduce bacterial taxainto the pitcher that would otherwise not occur in the fluid,since we found many taxa exclusive to these two samples,most notably a group of several Chitinophagaceae(Supplemental File 3). These might be important gut inhabi-tants of the insectivorous K. hardwickii. Additionally, severaltaxa associated with mammalian digestive tracts were signif-icantly enriched in the N. hemsleyana fluid, includingLactobacillus [65, 75–77], Mobiluncus and Anaerococcus[63]. These genera were absent from N. rafflesiana fluid orvery rare. However, these are only indications and since wecould not control for nutrient source in the natural setting, it isdifficult to attribute these differences to bat faeces alone. Thus,the effect of faeces introduction on the bacterial community asopposed to arthropod prey should be assessed in more con-trolled approaches. However, this increase in bacterial rich-ness might entail increased competition with bacteria for nu-trients. Indeed, some taxa with urease and nitrate reductionactivities were present, such as Mycobacterium [78, 79],Corynebacterium [80, 81] and Sphingobacterium [82]. Thegenus Mycobacterium also includes animal pathogens [83,84] and thus could possibly have been introduced by infectedbats. Nonetheless, saprophytes would certainly be able to ab-sorb nutrients from bat faeces and urine, so that they may betemporally nutrient competitors for N. hemsleyana or mutual-ists. However, at the end, they might also be digested by thepitcher plant.
The variability in community structure between fluid rep-licates of both species is in line with previous findings [38,73], and is already reflected in different profiles of bacterialfamilies (Fig. 4a). However, community variability could notbe attributed to specific bacterial taxa or groups of ecological-ly similar bacteria. Instead, community differences were rather
�Fig. 5 Differences in taxa distributions within the digestive fluids basedon logarithmic fold change.Negative logarithmic fold change enrichmentin N. hemsleyana fluid, positive logarithmic fold change enrichment inN. rafflesiana fluid. Data point shading indicates p value, with lightershading indicating higher p values. For visualisation reasons, only taxawith significantly different distributions are shown (exact test as definedin edgeR [69]). The taxa were split by putative ecological/functional rolesas identified from literature and described in ‘Materials and Methods’.Since assignment to such putative functions was based solely on literatureresearch, functions might not be shared among all taxa within a group andadditionally taxa with similar functions might be missing from thegroups, respectively. a acidophilic taxa: Acidobacteriaceae andAcetobacteraceae; b nitrogen-fixing taxa: Burkholderiales andRhizobiales; c vertebrate and insect gut symbionts: Mobiluncus,Clostridium, Anaerococcus, Lactobacillus, Streptococcus, Serratia,Pantoea, Rhodococcus, Lactococcus, Chryseobacterium, and otherEnterobacteriaceae; d other: all remaining taxa with significantlydifferent distributions. Bold taxa indicate taxa previously identified inNepenthes by Chou et al. [38]; asterisk indicates saprophytic taxa:Microbacterium, Mycobacterium, and Corynebacterium
Bacterial Communities in Nepenthes Fluid
Author's personal copy
OTU-specific and influenced by different high and low abun-dance OTUs as well as sample-specific OTUs. Thus,Nepenthes pitchers seem to constitute highly complex systemsregarding their bacterial communities, with strain-specific dif-ferences. This can have several reasons, which probably allinteract in shaping the bacterial community of Nepenthespitcher fluid. Firstly, horizontal transfer of an endogenouscommunity (see [38]) and subsequent diversification of taxabetween unrelated plant individuals, which could be tested bycomparing intra- and inter-individual differences in fluid mi-crobiota. Secondly, the life history of a pitcher probably playsa big role in shaping the bacterial community, influenced bytypes of prey caught and time since last prey capture. Addi-tionally, bacteria might also be passively introduced from theenvironment. Thus, the exogenous bacterial community [38]can be very different between different pitchers. Thirdly,Nepenthes pitchers, especially the fluids, could be interpretedas micro-ecosystems with high selective pressure due to highfluid pH [16, 85], but also highly dynamic conditions withinthe pitcher, due to prey capture and subsequent release ofdifferent nutrients. Fourthly, an alternative explanation hasbeen given by Takeuchi et al. [73] who suggested that it isnot particular bacterial taxa that are selected for but ratherfunction-related traits. This is supported by the fact that wecould detect members of groups with putative ecological func-tions in most samples.
As already mentioned, one major influence on bacterialcommunity composition is probably the fluid pH, whichchanges during the digestion process [13] or due to ageing[16] and has been shown to be a major predictor of bacterialcommunity structure [86, 87]. The influence of fluid pHseemed to be further supported by the distribution of oneparticular bacterial genus, Acidocella within N. rafflesianafluids. Acidocella spp. could be extremely abundant with upto 74 % of the entire sample community, but at the same timewere very variable in their relative abundance and even absentfrom some samples. Bacteria of this genus are acidophilic, fastgrowing and some produce acid from a variety of substrates[88, 89]. Acidocella has been found in other Nepenthes spe-cies [38] and also in close associations with other plants inacidic environments [89, 90], indicating a common associa-tion of that genus with a variety of plants, but the nature ofsuch an association remains unclear. Considering the highvariability ofAcidocella distribution, its occurrencemight alsosimply be affected by fluid pH or be even only occasional.Further analyses of a potential relationship betweenNepenthes and Acidocella have to be undertaken in futurestudies.
Apart from Acidocella, other acidophilic taxa occurred atlow abundance levels in both Nepenthes species, which hasalso been observed in other Nepenthes species [73]. This wasreally surprising, since the fluids of both species are highlyacidic (pH = 2.7 for N. hemsleyana and pH = 2.1 for
N. rafflesiana [85]) and can be as low as 1.95 inN. rafflesiana[16]. A possible explanation for this is that most bacteria liv-ing in the fluid are already adapted to be at least acid-tolerant,but do not belong to ‘typical’ acidophilic lineages, such asAcidobacteriaceae and Acetobacteraceae. Each of thosestrains might exhibit particular ecological characteristics, giv-ing them certain roles in the fluid community.
Interestingly, one N. rafflesiana fluid sample with extremeAcidocella levels (a in Fig. 2), was also associated with severalOTUs identified as Treponema. Some Treponema spp. aretermite gut symbionts [91, 92], and thus this association mightgive an indication of the type of prey recently caught, which isinteresting, because we sampled only aerial pitchers. Similar-ly, we found many Chitinophagaceae in the N. hemsleyanafluids with observed bat roosting (# in Fig. 2), which werealmost exclusive to these pitchers. Other Chitinophagaceae,apart from Sediminibacterium, were mostly detected in otherN. hemsleyana samples, with a few exceptions. Thus, theseChitinophagaceae might in some way be associated with theNepenthes-bat mutualism.
An important finding is that the fluids of both species aswell as the other pitcher parts additionally contained consid-erable amounts of putative nitrogen-fixing bacteria, account-ing for 14.6 % (Rhizobiales) and 3.2 % (Burkholderiales) ofall detected bacteria in the complete data set. Genera withinthose two families included Bradyrhizobium, Methylosinusand Burkholderia. Additionally, according to the commonOTU analysis, those bacterial groups were also representedin the core microbiota of the fluid samples. Burkholderiaand Rhizobiaceae were also found in the fluids of Northernpitcher plants of the genus Sarracenia [41], but so far onlyKaistia spp. have been found in other Nepenthes species [38].Such bacteria are common rhizosphere symbionts [59]converting atmospheric nitrogen to ammonia, which is readilyabsorbed by the plant (reviewed in e.g. [93]), or promotingplant growth in other ways, for example by producing phyto-hormones [94]. Bacterial nitrogen fixation has been shown tooccur on submerged leaf surfaces of Sarracenia [95] and Ec-uadorian bromeliads [96], although the nitrogen fixation rateswere rather low [95, 96] and it remains unclear whether thehost plants actually absorb the resulting ammonia [95, 96].The detection of putative nitrogen fixers even in the extremelyacidic fluids of N. rafflesiana and N. hemsleyana, indicatesthat strains exist that can tolerate such challenging environ-ments. This finding is very interesting, and the nitrogen-fixingabilities of these strains should be further investigated by ex-perimental approaches or nitrogen fixation gene analysis. Thiswould provide further evidence for potentially mutualistic re-lationships between Nepenthes plants and fluid bacteria,which has already been proposed previously [4, 13]. Sum-ming up, our results and previous studies in plantphytotelmata [95, 96] indicate that this particular plant-microbe mutualism might be more ubiquitous than previously
W. Sickel et al.
Author's personal copy
thought and might also occur in other nutrient sequestrationsystems apart from root systems. It is to be speculated thatdiverse microbial associations may contribute to nitrogen up-take during low-prey periods. In that respect, prey items mightserve not only as the main nutrient source, but additionally asa substrate for cultivation of nitrogen-fixing taxa by the plant,which remains to be tested. The apparent acid tolerance ofnitrogen-fixing bacteria found in N. rafflesiana fluid couldbe exploited in agricultural settings, potentially as abiofertiliser in acidic soils. Sphingomonas spp. were identifiedboth in our study and other Nepenthes species [38] and werealso identified as one of the OTUs belonging to the commonbacteria of the fluids. This points towards a general associa-tion with Nepenthes pitcher plants, possibly as endophytes[38, 97], a relationship that has been reported for other plantsas well [98, 99]. Finally, this great variety of potential symbi-onts suggests that interactions between the plant and otherorganisms involve networks of several species [100], in ourcase between pitcher plants, bats, symbiotic saprophytes andnitrogen-fixing bacteria.
Conclusions
Analysing microbial communities in the two species of trop-ical pitchers plants, N. rafflesiana and N. hemsleyana, re-vealed new insights into associations with microorganisms.We showed that both species harboured diverse bacterial com-munities in their pitchers, although only the fluids and externalsurfaces showed differences to the remaining pitcher tissues.We found high variability of bacterial community structure inthe digestive fluids, which could not be associated with par-ticular groups of bacteria, but which could be caused by diet,as well as other factors, for example fluid pH and time sincelast prey capture. These potential factors and their effect onbacterial communities should be investigated in controlledexperiments. We detected Acidocella spp. at variable abun-dance levels, which might be commonly associated with avariety of plants. The occurrence of putative nitrogen-fixingbacteria indicated that such bacteria are not restricted to rootsystems, although nitrogen fixation within pitchers ofNepenthes remains to be shown.
Acknowledgments We are grateful to the Universitätsbund Würzburge.V. for financially supporting this project (Grant number AZ-13-43) andthe University ofWürzburg/Land Bavaria for covering staff costs. We arefurthermore most grateful to the Universiti Brunei Darussalam for logis-tical and financial support (URG 193) and the Brunei Darussalam For-estry Department for permission to enter forests and for granting thesampling permits (46/JPH/UND/17 PT.1).
Compliance with Ethical Standards
Conflict of Interest The authors declare that they have no competinginterests.
References
1. Juniper BE, Robins RJ, Joel D (1989) The carnivorous plants.Academic Press, London
2. Clarke MC (1997) Nepenthes of Borneo. Nat. Hist. Publ3. Clarke MC (2001) Nepenthes of Sumatra and Peninsular
Malaysia. Nat. Hist. Publ4. Schulze W, Frommer WB, Ward JM (1999) Transporters for am-
monium, amino acids and peptides are expressed in pitchers of thecarnivorous plant Nepenthes. Plant J 17:637–646
5. Gaume L, Forterre Y (2007) Aviscoelastic deadly fluid in carniv-orous pitcher plants. PLoS One 2:e1185. doi:10.1371/journal.pone.0001185
6. Gaume L, Gorb S, Rowe N (2002) Function of epidermal surfacesin the trapping efficiency ofNepenthes alata pitchers. New Phytol156:479–489. doi:10.1046/j.1469-8137.2002.00530.x
7. Riedel M, Eichner A, Jetter R (2003) Slippery surfaces of carniv-orous plants: composition of epicuticular wax crystals inNepenthes alata Blanco pitchers. Planta 218:87–97. doi:10.1007/s00425-003-1075-7
8. Riedel M, Eichner A, Meimberg H, Jetter R (2007) Chemicalcomposition of epicuticular wax crystals on the slippery zone inpitchers of five Nepenthes species and hybrids. Planta 225:1517–1534. doi:10.1007/s00425-006-0437-3
9. Pavlovič A, Masarovičová E, Hudák J (2007) Carnivorous syn-drome in Asian pitcher plants of the genus Nepenthes. Ann Bot100:527–536
10. Moran JA, Clarke CM (2010) The carnivorous syndrome inNepenthes pitcher plants. Current state of knowledge and potentialfuture directions. Plant Signal Behav 5:644–648
11. Gaume L, Perret P, Gorb E et al (2004) How do plant waxes causeflies to slide? Experimental tests of wax-based trapping mecha-nisms in three pitfall carnivorous plants. Arthropod Struct Dev 33:103–111. doi:10.1016/j.asd.2003.11.005
12. Bonhomme V, Pelloux-Prayer H, Jousselin E et al (2011) Slipperyor sticky? Functional diversity in the trapping strategy ofNepenthes carnivorous plants. New Phytol 191:545–554
13. Higashi S, Nakashima A, Ozaki H et al (1993) Analysis of feedingmechanism in a pitcher ofNepenthes hybrida. J Plant Res 106:47–54
14. An C-I, Fukusaki E, Kobayashi A (2001) Plasma-membrane H+ -ATPases are expressed in pitchers of the carnivorous plantNepenthes alata Blanco. Planta 212:547–555
15. An C-I, Fukusaki E, Kobayashi A (2002) Aspartic proteinases areexpressed in pitchers of the carnivorous plant Nepenthes alataBlanco. Planta 214:661–667. doi:10.1007/s004250100665
16. Bauer U, Willmes C, Federle W (2009) Effect of pitcher age ontrapping efficiency and natural prey capture in carnivorousNepenthes rafflesiana plants. Ann Bot 103:1219–1226. doi:10.1093/aob/mcp065
17. Grafe TU, Schöner CR, Kerth G et al (2011) A novel resource-service mutualism between bats and pitcher plants. Biol Lett 7:436–439. doi:10.1098/rsbl.2010.1141
18. Schöner CR, Schöner MG, Kerth G, Grafe TU (2013) Supplydetermines demand: influence of partner quality and quantity onthe interactions between bats and pitcher plants. Oecologia 173:191–202. doi:10.1007/s00442-013-2615-x
19. Clarke C, Moran JA, Lee CC (2011) Nepenthes baramensis(Nepenthaceae)—a new species from north-western Borneo.Blumea 56:229–233
20. Scharmann M, Grafe TU (2013) Reinstatement of Nepentheshemsleyana (Nepenthaceae), an endemic pitcher plant fromBorneo, with a discussion of associated Nepenthes taxa. Blumea58:8–12. doi:10.3767/000651913X668465
Bacterial Communities in Nepenthes Fluid
Author's personal copy

21. Gaume L, Di Giusto B (2009) Adaptive significance and ontoge-netic variability of the waxy zone in Nepenthes rafflesiana. AnnBot 104:1281–91. doi:10.1093/aob/mcp238
22. Bauer U, Grafe TU, Federle W (2011) Evidence for alternativetrapping strategies in two forms of the pitcher plant, Nepenthesrafflesiana. J Exp Bot 62:3683–3692. doi:10.1093/jxb/err082
23. Lim YS, Schöner CR, Schöner MG et al (2015) How apitcher plant facilitates roosting of mutualistic woolly bats.Evol Ecol Res 16:1–11
24. Schöner MG, Schöner CR, Simon R et al (2015) Bats are acous-tically attracted to mutualistic carnivorous plants. Curr Biol 25:1911–1916. doi:10.1016/j.cub.2015.05.054
25. Mithöfer A (2011) Carnivorous pitcher plants: insights in an oldtopic. Phytochemistry 72:1678–1682. doi:10.1016/j.phytochem.2010.11.024
26. Takeuchi Y, Salcher MM, Ushio M et al (2011) In situ enzymeactivity in the dissolved and particulate fraction of the fluid fromfour pitcher plant species of the genus Nepenthes. PLoS One 6:e25144. doi:10.1371/journal.pone.0025144
27. Amagase S, Mori M, Nakayama S (1972) Digestive enzymes ininsectivorous plants. IV Enzymatic digestion of insects byNepenthes secretion and drosera peltata extract: proteolytic andchitinolytic activities. J Biochem 72:765–767
28. Mayer E, Adlassnig W, Peroutka M, Lichtscheidl IK (2005)Microflora in the traps of pitcher plants. In: VXII Int. Bot.Congr. p 510
29. Buch F, RottM, Rottloff S et al (2013) Secreted pitfall-trap fluid ofcarnivorous Nepenthes plants is unsuitable for microbial growth.Ann Bot 111:375–383. doi:10.1093/aob/mcs287
30. Eilenberg H, Pnini-Cohen S, Schuster S et al (2006) Isolation andcharacterization of chitinase genes from pitchers of the carnivo-rous plant Nepenthes khasiana. J Exp Bot 57:2775–2784. doi:10.1093/jxb/erl048
31. Hatano N, Hamada T (2008) Proteome analysis of pitcher fluid ofthe carnivorous plantNepenthes alata. J Proteome Res 7:809–816.doi:10.1021/pr700566d
32. Hatano N, Hamada T (2012) Proteomic analysis of secreted pro-tein induced by a component of prey in pitcher fluid of the carniv-orous plant Nepenthes alata. J Proteomics 75:4844–4852. doi:10.1016/j.jprot.2012.05.048
33. Rottloff S, Stieber R, Maischak H et al (2011) Functional charac-terization of a class III acid endochitinase from the traps of thecarnivorous pitcher plant genus, Nepenthes. J Exp Bot 62:4639–4647. doi:10.1093/jxb/err173
34. Sota T,MogiM, KatoK (1998) Local and regional-scale food webstructure in Nepenthes alata pitchers. Biotropica 30:82–91
35. Yogiara AS, Suhartono MT (2006) A complex bacterial commu-nity living in pitcher plant fluid. J Mikrobiol Indones 11:9–14
36. Morohoshi T, Oikawa M, Sato S et al (2011) Isolation and char-acterization of novel lipases from a metagenomic library of themicrobial community in the pitcher fluid of the carnivorous plantNepenthes hybrida. J Biosci Bioeng 112:315–20. doi:10.1016/j.jbiosc.2011.06.010
37. Lüttge U (1964) Untersuchungen zur Physiologie der Carnivoren-Drüsen. Planta 63:103–117
38. Chou LY, Clarke CM, Dykes GA (2014) Bacterial communitiesassociated with the pitcher fluids of three Nepenthes(Nepenthaceae) pitcher plant species growing in the wild. ArchMicrobiol 196:709–717. doi:10.1007/s00203-014-1011-1
39. Siragusa AJ, Swenson JE, Casamatta DA (2007) Culturable bac-teria present in the fluid of the hooded-pitcher plant Sarraceniaminor based on 16S rDNA gene sequence data. Microb Ecol 54:324–31. doi:10.1007/s00248-006-9205-y
40. Peterson CN, Day S, Wolfe BE et al (2008) A keystone predatorcontrols bacterial diversity in the pitcher-plant (Sarracenia
purpurea) microecosystem. Environ Microbiol 10:2257–66. doi:10.1111/j.1462-2920.2008.01648.x
41. Koopman MM, Fuselier DM, Hird S, Carstens BC (2010) Thecarnivorous pale pitcher plant harbors diverse, distinct, and time-dependent bacterial communities. Appl Environ Microbiol 76:1851–1860. doi:10.1128/AEM.02440-09
42. Mouquet N, Daufresne T, Gray SM, Miller TE (2008) Modellingthe relationship between a pitcher plant (Sarracenia purpurea)and its phytotelma community: mutualism or parasitism? FunctEcol 22:728–737. doi:10.1111/j.1365-2435.2008.01421.x
43. Kozich JJ, Westcott SL, Baxter NT et al (2013) Development of adual-index sequencing strategy and curation pipeline for analyzingamplicon sequence data on the MiSeq Illumina sequencing plat-form. Appl Environ Microbiol 79:5112–5120. doi:10.1128/AEM.01043-13
44. Caporaso JG, Lauber CL,Walters WA et al (2011) Global patternsof 16S rRNA diversity at a depth of millions of sequences persample. Proc Natl Acad Sci 108:4516–4522. doi:10.1073/pnas.1000080107/-/DCSupplemental.www.pnas.org/cgi/doi/10.1073/pnas.1000080107
45. Fierer N, Hamady M, Lauber CL, Knight R (2008) The influenceof sex, handedness, and washing on the diversity of hand surfacebacteria. Proc Natl Acad Sci 105:17994–17999
46. llumina Inc. (2013) Preparing libraries for sequencing on theMiSeq
47. Caporaso JG, Kuczynski J, Stombaugh J et al (2010) QIIME al-lows analysis of high- throughput community sequencing data.Nat Methods 7:335–336. doi:10.1038/nmeth0510-335
48. Edgar RC (2010) Search and clustering orders of magnitude fasterthan BLAST. Bioinformatics 26:2460–2461
49. Edgar RC, Haas BJ, Clemente JC et al (2011) UCHIME improvessensitivity and speed of chimera detection. Bioinformatics 27:2194–2200
50. R Core Team (2014) R: a language and environment for statisticalcomputing
51. McMurdie PJ, Holmes S (2013) phyloseq: an R package for re-producible interactive analysis and graphics of microbiome censusdata. PLoS One 8:e61217. doi:10.1371/journal.pone.0061217
52. Dixon P (2003) VEGAN, a package of R functions for communityecology. J Veg Sci 14:927–930
53. Shannon CE, Weaver W (1949) The mathematical theory of com-munication. University of Illinois Press, Urbana
54. Hill MO, Gauch HG Jr (1980) Detrended correspondence analy-sis: an improved ordination technique. Vegetatio 42:47–58
55. Lozupone CA, Knight R (2005) UniFrac: a new phylogeneticmethod for comparing microbial communities. Appl EnvironMicrobiol 71:8228–8235
56. Clarke KR (1993) Non-parametric multivariate analyses of chang-es in community structure. Aust J Ecol 18:117–143
57. Bray JR, Curtis T (1957) An ordination of upland forest commu-nities of Southern Wisconsin. Ecol Monogr 27:325–349
58. Vessey JK (2003) Plant growth promoting rhizobacteria asbiofertilizers. Plant Soil 255:571–586
59. Lucy M, Reed E, Glick BR (2004) Applications of free livingplant growth-promoting rhizobacteria . Antonie VanLeeuwenhoek 86:1–25. doi:10.1023/B:ANTO.0000024903.10757.6e
60. Rowe OF, Sánchez-España J, Hallberg KB, Johnson DB (2007)Microbial communities and geochemical dynamics in an extreme-ly acidic, metal-rich stream at an abandoned sulfide mine (Huelva,Spain) underpinned by two functional primary production sys-tems. Environ Microbiol 9:1761–1771. doi:10.1111/j.1462-2920.2007.01294.x
61. Kersters K, Lisdiyanti P, Komagata K, Swings J (2006) The familyAcetobacteraceae: the genera Acetobacter, Acidimonas, Asaia,Gluconacetobacter, Gluconobacter, and Kozakia. In: Dworkin
W. Sickel et al.
Author's personal copy

M, Falkow S, Rosenberg E, et al. (eds) Prokaryotes Vol. 5Proteobacteria Alpha Beta Subclasses, Third Edit. Springer, pp163–200
62. Belova SE, Pankratov TA, Detkova EN et al (2009) Acidisomatundrae gen. nov., sp. nov. and Acidisoma sibiricum sp. nov., twoacidophilic, psychrotolerant members of the Alphaproteobacteriafrom acidic northern wetlands. Int J Syst EvolMicrobiol 59:2283–2290. doi:10.1099/ijs.0.009209-0
63. Lee JE, Lee S, Sung J, KoG (2011) Analysis of human and animalfecal microbiota for microbial source tracking. ISME J 5:362–365
64. Ley RE, Hamady M, Lozupone CA et al (2008) Evolution ofmammals and their gut microbes. Science 320(80-):1647–1651
65. Endo A, Irisawa T, Futagawa-Endo Y et al (2013) Lactobacillusfaecis sp. nov., isolated from animal faeces. Int J Syst EvolMicrobiol 63:4502–4507
66. O’Shea EF, Gardiner GE, O’Connor PM et al (2009)Characterization of enterocin- and salivaricin-producing lactic ac-id bacteria from the mammalian gastrointestinal tract. FEMSMicrobiol Lett 291:24–34
67. Sayers EW, Barrett T, Benson DA et al (2011) Database resourcesof the national centre for biotechnology information. NucleicAcids Res 39:D38–D51
68. Altschul SF, Gish W, Miller W et al (1990) Basic local alignmentsearch tool. J Mol Biol 215:403–410. doi:10.1016/S0022-2836(05)80360-2
69. Robinson MD, McCarthy DJ, Smyth GK (2010) edgeR: abioconductor package for differential expression analysis of dig-ital gene expression data. Bioinformatics 26:139–140
70. McMurdie PJ, Holmes S (2014) Waste not, want not: why rarefy-ing microbiome data is inadmissible. PLoS Comput Biol 10:e1003531. doi:10.1371/journal.pcbi.1003531
71. Bagley S (1985) Habitat association of Klebsiella species. InfectControl 6:52–58
72. Redford AJ, Fierer N (2009) Bacterial succession on the leaf sur-face: a novel system for studying successional dynamics. Plant-Microbe Interact 58:189–198
73. Takeuchi Y, Chaffron S, Salcher MM et al (2015) Bacterial diver-sity and composition in the fluid of pitcher plants of the genusNepenthes. Syst Appl Microbiol 38:330–339. doi:10.1016/j.syapm.2015.05.006
74. Raj G, Kurup R, Hussain AA, Baby S (2011) Distribution ofnaphthoquinones, plumbagin, droserone, and 5-O-methyldroserone in chitin-induced and uninduced Nepenthes khasiana:molecular events in prey capture. J Exp Bot 62:5429–5436. doi:10.1093/jxb/err219
75. Morotomi M, Yuki N, Kado Yet al (2002) Lactobacillus equi sp.nov., a predominant intestinal Lactobacillus species of the horseisolated from faeces of healthy horses. Int J Syst Evol Microbiol52:211–214
76. Roos S, Karner F, Axelsson L, Jonsson H (2000) Lactobacillusmucosae sp. nov., a new species with in vitro mucus-binding ac-tivity isolated from pig intestine. Int J Syst Evol Microbiol 50:251–258
77. Walter J, Britton RA, Roos S (2011) Host-microbial symbiosis inthe vertebrate gastrointestinal tract and the Lactobacillus reuteriparadigm. Proc Natl Acad Sci 108:4645–4652
78. Howard ST, Byrd TF (2000) The rapidly growing mycobacteria:saprophytes and parasites. Microbes Infect 2:1845–1853
79. Oram DM, Avdalovic A, Holmes RK (2004) Analysis of genesthat encode DtxR-like transcriptional regulators in pathogenic andsaprophytic corynebacterial species. Infect Immunol 72:1885–1895
80. Abe S, Takayama KI, Kinoshita S (1967) Taxonomicalstudies on glutamic acid-producing bacteria. J Gen ApplMicrobiol 13:279–301
81. Pitcher D, Soto A, Soriano F, Valero-Guillén P (1992)Classification of coryneform bacteria associated with human uri-nary tract infection (group D2) as Corynebacterium urealyticumsp. nov. Int J Syst Bacteriol 42:178–181
82. Yabuuchi E, Kaneko T, Yano I et al (1983) Sphingobacterium gen.nov. , Sphingobac te r ium sp i r i t i vorum comb. nov. ,Sphingobacterium multivorum comb. nov., Sphingobacteriummizutae sp. nov., and Flavobacterium indologenes sp. nov.:glucose-nonfermenting gram-negative rods in CDC groups IIK-2and IIb. Int J Syst Evol Bacteriol 33:580–598
83. Anes E, Kühnel MP, Bos E et al (2003) Selected lipids activatephagosome actin assembly and maturation resulting in killing ofpathogenic mycobacteria. Nat Cell Biol 5:793–802. doi:10.1038/ncb1036.NATURE
84. Cosma CL, ShermanDR, Ramakrishnan L (2003) The secret livesof the pathogenic mycobacteria. Annu Rev Microbiol 57:641–676. doi:10.1146/annurev.micro.57.030502.091033
85. Bazile V, Le Moguédec G, Marshall DJ, Gaume L (2015) Fluidphysico-chemical properties influence capture and diet in Nepenthespitcher plants. Ann Bot 115:705–716. doi:10.1093/aob/mcu266
86. Lauber CL, Hamady M, Knight R, Fierer N (2009)Pyrosequencing-based assessment of soil pH as a predictor of soilbacterial community structure at the continental scale. ApplEnviron Microbiol 75:5111–5120
87. Fierer N, Jackson RB (2006) The diversity and biogeography ofsoil bacterial communities. Proc Natl Acad Sci 103:626–631
88. Kimoto KI, Aizawa T, Urai M et al (2010) Acidocellaaluminiidurans sp. nov., an aluminium-tolerant bacterium isolat-ed from Panicum repens grown in a highly acidic swamp in actualacid sulfate soil area of Vietnam. Int J Syst Evol Microbiol 60:764–768
89. Jones RM, Hedrich S, Johnson DB (2013) Acidocella aromaticasp. nov.: an acidophilic heterotrophic alphaproteobacterium withunusual phenotypic traits. Extremophiles 17:841–850
90. Bragina A, Maier S, Berg C et al (2012) Similar diversity ofAlphaproteobacteria and nitrogenase gene amplicons on two re-lated Sphagnum mosses. Front Microbiol 2:1–10
91. Dröge S, Rachel R, Radek R, König H (2008) Treponemaisoptericolens sp. nov., a novel spirochaete from the hind-gut of the termite Incisitermes tabogae. Int J Syst EvolMicrobiol 58:1079–1083. doi:10.1099/ijs.0.64699-0
92. Graber JR, Leadbetter JR, Breznak JA (2004) Descriptionof Treponema azotonutricium sp. nov. and Treponemaprimitia sp. nov., the first spirochetes isolated from termiteguts. Appl Environ Microbiol 70:1315–1320. doi:10.1128/AEM.70.3.1315
93. Richardson AE, Barea J-M, McNeill AM, Prigent-Combaret C(2009) Acquisition of phosphorous and nitrogen in the rhizo-sphere and plant growth promotion by microorganisms. PlantSoil 321:305–339
94. Boiero L, Perrig D, Masciarelli O et al (2007) Phytohormoneproduction by three strains of Bradyrhizobium japonicum andpossible physiological and technological implications. ApplMicrobiol Biotechnol 74:874–880
95. Prankevicius AB, Cameron DM (1991) Bacterial dinitrogen fixa-tion in the leaf of the northern pitcher plant (Sarracenia purpurea).Can J Bot 69:2296–2298. doi:10.1139/b91-289
96. Bermudes D, Benzing DH (1991) Nitrogen fixation in associationwith Ecuadorean bromeliads. J Trop Ecol 7:531–536
97. Bhore SJ, Komathi V, Kandasamy KI (2013) Diversity of endo-phytic bacteria in medicinally important Nepenthes species. J NatSci Biol Med 4:431–434
98. Videira SS, de Araujo JLS, da Silva RL et al (2009) Occurrenceand diversity of nitrogen-fixing Sphingomonas bacteria associatedwith rice plants grown in Brazil. FEMSMicrobiol Lett 293:11–19.doi:10.1111/j.1574-6968.2008.01475.x
Bacterial Communities in Nepenthes Fluid
Author's personal copy

99. Chen B, Shen J, Zhang X et al (2014) The endophytic bacterium,Sphingomonas SaMR12, improves the potential for zincphytoremediation by its host, Sedum alfredii. PLoS One 9:e106826. doi:10.1371/journal.pone.0106826
100. Blatrix R, Djiéto-Lordon C, Mondolot L et al (2012) Plant-antsuse symbiotic fungi as a food source: new insight into the nutri-tional ecology of ant-plant interactions. Proc R Soc B 279:3940–3947. doi:10.1098/rspb.2012.1403
W. Sickel et al.
Author's personal copy

Part III.
Discussion
63

Part III Discussion
Overview
The studies presented above have given an overview of meta-barcodingas a method (Publication P.1) and described example applications of meta-barcoding in pollen analysis (Publications P.2 and P.3) and host-microbe as-sociation studies (Publications P.4 and P.5). These now form the basis for acritical evaluation of meta-barcoding in high-throughput biodiversity assess-ments, which will include the advantages and disadvantages of the methodas well as recommendations for the application of meta-barcoding to spe-cific research questions and an outlook of future developments.
Advantages of meta-barcoding
Meta-barcoding has been rapidly adopted in different fields of biological re-search. The main reasons for this are that species resolution can be higherthan in traditional species identification based on morphological characters;species assemblages can be studied easily without prior separation of indi-viduals; large-scale studies have become affordable due to the high through-put of sequencing platforms that allows sample multiplexing and the avoid-ance of cultivation especially for microbiology.
Taxonomic assignment. Meta-barcoding circumvents two central problemscommonly encountered in traditional species identification. Firstly, taxon-omy is assigned via DNA sequence analysis, thus limited resolution of mor-phological species identification (Williams and Kremen 2007; Galimberti etal. 2014; Handelsman and Smalla 2003) is not an issue. It is also highlybeneficial in the analysis of processed and degraded material, which is thecase in palaeo-ecological studies (Murray et al. 2012; Behling et al. 2004;Turner et al. 2013), diet analysis (Soininen et al. 2009; Valentini et al. 2009;Pompanon et al. 2012), food safety and quality issues (Woolfe and Primrose2004; Galimberti et al. 2014; Bruni et al. 2015) and analysis of traditionalChinese medicine (Yip et al. 2007; Li et al. 2011; Coghlan et al. 2012).
Since taxonomy is assigned via DNA-barcoding, experts in taxonomy arenot required for most applications of meta-barcoding, which is especiallyadvantageous considering the approaching shortage of taxonomists (Gas-ton and May 1992; Carvalho et al. 2007). For meta-barcoding, knowledge ofbasic techniques of molecular biology is sufficient and samples can be pre-pared with basic molecular biology laboratory equipment (see PublicationsP.2; P.3; Kozich et al. 2013). For data analysis, some expertise in bioinfor-matics is needed, but there are already a variety of tools available that can
64

Part III Discussion
be used with a basic understanding of command line usage (see PublicationP.3; Caporaso et al. 2010; Edgar 2013).
Circumventing manual separation. Secondly, due to the high throughput ofsequences in modern sequencing platforms, manual separation of individualspecimens (Galimberti et al. 2014; Handelsman and Smalla 2003) is not re-quired. This is highly beneficial in pollen analysis (see Publications P.2 andP.3), because complete assemblages can be processed as one. This is alsohighly advantageous in bacterial community analysis (see Publications P.4and P.5), since isolation and cultivation prior to analysis (Handelsman andSmalla 2003) is bypassed. Circumventing manual separation before DNA-barcoding is furthermore exploited in environmental DNA (eDNA) analysis,which is important for biodiversity monitoring (Hajibabaei et al. 2016).
High throughput. The high data output further allows sample multiplexing,which allows scaling up sample sizes per study, thus enabling the adoptionof meta-barcoding in large-scale studies. The amount of multiplexing canbe estimated in well-studied systems (see Publication P.2), but should al-ways allow a sufficient sequencing output per sample and still be practicalconcerning the workflow within a laboratory. There is another advantage ofmeta-barcoding due to the high sequencing throughput, which is the detec-tion of low abundance members of a community. This is the case both forpollen analysis (see Publication P.2) as well as bacterial community analysis(Bent and Forney 2008) and diet analysis (Pompanon et al. 2012).
From sequence to cultivation. Additionally, in bacterial community analysis,meta-barcoding data can be useful in advancing cultivation (Handelsmanand Smalla 2003). Taxa, that have so far not been described can be de-tected and close relatives identified. Such taxa may be identified as poten-tially major players within an ecosystem or as taxa with potentially interestingcharacteristics. It is then possible to devise directed cultivation approachesusing prior knowledge of close relatives. Further analysis of the taxon inquestion would thus advance the knowledge of microbial ecology. For ex-ample, in publication P.5 the bacterial genus Acidocella reached extremelyhigh levels of abundance within the bacterial community. This genus hasalso been detected in other Nepenthes species (Chou et al. 2014), as wellas Sphagnum mosses (Bragina et al. 2012). It might thus be an interestinggenus to cultivate and study in more detail, especially regarding its asso-ciation Nepenthes and Sphagnum. Knowing that Acidocella species areacidophilic (Kimoto et al. 2010; Jones et al. 2013) means that directed cul-tivation approaches should be performed on acidic media (Kishimoto et al.1995).
65
Part III Discussion
Disadvantages of meta-barcoding
Despite these advantages, there are some drawbacks of meta-barcoding,especially during data analysis, how the data can be handled and whatcan be inferred from the data. In the following, five important limitationswill be discussed: application of algorithms during data processing, insuf-ficient species resolution and taxonomy assignments, quality of referencedatabases, abundance estimation and functional profiling.
Data processing. Data processing in meta-barcoding requires several con-secutive steps, for example quality filtering, OTU clustering, chimera check-ing and taxonomic classification. These steps typically rely on algorithms(Wang et al. 2007; Caporaso et al. 2010; Edgar 2010; Edgar et al. 2011;Coissac et al. 2012; Edgar 2013). During sequencing, errors can be in-troduced and it is of utmost importance to distinguish these from true se-quence variety, otherwise diversity estimates will be overestimated dramat-ically (Coissac et al. 2012). Sequencing errors can be reduced by joiningforward and reverse reads, filtering out low-quality sequences, but also byremoving sequences that only occur once, so-called singletons. Joining for-ward and reverse reads generally improves the data, because sequencequality drops towards the end of the read (Cuesta-Zuluaga and Escobar2016). Filtering out sequences that are below a certain quality threshold(e.g. probability of erroneous base calls within a sequence 1 in 100) is com-mon practice (Cuesta-Zuluaga and Escobar 2016). Removing singletonsis performed, because they are assumed to have arisen from sequencingerrors (Coissac et al. 2012).
Another step is OTU clustering, which is the formation of so-called opera-tional taxonomic units as a proxy for species-level taxa (Blaxter 2016). OTUclustering is performed before taxonomic classification, because it would betoo computationally intensive to run every single sequence obtained againsta database for taxonomic classification. OTU clustering algorithms usuallyrely on sequence alignment and differentiate OTUs based on sequence dis-similarity (Edgar 2013; Cuesta-Zuluaga and Escobar 2016). Following OTUclustering, chimera checking is performed to remove a common PCR arti-fact. Chimeras are PCR products that originate from at least two differentorigins. Chimeras can be identified by running the clustered OTUs against areference database (Edgar et al. 2011; Cuesta-Zuluaga and Escobar 2016).For taxonomic classification one representative sequence per OTU is thenrun against a reference database (Coissac et al. 2012; Ji et al. 2013).
For these different steps, a variety of tools with different implementations
66

Part III Discussion
of the underlying algorithms have already been developed (Cuesta-Zuluagaand Escobar 2016) and further will probably be developed in future. Thesetools often differ in their outcome and are generally often imperfect (Cuesta-Zuluaga and Escobar 2016). Thus, it is difficult to choose the most desirabletools for data processing.
Insufficient species resolution. DNA-barcoding can be applied to any type oforganism and the same is true for meta-barcoding. However, in single speci-men DNA-barcoding, sequences of up to 1,000 base pairs can be obtained,because Sanger sequencing is employed . This can cover the completebacterial 16S rRNA gene or the animal COI gene (cf. Coissac et al. 2012),which is sufficient for resolving species. In meta-barcoding however, readlengths of high-throughput sequencers are shorter, e.g. 2x300bp for Illu-mina MiSeq (see www.illumina.com, accessed 20/09/2016). This might notbe enough to cover sufficient sequence differences for species distinction(Coissac et al. 2012), thus species resolution can be insufficient in meta-barcoding.
This is especially the case for the animal kingdom, because the commonlyused COI gene for species identification is longer than current read lengths,although special meta-barcoding primers have been developed based onother genes (Epp et al. 2012; Pompanon et al. 2012). In microbiology, the16S rRNA gene is only partially sequenced for bacterial meta-barcoding(Cuesta-Zuluaga and Escobar 2016).
Incomplete reference databases. Considering species resolution, and tax-onomic classification in general based on DNA-barcoding, it is not only thegenetic marker that influences the success of assigning taxonomy to a se-quence, but the quality of the underlying database is also essential (seePublications P.1; P.2; P.3; Nilsson et al. 2006; Pompanon et al. 2012). A gooddatabase contains reference sequences covering a broad range of organ-isms that have been obtained from correctly identified specimens. However,some commonly used databases contain incorrectly assigned sequences(Nilsson et al. 2006; Epp et al. 2012; Pompanon et al. 2012), which canlead to misclassifications. The importance of a good reference databasehas been stressed in the pollen analysis study, where previously undetectedtaxa could be identified after a database update that included additional taxa(Publication P.2).
Yet, most classification algorithms can deal with incomplete database cov-erage by assigning taxonomy hierarchically and determining confidence val-ues for each assignment as well (Cuesta-Zuluaga and Escobar 2016). So,in the case of incomplete databases, taxonomic classification will be as-
67

Part III Discussion
signed on higher taxonomic levels only. Whilst this can be sufficient in somestudies, constant database improvements are called for.
On a different note, incomplete database coverage can be used to identifytarget taxa for more in depth studies. For example Verrucomicrobia seemto be globally prevalent and abundant (Handelsman and Smalla 2003), asidentified using meta-barcoding, but are not well studied (Cao et al. 2015)and thus constitute a focus phylum for future database improvements.
Abundace estimation. Abundance estimation of taxa is highly limited inmeta-barcoding. Several studies have assessed the suitability of HTS datafor abundance estimation, with contrasting results (Murray et al. 2011; Kelleret al. 2014; Kraaijeveld et al. 2015; Richardson et al. 2015). The inaccuracyfor abundance estimation is caused by two underlying mechanisms: firstly,different copy numbers per cell of the selected marker gene among differ-ent species (Prokopowich et al. 2003; Cuesta-Zuluaga and Escobar 2016)and secondly, introducing unknown and difficult to estimate biases or skewsby each step of library preparation (Fierer et al. 2008; Cuesta-Zuluaga andEscobar 2016).
In the case of difference in gene copy numbers, it can be possible to accountfor when the copy number of the taxon in question is known (Langille etal. 2013). However, this again requires a good underlying database andespecially one that contains this exact information. Currently, this is onlypossible for taxa with completely sequenced genomes (Cuesta-Zuluaga andEscobar 2016).
The unknown bias introduced by sample processing, however, poses agreater challenge. It has been shown that each step of the process, fromDNA isolation to sequencing, can influence the outcome of a high-throughputbiodiversity study (Fierer et al. 2008; Cuesta-Zuluaga and Escobar 2016),complicating abundance estimation as well as study comparability. It is thusadvisable, to create a laboratory workflow with as few steps as possible (seePublication P.2) and stick to the exact same workflow for study comparability.One approach to estimate the skew introduced by sample processing canbe to include an internal control early in the process (Smets et al. 2015).Whilst this is certainly a good approach, it is limited to well-studied systems,because it relies on adding genomic DNA of a taxon that is known to not oronly very rarely occur in the study system (Smets et al. 2015). In systemsthat are less well-studied, such as carnivorous plants (see Publication P.5),it is difficult to choose an appropriate organism.
In the raw data, abundance is estimated as sequence counts, which is often
68

Part III Discussion
not correlated with actual taxon abundance. Many studies, including publi-cations P.2, P.4 and P.5 relativise the count data for abundance estimation,but this should still be handled with care, since relative abundance is notcorrelated with biomass when dealing with multicellular organisms (Pom-panon et al. 2012). One approach to compare abundance of taxa betweensamples can be a differential approach (see Publication P.5; Robinson et al.2010), inherited from gene expression studies. However, this still does notgive an estimate of the actual abundance, but can only infer differences intaxon abundance between samples or states. Another approach for betterabundance estimates, often taken in microbiology, can be quantitative PCR(qPCR; Redford and Fierer 2009; Hollister et al. 2010; Murray et al. 2011),although this might also be affected by copy number variation of the markergene. Despite the different approaches to improve abundance estimationbased on HTS data, it remains advisable to additionally analyse at least asubset of samples with an alternative method, which is more robust in abun-dance estimation, as proposed previously (Pompanon et al. 2012; Keller etal. 2015) and in the pollen meta-barcoding establishment (Publication P.2).
Functional profiling. One major drawback in meta-barcoding is that from thetaxonomic profiles obtained it is not possible to infer functionality of the taxadetected, which would be the case with metagenomics. This is especiallythe case in bacterial community analysis. One approach to infer functionsof the microbiota is to identify common functionalities of a certain group ofbacteria from literature, as has been done in publication P.5. For example,members of the Burkholderiales or Rhizobiales are commonly reported asnitrogen fixing taxa (Vessey 2003; Lucy et al. 2004). Thus, detecting suchtaxa in a bacterial community can imply that nitrogen fixation is part of thefunctional profile of the community. However, this can only potentially bethe case, for several reasons. Firstly, it is possible that there are taxa withinthose lineages that are not able to fix nitrogen. Secondly, it is possible thatbacteria possess nitrogen fixation genes, but do not express them within agiven community. In publication P.5, the bacterial community was screenedfor putative nitrogen fixers, but it was not possible to conclude whether thisfunction was part of the host-bacteria association.
Another approach for functional profiling is the use of recently developedtools that infer potential functionality based on the 16S profile (Langille etal. 2013; Keller et al. 2014). These tools screen databases of sequencedbacterial genomes for close relatives of the taxa identified through meta-barcoding and infer probable functions based on phylogenetic relationships.Additionally, it is possible to estimate uncertainty of the reported functions(Langille et al. 2013). This approach has an advantage over metagenomics,because it is possible to map functionality to a specific OTU (Langille et al.
69

Part III Discussion
2013). Thus, in cases where metagenomics is not an option, this approachis a feasible alternative. However, it is still only a putative functional pro-file, whilst metagenomics truly characterises the availability of functions ina bacterial community. However, to obtain true functional profiles, i.e. es-timate which functionality a bacterial community actually exhibits in a givenstate, other approaches, such as (meta-)transcriptomics, bioassays or di-rected experimental approaches are required.
Recommendations for the application ofmeta-barcoding in ecological research
Considering the pros and cons discussed above, it needs to be consideredhow meta-barcoding can be applied in ecological research. The two majoradvantages of meta-barcoding are that species assemblages can be stud-ied and members identified without considering morphological characteris-tics and without taxonomic expertise. The high throughput of modern se-quencing platforms enables large-scale studies, because a high number ofsamples can be processed simultaneously, e.g. 384 samples in the presentstudies (see Publications P.2 and P.3; Kozich et al. 2013), whilst workinghours and costs per sample are dramatically reduced compared to man-ual analysis of species assemblages. Additionally, processed and degradedmaterial can be studied and classified successfully.
For ecologists, this means that large-scale biodiversity studies can be per-formed at reasonable costs, whilst results can be obtained in a timely man-ner and meta-barcoding can thus be applied to a variety of research ques-tions. Examples where material is degraded or processed and classifica-tion based on morphology are very difficult include diet analysis and foodsafety issues. Analysis of pollen assemblages, for example in agro-ecologyand palaeo-ecology, is challenging, because pollen grains need to be manu-ally separated and closely-related species cannot be distinguished by pollengrain morphology. The application of meta-barcoding in such studies thusconstitutes a suitable and powerful alternative to traditional approaches.
In microbial ecology, meta-barcoding has become a common approach forbacterial community analysis, because it avoids the need to bring bacteriainto culture. Thus, it allows studying complete bacterial communities, ratherthan introducing bias by cultivation media. Currently, microbial communityresearch focuses on creating an overview of the global diversity and dis-tribution of microbial taxa and it is sufficient to identify dominant and lowabundance taxa, rather than estimating their actual abundance.
70

Part III Discussion
Another great advantage of meta-barcoding is the potential for sample multi-plexing together with automatic sample and data processing, which is highlybeneficial in biodiversity monitoring, for example through routine eDNA anal-ysis. This is also beneficial for large-scale studies or when a large amountof samples is collected over a considerable amount of time before they canbe processed.
However, if abundance estimation is a central aspect of the research ques-tion, meta-barcoding alone might yield skewed data. In cases like these, itremains advisable to combine meta-barcoding with other methods. For ex-ample, for bee foraging studies, combining meta-barcoding for plant speciesidentification of the collected pollen with light microscopy of at least a sub-set of the samples for abundance estimation would exploit the advantagesof both methods.
Generally, combining different approaches with meta-barcoding can be highlybeneficial. For example, for functional profiling, a subset of samples can beanalysed using (meta-)genomics or (meta-)transcriptomics to complementthe taxonomic profiles obtained with meta-barcoding. Other complement-ing methods for functional analysis can include bio-assays of the completecommunity (Kaur et al. 2009) or of selected bacterial taxa (Sugahara et al.2015).
Another aspect is that sometimes and for some taxonomic groups, speciesresolution obtained with meta-barcoding is still not sufficient. This is dueto incomplete databases, imperfect marker genes coupled with short readlengths, but also classification algorithms. Whilst there are many studieswhere the current species resolution is sufficient, for example prime studiesof bacterial communities (Junker et al. 2011; Keller et al. 2013; Kuenemanet al. 2013), there are applications where the distinction of closely relatedtaxa is of utmost importance, for examples in allergen load assessment(Kraaijeveld et al. 2015) or for the enforcement of conservation efforts (Jiet al. 2013; Hajibabaei et al. 2016). Thus, when devising a study based onmeta-barcoding, it is important to determine, whether the expected speciesresolution that can be obtained is sufficient for the specific purpose.
Future aspects
Some of the above-mentioned drawbacks are not limitations of the methodper se, but rather logisitcal and technological limitations, such as read lengthsstill being too short for sufficient species resolution or incomplete databases.Thus, with database improvements and technological advances, species
71

Part III Discussion
resolution will improve in future. Additionally, more research into copy num-ber variation of marker genes together with an increase in whole genomedata will improve abundance estimates and functional prediction with meta-barcoding. Further technological advances and reductions in the costs ofhigh-throughput sequencing will facilitate increased sample sizes, but mightalso allow simultaneous sequencing of multiple genetic markers, which wouldfacilitate the study of species interactions across kingdoms. For bacterialcommunity studies, a shift from meta-barcoding to metagenomics can beexpected with further decreases of sequencing costs, because both taxo-nomic and functional profiles can be obtained from the same data set.
On a different note, data processing and analysis might always pose achallenge, especially for scientists without bioinformatic training. The ex-isting tools for data processing utilise various algorithms, which might bedifficult to understand and implement by the majority of researchers. Itcan also be expected that these algorithms and tools will be further de-veloped, which will probably lead to improvements, but will remain to bea challenge for untrained scientists. This actually does not only apply tometa-barcoding, but to all HTS applications, including (meta-)genomics and(meta-)transcriptomics. Thus, appropriate training needs to be implementedin the education of future researchers, whilst bioinformatic tools need to bestraightforward in their implementation.
It has been mentioned above that each processing step can affect the out-come of meta-barcoding results and that these effects are difficult to esti-mate. It is thus recommended to develop standard protocols for sampling,library preparation and data processing. This is especially important for thestudies within international consortia, but will also facilitate study compara-bility. Such protocols need to be straightforward to implement and suitablefor laboratories with basic equipment only. At the same time, the standardprotocols should facilitate the automation of sample processing to make useof the high throughput potential of meta-barcoding.
Conclusion
Meta-barcoding, as every methodology, has its merits and pitfalls, all ofwhich need to be considered at every step of research, from study andsample design, to laboratory and data processing to data analysis. Thegreat powers of meta-barcoding lie in the species identification of individu-als within assemblages and the high throughput of sequences and samples.Additionally, since taxonomy is assigned via DNA-barcoding, taxonomy ex-perts are not required, which is highly beneficial concerning the lack of these
72

Part III Discussion
(Gaston and May 1992; Carvalho et al. 2007). Challenges are associatedwith read lengths as well as data processing, the sometimes insufficientspecies resolution, inaccurate abundance estimation and limited functionalprofiling. Whilst some of the problems are expected to improve in futureit remains advisable to combine meta-barcoding with other methodologicalapproaches. In conclusion, meta-barcoding is at the moment the gold stan-dard for high-throughput analysis of specimen assemblages. The potentialto automate meta-barcoding holds great promises for routine biodiversitymonitoring, amongst other applications.
73

Bibliography
Abe, S et al. (1967). “Taxonomical studies on glutamic acid-producing bac-teria”. In: Journal of General and Applied Microbiology 13.3, pp. 279–301.
Abrahamian, F M and E J C Goldstein (2011). “Microbiology of animal bitewound infections”. In: Clinical Microbiolgy Reviews 24, pp. 231–246.
Altschul, Stephen F et al. (1990). “Basic local alignment search tool”. In:Journal of molecular biology 215, pp. 403–410.
Amagase, Shizuko et al. (1972). “Digestive enzymes in insectivorous plants.IV. Enzymatic digestion of insects by Nepenthes secretion and droserapeltata extract: proteolytic and chitinolytic activities”. In: Journal of Bio-chemistry 72, pp. 765–767.
An, Chung-Il et al. (2001). “Plasma-membrane H+-ATPases are expressedin pitchers of the carnivorous plant Nepenthes alata Blanco”. In: Planta212, pp. 547–555.
An, Chung-Il et al. (2002). “Aspartic proteinases are expressed in pitchers ofthe carnivorous plant Nepenthes alata Blanco”. In: Planta 214, pp. 661–667.
Anes, Elsa et al. (2003). “Selected lipids activate phagosome actin assemblyand maturation resulting in killing of pathogenic mycobacteria”. In: NatureCell Biology 5.9, pp. 793–802.
Ankenbrand, Markus Johannes et al. (2015). “The ITS2 database V – Twiceas much”. In: Molecular Biology and Evolution 32.11, pp. 3030–3032.
Aronesty, Erik (2011). ea-utils: ”Command-line tools for processing biologi-cal sequencing data”.
Arroyo, O et al. (1980). “The bacterial flora of venoms and mouth cavities ofCosta Rican snakes”. In: Bulletin of the Pan American Health Organization14, pp. 280–285.
Avila, M et al. (2009). “The oral microbiota: living with a permanent guest”.In: DNA and Cell Biology 28, pp. 405–411.
Bagley, ST (1985). “Habitat association of Klebsiella species”. In: InfectionControl 6.2, pp. 52–58.
74
Appendix
Balakrishnan, Rohini (2005). “Species concepts, species boundaries andspecies identification: a view from the tropics.” In: Systematic biology54.4, pp. 689–693.
Balint, M et al. (2014). “An Illumina metabarcoding pipeline for fungi”. In:Ecology and Evolution 4, pp. 2642–2653.
Bauer, Ulrike et al. (2009). “Effect of pitcher age on trapping efficiency andnatural prey capture in carnivorous Nepenthes rafflesiana plants”. In: An-nals of Botany 103, pp. 1219–1226.
Bauer, Ulrike et al. (2011). “Evidence for alternative trapping strategies intwo forms of the pitcher plant, Nepenthes rafflesiana”. In: Journal of Ex-perimental Botany 62.10, pp. 3683–3692.
Bazile, Vincent et al. (2015). “Fluid physico-chemical properties influencecapture and diet in Nepenthes pitcher plants”. In: Annals of botany 115,pp. 705–716.
Behling, Hermann et al. (2004). “Late Quaternary Araucaria forest, grass-land (Campos), fire and climate dynamics, studied by high-resolution pollen,charcoal and multivariate analysis of the Cambara do Sul core in south-ern Brazil”. In: Palaeogeography, Palaeoclimatology, Palaeoecology 203,pp. 277–297.
Beil, Marion et al. (2008). “Analysis of pollen loads in a wild bee commu-nity (Hymenoptera : Apidae) - a method for elucidating habitat use andforaging distances”. In: Apidologie 39, pp. 456–467.
Bell, Karen L. et al. (2016). “Pollen DNA barcoding: current applications andfuture prospects”. In: Genome 59, pp. 1–12.
Belova, Svetlana E et al. (2009). “Acidisoma tundrae gen. nov., sp. nov. andAcidisoma sibiricum sp. nov., two acidophilic, psychrotolerant members ofthe Alphaproteobacteria from acidic northern wetlands”. In: Internationaljournal of Systematic and Evolutionary Microbiology 59, pp. 2283–2290.
Bennett, K D and L Parducci (2006). “DNA from pollen: principles and po-tential”. In: The Holocene 16.8, pp. 1031–1034.
Benson, Dennis A et al. (2013). “GenBank”. In: Nucleic Acids Research41.Database issue, pp. D36–D42.
Bent, S J and L J Forney (2008). “The tragedy of the uncommon: under-standing limitations in the analysis of microbial diversity”. In: The ISMEJournal 2, pp. 689–695.
Bermudes, David and David H Benzing (1991). “Nitrogen fixation in asso-ciation with Ecuadorean bromeliads”. In: Journal of Tropical Ecology 7,pp. 531–536.
Bhore, S J et al. (2013). “Diversity of endophytic bacteria in medicinally im-portant Nepenthes species”. In: Journal of Natural Science, Biology andMedicine 4.2, pp. 431–434.
75

Appendix
Binladen, Jonas et al. (2007). “The use of coded PCR primers enables high-throughput sequencing of multiple homolog amplification products by 454parallel sequencing”. In: PLoS ONE 2, e197.
Blatrix, Rumsaıs et al. (2012). “Plant-ants use symbiotic fungi as a foodsource: new insight into the nutritional ecology of ant-plant interactions.”In: Proceedings of the Royal Society B 279, pp. 3940–3947.
Blaxter, Mark (2016). “Imagining Sisyphus happy: DNA barcoding and theunnamed majority”. In: Philosophical Transactions of the Royal Society B:Biological Sciences 371, p. 20150329.
Blaylock, R S M (2001). “Normal oral bacterial flora from some southernAfrican snakes”. In: Onderstepoort Journal of Veterinary Research 68,pp. 175–182.
Boiero, L. et al. (2007). “Phytohormone production by three strains of Bradyrhi-zobium japonicum and possible physiological and technological implica-tions”. In: Applied Microbiology and Biotechnology 74, pp. 874–880.
Bonhomme, Vincent et al. (2011). “Slippery or sticky? Functional diversity inthe trapping strategy of Nepenthes carnivorous plants”. In: New Phytolo-gist 191, pp. 545–554.
Bragina, A et al. (2012). “Similar diversity of Alphaproteobacteria and nitro-genase gene amplicons on two related Sphagnum mosses”. In: Frontiersin Microbiology 2, pp. 1–10.
Bray, J R and T Curtis (1957). “An ordination of upland forest communitiesof Southern Wisconsin”. In: Ecological Monographs 27.4, pp. 325–349.
Bruni, I et al. (2015). “A DNA barcoding approach to identify plant speciesin multiflower honey”. In: Food Chemistry 170, pp. 308–315.
Buch, Franziska et al. (2013). “Secreted pitfall-trap fluid of carnivorous Ne-penthes plants is unsuitable for microbial growth”. In: Annals of Botany111, pp. 375–383.
Cao, Hieu X. et al. (2015). “Metatranscriptome analysis reveals host-microbiomeinteractions in traps of carnivorous Genlisea species”. In: Frontiers in Mi-crobiology 6, p. 526.
Caporaso, J Gregory et al. (2010). “QIIME allows analysis of high- through-put community sequencing data”. In: Nature Methods 7.5, pp. 335–336.
Caporaso, J Gregory et al. (2011). “Global patterns of 16S rRNA diversityat a depth of millions of sequences per sample”. In: Proceedings of theNational Academy of Sciences 108.Suppl. 1, pp. 4516–4522.
Carvalho, Marcelo R. de et al. (2007). “Taxonomic impediment or impedi-ment to taxonomy? A commentary on systematics and the cybertaxonomic-automation paradigm”. In: Evolutionary Biology 34.3, pp. 140–143.
Carvell, Claire et al. (2006). “Assessing the value of annual and perennialforage mixtures for bumblebees by direct observation and pollen analy-sis”. In: Apidologie 37.3, pp. 326–340.
76

Appendix
Chen, Bao et al. (2014). “The endophytic bacterium, Sphingomonas SaMR12,improves the potential for zinc phytoremediation by its host, Sedum al-fredii”. In: PloS one 9.9, e106826.
Chen, Shilin et al. (2010). “Validation of the ITS2 region as a novel DNAbarcode for identifying medicinal plant species”. In: PloS one 5.1, e8613.
Chou, Lee Yiung et al. (2014). “Bacterial communities associated with thepitcher fluids of three Nepenthes (Nepenthaceae) pitcher plant speciesgrowing in the wild.” In: Archives of Microbiology 196.10, pp. 709–717.
Clarke, C et al. (2011). “Nepenthes baramensis (Nepenthaceae) - a newspecies from north-western Borneo”. In: Blumea 56, pp. 229–233.
Clarke, K R (1993). “Non-parametric multivariate analyses of changes incommunity structure”. In: Australian Journal of Ecology 18, pp. 117–143.
Clarke, M C (1997). “Nepenthes of Borneo”. In: Natural History Publications.Malaysia, Sabah, Kota Kinabalu.
Clarke, M C (2001). “Nepenthes of Sumatra and Peninsular Malaysia”. In:Natural History Publications2. Malaysia, Sabah, Kota Kinabalu.
Coghlan, Megan L. et al. (2012). “Deep sequencing of plant and animal DNAcontained within traditional Chinese medicines reveals legality issues andhealth safety concerns”. In: PLoS Genetics 8.4, e1002657.
Coissac, Eric et al. (2012). “Bioinformatic challenges for DNA metabarcod-ing of plants and animals”. In: Molecular Ecology 21, pp. 1834–1847.
Cosma, Christine L et al. (2003). “The secret lives of the pathogenic my-cobacteria”. In: Annual Review of Microbiology 57, pp. 641–676.
Cuesta-Zuluaga, Jacobo de la and Juan S Escobar (2016). “Considerationsfor optimizing microbiome analysis using a marker gene”. In: Frontiers inNutrition 3, p. 26.
Davies, Althea L and Richard Tipping (2004). “Sensing small-scale humanactivity in the palaeoecological record: fine spatial resolution pollen analy-ses from Glen Affric, northern Scotland”. In: The Holocene 14.2, pp. 233–245.
Dixon, Philip (2003). “VEGAN, a package of R functions for community ecol-ogy”. In: Journal of Vegetation Science 14, pp. 927–930.
Droge, Stefan et al. (2008). “Treponema isoptericolens sp. nov., a novelspirochaete from the hindgut of the termite Incisitermes tabogae”. In:International Journal of Systematic and Evolutionary Microbiology 58,pp. 1079–1083.
Dupuis, J et al. (2012). “Multi-locus species delimitation in closely relatedanimals and fungi: one marker is not enough”. In: Molecular Ecology 21,pp. 4422–4436.
Edberg, Stephen C et al. (1986). “Phenotypic characteristics of coliform andnoncoliform bacteria from a public water supply compared with regional
77

Appendix
and national clinical species”. In: Applied and Environmental Microbiology52.3, pp. 474–478.
Edgar, R C (2010). “Search and clustering orders of magnitude faster thanBLAST”. In: Bioinformatics 26.19, pp. 2460–2461.
Edgar, Robert C (2013). “UPARSE: highly accurate OTU sequences frommicrobial amplicon reads”. In: Nature Methods 10.10, pp. 996–998.
Edgar, Robert C et al. (2011). “UCHIME improves sensitivity and speed ofchimera detection”. In: Bioinformatics 27.16, pp. 2194–2200.
Eilenberg, Haviva et al. (2006). “Isolation and characterization of chitinasegenes from pitchers of the carnivorous plant Nepenthes khasiana.” In:Journal of Experimental Botany 57.11, pp. 2775–2784.
Endo, A et al. (2013). “Lactobacillus faecis sp. nov., isolated from animalfaeces”. In: International Journal of Systematic and Evolutionary Microbi-ology 63, pp. 4502–4507.
Epp, Laura S. et al. (2012). “New environmental metabarcodes for analysingsoil DNA: Potential for studying past and present ecosystems”. In: Molec-ular Ecology 21, pp. 1821–1833.
Federhen, Scott (2012). “The NCBI Taxonomy database.” In: Nucleic acidsresearch 40.Database issue, pp. D136–43.
Ferreira Junior, R S et al. (2009). “Comparison of wildlife and captivity rat-tlesnakes (Crotalus durissus terrificus) microbiota”. In: Pesquisa VeterinariaBrasileira 29.999-1003.
Fierer, Noah and R B Jackson (2006). “The diversity and biogeography ofsoil bacterial communities”. In: Proceedings of the National Academy ofSciences 103.3, pp. 626–631.
Fierer, Noah et al. (2008). “The influence of sex, handedness, and washingon the diversity of hand surface bacteria”. In: Proceedings of the NationalAcademy of Sciences 105.46, pp. 17994–17999.
Fonseca, M G et al. (2009). “Oral microbiota of Brazilian captive snakes”. In:Journal of Venomous Animals and Toxins including Tropical Diseases 15,pp. 54–60.
Fox, G E et al. (1977). “Comparative cataloging of 16S ribosomal ribonu-cleic acid: molecular approach to procaryotic systematics”. In: Interna-tional Journal of Systematic and Evolutionary Microbiology 27, pp. 44–57.
Galimberti, Andrea et al. (2014). “A DNA barcoding approach to character-ize pollen collected by honeybees”. In: PloS one 9.10, e109363.
Garg, A et al. (2009). “Wound infections secondary to snakebite”. In: Journalof Infection in Developing Countries 3, pp. 221–223.
Gaston, Kevin J. and Robert M. May (1992). “Taxonomy of taxonomists”. In:Nature 356, pp. 281–282.
78

Appendix
Gathmann, Achim and Teja Tscharntke (2002). “Foraging ranges of solitarybees”. In: Journal of Animal Ecology 71, pp. 757–764.
Gaume, Laurence and Bruno Di Giusto (2009). “Adaptive significance andontogenetic variability of the waxy zone in Nepenthes rafflesiana.” In: An-nals of botany 104.7, pp. 1281–91.
Gaume, Laurence and Yoel Forterre (2007). “A viscoelastic deadly fluid incarnivorous pitcher plants”. In: PloS one 2.11, e1185.
Gaume, Laurence et al. (2002). “Function of epidermal surfaces in the trap-ping efficiency of Nepenthes alata pitchers”. In: New Phytologist 156,pp. 479–489.
Gaume, L et al. (2004). “How do plant waxes cause flies to slide? Exper-imental tests of wax-based trapping mechanisms in three pitfall carnivo-rous plants”. In: Arthropod Structure & Development 33.1, pp. 103–111.
Gerner-Smidt, Peter et al. (1991). “Reliability of phenotypic tests for identifi-cation of Acinetobacter species”. In: Journal of Clinical Microbiology 29.2,pp. 277–282.
Goldstein, E J C et al. (1979). “Bacteriology of rattlesnake venom and im-plications for therapy”. In: Journal of Infectious Diseases 140, pp. 818–821.
Goldstein, E J C et al. (1981). “Aerobic bacterial oral flora of garter snakes:development of normal flora and pathogenic potential for snakes and hu-mans”. In: Journal of Clinical Microbiology 13, pp. 954–956.
Graber, Joseph R et al. (2004). “Description of Treponema azotonutriciumsp. nov. and Treponema primitia sp. nov., the first spirochetes isolatedfrom termite guts”. In: Applied and Environmental Microbiology 70.3, pp. 1315–1320.
Grafe, T Ulmar et al. (2011). “A novel resource-service mutualism betweenbats and pitcher plants”. In: Biology Letters 7, pp. 436–439.
Gu, S et al. (2013). “Bacterial community mapping of the mouse gastroin-testinal tract”. In: PloS one 8, e74957.
Gugerli, Felix et al. (2005). “Ancient plant DNA: review and prospects”. In:New Phytologist 166, pp. 409–418.
Hajibabaei, Mehrdad et al. (2016). “A new way to contemplate Darwin’s tan-gled bank: how DNA barcodes are reconnecting biodiversity science andbiomonitoring”. In: Philosophical Transactions of the Royal Society of Lon-don B: Biological Sciences 371, p. 20150330.
Handelsman, Jo and Kornelia Smalla (2003). “Conversations with the silentmajority”. In: Current Opinion in Microbiology 6.3, pp. 271–273.
Harris, J. Kirk et al. (2010). “Comparison of normalization methods for con-struction of large, multiplex amplicon pools for next-generation sequenc-ing”. In: Applied and Environmental Microbiology 76.12, pp. 3863–3868.
79

Appendix
Hatano, Naoya and Tatsuro Hamada (2008). “Proteome analysis of pitcherfluid of the carnivorous plant Nepenthes alata”. In: The Journal of Pro-teome Research 7, pp. 809–816.
Hatano, Naoya and Tatsuro Hamada (2012). “Proteomic analysis of se-creted protein induced by a component of prey in pitcher fluid of the car-nivorous plant Nepenthes alata”. In: Journal of Proteomics 75, pp. 4844–4852.
Hebert, P. D. et al. (2003). “Biological identifications through DNA barcodes”.In: Proceedings of the Royal Society B: Biological Sciences 270, pp. 313–321.
Higashi, Shiro et al. (1993). “Analysis of feeding mechanism in a pitcher ofNepenthes hybrida”. In: Journal of Plant Research 106, pp. 47–54.
Hill, M O and H G Gauch Jr (1980). “Detrended correspondence analysis:an improved ordination technique”. In: Vegetatio 42, pp. 47–58.
Hollingsworth, Peter M et al. (2011). “Choosing and using a plant DNA bar-code”. In: PloS one 6.5, e19254.
Hollister, Emily B et al. (2010). “Shifts in microbial community structure alongan ecological gradient of hypersaline soils and sediments.” In: The ISMEjournal 4, pp. 829–838.
Holmes, B. et al. (1994). “Evaluation of two BBL crystal systems for identifi-cation of some clinically important gram-negative bacteria”. In: Journal ofClinical Microbiology 32.9, pp. 2221–2224.
Howard, S T and T F Byrd (2000). “The rapidly growing mycobacteria: sapro-phytes and parasites”. In: Microbes and Infection 2, pp. 1845–1853.
Illumina Inc. (2013). Preparing libraries for sequencing on the MiSeq. Tech.rep.
Ji, Yinqiu et al. (2013). “Reliable, verifiable and efficient monitoring of biodi-versity via metabarcoding”. In: Ecology Letters 16.10, pp. 1245–1257.
Jones, R M et al. (2013). “Acidocella aromatica sp. nov.: an acidophilic het-erotrophic alphaproteobacterium with unusual phenotypic traits”. In: Ex-tremophiles 17.5, pp. 841–850.
Juniper, B E et al. (1989). The carnivorous plants. London: Academic Press.Junker, R R and A Keller (2015). “Microhabitat heterogeneity across leaves
and flower organs promotes bacterial diversity”. In: FEMS MicrobiologyEcology 91, fiv097.
Junker, R R et al. (2011). “Composition of epiphytic bacterial communitiesdiffers on petals and leaves”. In: Plant Biology 13, pp. 918–924.
Kaur, Harleen et al. (2009). “Taking ecological function seriously: Soil micro-bial communities can obviate allelopathic effects of released metabolites”.In: PLoS ONE 4.3, pp. 1–6.
Keller, Alexander et al. (2009). “5.8S-28S rRNA interaction and HMM-basedITS2 annotation”. In: Gene 430, pp. 50–57.
80

Appendix
Keller, Alexander et al. (2014). “Computational integration of genomic traitsinto 16S rDNA microbiota sequencing studies”. In: Gene 549.1, pp. 186–191.
Keller, A et al. (2013). “Diverse microbiota identified in whole intact nestchambers of the red mason bee Osmia bicornis”. In: PloS one 8.10, e78296.
Keller, A et al. (2015). “Evaluating multiplexed next-generation sequencingas a method in palynology for mixed pollen samples”. In: Plant Biology17.2, pp. 558–566.
Kersters, K et al. (2006). “The family Acetobacteraceae: the genera Aceto-bacter, Acidimonas, Asaia, Gluconacetobacter, Gluconobacter, and Koza-kia”. In: The Prokaryotes: Volume 5: Proteobacteria: Alpha and Beta Sub-classes. Ed. by Martin Dworkin et al. Third Edit. Springer, pp. 163–200.
Kimoto, K I et al. (2010). “Acidocella aluminiidurans sp. nov., an aluminium-tolerant bacterium isolated from Panicum repens grown in a highly acidicswamp in actual acid sulfate soil area of Vietnam”. In: International Journalof Systematic and Evolutionary Bacteriology 60, pp. 764–768.
Kishimoto, N et al. (1995). “Transfer of Acidiphilium facilis and Acidiphiliumaminolytica to the Genus Acidecella gen. nov., and Emendation of theGenus Acidiphilium”. In: Systematic and Applied Microbiology 18, pp. 85–91.
Koetschan, Christian et al. (2010). “The ITS2 Database III–sequences andstructures for phylogeny.” In: Nucleic Acids Research 38.Database issue,pp. D275–D279.
Koopman, Margaret M et al. (2010). “The carnivorous pale pitcher plant har-bors diverse, distinct, and time-dependent bacterial communities”. In: Ap-plied and Environmental Microbiology 76.6, pp. 1851–1860.
Koppler, Kirsten et al. (2007). “Comparison of pollen spectra collected byfour different subspecies of the honey bee Apis mellifera”. In: Apidologie38, pp. 341–353.
Kozich, James J et al. (2013). “Development of a dual-index sequencingstrategy and curation pipeline for analyzing amplicon sequence data onthe MiSeq Illumina sequencing platform”. In: Applied and EnvironmentalMicrobiology 79.17, pp. 5112–5120.
Kraaijeveld, Ken et al. (2015). “Efficient and sensitive identification and quan-tification of airborne pollen using next-generation DNA sequencing”. In:Molecular Ecology Resources 15, pp. 8–16.
Krupke, Christian H et al. (2012). “Multiple routes of pesticide exposure forhoney bees living near agricultural fields”. In: PloS one 7.1, e29268.
Krych, L et al. (2013). “Quantitatively different, yet qualitatively alike: a meta-analysis of the mouse core gut microbiome with a view towards the humangut microbiome”. In: PloS one 8, e62578.
81

Appendix
Kueneman, Jordan G et al. (2013). “The amphibian skin-associated micro-biome across species, space and life history stages”. In: Molecular ecol-ogy 23.6, pp. 1238–1250.
Lam, K K et al. (2010). “A cross-sectional survey of snake oral bacterialflora from Hong Kong, SAR, China.” In: Emergency Medicine Journal 28,pp. 107–114.
Langille, Morgan G I et al. (2013). “Predictive functional profiling of micro-bial communities using 16S rRNA marker gene sequences.” In: NatureBiotechnology 31, pp. 814–821. arXiv: NIHMS150003.
Lauber, Christian L. et al. (2009). “Pyrosequencing-based assessment ofsoil pH as a predictor of soil bacterial community structure at the continen-tal scale”. In: Applied and Environmental Microbiology 75.15, pp. 5111–5120.
Lee, J E et al. (2011). “Analysis of human and animal fecal microbiota formicrobial source tracking”. In: The ISME Journal 5, pp. 362–365.
Ley, Ruth E et al. (2008). “Evolution of mammals and their gut microbes”. In:Science 320, pp. 1647–1651.
Li, Ming et al. (2011). “Identification of herbal medicinal materials using DNAbarcodes”. In: Journal of Systematics and Evolution 49.3, pp. 271–283.
Lim, Y. S. et al. (2015). “How a pitcher plant facilitates roosting of mutualisticwoolly bats”. In: Evolutionary Ecology Research 16, pp. 1–11.
Loudon, Andrew H et al. (2014). “Microbial community dynamics and ef-fect of environmental microbial reservoirs on red-backed salamanders(Plethodon cinereus)”. In: The ISME journal 8, pp. 830–840.
Lozupone, Catherine A and Rob Knight (2005). “UniFrac: a new phyloge-netic method for comparing microbial communities”. In: Applied and Envi-ronmental Microbiology 71.12, pp. 8228–8235.
Lucy, M et al. (2004). “Applications of free living plant growth-promoting rhi-zobacteria”. In: Antonie van Leeuwenhoek 86, pp. 1–25.
Luttge, Ulrich (1964). “Untersuchungen zur Physiologie der Carnivoren-Drusen”.In: Planta 63, pp. 103–117.
Mata, Juan Antonio et al. (2002). “A detailed phenotypic characterisationof the type strains of Halomonas species”. In: Systematic and AppliedMicrobiology 25, pp. 360–375.
Mayer, E. et al. (2005). “Microflora in the traps of pitcher plants”. In: VXIIInternational Botanical Congress. July, p. 510.
McMurdie, Paul J and Susan Holmes (2013). “phyloseq: an R packagefor reproducible interactive analysis and graphics of microbiome censusdata”. In: PloS one 8.4, e61217.
McMurdie, Paul J. and Susan Holmes (2014). “Waste not, want not: why rar-efying microbiome data is inadmissible”. In: PLoS Computational Biology10.4, e1003531. arXiv: 1310.0424.
82

Appendix
Mithofer, Axel (2011). “Carnivorous pitcher plants: insights in an old topic”.In: Phytochemistry 72, pp. 1678–1682.
Moran, Jonathan A et al. (2010). “Ion fluxes across the pitcher walls of threeBornean Nepenthes pitcher plant species: flux rates and gland distributionpatterns reflect nitrogen sequestration strategies”. In: Journal of Experi-mental Botany 61.5, pp. 1365–1374.
Morin, P J (1999). Community ecology. Malden: Blackwell Science.Morotomi, M et al. (2002). “Lactobacillus equi sp. nov., a predominant in-
testinal Lactobacillus species of the horse isolated from faeces of healthyhorses”. In: International Journal of Systematic and Evolutionary Microbi-ology 52, pp. 211–214.
Mouquet, N. et al. (2008). “Modelling the relationship between a pitcher plant(Sarracenia purpurea) and its phytotelma community: mutualism or para-sitism?” In: Functional Ecology 22, pp. 728–737.
Mullins, J and J Emberlin (1997). “Sampling pollens”. In: Journal of AerosolScience 28.3, pp. 365–370.
Murray, Daithı C. et al. (2011). “DNA-based faecal dietary analysis: A com-parison of qPCR and high throughput sequencing approaches”. In: PLoSONE 6.10, e25776.
Murray, Daithı C et al. (2012). “High-throughput sequencing of ancient plantand mammal DNA preserved in herbivore middens”. In: Quaternary Sci-ence Reviews 58, pp. 135–145.
Nilsson, R. Henrik et al. (2006). “Taxonomic reliability of DNA sequences inpublic sequence databases: a fungal perspective”. In: PloS one 1, e59.
Nord, Carl-Erik et al. (1974). “Evaluation of five test-kits - API , AuxoTab ,Enterotube , PathoTec and R/B - for identification of Enterobacteriaceae”.In: Medical Microbiology and Immunology 159, pp. 211–220.
Odumeru, Joseph A et al. (1999). “Evaluation of accuracy and repeatabilityof identification of food-borne pathogens by automated bacterial identifi-cation systems”. In: Journal of Clinical Microbiology 37.4, pp. 944–949.
Ogden, Rob et al. (2009). “Wildlife DNA forensics - Bridging the gap betweenconservation genetics and law enforcement”. In: Endangered Species Re-search 9, pp. 179–195.
Oram, Diana Marra et al. (2004). “Analysis of genes that encode DtxR-liketranscriptional regulators in pathogenic and saprophytic corynebacterialspecies”. In: Infection and Immunology 72.4, pp. 1885–1895.
O’Shea, Eileen F et al. (2009). “Characterization of enterocin- and salivaricin-producing lactic acid bacteria from the mammalian gastrointestinal tract”.In: FEMS Microbiology Letters 291, pp. 24–34.
Parducci, L et al. (2005). “Ancient DNA from pollen: a genetic record ofpopulation history in Scots pine”. In: Molecular Ecology 14, pp. 2873–82.
83

Appendix
Pavlovic, Andrej et al. (2007). “Carnivorous syndrome in Asian pitcher plantsof the genus Nepenthes”. In: Annals of botany 100.3, pp. 527–536.
Peterson, Celeste N et al. (2008). “A keystone predator controls bacterialdiversity in the pitcher-plant (Sarracenia purpurea) microecosystem.” In:Environmental Microbiology 10.9, pp. 2257–66.
Pitcher, David et al. (1992). “Classification of coryneform bacteria associ-ated with human urinary tract infection (group D2) as Corynebacteriumurealyticum sp. nov.” In: International Journal of Systematic Bacteriology42.1, pp. 178–181.
Pompanon, Francois et al. (2012). “Who is eating what: Diet assessmentusing next generation sequencing”. In: Molecular Ecology 21, pp. 1931–1950.
Prankevicius, Andrew B. and Duncan M. Cameron (1991). “Bacterial dini-trogen fixation in the leaf of the northern pitcher plant (Sarracenia pur-purea)”. In: Canadian Journal of Botany 69, pp. 2296–2298.
Praz, Christophe J et al. (2008). “Host recognition in a pollen-specialist bee:evidence for a genetic basis”. In: Apidologie 39, pp. 547–557.
Prokopowich, Cheryl D et al. (2003). “The correlation between rDNA copynumber and genome size in eukaryotes”. In: Genome 46.1, pp. 48–50.
R Core Team (2014). R: A language and environment for statistical comput-ing.
Raj, Gopan et al. (2011). “Distribution of naphthoquinones, plumbagin, droserone,and 5-O-methyl droserone in chitin-induced and uninduced Nepentheskhasiana: molecular events in prey capture”. In: Journal of ExperimentalBotany 62.15, pp. 5429–5436.
Rappe, M S and S J Giovannoni (2003). “The uncultured microbial majority”.In: Annual Review of Microbiology 57, pp. 369–394.
Ratnasingham, Sujeevan and Paul D N Hebert (2007). “BOLD : The Bar-code of Life Data System (www.barcodinglife.org)”. In: Molecular EcologyNotes 7.3, pp. 355–364.
Redford, Amanda J and Noah Fierer (2009). “Bacterial succession on theleaf surface: a novel system for studying successional dynamics”. In: PlantMicrobe Interactions 58, pp. 189–198.
Richardson, Alan E et al. (2009). “Acquisition of phosphorous and nitrogenin the rhizosphere and plant growth promotion by microorganisms”. In:Plant and Soil 321, pp. 305–339.
Richardson, Rodney T. et al. (2015). “Application of ITS2 metabarcoding todetermine the provenance of pollen collected by honey bees in an agroe-cosystem”. In: Applications in Plant Sciences 3.1, p. 1400066.
Riedel, Michael et al. (2003). “Slippery surfaces of carnivorous plants: com-position of epicuticular wax crystals in Nepenthes alata Blanco pitchers”.In: Planta 218, pp. 87–97.
84

Appendix
Riedel, Michael et al. (2007). “Chemical composition of epicuticular waxcrystals on the slippery zone in pitchers of five Nepenthes species andhybrids”. In: Planta 225, pp. 1517–1534.
Robinson, Mark D. et al. (2010). “edgeR: a Bioconductor package for dif-ferential expression analysis of digital gene expression data”. In: Bioinfor-matics 26.1, pp. 139–140.
Roos, Stefan et al. (2000). “Lactobacillus mucosae sp. nov., a new specieswith in vitro mucus-binding activity isolated from pig intestine”. In: Interna-tional Journal of Systematic and Evolutionary Microbiology 50, pp. 251–258.
Rottloff, Sandy et al. (2011). “Functional characterization of a class III acidendochitinase from the traps of the carnivorous pitcher plant genus, Ne-penthes”. In: Journal of Experimental Botany 62.13, pp. 4639–4647.
Rowe, Owen F et al. (2007). “Microbial communities and geochemical dy-namics in an extremely acidic, metal-rich stream at an abandoned sulfidemine (Huelva, Spain) underpinned by two functional primary productionsystems”. In: Environmental Microbiology 9.7, pp. 1761–1771.
Sayers, Eric W et al. (2011). “Database resources of the national centrefor biotechnology information”. In: Nucleic Acids Research 39.DatabaseIssue, pp. D38–D51.
Scharmann, M. and T.U. Grafe (2013). “Reinstatement of Nepenthes hem-sleyana (Nepenthaceae), an endemic pitcher plant from Borneo, with adiscussion of associated Nepenthes taxa”. In: Blumea 58, pp. 8–12.
Schoch, Conrad L. et al. (2012). “Nuclear ribosomal internal transcribedspacer (ITS) region as a universal DNA barcode marker for Fungi”. In:Proceedings of the National Academy of Sciences of the United States ofAmerica 109.16, pp. 1–6. arXiv: arXiv:1408.1149.
Schoner, Caroline R et al. (2013). “Supply determines demand: influence ofpartner quality and quantity on the interactions between bats and pitcherplants”. In: Oecologia 173, pp. 191–202.
Schoner, Michael G. et al. (2015). “Bats are acoustically attracted to mutu-alistic carnivorous plants”. In: Current Biology 25, pp. 1911–1916.
Schultz, Jorg et al. (2006). “The internal transcribed spacer 2 database–a web server for (not only) low level phylogenetic analyses.” In: Nucleicacids research 34.Web Server issue, W704–7.
Schulze, Waltraud et al. (1999). “Transporters for ammonium, amino acidsand peptides are expressed in pitchers of the carnivorous plant Nepenthes”.In: The Plant Journal 17.6, pp. 637–646.
Shannon, C. E. and W. Weaver (1949). The mathematical theory of commu-nication. Urbana: University of Illinois Press, p. 117.
85

Appendix
Shebl, R I et al. (2012). “Antimicrobial profile of selected snake venoms andtheir associated enzymatic activities”. In: British Microbiology ResearchJournal 2, pp. 251–263.
Shokralla, Shadi et al. (2012). “Next-generation sequencing technologies forenvironmental DNA research”. In: Molecular Ecology 21, pp. 1794–1805.
Sickel, Wiebke et al. (2015). “Increased efficiency in identifying mixed pollensamples by meta-barcoding with a dual-indexing approach”. In: BMC Ecol-ogy 15.20.
Siragusa, Alex J. et al. (2007). “Culturable bacteria present in the fluid ofthe hooded-pitcher plant Sarracenia minor based on 16S rDNA gene se-quence data”. In: Microbial Ecology 54.2, pp. 324–331.
Smets, Wenke et al. (2015). “A method for simultaneous measurement ofsoil bacterial abundances and community composition via 16S rRNA genesequencing”. In: PeerJ PrePrints 3, e1622.
Soininen, Eeva M et al. (2009). “Analysing diet of small herbivores: the ef-ficiency of DNA barcoding coupled with high-throughput pyrosequencingfor deciphering the composition of complex plant mixtures”. In: Frontiersin Zoology 6, p. 16.
Sota, T et al. (1998). “Local and regional-scale food web structure in Ne-penthes alata pitchers”. In: Biotropica 30.1, pp. 82–91.
Stackebrandt, E. and B. M. Goebel (1994). “Taxonomic note: A place forDNA-DNA reassociation and 16S rRNA sequence analysis in the presentspecies definition in bacteriology”. In: International Journal of SystematicBacteriology 44.4, pp. 846–849. arXiv: /dx.doi.org/10.1099/00207713-44-4-846 [http:].
Stackebrandt, Erko et al. (2002). “Report of the ad hoc committee for there-evaluation of the species definition in bacteriology”. In: InternationalJournal of Systematic and Evolutionary Microbiology 52, pp. 1043–1047.
Sugahara, Hirosuke et al. (2015). “Probiotic Bifidobacterium longum altersgut luminal metabolism through modification of the gut microbial commu-nity”. In: Nature 5.13548, pp. 1–11.
Takeuchi, Yayoi et al. (2011). “In situ enzyme activity in the dissolved andparticulate fraction of the fluid from four pitcher plant species of the genusNepenthes”. In: PloS one 6.9, e25144.
Takeuchi, Yayoi et al. (2015). “Bacterial diversity and composition in the fluidof pitcher plants of the genus Nepenthes”. In: Systematic and AppliedMicrobiology 38.5, pp. 330–339.
Turner, Thomas R et al. (2013). “Comparative metatranscriptomics revealskingdom level changes in the rhizosphere microbiome of plants”. In: TheISME Journal 7, pp. 2248–2258.
86
Appendix
Valentini, Alice et al. (2009). “New perspectives in diet analysis based onDNA barcoding and parallel pyrosequencing: the trnL approach”. In: Molec-ular Ecology Resources 9, pp. 51–60.
Valentini, Alice et al. (2010). “DNA barcoding for honey biodiversity”. In: Di-versity 2, pp. 610–617.
Vessey, J Kevin (2003). “Plant growth promoting rhizobacteria as biofertiliz-ers”. In: Plant and Soil 255, pp. 571–586.
Videira, Sandy Sampaio et al. (2009). “Occurrence and diversity of nitrogen-fixing Sphingomonas bacteria associated with rice plants grown in Brazil”.In: FEMS Microbiology Letters 293, pp. 11–19.
Walter, Jens et al. (2011). “Host-microbial symbiosis in the vertebrate gas-trointestinal tract and the Lactobacillus reuteri paradigm”. In: Proceedingsof the National Academy of Sciences 108.Suppl 1, pp. 4645–4652.
Wang, Qiong et al. (2007). “Naive Bayesian classifier for rapid assignmentof rRNA sequences into the new bacterial taxonomy”. In: Applied andEnvironmental Microbiology 73.16, pp. 5261–5267.
Warwick, C et al. (2001). “Reptile-related salmonellosis”. In: Journal of theRoyal Society of Medicine 94, pp. 124–126.
White, T J et al. (1990). “Amplification and direct sequencing of fungal ri-bosomal RNA genes for phylogenetics”. In: PCR Protocols: A Guide toMethods and Applications. Ed. by M A Innis et al. New York: AcademicPress, pp. 315–322.
Wiens, John J. and Maria R. Servedio (2000). “Species delimitation in sys-tematics: inferring diagnostic differences between species.” In: Proceed-ings of the Royal Society of London - Series B: Biological Sciences 267,pp. 631–636.
Williams, Neal M. and Claire Kremen (2007). “Resource distributions amonghabitats determine solitary bee offspring production in a mosaic land-scape”. In: Ecological Applications 17, pp. 910–921.
Wilson, Erin E et al. (2010). “Pollen foraging behaviour of solitary Hawaiianbees revealed through molecular pollen analysis”. In: Molecular Ecology19, pp. 4823–4829.
Woese, C R and G E Fox (1977). “Phylogenetic structure of the prokaryoticdomain: the primary kingdoms”. In: Proceedings of the National Academyof Sciences USA 74, pp. 5088–5090.
Woolfe, Mark and Sandy Primrose (2004). “Food forensics: using DNA tech-nology to combat misdescription and fraud”. In: Trends in Biotechnology22.5, pp. 222–226.
Yabuuchi, Eiko et al. (1983). “Sphingobacterium gen. nov., Sphingobac-terium spiritivorum comb. nov., Sphingobacterium multivorum comb. nov.,Sphingobacterium mizutae sp. nov., and Flavobacterium indologenes sp.nov.: glucose-nonfermenting gram-negative rods in CDC groups IIK-2 and
87
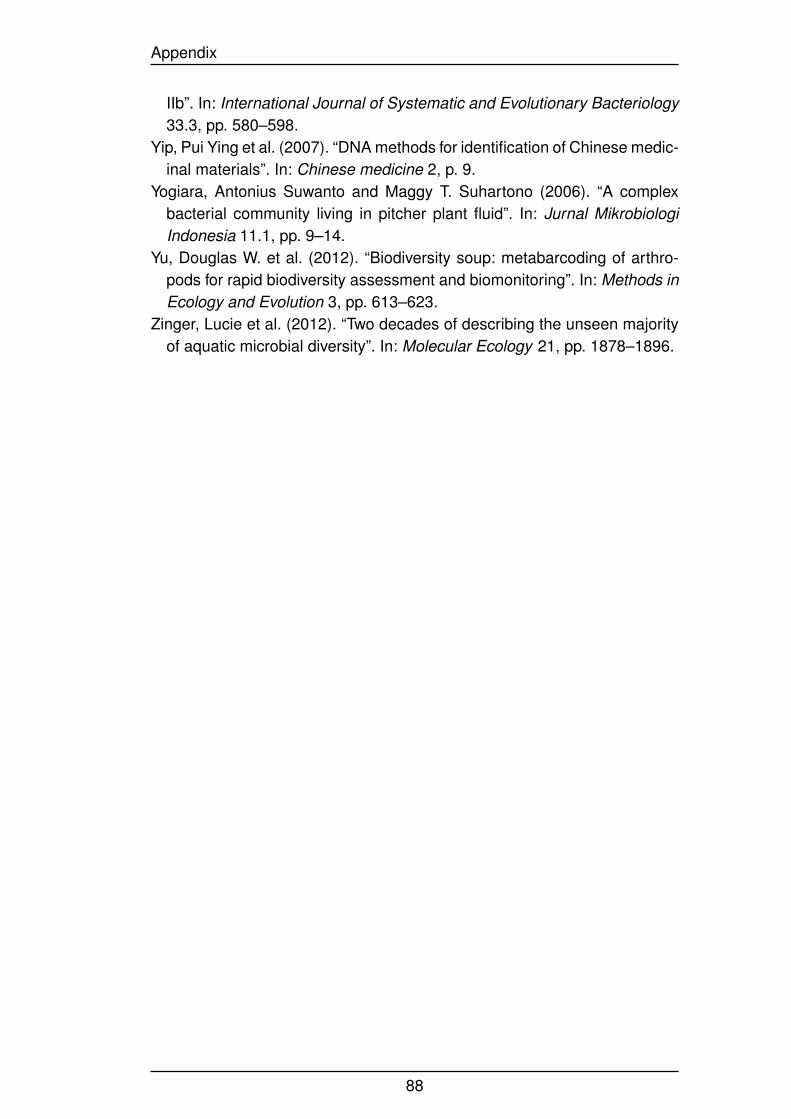
Appendix
IIb”. In: International Journal of Systematic and Evolutionary Bacteriology33.3, pp. 580–598.
Yip, Pui Ying et al. (2007). “DNA methods for identification of Chinese medic-inal materials”. In: Chinese medicine 2, p. 9.
Yogiara, Antonius Suwanto and Maggy T. Suhartono (2006). “A complexbacterial community living in pitcher plant fluid”. In: Jurnal MikrobiologiIndonesia 11.1, pp. 9–14.
Yu, Douglas W. et al. (2012). “Biodiversity soup: metabarcoding of arthro-pods for rapid biodiversity assessment and biomonitoring”. In: Methods inEcology and Evolution 3, pp. 613–623.
Zinger, Lucie et al. (2012). “Two decades of describing the unseen majorityof aquatic microbial diversity”. In: Molecular Ecology 21, pp. 1878–1896.
88

Abbreviations
ANOSIM analysis of similarityCOI cytochrome oxidase IDCA detrended correspondence analysiseDNA environmental DNAF fluidHTS high throughput sequencingI insideITS internal transcribed spacerITS 2 internal transcribed spacer 2L leaflogFC logarithmic fold changeO outsideOTU operational taxonomic unitP peristomePBS phosphate-buffered salineqPCR quantitative PCRrDNA ribosomal DNArRNA ribosomal RNATm melting temperature
89

List of Figures
P.1.1. .Bioinformatischer Ablauf einer DNA-Barcoding-Studie . . . . 12P.1.2. .Uberblick uber Metabarcoding . . . . . . . . . . . . . . . . . . 13P.1.3. .Feinskalige Analyse von Bakteriengemeinschaften auf Bluten 14
P.2.1. .Comparison of different approaches for plant species identifi-cation in mixed pollen samples . . . . . . . . . . . . . . . . . 18
P.2.2. .Species accumulation curves . . . . . . . . . . . . . . . . . . 21P.2.3. .Pollen spectrum of the two bee species . . . . . . . . . . . . 22P.3.4. .Planning scheme for samples and the corresponding index-
combinations . . . . . . . . . . . . . . . . . . . . . . . . . . . 36P.3.5. .Detailed workflow (schematic) suitable for laboratories with
limited access to equipment for automated pipetting . . . . . 37
P.4.1. .Relative abundances of bacterial families from the oral cavityof captive reptiles and the vivarium substrate . . . . . . . . . 44
P.5.2. .Bacterial diversity with respect to plant species and tissue . . 53P.5.3. .Detrended correspondance analysis (DCA) based on UniFrac
distance . . . . . . . . . . . . . . . . . . . . . . . . . . . . . . 54P.5.4. .Analysis of similarity (ANOSIM) for tissues based on Bray-
Curtis dissimilarity . . . . . . . . . . . . . . . . . . . . . . . . 54P.5.5. .Community composition . . . . . . . . . . . . . . . . . . . . . 55P.5.6. .Differences in distributions within the digestive fluids based
on logarithmic fold change . . . . . . . . . . . . . . . . . . . . 56
90

List of Tables
P.3.3. .Primer Sequences with indexes SA501 - SB712 (adapted from(Kozich et al. 2013)) . . . . . . . . . . . . . . . . . . . . . . . 35
P.4.0. .Relative abundance of important bacteria from the oral cavityof captive reptiles and the substrate of the vivaria . . . . . . . 41
P.5.1. .Sample list including index allocation and obtained sequencereads . . . . . . . . . . . . . . . . . . . . . . . . . . . . . . . 49
P.5.3. .Relative amounts of OTUs in clusters contributing to fluid com-munities . . . . . . . . . . . . . . . . . . . . . . . . . . . . . . 54
91

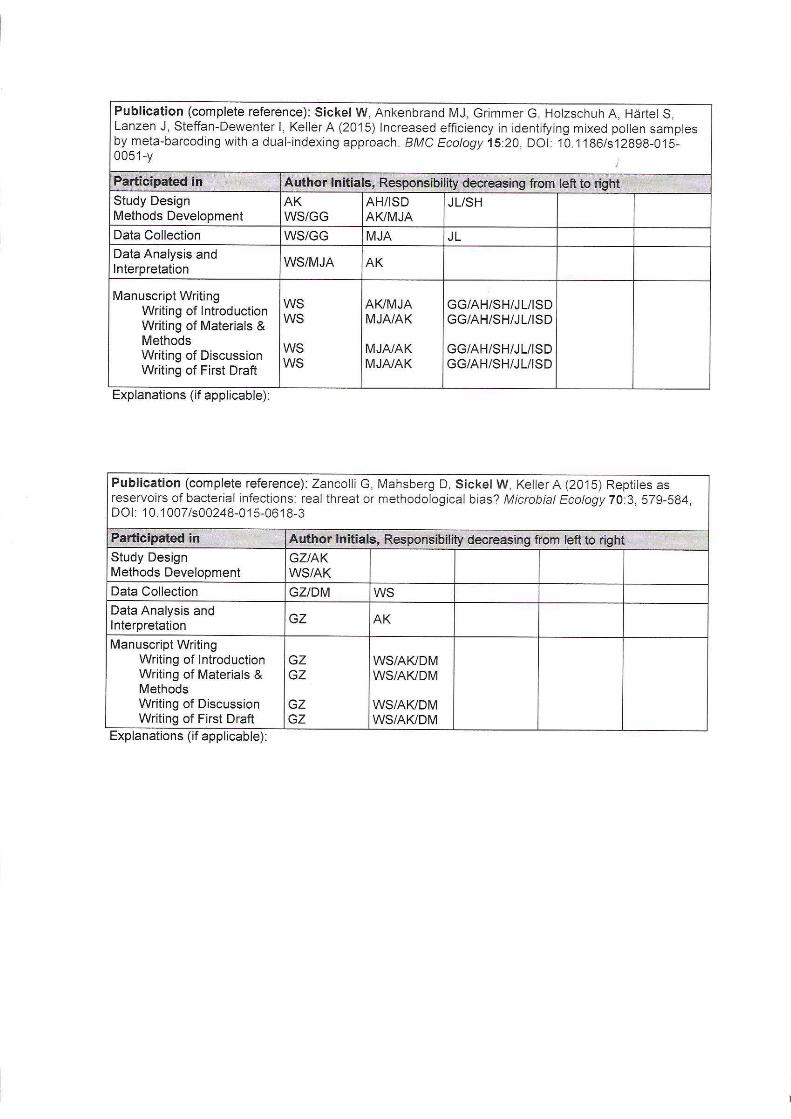

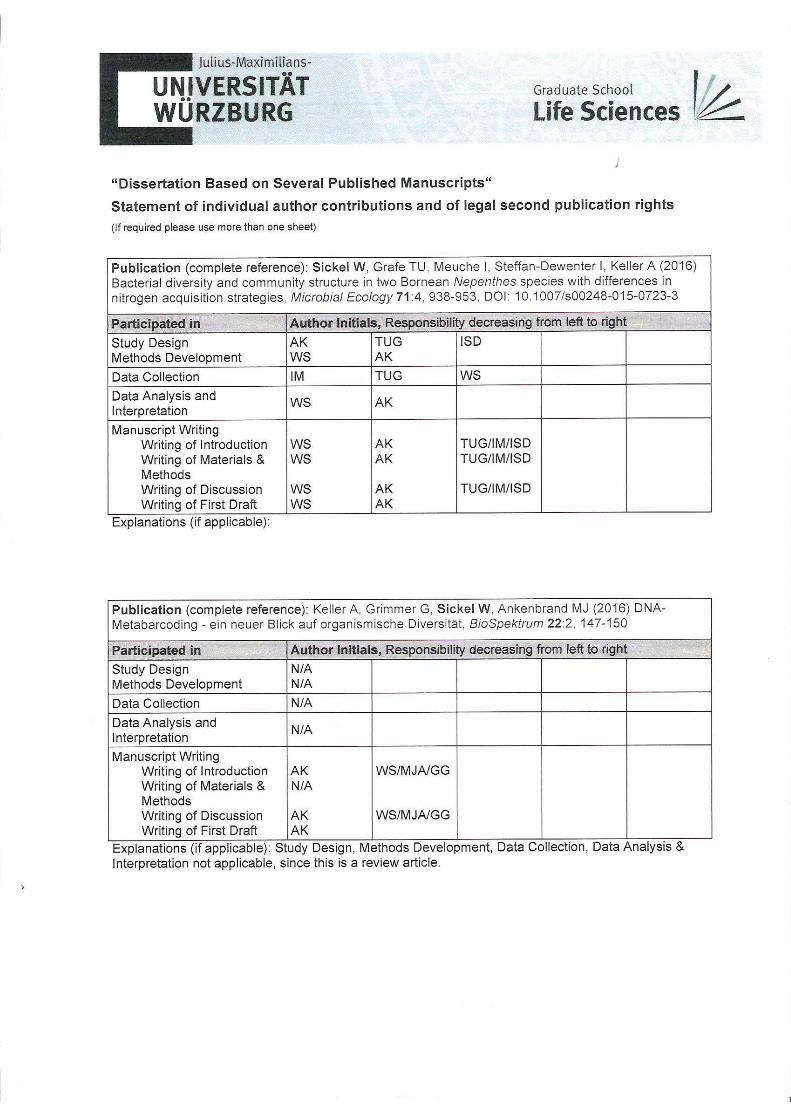


Curriculum Vitae
Wiebke Sickel, PhD Studentborn 10 March 1989 in Oranienburg, Germany,unmarried, no children
Main areas of research
Biodiversity, Carnivorous plants, High-throughput sequencing, Microbial Genomics, MicrobialEcology, Plant-microbe interactions
Scientific career and education
planned:10/2016 -
01/2017
Research stay at Genecology Research Center, Faculty of Science, Health, Ed-ucation, Engineering, University of the Sunshine Coast, Australia; followed byprivate stay
since 10/2014 PhD Student, Molecular Biodiversity Group, Department for Animal Ecologyand Tropical Biology, University of Wurzburg; Thesis title: High-throughputbiodiversity assessment - Powers and limitations of meta-barcoding, submission:09/2016
10/2013 -09/2014
MSc Biology, University of Wurzburg, Grade: 1.4; MSc thesis title: Diet as apotential factor determining microbial communities in Bornean pitcher plants
05/2013 -09/2013
Research stay at Leibniz Institute for Zoo and Wildlife Research; MSc thesistitle: Phylogeography of the Marbled Cat ( Pardofelis marmorata, Martin 1837)in South East Asia
09/2012 -09/2013
MSc Forensic and Conservation Genetics, University of Central Lancashire,UK, Grade: Distinction
09/2011 -05/2012
BSc (Hons) Forensic Science, Robert Gordon University Aberdeen, UK (DoubleDegree Programme); Grade: First Class; BSc thesis title: An investigation intothe potential use of elemental profiles of soil samples as a method of between-city discrimination for forensic purposes - A SoilFUN Project (in conjunctionwith The James Hutton Institute, Aberdeen, UK)
09/2009 -07/2012
BSc Forensic Science, University of Applied Science Bonn-Rhein-Sieg, Ger-many; Grade: 1.3
09/2006 -06/2009
Secondary Education (Abitur), Gymnasium ’Friedlieb Ferdinand Runge’,Oranienburg, Germany; Grade: 1.2

Skills
Laboratorytechniques
Bacterial cultivation, DNA isolation, DNA quantification, PCR, Sanger Se-quencing, High throughput sequencing
IT R, LATEX, MS Office, Perl, Unix/Linux, QIIME, USEARCH
Languages German (mother tongue), English (fluent, Cambridge Certificate in AdvancedEnglish)
Research grants
2015 e 1,000 for covering sequencing costs, granted by Universitatsbund Wurzburge.V. for the project Microbiota of the poison dart frog Oophaga pumilio andits variability regarding toxicity, biogeography and behaviour
Scientific activities
since 2015 Member of German Carnivorous Plant Society (Gesellschaft fur Fleis-chfressende Pflanzen im deutschsprachigen Raum e.V.)
Member of International Carnivorous Plant Society
Member of German Herpetological Society (Deutsche Gesellschaft fur Her-petologie und Terrarienkunde)
International Conferences & Workshops
08/2016 11th International Carnivorous Plant Conference, Kew, London, UK; Oral Pre-sentation: Inventorying carnivorous plant associated bacteria: co-evolution,convergence and function; Travel grant of German Academic Exchange Ser-vice (DAAD), Travel grant of Graduate School of Life Sciences, University ofWurzburg, Germany
05/2016 Plant and Pollen Metabarcoding Summerschool 2016 with Pollen BoL Mini-Symposium, Wurzburg, Germany; Co-Organiser and Lecturer
10/2015 Eureka! - 10th Symposium of the Graduate School of Life Sciences, Wurzburg,Germany; Poster Presentation: You shall not pass! The Venus flytrap micro-biota is resistant against invaders introduced by prey items; Co-Organiser
06/2015 13th Symposium on Bacterial Genetics and Ecology, Milan, Italy; Poster Pre-sentation: Bat mutualism or not: microbiota comparison of two closely relatedBornean Nepenthes species; Travel grant of Graduate School of Life Sciences,University of Wurzburg, Germany
10/2014 Eureka! - 9th International Symposium of the Graduate School of Life Sciences,Wurzburg, Germany; Poster Presentation: Diet determines bacterial diversityand community structure in Bornean pitcher plants
07/2014 ISFAS 2014 - International Symposium on Research and Conservation Biologyin South America, Nurnberg, Germany
09/2013 9th International Conference on Behaviour, Physiology and Genetics ofWildlife, Berlin, Germany
Other workshops
06/2016 Open Access and Copyright in Science, organised by the Graduate School ofLife Sciences, University of Wurzburg
Slidewriting and Storylining, organised by the Graduate School of Life Sciences,University of Wurzburg
01/2016 Introduction to System Administration, organised by the Bioinformatics De-partment, University of Wurzburg
03/2015 Intercultural Communication, organised by the Graduate School of Life Sci-ences, University of Wurzburg
Good Scientific Practice, organised by the Graduate School of Life Sciences,University of Wurzburg
09/2014 Scientific Writing and Publishing, organised by the Graduate School of LifeSciences, University of Wurzburg
10/2013 Leading Skills for Professionals and Students (Fuhrungskompetenzen fur Berufund Studium), organised by Deutsche Bildung AG
Publications
2016
Sickel W, U Grafe, I Meuche, I Steffan-Dewenter, A Keller. Bacterial diversity and communitystructure in two Bornean Nepenthes species with differences in nitrogen acquisition strategies, Mi-crobial Ecology 71:4, 938-953, DOI: 10.1007/s00248-015-0723-3
Keller A, G Grimmer, W Sickel, MJ Ankenbrand (2016) DNA-Metabarcoding - ein neuer Blickauf organismische Diversitat, BioSpektrum 22:2, 147-150
2015
Sickel W, M Ankenbrand, G Grimmer, A Holzschuh, S Hartel, J Lanzen, I Steffan-Dewenter, AKeller (2015) Increased efficiency in identifying mixed pollen samples by meta-barcoding with adual-indexing approach. BMC Ecology 15:20, DOI: 10.1186/s12898-015-0051-y
Zancolli G, D Mahsberg, W Sickel, A Keller (2015) Reptiles as reservoirs of bacterial infections:real threat or methodological bias? Microbial Ecology 70:3, 579-584, DOI: 10.1007/s00248-015-0618-3
in press
Sickel W*, MJ Ankenbrand*, G Grimmer, F Forster, I Steffan-Dewenter, A Keller (in press)Standard method for identification of bee pollen mixtures through meta-barcoding. COLOSS Bee-Book, Vol. III
*equally contributing