How do financial development and financial integration ... · PDF fileDespite this, the...
68
econstor www.econstor.eu Der Open-Access-Publikationsserver der ZBW – Leibniz-Informationszentrum Wirtschaft The Open Access Publication Server of the ZBW – Leibniz Information Centre for Economics Standard-Nutzungsbedingungen: Die Dokumente auf EconStor dürfen zu eigenen wissenschaftlichen Zwecken und zum Privatgebrauch gespeichert und kopiert werden. Sie dürfen die Dokumente nicht für öffentliche oder kommerzielle Zwecke vervielfältigen, öffentlich ausstellen, öffentlich zugänglich machen, vertreiben oder anderweitig nutzen. Sofern die Verfasser die Dokumente unter Open-Content-Lizenzen (insbesondere CC-Lizenzen) zur Verfügung gestellt haben sollten, gelten abweichend von diesen Nutzungsbedingungen die in der dort genannten Lizenz gewährten Nutzungsrechte. Terms of use: Documents in EconStor may be saved and copied for your personal and scholarly purposes. You are not to copy documents for public or commercial purposes, to exhibit the documents publicly, to make them publicly available on the internet, or to distribute or otherwise use the documents in public. If the documents have been made available under an Open Content Licence (especially Creative Commons Licences), you may exercise further usage rights as specified in the indicated licence. zbw Leibniz-Informationszentrum Wirtschaft Leibniz Information Centre for Economics Hoffmann, Mathias; Okubo, Toshihiro Working Paper 'By a silken thread': Regional banking integration and pathways to financial development in Japan's Great Recession CESifo Working Paper: Monetary Policy and International Finance, No. 4090 Provided in Cooperation with: Ifo Institute – Leibniz Institute for Economic Research at the University of Munich Suggested Citation: Hoffmann, Mathias; Okubo, Toshihiro (2013) : 'By a silken thread': Regional banking integration and pathways to financial development in Japan's Great Recession, CESifo Working Paper: Monetary Policy and International Finance, No. 4090 This Version is available at: http://hdl.handle.net/10419/69600
Transcript of How do financial development and financial integration ... · PDF fileDespite this, the...
econstor www.econstor.eu
Der Open-Access-Publikationsserver der ZBW – Leibniz-Informationszentrum WirtschaftThe Open Access Publication Server of the ZBW – Leibniz Information Centre for Economics
Standard-Nutzungsbedingungen:
Die Dokumente auf EconStor dürfen zu eigenen wissenschaftlichenZwecken und zum Privatgebrauch gespeichert und kopiert werden.
Sie dürfen die Dokumente nicht für öffentliche oder kommerzielleZwecke vervielfältigen, öffentlich ausstellen, öffentlich zugänglichmachen, vertreiben oder anderweitig nutzen.
Sofern die Verfasser die Dokumente unter Open-Content-Lizenzen(insbesondere CC-Lizenzen) zur Verfügung gestellt haben sollten,gelten abweichend von diesen Nutzungsbedingungen die in der dortgenannten Lizenz gewährten Nutzungsrechte.
Terms of use:
Documents in EconStor may be saved and copied for yourpersonal and scholarly purposes.
You are not to copy documents for public or commercialpurposes, to exhibit the documents publicly, to make thempublicly available on the internet, or to distribute or otherwiseuse the documents in public.
If the documents have been made available under an OpenContent Licence (especially Creative Commons Licences), youmay exercise further usage rights as specified in the indicatedlicence.
zbw Leibniz-Informationszentrum WirtschaftLeibniz Information Centre for Economics
Hoffmann, Mathias; Okubo, Toshihiro
Working Paper
'By a silken thread': Regional banking integration andpathways to financial development in Japan's GreatRecession
CESifo Working Paper: Monetary Policy and International Finance, No. 4090
Provided in Cooperation with:Ifo Institute – Leibniz Institute for Economic Research at the University ofMunich
Suggested Citation: Hoffmann, Mathias; Okubo, Toshihiro (2013) : 'By a silken thread': Regionalbanking integration and pathways to financial development in Japan's Great Recession, CESifoWorking Paper: Monetary Policy and International Finance, No. 4090
This Version is available at:http://hdl.handle.net/10419/69600
‘By a Silken Thread’: Regional Banking Integration and Pathways to Financial
Development in Japan’s Great Recession
Mathias Hoffmann Toshihiro Okubo
CESIFO WORKING PAPER NO. 4090 CATEGORY 7: MONETARY POLICY AND INTERNATIONAL FINANCE
JANUARY 2013
An electronic version of the paper may be downloaded • from the SSRN website: www.SSRN.com • from the RePEc website: www.RePEc.org
• from the CESifo website: Twww.CESifo-group.org/wp T
CESifo Working Paper No. 4090
‘By a Silken Thread’: Regional Banking Integration and Pathways to Financial
Development in Japan’s Great Recession
Abstract How do financial development and financial integration interact? We focus on Japan’s Great Recession after 1990 to study this question. Regional differences in banking integration affected how the recession spread across the country: financing frictions for credit-dependent firms were more severe in less integrated prefectures, which saw larger decreases in lending by nationwide banks and lower GDP growth. We explain these cross-prefectural differences in banking integration by reference to prefectures’ different historical pathways to financial development. After Japan’s opening to trade in the 19th century, silk reeling emerged as the main export industry. The silk reeling industry depended heavily on credit for working capital but comprised many small firms that could not borrow directly from larger banks. Instead, silk merchants in Yokohama, the main export hub for silk, provided silk reelers with trade loans. Many regional banks in Japan were founded as local clearing houses for such loans, and regional banks continued to account for above-average shares in lending in the formerly silk-exporting prefectures long after the decline of the silk industry. Using the cross-prefectural variation in the number of silk filatures in 1895 as an instrument, we confirm that the post-1990 decline was worse in prefectures where credit constraints were tightened through low levels of banking integration. Our findings suggest that different pathways to financial development can lead to long-term differences in de facto financial integration, even if there are no formal barriers to capital mobility between regions, as is the case in modern Japan.
JEL-Code: F150, F300, F400, G010, N150, N250, O160.
Keywords: financial development, financial integration, Japan, Great Recession, Lost Decade, banking integration, regional business cycles, transmission of financial shocks, misallocation of credit, trade credit, export finance, silk industry.
Mathias Hoffmann University of Zurich / Dept. of Economics Chair of International Trade and Finance
Switzerland – 8032 Zurich [email protected]
Toshihiro Okubo Keio University
2-15-45 Mita Minato-ku Japan - Tokyo, 108-8345 [email protected]
December 2012 We are grateful for feedback from and discussions with Sascha Becker, Linda Goldberg, Pierre-Olivier Gourinchas, Takeo Hoshi, Masaki Nakabayashi, Joe Peek, Bent Sorensen, Pascal Towbin, FrankWestermann and seminar participants at the University of Bonn, Hitotsubashi University, Keio University, RIETI, University of Muenster, University of Osnabrück, University of Tübingen, the 3rd Bundesbank Workshop on Money, Finance and Banking in East Asia, the conference on “Financial globalization, financial crises and the (re)-regulation of banking” at the University of Zurich, the Austrian National Bank Workshop on “Financial Markets and Real Economic Activity” and the EEA-ESEM meetings 2012 in Malaga.
Introduction
How do financial development and financial integration interact? We focus on Japan’s Great
Recession after 1990 to study this question. First, we show that differences in banking integra-
tion between prefectures affected the regional spread of the crisis. Prefectures with many credit-
dependent, small manufacturing firms grew much more slowly after 1990 if their banking sector
was weakly integrated with the rest of the country. The financially least integrated and most credit-
dependent prefectures also saw the largest declines in lending by nationwide banks. Hence, the
regional segmentation of Japan’s banking market significantly influenced the way in which the
recession affected different parts of the country. We then show that in Japan’s otherwise highly
integrated national economy, these regional differences in banking integration have long-standing
historical origins. Prefectures in which silk reeling emerged as the first main export industry in
the late 19th century developed a particular system of trade credit and export finance in which
regional, cooperative or mutual banks came to play a key role in local banking markets. In other
regions, larger, nationwide banks eventually came to dominate the market. Therefore, the old silk
regions had de facto weakly integrated banking markets at the onset of the Great Recession. Hence,
the extent to which a large, common, countrywide shock—the bursting of Japan’s asset price bub-
ble in the early 1990s—was transmitted to different parts of the country literally hung ‘by a silken
thread’ that was reeled 100 years earlier, during the days of Meiji-era Japan (1868–1912).
Our empirical approach follows a large body of literature initiated by Rajan and Zingales
(1998). We identify cross-regional differences in credit dependence using the output or employ-
ment share of small manufacturing firms in each prefecture. Our main measure of regional finan-
cial integration is the prefecture-level market share of big banks that operate countrywide (termed
‘city banks’) as opposed to that of purely regional lenders (mainly small cooperative and mutual
banks). We find that the effects of credit dependence were compounded by low levels of financial
integration: over the period 1991–2005, some of the most credit-dependent prefectures may have
grown by up to 0.7 percentage points per year less because of their low levels of financial inte-
gration. Increasing our main measure of financial integration by one standard deviation would
have increased post-1990 growth rates by around 0.4 percentage points per annum for the average
1
prefecture. We identify the lending behavior of the large, nationwide banks as the transmission
channel from the financial shock to the real economy: these banks restricted their lending most
severely in prefectures where they traditionally had the lowest market share (i.e. in the least finan-
cially integrated prefectures).
The second part of our analysis then turns to the question: what determines variation in the
degree of financial integration across prefectures? We turn to Japan’s economic history to argue
that cross-prefectural differences in financial integration at the onset of the Great Recession can,
to a large extent, be explained by the regions’ different historical pathways to financial develop-
ment. After Japan’s opening to trade in the 19th century, silk thread emerged as Japan’s first export
staple. The development of this industry had a huge impact on the development of the financial
system. With the mechanization of the reeling process in the 1880s and 1890s, silk reeling became
increasingly separated from the growing of cocoons. Therefore, silk reelers had to purchase co-
coons, which accounted for more than 80 percent of their operating cost. This made the silk reeling
business highly dependent on trade credit. However, small reelers—most of them located in the
mountain regions of central Japan—were largely cut off from direct access to finance from the large
city banks in Yokohama and other treaty ports. The silk reelers therefore often founded coopera-
tive or mutual banks that provided operating loans against so-called ‘documentary bills’ drawn on
reputed Yokohama silk export merchants, to whom the reelers would ship their produce after hav-
ing reeled the cocoons. Hence, these regional banks essentially acted as clearing houses for loans
that were ultimately provided by the Yokohama export merchants. As a result of their central role
in this system of export finance for the silk reeling firms, regional cooperative or mutual banks
became particularly important (compared with large, nationwide banks) in the silk-producing re-
gions. As we show, these regional differences in banking structure persisted even after the silk
industry had virtually vanished, which happened by the mid-20th century. Regional banks op-
erating in Japan today often have their origins in these small-scale cooperative institutions that
emerged in the late 19th century.
We show that the prefecture-level number of silk reeling mills (normalized by population) in
the late 19th century is indeed a powerful predictor of the prefecture-level market share of these
2
local lenders (as opposed to that of city banks) 100 years later, at the onset of Japan’s Great Re-
cession, and therefore of the degree of regional banking integration after 1990. We then use the
prefecture-level variation in the number of silk filatures (reeling factories) in the late 19th century
as an instrument for financial integration in the 1980s. We corroborate our previous results: the
negative effect of credit constraints on output growth in the recession after 1990 was worse in less
financially integrated areas.
Our results shed new light on the interdependency between financial development and finan-
cial integration: different pathways to financial development had a century-long impact on the de-
gree to which prefectures were effectively financially integrated when the Japanese bubble burst
in the early 1990s. During Japan’s industrialization, large-scale bank finance was extremely im-
portant in developing other industries—cotton reeling, railways, steel milling and coal mining—
whereas the main silk reeling areas achieved economic growth through financial development
based mainly on small, often cooperatively owned banks. While this model certainly served the
needs of the silk industry very well, it eventually led to a long-lasting regional fragmentation of
the banking system that persisted for over a century. As we argue, these regional differences in the
level of financial integration, in turn, had a considerable impact on small firms’ access to finance
during the crisis and on post-crisis growth differentials between prefectures.
Contribution to the literature
Our study incorporates and builds on several strands of literature. First, we contribute to the
empirical literature on financial development and macroeconomic performance (King and Levine
(1993), Rajan and Zingales (1998), Jayaratne and Strahan (1996) and Morgan, Rime and Strahan
(2004)). While much of this literature has focused on the growth implications of financial de-
velopment and on international comparisons, our focus is more on the implications for business
cycles and medium-term growth, and on intranational (regional) differences in financial structure.
Here, we have precursors in the work of Jayaratne and Strahan (1996), Morgan, Rime and Strahan
(2004), Dehejia and Lleras-Muney (2007) and Rajan and Ramcharan (2011) for the United States
and Guiso, Sapienza and Zingales (2004) for Italy. We add an important, novel aspect to this lit-
3
erature by illustrating how differences in financial integration can be the outcome of alternative
pathways of financial development. Each model of financial development—the system of small,
regional, cooperative banks for the silk-producing regions and the system of large, nationwide
banks for other regions—seems to have served the specific financing needs of each region’s major
industries at the time, and each seems to have been instrumental for regional economic develop-
ment over the past century (see Miwa and Ramseyer (2006)). Today, the regions that form modern
Japan at first sight appear to be highly financially integrated, and they share the same regulatory
and legal framework. Despite this, the different historical pathways have created interesting het-
erogeneity in terms of regional differences in de facto financial integration. We argue that these
differences influenced the spread of a large, common shock across the country 100 years later (the
Great Recession).
Our results shed new light on the debate about the interdependency of financial development
and financial integration, and their roles in growth and the transmission of macroeconomic distur-
bances. Studies in the spirit of Rajan and Zingales (1998) emphasize that financial development
has a particularly strong impact on sectors that are especially dependent on external finance. This
implicitly assumes that firms in these credit-constrained sectors cannot substitute local access to
financial markets for finance from other countries or regions. An important question, therefore,
is whether financial development matters per se or because it often arises in conjunction with a
low degree of financial integration. Guiso, Sapienza and Zingales (2004) show that differences in
local financial development can matter even in integrated financial markets. By contrast, Bekaert
et al. (2007) argue that it is mainly financial integration—stock market and banking integration, in
particular—rather than local financial development per se that removes financial constraints and
helps in aligning growth opportunities with actual growth rates.
Our empirical findings complement the results in these papers. Prima facie, we find that dif-
ferences in financial integration (rather than differences in local financial development) mattered
most directly for the macroeconomic transmission of the shocks associated with the Japanese crisis:
credit-dependent prefectures performed significantly worse if their banking sectors were poorly
integrated with the rest of the country, irrespective of how financially developed they were in
4
other respects. What we do find, however, is that a prefecture’s particular pathway to financial
development effectively determined its de facto level of financial integration with the rest of the
country, which, in turn, affected the regional spread of the crisis. We believe that this result is in-
teresting at a general level because it suggests that de facto differences in financial integration can
persist even in an environment in which formal barriers to interregional capital mobility are very
low, as is certainly the case in modern Japan.1
Our results also bear an interesting resemblance to the findings by Do and Levchenko (2008),
who show that export structure may be an important determinant of financial development: coun-
tries with a comparative advantage in industries with high external finance dependence will ul-
timately develop a financial sector that is suited to sustaining these industries, whereas countries
specializing in industries with low external finance dependence will have lower financial develop-
ment. Our findings here suggest that a prefecture’s comparative advantage in a key export indus-
try (silk reeling) determined the development of financial institutions in that prefecture. However,
our results do not allow us to conclude whether silk regions ultimately have higher or lower levels
of financial development. For our argument it is, however, sufficient that the silk regions have
developed financial institutions that are different from those in other regions, in such a way as to
render the silk regions effectively less financially integrated with the rest of the country during the
1990s.
We use the bursting of Japan’s big property and stock market bubbles of the 1980s as an iden-
tifying shock to banks’ lending behavior that tightened the financial constraints faced by credit-
dependent households and firms. Besides being of interest in its own right, the Japanese expe-
rience during the 1990s and 2000s is important for at least two reasons, as follows. First, the
workings of the financial accelerator and the balance sheet channel (see Bernanke (1983), Gertler
and Gilchrist (1994) and Bernanke and Gertler (1989)) are plausibly much stronger in a major crisis
1Relationship lending by banks (Berger and Udell (1995)) is one possible reason why regions are imperfectly inte-grated. As we will argue, in the case of Japan such networks of banking relationships have long-standing historicalroots that may have given regional banks an informational advantage with respect to local customers (in particular,small businesses). This may have prevented these businesses from obtaining credit from nationally integrated banksin a downturn—leading to a de facto segmentation of markets even though there are no formal impediments to capitalflows. See Berger et al. (2005) for the role of small banks in relationship lending and Uchida, Udell and Watanabe (2008)for an analysis of Japanese banks in particular.
5
than in a “normal” downturn. Second, the Japanese crisis had very persistent effects on economic
activity, leading to what is often referred to as the ‘Lost Decade’. This provides us with a long
period of observation after the crisis, allowing us to study its longer-term impact. Our use of
the Japanese crisis as an identifying shock follows Peek and Rosengren (2000), Amiti and Wein-
stein (2011) and Imai and Takarabe (2011). Peek and Rosengren (2000) and Imai and Takarabe
(2011) focus on common lender effects and on how integrated banking markets can accelerate the
spread of a crisis. By contrast, our analysis emphasizes how a lack of regional banking integration
can worsen a recession in particularly credit-dependent sectors and regions. Amiti and Weinstein
(2011) use differences in the external finance dependence of exporting and nonexporting firms to
identify the impact of bank-level loan supply shocks on real economic activity. In our analysis,
we focus on differences between prefectures to identify the impact of financial constraints on real
economic activity.
This focus on the regional dimension of Japan’s Great Recession is relatively novel in the lit-
erature.2 The Japanese experience has been studied in significant detail from a macroeconomic
perspective or based on bank- and firm-level data. However, there is significantly less evidence
about the implications of the crisis (and about the importance of regional differences in financial
integration) for regional business cycles and medium-term growth. We provide such evidence
here.
The paper therefore also contributes a regional perspective to the literature on banking crises
and financial integration (Dell’Ariccia, Detragiache and Rajan (2008) and Kroszner, Laeven and
Klingebiel (2007)). These studies examine the aftermath of banking crises in a large cross-section
of countries. Our focus here is on the regional implications of a common (countrywide) shock over
time.
We also add a regional dimension to the literature on the role of international banking in the
cross-country transmission of shocks (Cetorelli and Goldberg (forthcoming) and Peek and Rosen-
2The only recent paper we are aware of is by Imai and Takarabe (2011), who study the role of banking integrationin cross-prefecture differences in exposure to the house price shock. They conclude that house price shocks in the coreareas had bigger (negative) spillovers in areas with high banking integration. We corroborate their results below as atest of the robustness of our main findings. Our analysis, however, focuses on how the lack of financial integration hasexacerbated the financial frictions that were induced by the common shock. Furthermore, Imai and Takarabe (2011) donot offer a historical explanation for why there are cross-regional differences in financial integration, as we do here.
6
gren (2000, 1997)). Peek and Rosengren (2000) emphasize the common lender effect of the Japanese
shock of the early 1990s on US banks. Peek and Rosengren (1997) show that Japanese banks that
operated in international markets cut back on their foreign lending—markets that they often had
only recently entered. One way to interpret these results is as evidence of relationship lending:
banks withdraw from regions with which they have relatively weak ties. Our results are quite
analogous: in fact, city banks reduced their lending in particular in prefectures in which they tra-
ditionally had a low market share. We add to this by showing that this effect was stronger in areas
with many small firms. Our results also relate to recent findings by Cetorelli and Goldberg (forth-
coming), who show that the internal liquidity management of US banks operating internationally
actually exacerbated the transmission of domestic (i.e. US) liquidity shocks to foreign economies,
leading to a reduction in lending.
Recent important literature focusing on the Japanese experience after 1990 has emphasized that
Japan’s bursting bubble cannot be characterized as a conventional credit crunch (Caballero, Hoshi
and Kashyap (2008), Peek and Rosengren (2005)). Rather, banks seem to have engaged in ‘ev-
ergreening’ insolvent borrowers in the hope that either these borrowers or the banks themselves
would eventually be bailed out by the government. This seems to have led to the emergence of
a class of ‘zombie’ firms, i.e. insolvent firms that starved other, productive firms of credit and
hindered the creation and growth of new firms, and thus stifled growth in the aggregate economy
(Caballero, Hoshi and Kashyap (2008). Evergreening may help explain our findings in this paper.
First, Caballero, Hoshi and Kashyap (2008) show that manufacturing was one of the sectors that
was least affected by evergreening. Our focus here is on small manufacturing firms—the ones that
were therefore most likely to be deprived of the credit from which the (generally large) ‘zombies’
benefited. Furthermore, it seems that evergreening was particularly pervasive within Zaibatsu—
the tight industrial conglomerates that encompass industrial firms and banks—and that it was
conducted in particular by large banks. One of our findings is that large banks withdrew from
areas where they traditionally had a low market share and where there were many small manu-
facturing firms. Clearly, this is consistent with the possibility that large banks withdrew credit in
order to evergreen large customers in their core business regions.
7
A key innovation of our paper is that it explores the long-term historical origins of why Japan’s
crisis of the 1990s spread across the country as it did. These historical aspects of our results build
on literature showing that Japan’s opening to trade was indeed a natural experiment. Bernhofen
and Brown (2005, 2004) demonstrate that this opening spurred the development of industries in
which Japan had a comparative advantage, with the silk industry as a preeminent example. The
role of special institutions involved in trade credit and export finance for the development of the
silk industry has been explored by several scholars of Japanese economic history (e.g. Nakabayashi
(2001) and Miwa and Ramseyer (2006)).3 However, to our knowledge, we are the first to identify
the persistence of the role of these institutions, and that it led to a regional segmentation in banking
markets that lasted for over a century. In explaining these differences in banking market structure,
we also relate to recent literature that has emphasized the role that trade credit can play in at-
tenuating informational asymmetries (Petersen and Rajan (1997)) and in overcoming barriers to
growth in environments with low financial development (Fisman and Love (2003)). Most silk reel-
ing firms were located in remote prefectures and were unable to borrow directly from the banks
in the big port cities. Instead, the Yokohama silk merchants who sold the silk to the international
market also effectively provided trade credit to the reelers. In the longer run, only mechanized
reelers were able to provide the consistently high quality of silk required by international mar-
kets (in particular the US). Therefore, only the prefectures in which there was a high concentration
of reeling firms (and in which these firms switched to mechanized production quite early) could
keep their competitive advantage, and these eventually became the main silk-exporting regions.
Furthermore, with Yokohama as the export hub, eventually only regions that were able to export
internationally enjoyed continued access to the particular form of nonbank credit provided by the
3The terms ‘trade credit’ and ‘trade finance’ are ambiguous in the literature. We follow Amiti and Weinstein (2011)and use the term ‘trade credit’ to denote financing by suppliers (e.g. by allowing deferred payment of materials).By contrast, the term ‘trade finance’ refers to the financing of international trade. As we argue below, both conceptsare relevant in understanding the development of the institutions financing the silk trade. To further facilitate thedistinction between the two concepts, in the remainder of the paper we do not use the term ‘trade finance’ but insteadrefer to financing of international trade as ‘export finance’.
8
Yokohama silk merchants.4,5
There are a number of explanations of why the silk industry had such a long-lasting effect
on Japan’s regional banking landscape. First, the specific type of regional bank that emerged in
the silk regions served its purpose well: scholars of Japan’s economic and social history have
noted that these institutions—many of them organized as cooperatives—successfully resolved the
financing frictions faced by the fragmented silk industry, whereas big national banks tended to
cater to the financing needs of large-scale, capital-intensive industries such as cotton reeling, rail-
roads and heavy industry (see Miwa and Ramseyer (2006)). As the silk industry remained the
foremost export industry until the onset of World War II, it is not surprising that its small-scale,
regional institutions shaped Japan’s banking landscape well into the 20th century—in fact, until
after the war.6 Heavy regulation of Japanese banking in the post-WWII era—the ‘convoy system’
and separate legal frameworks for Shinkins (industrial and commercial cooperative banks) and
Sogo (mutual) banks—then consolidated this de facto separation of regional banking markets for at
least the next 40 years.
An important challenge faced by studies in the spirit of Rajan and Zingales (1998) (such as
ours) is that access to finance may affect industrial structure in the long run: areas where access to
finance is poor will have a comparative advantage in industries with low levels of external finance
dependence (see Fisman and Love (2004) and Bekaert et al. (2007)). If this was the case, this could
lead us to overestimate the importance of low levels of financial integration for economic activity
in areas with high levels of credit dependence: areas with low levels of financial integration would
then simply not be very dependent on credit in general. To show that our results are not affected
by this objection, we also estimate specifications in which we allow for the possibility that the
4As we discuss in detail below, the institutional details of the silk trade resemble those of modern export financeas described in Amiti and Weinstein (2011). In this system, the silk reelers played the role of the ‘exporting’ firm, theYokohama-based silk merchants played the role of the ‘importer’ and regional banks acted as the exporters’ ‘advising’bank. Large Yokohama banks essentially issued letters of credit on behalf of the Yokohama silk merchants, but theydid not generally lend to the silk reelers directly. This is likely to have led to a long-term informational advantagefor the regional banks with respect to their customer base of small businesses, thus contributing to banking marketsegmentation long after the eventual decline of the silk industry.
5To our knowledge, no prefecture-level data on silk exports exist, so this argument cannot be directly tested. How-ever, our reasoning implies that early mechanization, if it is linked to export success, should also be linked to thepersistence of the regional system of banks. In our empirical analysis below, we show that this is indeed the case.
6This is plausible because the regional distribution of economic activity remained remarkably stable after the war(see Davis and Weinstein (2002)).
9
pre-1990 prefecture-level output shares of small manufacturing firms—our main measure of credit
dependence—may be endogenous, in the sense that they were influenced by the path to financial
development taken by the prefecture since the late 19th century. We overcome the endogeneity
by building on insights from the literature on agglomeration effects and knowledge spillovers (see
Glaeser et al. (1992)), using a prefecture’s distance to the main silk regions as an exogenous measure
of growth prospects in the manufacturing sector in the late 19th century. Using this measure as
an additional instrument, we then treat both financial integration and financial dependence as
endogenous in our regressions. Our previous results remain valid.
The remainder of this paper is structured as follows. Section 2 provides background on our
identification strategy and presents details about small business finance and the regional segmen-
tation of the banking sector in Japan. It also introduces the data. Section 3 presents our basic
stylized facts: the fallout from the crisis was particularly strong in regions where banking markets
were not very integrated with the rest of the country and where there were many credit-dependent,
small manufacturing firms. Section 4 acknowledges the potential endogeneity of our banking in-
tegration measures and introduces our instrument: we show that the importance of silk reeling in
a prefecture in the late 19th century is a powerful predictor of the prefecture-level importance of
regional banks in the late 20th century, and we proceed to demonstrate that these long-standing
differences in financial integration significantly affected regional differences in macroeconomic
transmission during the Great Recession of the 1990s. Section 5 discusses our results further and
concludes.
Identification: small business finance and regional banking in Japan
To identify how cross-prefecture differences in financial integration affected the regional spread of
the Great Recession, we adopt the approach of Rajan and Zingales (1998) in arguing that access to
finance should matter more where dependence on credit is stronger. Hence, it should be the in-
teraction between dependence on finance and access to finance that determines how severely the
crisis hits a region. Our conjecture at the outset is that access to finance is worse in financially less
integrated regions because there are barriers to the free flow of credit from outside the region in
10
response to credit demand shocks.7 As argued by Rajan and Zingales (1998) and Guiso, Sapienza
and Zingales (2004), focusing on such interactions strengthens the identification of the effects of
the treatment (in their case, financial development; in our case, our measure of financial integra-
tion) because unobserved confluent factors can easily be controlled for: if regional differences in
financial integration are time invariant, or only evolving very slowly (as we would expect), then it
is impossible to separate their effect from a fixed effect in a panel setting if the marginal impact of
financial integration on the outcome (e.g. growth or volatility) is fixed. If, however, the marginal
impact of financial integration on the observed outcome depends on other characteristics (such as
the dependence on external finance of households or firms), then the interaction allows us to sepa-
rate the effect of financial integration from any first-order confluent factor that would be captured
by the fixed effect.
As our primary measures of a prefecture’s dependence on external finance, we use the share of
small manufacturing firms in the prefecture’s output or employment. Our data are from Japan’s
manufacturing census, and they provide a detailed account of value-added and employment ac-
cording to firm size in the manufacturing sector.
Our main indicator of differences across prefectures in financial integration is the prefecture-
level share in bank lending accounted for by banks that operate nationwide (and which therefore
pool bank funds across prefectures) vs. those that operate only regionally (and therefore are more
directly exposed to local economic conditions). To construct these shares, we obtain data on bank
lending by prefecture and by bank type from the Bank of Japan. These data allow us to distinguish
between lending by ‘city banks’ (i.e. nationwide and first-tier regional banks), second-tier regional
mutual banks (Sogo banks), industrial credit associations (Shinkins), and agricultural, fishery and
other credit cooperatives. Our data set also contains prefecture-level lending by the post office and
by Shoko Chukin, a government-sponsored bank lending to small businesses nationwide.
Until the onset of the Great Recession of the 1990s and the ensuing banking crisis, Japan’s
banking system was clearly regionally tiered and segmented (Hoshi and Kashyap (2004); Kano
7In this respect, we differ from Rajan and Zingales (1998), who focus on the level of financial development moregenerally. However, as we will argue and illustrate in more detail below, our result suggests that it is mainly theregional segmentation of the banking market (rather than differences in the local development of these markets) thatseems to drive our results.
11

and Tsutsui (2003)). The big city banks are the foremost lenders overall and are the main banks
that operate nationwide. There are also some large, previously regional banks (so-called first-
tier regional banks) that operate nationwide or at least in most parts of the country. These two
groups are combined in our measurements; for brevity, we refer to these large banks collectively
as city banks. The post office and Shoko Chukin are also nationwide lenders but account for only
a modest share of overall lending. The genuinely regional banks on which we have data fall into
two main groups: mutual banks (Sogo banks, also often referred to as ‘second-tier’ regional banks)
and industrial credit associations (Shinkins).8
Many of the regional lenders are cooperative or mutual banks. Below we discuss in detail the
origins of many of these banks in the development of cooperatives in the silk reeling sector in
the late 19th century. From the outset, they were set up mainly to lend regionally, not nationally.
Furthermore, constrained by regulation and statutes, they largely continued to operate regionally
until the end of the 1980s. During the postwar era and well into the 1990s, government regulation
under the convoy system restricted these regional banks from opening branch networks outside
their prefecture of origin (see Hoshi and Kashyap (2000) and Hosono, Sakai and Tsuru (2007) for
details). The situation was similar before World War II: while a national banking market had
started to develop during the late 19th century, regional banking integration in the prewar era
remained limited.9
The group of industrial credit associations (Shinkins) allows us to illustrate the regional seg-
mentation in Japan’s banking sector. Shinkins are cooperative banks that lend exclusively at a
regional level and to their members, which are small businesses. Their historical roots are in the
industrial and commercial cooperatives founded in the late 19th century—in particular, those in
the silk industry. An industrial cooperative law governing the operation of such credit coopera-
tives was enacted in 1900. The Shinkins’ operation today is governed by the Shinkin Bank Law of
1951, which stipulates that Shinkin banks can only lend to their members, i.e. small firms, and are
8Our data set also provides detail on lending by other nonagricultural cooperatives by prefecture, and we also in-clude this item in our measure of regional bank lending.
9Grossman and Imai (2008) study the impact of banking integration on spreads between borrowing and lending ratesand on their cross-prefectural dispersion during that period. While they find that regional markets gradually becamemore integrated during the 1920s and 1930s, they conclude that significant regional fragmentation ultimately persisted.They ascribe this to the very anticompetitive banking regulations of the period.
12
confined in their lending to their prefecture of origin and only to firms below a certain equity (and
employment) threshold. Hence, by virtue of the legal restriction faced by Shinkins, their lending
is a) particularly likely to be directed at small businesses and b) very clearly restricted to their
prefecture of origin. Hence, we expect the lending share of Shinkin banks to be a good measure
of regional segmentation (see Kano and Tsutsui (2003) and the literature surveyed therein). The
situation is similar for second-tier regional banks (Sogo banks), which also lend mainly locally but
are generally not quite as severely restricted by their governing statutes.10
Our two main measures of regional banking integration therefore are the share of regional
banks (Sogo banks, Shinkins and other credit cooperatives) and the share of nationwide banks
(‘zenkoku ginko’, i.e. city and first-tier regional banks) in prefecture-level lending. We refer to the
former as the ‘regional bank’ share and to the latter as the ‘city bank’ share. By construction, the
regional bank lending share is negatively related to financial integration, whereas the city bank
lending share is positively related. As we have discussed, there is a host of smaller regional and
nationwide (government-sponsored) banks, and so the joint share of Sogo banks and Shinkins in
a prefecture’s total lending is not exactly equal to one minus the share of city banks. For robust-
ness, we therefore generally report results for both measures, and sometimes also for the narrower
regional measure based on the Shinkin lending share alone. 11
Clearly, the share of lending by regional vs. city banks could be a function of the local demand
for credit. We note at the outset, however, that aggregate (countrywide) variation in the demand
for credit (stimulated e.g. by variations in monetary policy or by an asset market boom as hap-
pened during the 1980s) should a priori affect banks of all types in a similar manner, leaving the
cross-regional pattern of their lending shares largely unaffected.12 Furthermore, in all our regres-
10The separating line between first- and second-tier banks started to blur in the late 1980s and 1990s. Many second-tier (Sogo) banks were purchased by first-tier regional banks or city banks throughout the 1980s. In the Bank of Japandata set that we use, Sogo banks no longer appear as a separate item after 1990. Furthermore, since the mid-1980s, someof the Sogo banks have had access to the interbank market, whereas Shinkins have not.
11Our interpretation of these lending shares as measure of financial integration is further buttressed by their highcorrelation with a widely used macroeconomic indicator of financial integration, that is, savings–investment correlationsin the spirit of Feldstein and Horioka (1980). In panel regressions of prefecture-level investment rates on savings rates,we include an interaction term with our regional and city bank lending shares. The coefficient of the interaction termsis significant in both specifications, and is negatively signed for the city banks’ lending share and positively signed forthe regional banks’ lending share.
12This is a commonly used identifying restriction in credit-supply equations (see Kashyap and Stein (2000)).
13

sions, we use precrisis (i.e. pre-1990) lending shares as measures of financial integration. This
should alleviate the most direct feedbacks of the crisis on the lending shares of individual banks.13
Still, it could be the case that the lending share of regional banks is relatively high simply because
there are many small businesses or because these businesses are doing particularly well. To the
extent that Shinkins or other regional banks offer the best financing conditions for small firms,
they would then be the first preference of these businesses. This would increase the share in total
prefecture-level lending accounted for by the regional banks. Conversely, bias might exist in the
opposite direction if nationwide banks withdraw from an area where growth prospects are poor,
whereas regional lenders have no choice but to keep on lending locally. Our discussion of the his-
torical roots of the cooperative banking sector will provide us with an instrument that allows us to
address such issues of simultaneity. We now turn to our econometric implementation.
Econometric implementation
Our main results are based on two basic econometric specifications. The first are panel regressions
of the form
∆gdpkt = αAggShockt × SMEk + µk + τt + εk
t (1)
where ∆gdpkt is GDP growth in period t in prefecture k, SMEkis a measure of the precrisis (i.e.
before 1990) importance of small businesses (termed ‘small business/firm importance’) in prefec-
ture k and AggShockt is a measure of the aggregate shock that hit the economy in 1990. The terms
µkand τt are prefecture-fixed and time effects, respectively, and εkt is the error term. We chose
AggShockt = Post1990t
where Post1990t is a dummy that is zero until 1990 and one from 1991 onward. This specification
allows us to focus on the effects of the crisis on post-1990 growth rates.
Specification (1) allows the impact of the aggregate shock on prefecture-level GDP growth to
vary as a function of small business importance in a given prefecture. As we have discussed, this is
13For example, some regional banks were hit strongly by the banking crisis of 1997/98. See e.g. Spiegel and Yamori(2006) for the disclosure decisions of Shinkin banks during that crisis.
14
an indicator of the prefecture-level demand for, or dependence on, credit. Our conjecture—based
on Rajan and Zingales (1998) —is that the link between credit dependence and aggregate GDP
growth is negative: when the crisis dummy variable changes from zero to one, regions with more
small businesses experience lower average growth rates.
Our main hypothesis is that the coefficient α depends on credit supply and that financial inte-
gration plays an important role in improving local credit conditions after the aggregate shock: α
should be negative, but we would expect it to be more negative in regions with low levels of finan-
cial integration. Our first method of testing this hypothesis is to split the sample into one group of
prefectures with high financial integration and another group with low financial integration, and
estimate the specification (1) separately for each group.
Our second, more formal way of testing the same hypothesis allows α to depend linearly on our
continuous measures of financial integration so that, controlling for first-order effects, we obtain
∆gdpkt = AggShockt ×
[α0FIk × SMEk + α1FIk + α2SMEk + α′3Xk
]+ β′Zk
t + µk + τt + εkt (2)
where FIk is one of our measures of financial integration discussed above, and we have added Xk, a
vector of additional prefecture-level characteristics that also may affect the impact of the aggregate
shock on regional output growth. Zkt is a vector of additional controls that may vary by time and
prefecture, and β the associated vector of coefficients. This is our second main specification. In this
specification, the marginal effect of credit dependence is a continuous linear function of financial
integration so that∂∆gdpk
t∂SMEk = α0FIk + α2
and we would expect that—conditional on the number of credit-dependent firms in the prefecture—
growth should be higher if financial integration is high, so that α0 > 0.14
A couple of remarks are in order on this specification. Regression (2) is a differences-in-
differences (DD) specification in which the interactions with the intervention (the aggregate shock)
vary only by prefecture (k) and not by time. This approach emphasizes the spirit of our analysis:
14Clearly, the specification using the split sample (1) can be interpreted as a nested version of (2) if we code FIk
noncontinuously as a dummy variable indicating above- or below-median financial integration.
15
we do not claim that short-term, year-to-year fluctuations in financial integration or small business
importance affect growth outcomes in the longer run. Rather, we argue that there are long-standing
differences in the degree of financial integration or small business importance that have long-term
effects. We want to focus on those. 15 Bertrand, Duflo and Mullainathan (2004) strongly advocate
this approach, arguing that the use of longer-term averages (instead of characteristics that vary
over time and cross-section) significantly improves the reliability of DD estimates.
After a description of our data, we discuss our baseline results that are based on the above spec-
ifications. We then discuss the different historical origins of regional versus nationwide banks. This
discussion will allow us to suggest an instrument with which to address the potential endogeneity
of FI in the above regressions.
Data
Our data are at the prefectural level. There are 47 prefectures in Japan. We drop Okinawa prefec-
ture, which had a special status as a US territory until the early 1970s and still remains economically
separate from the mainland in many ways. Hence, there are 46 prefectures in our sample. Nom-
inal prefectural GDPs are taken from the Annual Report on Prefectural Accounts (Cabinet Office of
Japan). We obtain per capita values using population data from the same source. We deflate using
the countrywide consumer price index, obtained from the Ministry of Internal Affairs and Com-
munications of Japan. The importance of small manufacturing firms in terms of employees and
value added at the prefectural level is taken from the Manufacturing Census of Japan by the Ministry
of Economy, International Trade and Industry.16 We define small and medium manufacturing en-
terprises (SMEs) as having fewer than 300 employees.17 The lending data by bank type (City and
first-tier regional bank, Sogo banks, Shinkin, Shoko Chukin, etc.) at the prefecture level are taken
from the Economic Statistics Annual by Prefecture (Bank of Japan). The prefecture-level breakdown
of these data by bank type only runs to 1996. GDP and SME data cover the period 1980–2005.
15In fact, as we discuss in detail below, we will use pre-1990 characteristics to eliminate short-term feedbacks ofgrowth on financial integration or the share of small businesses in the prefectural economy from our analysis.
16The number of manufacturing establishments in the years 1981, 1986, 1991 and 1996 was 873,000, 875,000, 857,000and 772,000, respectively. This tells us that the number of Japanese firms remained unchanged during the 1980s and1990s.
17Note that this cut-off is also consistent with the membership constraint of Shinkin banks.
16
Prefectural borders in Japan have remained largely unchanged since the early 1890s. This will
allow us to use late 19th century prefecture-level data as instruments in the second part of our
analysis. Specially, data on the number of silk filatures in the late 19th century are taken from
Zenkoku Seishi Kojo Chosa (Survey of Silk-reeling Factories throughout Japan). Filatures are classified
by whether they used mechanized-reeling or hand-reeling equipment and by total production per
year (again: by machines, by hand and in total), all at the prefecture level. We use data from the
earliest available year, which is 1895. The largest, most important silk prefectures by output are
Nagano and Gifu, followed by Aichi, Kyoto and Yamanashi. Prefecture-level data on population
in 1895 are from the Nihon Teikoku Minseki Kokouhyo (Registered Household Tables of Imperial Japan).
Results
A first look at the data
Table 1 provides a first look at the data. For each prefecture, the first two columns of the ta-
ble present averages over the period 1980–1990 of city bank lending shares and of our measure
of SME importance (by valued added). The last two columns report post-1990 (1991–2005) pre-
fectural GDP growth rates and the growth rates of lending by city banks. We also highlight the
core economic areas that may differ from the rest of the country: these include Greater Tokyo
(Tokyo, Chiba, Saitama and Kanagawa—with Yokohama as the major city), the Kansai region (Os-
aka, Hyogo—with Kobe as the major city—and Kyoto) and Aichi prefecture (with Nagoya as the
major city). The cross-prefectural standard deviations show that for each of these characteristics,
there is considerable variation around the mean. The average lending share of city banks is around
55 percent, ranging from just over 40 percent in prefectures such as Kochi, Kagoshima, Gifu and
Nagano (the latter two of which are silk prefectures, as we will see later) to over 70 or even 80
percent in Greater Tokyo and other core prefectures. The GDP share of small manufacturing firms
is around 16 percent, ranging from around 10 percent in remote prefectures such as Hokkaido (in
the north) and Kagoshima (in the southwest) to almost 25 percent in Gifu, Shiga and Saitama.
Post-1990 GDP growth (per capita) was particularly low (or strongly negative) in some of the
17
core areas, which were particularly exposed to the bursting of the stock market and property
bubbles. Prefectures such as Tochigi, Gunma and Yamanashi even had negative average growth
rates. Maybe somewhat surprisingly, the highest average post-1990 growth rates (per capita) were
achieved in some remote prefectures, such as Miyazaki and Saga in the west.
A visual impression of the regional distribution of pre-1990 characteristics (SME importance
and banking integration) and post-1990 growth can be gleaned from the two maps in Figure 1. The
map on the left shows the geographical dispersion of SME importance and financial integration
(the city bank lending share). Clearly, the city bank share is highest in the core areas: the Greater
Tokyo and Kansai regions. Conversely, financial integration is quite low not only in some remote
regions but also in many manufacturing regions in central Japan and in the areas surrounding the
big cities. As we will argue later, this is the silken thread: many of these regions were silk reeling
regions and took a special pathway to financial development. Turning to post-1990 GDP growth
(right map), we again see the fallout of the crisis in the core areas (white, low growth), but there
is significant variation in GDP growth rates across prefectures, and again many areas in central
Japan have relatively low growth rates. As we saw in the map on the left, many of these regions
have no shading, i.e. they are regions with a low city bank lending share and, often, a high SME
share in value added and/or employment. We now explore this link more formally and present
our first regression results.
Baseline results
Table 2 presents our first set of results: Panel A for the measure of small business importance based
on value added and Panel B for the employment-based measure. The first column estimates the
baseline specification (1) based on all prefectures. Regions with a higher share of small manufac-
turing businesses in either output or employment clearly were affected more severely by the crisis.
The effect is large: increasing the share of small manufacturing firms in employment or output by
just one percentage point lowers the average growth rate by between 0.07 and 0.08 percent. Even
though this estimate is for all prefectures and is significant only at the 10 percent level, it is econom-
ically quite sizable: the average SME share (based on valued added) is 16 percent, and the range is
18
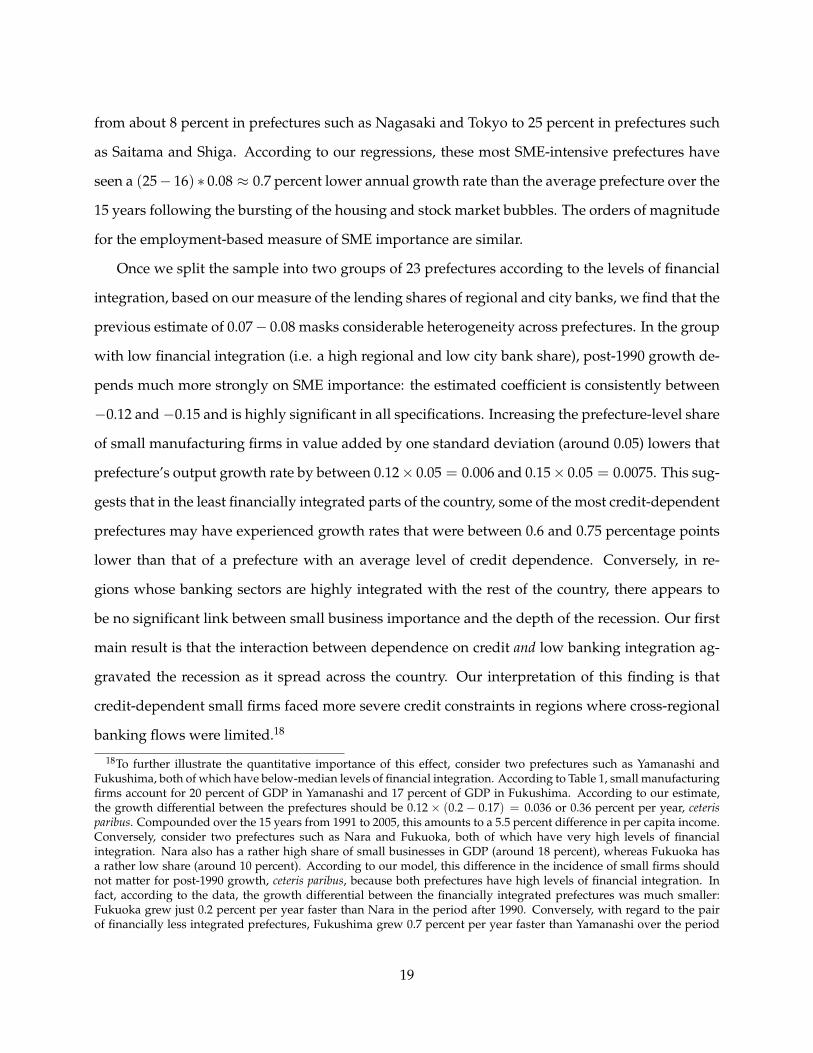
from about 8 percent in prefectures such as Nagasaki and Tokyo to 25 percent in prefectures such
as Saitama and Shiga. According to our regressions, these most SME-intensive prefectures have
seen a (25− 16) ∗ 0.08 ≈ 0.7 percent lower annual growth rate than the average prefecture over the
15 years following the bursting of the housing and stock market bubbles. The orders of magnitude
for the employment-based measure of SME importance are similar.
Once we split the sample into two groups of 23 prefectures according to the levels of financial
integration, based on our measure of the lending shares of regional and city banks, we find that the
previous estimate of 0.07− 0.08 masks considerable heterogeneity across prefectures. In the group
with low financial integration (i.e. a high regional and low city bank share), post-1990 growth de-
pends much more strongly on SME importance: the estimated coefficient is consistently between
−0.12 and−0.15 and is highly significant in all specifications. Increasing the prefecture-level share
of small manufacturing firms in value added by one standard deviation (around 0.05) lowers that
prefecture’s output growth rate by between 0.12× 0.05 = 0.006 and 0.15× 0.05 = 0.0075. This sug-
gests that in the least financially integrated parts of the country, some of the most credit-dependent
prefectures may have experienced growth rates that were between 0.6 and 0.75 percentage points
lower than that of a prefecture with an average level of credit dependence. Conversely, in re-
gions whose banking sectors are highly integrated with the rest of the country, there appears to
be no significant link between small business importance and the depth of the recession. Our first
main result is that the interaction between dependence on credit and low banking integration ag-
gravated the recession as it spread across the country. Our interpretation of this finding is that
credit-dependent small firms faced more severe credit constraints in regions where cross-regional
banking flows were limited.18
18To further illustrate the quantitative importance of this effect, consider two prefectures such as Yamanashi andFukushima, both of which have below-median levels of financial integration. According to Table 1, small manufacturingfirms account for 20 percent of GDP in Yamanashi and 17 percent of GDP in Fukushima. According to our estimate,the growth differential between the prefectures should be 0.12× (0.2− 0.17) = 0.036 or 0.36 percent per year, ceterisparibus. Compounded over the 15 years from 1991 to 2005, this amounts to a 5.5 percent difference in per capita income.Conversely, consider two prefectures such as Nara and Fukuoka, both of which have very high levels of financialintegration. Nara also has a rather high share of small businesses in GDP (around 18 percent), whereas Fukuoka hasa rather low share (around 10 percent). According to our model, this difference in the incidence of small firms shouldnot matter for post-1990 growth, ceteris paribus, because both prefectures have high levels of financial integration. Infact, according to the data, the growth differential between the financially integrated prefectures was much smaller:Fukuoka grew just 0.2 percent per year faster than Nara in the period after 1990. Conversely, with regard to the pairof financially less integrated prefectures, Fukushima grew 0.7 percent per year faster than Yamanashi over the period
19
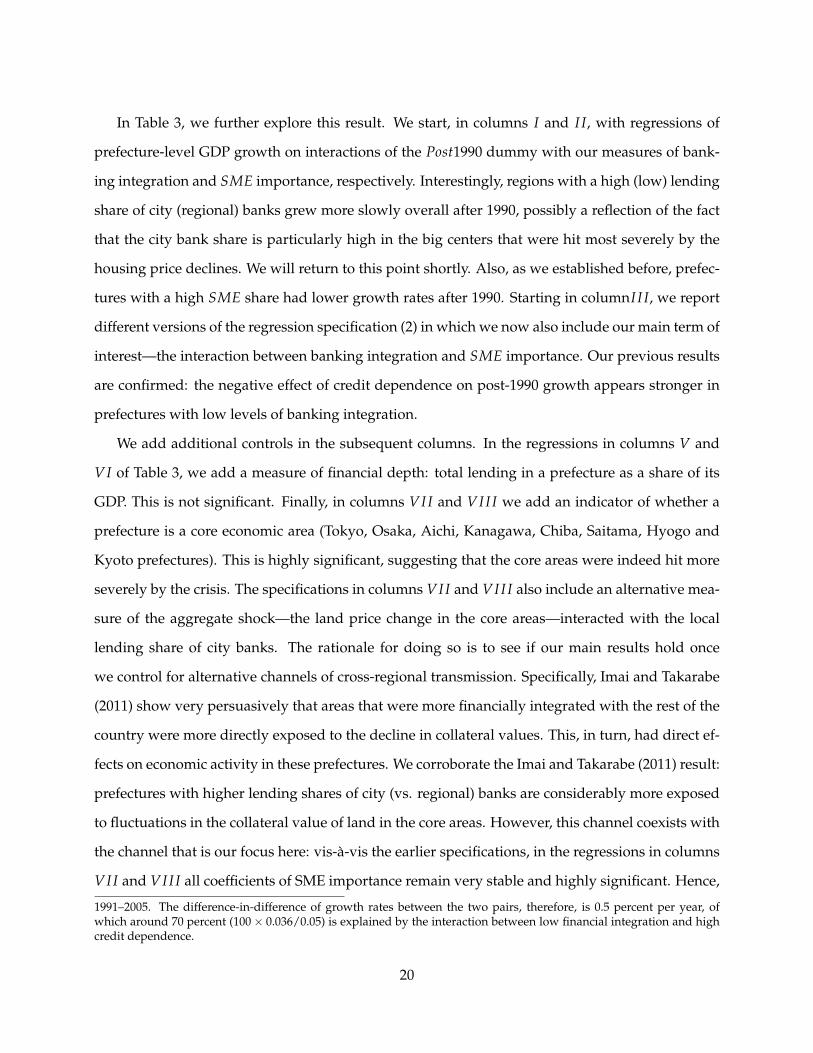
In Table 3, we further explore this result. We start, in columns I and I I, with regressions of
prefecture-level GDP growth on interactions of the Post1990 dummy with our measures of bank-
ing integration and SME importance, respectively. Interestingly, regions with a high (low) lending
share of city (regional) banks grew more slowly overall after 1990, possibly a reflection of the fact
that the city bank share is particularly high in the big centers that were hit most severely by the
housing price declines. We will return to this point shortly. Also, as we established before, prefec-
tures with a high SME share had lower growth rates after 1990. Starting in columnI I I, we report
different versions of the regression specification (2) in which we now also include our main term of
interest—the interaction between banking integration and SME importance. Our previous results
are confirmed: the negative effect of credit dependence on post-1990 growth appears stronger in
prefectures with low levels of banking integration.
We add additional controls in the subsequent columns. In the regressions in columns V and
VI of Table 3, we add a measure of financial depth: total lending in a prefecture as a share of its
GDP. This is not significant. Finally, in columns VII and VII I we add an indicator of whether a
prefecture is a core economic area (Tokyo, Osaka, Aichi, Kanagawa, Chiba, Saitama, Hyogo and
Kyoto prefectures). This is highly significant, suggesting that the core areas were indeed hit more
severely by the crisis. The specifications in columns VII and VII I also include an alternative mea-
sure of the aggregate shock—the land price change in the core areas—interacted with the local
lending share of city banks. The rationale for doing so is to see if our main results hold once
we control for alternative channels of cross-regional transmission. Specifically, Imai and Takarabe
(2011) show very persuasively that areas that were more financially integrated with the rest of the
country were more directly exposed to the decline in collateral values. This, in turn, had direct ef-
fects on economic activity in these prefectures. We corroborate the Imai and Takarabe (2011) result:
prefectures with higher lending shares of city (vs. regional) banks are considerably more exposed
to fluctuations in the collateral value of land in the core areas. However, this channel coexists with
the channel that is our focus here: vis-à-vis the earlier specifications, in the regressions in columns
VII and VII I all coefficients of SME importance remain very stable and highly significant. Hence,
1991–2005. The difference-in-difference of growth rates between the two pairs, therefore, is 0.5 percent per year, ofwhich around 70 percent (100× 0.036/0.05) is explained by the interaction between low financial integration and highcredit dependence.
20
low levels of interregional banking integration lead to a deeper recession in areas with many small,
finance-dependent firms.
We note that our results do not imply that less integrated prefectures necessarily grow more
slowly overall. Indeed, our estimates suggest that more financial integration would, if anything,
lead to lower growth rates if there were no regional differences in credit dependence: the coefficient
α1 on the first-order term for financial integration is always significantly negative for the regional
bank lending share and positive for the city bank lending share. It is the interaction between credit
dependence (small firm importance) and low levels of financial integration that is associated with
lower post-1990 growth. To appreciate this effect quantitatively, consider the last specification in
Table 3 (column 8) and an average prefecture. According to Table 1, the average share of small
firms in GDP is 16 percent. Increasing financial integration by one standard deviation (according
to Table 1, this is 9 percent in terms of city bank lending share) implies a predicted increase in the
prefecture’s annual post-1990 growth rate of 0.45 percentage points. The numbers are similar for
the specifications that use regional banks’ lending share: increasing the lending share of regional
banks by 10 percentage points would lower the growth rate of the average prefecture by 0.35
percentage points. We believe these are quite sizable effects. As we noted before, the effects will be
even stronger for particularly credit-dependent prefectures. According to specification VII I, for a
prefecture with a small firm share of 20 percent in value added (roughly one standard deviation
above average), the predicted effect of increasing the city bank lending share by 10 percentage
points would be a growth rate gain of 0.8 percentage points per year.
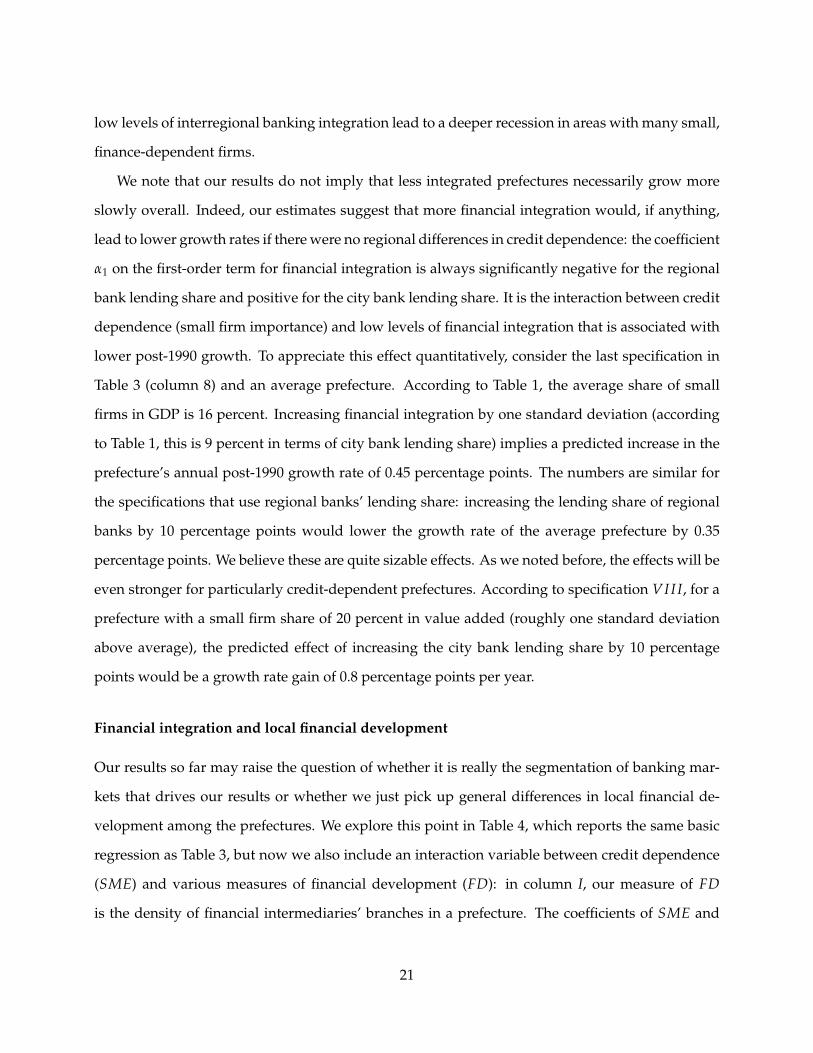
Financial integration and local financial development
Our results so far may raise the question of whether it is really the segmentation of banking mar-
kets that drives our results or whether we just pick up general differences in local financial de-
velopment among the prefectures. We explore this point in Table 4, which reports the same basic
regression as Table 3, but now we also include an interaction variable between credit dependence
(SME) and various measures of financial development (FD): in column I, our measure of FD
is the density of financial intermediaries’ branches in a prefecture. The coefficients of SME and
21
SME× FD are both insignificant, whereas the coefficient of financial integration (FI) remains es-
sentially unchanged vis-à-vis the specifications in Table 3.
A popular indicator of financial development is lending relative to GDP. Once we choose this
indicator as our measure of FD (column II), we do indeed find significant coefficients with the
expected signs: higher pre-1990 levels of lending relative to GDP mitigated the impact of the credit
dependence of growth. However, the interaction between SME and FI remains significant, if
only at the 10 percent level. Note also that lending/GDP will be affected by the ability of the
financial system to raise funds both locally and from outside the region. The latter, however,
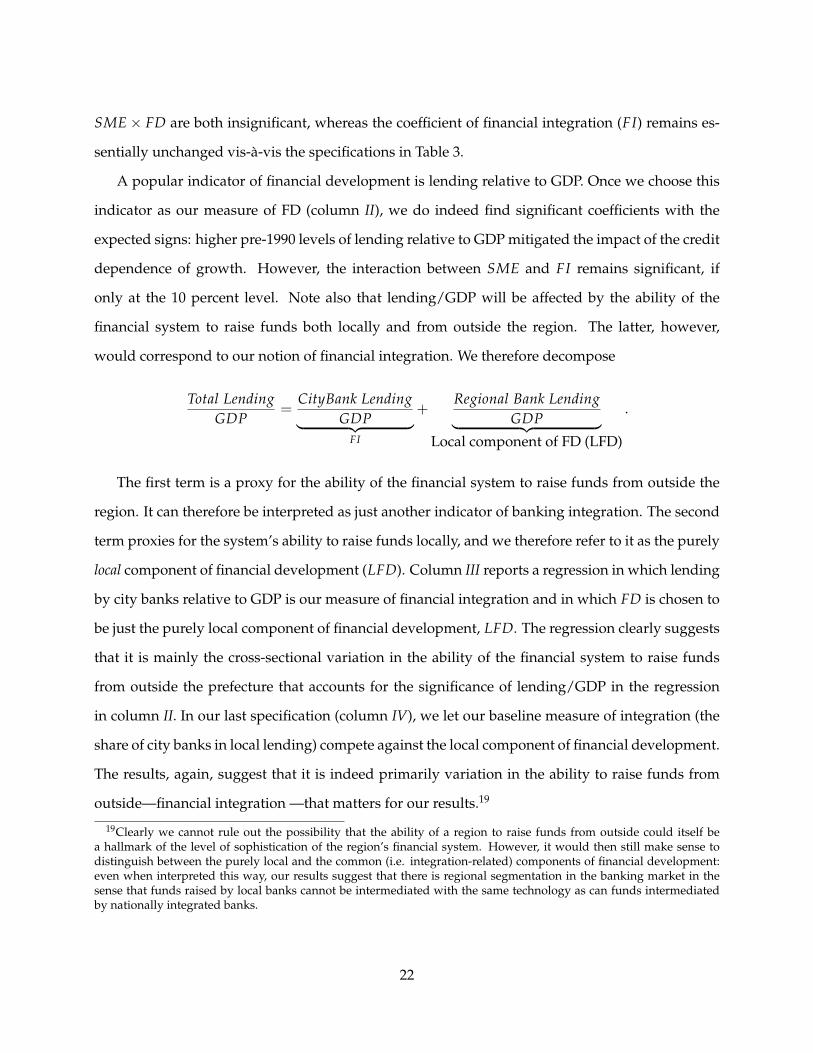
would correspond to our notion of financial integration. We therefore decompose
Total LendingGDP
=CityBank Lending
GDP︸ ︷︷ ︸FI
+Regional Bank Lending
GDP︸ ︷︷ ︸Local component of FD (LFD)
.
The first term is a proxy for the ability of the financial system to raise funds from outside the
region. It can therefore be interpreted as just another indicator of banking integration. The second
term proxies for the system’s ability to raise funds locally, and we therefore refer to it as the purely
local component of financial development (LFD). Column III reports a regression in which lending
by city banks relative to GDP is our measure of financial integration and in which FD is chosen to
be just the purely local component of financial development, LFD. The regression clearly suggests
that it is mainly the cross-sectional variation in the ability of the financial system to raise funds
from outside the prefecture that accounts for the significance of lending/GDP in the regression
in column II. In our last specification (column IV), we let our baseline measure of integration (the
share of city banks in local lending) compete against the local component of financial development.
The results, again, suggest that it is indeed primarily variation in the ability to raise funds from
outside—financial integration —that matters for our results.19
19Clearly we cannot rule out the possibility that the ability of a region to raise funds from outside could itself bea hallmark of the level of sophistication of the region’s financial system. However, it would then still make sense todistinguish between the purely local and the common (i.e. integration-related) components of financial development:even when interpreted this way, our results suggest that there is regional segmentation in the banking market in thesense that funds raised by local banks cannot be intermediated with the same technology as can funds intermediatedby nationally integrated banks.
22
Dynamic effects
Our results so far suggest that post-1990 growth was lower, ceteris paribus, in areas with low fi-
nancial integration and many credit-dependent firms on average. In Figure 2, we look at the role
of banking integration in the dynamics of growth during the ‘Lost Decade’. We split prefectures
into four groups based on pre-1990 characteristics: above/below-median banking integration and
above/below-median small business importance. Then, within each financial integration group,
we look at the cumulative growth differential between the high-SME (i.e. high credit dependence)
and the low-SME (low credit dependence) subgroups. The results in the figure show that, irre-
spective of the degree of banking integration, prefectures with many small manufacturing firms
generally grew less than did those with few small firms: both the blue (solid) and the red (dashed)
lines are below zero. However, the within-group growth differential is particularly marked for the
group with low financial integration, suggesting that low regional banking integration was indeed
associated with particularly low growth in very credit-dependent areas. This effect is large: in the
least financially integrated areas, the cumulative growth difference until 2005 between the high-
and low-SME groups amounts to an almost 8 percent difference in per capita GDP; in the most
financially integrated areas, the effect is only around three percent. Furthermore, for the least in-
tegrated areas, the maximum cumulative growth differential between low- and high-SME groups
was almost nine percent in 2001.
Transmission channels
To shed light on the transmission of the Great Recession to credit-dependent prefectures, Table
5 repeats the regressions from Table 3 but now with lending as the dependent variable.20 Our
interpretation of the previous results was that low financial integration would make small firms’
access to credit more difficult in the Great Recession. The results in Table 5 are consistent with this
notion: the first five columns provide results for total lending, while in columns VI–X and XI–XV
we distinguish between lending by city banks and lending by regional banks.
20Our prefecture lending data set ends in 1996. Note also that lending by Sogo banks after 1991 is no longer reportedas a separate item in our data set but is included in the definition of ‘zenkoku ginko’ (the nationwide or ’city’ banks). AsSogo banks account for a small share of total lending by ‘zenkoku ginko’, we continue to refer to this category as ‘citybanks’ and to the remainder as ‘regional banks’.
23
In each panel, the first two columns show the results for small firm importance and financial
integration, but without the interaction term: the results show that lending declined more strongly
in areas with a high lending share of city banks. Furthermore, the first two columns in the next
two panels (V and VI, and XI and XII) show that it is indeed city bank lending that declined most
strongly in the areas that had high market penetration by city banks. This is essentially a version of
the findings in Imai and Takarabe (2011), who report that lending declined most strongly in areas
with many city banks because of a common lender effect: city banks were heavily affected by the
land price decline in the core areas, and also cut back their lending in more provincial areas.
The last three columns of each panel report the results after adding the interaction term be-
tween small firm importance and our financial integration measure. High financial integration
does seem to lead to more lending in areas of high credit dependence. Conversely, lending growth
seems lower, ceteris paribus, in areas with many credit-dependent firms and low levels of financial
integration. The corresponding columns in the second and third panel show that, in particular, the
lending by city banks declined in credit-dependent but financially less integrated regions. Con-
versely, the countrywide decline in city bank lending because of the bursting of the asset bubble
seems to have been considerably mitigated in areas where city banks traditionally had a high mar-
ket share and where there are many small firms. Finally, the growth in lending by regional banks
seems quite unaffected by the degree of financial integration or the importance of small firms.
On the one hand, these findings suggest that Japan’s financial crisis constituted a major credit
supply shock and that this shock spread very unequally across prefectures. It strongly affected
regions with many credit-dependent firms and low levels of financial integration—understood
here as a locally low market share of banks that operate nationwide. On the other hand, we do
not think that our results are best interpreted as a simple credit crunch: a priori, we would expect
a credit crunch to affect credit supply rather uniformly across different types of banks. We find
that this is clearly not the case. Rather, the decline in lending in the least integrated and most
credit-dependent prefectures is predominately explained by nationwide banks cutting back on
their lending. Peek and Rosengren (2000, 1997) show that Japanese banks that operated interna-
tionally predominantly cut back on lending in foreign markets following the crisis—markets that
24
they had often only recently entered. Our results are the first to document the relevance of this
channel for intranational effects, i.e. the regional dimension of Japan’s Great Recession: regions
in which nationwide banks had relatively weak standing experienced the largest declines in credit
and economic activity.21
Our results are related to an important strand of the recent literature that has emphasized the
role of evergreening in banks’ credit decisions during Japan’s Great Recession (Peek and Rosengren
(2005) and Caballero, Hoshi and Kashyap (2008)). These authors argue that big banks would often
defer action on bad loans in the hope that the situation of borrowing firms might improve or
that the government would take action to bail out the banks or their borrowers. Caballero, Hoshi
and Kashyap (2008) show that this evergreening behavior led to the creation of ‘zombie’ firms
that were effectively bankrupt but, due to their ongoing preferential access to finance, could keep
more productive competitors out of the market or at least make it difficult for them to access
credit. We emphasize that our results are actually very much consistent with this pattern. First,
Caballero, Hoshi and Kashyap (2008) document their finding based on a set of publicly listed
(and therefore rather large) firms. In fact, they argue that evergreening was particularly pervasive
within Zaibatsu, the tight-knit industrial conglomerates that encompass industrial firms and banks.
Second, Caballero, Hoshi and Kashyap (2008) show that manufacturing was one of the sectors that
was least affected by evergreening. Our focus here is on small manufacturing firms—the ones that
were therefore most likely to be deprived of the credit from which the ‘zombies’ benefited.22
21One possible explanation of this pattern is relationship lending: banks withdraw first from markets in which theyhave relatively few long-standing credit relationships in order to keep on lending to large, long-standing customers.Small banks also tend to lend to small businesses (see Berger et al. (2005) for the US and Uchida, Udell and Watanabe(2008) for Japan). The evidence we present in the second part of the paper is also consistent with the view that relation-ship lending matters here: we show that the market share of regional banks vs. nationwide banks at the prefecture levelhas deep historical roots and that regional banks are strongest in areas where silk reeling was important in the late 19thcentury and where silk reelers’ cooperatives were important in founding the first regional banks. It seems plausiblethat small firms in such areas are more likely to have long-standing relationships with their regional banks (if it is acooperative, they may even be a member) rather than with a local branch of a nationwide bank.
22Peek and Rosengren (2005) discuss how the incentive to evergreen clearly depends on the importance of the bor-rowers’ debt for the bank’s balance sheet. Clearly, banks will therefore tend to evergreen mainly large borrowers. Thesmall firms that are our focus here, however, are likely to be small borrowers for city banks. They may still be relativelybig borrowers from the perspective of a small regional bank, however, and our results do not preclude the possibil-ity that regional banks for their part also engaged in some evergreening. However, this does not affect the empiricalrelevance of the channel we are investigating here: if regional banks evergreen inefficient small firms, depriving moreefficient competitors of credit, then we expect that better access for these competitors to credit from outside their region(i.e. big city banks) would certainly help alleviate the adverse aggregate effects of the evergreening by regional banks.Hence, evergreening by regional banks could actually help explain the pattern we see here by increasing the importance
25
Our findings so far suggest that cross-prefectural variation in financial integration played a
major role in the transmission of Japan’s crisis to its regions: low financial integration had the
most adverse effects in the most credit-dependent areas. The reason for this was that nationwide
banks reduced their lending particularly strongly in areas where they historically had relatively
weak standing.
Endogeneity issues
Clearly, both small business importance and (in particular) the prefecture-level lending shares of
city and regional banks could be endogenous. Note that the setup of our regression should allevi-
ate the most immediate concerns: all regressions presented so far use SME and lending shares that
are time averages from the period before the bursting of the bubble (i.e. over the period 1980–1990).
This clearly limits the immediate feedback from post-1990 GDP growth on small firm importance
and bank lending shares and therefore eliminates many sources of potential endogeneity. We ac-
knowledge, however, that it may not fully solve the problem—in particular, to the extent that bank
lending behavior and firm creation depend on growth expectations in an area. For example, if
city banks withdrew business from areas in which they perceived low growth potential, whereas
lenders who could only lend in their region of origin just kept on lending irrespective of local
growth opportunities, then we would indeed find that areas with low shares of city banks in local
lending experienced lower growth after the recession. Furthermore, the recession may then still
have affected small firms more severely, but it would not be for the reason that these firms had
limited access to credit but rather because the region had poor growth prospects anyway. In the
same way, it could be the case that the importance of small firms is higher or lower in areas with
low growth opportunities. On the one hand, high regional growth opportunities may favor the
creation of new firms; on the other hand, low growth prospects may limit firm growth, keeping
firms small.
We now turn to identifying the determinants of cross-regional differences in banking integra-
tion in Japan. This analysis will deliver a powerful predictor of the lending shares of regional and
of financial integration for productive small firms’ access to credit and therefore for growth in the region.
26
city banks in the 1980s. We argue that this predictor is very plausibly uncorrelated with growth
opportunities for the period after 1990 and therefore constitutes a valid instrument for financial in-
tegration in our regressions above. In an extension, we then also address the potential endogeneity
of small firm importance.
The silken thread: historical pathways to financial development
Our results so far suggest that cross-regional variation in the severity of the Great Recession is to a
large extent determined by the interaction between external credit dependence (measured by small
business importance) and the integration of the region’s banking sector into the national economy.
We argue next that cross-regional differences in the importance of regional vs. nationwide banks
ultimately reflect long-standing differences in local financial development that can historically be
traced back to the opening of the treaty ports. This historical backdrop then motivates the instru-
ment that we propose for the market shares of regional banks during the 1990s: the number of silk
filatures per head of population in a prefecture in 1895.
Historical background
The opening of Japan’s ports for trade following the Harris Treaty of 1858 was an exogenous event
that led to the emergence of silk thread as Japan’s first and (until the onset of World War II) fore-
most export good.23 The international circumstances of Japan’s entry into the world market for
raw silk were propitious. Silkworm pests had severely reduced French and Italian silk output by
the mid-19th century. The opening of the Suez Canal also substantially increased access to Eu-
ropean markets. Furthermore, and most importantly, the increased industrialized use of silk in
the US had opened up a new market on the other side of the Pacific (see Federico (1997) and Li
(1982)).24
23Bernhofen and Brown (2005, 2004) argue very convincingly that Japan’s opening was a natural experiment and thatthe specialization in silk reflected a comparative advantage.
24While China was historically the leading producer of silk, with its best produce outstripping Japanese silk in quality,Japanese innovations in sericulture in the late Tokugawa period and the emergence of cooperative structures to ensurequality, provide credit and assist in the purchase of machinery (to be discussed below) soon put Japan in a positionto provide silk of very consistent quality to the world market. This standardization in quality proved a particularlyimportant competitive advantage for Japan, as silk weaving became increasingly industrialized, in particular in the US
27
Unlike other industries that started to emerge with the opening of the treaty ports, e.g. cotton
mills and machinery, the silk industry was highly fragmented—and largely remained so until its
decline on the eve of World War II. While sericulture had started to spread throughout Japan
during the Tokugawa period, the mountainous areas of central Japan were climatically best suited
for raising silkworms. This initially led sericulture to be particularly concentrated in these areas.
In the early days, silk growing and reeling was largely a cottage industry, with farmers who grew
the cocoons also reeling the silk.
The reeling of cocoons was initially largely done by hand. As described in Nakabayashi (2006),
the French depression of the 1880s changed this. France had traditionally been a market for high-
quality, hand-reeled silk. The depression therefore led to a huge decline in the price of hand-reeled
silk, whereas demand for machine-reeled silk exploded in the US, leading to a huge relative price
increase for the latter. The reason for this shift in demand from hand-reeled to machine-reeled silk
was that the US market—as the first mass consumer market for silk products—required industrial-
scale quantities of silk thread of very consistent (though not necessarily the highest) quality. Only
thread of such consistent quality could be woven on mechanized looms. Furthermore, the consis-
tent quality of the thread, in turn, could mainly be achieved through a mechanized reeling process
(Nakabayashi (2006)).
The need for increased mechanization accelerated the separation of silkworm farming and silk
reeling. This was the case for two reasons. First, though not particularly capital intensive, mech-
anization required some capital, which not all small hand reelers could raise (Nakabayashi (2006)
and Miwa and Ramseyer (2006)).25 Second, and most importantly for this paper, the separation
of reeling and cocoon growing made it necessary for reelers to purchase cocoons. This required
access to working capital: cocoons had to be bought in the spring, but the reeled raw silk could
only be shipped to the Yokohama market toward the end of the summer. Hence, filatures strongly
depended on credit for working capital. In fact, the purchase of cocoons accounted for up to 80
(Li (1982)). Note also that the US maintained high tariffs on woven silk but strongly depended on imports of silk threadfor its weaving factories. Hence, it was reeled silk thread that became Japan’s main export staple.
25Many farmers who had previously also reeled silk by hand would now specialize in the growing of cocoons. Theshift in demand led to an expansion of sericulture to all parts of Japan. Gradually, infrastructure improved and railwaysmade possible the quick transport of cocoons over large distances by the late 1880s.
28
percent of the annual operating costs of a filature (see e.g. Federico (1997)).
We argue that this need for credit, which was brought about by the separation of sericulture
from the increasingly mechanized process of silk reeling, had a considerable impact on regional fi-
nancial development. Smaller filatures were largely unable to borrow from the new, western-style
banks that had started to emerge soon after the opening of the country in the 1870s and 1880s.
Located mainly in the big cities such as Yokohama, Osaka or Tokyo, these banks found it difficult
to assess borrower quality among the small silk reeling firms, most of which were located in re-
mote and inaccessible parts of the country.26 A key role was therefore played by the Yokohama
silk brokers, who not only acted as intermediaries between the international market for silk thread
(largely based in Yokohama, as foreigners were not allowed to travel the country by themselves)
and the reelers, but also organized the whole production and marketing chain. Importantly, these
brokers had detailed knowledge of market conditions in Yokohama. They also travelled to the silk
regions frequently and therefore had an informational advantage when it came to knowledge of
local conditions in the silk reeling areas and the borrower quality of small silk reeling firms. It was
these silk brokers who extended trade credit to small filatures so they were able to buy cocoons.
The growing financing needs of the silk business soon also led to the emergence of the first local
banks. Often, these banks were founded by silk reelers’ cooperatives and/or with the help of the
Yokohama merchants. However, these banks did not effectively raise the capital required for the
loans from outside the region. Rather, it was the Yokohama silk merchant who effectively raised
the capital for the loan to the silk reelers in the Yokohama market. Nakabayashi (2001) details the
working of this system of silk finance as follows. A silk reeling firm would promise to sell its en-
tire production for the year to a Yokohama silk merchant, obtaining in return a documentary bill
issued by a Yokohama bank on behalf of the silk merchant. At this stage, the merchant would then
either make a working capital loan to the silk reeler directly, or the silk reeler would obtain such a
loan from his regional bank against presentation of the documentary bill. This advance on the doc-
umentary bill would allow the reeler to purchase cocoons and to reel the silk. A couple of months
later, once the silk had been reeled and transported to Yokohama, the Yokohama bank would issue
26In particular, in the early stages of the industry’s development, there was no direct access to these prefectures viarailway.
29
a bill of acceptance to the reeler, who would then be able to fully discount the documentary bill
with his regional bank, thus obtaining final payment for the merchandise and clearing the working
capital loan received earlier. The regional bank would then settle payment of the documentary bill
with the Yokohama bank, which would, in turn, pass the silk on to the merchant after receiving
payment.
In this system, while the Yokohama wholesalers would refinance themselves from city banks in
Yokohama, or directly based on promissory notes discounted by the Bank of Japan, the Yokohama
banks would generally not lend to the reelers directly. As Nakabayashi emphasizes, it was there-
fore the wholesaler who ultimately had to screen the quality of the borrower, i.e. the silk reeling
firms. Conversely, the regional banks mainly acted as local intermediaries and, essentially, clearing
houses for the documentary bills issued by Yokohama banks on behalf of the silk merchants.27
The financing institutions of the silk trade were in fact very similar to the modern institutions
of export finance as they have recently been described in e.g. Amiti and Weinstein (2011). In the
terminology of export finance, the regional banks acted as the ‘advising’ bank of the silk reeler (the
‘exporter’). The Yokohama banks acted as ‘issuing’ banks for ‘letters of credit’ (the documentary
bills) drawn on the Yokohama merchant (the ‘importer’).28 Very much like modern export finance,
this system was designed to overcome the many possible frictions that could occur in any stage of
the process: the financing friction faced by the silk reeler who needed working capital to produce
silk, the informational friction arising from the uncertainty about the quality of the silk the reeler
might produce, the risk of damage to the silk during transport from remote prefectures such as
Nagano and Gifu to the port of Yokohama and, finally, the possibility of the silk merchant failing
27Miwa and Ramseyer (2006) argue that, even when they started to make direct loans to the silk reelers, banks ‘piggy-backed’ on the informational advantage of the Yokohama silk brokers, e.g. by only complementing loans that were madeby the silk brokers. Furthermore, the Yokohama merchants themselves were also often involved in the foundation of theregional banks or had substantial shareholdings in them. See also Naito (2008) for a detailed case study of the emergenceof local banks in the silk reeling regions.
28In this context, it is important to note that, as a treaty port, Yokohama was an almost extraterritorial market for silkin which the silk merchants acted as de facto importers. Once in Yokohama, the silk would usually be sold on directlyto the foreign trading companies, whose representatives were not allowed to source silk outside Yokohama directly.Nakabayashi (2009) studies the price dynamics for silk in the Yokohama market and the New York market, showingthat these two markets were very highly integrated. Hence, market segmentation mainly existed between the Yokohamamarket and the silk-producing regions within Japan, and the Yokohama silk merchants acted as export intermediariesfor the many small silk reeling firms. The importance of such trade intermediaries in modern-day emerging marketssuch as China has recently also been emphasized by Ahn, Khandelwal and Wei (2011).
30
to pay for the silk upon its arrival in Yokohama.29
Like modern export finance, this system allowed the ‘advising’ banks in the silk region to re-
main predominantly local: the bank raised deposits locally and lent locally to the silk reelers. In
this system, international (or out-of-region) transactions by the local banks could remain limited
to the settlement of the documentary bills with the Yokohama banks. Hence, the Yokohama banks,
from the outset, transacted with local banks in many prefectures—they were financially integrated
with the whole country. Conversely, local banks in the silk reeling regions could remain predomi-
nantly regional.
The growth of the silk industry is a case in point for recent literature that has emphasized that
access to trade credit is an important driver of industry growth when financial development is low
and bank finance is not available (Petersen and Rajan (1997) and Fisman and Love (2003)). We go
beyond these papers in arguing that relatively easy access to trade credit through the Yokohama
silk brokers also had an important feedback effect on the development of the banking system in
the silk reeling regions.
The informational advantages that come with trade credit relationships (see Petersen and Ra-
jan (1997)) also provide a related but distinct explanation for why the banking system in the silk
regions developed very much along regional lines. As we have argued, mechanization was impor-
tant for improving quality and for competing in the US market. However, mechanization also led
to a separation of cocoon growing from silk reeling, thus making trade credit for working capital
a necessity. Silk reelers reacted to this challenge by forming regional cooperatives. These coopera-
tives were at the forefront of mechanization, and they also acted as local financial intermediaries.
Specifically, cooperatives played a key role in attaining the consistent quality levels required
for the US market by organizing a process called re-reeling. Japan’s high humidity levels during
29Note that this system did not require the Yokohama banks that issued the letters of credit to acquire much infor-mation about individual exporters. It was the Yokohama silk merchants and, as we will discuss shortly, the local banksthat gathered information about the quality of individual silk reelers. It is conceivable that this network of local lendingrelationships, with its customer base of small silk filatures, may have endowed the regional banks with an importantcompetitive advantage relative to their nationwide competitors— even long after the silk industry had eventually de-clined and been displaced by other small-scale manufacturing industries. However, this network of long-standingrelationships may in turn have made it difficult for these small firms to switch to nationwide, integrated lenders whencredit dried up during the recession of the 1990s. We believe that this is just one possible but potentially powerfulchannel that illustrates how the de facto segmentation of banking markets may have persisted even after technology andregulation had removed any formal barriers to banking flows between prefectures.
31
the summer carried the risk that reeled silk would curl or get sticky during transport. Therefore,
the thread was reeled a second time. Whereas the first round of reeling would usually take place in
a decentralized way in the individual small reeling firms—initially often still by hand—a second
round of mechanical reeling was performed centrally in larger filatures that were operated by the
cooperatives. Not only did the centralized mechanical re-reeling allow small reelers to improve
the quality of their silk without having to invest in mechanized filatures of their own, but the
centralized reprocessing of the silk also enabled reelers’ cooperatives to implement a strict quality
control system (see again Nakabayashi (2006) for an excellent and detailed description). Thanks
to this type of quality assurance system, Japanese silk exporters came to dominate the US market
and were able to build considerable brand reputations in the New York silk market by the late
19th century. However, the quality control system also allowed the cooperatives to acquire much
information about their member firms. This information, in turn, allowed the silk cooperatives to
act as intermediaries and provide trade credit to their members (e.g. by providing advances on the
documentary bills drawn on Yokohama merchants).
By the turn of the century, the role of the cooperatives had become so important that they
were regulated by law in the first industrial cooperative act of 1900. For the first time, this law
also regulated the role of industrial credit cooperatives. These industrial credit cooperatives were
the direct precursors of modern-day Shinkins (cooperative banks), which (along with the Sogo—
mutual—banks) are the main regional banks that we are studying here and which, to the present
day, mainly raise capital from and lend to their local membership of small businesses.
Mechanization and the development of the trade credit and export finance system fed on each
other: with high-quality silk came access to the Yokohama export market and, therefore, access to
trade credit. The consistent quality of the raw silk was an important part of the credit relationship
between the Yokohama silk merchants and the reelers and their cooperatives (see Nakabayashi
(2006)). The most reputed producers of silk (e.g. the Kaimeisha cooperative from the Suwa district,
Japan’s silk heartland, in Nagano prefecture) also had access to the most reputed Yokohama silk
merchants—those with the best refinancing options.30 Access to trade credit (and export finance)
30There were different strata of wholesalers. The most reputed wholesalers could refinance themselves directly fromthe Bank of Japan and Japan’s export bank, the Yokohama Specie Bank. A second tier of wholesalers would refinance
32
fostered the growth of the silk industry, and it was the most reputed, high-quality reelers who
came to dominate the export market, whereas hand reelers and lower-quality mechanical reelers
ended up serving only the domestic market.
In this way, the system of trade credit and export finance that was specific to the highly frag-
mented silk industry came to perpetuate itself, leading silk regions to develop a banking sector that
was largely regional and in which large supra-regional city banks played, and continue to play, a
relatively limited role.31 This reasoning provides us with our instrument: we use the number of
silk filatures per capita in a prefecture in 1895 as an instrument for the lending share of regional
banks in a prefecture during the 1980s.
Figure 3 plots the (logarithmic) number of filatures per head in 1895 against the average prefecture-
level lending share between 1980 and 1990 of regional and city banks. There is a clear positive
relation between regional bank lending shares and the number of silk filatures per capita in 1895,
whereas the link is clearly negative for city banks. Table 6 provides further analysis of this link.
The coefficient of a regression of lending shares on silk filatures is significant for all three bank
types. We also run the same regression with a set of controls: the pre-1990 relative GDP of a pre-
fecture, a dummy for the core prefectures (Greater Tokyo, comprising Tokyo, Chiba, Kanagawa
and Saitama; the Kansai region, comprising Osaka, Hyogo and Kyoto; and Aichi) and the (loga-
rithmic) distance to Yokohama, as the first and biggest open port. These are the controls we also
include later in our IV regressions. The link between the importance of silk reeling and lending
shares remains unaffected by these controls, and the individual t-statistics in the regressions with
controls are all greater than four in absolute value.
The last set of columns in Table 6 also report regressions of indicators of a prefecture’s general
level of financial development on our silk instrument, again with and without controls. There is
no significant link between silk and the density of bank branches in a region. Total lending relative
themselves only through the private city banks (see Nakabayashi (2009)).31Miwa and Ramseyer (2006) emphasize the role of trade credit and cooperative structures in providing working
capital for the silk reeling industry. They contrast this with the cotton reeling industry: cotton mills were hugely capitalintensive, and many of them actually raised capital on the new stock exchanges and imported much modern machinery.Not so silk reeling. This industry remained relatively labor intensive and was highly fragmented, characterized by manysmall firms. As Miwa and Ramseyer (2006) note, none of the 40 firms listed on the Osaka stock exchange in 1900 werein the silk industry.
33
to GDP is negatively correlated with the instrument, but it is much less significant than in the
regressions for the integration indicators. Once we also include our financial integration measure,
silk becomes insignificant in the regression for lending/GDP. This suggests that lending/GDP
is correlated with silk mainly via the correlation with regional financial integration.32 We think
that these findings are important for the interpretation of our results: the silk regions were not
necessarily financially less developed than other regions at the onset of the recession of the 1990s.
Instead, we are claiming that the silk regions embarked on a path to financial development that
was strongly influenced by the specific institutions of trade and export finance in the silk industry.
For the reasons discussed above, this led silk regions to adopt a financial system characterized by
regional, cooperative banks, in contrast to the nonsilk regions, in which larger, countrywide banks
came to dominate the market. Both routes to development seem to have served the specific needs
of the industries that developed in these regions at the time.33 What is important for our analysis
is that these different pathways to financial development influenced the transmission of the Great
Recession of 1990 because they led to different levels of financial integration: the regional model of
banking in the silk reeling regions in the 19th century implied a lower level of de facto integration
with the rest of the country during the 1990s downturn. This seems to have adversely affected
access to credit in these regions, exacerbating the crisis.
Our reasoning suggests that our instrument is relevant. Before we present the results, we dis-
cuss potential challenges to instrument validity.
Exogeneity
Several concerns could be raised concerning silk as an instrument for regional banking integration
during the 1980s. First, access to finance may have been a precondition for the mechanization of
the silk industry, not its outcome. Therefore, second, mechanization may just be one aspect of the
general growth of the silk industry, which as a whole had to rely on credit for its development. We
make the following remarks. First, even if true, this objection is unlikely to invalidate our instru-
32Conversely, if we include lending/GDP in our regression for the integration indicators, it is insignificant, whereassilk is even more significant. These results are available upon request.
33After all, with regard to silk reeling, Japan did come to dominate the world market until silk as an industry startedto decline after World War II.
34
ment for the late 20th century market shares of regional vs. city banks. The reason is that the main
concern about endogeneity of the financial integration measures in our late 20th century regres-
sions arises from expectational feedbacks from post-1990 growth rates to pre-1990 lending shares.
We think that it is very unlikely that post-1990 prefecture-level growth expectations feedback on
the development of the financial sector and the silk industry before 1900.
Second, even to the extent that preexisting differences in financial development, or other unob-
served regional characteristics, may have favored the move towards mechanization, they did not
directly cause it. As we have argued, it was an exogenous price shock that produced the incentives
for mechanization. We address these two issues in turn.
Scholars of economic history who have studied industrialization during the Meiji period (1862–
1912) have argued that one of the factors that favored the emergence of silk as an export staple
was that silk reeling, mechanized or not, was not particularly intensive in terms of fixed capi-
tal.34,35 In the early stages of the industry’s development, it is not even clear that mechanization
offered huge advantages in terms of increased productivity. In fact, mechanization made only slow
progress throughout the 1860s and 1870s, in spite of significant government support aimed at the
improvement of silk quality. The exogenous shock that changed this was the decline in the price
of hand-woven silk in the 1880s following the French depression, coupled with the huge demand
for mechanically reeled silk in the US (see Nakabayashi (2009)).36
Table 7 shows that it was not the general development of the silk sector per se but rather its
mechanization that is closely related to the development of regional vs. city banking. In the table,
we report specifications in which we regress our pre-1990 lending shares by bank type on both
mechanized and hand filatures. We also consider output-related measures: i.e. we regress lending
shares on the output of hand-reeled silk (so-called ‘hanks’) and on the output of machine-reeled
34See e.g. Yamazawa and Yamamoto (1979), Yamazawa (1975) and Fujino, Fujino and Ono (1979).35Even mechanized filatures are not particularly lumpy investments. In principle, what is required is a steam boiler
to heat the thread at a constant temperature and water or steam power for the reeling. Even in the mechanized filatures,manual labor, not fixed capital, remained the main input. Thus, mechanization could, in principle, be afforded by evensmall firms or groups of silk farmers.
36As a prime example, Nakabayashi (2009) reports the attempt of the Meiji government to install a role-model plant inthe village of Tomioka in Gunma prefecture in the 1870s. This plant was very successful in training skilled workers butdid not become economically viable. Instead, it was in the Suwa area in the neighboring Nagano prefecture and in Aichiprefecture that mechanization quickly took hold in the 1880s, following the decline in the relative price of hand-wovensilk.
35
silk. In all specifications and across all bank types it is apparent that it is always the variable
measuring mechanization—be it the number of filatures or the machine-reeled output—that is
significant, whereas the variables related to hand reeling are all insignificant for all bank types.37
This suggests that mechanization plays a special role in explaining the link between silk and the
regional fragmentation of banking markets. This is consistent with our interpretation that mecha-
nization led to the need for trade credit because it necessitated a separation of cocoon growing and
reeling and because it improved silk quality, thus signaling borrower quality to the Yokohama silk
merchants.
IV results
Table 8 now presents our IV results. As the endogenous variable, FI, appears as an interaction in
our regressions, we need to instrument two variables: our measure of banking integration, FI, and
its interaction with our measure of credit dependence, SMEk × FIk. We use our silk variable and
its interaction with SMEk as instruments.
Our instruments are relevant in all specifications reported here and for all three of our mea-
sures of financial integration. At the bottom of the table, we report the first-stage F-statistics for
the regression of the interaction term of the post-1990 dummy with SME× FI on the instruments.
The value of this first-stage F-statistic is above 10 throughout, which provides a first indication as
to the strength of the instruments with respect to the individual endogenous regressors (Staiger
and Stock (1997)). However, these values can be misleading with respect to the overall instrument
strength and with respect to identification if there is more than one endogenous variable, as is
the case here. We therefore also report the Kleibergen–Paap (2006) rank test for underidentifica-
tion. For all specifications reported in Table 8, we strongly reject the null of underidentification.
The Kleibergen and Paap (2006) statistics are also all well beyond the critical values tabulated by
Stock and Yogo (2005), suggesting that our instruments are also sufficiently strong to avoid large
37Note that this result is not because of a generally very low share of hand production: on average, machine-reeledsilk accounted for approximately three quarters of prefecture-level output of silk in 1895, and the range is from aroundfive percent to more than 90 percent. Hence, in many prefectures, a significant share of output continued to be reeledby hand. Note also that the cross-sectional correlation between the prefecture-level output of hand-reeled and machine-reeled silk is quite low: no higher than 0.3.
36
asymptotic bias.38
The first set of regressions in Table 8 shows the results without further controls. The magnitude
of our main coefficient of interest—the interaction between the post-1991 dummy, the SME share
and our measure of financial integration—is generally similar to the one obtained from the baseline
panel regressions in Table 3. If anything, the estimated effects are even stronger than in the baseline
specification.
In the remaining regressions in the table, we now include additional controls in the first and
second stages. First, we present a set of regressions in which, besides a core area dummy, we also
include relative GDP. This leaves our first-stage results very much intact. Furthermore, our coef-
ficient of interest in the IV regression remains stable relative to the specifications without controls
and vis-à-vis the baseline regressions. We lose some of the significance for the IV estimate, but this
is likely to arise because of a colinearity between financial integration, the role of manufacturing
and relative GDP. Note that relative GDP is not close to being significant (except for the Shinkin
regression), whereas our coefficient of interest remains significant at the 10 percent level for city
banks’ lending shares, or not too far below that level (with t-statistics above 1.40) for the regional
banks’ lending shares. Our main results hold and our main coefficient of interest remains stable
vis-à-vis the previous specifications without controls. Clearly, relative GDP is likely to be endoge-
nous, so this regression is a rather unfair test of our model. For example, the property bubble in the
1980s is likely to have fueled growth expectations in some of the richest prefectures. More impor-
tantly, financial integration may be causal for GDP. We therefore drop GDP and replace it with a
plausibly exogenous measure of economic and financial development: the logarithmic distance of
a prefecture to Yokohama as the first open port after 1858.39 Now, our coefficient of interest, while
again remarkably stable vis-à-vis the other specifications, is significant at the 10 percent level for
all three measures of banking integration.
These results suggest a strong link between the degree of regional financial (and, in particular,
banking) integration in the 1980s, the spread of the Great Recession and the silk industry. Our
38The critical values from Stock and Yogo (2005) apply to the Cragg and Donald (1993) statistic, which is identical tothe Kleibergen and Paap (2006) rank test if the errors are homoscedastic.
39The cross-sectional correlation between relative GDP and distance to Yokohama is −0.47.
37
instrument, however, is purely cross-sectional, whereas our main regressions here are based on a
panel. Clearly, this helps us overcome the limited coverage of our cross-section (with 46 prefec-
tures, excluding Okinawa) and allows us to control for common time variation and unobserved
heterogeneity at the prefecture level. However, we also check our results based on what Bertrand,
Duflo and Mullainathan (2004) have called a “before–after” regression, i.e. a cross-sectional regres-
sion of average post-1991 growth rates on pre-1991 characteristics. We report the results for such
regressions in Table 9, one based on OLS and one based on IV. Besides our interaction variable
of interest, SMEk × FIk, we include the first-order terms SMEk and FIk and the core dummy as a
control.
In all cases and for all three measures of banking integration and the two measures of small
firm importance (based on value added and employment), the coefficient of SMEk × FIk has the
same sign as before. Given that we estimate five coefficients from a cross-section of 46 prefectures,
it is also very interesting to see that the coefficient is significant at the 10 percent level or close to it
in most specifications, by both OLS and IV. Note also that, in spite of the limited sample size, the
F-statistics for the individual first-stage regressions as well as the Kleibergen–Paap rank statistics
in most cases indicate that our instruments are relevant. This suggests that the basic patterns in the
data that we document in this paper, including the link between silk and regional banking sector
integration, are discernible even in a simple cross-sectional regression that does not allow us to
control for common time variation or unobserved heterogeneity across prefectures.
We conduct further robustness checks in Table 10, where we examine alternative measures of
credit dependence at the prefecture level. Two concerns could be raised about our results so far:
first small firm importance could be could be measured with error and it may therefore be a noisy
proxy for credit dependence in a local economy. Secondly, small firm importance could itself be en-
dogenous. For example, many firms might remain small because there are poor growth prospects
in their prefecture. This might then also lead nationwide banks to withdraw credit from these ar-
eas, invalidating our identification. We address these concerns in several ways. First, we consider
alternative measures of credit dependence that plausibly are less affected by measurement error
and endogeneity. Second, in the next sub-section, we explicitly instrument for industrial structure
38
(and hence credit dependence).
As our first alternative measure of credit dependence, we use the rank of a prefecture in the
cross-sectional distribution of small firm importance.40 This allows us to deal with potential mea-
surement error that arises from using small-firm importance as a potentially imperfect measure of
credit dependence.
Second, we build on Rajan and Zingales (1998) to construct an exogenous measure of external
credit dependence at the prefecture level. The Rajan–Zingales measures pertain to manufacturing
industries in the US. We obtain pre-1990 prefecture-level shares for Japan for each of these man-
ufacturing industries from the manufacturing census. We then use these weights to construct a
measure of the average external finance dependence of manufacturing in a prefecture. Finally, we
scale this measure with the share of manufacturing in local GDP.
Table 10 presents our results based on both IV and OLS. The results strongly confirm our pre-
vious findings: in areas with high levels of credit-dependence, the downturn was much worse if
the area had a low degree of banking integration with the rest of the country.
In our final subsection, we now turn to instrumenting for industrial structure explicitly.
Credit dependence and long-term growth prospects
As a final exercise, we address the concern that recent literature has raised about the Rajan–
Zingales “external-finance dependence” approach that we have used in this paper: financial devel-
opment, financial integration and industry structure may go hand in hand in the long run. Higher
levels of financial development and better access to international financial markets may eventu-
ally foster the development of particularly finance-dependent sectors and firms (Fisman and Love
(2004) and Bekaert et al. (2007)). Clearly, this reasoning could constitute a challenge to the causal
interpretation of our main coefficient of interest, i.e. the one for the interaction between SME and
FI: if the specific financial institutions that were associated with the rise of the silk industry also
fostered the emergence of particular industries (other than just silk, such as e.g. manufacturing at
large) or were conducive to the emergence of many small firms, then it will be impossible to in-
40This follows the classical approach by Durbin (1954), who advocated the use of rank indicators as an instrument inerror-in-variables models.
39
terpret our coefficient of interest as the marginal effect of financial integration given a certain level
of finance dependence. We therefore require an exogenous (with respect to finance) measure of
the growth potential of the credit-dependent industries of a prefecture (and of its plausible future
industry structure).
We expect that the influence of finance on industry structure would actually lead our results
so far to be weaker than they should be in the absence of this influence: as we have shown, the
availability of trade credit to silk exporting firms held back the banking integration of these regions
with the rest of the country. This would mean that growth prospects for other sectors dependent
on external finance in these regions were likely to be constrained by limited access to finance (be-
cause these industries would not have access to the same preferential trade finance arrangements
enjoyed by the silk industry in its early days).41 Therefore, if this ‘access to finance’ channel was the
main determinant of modern-day industry structure, we would expect to see that credit-dependent
sectors, such as e.g. small manufacturing firms, would actually account for a relatively small part
of the regional economy in the silk prefectures. The opposite is the case.
In Table 11, we regress our measures of external finance dependence on the total number of fi-
latures per head of population and a set of controls. This link is highly significant and positive; silk
regions are particularly manufacturing intensive. Given that manufacturing is credit dependent,
this is the opposite of what we should expect if limited access to finance was the main determinant
of industry structure in our data set. The finding therefore suggests that silk has affected the rise
of a large manufacturing sector with many small firms through channels other than finance. In
fact, it is well documented in the literature, that, as hosts to Japan’s first large export industry, silk
reeling prefectures served as a nucleus for the development of manufacturing know-how, notably
in the machinery sector.42 As Japan learned to produce and export high-quality silk, it also devel-
oped its manufacturing sector.43 We exploit this insight to separate the long-term impact of silk
41Exporting firms in other sectors have likely benefited from access to trade finance in some way. However, note thatsilk was the main export product until the onset of World War II. Furthermore, Japan became a significant exporter ofmachinery and other capital-intensive and credit-dependent sectors only well after the turn of the 20th century.
42See e.g. Yamazawa (1975), Ma (2004), Nakabayashi (2006) and Atsumi (2010).43This view is consistent with the role of interindustry spillovers emphasized by Glaeser et al. (1992). Specifically,
Jacobian (i.e. interindustry) externalities tend to be particularly important in the early stages of an industry’s develop-ment.
40
production on manufacturing from that on finance. Specifically, we conjecture that interindustry
(Jacobian) externalities that may lead to the emergence of manufacturing clusters are a direct func-
tion of proximity. Therefore, we use a prefecture’s minimum distance to one of the four prefectures
with the highest number of mechanized filatures in 1895 (Kyoto, Nagano, Gifu and Shizuoka) as
an exogenous measure of growth expectations in the manufacturing sector at the end of the 19th
century.
The remaining columns of Table 11 show that this identification assumption is justified em-
pirically: once we include the logarithmic distance to the main (mechanized) silk regions as an
additional regressor along with the (logarithmic) number of total filatures per head, we can dis-
entangle the two effects quite clearly. In the regression where industry structure is the dependent
variable, the distance variable has a much larger coefficient than does the number of filatures per
head, and it is also much more highly significant. Conversely, where our financial integration
measure is the dependent variable, the picture is exactly the opposite: the coefficient of distance is
small and insignificant, whereas that of the number of filatures is both large and significant. This
suggests we can use the logarithmic distance to the main silk areas as an indicator of growth ex-
pectations in the late 19th century and as an instrument for the role of manufacturing (and credit
dependence) at the end of the 20th century. Conversely, we continue to use the number of filatures
per capita as a measure of dependence on working capital and trade credit, and therefore as an
instrument for banking sector integration during the 1980s.44
In Table 12, we repeat our Panel IV regressions, but now treating both SME importance and fi-
nancial integration as endogenous variables. Based on our discussion from before, we instrument
SME, FI and their interaction using the distance to the main mechanized silk filatures, the number
of filatures and the interaction of these two, respectively. We again include our set of controls: a
core area dummy and the logarithmic distance to Yokohama. The results corroborate our previous
findings: the first stages of the IV regressions are highly relevant throughout, and our coefficient
of interest generally stays significant and quantitatively stable vis-à-vis our baseline OLS specifi-
44Our line of argument is similar to that of Acemoglu and Johnson (2005), who, in a different setting, report that bothcolonial settler mortality and English legal origin individually have prognostic power for measures of property rightsand contracting institutions today. However, when both are included as regressors simultaneously, English legal originmainly affects contracting institutions whereas settler mortality affects property rights but not contracting institutions.
41
cations. We conclude that, while the specific institutions of the silk industry have had an impact
on the rise of manufacturing at large, our main conclusion remains intact: the downturn of the
1990s was deeper and more prolonged in areas with many credit-dependent firms and low levels
of banking sector integration with the rest of the country. These were essentially the silk regions
that were the main powerhouses of Japan’s rise as an export nation from the late 19th century
onward. Hence, the regional spread of the Great Recession was determined by an invisible silken
thread that links the silk regions of the 19th century, their specific financing institutions and their
specific pathway to financial development to cross-regional differences in financial integration and
industry structure in the late 20th century.
Conclusion
This paper has explored the regional spread of Japan’s Great Recession following the bursting of
the stock market and housing bubbles in the early 1990s. We showed that an important determi-
nant of how severely a prefecture was hit during the ‘Lost Decade’ was its degree of integration
into the national banking market. Clearly, Japan is a highly financially integrated economy, and
it seems surprising that cross-regional differences in financial integration are sufficiently large to
account for substantial regional heterogeneity in the responses to the common shock of the burst-
ing bubbles. However, we recognized that until at least the onset of the crisis, there was a highly
regionally fragmented banking system whose historical roots go back to the rise of silk reeling as
Japan’s first main export industry. This regional fragmentation has had a considerable impact on
access to finance by small, credit-dependent manufacturing firms. We showed that the impact of
the crisis on areas with many credit-dependent firms was exacerbated in prefectures with low pre-
1990 levels of banking integration. As a transmission channel, we identified a drop in lending by
nationwide banks in credit dependent-prefectures, in which these banks traditionally had a small
market share.
We then identified the deep historical and economic origins of this regional segmentation of
the banking market. We argued that the development of regional banks was largely triggered by
the development of the silk industry in the years following the Meiji Restoration and the opening
42
of Japan to international trade: for exogenous reasons such as climate and the need to source
cocoons, the silk reeling industry was located in the mountain areas of central Japan. The main
market for silk was in the port of Yokohama. Silk reeling was heavily dependent on trade credit
because cocoons had to be bought after harvest in spring or early summer, whereas the reeled silk
thread could only be shipped to Yokohama a couple of months later. The many small firms in
the silk reeling industry could not, however, borrow directly from the larger banks in the major
port cities. Instead, silk finance was largely provided by small regional, often cooperative banks
who made operating loans against so-called ‘documentary bills’ issued by larger Yokohama banks
on behalf of reputed Yokohama silk dealers. Therefore, regional banks provided a loan for which
the Yokohama merchant was ultimately liable, and it was ultimately the Yokohama silk merchants
who had to monitor the quality of the credit relation with the silk reelers. In this system, which
shares many features with the institutions of modern export finance, the regional banks remained
heavily focused on their regions of origin long after the eventual decline of the silk industry: the
banks raised deposits locally and lent locally to the silk reelers. International (or out-of-region)
transactions by the local banks remained limited to the settlement of the documentary bills with
the Yokohama banks. Hence, the Yokohama banks, from the outset, transacted with local banks
in many prefectures—they were financially integrated with the whole country. Conversely, local
banks in the silk reeling regions remained predominantly regional. To a large extent, the regional
tiering of Japan’s banking system in modern times has its origins in this particular system of export
finance in the silk sector.
We showed that the prefecture-level number of silk reeling mills in the late 19th century is in-
deed a powerful predictor of the prefecture-level market share of these local lenders (as opposed
to city banks) 100 years later, at the onset of Japan’s Great Recession, and therefore of the degree of
financial integration in modern times. Using the number of silk filatures as an instrument for finan-
cial integration, we corroborate our results: given the role of small firms in the regional economy,
the effects of the recession of the 1990s were worse in less financially integrated areas.
Our findings also support the view that regional differences in financial integration can be
the outcome of different historical pathways to financial development. The cooperative, regional
43
banking model overcame the specific financing and trade frictions faced by the silk reeling indus-
try, whereas direct finance from the large Yokohama banks or through bond issuance was prevalent
in other, less fragmented export industries (e.g. cotton). We therefore did not find that the histor-
ical silk regions are now generally less financially developed. However, they turned out to be
significantly less financially integrated with the rest of the country when a big shock hit 100 years
later. Our findings therefore also shed light on the trade–finance nexus: they provide a case study
for how comparative advantage in one industry, silk reeling, can have an impact on a region’s
particular pathway to financial development after the country’s exogenous opening to trade.
Finally, our results illustrated that regional variation in de facto financial integration can per-
sist within a country even if there are no formal barriers to capital flows, as is clearly the case
for modern Japan. These de facto differences could take many forms. One possible way in which
such regional segmentation could occur is through banking relationship networks: the traditional
regional tiering of Japan’s banking market may have given regional banks a long-lasting informa-
tional advantage vis-à-vis nationwide banks with respect to their customer base of small, credit-
dependent businesses. These informational asymmetries may, however, have made it difficult for
credit-dependent businesses to switch to nationwide banks during the crisis, when credit became
hard to obtain. Our results could have implications for regional business cycle transmission in
many countries in which banking markets are traditionally regionally segmented, even though
there are no formal limitations to capital mobility between regions. Germany’s Volksbanken and
Sparkassen are a case in point, as are Spain’s Caixas and the historical fragmentation of the US
banking market along state borders, which was removed only during the 1980s.
References
Acemoglu, Daron, and Simon Johnson. 2005. “Unbundling institutions.” Journal of Political Econ-
omy, 113(5): 949–95.
Ahn, JaeBin, Amit K. Khandelwal, and Shang-Jin Wei. 2011. “The role of intermediaries in facil-
itating trade.” Journal of International Economics, 84(1): 73–85.
44
Amiti, Mary, and David E. Weinstein. 2011. “Exports and Financial Shocks.” The Quarterly Journal
of Economics, 126(4): 1841–1877.
Atsumi, Toshihiro. 2010. “Silk, regional rivalry, and the impact of the port openings in nineteenth
century Japan.” Journal of the Japanese and International Economies, 24(4): 519–539.
Bekaert, Geert, Campbell R. Harvey, Christian Lundblad, and Stephan Siegel. 2007. “Global
Growth Opportunities and Market Integration.” Journal of Finance, 62(3): 1081–1137.
Berger, Allen N, and Gregory F Udell. 1995. “Relationship Lending and Lines of Credit in Small
Firm Finance.” The Journal of Business, 68(3): 351–81.
Berger, Allen N., Nathan H. Miller, Mitchell A. Petersen, Raghuram G. Rajan, and Jeremy C.
Stein. 2005. “Does function follow organizational form? Evidence from the lending practices of
large and small banks.” Journal of Financial Economics, 76(2): 237–269.
Bernanke, Ben. 1983. “Non-Monetary Effects of the Financial Crisis in the Propagation of the Great
Depression.” American Economic Review, 73: 257–76.
Bernanke, Ben, and Mark Gertler. 1989. “Agency Costs, Net Worth and Business Fluctuations.”
American Economic Review, 79: 14–31.
Bernhofen, D. M, and J. C Brown. 2004. “A Direct Test of the Theory of Comparative Advantage:
The Case of Japan.” Journal of Political Economy, 112(1): 48–67.
Bernhofen, D. M, and J. C Brown. 2005. “An Empirical Assessment of the Comparative Advantage
Gains From Trade: Evidence from Japan.” The American economic review, 95(1): 208–225.
Bertrand, Marianne, Esther Duflo, and Sendhil Mullainathan. 2004. “How much should we trust
Differences-in-Differences Estimates?” Quarterly Journal of Economics, 119 (1): 249–275.
Caballero, Ricardo J., Takeo Hoshi, and Anil K. Kashyap. 2008. “Zombie Lending and Depressed
Restructuring in Japan.” American Economic Review, 98(5): 1943–77.
Cetorelli, Nicola, and Linda Goldberg. forthcoming. “Banking Globalization and Monetary
Transmission.” Journal of Finance.
45
Cragg, John G., and Stephen G. Donald. 1993. “Testing Identifiability and Specification in Instru-
mental Variable Models.” Econometric Theory, 9(02): 222–240.
Davis, Donald R., and David E. Weinstein. 2002. “Bones, Bombs, and Break Points: The Geogra-
phy of Economic Activity.” American Economic Review, 92(5): 1269–1289.
Dehejia, Rajeev, and Adriana Lleras-Muney. 2007. “Financial Development and Pathways of
Growth: State Branching and Deposit Insurance Laws in the United States, 1900–1940.” Jour-
nal of Law and Economics, 50: 239–272.
Dell’Ariccia, Giovanni, Enrica Detragiache, and Raghuram Rajan. 2008. “The real effect of bank-
ing crises.” Journal of Financial Intermediation, 17(1): 89–112.
Do, Quy-Toan, and Andrei A. Levchenko. 2008. “Comparative advantage, demand for external
finance, and financial development.” Journal of Financial Economics, 86(3): 796 – 834.
Durbin, J. 1954. “Errors in Variables.” Revue de l’Institut International de Statistique / Review of the
International Statistical Ins titute, 22(1/3): pp. 23–32.
Federico, Giovanni. 1997. An Economic History of the Silk Industry, 1830-1930. Cambridge Studies in
Modern Economic History, Cambridge University Press.
Feldstein, Martin, and Charles Horioka. 1980. “Domestic Saving and International Capital
Flows.” Economic Journal, 90(358): 314–29.
Fisman, Raymond, and Inessa Love. 2003. “Trade Credit, Financial Intermediary Development,
and Industry Growth.” Journal of Finance, 58(1): 353–374.
Fisman, Raymond, and Inessa Love. 2004. “Financial Development and Intersectoral Allocation:
A New Approach.” Journal of Finance, 59(6): 2785–2807.
Fujino, Shozaburo, Shiro Fujino, and Akira Ono. 1979. Estimates of long-term economic statistics
of Japan since 1868, vol. 11 Textile Industry (Chouki Keizai Toukei, 11 Senni Kougyou). Toyo Keizai
Shinpou Sha, Tokyo, Japan.
46
Gertler, Mark, and Simon Gilchrist. 1994. “Monetary Policy, Business Cycles, and the Behavior of
Small Manufacturing Firms.” Quarterly Journal of Economics, 109 (2): 309–40.
Glaeser, Edward L, Hedi D. Kallal, Jose A. Scheinkman, and Andrei Shleifer. 1992. “Growth in
Cities.” Journal of Political Economy, 100(6): 1126–52.
Grossman, Richard S., and Masami Imai. 2008. “The evolution of a national banking market in
pre-war Japan.” Explorations in Economic History, 45(1): 17 – 29.
Guiso, L., P. Sapienza, and L. Zingales. 2004. “Does Local Financial Development Matter?” Quar-
terly Journal of Economics, 119(3): 929–969.
Hoshi, Takeo, and Anil Kashyap. 2000. “The Japanese Banking Crisis: Where Did it Come from
and How Will it End?” NBER Macroeconomics Annual 1999, 14: 129–201.
Hoshi, T., and A. Kashyap. 2004. “Japan’s Economic and Financial Crisis: an Overview.” Journal of
Economic Perspectives, 18: 3–26.
Hosono, K., K. Sakai, and K. Tsuru. 2007. Consolidation of Banks in Japan: Causes and Consequences.
National Bureau of Economic Research Cambridge, Mass., USA.
Imai, M., and S. Takarabe. 2011. “Bank Integration and Transmission of Financial Shocks: Evi-
dence from Japan.” American Economic Journal: Macroeconomics, 3(1): 155–183.
Jayaratne, Jith, and Philip E. Strahan. 1996. “The Finance-Growth Nexus: Evidence from Bank
Branch Deregulation.” Quarterly Journal of Economics, 111 (3): 639–70.
Kano, Masaji, and Yoshiro Tsutsui. 2003. “Geographical segmentation in Japanese bank loan mar-
kets.” Regional Science and Urban Economics, 33(2): 157 – 174.
Kashyap, Anil K., and Jeremy C. Stein. 2000. “What Do a Million Observations on Banks Say
about the Transmission of Monetary Policy?” American Economic Review, 90(3): 407–428.
King, R. G, and R. Levine. 1993. “Finance and Growth: Schumpeter might be right.” The Quarterly
Journal of Economics, 108(3): 717.
47
Kleibergen, Frank, and Richard Paap. 2006. “Generalized reduced rank tests using the singular
value decomposition.” Journal of Econometrics, 133(1): 97–126.
Kroszner, Randall S., Luc Laeven, and Daniela Klingebiel. 2007. “Banking crises, financial de-
pendence, and growth.” Journal of Financial Economics, 84(1): 187–228.
Li, M. L. 1982. “Silks by Sea: Trade, Technology, and Enterprise in China and Japan.” The Business
History Review, 56(2): 192–217.
Ma, D. 2004. “Why Japan, not China, was the First to Develop in East Asia: Lessons from Sericul-
ture, 1850-1937.” Economic Development and Cultural Change, 369–394.
Miwa, Y., and J. M Ramseyer. 2006. “Japanese Industrial Finance at the Close of the 19th Century:
Trade Credit and Financial Intermediation.” Explorations in Economic History, 43(1): 94–118.
Morgan, Donald P., Bertrand Rime, and Philip E. Strahan. 2004. “Bank Integration and State
Business Cycles.” Quarterly Journal of Economics, 119 (4): 1555–85.
Naito, T. 2008. “A Business Model of Silk Filature Financing by Local Banks: The Case of the Koide
Bank.” Japanese Research in Business History, 25: 11–32.
Nakabayashi, M. 2001. “The Rise of the Modern Silk Reeling Industry and Financial Institutions:
The Formation of the Institution of Providing Advances on Documentary Bills.” Japanese Yearbook
on Business History, 18: 119–139.
Nakabayashi, M. 2009. “Imposed Efficiency of the Treaty Port: Japanese Industrialization and
Western Imperialist Institutions.” ISS Discussion Paper Series.
Nakabayashi, Masaki. 2006. “The Rise of a Factory Industry: Silk Reeling in Suwa District.” In The
Role of Tradition in Japan’s Industrialization. Vol. Volume 2 of Japanese Studies in Economic and Social
History, , ed. Masayuki Tanimoto. Oxford University Press.
Peek, J., and E. S Rosengren. 2000. “Collateral Damage: Effects of the Japanese Bank Crisis on
Real Activity in the United States.” The American Economic Review, 90(1): 30–45.
48
Peek, Joe, and Eric S. Rosengren. 1997. “The International Transmission of Financial Shocks: The
Case of Japan.” The American Economic Review, 87(4): pp. 495–505.
Peek, Joe, and Eric S. Rosengren. 2005. “Unnatural Selection: Perverse Incentives and the Misal-
location of Credit in Japan.” The American Economic Review, 95(4): pp. 1144–1166.
Petersen, Michell A., and Raghuram G. Rajan. 1997. “Trade Credit: Theories and Evidence.” The
Review of Financial Studies, 10(3): pp. 661–691.
Rajan, Raghuram G., and Luigi Zingales. 1998. “Financial Dependence and Growth.” The Ameri-
can Economic Review, 88(3): 559–586.
Rajan, Raghuram G., and Rodney Ramcharan. 2011. “Land and Credit: A Study of the Polit-
ical Economy of Banking in the United States in the Early 20th Century.” Journal of Finance,
66(6): 1895–1931.
Spiegel, Mark M., and Nobuyoshi Yamori. 2006. “Determinants of Voluntary Bank Disclosure:
Evidence from Japanese Shinkin Banks.” In Japan’s Great Stagnation. , ed. Michael Hutchison and
Frank Westermann, 103–128. Cambridge, MA: MIT Press.
Staiger, Douglas, and James H. Stock. 1997. “Instrumental Variables Regression with Weak In-
struments.” Econometrica, 65(3): 557–586.
Stock, James H., and Motohiro Yogo. 2005. “Testing for Weak Instruments in Linear IV Regres-
sion.” In Identification and Inference for Econometric Models: Essays in Honor of Thomas Rothenberg.
, ed. Donald W. K. Andrews and James H. Stock, 80–108. Cambridge: Cambridge University
Press.
Uchida, Hirofumi, Gregory F. Udell, and Wako Watanabe. 2008. “Bank size and lending relation-
ships in Japan.” Journal of the Japanese and International Economies, 22(2): 242–267.
Yamazawa, Ippei. 1975. “Silk export and Japanese economic development (Kiito Yushutu to Nihon
no Keizai Hatten).” Department of Economics, Hitotsubashi University, Tokyo, Japan. Depart-
ment Bulletin Paper 19.
49

Yamazawa, Ippei, and Yuzo Yamamoto. 1979. Estimates of long-term economic statistics of Japan since
1868. Vol. 14 of Foreign trade and balance of payments, Toyo Keizai Shinpou Sha, Tokyo, Japan.
50
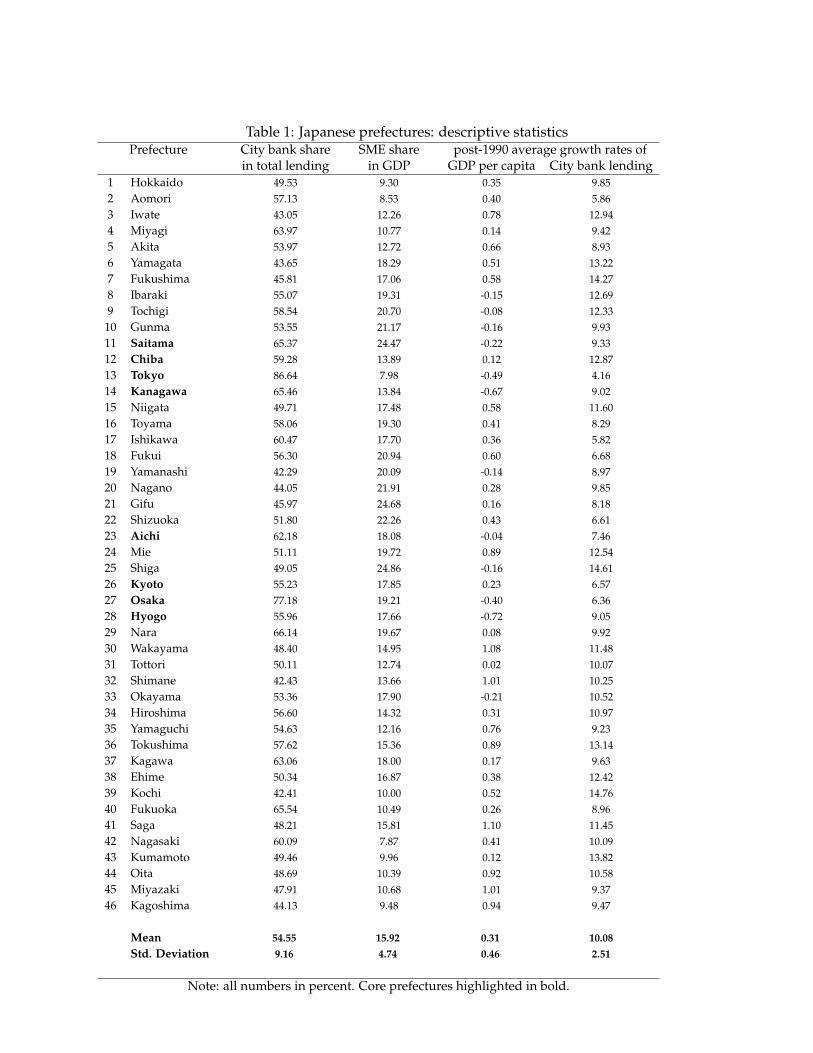
Table 1: Japanese prefectures: descriptive statisticsPrefecture City bank share SME share post-1990 average growth rates of
in total lending in GDP GDP per capita City bank lending1 Hokkaido 49.53 9.30 0.35 9.852 Aomori 57.13 8.53 0.40 5.863 Iwate 43.05 12.26 0.78 12.944 Miyagi 63.97 10.77 0.14 9.425 Akita 53.97 12.72 0.66 8.936 Yamagata 43.65 18.29 0.51 13.227 Fukushima 45.81 17.06 0.58 14.278 Ibaraki 55.07 19.31 -0.15 12.699 Tochigi 58.54 20.70 -0.08 12.33
10 Gunma 53.55 21.17 -0.16 9.9311 Saitama 65.37 24.47 -0.22 9.3312 Chiba 59.28 13.89 0.12 12.8713 Tokyo 86.64 7.98 -0.49 4.1614 Kanagawa 65.46 13.84 -0.67 9.0215 Niigata 49.71 17.48 0.58 11.6016 Toyama 58.06 19.30 0.41 8.2917 Ishikawa 60.47 17.70 0.36 5.8218 Fukui 56.30 20.94 0.60 6.6819 Yamanashi 42.29 20.09 -0.14 8.9720 Nagano 44.05 21.91 0.28 9.8521 Gifu 45.97 24.68 0.16 8.1822 Shizuoka 51.80 22.26 0.43 6.6123 Aichi 62.18 18.08 -0.04 7.4624 Mie 51.11 19.72 0.89 12.5425 Shiga 49.05 24.86 -0.16 14.6126 Kyoto 55.23 17.85 0.23 6.5727 Osaka 77.18 19.21 -0.40 6.3628 Hyogo 55.96 17.66 -0.72 9.0529 Nara 66.14 19.67 0.08 9.9230 Wakayama 48.40 14.95 1.08 11.4831 Tottori 50.11 12.74 0.02 10.0732 Shimane 42.43 13.66 1.01 10.2533 Okayama 53.36 17.90 -0.21 10.5234 Hiroshima 56.60 14.32 0.31 10.9735 Yamaguchi 54.63 12.16 0.76 9.2336 Tokushima 57.62 15.36 0.89 13.1437 Kagawa 63.06 18.00 0.17 9.6338 Ehime 50.34 16.87 0.38 12.4239 Kochi 42.41 10.00 0.52 14.7640 Fukuoka 65.54 10.49 0.26 8.9641 Saga 48.21 15.81 1.10 11.4542 Nagasaki 60.09 7.87 0.41 10.0943 Kumamoto 49.46 9.96 0.12 13.8244 Oita 48.69 10.39 0.92 10.5845 Miyazaki 47.91 10.68 1.01 9.3746 Kagoshima 44.13 9.48 0.94 9.47
Mean 54.55 15.92 0.31 10.08Std. Deviation 9.16 4.74 0.46 2.51
Note: all numbers in percent. Core prefectures highlighted in bold.
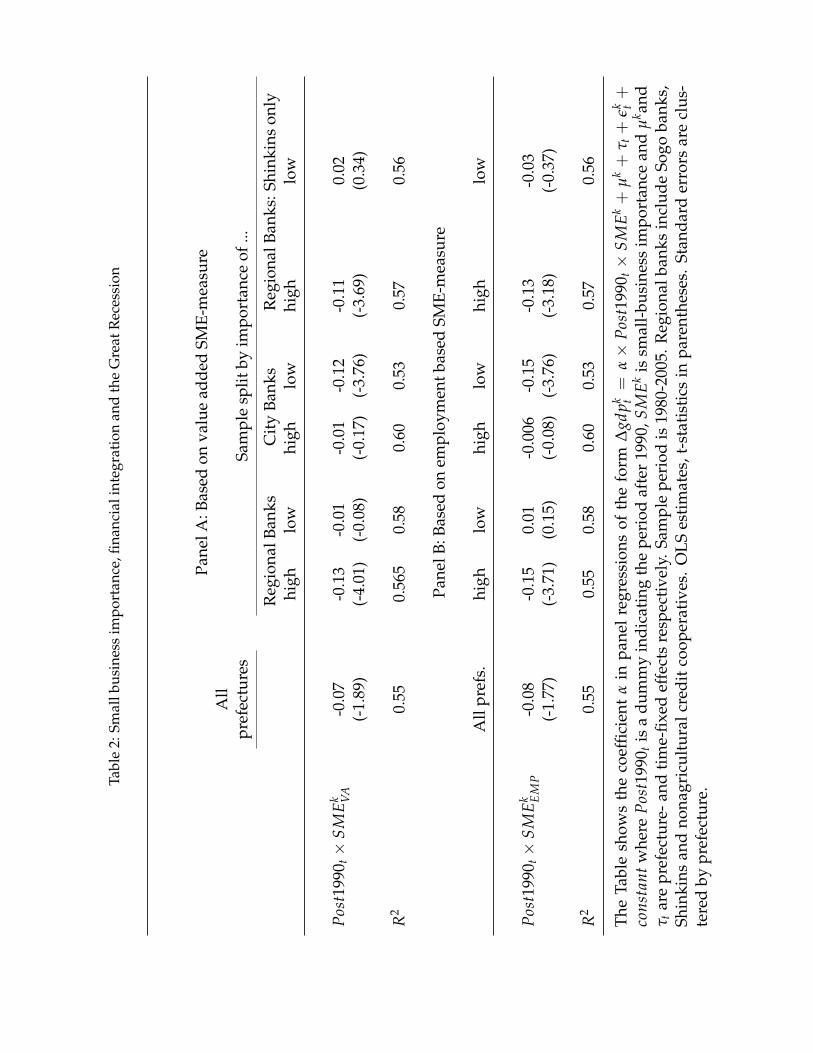
Tabl
e2:
Smal
lbus
ines
sim
port
ance
,fina
ncia
lint
egra
tion
and
the
Gre
atR
eces
sion
Pane
lA:B
ased
onva
lue
adde
dSM
E-m
easu
reA
llpr
efec
ture
sSa
mpl
esp
litby
impo
rtan
ceof
...
Reg
iona
lBan
ksC
ity
Bank
sR
egio
nalB
anks
:Shi
nkin
son
lyhi
ghlo
whi
ghlo
whi
ghlo
w
Pos
t199
0 t×
SM
Ek V
A-0
.07
-0.1
3-0
.01
-0.0
1-0
.12
-0.1
10.
02(-
1.89
)(-
4.01
)(-
0.08
)(-
0.17
)(-
3.76
)(-
3.69
)(0
.34)
R2
0.55
0.56
50.
580.
600.
530.
570.
56
Pane
lB:B
ased
onem
ploy
men
tbas
edSM
E-m
easu
re
All
pref
s.hi
ghlo
whi
ghlo
whi
ghlo
w
Pos
t199
0 t×
SM
Ek E
MP
-0.0
8-0
.15
0.01
-0.0
06-0
.15
-0.1
3-0
.03
(-1.
77)
(-3.
71)
(0.1
5)(-
0.08
)(-
3.76
)(-
3.18
)(-
0.37
)
R2
0.55
0.55
0.58
0.60
0.53
0.57
0.56
The
Tabl
esh
ows
the
coef
ficie
ntα
inpa
nel
regr
essi
ons
ofth
efo
rm∆
gdpk t
=α×
Pos
t199
0 t×
SM
Ek+
µk+
τ t+
εk t+
cons
tant
whe
reP
ost1
990 t
isa
dum
my
indi
cati
ngth
epe
riod
afte
r19
90,S
ME
kis
smal
l-bu
sine
ssim
port
ance
and
µk an
dτ t
are
pref
ectu
re-a
ndti
me-
fixed
effe
cts
resp
ecti
vely
.Sam
ple
peri
odis
1980
-200
5.R
egio
nalb
anks
incl
ude
Sogo
bank
s,Sh
inki
nsan
dno
nagr
icul
tura
lcre
ditc
oope
rati
ves.
OLS
esti
mat
es,t
-sta
tist
ics
inpa
rent
hese
s.St
anda
rder
rors
are
clus
-te
red
bypr
efec
ture
.
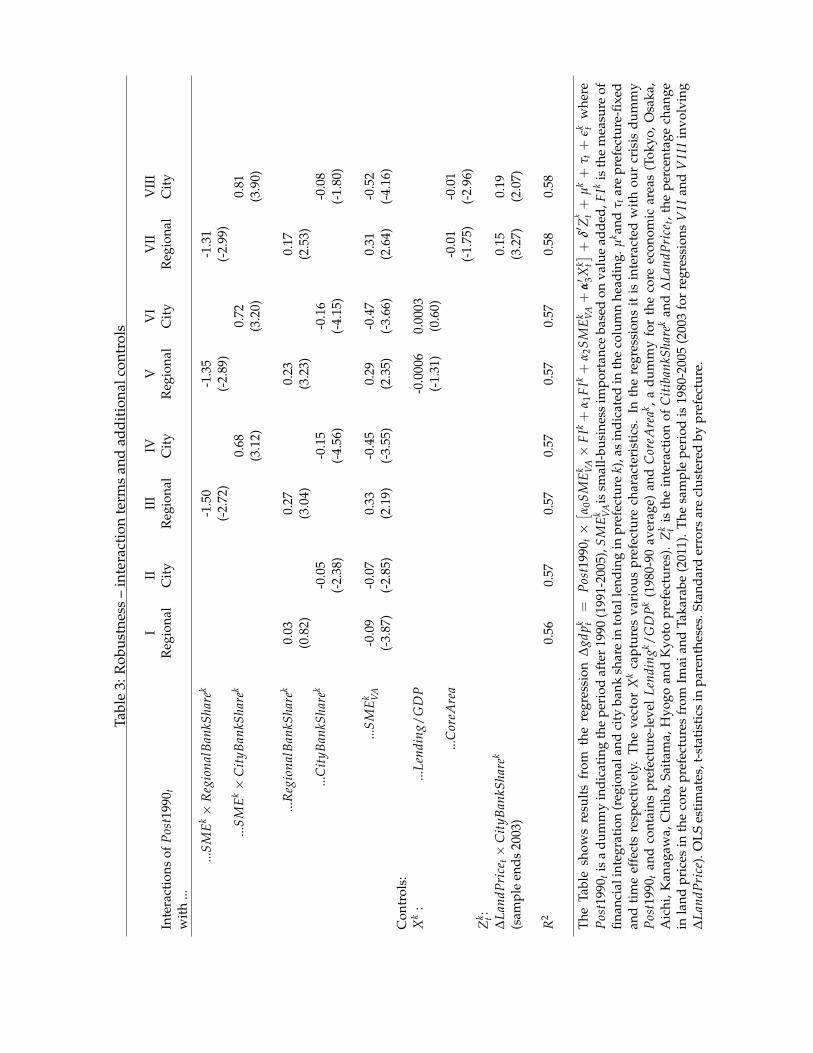
Tabl
e3:
Rob
ustn
ess
–in
tera
ctio
nte
rms
and
addi
tion
alco
ntro
ls
III
III
IVV
VI
VII
VII
IIn
tera
ctio
nsof
Pos
t199
0 tR
egio
nal
Cit
yR
egio
nal
Cit
yR
egio
nal
Cit
yR
egio
nal
Cit
yw
ith
...
...S
ME
k×
Reg
iona
lBan
kSha
rek
-1.5
0-1
.35
-1.3
1(-
2.72
)(-
2.89
)(-
2.99
)...
SM
Ek×
Cit
yBan
kSha
rek
0.68
0.72
0.81
(3.1
2)(3
.20)
(3.9
0)
...R
egio
nalB
ankS
hare
k0.
030.
270.
230.
17(0
.82)
(3.0
4)(3
.23)
(2.5
3)...
Cit
yBan
kSha
rek
-0.0
5-0
.15
-0.1
6-0
.08
(-2.
38)
(-4.
56)
(-4.
15)
(-1.
80)
...S
ME
k VA
-0.0
9-0
.07
0.33
-0.4
50.
29-0
.47
0.31
-0.5
2(-
3.87
)(-
2.85
)(2
.19)
(-3.
55)
(2.3
5)(-
3.66
)(2
.64)
(-4.
16)
Con
trol
s:X
k:
...Le
ndin
g/G
DP
-0.0
006
0.00
03(-
1.31
)(0
.60)
...C
oreA
rea
-0.0
1-0
.01
(-1.
75)
(-2.
96)
Zk t:
∆La
ndP
rice
t×
Cit
yBan
kSha
rek
0.15
0.19
(sam
ple
ends
2003
)(3
.27)
(2.0
7)
R2
0.56
0.57
0.57
0.57
0.57
0.57
0.58
0.58
The
Tabl
esh
ows
resu
lts
from
the
regr
essi
on∆
gdpk t
=P
ost1
990 t×[ α
0SM
Ek V
A×
FIk+
α1F
Ik+
α2S
ME
k VA+
α′ 3X
k t] +δ′ Z
k t+
µk+
τ t+
εk tw
here
Pos
t199
0 tis
adu
mm
yin
dica
ting
the
peri
odaf
ter
1990
(199
1-20
05),
SM
Ek V
Ais
smal
l-bu
sine
ssim
port
ance
base
don
valu
ead
ded,
FIk
isth
em
easu
reof
finan
cial
inte
grat
ion
(reg
iona
land
city
bank
shar
ein
tota
llen
ding
inpr
efec
ture
k),a
sin
dica
ted
inth
eco
lum
nhe
adin
g.µ
k and
τ tar
epr
efec
ture
-fixe
dan
dti
me
effe
cts
resp
ecti
vely
.T
heve
ctor
Xk
capt
ures
vari
ous
pref
ectu
rech
arac
teri
stic
s.In
the
regr
essi
ons
itis
inte
ract
edw
ith
our
cris
isdu
mm
yP
ost1
990 t
and
cont
ains
pref
ectu
re-l
evel
Lend
ingk /
GD
Pk
(198
0-90
aver
age)
and
Cor
eAre
ak ,a
dum
my
for
the
core
econ
omic
area
s(T
okyo
,O
saka
,A
ichi
,Kan
agaw
a,C
hiba
,Sai
tam
a,H
yogo
and
Kyo
topr
efec
ture
s).
Zk t
isth
ein
tera
ctio
nof
Cit
iban
kSha
rek
and
∆La
ndP
rice
t,th
epe
rcen
tage
chan
gein
land
pric
esin
the
core
pref
ectu
res
from
Imai
and
Taka
rabe
(201
1).
The
sam
ple
peri
odis
1980
-200
5(2
003
for
regr
essi
ons
VII
and
VII
Iin
volv
ing
∆La
ndP
rice
).O
LSes
tim
ates
,t-s
tati
stic
sin
pare
nthe
ses.
Stan
dard
erro
rsar
ecl
uste
red
bypr
efec
ture
.
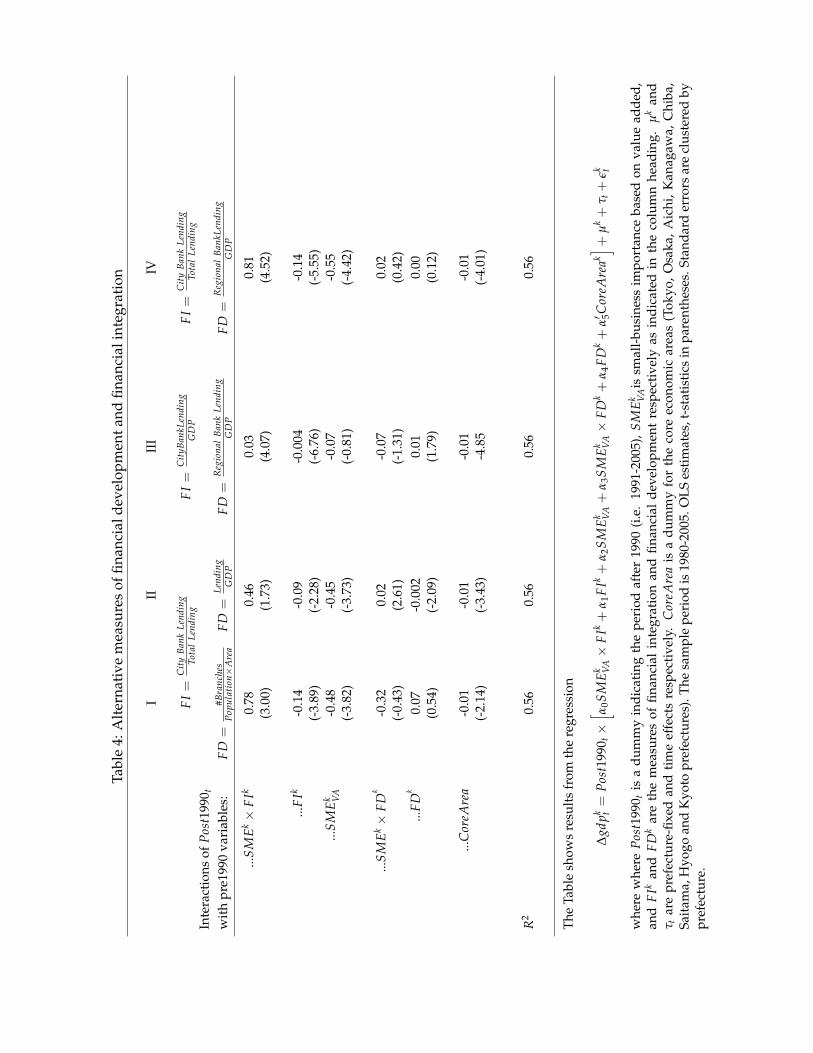
Tabl
e4:
Alt
erna
tive
mea
sure
sof
finan
cial
deve
lopm
enta
ndfin
anci
alin
tegr
atio
n
III
III
IV
FI=
Cit
yB
ank
Lend
ing
Tota
lLe
ndin
gF
I=
Cit
yBan
kLen
ding
GD
PF
I=
Cit
yB
ank
Lend
ing
Tota
lLe
ndin
gIn
tera
ctio
nsof
Pos
t199
0 tw
ith
pre1
990
vari
able
s:FD
=#B
ranc
hes
Pop
ulat
ion×
Are
aFD
=Le
ndin
gG
DP
FD=
Reg
iona
lB
ank
Lend
ing
GD
PFD
=R
egio
nal
Ban
kLen
ding
GD
P
...S
ME
k×
FIk
0.78
0.46
0.03
0.81
(3.0
0)(1
.73)
(4.0
7)(4
.52)
...F
Ik-0
.14
-0.0
9-0
.004
-0.1
4(-
3.89
)(-
2.28
)(-
6.76
)(-
5.55
)...
SM
Ek V
A-0
.48
-0.4
5-0
.07
-0.5
5(-
3.82
)(-
3.73
)(-
0.81
)(-
4.42
)
...S
ME
k×
FDk
-0.3
20.
02-0
.07
0.02
(-0.
43)
(2.6
1)(-
1.31
)(0
.42)
...FD
k0.
07-0
.002
0.01
0.00
(0.5
4)(-
2.09
)(1
.79)
(0.1
2)
...C
oreA
rea
-0.0
1-0
.01
-0.0
1-0
.01
(-2.
14)
(-3.
43)
-4.8
5(-
4.01
)
R2
0.56
0.56
0.56
0.56
The
Tabl
esh
ows
resu
lts
from
the
regr
essi
on
∆gd
pk t=
Pos
t199
0 t×[ α
0SM
Ek V
A×
FIk+
α1F
Ik+
α2S
ME
k VA+
α3S
ME
k VA×
FDk+
α4FD
k+
α′ 5C
oreA
reak] +
µk+
τ t+
εk t
whe
rew
here
Pos
t199
0 tis
adu
mm
yin
dica
ting
the
peri
odaf
ter
1990
(i.e
.19
91-2
005)
,SM
Ek V
Ais
smal
l-bu
sine
ssim
port
ance
base
don
valu
ead
ded,
and
FIk
and
FDk
are
the
mea
sure
sof
finan
cial
inte
grat
ion
and
finan
cial
deve
lopm
ent
resp
ecti
vely
asin
dica
ted
inth
eco
lum
nhe
adin
g.µ
kan
dτ t
are
pref
ectu
re-fi
xed
and
tim
eef
fect
sre
spec
tive
ly.
Cor
eAre
ais
adu
mm
yfo
rth
eco
reec
onom
icar
eas
(Tok
yo,
Osa
ka,
Aic
hi,
Kan
agaw
a,C
hiba
,Sa
itam
a,H
yogo
and
Kyo
topr
efec
ture
s).T
hesa
mpl
epe
riod
is19
80-2
005.
OLS
esti
mat
es,t
-sta
tist
ics
inpa
rent
hese
s.St
anda
rder
rors
are
clus
tere
dby
pref
ectu
re.
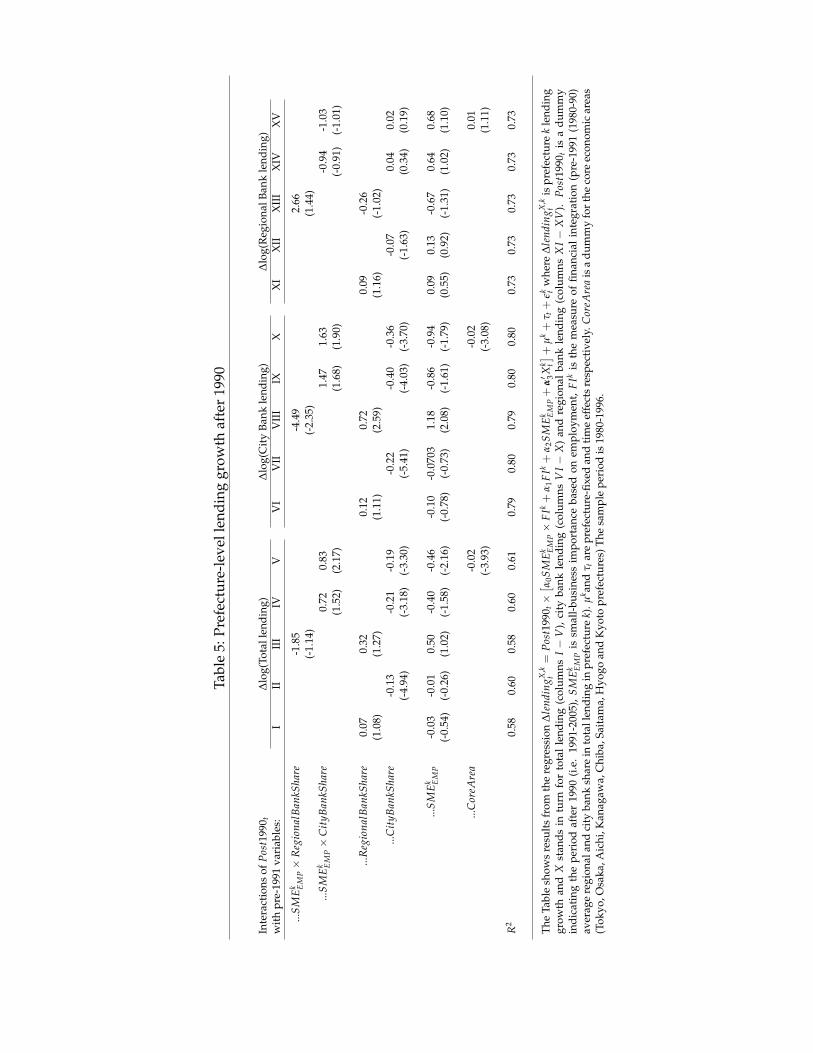
Tabl
e5:
Pref
ectu
re-l
evel
lend
ing
grow
thaf
ter
1990
Inte
ract
ions
ofP
ost1
990 t
∆lo
g(To
tall
endi
ng)
∆lo
g(C
ity
Bank
lend
ing)
∆lo
g(R
egio
nalB
ank
lend
ing)
wit
hpr
e-19
91va
riab
les:
III
III
IVV
VI
VII
VII
IIX
XX
IX
IIX
III
XIV
XV
...S
ME
k EM
P×
Reg
iona
lBan
kSha
re-1
.85
-4.4
92.
66(-
1.14
)(-
2.35
)(1
.44)
...S
ME
k EM
P×
Cit
yBan
kSha
re0.
720.
831.
471.
63-0
.94
-1.0
3(1
.52)
(2.1
7)(1
.68)
(1.9
0)(-
0.91
)(-
1.01
)
...R
egio
nalB
ankS
hare
0.07
0.32
0.12
0.72
0.09
-0.2
6(1
.08)
(1.2
7)(1
.11)
(2.5
9)(1
.16)
(-1.
02)
...C
ityB
ankS
hare
-0.1
3-0
.21
-0.1
9-0
.22
-0.4
0-0
.36
-0.0
70.
040.
02(-
4.94
)(-
3.18
)(-
3.30
)(-
5.41
)(-
4.03
)(-
3.70
)(-
1.63
)(0
.34)
(0.1
9)
...S
ME
k EM
P-0
.03
-0.0
10.
50-0
.40
-0.4
6-0
.10
-0.0
703
1.18
-0.8
6-0
.94
0.09
0.13
-0.6
70.
640.
68(-
0.54
)(-
0.26
)(1
.02)
(-1.
58)
(-2.
16)
(-0.
78)
(-0.
73)
(2.0
8)(-
1.61
)(-
1.79
)(0
.55)
(0.9
2)(-
1.31
)(1
.02)
(1.1
0)
...C
oreA
rea
-0.0
2-0
.02
0.01
(-3.
93)
(-3.
08)
(1.1
1)
R2
0.58
0.60
0.58
0.60
0.61
0.79
0.80
0.79
0.80
0.80
0.73
0.73
0.73
0.73
0.73
The
Tabl
esh
ows
resu
lts
from
the
regr
essi
on∆
lend
ingX
,kt
=P
ost1
990 t×[ α
0SM
Ek E
MP×
FIk+
α1F
Ik+
α2S
ME
k EM
P+
α′ 3X
k t] +µk+
τ t+
εk tw
here
∆le
ndin
gX,k
tis
pref
ectu
rek
lend
ing
grow
than
dX
stan
dsin
turn
for
tota
lle
ndin
g(c
olum
nsI−
V),
city
bank
lend
ing
(col
umns
VI−
X)
and
regi
onal
bank
lend
ing
(col
umns
XI−
XV
).P
ost1
990 t
isa
dum
my
indi
cati
ngth
epe
riod
afte
r19
90(i
.e.
1991
-200
5),
SM
Ek E
MP
issm
all-
busi
ness
impo
rtan
ceba
sed
onem
ploy
men
t,F
Ikis
the
mea
sure
offin
anci
alin
tegr
atio
n(p
re-1
991
(198
0-90
)av
erag
ere
gion
alan
dci
tyba
nksh
are
into
tall
endi
ngin
pref
ectu
rek)
.µk an
dτ t
are
pref
ectu
re-fi
xed
and
tim
eef
fect
sre
spec
tive
ly.C
oreA
rea
isa
dum
my
for
the
core
econ
omic
area
s(T
okyo
,Osa
ka,A
ichi
,Kan
agaw
a,C
hiba
,Sai
tam
a,H
yogo
and
Kyo
topr
efec
ture
s)Th
esa
mpl
epe
riod
is19
80-1
996.
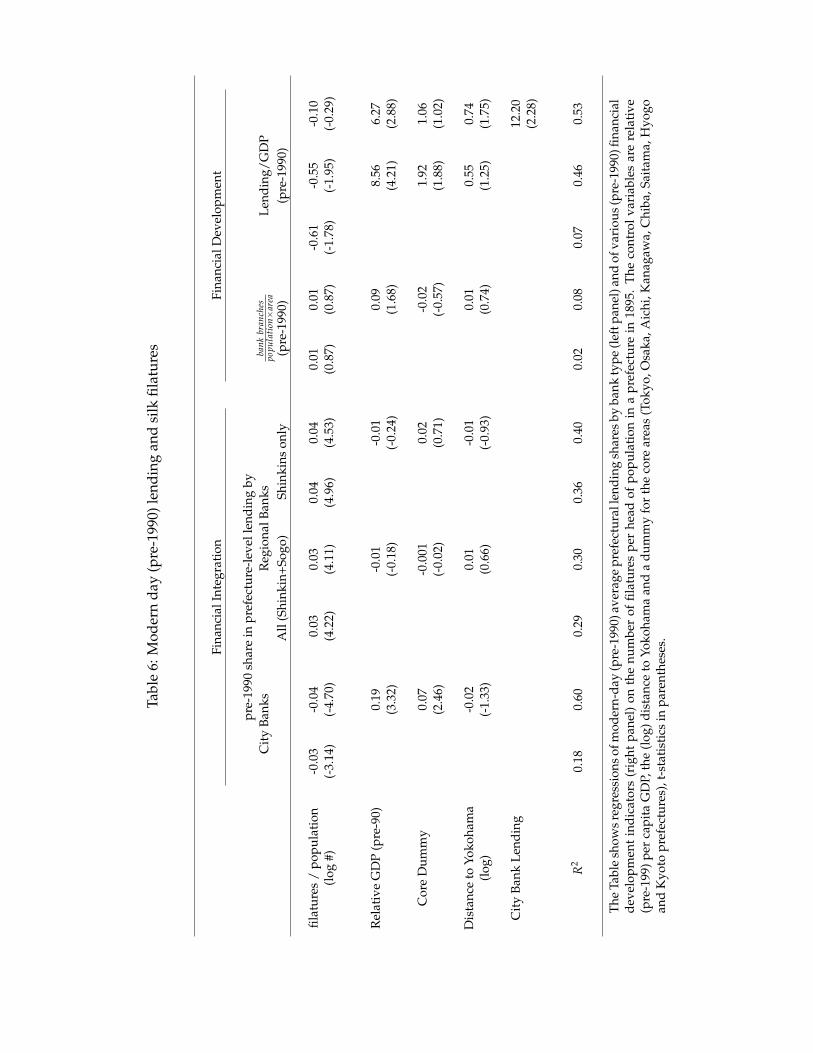
Tabl
e6:
Mod
ern
day
(pre
-199
0)le
ndin
gan
dsi
lkfil
atur
es
Fina
ncia
lInt
egra
tion
Fina
ncia
lDev
elop
men
t
pre-
1990
shar
ein
pref
ectu
re-l
evel
lend
ing
byC
ity
Bank
sR
egio
nalB
anks
bank
bran
ches
popu
lati
on×
area
Lend
ing/
GD
PA
ll(S
hink
in+S
ogo)
Shin
kins
only
(pre
-199
0)(p
re-1
990)
filat
ures
/po
pula
tion
-0.0
3-0
.04
0.03
0.03
0.04
0.04
0.01
0.01
-0.6
1-0
.55
-0.1
0(l
og#)
(-3.
14)
(-4.
70)
(4.2
2)(4
.11)
(4.9
6)(4
.53)
(0.8
7)(0
.87)
(-1.
78)
(-1.
95)
(-0.
29)
Rel
ativ
eG
DP
(pre
-90)
0.19
-0.0
1-0
.01
0.09
8.56
6.27
(3.3
2)(-
0.18
)(-
0.24
)(1
.68)
(4.2
1)(2
.88)
Cor
eD
umm
y0.
07-0
.001
0.02
-0.0
21.
921.
06(2
.46)
(-0.
02)
(0.7
1)(-
0.57
)(1
.88)
(1.0
2)
Dis
tanc
eto
Yoko
ham
a-0
.02
0.01
-0.0
10.
010.
550.
74(l
og)
(-1.
33)
(0.6
6)(-
0.93
)(0
.74)
(1.2
5)(1
.75)
Cit
yBa
nkLe
ndin
g12
.20
(2.2
8)
R2
0.18
0.60
0.29
0.30
0.36
0.40
0.02
0.08
0.07
0.46
0.53
The
Tabl
esh
ows
regr
essi
ons
ofm
oder
n-da
y(p
re-1
990)
aver
age
pref
ectu
rall
endi
ngsh
ares
byba
nkty
pe(l
eftp
anel
)and
ofva
riou
s(p
re-1
990)
finan
cial
deve
lopm
ent
indi
cato
rs(r
ight
pane
l)on
the
num
ber
offil
atur
espe
rhe
adof
popu
lati
onin
apr
efec
ture
in18
95.
The
cont
rolv
aria
bles
are
rela
tive
(pre
-199
)per
capi
taG
DP,
the
(log
)dis
tanc
eto
Yoko
ham
aan
da
dum
my
for
the
core
area
s(T
okyo
,Osa
ka,A
ichi
,Kan
agaw
a,C
hiba
,Sai
tam
a,H
yogo
and
Kyo
topr
efec
ture
s),t
-sta
tist
ics
inpa
rent
hese
s.
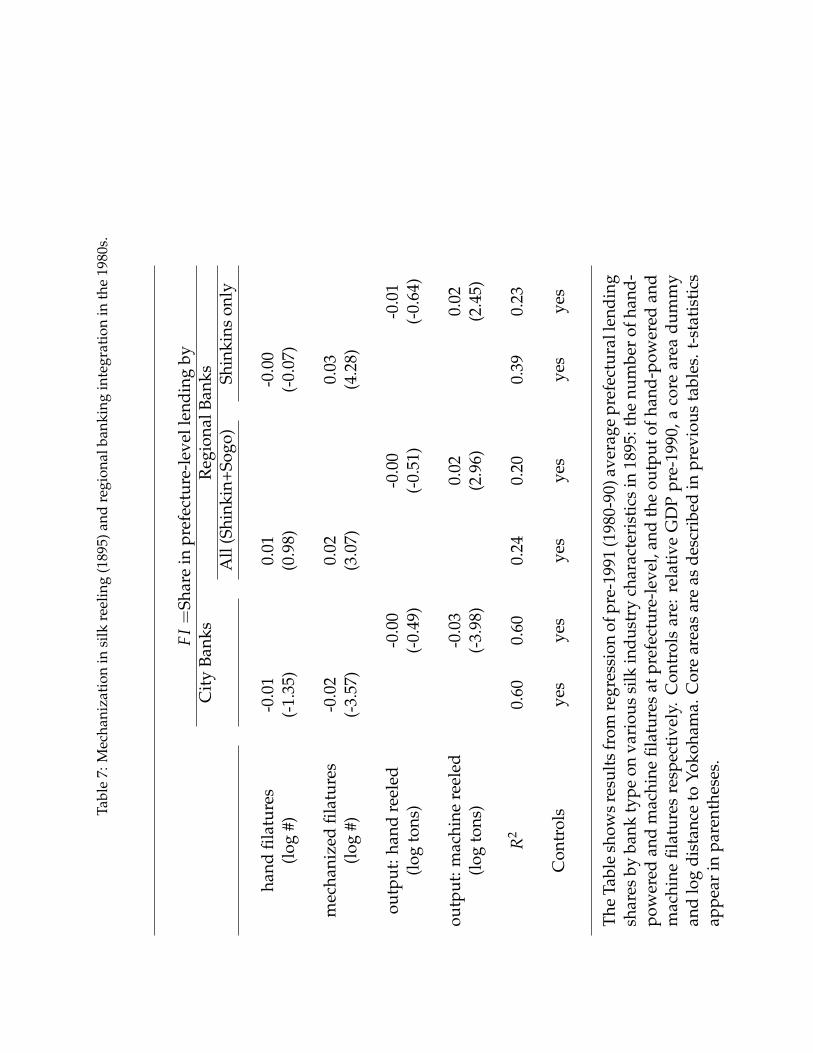
Tabl
e7:
Mec
hani
zati
onin
silk
reel
ing
(189
5)an
dre
gion
alba
nkin
gin
tegr
atio
nin
the
1980
s.
FI=
Shar
ein
pref
ectu
re-l
evel
lend
ing
byC
ity
Bank
sR
egio
nalB
anks
All
(Shi
nkin
+Sog
o)Sh
inki
nson
ly
hand
filat
ures
-0.0
10.
01-0
.00
(log
#)(-
1.35
)(0
.98)
(-0.
07)
mec
hani
zed
filat
ures
-0.0
20.
020.
03(l
og#)
(-3.
57)
(3.0
7)(4
.28)
outp
ut:h
and
reel
ed-0
.00
-0.0
0-0
.01
(log
tons
)(-
0.49
)(-
0.51
)(-
0.64
)
outp
ut:m
achi
nere
eled
-0.0
30.
020.
02(l
ogto
ns)
(-3.
98)
(2.9
6)(2
.45)
R2
0.60
0.60
0.24
0.20
0.39
0.23
Con
trol
sye
sye
sye
sye
sye
sye
s
The
Tabl
esh
ows
resu
lts
from
regr
essi
onof
pre-
1991
(198
0-90
)ave
rage
pref
ectu
rall
endi
ngsh
ares
byba
nkty
peon
vari
ous
silk
indu
stry
char
acte
rist
ics
in18
95:t
henu
mbe
rof
hand
-po
wer
edan
dm
achi
nefil
atur
esat
pref
ectu
re-l
evel
,and
the
outp
utof
hand
-pow
ered
and
mac
hine
filat
ures
resp
ecti
vely
.C
ontr
ols
are:
rela
tive
GD
Ppr
e-19
90,a
core
area
dum
my
and
log
dist
ance
toYo
koha
ma.
Cor
ear
eas
are
asde
scri
bed
inpr
evio
usta
bles
.t-s
tati
stic
sap
pear
inpa
rent
hese
s.
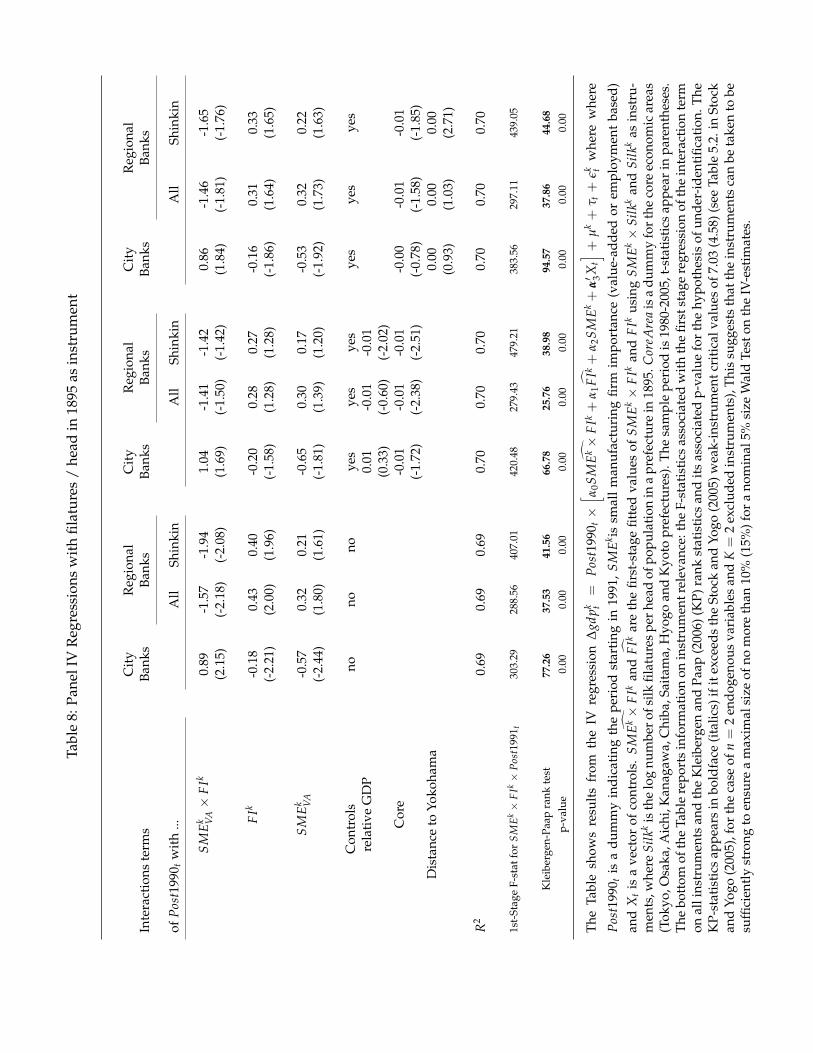
Tabl
e8:
Pane
lIV
Reg
ress
ions
wit
hfil
atur
es/
head
in18
95as
inst
rum
ent
Cit
yR
egio
nal
Cit
yR
egio
nal
Cit
yR
egio
nal
Inte
ract
ions
term
sBa
nks
Bank
sBa
nks
Bank
sBa
nks
Bank
s
ofP
ost1
990 t
wit
h...
All
Shin
kin
All
Shin
kin
All
Shin
kin
SM
Ek V
A×
FIk
0.89
-1.5
7-1
.94
1.04
-1.4
1-1
.42
0.86
-1.4
6-1
.65
(2.1
5)(-
2.18
)(-
2.08
)(1
.69)
(-1.
50)
(-1.
42)
(1.8
4)(-
1.81
)(-
1.76
)
FIk
-0.1
80.
430.
40-0
.20
0.28
0.27
-0.1
60.
310.
33(-
2.21
)(2
.00)
(1.9
6)(-
1.58
)(1
.28)
(1.2
8)(-
1.86
)(1
.64)
(1.6
5)
SM
Ek V
A-0
.57
0.32
0.21
-0.6
50.
300.
17-0
.53
0.32
0.22
(-2.
44)
(1.8
0)(1
.61)
(-1.
81)
(1.3
9)(1
.20)
(-1.
92)
(1.7
3)(1
.63)
Con
trol
sno
nono
yes
yes
yes
yes
yes
yes
rela
tive
GD
P0.
01-0
.01
-0.0
1(0
.33)
(-0.
60)
(-2.
02)
Cor
e-0
.01
-0.0
1-0
.01
-0.0
0-0
.01
-0.0
1(-
1.72
)(-
2.38
)(-
2.51
)(-
0.78
)(-
1.58
)(-
1.85
)D
ista
nce
toYo
koha
ma
0.00
0.00
0.00
(0.9
3)(1
.03)
(2.7
1)
R2
0.69
0.69
0.69
0.70
0.70
0.70
0.70
0.70
0.70
1st-
Stag
eF-
stat
for
SM
Ek×
FIk×
Pos
t199
1 t30
3.29
288.
5640
7.01
420.
4827
9.43
479.
2138
3.56
297.
1143
9.05
Kle
iber
gen-
Paap
rank
test
77.2
637
.53
41.5
666
.78
25.7
638
.98
94.5
737
.86
44.6
8p-
valu
e0.
000.
000.
000.
000.
000.
000.
000.
000.
00
The
Tabl
esh
ows
resu
lts
from
the
IVre
gres
sion
∆gd
pk t=
Pos
t199
0 t×[ α
0
SM
Ek×
FIk+
α1F
Ik+
α2S
ME
k+
α′ 3X
t] +µ
k+
τ t+
εk tw
here
whe
re
Pos
t199
0 tis
adu
mm
yin
dica
ting
the
peri
odst
arti
ngin
1991
,S
ME
k issm
all
man
ufac
turi
ngfir
mim
port
ance
(val
ue-a
dded
orem
ploy
men
tba
sed)
and
Xt
isa
vect
orof
cont
rols
.
SM
Ek×
FIk
and
FIk
are
the
first
-sta
gefit
ted
valu
esof
SM
Ek×
FIk
and
FIk
usin
gS
ME
k×
Silk
kan
dSi
lkk
asin
stru
-m
ents
,whe
reSi
lkk
isth
elo
gnu
mbe
rofs
ilkfil
atur
espe
rhea
dof
popu
lati
onin
apr
efec
ture
in18
95.C
oreA
rea
isa
dum
my
fort
heco
reec
onom
icar
eas
(Tok
yo,O
saka
,Aic
hi,K
anag
awa,
Chi
ba,S
aita
ma,
Hyo
goan
dK
yoto
pref
ectu
res)
.The
sam
ple
peri
odis
1980
-200
5,t-
stat
isti
csap
pear
inpa
rent
hese
s.Th
ebo
ttom
ofth
eTa
ble
repo
rts
info
rmat
ion
onin
stru
men
trel
evan
ce:t
heF-
stat
isti
csas
soci
ated
wit
hth
efir
stst
age
regr
essi
onof
the
inte
ract
ion
term
onal
lins
trum
ents
and
the
Kle
iber
gen
and
Paap
(200
6)(K
P)ra
nkst
atis
tics
and
its
asso
ciat
edp-
valu
efo
rth
ehy
poth
esis
ofun
der-
iden
tific
atio
n.Th
eK
P-st
atis
tics
appe
ars
inbo
ldfa
ce(i
talic
s)if
itex
ceed
sth
eSt
ock
and
Yogo
(200
5)w
eak-
inst
rum
entc
riti
calv
alue
sof
7.03
(4.5
8)(s
eeTa
ble
5.2.
inSt
ock
and
Yogo
(200
5),f
orth
eca
seof
n=
2en
doge
nous
vari
able
san
dK=
2ex
clud
edin
stru
men
ts),
This
sugg
ests
that
the
inst
rum
ents
can
beta
ken
tobe
suffi
cien
tly
stro
ngto
ensu
rea
max
imal
size
ofno
mor
eth
an10
%(1
5%)f
ora
nom
inal
5%si
zeW
ald
Test
onth
eIV
-est
imat
es.
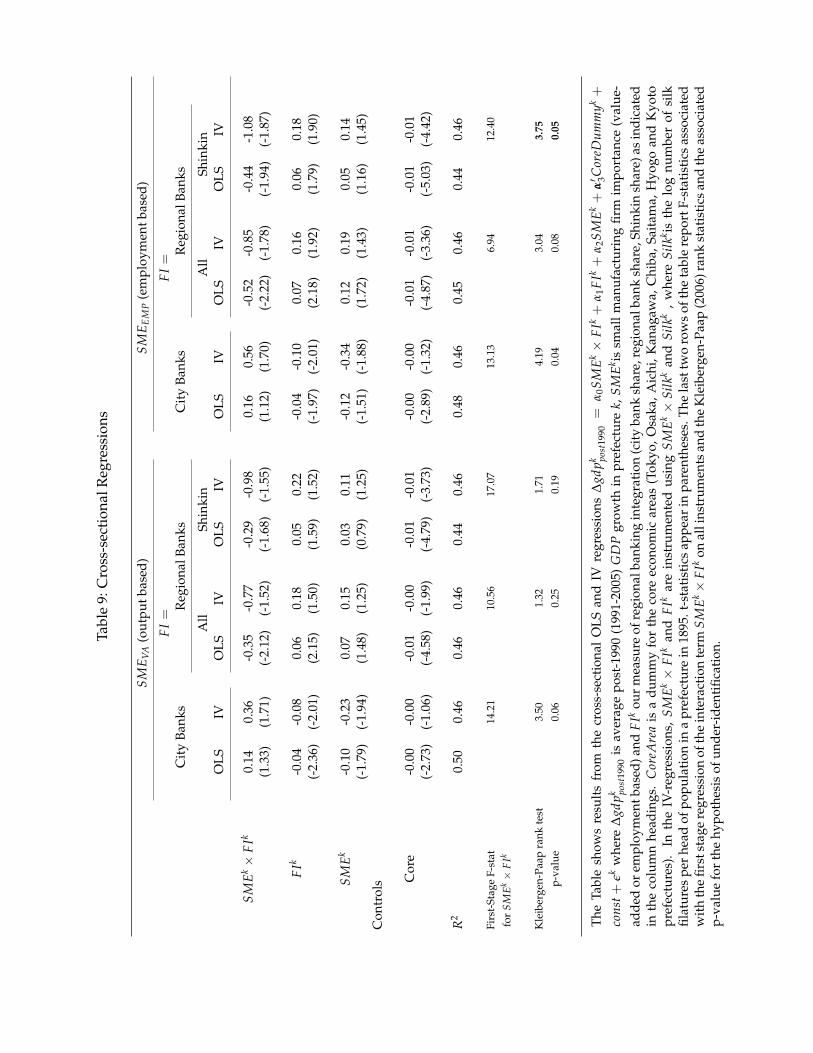
Tabl
e9:
Cro
ss-s
ecti
onal
Reg
ress
ions
SM
E VA
(out
putb
ased
)S
ME E
MP
(em
ploy
men
tbas
ed)
FI=
FI=
Cit
yBa
nks
Reg
iona
lBan
ksC
ity
Bank
sR
egio
nalB
anks
All
Shin
kin
All
Shin
kin
OLS
IVO
LSIV
OLS
IVO
LSIV
OLS
IVO
LSIV
SM
Ek×
FIk
0.14
0.36
-0.3
5-0
.77
-0.2
9-0
.98
0.16
0.56
-0.5
2-0
.85
-0.4
4-1
.08
(1.3
3)(1
.71)
(-2.
12)
(-1.
52)
(-1.
68)
(-1.
55)
(1.1
2)(1
.70)
(-2.
22)
(-1.
78)
(-1.
94)
(-1.
87)
FIk
-0.0
4-0
.08
0.06
0.18
0.05
0.22
-0.0
4-0
.10
0.07
0.16
0.06
0.18
(-2.
36)
(-2.
01)
(2.1
5)(1
.50)
(1.5
9)(1
.52)
(-1.
97)
(-2.
01)
(2.1
8)(1
.92)
(1.7
9)(1
.90)
SM
Ek
-0.1
0-0
.23
0.07
0.15
0.03
0.11
-0.1
2-0
.34
0.12
0.19
0.05
0.14
(-1.
79)
(-1.
94)
(1.4
8)(1
.25)
(0.7
9)(1
.25)
(-1.
51)
(-1.
88)
(1.7
2)(1
.43)
(1.1
6)(1
.45)
Con
trol
s Cor
e-0
.00
-0.0
0-0
.01
-0.0
0-0
.01
-0.0
1-0
.00
-0.0
0-0
.01
-0.0
1-0
.01
-0.0
1(-
2.73
)(-
1.06
)(-
4.58
)(-
1.99
)(-
4.79
)(-
3.73
)(-
2.89
)(-
1.32
)(-
4.87
)(-
3.36
)(-
5.03
)(-
4.42
)
R2
0.50
0.46
0.46
0.46
0.44
0.46
0.48
0.46
0.45
0.46
0.44
0.46
Firs
t-St
age
F-st
at14
.21
10.5
617
.07
13.1
36.
9412
.40
for
SM
Ek×
FIk
Kle
iber
gen-
Paap
rank
test
3.50
1.32
1.71
4.19
3.04
3.75
p-va
lue
0.06
0.25
0.19
0.04
0.08
0.05
The
Tabl
esh
ows
resu
lts
from
the
cros
s-se
ctio
nal
OLS
and
IVre
gres
sion
s∆
gdpk po
st19
90=
α0S
ME
k×
FIk+
α1F
Ik+
α2S
ME
k+
α′ 3C
oreD
umm
yk+
cons
t+εk
whe
re∆
gdpk po
st19
90is
aver
age
post
-199
0(1
991-
2005
)G
DP
grow
thin
pref
ectu
rek,
SM
Ek is
smal
lman
ufac
turi
ngfir
mim
port
ance
(val
ue-
adde
dor
empl
oym
entb
ased
)and
FIk
our
mea
sure
ofre
gion
alba
nkin
gin
tegr
atio
n(c
ity
bank
shar
e,re
gion
alba
nksh
are,
Shin
kin
shar
e)as
indi
cate
din
the
colu
mn
head
ings
.C
oreA
rea
isa
dum
my
for
the
core
econ
omic
area
s(T
okyo
,Osa
ka,A
ichi
,Kan
agaw
a,C
hiba
,Sai
tam
a,H
yogo
and
Kyo
topr
efec
ture
s).
Inth
eIV
-reg
ress
ions
,S
ME
k×
FIk
and
FIk
are
inst
rum
ente
dus
ing
SM
Ek×
Silk
kan
dSi
lkk
,w
here
Silk
k isth
elo
gnu
mbe
rof
silk
filat
ures
per
head
ofpo
pula
tion
ina
pref
ectu
rein
1895
.t-s
tati
stic
sap
pear
inpa
rent
hese
s.Th
ela
sttw
oro
ws
ofth
eta
ble
repo
rtF-
stat
isti
csas
soci
ated
wit
hth
efir
stst
age
regr
essi
onof
the
inte
ract
ion
term
SM
Ek×
FIk
onal
lins
trum
ents
and
the
Kle
iber
gen-
Paap
(200
6)ra
nkst
atis
tics
and
the
asso
ciat
edp-
valu
efo
rth
ehy
poth
esis
ofun
der-
iden
tific
atio
n.
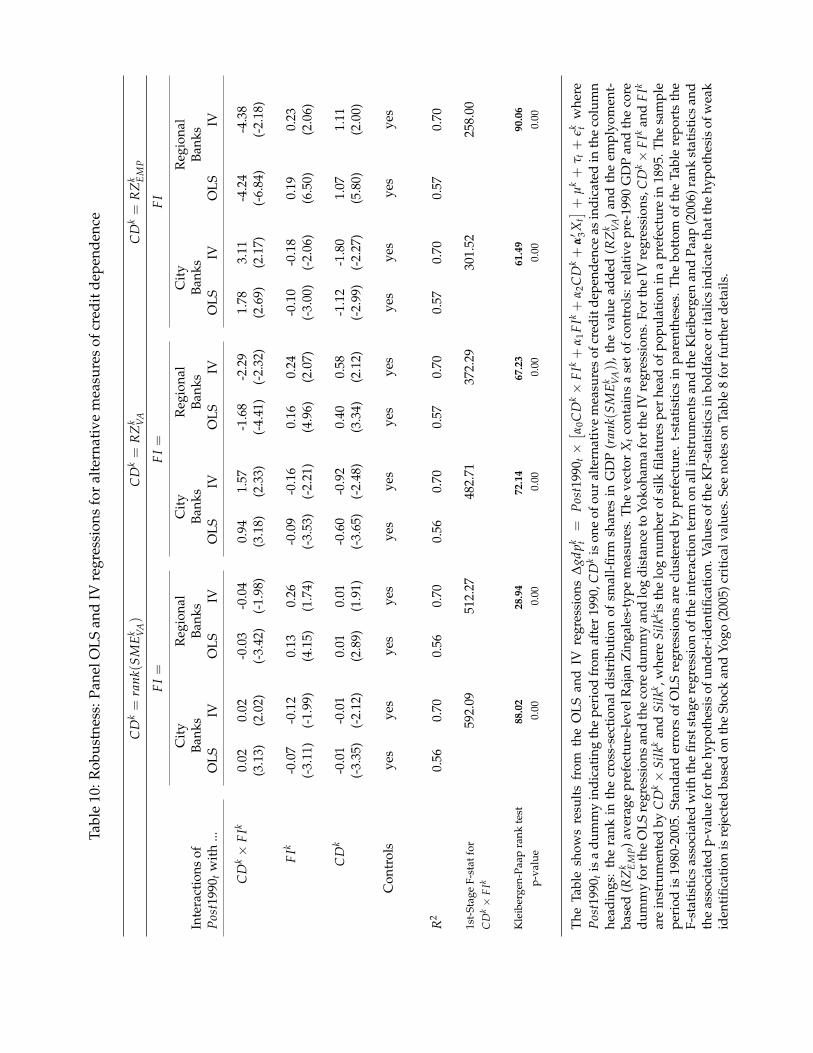
Tabl
e10
:Rob
ustn
ess:
Pane
lOLS
and
IVre
gres
sion
sfo
ral
tern
ativ
em
easu
res
ofcr
edit
depe
nden
ce
CD
k=
rank
(SM
Ek V
A)
CD
k=
RZ
k VA
CD
k=
RZ
k EM
P
FI=
FI=
FI
Cit
yR
egio
nal
Cit
yR
egio
nal
Cit
yR
egio
nal
Inte
ract
ions
ofBa
nks
Bank
sBa
nks
Bank
sBa
nks
Bank
sP
ost1
990 t
wit
h...
OLS
IVO
LSIV
OLS
IVO
LSIV
OLS
IVO
LSIV
CD
k×
FIk
0.02
0.02
-0.0
3-0
.04
0.94
1.57
-1.6
8-2
.29
1.78
3.11
-4.2
4-4
.38
(3.1
3)(2
.02)
(-3.
42)
(-1.
98)
(3.1
8)(2
.33)
(-4.
41)
(-2.
32)
(2.6
9)(2
.17)
(-6.
84)
(-2.
18)
FIk
-0.0
7-0
.12
0.13
0.26
-0.0
9-0
.16
0.16
0.24
-0.1
0-0
.18
0.19
0.23
(-3.
11)
(-1.
99)
(4.1
5)(1
.74)
(-3.
53)
(-2.
21)
(4.9
6)(2
.07)
(-3.
00)
(-2.
06)
(6.5
0)(2
.06)
CD
k-0
.01
-0.0
10.
010.
01-0
.60
-0.9
20.
400.
58-1
.12
-1.8
01.
071.
11(-
3.35
)(-
2.12
)(2
.89)
(1.9
1)(-
3.65
)(-
2.48
)(3
.34)
(2.1
2)(-
2.99
)(-
2.27
)(5
.80)
(2.0
0)
Con
trol
sye
sye
sye
sye
sye
sye
sye
sye
sye
sye
sye
sye
s
R2
0.56
0.70
0.56
0.70
0.56
0.70
0.57
0.70
0.57
0.70
0.57
0.70
1st-
Stag
eF-
stat
for
592.
0951
2.27
482.
7137
2.29
301.
5225
8.00
CD
k×
FIk
Kle
iber
gen-
Paap
rank
test
88.0
228
.94
72.1
467
.23
61.4
990
.06
p-va
lue
0.00
0.00
0.00
0.00
0.00
0.00
The
Tabl
esh
ows
resu
lts
from
the
OLS
and
IVre
gres
sion
s∆
gdpk t
=P
ost1
990 t×[ α
0CD
k×
FIk+
α1F
Ik+
α2C
Dk+
α′ 3X
t] +µ
k+
τ t+
εk tw
here
Pos
t199
0 tis
adu
mm
yin
dica
ting
the
peri
odfr
omaf
ter
1990
,CD
kis
one
ofou
ral
tern
ativ
em
easu
res
ofcr
edit
depe
nden
ceas
indi
cate
din
the
colu
mn
head
ings
:th
era
nkin
the
cros
s-se
ctio
nal
dist
ribu
tion
ofsm
all-
firm
shar
esin
GD
P(r
ank(
SM
Ek V
A))
,the
valu
ead
ded
(RZ
k VA
)an
dth
eem
plyo
men
t-ba
sed
(RZ
k EM
P)a
vera
gepr
efec
ture
-lev
elR
ajan
Zin
gale
s-ty
pem
easu
res.
The
vect
orX
tco
ntai
nsa
seto
fcon
trol
s:re
lati
vepr
e-19
90G
DP
and
the
core
dum
my
for
the
OLS
regr
essi
ons
and
the
core
dum
my
and
log
dist
ance
toYo
koha
ma
for
the
IVre
gres
sion
s.Fo
rth
eIV
regr
essi
ons,
CD
k×
FIk
and
FIk
are
inst
rum
ente
dby
CD
k×
Silk
kan
dSi
lkk ,w
here
Silk
k isth
elo
gnu
mbe
rof
silk
filat
ures
per
head
ofpo
pula
tion
ina
pref
ectu
rein
1895
.The
sam
ple
peri
odis
1980
-200
5.St
anda
rder
rors
ofO
LSre
gres
sion
sar
ecl
uste
red
bypr
efec
ture
.t-
stat
isti
csin
pare
nthe
ses.
The
bott
omof
the
Tabl
ere
port
sth
eF-
stat
isti
csas
soci
ated
wit
hth
efir
stst
age
regr
essi
onof
the
inte
ract
ion
term
onal
lins
trum
ents
and
the
Kle
iber
gen
and
Paap
(200
6)ra
nkst
atis
tics
and
the
asso
ciat
edp-
valu
efo
rth
ehy
poth
esis
ofun
der-
iden
tific
atio
n.V
alue
sof
the
KP-
stat
isti
csin
bold
face
orit
alic
sin
dica
teth
atth
ehy
poth
esis
ofw
eak
iden
tific
atio
nis
reje
cted
base
don
the
Stoc
kan
dYo
go(2
005)
crit
ical
valu
es.S
eeno
tes
onTa
ble
8fo
rfu
rthe
rde
tails
.
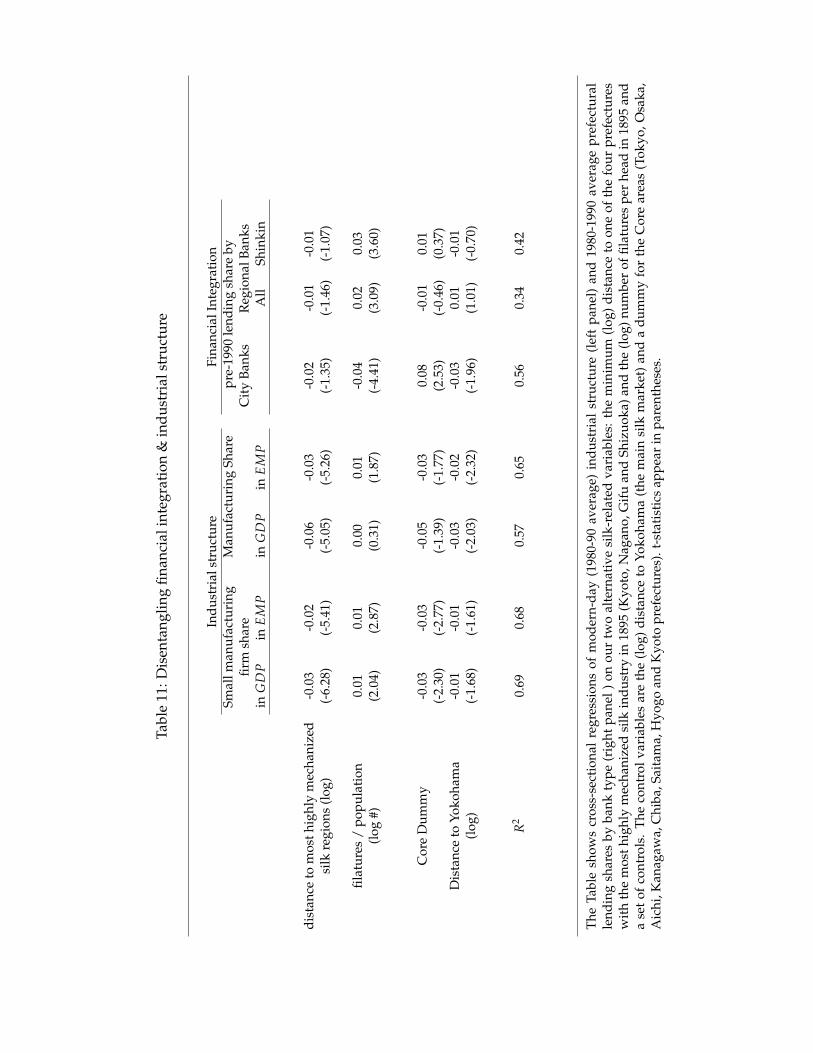
Tabl
e11
:Dis
enta
nglin
gfin
anci
alin
tegr
atio
n&
indu
stri
alst
ruct
ure
Indu
stri
alst
ruct
ure
Fina
ncia
lInt
egra
tion
Smal
lman
ufac
turi
ngM
anuf
actu
ring
Shar
epr
e-19
90le
ndin
gsh
are
byfir
msh
are
Cit
yBa
nks
Reg
iona
lBan
ksin
GD
Pin
EM
Pin
GD
Pin
EM
PA
llSh
inki
n
dist
ance
tom
osth
ighl
ym
echa
nize
d-0
.03
-0.0
2-0
.06
-0.0
3-0
.02
-0.0
1-0
.01
silk
regi
ons
(log
)(-
6.28
)(-
5.41
)(-
5.05
)(-
5.26
)(-
1.35
)(-
1.46
)(-
1.07
)
filat
ures
/po
pula
tion
0.01
0.01
0.00
0.01
-0.0
40.
020.
03(l
og#)
(2.0
4)(2
.87)
(0.3
1)(1
.87)
(-4.
41)
(3.0
9)(3
.60)
Cor
eD
umm
y-0
.03
-0.0
3-0
.05
-0.0
30.
08-0
.01
0.01
(-2.
30)
(-2.
77)
(-1.
39)
(-1.
77)
(2.5
3)(-
0.46
)(0
.37)
Dis
tanc
eto
Yoko
ham
a-0
.01
-0.0
1-0
.03
-0.0
2-0
.03
0.01
-0.0
1(l
og)
(-1.
68)
(-1.
61)
(-2.
03)
(-2.
32)
(-1.
96)
(1.0
1)(-
0.70
)
R2
0.69
0.68
0.57
0.65
0.56
0.34
0.42
The
Tabl
esh
ows
cros
s-se
ctio
nal
regr
essi
ons
ofm
oder
n-da
y(1
980-
90av
erag
e)in
dust
rial
stru
ctur
e(l
eft
pane
l)an
d19
80-1
990
aver
age
pref
ectu
ral
lend
ing
shar
esby
bank
type
(rig
htpa
nel)
onou
rtw
oal
tern
ativ
esi
lk-r
elat
edva
riab
les:
the
min
imum
(log
)di
stan
ceto
one
ofth
efo
urpr
efec
ture
sw
ith
the
mos
thig
hly
mec
hani
zed
silk
indu
stry
in18
95(K
yoto
,Nag
ano,
Gif
uan
dSh
izuo
ka)a
ndth
e(l
og)n
umbe
rof
filat
ures
per
head
in18
95an
da
set
ofco
ntro
ls.
The
cont
rolv
aria
bles
are
the
(log
)di
stan
ceto
Yoko
ham
a(t
hem
ain
silk
mar
ket)
and
adu
mm
yfo
rth
eC
ore
area
s(T
okyo
,Osa
ka,
Aic
hi,K
anag
awa,
Chi
ba,S
aita
ma,
Hyo
goan
dK
yoto
pref
ectu
res)
.t-s
tati
stic
sap
pear
inpa
rent
hese
s.
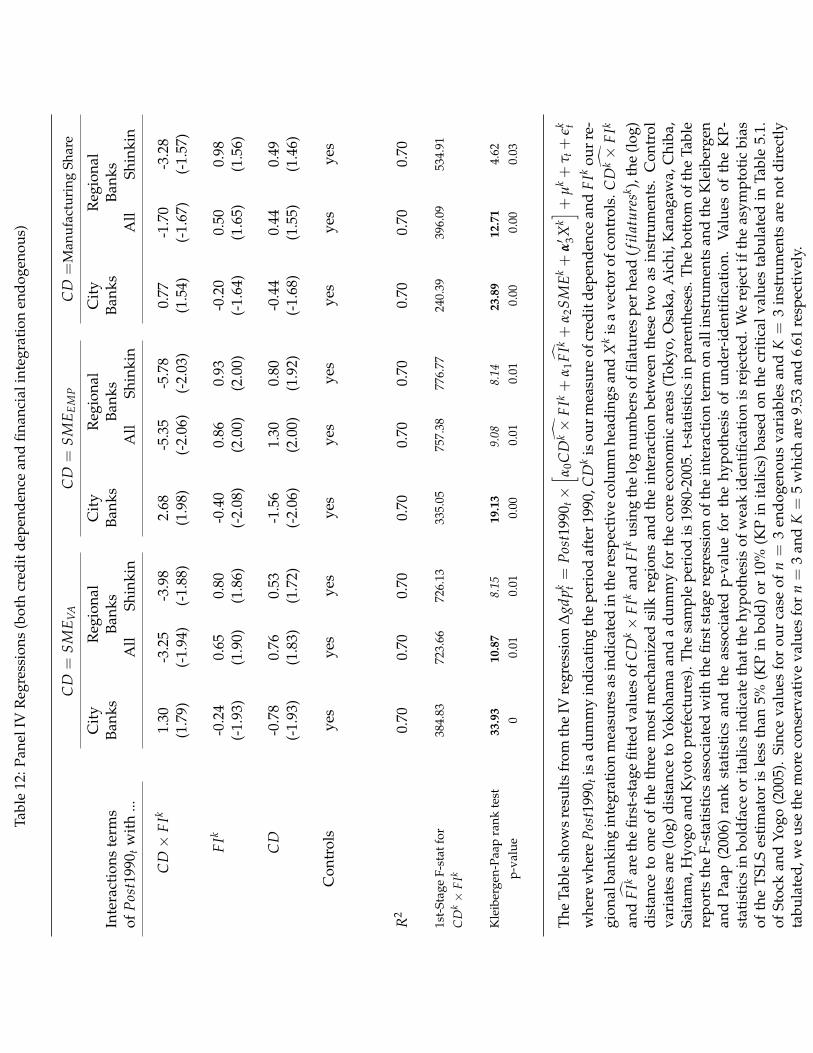
Tabl
e12
:Pan
elIV
Reg
ress
ions
(bot
hcr
edit
depe
nden
cean
dfin
anci
alin
tegr
atio
nen
doge
nous
)
CD
=S
ME V
AC
D=
SM
E EM
PC
D=
Man
ufac
turi
ngSh
are
Cit
yR
egio
nal
Cit
yR
egio
nal
Cit
yR
egio
nal
Inte
ract
ions
term
sBa
nks
Bank
sBa
nks
Bank
sBa
nks
Bank
sof
Pos
t199
0 tw
ith
...A
llSh
inki
nA
llSh
inki
nA
llSh
inki
n
CD×
FIk
1.30
-3.2
5-3
.98
2.68
-5.3
5-5
.78
0.77
-1.7
0-3
.28
(1.7
9)(-
1.94
)(-
1.88
)(1
.98)
(-2.
06)
(-2.
03)
(1.5
4)(-
1.67
)(-
1.57
)
FIk
-0.2
40.
650.
80-0
.40
0.86
0.93
-0.2
00.
500.
98(-
1.93
)(1
.90)
(1.8
6)(-
2.08
)(2
.00)
(2.0
0)(-
1.64
)(1
.65)
(1.5
6)
CD
-0.7
80.
760.
53-1
.56
1.30
0.80
-0.4
40.
440.
49(-
1.93
)(1
.83)
(1.7
2)(-
2.06
)(2
.00)
(1.9
2)(-
1.68
)(1
.55)
(1.4
6)
Con
trol
sye
sye
sye
sye
sye
sye
sye
sye
sye
s
R2
0.70
0.70
0.70
0.70
0.70
0.70
0.70
0.70
0.70
1st-
Stag
eF-
stat
for
384.
8372
3.66
726.
1333
5.05
757.
3877
6.77
240.
3939
6.09
534.
91C
Dk×
FIk
Kle
iber
gen-
Paap
rank
test
33.9
310
.87
8.15
19.1
39.
088.
1423
.89
12.7
14.
62p-
valu
e0
0.01
0.01
0.00
0.01
0.01
0.00
0.00
0.03
The
Tabl
esh
ows
resu
lts
from
the
IVre
gres
sion
∆gd
pk t=
Pos
t199
0 t×[ α
0
CD
k×
FIk+
α1F
Ik+
α2S
ME
k+
α′ 3X
k] +µ
k+
τ t+
εk t
whe
rew
here
Pos
t199
0 tis
adu
mm
yin
dica
ting
the
peri
odaf
ter1
990,
CD
kis
ourm
easu
reof
cred
itde
pend
ence
and
FIk
ourr
e-gi
onal
bank
ing
inte
grat
ion
mea
sure
sas
indi
cate
din
the
resp
ecti
veco
lum
nhe
adin
gsan
dX
kis
ave
ctor
ofco
ntro
ls.
C
Dk×
FIk
and
FIk
are
the
first
-sta
gefit
ted
valu
esof
CD
k×
FIk
and
FIk
usin
gth
elo
gnu
mbe
rsof
filat
ures
per
head
(fil
atur
esk ),
the
(log
)di
stan
ceto
one
ofth
eth
ree
mos
tm
echa
nize
dsi
lkre
gion
san
dth
ein
tera
ctio
nbe
twee
nth
ese
two
asin
stru
men
ts.
Con
trol
vari
ates
are
(log
)dis
tanc
eto
Yoko
ham
aan
da
dum
my
for
the
core
econ
omic
area
s(T
okyo
,Osa
ka,A
ichi
,Kan
agaw
a,C
hiba
,Sa
itam
a,H
yogo
and
Kyo
topr
efec
ture
s).T
hesa
mpl
epe
riod
is19
80-2
005.
t-st
atis
tics
inpa
rent
hese
s.T
hebo
ttom
ofth
eTa
ble
repo
rts
the
F-st
atis
tics
asso
ciat
edw
ith
the
first
stag
ere
gres
sion
ofth
ein
tera
ctio
nte
rmon
alli
nstr
umen
tsan
dth
eK
leib
erge
nan
dPa
ap(2
006)
rank
stat
isti
csan
dth
eas
soci
ated
p-va
lue
for
the
hypo
thes
isof
unde
r-id
enti
ficat
ion.
Val
ues
ofth
eK
P-st
atis
tics
inbo
ldfa
ceor
ital
ics
indi
cate
that
the
hypo
thes
isof
wea
kid
enti
ficat
ion
isre
ject
ed.
We
reje
ctif
the
asym
ptot
icbi
asof
the
TSLS
esti
mat
oris
less
than
5%(K
Pin
bold
)or
10%
(KP
init
alic
s)ba
sed
onth
ecr
itic
alva
lues
tabu
late
din
Tabl
e5.
1.of
Stoc
kan
dYo
go(2
005)
.Si
nce
valu
esfo
rou
rca
seof
n=
3en
doge
nous
vari
able
san
dK
=3
inst
rum
ents
are
not
dire
ctly
tabu
late
d,w
eus
eth
em
ore
cons
erva
tive
valu
esfo
rn=
3an
dK=
5w
hich
are
9.53
and
6.61
resp
ecti
vely
.
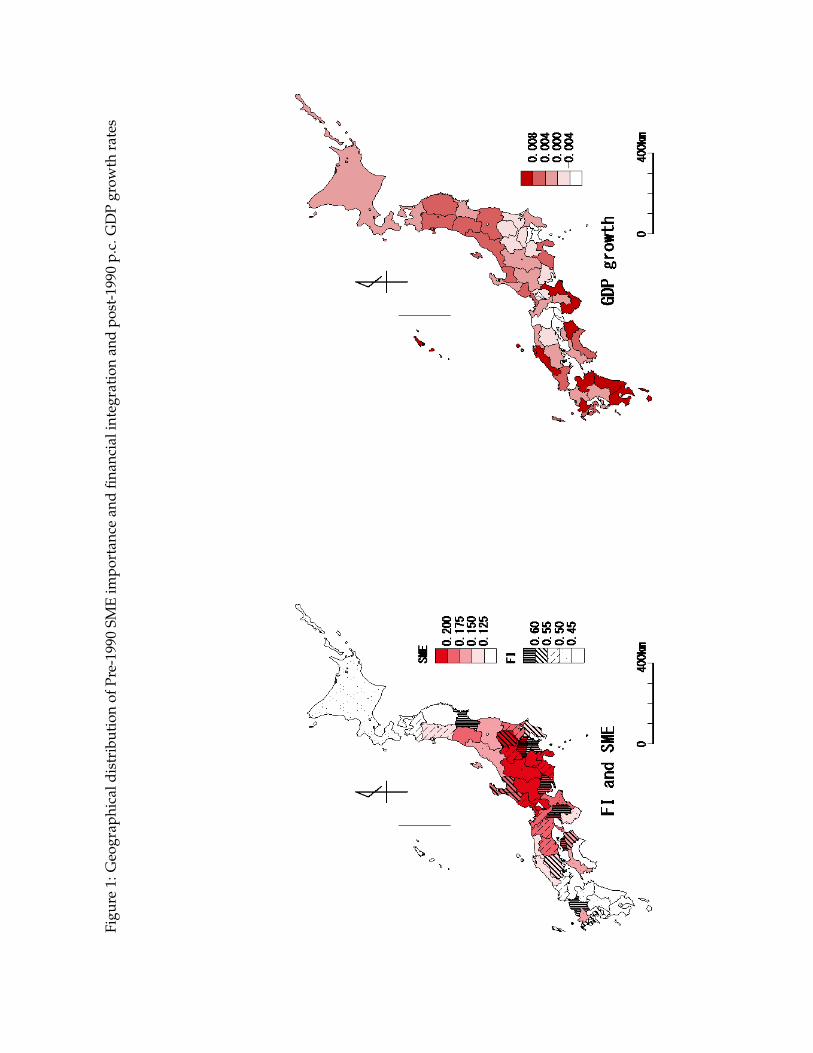
Figu
re1:
Geo
grap
hica
ldis
trib
utio
nof
Pre-
1990
SME
impo
rtan
cean
dfin
anci
alin
tegr
atio
nan
dpo
st-1
990
p.c.
GD
Pgr
owth
rate
s
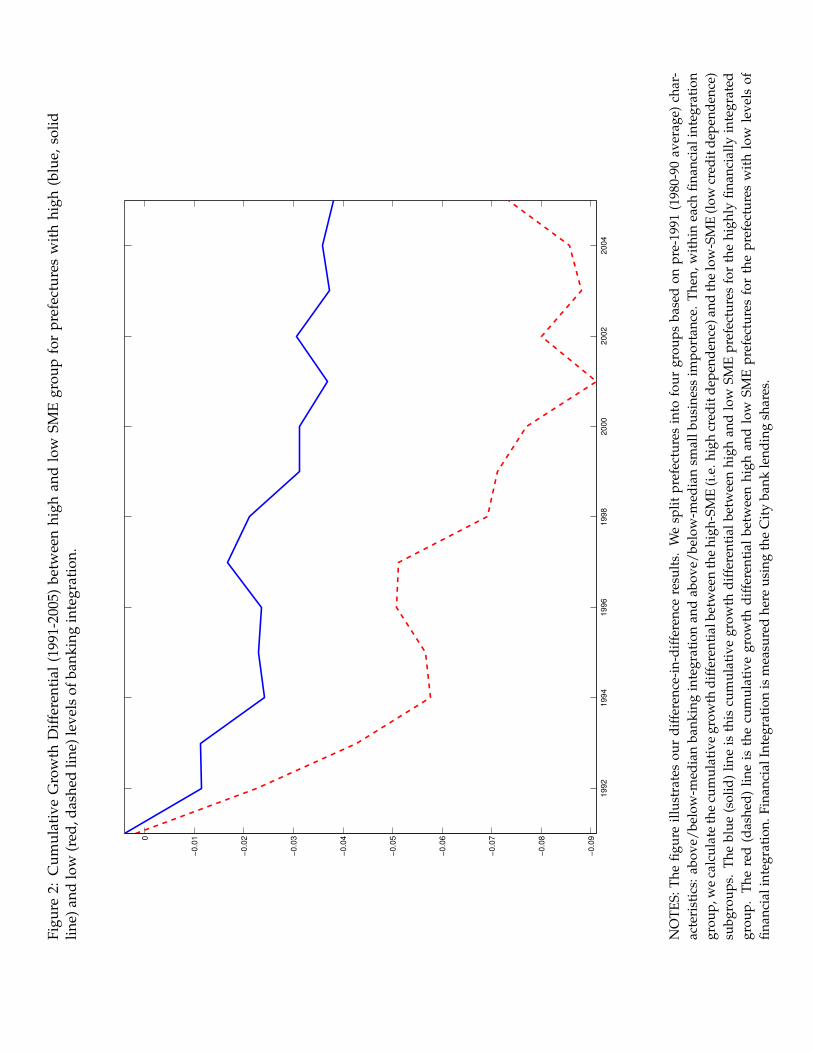
Figu
re2:
Cum
ulat
ive
Gro
wth
Diff
eren
tial
(199
1-20
05)
betw
een
high
and
low
SME
grou
pfo
rpr
efec
ture
sw
ith
high
(blu
e,so
lidlin
e)an
dlo
w(r
ed,d
ashe
dlin
e)le
vels
ofba
nkin
gin
tegr
atio
n.
1992
1994
1996
1998
2000
2002
2004
−0.0
9
−0.0
8
−0.0
7
−0.0
6
−0.0
5
−0.0
4
−0.0
3
−0.0
2
−0.0
10
NO
TES:
The
figur
eill
ustr
ates
our
diff
eren
ce-i
n-di
ffer
ence
resu
lts.
We
split
pref
ectu
res
into
four
grou
psba
sed
onpr
e-19
91(1
980-
90av
erag
e)ch
ar-
acte
rist
ics:
abov
e/be
low
-med
ian
bank
ing
inte
grat
ion
and
abov
e/be
low
-med
ian
smal
lbus
ines
sim
port
ance
.Th
en,w
ithi
nea
chfin
anci
alin
tegr
atio
ngr
oup,
we
calc
ulat
eth
ecu
mul
ativ
egr
owth
diff
eren
tial
betw
een
the
high
-SM
E(i
.e.h
igh
cred
itde
pend
ence
)and
the
low
-SM
E(l
owcr
edit
depe
nden
ce)
subg
roup
s.T
hebl
ue(s
olid
)lin
eis
this
cum
ulat
ive
grow
thdi
ffer
enti
albe
twee
nhi
ghan
dlo
wSM
Epr
efec
ture
sfo
rth
ehi
ghly
finan
cial
lyin
tegr
ated
grou
p.T
here
d(d
ashe
d)lin
eis
the
cum
ulat
ive
grow
thdi
ffer
enti
albe
twee
nhi
ghan
dlo
wSM
Epr
efec
ture
sfo
rth
epr
efec
ture
sw
ith
low
leve
lsof
finan
cial
inte
grat
ion.
Fina
ncia
lInt
egra
tion
ism
easu
red
here
usin
gth
eC
ity
bank
lend
ing
shar
es.
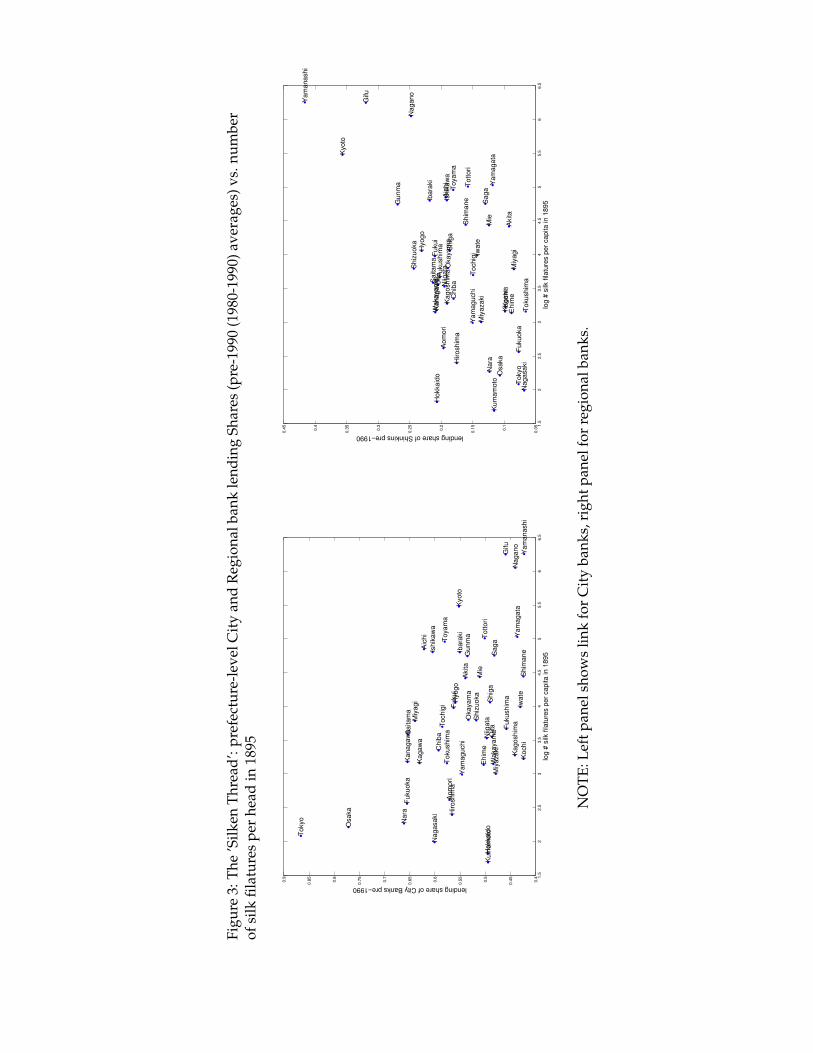
Figu
re3:
The
’Silk
enTh
read
’:pr
efec
ture
-lev
elC
ity
and
Reg
iona
lban
kle
ndin
gSh
ares
(pre
-199
0(1
980-
1990
)ave
rage
s)vs
.num
ber
ofsi
lkfil
atur
espe
rhe
adin
1895
1.5
22
.53
3.5
44
.55
5.5
66
.50
.4
0.4
5
0.5
0.5
5
0.6
0.6
5
0.7
0.7
5
0.8
0.8
5
0.9
Hokkaid
o
Aom
ori
Iwate
Miy
agi
Akita
Yam
agata
Fukushim
a
Ibara
ki
Tochig
i
Gunm
a
Saitam
a
Chib
a
Tokyo
Kanagaw
a
Niigata
Toyam
a
Ishik
aw
a
Fukui
Yam
anashi
Nagano
Gifu
Shiz
uoka
Aic
hi
Mie
Shig
a
Kyoto
Osaka
Hyogo
Nara
Wakayam
a
Tottori
Shim
ane
Okayam
a
Hiroshim
a
Yam
aguchi
Tokushim
a
Kagaw
a
Ehim
e
Kochi
Fukuoka
Saga
Nagasaki
Kum
am
oto
Oita
Miy
azaki
Kagoshim
a
log #
silk filatu
res p
er
capita in 1
895
lending share of City Banks pre−1990
1.5
22
.53
3.5
44
.55
5.5
66
.50
.05
0.1
0.1
5
0.2
0.2
5
0.3
0.3
5
0.4
0.4
5
Hokkaid
o
Aom
ori
Iwate
Miy
agi
Akita
Yam
agata
Fukushim
a
Ibara
ki
Tochig
i
Gunm
a
Saitam
a
Chib
a
Tokyo
Kanagaw
a
Niigata
Toyam
a
Ishik
aw
a
Fukui
Yam
anashi
Nagano
Gifu
Shiz
uoka
Aic
hi
Mie
Shig
a
Kyoto
Osaka
Hyogo
Nara
Wakayam
a
Tottori
Shim
ane
Okayam
a
Hiroshim
a
Yam
aguchi
Tokushim
a
Kagaw
a
Ehim
eK
ochi
Fukuoka
Saga
Nagasaki
Kum
am
oto
Oita
Miy
azaki
Kagoshim
a
log #
silk filatu
res p
er
capita in 1
895
lending share of Shinkins pre−1990
NO
TE:L
eftp
anel
show
slin
kfo
rC
ity
bank
s,ri
ghtp
anel
for
regi
onal
bank
s.