How to benchmark hybrid- and electro-chemical energy ...
31
KIT – Universität des Landes Baden-Württemberg und nationales Forschungszentrum in der Helmholtz-Gemeinschaft Institut für Technikfolgenabschätzung und Systemanalyse (ITAS) www.kit.edu How to benchmark hybrid- and electro-chemical energy storage systems Manuel Baumann 1 , Marcel Weil 1,2 , Jens Peters 2 1 Institute for Technology Assessment and System Anayses - Karlsruhe Institute of Technology 2 Helmholtz Institute Ulm - Karlsruhe Institute of Technology Joint “EERA – ON-SITE Project” Workshop on Hybrid Energy and Energy Storage Systems 21 - 22 September 2017 Ericsson – Via Anagnina 203, 00118 Morena, Rome, Italy
Transcript of How to benchmark hybrid- and electro-chemical energy ...

KIT ndash Universitaumlt des Landes Baden-Wuumlrttemberg und
nationales Forschungszentrum in der Helmholtz-Gemeinschaft
Institut fuumlr Technikfolgenabschaumltzung und Systemanalyse (ITAS)
wwwkitedu
How to benchmark hybrid- and electro-chemical
energy storage systems
Manuel Baumann1 Marcel Weil12 Jens Peters2
1Institute for Technology Assessment and System Anayses - Karlsruhe Institute of Technology 2Helmholtz Institute Ulm - Karlsruhe Institute of Technology
Joint ldquoEERA ndash ON-SITE Projectrdquo Workshop on Hybrid Energy and Energy Storage Systems 21 -
22 September 2017 Ericsson ndash Via Anagnina 203 00118 Morena Rome Italy
ITAS2 05102017 Manuel Baumann
Introduction
German Energy transition gt 80 share of RES in 2050
Increasing demand for energy storage technologies
ldquoShort term storagerdquo
4ltxlt5 h
ldquoMid term storagerdquo
8ltxlt10 h
ITAS3 05102017 Manuel Baumann
Introduction
Several Energy Storage Technologies are available
No technology is able to cover all grid applications in the near term
Power amp Quality Regulation
Bridging power
Energy Management
Inspired by Sauer et al 2010
ITAS4 05102017 Manuel Baumann
IntroductionC
ycle
s p
er
use
Duration of cycles
01 s 15 s 15 min 1 h 8 h days
1m
1day
12d
30h
30min
5sec
Multiple application fields each with specific requirements
bull Response time
bull Cycles cost
bull hellip
bull Cycles costs
bull Response time
bull hellip
PampQ - Regulation Energy managementCriteria are the
same but priorities
are different
Bridging power
Spinning reserves ramping load following
etc
Power amp Quality Regulation
Maintain power quality Defer
system Inertia etc
Energy Management
Defer up-grades price arbitrage etc
Inspired by IEC 2011
ITAS5 05102017 Manuel Baumann
Benchmarking Energy Storage
General approach
1
2
3
n
Efficieny
Investment cost
Cycle life time etc
xxxx
Abull Time resolutionbull Cycles bull DoDs bull Response time
x
Which technology is suitable to which application
Which one performs best
B
Energy storage
characteristicsRelevant
Technology
Application field Business
case definitionrequirements
Performance metrics
Benchmark
ITAS6 05102017 Manuel Baumann
Benchmarking Energy Storage
Overview
Benchmarking dimensions methods and metrics
Techno-Economic
Levelized cost of Electricity euroMWh
Total installed capital cost eurokW
Levelized Cost of Capacity eurokW-Yr
Life Cycle Cost euroMWh
Environmental
Life Cycle Assessment
Carbon footprint kgCO2 eqkWh
Others
Social
Acceptance of technologies
Social Life Cycle Assessment
ITAS7 05102017 Manuel Baumann
Benchmarking energy storage
Example for two approaches
Life cycle costing (LCC) systematic comparison over the whole
economic life time of a product
Initial investment capital replacement operation energy and disposal
costs etc
IEC 60300-3-3 or VDI 2884
Eg Annuity method NPV etc
Carbon footprint greenhouse gas
(GHG) emissions
Greenhouse effects causing substances
Methane (CH4) nitrous oxide (N2O) car-
bon tetra-fluoride (CF4) etc
Based on life cycle assessment (LCA)
ISO 14040 and ISO 14044
ITAS8 05102017 Manuel Baumann
Energy Storage Benchmarking
Methodology LCA und LCC
Deterministic LCC Calculation
Optimization of battery capacity
Benchmarking
Scale amp learning curve effects
Life cycle inventory (ecoinvent
32 database)
LCA results
Carbon footprint
Probabilistic calculation Inputs Cycles eurokWh Balance of plant cost efficiency power
conversion system cost calendric life time charging amp disch
duration el price operation and maintenance cost
Probabilistic calculationInputs Battery size charging amp dis-charging duration impact per
kWh battery ex-changements over life time
Economic Calculus (EC) Carbon Footprint
Inp
ut E
C
Techno-econ inputs Batt-DB with 28 data categories
gt5000 data points
Application field data different load profiles from
literature amp own calculations
LCA-input Comprehensive
literature review + techno-economic
data and operation data
Input data
LCC eurokWh GWP kgCO2-eqkWh
ITAS9 05102017 Manuel Baumann
Energy Storage Benchmarking
Use cases
Electric time shift (ETS)
EnergyPower = 4
10 MW40 MWh
PV self-consumption PVSC
EnergyPower = 32
25 kW 8 kWh
PR Primary regulation
EnergyPower = 1
1MW 1 MWh
RS Renewables support
EnergyPower =10
2MW 20 MWh
RS Energy stored in periods of
low electricity prices and dis-
charged during times of high
prices
PVSC Energy storage used by
end-use customers to reduce
their electricity bill by storing
the energy
PR Measures for short time
reconciliation of supply and
demand
ETS Energy is stored when
RES produce excess electricity
and dispatched during high
demand times
ITAS10 05102017 Manuel Baumann
Energy Storage Benchmarking
Electrochemical Energy Storage Technologies
bull LFP li-iron-phosphate graphite anode
bull LTO li-iron-phosphate lithium-titanate anode
bull NCM li-ni-cobalt-mg-oxide graphite anode
bull NCA li-ni-cobalt-aluminum-oxide graphite anode
bull LMO li-mg-oxide graphite anode
bull NaNiCl sodium-nickel-chloride battery
bull VRFB vanadium redox flow battery
bull VRLA valve regulated lead acid
httpwwwaltenergymagcomimagesuploadimagesA12320Systems2
0energy20storage20system20cutawayjpg
ITAS11 05102017 Manuel Baumann
Costs
ITAS12 05102017 Manuel Baumann
Energy Storage benchmarking
Life Cycle Costing
Source Baumann et al 2017
ITAS13 05102017 Manuel Baumann
Sensitivity analysis
Life Cycle Costing
A)
operation conditions including
number of cycles and charging
time per cycle
B)
Influence of efficiency and
purchased electricity
Source Baumann et al 2017
ITAS14 05102017 Manuel Baumann
Global Warming
Potential GWP
ITAS15 05102017 Manuel Baumann
Energy Storage Benchmarking
Carbon Footprint Global Warming Potential
Source Baumann et al 2017
ITAS16 05102017 Manuel Baumann
Sensitivity analysis
Carbon Footprint
A)
Variation of efficiency and total
stored energy per year
B)
battery production vs
charged electricity
Source Baumann et al 2017
ITAS17 05102017 Manuel Baumann
Energy Storage Benchmarking
LCC vs Carbon Footprint
Different Benchmark metrics might lead to conflicting results
Source Baumann et al 2017
ITAS18 05102017 Manuel Baumann
Benchmarking Hybrid Energy Storage
Technologies LIQHYSMES
Hybrid energy storage combination of complementary technologies
Fuel cells+batteries SuperCaps+Lead acid etc
Liquid hydrogen (LH2) with
Superconducting Magnetic
Energy Storage (SMES)
LH2 High vol energy density
20 ndash 40 kgmsup3 350 ndash 700 bar
Operated with SMES (eg MgB2)
high temp Superconducter in LH2
bath 20 K empty 30 m ~ 60 GWh
Maturity level ndash very low
Sander et al 2014
ITAS19 05102017 Manuel Baumann
Benchmarking Hybrid Energy Storage
Technologies LIQHYSMES
Comparison of LCC of LIQHYSMES H2 PHS and CAES for load shifting
LIQHYSMES is only hardly competitive in this certain application
Low maturity level leads to high uncertainty of results (eg PHS vs
LIQHYSMES) due to limited availability of data
Load shifting 1 GW 8 GWh
1 cycle per day
Hajek 2014
ITAS20 05102017 Manuel Baumann
Benchmarking Hybrid Energy Storage
Technologies LIQHYSMES
Power amp Quality Regulation
Bridging power
Energy Management
LIQHYSMES
LIQHYSMES is able to cover a wide range of applications
Hajek 2014
ITAS21 05102017 Manuel Baumann
Benchmarking Hybrid Energy Storage
Technologies Cost Vs Benefits
Costs only provide one side of the coin
Stacking of services aggregation of complementary benefits through
the provision of multiple services might outweigh cost
High potential especially for hybrid Energy Storage technologies
Market Services
Rate-based
Services
Customer Side
Services
Benefits
Inspired by EPRI 2012
ITAS22 05102017 Manuel Baumann
Summary
Different application areas ndashgt requirements have to be defined
Storage technology properties have to be matched with application
requirements
Several indicators available for benchmarking
Benchmarking with LCC amp GWP potentially conflicting results
Potential solutions are eg Multi-Criteria Decision Analysis
Hybrid technologies are able to cover various application areas
Proper application fields business cases have to be defined
Availability of robust data is a challenge
ITAS23 05102017 Manuel Baumann
Key questions for further discussion
1 How can energy technologies be benchmarked
considering their specific properties in face of different
grid needs
2 How to define suitable application cases for single and
especially hybrid energy storage technology
benchmarking
ITAS24 05102017 Manuel Baumann
Where to find us
Manuel Baumann
Manuelbaumannkitedu
ITASInstitute for Technology Analysis and
System Analysis
Karlstraszlige 11 Karlsruhe
Germany
httpwwwitaskitedu
Research area Innovation processes and impacts of technology
Marcel Weil
Marcelweilkitedu
Jens Peters
Jenspeters2kitedu
ITAS25 05102017 Manuel Baumann
Literature
M Sander 2014 LIQHYSMES ndash a Novel Hybrid Energy Storage Option for
Buffering Short- amp Long-Term Imbalances between Electricity Supply amp Load
httpsindicopsichgetFilepyaccessresId=0ampmaterialId=slidesampconfId=2191
M Hajek 2014 Analyse potentieller Einsatzbereiche von LIQHYSMES im
deutschen Stromnetz Bachelor thesis technische Hochschule Ingolstadt
Baumann M Peters J Weil M Grunwald A CO2 footprint and life cycle
costs of electrochemical energy storage for stationary grid applications Energy
Technology - Generation Conversion Storage Distribution 2017 DOI
101002ente201600622
D Mooney 2015 Large-Scale Energy Storage GCEP Tutorial Series NREL
IEC 2011 Electrical Energy Storage - White paper ISBN 978-2-88912-889-1
Sauer U (09 Februar 2010) Energiespeicher fuumlr ein stabiles Netz Abgerufen
am 28 Juli 2011 von httpwwwcefnrwde_database_datadata-
infopoolFK2010-E-Sauerpdf
ITAS26 05102017 Manuel Baumann
Major techno-economic inputs for cells
Table 1 Key performance parameters of the assessed batteries using upper quartiles median and lower quartile values based
on available recent literature and industry data sources from the Batt-DB [7] [16] [17] using the most recent (complete) datasets
as indicated in the second row for each technology
Component Unit Range VRLA LTO LFP LMO NMC NCA NaNiCl VRFB
Oldest source used from Batt-DB 2013 2013 2013 2013 2013 2013 2012 2010
Cost eurokWh
min 75 q 169 600 289 153 192 172 86 129
median 230 900 309 238 318 213 220 458
max 25 q 320 1200 315 564 554 355 403 860
Cycle lifetime
DoD[a]
80
min 75 q 300 4500 1750 1000 1000 1250 1000 9000
- median 1400 8000 5000 1500 4000 3000 3000 10000
max 25 q 1600 9750 5325 5000 4875 5125 6250 13250
Efficiency
min 75 q 63 81 83 85 83 90 8425 65
DC-DC median 765 90 96 94 938 9155 86 75
max 25 q 90 945 965 9825 97275 931 9125 85
Calendric
Lifetime
min 75 q 10 10 75 5 5 10 10 625
a median 180 175 150 100 100 100 140 150
max 25 q 200 250 200 150 150 150 148 200
OampM[b] cost
min 75 q 43 110 170 200 200 200 124 177
eurokW y median 169 250 250 250 200 250 209 400
max 25 q 374 338 313 300 300 300 448 505
[a] DoD=Depth of Discharge
[b] OampM=Operation and maintenance
Source Baumann et al 2017
ITAS27 05102017 Manuel Baumann
Major techno-economic inputs for system
Table S1 Cost assumptions (first year) obtained from literature BMS = battery
management system BOS=Balance of system
Type Cost eurokW Comment Source
Contingency 83 Covers unforseeable events [12]
Installation ~125 [12] [16]
BMS+BOS 273 - 475 Missing common definition [12] [16] [2]
Enclosure ~10 Dependent on technology [12]
Inverter - Depends on scale effects [13] [2]
Utility Intercon Eq ~59 Can vary extremely [12]
Battery see table
X Technology dependent Batt-DB
Interconnection eq ~59 Dependent from location [12]
Permitting ~50 Dependent of region [16]
Source Baumann et al 2017
ITAS28 05102017 Manuel Baumann
LCA sources
Table 4 CO2 footprint of battery production as calculated based on
corresponding LCI source
Technology kgCO2kg Whkg kgCO2kWh Source
LFP 1611 1398
109 83
14741 16856
[50] [51] [49]
LTO 1419 52 27099 [49] [52]
LMO 1380 116 11890 [49] [53]
NCM 1412 1613
130 139
10830 11598
[54] [50] [49]
NCA 1540 133 11574 [49] [52]
VRLA 233 45 5160 [55]
NaNiCl 1301 112 116 [56] [57]
[58]
VRFB 320 17 183 [45] [59]
Source Baumann et al 2017
ITAS29 05102017 Manuel Baumann
SoC-Optimization
Based on energy storage data-
base
Fitting curves to these data
Optimum ration between
exchanges amp total cost over
life-time
Only available for LIBs
and VRLA
NaNiCl and NaS to be
tested
Source Baumann et al 2017
ITAS30 05102017 Manuel Baumann
SoC-Optimization
Table 5 Median values of SoC optimization resulting storage capacity and number of replacements
Application LFP LTO LMO NCA NCM NaNiCl VRLA VRFB
ETS
minSoC 23 10 30 46 34 20 44 20
Nom Size MWh 57 52 64 85 68 61 99 70
Replacements 1 1 4 1 2 4 6 1
PVSC
minSoC 10 10 37 12 10 20 39 20
Nom Size MWh 0010 0010 0014 0011 0010 0012 0018 0014
Replacement 1 1[a] 1 1 1 2 4 1[a]
PR
minSoC 12 10 44 38 25 20 44 20
Nom Size MWhC 13 13 20 19 15 18 24 18
Replacement 2 1 4 2 2 3 6 1
RS
minSoC 10 10 22 19 10 20 44 20
Nom Size MWh 24 26 29 28 25 31 49 35
Replacement 1 1[a] 3 1 1 2 4 1[a]
[a] Battery exchange due to insufficient calendric life time
Source Baumann et al 2017
ITAS31 05102017 Manuel Baumann
MCDA ndash CF vs LCC
Technique for Order Preference by Similarity to Ideal Solution
Source Baumann et al 2017
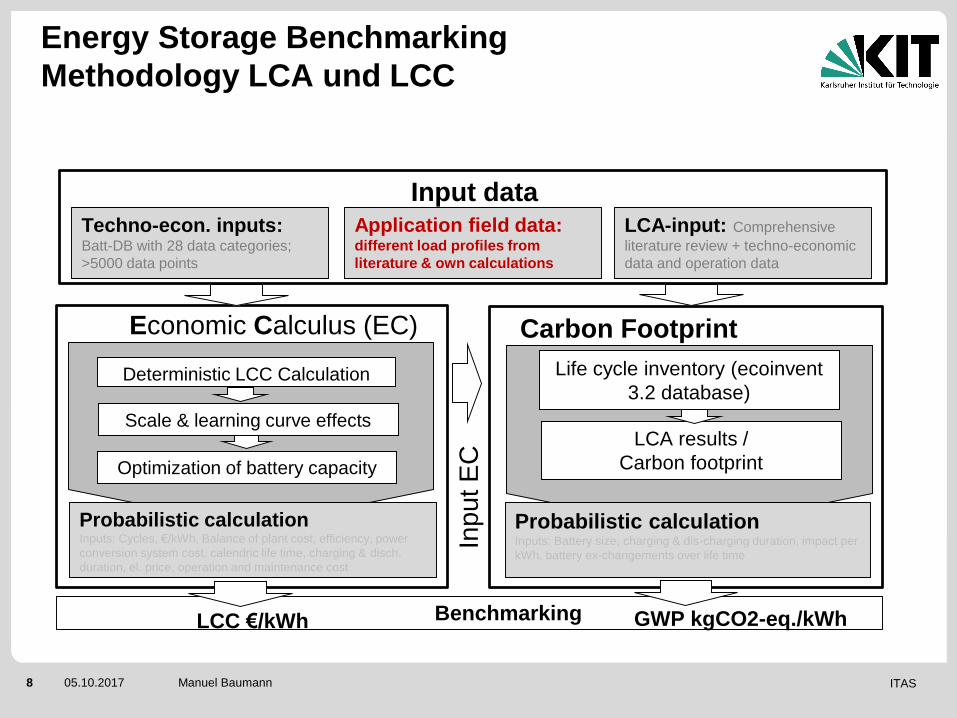
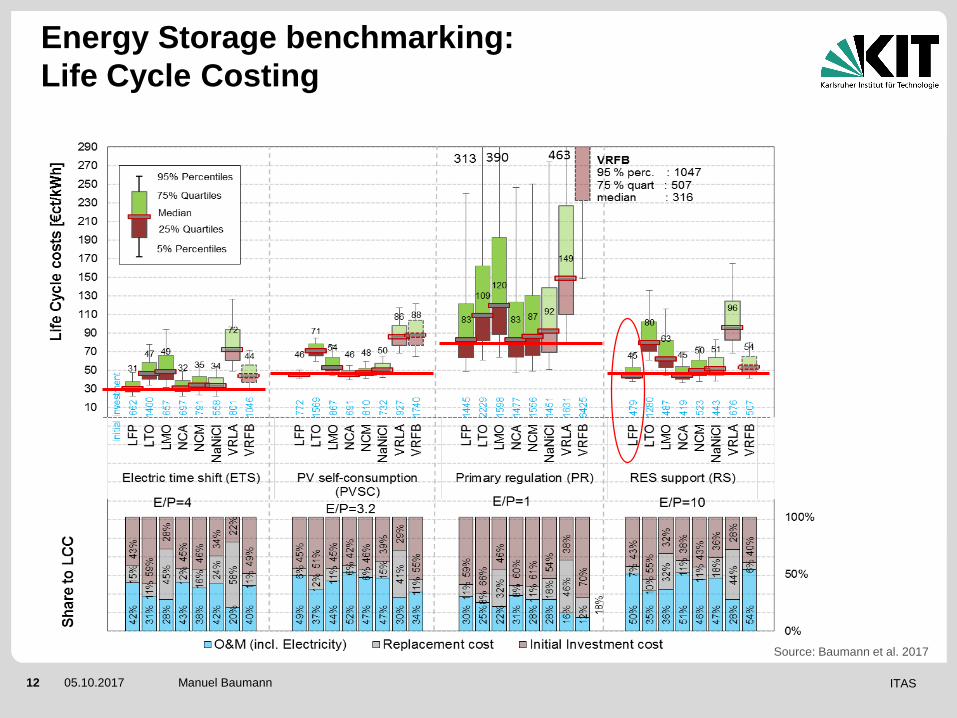
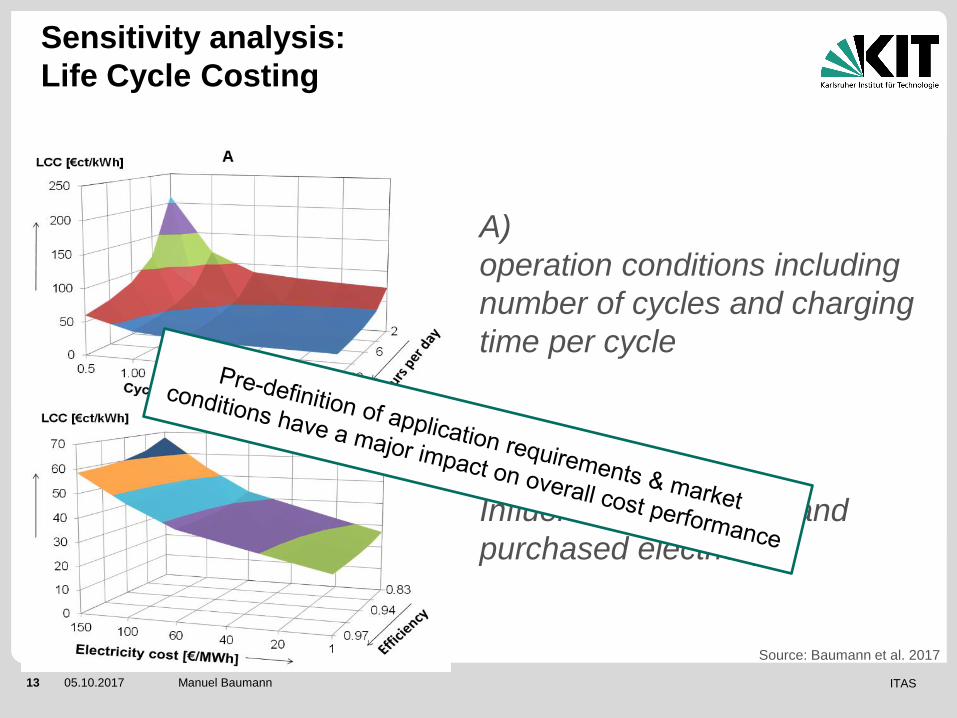
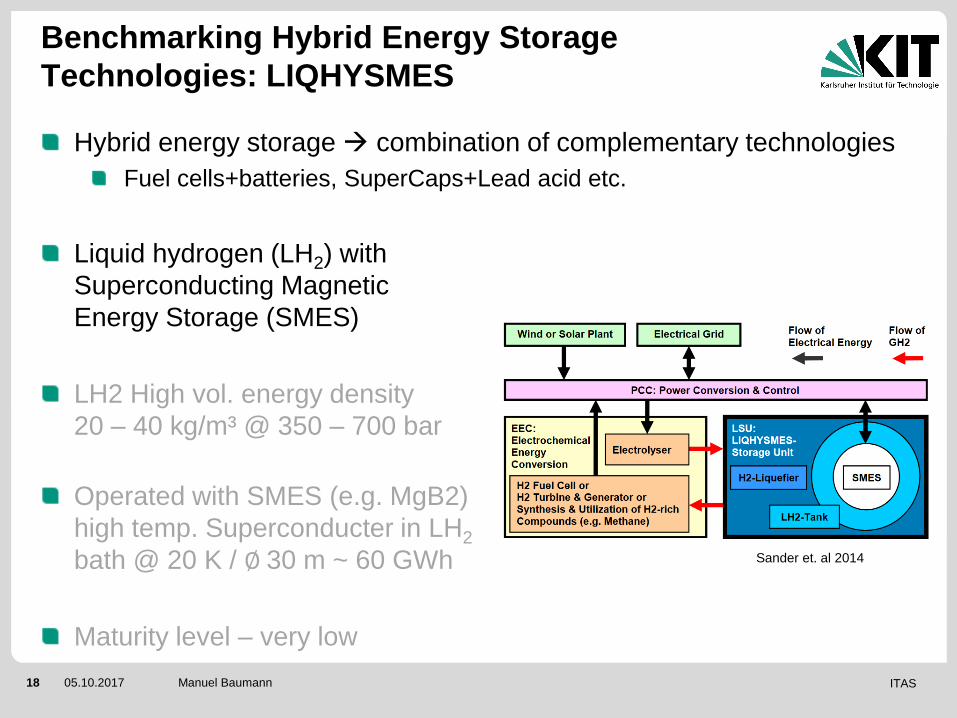

ITAS31 05102017 Manuel Baumann
MCDA ndash CF vs LCC
Technique for Order Preference by Similarity to Ideal Solution
Source Baumann et al 2017