Impact Assessment of Oil Exploitation in South Sudan using ... · ever, so far only a few studies...
13
PFG 2016 / 4, 211 – 223 Report Stuttgart, October 2016 © 2016 E. Schweizerbart'sche Verlagsbuchhandlung, Stuttgart, Germany www.schweizerbart.de DOI: 10.1127/pfg/2016/0300 1432-8364/16/0300 $ 3.50 dan People’s Liberation Movement/Army (SPLM/A) in 2005, a referendum on the 9 th of July 2011 ended not only this six-year interim phase and four decades of bloody North-South conflict but even more so sealed the split of South Sudan from Sudan. Since its secession South Sudan is the most oil-dependent coun- try in the world. Almost all of the state bud- 1 Introduction Oil plays a vital role in the economy of the Republic of South Sudan, which gained in- dependence from the Republic of Sudan only in 2011. Six years after the conclusion of the ‘Comprehensive Peace Agreement’ (CPA) be- tween the government of Sudan und the Su- Impact Assessment of Oil Exploitation in South Sudan using Multi-Temporal Landsat Imagery ALEXANDER MAGER, Oberpfaffenhofen, LARS WIRKUS, Bonn & ELISABETH SCHOEPFER, Oberpfaffenhofen Keywords: remote sensing, natural resources, land cover change, landscape monitoring, South Sudan Summary: This scientific report examines the spa- tial impacts of oil exploitation in Melut County, South Sudan, at six points in the time span between 1999 and 2011, based on Landsat satellite data. Three features were analysed: cropland, oil well pads and roads. Feature extraction consisted of pixel- and object-based classification approaches as well as on-screen digitization. Land cover classifi- cation was performed as a base for further object- based classification of cropland areas and oil well pads. Spatial analysis of the relationship between the detected features was performed. Apart from a sharp decline in cropland areas between 1999 and 2002, croplands increased steadily over time and more than doubled in size. Oil infrastructure grew enormously in size throughout the whole time se- ries from a single pad in 1999 to 555 pads in 2011. The example exhibited the potential of Earth obser- vation as a tool to support the field of peace and conflict research (MAGER 2013). Zusammenfassung: Untersuchung des Einflusses der Erdölförderung im Süd-Sudan auf die räumli- che Entwicklung basierend auf multitemporalen Landsat-Bildern. Dieser Beitrag untersucht die räumlichen Auswirkungen der Erdölförderung in Melut County im Süd-Sudan anhand von sechs ver- schiedenen Zeitpunkten zwischen 1999 und 2011 basierend auf Landsat Satellitendaten. Drei Ob- jektarten wurden analysiert: Ackerflächen, Ölbohr- stellen und Straßen. Die Objekterfassung bestand aus pixel- und objektbasierten Klassifikationsme- thoden sowie Digitalisierung. Landbedeckungs- klassifikationen wurden als Basis für weitere Klas- sifikationen von Ackerland und Ölbohrstellen durchgeführt. Eine Analyse bezüglich der räumli- chen Zusammenhänge zwischen den erfassten Ob- jekten wurde durchgeführt. Abgesehen von einem starken Rückgang der Ackerflächen zwischen 1999 und 2002 stieg die Fläche der landwirtschaftlich genutzten Gebiete stetig an und verdoppelte sich in ihrer Größe. Über die gesamte Zeitreihe hinweg wuchs die Erdölinfrastruktur enorm, und zwar von einer Ölbohrstelle im Jahr 1999 auf 555 Ölbohrstel- len im Jahr 2011. Die Studie zeigt das Potential der Erdbeobachtung als unterstützendes Werkzeug in der Friedens- und Konfliktforschung auf (MAGER 2013).
Transcript of Impact Assessment of Oil Exploitation in South Sudan using ... · ever, so far only a few studies...
PFG 2016 / 4, 211 – 223 ReportStuttgart, October 2016
© 2016 E. Schweizerbart'sche Verlagsbuchhandlung, Stuttgart, Germany www.schweizerbart.deDOI: 10.1127/pfg/2016/0300 1432-8364/16/0300 $ 3.50
dan People’s Liberation Movement/Army (SPLM/A) in 2005, a referendum on the 9th of July 2011 ended not only this six-year interim phase and four decades of bloody North-South conflict but even more so sealed the split of South Sudan from Sudan. Since its secession South Sudan is the most oil-dependent coun-try in the world. Almost all of the state bud-
1 Introduction
Oil plays a vital role in the economy of the Republic of South Sudan, which gained in-dependence from the Republic of Sudan only in 2011. Six years after the conclusion of the ‘Comprehensive Peace Agreement’ (CPA) be-tween the government of Sudan und the Su-
Impact Assessment of Oil Exploitation in South Sudan using Multi-Temporal Landsat Imagery
AlexAnder MAger, Oberpfaffenhofen, lArs Wirkus, Bonn & elisAbeth schoepfer, Oberpfaffenhofen
Keywords: remote sensing, natural resources, land cover change, landscape monitoring, South Sudan
Summary: This scientific report examines the spa-tial impacts of oil exploitation in Melut County, South Sudan, at six points in the time span between 1999 and 2011, based on Landsat satellite data. Three features were analysed: cropland, oil well pads and roads. Feature extraction consisted of pixel- and object-based classification approaches as well as on-screen digitization. Land cover classifi-cation was performed as a base for further object-based classification of cropland areas and oil well pads. Spatial analysis of the relationship between the detected features was performed. Apart from a sharp decline in cropland areas between 1999 and 2002, croplands increased steadily over time and more than doubled in size. Oil infrastructure grew enormously in size throughout the whole time se-ries from a single pad in 1999 to 555 pads in 2011. The example exhibited the potential of Earth obser-vation as a tool to support the field of peace and conflict research (Mager 2013).
Zusammenfassung: Untersuchung des Einflusses der Erdölförderung im Süd-Sudan auf die räumli-che Entwicklung basierend auf multitemporalen Landsat-Bildern. Dieser Beitrag untersucht die räumlichen Auswirkungen der Erdölförderung in Melut County im Süd-Sudan anhand von sechs ver-schiedenen Zeitpunkten zwischen 1999 und 2011 basierend auf Landsat Satellitendaten. Drei Ob-jektarten wurden analysiert: Ackerflächen, Ölbohr-stellen und Straßen. Die Objekterfassung bestand aus pixel- und objektbasierten Klassifikationsme-thoden sowie Digitalisierung. Landbedeckungs-klassifikationen wurden als Basis für weitere Klas-sifikationen von Ackerland und Ölbohrstellen durchgeführt. Eine Analyse bezüglich der räumli-chen Zusammenhänge zwischen den erfassten Ob-jekten wurde durchgeführt. Abgesehen von einem starken Rückgang der Ackerflächen zwischen 1999 und 2002 stieg die Fläche der landwirtschaftlich genutzten Gebiete stetig an und verdoppelte sich in ihrer Größe. Über die gesamte Zeitreihe hinweg wuchs die Erdölinfrastruktur enorm, und zwar von einer Ölbohrstelle im Jahr 1999 auf 555 Ölbohrstel-len im Jahr 2011. Die Studie zeigt das Potential der Erdbeobachtung als unterstützendes Werkzeug in der Friedens- und Konfliktforschung auf (Mager 2013).
212 Photogrammetrie • Fernerkundung • Geoinformation 4/2016
of survey are not possible due to geographic or financial considerations, or limitations in time. Other hindering factors might be great travel distances, security concerns, or both. In the above-described context the use of satel-lite images seems to be most suitable. How-ever, so far only a few studies have document-ed the benefits of remote sensing within the context of impact assessment of oil exploita-tion. Prins (2009) compared Landsat satellite data for the years 1999, 2000, 2001 and 2005 for parts of Melut County in Sudan and uti-lized Quickbird data in order to investigate the land use development during the preliminary phase of oil exploration. sergey & Oganes (2009) and aksyOnOv (2006) investigated the impacts of oil extraction on the Russian landscape using Landsat data. Even though they focus on oil spills, which is not of con-cern for this study, they also captured oil in-frastructure from satellite data and analyzed the possibilities and limits of doing so. Rus-sia was also the focus for Hese & scHMullius (2009) who, amongst other features, classified oil well pads from Landsat-5 data. Landsat-7 data was used by Duncan et al. (2014) to as-sess the impact of oil exploration activities in the Sahara. In 2014, Plank et al. presented an automated feature extraction procedure based on the combination of a pixel-based unsuper-vised classification of polarimetric synthetic aperture radar data (PolSAR) and an object-based post-classification. All these studies uti-lize the principle of change detection, i.e. the process of identifying differences in the state of an object or phenomenon by observing it at different times (singH 1989), for monitoring the different features of interest.
This paper provides an overview of oil-re-lated developments in Melut County, locat-ed in the Upper Nile region, in South Sudan for the period from 1999 to 2011. The objec-tive of the study was to map human activity in the context of oil extraction and to assess its impacts in the area of interest (AOI). In or-der to document the spatio-temporal devel-opment of the oil fields and impacts on their surroundings, six points in time were chosen. The study aimed at answering the following research questions: What changes can be ob-served by means of remote sensing? What spatial connections exist between those ob-
get is oil revenue. Right after its independence oil represented 98% of South Sudan’s state revenue. In the more recent years, the exact share is unclear because of the frequent dis-ruptions to the country’s oil production (EIA 2014). According to the WOrlD Bank (2015) the oil revenues currently account for around 60% of South Sudan’s gross domestic product. Most of the oil production capacity is located in South Sudan, whose proved oil reserves ac-count for 3.5 billion barrels, being more than twice as high as those of Sudan (EIA 2014). Nevertheless, being a landlocked country, South Sudan still remains dependent on Su-dan. It still is forced to use Sudan’s pipelines and port to export its oil. Armed civil con-flicts within South Sudan and continued ten-sions between the two countries, partly vio-lent, but also disagreements over oil revenue sharing have cut down oil production from both countries over the past few years with the consequence of severe economic crisis in both countries (EIA 2014, graWert 2013).
The development of the oil fields took place against the backdrop of Sudan’s second civil war, which lasted from 1983 to 2005. The dis-covery of oil added a major economic compo-nent to the conflict and deepened the divide between North and South. The central gov-ernment in Khartoum tried to achieve full control of the oil fields, a majority of which is located in the South. Hence, oil exploration was mostly limited to the central and south-central regions of the unified Sudan at that pe-riod. Thousands of people were evicted from their homes in order to secure undisturbed development of the fields. Villages were de-stroyed, people killed and thousands forceful-ly displaced (rOBinsOn 2003, terMinski 2011). Apart from the bloodshed, oil field develop-ment led to big-scale environmental problems. Crop patterns changed, poorly constructed roads led to drain blockages which caused droughts and floods and polluted ponds pose a danger for humans and animals alike (BICC 2013, ECOS 2006, ECOS 2009, ECOS 2014).
Earth observation is capable of providing important information about such processes on the ground. Remote sensing data are used as an independent source of data to comple-ment local information. This is in particular important for regions where traditional means
A. Mager, L. Wirkus & E. Schoepfer, Impact Assessment of Oil Exploitation 213
served changes? Can they be explained with existing knowledge about events related to oil production? In order to answer the questions, a three-step approach was followed: (1) An in-itial land cover classification was performed in order to gather core environmental infor-mation; (2) classes of interest were extracted using both semi-automatic (pixel- and object-based) and manual classification techniques, and (3) the extracted features were being used to map the state of the AOI at the aforemen-tioned points in time and to analyse the rela-tionships between them. One key assumption of this study is that the development of oil in-frastructure leads to a loss of cropland areas (ECOS 2011, 2014). Taken together, an over-all picture of the situation and its development over time was expected to emerge.
2 Study Area
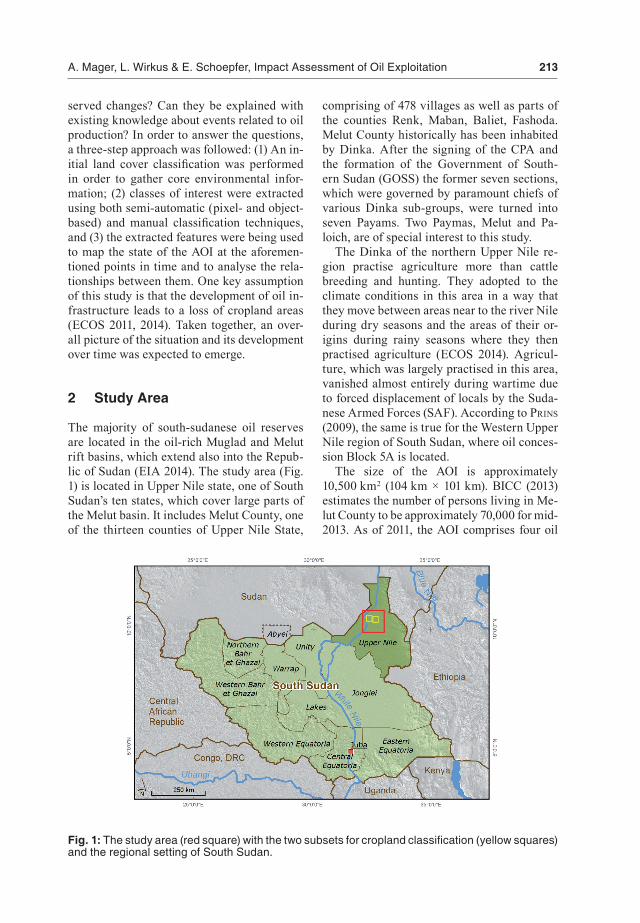
The majority of south-sudanese oil reserves are located in the oil-rich Muglad and Melut rift basins, which extend also into the Repub-lic of Sudan (EIA 2014). The study area (Fig. 1) is located in Upper Nile state, one of South Sudan’s ten states, which cover large parts of the Melut basin. It includes Melut County, one of the thirteen counties of Upper Nile State,
comprising of 478 villages as well as parts of the counties Renk, Maban, Baliet, Fashoda. Melut County historically has been inhabited by Dinka. After the signing of the CPA and the formation of the Government of South-ern Sudan (GOSS) the former seven sections, which were governed by paramount chiefs of various Dinka sub-groups, were turned into seven Payams. Two Paymas, Melut and Pa-loich, are of special interest to this study.
The Dinka of the northern Upper Nile re-gion practise agriculture more than cattle breeding and hunting. They adopted to the climate conditions in this area in a way that they move between areas near to the river Nile during dry seasons and the areas of their or-igins during rainy seasons where they then practised agriculture (ECOS 2014). Agricul-ture, which was largely practised in this area, vanished almost entirely during wartime due to forced displacement of locals by the Suda-nese Armed Forces (SAF). According to Prins (2009), the same is true for the Western Upper Nile region of South Sudan, where oil conces-sion Block 5A is located.
The size of the AOI is approximately 10,500 km2 (104 km × 101 km). BICC (2013) estimates the number of persons living in Me-lut County to be approximately 70,000 for mid-2013. As of 2011, the AOI comprises four oil
Fig. 1: The study area (red square) with the two subsets for cropland classification (yellow squares) and the regional setting of South Sudan.
214 Photogrammetrie • Fernerkundung • Geoinformation 4/2016
fields: Paloich, Adar Yale, Gumry and Mu-leeta. Exploration of the Paloich field began in 2001. In order to make way for oil exploration and to ensure undisturbed oil production, the government of Sudan continued to forcefully displace thousands of people in Melut and Ma-ban Counties after the signing of the CPA in 2005. Hundreds of villages were affected by the construction of oil well pads, roads, ponds and other infrastructure. Some villages van-ished completely (BICC 2013, ECOS 2011, ECOS 2014, HuMan rigHts WatcH 2003). ECOS (2014) states that “Assuming that on average a village consists of 100 people, this means that the lives of about 38,000 people have been affected by oil industry develop-ment in some way or another in Melut County.”
3 Data
The main data sources for this study were Landsat-5 TM and Landsat-7 ETM+ images. The area of interest is completely covered by Landsat paths 173 and 172 of row 53. Six points in time (1999, 2002, 2004, 2006, 2009, 2011) were chosen based on events that occurred in
the study area as well as data availability (Tab. 1). The first one – 1999 – was of interest be-cause it showed the state of the area before oil production started. The second point in time – 2002 – supposedly not only showed the first stages of oil field expansion but also the effects of the heavy fighting that took place between 1999 and 2002 as mentioned in chapter 1. In the year 2004, displaced people and persons that had fled the areas started to return to Me-lut County (BICC 2013). The last date in the list – 2011 – was set as an endpoint of the time series upon design of the study in mid-2012. The fact that early 2011 was the last time for which Landsat-5 imagery of the area of inter-est was available also contributed to this deci-sion. The two remaining dates in-between – 2006 and 2009 – were chosen in order to keep the time interval of two to three years between dates. In May 2003 the Scan Line Corrector (SLC) in the ETM+ instrument failed. Thus, additional data were selected for the years 2004 and 2006 in order to fill the data gaps which are caused by the SLC’s failure.
Landsat-5 data was available for 2009 and 2011, which were used to keep the number of images that contain gaps to a minimum. For
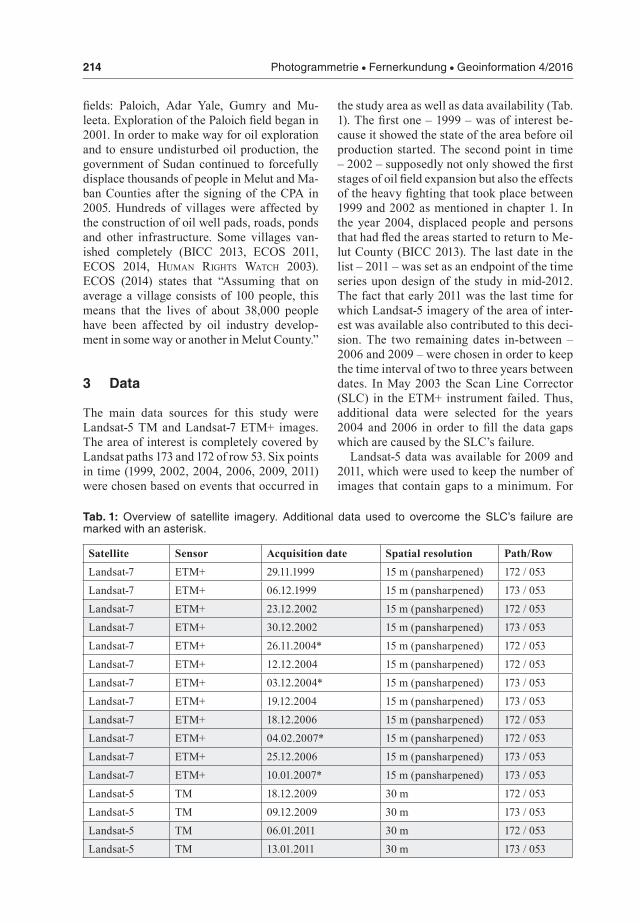
Tab. 1: Overview of satellite imagery. Additional data used to overcome the SLC’s failure are marked with an asterisk.
Satellite Sensor Acquisition date Spatial resolution Path/RowLandsat-7 ETM+ 29.11.1999 15 m (pansharpened) 172 / 053Landsat-7 ETM+ 06.12.1999 15 m (pansharpened) 173 / 053Landsat-7 ETM+ 23.12.2002 15 m (pansharpened) 172 / 053Landsat-7 ETM+ 30.12.2002 15 m (pansharpened) 173 / 053Landsat-7 ETM+ 26.11.2004* 15 m (pansharpened) 172 / 053Landsat-7 ETM+ 12.12.2004 15 m (pansharpened) 172 / 053Landsat-7 ETM+ 03.12.2004* 15 m (pansharpened) 173 / 053Landsat-7 ETM+ 19.12.2004 15 m (pansharpened) 173 / 053Landsat-7 ETM+ 18.12.2006 15 m (pansharpened) 172 / 053Landsat-7 ETM+ 04.02.2007* 15 m (pansharpened) 172 / 053Landsat-7 ETM+ 25.12.2006 15 m (pansharpened) 173 / 053Landsat-7 ETM+ 10.01.2007* 15 m (pansharpened) 173 / 053Landsat-5 TM 18.12.2009 30 m 172 / 053Landsat-5 TM 09.12.2009 30 m 173 / 053Landsat-5 TM 06.01.2011 30 m 172 / 053Landsat-5 TM 13.01.2011 30 m 173 / 053
A. Mager, L. Wirkus & E. Schoepfer, Impact Assessment of Oil Exploitation 215
preprocessing, a tasseled cap transformation as developed by kautH & tHOMas (1976) was performed on all images. It resulted in a three-band feature space. The first band corresponds to brightness. The second represents green-ness. The third band indicates wetness and re-lates to soil and surface moisture (lillesanD et al. 2008). For this study, the third band proved to be suitable for identifying human-made structures with very little or no sur-face moisture such as oil well pads. Landsat-7 data was pansharpened by merging the pan-chromatic 15 m-band with a layer stack of the bands 1-2-3-4-5-7 to produce colour images, which in turn feature a resolution of 15 m in-stead of 30 m (lillesanD et al. 2008).
4 Methodology
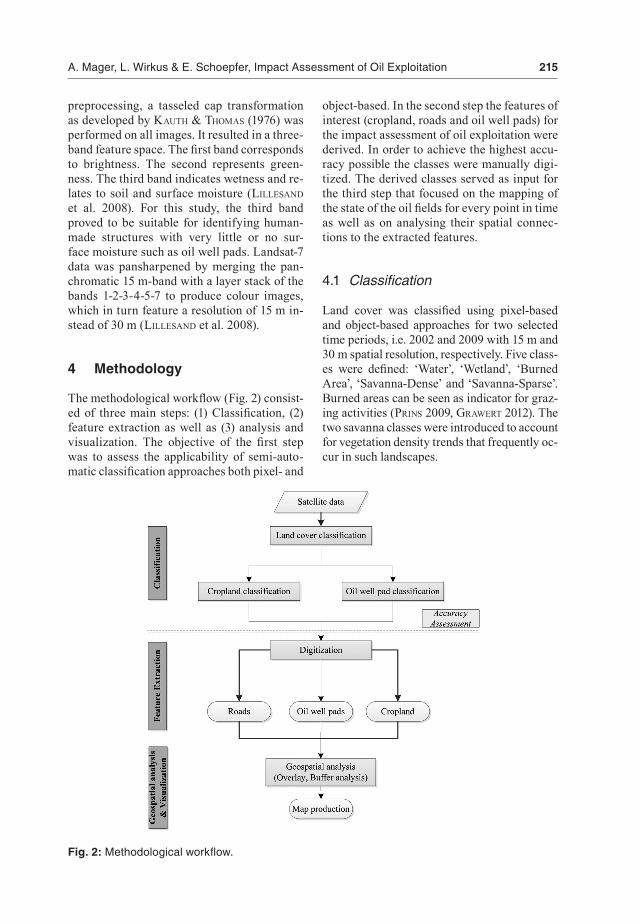
The methodological workflow (Fig. 2) consist-ed of three main steps: (1) Classification, (2) feature extraction as well as (3) analysis and visualization. The objective of the first step was to assess the applicability of semi-auto-matic classification approaches both pixel- and
object-based. In the second step the features of interest (cropland, roads and oil well pads) for the impact assessment of oil exploitation were derived. In order to achieve the highest accu-racy possible the classes were manually digi-tized. The derived classes served as input for the third step that focused on the mapping of the state of the oil fields for every point in time as well as on analysing their spatial connec-tions to the extracted features.
4.1 Classification
Land cover was classified using pixel-based and object-based approaches for two selected time periods, i.e. 2002 and 2009 with 15 m and 30 m spatial resolution, respectively. Five class-es were defined: ‘Water’, ‘Wetland’, ‘Burned Area’, ‘Savanna-Dense’ and ‘Savanna-Sparse’. Burned areas can be seen as indicator for graz-ing activities (Prins 2009, graWert 2012). The two savanna classes were introduced to account for vegetation density trends that frequently oc-cur in such landscapes.
Fig. 2: Methodological workflow.
216 Photogrammetrie • Fernerkundung • Geoinformation 4/2016
For the pixel-based classification a super-vised maximum-likelihood approach was se-lected. The method is based on training areas, which numerically describe the spectral attrib-utes of the classes to be mapped (lillesanD et al. 2008).
At the turn of the millennium the concept of image segmentation, which is not new in computer vision (Haralick & sHaPirO 1985, Pal & Pal 1993), was transferred to the re-mote sensing domain in order to complement the more traditional pixel-based methods (Baatz & scHäPe 2000, BlascHke & strOBl 2001, aDDink et al. 2012). Object-based im-age analysis (OBIA) (BlascHke 2010, cHen et al. 2012, Hussain et al. 2013, BlascHke et al. 2014) was employed using the Cognition Network Language (CNL) (Baatz et al. 2008). The segmentation algorithm used is a mul-tiresolution segmentation as defined in Baatz & scHäPe (2000). An initial segmentation was applied to separate water from vegetation fol-lowed by a second segmentation with a small-er scale parameter. The class descriptions are mainly based on spectral features and vari-ous ratios of the bands. The following indi-ces proved to be highly suitable for the class separation: Normalized Difference Vegetation Index (NDVI) (rOuse et al. 1974), Modified Soil-Adjusted Vegetation Index (MSAVI) (QI et al. 1994), Burned Area Index (BAI) (cHu-viecO et al. 2002) and Bare Soil Index (BSI) (azizi et al. 2008).
Two additional classifications were per-formed to test the identification of further classes. The distinction of cropland and non-cropland areas was tested on two subsets measuring 25 km × 25 km each. The previ-ously defined ruleset in CNL was enhanced by introducing geometrical and contextual information and applied accordingly. In ad-dition, a ruleset was developed to classify oil well pads in the whole study area. The well pads are characterized by flattened, unvege-tated squares measuring 100 m × 100 m. Ac-cordingly, the class description is based on ge-ometrical information and brightness values.
To quantify the quality of the classifica-tions, an accuracy assessment was performed (cOngaltOn 1991). Since no ground reference data were available, the classified images were compared to the original satellite imagery and
evaluated by visual interpretation. A stratified random sampling approach was chosen to per-form the accuracy assessment. For each land cover classification, a minimum of 50 sam-ple points per class and a total of 500 sample points were randomly selected. The number of sample points increased with the total number of pixels per class, ranging from 50 in the least populated class (‘Water’) to more than 200 in the ‘Savanna-Sparse’ class.
4.2 FeatureExtraction
Based on visual inspection of the imagery as well as the expert knowledge of involved re-searchers, three landscape features were found to be of interest for the analysis of the impact of oil exploitation, namely ‘Cropland’, ‘Roads’ and ‘Oil well pads’. The features can be de-scribed according to the satellite data as fol-lows: (1) ‘Oil well pads’ are mostly clear and distinct features. The oil well pads measure approximately 100 m in width and length and are used to drill for oil. Oil pads are character-ized by a squared shape and bright ground. It has to be noted that no information of the sta-tus, i.e. active or inactive, of the pad can be given. Pads which are used for water injection were also considered under the same category. This is permitted in the context of this study since man-made structures themselves were more important than the exact use of the pads. (2) The feature class ‘Road’ covers a variety of features that are used for transport between different places. They include paved and un-paved roads, simple tracks as well as routes specifically built to connect oil well pads to the road network. Due to their long and nar-row shape, roads are most often easily iden-tifiable. (3) The feature class ‘Cropland’ cov-ers all areas used for agricultural purposes. It includes small and big scale farming. Small scale farming comprises rain fed agriculture being done without the help of motorized ma-chinery. The plots of land that are cultivated this way are quite small and heterogeneous. On the other hand big scale farm lands have a distinctive shape and compactness.
For all six points in time (1999, 2002, 2004, 2006, 2009, 2011), cropland, roads, and oil well pads were digitized. The manual interpretation
A. Mager, L. Wirkus & E. Schoepfer, Impact Assessment of Oil Exploitation 217
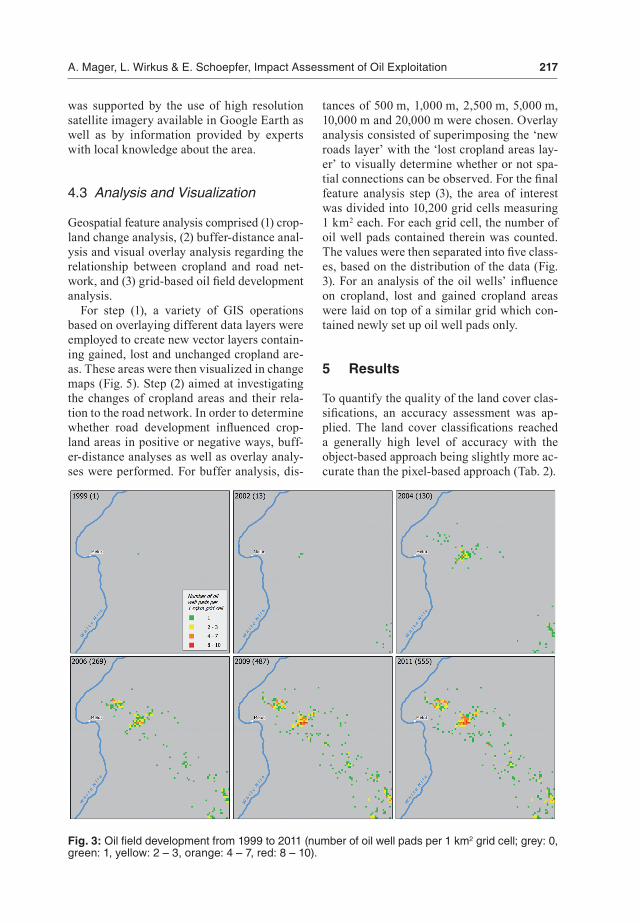
tances of 500 m, 1,000 m, 2,500 m, 5,000 m, 10,000 m and 20,000 m were chosen. Overlay analysis consisted of superimposing the ‘new roads layer’ with the ‘lost cropland areas lay-er’ to visually determine whether or not spa-tial connections can be observed. For the final feature analysis step (3), the area of interest was divided into 10,200 grid cells measuring 1 km2 each. For each grid cell, the number of oil well pads contained therein was counted. The values were then separated into five class-es, based on the distribution of the data (Fig. 3). For an analysis of the oil wells’ influence on cropland, lost and gained cropland areas were laid on top of a similar grid which con-tained newly set up oil well pads only.
5 Results
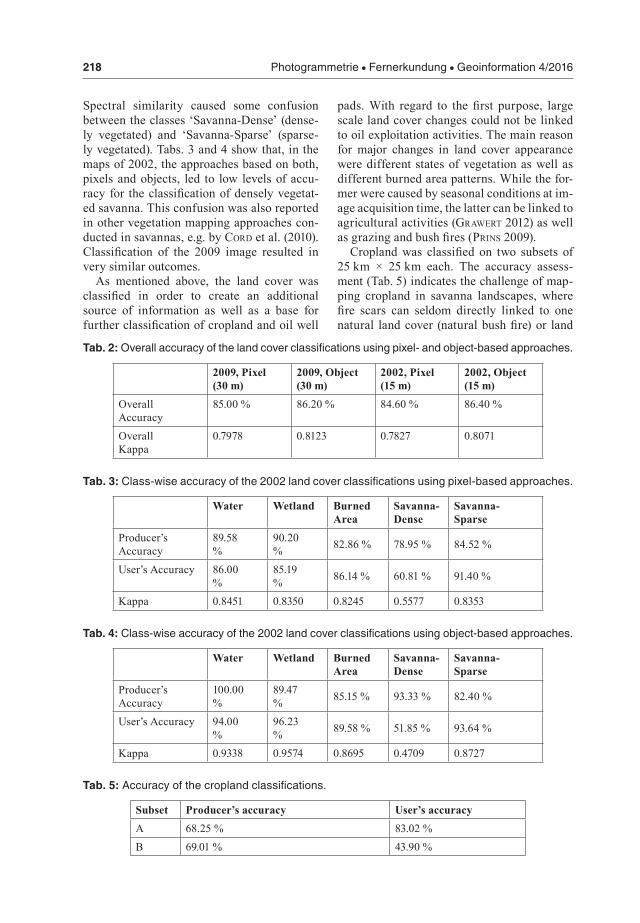
To quantify the quality of the land cover clas-sifications, an accuracy assessment was ap-plied. The land cover classifications reached a generally high level of accuracy with the object-based approach being slightly more ac-curate than the pixel-based approach (Tab. 2).
was supported by the use of high resolution satellite imagery available in Google Earth as well as by information provided by experts with local knowledge about the area.
4.3 AnalysisandVisualization
Geospatial feature analysis comprised (1) crop-land change analysis, (2) buffer-distance anal-ysis and visual overlay analysis regarding the relationship between cropland and road net-work, and (3) grid-based oil field development analysis.
For step (1), a variety of GIS operations based on overlaying different data layers were employed to create new vector layers contain-ing gained, lost and unchanged cropland are-as. These areas were then visualized in change maps (Fig. 5). Step (2) aimed at investigating the changes of cropland areas and their rela-tion to the road network. In order to determine whether road development influenced crop-land areas in positive or negative ways, buff-er-distance analyses as well as overlay analy-ses were performed. For buffer analysis, dis-
Fig. 3: Oil field development from 1999 to 2011 (number of oil well pads per 1 km2 grid cell; grey: 0, green: 1, yellow: 2 – 3, orange: 4 – 7, red: 8 – 10).
218 Photogrammetrie • Fernerkundung • Geoinformation 4/2016
pads. With regard to the first purpose, large scale land cover changes could not be linked to oil exploitation activities. The main reason for major changes in land cover appearance were different states of vegetation as well as different burned area patterns. While the for-mer were caused by seasonal conditions at im-age acquisition time, the latter can be linked to agricultural activities (graWert 2012) as well as grazing and bush fires (Prins 2009).
Cropland was classified on two subsets of 25 km × 25 km each. The accuracy assess-ment (Tab. 5) indicates the challenge of map-ping cropland in savanna landscapes, where fire scars can seldom directly linked to one natural land cover (natural bush fire) or land
Spectral similarity caused some confusion between the classes ‘Savanna-Dense’ (dense-ly vegetated) and ‘Savanna-Sparse’ (sparse-ly vegetated). Tabs. 3 and 4 show that, in the maps of 2002, the approaches based on both, pixels and objects, led to low levels of accu-racy for the classification of densely vegetat-ed savanna. This confusion was also reported in other vegetation mapping approaches con-ducted in savannas, e.g. by cOrD et al. (2010). Classification of the 2009 image resulted in very similar outcomes.
As mentioned above, the land cover was classified in order to create an additional source of information as well as a base for further classification of cropland and oil well
Tab. 2: Overall accuracy of the land cover classifications using pixel- and object-based approaches.
2009, Pixel (30 m)
2009, Object (30 m)
2002, Pixel (15 m)
2002, Object (15 m)
Overall Accuracy
85.00 % 86.20 % 84.60 % 86.40 %
Overall Kappa
0.7978 0.8123 0.7827 0.8071
Tab. 3: Class-wise accuracy of the 2002 land cover classifications using pixel-based approaches.
Water Wetland Burned Area
Savanna-Dense
Savanna-Sparse
Producer’s Accuracy
89.58 %
90.20 % 82.86 % 78.95 % 84.52 %
User’s Accuracy 86.00 %
85.19 % 86.14 % 60.81 % 91.40 %
Kappa 0.8451 0.8350 0.8245 0.5577 0.8353
Tab. 4: Class-wise accuracy of the 2002 land cover classifications using object-based approaches.
Water Wetland Burned Area
Savanna-Dense
Savanna-Sparse
Producer’s Accuracy
100.00 %
89.47 % 85.15 % 93.33 % 82.40 %
User’s Accuracy 94.00 %
96.23 % 89.58 % 51.85 % 93.64 %
Kappa 0.9338 0.9574 0.8695 0.4709 0.8727
Tab. 5: Accuracy of the cropland classifications.
Subset Producer’s accuracy User’s accuracyA 68.25 % 83.02 %B 69.01 % 43.90 %
A. Mager, L. Wirkus & E. Schoepfer, Impact Assessment of Oil Exploitation 219
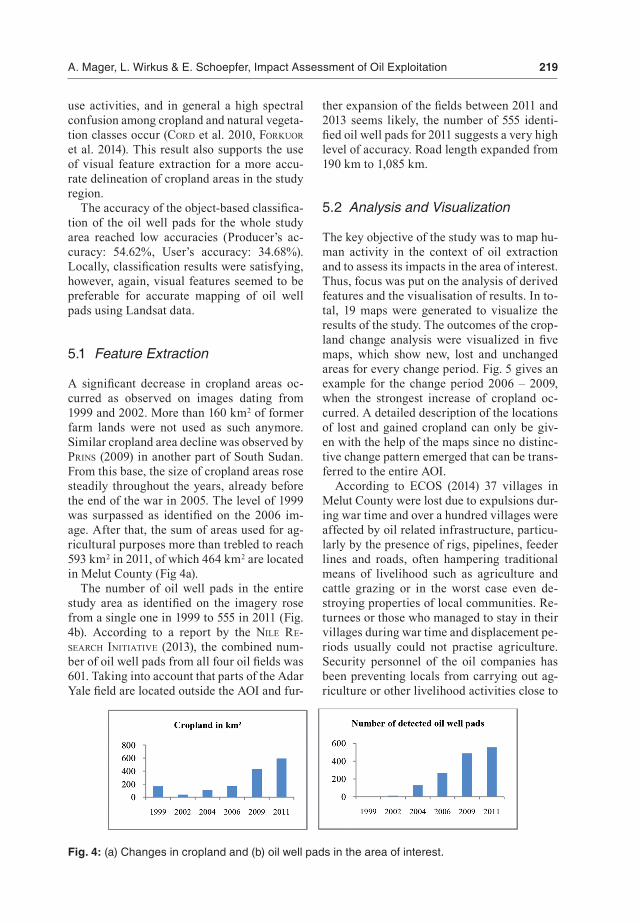
ther expansion of the fields between 2011 and 2013 seems likely, the number of 555 identi-fied oil well pads for 2011 suggests a very high level of accuracy. Road length expanded from 190 km to 1,085 km.
5.2 AnalysisandVisualization
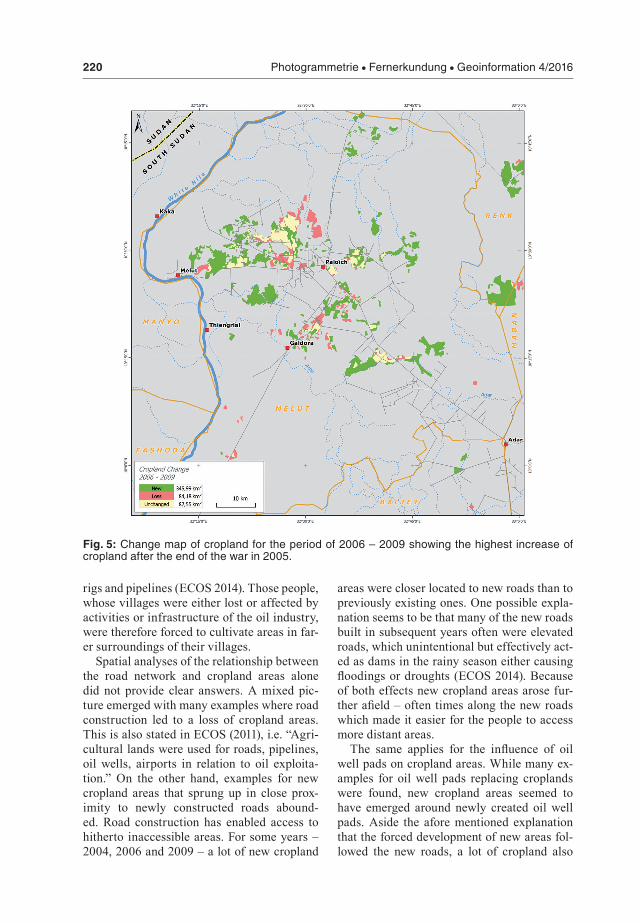
The key objective of the study was to map hu-man activity in the context of oil extraction and to assess its impacts in the area of interest. Thus, focus was put on the analysis of derived features and the visualisation of results. In to-tal, 19 maps were generated to visualize the results of the study. The outcomes of the crop-land change analysis were visualized in five maps, which show new, lost and unchanged areas for every change period. Fig. 5 gives an example for the change period 2006 – 2009, when the strongest increase of cropland oc-curred. A detailed description of the locations of lost and gained cropland can only be giv-en with the help of the maps since no distinc-tive change pattern emerged that can be trans-ferred to the entire AOI.
According to ECOS (2014) 37 villages in Melut County were lost due to expulsions dur-ing war time and over a hundred villages were affected by oil related infrastructure, particu-larly by the presence of rigs, pipelines, feeder lines and roads, often hampering traditional means of livelihood such as agriculture and cattle grazing or in the worst case even de-stroying properties of local communities. Re-turnees or those who managed to stay in their villages during war time and displacement pe-riods usually could not practise agriculture. Security personnel of the oil companies has been preventing locals from carrying out ag-riculture or other livelihood activities close to
use activities, and in general a high spectral confusion among cropland and natural vegeta-tion classes occur (cOrD et al. 2010, FOrkuOr et al. 2014). This result also supports the use of visual feature extraction for a more accu-rate delineation of cropland areas in the study region.
The accuracy of the object-based classifica-tion of the oil well pads for the whole study area reached low accuracies (Producer’s ac-curacy: 54.62%, User’s accuracy: 34.68%). Locally, classification results were satisfying, however, again, visual features seemed to be preferable for accurate mapping of oil well pads using Landsat data.
5.1 FeatureExtraction
A significant decrease in cropland areas oc-curred as observed on images dating from 1999 and 2002. More than 160 km2 of former farm lands were not used as such anymore. Similar cropland area decline was observed by Prins (2009) in another part of South Sudan. From this base, the size of cropland areas rose steadily throughout the years, already before the end of the war in 2005. The level of 1999 was surpassed as identified on the 2006 im-age. After that, the sum of areas used for ag-ricultural purposes more than trebled to reach 593 km2 in 2011, of which 464 km2 are located in Melut County (Fig 4a).
The number of oil well pads in the entire study area as identified on the imagery rose from a single one in 1999 to 555 in 2011 (Fig. 4b). According to a report by the nile re-searcH initiative (2013), the combined num-ber of oil well pads from all four oil fields was 601. Taking into account that parts of the Adar Yale field are located outside the AOI and fur-
Fig. 4: (a) Changes in cropland and (b) oil well pads in the area of interest.
220 Photogrammetrie • Fernerkundung • Geoinformation 4/2016
areas were closer located to new roads than to previously existing ones. One possible expla-nation seems to be that many of the new roads built in subsequent years often were elevated roads, which unintentional but effectively act-ed as dams in the rainy season either causing floodings or droughts (ECOS 2014). Because of both effects new cropland areas arose fur-ther afield – often times along the new roads which made it easier for the people to access more distant areas.
The same applies for the influence of oil well pads on cropland areas. While many ex-amples for oil well pads replacing croplands were found, new cropland areas seemed to have emerged around newly created oil well pads. Aside the afore mentioned explanation that the forced development of new areas fol-lowed the new roads, a lot of cropland also
rigs and pipelines (ECOS 2014). Those people, whose villages were either lost or affected by activities or infrastructure of the oil industry, were therefore forced to cultivate areas in far-er surroundings of their villages.
Spatial analyses of the relationship between the road network and cropland areas alone did not provide clear answers. A mixed pic-ture emerged with many examples where road construction led to a loss of cropland areas. This is also stated in ECOS (2011), i.e. “Agri-cultural lands were used for roads, pipelines, oil wells, airports in relation to oil exploita-tion.” On the other hand, examples for new cropland areas that sprung up in close prox-imity to newly constructed roads abound-ed. Road construction has enabled access to hitherto inaccessible areas. For some years – 2004, 2006 and 2009 – a lot of new cropland
Fig. 5: Change map of cropland for the period of 2006 – 2009 showing the highest increase of cropland after the end of the war in 2005.
A. Mager, L. Wirkus & E. Schoepfer, Impact Assessment of Oil Exploitation 221
sprung up as a consequence of the return flow of displaced persons as well as the influx of refugees since 2006 (BICC 2013, ECOS 2014).
Summarizing, satellite data can only pro-vide an “as is” picture, documenting the sta-tus quo as shown in the oil field development map (Fig. 3).
6 Discussion
The observed changes are in line with what is known to have happened in the area. As stated above, the period between 1999 and 2002 saw vicious fighting with displacement and flight of thousands of people. A sharp de-cline of cropland reflects these circumstances. From the year 2004 on, thousands of refugees returned which in turn led to new cropland areas being cultivated all over Melut County. Cropland losses (after war) and parts of newly cultivated areas were direct consequences of the oil field exploration and exploitation activ-ities in the past years, which for various rea-sons forced people to look for new land. Apart from all the negative effects on people and the environment, the development of the oil fields brought also benefits to the area like improved transport possibilities through the extended and improved road network and as a follow-up access to local and regional markets as well as the extension of the mobile network cover-age (ECOS 2014). After the expulsions during war times, numerous villages vanished com-pletely, others like New Paloich were new-ly established (ECOS 2014). Some began to exhibit signs of socio-economic change with emerging local and regional market integra-tion (BICC 2013).
The observation of both, decrease and in-crease of cropland where new roads were con-structed showed only weak evidence of caus-al spatial relationships between the develop-ment of roads and oil well pads on the one and cropland on the other side. It is beyond dispute that the erection of oil well pads led to the dis-appearance of croplands and even whole vil-lages. On the other hand, new cropland areas sprung up in very close proximity to new well pads, often alongside the newly built roads. The distance analysis concerning proximity of new roads to new cropland areas showed
that for some years it was likely that new roads enabled new croplands to emerge. Thus, ex-plicit conclusions about the interplay between certain developments could not be made, how-ever, the maps can support site specific dis-cussion and complement ground-truth data as well as local knowledge.
From the methodological point of view, it was shown that Landsat data and related semi-automatic analysis (OBIA) are highly suitable for monitoring land cover classes. It was also demonstrated that object-based image analy-sis has advantages in the identification of the desired features (cropland, oil wells) as it of-fers the integration of geometrical and contex-tual information. However, due to the coarse resolution of the input data semi-automatic approaches are limited in the classification of subtle features such as oil well pad structures. In that case, visual feature extraction may be more suitable.
The oil-rich South Sudan represents a coun-try in transition. A process of nation-building occurs that involves a high level of violence (graWert 2013, WiMMer & Min 2006). The re-sults revealed in this study show that Earth ob-servation can provide valuable information in such situations, e.g. for conflict research. Due to its unique point of view from space, remote sensing puts apparently isolated incidents into a larger context and adds a new perspective. Earth observation not only provides evidence for the impacts associated with violent con-flicts but furthers the understanding of related processes, especially in situations when field access is limited. If combined with second-ary or ground truth information a more reli-able analysis is possible. The results provided in this research helped to better understand important processes related to oil exploitation in South Sudan by visualizing changes in land use patterns over time.
A potential next step for research would be, based on the geospatial analysis of the oil field evolution, its impacts and changes on land cover and land use (oil pads, road network, cropland, villages), to superimpose other geo-referenced data, such as data about the spatial-temporal evolution of violent incidences, or data on refugee camps and migration routes to even further the analysis of interlinkages be-tween organized violence and oil exploration.
222 Photogrammetrie • Fernerkundung • Geoinformation 4/2016
cHen, G., Hay, G.J., carvalHO, L.M.T. & ulDer, M.A., 2012: Object-based change detection. – International Journal of Remote Sensing 33 (14): 4434–4457.
cHuviecO, E., Martin, M.P. & PalaciOs, A., 2002: Assessment of different spectral indices in the red-near-infrared spectral domain for burned land discrimination. – International Journal of Remote Sensing 23 (23): 5103–5110.
cOngaltOn, R.G., 1991: A review of assessing the accuracy of classifications of remotely sensed data. – Remote Sensing of the Environment 37 (1): 35–46.
cOrD, A., cOnraD, C., scHMiDt, M. & DecH, S., 2010: Standardized FAO-LCCS land cover map-ping in heterogeneous tree savannas of West Af-rica. – Journal of Arid Environments 74: 1083–1091.
Duncan, C., kretz, D., WegMann, M., raBeil, T. & PettOrelli, N., 2014: Oil in the Sahara: mapping anthropogenic threats to Saharan biodiversity from space. – Philosophical Transactions of the Royal Society B-Biological Sciences 369 (1643): 1–12.
EIA, 2014: Country Analysis Brief: Sudan and South Sudan. – U.S. Energy Information Admin-istration, https://www.eia.gov/beta/international/analysis_includes/countries_long/Sudan_and_South_Sudan/sudan.pdf (20.4.2016).
ECOS, 2006: Oil development in Northern Upper Nile, Sudan. – European Coalition on Oil in Sudan, http://www.ecosonline.org/reports/2006/melut.pdf (20.4.2016).
ECOS, 2009: Sudan, Whose oil? Facts and Analy-sis. – European Coalition on Oil in Sudan, http://www.ecosonline.org/reports/2008/dossier%20final%20groot%20web.pdf (20.4.2016).
ECOS, 2011: Sudan’s Oil Industry after the Refer-endum. Conference Report. – European Coali-tion on Oil in Sudan, http://www.ecosonline.org/reports/2011/Oil_conference_report_Dec2010.pdf (20.4.2016).
ECOS, 2014: Scrutiny of South Sudan’s oil industry – Community Relations, Labour Practices and Impact on Land Use Patterns. – European Coali-tion on Oil in Sudan, http://www.ecosonline.org/reports/2014/Scrutiny_of_South_Sudans_Oil_Industry.pdf (20.4.2016).
FOrkuOr, G., cOnraD, C., tHiel, M., ullMann, T. & zOungrana, E., 2014: Integration of Optical and Synthetic Aperture Radar Imagery for Improv-ing Crop Mapping in Northwestern Benin, West Africa. – Remote Sensing 6: 6472–6499.
graWert, E., 2012: Information on burned areas. – (Personal communication, October 23, 2012).
graWert, E. (ed.), 2013: Forging two nations – In-sights on Sudan and South Sudan. – 1st ed., 270 p.,
Acknowledgement
We would like to express our special thanks to lena guesnet and elke graWert from BICC for their support and fruitful discussions. We would like to thank FaBian selg for preced-ing work.
References
aDDink, E.A., van cOillie, F.M.B. & De JOng, S.M., 2012: Introduction to the GEOBIA 2010 special issue: From pixels to geographic objects in re-mote sensing image analysis. – International Journal of Applied Earth Observation and Geo-information 15: 1–6.
aksyOnOv, D.E., 2006: Cumulative Environmental Impact Assessment of Oil Production Using Space Imagery Products. – http://scanex.com/en/publications/pdf/publication15.pdf (20.4.2016).
azizi, Z., naJaFi, A. & sOHraBi, H., 2008: Forest canopy density estimating, using satellite imag-es. – The International Archives of the Photo-grammetry, Remote Sensing and Spatial Infor-mation Sciences, XXXVII, Part B8: 1127–1130.
Baatz, M., HOFMann, P. & WillHauck, G., 2008: Progressing from object-based to object-orient-ed image analysis. – BlascHke, T., lang, S. & Hay, G.J. (eds.): Object-based image analysis. – Spatial concepts for knowledge-driven remote sensing applications, Springer, Berlin.
Baatz, M. & scHäPe, A., 2000: Multiresolution Segmentation: an optimization approach for high quality multi-scale image segmentation. – strOBl, J., BlascHke, T. & grieseBner, G. (eds.): Angewandte Geographische Informationsverar-beitung, Heidelberg, Wichmann: 12–23.
BICC, 2013: Oil Investment and Conflict in Upper Nile State, South Sudan. – Bonn International Center for Conversion (BICC), Brief 48, Bonn.
BlascHke, T. & strOBl, J., 2001: What’s wrong with pixels? Some recent developments interfac-ing remote sensing and GIS. – GeoBIT/GIS 6: 12–17.
BlascHke, T., 2010: Object based image analysis for remote sensing. – ISPRS Journal of Photo-grammetry and Remote Sensing 65: 2–16.
BlascHke, T., Hay, G.J., kelly, M., lang, S., HOF-Mann, P., aDDink, E., FeitOsa, R.Q., van Der Meer, F., van Der WerFF, H., van cOillie, F. & tieDe, D., 2014: Geographic Object-Based Image Analysis – Towards a new paradigm. – ISPRS Journal of Photogrammetry and Remote Sensing 87: 180–191.
A. Mager, L. Wirkus & E. Schoepfer, Impact Assessment of Oil Exploitation 223
2006; http://www.ecosonline.org/reports/2009/Satellite_mapping_Block5a_small.pdf (20.4.2016).
Qi, J., cHeHBOuni, A., Huete, A.R., kerr, Y.H. & sOrOOsHian, S., 1994: A Modified Soil Adjusted Vegetation Index. – Remote Sensing of Environ-ment 48: 119–126.
rOBinsOn, C.W., 2003: Risks and Rights: The Caus-es, Consequenses, and Challenges of Develop-ment-Induced Displacement. – Occasional Pa-per, The Brookings Institute-SAIS Project of Internal Displacement, Washington DC, USA.
rOuse Jr., J.W., Haas, R.H. , scHell, J.A. & Deer-ing, D.W., 1974: Monitoring vegetation systems in the Great Plains with ERTS. – Goddard Space Flight Center 3d ERTS-1 Symp, Vol. 1, Sect. A: 309–317.
sergey, M. & Oganes, T., 2009: Landscape Impact Assessment of the Oil and Gas Industry in the Russia using space images interpretation. – XIV Simpósio Brasileiro de Sensoriamento Remoto, Natal, Brasil, INPE: 6711–6717.
singH, A., 1989: Digital change detection tech-niques using remotely-sensed data. – Interna-tional Journal of Remote Sensing 10: 989–1003.
terMinski, B., 2011: Oil-Induced Displacement and Resettlement: Social Problem and Human Rights Issue. – http://ssrn.com/abstract=2029770 (20.4.2016).
WiMMer, A. & Min, B., 2006: From Empire to Na-tion-State: Explaining Wars in the Modern World, 1861 – 2001. – American Sociological Review 71 (6): 867–897.
WOrlD Bank, 2015: South Sudan Overview. –http://www.worldbank.org/en/country/southsudan/overview (20.4.2016).
Addresses of the Authors:
alexanDer Mager, German Aerospace Center (DLR), German Remote Sensing Data Center (DFD), D-82234 Oberpfaffenhofen, e-mail: [email protected]
lars Wirkus, Bonn International Center for Conver-sion (BICC), D-53121 Bonn, e-mail: [email protected]
elisaBetH scHOePFer, German Aerospace Center (DLR), German Remote Sensing Data Center (DFD), D-82234 Oberpfaffenhofen, e-mail: [email protected]
Manuskript eingereicht: Dezember 2015Angenommen: Juli 2016
Organisation for Social Science Research in Eastern and Southern Africa, Addis Abbeba, Ethiopia.
Haralick, R.M. & sHaPirO, L., 1985: Survey: im-age segmentation techniques. – Computer Vi-sion, Graphics, and Image Processing 29: 100–132.
Hese, S. & scHMullius, C., 2009. High spatial reso-lution image object classification for terrestrial oil spill contamination mapping in West Siberia. – International Journal of Applied Earth Obser-vation and Geoinformation 11: 130–141.
HuMan rigHts WatcH, 2003. Sudan, Oil, And Hu-man Rights. – https://www.hrw.org/reports/2003/sudan1103/sudanprint.pdf (20.4.2016).
Hussain, M., cHen, D., cHeng, A., Wei, H. & stan-ley, D., 2013. Change detection from remotely sensed images: From pixel-based to object-based approaches. – ISPRS Journal of Photogramme-try and Remote Sensing 80: 91–106.
kautH, R.J. & tHOMas, G.S., 1976: The Tasseled Cap – A Graphic Description of the Spectral-Temporal Development of Agricultural Crops as Seen by LANDSAT. – Symposium on Machine Processing of Remotely Sensed Data, Purdue University of West Lafayette, IN, USA. 4B-41 - 4B-51.
lillesanD, t.M., kieFer, R.W. & cHiPMan, J.W., 2008: Remote sensing and image interpretation. – 6th ed., John Wiley & Sons Ltd., Chichester, Great Britain.
Mager, A., 2013: Impact assessment of oil exploita-tion in Upper Nile State, South Sudan, using multi-temporal Landsat-data. – MSc thesis, Par-is-Lodron-University Salzburg, Austria.
nile researcH initiative, 2013: Research on oil business in Melut County in Upper Nile State. – Study report, Catholic Diocese of Malakal, Jus-tice and Peace Department.
Pal, N.R. & Pal, S.K., 1993: A review on image segmentation techniques. – Pattern Recognition 26 (9): 1274–1294.
Plank, S., Mager, A. & scHOePFer, E., 2014: Moni-toring of Oil Exploitation Infrastructure by Combining Unsupervised Pixel-Based Classifi-cation of Polarimetric SAR and Object-Based Image Analysis. – Remote Sensing 6: 11977–12004.
Prins, E., 2009: Satellite Mapping of Land Cover and Use in relation to Oil Exploitation in Con-cession Block 5A in Southern Sudan 1987 –