
Innovation Performance in China - uni-halle.de
134
Innovation Performance in China: Innovation Systems, Market Structure and State Ownership Dissertation zur Erlangung des Grades Doktor der Wirtschaftswissenschaft (Dr. rer. pol.) der Juristischen und Wirtschaftswissenschaftlichen Fakultät der Martin-Luther-Universität Halle-Wittenberg vorgelegt von Kou Kou Halle (Saale), Juni 2017
Transcript of Innovation Performance in China - uni-halle.de

Innovation Performance in China: Innovation Systems, Market Structure and State Ownership
Dissertation
zur Erlangung des Grades
Doktor der Wirtschaftswissenschaft (Dr. rer. pol.)
der Juristischen und Wirtschaftswissenschaftlichen Fakultät
der Martin-Luther-Universität Halle-Wittenberg
vorgelegt von
Kou Kou
Halle (Saale),
Juni 2017

1. Gutachter: Prof. Dr. Ulrich Blum
2. Gutachter: Prof. Dr. Shiwei Shi
Tag der Verteidigung: 20. Dezember 2017

Acknowledgements
Firstly, I would like to express my sincere thanks to Prof. Ulrich Blum for his intellectual
guidance and constant supervision. He brought me from China to Germany and helped me come
up with the thesis topic. During my doctoral career he provided me with various opportunities
to broaden my knowledge in different disciplines and to learn how to do real research, and gave
me the freedom I needed to move on. I still remember he used to say “Ihr Erfolg ist mein Erfolg!”
(Your success is my success!), which made me feel that he is not only a good supervisor, but
also a true leader. The enthusiasm and joy he has for academic research was contagious and
motivational for me.
I am greatly thankful to Prof. Shi Shiwei for his support of my research on the Chinese and
German economy. He has been supportive since I was a master student in China and brought
me into the academic world step by step. I would not forget when I was suffering the “pain” of
difficult economic courses in my first semester as a doctoral student in Halle, he said “You are
still young. Just learn it!” to encourage me to face up to the academic challenges.
My sincere thanks also goes to the Konrad-Adenauer-Foundation, which provided me with a
doctoral scholarship throughout the last years. Without its financial support and training
program it would not be possible to finish this research.
Besides, I wish to thank Prof. Feng Xiaohu, who established cooperation between Martin-
Luther-University Halle-Wittenberg and University of International Business and Economics;
Dr. Thomas Kohl, Dr. Georg Licht and Dr. Philipp Boeing for their support at the Centre for
European Economic Research (ZEW) in Mannheim; Dr. Rainer Frietsch and Dr. Henning Kroll
for their academic guidance at the Fraunhofer Institute for Systems and Innovation Research
(ISI) in Karlsruhe.
Finally, last but not the least, I owe my deepest gratitude to my mother for her encouragement
and spiritual support from China.

I
Contents
List of Figures .......................................................................................................................... III
List of Tables ............................................................................................................................ IV
List of Abbreviations ................................................................................................................. V
1. Introduction ......................................................................................................................... 1
1.1 Motivation ................................................................................................................... 1
1.2 Chapter summaries .................................................................................................... 13
2. Background ....................................................................................................................... 20
2.1 China’s transition: governmental competition .......................................................... 20
2.1.1 The emergence of governmental competition .................................................... 20
2.1.2 Institutional governmental competition ............................................................. 23
2.1.3 Transition and innovation performance ............................................................. 25
2.2 Innovation systems, market structure and state-owned enterprises ........................... 27
2.2.1 Innovation systems ............................................................................................. 27
2.2.2 Market and industrial structure .......................................................................... 29
2.2.3 State-owned enterprises ...................................................................................... 32
3. Literature review ............................................................................................................... 36
3.1 Overview of innovation economics ........................................................................... 36
3.2 Theories of innovation systems ................................................................................. 39
3.3 Schumpeter’s hypothesis: monopoly and innovation ................................................ 41
3.4 Ownership and innovation ......................................................................................... 46
4. Innovation system and innovation performance ............................................................... 48
4.1 Introduction ............................................................................................................... 48
4.2 Theoretical basis and model ...................................................................................... 49
4.3 Data ............................................................................................................................ 53
4.3.1 Innovation output ............................................................................................... 53
4.3.2 Traditional innovation input ............................................................................... 55
4.3.3 Indicators of innovation systems ........................................................................ 56
4.4 Empirical results ........................................................................................................ 58
4.5 Conclusions ............................................................................................................... 61
5. Market structure and innovation ....................................................................................... 63
5.1 Introduction ............................................................................................................... 63
5.2 Conceptual background and hypotheses .................................................................... 64
II
5.3 Data ............................................................................................................................ 69
5.4 Empirical Results ....................................................................................................... 71
5.5 Conclusions ............................................................................................................... 76
6. Innovation output and state ownership ............................................................................. 78
6.1 Introduction ............................................................................................................... 78
6.2 Conceptual Background and Hypotheses .................................................................. 80
6.3 Data and methods ...................................................................................................... 88
6.4 Empirical results ........................................................................................................ 91
6.5 Summary and discussion ........................................................................................... 95
6.6 Conclusions ............................................................................................................... 96
7. Conclusions ....................................................................................................................... 99
Appendix A ............................................................................................................................ 105
Appendix B ............................................................................................................................ 107
Appendix C ............................................................................................................................ 109
8. References ....................................................................................................................... 114

III
List of Figures
Figure 1.1: The West and the Rest: A long-term perspective .................................................... 2
Figure 1.2: China’s growth rates vs. the Rest and its economic policy assessment................... 4
Figure 1.3: The West and the Rest: Since the reforms ............................................................... 5
Figure 1.4: GDP growth of China (%) ....................................................................................... 6
Figure 1.5: Working age (15-64) pupulation (% of total) .......................................................... 6
Figure 1.6: Analytical framework of the thesis ........................................................................ 12
Figure 2.1: Analytical framework of governmental competition ............................................. 22
Figure 2.2: Structure of government institution in China ........................................................ 24
Figure 2.3: Market reform and firm performance in China ..................................................... 27
Figure 2.4: Flying-geese paradigm ........................................................................................... 30
Figure 2.5: Marketization index of China ................................................................................ 31
Figure 2.6: The number of invention patent application .......................................................... 35
Figure 3.1: Evolution of innovation process models ................................................................ 37
Figure 3.2: Technology push model ......................................................................................... 37
Figure 3.3: Need pull model ..................................................................................................... 38
Figure 4.1: The number of patents granted 1998 to 2008 ........................................................ 54
Figure 4.2: The number of patents granted per million persons 1998 to 2008 ........................ 55
Figure 4.3: Change of R&D human capital .............................................................................. 56
Figure 5.1: matrix of market structure and effects ................................................................... 66
Figure 5.2: Simulation results from the model (3-digit and 4-digit level) ............................... 72
Figure 5.3: Simulation results from the model (in different industries) ................................... 76
IV
List of Tables
Table 2.1: The number of SOEs ............................................................................................... 33
Table 2.2: Average annual total factor productivity growth (%), nonagricultural sector ........ 34
Table 4.1: Definition of variables ............................................................................................ 58
Table 4.2: Estimation results (granted patents as dependent variable) .................................... 60
Table 5.1: Definitions of variables ........................................................................................... 70
Table 5.2: Effects of market concentration .............................................................................. 72
Table 5.3: Empirical results in different regions ...................................................................... 74
Table 5.4: Empirical results in different industries .................................................................. 75
Table 6.1: Definition of variables ............................................................................................ 91
Table 6.2: Basic model with year differences .......................................................................... 93
Table 6.3: Separate models for different regions ..................................................................... 94
Table 6.4: Separate models for different industries ................................................................. 95
Table A.1: Descriptive statistics ............................................................................................. 105
Table A.2: Estimation results (granted patents per million people as dependent variable) ... 106
Table B.1: Descriptive statistics ............................................................................................. 108
Table C.1: Correlation matrix ................................................................................................ 109
Table C.2: Descriptive statistics ............................................................................................. 109
Table C.3: Basic model with year differences ....................................................................... 111
Table C.4: Separate models for different regions .................................................................. 112
Table C.5: Separate models for different industries ............................................................... 113
V
List of Abbreviations
BC before Christ
CCER China Center for Economic Research
CSMAR China Stock Market & Accounting Research
EPO European Patent Office
FP&S Furman, Porter and Stern's Model
GDP Gross Domestic Product
HHI Herfindal Index
IO Industrial Organization
LL Leader-and-Laggard Market
NERI National Economic Research Institute
NIS National Innovation System
NN Neck-and-Neck Market
OECD Organization for Economic Co-operation and Development
POE Privately Owned Enterprises
R&D Research and Development
RIS Regional Innovation System
S&T Science and Technology
SASAC State-owned Assets Supervision and Administration Commission
SCP Structure, Conduct and Performance Paradigm
SIC Standard Industrial Classification
SME Small- and Medium-Sized Enterprise
SOE State-owned Enterprise
TFP Total Factor Productivity
UK United Kingdom
US United States
USPTO United States Patent and Trademark Office
WTO World Trade Organization

1
1. Introduction
1.1 Motivation
Knowledge is the information which is acquired through experience or education and can help
to understand inner or outer world. Between the 8th and 3rd centuries BC, new knowledge and
new ways of thinking appeared in different regions of the world in a striking parallel
development, without any obvious direct cultural contact between the regions, including that
which took place between PLATO (428/427 BC. – 348/347 BC.), ARISTOTLE (384 BC. – 322
BC.), ZENO (322 BC. – 262/261 BC.) and EPICURUS (341 BC. – 348/347 BC.) in Greece,
GAUTAMA BUDDHA (563 BC. – 483 BC.) in India, ZOROASTER/ZARATHUSTRA (? – 583 BC.) in
Iran, ISAIAH (lived in the 8th. Century BC.) in Palestine, and LAO TSE (604 BC. – 531 BC.) and
CONFUCIUS (551 BC. – 479 BC.) in China. This phenomenon was called by the German-Swiss
philosopher Jaspers (2014) as the “Axis Age” (Achsenzeit) in his book The Origin and Goal of
History. These ancient sages are considered the greatest and the most important thinkers in their
countries (regions) to this day, and the knowledge they discovered shaped the philosophical
system, and the behavior of the people in their region. From the 14th to the 18th century – in
the age of the Renaissance and Enlightenment – the heritage of the ancient Greek philosophy
was revived after the medieval period in Europe. Since then recognition of an individual’s
consciousness has become a foundation of European society; such recognition did not take
place in China.
The revolution in knowledge and growing awareness of individual freedom, liberty and
rationalism helped to incite a new competition mechanism and stimulated the spirit of
innovation among people in Europe, and is considered one of the motivations leading to the
“scientific revolution” (Koyre, 1943) with the emergence of modern nature science – including
mathematics, physics and astronomy – resulting then in the industrial revolution in Europe. It
not only boosted the development of science and technology (S&T) but also the economic
growth of European countries like England, Germany and the Netherlands. But at the same time,
China turned inwards and cut off its contact with the rest of the world. According to the
Maddison Database, in the 18th century, western European countries surpassed China in terms
of GDP, with an economic boom commencing, while China entered into a long, difficult
economic age, identified by Pomeranz (2000) as “the Great Divergence” and – on the European
side – by Jones (2003) as “the European Miracle”. With respect to per capita income the West

2
exceeded the rest of the world in the 13th century and has kept its economic dominance since
then (see Figure 1.1).
Figure 1.1: The West and the Rest: A long-term perspective
Source: Blum (2017b), Maddison (2010).
The British scientist and historian Needham (1969) raised a famous question half a century ago:
why had China been overtaken by the West in science and technology, despite its earlier
successes? This puzzle is one of the most intriguing issues for researchers of Chinese economic
history. Lin (1995) argues that because in premodern times, most technological inventions
stemmed from the experiences of people, they would be more likely to occur in a large society
with large population like China, while in modern times, technological progress mainly results
from mathematized hypotheses and experiment, which has become an important trend in
Europe since the scientific revolution of the 17th century. In contrast, the institutional
arrangements in pre-modern periods of China, like civil service examinations and the criteria
of promotion, distracted the attention of people away from human capital investment to
scientific research. In the book Civilization: The West and the Rest, Ferguson (2012) explains
the success of European civilization (“the West”) with six factors largely missing elsewhere in
the world (“the Rest”): competition, science, the rule of law, medicine, consumerism and the
work ethic.
Acemoglu and Robinson (2012) trace the divergence of growth to institutional elements in their
book Why Nations Fail: The Origins of Power, Prosperity, and Poverty. Inclusive institutions
would favor nations and benefit the economic prosperity, while extractive institutions in which
individuals exploit the society and the rest of the population, would lead countries to poverty
0,5
1
1,5
2
2,5
3
3,5
0 500 1000 1500 2000
pe
r-ca
pit
a in
com
e r
atio
We
st/R
est
Year

3
and backwardness. The book The Wealth and Poverty of Nations of Landes (1999) indicates
the following reasons why the west experienced a rapid growth while the rest stagnated: the
culture thesis, namely Protestant work ethic of Weber (1905); the geographic condition;
political competition and economic freedom; and innovation pressure that promotes the
technological development. Blum and Dudley (1999) argue that economic divergence is
inspired by Schumpeter’s concept of the destructive impact of innovations on existing
technologies.
In fact, the Chinese have never stopped searching for ways to revive their country using
knowledge and science. In the “New Culture Movement” of the 1910s, a group of Chinese
scholars appealed to create a new Chinese culture based on global and Western standards,
especially in science, known in metaphorical terms as “Mr. Science” in China at that time. But
the wars and unrest of the 20th century delayed any modernization that could take place through
S&T until the reform and opening up policy in the 1970s. At the beginning of the reform, the
Chinese leader Deng Xiaoping implemented the recovery of “Gaokao” (national higher
education entrance examination), which was officially canceled during the Cultural Revolution.
With the implementation of this examination, the higher education system – the most important
channel in cultivating human capital – was recovered. Since then, the system of S&T began to
be transformed to encompass a market-oriented structure. Innovation and knowledge have been
considered important elements of economic growth in China.
China’s rapid economic growth in the last decades has been driven by two sets of factors: 1)
marketization reform, which has built up a market-oriented system in China to reduce
administrative commands to strengthen property rights and to introduce competition in the
market (Xu, 2011); and 2) economic fundamentals, above all comparative advantages (Lin, Cai,
& Li, 2003), including a favorable demographic structure, low labor cost and participation in
the global labor division (Wei, Xie, & Zhang, 2017). In contrast to eastern European countries,
China’s initial reform began with experimental changes and a gradual transition aimed at
improving economic performance rather than directly building up a Western market economy.
One of the advantages of gradualism was that policymakers could learn from the experience
gained from previous experiments and thereby reduce the cost of the decision (Knight, 2014).
This “Trial and Error” strategy has avoided the risk and side effects of the Shock Therapy, but
some features and elements of the pre-transition system have survived to this day. Rather than
a “big bang”, China’s reform path could be more aptly described as “growing out of the plan”
(Naughton, 1994).

4
China’s economic system under Mao Zedong was transferred from the model of the Soviet
Union, which was characterized by the absolute dominance of the government controlling the
power of resource allocation. Although the centrally planned economy has reached a quick
growth rate at the beginning of the post-war era, its disadvantages, such as misallocation of
resources and low efficiency, appeared gradually and led the country to a long period of
economic turbulence and downturn. A good example is the campaign “Great Leap Forward”
from 1958 to 1962, which aimed to rapidly transform China from an agrarian economy into an
industrial country through radical approaches, but finally failed with famine and economic
depression. Since economic reforms began in the late 1970s, China sought to partly liberalize
the market and decentralize its trade system to integrate itself into the international trading
system. Figure 1.2 illustrates the growth rate of China and its reform policy since 1961. It is
notable that most reform measures have triggered considerable growth impulses successfully
when the economy had fallen into recession. Through economic policy the Chinese government
has reduced negative influences of economic fluctuations and overcome growth weakness in
the last decades.
Figure 1.2: China’s growth rates vs. the Rest and its economic policy assessment
Source: Blum (2017b), World Bank

5
One “secret” behind China’s successful transition is restructuring an incentive mechanism,
which encourages local officials to concentrate on economic development by increasing the
level of competition between local governments. Setting incentives for local bureaucrats to
encourage growth is unusual, but has proven itself to be a powerful tool, stimulating growth
and indirectly promoting investment and development projects (Naughton, 2017). Xu (2011)
argues that China’s institution is a regionally decentralized authoritarian system, which
indicates that political control is centralized, while economic management is decentralized to
local governments. Knight (2014) considers China as a “developmental” country, because the
government gives high policy priority to economic growth and this target is built into the system
at all levels. In the last almost 40 years, China’s transformation from the centrally planned
system to a market-oriented economy has achieved a great success: Since the beginning of the
reform and opening up policy in 1978, China’s GDP has increased by over 9% per year. By
redefining the role of government and restructuring state enterprises, developing private
enterprises and promoting market competition, China has implemented structural reforms to
strengthen the foundations for a market-based economy (World Bank, 2013).
However, it should not be ignored that despite the rapid GDP growth there exists still a
development gap with high income countries in terms of per capita GDP (see Figure 1.3). In
fact, China has not caught up the world average level until today.
Figure 1.3: The West and the Rest: Since the reforms
Source: Blum (2017b), World Development Indicators
-
5
10
15
20
25
30
35
40
45
50
1966196819701972197419761978198019821984198619881990199219941996199820002002200420062008201020122014
per
-ca
pit
a G
DP
( U
S-$
of
20
05
)
China World North America OECD members High income: OECD

6
Moreover, China’s development has reached a crossroad since 2010. The GDP growth rate of
China has decelerated since the financial crisis (see Figure 1.4). Part of the reason for the
slowdown could be cyclical, namely, a weak world economy. But a major part of the reason
comes from structural und fundamental shortcomings (Wei et al., 2017). China’s economic
surge has benefited from catching up in industry and services with the help of absorbing
sophiscated technologies and attracting foreign investment from developed countries or regions,
and from low human cost and a favorable demographic structure, which has almost been
exhausted.
Firstly, the working age population in China – defined as people between the ages of 15 and 64
– has been shrinking since 2012 (see Figure 1.5) and is predicted to fall by more than 10% by
2040, equivalent to 90 million workers, as estimated by the World Bank1.
Figure 1.4: GDP growth of China (%)
Source: World Bank
Figure 1.5: Working age (15-64) pupulation (%
of total)
Secondly, wages in China have increased rapidly since the financial crisis. Now Chinese wages
are higher than the majority of non-OECD economies and are almost three times as high as in
India (Wei et al., 2017). Many industries that had contributed to China’s growth but demand a
large amount of cheap labor have been transferred to more low-cost countries. Akamatsu (1962)
calls this industrial transfer in East Asia the “flying geese paradigm,” which indicates that
leading countries transfer their overcapacities to underdeveloped economies successively, like
the pattern of flying geese. Stan Shih, the founder of Acer Inc., framed the concept “smilling
curve” around 1992, which describes how value-added varies across the different stages of
1 https://www.ft.com/content/d6681cba-9e3c-11e5-b45d-4812f209f861
0
2
4
6
8
10
12
14
16
2000
2001
2002
2003
2004
2005
2006
2007
2008
2009
2010
2011
2012
2013
2014
2015
GDPgrowthChina(%)
65
66
67
68
69
70
71
72
73
74
75
2000
2001
2002
2003
2004
2005
2006
2007
2008
2009
2010
2011
2012
2013
2014
2015
Workingagepopulation(%oftotal)

7
bringing a product to the market in a manufacturing industry, with high value-added in the
initial R&D, low value-added in the middle-part of assembly, and then high value-added in the
final part marketing and distribution (Bartlett & Ghoshal, 2000; Hung & Whittington, 2011;
Shin, Kraemer, & Dedrick, 2012). Many Chinese firms still stay in the middle of value chains,
resulting in that they obtain low value-added and profits from international division of labor.
Therefore, it is necessary to accelerate shift from assembly to global marketing and R&D to
develop innovative technologies.
Thirdly, some segments and sectors of Chinese industry are approaching the technology frontier,
indicating that the contribution of capital and cheap labor as growth drivers will decline (World
Bank, 2013). The “learning from abroad” strategy of firms now seems to be unworkable. An
important reason lies in the growing worry of technologically advanced countries about the
transfer of China’s role from business partner to competitor in world markets.
Last but not least, the side effects of China’s unsustainable development have emerged
gradually: from latent dangers for the economy, including rapidly increasing local-government
public debt and overcapacity in some basic industries such as cement and steel, to various forms
of environmental pollution such as air, soil and water, which has caused and is causing
widespread health problems. Therefore, the past “growth miracle” phase is now ending
(Naughton, 2017).
Economic growth is no longer to be China’s most important objective and the government has
begun to introduce new instruments to achieve other goals, such as social outcomes. As for the
development pattern, China has planned its development model on the basis of an innovation-
driven path with own its technologies. According to the Outline of China’s National Innovation-
Driven Development Strategy of State Council in 2016, the Chinese government is aiming for
the country to become an innovative nation by 2020, an international leader in innovation by
2030 and a world powerhouse of innovation by 20502. In fact, the performance of China in
innovation is rising rapidly. In recent years, China’s spending on research and development
(R&D) and education has shown a steep upward trend and, consequently, the innovative
capacity has already become a crucial factor in national competitiveness.
Innovation is identified by Schumpeter (1942) as the critical dimension of economic change.
He introduced the term “creative destruction” to describe innovative entry by entrepreneurs and
the disruptive process of transformation that accompanies such innovation. Romer (1989)
endogenizes the accumulation of knowledge into economic growth and argues that the
2 Outline of China’s national innovation-driven development strategy of State Council
(http://news.xinhuanet.com/politics/2016-05/19/c_1118898033.htm)
8
technological change and accumulation of human capital make great contributions to economic
growth. Aghion and Howitt (1992) construct a model of growth through creative destruction
and find that individual innovations are sufficiently important to affect the entire economy.
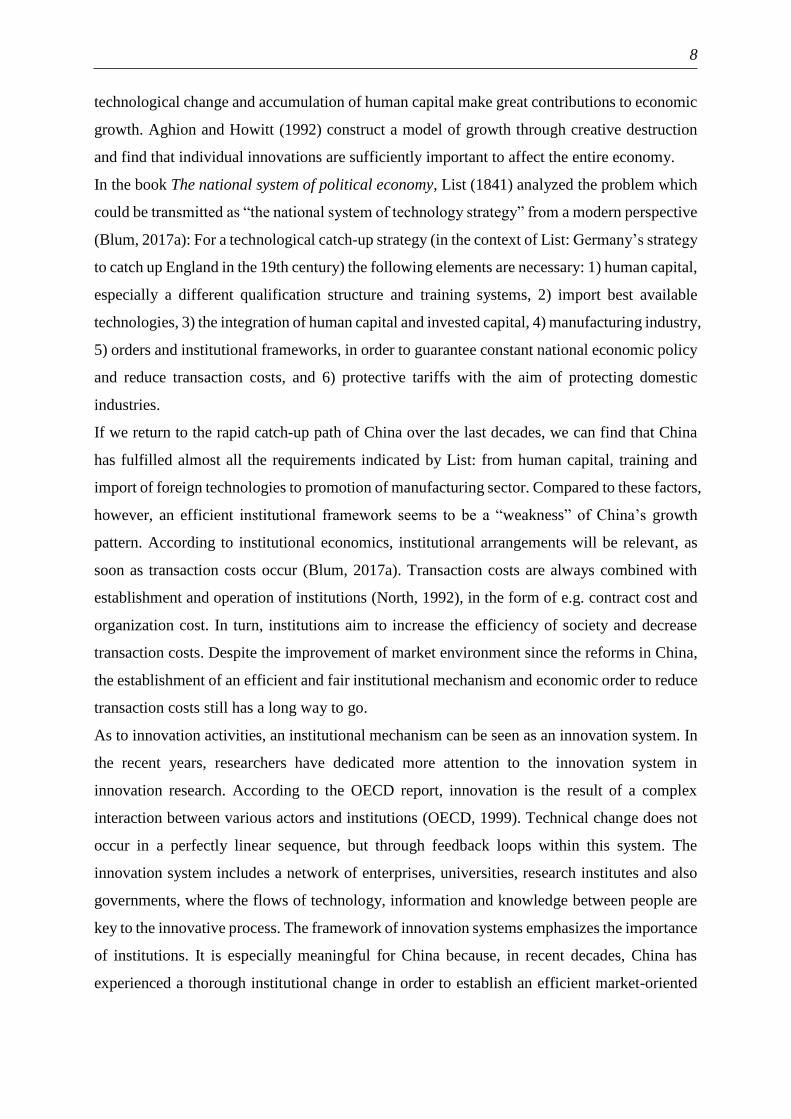
In the book The national system of political economy, List (1841) analyzed the problem which
could be transmitted as “the national system of technology strategy” from a modern perspective
(Blum, 2017a): For a technological catch-up strategy (in the context of List: Germany’s strategy
to catch up England in the 19th century) the following elements are necessary: 1) human capital,
especially a different qualification structure and training systems, 2) import best available
technologies, 3) the integration of human capital and invested capital, 4) manufacturing industry,
5) orders and institutional frameworks, in order to guarantee constant national economic policy
and reduce transaction costs, and 6) protective tariffs with the aim of protecting domestic
industries.
If we return to the rapid catch-up path of China over the last decades, we can find that China
has fulfilled almost all the requirements indicated by List: from human capital, training and
import of foreign technologies to promotion of manufacturing sector. Compared to these factors,
however, an efficient institutional framework seems to be a “weakness” of China’s growth
pattern. According to institutional economics, institutional arrangements will be relevant, as
soon as transaction costs occur (Blum, 2017a). Transaction costs are always combined with
establishment and operation of institutions (North, 1992), in the form of e.g. contract cost and
organization cost. In turn, institutions aim to increase the efficiency of society and decrease
transaction costs. Despite the improvement of market environment since the reforms in China,
the establishment of an efficient and fair institutional mechanism and economic order to reduce
transaction costs still has a long way to go.
As to innovation activities, an institutional mechanism can be seen as an innovation system. In
the recent years, researchers have dedicated more attention to the innovation system in
innovation research. According to the OECD report, innovation is the result of a complex
interaction between various actors and institutions (OECD, 1999). Technical change does not
occur in a perfectly linear sequence, but through feedback loops within this system. The
innovation system includes a network of enterprises, universities, research institutes and also
governments, where the flows of technology, information and knowledge between people are
key to the innovative process. The framework of innovation systems emphasizes the importance
of institutions. It is especially meaningful for China because, in recent decades, China has
experienced a thorough institutional change in order to establish an efficient market-oriented

9
framework and reduce transaction costs, and this process is still on-going. Both innovation
systems and institutional factors are influenced by this marketization transformation.
In innovation systems, a firm is viewed as a core innovation actor, because in a mature economy,
firms invest the majority of R&D capital and implement most innovation activities. Since the
concept of “innovation” denotes not only inventions, but also “new combinations” that are
readily available to markets (Schumpeter, 1934), firms own more information about market
circumstances, especially demand, than any other innovation participants (North, 1990). The
activities of firms are not independent of economic system and institutional change. In fact, the
institutional environment is viewed as a critical determinant that distinguishes a firm’s
performance in transition economies from that in mature market economies (Li & Xia, 2008).
In the context of China’s transformation, the institutional transition measures – including
decentralization of control, ownership restructuring and industrial policy – impact a firm’s
performance by shaping managerial incentives and affecting transaction agency costs (Park, Li,
& David, 2006).
The change in the market and industrial structure is one of the factors of transition influencing
a firm’s performance. On the one hand, the marketization reform is one of the key measures of
the institutional change from planned to market-oriented economy. According to the
marketization index of the National Economic Research Institute, the market reform process
has been promoted step by step since the end of the 20th century (Fan, Wang, & Zhu, 2011),
enabling State-owned Enterprises (SOE) to operate as market-oriented firms and to reduce state
interference in the market by changing the legal and business environment in which firms
operate (van der Hoeven & Sziraczki, 1997). The new market structure, which allows for both
competition and monopolies, along with the remaining state intervention, influence and shape
innovation activities of firms. Though the relationship between market structure and innovation
is considered an important topic both in the field of industrial organization and innovation
economics, the results still remain controversial under different conditions with different
datasets (Acs & Audretsch, 1987; Castellacci, 2011; Scherer, 1965). It makes it reasonable to
investigate the situation in China with data of Chinese firms instead utilizing the existing
assumptions and experiences in other countries. On the other hand, against the backdrop of
industrial transfer in East Asia since the 1960s and the accession to the WTO in 2001, the
industrial structure has been changed and updated from low-tech and labor-intensive to
medium- and high-tech, while also encompassing knowledge-intensive industries. Innovation
has gained more importance in technologically advanced sectors than in traditional industries,

10
from R&D input and innovation behavior to innovation output. For that reason, it tends to be
necessary to distinguish between the innovation performance of firms in distinct industries.
Besides competition in the market, the ownership of firms is also an essential determinant that
impacts on the ability of firms to allocate efficiently (Vining & Boardman, 1992), including
economic performance like innovation. In fact, market structure and ownership are two factors
that are interconnected. One reason why SOEs have performed below private counterparts is
that SOEs are shielded from competitive pressures by the state (Budiman, Lin, & Singham,
2009). The key driver of SOE reform in China is believed to be the introduction of competition
across China’s economy, both from new forms of domestic ownership, like private enterprises,
and the expanding access to modern business models and technology methods from abroad
(Jefferson, 2016).
Coase (1937) argued that every company will expand as long as the company’s activities can
be performed cheaper within the company (internal transaction costs), than by outsourcing the
activities to external providers in the market (external transaction costs). Due to information
asymmetries and high costs of hierarchical coordination, transaction costs of SOEs are
generally higher than those of private firms. Nevertheless, in countries where market failure is
severe, SOEs may be a viable mode of organization because private firms do not exist or may
not have sufficient capacities to promote economic development (Rajan, 2011). For that reason,
SOEs often arise in underdeveloped economies, such as China in the 1950s – 1970s, and could
reduce transaction costs if economies are infested with severe market failure (Peng, Bruton,
Stan, & Huang, 2016).
However, with economic growth and the introduction of market institutions, the imperfections
of state ownership would become an obstacle to improving economic performances of firms.
The role and reform of SOEs have attracted the interest of researchers since the 1980s. In the
period of a centrally planned economy, state ownership dominates almost all aspects of market
and is associated with the life and work of people. However, the institutional problems of SOEs,
such as unclearly defined property rights and high information asymmetry and transaction costs,
have impeded the efficiency optimization of firms and then become an obstacle to the
development of the whole economy. SOEs are considered to consume a much larger proportion
of capital, materials and intermediate inputs to produce similar or even less output than the
private sector (World Bank, 2013). Since the reforms, in particular during the 1990s, an effort
to restructure the SOEs has been carried out aiming to increase their economic performance,
which includes converting vaguely defined state ownership to more explicit, legally defined
11
ownership categories (Naughton, 2007). China’s rapid economic growth since 2003 has
benefited from SOE restructuring and the development of private sectors (World Bank, 2013).
The weak performance of SOEs has been criticized by several researchers and many previous
studies have argued that private firms perform better than SOEs in China (Bai, Lu, & Tao, 2006;
Jefferson & Su, 2006), although SOEs have received more subsidies and political support from
the government (Wei et al., 2017). There are at least two reasons for SOEs performing less
efficiently: the first is internal institutional demerits, including unclearly defined property rights
and the principal-agent problem (Shirley, 1999). The second stems from the assumption that
managers of SOEs lack the clarifying objectives of their private counterparts, for instance profit
maximization. In many countries, SOEs are responsible for delivering public services such as
energy and infrastructure, which means they are constrained to offering regulated prices. The
motives of SOEs are usually associated with political targets like maintaining social stability
and fulfilling social outcomes. In turn, SOEs obtain more subsidies and political support from
governments, enjoy preferential access to production resources like state-owned funding
sources and, in turn, benefit from their privileges in competing with their private and foreign
rivals.
As one of the frequently used measurements of firm performance (OECD, 2016), innovation
performance is viewed as a commonly discussed difference between SOEs and private
enterprises. Blum and Dudley (1998) trace the distortion of economic choices in East Germany
back to state control of investment, which led to a serious under-capitalization of the industrial
sector and the absence of incentives of workers and managers.
Using the dataset of China’s large- and medium-size enterprises, it was found that SOEs with
the highest concentrations of state assets perform at the low end with regard to innovation
performance (Jefferson, Hu, Guan, & Yu, 2003). In some previous studies, however, it was also
not uncommon finding that the SOE reform of China – the so-called corporatization without
privatization – was an effective way of improving the performance of SOEs (Aivazian, Ge, &
Qiu, 2005). Scholars argue that the poor performance of SOEs is less a result of political
responsibilities, such as high social welfare burdens, but of weak market incentives and
government interference in enterprises (Park et al., 2006). If SOEs were given priority to
maximizing profit as private enterprises do, they might achieve an economic performance
similar to their private counterparts (Bozec, Breton, & Cote, 2002). It is argued that the
privatization model of Western countries might not be implemented in China and the Chinese
government would not withdraw from corporation governance of SOEs completely. The SOE
reform focuses more on incremental instead of cumulative parts, which means the government

12
reduces its interference in market, but at the same time maintains its partial ownership. Privately
owned capital is encouraged to invest in state owned industries and firms, and meanwhile share
profits (Blum & Zhao, 2015).
In summary, this work will analyze the innovation performance of China at: 1) provincial level
– innovation systems; 2) industrial level – market structure; and 3) firm level – state ownership
(see Figure 1.6). The core question that will be answered in this thesis is formulated as follows:
Which factors of innovation systems, market structure and state ownership influence the
innovation performance of China against the backdrop of institutional transition?
Figure 1.6: Analytical framework of the thesis
In addition to the development gap, there is also an “innovation gap” between different regions
of China. The innovation performance of provinces and firms as well as political and
institutional framework conditions vary from region to region. On the one hand, concerning the
area and population, most provinces are as large as a European country. On the other hand,
local governments are no longer controlled by the central government in all fields. Since the
reform policy in 1978, the central government has provided substantial leeway and relative
autonomy in the sense of economic policy to local governments, who can decide on the majority
of concrete economic measures for themselves. Moreover, China is experiencing an industrial
structure transformation from labor-intensive to capital-intensive and technologically advanced
industry. Leading regions transfer their low-tech sectors to backward regions and develop
knowledge-dependent industries, while in catching-up provinces in the middle and west,

13
innovation activities are dominated by mature industrial sectors, which not only leads to a
disparity between technologies, but also to different industrial structures in different regions.
For these reasons, it is appropriate to investigate the innovation performance of both provinces
and firms on the basis of various criteria and thus, in this work, more categories – including
disparity between regions and technology characteristics – will be taken into consideration.
1.2 Chapter summaries
The remainder of this work is organized as follows: Chapter 2 provides the background of this
thesis; the literature review is presented in Chapter 3; Chapter 4 analyzes the effects of
innovation systems on innovation performance in Chinese provinces; Chapter 5 investigates the
influences of market structure on innovation output of China’s industrial enterprises; Chapter 6
explores the effects of state ownership on innovation performance of China’s listed firms; and
in Chapter 7 the conclusion is presented.
Background:
Chapter 2 introduces the background of this dissertation, namely, China’s transition since the
reform in 1978. The reform and opening policy is the most important background feature not
only for the innovation performance, but also for the whole economy of China. Although the
economic measurement is called “reform and opening policy” and seen as an entire policy, it
has actually been implemented in order: The “opening” began at the first step, subsequently
motivating in turn the reform measures (Shi, 2009). Under competition pressure from their
colleagues of other provinces, officials of local governments, in particular, provincial
governments, had to “compete” with each other in order to obtain more possibilities to get
access to promotion. The governmental competition characterizes the reform and is considered
an important factor in causing the economic surge in China.
Using the theories of governmental and institutional competition on the basis of evolutional
economics, this Chapter firstly analyzes the competition of local governments during the
institutional change in China of recent decades. The economic and institutional transition has
changed the economic behavior of almost all economic actors and environments, with these
being divided into three levels. In the second subsection of this chapter, we will introduce these
three parts: The first is the innovation system, which indicates institutional and systematic
changes at regional level. China’s innovation systems or, at that time, scientific systems, were
established according to the so-called Soviet Union Model. The state intervened in almost all

14
science activities and played a key role in R&D and innovation, while there were few private
innovators, including enterprises and research institutes, participating in innovation activities.
The establishment of Chinese modern innovation systems started with a range of policies at the
central government level in mid-1980s. The reforms focus not only on basis research as prior
to the reform, but also on the combination of basis scientific activities and industrial
applications, along with the commercialization of S&T. On the other hand, the government
rewards individuals for participating in scientific activities. In 2006, the National Medium- and
Long-term Program for Science and Technology 2006-2020 was released by the central
government, aiming to establish an innovation-oriented country by achieving “indigenous
innovation”.
We find that innovation systems are changed in step with the transition process of China. As
the basis of innovation activities, innovation systems provide a framework for innovation actors
and influence the innovation behavior deeply. Nonetheless, if we observe the “downstream” of
the system, we find that the market structure and industry is also shaped and changed by the
Chinese transition. Thus in the second subsection, we will present the transformation of market
and industrial structures at sectoral level.
The impacts of the reform process on the market could be analyzed from two perspectives. The
first is the change in the industrial structure as influenced by the opening policy, in particular,
the industrial transfer that has taken place in East Asia since the 1960s. The economically
advanced countries, starting with Japan, transfer their lagging industries to underdeveloped
economies, which then – years later – move their overcapacities to other regions through
investment. The relatively underdeveloped countries attract foreign capital with the help of their
comparative advantages (Lin, 2012), for instance, the low cost of labor and resources. This
industrial transfer model is named the Flying Geese Paradigm (Akamatsu, 1962). China has
taken advantage of this development trend and, in the 1980s, began to absorb the investment
from the four so-called “Asian Tigers”, South Korea, Taiwan, Singapore and Hong Kong,
helping China participate in the international division of labor.
The other aspect of the influence on the market is the marketization process, which is combined
closely with domestic reform policy. The market structure was controlled by state power in
almost every area during the period of the centrally planned economy. Since the reform, the
market has become more open and private entities have, step by step, created a healthier and
more efficient relationship between the government and the market, which has built up a new
framework for various firms with different ownership types. Moreover, China’s accession to
the WTO in 2001 motivated the domestic reform from international circumstances, since a

15
member of the WTO must accept the principles of market economics and a range of
preconditions to establish a fair competition environment.
The third level that China’s transition influenced is the state ownership of SOEs. SOEs played
a key role in pre-transition countries and were considered the pillar and core of the whole
economy of China. However, the low efficiency of SOEs, unclearly defined property rights and
favored political supports from governments are severely criticized by scholars (Jefferson & Su,
2006; Qian, 1996; Zheng, Liu, & Bigsten, 2003). Since the 1990s, the government has taken
measures for reform or, in other words, has restructured SOEs, in order to increase their
performance and establish new and modern corporate governance SOEs models with state
participation, such as decreasing state shares, while also founding a new authority – the State-
owned Assets Supervision and Administration Commission – to manage and supervise the
remaining SOEs.
Literature review:
The theory of innovation economics can be traced to Schumpeter, who defined innovation as
new combinations of new or existing knowledge, resources and equipment, including new
products, new means of production, opening a new market, acquisition of a new source and
carrying out new forms of organization. With the core term of his innovation theory,
Schumpeter used “creative destruction” to describe the process of industrial mutation that
revolutionizes the economic structure from within, not only destroying the old structure but also
creating a new one, and to interpret the economic growth and change (Schumpeter, 1942).
In fact, innovation or other similar concepts like technological progress or knowledge have been
used to enrich growth theories frequently since the 1950s. Solow (1957), Arrow (1962) and
Romer (1989) have proven the importance of technology for growth in their respective theories.
Although it is a widely-held belief that innovation or technology has an influence on economic
growth, the question of what its influence is and the extent of such influence still remains
controversial.
Innovation process models have experienced five rounds of evolution: the “technology push
model” of the 1950s and mid-1960 (Carter & Williams, 1957), the “demand pull model” of the
1960s and 1970s (Myers & Marquis, 1969), the coupling model until early 1980s (Mowery &
Rosenberg, 1979), the Integrated Model in the 1980s and 1990s (Rothwell & Zegveld, 1985)
and the Networking Model since the 1990s (Rothwell, 1992). To this day, innovation is
considered a consequence of national systems in terms of network concepts (Freeman, 1989;
Lundvall, 1985; Nelson, 1993), and contains various innovation actors, including firms,

16
research institutes, universities and government, as well as their interactions and diffusion of
knowledge. In addition, due to distinctions and the complexity of regional characteristics, it is
argued that innovation systems should be investigated from a regional perspective (Asheim &
Isaksen, 2002; Cooke, Uranga, & Etxebarria, 1997).
With respect to innovation and market structures, the most influential assumption is traced to
Schumpeter (Schumpeter, 1942), who argued that a monopolist in the market performs with
greater innovation than a firm with lower market concentration, because the monopolist
possesses more resources to participate in R&D activities. Nonetheless, Schumpeter’s idea that
a monopoly increases innovation leads to a large-scaled discussion in this area. Arrow (1962)
believes that a firm that dominates the market with high profits prefers to protect its status quo
rather than taking risks to innovate, while Demsetz (1969) argues that Arrow’s idea is not
convincing in real-life situations because of incomplete information.
In empirical research, scholars have also obtained a variety of results, as in the theoretical field:
A few researchers argue that there is no relationship between market structure and innovation
(Scherer, 1965). In line with Schumpeter’s assumption, some find that large firms with a higher
market share tend to have an advantage in innovation activities (Acs & Audretsch, 1987; Kraft,
1989). In contrast, Blundell, Griffith, and van Reenen (1999), Geroski (1990) and Nickell (1996)
believe that it is competition rather than a monopoly that promotes the innovation performance
of firms. Despite this, more and more recent research has found that the relationship between
market structures and innovation is not simply linear. Using the data of UK companies from
the 1960s to 1990s, Aghion, Bloom, Blundell, Griffith, and Howitt (2005) argue that the
relationship between product market competition and innovation is an inverted U-shape.
From the abovementioned review, we can find that – unlike theories of innovation systems –
the influences of a market monopoly or competition on innovation performance still remain
controversial, both in theoretical and empirical terms. The results vary under different
conditions in different regions with different datasets.
Although the framework and market structure are essential factors for innovation, it is firms
that play a central role in innovation activities (Mortensen & Bloch, 2005). The transformation
of China has changed the relationship between SOEs and private-owned enterprises. The
influences of ownership on innovation performance have attracted the attention of researchers,
especially those from transition countries like China. Most of the conclusions argue that SOEs
exhibit lower efficiency in economic and innovation activities than other types of ownership
(Jefferson et al., 2003; Jefferson, 2006), due to their unclearly defined property rights, agency

17
problem and lacking incentives for profitability (Demsetz, 1974; Megginson & Netter, 2001;
Shleifer, 1998).
Innovation system and innovation performance:
The next three sections investigate determinants of innovation performance from the
perspectives of regional, industrial and firm level, respectively. China has increased its
investments in R&D in recent years. The number of full-time equivalent R&D personnel has
risen from almost 0.67 million in 1998 to around 3.76 million in 2015. The expenditure has
gone up from approximately 49 billion Yuan (6.8 billion euro) to 1.4 trillion Yuan
(approximately 194 billion euro). On the other hand, the patent activities have also achieved
great success: the number of invention patent applications rose from 13,726 to 968,251 between
1998 and 20153. In this chapter, we present the influence of innovation systems on the regional
innovation performance in China for the time period 1998 – 2008.
This section is based on the model of Furman, Porter, and Stern (2002) (FP&S Model), which
stems from Romer’s growth theory (1989), Porter’s theory of national competitive strategy
(1990) and Nelson’s national innovation systems (1993). This model divides the determinants
of innovation systems into three parts: innovation infrastructure, cluster and the linkage
between these two elements. In addition, the traditional factors relevant to innovation,
innovation input, such as R&D personal and expenditures, and knowledge accumulation, will
be taken into consideration. As mentioned above, China’s transition has changed and continues
to change the whole economy deeply. Thus, based on FP&S Model, this section combines with
the real-life situation of China’s economy and introduces marketization reform to measure the
impacts of institutional transformation. This model has been applied to the national level
research of some OECD and Asian countries (Furman et al., 2002; Hu & Mathews, 2005, 2008),
but we believe it is also appropriate for the exploration of the regional innovation systems of
Chinese provinces because most Chinese provinces resemble an OECD country and Asia, not
only because of the area and population, but the economic freedom transferred from the central
government since the 1990s. Moreover, the large disparity of culture, history and habit among
regions makes it necessary to investigate the innovation performance at a regional level.
We find that the innovation system contributes greatly to the increase of the innovation
performance of Chinese provinces, including the openness of the region, while the expenditure
on education from the government plays a key role. Indeed, a market-oriented institutional
3 Data Source: National Bureau of Statistics of China

18
arrangement also raises the innovation output. However, it is surprising that the frequent
engagement of banks in R&D financing cannot promote the level of innovation.
Market structure and innovation:
China’s transition has changed the market structure, which influences the innovation
performance of firms. The relationship between market structure and firm behavior is one of
the most important fields of industrial organization. In the theoretical field, there are some
controversial arguments about the relationship between market structure and firm performance.
The Chicago School argues that the market structure is determined by firm performance. If a
firm has high productivity and profitability, it will obtain a large market share and shape the
market structure (Friedman, 1964). In contrast, using the Structure, Conduct and Performance
Paradigm (SCP) as an analytical framework, the Harvard School believes that market structure
influences firm performance through the channel of market conduct (Bain, 1968).
As to firm performance, the level of innovation – or, in other words, innovation performance –
is considered an important indicator (Porter, 1981). At the same time, the relationship between
market structure and innovation performance represents one traditional and essential research
topic in the economics of innovation. There are two main assumptions in interpreting this
relationship: the first one is Schumpeter effect, which indicates that competition has a negative
effect on innovation; the second one is escape-competition effect, demonstrating that market
competition increases the innovation of firms (Aghion et al., 2005; Castellacci, 2011).
This chapter combines the abovementioned two effects with the market competition level and
explores the influence of market structures on innovation performance at firm-level. Besides
focusing on the relationship between market structure and innovation, this part also takes factors
of geographic disparity of regions and technological features of industries into account. We use
a rich dataset of Chinese industrial enterprises between 2005 and 2007, containing over 200,000
firms.
We find that there is an inverted-U relationship between market concentration and innovation
and that – more specifically – firms with a high market concentration could undertake more
innovative activities in the market with a high competition level, while the effects would turn
negative after a threshold is reached if the market is monopolized by a few firms. Furthermore,
as to technology characteristics, it is notable that high market concentration is especially
harmful for technologically advanced firms, while in low-tech industries the innovation
performance of firms does not depend on market structure.
19
Innovation output and state ownership:
In many countries, SOEs are still the main provider of public services, though privatization is
a frequently discussed topic by researchers. In post-transition countries like China, SOEs have
played a critical role in the economy. Nevertheless, the institutional transformation has not only
influenced the macro environment and market structure, but also the ownership structure of
SOEs, in order to increase their economic performance. On the other hand, improving SOE
performance is crucial for social stability and sustained growth in China.
Most previous studies argue that the economic performance of SOEs is lower than that of
private companies (Shirley, 1999), which is traced to state interference in cooperate governance,
resulting in market failure as well as the property rights (Alchian & Demsetz, 1972) and
principle-agent problem (Laffont & Tirole, 1985). Many empirical researchers have also proven
that private firms perform better than SOEs (Goldeng, Grünfeld, & Benito, 2008; Li & Xia,
2008).
Although scholars have also criticized the management problem and low efficiency of Chinese
SOEs, it is surprising that they have brought some innovative achievements in strategic
industries like in nuclear energy and the defense sector. The cognitive discrepancy between
common academic research and Chinese reality makes it necessary to explore the performance
of SOEs in more detail.
Since previous research, for the most part, does not take the specific issues of SOEs into
consideration (Bozec et al., 2002), this study focuses on the relationship between innovative
activities and state ownership in listed firms in China, controlling the provincial and sectoral
differences. We find that, in general terms, the state ownership inhibits innovation performance
of firms. However, after running separate models for different time periods, it is remarkable
that SOEs generated more innovation output than other firms after the financial crisis. In
addition, we find that the impact of state ownership on innovation performance depends on a
number of conditions. More precisely, state control of firms has a negative impact on innovation
output, in particular, in China’s Northeast region and in some high-tech industries.
In the last part, Conclusions, we summarize all the important findings of the previous sections
and outline the political implications.
20
2. Background
2.1 China’s transition: governmental competition
2.1.1 The emergence of governmental competition
The transformation of China from a planned to a market economy is an institutional change.4
Since 1978, China’s reform has often been explained from two institutional perspectives: one
is governmental reform, which suggests that the reform was implemented through institutional
supply by the government. The other states that it is spontaneous institutional innovation that
led to the change (Zhou, 2000). However, neither perspective truly reflects China’s
transformation, as the first only focuses on the role of the government, while the latter ignores
the political mechanisms of the transformation.
A third direction of research that seeks to explain the transformation is governmental
competition. Similar to countries in Europe and America, competition between local
governments also exists in China. This is seen as an important cause of China’s economic
development (Zhou, 2003). Governmental competition is, to a large extent, institutional
competition, especially in transformational countries like China, where the government
participates in supplying and innovating institutions. The country’s transformation is a process
of institutional change that is regarded as a result of interaction between the internal rules of
individuals and external rules of the organization (Zhou, 2000). Governmental competition can,
therefore, also be seen as the discovery (Hayek, 1968) of knowledge, information and
institutions.
“Governmental competition” is a variation of the term “competitive governments” (Breton,
1998). In federal states, competition exists within and between local governments. Due to
pressure from non-governmental actors, governments must, for instance, provide relevant
products and services that are not supplied by the market to fulfill the needs of local citizens
and organizations. Competition for votes and resources develops between the governments and
the different authorities within the government (Breton, 1998) in order for these institutions to
increase their own levels of activity. This competition mainly addresses institutional supply,
such as infrastructure, technological platform, services, and tax reductions.
4 The findings of this chapter has been published as: Kou, Kou: “Regierungswettbewerb in China seit der
Reform 1978” (“Governmental competition in China since the reform 1978”), in: Blum, Ulrich (eds.), Economic
Governance und Ordonomik, REPROCENTER GmbH, Halle, 2015. For the purpose of this thesis, this chapter
has been slightly modified.

21
This paradigm involves two types of competition: horizontal and vertical. On the one hand,
each government (authority) is in competition with its superordinate government (authority) for
resources and power. On the other hand, the government also competes with other bodies at the
same level.
Feng (2002) argues that governmental competition incorporates competition between
governments with regards to material and immaterial resources and contains direct and indirect
as well as horizontal and vertical competition. According to him, the “economic miracle” of
China can be traced back to “spontaneous order” (Hayek, 1968). The initiative of civil society
and market subjects led to the creation of this spontaneous order. The government recognized
the results of this initiative and implemented corresponding measures throughout China. The
order must fulfill two potential requirements: compatibility with personal freedom and the
division of labor in relation to knowledge (Feng, 2002).
Using Breton’s theory, Herrmann-Pillath (1999) establishes a new research framework with the
help of evolutionary economics (see Figure 2.1). According to his theory, the government does
not supply the institutional environment, the preferences of market subjects or information.
Especially during the transformation, no clear institutional framework is available, and no
decision-maker possesses complete information. Everyone must search for a substitutive
institutional framework. This is why evolutionary economics places much value on the
spreading of power and decision-making of local governments. The division of power in a
federal system increases the level of competition between local governments. Vertical and
horizontal competition are connected to one another, and the result of one form of competition
can influence the other. For example, a local government would benefit from obtaining more
resources or political support from the central government than its competitors.

22
Figure 2.1: Analytical framework of governmental competition
Source: Herrmann-Pillath (1999)
Both types of competition target the resources required for economic development as well as
social stability and harmony. Most of the pressure and incentives come from voters and market
subjects. This section mainly focuses on governmental competition and does not consider
competition between authorities.
One main type of governmental competition is institutional competition (Feng, 2002).
Institutional competition emphasizes the importance of the system of internal and external rules
for the level of cost and the competitiveness of a region. There exists a passive and an active
institutional adjustment.
In this section, governmental competition is delineated at the level of institutional competition,
because 1) China’s transformation is, in general, an institutional change; 2) the governmental
competition in this section is a horizontal competition between local governments, which could,
in fact, be viewed as external rules; and 3) this section focuses on how local governments react
to spontaneous changes in society, namely the internal rules and results that have been brought
about as a consequence of decisions. The government that builds the order plays an important
role as the institution supplier. In this chapter we observe the institutional competition of local
governments.
Hayek’s theory of social order helps us to understand the reform process from the perspective
of institutional change. Hayek (1973) differentiated between two types of orders: one is
spontaneous order (“kosmos”), in which the individuals follow their goals by their own means.
This requires abstract rules and is described as an internal rule. The other is organization

23
(“taxis”), which means the result of a conscious design. Concrete rules with a vertical hierarchy
(Hayek, 1973) are described as external rules. Both types of rules exist in all forms of society.
There are interactive relationships between individuals and internal rules, between individuals
and organizations and between internal and external rules. Hayek regarded these complex
connections as the driving force of social evolution. Due to the heterogeneity of individuals and
the uneven distribution of knowledge, distinct possibilities exist to look for corresponding rules.
The groups that introduce abstract rules are more successful (productive) than others. Other
groups either accept the successful rules or are excluded (Hayek, 1973). However, the
spontaneous order cannot resolve the uncertainty of institutions completely, which could be
corrected by organizations. The institution supplier offers an optimum institutional arrangement
for maximizing welfare.
2.1.2 Institutional governmental competition
According to the theory above, the local government is under pressure from the higher-level
government, from citizens and from other local governments, which is vertical competition. In
China, competition has different properties.
Figure 2.2 illustrates the structure of Chinese government institutions. As a result of the Cultural
Revolution, China fell into poverty and chaos. The centrally planned economic system could
not be applied as the economic guideline any more. Yet, unlike most Eastern European
countries, China did not adopt shock therapy, but used an experimental approach instead. An
important reason for this is that the central government had neither a clear development plan
nor experience in transforming a nation. In addition, society had already started to change
before the official reform policy came into force. The central government divided its power and
ordered local governments to transfer more freedom to regions. The local governments obtained
relative autonomy with regards to economic policies and the organization and management of
civil society. Citizens now express their opinions to local governments, which, in turn, issue
reports to the central government. After evaluating the “outcome” of local governments, the
central government selects and appoints provincial officials.

24
Figure 2.2: Structure of government institution in China
Source: Own Illustration
Because leaders of the local governments must be appointed by superordinates, the selection
criteria have become a critical factor for the bureaucratic system. The term of office for local
officials is usually limited to five years. The officials must achieve political and economic
results during this period to be promoted to a higher position after or even during that term.
Government officials play an important role as institutional entrepreneurs at the local level
(Zhou, 2003), who create institutions that fulfill (or exceed) the local community’s expectations
regarding stability. In the context of the Chinese reform, the government is the organization.
The inhabitants and companies are regarded as individuals. Governmental competition could
be viewed as the competition of external rules.
Indeed, the main reason that the Chinese government intervened in institutional innovation at
the beginning of the reform was not to maximize welfare, but rather to react to the fierce
competition by external rules. These rules forced the governments to understand or imitate other
successful institutions by way of different learning methods such as the exchange of officials
between local governments and study trips to other countries (Zhou, 2000).
Even though internal rules play an important role in the establishment of social order (Hayek,
1973), China’s reform was shaped from the beginning by the “government,” due to its gradualist
approach, which is characterized by continuous conflicts and compromises between internal
and external rules. The critical factor in governmental competition is whether the government
can establish a fair competition and market order, if a spontaneous order emerges. A successful
external rule that provides the market with freedom and intervenes less in the market could, in
turn, promote internal rules and is therefore the key to marketization and transformation.

25
However, there is also unfair competition between governments that implement state
regulations and intervention with the aim of limiting competition within local regions, for
instance, through protectionist measures like establishing market entry barriers or
administrative monopolies. This inhibits the creation of internal rules and could lead back to a
planned economy.
Competition between local institutions can lead to three types of institutions. 1) Inclusive
institutions (Acemoglu & Robinson, 2012) are those in which a market-oriented economy with
relatively symmetrical information is established. The government aims for institutional
innovation, the economic situation becomes sound and productivity rises enormously. 2)
Medium institutions are those regions with a “semi-market-oriented” and “semi-regulatory”
economic system. Less importance is attached to institutional innovation, and there is partial
protectionism. 3) Extractive institutions (Acemoglu & Robinson, 2012) are closed and
protectionist. The government frequently intervenes in the market and exploits society and the
economy. Most of the coastal provinces of China are successful examples of inclusive
institutions that began reform experiments quite early and thereby introduced a market-oriented
mechanism at an early stage. They are regarded as “reform pioneers”. In Central China,
however, medium institutions exist, in which protectionism and bureaucracy still partially
influence the external order. In some western and northeastern provinces, there are still many
planned economic elements in the market.
2.1.3 Transition and innovation performance
China’s reform is a process of competition between local governments that compete for political
and economic resources. The question is whether they can supply a reasonable institutional
arrangement. According to Hayek’s theory of “competition as a discovery procedure” (Hayek,
1968), market competition is a procedure of discovering knowledge, information and
institutions. The government receives diffused knowledge and information from spontaneous
orders, and then establishes the organization. This is the reason why governmental competition
is also associated with an institutional “discovery procedure” (Hayek, 1968), which involves
learning, imitation and innovation of institutions.
Since the central government divided its power, numerous spontaneous orders have appeared
in regional society. Governmental competition forces local governments to choose appropriate
rules. On the other hand, new awareness is disseminated to society during the innovation of
external rules, which could save costs for institutional innovation (Zhou, 2000). It is important

26
for local governments to avoid intervening in the market too frequently. A proper external rule
is a framework in which there is fair competition and an effective market mechanism.
Based on the experience of the Western world and some transitional countries, North (1990)
found that institutional arrangements affect economic performance, for instance the
restructuring of property rights which led to the rise of European industrial countries and the
US by providing necessary incentives for economic growth (North & Thomas, 1973). As for
the Chinese transition, it has also changed almost all of that country’s economic circumstances.
In terms of innovation systems, institutional arrangement could refer to “administrative regions”
with some degree of policy making and political capacity, and also combine other different
trajectories of economic and cultural factors (Cooke et al., 1997), in the context of China, at the
provincial level. Institutional reform influences the behavior of the market structure and market
actors including the government, firms and consumers.
At the firm level, the reforms have impacted all ownership types of firms. Firm leaders consider
the state regulatory organ and state inference the most influential and complex factors affecting
firm performance in China (Tan & Litsschert, 1994). Institutional changes such as restructuring
property rights and establishing a market-oriented mechanism increasingly optimize
governance structures and favor private firms (Nee, 1992), while large numbers of SOEs, which
are criticized fiercely due to their rigid organizational systems and low economic performance,
are restructured, or as described by some researchers, “privatized”, which determines firm
behavior in the market.
Park et al. (2006) argue that the channels of influence of institutional changes on firm
performance is reflected in three forms: decentralization of control to local government,
privatization of property rights and industrial policies (see Figure 2.3). As mentioned above,
decentralization is the start of the reform as well as the motivation for following market-oriented
measures, allowing more autonomy for local officials and managers of economic units. The
protection of property rights has increased the incentives of market actors to participate in
business activities including innovating and pursuing different economic objectives. On the
other hand, it has changed the structure of firm ownership from the single state-owned firm to
a complex and diverse ownership structure containing restructured SOEs, collectively owned
enterprises and newly created private enterprises. As for the last element of industrial policy, it
concentrates on political support for certain sectors, or in other word, strategical industries that
facilitate industrial upgrading and diversification (Lin & Monga, 2011). These three factors
influence firm behavior by optimizing resource allocation and providing information to reduce
transaction and agency costs.
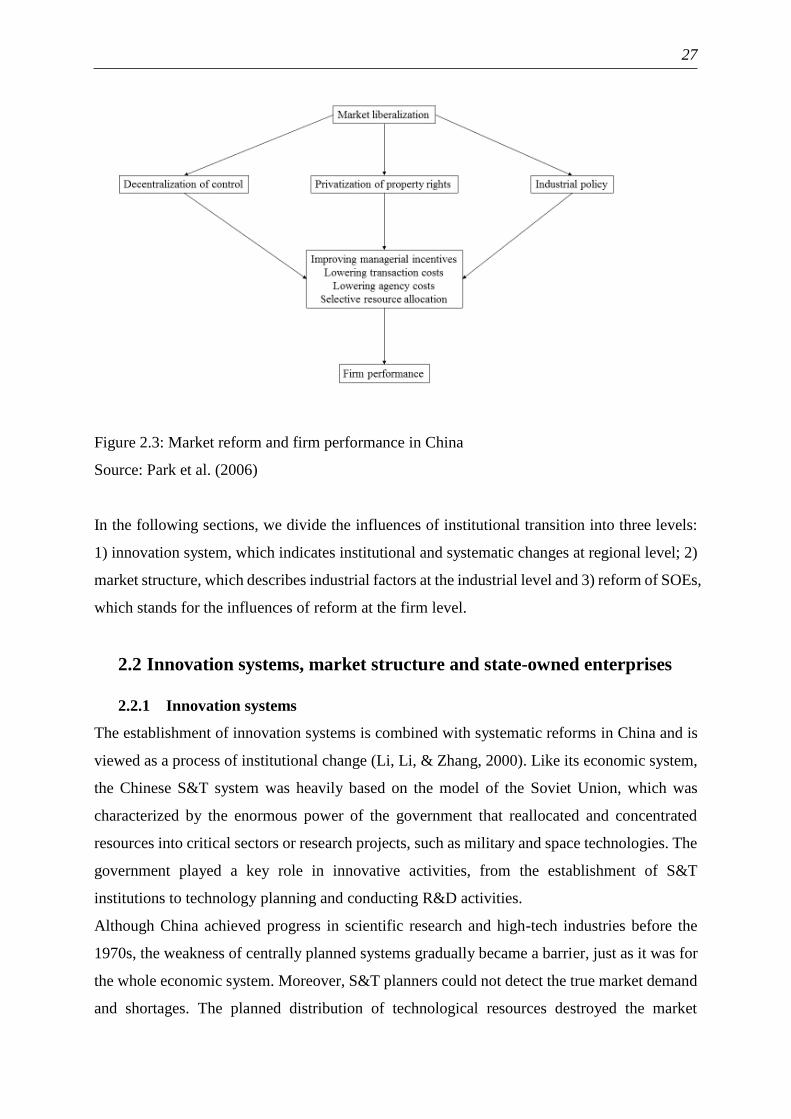
27
Figure 2.3: Market reform and firm performance in China
Source: Park et al. (2006)
In the following sections, we divide the influences of institutional transition into three levels:
1) innovation system, which indicates institutional and systematic changes at regional level; 2)
market structure, which describes industrial factors at the industrial level and 3) reform of SOEs,
which stands for the influences of reform at the firm level.
2.2 Innovation systems, market structure and state-owned enterprises
2.2.1 Innovation systems
The establishment of innovation systems is combined with systematic reforms in China and is
viewed as a process of institutional change (Li, Li, & Zhang, 2000). Like its economic system,
the Chinese S&T system was heavily based on the model of the Soviet Union, which was
characterized by the enormous power of the government that reallocated and concentrated
resources into critical sectors or research projects, such as military and space technologies. The
government played a key role in innovative activities, from the establishment of S&T
institutions to technology planning and conducting R&D activities.
Although China achieved progress in scientific research and high-tech industries before the
1970s, the weakness of centrally planned systems gradually became a barrier, just as it was for
the whole economic system. Moreover, S&T planners could not detect the true market demand
and shortages. The planned distribution of technological resources destroyed the market

28
allocation system and therefore could not efficiently coordinate R&D and innovation activities,
which led to a discrepancy between scientific research and economic demand. As such, despite
scientific achievements, the innovative efficiency still remains controversial.
The establishment of Chinese innovation systems began with a series of central government
policies in the mid-1980s. In 1985, the “Decisions on the Reform of the Science and
Technology System” were released, which contained three missions: supporting economic
construction; developing high technologies and conducting basic research. In order to support
scientific research to meet the needs of industry, the government improved the method of
funding research institutes, encouraged the commercialization of S&T and rewarded
individuals for participating in scientific activities. These were necessary measures to change
the Soviet model, which was characterized by the separation of research from production and a
high priority of S&T in political targets. In order to provide an alternative financing channel for
public and applied research, the National Natural Science Foundation of China was founded in
1986.
Since the “Decisions on Accelerating S&T Development” and the “Strategy of Invigorating the
Country Through Science, Technology and Education” in 1995, as well as the “Strategy of
Sustainable Development” in 1999, China has decided to transfer its development path from an
extensive to an S&T-driven growth model.
In 2006, the central government released the “National Medium- and Long-Term Program for
Science and Technology 2006-2020,” which aims to establish an innovation-oriented country
by achieving “indigenous innovation.” The government planned to invest intensively in crucial
high-tech products and industries and promote and reward indigenous innovative technologies.
The most recent central government measure, the “Outline of the National Strategy of
Innovation-Driven Development” released in 2016, defined the goals of China’s new
development path for the next three decades. One of the highlights of the outline is that it has
pledged safeguards for the implementation of the strategy with a focus on building an efficient
national innovation system by 2020. It defines such a system as an ecosystem featuring close
coordination and interaction among various innovation entities as well as the unimpeded flow
and efficient allocation of innovation factors, and bringing about the carriers, institutional
arrangements and safeguards for achieving innovation-driven development.5 Enterprises are
encouraged to invest in scientific activities and establish high-level R&D institutes. These goals
are set to increase the competitiveness and innovation competence of China’s universities and
5 http://www.china.com.cn/zhibo/zhuanti/ch-xinwen/2016-05/23/content_38515829.htm

29
research institutes and to promote some of them to become first-tier institutions internationally.
Another target is to build an efficient technology transfer service system to optimize the
commercialization process of research results.
2.2.2 Market and industrial structure
1) Change of industrial structure
Another consequence that the transformation has led to is a change of the industrial structure.
As mentioned above, the transformation can be divided into two parts: opening up and reform.
With respect to “opening up,” one of the most important pieces of historical background is the
industrial transfer in East Asia since the 1960s: the advanced economies transfer their
overcapacities to underdeveloped countries through foreign investment successively, like the
“pattern of flying geese”. The lead country (or goose) in this pattern is Japan, the second-tier
consists of the four Asian Tigers (South Korea, Taiwan, Singapore and Hong Kong). After these
two groups follow Malaysia, Thailand, Indonesia, the Philippines and China (Kasahara, 2004).
This development model is called the flying-geese paradigm (Akamatsu, 1962) (see Figure 2.4).
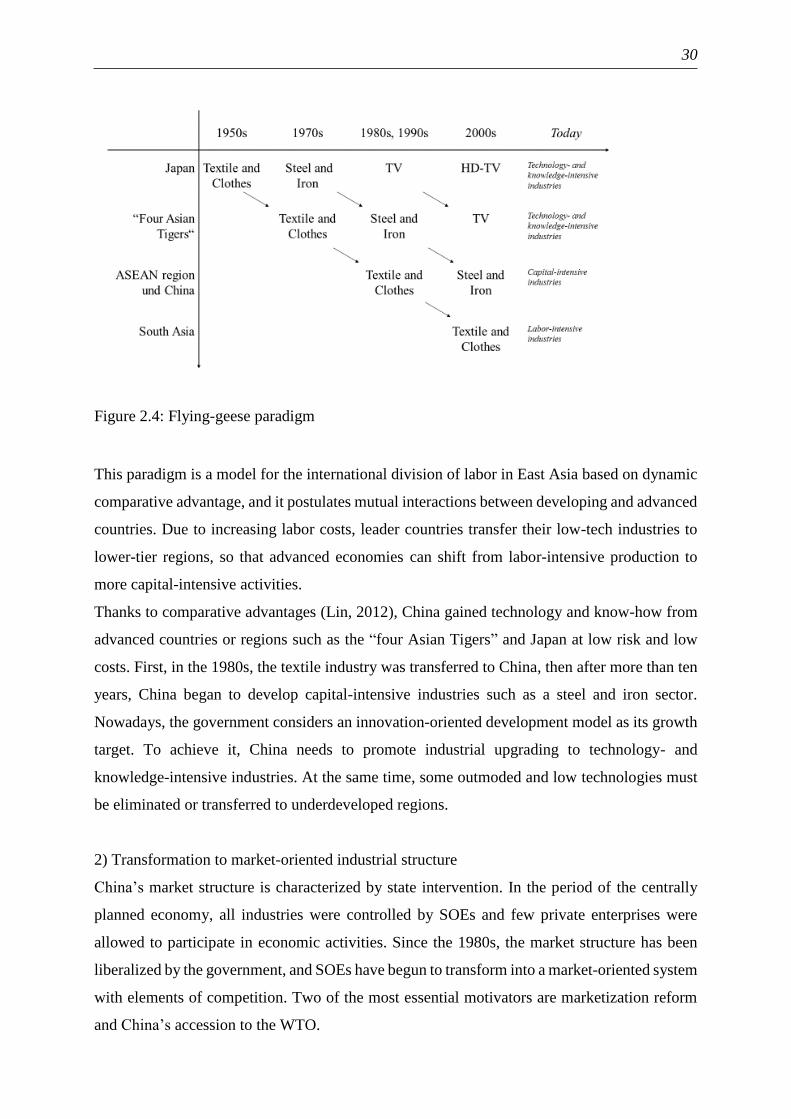
30
Figure 2.4: Flying-geese paradigm
This paradigm is a model for the international division of labor in East Asia based on dynamic
comparative advantage, and it postulates mutual interactions between developing and advanced
countries. Due to increasing labor costs, leader countries transfer their low-tech industries to
lower-tier regions, so that advanced economies can shift from labor-intensive production to
more capital-intensive activities.
Thanks to comparative advantages (Lin, 2012), China gained technology and know-how from
advanced countries or regions such as the “four Asian Tigers” and Japan at low risk and low
costs. First, in the 1980s, the textile industry was transferred to China, then after more than ten
years, China began to develop capital-intensive industries such as a steel and iron sector.
Nowadays, the government considers an innovation-oriented development model as its growth
target. To achieve it, China needs to promote industrial upgrading to technology- and
knowledge-intensive industries. At the same time, some outmoded and low technologies must
be eliminated or transferred to underdeveloped regions.
2) Transformation to market-oriented industrial structure
China’s market structure is characterized by state intervention. In the period of the centrally
planned economy, all industries were controlled by SOEs and few private enterprises were
allowed to participate in economic activities. Since the 1980s, the market structure has been
liberalized by the government, and SOEs have begun to transform into a market-oriented system
with elements of competition. Two of the most essential motivators are marketization reform
and China’s accession to the WTO.
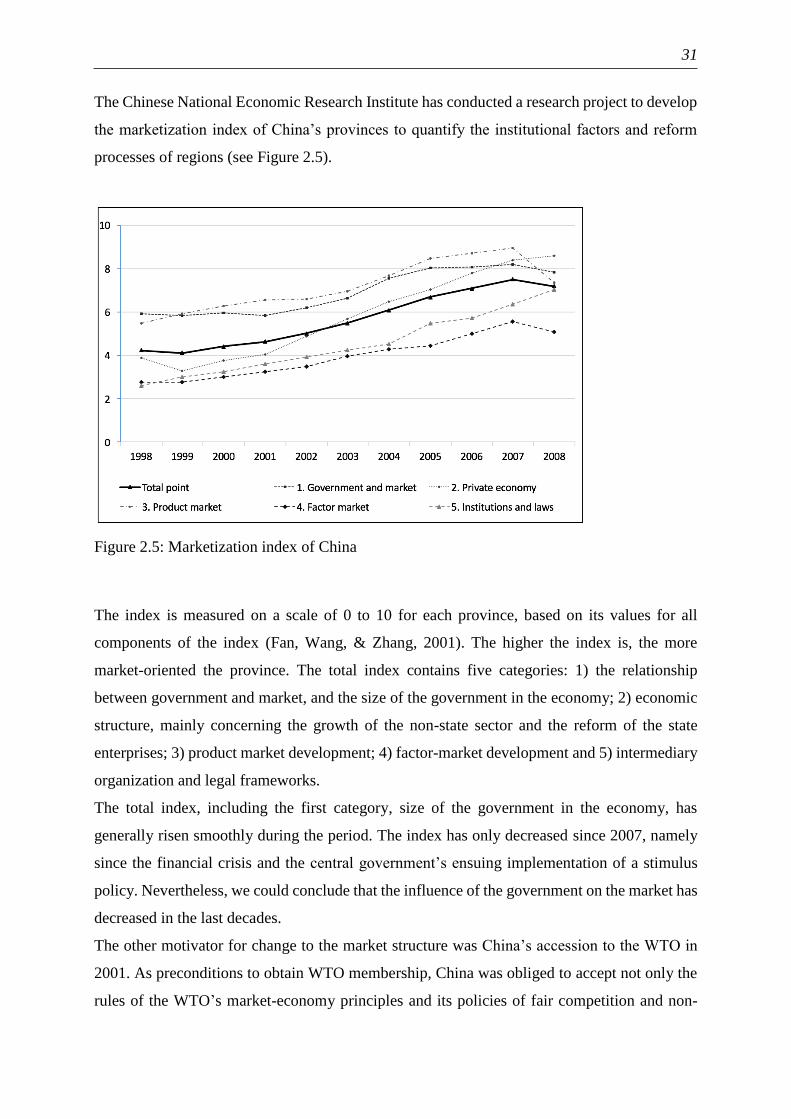
31
The Chinese National Economic Research Institute has conducted a research project to develop
the marketization index of China’s provinces to quantify the institutional factors and reform
processes of regions (see Figure 2.5).
Figure 2.5: Marketization index of China
The index is measured on a scale of 0 to 10 for each province, based on its values for all
components of the index (Fan, Wang, & Zhang, 2001). The higher the index is, the more
market-oriented the province. The total index contains five categories: 1) the relationship
between government and market, and the size of the government in the economy; 2) economic
structure, mainly concerning the growth of the non-state sector and the reform of the state
enterprises; 3) product market development; 4) factor-market development and 5) intermediary
organization and legal frameworks.
The total index, including the first category, size of the government in the economy, has
generally risen smoothly during the period. The index has only decreased since 2007, namely
since the financial crisis and the central government’s ensuing implementation of a stimulus
policy. Nevertheless, we could conclude that the influence of the government on the market has
decreased in the last decades.
The other motivator for change to the market structure was China’s accession to the WTO in
2001. As preconditions to obtain WTO membership, China was obliged to accept not only the
rules of the WTO’s market-economy principles and its policies of fair competition and non-
32
discrimination, but also the market-access conditions for goods and services. The government
monopoly, including, for example, the administrative entry barrier, had to be eliminated.
China’s reform from a planned to a market economy, a transformation process from a state-
monopolistic market to a competitive market, shaped its change of market structure. Although
there are still some monopolistic activities in several sectors, many industries have changed to
competitive markets. Meanwhile, like in other economies, some of the markets no longer
subject to state interference have been liberalized.
In summary, high-tech, medium-tech and low-tech industries are all represented in China and
the government aims to upgrade the industry structure to sustainable and technology-advanced
sectors and eliminate outdated capacities. In most industries, state intervention has decreased
as a result of the reforms, but market concentration still exists.
2.2.3 State-owned enterprises
Due to the institutional arrangement of the centrally planned economy at the beginning of
People’s Republic China, SOEs were considered a pillar of the economic system. Some SOEs
evolved directly from governmental authorities and continue to belong to governments. The
government invests much of its budget in SOEs.
The reform of SOEs began with China’s reform and opening up policy at the end of the 1970s.
The first period lasted from 1978 to 1992 and focused on breaking up the proprietary and
management rights of SOEs. After this exploratory reform, the government concentrated on
establishing modern enterprise systems throughout the second reform decade from 1993 to 1998.
In order to support employment in the state sector and maintain social stability, the central
government let the non-state enterprises grow but did not downsize the state sector. Indeed, in
this period, most of the SOEs had very low productivity growth rates (Zhu, 2012) and could not
have survived without support from the government such as subsidies, preferential access to
credit and privileges in protected industries. The reform before the 1990s is called “reform
without losers” (Lau, Qian, & Roland, 2000).
However, the lack of exit elimated market selection in the state sector and hindered further
reform. Thus, in the mid-1990s, the central government reduced its commitment to stable
employment in the state sector and introduced the mechanism of competition into the market.
SOEs in non-state sectors had to compete with private enterprises and were allowed to go
bankrupt or be privatized by companies with other forms of ownership.
Despite several series of reforms in the past decades, many previous studies have criticized the
low level of economic performance of the restructured SOEs, as the internal problems of SOEs,

33
such as property rights and weaker incentives to profitability, impede the increases in
performance and productivity as well as further reforms (Bai et al., 2006; Qian, 1996). One of
the largest problems of SOEs is unclearly assigned property rights. Property rights can be
viewed as an attribute of a good economy. Well-defined property rights should contain the right
to use, benefit from, transfer and exchange the property. However, the property rights of most
SOEs, which are owned by the government, are not defined clearly, thus making the operation
of these firms inefficient. An important reason for this lack of clearly defined rights is that a
mechanism for defining and enforcing liabilities when the value of the enterprise’s residual
profit streams is negative has not yet been established (Xiao, 1996). Clearing up SOE property
rights has become the essential goal of the SOE reform.
Since the 1990s, deep structural transformation has accelerated the privatization of former state-
owned firms, and, subsequently, the establishment of private firms has become formally
legalized (Boeing, Mueller, & Sandner, 2016). More diversified ownership forms were
introduced within the state sector. Some of the large-scale SOEs were converted into
shareholding companies (Zhu, 2012). Many inefficient SOEs, especially small-scale firms and
firms in competitive sectors, were shut down or privatized. From 1998 to 2014, the number of
industrial large- and medium-sized SOEs decreased from 64,737 to 17,830. The share of SOEs
has dropped significantly from around 40% in 1998 to under 5% in 2014 (see Table 2.1). Most
of the surviving SOEs are large and operate in upstream sectors or strategical and state-
monopolistic industries (Hsieh & Song, 2015).
Number of all large and
medium-sized industrial
enterprises
Number of state-owned
large and medium-sized
industrial enterprises
Share of SOEs
2014 361,286 17,830 4.94%
2004 301,961 24,961 8.27%
1998 165,080 64,737 39.22%
Table 2.1: The number of SOEs
Sources: National Bureau of Statistics of China, Jefferson (2016)
Since China’s accession to the WTO in 2001, the government has concentrated more on
reforming the management of state-owned assets. In 2003, the State-owned Assets Supervision
and Administration Commission of the State Council (SASAC), a special commission directly
under the control of the State Council, was founded. SASAC is responsible for managing the

34
SOEs, including appointing top executives and approving any mergers or sales of stocks or
assets, as well as drafting laws related to state-owned enterprises.
The reform has not only reduced the number of SOEs, but also increased their efficiency.
Although between 1978 and 2007, the annual average total factor productivity (TFP) growth
rate of non-state sectors (3.91%) was higher than that of state sectors (see Table 2.2), for 1998
to 2007, the growth rate of 5.5% in the state sector surpassed that of 3.67% in the non-state
sector for the first time since the reforms (Boeing et al., 2016; Zhu, 2012).
Period Nonstate State
1978-2007 3.91 1.68
1978-1988 5.87 -0.36
1988-1998 2.17 0.27
1998-2007 3.67 5.50
Table 2.2: Average annual total factor productivity growth (%), nonagricultural sector
Source: Zhu (2012)
(Notes: The “state sector” includes state-owned enterprises and shareholding companies. The
“nonstate sector” includes domestic private fifirms, foreign-invested firms, and collective firms.)
With their increased efficiency, the innovation performance of Chinese SOEs has also risen
rapidly in recent years. Although the relative share of applications for invention patents
decreased from 5.58% to 4.34% due to the increasing rate of patent applications by non-SOEs,
the absolute number tripled (from 3,306 to 10,423) between 2008 and 2014 (see Figure 2.6).
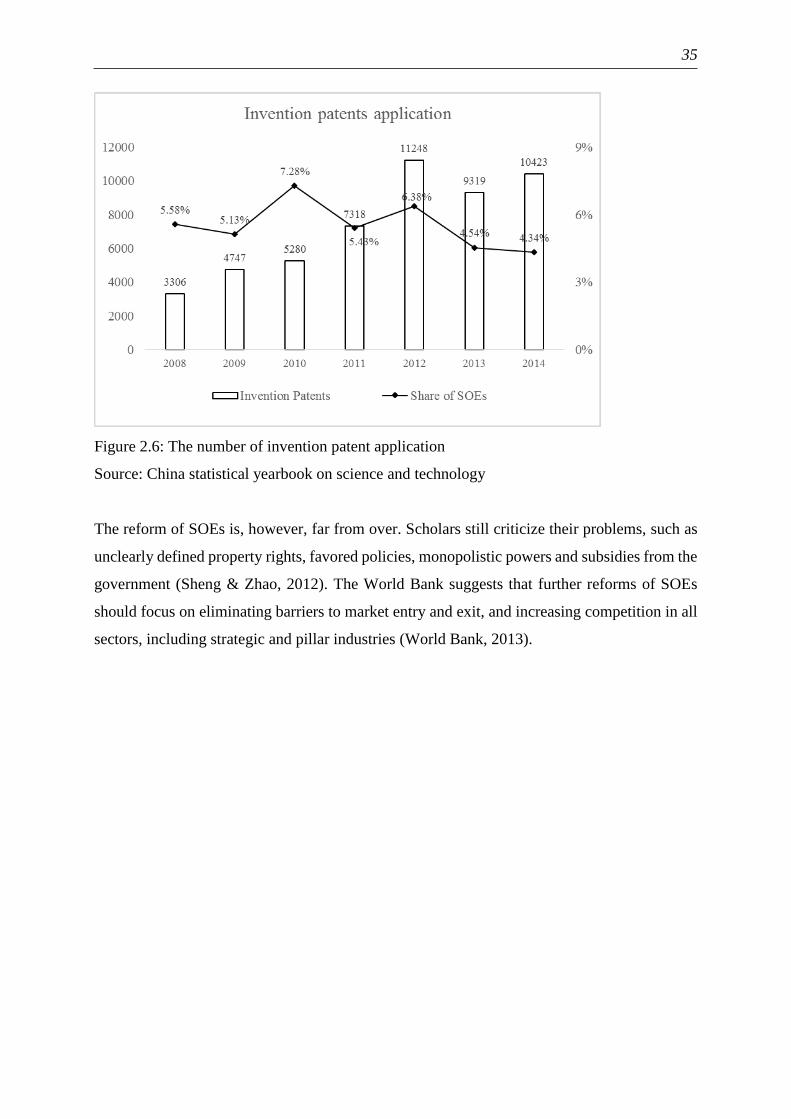
35
Figure 2.6: The number of invention patent application
Source: China statistical yearbook on science and technology
The reform of SOEs is, however, far from over. Scholars still criticize their problems, such as
unclearly defined property rights, favored policies, monopolistic powers and subsidies from the
government (Sheng & Zhao, 2012). The World Bank suggests that further reforms of SOEs
should focus on eliminating barriers to market entry and exit, and increasing competition in all
sectors, including strategic and pillar industries (World Bank, 2013).

36
3. Literature review
3.1 Overview of innovation economics
Schumpeter was the most influential pioneer and thinker of innovation research. He believed
that the “source of energy” (Schumpeter, 1934) within the economic system is innovation that
disrupts any equilibrium. The central point of his whole life’s work is that capitalism can only
be understood as an evolutionary process of continuous innovation and “creative destruction”
(Freeman, 1998; Schumpeter, 1942). He defined “innovation” as new combinations of new or
existing knowledge, resources and equipment, including introducing new products, new means
of production, opening up new markets, the conquest of new sources and carrying out new
forms of organization. This innovation activity is labeled the entrepreneurial function and
contains not only potential profits, but also difficulties. Thus, Schumpeter believed that in order
to overcome these difficulties and succeed in the new combinatory activities, more was required
than just ordinary managerial competence. The social agents fulfilling this function are
entrepreneurs (Fagerberg, 2007; Schumpeter, 1934). This is called “Schumpeter Mark I.” In his
book Capitalism, Socialism and Democracy, Schumpeter demonstrated that technical
innovation is an endogenous factor for economic growth. He argued that perfect competition is
not suitable for economic development, and some degree of monopoly is preferable for perfect
competition. Large firms are more successful and efficient in innovation activities. This is
referred to as “Schumpeter Mark II.”
Mainstream economists did not accept Schumpeter’s theory of innovation until the 1950s. With
the rapid development of S&T after the war, the importance of innovation became an attractive
research topic for the academy. Solow (1957), Arrow (1962) and Romer (1989) introduce
technical progress as a crucial variate into the economic growth functions and have proven the
importance of technology for economic development. Some other economists have focused
mostly on innovation and have made great contributions to this area. Rothwell (1992) divides
the development of theories about industrial innovation process into five stages (see Figure 3.1)

37
Figure 3.1: Evolution of innovation process models
Source: Wan (2013)
First generation: “technology push” model of the 1950s and mid-1960s
The 1950s and 1960s were characterized by post-war recovery. New technologies created new
sectors and regenerated existing ones. During the 1950s, industrial innovation was generally
considered a linear process from basic scientific research to R&D, engineering and
manufacturing, ending with market activities (Carter & Williams, 1957). In this model,
technology was the motive of innovation and the marketplace was a passive receptacle for R&D.
Thus, it is called the “technology push” model (see Figure 3.2).
Figure 3.2: Technology push model
Source: Wan (2013)
Second generation: “need pull” model of the mid-1960s and early 1970s
In mid- and late 1960s, intense market competition led to a growing level of corporate
diversification as well as mergers and acquisitions of firms. The capacities of suppliers and
demand generally came into balance. Corporations began to pay more attention to market

38
demand. The new innovation theory, the “need pull” model (see Figure 3.3), emphasizes the
role of the marketplace and considered the market the motive of industrial innovation, resulting
in R&D activities (Myers & Marquis, 1969). The growth of demand pulls R&D inventions and
innovations forward, and results in productivity growth.
Figure 3.3: Need pull model
Source: Wan (2013)
Third generation: Coupling model of the mid-1970s and early 1980s
The economic crisis of the 1970s created stagnation, and supply capacity exceeded market
demand. The innovation model returned to an approach more balanced between R&D and the
market. According to the “coupling” model, industrial innovation was the result of the
interaction of technology and the market, which were to be integrated into the innovation
process (Mowery & Rosenberg, 1979).
Fourth more balanced: Integrated model of the early 1980s and 1990s
Rothwell and Zegveld (1985) generate a more representative model, namely the “interactive”
model, which represents the confluence of technological capabilities and market demand within
the framework of innovating firms. This integrated model marked a shift from considering
innovation as a sequential process from technology to the market, to considering innovation as
a parallel process simultaneously involving elements of R&D, design, manufacturing,
management and commercial activities.
Fifth involving: Systems integration and networking model since the 1990s
During the 1990s, the strategic situation became more complex with themes coming to the fore
such as a rate of technological change, integrated products, intra- and inter-firm integration and
networking and manufacturing strategies. Rothwell (1992) argues that industrial innovation
involves considerably more than just technological change activities, but can be accompanied
by organizational factors such as organizational and commercial innovation. Organizations
must be sufficiently flexible to accommodate the requirements of the emerging innovation
programs.

39
3.2 Theories of innovation systems
In 1989, C. Freeman first defined national innovation systems in his book Technology and
Economic Performance: Lessons from Japan (Freeman, 1989). He argues that in order to catch
up to other economies, a country not only needs a market economy with free competition, but
public goods from the government. The economic rise of Japan starting in the 1960s can be
traced back to the rapid improvement of innovation, which includes technological as well as
institutional and organizational innovation. Freeman summarizes the experience of Japan’s rise
and defined the national innovation system as the network of institutions in the public and
private sectors whose activities and interactions initiate, import, modify and diffuse new
technologies.
Innovation is viewed as a dynamic process (OECD, 1997). The systems of innovation approach
studies contain the influence of external institutions and focus on the importance of the transfer
and diffusion of ideas, skills, knowledge and information, which are linked in social, political
and cultural networks that influence innovation activities and capabilities (Mortensen & Bloch,
2005). Market conditions and regulations, as well as policy, also influence innovation.
Lundvall (1985) introduces a user-producer perspective to innovation research. He raises
critical objections to technology-push (producer-side) and demand-pull (user-side) models and
argues that the user-producer interaction transmits signals from the top to the bottom of the
“Black Box” (Rosenberg, 1982) and vice versa. In innovative activities, the universities are
centers of scientific research, in other word, producers of science. Private firms and public
agencies also participate in R&D. Between these two levels, there are many research
organizations which are neither integrated in universities nor subordinated to firms, nor engaged
in basic or applied research (Lundvall, 1985). Unlike traditional industries, the so-called
science-based industries present their problems in a form suitable for scientific treatment,
communicate in a scientific code and stimulate the scientific institutions. This linkage between
science-based industry and scientific institutions establishes information channels and reflects
a tendency toward a new pattern of agglomerations of industries and universities. Lundvall
considers this relationship a “system” and defines as national innovation systems the elements
and relationships which interact in the production, diffusion and use of new and economically
useful knowledge and are either located within or rooted inside the borders of a nation state
(Lundvall, 1995).
Nelson (1993) agrees with the belief that the rise of Japan in post-war years was partly due to
a powerful and efficient innovation system established through the technology policy of the

40
Japanese government as well as strong inter-firm cooperation. These features are currently the
popular models in Europe and the United States, who have designed national programs to
enable their respective industries to stay ahead or catch up technologically. Such systems or
networks involve key interactions between component and systems producers, upstream and
downstream firms, universities and industry, and government agencies and universities and
industries. Among these actors, firms are the core of innovation systems (Nelson & Winter,
1982). Besides the interactions, the national innovation systems include a set of institutions
whose interactions determine the innovative performance of national firms. The institutions are
supposed to establish a balance of technologies between public and private organizations.
Patel and Pavitt (1994) suggest that the notion of “national systems of innovation” covers what
was ignored in earlier models of technical change: namely, deliberate “intangible” investment
in technological learning activities. NIS not only involves a variety of institutions like business
firms, universities, other educational and training institutions, and governments, but also
considers the linkage among them and associated incentive structures and competencies. They
define NIS as the national institutions, their incentive structures and their competencies that
determine the rate and direction of technological learning (or the volume and composition of
change-generating activities) in a country (OECD, 1997).
The OECD’s study of national innovation systems focuses on flows of knowledge, which is
embodied in human beings as human capital and in technology, and are considered central
economic development (OECD, 1997). In today’s knowledge-based economy, where the
production of goods and services tends to be more knowledge- and science-intensive,
innovation has become a creative and interactive process involving market and non-market
institutions. A national innovation system can be constituted by the market and non-market
institutions in a country that influences the direction and speed of innovation and technology
diffusion (OECD, 1999).
Moreover, research on national innovation systems has been developed at a regional level.
Cooke et al. (1997) argues that for conceptual and methodological reasons, many problems of
innovation systems research concerning scale and complexity may be complemented by a sub-
national focus. Regions evolve along different patterns through political, cultural and economic
factors. Thus, the designation of regions referred to by Cooke et al. (1997) can be split into two
key processes: the first is regionalization (Hadjimichalis, 2005), which is linked to the
constraints from above by the superordinate state. The second is regionalism (Harvie, 2005),
which involves cultural influence from below, namely so-called “social capital” (Putnam,

41
Leonardi, & Nanetti, 1993). These factors determine the evolutionary processes of the region,
the interactions of innovative actors, learning process and the innovation process.
Cooke and Morgan (1990, 1994) claim that Baden-Württemberg in Germany is one of the
leading regional innovation systems in Europe. The robustness of the economic system of this
German federal state rests on networks between firms, a rich institutional system of vocational
training and substantial public and private investment in innovation activities. Among them,
the networks of business and government are of key importance to the development process.
The authors argue that the successful lessons of Baden-Württemberg’s innovation networks can
be applied to less developed economies.
Porter (1998) argues that the enduring competitive advantages in a global economy lie
increasingly in local things—knowledge, relationships, motivations—that distant rivals cannot
match, and he emphasizes the key role of clusters, which, according to his theory of competitive
strategy, dominate today’s economic world map, competing with nations. Asheim and Isaksen
(2002) suggest that the regional (sub-national) level and specific local and regional resources
are still important in firms’ efforts to obtain global competitiveness, because the resources
important for innovation including labor force, specialized suppliers, learning process,
technology transfer and spill-over effects are mostly linked to regions. Knowledge is “sticky”
as it is partly embedded in local patterns of interaction.
Liu (2014) analyzes the theories of National Innovation System (NIS) and Regional Innovation
System (RIS) and argues that the following relationships between the two innovation system
levels exist: (1) NIS is the aggregation of different RIS in a country. Because the government
and policy play a crucial role in shaping NIS, the structure of NIS is more like a pattern from
“top to bottom.” On the contrary, many RIS are formed spontaneously. (2) Compared to NIS,
RIS are characterized more deeply by local culture and geographic factors. (3) Both of the
systems concentrate on the importance of institutions and organizations.
3.3 Schumpeter’s hypothesis: monopoly and innovation
In a static economic analysis, high concentration or, in the extreme, monopoly leads to welfare
losses. This result was challenged, however, by Schumpeter (1942), who has argued that
incentives to innovate are greater if an industry has a high degree of concentration. He has
asserted that a firm possessing monopoly power faces less market uncertainty and can prevent
imitation. Thereby, they can better recoup their R&D expenses and more easily appropriate
returns from their R&D investment. Secondly, due to their large monopoly profits, firms of this
42
type has many resources to invest in R&D.
One of the largest bodies of literature in the field of industrial organization is devoted to the
interpretation and testing of several hypotheses advanced by Joseph Schumpeter concerning
innovation and industrial market structure (Levin, Cohen, & Mowery, 1985). Schumpeter’s idea
initiated a new research area on relationships between market monopoly and innovation.
Several theoretical studies have confirmed that the relationship between these two factors may
take different forms, depending on details of the strategic environment, the definition of
competition intensity and the type of innovation being studied (Tishler & Milstein, 2009).
The counter-argument was presented by Arrow (1962), who stated that not monopoly, but
competition is beneficial to innovation activities. This became known as the Schumpeter-Arrow
debate. The reason that a monopolist’s incentive to innovate is less than that of a competitive
firm, is that a firm with high profits in a monopoly market has an interest in protecting the status
quo and is thus less likely to introduce new disruptive technology (Shapiro, 2011).
Arrow’s idea was criticized by some scholars, especially Demsetz. Demsetz (1969) challenges
the assumption of complete information and augues that if an economy has no serious
indivisibilities and if information is complete, as Arrow assumed, then modern analysis can
describe the characteristics of an efficient long-run equilibrium. Yet, in the real world,
indivisibilities are present and knowledge is costly to produce, because the latter is imperfect
and information is incomplete. As such, truly efficient institutions will yield different long-run
equilibrium conditions than those now used to describe the ideal norm (Demsetz, 1969). The
power of monopolists and their capital ensure them to obtain necessary investment for
innovation. The experience of previous success and the ability to attract professionals reduce
risks in the process of innovation. Demsetz has emphasized that the power of a monopolist
position is beneficial for firm innovation.
Since the debates between Arrow and Demsetz, a large number of economists have joined this
discussion about the relationship between market structure and innovation. Holmes, Levine,
and Schmitz (2012) develop a new theory based on Arrow’s model to explain why a
monopolistic industry innovates less than a competitive one. They introduce the concept of
switchover disruptions: the problem that in some cases, firms must temporarily reduce ouput in
order to adopt technology. The greater monopoly power is, the greater the cost of adoption will
be.
Theoretical debates have stimulated empirical studies since the recent 50 years. Many scholars
have contributed to testing the theories of Schumpeter with modern empirical methods, but they
have obtained different results under different conditions. We could classify the research results

43
about the relationships between monopoly and innovation into four types:
1) No effects:
As one of the earliest scholars engaging in empirical research in the field of market structure
and innovation, Scherer (1965) focuses on the relationships between inventive activity and
technological opportunity, firm size, product-line diversification and monopoly power with a
dataset of 448 Fortune 500 firms between 1955 and 1960. He ascertains that inventive output
is not related to variations in market power. This finding raised doubts about whether the
monopolistic and conglomerate corporation is as efficient as disciples of Schumpeter had
supposed it to be.
2) Positive relationship:
In spite of conclusions that there is no significant tendency for inventive output with market
concentration ratios in his previous research, Scherer (1967) uses a new and more
comprehensive dataset of the US manufacturing industry for 1960 and extended his early
analysis. He discovers that the relationship between industrial inventive and concentration is a
complex one, and technological improvement increases with concentration at low levels of
concentration.
Mansfield (1963) introduces industrial data regarding steel, petroleum and coal in the US from
1919 to 1958 and reveals that the relationship between market structure and innovation depends
on sectoral characteristics. The sixth largest firms in the petroleum and coal industries were of
about the perfect size from the point of view of maximizing the rate of innovation, while in the
steel industry, much smaller firms seem to have been better in this respect.
Acs and Audretsch (1987) use two samples consisting of 172 innovative and 42 highly
innovative industries and differentiate firms by size and sector. They find that large firms tend
to have the relative innovative advantage in industries which are capital-intensive and
concentrated, while the small firms have the relative advantage in highly innovative industries.
Kraft (1989) investigates the determinants of product innovation with data from 57 West
German firms in the metal industry for the year 1979 and measures innovative activity as a
percentage of new products in sales. He argues that competition has a strong negative impact
on innovative activity.
3) Negative relationship:
As mentioned before, Schumpeter’s idea has been challanged by Kenneth Arrow. Based on

44
perfect competiton, Arrow (1962) has created a model about incentives to invest for
monopolistic and competitive markets and has found that the incentive under competition
always exceeds the monopolist’s incentive. The only advantage of monopoly is that
appropriability may be greater than under competition, but Arrow has argued that this difference
is offset against the monopolist’s disincentive created by his preinvention monopoly profits.
Since the problem of competition and innovation involves competition policy directly, Geroski
(1990) provides implications for policy after exploring this correlation using a cross-section
dataset for the UK during the 1970s. He finds almost no support in the data for popular
Schumpeterian assertions about the role of actual monopoly in stimulating progressiveness.
Similarly, Nickell (1996) and Blundell et al. (1999) also use the data of UK companies and
argue that market competition rather than market monopoly improves innovative output.
Acs and Audretsch (1988) use the four-digit Standard Industrial Classification (SIC) released
by the U.S. Small Business Administration consisting 8074 innovations and establish that the
total number of innovations is negatively related to concentration and unionization.
4) Non-linear relationship:
The relationship between market structure and innovation is not always linear. Levin et al. (1985)
use the data on R&D appropriability and technological opportunity collected by Levin,
Klevorick, Nelson, and Winter (1984) in a survey of R&D executives in 130 industries in the
US. They discover an inverted-U relationship between innovative output and concentration.
However, Aghion et al. (2005) argue that the relationship between product market competition
and innovation is an inverted U-shape, after developing a Schumpeterian growth model and
using a panel dataset of individual UK companies covering the period 1968-1997. Their
research demonstrates that although competition increases the profits from innovation, it
weakens the innovation incentive of firms in some cases. According to their empirical results,
the relationship between competition and innovation is an inverted U-shape. The positive
impact of competition on R&D dominates when the level of competition is low, while at a
higher level of competition, additional increases in competition decrease firm R&D.
As mentioned above, the results on monopoly and innovation depend on definitions of market
structure in some cases. Using the Statistics Canada 1999 Survey of Innovation, Tang (2006)
develops new measures of competition, arguing that firms’ perceptions about their competitive
environment are important for innovation and are better measures of firm-specific competition.
Since this relationship cannot be summarized with simple interpretations, Tang (2006) estimates
it among four types including both positive and negative correlation, depending on the specific
45
competition perception and specific innovation activity of firms.
Since most of these studies are built on the assumption of a product market and have not yet
been empirically tested on service-sector firms, Tingvall and Karpaty (2010) use firm-level data
in Sweden from Statistics Sweden between 1997 and 2005. They find an inverse U-shaped
relation to hold for both small and large service-sector firms. As competition increases, small
firms tend to seek more strategic alliances with competitors, while large firms tend to decrease
their collaboration with competitors.
With the help of the rich set of panel data from China’s large and medium-size manufacturing
enterprises from 1995 to 1999, Jefferson (2006) investigates the determinants of firm-level
R&D intensity, the process of knowledge production and the impact of innovation on firm
performance. His research presents that R&D performers are more concentrated among SOEs
and shareholding companies and the least concentrated among foreign and overseas enterprises.
However, SOEs exhibit the lowest efficiency in knowledge production.
Hu (2001) uses an emprical methodology that contains a system of three equations, i.e. the
production function, a private R&D equation and a government R&D equation with a a cross-
sectional data set for Chinese enterprises of various ownership types. The data comes from a
survey of all high-tech firms in the Haidian District of Beijing for 1995. He ascertains a strong
link between private R&D and firm productivity.
Nie, Tan, and Wang (2008) use firm-level panel data from “above-scale” manufacturing firms
in China between 2001 and 2005 to analyze the factors which affect Chinese firms’ innovative
activities. Using a four-firm concentration ratio as an indicator of market structure and
advertising expenditures for market power, they argue that there is an inverted-U relationship
between innovation and size or competition, and a certain size and amount of competition can
increase firms’ innovative activities.
Boeing et al. (2016) examine whether different R&D activities have a positive influence on TFP
for firms of different ownership types and across two time periods, 2001-2006 and 2007-2011,
with a dataset of Chinese listed firms. They find that privately owned enterprises (POEs) obtain
higher returns from their own R&D than majority and minority SOEs.
From the studies above, we find that different scholars have reached different empirical results.
The resons for this could be summarized as: 1) the variety of data samples and 2) the variety of
variables, which contain two levels, firm-level and industry-level (Nie et al., 2008). In order to
investigate the factors that influence the innovation of firms, one should look for a relatively
comprehensive data set to measure firms’ industrial and individual character.

46
Most of the studies on the relationship between market structure and innovation are based on
industrial countries that have already established stable market-economy institutions and legal
systems. Scholars thus have concentrated more on non-institutional factors including market
structure and technological improvements. But in fact, for transitional countries, for instance
China, which are experiencing institutional changes, the institutional factors, such as market-
economy mechanisms and ownership engagement, should be considered (Wu, 2007) to make
these factors become new constraints for innovation performance. It would hence improve
innovation research on China if not only market structure but institutional elements were also
introduced into the analytical framework to investigate relationships between institutions,
innovation activities and growth of firms.
3.4 Ownership and innovation
In China, the influence of ownership should be especially taken into consideration, because a
large number of manufacturing enterprises that perform R&D or innovation are SOEs or private
enterprises (Nie et al., 2008).
Gary Jefferson and Albert Guangzhou Hu have contributed greatly to the research on
relationships between innovation and ownership in China. Jefferson et al. (2003) use a panel of
China’s 22,000 large- and medium-size enterprises’ data for 1994–1999, which collectively
accounts for one third of the nation’s total industrial output, and find considerable variation in
measures of performance across ownership types in which the role of the state is steadily
retreating. For SOEs, patterns of asset ownership are associated with performance. SOEs with
the highest concentrations of state assets perform at the low end, whereas those with low
concentrations of state-owned assets perform at the high end.
With the same dataset of China’s industrial enterprises, Jefferson (2006) explores the
determinants of firm-level R&D intensity, the process of knowledge production, and the impact
of innovation on firm performance, using a recursive three-equation system. Across ownership
types, R&D performers are more concentrated among SOEs and shareholding companies and
the least concentrated among foreign and overseas enterprises. State-owned enterprises exhibit
the lowest efficiency in knowledge production.
Hu and Jefferson (2009) employ a dataset that spans the population of China’s large and
medium-size enterprises for the period from 1995 to 2001 and assess the different hypotheses
regarding the causes of the patent surge by estimating a patent’s production function. As one of

47
their hyphotheses, they compute the marginal effects of ownership and establish that all non-
state enterprises except the jointly-owned group have a higher propensity to patents than SOEs.
Boeing et al. (2016) use a panel dataset of Chinese listed firms over two time periods, 2001-
2006 and 2007-2011, to analyze whether different R&D activities exhibit a positive influence
on TFP for firms of different ownership types. They ascertain that privately owned enterprises
not only obtain higher returns from their own R&D than majority and minority SOEs but that
they are also able to increase their leading position.
Besides ownership, the effect of the Party has become another indicator for the influence of
state. Using survey data of private small and medium-sized enterprises (SME) in the electronics
industry of the Pearl River Delta in China, Liefner, Kroll, and Peighambari (2016) examine the
influence of firms’ formal ties with the Communist Party of China on their patenting behavior.
Different from previous studies, which argue that SMEs are less susceptible to central
government influence than other Chinese firms, they reveal that state influence remains
intricately connected to the patenting behavior not only of larger state-owned corporations but
also of those smaller firms.
The influence of a firm’s ownership on innovation has also become an important research field
in China, especially since the reform of state-owned firms in the 1990s. As mentioned above,
using a dataset of above-scale Chinese manufacturing firms, Nie et al. (2008) compare the
influence of different types of firms on innovation. They find that SOE have a strong advantage
on innovation activities, and that the comparative advantage tends to become stronger with the
increase of firm size, while the innovative efficiency of SOEs is less than that of private
enterprises.
With a firm-level dataset of China’s industrial enterprises in 2005 and 2006, Chen and Zhu
(2011) differentiate between sectors by the level of administrative barriers to entry, using the
share of SOEs in an industry. They highlight that in innovation research, the institutional factors
in sectors should be considered.

48
4. Innovation system and innovation performance
This chapter presents the influence of innovation systems on regional innovation performance
in China for the period 1998-2008.6 It places special emphasis on the effects of institutional
factors, namely marketization level. The findings indicate that the innovation system contributes
greatly to increasing the level of innovation. Among the factors of innovation systems, the
openness of the region and government expenditure on education play key roles. Market-
oriented institutional arrangements also increase innovation performance.
4.1 Introduction
China’s transformation from a centrally planned system to a market-oriented economy has been
a great success: Since the beginning of the “Reform and opening up policy” in 1978, China’s
GDP has increased by approximately 9.8% per year. With the economic boom, China’s level
of innovation has also been increasing rapidly, and consequently, innovation performance has
already become a crucial factor for national competitiveness.
Currently, researches are paying more attention to the innovation system in innovation research.
According to a report by the OECD, innovation is the result of a complex interaction between
various actors and institutions. Technical change does not occur in a perfectly linear sequence,
but through feedback loops within this system. The innovation system includes a network of
enterprises, universities, research institutes and governments, where the flows of technology,
information and knowledge among people are key to the innovative process (OECD, 1997).
Research on innovation systems was initially carried out at the national level. Patel and Pavitt
(1994) have built a framework for the analysis of national innovation systems and believed that
it should consider immaterial investment in technological learning. This refers to the whole
institution (essentially enterprises, universities and governments), the linkage between them
and their infrastructure. In empirical studies, Furman et al. (2002) investigate the innovative
capacity in OECD countries, and Hu and Mathews (2005, 2008) examine the same for the four
East Asian “Tiger” economies (Hong Kong, Singapore, South Korea and Taiwan) as well as
China, with the help of Furman, Porter and Stern’s model (FP&S). Longitudinal comparisons
at the national level, however, often fall into dispute. Rosenberg and Nelson (1994) point out
6 This chapter, Effects of the Chinese innovation system on regional innovation performance, is part of the
research project “Comparative research on innovation systems in China and EU” of the Ministry of Education of
China and will be published as Shi, Shiwei & Kou, Kou (2017). Comparative research on national and regional
innovation systems in China and Germany: Institution, performance and policy (in Chinese).

49
that regions and industries within one country can be different. The national innovation system
cannot reflect the performance of individual actors well. Asheim and Isaksen (2002)
demonstrate that regional (subnational) resources and innovation activities are essential for
companies to increase their global competitiveness.
In emerging countries like China, regional diversity is greater than in industrialized ones; thus,
research at the national level may reflect real situations inaccurately. Moreover, many articles
ignore institutional transformation factors such as marketization, which is seen as one of the
most important reasons for technical progress in China (Fan et al., 2011). Thus, in this chapter,
we investigate regional innovation performance in China at the provincial level and analyze the
effects of innovation systems at the level of innovation output. We use a methodology
introduced by Furman et al. (2002), who present an examination of the determinants of patent
production in 17 OECD countries. We use the number of patents granted per Chinese province
between 1998 and 2008 as an indicator for regional innovative output.
Although Furman et al. (2002) introduce their model at the national level, we believe that it is
still suitable for regional innovation, as Chinese provinces can be seen as countries in terms of
geographic characteristics and freedom and independence in the area of economic policy (Kou,
2015). The innovation system in this part is divided into three parts: institution and policy,
namely innovation infrastructure; location and actors in clusters (cluster milieu); and the linkage
between them. In innovation infrastructure, the marketization level is included, because market
power could not be limited if the market lacks market entry freedom and competition (Blum,
Veltins, Bauer, & Huber, 2004). Our results demonstrate that the regional innovation system,
particularly its innovation infrastructure, affects innovation performance.
This chapter is organized as follows: Section 4.2 presents the theoretical basis and econometric
model, Sections 4.3 and 4.4 demonstrate the dataset and research results and Section 4.5 is the
conclusion.
4.2 Theoretical basis and model
This chapter is based on the FP&S model (Furman et al., 2002). The framework of the model
is based on three different theories: ideas-driven endogenous growth theory (Romer, 1989), the
theory of national industrial competitive advantage (Porter, 1990) and national innovation
systems (Nelson, 1993). Romer’s growth theory focuses on innovation input, that is to say, new
input and knowledge stock, while the latter two theories focus on innovation systems.
According to the knowledge production function, knowledge production is a function of new
input into R&D and the stock of knowledge. Technological progress and the accumulation of

50
knowledge are both the consequence of economic development and forces that promote
economic development at the same time. The knowledge production function can be formulated
as follows:
�̇�𝑡 = 𝛿 𝐿𝐴,𝑡𝜆 𝐴𝑡
𝜙 [1]
where �̇�𝑡 stands for the output of the new knowledge and innovation in year t, 𝐿𝐴,𝑡𝜆 for human
capital which is invested in R&D and 𝐴𝑡𝜙
for knowledge accumulation in year t.
Because the growth of knowledge stock depends on R&D professionals, the influence of the
state should not be ignored. Good governance is a “good” process of decision-making and the
process by which decisions are implemented (or not implemented) (Unescap, 2009). It includes
participation, rule of law, transparency and a market-oriented economy. Government policy,
which is relevant to the professional workforce and R&D activities in the long term, contributes
to economic growth.
Porter develops the theory of national competitive strategy, namely the diamond model, which
evaluates the competitiveness of industries and companies in a national cluster. In a domestic
cluster, there are four important factors: 1) factor conditions including product factors such as
human capital, real capital and knowledge resources, 2) competition promoting the innovation
and productivity of enterprises; however, stress does not only come from local competitors, but
also from international rivals, which depends on the level of openness, 3) demand conditions
influencing innovation behavior, when sophisticated domestic clients pressure firms to be more
efficient and create more advanced products and 4) related and supporting industries providing
the fundamental infrastructure, which strengthens the knowledge spill-over effect through
communication among geographically nearby industries and reduces transaction costs. Two
additional factors should not be discounted: one is chance, which affects competition but is
beyond the control of a firm. The other is government, which can influence each of the four
determinants above (either positively or negatively). Traditional innovation policy focuses
mainly on correcting market failure and maintaining competition orders through competition
policy, while the innovation system theory emphasizes the interaction synthesis effect between
different actors. Innovation-oriented competition in domestic clusters determines the
innovation performance of firms and industries (Porter, 1990). The firms play a key role in the
competition and innovation process. The government needs to provide necessary resources and
a fair growth milieu for firms.
Similar to Porter, Nelson attaches great value to the impact of institutions and systems (Nelson,

51
1993). His national innovation system highlights the importance of state policy and specific
institutions for innovation. Furman, Porter and Stern combine all the three of the theories above
and divide the determinants of the national innovation environment into three categories: 1)
infrastructure, innovation resources and policy, 2) the role of the industrial cluster and 3) the
linkage between these two parts (Furman et al., 2002). The new national innovative capacity
framework suggests not only the general innovation input formulated in the Romer function [1]
but also the determinants of the innovative milieu:
�̇�𝑗,𝑡 = 𝛿𝑗,𝑡(𝑋𝑗,𝑡𝐼𝑁𝐹, 𝑌𝑗,𝑡
𝐶𝐿𝑈𝑆, 𝑍𝑗,𝑡𝐿𝐼𝑁𝐾) 𝐿𝑗,𝑡
𝐴𝜆 𝐴𝑗,𝑡𝜙
[2]
where �̇�𝑗,𝑡 denotes the innovation production of region j in year t, 𝐿𝑗,𝑡𝐴𝜆 the input of capital and
human resources and 𝐴𝑗,𝑡𝜙
the knowledge stock. The vector 𝑋𝑗,𝑡𝐼𝑁𝐹 is the entire innovation
infrastructure, the R&D activities of the government and the openness of the region; vector
𝑌𝑗,𝑡𝐶𝐿𝑈𝑆 is the cluster-specific circumstance for innovation in the region, particularly universities
and research institutes and 𝑍𝑗,𝑡𝐿𝐼𝑁𝐾 is the linkage between the innovation infrastructure and the
cluster.
Vectors 𝑋𝑗,𝑡𝐼𝑁𝐹, 𝑌𝑗,𝑡
𝐶𝐿𝑈𝑆 and 𝑍𝑗,𝑡𝐿𝐼𝑁𝐾 complement each other and play a role similar to indicators of
innovation input and knowledge accumulation. These three factors are introduced in
exponential form; thus, equation [2] would be rewritten into a new form, �̇�𝑗,𝑡 =
𝛿 𝑋𝑗,𝑡𝐼𝑁𝐹 𝛿1 𝑌𝑗,𝑡
𝐶𝐿𝑈𝑆 𝛿2 𝑍𝑗,𝑡𝐿𝐼𝑁𝐾 𝛿3 𝐿𝑗,𝑡
𝐴𝜆 𝐴𝑗,𝑡𝜙
(Furman & Hayes, 2004), which can be transformed into a
new model via a logarithmic transformation (the natural logarithm of “ln” in model [3]):
ln �̇�𝑗,𝑡 = 𝛿1 ln 𝑋𝑗,𝑡𝐼𝑁𝐹 + 𝛿2 ln 𝑌𝑗,𝑡
𝐶𝐿𝑈𝑆 + 𝛿3 ln 𝑍𝑗,𝑡𝐿𝐼𝑁𝐾 + 𝜆 ln 𝐿𝑗,𝑡
𝐴 + 𝜙 ln 𝐴𝑗,𝑡 + 𝜖𝑗,𝑡 [3]
Furman et al. (2002) and Hu and Mathews (2005, 2008) apply model [3] to the national level
for the OECD and Asian countries, yet the model could also be appropriate for the regional
innovation systems on a provincial level in China for the following reasons: 1) With regard to
area, population and economic volume, most Chinese provinces are as large as a country. 2)
Since the reform of the late 1970s, and especially since the 1990s, the central government has
given more and more freedom in terms of economic policy to local governments, who can now
decide most concrete economic measures by themselves. 3) It is reasonable to analyze at a local
instead of a national level, because the development stages, culture and habits are quite different

52
in different provinces of China (Liu & White, 2001).
Regional decentralization has shaped China’s transition. In China’s institutions, which are
viewed as a regionally decentralized authoritarian system, the central government has control
over personnel affairs, while local governments are responsible for the economy (Xu, 2011). Li
(2007a) estimates the determinants for the disparity between the innovative capacities of
China’s provinces by analyzing the innovation subjects in innovation systems. He divides the
innovation system into two parts. The first part concerns the participants in a region, including
companies, universities, research institutes, the government and the interaction between these
participants. The other part is institutions such as rules and the relationship between government
and market. But this kind of institution is normally established at a national level, while the
impact of regional institutional factors is frequently ignored. The changes of innovation
participants and the differences in the innovative capacity of companies at a regional level has
led to the gap in regional innovative capacity. However, reform and the division of power have
induced local institutional competition in China (Cheung, 2009; Kou, 2015), which has resulted
in regional institutional divergence. As such, hypothesis 1 is that the innovation system
influences regional innovation performance in China.
Unlike the OECD countries, China is a latecomer and has experienced massive reforms and a
process of transformation to a market-oriented economy in the last decades. Marketization
refers to building an order of fair competition and an economic system where the market plays
a fundamental role in resource allocation. Park et al. (2006) find that the market-oriented
reform, including the decentralization of control, refreshing the government-firm relationship,
improving the competitive environment and defining property rights clearly, has affected the
economic performance of China by shaping incentives in management and changing transaction
and agency costs.
Thanks to the Chinese marketization index of the Chinese National Economic Research
Institute (Fan et al., 2011), we can quantify and distinguish the important institutional factors
in terms of marketization. We apply the marketization index to the innovation infrastructure
parameters 𝑋𝑗,𝑡𝐼𝑁𝐹. Hypothesis 2 is formulated as follows: market-oriented institutions has a
positive impact on China’s regional innovation performance.
In the following sections, we evaluate the extent to which the regional innovation system
influences China’s local innovation performance, thereby analyzing the innovation
infrastructure, cluster milieu and linkages between them with the help of the model of Furman
et al. (2002). We place special emphasis on the impact of the marketization level.
53
4.3 Data
We established a panel dataset with information on the innovation activities of 30 Chinese
provinces, autonomous regions and directly controlled municipalities in mainland China
(hereinafter called provinces) between 1998 and 2008,7 which is partly comparable to that
employed by Furman et al. (2002) for the OECD countries. The data used here comes from the
National Bureau of Statistics of China, the China Statistical Yearbook on Science and
Technology and the National Economic Research Institute (NERI) Index of Marketization.
4.3.1 Innovation output
We chose the number of patents granted as an indicator of regional innovation output. Patents
are a frequently used variable for innovative activity in the literature on innovation research,
and the association between these two factors is widely recognized (Griliches, 1984, 1990;
Mansfield, 1986; Patel & Pavitt, 1994; Pavitt, 1988; Schmookler, 1966). Acs and Audretsch
(1989) and Acs, Anselin, and Varga (2002) argue that patents provide a fairly reliable measure
of innovative capacity. Because patent laws and regulations have no large differences at the
provincial level in China, patents are an appropriate indicator for reflection regional levels of
innovation. In this chapter, we only used the invention patent, because compared with the other
two types (utility and design patents), invention patents require more high-tech and are often
used as an indicator for independent intellectual property (Li, 2012).
Generally, the process from patent application to granting lasts a period of time, so we had to
consider the lag between research input and patent output. Furman and Hayes (2004), Furman
et al. (2002) and Hu and Mathews (2005, 2008) use a lagged variable of three years in their
regression. In China, this process usually lasts three years as well (Li, 2007b). As such, we
imported the number of domestic invention patents granted in year t+3 (PATENT_GRA) and
patents granted per capita in year t+3 (in terms of population, in millions) (PATENT_POP).
Figure 4.1 and Figure 4.2 report two province-level measures of differences in the intensity of
innovation across regions. Figure 4.1 presents the total number of patents granted, and Figure
4.2 provides the number per million residents between 1998 and 2008. Both of the graphs
demonstrate that there are distinct trends in innovation performance among provinces. Beijing
and Shanghai are the most innovative regions in China. Guangdong, Jiangsu, Zhejiang and
Tianjin also could be seen as important innovation centers, while the other regions suffer from
a relatively low level of innovation performance. This phenomenon also demonstrates the
7 Due to missing values we didn’t use the data of Tibet.

54
necessity of controlling for the individual effects of provinces in regressions.
Figure 4.1: The number of patents granted 1998 to 2008
Source: National Bureau of Statistics of China

55
Figure 4.2: The number of patents granted per million persons 1998 to 2008
Source: National Bureau of Statistics of China
4.3.2 Traditional innovation input
According to the FP&S model, innovation input includes professional labor forces (or real
capital) and knowledge stock. For labor input, we used the number of full-time equivalents of
R&D personnel in a province from the China Statistical Yearbook on Science and Technology
(PERSONAL), which contains all of the full-time R&D staff in research institutes, universities
and enterprises. For knowledge stock, we employed the GDP per capita of the province. Per
capita GDP captures the ability of a country, or in this case a province, to translate its knowledge
stock into a realized state of economic development (and thus yields an aggregate control for a
country’s, or province’s, technological sophistication) (Furman et al., 2002). Figure 4.3
demonstrates the number of R&D employees in each province between 1998 and 2008. Beijing,
Guangzhou, Jiangsu and Zhejiang have invested more in R&D employees than the other
provinces, which corresponds partly to the innovation output presented in Figure 4.1 and Figure
4.2.

56
Figure 4.3: Change of R&D human capital
Source: National Bureau of Statistics of China
4.3.3 Indicators of innovation systems
Innovation infrastructure refers to factors of fundamental institutions and the role of the
government. We imported the percentage of international trade volume in relation to GDP
(OPENNESS) and the share of education expenditure of total government spending
(ED_SHARE). Another important element is the marketization process. The experience of
industrial countries has proven that the best way to modernize is to build a market-based
economic system (Fan, Wang, & Zhu, 2006). The NERI Marketization Index measures the
marketization levels of 31 Chinese provinces between 1997 and 2009 and demonstrates the
growth process of a market-oriented economy in China. This index has been widely used by
many researchers to measure regional institutional development (Chen, Firth, Gao, & Rui,
2006; Chen, Firth, & Xu, 2009; Firth, Lin, Liu, & Wong, 2009; Li, Yue, & Zhao, 2009; Wang,
Wong, & Xia, 2008). The higher the point value is, the more “market-oriented” the province is.
Marketization is divided into five subcategories: (1) the relationship between government and
market, such as the role of markets in allocating resources; (2) the development of non-state

57
economy, such as industrial output of private sector; (3) the development of product markets,
such as regional trade barriers; (4) the development of factor markets, such as foreign direct
investment and mobility of labor; and (5) the development of intermediary organizations and
the legal system, such as the protection of property rights (Chen et al., 2006). We introduced
the development of intermediary organizations and the legal system (rule of law) (INTER)
which encompasses the development of intermediary organizations, the protection of the rights
of employees, intellectual property and the protection of the rights of consumers. In China,
legislative power is exercised by the National People’s Congress at the national level. The
province has no power to adopt laws, but it may enact corresponding local orders and
regulations and must create a fair environment for the rule of law. In order to estimate the effects
of marketization reform more precisely, we added another a subcategory to this index, which
contains concrete indicators of market-oriented institutions: the protection of intellectual
property (IP).
Besides infrastructure, regional innovation performance also depends on the milieu of concrete
clusters at a meso-level. The variable that we chose as indicator of the properties of clusters and
industry structure is the share of the tertiary sector of GDP. As Porter (1990) argues, individual
clusters tend to be associated with the industrial structure of local areas. We introduced the
share of the tertiary sector of a province’s GDP (TERTIARY) as a proxy for economic structure
in a province’s cluster.
For a given cluster innovation environment, innovation output may tend to increase with the
strength of the common innovation infrastructure (Furman et al., 2002). Network formation and
establishing new linkages might be established by affecting career patterns and incentive
systems in firms and at universities (Lundvall, Johnson, Andersen, & Dalum, 2002). The
connection and interaction between infrastructure and innovation-oriented clusters, as well as
between R&D and production in clusters, are essential for an innovation system. This
relationship can be interpreted through the behavior of institutions, such as research institutes,
universities and financial institutions that fill in the blanks in the network. As such, we
introduced two variables of this linkage. The first is the share of universities’ R&D spending of
the total R&D expenditure (UNI_RD). In latecomer countries, several fields of academic
science are application-oriented, because these countries require more practical engineers for
construction. This model not only influences people in industry, but also develops the scientific
foundations of industrial technologies (Hu & Mathews, 2005). The second variable is the
contribution of bank credit to S&T activities in a province (BANK). The bank plays a crucial
role in China’s economic growth and did so particularly when China was still lacking wide-

58
ranging financing channels decades ago. As such, we calculated the share of bank credits in
total S&T funding to estimate the effect of financing channels. Table 4.1 presents the variable
definitions and Table A.1 (see Appendix A) the descriptive statistics for all variables.
Variable Definitions
L_PATENT_GRA Log of granted patents in the province i in year (t+3)
L_PATENT_POP Log of granted patents per million persons in the province i in
year (t+3)
𝐴𝑗,𝑡𝜙
L_GDP_PC Log of GDP per capita
𝐿𝑗,𝑡𝐴𝜆 L_PERSONAL Log of amount of full-time equivalent of R&D personnel
𝑋𝑗,𝑡𝐼𝑁𝐹 OPENNESS Openness level (%): share of trade volume in GDP
𝑋𝑗,𝑡𝐼𝑁𝐹 ED_SHARE Share of local government’s expenditures spent on education
(%)
𝑋𝑗,𝑡𝐼𝑁𝐹 INTER Intermediary and law system
𝑋𝑗,𝑡𝐼𝑁𝐹 IP Strength of protection for intellectual property
𝑌𝑗,𝑡𝐶𝐿𝑈𝑆 TERTIARY Share of tertiary sector in GDP (%)
𝑍𝑗,𝑡𝐿𝐼𝑁𝐾 UNI_RD Percentage of R&D expenditures from universities (%)
𝑍𝑗,𝑡𝐿𝐼𝑁𝐾 BANK Contributions of bank to scientific and technical activities (%)
Table 4.1: Definition of variables
4.4 Empirical results
Table 4.2 reports the empirical results of our research.8 The dependent variable is the number
of invention patents granted in province i in year t + 3. We analyzed the innovation performance
in different variants through columns (1) to (4): First, we introduced only the regression with
the fundamental factors of innovation input, followed by the variables of innovation systems
and institutions, step by step.
According to Romer’s endogenous growth theory, the volume of knowledge stock and the
factor input determine innovation productivity. In column (1), we used the logarithm of GDP
per capita and full-time equivalents of R&D personnel as indicators of the basic input level.
According to regression results, both of the factors have positive effects on innovation
performance. If GDP per capita increases by 10%, the number of patents granted rises by
approximately 14.38%. If a region hires 10% more R&D staff, the number of patents granted
goes up by approximately 8.74%.
8 More details about regressions see Appendix A.

59
As explained above, the regional innovative capacity depends not only on innovation input, but
also on the institutional milieu. Column (2) includes all variables of the innovation
infrastructure. Both of the innovation infrastructure factors, OPENNESS (0.016) and
ED_SHARE (0.090), have significantly positive effects. Although China’s transition strategy
since the late 1970s has been called the “reform and opening-up policy,” “reform” and
“opening-up” were in fact two separate parts, meaning that they were not simultaneously
implemented. Opening-up was an engine for China’s reform. Each further process of opening
up brought the transition a step forward (Shi, 2009). The opening-up policy “forced” China to
participate in the global division of labor and international competition. The other factor,
education expenditure by local government, remains at a significant level, suggesting that
policy variation plays an important role in determining innovation output. The amount of
patents granted rises by approximately 0.9% if the government spends 10% more on education.
Indicators of cluster circumstances were then added into the regressions. Furman et al. (2002)
argue that the environment for innovation in industrial clusters is difficult to measure due to the
subtlety of the concepts involved as well as the lack of systematic data. Because of the limit of
data, we only used the development of tertiary sectors as indicator of industrial clusters. It is
evident that TERTIARY contributes to innovation output. With the development of the
economy the tertiary sector has been growing rapidly and contributed to the economic growth
greatly. Provinces where the service sector is well developed are particularly innovative. One
of the reasons for this could be that the tertiary sector contains a large number of industries that
supply innovation activities with necessary services. Moreover, if we observe the financing
channel, we find that if banks dominate the financing channel of S&T activities, the innovation
output decreases.
The last factor that we observed is the influence of marketization reform. Columns (3) and (4)
introduce the two marketization indicators respectively: intermediary organizations (INTER)
and protection for intellectual property (IP). It is remarkable that both of these have significantly
positive effects. Every additional unit of INTER and IP increases the amount of patents granted
by around 0.87% and 0.44%, respectively. This proves that institutions influence innovation
output in China and that a market-oriented system increases regional innovation performance.

60
(1) (2) (3) (4)
L_GDP_PC 1.438*** 1.358*** 1.121*** 1.254***
(0.186) (0.176) (0.193) (0.185)
L_PERSONAL 0.874*** 0.651*** 0.358*** 0.393***
(0.169) (0.149) (0.124) (0.130)
OPENNESS 0.016*** 0.012*** 0.009**
(0.003) (0.003) (0.004)
ED_SHARE 0.090*** 0.062** 0.061**
(0.023) (0.023) (0.022)
INTER 0.087***
(0.020)
IP 0.044***
(0.014)
TERTIARY 0.071*** 0.070***
(0.010) (0.011)
UNI_RD 0.004 0.002
(0.007) (0.007)
BANK -0.013* -0.014*
(0.007) (0.007)
_cons -16.180*** -15.092*** -12.646*** -13.825***
(1.662) (1.446) (1.113) (1.186)
N 240 240 240 240
r2 0.766 0.806 0.865 0.864
r2_a 0.764 0.802 0.861 0.859
Standard errors in parentheses
* p<0.1, ** p<0.05, *** p<0.01
Table 4.2: Estimation results (granted patents as dependent variable)
In Table A.2 (see Appendix A), we replaced the dependent variable, the logarithm of the
number of patents granted (L_PATENT_GRA), with the logarithm of the number of patents
granted per million people (L_PATENT_POP) and estimated columns (1) to (4) once again in
order to test the results’ robustness. The coefficients are similar to those in Table 4.2. From
columns (1) to (4) the variables L_GDP_PC and L_PERSONAL are positive and significant.
We interpret this to suggest that the classic determinants of innovation are also important motors
for innovation performance. The other results are also robust to the modification: OPENNESS,
ED_SHARE, INTER, IP, TERTIARY and BANK.

61
4.5 Conclusions
In this section, we estimate the effects of innovation systems on regional innovation
performance in China. For this purpose, we established a dataset across 30 provincial-level
regions between 1998 and 2008. The results indicate that the traditional innovation input and
innovation system contribute to increasing the level of innovation. The GDP per capita as
indicator of knowledge stock plays a key role, which is identical with the results of Furman et
al. (2002) and Hu and Mathews (2005, 2008). In the transition from a planned to a market
economy, it is conceivable that output gains are the productive combination of existing factor
stocks (Blum & Dudley, 1998). In addition, institutional arrangements also affect innovation
output.
The different factors of the innovation system have different effects: innovation infrastructure,
including the level of openness of a region and government expenditure on education, is
necessary for innovation. As to openness, it is of importance for local firms to be active in
international competition. The combination of global orientation and local strength is
considered essential for China to catch up the West. However, some firms hesitate to enter
foreign markets (Blum & Zhao, 2015). The provincial government should build an efficient
mechanism to encourage local firms to participate in “go-out strategy”9. Furthermore, attracting
international capital and technology to China can also help provinces to improve their
innovation performance. Besides capital, human resources play an important role. Indeed, the
integration of human capital and invested capital is seen as one of the factors influencing the
prosperity and the education and training at work places are especially essential (List, 1841).
Another result is that the extent of bank credit does not influence innovation output. In China,
the largest banks are controlled or influenced strongly by the state and would prefer to grant
credit to SOEs, because SOEs’ credit is “endorsed” by the government. It is evident that the
frequent engagement of banks in R&D financing cannot promote the level of innovation. The
reason could be that the innovation capacity of SOEs still stay at a relatively low level, although
it is easier for them to obtain capital for R&D from banks than private firms.
Finally, our results suggest that institutional factors play an important role in increasing the
level of innovation. A market-oriented economic structure, especially healthy intermediary
organizations and protection of intellectual property, helps a region to achieve a better outcome
in innovation activities.
In political terms, the findings suggest that an ideas-driven growth model is appropriate for
9 http://english.gov.cn/news/top_news/2016/04/11/content_281475325205328.htm
62
innovative activities in China. The provinces should not only concentrate on training
sophisticated engineers and researchers but also attempt to participate in international
competition and focus on the education and training of new generations. It is necessary to
continue to promote China’s economic reform and transformation to a market economy. For
local governments, it is beneficial to build a framework of economic fairness for the
intermediary market to provide infrastructure services to innovation performers.

63
5. Market structure and innovation
China’s transition is leading to a change in market structure, which in turn is influencing
innovation activities. Using panel data from Chinese industrial firms, this chapter examines the
effects of the market structure on innovation performance at the firm level. We find there is a
non-linear relationship between market concentration and innovation, and the influences of
market structure vary by region and industry.
5.1 Introduction
The relationship between market structure and firm behavior is one of the most important fields
of industrial organization (IO). There have been many significant contributions to the research
of market structure ranging from the Harvard School, the Chicago School to the various
approaches of game theory, from economists, jurists to politicians. This research into market
structure includes competition and monopoly, firm organization such as internal R&D, and also
public policy such as economic regulation.
An attractive area of IO that has interested scholars in recent years is the relationship between
market structure and innovation, a field tackled by the theoretical IO and the endogenous
growth literature (Aghion et al., 2005). However, both theoretical and empirical research
obtained controversial results under different preconditions with distinct datasets from different
countries or regions.
Meanwhile, the relationship between market structure and innovation performance, considered
a crucial element of firm behavior, represents one traditional and essential research topic in the
economics of innovation (Castellacci, 2011). As the core entity of innovation activities
(Mortensen & Bloch, 2005), firms play a key role in improving the innovation performance of
the whole system. On the other hand, besides the firm itself, innovation activities are also
influenced by market features such as competition or the monopoly level in a market. According
to the Harvard School, market structure determines a firm’s economic conduct, which impacts
its performance (Bain, 1968) pertaining to technical efficiency and innovativeness (Porter,
1981). Aghion et al. (2005) divide market competition into two types: “neck-and-neckness” and
“leader-laggard”, based on the technology gap of firms. In distinct markets there can exist two
different effects of market structure on innovation. First, the escape-competition effect, which

64
postulates that competition leads to high levels of innovation. Second, the Schumpeterian effect,
which argues that a monopoly increases innovation output.
This chapter reexamines this topic from an empirical perspective and provides evidence from
China’s industrial enterprises. In recent decades, China has experienced a thorough change in
economic institutions. The transformation from a planned economy to a market-oriented system
has changed market structures that were previously shaped by the Soviet-Model. On the one
hand, the state no longer interferes in many industries, and at the same time, private enterprises
play a more important role in the economic system. On the other hand, state-owned enterprises
(SOE) are concentrated in certain sectors, meaning barriers to market entry still exist.
Meanwhile in some other industries, technologically-advanced (private) firms or market
pioneers dominate markets. This recent phenomenon has re-shaped market structures in China.
Moreover, China has experienced several rounds of industrial structure upgrading. This
upgrading is attributable to changes in the international environment such as the industrial
transfer in East Asia, China’s accession to the WTO, and the diversification of indigenous
demands. Indeed, this industrial structure upgrade has led to outdated and unsustainable
industries being eliminated from China, or transferred to underdeveloped countries. In some
cases, these industries are relocated from China’s eastern provinces to western and central
regions, whereas more and more technology-oriented industries are being established in China.
The industrial upgrading and the diversity of technological patterns characterize the innovation
activities and innovation performance of firms.
The core question of this chapter is how market structure affects innovation performance.
Besides focusing on the relationship between market structure and innovation, this part also
takes the geographic disparity between regions and the technological features of industries into
account. Based on theories of IO and innovation economics, we investigate this research
question by using panel data from Chinese industrial enterprises between 2005 and 2007.
The remainder of this chapter is organized as follows: Section 5.2 provides the conceptual
background and hypotheses, Section 5.3 presents the dataset. Section 5.4 demonstrates the
results and Section 5.5 concludes.
5.2 Conceptual background and hypotheses
The Harvard School and Chicago School originated two important economic theories in the IO
field. The Chicago School argues that firm performance determines market structure. An
enterprise can obtain large market share as it has higher productivity when competing with its
rivals. The market concentration is the consequence of firm behavior and the market’s
65
efficiency, without government interference, encourages firms to seek efficiency in their
production and distribution (Friedman, 1964). In contrast, the Harvard School uses the Structure,
Conduct and Performance paradigm as an analytical framework to explain the relationship
among market structure, market conduct and firm performance (Bain, 1968).
According to this traditional industrial organization paradigm, market structure, defined as the
economic and technical dimensions of a market that provides the context in which competition
or monopoly occurs (Bain, 1972), influences the conduct, which presents the firm’s choice and
strategy such as price or advertising. The firm performance, for instance allocative efficiency
(profitability), technical efficiency (cost minimization) and innovativeness (Porter, 1981), is
then determined by market conduct. For this reason, the market structure plays a dominant role.
Large-scale enterprises with high market concentration tend to increase prices and build barriers
to entry in order to pursue monopoly profit. Thus, as far as the implications for economic
policies are concerned, the government should focus more on market structure and use public
policy to influence firm behavior (Mason, 1939), limit possible monopolistic activities and
secure proper competition in markets. The Harvard School theory is considered a useful
contribution to strategy formulation in a market and provides a systematic model for assessing
the nature of competition in an industry (Porter, 1981).
As mentioned above, firm performance contains factors of innovation performance which
describes the innovation output of innovation activities of firms. In recent years, the influence
of market structure on innovation performance is considered to be an important topic in the
economics of innovation. Several scholars have contributed to both theoretical and empirical
research in this field. The theoretical study of the relationship between market structure and
innovation represents two main arguments (Aghion et al., 2005; Castellacci, 2011; Hashmi,
2013): First, the idea itself goes as far back as Schumpeter (1942), who found that competition
may decrease the monopoly rents of firms, thus reducing their incentive to innovate. This is the
first argument known as the Schumpeterian effect, which demonstrates that profits will be
limited at high levels of competition and thus competition reduces innovation. The second is
the escape-competition effect. This theory highlights that the relationship between competition
and innovation is positive because a firm needs to innovate to escape competition from rivals.
In order to combine market structure with innovation performance, we assume a market with
duopolies. The market can be categorized into two types. The first is a sector in which firms
compete neck-and-neck (NN) and the technological gap between competing firms is small. In
contrast, in the other market, firms are technologically unequal, meaning that one firm, as the

66
market leader, is more technologically-advanced than the other (the laggard). Therefore, it is
called the leader-laggard market (LL) (Aghion et al., 2005; Hashmi, 2013).
As regards the Schumpeterian effect, which puts forward that high competitive intensity in a
market reduces the profits of a firm, monopoly would increase innovation, while considering
an escape-competition effect, more competition could increase innovation. With both market
structures and their effects on innovation we combine them in a four-field matrix (see Figure
5.1):
Figure 5.1: matrix of market structure and effects
With respect to the Schumpeterian effect, both of the technologically equal firms would not
have high motivations to participate in innovation activities in NN market. However, in the LL
market the technology-advanced firm will innovate more than the laggard counterpart. Aghion
and Howitt (1992) demonstrate the Schumpeterian effect in their original Schumpeterian
growth model. As for the escape-competition effect, firms in NN markets have incentives to
innovate in order to escape competition from rivals. By contrast, in LL markets, where
competition stays at a low level, firms do not have high motivations to invest in innovation.
Besides these two cases, the effects on the level of innovation might vary under different types
of market structure. Aghion et al. (2005) argue that escape-competition effect dominates the
Schumpeterian effect in the NN market, while the Schumpeterian effect dominates the escape-
competition effect in the LL market. For these reasons, they believe there is a non-linear
relationship between competition and innovation. In summary, as regards all circumstances
touched upon above, the relationship between market structure and innovation should not be
simply interpreted as a linear correlation.

67
The theoretical arguments can be further substantiated by empirical research. In fact, the classic
works in this field were motivated by empirical investigations (Castellacci, 2011). The results
of the empirical research for these two effects, however, are controversial. In some cases, it is
shown that competition enhances innovation (Arrow, 1962; Geroski, 1990; Nickell, 1996),
while in other cases, competition is seen to discourage innovation (Acs & Audretsch, 1987;
Mansfield, 1963; Scherer, 1967). In recent years, scholars have discovered that the degree to
which competition or the concentration of a market may have on a firms’ innovative activities
could be more complex than simply a positive or negative linear relationship. Aghion et al.
(2005) point out the existence of an inverted U-shape relationship between market competition
and innovation (Castellacci, 2011). Based on Cournot competition, Tingvall and Karpaty (2010)
focus attention on industrial organizations and describe the optimal R&D choice of firms
operating in an oligopoly market. The authors predict an inverse U-shape relationship between
competition and innovation in service sectors.
So our Hypothesis 1 is formulated as: Due to the two contradicting forces of the Schumpeterian
effect and escape-competition effect, there is a non-linear relationship between market structure
and innovation.
However, turning to China’s current situation, it is insufficient to only investigate the market
structure of China as a whole entity due to the great disparities in the country. The development
periods, the innovation competence, geographic characteristics and the institutional framework
vary from region to region. Due to the vast expanse of the area, these regional disparities are
much larger in China than in many other countries. Moreover, regarding China’s reform process
in recent decades, it is worth noting how the disparity in the establishment of market-oriented
institutions has risen (see Chapter 4). This disparity leads to a widening development gap and
obvious distinctions in the market and industrial structure between regions. Therefore, another
factor that should be taken into account is geographic location. In China’s economic
development, innovation performance, as well as political and institutional framework
conditions vary from province to province – much more so than in many other countries. Thus,
it is reasonable to assume that the innovation performance of firms would differ accordingly.
In the eastern regions for example, since the reforms, provinces have developed dynamically
and have established relative market-oriented institutions. State power intervenes less
frequently in markets than in other provinces. Meanwhile, many outdated industries have been
eliminated or transferred to South Asian countries or western and central Chinese provinces.
Provinces in eastern China, like the classic “islands of innovation”, including Beijing, Shanghai
and Guangdong (Kroll & Liefner, 2008; Kroll & Schiller, 2010), concentrate more on high-tech

68
sectors and invest more into R&D. On the other hand, regions in western and central China
continue to lag behind (Kroll, 2010). For these reasons, it is reasonable to analyze to what extent
these general trends with regard to the regional distribution of development as well as
geographic locations influence the innovation performance of firms. Hence, we suggest as
Hypothesis 2, that due to the disparity in the development level of the provinces, the influences
of market monopoly vary from region to region.
Furthermore, the performance of firms is determined, not only by their market power, but also
by their sectoral environment. China has experienced, and is experiencing, the process of
industrial upgrading, which leads to low-tech industries exiting the market gradually and to
technologically advanced sectors obtaining large amounts of support not only from private
sectors, but also from government. The innovation performance of firms could also vary from
industry to industry. In the catching-up regions in the middle and west of China, innovation
activities are dominated by mature industrial sectors that have been transferred out of leading
provinces. An argument for this phenomenon is that political interference demands a
contribution from these provinces to the so-called “indigenous innovation” (Kroll, 2015), more
precisely, to innovate through indigenous S&T and resources instead of purchasing foreign
technologies and know-how. The profitability and innovation performance of firms in these
low-or medium-tech industries are more dependent on their scale and the market share as there
is little potential to achieve huge technological progress in these mature sectors. In addition,
firms have to obtain new products or production processes through size expansion, while in
high-tech or young industries, innovations, especially radical innovations, occur more
frequently (Bos, Economidou, & Sanders, 2013). Jefferson et al. (2003) use panel data from
China’s 22,000 large-and medium-size enterprises for 1994–1999 and investigate patent
applications in different sectors. They find a high concentration of patenting activity within
China’s manufacturing sector, and among the patent applicants, the petroleum and gas industry
leads by a wide margin.
As Hypothesis 3, we suggest the effects of market structure on innovation of firms could be
distinct in different industries. The innovation performance of firms in low-tech sectors might
more depend on the their market share than those in technology-advanced industries. So the
model of our analysis is formulated as:
𝐼𝑁𝑁𝑂𝑖,𝑡 = 𝛽0 + 𝛽1𝐻𝐻𝐼𝑗,𝑡 + 𝛽2𝐻𝐻𝐼𝑗,𝑡2 + ∑ 𝛿𝑠
𝑠
𝑝=1𝑋𝑖,𝑡 + 𝜖𝑖,𝑡

69
where 𝐼𝑁𝑁𝑂𝑖,𝑡 stands for innovative output of firm i in year t, HHI is the Herfindahl Index and
HHI2 is the quadratic term, and X is the vector for other control variables.
5.3 Data
This chapter uses a rich dataset from China’s large-and-medium-sized industrial enterprises
collected by China’s National Bureau of Statistics since 1994. This “China Annual Survey of
Industrial Firms” (Nie, Jiang, & Yang, 2012) is considered to be one of the most important and
comprehensive micro-level dataset of firms in China and has been used widely by researchers10
(Hsieh & Klenow, 2009; Hu & Jefferson, 2009; Song, Storesletten, & Zilibotti, 2011). Our
dataset includes around 200,000 large- and medium-sized industrial enterprises between 2005
and 2007, containing 582,712 observations.
The dataset covers 482 four-digit industries over three years. If an industry includes too few
companies, the Herfindahl Index would become extremely large, which, could in turn, create
bias in the regression results (Chen & Zhu, 2011). Therefore, we eliminate industries containing
less than 15 companies and preserve 468 four-digit industries.11
As an indicator for innovation performance we use new products. Schumpeter (1934)
distinguished between five types of innovations: new products, new methods of production,
new sources of supply, exploitation of new markets, and new ways to organize business. Kraft
(1989) measures innovation as the percentage of products newly developed in sales. Jefferson
(2006) also uses new products as an indicator for innovation output. So we use the percentage
of newly developed products of firms in sales to measure innovation output. According to
Jefferson et al. (2003) the criteria used in the dataset for measuring the variable “new products
sales” is defined below:
“Products included in the category of ‘new product sales’ are those which are new in relation
to the reporting firm’s prior product mix. Products that involve the use of new principles,
incorporate design improvements, utilize new materials, or embody new techniques constitute
new products; existing products that are used for new functions or expand capabilities (e.g.,
production or speed) also constitute new products.”
The reason that we give up patents, which are also widely used as indicators of innovation, is
that many firm’s patents have never been commercialized, or are rather only used for minor
10 More details about this database see Nie et al. (2012) 11 More details about regressions see Appendix B.
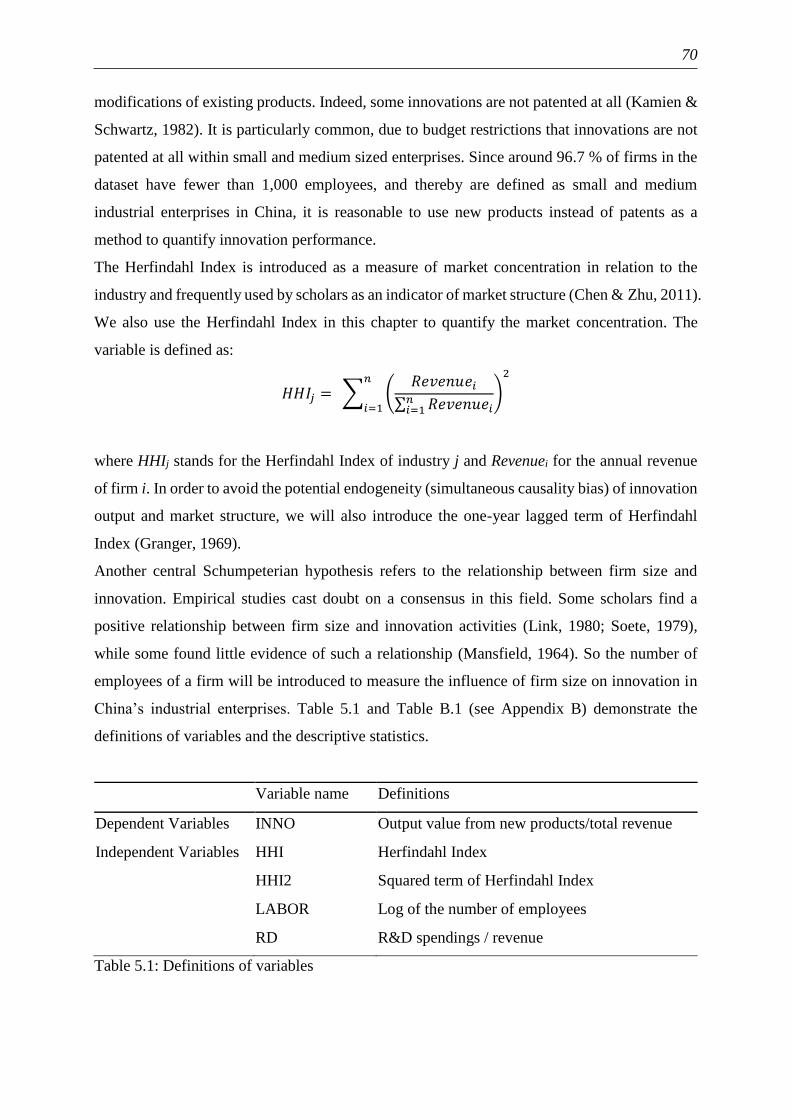
70
modifications of existing products. Indeed, some innovations are not patented at all (Kamien &
Schwartz, 1982). It is particularly common, due to budget restrictions that innovations are not
patented at all within small and medium sized enterprises. Since around 96.7 % of firms in the
dataset have fewer than 1,000 employees, and thereby are defined as small and medium
industrial enterprises in China, it is reasonable to use new products instead of patents as a
method to quantify innovation performance.
The Herfindahl Index is introduced as a measure of market concentration in relation to the
industry and frequently used by scholars as an indicator of market structure (Chen & Zhu, 2011).
We also use the Herfindahl Index in this chapter to quantify the market concentration. The
variable is defined as:
𝐻𝐻𝐼𝑗 = ∑ (𝑅𝑒𝑣𝑒𝑛𝑢𝑒𝑖
∑ 𝑅𝑒𝑣𝑒𝑛𝑢𝑒𝑖𝑛𝑖=1
)
2𝑛
𝑖=1
where HHIj stands for the Herfindahl Index of industry j and Revenuei for the annual revenue
of firm i. In order to avoid the potential endogeneity (simultaneous causality bias) of innovation
output and market structure, we will also introduce the one-year lagged term of Herfindahl
Index (Granger, 1969).
Another central Schumpeterian hypothesis refers to the relationship between firm size and
innovation. Empirical studies cast doubt on a consensus in this field. Some scholars find a
positive relationship between firm size and innovation activities (Link, 1980; Soete, 1979),
while some found little evidence of such a relationship (Mansfield, 1964). So the number of
employees of a firm will be introduced to measure the influence of firm size on innovation in
China’s industrial enterprises. Table 5.1 and Table B.1 (see Appendix B) demonstrate the
definitions of variables and the descriptive statistics.
Variable name Definitions
Dependent Variables INNO Output value from new products/total revenue
Independent Variables HHI Herfindahl Index
HHI2 Squared term of Herfindahl Index
LABOR Log of the number of employees
RD R&D spendings / revenue
Table 5.1: Definitions of variables
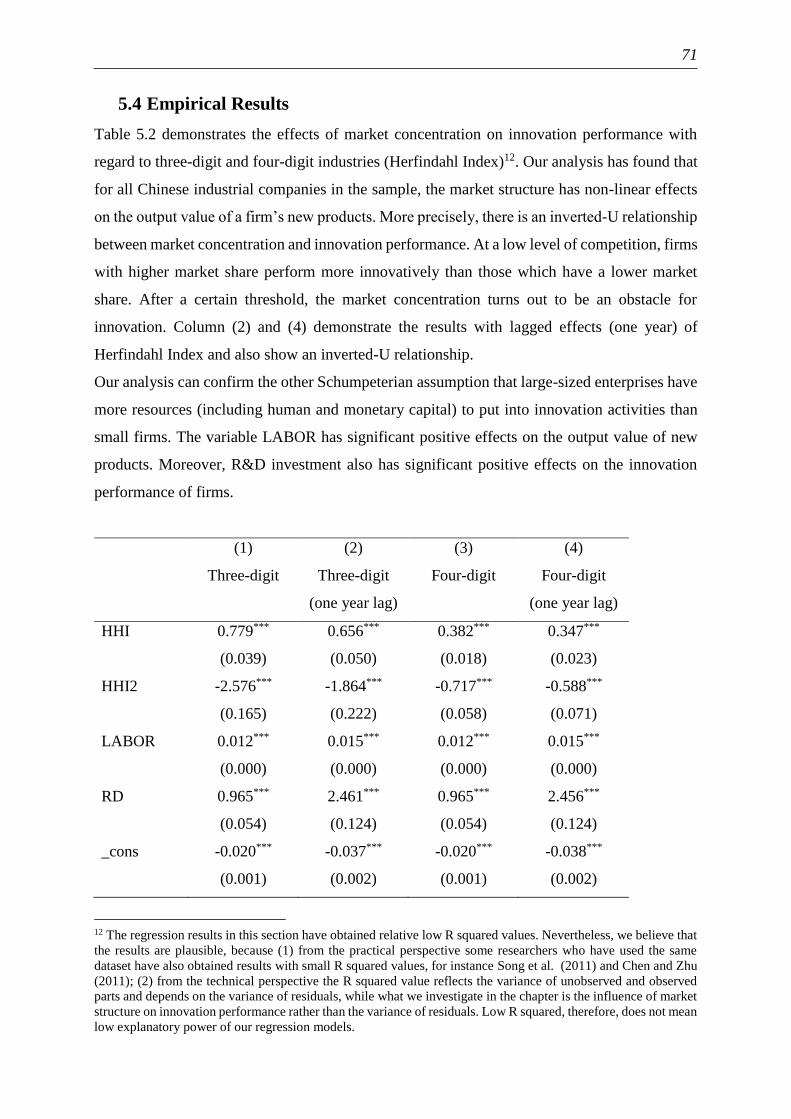
71
5.4 Empirical Results
Table 5.2 demonstrates the effects of market concentration on innovation performance with
regard to three-digit and four-digit industries (Herfindahl Index)12. Our analysis has found that
for all Chinese industrial companies in the sample, the market structure has non-linear effects
on the output value of a firm’s new products. More precisely, there is an inverted-U relationship
between market concentration and innovation performance. At a low level of competition, firms
with higher market share perform more innovatively than those which have a lower market
share. After a certain threshold, the market concentration turns out to be an obstacle for
innovation. Column (2) and (4) demonstrate the results with lagged effects (one year) of
Herfindahl Index and also show an inverted-U relationship.
Our analysis can confirm the other Schumpeterian assumption that large-sized enterprises have
more resources (including human and monetary capital) to put into innovation activities than
small firms. The variable LABOR has significant positive effects on the output value of new
products. Moreover, R&D investment also has significant positive effects on the innovation
performance of firms.
(1) (2) (3) (4)
Three-digit Three-digit
(one year lag)
Four-digit Four-digit
(one year lag)
HHI 0.779*** 0.656*** 0.382*** 0.347***
(0.039) (0.050) (0.018) (0.023)
HHI2 -2.576*** -1.864*** -0.717*** -0.588***
(0.165) (0.222) (0.058) (0.071)
LABOR 0.012*** 0.015*** 0.012*** 0.015***
(0.000) (0.000) (0.000) (0.000)
RD 0.965*** 2.461*** 0.965*** 2.456***
(0.054) (0.124) (0.054) (0.124)
_cons -0.020*** -0.037*** -0.020*** -0.038***
(0.001) (0.002) (0.001) (0.002)
12 The regression results in this section have obtained relative low R squared values. Nevertheless, we believe that
the results are plausible, because (1) from the practical perspective some researchers who have used the same
dataset have also obtained results with small R squared values, for instance Song et al. (2011) and Chen and Zhu
(2011); (2) from the technical perspective the R squared value reflects the variance of unobserved and observed
parts and depends on the variance of residuals, while what we investigate in the chapter is the influence of market
structure on innovation performance rather than the variance of residuals. Low R squared, therefore, does not mean
low explanatory power of our regression models.

72
N 582712 267455 582712 267455
r2_a 0.030 0.081 0.030 0.082
Standard errors in parentheses * p < 0.1, ** p < 0.05, *** p < 0.01
Table 5.2: Effects of market concentration
Figure 5.2 illustrates the simulation of effects of market concentration on innovation. The
thresholds of the market concentration are ca. 0.151 and 0.266 at three-digit (graph 1) and four-
digit level (graph 3) respectively. Graph (2) and (4) present the curves of HHI with one-year
lag. Although all results can confirm our hypothesis, we choose the Herfindal Index at a four-
digit level in the following sections. We do this because firstly, the value of the dependent
variable that turns to be negative after HHI is larger than around 0.8, which makes the analysis
unable to correspond to reality in the interval ca. 0.8 to 1. Secondly, because so much can be
observed from the dataset, it is reasonable to classify industries in more categories to avoid the
situation that too many firms concentrate in too few industrial classifications. Meanwhile, we
will also present empirical results with lag effects of four-digit HHI in the next parts. The graph
(3) in Figure 5.2 demonstrates the optimal market concentration that promotes innovation is
0.266, while the overall trend shows that market concentration at a low level increases
innovation output more than that at high level. The increasing trend on the left of the maximum
point is milder than the declining trend on the right side.
Figure 5.2: Simulation results from the model (3-digit and 4-digit level)

73
With respect to geographic locations in Hypothesis 2, our results have confirmed that market
concentration has different effects in different regions (see Table 5.3). In eastern, central and
western China, the relationship remains as an inverted U-shaped. However, it is remarkable to
find that in the northeastern provinces, where the economy has fallen into financial difficulties
due to structural problems, firms with high market concentration contribute to increasing the
output of new products. Although their whole industrial infrastructure was established on a
socialistic economic model since the beginning of People’s Republic of China like other
provinces, the northeastern provinces, including Heilongjiang, Jilin and Liaoning, which were
viewed as one of the most important industrial bases of socialistic China before the reforms,
were influenced most deeply by the planned economy and thus can be distinguished from other
regions in the country.
However, since the marketization reforms, the economic structure of these northeastern
provinces has been destroyed. This is partly because of the low capacity and low
competitiveness of the central-planned enterprises and industries. Nowadays, there are few
successful small- and medium-sized enterprises in northeast remaining. If we introduce the
lagged effects of market structure in Northeast in Column (6), the effect of concentration turns
to be insignificant.
Moreover, R&D investment and the size of the firms still play an essential role in innovation
activities in all regions. The coefficient of R&D in the east achieves a higher level than that in
other regions, which means that the innovation capital input is more important in coastal regions.

74
(1)
(2)
(3)
(4)
(5)
(6)
(7)
(8)
ea
st
east
(one
yea
r la
g)
mid
m
id
(one
yea
r la
g)
nort
hea
st
nort
hea
st
(one
yea
r la
g)
wes
t w
est
(one
yea
r la
g)
HH
I 0.3
92
***
0.3
38
***
0.3
70
***
0.4
69
***
0.3
13
***
0.1
58
0.2
74
***
0.2
97
***
(0
.022)
(0.0
27)
(0.0
42)
(0.0
69)
(0.0
81)
(0.1
32)
(0.0
55)
(0.0
71)
HH
I2
-0.7
38
***
-0.6
11
***
-0.7
24
***
-0.7
54
***
-0.3
38
0.2
01
-0
.612
***
-0.5
24
***
(0
.074)
(0.0
80)
(0.0
82)
(0.1
69)
(0.3
85)
(0.7
14)
(0.1
32)
(0.1
39)
LA
BO
R
0.0
10
***
0.0
13
***
0.0
11
***
0.0
15
***
0.0
17
***
0.0
21
***
0.0
20
***
0.0
25
***
(0
.000)
(0.0
00)
(0.0
01)
(0.0
01)
(0.0
01)
(0.0
02)
(0.0
01)
(0.0
02)
RD
1.1
15
***
2.6
72
***
0.5
17
***
1.7
76
***
0.7
61
***
1.3
95
***
0.4
64
***
1.6
24
***
(0
.069)
(0.1
49)
(0.1
12)
(0.3
92)
(0.1
39)
(0.2
87)
(0.0
85)
(0.2
77)
_co
ns
-0.0
15
***
-0.0
30
***
-0.0
21
***
-0.0
50
***
-0.0
42
***
-0.0
59
***
-0.0
40
***
-0.0
67
***
(0
.002)
(0.0
02)
(0.0
04)
(0.0
06)
(0.0
06)
(0.0
08)
(0.0
06)
(0.0
08)
N
439283
210930
56551
19390
36960
15856
49918
21279
r2_a
0.0
41
0.0
98
0.0
14
0.0
54
0.0
19
0.0
31
0.0
17
0.0
52
Sta
nd
ard
err
ors
in p
aren
thes
es
* p
< 0
.1,
** p
< 0
.05
, *
** p
< 0
.01
Tab
le 5
.3:
Em
pir
ical
res
ult
s in
dif
fere
nt
regio
ns

75
With respect to industrial sectors, Hypothesis 3 could only be partly confirmed (see Table 5.4).
In high- and medium-tech industries, there still exists an inverted-U relationship between
market concentration and innovation, while in low-tech sectors, market structure has no
influence. Although the influence of R&D expenditure and labor stay positive significant, R&D
could make more contributions to innovation in high-tech industries than the other two, which
corresponds to the reality that technologically-advanced firms depend more on R&D. Moreover,
like the previous results, HHI with lagged effects demonstrates similar influences to that
without time-lagged factors.
(1) (2) (3) (4) (5) (6)
High-tech High-tech
(one year
lag)
Mid-tech Mid-tech
(one year
lag)
Low-tech Low-tech
(one year
lag)
HHI 0.784*** 0.673*** 0.270*** 0.261*** 0.026 -0.018
(0.065) (0.092) (0.022) (0.028) (0.027) (0.042)
HHI2 -2.078*** -1.738*** -0.509*** -0.437*** 0.045 0.260
(0.268) (0.404) (0.067) (0.072) (0.118) (0.222)
LABOR 0.014*** 0.019*** 0.014*** 0.017*** 0.006*** 0.008***
(0.001) (0.001) (0.000) (0.001) (0.000) (0.001)
RD 1.168*** 2.176*** 0.945*** 2.447*** 0.337*** 2.480***
(0.111) (0.160) (0.063) (0.203) (0.055) (0.477)
_cons -0.009** -0.036*** -0.030*** -0.047*** -0.001 -0.013***
(0.005) (0.006) (0.002) (0.003) (0.002) (0.002)
N 89848 42245 290588 133246 202276 91964
r2_a 0.050 0.109 0.030 0.081 0.004 0.022
Standard errors in parentheses
* p < 0.1, ** p < 0.05, *** p < 0.01
Table 5.4: Empirical results in different industries
In Figure 5.3, we use the parameter values of high-tech and mid-tech industries given in Table
5.4 for new simulations. Comparing the relationships between HHI and innovation in these two
industries we find strong evidence that the negative effects of market concentration are
particularly obvious in technology-advanced industries: The optimum of HHI in high-tech

76
sectors (0.189) is smaller than that in mid-tech industries (0.265) and it is unsurprising that
high-tech firms could achieve higher levels of innovation at the “peak” of the curve than their
counterparts in mid-tech sectors. Furthermore, the right side of the curve in high-tech industries
drops much more rapidly than that in mid-tech fields, indicating that market concentration is
especially harmful for technology-oriented industries.
Figure 5.3: Simulation results from the model (in different industries)
5.5 Conclusions
Based on theories of industrial organization and innovation, this chapter explored the effects of
market structure on innovation performance of Chinese industrial firms. In line with earlier
studies, this research found that firm size and R&D expenditures are associated with the
innovation output of firms. To be more precise, large enterprises produce more new products
than small firms, and companies that invest more capital in R&D achieve more success in
innovative activities. As far as industrial categories are concerned, R&D investment makes
more of a contribution to innovation in high-tech industries than mid-tech and low-tech sectors.
Most importantly, this chapter has provided new evidence from Chinese industrial firms for the
long-term debate over the relationship between market structure and innovation. Our analysis
has empirically confirmed that there is an inverted U relationship between market concentration
and innovation performance, thus demonstrating that firms with high market concentration
could undertake more innovative activities if the competition level in the market stays high. In
addition, our analysis further confirms the effects would turn to negative after a certain
threshold if the market is monopolized by a few firms. Despite the inverted-U relationship, it is
remarkable to find that the overall trend of the curve is negative, which indicates that, in general,
competition has a positive effect on innovation. Moreover, the positive effect of market
concentration increases more slowly than its negative influence after it reaches the maximum
of innovation. The reason that market concentration promotes innovation when concentration

77
stays at a low level might be that in a “radically” competitive market, where the Herfindahl
Index is slightly higher than 0, firms need to obtain certain market shares to allocate enough
resources to innovate.
As for technology levels, it is evident from the findings that high market concentration is
particularly harmful for technologically-advanced firms. Competition plays a particularly
important role in high-tech industries, while in low-tech sectors the innovation performance of
firms does not depend on market structure. But from the results we realized our model may not
supply appropriate variables to explain this relationship in low-tech industries. Future research
investigating the effects of market structure for certain industries would be of value.
In political terms, public policy in relation to market structure greatly influences firm’s
innovation performance. Our findings suggest that market concentration could not increase
innovation in most cases, despite firms with high market share own more resources for
innovation. The competition policy should take regional and industrial characteristics into
consideration. For technology-oriented industries the government should especially focus on
competition order of markets.

78
6. Innovation output and state ownership
China has experienced a surge in innovation output in which state-owned enterprises (SOE)
play an essential role.13 Using panel data of Chinese listed firms, this chapter examines the
influence of the state ownership on innovation output at the firm level. Controlling for size, we
analyze the effects of central and local government control on the number of firms’ patent
applications in different time periods. Doing so, standard assumptions on state ownership’s
inhibiting character are confirmed. However, we then qualify these finding by running separate
models for different regions and sectors and find that the impact of state-control on innovation
performance depends on a number of conditions. More precisely, state control of firms has a
negative impact on innovation output in particular in China’s Northeast region and in mid-tech
sectors whereas under other circumstances it does either not matter or can even exert a positive
influence.
6.1 Introduction
In many countries, SOEs are the main providers of public services such as energy, infrastructure
and transport, which indicates that SOEs have an influence on everyday life of citizens and the
economy. In some other countries, especially transition economies such as China, SOEs have
played or are playing an important role in the market, so that their performance, not least with
a view to innovation, is of great importance to broad segments of the population and to many
other parts of the economy (OECD, 2015). In these countries, it is essential to ensure that the
governance of SOEs is implemented effectively.
During China’s economic transition, the role of SOEs has been changing with the reform of the
economic system. Nonetheless, the reform of SOEs remains one of the most important issues
in China’s transition to a market economy. Improving SOE performance is crucial for social
stability and sustained growth in China (Bai et al., 2006; Lin, Cai, & Li, 1998).
In 1980s, most SOEs were assigned a compulsory plan for input, output and employment. Until
the end of that decade, some SOEs had additional capacity available for production of above-
plan and were allowed to exchange a small amount of goods in the market. The surpluses of
government-controlled firms made up the main source of government revenue. Due to the
13 This chapter has been published as Kou, Kou & Kroll, Henning: Innovation output and state ownership:
Empirical evidence from China's listed firms, Discussion Papers Innovation Systems and Policy Analysis Nr. 55,
Karlsruhe: Fraunhofer ISI, 2017

79
distorted price system in the centrally-planned economy, SOEs became extremely profitable,
even when they were not very efficient, and they served as a "cash cow" for the government
and for the economy (Naughton, 2007). At that time, SOEs were seen as the pillar and the core
of the whole economy.
An effort to restructure the SOEs began in 1990s. Followed by the adoption of the new
Company Law in 1994 which provided a uniform legal framework for ownership reform, the
government gave more freedom and autonomy to its SOEs step by step. From the mid-1990s,
Chinese government began to allow SOEs to go bankrupt or be sold to private buyers and
companies if they had lost their competitiveness. In this period it restructured not only the
enterprises, but also the sectors dominated by SOEs, such as textile and coal industry, in which,
as a consequence a large number of SOEs exited from market. SOE restructuring meant
converting vaguely defined state ownership into more explicit, legally defined ownership
categories, sometimes involving "privatization" (Naughton, 2007), a term that was frequently
used by scholars, but avoided by the Chinese government.
In 2003, a new organization, the State-owned Assets Supervision and Administration
Commission (SASAC) was formed through the consolidation of various other industry-specific
ministries to take over the control of large SOEs. SASAC is responsible for managing and
restructuring the remaining SOEs, including approving exchanges of stock or assets and
appointing top managers, assessing and supervising firm performance, exercising ownership
rights of the central government, as well as drafting legislation related to SOEs.
Up to today, SOE reform is considered a central challenge in China’s transition process.
Motivations for reform are found not only in economic but also in political considerations, such
as the ambition to give a greater role to market forces in domestic demand through enhanced
enterprise autonomy, and central government policies to promote large businesses with a view
to the nation’s strategic integration with the world economy (Nolan & Wang, 1999). The
creation of modern, flexible, and efficient corporations is the crucial prerequisite to moving to
a higher level of market economy and a more productive firm sector that is able to face
international competition (Naughton, 2007). Although past SOE reforms have already brought
some achievements in terms of average firm performance, detrimental effects of state
ownership remain an issue in many areas. Despite reforms, it is still widely believed that
China’s SOEs tend to have lower performance than private or foreign enterprises in the market
(Qian, 1996; Zheng et al., 2003). At the same time, their role in the market is artificially
enhanced by preferential policies and unfair competition supported by both central and local
governments (Sheng & Zhao, 2012). Against this background, it is the aim of this chapter to
80
analyze the innovation performance of Chinese enterprises in light of the influence of state
ownership.
So far, most academic literature suggests that SOEs’ economic performance is lower than that
of private companies (Shirley, 1999; Shleifer, 1998). In the field of innovation economics there
is similar evidence that SOEs operate less innovatively (Jefferson, 2006; Zhang, Zhang, & Zhao,
2003). That notwithstanding PwC’s CEO Pulse survey suggests that even many top managers
of private firms believe that state ownership has advantages in infrastructure related and can
help to ascertain stability within and across supply chains in times of crisis (PwC, 2015). With
a specific view on China, anecdotal evidence suggests that some SOEs have achieved great
success in applied research and innovation, e.g. in nuclear energy, the defense sector and
electricity networks but also in less obvious areas like telecommunications. This apparent
discrepancy between mainstream academic research and Chinese reality makes it necessary to
investigate the performance of SOEs on a broader basis and in more detail.
As many previous theoretical and empirical studies do not take the specificity of SOEs into
consideration (Bozec et al., 2002), this study focuses on the relation between innovative
activities and state ownership in listed firms in China, controlling for provincial and sectoral
differences. Overall, the chapter aims to establish under which framework conditions state
ownership will inhibit innovative activities in firms and under which others it may – contrary
to general expectations – be beneficial.
The remainder of this chapter is organized as follows: Section 6.2 provides the conceptual
framework and hypotheses. Section 6.3 presents the dataset and empirical method. Section 6.4
reports the results. Section 6.5 discusses them in light of the initial conceptual considerations
and Section 6.6 concludes.
6.2 Conceptual Background and Hypotheses
By definition, SOEs are characterized by state ownership and/or dominant state influence on
corporate governance. Depending on the specific country’s legal system, public ownership
rights of state can be exercised under various frameworks and through different legal structures.
According to OECD (2015), the state can exercise control in different ways, from an excessive
"intervenor" to an "absentee owner", with the third option of "informed and active ownership"
the preferable one. At both the micro and the macro level, the challenge is to ensure that SOEs
operate transparently in an accountable manner, with a high degree of professionalism and
effectiveness. Despite these acknowledged differences, however, the prevailing academic

81
paradigm suggests that state ownership is in a generic manner harmful, favors undue
interference and remains inferior to robust regulation (Megginson & Netter, 2001).
Generally, state interference in enterprise governance will result in market failures due to SOE
governance systems’ inability to properly attribute property rights and risk (Shirley, 1999). At
the same time, state interference can enable firms to mobilize capital and resources at lower
cost and unduly increase their propensity to spend and invest. Hence, a company operating
under an unclear property rights regime will perform less efficiently and less profitably than
private enterprises (Alchian & Demsetz, 1972; Barzel, 1989; Boardman & Vining, 1989;
Demsetz, 1991; Grossman & Hart, 1986; Naughton, 1994; Weitzman & Xu, 1994).
Against this background, a system of well-defined private property rights is seen as a basic
precondition to the proper functioning of a market economy and the foundation of enterprise
governance. In firms with governance systems based on private property rights, owners have
the rights and incentives to monitor inputs, manage and assign worker to various tasks to
increase the profit of firms and benefit from it. At the same time, they bear the risk of mistakes
(Demsetz, 1974; Weitzman & Xu, 1994). If no such property rights exist or a state-owned mode
of governance does not hold managers accountable for their performance, firms will tend to fall
short of their economic and innovative potential (Shirley, 1999; Vickers & Yarrow, 1988).
Another argument can be developed based on principle-agent theory, pointing out that in case
of information problems principals will face difficulties to hold agents accountable for
achieving agreed targets (Laffont & Tirole, 1985). This theory views the firm as a nexus of
contracts between principal (owners) and agent (managers) (Peng et al., 2016). Routinely,
agents tend to have better information than principals in a way that maximizes their own utility
instead of principal’s interest. In SOEs the state employs managers as agents to make decisions
in the interest of the firms and – ultimately – in the public interest. However, self-interested
managers will often pursue own agendas not directly related to a high level of firm performance
(Peng et al., 2016). Unless there are proper corporate governance mechanisms, such rent
seeking behavior is difficult to prevent in both private and public firms. Compared with e.g.
related issues in share-holding corporations, however, conflicts of interest between principals
and agents tend to be more fundamental in SOEs (Jensen & Meckling, 1976). Firms that are
managed by bureaucrats, will not only have to deal with personal opportunism, but also with
the fact that bureaucratic systems reward budget maximization and associated career benefits
rather than efficiency (Buchanan, Tollison, & Tullock, 1980). Hence, the deviation of the
agent’s interests from the defined objective is higher and the (equally bureaucratic) principle’s
ability to manage that situation lower than in e.g. shareholding corporations.

82
Consequently, many previous studies find that private firms perform better than SOEs and that
privatization is the best way to improve the performance of SOEs (Bai et al., 2006; Djankov &
Murrell, 2002; Jefferson & Su, 2006; Megginson & Netter, 2001). In Norway, where SOEs play
an important role, it is found that private companies perform significantly better than SOEs
with regard to return on assets and costs relative to sales revenue by referring market structure
(Goldeng et al., 2008). In China it is also commonly argued that SOEs are less efficient than
private enterprises. The leaders of Chinese SOEs act as both managers and government officials
and tend to give priority to their political career, requiring that they ascertain the security of
state assets or social stability or duly perform assigned administrative tasks, while the firm
could be more profitable if it operated uninhibited in the market (Li & Xia, 2008). Furthermore,
institutional arrangements, include weak incentive mechanisms and government interference in
corporate decision making are also viewed as a reason of SOEs’ poor performance (Park et al.,
2006).
With regard to measurements of firm performance, the OECD (2016) lists several performance
evaluation indicators for SOEs, for instance return on investment, value added and labor
productivity. In this context, it is notable that the frequently used measurement for innovation
output, the number of new products, is also seen as an important indicator measuring SOEs’
performance by the OECD, underlining that innovation is an essential activity for SOEs, and a
relevant part of their activities.
Although many results thus suggest that private firms are more efficient than public ones, the
evidence remains inconclusive, because these studies have the common limitation that they
compare firms which do not have the same goals (Bozec et al., 2002). State ownership results
in problems in defining the targets of the firm (Megginson & Netter, 2001). As outlined above,
most of the established arguments in favor of private firms are derived more or less directly
from property rights or principle-agent theory, leading on to the argument that managers of
SOEs have weaker incentives for profit-maximizing behavior (Goldeng et al., 2008; Megginson
& Netter, 2001; Shleifer, 1998). As mentioned above, however, many SOEs either operate in
public sectors where profit maximization is a less prominent objective to start with. Taking into
account that this paper’s aim is to analyze innovative performance, moreover, it seems relevant
that successful investment in innovation is in objective to which action guided by short-term
profit maximization has often been found harmful rather than conducive.
Since the underlying motivations could thus influence the relative performance of state-owned
firms, it is meaningful to compare the performance between SOEs and private enterprises with
similar financial goals. Bozec et al. (2002) use the data of the large Canadian SOEs, some of
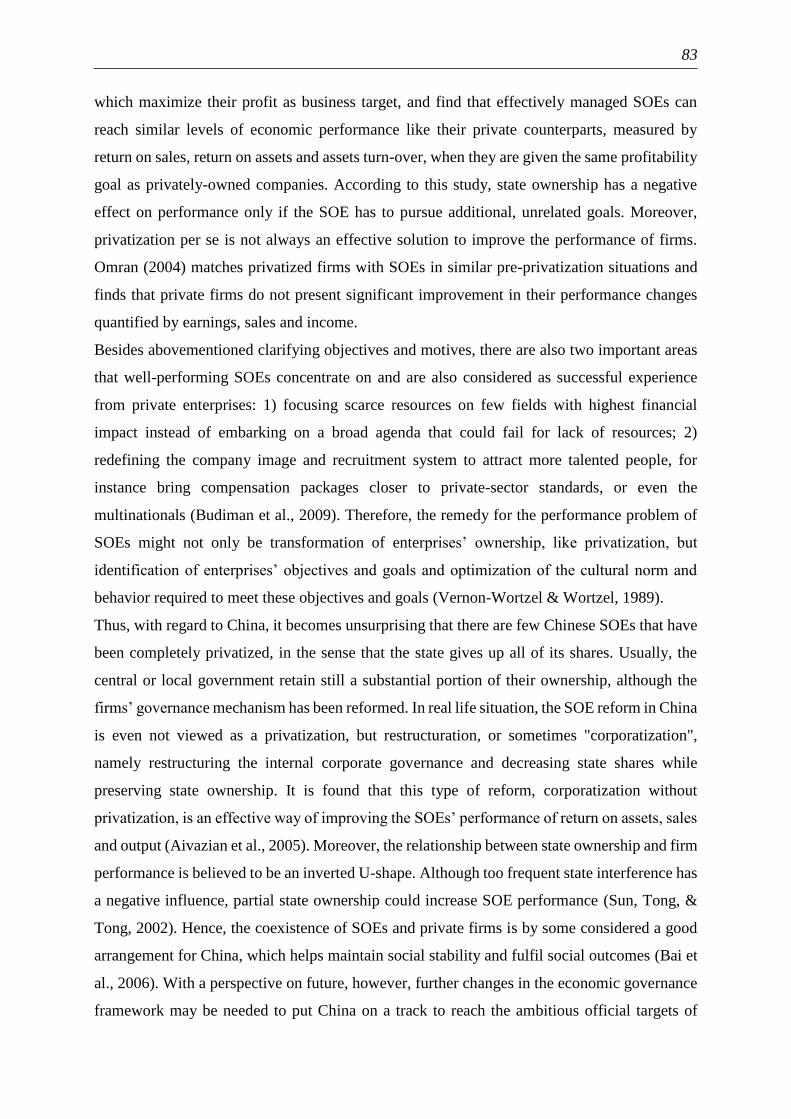
83
which maximize their profit as business target, and find that effectively managed SOEs can
reach similar levels of economic performance like their private counterparts, measured by
return on sales, return on assets and assets turn-over, when they are given the same profitability
goal as privately-owned companies. According to this study, state ownership has a negative
effect on performance only if the SOE has to pursue additional, unrelated goals. Moreover,
privatization per se is not always an effective solution to improve the performance of firms.
Omran (2004) matches privatized firms with SOEs in similar pre-privatization situations and
finds that private firms do not present significant improvement in their performance changes
quantified by earnings, sales and income.
Besides abovementioned clarifying objectives and motives, there are also two important areas
that well-performing SOEs concentrate on and are also considered as successful experience
from private enterprises: 1) focusing scarce resources on few fields with highest financial
impact instead of embarking on a broad agenda that could fail for lack of resources; 2)
redefining the company image and recruitment system to attract more talented people, for
instance bring compensation packages closer to private-sector standards, or even the
multinationals (Budiman et al., 2009). Therefore, the remedy for the performance problem of
SOEs might not only be transformation of enterprises’ ownership, like privatization, but
identification of enterprises’ objectives and goals and optimization of the cultural norm and
behavior required to meet these objectives and goals (Vernon-Wortzel & Wortzel, 1989).
Thus, with regard to China, it becomes unsurprising that there are few Chinese SOEs that have
been completely privatized, in the sense that the state gives up all of its shares. Usually, the
central or local government retain still a substantial portion of their ownership, although the
firms’ governance mechanism has been reformed. In real life situation, the SOE reform in China
is even not viewed as a privatization, but restructuration, or sometimes "corporatization",
namely restructuring the internal corporate governance and decreasing state shares while
preserving state ownership. It is found that this type of reform, corporatization without
privatization, is an effective way of improving the SOEs’ performance of return on assets, sales
and output (Aivazian et al., 2005). Moreover, the relationship between state ownership and firm
performance is believed to be an inverted U-shape. Although too frequent state interference has
a negative influence, partial state ownership could increase SOE performance (Sun, Tong, &
Tong, 2002). Hence, the coexistence of SOEs and private firms is by some considered a good
arrangement for China, which helps maintain social stability and fulfil social outcomes (Bai et
al., 2006). With a perspective on future, however, further changes in the economic governance
framework may be needed to put China on a track to reach the ambitious official targets of

84
becoming an innovative nation by 2020, an international leader in innovation by 2030, and a
world powerhouse of innovation by 205014. In this process, the role of SOE may once more
have to be reconsidered in an informed manner.
In general, there are a lot of empirical studies on the role and performance of SOEs based on
evidence from industrial countries with developed market economy systems, but their results
will not necessarily apply under other conditions. Typically, theory tends to consider the
standard case in which SOEs and private firms compete on equal terms without specific
institutional and political preference – which then results in a better performance of private
forms.
In reality, however, the performance of SOEs and the extent to which principle-agent issues
resulting from state ownership will occur is strongly associated with the political and
institutional environment they operate under. In countries that follow a comprehensive strategy
of reforms to improve SOE performance while at the same time still dis- playing an institutional
environment and market conditions that discourage innovation in private enterprises, the
situation may be reversed – with SOE becoming more productive than private firms. At the
same time, privatization and corporatization are associated with politically costly reforms
(Shirley, 1999) so that they may remain incomplete under circumstances in which both SOEs
and private firms are inhibited by diffuse policies and an unclear institutional framework.
In an economy under transition like China, therefore, different institutional and political
framework conditions in regions and sectors suggest that entirely or at least substantially
different relations of performance may result, depending on the specific framework conditions.
So far, some studies have been conducted a panel of China’s 22,000 large- and medium-size
enterprises’ data, which collectively account for one third of the nation’s total industrial output.
Across ownership types considerable variation was found with respect to measures of
innovation performance, including new product output and patents (Acs et al., 2002; Acs
& Audretsch, 1988; Jefferson et al., 2003; Kraft, 1989). As mentioned above, China’s SOEs
have been deeply reformed by the government in the last years. In the abovementioned studies,
patterns of asset ownership were found associated with performance. SOEs with the highest
concentrations of state assets perform at the low end, whereas those with low concentrations of
state-owned assets perform at the high end (Jefferson et al., 2003). The distribution of R&D
resources shows different images in different ownership types. R&D performers are more
concentrated among SOEs and shareholding companies and less concentrated among foreign
14 Outline of China’s national innovation-driven development strategy of State Council
(http://news.xinhuanet.com/politics/2016-05/19/c_1118898033.htm)

85
and overseas enterprises. But the R&D resources of SOEs are not transferred from input to
output efficiently. Although there is a high growth rate of technical efficiency for SOEs (Zhang
et al., 2003), state-owned enterprises exhibit the lowest efficiency in knowledge production
(Jefferson, 2006). Within the non-state sector, foreign firms have higher R&D and productive
efficiency, followed by firms from Hong Kong, Macau and Taiwan, joint stock enterprises and
collective-owned enterprises (Zhang et al., 2003).
Since the rapid increase of patent applications and grants in China during the last decade, the
question which types of companies contribute most strongly to this trend has been repeatedly
analyzed. It seems that all non-state enterprises but jointly-owned groups have a higher
propensity to patent than SOEs (Hu & Jefferson, 2009). The image among listed firms is a
similar one. Privately owned enterprises not only obtain higher returns from own R&D than
majority and minority SOEs, they are also able to increase their leading position (Boeing et al.,
2016).
Except ownership, the involvement of the Chinese Communist Party in companies has been
analyzed as an indicator of the state influence in Chinese firms. Using survey data of private
SME in the electronics industry of the Pearl River Delta in China, Liefner et al. (2016) examine
the influence of firms’ formal ties with the Chinese Communist Party on their patenting
behavior. Different from previous studies which argued that SMEs were less susceptible to
central government influence than other Chinese firms, they find that the state has a notable
influence on the patenting behavior not only of larger state-owned corporations, but also of
those smaller firms.
In summary, Hypothesis 1 can be formulated as: In principle, i.e. on national average, state
ownership has negative influences on the innovation output of firms.
However, as stated before, state-owned firms might occasionally outperform private ones, at
least with regard to quantitative performance measures in their role as executors of Keynesian
public investment in times of crises. In late 2008, the central government of China launched a
controversial stimulus package of 4 trillion yuan (equivalent to 586 billion dollar) as an attempt
to minimize the impact of the financial crisis. In the following two years, the Chinese economy
recovered from the recession gradually, not least due to this stimulus plan. At the same time,
however, it has caused a surge in Chinese debt among local governments (Huang & Bosler,
2014). The stimulus package was invested in key areas such as rural infrastructure and
transportation, which were dominated by SOEs. The stimulus is traced to state control over its
banking system and corporate sector (Deng, Morck, Wu, & Yeung, 2011). Since then, the SOEs
obtained credit from state-owned banks much more easily. The average leverage ratio of state-

86
owned manufacturing firms increased steadily and SOEs promptly expanded their fixed assets
investment due to new loans. During the recession period, SOEs expanded their credit
borrowing, investment and production capacity, which generated a prompt recovery of
aggregate demand. It is found that the effectiveness of China’s stimulus packages is derived
from the contribution of the SOEs (Wen & Wu, 2014). It remains remarkable that one of the
measurements in the policy package is a new political initiative towards "indigenous
innovation", which means that the government invested a large amount of capital in R&D, in
order to improve the S&T development.
In summary, Hypothesis 2 can be formulated as: (nominal) deviations from the rule outlined
in Hypothesis 1 are likely to emerge as a result of SOEs role in the stimulus package that
changed the political and institutional ‘rules of the game’. Positive deviations in SOE
performance will result from a recovery policy that emphasized the need to increase
independent innovation capabilities in national high-tech industries.
Furthermore, most of the enterprises that are nominally "state-owned" are not actually
controlled by the central government. Central SOEs are defined as SOEs that controlled by
ministries of central government like SASAC (which manages around 100 central SOEs),
Ministry of Finance and China Banking Regulatory Commission. After China embraced the
development of small-scale enterprises in mid-1990s, when the central government decided
only to keep control of large SOEs and to release more autonomy to small-sized SOEs, it was
impossible for the central government to exercise effective oversight of assets of all types of
SOEs (Naughton, 2007). In 2004 and 2005 local SASACs were set up at the provincial and
municipal level. The authority to manage local SOEs was delegated to local governments, in
particular local SASACs. The local government obtained the power to take part into decision-
making and management of local SOEs and exerted influence on financing and accessing to
production materials. Due to fiscal reforms local government officials have more incentives to
pursue economic development (Oi, 1992). Local SOEs were seen as the core of local economy,
so that they could obtain more financial and political supports from governments than private
counterparts.
The supports that come from central and local governments to central and local SOEs are not
the same. Local SOEs focus more on local market, while central SOEs possess more sources to
enter new markets around China. However, most of the existing researches ignore the effects
of the administrative level of enterprises and do not differentiate central and local SOEs.
So as Hypothesis 3 we suggest that, due to the different amount of resources, competences and
political power available to them central and local SOEs will perform differently with respect

87
to innovation. Central SOEs are still deeply influenced by assignments from the national
authorities and are responsible for the fulfilment of political targets of central government. They
control more resources with a view to R&D capital than local SOEs and enjoy preferential
market access. A large number of national strategic technology projects are implemented in
central SOEs. For that reason, we suggest that central SOEs are more innovative than local ones.
Another factor that should be taken into account is geographic location. In China economic
development, innovation performance as well as political and institutional framework
conditions vary from province to province – more strongly than in many other countries. With
regard to the area, population and economic volume, most Chinese provinces are as large as a
country. Since the reform in the late 1970s, especially since the 1990s, the central government
has given provincial (and some local) governments substantial leeway in the design of
economic policy. Today, most of them can decide rather autonomously about their support
policy, public expenditure and, to some extent, institutional framework conditions (Gu &
Lundvall, 2006). As development pathway, business culture, cultural habits as well as progress
in economic transformation differ strongly among different provinces (Kou, 2015; Liu & White,
2001), it is reasonable to assume that the role and performance of SOEs would differ
accordingly. In the coastal regions, for example, provinces develop dynamically and have
established relative market-oriented institutions since the reforms. Amounts of SOEs have been
reformed or privatized in late 1990s. In contrast, the regions in Western and Central China still
keep lagging behind (Kroll, 2010). Despite the new trends, these traditional innovation centers
still belong to the most innovative regions of China (Kroll & Frietsch, 2014; Tagscherer, Kroll,
& Luo, 2012).
Moreover, the overall pattern of developed and less developed regions is changing in recent
years. Technologically advanced industries are moving further inland while more and more
regional innovation systems are developing outside the classic "islands of innovation", like
Beijing, Shanghai and Guangdong (Kroll & Liefner, 2008; Kroll & Schiller, 2010).
For these reasons, it is reasonable to analyze to what extent these general trends with regard to
the regional distribution of development as well as science and innovation influence the local
role of SOEs in the respective innovation systems.
Hence, we suggest as Hypothesis 4, that due to the disparity of development levels and
innovative capacity between provinces and larger statistical regions15, state ownership may play
15 East: Beijing, Tianjin, Hebei, Shanghai, Jiangsu, Zhejiang, Fujian, Shandong, Guangdong, Hainan; Northeast:
Liaoning, Jilin, Heilongjiang; Central: Shanxi, Anhui, Jiangxi, Henan, Hubei, Hunan; West: Inner Mongolia,
Guangxi, Chongqing, Sichuan, Guizhou, Yunnan, Ti- bet, Shaanxi, Gansu, Qinghai, Ningxia, Xinjiang.

88
a distinct role in different environments. In innovative regions, such as China’s Eastern
provinces, firms including SOEs obtain stronger and more strategically coordinated support to
participate in innovative activities while, at the same time, their internal governance
mechanisms have been more profoundly reformed and create less principle-agent problems.
Hence, they will likely be more innovative or at least lag behind less than those in Central or
Northeastern China.
Finally, the institutional and political environment and thus the role and performance of SOE
is determined not only by their regional, but also by their sectoral position. SOEs dominate not
only strategic industries such as natural resource, aerospace and arms industry, but also
infrastructure industry. Depending on the concrete sector in which they are active, not only the
intensity of private competition will differ, but also the amount of resources, competences, and
preferential treatment by policy makers that SOEs can draw upon to survive in this competition.
In the catching-up regions in the middle and west, innovation activities are dominated by mature
industrial sectors, which have been transferred out of leading provinces. An argument for this
phenomenon is that political interference demands a contribution of these provinces to the so-
called "indigenous innovation" (Kroll, 2015), more precisely, to innovate through indigenous
S&T and resources instead of purchasing foreign technologies and know-how. Jefferson et al.
(2003) use a panel data of China’s 22,000 large- and medium-size enterprises for 1994–1999
and investigate patent applications in different sectors. They find a high concentration of
patenting activity within China’s manufacturing sector, and among the patent applicants, the
petroleum and gas industry leads by a wide margin.
As Hypothesis 5, we suggest that the firms in different sectors have different innovation
performance. In the sectors in which the government intervenes less, market-oriented factors
play a more important role and thus SOEs are more likely to hinder the increase of innovation
output.
6.3 Data and methods
To obtain the companies assessment of innovation activities, this chapter established a dataset
of the Chinese firms listed at the two stock exchanges of Shanghai and Shenzhen throughout
the period 2003 – 2014. Information on companies is obtained from the database China Stock
Market & Accounting Research (CSMAR) of GTA which is a provider of China financial
market data, China industries and economic data, and the economic and financial database of

89
Peking University China Center for Economic Research (CCER). The provincial data is
collected from National Bureau of Statistics of China.
As previously stated, due to complex ownership policy and structure and interference of state,
SOEs are often less transparent and insulated from the legal framework applicable to other
companies such as competition laws and government subsidy16, which increases the difficulty
of evaluating the economic performance of SOEs, since SOEs rarely aim at the maximization
of profit (Rainey, 2009; Ramanadham, 1991), but specific non-commercial goals and social
outcomes. In order to avoid this bias, this chapter used the data of listed firms. The reason is
that in order to be a listed firm, a SOE must be restructured into a stock company through selling
shares to other companies, legal entities or its own employees firstly. Then, the SOE sells part
of shares (usually 1/3) to the general public investors. Thereafter, shares of the SOE are split
into three parts: state, legal-entity, and tradable shares. Regardless of share type, each share
enjoys the same cash flow and voting right (Wang, 2005). Firms that are publicly traded must
concentrate on the interest of stakeholders, for instance profitability and firm value. Xu and
Wang (1997) find that value of listed firms in China has no relation with state ownership. Even
at an early stage of the country’s institutional transformation, this confirmed that state
ownership is not in principle an obstacle to pursuing commercial goals successfully. When
public firms set themselves the target to generate profits, their performance can be comparable
to that of the private counterparts (Bozec et al., 2002), and thus, these SOEs also obtain similar
circumstances and motivations to participate in innovation activities like privately owned
companies. The second advantage of focusing on listed firms is that due to the legal structure
of stock exchanges, listed firms must provide a high degree of transparency, including
disclosure of information (OECD, 2015), which makes their financial data more reliable than
that of non-listed SOEs.
The patent information of CSMAR is a relatively new dataset which was published in 2015.
There are still few studies applying this data to investigate the innovative performance of
Chinese firms. The dataset of CSMAR includes all industries from agriculture, industry to
service sectors. Because innovation activities, precisely, patenting activities, are of limited
importance in some industries such as financial and the retail sector (Boeing et al., 2016), the
observations from the agricultural and service sectors are excluded. The few firms that did not
release the number of patents in their financial report are also eliminated. The full estimation
sample is based on information for 1,625 firms including 10,203 observations. With regard to
16 See PwC report "State-Owned Enterprises Catalysts for public value creation?" for more details.

90
data quality, the dataset of Chinese listed firms including CSMAR data has been found
representative and of high quality in a number of studies (Fisman & Wang, 2010; Gul, Kim, &
Qiu, 2010; Kato & Long, 2006; Sun & Tong, 2003), not least because the information efficiency
of China’s leading stock markets has increased substantially since the late 1999s (Boeing, 2016;
Long, Payne, & Feng, 1999).
The dependent and independent variables are summarized in Table 6.1. The descriptive
information on all variables is presented in Table C.2 (see Appendix C). As indicator of
innovation output we use the number of invention patents. In China there are three categories
of patents: invention, utility model and design patents. According to Article 22 of the Chinese
Patent Law, an invention patent should possess prominent substantive features and indicate
remarkable advancements. Invention patents are granted after a substantive and strict
examination, while the other two are in a strict sense only registered, rather than examined and
granted (Lei, Sun, & Wright, 2012b; Prud'homme, 2017). Compared with the other two patent
types, invention patents are judged by higher standards, closest to those typically required by
United States Patent and Trademark Office (USPTO) or European Patent Office (EPO) and, in
the literature, therefore often used as an indicator for the independent intellectual property (Lei,
Sun, & Wright, 2012a; Li, 2012). Hence, the dependent variable used in this chapter reflects
exclusively invention patents.
To measure state ownership, three independent dummy variables are introduced: STATE_NAT
for SOE controlled by central government, STATE_PRV for SOE controlled by provincial
governments and STATE_MUN for SOE controlled by municipal governments.
As is well-known, firm size is an important general predictor of innovative capacity (Acs
& Audretsch, 1987; Scherer, 1965; Schumpeter, 1942). To take into account these generic
effects of firm size, and to thus compensate the use of absolute numbers in the dependent
variable, the annual revenue of the firm is introduced as a further main independent variable.
Further general control variables are the GDP per capita in the respective province, which
measures the influence of macroeconomic environment, the interaction term of dummy variable
of SOE and the number of employees, which presents to what extent the size of SOE influences
innovative activities. Additionally, the model controls for Chinese firms surge in patenting by
means of time dummies for each year covered by the regression.
In summary, the regression model can be written as the following equation:
𝑦 = 𝛽0 + 𝛽1𝑥1 + 𝛽2𝑥2 + 𝛽3𝑥3 + 𝜖

91
where y is the number of patent applications, x1 stands for the revenue of firms, x2 is the vector
for SOE factors, x3 is the vector for control variables.
Variable name Definition
L_PATENT log of number of invention patent
L_REVENUE log of revenue
STATE_NAT dummy for central SOE
STATE_PRV dummy for provincial SOE
STATE_MUN dummy for municipal SOE
L_GDP_PC log of GDP per capita
SOE_SIZE interaction between SOE and log of number of employee
Table 6.1: Definition of variables
6.4 Empirical results
Table 6.2 summarizes the results of the main regression models.17
With a view to Hypothesis 1, the analysis finds that for all listed companies, state ownership
controlled by central authorities and provincial governments has significant negative effects on
the number of patent applications even if the significance of the latter is somewhat lower.
Effects of municipal government ownership, to the contrary, remain insignificant (although in
principle also negative).
Moreover, all other independent and control variables behave in line with expectations.
Revenue is associated positively with patent output for all types of firm ownership. Large
companies contribute more to innovation. If the revenue of a firm increases by 1%, the number
of patent applications rises by around 0.13%. In particular, this effect is found in the 2011-2014
period, while it is not significant for the 2003-2010 period. Likewise, the negative association
of average per capita income in the host province ad patent behavior seems counterintuitive
only at first. Overall, however, it is not that surprising, at least for the 2003-2010 period. At that
time, many of the most extensively patenting firms were located in Guangdong. Among the
leading group of regions, however, Guangdong displays a comparatively low GDP per capita,
due to internal disparities. Furthermore, large SOE appeared more productive in terms of patent
applications on top of the general size effect from 2003-2010 while this additional effect was
17 Details about the regressions and complete results see Appendix C

92
reversed during the 2011-2014 period. Apparently, many large SOEs have in some respect
either become less effective in absolute terms or, with more private firms catching up, less
exclusively benefit from size effects than before. Finally, the year specific dummies
appropriately capture the nationwide uptake in industrial patenting in China during the 2003-
2014 period of observation.
With a view to Hypothesis 2, the analysis finds that all of the three types of public control have
significantly negative impacts on innovation output between 2003 and 2010 while for the 2011-
2014 period, the effects for all three of them turn significantly positive. The stimulus policy of
Chinese government was implemented since the end of 2008 and lasted until 2010.
Acknowledging that a certain time lag should be taken into account because, in itself, the
adjustment of a firm’s R&D portfolio might take time and, more importantly, its full effect only
emerges with delay (Boeing, 2015). Thus, Hypothesis 2 can be considered confirmed.
In contrast, Hypothesis 3 can surprisingly not be confirmed. SOEs controlled by central
government do not produce more innovative output than local SOEs. To the contrary, central
government control over an enterprise decreases its number of patent applications more strongly
than provincial or municipal ownership. Between 2011 and 2014, when effects are positive, the
positive coefficient of the dummy for central government control is lower and less significant
than that of those for provincial and municipal ownership.
Concerning Hypothesis 4, Table 6.3 confirms that the role of state ownership for innovative
output varies between different regions. Interestingly, no effects of state-ownership can be
found in either the most or the least developed areas of the country (Eastern and Western region).
In Northeast and Central China, to the contrary, all types of state ownership have negative
effects on firms’ tendency to apply for patents. In the North-east, affected by structural change
in old industries, the coefficients are extraordinarily high and above average for provincial and
municipal ownership. In this area, much of the currently state-owned industrial infrastructure
was established as part of large, soviet-style combines in the 1950s and 1960s and at a later
stage severely disrupted by the market reforms. Nonetheless, large SOEs perform notably better
than smaller ones in that region, although industrial patenting in the Northeast does not in
general depend on firm size. This situation is reversed on the developed East coast where the
general effect is notable and highly significant but the one for SOE cannot be detected.
As for Hypothesis 5, Table 6.4 illustrates the effect of state-ownership on SOEs innovation
output in different sectors. In low-tech industries, state ownership does not exert a negative
effect on patenting behavior. In the "textile and apparel" sector, all types of state ownership
lead to a significantly higher number of patent applications. In the "paper and print" sector,

93
these effects may not be significant, but they are still detectable as a tendency. In these sectors,
firm size does not influence innovation significantly. In line with that, the additional effect of
being a large SOE is significantly or as a tendency negative. The geographical distribution of
highly patenting firms, in contrast, seems to differ, with more leading textile firms located in
wealthier provinces while the opposite is true for the paper sector. Quite different, in contrast,
is the picture for machinery and IT, representing mid-tech and high-tech sectors. In those,
general size effects are notable and all types of state ownership is, in principle, negatively
associated with firm level patent output. Their association with provinces with high GDP per
capita levels (Beijing, Shanghai, etc.) is as a tendency high, yet insignificant. Despite these
commonalities, the effects for genuinely technology-related industries like the IT sector, differ
notably from that for mid-tech sectors in that the effects of central government ownership are
not significantly negative and that there are positive additional effects of SOE size.
(1) (2) (3)
all 2003-2010 2011-2014
L_REVENUE 0.132*** 0.075 0.066***
(0.037) (0.049) (0.026)
STATE_NAT -0.874** -1.289** 0.601*
(0.416) (0.563) (0.352)
STATE_PRV -0.717* -1.189** 0.698**
(0.426) (0.566) (0.356)
STATE_MUN -0.628 -1.102* 0.712**
(0.411) (0.563) (0.352)
L_GDP_PC -0.429* -0.876*** 0.240
(0.232) (0.294) (0.371)
SOE_SIZE 0.102** 0.143** -0.081*
(0.051) (0.069) (0.045)
Year effect + + +
_cons 1.105 6.750** -2.781
(2.382) (2.938) (3.985)
N 10203 4386 5817
r2 0.598 0.433 0.511
r2_a 0.597 0.431 0.511
Standard errors in parentheses
* p<0.1, ** p<0.05, *** p<0.01
Table 6.2: Basic model with year differences

94
(1) (2) (3) (4)
east northeast mid west
L_REVENUE 0.188*** 0.151 0.039 -0.005
(0.050) (0.162) (0.110) (0.085)
STATE_NAT -0.585 -5.747* -1.970** -0.145
(0.524) (3.034) (0.787) (1.230)
STATE_PRV -0.386 -8.743** -1.897** -0.013
(0.537) (3.843) (0.833) (1.288)
STATE_MUN -0.380 -6.437** -1.609** -0.119
(0.514) (2.844) (0.810) (1.213)
L_GDP_PC 0.157 -0.640 -0.158 0.215
(0.345) (1.905) (0.954) (0.758)
SOE_SIZE 0.075 0.920** 0.222** 0.030
(0.062) (0.419) (0.100) (0.152)
Year effect + No effects No effects No effects
_cons -5.827 2.325 0.393 -1.883
(3.579) (17.904) (8.309) (7.389)
N 6729 407 1722 1345
r2 0.627 0.629 0.580 0.511
r2_a 0.626 0.612 0.575 0.505
Standard errors in parentheses
* p<0.1, ** p<0.05, *** p<0.01
Table 6.3: Separate models for different regions
(1) (2) (3) (4)
textile paper machinery IT
L_REVENUE 0.039 -0.092 0.226*** 0.376
(0.175) (0.276) (0.071) (0.273)
STATE_NAT 1.688 2.259 -2.003*** -3.869
(1.067) (2.321) (0.752) (2.775)
STATE_PRV 3.057** 1.777 -2.055** -4.494*
(1.243) (2.266) (0.796) (2.693)
STATE_MUN 2.896** 2.057 -1.432* -4.659*
(1.166) (2.141) (0.752) (2.728)
L_GDP_PC 2.230** -3.550** 0.101 0.852
(1.010) (1.564) (0.587) (1.266)
SOE_SIZE -0.314** -0.253 0.089 0.645*
(0.139) (0.279) (0.100) (0.353)
Year effects No effects - - -
_cons -24.232** 42.432** -3.090 -15.169

95
(10.316) (17.499) (6.627) (13.731)
N 286 227 1414 370
r2 0.620 0.602 0.636 0.683
r2_a 0.599 0.574 0.632 0.669
Standard errors in parentheses
* p<0.1, ** p<0.05, *** p<0.01
(Note: dummies for years 2004 and 2014 excluded during estimation for technical reasons)
Table 6.4: Separate models for different industries
6.5 Summary and discussion
Evidently, most of our findings have been found to be in line with our general assumptions
while one of the assumptions could be proved to be wrong. With a view to this chapter’s
hypotheses, the following findings can be reported:
Firstly, there is indeed a notable influence of state ownership on the innovation performance of
China’s listed firms. In general terms, this underlines the mainstream assumption that state
ownership inhibits innovative activities. Equally in line with previous literature, however, this
finding needs to be qualified along several dimensions when more dimensions such as time,
disparity of regional development and technological orientation of industries are taken into
account.
Secondly, as developed in the conceptual section, the effect of state control on innovative output
varies over time, depending on the evolution of a country’s economic and institutional system.
In line with this, this study suggests that time should be taken into consideration as a proxy for
overall framework conditions before any general statements on the role of state ownership are
derived. Possibly due to the effects of the fiscal recovery package or other policies aiming to
boost indigenous innovation, SOEs in fact generated more innovation output than other firms
during the years following the financial crisis.
Thirdly, the administrative hierarchy of SOEs in China’s bureaucracy system influences
patenting behavior even though in a different manner than intuition might suggest. Differing
from our assumption, national SOEs do not per se become more productive in terms of output
despite their prominent role in central government policy and the wealth of resources bestowed
upon them. A reason might be that, in line with initial conceptual arguments, some local SOEs
not only obtain more effective and targeted direct support from their provincial or municipal
government, but, one the micro level, deploy more effective governance models and pursue
more clearly defined strategies – profiting especially in those provinces where a market-

96
oriented system is already best established and management skills more broadly available.
However, this paper’s results equally suggest that some exceptions from this rule might apply
in particular sectors, most notably in the low-tech area, but possibly also in the government-
driven IT sector, where central control has no significantly negative effects and larger SOE
churn out more patents than others.
Fourthly, China’s provinces can be divided into four main groups based on geographic locations
and development level. Among them, the Northeastern and Central provinces remain most
strongly characterized by planned economy mechanisms. In these areas, the governance and
management models of many traditional SOEs have hardly been reformed. Consequently, the
negative impact of state ownership is found to be particularly severe in Northeast and Central
China in a close to paradigmatic manner. In China’s Eastern provinces, in contrast, there is no
traceably negative effect of state control on patenting behavior. One possible explanation for
these findings is that better SOE governance can be assumed in economically and institutionally
more developed provinces.
Finally, the association of negative effects of state ownership and certain industries remains
partially in line with conceptual considerations, partially surprising. While it appears logical
that it is somewhat more pronounced in the market oriented machinery industry than in the
government-driven, research-based IT sector, its positive role in low-tech sectors appears
surprising and merits further investigation. Possibly, it could be due to the fact that many,
strictly price and profit-maximization oriented firms in these sectors do not innovate at all and
all firms that are in any way active in the area of innovation remain associated with the state.
6.6 Conclusions
In summary, this chapter has explored the effects of state ownership of listed firms on patent
applications. In line with earlier studies, it confirmed that in the most general terms, state
ownership can be considered as an obstacle to innovation.
Beyond confirming the well-known general assumptions that state-ownership and SOE
management models can hinder innovative activities, the analyses developed in this chapter
revealed several relevant qualifications – using data for the concrete case of China but providing
a basis for generalization. Firstly, the effects of state ownership on innovation vary dynamically
over time, visibly correlating with changes in political and institutional framework conditions.
Secondly, stronger economic and political support for some SOE does not per se position them
more favorably in comparison to others, while, thirdly, positioning them in more developed
97
regional innovation ecosystems might well have that effect, even with respect to private
enterprises. With respect to sectoral orientation, finally, this study underlined the already
established finding that mainstream assumptions on the role of state ownership for innovation
may apply less in government-driven high-tech industries. Surprisingly, however, this
difference was less clear than expected, but instead, larger in low-tech sectors where it remains
less easy to explain.
Consequently, the most important contribution of this study is to have conceptually developed
and empirically confirmed that the role of state ownership for innovative performance needs to
be analyzed in its specific economic, institutional and political context, rather than on a generic
level. That said, some specific findings will require further inquiry in subsequent studies to be
fully understood and the precise nature of those policies and circumstances that have put SOEs
ahead of private enterprises under specific circumstances remains to be uncovered.
Similar research questions than those addressed in this study could be addressed with a view to
the effects a concrete innovation promotion strategies implemented by the Chinese government
bringing later studies closer to the establishment of causal relations. Another further research
avenue could be to explain innovation output by more detailed information on corporate
governance and internal management mechanisms of specific SOEs that influences the level of
principal-agent conflicts in their governance and the decision processes relevant for R&D and
innovative activity. Finally, it would be worthwhile to expand the reach of the dataset to non-
listed companies and additional industries.
Politically, the results underline that SOE reform remains a matter of urgency in particular in
China’s northeast and should arguably concentrate on reducing political, administrative and
agency costs through effective and modern corporate governance. SOEs managers should be
given clear objectives and goals and operate under clear frameworks of accountability. In
addition, our findings suggest that the provision of more resources to central government-level
SOEs as "innovation drivers" will probably not in a general manner create much added value
for the national innovation system outside very specific areas. In that light, the identified lead
of SOEs under specific framework conditions should be interpreted with care. Even in the case
of the research-driven IT sector, it remains, as a tendency, negative. In summary, the relative
nature of all analyses presented in this paper needs to be consciously considered before drawing
simplistic conclusions – not least, as the most recent changes may not yet empirically be
covered.
While this study’s findings suggest that a smart reform of the SOE sector can bring concrete
benefits it may at the same time simply highlight a remaining lack of attention for the needs of
98
requirements of private enterprises – even in China’s more developed regions. That attention,
however, will certainly be needed if China is to become an international leader in innovation
by 2030.

99
7. Conclusions
Many emerging countries including China commonly use market-oriented reforms as a strategy
to promote economic development (Park et al., 2006). The transition of China is considered the
most influential institutional change since the founding of the People’s Republic of China and
has changed almost all fields of China’s economy, from institutions and industrial structure to
firm behavior. China, classified as “a developmental state” (Knight, 2014), which means that
the government gives the highest policy priority to development and places emphasis on
economic growth objectives, has achieved rapid growth. However, due to demographic changes,
rising labor costs, a growing need for industrial upgrading and a much-reduced distance to the
global technological frontier, the high growth phase of China is almost coming to an end. The
annual growth rate has slowed from about 10% to under 7% and will likely diminish further.
The side effects of unsustainable development have emerged: overcapacity in some industries,
rapidly increasing public debt, and in particular, environmental pollution. On the other hand,
since China has achieved economic success and fulfilled economic outcomes in the last decades,
the government has clearly shifted from growth-before-all-else to a more comprehensive set of
objectives such as sustained development and some social goals (Naughton, 2017). From the
perspective of the demand side, economic growth is no longer considered the only expectation
of Chinese people, who in turn appeal for environmental protection, including clean air, and
request more social equity and equal legal status of market entities with various ownership types.
Facing weakened global demand and domestic structural problems, China’s development
model has reached a growth bottleneck, identified as the middle-income trap (Gill & Kharas,
2007), which indicates a sharp deceleration in growth of a country trying to “jump” from the
middle-income to high-income club. The solution is to find effective ways to embrace a shift to
a more innovative economy (Wei et al., 2017). An innovation-driven development pattern has
already settled upon as the target of China’s government for the next decades. In fact, due to
the surge of China’s economy and innovation output in recent decades, the question of which
factors influence China’s innovation performance has become an important topic.
In this thesis, we investigate the determinants of China’s innovation performance at three levels:
the systematic level, market structure and ownership of SOEs. The systematic analysis focuses
on the innovation of Chinese provinces, in particular innovation systems (Chapter 4), and the
second and third parts concentrate on innovation of firms, in which the market structure section

100
explores the influences of market concentration (Chapter 5) and the latter the effects of state
ownership on the innovation output of China’s listed firms (Chapter 6).
The establishment of an innovation-driven path begins with a redefinition of the government’s
role in the innovation system, shifting away from a centrally controlled system by the
government toward institutional transition and an enabling environment that supports economy-
wide innovation efforts within a fair and efficient market system (World Bank, 2013). In this
context, the marketization reform process that reflects the relationship between state and market,
the protection mechanism of intellectual property and the roles and network of innovation actors
would expedite the growth of China’s innovation performance.
The distinctions and relations among these three main parts could be formulated as follows: (1)
From the perspective of data, in Chapter 4 we establish a dataset of 30 Chinese provinces, which
reflects the innovation performance of regional innovation systems. The dataset of Chapter 5
includes all the large and medium-sized manufacturing firms in China, demonstrating a
relatively complete image of innovation activities at the firm level, whereas Chapter 6 focuses
on listed firms, which are representative of the most successful firms in China. (2) As for
innovation measurements, there are two frequently used indicators for innovation performance,
one is patents (Acs et al., 2002) and the other is new products (Schumpeter, 1934). In order to
measure the innovation output of regional systems, we have used the number of patent
applications in Chapter 4, because as a measurement of the innovation of enterprises, the output
of new products could not reflect the innovation activities of non-enterprise units like research
institutes and universities, which, in contrast, play a key role in innovation activities in
provinces. At the firm level, we use the revenue of new products as an indicator of innovative
capacity in Chapter 5, while in Chapter 6, the number of patent applications is introduced.
Enterprises require a large amount of capital and resources to apply for patents, so that some
small firms with limited budgets have to abandon patent activities entirely. The dataset of
Chapter 5 includes not only large companies, but also relatively smaller firms, thus it is
reasonable to use a “less costly” method to measure their innovativeness. For this reason, it
makes sense to introduce different variables to measure the innovation output of different types
of firms, as the revenue of new products is more appropriate for all patterns of firms including
small ones, and patents are more suitable for large successful companies.
In line with previous studies, this research confirms that classic innovation input, such as
education and R&D including professionals and capital, plays an important role. With respect
to the innovation performance of provinces, we find that regional innovation systems play an
essential role. More precisely, the level of openness of a region and government expenditure on

101
education have a positive effect, while bank credit does not influence innovation output.
Another factor taken into account is China’s marketization reform process. Since marketization
began changing institutions and systems in China, it has impacted the innovation performance
of the provinces profoundly. Well established intermediary organizations and protection for
intellectual property tend to be drivers for regions to improve their patent activities.
At the industrial level, we provide new evidence from the perspective of China’s manufacturing
firms in terms of the relationship between market structure and firms’ innovation performance.
We find that there is an inverted-U relationship between market concentration and innovation
output measured by the value of new products, which indicates that firms with high market
concentration tend to undertake more innovation activities if the intensity of competition
remains high, whereas its influence turns to be negative if the market is monopolized by a few
firms. However, the overall trend of the influence of market concentration is negative, which
demonstrates that, in general, market concentration has negative effects on innovation.
Concerning the technology level, a high level of market concentration is especially harmful for
technologically advanced firms, while in low-tech sectors, firms’ innovative activities are not
dependent on market structure.
As for the effect of state ownership and the performance of SOEs, we find that state ownership
has a significant influence on innovation output. However, this influence should be observed
along more dimensions. The effect of state control on innovation varies over time, and SOEs
perform better in innovation activities, which might possibly be traced back to the recovery
policy since the financial crisis which aimed to stimulate indigenous innovation. Causal
relationships between stimulus policy and innovation output, however, need more concrete
analysis in further research. Moreover, the administrative hierarchy of SOEs is also considered,
because central and local SOEs are controlled by central and local government respectively and
obtain different financial and political support from governments. Despite their prominent role
in central government policy, national SOEs are not much more innovative than other types of
SOEs. In addition, we divide China’s provinces into four groups because of the possible
variation of innovation performance between regions, and find that in Northeast and Central
China, the areas that were shaped the most by the centrally planned economy, state ownership
is still an obstacle to increasing innovation output, whereas in Eastern provinces, there is no
significantly negative effect on patent applications. With respect to technological characteristics,
state ownership does not exert a negative effect in low-tech industries such as the textile and
apparel sector, while in technologically advanced industries like the IT sector, it tends to hinder
innovative activities.

102
The debate of governance approach between liberal market and state dominance has lasted a
lot of years in China. We can even find out such discussions among Legalism, Confucianism
and Daoism in Chinese history over two thousands years ago. However, neither absolute
lasissez-faire nor centrally planned economy has been proven to be an efficient long-term way
to economic prosperity. A rational governor would consistently seek balance between
liberalism and state intervention, as the Chinese philosophical concept “Doctrine of the Mean”,
which means maintaining balance and harmonoy from directing the mind to a state of constant
equilibrium. Therefore, from a historical perspective, the crossroad of governmental
interference in innovation activities and liberal market mechanism is in fact an traditional
question for China. Concerning years of a planned economy, a further market-oriented
transition becomes a remedy for avoiding the middle income trap and finding out a sustainable
growth pattern.
The focus of the next reforms should be on optimizing institution-building. Not only for non-
governmental entities like firms but also for the government is it difficult to act on markets
without appropriate market orders (Blum & Zhao, 2015). Nevertheless, a vital challenge faced
by transitional countries including China is how to establish efficient and market-oriented
institutions (Xu, 2011). If we return to the suggestions of the World Bank (2013) mentioned in
previous chapters, we can find that, in political terms, most of its advice has been confirmed by
our work: further reform of SOEs, further marketization including eliminating barriers to
market entry and exit and increasing competition intensity in high-tech industries that contain
the most strategic and pillar industries. To be precise, at the macro-level, in order to increase
China’s innovation performance, further reform should focus more frequently on building
efficient intermediary organizations such as fund-raising institutes, since innovative activities
are often associated with high risk. Bank credit alone cannot satisfy all of their requirments. On
the other hand, it is necessary to improve the protection mechanism for innovators, which would
entail furthering the reforms to optimize the protection of intellectual property rights. This
would ensure an institutional respect for and assurence of knowledge and innovation activities.
Moreover, the government should concentrate more on supplying public goods such as
education and some basic R&D and separate itself from business (Acemoglu & Johnson, 2005;
Rodrik, 2006), although the Chinese government is still deeply involved in market activities in
some fields (Xu, 2011). Above all, it is imperative that China accelerates its marketization
reforms and develop a market-based system with sound foundations in which public resources
mainly finance the delivery of key public goods and services, such as institution supply and
education, while a vigorous private sector plays the more important role of driving growth

103
(World Bank, 2013). China should reduce its misallocation of economic resources, including
innovation resources, by establishing a market-oriented competitive environment for all
ownership types, limiting state inference in market activities such as innovation and assuring
that private firms have fair access to receiving innovation input factors (Wei et al., 2017).
At the industrial level, public policy influences firms’ innovative activities in the field of market
structure. Though more competition is key to improving the economic performance and
innovativeness of firms (World Bank, 2013), competition policy should consider regional and
industrial specifications. In Central, Eastern and Western China, market monopoly tends to be
a significantly negative factor for innovation if market concentration stays at a high level.
Compared with medium- and low-tech industries, the government should focus more on
technology-oriented sectors to ensure an appropriate level of competition. Moreover,
competitiveness and innovation performance will also be increased by measures to enhance
international participation through further policies of openness and integration with the global
economy (World Bank, 2013). The innovation actors, including regional systems, should be
encouraged to reduce unnecessary barriers and participate more actively in international
competition.
When it comes to ownership reform, the effect of “privatization” remains disputed. Indeed,
many large SOEs, which have improved their governance structure, economic performance and
profitability, have been “corporatized” (Aivazian et al., 2005), but are still directly monitored
by the central or local government (World Bank, 2013). It is argued that in the next years a new
pattern of “mixed ownership” would be employed to SOEs to replace current state ownership,
which indicates that the government would decrease its intervention in markets, but meanwhile
maintains its present ownership ensuring funding for social goals. The real value of state
ownership would not change enormously, but incremental parts would be reformed. For
example, if the scale of a SOE with 100% state ownership increases to three times through
private investment, the state-owned share will be reduced to 30%, while its absolute value
remains unchanged (Blum & Zhao, 2015).
To use public resources in an efficient way, the specific framework conditions should be
considered. SOE reform remains an urgent mission particularly in Northeast and Central China
and should evidently focus on reducing administrative and agency costs through modern
corporate governance. The managers, or “agents,” of SOEs should be given clear business
objectives and goals rather than ambiguous political targets. In addition, public resources should
be used mainly for the provision of certain sectors or the production of which results in positive

104
externalities (World Bank, 2013). In some other industries, especially high-tech sectors such as
IT, SOEs do not always play a role as “innovation leaders.”
In summary, the model of China’s reforms mainly focuses on the gradual decentralization of
government control and pursuing an incremental transformation from a hierarchical to a market-
oriented system (Park et al., 2006). This transition path is different from those of Eastern
European and some other Asian countries. The reforms have achieved rapid economic growth
including a surge of innovation output in the last decades. Also, we would not deny the
contributions of the government to these achievements, since in almost all countries, both in
Europe and Asia, that have transformed from agrarian or planned economies to modern market-
oriented ones, the government has played an important role in restructuring industries,
supplying public services and institutions and facilitating firm performance (Lin & Monga,
2011). Nevertheless, the shortcomings and remaining unsolved problems of institutions and
government intervention in the areas of innovation systems, market structure and firm
ownership should not be ignored, since they have become newly emerging obstacles for
industrial upgrading and the further increase of innovation performance. For knowledge
generation and diffusion, as well as innovation, it is not sufficient to have sages. Without an
appropriate environment, knowledge would not be diffused and innovation would be separated
from human society. It is expected that the innovation-performance approach proposed in this
thesis will help to understand the surge of innovation performance in China in the past years
and contribute to finding remedies for shifting to an efficient, sustainable and environmentally
friendly innovation-driven development pattern.

105
Appendix A
Additional information about regressions in Chapter 4:
The Hausman test shows that fixed effect model is more appropriate than random effect model.
In this part fixed effect models are estimated in STATA with heteroscedasticity robust standard
errors.
To test multicollinearity we used “collin” command in STATA and then obtained reasonable
values of VIF (Variance Inflation Factor). All the values are lower than 6. The mean VIF of the
first regression is 2.62 and that of the second regression is 2.18, which means that there is no
multicollinearity problem.
The following table shows the descriptive statistics.
Variable Obs Mean Std. Dev. Min Max
L_PATENT_GRA 240 5.579 1.313 1.792 8.936
L_PATENT_POP 240 2.064 1.158 0.100 5.946
L_GDP_PC 240 9.093 0.590 7.768 10.813
L_PERSONAL 240 9.942 1.117 6.743 12.050
OPENNESS 240 29.287 38.272 3.213 165.227
ED_SHARE 240 15.380 2.281 9.697 21.140
INTER 240 3.868 2.069 1.150 12.840
IP 240 2.621 3.835 0.010 25.130
TERTIARY 240 40.540 6.359 30.048 69.651
UNI_RD 240 10.039 5.828 0.958 30.943
BANK 240 6.920 4.773 0.000 27.210
Table A.1: Descriptive statistics

106
Robustness test:
(1) (2) (3) (4)
L_GDP_PC 1.406*** 1.339*** 1.105*** 1.241***
(0.185) (0.178) (0.196) (0.188)
L_PERSONAL 0.836*** 0.634*** 0.333** 0.370***
(0.164) (0.147) (0.126) (0.132)
OPENNESS 0.014*** 0.011*** 0.008*
(0.003) (0.003) (0.004)
ED_SHARE 0.085*** 0.057** 0.055**
(0.025) (0.026) (0.024)
INTER 0.088***
(0.019)
IP 0.043***
(0.014)
TERTIARY 0.072*** 0.072***
(0.010) (0.011)
UNI_RD 0.004 0.002
(0.006) (0.006)
BANK -0.013 -0.014*
(0.008) (0.007)
_cons -19.034*** -18.145*** -15.702*** -16.932***
(1.628) (1.472) (1.244) (1.240)
N 240 240 240 240
r2 0.763 0.797 0.863 0.860
r2_a 0.761 0.794 0.858 0.856
Standard errors in parentheses
* p<0.1, ** p<0.05, *** p<0.01
Table A.2: Estimation results (granted patents per million people as dependent variable)

107
Appendix B
Additional information about regressions in Chapter 5:
We applied random effect models in STATA with heteroscedasticity robust standard errors.
As we are working with a panel dataset, it is important to use an appropriate panel estimation
strategy from fixed-effects and random-effects. As is well known, fixed effects and random
effects differ by 𝜎𝜖
2
𝜎𝜖2+𝑇 𝜎𝛼
2 . As T (Time) gets larger, this term goes to zero, so the random-effects
and fixed-effects estimators become identical. But if T is small in the panel data, then they will
get considerably different results and random-effects are of great use (Beck, 2001). The fixed-
effects estimator focuses on the time variation of each unit and ignores information about the
cross-sectional variability. By contrast, the random-effects estimator exploits both the within
and between components of the variability, and it is therefore more efficient when the time
variation of the dataset is limited (Castellacci, 2011). As shown in Table B.1 in Appendix B,
most of the variables in our dataset change slowly over time. So the between part of the variance
is substantially larger than the within component, which makes random-effects more efficient
and reliable. So, in this paper we will use random-effects to estimate.
To test multicollinearity we have used “collin” command in STATA and then obtained
reasonable values of VIF (Variance Inflation Factor). All the values are lower than 3. The mean
VIF of the regression with HHI2 is 1.72 and that of the regression with HHI3 is 1.56, which
means that there is no multicollinearity problem.
The following table shows the descriptive statistics.

108
A
ll
(N=
582712)
2005
N=
148064
2006
N=
212085
2007
N=
222563
Var
iab
le
Mea
n
Std
.
Dev
. M
in
Max
M
ean
S
td.
Dev
. M
in
Max
M
ean
S
td.
Dev
. M
in
Max
M
ean
S
td.
Dev
. M
in
Max
INN
O
0.0
42
0.1
81
0.0
00
15.2
07
0.0
40
0.1
82
0.0
00
15.2
07
0.0
41
0.1
71
0.0
00
10.0
00
0.0
44
0.1
91
0.0
00
13
.93
8
HH
I_4-d
igit
0.0
17
0.0
29
0.0
01
0.6
82
0.0
20
0.0
33
0.0
02
0.6
82
0.0
15
0.0
28
0.0
01
0.6
33
0.0
15
0.0
28
0.0
01
0.5
51
HH
I2_
4-d
igit
0.0
01
0.0
10
0.0
00
0.4
65
0.0
01
0.0
11
0.0
00
0.4
65
0.0
01
0.0
10
0.0
00
0.4
01
0.0
01
0.0
08
0.0
00
0.3
04
HH
I_3-d
igit
0.0
08
0.0
13
0.0
01
0.3
41
0.0
10
0.0
14
0.0
01
0.3
41
0.0
08
0.0
12
0.0
01
0.2
95
0.0
08
0.0
12
0.0
01
0.2
44
HH
I2_
3-d
igit
0.0
00
0.0
02
0.0
00
0.1
16
0.0
00
0.0
03
0.0
00
0.1
16
0.0
00
0.0
02
0.0
00
0.0
87
0.0
00
0.0
02
0.0
00
0.0
59
LA
BO
R
4.6
64
1.0
78
2.1
97
12.1
45
4.7
53
1.0
77
2.1
97
11.4
95
4.6
57
1.0
77
2.1
97
11.9
07
4.6
12
1.0
76
2.1
97
12
.14
5
RD
0.0
02
0.0
14
0.0
00
0.9
89
0.0
02
0.0
16
0.0
00
0.9
75
0.0
02
0.0
12
0.0
00
0.9
89
0.0
02
0.0
13
0.0
00
0.9
67
Tab
le B
.1:
Des
crip
tiv
e st
atis
tics

109
Appendix C
Additional information about regressions in Chapter 6:
The Hausman test shows that fixed effect model is better than random effect model. In this part
fixed effect models are estimated in STATA with heteroscedasticity robust standard errors.
The following table demonstrates the correlation matrix:
L_REVENUE L_GDP_PC SOE_SIZE STATE1 STATE2 STATE3
L_REVENUE 1.0000
L_GDP_PC 0.0623 1.0000
SOE_SIZE 0.4632 -0.2621 1.0000
STATE1 0.2184 -0.0166 0.5011 1.0000
STATE2 0.2014 -0.2847 0.4107 -0.1541 1.0000
STATE3 0.0898 -0.123 0.4699 -0.1954 -0.1517 1.0000
Table C.1: Correlation matrix
This table shows the descriptive statistics:
Variable Obs Mean Std. Dev. Min Max
L_PATENT 10,203 1.31 1.40 0 9.62
L_REVENUE 10,203 21.17 1.43 11.60 28.69
STATE_NAT 10,203 0.17 0.37 0 1
STATE_PRV 10,203 0.11 0.31 0 1
STATE_MUN 10,203 0.16 0.37 0 1
L_GDP_PC 10,203 10.61 0.60 8.22 11.56
SOE_SIZE 10,203 3.54 4.13 0 13.22
Table C.2: Descriptive statistics
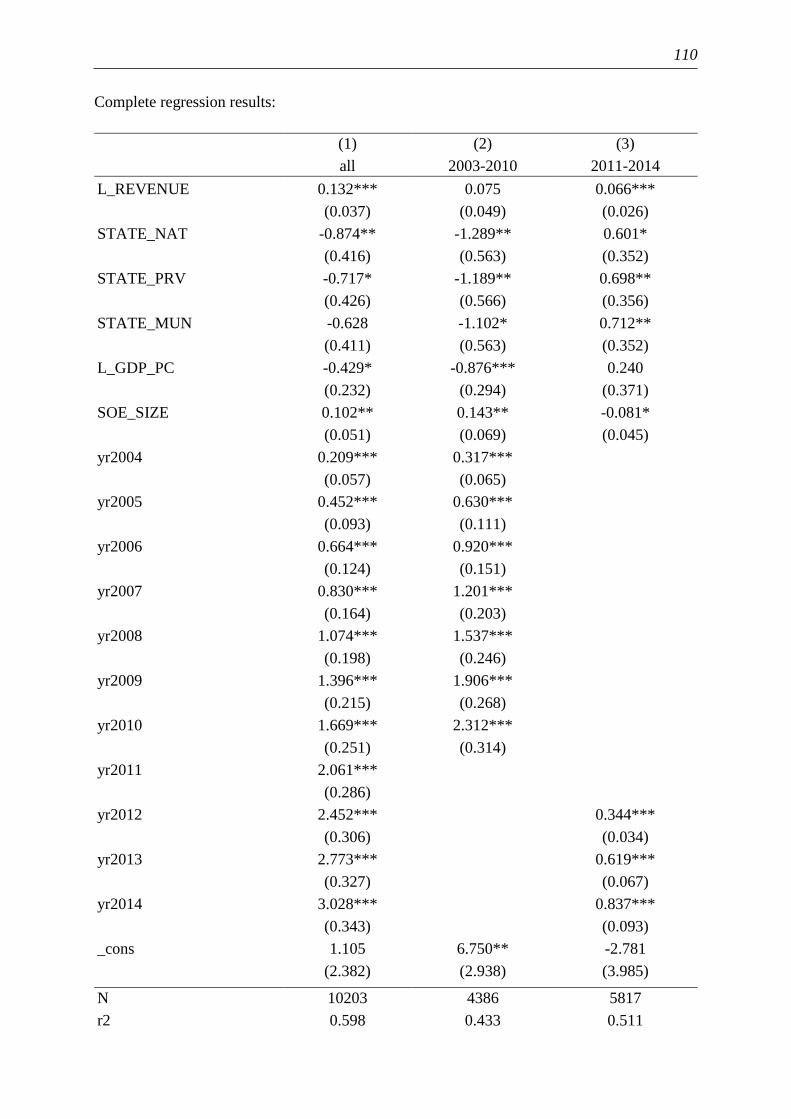
110
Complete regression results:
(1) (2) (3)
all 2003-2010 2011-2014
L_REVENUE 0.132*** 0.075 0.066***
(0.037) (0.049) (0.026)
STATE_NAT -0.874** -1.289** 0.601*
(0.416) (0.563) (0.352)
STATE_PRV -0.717* -1.189** 0.698**
(0.426) (0.566) (0.356)
STATE_MUN -0.628 -1.102* 0.712**
(0.411) (0.563) (0.352)
L_GDP_PC -0.429* -0.876*** 0.240
(0.232) (0.294) (0.371)
SOE_SIZE 0.102** 0.143** -0.081*
(0.051) (0.069) (0.045)
yr2004 0.209*** 0.317***
(0.057) (0.065)
yr2005 0.452*** 0.630***
(0.093) (0.111)
yr2006 0.664*** 0.920***
(0.124) (0.151)
yr2007 0.830*** 1.201***
(0.164) (0.203)
yr2008 1.074*** 1.537***
(0.198) (0.246)
yr2009 1.396*** 1.906***
(0.215) (0.268)
yr2010 1.669*** 2.312***
(0.251) (0.314)
yr2011 2.061***
(0.286)
yr2012 2.452*** 0.344***
(0.306) (0.034)
yr2013 2.773*** 0.619***
(0.327) (0.067)
yr2014 3.028*** 0.837***
(0.343) (0.093)
_cons 1.105 6.750** -2.781
(2.382) (2.938) (3.985)
N 10203 4386 5817
r2 0.598 0.433 0.511

111
r2_a 0.597 0.431 0.511
Standard errors in parentheses
* p<0.1, ** p<0.05, *** p<0.01
Table C.3: Basic model with year differences
(1) (2) (3) (4)
east northeast mid west
L_REVENUE 0.188*** 0.151 0.039 -0.005
(0.050) (0.162) (0.110) (0.085)
STATE_NAT -0.585 -5.747* -1.970** -0.145
(0.524) (3.034) (0.787) (1.230)
STATE_PRV -0.386 -8.743** -1.897** -0.013
(0.537) (3.843) (0.833) (1.288)
STATE_MUN -0.380 -6.437** -1.609** -0.119
(0.514) (2.844) (0.810) (1.213)
L_GDP_PC 0.157 -0.640 -0.158 0.215
(0.345) (1.905) (0.954) (0.758)
SOE_SIZE 0.075 0.920** 0.222** 0.030
(0.062) (0.419) (0.100) (0.152)
yr2004 0.138* 0.154 0.181 -0.050
(0.079) (0.278) (0.195) (0.190)
yr2005 0.318** 0.350 0.354 0.071
(0.133) (0.579) (0.333) (0.283)
yr2006 0.456** 0.343 0.559 0.181
(0.178) (0.845) (0.466) (0.395)
yr2007 0.542** 0.484 0.689 0.208
(0.228) (1.189) (0.648) (0.559)
yr2008 0.760*** 0.579 0.744 0.325
(0.271) (1.547) (0.824) (0.695)
yr2009 1.034*** 0.854 1.142 0.546
(0.295) (1.750) (0.925) (0.751)
yr2010 1.215*** 1.234 1.346 0.718
(0.341) (2.100) (1.117) (0.896)
yr2011 1.524*** 1.833 1.671 0.970
(0.386) (2.459) (1.293) (1.055)
yr2012 1.867*** 2.278 2.033 1.302
(0.411) (2.661) (1.391) (1.147)
yr2013 2.131*** 2.655 2.338 1.550
(0.440) (2.803) (1.477) (1.232)
yr2014 2.339*** 2.857 2.595* 1.764

112
(0.465) (2.897) (1.549) (1.297)
_cons -5.827 2.325 0.393 -1.883
(3.579) (17.904) (8.309) (7.389)
N 6729 407 1722 1345
r2 0.627 0.629 0.580 0.511
r2_a 0.626 0.612 0.575 0.505
Standard errors in parentheses
* p<0.1, ** p<0.05, *** p<0.01
Table C.4: Separate models for different regions
(1) (2) (3) (4)
textile paper machinery IT
L_REVENUE 0.039 -0.092 0.226*** 0.376
(0.175) (0.276) (0.071) (0.273)
STATE_NAT 1.688 2.259 -2.003*** -3.869
(1.067) (2.321) (0.752) (2.775)
STATE_PRV 3.057** 1.777 -2.055** -4.494*
(1.243) (2.266) (0.796) (2.693)
STATE_MUN 2.896** 2.057 -1.432* -4.659*
(1.166) (2.141) (0.752) (2.728)
L_GDP_PC 2.230** -3.550** 0.101 0.852
(1.010) (1.564) (0.587) (1.266)
SOE_SIZE -0.314** -0.253 0.089 0.645*
(0.139) (0.279) (0.100) (0.353)
yr2005 0.653 -5.915*** -2.078*** -1.367
(1.015) (1.741) (0.697) (1.259)
yr2006 0.397 -4.951*** -2.021*** -1.503
(0.840) (1.581) (0.609) (1.119)
yr2007 0.122 -4.240*** -1.952*** -1.562*
(0.711) (1.272) (0.500) (0.868)
yr2008 0.074 -3.506*** -1.770*** -1.450**
(0.613) (1.004) (0.416) (0.661)
yr2009 0.111 -3.150*** -1.489*** -1.048*
(0.555) (0.894) (0.355) (0.567)
yr2010 -0.154 -2.168*** -1.250*** -1.043**
(0.430) (0.606) (0.256) (0.439)
yr2011 -0.198 -1.382*** -0.933*** -0.815***
(0.279) (0.375) (0.161) (0.282)
yr2012 -0.086 -0.907*** -0.518*** -0.445**
(0.188) (0.251) (0.107) (0.198)

113
yr2013 -0.069 -0.395*** -0.215*** -0.204**
(0.089) (0.119) (0.051) (0.097)
_cons -24.232** 42.432** -3.090 -15.169
(10.316) (17.499) (6.627) (13.731)
N 286 227 1414 370
r2 0.620 0.602 0.636 0.683
r2_a 0.599 0.574 0.632 0.669
Standard errors in parentheses
* p<0.1, ** p<0.05, *** p<0.01
(Note: dummies for years 2004 and 2014 excluded during estimation for technical reasons)
Table C.5: Separate models for different industries
114
8. References
Acemoglu, D., & Johnson, S. (2005). Unbundling institutions. Journal of Political Economy,
113(5), 949–995.
Acemoglu, D., & Robinson, J. (2012). Why nations fail: The origins of power, prosperity, and
poverty: Crown Business.
Acs, Z. J., Anselin, L., & Varga, A. (2002). Patents and innovation counts as measures of
regional production of new knowledge. Research policy, 31(7), 1069–1085.
Acs, Z. J., & Audretsch, D. B. (1987). Innovation, market structure, and firm size. The review
of Economics and Statistics, 567–574.
Acs, Z. J., & Audretsch, D. B. (1988). Innovation in Large and Small Firms: An Empirical
Analysis. The American economic review, 78(4), 678–690.
Acs, Z. J., & Audretsch, D. B. (1989). Patents as a measure of innovative activity. Kyklos, 42(2),
171–180.
Aghion, P., Bloom, N., Blundell, R., Griffith, R., & Howitt, P. (2005). Competition and
innovation: An inverted U relationship. The quarterly journal of economics, 120(May), 701–
728. https://doi.org/10.1007/s10842-011-0123-4
Aghion, P., & Howitt, P. (1992). A Model of Growth through Creative Destruction.
Econometrica, 60(2), 323–351. https://doi.org/10.2307/2951599
Aivazian, V. A., Ge, Y., & Qiu, J. (2005). Can corporatization improve the performance of
state-owned enterprises even without privatization? Journal of Corporate Finance, 11(5),
791–808.
Akamatsu, K. (1962). A historical pattern of economic growth in developing countries. The
Developing Economies, 1(s1), 3–25.
Alchian, A. A., & Demsetz, H. (1972). Production, information costs, and economic
organization. The American economic review, 62(5), 777–795.
Arrow, K. (1962). Economic welfare and the allocation of resources for invention. National
Bureau of Economical research: The Rate and Direction of Inventive Activity: Economic
and Social Factors, I, S. 609‐626. https://doi.org/10.1521/ijgp.2006.56.2.191
Asheim, B. T., & Isaksen, A. (2002). Regional innovation systems: the integration of local
‘sticky’and global ‘ubiquitous’ knowledge. The Journal of Technology Transfer, 27(1), 77–
86.
Bai, C.-E., Lu, J., & Tao, Z. (2006). The multitask theory of state enterprise reform: empirical
evidence from China. The American economic review, 96(2), 353–357.
Bain, J. S. (1968). Industrial organization: John Wiley & Sons.
Bain, J. S. (1972). Essays on price theory and industrial organization.
Bartlett, C. A., & Ghoshal, S. (2000). Going global lessons from late movers. Harvard Business
Review.
Barzel, Y. (1989). Economic analysis of property rights. Political economy of institutions and
decisions. Cambridge, New York: Cambridge University Press.
115
Beck, N. (2001). Time-series–cross-section data: What have we learned in the past few years?
Annual Review of Political Science, 4(1), 271–293.
Blum, U. (2017a). Grundlagen der Volkswirtschaftslehre (1 Edition). De Gruyter Studium.
Berlin/Boston: De Gruyter.
Blum, U. (2017b). The West against the Rest: Wie wirtschaftlich erfolgreich ist das sogenannte
Abendland im Vergleich zu China? Eine kurze Einordnung. Conference paper of SMS-
Tagung ("Silk Meets Salt") in Februar 2017.
Blum, U., & Dudley, L. (1998). Fast Convergence. Institutions and Economic Growth in the
New East Germany. Jahrbuch für Wirtschaftswissenschaften/Review of Economics, 124–
143.
Blum, U., & Dudley, L. (1999). The Two Germanies: Information Technology and Economic
Divergence, 1949-1989. Journal of Institutional and Theoretical Economics
(JITE)/Zeitschrift für die gesamte Staatswissenschaft, 710–737.
Blum, U., Veltins, M., Bauer, H., & Huber, F. (2004). Marktmacht, Kartelle und die
Berechnung des Mehrerlöses. Strategien und Trends im Handelsmanagement. H. Bauer, F.
Huber ed., Vahlen, München, 251–271.
Blum, U., & Zhao, Z. (2015). Aktulle Entwicklungen in China. In Orientierungen zur
Wirtschafts- und Gesellschaftspolitik (pp. 36–43).
Blundell, R., Griffith, R., & van Reenen, J. (1999). Market share, market value and innovation
in a panel of British manufacturing firms. Review of Economic Studies, 66(3), 529–554.
https://doi.org/10.1111/1467-937X.00097
Boardman, A. E., & Vining, A. R. (1989). Ownership and performance in competitive
environments: A comparison of the performance of private, mixed and state-owned
enterprises. The Journal of Law & Economics, 32(1), 1–33.
Boeing, P. (2015). Innovation Made in China. Frankfurt am Main, Hochsch., Diss., 2015.
Boeing, P. (2016). The allocation and effectiveness of China’s R&D subsidies-Evidence from
listed firms. Research policy, 45(9), 1774–1789.
Boeing, P., Mueller, E., & Sandner, P. (2016). China's R&D explosion-Analyzing productivity
effects across ownership types and over time. Research policy, 45(1), 159–176.
Bos, J. W. B., Economidou, C., & Sanders, M. W. (2013). Innovation over the industry life-
cycle: Evidence from EU manufacturing. Journal of Economic Behavior & Organization,
86, 78–91.
Bozec, R., Breton, G., & Cote, L. (2002). The performance of state–owned enterprises revisited.
Financial Accountability & Management, 18(4), 383–407.
Breton, A. (1998). Competitive governments: An economic theory of politics and public finance:
Cambridge University Press.
Buchanan, J. M., Tollison, R. D., & Tullock, G. (1980). Toward a theory of the rent-seeking
society (Vol. 4): Texas A & M Univ Pr.
Budiman, A., Lin, D., & Singham, S. (2009). Improving performance at state-owned enterprises.
McKinsey Quarterly, 1–5.
Carter, C. F., & Williams, B. R. (1957). Industry and technical progress.

116
Castellacci, F. (2011). How does competition affect the relationship between innovation and
productivity? Estimation of a CDM model for Norway. Economics of Innovation and New
Technology, 20(7), 637–658.
Chen, G., Firth, M., Gao, D. N., & Rui, O. M. (2006). Ownership structure, corporate
governance, and fraud: Evidence from China. Journal of Corporate Finance, 12(3), 424–
448. https://doi.org/10.1016/j.jcorpfin.2005.09.002
Chen, G., Firth, M., & Xu, L. (2009). Does the type of ownership control matter? Evidence
from China’s listed companies. Journal of Banking & Finance, 33(1), 171–181.
Chen, L., & Zhu, W. (2011). Innovation, market structure and administrative entry barriers.
China Economic Quarterly, 10(2), 653–674.
Cheung, S. N. S. (2009). The 30th Anniversary of China’s Economic Reform: CITIC Press.
Coase, R. H. (1937). The nature of the firm. economica, 4(16), 386–405.
Cooke, P., & Morgan, K. (1990). Learning through networking: Regional innovation and the
lessons of Baden-Württemberg: Regional Industrial Research Cardiff.
Cooke, P., & Morgan, K. (1994). The regional innovation system in Baden-Württemberg.
International Journal of Technology Management, 9, 394–429.
Cooke, P., Uranga, M. G., & Etxebarria, G. (1997). Regional innovation systems: Institutional
and organizational dimensions. Research policy, 26, 475–491.
Demsetz, H. (1969). Information and efficiency: another viewpoint. The Journal of Law &
Economics, 12(1), 1–22.
Demsetz, H. (1974). Toward a theory of property rights. In Classic Papers in Natural Resource
Economics (pp. 163–177). Springer.
Demsetz, H. (1991). The organization of economic activity. Oxford: Blackwell.
Deng, Y., Morck, R., Wu, J., & Yeung, B. (2011). Monetary and fiscal stimuli, ownership
structure, and China's housing market. National Bureau of Economic Research.
Djankov, S., & Murrell, P. (2002). Enterprise restructuring in transition: A quantitative survey.
Journal of economic literature, 40(3), 739–792.
Fagerberg, J. (2007). A guide to Schumpeter. Confluence: Interdisciplinary Communications,
2008, 20–22.
Fan, G., Wang, X., & Zhang, L. (2001). Annual report 2000: Marketization index for China’s
provinces.
Fan, G., Wang, X., & Zhu, H. (2006). NERI INDEX of marketization of China’s provinces 2006
report.
Fan, G., Wang, X., & Zhu, H. (2011). NERI INDEX of Marketization of China’s Provinces
2011 Report (in Chinese): Economic and Science Press.
Feng, X. (2002). An Analytic Framework for the Chinese Intergovernmental Competition
Theory (in Chinese). Discussion Paper of Unirule Institute of Economics.
Ferguson, N. (2012). Civilization: The West and the rest: Penguin.
Firth, M., Lin, C., Liu, P., & Wong, S. M. L. (2009). Inside the black box: Bank credit allocation
in China’s private sector. Journal of Banking & Finance, 33(6), 1144–1155.
Fisman, R., & Wang, Y. (2010). Trading favors within Chinese business groups. The American
economic review, 100(2), 429–433.
117
Freeman, C. (1989). Technology policy and economic performance: Pinter Publishers Great
Britain.
Freeman, C. (1998). Schumpeter's business cycles reviseted: Fondazione Carivit.
Friedman, M. (1964). Capitalism and freedom: JSTOR.
Furman, J. L., & Hayes, R. (2004). Catching up or standing still? National innovative
productivity among ’follower’ countries, 1978-1999. Research policy, 33(9), 1329–1354.
https://doi.org/10.1016/j.respol.2004.09.006
Furman, J. L., Porter, M. E., & Stern, S. (2002). The determinants of national innovative
capacity. Research policy, 31(6), 899–933.
Geroski, P. A. (1990). Innovation, technological opportunity, and market structure. Oxford
economic papers, 42(3), 586–602.
Gill, I. S., & Kharas, H. J. (2007). An East Asian Renaissance: Ideas for Economic Growth:
World Bank Publications.
Goldeng, E., Grünfeld, L. A., & Benito, G. R. G. (2008). The performance differential between
private and state owned enterprises: The roles of ownership, management and market
structure. Journal of Management Studies, 45(7), 1244–1273.
Granger, C. W. J. (1969). Investigating Causal Relations by Econometric Models and Cross-
spectral Methods. Econometrica, 37(3), 424. https://doi.org/10.2307/1912791
Griliches, Z. (1984). R&D, Patents and Productivity (Vol. 21). Retrieved from
http://www.sciencedirect.com/science/article/pii/S0264275104000939
Griliches, Z. (1990). Patent Statistics as Economic Indicators: A Survey (Vol. 28). Retrieved
from
http://search.ebscohost.com/login.aspx?direct=true&db=bth&AN=19291971&site=ehost-
live
Grossman, S. J., & Hart, O. D. (1986). The costs and benefits of ownership: A theory of vertical
and lateral integration. The Journal of Political Economy, 691–719.
Gu, S., & Lundvall, B.-Å. (2006). China's innovation system and the move toward harmonious
growth and endogenous innovation. DRUID working paper: Vol. 2006,7. Göttingen,
Aalborg: Niedersächsische Staats- und Universitätsbibliothek; DRUID.
Gul, F. A., Kim, J.-B., & Qiu, A. A. (2010). Ownership concentration, foreign shareholding,
audit quality, and stock price synchronicity: Evidence from China. Journal of financial
economics, 95(3), 425–442.
Hadjimichalis, C. (2005). Uneven development and regionalism: state, territory and class in
southern Europe: Routledge.
Harvie, C. (2005). The rise of regional Europe: Routledge.
Hashmi, A. R. (2013). Competition and innovation: the inverted-U relationship revisited.
Review of Economics and Statistics, 95(5), 1653–1668.
Hayek, F. A. (1973). Law, legislation and liberty: a new statement of the liberal principles of
justice and political economy, v. 1: Rules and order: London: Routledge.
Hayek, F. A. (1968). Der Wettbewerb als Entdeckungsverfahren: Institut für Weltwirtschaft an
der Universität.
118
Herrmann-Pillath, C. (1999). Die fiskalische und regionale Dimension des systemischen
Wandels großer Länder: Regierungswettbewerb in China und Rußland: Univ. Witten,
Herdecke, Fak. für Wirtschaftswiss.
Holmes, T. J., Levine, D. K., & Schmitz, J. A. (2012). Monopoly and the incentive to innovate
when adoption involves switchover disruptions. American Economic Journal:
Microeconomics, 4(3), 1–33. https://doi.org/10.1257/mic.4.3.1
Hsieh, C.-T., & Klenow, P. J. (2009). Misallocation and manufacturing TFP in China and India.
The quarterly journal of economics, 124(4), 1403–1448.
Hsieh, C.-T., & Song, Z. M. (2015). Grasp the large, let go of the small: The transformation of
the state sector in China.
Hu, A. G. (2001). Ownership, government R&D, private R&D, and productivity in Chinese
industry. Journal of Comparative Economics, 29(1), 136–157.
https://doi.org/10.1006/jcec.2000.1704
Hu, A. G., & Jefferson, G. (2009). A great wall of patents: What is behind China's recent patent
explosion? Journal of Development Economics, 90(1), 57–68.
Hu, M.-C., & Mathews, J. a. (2005). National innovative capacity in East Asia. Research policy,
34(9), 1322–1349.
Hu, M.-C., & Mathews, J. a. (2008). China's national innovative capacity. Research policy,
37(9), 1465–1479.
Huang, Y., & Bosler, C. (2014). China’s debt dilemma: deleveraging while generating growth:
Carnegie Endowment for International Peace, September.
Hung, S.-C., & Whittington, R. (2011). Agency in national innovation systems: Institutional
entrepreneurship and the professionalization of Taiwanese IT. Research policy, 40(4), 526–
538.
Jaspers, K. (2014). The Origin and Goal of History (Routledge Revivals): Routledge.
Jefferson, G. (2006). R and D Performance in Chinese Industry. Economics of Innovation and
New Technology.
Jefferson, G. (2016). State-Owned Enterprise in China: Reform, Performance, and Prospects.
Jefferson, G., Hu, A. G., Guan, X., & Yu, X. (2003). Ownership, performance, and innovation
in China's large- and medium-size industrial enterprise sector. China Economic Review,
14(1), 89–113.
Jefferson, G. H., & Su, J. (2006). Privatization and restructuring in China: Evidence from
shareholding ownership, 1995–2001. Journal of Comparative Economics, 34(1), 146–166.
Jensen, M. C., & Meckling, W. H. (1976). Theory of the firm: Managerial behavior, agency
costs and ownership structure. Journal of financial economics, 3(4), 305–360.
Jones, E. (2003). The European miracle: environments, economies and geopolitics in the
history of Europe and Asia: Cambridge University Press.
Kamien, M. I., & Schwartz, N. L. (1982). Market structure and innovation: Cambridge
University Press.
Kasahara, S. (2004). The Flying Geese Paradigm: A critical study of its application to East
Asian regional development.
Kato, T., & Long, C. (2006). Executive turnover and firm performance in China. The American
economic review, 96(2), 363–367.

119
Knight, J. B. (2014). China as a developmental state. The World Economy, 37(10), 1335–1347.
Kou, K. (2015). Auswirkungen des chinesischen Innovationsmilieus auf das regionale
Wachstumspotenzial. In U. Blum (Ed.), Cultural heritage and green economy. Technology,
industrial growth, mobility ; Beijing Humboldt Forum (Vol. 4, pp. 41–61). Halle (Saale):
Martin-Luther-Univ.
Koyre, A. (1943). Galileo and the Scientific Revolution of the Seventeenth Century. The
Philosophical Review, 52(4), 333. https://doi.org/10.2307/2180668
Kraft, K. (1989). Market structure, firm characteristics and innovative activity. The Journal of
Industrial Economics, 329–336.
Kroll, H. (2010). Indicator-based reporting on the chinese innovation system 2010: The
regional dimension of science and innovation in China. Fraunhofer ISI discussion papers
innovation system and policy analysis: Vol. 2011,25. Karlsruhe: Fraunhofer ISI.
Kroll, H. (2015). Exploring pathways of regional technological development in China through
patent analysis.
Kroll, H., & Frietsch, R. (2014). Regional Structures and Trends in China’s Innovation System:
An Indicator-Based Account of the Last Decade’s Developments. Innovation and Regional
Development in China. London: Routledge, 41–72.
Kroll, H., & Liefner, I. (2008). Spin-off enterprises as a means of technology commercialisation
in a transforming economy—Evidence from three universities in China. Technovation, 28(5),
298–313.
Kroll, H., & Schiller, D. (2010). Establishing an interface between public sector applied
research and the Chinese enterprise sector: Preparing for 2020. Technovation, 30(2), 117–
129.
Laffont, J.-J., & Tirole, J. (1985). Using cost observation to regulate firms. Technical report /
Institute for Mathematical Studies in the Social Sciences, Stanford University: no. 477.
Stanford, Calif.: Institute for Mathematical Studies in the Social Sciences, Stanford
University.
Landes, D. S. (1999). The wealth and poverty of nations: Why some are so rich and some so
poor (1st Norton paperback ed.). New York: W.W. Norton & Co.
Lau, L. J., Qian, Y., & Roland, G. (2000). Reform without losers: an interpretation of China's
dual‐track approach to transition. Journal of Political Economy, 108(1), 120–143.
Lei, Z., Sun, Z., & Wright, B. (2012a). Are Chinese Patent Applications Politically Driven?
Evidence from China’s Domestic Patent Applications. In Patent Statistics for Decision
Makers Conference, OECD, Paris.
Lei, Z., Sun, Z., & Wright, B. (2012b). Patent subsidy and patent filing in China. University of
California, Berkeley, mimeo.
Levin, R., Cohen, W. M., & Mowery, D. C. (1985). R & D appropriability, opportunity, and
market structure: new evidence on some Schumpeterian hypotheses. The American
economic review, 75(2), 20–24.
Levin, R., Klevorick, A., Nelson, R. R., & Winter, S. (1984). Survey research on R&D
appropriability and technological opportunity. Unpublished manuscript. Yale University,
New Haven, CT.
Li, K., Yue, H., & Zhao, L. (2009). Ownership, institutions, and capital structure: Evidence
from China. Journal of Comparative Economics, 37(3), 471–490.

120
Li, S., Li, S., & Zhang, W. (2000). The road to capitalism: Competition and institutional change
in China. Journal of Comparative Economics, 28(2), 269–292.
Li, S., & Xia, J. (2008). The roles and performance of state firms and non-state firms in China’s
economic transition. World Development, 36(1), 39–54.
Li, X. (2007a). An empirical analysis of the change of chinese regional innovation capability:
Based on the view of innovation system (in Chinese). Management World.
Li, X. (2007b). An empirical analysis of the effect of institutional factors on regional innovation
performance (in Chinese). The Journal of Quantitative & Technical Economics, 24(8), 13–
24.
Li, X. (2012). Behind the recent surge of Chinese patenting: An institutional view (No. 1).
Research policy, 41.
Liefner, I., Kroll, H., & Peighambari, A. (2016). Research-driven or party-promoted? Factors
affecting patent applications of private small and medium-sized enterprises in China’s Pearl
River Delta. Science and Public Policy, scw002.
Lin, J. Y. (1995). The Needham puzzle: Why the industrial revolution did not originate in China.
Economic development and cultural change, 43(2), 269–292.
Lin, J. Y. (2012). New structural economics: A framework for rethinking development and
policy: World Bank Publications.
Lin, J. Y., Cai, F., & Li, Z. (1998). Competition, policy burdens, and state-owned enterprise
reform. Estados Unidos: American Economic Review.
Lin, J. Y., Cai, F., & Li, Z. (2003). The China miracle: Development strategy and economic
reform: Chinese University Press.
Lin, J. Y., & Monga, C. (2011). Growth Identification and Facilitation: The Role of the State
in the Process of Dynamic Growth. Development Policy Review, 29(3), 264–290.
Link, A. N. (1980). Firm size and efficient entrepreneurial activity: A reformulation of the
Schumpeter hypothesis. The Journal of Political Economy, 771–782.
List, F. (1841). Das nationale System der politischen Ökonomie. Stuttgart & Tübingen: J. G.
Cotta.
Liu, X. (2014). Economics of technological innovation. Beijing: Tsinghua University Press.
Liu, X., & White, S. (2001). Comparing innovation systems: a framework and application to
China's transitional context. Research policy, 30(7), 1091–1114.
Long, D. M., Payne, J. D., & Feng, C. (1999). Information transmission in the Shanghai equity
market. Journal of Financial Research, 22(1), 29–45.
Lundvall, B.-Å. (1985). Product innovation and user-producer interaction, industrial
development".
Lundvall, B.-Å. (1995). National systems of innovation: towards a theory of innovation and
interactive learning. London. Retrieved from http://orton.catie.ac.cr/cgi-
bin/wxis.exe/?IsisScript=CIENL.xis&method=post&formato=2&cantidad=1&expresion=
mfn=002923\npapers2://publication/uuid/719EE451-FB79-47D0-8E30-F2FD6674D753
Lundvall, B.-Å., Johnson, B., Andersen, E. S., & Dalum, B. (2002). National systems of
production, innovation and competence building. Research policy, 31(2), 213–231.
https://doi.org/10.1016/S0048-7333(01)00137-8

121
Maddison, A. (2010). Statistics on world population, GDP and per capita GDP, 1-2008 AD.
Historical Statistics, 1–36.
Mansfield, E. (1963). Size of firm, market structure, and innovation. The Journal of Political
Economy, 556–576.
Mansfield, E. (1964). Industrial research and development expenditures: Determinants,
prospects, and relation to size of firm and inventive output. Cowles Foundation paper: no.
216. New Haven, Conn.: Cowles Foundation for Research in Economics at Yale University.
Mansfield, E. (1986). Patents and Innovation: An Empirical Study. Management Science, 32(2),
173–181. https://doi.org/10.1287/mnsc.32.2.173
Mason, E. S. (1939). Price and production policies of large-scale enterprise. The American
economic review, 29(1), 61–74.
Megginson, W. L., & Netter, J. M. (2001). From state to market: A survey of empirical studies
on privatization. Journal of economic literature, 39(2), 321–389.
Mortensen, P. S., & Bloch, C. W. (2005). Oslo Manual-Guidelines for collecting and
interpreting innovation data: Organisation for Economic Cooporation and Development,
OECD.
Mowery, D., & Rosenberg, N. (1979). The influence of market demand upon innovation: a
critical review of some recent empirical studies. Research policy, 8(2), 102–153.
Myers, S., & Marquis, D. G. (1969). Successful industrial innovations. A study of factors
underlying innovation in selected firms.
Naughton, B. (1994). Chinese institutional innovation and privatization from below. The
American economic review, 84(2), 266–270.
Naughton, B. (2007). The Chinese economy: Transitions and growth. Cambridge, Mass.: MIT
Press.
Naughton, B. (2017). Is China Socialist? The Journal of Economic Perspectives, 31(1), 3–24.
Nee, V. (1992). Organizational dynamics of market transition: Hybrid forms, property rights,
and mixed economy in China. Administrative science quarterly, 1–27.
Needham, J. (1969). The grand titration: Science and society in East and West: University of
Toronto Press. Retrieved from https://books.google.de/books?id=OwRgAAAAMAAJ
Nelson, R. R. (1993). National Innovation Systems: A Comparative Analysis: Oxford
University Press.
Nelson, R. R., & Winter, S. G. (1982). An evolutionary theory of economic change. Cambridge,
Mass.: Belknap Press of Harvard University Press.
Nickell, S. J. (1996). Competition and Corporate Performance. The Journal of Political
Economy, 104(4), 724–746. https://doi.org/10.1086/262040
Nie, H., Jiang, T., & Yang, R. (2012). A Review and Reflection on the Use and Abuse of
Chinese Industrial Enterprises Database. The Journal of World Econom, 5.
Nie, H., Tan, S., & Wang, Y. (2008). Innovation, Firm Size and Market Competition: From the
Evidence of Firm-level Panel Data in China (in Chinese). School of Economics, Renmin
University of China Working Paper Series.
Nolan, P., & Wang, X. (1999). Beyond privatization: Institutional innovation and growth in
China's large state-owned enterprises. World Development, 27(1), 169–200.

122
North, D. C. (1990). Institutions, institutional change and economic performance: Cambridge
University Press.
North, D. C. (1992). Transaction costs, institutions, and economic performance: ICS Press San
Francisco, CA.
North, D. C., & Thomas, R. P. (1973). The rise of the western world: A new economic history:
Cambridge University Press.
OECD. (1997). National innovation systems. Retrieved from
http://www.oecd.org/science/inno/2101733.pdf
OECD. (1999). Managing National Innovation Systems (Vol. 26). Retrieved from
http://new.sourceoecd.org/9264170383
OECD. (2015). OECD Guidelines on corporate governance of state-owned enterprises 2015
Edition.
OECD. (2016). State-Owned Enterprises in Asia: National Practices for Performance
Evaluation and Management.
Oi, J. C. (1992). Fiscal reform and the economic foundations of local state corporatism in China.
World Politics, 45(01), 99–126.
Omran, M. (2004). The performance of state-owned enterprises and newly privatized firms:
does privatization really matter? World Development, 32(6), 1019–1041.
Park, S. H., Li, S., & David, K. T. (2006). Market liberalization and firm performance during
China's economic transition. Journal of International Business Studies, 37(1), 127–147.
Patel, P., & Pavitt, K. (1994). National innovation systems: why they are important, and how
they might be measured and compared. Economics of Innovation and New Technology, 3(1),
77–95.
Pavitt, K. (1988). Uses and abuses of patent statistics. In Handbook of Quantitative Studies of
Science and Technology (pp. 509–536). https://doi.org/10.1016/B978-0-444-70537-
2.50021-0
Peng, M. W., Bruton, G. D., Stan, C. V., & Huang, Y. (2016). Theories of the (state-owned)
firm. Asia Pacific Journal of Management, 33(2), 293–317.
Pomeranz, K. (2000). The Great Divergence: China, Europe, and the Making of the Modern
World Economy: Princeton University Press.
Porter, M. E. (1998). Clusters and the new economics of competition. Harvard Business Review,
76(6), 77–90. https://doi.org/10.1042/BJ20111451
Porter, M. E. (1981). The contributions of industrial organization to strategic management.
Academy of management review, 6(4), 609–620.
Porter, M. E. (1990). The Competitive Advantage of Nations. Harvard Business Review, 68,
73–93. Retrieved from http://esc-
web.lib.cbs.dk/login?url=http://search.ebscohost.com/login.aspx?direct=true&db=bth&AN
=9005210820&login.asp&site=ehost-live&scope=site
Prud'homme, D. (2017). Utility model patent regime “strength” and technological development:
Experiences of China and other East Asian latecomers. China Economic Review, 42, 50–73.
https://doi.org/10.1016/j.chieco.2016.11.007
Putnam, R. D., Leonardi, R., & Nanetti, R. (1993). Making democracy work.
PwC. (2015). State-Owned Enterprises: Catalysts for public value creation?

123
Qian, Y. (1996). Enterprise reform in China: Agency problems and political control. Economics
of Transition, 4(2), 427–447.
Rainey, H. G. (2009). Understanding and managing public organizations: John Wiley & Sons.
Rajan, R. G. (2011). Fault lines: How hidden fractures still threaten the world economy:
Princeton University Press.
Ramanadham, V. V. (1991). The economics of public enterprise: Taylor & Francis.
Rodrik, D. (2006). Goodbye Washington consensus, hello Washington confusion? A review of
the World Bank's economic growth in the 1990s: learning from a decade of reform. Journal
of economic literature, 44(4), 973–987.
Romer, P. (1989). Endogenous technological change.
Rosenberg, N. (1982). Inside the Black Box: Technology and Economics (Vol. 1). Retrieved
from http://www.amazon.com/Inside-Black-Box-Technology-Economics/dp/0521273676
Rosenberg, N., & Nelson, R. R. (1994). American universities and technical advance in industry.
Research policy, 23(3), 323–348.
Rothwell, R. (1992). Successful industrial innovation: critical factors for the 1990s. R&D
Management, 22(3), 221–240.
Rothwell, R., & Zegveld, W. (1985). Reindustrialization and technology: ME Sharpe.
Scherer, F. M. (1965). Firm size, market structure, opportunity, and the output of patented
inventions. The American economic review, 55(5), 1097–1125.
Scherer, F. M. (1967). Market structure and the employment of scientists and engineers. The
American economic review, 57(3), 524–531.
Schmookler, J. (1966). Invention and Economic Growth. Cambridge, MA.
Schumpeter, J. (1942). Capitalism, Socialism, and Democracy. New York: Harper and Row.
Schumpeter, J. A. (1934). The Theory of Economic Development.
Shapiro, C. (2011). Competition and Innovation: Did Arrow Hit the Bull's Eye? In The rate and
direction of inventive activity revisited (pp. 361–404). University of Chicago Press.
Sheng, H., & Zhao, N. (2012). China's state-owned enterprises: Nature, performance and
reform: World Scientific.
Shi, S. (2009). Auswirkungen des Beitritts Chinas zur WTO auf die Wettbewerbspolitik in China:
Eine institutionenöknomische Betrachtung.
Shin, N., Kraemer, K. L., & Dedrick, J. (2012). Value capture in the global electronics industry:
Empirical evidence for the “smiling curve” concept. Industry and Innovation, 19(2), 89–107.
Shirley, M. M. (1999). Bureaucrats in business: The roles of privatization versus corporatization
in state-owned enterprise reform. World Development, 27(1), 115–136.
Shleifer, A. (1998). State versus private ownership. The Journal of Economic Perspectives,
12(4), 133–150.
Soete, L. L. G. (1979). Firm size and inventive activity: The evidence reconsidered. European
Economic Review, 12(4), 319–340.
Solow, R. M. (1957). Technical change and the aggregate production function. The review of
Economics and Statistics, 312–320.
Song, Z., Storesletten, K., & Zilibotti, F. (2011). Growing like china. American Economic
Review, 101(1), 196–233.

124
Sun, Q., & Tong, W. H. S. (2003). China share issue privatization: the extent of its success.
Journal of financial economics, 70(2), 183–222.
Sun, Q., Tong, W. H. S., & Tong, J. (2002). How does government ownership affect firm
performance? Evidence from China’s privatization experience. Journal of Business Finance
& Accounting, 29(1‐2), 1–27.
Tagscherer, U., Kroll, H., & Luo, X. (2012). Regional Innovation Systems in China-An
Analysis of Industry-Science Linkages in Bohai Bay Area. Technological Entrepreneurship
in China. Cheltenham: Edward Elgar, 16–40.
Tan, J., & Litsschert, R. J. (1994). Environment‐strategy relationship and its performance
implications: An empirical study of the Chinese electronics industry. Strategic management
journal, 15(1), 1–20.
Tang, J. (2006). Competition and innovation behaviour. Research policy, 35(1), 68–82.
https://doi.org/10.1016/j.respol.2005.08.004
Tingvall, P. G., & Karpaty, P. (2010). Service-sector competition, innovation and R&D.
Economics of Innovation and New Technology, 20(1), 63–88.
https://doi.org/10.1080/10438590903073675
Tishler, A., & Milstein, I. (2009). R&D wars and the effects of innovation on the success and
survivability of firms in oligopoly markets. International Journal of Industrial Organization,
27(4), 519–531.
Unescap. (2009). What is Good Governance ? United Nations Economic and social Comission
for Asia and the Pacific, 1–3.
van der Hoeven, R., & Sziraczki, G. (1997). Lessons from privatization: labour issues in
developing and transitional countries: International Labour Organization.
Vernon-Wortzel, H., & Wortzel, L. H. (1989). Privatization: Not the only answer. World
Development, 17(5), 633–641.
Vickers, J., & Yarrow, G. K. (1988). Privatization: an economic analysis. MIT Press series on
the regulation of economic activity: Vol. 18. Cambridge, MA: The MIT Press.
Vining, A. R., & Boardman, A. E. (1992). Ownership versus competition: Efficiency in public
enterprise. Public choice, 73(2), 205–239.
Wan, J. (2013). The economics of innovation. Beijing: Intecllectual property publishing house
(in Chinese).
Wang, C. (2005). Ownership and operating performance of Chinese IPOs. Journal of Banking
& Finance, 29(7), 1835–1856.
Wang, Q., Wong, T.-J., & Xia, L. (2008). State ownership, the institutional environment, and
auditor choice: Evidence from China. Journal of Accounting and Economics, 46(1), 112–
134.
Weber, M. (1905). Die protestantische Ethik und der Geist des Kapitalismus. Wort-Schätze.
Gütersloh: Verlagshaus Gerd Mohn.
Wei, S.-J., Xie, Z., & Zhang, X. (2017). From “Made in China” to “Innovated in China”:
Necessity, Prospect, and Challenges. Journal of Economic Perspectives, 31(1), 49–70.
https://doi.org/10.1257/jep.31.1.49
Weitzman, M. L., & Xu, C. (1994). Chinese township-village enterprises as vaguely defined
cooperatives. Journal of Comparative Economics, 18(2), 121–145.

125
Wen, Y., & Wu, J. (2014). Withstanding great recession like China. FRB of St. Louis Working
Paper No.
World Bank. (2013). China 2030: building a Modern, Harmonious, and Creative Society.
Washington, DC: World Bank Publications. Retrieved from
http://documents.worldbank.org/curated/en/781101468239669951/China-2030-building-a-
modern-harmonious-and-creative-society
Wu, Y. (2007). Firm Size, Market Concentration and Innovation: A Survey. Economic
Research Journal.
Xiao, G. (1996). Clarification of SOE Property Rights.
Xu, C. (2011). The fundamental institutions of China's reforms and development. Journal of
economic literature, 49(4), 1076–1151.
Xu, X., & Wang, Y. (1997). Ownership structure, corporate governance, and corporate
performance: The case of Chinese stock companies: World Bank Publications.
Zhang, A., Zhang, Y., & Zhao, R. (2003). A study of the R&D efficiency and productivity of
Chinese firms. Journal of Comparative Economics, 31(3), 444–464.
Zheng, J., Liu, X., & Bigsten, A. (2003). Efficiency, technical progress, and best practice in
Chinese state enterprises (1980–1994). Journal of Comparative Economics, 31(1), 134–152.
Zhou, Y. (2000). The Institutional Change of China in an Evolutionary Perspective (in Chinese).
Economic Research Journal, 5, 3–11.
Zhou, Y. (2003). Local Government Competition and Economic Growth (in Chinese). Journal
of Renmin University of China, 1, 97–103.
Zhu, X. (2012). Understanding China's growth: Past, present, and future. The Journal of
Economic Perspectives, 26(4), 103–124.

Eidesstattliche Erklärung
Hiermit erkläre ich, dass ich die Dissertation selbst und ohne unerlaubte fremde Hilfe
angefertigt und außer den im Literaturverzeichnis sowie in den Anmerkungen genannten
Hilfsmitteln keine weiteren benutzt habe.