Investigating dead spots of electric guitars
22
1 IMPROVED VERSION 2015 Investigating dead spots of electric guitars ACUSTICA – acta acustica 85 (1999), 128 - 135 Helmut Fleischer Institut für Mechanik, Fakultät für Luft- und Raumfahrttechnik, Universität der Bundeswehr München, D-85577 Neubiberg, Germany Tilmann Zwicker Maenherstr. 39, D-81375 München, Germany Current address: Prof. Dr. Helmut Fleischer LRT 4 UniBwM D-85577 Neubiberg Deutschland Phone: 089/60042385 Fax: 089/60042386 e-mail: [email protected]
Transcript of Investigating dead spots of electric guitars
1
IMPROVED VERSION 2015
Investigating dead spots of electric guitars
ACUSTICA – acta acustica 85 (1999), 128 - 135
Helmut Fleischer
Institut für Mechanik, Fakultät für Luft- und Raumfahrttechnik,
Universität der Bundeswehr München, D-85577 Neubiberg, Germany
Tilmann Zwicker
Maenherstr. 39, D-81375 München, Germany
Current address:
Prof. Dr. Helmut Fleischer
LRT 4 UniBwM
D-85577 Neubiberg
Deutschland
Phone: 089/60042385
Fax: 089/60042386
e-mail: [email protected]
2
Summary
A long decay of the string vibrations of an electric guitar ("sus-
tain") is considered as a quality attribute. In practice, there are
particular locations on the fretboard where for one of the strings the
sustain is shorter than at adjacent frets. The player calls this
irregularity a "dead spot". It originates from the fact that the
string causes the neck of the guitar to vibrate. As a consequence,
energy flows from the string to the neck which results in a faster
decay.
Three structurally different electric guitars (symmetric and asymme-
tric heads; neck screwed and glued to the body, respectively) served
as measuring objects. In a first step, the decay times of the string
signals were measured. In a second step, a technique was applied which
allowed for in-situ measurements of the mechanical point conductance
on the neck of guitars [7]. The experiments revealed a clear inverse
relation between the decay time of the string vibrations and the mag-
nitude of the neck conductance. A local high neck conductance indi-
cates a dead spot. In conclusion, the driving-point conductance, meas-
ured on the neck perpendicular to the fretboard, promises to be a key
parameter for the diagnosis of dead spots.
3
1. Introduction
The body of an electric guitar is normally manufactured from solid
material in such a way that the bridge is as rigid as possible. As a
rule, no considerable energy is transferred from the string to the
body, and therefore the string signal of a solid-body electric guitar
does not decay as rapidly as the signal of an acoustic instrument. In
general, the "sustain" (long decay) of the electric guitar exceeds
that of the acoustic guitar.
The sustain depends on several factors, e.g. the quality and the state
of the string. For a given string, a uniform decrease in the sustain
with increasing pitch can be observed. However, there are exceptions
to this rule. At particular locations on the fretboard of an electric
guitar the sustain is shorter than at adjacent frets. Players call
this a "dead spot".
Theoretical considerations suggest that interactions the string and
the instrument body have to be taken into account in order to explain
the dead spots (cf. Fletcher and Rossing [1], Gough [2]). Heise [3],
Wogram [4] and Fleischer and Zwicker [5] have measured the vibrations
of the bodies of electric basses. Ziegenhals [6] dealt with the vibra-
tions of electric guitars at the bridge. In a recent study, Fleischer
and Zwicker [7] concentrated on the necks of electric guitars. They
found that the mechanical point conductance proved to be a promising
parameter for characterizing the energy-absorbing behaviour of the
string supports.
In this study, three solid-body electric guitars are investigated with
respect to dead spots and the relation to the conductance at the
string terminations.
2. The guitars
The three guitars included in the study were made by well-known Ameri-
can manufacturers. All have six steel strings, about 62 to 65 cm in
length, and 18 to 22 frets. The string vibrations are picked up by
electromagnetic transducers. During the measurements the strings were
normally tuned (E2, A2, D3, G3, B3, and E4, bottom to top open
strings), and to concert pitch (A2 = 110 Hz). The bodies and necks are
all of wooden construction. The instruments can be characterized as
follows:
4
* Stratocaster SRV Signature. Body made from ash wood and the neck
from maple with a glued-on fretboard of rosewood. The headstock is
asymmetrically shaped. The neck is bolted to the body by four screws.
A typical Stratocaster-type vibrato unit is included.
* Les Paul K.M. A version of the well-known Les Paul Standard. Mahog-
any is used for the body and the neck, rosewood for the fretboard and
maple for the top of the body. The neck is glued to the body. The
headstock is symmetric.
* Explorer. This instrument originates from the same manufacturer as
the Les Paul. Mahogany and rosewood are used for the same parts as
above, and the neck is glued to the body. There is no maple top. The
headstock is highly asymmetric. A Bigsby-style vibrato unit is added.
3. Decay of the string signals
In a first step, the sustain was investigated. Some typical experi-
mental results will be presented for the three guitars.
3.1. Measuring procedure
The string signals of an electric guitar are easily accessed via the
electric output socket of the built-in pick-ups. For the measurements,
the tone and volume knobs were turned to their maximum positions. The
pick-up closest to the neck was selected, located at approximately 1/4
of the string length from the bridge. No check of the amplitude lin-
earity (mV/mm string amplitude) of the pick-ups was made. The measured
decay processes represent, however, the actual conditions in playing.
The single strings (denoted E for E2, A for A2, D for D3, G for G3, B
for B3 and e for E4) were plucked manually by means of a plectrum. The
output signal was fed to an FFT analyzer (Ono Sokki CF 350) and ana-
lyzed. The time window had a length of 0.4 s corresponding to a band-
width of 1 kHz.
As an example, the decay of the open strings of the Explorer guitar is
shown in Figure 1. The level is plotted in a 3D-representation as a
function of frequency and time. Since the neck pick-up was used, the
level of the fundamental is relatively high. As a rule, the fundamen-
tal decays more slowly than the higher partials. This means that under
normal conditions, the decay of the total signal will be dominated by
the fundamental. As can be seen from a comparison of the six diagrams,
the high-pitched strings will normally decay faster than the lower. A
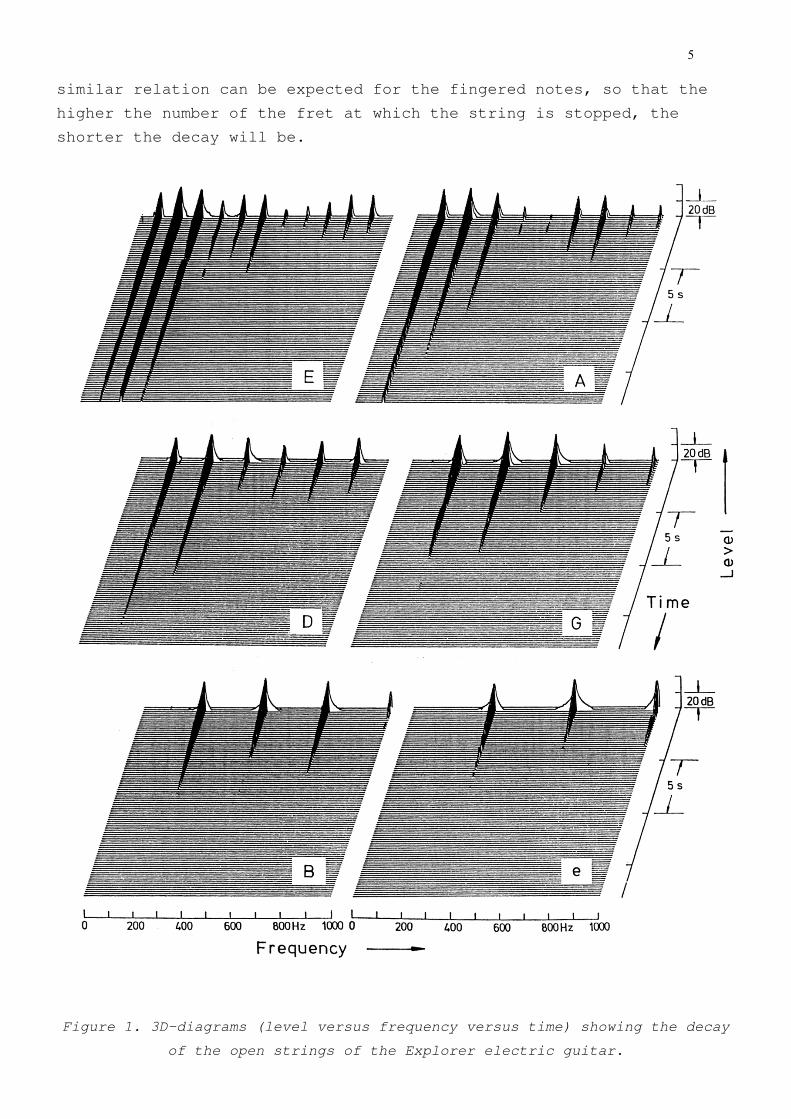
5
similar relation can be expected for the fingered notes, so that the
higher the number of the fret at which the string is stopped, the
shorter the decay will be.
Figure 1. 3D-diagrams (level versus frequency versus time) showing the decay
of the open strings of the Explorer electric guitar.
6
In order to quantify the sustain, the level of the total string signal
was evaluated. The guitar under measurement was held by author T.Z. -
an experienced amateur musician - in playing position. The player
plucked the string by means of a plectrum in such an angle that the
string vibration contained components both parallel and perpendicular
to the fretboard. The output signal of the neck pick-up was fed to a
level recorder (BK 2305).
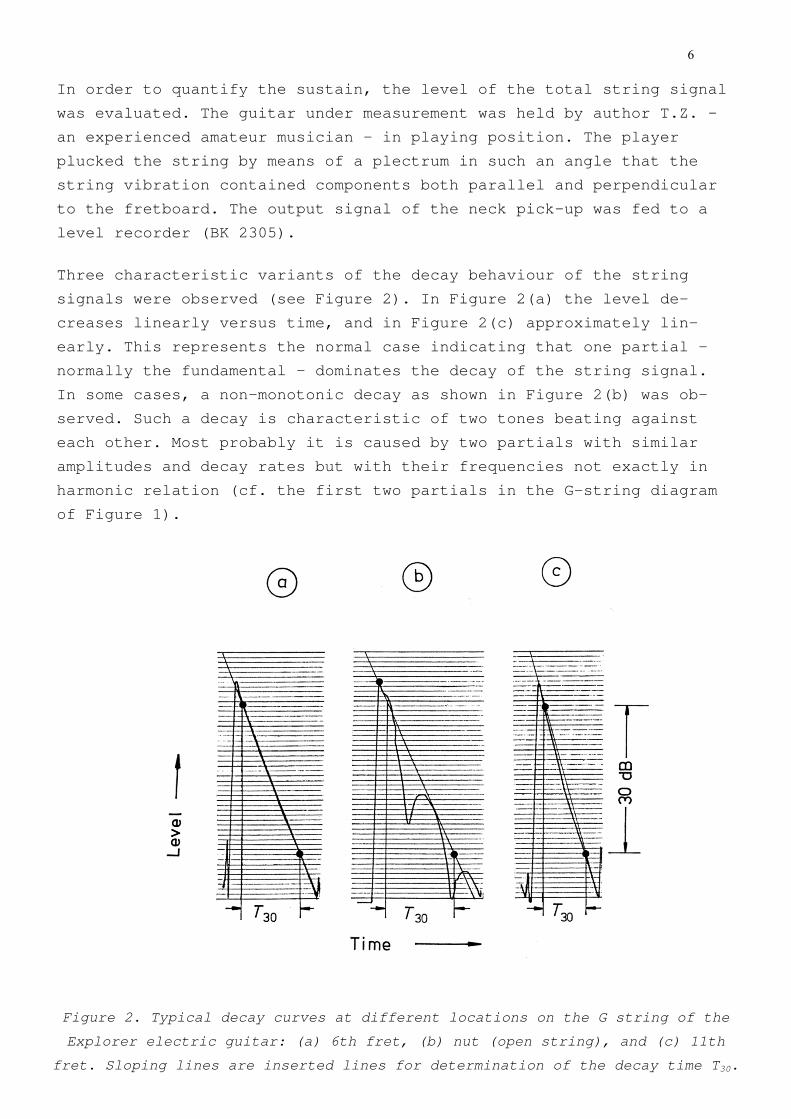
Three characteristic variants of the decay behaviour of the string
signals were observed (see Figure 2). In Figure 2(a) the level de-
creases linearly versus time, and in Figure 2(c) approximately lin-
early. This represents the normal case indicating that one partial -
normally the fundamental - dominates the decay of the string signal.
In some cases, a non-monotonic decay as shown in Figure 2(b) was ob-
served. Such a decay is characteristic of two tones beating against
each other. Most probably it is caused by two partials with similar
amplitudes and decay rates but with their frequencies not exactly in
harmonic relation (cf. the first two partials in the G-string diagram
of Figure 1).
Figure 2. Typical decay curves at different locations on the G string of the
Explorer electric guitar: (a) 6th fret, (b) nut (open string), and (c) 11th
fret. Sloping lines are inserted lines for determination of the decay time T30.
7
The decay curves were approximated with straight lines in order to
calculate the average decay (see Figure 2). These lines were manually
fitted to the curves. A decay time T30 was determined, during which the
total level of the string signal decreased by 30 dB. According to
Zwicker and Fastl [8] this level difference corresponds roughly to a
decrease of the loudness sensation by a factor of eight. In the fol-
lowing, the sustain will be characterized by the decay time T30. A
"dead spot" on the fretboard is indicated by an abnormally short T30
for the respective note. Correspondingly, a position on the neck where
the decay time is longer than at adjacent frets is called a "live
spot"
3.2. Experimental results
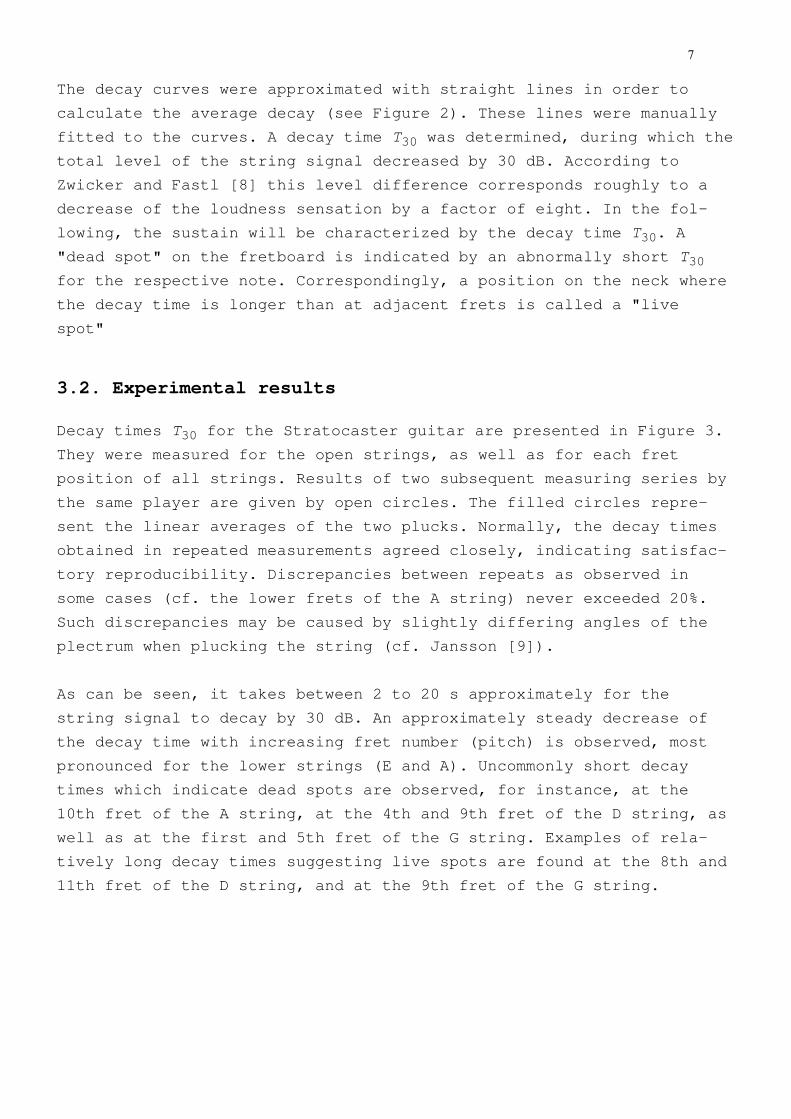
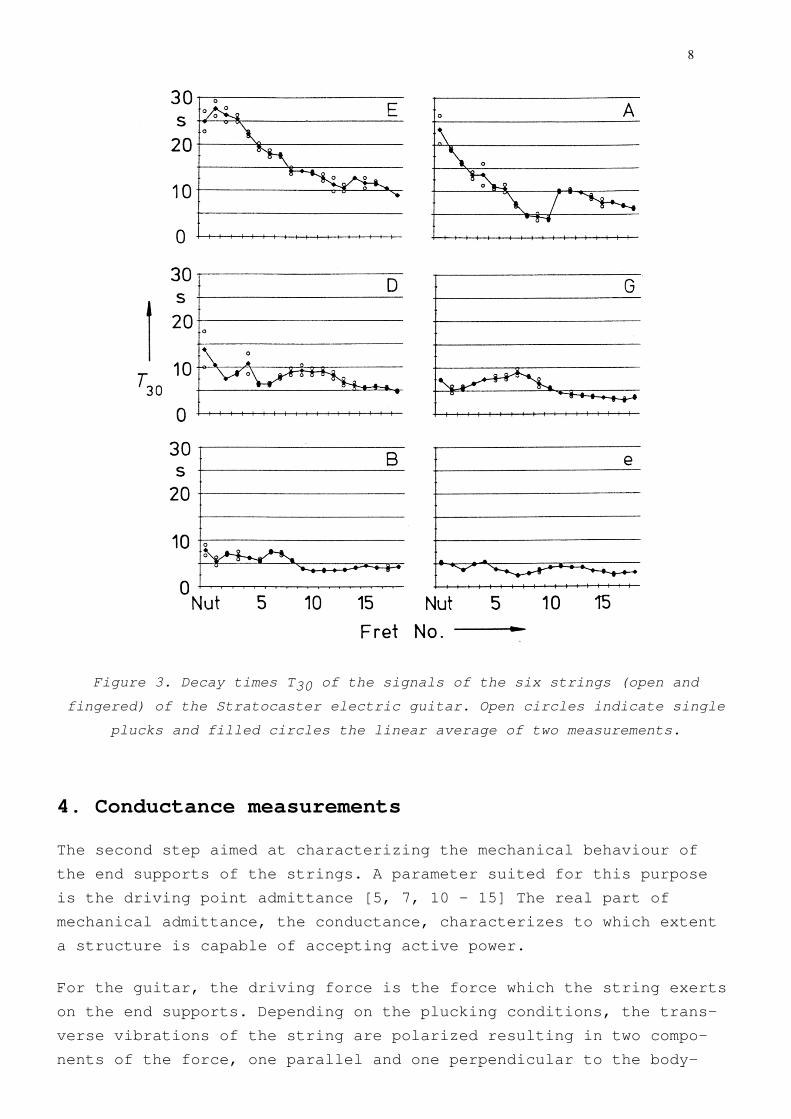
Decay times T30 for the Stratocaster guitar are presented in Figure 3.
They were measured for the open strings, as well as for each fret
position of all strings. Results of two subsequent measuring series by
the same player are given by open circles. The filled circles repre-
sent the linear averages of the two plucks. Normally, the decay times
obtained in repeated measurements agreed closely, indicating satisfac-
tory reproducibility. Discrepancies between repeats as observed in
some cases (cf. the lower frets of the A string) never exceeded 20%.
Such discrepancies may be caused by slightly differing angles of the
plectrum when plucking the string (cf. Jansson [9]).
As can be seen, it takes between 2 to 20 s approximately for the
string signal to decay by 30 dB. An approximately steady decrease of
the decay time with increasing fret number (pitch) is observed, most
pronounced for the lower strings (E and A). Uncommonly short decay
times which indicate dead spots are observed, for instance, at the
10th fret of the A string, at the 4th and 9th fret of the D string, as
well as at the first and 5th fret of the G string. Examples of rela-
tively long decay times suggesting live spots are found at the 8th and
11th fret of the D string, and at the 9th fret of the G string.
8
Figure 3. Decay times T30 of the signals of the six strings (open and
fingered) of the Stratocaster electric guitar. Open circles indicate single
plucks and filled circles the linear average of two measurements.
4. Conductance measurements
The second step aimed at characterizing the mechanical behaviour of
the end supports of the strings. A parameter suited for this purpose
is the driving point admittance [5, 7, 10 - 15] The real part of
mechanical admittance, the conductance, characterizes to which extent
a structure is capable of accepting active power.
For the guitar, the driving force is the force which the string exerts
on the end supports. Depending on the plucking conditions, the trans-
verse vibrations of the string are polarized resulting in two compo-
nents of the force, one parallel and one perpendicular to the body-
9
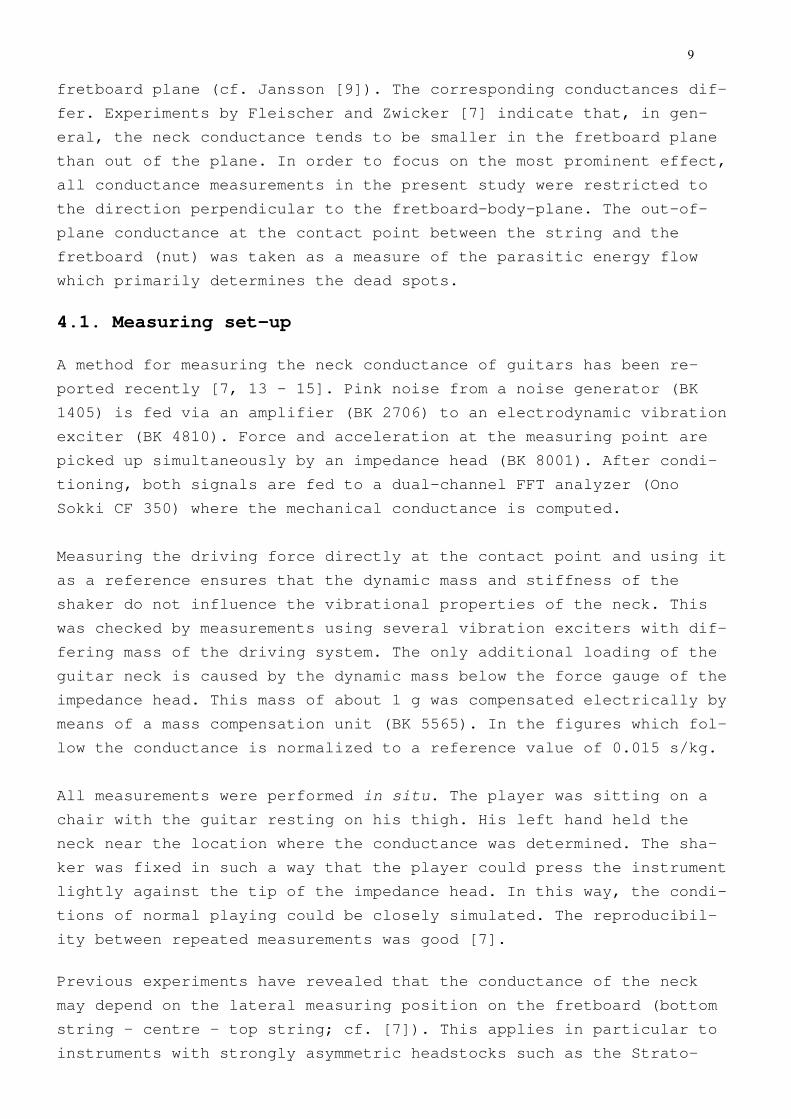
fretboard plane (cf. Jansson [9]). The corresponding conductances dif-
fer. Experiments by Fleischer and Zwicker [7] indicate that, in gen-
eral, the neck conductance tends to be smaller in the fretboard plane
than out of the plane. In order to focus on the most prominent effect,
all conductance measurements in the present study were restricted to
the direction perpendicular to the fretboard-body-plane. The out-of-
plane conductance at the contact point between the string and the
fretboard (nut) was taken as a measure of the parasitic energy flow
which primarily determines the dead spots.
4.1. Measuring set-up
A method for measuring the neck conductance of guitars has been re-
ported recently [7, 13 - 15]. Pink noise from a noise generator (BK
1405) is fed via an amplifier (BK 2706) to an electrodynamic vibration
exciter (BK 4810). Force and acceleration at the measuring point are
picked up simultaneously by an impedance head (BK 8001). After condi-
tioning, both signals are fed to a dual-channel FFT analyzer (Ono
Sokki CF 350) where the mechanical conductance is computed.
Measuring the driving force directly at the contact point and using it
as a reference ensures that the dynamic mass and stiffness of the
shaker do not influence the vibrational properties of the neck. This
was checked by measurements using several vibration exciters with dif-
fering mass of the driving system. The only additional loading of the
guitar neck is caused by the dynamic mass below the force gauge of the
impedance head. This mass of about 1 g was compensated electrically by
means of a mass compensation unit (BK 5565). In the figures which fol-
low the conductance is normalized to a reference value of 0.015 s/kg.
All measurements were performed in situ. The player was sitting on a
chair with the guitar resting on his thigh. His left hand held the
neck near the location where the conductance was determined. The sha-
ker was fixed in such a way that the player could press the instrument
lightly against the tip of the impedance head. In this way, the condi-
tions of normal playing could be closely simulated. The reproducibil-
ity between repeated measurements was good [7].
Previous experiments have revealed that the conductance of the neck
may depend on the lateral measuring position on the fretboard (bottom
string - centre - top string; cf. [7]). This applies in particular to
instruments with strongly asymmetric headstocks such as the Strato-
10
caster or Explorer guitars. In contrast, the conductance is largely
independent of the lateral location for essentially symmetric instru-
ments such as the Les Paul guitar. For the sake of simplicity, only
results which refer to measurements at the mid-points of the nut and
the bridge, and along the centre line of the fretboard will be pre-
sented in the following. Consequently, only dead spots on the mid-
strings D and G will be discussed.
4.2. Nut and bridge conductances
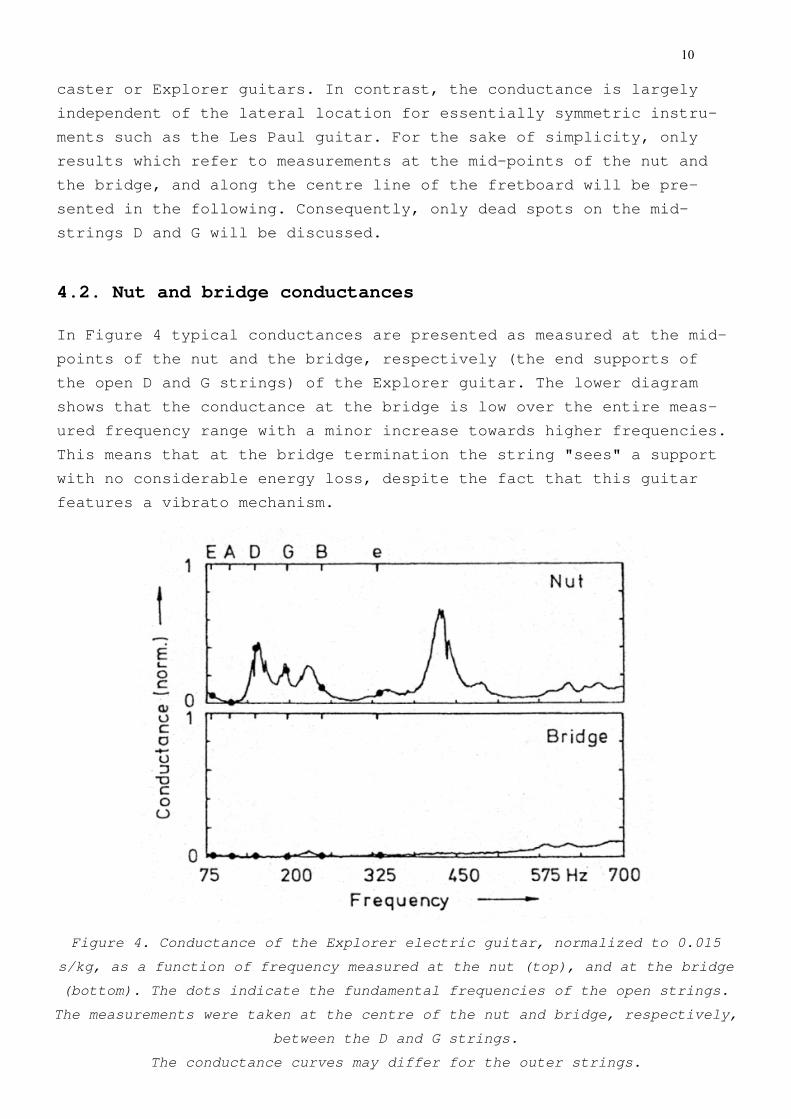
In Figure 4 typical conductances are presented as measured at the mid-
points of the nut and the bridge, respectively (the end supports of
the open D and G strings) of the Explorer guitar. The lower diagram
shows that the conductance at the bridge is low over the entire meas-
ured frequency range with a minor increase towards higher frequencies.
This means that at the bridge termination the string "sees" a support
with no considerable energy loss, despite the fact that this guitar
features a vibrato mechanism.
Figure 4. Conductance of the Explorer electric guitar, normalized to 0.015
s/kg, as a function of frequency measured at the nut (top), and at the bridge
(bottom). The dots indicate the fundamental frequencies of the open strings.
The measurements were taken at the centre of the nut and bridge, respectively,
between the D and G strings.
The conductance curves may differ for the outer strings.
11
For the open string, the other termination is defined by the nut. The
upper diagram in Figure 4 shows sharply pronounced peaks in the con-
ductance at the nut in the low and mid frequency range. In certain
frequency bands the conductance at the nut exceeds that at the bridge
considerably. Obviously, the strings of the electric guitar tend to
lose less energy via the bridge termination than via the nut.
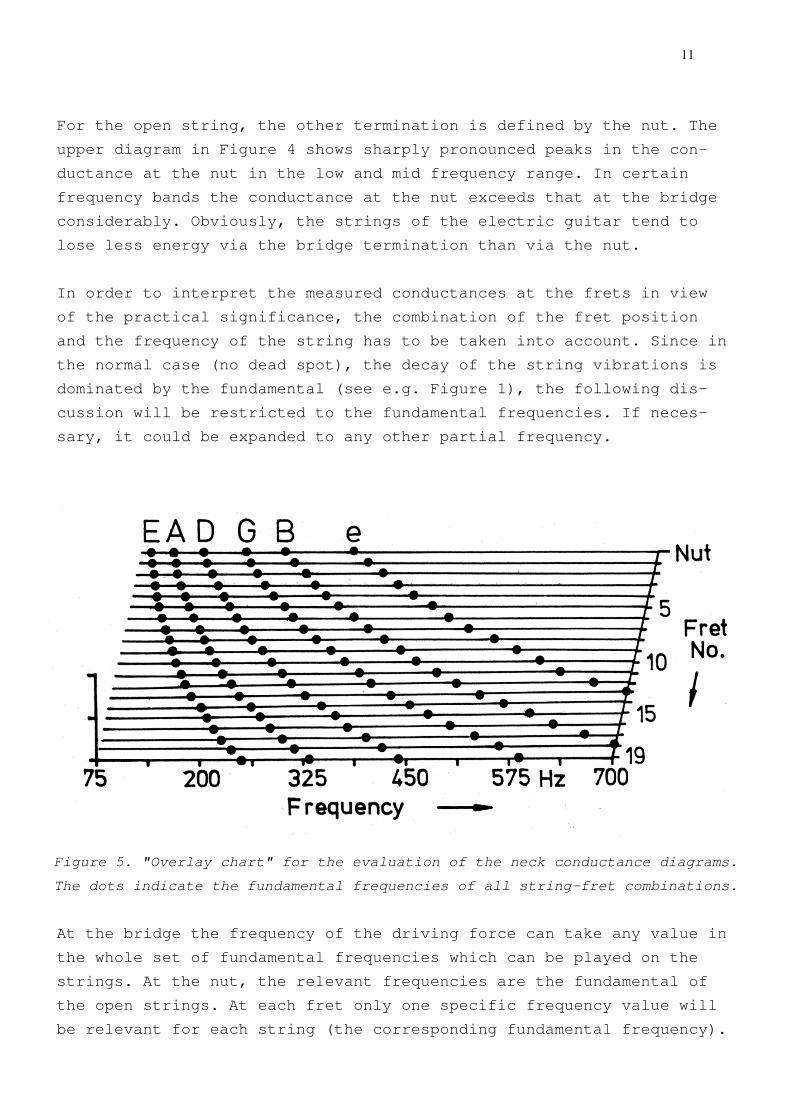
In order to interpret the measured conductances at the frets in view
of the practical significance, the combination of the fret position
and the frequency of the string has to be taken into account. Since in
the normal case (no dead spot), the decay of the string vibrations is
dominated by the fundamental (see e.g. Figure 1), the following dis-
cussion will be restricted to the fundamental frequencies. If neces-
sary, it could be expanded to any other partial frequency.
Figure 5. "Overlay chart" for the evaluation of the neck conductance diagrams.
The dots indicate the fundamental frequencies of all string-fret combinations.
At the bridge the frequency of the driving force can take any value in
the whole set of fundamental frequencies which can be played on the
strings. At the nut, the relevant frequencies are the fundamental of
the open strings. At each fret only one specific frequency value will
be relevant for each string (the corresponding fundamental frequency).
12
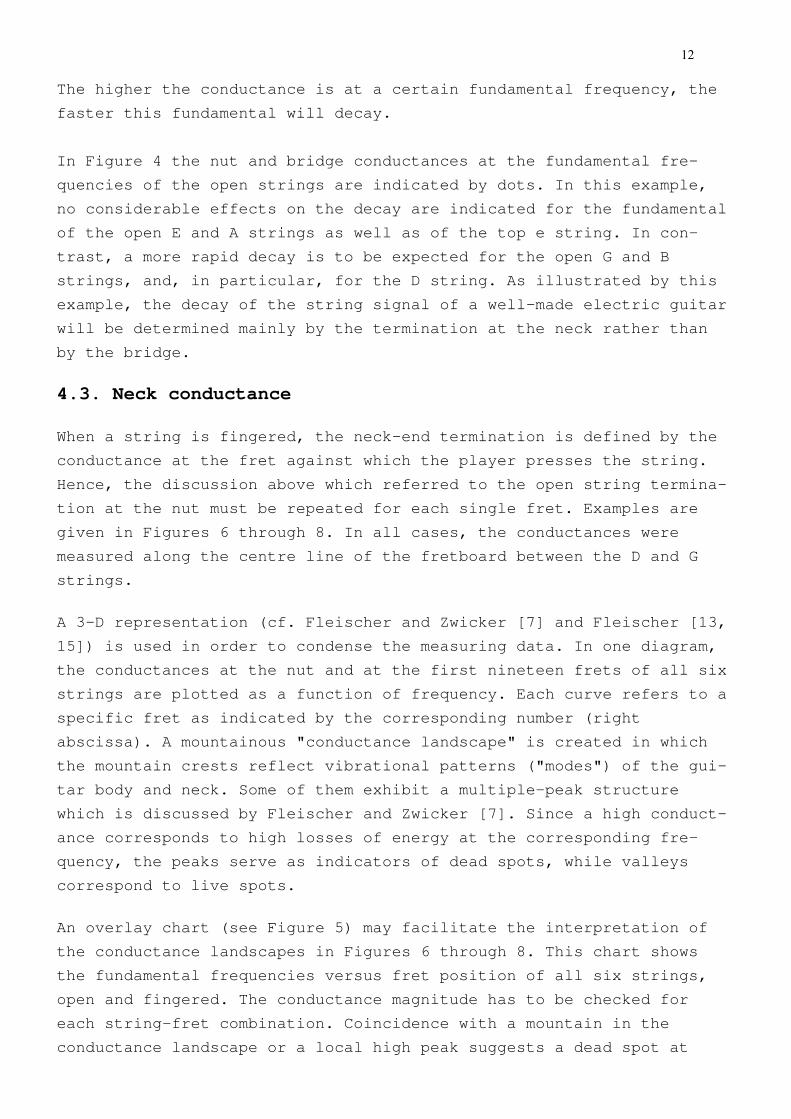
The higher the conductance is at a certain fundamental frequency, the
faster this fundamental will decay.
In Figure 4 the nut and bridge conductances at the fundamental fre-
quencies of the open strings are indicated by dots. In this example,
no considerable effects on the decay are indicated for the fundamental
of the open E and A strings as well as of the top e string. In con-
trast, a more rapid decay is to be expected for the open G and B
strings, and, in particular, for the D string. As illustrated by this
example, the decay of the string signal of a well-made electric guitar
will be determined mainly by the termination at the neck rather than
by the bridge.
4.3. Neck conductance
When a string is fingered, the neck-end termination is defined by the
conductance at the fret against which the player presses the string.
Hence, the discussion above which referred to the open string termina-
tion at the nut must be repeated for each single fret. Examples are
given in Figures 6 through 8. In all cases, the conductances were
measured along the centre line of the fretboard between the D and G
strings.
A 3-D representation (cf. Fleischer and Zwicker [7] and Fleischer [13,
15]) is used in order to condense the measuring data. In one diagram,
the conductances at the nut and at the first nineteen frets of all six
strings are plotted as a function of frequency. Each curve refers to a
specific fret as indicated by the corresponding number (right
abscissa). A mountainous "conductance landscape" is created in which
the mountain crests reflect vibrational patterns ("modes") of the gui-
tar body and neck. Some of them exhibit a multiple-peak structure
which is discussed by Fleischer and Zwicker [7]. Since a high conduct-
ance corresponds to high losses of energy at the corresponding fre-
quency, the peaks serve as indicators of dead spots, while valleys
correspond to live spots.
An overlay chart (see Figure 5) may facilitate the interpretation of
the conductance landscapes in Figures 6 through 8. This chart shows
the fundamental frequencies versus fret position of all six strings,
open and fingered. The conductance magnitude has to be checked for
each string-fret combination. Coincidence with a mountain in the
conductance landscape or a local high peak suggests a dead spot at
13
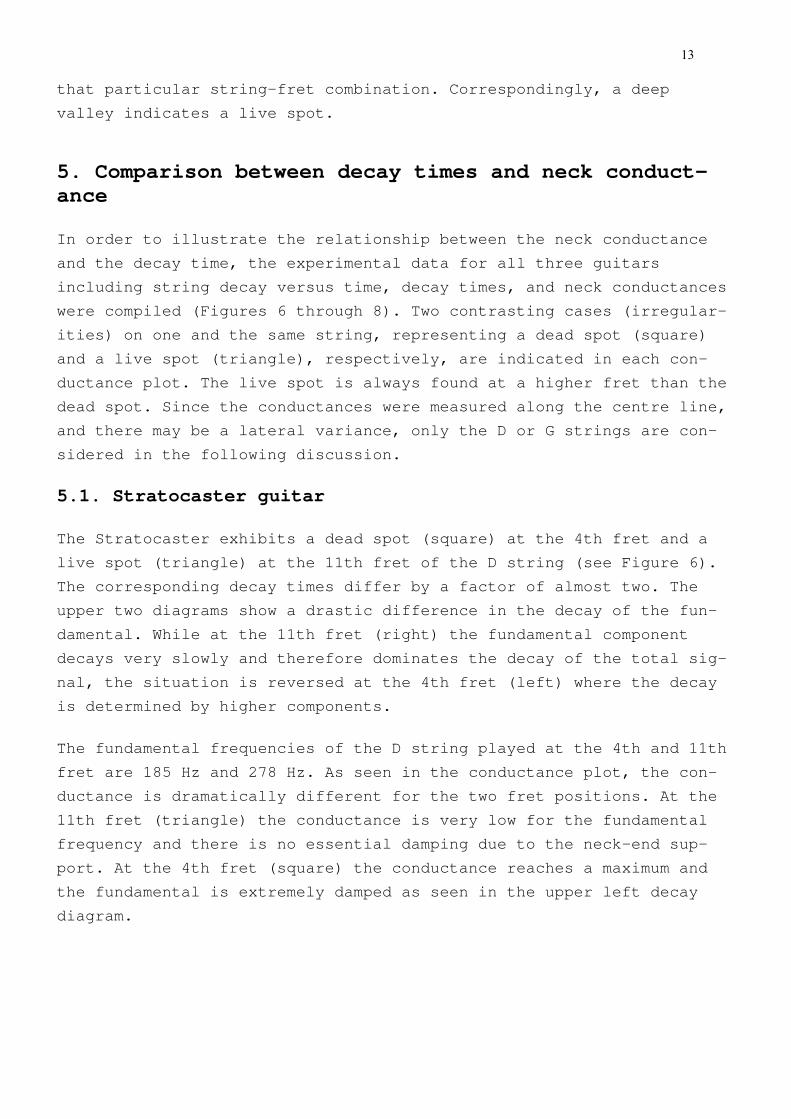
that particular string-fret combination. Correspondingly, a deep
valley indicates a live spot.
5. Comparison between decay times and neck conduct-
ance
In order to illustrate the relationship between the neck conductance
and the decay time, the experimental data for all three guitars
including string decay versus time, decay times, and neck conductances
were compiled (Figures 6 through 8). Two contrasting cases (irregular-
ities) on one and the same string, representing a dead spot (square)
and a live spot (triangle), respectively, are indicated in each con-
ductance plot. The live spot is always found at a higher fret than the
dead spot. Since the conductances were measured along the centre line,
and there may be a lateral variance, only the D or G strings are con-
sidered in the following discussion.
5.1. Stratocaster guitar
The Stratocaster exhibits a dead spot (square) at the 4th fret and a
live spot (triangle) at the 11th fret of the D string (see Figure 6).
The corresponding decay times differ by a factor of almost two. The
upper two diagrams show a drastic difference in the decay of the fun-
damental. While at the 11th fret (right) the fundamental component
decays very slowly and therefore dominates the decay of the total sig-
nal, the situation is reversed at the 4th fret (left) where the decay
is determined by higher components.
The fundamental frequencies of the D string played at the 4th and 11th
fret are 185 Hz and 278 Hz. As seen in the conductance plot, the con-
ductance is dramatically different for the two fret positions. At the
11th fret (triangle) the conductance is very low for the fundamental
frequency and there is no essential damping due to the neck-end sup-
port. At the 4th fret (square) the conductance reaches a maximum and
the fundamental is extremely damped as seen in the upper left decay
diagram.
14
Figure 6. Stratocaster electric guitar.
3D-diagrams at the top: Signals of the D string at the 4th fret (dead spot, left)
and at the 11th fret (live spot; right).
Bottom: Decay time T30 of the D string (left)
and normalized neck conductance (right).
The square indicates a dead spot and the triangle a live spot.
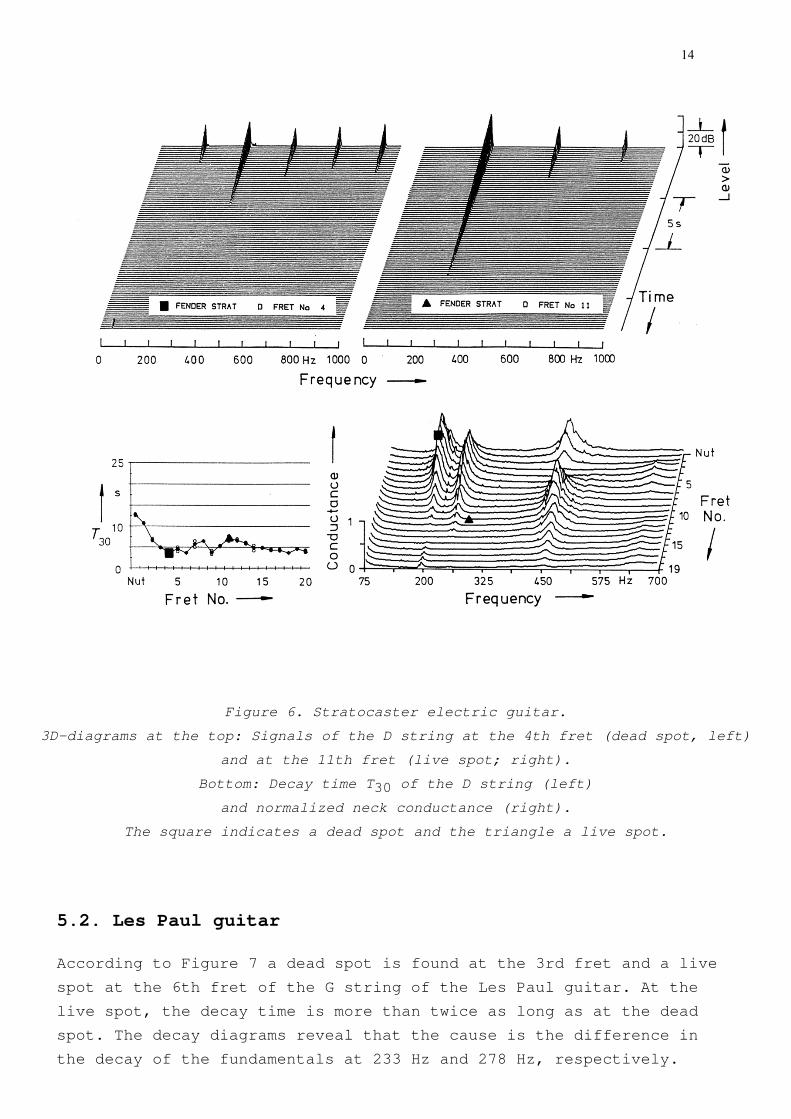
5.2. Les Paul guitar
According to Figure 7 a dead spot is found at the 3rd fret and a live
spot at the 6th fret of the G string of the Les Paul guitar. At the
live spot, the decay time is more than twice as long as at the dead
spot. The decay diagrams reveal that the cause is the difference in
the decay of the fundamentals at 233 Hz and 278 Hz, respectively.
15
The square in the conductance diagram at the 3rd fret indicates a very
high conductance value, which promotes the decay of the fundamental.
The second partial at 466 Hz also decays relatively fast. This is
caused by a peak of the second mountain at approximately the corre-
sponding frequency. In contrast, the triangle attests a very low con-
ductance at the 6th fret of the G string, indicating a live spot.
Figure 7. Les Paul electric guitar.
3D-diagrams at the top: Signals of the G string at the 3rd fret (dead spot,
left) and at the 6th fret (live spot; right).
Bottom: Decay rate T30 of the G string (left)
and normalized neck conductance (right).
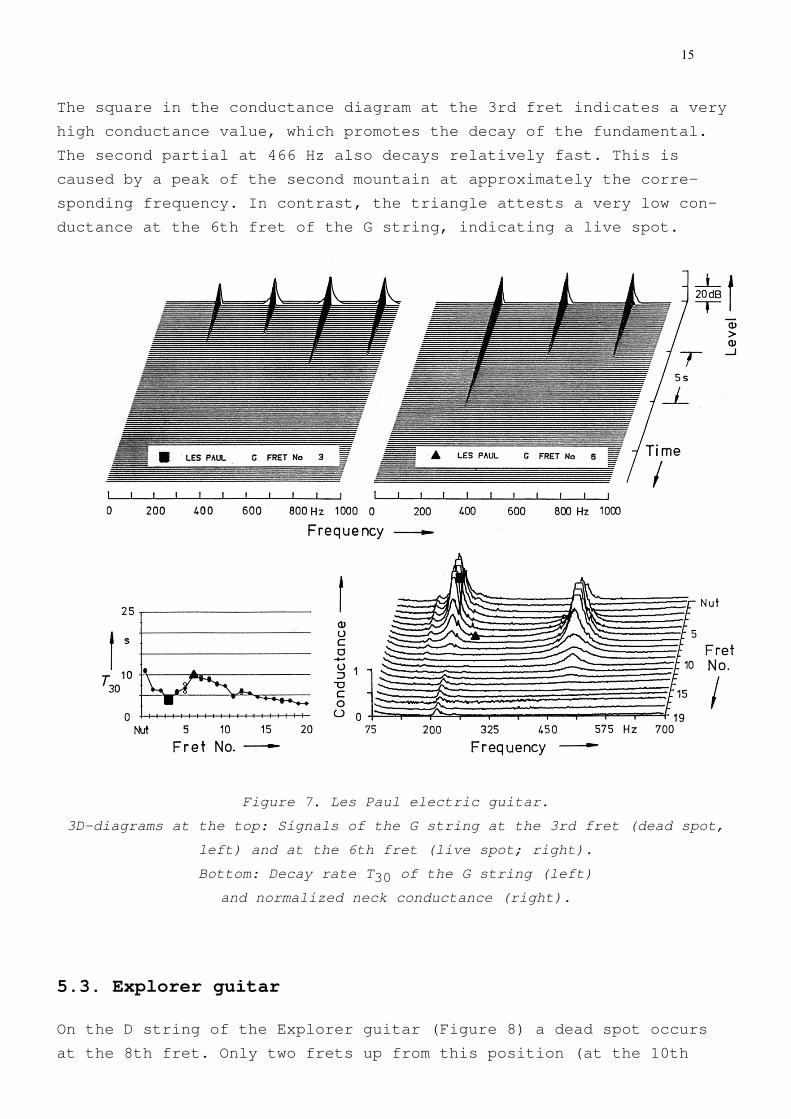
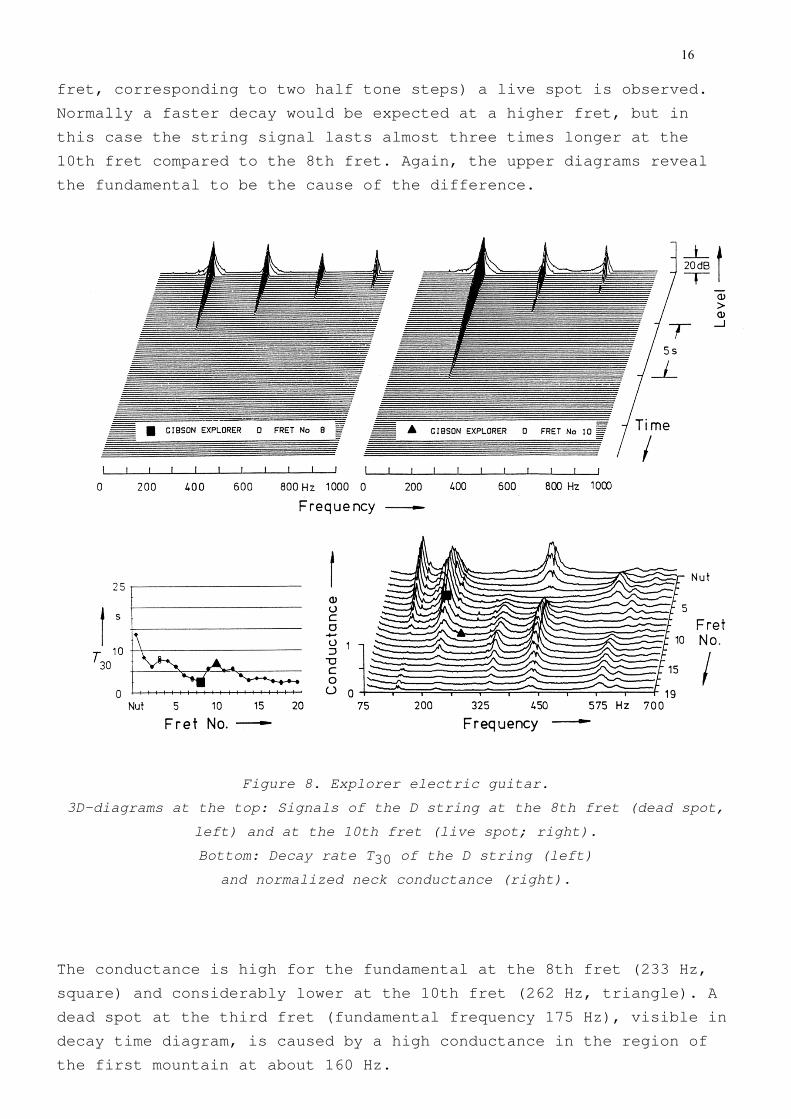
5.3. Explorer guitar
On the D string of the Explorer guitar (Figure 8) a dead spot occurs
at the 8th fret. Only two frets up from this position (at the 10th
16
fret, corresponding to two half tone steps) a live spot is observed.
Normally a faster decay would be expected at a higher fret, but in
this case the string signal lasts almost three times longer at the
10th fret compared to the 8th fret. Again, the upper diagrams reveal
the fundamental to be the cause of the difference.
Figure 8. Explorer electric guitar.
3D-diagrams at the top: Signals of the D string at the 8th fret (dead spot,
left) and at the 10th fret (live spot; right).
Bottom: Decay rate T30 of the D string (left)
and normalized neck conductance (right).
The conductance is high for the fundamental at the 8th fret (233 Hz,
square) and considerably lower at the 10th fret (262 Hz, triangle). A
dead spot at the third fret (fundamental frequency 175 Hz), visible in
decay time diagram, is caused by a high conductance in the region of
the first mountain at about 160 Hz.
17
6. Conclusions
The aims of the present study were to find the origin of dead spots,
to develop a diagnostic tool, and to investigate its applicability.
Dead spots are caused by the fact that the instrument body is flexible
and may be excited to considerable vibrations with the consequence
that the string vibration is additionally damped. The real part of the
mechanical admittance, the conductance, determines the rate at which
energy flows irreversibly from the string into the neck and body via
the string supports. For this reason the conductance is a suitable
indicator of the frequency-selective damping behaviour of the end sup-
ports.
In contrast to the acoustic guitar, the conductance at the bridge is
very low for a well-made electric guitar, and the decay of the string
vibrations is determined mainly by the neck-end support. The conduct-
ance should therefore be measured at the nut and at the frets. Earlier
investigations [7] have suggested that the neck of the electric guitar
is more mobile out of the fretboard-body plane than in the plane. Con-
sequently, to describe the main effect, the conductance was measured
perpendicular to the fretboard.
An in-situ measuring set-up was used which allowed for positioning the
guitar in contact with the body and the hand of the player. In this
way, "natural" boundary conditions were achieved, comparable to those
in actual playing.
The conductance was measured at the centre line of the fretboard and
is therefore relevant for the D and G strings. As the conductance may
depend on the lateral measuring position [7], it may be necessary to
make several conductance measurements at each fret position, in the
extreme case as many as one at each string position, in order to char-
acterize a guitar completely.
Measurements of the decay time ("sustain") were made, using the output
of the neck pick-up. As the fundamental normally dominates the decay
of the signal, when using this pick-up, a dead spot can be identified
as an abnormally fast decay of the fundamental. For all three guitars
investigated, a close inverse relation between the decay time T30 and
18
the height in the "conductance landscape" at the corresponding string-
fret combination was evident.
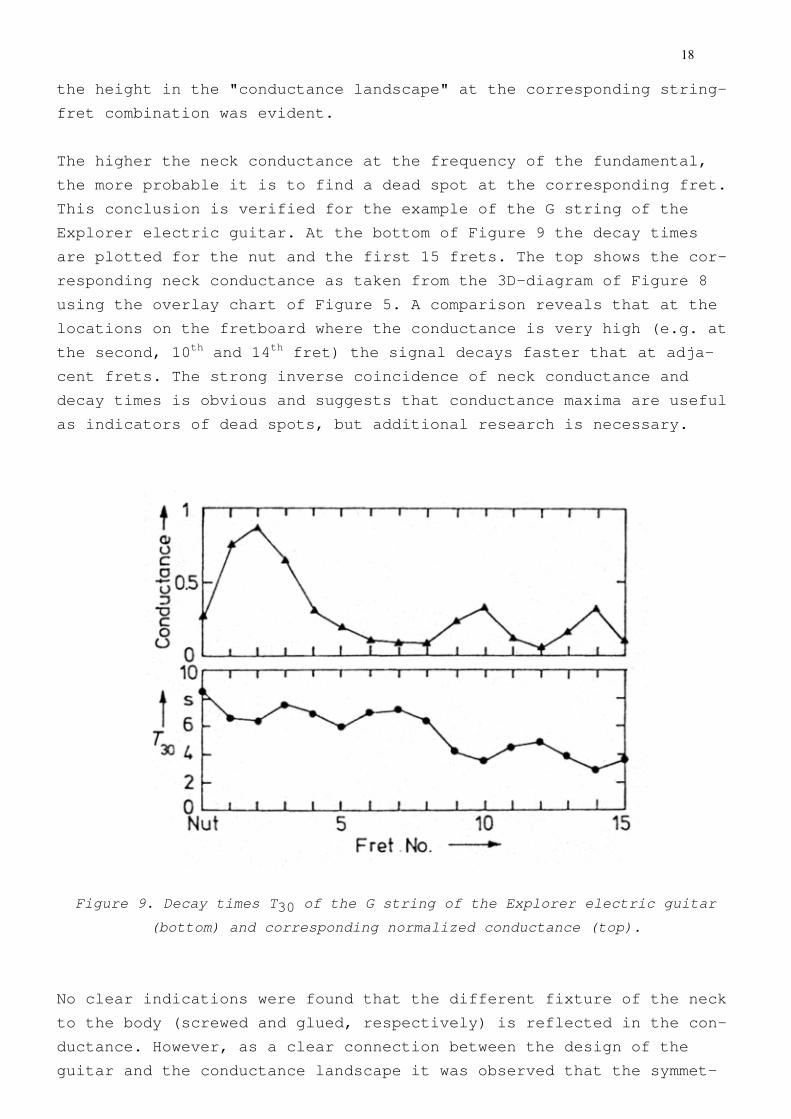
The higher the neck conductance at the frequency of the fundamental,
the more probable it is to find a dead spot at the corresponding fret.
This conclusion is verified for the example of the G string of the
Explorer electric guitar. At the bottom of Figure 9 the decay times
are plotted for the nut and the first 15 frets. The top shows the cor-
responding neck conductance as taken from the 3D-diagram of Figure 8
using the overlay chart of Figure 5. A comparison reveals that at the
locations on the fretboard where the conductance is very high (e.g. at
the second, 10th and 14th fret) the signal decays faster that at adja-
cent frets. The strong inverse coincidence of neck conductance and
decay times is obvious and suggests that conductance maxima are useful
as indicators of dead spots, but additional research is necessary.
Figure 9. Decay times T30 of the G string of the Explorer electric guitar
(bottom) and corresponding normalized conductance (top).
No clear indications were found that the different fixture of the neck
to the body (screwed and glued, respectively) is reflected in the con-
ductance. However, as a clear connection between the design of the
guitar and the conductance landscape it was observed that the symmet-
19
ric headstock of the Les Paul guitar results in only one mountain in
the 200 Hz region while the asymmetric headstock of the Stratocaster
and Explorer guitars result in two. As shown in [7], the asymmetry
causes splitting of the corresponding bending vibrational shape due to
superimposed torsional motion as well as shifting of the frequencies.
The conductance mountain of the Les Paul guitar influences primarily
the lower frets of the G string (cf. Figure 7). The additional low-
frequency mountain of the Explorer guitar indicates further dead spots
at the low frets of the D string are (cf. Figure 8).
The results suggest that it is not necessary to suppress the vibra-
tions of the neck per se in order to avoid dead spots. Rather, the
neck vibrations need to be tuned in such a way that the conductance
does not exceed a certain level at the fundamental frequencies of the
scale tones which correspond to the fret positions. Using the land-
scape representation, this means that conductance mountains may exist
as long as the fundamental frequencies do not coincide with high
peaks, but stay in valleys or plains of the conductance relief.
In conclusion, the out-of-plane conductance as measured in situ at the
neck of an electric guitar can be simply determined. Such a measure-
ment yields condensed information about the amount of damping at the
neck-end support where the main part of the losses occur. The neck
conductance promises to be a key parameter for assessing the quality
of electric plucked instruments since it can be used as a tool for
predicting (and avoiding) dead spots.
20
References
[1] Fletcher, N. H. and Rossing, T. D.
The physics of musical instruments
Especially Chapter 9: Guitars and lutes
Springer
New York
1991
[2] Gough, C. E.
The theory of string resonances on musical instruments
Acustica
49
1981
124-141
[3] Heise, U.
Untersuchungen zur Ursache von Dead Spots an Baßgitarren
Das Musikinstrument
42
Volume 6/7
1993
112-115
[4] Wogram, K.
Schwingungsuntersuchungen an Musikinstrumenten
In: Fortschritte der Akustik (DAGA '94)
DPG-GmbH
Bad Honnef
1994
53-64
[5] Fleischer, H. and Zwicker, T.
Admittanzmessungen an Elektrobässen
In: Fortschritte der Akustik (DAGA '97)
DEGA
Oldenburg
1997
301-302
[6] Ziegenhals, G.
Zum mechanisch-akustischen Verhalten von Halbresonanz-Elektrogitarren
In: Fortschritte der Akustik (DAGA '97)
DEGA
Oldenburg
1997
309-310
[7] Fleischer, H. and Zwicker, T.
Mechanical vibrations of electric guitars
ACUSTICA-acta acustica, Vol. 84 (1998), 758-765.
1998
21
[8] Zwicker, E. and Fastl, H.
Psychoacoustics. Facts and Models
Springer
Berlin
1990
[9] Jansson, E. V.
Acoustics for the guitar player; acoustics for the guitar maker
In: Function, construction and quality of the guitar
Editor: E. V. Jansson
Publication of the Royal Swedish Academy of Music
No. 38
Stockholm
1983
[10] Jansson, E. and Meinel, E.
Zum Einfluß des Halses auf Schwingungen des Gitarrenkorpus
Das Musikinstrument
41
Vol. 8
1992
48-52
[11] Pfaffelhuber, K.
Das dynamische Verhalten der Geige an der Anstreichstelle und sein Einfluß
auf das Klangsignal
Doctoral Thesis
TU München
München
1993
[12] Jansson, E. V.
Admittance measurements of 25 high quality violins
Acustica - acta acustica
83
1997
337-341
[13] Fleischer, H.
Admittanzmessungen an akustischen Gitarren
Forschungs- und Seminarberichte aus dem Gebiet Technische Mechanik und
Flächentragwerke
01/97
Editors: F. A. Emmerling and A. H. Heinen
UniBw München
Neubiberg
1997
[14] Fleischer, H.
Schwingungen akustischer Gitarren
Beiträge zur Vibro- und Psychoakustik

22
1/98
Editors: H. Fleischer and H. Fastl
UniBw München
Neubiberg
1998
[15] Fleischer, H.
In-situ-Messungen der Schwingungen von E-Gitarren
In: Fortschritte der Akustik (DAGA '98)
DEGA
Oldenburg
1998
300 - 301