
Lehmannaudio Linear /Linear USB headphone amplifier manual - 5 languages
Upload
truongcongCategory
view
217download
1
Investigation and Optimisation of the
Presster – A Linear Compaction
Simulator for Rotary Tablet Presses
DISSERTATION
ZUR ERLANGUNG DES DOKTORGRADES (DR. RER. NAT.)
DER MATHEMATISCH-NATURWISSENSCHAFTLICHEN FAKULTÄT
DER RHEINISCHEN FRIEDRICH-WILHELMS-UNIVERSITÄT BONN
VORGELEGT VON
THORSTEN NEUHAUS
AUS OCHSENHAUSEN
BONN 2007

DIE DISSERTATION WURDE ANGEFERTIGT MIT GENEHMIGUNG
DER MATHEMATISCH-NATURWISSENSCHAFTLICHEN FAKULTÄT
DER RHEINISCHEN FRIEDRICH-WILHELMS-UNIVERSITÄT BONN
DIESE DISSERTATION IST AUF DEM
HOCHSCHULSCHRIFTENSERVER DER ULB BONN
http://hss.ulb.uni-bonn.de/diss_online
ELEKTRONISCH PUBLIZIERT
ERSCHEINUNGSJAHR 2007
1. REFERENT: PROF. DR. K.-J. STEFFENS
2. REFERENT: PD. DR. K. G. WAGNER
EINGEREICHT AM: 16. MAI 2007
TAG DER PROMOTION: 02. JULI 2007


PUBLICATIONS FROM PHD-THESIS
The following contributions, being abstracts from this work, have been
published previously by permission of the Faculty of Mathematics and
Natural Sciences, represented by the mentor of this work:
Neuhaus T.
The Presster – A Rotary Tablet Press Simulator for Handling Small Amounts
of Powder at High Densification Speeds: Technical Performance Aspects.
From Powder to Tablet – Recent Developments in Solid Dosage Forms
Manufacturing. Schloss Meeting – October 7-8, 2004 – Bonn – Germany
Neuhaus T., Lammens R.F., Steffens K.-J.
Validation and Qualification, Including Dynamic Force Calibration, of the
Linear Compaction Simulator Presster and its Applicability in Research and
Development. AAPS – American Association of Pharmaceutical Scientists –
Annual Meeting and Exposition – November 7-11, 2004 – Baltimore – USA
Neuhaus T., Lammens R.F., Kohlrausch A., Schreder S., Steffens K.-J.
Improvement of a Linear Compaction Simulator for Rotary Tablet Presses to
Obtain an Easy to Use and Powerful Tool for Research and Development
Purposes. 5th World Meeting on Pharmaceutics, Biopharmaceutics and
Pharmaceutical Technology – March 27-30, 2006 – Geneva – Switzerland
Neuhaus T.
Wegmessung auf Tablettenpressen
APV basics – Praktikum Tablettieren – October 4-5, 2006 – Bonn – Germany


Die vorliegende Arbeit entstand unter der Leitung von
Herrn Prof. Dr. Klaus-Jürgen Steffens
am Institut für Pharmazeutische Technologie der
Rheinischen Friedrich-Wilhelms-Universität Bonn
Meinem Doktorvater, Herrn Prof. Dr. K.-J. Steffens, danke ich für die
freundliche Aufnahme in seinen Arbeitskreis und die Vergabe dieses
interessanten, vielschichtigen Themas. Insbesondere das mir
entgegengebrachte Vertrauen, die stete Unterstützung, die mir gewährten
Freiräume sowie die hervorragenden Arbeitsbedingungen wusste ich sehr zu
schätzen.
Herrn PD Dr. K. G. Wagner danke ich für fruchtbare Diskussionen während
der Endphase dieser Arbeit, deren kritische Durchsicht sowie für die
freundliche Übernahme des Koreferats.
Herrn Prof. Dr. G. Bendas und Herrn Prof. Dr.-Ing. B. Kunz danke ich für Ihre
freundliche Bereitschaft der Prüfungskommission beizuwohnen.
Herrn Dr. R. F. Lammens gilt besonderer Dank für die zahlreichen
produktiven Gespräche, Anregungen und Diskussionen, die wesentlich zum
Gelingen dieser Arbeit beigetragen haben.
Herrn Prof. Dr. R. Süverkrüp sowie Herrn PD Dr. H. Rein danke ich für Ihre
stete Hilfs- und Diskussionsbereitschaft.
Besonderer Dank gilt der Fa. Boehringer Ingelheim Pharma GmbH & Co. KG
für die Bereitstellung des Presster sowie die Finanzierung dieser Arbeit.
Allen Kollegen, insbesondere Frau Dr. A. Kohlrausch, möchte ich an dieser
Stelle für Ihre Unterstützung danken.

Frau Dr. D. Stauch-Steffens danke ich für Ihre stete Unterstützung und
Hilfsbereitschaft in allen Phasen dieser Arbeit.
Herrn Dr. M. Hucke sei für die stetige Weiterentwicklung der DAQ4-Software
sowie zahlreiche fruchtbare Diskussionen gedankt.
Scott und Martina Robertson danke ich für die Durchsicht der Arbeit und
Ihre wertvollen Anmerkungen.
Herrn Backhausen und seinen Mitarbeitern vom Institut für Physikalische
Chemie der Universität Bonn möchte ich für die zeitnahe und präzise
Anfertigung zahlreicher Bauteile danken.
Dank gilt auch der Firma Pass Stanztechnik für die hochpräzise Anfertigung
einzelner Bauteile.
Den Firmen Bärlocher GmbH, Meggle GmbH, J. Rettenmaier GmbH,
Roquette GmbH danke ich für die großzügige Bereitstellung der in dieser
Arbeit verwendeten Materialien.
Dank gilt Herrn G. Feldkeller, Herrn J. Hohmann, Frau K. Piskorz sowie Frau
M. Simpson für deren unablässige technische Unterstützung, Unterweisung
in analytische Geräte sowie ihre stete Diskussions- und Hilfsbereitschaft.
Besonders möchte ich mich bei allen Kollegen, insbesondere meinen
Bürokolleginnen Barbara Fretter und Dr. Sandra Zimontkowski, sowie
meinen Kollegen aus der Feststoffabteilung Dr. Till Jahn, Dr. Heiko Busies
und Jan-Nicklas Francke für die vielen interessanten fachlichen und
persönlichen Gespräche bedanken, die zu immer neuen Anregungen führten.
Der größte Dank gilt meinen Eltern und meiner Schwester für Ihre
unerschöpfliche Unterstützung und Zuversicht in jeder Lebenslage sowie den
Freiraum, den sie mir zur Entwicklung eigener Entscheidungen und eines
eigenen Lebenswegs gewährten.

Meinen Eltern und meiner Schwester gewidmet
Das Schönste, was wir entdecken können, ist das Geheimnisvolle.
(Albert Einstein)

Contents
Contents
1 Introduction and Objectives .............................. 1
2 Theoretical Aspects and Analysis of
Powder Compaction Behaviour.......................... 5
2.1 Compactibility .............................................................. 5
2.2 Tensile Strength ........................................................... 6
2.3 Compressibility ............................................................ 7
2.4 Compaction Pressure vs. In-Die-Tablet-Height Plot ...... 8
2.5 Porosity ........................................................................ 9
2.6 Heckel-Plot................................................................. 10
2.7 Dwell Time ................................................................. 12
3 The Presster –
A Linear Compaction Simulator....................... 14
4 Results and Discussion ................................... 18
4.1 Data Acquisition System............................................. 19
4.1.1 Original Presster Data Acquisition System.................................. 19
4.1.2 Presster-Independent Data Acquisition System DAQ4................. 22
4.1.3 Summary .................................................................................. 26
Contents
4.2 Compaction Force Measurement Systems...................27
4.2.1 Techniques for Force Measurements.......................................... 27
4.2.2 Investigation of the Original Presster Pre- and Main
Compaction Force Measurement Systems.................................. 29
4.2.3 Dynamic Calibration of the Original Pre- and Main
Compaction Force Measurement Systems.................................. 32
4.2.4 Compactibility Studies Simulating a Fette P1200
Rotary Tablet Press................................................................... 34
4.2.5 Summary.................................................................................. 38
4.3 Ejection Force Measurement System ..........................40
4.3.1 Investigation of the Original Presster Ejection Force
Measurement System................................................................ 43
4.3.2 Modification of the Ejection Force Measurement System ............ 46
4.3.3 Calibration of the Modified Ejection Force
Measurement System................................................................ 47
4.3.4 Evaluation of Measurements Performed by the Modified
Ejection Force Measurement System ......................................... 49
4.3.5 Summary.................................................................................. 63
4.4 Take-Off Force Measurement System..........................65
4.4.1 Different Techniques for Take-Off Force Measurements .............. 66
4.4.2 Investigation of the Original Presster Take-Off Force
Measurement System................................................................ 67
4.4.3 Modification of the Take-Off Force Measurement System............ 69
4.4.4 Calibration of the Modified Take-Off Force
Measurement System................................................................ 71
4.4.5 Evaluation of Measurements Performed by the Modified
Take-Off Force Measurement System......................................... 73
4.4.6 Summary.................................................................................. 81
Contents
4.5 Punch Displacement Measurement System ................ 83
4.5.1 Technologies for Punch Displacement Measurements................. 84
4.5.2 Correction for Deformation of Machine Parts and Punches ......... 85
4.5.3 Correction for Punch Tilting ....................................................... 90
4.5.4 Investigation of the Original Presster Punch
Displacement Measurement System .......................................... 93
4.5.5 Modification of the Punch Displacement
Measurement System ................................................................ 96
4.5.6 Calibration of the Modified Punch Displacement
Measurement System .............................................................. 100
4.5.7 Evaluation of Measurements Performed by the
Modified Punch Displacement Measurement System................ 103
4.5.7.1 Punch Tilting........................................................................... 103
4.5.7.2 Compaction Pressure vs. In-Die Tablet Height Plot ................... 109
4.5.7.3 Heckel-Plot.............................................................................. 111
4.5.8 Summary ................................................................................ 119
4.6 Speed of the Turret and Resulting Dwell Time.......... 121
4.6.1 Summary ................................................................................ 123
4.7 General Aspects ....................................................... 124
4.7.1 Vertical Adjustment of Compaction Rollers............................... 124
4.7.2 Vertical Punch Movements Unrelated to
Any Compaction Event............................................................. 126
4.7.3 Lag Time Between Pre- and Main Compaction Station .............. 128
4.7.4 Die Feeding Process ................................................................ 129
4.7.5 Inertial Forces ......................................................................... 134
4.7.6 Tablet Handling After the Take-Off Event .................................. 138
4.7.7 Compaction Rollers ................................................................. 139
4.7.8 Sticking Punches..................................................................... 140
4.7.9 Press Chamber Lubrication...................................................... 141
Contents
4.7.10 Multilayer and Laminated Tablets............................................ 141
4.7.11 Special Aspects of the Presster................................................ 142
4.7.12 Summary................................................................................ 143
5 Summary and Conclusions .............................148
6 Materials and Methods...................................154
6.1 Presster....................................................................154
6.2 Fette P1200..............................................................154
6.3 Multicheck Turbo III..................................................155
6.4 Data Acquisition System DAQ4 .................................155
6.5 High Speed Imaging System .....................................155
6.6 DigiPunch .................................................................156
6.7 Pharmaceutical Excipients........................................157
6.7.1 Lactose................................................................................... 157
6.7.1.1 Flowlac 100 ............................................................................ 158
6.7.2 Dibasic calcium phosphate...................................................... 158
6.7.2.1 Di-Cafos.................................................................................. 158
6.7.2.2 Emcompress........................................................................... 159
6.7.3 Microcrystalline Cellulose ........................................................ 159
6.7.3.1 Vivapur 102 ............................................................................ 159
6.7.4 Pregelatinised Starch .............................................................. 159
6.7.4.1 Starch 1500............................................................................ 160
6.7.5 Sorbitol................................................................................... 161
Contents
6.7.5.1 Neosorb P60W ........................................................................ 161
6.7.6 Magnesium stearate ................................................................ 161
6.7.6.1 Magnesium stearate Pharma veg. ............................................ 162
6.8 Preparation of Tableting blends................................ 163
7 References.................................................... 164
8 Symbols and Abbreviations ........................... 175
9 Special Notes................................................ 177

Introduction and Objectives
1
1 Introduction and Objectives
More than 160 years ago, since the patent for `Shaping pills, lozenges, and
blacklead by pressure in a die` was granted to William Brockedon in 1843,
tablets started their evolution to become the most frequently used
pharmaceutical dosage form.
Both eccentric and rotary tablet presses had been developed by 1874
(Rubinstein, 1996). Nevertheless, it took almost a century before
Brake (1951) and Higuchi (1952, 1953 and 1954) described the
instrumentation of tablet presses using strain gauges.
This was the beginning of preliminary investigations of the physics of powder
compression. Instrumented tablet presses became the fundamental tool in
tablet research and development. Instrumentation of tablet presses has
been progressing since then.
A review of different techniques applicable to perform force measurements
on tablet presses was published by Erdem (1982).
More detailed information about the physics of powder compression have
been collected by additionally monitoring the vertical displacement of both
the upper and lower punch during the compression event using preferably
linear variable displacement transducers (LVDT´s) (Watt, 1988).
Instrumentation of modern single to triple sided rotary tablet presses,
realising a production capacity up to one and a half million tablets per hour,
often showed to be difficult and sometimes inaccurate (Bateman, 1987).
Anyhow, process data obtained from instrumented production scale rotary
tablet presses will always be necessary to control and adapt the
compression process. Therefore tablet press manufacturers try to
continuously optimise their machine instrumentation as well as the
machines in order to improve the precision and accuracy and thus to
minimise the quantity of waste produced.
Nevertheless, the predominant utilisation of rotary tablet presses is still in
the field of production. This is due to the rather large amount of powder
required for operation which is often not available in the very early stages of
Introduction and Objectives
2
a new formulation development.
For this reason new formulations are often developed using either small
scale rotary tablet presses or even eccentric presses in order to be able to
gather preliminary compaction data as early as possible.
Due to fundamental differences between eccentric and rotary tablet presses
as well as small scale and production size rotary tablet presses, results and
the subsequently developed formulations may not be easily transferable
from one machine to another (Palmieri, 2005).
Varying dwell time, magnitude and rate of applied forces, as they can be
found for different brands of machines of the same working principle, may
cause major differences in tablet properties as well.
Compaction simulators, requiring only small amounts of powder while
running at comparable working principles as rotary tablet presses are
therefore the most appropriate to gather compaction data during the early
stages of development.
A comparison of the compaction simulator with various other methods in the
field of pharmaceutical formulation development is shown by Tab. 1-1.
The first device for simulating the compression conditions of rotary tablet
presses was developed by Cole (1971). Two-sided powder compression was
realised on a testing device, which was similar in design to a single stroke
tablet press, by moving the die downwards during the compaction event to
simulate the upward movement of the lower punch. The whole compression
process was therefore somewhat closer to the machines to be simulated.
Mechanical testing machines, based on a rotating screw drive to compress
materials in a single punch and die set, have often been used for
fundamental investigations (Bateman, 1987), but due to their different
working principle, the data produced on this machines showed a similar lack
of transferability to rotary presses as known from eccentric tablet presses.
Introduction and Objectives
3
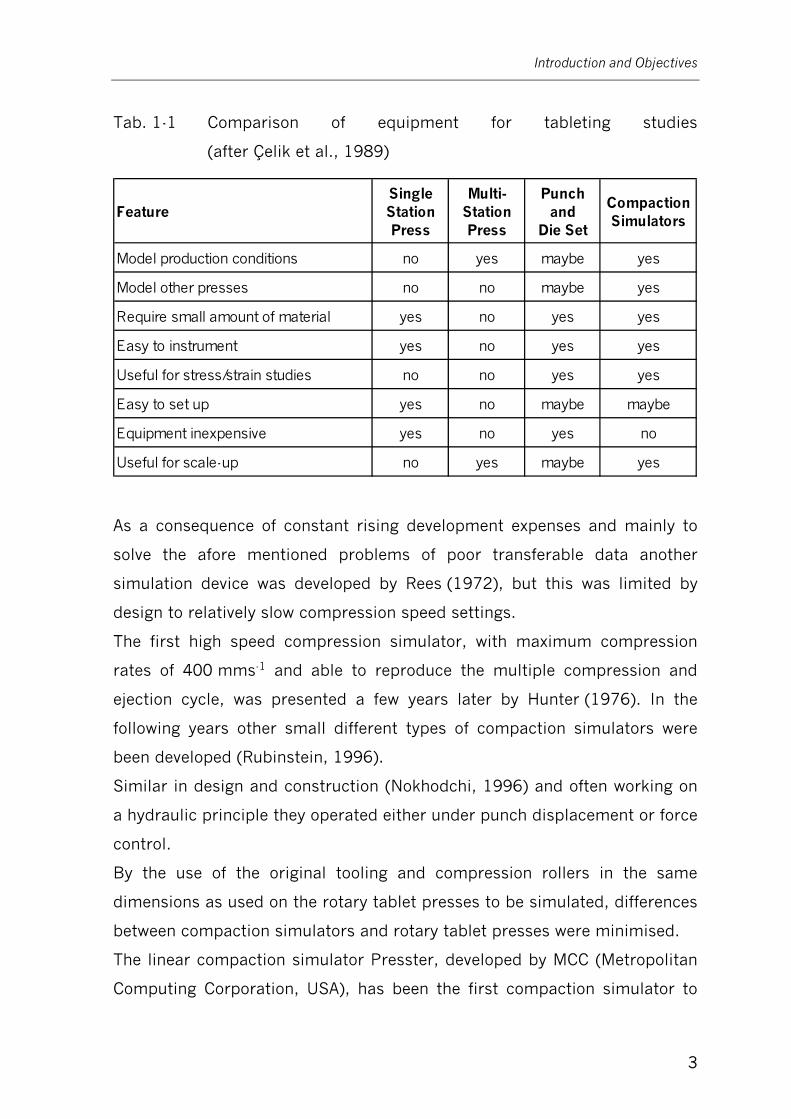
Tab. 1-1 Comparison of equipment for tableting studies
(after Çelik et al., 1989)
FeatureSingle Station Press
Multi-Station Press
Punch and
Die Set
Compaction Simulators
Model production conditions no yes maybe yes
Model other presses no no maybe yes
Require small amount of material yes no yes yes
Easy to instrument yes no yes yes
Useful for stress/strain studies no no yes yes
Easy to set up yes no maybe maybe
Equipment inexpensive yes no yes no
Useful for scale-up no yes maybe yes
As a consequence of constant rising development expenses and mainly to
solve the afore mentioned problems of poor transferable data another
simulation device was developed by Rees (1972), but this was limited by
design to relatively slow compression speed settings.
The first high speed compression simulator, with maximum compression
rates of 400 mms-1 and able to reproduce the multiple compression and
ejection cycle, was presented a few years later by Hunter (1976). In the
following years other small different types of compaction simulators were
been developed (Rubinstein, 1996).
Similar in design and construction (Nokhodchi, 1996) and often working on
a hydraulic principle they operated either under punch displacement or force
control.
By the use of the original tooling and compression rollers in the same
dimensions as used on the rotary tablet presses to be simulated, differences
between compaction simulators and rotary tablet presses were minimised.
The linear compaction simulator Presster, developed by MCC (Metropolitan
Computing Corporation, USA), has been the first compaction simulator to

Introduction and Objectives
4
mimic both, punch displacement and force application rate curve at the
same time (Levin, 2000).
With respect to the reliable application of the Presster within any
formulation development, the objectives of this work have been as follows:
Estimation of the specifications and measurement systems of the Presster in
its original state, simulating a Fette P1200 (Fette, Germany) rotary tablet
press.
In case of proven necessity the Presster might be improved in order to
obtain an easy to use and powerful tool for research and development
purposes.
Furthermore, the quality of improvements had to be verified simulating a
Fette P1200 rotary tablet press with respect to the precision and accuracy
required for the various force and displacement measurements.
Finally the quality and validity of data gained using the improved
measurement systems had to be evaluated in consideration of conceivable
applications in Pharmaceutical Research and Development.
Theoretical Aspects and Analysis of Powder Compaction Behaviour
5
2 Theoretical Aspects and Analysis of Powder
Compaction Behaviour
The processes and principles of powder compaction behaviour cause issues
for Pharmacists in both formulation development as well as production.
Although the first tablet machine instrumentation was performed in
1954 (Higuchi) the multifaceted processes of powder compaction are still
not categorically understood today.
Missing or inadequate instrumentation on tablet presses seems to be one
reason for the above mentioned lack of knowledge. Therefore, concerted
efforts have been undertaken throughout the last few years to enhance the
precision and accuracy of tablet machine instrumentation as well as data
processing.
Nevertheless, problems like low tablet strength, capping or even batch
variability still exist in the large scale production of tablets. These can cause
the rejection of whole batches for quality and safety reasons. Many of these
problems could be avoided by proper investigations of powder compaction
behaviour using high precision instrumented tablet presses or compaction
simulators either in advance of or isochronous to any formulation
development.
Some commonly used measurements and assessments are discussed below
along with their effect on the final compact.
2.1 Compactibility
The compactability, i.e. the ability of a powder bed to form a compact of a
specific strength by the application of pressure, gives, in combination with
the compressibility, essential information about the tabletability of
(pharmaceutical) materials and thus successful tablet production.
Usually, the compactibility is described in terms of tablet tensile strength as
Theoretical Aspects and Analysis of Powder Compaction Behaviour
6
a function of the applied compaction pressure. As the tensile strength is
affected by various process parameters such as machine settings, time
period of storage and storage conditions between the compaction event and
the strength analysis, type of compaction tester and its working principle
etc., the experimental setup has to be kept constant to be able to generate
comparable results.
Furthermore, particulate characteristics of the uncompacted particles, such
as particle size distribution and particle shape of the powder to be
compressed also affect the compactibility of any powder.
Due to multiple variations in the setup of investigations, a large number of
the findings presented in literature are unfortunately not comparable.
2.2 Tensile Strength
In addition to the determination of compaction force, tablet mass, height
and diameter, the evaluation of tablet crushing force, using tablet
compression testers, is one of the most common methods for the
determination of tablet properties with respect to the stability of the
compact during subsequent processing steps such as film coating or
packaging.
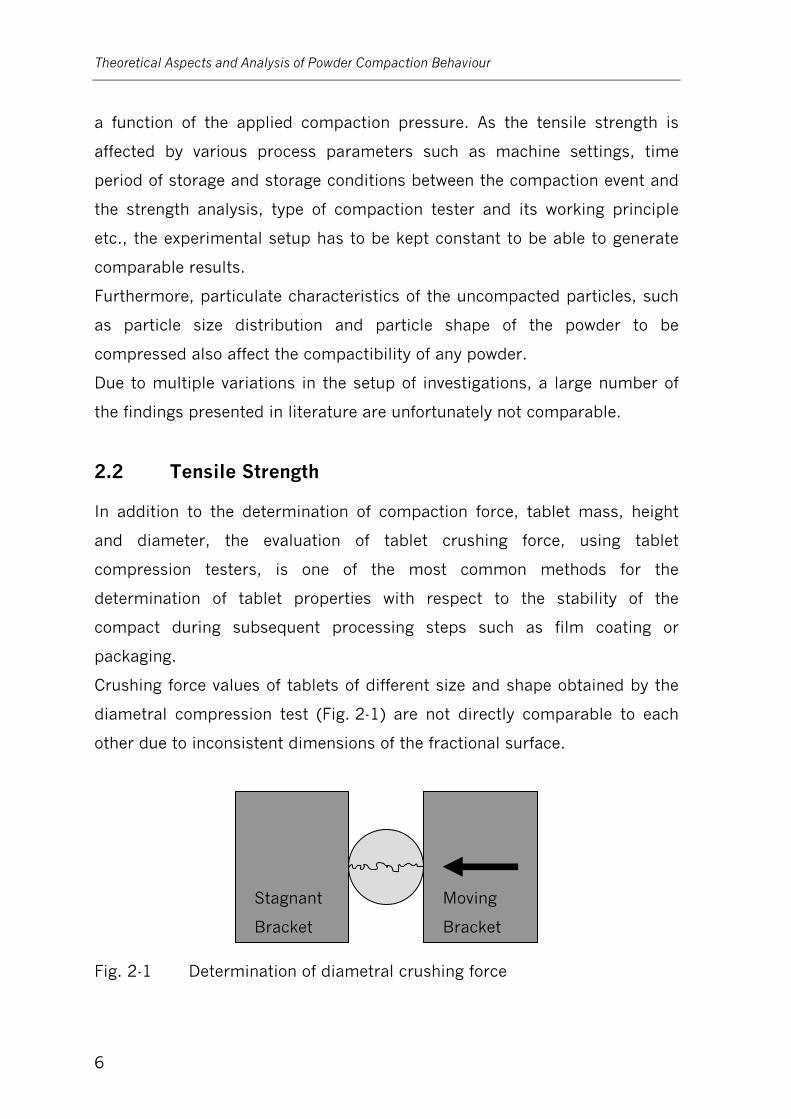
Crushing force values of tablets of different size and shape obtained by the
diametral compression test (Fig. 2-1) are not directly comparable to each
other due to inconsistent dimensions of the fractional surface.
Fig. 2-1 Determination of diametral crushing force
Stagnant
Bracket
Moving
Bracket
Theoretical Aspects and Analysis of Powder Compaction Behaviour
7
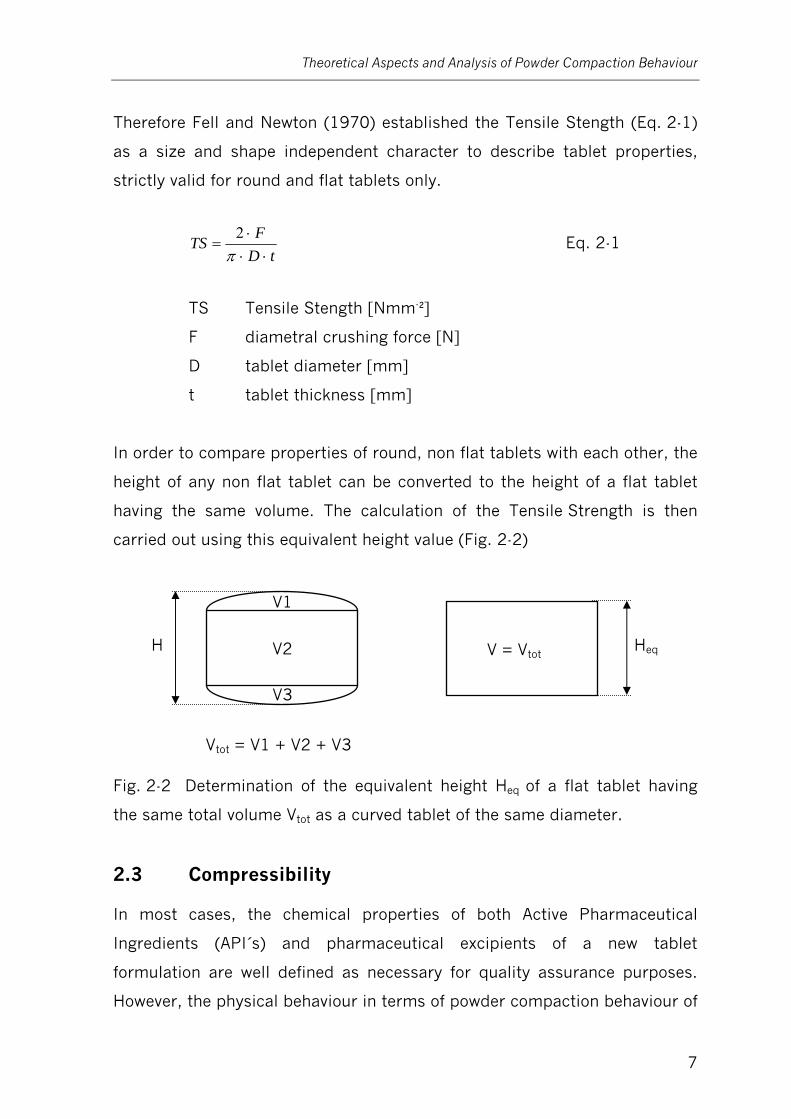
Therefore Fell and Newton (1970) established the Tensile Stength (Eq. 2-1)
as a size and shape independent character to describe tablet properties,
strictly valid for round and flat tablets only.
tDFTS⋅⋅
⋅=π
2 Eq. 2-1
TS Tensile Stength [Nmm-²]
F diametral crushing force [N]
D tablet diameter [mm]
t tablet thickness [mm]
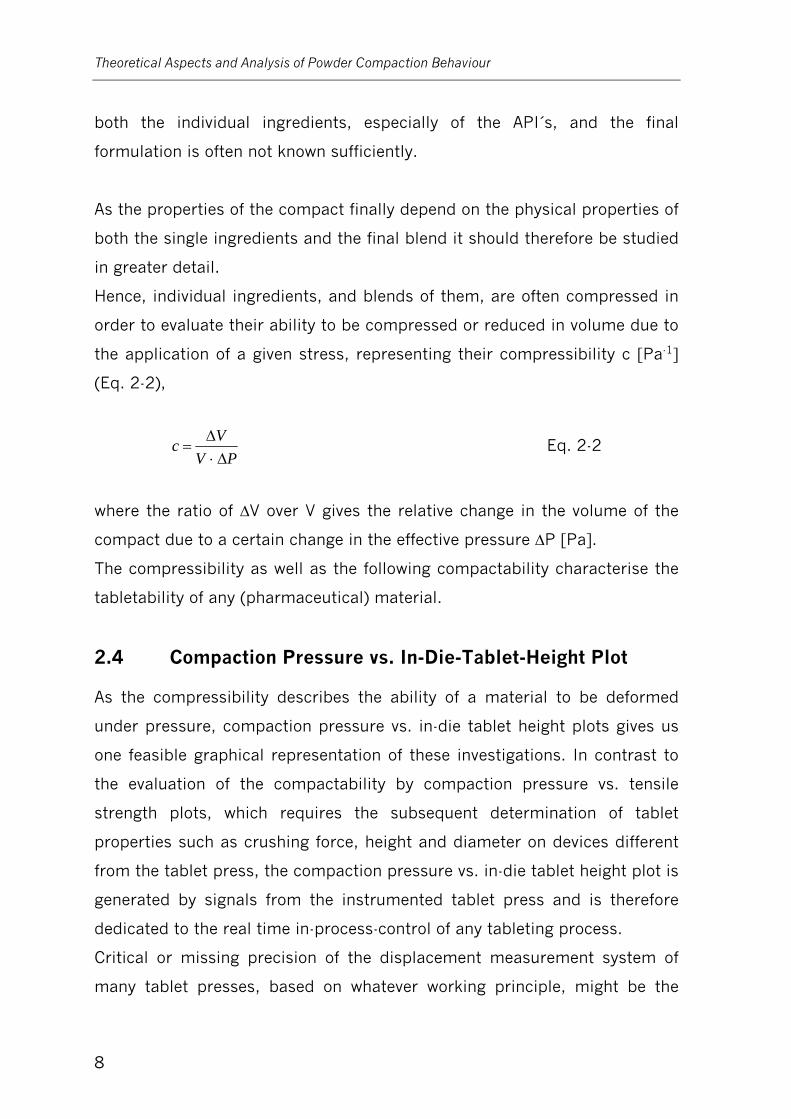
In order to compare properties of round, non flat tablets with each other, the
height of any non flat tablet can be converted to the height of a flat tablet
having the same volume. The calculation of the Tensile Strength is then
carried out using this equivalent height value (Fig. 2-2)
Fig. 2-2 Determination of the equivalent height Heq of a flat tablet having
the same total volume Vtot as a curved tablet of the same diameter.
2.3 Compressibility
In most cases, the chemical properties of both Active Pharmaceutical
Ingredients (API´s) and pharmaceutical excipients of a new tablet
formulation are well defined as necessary for quality assurance purposes.
However, the physical behaviour in terms of powder compaction behaviour of
Vtot = V1 + V2 + V3
V1
V3
V2 V = Vtot Heq H
Theoretical Aspects and Analysis of Powder Compaction Behaviour
8
both the individual ingredients, especially of the API´s, and the final
formulation is often not known sufficiently.
As the properties of the compact finally depend on the physical properties of
both the single ingredients and the final blend it should therefore be studied
in greater detail.
Hence, individual ingredients, and blends of them, are often compressed in
order to evaluate their ability to be compressed or reduced in volume due to
the application of a given stress, representing their compressibility c [Pa-1]
(Eq. 2-2),
PVVcΔ⋅
Δ= Eq. 2-2
where the ratio of ΔV over V gives the relative change in the volume of the
compact due to a certain change in the effective pressure ΔP [Pa].
The compressibility as well as the following compactability characterise the
tabletability of any (pharmaceutical) material.
2.4 Compaction Pressure vs. In-Die-Tablet-Height Plot
As the compressibility describes the ability of a material to be deformed
under pressure, compaction pressure vs. in-die tablet height plots gives us
one feasible graphical representation of these investigations. In contrast to
the evaluation of the compactability by compaction pressure vs. tensile
strength plots, which requires the subsequent determination of tablet
properties such as crushing force, height and diameter on devices different
from the tablet press, the compaction pressure vs. in-die tablet height plot is
generated by signals from the instrumented tablet press and is therefore
dedicated to the real time in-process-control of any tableting process.
Critical or missing precision of the displacement measurement system of
many tablet presses, based on whatever working principle, might be the

Theoretical Aspects and Analysis of Powder Compaction Behaviour
9
reason for the seldom use of this plot.
The well known Heckel-plot, i.e. used for the investigation of the materials
deformation behaviour, is a modification of this compaction pressure vs.
in-die tablet height plot but is, due to the missing information of the final
mass of the compact, not applicable with respect to real time process
control purposes.
2.5 Porosity
Tablet properties like tensile strength, friability, disintegration and
dissolution time depend mainly on the porosity of tablets. Therefore, the
information about the actual in-die-porosity of tablets at a certain pressure
is precious information during development stages.
Based on precise and accurate punch displacement measurements, the
recent in-die-porosity and therefore the degree of densification at each point
during the compression cycle can be calculated using the following Eq. 2-3:
[ ] ⎥⎦
⎤⎢⎣
⎡−⋅=
c
t
VV
1100%ε Eq. 2-3
where ε [%] is the percentage porosity of the compact, Vt is the “true”
volume of the powdered material (determined by helium pycnometric
measurement) and Vc is the volume of the compact at a certain pressure.
In most cases, alterations of compact properties, e.g. in terms of tablet
strength, might be observed as a consequence of any variation in the
compacts porosity.
The information obtained by the measurement of the in-die-porosity of
course exceeds the information of out-of-die measurements as the latter give
no information about any elastic recovery, equalizing an increasing porosity
during decompression. To guarantee constant tablets properties, the in-die
porosity during compaction must be kept constant.
The reliable and accurate investigation of porosity alterations during
Theoretical Aspects and Analysis of Powder Compaction Behaviour
10
compaction is furthermore most important for the evaluation of the
compaction behaviour in terms of Heckel-plots.
2.6 Heckel-Plot
The examination of volume reduction of the particle bed inside the die under
pressure, i.e. the compressibility, is one of the most commonly used
methods to investigate and evaluate powder compression behaviour and
particle deformation mechanisms. Different empirical models, based on the
relative density of the compact under pressure have been established by
Walker (1923), Kawakita (1971), Cooper (1962), Heckel (1961a, 1961b) and
some others.
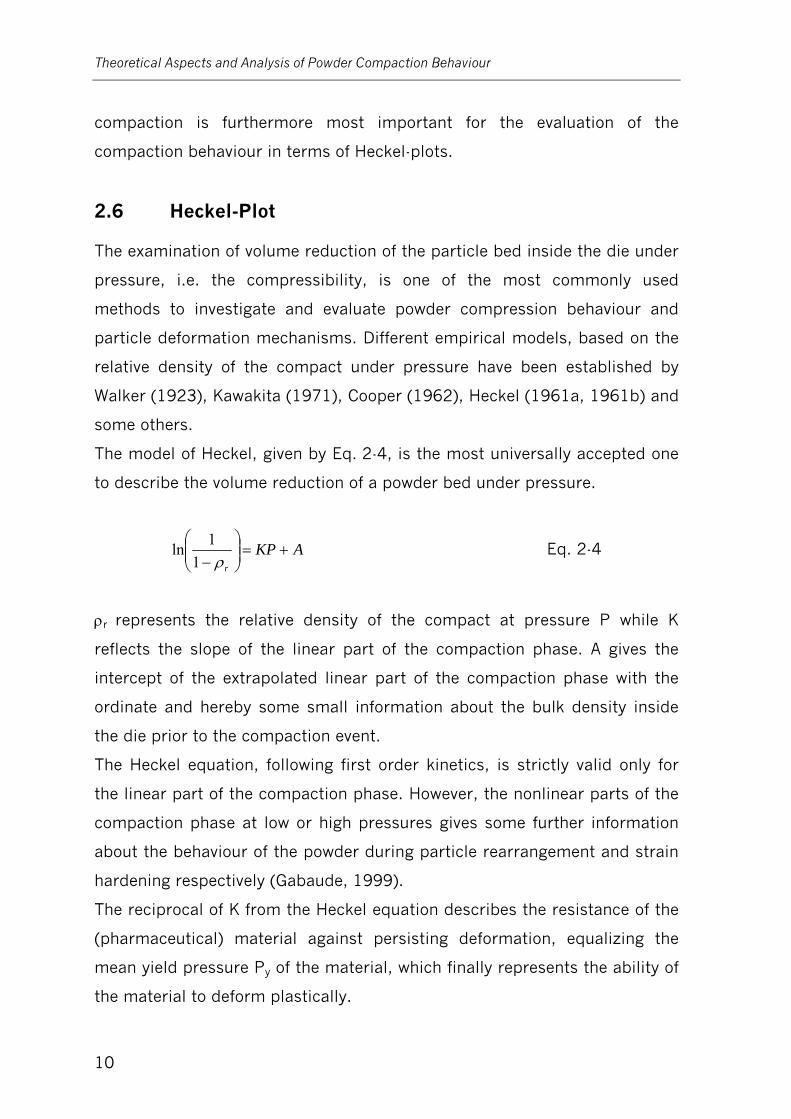
The model of Heckel, given by Eq. 2-4, is the most universally accepted one
to describe the volume reduction of a powder bed under pressure.
AKPr
+=⎟⎟⎠
⎞⎜⎜⎝
⎛− ρ11ln Eq. 2-4
ρr represents the relative density of the compact at pressure P while K
reflects the slope of the linear part of the compaction phase. A gives the
intercept of the extrapolated linear part of the compaction phase with the
ordinate and hereby some small information about the bulk density inside
the die prior to the compaction event.
The Heckel equation, following first order kinetics, is strictly valid only for
the linear part of the compaction phase. However, the nonlinear parts of the
compaction phase at low or high pressures gives some further information
about the behaviour of the powder during particle rearrangement and strain
hardening respectively (Gabaude, 1999).
The reciprocal of K from the Heckel equation describes the resistance of the
(pharmaceutical) material against persisting deformation, equalizing the
mean yield pressure Py of the material, which finally represents the ability of
the material to deform plastically.
Theoretical Aspects and Analysis of Powder Compaction Behaviour
11
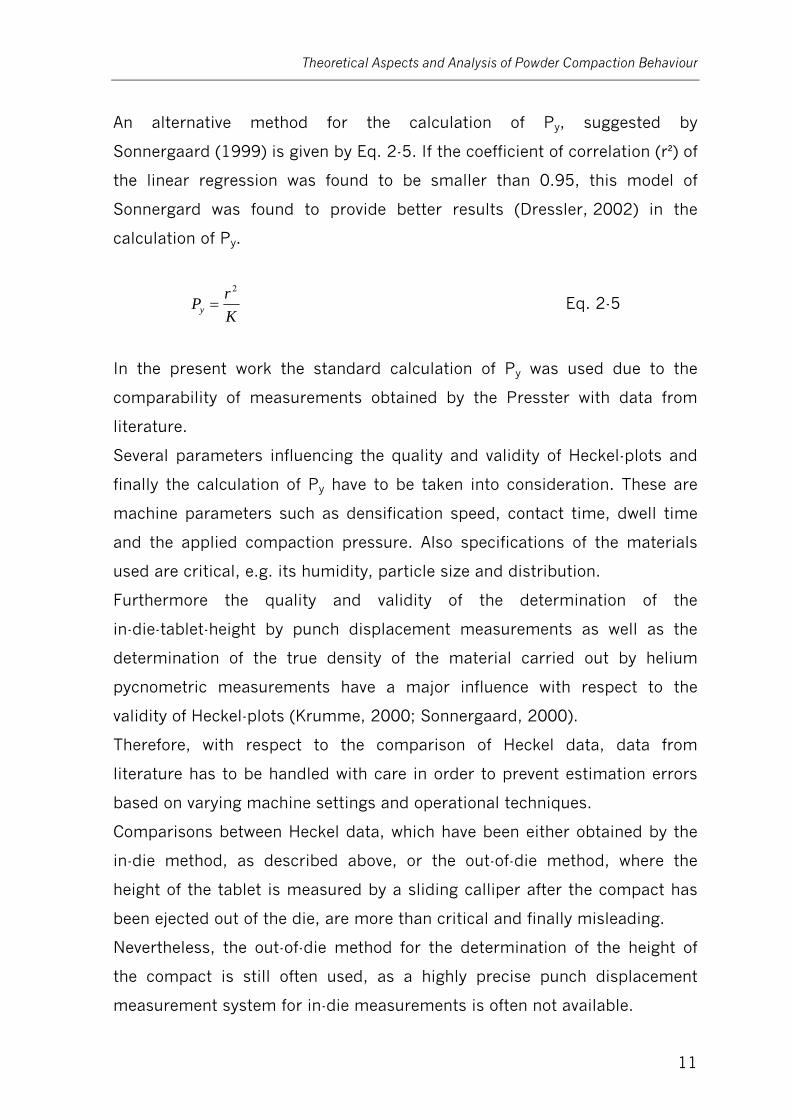
An alternative method for the calculation of Py, suggested by
Sonnergaard (1999) is given by Eq. 2-5. If the coefficient of correlation (r²) of
the linear regression was found to be smaller than 0.95, this model of
Sonnergard was found to provide better results (Dressler, 2002) in the
calculation of Py.
KrPy
2
= Eq. 2-5
In the present work the standard calculation of Py was used due to the
comparability of measurements obtained by the Presster with data from
literature.
Several parameters influencing the quality and validity of Heckel-plots and
finally the calculation of Py have to be taken into consideration. These are
machine parameters such as densification speed, contact time, dwell time
and the applied compaction pressure. Also specifications of the materials
used are critical, e.g. its humidity, particle size and distribution.
Furthermore the quality and validity of the determination of the
in-die-tablet-height by punch displacement measurements as well as the
determination of the true density of the material carried out by helium
pycnometric measurements have a major influence with respect to the
validity of Heckel-plots (Krumme, 2000; Sonnergaard, 2000).
Therefore, with respect to the comparison of Heckel data, data from
literature has to be handled with care in order to prevent estimation errors
based on varying machine settings and operational techniques.
Comparisons between Heckel data, which have been either obtained by the
in-die method, as described above, or the out-of-die method, where the
height of the tablet is measured by a sliding calliper after the compact has
been ejected out of the die, are more than critical and finally misleading.
Nevertheless, the out-of-die method for the determination of the height of
the compact is still often used, as a highly precise punch displacement
measurement system for in-die measurements is often not available.
Theoretical Aspects and Analysis of Powder Compaction Behaviour
12
To generate Heckel-plots according to the out-of-die method several tablets
have to be produced at varying pressure levels. Therefore the amount of
material required to set up this plot is comparably larger. This has
considerable time and cost implications to the overall development process.
Beyond that, the out-of-die method gives no information about pressure
relaxation (Rx) and elastic recovery (ER) of the compact, which might
indicate to capping or lamination tendencies.
Therefore, Heckel-plots generated by the out-of-die method only consist of
the compression slope.
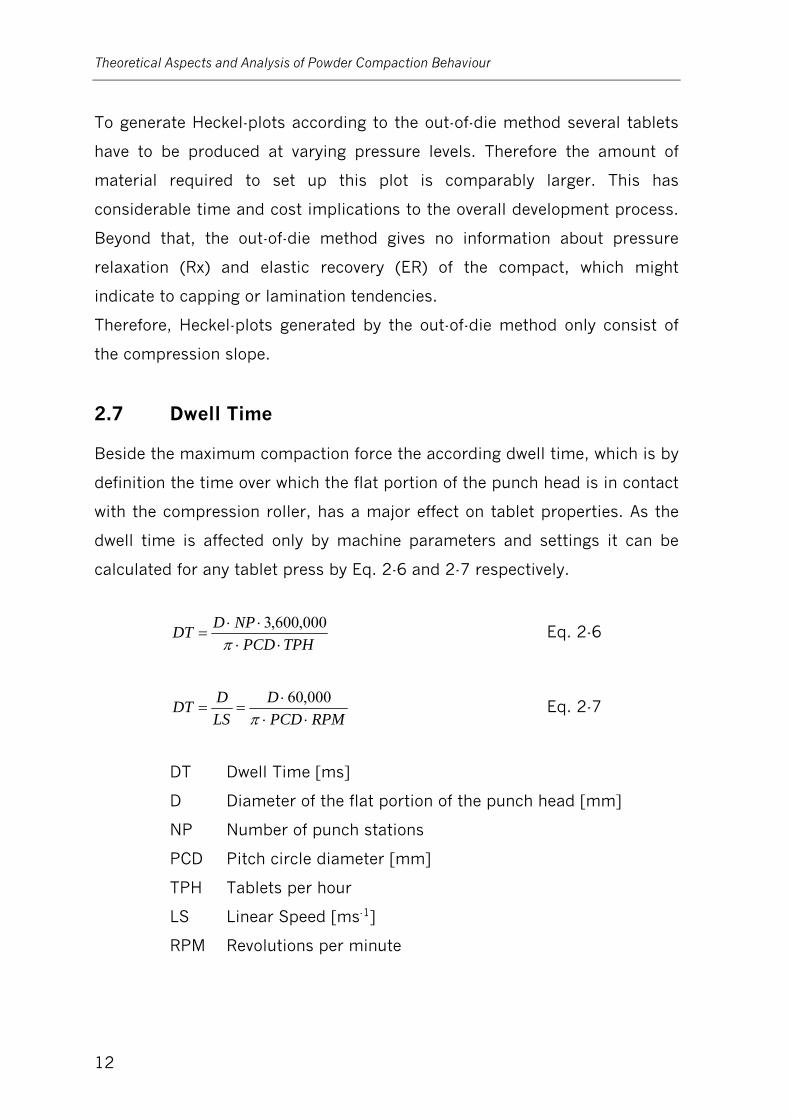
2.7 Dwell Time
Beside the maximum compaction force the according dwell time, which is by
definition the time over which the flat portion of the punch head is in contact
with the compression roller, has a major effect on tablet properties. As the
dwell time is affected only by machine parameters and settings it can be
calculated for any tablet press by Eq. 2-6 and 2-7 respectively.
TPHPCDNPDDT
⋅⋅⋅⋅
=π
000,600,3 Eq. 2-6
RPMPCDD
LSDDT
⋅⋅⋅
==π
000,60 Eq. 2-7
DT Dwell Time [ms]
D Diameter of the flat portion of the punch head [mm]
NP Number of punch stations
PCD Pitch circle diameter [mm]
TPH Tablets per hour
LS Linear Speed [ms-1]
RPM Revolutions per minute
Theoretical Aspects and Analysis of Powder Compaction Behaviour
13
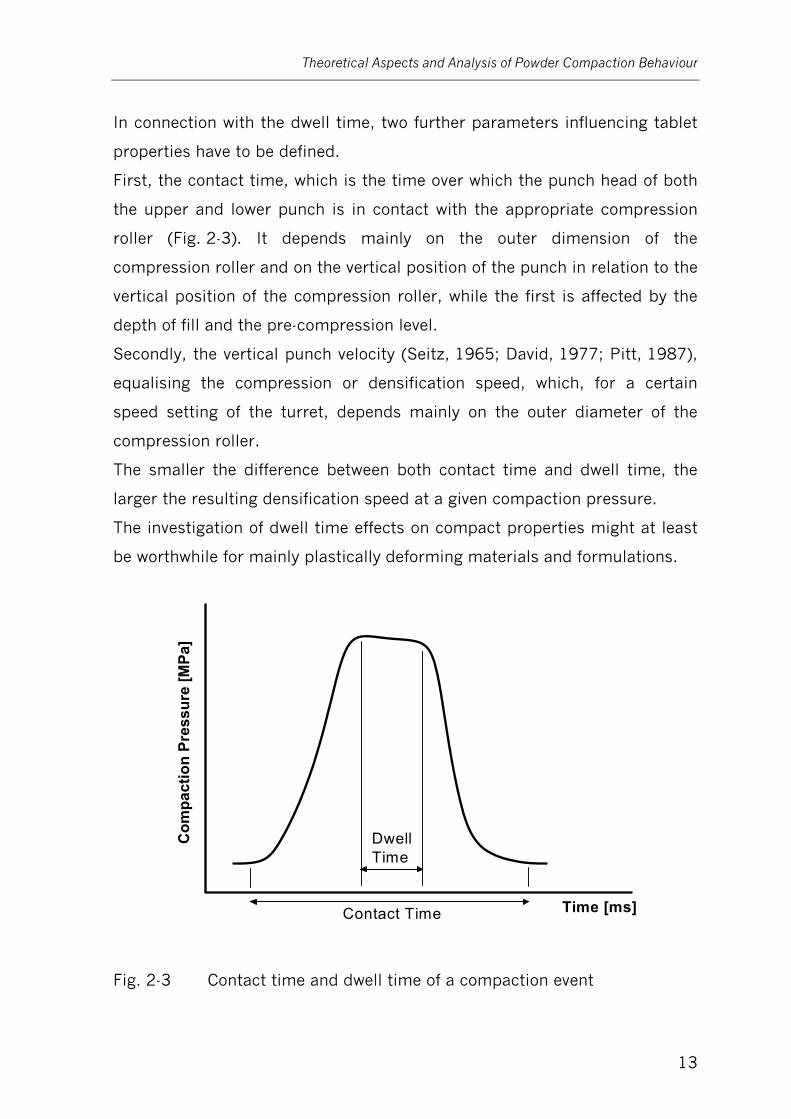
In connection with the dwell time, two further parameters influencing tablet
properties have to be defined.
First, the contact time, which is the time over which the punch head of both
the upper and lower punch is in contact with the appropriate compression
roller (Fig. 2-3). It depends mainly on the outer dimension of the
compression roller and on the vertical position of the punch in relation to the
vertical position of the compression roller, while the first is affected by the
depth of fill and the pre-compression level.
Secondly, the vertical punch velocity (Seitz, 1965; David, 1977; Pitt, 1987),
equalising the compression or densification speed, which, for a certain
speed setting of the turret, depends mainly on the outer diameter of the
compression roller.
The smaller the difference between both contact time and dwell time, the
larger the resulting densification speed at a given compaction pressure.
The investigation of dwell time effects on compact properties might at least
be worthwhile for mainly plastically deforming materials and formulations.
Com
pact
ion
Pres
sure
[MPa
]
Time [ms]
DwellTime
Contact Time
Fig. 2-3 Contact time and dwell time of a compaction event
The Presster – A Linear Compaction Simulator
14
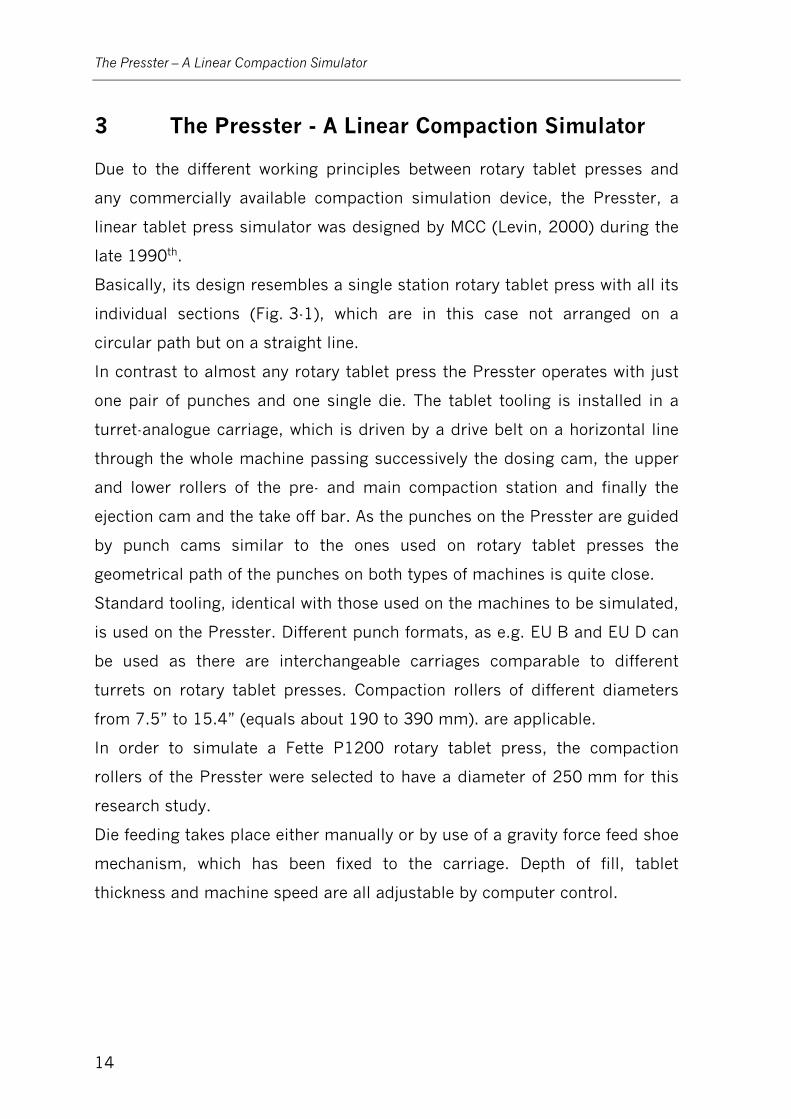
3 The Presster - A Linear Compaction Simulator
Due to the different working principles between rotary tablet presses and
any commercially available compaction simulation device, the Presster, a
linear tablet press simulator was designed by MCC (Levin, 2000) during the
late 1990th.
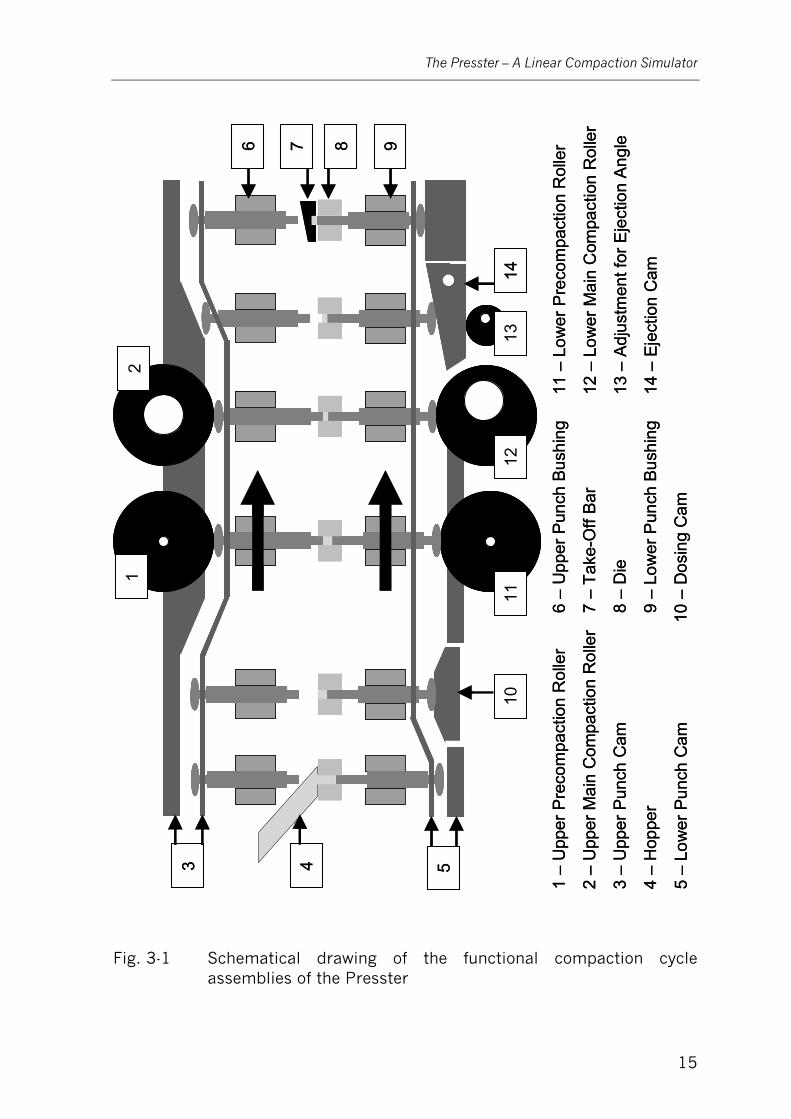
Basically, its design resembles a single station rotary tablet press with all its
individual sections (Fig. 3-1), which are in this case not arranged on a
circular path but on a straight line.
In contrast to almost any rotary tablet press the Presster operates with just
one pair of punches and one single die. The tablet tooling is installed in a
turret-analogue carriage, which is driven by a drive belt on a horizontal line
through the whole machine passing successively the dosing cam, the upper
and lower rollers of the pre- and main compaction station and finally the
ejection cam and the take off bar. As the punches on the Presster are guided
by punch cams similar to the ones used on rotary tablet presses the
geometrical path of the punches on both types of machines is quite close.
Standard tooling, identical with those used on the machines to be simulated,
is used on the Presster. Different punch formats, as e.g. EU B and EU D can
be used as there are interchangeable carriages comparable to different
turrets on rotary tablet presses. Compaction rollers of different diameters
from 7.5” to 15.4” (equals about 190 to 390 mm). are applicable.
In order to simulate a Fette P1200 rotary tablet press, the compaction
rollers of the Presster were selected to have a diameter of 250 mm for this
research study.
Die feeding takes place either manually or by use of a gravity force feed shoe
mechanism, which has been fixed to the carriage. Depth of fill, tablet
thickness and machine speed are all adjustable by computer control.
The Presster – A Linear Compaction Simulator
15
1
43 5
12
1211
1314
10
86 97
1 –
Upp
er P
reco
mpa
ctio
nR
olle
r
2 –
Upp
er M
ain
Com
pact
ion
Rol
ler
3 –
Upp
er P
unch
Cam
4 –
Hop
per
5 –
Low
erPu
nch
Cam
6 –
Upp
er P
unch
Bush
ing
7 –
Take
-Off
Bar
8 –
Die
9 –
Low
erP
unch
Bush
ing
10 –
Dos
ing
Cam
11 –
Low
erP
reco
mpa
ctio
nR
olle
r
12 –
Low
erM
ain
Com
pact
ion
Rol
ler
13 –
Adju
stm
entf
orE
ject
ion
Ang
le
14 –
Ejec
tion
Cam
11
43 5
12
1211
1314
10
86 97
1 –
Upp
er P
reco
mpa
ctio
nR
olle
r
2 –
Upp
er M
ain
Com
pact
ion
Rol
ler
3 –
Upp
er P
unch
Cam
4 –
Hop
per
5 –
Low
erPu
nch
Cam
6 –
Upp
er P
unch
Bush
ing
7 –
Take
-Off
Bar
8 –
Die
9 –
Low
erP
unch
Bush
ing
10 –
Dos
ing
Cam
11 –
Low
erP
reco
mpa
ctio
nR
olle
r
12 –
Low
erM
ain
Com
pact
ion
Rol
ler
13 –
Adju
stm
entf
orE
ject
ion
Ang
le
14 –
Ejec
tion
Cam
Fig. 3-1 Schematical drawing of the functional compaction cycle assemblies of the Presster
The Presster – A Linear Compaction Simulator
16
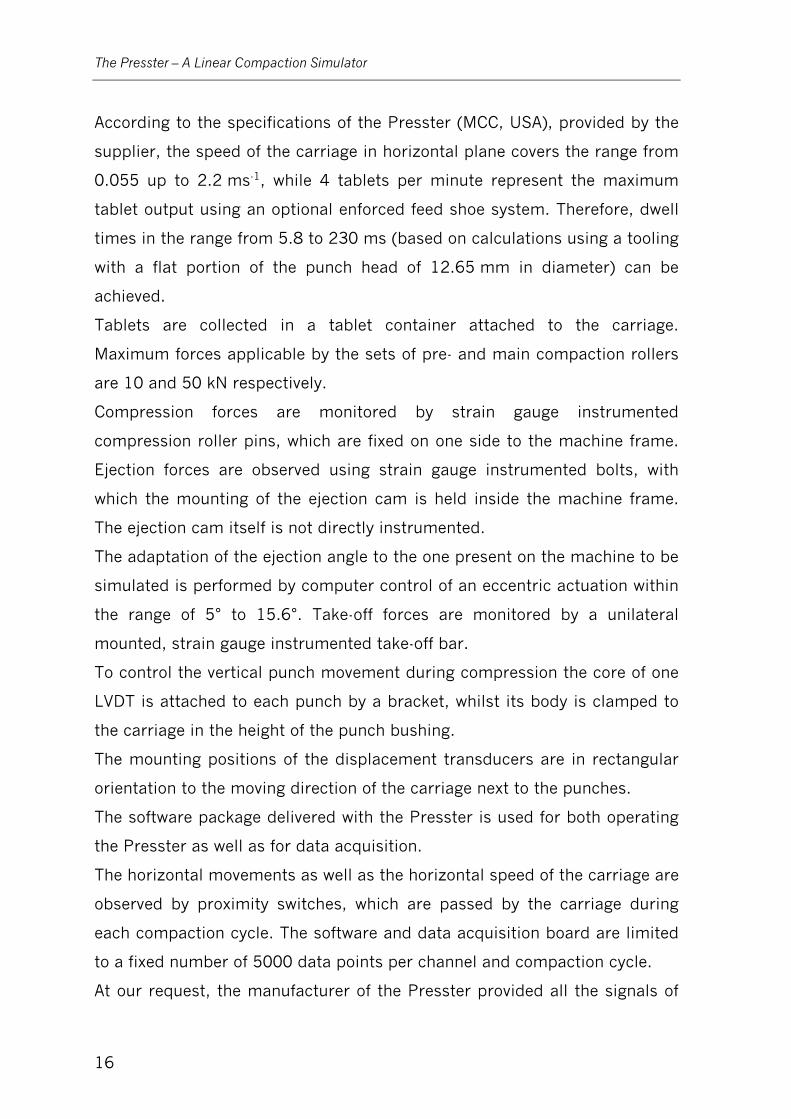
According to the specifications of the Presster (MCC, USA), provided by the
supplier, the speed of the carriage in horizontal plane covers the range from
0.055 up to 2.2 ms-1, while 4 tablets per minute represent the maximum
tablet output using an optional enforced feed shoe system. Therefore, dwell
times in the range from 5.8 to 230 ms (based on calculations using a tooling
with a flat portion of the punch head of 12.65 mm in diameter) can be
achieved.
Tablets are collected in a tablet container attached to the carriage.
Maximum forces applicable by the sets of pre- and main compaction rollers
are 10 and 50 kN respectively.
Compression forces are monitored by strain gauge instrumented
compression roller pins, which are fixed on one side to the machine frame.
Ejection forces are observed using strain gauge instrumented bolts, with
which the mounting of the ejection cam is held inside the machine frame.
The ejection cam itself is not directly instrumented.
The adaptation of the ejection angle to the one present on the machine to be
simulated is performed by computer control of an eccentric actuation within
the range of 5° to 15.6°. Take-off forces are monitored by a unilateral
mounted, strain gauge instrumented take-off bar.
To control the vertical punch movement during compression the core of one
LVDT is attached to each punch by a bracket, whilst its body is clamped to
the carriage in the height of the punch bushing.
The mounting positions of the displacement transducers are in rectangular
orientation to the moving direction of the carriage next to the punches.
The software package delivered with the Presster is used for both operating
the Presster as well as for data acquisition.
The horizontal movements as well as the horizontal speed of the carriage are
observed by proximity switches, which are passed by the carriage during
each compaction cycle. The software and data acquisition board are limited
to a fixed number of 5000 data points per channel and compaction cycle.
At our request, the manufacturer of the Presster provided all the signals of

The Presster – A Linear Compaction Simulator
17
the individual instrumentation in this Presster, serial number 107 by parallel
wiring, in order to allow collection of all the measurement data of the
Presster using a data acquisition system separate to the original one.

Results and Discussion
18
4 Results and Discussion
The investigation of powder compaction behaviour requires reliable and
accurate measurements of compaction cycle related forces and punch
movements.
Prior to any investigation of this kind, the measurement systems of the
various equipment used during these trials has to be examined properly in
order to guarantee the qualification of these measurement systems with
respect to their reliable precision and accuracy.
Therefore, the various measurement systems of the Presster as well as the
uninstrumented machine parts, which also have an influence on tablet
properties, have been investigated with respect to the accurate simulation of
a Fette P1200 rotary tablet press.
In case of proven necessity, the individual systems have been improved in
order to guarantee accurate and reliable results.
In the following the results of the investigations of the linear compaction
simulator Presster, the finally implemented modifications and a comparison
between the measured results of both the original and the improved systems
are presented.
Results and Discussion – Data Acquisition System
19
4.1 Data Acquisition System
4.1.1 Original Presster Data Acquisition System
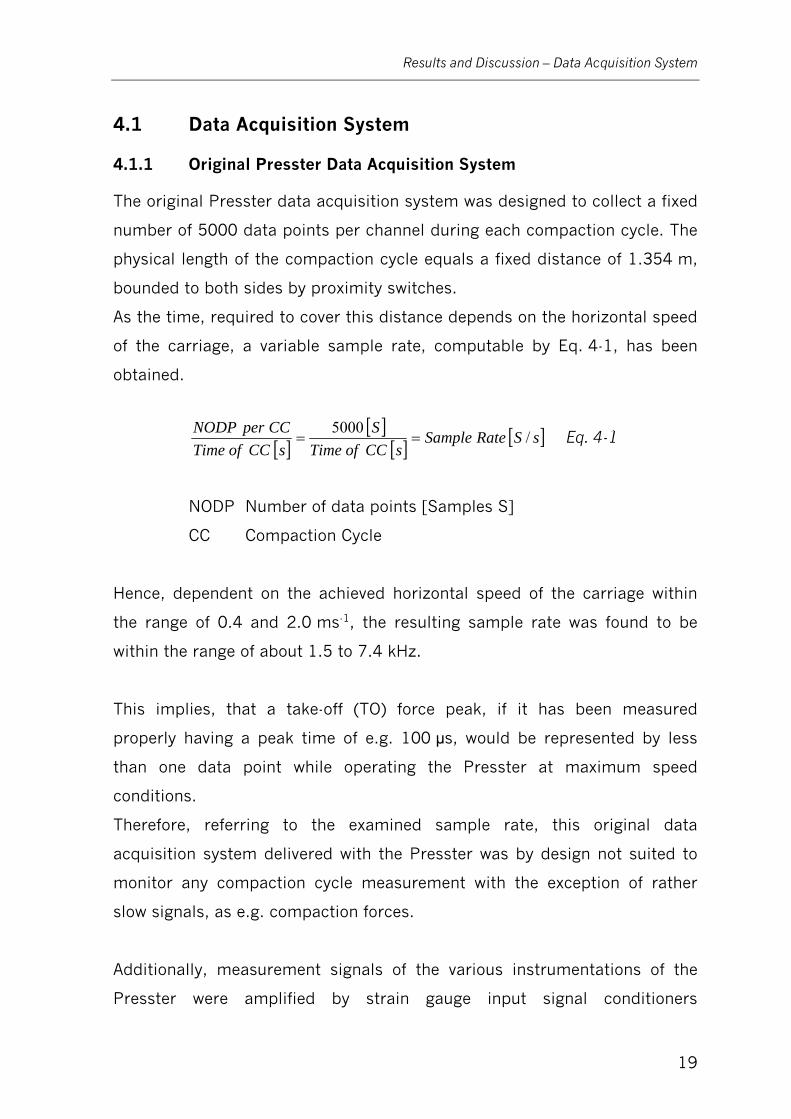
The original Presster data acquisition system was designed to collect a fixed
number of 5000 data points per channel during each compaction cycle. The
physical length of the compaction cycle equals a fixed distance of 1.354 m,
bounded to both sides by proximity switches.
As the time, required to cover this distance depends on the horizontal speed
of the carriage, a variable sample rate, computable by Eq. 4-1, has been
obtained.
[ ][ ]
[ ] [ ]sSRateSamplesCCofTime
SsCCofTime
CCperNODP /5000== Eq. 4-1
NODP Number of data points [Samples S]
CC Compaction Cycle
Hence, dependent on the achieved horizontal speed of the carriage within
the range of 0.4 and 2.0 ms-1, the resulting sample rate was found to be
within the range of about 1.5 to 7.4 kHz.
This implies, that a take-off (TO) force peak, if it has been measured
properly having a peak time of e.g. 100 μs, would be represented by less
than one data point while operating the Presster at maximum speed
conditions.
Therefore, referring to the examined sample rate, this original data
acquisition system delivered with the Presster was by design not suited to
monitor any compaction cycle measurement with the exception of rather
slow signals, as e.g. compaction forces.
Additionally, measurement signals of the various instrumentations of the
Presster were amplified by strain gauge input signal conditioners

Results and Discussion – Data Acquisition System
20
(DSCA38-05, Dataforth, USA). Both the voltage raw data as well as the
processed data were monitored by the original data acquisition system of
the Presster.
To ensure a signal processing without any distortion of the signal amplitude,
the signal frequency should not exceed 50 % of the cut-off frequency of a
certain measurement system. This frequency range might be used as long
as a possible signal phase shift has no effect on the validity of
measurements.
If it is even necessary to prevent any signal phase shift, the signal frequency
should be below the twentieth part of the cut-off frequency of the
measurement system used (Hoffmann, 1995).
Therefore, the cut-off frequency of the DSCA38-05 amplifiers has been
investigated by the application of a unit step function using a function
generator (HM 8130, HAMEG, Germany). An example result of these trials is
shown by Fig. 4-1.
90 91 92 93 94
0
1
2
3
4
5
0.000
0.002
0.004
0.006
0.008
0.010 Voltage Unit Step Function [V]
Volta
ge A
mpl
ifier
[V]
Time [ms]
Unit Step Function Amplifier Response
Fig. 4-1 Unit step function and amplifier voltage signal of DSCA38-05 amplifier to investigate its cut-off frequency
Results and Discussion – Data Acquisition System
21
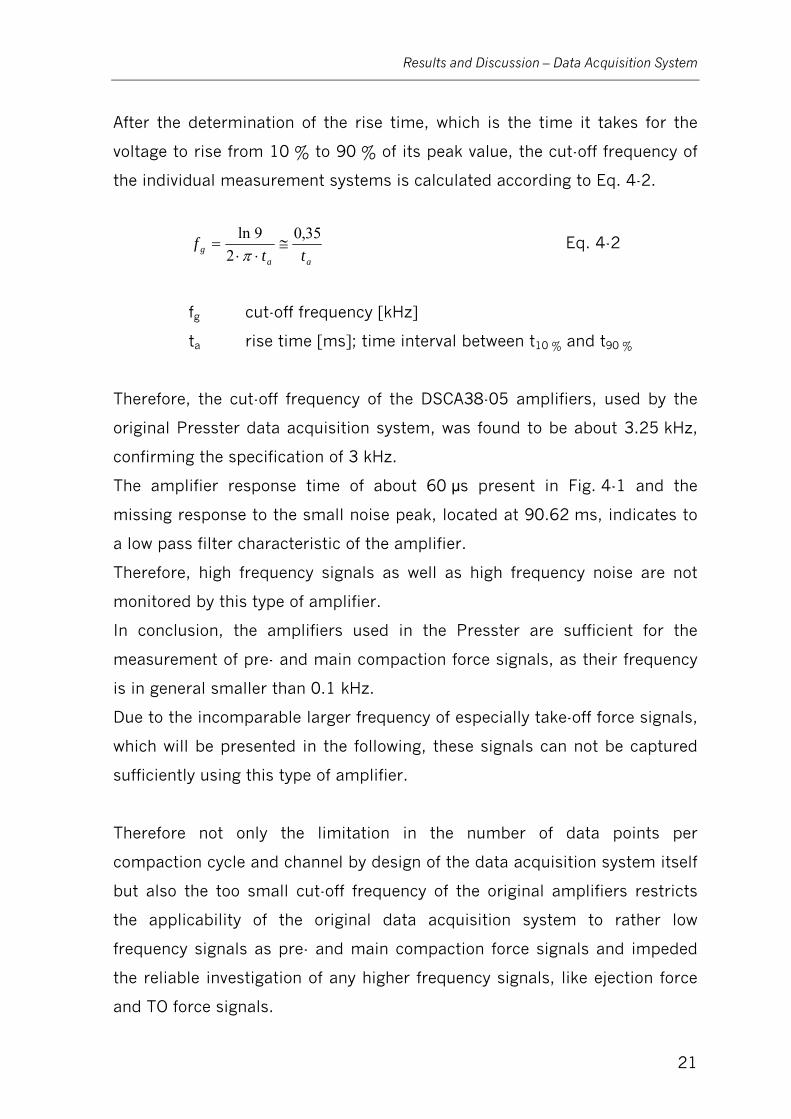
After the determination of the rise time, which is the time it takes for the
voltage to rise from 10 % to 90 % of its peak value, the cut-off frequency of
the individual measurement systems is calculated according to Eq. 4-2.
aag tt
f 35,02
9ln≅
⋅⋅=
π Eq. 4-2
fg cut-off frequency [kHz]
ta rise time [ms]; time interval between t10 % and t90 %
Therefore, the cut-off frequency of the DSCA38-05 amplifiers, used by the
original Presster data acquisition system, was found to be about 3.25 kHz,
confirming the specification of 3 kHz.
The amplifier response time of about 60 μs present in Fig. 4-1 and the
missing response to the small noise peak, located at 90.62 ms, indicates to
a low pass filter characteristic of the amplifier.
Therefore, high frequency signals as well as high frequency noise are not
monitored by this type of amplifier.
In conclusion, the amplifiers used in the Presster are sufficient for the
measurement of pre- and main compaction force signals, as their frequency
is in general smaller than 0.1 kHz.
Due to the incomparable larger frequency of especially take-off force signals,
which will be presented in the following, these signals can not be captured
sufficiently using this type of amplifier.
Therefore not only the limitation in the number of data points per
compaction cycle and channel by design of the data acquisition system itself
but also the too small cut-off frequency of the original amplifiers restricts
the applicability of the original data acquisition system to rather low
frequency signals as pre- and main compaction force signals and impeded
the reliable investigation of any higher frequency signals, like ejection force
and TO force signals.
Results and Discussion – Data Acquisition System
22
4.1.2 Presster-Independent Data Acquisition System DAQ4
Initially in order to qualify the original data acquisition system of the
Presster but finally to be able to reliably monitor the whole compaction cycle
or just parts of it at an acceptable user selectable sample rate, the
independent data acquisition system DAQ4 (Hucke Software, Germany) was
connected to the Presster.
In the first instance, the DAQ4 has been connected to the Presster using
electrically isolating amplifiers (DSCA49, Dataforth, USA), which have been
preinstalled for this application by the manufacturer for the purpose of
preventing any electronic interference between the DAQ4 and the Presster
system.
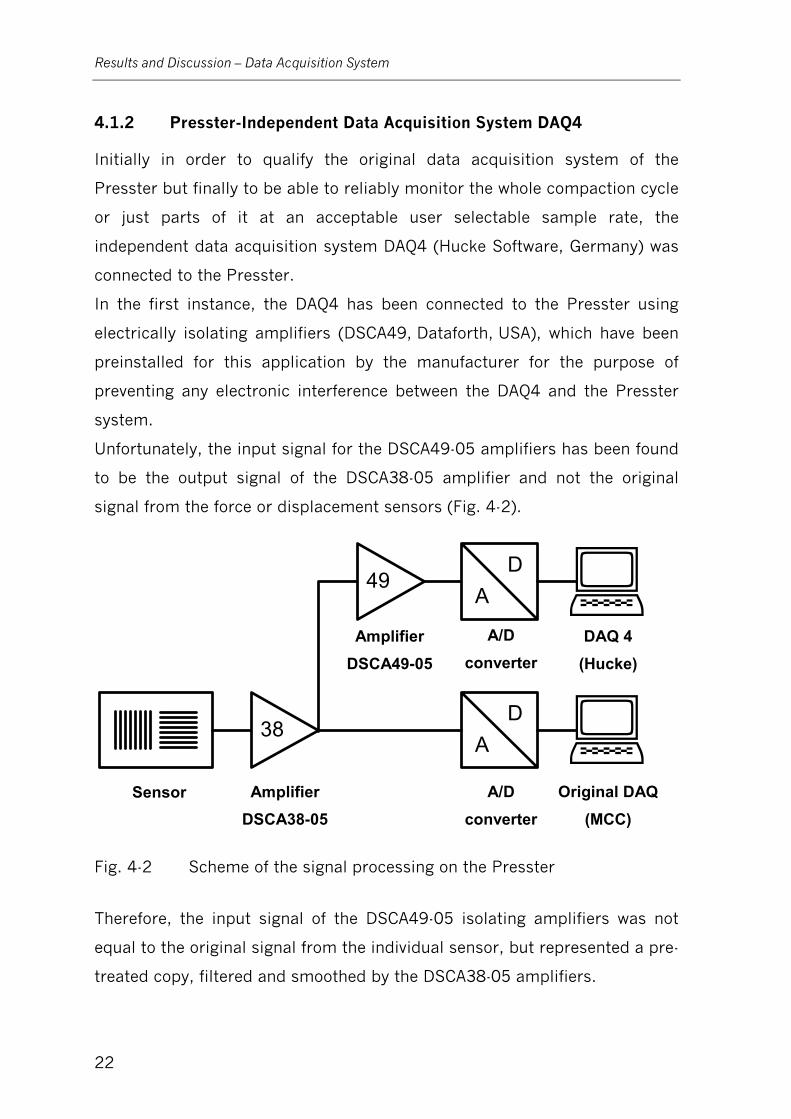
Unfortunately, the input signal for the DSCA49-05 amplifiers has been found
to be the output signal of the DSCA38-05 amplifier and not the original
signal from the force or displacement sensors (Fig. 4-2).
AD
38
49A
D
Sensor
Amplifier DSCA49-05
Amplifier DSCA38-05
A/D converter
Original DAQ (MCC)
DAQ 4 (Hucke)
A/D converter
Fig. 4-2 Scheme of the signal processing on the Presster
Therefore, the input signal of the DSCA49-05 isolating amplifiers was not
equal to the original signal from the individual sensor, but represented a pre-
treated copy, filtered and smoothed by the DSCA38-05 amplifiers.
Results and Discussion – Data Acquisition System
23
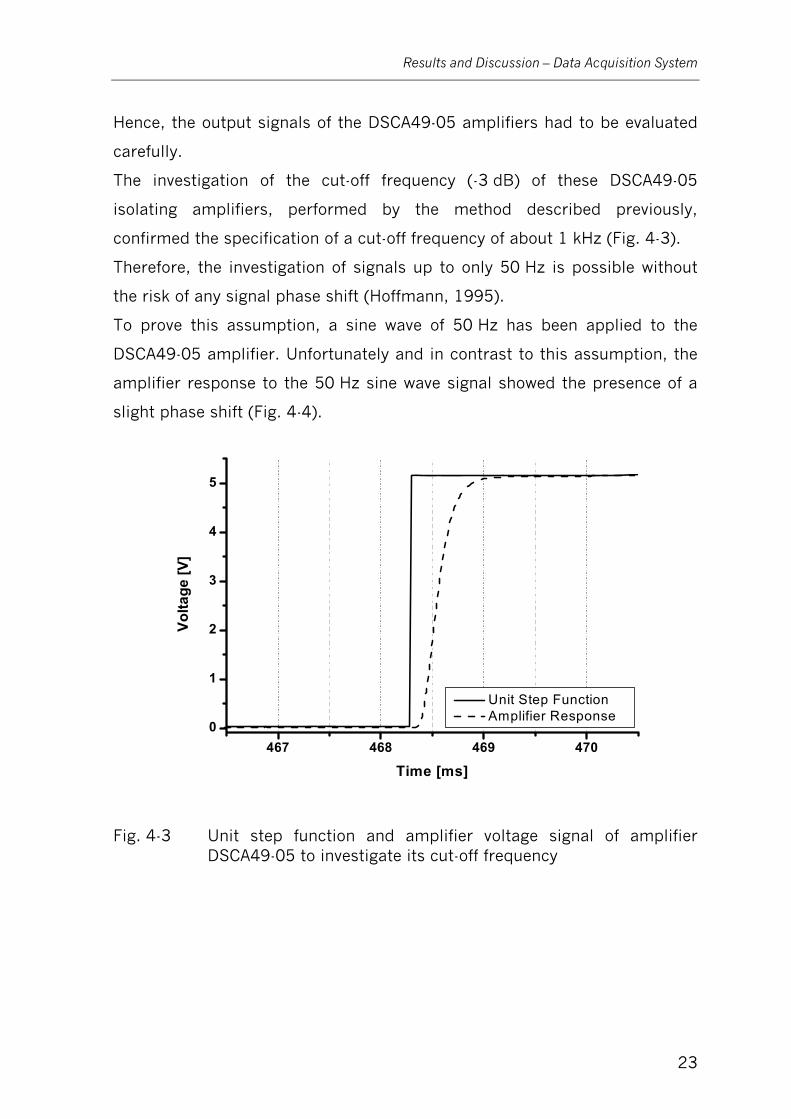
Hence, the output signals of the DSCA49-05 amplifiers had to be evaluated
carefully.
The investigation of the cut-off frequency (-3 dB) of these DSCA49-05
isolating amplifiers, performed by the method described previously,
confirmed the specification of a cut-off frequency of about 1 kHz (Fig. 4-3).
Therefore, the investigation of signals up to only 50 Hz is possible without
the risk of any signal phase shift (Hoffmann, 1995).
To prove this assumption, a sine wave of 50 Hz has been applied to the
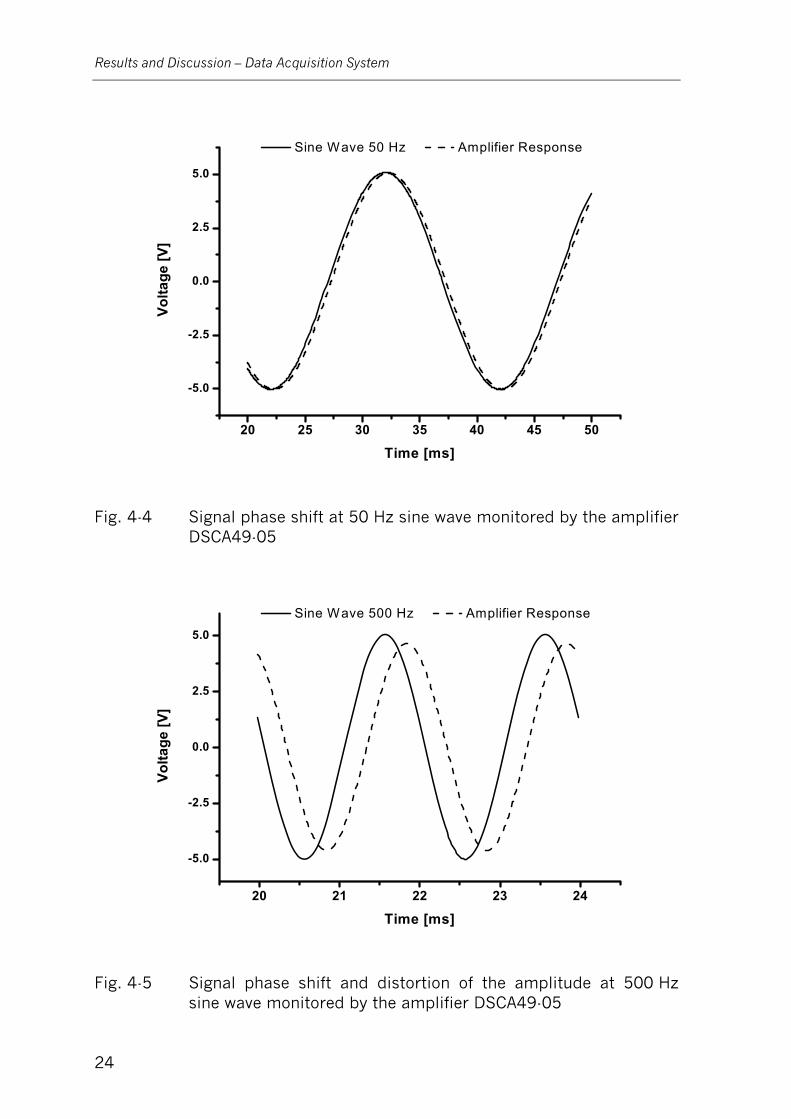
DSCA49-05 amplifier. Unfortunately and in contrast to this assumption, the
amplifier response to the 50 Hz sine wave signal showed the presence of a
slight phase shift (Fig. 4-4).
467 468 469 4700
1
2
3
4
5
Unit Step Function Amplifier Response
Volta
ge [V
]
Time [ms]
Fig. 4-3 Unit step function and amplifier voltage signal of amplifier DSCA49-05 to investigate its cut-off frequency
Results and Discussion – Data Acquisition System
24
20 25 30 35 40 45 50
-5.0
-2.5
0.0
2.5
5.0
Sine Wave 50 Hz Amplifier ResponseVo
ltage
[V]
Time [ms]
Fig. 4-4 Signal phase shift at 50 Hz sine wave monitored by the amplifier DSCA49-05
20 21 22 23 24
-5.0
-2.5
0.0
2.5
5.0
Sine Wave 500 Hz Amplifier Response
Volta
ge [V
]
Time [ms]
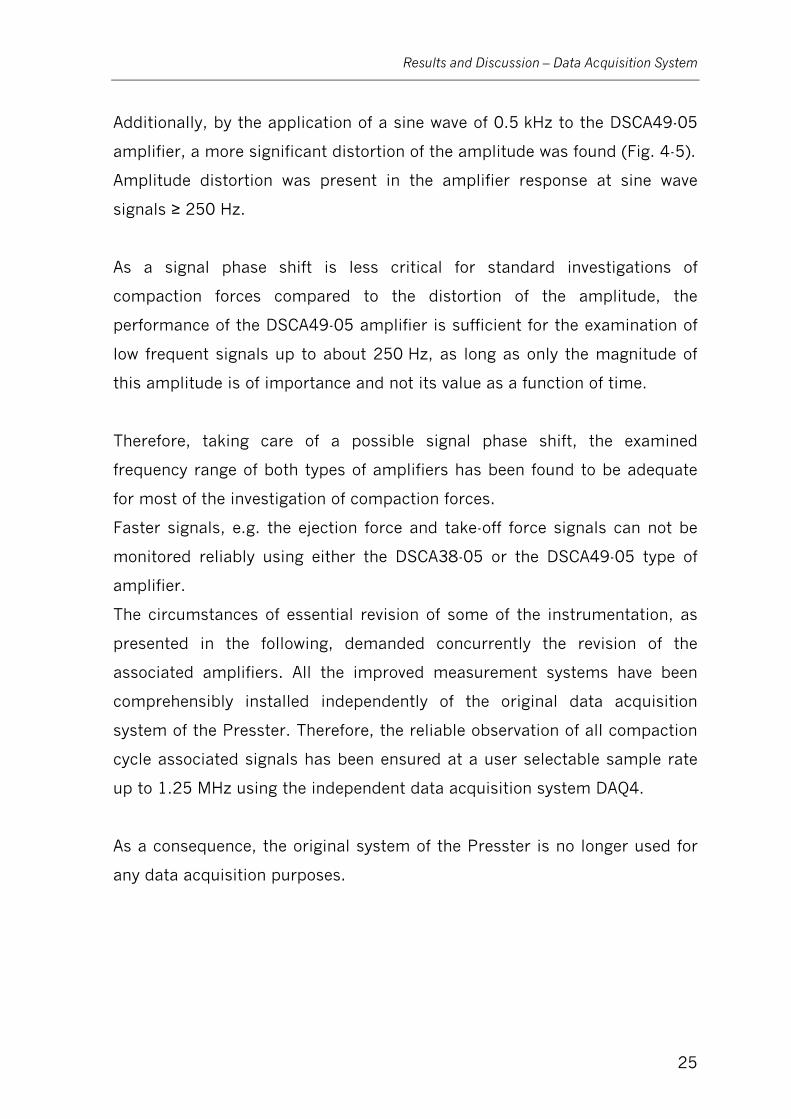
Fig. 4-5 Signal phase shift and distortion of the amplitude at 500 Hz sine wave monitored by the amplifier DSCA49-05
Results and Discussion – Data Acquisition System
25
Additionally, by the application of a sine wave of 0.5 kHz to the DSCA49-05
amplifier, a more significant distortion of the amplitude was found (Fig. 4-5).
Amplitude distortion was present in the amplifier response at sine wave
signals ≥ 250 Hz.
As a signal phase shift is less critical for standard investigations of
compaction forces compared to the distortion of the amplitude, the
performance of the DSCA49-05 amplifier is sufficient for the examination of
low frequent signals up to about 250 Hz, as long as only the magnitude of
this amplitude is of importance and not its value as a function of time.
Therefore, taking care of a possible signal phase shift, the examined
frequency range of both types of amplifiers has been found to be adequate
for most of the investigation of compaction forces.
Faster signals, e.g. the ejection force and take-off force signals can not be
monitored reliably using either the DSCA38-05 or the DSCA49-05 type of
amplifier.
The circumstances of essential revision of some of the instrumentation, as
presented in the following, demanded concurrently the revision of the
associated amplifiers. All the improved measurement systems have been
comprehensibly installed independently of the original data acquisition
system of the Presster. Therefore, the reliable observation of all compaction
cycle associated signals has been ensured at a user selectable sample rate
up to 1.25 MHz using the independent data acquisition system DAQ4.
As a consequence, the original system of the Presster is no longer used for
any data acquisition purposes.
Results and Discussion – Data Acquisition System
26
4.1.3 Summary
The reliable and accurate investigation of powder compaction behaviour, as
well as compaction related processes, require a data acquisition system
providing a sample rate which exceeds the signal frequency at least by
100 %, in order to avoid any distortion of the signal amplitude as measured
by the amplifiers.
Due to the cut-off frequency of the original amplifiers of the Presster,
accurate data acquisition has been limited to signals having a frequency
below 1.5 kHz. Using the manufacturer provided parallel wiring, signal
distortion has already been found for signals having a frequency larger than
0.25 kHz.
Therefore the original data acquisition system of the Presster was found to
be inadequate as the speed dependant sample rate in the range of 1.5 and
7.4 kHz worked only for slow signals e.g. pre- and main compaction force
signals.
It was been found to be unsuitable to monitor rather high frequency signals,
e.g. those of the TO event.
In order to reliably monitor all the signals of the Presster properly without
any limitations and at a user selectable sample rate, the independent data
acquisition system DAQ4 has been used in all subsequent data capture.
Therefore, the original system of the Presster became redundant except for
control aspects.

Results and Discussion – Compaction Force Measurement System
27
4.2 Compaction Force Measurement Systems
The evaluation of the process of powder compaction in terms of
compactibility requires an accurate determination of the compaction
pressure over the entire contact time between punch and compaction roller.
In contrast to the standard instrumentation of just the lower pre- and main
compaction rollers on research and production size rotary tablet presses,
both the upper and lower pre- and main compaction forces have been
monitored on the Presster.
With respect to the simulation of a Fette P1200 rotary tablet press the lower
pre- and main compaction forces of the Presster have been investigated,
since on a Fette P1200 only the lower pre- and main compaction forces are
displayed.
4.2.1 Techniques for Force Measurements
On the field of tableting mainly two different technologies, strain gauges and
piezoelectric transducers, are in use for the measurement of the applied
compaction forces.
The most popular way until today is the use of strain gauges applied to
different machine parts (Watt, 1988; Bauer-Brandl, 1998), as Higuchi and
co-workers previously had in 1952.
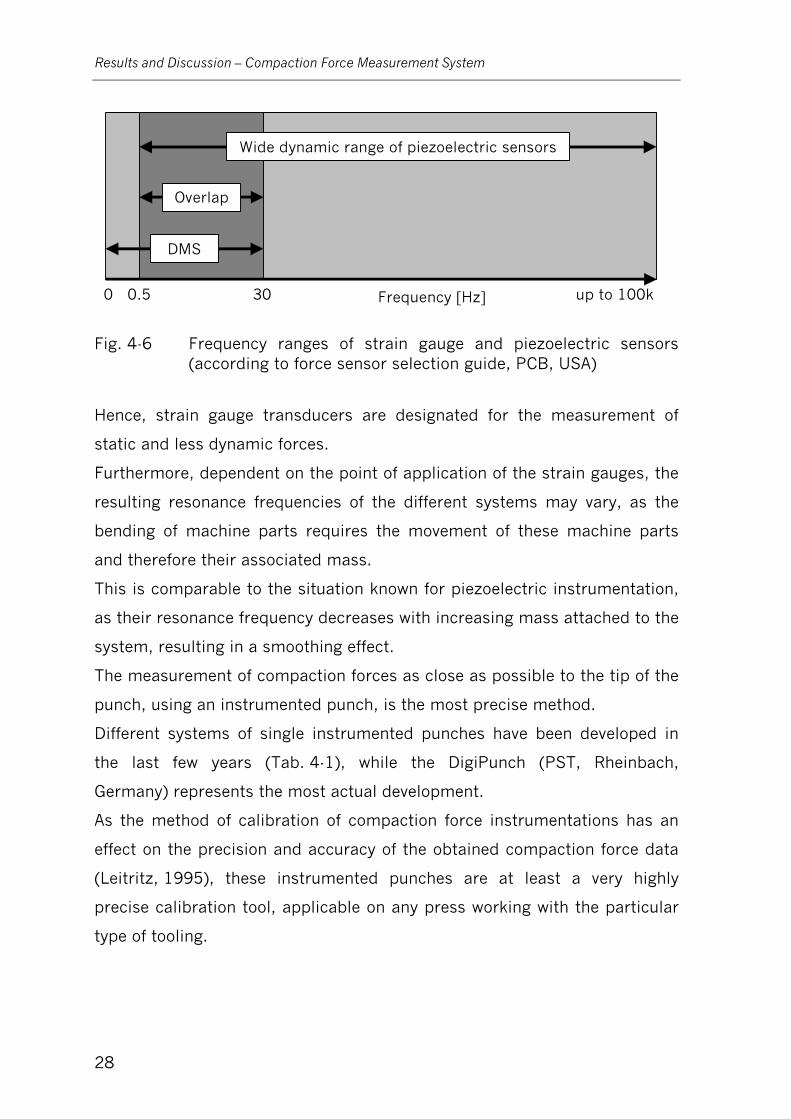
As a consequence of the mechanical design of these strain gauge
transducers and their need for linear bending or shearing machine parts,
their resonance frequency is limited to lower frequencies (Fig. 4-6).
Results and Discussion – Compaction Force Measurement System
28
0 0.5 30 up to 100k
DMS
Overlap
Wide dynamic range of piezoelectric sensors
Frequency [Hz]
Fig. 4-6 Frequency ranges of strain gauge and piezoelectric sensors (according to force sensor selection guide, PCB, USA)
Hence, strain gauge transducers are designated for the measurement of
static and less dynamic forces.
Furthermore, dependent on the point of application of the strain gauges, the
resulting resonance frequencies of the different systems may vary, as the
bending of machine parts requires the movement of these machine parts
and therefore their associated mass.
This is comparable to the situation known for piezoelectric instrumentation,
as their resonance frequency decreases with increasing mass attached to the
system, resulting in a smoothing effect.
The measurement of compaction forces as close as possible to the tip of the
punch, using an instrumented punch, is the most precise method.
Different systems of single instrumented punches have been developed in
the last few years (Tab. 4-1), while the DigiPunch (PST, Rheinbach,
Germany) represents the most actual development.
As the method of calibration of compaction force instrumentations has an
effect on the precision and accuracy of the obtained compaction force data
(Leitritz, 1995), these instrumented punches are at least a very highly
precise calibration tool, applicable on any press working with the particular
type of tooling.

Results and Discussion – Compaction Force Measurement System
29
Tab. 4-1 Various models of instrumented punches
Brand Supplier
Portable Press Analyzer Puuman Oy, Kuopio, Finland
Telemetric Punch University of Bonn, Germany
The Punch SMI, Whitehouse, New Jersey, USA
DigiPunch PST, Rheinbach, Germany
Especially with scale-up problems or the comparability between presses of
different brands or size, the dynamic calibration of tablet presses may help
to identify and finally minimise calibration induced discrepancies and is
therefore the calibration method of choice.
4.2.2 Investigation of the Original Presster Pre- and Main Compaction
Force Measurement Systems
In case of the Presster, the strain gauges (Tab. 4-2) have been placed on the
compaction roller pins.
Each single strain gauge works as a Wheatstone bridge, is fully active and
temperature compensated.
Tab. 4-2 Strain gauges used for compression roller pin instrumentation
on the Presster
Point of Application Type of strain gauge Supplier
Upper and lower pre-compression roll pin N2A-06-T031P-350 Vishay
Upper and lower main compression roll pin TK-06-S145R-10C Vishay
The investigation of the compactibility of different excipients simulating a
Fette P1200 rotary tablet press has been performed to evaluate the
comparability of tablets produced on both the Presster and the Fette P1200
at similar compression pressure settings.
Results and Discussion – Compaction Force Measurement System
30
On both presses a 9R15 Euro B tooling has been used. The Fette P1200 has
been equipped with a full set of this type of punches and dies.
Depending on the deformation behaviour of any pharmaceutical material,
the densification speed is known to have a major influence on tablet
properties (Roberts, 1985). Therefore, the diameter of both the pre- and
main compaction rollers used on the Presster have been selected to match
the diameters of the compaction rollers of the Fette P1200 (all 250 mm).
Excipients and lubricants used within this investigation have been blended in
a 20 l metal vessel using a lab-scale free fall blender (Bohle, Germany).
As the vessel had been filled by a maximum of 5 kg, the remaining space
was sufficient for the blending process. The lubricant has been placed in
between two fractions of the individual excipients inside the vessel, in order
to minimise lubricant adhesion to the inner wall of the blending vessel.
Blending time was set to 3 minutes at 60 RPM, while the direction of
rotation of the blending vessel was changed every 30 seconds.
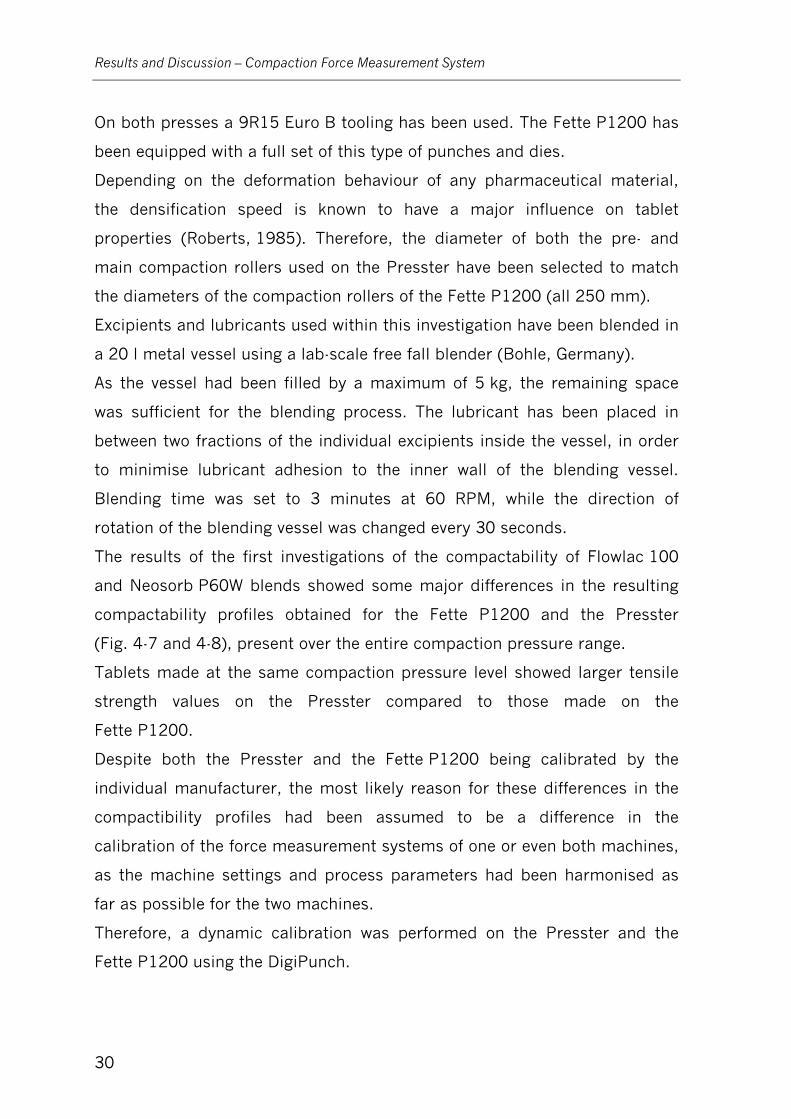
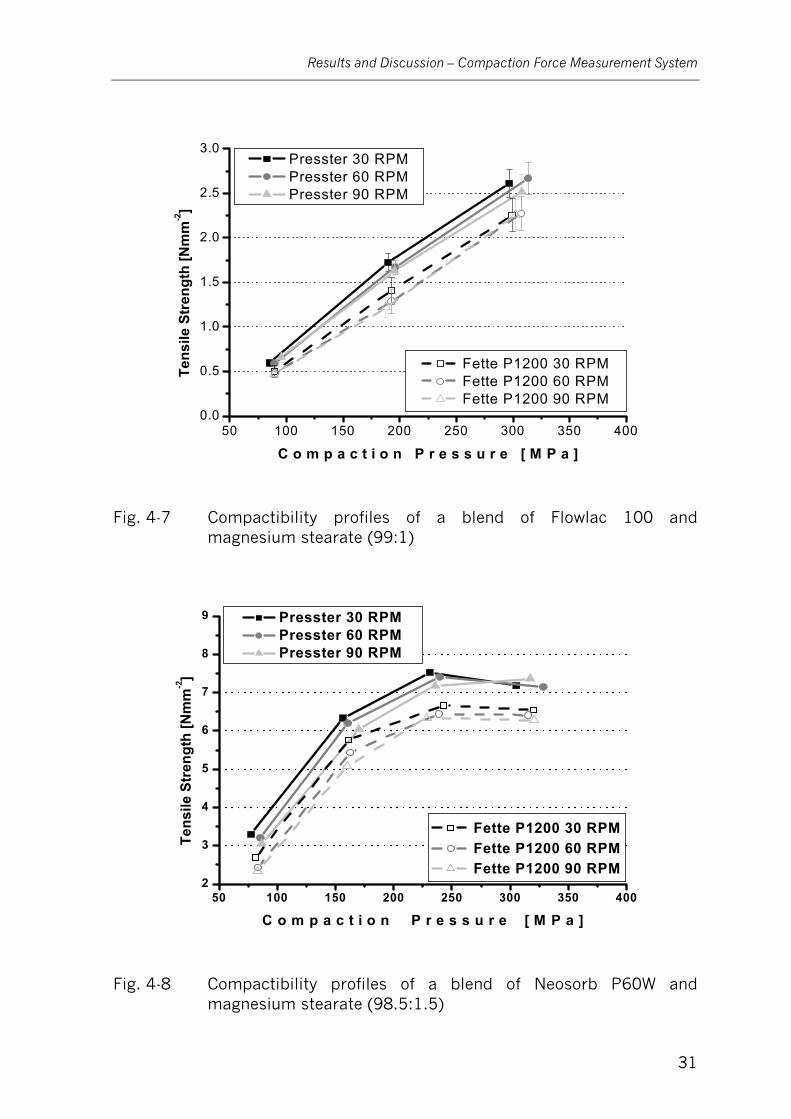
The results of the first investigations of the compactability of Flowlac 100
and Neosorb P60W blends showed some major differences in the resulting
compactability profiles obtained for the Fette P1200 and the Presster
(Fig. 4-7 and 4-8), present over the entire compaction pressure range.
Tablets made at the same compaction pressure level showed larger tensile
strength values on the Presster compared to those made on the
Fette P1200.
Despite both the Presster and the Fette P1200 being calibrated by the
individual manufacturer, the most likely reason for these differences in the
compactibility profiles had been assumed to be a difference in the
calibration of the force measurement systems of one or even both machines,
as the machine settings and process parameters had been harmonised as
far as possible for the two machines.
Therefore, a dynamic calibration was performed on the Presster and the
Fette P1200 using the DigiPunch.
Results and Discussion – Compaction Force Measurement System
31
50 100 150 200 250 300 350 4000.0
0.5
1.0
1.5
2.0
2.5
3.0
Fette P1200 30 RPM Fette P1200 60 RPM Fette P1200 90 RPM
Presster 30 RPM Presster 60 RPM Presster 90 RPM
Tens
ile S
tren
gth
[Nm
m-2]
C o m p a c t i o n P r e s s u r e [ M P a ]
Fig. 4-7 Compactibility profiles of a blend of Flowlac 100 and magnesium stearate (99:1)
50 100 150 200 250 300 350 4002
3
4
5
6
7
8
9
Fette P1200 30 RPM Fette P1200 60 RPM Fette P1200 90 RPM
Presster 30 RPM Presster 60 RPM Presster 90 RPM
Tens
ile S
tren
gth
[Nm
m-2]
C o m p a c t i o n P r e s s u r e [ M P a ]
Fig. 4-8 Compactibility profiles of a blend of Neosorb P60W and magnesium stearate (98.5:1.5)

Results and Discussion – Compaction Force Measurement System
32
4.2.3 Dynamic Calibration of the Original Pre- and Main Compaction
Force Measurement Systems
Differences between static and dynamic calibrations of tablet presses have
been shown by Leitritz (1995). Therefore, to calibrate the Presster pre- and
main compaction force measurement instrumentations, a dynamic
calibration method was preferred.
After all the amplifiers have been warmed up for minimum 1 hour, at least
10 tablets of Emcompress have been made at the load settings of the final
calibration runs, before the dynamic calibration has been performed at a
horizontal speed of 1.2 ms-1.
The compaction forces monitored by the instrumented punch DigiPunch
(PST, Germany) during the calibration runs were used as the reference force
in order to calibrate the original pre- and main compaction force
measurement systems, of which the voltage output has been monitored by
the DAQ4 system.
Both data sets were analyzed using the CaliDat software
(Hucke Software, Solingen, Germany).
As long as the residuals of the linear fit of the data points of the calibration
run described a mathematical function, polynomial fits have been used to
adequately characterise the data sets.
The degree of the polynomial function has been increased up to the
maximum of a forth degree, until the residuals of the following polynomial
degree either became more narrow or had been spread randomly around the
fit. If none of these two demands had been fulfilled by the following
polynomial degree the smaller one had been accepted.
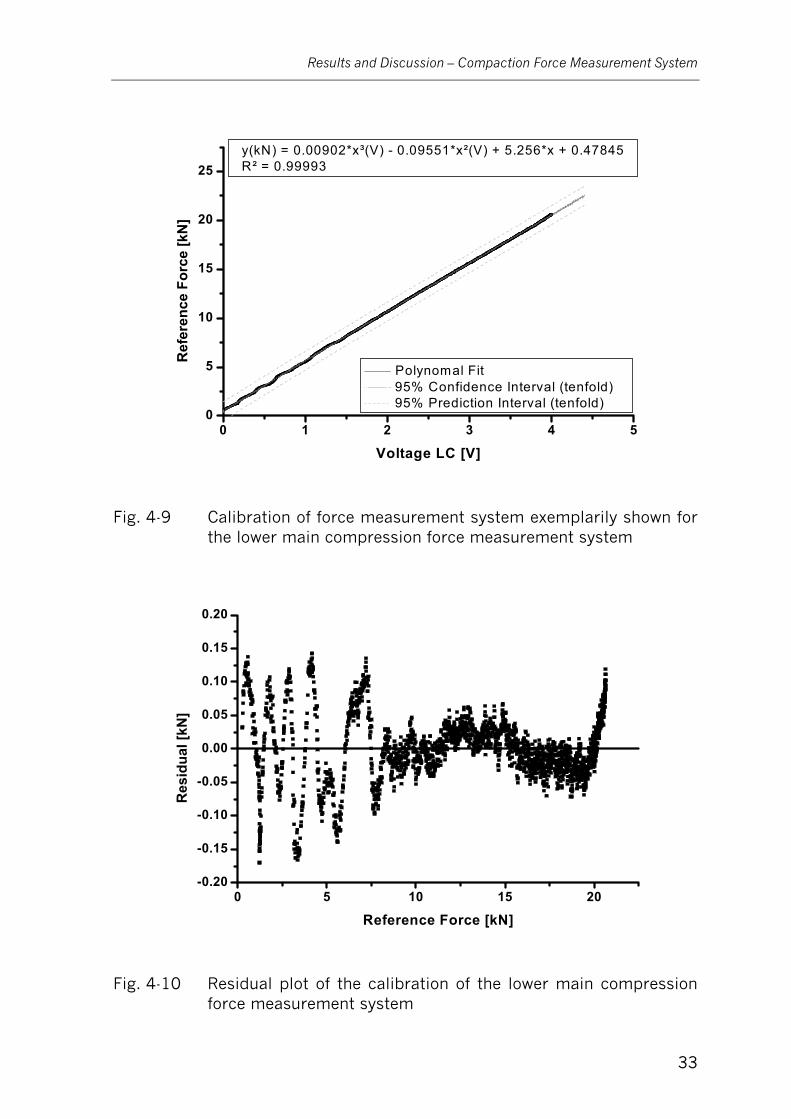
The calibration function of the lower main compaction force measurement
system of the Presster as well as the corresponding residual plot is given by
Fig. 4-9 and 4-10, respectively, which have been significantly different to the
ones preset by the manufacturer within the original data acquisition system.
The 95 % confidence and prediction intervals are shown tenfold enhanced
for better recognisability.
Results and Discussion – Compaction Force Measurement System
33
0 1 2 3 4 50
5
10
15
20
25R
efer
ence
For
ce [k
N]
Voltage LC [V]
Polynomal Fit 95% Confidence Interval (tenfold) 95% Prediction Interval (tenfold)
y(kN) = 0.00902*x³(V) - 0.09551*x²(V) + 5.256*x + 0.47845R² = 0.99993
Fig. 4-9 Calibration of force measurement system exemplarily shown for the lower main compression force measurement system
0 5 10 15 20-0.20
-0.15
-0.10
-0.05
0.00
0.05
0.10
0.15
0.20
Res
idua
l [kN
]
Reference Force [kN]
Fig. 4-10 Residual plot of the calibration of the lower main compression force measurement system
Results and Discussion – Compaction Force Measurement System
34
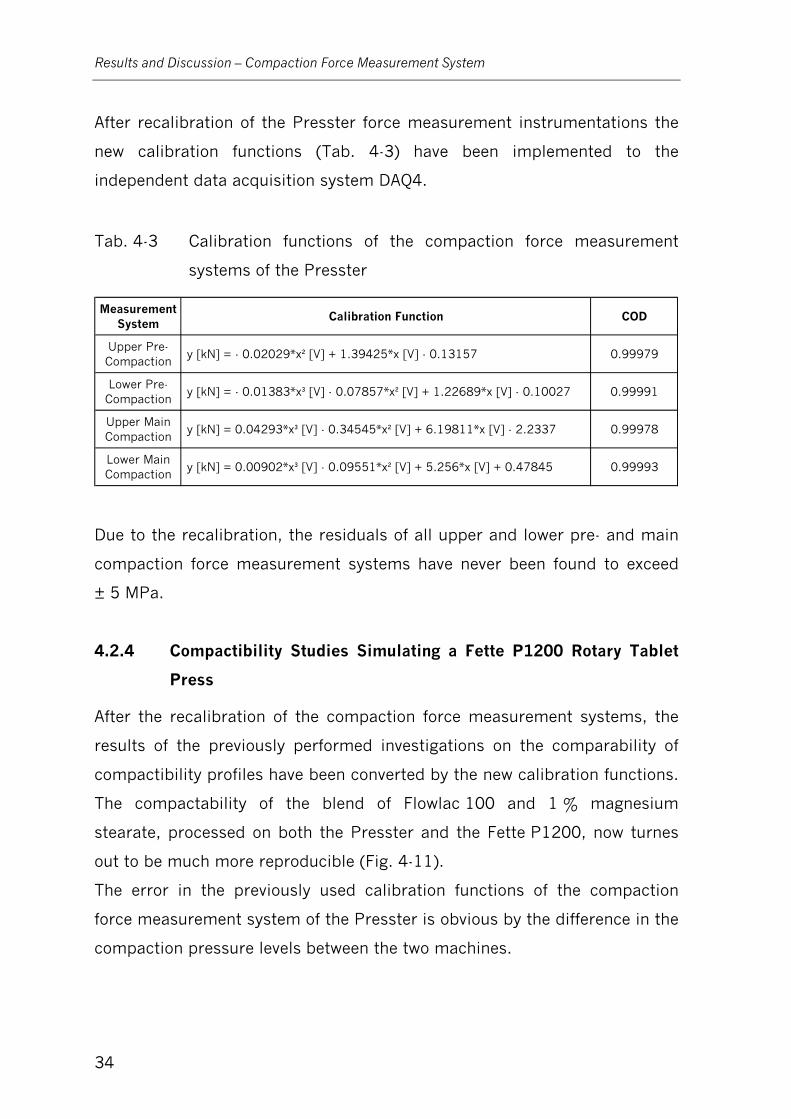
After recalibration of the Presster force measurement instrumentations the
new calibration functions (Tab. 4-3) have been implemented to the
independent data acquisition system DAQ4.
Tab. 4-3 Calibration functions of the compaction force measurement
systems of the Presster
Measurement System
Calibration Function COD
Upper Pre-Compaction
y [kN] = - 0.02029*x² [V] + 1.39425*x [V] - 0.13157 0.99979
Lower Pre-Compaction
y [kN] = - 0.01383*x³ [V] - 0.07857*x² [V] + 1.22689*x [V] - 0.10027 0.99991
Upper Main Compaction
y [kN] = 0.04293*x³ [V] - 0.34545*x² [V] + 6.19811*x [V] - 2.2337 0.99978
Lower Main Compaction
y [kN] = 0.00902*x³ [V] - 0.09551*x² [V] + 5.256*x [V] + 0.47845 0.99993
Due to the recalibration, the residuals of all upper and lower pre- and main
compaction force measurement systems have never been found to exceed
± 5 MPa.
4.2.4 Compactibility Studies Simulating a Fette P1200 Rotary Tablet
Press
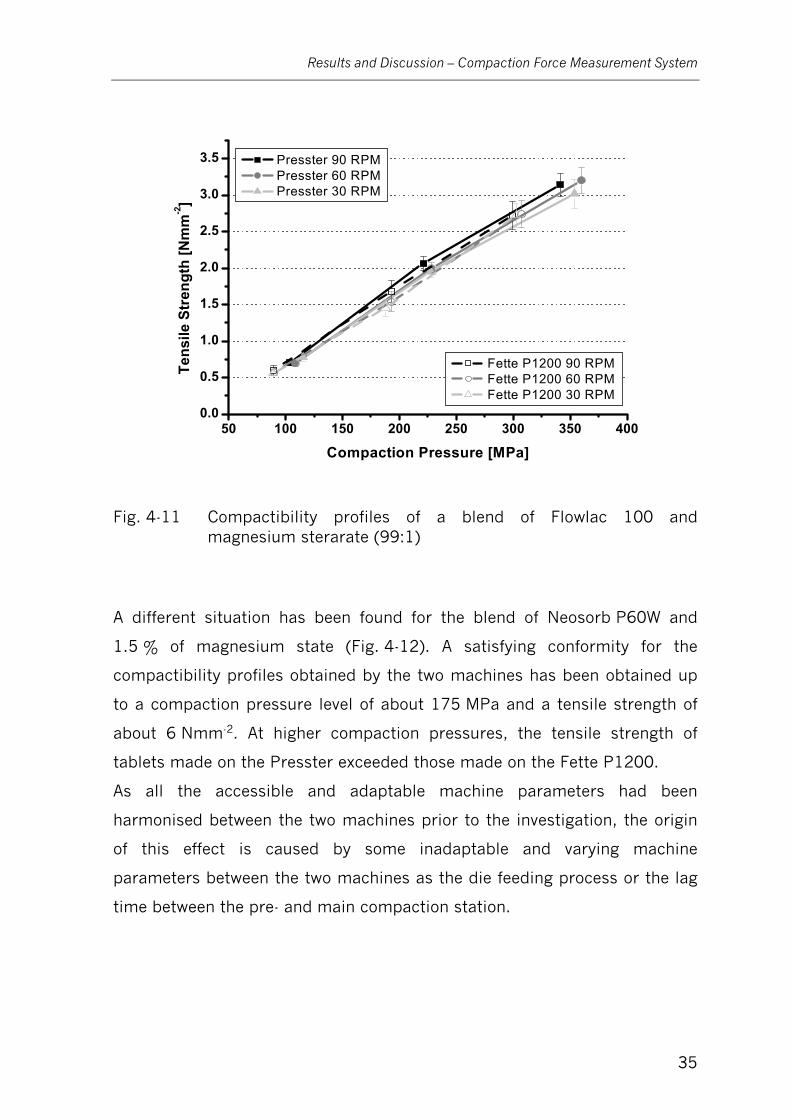
After the recalibration of the compaction force measurement systems, the
results of the previously performed investigations on the comparability of
compactibility profiles have been converted by the new calibration functions.
The compactability of the blend of Flowlac 100 and 1 % magnesium
stearate, processed on both the Presster and the Fette P1200, now turnes
out to be much more reproducible (Fig. 4-11).
The error in the previously used calibration functions of the compaction
force measurement system of the Presster is obvious by the difference in the
compaction pressure levels between the two machines.
Results and Discussion – Compaction Force Measurement System
35
50 100 150 200 250 300 350 4000.0
0.5
1.0
1.5
2.0
2.5
3.0
3.5
Fette P1200 90 RPM Fette P1200 60 RPM Fette P1200 30 RPM
Presster 90 RPM Presster 60 RPM Presster 30 RPM
Tens
ile S
tren
gth
[Nm
m-2]
Compaction Pressure [MPa]
Fig. 4-11 Compactibility profiles of a blend of Flowlac 100 and magnesium sterarate (99:1)
A different situation has been found for the blend of Neosorb P60W and
1.5 % of magnesium state (Fig. 4-12). A satisfying conformity for the
compactibility profiles obtained by the two machines has been obtained up
to a compaction pressure level of about 175 MPa and a tensile strength of
about 6 Nmm-2. At higher compaction pressures, the tensile strength of
tablets made on the Presster exceeded those made on the Fette P1200.
As all the accessible and adaptable machine parameters had been
harmonised between the two machines prior to the investigation, the origin
of this effect is caused by some inadaptable and varying machine
parameters between the two machines as the die feeding process or the lag
time between the pre- and main compaction station.

Results and Discussion – Compaction Force Measurement System
36
50 100 150 200 250 300 350 4002
3
4
5
6
7
8
9
Fette P1200 30 RPM Fette P1200 60 RPM Fette P1200 90 RPM
Presster 30 RPM Presster 60 RPM Presster 90 RPM
Tens
ile S
tren
gth
[Nm
m-2]
Compaction Pressure [MPa]
Fig. 4-12 Compactibility profiles of a blend of Neosorb P60W and magnesium sterarate (98.5:1.5)
The production and investigation of sorbitol tablets, having a tensile strength
larger than 5 to 6 Nmm-2, is quite unusual and of rather limited practical
interest, as those large tensile strength values in most cases will have an
adverse effect on disintegration and dissolution profiles.
The conformity of the compactibility profiles over the range of practical use
for production, including the consistency for the observed speed
dependency, predominates the deviation in the range above 175 MPa or
rather 5-6 Nmm-2.
As the compactibility profiles of other blends did not show any obscurity in
the upper compaction pressure ranges, it might be suggested, that the
reason for this difference has to be located in the determination of the
crushing force of the tablets and the particular hardness tester.
As the crushing force of tablets of both machines have been investigated on
the same type of hardness tester (Multicheck Turbo III, Erweka, Germany)
this assumption is unlikely and it’s a true difference.

Results and Discussion – Compaction Force Measurement System
37
The repetition of the investigation of the compactibility of Neosorb P60W did
not show any significant variation compared to Fig. 4-12.
Finally, the same investigation has been performed for a blend of Di-Cafos
and 1 % magnesium stearate (Fig. 4-13).
50 100 150 200 250 300 350
0.5
1.0
1.5
2.0
2.5
3.0
3.5
4.0 Presster 27.3 RPM (1200) /
18.6 RPM (2090) "136.4" RPM (1200) /
93.2 RPM (2090)
Fette P1200 15 RPM 30 RPM 60 RPM 85 RPM
Tens
ile S
tren
gth
[Nm
m-2]
C o m p a c t i o n P r e s s u r e [ M P a ]
Fig. 4-13 Compaction Pressure vs. Tensile Strength Profile of a blend of Di-Cafos and Magnesium Sterarate (99:1)
Due to the brittle nature of dicalcium phosphate dihydrates it has been
expected, that the tensile strength of tablets of Di-Cafos are hardly affected
by an increase in tableting speed (Armstrong, 1989; Rees, 1978).
Therefore, the set speed values of the Presster have been selected to match
its minimum and maximum achievable speed conditions. As the maximum
horizontal speed of the Presster exceeds the speed range of the Fette P1200
a Fette 2090 has been simulated, while the Fette P1200 has been operated
at four different speed settings of 15, 30, 60 and 90 RPM.
The resulting compactibility profiles obtained by both the Presster and the
Fette P1200 complied sufficiently with each other and finally confirmed the
more or less speed independent compactibility of dicalcium phosphates.
Results and Discussion – Compaction Force Measurement System
38
4.2.5 Summary
The compaction force measurement systems of the Presster have been
investigated in order to ensure reliable compaction force measurements
during compressibility and compactibility studies.
Comparable pressure levels on both the Presster and the Fette P1200
should result in compacts having similar properties.
Therefore, compactibility profiles of three different blends of pharmaceutical
excipients have been investigated at different speed settings on both the
Presster and the Fette P1200 rotary tablet press, revealing major
differences, in particular at higher pressure levels.
A dynamic recalibration of both the Fette P1200 and the Presster finally
disclosed a wrong calibration of the compaction force measurement systems
of the Presster.
Hence, after recalibration, compactibility profiles of the blends of
Flowlac 100 and Di-Cafos complied satisfyingly between the two machines,
while the blend of Neosorb P60W still showed some inconsistency at
compaction pressure levels larger than 175 MPa and tensile strength values
of the compact of about 6 Nmm-2 respectively.
As the compaction cycle on both the Presster and the Fette P1200 has been
harmonised as far as possible, the remaining, inaccessible variations in the
compaction process of the two machines, as e.g. the die feeding system and
the lag time between pre- and main compaction stations, account for these
discrepancies.
Therefore, compactibility data obtained at compaction pressure levels
beyond 175 MPa or accompanying tensile strength values larger than
6 Nmm-2 have to be handled carefully, while a general rejection of
compaction data obtained at pressure levels beyond 175 MPa has not been
indicated due to the consistency in the results observed for the blends of
Flowlac 100 and Di-Cafos.
Nevertheless, the production of tablets, having tensile strength values above
6 Nmm-2 is rather seldom due to the increasing number of adverse effects

Results and Discussion – Compaction Force Measurement System
39
like unsatisfying disintegration time or lacking divisibility of tablets.
Therefore, the compaction force measurement systems of the Presster have
finally been applicable to monitor compression forces reliably.
Results and Discussion – Ejection Force Measurement System
40
4.3 Ejection Force Measurement System
The ejection force in general represents the maximum force necessary to
overcome the friction of the tablet at the beginning of the ejection phase.
It has often been found to be unequal to the overall maximum force of the
ejection event (Herzog, 1991).
The maximum, as well as the shape of the ejection force signal, sometimes
in combination with the residual force (Hanssen, 1970), are commonly used
to estimate the necessary lubrication of tableting blends with respect to
preventing friction and sticking problems.
Sticking tablets and increasing friction between tablets and punches and/or
dies are often first recognised by increasing ejection forces. Therefore, the
monitoring of these signals during research and development as well as
during production activities is recommended.
Investigations on this topic have been first published by Nelson (1954).
The instrumentation of the ejection cam of rotary tablet presses proved to be
more complex compared to the situation present on eccentric tablet
presses.
Knoechel (1967) placed the ejection cam of a rotary tablet press on two
strain-gauge instrumented bolts. The interpretation of ejection force signals
was quite difficult, as always more than one punch has been in contact with
the ejection cam at the same time. Therefore, a reduced number of punches
had to be used to eliminate this problem. To avoid any dependency between
the location of the punch on the cam and the measured load, the ejection
cam had to be supported on three widely spread transducers, whose outputs
have been summed (Williams, 1984).
Marshall (1983) suggested a segmented ejection cam in order to be able to
use a full set of punches on rotary tablet presses. Furthermore, the ejection
cams of rotary tablet presses have been shortened and, at the same time,
the width of the gauged section has been designed to be narrower.
Influences of the tablet band height as well as the machine speed on the
maximum height of the ejection peak have been found by Führer (1970),
Results and Discussion – Ejection Force Measurement System
41
using an instrumented eccentric tablet press.
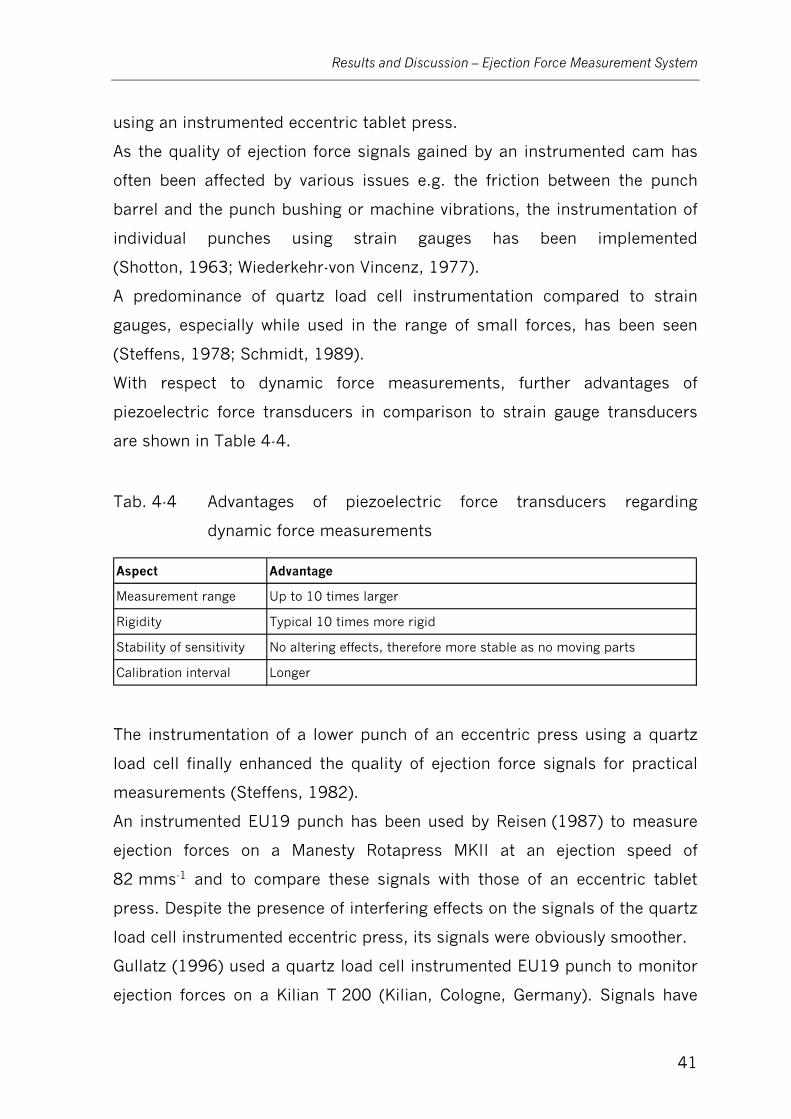
As the quality of ejection force signals gained by an instrumented cam has
often been affected by various issues e.g. the friction between the punch
barrel and the punch bushing or machine vibrations, the instrumentation of
individual punches using strain gauges has been implemented
(Shotton, 1963; Wiederkehr-von Vincenz, 1977).
A predominance of quartz load cell instrumentation compared to strain
gauges, especially while used in the range of small forces, has been seen
(Steffens, 1978; Schmidt, 1989).
With respect to dynamic force measurements, further advantages of
piezoelectric force transducers in comparison to strain gauge transducers
are shown in Table 4-4.
Tab. 4-4 Advantages of piezoelectric force transducers regarding
dynamic force measurements
Aspect Advantage
Measurement range Up to 10 times larger
Rigidity Typical 10 times more rigid
Stability of sensitivity No altering effects, therefore more stable as no moving parts
Calibration interval Longer
The instrumentation of a lower punch of an eccentric press using a quartz
load cell finally enhanced the quality of ejection force signals for practical
measurements (Steffens, 1982).
An instrumented EU19 punch has been used by Reisen (1987) to measure
ejection forces on a Manesty Rotapress MKII at an ejection speed of
82 mms-1 and to compare these signals with those of an eccentric tablet
press. Despite the presence of interfering effects on the signals of the quartz
load cell instrumented eccentric press, its signals were obviously smoother.
Gullatz (1996) used a quartz load cell instrumented EU19 punch to monitor
ejection forces on a Kilian T 200 (Kilian, Cologne, Germany). Signals have
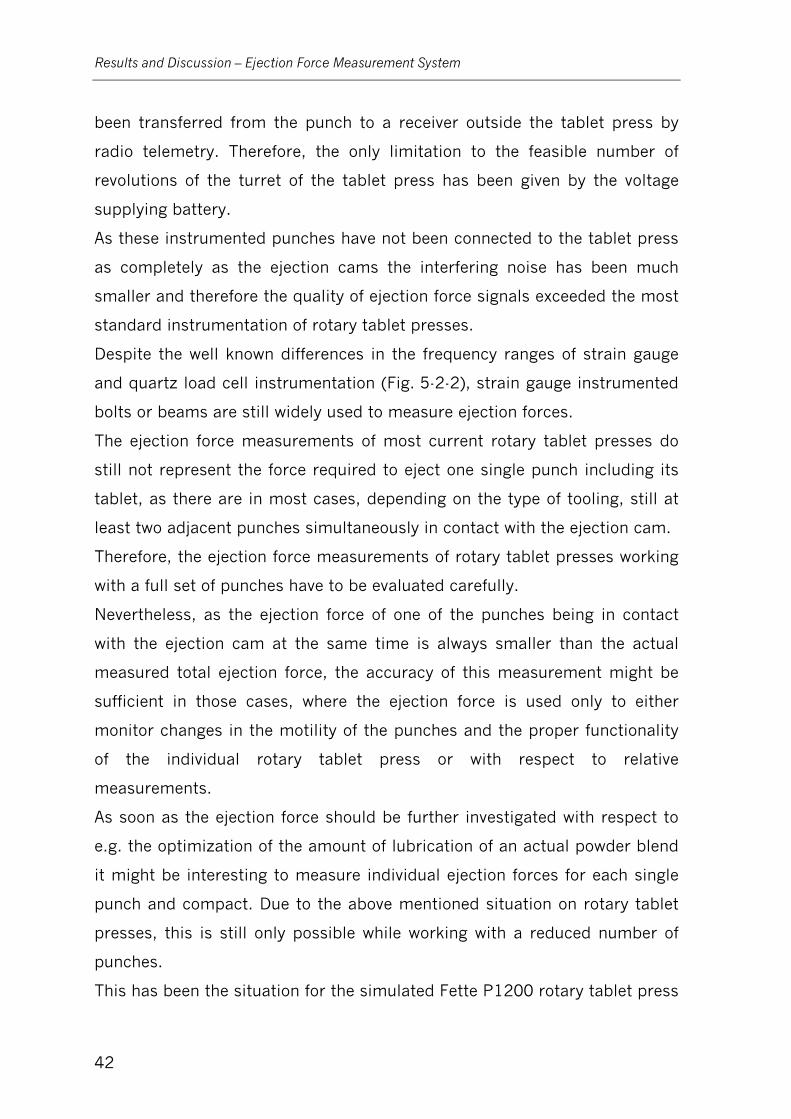
Results and Discussion – Ejection Force Measurement System
42
been transferred from the punch to a receiver outside the tablet press by
radio telemetry. Therefore, the only limitation to the feasible number of
revolutions of the turret of the tablet press has been given by the voltage
supplying battery.
As these instrumented punches have not been connected to the tablet press
as completely as the ejection cams the interfering noise has been much
smaller and therefore the quality of ejection force signals exceeded the most
standard instrumentation of rotary tablet presses.
Despite the well known differences in the frequency ranges of strain gauge
and quartz load cell instrumentation (Fig. 5-2-2), strain gauge instrumented
bolts or beams are still widely used to measure ejection forces.
The ejection force measurements of most current rotary tablet presses do
still not represent the force required to eject one single punch including its
tablet, as there are in most cases, depending on the type of tooling, still at
least two adjacent punches simultaneously in contact with the ejection cam.
Therefore, the ejection force measurements of rotary tablet presses working
with a full set of punches have to be evaluated carefully.
Nevertheless, as the ejection force of one of the punches being in contact
with the ejection cam at the same time is always smaller than the actual
measured total ejection force, the accuracy of this measurement might be
sufficient in those cases, where the ejection force is used only to either
monitor changes in the motility of the punches and the proper functionality
of the individual rotary tablet press or with respect to relative
measurements.
As soon as the ejection force should be further investigated with respect to
e.g. the optimization of the amount of lubrication of an actual powder blend
it might be interesting to measure individual ejection forces for each single
punch and compact. Due to the above mentioned situation on rotary tablet
presses, this is still only possible while working with a reduced number of
punches.
This has been the situation for the simulated Fette P1200 rotary tablet press
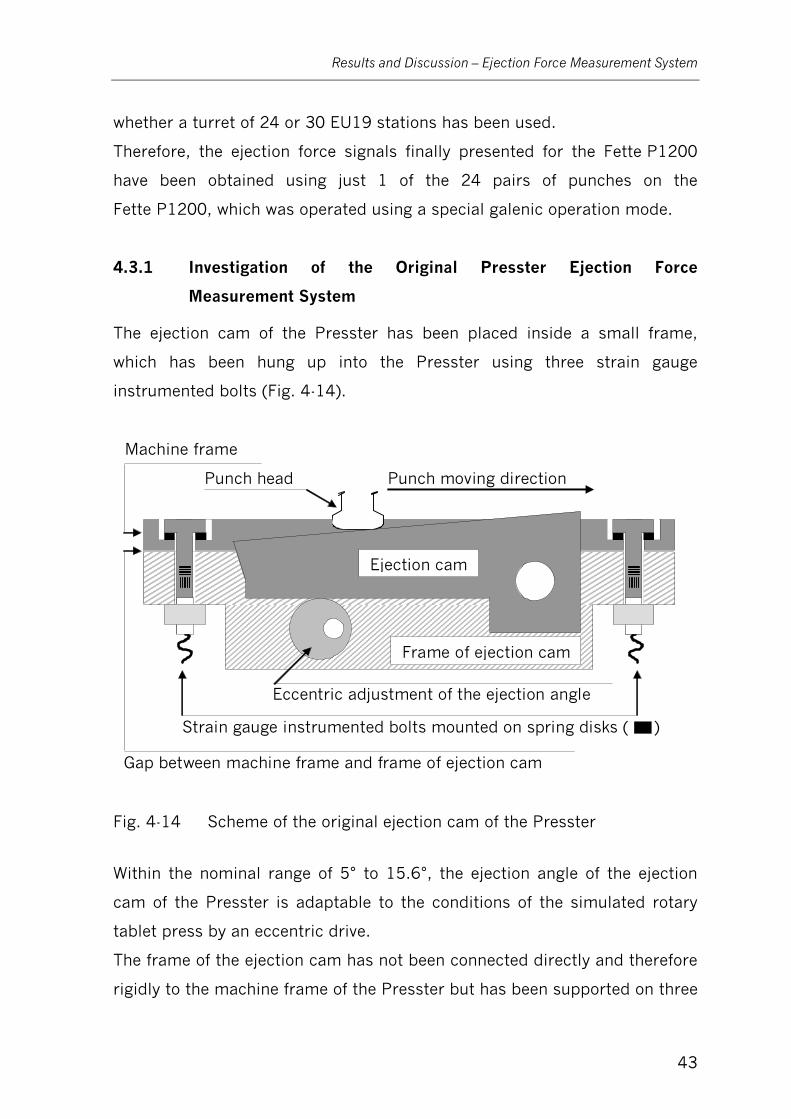
Results and Discussion – Ejection Force Measurement System
43
whether a turret of 24 or 30 EU19 stations has been used.
Therefore, the ejection force signals finally presented for the Fette P1200
have been obtained using just 1 of the 24 pairs of punches on the
Fette P1200, which was operated using a special galenic operation mode.
4.3.1 Investigation of the Original Presster Ejection Force
Measurement System
The ejection cam of the Presster has been placed inside a small frame,
which has been hung up into the Presster using three strain gauge
instrumented bolts (Fig. 4-14).
Eccentric adjustment of the ejection angle
Punch head
Punch moving direction
Ejection cam
Strain gauge instrumented bolts mounted on spring disks ( )
Frame of ejection cam
Gap between machine frame and frame of ejection cam
Fig. 4-14 Scheme of the original ejection cam of the Presster
Within the nominal range of 5° to 15.6°, the ejection angle of the ejection
cam of the Presster is adaptable to the conditions of the simulated rotary
tablet press by an eccentric drive.
The frame of the ejection cam has not been connected directly and therefore
rigidly to the machine frame of the Presster but has been supported on three
Machine frame
Results and Discussion – Ejection Force Measurement System
44
sets of disk springs, one at each mounting point, working as an overload
protection for the ejection cam.
As the ejection cam was designed to be not directly instrumented by itself,
the ejection force measured by this system equals the extension of the
instrumented bolts.
The signals of the three strain gauge instrumented bolts have been summed
up to one signal, which has been processed by the associated amplifier
(DSCA38-05, Dataforth, USA) before being sent to the data acquisition
system.
300 350 400 450 500-150
-100
-50
0
50
100
150
200
250
EJMC
Ejec
tion
Forc
e [N
]
Time [ms]
PC
Fig. 4-15 Ejection force signal gained by the original instrumentation of the Presster
The already previously mentioned, rather loose supporting of the frame of
the ejection cam on disk springs with respect to an overload protection,
being more than obvious due to the presence of a small gap in between the
two frames, was supposed to be responsible for the quite noisy signal
monitored by the ejection (EJ) force measurement system (Fig. 4-15).

Results and Discussion – Ejection Force Measurement System
45
Early parts of the ejection force signal could be clearly associated to the
previous pre- and main compaction events (PC and MC in Fig. 4-15).
These observations would resemble the behaviour of the ejection force
measurement system of a Korsch PH-106 rotary tablet press (Korsch,
Germany). Gullatz (1996) observed the lower compaction roller pin of the
PH-106, on which its ejection cam has been supported, evading the applied
ejection force as soon as a counter pressure of a hydraulic piston fell short
of a certain value.
Due to the huge oscillations of the entire ejection force signals obtained by
the original instrumentation of the Presster, representing a resonance
frequency of about 170 Hz, the evaluation of these signals has not been
possible.
The original calibration function of the ejection force measurement system
became invalid by any modification of the tightening of the connection
between the frame of the ejection cam and the machine frame of the
Presster.
Unfortunately, the adaptation of the calibration function of the ejection force
measurement system, as well as those of any other original measurement
system of the Presster, has been inaccessible to the user by design of the
Presster data acquisition system.
So, the influence of the quality of fixation on the signal quality and the signal
to noise ratio could not be evaluated.
Additionally, as the ejection force measurement system has been activated
right at the beginning of the entire compaction cycle, the base line noise
level of the ejection force signal has been changed for the worse due to
machine vibrations caused by the pre- (PC) and main compaction (MC)
events prior to the native ejection event.
Due to these results, the ejection force measurement system had to be
totally redesigned in order to use the ejection force signal with respect to
product development and/or trouble-shooting purposes.
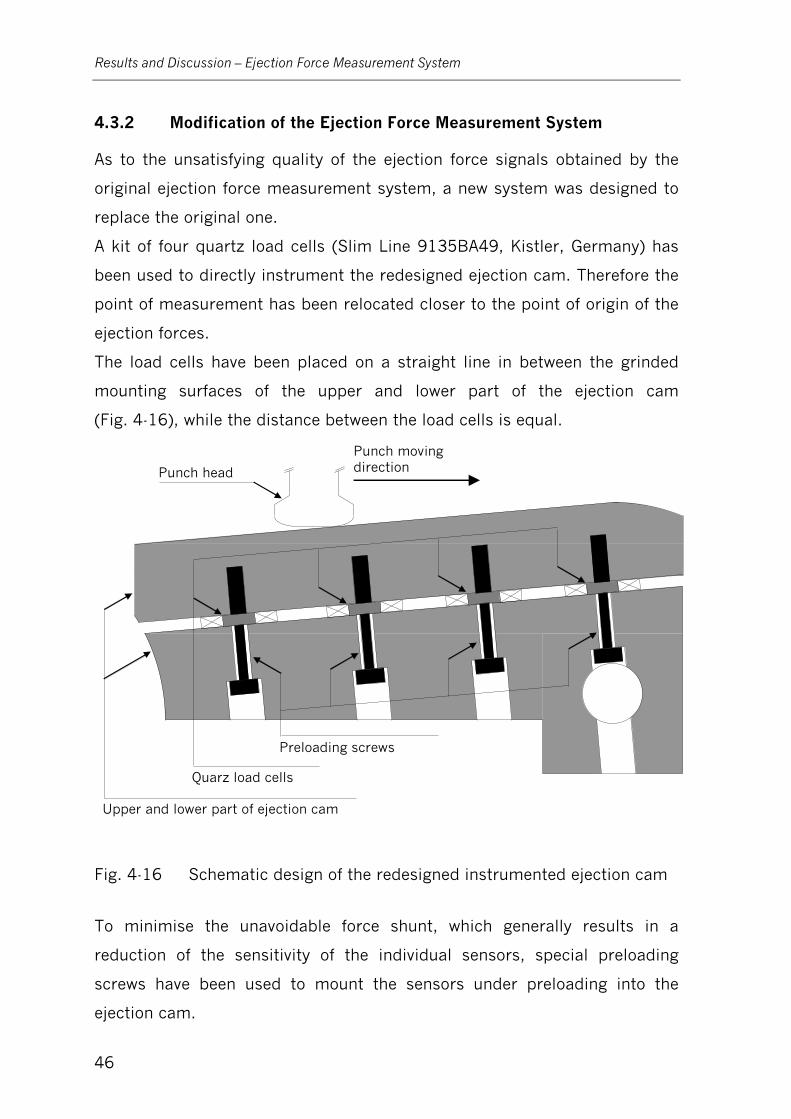
Results and Discussion – Ejection Force Measurement System
46
4.3.2 Modification of the Ejection Force Measurement System
As to the unsatisfying quality of the ejection force signals obtained by the
original ejection force measurement system, a new system was designed to
replace the original one.
A kit of four quartz load cells (Slim Line 9135BA49, Kistler, Germany) has
been used to directly instrument the redesigned ejection cam. Therefore the
point of measurement has been relocated closer to the point of origin of the
ejection forces.
The load cells have been placed on a straight line in between the grinded
mounting surfaces of the upper and lower part of the ejection cam
(Fig. 4-16), while the distance between the load cells is equal.
Upper and lower part of ejection cam
Quarz load cells
Preloading screws
Punch moving direction Punch head
Fig. 4-16 Schematic design of the redesigned instrumented ejection cam
To minimise the unavoidable force shunt, which generally results in a
reduction of the sensitivity of the individual sensors, special preloading
screws have been used to mount the sensors under preloading into the
ejection cam.
Results and Discussion – Ejection Force Measurement System
47
By design, the partial forces on each sensor are either summed up to give
the total force or measured as specific forces, acting on the individual
sensors.
The placement of the sensors inside the cam has been designed to avoid the
punch to load the ejection cam outside the outer two of the four sensors.
Therefore the bending of the cam over the edge of the outer sensors has
been avoided.
Finally, a photoelectric proximity sensor (WT 150-P460, Sick, Germany) has
been installed to initialise the data acquisition of signals monitored by the
revised ejection force measurement system immediately before the ejection
event, and therefore to prevent a time dependant base line drift of the
ejection force signals.
4.3.3 Calibration of the Modified Ejection Force Measurement System
The revised ejection force measurement system has been set up to measure
the total force applied to the ejection cam. Therefore the sum of the signals
of the four load cells has been transferred to the affiliated charge meter
(5015A1000, Kistler, Germany).
As the quartz load cells have been supplied uncalibrated, the sensitivity of
the new arrangement has to be determined prior to any calibration.
Therefore, each sensor has been individually preloaded up to an
uncalibrated force of 2,000 ± 100 N, working with a standard sensitivity for
the appropriated load cells of -3.5 pCN-1, which has been recommended by
the supplier.
The preload has been applied to the individual load cells to guarantee a
straight vertical force transmission from the punch via the upper part of the
ejection cam to the load cells and therefore minimised interfering effects of
both bending moment and force shunt.
Too small a preload may lead to falsified ejection force signals due to
oblique and inconsistent force transmission over the edge of the sensors.
As with the preload, applied to one load cell mounted in the new ejection
Results and Discussion – Ejection Force Measurement System
48
cam partly affects the preload of the adjacent load cells, the actual applied
partial load on each load cell has to be determined individually by the use of
one charge meter per load cell.
Afterwards, the system has been adapted to measure the total force. In the
following, the setting of the total sensitivity for the new system has been
adjusted until the precision and accuracy of the measured total forces has
been found to result in an error smaller than 10 N for the entire
measurement range up to 100 kg.
By this method the final used total sensitivity of the new ejection force
measurement system was determined to be -3.89 pCN-1.
In the end, each quartz load cell within the redesigned ejection cam has
been preloaded again individually between the upper and lower parts of the
ejection cam to a still uncalibrated partial force applied on each sensor of
2,000 ± 100 N using the previously specified sensitivity of 3.89 pCN-1.
For calibration as well as for measurements purposes, the measurement
range of the charge meter has been set to 250 MUV-1 at the recommended
operation mode “DC long” (τ > 105 s).
A static calibration was performed by the application of different weights up
to 100 kg, while 10 kg equals 98.1 N. The ejection cam was therefore
levelled horizontally giving a virtual ejection angle of 0° to ensure a straight
vertical force transmission to the sensors.
Due to the small dimensions of the ejection cam compared to the one of the
weights, a calibration above 100 kg was not possible.
This ejection force measurement system turned out to be linear under
preload within an error of ≤ 2 % FSO, the calibration function obtained
(Fig. 4-17) was finally extrapolated to larger force values than those of the
calibration run. The quality of the calibration function has been shown by the
95 % confidence and prediction intervals, which are both displayed
expanded by a factor of ten.
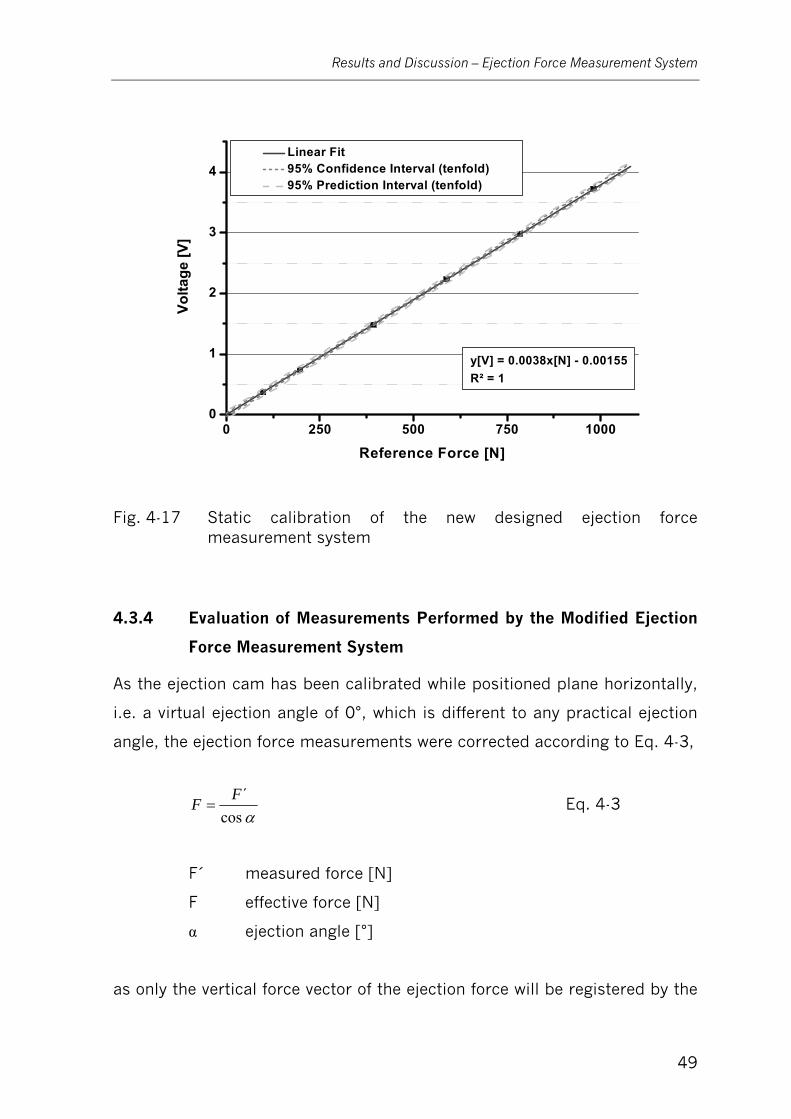
Results and Discussion – Ejection Force Measurement System
49
0 250 500 750 10000
1
2
3
4 Linear Fit 95% Confidence Interval (tenfold) 95% Prediction Interval (tenfold)
Volta
ge [V
]
Reference Force [N]
y[V] = 0.0038x[N] - 0.00155R² = 1
Fig. 4-17 Static calibration of the new designed ejection force measurement system
4.3.4 Evaluation of Measurements Performed by the Modified Ejection
Force Measurement System
As the ejection cam has been calibrated while positioned plane horizontally,
i.e. a virtual ejection angle of 0°, which is different to any practical ejection
angle, the ejection force measurements were corrected according to Eq. 4-3,
αcos´FF = Eq. 4-3
F´ measured force [N]
F effective force [N]
α ejection angle [°]
as only the vertical force vector of the ejection force will be registered by the
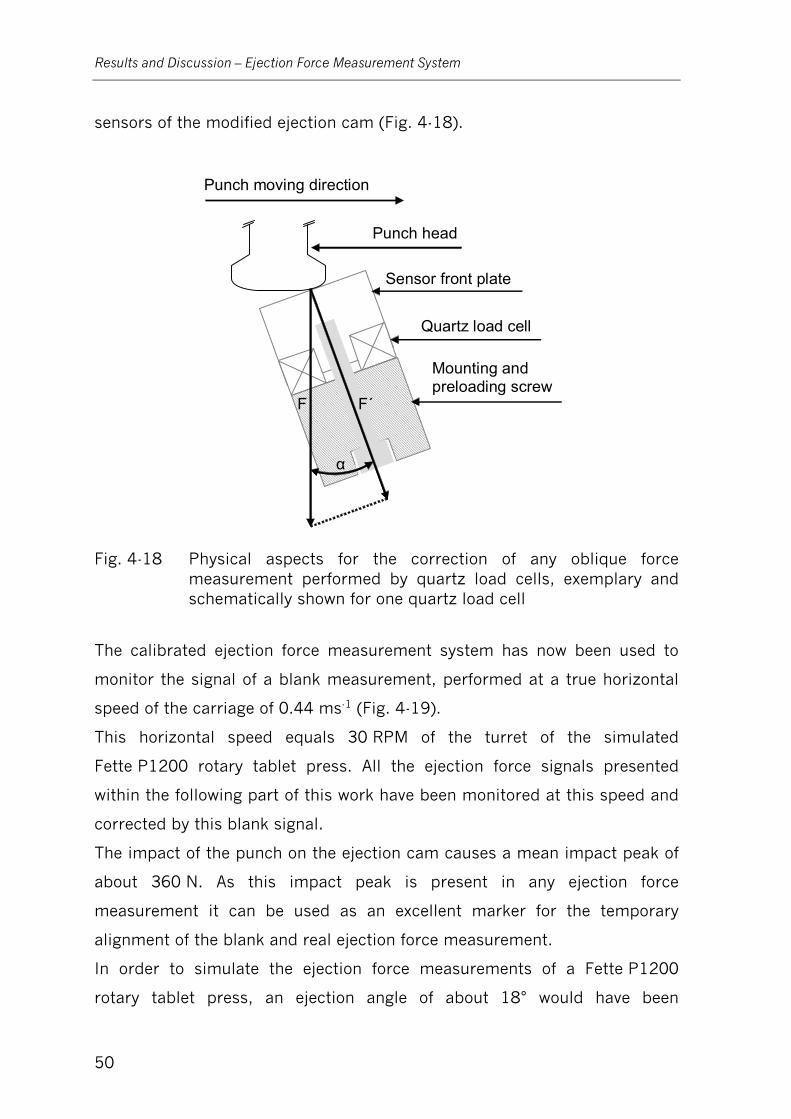
Results and Discussion – Ejection Force Measurement System
50
sensors of the modified ejection cam (Fig. 4-18).
Punch moving direction
Mounting and preloading screw
α
F´F
Sensor front plate
Quartz load cell
Punch head
Fig. 4-18 Physical aspects for the correction of any oblique force measurement performed by quartz load cells, exemplary and schematically shown for one quartz load cell
The calibrated ejection force measurement system has now been used to
monitor the signal of a blank measurement, performed at a true horizontal
speed of the carriage of 0.44 ms-1 (Fig. 4-19).
This horizontal speed equals 30 RPM of the turret of the simulated
Fette P1200 rotary tablet press. All the ejection force signals presented
within the following part of this work have been monitored at this speed and
corrected by this blank signal.
The impact of the punch on the ejection cam causes a mean impact peak of
about 360 N. As this impact peak is present in any ejection force
measurement it can be used as an excellent marker for the temporary
alignment of the blank and real ejection force measurement.
In order to simulate the ejection force measurements of a Fette P1200
rotary tablet press, an ejection angle of about 18° would have been
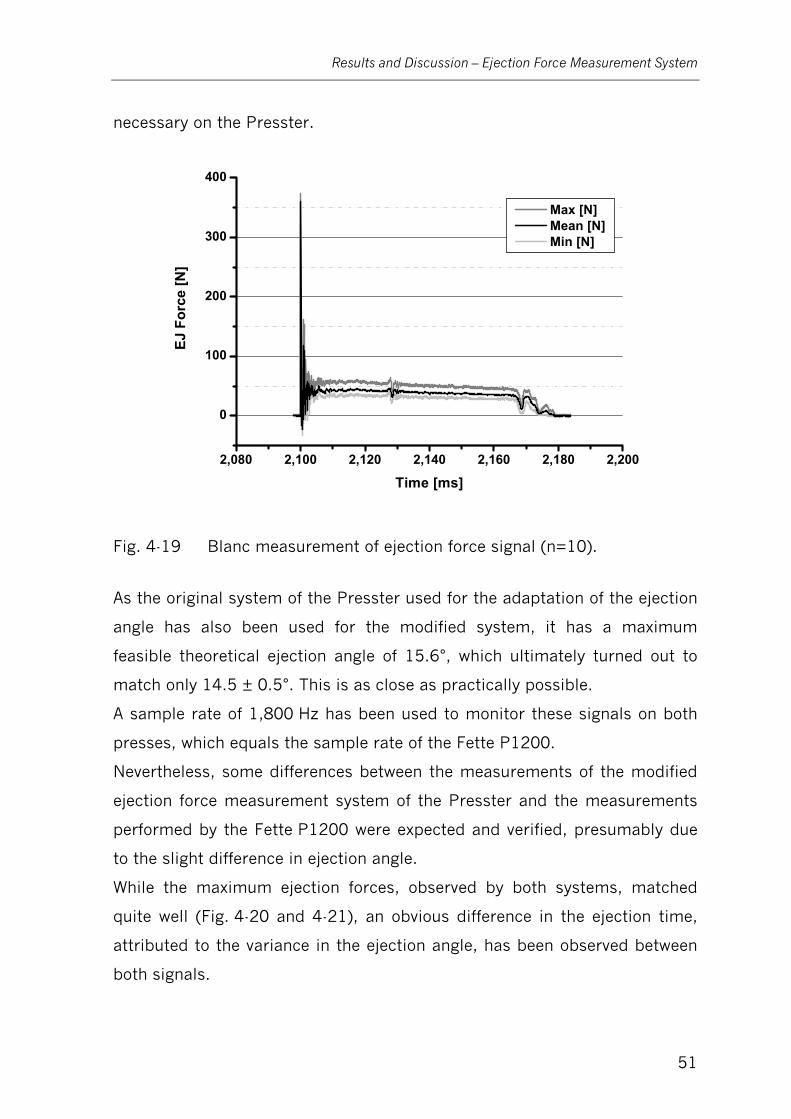
Results and Discussion – Ejection Force Measurement System
51
necessary on the Presster.
2,080 2,100 2,120 2,140 2,160 2,180 2,200
0
100
200
300
400
Max [N] Mean [N] Min [N]
EJ F
orce
[N]
Time [ms]
Fig. 4-19 Blanc measurement of ejection force signal (n=10).
As the original system of the Presster used for the adaptation of the ejection
angle has also been used for the modified system, it has a maximum
feasible theoretical ejection angle of 15.6°, which ultimately turned out to
match only 14.5 ± 0.5°. This is as close as practically possible.
A sample rate of 1,800 Hz has been used to monitor these signals on both
presses, which equals the sample rate of the Fette P1200.
Nevertheless, some differences between the measurements of the modified
ejection force measurement system of the Presster and the measurements
performed by the Fette P1200 were expected and verified, presumably due
to the slight difference in ejection angle.
While the maximum ejection forces, observed by both systems, matched
quite well (Fig. 4-20 and 4-21), an obvious difference in the ejection time,
attributed to the variance in the ejection angle, has been observed between
both signals.
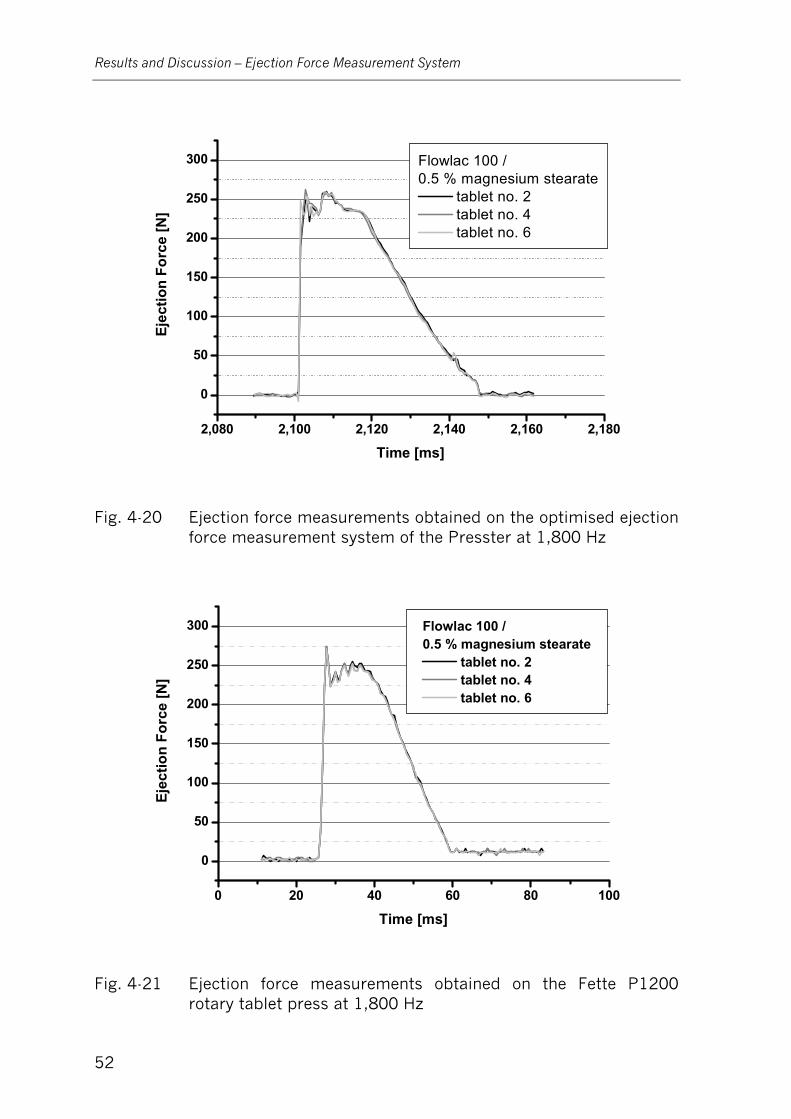
Results and Discussion – Ejection Force Measurement System
52
2,080 2,100 2,120 2,140 2,160 2,180
0
50
100
150
200
250
300 Flowlac 100 / 0.5 % magnesium stearate
tablet no. 2 tablet no. 4 tablet no. 6
Ejec
tion
Forc
e [N
]
Time [ms]
Fig. 4-20 Ejection force measurements obtained on the optimised ejection force measurement system of the Presster at 1,800 Hz
0 20 40 60 80 100
0
50
100
150
200
250
300 Flowlac 100 / 0.5 % magnesium stearate
tablet no. 2 tablet no. 4 tablet no. 6
Ejec
tion
Forc
e [N
]
Time [ms]
Fig. 4-21 Ejection force measurements obtained on the Fette P1200 rotary tablet press at 1,800 Hz
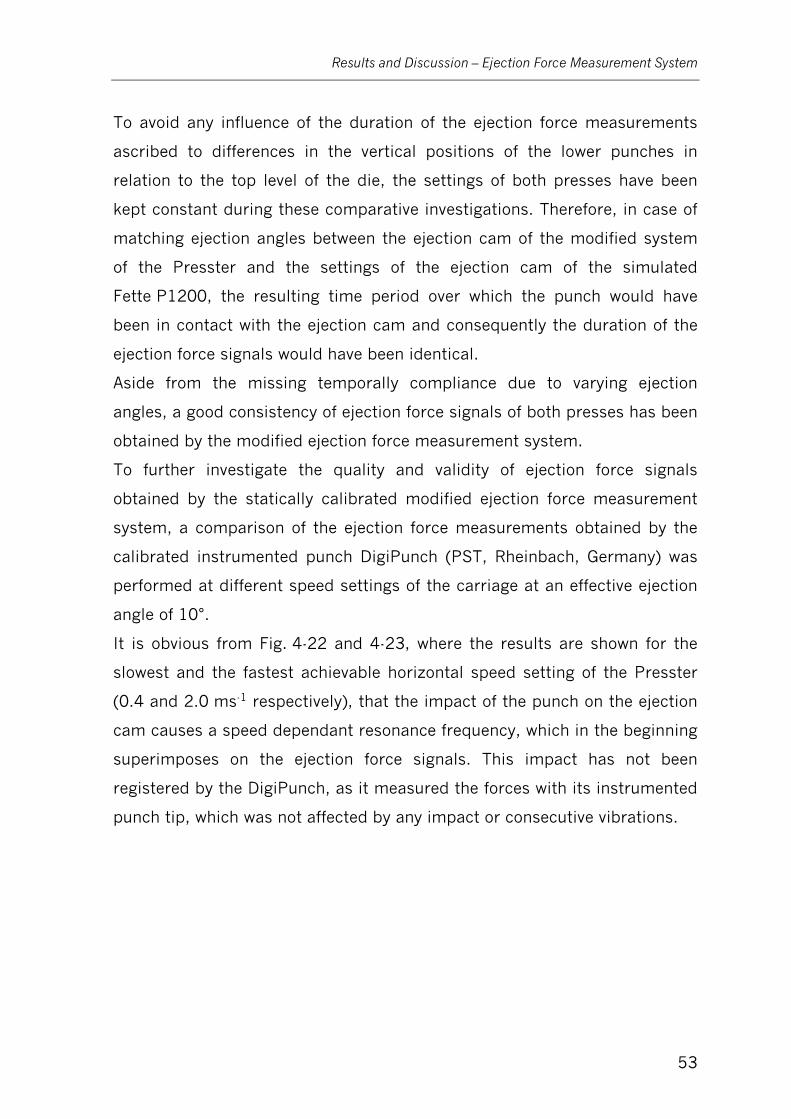
Results and Discussion – Ejection Force Measurement System
53
To avoid any influence of the duration of the ejection force measurements
ascribed to differences in the vertical positions of the lower punches in
relation to the top level of the die, the settings of both presses have been
kept constant during these comparative investigations. Therefore, in case of
matching ejection angles between the ejection cam of the modified system
of the Presster and the settings of the ejection cam of the simulated
Fette P1200, the resulting time period over which the punch would have
been in contact with the ejection cam and consequently the duration of the
ejection force signals would have been identical.
Aside from the missing temporally compliance due to varying ejection
angles, a good consistency of ejection force signals of both presses has been
obtained by the modified ejection force measurement system.
To further investigate the quality and validity of ejection force signals
obtained by the statically calibrated modified ejection force measurement
system, a comparison of the ejection force measurements obtained by the
calibrated instrumented punch DigiPunch (PST, Rheinbach, Germany) was
performed at different speed settings of the carriage at an effective ejection
angle of 10°.
It is obvious from Fig. 4-22 and 4-23, where the results are shown for the
slowest and the fastest achievable horizontal speed setting of the Presster
(0.4 and 2.0 ms-1 respectively), that the impact of the punch on the ejection
cam causes a speed dependant resonance frequency, which in the beginning
superimposes on the ejection force signals. This impact has not been
registered by the DigiPunch, as it measured the forces with its instrumented
punch tip, which was not affected by any impact or consecutive vibrations.
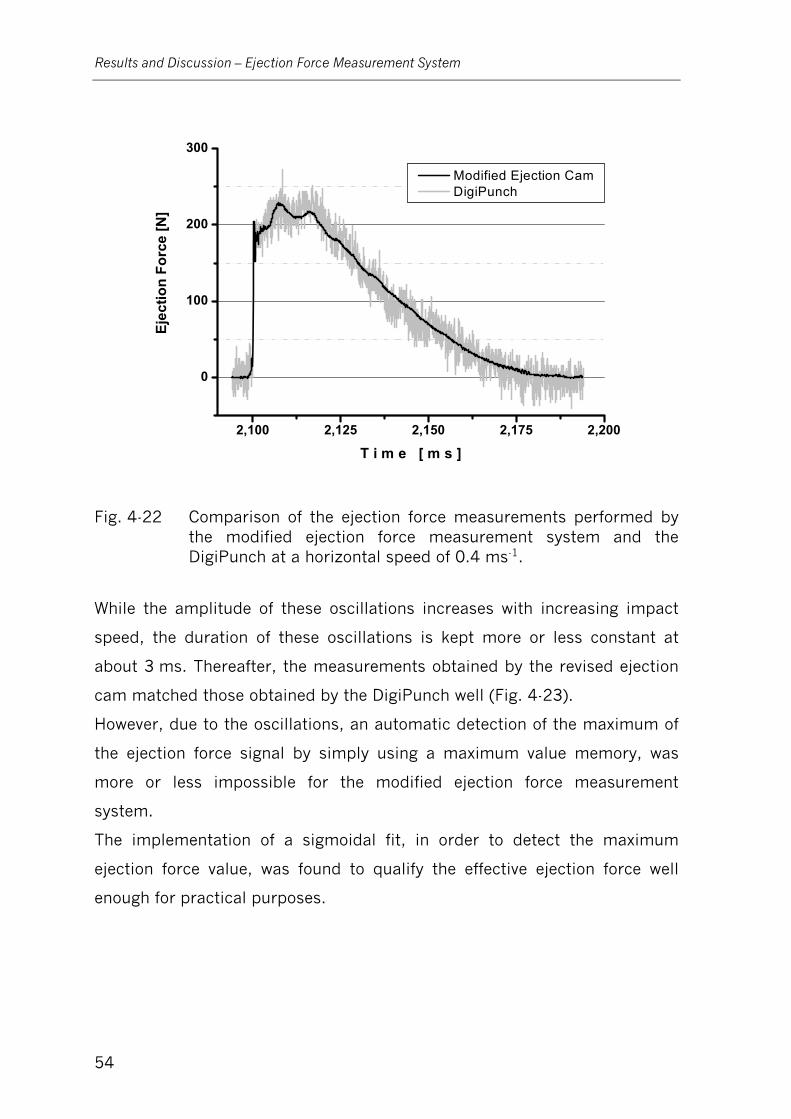
Results and Discussion – Ejection Force Measurement System
54
2,100 2,125 2,150 2,175 2,200
0
100
200
300
Modified Ejection Cam DigiPunch
Ejec
tion
Forc
e [N
]
T i m e [ m s ]
Fig. 4-22 Comparison of the ejection force measurements performed by the modified ejection force measurement system and the DigiPunch at a horizontal speed of 0.4 ms-1.
While the amplitude of these oscillations increases with increasing impact
speed, the duration of these oscillations is kept more or less constant at
about 3 ms. Thereafter, the measurements obtained by the revised ejection
cam matched those obtained by the DigiPunch well (Fig. 4-23).
However, due to the oscillations, an automatic detection of the maximum of
the ejection force signal by simply using a maximum value memory, was
more or less impossible for the modified ejection force measurement
system.
The implementation of a sigmoidal fit, in order to detect the maximum
ejection force value, was found to qualify the effective ejection force well
enough for practical purposes.
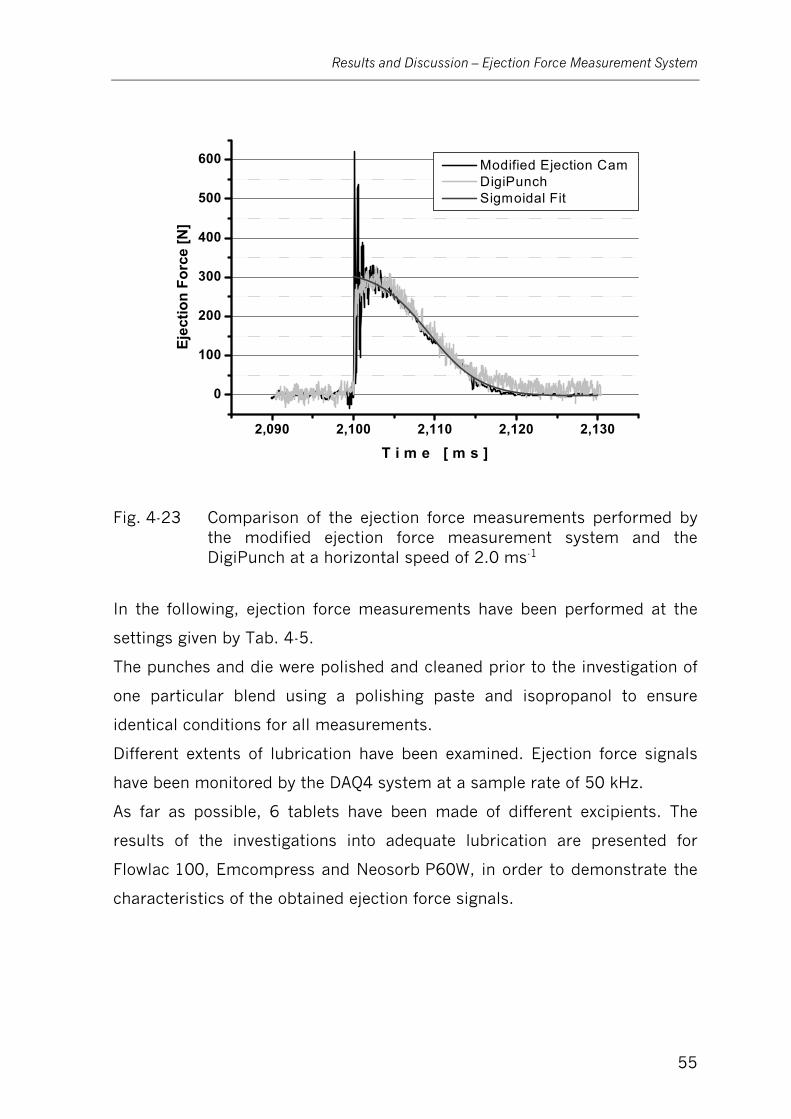
Results and Discussion – Ejection Force Measurement System
55
2,090 2,100 2,110 2,120 2,130
0
100
200
300
400
500
600 Modified Ejection Cam DigiPunch Sigmoidal Fit
Ejec
tion
Forc
e [N
]
T i m e [ m s ]
Fig. 4-23 Comparison of the ejection force measurements performed by the modified ejection force measurement system and the DigiPunch at a horizontal speed of 2.0 ms-1
In the following, ejection force measurements have been performed at the
settings given by Tab. 4-5.
The punches and die were polished and cleaned prior to the investigation of
one particular blend using a polishing paste and isopropanol to ensure
identical conditions for all measurements.
Different extents of lubrication have been examined. Ejection force signals
have been monitored by the DAQ4 system at a sample rate of 50 kHz.
As far as possible, 6 tablets have been made of different excipients. The
results of the investigations into adequate lubrication are presented for
Flowlac 100, Emcompress and Neosorb P60W, in order to demonstrate the
characteristics of the obtained ejection force signals.
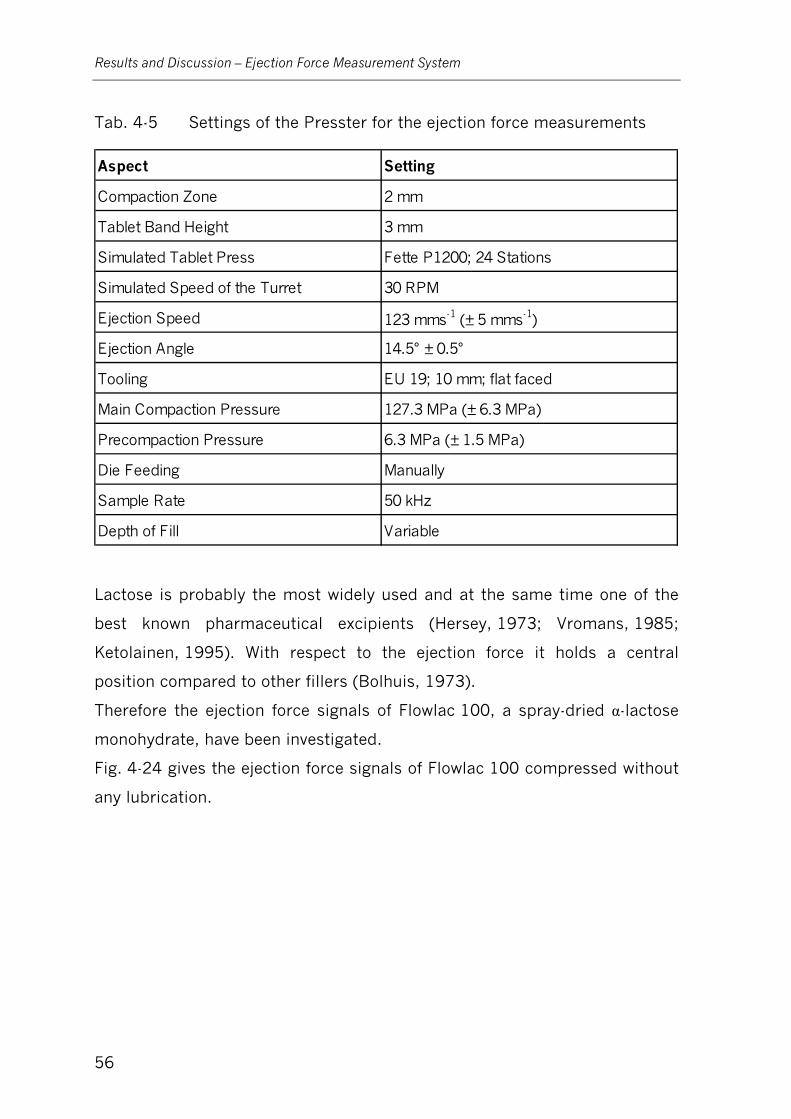
Results and Discussion – Ejection Force Measurement System
56
Tab. 4-5 Settings of the Presster for the ejection force measurements
Aspect Setting
Compaction Zone 2 mm
Tablet Band Height 3 mm
Simulated Tablet Press Fette P1200; 24 Stations
Simulated Speed of the Turret 30 RPM
Ejection Speed 123 mms-1 (± 5 mms-1)
Ejection Angle 14.5° ± 0.5°
Tooling EU 19; 10 mm; flat faced
Main Compaction Pressure 127.3 MPa (± 6.3 MPa)
Precompaction Pressure 6.3 MPa (± 1.5 MPa)
Die Feeding Manually
Sample Rate 50 kHz
Depth of Fill Variable
Lactose is probably the most widely used and at the same time one of the
best known pharmaceutical excipients (Hersey, 1973; Vromans, 1985;
Ketolainen, 1995). With respect to the ejection force it holds a central
position compared to other fillers (Bolhuis, 1973).
Therefore the ejection force signals of Flowlac 100, a spray-dried α-lactose
monohydrate, have been investigated.
Fig. 4-24 gives the ejection force signals of Flowlac 100 compressed without
any lubrication.
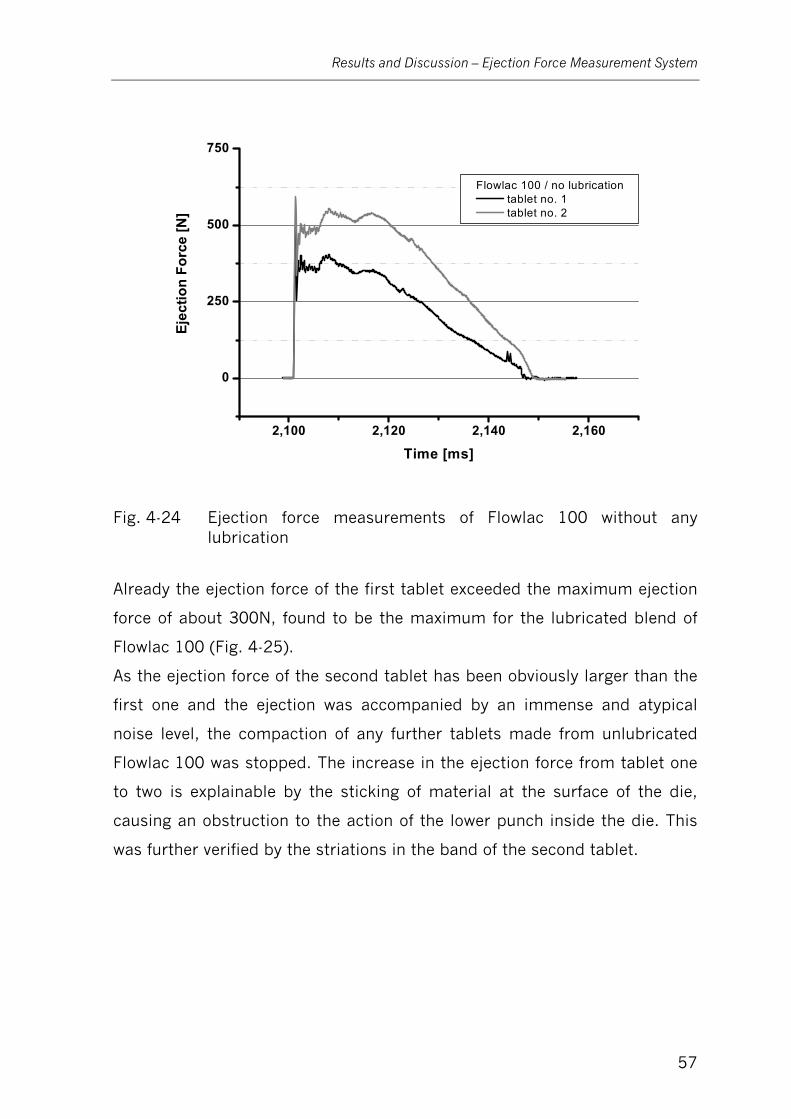
Results and Discussion – Ejection Force Measurement System
57
2,100 2,120 2,140 2,160
0
250
500
750
Flowlac 100 / no lubrication tablet no. 1 tablet no. 2
Ejec
tion
Forc
e [N
]
Time [ms]
Fig. 4-24 Ejection force measurements of Flowlac 100 without any lubrication
Already the ejection force of the first tablet exceeded the maximum ejection
force of about 300N, found to be the maximum for the lubricated blend of
Flowlac 100 (Fig. 4-25).
As the ejection force of the second tablet has been obviously larger than the
first one and the ejection was accompanied by an immense and atypical
noise level, the compaction of any further tablets made from unlubricated
Flowlac 100 was stopped. The increase in the ejection force from tablet one
to two is explainable by the sticking of material at the surface of the die,
causing an obstruction to the action of the lower punch inside the die. This
was further verified by the striations in the band of the second tablet.
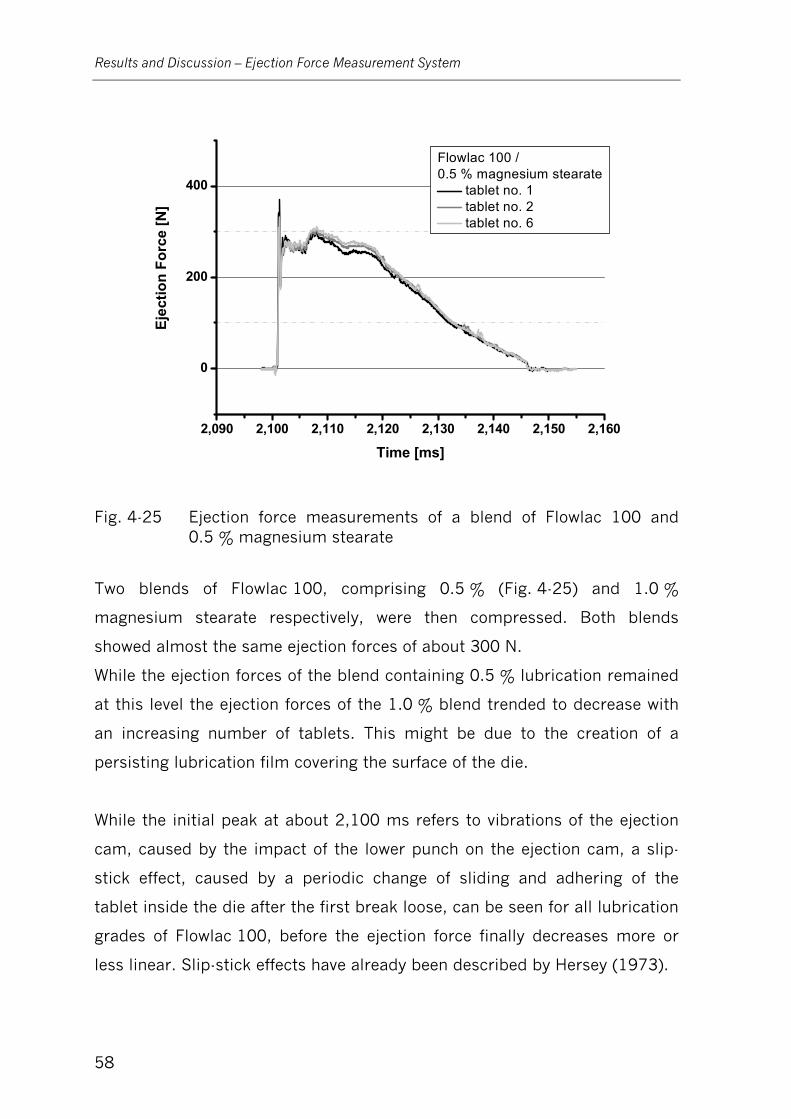
Results and Discussion – Ejection Force Measurement System
58
2,090 2,100 2,110 2,120 2,130 2,140 2,150 2,160
0
200
400
Flowlac 100 / 0.5 % magnesium stearate
tablet no. 1 tablet no. 2 tablet no. 6
Ejec
tion
Forc
e [N
]
Time [ms]
Fig. 4-25 Ejection force measurements of a blend of Flowlac 100 and 0.5 % magnesium stearate
Two blends of Flowlac 100, comprising 0.5 % (Fig. 4-25) and 1.0 %
magnesium stearate respectively, were then compressed. Both blends
showed almost the same ejection forces of about 300 N.
While the ejection forces of the blend containing 0.5 % lubrication remained
at this level the ejection forces of the 1.0 % blend trended to decrease with
an increasing number of tablets. This might be due to the creation of a
persisting lubrication film covering the surface of the die.
While the initial peak at about 2,100 ms refers to vibrations of the ejection
cam, caused by the impact of the lower punch on the ejection cam, a slip-
stick effect, caused by a periodic change of sliding and adhering of the
tablet inside the die after the first break loose, can be seen for all lubrication
grades of Flowlac 100, before the ejection force finally decreases more or
less linear. Slip-stick effects have already been described by Hersey (1973).
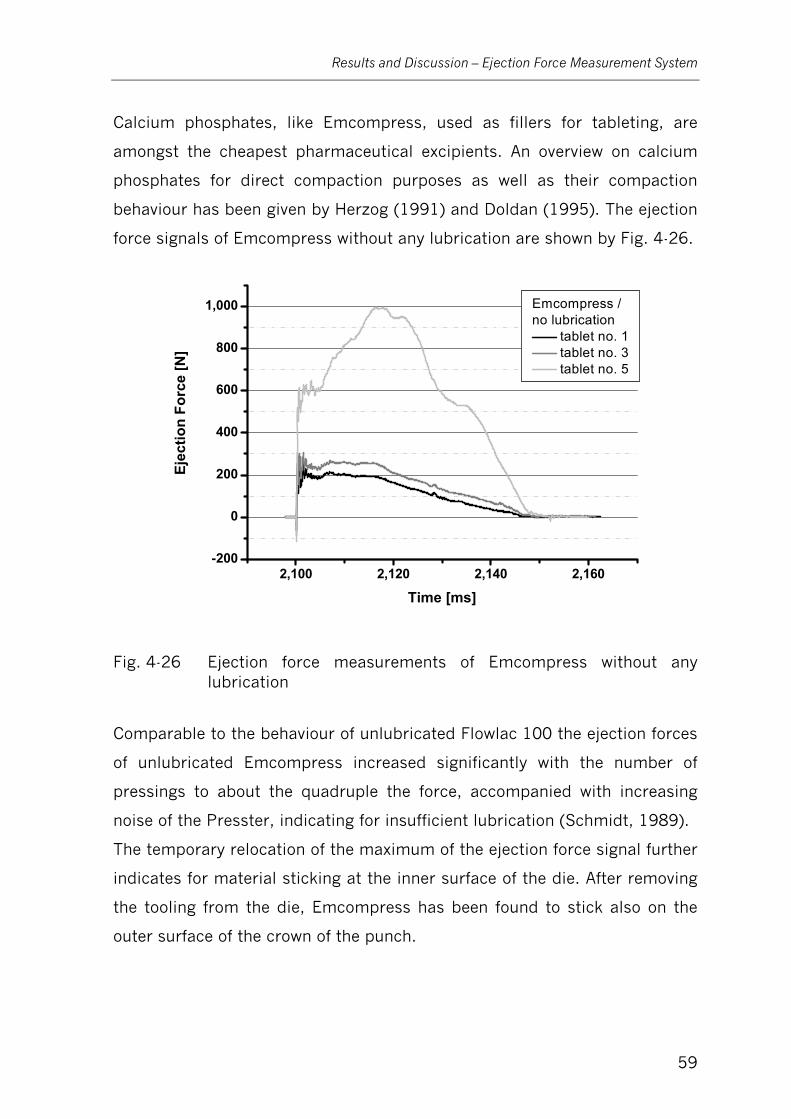
Results and Discussion – Ejection Force Measurement System
59
Calcium phosphates, like Emcompress, used as fillers for tableting, are
amongst the cheapest pharmaceutical excipients. An overview on calcium
phosphates for direct compaction purposes as well as their compaction
behaviour has been given by Herzog (1991) and Doldan (1995). The ejection
force signals of Emcompress without any lubrication are shown by Fig. 4-26.
2,100 2,120 2,140 2,160-200
0
200
400
600
800
1,000 Emcompress / no lubrication
tablet no. 1 tablet no. 3 tablet no. 5
Ejec
tion
Forc
e [N
]
Time [ms]
Fig. 4-26 Ejection force measurements of Emcompress without any lubrication
Comparable to the behaviour of unlubricated Flowlac 100 the ejection forces
of unlubricated Emcompress increased significantly with the number of
pressings to about the quadruple the force, accompanied with increasing
noise of the Presster, indicating for insufficient lubrication (Schmidt, 1989).
The temporary relocation of the maximum of the ejection force signal further
indicates for material sticking at the inner surface of the die. After removing
the tooling from the die, Emcompress has been found to stick also on the
outer surface of the crown of the punch.
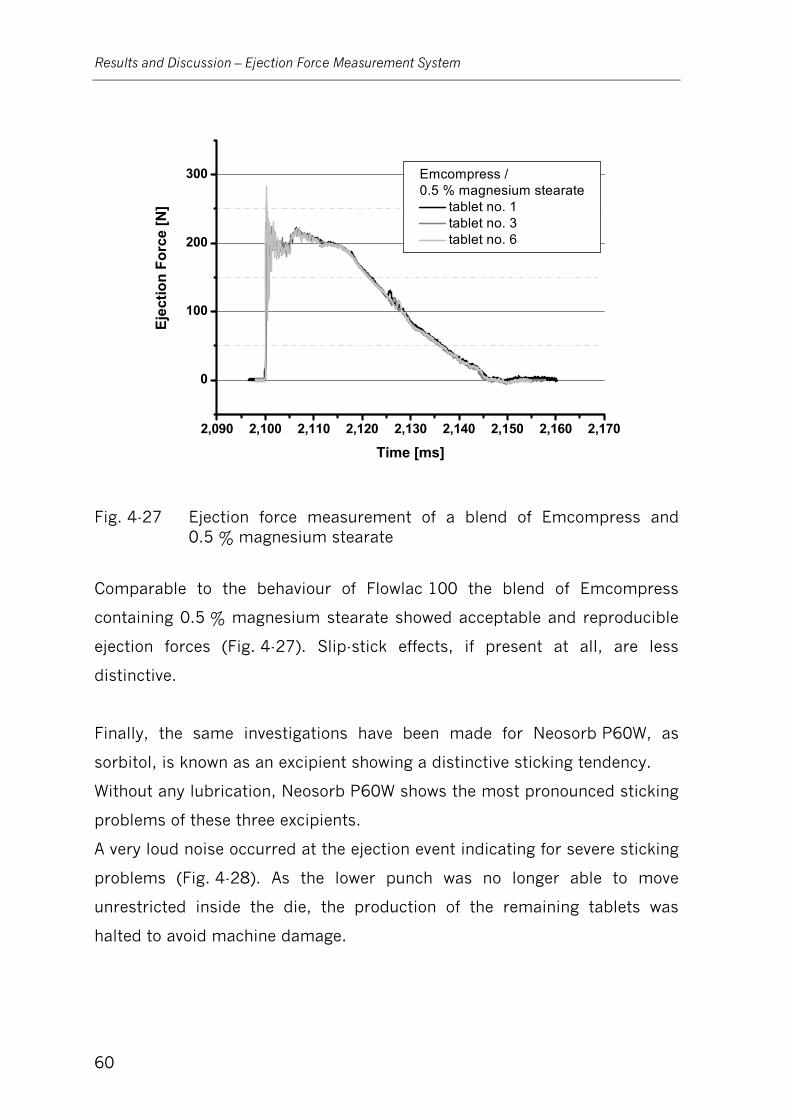
Results and Discussion – Ejection Force Measurement System
60
2,090 2,100 2,110 2,120 2,130 2,140 2,150 2,160 2,170
0
100
200
300 Emcompress / 0.5 % magnesium stearate
tablet no. 1 tablet no. 3 tablet no. 6
Ejec
tion
Forc
e [N
]
Time [ms]
Fig. 4-27 Ejection force measurement of a blend of Emcompress and 0.5 % magnesium stearate
Comparable to the behaviour of Flowlac 100 the blend of Emcompress
containing 0.5 % magnesium stearate showed acceptable and reproducible
ejection forces (Fig. 4-27). Slip-stick effects, if present at all, are less
distinctive.
Finally, the same investigations have been made for Neosorb P60W, as
sorbitol, is known as an excipient showing a distinctive sticking tendency.
Without any lubrication, Neosorb P60W shows the most pronounced sticking
problems of these three excipients.
A very loud noise occurred at the ejection event indicating for severe sticking
problems (Fig. 4-28). As the lower punch was no longer able to move
unrestricted inside the die, the production of the remaining tablets was
halted to avoid machine damage.
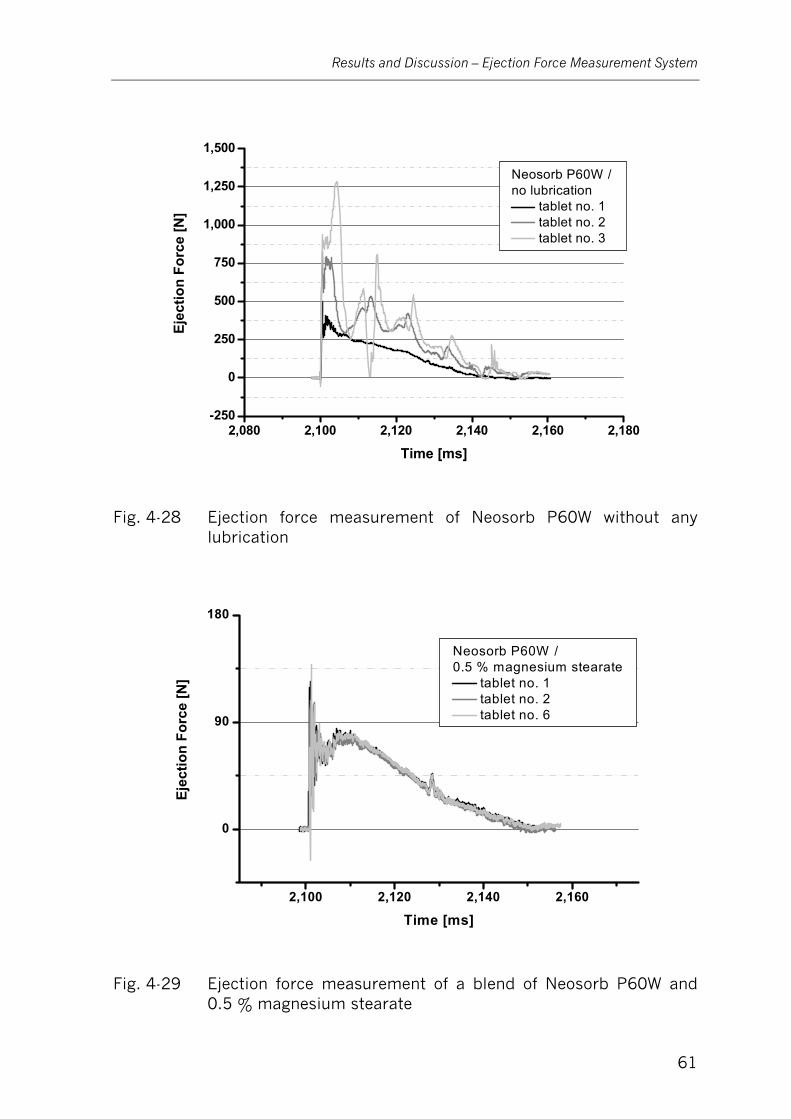
Results and Discussion – Ejection Force Measurement System
61
2,080 2,100 2,120 2,140 2,160 2,180-250
0
250
500
750
1,000
1,250
1,500
Neosorb P60W / no lubrication
tablet no. 1 tablet no. 2 tablet no. 3
Ejec
tion
Forc
e [N
]
Time [ms]
Fig. 4-28 Ejection force measurement of Neosorb P60W without any lubrication
2,100 2,120 2,140 2,160
0
90
180
Neosorb P60W / 0.5 % magnesium stearate
tablet no. 1 tablet no. 2 tablet no. 6
Ejec
tion
Forc
e [N
]
Time [ms]
Fig. 4-29 Ejection force measurement of a blend of Neosorb P60W and 0.5 % magnesium stearate
Results and Discussion – Ejection Force Measurement System
62
The blend of Neosorb P60W and 0.5 % of magnesium stearate (Fig. 4-29)
did not show any detectable issues and had smallest ejection forces of these
three excipients.
Therefore, the sticking tendency of all the three excipients has been reduced
by the use of only small amounts of magnesium stearate, which verifies the
anti-sticking properties of the lubricant magnesium stearate (Lerk, 1988).
Finally, compared to the quality of ejection force signals obtained by the
original ejection force measurement system of the Presster, the investigated
ejection force measurements demonstrated the improved quality and validity
of ejection force measurements performed with the revised ejection force
measurement system.
Therefore, the new system might be used to basically investigate the
adequate extent of lubrication required in a certain blend during very early
stages of development, as the amount of material necessary to perform
these investigations under the conditions of rotary tablet presses is
comparably small.
The ultimate determination of lubrication, whether there might be any
process time dependent sticking problem for a particular formulation
definitively requires a larger amount of material and is therefore not going to
be investigated on this system, but in full scale production.
Results and Discussion – Ejection Force Measurement System
63
4.3.5 Summary
The quality of ejection force measurements, obtained by the original ejection
force measurement system of the Presster, was found to be unsuitable to
perform reliable ejection force measurements.
The loose supporting of the frame of the original ejection cam within the
Presster, based on disk springs, caused interference between other
compaction cycle events. Machine vibrations, caused by the compaction
events, have been transferred to and monitored by the original ejection force
measurement system. Furthermore, as the vibrations have been speed and
force dependent, the base line of the original ejection force measurement
system has been impinged by variable fluctuations.
Too small sample rate in combination with the missing option for the
adaptation of the actual valid calibration function, made the system unable
to reliably investigate the ejection behaviour of pharmaceutical excipients or
blends.
The entire ejection force measurement system was modified. As quartz load
cells have been found to be superior for the measurement of ejection forces
compared to strain gauge instrumentations, a kit of 4 quartz load cells was
installed in a newly designed ejection cam. The new system was fixed
directly and securely to the frame of the Presster, while the data acquisition
of the ejection forces has been additionally initialised just a few milliseconds
prior to the ejection event using a photoelectric proximity sensor, in order to
prevent any time dependant base line drift.
The higher sample rate, provided by the DAQ4, guarantees the proper
monitoring of ejection forces even at higher speed settings of the carriage.
Unfortunately, the impact of the punch onto the ejection cam caused an
overlaying oscillation, but a satisfying correlation between the oscillation
carrying signal of the revised ejection cam and the oscillation-free
measurement performed by the instrumented punch DigiPunch has been
shown using a sigmoidal fit.
Results and Discussion – Ejection Force Measurement System
64
A modification of the original system for the adaptation of the ejection angle
was not possible due to the missing access to the control unit of the
Presster. Therefore, this system had to be used as well for setting the
ejection angle of the new designed ejection cam. A limitation of the range of
the ejection angle in between 5 and 14.5 ± 0.5°, impeding a most accurate
simulation of the ejection process of the Fette P1200, therefore had to be
accepted, being a serious drawback of a compaction simulator.
Fortunately, the restriction in the ejection angle showed only small effect on
the maximum ejection force observed, as proven by the simulation of the
ejection force measurements of the Fette P1200.
The total duration of the ejection force measurement, which is mainly
affected by the different ejection angle, is of secondary interest and
significance with respect to the evaluation of lubrication levels, as long as
the maximum force level will be consistently determined.
Nevertheless, the limitations in the simulation of the proper ejection
conditions have to be kept in mind as a potential reason for any observed
difference in tablet properties.
Finally, the quality and validity of ejection force signals obtained by the
revised ejection force measurement system present a distinctive
improvement compared to the original ejection force measurement system
of the Presster and therefore facilitates its application for development and
trouble-shooting purposes.
Sticking problems and consequently increasing ejection forces do often not
occur until a larger number of tablets have been made. So whether a certain
extent of lubrication is adequate to avoid those problems during long term
production runs on rotary tablet presses, can not be categorically derived
from the results obtained by this system.
Results and Discussion – Take-Off Force Measurement System
65
4.4 Take-Off Force Measurement System
Sticking of tablets to the surfaces of the punches is a substantial hindrance
to the process of tablet production and often observed as a consequence of
engravings present on the punch surface.
Usually the powder sticks to the lateral symbols first and finally covers the
whole surface of the punch tip.
As the identification of tablets produced in the following is missing, these
tablets have to be rejected. Increasing take-off forces might indicate the
emerging of these sticking problems.
While the sticking tendency itself can not be influenced by monitoring the
take-off forces, at least the waste production of tablets can be limited.
Therefore, the investigation of take-off forces during early stages of
formulation development helps to identify and ultimately minimise the risk
of sticking problems later on during production.
At least three cases of sticking problems are possible: first sticking of
tablets only to the upper punches, second only to the lower punches and
finally to the surfaces of both punches.
If tablets stick to the upper punches they might be compacted twice, as the
take-off bar will not take the tablets away from the upper punch. Damage to
tooling or other machine parts can occur, as the additional amount of
powder inside the die multiplies the force during the subsequent compaction
cycle.
When tablets adhere to the surface of the lower punches this often leads to
damaged tablets due to the shear stress applied to the tablets during the
take-off event.
The measurement of forces required to take-off tablets, sticking to the
surface of the lower punch only, will be discussed within this work.
Tablets sticking to the surfaces of both punches might cause a mixture of
the above mentioned symptoms. As tablets will be split into fractions, both
increasing compaction pressure levels and increasing take-off forces will be
observed.
Results and Discussion – Take-Off Force Measurement System
66
4.4.1 Different Techniques for Take-Off Force Measurements
On most rotary tablet presses, the measurement of take-off forces, if
provided at all, takes place by a strain gauge instrumented take-off bar.
Schmidt (1983a) already described the signals obtained by those types of
instrumented take-off bars as absorbed oscillations and concluded, that the
sensitivity of this type of instrumentation is not sufficient for the detection of
rather small take-off forces of quite well lubricated tableting blends
(Ritter, 1978).
The instrumentation of a take-off bar using a small quartz load cell improved
the sensitivity and allowed the measurement of adhesion forces below 1 N
(Schmidt, 1983a).
The precision and accuracy of measurements performed by this quartz load
cell instrumented take-off bar predominated the quality of measurements of
a strain gauge instrumented take-off bar and have been proved to be
sufficient to detect sticking problems.
The influence of the presence and the shape of engravings on the punch
surfaces with respect to the occurrence of sticking problems as well as the
dependency between sticking problems and the applied compaction force
and finally the compression behaviour of the excipients have already been
investigated by Waimer (1999a, 1999b), using an instrumented upper
punch.

Results and Discussion – Take-Off Force Measurement System
67
4.4.2 Investigation of the Original Presster Take-Off Force
Measurement System
The original take-off bar instrumentation of the Presster has been designed
as a strain gauge instrumented bar supported unilateral within a mounting,
which has been fixed to the machine frame (Fig. 4-30).
Machine Frame
Tabletmovingdirection
Bonded strain gauges
Centre lineof punch tip
Side walls Tablets of varying diameter
Machine Frame
Tabletmovingdirection
Bonded strain gauges
Centre lineof punch tip
Side walls Tablets of varying diameter
Fig. 4-30 Overview (left) and detailed scheme (right) of the original take-off bar of the Presster within its mounting (top view)
Presumably, the side walls of the mounting, shaping a cavity in front of the
take-off bar, have been designed to prevent the tablets from spilling around
inside the Presster and to guarantee the collection of tablets in a small
container, which has been attached to the rear end of the die table.
As soon as the die table has passed underneath the take-off bar by its entire
length, the tablet falls out of the cavity in front of the take-off bar and is
collected within the tablet collection container.
Due to the fixation of tablets inside this cavity, tablets are not been taken
away directly after the first collision with the take-off bar.
Therefore, as the tablets have still been placed upon the die table, which by
itself was still passing underneath the take-off bar, the tablets hit the take-off
bar repeatedly.
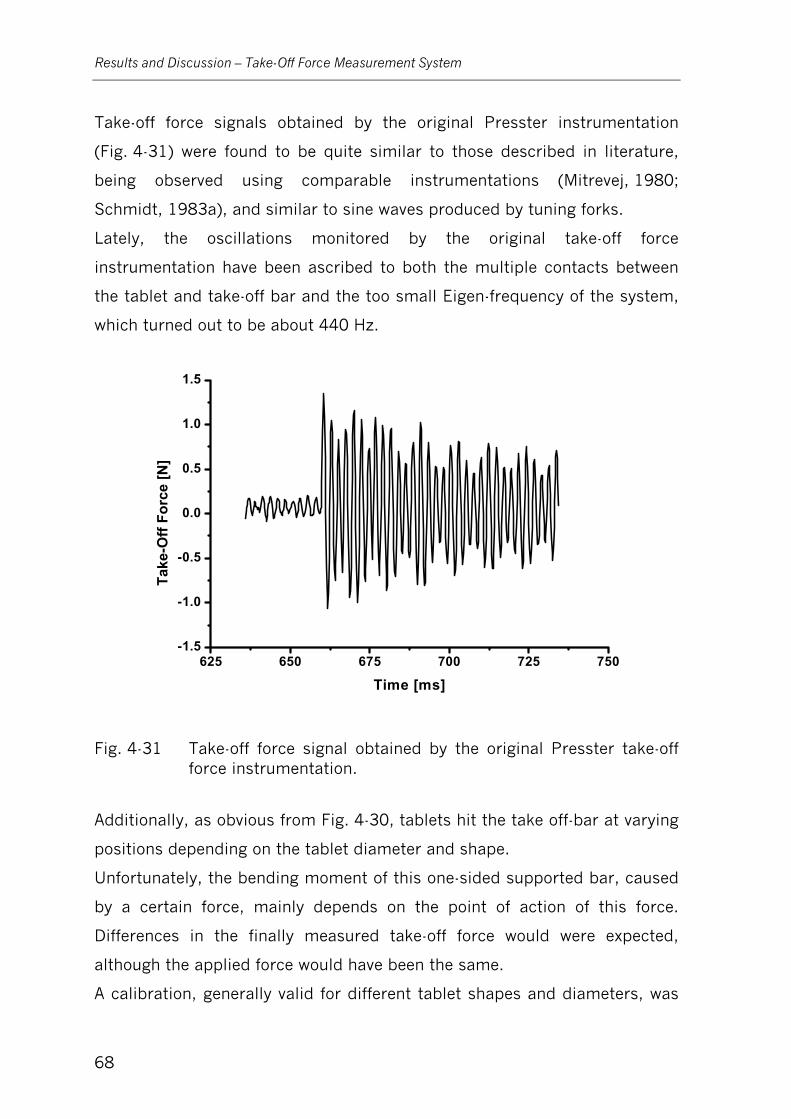
Results and Discussion – Take-Off Force Measurement System
68
Take-off force signals obtained by the original Presster instrumentation
(Fig. 4-31) were found to be quite similar to those described in literature,
being observed using comparable instrumentations (Mitrevej, 1980;
Schmidt, 1983a), and similar to sine waves produced by tuning forks.
Lately, the oscillations monitored by the original take-off force
instrumentation have been ascribed to both the multiple contacts between
the tablet and take-off bar and the too small Eigen-frequency of the system,
which turned out to be about 440 Hz.
625 650 675 700 725 750-1.5
-1.0
-0.5
0.0
0.5
1.0
1.5
Take
-Off
Forc
e [N
]
Time [ms]
Fig. 4-31 Take-off force signal obtained by the original Presster take-off force instrumentation.
Additionally, as obvious from Fig. 4-30, tablets hit the take off-bar at varying
positions depending on the tablet diameter and shape.
Unfortunately, the bending moment of this one-sided supported bar, caused
by a certain force, mainly depends on the point of action of this force.
Differences in the finally measured take-off force would were expected,
although the applied force would have been the same.
A calibration, generally valid for different tablet shapes and diameters, was
Results and Discussion – Take-Off Force Measurement System
69
almost impossible. A recalibration would have been necessary after any
change of tooling size and shape, but has been impeded from the user by
design of the original data acquisition system.
Furthermore, the amplifier (DSCA38-05, Dataforth, USA) used within the
original take-off force measurement system has been found to be identical
with those of the compaction force measurement system.
As already mentioned above, the bandwidth of this type of amplifier has
been confirmed to be about 3 kHz.
Therefore, the acquisition of take-off force signals without any signal
amplitude distortion would only be possible up to a frequency of about
1.5 kHz (equals 50 % of the cut-off frequency of the DSCA38-05 amplifier).
Hence, this type of amplifier is not suitable for the investigation of the
take-off force signals, as their frequencies, even if the measurements have
been performed at rather low speed settings of rotary tablet presses, have
already been described in literature to be about 4.5 kHz (Schmidt, 1983a).
Therefore, evaluations of take-off force signals, monitored by the original
take-off force measurement system of the Presster, are not possible with
this system.
4.4.3 Modification of the Take-Off Force Measurement System
Due to the unsatisfying results obtained by the original take-off force
instrumentation of the Presster a new take-off force measurement system
was designed (Fig. 4-32).
As, due to its rather high linear speed conditions, peak times of the take-off
force measurements performed on the Presster have been expected to be
even shorter as those described in literature for rotary tablet presses, and
therefore the resulting signal frequencies have been expected to be even
higher.
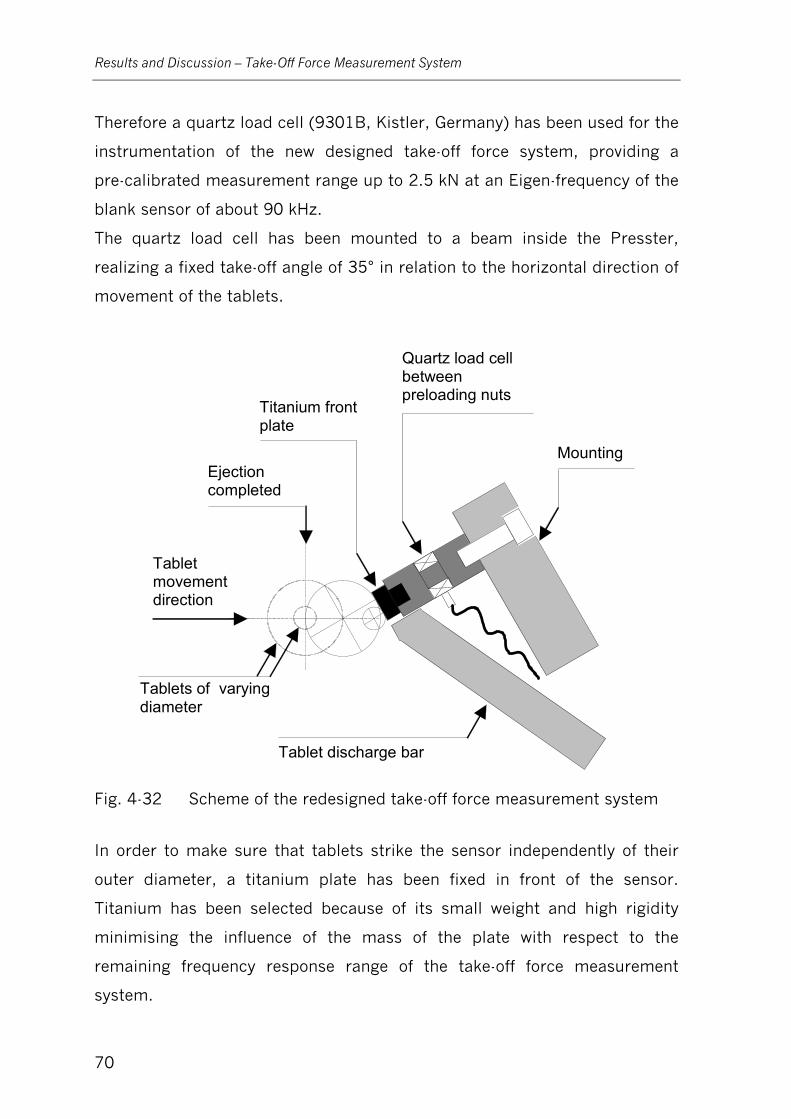
Results and Discussion – Take-Off Force Measurement System
70
Therefore a quartz load cell (9301B, Kistler, Germany) has been used for the
instrumentation of the new designed take-off force system, providing a
pre-calibrated measurement range up to 2.5 kN at an Eigen-frequency of the
blank sensor of about 90 kHz.
The quartz load cell has been mounted to a beam inside the Presster,
realizing a fixed take-off angle of 35° in relation to the horizontal direction of
movement of the tablets.
Tablets of varying diameter
Quartz load cell between preloading nuts
Mounting
Tablet discharge bar
Tablet movement direction
Titanium front plate
Ejection completed
Fig. 4-32 Scheme of the redesigned take-off force measurement system
In order to make sure that tablets strike the sensor independently of their
outer diameter, a titanium plate has been fixed in front of the sensor.
Titanium has been selected because of its small weight and high rigidity
minimising the influence of the mass of the plate with respect to the
remaining frequency response range of the take-off force measurement
system.
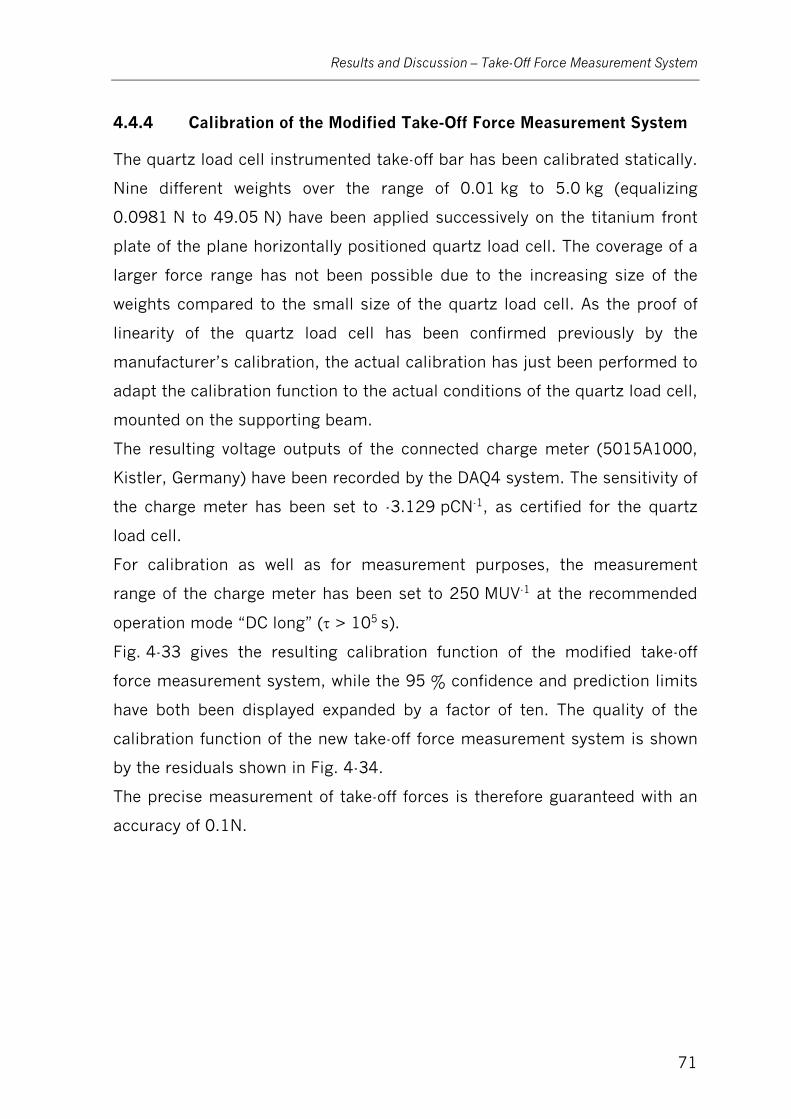
Results and Discussion – Take-Off Force Measurement System
71
4.4.4 Calibration of the Modified Take-Off Force Measurement System
The quartz load cell instrumented take-off bar has been calibrated statically.
Nine different weights over the range of 0.01 kg to 5.0 kg (equalizing
0.0981 N to 49.05 N) have been applied successively on the titanium front
plate of the plane horizontally positioned quartz load cell. The coverage of a
larger force range has not been possible due to the increasing size of the
weights compared to the small size of the quartz load cell. As the proof of
linearity of the quartz load cell has been confirmed previously by the
manufacturer’s calibration, the actual calibration has just been performed to
adapt the calibration function to the actual conditions of the quartz load cell,
mounted on the supporting beam.
The resulting voltage outputs of the connected charge meter (5015A1000,
Kistler, Germany) have been recorded by the DAQ4 system. The sensitivity of
the charge meter has been set to -3.129 pCN-1, as certified for the quartz
load cell.
For calibration as well as for measurement purposes, the measurement
range of the charge meter has been set to 250 MUV-1 at the recommended
operation mode “DC long” (τ > 105 s).
Fig. 4-33 gives the resulting calibration function of the modified take-off
force measurement system, while the 95 % confidence and prediction limits
have both been displayed expanded by a factor of ten. The quality of the
calibration function of the new take-off force measurement system is shown
by the residuals shown in Fig. 4-34.
The precise measurement of take-off forces is therefore guaranteed with an
accuracy of 0.1N.
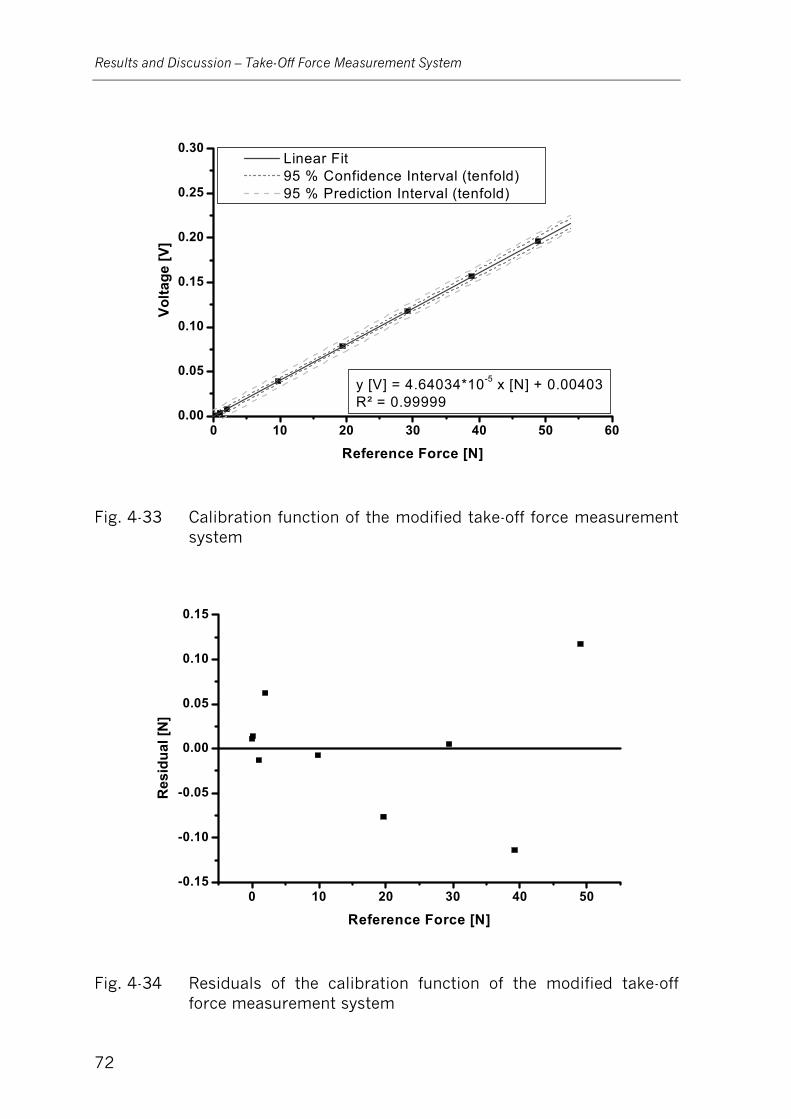
Results and Discussion – Take-Off Force Measurement System
72
0 10 20 30 40 50 600.00
0.05
0.10
0.15
0.20
0.25
0.30 Linear Fit 95 % Confidence Interval (tenfold) 95 % Prediction Interval (tenfold)
Vo
ltage
[V]
Reference Force [N]
y [V] = 4.64034*10-5 x [N] + 0.00403R² = 0.99999
Fig. 4-33 Calibration function of the modified take-off force measurement system
0 10 20 30 40 50-0.15
-0.10
-0.05
0.00
0.05
0.10
0.15
Res
idua
l [N
]
Reference Force [N]
Fig. 4-34 Residuals of the calibration function of the modified take-off force measurement system
Results and Discussion – Take-Off Force Measurement System
73
Due to the take-off angle of 35°, designed in order to prevent multiple
take-off force peaks, the take-off event equals an oblique impact similar to
the situation found for the redesigned ejection force measurement system.
Therefore, the signal of the take-off force measurement system had to be
corrected as well according to Eq. 4-3.
The take-off angle has been set by design to a fixed value of 35°, the
constant correction factor of cos 35° equalizing 1.22077 has been
implemented to the DAQ4 system.
All take-off forces, monitored by the modified take-off force measurement
system, have therefore been automatically corrected by this factor, in order
to record the true take-off forces by the DAQ4 system.
4.4.5 Evaluation of Measurements Performed by the Modified
Take-Off Force Measurement System
A correction for the momentum of the tablet mass, which causes a virtual
take-off force signal but which is not related to the adhesion between the
compact and the lower punch, is necessary for take-off force measurements
(Walz, 1988).
Due to the known mass and horizontal speed of the tablet, the momentum of
the compact is calculated by Eq. 4-4.
vmp ⋅= Eq. 4-4
p momentum [Ns]
m tablet mass [kg]
v horizontal speed of the compact [ms-1]
If the friction between the compact and the punch is neglected, the
momentum of the compact before and after the take-off event would be
equal.

Results and Discussion – Take-Off Force Measurement System
74
The change in the momentum during deceleration and acceleration of the
compact during the take-off event has been registered as the impulse, which
is the product of force and peak time and equals the sum of the momentum
from before and after the impact.
As the force is not constant over the entire impact time, the impulse can be
determined as the integral of the take-off force over the impact time, and
therefore as the area under the take-off-force-time-plot (Eq. 4-5).
αcos2 ⋅⋅⋅==Δ=Ι ∫ vmFdtp Eq. 4-5
I impulse [Ns]
∆p change in the momentum [Ns]
F Take-off force [N]
m tablet mass [kg]
v speed of the carriage [ms-1]
α take-off angle [°]
By the calculation of the momentum as the product of the tablet mass, the
carriage speed and the take-off angle, the monitored impulse can be
checked.
The take-off event of sticking tablets leads to an increased impulse.
Physically, the take-off force, measured by the take-off bar, partially
describes an inelastic impact of the compact against the take-off bar, while
the part of the impulse, which goes beyond the momentum, equals the force
required to overcome the adhesion between the compact and the lower
punch (Eq. 4-6).
∫ ∫ ∫+=− adhesionmomentumofftake FdtFdtFdt Eq. 4-6
Exactly this part of the registered take-off force, required to overcome the
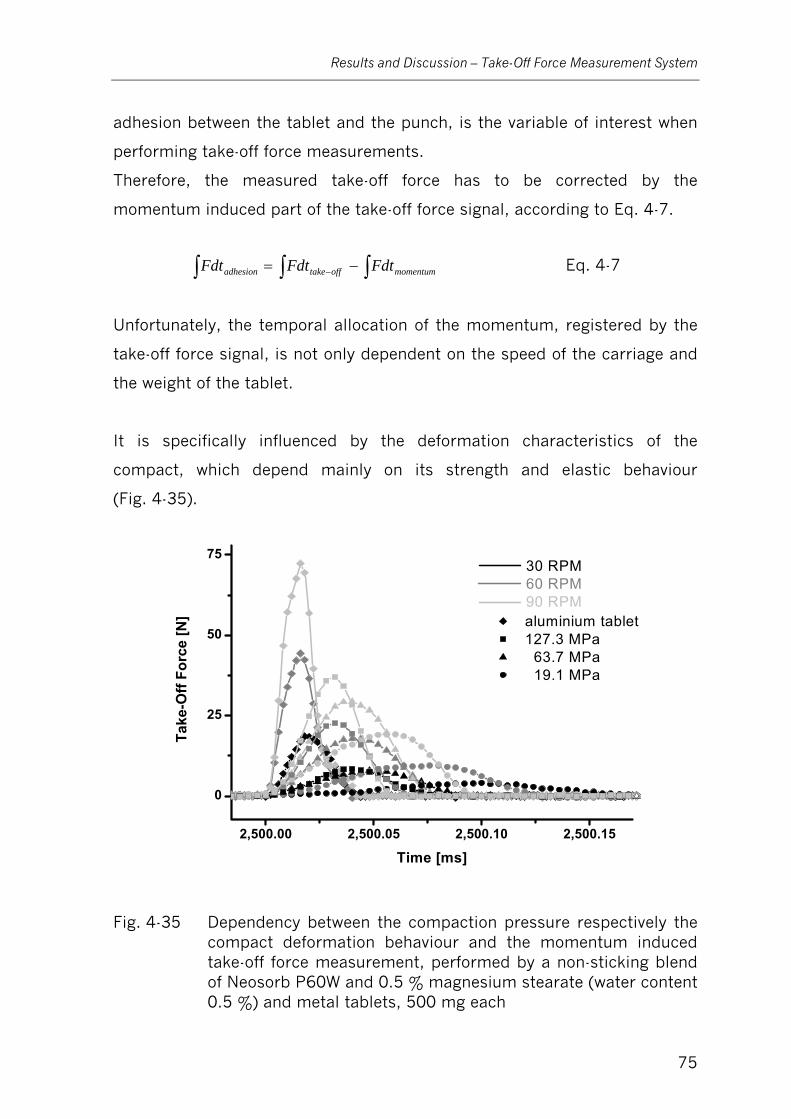
Results and Discussion – Take-Off Force Measurement System
75
adhesion between the tablet and the punch, is the variable of interest when
performing take-off force measurements.
Therefore, the measured take-off force has to be corrected by the
momentum induced part of the take-off force signal, according to Eq. 4-7.
∫ ∫ ∫−= − momentumofftakeadhesion FdtFdtFdt Eq. 4-7
Unfortunately, the temporal allocation of the momentum, registered by the
take-off force signal, is not only dependent on the speed of the carriage and
the weight of the tablet.
It is specifically influenced by the deformation characteristics of the
compact, which depend mainly on its strength and elastic behaviour
(Fig. 4-35).
2,500.00 2,500.05 2,500.10 2,500.15
0
25
50
75
aluminium tablet 127.3 MPa 63.7 MPa 19.1 MPa
30 RPM60 RPM90 RPM
Take
-Off
Forc
e [N
]
Time [ms]
Fig. 4-35 Dependency between the compaction pressure respectively the compact deformation behaviour and the momentum induced take-off force measurement, performed by a non-sticking blend of Neosorb P60W and 0.5 % magnesium stearate (water content 0.5 %) and metal tablets, 500 mg each

Results and Discussion – Take-Off Force Measurement System
76
Therefore, if the shape and finally the peak maximum of the adhesional part
of the take-off force signals are of interest, the correction of the take-off
force signal for the momentum of the compact requires a reference
measurement, performed by a non-sticking compact of the excipient or
blend at the required compaction force and speed of the rotary tablet press.
The correction of take-off force signals, using a non-sticking tablet as a
reference of course implies negligible influence of, for example, different
moisture contents on compact properties like deformation behaviour.
To verify this method and to investigate the quality of the improved take-off
force measurement system, take-off forces of a model formulation of
Neosorb P60W and 0.5 % magnesium stearate, conditioned at varying
humidities in order to obtain different batches with different sticking
tendencies, were monitored.
A first trial, comparing two blends containing 0.1 % (Blend A) and 0.5 %
(Blend B) of water, performed to investigate the necessity to dry the blend to
a very low water content of 0.1 %, did not show any differences in the
observed take-off forces (Fig. 4-36).
Therefore, in the following blend B, containing 0.5 % of water has been used
as the non-sticking reference.
A third blend (Blend C) has been conditioned to a water content of about
1.1 % and has been used to show significant sticking tendencies compared
to the reference blend.
Tablets have been compressed on the Presster simulating a Fette P1200
rotary tablet press, running at 30, 60 and 90 RPM, using 10 mm flat faced
Euro B tooling without any engraving and an untapered die.
Pre- and main compaction pressures were set to 6.4 MPa (± 1.3 MPa) and
133.7 MPa (± 6.4 MPa) respectively, while the Presster was set up to work
at a compaction zone of 2 mm.
Take-off force signals have been monitored by the DAQ4 system at a sample
rate of 250 kHz.
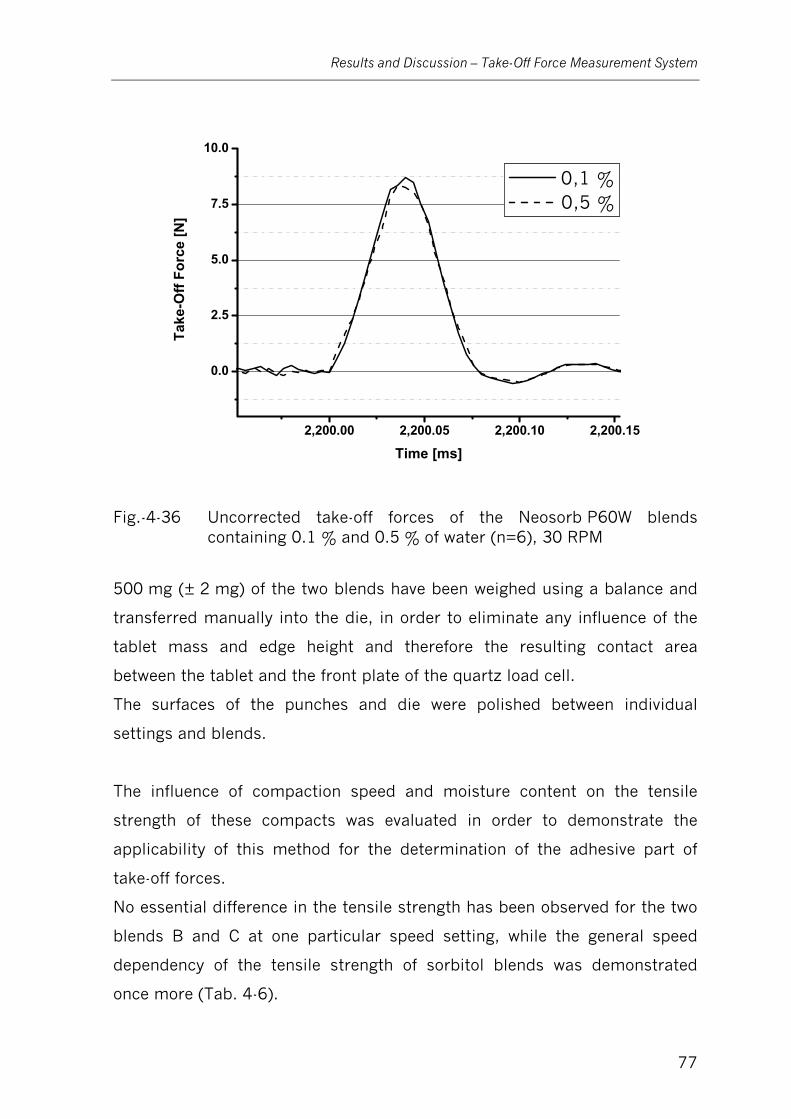
Results and Discussion – Take-Off Force Measurement System
77
2,200.00 2,200.05 2,200.10 2,200.15
0.0
2.5
5.0
7.5
10.0
0,1 % 0,5 %
Take
-Off
Forc
e [N
]
Time [ms]
Fig.-4-36 Uncorrected take-off forces of the Neosorb P60W blends containing 0.1 % and 0.5 % of water (n=6), 30 RPM
500 mg (± 2 mg) of the two blends have been weighed using a balance and
transferred manually into the die, in order to eliminate any influence of the
tablet mass and edge height and therefore the resulting contact area
between the tablet and the front plate of the quartz load cell.
The surfaces of the punches and die were polished between individual
settings and blends.
The influence of compaction speed and moisture content on the tensile
strength of these compacts was evaluated in order to demonstrate the
applicability of this method for the determination of the adhesive part of
take-off forces.
No essential difference in the tensile strength has been observed for the two
blends B and C at one particular speed setting, while the general speed
dependency of the tensile strength of sorbitol blends was demonstrated
once more (Tab. 4-6).
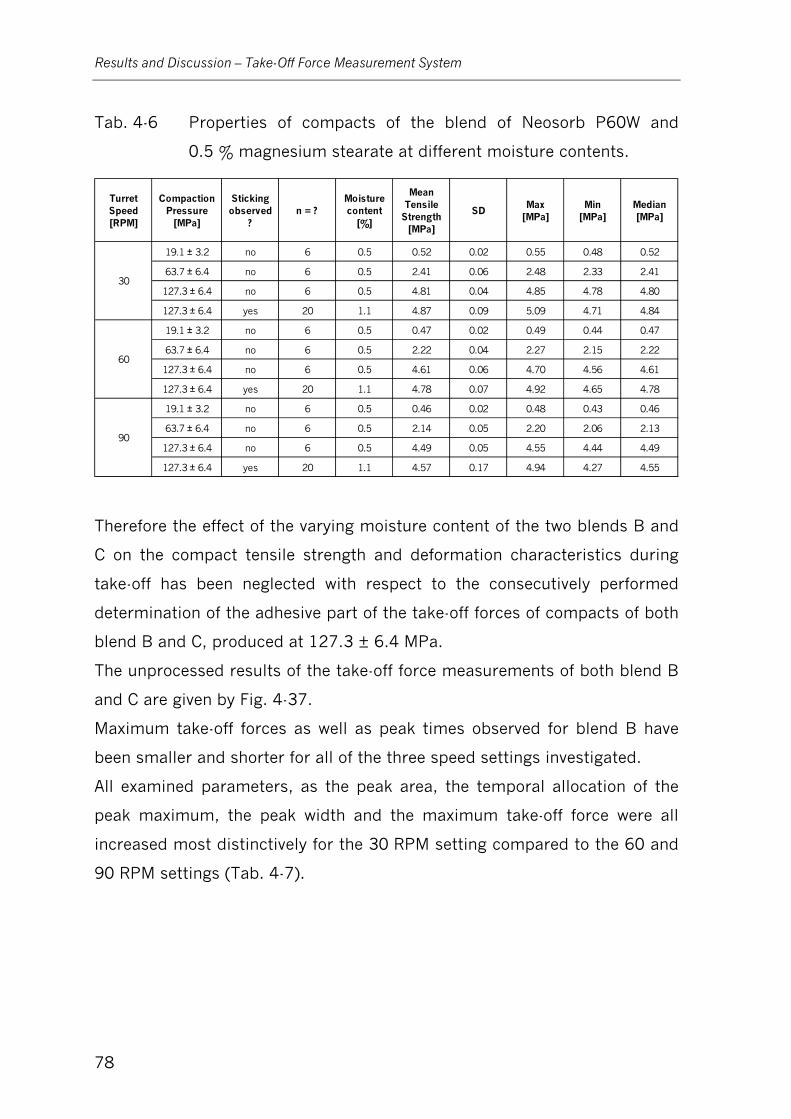
Results and Discussion – Take-Off Force Measurement System
78
Tab. 4-6 Properties of compacts of the blend of Neosorb P60W and
0.5 % magnesium stearate at different moisture contents.
Turret Speed [RPM]
Compaction Pressure
[MPa]
Sticking observed
?n = ?
Moisture content
[%]
Mean Tensile
Strength [MPa]
SDMax
[MPa]Min
[MPa]Median [MPa]
19.1 ± 3.2 no 6 0.5 0.52 0.02 0.55 0.48 0.52
63.7 ± 6.4 no 6 0.5 2.41 0.06 2.48 2.33 2.41
127.3 ± 6.4 no 6 0.5 4.81 0.04 4.85 4.78 4.80
127.3 ± 6.4 yes 20 1.1 4.87 0.09 5.09 4.71 4.84
19.1 ± 3.2 no 6 0.5 0.47 0.02 0.49 0.44 0.47
63.7 ± 6.4 no 6 0.5 2.22 0.04 2.27 2.15 2.22
127.3 ± 6.4 no 6 0.5 4.61 0.06 4.70 4.56 4.61
127.3 ± 6.4 yes 20 1.1 4.78 0.07 4.92 4.65 4.78
19.1 ± 3.2 no 6 0.5 0.46 0.02 0.48 0.43 0.46
63.7 ± 6.4 no 6 0.5 2.14 0.05 2.20 2.06 2.13
127.3 ± 6.4 no 6 0.5 4.49 0.05 4.55 4.44 4.49
127.3 ± 6.4 yes 20 1.1 4.57 0.17 4.94 4.27 4.55
60
90
30
Therefore the effect of the varying moisture content of the two blends B and
C on the compact tensile strength and deformation characteristics during
take-off has been neglected with respect to the consecutively performed
determination of the adhesive part of the take-off forces of compacts of both
blend B and C, produced at 127.3 ± 6.4 MPa.
The unprocessed results of the take-off force measurements of both blend B
and C are given by Fig. 4-37.
Maximum take-off forces as well as peak times observed for blend B have
been smaller and shorter for all of the three speed settings investigated.
All examined parameters, as the peak area, the temporal allocation of the
peak maximum, the peak width and the maximum take-off force were all
increased most distinctively for the 30 RPM setting compared to the 60 and
90 RPM settings (Tab. 4-7).
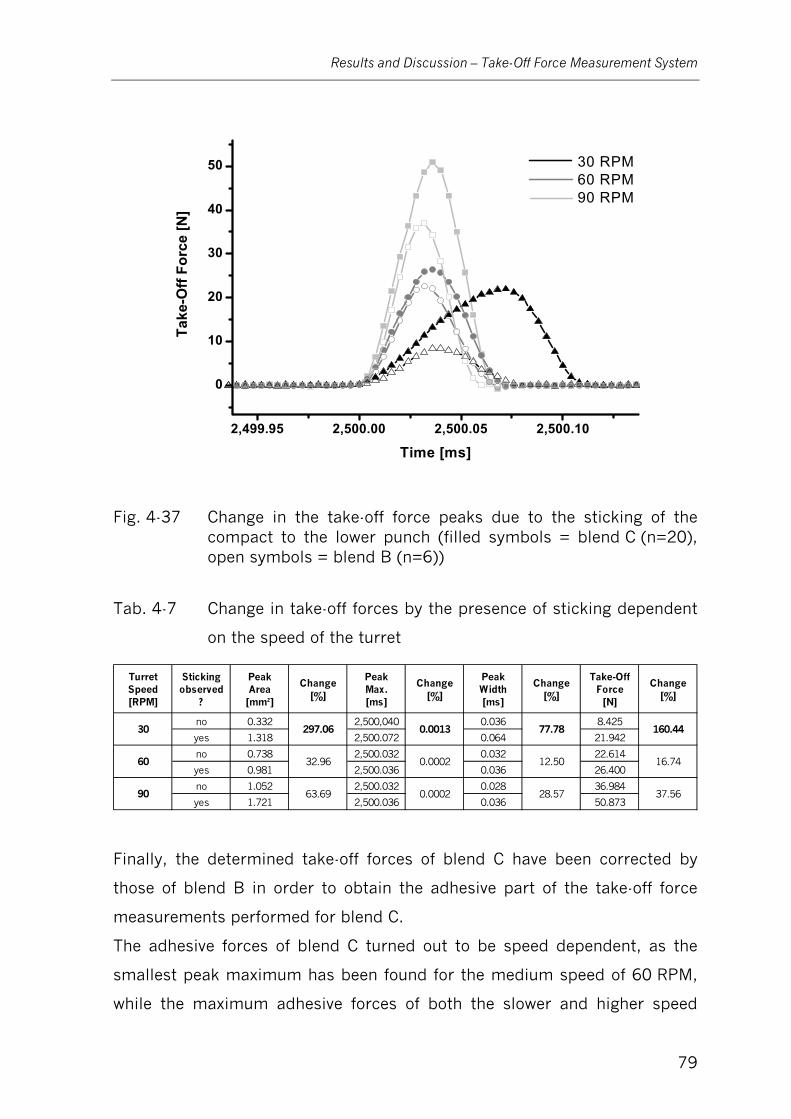
Results and Discussion – Take-Off Force Measurement System
79
2,499.95 2,500.00 2,500.05 2,500.10
0
10
20
30
40
50 30 RPM60 RPM90 RPM
Take
-Off
Forc
e [N
]
Time [ms]
Fig. 4-37 Change in the take-off force peaks due to the sticking of the compact to the lower punch (filled symbols = blend C (n=20), open symbols = blend B (n=6))
Tab. 4-7 Change in take-off forces by the presence of sticking dependent
on the speed of the turret
Turret Speed [RPM]
Sticking observed
?
Peak Area [mm²]
Change [%]
Peak Max. [ms]
Change [%]
Peak Width [ms]
Change [%]
Take-Off Force
[N]
Change [%]
no 0.332 2,500,040 0.036 8.425
yes 1.318 2,500.072 0.064 21.942
no 0.738 2,500.032 0.032 22.614
yes 0.981 2,500.036 0.036 26.400
no 1.052 2,500.032 0.028 36.984
yes 1.721 2,500.036 0.036 50.873
160.44
60 32.96 0.0002 12.50 16.74
30 297.06 0.0013 77.78
37.5690 63.69 0.0002 28.57
Finally, the determined take-off forces of blend C have been corrected by
those of blend B in order to obtain the adhesive part of the take-off force
measurements performed for blend C.
The adhesive forces of blend C turned out to be speed dependent, as the
smallest peak maximum has been found for the medium speed of 60 RPM,
while the maximum adhesive forces of both the slower and higher speed
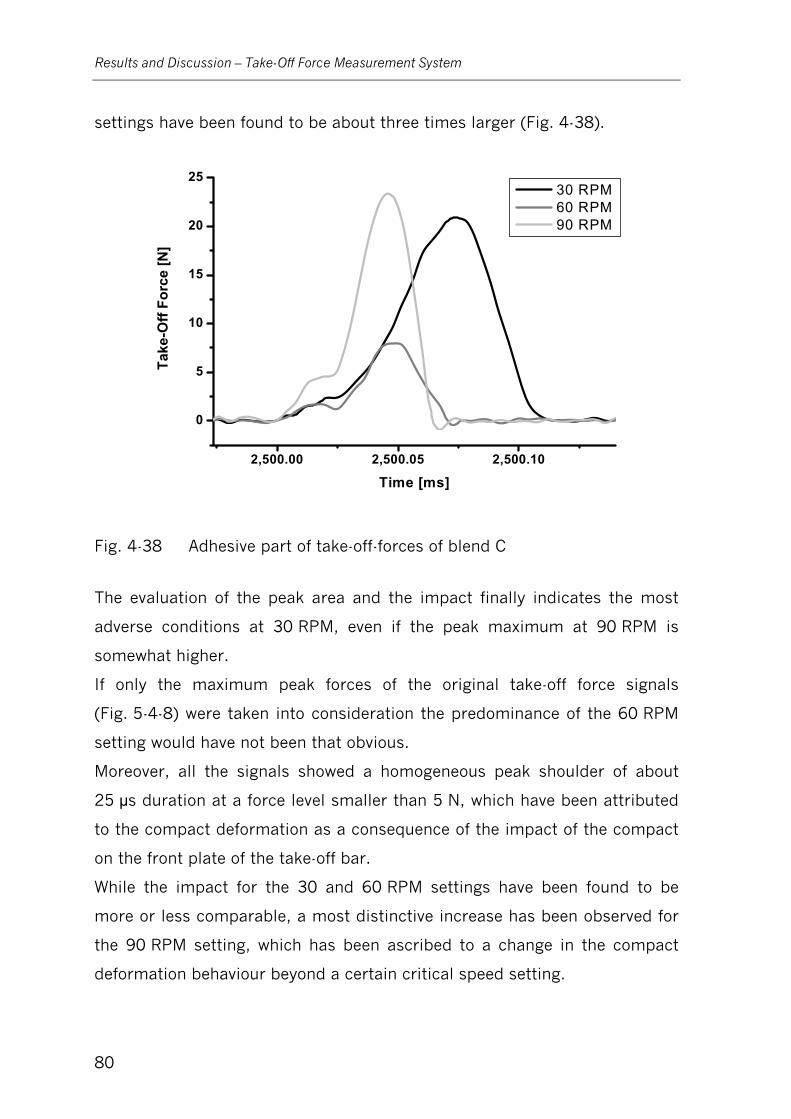
Results and Discussion – Take-Off Force Measurement System
80
settings have been found to be about three times larger (Fig. 4-38).
2,500.00 2,500.05 2,500.10
0
5
10
15
20
25 30 RPM 60 RPM 90 RPM
Take
-Off
Forc
e [N
]
Time [ms]
Fig. 4-38 Adhesive part of take-off-forces of blend C
The evaluation of the peak area and the impact finally indicates the most
adverse conditions at 30 RPM, even if the peak maximum at 90 RPM is
somewhat higher.
If only the maximum peak forces of the original take-off force signals
(Fig. 5-4-8) were taken into consideration the predominance of the 60 RPM
setting would have not been that obvious.
Moreover, all the signals showed a homogeneous peak shoulder of about
25 μs duration at a force level smaller than 5 N, which have been attributed
to the compact deformation as a consequence of the impact of the compact
on the front plate of the take-off bar.
While the impact for the 30 and 60 RPM settings have been found to be
more or less comparable, a most distinctive increase has been observed for
the 90 RPM setting, which has been ascribed to a change in the compact
deformation behaviour beyond a certain critical speed setting.
Results and Discussion – Take-Off Force Measurement System
81
4.4.6 Summary
Take-off force signals obtained by the original take-off force instrumentation
turned out to be alike the absorbed oscillations already described during the
1980´s by Schmidt (1983a).
By the design of the original take-off bar, tablets have been kept in front of
the take-off bar resulting in multi-peak signals due to repeated contacts
between tablet and take-off bar.
Additionally, tablets hit the take-off bar at varying positions depending on
their diameter and shape.
As the bending moment of the take-off bar, caused by a certain force, is
expected to vary depending on its point of application, a general valid
calibration of the original take-off bar has not been possible.
Moreover, due to the too low sample rate of the original data acquisition
system of the Presster as well as the too low cut-off frequency of the
amplifier, a reliable investigation of high frequency take-off forces was not
possible using the original take-off force measurement system.
Hence, a new take-off force measurement system was designed and installed
on the Presster.
This new system has been instrumented using a quartz load cell in
combination with a new amplifier, providing an Eigen-frequency of the blank
sensor of 90 kHz and a cut-off frequency of the amplifier of 200 kHz
respectively.
In conjunction with the DAQ4 data acquisition system this new measurement
system covers the requirements to reliably investigate high frequency
take-off force signals with sufficient precision and accuracy.
By design, the new system multi-peak signals, caused by multiple contacts
between tablet and take-off bar, have been ruled out. Beyond that, the
validity of the calibration function has been guaranteed to be independent of
the tablet diameter and shape.
The investigation of different blends of Neosorb P60W and
Results and Discussion – Take-Off Force Measurement System
82
0.5 % magnesium stearate at varying moisture contents approved the
possibility to discriminate between sticking and non-sticking blends or
compacts respectively.
The correction of the total take-off force by its momentum induced part, the
parameter of interest, being the adhesive component of the total take-off
force, has been accessible and examined.
Therefore, the most advantageous machine settings and formulations, in
order to avoid or even minimise sticking tendencies between the compact
and the punches, are now easily and clearly detectable using the revised
take-off force measurement system.
Furthermore, this optimised take-off force measurement system can be
easily used for e.g. the optimisation of the orientation of both engravings on
punch tips as well as the one of non-round punches itself with respect to the
moving direction of the turret.
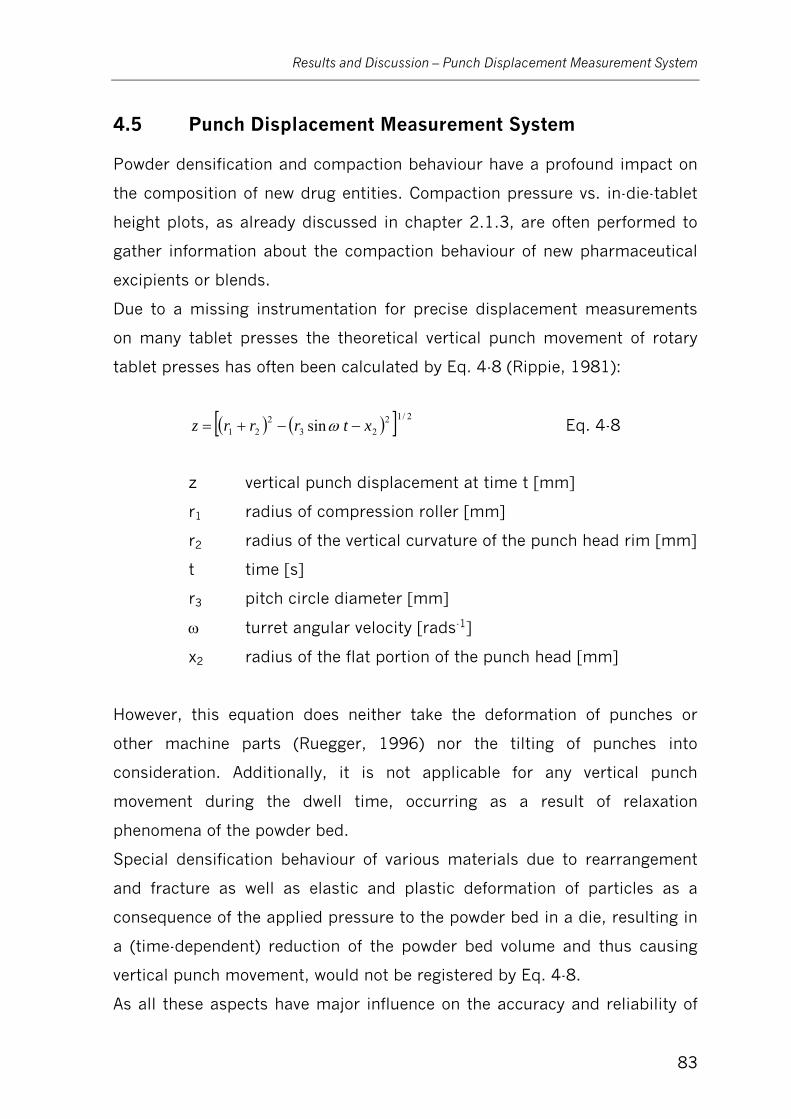
Results and Discussion – Punch Displacement Measurement System
83
4.5 Punch Displacement Measurement System
Powder densification and compaction behaviour have a profound impact on
the composition of new drug entities. Compaction pressure vs. in-die-tablet
height plots, as already discussed in chapter 2.1.3, are often performed to
gather information about the compaction behaviour of new pharmaceutical
excipients or blends.
Due to a missing instrumentation for precise displacement measurements
on many tablet presses the theoretical vertical punch movement of rotary
tablet presses has often been calculated by Eq. 4-8 (Rippie, 1981):
( ) ( )[ ] 2/1223
221 sin xtrrrz −−+= ω Eq. 4-8
z vertical punch displacement at time t [mm]
r1 radius of compression roller [mm]
r2 radius of the vertical curvature of the punch head rim [mm]
t time [s]
r3 pitch circle diameter [mm]
ω turret angular velocity [rads-1]
x2 radius of the flat portion of the punch head [mm]
However, this equation does neither take the deformation of punches or
other machine parts (Ruegger, 1996) nor the tilting of punches into
consideration. Additionally, it is not applicable for any vertical punch
movement during the dwell time, occurring as a result of relaxation
phenomena of the powder bed.
Special densification behaviour of various materials due to rearrangement
and fracture as well as elastic and plastic deformation of particles as a
consequence of the applied pressure to the powder bed in a die, resulting in
a (time-dependent) reduction of the powder bed volume and thus causing
vertical punch movement, would not be registered by Eq. 4-8.
As all these aspects have major influence on the accuracy and reliability of

Results and Discussion – Punch Displacement Measurement System
84
investigations of powder compaction behaviour, a precise and accurate
measurement in place of calculation of vertical punch displacement is
essential.
In order to measure the individual punch positions of the upper and lower
punch, especially during the dwell time period, over which the contact
between the flat portion of the punch head and the compaction roller
theoretically implies the absence of any vertical punch movement, both
punches have to be instrumented independently from each other.
4.5.1 Technologies for Punch Displacement Measurements
Some of the most important technologies used to perform punch
displacement measurements are shown in Tab. 4-8.
Tab. 4-8 Different technologies for displacement measurements
Capacitive sensors Inductive sensors (LVDT)
Digital gauges Laser sensors
Digital magnetic scale Linear potentiometers
Digital rulers Magentostrictive sensors
Draw wire sensors Optical sensors
Eddy current sensors Ultrasonic sensors
The choice for the one or the other measurement system or technology
depends on various factors like for example accuracy, linearity, densification
speed, measurement range or sensor dimension.
A general valid recommendation to prefer the one or the other system for the
punch displacement measurement on either rotary or eccentric tablet
presses is therefore hardly possible.
The probably most commonly used technology is the one of inductive
displacement transducers.
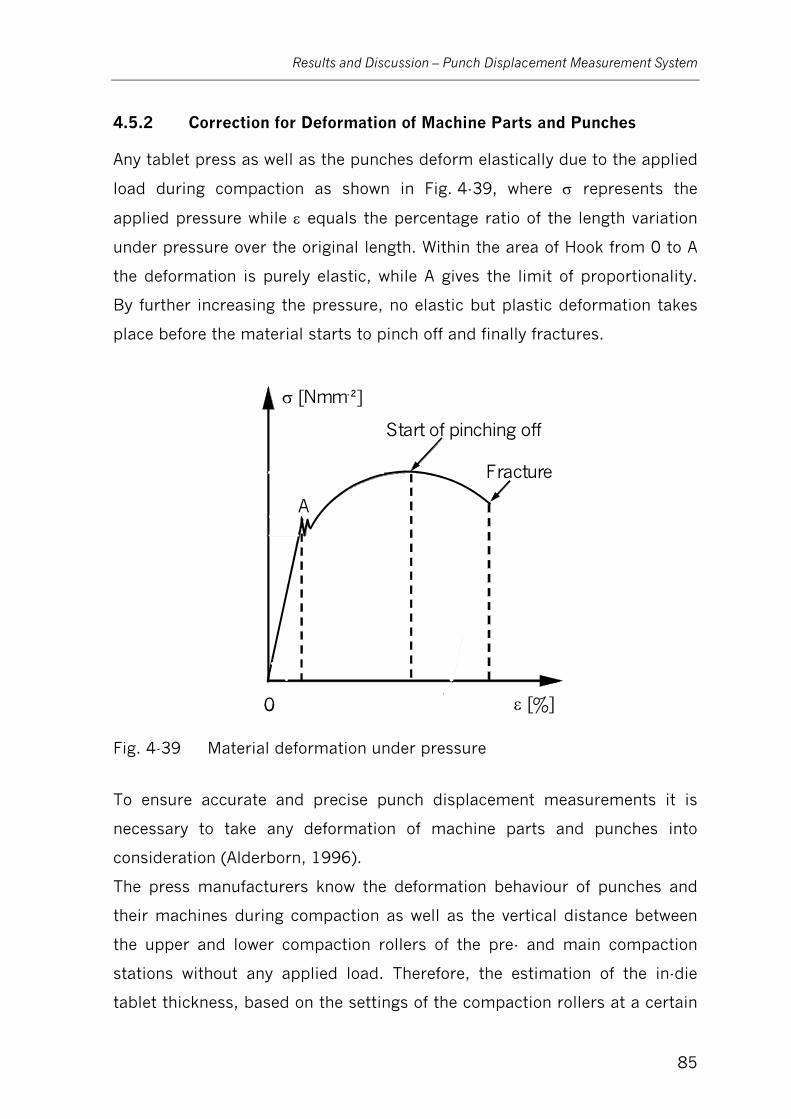
Results and Discussion – Punch Displacement Measurement System
85
4.5.2 Correction for Deformation of Machine Parts and Punches
Any tablet press as well as the punches deform elastically due to the applied
load during compaction as shown in Fig. 4-39, where σ represents the
applied pressure while ε equals the percentage ratio of the length variation
under pressure over the original length. Within the area of Hook from 0 to A
the deformation is purely elastic, while A gives the limit of proportionality.
By further increasing the pressure, no elastic but plastic deformation takes
place before the material starts to pinch off and finally fractures.
Start of pinching off
σ [Nmm-²]
ε [%]
A
Fracture
0
Start of pinching off
σ [Nmm-²]
ε [%]
A
Fracture
0
Fig. 4-39 Material deformation under pressure
To ensure accurate and precise punch displacement measurements it is
necessary to take any deformation of machine parts and punches into
consideration (Alderborn, 1996).
The press manufacturers know the deformation behaviour of punches and
their machines during compaction as well as the vertical distance between
the upper and lower compaction rollers of the pre- and main compaction
stations without any applied load. Therefore, the estimation of the in-die
tablet thickness, based on the settings of the compaction rollers at a certain
Results and Discussion – Punch Displacement Measurement System
86
pressure level, might be possible.
However, this method does neither compensate for slightly different lengths
of punches nor different deformation behaviours of punches of different size,
shape and material (Lloyd, 1991).
Therefore, the precision and accuracy of this method does not sufficiently
fulfil the requirements for the investigations of powder compaction
behaviour.
As a small error in the determination of punch displacement has a major
effect on the reliability of displacement measurements and the subsequent
estimation of powder compaction behaviour (Lammens, 1980;
Muñoz-Ruiz 1995), the minimisation of this error, by correcting for any
deformation as precisely as possible, is essential.
Depending on the mounting position of the displacement transducers on a
given tablet press, a correction for the deformation of machine parts and
punches or just for the latter is necessary to obtain reliable and accurate
punch displacement measurements.
In case of mounting the displacement sensors directly onto the punches the
only deformation to be corrected for is the one of the punch sections in
between the tip of the punch and the mounting position of the transducer on
the punch barrel.
All other deformations, like e.g. of further punch sections up to the punch
head or deformations of other machine parts, only need to be taken into
account while either the displacement transducers are mounted not directly
to the punches but to other machine parts e.g. the machine frame, or the
reference position is different from the top level of the die or the die table
respectively.
Different methods for the determination of the deformation are conceivable,
mainly depending on the mounting position of the sensors.
In case the sensors are not directly mounted to the punches, a punch to
punch pressing in connection with a coincident measurement of the
theoretical punch movements, monitored by the displacement transducers,
Results and Discussion – Punch Displacement Measurement System
87
might lead to sufficiently precise results and might therefore be the method
of choice, as the calculation of the deformation of machine parts might be
quite difficult due to their rather complex geometry.
However, this method is limited to the use of flat faced punches as any
varying punch tip will be irretrievably damaged by this method.
Whenever the displacement transducers have been mounted directly to the
punches the deformation of punches or individual punch sections can be
calculated according to Hook´s law.
Different methods of mounting displacement transducers on an
instrumented tablet machine result in varying errors in the determination of
the in-die tablet height (Ho, 1979). The smallest error was obtained by
mounting the displacement transducer directly to the punches and as close
to the punch tips as possible. This is due to the fact that no machine part
deformation except for the punch deformation affects the displacement
measurement, and, as shown in chapter 4.5.3., the precision and accuracy
of punch displacement measurements turns out to be less influenced by
tilting punches compared to other methods, as the distance between
punches and displacement sensors would be considerably larger.
Within this work, the calculation of the punch deformation has been
performed according to Hook´s law. Therefore, the punch sections of interest
in between the tip of the punch and the overall mounting position of the
clamp of the displacement sensors have been divided into several cylindrical
segments (Fig. 4-40), of which the dimensions, determined by a sliding
calliper (Mitutoyo, Neuss, Germany) are given by Tab. 4-9.
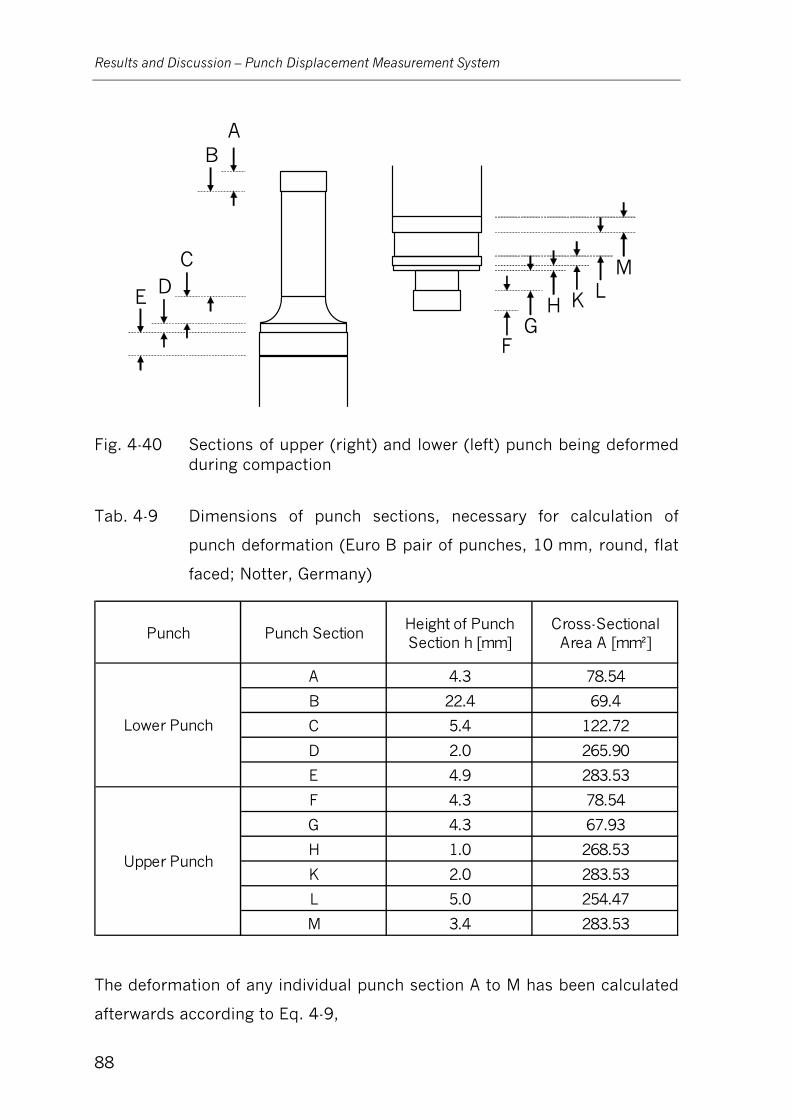
Results and Discussion – Punch Displacement Measurement System
88
B A
C D E
F G
H K L M
Fig. 4-40 Sections of upper (right) and lower (left) punch being deformed during compaction
Tab. 4-9 Dimensions of punch sections, necessary for calculation of
punch deformation (Euro B pair of punches, 10 mm, round, flat
faced; Notter, Germany)
Punch Punch SectionHeight of Punch Section h [mm]
Cross-Sectional Area A [mm²]
A 4.3 78.54
B 22.4 69.4
C 5.4 122.72
D 2.0 265.90
E 4.9 283.53
F 4.3 78.54
G 4.3 67.93
H 1.0 268.53
K 2.0 283.53
L 5.0 254.47
M 3.4 283.53
Lower Punch
Upper Punch
The deformation of any individual punch section A to M has been calculated
afterwards according to Eq. 4-9,
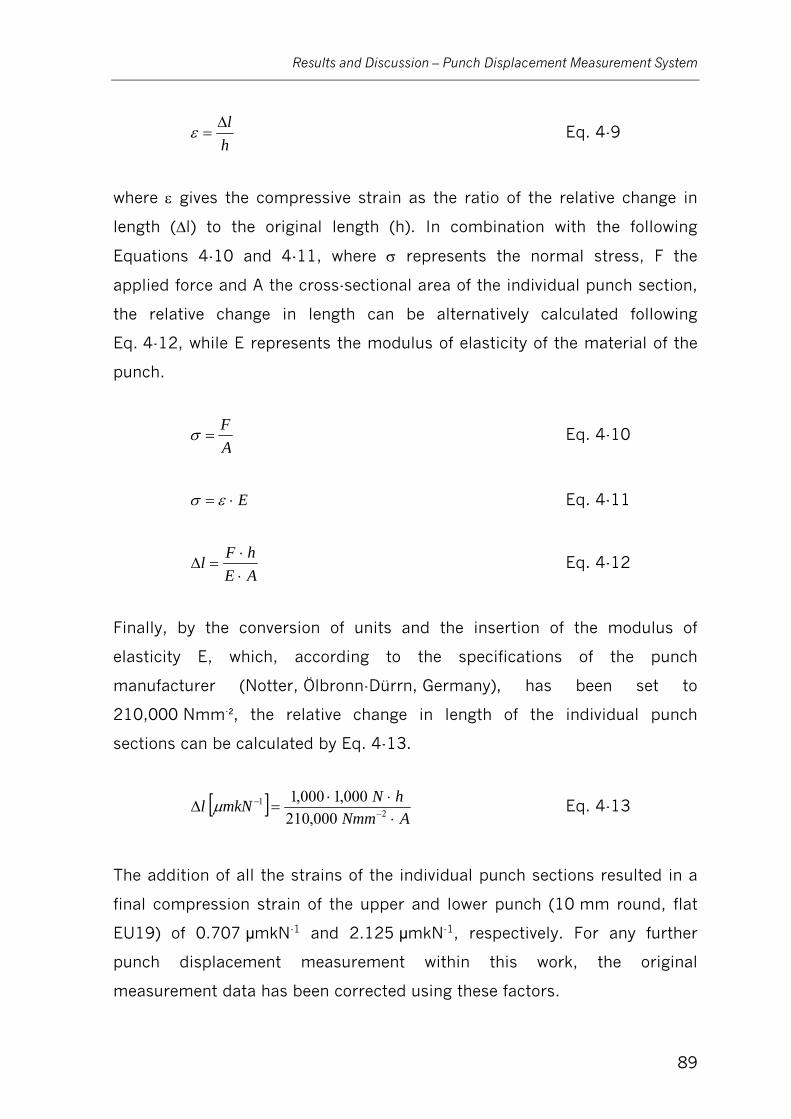
Results and Discussion – Punch Displacement Measurement System
89
hlΔ
=ε Eq. 4-9
where ε gives the compressive strain as the ratio of the relative change in
length (∆l) to the original length (h). In combination with the following
Equations 4-10 and 4-11, where σ represents the normal stress, F the
applied force and A the cross-sectional area of the individual punch section,
the relative change in length can be alternatively calculated following
Eq. 4-12, while E represents the modulus of elasticity of the material of the
punch.
AF
=σ Eq. 4-10
E⋅= εσ Eq. 4-11
AEhFl
⋅⋅
=Δ Eq. 4-12
Finally, by the conversion of units and the insertion of the modulus of
elasticity E, which, according to the specifications of the punch
manufacturer (Notter, Ölbronn-Dürrn, Germany), has been set to
210,000 Nmm-², the relative change in length of the individual punch
sections can be calculated by Eq. 4-13.
[ ]ANmm
hNmkNl⋅⋅⋅
=Δ −−
21
000,210000,1000,1μ Eq. 4-13
The addition of all the strains of the individual punch sections resulted in a
final compression strain of the upper and lower punch (10 mm round, flat
EU19) of 0.707 μmkN-1 and 2.125 μmkN-1, respectively. For any further
punch displacement measurement within this work, the original
measurement data has been corrected using these factors.
Results and Discussion – Punch Displacement Measurement System
90
4.5.3 Correction for Punch Tilting
In order to allow free movement of punches within the punch bushing and to
provide adequate room for lubrication between punch barrel and punch
bushing, turret guideways for punches are a bit larger as the punch barrels
outer diameter.
Unfortunately, the resulting clearance allows the punches to tilt within the
bushing. This tilting represents a second source of error in the
determination of punch displacement next to the already discussed
deformation of punches under load.
Tilting appears, as the orientation of the compaction force vectors has been
found to be not strictly straight vertical on both eccentric and rotary tablet
presses, as the participating machine parts of the force transmission are not
continuously positioned on a straight vertical line during the entire
compaction event (Schmidt, 1986).
Only during the dwell time period the orientation of the force vector is
expected to be straight vertical, which theoretically inhibits any punch
tilting.
The investigation of the compactibility of excipients, e.g. in terms of
compaction pressure vs. in-die tablet height plots or even Heckel-plots,
requires a precise and accurate determination of the positions of the tips of
the punches with respect to each other or a certain reference position as e.g.
the top level of the die, in order to minimise the error in the calculation of
the compacts in-die thickness and its volume, respectively.
The investigation of the positions of the tips of the punches, using just one
displacement transducer per punch, impedes the observation and
investigation of any punch tilting during the compaction cycle.
Hence, two displacement transducers, mounted on a straight line with the
punch, one on each side of the punch, are necessary to detect and correct
for any punch tilting and therefore being able to improve the precision and
accuracy of displacement measurements (Matz, 1999) on any type of tablet
press.
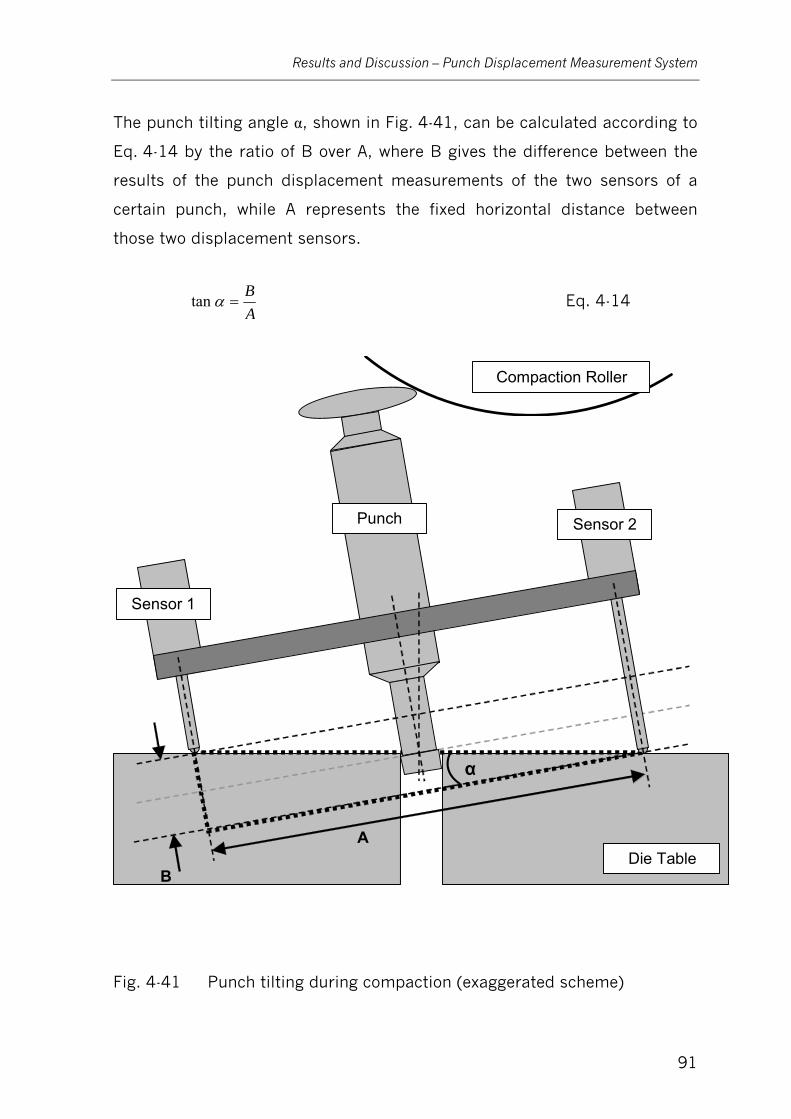
Results and Discussion – Punch Displacement Measurement System
91
The punch tilting angle α, shown in Fig. 4-41, can be calculated according to
Eq. 4-14 by the ratio of B over A, where B gives the difference between the
results of the punch displacement measurements of the two sensors of a
certain punch, while A represents the fixed horizontal distance between
those two displacement sensors.
AB
=αtan Eq. 4-14
Fig. 4-41 Punch tilting during compaction (exaggerated scheme)
α
A
B
Sensor 1
Sensor 2 Punch
Compaction Roller
Die Table
Results and Discussion – Punch Displacement Measurement System
92
The basic requirement for this calculation is, firstly, the mounting of the two
sensors on a straight line with the punch, one on each side of the punch
while both have the same vertical and horizontal distance to the tip of the
punch. And secondly, the absence of any deformation or deflection of the
mounting of the displacement sensors and the sensors itself under pressure.
By the knowledge of the tilting angle α of the investigated punch, the
theoretical error in the determination of the position of the tip of this punch,
in case of using just one displacement transducer per punch, can be
calculated by Eq. 4-15.
1000tan ⋅⋅=± dietilt rerr α Eq. 4-15
errtilt error in the measurement of the position of the tip of the
punch caused by punch tilting [μm]
α punch tilting angle [°]
rdie radius of the die cavity [mm]
As the positions of the tips of both the upper and lower punch might be
afflicted with a variable error, the tilting angle has to be determined
individually for each punch.
By the use of two displacement sensors per punch, errtilt will be eliminated
automatically, as all calculations will base on the mean punch displacement
of the two displacement sensors of one punch, as performed within this
work.
Therefore, two displacement transducers per punch are recommended and
ultimately indispensable to perform reliable and convincing punch
displacement measurements on any type of tablet press until the evidence of
no punch tilting under pressure has been furnished.
Beside the determination and quantification of any potential punch tilting
under pressure as well as the estimation of the feasibility of punch
Results and Discussion – Punch Displacement Measurement System
93
displacement measurements using just one displacement transducer per
punch, the dimension of the observed punch tilting allows the rating of the
mechanical quality of the punch guidance.
Any distinctive punch tilting points to an inadequate clearance between the
punch and its bushing, raised by either unacceptable tolerances during
production or as a consequence of wear, finally indicating to the need for at
least extensive machine inspection and an ongoing preventative
maintenance program to minimise the risk of further machine damage.
4.5.4 Investigation of the Original Presster Punch Displacement
Measurement System
The original punch displacement measurement system of the Presster
consisted of only one linear variable displacement transducer (LVDT;
250MHR, Schaevitz, USA) connected to each punch.
Signal processing has been preformed by Schaevitz (USA) conditioners
(LDM 1000) and amplifiers (DSCA49-05), while a moving ribbon cable,
which was not protected against any interfering signals, had been used
within the system.
Referring to the horizontal moving direction of the carriage, the LVDT´s have
been mounted square to the punches as seen in Fig. 4-42.
The moving armature of the LVDT`s has been fixed to the punch by a
bracket, while the housing of the transformer windings has been mounted
next to the punch bushings inside the carriage. Due to this kind of
instrumentation, the reference position for the punch displacement
measurement has not been located at the top level of the die but in a rather
large distance in the height of the middle of the punch bushing of the upper
and lower punch respectively.
Therefore, a punch-to-punch-pressing would have been required to correct
for both the punch and machine deformation, which would have affected any
punch displacement measurement.
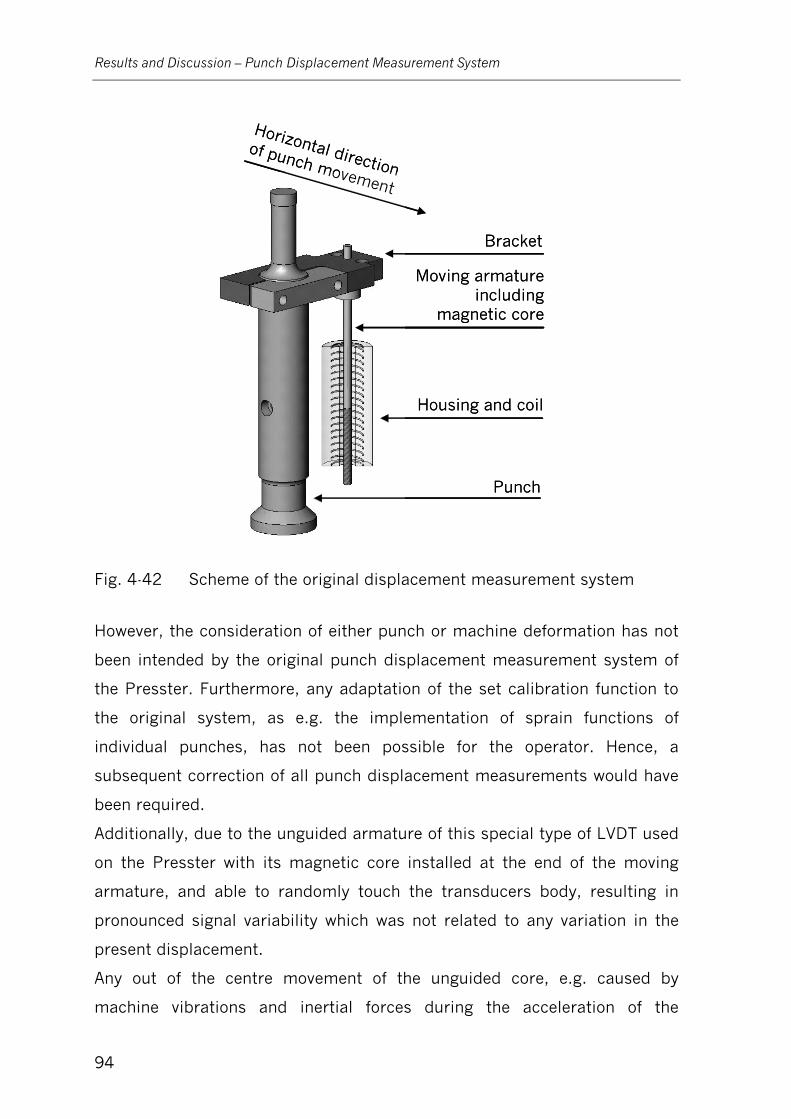
Results and Discussion – Punch Displacement Measurement System
94
Bracket
Punch
Moving armatureincluding
magnetic core
Housing and coil
Horizontal directionof punch movement
Bracket
Punch
Moving armatureincluding
magnetic core
Housing and coil
Horizontal directionof punch movement
Fig. 4-42 Scheme of the original displacement measurement system
However, the consideration of either punch or machine deformation has not
been intended by the original punch displacement measurement system of
the Presster. Furthermore, any adaptation of the set calibration function to
the original system, as e.g. the implementation of sprain functions of
individual punches, has not been possible for the operator. Hence, a
subsequent correction of all punch displacement measurements would have
been required.
Additionally, due to the unguided armature of this special type of LVDT used
on the Presster with its magnetic core installed at the end of the moving
armature, and able to randomly touch the transducers body, resulting in
pronounced signal variability which was not related to any variation in the
present displacement.
Any out of the centre movement of the unguided core, e.g. caused by
machine vibrations and inertial forces during the acceleration of the
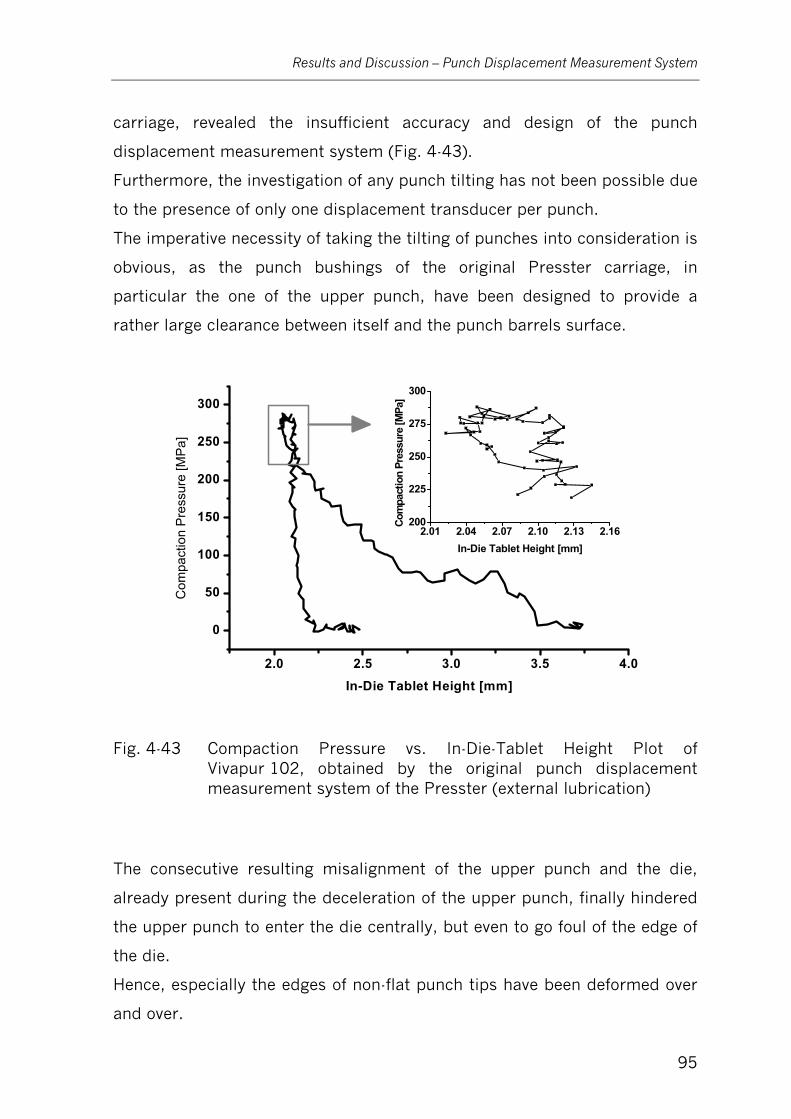
Results and Discussion – Punch Displacement Measurement System
95
carriage, revealed the insufficient accuracy and design of the punch
displacement measurement system (Fig. 4-43).
Furthermore, the investigation of any punch tilting has not been possible due
to the presence of only one displacement transducer per punch.
The imperative necessity of taking the tilting of punches into consideration is
obvious, as the punch bushings of the original Presster carriage, in
particular the one of the upper punch, have been designed to provide a
rather large clearance between itself and the punch barrels surface.
2.0 2.5 3.0 3.5 4.0
0
50
100
150
200
250
300
2.01 2.04 2.07 2.10 2.13 2.16200
225
250
275
300Co
mpa
ctio
n Pr
essu
re [M
Pa]
In-Die Tablet Height [mm]
Com
pact
ion
Pre
ssur
e [M
Pa]
In-Die Tablet Height [mm]
Fig. 4-43 Compaction Pressure vs. In-Die-Tablet Height Plot of Vivapur 102, obtained by the original punch displacement measurement system of the Presster (external lubrication)
The consecutive resulting misalignment of the upper punch and the die,
already present during the deceleration of the upper punch, finally hindered
the upper punch to enter the die centrally, but even to go foul of the edge of
the die.
Hence, especially the edges of non-flat punch tips have been deformed over
and over.
Results and Discussion – Punch Displacement Measurement System
96
The big clearance between the upper punch and the comparably soft original
punch bushing might have been also a result of the lateral stress applied to
the punch bushings as a consequence of the impact of the punch head to
the compaction rollers. This scenario might have been supported by the
shorter length of the punch bushing of the upper punch, providing less
lateral stability.
As a consequence of all the above mentioned shortcomings of the original
punch displacement measurement system of the Presster a new system has
been designed and finally used for all further punch displacement
measurements performed within this work.
4.5.5 Modification of the Punch Displacement Measurement System
As a result of the previously described shortcomings of the punch
displacement measurement system and the misalignment of punches and
die present on the original carriage, the modifications of the punch
displacement measurement system have not been restricted to the
optimisation of the displacement sensors itself, but included a revision of
the entire carriage.
Revised punch bushings have been used on the new carriage, providing less
clearance between the punch barrels surface and the punch bushing itself,
while the upper bushing has been additionally prolonged up to the maximum
possible length of 49 mm. Additionally both bushings have been made out of
steel and have been hardened up to 58 HRC to avoid any further deflection
and punch damage.
The lack in precision of the original displacement measurement system also
required the redraft of a modified punch displacement measurement
system.
Based on a precision of compaction force measurement systems providing
an error less than ± 2 MPa, the requirements to the precision and accuracy
of displacement measurement systems, used for the reliable determination
of the height of the powder bed inside the die, have been defined to exceed
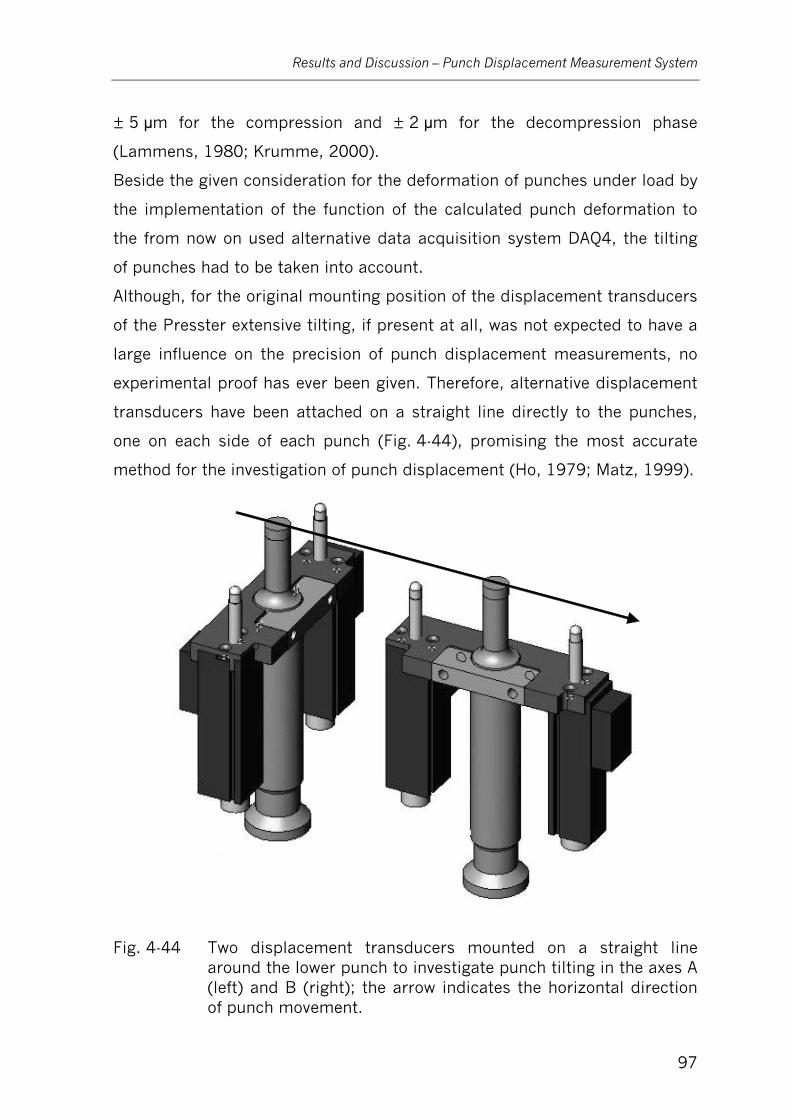
Results and Discussion – Punch Displacement Measurement System
97
± 5 μm for the compression and ± 2 μm for the decompression phase
(Lammens, 1980; Krumme, 2000).
Beside the given consideration for the deformation of punches under load by
the implementation of the function of the calculated punch deformation to
the from now on used alternative data acquisition system DAQ4, the tilting
of punches had to be taken into account.
Although, for the original mounting position of the displacement transducers
of the Presster extensive tilting, if present at all, was not expected to have a
large influence on the precision of punch displacement measurements, no
experimental proof has ever been given. Therefore, alternative displacement
transducers have been attached on a straight line directly to the punches,
one on each side of each punch (Fig. 4-44), promising the most accurate
method for the investigation of punch displacement (Ho, 1979; Matz, 1999).
Fig. 4-44 Two displacement transducers mounted on a straight line around the lower punch to investigate punch tilting in the axes A (left) and B (right); the arrow indicates the horizontal direction of punch movement.
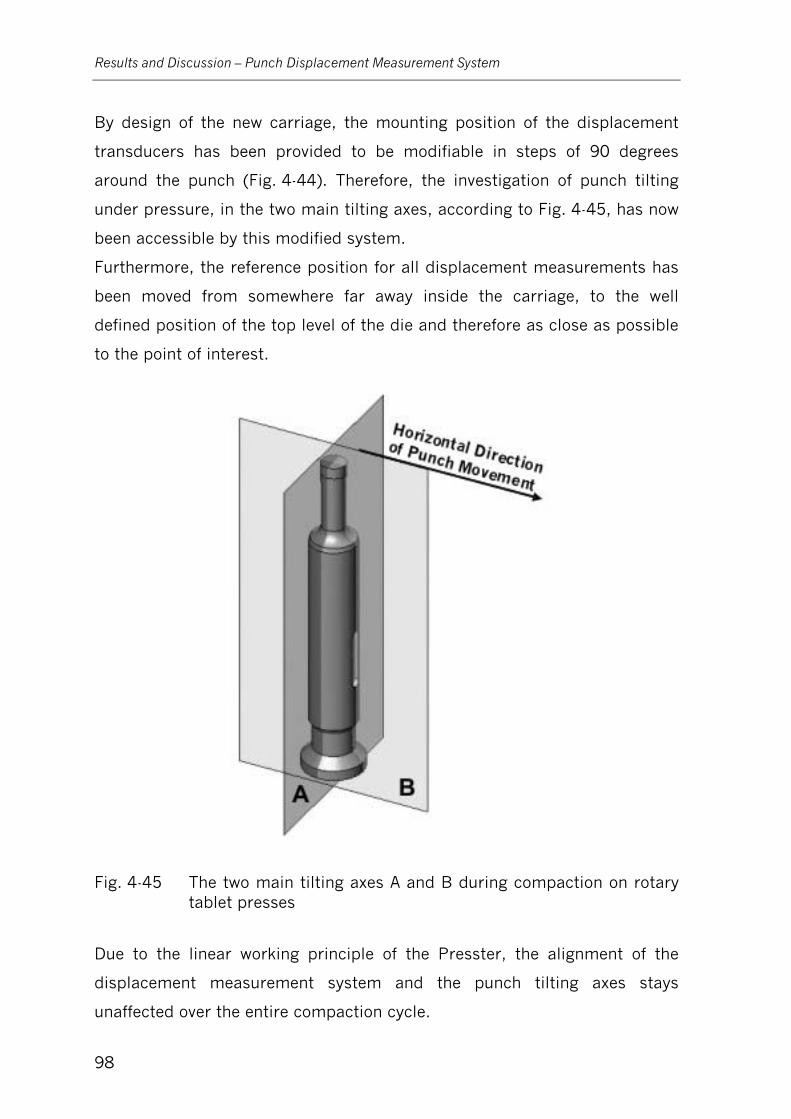
Results and Discussion – Punch Displacement Measurement System
98
By design of the new carriage, the mounting position of the displacement
transducers has been provided to be modifiable in steps of 90 degrees
around the punch (Fig. 4-44). Therefore, the investigation of punch tilting
under pressure, in the two main tilting axes, according to Fig. 4-45, has now
been accessible by this modified system.
Furthermore, the reference position for all displacement measurements has
been moved from somewhere far away inside the carriage, to the well
defined position of the top level of the die and therefore as close as possible
to the point of interest.
Fig. 4-45 The two main tilting axes A and B during compaction on rotary tablet presses
Due to the linear working principle of the Presster, the alignment of the
displacement measurement system and the punch tilting axes stays
unaffected over the entire compaction cycle.
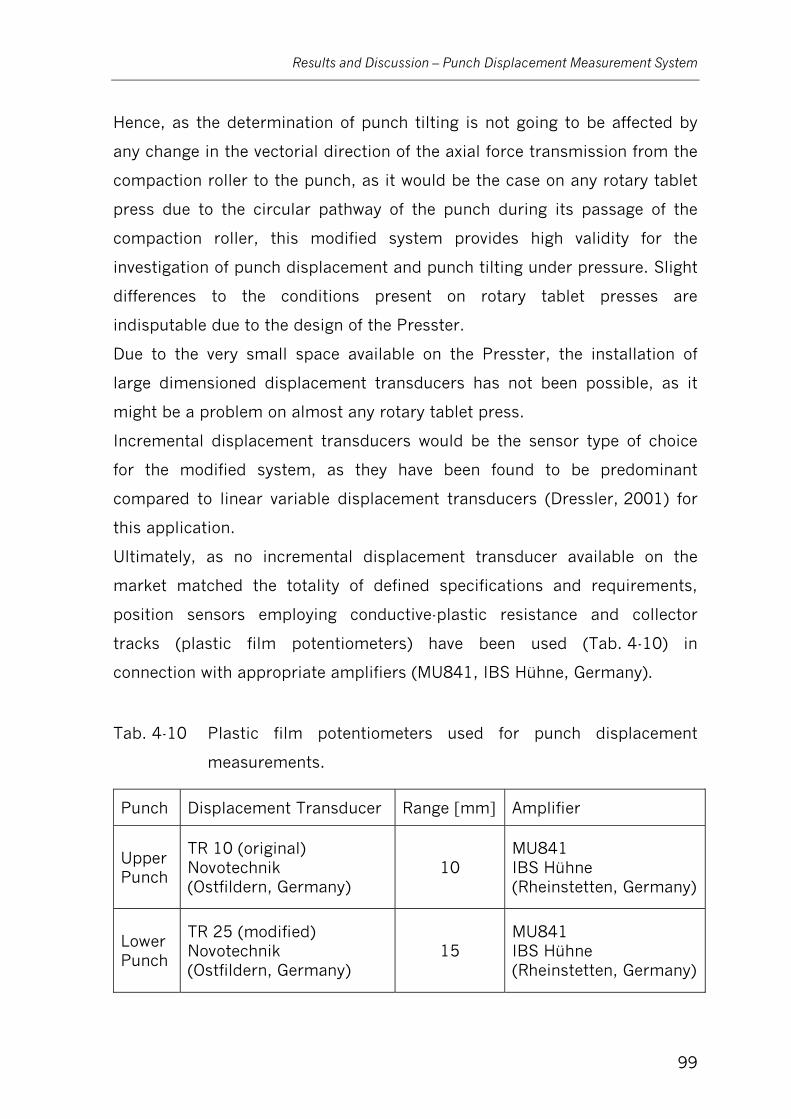
Results and Discussion – Punch Displacement Measurement System
99
Hence, as the determination of punch tilting is not going to be affected by
any change in the vectorial direction of the axial force transmission from the
compaction roller to the punch, as it would be the case on any rotary tablet
press due to the circular pathway of the punch during its passage of the
compaction roller, this modified system provides high validity for the
investigation of punch displacement and punch tilting under pressure. Slight
differences to the conditions present on rotary tablet presses are
indisputable due to the design of the Presster.
Due to the very small space available on the Presster, the installation of
large dimensioned displacement transducers has not been possible, as it
might be a problem on almost any rotary tablet press.
Incremental displacement transducers would be the sensor type of choice
for the modified system, as they have been found to be predominant
compared to linear variable displacement transducers (Dressler, 2001) for
this application.
Ultimately, as no incremental displacement transducer available on the
market matched the totality of defined specifications and requirements,
position sensors employing conductive-plastic resistance and collector
tracks (plastic film potentiometers) have been used (Tab. 4-10) in
connection with appropriate amplifiers (MU841, IBS Hühne, Germany).
Tab. 4-10 Plastic film potentiometers used for punch displacement
measurements.
Punch Displacement Transducer Range [mm] Amplifier
Upper Punch
TR 10 (original) Novotechnik (Ostfildern, Germany)
10 MU841 IBS Hühne (Rheinstetten, Germany)
Lower Punch
TR 25 (modified) Novotechnik (Ostfildern, Germany)
15 MU841 IBS Hühne (Rheinstetten, Germany)

Results and Discussion – Punch Displacement Measurement System
100
The previously discussed requirements for the precision and accuracy of
displacement measurements were not achievable using these plastic film
potentiometers, as their independent linearity was not within the desired
specification.
But, due to the provided accuracy in repeatability of +/- 2 μm, they
represented the most promising alternative with the background of the
necessity for the improvement to the punch displacement measurement
system.
As a result of the plastic bearings on both ends of the shaft and the
elastomer-damped multi finger wiper these sensors have been quite
insensitive to shock and vibration.
Due to the different measurement ranges being of interest for the upper and
lower punch, different types of these sensors have been installed. As the
TR 25 sensors, used at the lower punch, did not fit in properly, the length of
their actuating shaft has been modified to finally match the space restraints
of the new carriage.
4.5.6 Calibration of the Modified Punch Displacement Measurement
System
For the individual calibration of the plastic film potentiometers TR 10 and
TR 25 (Novotechnik, Germany) outside of the carriage, a digital micrometer
screw (164-151, Mitutoyo, Japan), providing an accuracy of 0.003 mm, has
been used to relocate the shaft of the potentiometer with respect to its
housing. The shaft has been displaced in steps of 0.1 mm over its entire
measurement range of 10 and 15 mm respectively. The output voltage of the
total instrumentation has been set to be 0 V at 0 mm (TR 10) or 15 mm
(TR 25) and 10 V at 10 mm (TR 10) or 0 mm (TR 25) prior to the calibration
run.
In order to avoid any hysteresis of the spindle drive of the micrometer screw,
affecting the quality of reference positions, the micrometer screw has been
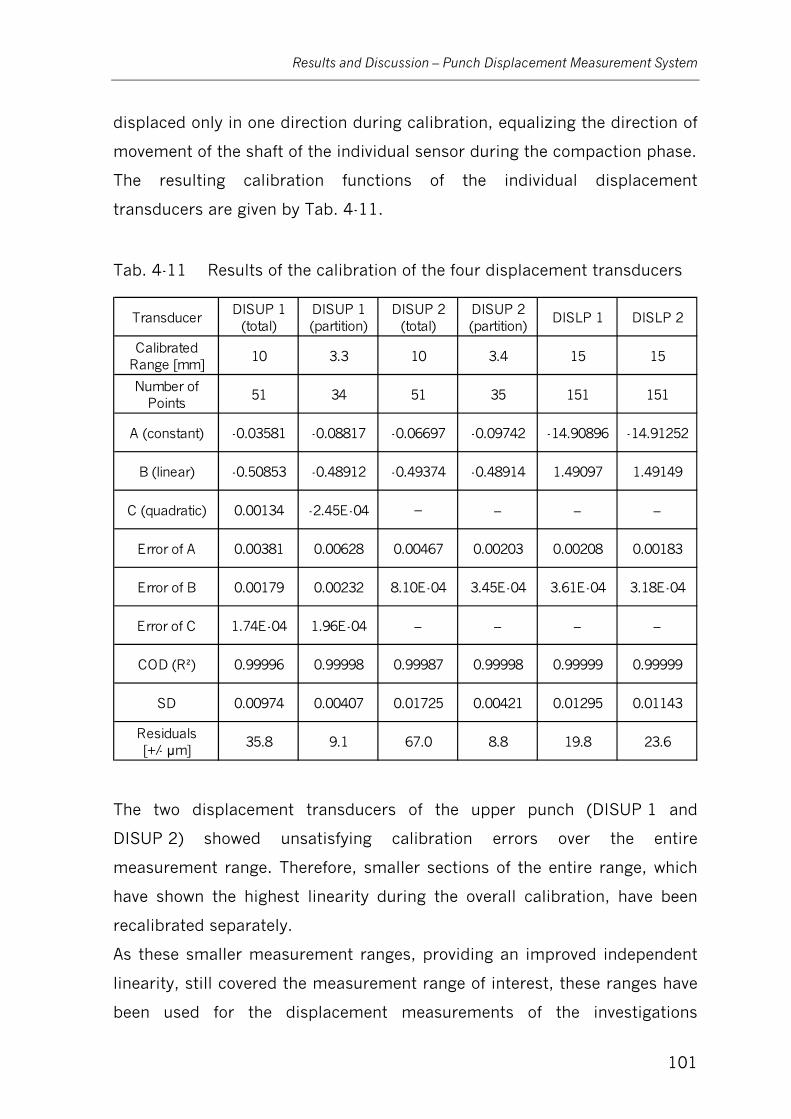
Results and Discussion – Punch Displacement Measurement System
101
displaced only in one direction during calibration, equalizing the direction of
movement of the shaft of the individual sensor during the compaction phase.
The resulting calibration functions of the individual displacement
transducers are given by Tab. 4-11.
Tab. 4-11 Results of the calibration of the four displacement transducers
TransducerDISUP 1
(total)DISUP 1 (partition)
DISUP 2 (total)
DISUP 2 (partition)
DISLP 1 DISLP 2
Calibrated Range [mm]
10 3.3 10 3.4 15 15
Number of Points
51 34 51 35 151 151
A (constant) -0.03581 -0.08817 -0.06697 -0.09742 -14.90896 -14.91252
B (linear) -0.50853 -0.48912 -0.49374 -0.48914 1.49097 1.49149
C (quadratic) 0.00134 -2.45E-04 – – – –
Error of A 0.00381 0.00628 0.00467 0.00203 0.00208 0.00183
Error of B 0.00179 0.00232 8.10E-04 3.45E-04 3.61E-04 3.18E-04
Error of C 1.74E-04 1.96E-04 – – – –
COD (R²) 0.99996 0.99998 0.99987 0.99998 0.99999 0.99999
SD 0.00974 0.00407 0.01725 0.00421 0.01295 0.01143
Residuals [+/- μm]
35.8 9.1 67.0 8.8 19.8 23.6
The two displacement transducers of the upper punch (DISUP 1 and
DISUP 2) showed unsatisfying calibration errors over the entire
measurement range. Therefore, smaller sections of the entire range, which
have shown the highest linearity during the overall calibration, have been
recalibrated separately.
As these smaller measurement ranges, providing an improved independent
linearity, still covered the measurement range of interest, these ranges have
been used for the displacement measurements of the investigations
Results and Discussion – Punch Displacement Measurement System
102
described in the following.
The displacement of the lower punch has been of interest for both the
compaction and the ejection event. Hence, a restriction of the measurement
range of the lower punch displacement transducers has not been possible to
avoid any restriction with respect to lower punch displacement
measurements during ejection. Therefore the rather large residuals of the
two displacement measurement systems of the lower punch (DISLP 1 and
DISLP 2) had to be accepted.
After calibration, two transducers have been fixed within one linkage, which
has been mounted securely to the punch barrel.
The mounting position of the linkage on the punch has been chosen to
prevent any limitation of the vertical punch movement as well as to
guarantee the operation of the transducers within their calibrated
measurement range.
Prior to any investigation, all individual channels of the modified punch
displacement measurement system have been readjusted by implementing
the final physical offset of any individual displacement transducer into the
DAQ4 data acquisition system.
In order to take any unevenness within the top levels of the die table and die
into consideration, the readjustment of the measurement systems of both
punches has been carried out in relation to their individual reference
positions, being the top level of the die table for the systems of the upper
punch as well as the top level of the die for the measurement systems of the
lower punch.
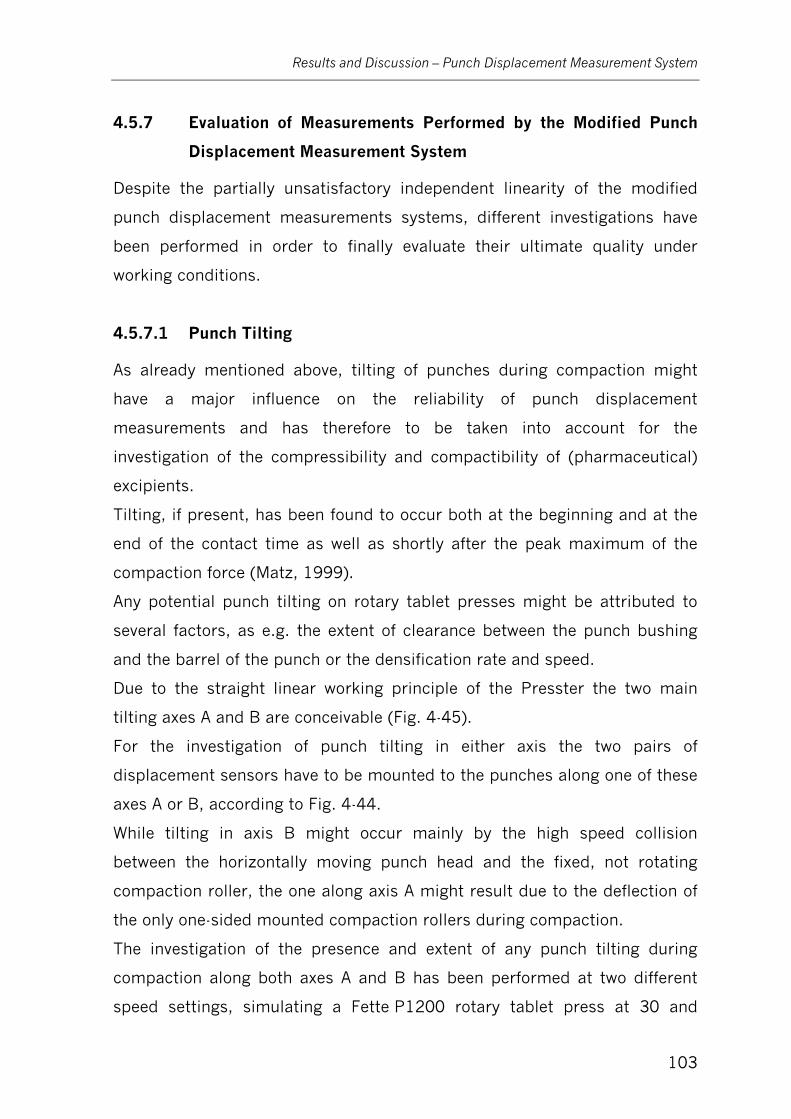
Results and Discussion – Punch Displacement Measurement System
103
4.5.7 Evaluation of Measurements Performed by the Modified Punch
Displacement Measurement System
Despite the partially unsatisfactory independent linearity of the modified
punch displacement measurements systems, different investigations have
been performed in order to finally evaluate their ultimate quality under
working conditions.
4.5.7.1 Punch Tilting
As already mentioned above, tilting of punches during compaction might
have a major influence on the reliability of punch displacement
measurements and has therefore to be taken into account for the
investigation of the compressibility and compactibility of (pharmaceutical)
excipients.
Tilting, if present, has been found to occur both at the beginning and at the
end of the contact time as well as shortly after the peak maximum of the
compaction force (Matz, 1999).
Any potential punch tilting on rotary tablet presses might be attributed to
several factors, as e.g. the extent of clearance between the punch bushing
and the barrel of the punch or the densification rate and speed.
Due to the straight linear working principle of the Presster the two main
tilting axes A and B are conceivable (Fig. 4-45).
For the investigation of punch tilting in either axis the two pairs of
displacement sensors have to be mounted to the punches along one of these
axes A or B, according to Fig. 4-44.
While tilting in axis B might occur mainly by the high speed collision
between the horizontally moving punch head and the fixed, not rotating
compaction roller, the one along axis A might result due to the deflection of
the only one-sided mounted compaction rollers during compaction.
The investigation of the presence and extent of any punch tilting during
compaction along both axes A and B has been performed at two different
speed settings, simulating a Fette P1200 rotary tablet press at 30 and
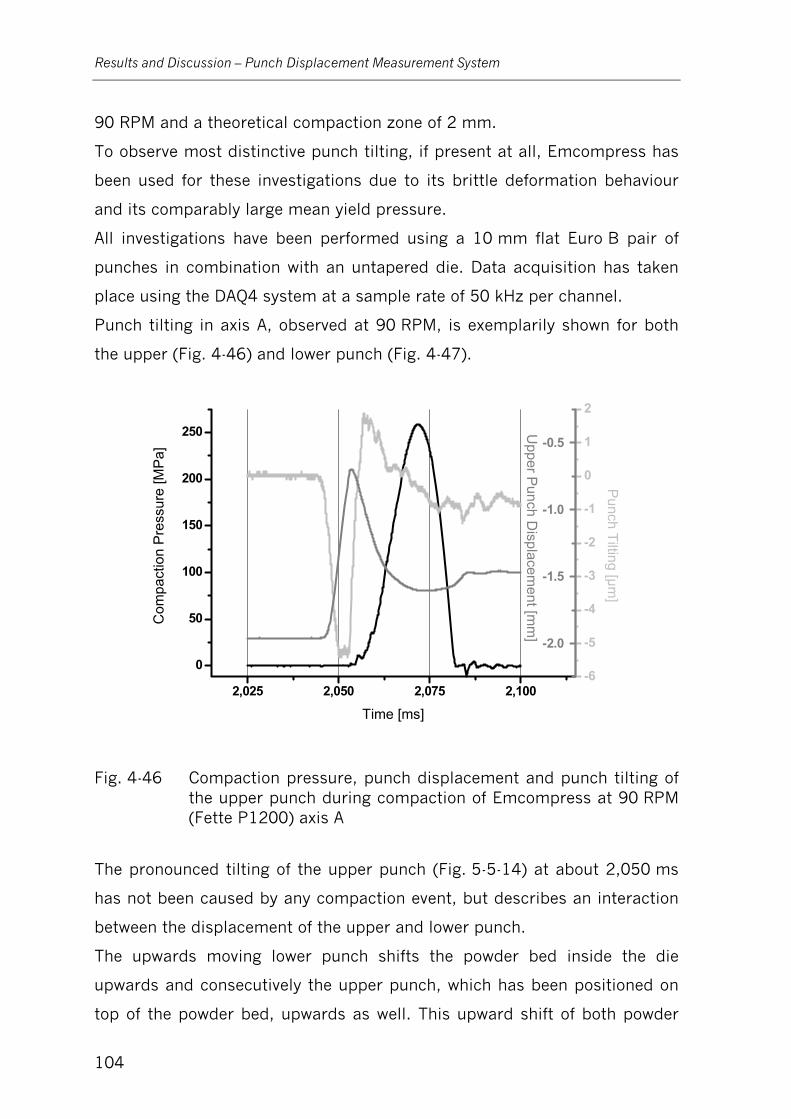
Results and Discussion – Punch Displacement Measurement System
104
90 RPM and a theoretical compaction zone of 2 mm.
To observe most distinctive punch tilting, if present at all, Emcompress has
been used for these investigations due to its brittle deformation behaviour
and its comparably large mean yield pressure.
All investigations have been performed using a 10 mm flat Euro B pair of
punches in combination with an untapered die. Data acquisition has taken
place using the DAQ4 system at a sample rate of 50 kHz per channel.
Punch tilting in axis A, observed at 90 RPM, is exemplarily shown for both
the upper (Fig. 4-46) and lower punch (Fig. 4-47).
2,025 2,050 2,075 2,100
0
50
100
150
200
250
-6
-5
-4
-3
-2
-1
0
1
2
-2.0
-1.5
-1.0
-0.5
Upper P
unch Displacem
ent [mm
]
Punch Tilting [µm
] C
ompa
ctio
n P
ress
ure
[MP
a]
Time [ms]
Fig. 4-46 Compaction pressure, punch displacement and punch tilting of the upper punch during compaction of Emcompress at 90 RPM (Fette P1200) axis A
The pronounced tilting of the upper punch (Fig. 5-5-14) at about 2,050 ms
has not been caused by any compaction event, but describes an interaction
between the displacement of the upper and lower punch.
The upwards moving lower punch shifts the powder bed inside the die
upwards and consecutively the upper punch, which has been positioned on
top of the powder bed, upwards as well. This upward shift of both powder
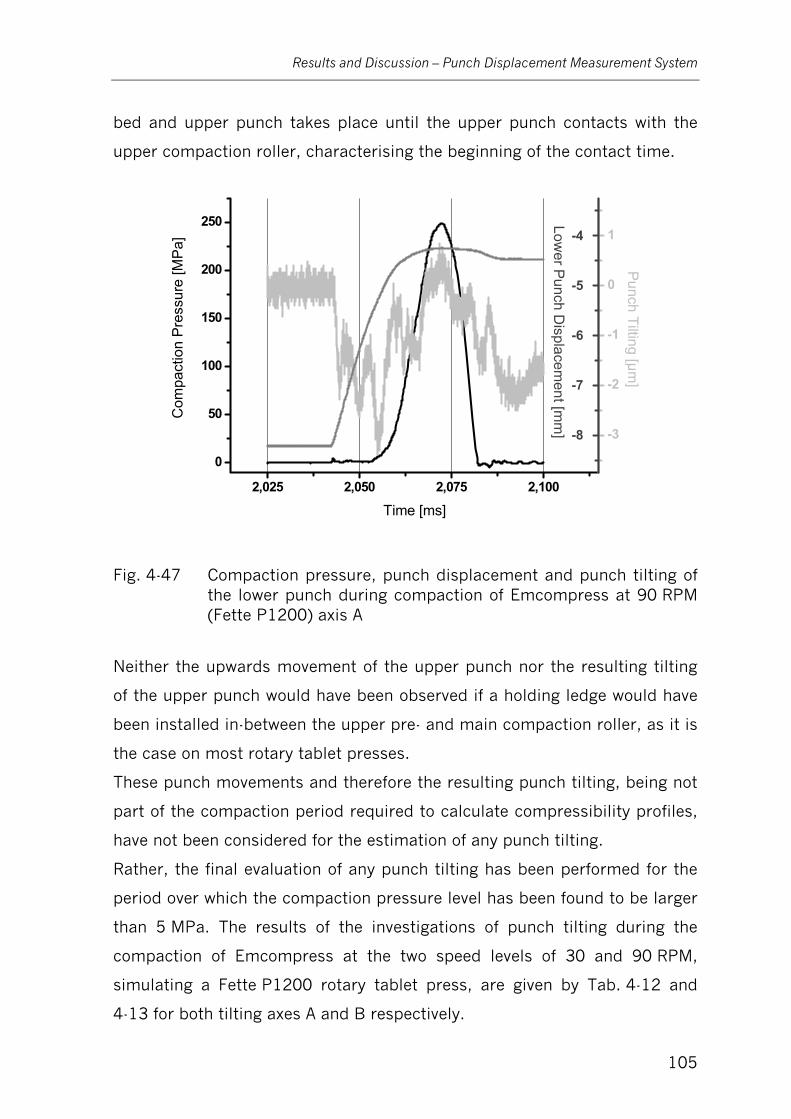
Results and Discussion – Punch Displacement Measurement System
105
bed and upper punch takes place until the upper punch contacts with the
upper compaction roller, characterising the beginning of the contact time.
2,025 2,050 2,075 2,100
0
50
100
150
200
250
-3
-2
-1
0
1
-8
-7
-6
-5
-4
Com
pact
ion
Pre
ssur
e [M
Pa]
Time [ms]
Lower P
unch Displacem
ent [mm
]
Punch Tilting [µm
]
Fig. 4-47 Compaction pressure, punch displacement and punch tilting of the lower punch during compaction of Emcompress at 90 RPM (Fette P1200) axis A
Neither the upwards movement of the upper punch nor the resulting tilting
of the upper punch would have been observed if a holding ledge would have
been installed in-between the upper pre- and main compaction roller, as it is
the case on most rotary tablet presses.
These punch movements and therefore the resulting punch tilting, being not
part of the compaction period required to calculate compressibility profiles,
have not been considered for the estimation of any punch tilting.
Rather, the final evaluation of any punch tilting has been performed for the
period over which the compaction pressure level has been found to be larger
than 5 MPa. The results of the investigations of punch tilting during the
compaction of Emcompress at the two speed levels of 30 and 90 RPM,
simulating a Fette P1200 rotary tablet press, are given by Tab. 4-12 and
4-13 for both tilting axes A and B respectively.
Results and Discussion – Punch Displacement Measurement System
106
As both punches might tilt in both, a positive and negative direction, a tilting
orientation had to be defined. For both punches the punch tilting has been
described in terms of action of the individual punch head along one certain
tilting axis.
Therefore, referring to the horizontal moving direction of the punches, the
punch head tilts to the left or right for tilting axis A, for tilting axis B the
punch head might tilt to the front or back.
The overall punch tilting gives the tilting of one punch observed in both
directions during one defined compaction event. A punch head tilting to one
direction implicates the tip of the same punch tilting to the opposite
direction.
The most distinctive punch tilting, if at all, would have been expected to
appear for the upper punch, as its punch bushing had to be designed
shorter compared to the one of the lower punch, due to the cramped
conditions.
Therefore the guidance of the upper punch would have been expected to be
of lower quality compared to the one of the lower punch.
Furthermore, punch tilting would have been expected to increase by
increasing speed settings of the turret.
The results tend to confirm the speed dependency for both tilting axes, but
showed the contrary to that expected for the magnitude of tilting for the
upper and lower punch, as the more pronounced tilting has been found for
the latter. No major difference has been observed for the tilting of punches
along the two tilting axes A and B.
The most distinctive absolute punch tilting, observed for both the upper and
lower punch and both tilting axes A and B, has been found to be smaller
than 4.4 μm.
The small extent of punch tilting is ascribed to the rather small clearance
between the barrels of the punches and the new punch bushings, which have
been redesigned in combination with the new designed carriage, in order to
prevent or at least minimise any potential punch tilting.
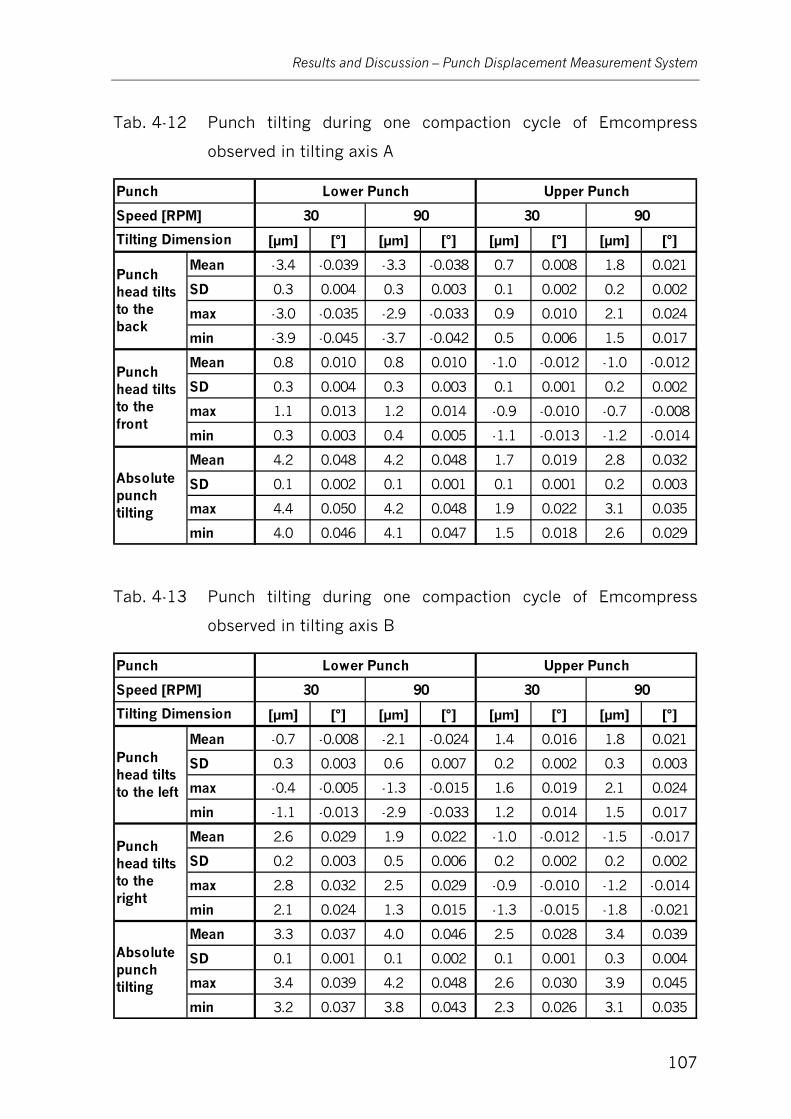
Results and Discussion – Punch Displacement Measurement System
107
Tab. 4-12 Punch tilting during one compaction cycle of Emcompress
observed in tilting axis A
[μm] [°] [μm] [°] [μm] [°] [μm] [°]
Mean -3.4 -0.039 -3.3 -0.038 0.7 0.008 1.8 0.021
SD 0.3 0.004 0.3 0.003 0.1 0.002 0.2 0.002
max -3.0 -0.035 -2.9 -0.033 0.9 0.010 2.1 0.024
min -3.9 -0.045 -3.7 -0.042 0.5 0.006 1.5 0.017
Mean 0.8 0.010 0.8 0.010 -1.0 -0.012 -1.0 -0.012
SD 0.3 0.004 0.3 0.003 0.1 0.001 0.2 0.002
max 1.1 0.013 1.2 0.014 -0.9 -0.010 -0.7 -0.008
min 0.3 0.003 0.4 0.005 -1.1 -0.013 -1.2 -0.014
Mean 4.2 0.048 4.2 0.048 1.7 0.019 2.8 0.032
SD 0.1 0.002 0.1 0.001 0.1 0.001 0.2 0.003
max 4.4 0.050 4.2 0.048 1.9 0.022 3.1 0.035
min 4.0 0.046 4.1 0.047 1.5 0.018 2.6 0.029
Tilting Dimension
Punch head tilts to the back
Punch head tilts to the front
Absolute punch tilting
Punch Lower Punch Upper Punch
Speed [RPM] 30 90 30 90
Tab. 4-13 Punch tilting during one compaction cycle of Emcompress
observed in tilting axis B
[μm] [°] [μm] [°] [μm] [°] [μm] [°]
Mean -0.7 -0.008 -2.1 -0.024 1.4 0.016 1.8 0.021
SD 0.3 0.003 0.6 0.007 0.2 0.002 0.3 0.003
max -0.4 -0.005 -1.3 -0.015 1.6 0.019 2.1 0.024
min -1.1 -0.013 -2.9 -0.033 1.2 0.014 1.5 0.017
Mean 2.6 0.029 1.9 0.022 -1.0 -0.012 -1.5 -0.017
SD 0.2 0.003 0.5 0.006 0.2 0.002 0.2 0.002
max 2.8 0.032 2.5 0.029 -0.9 -0.010 -1.2 -0.014
min 2.1 0.024 1.3 0.015 -1.3 -0.015 -1.8 -0.021
Mean 3.3 0.037 4.0 0.046 2.5 0.028 3.4 0.039
SD 0.1 0.001 0.1 0.002 0.1 0.001 0.3 0.004
max 3.4 0.039 4.2 0.048 2.6 0.030 3.9 0.045
min 3.2 0.037 3.8 0.043 2.3 0.026 3.1 0.035
Tilting Dimension
Punch head tilts to the left
Punch head tilts to the right
Absolute punch tilting
Punch Lower Punch Upper Punch
Speed [RPM] 30 90 30 90
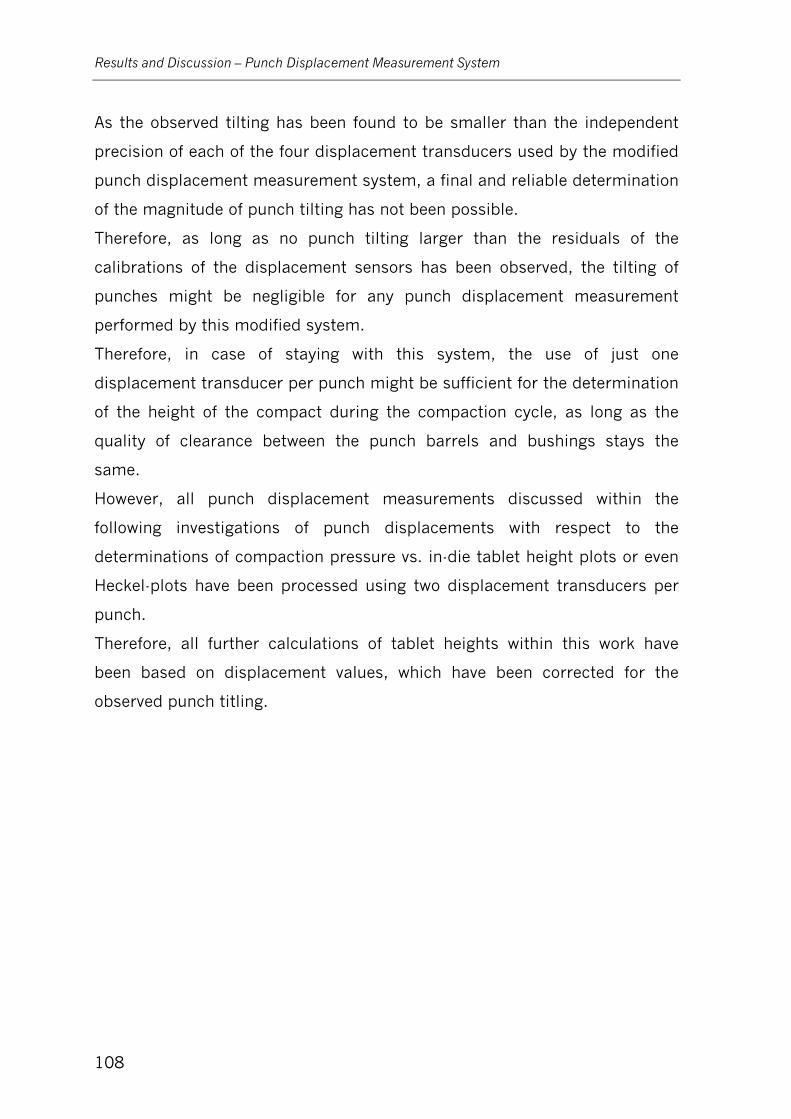
Results and Discussion – Punch Displacement Measurement System
108
As the observed tilting has been found to be smaller than the independent
precision of each of the four displacement transducers used by the modified
punch displacement measurement system, a final and reliable determination
of the magnitude of punch tilting has not been possible.
Therefore, as long as no punch tilting larger than the residuals of the
calibrations of the displacement sensors has been observed, the tilting of
punches might be negligible for any punch displacement measurement
performed by this modified system.
Therefore, in case of staying with this system, the use of just one
displacement transducer per punch might be sufficient for the determination
of the height of the compact during the compaction cycle, as long as the
quality of clearance between the punch barrels and bushings stays the
same.
However, all punch displacement measurements discussed within the
following investigations of punch displacements with respect to the
determinations of compaction pressure vs. in-die tablet height plots or even
Heckel-plots have been processed using two displacement transducers per
punch.
Therefore, all further calculations of tablet heights within this work have
been based on displacement values, which have been corrected for the
observed punch titling.
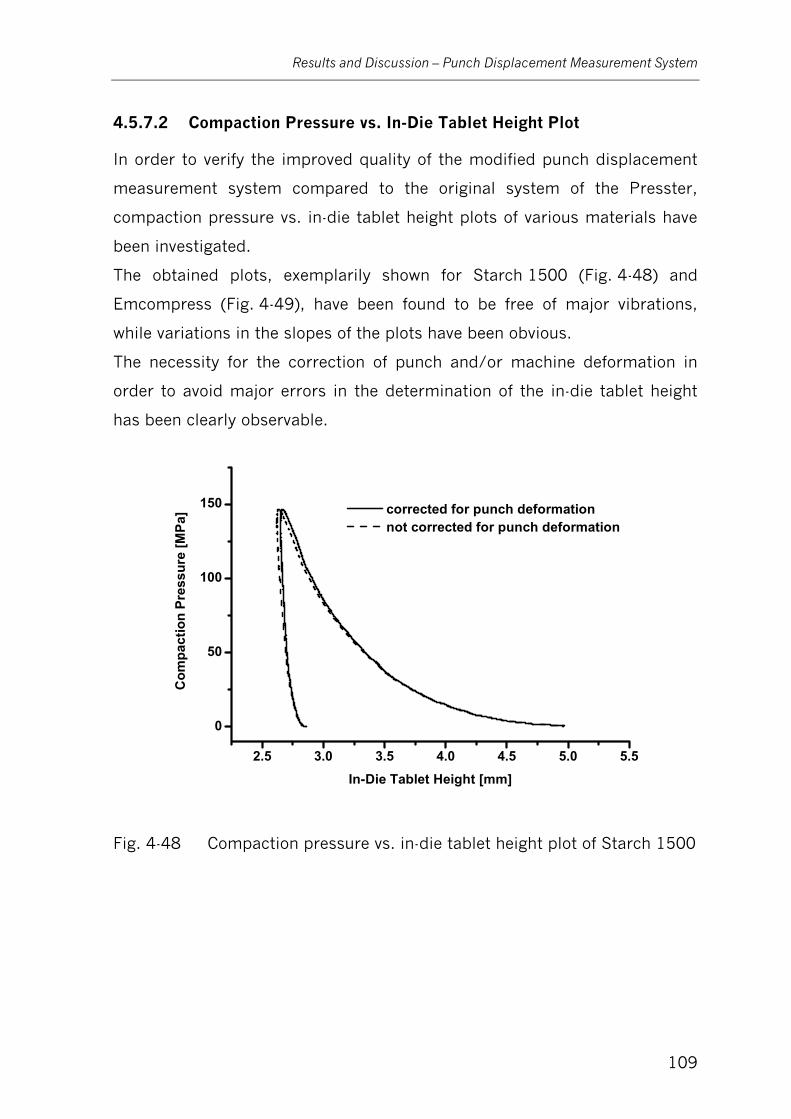
Results and Discussion – Punch Displacement Measurement System
109
4.5.7.2 Compaction Pressure vs. In-Die Tablet Height Plot
In order to verify the improved quality of the modified punch displacement
measurement system compared to the original system of the Presster,
compaction pressure vs. in-die tablet height plots of various materials have
been investigated.
The obtained plots, exemplarily shown for Starch 1500 (Fig. 4-48) and
Emcompress (Fig. 4-49), have been found to be free of major vibrations,
while variations in the slopes of the plots have been obvious.
The necessity for the correction of punch and/or machine deformation in
order to avoid major errors in the determination of the in-die tablet height
has been clearly observable.
2.5 3.0 3.5 4.0 4.5 5.0 5.5
0
50
100
150 corrected for punch deformation not corrected for punch deformation
Com
pact
ion
Pres
sure
[MPa
]
In-Die Tablet Height [mm]
Fig. 4-48 Compaction pressure vs. in-die tablet height plot of Starch 1500
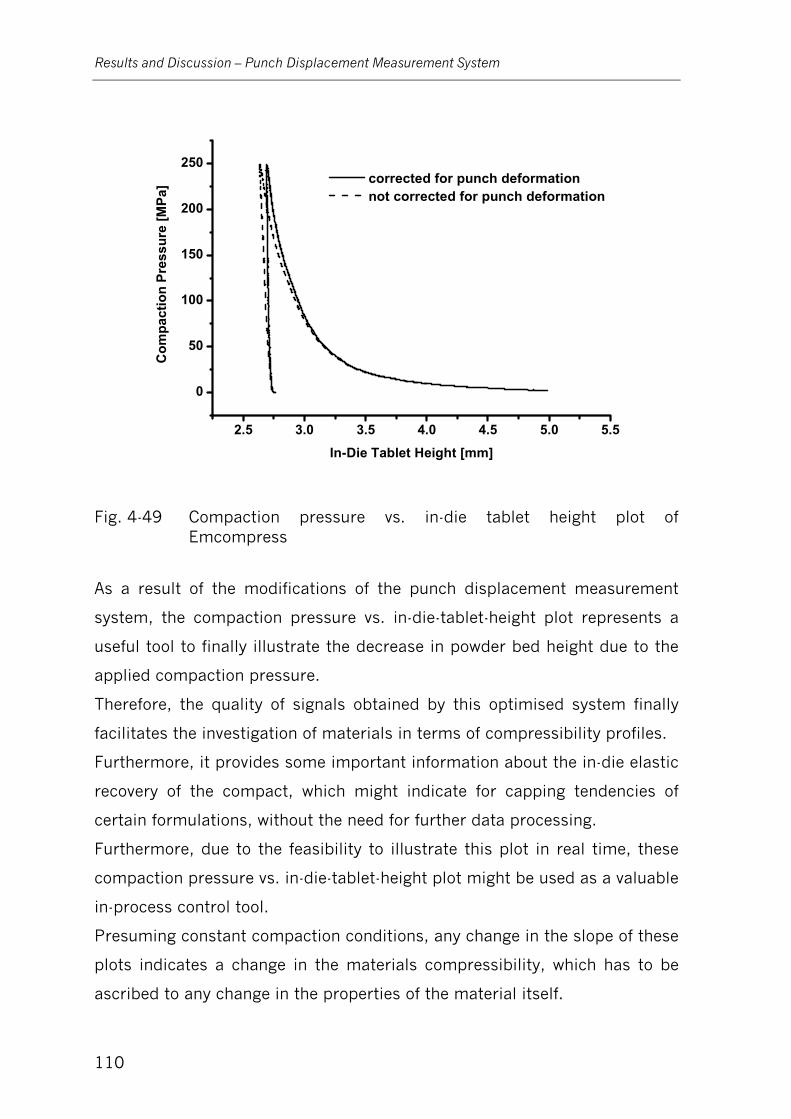
Results and Discussion – Punch Displacement Measurement System
110
2.5 3.0 3.5 4.0 4.5 5.0 5.5
0
50
100
150
200
250 corrected for punch deformation not corrected for punch deformation
Com
pact
ion
Pres
sure
[MPa
]
In-Die Tablet Height [mm]
Fig. 4-49 Compaction pressure vs. in-die tablet height plot of Emcompress
As a result of the modifications of the punch displacement measurement
system, the compaction pressure vs. in-die-tablet-height plot represents a
useful tool to finally illustrate the decrease in powder bed height due to the
applied compaction pressure.
Therefore, the quality of signals obtained by this optimised system finally
facilitates the investigation of materials in terms of compressibility profiles.
Furthermore, it provides some important information about the in-die elastic
recovery of the compact, which might indicate for capping tendencies of
certain formulations, without the need for further data processing.
Furthermore, due to the feasibility to illustrate this plot in real time, these
compaction pressure vs. in-die-tablet-height plot might be used as a valuable
in-process control tool.
Presuming constant compaction conditions, any change in the slope of these
plots indicates a change in the materials compressibility, which has to be
ascribed to any change in the properties of the material itself.
Results and Discussion – Punch Displacement Measurement System
111
Therefore, compared to the quality of compaction pressure vs.
in-die-tablet-height plot (Fig. 4-43) and the overall performance of the
original punch displacement measurement system, the modified punch
displacement measurement system has been found to be better.
Hence, by the use of this modified system, further investigations with
respect to compressibility profiles or Heckel-plots of individual excipients
and/or active ingredients as well as binary or ternary blends can now be
performed with adequate precision.
4.5.7.3 Heckel-Plot
To further prove the improved quality of the modified punch displacement
measurement system, Heckel-plots of five excipients, representing the three
main deformation mechanisms (brittle fracture, plastic and viscoelastic flow)
of pharmaceutical excipients, have been investigated, based on the
determination of the in-die compact height, as already mentioned above.
Each of the five excipients has been compressed at two different speed
settings equivalent to 30 and 90 RPM of the simulated Fette P1200 rotary
tablet press, in order to evaluate the feasibility to detect any speed
dependency in materials compressibility.
External lubrication has been used to minimise the lubricant affected
modification of the materials compressibility profiles, which has been shown
by Dressler (2002). Therefore, magnesium stearate used as the lubricant
has been applied to the punches and die before each compaction cycle using
a small brush, while excess lubricant has been exhausted using a vacuum
cleaner. All the excipients have been weighed out on a balance before being
transferred to the die manually.
To detect the most linear span of the compaction slope of the Heckel-plot a
set of 50 data points, separated in steps of 1 MPa, has been selected out of
a pressure interval of 50 MPa. A pressure interval of 50 MPa has been
selected as it firstly contains a sufficient number of data points and secondly
Results and Discussion – Punch Displacement Measurement System
112
to limit the interval to a maximum of about 30% of the investigated
compaction pressure range. A linear regression has been applied to this
data set. Parameters as the slope of the linear regression, the intercept with
the ordinate and the coefficient of determination, have been stored.
Afterwards, the data point, showing the smallest pressure level within the
50 MPa interval, has been displaced by a new data point, showing a by
1 MPa larger pressure level than the data point with the largest pressure
level so far, followed by another linear regression and storage of the
parameters as before (stepwise linear regression).
This procedure has been continued over the entire compaction slope of the
Heckel-plot, while all parameters have been calculated for each setting.
Finally the 50 MPa pressure interval showing the largest coefficient of
determination has consecutively been selected to be the most linear span of
the compaction slope of the Heckel-plot.
The reciprocal of the slope of the linear regression has been set as the mean
yield pressure of the particular excipient investigated, referring to the
resistance of the material against persisting deformation.
The minimum edge height of the compact during a compaction cycle has not
been necessarily obtained at the point of maximum pressure. Usually, the
edge height of the compact rather decreases due to relaxation even though
the maximum pressure level has already been achieved.
Depending on the investigated material, a varying pressure relaxation Rx [%]
between the edge height at maximum pressure level of the compaction cycle
and the minimum edge height have been observed and evaluated by
Eq. 4-16.
min
minmax 100)([%]
hhh
Rx P ⋅−= Eq. 4-16
where hPmax has been set as the tablet edge height at maximum pressure,
while hmin gives the minimum edge height observed.
Results and Discussion – Punch Displacement Measurement System
113
Furthermore, a variable elastic recovery ER [%] has been observed during
the decompression phase. The calculation of ER has been carried out
according to Armstrong (1974), while the elastic recovery has been
calculated for the range between the minimum edge height of the compact
and the edge height at a residual force level of 5 MPa. To be able to
compare the elastic recovery of compacts of varying edge heights, a relative
ER, referring to the minimum edge height, has been calculated by Eq. 4-17:
min
min5 100)([%]
hhh
ER MPa ⋅−= Eq. 4-17
where h5 MPa gives the edge height of the compact at a residual force level of
5 MPa, while the minimum edge height of the compact is represented by
hmin.
Resulting parameters of the Heckel-plots of the five investigated excipients
have been summarised in Tab. 4-14, showing the average values of 6
individual plots.
Fragmenting materials, in some cases also called brittle substances, e.g.
Emcompress (Fig. 4-50) and Flowlac 100 (Fig. 4-51), show significant
deviations from linearity at smaller pressure levels.
By increasing pressure levels, the yield pressure increases while the primary
particle size is reduced. From a certain particle size, the energy required to
further reduce the particle size increases dramatically. The deformation
mechanism switches over to plastic flow, identifiable by the approximate
linearity of the compaction slope at higher pressure levels.
Furthermore, the constant linearity at high pressure levels indicates to very
low viscoelastic behaviour.
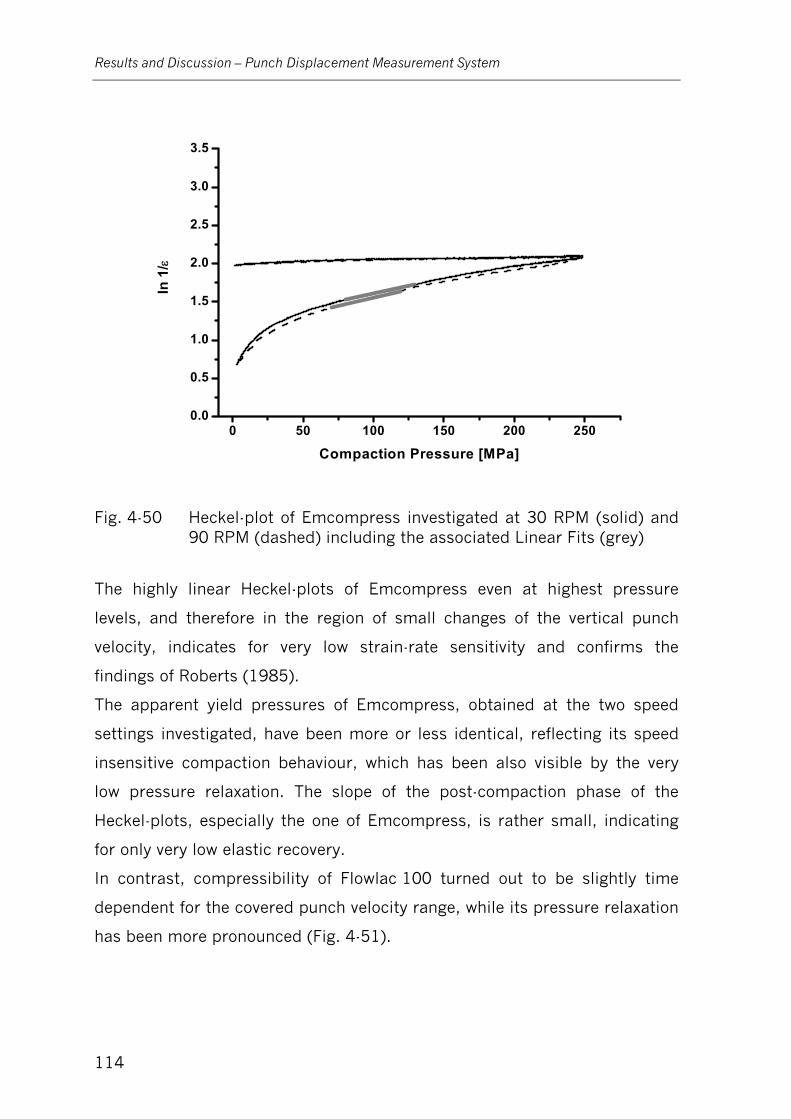
Results and Discussion – Punch Displacement Measurement System
114
0 50 100 150 200 2500.0
0.5
1.0
1.5
2.0
2.5
3.0
3.5ln
1/ε
Compaction Pressure [MPa]
Fig. 4-50 Heckel-plot of Emcompress investigated at 30 RPM (solid) and 90 RPM (dashed) including the associated Linear Fits (grey)
The highly linear Heckel-plots of Emcompress even at highest pressure
levels, and therefore in the region of small changes of the vertical punch
velocity, indicates for very low strain-rate sensitivity and confirms the
findings of Roberts (1985).
The apparent yield pressures of Emcompress, obtained at the two speed
settings investigated, have been more or less identical, reflecting its speed
insensitive compaction behaviour, which has been also visible by the very
low pressure relaxation. The slope of the post-compaction phase of the
Heckel-plots, especially the one of Emcompress, is rather small, indicating
for only very low elastic recovery.
In contrast, compressibility of Flowlac 100 turned out to be slightly time
dependent for the covered punch velocity range, while its pressure relaxation
has been more pronounced (Fig. 4-51).

Results and Discussion – Punch Displacement Measurement System
115
0 50 100 150 200 2500.0
0.5
1.0
1.5
2.0
2.5
3.0
3.5
ln 1
/ε
Compaction Pressure [MPa]
Fig. 4-51 Heckel-plot of Flowlac 100 investigated 30 RPM (solid) and 90 RPM (dashed) including the associated Linear Fits (grey)
0 50 100 150 200 2500.0
0.5
1.0
1.5
2.0
2.5
3.0
3.5
ln 1
/ε
Compaction Pressure [MPa]
Fig. 4-52 Heckel-plot of Neosorb P60W investigated 30 RPM (solid) and 90 RPM (dashed) including the associated Linear Fit (grey)
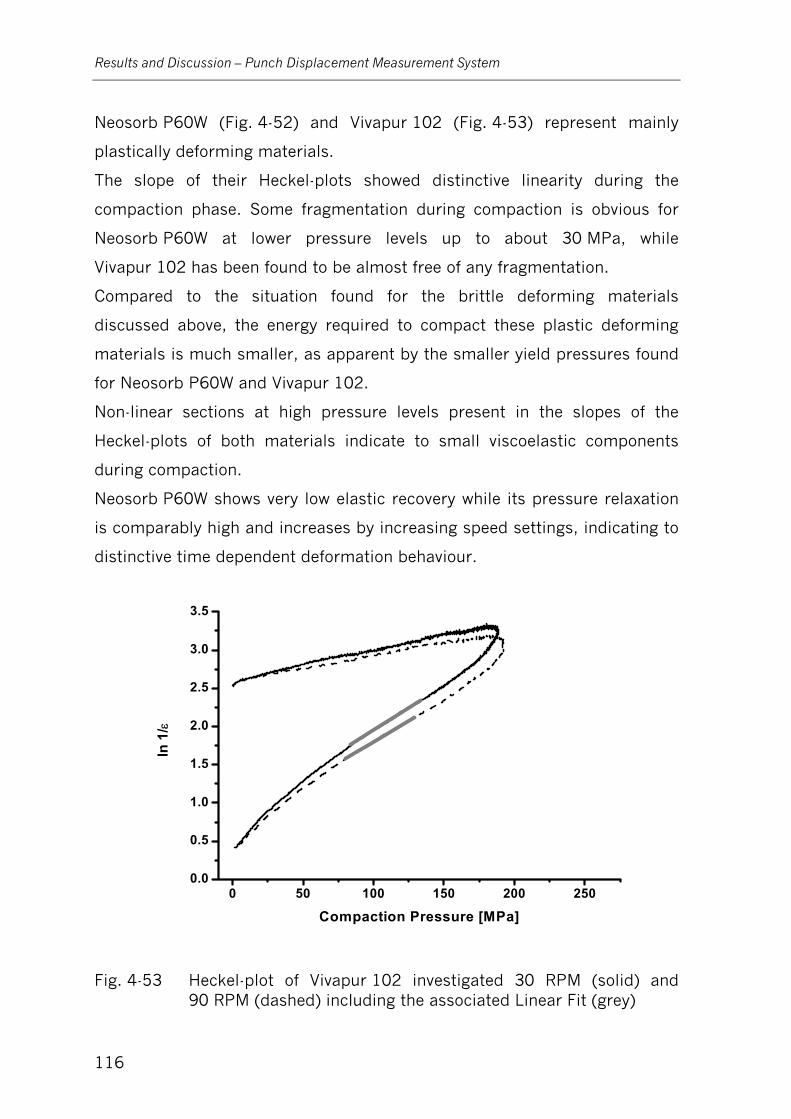
Results and Discussion – Punch Displacement Measurement System
116
Neosorb P60W (Fig. 4-52) and Vivapur 102 (Fig. 4-53) represent mainly
plastically deforming materials.
The slope of their Heckel-plots showed distinctive linearity during the
compaction phase. Some fragmentation during compaction is obvious for
Neosorb P60W at lower pressure levels up to about 30 MPa, while
Vivapur 102 has been found to be almost free of any fragmentation.
Compared to the situation found for the brittle deforming materials
discussed above, the energy required to compact these plastic deforming
materials is much smaller, as apparent by the smaller yield pressures found
for Neosorb P60W and Vivapur 102.
Non-linear sections at high pressure levels present in the slopes of the
Heckel-plots of both materials indicate to small viscoelastic components
during compaction.
Neosorb P60W shows very low elastic recovery while its pressure relaxation
is comparably high and increases by increasing speed settings, indicating to
distinctive time dependent deformation behaviour.
0 50 100 150 200 2500.0
0.5
1.0
1.5
2.0
2.5
3.0
3.5
ln 1
/ε
Compaction Pressure [MPa]
Fig. 4-53 Heckel-plot of Vivapur 102 investigated 30 RPM (solid) and 90 RPM (dashed) including the associated Linear Fit (grey)
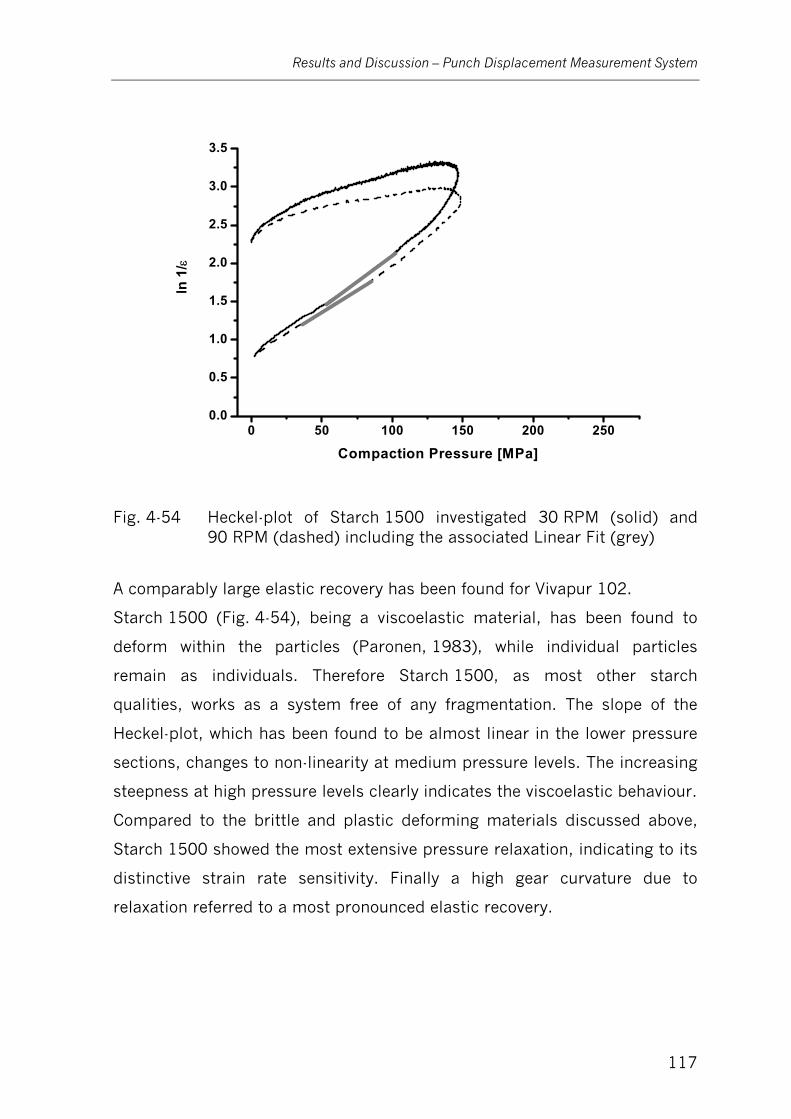
Results and Discussion – Punch Displacement Measurement System
117
0 50 100 150 200 2500.0
0.5
1.0
1.5
2.0
2.5
3.0
3.5
ln 1
/ε
Compaction Pressure [MPa]
Fig. 4-54 Heckel-plot of Starch 1500 investigated 30 RPM (solid) and 90 RPM (dashed) including the associated Linear Fit (grey)
A comparably large elastic recovery has been found for Vivapur 102.
Starch 1500 (Fig. 4-54), being a viscoelastic material, has been found to
deform within the particles (Paronen, 1983), while individual particles
remain as individuals. Therefore Starch 1500, as most other starch
qualities, works as a system free of any fragmentation. The slope of the
Heckel-plot, which has been found to be almost linear in the lower pressure
sections, changes to non-linearity at medium pressure levels. The increasing
steepness at high pressure levels clearly indicates the viscoelastic behaviour.
Compared to the brittle and plastic deforming materials discussed above,
Starch 1500 showed the most extensive pressure relaxation, indicating to its
distinctive strain rate sensitivity. Finally a high gear curvature due to
relaxation referred to a most pronounced elastic recovery.
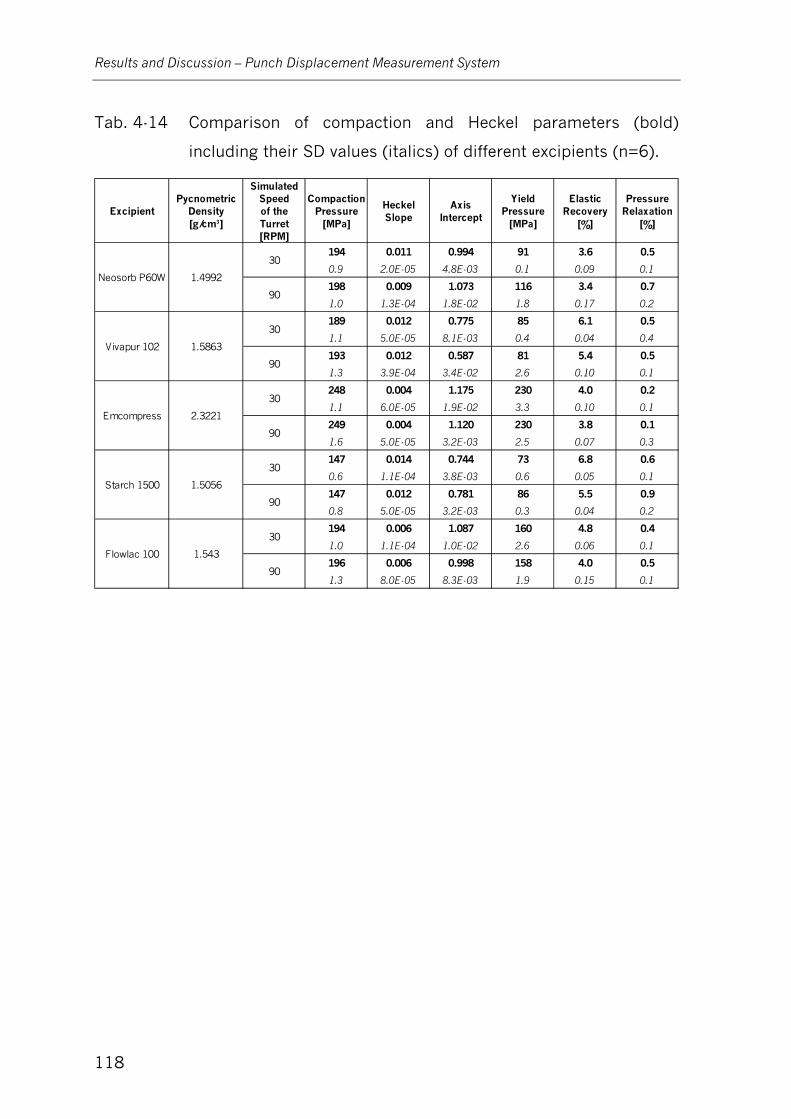
Results and Discussion – Punch Displacement Measurement System
118
Tab. 4-14 Comparison of compaction and Heckel parameters (bold)
including their SD values (italics) of different excipients (n=6).
ExcipientPycnometric
Density [g/cm³]
Simulated Speed of the Turret [RPM]
Compaction Pressure
[MPa]
Heckel Slope
Axis Intercept
Yield Pressure
[MPa]
Elastic Recovery
[%]
Pressure Relaxation
[%]
194 0.011 0.994 91 3.6 0.5
0.9 2.0E-05 4.8E-03 0.1 0.09 0.1
198 0.009 1.073 116 3.4 0.7
1.0 1.3E-04 1.8E-02 1.8 0.17 0.2
189 0.012 0.775 85 6.1 0.5
1.1 5.0E-05 8.1E-03 0.4 0.04 0.4
193 0.012 0.587 81 5.4 0.5
1.3 3.9E-04 3.4E-02 2.6 0.10 0.1
248 0.004 1.175 230 4.0 0.2
1.1 6.0E-05 1.9E-02 3.3 0.10 0.1
249 0.004 1.120 230 3.8 0.1
1.6 5.0E-05 3.2E-03 2.5 0.07 0.3
147 0.014 0.744 73 6.8 0.6
0.6 1.1E-04 3.8E-03 0.6 0.05 0.1
147 0.012 0.781 86 5.5 0.9
0.8 5.0E-05 3.2E-03 0.3 0.04 0.2
194 0.006 1.087 160 4.8 0.4
1.0 1.1E-04 1.0E-02 2.6 0.06 0.1
196 0.006 0.998 158 4.0 0.5
1.3 8.0E-05 8.3E-03 1.9 0.15 0.1
Neosorb P60W 1.4992
30
90
Vivapur 102 1.5863
30
90
Emcompress 2.3221
30
90
Starch 1500 1.5056
30
90
Flowlac 100 1.543
30
90

Results and Discussion – Punch Displacement Measurement System
119
4.5.8 Summary
The original punch displacement measurement system of the Presster has
been investigated with respect to the precision and accuracy as well as the
reliability of measurements, in particular in terms of compaction pressure
vs. in-die tablet height plots.
These plots contained comparably large noise levels, which have been
ascribed to machine vibrations monitored by the LVDT´s due to their
unguided core inside their housing.
Furthermore, the quite large clearance between the punch barrel and its
bushing, which allowed the punch tip to hit the edge of the die bore while
entering the die and finally resulting in damaged tips of upper punches, lead
to tilting punches during compaction, increasing the noise level and
inaccuracy present in punch displacement measurements.
Finally, neither the deformation of machine parts and punches nor the tilting
of punches during compaction has been taken into consideration.
Any implementation of these aspects to the standard data acquisition
system of the Presster has been impossible either by restrictions of the
system itself or by design of the punch displacement measurement system,
using only one displacement transducer per punch.
Hence, a reliable investigation of the compressibility of pharmaceutical
excipients was not possible with the original system.
Therefore, a new punch displacement measurement system was designed in
order to meet the requirements for punch displacement measurements and
hence being able to reliably investigate powder compaction behaviour.
The clearance between punch barrel and its bushing has been minimised on
the new designed carriage to avoid any further major shortcoming by tilting
punches. Despite the prospect for only minor punch tilting present in punch
displacement measurements performed by the redesigned system, two
displacement transducers have been used per punch in order to be able to
finally correct for the from now on accessible and quantifiable punch tilting.
The option to install the two pairs of displacement transducers in steps of
Results and Discussion – Punch Displacement Measurement System
120
90° around each punch opened the possibility to investigate the tilting of
punches in the two main tilting axes.
The new displacement transducers of the redesigned system have been
connected directly to the punches while their reference position has been
moved to the well defined top level of the die and therefore as close as
possible towards the compaction area.
As no machine deformation will furthermore affect the punch displacement
measurement it is no longer taken into consideration. The deformation of
punches has been calculated according to Hook´s law and taken into
account by implementing these correction functions to the new data
acquisition system DAQ4.
Using the new punch displacement measurement system the compressibility
profiles of five pharmaceutical excipients has finally been investigated in
terms of Heckel-plots at two different speed levels simulating a Fette P1200
rotary tablet press.
The compressibility profiles, obtained by the new punch displacement
measurement system, matched the well known compressibility data of the
individual excipients and therefore demonstrated the improved quality of the
redesigned system and the reliability of measurements.
Typical compaction behaviour as brittle fracture, plastic and viscoelastic
flow as well as conversions within the deformation behaviour during
compression phase has been identified reliably.
Nevertheless, the estimation of the compressibility data had to be carried
out carefully, as the accuracy in the determination of the height of the
compact performed by the new punch displacement measurement system
did not match the above-mentioned requirements of ± 5μm and ± 2μm
during compression and relaxation phase respectively.
A further optimization of the accuracy of the punch displacement
measurement system by e.g. incremental sensors would therefore be
recommended as soon as suitable sensors become available.

Results and Discussion – Speed of the Turret and Resulting Dwell Time
121
4.6 Speed of the Turret and Resulting Dwell Time
Depending on the deformation behaviour of the individual ingredients of a
formulation, the speed of the turret and the resulting densification speed
and the dwell time have a major influence on tablet properties. This is
especially valid for the time depending deformation of plastically deforming
excipients.
Therefore, the achieved horizontal speed of the carriage of the Presster has
to match the set simulated speed of the turret of a rotary tablet press as
close as possible. Hence, the horizontal speed of the carriage of the Presster
has been investigated using a digital high speed imaging system
(Hisis 2002, KSV Instruments, Finland).
A blend of Flowlac 100 and 1 % of magnesium stearate has been compacted
within these trials at a compaction pressure of 127 ± 6 MPa, forming
10 mm round, flat tablets of 300 mg. The achievable linear speed of the
Presster, in contrast to its specification of 0.055 and 2.2 ms-1, has been
found to be within the range of only 0.4 to 2.0 ms-1 (Fig. 4-55).
0.0 0.4 0.8 1.2 1.6 2.00.0
0.4
0.8
1.2
1.6
2.0
Ach
ieve
d Sp
eed
of th
e C
arria
ge [m
s-1]
Set Speed of the Carriage [ms-1]
Specified speed range
Usable speed range
Fig. 4-55 Differences between the set and the achieved horizontal speed of the carriage of the Presster
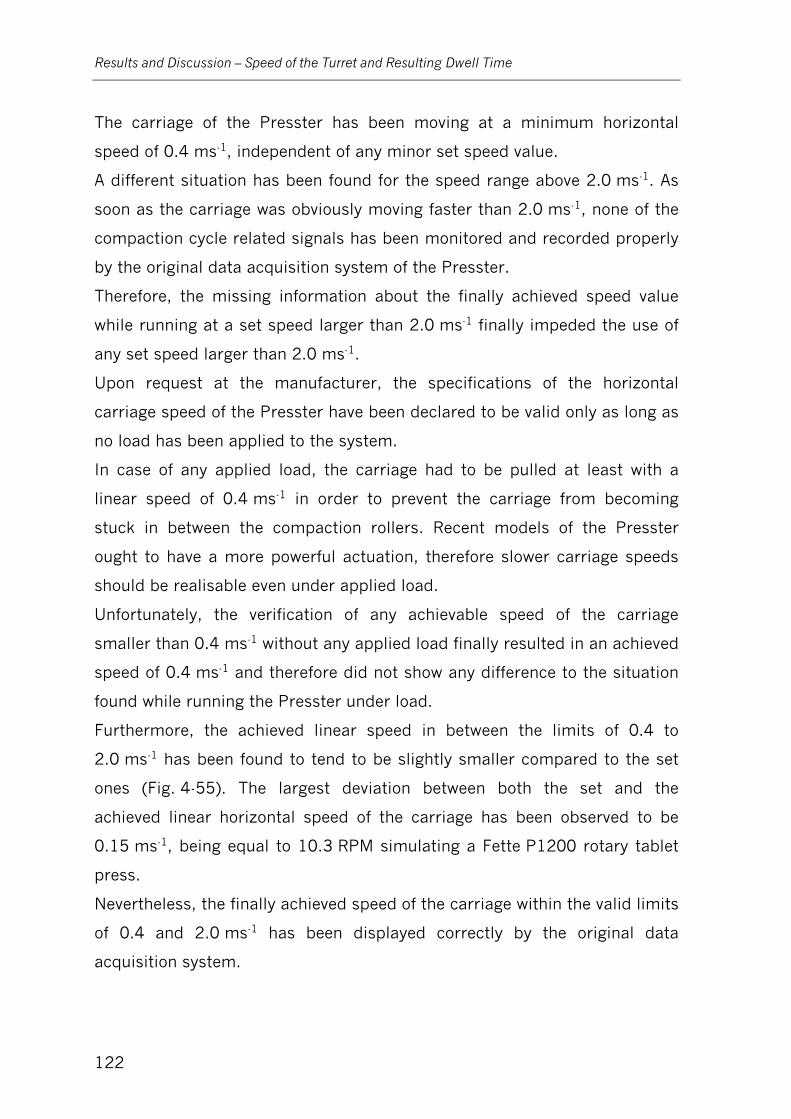
Results and Discussion – Speed of the Turret and Resulting Dwell Time
122
The carriage of the Presster has been moving at a minimum horizontal
speed of 0.4 ms-1, independent of any minor set speed value.
A different situation has been found for the speed range above 2.0 ms-1. As
soon as the carriage was obviously moving faster than 2.0 ms-1, none of the
compaction cycle related signals has been monitored and recorded properly
by the original data acquisition system of the Presster.
Therefore, the missing information about the finally achieved speed value
while running at a set speed larger than 2.0 ms-1 finally impeded the use of
any set speed larger than 2.0 ms-1.
Upon request at the manufacturer, the specifications of the horizontal
carriage speed of the Presster have been declared to be valid only as long as
no load has been applied to the system.
In case of any applied load, the carriage had to be pulled at least with a
linear speed of 0.4 ms-1 in order to prevent the carriage from becoming
stuck in between the compaction rollers. Recent models of the Presster
ought to have a more powerful actuation, therefore slower carriage speeds
should be realisable even under applied load.
Unfortunately, the verification of any achievable speed of the carriage
smaller than 0.4 ms-1 without any applied load finally resulted in an achieved
speed of 0.4 ms-1 and therefore did not show any difference to the situation
found while running the Presster under load.
Furthermore, the achieved linear speed in between the limits of 0.4 to
2.0 ms-1 has been found to tend to be slightly smaller compared to the set
ones (Fig. 4-55). The largest deviation between both the set and the
achieved linear horizontal speed of the carriage has been observed to be
0.15 ms-1, being equal to 10.3 RPM simulating a Fette P1200 rotary tablet
press.
Nevertheless, the finally achieved speed of the carriage within the valid limits
of 0.4 and 2.0 ms-1 has been displayed correctly by the original data
acquisition system.
Results and Discussion – Speed of the Turret and Resulting Dwell Time
123
4.6.1 Summary
The investigation of the speed of the carriage of the Presster showed some
differences between both the set and the achieved horizontal speed, while
the achieved speed has been found to be up to 0.15 ms-1 smaller compared
to the set one.
Therefore, in order to achieve the desired linear speed of the carriage, finally
matching the horizontal speed of the turret of a certain simulated rotary
tablet press and hence resulting in similar dwell times, an adequate larger
speed value has been chosen for any investigation within this work.
As the adjustment of the speed settings might be accompanied with the
need for additional material, which might be rare and therefore expensive
during the early development stages, the speed deviation has been declared
as a major shortcoming, which would not be accepted in a standard rotary
tablet press.
Hence, a more accurate and precise actuation should be installed on all
further Presster models to avoid any inconsistency between set and achieved
speed of the turret and therefore to simplify the operation of the Presster
and to further reduce the amount of material required to match the tableting
conditions to be simulated.
Results and Discussion – General Aspects
124
4.7 General Aspects
Beside the investigation of the various measurement systems of the
Presster, some uninstrumented machine parts and process steps, some of
which also having an influence on tablet properties, have been investigated
with respect to the most accurate simulation of a Fette P1200 rotary tablet
press.
4.7.1 Vertical Adjustment of Compaction Rollers
To change the applied compaction force the vertical position of the lower
compaction rollers in relation to the upper compaction rollers is adjusted by
computer control.
While the adjustment of the vertical position of the lower pre-compaction
roller has been achieved with retention of the vertical alignment of the upper
and lower pre-compression rollers, the situation was found to be different for
the main compaction station.
The vertical adjustment of the lower main compaction roller takes place
according to the method which is still found on older rotary tablet presses,
like e.g. Kilian T100 (Kilian, Germany).
Instead of changing the vertical position of the lower main compaction roller
on a linear vertical path, as found on for example Fette presses, an eccentric
vertical adjustment system has been installed on the Presster.
The vertical alignment of the upper and lower main compaction rollers has
been given at a set position of the lower main compaction roller resulting in
a distance of the tip of the punches without any applied load (resembling the
theoretical band width of the tablet) of about 4.1 mm.
A vertical misalignment of the main compaction rollers appears and
increases up to the maximum of 0.75 mm, as soon as the distance between
the tips of the punches is either increased up to the maximum of 8.1 mm or
decreasing towards its minimum of 0 mm.
This misalignment shifts the lower main compaction roller rightwards and
therefore the moment when the lower punch gets into contact with its
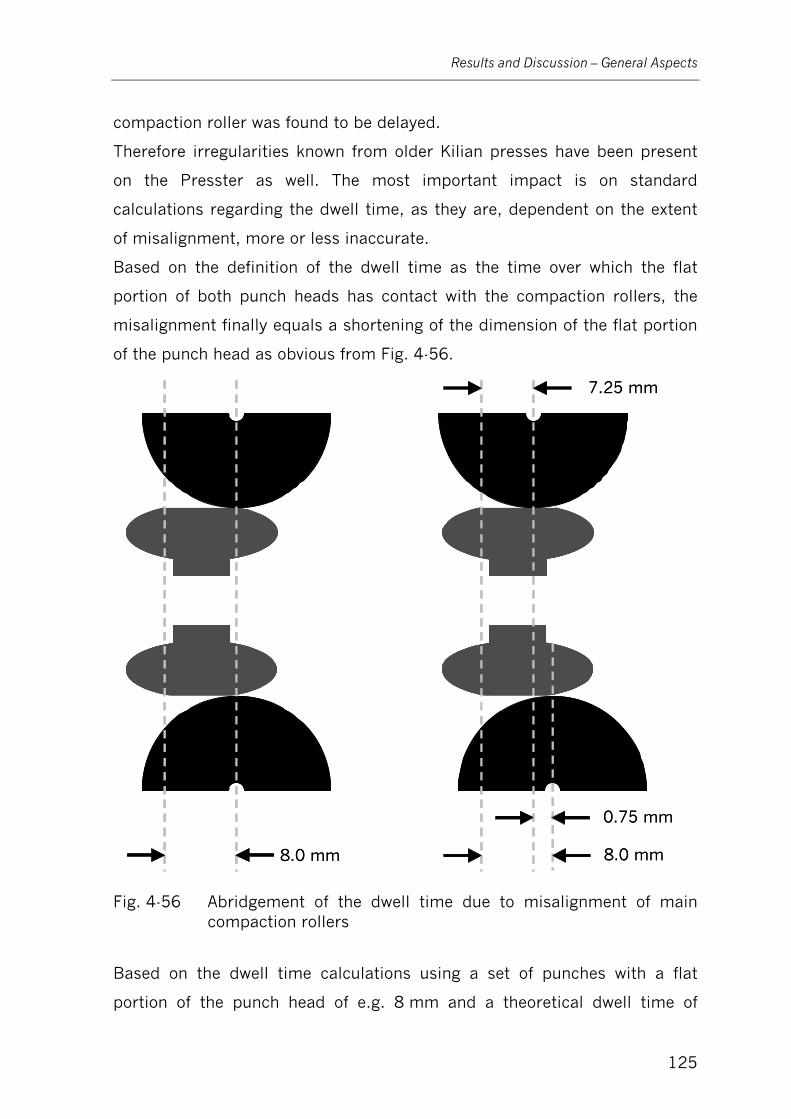
Results and Discussion – General Aspects
125
compaction roller was found to be delayed.
Therefore irregularities known from older Kilian presses have been present
on the Presster as well. The most important impact is on standard
calculations regarding the dwell time, as they are, dependent on the extent
of misalignment, more or less inaccurate.
Based on the definition of the dwell time as the time over which the flat
portion of both punch heads has contact with the compaction rollers, the
misalignment finally equals a shortening of the dimension of the flat portion
of the punch head as obvious from Fig. 4-56.
0.75 mm
8.0 mm
7.25 mm
8.0 mm
0.75 mm
8.0 mm
7.25 mm
8.0 mm
Fig. 4-56 Abridgement of the dwell time due to misalignment of main compaction rollers
Based on the dwell time calculations using a set of punches with a flat
portion of the punch head of e.g. 8 mm and a theoretical dwell time of
Results and Discussion – General Aspects
126
10 ms, the finally resulting dwell time would be abridged to 9.06 ms
(-9.4 %). A similar effect on the dwell time might be observed by a change of
the machine speed from 61.1 RPM to 67.5 RPM.
Adaptations in the speed settings of the Presster, which might result in
matching dwell times, are finally inappropriate to solve this shortcoming, as
the densification speeds and therefore both compressibility and
compactibility profiles would be affected as well.
4.7.2 Vertical Punch Movements Unrelated to Any Compaction Event
Beside the simulation of applied forces, the Presster has been designed to
mimic vertical punch movements of rotary tablet presses as close as
possible.
The path profiles of the punches on the Presster should match exactly the
conditions of rotary tablet presses, guaranteed first by the use of punch
cams and secondly by compaction rollers in the same dimensions as those
of the rotary tablet presses to be simulated.
A closer investigation of vertical punch movements showed some major
differences between the Presster and rotary tablet presses, not only affecting
tablet properties and the quality and reliability of measurements, but also
the condition of machine parts, especially the condition of punches.
In order to avoid any vertical punch movement not related to the compaction
cycle, the upper and lower punches of the Fette P1200 as well as of other
rotary tablet presses are guided closely. Furthermore, holding ledges keep
the punches in contact with the compact, in particular in between the pre-
and main compaction station.
The situation on the Presster has been somewhat different, as holding
ledges have been missing. Furthermore, the punch cams present on the
Presster have been found to be inappropriate by design to sufficiently
control the action of the punches.
Only the vertical movements of the lower punch have been restricted by an
attached punch break. This break has been designed as a plastic pin which
Results and Discussion – General Aspects
127
has been pushed against the punch barrel’s surface by a screw.
The effectiveness of the break depends on the tightening torque of the
screw. This way of limitation of the vertical punch movements of the lower
punch was working satisfactorily for the whole compaction process.
However, as the vertical movements of the upper punch have not been
restricted, it has been found to simply sit on top of the compact due to its
own mass.
Therefore, accidental upper punch movements, caused by e.g. machine
vibrations, have been observed.
Hence, in combination with the redesigned carriage, which has been already
described in chapter 4.5.5, punch breaks, similar in design to the original
one, have been installed for both the upper and lower punch, to ensure that
both punches stay in contact with the powder bed during the compaction
cycle and therefore to improve the reliability of punch displacement
measurements.
The tightening torque of the screws, with which the punch brake has been
pushed against the punch barrel’s surface has been standardised by
tightening the screws to a predefined position. Therefore, user-dependant
influences of the punch break with respect to compaction or ejection forces
have been foreclosed.
The influences of these breaks on compaction and ejection force
measurements have been eliminated by taking these effects into
consideration during the calibration of the affected measurement systems.
Furthermore, the missing restrictions for the vertical movement of the upper
punch caused some additional friction to the powder column inside the die.
As the lower punch gets into contact with its main compaction roller prior to
the upper punch, both the powder inside the die as well as the upper punch
have been lifted by the upwards moving lower punch.
In rare cases of either rather large settings for the depth of fill, e.g. due to a
small bulk density of the powder, or as a result of rather small compaction
Results and Discussion – General Aspects
128
zones, the upper punch has been lifted even above the top level of the die,
only snatches before the position of the upper punch has been lowered due
to its in the meantime obtained contact with the upper main compaction
roller.
This situation has been most distinctive when no pre-compaction has been
applied and therefore the lower punch has been still positioned at the depth
of fill, hence getting into contact with its main compaction roller quite early.
As a result, powder spilled out of the die and thus the resulting tablets did
not match the weight specifications.
Even if the upper punch has not been totally pushed out of the die, the
additional frictional work applied to the (pre-compacted) powder bed, might
have some influence on the properties of the final compact, especially in
case of some very sensitive tablet formulations, provoking some significant
and vital differences between simulation and reality.
Also working with tapered dies, the compaction zone might be shifted into
the tapered region of the die, which might yield to varying tablet properties.
These shortcomings should be avoided by either working at a deeper
compaction zone or by simply installing holding ledges between the pre- and
main compaction station, impeding the upper punch to be lifted far above
the top level of the compaction zone.
4.7.3 Lag Time between Pre- and Main Compaction Station
Beside the need for consistent punch movements between Presster and
simulated rotary tablet presses during the time period between pre- and
main compaction station, the duration of this period at a certain horizontal
speed has to be kept in mind. To simulate rotary tablet presses as close as
possible, this lag time between both compaction stations should be adopted
to the conditions present on the particular rotary tablet press to be
simulated. As the positions of the pre- and main compaction station of the
Presster have been fixed with respect to each other at a distance of about
0.56 m, an adaptation of the lag time to the conditions of any particular
Results and Discussion – General Aspects
129
rotary tablet press, about 0.31 m for the Fette P1200, has not been
possible.
Therefore, variations in the time available for some intermediate elastic
recovery, which might take place between pre- and main compaction event,
might be responsible for slight differences in the properties of compacts
produced on both the Presster and the Fette P1200.
4.7.4 Die Feeding Process
Regarding the die feeding process of the Presster, the main difference
obvious to the system of rotary tablet presses has been the gravity feeding
unit compared to enforced feeding systems of rotary tablet presses.
The design of the feeder of the Presster has been closer to the ones of
eccentric presses than to those of rotary tablet presses.
Even the impeller, present on many gravity feeding systems of eccentric
tablet presses to guarantee a more constant die fill and a destruction of
powder bridges inside the feeder is missing.
Due to less powder densification by the gravity feeding unit of the Presster in
comparison to the enforced feeding system of the Fette P1200, variable
larger settings for the depth of fill had to be realised for any material on the
Presster, to finally produce tablets having the same final edge height than
those produced on the Fette P1200 at comparable pressure level.
The advantage of the pure gravity feeding, applying less stress to the powder
was more than offset by some disadvantages which will be described as
follows.
The feeder, connected to the carriage, has been designed to wipe several
times over the die right at the beginning of each compaction cycle. After the
die feeding has been finished, the feeder has been positioned at one side of
the die table in order not to interfere with the upper punch during the
compaction event. But, in contrast to any rotary tablet press, where the
feeder has been fixed at a certain position on the press, the feeder of the
Presster, as it has been fixed to the carriage, had to follow the carriage
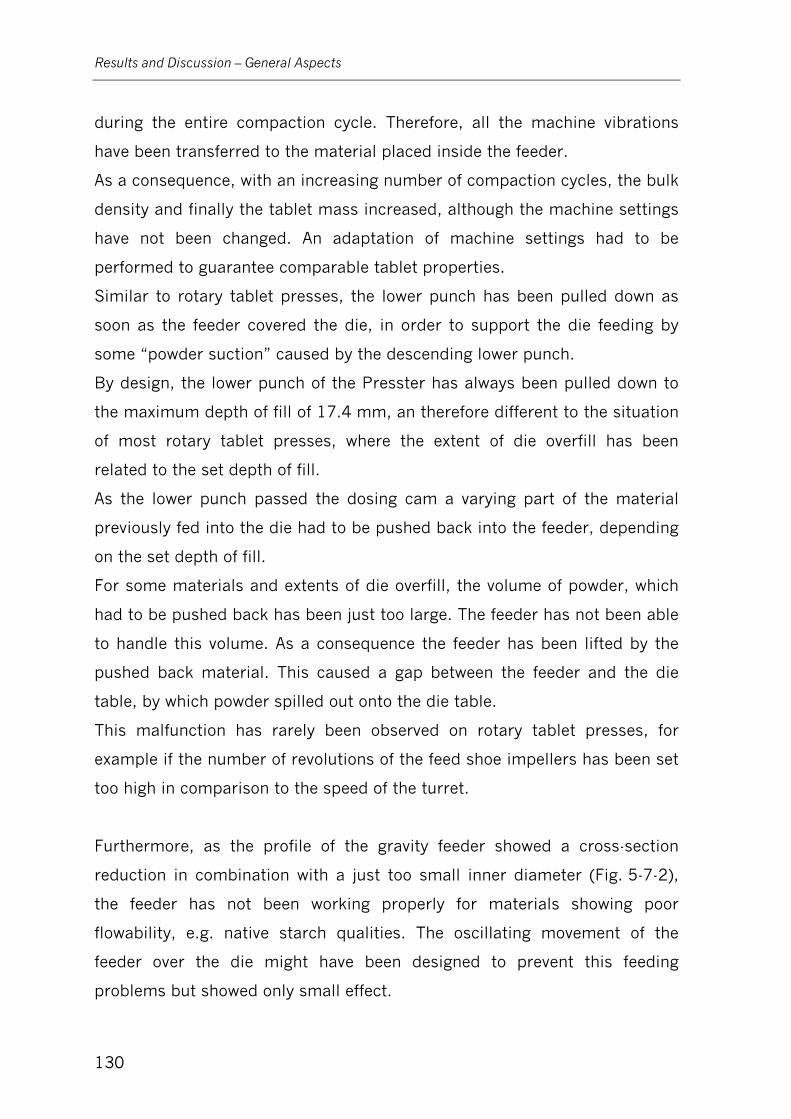
Results and Discussion – General Aspects
130
during the entire compaction cycle. Therefore, all the machine vibrations
have been transferred to the material placed inside the feeder.
As a consequence, with an increasing number of compaction cycles, the bulk
density and finally the tablet mass increased, although the machine settings
have not been changed. An adaptation of machine settings had to be
performed to guarantee comparable tablet properties.
Similar to rotary tablet presses, the lower punch has been pulled down as
soon as the feeder covered the die, in order to support the die feeding by
some “powder suction” caused by the descending lower punch.
By design, the lower punch of the Presster has always been pulled down to
the maximum depth of fill of 17.4 mm, an therefore different to the situation
of most rotary tablet presses, where the extent of die overfill has been
related to the set depth of fill.
As the lower punch passed the dosing cam a varying part of the material
previously fed into the die had to be pushed back into the feeder, depending
on the set depth of fill.
For some materials and extents of die overfill, the volume of powder, which
had to be pushed back has been just too large. The feeder has not been able
to handle this volume. As a consequence the feeder has been lifted by the
pushed back material. This caused a gap between the feeder and the die
table, by which powder spilled out onto the die table.
This malfunction has rarely been observed on rotary tablet presses, for
example if the number of revolutions of the feed shoe impellers has been set
too high in comparison to the speed of the turret.
Furthermore, as the profile of the gravity feeder showed a cross-section
reduction in combination with a just too small inner diameter (Fig. 5-7-2),
the feeder has not been working properly for materials showing poor
flowability, e.g. native starch qualities. The oscillating movement of the
feeder over the die might have been designed to prevent this feeding
problems but showed only small effect.
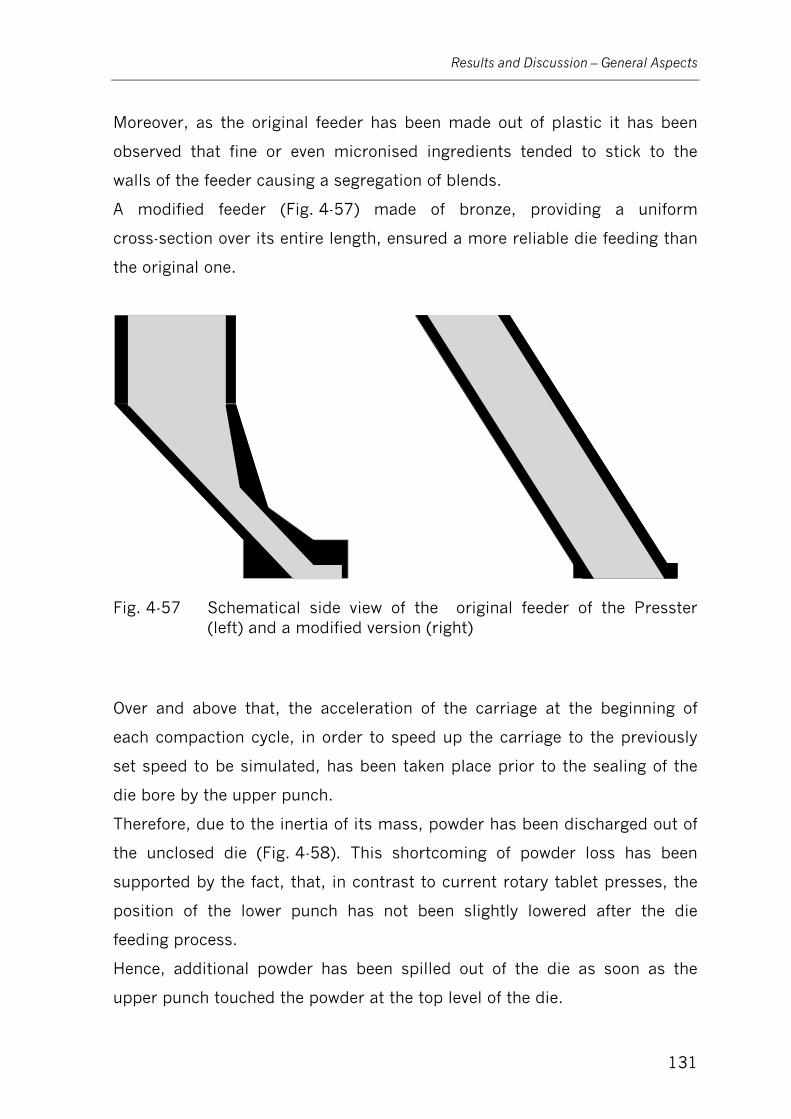
Results and Discussion – General Aspects
131
Moreover, as the original feeder has been made out of plastic it has been
observed that fine or even micronised ingredients tended to stick to the
walls of the feeder causing a segregation of blends.
A modified feeder (Fig. 4-57) made of bronze, providing a uniform
cross-section over its entire length, ensured a more reliable die feeding than
the original one.
Fig. 4-57 Schematical side view of the original feeder of the Presster (left) and a modified version (right)
Over and above that, the acceleration of the carriage at the beginning of
each compaction cycle, in order to speed up the carriage to the previously
set speed to be simulated, has been taken place prior to the sealing of the
die bore by the upper punch.
Therefore, due to the inertia of its mass, powder has been discharged out of
the unclosed die (Fig. 4-58). This shortcoming of powder loss has been
supported by the fact, that, in contrast to current rotary tablet presses, the
position of the lower punch has not been slightly lowered after the die
feeding process.
Hence, additional powder has been spilled out of the die as soon as the
upper punch touched the powder at the top level of the die.

Results and Discussion – General Aspects
132
Fig. 4-58 High speed images of powder discharge out of the unsealed die during carriage acceleration at time t0-t3 (the arrow indicates the direction of movement of the carriage).
As the amount of powder discharge has been found to be dependent on the
extent of acceleration of the carriage, the weight of tablets made at a certain
depth of fill abated with increasing speed of the carriage (Fig. 4-59).
Due to limited availability of material during early stages of development,
this discharge is unacceptable. Therefore, by revision of first the upper
punch push-down cam the upper punch is now lowered sooner. Second, by
modification of the lower punch cam and the feeding cam the lower punch
has been additionally descended after the die feeding, according to the
principle of rotary tablet presses, and thus preventing any powder being
blown out of the die as the upper punch enters the die bore.
Hence, the powder filled die has been sealed by the upper punch prior to the
acceleration of the carriage. Hereby the discharge of powder has been
eliminated totally (Fig. 4-59), thus preventing variations in tablet weight by
changes in the carriage speed.
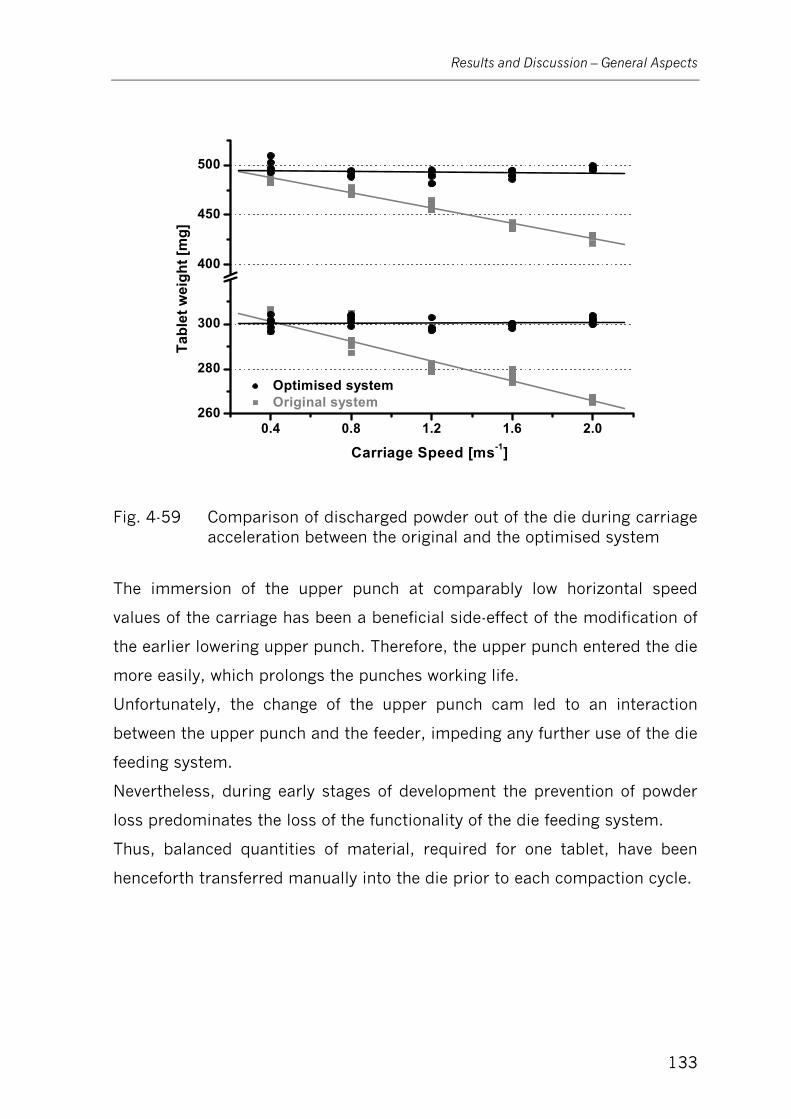
Results and Discussion – General Aspects
133
0.4 0.8 1.2 1.6 2.0260
280
300
400
450
500
Optimised system Original system
Tabl
et w
eigh
t [m
g]
Carriage Speed [ms-1]
Fig. 4-59 Comparison of discharged powder out of the die during carriage acceleration between the original and the optimised system
The immersion of the upper punch at comparably low horizontal speed
values of the carriage has been a beneficial side-effect of the modification of
the earlier lowering upper punch. Therefore, the upper punch entered the die
more easily, which prolongs the punches working life.
Unfortunately, the change of the upper punch cam led to an interaction
between the upper punch and the feeder, impeding any further use of the die
feeding system.
Nevertheless, during early stages of development the prevention of powder
loss predominates the loss of the functionality of the die feeding system.
Thus, balanced quantities of material, required for one tablet, have been
henceforth transferred manually into the die prior to each compaction cycle.
Results and Discussion – General Aspects
134
4.7.5 Centrifugal and Inertial Forces
Centrifugal forces are especially present on rotary tablet presses working at
high speed conditions. The Comprima (IMA, Italy) rotary tablet press even
feeds its dies using centrifugal forces.
Initially, the powder inside the die is filled in quite loosely and therefore
might to tend to move towards the outer wall of the die.
Therefore, in some special cases, the height of the powder bed inside the die
might not be uniform over the diameter of the die. In relation to the die wall
next to the centre of the turret it might be somewhat higher at the die wall
furthermost to the centre of the turret.
The powder inside die of the Presster shows similar behaviour. But, as the
carriage of the Presster works on a straight line instead on a circle path the
powder moves not to the die wall comparable to the furthermost to the
centre of the turret on rotary tablet presses, but rather moves in the
opposite direction compared to the moving direction of the die itself as a
consequence of inertial forces. This of course is the reason for the powder
discharge out of the unclosed die mentioned in chapter 4.7.4.
With respect to the instant when the dies on both machines passes the
compaction rollers the following situations, shown in Fig. 4-60, might be
distinguished.
It is obvious from Fig. 4-60, that the influence of oblique powder beds on
tablet properties, present on rotary tablet presses working at high speed
conditions, can not be simulated exactly by the Presster due to their slightly
different working conditions.
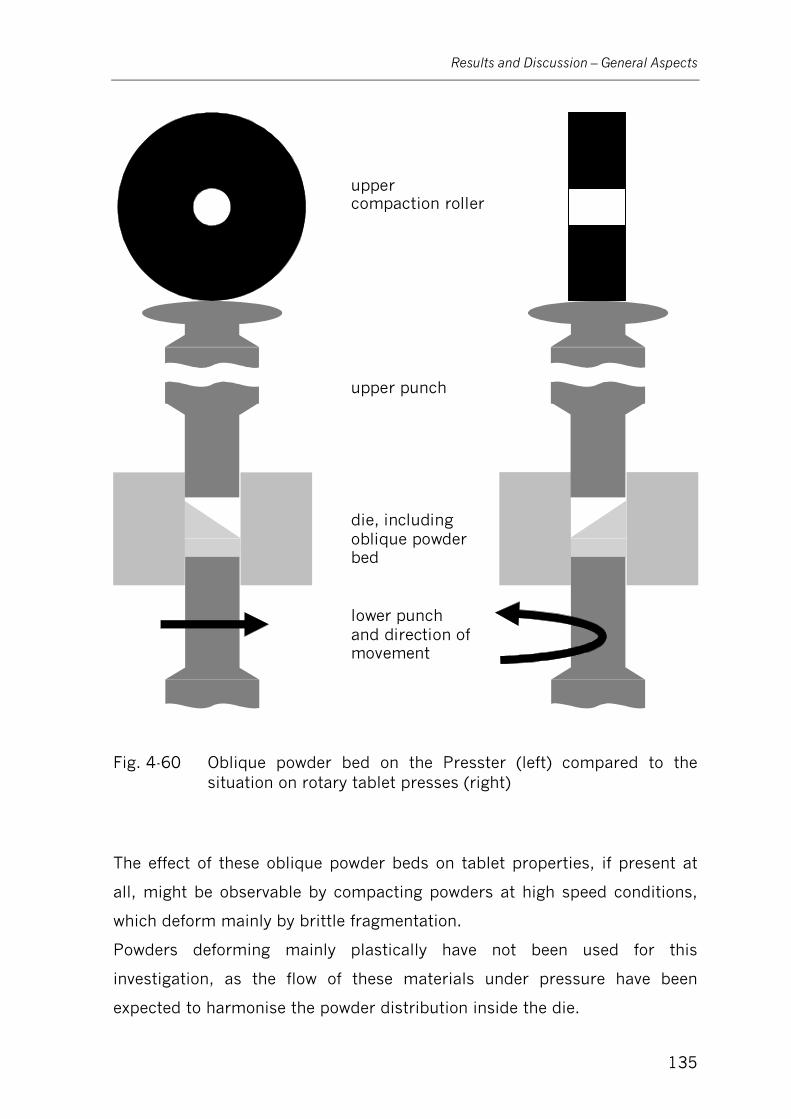
Results and Discussion – General Aspects
135
upper compaction roller
upper punch
die, including oblique powder bed
lower punch and direction of movement
Fig. 4-60 Oblique powder bed on the Presster (left) compared to the situation on rotary tablet presses (right)
The effect of these oblique powder beds on tablet properties, if present at
all, might be observable by compacting powders at high speed conditions,
which deform mainly by brittle fragmentation.
Powders deforming mainly plastically have not been used for this
investigation, as the flow of these materials under pressure have been
expected to harmonise the powder distribution inside the die.
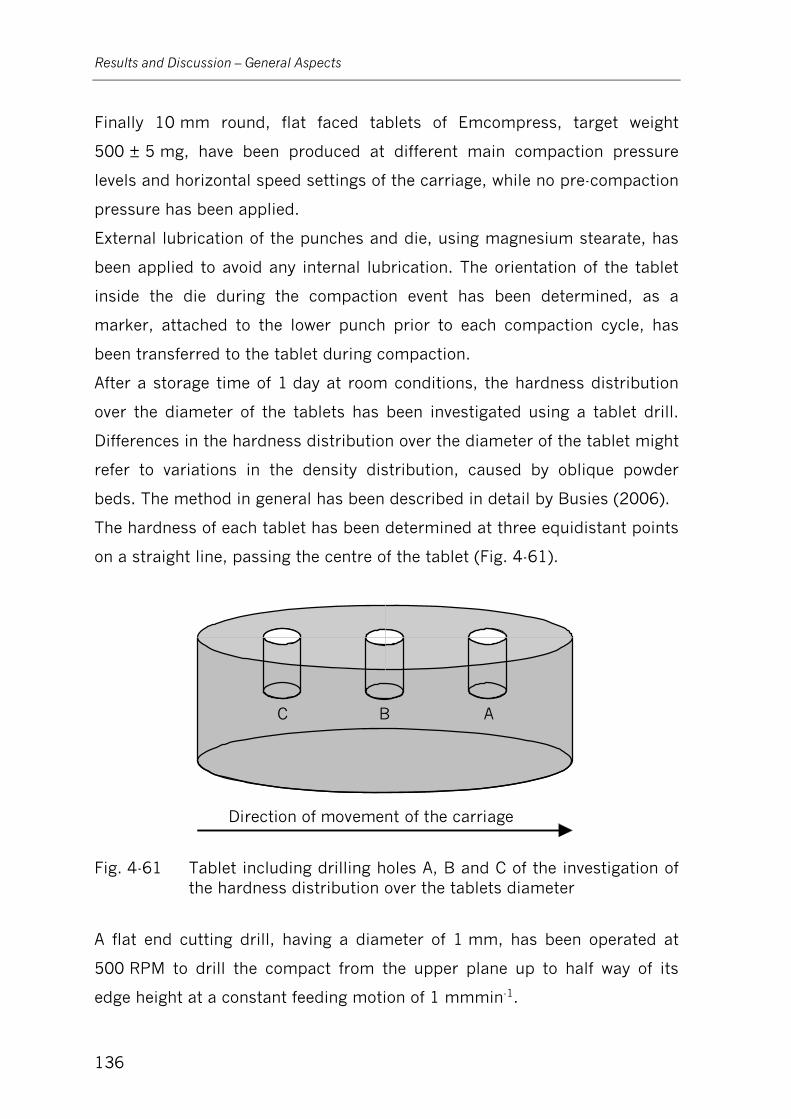
Results and Discussion – General Aspects
136
Finally 10 mm round, flat faced tablets of Emcompress, target weight
500 ± 5 mg, have been produced at different main compaction pressure
levels and horizontal speed settings of the carriage, while no pre-compaction
pressure has been applied.
External lubrication of the punches and die, using magnesium stearate, has
been applied to avoid any internal lubrication. The orientation of the tablet
inside the die during the compaction event has been determined, as a
marker, attached to the lower punch prior to each compaction cycle, has
been transferred to the tablet during compaction.
After a storage time of 1 day at room conditions, the hardness distribution
over the diameter of the tablets has been investigated using a tablet drill.
Differences in the hardness distribution over the diameter of the tablet might
refer to variations in the density distribution, caused by oblique powder
beds. The method in general has been described in detail by Busies (2006).
The hardness of each tablet has been determined at three equidistant points
on a straight line, passing the centre of the tablet (Fig. 4-61).
Direction of movement of the carriage
A B C
Fig. 4-61 Tablet including drilling holes A, B and C of the investigation of the hardness distribution over the tablets diameter
A flat end cutting drill, having a diameter of 1 mm, has been operated at
500 RPM to drill the compact from the upper plane up to half way of its
edge height at a constant feeding motion of 1 mmmin-1.

Results and Discussion – General Aspects
137
As no change in the hardness distribution over the diameter of the
investigated tablets has been detected (Tab. 4-15), the influence of the
oblique powder bed might be just visible for some most challenging
formulations and machine settings.
Tab. 4-15 Hardness distribution in terms of drilling force of Emcompress
tablets including SD values (italics); (n=10)
Simulated Speed of the Turret
[RPM]
Compaction Pressure [MPa]
Tablet Height [mm]
Drilling position on Tablet
Drilling Force [N]
8.79
1.30
65 3.58 8.19
1.28 0.01 1.21
8.02
1.39
15.49
1.17
129 3.32 15.23
0.88 0.02 1.12
15.46
1.09
7.64
1.43
65 3,58 7.4
1.47 0.01 1.14
7.58
1.45
15.21
1.13
130 3.34 15.21
0.99 0.01 1.17
14.78
1.33
30
A
B
C
A
B
C
90
A
B
C
A
B
C
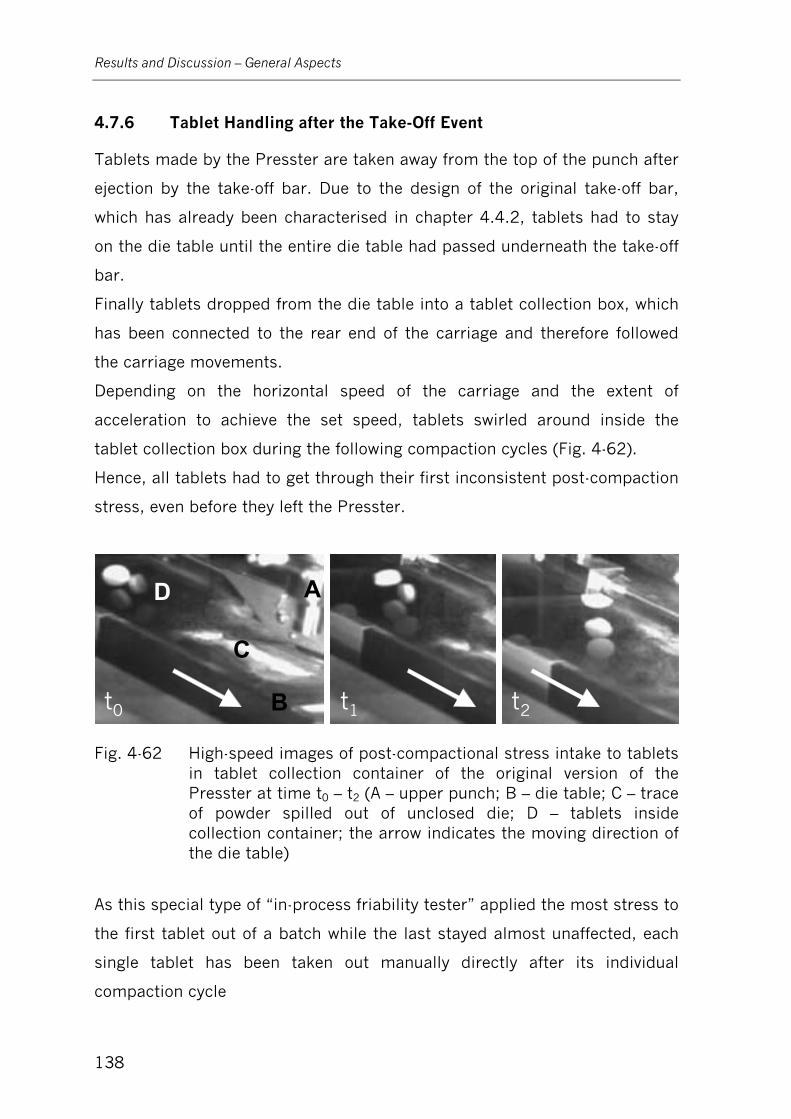
Results and Discussion – General Aspects
138
4.7.6 Tablet Handling after the Take-Off Event
Tablets made by the Presster are taken away from the top of the punch after
ejection by the take-off bar. Due to the design of the original take-off bar,
which has already been characterised in chapter 4.4.2, tablets had to stay
on the die table until the entire die table had passed underneath the take-off
bar.
Finally tablets dropped from the die table into a tablet collection box, which
has been connected to the rear end of the carriage and therefore followed
the carriage movements.
Depending on the horizontal speed of the carriage and the extent of
acceleration to achieve the set speed, tablets swirled around inside the
tablet collection box during the following compaction cycles (Fig. 4-62).
Hence, all tablets had to get through their first inconsistent post-compaction
stress, even before they left the Presster.
t0 t1 t2
A
B
C
D
t0 t1 t2t0 t1 t2
A
B
C
D
Fig. 4-62 High-speed images of post-compactional stress intake to tablets in tablet collection container of the original version of the Presster at time t0 – t2 (A – upper punch; B – die table; C – trace of powder spilled out of unclosed die; D – tablets inside collection container; the arrow indicates the moving direction of the die table)
As this special type of “in-process friability tester” applied the most stress to
the first tablet out of a batch while the last stayed almost unaffected, each
single tablet has been taken out manually directly after its individual
compaction cycle
Results and Discussion – General Aspects
139
Of course, this procedure impedes once more the use of the serial mode
option of the Presster, but has been necessary to prevent adulteration of
compact properties causing misinterpretation.
The installation of the modified take off bar eliminated this problem, as it
removed any individual tablet from the die table directly to a small container
outside the Presster, like on any rotary tablet press.
4.7.7 Compaction Rollers
Regarding the compaction rollers of the pre- and main compression station
of the Presster, a deviation from the ideal round shape up to +/- 55 μm has
been observed. Therefore, the precision of these Presster compaction rollers
has been more than 10 times greater deviation than found on the
Fette P1200 (+/- 5 μm). This shortcoming would not extensively affect tablet
properties but will affect the consistency of compaction forces with respect
to for example investigations of materials compressibility.
Due to the already discussed large fluctuations in tablet weight due to the
gravity die feeding, there has been no given necessity to improve the quality
of the roundness of those compaction rollers.
The compaction rollers have rather been adjusted manually to a predefined
position to finally minimise influences of the deviation of the rollers on
compact properties and the consistency of measurements.
Furthermore, the compression rollers of the Presster don’t move until
punches actually hit the rollers. Therefore, compared to rotary tablet
presses, where the compaction rollers never stop while the machine is
running, the stress to and abrasion of both the rollers surface and the punch
head is much more extensive on the Presster.
Hereby, especially the integrity of the flat portion of the punch head has
been worn out much more extensively compared to punch heads of punches
running on rotary tablet presses. Additionally, as the rotation of the punches
inside the bushings has been intentionally impeded on the Presster to
Results and Discussion – General Aspects
140
ensure the alignment of the punch displacement measurement system, the
wearing of the punch head takes place in only one spot and is therefore even
more pronounced.
As the flat portion of the punch head represents the critical dimension for
the calculation of the dwell time it might be recommended to use brand new
punches to perform reliable investigations of the influence of dwell time on
tablet properties. Due to this evidently higher stress, the compaction rollers
and the punches of the Presster have a shortened working life, which might
be compensated by the comparably small number of compaction cycles
performed by the Presster.
Finally, the punches of the Presster do not get into contact with the centre of
the compaction rollers surface, but contact on one side.
4.7.8 Sticking Punches
The consequence of the powder entering the lateral clearance in between the
tip of punches, in particular the lower punch, and the die bore are tight
moving or even sticking punches.
The force, necessary to move the punches in vertical direction is often
measured on rotary tablet presses to avoid any damage to either machine or
tooling parts.
As there has been no equivalent instrumentation on the Presster, the
information and control of sticking punches has not been directly accessible.
As the ejection force might be affected at first by a sticking lower punch, the
observation of this signal might be used in place of the missing
instrumentation for tight moving punches.
On the other hand, as the ejection forces measured on the Presster might be
affected by tight running punches, the unrestricted vertical movement of the
lower punch has to be guaranteed with respect to the investigation of
ejection force measurements.
Results and Discussion – General Aspects
141
4.7.9 Press Chamber Lubrication
In order to minimise the quantity of lubrication required to ensure either a
proper lubrication in order to reduce the friction between the compact and
tooling during compaction or to minimise the adverse interaction between
the lubricant and any other ingredient of a tablet formulation, the press
chamber lubrication has been established on rotary tablet presses
(Gruber, 1988; Laich, 1997, 1998).
A comparable press chamber lubrication system as e.g. the PKB II system
used on Fette rotary tablet presses has not been available for the Presster.
The only way to roughly simulate the press chamber lubrication is to
manually apply some dry lubricant on the surface of the tooling using a
brush, as it has been performed within this work.
4.7.10 Multilayer and Laminated Tablets
Due to different reasons, as e.g. incompatibility of compounds, modified
release options or just unpleasant taste of ingredients, multilayer tablets
have been developed more often in recent years.
The production of these special forms of tablets takes place either on special
single punch presses as e.g. the pneumo-hydraulic FlexiTab (Roeltgen,
Germany) or on multi-station rotary tablet presses.
After the first layer has been only pre-compacted the powder of the second
layer is filled into the die on top of the first layer by a second feeder.
Followed by an optional second pre-compression event the final main
compression event has to take place before the tablet will be ejected.
As there has been only one filling station available on the Presster, the serial
and automated production of both multilayer and laminated tablets is not
possible. It might only be feasible by the manual preparation of the final
tablet layers inside the die prior to the compaction cycle.
Therefore, the production of both multilayer and laminated tablets using the
Presster, simulating a rotary tablet press, might be restricted to a rather
small number of tablets.
Results and Discussion – General Aspects
142
4.7.11 Special Aspects of the Presster
In contrast to any rotary tablet press, the punches of the Presster have to
pass also anti-cyclical through all the various compaction cycle related
stations on their way back to the start position for the subsequent
compaction cycle.
Due to the lack of a pull down cam for the way back to the start position and
the manually tightened punch break of the lower punch, present on both the
original and the modified carriage of the Presster, the position of the lower
punch has not been lowered on its way back to the start position after
passing the ejection cam.
Therefore, its tip has been still positioned on the same plane as the top level
of the die, when the punches came across the compaction rollers. However,
as the upper punch has been pushed down by a cam just before getting into
contact with its compaction roller, the upper punch tip went foul of the lower
punch ones.
This has been of minor importance for the quality of punch tips of flat faced
punches, but provoked the damage of any convex-faced or facetted punch
tip.
Therefore the punch break of the lower punch had to be loosened manually
prior to any run of the carriage back to the start position of the Presster, in
order to allow the lower punch to fall inside the punch bushing by its own
weight and finally to follow the path profile of the ejection cam.
This finally prevented the use of the serial mode of the Presster, by which a
certain predefined number of compacts would have been produced in
several sequent compaction cycles.
Results and Discussion – General Aspects
143
4.7.12 Summary
Various general aspects of the Presster have been investigated with respect
to the simulation efficacy of rotary tablet presses, in particular a
Fette P1200.
The eccentric system of the Presster, used to adjust the vertical position of
the lower main compaction roller and consecutively apply the compaction
pressure level, resulted in a variable vertical misalignment of the main
compaction rollers.
The misalignment of main compactions rollers finally shortens the effective
dwell time, similar to an increased machine speed of the simulated rotary
tablet press.
A comparison of compactability and compressibility data has therefore to be
carried out carefully, in case of dwell time sensitive materials, even while
working at ostensible equal conditions.
In comparison, on the Fette P1200 dwell time conditions did not change by
any adaptation of the compaction pressure level, as the vertical position of
compaction rollers has been adjusted under retention of their vertical
alignment.
A further effect on the validity of dwell time calculations has been found by
the abrasion of punch heads, which has been observed to be much more
distinctive on the Presster compared to rotary tablet presses, due to the
collision between the punch head and compaction rollers being static prior
to contact.
Vertical punch movements, not related to any compaction event, have been
observed in particular for the upper punch and the time in between the pre-
and main compaction station.
To ensure both punches to stay in contact with the compact over the entire
compaction cycle, an additional punch break for the upper punch has been
installed on the revised carriage.
Nevertheless, punch cams present on the Presster did not restrict the
Results and Discussion – General Aspects
144
vertical liberty of action of the upper punch sufficiently, as holding ledges
have been missing. Therefore, in case of rather large settings for the depth
off fill (pre-compressed) powder inside the die as well as the upper punch
have been lifted as soon as the lower punch got into contact with its
compaction roller.
Dependant on the set compaction zone and the edge height of the powder
column inside the die immediately before the main compaction event, the
upper punch has been lifted upwards, provoking additional friction, shifted
compaction zones and occasionally powder loss from the die.
Above that, an adaptation of the horizontal distance between the pre- and
main compaction station, to most accurately match the conditions of the
simulated Fette P1200 rotary tablet press, has not been possible, as the
distance between both stations of the Presster has been fixed by design.
The gravity feeding unit of the Presster has been found to work satisfactorily
only for quite well flowing materials. Beyond that, it represents one of the
most distinctive differences compared to the force feeding systems of rotary
tablet presses.
The consecutive differences in stress intake and the die feeding process
impeded the simulation of the influence of the feeder on tablet properties.
The importance of taking this aspect into consideration for any tablet
formulation development has been shown by Jahn (2005).
Of course, the simulation of some special designs of rotary tablet presses,
including their unique die feeding process using centrifugal forces, as seen
on the Comprima (IMA, Italy), will not be possible at all.
Furthermore, dependant on the set horizontal speed of the carriage, powder
loss from the unclosed die bore has been observed during the acceleration
of the carriage, resulting in speed dependent deviations between the
specified and the obtained tablet weight.
Results and Discussion – General Aspects
145
Modifications of both the upper and lower punch cam finally eliminated this
shortcoming, ensuring a consistent compact weight at a particular machine
setting, independent of the extent of acceleration necessary to achieve the
set speed of the carriage.
Unfortunately, due to spatial interactions between the upper punch and the
feeder, the modifications impeded any further application of the gravity
feeding unit of the Presster.
Although, being able to use all the disposable material for investigation
purposes takes priority over the imperative necessity of manual die feeing.
Oblique powder beds have been observed inside the die prior to the
compaction event as a consequence of the inertia of the powder mass during
the acceleration of the carriage. However, a homogenous hardness
distribution, referring to a consistent density distribution has been found
over the diameter of Emcompress tablets.
The possible impact of oblique powder beds on compact properties as, for
example, the density distribution of tablets, must be considered.
On the original version of the Presster, tablets have been collected in a small
container attached to the carriage, where they stayed until the end of a
particular batch. Due to unrestricted tablet movement inside the container
the tablets were subject to unplanned stress.
By modifications of the take-off bar, a consistent removal of tablets out of
the Presster, similar to the system of rotary tablet presses, has been
ensured.
The roundness of the compaction rollers of the Presster have been found to
be less accurate compared to the ones of the Fette P1200. Manual
adjustment of the compaction rollers has been carried out to avoid any
impact on compact properties and to ensure consistency of measurements.
Non-continuously rotating compaction rollers exacerbates the wear of both
Results and Discussion – General Aspects
146
the rollers and the punch heads, the latter affects the reliability of
investigations based on dwell time calculations.
A dedicated measurement system for the observation of tight moving or even
sticking punches, as present on some rotary tablet presses, was not present
on the Presster.
Unrestricted vertical movement of especially the lower punch has to be
guaranteed in particular to avoid any interference of sticking punches with
the investigation of ejection force measurements.
Therefore, the ejection force measurement system might be used as an
alternative system to monitor the unrestricted vertical movement of the
lower punch.
An equivalent press chamber lubrication system as e.g. the PKB II of the
Fette P1200 was not available for the Presster. Lubricating material had to
be applied manually to the punches and the die using a brush to simulate
these systems and therefore avoiding internal lubrication, which could affect
the reliability of compressibility investigations.
The automated production of both multilayer and laminated tablets is not
possible using the Presster, as options for repeated and variable die feeding
are not present.
The manual preparation of both types of compacts might be possible, but
heavily manual and ensuring uniformity would be a challenge.
Therefore, the specification of the Presster, being able to simulate all rotary
tablet presses, should be further specified to the simulation of single station
rotary tablet presses only.
As the Presster works on a straight line in comparison to the circular path of
rotary tablet presses, the carriage including the punches had to pass all the
various compaction cycle related stations also in anti-cyclical direction. Due
to missing punch cams, the punch break of the lower punch had to be

Results and Discussion – General Aspects
147
loosened manually prior to any movement of the carriage back to the
starting position of the compaction cycle, in order to avoid punch tip
deflection of non flat punches.
Therefore, the serial mode of the Presster has been deactivated.

Summary and Conclusions
148
5 Summary and Conclusions
The present work first dealt with investigations of the linear compaction
simulator Presster, in particular with respect to its data acquisition system,
the various force and displacement measurement systems as well as of
general aspects, which might have an influence on compact properties.
Secondly, in order to have an easy to use and powerful tool for reliable and
convincing investigations of powder compaction behaviour under the
conditions of a Fette P1200 rotary tablet press, feasible optimisations have
been realised where necessary.
Finally, the predominant quality and reliability of measurements obtained by
the various improved systems have been furnished evidence during
exemplary investigations.
The machine speed dependant maximum sample rate of about 7.4 kHz,
observed for the original data acquisition system of the Presster, has been
found to be too low to reliably monitor high frequency signals, for example
take-off forces.
Furthermore, due to their specified cut-off frequency the amplifiers used
within the original measurement systems of the Presster, as well as those
implemented to provide all signals electrically isolated to an independent
external data acquisition system, proved to be appropriate to process only
rather low frequency compaction force signals without any signal distortion
or phase shift.
In addition to the replacement of amplifiers in connection with the revision
of entire measurement systems, the Presster independent data acquisition
system DAQ4, providing a user selectable sample rate up to 1.25 MHz
superseded the original one.
Investigations of the compaction force measurement systems of the Presster
have been performed by simulating a Fette P1200 rotary tablet press.
Differences in the obtained compactibility profiles have been revealed over

Summary and Conclusions
149
the entire range of compaction pressures and speed settings, while both
machines have been operated at comparable conditions.
Dynamic recalibrations of all the compaction force measurement systems of
both the Presster and the Fette P1200 revealed wrong calibrated
compression force measurement systems of the Presster only.
After recalibration, compactibility profiles of the blends of Emcompress and
Flowlac 100 matched for the two machines, while the ones of Neosorb P60W
still showed some inconsistency, in particular at compaction pressure levels
larger than 175 MPa.
As the profiles of Emcompress and Flowlac 100 matched even at high
pressure levels, a general rejection of compaction data, obtained at high
pressure settings, has not been indicated. Data obtained at compaction
pressures larger than 175 MPa as well as compacts, having a tensile
strength larger than 6 Nmm-2, have to be handled carefully, while the latter
might be found quite seldom during normal situations.
Remaining deviations in the compactibility profiles are ascribed to
inaccessible and therefore unadjustable general variations in the compaction
process of the two machines.
A rather small Eigen-frequency of the ejection force measurement system, in
combination with the impact of machine and process vibrations on its base
line noise level and signal integrity, initially impeded accurate investigations
of ejection force signals.
Therefore, the original ejection force measurement system of the Presster
was found to be unsuitable for reliable investigations of the ejection
behaviour and forces of pharmaceutical excipients or blends.
Hence, a revised ejection force measurement system has been designed and
installed on the Presster. Providing a higher Eigen-frequency and less
vibration sensitivity, the reliable monitoring of ejection force signals has
been improved.
As a result of both increased data acquisition rate and higher cut-off

Summary and Conclusions
150
frequency of the entire system, impact signals have been found to temporary
superimpose the ejection force signals, in particular present while running
the Presster at high speed conditions.
Unchangeable constructive limitations of the range of the ejection angle
impeded a most accurate simulation of the ejection process of the simulated
Fette P1200.
Nevertheless, effective ejection forces have finally been reliably determinable
by adequate approximation, clearly demonstrating the improved quality of
the revised ejection force measurement system.
Due to its design and its too small Eigen-frequency, the original take-off
force measurement system of the Presster turned out to be inapplicable with
respect to accurate and reliable investigations of take-off forces.
The previously mentioned too low sample rate of the original data
acquisition system, in combination with the too low cut-off frequency of the
amplifiers, the measurement was of the absorbed oscillation of the system
itself and not of the take-off event.
Therefore, a redesigned take-off force measurement system has been
installed on the Presster.
The revised system provided a sufficient Eigen-frequency and has been
proved to monitor take-off forces accurately and reliably, even at high speed
conditions. Hence, discriminations between the adhesive and the
momentum induced part of the total take-off force have been possible.
Therefore, the redesigned system has been applicable to investigate the
effect of e.g. varying lubrication levels and extents of humidity on the
sticking tendencies of formulations.
Punch displacement measurements, performed by the original system of the
Presster, contained comparably large noise levels. These were a result of the
unguided cores of the displacement transducers as well as machine
vibrations and tilting punches. Tilting of punches was not measurable due to
Summary and Conclusions
151
the presence of only one displacement transducer per punch. Neither
machine nor punch deformations were taken into account by the original
system.
Therefore, accurate and reliable punch displacement measurements, with
respect to the investigations of powder compression behaviour in terms of
compaction pressure vs. in-die tablet height plots, compressibility plots or
even Heckel-plots, were not possible using the original punch displacement
measurement system of the Presster.
Hence, a new punch displacement measurement system has been designed
and installed within a redesigned carriage. By the use of two vibration
resistant displacement transducers per punch, the investigation of punch
tilting became possible. The absolute punch tilting under pressure observed
for the new system for both tilting axes A and B did finally not exceed
4.4 μm, indicating the improved conditions of the revised system.
The deformation of punches, calculated according to Hook´s law, has been
taken into account for the new system, while the deformation of the machine
itself became negligible, as the new displacement transducers have been
mounted directly onto the punches, while their reference position has been
the well defined top level of the die.
Compaction pressure vs. in-die tablet height plots as well as Heckel-plots of
various excipients, obtained by the new punch displacement measurement
system at various speed settings, further demonstrated the improved quality
of the redesigned system.
Reliable discriminations between deformation characteristics of various
excipients have been feasible within the investigated speed range.
Even while the quality of measurements obtained by the improved punch
displacement measurement system of the modified Presster has been
proved to enable relevant investigations of powder compression behaviour
with sufficient accuracy and reliability, further improvements of the punch
displacement measurement, in particular its displacement transducers,
would be recommended.
Summary and Conclusions
152
Furthermore, beside the investigation of the various measurement systems
of the Presster, general process aspects have been examined with respect to
the simulation efficacy of rotary tablet presses, in particular a Fette P1200.
The eccentric system for the adjustment of the vertical position of the lower
main compaction roller has been found to cause a vertical misalignment of
the main compaction rollers.
Therefore, the validity of dwell time calculations, which has already been
impaired due to excessive abrasion of the flat portion of the punch heads,
has been additionally affected.
Vertical punch movements in between the pre- and main compaction station,
caused by less accurate punch guidances, resulted in additional friction
between the material and the die, shifted compaction zones and rarely
powder loss out of the die.
Due to a fixed horizontal distance between the pre-and main compaction
stations of the Presster, a most accurate adaptation to the conditions of the
simulated rotary tablet press has not been possible.
The gravity feeding unit of the Presster was redesigned. Unfortunately, the
simulation of any influence of the die feeding process on compact properties
was found to be impossible using the Presster.
Speed dependant powder loss has been observed out of the unclosed die
prior to the pre-compaction station, resulting in major compact weight
variations. Modifications of punch cams finally stopped further powder loss
and ensured a constant compact weight, independent of the set speed of the
carriage, but impeded any further use of the gravity feeding unit due to
spatial interactions.
Oblique powder beds observed on the Presster did not show any distinctive
effect on the uniformity of the compact hardness distribution.
Variable stress to tablets collected in a small container, attached to the
carriage, has been eliminated in progress of the modifications of the take-off
bar.

Summary and Conclusions
153
The roundness of compaction rollers has been found to be less accurate
compared to ones of the Fette P1200. Manual positioning of the rollers
prevented any effect on the consistency of measurements.
Systems for the observation of tight moving punches as well as for an
automatic press chamber lubrication have not been available for the
Presster, while the manual application of lubricant material to the die and
punches has been used.
The automated production of both multilayer and laminated tablets has not
been possible using the Presster, as options for repeated and variable die
feeding as well as options for partial compaction cycles are missing.
Anti-cyclical passages of all the compaction cycle related stations finally
applied some additional stress and wear to the system, in particular to the
punches, impeding any further use of the Presster in serial mode.
Finally, the numerous modifications implemented on the Presster, as a
consequence of the results of the entirety of investigations of the original
version of the Presster, improved the quality and reliability of measurements
taken.
Even while some differences within the compaction process of the Presster
and the simulated Fette P1200 were not possible to harmonise, the
improved accuracy and reliability of measurements, performed by the
modified version of the Presster, allows the investigation of powder
compaction and compression behaviour already during very early stages of
development.
Therefore, this modified Presster has been proved to be applicable as a
valuable tool, going to be used for research and development as well as for
trouble-shooting purposes.

Materials and Methods
154
6 Materials and Methods
6.1 Presster
Presster; Model PR2002; s/n: 107
Metropolitan Computing Corporation (MCC), New Jersey, USA
6.2 Fette P1200
Fette P1200; s/n: 391
Fette GmbH, Schwarzenbek, Germany
The Fette P1200 rotary tablet press, placed at the University of Bonn, has
been fully equipped with 24 sets of punches and dies.
Force measurements on the Fette P1200 have been carried out by standard
load cell instrumented mountings of the lower pre- and main compression
rollers.
A 9R15 Euro B tooling has been used during investigations of the
compactibility of excipients, while die feeding has been performed using the
standard Fil-O-Matic feeder.
In contrast, ejection force measurements performed on the Fette P1200
have been carried out using only one pair of 10 mm round, flat faced
punches, while the Fette P1200 has been operated in a special galenic
mode.
Hereby, the machine stopped automatically after one rotation of the turret,
in order to impede any punch damage. This operation mode has been
selected to prevent multiple ejection force signals as a result of more than
one punch being in contact with the ejection cam simultaneously. Die
feeding has been performed manually for this investigation.

Materials and Methods
155
6.3 Multicheck Turbo III
Multickeck Turbo III; s/n: 1113326.0518
Erweka, Heusenstamm, Germany
The Multicheck Turbo III is a tablet testing tool used to automatically
analyse tablets weight, diameter, height and crushing force.
6.4 Data Acquisition System DAQ4
DAQ4; Version 1.5 rev. 644
Hucke Software, Solingen, Germany
DAQ4 has been designed on a LabView (National Instruments, USA) basis.
High-speed multifunction data acquisition boards (NI 6254 and NI 6250,
National Instruments, USA) providing a sample rate of up to 1.25 MSs-1 and
a 16 bit resolution have been used to monitor the various signals.
Exclusively screened cables have been used in between sensors and
amplifiers as well as to fed the amplified signals to the DAQ4 system, in
order to minimise the impact of external drop ins to the signal quality.
6.5 High Speed Imaging System
Hisis 2002; s/n 2145
KSV Instruments Ltd., Finland
The high speed imaging system has been used in combination with several
lenses and the HISIS 2000 software package to monitor particulars of the
compaction cycle process, recorded at 2000 frames per second.
Materials and Methods
156
6.6 DigiPunch
DigiPunch; s/n: prototype
Pharmaceutical Science Technology (PST), Rheinbach, Germany
The instrumented punch DigiPunch has been developed to measure
compression forces on tablet presses as close as possible at their point of
origin, particularly inside the die.
A standard EU19 punch has been instrumented at its tapered punch stem by
the application of two strain gauges, each working as an active Wheatstone
bridge.
The resonance frequency of the electronic module of the DigiPunch,
implemented to the hollowed punch barrel, has been about 10 kHz (-3dB).
Therefore, due to the low mass in between its tip and the instrumented
punch stem, the frequency response of the entire force measurement system
of the DigiPunch has been adequate for force calibration purposes on any
type and size of tablet press.
The internal electronic module monitored compression force signals
measured by the strain gauges at a pre-selected sample rate of 50 kHz.
As no cable is necessary to connect the DigiPunch with any external
amplifier, its running time is restricted by the lifetime of its battery only.
Compression force data, monitored by the DigiPunch, have been afterwards
transferred to a standard PC, where they have been compared with those
measured and monitored by the compression force measurement systems of
the Presster and the DAQ4 system respectively.
A 9 mm flat faced EU19 version of the DigiPunch has been used to review
the calibration functions of both pre- and main compression force
measurement systems of both the Presster and the Fette P1200 and finally
to recalibrate the ones of the Presster dynamically at 30 RPM.

Materials and Methods
157
6.7 Pharmaceutical Excipients
The selection of pharmaceutical excipients used in this work went by to
cover the following aspects:
- universally used materials for direct compaction purposes
- varying powder compressibility and compactabilty profiles
- well-known powder compaction behaviour during tableting
6.7.1 Lactose
Lactose is probably the most widely used diluent in tablet formulation.
Amongst its modifications, α-lactose monohydrate is the most commonly
used. Different qualities of α-lactose monohydrate are produced by either
sieving, milling, agglomeration or spray-drying. Depending on the production
process the portion of amorphous lactose varies, being up to 15 % in
spray-dried qualities. Compared to other lactose grades, spray dried
α-lactose monohydrate exhibits a higher rate of plastic deformation and a
better compactability (Bolhuis, 1996), mainly attributed to its
non-crystalline portion. The crystalline portion of the α-lactose monohydrate
accounts for the compressibility while the amorphous parts are responsible
for its compactability. Spraying lactose suspensions, the amorphous lactose
covers the lactose crystals, which are sticking together inside the sprayed
droplets. This results in more or less spherical particles showing good
flowability. As the amorphous part of spray-dried α-lactose monohydrate
crystallises out in time, it is responsible for a known storage instability. Long
storage periods of spray dried α-lactose monohydrate may therefore lead to
decreasing tensile strength values. Flowlac 100 was especially designed for
direct compression purposes. It shows an angle of repose of 28° (Meggle,
2000), unifying excellent flow properties with a quite good compactability.

Materials and Methods
158
6.7.1.1 Flowlac 100
Spray dried α-lactose-monohydrate; LOT: L0307 A 4921
Meggle, Wasserburg, Germany
6.7.2 Dibasic calcium phosphate
Derivatives of calcium phosphate, especially dibasic calcium phosphates,
are widely used in pharmaceutical applications. This is on the one hand due
to its cost and therefore helps to keep down the expenses for new tablet
development, but on the other hand mainly due to its product
characteristics as to enhance the flowability of blends or simply its
functionality as a tablet filler-binder in direct compression (Schmidt, 1993).
Di-Cafos consists of small primary particles (crystals) of calcium phosphate.
As all the different types of calcium phosphates available at the market also
Di-Cafos deforms extensively by brittle fragmentation (Bolhuis, 1996) at
relatively low and intermediate compaction pressures (Duberg, 1986). The
fracture creates a large number of clean, lubricant-free surfaces. Therefore,
lubricants, such as magnesium stearate, have practically no effect on the
binding properties of dicalcium phosphate dihydrates. Additionally, these
new surfaces show clear bindings sites to produce new interactions, such as
van-der-Waals forces.
As previously mentioned for Di-Cafos, also Emcompress deforms mainly by
brittle fragmentation. The plastic deformation of Emcompress at higher
pressures (Duberg, 1986) accounts for the time difference between the
maximum load and the minimum porosity.
6.7.2.1 Di-Cafos
Dibasic calcium phosphate dihydrate; LOT: A15439A
Chemische Werke Budenheim, Budenheim, Germany
Materials and Methods
159
6.7.2.2 Emcompress
Dibasic calcium phosphate dihydrate; LOT: C27LX
JRS Pharma, Rosenberg, Germany
6.7.3 Microcrystalline Cellulose
While powdered cellulose is used just as a tablet diluent, microcrystalline
cellulose offers properties of a binder as well. It is therefore used in both wet
granulation and direct compression blends. Several grades of
microcrystalline cellulose are commercially available, which differ in their
physical properties, for example, their particle size, flowability or moisture.
The larger particle-size grades provide better flowability while the higher
density grades improve flowability and weight uniformity (Rowe, 2006). The
quality used in this work provides a mean particle size of about 90μm and is
frequently used for direct compression.
6.7.3.1 Vivapur 102
Microcrystalline Cellulose; LOT: 5610230605
JRS Pharma, Rosenberg, Germany
6.7.4 Pregelatinised Starch
Pregelatinised starch qualities are processed by mechanical or thermal
modifications of native starch qualities. The starch granules show a water
take-up during this pregelatination process. The swollen granules burst at
higher temperature and the partially dissolved polysaccharides form a gel
with the surrounding liquid. This process is described as gelatination
(Rein, 1993). Starch 1500 is a partially pregelatinised maize starch
consisting of both individual starch grains and aggregates of starch grains
bonded to the hydrolysed starch. As part of the hydrogen bonding between
amylose and amylopectin are partially ruptured due to the manufacturing
process, it contains 15 % free amylopectin, 5 % free amylose and 80 %
Materials and Methods
160
native starch (Rowe, 2006). The free amylopectin, which is soluble in cold
water, is responsible for the binding properties of Starch 1500, while the
rate of free amylose and unmodified starch accounts for its disintegration
properties. Compared with other filler/binders, the flowability of
Starch 1500 is poor due to the large specific surface of the powder, resulting
in cohesion between particles (Bolhuis, 1973). Starch products exhibits
plastic deformation during compaction. Changes in contact time have a
major effect on tablet properties (Rees, 1978).
The post-compactional elastic recovery of starch compacts is comparably
large (Schmidt, 1988). This matches some post-compactional observations
of discrete primary particles in the same size as before compaction. Due to
this extensive elastic recovery (Sheth, 1980) tensile strength values of starch
compacts are low compared to other plastically deforming materials
(Bolhuis, 1996). The work of compaction applied to starch granules does not
lead to the formation of new bonds but is just stored over a short period of
time before being released due to elastic recovery of reversible deformed
particles. Pregelatinised starches and Starch 1500 in particular are, due to
its plastic behaviour under pressure and the film formation of lubricant
around the granules (Bolhuis, 1975), very sensitive to mixing with lubricants.
As starch products have lubrication properties on their own (Gullatz, 1996)
the amount of additional lubrication (~0.25 % magnesium stearate)
necessary for direct compression is rather small (Bolhuis, 1973). Therefore,
the residual forces as well as ejection forces of starch compacts are quite
small.
6.7.4.1 Starch 1500
Partially pregelatinised maize starch; LOT: IN507820
Colorcon, Dartford, Kent, England
Materials and Methods
161
6.7.5 Sorbitol
Sorbitol is a chemical isomer of mannitol. It has become a major industrial
sugar alcohol used in the food and pharmaceutical industries, where it is
used for direct compression as well as for wet granulation purposes. Sorbitol
deforms plastically into very hard compacts. At high pressures sorbitol
undergoes a sintering effect leading to glittering tablets (Schmidt, 1983b).
The individual particles of a compact, which are visible after compression at
low pressures, were completely sintered forming a smooth surface. The very
high hygroscopicity of Sorbitol and its tendency to stick to the surface of the
punches are appreciable disadvantages of Sorbitol and limit its use for
direct compression. Furthermore, tablets of sorbitol can become harder
during storage due to dissolution and recrystallisation during aging
(Bauer, 1997). Neosorb P60W, produced by crystallization, is a
representative of the χ-modification of Sorbitol providing the least
hygroscopicity and the best compactability of all the Sorbitol modifications
(Bolhuis, 1996). It has a mean particle diameter (d50) of 180μm and
provides, due to its coarser grade compared to other sorbitol qualities, a
flowability sufficient for direct compaction.
6.7.5.1 Neosorb P60W
Sorbitol; LOT: E041X
Roquette, Lestrem, France
6.7.6 Magnesium stearate
Lubricants, such as the most universally used magnesium stearate, are used
in tableting to reduce the extent of interparticular friction as well as the
friction between particles and the die during compaction and ejection phase.
The radial and axial transmission of forces has improved (Koglin, 1992).,
Needle-shaped magnesium stearate qualities have superior lubricant
properties compared to platelet shaped ones (Steffens, 1982). Magnesium
stearate of animal origin, manufactured by the use of fatty acids extracted

Materials and Methods
162
from beef tallow, is nowadays used infrequently as of BSE, commonly known
as the mad cow disease. Nowadays magnesium stearate used is more or
less all of vegetable origin. Commonly used concentrations are within the
range of 0.25 to 1.5 %, in some special cases up to 5 % (Ritschel, 2002).
Beside its favourable characteristic to work as a lubricant magnesium
stearate has some negative influences on tablet properties, some of which
have already been described previously. Particularly, its very hydrophobic
character has a retarding effect on tablet disintegration and prolongs tablet
dissolution (Lowenthal, 1972; Bolhuis, 1975).
6.7.6.1 Magnesium stearate Pharma veg.
Magnesium stearate, vegetable; LOT: 2079
Bärlocher, Unterschleißheim, Germany

Materials and Methods
163
6.8 Preparation of Tableting blends
The preparation of tableting blends used for the comparison of the
compactibility profiles of the Presster and the Fette P1200 have been
performed using 20 litre metal vessel on a lab-scale free-fall blender
(Bohle, Enningerloh, Germany).
To guarantee enough space within the vessel during blending, the maximum
batch size has been set to 5kg (Sucker, 1991).
After sieving the excipients and the lubricant by a 710 μm and 315 μm sieve
respectively, the lubricant has been placed between two fractions of the
excipients inside the vessel, in order to keep the adhesion of lubricant to the
wall of the vessel as small as possible.
The blender has been set to work at 60 RPM for 3 minutes, while the
direction of rotation of the vessel changed every 30 seconds.
The blend of Dicafos and 1 % of magnesium stearate, also used within the
comparison of compactibility profiles of the Presster and the Fette P1200,
was blended using a PM 1000 free fall blender
(Bohle, Enningerloh, Germany) for 5 minutes at 6 RPM.
Tableting blends for both the investigation of ejection forces and take-off
forces have been prepared using a Turbula mixer T2F (Bachofen, Basel,
Switzerland).
After sieving the excipients and the lubricant by a 710 μm and 315 μm sieve
respectively, the lubricant has been placed between two fractions of the
excipients inside the 500ml glass blending vessel, which has been filled up
to about two thirds of its volume. Blending took place at 60 RPM for
3 minutes.
Lubricant of all the investigations has been magnesium stearate veg.
(Bärlocher, Unterschleißheim, Germany)
References
164
7 References
Armstrong, N.A.; Haines-Nutt, R.F.: Elastic recovery and surface area
changes in compacted powder systems.
Powder Technol., 9:287-290, 1974
Armstrong, N.A.; Palfrey, L.P.: The effect of machine speed on the
consolidation of four directly compressible tablet diluents.
J. Pharm. Pharmacol., 41(3):149-151, 1989
Bateman, S.: High speed compression simulators in tableting research.
Pharm. J., pE8, 1987
Bauer-Brandl, A.: Qualifizierung der Kraftmessung an Tablettenpressen.
Pharm. Ind., 60(1):63-69, 1998
Bauer, K.H.; Frömming, K.H.; Führer, C.: Feste Arzneiformen.
Pharmazeutische Technologie, 4. Edition, Bauer, K.H.,
Frömming, K.H., Führer, C., G. Fischer, Stuttgart, Germany, 1997
Bolhuis, G.K.; Chowan, Z.T.: Material for Direct Compression.
Pharm. Pow. Comp. Techn., M.Decker, New York, USA,
419-500, 1996
Bolhuis, G.K.; Lerk, C.F.: Comparative evaluation of excipients for direct
compression. Pharm. Weekbl., 108:469-481, 1973
Bolhuis, G.K.; Lerk, C.F.; Zijlstra, H.T.; De Boer, A.H.: Film formation by
magnesium stearate during mixing and its effect on tabletting.
Pharm. Weekbl., 110:317-325, 1975
Brake, E.F.: Development of methods for measuring pressures during tablet
manufacture. M.S. thesis, Purdue University, West Lafayette,
USA, 1951

References
165
Brockedon, W.: British Patent No. 9977, England, 1843
Busies, H.T.: Dichteverteilung in Schülpen. PhD thesis, Bonn,
Germany, 2006
Cole, E.T.; Rees, J.E.; Hersey, J.A.: Preliminary compaction studies using a
device to simulate a rotary tabletting machine.
J. Pharm. Pharmacol., 23:258, 1971
Cooper, A.R.; Eaton, L.E.: Compaction behavior of several ceramic powders.
J. Am. Ceram. Soc., 45:97-101, 1962
David, S.T.; Augsburger, L.L.: Plastic flow during compression of directly
compressible fillers and its effect on tablet strength. J. Pharm. Sci.,
66(2):155-159, 1977
Doldan, C.; Souto, C.; Concheiro, A.; Martinez-Pacheco, R.;
Gomez-Amoza, J.L.: Dicalcium phosphate dihydrate and anhydrous
dicalcium phosphate for direct compression: a comparative study.
Int. J. Pharm., 124:69-74, 1995
Duberg, M.; Nyström, C.: Studies on direct compression of tablets. VI.
Evaluation of methods for the estimation of particle fragmentation
during compaction. Acta Pharm. Suec., 19:421-436, 1982
Duberg, M.; Nystöm, C.: Studies on direct compression of tablets. XVII.
Porosity-pressure curves for the characterization of volume reduction
mechanisms in powder compression. Powder Technol.,
46(1):67, 1986
References
166
Dressler, J.A.: Vergleichende Untersuchungen pharmazeutischer Hilfsstoffe
unter Einsatz eines inkrementalen Weggebers zur präzisen
Wegmessung an einer Exzenter-Tablettenpresse. PhD thesis,
Tübingen, Germany, 2002
Dressler, J.A.; Wagner, K.G.; Wahl, M.A.; Schmidt, P.C.: Comparison of
Incremental and Inductive Displacement Transducers on an
Eccentric Tablet Press. Pharm. Ind., 63(8):886-893, 2001
Eilbracht, M.: Instrumentierung von Rundlauftablettenpressen:
Untersuchungen zur Relevanz für Entwicklungs- und
Produktionsprozesse. PhD thesis, Bonn, Germany, 2001
Erdem, U.: Force and weight measurement. J. Phys. E.: Sci. Instrum.,
15:857-872, 1982
Fell, J.T.; Newton, J.M.: Determination of Tablet Strength by the
Diametral-Compression Test. J. Pharm. Sci., 59(5):688-691, 1970
Führer, C.; Hanssen, D.; Schäfer, B.: Messung und Interpretation von Rest-
und Ausstoßdruck bei der Tablettierung. Pharm. Ind.,
32:17-21, 1970
Gabaude C.M.D.; Guillot M.; Gautier J.-C.; Saudemon P.; Chulia D.: Effects of
true density, compacted mass, compression speed, and punch
deformation on the mean yield pressure. J. Pharm. Sci.,
88(7):725-730, 1999
Goodhart, F.W.; Mayorga, G.; Ninger, F.C.: Measurement of lower punch
pulldown force and its significance. J. Pharm. Sci.,
58(2):248-251, 1969
References
167
Gruber, P.; Gläsel, V.I.; Klingelhöller, W.; Liske, T.:
Presskammerbeschichtung, ein Beitrag zur Optimierung der
Tablettenherstellung. Pharm. Ind., 50:839-845, 1988
Gullatz, A.: Darstellung und Auswertung von Ausstoßkräften an
Tablettenpressen. PhD thesis, Bonn, Germany, 1996
Heckel R.W.: Density-pressure relationships in powder compaction.
Trans. Metall. Soc. AIME, 221:671-675, 1961a
Heckel R.W.: An analysis of powder compaction phenomena.
Trans. Metall. Soc. AIME, 221:1001-1008, 1961b
Hersey, J.A.; Cole, E.T.; Rees, J.E.; Slip-stick during the ejection of tablets.
Aust. J. Pharm. Sci., 2:21-24, 1973
Hersey, J.A.; Rees, J.E.; Cole, E.T.: Density changes in lactose tablets.
J. Pharm. Sci., 12:2060, 1973
Herzog, R.: Calciumphosphate in der Tablettierung. PhD thesis, Tübingen,
Germany, 1991
Higuchi, T.; Arnold, R.D.; Tucker, S.J.; Busse, L.W.: The physics of tablet
compression, 1: a preliminary report. J. Am. Pharm. Assoc. Sci. Ed.,
41:93-96, 1952
Higuchi, T.; Rao, A.N.; Busse, L.W.; Swintosky, J.V.: The physics of tablet
compression, 2: the influence of degree of compression properties of
tablets. J. Am. Pharm. Assoc. Sci. Ed., 42:194-200, 1953
Higuchi, T.; Nelson, E.; Busse, L.W.: The physics of tablet compression, 3:
design and construction of an instrumented tabletting machine.
J. Am. Pharm. Assoc. Sci. Ed., 43:344-348, 1954

References
168
Ho, A.; Barker, J.F.; Spence, J.; Jones, T.M.: A comparison of three methods
of mounting a linear variable displacement transducer on an
instrumented tablet machine. J. Pharm. Pharmacol.,
31:471-472, 1979
Hoffmann, S.: Entwurf und Test eines mathematischen Modells zur
Qualifizierung von Kraftmeßanordnungen in Tablettenpressen.
dissertation submitted for diploma, FH Niederrhein, 1995
Hunter, B.M.; Fisher, D.G.; Pratt, R.M.; Rowe, R.C.: A high speed
compression simulator. J. Pharm. Pharmacol., 28:65P, 1976
Jahn, T.: Untersuchungen zur Prozessoptimierung und Einsatzmöglichkeit
neuer Baugruppenbestandteile einer Rundlauftablettenpresse
(Fette P1200). PhD thesis, Bonn, Germany, 2005
Kawakita, K.; Lüdde, K.H.: Some considerations on powder compression
equations. Powder Technol., 4:61-68, 1971
Ketolainen, J.; Kubicar, L.; Bohac, V.; Markovic, M.; Paronen, P.:
Thermophysical properties of some pharmaceutical excipients
compressed in tablets. Pharm. Res., 11:1701-1707, 1995
Koglin, J.: Untersuchungen zur pharmazeutisch-technologischen Qualität von
Magnesiumstearat. PhD thesis, Marburg/Lahn, 1992
Krumme, M.; Schwabe, L.; Frömming, K.-H.: Development of computerised
procedures for the characterisation of the tableting properties with
eccentric machines: extended Heckel analysis.
Eur. J. Pharm. Biopharm., 49:275-286, 2000
References
169
Laich, T.; Kissel, T.: Experimentelle Charakterisierung der
Presskammerbeschichtung auf Rundlauftablettenpressen.
Pharm. Ind., 59:265-272, 1997
Laich, T.; Kissel, T.: Untersuchung schmiermittelabhängiger Kenngrößen an
einer Exzentertablettenpresse ausgerüstet mit einem externen
Schmiersystem. Pharm. Ind., 60:547-554, 1998
Lammens, R.F.: The evaluation of force-displacement measurements during
one-sided powder compaction in cylindrical dies. PhD thesis,
Leiden, Netherlands, 1980
Leitritz, M.; Krumme, M.; Schmidt, P.C.: Vergleich von statischer und
dynamischer Kraftkalibrierung bei einer Rundlauftablettenpresse.
Pharm. Ind., 57(12):1033-1038, 1995
Levin, M.; Tsygan, L.; Dukler, S.: Press simulation apparatus. United States
Patent No. 6,106,262, USA, 2000
Lloyd, J.; York, P.; Cook, G.D.: Punch elasticity compensation in the
calibration of displacement measurements on a compaction
simulator. J. Pharm. Pharmacol., 43S:80P, 1991
Lowenthal, W.: Disintegration of tablets. J. Pharm. Sci.,
61:1695-1711, 1972
Matz, C.; Bauer-Brandl, A.; Rigassi, T.; Schubert, R.; Becker, D.: On the
Accuracy of a New Displacement Instrumentation for Rotary Tablet
Presses. Drug. Dev. Ind. Pharm., 25(2):117-130, 1999
Marshall, K.: Instrumentation of tablet and capsule filling machines.
Pharm. Tech., 7(3):68-82, 1983
References
170
Mitrevej, A.; Augsburger, L.L.: Adhesion of tablets in a rotary tablet press.
I. Instrumentation and preliminary studies of variables affecting
adhesion. Drug. Dev. Ind. Pharm., 6:331-337, 1980
Muñoz-Ruiz, A.; Gallego, R.; del Pozo, M.; Jiménez-Castellanos, R.;
Domínguez-Abascal, J.: A comparison of three methods of estimating
displacement on an instrumented single punch machine.
Drug. Dev. Ind. Pharm., 21(2):215-227, 1995
Nelson, E.; Naqvi, S.M.; Busse, L.W.; Higuchi, T.: The physics of tablet
compression. VI. Relationship of ejection, and upper and lower punch
forces during compressional process: application of measurements
to comparison of tablet lubricants. J. Amer. Pharm. Ass. Sci.,
43(10):596-602, 1954
Nokhodchi, A.; Rubinstein, M.H.: Compaction simulators in tableting
research. Pharm. Tech. – Tab. Gran. Yearbook, 1996
Palmieri, G.F.; Joiris, E.; Bonacucina, G.; Cespi, M.; Mercuri, A.: Differences
between eccentric and rotary tablet machines in the evaluation of
powder densification behaviour. Int. J. Pharm., 298:164-175, 2005
Paronen, P.; Juslin, M.: Compressional characteristics of four starches.
J. Pharm. Pharmacol., 35:627-635, 1983
Pitt, K.G.; Newton, J.M.: The effect of punch velocity on the tensile strength
of aspirin tablets. J. Pharm. Pharmacol., 39:65P, 1987
Rees, J.E.; Hersey, J.A.; Cole, E.T.: Simulation device for preliminary tablet
compression studies. J. Pharm. Sci., 61:1313-1315, 1972
Rees, J.E.; Rue, P.J.: Time-dependent deformation of some direct
compression excipients. J. Pharm. Pharmacol., 30:601-607, 1978

References
171
Rein, H.: Mikroverkapseln mit Stärke. PhD thesis, Marburg/Lahn,
Germany, 1993
Rippie, E.G.; Danielson, D.W.: Viscoelastic stress/strain behavior of
pharmaceutical tablets: analysis during unloading and
postcompression periods. J. Pharm. Sci., 70(5):476-482, 1981
Ritschel, W.A.; Bauer-Brandl, A.: Die Tablette. 2nd Edition, Ritschel, W.A.,
Editor, Editio Cantor Verlag, Aulendorf, Germany, 2002
Ritter, A.; Dürrenberger, M.; Sucker, H.: Meßmethode zur Quantifizierung
des Klebens von Tabletten. Pharm. Ind., 40(11), 1181-1183, 1978
Roberts, R.J.; Rowe, R.C.: The effect of punch velocity on the compaction of
a variety of materials. J. Pharm. Pharmacol., 37:377-384, 1985
Rowe, R.C.; Sheskey, P.J.; Owen, S.C.: Handbook of pharmaceutical
excipients. 5th Edition, Pharmaceutical Press and the American
Pharmaceutical Association, London, Chicago, 2006
Rubinstein, M.H.: Compaction Simulators – Industrial Tool or Research Toy?
European Pharmaceutical Review, 25-33, 1996
Schmidt, P.C.: Instrumentierungsmöglichkeiten an
Rundlauftablettenpressen. Chem. Ing. Tech., 61(2):115-123, 1989
Schmidt, P.C.; Herzog, R.: Calcium phosphates in pharmaceutical tabletting
2. Comparison of tabletting properties. Pharm. World. Sci.,
15:116-122, 1993
Schmidt, P.C.; Steffens, K.-J.; Knebel, G.: Vereinfachung der Registrierung
physikalischer Parameter bei der Tablettierung, 3. Mitt.: Quantitative
Erfassung des „Klebens“ von Tabletten. Pharm. Ind.,
45(8):800-805, 1983a

References
172
Schmidt, P.C.: Tableting characteristics of sorbitol. Pharm. Tech.,
7(11):65-74, 1983b
Schmidt, P.C.; Tenter, U.; Hocke, J.: Presskraft- und Weg-Zeit-Charakteristik
von Rundlauftablettenpressen, 1. Mitt.: Instrumentierung von
Einzelstempeln zur Presskraftmessung. Pharm. Ind.,
48(12):1546-1553, 1986
Schmidt, P.C.; Tenter, U.: Presskraft- und Weg-Zeit-Charakteristik von
Rundlauftablettenpressen, 3. Mitt.: Vergleich verschiedener
Pressmaterialien. Pharm. Ind., 50:376-381, 1988
Schmidt, P.C.; Tenter, U.: Presskraft- und Weg-Zeit-Charakteristik von
Rundlauftablettenpressen, 5. Mitt.: Messung und Auswertung von
Ausstoßkräften. Pharm. Ind., 51(2):183-187, 1989
Seitz, J.A.; Flessland, G.M.: Evaluation of the physical properties of
compressed tablets. I. Tablet hardness and friability. J. Pharm. Sci.,
54(9):1553-1557, 1965
Sheth, B.B.; Bandelin, F.J.; Shangraw, R.F.: Compressed Tablets. In:
Pharmaceutical Dosage Forms: Tablets. Liebermann, Lachmann;
Editors. M.Decker, New York, USA, 109-185, 1980
Shotton, E.; Deer, J.J.; Ganderton, D.: The instrumentation of a rotary tablet
machine. J. Pharm. Pharmacol., 15(Suppl.):106T-114T, 1963
Sonnergaard, J.M.: A critical evaluation of the Heckel equation.
Int. J. Pharm., 193:63-71, 1999
Sonnergaard, J.M.: Impact of particle density and initial volume on
mathematical compression models. Eur. J. Pharm. Sci.,
11:307-315, 2000

References
173
Steffens, K.-J.: Die physikalischen Eigenschaften von Magnesiumstearat und
ihr Einfluß auf das tribologische Verhalten bei der Tablettierung.
PhD thesis, Marburg, Germany, 1978
Steffens, K.-J.; Müller, B.W.; List, P.H.: Tribologische Gesetzmäßigkeiten und
Erkenntnisse in der Tablettentechnologie, 7. Mitteilung:
Untersuchungen an Magnesiumstearat-Handelspräparaten.
Pharm. Ind., 44:826-830, 1982
Sucker, H.; Fuchs, P.; Speiser, P.: Pharmazeutische Technologie. 2nd edition,
Thieme Verlag, Stuttgart, 54-57, 1991
Vromans, H.; De Boer, A.H.; Bolhuis, G.K.; Lerk, D.F.; Kussendrager, K.D.;
Bosch, H.: Studies on tabletting properties of lactose. Part 2.
Consolidation and compaction of different types of crystalline
lactose. Pharm. Weekbl., 7:186-193, 1985
Waimer, F.; Krumme, M.; Danz, P.; Tenter, U.; Schmidt, P.C.: A novel
method for the detection of sticking of tablets. Pharm. Dev. Technol.,
4(3):359-367, 1999a
Waimer, F.; Krumme, M.; Danz, P.; Tenter, U.; Schmidt, P.C.: The influence
of engravings on the sticking of tablets. Investigations with an
instrumented upper punch. Pharm. Dev. Technol.,
4(3):369-375, 1999b
Walker, E.E.: The properties of powders. Part VIII. The influence of the
velocity of compression on the apparent compressibility of powders.
Trans. Faraday Soc., 19:614-622 1923
Wallace, J.W.; Capozzi, J.T.; Shangraw, R.F.: Performance of pharmaceutical
filler/binders as related to methods of powder characterization.
Pharm. Technol., 7(9):94-104, 1983

References
174
Walz, M.: Haftung und Kleben von Tablettiermassen an Presswerkzeugen.
PhD thesis, Heidelberg, Germany, 1988
Watt, P.R.: Tablet machine instrumentation in pharmaceutics. Principles and
practice. Ellis Horwood Limited, Chichester, England, 1988
Wiederkehr-von Vincenz, C.: Instrumentierung und Einsatz einer
Rundlauf-Tablettenpresse zur Beurteilung des Pressverhaltens von
pharmazeutischen Pressmaterialien. PhD thesis,
Zürich, Switzerland, 1979
Williams, J.J.; Stiel, D.M.: An intelligent tablet press monitor for formulation
development. Pharm. Technol., 8(3):26-38, 1984
Symbols and Abbreviations
175
8 Symbols and Abbreviations
° degree
% percent
A/D analogue to digital
API active pharmaceutical ingredient
BSE bovine spongiform encephalopathy
CC compaction cycle
ccm cubic centimetre
COD coefficient of determination, sample variance
cos cosinus
D tablet diameter [mm]
DAQ data acquisition
DISLP displacement sensor of lower punch
DISUP displacement sensor of upper punch
ε porosity [%]
EJ ejection
Eq. equation
et al. et alii [Lat.]
EU 19 Euro 19 = Euro B
F diametral crushing force [N]
Fig. figure
FSO full scale output
Hz Hertz
kHz kiloHertz
kN kiloNewton
LVDT Linear variable displacement transducer
max maximum
min minimum
mm millimetre
ms-1 meter per second
ms millisecond
Symbols and Abbreviations
176
mV milliVolt
MU Mechanical Unit
N Newton
NODP Number of data points in terms of samples per second [S/s]
pC pico-Coulomb
s second
S samples
sin sinus
s/n serial number
sps samples per second
R² coefficient of determination, sample variance
RPM revolutions per minute
SD standard deviation
t tablet thickness [mm]
Tab. table
TO take-off
TS tensile strength [MPa]
V voltage
Vc volume of the compact at certain pressure [ccm]
Vt “true” volume of the material determined by helium pycometric
measurement
w/w weight by weight
μm micrometer

Special Notes
177
9 Special Notes
Data about percental content of tableting blends do refer to percent by
weight (w/w), unless stated otherwise.
Trademarks have been used without special marking.
All statements within this work, as well as within any publication out of this
work, concerning the Presster refer to the Presster model 2002, having the
serial number 107 exclusively.