Investigation of gravity waves in the troposphere and ...
22
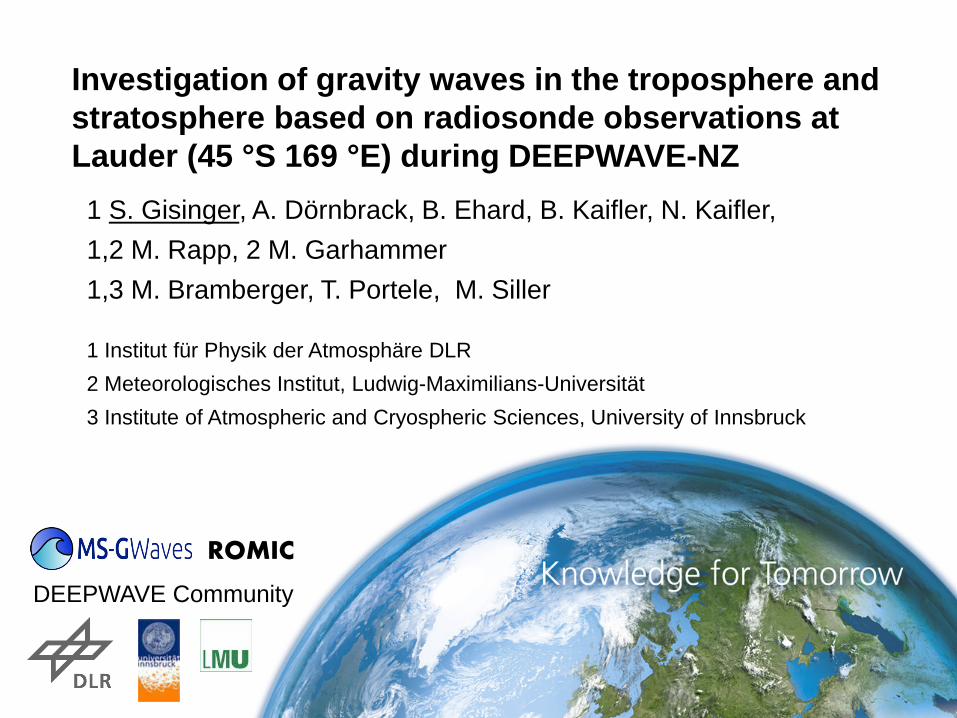
Investigation of gravity waves in the troposphere and stratosphere based on radiosonde observations at Lauder (45 °S 169 °E) during DEEPWAVE-NZ 1 S. Gisinger, A. Dörnbrack, B. Ehard, B. Kaifler, N. Kaifler, 1,2 M. Rapp, 2 M. Garhammer 1,3 M. Bramberger, T. Portele, M. Siller 1 Institut für Physik der Atmosphäre DLR 2 Meteorologisches Institut, Ludwig-Maximilians-Universität 3 Institute of Atmospheric and Cryospheric Sciences, University of Innsbruck DEEPWAVE Community ROMIC
Transcript of Investigation of gravity waves in the troposphere and ...
Investigation of gravity waves in the troposphere and stratosphere based on radiosonde observations at Lauder (45 °S 169 °E) during DEEPWAVE-NZ 1 S. Gisinger, A. Dörnbrack, B. Ehard, B. Kaifler, N. Kaifler,
1,2 M. Rapp, 2 M. Garhammer 1,3 M. Bramberger, T. Portele, M. Siller
1 Institut für Physik der Atmosphäre DLR 2 Meteorologisches Institut, Ludwig-Maximilians-Universität 3 Institute of Atmospheric and Cryospheric Sciences, University of Innsbruck
DEEPWAVE Community
ROMIC
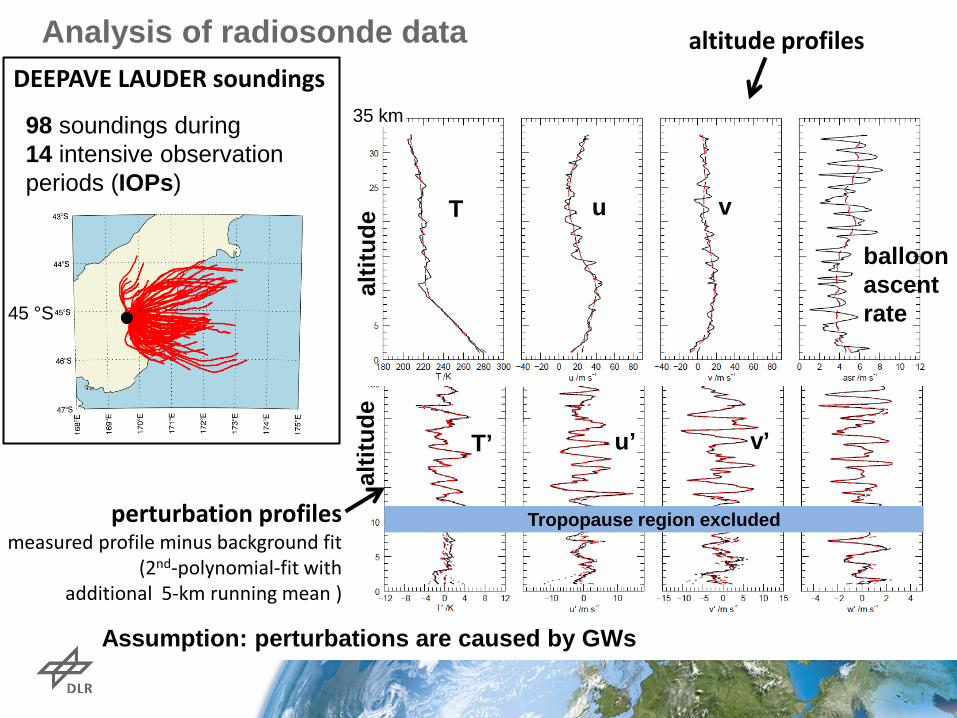
Analysis of radiosonde data DEEPAVE LAUDER soundings
perturbation profiles measured profile minus background fit
(2nd-polynomial-fit with additional 5-km running mean )
Assumption: perturbations are caused by GWs
45 °S
Tropopause region excluded
98 soundings during 14 intensive observation periods (IOPs)
T u v
balloon ascent rate
altit
ude
35 km
altitude profiles
altit
ude
T’ u’ v’
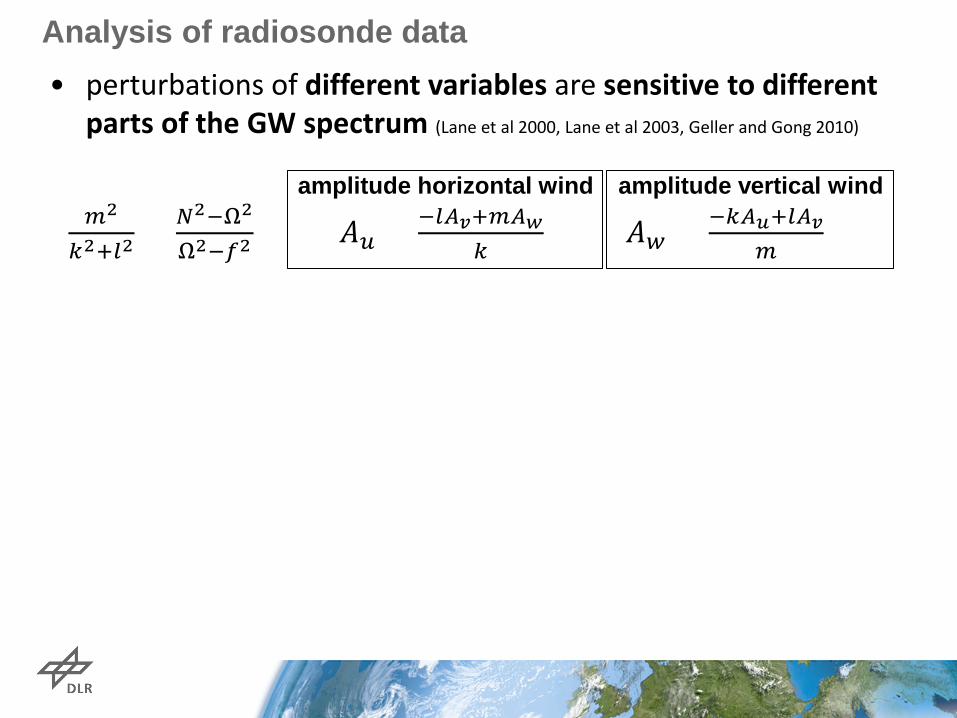
Analysis of radiosonde data • perturbations of different variables are sensitive to different
parts of the GW spectrum (Lane et al 2000, Lane et al 2003, Geller and Gong 2010)
𝑚𝑚2
𝑘𝑘2+𝑙𝑙2= 𝑁𝑁2−Ω2
Ω2−𝑓𝑓2 𝐴𝐴𝑢𝑢 = −𝑙𝑙𝐴𝐴𝑣𝑣+𝑚𝑚𝐴𝐴𝑤𝑤
𝑘𝑘 𝐴𝐴𝑤𝑤 = −𝑘𝑘𝐴𝐴𝑢𝑢+𝑙𝑙𝐴𝐴𝑣𝑣
𝑚𝑚
amplitude vertical wind amplitude horizontal wind
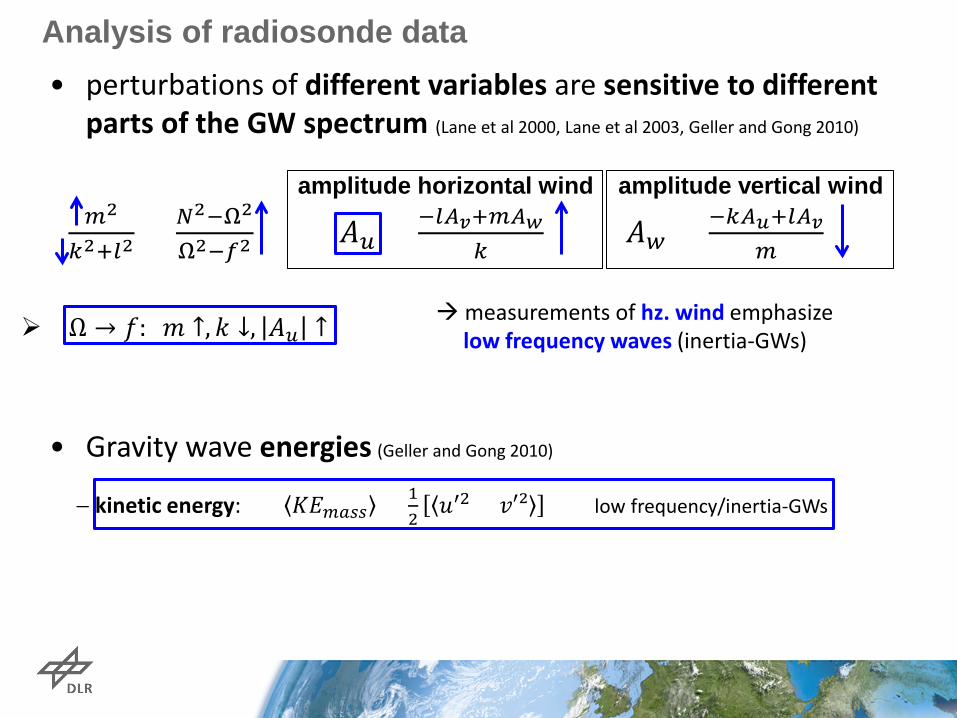
Analysis of radiosonde data • perturbations of different variables are sensitive to different
parts of the GW spectrum (Lane et al 2000, Lane et al 2003, Geller and Gong 2010)
𝑚𝑚2
𝑘𝑘2+𝑙𝑙2= 𝑁𝑁2−Ω2
Ω2−𝑓𝑓2 𝐴𝐴𝑢𝑢 = −𝑙𝑙𝐴𝐴𝑣𝑣+𝑚𝑚𝐴𝐴𝑤𝑤
𝑘𝑘 𝐴𝐴𝑤𝑤 = −𝑘𝑘𝐴𝐴𝑢𝑢+𝑙𝑙𝐴𝐴𝑣𝑣
𝑚𝑚
Ω → 𝑓𝑓: 𝑚𝑚 ↑, 𝑘𝑘 ↓, 𝐴𝐴𝑢𝑢 ↑
measurements of hz. wind emphasize low frequency waves (inertia-GWs)
• Gravity wave energies (Geller and Gong 2010)
− kinetic energy: 𝐾𝐾𝐾𝐾𝑚𝑚𝑚𝑚𝑚𝑚𝑚𝑚 = 12
𝑢𝑢′2 + 𝑣𝑣𝑣𝑣 low frequency/inertia-GWs
amplitude vertical wind amplitude horizontal wind
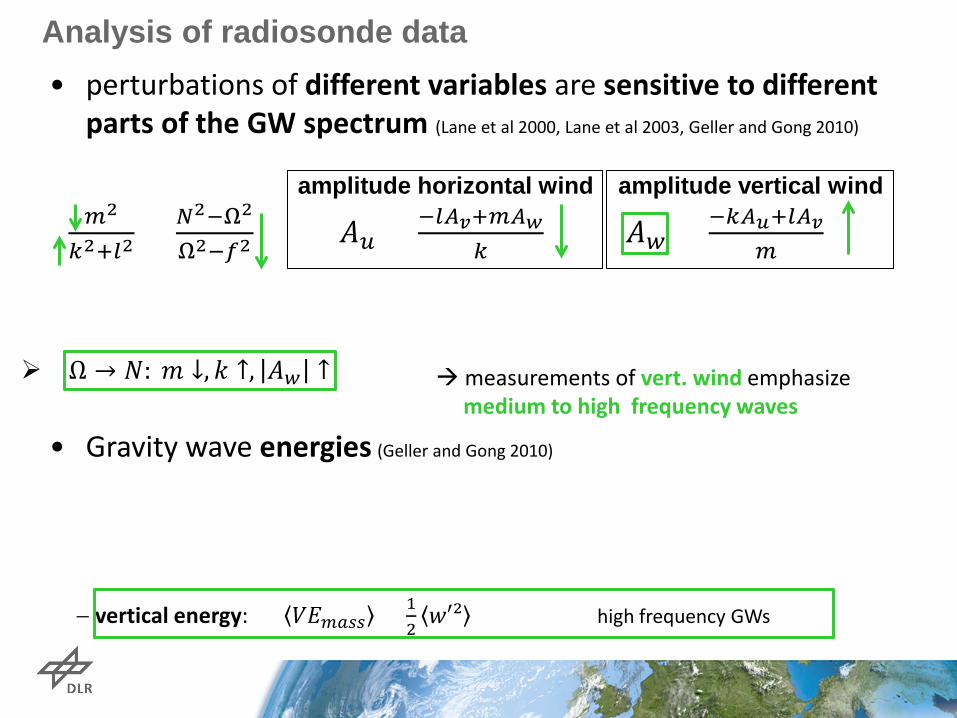
Analysis of radiosonde data • perturbations of different variables are sensitive to different
parts of the GW spectrum (Lane et al 2000, Lane et al 2003, Geller and Gong 2010)
𝑚𝑚2
𝑘𝑘2+𝑙𝑙2= 𝑁𝑁2−Ω2
Ω2−𝑓𝑓2 𝐴𝐴𝑢𝑢 = −𝑙𝑙𝐴𝐴𝑣𝑣+𝑚𝑚𝐴𝐴𝑤𝑤
𝑘𝑘 𝐴𝐴𝑤𝑤 = −𝑘𝑘𝐴𝐴𝑢𝑢+𝑙𝑙𝐴𝐴𝑣𝑣
𝑚𝑚
Ω → 𝑁𝑁: 𝑚𝑚 ↓, 𝑘𝑘 ↑, 𝐴𝐴𝑤𝑤 ↑
measurements of vert. wind emphasize medium to high frequency waves • Gravity wave energies (Geller and Gong 2010)
− vertical energy: 𝑉𝑉𝐾𝐾𝑚𝑚𝑚𝑚𝑚𝑚𝑚𝑚 = 12𝑤𝑤𝑣𝑣 high frequency GWs
amplitude vertical wind amplitude horizontal wind
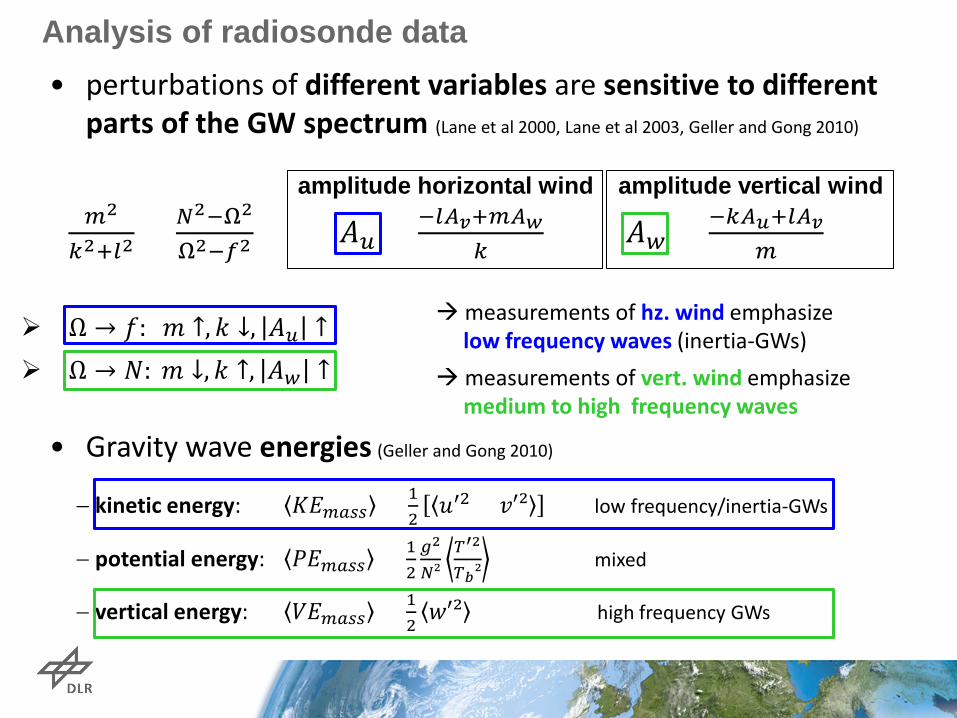
Analysis of radiosonde data • perturbations of different variables are sensitive to different
parts of the GW spectrum (Lane et al 2000, Lane et al 2003, Geller and Gong 2010)
𝑚𝑚2
𝑘𝑘2+𝑙𝑙2= 𝑁𝑁2−Ω2
Ω2−𝑓𝑓2 𝐴𝐴𝑢𝑢 = −𝑙𝑙𝐴𝐴𝑣𝑣+𝑚𝑚𝐴𝐴𝑤𝑤
𝑘𝑘 𝐴𝐴𝑤𝑤 = −𝑘𝑘𝐴𝐴𝑢𝑢+𝑙𝑙𝐴𝐴𝑣𝑣
𝑚𝑚
Ω → 𝑓𝑓: 𝑚𝑚 ↑, 𝑘𝑘 ↓, 𝐴𝐴𝑢𝑢 ↑
Ω → 𝑁𝑁: 𝑚𝑚 ↓, 𝑘𝑘 ↑, 𝐴𝐴𝑤𝑤 ↑
measurements of hz. wind emphasize low frequency waves (inertia-GWs) measurements of vert. wind emphasize medium to high frequency waves • Gravity wave energies (Geller and Gong 2010)
− kinetic energy: 𝐾𝐾𝐾𝐾𝑚𝑚𝑚𝑚𝑚𝑚𝑚𝑚 = 12
𝑢𝑢′2 + 𝑣𝑣𝑣𝑣 low frequency/inertia-GWs
− potential energy: 𝑃𝑃𝐾𝐾𝑚𝑚𝑚𝑚𝑚𝑚𝑚𝑚 = 12𝑔𝑔2
𝑁𝑁𝑣𝑇𝑇′2
𝑇𝑇𝑏𝑏𝑣 mixed
− vertical energy: 𝑉𝑉𝐾𝐾𝑚𝑚𝑚𝑚𝑚𝑚𝑚𝑚 = 12𝑤𝑤𝑣𝑣 high frequency GWs
amplitude vertical wind amplitude horizontal wind
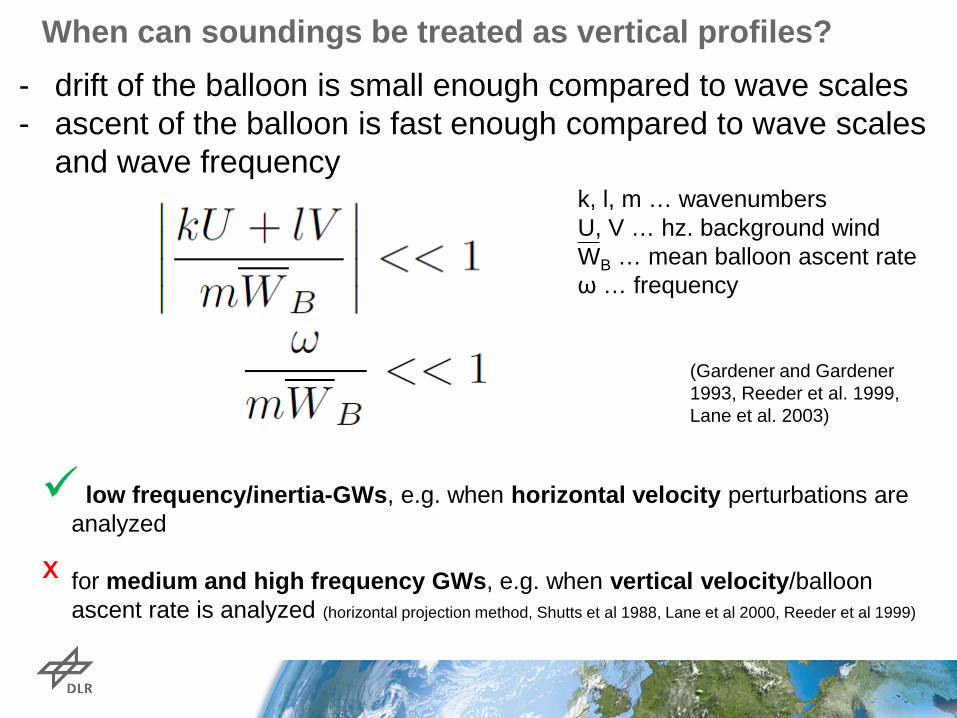
When can soundings be treated as vertical profiles?
(Gardener and Gardener 1993, Reeder et al. 1999, Lane et al. 2003)
k, l, m … wavenumbers U, V … hz. background wind WB … mean balloon ascent rate ω … frequency
low frequency/inertia-GWs, e.g. when horizontal velocity perturbations are analyzed
for medium and high frequency GWs, e.g. when vertical velocity/balloon ascent rate is analyzed (horizontal projection method, Shutts et al 1988, Lane et al 2000, Reeder et al 1999)
- drift of the balloon is small enough compared to wave scales - ascent of the balloon is fast enough compared to wave scales
and wave frequency
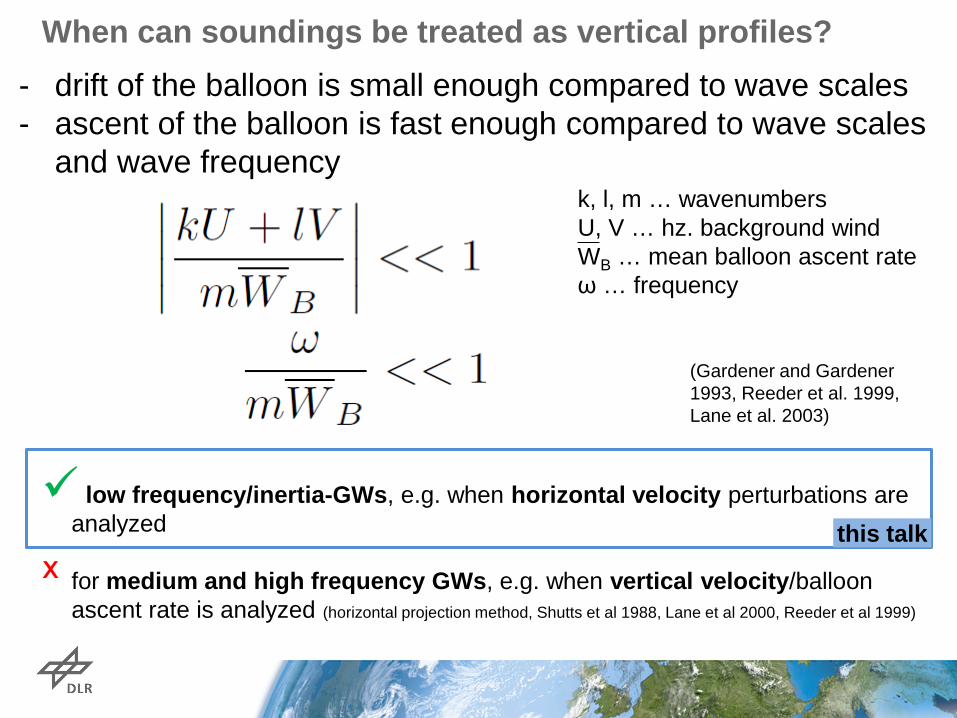
this talk
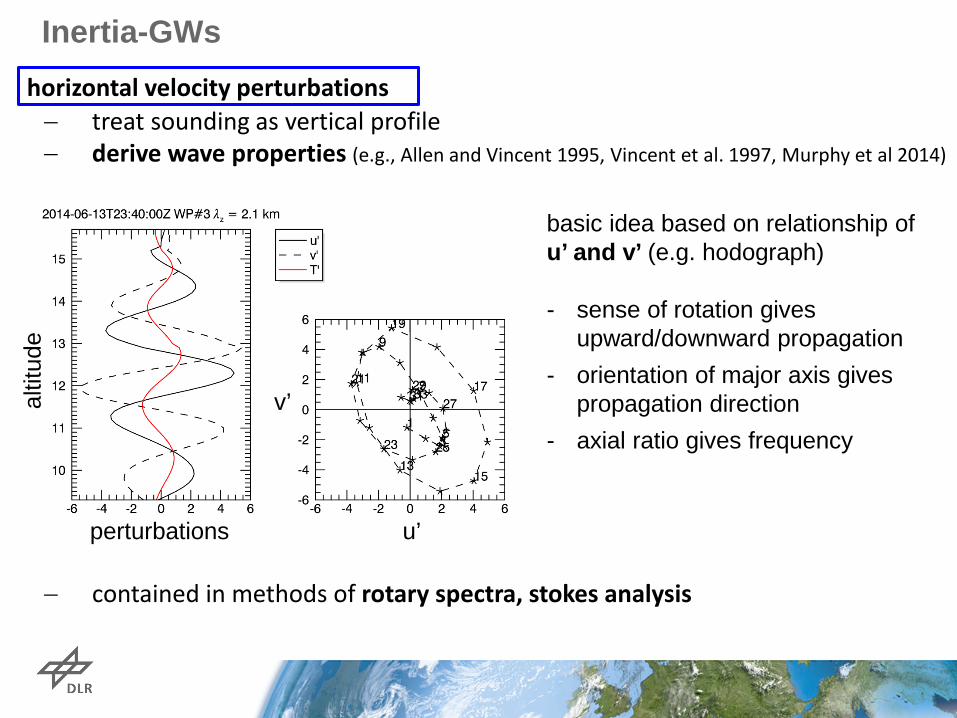
horizontal velocity perturbations − treat sounding as vertical profile − derive wave properties (e.g., Allen and Vincent 1995, Vincent et al. 1997, Murphy et al 2014)
− contained in methods of rotary spectra, stokes analysis
basic idea based on relationship of u’ and v’ (e.g. hodograph) - sense of rotation gives
upward/downward propagation - orientation of major axis gives
propagation direction - axial ratio gives frequency
Inertia-GWs
perturbations
altit
ude
u’
v’
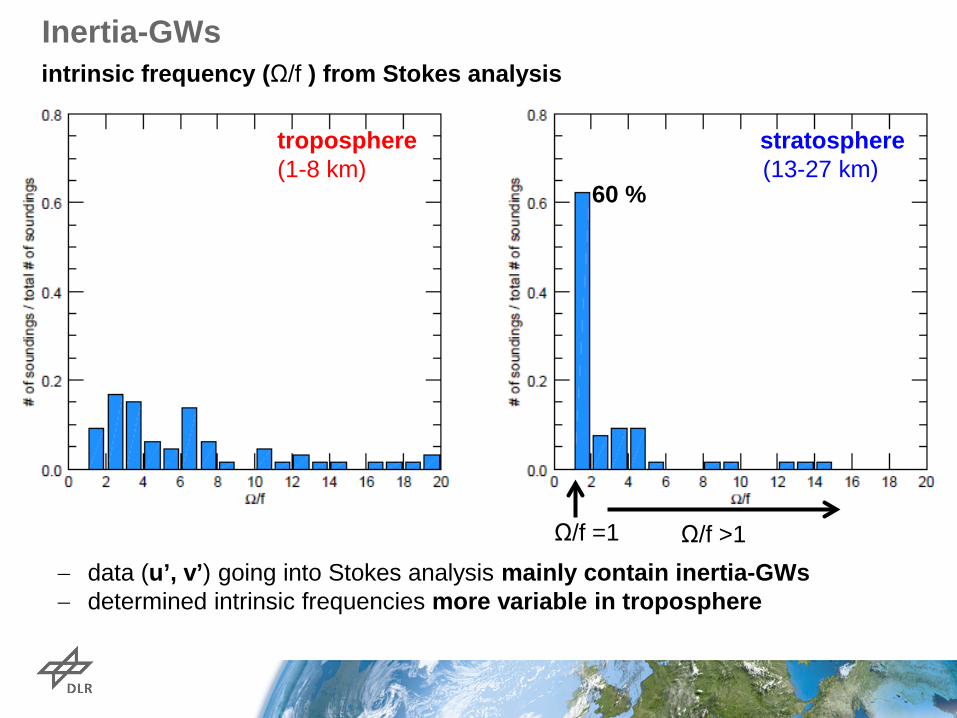
Inertia-GWs intrinsic frequency (Ω/f ) from Stokes analysis
60 %
troposphere stratosphere (1-8 km) (13-27 km)
− data (u’, v’) going into Stokes analysis mainly contain inertia-GWs − determined intrinsic frequencies more variable in troposphere
Ω/f =1 Ω/f >1
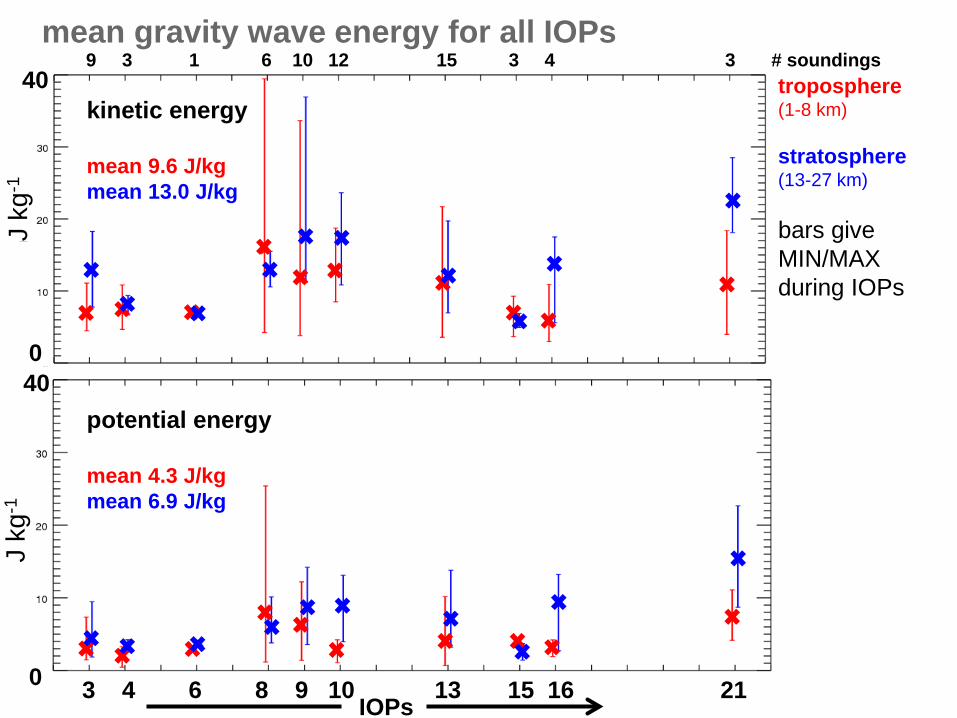
9 3 1 6 10 12 15 3 4 3 # soundings
3 4 6 8 9 10 13 15 16 21
mean gravity wave energy for all IOPs
kinetic energy mean 9.6 J/kg mean 13.0 J/kg potential energy mean 4.3 J/kg mean 6.9 J/kg
troposphere (1-8 km) stratosphere (13-27 km)
IOPs
J kg
-1
J kg
-1
40
0 40
0
bars give MIN/MAX during IOPs
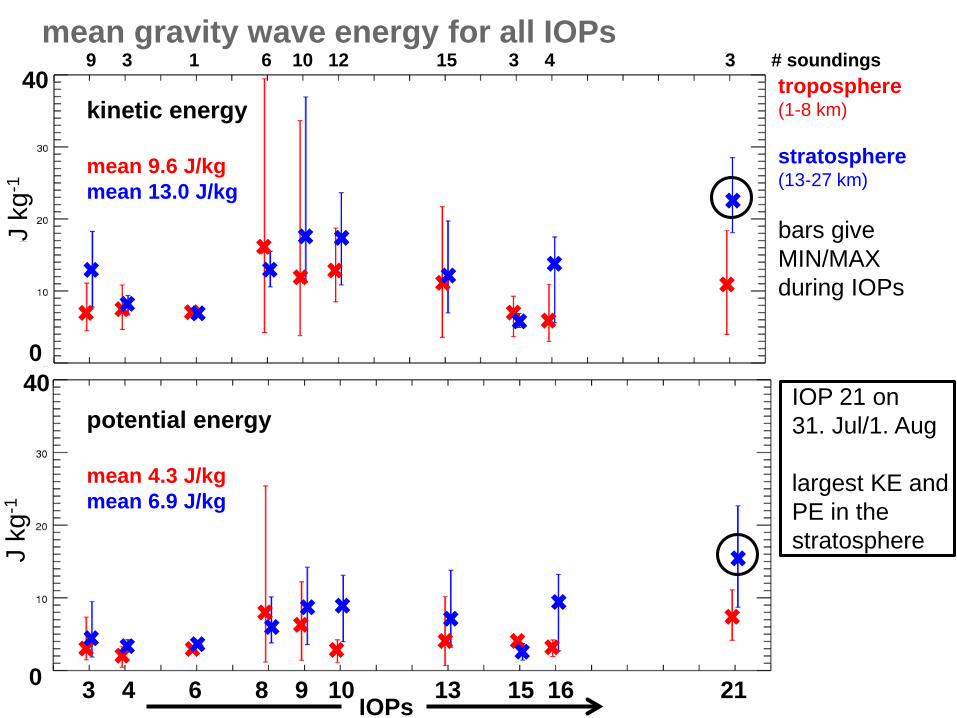
9 3 1 6 10 12 15 3 4 3 # soundings
3 4 6 8 9 10 13 15 16 21
mean gravity wave energy for all IOPs
kinetic energy mean 9.6 J/kg mean 13.0 J/kg potential energy mean 4.3 J/kg mean 6.9 J/kg
troposphere (1-8 km) stratosphere (13-27 km)
IOPs
J kg
-1
J kg
-1
40
0 40
0
bars give MIN/MAX during IOPs
IOP 21 on 31. Jul/1. Aug largest KE and PE in the stratosphere
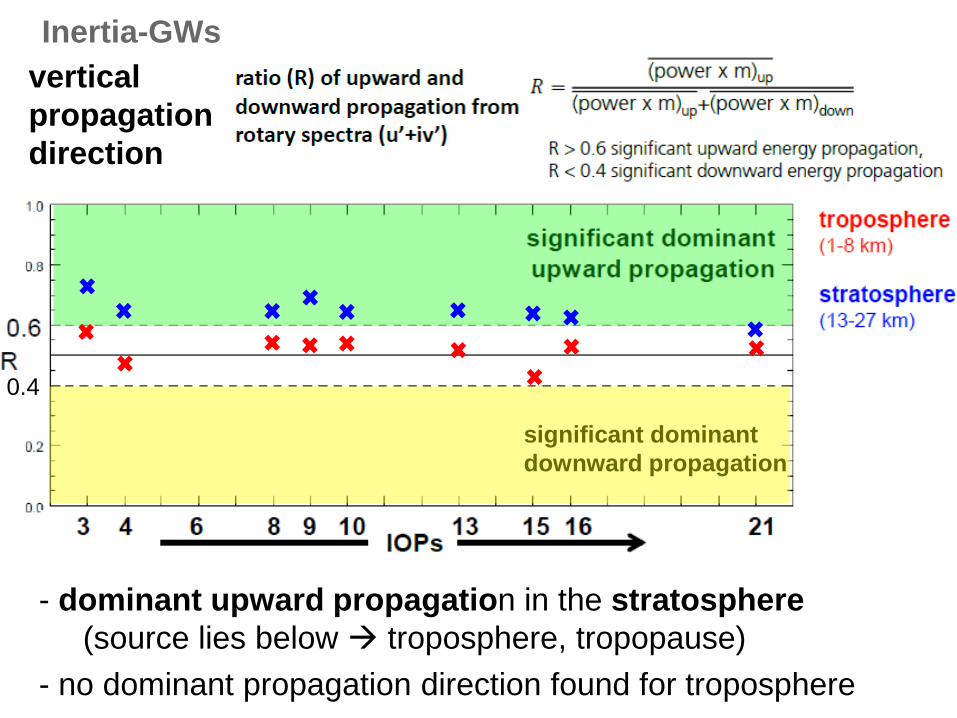
Inertia-GWs vertical propagation direction
significant dominant downward propagation
0.4
- dominant upward propagation in the stratosphere (source lies below troposphere, tropopause) - no dominant propagation direction found for troposphere
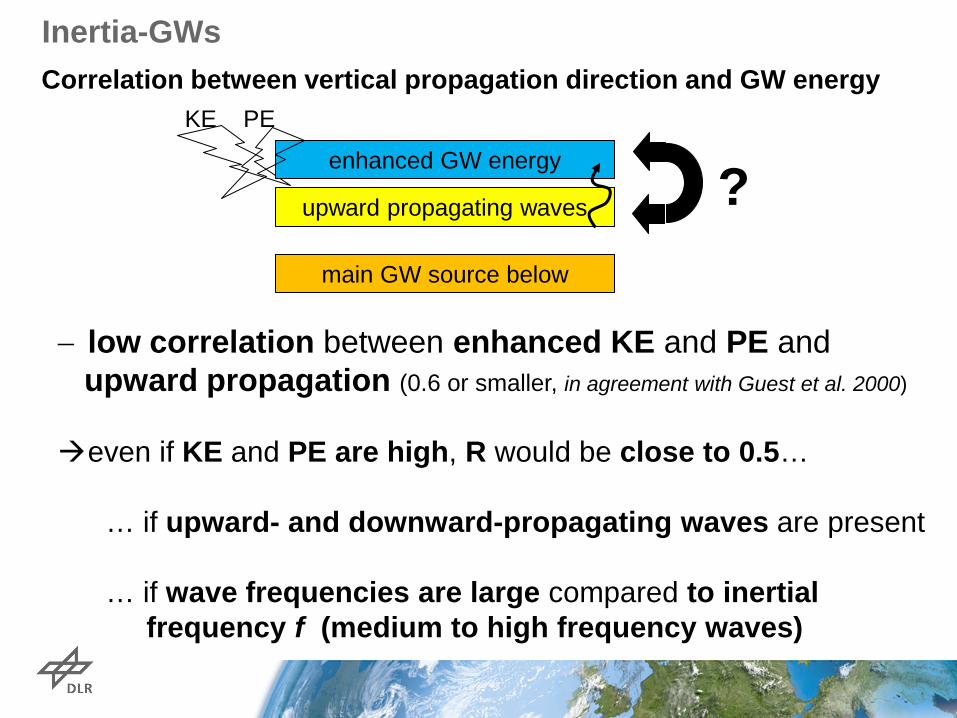
− low correlation between enhanced KE and PE and upward propagation (0.6 or smaller, in agreement with Guest et al. 2000)
even if KE and PE are high, R would be close to 0.5…
… if upward- and downward-propagating waves are present … if wave frequencies are large compared to inertial frequency f (medium to high frequency waves)
Inertia-GWs
? main GW source below
upward propagating waves
enhanced GW energy
Correlation between vertical propagation direction and GW energy KE PE

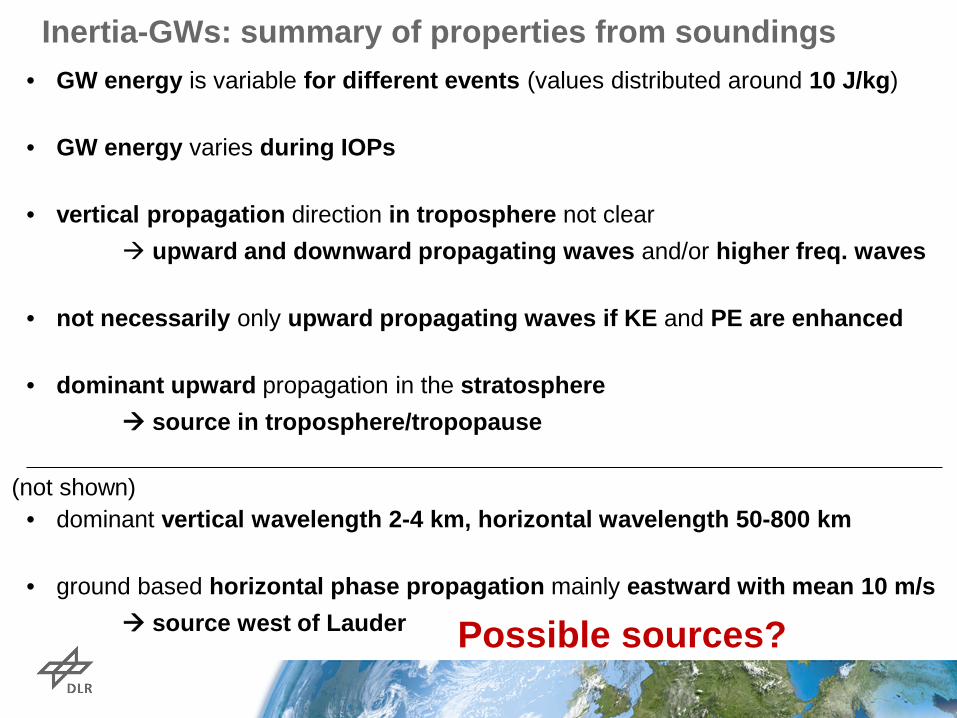
Inertia-GWs: summary of properties from soundings • GW energy is variable for different events (values distributed around 10 J/kg)
• GW energy varies during IOPs
• vertical propagation direction in troposphere not clear upward and downward propagating waves and/or higher freq. waves
• not necessarily only upward propagating waves if KE and PE are enhanced
• dominant upward propagation in the stratosphere source in troposphere/tropopause
• dominant vertical wavelength 2-4 km, horizontal wavelength 50-800 km
• ground based horizontal phase propagation mainly eastward with mean 10 m/s source west of Lauder
(not shown)
Possible sources?
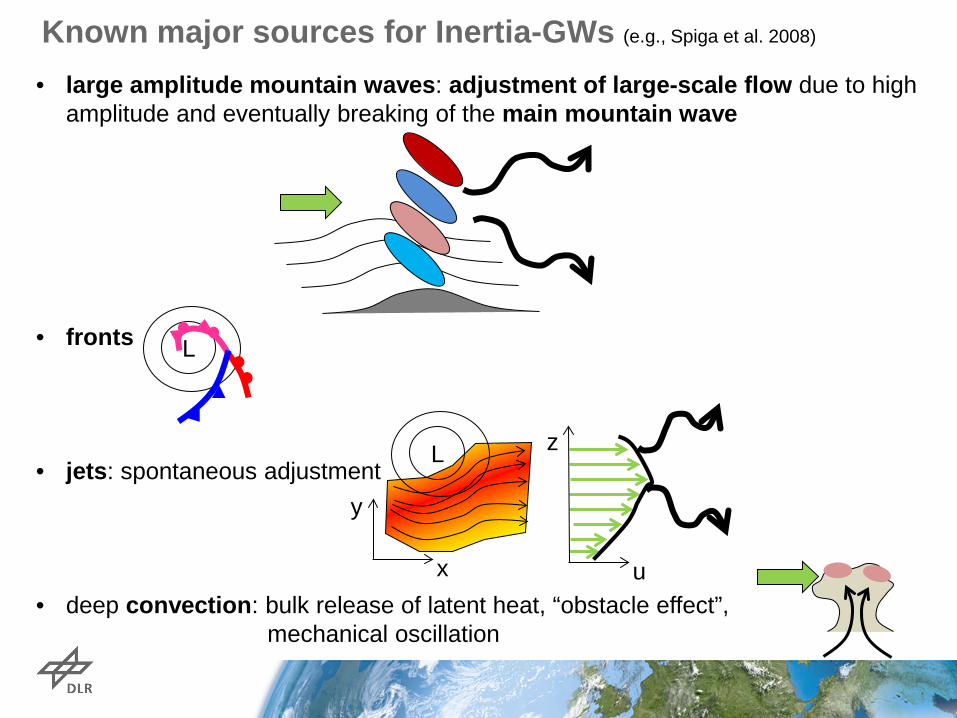
• large amplitude mountain waves: adjustment of large-scale flow due to high amplitude and eventually breaking of the main mountain wave
• fronts
• jets: spontaneous adjustment
• deep convection: bulk release of latent heat, “obstacle effect”, mechanical oscillation
Known major sources for Inertia-GWs (e.g., Spiga et al. 2008)
L
L
x
y
u
z
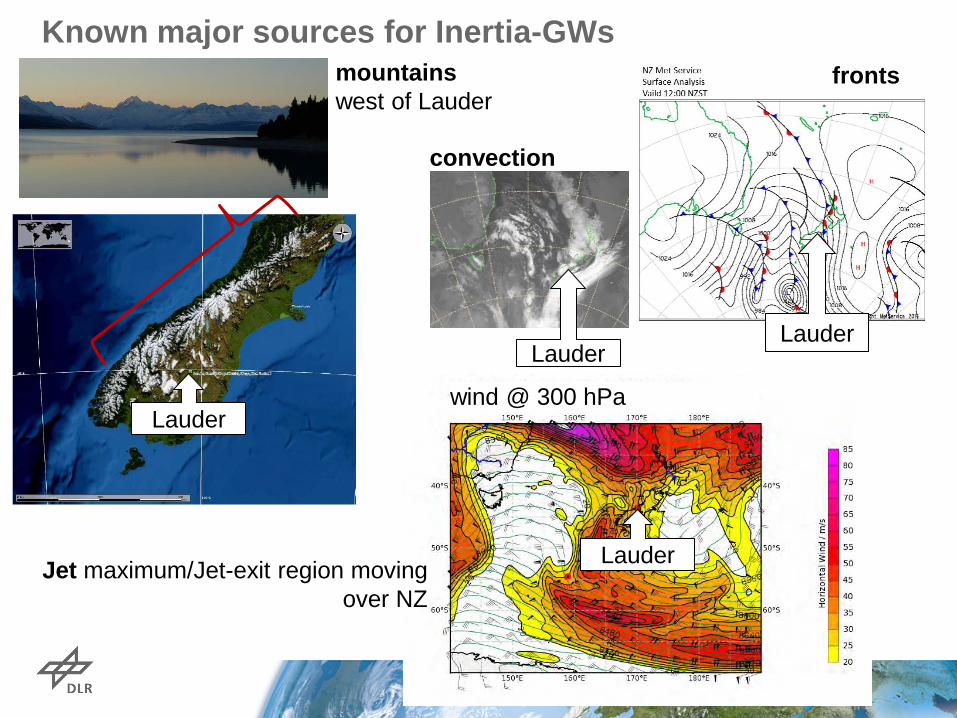
wind @ 300 hPa Lauder
mountains west of Lauder
Jet maximum/Jet-exit region moving over NZ
Known major sources for Inertia-GWs
Lauder
Lauder
fronts
Lauder
convection
Lauder
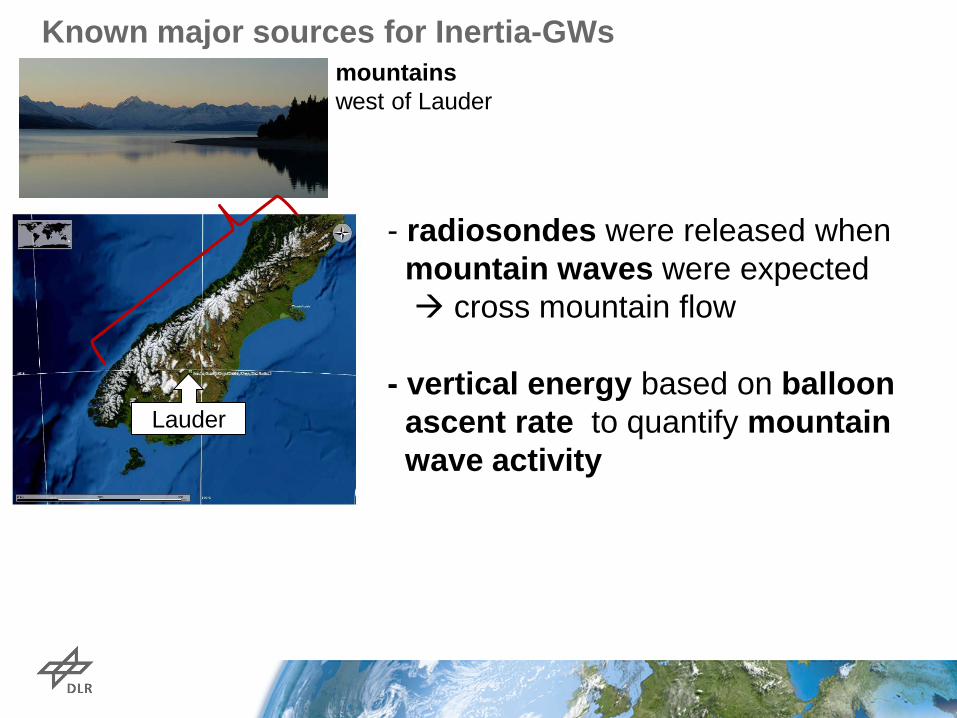
mountains west of Lauder
Known major sources for Inertia-GWs
- radiosondes were released when mountain waves were expected cross mountain flow - vertical energy based on balloon ascent rate to quantify mountain wave activity
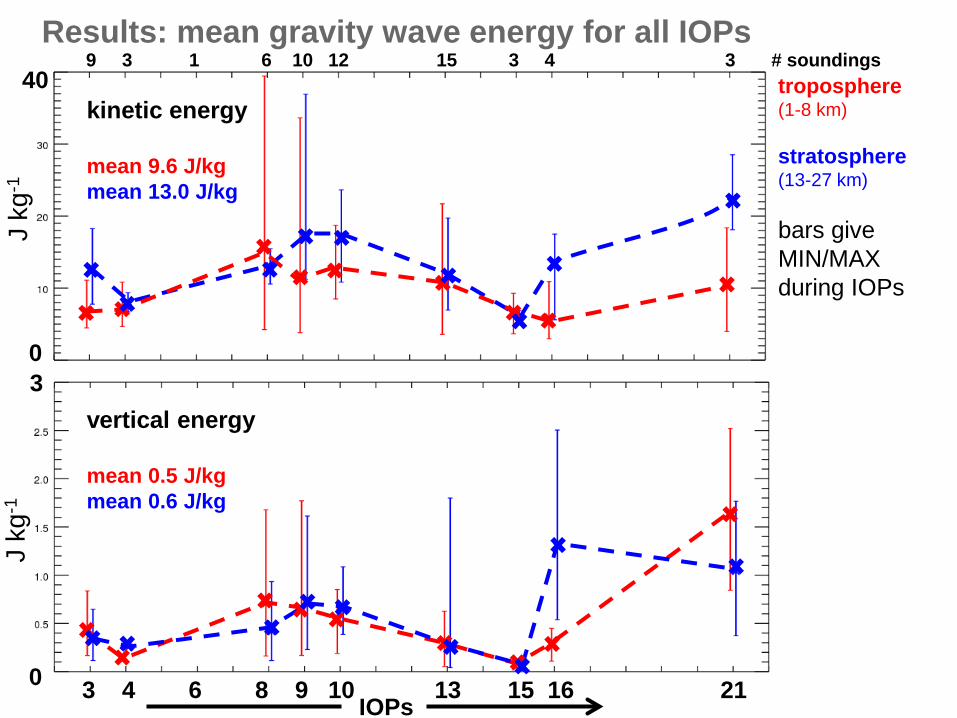
9 3 1 6 10 12 15 3 4 3 # soundings
3 4 6 8 9 10 13 15 16 21
Results: mean gravity wave energy for all IOPs
kinetic energy mean 9.6 J/kg mean 13.0 J/kg vertical energy mean 0.5 J/kg mean 0.6 J/kg
troposphere (1-8 km) stratosphere (13-27 km)
IOPs
J kg
-1
J kg
-1
40
0 3
0
bars give MIN/MAX during IOPs
9 3 1 6 10 12 15 3 4 3 # soundings
3 4 6 8 9 10 13 15 16 21
Results: mean gravity wave energy for all IOPs
kinetic energy mean 9.6 J/kg mean 13.0 J/kg vertical energy mean 0.5 J/kg mean 0.6 J/kg
troposphere (1-8 km) stratosphere (13-27 km)
IOPs
J kg
-1
J kg
-1
40
0 3
0
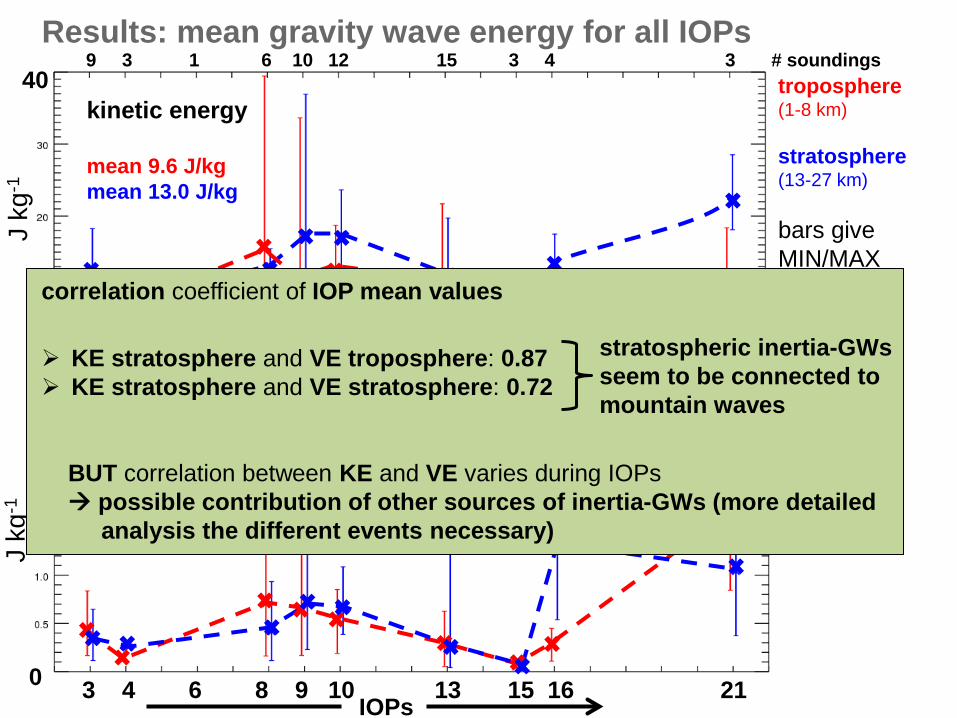
bars give MIN/MAX during IOPs correlation coefficient of IOP mean values
KE stratosphere and VE troposphere: 0.87 KE stratosphere and VE stratosphere: 0.72
BUT correlation between KE and VE varies during IOPs possible contribution of other sources of inertia-GWs (more detailed analysis the different events necessary)
stratospheric inertia-GWs seem to be connected to mountain waves
9 3 1 6 10 12 15 3 4 3 # soundings
3 4 6 8 9 10 13 15 16 21
Results: mean gravity wave energy for all IOPs
kinetic energy mean 9.6 J/kg mean 13.0 J/kg vertical energy mean 0.5 J/kg mean 0.6 J/kg
troposphere (1-8 km) stratosphere (13-27 km)
IOPs
J kg
-1
J kg
-1
40
0 3
0
bars give MIN/MAX during IOPs
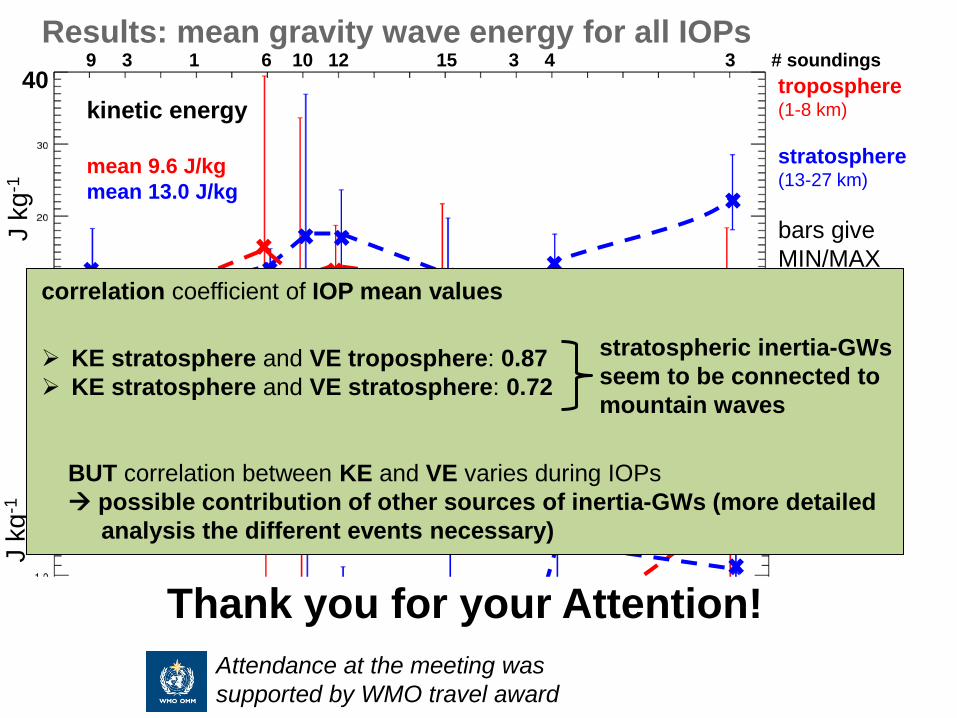
Thank you for your Attention!
Attendance at the meeting was supported by WMO travel award
correlation coefficient of IOP mean values
KE stratosphere and VE troposphere: 0.87 KE stratosphere and VE stratosphere: 0.72
BUT correlation between KE and VE varies during IOPs possible contribution of other sources of inertia-GWs (more detailed analysis the different events necessary)
stratospheric inertia-GWs seem to be connected to mountain waves


![Spin waves in coupled YIG/Co heterostructuresexcitation of exchange spin waves by microwave magnetic fields requires nanolithographically defined microwave an-tennas [11] that have](https://static.fdokument.com/doc/165x107/6068fa3a8fa72b2c5a423f16/spin-waves-in-coupled-yigco-heterostructures-excitation-of-exchange-spin-waves.jpg)