Investigation of the Transport of Lipophilic Drugs in ...
172
Investigation of the Transport of Lipophilic Drugs in Structurally Diverse Lipid Formulations through Caco-2 Cell Monolayer Using Mathematical Modeling Inauguraldissertation zur Erlangung der Würde eines Doktors der Philosophie vorgelegt der Philosophisch-Naturwissenschaftlichen Fakultät der Universität Basel von Marcel Schneider aus Koppigen, Kanton Bern (Schweiz) Basel, 2008
Transcript of Investigation of the Transport of Lipophilic Drugs in ...
Investigation of the Transport of Lipophilic Drugs in
Structurally Diverse Lipid Formulations through Caco-2
Cell Monolayer Using Mathematical Modeling
Inauguraldissertation
zur
Erlangung der Würde eines Doktors der Philosophie
vorgelegt der
Philosophisch-Naturwissenschaftlichen Fakultät
der Universität Basel
von
Marcel Schneider
aus Koppigen, Kanton Bern (Schweiz)
Basel, 2008
Marcel Schneider Page 2 of 172 University of Basel, 2008
Genehmigt von der von der Philosophisch-Naturwissenschaftlichen Fakultät
auf Antrag von
Herrn Prof. Dr. Georgios Imanidis (Fakultätsverantwortlicher und Dissertationsleiter)
Herrn PD Dr. Peter van Hoogevest (Korreferent)
Basel, den 09.12.2008
Prof. Dr. Eberhard Parlow
Dekan
Marcel Schneider Page 3 of 172 University of Basel, 2008
meinen Eltern und Esther
Marcel Schneider Page 4 of 172 University of Basel, 2008
Acknowledgements
Herrn Prof. Dr. Hans Leuenberger danke ich für die Möglichkeit, dass ich meine Dissertation am
Institut für Pharmazeutische Technologie der Universität Basel durchführen konnte.
Bei Prof. Dr. Georgios Imanidis möchte ich mich für die wissenschaftliche Betreuung der vorliegenden
Arbeit bedanken. Er ließ mir die Freiräume, die Arbeit nach meinen Vorstellungen zu gestalten, war
aber auch jederzeit mit interessanten und kritischen Diskussionen eine wertvolle Unterstützung.
Ausserdem möchte ich ihm für den ermöglichten reibungslosen Wechsel an die FHNW danken.
Bedanken möchte ich mich bei PD Dr. Peter van Hoogevest für das Interesse an meiner Arbeit und
die Übernahme des Korreferates.
Sabrina Toscano und Daniela Murer danke ich recht herzlich für das Engagement und die produktive
Zusammenarbeit während Ihrer Masterarbeiten und das mir entgegengebrachte Vertrauen als
Betreuer ihrer Masterarbeiten.
Stefan Winzap danke ich für jegliche technische Unterstützung und für seinen unverzichtbaren Beitrag
zum reibungslosen Ablauf des Institutsalltages, Sonja Reutlinger für ihre immer wieder motivierende
Art und ihre unverzichtbare Unterstützung beim Übertritt ins IPT der FHNW und ihrem Beitrag zum
reibungslosen Ablauf des Institutsalltages.
Weiter möchte ich mich bei meinen Kollegen für die freundliche Atmosphäre und all die Dinge
bedanken, die dazu beitrugen, dass mir meine Zeit am Institut für pharmazeutische Technologie der
Universität Basel und dem Institut Pharma Technology der Fachhochschule Nordwestschweiz in
positiver Erinnerung bleiben wird. Besonders bedanke ich mich bei meinen Laborkollegen /-innen
Susanne Reitbauer, David Blaser, Miriam Reiser und Constantinos Markopopoulos sowie bei allen
beteiligten für die Hilfe in der Durchführung des Studentenpraktikums in flüssig-sterilen Arzneiformen,
im speziellen bei Johannes von Orelli, Heiko Nalenz und Maxim Puchkov.
Ein ganz spezieller Dank geht an „die letzten Mohikaner“ Thomas Meyer, Franziska Müller und Miriam
Reiser
Ganz besonders aber bedanke ich mich bei Esther und meiner Familie für die Geduld
und die unermessliche Unterstützung auf dem Weg zur Promotion
Marcel Schneider Page 5 of 172 University of Basel, 2008
ABBREVIATIONS 10
1 SUMMARY 11
2 INTRODUCTION AND OBJECTIVES 14
2.1 Introduction 14
2.2 Objectives 16
3 THEORETICAL SECTION 18
3.1 Drug Absorption after Oral Application 18
3.2 The Gastro-Intestinal Tract and the Intestinal Epithelium 19
3.3 Mechanisms of Membrane Permeation 20
3.3.1 Passive Transcellular Permeation 21
3.3.2 Paracellular Transport 22
3.3.3 Drug Transporters: Carrier Mediated Influx and Efflux 22
3.3.4 Vesicular Transport 23
3.4 In Vitro Assessment of Drug Permeability: Models 23
3.4.1 Excised Tissue Models 23
3.4.2 Cell Models to Study Drug Absorption 24
3.4.3 In Vitro Models Without Cells 25
3.5 In Vitro Assessment of Drug Permeability: Data Analysis 25
3.6 Effect of Food on Drug Absorption 29
3.7 Absorption Enhancement by Solubility Enhancement for Oral Drug Delivery 29
3.8 Absorption Enhancement with Intestinal Permeation Enhancers 29
3.8.1 Permeation Enhancement by Tight Junction Opening 29
3.8.2 Permeation Enhancement by Inhibition of Efflux Transporters 30
3.8.3 Permeation Enhancement by Influencing the Cell Membrane 30
3.9 Influence of Pharmaceutical Formulations on Gastrointestinal Drug Absorption 31
3.10 Mass Transfer of Lipophilic Compounds Between Lipid Particles or Membrane Vesicles
and Cell Membranes 32
3.11 Choice of Model Compounds 32
3.12 Choice of Model Formulations 34
4 EXPERIMENTAL SECTION 36
4.1 Influence of Structurally Diverse Lipid Containing Drug Formulations on the Transport of
Lipophilic Drugs through Caco-2 Cell Monolayer (Publication Part) 36
4.1.1 Abstract 36
4.1.2 Introduction 36
4.1.3 Material and Methods 39
4.1.3.1 Material 39
4.1.3.2 Cell Culture Procedures 40
4.1.3.3 Drug Quantification 40
4.1.3.4 TEER Measurements 41
4.1.3.5 Drug Permeation Across Caco-2 Cell Monolayers 41
Marcel Schneider Page 6 of 172 University of Basel, 2008
4.1.3.6 Cell Monolayer Drug Extraction 42
4.1.3.7 Drug Extraction out of Transwell Plates 42
4.1.3.8 Production and Characterization of Lipid Containing Drug Dosage Forms 43
4.1.3.8.1 Preparation of Liposomes 43
4.1.3.8.2 Preparation of Emulsions and Microemulsions 43
4.1.3.8.3 Particle Size Measurement 43
4.1.3.9 Equilibrium Dialysis for Free Fraction Determination 44
4.1.3.10 Theoretical Modeling 45
4.1.3.10.1 Mathematical Model for the Determination of Drug Absorption Parameters in
Caco-2 Cell Monolayers Including a Term Describing Drug Partition between Donor,
Acceptor, and Cell Compartment 45
4.1.3.10.2 Delineating the Components of Apparent Permeability Coefficient Based on a
Biophysical Model 50
4.1.3.10.3 Analysis of the Permeation Data 54
4.1.4 Results 55
4.1.4.1 Formulation Characterization 55
4.1.4.2 Cell Permeation of Drugs from Aqueous Solutions and Formulations 57
4.1.4.3 Qualitative Influence of Lipid Phase Concentration on Apparent Permeability
Coefficient 67
4.1.4.4 Quantitative Influence of Free Fraction on Apparent Permeability Coefficient 68
4.1.4.5 Effect of Lipid Containing Drug Formulations on Drug Fluxes 74
4.1.5 Discussion 76
4.1.5.1 Cell Permeation Kinetics 76
4.1.5.2 Influence of Lipid Containing Formulations on Carrier Mediated Efflux 77
4.1.5.3 Influence of Formulation and Free Fraction on Apparent Permeability Coefficient 78
4.1.5.4 Drug Flux: Consequences for In-Vivo Drug Delivery? 81
4.1.6 Conclusions 82
4.1.7 Acknowledgements 83
4.2 Screening of Several Lipophilic Compounds to Find a Poorly Soluble Compound with Low
Membrane Permeability and No Carrier Mediated Efflux 84
4.2.1 Material and Methods 84
4.2.1.1 Material 84
4.2.1.2 Drug Quantification 85
4.2.1.3 TEER Measurements 86
4.2.1.4 Drug Permeation Across Caco-2 Cell Monolayers 86
4.2.1.5 Data Analysis 87
4.2.2 Results and Discussion 88
4.2.3 Conclusion 89
4.3 Screening of Different Emulsions and Microemulsions for their Suitability as Model
Formulation 90
4.3.1 Material 90
Marcel Schneider Page 7 of 172 University of Basel, 2008
4.3.2 Methods 91
4.3.2.1 Preparation of the Formulations 91
4.3.2.2 Particle Size Measurement 91
4.3.2.3 TEER Measurements 91
4.3.2.4 Determination of Transcellular Drug Permeation 91
4.3.2.5 Fluoresceine Quantification 92
4.3.2.6 Data Analysis 92
4.3.3 Results and Discussion 93
4.3.4 Conclusions 94
4.4 Maintaining TEER over Time of the Chosen Formulations: Determination of Duration of
Transport Experiments 96
4.4.1 Material and Methods 96
4.4.1.1 Material 96
4.4.1.2 Preparation of Emulsions and Microemulsions 96
4.4.1.3 TEER Measurements 97
4.4.2 Results 97
4.4.3 Conclusions 98
4.5 Development of a Method to Determine the Free Fraction of a Drug Formulation Containing
Lipids 99
4.5.1 Material and Methods 99
4.5.1.1 Material 99
4.5.1.2 Preparation of Liposomes 99
4.5.1.3 Preparation of Microemulsions 100
4.5.1.4 Particle Size 100
4.5.1.5 Ultrafiltration 100
4.5.1.6 Ultracentrifugation 100
4.5.1.7 Equilibrium Dialysis 100
4.5.1.8 Drug Quantification 101
4.5.2 Results and Discussion 101
4.5.2.1 Ultrafiltration 101
4.5.2.2 Ultracentrifugation 102
4.5.2.3 Equilibrium Dialysis 103
4.5.3 Conclusions 106
4.6 Calculation of the Free Fraction of Progesterone Liposome Formulations 107
4.6.1 Derivation of an Equation for the Calculation of a Partition Coefficient of a Drug Between
Lipid Phase and Water Phase out of Equilibrium Dialysis Experiments 107
4.6.1.1 Results of the Calculated Partition Coefficients 110
4.6.2 Graphical Approach to Assess the Free Fraction of Liposome Formulations 111
4.6.3 Conclusions 112
4.7 Measurements of Cellular Drug Uptake 113
4.7.1 Material and Methods 113
Marcel Schneider Page 8 of 172 University of Basel, 2008
4.7.1.1 Material 113
4.7.1.2 Preparation of the Emulsions 114
4.7.1.3 Measuring the Cellular Uptake to the Cellular Compartment 114
4.7.1.4 Drug Quantification 114
4.7.1.5 Calculation of the Permeability Coefficients 115
4.7.2 Results and Discussion 115
4.7.3 Conclusions 117
4.8 Measurements of Passive Cellular Efflux 118
4.8.1 Material and Methods 118
4.8.1.1 Material 118
4.8.1.2 Preparation of the Formulations 119
4.8.1.3 Determination of Passive Drug Efflux 119
4.8.1.4 Drug Quantification 119
4.8.1.5 Calculation of Permeability Coefficient Delineating Drug Efflux 120
4.8.2 Results and Discussion 120
4.8.3 Conclusions 122
5 CONCLUSIONS AND OUTLOOK 123
5.1 Conclusions 123
5.2 Outlook 125
6 APPENDIX 127
6.1 Determined TEER Values 127
6.1.1 Screening Experiments 127
6.1.2 Microemulsions 127
6.1.3 Emulsions 129
6.1.4 Liposomes 131
6.2 Drug Extraction from Caco-2 Cell Monolayer at the Endpoint of the Transport Experiments
134
6.3 Additional Figures of Qualitative Influence of Lipid Phase Concentration on Apparent
Permeability Coefficient 138
6.4 Determination of Maximal Drug Solubility in Formulation Lipid Phases and Calculation of
Theoretical Maximal Fluxes 141
6.4.1 Methods 141
6.4.2 Results 141
6.5 Determination of Inorganic and Organic Phosphate of the Acceptor Compartment after
Equilibrium Dialysis of a Liposome Formulation 142
6.5.1 Material and Methods 142
6.5.2 Results 142
6.5.3 Conclusions 143
6.6 Detailed Derivations of Used Models and Additional Calculations 144
6.6.1 Detailed Derivation of Delineation of Apparent Permeability Coefficient Based on a
Biophysical Model 144
Marcel Schneider Page 9 of 172 University of Basel, 2008
6.6.2 Subdivision of the Apparent Permeability Coefficient Including Permeation through
Diffusion Boundary Layer and through Cellular Membrane Including Model Extension for Non-
Sink Conditions. 149
6.6.2.1 Fitting the Biophysical Model for the Subdivision of Apparent Permeability
Coefficient Including Permeation through Diffusion Boundary Layer and through Cellular
Membrane to Apparent Permeability Coefficients out of Cell Permeation Experiments 154
6.6.2.2 Model Extension for Non-Sink Conditions of the Subdivision of the Apparent
Permeability Coefficient Including Permeation through Diffusion Boundary Layer and through
Cellular Membrane 154
7 REFERENCES 159
Marcel Schneider Page 10 of 172 University of Basel, 2008
ABBREVIATIONS Å Angstrom
ABC ATP binding cassette
ADME Absorption, Distribution, Metabolism, Elimination of a Drug
ATP Adenosine triphosphate
AUC Area under the curve
BCRP Breast cancer resistance protein
BCS Biopharmaceutics Classification System
D Dalton
D-PBS Dulbecco’s Phosphate Buffered Saline
ER Efflux ratio
HPLC High performance liquid chromatography
HPLC-UV High performance liquid chromatography with UV-Vis absorbance detection
HPLC-MS High performance liquid chromatography with mass spectrometry detection
IAM Immobilized artificial membrane column
KCts/s kilo-counts per second
log D Distribution coefficient (pH dependent ratio of the sum of the concentrations of ionized
plus neutral compound in octanol water system).
log P Partition coefficient (logarithm of the ratio of the concentrations of the un-ionized
solute in octanol water system)
MRP 2 Multi resistance protein 2
Pa Apparent permeability coefficient of the apical membrane
PAMPA Parallel artificial membrane permeation assay
Papp Apparent permeability coefficient of Caco-2 cell monolayer
Pb Apparent permeability coefficient of the basal membrane
PCS Photon Correlation Spectroscopy (dynamic light scattering)
Pgp P-glycoprotein
pKa Acid dissociation constant (equal to −log10 Ka).
TEER Trans epithelial electric resistance
SEDDS Self emulsifying drug delivery system
Marcel Schneider Page 11 of 172 University of Basel, 2008
1 SUMMARY Introduction: To be absorbed from the gastrointestinal tract, a drug has to be sufficiently soluble,
because, with some exceptions, passive diffusion of dissolved drug molecules from high to low drug
concentration is the driving force of drug absorption. Different physicochemical and physiological
properties determine the reasons for poor drug absorption, which are poor water solubility, low
membrane permeability, carrier mediated drug efflux, drug metabolism, and pharmacological
interactions. A successful strategy to improve the oral bioavailability of poorly water soluble drugs in
vivo is the use of lipid containing dosage forms. Lipid formulation can reduce the inherent limitation of
slow and incomplete dissolution of poorly water soluble drugs by facilitating the formation of
solubilized phases containing the drug, from which absorption may occur. Only few commercially
available products on this basis have been approved so far. Reasons for this small number of
approved products may be the limited knowledge about formulation parameters that are responsible
for good in vivo performance because of limited understanding of the underlying mechanisms.
Compared to an aqueous suspension of lipophilic drug, it is generally agreed so far that improved drug
absorption takes place because the drug is solubilized already in a lipid containing dosage form. There
is little information in literature dealing with the effect of lipid containing dosage forms on the passive
permeation. The objective of this thesis was to elucidate mechanisms by which a lipophilic drug that is
contained in a lipid formulation is absorbed by the intestine. For this purpose, a theoretical model and
experimental procedures were developed, using Caco-2 cell monolayer.
Methods: Different formulations were tested as model formulations. Since it is known that several
formulation components may work as permeation enhancers by tight junction modulation,
trans-epithelial electrical resistance (TEER) was used as criteria to test monolayer integrity. As model
formulations phosphatidylcholine liposomes, an emulsion with a lipid phase consisting of 67% (m/m)
triglyceride (Captex 8000), 5% (m/m) mixture of mono- and diglycerides (Capmul MCM), 18% (m/m)
surfactant (Cremophor EL), and 10% (m/m) ethanol, and a microemulsion with a lipid phase consisting
of 35.05% (m/m) Captex 8000, 17.58% (m/m) Capmul MCM, 36.84% (m/m) Cremophor EL, and 10% (m/m)
ethanol were chosen. To determine the influence of these model formulations on the permeation of
lipophilic drugs, different drugs were evaluated as suitable model compounds. Propranolol,
progesterone, saquinavir, and triclabendazole were finally selected. An equilibrium dialysis method to
determine the free fraction of the drugs in the different formulations was developed. The influence of
liposomes, microemulsion, and emulsion on transport processes of the model drugs through Caco-2
monolayer was determined with a bi-directional Caco-2 assay, using purely aqueous drug solutions as
reference. At least three different lipid concentrations for each formulation in the range of 0.1-50 mg/ml
were tested. Within each lipid concentration at least three different drug concentrations were tested
per drug. Apparent passive permeability coefficient of the apical (Pa) and of the basal membrane (Pb),
formulation-to-cell partition coefficient, and carrier mediated apical efflux rate were deduced by fitting a
mathematical model to the experimental concentration data of the bi-directional assay using Easy Fit®
fitting software. Further, a biophysical model was developed to delineate the contribution of drug
transport in the diffusion boundary layer and drug permeation through cell membrane to the
Marcel Schneider Page 12 of 172 University of Basel, 2008
determined apparent permeability coefficient. Additionally, a differentiation was introduced between
permeation of free drug through the cell membrane and permeation following direct drug transfer from
the lipid particles to the membrane upon collision. Drug uptake and passive drug efflux for selected
drugs and formulations were further studied in the Caco-2 cell monolayer.
Results and Discussion: Both, the model for the determination of absorption parameters in Caco-2
cells and the biophysical model for delineating the components of apparent permeability coefficient
explained the experimental data satisfactorily. Generally Pa, Pb, and free fraction decreased with
increasing lipid concentration. Within the same lipid concentration, no influence of drug concentration
on Pa, Pb, and free fraction was determined. Triclabendazole showed lower Pb than Pa whereas
permeability coefficients of all other drugs were equal for both membranes. Carrier mediated apical
drug efflux was found for saquinavir only and its rate, when expressed as zero order, decreased with
increasing lipid concentration and increased with increasing drug concentration. Formulation-to-cell
partition coefficient increased with increasing lipid concentration for all drugs and formulations.
Deduced permeability coefficients of diffusion boundary layer, reflecting drug transport in the apical
and basal solution, was smaller than overall permeability coefficient of cell membrane for all drugs
except saquinavir for which values were comparable. This indicates that the compounds are good
permeable for cell membrane. Permeability coefficient of the drug corresponding to direct mass
transfer from lipid particle to cell membrane (Pm,L) was for progesterone greater than the permeability
coefficient corresponding to permeation of free drug through cell membrane (Pm,d). For triclabendazole
Pm,L was smaller than Pm,d. For saquinavir Pm,L was comparable or smaller than Pm,d. Finally for
propranolol Pm,L was smaller than Pm,d for liposome formulation. For propranolol emulsion and
microemulsion, no interaction of formulation and drug was observed, therefore no meaningful values
were obtained for Pm,L. The rate limiting step of transport and the dominating mechanism of membrane
permeation depend on the corresponding permeability coefficients and the free and lipid bound drug
concentration. These observations apply to all three structurally different lipid formulations used in this
study. Permeability coefficients of drug uptake of progesterone formulations and passive drug efflux of
progesterone and triclabendazole formulations in the Caco-2 monolayer decreased with increasing
lipid concentration, which was consistent with the permeation experiments.
Drug fluxes increased with increasing drug concentration within the same lipid concentration and
decreased with increasing lipid concentration within the same drug concentration. Fluxes of
progesterone in experiments with equal free drug concentration increased with simultaneously
increasing drug and lipid concentration. This was demonstrated with progesterone liposomes and can
be related to the larger Pm,L compared to Pm,d found for this drug.
Conclusions: Lipid formulations containing the drug in a molecular form provide the possibility to
increase the concentration of poorly water soluble drugs in a macroscopically aqueous system.
Apparent drug permeability coefficient for the cell membrane is decreased by these formulations.
Apparent drug permeability coefficient depends on free fraction, whereas drug flux depends on
absolute amount of free drug in water phase. Therefore simultaneous increase of drug and lipid
concentration can provide an undiminished drug flux, which may improve bioavailability by prolonged
Marcel Schneider Page 13 of 172 University of Basel, 2008
intestinal absorption at a sustained rate. These findings are independent of the composition and the
structure of the lipid formulation lending support to the universal nature of this conclusion. In addition
flux can be further increased by direct drug transfer from lipid particle to cellular membrane. This was
observed for only one drug in the present work. The necessary drug properties for this direct transfer
to take place should be investigated in the future. The results of this work shed light into the
mechanism of drug absorption from lipid formulations and demonstrate potential beneficial effects of
these formulations on absorption of lipophilic drugs in vivo. They may be used for the development of
efficient oral dosage forms to improve bioavailability for these drugs.
Marcel Schneider Page 14 of 172 University of Basel, 2008
2 INTRODUCTION AND OBJECTIVES
2.1 Introduction
After oral drug administration, which is the most accepted route for drug administration, a drug has to
overcome several obstacles to reach the site of its pharmacological action. The drug has to be
absorbed from the gut lumen to the blood stream which is the most important prerequisite for a
compound to act as drug. The unchanged amount of absorbed drug determines the bioavailability and
the systemic exposure of the body to the drug. Many in vitro highly active compounds, generated by
modern drug discovery strategies, possess unfavorable biopharmaceutical properties including poor
oral absorption, caused by poor solubility or low intestinal wall permeability. A general drug
classification of the impact of drug solubility and membrane permeability on drug absorption has been
done by the framework of the biopharmaceutics classification system (BCS) (1, 2). Different
physiological properties determine the reasons for poor drug absorption such as carrier mediated drug
efflux, drug metabolism, and pharmacological interactions. The most important cause for low
permeability is the inability of the molecule itself to cross a biological barrier by passive diffusion.
Several physicochemical properties are influencing the ability to cross biological barriers which are
lipophilicity, molecular weight, hydrogen bonding capacity, and charge (3-6). Lipinski’s “rule of five”
assesses on the basis of these properties the ability of a drug to be absorbed after oral administration
(7).
An increasing number of drugs have been identified to be subject of carrier mediated efflux which is
limiting the trans-membrane permeability and finally oral bioavailability. Carrier mediated efflux is
caused by proteins located in the apical cell membrane by pumping back drug molecules from the
cellular lumen to the intestinal lumen. These efflux pumps have a broad substrate specifity which is a
powerful mechanism to prevent the body from the uptake of toxic alimentary ingredients and,
unfortunately, from the oral absorption of many drugs (8). Most important efflux transporters for drugs
belong to the ATP-binding cassette (ABC) family, e.g. P-glycoprotein (Pgp), breast cancer resistance
protein (BCRP) and MRP2 (9-13).
Drug metabolism may affect oral bioavailability by an extensive first pass metabolism of both, the
intestinal epithelium and the liver. Drug metabolism is divided into phase I metabolism that includes
degradation of the drug molecule by oxidative reactions catalyzed by enzymes, e.g. Cytochrome
P450, and phase II metabolism that includes conjugation of the drug or its phase I metabolite with
hydrophilic moieties such as glucuronic acid or sulfate (14-19). Because of a large pH-range from 1.5
to 7.4 in the intestinal tract, orally administered drugs may further undergo chemical degradation,
which is limiting oral bioavailability too.
The water solubility of poorly water soluble drugs strongly influences absorption and oral
bioavailability. It is generally agreed that one of the preconditions for diffusion through a biological
membrane is dissolution of the compound in the occurring media. Consequently, water solubility of a
compound is one of the most important parameters affecting drug absorption. If the solubility of poorly
water soluble drugs is increased, an increase in absorption is observed (2, 20, 21). Several strategies
have been developed to increase solubility of poorly water soluble compounds such as chemical
Marcel Schneider Page 15 of 172 University of Basel, 2008
modification, use of salts of ionizable compounds, use of cosolvents, use of surfactants and the use of
complexing agents like cyclodextrins. Another strategy is the formulation of poorly water soluble drugs
with lipid containing formulations such as self emulsifying drug delivery systems (SEDDS). This
strategy has been used successfully to improve the oral bioavailability of some drugs deemed to be
hardly deliverable, like cyclosporine A, saquinavir or indinavir (22-28). Only a small number of
approved oral lipid formulations are commercially available. Reasons for this small number may be the
limited knowledge about formulation parameters that are responsible for good in vivo performance
because of limited understanding of the underlying mechanisms. It is generally agreed so far that lipid
formulation can reduce the inherent limitation of slow and incomplete dissolution of poorly water
soluble drugs by facilitating the formation of solubilized phases containing the drug from which
absorption may occur. The underlying molecular mechanisms besides the solubility enhancement and
the possibility of direct lymphatic uptake of these lipid containing systems in vivo are rarely known (29,
30).
Many in situ and in vitro models of different levels of complexity and sophistication have been
developed to assess and predict the absorption and permeation properties of compounds at different
administration sites of the body (31). One of the best characterized and most used model to study
drug absorption in the gastrointestinal tract is the Caco-2 cell model. The cells of human colon
adenocarcinoma cell line Caco-2 spontaneously differentiate into enterocyte like cells. Seeded on
semipermeable filter supports, a cell monolayer expressing a number of active transport proteins
results, which permits to investigate simultaneously different absorption mechanisms e.g. passive
diffusion and active carrier mediated efflux (32, 33). The Caco-2 model is a useful tool for a
mechanistically understanding of drug absorption, which results in an increasing knowledge of the
different mechanisms that are part of drug absorption (34).
Like all in vitro models the Caco-2 model has some disadvantages. Caco-2 cells require under
standard culture conditions usually three weeks culture on filters before they can be used for drug
permeation experiments. Because of their nature as tumor cells, Caco-2 cells may possess different
expression levels of transporters and metabolic enzymes and may undergo spontaneous
mutagenesis. Inter-laboratory variability and variation of morphological and biochemical properties
depending on used passage numbers and culturing conditions are often encountered problems.
Standardized cell culture conditions (media, seeding density), the use of established marker
compounds, and the use of a predefined small number of passages may help to lower often reported
differences of permeability measurements of selected compound for different labs (35-39).
The commonly used approach to assess cell permeability of drugs by the calculation of apparent
permeability coefficient Papp possesses some limitations: The cell monolayer is modeled as a single
rate limiting barrier, without taking into account the influence of a diffusion boundary layer on
permeability of highly permeable compounds. This method is not sensitive to mass balance problems
such as metabolism, cellular accumulation or nonspecific binding to the device surfaces, and drug
stability, because it depends on the total mass transported to the receiver relative to initial mass. The
use of this approach still requires the establishment of the linear phase of absorption because the
method describes just the initial drug transport under sink conditions. Active apical efflux substrates
are identified by comparison of the drug permeability coefficient from apical to basal compartment with
Marcel Schneider Page 16 of 172 University of Basel, 2008
the drug permeability coefficient from basal to apical compartment, forming the efflux ratio (ER) and by
performing transport experiments with inhibition of the carrier (40). To overcome unspecific adsorption
of highly lipophilic drug molecules to the plastic made surface and to maintain sink conditions additives
like albumin were commonly used, sometimes without taking into account a possible influence of
these additives to drug permeation (41-43).
Few attempts have been undertaken to investigate complex drug formulations with the Caco-2
models, most of them by searching more physiologically relevant media. Most of these experiments
were focusing on cell viability and qualitative effects of the tested formulation on various model drugs
(44-53). Little systematical work on the quantitative interactions of lipid containing drug formulations on
cellular drug permeation has been published so far.
2.2 Objectives
Because the mechanism of lipid formulations on drug absorption is not clear, in particular the pathway
by which the drug that is contained in lipid particles is taken up by epithelial cells has been debated in
literature.
The objective of this thesis was to elucidate mechanisms by which a lipophilic drug that is contained in
a lipid formulation is absorbed by the intestine. For this purpose, a methodology for determining
unbiased parameters in in-vitro cell culture models describing the absorption of lipid containing
formulations of poorly soluble drugs in the Caco-2 system was developed. A mathematical model had
to be developed and evaluated, describing the processes involved in this system. The aim was to
provide a tool to investigate the influence of lipid containing drug formulations on drug permeation
through the Caco-2 cell monolayers grown on permeable filter supports in Transwell plates. This
methodology consisting of a mathematical model and an appropriate experimental design was
developed to provide parameters that delineate passive, carrier mediated, and formulation induced
effects on drug permeation and allows the study of different lipid containing drug formulations. It
should be able to quantify the contribution of different transport parameters to the epithelial
permeation. The model included additionally a partition coefficient describing drug partition of the
formulation to the cell and should be used for the quantitative analysis of model compound bi-
directional permeation through Caco-2 cell monolayer. Suitable lipophilic model drugs had to be found
exhibiting different properties with respect to solubility and permeability. Model compounds with the
following properties were identified: High permeability and high solubility (propranolol), high
permeability and low solubility (progesterone), low solubility and low permeability (triclabendazole),
low permeability, low solubility, and subject to carrier mediated efflux (saquinavir).
Different lipid containing drug formulations were investigated which had different properties concerning
the nature of particles. It was of high importance to use formulations of simple composition out of
components that are known to be compatible with the Caco-2 cell model. The used model
formulations were liposomes, a microemulsion and an emulsion. The formulations were characterized
for optical aspect, particle size and free fraction. Concerning free fraction, a reliable method had to be
developed for the quantification of the free fraction of structurally different lipid containing dosage
forms, which was equilibrium dialysis.
Marcel Schneider Page 17 of 172 University of Basel, 2008
The final benefit of this work is to gain fundamental knowledge about the influence of lipid containing
formulations on drug absorption by understanding the mechanism. The result of this work may be
used for the development of efficient oral dosage forms to improve bioavailability of poorly water
soluble drugs.
Marcel Schneider Page 18 of 172 University of Basel, 2008
3 THEORETICAL SECTION
3.1 Drug Absorption after Oral Application
The oral delivery of drugs is the most accepted administration of drugs for patients. Orally
administered drug formulations are preferred to their non-invasive alternatives like dermal or
pulmonary delivery for different reasons. A tablet or capsule is very suitable for self medication and
compliance; it can easily be swallowed and transported. For the industry, the low production costs,
established formulation strategies and long shelf life are important issues.
To ensure an efficient oral delivery, a drug has to be suitable for oral administration. Several criteria
have to be met. Due to the enormous pH-range of the gastrointestinal tract from 1.5 in the stomach up
to 7-8 in the intestine, a drug has to resist to these conditions. Furthermore, a drug has to resist to
high enzymatic activity, specially degradation and metabolism. To be absorbed from the
gastrointestinal tract, a drug has to be sufficient soluble, because, with some exceptions, passive
diffusion from high to low drug concentration of dissolved drug molecules is the driving force of drug
absorption. Drug absorption is generally defined as the process by which unchanged drug proceeds
from site of administration to site of measurement within the body (54). Consequently, this means that
an orally administered drug has to be able to permeate sufficiently through the gastrointestinal
epithelium to reach its active site.
A huge number of potentially new chemical entities have been generated since the introduction of
modern drug discovery strategies like combinatorial chemistry and high throughput screening.
Resulting compounds of these strategies are often more lipophilic, less soluble, and have a higher
molecular weight than traditionally synthesized compounds. A lot of these in vitro highly active
compounds possess unfavorable biopharmaceutical properties, which can lead to termination of the
clinical development. If the drug development is stopped in an early clinical phase, because the
candidate has a low oral bioavailability, an enormous financial effort was spent. One effort to improve
properties of potential drug candidates was the introduction of the “Rule of 5” which defines a range of
certain properties that a compound has to possess to be absorbed in gastrointestinal tract to achieve
good oral bioavailability (7). Oral bioavailability is defined as the fraction of an oral dose reaching the
systemic circulation (55).
A growing effort to predict the oral bioavailability at an early development stage is spent. Ideally, the
bioavailability may be predicted out of the chemical structure of the compound. The most important
predictive properties of a drug for the determination of the absorption are considered to be solubility
and permeability. While a lot of strategies are available to increase the solubility of a drug, limited
options to increase the membrane permeability are available. It is of enormous importance to assess
the solubility and permeability of a new potential compound as early as possible during the
development, to secure that the new compound achieves good solubility and good membrane
permeability.
In recent years, the biopharmaceutics classification system (BCS) was proposed, established, and
many commercial available drugs have been classified according to this system (1, 2). It classifies
Marcel Schneider Page 19 of 172 University of Basel, 2008
drugs into four different classes according to their solubility and permeability. This theoretical
classification enables an estimation of oral absorption if conclusive data are available. The BCS
classifies compounds into 4 classes: Class I contains compounds with good solubility and high
permeability, class II contains compounds with low solubility and high permeability, class III contains
compounds with high solubility and low permeability, and class IV contains compounds with low
solubility and low permeability (2). According to the BCS classification, a drug is highly soluble if the
highest oral dose strength is soluble in 250 ml or less of aqueous media over a pH range of 1-7.5. A
drug is highly permeable if the extent of absorption is determined 90% or more of the administered
dose in vivo (2, 56).
Aqueous solubility of a drug is an important physicochemical parameter that has a significant role in
various physical and biological processes. According to the simplest definition, the solubility of a drug
is the maximum amount of the most stable crystalline form, which is molecularly dispersed in a solvent
in equilibrium, in a given volume at a given temperature and pressure. Inadequate solubility of a drug
results in incomplete and slow oral absorption in vivo. Through the various phases of discovery and
development of a drug, solubility information serves a wide range of needs: At an early stage of
development, solubility is an important parameter to decide that a compound is soluble enough to be
used in activity screenings. Later, solubility data is extensively used to assess absorption of the drug
and in formulation development for early and late clinical phases (20). Strategies to improve the
solubility and the permeability of a drug will be discussed later in this section.
3.2 The Gastro-Intestinal Tract and the Intestinal Epithelium
After swallowing, an oral dosage form enters the stomach. The acidic environment of pH 1-2 in fasted
state and 3-4 in fed state degrades bacteria as well as some drugs (57). A drug solution, drug
suspension, or an intact dosage form enters then the duodenum and the small intestine, which are the
main intestinal segments for absorption. The gastrointestinal tract is geometrically idealized a tube,
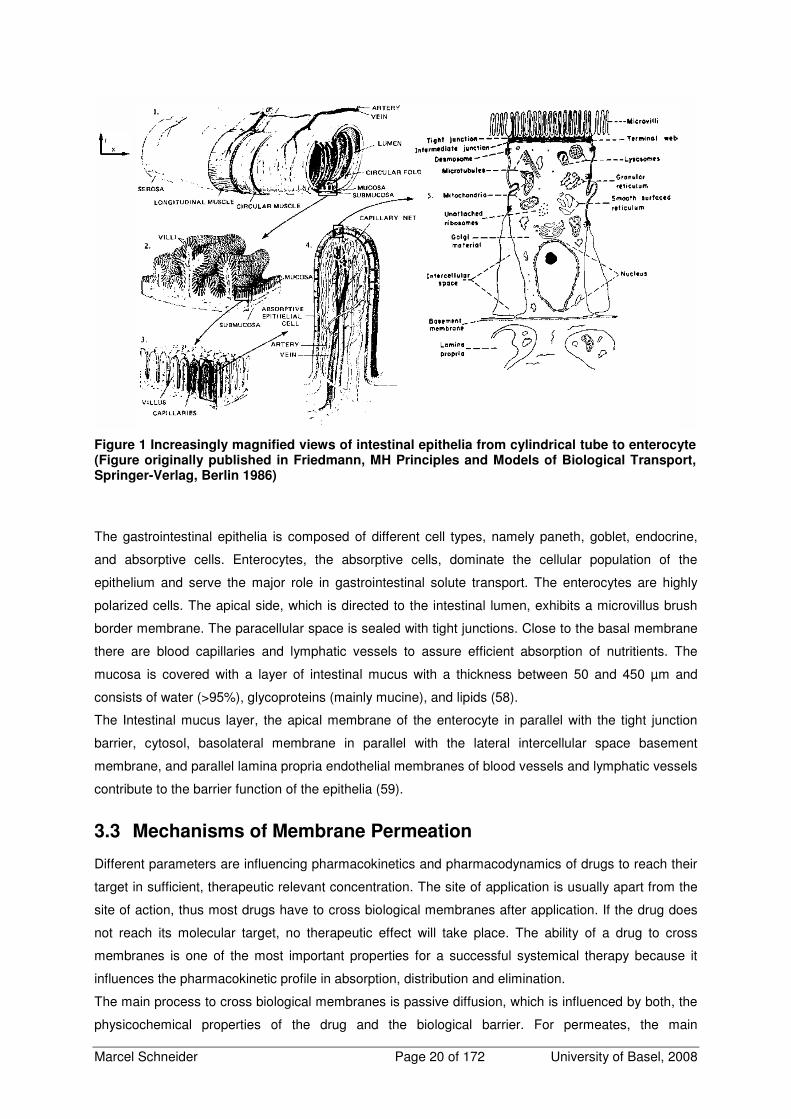
covered with epithelia. In the duodenum and the small intestine, a macroscopic mucosal surface area
magnification including circular folds, villi, and a microscopic surface area with brush border on the
apical membrane, ensures a huge surface (around 200 m2) for absorption (see Figure 1). The mucosal
membrane of the intestinal epithelial cells is regarded as the primary permeability barrier to drug
absorption from oral administration. Epithelial tissues generally demarcate body entry points like skin,
respiratory and gastrointestinal epithelia, predisposing a general barrier function. The gastrointestinal
epithelia serve special function promoting efficient nutrient digestion and absorption. This dual
absorption-protection function of the epithelia requires an efficient strategy to attenuate the entry of
noxious solutes.
Marcel Schneider Page 20 of 172 University of Basel, 2008
The gastrointestinal epithelia is composed of different cell types, namely paneth, goblet, endocrine,
and absorptive cells. Enterocytes, the absorptive cells, dominate the cellular population of the
epithelium and serve the major role in gastrointestinal solute transport. The enterocytes are highly
polarized cells. The apical side, which is directed to the intestinal lumen, exhibits a microvillus brush
border membrane. The paracellular space is sealed with tight junctions. Close to the basal membrane
there are blood capillaries and lymphatic vessels to assure efficient absorption of nutritients. The
mucosa is covered with a layer of intestinal mucus with a thickness between 50 and 450 µm and
consists of water (>95%), glycoproteins (mainly mucine), and lipids (58).
The Intestinal mucus layer, the apical membrane of the enterocyte in parallel with the tight junction
barrier, cytosol, basolateral membrane in parallel with the lateral intercellular space basement
membrane, and parallel lamina propria endothelial membranes of blood vessels and lymphatic vessels
contribute to the barrier function of the epithelia (59).
3.3 Mechanisms of Membrane Permeation
Different parameters are influencing pharmacokinetics and pharmacodynamics of drugs to reach their
target in sufficient, therapeutic relevant concentration. The site of application is usually apart from the
site of action, thus most drugs have to cross biological membranes after application. If the drug does
not reach its molecular target, no therapeutic effect will take place. The ability of a drug to cross
membranes is one of the most important properties for a successful systemical therapy because it
influences the pharmacokinetic profile in absorption, distribution and elimination.
The main process to cross biological membranes is passive diffusion, which is influenced by both, the
physicochemical properties of the drug and the biological barrier. For permeates, the main
Figure 1 Increasingly magnified views of intestinal epithelia from cylindrical tube to enterocyte (Figure originally published in Friedmann, MH Principles and Models of Biological Transport, Springer-Verlag, Berlin 1986)
Marcel Schneider Page 21 of 172 University of Basel, 2008
physicochemical properties influencing the permeation through membranes are lipophilicity, molecular
weight, size, hydrogen-bonding capacity, and charge. The presence of water pores, the lipophilic
manner of the bilayer, and the membrane surface area are considered to be important factors
influencing membrane transport. The transport through a biological barrier, e.g. the gastrointestinal
epithelium, can be divided into passive transport through the cellular membrane (passive transcellular
permeation), passive transport through tight junctions (paracellular transport) and active transport
processes (carrier or vesicle mediated) (3, 60). These different mechanisms will be discussed in the
next chapters.
3.3.1 Passive Transcellular Permeation
Our current understanding of the structure of biological membranes, consisting of a lipid-double-layer,
is the fluid-mosaic model (61). The double layer structure is a result of the orientation of amphoteric
lipids in aqueous medium. The double layer consists of phospholipids, glycolipids, and cholesterol.
Major membrane constituents are different amphiphilic phospholipids. Phospholipids consist of a
glycerol backbone, two fatty acids and a phosphorylated alcohol. Typical chain length of the fatty acids
are 14-18 carbon atoms. Most important phospholipids are phosphatidylcholine, phosphatidylserine,
and phosphatidylethanolamine. The double layer structure with a lipophilic core and a polar surface is
highly flexible and allows its constituents lateral and transversal movements (3). Inner and outer leaflet
of cellular membranes are differently composed. Additionally, there are many different proteins
embedded in the membrane performing different functions. A cellular membrane is 7-8 nm thick and is
permeable for neutral and lipophilic compounds and water. Ions are not able to pass the phospholipid
barrier. Special trans-membranal proteins form selective ion channels. Membrane composition varies
depending on tissue type and location.
The fluid mosaic model was further developed by the lipid raft hypothesis. Lipid rafts are membrane
microdomains enriched in cholesterol and sphingolipids. These extremely small rafts are formed by
highly dynamic clustering of sphingolipids and cholesterol and involve interactions of both proteins and
lipids (62). The rafts have been implicated in processes as diverse as signal transduction,
endocytosis, cholesterol trafficking, and altering of function of trans-membranal proteins. A lot of
papers dealing with rafts were published but there is still skepticism about the real nature of existence
and their functions. More work is still needed to confirm or neglect the raft hypothesis (63).
The passive transcellular transport can be divided into several steps. The partitioning of the permeant
into the apical monolayer is considered to be the first step, followed by either partitioning and diffusion
through the cytoplasm following partition into the basolateral membrane or translateral diffusion inside
of the lipophilic core of the cell membrane. The resulting pathway is depending on the
physicochemical properties of the permeate, as translateral diffusion is expected mainly for highly
lipophilic molecules. After reaching basolateral membrane, the permeate partitions out of the
membrane to the basolateral space. Diffusion to the membrane surface and through the cytoplasm are
fast processes, whereas the rate of passive transcellular permeability is mainly determined by the
transport across the cell membrane. Passive permeation depends to a large extent on three
interdependent physicochemical properties, which were lipophilicity (independent of pKa: log P,
dependent of pKa: log D), polarity (charge, hydrogen bonding), and molecular size of the permeant (3,
Marcel Schneider Page 22 of 172 University of Basel, 2008
60). Gastrointestinal epithelial cells are polarized. The apical surface borders to the intestinal lumen
and is covered with microvilli and the brush border, while basolateral plasma membrane faces the
basal lamina and underlying tissue. To maintain an optimal physiological function, the two membranes
are different in their protein and lipid compositions. The basolateral membrane is enriched e.g. in
sphingomyelin and phosphatidylcholine (64, 65). Consequently, the membrane permeability coefficient
of a compound may be different through apical and basolateral membrane.
3.3.2 Paracellular Transport
The passive paracellular pathway is an aqueous, extracellular route across the epithelium. The driving
forces are the electrochemical potential gradients derived from differences in concentration, electrical
potential, and hydrostatic pressure between the two sides of the epithelium. The main barrier to
passive paracellular diffusion is the tight junction (66). The tight junction is an intracellular junctional
structure that mediates adhesion between epithelial cells and is required for epithelial cell function.
Tight junctions control paracellular permeability across epithelial cell sheets (67). The dimension of the
paracellular space in tissues is between 10 and 30-50 Å suggesting that molecules with a molecular
radius exceeding 15 Å (ca. 3.5 kD) will be excluded from this uptake route (68). The available pores of
epithelial tissues, where cells are connected to each other by tight junctions are smaller. The
calculated pore radii of the human intestinal tract tight junctions are 6-8 Å in jejunum, 2.9-3.8 Å in
ileum, and less than 2.3 Å in colon (69). The pore radius of Caco-2 monolayer was determined to be
12 Å (59). The paracellular pathway is the preferred pathway of larger hydrophilic compounds and
ions. The total contribution of the paracellular pathway to general drug transport is very low because of
the low surface fraction of the pores to the total surface. The cell membrane surface is more than 1000
times larger than the paracellular surface area (70).
3.3.3 Drug Transporters: Carrier Mediated Influx and Efflux
The small intestinal mucosa expresses large numbers of absorption transporters responsible for
absorption of nutritients and vitamins. In addition to their physiological function, these transporters
have shown to mediate the absorption of some drugs, e.g. transporters for di- and tripeptides, amino
acids, bile acids, nucleosides, and monocarboxylic acids. These influx transporters can increase the
drug absorption by binding dissolved compounds from intestinal fluid and transport them through the
epithelial membrane. Compounds that are substrates of these transporters exhibit intestinal absorption
higher than expected from their diffusion across cell membranes.
In contrast to absorption transporters, efflux transporters can have the opposite effect by transporting
compounds from the cell lumen or the inner membrane leaflet to the intestinal lumen. This process is
called apical efflux and is mediated by transporters that belong to the ATP binding cassette (ABC)
superfamily. P-glycoprotein (Pgp) is the most studied member of the apical efflux transporters and is
the product of the MDR1 gene. Pgp has 2 subunits with 6 trans-membrane domains and two ATP
binding sites. It is located on the apical cell membrane of enterocytes and also expressed in other
tissues (66). Pgp was one of the first transporters that have been identified to be involved in the efflux
of drugs. It has broad substrate specificity and transports a lot of structurally diverse drugs (12).
Marcel Schneider Page 23 of 172 University of Basel, 2008
All of these described mechanisms and examples of transporters have in common, that carrier
mediated transport can be directed against a concentration gradient, is energy dependent, and
undergoes saturable transport kinetics. A saturable transport undergoes an increased passive
transported fraction with increased dose. If the drug has a low permeability, a decreased fraction
absorbed results (70).
3.3.4 Vesicular Transport
The vesicular transport process starts when the plasma membrane forms invaginations that pinch off
and form small vesicles that migrate from the cell membrane inwards to the cellular lumen. These
vesicles fuse with endosomes and if they undergo fusion with the basolateral side of the cell
membrane followed by release of the vesicle lumen to the basolateral space the process is called
transcytosis (66). This route is less attractive for drug transport, because of its low capacity, but it is an
interesting transport pathway for large and highly potent molecules. In gastrointestinal tract
transcytosis of macromolecules is mainly performed by M-cells that are overlying the lymphoid tissue
in gastrointestinal tract (70).
3.4 In Vitro Assessment of Drug Permeability: Models
In vivo drug absorption in animals is generally a good predictor for human absorption, but with the
increasing number of potential drug candidates resulting out of modern lead finding strategies, in vivo
models are too complex and too inefficient to screen a large number of compounds. Due to the
hazardous potential of unknown compounds, ethical concerns, complexity of the analytical methods,
and the time and work intensive nature of the experiments are disadvantages of in vivo experiments.
For an efficient strategy to test compounds of ADME properties, fast and easy in vitro models are of
growing importance to the pharmaceutical research. The following section gives a brief overview over
in vitro methods used in drug discovery.
3.4.1 Excised Tissue Models
Excised tissue models have been extensively used to study drug absorption. They have the big
advantage that the architecture of the tissue is obtained. One of the common tissue models is the use
of perfused intestinal segments. The isolated segment comprises the absorptive cells and the
underlying muscle layers. Sampling is done only on the mucosal side which implies that drug
disappearance is assumed to be equal to the drug absorption. Efflux, metabolism and accumulation in
the tissue could lead to a wrong estimation of absorption. Because of physiological differences of
intestinal segments, the number of intestinal segments obtained from one animal are limited.
Additionally, the viability of a segment is limited. This technique is not suitable for a screening tool but
may be useful in the evaluation of complex drug formulations (71, 72).
Another common tissue model is the everted sac model. A piece of intestine is inverted and the ends
are tied. After filling the segment with buffer, the sac is placed in a solution of the test compound and
samples are taken inside and outside of the sac. It suffers from similar problems as the perfused
intestinal segments model (73, 74).
Marcel Schneider Page 24 of 172 University of Basel, 2008
Diffusion cells with intestinal mucosa without muscle layer as barrier between the two compartments is
used too. It allows the determination of transport polarity and the study of drug absorption within
different intestinal segments. The complexity of this technique, specially the preparation of mucosa, is
a big disadvantage compared with modern cell models (66, 72).
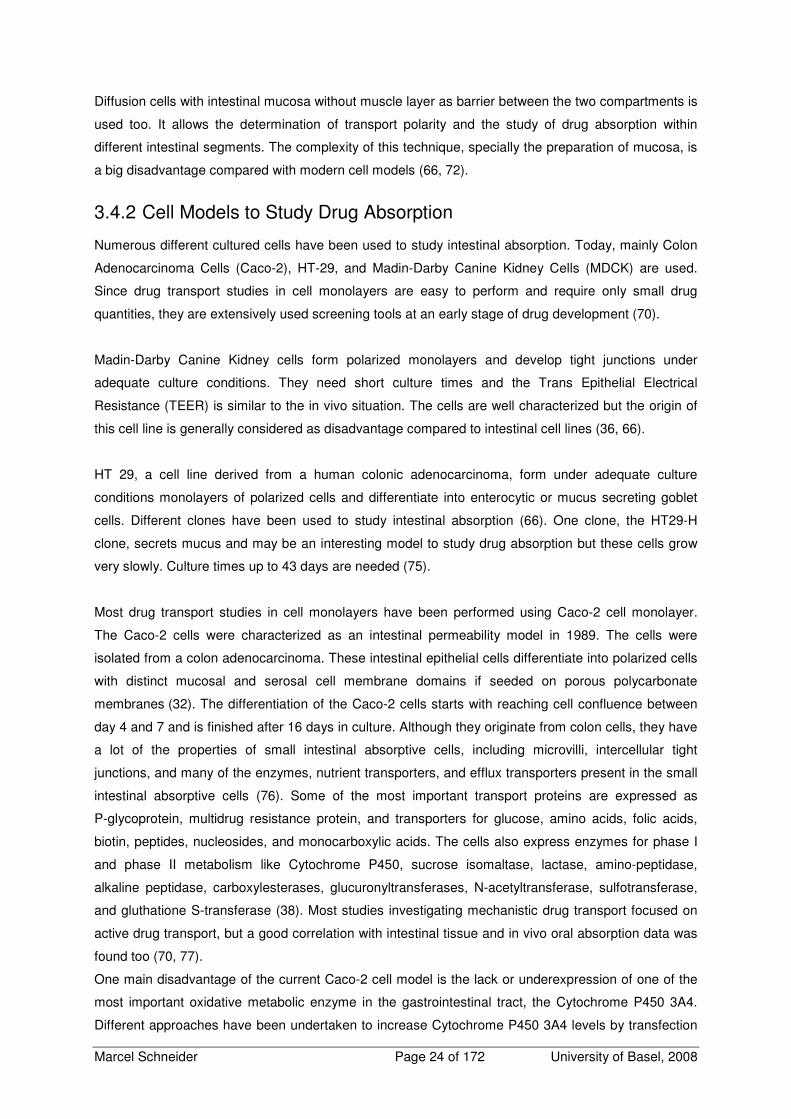
3.4.2 Cell Models to Study Drug Absorption
Numerous different cultured cells have been used to study intestinal absorption. Today, mainly Colon
Adenocarcinoma Cells (Caco-2), HT-29, and Madin-Darby Canine Kidney Cells (MDCK) are used.
Since drug transport studies in cell monolayers are easy to perform and require only small drug
quantities, they are extensively used screening tools at an early stage of drug development (70).
Madin-Darby Canine Kidney cells form polarized monolayers and develop tight junctions under
adequate culture conditions. They need short culture times and the Trans Epithelial Electrical
Resistance (TEER) is similar to the in vivo situation. The cells are well characterized but the origin of
this cell line is generally considered as disadvantage compared to intestinal cell lines (36, 66).
HT 29, a cell line derived from a human colonic adenocarcinoma, form under adequate culture
conditions monolayers of polarized cells and differentiate into enterocytic or mucus secreting goblet
cells. Different clones have been used to study intestinal absorption (66). One clone, the HT29-H
clone, secrets mucus and may be an interesting model to study drug absorption but these cells grow
very slowly. Culture times up to 43 days are needed (75).
Most drug transport studies in cell monolayers have been performed using Caco-2 cell monolayer.
The Caco-2 cells were characterized as an intestinal permeability model in 1989. The cells were
isolated from a colon adenocarcinoma. These intestinal epithelial cells differentiate into polarized cells
with distinct mucosal and serosal cell membrane domains if seeded on porous polycarbonate
membranes (32). The differentiation of the Caco-2 cells starts with reaching cell confluence between
day 4 and 7 and is finished after 16 days in culture. Although they originate from colon cells, they have
a lot of the properties of small intestinal absorptive cells, including microvilli, intercellular tight
junctions, and many of the enzymes, nutrient transporters, and efflux transporters present in the small
intestinal absorptive cells (76). Some of the most important transport proteins are expressed as
P-glycoprotein, multidrug resistance protein, and transporters for glucose, amino acids, folic acids,
biotin, peptides, nucleosides, and monocarboxylic acids. The cells also express enzymes for phase I
and phase II metabolism like Cytochrome P450, sucrose isomaltase, lactase, amino-peptidase,
alkaline peptidase, carboxylesterases, glucuronyltransferases, N-acetyltransferase, sulfotransferase,
and gluthatione S-transferase (38). Most studies investigating mechanistic drug transport focused on
active drug transport, but a good correlation with intestinal tissue and in vivo oral absorption data was
found too (70, 77).
One main disadvantage of the current Caco-2 cell model is the lack or underexpression of one of the
most important oxidative metabolic enzyme in the gastrointestinal tract, the Cytochrome P450 3A4.
Different approaches have been undertaken to increase Cytochrome P450 3A4 levels by transfection
Marcel Schneider Page 25 of 172 University of Basel, 2008
or change of culture conditions (78, 79). Because of their nature as tumor cells, Caco-2 cells may
possess different expression levels of transporters and metabolic enzymes and may undergo
spontaneous mutagenesis. Morphological and biochemical properties vary with passage numbers
(38). Standardized cell culture conditions (media, seeding density) and Transwell inserts, the use of
marker compounds and the use of a small number of passages may help to lower inter- laboratory
differences (35-37, 80). The long culture time of around 20 days may be disadvantageous but shorter
protocols have been developed but not established (81). Despite these limitations, the Caco-2 cells
constitute an excellent model to study the drug transport across the intestinal barrier, provided that its
limitations are taken into account in interpreting the data.
3.4.3 In Vitro Models Without Cells
To classify compounds to their ability to simple passive membrane permeation, several methods that
do not involve biological material have been developed. The advantages of these techniques are the
higher throughput and better reproducibility.
A system to study relationship between molecular structures and lipophilicity is Immobilized Artificial
Membrane Column (IAM). It consists of a special reverse-phase liquid chromatography column, where
the support of the solid phase is coated with lipids. The correlation between membrane permeability
and IAM is done by the retention time. A good membrane permeable compound has a long retention.
The use and relevance of this method to study drug absorption is limited (66).
Parallel Artificial Membrane Permeation Assay (PAMPA) uses 96- well plates consisting of two parts.
The bottom is a standard 96-well plate filled with buffer. A special top part contains filters impregnated
with an organic solvent which are mimicking the cell membrane. The test compound is added to the
top part and membrane permeation is measured. This fast and cheap method has shown a good
correlation with Caco-2 and human absorption data (66, 82, 83). PAMPA allows studying passive
membrane absorption only, but it ignores the possible role of active processes, enzymes, and drug
metabolism. PAMPA and Caco-2 can be synergistically applied for efficient and rapid investigation of
permeation mechanisms in drug discovery. During early discovery, all compounds can be rapidly
screened using PAMPA to assess passive diffusion permeability to indicate potential for
gastrointestinal and cell assay permeation. Later in drug discovery, a combination of PAMPA with
Caco-2 assay for potentially interesting compounds may be reasonable to characterize completely
permeation mechanisms (84).
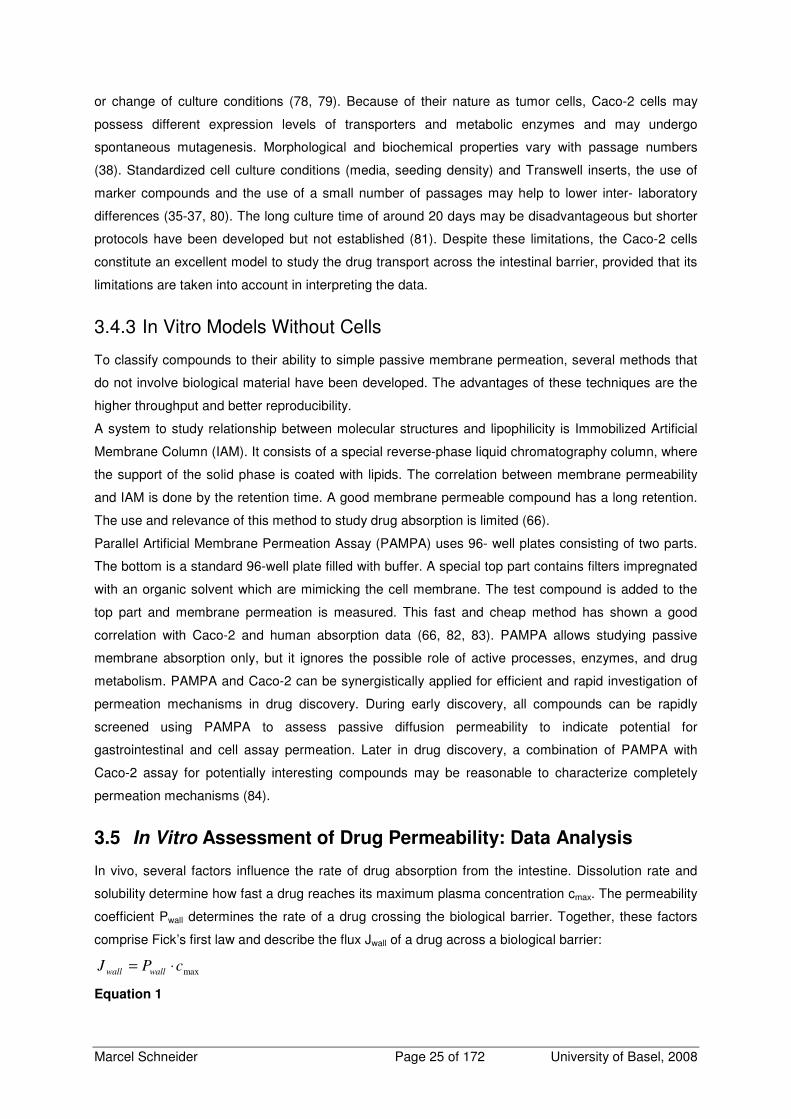
3.5 In Vitro Assessment of Drug Permeability: Data Analysis
In vivo, several factors influence the rate of drug absorption from the intestine. Dissolution rate and
solubility determine how fast a drug reaches its maximum plasma concentration cmax. The permeability
coefficient Pwall determines the rate of a drug crossing the biological barrier. Together, these factors
comprise Fick’s first law and describe the flux Jwall of a drug across a biological barrier:
maxcPJ wallwall ⋅=
Equation 1
Marcel Schneider Page 26 of 172 University of Basel, 2008
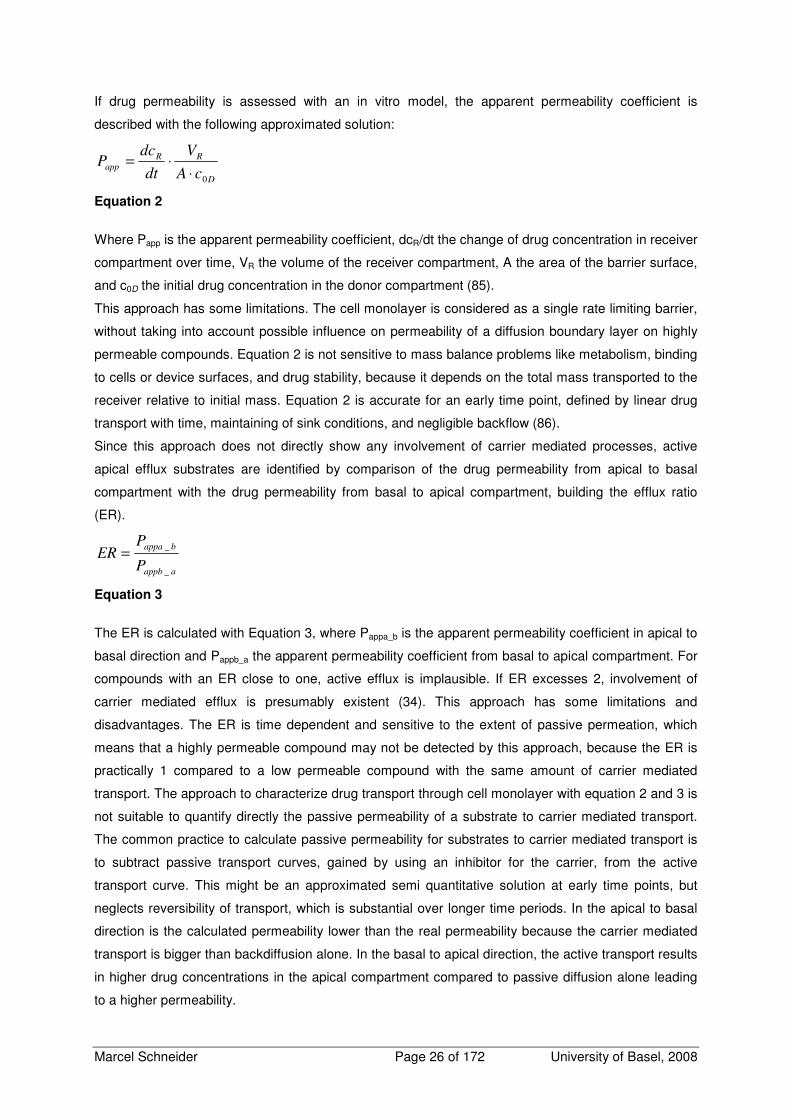
If drug permeability is assessed with an in vitro model, the apparent permeability coefficient is
described with the following approximated solution:
D
RR
appcA
V
dt
dcP
0⋅⋅=
Equation 2
Where Papp is the apparent permeability coefficient, dcR/dt the change of drug concentration in receiver
compartment over time, VR the volume of the receiver compartment, A the area of the barrier surface,
and c0D the initial drug concentration in the donor compartment (85).
This approach has some limitations. The cell monolayer is considered as a single rate limiting barrier,
without taking into account possible influence on permeability of a diffusion boundary layer on highly
permeable compounds. Equation 2 is not sensitive to mass balance problems like metabolism, binding
to cells or device surfaces, and drug stability, because it depends on the total mass transported to the
receiver relative to initial mass. Equation 2 is accurate for an early time point, defined by linear drug
transport with time, maintaining of sink conditions, and negligible backflow (86).
Since this approach does not directly show any involvement of carrier mediated processes, active
apical efflux substrates are identified by comparison of the drug permeability from apical to basal
compartment with the drug permeability from basal to apical compartment, building the efflux ratio
(ER).
aappb
bappa
P
PER
_
_=
Equation 3
The ER is calculated with Equation 3, where Pappa_b is the apparent permeability coefficient in apical to
basal direction and Pappb_a the apparent permeability coefficient from basal to apical compartment. For
compounds with an ER close to one, active efflux is implausible. If ER excesses 2, involvement of
carrier mediated efflux is presumably existent (34). This approach has some limitations and
disadvantages. The ER is time dependent and sensitive to the extent of passive permeation, which
means that a highly permeable compound may not be detected by this approach, because the ER is
practically 1 compared to a low permeable compound with the same amount of carrier mediated
transport. The approach to characterize drug transport through cell monolayer with equation 2 and 3 is
not suitable to quantify directly the passive permeability of a substrate to carrier mediated transport.
The common practice to calculate passive permeability for substrates to carrier mediated transport is
to subtract passive transport curves, gained by using an inhibitor for the carrier, from the active
transport curve. This might be an approximated semi quantitative solution at early time points, but
neglects reversibility of transport, which is substantial over longer time periods. In the apical to basal
direction is the calculated permeability lower than the real permeability because the carrier mediated
transport is bigger than backdiffusion alone. In the basal to apical direction, the active transport results
in higher drug concentrations in the apical compartment compared to passive diffusion alone leading
to a higher permeability.
Marcel Schneider Page 27 of 172 University of Basel, 2008
The use of these approximated equations still requires the establishment of the linear phase of
permeability because the equation describes just the initial slope of the transport curve. To study
substrates of carrier mediated transport or the influence of drug formulations on transport processes it
is important to gain knowledge about the equilibrium conditions and the interaction with the cells.
Further, this method does not take into account a potential cellular retention of compounds, which is
known for lipophilic drugs (42).
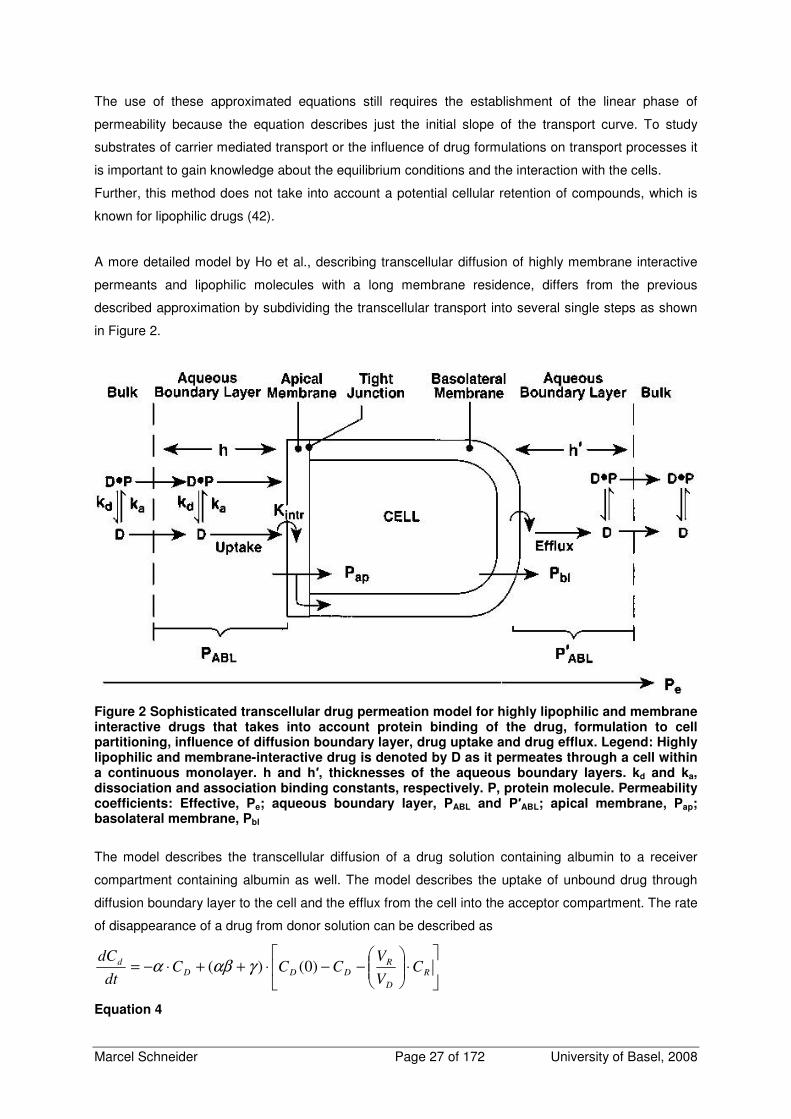
A more detailed model by Ho et al., describing transcellular diffusion of highly membrane interactive
permeants and lipophilic molecules with a long membrane residence, differs from the previous
described approximation by subdividing the transcellular transport into several single steps as shown
in Figure 2.
Figure 2 Sophisticated transcellular drug permeation model for highly lipophilic and membrane interactive drugs that takes into account protein binding of the drug, formulation to cell partitioning, influence of diffusion boundary layer, drug uptake and drug efflux. Legend: Highly lipophilic and membrane-interactive drug is denoted by D as it permeates through a cell within a continuous monolayer. h and h′, thicknesses of the aqueous boundary layers. kd and ka, dissociation and association binding constants, respectively. P, protein molecule. Permeability coefficients: Effective, Pe; aqueous boundary layer, PABL and P′ABL; apical membrane, Pap; basolateral membrane, Pbl
The model describes the transcellular diffusion of a drug solution containing albumin to a receiver
compartment containing albumin as well. The model describes the uptake of unbound drug through
diffusion boundary layer to the cell and the efflux from the cell into the acceptor compartment. The rate
of disappearance of a drug from donor solution can be described as
⋅
−−⋅++⋅−= R
D
R
DDD
d CV
VCCC
dt
dC)0()( γαβα
Equation 4
Marcel Schneider Page 28 of 172 University of Basel, 2008
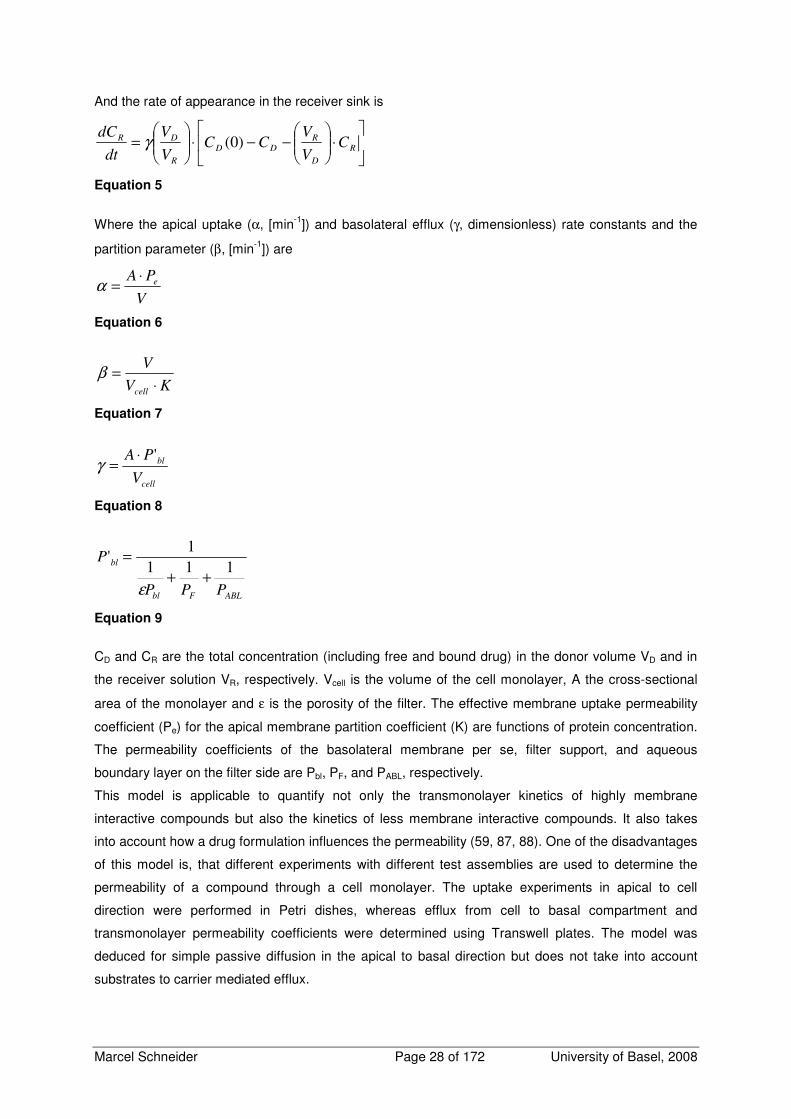
And the rate of appearance in the receiver sink is
⋅
−−⋅
= R
D
R
DD
R
DR CV
VCC
V
V
dt
dC)0(γ
Equation 5
Where the apical uptake (α, [min-1]) and basolateral efflux (γ, dimensionless) rate constants and the
partition parameter (β, [min-1]) are
V
PA e⋅=α
Equation 6
KV
V
cell ⋅=β
Equation 7
cell
bl
V
PA '⋅=γ
Equation 8
ABLFbl
bl
PPP
P111
1'
++
=
ε
Equation 9
CD and CR are the total concentration (including free and bound drug) in the donor volume VD and in
the receiver solution VR, respectively. Vcell is the volume of the cell monolayer, A the cross-sectional
area of the monolayer and ε is the porosity of the filter. The effective membrane uptake permeability
coefficient (Pe) for the apical membrane partition coefficient (K) are functions of protein concentration.
The permeability coefficients of the basolateral membrane per se, filter support, and aqueous
boundary layer on the filter side are Pbl, PF, and PABL, respectively.
This model is applicable to quantify not only the transmonolayer kinetics of highly membrane
interactive compounds but also the kinetics of less membrane interactive compounds. It also takes
into account how a drug formulation influences the permeability (59, 87, 88). One of the disadvantages
of this model is, that different experiments with different test assemblies are used to determine the
permeability of a compound through a cell monolayer. The uptake experiments in apical to cell
direction were performed in Petri dishes, whereas efflux from cell to basal compartment and
transmonolayer permeability coefficients were determined using Transwell plates. The model was
deduced for simple passive diffusion in the apical to basal direction but does not take into account
substrates to carrier mediated efflux.
Marcel Schneider Page 29 of 172 University of Basel, 2008
3.6 Effect of Food on Drug Absorption
The presence of food in the gastrointestinal tract may alter the oral bioavailability of drugs. Food leads
to secretion of gastric acid, bile, and pancreatic fluids which may alter the rate and extent of
absorption. A slowed gastrointestinal motility and alterations in blood and lymph flow have also an
impact on absorption.
The digestion of dietary lipids decreases gastric motility and increases the secretion of bile and
pancreatic fluids. Bile may improve the bioavailability of poorly water soluble drugs by enhancing the
dissolution rate and the solubility. Bile and the products of lipid digestion (mono- and di-glycerides and
free fatty acids) are effective emulsifying agents. Lipids and lipophilic drugs can also be absorbed by
the lymphatic pathway, which bypasses the liver first pass metabolism and may increase the
bioavailability. Examples for drugs with increased postprandial oral bioavailability are griseofulvin,
danazol, and halofantrine (89).
3.7 Absorption Enhancement by Solubility Enhancement for Oral
Drug Delivery
Drugs classified in BCS class II achieve high membrane permeability but a low solubility leading to a
low dissolution, slow drug uptake, low blood and plasma levels, and poor bioavailability after oral drug
uptake. If solubility may be increased with appropriate methods, higher dissolution accomplished by
higher drug uptake, and increased plasma levels is achieved. Hence, a lot of strategies were
developed in pharmaceutical technology to increase the solubility of drug solutions. Salts are used to
increase the solubility of ionizable compounds. Some compounds were able to build complexes with
appropriate complexing agents, e.g. cyclodextrins may be used to solubilize lipophilic compounds by
embedding them. Cosolvents are used extensively to increase solubility of lipophilic poorly soluble
compounds by disturbing the cluster structure of water. The use of surfactants increases the solubility
of poorly soluble compounds by formation of micelles, which incorporate the drug molecules.
As mentioned before, oral drug intake after a fatty meal may increase bioavailability of diverse
lipophilic compounds. It is obvious as a strategy to improve bioavailability of poorly soluble or poorly
absorbed compounds by the use of lipid containing dosage forms (89).
3.8 Absorption Enhancement with Intestinal Permeation Enhancers
3.8.1 Permeation Enhancement by Tight Junction Opening
Hydrophilic, charged compounds are absorbed via the paracellular route. In epithelial tissues, tight
junctions are limiting paracellular transport. A transient opening of tight junctions potentially increases
paracellular transport and would seem less damaging than a disruption of cell membrane structure.
Thus, it is important to develop an understanding of the mechanism of action of an absorption
enhancing formulation or excipient.
Various fatty acids have been shown to have membrane permeation enhancing activity. Sodium
caprate has been the most thoroughly characterized for use as an absorption enhancing excipient. It
increases the Caco-2 permeabilities because of dilatation of tight junctions. In vivo, absorption
Marcel Schneider Page 30 of 172 University of Basel, 2008
enhancement was shown. The absorption enhancing effect was higher in colon than in jejunum.
Chitosan acts in vitro as an intestinal permeation enhancer by opening tight junctions in a
concentration and pH dependent way. Chitosan reduced Caco-2 TEER values and increased
apparent permeability of mannitol. Nevertheless a vehicle containing 1.5% chitosan at pH 6.7
increased the bioavailability of intraduodenally administered buserelin in rats (90).
Degradation products of phospholipids like lysophosphatidylcholine decrease significantly TEER
compared to controls in cell models, indicating tight junction opening. Lysophosphatidylcholine may be
formed out of phospholipids by the activity of Phospholipase A2 which is expressed in the intestinal
epithelia (91).
3.8.2 Permeation Enhancement by Inhibition of Efflux Transporters
An increasing number of drugs have been recognized as substrates to carrier mediated efflux, which
may limit drug absorption. Inhibition of efflux transporters in the intestine offers a potential strategy to
improve oral bioavailability. Strategies like coadministration of a drug with affinity to the efflux
transporter, coadministration of a specific inhibitor without pharmacological effect, or nonspecific
inhibition of the efflux transporter Pgp by pharmaceutical excipients are discussed. Some widely used
pharmaceutical excipients, including surface active compounds, lipids, and polymers, are known to
enhance the intestinal absorption by inhibiting nonspecifically efflux transporters (92). The underlying
mechanisms of efflux inhibition of the pharmaceutical excipients are still under discussion. Several
excipients can indirectly inhibit Pgp through effects on the lipid membrane because the activity of Pgp
is modulated by the physical state of the lipid bilayer. For example PEG-300 alters the membrane
fluidity by changing the microenvironment of the Caco-2 cell membranes, which perturbs the ability of
efflux transporters to efflux substrates such as taxol and doxorubicin. PEG-300 causes almost
complete inhibition of Pgp activity in an MDR1- transfected Madin-Darby Canine Kidney cell line (93).
Also Tween 80 and Cremophor EL increase the membrane fluidity, whereas Vitamin E TPGS
decreases the membrane fluidity (94). But changes in membrane fluidity alone may not be generalized
as mechanism to reduce transporter activity (95). An alteration in the fluidity of the lipid membrane
environment of Pgp modulates the drug efflux, by reduction of the ATPase activity (96). Other
mechanism are discussed like energy depletion by decreasing the ATP pool available for Pgp which is
together with membrane fluidization, that causes inhibition of Pgp ATPase activity, a critical factor
contributing to the Pgp inhibition (97). Pluronic P85 inhibits P- glycoprotein mediated efflux of
rhodamine 123 in Caco-2 cells (98).
Some of these in vitro effects have been also verified in vivo (99). In vitro, D-α-tocopheryl polyethylene
glycol 1000 succinate (TPGS) acts as a reversal agent for P-glycoprotein multidrug resistance and
inhibits Pgp mediated drug transport of paclitaxel and rhodamine 123 in a Caco-2 cell assay (100). In
an in vivo intraduodenal perfusion study, low TPGS concentrations (0.04%) significantly increased the
bioavailability of talinolol (99).
3.8.3 Permeation Enhancement by Influencing the Cell Membrane
The easiest way to evaluate the effectiveness, mechanism, and potential for toxicity of absorption
enhancers is to use in vitro models of the intestinal epithelium (Caco-2 models or animal intestinal
Marcel Schneider Page 31 of 172 University of Basel, 2008
segments). These in vitro studies can provide an initial consideration of the possible extent of
permeation enhancement for a drug or excipient of interest and whether this can be accomplished
without damaging the membrane. But many of the compounds examined in vitro as membrane
permeation enhancers cause cytotoxicity or membrane damage. Intact intestinal tissues are found to
be more resistant to the cytotoxic effects of permeation enhancer than cell culture models, because
intact tissue has mechanisms for recovery and an additional physical barrier like intestinal mucus.
Various nonionic, anionic, and cationic surfactants have been investigated as intestinal permeation
enhancers. Nonionic surfactants influence absorption enhancing activity by size and structure of both
the alkyl chain and the polar group. Generally these seem to affect membranes by solubilizing
membrane components. Medium chain glycerides, e.g. mono- and diglycerides of caprylic and capric
acid, are used as pharmaceutical excipients and as nutritional agents. Diglycerides are much less
active than monoglycerides as membrane permeation enhancers. Steroidal detergents like
physiologically occurring bile salts have membrane permeation enhancing effects. Many investigators
explain membrane permeation enhancing effects with reversibly damaging the intestinal mucosa. The
colon may be more sensitive than the small intestine to the absorption enhancing effect of bile acids,
as shown in the effects of glycocholate on insulin absorptions in rats. Physiologically, bile salts are
present in the intestinal lumen in the form of mixed micelles. The in vitro effects of bile salt on
epithelial membranes can be quite different when they are incorporated with other agents in mixed
micelles. For example the permeation-enhancing effects and cytotoxicity of taurocholate on Caco-2
monolayers was greatly reduced when incorporated with phospholipids or cholesterol in mixed
micelles, but a mixed micelle composed of taurocholate and oleic acid had much more potent
membrane effects than taurocholate alone (101).
3.9 Influence of Pharmaceutical Formulations on Gastrointestinal
Drug Absorption
In previous chapters, the influence of different pharmaceutical excipients on gastrointestinal drug
absorption was summarized. Similar effects have been expected, when complex pharmaceutical
preparations have been investigated on their influence on gastrointestinal drug absorption. A
successful strategy is the formulation of poorly water soluble drugs with lipid containing formulations
like self emulsifying drug delivery systems (SEDDS). These orally administered lipid containing
dosage forms generally consist of a drug dissolved in a mixture of two or more excipients like
triglycerides, partial glycerides, surfactants and cosolvents. The underlying molecular mechanisms of
the absorption enhancement are known partially (29, 30). It is generally agreed so far that improved
dissolution compared to an aqueous suspension of lipophilic drug increases the absorption because
the drug is solubilized in a lipid containing dosage form already (102-104). The dissolution is improved
by facilitating the formation of solubilized phases from which absorption may occur. The presence of
digestion products and bile salts in the intestine may facilitate diffusion through diffusion boundary
layer and alter intrinsic permeability of the intestinal membrane via paracellular and transcellular
permeation. It was observed that drug solubilization may decrease the free fraction of poorly soluble
drugs. This could potentially lead to a decrease in absorption, if no other beneficial mechanisms are
involved (105).
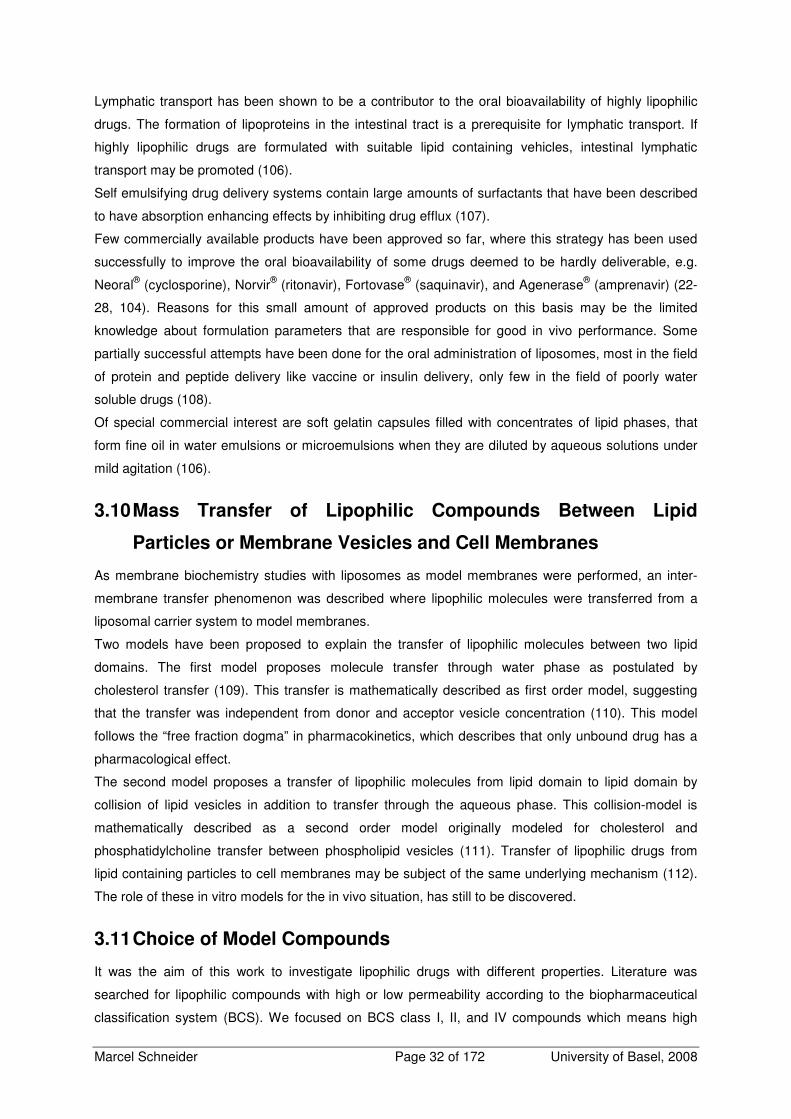
Marcel Schneider Page 32 of 172 University of Basel, 2008
Lymphatic transport has been shown to be a contributor to the oral bioavailability of highly lipophilic
drugs. The formation of lipoproteins in the intestinal tract is a prerequisite for lymphatic transport. If
highly lipophilic drugs are formulated with suitable lipid containing vehicles, intestinal lymphatic
transport may be promoted (106).
Self emulsifying drug delivery systems contain large amounts of surfactants that have been described
to have absorption enhancing effects by inhibiting drug efflux (107).
Few commercially available products have been approved so far, where this strategy has been used
successfully to improve the oral bioavailability of some drugs deemed to be hardly deliverable, e.g.
Neoral® (cyclosporine), Norvir® (ritonavir), Fortovase® (saquinavir), and Agenerase® (amprenavir) (22-
28, 104). Reasons for this small amount of approved products on this basis may be the limited
knowledge about formulation parameters that are responsible for good in vivo performance. Some
partially successful attempts have been done for the oral administration of liposomes, most in the field
of protein and peptide delivery like vaccine or insulin delivery, only few in the field of poorly water
soluble drugs (108).
Of special commercial interest are soft gelatin capsules filled with concentrates of lipid phases, that
form fine oil in water emulsions or microemulsions when they are diluted by aqueous solutions under
mild agitation (106).
3.10 Mass Transfer of Lipophilic Compounds Between Lipid
Particles or Membrane Vesicles and Cell Membranes
As membrane biochemistry studies with liposomes as model membranes were performed, an inter-
membrane transfer phenomenon was described where lipophilic molecules were transferred from a
liposomal carrier system to model membranes.
Two models have been proposed to explain the transfer of lipophilic molecules between two lipid
domains. The first model proposes molecule transfer through water phase as postulated by
cholesterol transfer (109). This transfer is mathematically described as first order model, suggesting
that the transfer was independent from donor and acceptor vesicle concentration (110). This model
follows the “free fraction dogma” in pharmacokinetics, which describes that only unbound drug has a
pharmacological effect.
The second model proposes a transfer of lipophilic molecules from lipid domain to lipid domain by
collision of lipid vesicles in addition to transfer through the aqueous phase. This collision-model is
mathematically described as a second order model originally modeled for cholesterol and
phosphatidylcholine transfer between phospholipid vesicles (111). Transfer of lipophilic drugs from
lipid containing particles to cell membranes may be subject of the same underlying mechanism (112).
The role of these in vitro models for the in vivo situation, has still to be discovered.
3.11 Choice of Model Compounds
It was the aim of this work to investigate lipophilic drugs with different properties. Literature was
searched for lipophilic compounds with high or low permeability according to the biopharmaceutical
classification system (BCS). We focused on BCS class I, II, and IV compounds which means high
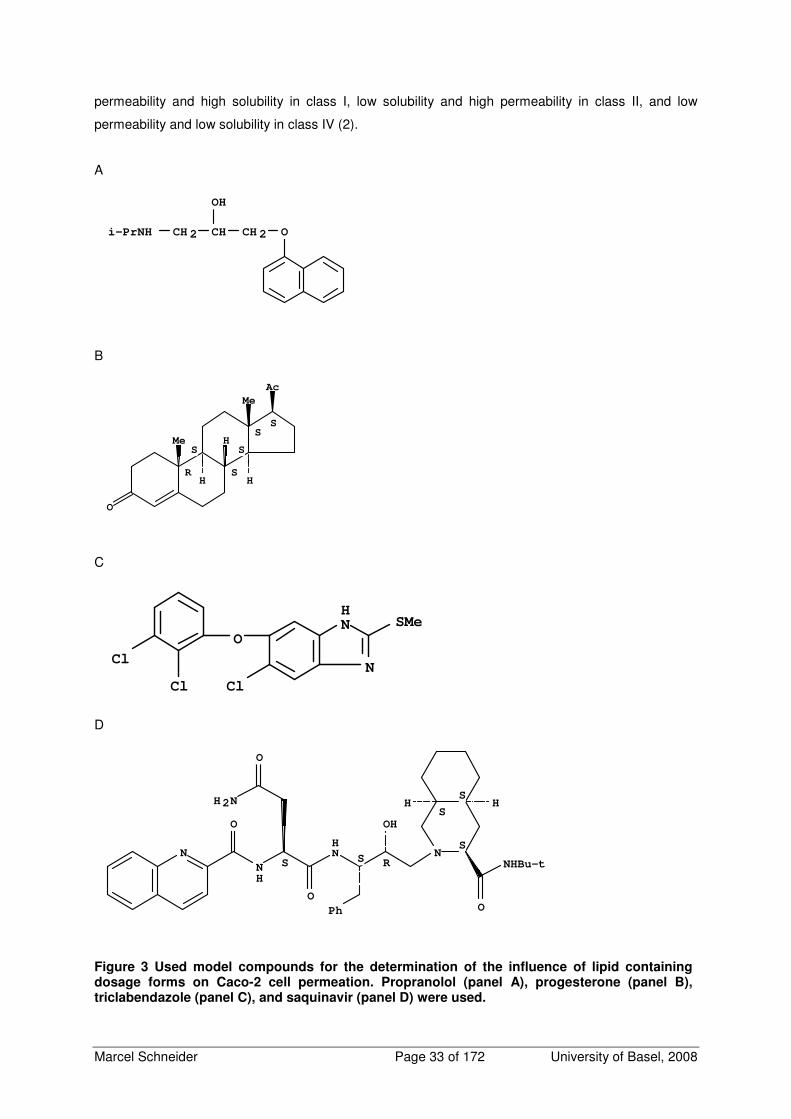
Marcel Schneider Page 33 of 172 University of Basel, 2008
permeability and high solubility in class I, low solubility and high permeability in class II, and low
permeability and low solubility in class IV (2).
A
i-PrNH OCH 2CHCH 2
OH
B
Ac
Me
Me
O
H
H HR
S
S
S
S
S
C
SMe
ClCl
Cl
O
N
H
N
D
NHBu-t
Ph
N
OH
N
H
O
O
N
H
O
H2N
O
N
HH
RS
S
S
S
S
Figure 3 Used model compounds for the determination of the influence of lipid containing dosage forms on Caco-2 cell permeation. Propranolol (panel A), progesterone (panel B), triclabendazole (panel C), and saquinavir (panel D) were used.
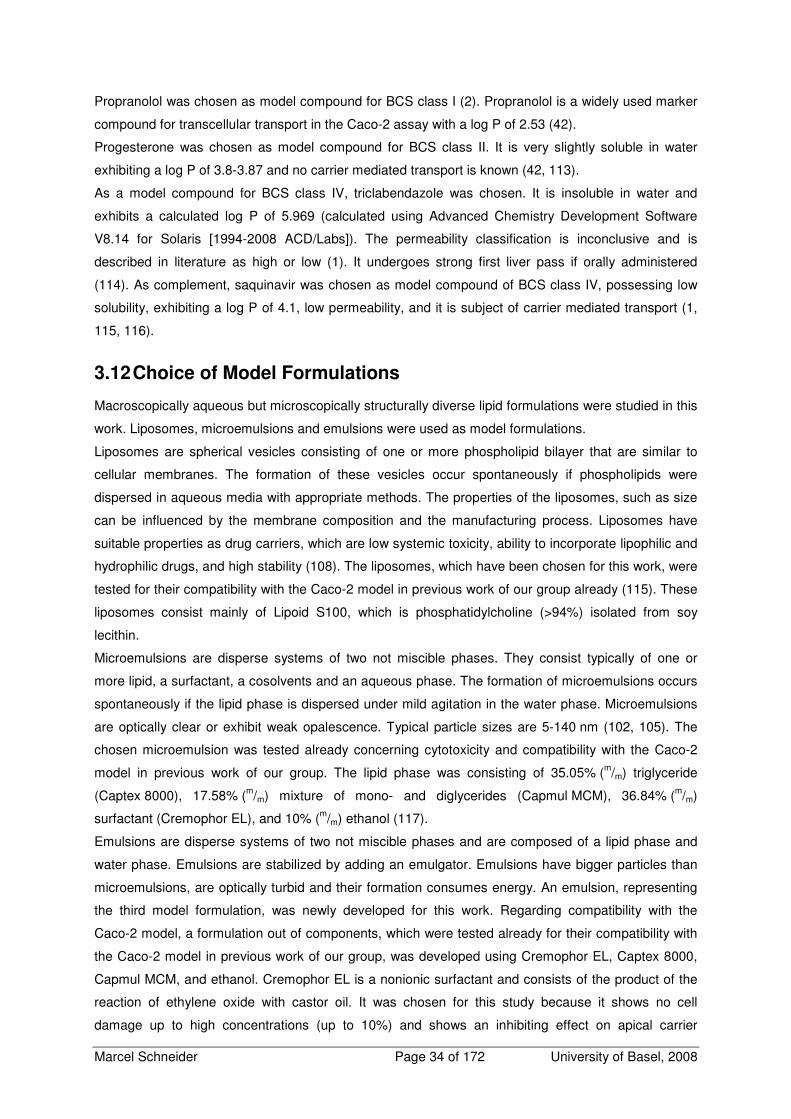
Marcel Schneider Page 34 of 172 University of Basel, 2008
Propranolol was chosen as model compound for BCS class I (2). Propranolol is a widely used marker
compound for transcellular transport in the Caco-2 assay with a log P of 2.53 (42).
Progesterone was chosen as model compound for BCS class II. It is very slightly soluble in water
exhibiting a log P of 3.8-3.87 and no carrier mediated transport is known (42, 113).
As a model compound for BCS class IV, triclabendazole was chosen. It is insoluble in water and
exhibits a calculated log P of 5.969 (calculated using Advanced Chemistry Development Software
V8.14 for Solaris [1994-2008 ACD/Labs]). The permeability classification is inconclusive and is
described in literature as high or low (1). It undergoes strong first liver pass if orally administered
(114). As complement, saquinavir was chosen as model compound of BCS class IV, possessing low
solubility, exhibiting a log P of 4.1, low permeability, and it is subject of carrier mediated transport (1,
115, 116).
3.12 Choice of Model Formulations
Macroscopically aqueous but microscopically structurally diverse lipid formulations were studied in this
work. Liposomes, microemulsions and emulsions were used as model formulations.
Liposomes are spherical vesicles consisting of one or more phospholipid bilayer that are similar to
cellular membranes. The formation of these vesicles occur spontaneously if phospholipids were
dispersed in aqueous media with appropriate methods. The properties of the liposomes, such as size
can be influenced by the membrane composition and the manufacturing process. Liposomes have
suitable properties as drug carriers, which are low systemic toxicity, ability to incorporate lipophilic and
hydrophilic drugs, and high stability (108). The liposomes, which have been chosen for this work, were
tested for their compatibility with the Caco-2 model in previous work of our group already (115). These
liposomes consist mainly of Lipoid S100, which is phosphatidylcholine (>94%) isolated from soy
lecithin.
Microemulsions are disperse systems of two not miscible phases. They consist typically of one or
more lipid, a surfactant, a cosolvents and an aqueous phase. The formation of microemulsions occurs
spontaneously if the lipid phase is dispersed under mild agitation in the water phase. Microemulsions
are optically clear or exhibit weak opalescence. Typical particle sizes are 5-140 nm (102, 105). The
chosen microemulsion was tested already concerning cytotoxicity and compatibility with the Caco-2
model in previous work of our group. The lipid phase was consisting of 35.05% (m/m) triglyceride
(Captex 8000), 17.58% (m/m) mixture of mono- and diglycerides (Capmul MCM), 36.84% (m/m)
surfactant (Cremophor EL), and 10% (m/m) ethanol (117).
Emulsions are disperse systems of two not miscible phases and are composed of a lipid phase and
water phase. Emulsions are stabilized by adding an emulgator. Emulsions have bigger particles than
microemulsions, are optically turbid and their formation consumes energy. An emulsion, representing
the third model formulation, was newly developed for this work. Regarding compatibility with the
Caco-2 model, a formulation out of components, which were tested already for their compatibility with
the Caco-2 model in previous work of our group, was developed using Cremophor EL, Captex 8000,
Capmul MCM, and ethanol. Cremophor EL is a nonionic surfactant and consists of the product of the
reaction of ethylene oxide with castor oil. It was chosen for this study because it shows no cell
damage up to high concentrations (up to 10%) and shows an inhibiting effect on apical carrier
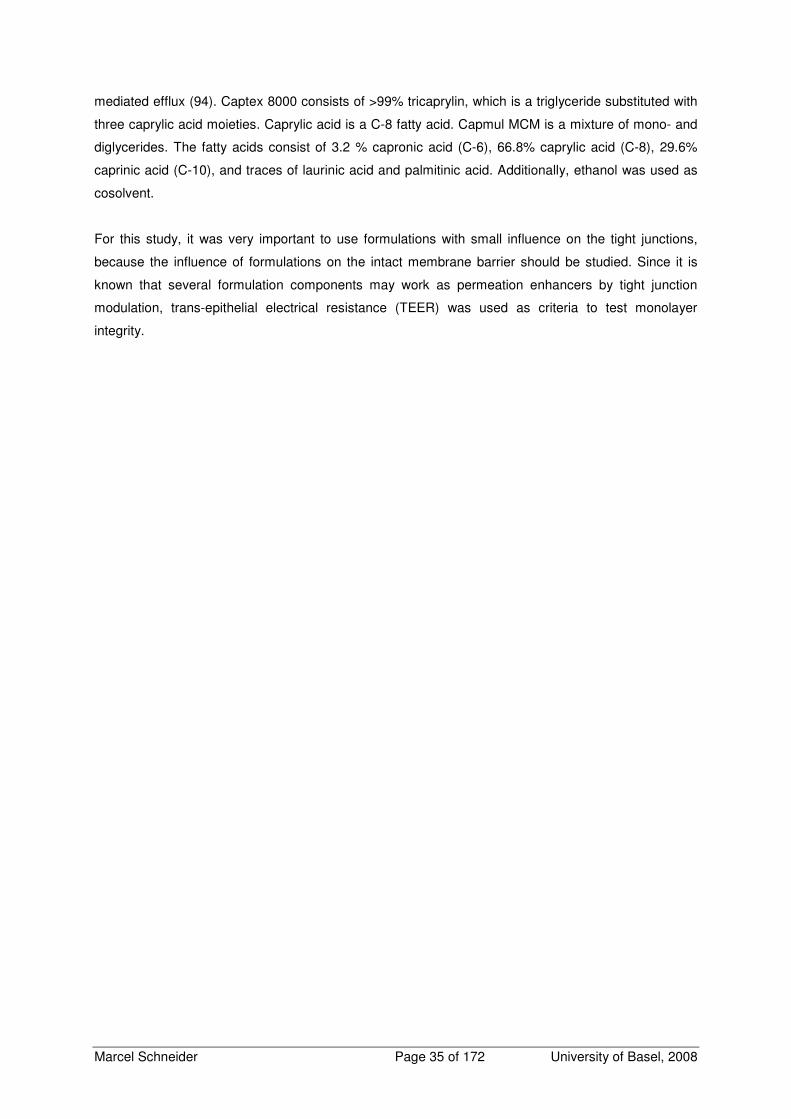
Marcel Schneider Page 35 of 172 University of Basel, 2008
mediated efflux (94). Captex 8000 consists of >99% tricaprylin, which is a triglyceride substituted with
three caprylic acid moieties. Caprylic acid is a C-8 fatty acid. Capmul MCM is a mixture of mono- and
diglycerides. The fatty acids consist of 3.2 % capronic acid (C-6), 66.8% caprylic acid (C-8), 29.6%
caprinic acid (C-10), and traces of laurinic acid and palmitinic acid. Additionally, ethanol was used as
cosolvent.
For this study, it was very important to use formulations with small influence on the tight junctions,
because the influence of formulations on the intact membrane barrier should be studied. Since it is
known that several formulation components may work as permeation enhancers by tight junction
modulation, trans-epithelial electrical resistance (TEER) was used as criteria to test monolayer
integrity.
Marcel Schneider Page 36 of 172 University of Basel, 2008
4 EXPERIMENTAL SECTION The experimental section is divided into different parts which are a publication part (section 4.1),
preliminary experiments, and additional work. Each part is discussed separately.
4.1 Influence of Structurally Diverse Lipid Containing Drug
Formulations on the Transport of Lipophilic Drugs through
Caco-2 Cell Monolayer (Publication Part)
4.1.1 Abstract
Introduction: To overcome poor bioavailability of poorly water soluble drugs, lipid containing drug
formulations were used. We determined the influence of structurally diverse lipid containing drug
formulations, including liposomes, a microemulsion, and an emulsion, on transport processes of
lipophilic model drugs (propranolol, progesterone, saquinavir, and triclabendazole) through Caco-2
monolayers. Methods: Drug absorption was determined in a bi-directional Caco-2 assay, using purely
aqueous drug solutions as reference. Passive permeability coefficient of the apical (Pa) and of the
basal membrane (Pb), formulation-to-cell partition coefficient, and carrier mediated efflux kinetics were
deduced by fitting a mathematical model to the transport data with the software Easy Fit®. At least
three different lipid concentrations for each formulation in the range of 0.1-50 mg/ml were tested.
Within each lipid concentration at least three different drug concentrations were tested per drug. The
formulations were characterized for free fraction of drug by equilibrium dialysis. Further, a biophysical
model was developed to delineate the contribution of drug transport in the diffusion boundary layer
and drug permeation through cell membrane to the determined apparent permeability coefficient.
Additionally, a differentiation was introduced between permeation of free drug through the cell
membrane and permeation following direct drug transfer from the lipid particles to the membrane upon
collision. Results and Discussion: Pa, Pb and free fraction decreased with increasing lipid
concentration. Within one lipid concentration, no influence of drug concentration on Pa, Pb, and free
fraction was determined. No effect on permeability and free fraction was observed with propranolol
emulsions and microemulsions. Triclabendazole showed lower Pb whereas permeability coefficients of
all other drugs were equal for both membranes. Free fraction of drug plays an important role for
intestinal cell permeation but direct transfer of lipophilic drugs from lipid phase of the formulation to cell
membrane can also make an essential contribution to drug permeation. The relative significance of
these two processes may depend on the drug and the formulation. These observations apply to
structurally different lipid containing drug formulations. This could explain differences in permeability
coefficients of the drugs.
4.1.2 Introduction
The modern drug discovery strategies like combinatorial chemistry and high throughput screening
prefer lipophilic, poorly soluble compounds. These compounds show often solubility and oral
bioavailability problems in vivo. To ensure an efficient oral delivery, a drug has to be suitable for oral
Marcel Schneider Page 37 of 172 University of Basel, 2008
administration. To be absorbed from the gastrointestinal tract, a drug has to be sufficient soluble,
because, with some exceptions, passive diffusion from high to low drug concentration of dissolved
drug molecules is the driving force of drug absorption. Drug absorption is generally defined as the
process by which unchanged drug proceeds from site of administration to site of measurement within
the body (54). A general drug classification of the impact of drug solubility and membrane permeability
on the drug absorption has been done by the framework of the biopharmaceutics classification system
(BCS) (1, 2). Different physicochemical and physiological properties determine the reasons for poor
drug absorption which are poor water solubility, low membrane permeability, carrier mediated drug
efflux, drug metabolism, and pharmacological interactions. The most important cause for low
permeability is the ability of the molecule itself to cross a biological barrier by passive diffusion.
Several physicochemical properties are influencing the ability to cross biological barriers, which are
lipophilicity, molecular weight, hydrogen bonding capacity, and charge (3-6).
An increasing number of drugs has been identified to be subject of carrier mediated efflux, which is
limiting the trans-membrane permeability and finally the oral bioavailability. Carrier mediated efflux is
caused by proteins located in the apical cell membrane by pumping back drug molecules from the
cellular compartment to the intestinal lumen. These efflux pumps have a broad substrate spectrum
which is a powerful mechanism to prevent the body from the uptake of toxic alimentary ingredients
and, unfortunately, from the oral absorption of many drugs (8). Most important efflux transporters for
drugs belong to the ATP-binding cassette (ABC) family, e.g. P-glycoprotein (Pgp), breast cancer
resistance protein (BCRP) and MRP2 (9-13).
A successful strategy to improve the oral bioavailability of poorly water soluble drugs is the use of lipid
containing dosage forms in vivo. Lipid formulation can reduce the inherent limitation of slow and
incomplete dissolution of poorly water soluble drugs by facilitating the formation of solubilized phases
from which absorption may occur (105). Oral administered lipid containing dosage forms generally
consist of a drug dissolved in a mixture of two or more excipients like triglycerides, partial glycerides,
surfactants and cosolvents (107). Some partially successful attempts have been done for the oral
administration of liposomes, most in the field of protein and peptide delivery like vaccine or insulin
delivery, only few in the field of poorly water soluble drugs (108). Of special commercial interest are
soft gelatine capsules filled with concentrates of lipid phases, that form fine oil in water emulsions or
microemulsions when they are diluted by aqueous solutions under mild agitation (106). Few
commercially available products on this basis have been approved so far, e.g. Neoral® (cyclosporine),
Norvir® (ritonavir), Fortovase® (saquinavir), and Agenerase® (amprenavir) (22-28, 104). Reasons for
this small amount of approved products may be limited knowledge about formulation parameters that
are responsible for good in vivo performance based on limited knowledge about the underlying
mechanisms. It is generally agreed so far that improved dissolution compared to an aqueous
suspension of lipophilic drug increases the absorption because the drug is already solubilized in a lipid
containing dosage form (102-104). The formation of lipoproteins in the intestinal tract of highly
lipophilic drugs formulated with suitable vehicles promotes intestinal lymphatic transport (106). The
presence of digestion products and bile salts may facilitate diffusion through diffusion boundary layer
and alter intrinsic permeability of the intestinal membrane via paracellular and transcellular permeation
(105). Ingredients like surfactants are known to have an inhibitory potential on efflux (92-100, 118).
Marcel Schneider Page 38 of 172 University of Basel, 2008
There is little information in the literature dealing with the effect of lipid containing dosage forms on the
passive permeation, which is considered to be the main pathway of drug absorption of poorly water
soluble drugs. It was observed that drug solubilization may decrease the free fraction of poorly soluble
drugs (105). This could potentially lead to a decrease in absorption, if no other beneficial mechanisms
are involved (4, 59, 88, 115). There is little information in literature describing a mechanism for
lipophilic drugs that contributes to the transmembranal permeability based on mass transfer from lipid
particles to membrane surfaces originating from membrane biochemistry studies with liposomes as
model membranes. Two models have been proposed to explain the inter-membrane transfer of
lipophilic molecules between two lipid domains. The first model proposes molecule transfer through
water phase as postulated by cholesterol transfer (109). This transfer is mathematically described as
first order model, suggesting that the transfer is independent from donor and acceptor vesicle
concentration (110). The second model proposes a transfer of lipophilic molecules from lipid domain to
lipid domain by collision of lipid vesicles in addition to transfer through the aqueous phase. This
collision-model is mathematically described as a second order model (111). Lipophilic drugs may be
subject of the same underlying mechanism (112). The role of these models for drug transport from
lipid vesicles to cellular membranes is rarely known.
In vitro cell models are useful tools to investigate the influence of lipid containing formulations on
passive permeation and efflux of poorly water soluble drugs, because none of the in vivo described
possible beneficial mechanisms, such as lymphatic transport and lipid digestion, may take place. One
of the most frequently used and best characterized cell models for mechanistical studies on drug
absorption is the human colon adenocarcinoma cell line Caco-2. These cells spontaneously
differentiate into enterocyte like cells and form a cell monolayer when cultivated on a semipermeable
filter support. The characteristics of Caco-2 cells have been well described and nicely reviewed
elsewhere (32-39, 43, 70, 77-80). Few attempts have been undertaken to investigate complex drug
formulations with the Caco-2 model, most of them by testing physiologically more relevant media for
their suitability as transport media. Most of these experiments were focusing on cell viability and
qualitative effects of the tested formulation on model drugs (44-53, 115, 117). Little systematical work
on the quantitative interactions of lipids on cellular drug permeation has been done so far. Previous
work of our group showed the possibility to use liposomes as tool to increase solubility of poorly water
soluble compounds saquinavir and indinavir (115).
Aim of the study: One of the major objectives of this work was to refine the previously published
mathematical model for the kinetics of cellular transport, because this model predicted intracellular
concentrations systematically too low (115). On the basis of cell permeation experiments a new
biophysical model was developed describing the interactions between lipid containing drug
formulation, the drugs, and the cell monolayer for a better understanding of the absorption process
through the epithelial barrier. We focused on the influence of the formulations on passive permeability.
Additionally we investigated the influence of microemulsions and emulsions on the carrier mediated
efflux, because an inhibition of Pgp was observed for saquinavir liposomes in previous work of our
group. As model formulations we chose liposomes, an emulsion, and a microemulsion. All
components of the formulations, the liposomes, and the microemulsion were tested already for their
compatibility with the Caco-2 cell model in previous work of our group regarding cell toxicity (115,

Marcel Schneider Page 39 of 172 University of Basel, 2008
117). Since it is known that several formulation components may work as permeation enhancers by
tight junction modulation and we wanted to study the influence of formulations on the intact monolayer,
it was very important to use formulations with small influence on the cell monolayer integrity. In this
context Cremophor EL was chosen as surfactant in emulsion and microemulsion for this study
because it shows no cell damage up to high concentrations (up to 10%) and shows additionally an
inhibiting effect on active efflux (94). To determine the influence of the different formulations, we used
different model drugs, which had lipophilic properties in common. Propranolol was chosen as model
compound for high water solubility and high permeability and belongs to the BCS class I (2).
Propranolol is a widely used marker compound for transcellular transport in the Caco-2 assay with a
log P of 2.53 (42). Progesterone was chosen as model compound for low water solubility and high
permeability and belongs to the BCS class II. Progesterone is very slightly soluble in water exhibiting a
log P of 3.8-3.87, no carrier mediated transport is known (42, 113). Triclabendazole was chosen as a
model compound for BCS class IV. It is practically insoluble in water and exhibits a calculated log P of
5.969 (calculated using Advanced Chemistry Development Software V8.14 for Solaris [1994-2008
ACD/Labs]). The permeability classification is inconclusive and is described in literature as high or low
(1, 114). No carrier mediated apical drug efflux has been reported. As complement saquinavir was
chosen as model compound of BCS class IV, possessing low solubility, exhibiting a log P of 4.1, low
permeability, and it is subject of carrier mediated transport (1, 115, 116).
4.1.3 Material and Methods
4.1.3.1 Material
The human colon adenocarcinoma cell line Caco-2 was a kindly provided by Prof. H P Hauri,
Biocenter, University of Basel, and originated from the American Type Culture Collection (ATCC,
Rockville, MD, USA). Dulbecco’s Modified Eagle’s Medium (DMEM) (with l-glutamine, 4500 mg/l D-
glucose, without sodium pyruvate), l-glutamine 200 mM (100x), MEM non essential amino acids
solution (100x, without l-glutamine), foetal bovine serum (FBS), Trypsin EDTA (10x) liquid, and
Dulbecco’s Phosphate Buffered Saline (without Ca2+, Mg2+) were all purchased from Gibco
(Gaithersburg, MD, USA). The cell culture medium was composed of DMEM supplemented with
10% (V/V) FBS, 2 mM l-glutamine, and 1% (V/V) MEM.
Transport media used for the permeation studies and the equilibrium dialysis experiments were
prepared with Dulbecco’s Modified Eagle’s Medium (DMEM) base powder (without glucose,
l-glutamine, phenol red, sodium pyruvate and sodium bicarbonate, purchased from SIGMA-Aldrich,
Fluka Chemie GmbH, Buchs, Switzerland). DMEM base powder was dissolved in bi-distilled and
autoclaved water and supplemented with glucose (4.5 g/l), HEPES (4.76 g/l), NaCl (1.987 g/l), and
l-glutamine (0.876 g/l). The pH was adjusted to 7.4 and the final medium was filtered through a sterile
filter (Supor-200, 0.2 µm pore size, Pall Corporation, Michigan, USA) under aseptic conditions.
Glucose, HEPES, NaCl, and l-glutamine were purchased from SIGMA-Aldrich (Fluka Chemie GmbH,
Buchs, Switzerland). Dulbecco’s Phosphate Buffered Saline (D-PBS) (with Ca2+, Mg2+) was purchased
from SIGMA-Aldrich (Fluka Chemie GmbH, Buchs, Switzerland).
Marcel Schneider Page 40 of 172 University of Basel, 2008
Petri dishes (56.7 cm2) were purchased from Nunc (Roskilde, Denmark) and 6-well Polycarbonate
Membrane Transwell Plates with an insert area of 4.7 cm2 and 0.4 µm pore size were ordered from
Costar (Corning Incorporated, Corning, NY, USA).
Captex 8000 was purchased from SIGMA-Aldrich (Fluka Chemie GmbH, Buchs, Switzerland), Capmul
MCM was purchased from Abitec Corporation (Janesville, USA). Cremophor EL was ordered from
Fluka (Fluka Chemie GmbH, Buchs, Switzerland). Lipoid S 100 and Lipoid EPG were kindly provided
by Lipoid GMBH (Ludwigshafen, Germany). Saquinavir was kindly provided by Roche
Pharmaceuticals (Basel, Switzerland). Progesterone and propranolol were purchased from Fluka
(SIGMA-Aldrich, Fluka Chemie GmbH, Buchs, Switzerland). Triclabendazole was kindly provided by
Phares Drug Delivery (Muttenz, Switzerland). All other chemicals were of analytical grade.
4.1.3.2 Cell Culture Procedures
Caco-2 cells were cultivated in Petri dishes using culture medium at 37°C in a water saturated
atmosphere of 8% CO2. The cells were passaged by treatment with a solution of 0.25% trypsin and
2.65 mM EDTA with a splitting ratio of 1:12 when the cell monolayer reached 90% confluence on the
Petri dishes. Transwell were seeded at a density of 1.14*105 cells/cm2 into 6-well Transwell plates.
The culture medium was changed every alternating day.
4.1.3.3 Drug Quantification
Drug quantification of all drugs was performed by HPLC-UV (Agilent series 1100, Agilent
Technologies USA, equipped with a G1312A binary pump, an auto sampler G1367B and a variable
wavelength detector G1314B) using a C-18 reversed phase column (CC 125/2 Lichrospher 100 RP 18
ec, Macherey Nagel, Oensingen, Switzerland). Isocratic methods with a flow rate of 0.25 ml/min were
used. The samples were stored at 4°C. Quantification was performed against a set of external
standard solutions within the linear response concentration range.
The drug concentration of progesterone was determined with the following mobile phase: distilled
water (bi-distilled and filtered through 0.45 µm)/methanol/tetrahydrofuran 40/45/15 (V/V). Ammonium
acetate with a concentration of 0.55 g/l was added to the mobile phase. The pH-value at 25°C was
6.9. An injection volume of 100 µl and a runtime of 7.5 min were used to detect progesterone at
239 nm in UV. Using this method, retention time of progesterone was approximately 5 min.
The drug concentration of propranolol was determined with the following mobile phase: distilled water
(bi-distilled and filtered through 0.45 µm)/methanol/tetrahydrofuran 55/20/25 (V/V). Ammonium acetate
with a concentration of 0.55 g/l was added to the mobile phase. The pH- value at 25°C was 7.0. An
injection volume of 100 µl and a runtime of 8 min were used to detect propranolol at 295 nm in UV.
Using this method retention time of propranolol was approximately 3.5 min.
The drug concentration of saquinavir was determined with the following mobile phase: distilled water
(bi-distilled and filtered through 0.45 µm)/methanol/tetrahydrofuran 40/45/15 (V/V). Ammonium acetate
with a concentration of 0.55 g/l was added to the mobile phase. The pH- value at 25°C was 6.7. An
injection volume of 100 µl and a runtime of 8 min were used to detect saquinavir at 239 nm in UV.
Using this method retention time of saquinavir was approximately 5 min.
Marcel Schneider Page 41 of 172 University of Basel, 2008
The drug concentration of triclabendazole was determined with the following mobile phase: distilled
water (bi-distilled and filtered through 0.45 µm)/methanol/tetrahydrofuran 35/40/25 (V/V). Ammonium
acetate with a concentration of 0.55 g/l was added to the mobile phase. The pH- value at 25°C was
6.7. An injection volume of 100 µl and a runtime of 8 min were used to detect triclabendazole at
305 nm in UV. Using this method retention time of triclabendazole was approximately 5.6 min.
Quantification of triclabendazole was performed against a set of external standard solutions within the
linear response concentration range. To maintain the sample stability over time and reproducibility of
the method, the standard solutions of triclabendazole contained the same amount of lipids as the
samples. Samples were stored at 4°C.
4.1.3.4 TEER Measurements
The integrity of the Caco-2 cell monolayer in the Transwell plates was ensured with the measurement
of the trans-epithelial electrical resistance (TEER) before and after every drug permeation study.
After washing the cell monolayer with 37°C tempered D-PBS (with Ca2+, Mg2+), 1600 µl transport
medium was added into the apical and 2800 µl transport medium was added into the basal
compartment. The Transwell plate was equilibrated 60 min in the cell culture incubator before the pre-
experimental measurement. The TEER was measured with an EVOM-G-Meter (EVOM-G-Meter
Modell -24, World Precision Instruments, Berlin, Germany) equipped with an EndohmTM tissue
resistance measurement chamber containing 4.6 ml tempered transport media (World Precision
Instruments, Berlin, Germany). The measurement chamber was tempered to 37°C with transport
medium before the measurement. For the post-experimental TEER measurement, the withdrawn
volume in the apical compartment was replaced with transport medium before TEER was measured.
Caco-2 monolayer with TEER values exceeding 250 Ωcm2 were used for transport experiments.
4.1.3.5 Drug Permeation Across Caco-2 Cell Monolayers
Cells between culture days 19-23 at passage numbers 60-65 were used for the permeation studies.
After the pre-experimental TEER measurement, the transport medium was removed and the
formulations, tempered to 37°C, were added. In the apical to basal direction, 1600 µl of the drug
formulation was added to the apical compartment and 2800 µl of the placebo formulation was added
to the basal compartment. In the basal to apical direction, 1600 µl of the placebo formulation was
added to the apical compartment and 2800 µl of the drug formulation was added to the basal
compartment. At least three wells were used for each direction. The Transwell plate was shaken at
37°C in a water saturated atmosphere under an incubator hood (KS15, Edmund Bühler GmbH,
Tübingen& Hechingen, Germany) with a stirring rate of 75 rpm on an orbital shaker (KS15, Edmund
Bühler GmbH, Tübingen& Hechingen, Germany). Permeation of drug across the cell monolayer was
monitored by sampling the solutions of both compartments at predefined points of time during 5 h,
except for the microemulsion experiments with 5 mg/ml lipid phase, where the permeation was
monitored during 3 h only.
Samples were drawn after 15, 30, 60, 90, 120, 180, and 300 min for the 5 h experiments and after 15,
30, 45, 60, 90, 120, and 180 min for the 3 h experiments. The sample volume was 50 µl. The
withdrawn volume was not replaced. The samples were diluted 1:10 with transport medium and
Marcel Schneider Page 42 of 172 University of Basel, 2008
collected in glass vials (Schmidlin Labor& Service AG, Sarbach, Switzerland) and stored at 4°C until
the HPLC analysis was performed.
4.1.3.6 Cell Monolayer Drug Extraction
Following the post-experimental TEER measurement, the 6-well Transwell plate was washed apical
with 3 ml and basal with 4 ml of 4°C D-PBS (without Ca2+ and Mg2+). The inserts were transferred to
Petri dishes and 0.3 ml trypsin solution (0.25% trypsin and 2.65 mM EDTA) was added to each insert.
The inserts were incubated in the cell culture incubator for 15 min. After neutralizing the trypsin
solution with 1 ml of cell culture medium, the cells were scraped off the polycarbonate membrane
using a cell scraper (BD Falcon, BD Biosciences Discovery Labware, Bedford, USA), transferred into
centrifuge tubes (BD Falcon blue max 15 ml, BD Biosciences Discovery Labware, Bedford, USA), and
spun 5 min with 1000 rpm (Sigma 302K, Sigma Laborzentrifugen GmbH, Germany). The pellets were
suspended in 750 µl bi-distilled water and transferred to microtubes (Treff AG, Degersheim,
Switzerland). The microtubes were frozen at -80°C over night and thawed at 37°C under shaking with
1400 rpm (Thermomixer comfort, Eppendorf, Hechingen, Germany) then 750 µl methanol was added
to the samples. The samples were put on ice for 20 min, shaken at 37°C for 10 min, and spun on an
Eppendorf centrifuge for 3 min at 14000 rpm (5415C, Eppendorf / Dr. Vaudaux AG, Schönenbuch,
Switzerland). The supernatants of the first extraction were transferred into microtubes and stored at
4°C. After adding 750 µl methanol, the cell pellets were disintegrated with 6 pulses of an ultrasonic
disintegrator (Branson Sonifier 250, Model 101-063-197, SKAN AG, Basel, Switzerland, Instrument
settings were: output control: 2, duty cycle: 30%), followed by 5 min on the thermomixer (37°C and
1400 rpm) and centrifugation with the Eppendorf centrifuge at 14000 rpm for 3 min. After an additional
extraction with 750 µl methanol, 5 min shaking on the thermomixer at 37°C, and centrifugation for
3 min at 14000 rpm, the methanolic supernatant of the second extraction was united with its
supernatant of the third extraction. Then, the methanol was evaporated under nitrogen flow. Each
residue was merged with its supernatant of the first methanol- water extraction step on the
thermomixer at 37°C for 3 min. Before the HPLC-analysis, the cell extracts were spun with the
Eppendorf centrifuge for 25 min at 14000 rpm.
4.1.3.7 Drug Extraction out of Transwell Plates
After removal of the Caco-2 cells, the 6-well Transwell plates and the filter inserts were extracted with
methanol to determine the surface bound amount of drug. To the apical compartment 1600 µl
methanol was added, 2800 µl to the basal. The plate was sealed with four layers of Parafilm to avoid
methanol evaporation and incubated at 37°C for 45 min under the incubator hood with a stirring rate of
75 rpm. Samples of 500 µl were taken and diluted 1:1 with distilled water before drug quantification by
HPLC.
Marcel Schneider Page 43 of 172 University of Basel, 2008
4.1.3.8 Production and Characterization of Lipid Containing Drug Dosage
Forms
4.1.3.8.1 Preparation of Liposomes
The liposomes were composed of Lipoid S 100 (soy lecithin, >94% phosphatidylcholine) and Lipoid
EPG (EPG) (egg phosphatidylglycerin-sodium >98%). To prepare drug loaded liposomes, the film
method was used. Lipoid S 100 concentrations were corresponding to the lipid concentrations.
Additionally, the indicated amount of drug and EPG corresponding to 10% (m/m) of the drug mass
were added. Lipoid S100, EPG, and drug were dissolved in ethanol 96% in a round bottomed flask.
The solvent was evaporated to dryness at 40°C and the lipid film was kept under vacuum for 30 min to
eliminate solvent traces. The lipid film was suspended with 20 ml of tempered transport medium. The
suspension was extruded under nitrogen pressure with a filter candle through polycarbonate filters
(Nucleopore track edge membrane filters, Whatman plc, Kent, UK) with descending pore sizes in the
following scheme: 2 x 0.4 µm, 5 x 0.2 µm, and 20 x 0.1 µm. The addition of the drugs and the variable
EPG concentrations had no measurable effect on the size of the liposomes.
4.1.3.8.2 Preparation of Emulsions and Microemulsions
The lipid phase was prepared by mixing the components at 37°C as following: 35.05% (m/m)
triglyceride (Captex 8000), 17.58% (m/m) of a mixture of mono- and diglycerides (Capmul MCM),
36.84% (m/m) surfactant (Cremophor EL), and 10% (m/m) ethanol for the microemulsion and
67% (m/m) Captex 8000, 5% (m/m) Capmul MCM, 18% (m/m) Cremophor EL, and 10% (m/m) ethanol for
the emulsion. The lipid phases were stored at 4°C. The lipid phase was warmed to 37°C before use
and the according amount was balanced and mixed with two thirds of the final transport medium
volume. The formulation was homogenized for 5 min at 15000 rpm with a Polytron homogenizer
(Polytron PT 3000, Kinematica AG, Littau, Switzerland) and preheated transport medium was added
to the final volume.
4.1.3.8.3 Particle Size Measurement
Particle size of the formulations was measured by dynamic light scattering. The z-average diameter of
the liposomes was determined in disposable cuvettes (2 ml sample volume, Greiner Labortechnik,
Kremsmünster, Austria) with a Zetasizer 1000 HSA (Malvern Instruments Ltd, Worcestershire,
England), equipped with a 100 nm lens, at 25°C and a wavelength of 633 nm. A detector angle of 90°
was used. Samples were diluted with sterile filtered transport media (filter pore size 0.2 µm) until
counting rates between 100 and 300 KCts/s were reached. The resulting z-average diameter was the
average out of 5 runs, consisting of 10 measurements each.
The z-average particle size of the emulsions and the microemulsions were measured with a Zetasizer
Nano ZS ZEN 3600 (Malvern Instruments Ltd, Worcestershire, England) in disposable cuvettes
(2.5 ml sample volume, Brand GmbH & Co, Wertheim, Germany) at 37°C. The resulting z-average
diameter was the average out of 3 runs, consisting of 10 measurements each.
Marcel Schneider Page 44 of 172 University of Basel, 2008
4.1.3.9 Equilibrium Dialysis for Free Fraction Determination
The formulations were dialyzed with glass made horizontal diffusion cells with a chamber volume of
10 ml and a membrane surface of approximately 2 cm2. The chambers were separated by a
SpectraPor® 7 regenerated cellulose membrane with a molecular weight cutoff of 50000 D (Spectrum
Labs, DG Breda, Netherlands). To maintain a temperature of 37°C, a water bath was used. The
solutions in the cells were stirred at 1000 rpm with Teflon-paddles driven by a stirring device (Janke &
Kunkel RE162, IKA Labortechnik, Staufen, Germany). The formulations were dialyzed for at least 34-
48 h until equilibrium was reached. At least 5 samples were taken during the experiment. The samples
were analyzed with HPLC. To avoid microbial contamination, resulting in a possible degradation of the
drug or the formulation, 0.5% (m/V) sodium azide was added to the transport media and the
formulations.
Marcel Schneider Page 45 of 172 University of Basel, 2008
4.1.3.10 Theoretical Modeling
4.1.3.10.1 Mathematical Model for the Determination of Drug Absorption
Parameters in Caco-2 Cell Monolayers Including a Term Describing Drug
Partition between Donor, Acceptor, and Cell Compartment
Our group has introduced previously a mathematical model to describe the transport of drug between
the apical, the basal, and the cellular compartment (115). This model enables a direct estimation of
transport parameters from concentration-time profiles. The model takes into account passive
permeation, described by the permeability coefficient P, and carrier mediated efflux described by the
kinetic parameters vmax and K.
An extension of this model including a partition coefficient from formulation to cell is derived in this
section. The model was based on the following assumptions:
1) Three different compartments are considered in which drug concentration varies with time, the
apical, the cellular, and the basal compartment.
2) Drug may move between the apical and the cellular and the basal compartment in both
directions by passive diffusion. Permeation through the apical and the basal cell membrane
may not be symmetrical and is characterized in both cases by a permeability coefficient,
where Pa denotes permeability coefficient of the apical and Pb the permeability coefficient of
the basal membrane. No effect of electrical membrane potential on the transport is
considered.
3) Because of their properties, lipophilic compounds may partition from an aqueous solution into
lipophilic structures such as cell membranes.
4) Drug may be subject to carrier mediated efflux from the cellular to the apical compartment.
This follows saturable kinetics that may be characterized by one global parameter vk, the
carrier mediated efflux rate.
5) No two different orientations or conformations of the carrier at the two faces of the membrane
are explicitly involved, the drug concentration in the apical compartment does not influence
efflux transport and the entire mass of drug present in the cellular compartment is substrate of
the transporter.
6) The total mass of drug in the three compartments is preserved.
The substance flux J of a drug from the apical compartment to the cellular compartment through the
apical cell membrane in apical to basal direction can be described as
h
ccD
h
ccD
dx
dcDJ mmmm 2112 −
=−
−=−=
Equation 10
where D is the diffusion coefficient of the compound in the membrane, cm1 the concentration of the
compound at the outer membrane surface [µM], cm2 the concentration of the compound at the inner
Marcel Schneider Page 46 of 172 University of Basel, 2008
membrane surface and h the membrane thickness. The partition coefficient between cell membrane
and apical compartment (Km/a) of a drug is defined as
amK
c
c
a
m =1
Equation 11
where ca denotes apical total concentration. The partition coefficient between apical cell membrane
and cell lumen (Km/C) of a drug is defined as
CmK
c
c
c
m =2
Equation 12
where cc denotes the cellular concentration of the drug, which is homogeneous in the cellular
compartment. Equation 11 and Equation 12 were solved after cm1 and cm2 and were inserted in
Equation 10:
−=
−=
−= caaca
cac
K
KcPc
K
Kc
h
DK
h
cKcKDJ
am
Cm
am
Cm
am
Cm
am
Equation 13
In Equation 13, Pa denotes the apparent permeability coefficient of the apical membrane. If the apical
compartment is identical with the cellular compartment it follows out of Equation 13 that the ratio of the
partition coefficient between cell membrane and apical compartment and partition coefficient between
apical cell membrane and cell lumen is 1. It follows:
( )caa ccPJ −=
Equation 14
If apical compartment and cellular compartment are not identical it follows out of Equation 13 that the
partition coefficient between cell membrane and apical compartment and the partition coefficient
between apical cell membrane and cell lumen are different. Because the membrane is the same for
both partition coefficients, formulation-to-cell partition coefficient Ka/C is defined as
Ca
am
Cm
KK
K=
Equation 15
It follows, out of Equation 13, that the flux of a compound from apical to cellular compartment is:
)( caa cKcPJC
a−=
Equation 16
The substance flux of a drug from the cellular compartment to the basal compartment through the
basal cell membrane in apical to basal direction can be described as:
Marcel Schneider Page 47 of 172 University of Basel, 2008
h
ccDJ mm 34 −
−=
Equation 17
In Equation 17, D is the diffusion coefficient of the compound, cm3 the concentration of the compound
at the inner cellular surface of the basal membrane [µM], cm4 the concentration of the compound at the
outer membrane surface of basal membrane and h the membrane thickness. The partition coefficient
of a drug between cell lumen and basal membrane (Km/C) is defined as
CmK
c
c
c
m =3
Equation 18
whereas partition of a drug between basal membrane and basal compartment (Km/b) is defined as
bmK
c
c
b
m =4
Equation 19
Equation 18 and Equation 19 were solved after cm3 and cm4 and were inserted in Equation 17
( )bcbbcbbc
bcccKPcc
K
KPcc
K
K
h
KD
h
cKcKDJ
Cb
bm
Cm
bm
Cm
bm
bm
Cm
−=
−=
−
⋅=
−=
Equation 20
In Equation 20, Pb denotes the apparent permeability coefficient of the basal membrane for
non-identical cellular and basal compartment. Since the apical and the basal compartment are always
identically composed regarding lipid formulation, it follows:
Cb
Ca KK =
Equation 21
In Equation 16 and Equation 20, the partition coefficient Ka/C is not related to the permeability
coefficient but depends on the composition of the media in apical and basal compartment. Pa
describes the entire passive transport process between apical compartment and cellular compartment
and Pb the entire passive transport process between cellular and basal compartment. These
parameters are independent of the direction of the permeation according to the formal definition.
Because of different membrane composition (expressed in different partition coefficients between cell
membrane and compartment), different thickness of the cellular membranes, and different thickness of
diffusion boundary layer, Pa and Pb may be different. The derivation in the basal to apical direction is
analogous.
Equation 16 and Equation 20 were implemented into the mathematical model to describe the transport
of drug between the apical, the basal, and the cellular compartment. The resulting extended model
allows a direct estimation of relevant transport parameters out of concentration-time profiles. These
parameters are apparent passive permeation over the apical and basal membrane denoted by the
Marcel Schneider Page 48 of 172 University of Basel, 2008
permeation coefficients Pa and Pb, carrier mediated apical efflux rate expressed by the simplified zero
order parameter vk, and formulation-to-cell partition coefficient Ka/C. The apical and the basal
compartment were containing the same formulation, except for the drug which was added only to the
donor compartment according to the transport direction, resulting in the same drug partition between
apical and cellular compartment and between basal and cellular compartment denoted both by the
formulation-to-cell partition coefficient Ka/C.
The model encompasses the following equations:
apical to basal direction
( )a
mk
a
mcABaABa
aAB
V
Sv
V
ScKcP
dt
dcC
a *** +⋅−−=
Equation 22 Change of concentration in apical compartment
b
mbABcABb
bAB
V
SccKP
dt
dcC
a *)(* −⋅=
Equation 23 Change of concentration in basal compartment
mbABcABbmkmcABaABacAB SccKPSvScKcP
dt
dmC
aC
a *)(***)(* −⋅−−⋅−=
Equation 24 Change of mass in cellular compartment
basal to apical direction
a
mk
a
maBAcBAa
aBA
V
Sv
V
SccKP
dt
dcC
a **)(* +−⋅=
Equation 25 Change of concentration in apical compartment
b
mcBAbBAb
bBA
V
ScKcP
dt
dcC
a *)(* ⋅−−=
Equation 26 Change of concentration in basal compartment
mkmaBAcBAamcBAbBAbcBA SvSccKPScKcP
dt
dmC
aC
a **)(**)(* −−⋅−⋅−=
Equation 27 Change of mass in cellular compartment
The molar concentration [µM] in Equation 22 to Equation 27 is denoted by c. The indices a, b, and c
denote the apical, basal, and cellular compartment. Indices AB and BA denote the transport direction
apical to basal and basal to apical, respectively. Pa is the apparent permeability coefficient [cm*min-1]
of the apical membrane, Pb the apparent permeability coefficient [cm*min-1] of the basal membrane.
These permeation coefficients were apparent because they summarize permeation through diffusion
boundary layer and through the cellular membrane. Sm denotes the cell monolayer surface area [cm2],
Marcel Schneider Page 49 of 172 University of Basel, 2008
V the compartment volume [ml], Ka/C the partition coefficient of a compound between formulation and
cell compartment, and vk [nmol*cm-2*min-1] carrier mediated apical efflux rate.
cAB
cAB
kmK
mvv
+=
*max
Equation 28
The carrier mediated apical efflux rate is described by the kinetic parameters vmax and K and depends
on the molar amount of drug in the cellular compartment, which is denoted as mcAB or mcBA [nmol]. A
cell monolayer volume of 0.00094 ml was used based on a monolayer thickness of 20 µm to calculate
cellular drug concentrations.
The reduction of the solution volume in the apical and the basal compartment due to sampling as a
function of time was accounted for by the following relations that were determined empirically using
regression analysis.
3826
)0( 10247.1108457.90029681.0 tttVV ⋅⋅−⋅⋅+⋅−= −−
Equation 29
3825
)0( 100985.21063953.10042.0 tttVV ⋅⋅−⋅⋅+⋅−= −−
Equation 30
Where V(0) is volume of the respective compartment at time zero and t the time [min]. Equation 29
applies to both compartments to a sampling volume of 50 µl over 5 h, Equation 30 applies to both
compartments to a sampling volume of 50 µl over 3 h.

Marcel Schneider Page 50 of 172 University of Basel, 2008
4.1.3.10.2 Delineating the Components of Apparent Permeability Coefficient
Based on a Biophysical Model
For understanding the mechanism that considers contribution of individual processes to drug
permeation influenced by lipid containing drug formulations, contributions were expressed
quantitatively by permeability coefficients. The relationship between individual permeability coefficients
and measured apparent permeability coefficients was established based on a developed biophysical
model that describes the overall process. A schematic overview of the model is given in Figure 4.
Figure 4 Biophysical model of a drug flux over a Caco-2 cell membrane from donor compartment containing lipid particles to cellular lumen.
This model is based on the following assumptions:
1) Diffusional transport of free drug molecules and lipid particles takes place in solution adjacent
to cell membrane. Kinetics of this transport is expressed by permeability coefficient of diffusion
boundary layer.
2) Unbound drug molecules permeate through the cell monolayer.
3) Lipid particles do not permeate through the cell monolayer.
4) If lipid particles collide with the cell membrane, direct drug transfer from lipid particles to the
cell membrane may take place.
5) The free fraction of a drug is dependent on lipid concentration and is independent of drug
concentration except concentrations reaching saturation.
Substance fluxes are defined by flux through cell membrane Jm (Equation 31) and flux through
diffusion boundary layer JDBL (Equation 32):
)c(ch
DJ mm,
m
mm 2,1 −=
Equation 31
Marcel Schneider Page 51 of 172 University of Basel, 2008
where hm denotes thickness of cell membrane, Dm diffusion coefficient of drug in cell membrane, cm,1
drug concentration at outer cell membrane surface inside of the membrane, cm,2 drug concentration at
inner membrane surface inside of the membrane.
( ) ( )L,mL
DBL
w,L
w,mw
DBL
w,d
DBL cch
Dcc
h
DJ −+−⋅=
Equation 32
The flux through diffusion boundary layer is composed of the flux of the free drug molecules and the
flux of the lipid particles, where cw,m denotes drug concentration of the water phase at membrane
surface, cL drug concentration associated with lipid phase referring to total volume, cL,m drug
concentration associated with lipid phase referring to total volume at membrane surface, cw drug
concentration in water phase, hDBL thickness of diffusion boundary layer, Dw,d the diffusion coefficient
of drug in water phase, and Dw,L diffusion coefficient of lipid particle in water phase.
The free fraction (z) of a drug is defined as ratio of drug concentration in the water phase (cw) of the
formulation to the total drug concentration in the formulation denoted by ctot:
zc
c
tot
w =
Equation 33
Substitutions that were used to replace unknown parameters are shown in Equation 34 to Equation
37:
w,L
w,d
D
Dq =
Equation 34
q is defined as ratio of diffusion coefficient of drug in water phase (Dw,d) to diffusion coefficient of lipid
particle in water phase (Dw,L).
tot
w
V
VVF =
Equation 35
The volume fraction VF is defined as ratio of the volume of the water phase (Vw) to the volume of the
formulation (Vtot). Because lipid phase concentrations were low in performed cell permeation
experiments, 1-VF was assumed to be the ratio of the amount of lipid phase [g] to the volume of
aqueous phase [ml].
The mass of drug in lipid phase (mL) was assumed to be the total mass of drug (mtot) minus the mass
of drug in water phase (mw). This was used to express cL with ctot and cw.
VFccV
Vcc
V
VcVc
V
mm
V
mc wtot
tot
wwtot
tot
wwtottot
tot
wtot
tot
LL −=−=
−=
−==
Equation 36
Marcel Schneider Page 52 of 172 University of Basel, 2008
Equation 36 applies to bulk, and with indices m (e.g. cw,m) at cell membrane surface.
The unknown drug concentration at cell membrane surface inside the membrane (cm,1) was
substituted by the following equation:
Lm
wm KcKcc mLmwm ⋅+⋅= ,,1,
Equation 37
where Km/w denotes the partition coefficient of the free drug between aqueous phase and membrane
and Km/L denotes the partition coefficient between lipid associated drug in solution and cell membrane.
Inserting Equation 37 into Equation 31 and rearranging yields:
c
m
m
L,mm,Lw,mm,dm,
m
m
L,m
m
m
w,m
m
m
m,L,mw,m
m
m
mm,
m
m
m
cKh
DcPcPc
h
Dc
h
KDc
h
KD
)cKcK(ch
D)c(c
h
DJ
cm
Lm
wm
Lm
wm
⋅−⋅+⋅=−⋅
+⋅
=
−⋅+⋅=−=
2
22,1
Equation 38
In Equation 38 denotes Pm,d the permeability coefficient of the free drug through cell monolayer, Pm,L
the permeability coefficient of the drug because of direct drug transfer from lipid particle to the cell
membrane, cc cellular drug concentration and Km/c the partition coefficient between cellular drug
concentration and cell membrane.
Inserting Equation 33 and Equation 36 into Equation 38 and rearranging yields:
cc
m
m
mm,L
m,L
m,dw,mm cKh
DVFP
z
PPcJ ⋅−
⋅−+=
Equation 39
Inserting Equation 34 into Equation 32 and rearranging yields:
( )L,mLw,mw
dbl,d
DBL ccqcqcq
PJ −+−⋅=
Equation 40
where Pdbl,d denotes the permeability coefficient of the free drug through diffusion boundary layer.
At steady state fluxes are set equal ( DBLm JJ = ), Equation 33 and Equation 36 were inserted and the
resulting equation was rearranged and solved for the unknown concentration cw,m.
( )[ ]cw,mmtotLmmwdmw,mmtotwtotw,mtot
dbl,dcKVFccPcPVFccVFccqcqzc
q
P
cm ⋅−−⋅+⋅=−−⋅−+−⋅
m
m
hD
)((,,,,,
Equation 41
Marcel Schneider Page 53 of 172 University of Basel, 2008
( )
−++⋅−+
⋅+⋅−+⋅
=
VFz
PVFP
z
PP
cKh
DVFzqzc
q
P
cdbl,d
Lm
Lm
dm
c
m
mtot
dbl,d
mw
cm
1
1
,
,
,
,
Equation 42
Equation 42 was inserted into Equation 39. Transformation of this equation after insertion resulted in:
−++
⋅−+
⋅−
⋅−+⋅⋅
−+
=
VFz
PVFP
z
PP
cKh
DVFP
z
PPzcVF
zq
q
P
mJ
dbl,d
m,L
m,L
m,d
cc
m
m
mm,L
Lm
m,dtot
dbl,d
1
1 ,
Equation 43
Assuming for the sake of simplicity sink conditions on the receiver (cell) side and setting cc to zero and
dividing Equation 43 by ctot, it follows:
−++
⋅−+
⋅−+⋅
−+
=
VFz
PVFP
z
PP
VFPz
PPVF
zqz
q
P
Pdbl,d
m,L
m,L
m,d
m,L
Lm
m,d
dbl,d
1
1 ,
Equation 44
Conversion of this formula leads to the following equation:
( )
⋅−+
+
⋅−+⋅⋅
=
VFPz
PPzVFzzq
q
PPm,L
m,L
m,d
dbl,d
1
1
11
Equation 45
In Equation 32 was assumed that thickness of diffusion boundary layer (hDBL) is the same for free drug
molecules and lipid particles. However, based on hydrodynamics of lipid particles and the aqueous
solubilized drug, hDBL is proportional to D1/3 (119). Therefore, it follows for the ratio of diffusion
boundary layer thicknesses:
31
31
,
,
,
,q
D
D
h
h
Lw
dw
LDBL
dDBL=
=
Equation 46
Where hDBL,d is the thickness of diffusion boundary layer of the unbound drug and hDBL,L the thickness
of diffusion boundary layer of the lipid particles in water phase.
Accordingly, for the ratio of diffusion coefficient of the lipid particle in water phase to thickness of
diffusion boundary layer of the lipid particles holds:
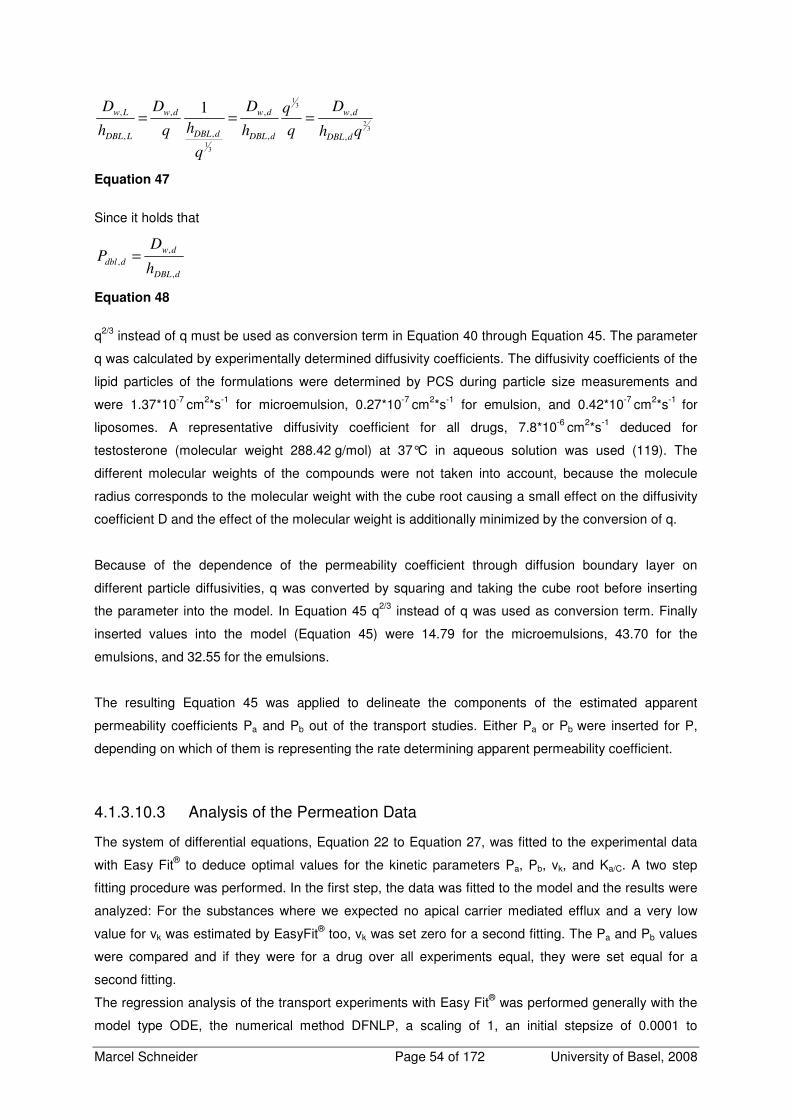
Marcel Schneider Page 54 of 172 University of Basel, 2008
32
31
31
,
,
,
,
,
,
,
, 1
qh
D
q
q
h
D
q
hq
D
h
D
dDBL
dw
dDBL
dw
dDBL
dw
LDBL
Lw ===
Equation 47
Since it holds that
dDBL
dw
ddblh
DP
,
,
, =
Equation 48
q2/3 instead of q must be used as conversion term in Equation 40 through Equation 45. The parameter
q was calculated by experimentally determined diffusivity coefficients. The diffusivity coefficients of the
lipid particles of the formulations were determined by PCS during particle size measurements and
were 1.37*10-7 cm2*s-1 for microemulsion, 0.27*10-7 cm2*s-1 for emulsion, and 0.42*10-7 cm2*s-1 for
liposomes. A representative diffusivity coefficient for all drugs, 7.8*10-6 cm2*s-1 deduced for
testosterone (molecular weight 288.42 g/mol) at 37°C in aqueous solution was used (119). The
different molecular weights of the compounds were not taken into account, because the molecule
radius corresponds to the molecular weight with the cube root causing a small effect on the diffusivity
coefficient D and the effect of the molecular weight is additionally minimized by the conversion of q.
Because of the dependence of the permeability coefficient through diffusion boundary layer on
different particle diffusivities, q was converted by squaring and taking the cube root before inserting
the parameter into the model. In Equation 45 q2/3 instead of q was used as conversion term. Finally
inserted values into the model (Equation 45) were 14.79 for the microemulsions, 43.70 for the
emulsions, and 32.55 for the emulsions.
The resulting Equation 45 was applied to delineate the components of the estimated apparent
permeability coefficients Pa and Pb out of the transport studies. Either Pa or Pb were inserted for P,
depending on which of them is representing the rate determining apparent permeability coefficient.
4.1.3.10.3 Analysis of the Permeation Data
The system of differential equations, Equation 22 to Equation 27, was fitted to the experimental data
with Easy Fit® to deduce optimal values for the kinetic parameters Pa, Pb, vk, and Ka/C. A two step
fitting procedure was performed. In the first step, the data was fitted to the model and the results were
analyzed: For the substances where we expected no apical carrier mediated efflux and a very low
value for vk was estimated by EasyFit® too, vk was set zero for a second fitting. The Pa and Pb values
were compared and if they were for a drug over all experiments equal, they were set equal for a
second fitting.
The regression analysis of the transport experiments with Easy Fit® was performed generally with the
model type ODE, the numerical method DFNLP, a scaling of 1, an initial stepsize of 0.0001 to
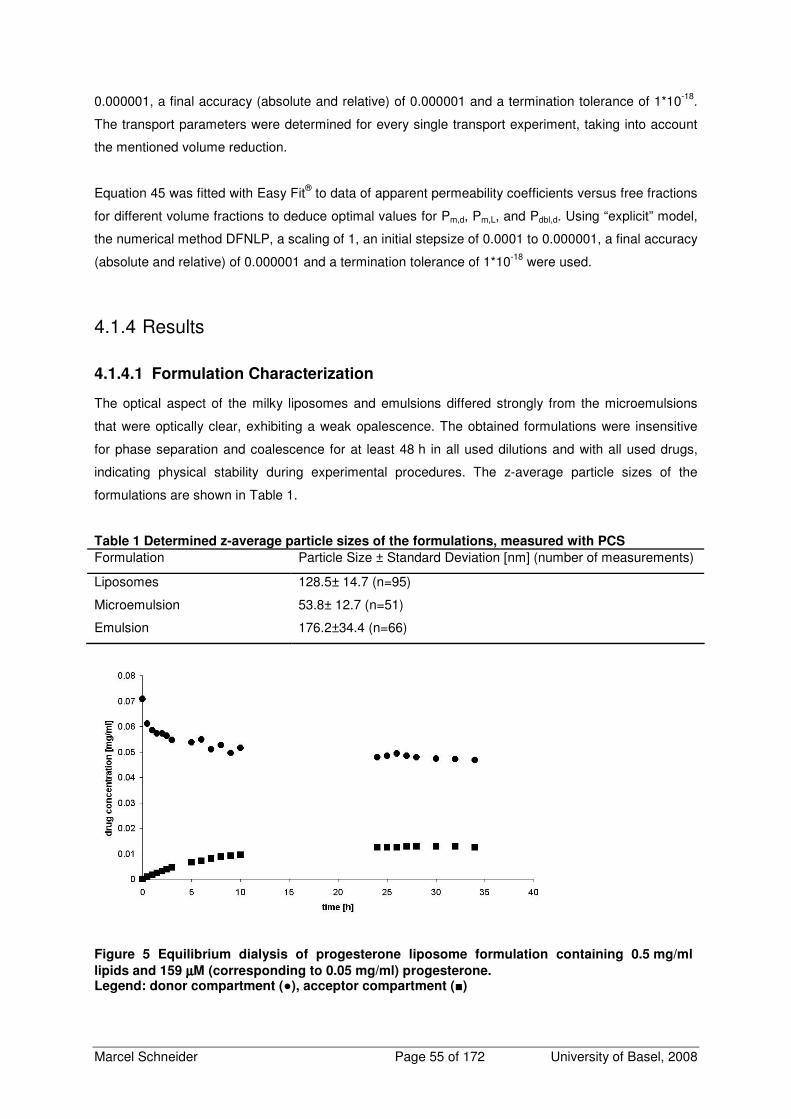
Marcel Schneider Page 55 of 172 University of Basel, 2008
0.000001, a final accuracy (absolute and relative) of 0.000001 and a termination tolerance of 1*10-18.
The transport parameters were determined for every single transport experiment, taking into account
the mentioned volume reduction.
Equation 45 was fitted with Easy Fit® to data of apparent permeability coefficients versus free fractions
for different volume fractions to deduce optimal values for Pm,d, Pm,L, and Pdbl,d. Using “explicit” model,
the numerical method DFNLP, a scaling of 1, an initial stepsize of 0.0001 to 0.000001, a final accuracy
(absolute and relative) of 0.000001 and a termination tolerance of 1*10-18 were used.
4.1.4 Results
4.1.4.1 Formulation Characterization
The optical aspect of the milky liposomes and emulsions differed strongly from the microemulsions
that were optically clear, exhibiting a weak opalescence. The obtained formulations were insensitive
for phase separation and coalescence for at least 48 h in all used dilutions and with all used drugs,
indicating physical stability during experimental procedures. The z-average particle sizes of the
formulations are shown in Table 1.
Table 1 Determined z-average particle sizes of the formulations, measured with PCS
Formulation Particle Size ± Standard Deviation [nm] (number of measurements)
Liposomes 128.5± 14.7 (n=95)
Microemulsion 53.8± 12.7 (n=51)
Emulsion 176.2±34.4 (n=66)
Figure 5 Equilibrium dialysis of progesterone liposome formulation containing 0.5 mg/ml
lipids and 159 µµµµM (corresponding to 0.05 mg/ml) progesterone. Legend: donor compartment (), acceptor compartment ()
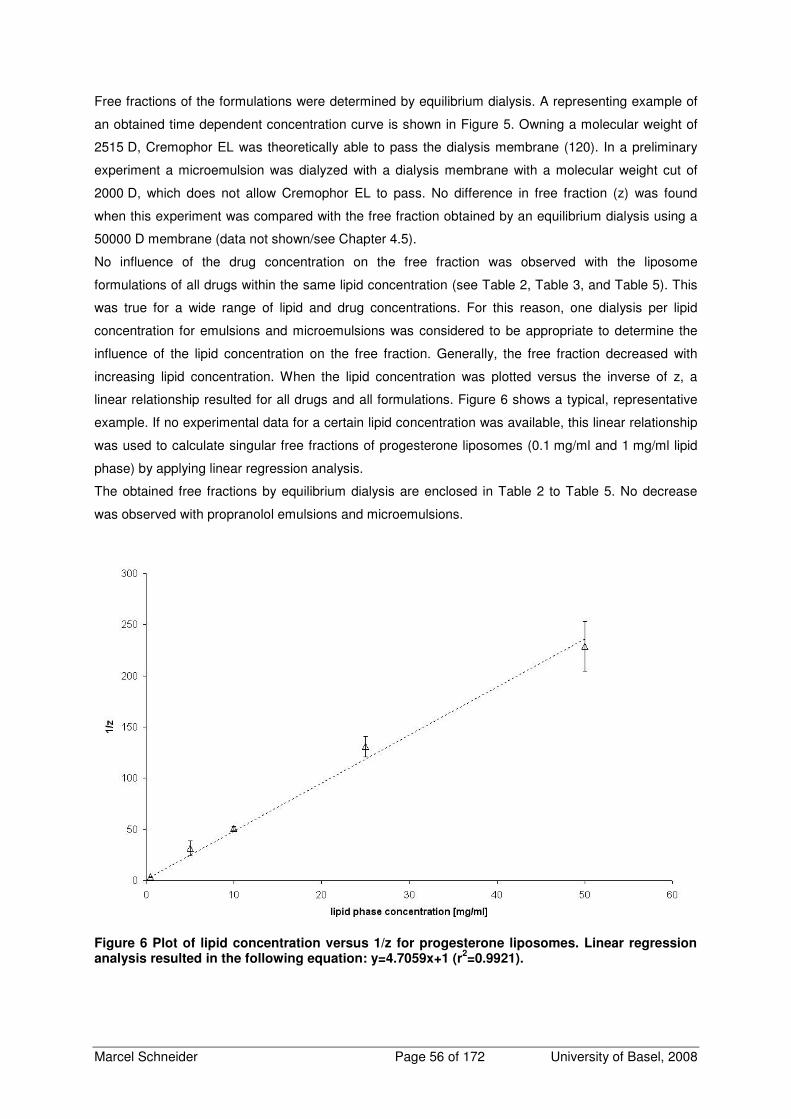
Marcel Schneider Page 56 of 172 University of Basel, 2008
Free fractions of the formulations were determined by equilibrium dialysis. A representing example of
an obtained time dependent concentration curve is shown in Figure 5. Owning a molecular weight of
2515 D, Cremophor EL was theoretically able to pass the dialysis membrane (120). In a preliminary
experiment a microemulsion was dialyzed with a dialysis membrane with a molecular weight cut of
2000 D, which does not allow Cremophor EL to pass. No difference in free fraction (z) was found
when this experiment was compared with the free fraction obtained by an equilibrium dialysis using a
50000 D membrane (data not shown/see Chapter 4.5).
No influence of the drug concentration on the free fraction was observed with the liposome
formulations of all drugs within the same lipid concentration (see Table 2, Table 3, and Table 5). This
was true for a wide range of lipid and drug concentrations. For this reason, one dialysis per lipid
concentration for emulsions and microemulsions was considered to be appropriate to determine the
influence of the lipid concentration on the free fraction. Generally, the free fraction decreased with
increasing lipid concentration. When the lipid concentration was plotted versus the inverse of z, a
linear relationship resulted for all drugs and all formulations. Figure 6 shows a typical, representative
example. If no experimental data for a certain lipid concentration was available, this linear relationship
was used to calculate singular free fractions of progesterone liposomes (0.1 mg/ml and 1 mg/ml lipid
phase) by applying linear regression analysis.
The obtained free fractions by equilibrium dialysis are enclosed in Table 2 to Table 5. No decrease
was observed with propranolol emulsions and microemulsions.
Figure 6 Plot of lipid concentration versus 1/z for progesterone liposomes. Linear regression analysis resulted in the following equation: y=4.7059x+1 (r
2=0.9921).
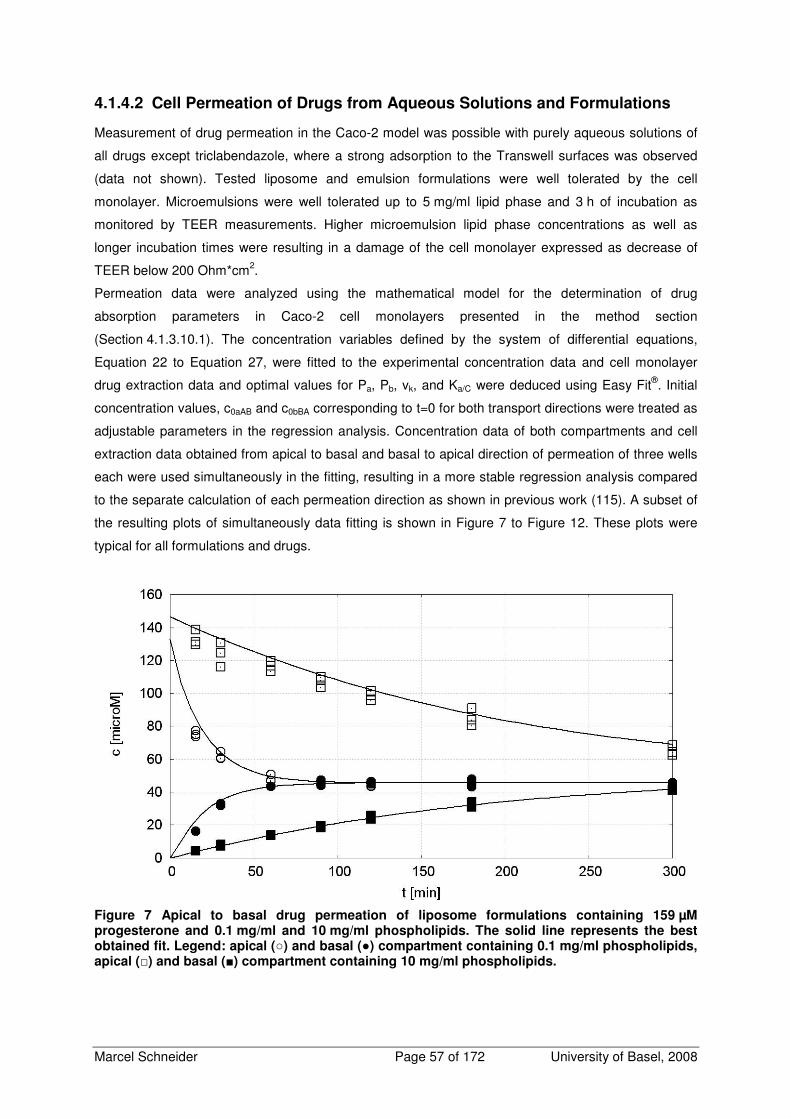
Marcel Schneider Page 57 of 172 University of Basel, 2008
4.1.4.2 Cell Permeation of Drugs from Aqueous Solutions and Formulations
Measurement of drug permeation in the Caco-2 model was possible with purely aqueous solutions of
all drugs except triclabendazole, where a strong adsorption to the Transwell surfaces was observed
(data not shown). Tested liposome and emulsion formulations were well tolerated by the cell
monolayer. Microemulsions were well tolerated up to 5 mg/ml lipid phase and 3 h of incubation as
monitored by TEER measurements. Higher microemulsion lipid phase concentrations as well as
longer incubation times were resulting in a damage of the cell monolayer expressed as decrease of
TEER below 200 Ohm*cm2.
Permeation data were analyzed using the mathematical model for the determination of drug
absorption parameters in Caco-2 cell monolayers presented in the method section
(Section 4.1.3.10.1). The concentration variables defined by the system of differential equations,
Equation 22 to Equation 27, were fitted to the experimental concentration data and cell monolayer
drug extraction data and optimal values for Pa, Pb, vk, and Ka/C were deduced using Easy Fit®. Initial
concentration values, c0aAB and c0bBA corresponding to t=0 for both transport directions were treated as
adjustable parameters in the regression analysis. Concentration data of both compartments and cell
extraction data obtained from apical to basal and basal to apical direction of permeation of three wells
each were used simultaneously in the fitting, resulting in a more stable regression analysis compared
to the separate calculation of each permeation direction as shown in previous work (115). A subset of
the resulting plots of simultaneously data fitting is shown in Figure 7 to Figure 12. These plots were
typical for all formulations and drugs.
Figure 7 Apical to basal drug permeation of liposome formulations containing 159 µM progesterone and 0.1 mg/ml and 10 mg/ml phospholipids. The solid line represents the best obtained fit. Legend: apical () and basal () compartment containing 0.1 mg/ml phospholipids, apical () and basal () compartment containing 10 mg/ml phospholipids.
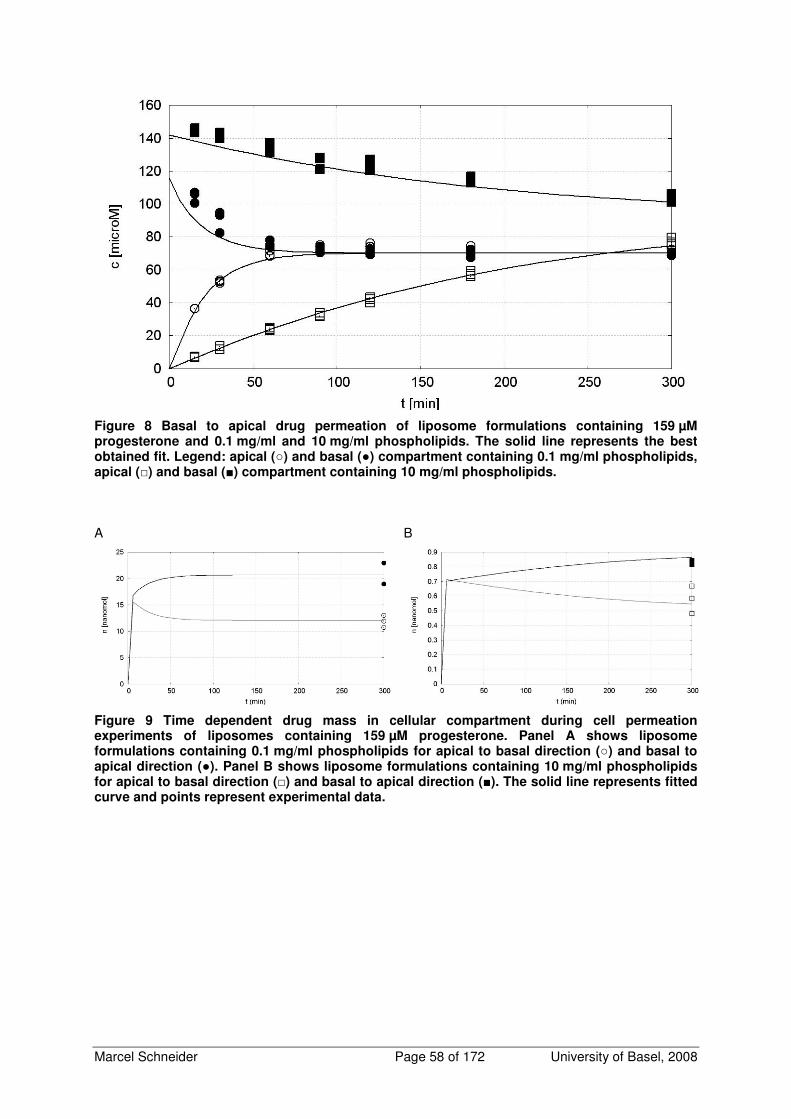
Marcel Schneider Page 58 of 172 University of Basel, 2008
Figure 8 Basal to apical drug permeation of liposome formulations containing 159 µM progesterone and 0.1 mg/ml and 10 mg/ml phospholipids. The solid line represents the best obtained fit. Legend: apical () and basal () compartment containing 0.1 mg/ml phospholipids, apical () and basal () compartment containing 10 mg/ml phospholipids.
A
B
Figure 9 Time dependent drug mass in cellular compartment during cell permeation experiments of liposomes containing 159 µM progesterone. Panel A shows liposome formulations containing 0.1 mg/ml phospholipids for apical to basal direction () and basal to apical direction (). Panel B shows liposome formulations containing 10 mg/ml phospholipids for apical to basal direction () and basal to apical direction (). The solid line represents fitted curve and points represent experimental data.

Marcel Schneider Page 59 of 172 University of Basel, 2008
Figure 10 Apical to basal drug permeation of liposome formulations containing 63 µM triclabendazole and 0.1 mg/ml, 1 mg/ml, and 10 mg/ml phospholipids. The solid line represents the best obtained fit. Legend: apical () and basal () compartment containing 0.1 mg/ml
phospholipids , apical (∇∇∇∇) and basal (x) compartment containing 1 mg/ml phospholipids apical () and basal () compartment containing 10 mg/ml phospholipids.
Figure 11 Basal to apical drug permeation of liposome formulations containing 63 µM triclabendazole and 0.1 mg/ml, 1 mg/ml, and 10 mg/ml phospholipids. The solid line represents the best obtained fit. Legend: apical () and basal () compartment containing 0.1 mg/ml
phospholipids, apical (∇∇∇∇) and basal (x) compartment containing 1 mg/ml phospholipids apical () and basal () compartment containing 10 mg/ml phospholipids
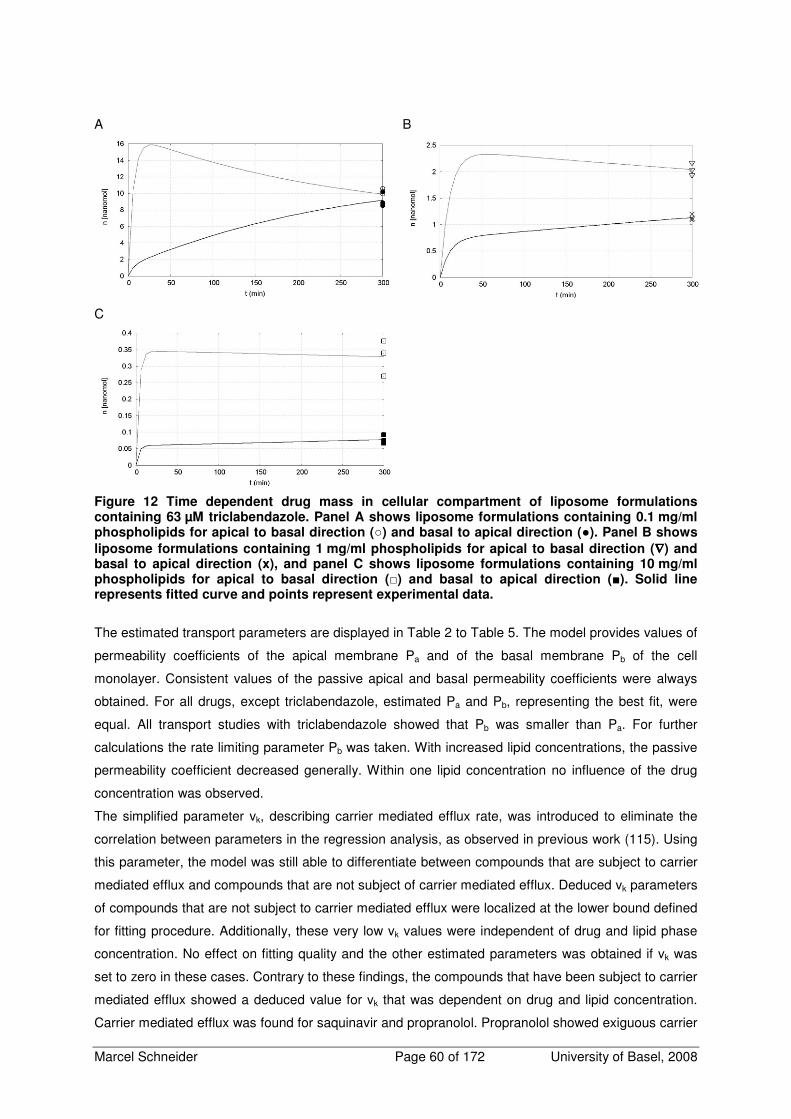
Marcel Schneider Page 60 of 172 University of Basel, 2008
A B
C
Figure 12 Time dependent drug mass in cellular compartment of liposome formulations containing 63 µM triclabendazole. Panel A shows liposome formulations containing 0.1 mg/ml phospholipids for apical to basal direction () and basal to apical direction (). Panel B shows
liposome formulations containing 1 mg/ml phospholipids for apical to basal direction (∇∇∇∇) and basal to apical direction (x), and panel C shows liposome formulations containing 10 mg/ml phospholipids for apical to basal direction () and basal to apical direction (). Solid line represents fitted curve and points represent experimental data.
The estimated transport parameters are displayed in Table 2 to Table 5. The model provides values of
permeability coefficients of the apical membrane Pa and of the basal membrane Pb of the cell
monolayer. Consistent values of the passive apical and basal permeability coefficients were always
obtained. For all drugs, except triclabendazole, estimated Pa and Pb, representing the best fit, were
equal. All transport studies with triclabendazole showed that Pb was smaller than Pa. For further
calculations the rate limiting parameter Pb was taken. With increased lipid concentrations, the passive
permeability coefficient decreased generally. Within one lipid concentration no influence of the drug
concentration was observed.
The simplified parameter vk, describing carrier mediated efflux rate, was introduced to eliminate the
correlation between parameters in the regression analysis, as observed in previous work (115). Using
this parameter, the model was still able to differentiate between compounds that are subject to carrier
mediated efflux and compounds that are not subject of carrier mediated efflux. Deduced vk parameters
of compounds that are not subject to carrier mediated efflux were localized at the lower bound defined
for fitting procedure. Additionally, these very low vk values were independent of drug and lipid phase
concentration. No effect on fitting quality and the other estimated parameters was obtained if vk was
set to zero in these cases. Contrary to these findings, the compounds that have been subject to carrier
mediated efflux showed a deduced value for vk that was dependent on drug and lipid concentration.
Carrier mediated efflux was found for saquinavir and propranolol. Propranolol showed exiguous carrier
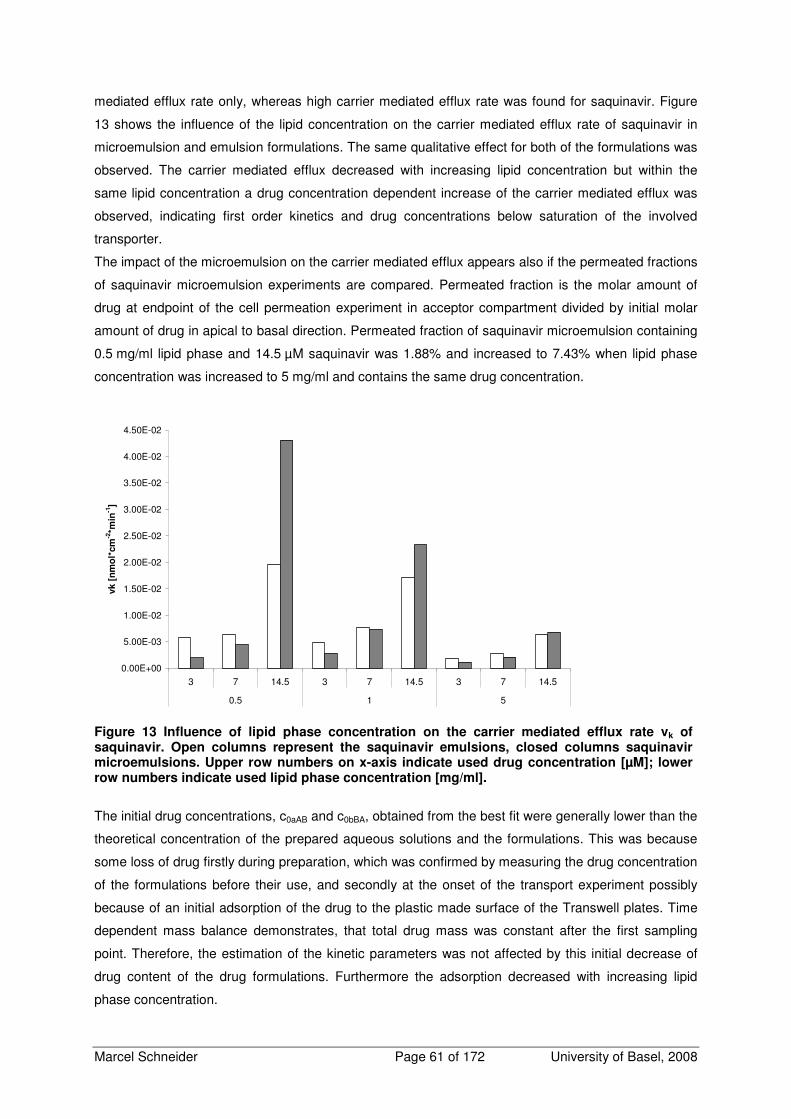
Marcel Schneider Page 61 of 172 University of Basel, 2008
mediated efflux rate only, whereas high carrier mediated efflux rate was found for saquinavir. Figure
13 shows the influence of the lipid concentration on the carrier mediated efflux rate of saquinavir in
microemulsion and emulsion formulations. The same qualitative effect for both of the formulations was
observed. The carrier mediated efflux decreased with increasing lipid concentration but within the
same lipid concentration a drug concentration dependent increase of the carrier mediated efflux was
observed, indicating first order kinetics and drug concentrations below saturation of the involved
transporter.
The impact of the microemulsion on the carrier mediated efflux appears also if the permeated fractions
of saquinavir microemulsion experiments are compared. Permeated fraction is the molar amount of
drug at endpoint of the cell permeation experiment in acceptor compartment divided by initial molar
amount of drug in apical to basal direction. Permeated fraction of saquinavir microemulsion containing
0.5 mg/ml lipid phase and 14.5 µM saquinavir was 1.88% and increased to 7.43% when lipid phase
concentration was increased to 5 mg/ml and contains the same drug concentration.
0.00E+00
5.00E-03
1.00E-02
1.50E-02
2.00E-02
2.50E-02
3.00E-02
3.50E-02
4.00E-02
4.50E-02
3 7 14.5 3 7 14.5 3 7 14.5
0.5 1 5
vk
[n
mo
l*cm
-2*m
in-1
]
Figure 13 Influence of lipid phase concentration on the carrier mediated efflux rate vk of saquinavir. Open columns represent the saquinavir emulsions, closed columns saquinavir microemulsions. Upper row numbers on x-axis indicate used drug concentration [µM]; lower row numbers indicate used lipid phase concentration [mg/ml].
The initial drug concentrations, c0aAB and c0bBA, obtained from the best fit were generally lower than the
theoretical concentration of the prepared aqueous solutions and the formulations. This was because
some loss of drug firstly during preparation, which was confirmed by measuring the drug concentration
of the formulations before their use, and secondly at the onset of the transport experiment possibly
because of an initial adsorption of the drug to the plastic made surface of the Transwell plates. Time
dependent mass balance demonstrates, that total drug mass was constant after the first sampling
point. Therefore, the estimation of the kinetic parameters was not affected by this initial decrease of
drug content of the drug formulations. Furthermore the adsorption decreased with increasing lipid
phase concentration.
Marcel Schneider Page 62 of 172 University of Basel, 2008
Estimated drug mass in the cellular compartment obtained from model simulation was the same at the
endpoint of the experiment as the drug mass determined by cell extraction. The introduction of Ka/C,
the formulation-to-cell partition coefficient, improved the fitting quality. Without this coefficient, the drug
mass in cellular compartment obtained from model simulation was systematically much lower than the
drug mass measured by cell extraction. Simultaneous increase of Ka/C with increasing lipid phase
concentration was observed indicating that the lipophilic drugs remain in the formulation rather than
diffusing out of the lipid particles to cross the cell monolayer. No systematic effect of the drug
concentration on Ka/C was observed.
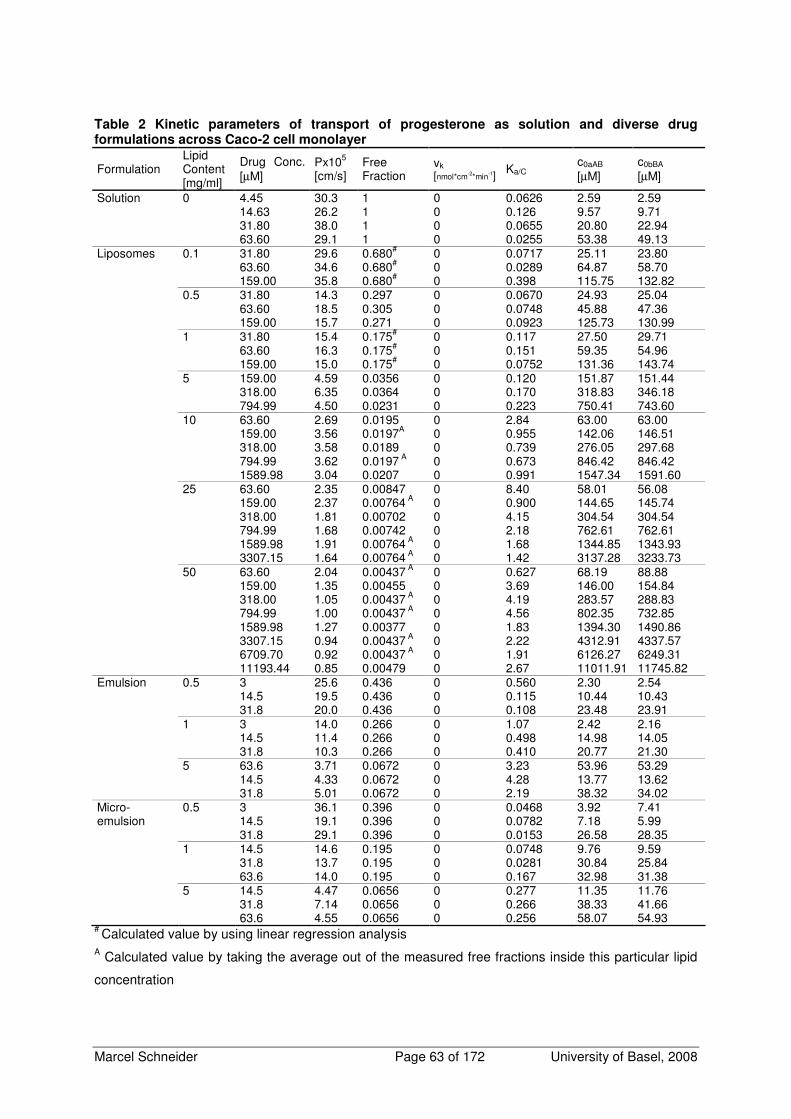
Marcel Schneider Page 63 of 172 University of Basel, 2008
Table 2 Kinetic parameters of transport of progesterone as solution and diverse drug formulations across Caco-2 cell monolayer
Formulation Lipid Content [mg/ml]
Drug Conc. [µM]
Px105 [cm/s]
Free Fraction
vk [nmol*cm-2*min-1] Ka/C
c0aAB [µM]
c0bBA [µM]
Solution 0 4.45 30.3 1 0 0.0626 2.59 2.59 14.63 26.2 1 0 0.126 9.57 9.71 31.80 38.0 1 0 0.0655 20.80 22.94 63.60 29.1 1 0 0.0255 53.38 49.13 Liposomes 0.1 31.80 29.6 0.680# 0 0.0717 25.11 23.80 63.60 34.6 0.680# 0 0.0289 64.87 58.70 159.00 35.8 0.680# 0 0.398 115.75 132.82 0.5 31.80 14.3 0.297 0 0.0670 24.93 25.04 63.60 18.5 0.305 0 0.0748 45.88 47.36 159.00 15.7 0.271 0 0.0923 125.73 130.99 1 31.80 15.4 0.175# 0 0.117 27.50 29.71 63.60 16.3 0.175# 0 0.151 59.35 54.96 159.00 15.0 0.175# 0 0.0752 131.36 143.74 5 159.00 4.59 0.0356 0 0.120 151.87 151.44 318.00 6.35 0.0364 0 0.170 318.83 346.18 794.99 4.50 0.0231 0 0.223 750.41 743.60 10 63.60 2.69 0.0195 0 2.84 63.00 63.00 159.00 3.56 0.0197A 0 0.955 142.06 146.51 318.00 3.58 0.0189 0 0.739 276.05 297.68 794.99 3.62 0.0197 A 0 0.673 846.42 846.42 1589.98 3.04 0.0207 0 0.991 1547.34 1591.60 25 63.60 2.35 0.00847 0 8.40 58.01 56.08 159.00 2.37 0.00764 A 0 0.900 144.65 145.74 318.00 1.81 0.00702 0 4.15 304.54 304.54 794.99 1.68 0.00742 0 2.18 762.61 762.61 1589.98 1.91 0.00764 A 0 1.68 1344.85 1343.93 3307.15 1.64 0.00764 A 0 1.42 3137.28 3233.73 50 63.60 2.04 0.00437 A 0 0.627 68.19 88.88 159.00 1.35 0.00455 0 3.69 146.00 154.84 318.00 1.05 0.00437 A 0 4.19 283.57 288.83 794.99 1.00 0.00437 A 0 4.56 802.35 732.85 1589.98 1.27 0.00377 0 1.83 1394.30 1490.86 3307.15 0.94 0.00437 A 0 2.22 4312.91 4337.57 6709.70 0.92 0.00437 A 0 1.91 6126.27 6249.31 11193.44 0.85 0.00479 0 2.67 11011.91 11745.82 Emulsion 0.5 3 25.6 0.436 0 0.560 2.30 2.54 14.5 19.5 0.436 0 0.115 10.44 10.43 31.8 20.0 0.436 0 0.108 23.48 23.91 1 3 14.0 0.266 0 1.07 2.42 2.16 14.5 11.4 0.266 0 0.498 14.98 14.05 31.8 10.3 0.266 0 0.410 20.77 21.30 5 63.6 3.71 0.0672 0 3.23 53.96 53.29 14.5 4.33 0.0672 0 4.28 13.77 13.62 31.8 5.01 0.0672 0 2.19 38.32 34.02 Micro- 0.5 3 36.1 0.396 0 0.0468 3.92 7.41 emulsion 14.5 19.1 0.396 0 0.0782 7.18 5.99 31.8 29.1 0.396 0 0.0153 26.58 28.35 1 14.5 14.6 0.195 0 0.0748 9.76 9.59 31.8 13.7 0.195 0 0.0281 30.84 25.84 63.6 14.0 0.195 0 0.167 32.98 31.38 5 14.5 4.47 0.0656 0 0.277 11.35 11.76 31.8 7.14 0.0656 0 0.266 38.33 41.66 63.6 4.55 0.0656 0 0.256 58.07 54.93
# Calculated value by using linear regression analysis A Calculated value by taking the average out of the measured free fractions inside this particular lipid
concentration
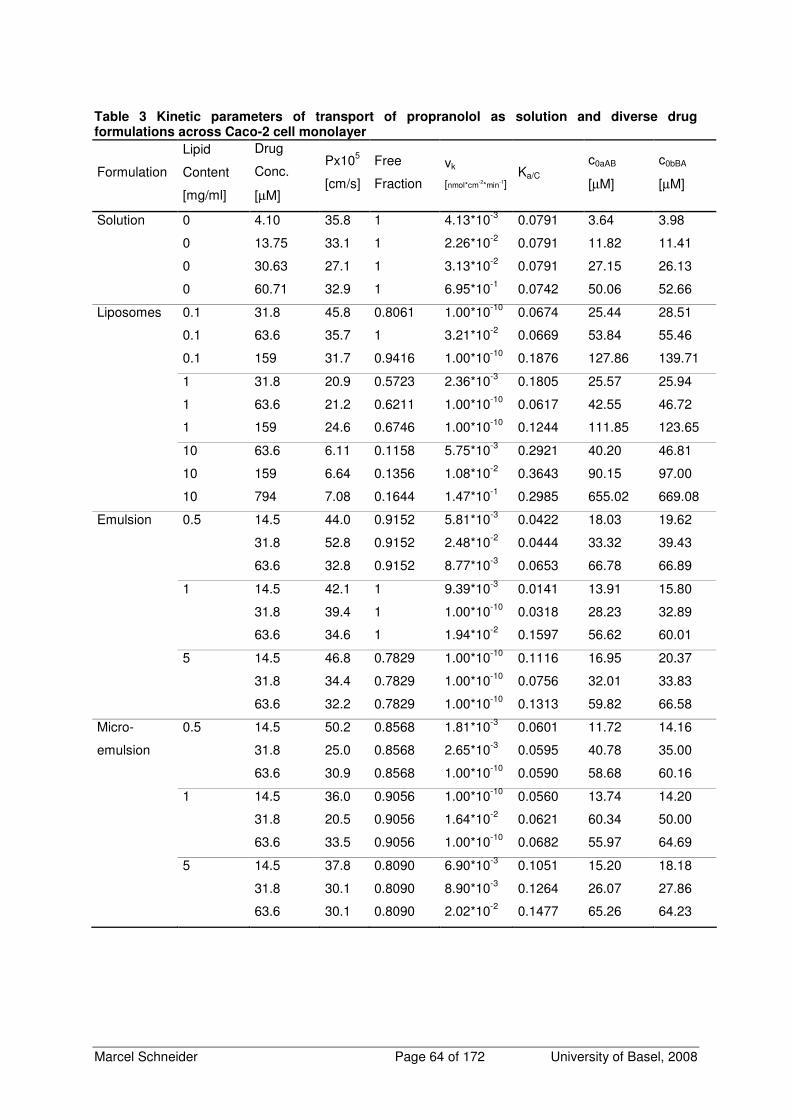
Marcel Schneider Page 64 of 172 University of Basel, 2008
Table 3 Kinetic parameters of transport of propranolol as solution and diverse drug formulations across Caco-2 cell monolayer
Formulation
Lipid
Content
[mg/ml]
Drug
Conc.
[µM]
Px105
[cm/s]
Free
Fraction
vk
[nmol*cm-2*min-1] Ka/C
c0aAB
[µM]
c0bBA
[µM]
Solution 0 4.10 35.8 1 4.13*10-3 0.0791 3.64 3.98
0 13.75 33.1 1 2.26*10-2 0.0791 11.82 11.41
0 30.63 27.1 1 3.13*10-2 0.0791 27.15 26.13
0 60.71 32.9 1 6.95*10-1 0.0742 50.06 52.66
Liposomes 0.1 31.8 45.8 0.8061 1.00*10-10 0.0674 25.44 28.51
0.1 63.6 35.7 1 3.21*10-2 0.0669 53.84 55.46
0.1 159 31.7 0.9416 1.00*10-10 0.1876 127.86 139.71
1 31.8 20.9 0.5723 2.36*10-3 0.1805 25.57 25.94
1 63.6 21.2 0.6211 1.00*10-10 0.0617 42.55 46.72
1 159 24.6 0.6746 1.00*10-10 0.1244 111.85 123.65
10 63.6 6.11 0.1158 5.75*10-3 0.2921 40.20 46.81
10 159 6.64 0.1356 1.08*10-2 0.3643 90.15 97.00
10 794 7.08 0.1644 1.47*10-1 0.2985 655.02 669.08
Emulsion 0.5 14.5 44.0 0.9152 5.81*10-3 0.0422 18.03 19.62
31.8 52.8 0.9152 2.48*10-2 0.0444 33.32 39.43
63.6 32.8 0.9152 8.77*10-3 0.0653 66.78 66.89
1 14.5 42.1 1 9.39*10-3 0.0141 13.91 15.80
31.8 39.4 1 1.00*10-10 0.0318 28.23 32.89
63.6 34.6 1 1.94*10-2 0.1597 56.62 60.01
5 14.5 46.8 0.7829 1.00*10-10 0.1116 16.95 20.37
31.8 34.4 0.7829 1.00*10-10 0.0756 32.01 33.83
63.6 32.2 0.7829 1.00*10-10 0.1313 59.82 66.58
Micro- 0.5 14.5 50.2 0.8568 1.81*10-3 0.0601 11.72 14.16
emulsion 31.8 25.0 0.8568 2.65*10-3 0.0595 40.78 35.00
63.6 30.9 0.8568 1.00*10-10 0.0590 58.68 60.16
1 14.5 36.0 0.9056 1.00*10-10 0.0560 13.74 14.20
31.8 20.5 0.9056 1.64*10-2 0.0621 60.34 50.00
63.6 33.5 0.9056 1.00*10-10 0.0682 55.97 64.69
5 14.5 37.8 0.8090 6.90*10-3 0.1051 15.20 18.18
31.8 30.1 0.8090 8.90*10-3 0.1264 26.07 27.86
63.6 30.1 0.8090 2.02*10-2 0.1477 65.26 64.23
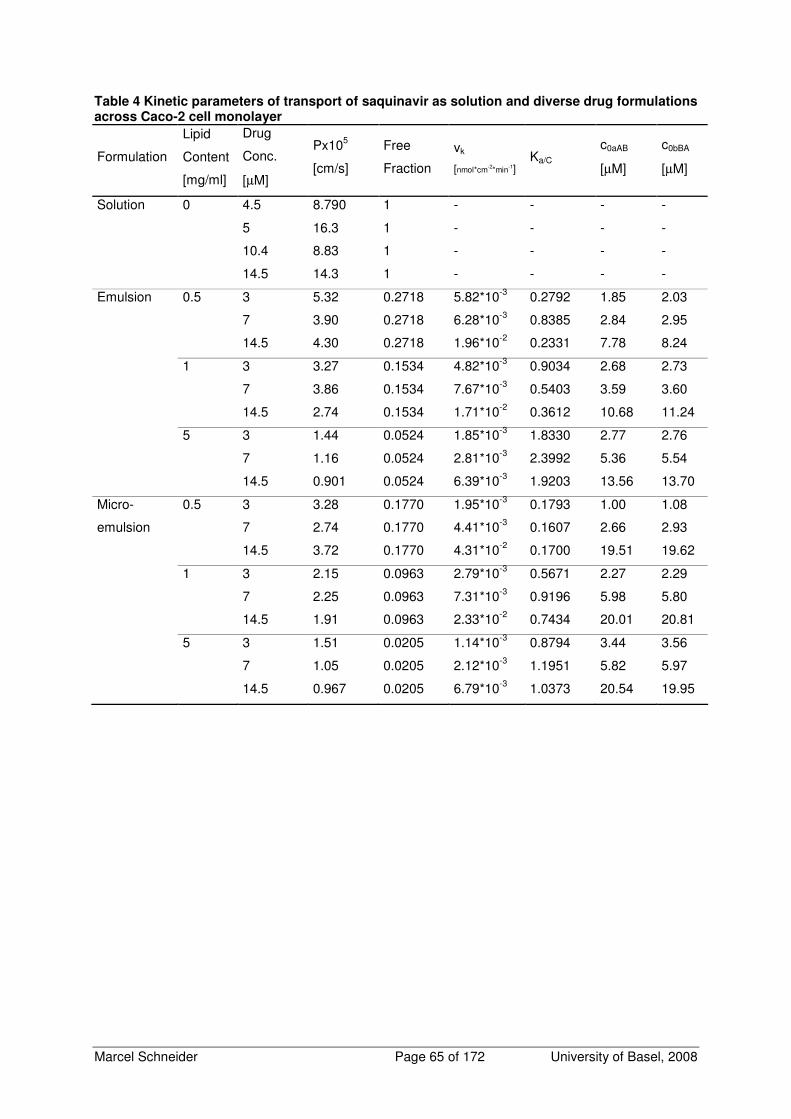
Marcel Schneider Page 65 of 172 University of Basel, 2008
Table 4 Kinetic parameters of transport of saquinavir as solution and diverse drug formulations across Caco-2 cell monolayer
Formulation
Lipid
Content
[mg/ml]
Drug
Conc.
[µM]
Px105
[cm/s]
Free
Fraction
vk
[nmol*cm-2*min-1] Ka/C
c0aAB
[µM]
c0bBA
[µM]
Solution 0 4.5 8.790 1 - - - -
5 16.3 1 - - - -
10.4 8.83 1 - - - -
14.5 14.3 1 - - - -
Emulsion 0.5 3 5.32 0.2718 5.82*10-3 0.2792 1.85 2.03
7 3.90 0.2718 6.28*10-3 0.8385 2.84 2.95
14.5 4.30 0.2718 1.96*10-2 0.2331 7.78 8.24
1 3 3.27 0.1534 4.82*10-3 0.9034 2.68 2.73
7 3.86 0.1534 7.67*10-3 0.5403 3.59 3.60
14.5 2.74 0.1534 1.71*10-2 0.3612 10.68 11.24
5 3 1.44 0.0524 1.85*10-3 1.8330 2.77 2.76
7 1.16 0.0524 2.81*10-3 2.3992 5.36 5.54
14.5 0.901 0.0524 6.39*10-3 1.9203 13.56 13.70
Micro- 0.5 3 3.28 0.1770 1.95*10-3 0.1793 1.00 1.08
emulsion 7 2.74 0.1770 4.41*10-3 0.1607 2.66 2.93
14.5 3.72 0.1770 4.31*10-2 0.1700 19.51 19.62
1 3 2.15 0.0963 2.79*10-3 0.5671 2.27 2.29
7 2.25 0.0963 7.31*10-3 0.9196 5.98 5.80
14.5 1.91 0.0963 2.33*10-2 0.7434 20.01 20.81
5 3 1.51 0.0205 1.14*10-3 0.8794 3.44 3.56
7 1.05 0.0205 2.12*10-3 1.1951 5.82 5.97
14.5 0.967 0.0205 6.79*10-3 1.0373 20.54 19.95
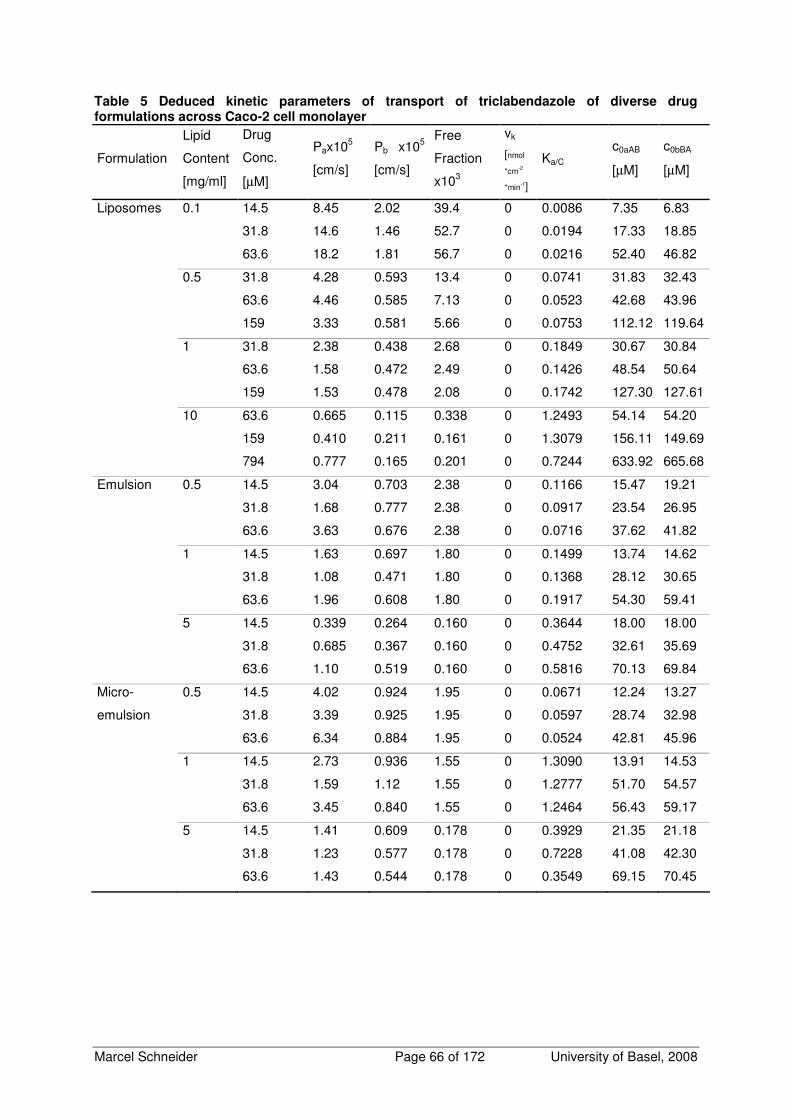
Marcel Schneider Page 66 of 172 University of Basel, 2008
Table 5 Deduced kinetic parameters of transport of triclabendazole of diverse drug formulations across Caco-2 cell monolayer
Formulation
Lipid
Content
[mg/ml]
Drug
Conc.
[µM]
Pax105
[cm/s]
Pb x105
[cm/s]
Free
Fraction
x103
vk
[nmol
*cm-2
*min-1]
Ka/C
c0aAB
[µM]
c0bBA
[µM]
Liposomes 0.1 14.5 8.45 2.02 39.4 0 0.0086 7.35 6.83
31.8 14.6 1.46 52.7 0 0.0194 17.33 18.85
63.6 18.2 1.81 56.7 0 0.0216 52.40 46.82
0.5 31.8 4.28 0.593 13.4 0 0.0741 31.83 32.43
63.6 4.46 0.585 7.13 0 0.0523 42.68 43.96
159 3.33 0.581 5.66 0 0.0753 112.12 119.64
1 31.8 2.38 0.438 2.68 0 0.1849 30.67 30.84
63.6 1.58 0.472 2.49 0 0.1426 48.54 50.64
159 1.53 0.478 2.08 0 0.1742 127.30 127.61
10 63.6 0.665 0.115 0.338 0 1.2493 54.14 54.20
159 0.410 0.211 0.161 0 1.3079 156.11 149.69
794 0.777 0.165 0.201 0 0.7244 633.92 665.68
Emulsion 0.5 14.5 3.04 0.703 2.38 0 0.1166 15.47 19.21
31.8 1.68 0.777 2.38 0 0.0917 23.54 26.95
63.6 3.63 0.676 2.38 0 0.0716 37.62 41.82
1 14.5 1.63 0.697 1.80 0 0.1499 13.74 14.62
31.8 1.08 0.471 1.80 0 0.1368 28.12 30.65
63.6 1.96 0.608 1.80 0 0.1917 54.30 59.41
5 14.5 0.339 0.264 0.160 0 0.3644 18.00 18.00
31.8 0.685 0.367 0.160 0 0.4752 32.61 35.69
63.6 1.10 0.519 0.160 0 0.5816 70.13 69.84
Micro- 0.5 14.5 4.02 0.924 1.95 0 0.0671 12.24 13.27
emulsion 31.8 3.39 0.925 1.95 0 0.0597 28.74 32.98
63.6 6.34 0.884 1.95 0 0.0524 42.81 45.96
1 14.5 2.73 0.936 1.55 0 1.3090 13.91 14.53
31.8 1.59 1.12 1.55 0 1.2777 51.70 54.57
63.6 3.45 0.840 1.55 0 1.2464 56.43 59.17
5 14.5 1.41 0.609 0.178 0 0.3929 21.35 21.18
31.8 1.23 0.577 0.178 0 0.7228 41.08 42.30
63.6 1.43 0.544 0.178 0 0.3549 69.15 70.45
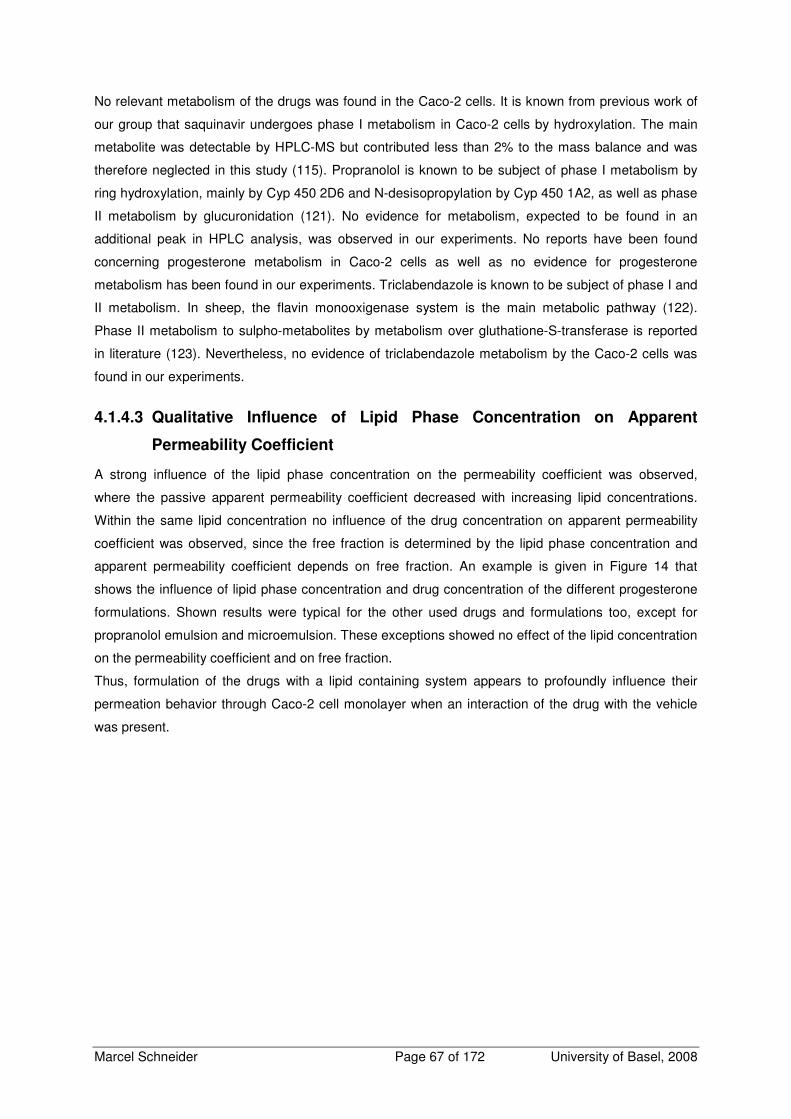
Marcel Schneider Page 67 of 172 University of Basel, 2008
No relevant metabolism of the drugs was found in the Caco-2 cells. It is known from previous work of
our group that saquinavir undergoes phase I metabolism in Caco-2 cells by hydroxylation. The main
metabolite was detectable by HPLC-MS but contributed less than 2% to the mass balance and was
therefore neglected in this study (115). Propranolol is known to be subject of phase I metabolism by
ring hydroxylation, mainly by Cyp 450 2D6 and N-desisopropylation by Cyp 450 1A2, as well as phase
II metabolism by glucuronidation (121). No evidence for metabolism, expected to be found in an
additional peak in HPLC analysis, was observed in our experiments. No reports have been found
concerning progesterone metabolism in Caco-2 cells as well as no evidence for progesterone
metabolism has been found in our experiments. Triclabendazole is known to be subject of phase I and
II metabolism. In sheep, the flavin monooxigenase system is the main metabolic pathway (122).
Phase II metabolism to sulpho-metabolites by metabolism over gluthatione-S-transferase is reported
in literature (123). Nevertheless, no evidence of triclabendazole metabolism by the Caco-2 cells was
found in our experiments.
4.1.4.3 Qualitative Influence of Lipid Phase Concentration on Apparent
Permeability Coefficient
A strong influence of the lipid phase concentration on the permeability coefficient was observed,
where the passive apparent permeability coefficient decreased with increasing lipid concentrations.
Within the same lipid concentration no influence of the drug concentration on apparent permeability
coefficient was observed, since the free fraction is determined by the lipid phase concentration and
apparent permeability coefficient depends on free fraction. An example is given in Figure 14 that
shows the influence of lipid phase concentration and drug concentration of the different progesterone
formulations. Shown results were typical for the other used drugs and formulations too, except for
propranolol emulsion and microemulsion. These exceptions showed no effect of the lipid concentration
on the permeability coefficient and on free fraction.
Thus, formulation of the drugs with a lipid containing system appears to profoundly influence their
permeation behavior through Caco-2 cell monolayer when an interaction of the drug with the vehicle
was present.
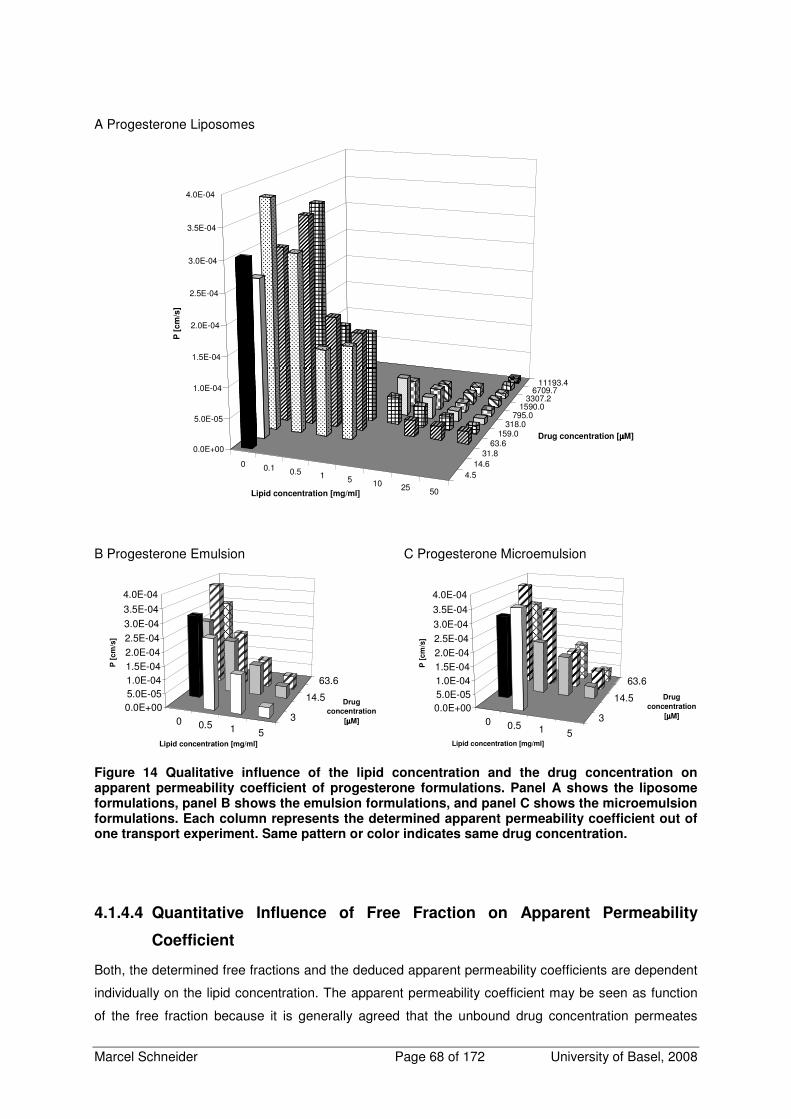
Marcel Schneider Page 68 of 172 University of Basel, 2008
A Progesterone Liposomes
0 0.1 0.5 1 5 10 25 50
4.514.6
31.863.6
159.0318.0
795.01590.0
3307.26709.7
11193.4
0.0E+00
5.0E-05
1.0E-04
1.5E-04
2.0E-04
2.5E-04
3.0E-04
3.5E-04
4.0E-04
P [
cm
/s]
Lipid concentration [mg/ml]
Drug concentration [µµµµM]
B Progesterone Emulsion
0 0.5 1 5
3
14.5
63.6
0.0E+005.0E-051.0E-041.5E-042.0E-042.5E-043.0E-043.5E-04
4.0E-04
P [
cm
/s]
Lipid concentration [mg/ml]
Drug
concentration
[µµµµM]
C Progesterone Microemulsion
0 0.5 1 5
3
14.5
63.6
0.0E+005.0E-051.0E-041.5E-042.0E-042.5E-043.0E-04
3.5E-04
4.0E-04
P [
cm
/s]
Lipid concentration [mg/ml]
Drug
concentration
[µµµµM]
Figure 14 Qualitative influence of the lipid concentration and the drug concentration on apparent permeability coefficient of progesterone formulations. Panel A shows the liposome formulations, panel B shows the emulsion formulations, and panel C shows the microemulsion formulations. Each column represents the determined apparent permeability coefficient out of one transport experiment. Same pattern or color indicates same drug concentration.
4.1.4.4 Quantitative Influence of Free Fraction on Apparent Permeability
Coefficient
Both, the determined free fractions and the deduced apparent permeability coefficients are dependent
individually on the lipid concentration. The apparent permeability coefficient may be seen as function
of the free fraction because it is generally agreed that the unbound drug concentration permeates
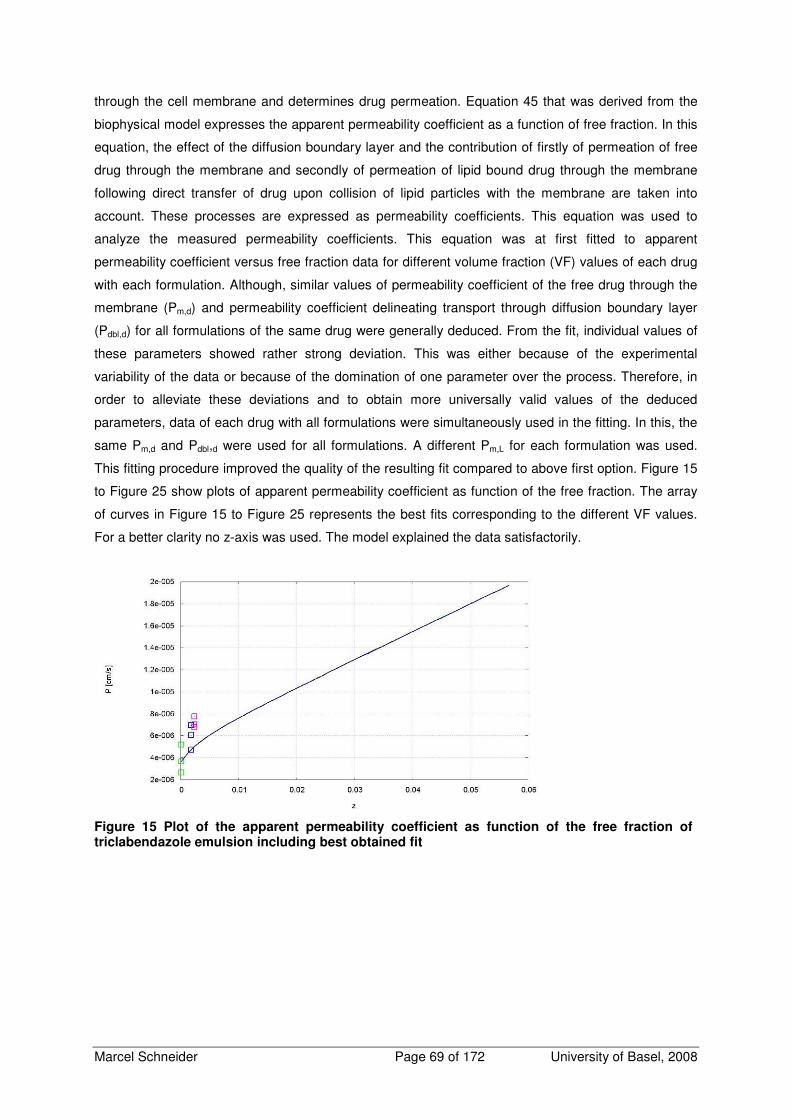
Marcel Schneider Page 69 of 172 University of Basel, 2008
through the cell membrane and determines drug permeation. Equation 45 that was derived from the
biophysical model expresses the apparent permeability coefficient as a function of free fraction. In this
equation, the effect of the diffusion boundary layer and the contribution of firstly of permeation of free
drug through the membrane and secondly of permeation of lipid bound drug through the membrane
following direct transfer of drug upon collision of lipid particles with the membrane are taken into
account. These processes are expressed as permeability coefficients. This equation was used to
analyze the measured permeability coefficients. This equation was at first fitted to apparent
permeability coefficient versus free fraction data for different volume fraction (VF) values of each drug
with each formulation. Although, similar values of permeability coefficient of the free drug through the
membrane (Pm,d) and permeability coefficient delineating transport through diffusion boundary layer
(Pdbl,d) for all formulations of the same drug were generally deduced. From the fit, individual values of
these parameters showed rather strong deviation. This was either because of the experimental
variability of the data or because of the domination of one parameter over the process. Therefore, in
order to alleviate these deviations and to obtain more universally valid values of the deduced
parameters, data of each drug with all formulations were simultaneously used in the fitting. In this, the
same Pm,d and Pdbl,d were used for all formulations. A different Pm,L for each formulation was used.
This fitting procedure improved the quality of the resulting fit compared to above first option. Figure 15
to Figure 25 show plots of apparent permeability coefficient as function of the free fraction. The array
of curves in Figure 15 to Figure 25 represents the best fits corresponding to the different VF values.
For a better clarity no z-axis was used. The model explained the data satisfactorily.
Figure 15 Plot of the apparent permeability coefficient as function of the free fraction of triclabendazole emulsion including best obtained fit
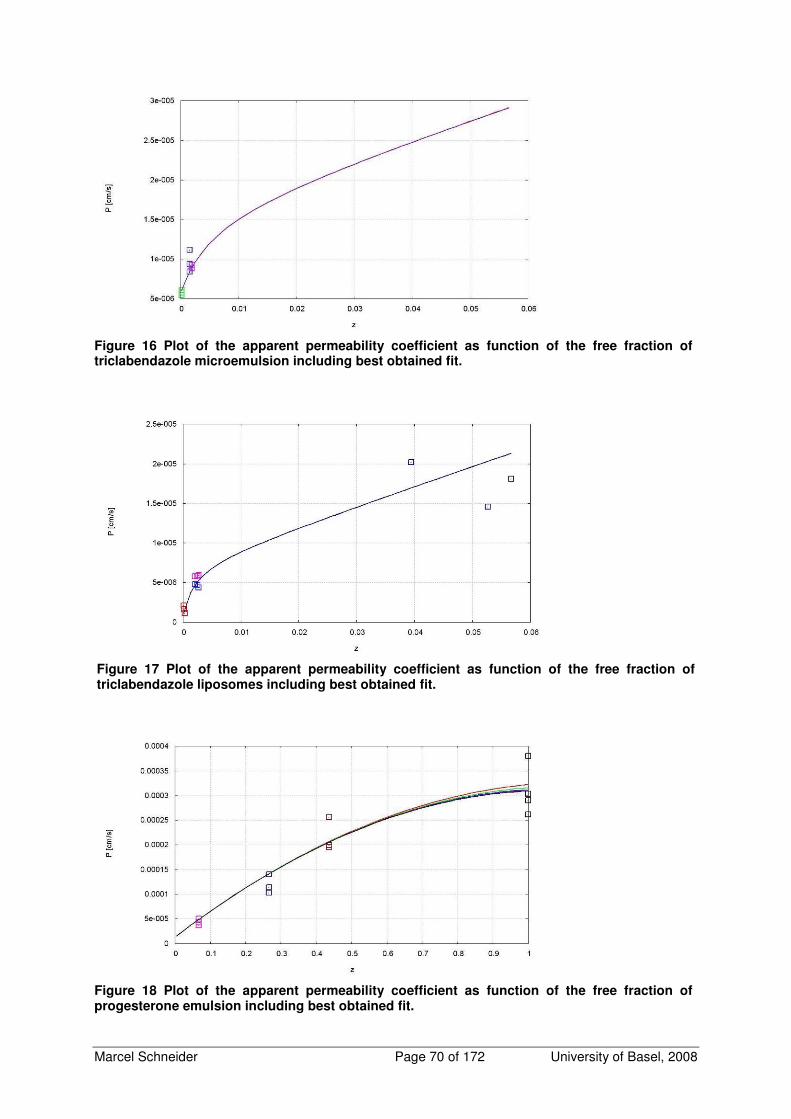
Marcel Schneider Page 70 of 172 University of Basel, 2008
Figure 16 Plot of the apparent permeability coefficient as function of the free fraction of triclabendazole microemulsion including best obtained fit.
Figure 17 Plot of the apparent permeability coefficient as function of the free fraction of triclabendazole liposomes including best obtained fit.
Figure 18 Plot of the apparent permeability coefficient as function of the free fraction of progesterone emulsion including best obtained fit.

Marcel Schneider Page 71 of 172 University of Basel, 2008
Figure 19 Plot of the apparent permeability coefficient as function of the free fraction of progesterone microemulsion including best obtained fit.
Figure 20 Plot of the apparent permeability coefficient as function of the free fraction of progesterone liposomes including best obtained fit.
Figure 21 Plot of the apparent permeability coefficient as function of the free fraction of propranolol emulsion including best obtained fit.
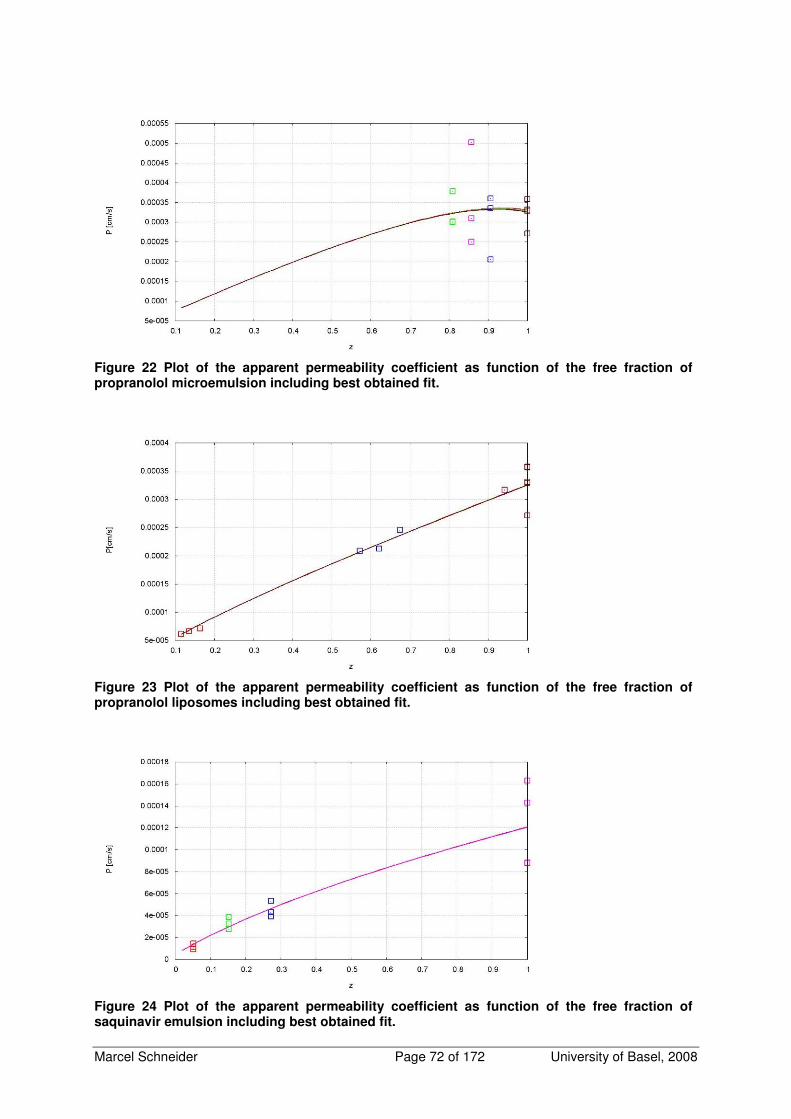
Marcel Schneider Page 72 of 172 University of Basel, 2008
Figure 22 Plot of the apparent permeability coefficient as function of the free fraction of propranolol microemulsion including best obtained fit.
Figure 23 Plot of the apparent permeability coefficient as function of the free fraction of propranolol liposomes including best obtained fit.
Figure 24 Plot of the apparent permeability coefficient as function of the free fraction of saquinavir emulsion including best obtained fit.
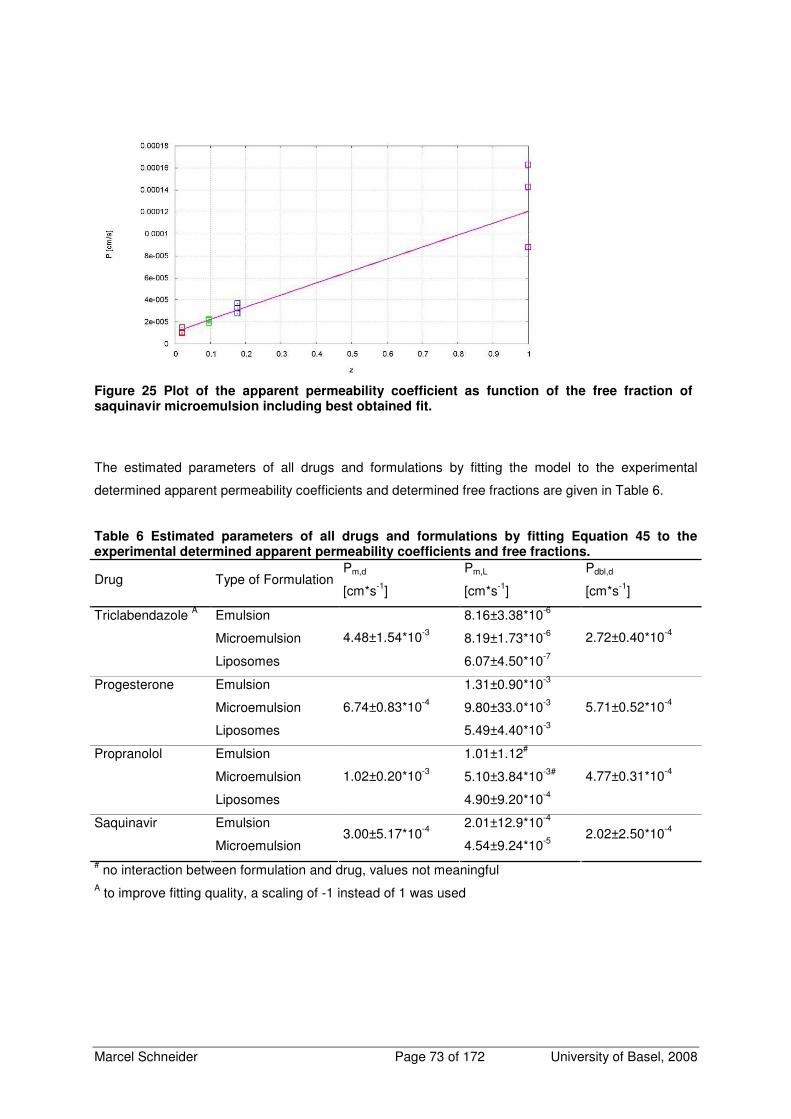
Marcel Schneider Page 73 of 172 University of Basel, 2008
Figure 25 Plot of the apparent permeability coefficient as function of the free fraction of saquinavir microemulsion including best obtained fit.
The estimated parameters of all drugs and formulations by fitting the model to the experimental
determined apparent permeability coefficients and determined free fractions are given in Table 6.
Table 6 Estimated parameters of all drugs and formulations by fitting Equation 45 to the experimental determined apparent permeability coefficients and free fractions.
Drug Type of Formulation Pm,d
[cm*s-1]
Pm,L
[cm*s-1]
Pdbl,d
[cm*s-1]
Triclabendazole A Emulsion 8.16±3.38*10-6
Microemulsion 8.19±1.73*10-6
Liposomes
4.48±1.54*10-3
6.07±4.50*10-7
2.72±0.40*10-4
Progesterone Emulsion 1.31±0.90*10-3
Microemulsion 9.80±33.0*10-3
Liposomes
6.74±0.83*10-4
5.49±4.40*10-3
5.71±0.52*10-4
Propranolol Emulsion 1.01±1.12#
Microemulsion 5.10±3.84*10-3#
Liposomes
1.02±0.20*10-3
4.90±9.20*10-4
4.77±0.31*10-4
Saquinavir Emulsion 2.01±12.9*10-4
Microemulsion 3.00±5.17*10-4
4.54±9.24*10-5 2.02±2.50*10-4
# no interaction between formulation and drug, values not meaningful
A to improve fitting quality, a scaling of -1 instead of 1 was used
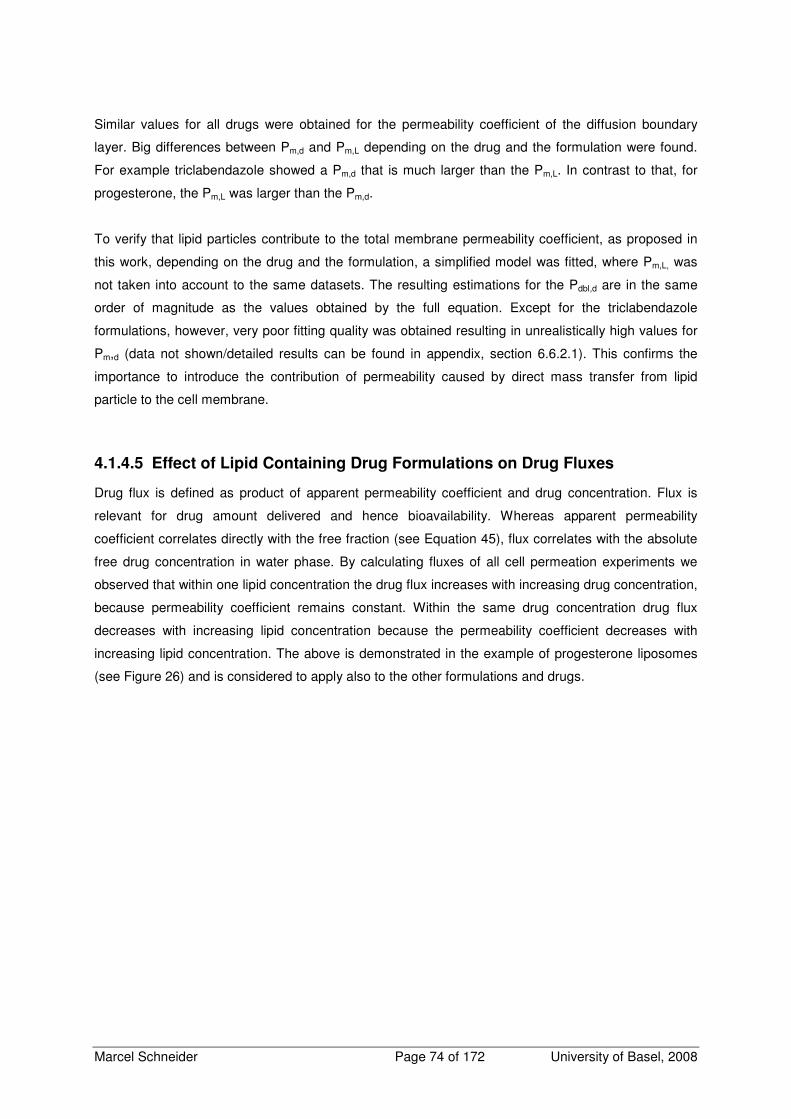
Marcel Schneider Page 74 of 172 University of Basel, 2008
Similar values for all drugs were obtained for the permeability coefficient of the diffusion boundary
layer. Big differences between Pm,d and Pm,L depending on the drug and the formulation were found.
For example triclabendazole showed a Pm,d that is much larger than the Pm,L. In contrast to that, for
progesterone, the Pm,L was larger than the Pm,d.
To verify that lipid particles contribute to the total membrane permeability coefficient, as proposed in
this work, depending on the drug and the formulation, a simplified model was fitted, where Pm,L, was
not taken into account to the same datasets. The resulting estimations for the Pdbl,d are in the same
order of magnitude as the values obtained by the full equation. Except for the triclabendazole
formulations, however, very poor fitting quality was obtained resulting in unrealistically high values for
Pm,d (data not shown/detailed results can be found in appendix, section 6.6.2.1). This confirms the
importance to introduce the contribution of permeability caused by direct mass transfer from lipid
particle to the cell membrane.
4.1.4.5 Effect of Lipid Containing Drug Formulations on Drug Fluxes
Drug flux is defined as product of apparent permeability coefficient and drug concentration. Flux is
relevant for drug amount delivered and hence bioavailability. Whereas apparent permeability
coefficient correlates directly with the free fraction (see Equation 45), flux correlates with the absolute
free drug concentration in water phase. By calculating fluxes of all cell permeation experiments we
observed that within one lipid concentration the drug flux increases with increasing drug concentration,
because permeability coefficient remains constant. Within the same drug concentration drug flux
decreases with increasing lipid concentration because the permeability coefficient decreases with
increasing lipid concentration. The above is demonstrated in the example of progesterone liposomes
(see Figure 26) and is considered to apply also to the other formulations and drugs.
Marcel Schneider Page 75 of 172 University of Basel, 2008
Figure 26 Qualitative influence of lipid concentration and drug concentration of progesterone liposomes on drug flux through Caco-2 cell monolayer. Each column represents the calculated flux of apparent permeability coefficient and total drug concentration of one transport experiment. Same pattern or color indicates same drug concentration and is the same as in Figure 14 panel A.
Because of the wide drug and lipid phase concentrations tested, progesterone liposome series offered
the possibility to compare experiments exhibiting the same free drug concentration. If experiments
exhibiting the same free drug concentration were considered, an increase of total drug concentration
is needed to maintain same free drug concentration with higher lipid concentration. Figure 27, Panel A
demonstrates a linear relationship of total drug concentration as a function of lipid concentration of
formulations having the same free drug concentration in water phase. Since drug flux correlates with
absolute free concentration, it follows that the flux should be constant for these formulations if free
drug alone is responsible for membrane permeation. Calculated drug fluxes of the experiments with
equal unbound drug concentration, however, showed an increased drug flux with increasing lipid and
drug concentration, using total drug concentration and apparent permeability coefficients for the
calculation. The resulting increasing relationship is shown in Figure 27, Panel B. In this plot the
apparent permeability is the slope.
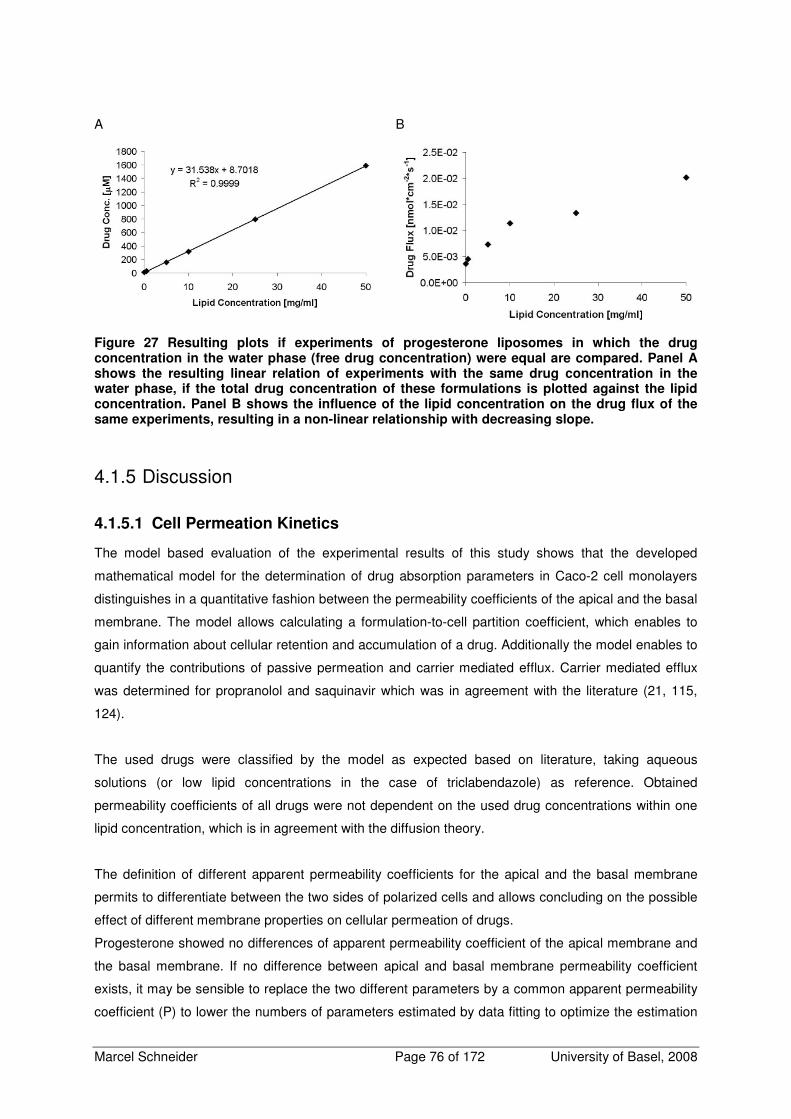
Marcel Schneider Page 76 of 172 University of Basel, 2008
A
B
Figure 27 Resulting plots if experiments of progesterone liposomes in which the drug concentration in the water phase (free drug concentration) were equal are compared. Panel A shows the resulting linear relation of experiments with the same drug concentration in the water phase, if the total drug concentration of these formulations is plotted against the lipid concentration. Panel B shows the influence of the lipid concentration on the drug flux of the same experiments, resulting in a non-linear relationship with decreasing slope.
4.1.5 Discussion
4.1.5.1 Cell Permeation Kinetics
The model based evaluation of the experimental results of this study shows that the developed
mathematical model for the determination of drug absorption parameters in Caco-2 cell monolayers
distinguishes in a quantitative fashion between the permeability coefficients of the apical and the basal
membrane. The model allows calculating a formulation-to-cell partition coefficient, which enables to
gain information about cellular retention and accumulation of a drug. Additionally the model enables to
quantify the contributions of passive permeation and carrier mediated efflux. Carrier mediated efflux
was determined for propranolol and saquinavir which was in agreement with the literature (21, 115,
124).
The used drugs were classified by the model as expected based on literature, taking aqueous
solutions (or low lipid concentrations in the case of triclabendazole) as reference. Obtained
permeability coefficients of all drugs were not dependent on the used drug concentrations within one
lipid concentration, which is in agreement with the diffusion theory.
The definition of different apparent permeability coefficients for the apical and the basal membrane
permits to differentiate between the two sides of polarized cells and allows concluding on the possible
effect of different membrane properties on cellular permeation of drugs.
Progesterone showed no differences of apparent permeability coefficient of the apical membrane and
the basal membrane. If no difference between apical and basal membrane permeability coefficient
exists, it may be sensible to replace the two different parameters by a common apparent permeability
coefficient (P) to lower the numbers of parameters estimated by data fitting to optimize the estimation
Marcel Schneider Page 77 of 172 University of Basel, 2008
of all other parameters. This approach makes sense especially if a carrier mediated transport is
involved.
Concerning propranolol and saquinavir, a high correlation level (~0.95-1) of Pa and Pb in the
regression analysis of most of the data sets was obtained. There were some data sets showing no
correlation, but Pa and Pb were estimated equal in these cases, indicating no difference of Pa and Pb.
For these reasons a common apparent permeability coefficient was used.
All tested triclabendazole formulations showed a distinct difference between Pa and Pb, whereas Pb
was always smaller. Lower apparent permeability coefficient of the basal membrane may be a
consequence of different interactions of triclabendazole with the apical and the basal membrane
caused by different membrane composition. It is known that the basolateral membrane is composed
different, e.g. enriched in sphingomyelin and phosphatidylcholine (64, 65).
The deduced permeability coefficients of aqueous solutions in this work were systematically higher
compared to apparent permeability coefficients from literature. Several parameters like hydrodynamics
inside the Transwell inserts, caused by different oscillation and stirring rate of the shaker, or cell
culture conditions may be responsible for this, but the different calculation method for apparent
permeability coefficients in the literature compared to the proposed model in this work mainly causes
this effect. The standard literature model for the calculation of the transcellular apparent permeability
coefficient takes into account the whole cell monolayer as barrier (34). In contrast to the standard
approach, the model proposed in this study takes into account two permeability coefficients to
describe the transcellular permeability, where Pa describes drug permeation through the apical
membrane between formulation and cellular compartment in both directions, and Pb describes the
same for the basal membrane. This different definition of permeability coefficients mainly causes the
obtained differences compared to literature.
The introduction of the formulation-to-cell partition coefficient Ka/C is very useful for a better
understanding of the mechanism responsible for the impact of a drug formulation on drug permeation.
Misinterpretation of the data is diminished because Ka/C is important for a precise assessment of the
time dependent concentration change in the cellular compartment. The partition coefficient additionally
explains, in addition to independent prediction of Pa and Pb, cellular accumulation of a compound that
could otherwise be interpreted wrongly as adsorption to the Transwell device, not detectable
metabolism, or substance loss because of degradation.
4.1.5.2 Influence of Lipid Containing Formulations on Carrier Mediated Efflux
A low carrier mediated apical efflux rate was estimated for propranolol, which is consistent with the
literature where a slightly higher permeability coefficient from basal to apical transport direction is
reported (21, 124). Saquinavir showed an extensive carrier mediated apical efflux, which was
expected and consistent with previous work of our group. The qualitative effect on the carrier mediated
efflux of saquinavir of microemulsions and emulsions, shown in Figure 13, indicates a common
underlying mechanism. The decrease of the carrier mediated efflux with increasing lipid concentration
Marcel Schneider Page 78 of 172 University of Basel, 2008
may be explained by the decreasing amount of free drug able to cross the cellular membrane. This is
expressed as well in the increase of the formulation-to-cell partition coefficient, indicating a lower
intracellular concentration compared to the donor and the acceptor with increasing lipid concentration.
Furthermore, the concentration dependence of the carrier mediated efflux within one lipid
concentration may be evidence that the amount of drug crossing the cellular membrane is below that
required for saturation of the involved carrier. Hence, a first order kinetics of apical efflux is implied.
Inhibition of the apical efflux rate by Cremophor EL is described in literature (94, 95, 125). While
containing the double amount of Cremophor EL in the lipid phase, no additional inhibition of the efflux
by the microemulsion compared to the emulsion was determined in the experiments of this work.
Maybe the difference in Cremophor EL content was too low or the influence of the surfactant is low in
the used experimental setting. However, significant effect of the used concentration range of
Cremophor EL (0.005%-0.1% (m/V)) on drug transport by inhibiting active efflux has been reported
(94, 125). It is assumed that the amount of Cremophor EL available to inhibit active efflux was very
low, because of the evidence, provided by equilibrium dialysis experiments, that Cremophor EL is
strongly associated with the lipid particles. No differences could be found in free fraction, caused by
free Cremophor EL molecules available to solubilize drug in the acceptor compartment, when
experiments using a dialysis membrane that was not permeable for Cremophor EL, were compared
with experiments using a dialysis membrane that was permeable for Cremophor EL. Therefore, a very
small concentration of monomeric Cremophor EL can be assumed in tested lipid formulations.
4.1.5.3 Influence of Formulation and Free Fraction on Apparent Permeability
Coefficient
The results of the study showed that free fraction generally determines apparent permeability. High
free fractions of drugs in a lipid containing dosage form results in similar permeability coefficients as
aqueous solutions, whereas low free fractions have low apparent permeability coefficients as a
consequence. All drugs showed strong interaction with lipid formulation regardless of structure of the
formulation. This was because of the lipophilicity of the used drugs. In contrast to all other drugs,
propranolol showed no interaction with the microemulsion and the emulsion causing apparent
permeability coefficients equal to the aqueous solutions which can be explained by its low solubility in
the lipid phase of the emulsion and the microemulsion, which is caused by its moderate lipophilicity
and its occurrence as mainly charged ion at pH 7.4. Propranolol is known to interact with cellular
membranes and model membrane systems. The naphthalene moiety of propranolol partitions into the
hydrocarbon core of the lipid bilayer and the charged amine side chain is most likely positioned in the
aqueous phospholipid head group region which may explain strong interaction of propranolol with the
liposomes and the cells (126). This may explain the observed strong interaction of propranolol with the
liposomes.
Besides the influence of the free fraction, the need of an additional mechanism to describe trans-
membranal drug permeability was evident, because a model taking into account only permeation of
free drug molecules did not adequately explain the data. Excluding paracellular permeation by
monitoring TEER and excluding phagocytotic activity of Caco-2 cells, it was obvious to assume a
Marcel Schneider Page 79 of 172 University of Basel, 2008
beneficial effect caused by the lipid containing drug formulations to the passive permeation.
Considering this effect, permeation caused by direct drug transfer from lipid particle to the cell
membrane was taken into account additionally to the permeability coefficient of the free drug through
the cell membrane, because direct drug transfer from lipid domain to lipid domain has been described
in literature.
The resulting model, proposed in this work, described the data satisfactorily. Standard error was
relatively large, because of experimental variation and depending on drug, cases of extremely high or
low free fractions making fitting difficult. Big differences were found regarding the Pm,L depending on
the drug and the formulation. Depending on the drug, mass transfer caused by direct drug transfer
from lipid particle to cellular membrane has high or low contributions to substance flux over the cellular
membrane.
Generally high Pm,L were found for all progesterone formulations indicating an important contribution of
the “lipid pathway” to the trans-membranal permeability. Progesterone is a physiologically occurring
compound and has the same scaffold and similar physicochemical properties as cholesterol that
occurs physiologically in the cellular membranes. This physicochemical similarity and even more the
physiological relevance for progesterone to cross membranes easily, because of the intracellular
localization of the steroid hormone receptor, may explain why progesterone may easily be transferred
between lipid particles and membrane. While progesterone is possessing a low free fraction, the
resulting apparent permeability coefficient is high compared to other drugs, because high Pm,L partially
compensates the effect of low permeability on drug permeation.
The lowest Pm,L was resulting for triclabendazole for all formulations, indicating a small contribution of
the lipid particles to the trans-membrane transport of the drug. Compared to progesterone and
saquinavir, which had both similar free fractions, the free fractions of triclabendazole were more than
one order of magnitude lower, indicating a strong interaction of the formulations with the drug. This
implies a low tendency of triclabendazole to leave the lipid phase of the formulations. The interaction
of the drug with the formulation seems to be stronger than the interaction of the drug with the cell,
causing low contribution of the “lipid pathway” to the trans-membranal permeability resulting in a low
apparent permeability.
Regarding the dataset used for this work, too little data were collected with only four drugs to conclude
on concrete molecular properties important to direct lipid-lipid transfer. Nevertheless, several general
points may be important for a contribution of lipid-lipid transfer to transcellular permeation. For
liposomes, the localization of the drug inside the bilayer may be important for lipid-lipid transfer from
liposomes to cell membrane. Less lipid-lipid drug transfer would be expected if a drug is located in the
core region of the bilayer compared to the localization of a drug in the surface region. Very high drug
solubility in the used lipid phase combined with a high lipophilicity may be disadvantageous, because
the drug is then trapped inside the lipid particles causing a low free fraction and a high affinity of the
drug to the lipid phase, which impedes together transcellular permeation.
The obtained permeability coefficients of the free drug through cell monolayer (Pm,d) were independent
of the formulations for all drugs. A classification of the used drugs results in the following order from
Marcel Schneider Page 80 of 172 University of Basel, 2008
highest to lowest Pm,d: triclabendazole > propranolol > progesterone > saquinavir. Surprisingly,
triclabendazole was found to be the compound with the highest Pm,d, indicating a high permeability
coefficient out of an aqueous solution. In vivo data of triclabendazole showed an increase of
bioavailability after oral triclabendazole administration together with a fatty meal (127). This is a typical
BCS class II substance behavior by which the permeability coefficient is high but the flux through the
epithelial barrier is limited because of low solubility. With an increase of the solubility an increase of
the flux is obtained. Additional indication of high membrane permeability of triclabendazole is a high
apparent permeability coefficient determined in our lab for albendazole, a structurally very similar
compound (unpublished results). Due to unspecific adsorption to the Transwell surfaces it was not
possible to measure the permeability of a purely aqueous triclabendazole solution as reference. If
triclabendazole is formulated with small amounts of lipids the permeability coefficient decreases
rapidly because of a very low free fraction caused by high lipophilicity.
All obtained Pdbl,d are in the same order of magnitude, but the resulting differences are bigger than
expected. It was expected that saquinavir resulted in the lowest Pdbl,d, because of its size. It was
expected further to find similar Pdbl,d for all other drugs because of nearly equal molecular weights.
There is very recently published work dealing with drug transport of bile micelle containing drug
formulations through diffusion boundary layer that shows, that the assumptions made in the present
work describes drug transport through diffusion boundary layer most appropriately (128).
Unspecific adsorption to the filter insert may contribute to determined differences because Pdbl,d of
triclabendazole and saquinavir were similar, but different from the other drugs. Both drugs undergo
unspecific adsorption to the Transwell device. It may be possible that triclabendazole and saquinavir
would be slightly retarded during diffusion through the polycarbonate filter caused by the tendency of
these drugs to adsorb to surfaces. The unspecific adsorption of triclabendazole was more distinctive
than the absorption of saquinavir and could explain the slow permeation through the basal diffusion
boundary layer.
It is often encountered in literature that for most lipophilic compounds that exceed log D 2-3 cell
membrane permeation is very rapid. Therefore, permeation through diffusion boundary layer would be
the rate limiting step for lipophilic compounds (85, 128-132). If aqueous solutions of the model drugs
tested in this work were regarded, this is confirmed for all compounds (see Table 6). If lipid containing
formulations of the tested model compounds are considered, one has to take into account, that the
resulting permeability coefficients are also dependent on the free fraction. Out of this follows that a low
free fraction decisively influences the apparent permeability coefficient of a drug through the
membrane. Depending on free fraction, lipid concentration, and the drug, the diffusion boundary layer
or the membrane may be rate determining. This is also expressed in the shape of apparent
permeability versus free fraction plots.
Taken together, lipid containing drug formulations influence transcellular drug permeation with
different mechanisms. Lipid containing formulations decrease the free fraction of a lipophilic drug and
decrease the apparent permeability coefficient. Depending on the drug, contribution of drug
Marcel Schneider Page 81 of 172 University of Basel, 2008
permeation because of direct drug transfer from lipid particle to cell membrane may compensate the
decrease of apparent permeability coefficient partially, as observed for progesterone. On the other
hand, very low apparent permeability coefficients may result if a highly lipophilic and highly membrane
permeable compound does not permeate by direct drug transfer from lipid particle to cell membrane.
In this case, the extremely low free fraction determines the permeation totally, such as observed for
triclabendazole.
4.1.5.4 Drug Flux: Consequences for In-Vivo Drug Delivery?
Drug flux depends on total drug concentration and apparent permeability coefficient and correlates
directly with the absolute free drug concentration. If a single drug concentration is considered with
different lipid concentrations, drug flux decreases with increasing lipid concentration because
decreasing apparent permeability coefficient with increasing lipid concentration. If free drug
concentration alone is responsible for membrane permeation, the flux of a drug of different lipid
containing formulations with the same absolute free concentration should be constant and
independent of lipid concentration. As displayed in Figure 27, Panel B, flux of progesterone increases
with increasing lipid concentration if experiments with the same absolute unbound drug concentration
were regarded. The fact that this plot, where the apparent permeability is the slope, does not show a
constant flux but an increase with increasing lipid concentration shows indirectly the contribution of the
lipid particles to the transmembranal drug permeation. This is consistent with the high Pm,L compared
to Pm,d obtained for progesterone. Drug fluxes of experiments with equal unbound drug concentration
showed an increased flux with increasing drug and lipid concentration, but the benefit for drug flux
leveled off at high lipid concentrations. Because apparent permeability coefficient remains constant
within one lipid concentration, the drug flux may be increased by augmenting the total drug
concentration to compensate the decrease of apparent permeability coefficient, if drug solubility in that
formulation is high enough. It is a precondition that the lipid containing formulation allows a large drug
solubility enhancement. This may lead to absorption enhancement in vivo. Since drug flux is time
dependent, a time independent parameter to characterize the influence on drug transport is the
situation in equilibrium. Regarding cell permeation experiments with different progesterone
formulations, the extent of drug permeation was always the same in equilibrium in apical to basal
direction, but time to reach equilibrium was prolonged with increasing lipid concentrations. If no active
efflux, degradation, and metabolism are involved, even formulations with high lipid concentrations
would equilibrate, but it is a question of time. Regarding a given amount of drug, this would result in
vivo in same area under the curve (AUC), but prolonged time to attain the maximal plasma
concentration. The maximal plasma concentration would be lowered because drug flux and
permeability were decreased with increasing lipid concentration resulting in slower drug invasion. Lipid
systems offer the possibility to compensate lower maximal plasma concentration by increasing drug
concentration in the formulation, which is not affecting the permeability coefficient of the drug and
would entail, assuming same permeated fraction, to increased AUC and maximal plasma
concentration. That again may cause longer time period exceeding the minimal effective drug
concentration.
Marcel Schneider Page 82 of 172 University of Basel, 2008
After peroral administration, the lipid formulations are altered by lipid digestion, presence of bile salts,
and phospholipids, but drug solubilization in colloidal systems may still take place in the intestine.
Because similar effects of structurally different formulations on drug permeation have been shown,
similar effects of the digested product were expected, if the particles are able to interact physically with
the cellular membrane.
There is a mucus layer present, which is first of all an additional hydrophilic diffusion barrier for drug
permeation itself. It was shown that mainly the lipid components of the mucus lower the diffusion of
lipophilic compounds (133). Additionally, the mucus layer is a barrier with unknown influence on the
mass transfer caused by direct drug transport from lipid particle to the cell membrane upon collision.
Few data are available dealing with small particles diffusing through mucus. These data indicate that,
depending on particle properties, diffusion of particles through mucus is possible (106, 134-136).
Alternatively, a drug transfer from lipid particles to lipophilic mucus components may be thinkable
since human intestinal mucus is containing glycolipids, lipids, and phospholipoidal constituents
0.5-5%[w/w] overall (58).
There is evidence, that lipid containing formulations have the ability to affect the pharmacokinetics of
an orally administered drug. Particularly for highly lipophilic molecules, lipid containing dosage forms
provide a good possibility to improve bioavailability. In vivo, different mechanisms like uptake of lipid
vesicles by the lymphatic tissue are involved and may contribute additionally to the absorption
enhancement which makes it difficult to estimate the importance of the drug permeation because of
direct drug transfer from lipid particle to the cell membrane out of the in vitro data of this work. It would
be challenging to asses the in vivo quantification of this transfer because other involved mechanisms
have to be excluded somehow. Another possibility to investigate on this open question would be to
use a suitable in vitro model e.g. to put a layer of mucus or artificial mucus on Caco-2 cell monolayer
or to use a mucus producing cell model.
4.1.6 Conclusions
The refined mathematical model, which is proposed in this study for the determination of drug
absorption parameters in Caco-2 cell monolayers, is able to differentiate between active and passive
transported compounds. The model is able to divide trans-monolayer permeability into independent
permeability coefficients of the apical membrane and the basal membrane. It allows deducing
formulation-to-cell partition coefficient, intracellular time dependent concentration, and quantification of
carrier mediated efflux rate directly out of time dependent experimental concentration data. The
analysis of the transcellular permeation experiments with this model indicated a decrease of apparent
permeability with increasing lipid concentration, if an interaction of a drug and a lipid containing
formulation is given.
A biophysical model for delineating contribution of different transport steps to the apparent
permeability coefficient was developed taking into account transport of lipid particles and free drug
molecules through diffusion boundary layer, permeation of free drug molecules through cell
membrane, and drug permeation because of direct drug transfer from lipid particles to the cell
membrane. This evaluation of the apparent permeability coefficient confirmed that the free fraction of a
Marcel Schneider Page 83 of 172 University of Basel, 2008
drug is the major determinant of intestinal cell permeation. Additionally, the direct transfer of lipophilic
drugs from lipid phase of the formulation to cell membrane can also make an essential contribution to
drug permeation. The relative significance of these two processes may depend on the drug and the
formulation. These observations apply to structurally different lipid containing drug formulations.
Since drug flux is relevant for the amount delivered and hence bioavailability, simultaneous increase of
drug and lipid concentration provides an undiminished flux which may improve bioavailability by
prolonged intestinal absorption at a sustained rate. The results of this study may be used for the
development of efficient oral dosage forms to improve bioavailability of poorly water soluble drugs.
4.1.7 Acknowledgements
We would like to thank Lipoid GmbH for the generous supply with Lipoid S 100 and Lipoid EPG. We
would like to thank Roche Pharmaceuticals for the kind gift of saquinavir and Phares Drug Delivery for
the kind gift of triclabendazole.
Marcel Schneider Page 84 of 172 University of Basel, 2008
4.2 Screening of Several Lipophilic Compounds to Find a Poorly
Soluble Compound with Low Membrane Permeability and No
Carrier Mediated Efflux
To investigate the influence of lipid containing dosage forms on drugs with different properties, a drug
exhibiting poor water solubility and low membrane permeability had to be chosen. Furthermore the
drug should be no subject of carrier mediated efflux. Ideally, the compound should have been used in
Caco-2 permeation studies already and drug metabolism should be known.
In a log D range from 0 to 5 and a molecular weight up to 500 D, high lipophilicity and good membrane
permeability are usually connected properties if the compound is no subject of carrier mediated
efflux (5). If log D exceeds 5 or the molecular weight exceeds 500 D membrane permeability
decreases (7).
After extensive literature study, some compounds were chosen to test their suitability with the Caco-2
model: Carbamazepine was chosen because of its poor solubility and high lipophilicity (log D 2.6), a
known moderate to low Caco-2 permeability, and no reported carrier mediated transport in the Caco-2
model (33, 84, 137).
The moderately lipophilic triamterene (log D 1.26) was chosen because of its poor solubility and
because it was one order of magnitude less permeable than propranolol in the mdr1-mdck cell
model (138).
A permeability coefficient in the Caco-2 model of 1.3*10-6 cm/s indicated that the poor soluble and
moderately lipophilic bendroflumethiazide (log D 1.91) may have the desired properties (33).
Poorly soluble proscillaridine was chosen because of its molecular weight of 531 D, a log D of 2.48,
and a reported permeability of 0.63*10-6 cm/s in the Caco-2 cell model (60).
Albendazole and triclabendazole were chosen because of their low solubility and their high lipophilicity
(log D of 3.01 and of 5.9, respectively). Both compounds achieve a low bioavailability if orally
administered in vivo (1).
4.2.1 Material and Methods
4.2.1.1 Material
Carbamazepine, triamterene, bendroflumethiazide, and albendazole were purchased from SIGMA-
Aldrich, Fluka Chemie GmbH, Buchs, Switzerland and were of analytical grade. Proscillaridine
(minimum 80%) was purchased from SIGMA-Aldrich, Fluka Chemie GmbH, Buchs, Switzerland.
Triclabendazole was kindly provided by Phares Drug Delivery, Muttenz, Switzerland. Transport media
used for the permeation studies were prepared with Dulbecco’s Modified Eagle’s Medium (DMEM)
base powder (without glucose, l-glutamine, phenol red, sodium pyruvate and sodium bicarbonate,
purchased from SIGMA-Aldrich, Fluka Chemie GmbH, Buchs, Switzerland). DMEM base powder was
dissolved in bi-distilled and autoclaved water and supplemented with glucose (4.5 g/l), HEPES
(4.76 g/l), NaCl (1.987 g/l), and l-glutamine (0.876 g/l). The pH was adjusted to 7.4 and the final
medium was filtered through a sterile filter (Supor-200, 0.2 µm pore size, Pall Corporation, Michigan,

Marcel Schneider Page 85 of 172 University of Basel, 2008
USA) under aseptic conditions. Glucose, HEPES, NaCl, and l-glutamine were purchased from SIGMA-
Aldrich (Fluka Chemie GmbH, Buchs, Switzerland). Dulbecco’s Phosphate Buffered Saline (D-PBS)
(with Ca2+, Mg2+) was purchased from SIGMA-Aldrich (Fluka Chemie GmbH, Buchs, Switzerland).
4.2.1.2 Drug Quantification
The drug quantification of cell permeation experiments with aqueous solutions of the drugs was
performed with HPLC-UV (Agilent series 1100, Agilent Technologies USA, equipped with a capillary
pump G1376A, an auto sampler G1377AµWPS and a variable wavelength detector G1314a). A C-18
reversed phase column was used (CC 125/2 Lichrospher 100 RP 18 ec, Macherey Nagel, Oensingen,
Switzerland).
The drug concentration of albendazole was determined using the following mobile phase: distilled
water (bi-distilled and filtered through 0.45 µm)/methanol/tetrahydrofuran 40/45/15 (V/V). Ammonium
acetate with a concentration of 0.55 g/l was added to the mobile phase. pH-value at 25°C was 7.30.
An isocratic method was used for quantification with a flow of 0.2 ml/min, an injection volume of 40 µl
and a runtime of 7 min. Albendazole was detected at 254 nm in UV. Quantification was performed
against a set of external standard solutions within the linear response concentration range. Samples
were stored at 4°C.
The drug concentration of bendroflumethazide was determined with the following mobile phase:
distilled water (bi-distilled and filtered through 0.45 µm)/methanol/tetrahydrofuran 50/35/15 (V/V).
Ammonium acetate with a concentration of 0.55 g/l was added to the mobile phase. pH-value at 25°C
was 6.95. An isocratic method was used for quantification with a flow of 0.2 ml/min, an injection
volume of 40 µl and a runtime of 8 min. Bendroflumethazide was detected at 254 nm in UV. Using this
method, retention of bendroflumethazide was approximately 4.7 min. Quantification was performed
against a set of external standard solutions within the linear response concentration range. Samples
were stored at 4°C.
The drug concentration of carbamazepine was determined with the following mobile phase: distilled
water (bi-distilled and filtered through 0.45 µm)/methanol/tetrahydrofuran 55/35/10 (V/V). Ammonium
acetate with a concentration of 0.55 g/l was added to the mobile phase. pH-value at 25°C was 6.9. An
isocratic method was used for quantification with a flow of 0.2 ml/min, an injection volume of 40 µl and
a runtime of 6 min. Carbamazepine was detected at 284 nm in UV. Using this method, retention of
carbamazepine was approximately 3.7 min. Quantification was performed against a set of external
standard solutions within the linear response concentration range. Samples were stored at 4°C.
The drug concentration of proscillaridine was determined with the following mobile phase: distilled
water (bi-distilled and filtered through 0.45 µm)/methanol/tetrahydrofuran 45/45/10 (V/V). Ammonium
acetate with a concentration of 0.55 g/l was added to the mobile phase. pH-value at 25°C was 7.21.
An isocratic method was used for quantification with a flow of 0.2 ml/min, an injection volume of 40 µl
and a runtime of 7 min. Proscillaridine was detected at 300 nm in UV. Using this method, retention of
Marcel Schneider Page 86 of 172 University of Basel, 2008
proscillaridine was approximately 4.7 min. Quantification was performed against a set of external
standard solutions within the linear response concentration range. Samples were stored at 4°C.
The drug concentration of triamterene was determined by HPLC-UV with the following mobile phase:
distilled water (bi-distilled and filtered through 0.45 µm)/methanol/tetrahydrofuran 60/35/5 (V/V).
Ammonium acetate with a concentration of 0.55 g/l was added to the mobile phase. pH-value at 25°C
was 6.81. An isocratic method was used for quantification with a flow of 0.2 ml/min, an injection
volume of 40 µl and a runtime of 8 min. Triamterene was detected at 233 nm in UV. Using this
method, retention of triamterene was approximately 5.5 min. Quantification was performed against a
set of external standard solutions within the linear response concentration range. Samples were
stored at 4°C.
The drug concentration of triclabendazole was determined with the following mobile phase: distilled
water (bi distilled and filtered through 0.45 µm)/methanol/tetrahydrofuran 35/40/25 (V/V). Ammonium
acetate with a concentration of 0.55 g/l was added to the mobile phase. pH-value at 25°C was 6.7. An
isocratic method was used for quantification with a flow of 0.25 ml/min, an injection volume of 40 µl
and a runtime of 8 min. Triclabendazole was detected at a wavelength of 305 nm. Using this method
retention of triclabendazole was approximately 5.6 min. Quantification was performed against a set of
external standard solutions within the linear response concentration range. To maintain the stability
and reproducibility, the standard solutions contained the same amount of lipids as the samples. Lipid
containing samples were diluted 1:10 with transport media before injection. Samples were stored at
4°C.
4.2.1.3 TEER Measurements
The integrity of the Caco-2 cell monolayer in the Transwell plates was ensured with the measurement
of the trans-epithelial electrical resistance (TEER) before and after every transport study.
After washing the cell monolayer with 37°C tempered D- PBS (with Ca2+, Mg2+), 1600 µl transport
medium was added into the apical and 2800 µl transport medium was added into the basal
compartment. The Transwell plate was equilibrated for 60 min in the cell culture incubator before the
pre-experimental measurement. The TEER was measured with an EVOM-G-Meter (EVOM-G-Meter
Modell -24, World Precision Instruments, Berlin, Germany) equipped with an EndohmTM tissue
resistance measurement chamber containing 4.6 ml tempered transport media (World Precision
Instruments, Berlin, Germany). The measurement chamber was tempered to 37°C with transport
medium before the measurement. For the post-experimental TEER measurement, the withdrawn
volume in the apical compartment was replaced with transport medium before TEER was measured.
Caco-2 monolayer exceeding TEER values of 250 Ωcm2 were used for transport experiments.
4.2.1.4 Drug Permeation Across Caco-2 Cell Monolayers
Cells between culture days 19-23 at passage numbers 60-65 were used for the permeation studies.
After the pre-experimental TEER measurement, the transport medium was removed from the donor
compartment and replaced by the tempered (37°C) drug solutions. In the apical to basal direction,
Marcel Schneider Page 87 of 172 University of Basel, 2008
1600 µl of the drug solution was added to the apical compartment whereas the basal compartment
contained 2800 µl of transport media. In the basal to apical direction, the apical compartment
contained 1600 µl transport media and 2800 µl of the drug formulation was added to the basal
compartment. Triclabendazole was tested additionally as liposomal formulation. After the pre-
experimental TEER measurement, transport medium was completely removed. In the apical to basal
direction, 1600 µl drug formulation was added to the apical compartment and 2800 µl placebo
formulation (same lipid concentration as donor) was added to the basal compartment. In the basal to
apical direction, 1600 µl placebo formulation was added to the apical compartment and 2800 µl drug
formulation was added to the basal compartment.
At least three wells were used for each direction. The Transwell plate was shaken at 37°C in a water
saturated atmosphere under an incubator hood (KS15, Edmund Bühler GmbH, Tübingen& Hechingen,
Germany) with a stirring rate of 75 rpm on an orbital shaker (KS15, Edmund Bühler GmbH, Tübingen&
Hechingen, Germany). Permeation of drug across the cell monolayer was monitored by sampling the
solutions in both compartments at predefined points of time during 5 h, which were 15, 30, 60, 90,
120, 180, and 300 min. The sample volume was 50 µl. The withdrawn volume was not replaced. The
samples were collected in glass vials (Schmidlin Labor& Service AG, Sarbach, Switzerland) and
stored at 4°C until the HPLC analysis was performed.
4.2.1.5 Data Analysis
The kinetic model describing cell permeation described by Kapitza et al. (115) was fitted to the time
dependent concentration data with the software Easy Fit® to deduce parameters describing cell
permeation. Easy Fit® deduced apparent permeability coefficient (P), carrier mediated efflux parameter
(vk), initial concentration in apical compartment in apical to basal direction (c0a_ab), and initial
concentration in basal compartment in basal to apical direction (c0b_ba).
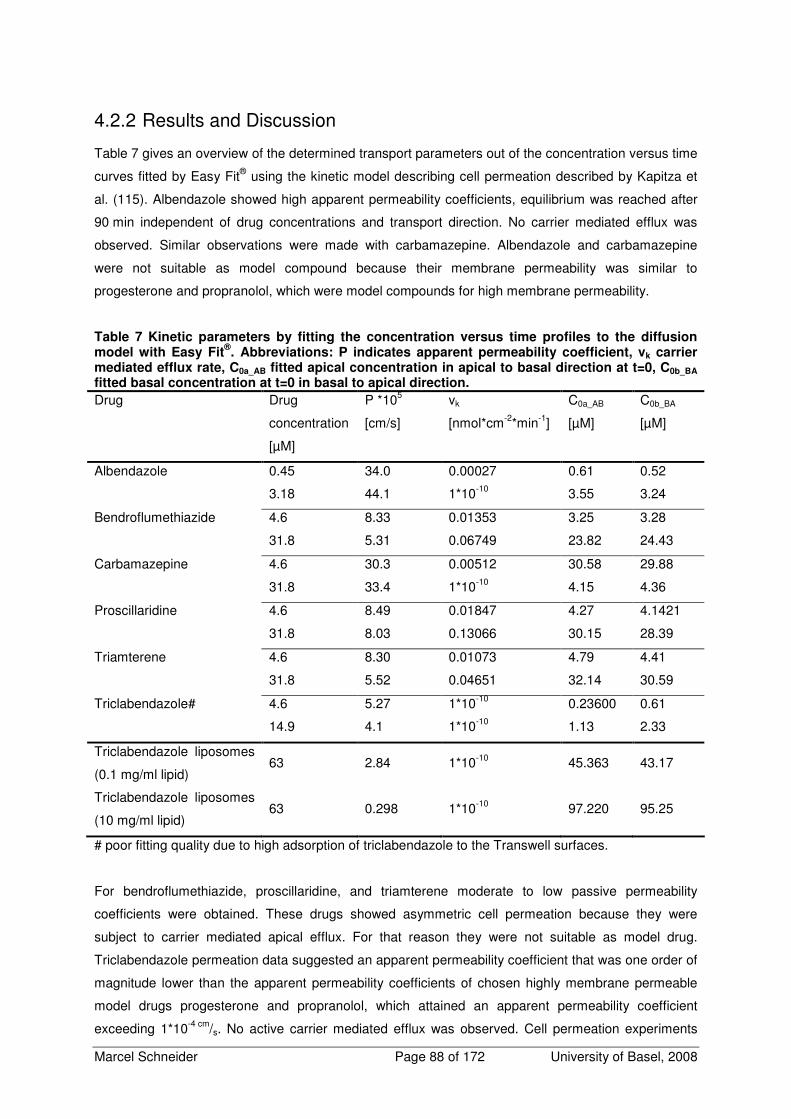
Marcel Schneider Page 88 of 172 University of Basel, 2008
4.2.2 Results and Discussion
Table 7 gives an overview of the determined transport parameters out of the concentration versus time
curves fitted by Easy Fit® using the kinetic model describing cell permeation described by Kapitza et
al. (115). Albendazole showed high apparent permeability coefficients, equilibrium was reached after
90 min independent of drug concentrations and transport direction. No carrier mediated efflux was
observed. Similar observations were made with carbamazepine. Albendazole and carbamazepine
were not suitable as model compound because their membrane permeability was similar to
progesterone and propranolol, which were model compounds for high membrane permeability.
Table 7 Kinetic parameters by fitting the concentration versus time profiles to the diffusion model with Easy Fit
®. Abbreviations: P indicates apparent permeability coefficient, vk carrier
mediated efflux rate, C0a_AB fitted apical concentration in apical to basal direction at t=0, C0b_BA fitted basal concentration at t=0 in basal to apical direction.
Drug Drug
concentration
[µM]
P *105
[cm/s]
vk
[nmol*cm-2*min-1]
C0a_AB
[µM]
C0b_BA
[µM]
Albendazole 0.45 34.0 0.00027 0.61 0.52
3.18 44.1 1*10-10 3.55 3.24
Bendroflumethiazide 4.6 8.33 0.01353 3.25 3.28
31.8 5.31 0.06749 23.82 24.43
Carbamazepine 4.6 30.3 0.00512 30.58 29.88
31.8 33.4 1*10-10 4.15 4.36
Proscillaridine 4.6 8.49 0.01847 4.27 4.1421
31.8 8.03 0.13066 30.15 28.39
Triamterene 4.6 8.30 0.01073 4.79 4.41
31.8 5.52 0.04651 32.14 30.59
Triclabendazole# 4.6 5.27 1*10-10 0.23600 0.61
14.9 4.1 1*10-10 1.13 2.33
Triclabendazole liposomes
(0.1 mg/ml lipid) 63 2.84 1*10-10 45.363 43.17
Triclabendazole liposomes
(10 mg/ml lipid) 63 0.298 1*10-10 97.220 95.25
# poor fitting quality due to high adsorption of triclabendazole to the Transwell surfaces.
For bendroflumethiazide, proscillaridine, and triamterene moderate to low passive permeability
coefficients were obtained. These drugs showed asymmetric cell permeation because they were
subject to carrier mediated apical efflux. For that reason they were not suitable as model drug.
Triclabendazole permeation data suggested an apparent permeability coefficient that was one order of
magnitude lower than the apparent permeability coefficients of chosen highly membrane permeable
model drugs progesterone and propranolol, which attained an apparent permeability coefficient
exceeding 1*10-4 cm/s. No active carrier mediated efflux was observed. Cell permeation experiments
Marcel Schneider Page 89 of 172 University of Basel, 2008
with aqueous solutions of triclabendazole showed a poor recovery because of extensive unspecific
drug adsorption to the Transwell surface. In an additional experiment, where liposomes with low lipid
phase concentrations were used, the unspecific adsorption of triclabendazole disappeared. Because
of the disappearance of adsorption to the surfaces in presence of lipids, triclabendazole could be used
to determine the influence of lipid containing drug formulations on passive permeation.
4.2.3 Conclusion
Despite the lack of reliable permeation data because of unspecific adsorption of aqueous
triclabendazole to Transwell surface, triclabendazole was the most suitable drug inside the tested
drugs. Triclabendazole exhibits poor water solubility, low cell membrane permeability, and no carrier
mediated efflux. Because unspecific adsorption to Transwell surfaces disappears if transport media is
supplemented with small amounts of phospholipids, triclabendazole is a suitable model drug to study
the influence of different lipid formulations on the passive permeation of poorly water soluble drugs.
Marcel Schneider Page 90 of 172 University of Basel, 2008
4.3 Screening of Different Emulsions and Microemulsions for their
Suitability as Model Formulation
To determine the influence of lipid containing drug formulations on the permeability of lipophilic drugs,
three structurally different formulations should be tested, which obtain ideally different microscopic
structures. Besides of liposomes, which had been characterized already regarding cell toxicity and
used for permeation studies through Caco-2 cell monolayer, and a microemulsion, that was
characterized regarding cell toxicity on Caco-2 cells in previous work of our group, a third, structurally
different lipid containing drug formulation had to be developed (115, 117). This formulation should
consist of well characterized excipients regarding compatibility with the Caco-2 cell model. Cytotoxicity
and influence on cell membrane of Caco-2 cell monolayer of Capmul MCM, Captex 8000,
Cremophor EL, and ethanol had been determined in previous work. Cytotoxic effects of Capmul MCM
had been shown exceeding concentrations of 0.02% (m/V) if used alone (117). Cremophor EL is
known to inhibit unspecifically Pgp, the main efflux transporter in Caco-2 cells achieving carrier
mediated efflux (94, 95, 120, 125, 139).
It was the aim of the following section to develop an emulsion consisting of these well characterized
components, which is well tolerated by the Caco-2 cells. Because Capmul MCM and Cremophor EL
are known to increase paracellular transport by thight junction modulation, cell permeation
experiments were performed observing TEER and paracellular permeability using the paracellular
marker compound fluoresceine.
4.3.1 Material
Fluoresceine sodium was purchased from SIGMA-Aldrich (Fluka Chemie GmbH, Buchs, Switzerland)
and was of analytical grade. Captex 8000 was purchased from SIGMA-Aldrich (Fluka Chemie GmbH,
Buchs, Switzerland). Capmul MCM was purchased from Abitec Corporation (Janesville, USA).
Cremophor was ordered from Fluka (Fluka Chemie GmbH, Buchs, Switzerland). Transport media
used for the permeation studies and the equilibrium dialysis experiments were prepared with
Dulbecco’s Modified Eagle’s Medium (DMEM) base powder (without glucose, l-glutamine, phenol red,
sodium pyruvate and sodium bicarbonate, purchased from SIGMA-Aldrich, Fluka Chemie GmbH,
Buchs, Switzerland). DMEM base powder was dissolved in bi-distilled and autoclaved water and
supplemented with glucose (4.5 g/l), HEPES (4.76 g/l), NaCl (1.987 g/l), and l-glutamine (0.876 g/l).
The pH was adjusted to 7.4 and the final medium was filtered through a sterile filter (Supor-200,
0.2 µm pore size, Pall Corporation, Michigan, USA) under aseptic conditions. Glucose, HEPES, NaCl,
and l-glutamine were purchased from SIGMA-Aldrich (Fluka Chemie GmbH, Buchs, Switzerland).
Dulbecco’s Phosphate Buffered Saline (D-PBS) (with Ca2+, Mg2+) was purchased from SIGMA-Aldrich
(Fluka Chemie GmbH, Buchs, Switzerland).
Marcel Schneider Page 91 of 172 University of Basel, 2008
4.3.2 Methods
4.3.2.1 Preparation of the Formulations
Lipid phases were prepared by melting the components at 37°C and mixing the components together.
Lipid phase was warmed to 37°C before use and the according amount for the final formulation was
balanced and mixed with two thirds of the final transport medium volume. The formulation was
homogenized for 5 min at 15000 rpm with a Polytron homogenizer (Polytron PT 3000, Kinematica AG,
Littau, Switzerland) then preheated transport medium was added to the final volume. The
manufactured formulations were analyzed for physical stability over 24 h by examining the optical
aspect and measuring particle size by PCS. No tendency for phase separation should be found after
24 h.
4.3.2.2 Particle Size Measurement
The particle size of the formulations was determined by dynamic light scattering. The z-average
particle size of the emulsions and the microemulsions were measured with a Zetasizer Nano ZS ZEN
3600 (Malvern Instruments Ltd, Worcestershire, England) in disposable cuvettes (2.5 ml sample
volume, Brand GmbH & Co, Wertheim, Germany) at 37°C. The resulting z-average diameter was the
average out of 3 runs, consisting of 10 measurements each.
4.3.2.3 TEER Measurements
The integrity of the Caco-2 cell monolayer in the Transwell plates was ensured with the measurement
of the trans-epithelial electrical resistance (TEER) before and after every transport study.
After washing the cell monolayer with 37°C tempered D- PBS (with Ca2+, Mg2+), 1600 µl transport
medium was added into the apical and 2800 µl transport medium was added into the basal
compartment. The Transwell plate was equilibrated 60 min in the cell culture incubator before the pre-
experimental measurement. The TEER was measured with an EVOM-G-Meter (EVOM-G-Meter
Modell -24, World Precision Instruments, Berlin, Germany) equipped with an EndohmTM tissue
resistance measurement chamber containing 4.6 ml tempered transport media (World Precision
Instruments, Berlin, Germany). The measurement chamber was tempered to 37°C with transport
medium before the measurement. For the post-experimental TEER measurement, the withdrawn
volume in the apical compartment was replaced with transport medium before TEER was measured.
Caco-2 monolayer exceeding TEER values of 250 Ωcm2 were used for transport experiments.
4.3.2.4 Determination of Transcellular Drug Permeation
Since it is known that nonionic surfactants like Cremophor EL were interacting with tight junctions of a
cell monolayer, physically stable formulations were tested in transport experiments, where the cell
monolayer integrity was indirectly determined by measuring the change of fluoresceine sodium
permeability coefficient caused by the formulations compared to the permeability coefficient of
aqueous fluoresceine solutions as reference. Fluoresceine is a hydrophilic marker compound for
paracellular transport (98, 140). Additionally, TEER was measured before and after the experiment.
Marcel Schneider Page 92 of 172 University of Basel, 2008
Decreased integrity of the cell monolayer is expressed as increased fluoresceine permeability
coefficient and a decreased post- experimental TEER compared to aqueous transport media.
Cells between culture days 19-23 at passage numbers 60-65 were used for the permeation studies.
After the pre-experimental TEER measurement, the transport medium was removed from the donor
compartment and replaced by the tempered (37°C) drug solutions for the determination of cell
permeation kinetics of the aqueous fluoresceine solutions. To determine the influence of the
formulations, placebo formulations were pipetted after pre-experimental TEER measurement into
Transwell, 1600 µl into the apical, 2800 µl to the basal compartment. Then, 30.1 µl ethanolic
fluoresceine sodium stock solution (concentration 2 mg/ml) was added into apical compartment (apical
to basal direction) and 52.6 µl to basal compartment (basal to apical direction). The resulting
Fluoresceine concentration in the donor compartment was 100 µM. At least three wells were used for
each direction. The Transwell plate was shaken at 37°C in a water saturated atmosphere under an
incubator hood (KS15, Edmund Bühler GmbH, Tübingen& Hechingen, Germany) with a stirring rate of
75 rpm on an orbital shaker (KS15, Edmund Bühler GmbH, Tübingen& Hechingen, Germany).
Permeation of drug across the cell monolayer was monitored by sampling the solutions in both
compartments at predefined points of time during 5 h, which were 15, 30, 60, 90, 120, 180, and
300 min. The sample volume was 50 µl. The withdrawn volume was not replaced. Lipid containing
samples were diluted 1:10 with transport medium. The samples were collected in glass vials
(Schmidlin Labor& Service AG, Sarbach, Switzerland) and stored at 4°C until the HPLC analysis was
performed.
4.3.2.5 Fluoresceine Quantification
The drug concentration of sodium fluoresceine was determined by HPLC-UV (Agilent series 1100,
Agilent Technologies USA, equipped with a capillary pump G1376A, an auto sampler G1377AµWPS
and a variable wavelength detector G1314a). A C-18 reversed phase column was used (CC 125/2
Lichrospher 100 RP 18 ec, Macherey Nagel, Oensingen, Switzerland) with the following mobile phase:
distilled water (bi-distilled and filtered through 0.45 µm)/methanol 60/40 (V/V). Ammonium acetate with
a concentration of 0.55 g/l was added to the mobile phase. pH-value at 25°C was 6.85. An isocratic
method was used for quantification with a flow of 0.2 ml/min, an injection volume of 40 µl and a
runtime of 6 min. Sodium fluoresceine was detected at 475 nm in UV. Using this method, retention of
sodium fluoresceine was approximately 4.5 min. Quantification was performed against a set of
external standard solutions within the linear response concentration range. Samples were stored at
4°C.
4.3.2.6 Data Analysis
The kinetic model describing cell permeation described by Kapitza et al. (115) was fitted to the time
dependent concentration data with the software Easy Fit® to deduce parameters describing cell
permeation. Easy Fit® deduced apparent permeability coefficient (P), carrier mediated efflux parameter
(vk), initial concentration in apical compartment in apical to basal direction (c0a_AB), and initial
concentration in basal compartment in basal to apical direction (c0b_BA).
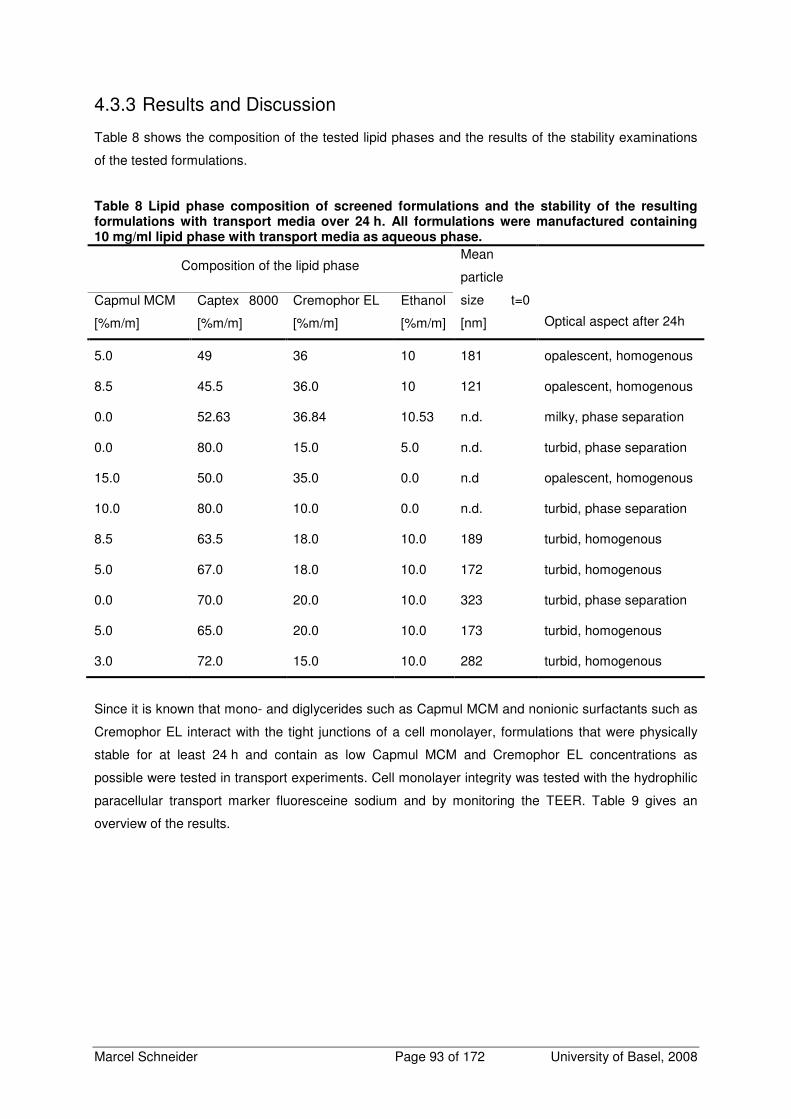
Marcel Schneider Page 93 of 172 University of Basel, 2008
4.3.3 Results and Discussion
Table 8 shows the composition of the tested lipid phases and the results of the stability examinations
of the tested formulations.
Table 8 Lipid phase composition of screened formulations and the stability of the resulting formulations with transport media over 24 h. All formulations were manufactured containing 10 mg/ml lipid phase with transport media as aqueous phase.
Composition of the lipid phase
Capmul MCM
[%m/m]
Captex 8000
[%m/m]
Cremophor EL
[%m/m]
Ethanol
[%m/m]
Mean
particle
size t=0
[nm] Optical aspect after 24h
5.0 49 36 10 181 opalescent, homogenous
8.5 45.5 36.0 10 121 opalescent, homogenous
0.0 52.63 36.84 10.53 n.d. milky, phase separation
0.0 80.0 15.0 5.0 n.d. turbid, phase separation
15.0 50.0 35.0 0.0 n.d opalescent, homogenous
10.0 80.0 10.0 0.0 n.d. turbid, phase separation
8.5 63.5 18.0 10.0 189 turbid, homogenous
5.0 67.0 18.0 10.0 172 turbid, homogenous
0.0 70.0 20.0 10.0 323 turbid, phase separation
5.0 65.0 20.0 10.0 173 turbid, homogenous
3.0 72.0 15.0 10.0 282 turbid, homogenous
Since it is known that mono- and diglycerides such as Capmul MCM and nonionic surfactants such as
Cremophor EL interact with the tight junctions of a cell monolayer, formulations that were physically
stable for at least 24 h and contain as low Capmul MCM and Cremophor EL concentrations as
possible were tested in transport experiments. Cell monolayer integrity was tested with the hydrophilic
paracellular transport marker fluoresceine sodium and by monitoring the TEER. Table 9 gives an
overview of the results.
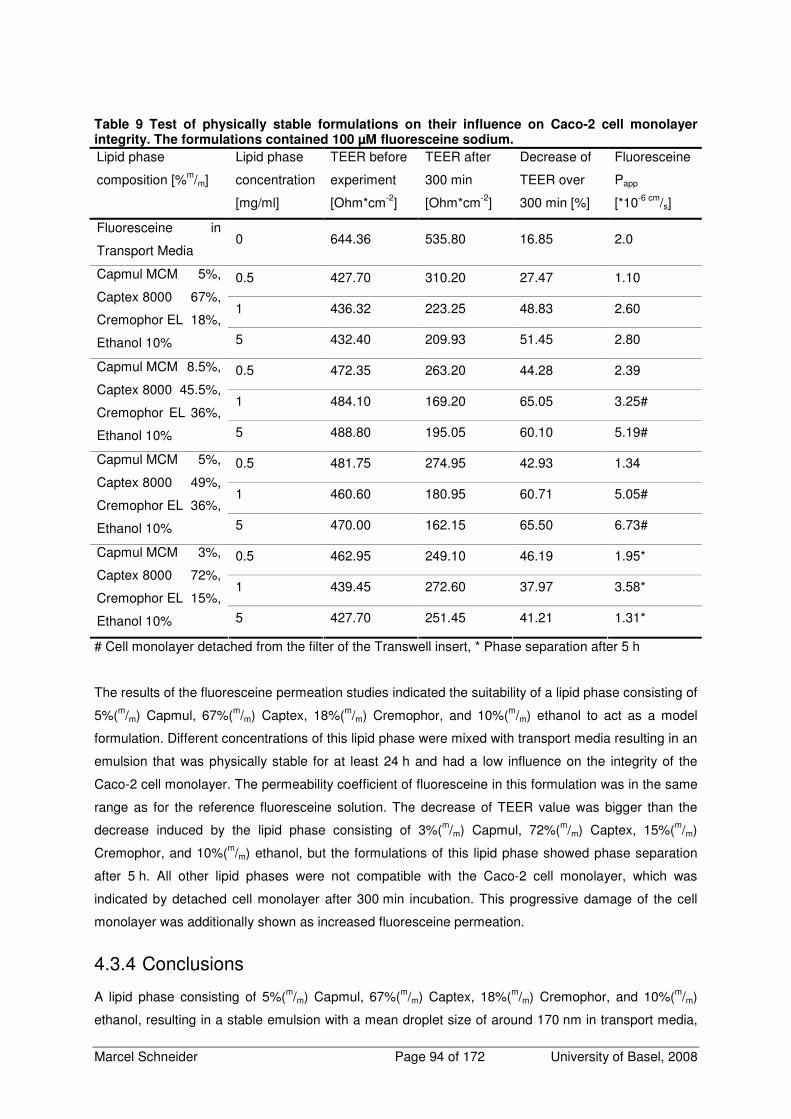
Marcel Schneider Page 94 of 172 University of Basel, 2008
Table 9 Test of physically stable formulations on their influence on Caco-2 cell monolayer integrity. The formulations contained 100 µM fluoresceine sodium.
Lipid phase
composition [%m/m]
Lipid phase
concentration
[mg/ml]
TEER before
experiment
[Ohm*cm-2]
TEER after
300 min
[Ohm*cm-2]
Decrease of
TEER over
300 min [%]
Fluoresceine
Papp
[*10-6 cm/s]
Fluoresceine in
Transport Media 0 644.36 535.80 16.85 2.0
0.5 427.70 310.20 27.47 1.10
1 436.32 223.25 48.83 2.60
Capmul MCM 5%,
Captex 8000 67%,
Cremophor EL 18%,
Ethanol 10% 5 432.40 209.93 51.45 2.80
0.5 472.35 263.20 44.28 2.39
1 484.10 169.20 65.05 3.25#
Capmul MCM 8.5%,
Captex 8000 45.5%,
Cremophor EL 36%,
Ethanol 10% 5 488.80 195.05 60.10 5.19#
0.5 481.75 274.95 42.93 1.34
1 460.60 180.95 60.71 5.05#
Capmul MCM 5%,
Captex 8000 49%,
Cremophor EL 36%,
Ethanol 10% 5 470.00 162.15 65.50 6.73#
0.5 462.95 249.10 46.19 1.95*
1 439.45 272.60 37.97 3.58*
Capmul MCM 3%,
Captex 8000 72%,
Cremophor EL 15%,
Ethanol 10% 5 427.70 251.45 41.21 1.31*
# Cell monolayer detached from the filter of the Transwell insert, * Phase separation after 5 h
The results of the fluoresceine permeation studies indicated the suitability of a lipid phase consisting of
5%(m/m) Capmul, 67%(m/m) Captex, 18%(m/m) Cremophor, and 10%(m/m) ethanol to act as a model
formulation. Different concentrations of this lipid phase were mixed with transport media resulting in an
emulsion that was physically stable for at least 24 h and had a low influence on the integrity of the
Caco-2 cell monolayer. The permeability coefficient of fluoresceine in this formulation was in the same
range as for the reference fluoresceine solution. The decrease of TEER value was bigger than the
decrease induced by the lipid phase consisting of 3%(m/m) Capmul, 72%(m/m) Captex, 15%(m/m)
Cremophor, and 10%(m/m) ethanol, but the formulations of this lipid phase showed phase separation
after 5 h. All other lipid phases were not compatible with the Caco-2 cell monolayer, which was
indicated by detached cell monolayer after 300 min incubation. This progressive damage of the cell
monolayer was additionally shown as increased fluoresceine permeation.
4.3.4 Conclusions
A lipid phase consisting of 5%(m/m) Capmul, 67%(m/m) Captex, 18%(m/m) Cremophor, and 10%(m/m)
ethanol, resulting in a stable emulsion with a mean droplet size of around 170 nm in transport media,
Marcel Schneider Page 95 of 172 University of Basel, 2008
does increase fluoresceine permeability only slightly. It lowers the TEER dose dependent but in all
cases not below the limit of 200 Ohm*cm-2 over 5 h. This emulsion is the most suitable emulsion-like
formulation for the determination of the influence of structurally different formulations on the
permeation of lipophilic drugs. An additional validation of the influence of the emulsion and the
microemulsion on time and lipid phase concentration dependent decrease of the monolayer integrity
was necessary to ensure optimal experimental conditions (see next chapter).
Marcel Schneider Page 96 of 172 University of Basel, 2008
4.4 Maintaining TEER over Time of the Chosen Formulations:
Determination of Duration of Transport Experiments
It was observed that different lipid containing drug formulations containing Captex 8000,
Capmul MCM, Cremophor EL, and ethanol, decrease the cell monolayer integrity. An optimal
experimental procedure had to be found to use these formulations for cell permeation experiments.
Observations during formulation screening experiments indicated that the cells tolerated lipid phase
concentrations up to 5 mg/ml for up to 3 h well. But after 5 h, depending on the formulation, detached
cell monolayer were observed. To assure the cell monolayer integrity during incubation of the cell
monolayer with the chosen formulations, TEER was observed over 5 h. This procedure was not
necessary for the liposomes, because no effect of the liposomes on the cell monolayer integrity was
observed up to 50 mg/ml phospholipids in previous work (115).
4.4.1 Material and Methods
4.4.1.1 Material
Captex 8000 was purchased from SIGMA-Aldrich (Fluka Chemie GmbH, Buchs, Switzerland). Capmul
MCM was purchased from Abitec Corporation (Janesville, USA). Cremophor was ordered from Fluka
(Fluka Chemie GmbH, Buchs, Switzerland). Transport media used for the permeation studies and the
equilibrium dialysis experiments were prepared with Dulbecco’s Modified Eagle’s Medium (DMEM)
base powder (without glucose, l-glutamine, phenol red, sodium pyruvate and sodium bicarbonate,
purchased from SIGMA-Aldrich, Fluka Chemie GmbH, Buchs, Switzerland). DMEM base powder was
dissolved in bi-distilled and autoclaved water and supplemented with glucose (4.5 g/l), HEPES
(4.76 g/l), NaCl (1.987 g/l), and l-glutamine (0.876 g/l). The pH was adjusted to 7.4 and the final
medium was filtered through a sterile filter (Supor-200, 0.2 µm pore size, Pall Corporation, Michigan,
USA) under aseptic conditions. Glucose, HEPES, NaCl, and l-glutamine were purchased from SIGMA-
Aldrich (Fluka Chemie GmbH, Buchs, Switzerland). Dulbecco’s Phosphate Buffered Saline (D-PBS)
(with Ca2+, Mg2+) was purchased from SIGMA-Aldrich (Fluka Chemie GmbH, Buchs, Switzerland).
4.4.1.2 Preparation of Emulsions and Microemulsions
Microemulsions containing 1 mg/ml and 5 mg/ml lipid phase (lipid phase consisting of 17.58%[m/m],
Capmul, 35.05%[m/m] Captex, 36.84%[m/m] Cremophor, and 10%[m/m] ethanol) and emulsions
containing 1 mg/ml and 5 mg/ml lipid phase (lipid phase consisting of 5%[m/m] Capmul, 67%[m/m]
Captex, 18%[m/m] Cremophor, and 10%[m/m] ethanol) were tested. The lipid phases were prepared by
mixing the components at 37°C. The lipid phases were stored at 4°C. Lipid phase was warmed up to
37°C before use and the according amount was balanced and mixed with two thirds of the final
transport medium volume. This crude formulation was homogenized for 5 min at 15000 rpm with a
Polytron homogenizer (Polytron PT 3000, Kinematica AG, Littau, Switzerland) then preheated
transport medium was added to the final volume.
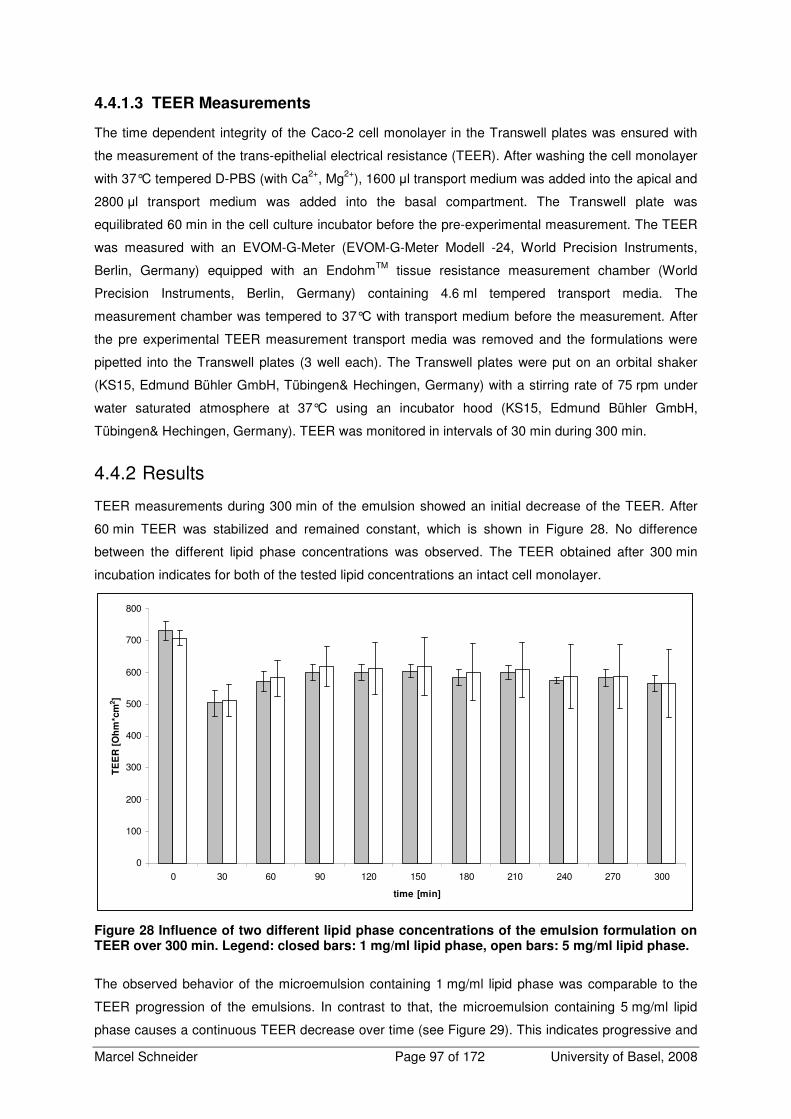
Marcel Schneider Page 97 of 172 University of Basel, 2008
4.4.1.3 TEER Measurements
The time dependent integrity of the Caco-2 cell monolayer in the Transwell plates was ensured with
the measurement of the trans-epithelial electrical resistance (TEER). After washing the cell monolayer
with 37°C tempered D-PBS (with Ca2+, Mg2+), 1600 µl transport medium was added into the apical and
2800 µl transport medium was added into the basal compartment. The Transwell plate was
equilibrated 60 min in the cell culture incubator before the pre-experimental measurement. The TEER
was measured with an EVOM-G-Meter (EVOM-G-Meter Modell -24, World Precision Instruments,
Berlin, Germany) equipped with an EndohmTM tissue resistance measurement chamber (World
Precision Instruments, Berlin, Germany) containing 4.6 ml tempered transport media. The
measurement chamber was tempered to 37°C with transport medium before the measurement. After
the pre experimental TEER measurement transport media was removed and the formulations were
pipetted into the Transwell plates (3 well each). The Transwell plates were put on an orbital shaker
(KS15, Edmund Bühler GmbH, Tübingen& Hechingen, Germany) with a stirring rate of 75 rpm under
water saturated atmosphere at 37°C using an incubator hood (KS15, Edmund Bühler GmbH,
Tübingen& Hechingen, Germany). TEER was monitored in intervals of 30 min during 300 min.
4.4.2 Results
TEER measurements during 300 min of the emulsion showed an initial decrease of the TEER. After
60 min TEER was stabilized and remained constant, which is shown in Figure 28. No difference
between the different lipid phase concentrations was observed. The TEER obtained after 300 min
incubation indicates for both of the tested lipid concentrations an intact cell monolayer.
0
100
200
300
400
500
600
700
800
0 30 60 90 120 150 180 210 240 270 300
time [min]
TE
ER
[O
hm
*cm
2]
Figure 28 Influence of two different lipid phase concentrations of the emulsion formulation on TEER over 300 min. Legend: closed bars: 1 mg/ml lipid phase, open bars: 5 mg/ml lipid phase.
The observed behavior of the microemulsion containing 1 mg/ml lipid phase was comparable to the
TEER progression of the emulsions. In contrast to that, the microemulsion containing 5 mg/ml lipid
phase causes a continuous TEER decrease over time (see Figure 29). This indicates progressive and
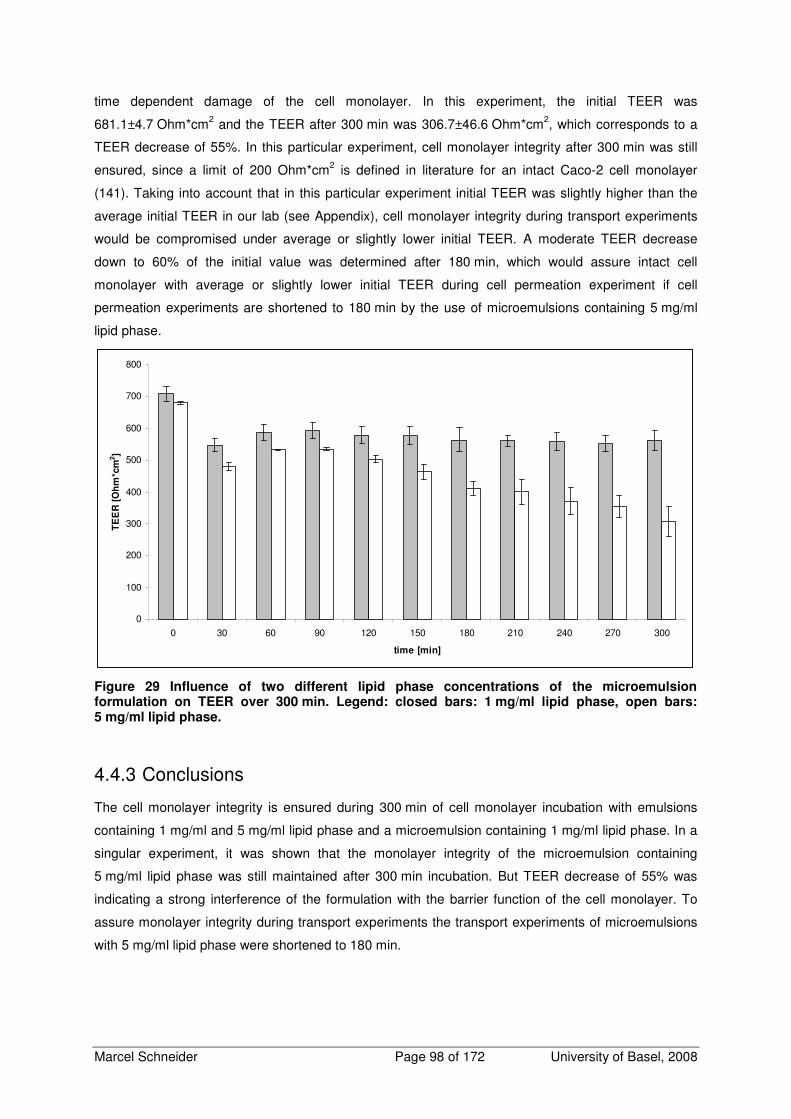
Marcel Schneider Page 98 of 172 University of Basel, 2008
time dependent damage of the cell monolayer. In this experiment, the initial TEER was
681.1±4.7 Ohm*cm2 and the TEER after 300 min was 306.7±46.6 Ohm*cm2, which corresponds to a
TEER decrease of 55%. In this particular experiment, cell monolayer integrity after 300 min was still
ensured, since a limit of 200 Ohm*cm2 is defined in literature for an intact Caco-2 cell monolayer
(141). Taking into account that in this particular experiment initial TEER was slightly higher than the
average initial TEER in our lab (see Appendix), cell monolayer integrity during transport experiments
would be compromised under average or slightly lower initial TEER. A moderate TEER decrease
down to 60% of the initial value was determined after 180 min, which would assure intact cell
monolayer with average or slightly lower initial TEER during cell permeation experiment if cell
permeation experiments are shortened to 180 min by the use of microemulsions containing 5 mg/ml
lipid phase.
0
100
200
300
400
500
600
700
800
0 30 60 90 120 150 180 210 240 270 300
time [min]
TE
ER
[O
hm
*cm
2]
Figure 29 Influence of two different lipid phase concentrations of the microemulsion formulation on TEER over 300 min. Legend: closed bars: 1 mg/ml lipid phase, open bars: 5 mg/ml lipid phase.
4.4.3 Conclusions
The cell monolayer integrity is ensured during 300 min of cell monolayer incubation with emulsions
containing 1 mg/ml and 5 mg/ml lipid phase and a microemulsion containing 1 mg/ml lipid phase. In a
singular experiment, it was shown that the monolayer integrity of the microemulsion containing
5 mg/ml lipid phase was still maintained after 300 min incubation. But TEER decrease of 55% was
indicating a strong interference of the formulation with the barrier function of the cell monolayer. To
assure monolayer integrity during transport experiments the transport experiments of microemulsions
with 5 mg/ml lipid phase were shortened to 180 min.
Marcel Schneider Page 99 of 172 University of Basel, 2008
4.5 Development of a Method to Determine the Free Fraction of a
Drug Formulation Containing Lipids
It was essential to have knowledge about the free fraction of the drug in the different formulations for a
deeper understanding of the results of the transport experiments. The development of a method to
determine the free amount of drug in lipid containing dosage forms like liposomes, microemulsions
and emulsions is described in this chapter. Three different approaches for the determination of
unbound drug concentration were evaluated. Ultrafiltration using centrifugal filter devices was
evaluated as fast technique for the separation of lipid particles and aqueous phase. As second
method, ultracentrifugation was evaluated, which allows fast separation of constituents with different
densities and is used for the phase separation of semisolid dosage forms. This method would allow
direct measurement of unbound drug concentration in the aqueous phase too. The third method,
which was evaluated, was equilibrium dialysis. This time consuming method allows indirectly
calculation of the drug concentration in the water phase of a formulation via the determination of the
lipid water partition coefficient. It allows the calculation of the free fraction of a drug in a formulation.
4.5.1 Material and Methods
4.5.1.1 Material
Lipoid S 100 and Lipoid EPG were kindly provided by Lipoid GmbH (Ludwigshafen, Germany).
Saquinavir was a kindly provided by Roche (Roche Pharmaceuticals, Basel, Switzerland).
Progesterone, Captex 8000, and Cremophor EL were purchased from Fluka (SIGMA-Aldrich, Fluka
Chemie GmbH, Buchs, Switzerland). Capmul MCM was purchased from Abitec (Abitec Corp.,
Janesville, WI, USA).Transport media used as buffer were made with Dulbecco’s modified Eagle’s
medium (DMEM) base (without glucose, l-glutamine, phenol red, sodium pyruvate and sodium
bicarbonate) (SIGMA-Aldrich, Fluka Chemie GmbH, Buchs, Switzerland). This was dissolved in bi-
distilled and autoclaved water and supplemented with glucose (4.5 g/l), HEPES (4.76 g/l), NaCl
(1.987 g/l) and l-glutamine (0.876 g/l), the pH was adjusted to 7.40 and the final medium was
subjected to sterile filtration and 0.5%(m/V) sodium azide was added as antimicrobial preservative.
Glucose, Hepes, NaCl, sodium azide, and l-glutamine were all obtained from SIGMA-Aldrich (Fluka
Chemie GmbH, Buchs, Switzerland). All other reagents were of analytical grade.
4.5.1.2 Preparation of Liposomes
Lipoid S100, EPG and the drug were dissolved in ethanol in a round bottomed flask. The solvent was
evaporated to dryness and the lipid film was kept under vacuum for 30 min to eliminate solvent traces.
The lipid film was suspended with 20 ml of tempered transport medium. The suspension was extruded
under nitrogen pressure with a filter candle through polycarbonate filters (Nucleopore track edge
membrane filters, Whatman plc, Kent, UK) with descending pore sizes in the following scheme:
Marcel Schneider Page 100 of 172 University of Basel, 2008
2 x 0.4 µm, 5 x 0.2 µm 20 x 0.1 µm. The liposomes were analyzed with dynamic light scattering for
particle size (see below).
4.5.1.3 Preparation of Microemulsions
The components of the lipid phase (Captex 8000 35.05% [m/m], Capmul MCM 17.58% [m/m],
Cremophor EL 36.84% [m/m], and ethanol 10% [m/m]) were mixed at 37°C. The lipid phase was stored
at 4°C. Before use, the lipid phase was warmed to 37°C and the according amount was balanced and
mixed with transport medium. The formulation was homogenized for 5 min at 15000 rpm with a
Polytron homogenizer (Polytron PT 3000, Kinematica AG, Littau, Switzerland). The formulations were
analyzed with dynamic light scattering for particle size.
4.5.1.4 Particle Size
The particle size of the formulations was measured by dynamic light scattering. The z-average
diameter of the formulations were determined with a Zetasizer 1000HSA (Malvern Instruments Ltd,
Worcestershire, England) equipped with a 100 nm lens in disposable cuvettes (2 ml size, Greiner
Labortechnik, Kremsmünster, Austria) at 25°C. Samples were diluted with sterile filtered transport
media (0.2 µm) until counting rates between 100 and 300 KCts/s were reached. The resulting z-
average diameter was the average out of 5 runs, consisting of 10 measurements each.
4.5.1.5 Ultrafiltration
Centrifugal filter devices with a molecular weight cut off of 3000 D, 100000 D (Microcon YM3,
Millipore, Bedford, MA, USA), and 30000 D (Ultrafree- 0.5 centrifugal filter NMWL Membrane, Tube
Biomax, Millipore, Bedford, MA, USA) were used. After pippetting 1 ml of the formulation, the filter
devices were spun for 30 min at 14000 rpm with an Eppendorf centrifuge (5415C, Eppendorf / Dr.
Vaudaux AG, Schönenbuch, Switzerland). This method allows a direct measurement of the free drug.
Therefore, the filtrate was injected into the HPLC for determination of drug content.
4.5.1.6 Ultracentrifugation
The formulations were fractionated by ultracentrifugation using an ultracentrifuge type Centricon T-
1075 and a rotor TFT 7013 (Kontron Instruments, Mailand, Italy). Quick-Seal centrifuge tubes, 5/8X3
(Beckman Instruments, Palo Alto, USA) were used. The formulations were centrifuged at 37°C for 2
and 4 h at 450000 g. The clear water phase was carefully removed by a syringe and analyzed with
HPLC for determination of drug concentration. This drug concentration represents the free drug
concentration.
4.5.1.7 Equilibrium Dialysis
The formulations were dialyzed with horizontal diffusion cells consisting of glass with a chamber
volume of 10 ml and a membrane surface of approximately 2 cm2. The chambers were separated by
the following membranes: SpectraPor® 7 regenerated cellulose membranes with a molecular weight
cut off of 50000 D, 2000 D (Spectrum Labs, DG Breda, Netherlands), and Membracell MD 34-14
(Amersham, Uppsala, Sweden) with a molecular weight cut off of 34000 D. To maintain a temperature
Marcel Schneider Page 101 of 172 University of Basel, 2008
of 37°C, a water bath was used. The solutions in the cells were stirred at 1000 rpm with Teflon-
paddles driven by a stirring device (Janke & Kunkel RE162, IKA Labortechnik, Staufen, Germany).
The formulations were dialyzed for at least 34-48 h until equilibrium was reached. The samples were
analyzed with HPLC. To avoid microbial contamination, resulting in a potential degradation of the drug
or the formulation, 0.5% (m/V) sodium azide was added to the transport media and the formulations.
The method does not allow measuring directly the unbound amount of drug, because the total volume
of the water phase changes. The partition between the lipid particles and the water phase was
calculated using Equation 49.
tot
w
c
cz =
Equation 49
Free fraction of drug is denoted by z, cw indicates equilibrium concentration of drug in water phase
(acceptor concentration) [mg/ml], and ctot indicates total equilibrium concentration of drug (donor
concentration) [mg/ml]
4.5.1.8 Drug Quantification
The drug concentration of progesterone and saquinavir was determined by HPLC-UV (Agilent series
1100, Agilent Technologies USA, equipped with a G1312A binary pump, an auto sampler G1367B and
a variable wavelength detector G1314B). A C-18 reversed phase column was used (CC 125/2
Lichrospher 100 RP 18 ec, Macherey Nagel, Oensingen, Switzerland) with the following mobile phase
for progesterone: distilled water (bi-distilled and filtered through 0.45 µm)/methanol/tetrahydrofuran
40/45/15 (V/V). Ammonium acetate with a concentration of 0.55 g/l was added to the mobile phase.
The pH-value at 25°C was 6.9. For saquinavir the following mobile phase was used: distilled water
(bi-distilled and filtered through 0.45 µm)/methanol/tetrahydrofuran 35/50/15 (V/V). Ammonium acetate
with a concentration of 0.55 g/l was added to the mobile phase. The pH-value at 25°C was 7.0. An
isocratic method was used for quantification with a flow of 0.25 ml/min, an injection volume of 100 µl
and a runtime of 8 min. Progesterone and saquinavir were detected at 239 nm in UV. Using this
methods, retention of progesterone was approximately 5 min, retention of saquinavir was
approximately 7 min. Quantification was performed against a set of external standard solutions within
the linear response concentration range. Lipid containing samples were diluted 1:10 with transport
media before injection.
4.5.2 Results and Discussion
4.5.2.1 Ultrafiltration
After the centrifugation of liposomes, containing saquinavir (2.2 mg/ml), Lipoid S100 (50 mg/ml), and
Lipoid EPG (0.22 mg/ml), the centrifugate was clear and no particles were detected with dynamic light
scattering, whereas liposomes had a particle size of approximately 140 nm. As control, a solution
containing saquinavir (10 µg/ml) was ultrafiltrated. The drug concentration of the clear filtrates and the
control solution was determined by HPLC (Table 10).
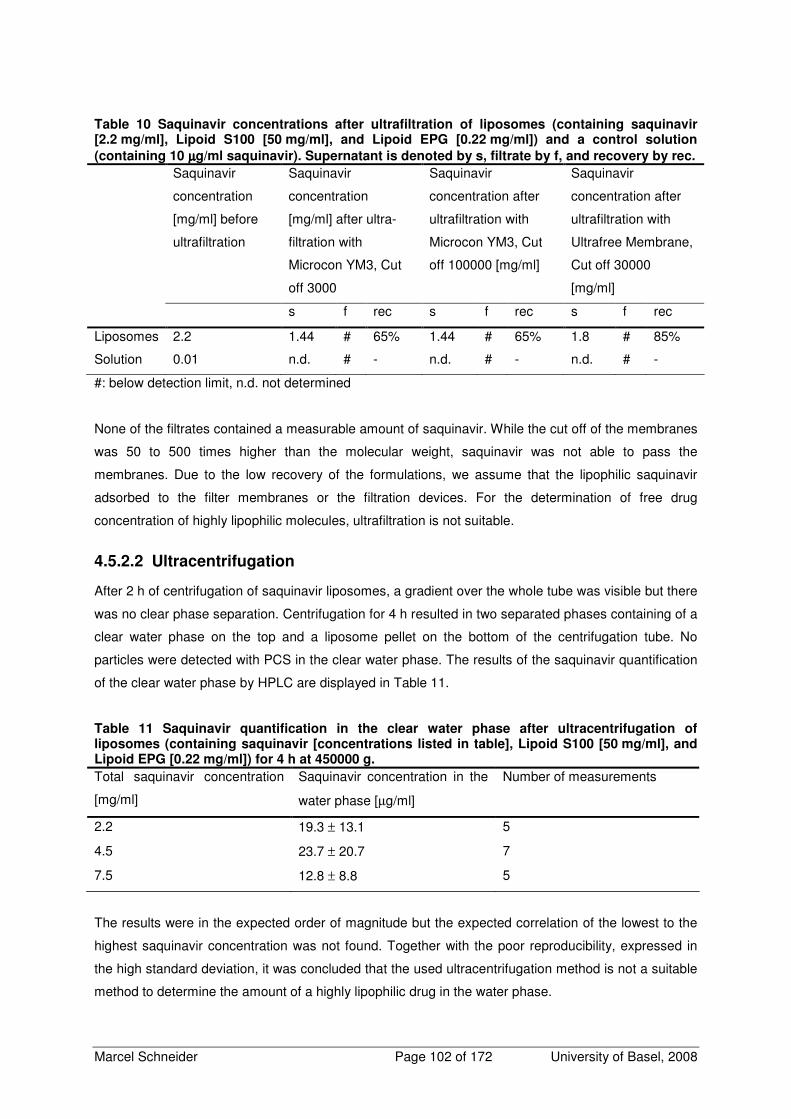
Marcel Schneider Page 102 of 172 University of Basel, 2008
Table 10 Saquinavir concentrations after ultrafiltration of liposomes (containing saquinavir [2.2 mg/ml], Lipoid S100 [50 mg/ml], and Lipoid EPG [0.22 mg/ml]) and a control solution
(containing 10 µµµµg/ml saquinavir). Supernatant is denoted by s, filtrate by f, and recovery by rec.
Saquinavir
concentration
[mg/ml] before
ultrafiltration
Saquinavir
concentration
[mg/ml] after ultra-
filtration with
Microcon YM3, Cut
off 3000
Saquinavir
concentration after
ultrafiltration with
Microcon YM3, Cut
off 100000 [mg/ml]
Saquinavir
concentration after
ultrafiltration with
Ultrafree Membrane,
Cut off 30000
[mg/ml]
s f rec s f rec s f rec
Liposomes 2.2 1.44 # 65% 1.44 # 65% 1.8 # 85%
Solution 0.01 n.d. # - n.d. # - n.d. # -
#: below detection limit, n.d. not determined
None of the filtrates contained a measurable amount of saquinavir. While the cut off of the membranes
was 50 to 500 times higher than the molecular weight, saquinavir was not able to pass the
membranes. Due to the low recovery of the formulations, we assume that the lipophilic saquinavir
adsorbed to the filter membranes or the filtration devices. For the determination of free drug
concentration of highly lipophilic molecules, ultrafiltration is not suitable.
4.5.2.2 Ultracentrifugation
After 2 h of centrifugation of saquinavir liposomes, a gradient over the whole tube was visible but there
was no clear phase separation. Centrifugation for 4 h resulted in two separated phases containing of a
clear water phase on the top and a liposome pellet on the bottom of the centrifugation tube. No
particles were detected with PCS in the clear water phase. The results of the saquinavir quantification
of the clear water phase by HPLC are displayed in Table 11.
Table 11 Saquinavir quantification in the clear water phase after ultracentrifugation of liposomes (containing saquinavir [concentrations listed in table], Lipoid S100 [50 mg/ml], and Lipoid EPG [0.22 mg/ml]) for 4 h at 450000 g.
Total saquinavir concentration
[mg/ml]
Saquinavir concentration in the
water phase [µg/ml]
Number of measurements
2.2 19.3 ± 13.1 5
4.5 23.7 ± 20.7 7
7.5 12.8 ± 8.8 5
The results were in the expected order of magnitude but the expected correlation of the lowest to the
highest saquinavir concentration was not found. Together with the poor reproducibility, expressed in
the high standard deviation, it was concluded that the used ultracentrifugation method is not a suitable
method to determine the amount of a highly lipophilic drug in the water phase.
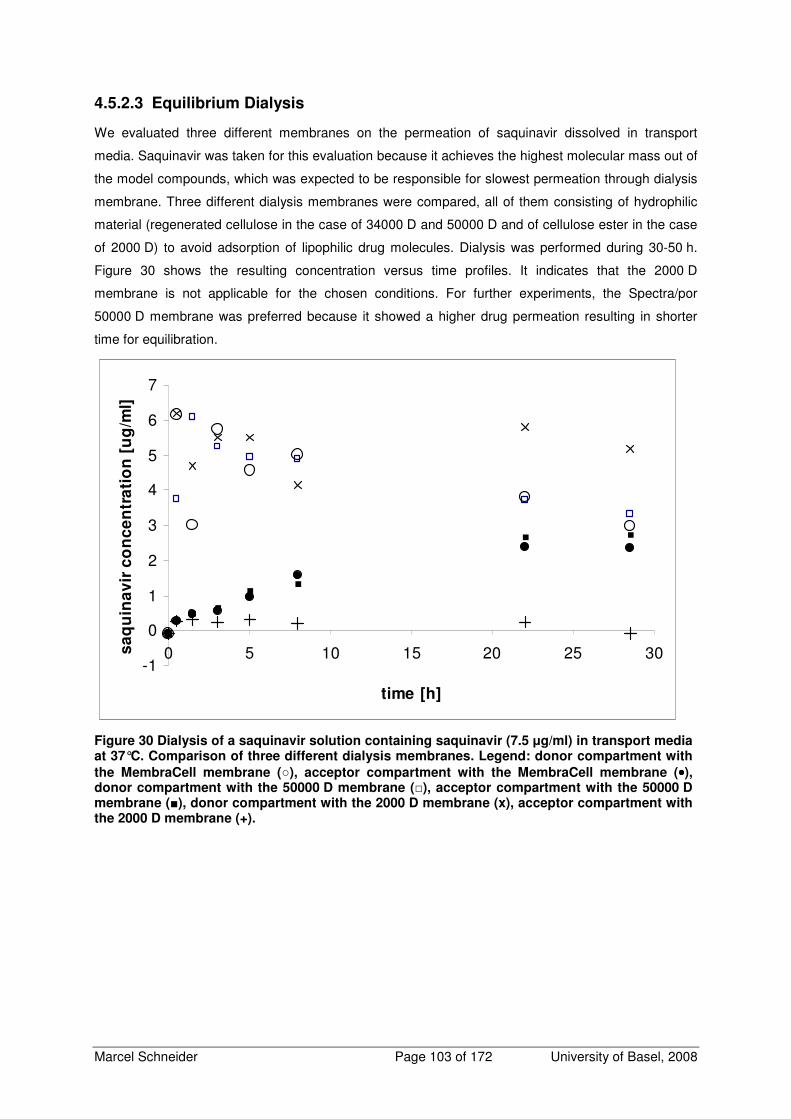
Marcel Schneider Page 103 of 172 University of Basel, 2008
4.5.2.3 Equilibrium Dialysis
We evaluated three different membranes on the permeation of saquinavir dissolved in transport
media. Saquinavir was taken for this evaluation because it achieves the highest molecular mass out of
the model compounds, which was expected to be responsible for slowest permeation through dialysis
membrane. Three different dialysis membranes were compared, all of them consisting of hydrophilic
material (regenerated cellulose in the case of 34000 D and 50000 D and of cellulose ester in the case
of 2000 D) to avoid adsorption of lipophilic drug molecules. Dialysis was performed during 30-50 h.
Figure 30 shows the resulting concentration versus time profiles. It indicates that the 2000 D
membrane is not applicable for the chosen conditions. For further experiments, the Spectra/por
50000 D membrane was preferred because it showed a higher drug permeation resulting in shorter
time for equilibration.
-1
0
1
2
3
4
5
6
7
0 5 10 15 20 25 30
time [h]
sa
qu
ina
vir
co
nc
en
tra
tio
n [
ug
/ml]
Figure 30 Dialysis of a saquinavir solution containing saquinavir (7.5 µg/ml) in transport media at 37°C. Comparison of three different dialysis membranes. Legend: donor compartment with
the MembraCell membrane (), acceptor compartment with the MembraCell membrane (••••), donor compartment with the 50000 D membrane (), acceptor compartment with the 50000 D membrane (), donor compartment with the 2000 D membrane (x), acceptor compartment with the 2000 D membrane (+).
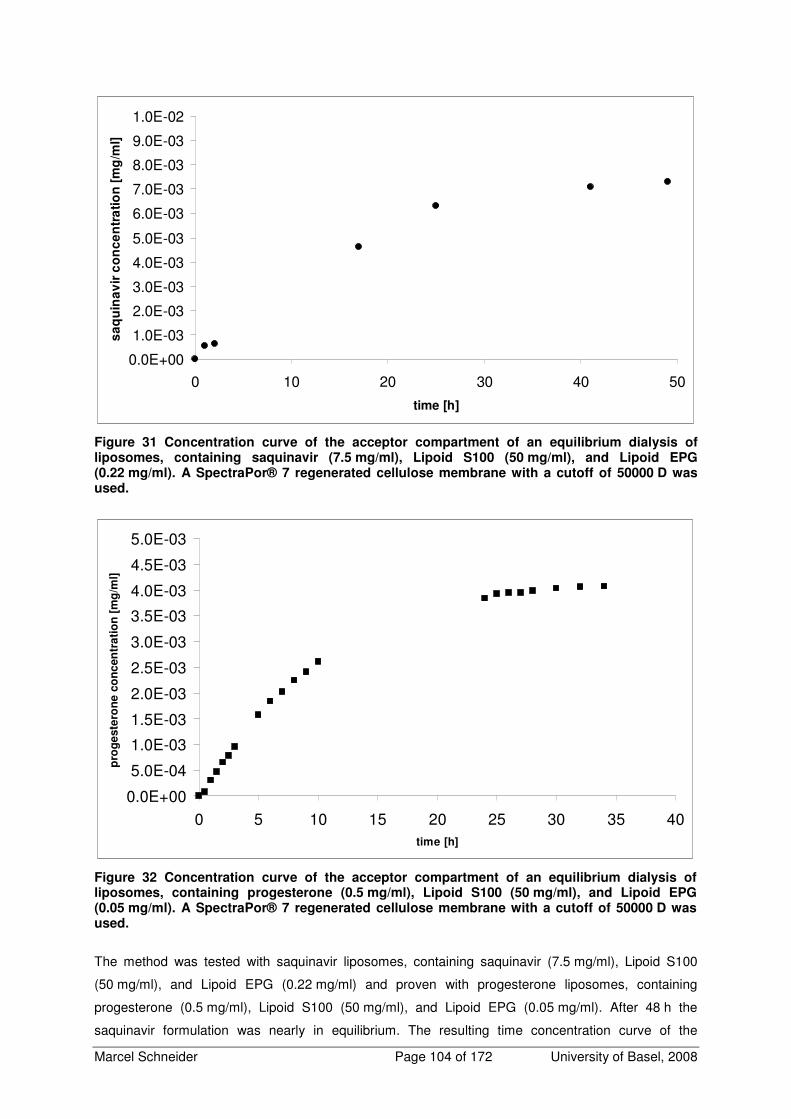
Marcel Schneider Page 104 of 172 University of Basel, 2008
0.0E+00
1.0E-03
2.0E-03
3.0E-03
4.0E-03
5.0E-03
6.0E-03
7.0E-03
8.0E-03
9.0E-03
1.0E-02
0 10 20 30 40 50
time [h]
sa
qu
ina
vir
co
nc
en
tra
tio
n [
mg
/ml]
Figure 31 Concentration curve of the acceptor compartment of an equilibrium dialysis of liposomes, containing saquinavir (7.5 mg/ml), Lipoid S100 (50 mg/ml), and Lipoid EPG (0.22 mg/ml). A SpectraPor® 7 regenerated cellulose membrane with a cutoff of 50000 D was used.
The method was tested with saquinavir liposomes, containing saquinavir (7.5 mg/ml), Lipoid S100
(50 mg/ml), and Lipoid EPG (0.22 mg/ml) and proven with progesterone liposomes, containing
progesterone (0.5 mg/ml), Lipoid S100 (50 mg/ml), and Lipoid EPG (0.05 mg/ml). After 48 h the
saquinavir formulation was nearly in equilibrium. The resulting time concentration curve of the
0.0E+00
5.0E-04
1.0E-03
1.5E-03
2.0E-03
2.5E-03
3.0E-03
3.5E-03
4.0E-03
4.5E-03
5.0E-03
0 5 10 15 20 25 30 35 40time [h]
pro
ge
ste
ron
e c
on
cen
tra
tio
n [
mg
/ml]
Figure 32 Concentration curve of the acceptor compartment of an equilibrium dialysis of liposomes, containing progesterone (0.5 mg/ml), Lipoid S100 (50 mg/ml), and Lipoid EPG (0.05 mg/ml). A SpectraPor® 7 regenerated cellulose membrane with a cutoff of 50000 D was used.
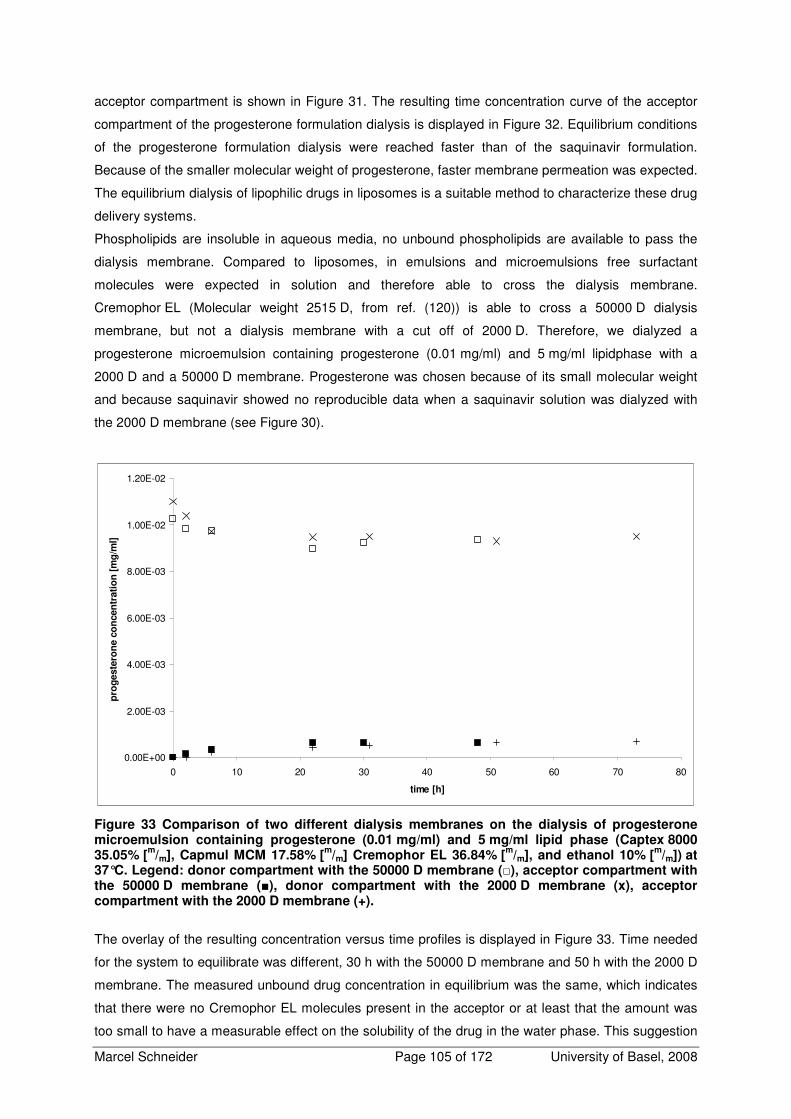
Marcel Schneider Page 105 of 172 University of Basel, 2008
acceptor compartment is shown in Figure 31. The resulting time concentration curve of the acceptor
compartment of the progesterone formulation dialysis is displayed in Figure 32. Equilibrium conditions
of the progesterone formulation dialysis were reached faster than of the saquinavir formulation.
Because of the smaller molecular weight of progesterone, faster membrane permeation was expected.
The equilibrium dialysis of lipophilic drugs in liposomes is a suitable method to characterize these drug
delivery systems.
Phospholipids are insoluble in aqueous media, no unbound phospholipids are available to pass the
dialysis membrane. Compared to liposomes, in emulsions and microemulsions free surfactant
molecules were expected in solution and therefore able to cross the dialysis membrane.
Cremophor EL (Molecular weight 2515 D, from ref. (120)) is able to cross a 50000 D dialysis
membrane, but not a dialysis membrane with a cut off of 2000 D. Therefore, we dialyzed a
progesterone microemulsion containing progesterone (0.01 mg/ml) and 5 mg/ml lipidphase with a
2000 D and a 50000 D membrane. Progesterone was chosen because of its small molecular weight
and because saquinavir showed no reproducible data when a saquinavir solution was dialyzed with
the 2000 D membrane (see Figure 30).
0.00E+00
2.00E-03
4.00E-03
6.00E-03
8.00E-03
1.00E-02
1.20E-02
0 10 20 30 40 50 60 70 80
time [h]
pro
geste
ron
e c
on
cen
trati
on
[m
g/m
l]
Figure 33 Comparison of two different dialysis membranes on the dialysis of progesterone microemulsion containing progesterone (0.01 mg/ml) and 5 mg/ml lipid phase (Captex 8000 35.05% [
m/m], Capmul MCM 17.58% [
m/m] Cremophor EL 36.84% [
m/m], and ethanol 10% [
m/m]) at
37°C. Legend: donor compartment with the 50000 D membrane (), acceptor compartment with the 50000 D membrane (), donor compartment with the 2000 D membrane (x), acceptor compartment with the 2000 D membrane (+).
The overlay of the resulting concentration versus time profiles is displayed in Figure 33. Time needed
for the system to equilibrate was different, 30 h with the 50000 D membrane and 50 h with the 2000 D
membrane. The measured unbound drug concentration in equilibrium was the same, which indicates
that there were no Cremophor EL molecules present in the acceptor or at least that the amount was
too small to have a measurable effect on the solubility of the drug in the water phase. This suggestion
Marcel Schneider Page 106 of 172 University of Basel, 2008
is supported by recently published findings of Mahler et al. where a polysorbate 20 containing protein
formulation was dialyzed. It was concluded that polysorbate 20, that has similar properties as
Cremophor EL, could not be significantly reduced by dialysis (142).
Table 12 displays the calculated free fractions of progesterone and saquinavir formulations. The
resulting free fractions were consistent with the theory, where one expects a lower free fraction for a
higher amount of lipid phase and for a higher lipophilicity of a drug. Saquinavir, representing the more
lipophilic drug, has the lower free fraction than progesterone.
Table 12 Calculated free fractions of different drugs and formulations
Formulation Drug Lipid phase [mg/ml] Free fraction (*104)
Liposomes saquinavir 50 6.73
progesterone 50 47.9
Microemulsion progesterone 5 696.4
4.5.3 Conclusions
Equilibrium dialysis was found to be a reliable method to determine the free fraction of a lipophilic drug
in liposomes and microemulsions. It was shown that the surfactant Cremophor EL had no influence on
the free fraction of progesterone in a microemulsion.
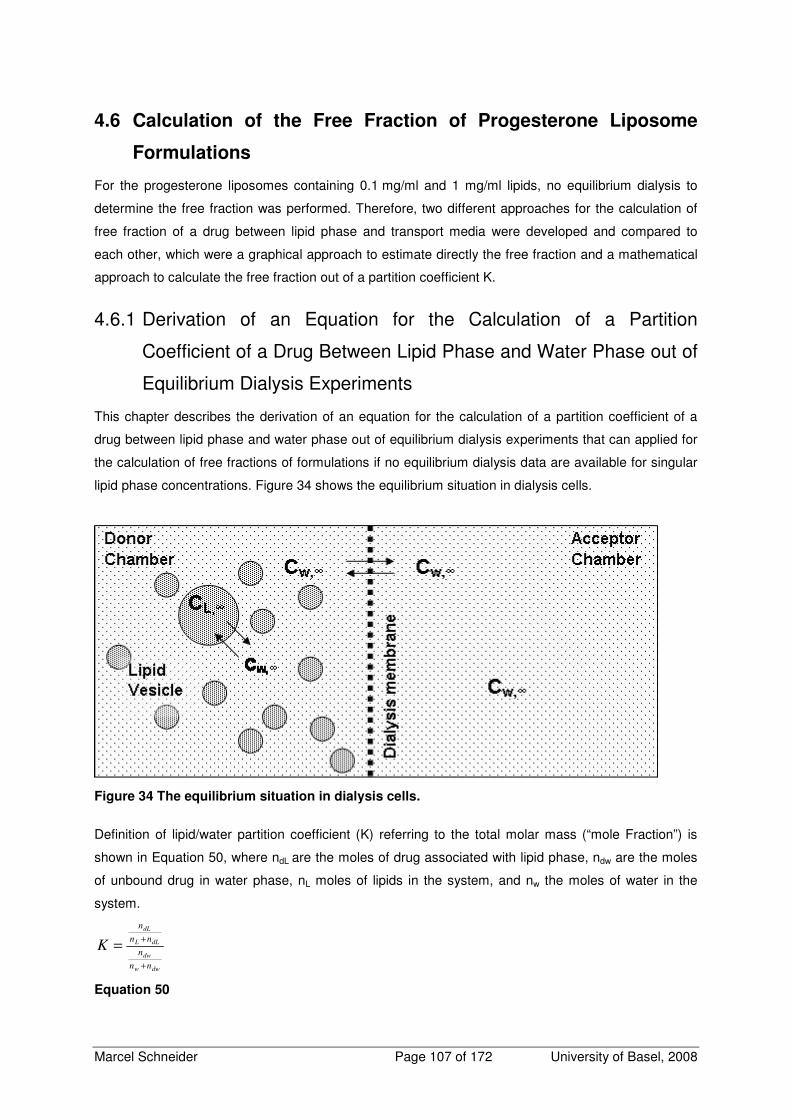
Marcel Schneider Page 107 of 172 University of Basel, 2008
4.6 Calculation of the Free Fraction of Progesterone Liposome
Formulations
For the progesterone liposomes containing 0.1 mg/ml and 1 mg/ml lipids, no equilibrium dialysis to
determine the free fraction was performed. Therefore, two different approaches for the calculation of
free fraction of a drug between lipid phase and transport media were developed and compared to
each other, which were a graphical approach to estimate directly the free fraction and a mathematical
approach to calculate the free fraction out of a partition coefficient K.
4.6.1 Derivation of an Equation for the Calculation of a Partition
Coefficient of a Drug Between Lipid Phase and Water Phase out of
Equilibrium Dialysis Experiments
This chapter describes the derivation of an equation for the calculation of a partition coefficient of a
drug between lipid phase and water phase out of equilibrium dialysis experiments that can applied for
the calculation of free fractions of formulations if no equilibrium dialysis data are available for singular
lipid phase concentrations. Figure 34 shows the equilibrium situation in dialysis cells.
Figure 34 The equilibrium situation in dialysis cells.
Definition of lipid/water partition coefficient (K) referring to the total molar mass (“mole Fraction”) is
shown in Equation 50, where ndL are the moles of drug associated with lipid phase, ndw are the moles
of unbound drug in water phase, nL moles of lipids in the system, and nw the moles of water in the
system.
dww
dw
dLL
dL
nn
n
nn
n
K
+
+=
Equation 50
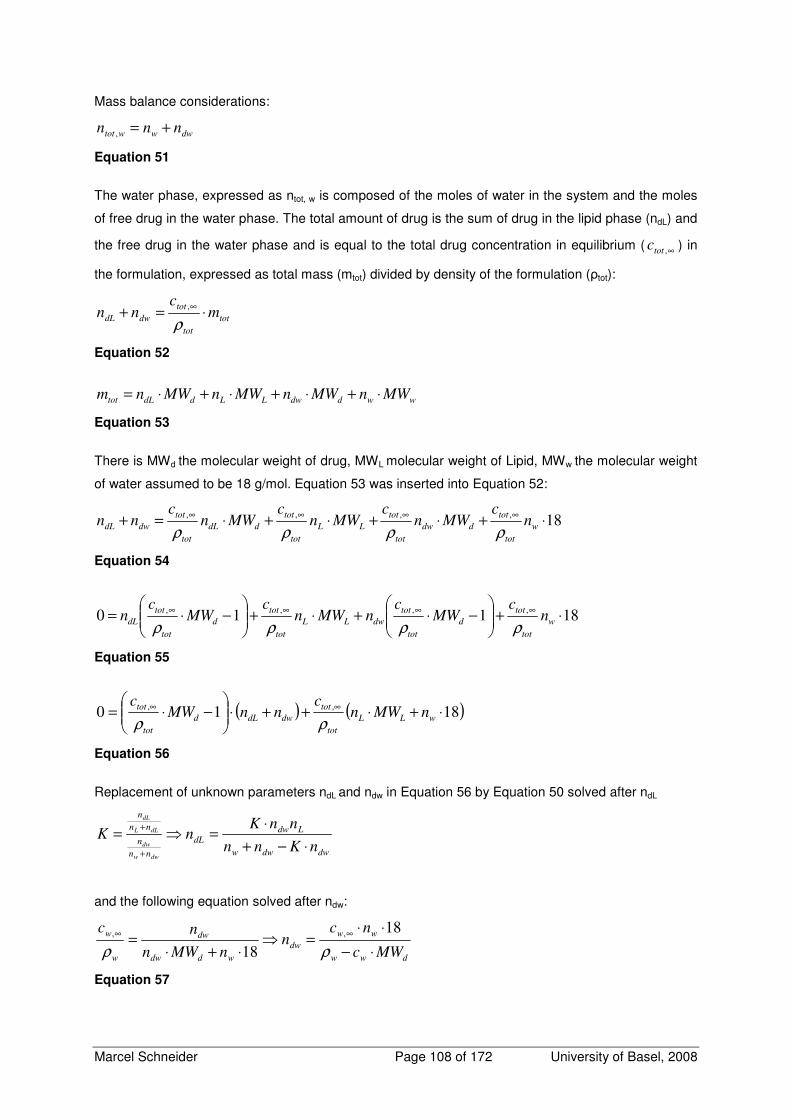
Marcel Schneider Page 108 of 172 University of Basel, 2008
Mass balance considerations:
dwwwtot nnn +=,
Equation 51
The water phase, expressed as ntot, w is composed of the moles of water in the system and the moles
of free drug in the water phase. The total amount of drug is the sum of drug in the lipid phase (ndL) and
the free drug in the water phase and is equal to the total drug concentration in equilibrium ( ∞,totc ) in
the formulation, expressed as total mass (mtot) divided by density of the formulation (ρtot):
tot
tot
tot
dwdL mc
nn ⋅=+∞
ρ
,
Equation 52
wwddwLLddLtot MWnMWnMWnMWnm ⋅+⋅+⋅+⋅=
Equation 53
There is MWd the molecular weight of drug, MWL molecular weight of Lipid, MWw the molecular weight
of water assumed to be 18 g/mol. Equation 53 was inserted into Equation 52:
18,,,, ⋅+⋅+⋅+⋅=+ ∞∞∞∞
w
tot
tot
ddw
tot
tot
LL
tot
tot
ddL
tot
tot
dwdL nc
MWnc
MWnc
MWnc
nnρρρρ
Equation 54
18110,,,, ⋅+
−⋅+⋅+
−⋅= ∞∞∞∞
w
tot
tot
d
tot
tot
dwLL
tot
tot
d
tot
tot
dL nc
MWc
nMWnc
MWc
nρρρρ
Equation 55
( ) ( )1810,, ⋅+⋅++⋅
−⋅= ∞∞
wLL
tot
tot
dwdLd
tot
totnMWn
cnnMW
c
ρρ
Equation 56
Replacement of unknown parameters ndL and ndw in Equation 56 by Equation 50 solved after ndL
dwdww
LdwdL
nn
n
nn
n
nKnn
nnKnK
dww
dw
dLL
dL
⋅−+
⋅=⇒=
+
+
and the following equation solved after ndw:
dww
ww
dw
wddw
dw
w
w
MWc
ncn
nMWn
nc
⋅−
⋅⋅=⇒
⋅+⋅=
∞∞
ρρ
18
18
,,
Equation 57
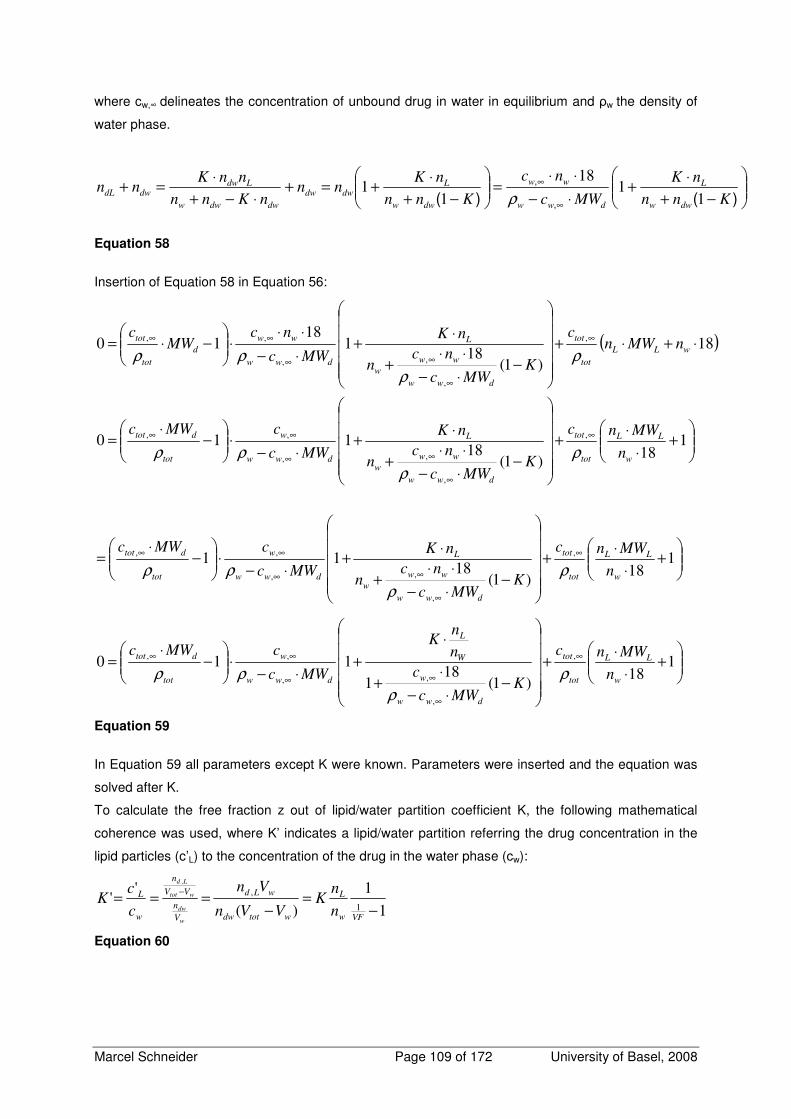
Marcel Schneider Page 109 of 172 University of Basel, 2008
where cw,∞ delineates the concentration of unbound drug in water in equilibrium and ρw the density of
water phase.
−+
⋅+
⋅−
⋅⋅=
−+
⋅+=+
⋅−+
⋅=+
∞
∞
)()( ,
,
Knn
nK
MWc
nc
Knn
nKnn
nKnn
nnKnn
dww
L
dww
ww
dww
Ldwdw
dwdww
LdwdwdL
11
18
11
ρ
Equation 58
Insertion of Equation 58 in Equation 56:
( )
+
⋅
⋅+
−⋅−
⋅⋅+
⋅+
⋅−⋅
−
⋅=
⋅+⋅+
−⋅−
⋅⋅+
⋅+
⋅−
⋅⋅⋅
−⋅=
∞
∞
∞∞
∞∞
∞
∞
∞∞
∞∞
118
)1(18
110
18
)1(18
118
10
,
,
,,
,,
,
,
,,
,,
w
LL
tot
tot
dww
ww
w
L
dww
w
tot
dtot
wLL
tot
tot
dww
ww
w
L
dww
ww
d
tot
tot
n
MWnc
KMWc
ncn
nK
MWc
cMWc
nMWnc
KMWc
ncn
nK
MWc
ncMW
c
ρ
ρ
ρρ
ρ
ρ
ρρ
+
⋅
⋅+
−⋅−
⋅⋅+
⋅+
⋅−⋅
−
⋅= ∞
∞
∞∞
∞∞1
18)1(
1811
,
,
,,
,,
w
LL
tot
tot
dww
ww
w
L
dww
w
tot
dtot
n
MWnc
KMWc
ncn
nK
MWc
cMWc
ρ
ρ
ρρ
+
⋅
⋅+
−⋅−
⋅+
⋅
+⋅−
⋅
−
⋅= ∞
∞
∞∞
∞∞1
18)1(
181
110,
,
,,
,,
w
LL
tot
tot
dww
w
W
L
dww
w
tot
dtot
n
MWnc
KMWc
c
n
nK
MWc
cMWc
ρ
ρ
ρρ
Equation 59
In Equation 59 all parameters except K were known. Parameters were inserted and the equation was
solved after K.
To calculate the free fraction z out of lipid/water partition coefficient K, the following mathematical
coherence was used, where K’ indicates a lipid/water partition referring the drug concentration in the
lipid particles (c’L) to the concentration of the drug in the water phase (cw):
1
1
)(
''
1
,
,
−=
−===
−
VFw
L
wtotdw
wLd
V
n
VV
n
w
L
n
nK
VVn
Vn
c
cK
w
dw
wtot
Ld
Equation 60
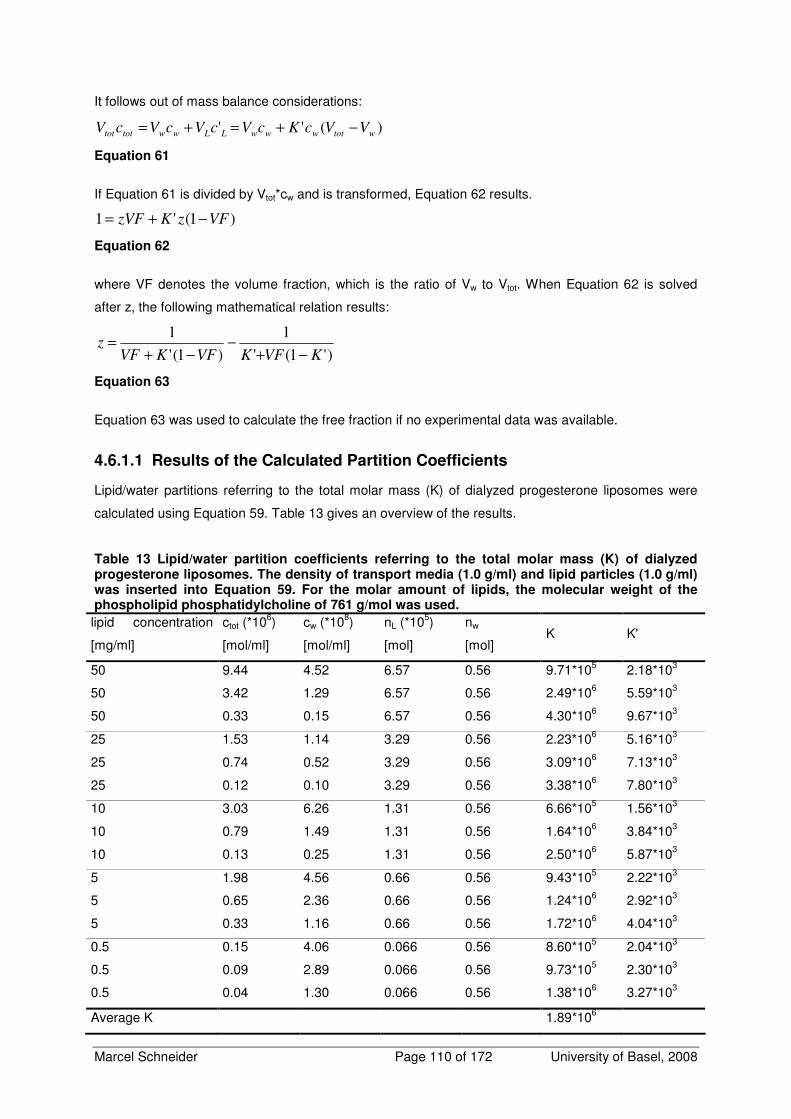
Marcel Schneider Page 110 of 172 University of Basel, 2008
It follows out of mass balance considerations:
)('' wtotwwwLLwwtottot VVcKcVcVcVcV −+=+=
Equation 61
If Equation 61 is divided by Vtot*cw and is transformed, Equation 62 results.
)1('1 VFzKzVF −+=
Equation 62
where VF denotes the volume fraction, which is the ratio of Vw to Vtot. When Equation 62 is solved
after z, the following mathematical relation results:
)'1('
1
)1('
1
KVFKVFKVFz
−+−
−+=
Equation 63
Equation 63 was used to calculate the free fraction if no experimental data was available.
4.6.1.1 Results of the Calculated Partition Coefficients
Lipid/water partitions referring to the total molar mass (K) of dialyzed progesterone liposomes were
calculated using Equation 59. Table 13 gives an overview of the results.
Table 13 Lipid/water partition coefficients referring to the total molar mass (K) of dialyzed progesterone liposomes. The density of transport media (1.0 g/ml) and lipid particles (1.0 g/ml) was inserted into Equation 59. For the molar amount of lipids, the molecular weight of the phospholipid phosphatidylcholine of 761 g/mol was used.
lipid concentration
[mg/ml]
ctot (*106)
[mol/ml]
cw (*108)
[mol/ml]
nL (*105)
[mol]
nw
[mol] K K'
50 9.44 4.52 6.57 0.56 9.71*105 2.18*103
50 3.42 1.29 6.57 0.56 2.49*106 5.59*103
50 0.33 0.15 6.57 0.56 4.30*106 9.67*103
25 1.53 1.14 3.29 0.56 2.23*106 5.16*103
25 0.74 0.52 3.29 0.56 3.09*106 7.13*103
25 0.12 0.10 3.29 0.56 3.38*106 7.80*103
10 3.03 6.26 1.31 0.56 6.66*105 1.56*103
10 0.79 1.49 1.31 0.56 1.64*106 3.84*103
10 0.13 0.25 1.31 0.56 2.50*106 5.87*103
5 1.98 4.56 0.66 0.56 9.43*105 2.22*103
5 0.65 2.36 0.66 0.56 1.24*106 2.92*103
5 0.33 1.16 0.66 0.56 1.72*106 4.04*103
0.5 0.15 4.06 0.066 0.56 8.60*105 2.04*103
0.5 0.09 2.89 0.066 0.56 9.73*105 2.30*103
0.5 0.04 1.30 0.066 0.56 1.38*106 3.27*103
Average K 1.89*106
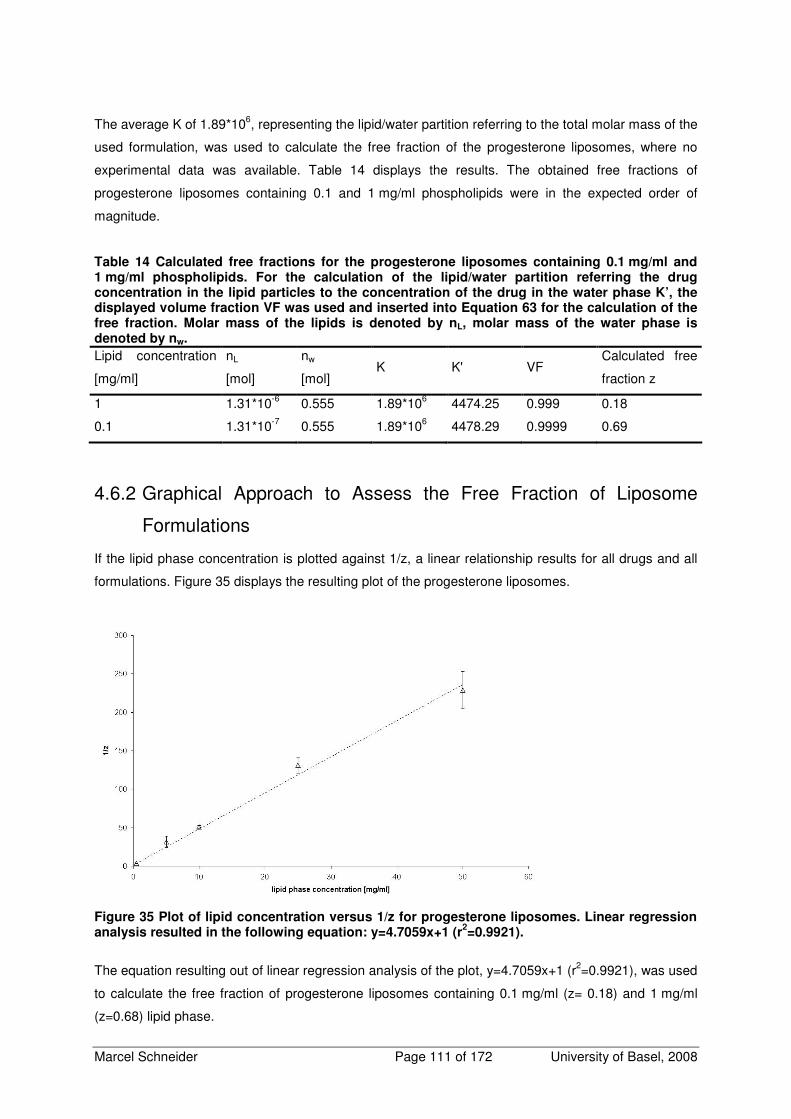
Marcel Schneider Page 111 of 172 University of Basel, 2008
The average K of 1.89*106, representing the lipid/water partition referring to the total molar mass of the
used formulation, was used to calculate the free fraction of the progesterone liposomes, where no
experimental data was available. Table 14 displays the results. The obtained free fractions of
progesterone liposomes containing 0.1 and 1 mg/ml phospholipids were in the expected order of
magnitude.
Table 14 Calculated free fractions for the progesterone liposomes containing 0.1 mg/ml and 1 mg/ml phospholipids. For the calculation of the lipid/water partition referring the drug concentration in the lipid particles to the concentration of the drug in the water phase K’, the displayed volume fraction VF was used and inserted into Equation 63 for the calculation of the free fraction. Molar mass of the lipids is denoted by nL, molar mass of the water phase is denoted by nw.
Lipid concentration
[mg/ml]
nL
[mol]
nw
[mol] K K' VF
Calculated free
fraction z
1 1.31*10-6 0.555 1.89*106 4474.25 0.999 0.18
0.1 1.31*10-7 0.555 1.89*106 4478.29 0.9999 0.69
4.6.2 Graphical Approach to Assess the Free Fraction of Liposome
Formulations
If the lipid phase concentration is plotted against 1/z, a linear relationship results for all drugs and all
formulations. Figure 35 displays the resulting plot of the progesterone liposomes.
Figure 35 Plot of lipid concentration versus 1/z for progesterone liposomes. Linear regression analysis resulted in the following equation: y=4.7059x+1 (r
2=0.9921).
The equation resulting out of linear regression analysis of the plot, y=4.7059x+1 (r2=0.9921), was used
to calculate the free fraction of progesterone liposomes containing 0.1 mg/ml (z= 0.18) and 1 mg/ml
(z=0.68) lipid phase.
Marcel Schneider Page 112 of 172 University of Basel, 2008
4.6.3 Conclusions
The two methods to calculate the free fractions of lipid containing drug formulations were equal for the
two free fractions where no equilibrium dialysis data was available. The mathematical approach is a
general solution to calculate free fractions of lipid containing dosage forms, if lipid/water partition is
known or can be calculated as shown in this section. For the calculation of the free fraction of
progesterone liposomes in this work, the easier and less error-prone approach to assess the missing
free fractions without experimental data was used. A free fraction of 0.18 for 1 mg/ml lipids and of 0.68
for 0.1 mg/ml lipids was used for further calculations.
Marcel Schneider Page 113 of 172 University of Basel, 2008
4.7 Measurements of Cellular Drug Uptake
The filter of the Transwell insert is a possible additional diffusion barrier for both, the drug and the lipid
particles. This additional barrier may hinder the drug permeation across the cell monolayer on the
basolateral side of the Caco-2 cell monolayer. If this arrives, different apparent permeability
coefficients from the apical to cellular compartment compared to basal to cellular compartment result.
Additionally, if the lipid particles are not able to diffuse through the filter pores, drug permeation
because of direct transfer from lipid particle to cell membrane will not take place on the basolateral
membrane.
Usually, drug uptake experiments were performed using a cell monolayer grown on a Petri dish after
adding a drug containing solution into the Petri dish by determination of the disappearance of drug
from this solution. Correlating this method with cell permeation experiments in Transwell plates may
lead to inconclusive data, because of different hydrodynamics, different monolayer density, different
cell differentiation, and a different surface area. Taking into consideration that the cell uptake of highly
permeable compounds may be diffusion boundary layer controlled, it is of importance to use Transwell
inserts for the evaluation of the uptake to ensure hydrodynamics. A procedure to estimate the
permeation of a compound between basal and cellular compartment using Transwell plates was
described by Ho et. al already for drug efflux (59). For the determination of the drug permeation from
apical to basal compartment, sealed Transwell inserts instead of Petri dishes were used (see method
section below).
Using this method, an experimental evaluation of uptake of lipophilic drugs is difficult, because the
intracellular concentration is calculated indirectly by the decrease of the donor concentration.
Permeation of a lipophilic drug could be overestimated easily because of possible unspecific drug
adsorption to the plastic made surface of the Transwell plates which could be wrongly interpreted as
drug permeation into the cell. For this reason drug uptake was performed for progesterone only,
because propranolol showed low interaction with the formulations and unspecific adsorption was
observed for saquinavir and triclabendazole. Assuming that the particle size of the formulation affects
drug permeation through the Transwell filter, the emulsion was taken as model formulation expecting
the highest influence on drug permeation because of its particle size that was bigger than particle
sizes of the other formulations.
4.7.1 Material and Methods
4.7.1.1 Material
Transport media used for the permeation studies and the equilibrium dialysis experiments were
prepared with Dulbecco’s Modified Eagle’s Medium (DMEM) base powder (without glucose,
l-glutamine, phenol red, sodium pyruvate and sodium bicarbonate, purchased from SIGMA-Aldrich,
Fluka Chemie GmbH, Buchs, Switzerland). DMEM base powder was dissolved in bi-distilled and
autoclaved water and supplemented with glucose (4.5 g/l), HEPES (4.76 g/l), NaCl (1.987 g/l), and
l-glutamine (0.876 g/l). The pH was adjusted to 7.4 and the final medium was filtered through a sterile
filter (Supor-200, 0.2 µm pore size, Pall Corporation, Michigan, USA) under aseptic conditions.
Marcel Schneider Page 114 of 172 University of Basel, 2008
Glucose, HEPES, NaCl, and l-glutamine were purchased from SIGMA-Aldrich (Fluka Chemie GmbH,
Buchs, Switzerland). Dulbecco’s Phosphate Buffered Saline (D-PBS) (with Ca2+, Mg2+) was purchased
from SIGMA-Aldrich (Fluka Chemie GmbH, Buchs, Switzerland). 6-well Polycarbonate Membrane
Transwell Plates with an insert area of 4.7 cm2 and 0.4 µm pore size were ordered from Costar
(Corning Incorporated, Corning, NY, USA). Captex 8000 was purchased from SIGMA-Aldrich (Fluka
Chemie GmbH, Buchs, Switzerland), Capmul MCM was purchased from Abitec Corporation
(Janesville, USA). Cremophor EL was ordered from Fluka (Fluka Chemie GmbH, Buchs, Switzerland).
Progesterone was purchased from Fluka (SIGMA-Aldrich, Fluka Chemie GmbH, Buchs, Switzerland).
4.7.1.2 Preparation of the Emulsions
Emulsions containing 14.5 µM progesterone and 0.5 mg/ml or 5 mg/ml of the emulsion lipid phase
(lipid phase consisting of 5%[m/m] Capmul MCM, 67%[m/m] Captex 8000, 18%[m/m] Cremophor EL, and
10%[m/m] ethanol) were tested. The lipid phase was prepared by mixing the components at 37°C. The
lipid phase was warmed up to 37°C before use and the according amount was balanced and mixed
with two thirds of the final transport medium volume. The formulation was homogenized for 5 min at
15000 rpm with a Polytron homogenizer (Polytron PT 3000, Kinematica AG, Littau, Switzerland) and
preheated transport medium was added to the final volume.
4.7.1.3 Measuring the Cellular Uptake to the Cellular Compartment
Caco-2 cells cultured during 21 days were used. Both compartments of the wells were rinsed with
tempered D-PBS (with magnesium and calcium). For determination of drug uptake from apical
compartment to cellular compartment, the Transwell inserts were sealed on the basal side using
aluminum foil, cut to the size of the filter insert. PTFE Thread seal tape was wrapped three times
around the insert to seal it completely. Then 1600 µl of the drug formulation was added into the apical
compartment.
For the drug uptake from the basal to the cellular compartment, 200 µl transport media was added to
the apical compartment to avoid desiccation of the cells and then 2800 µl of the drug formulation was
added into the basal compartment. The plate was shaken on an orbital shaker (KS15, Edmund Bühler
GmbH, Tübingen& Hechingen, Germany) with 75 rpm under water saturated atmosphere with 75 rpm
at 37°C. Samples of 100 µl were taken after 0, 2.5, 5, 7.5, 10, 15, 20, and 30 min. Drug quantification
was performed by HPLC.
4.7.1.4 Drug Quantification
Drug quantification of progesterone was performed by HPLC-UV (Agilent series 1100, Agilent
Technologies USA, equipped with a G1312A binary pump, an auto sampler G1367B and a variable
wavelength detector G1314B) using a C-18 reversed phase column (CC 125/2 Lichrospher 100 RP 18
ec, Macherey Nagel, Oensingen, Switzerland). An Isocratic method with a flow rate of 0.25 ml/min was
used with the following mobile phase: distilled water (bi-distilled and filtered through
0.45 µm)/methanol/tetrahydrofuran 40/45/15 (V/V). Ammonium acetate with a concentration of 0.55 g/l
was added to the mobile phase. The pH-value at 25°C was 6.9. An injection volume of 40 µl and a
runtime of 7.5 min were used to detect progesterone at 239 nm in UV. Using this method, retention
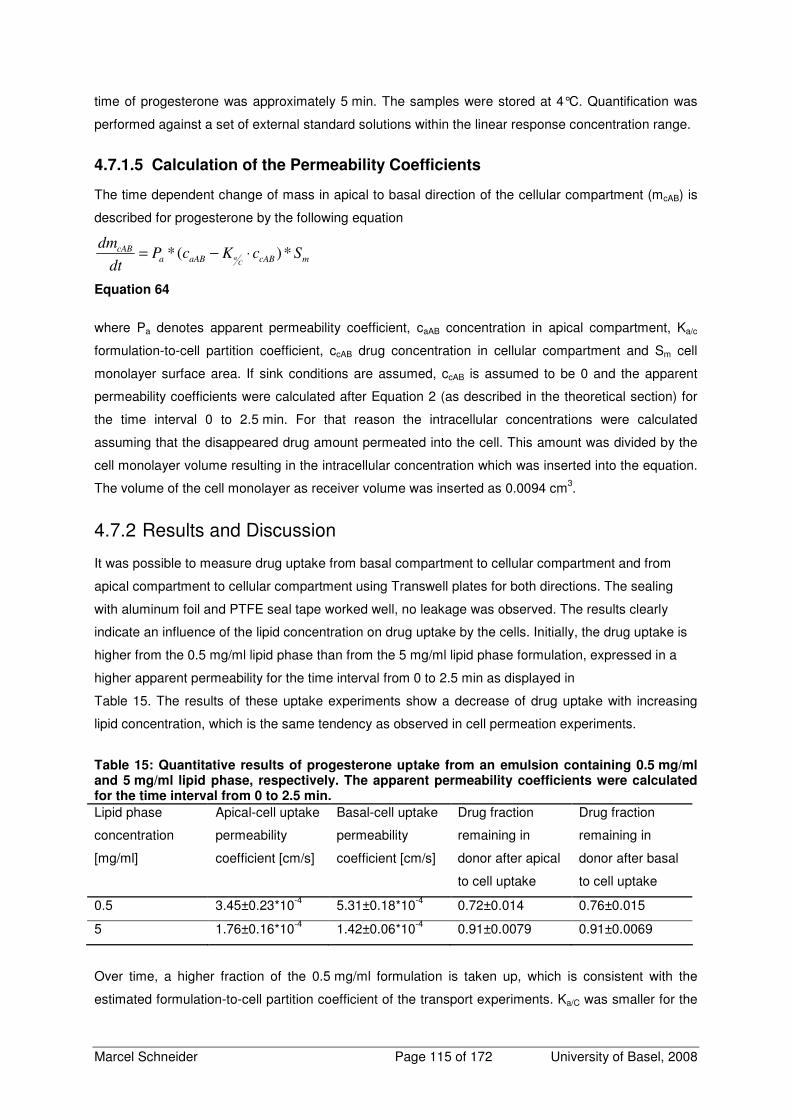
Marcel Schneider Page 115 of 172 University of Basel, 2008
time of progesterone was approximately 5 min. The samples were stored at 4°C. Quantification was
performed against a set of external standard solutions within the linear response concentration range.
4.7.1.5 Calculation of the Permeability Coefficients
The time dependent change of mass in apical to basal direction of the cellular compartment (mcAB) is
described for progesterone by the following equation
mcABaABacAB ScKcP
dt
dmC
a *)(* ⋅−=
Equation 64
where Pa denotes apparent permeability coefficient, caAB concentration in apical compartment, Ka/c
formulation-to-cell partition coefficient, ccAB drug concentration in cellular compartment and Sm cell
monolayer surface area. If sink conditions are assumed, ccAB is assumed to be 0 and the apparent
permeability coefficients were calculated after Equation 2 (as described in the theoretical section) for
the time interval 0 to 2.5 min. For that reason the intracellular concentrations were calculated
assuming that the disappeared drug amount permeated into the cell. This amount was divided by the
cell monolayer volume resulting in the intracellular concentration which was inserted into the equation.
The volume of the cell monolayer as receiver volume was inserted as 0.0094 cm3.
4.7.2 Results and Discussion
It was possible to measure drug uptake from basal compartment to cellular compartment and from
apical compartment to cellular compartment using Transwell plates for both directions. The sealing
with aluminum foil and PTFE seal tape worked well, no leakage was observed. The results clearly
indicate an influence of the lipid concentration on drug uptake by the cells. Initially, the drug uptake is
higher from the 0.5 mg/ml lipid phase than from the 5 mg/ml lipid phase formulation, expressed in a
higher apparent permeability for the time interval from 0 to 2.5 min as displayed in
Table 15. The results of these uptake experiments show a decrease of drug uptake with increasing
lipid concentration, which is the same tendency as observed in cell permeation experiments.
Table 15: Quantitative results of progesterone uptake from an emulsion containing 0.5 mg/ml and 5 mg/ml lipid phase, respectively. The apparent permeability coefficients were calculated for the time interval from 0 to 2.5 min.
Lipid phase
concentration
[mg/ml]
Apical-cell uptake
permeability
coefficient [cm/s]
Basal-cell uptake
permeability
coefficient [cm/s]
Drug fraction
remaining in
donor after apical
to cell uptake
Drug fraction
remaining in
donor after basal
to cell uptake
0.5 3.45±0.23*10-4 5.31±0.18*10-4 0.72±0.014 0.76±0.015
5 1.76±0.16*10-4 1.42±0.06*10-4 0.91±0.0079 0.91±0.0069
Over time, a higher fraction of the 0.5 mg/ml formulation is taken up, which is consistent with the
estimated formulation-to-cell partition coefficient of the transport experiments. Ka/C was smaller for the
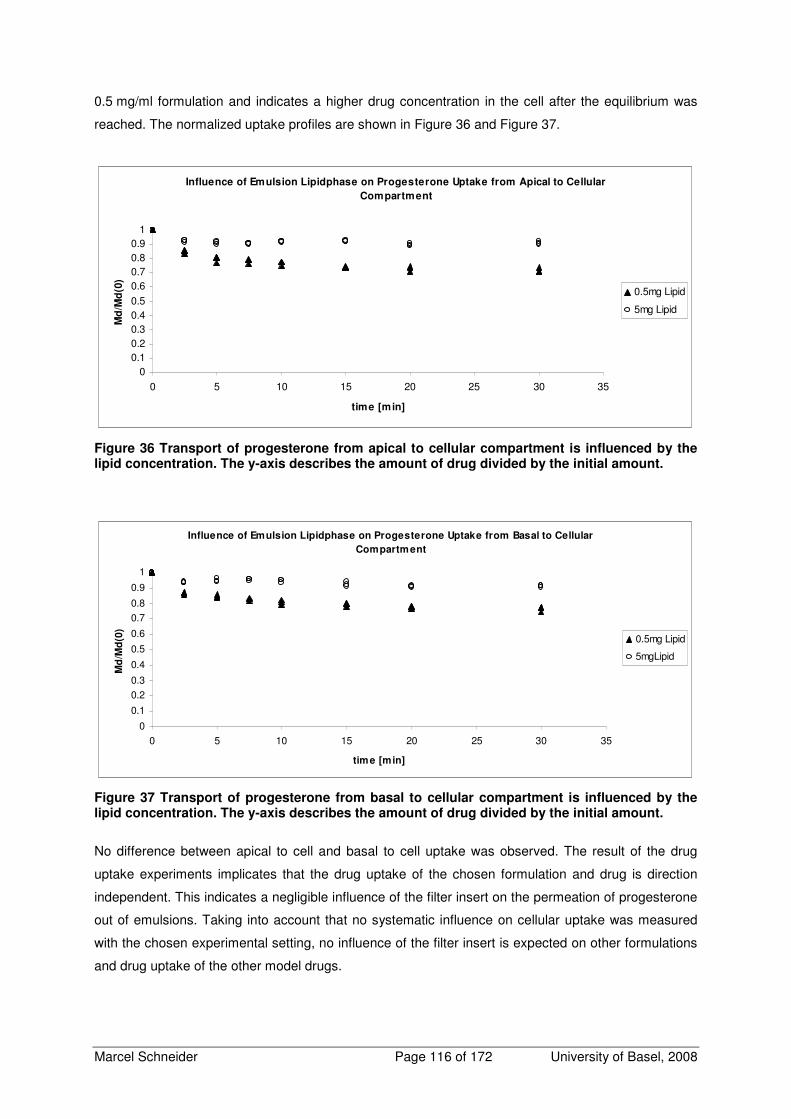
Marcel Schneider Page 116 of 172 University of Basel, 2008
0.5 mg/ml formulation and indicates a higher drug concentration in the cell after the equilibrium was
reached. The normalized uptake profiles are shown in Figure 36 and Figure 37.
Influence of Emulsion Lipidphase on Progesterone Uptake from Apical to Cellular
Compartment
00.10.20.30.40.50.60.70.80.9
1
0 5 10 15 20 25 30 35
time [min]
Md
/Md
(0)
0.5mg Lipid
5mg Lipid
Figure 36 Transport of progesterone from apical to cellular compartment is influenced by the lipid concentration. The y-axis describes the amount of drug divided by the initial amount.
Influence of Emulsion Lipidphase on Progesterone Uptake from Basal to Cellular
Compartment
0
0.1
0.20.3
0.4
0.5
0.6
0.70.8
0.9
1
0 5 10 15 20 25 30 35
time [min]
Md
/Md
(0)
0.5mg Lipid
5mgLipid
Figure 37 Transport of progesterone from basal to cellular compartment is influenced by the lipid concentration. The y-axis describes the amount of drug divided by the initial amount.
No difference between apical to cell and basal to cell uptake was observed. The result of the drug
uptake experiments implicates that the drug uptake of the chosen formulation and drug is direction
independent. This indicates a negligible influence of the filter insert on the permeation of progesterone
out of emulsions. Taking into account that no systematic influence on cellular uptake was measured
with the chosen experimental setting, no influence of the filter insert is expected on other formulations
and drug uptake of the other model drugs.
Marcel Schneider Page 117 of 172 University of Basel, 2008
4.7.3 Conclusions
The drug uptake of progesterone out of emulsions is influenced by the lipid concentration. Increased
lipid concentrations decrease the apparent permeability delineating drug uptake. The analogy of the
effects of the lipid phase to the cell permeation experiments is obvious. The filter insert did not
influence drug uptake with the chosen experimental setting. No influence of the filter insert is expected
on other formulations and drug uptake of the other model drugs either.
Marcel Schneider Page 118 of 172 University of Basel, 2008
4.8 Measurements of Passive Cellular Efflux
Similar to cell uptake experiments, drug permeation from cell monolayer to the apical or basal
compartment can be determined (59). Fundamental understanding of drug uptake and drug efflux by
the cells may help to understand the transcellular drug permeation. Passive drug efflux may be
influenced by lipophilicity of the drug, type and concentration of lipid particles, presence of carrier
mediated efflux, and presence of a filter on basolateral side. If the process is diffusion boundary layer
controlled, hydrodynamics may have a contribution to the permeation. Therefore all experiments were
performed into Transwell plates.
The aim of these experiments was the determination of the passive drug efflux from the cell monolayer
to the basal compartment. Progesterone and triclabendazole were used as model drugs to estimate
the influence of passive drug efflux from cellular to basal compartment. Using these drugs, drug
permeation on the basolateral side is not interfered by carrier mediated apical efflux. The different
lipophilicity of these two compounds may allow a conclusion on a possible influence of lipophilicity on
drug permeation from cell monolayer to basal compartment. We compared microemulsions and
emulsions of both drugs representing the formulations with the most different particle sizes. This may
allow conclusion on a possible effect of the particle size on drug permeation from cell monolayer to
basal compartment.
4.8.1 Material and Methods
4.8.1.1 Material
Transport media used for the permeation studies and the equilibrium dialysis experiments were
prepared with Dulbecco’s Modified Eagle’s Medium (DMEM) base powder (without glucose,
l-glutamine, phenol red, sodium pyruvate and sodium bicarbonate, purchased from SIGMA-Aldrich,
Fluka Chemie GmbH, Buchs, Switzerland). DMEM base powder was dissolved in bi-distilled and
autoclaved water and supplemented with glucose (4.5 g/l), HEPES (4.76 g/l), NaCl (1.987 g/l), and
l-glutamine (0.876 g/l). The pH was adjusted to 7.4 and the final medium was filtered through a sterile
filter (Supor-200, 0.2 µm pore size, Pall Corporation, Michigan, USA) under aseptic conditions.
Glucose, HEPES, NaCl, and l-glutamine were purchased from SIGMA-Aldrich (Fluka Chemie GmbH,
Buchs, Switzerland). Dulbecco’s Phosphate Buffered Saline (D-PBS) (with Ca2+, Mg2+) was purchased
from SIGMA-Aldrich (Fluka Chemie GmbH, Buchs, Switzerland). 6-well Polycarbonate Membrane
Transwell Plates with an insert area of 4.7 cm2 and 0.4 µm pore size were ordered from Costar
(Corning Incorporated, Corning, NY, USA). Captex 8000 was purchased from SIGMA-Aldrich (Fluka
Chemie GmbH, Buchs, Switzerland), Capmul MCM was purchased from Abitec Corporation
(Janesville, USA). Cremophor EL was ordered from Fluka (Fluka Chemie GmbH, Buchs, Switzerland).
Triclabendazole was provided by Phares Drug Delivery (Muttenz, Switzerland). Progesterone was
purchased from Fluka (SIGMA-Aldrich, Fluka Chemie GmbH, Buchs, Switzerland).
Marcel Schneider Page 119 of 172 University of Basel, 2008
4.8.1.2 Preparation of the Formulations
Emulsions containing 63 µM progesterone or 63 µM triclabendazole combined with 0.5 mg/ml or
5 mg/ml of the emulsion lipid phase (lipid phase consisting of 5%[m/m] Capmul MCM, 67%[m/m]
Captex 8000, 18%[m/m] Cremophor EL, and 10%[m/m] ethanol) and microemulsions containing 63 µM
progesterone or 63 µM triclabendazole and 0.5 mg/ml or 5 mg/ml of the microemulsion lipid phase
(lipid phase consisting of Captex 8000 35.05% [m/m], Capmul MCM 17.58% [m/m], Cremophor EL
36.84% [m/m], and ethanol 10% [m/m]) were tested. The lipid phase was prepared by mixing the
components at 37°C. The lipid phase was warmed to 37°C before use and the according amount was
balanced and mixed with two thirds of the final transport medium volume. The formulation was
homogenized for 5 min at 15000 rpm with a Polytron homogenizer (Polytron PT 3000, Kinematica AG,
Littau, Switzerland) and preheated transport medium was added to the final volume.
4.8.1.3 Determination of Passive Drug Efflux
The Transwell plates, cultured for 19-21 days, were rinsed with D-PBS (with magnesium and calcium).
The drug formulation was added to the apical compartment. Placebo formulation, containing the same
lipid concentration, was added to the basal compartment and the plates were incubated at 37°C under
water saturated atmosphere at a stirring rate of 75 rpm for 180 min on an orbital shaker (KS15,
Edmund Bühler GmbH, Tübingen& Hechingen, Germany). Before the formulations were removed and
the plates rinsed twice with transport media, samples were taken in apical and basal compartment.
Fresh placebo formulation was added to the basal compartment and to avoid dryness, 200 µl transport
media was added to the apical compartment. Samples of 100 µl were taken and quantified with HPLC
at predefined points of time after 0, 15, 30, 45, 60, 90, and 120 min.
4.8.1.4 Drug Quantification
Drug quantification of all drugs was performed by HPLC-UV (Agilent series 1100, Agilent
Technologies USA, equipped with a G1312A binary pump, an auto sampler G1367B and a variable
wavelength detector G1314B) using a C-18 reversed phase column (CC 125/2 Lichrospher 100 RP 18
ec, Macherey Nagel, Oensingen, Switzerland). Isocratic methods with a flow rate of 0.25 ml/min were
used. The drug concentration of progesterone was determined with the following mobile phase:
distilled water (bi-distilled and filtered through 0.45 µm)/methanol/tetrahydrofuran 40/45/15 (V/V).
Ammonium acetate with a concentration of 0.55 g/l was added to the mobile phase. The pH-value at
25°C was 6.9. An injection volume of 40 µl and a runtime of 7.5 min were used to detect progesterone
at 239 nm in UV. Using this method, retention time of progesterone was approximately 5 min. The
samples were stored at 4°C. Quantification was performed against a set of external standard solutions
within the linear response concentration range.
The drug concentration of triclabendazole was determined with the following mobile phase: distilled
water (bi-distilled and filtered through 0.45 µm)/methanol/tetrahydrofuran 35/40/25 (V/V). Ammonium
acetate with a concentration of 0.55 g/l was added to the mobile phase. The pH- value at 25°C was
6.7. An injection volume of 40 µl and a runtime of 8 min were used to detect triclabendazole at 305 nm
in UV. Using this method retention time of triclabendazole was approximately 5.6 min. Quantification
of triclabendazole was performed against a set of external standard solutions within the linear
Marcel Schneider Page 120 of 172 University of Basel, 2008
response concentration range. To maintain the sample stability and reproducibility, the standard
solutions of triclabendazole contained the same amount of lipids as the samples. Samples were stored
at 4°C.
4.8.1.5 Calculation of Permeability Coefficient Delineating Drug Efflux
The time dependent change of concentration in apical to basal direction of the basal compartment
(cbAB) is described for drugs, which were no subject to carrier mediated apical efflux, by the following
equation
b
mbABcABb
bAB
V
SccKP
dt
dcC
a *)(* −⋅=
Equation 65
where Pb denotes apparent permeability coefficient, cbAB concentration in basal compartment, Ka/c
formulation-to-cell partition coefficient, ccAB drug concentration in cellular compartment and Sm cell
monolayer surface area and Vb volume of basal compartment. If sink conditions are assumed cbAB is 0.
Consequently, apparent permeability coefficient delineating passive drug efflux from cellular to basal
compartment was calculated after Equation 66 for the time interval 0 to 15 min.
0cABm
bbABb
cKS
V
dt
dcP
Ca ⋅⋅
⋅=
Equation 66
For that reason the initial intracellular concentration (ccAB0) was calculated out of pre-experimental
mass balance, assuming that the disappeared drug amount had permeated into the cell. The
disappeared amount was calculated by comparing the initial drug amount of the formulation with the
sum of drug amounts of basal and apical compartment after 180 min of incubation. This amount was
divided by the cell monolayer volume resulting in the initial intracellular concentration which was used
for the calculation. The cell monolayer volume was assumed to be 0.0094 cm3.
4.8.2 Results and Discussion
It was possible to measure passive drug efflux from cell compartment to basal compartment for both
drugs with the described method. The results displayed in Table 16 indicate decreasing apparent
permeability coefficient with increased lipid concentration for both drugs. The obtained apparent
permeability coefficients of the passive efflux experiments were one order of magnitude lower than the
apparent permeability coefficients deduced by data fitting of cell permeation experiments.
Because of the initially small amount of drug inside of the cell monolayer and the high permeability
coefficient of progesterone, an initial time interval of 15 min was obviously too long to maintain sink
conditions which is a limitation of the used equation. This may explain the lower apparent permeability
coefficients compared to apparent permeability coefficients deduced from cell permeation
experiments.
The passive efflux of triclabendazole from the cellular to the basal compartment delineated by the
apparent permeability coefficient was lower than the passive efflux of progesterone. The permeation of
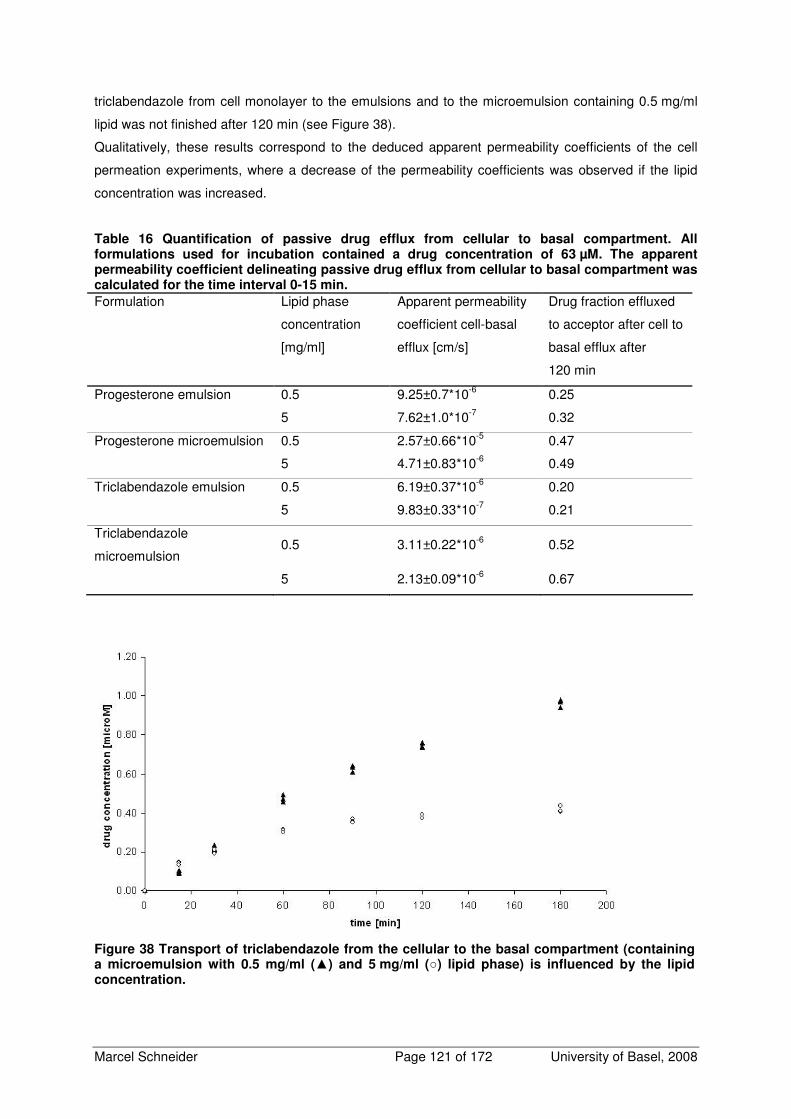
Marcel Schneider Page 121 of 172 University of Basel, 2008
triclabendazole from cell monolayer to the emulsions and to the microemulsion containing 0.5 mg/ml
lipid was not finished after 120 min (see Figure 38).
Qualitatively, these results correspond to the deduced apparent permeability coefficients of the cell
permeation experiments, where a decrease of the permeability coefficients was observed if the lipid
concentration was increased.
Table 16 Quantification of passive drug efflux from cellular to basal compartment. All formulations used for incubation contained a drug concentration of 63 µM. The apparent permeability coefficient delineating passive drug efflux from cellular to basal compartment was calculated for the time interval 0-15 min.
Formulation Lipid phase
concentration
[mg/ml]
Apparent permeability
coefficient cell-basal
efflux [cm/s]
Drug fraction effluxed
to acceptor after cell to
basal efflux after
120 min
Progesterone emulsion 0.5 9.25±0.7*10-6 0.25
5 7.62±1.0*10-7 0.32
Progesterone microemulsion 0.5 2.57±0.66*10-5 0.47
5 4.71±0.83*10-6 0.49
Triclabendazole emulsion 0.5 6.19±0.37*10-6 0.20
5 9.83±0.33*10-7 0.21
Triclabendazole
microemulsion 0.5 3.11±0.22*10-6 0.52
5 2.13±0.09*10-6 0.67
Figure 38 Transport of triclabendazole from the cellular to the basal compartment (containing a microemulsion with 0.5 mg/ml () and 5 mg/ml () lipid phase) is influenced by the lipid concentration.
Marcel Schneider Page 122 of 172 University of Basel, 2008
4.8.3 Conclusions
Apparent permeability coefficients delineating passive drug efflux from cell monolayer to basal
compartment show that the lipid concentration of a lipid containing formulation influences drug
permeation from cellular compartment to the acceptor. The observed decrease of apparent
permeability coefficients corresponds to observations made by cell permeation experiments. The
obtained permeabilities were much lower than the apparent trans-monolayer permeabilities caused by
violation of sink conditions. Therefore no quantitatively relevant statement can be made.
Marcel Schneider Page 123 of 172 University of Basel, 2008
5 CONCLUSIONS AND OUTLOOK
5.1 Conclusions
It was shown in this work, that it is possible to test the effect of lipid containing drug formulations on
drug permeation using the Caco-2 model, if the formulations are tolerated by the cell monolayer.
Therefore, much attention had to be paid on the maintenance of the cell monolayer integrity during the
cell permeation experiments which resulted in determination of the maximal applicable lipid phase
concentrations and additionally a limitation of duration of cell permeation experiment.
A methodology to determine unbiased parameters describing the in vitro absorption of lipid containing
formulations of poorly water soluble drugs was developed and evaluated in this work. This
methodology comprises the description of transcellular drug permeation through Caco-2 cell
monolayers and the analysis of the obtained data with a biophysical model for a mechanistic
understanding of the influence of lipid containing drug formulations on drug absorption.
For the determination of drug absorption parameters in Caco-2 cell monolayer, a refined mathematical
model based on previous work of our group was used. In earlier work, this model was derived for a
mechanistic description of transcellular drug permeation including passive permeation and carrier
mediated efflux. This model showed difficulties in prediction of intracellular drug concentration during
cell permeation experiment of highly lipophilic compounds. To improve prediction of intracellular drug
concentrations during cell permeation experiments, experimental cell monolayer extractions were
taken into account for data fitting. A formulation-to-cell partition coefficient and independent
permeability coefficients for the apical and the basal cell membrane were introduced into the model.
This refined mathematical model, which is proposed in this study for the determination of drug
absorption parameters in Caco-2 cell monolayers, is still able to detect carrier mediated transport. It
further divides trans-monolayer permeability into independent permeability coefficients of the apical
membrane and the basal membrane and allows deducing formulation-to-cell partition coefficient,
intracellular time dependent concentration, and quantification of carrier mediated efflux directly out of
time dependent experimental concentration data. If a compound undergoes carrier mediated efflux,
the differentiation of Pa and Pb is limited because of mathematical correlation of these parameters.
The analysis of the transcellular permeation experiments with this model indicates a decrease of
apparent permeability coefficient with increasing lipid concentration, if an interaction of a drug with a
lipid containing formulation is given. For a better understanding of this formulation effect, a reliable
method for the determination of the free fraction of drug was developed, based on equilibrium dialysis
that allows precise measurement of the free fraction. It was shown in this thesis, that this method is
applicable to the used lipid containing drug formulations.
A biophysical model for delineating contribution of different transport steps to the apparent
permeability coefficient was developed taking into account transport of lipid particles and free
molecules through diffusion boundary layer, permeation of free drug molecules through the cell
membrane, and the drug permeation caused by direct drug transfer from lipid particles to the cell
membrane. It was shown that the permeability coefficient that delineates the contribution of drug
transport in the diffusion boundary layer is in the same order of magnitude for all tested drugs and
Marcel Schneider Page 124 of 172 University of Basel, 2008
formulations and is the rate limiting step for an aqueous solution of the lipophilic model drugs. The
permeability coefficient of the free drug through the cell membrane was independent of the formulation
and dependent on the drug. This evaluation of the apparent permeability coefficient has confirmed that
the free fraction of a drug is the major determinant of intestinal cell permeation. High free fraction
indicates apparent permeability coefficients similar to aqueous solution; low free fraction indicates
lower apparent permeability coefficients. Additionally, the direct transfer of lipophilic drugs from lipid
phase of the formulation to cell membrane can also make an essential contribution to drug
permeation. The relative significance of these two processes depends on the drug and the
formulation. In this work drug transfer from the lipid particles to the membrane upon collision was
relevant for progesterone only. These observations apply to structurally different lipid containing drug
formulations.
It was shown that permeability coefficient that delineates drug uptake of progesterone formulations
and permeability coefficient that delineates passive drug efflux of progesterone and triclabendazole
formulations are influenced by the lipid concentration similar as observed in cell permeation
experiments. It was shown further that drug uptake of progesterone was independent of transport
direction. Based on these results we assume that the microporous Transwell filter support was not rate
limiting.
Summarized, the effects of lipid containing drug formulations on the absorption of lipophilic drugs are:
1) The use of lipid containing drug formulations lowers apparent permeability coefficient by
lowering the drug uptake from donor compartment to cellular compartment. The extent is
dependent on free fraction. Increased lipid phase concentration increases formulation-to-cell
partition coefficient.
2) The qualitative effect on apparent permeability coefficient is independent of the formulation if
the used drug interacts with the formulation.
3) Depending on formulation and drug, direct mass transfer from lipid particle to cellular
membrane may contribute to transcellular permeation.
Apparent drug permeability coefficient depends on free fraction, whereas drug flux depends on
absolute amount of free drug in water phase. Therefore simultaneous increase of drug and lipid
concentration provides an undiminished drug flux, which may improve bioavailability by prolonged
intestinal absorption at a sustained rate. These findings are independent of the composition and the
structure of the lipid formulation. In addition flux can be further increased by direct drug transfer from
lipid particle to cellular membrane. This was observed for only one drug in the present work. Possible
necessary structure activity relationship of drugs for this to take place should be investigated in the
future. The results of this work shed light into the mechanism of drug absorption from lipid formulations
and demonstrate potential beneficial effects of these formulations on absorption of lipophilic drugs in
vivo. They may be used for the development of efficient oral dosage forms to improve bioavailability
for these drugs.

Marcel Schneider Page 125 of 172 University of Basel, 2008
5.2 Outlook
The proposed mathematical model for the determination of drug absorption parameters in Caco-2 cell
monolayer is a useful tool for a better understanding of the mechanisms taking place during cell
monolayer permeation. To increase the knowledge about rate determining processes and partial steps
of the absorption process it may be of great interest to implement measurements of partial processes
into the model such as cellular uptake and cellular efflux from apical and basal side systematically,
since few uptake and passive efflux data have been used in this work.
The proposed biophysical model for the subdivision of the apparent permeability coefficient showed
that besides of the free fraction, a mass transfer caused by direct drug transport from lipid particles to
the cell membrane may take place. The data of this work are based on few model drugs and three
structurally different lipid containing drug formulations. To proof the proposed concept, one should
take into consideration additional drugs and formulations. Since we did not observe for all tested drugs
a mass transfer caused by direct drug transport from lipid particles to the cell membrane, it would be
essential to have a more profoundly understanding about possible systematical relationship between
drug molecular structure or physicochemical properties responsible for the ability of drugs to undergo
mass transfer caused by direct drug transfer. Ideally, the outcome may be used predictively for the
improvement of oral drug absorption of poorly water soluble compounds.
It is considered to be difficult to proof the observed mass transfer caused by direct drug transport from
lipid particles to the cell membrane by additional measurements and alternative methods. It is
considered to be easier to exclude the effects of direct mass transfer by comparing the results of this
thesis with a different experimental setting that does not allow any interaction of lipid vesicles with the
cellular membrane. This could be done by the introduction of an additional physical barrier, which is on
one hand not rate determining for the used drugs but does not allow permeation of any lipid particles
on the other hand. The use of particles with much larger particle sizes may help to separate the
particles from the cell surfaces without affecting drug permeation, if these large particles show similar
effects on drug permeation with the experimental setup used in this thesis. For the investigation of this
particular case, liposomes may be a useful model, because it is possible to produce large and
homogenous particles.
Another open question is the relevance of the described mechanism in vivo, because the situation in
the small intestine is different from the experimental setting used in this study. Most important
difference and possibly affecting mass transfer from lipid particle to cellular membrane is the presence
of a mucus layer in the intestine, which is described as an additional barrier for drug transport. The
mucus layer may allow particles to diffuse, but will surely influence the velocity of diffusion of these
particles because of an increased viscosity compared to buffer media. The investigation of permeation
of lipid particles through mucus, use of an artificial mucus layer on the Caco-2 cells, use of a cell
model producing a mucus layer, or use of animal intestinal tissue may be valuable tools for the
investigation of this interesting question.
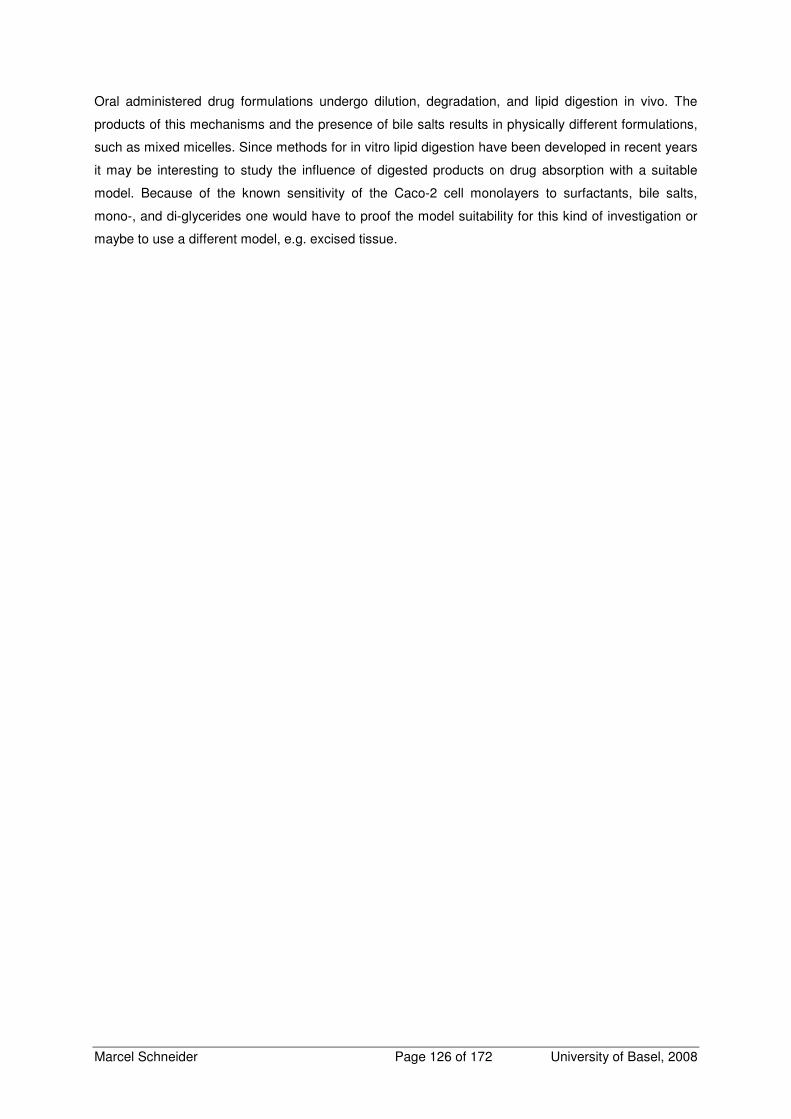
Marcel Schneider Page 126 of 172 University of Basel, 2008
Oral administered drug formulations undergo dilution, degradation, and lipid digestion in vivo. The
products of this mechanisms and the presence of bile salts results in physically different formulations,
such as mixed micelles. Since methods for in vitro lipid digestion have been developed in recent years
it may be interesting to study the influence of digested products on drug absorption with a suitable
model. Because of the known sensitivity of the Caco-2 cell monolayers to surfactants, bile salts,
mono-, and di-glycerides one would have to proof the model suitability for this kind of investigation or
maybe to use a different model, e.g. excised tissue.
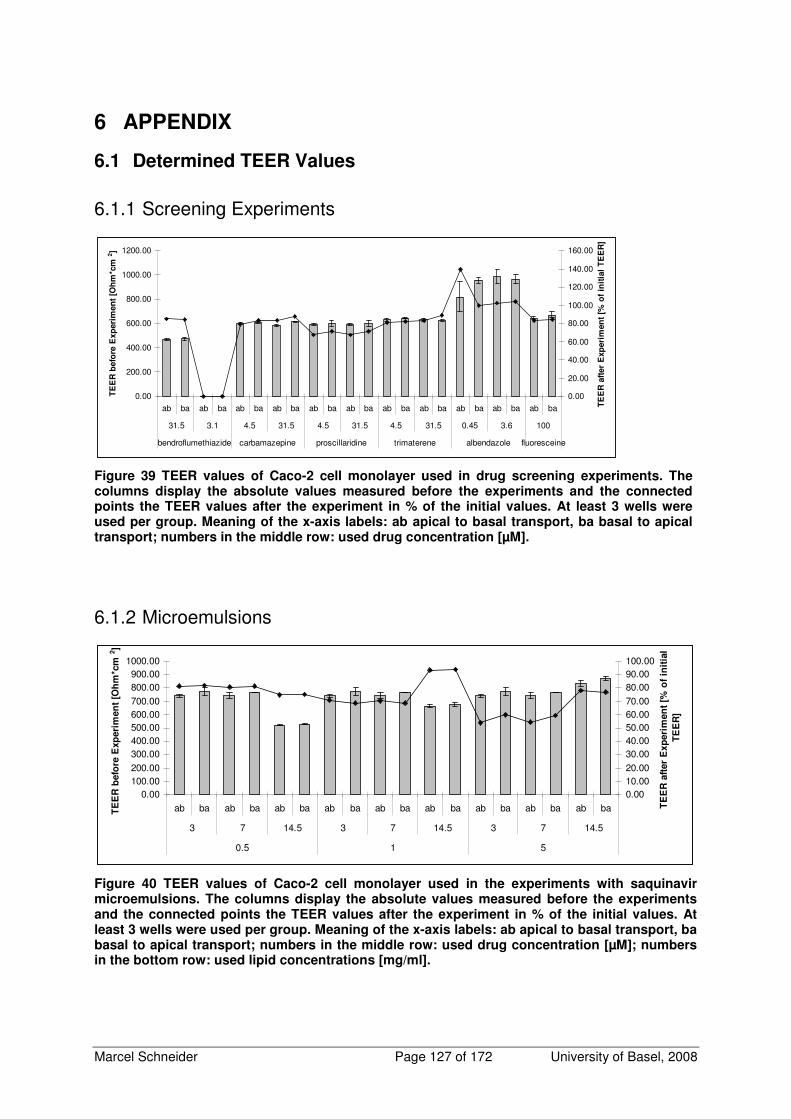
Marcel Schneider Page 127 of 172 University of Basel, 2008
6 APPENDIX
6.1 Determined TEER Values
6.1.1 Screening Experiments
0.00
200.00
400.00
600.00
800.00
1000.00
1200.00
ab ba ab ba ab ba ab ba ab ba ab ba ab ba ab ba ab ba ab ba ab ba
31.5 3.1 4.5 31.5 4.5 31.5 4.5 31.5 0.45 3.6 100
bendroflumethiazide carbamazepine proscillaridine trimaterene albendazole fluoresceine
TE
ER
befo
re E
xp
eri
men
t [O
hm
*cm
2]
0.00
20.00
40.00
60.00
80.00
100.00
120.00
140.00
160.00
TE
ER
aft
er
Exp
eri
men
t [%
of
init
ial
TE
ER
]
Figure 39 TEER values of Caco-2 cell monolayer used in drug screening experiments. The columns display the absolute values measured before the experiments and the connected points the TEER values after the experiment in % of the initial values. At least 3 wells were used per group. Meaning of the x-axis labels: ab apical to basal transport, ba basal to apical transport; numbers in the middle row: used drug concentration [µM].
6.1.2 Microemulsions
0.00100.00200.00300.00400.00500.00600.00700.00800.00900.00
1000.00
ab ba ab ba ab ba ab ba ab ba ab ba ab ba ab ba ab ba
3 7 14.5 3 7 14.5 3 7 14.5
0.5 1 5
TE
ER
befo
re E
xp
eri
men
t [O
hm
*cm
2]
0.0010.0020.0030.0040.0050.0060.0070.0080.0090.00100.00
TE
ER
aft
er
Exp
eri
men
t [%
of
init
ial
TE
ER
]
Figure 40 TEER values of Caco-2 cell monolayer used in the experiments with saquinavir microemulsions. The columns display the absolute values measured before the experiments and the connected points the TEER values after the experiment in % of the initial values. At least 3 wells were used per group. Meaning of the x-axis labels: ab apical to basal transport, ba basal to apical transport; numbers in the middle row: used drug concentration [µM]; numbers in the bottom row: used lipid concentrations [mg/ml].
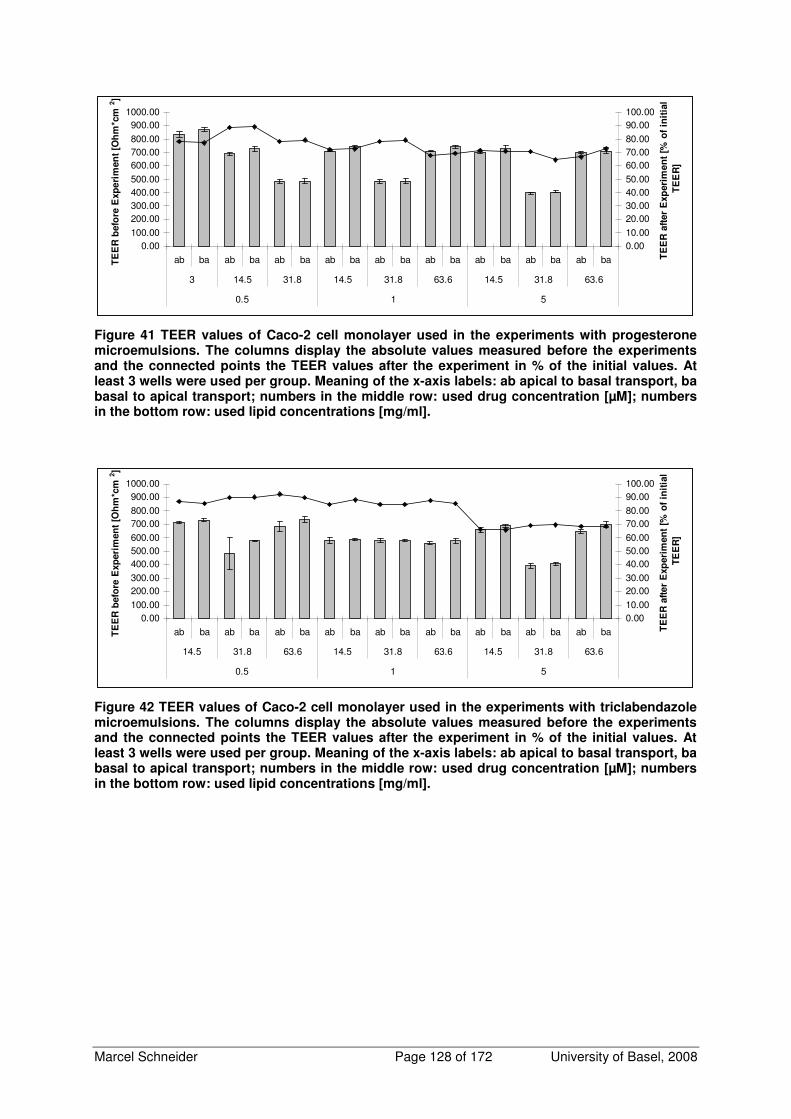
Marcel Schneider Page 128 of 172 University of Basel, 2008
0.00100.00200.00300.00400.00500.00600.00700.00800.00900.00
1000.00
ab ba ab ba ab ba ab ba ab ba ab ba ab ba ab ba ab ba
3 14.5 31.8 14.5 31.8 63.6 14.5 31.8 63.6
0.5 1 5
TE
ER
befo
re E
xp
eri
men
t [O
hm
*cm
2]
0.0010.0020.0030.0040.0050.0060.0070.0080.0090.00100.00
TE
ER
aft
er
Exp
eri
men
t [%
of
init
ial
TE
ER
]
Figure 41 TEER values of Caco-2 cell monolayer used in the experiments with progesterone microemulsions. The columns display the absolute values measured before the experiments and the connected points the TEER values after the experiment in % of the initial values. At least 3 wells were used per group. Meaning of the x-axis labels: ab apical to basal transport, ba basal to apical transport; numbers in the middle row: used drug concentration [µM]; numbers in the bottom row: used lipid concentrations [mg/ml].
0.00100.00200.00300.00400.00500.00600.00700.00800.00900.00
1000.00
ab ba ab ba ab ba ab ba ab ba ab ba ab ba ab ba ab ba
14.5 31.8 63.6 14.5 31.8 63.6 14.5 31.8 63.6
0.5 1 5
TE
ER
befo
re E
xp
eri
men
t [O
hm
*cm
2]
0.0010.0020.0030.0040.0050.0060.0070.0080.0090.00100.00
TE
ER
aft
er
Exp
eri
men
t [%
of
init
ial
TE
ER
]
Figure 42 TEER values of Caco-2 cell monolayer used in the experiments with triclabendazole microemulsions. The columns display the absolute values measured before the experiments and the connected points the TEER values after the experiment in % of the initial values. At least 3 wells were used per group. Meaning of the x-axis labels: ab apical to basal transport, ba basal to apical transport; numbers in the middle row: used drug concentration [µM]; numbers in the bottom row: used lipid concentrations [mg/ml].
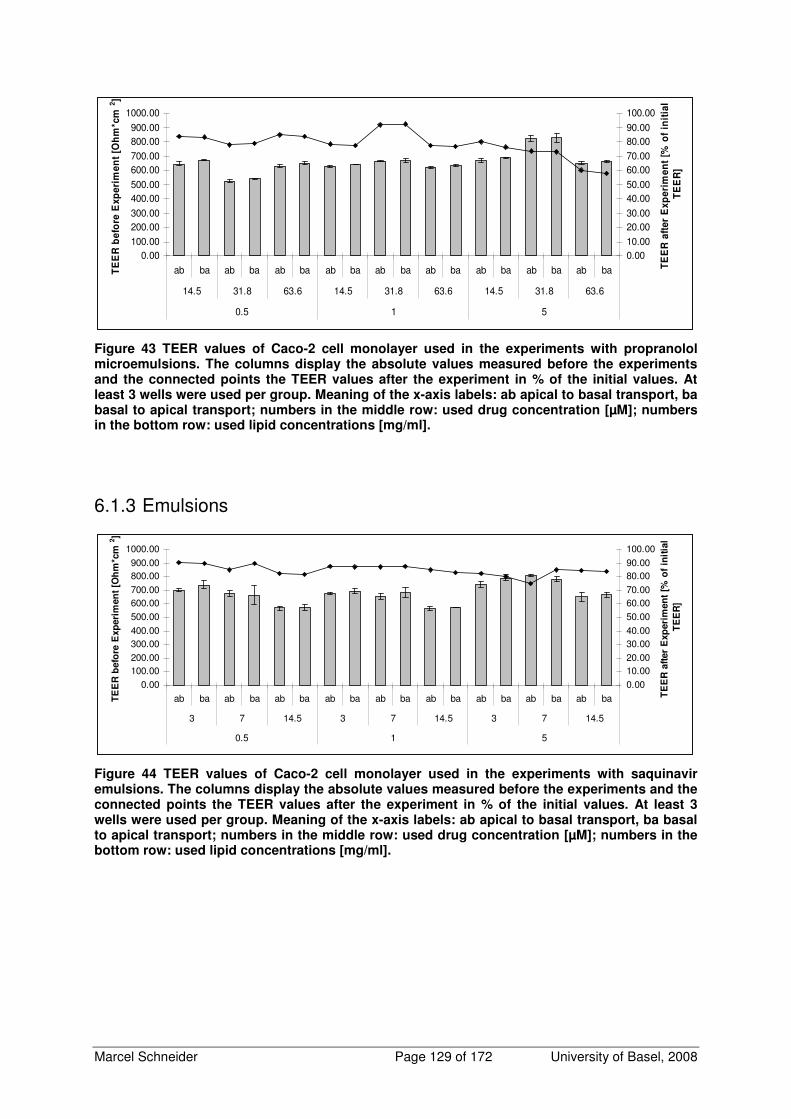
Marcel Schneider Page 129 of 172 University of Basel, 2008
0.00100.00200.00300.00400.00500.00600.00700.00800.00900.00
1000.00
ab ba ab ba ab ba ab ba ab ba ab ba ab ba ab ba ab ba
14.5 31.8 63.6 14.5 31.8 63.6 14.5 31.8 63.6
0.5 1 5
TE
ER
be
fore
Exp
eri
me
nt
[Oh
m*c
m2]
0.0010.0020.0030.0040.0050.0060.0070.0080.0090.00100.00
TE
ER
aft
er
Ex
pe
rim
en
t [%
of
init
ial
TE
ER
]
Figure 43 TEER values of Caco-2 cell monolayer used in the experiments with propranolol microemulsions. The columns display the absolute values measured before the experiments and the connected points the TEER values after the experiment in % of the initial values. At least 3 wells were used per group. Meaning of the x-axis labels: ab apical to basal transport, ba basal to apical transport; numbers in the middle row: used drug concentration [µM]; numbers in the bottom row: used lipid concentrations [mg/ml].
6.1.3 Emulsions
0.00100.00200.00300.00400.00500.00600.00700.00800.00900.00
1000.00
ab ba ab ba ab ba ab ba ab ba ab ba ab ba ab ba ab ba
3 7 14.5 3 7 14.5 3 7 14.5
0.5 1 5
TE
ER
befo
re E
xp
eri
men
t [O
hm
*cm
2]
0.0010.0020.0030.0040.0050.0060.0070.0080.0090.00100.00
TE
ER
aft
er
Exp
eri
men
t [%
of
init
ial
TE
ER
]
Figure 44 TEER values of Caco-2 cell monolayer used in the experiments with saquinavir emulsions. The columns display the absolute values measured before the experiments and the connected points the TEER values after the experiment in % of the initial values. At least 3 wells were used per group. Meaning of the x-axis labels: ab apical to basal transport, ba basal to apical transport; numbers in the middle row: used drug concentration [µM]; numbers in the bottom row: used lipid concentrations [mg/ml].
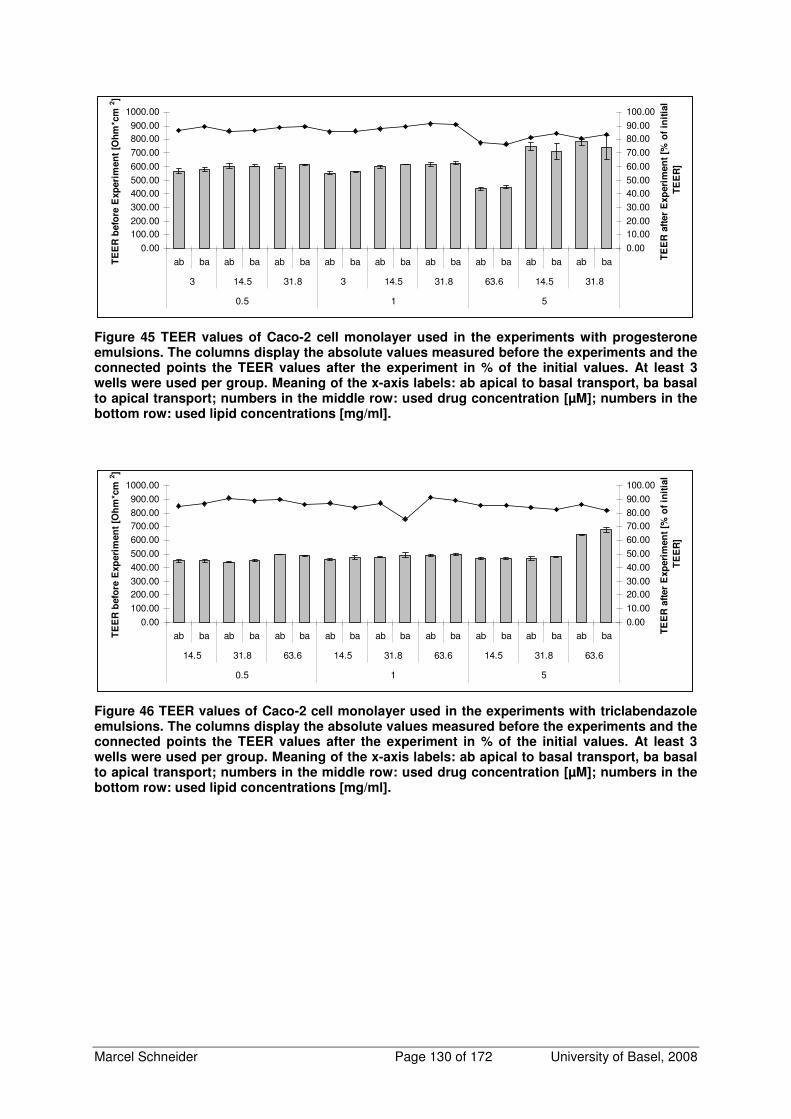
Marcel Schneider Page 130 of 172 University of Basel, 2008
0.00100.00200.00300.00400.00500.00600.00700.00800.00900.00
1000.00
ab ba ab ba ab ba ab ba ab ba ab ba ab ba ab ba ab ba
3 14.5 31.8 3 14.5 31.8 63.6 14.5 31.8
0.5 1 5
TE
ER
befo
re E
xp
eri
men
t [O
hm
*cm
2]
0.0010.0020.0030.0040.0050.0060.0070.0080.0090.00100.00
TE
ER
aft
er
Exp
eri
men
t [%
of
init
ial
TE
ER
]
Figure 45 TEER values of Caco-2 cell monolayer used in the experiments with progesterone emulsions. The columns display the absolute values measured before the experiments and the connected points the TEER values after the experiment in % of the initial values. At least 3 wells were used per group. Meaning of the x-axis labels: ab apical to basal transport, ba basal to apical transport; numbers in the middle row: used drug concentration [µM]; numbers in the bottom row: used lipid concentrations [mg/ml].
0.00
100.00
200.00300.00
400.00500.00
600.00700.00800.00900.00
1000.00
ab ba ab ba ab ba ab ba ab ba ab ba ab ba ab ba ab ba
14.5 31.8 63.6 14.5 31.8 63.6 14.5 31.8 63.6
0.5 1 5
TE
ER
befo
re E
xp
eri
men
t [O
hm
*cm
2]
0.00
10.00
20.0030.00
40.0050.00
60.0070.0080.0090.00
100.00
TE
ER
aft
er
Exp
eri
men
t [%
of
init
ial
TE
ER
]
Figure 46 TEER values of Caco-2 cell monolayer used in the experiments with triclabendazole emulsions. The columns display the absolute values measured before the experiments and the connected points the TEER values after the experiment in % of the initial values. At least 3 wells were used per group. Meaning of the x-axis labels: ab apical to basal transport, ba basal to apical transport; numbers in the middle row: used drug concentration [µM]; numbers in the bottom row: used lipid concentrations [mg/ml].
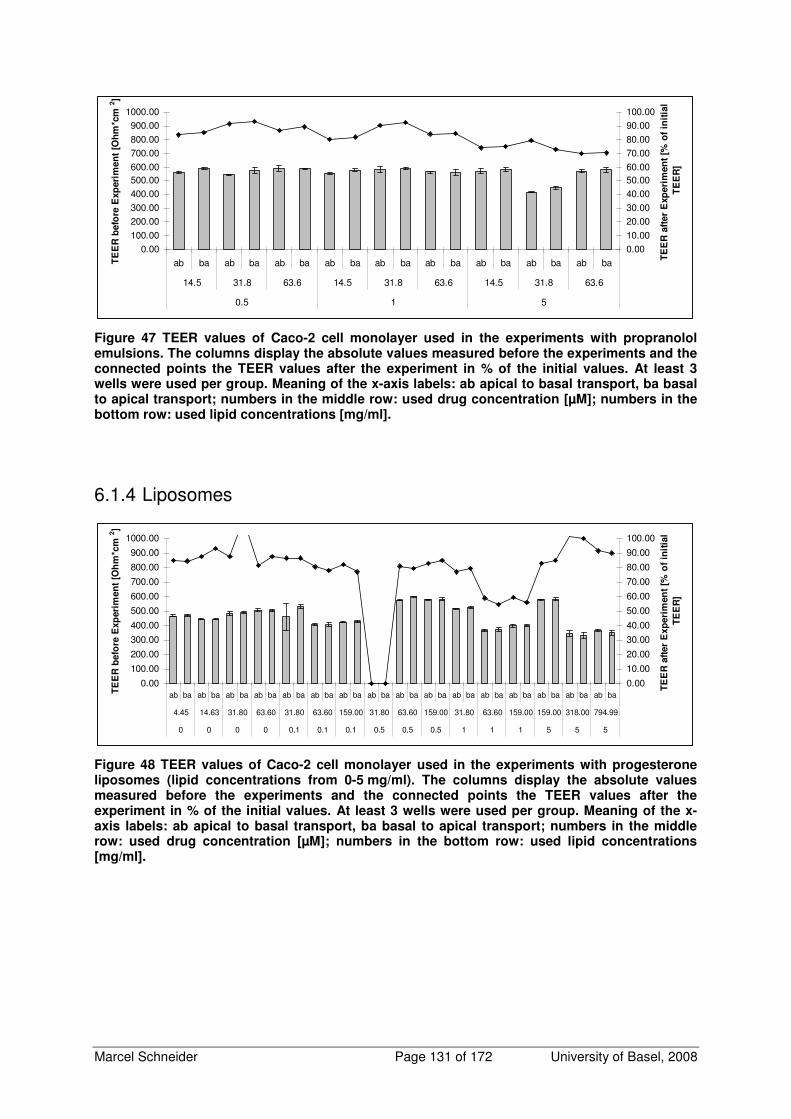
Marcel Schneider Page 131 of 172 University of Basel, 2008
0.00100.00
200.00300.00
400.00500.00600.00
700.00800.00
900.001000.00
ab ba ab ba ab ba ab ba ab ba ab ba ab ba ab ba ab ba
14.5 31.8 63.6 14.5 31.8 63.6 14.5 31.8 63.6
0.5 1 5
TE
ER
befo
re E
xp
eri
men
t [O
hm
*cm
2]
0.0010.00
20.0030.00
40.0050.0060.00
70.0080.00
90.00100.00
TE
ER
aft
er
Exp
eri
men
t [%
of
init
ial
TE
ER
]
Figure 47 TEER values of Caco-2 cell monolayer used in the experiments with propranolol emulsions. The columns display the absolute values measured before the experiments and the connected points the TEER values after the experiment in % of the initial values. At least 3 wells were used per group. Meaning of the x-axis labels: ab apical to basal transport, ba basal to apical transport; numbers in the middle row: used drug concentration [µM]; numbers in the bottom row: used lipid concentrations [mg/ml].
6.1.4 Liposomes
0.00
100.00
200.00
300.00
400.00
500.00
600.00
700.00
800.00
900.00
1000.00
ab ba ab ba ab ba ab ba ab ba ab ba ab ba ab ba ab ba ab ba ab ba ab ba ab ba ab ba ab ba ab ba
4.45 14.63 31.80 63.60 31.80 63.60 159.00 31.80 63.60 159.00 31.80 63.60 159.00 159.00 318.00 794.99
0 0 0 0 0.1 0.1 0.1 0.5 0.5 0.5 1 1 1 5 5 5
TE
ER
befo
re E
xp
eri
men
t [O
hm
*cm
2]
0.00
10.00
20.00
30.00
40.00
50.00
60.00
70.00
80.00
90.00
100.00
TE
ER
aft
er
Exp
eri
men
t [%
of
init
ial
TE
ER
]
Figure 48 TEER values of Caco-2 cell monolayer used in the experiments with progesterone liposomes (lipid concentrations from 0-5 mg/ml). The columns display the absolute values measured before the experiments and the connected points the TEER values after the experiment in % of the initial values. At least 3 wells were used per group. Meaning of the x-axis labels: ab apical to basal transport, ba basal to apical transport; numbers in the middle row: used drug concentration [µM]; numbers in the bottom row: used lipid concentrations [mg/ml].
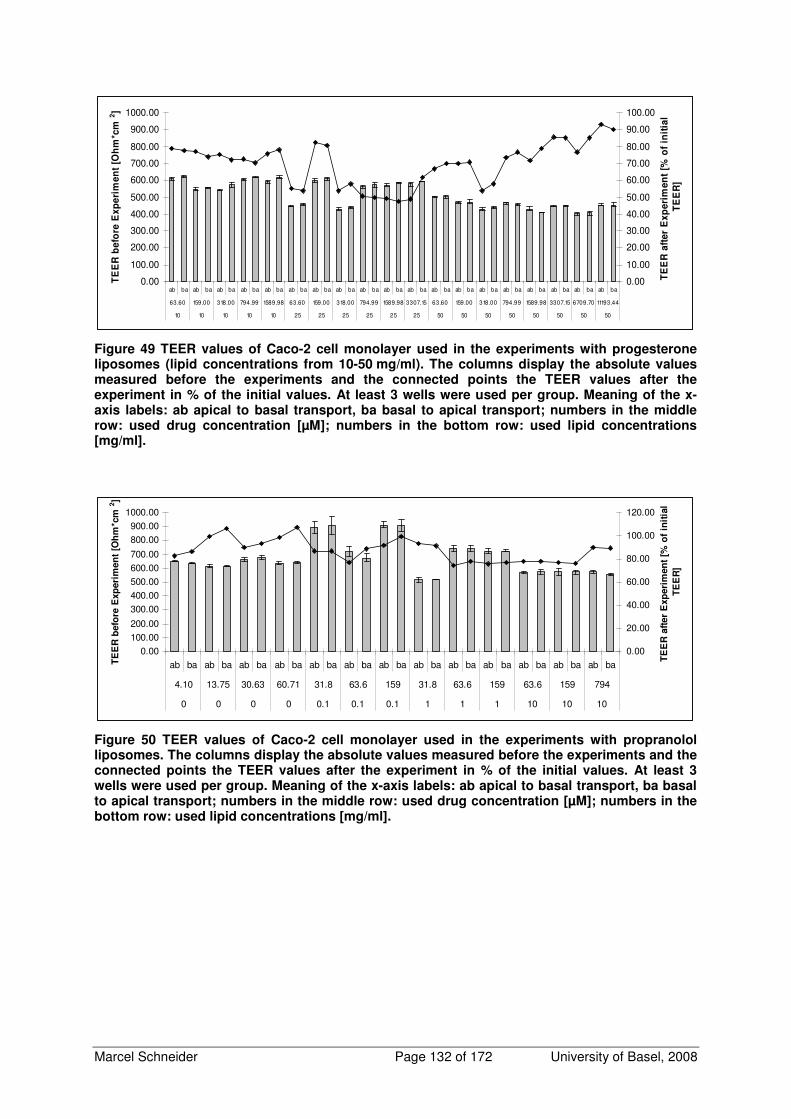
Marcel Schneider Page 132 of 172 University of Basel, 2008
0.00
100.00
200.00
300.00
400.00
500.00
600.00
700.00
800.00
900.00
1000.00
ab ba ab ba ab ba ab ba ab ba ab ba ab ba ab ba ab ba ab ba ab ba ab ba ab ba ab ba ab ba ab ba ab ba ab ba ab ba
63.60 159.00 318.00 794.99 1589.98 63.60 159.00 318.00 794.99 1589.98 3307.15 63.60 159.00 318.00 794.99 1589.98 3307.15 6709.70 11193.44
10 10 10 10 10 25 25 25 25 25 25 50 50 50 50 50 50 50 50
TE
ER
be
fore
Ex
pe
rim
en
t [O
hm
*cm
2]
0.00
10.00
20.00
30.00
40.00
50.00
60.00
70.00
80.00
90.00
100.00
TE
ER
aft
er
Ex
pe
rim
en
t [%
of
init
ial
TE
ER
]
Figure 49 TEER values of Caco-2 cell monolayer used in the experiments with progesterone liposomes (lipid concentrations from 10-50 mg/ml). The columns display the absolute values measured before the experiments and the connected points the TEER values after the experiment in % of the initial values. At least 3 wells were used per group. Meaning of the x-axis labels: ab apical to basal transport, ba basal to apical transport; numbers in the middle row: used drug concentration [µM]; numbers in the bottom row: used lipid concentrations [mg/ml].
0.00100.00200.00
300.00400.00500.00600.00700.00
800.00900.00
1000.00
ab ba ab ba ab ba ab ba ab ba ab ba ab ba ab ba ab ba ab ba ab ba ab ba ab ba
4.10 13.75 30.63 60.71 31.8 63.6 159 31.8 63.6 159 63.6 159 794
0 0 0 0 0.1 0.1 0.1 1 1 1 10 10 10
TE
ER
befo
re E
xp
eri
men
t [O
hm
*cm
2]
0.00
20.00
40.00
60.00
80.00
100.00
120.00
TE
ER
aft
er
Exp
eri
men
t [%
of
init
ial
TE
ER
]
Figure 50 TEER values of Caco-2 cell monolayer used in the experiments with propranolol liposomes. The columns display the absolute values measured before the experiments and the connected points the TEER values after the experiment in % of the initial values. At least 3 wells were used per group. Meaning of the x-axis labels: ab apical to basal transport, ba basal to apical transport; numbers in the middle row: used drug concentration [µM]; numbers in the bottom row: used lipid concentrations [mg/ml].
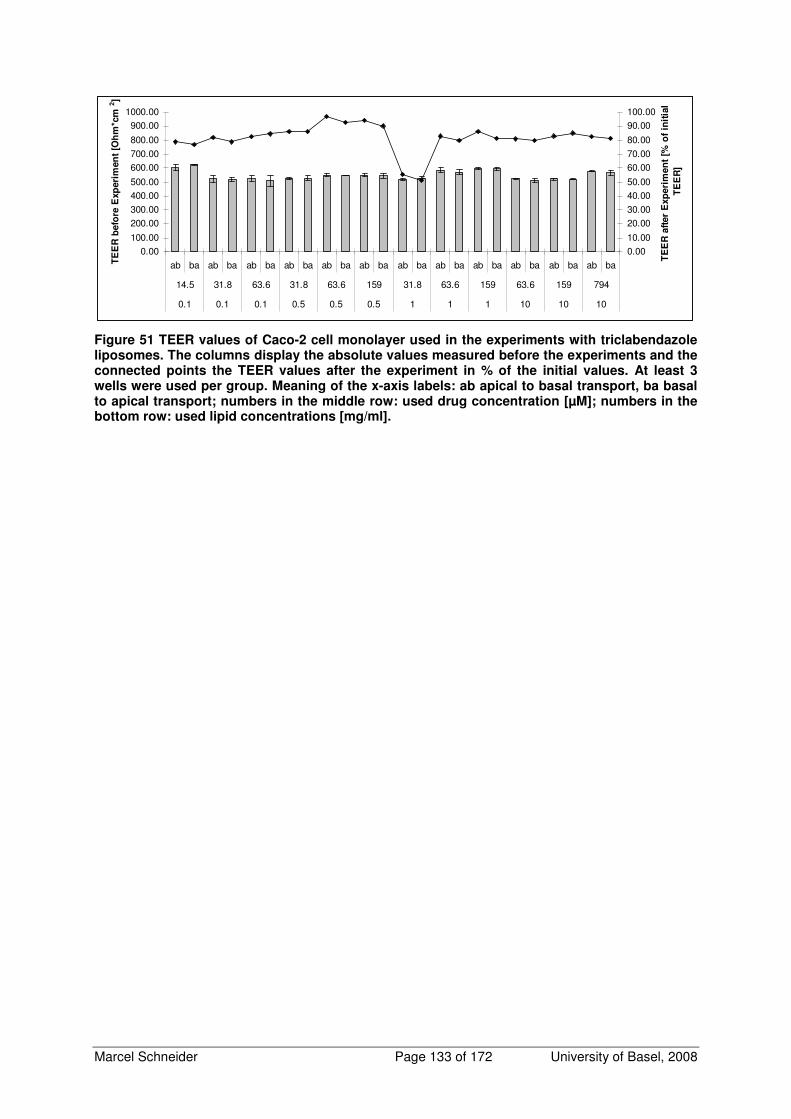
Marcel Schneider Page 133 of 172 University of Basel, 2008
0.00100.00
200.00300.00
400.00500.00
600.00700.00
800.00
900.001000.00
ab ba ab ba ab ba ab ba ab ba ab ba ab ba ab ba ab ba ab ba ab ba ab ba
14.5 31.8 63.6 31.8 63.6 159 31.8 63.6 159 63.6 159 794
0.1 0.1 0.1 0.5 0.5 0.5 1 1 1 10 10 10
TE
ER
befo
re E
xp
eri
men
t [O
hm
*cm
2]
0.0010.00
20.0030.00
40.0050.00
60.0070.00
80.00
90.00100.00
TE
ER
aft
er
Exp
eri
men
t [%
of
init
ial
TE
ER
]
Figure 51 TEER values of Caco-2 cell monolayer used in the experiments with triclabendazole liposomes. The columns display the absolute values measured before the experiments and the connected points the TEER values after the experiment in % of the initial values. At least 3 wells were used per group. Meaning of the x-axis labels: ab apical to basal transport, ba basal to apical transport; numbers in the middle row: used drug concentration [µM]; numbers in the bottom row: used lipid concentrations [mg/ml].
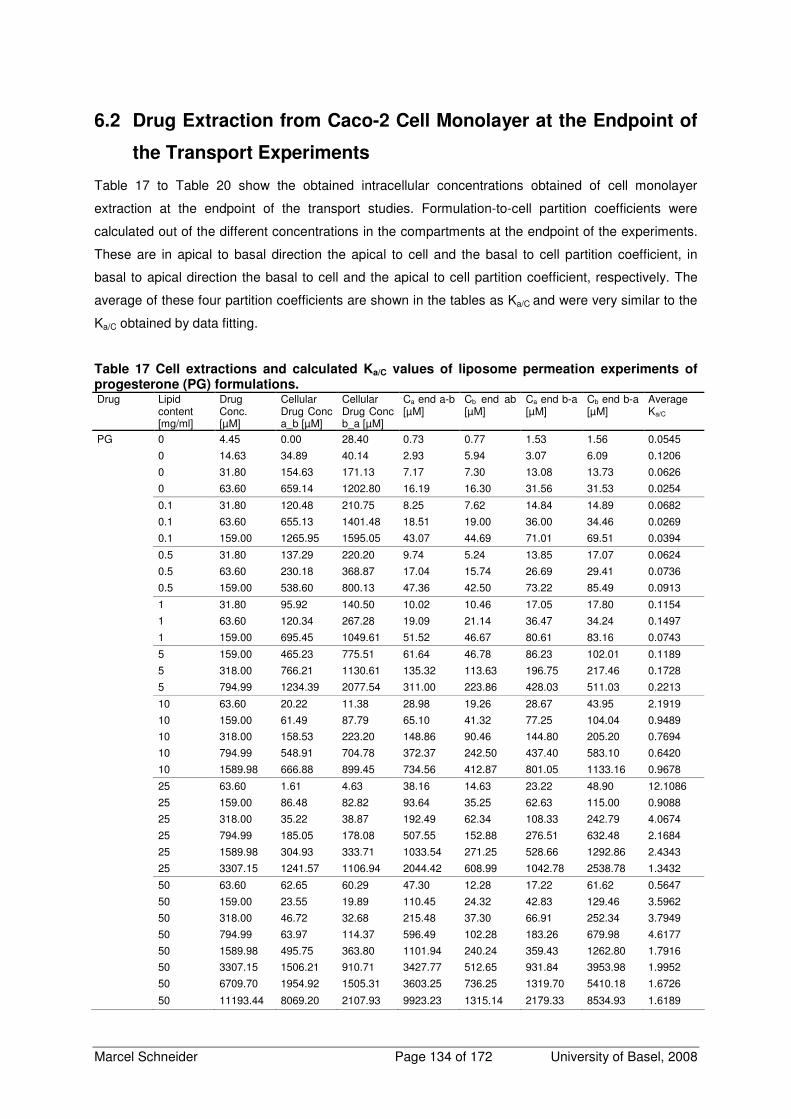
Marcel Schneider Page 134 of 172 University of Basel, 2008
6.2 Drug Extraction from Caco-2 Cell Monolayer at the Endpoint of
the Transport Experiments
Table 17 to Table 20 show the obtained intracellular concentrations obtained of cell monolayer
extraction at the endpoint of the transport studies. Formulation-to-cell partition coefficients were
calculated out of the different concentrations in the compartments at the endpoint of the experiments.
These are in apical to basal direction the apical to cell and the basal to cell partition coefficient, in
basal to apical direction the basal to cell and the apical to cell partition coefficient, respectively. The
average of these four partition coefficients are shown in the tables as Ka/C and were very similar to the
Ka/C obtained by data fitting.
Table 17 Cell extractions and calculated Ka/C values of liposome permeation experiments of progesterone (PG) formulations. Drug Lipid
content [mg/ml]
Drug Conc. [µM]
Cellular Drug Conc a_b [µM]
Cellular Drug Conc b_a [µM]
Ca end a-b [µM]
Cb end ab [µM]
Ca end b-a [µM]
Cb end b-a [µM]
Average Ka/C
PG 0 4.45 0.00 28.40 0.73 0.77 1.53 1.56 0.0545
0 14.63 34.89 40.14 2.93 5.94 3.07 6.09 0.1206
0 31.80 154.63 171.13 7.17 7.30 13.08 13.73 0.0626
0 63.60 659.14 1202.80 16.19 16.30 31.56 31.53 0.0254
0.1 31.80 120.48 210.75 8.25 7.62 14.84 14.89 0.0682
0.1 63.60 655.13 1401.48 18.51 19.00 36.00 34.46 0.0269
0.1 159.00 1265.95 1595.05 43.07 44.69 71.01 69.51 0.0394
0.5 31.80 137.29 220.20 9.74 5.24 13.85 17.07 0.0624
0.5 63.60 230.18 368.87 17.04 15.74 26.69 29.41 0.0736
0.5 159.00 538.60 800.13 47.36 42.50 73.22 85.49 0.0913
1 31.80 95.92 140.50 10.02 10.46 17.05 17.80 0.1154
1 63.60 120.34 267.28 19.09 21.14 36.47 34.24 0.1497
1 159.00 695.45 1049.61 51.52 46.67 80.61 83.16 0.0743
5 159.00 465.23 775.51 61.64 46.78 86.23 102.01 0.1189
5 318.00 766.21 1130.61 135.32 113.63 196.75 217.46 0.1728
5 794.99 1234.39 2077.54 311.00 223.86 428.03 511.03 0.2213
10 63.60 20.22 11.38 28.98 19.26 28.67 43.95 2.1919
10 159.00 61.49 87.79 65.10 41.32 77.25 104.04 0.9489
10 318.00 158.53 223.20 148.86 90.46 144.80 205.20 0.7694
10 794.99 548.91 704.78 372.37 242.50 437.40 583.10 0.6420
10 1589.98 666.88 899.45 734.56 412.87 801.05 1133.16 0.9678
25 63.60 1.61 4.63 38.16 14.63 23.22 48.90 12.1086
25 159.00 86.48 82.82 93.64 35.25 62.63 115.00 0.9088
25 318.00 35.22 38.87 192.49 62.34 108.33 242.79 4.0674
25 794.99 185.05 178.08 507.55 152.88 276.51 632.48 2.1684
25 1589.98 304.93 333.71 1033.54 271.25 528.66 1292.86 2.4343
25 3307.15 1241.57 1106.94 2044.42 608.99 1042.78 2538.78 1.3432
50 63.60 62.65 60.29 47.30 12.28 17.22 61.62 0.5647
50 159.00 23.55 19.89 110.45 24.32 42.83 129.46 3.5962
50 318.00 46.72 32.68 215.48 37.30 66.91 252.34 3.7949
50 794.99 63.97 114.37 596.49 102.28 183.26 679.98 4.6177
50 1589.98 495.75 363.80 1101.94 240.24 359.43 1262.80 1.7916
50 3307.15 1506.21 910.71 3427.77 512.65 931.84 3953.98 1.9952
50 6709.70 1954.92 1505.31 3603.25 736.25 1319.70 5410.18 1.6726
50 11193.44 8069.20 2107.93 9923.23 1315.14 2179.33 8534.93 1.6189

Marcel Schneider Page 135 of 172 University of Basel, 2008
Table 18 Cell extractions and calculated Ka/C values of liposome permeation experiments of triclabendazole (TBZ) and propranolol (PPL) formulations. Drug Lipid
content [mg/ml]
Drug Conc. [µM]
Cellular Drug Conc a_b [µM]
Cellular Drug Conc b_a [µM]
Ca end a-b [µM]
Cb end ab [µM]
Ca end b-a [µM]
Cb end b-a [µM]
Average Ka/C
PPL 0 60.71 252.33 376.64 19.44 15.83 36.22 29.48 0.0786
0 30.63 n.d. n.d. 10.13 7.90 18.82 14.60 n.d.
0 13.75 n.d. 88.30 5.04 3.13 8.26 6.10 0.0813
0 4.10 n.d. n.d. 1.56 1.29 2.59 1.93 n.d.
0.1 31.8 141.94 246.37 10.16 10.29 15.15 15.37 0.0670
0.1 63.6 294.14 472.63 17.56 14.64 30.65 25.55 0.0571
0.1 159 299.52 394.31 46.24 47.23 81.71 87.93 0.1856
1 31.8 53.37 85.52 7.16 6.88 15.06 13.88 0.1504
1 63.6 283.91 402.54 16.52 14.06 25.84 26.22 0.0593
1 159 382.88 528.89 43.94 42.01 73.95 75.33 0.1267
10 63.6 63.35 77.70 17.81 14.78 25.76 28.83 0.3043
10 159 99.29 146.16 38.76 31.23 62.22 60.55 0.3862
10 794 741.33 1388.24 271.28 214.28 399.55 452.47 0.3172
TBZ 0.1 14.5 311.67 303.71 2.59 1.36 2.34 4.19 0.0085
0.1 31.8 421.76 384.65 8.25 3.48 6.62 12.21 0.0192
0.1 63.6 1042.52 978.04 23.60 12.47 17.61 36.11 0.0224
0.5 31.8 279.46 132.46 22.78 3.99 7.90 28.72 0.0931
0.5 63.6 522.38 246.24 29.53 4.89 9.91 34.97 0.0620
0.5 159 960.73 494.59 80.36 13.39 27.84 98.51 0.0883
1 31.8 114.23 48.75 23.60 3.04 5.75 27.79 0.2303
1 63.6 217.46 120.93 41.01 4.22 9.46 40.63 0.1555
1 159 309.45 255.17 104.03 12.18 22.50 111.84 0.2255
10 63.6 34.94 8.27 49.83 1.66 2.89 50.58 1.9857
10 159 74.18 43.20 143.92 5.93 11.24 140.37 1.3824
10 794 669.20 212.06 642.85 24.02 51.60 572.38 0.9847
n.d.: not determined
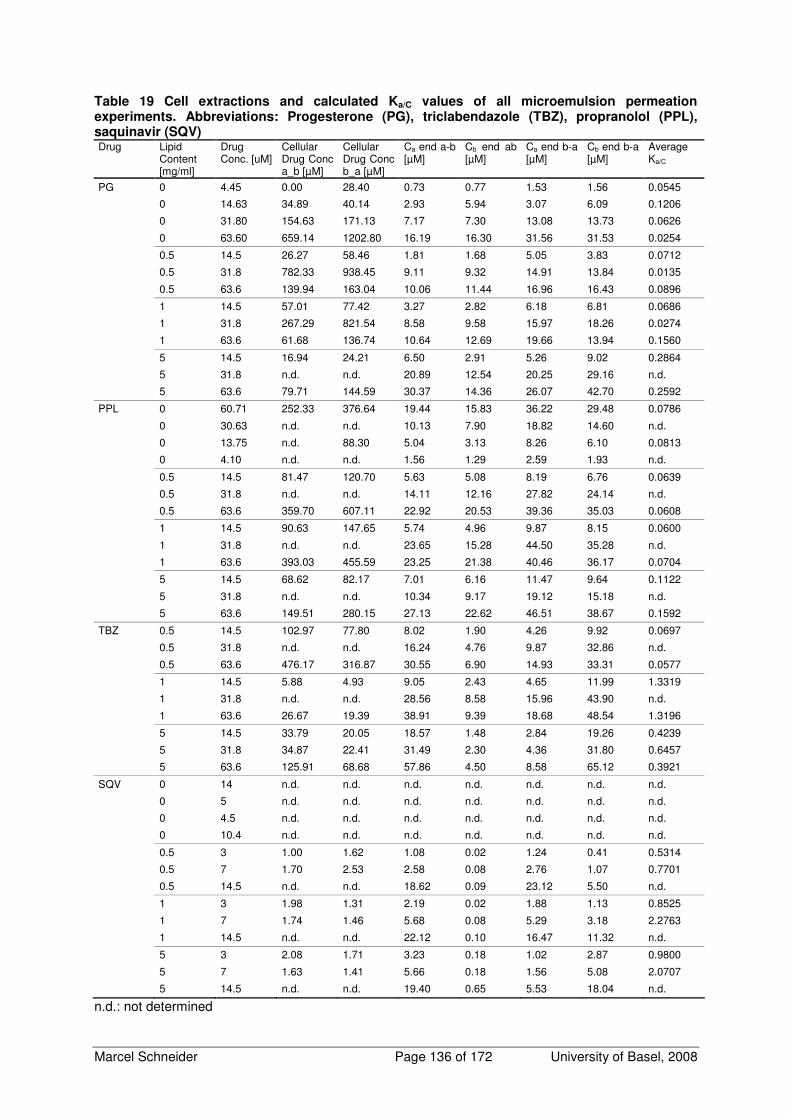
Marcel Schneider Page 136 of 172 University of Basel, 2008
Table 19 Cell extractions and calculated Ka/C values of all microemulsion permeation experiments. Abbreviations: Progesterone (PG), triclabendazole (TBZ), propranolol (PPL), saquinavir (SQV) Drug Lipid
Content [mg/ml]
Drug Conc. [uM]
Cellular Drug Conc a_b [µM]
Cellular Drug Conc b_a [µM]
Ca end a-b [µM]
Cb end ab [µM]
Ca end b-a [µM]
Cb end b-a [µM]
Average Ka/C
PG 0 4.45 0.00 28.40 0.73 0.77 1.53 1.56 0.0545
0 14.63 34.89 40.14 2.93 5.94 3.07 6.09 0.1206
0 31.80 154.63 171.13 7.17 7.30 13.08 13.73 0.0626
0 63.60 659.14 1202.80 16.19 16.30 31.56 31.53 0.0254
0.5 14.5 26.27 58.46 1.81 1.68 5.05 3.83 0.0712
0.5 31.8 782.33 938.45 9.11 9.32 14.91 13.84 0.0135
0.5 63.6 139.94 163.04 10.06 11.44 16.96 16.43 0.0896
1 14.5 57.01 77.42 3.27 2.82 6.18 6.81 0.0686
1 31.8 267.29 821.54 8.58 9.58 15.97 18.26 0.0274
1 63.6 61.68 136.74 10.64 12.69 19.66 13.94 0.1560
5 14.5 16.94 24.21 6.50 2.91 5.26 9.02 0.2864
5 31.8 n.d. n.d. 20.89 12.54 20.25 29.16 n.d.
5 63.6 79.71 144.59 30.37 14.36 26.07 42.70 0.2592
PPL 0 60.71 252.33 376.64 19.44 15.83 36.22 29.48 0.0786
0 30.63 n.d. n.d. 10.13 7.90 18.82 14.60 n.d.
0 13.75 n.d. 88.30 5.04 3.13 8.26 6.10 0.0813
0 4.10 n.d. n.d. 1.56 1.29 2.59 1.93 n.d.
0.5 14.5 81.47 120.70 5.63 5.08 8.19 6.76 0.0639
0.5 31.8 n.d. n.d. 14.11 12.16 27.82 24.14 n.d.
0.5 63.6 359.70 607.11 22.92 20.53 39.36 35.03 0.0608
1 14.5 90.63 147.65 5.74 4.96 9.87 8.15 0.0600
1 31.8 n.d. n.d. 23.65 15.28 44.50 35.28 n.d.
1 63.6 393.03 455.59 23.25 21.38 40.46 36.17 0.0704
5 14.5 68.62 82.17 7.01 6.16 11.47 9.64 0.1122
5 31.8 n.d. n.d. 10.34 9.17 19.12 15.18 n.d.
5 63.6 149.51 280.15 27.13 22.62 46.51 38.67 0.1592
TBZ 0.5 14.5 102.97 77.80 8.02 1.90 4.26 9.92 0.0697
0.5 31.8 n.d. n.d. 16.24 4.76 9.87 32.86 n.d.
0.5 63.6 476.17 316.87 30.55 6.90 14.93 33.31 0.0577
1 14.5 5.88 4.93 9.05 2.43 4.65 11.99 1.3319
1 31.8 n.d. n.d. 28.56 8.58 15.96 43.90 n.d.
1 63.6 26.67 19.39 38.91 9.39 18.68 48.54 1.3196
5 14.5 33.79 20.05 18.57 1.48 2.84 19.26 0.4239
5 31.8 34.87 22.41 31.49 2.30 4.36 31.80 0.6457
5 63.6 125.91 68.68 57.86 4.50 8.58 65.12 0.3921
SQV 0 14 n.d. n.d. n.d. n.d. n.d. n.d. n.d.
0 5 n.d. n.d. n.d. n.d. n.d. n.d. n.d.
0 4.5 n.d. n.d. n.d. n.d. n.d. n.d. n.d.
0 10.4 n.d. n.d. n.d. n.d. n.d. n.d. n.d.
0.5 3 1.00 1.62 1.08 0.02 1.24 0.41 0.5314
0.5 7 1.70 2.53 2.58 0.08 2.76 1.07 0.7701
0.5 14.5 n.d. n.d. 18.62 0.09 23.12 5.50 n.d.
1 3 1.98 1.31 2.19 0.02 1.88 1.13 0.8525
1 7 1.74 1.46 5.68 0.08 5.29 3.18 2.2763
1 14.5 n.d. n.d. 22.12 0.10 16.47 11.32 n.d.
5 3 2.08 1.71 3.23 0.18 1.02 2.87 0.9800
5 7 1.63 1.41 5.66 0.18 1.56 5.08 2.0707
5 14.5 n.d. n.d. 19.40 0.65 5.53 18.04 n.d.
n.d.: not determined
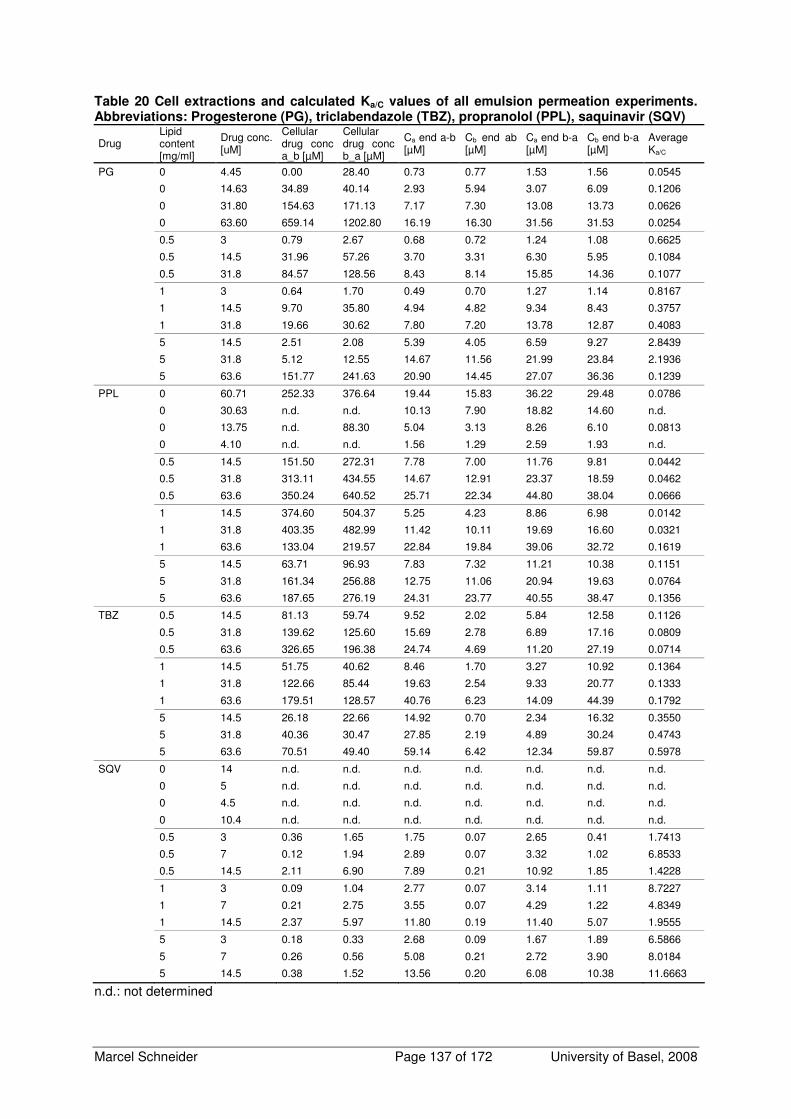
Marcel Schneider Page 137 of 172 University of Basel, 2008
Table 20 Cell extractions and calculated Ka/C values of all emulsion permeation experiments. Abbreviations: Progesterone (PG), triclabendazole (TBZ), propranolol (PPL), saquinavir (SQV)
Drug Lipid content [mg/ml]
Drug conc. [uM]
Cellular drug conc a_b [µM]
Cellular drug conc b_a [µM]
Ca end a-b [µM]
Cb end ab [µM]
Ca end b-a [µM]
Cb end b-a [µM]
Average Ka/C
PG 0 4.45 0.00 28.40 0.73 0.77 1.53 1.56 0.0545
0 14.63 34.89 40.14 2.93 5.94 3.07 6.09 0.1206
0 31.80 154.63 171.13 7.17 7.30 13.08 13.73 0.0626
0 63.60 659.14 1202.80 16.19 16.30 31.56 31.53 0.0254
0.5 3 0.79 2.67 0.68 0.72 1.24 1.08 0.6625
0.5 14.5 31.96 57.26 3.70 3.31 6.30 5.95 0.1084
0.5 31.8 84.57 128.56 8.43 8.14 15.85 14.36 0.1077
1 3 0.64 1.70 0.49 0.70 1.27 1.14 0.8167
1 14.5 9.70 35.80 4.94 4.82 9.34 8.43 0.3757
1 31.8 19.66 30.62 7.80 7.20 13.78 12.87 0.4083
5 14.5 2.51 2.08 5.39 4.05 6.59 9.27 2.8439
5 31.8 5.12 12.55 14.67 11.56 21.99 23.84 2.1936
5 63.6 151.77 241.63 20.90 14.45 27.07 36.36 0.1239
PPL 0 60.71 252.33 376.64 19.44 15.83 36.22 29.48 0.0786
0 30.63 n.d. n.d. 10.13 7.90 18.82 14.60 n.d.
0 13.75 n.d. 88.30 5.04 3.13 8.26 6.10 0.0813
0 4.10 n.d. n.d. 1.56 1.29 2.59 1.93 n.d.
0.5 14.5 151.50 272.31 7.78 7.00 11.76 9.81 0.0442
0.5 31.8 313.11 434.55 14.67 12.91 23.37 18.59 0.0462
0.5 63.6 350.24 640.52 25.71 22.34 44.80 38.04 0.0666
1 14.5 374.60 504.37 5.25 4.23 8.86 6.98 0.0142
1 31.8 403.35 482.99 11.42 10.11 19.69 16.60 0.0321
1 63.6 133.04 219.57 22.84 19.84 39.06 32.72 0.1619
5 14.5 63.71 96.93 7.83 7.32 11.21 10.38 0.1151
5 31.8 161.34 256.88 12.75 11.06 20.94 19.63 0.0764
5 63.6 187.65 276.19 24.31 23.77 40.55 38.47 0.1356
TBZ 0.5 14.5 81.13 59.74 9.52 2.02 5.84 12.58 0.1126
0.5 31.8 139.62 125.60 15.69 2.78 6.89 17.16 0.0809
0.5 63.6 326.65 196.38 24.74 4.69 11.20 27.19 0.0714
1 14.5 51.75 40.62 8.46 1.70 3.27 10.92 0.1364
1 31.8 122.66 85.44 19.63 2.54 9.33 20.77 0.1333
1 63.6 179.51 128.57 40.76 6.23 14.09 44.39 0.1792
5 14.5 26.18 22.66 14.92 0.70 2.34 16.32 0.3550
5 31.8 40.36 30.47 27.85 2.19 4.89 30.24 0.4743
5 63.6 70.51 49.40 59.14 6.42 12.34 59.87 0.5978
SQV 0 14 n.d. n.d. n.d. n.d. n.d. n.d. n.d.
0 5 n.d. n.d. n.d. n.d. n.d. n.d. n.d.
0 4.5 n.d. n.d. n.d. n.d. n.d. n.d. n.d.
0 10.4 n.d. n.d. n.d. n.d. n.d. n.d. n.d.
0.5 3 0.36 1.65 1.75 0.07 2.65 0.41 1.7413
0.5 7 0.12 1.94 2.89 0.07 3.32 1.02 6.8533
0.5 14.5 2.11 6.90 7.89 0.21 10.92 1.85 1.4228
1 3 0.09 1.04 2.77 0.07 3.14 1.11 8.7227
1 7 0.21 2.75 3.55 0.07 4.29 1.22 4.8349
1 14.5 2.37 5.97 11.80 0.19 11.40 5.07 1.9555
5 3 0.18 0.33 2.68 0.09 1.67 1.89 6.5866
5 7 0.26 0.56 5.08 0.21 2.72 3.90 8.0184
5 14.5 0.38 1.52 13.56 0.20 6.08 10.38 11.6663
n.d.: not determined
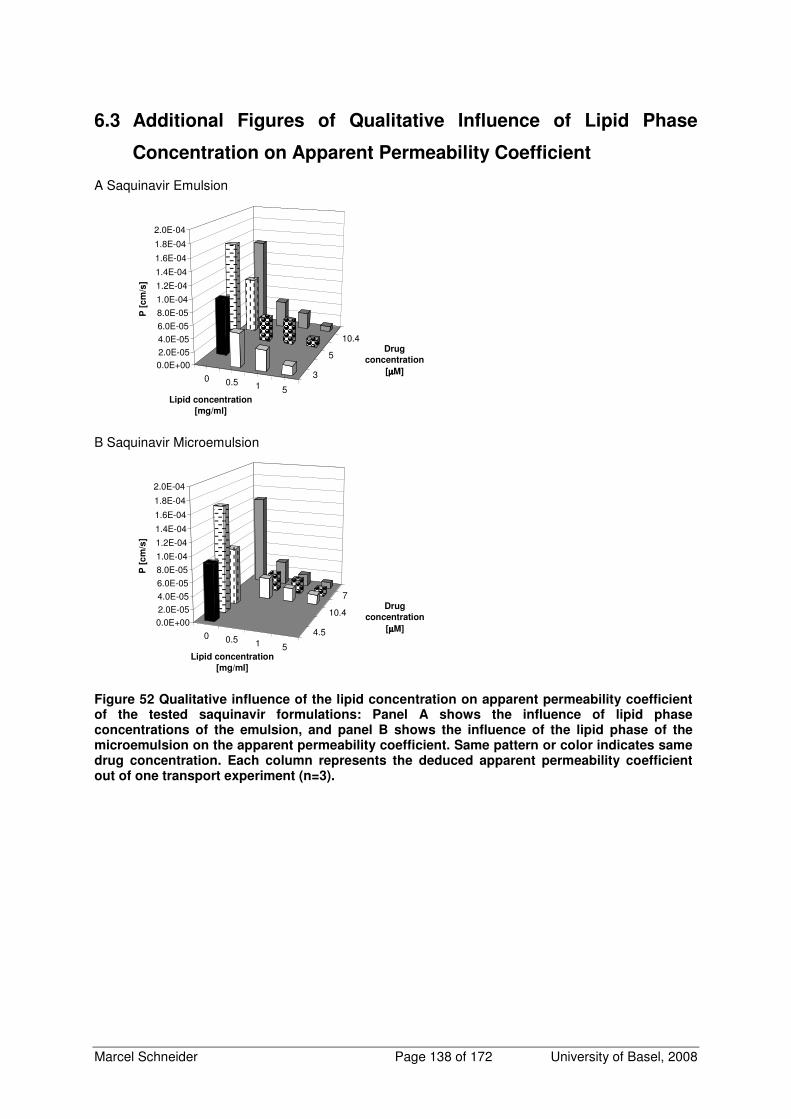
Marcel Schneider Page 138 of 172 University of Basel, 2008
6.3 Additional Figures of Qualitative Influence of Lipid Phase
Concentration on Apparent Permeability Coefficient
A Saquinavir Emulsion
0 0.5 1 5
3
5
10.4
0.0E+002.0E-054.0E-056.0E-05
8.0E-05
1.0E-04
1.2E-04
1.4E-04
1.6E-04
1.8E-04
2.0E-04
P [
cm
/s]
Lipid concentration
[mg/ml]
Drug
concentration
[µµµµM]
B Saquinavir Microemulsion
0 0.5 1 5
4.5
10.4
7
0.0E+002.0E-054.0E-05
6.0E-05
8.0E-05
1.0E-04
1.2E-04
1.4E-04
1.6E-04
1.8E-04
2.0E-04
P [
cm
/s]
Lipid concentration
[mg/ml]
Drug
concentration
[µµµµM]
Figure 52 Qualitative influence of the lipid concentration on apparent permeability coefficient of the tested saquinavir formulations: Panel A shows the influence of lipid phase concentrations of the emulsion, and panel B shows the influence of the lipid phase of the microemulsion on the apparent permeability coefficient. Same pattern or color indicates same drug concentration. Each column represents the deduced apparent permeability coefficient out of one transport experiment (n=3).
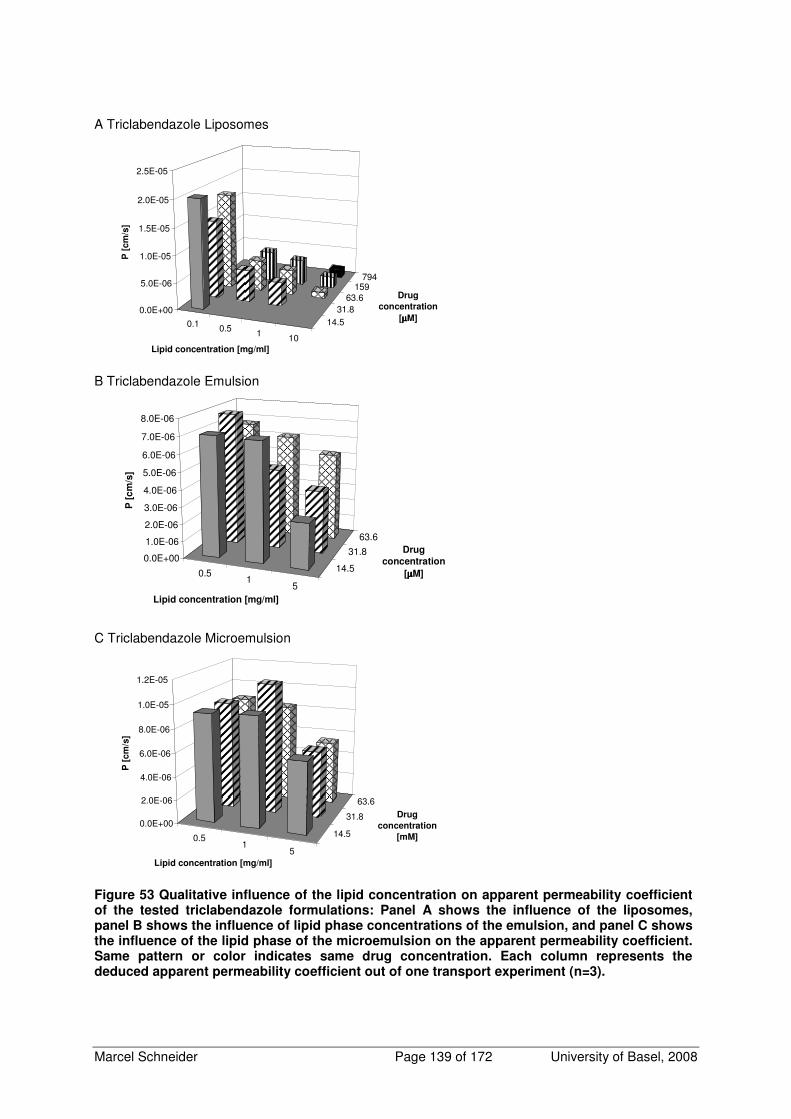
Marcel Schneider Page 139 of 172 University of Basel, 2008
A Triclabendazole Liposomes
0.1 0.5 1 10
14.531.8
63.6159
794
0.0E+00
5.0E-06
1.0E-05
1.5E-05
2.0E-05
2.5E-05
P [
cm
/s]
Lipid concentration [mg/ml]
Drug
concentration
[µµµµM]
B Triclabendazole Emulsion
0.51
5
14.5
31.8
63.6
0.0E+00
1.0E-06
2.0E-06
3.0E-06
4.0E-06
5.0E-06
6.0E-06
7.0E-06
8.0E-06
P [
cm
/s]
Lipid concentration [mg/ml]
Drug
concentration
[µµµµM]
C Triclabendazole Microemulsion
0.51
5
14.5
31.8
63.6
0.0E+00
2.0E-06
4.0E-06
6.0E-06
8.0E-06
1.0E-05
1.2E-05
P [
cm
/s]
Lipid concentration [mg/ml]
Drug
concentration
[mM]
Figure 53 Qualitative influence of the lipid concentration on apparent permeability coefficient of the tested triclabendazole formulations: Panel A shows the influence of the liposomes, panel B shows the influence of lipid phase concentrations of the emulsion, and panel C shows the influence of the lipid phase of the microemulsion on the apparent permeability coefficient. Same pattern or color indicates same drug concentration. Each column represents the deduced apparent permeability coefficient out of one transport experiment (n=3).
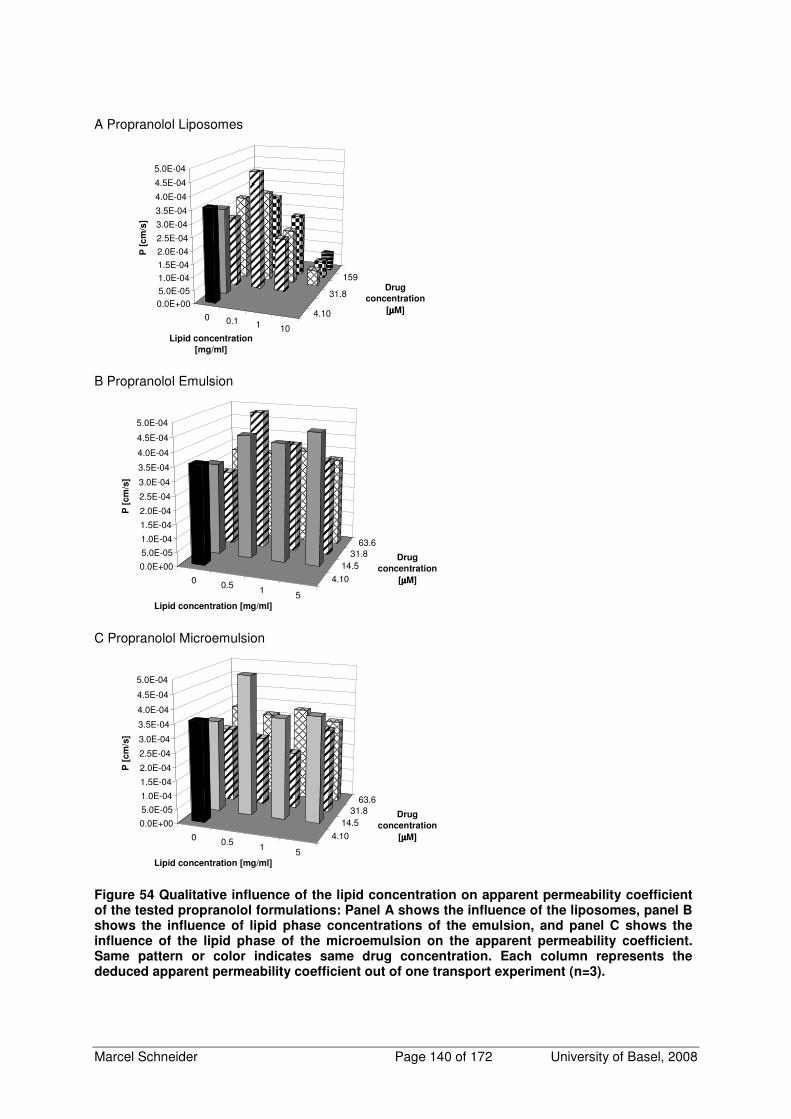
Marcel Schneider Page 140 of 172 University of Basel, 2008
A Propranolol Liposomes
0 0.1 1 10
4.10
31.8
159
0.0E+005.0E-051.0E-041.5E-04
2.0E-04
2.5E-04
3.0E-04
3.5E-04
4.0E-04
4.5E-04
5.0E-04
P [
cm
/s]
Lipid concentration
[mg/ml]
Drug
concentration
[µµµµM]
B Propranolol Emulsion
0 0.5 1 5
4.10
14.531.8
63.6
0.0E+00
5.0E-05
1.0E-04
1.5E-04
2.0E-04
2.5E-04
3.0E-04
3.5E-04
4.0E-04
4.5E-04
5.0E-04
P [
cm
/s]
Lipid concentration [mg/ml]
Drug
concentration
[µµµµM]
C Propranolol Microemulsion
0 0.5 1 5
4.10
14.531.8
63.6
0.0E+00
5.0E-05
1.0E-04
1.5E-04
2.0E-04
2.5E-04
3.0E-04
3.5E-04
4.0E-04
4.5E-04
5.0E-04
P [
cm
/s]
Lipid concentration [mg/ml]
Drug
concentration
[µµµµM]
Figure 54 Qualitative influence of the lipid concentration on apparent permeability coefficient of the tested propranolol formulations: Panel A shows the influence of the liposomes, panel B shows the influence of lipid phase concentrations of the emulsion, and panel C shows the influence of the lipid phase of the microemulsion on the apparent permeability coefficient. Same pattern or color indicates same drug concentration. Each column represents the deduced apparent permeability coefficient out of one transport experiment (n=3).
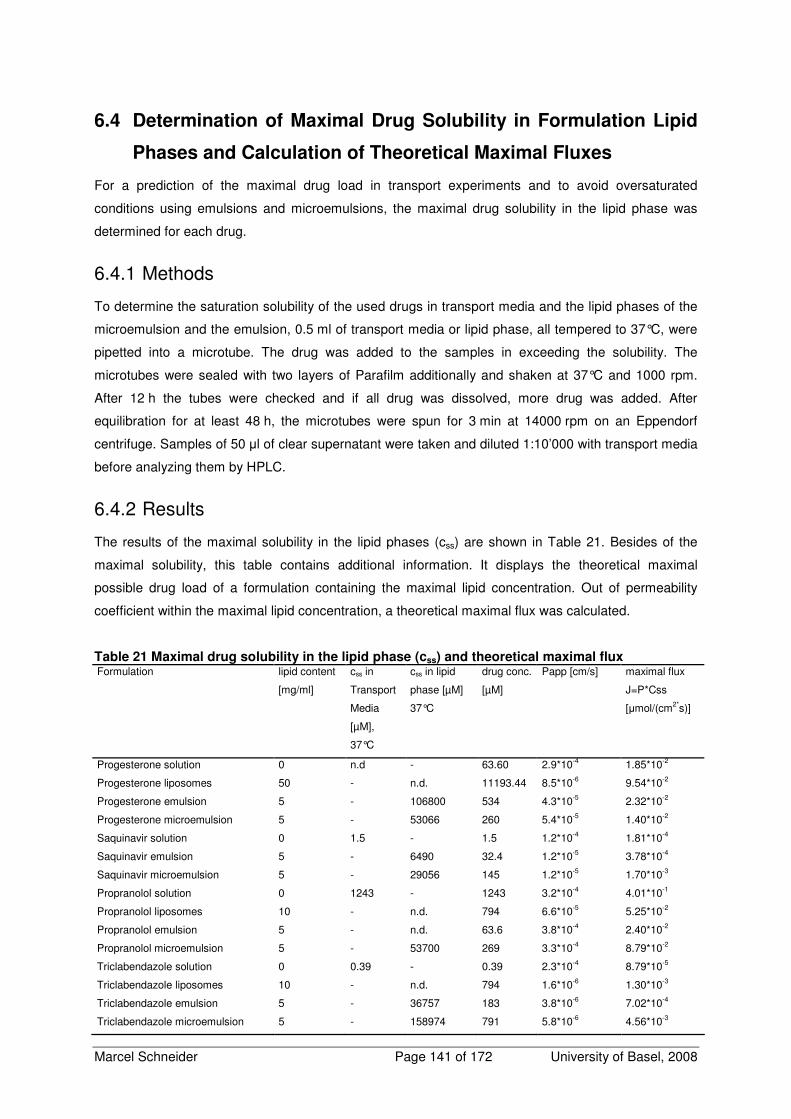
Marcel Schneider Page 141 of 172 University of Basel, 2008
6.4 Determination of Maximal Drug Solubility in Formulation Lipid
Phases and Calculation of Theoretical Maximal Fluxes
For a prediction of the maximal drug load in transport experiments and to avoid oversaturated
conditions using emulsions and microemulsions, the maximal drug solubility in the lipid phase was
determined for each drug.
6.4.1 Methods
To determine the saturation solubility of the used drugs in transport media and the lipid phases of the
microemulsion and the emulsion, 0.5 ml of transport media or lipid phase, all tempered to 37°C, were
pipetted into a microtube. The drug was added to the samples in exceeding the solubility. The
microtubes were sealed with two layers of Parafilm additionally and shaken at 37°C and 1000 rpm.
After 12 h the tubes were checked and if all drug was dissolved, more drug was added. After
equilibration for at least 48 h, the microtubes were spun for 3 min at 14000 rpm on an Eppendorf
centrifuge. Samples of 50 µl of clear supernatant were taken and diluted 1:10’000 with transport media
before analyzing them by HPLC.
6.4.2 Results
The results of the maximal solubility in the lipid phases (css) are shown in Table 21. Besides of the
maximal solubility, this table contains additional information. It displays the theoretical maximal
possible drug load of a formulation containing the maximal lipid concentration. Out of permeability
coefficient within the maximal lipid concentration, a theoretical maximal flux was calculated.
Table 21 Maximal drug solubility in the lipid phase (css) and theoretical maximal flux Formulation lipid content
[mg/ml]
css in
Transport
Media
[µM],
37°C
css in lipid
phase [µM]
37°C
drug conc.
[µM]
Papp [cm/s] maximal flux
J=P*Css
[µmol/(cm2*s)]
Progesterone solution 0 n.d - 63.60 2.9*10-4 1.85*10-2
Progesterone liposomes 50 - n.d. 11193.44 8.5*10-6 9.54*10-2
Progesterone emulsion 5 - 106800 534 4.3*10-5 2.32*10-2
Progesterone microemulsion 5 - 53066 260 5.4*10-5 1.40*10-2
Saquinavir solution 0 1.5 - 1.5 1.2*10-4 1.81*10-4
Saquinavir emulsion 5 - 6490 32.4 1.2*10-5 3.78*10-4
Saquinavir microemulsion 5 - 29056 145 1.2*10-5 1.70*10-3
Propranolol solution 0 1243 - 1243 3.2*10-4 4.01*10-1
Propranolol liposomes 10 - n.d. 794 6.6*10-5 5.25*10-2
Propranolol emulsion 5 - n.d. 63.6 3.8*10-4 2.40*10-2
Propranolol microemulsion 5 - 53700 269 3.3*10-4 8.79*10-2
Triclabendazole solution 0 0.39 - 0.39 2.3*10-4 8.79*10-5
Triclabendazole liposomes 10 - n.d. 794 1.6*10-6 1.30*10-3
Triclabendazole emulsion 5 - 36757 183 3.8*10-6 7.02*10-4
Triclabendazole microemulsion 5 - 158974 791 5.8*10-6 4.56*10-3
Marcel Schneider Page 142 of 172 University of Basel, 2008
6.5 Determination of Inorganic and Organic Phosphate of the
Acceptor Compartment after Equilibrium Dialysis of a
Liposome Formulation
If phosphatidylcholine is in contact with an aqueous environment, a degradation product, lyso-
phosphatidylcholine, may occur. This degradation product has surfactant like properties and may
influence the solubility of a poor soluble drug in transport media. Because of its mass of approximately
500 D it may pass the dialysis membrane and therefore alter drug partition between lipid- and water
phase. Diffusion of lyso-phosphatidylcholine through the dialysis membrane can be determined by
measuring the change of (anorganic and organic) phosphate content in acceptor compartment.
6.5.1 Material and Methods
Liposomes containing 50 mg/ml phospholipids were dialyzed as described and after 40 h of dialysis
phosphate content of the acceptor compartment was determined and compared with transport media
that contains a phosphate buffer. A method where phosphor in organic molecules is converted by
sulfuric acid to anorganic phosphate was used to determine the organic and the anorganic phosphate
(143). The phosphate forms a complex with ammonium molybdat and malachite green that can be
detected by extinction measurement at 610 nm. Quantification was performed against a set of external
standard solutions out of potassium hydrogenphosphat within the linear response concentration range
(0-12 nM). Samples of 10 µl were pipetted into test tubes and amended with 990 µl distilled water.
Three aliquots of the standard solutions (100 µl each) and of the diluted samples (50 µl each) were
pipetted into test tubes and 700 µl of a reagent containing 5%(V/V) sulfuric acid and 7%(V/V) of
perchloric acid solution (20%) in distilled water. The samples were incubated 1 h at 150°C and dried
2 h at 230°C. After cooling down, 1000 µl distilled water was added to the tubes. Samples of 100 µl
were transferred into 96-well plates (Nunc, Roskilde, Denmark) and mixed with 20 µl of a solution
containing 1.25% (m/V) ammonium heptamolybdat in distilled water. After 20 min incubation at room
temperature, 20 µl of a reagent, containing 0.35 g polyvinyl alcohol and 0.035 g malachite green in
100 ml reagent, was added and after an incubation of 10 min the samples were measured with a plate
reader (Versamax Tunable Multiplate Reader, No. SIN/B 02553, Molecular Devices Corporation,
Sunnyville, USA). All reagents were of analytical grade and purchased from SIGMA-Aldrich (Fluka
Chemie, Buchs, Switzerland).
6.5.2 Results
The result of the equilibrium dialysis of a liposome formulation is shown in Figure 55. Phosphate
content of acceptor transport media after equilibrium dialysis of a liposome formulation containing
50 mg/ml phospholipids did not change during dialysis compared to the initial phosphate concentration
of transport media. This indicates that no phospholipids or degradation products cross the dialysis
membrane during experimental duration.
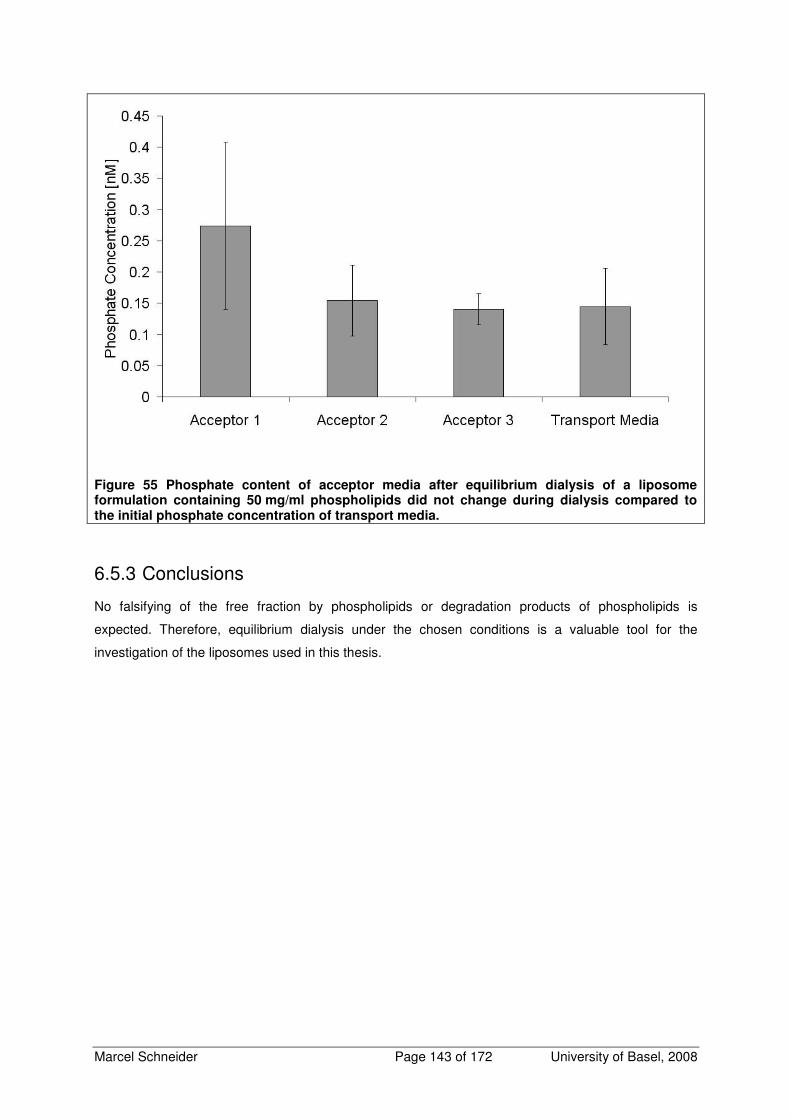
Marcel Schneider Page 143 of 172 University of Basel, 2008
Figure 55 Phosphate content of acceptor media after equilibrium dialysis of a liposome formulation containing 50 mg/ml phospholipids did not change during dialysis compared to the initial phosphate concentration of transport media.
6.5.3 Conclusions
No falsifying of the free fraction by phospholipids or degradation products of phospholipids is
expected. Therefore, equilibrium dialysis under the chosen conditions is a valuable tool for the
investigation of the liposomes used in this thesis.
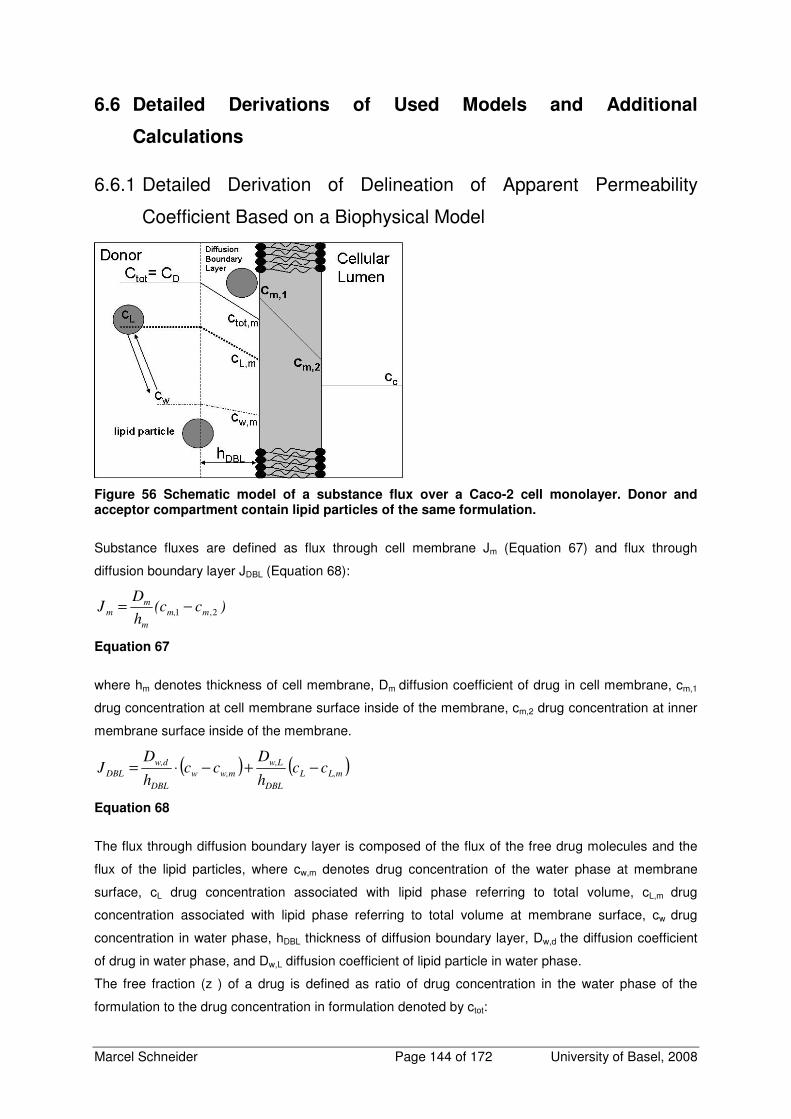
Marcel Schneider Page 144 of 172 University of Basel, 2008
6.6 Detailed Derivations of Used Models and Additional
Calculations
6.6.1 Detailed Derivation of Delineation of Apparent Permeability
Coefficient Based on a Biophysical Model
Figure 56 Schematic model of a substance flux over a Caco-2 cell monolayer. Donor and acceptor compartment contain lipid particles of the same formulation.
Substance fluxes are defined as flux through cell membrane Jm (Equation 67) and flux through
diffusion boundary layer JDBL (Equation 68):
)c(ch
DJ mm,
m
mm 2,1 −=
Equation 67
where hm denotes thickness of cell membrane, Dm diffusion coefficient of drug in cell membrane, cm,1
drug concentration at cell membrane surface inside of the membrane, cm,2 drug concentration at inner
membrane surface inside of the membrane.
( ) ( )L,mL
DBL
w,L
w,mw
DBL
w,d
DBL cch
Dcc
h
DJ −+−⋅=
Equation 68
The flux through diffusion boundary layer is composed of the flux of the free drug molecules and the
flux of the lipid particles, where cw,m denotes drug concentration of the water phase at membrane
surface, cL drug concentration associated with lipid phase referring to total volume, cL,m drug
concentration associated with lipid phase referring to total volume at membrane surface, cw drug
concentration in water phase, hDBL thickness of diffusion boundary layer, Dw,d the diffusion coefficient
of drug in water phase, and Dw,L diffusion coefficient of lipid particle in water phase.
The free fraction (z ) of a drug is defined as ratio of drug concentration in the water phase of the
formulation to the drug concentration in formulation denoted by ctot:
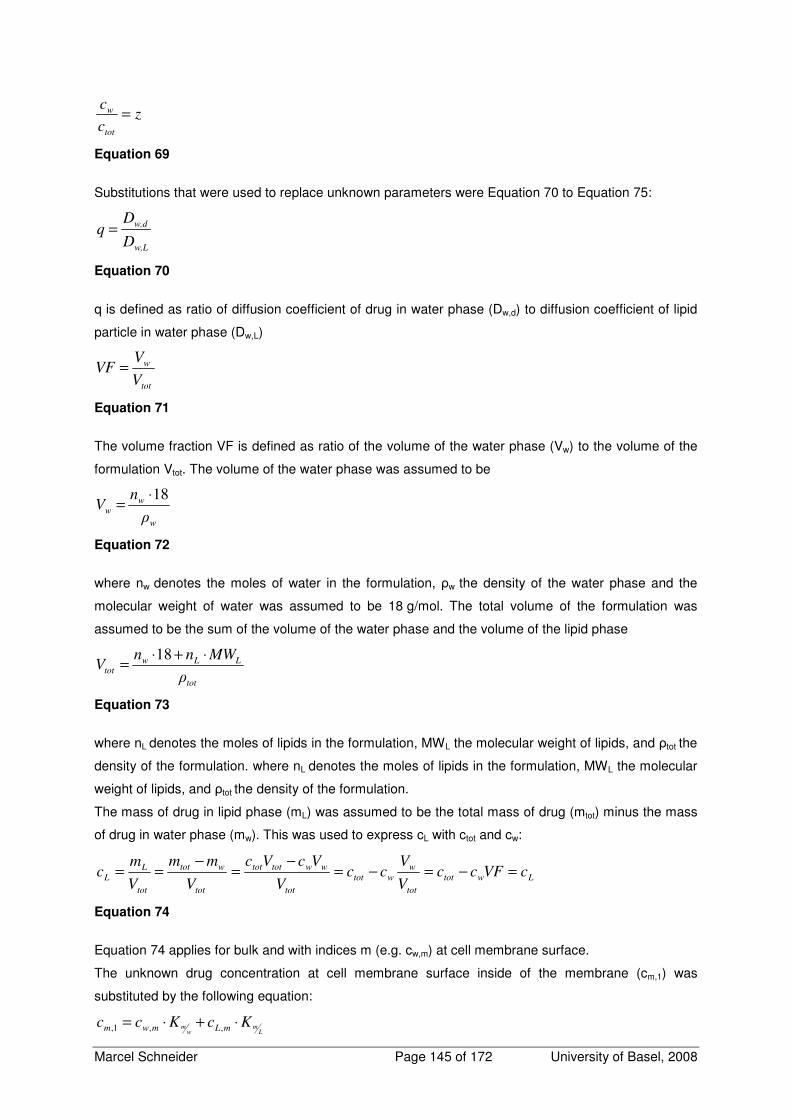
Marcel Schneider Page 145 of 172 University of Basel, 2008
zc
c
tot
w =
Equation 69
Substitutions that were used to replace unknown parameters were Equation 70 to Equation 75:
w,L
w,d
D
Dq =
Equation 70
q is defined as ratio of diffusion coefficient of drug in water phase (Dw,d) to diffusion coefficient of lipid
particle in water phase (Dw,L)
tot
w
V
VVF =
Equation 71
The volume fraction VF is defined as ratio of the volume of the water phase (Vw) to the volume of the
formulation Vtot. The volume of the water phase was assumed to be
w
ww
ρ
nV
18⋅=
Equation 72
where nw denotes the moles of water in the formulation, ρw the density of the water phase and the
molecular weight of water was assumed to be 18 g/mol. The total volume of the formulation was
assumed to be the sum of the volume of the water phase and the volume of the lipid phase
tot
LLwtot
ρ
MWnnV
⋅+⋅=
18
Equation 73
where nL denotes the moles of lipids in the formulation, MWL the molecular weight of lipids, and ρtot the
density of the formulation. where nL denotes the moles of lipids in the formulation, MWL the molecular
weight of lipids, and ρtot the density of the formulation.
The mass of drug in lipid phase (mL) was assumed to be the total mass of drug (mtot) minus the mass
of drug in water phase (mw). This was used to express cL with ctot and cw:
Lwtot
tot
w
wtot
tot
wwtottot
tot
wtot
tot
LL cVFcc
V
Vcc
V
VcVc
V
mm
V
mc =−=−=
−=
−==
Equation 74
Equation 74 applies for bulk and with indices m (e.g. cw,m) at cell membrane surface.
The unknown drug concentration at cell membrane surface inside of the membrane (cm,1) was
substituted by the following equation:
Lm
wm KcKcc mLmwm ⋅+⋅= ,,1,
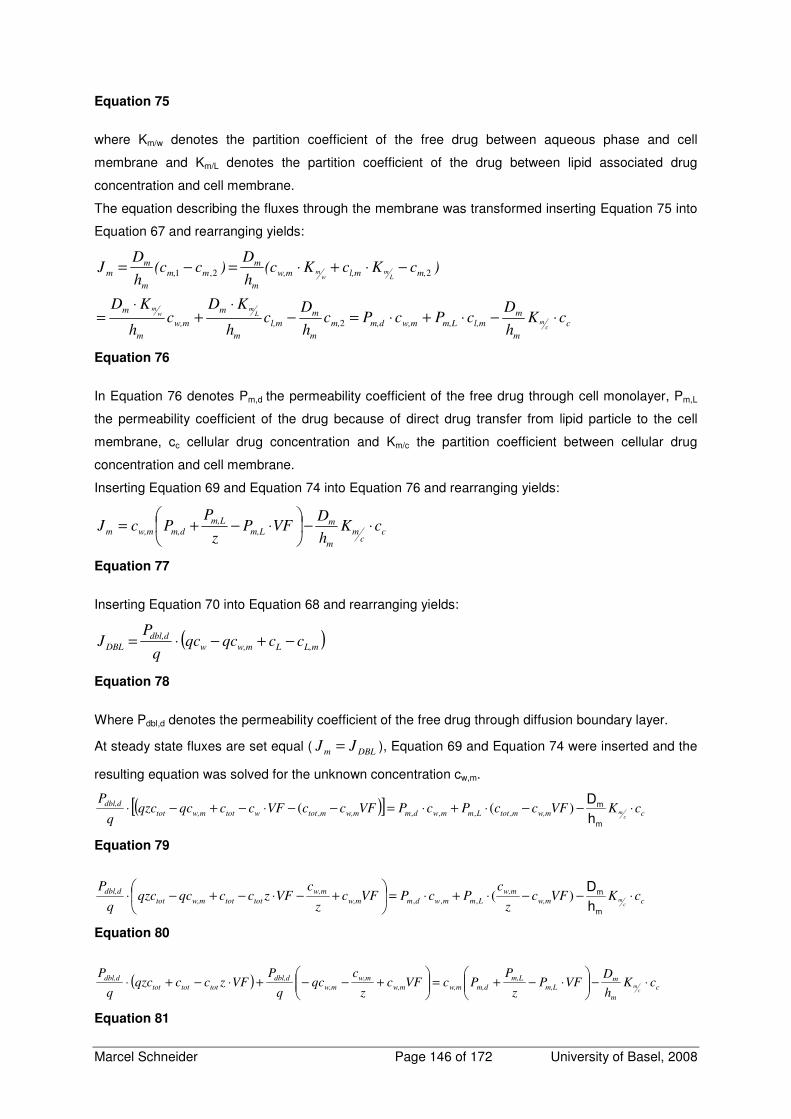
Marcel Schneider Page 146 of 172 University of Basel, 2008
Equation 75
where Km/w denotes the partition coefficient of the free drug between aqueous phase and cell
membrane and Km/L denotes the partition coefficient of the drug between lipid associated drug
concentration and cell membrane.
The equation describing the fluxes through the membrane was transformed inserting Equation 75 into
Equation 67 and rearranging yields:
c
m
ml,mm,Lw,mm,dm,
m
ml,m
m
m
w,m
m
m
m,l,mw,m
m
mmm,
m
mm
cKh
DcPcPc
h
Dc
h
KDc
h
KD
)cKcK(ch
D)c(c
h
DJ
cm
Lm
wm
Lm
wm
⋅−⋅+⋅=−⋅
+⋅
=
−⋅+⋅=−=
2
22,1
Equation 76
In Equation 76 denotes Pm,d the permeability coefficient of the free drug through cell monolayer, Pm,L
the permeability coefficient of the drug because of direct drug transfer from lipid particle to the cell
membrane, cc cellular drug concentration and Km/c the partition coefficient between cellular drug
concentration and cell membrane.
Inserting Equation 69 and Equation 74 into Equation 76 and rearranging yields:
cc
m
m
mm,L
m,L
m,dw,mm cKh
DVFP
z
PPcJ ⋅−
⋅−+=
Equation 77
Inserting Equation 70 into Equation 68 and rearranging yields:
( )L,mLw,mw
dbl,d
DBL ccqcqcq
PJ −+−⋅=
Equation 78
Where Pdbl,d denotes the permeability coefficient of the free drug through diffusion boundary layer.
At steady state fluxes are set equal ( DBLm JJ = ), Equation 69 and Equation 74 were inserted and the
resulting equation was solved for the unknown concentration cw,m.
( )[ ]cw,mmtotLmmwdmw,mmtotwtotw,mtot
dbl,dcKVFccPcPVFccVFccqcqzc
q
P
cm ⋅−−⋅+⋅=−−⋅−+−⋅
m
m
hD
)((,,,,,
Equation 79
cw,m
w,m
Lmmwdmw,m
w,m
tottotw,mtot
dbl,dcKVFc
z
cPcPVFc
z
cVFzccqcqzc
q
P
cm ⋅−−⋅+⋅=
+−⋅−+−⋅
m
m
hD
)(,,,
Equation 80
( ) c
m
mm,L
m,L
m,dw,mw,m
w,m
w,m
dbl,d
tottottot
dbl,d cKh
DVFP
z
PPcVFc
z
cqc
q
PVFzccqzc
q
P
cm ⋅−
⋅−+=
+−−+⋅−+⋅
Equation 81
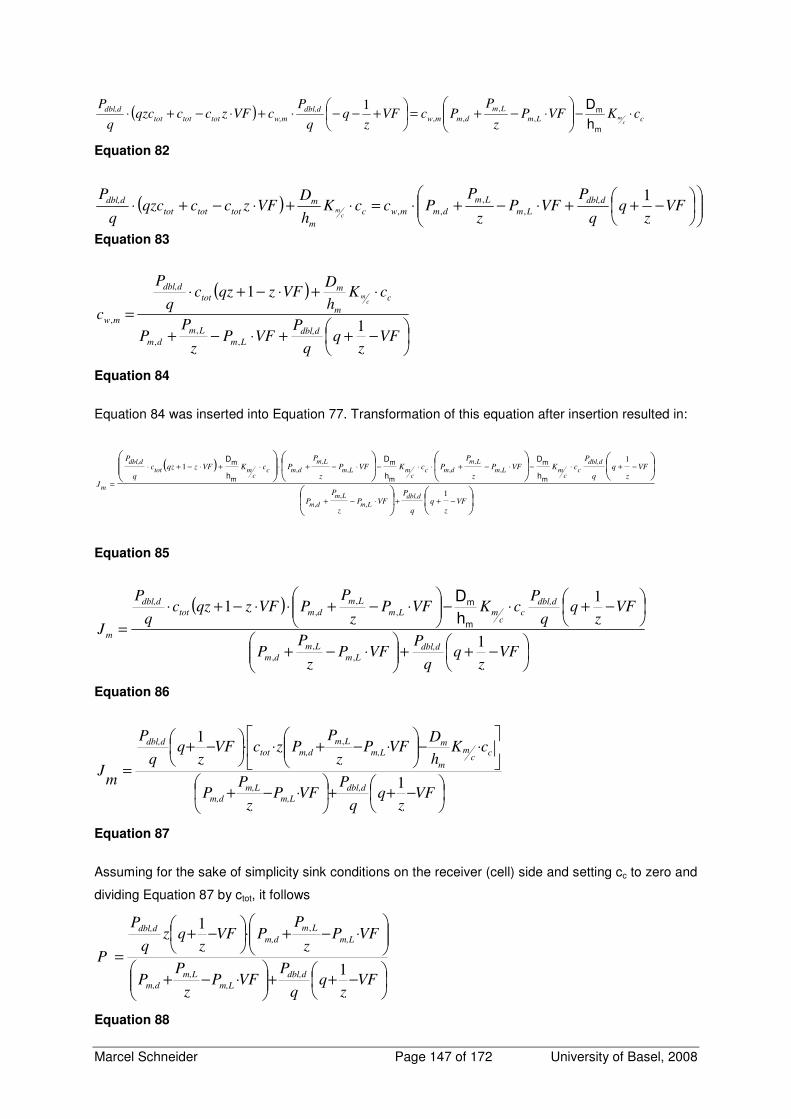
Marcel Schneider Page 147 of 172 University of Basel, 2008
( ) cLm
Lm
dmmw
dbl,d
w,mtottottot
dbl,dcKVFP
z
PPcVF
zq
q
PcVFzccqzc
q
P
cm ⋅−
⋅−+=
+−−⋅+⋅−+⋅
m
m
hD
,
,
,,
1
Equation 82
( )
−++⋅−+⋅=⋅+⋅−+⋅ VF
zq
q
PVFP
z
PPccK
h
DVFzccqzc
q
P dbl,d
Lm
Lm
dmmwc
m
mtottottot
dbl,d
cm
1,
,
,,
Equation 83
( )
−++⋅−+
⋅+⋅−+⋅
=
VFz
PVFP
z
PP
cKh
DVFzqzc
q
P
cdbl,d
Lm
Lm
dm
c
m
mtot
dbl,d
mw
cm
1
1
,
,
,
,
Equation 84
Equation 84 was inserted into Equation 77. Transformation of this equation after insertion resulted in:
( )
−++⋅−+
−+⋅−⋅−+⋅⋅−⋅−+⋅⋅+⋅−+⋅
=
VF
z
q
q
PVFP
z
PP
VF
z
q
q
PcKVFP
z
PPcKVFP
z
PPcKVFzqzc
q
P
J
dbl,d
Lm
Lm
dm
dbl,d
cc
mLm
Lm
dmcc
mLm
Lm
dmcc
mtot
dbl,d
m1
11
,
,
,
,
,
,,
,
,
m
m
m
m
m
m
h
D
h
D
h
D
Equation 85
( )
−++
⋅−+
−+⋅−
⋅−+⋅⋅−+⋅
=
VFz
PVFP
z
PP
VFz
PcKVFP
z
PPVFzqzc
q
P
Jdbl,d
Lm
Lm
dm
dbl,d
cc
mLm
Lm
dmtot
dbl,d
m1
11
,
,
,
,
,
,
m
m
hD
Equation 86
−++
⋅−+
⋅−
⋅−+⋅⋅
−+
=
VFz
PVFP
z
PP
cKh
DVFP
z
PPzcVF
zq
q
P
mJ
dbl,d
m,L
m,L
m,d
cc
m
m
mm,L
Lm
m,dtot
dbl,d
1
1 ,
Equation 87
Assuming for the sake of simplicity sink conditions on the receiver (cell) side and setting cc to zero and
dividing Equation 87 by ctot, it follows
−++
⋅−+
⋅−+⋅
−+
=
VFz
PVFP
z
PP
VFPz
PPVF
zqz
q
P
Pdbl,d
m,L
m,L
m,d
m,L
Lm
m,d
dbl,d
1
1 ,
Equation 88
Marcel Schneider Page 148 of 172 University of Basel, 2008
Conversion of this formula leads to the following equation:
( )
⋅−+
+
⋅−+⋅⋅
=
VFPz
PPzVFzzq
q
PPm,L
m,L
m,d
dbl,d
1
1
11
Equation 89
This equation looks similar to the model equation for the accumulation of permeability coefficients:
mDBL PPP
111+=
Equation 90
The additional terms in Equation 89 can be regarded as model specific explements containing a term
for the lipid/water partitioning of the drug and a term describing the contribution of the lipid particles on
the drug transport.
With Easyfit the following equation was used:
( )
⋅−+
+
⋅−+⋅⋅
=
VFPz
PPzVFzzq
q
P
P
m,L
m,L
m,d
dbl,d
a 1
1
1
1
Equation 91
The resulting Equation 91, was applied for the subdivision of the estimated apparent permeability
coefficients Pa and Pb out of the transport studies (because there was no influence of the order of the
layers see appendix (Subdivision of the Apparent Permeability Coefficient without Lipid Contribution
Including Model Extension for Non-Sink Conditions ) for further explanation.)
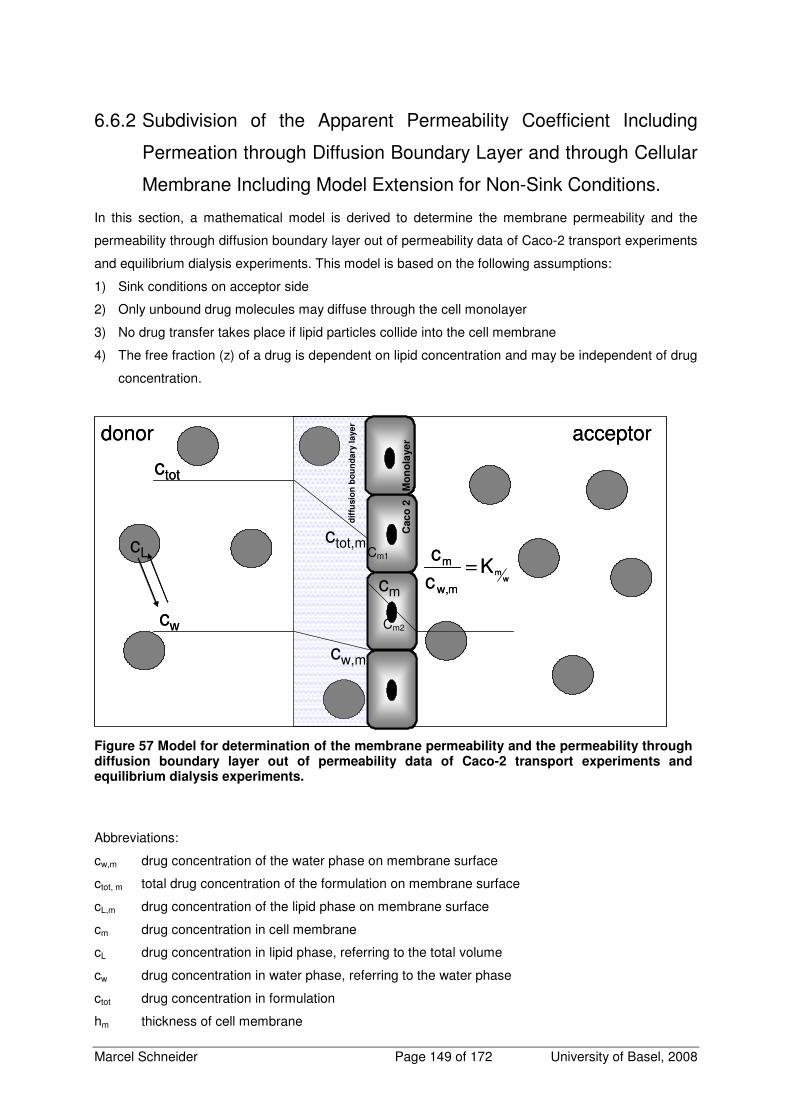
Marcel Schneider Page 149 of 172 University of Basel, 2008
6.6.2 Subdivision of the Apparent Permeability Coefficient Including
Permeation through Diffusion Boundary Layer and through Cellular
Membrane Including Model Extension for Non-Sink Conditions.
In this section, a mathematical model is derived to determine the membrane permeability and the
permeability through diffusion boundary layer out of permeability data of Caco-2 transport experiments
and equilibrium dialysis experiments. This model is based on the following assumptions:
1) Sink conditions on acceptor side
2) Only unbound drug molecules may diffuse through the cell monolayer
3) No drug transfer takes place if lipid particles collide into the cell membrane
4) The free fraction (z) of a drug is dependent on lipid concentration and may be independent of drug
concentration.
Figure 57 Model for determination of the membrane permeability and the permeability through diffusion boundary layer out of permeability data of Caco-2 transport experiments and equilibrium dialysis experiments.
Abbreviations:
cw,m drug concentration of the water phase on membrane surface
ctot, m total drug concentration of the formulation on membrane surface
cL,m drug concentration of the lipid phase on membrane surface
cm drug concentration in cell membrane
cL drug concentration in lipid phase, referring to the total volume
cw drug concentration in water phase, referring to the water phase
ctot drug concentration in formulation
hm thickness of cell membrane
donor acceptor
dif
fusio
n b
ou
nd
ary
la
ye
r
Cac
o 2
M
on
ola
ye
r
ctot
cw
cw,m
ctot,m
cmw
mKcc
mw,
m =cL
donor acceptor
dif
fusio
n b
ou
nd
ary
la
ye
r
Cac
o 2
M
on
ola
ye
r
ctot
cw
cw,m
ctot,m
cmw
mKcc
mw,
m =cL Cm1
Cm2
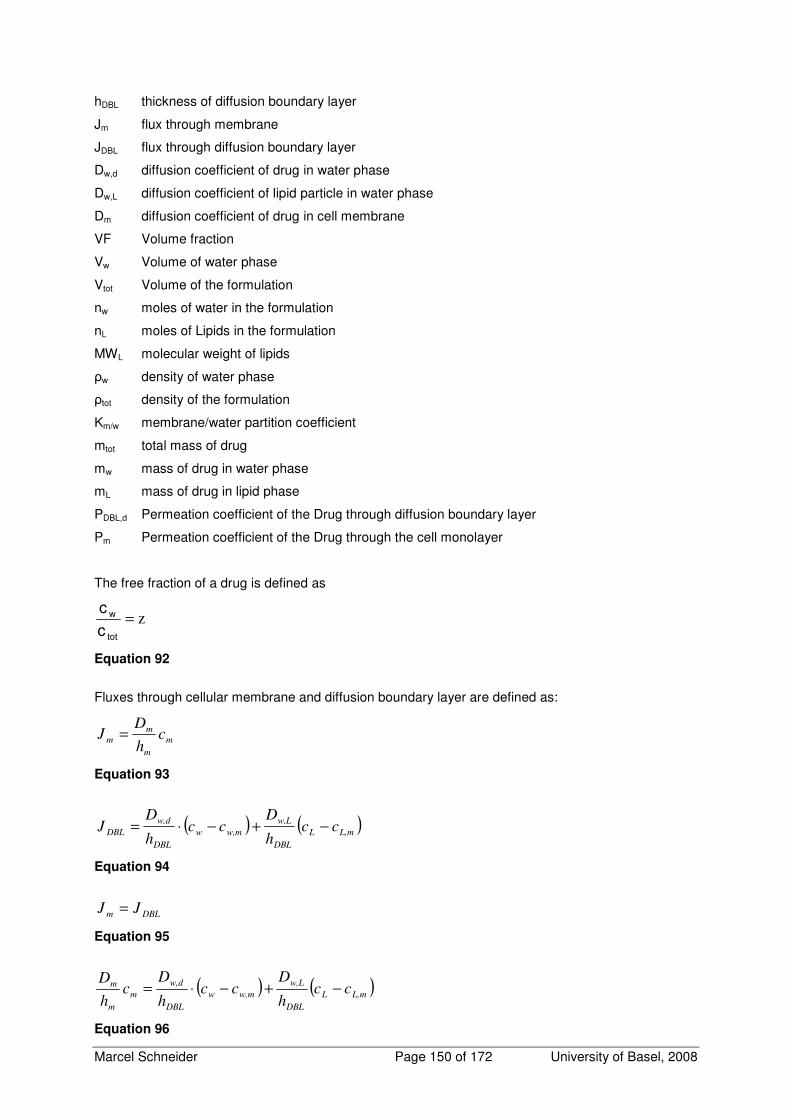
Marcel Schneider Page 150 of 172 University of Basel, 2008
hDBL thickness of diffusion boundary layer
Jm flux through membrane
JDBL flux through diffusion boundary layer
Dw,d diffusion coefficient of drug in water phase
Dw,L diffusion coefficient of lipid particle in water phase
Dm diffusion coefficient of drug in cell membrane
VF Volume fraction
Vw Volume of water phase
Vtot Volume of the formulation
nw moles of water in the formulation
nL moles of Lipids in the formulation
MWL molecular weight of lipids
ρw density of water phase
ρtot density of the formulation
Km/w membrane/water partition coefficient
mtot total mass of drug
mw mass of drug in water phase
mL mass of drug in lipid phase
PDBL,d Permeation coefficient of the Drug through diffusion boundary layer
Pm Permeation coefficient of the Drug through the cell monolayer
The free fraction of a drug is defined as
z=tot
w
cc
Equation 92
Fluxes through cellular membrane and diffusion boundary layer are defined as:
m
m
m
m ch
DJ =
Equation 93
( ) ( )L,mL
DBL
w,L
w,mw
DBL
w,d
DBL cch
Dcc
h
DJ −+−⋅=
Equation 94
DBLm JJ =
Equation 95
( ) ( )L,mL
DBL
w,L
w,mw
DBL
w,d
m
m
m cch
Dcc
h
Dc
h
D−+−⋅=
Equation 96
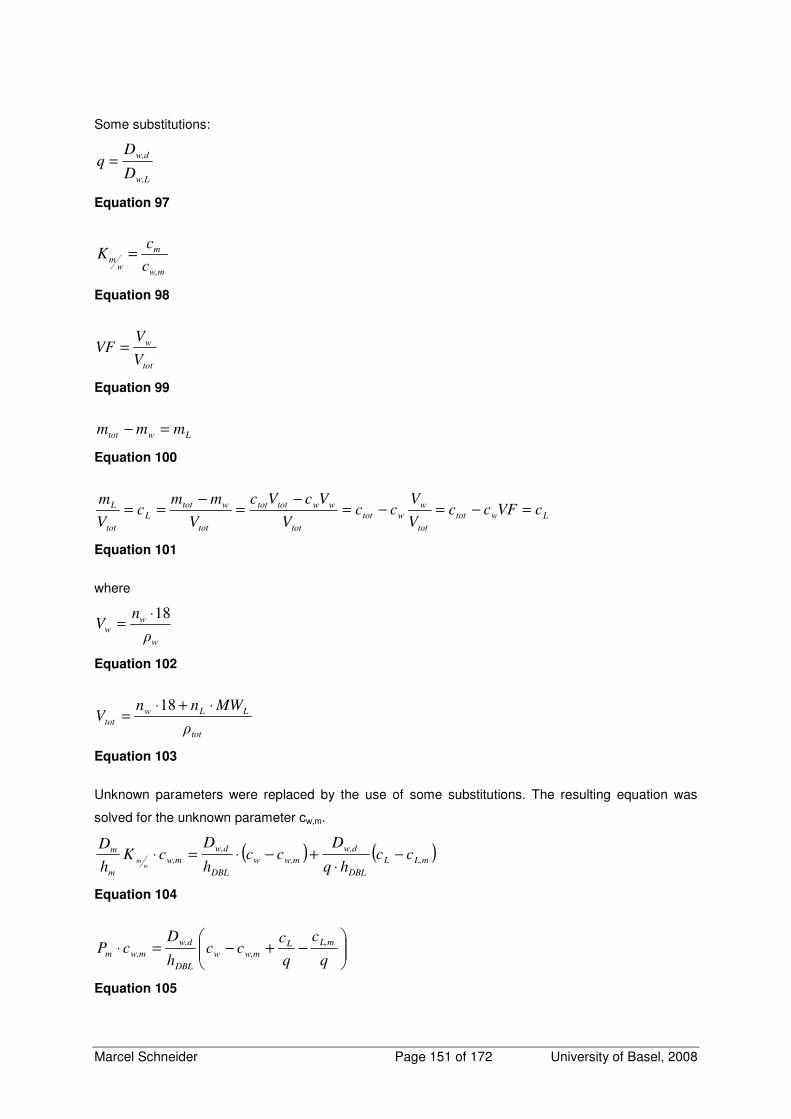
Marcel Schneider Page 151 of 172 University of Basel, 2008
Some substitutions:
w,L
w,d
D
Dq =
Equation 97
w,m
m
wm
c
cK =
Equation 98
tot
w
V
VVF =
Equation 99
Lwtot mmm =−
Equation 100
Lwtot
tot
w
wtot
tot
wwtottot
tot
wtot
L
tot
L cVFccV
Vcc
V
VcVc
V
mmc
V
m=−=−=
−=
−==
Equation 101
where
w
ww
ρ
nV
18⋅=
Equation 102
tot
LLw
totρ
MWnnV
⋅+⋅=
18
Equation 103
Unknown parameters were replaced by the use of some substitutions. The resulting equation was
solved for the unknown parameter cw,m.
( ) ( )L,mL
DBL
w,d
w,mw
DBL
w,d
w,m
m
m cchq
Dcc
h
DcK
h
D
wm
−⋅
+−⋅=⋅
Equation 104
−+−=⋅
q
c
q
ccc
h
DcP
L,mL
w,mw
DBL
w,d
w,mm
Equation 105
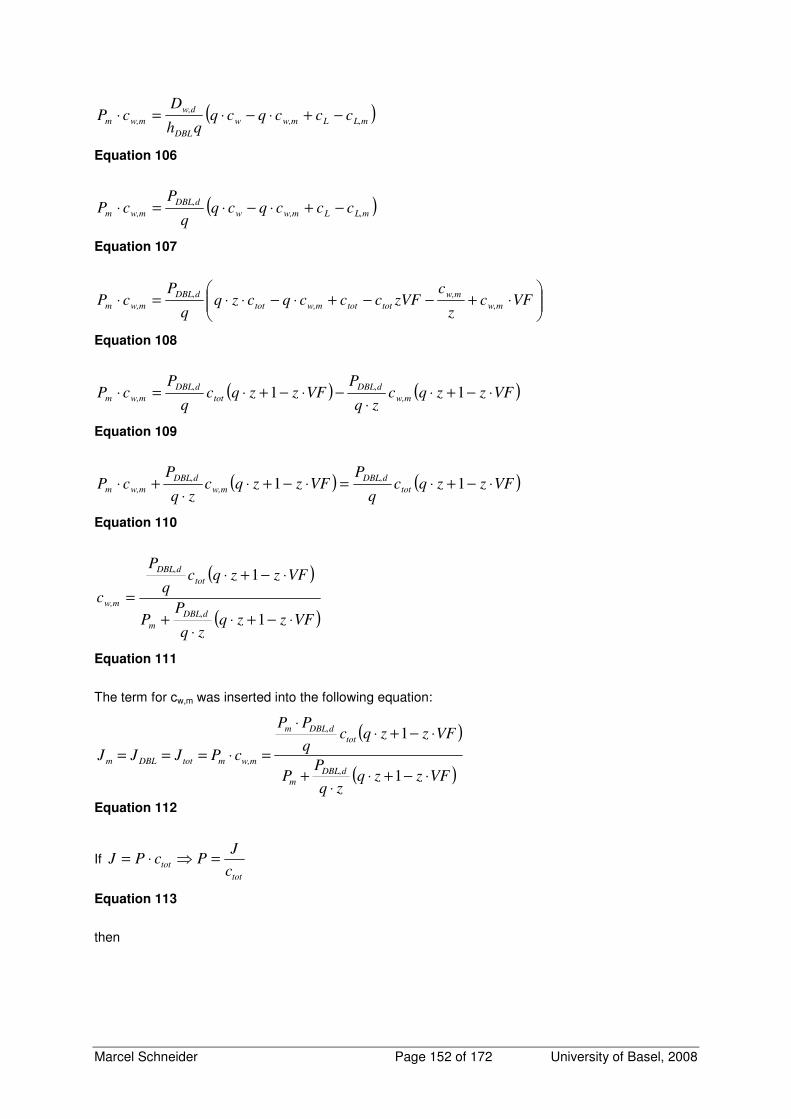
Marcel Schneider Page 152 of 172 University of Basel, 2008
( )L,mLw,mw
DBL
w,d
w,mm cccqcqqh
DcP −+⋅−⋅=⋅
Equation 106
( )L,mLw,mw
DBL,d
w,mm cccqcqq
PcP −+⋅−⋅=⋅
Equation 107
⋅+−−+⋅−⋅⋅=⋅ VFc
z
czVFcccqczq
q
PcP w,m
w,m
tottotw,mtot
DBL,d
w,mm
Equation 108
( ) ( )VFzzqczq
PVFzzqc
q
PcP w,m
DBL,d
tot
DBL,d
w,mm ⋅−+⋅⋅
−⋅−+⋅=⋅ 11
Equation 109
( ) ( )VFzzqcq
PVFzzqc
zq
PcP tot
DBL,d
w,m
DBL,d
w,mm ⋅−+⋅=⋅−+⋅⋅
+⋅ 11
Equation 110
( )
( )VFzzqzq
PP
VFzzqcq
P
cDBL,d
m
tot
DBL,d
w,m
⋅−+⋅⋅
+
⋅−+⋅
=
1
1
Equation 111
The term for cw,m was inserted into the following equation:
( )
( )VFzzqzq
PP
VFzzqcq
PP
cPJJJDBL,d
m
tot
DBL,dm
w,mmtotDBLm
⋅−+⋅⋅
+
⋅−+⋅⋅
=⋅===
1
1
Equation 112
If tot
totc
JPcPJ =⇒⋅=
Equation 113
then
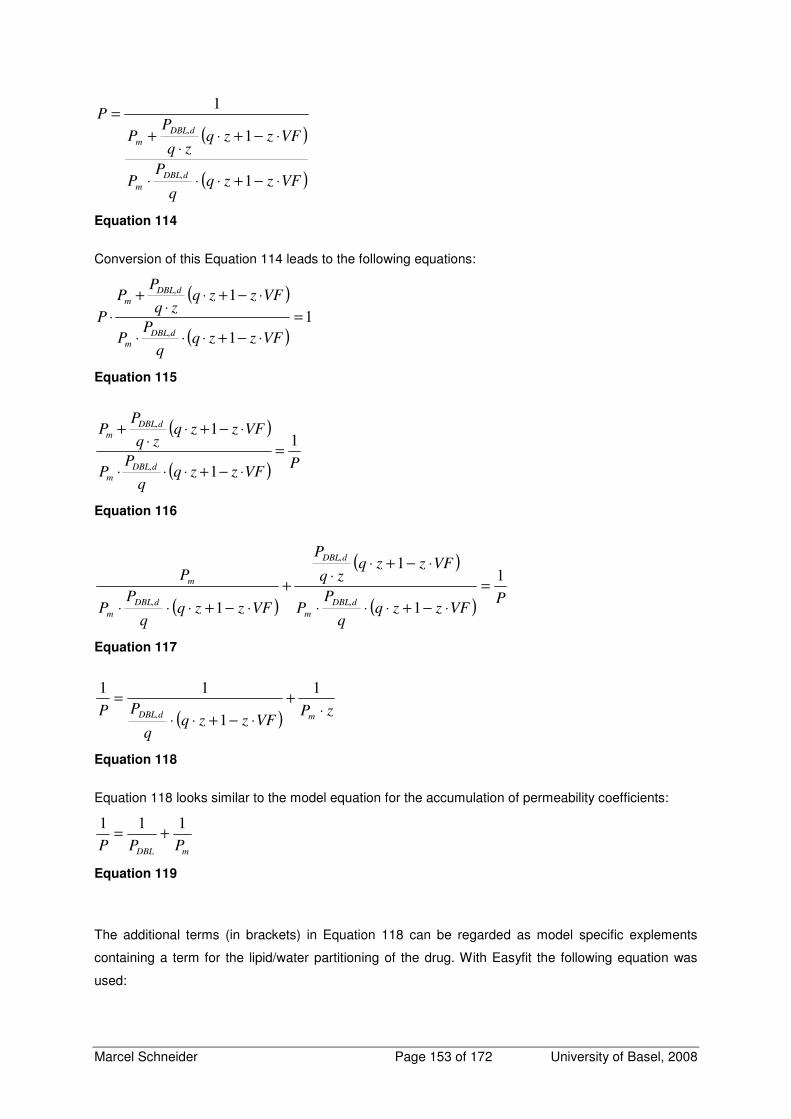
Marcel Schneider Page 153 of 172 University of Basel, 2008
( )
( )VFzzqq
PP
VFzzqzq
PP
P
DBL,d
m
DBL,d
m
⋅−+⋅⋅⋅
⋅−+⋅⋅
+
=
1
1
1
Equation 114
Conversion of this Equation 114 leads to the following equations:
( )
( )1
1
1
=
⋅−+⋅⋅⋅
⋅−+⋅⋅
+
⋅
VFzzqq
PP
VFzzqzq
PP
PDBL,d
m
DBL,d
m
Equation 115
( )
( ) PVFzzq
q
PP
VFzzqzq
PP
DBL,d
m
DBL,d
m1
1
1
=
⋅−+⋅⋅⋅
⋅−+⋅⋅
+
Equation 116
( )
( )
( ) PVFzzq
q
PP
VFzzqzq
P
VFzzqq
PP
P
DBL,d
m
DBL,d
DBL,d
m
m 1
1
1
1
=
⋅−+⋅⋅⋅
⋅−+⋅⋅
+
⋅−+⋅⋅⋅
Equation 117
( ) zPVFzzq
q
PP mDBL,d ⋅+
⋅−+⋅⋅
=1
1
11
Equation 118
Equation 118 looks similar to the model equation for the accumulation of permeability coefficients:
mDBL PPP
111+=
Equation 119
The additional terms (in brackets) in Equation 118 can be regarded as model specific explements
containing a term for the lipid/water partitioning of the drug. With Easyfit the following equation was
used:
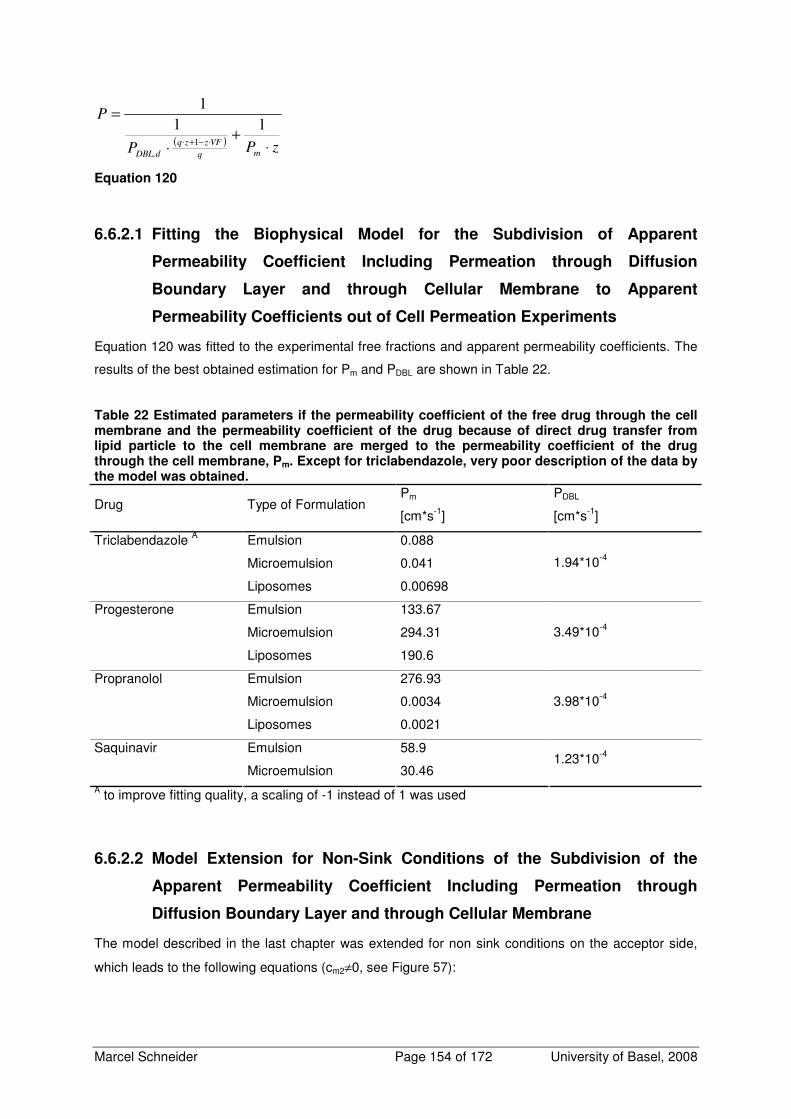
Marcel Schneider Page 154 of 172 University of Basel, 2008
( ) zPP
P
mq
VFzzq
DBL,d⋅
+⋅
=
⋅−+⋅
11
1
1
Equation 120
6.6.2.1 Fitting the Biophysical Model for the Subdivision of Apparent
Permeability Coefficient Including Permeation through Diffusion
Boundary Layer and through Cellular Membrane to Apparent
Permeability Coefficients out of Cell Permeation Experiments
Equation 120 was fitted to the experimental free fractions and apparent permeability coefficients. The
results of the best obtained estimation for Pm and PDBL are shown in Table 22.
Table 22 Estimated parameters if the permeability coefficient of the free drug through the cell membrane and the permeability coefficient of the drug because of direct drug transfer from lipid particle to the cell membrane are merged to the permeability coefficient of the drug through the cell membrane, Pm. Except for triclabendazole, very poor description of the data by the model was obtained.
Drug Type of Formulation Pm
[cm*s-1]
PDBL
[cm*s-1]
Triclabendazole A Emulsion 0.088
Microemulsion 0.041
Liposomes 0.00698
1.94*10-4
Progesterone Emulsion 133.67
Microemulsion 294.31
Liposomes 190.6
3.49*10-4
Propranolol Emulsion 276.93
Microemulsion 0.0034
Liposomes 0.0021
3.98*10-4
Saquinavir Emulsion 58.9
Microemulsion 30.46 1.23*10-4
A to improve fitting quality, a scaling of -1 instead of 1 was used
6.6.2.2 Model Extension for Non-Sink Conditions of the Subdivision of the
Apparent Permeability Coefficient Including Permeation through
Diffusion Boundary Layer and through Cellular Membrane
The model described in the last chapter was extended for non sink conditions on the acceptor side,
which leads to the following equations (cm2≠0, see Figure 57):
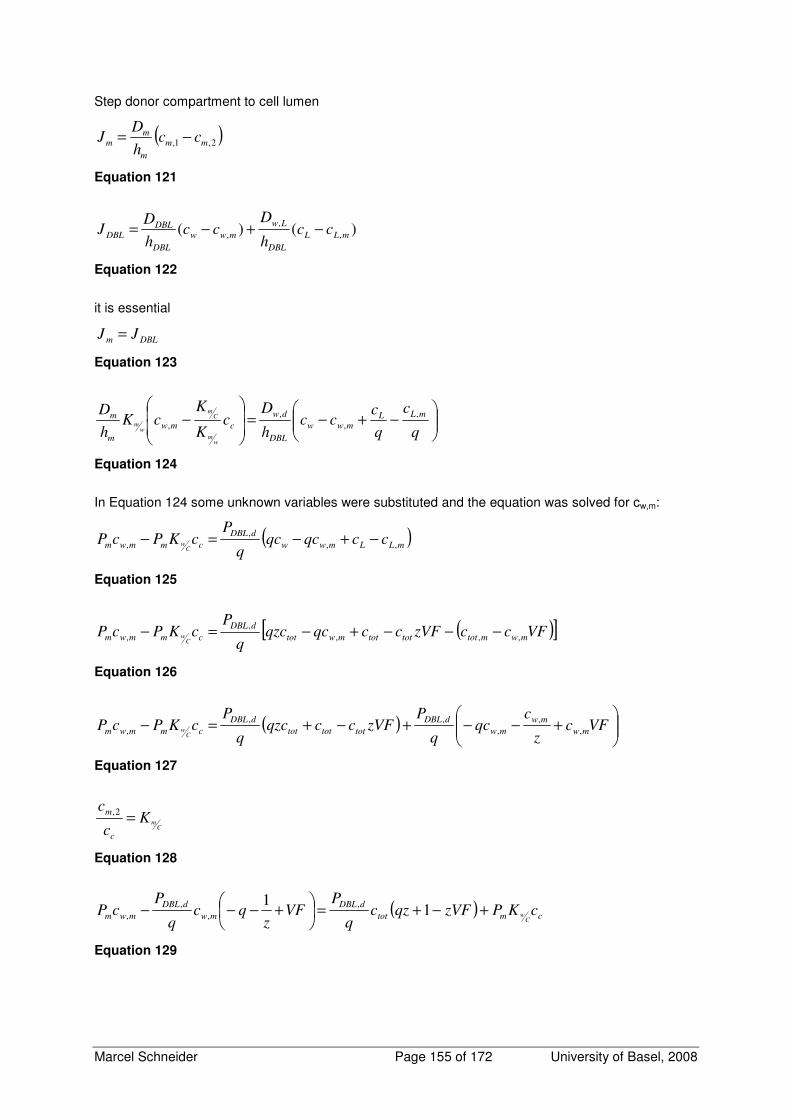
Marcel Schneider Page 155 of 172 University of Basel, 2008
Step donor compartment to cell lumen
( )2,1, mm
m
mm cc
h
DJ −=
Equation 121
)()( ,
,
, mLL
DBL
Lw
mww
DBL
DBLDBL cc
h
Dcc
h
DJ −+−=
Equation 122
it is essential
DBLm JJ =
Equation 123
−+−=
−
q
c
q
ccc
h
Dc
K
KcK
h
D mLLmww
DBL
dw
cmw
m
m
wm
Cm
wm
,
,
,
,
Equation 124
In Equation 124 some unknown variables were substituted and the equation was solved for cw,m:
( )mLLmww
dDBL
cmmwm ccqcqcq
PcKPcP
Cw ,,
,
, −+−=−
Equation 125
( )[ ]VFcczVFccqcqzcq
PcKPcP mwmtottottotmwtot
dDBL
cmmwmC
w ,,,
,
, −−−+−=−
Equation 126
( )
+−−+−+=− VFc
z
cqc
q
PzVFccqzc
q
PcKPcP mw
mw
mw
dDBL
tottottot
dDBL
cmmwmC
w ,
,
,
,,
,
Equation 127
CmK
c
c
c
m=
2,
Equation 128
( )cmtot
dDBL
mw
dDBL
mwm cKPzVFqzcq
PVF
zqc
q
PcP
Cw+−+=
+−−− 1
1 ,
,
,
,
Equation 129
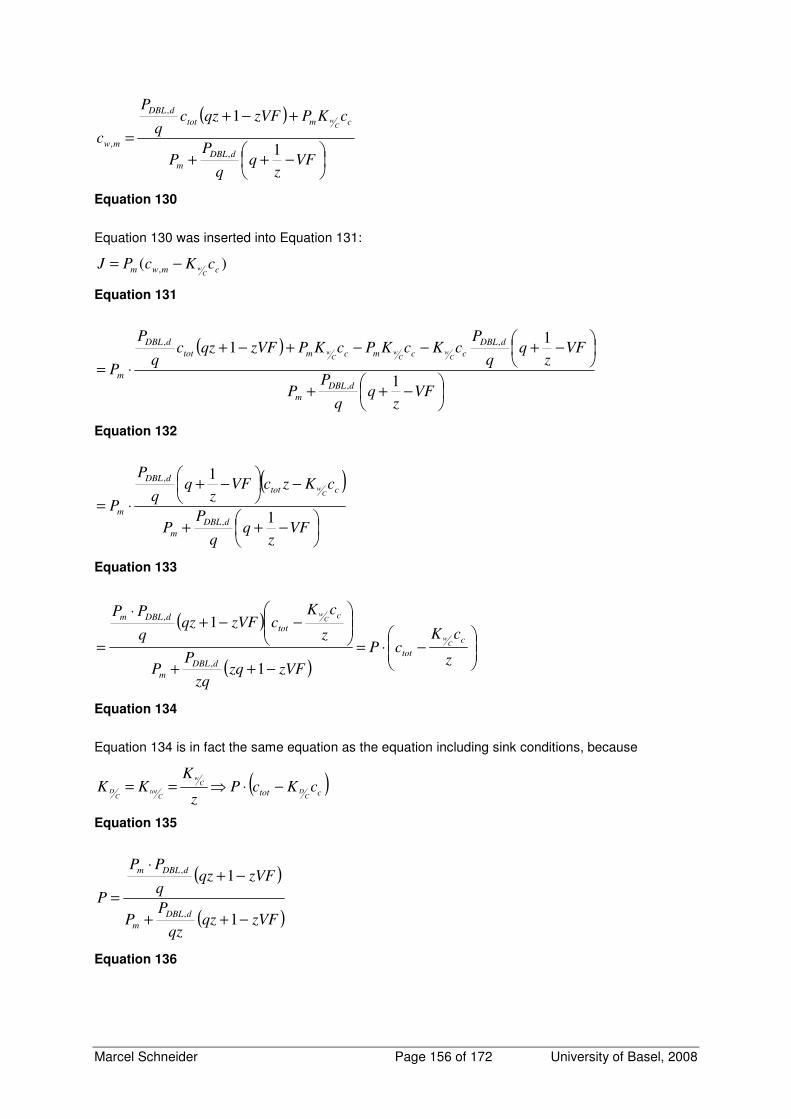
Marcel Schneider Page 156 of 172 University of Basel, 2008
( )
−++
+−+
=
VFz
PP
cKPzVFqzcq
P
cdDBL
m
cmtot
dDBL
mw
Cw
1
1
,
,
,
Equation 130
Equation 130 was inserted into Equation 131:
)( , cmwm cKcPJC
w−=
Equation 131
( )
−++
−+−−+−+
⋅=
VFz
PP
VFz
PcKcKPcKPzVFqzc
q
P
PdDBL
m
dDBL
ccmcmtot
dDBL
m
Cw
Cw
Cw
1
11
,
,,
Equation 132
( )
−++
−
−+
⋅=
VFz
PP
cKzcVFz
P
PdDBL
m
ctot
dDBL
m
Cw
1
1
,
,
Equation 133
( )
( )
−⋅=
−++
−−+
⋅
=z
cKcP
zVFzqzq
PP
z
cKczVFqz
q
PP
c
tot
dDBL
m
c
tot
dDBLm
Cw
Cw
1
1
,
,
Equation 134
Equation 134 is in fact the same equation as the equation including sink conditions, because
( )ctot cKcP
z
KKK
CD
Cw
Ctot
CD −⋅⇒==
Equation 135
( )
( )zVFqzqz
PP
zVFqzq
PP
PdDBL
m
dDBLm
−++
−+⋅
=
1
1
,
,
Equation 136
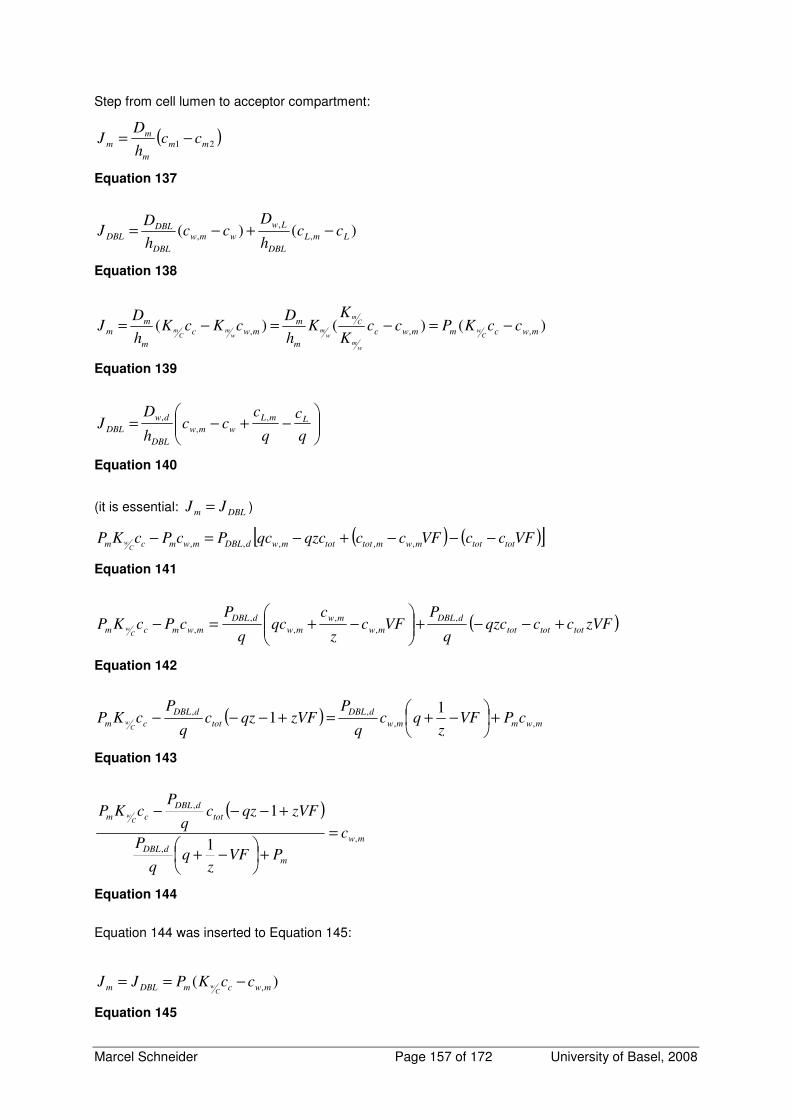
Marcel Schneider Page 157 of 172 University of Basel, 2008
Step from cell lumen to acceptor compartment:
( )21 mm
m
m
m cch
DJ −=
Equation 137
)()( ,
,
, LmL
DBL
Lw
wmw
DBL
DBLDBL cc
h
Dcc
h
DJ −+−=
Equation 138
)()()( ,,, mwcmmwc
m
mmwc
m
mm ccKPcc
K
KK
h
DcKcK
h
DJ
Cw
wm
Cm
wm
wm
Cm −=−=−=
Equation 139
−+−=
q
c
q
ccc
h
DJ LmL
wmw
DBL
dw
DBL
,
,
,
Equation 140
(it is essential: DBLm JJ = )
( ) ( )[ ]VFccVFccqzcqcPcPcKP tottotmwmtottotmwdDBLmwmcmC
w −−−+−=− ,,,,,
Equation 141
( )zVFccqzcq
PVFc
z
cqc
q
PcPcKP tottottot
dDBL
mw
mw
mw
dDBL
mwmcmC
w +−−+
−+=−
,
,
,
,
,
,
Equation 142
( )mwmmw
dDBL
tot
dDBL
cm cPVFz
qcq
PzVFqzc
q
PcKP
Cw ,,
,, 11 +
−+=+−−−
Equation 143
( )
mw
m
dDBL
tot
dDBL
cm
c
PVFz
P
zVFqzcq
PcKP
Cw
,
,
,
1
1
=
+
−+
+−−−
Equation 144
Equation 144 was inserted to Equation 145:
)( ,mwcmDBLm ccKPJJC
w −==
Equation 145
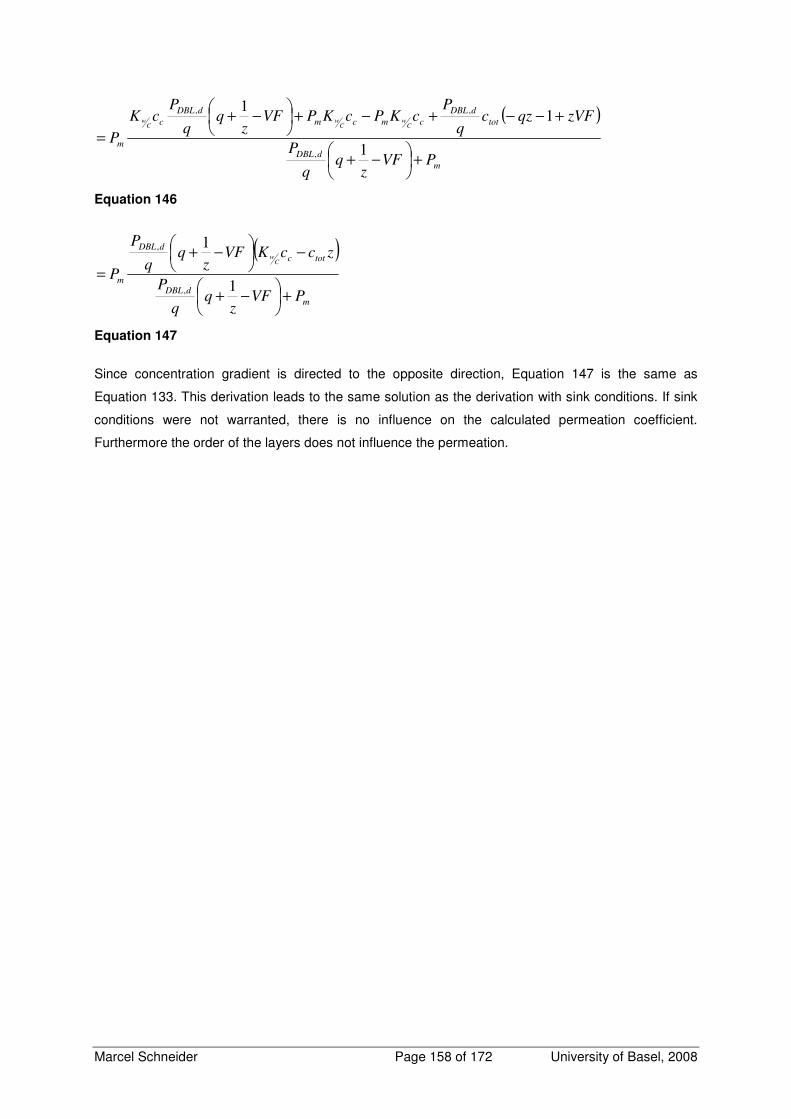
Marcel Schneider Page 158 of 172 University of Basel, 2008
( )
m
dDBL
tot
dDBL
cmcm
dDBL
c
m
PVFz
P
zVFqzcq
PcKPcKPVF
zq
q
PcK
PC
wC
wC
w
+
−+
+−−+−+
−+
=1
11
,
,,
Equation 146
( )
m
dDBL
totc
dDBL
m
PVFz
P
zccKVFz
P
PC
w
+
−+
−
−+
=1
1
,
,
Equation 147
Since concentration gradient is directed to the opposite direction, Equation 147 is the same as
Equation 133. This derivation leads to the same solution as the derivation with sink conditions. If sink
conditions were not warranted, there is no influence on the calculated permeation coefficient.
Furthermore the order of the layers does not influence the permeation.

Marcel Schneider Page 159 of 172 University of Basel, 2008
7 REFERENCES 1. Lindenberg M, Kopp S, Dressman JB. Classification of orally administered drugs on the World
Health Organization Model list of Essential Medicines according to the biopharmaceutics classification
system. Eur J Pharm Biopharm 2004;58(2):265-78.
2. Amidon GL, Lennernas H, Shah VP, Crison JR. A theoretical basis for a biopharmaceutic drug
classification: the correlation of in vitro drug product dissolution and in vivo bioavailability. Pharm Res
1995;12(3):413-20.
3. Camenisch G, Folkers G, van de Waterbeemd H. Review of theoretical passive drug
absorption models: historical background, recent developments and limitations. Pharm Acta Helv
1996;71(5):309-27.
4. Sawada GA, Barsuhn CL, Lutzke BS, Houghton ME, Padbury GE, Ho NF, et al. Increased
lipophilicity and subsequent cell partitioning decrease passive transcellular diffusion of novel, highly
lipophilic antioxidants. J Pharmacol Exp Ther 1999;288(3):1317-26.
5. Wils P, Warnery A, Phung-Ba V, Legrain S, Scherman D. High lipophilicity decreases drug
transport across intestinal epithelial cells. J Pharmacol Exp Ther 1994;269(2):654-8.
6. Fischer H, Kansy M, Avdeef A, Senner F. Permeation of permanently positive charged
molecules through artificial membranes--influence of physico-chemical properties. Eur J Pharm Sci
2007;31(1):32-42.
7. Lipinski CA, Lombardo F, Dominy BW, Feeney PJ. Experimental and computational
approaches to estimate solubility and permeability in drug discovery and development settings. Adv
Drug Deliv Rev 2001;46(1-3):3-26.
8. Hunter J, Hirst BH. Intestinal secretion of drugs. The role of P-glycoprotein and related drug
efflux systems in limiting oral drug absorption. Advanced Drug Delivery Reviews 1997;25(2-3):129-
157.
9. Seithel A, Karlsson J, Hilgendorf C, Bjorquist A, Ungell AL. Variability in mRNA expression of
ABC- and SLC-transporters in human intestinal cells: comparison between human segments and
Caco-2 cells. Eur J Pharm Sci 2006;28(4):291-9.
10. Xia CQ, Liu N, Yang D, Miwa G, Gan LS. Expression, localization, and functional
characteristics of breast cancer resistance protein in Caco-2 cells. Drug Metab Dispos
2005;33(5):637-43.
11. Gutmann H, Fricker G, Torok M, Michael S, Beglinger C, Drewe J. Evidence for different ABC-
transporters in Caco-2 cells modulating drug uptake. Pharm Res 1999;16(3):402-7.
12. Ambudkar SV, Kim IW, Sauna ZE. The power of the pump: mechanisms of action of P-
glycoprotein (ABCB1). Eur J Pharm Sci 2006;27(5):392-400.
13. Ambudkar SV, Dey S, Hrycyna CA, Ramachandra M, Pastan I, Gottesman MM. Biochemical,
cellular, and pharmacological aspects of the multidrug transporter. Annu Rev Pharmacol Toxicol
1999;39:361-98.
14. Brandon EF, Bosch TM, Deenen MJ, Levink R, van der Wal E, van Meerveld JB, et al.
Validation of in vitro cell models used in drug metabolism and transport studies; genotyping of
cytochrome P450, phase II enzymes and drug transporter polymorphisms in the human hepatoma
Marcel Schneider Page 160 of 172 University of Basel, 2008
(HepG2), ovarian carcinoma (IGROV-1) and colon carcinoma (CaCo-2, LS180) cell lines. Toxicol Appl
Pharmacol 2006;211(1):1-10.
15. de Waziers I, Cugnenc PH, Yang CS, Leroux JP, Beaune PH. Cytochrome P 450 isoenzymes,
epoxide hydrolase and glutathione transferases in rat and human hepatic and extrahepatic tissues. J
Pharmacol Exp Ther 1990;253(1):387-94.
16. Kolars JC, Lown KS, Schmiedlin-Ren P, Ghosh M, Fang C, Wrighton SA, et al. CYP3A gene
expression in human gut epithelium. Pharmacogenetics 1994;4(5):247-59.
17. Lamba JK, Lin YS, Schuetz EG, Thummel KE. Genetic contribution to variable human CYP3A-
mediated metabolism. Adv Drug Deliv Rev 2002;54(10):1271-94.
18. McKinnon RA, Burgess WM, Hall PM, Roberts-Thomson SJ, Gonzalez FJ, McManus ME.
Characterisation of CYP3A gene subfamily expression in human gastrointestinal tissues. Gut
1995;36(2):259-67.
19. Meunier V, Bourrie M, Berger Y, Fabre G. The human intestinal epithelial cell line Caco-2;
pharmacological and pharmacokinetic applications. Cell Biol Toxicol 1995;11(3-4):187-94.
20. Bhattachar SN, Deschenes LA, Wesley JA. Solubility: it's not just for physical chemists. Drug
Discov Today 2006;11(21-22):1012-8.
21. Pade V, Stavchansky S. Link between drug absorption solubility and permeability
measurements in Caco-2 cells. J Pharm Sci 1998;87(12):1604-7.
22. Dunn CJ, Wagstaff AJ, Perry CM, Plosker GL, Goa KL. Cyclosporin: an updated review of the
pharmacokinetic properties, clinical efficacy and tolerability of a microemulsion-based formulation
(neoral)1 in organ transplantation. Drugs 2001;61(13):1957-2016.
23. Figgitt DP, Plosker GL. Saquinavir soft-gel capsule: an updated review of its use in the
management of HIV infection. Drugs 2000;60(2):481-516.
24. Gill J, Feinberg J. Saquinavir soft gelatin capsule: a comparative safety review. Drug Saf
2001;24(3):223-32.
25. Griffin BT, O'Driscoll CM. A comparison of intestinal lymphatic transport and systemic
bioavailability of saquinavir from three lipid-based formulations in the anaesthetised rat model. J
Pharm Pharmacol 2006;58(7):917-25.
26. Hugen PW, Burger DM, Koopmans PP, Stuart JW, Kroon FP, van Leusen R, et al. Saquinavir
soft-gel capsules (Fortovase) give lower exposure than expected, even after a high-fat breakfast.
Pharm World Sci 2002;24(3):83-6.
27. Perry CM, Noble S. Saquinavir soft-gel capsule formulation. A review of its use in patients with
HIV infection. Drugs 1998;55(3):461-86.
28. Pereira de Oliveira M, Garcion E, Venisse N, Benoit JP, Couet W, Olivier JC. Tissue
distribution of indinavir administered as solid lipid nanocapsule formulation in mdr1a (+/+) and mdr1a
(-/-) CF-1 mice. Pharm Res 2005;22(11):1898-1905.
29. Sachs-Barrable K, Lee SD, Wasan EK, Thornton SJ, Wasan KM. Enhancing drug absorption
using lipids: a case study presenting the development and pharmacological evaluation of a novel lipid-
based oral amphotericin B formulation for the treatment of systemic fungal infections. Adv Drug Deliv
Rev 2008;60(6):692-701.
Marcel Schneider Page 161 of 172 University of Basel, 2008
30. Trevaskis NL, Charman WN, Porter CJ. Lipid-based delivery systems and intestinal lymphatic
drug transport: a mechanistic update. Adv Drug Deliv Rev 2008;60(6):702-16.
31. Bohets H, Annaert P, Mannens G, Van Beijsterveldt L, Anciaux K, Verboven P, et al.
Strategies for absorption screening in drug discovery and development. Curr Top Med Chem
2001;1(5):367-83.
32. Hidalgo IJ, Raub TJ, Borchardt RT. Characterization of the human colon carcinoma cell line
(Caco-2) as a model system for intestinal epithelial permeability. Gastroenterology 1989;96(3):736-49.
33. Skold C, Winiwarter S, Wernevik J, Bergstrom F, Engstrom L, Allen R, et al. Presentation of a
structurally diverse and commercially available drug data set for correlation and benchmarking
studies. J Med Chem 2006;49(23):6660-71.
34. Hubatsch I, Ragnarsson EG, Artursson P. Determination of drug permeability and prediction of
drug absorption in Caco-2 monolayers. Nat Protoc 2007;2(9):2111-9.
35. Hayeshi R, Hilgendorf C, Artursson P, Augustijns P, Brodin B, Dehertogh P, et al. Comparison
of drug transporter gene expression and functionality in Caco-2 cells from 10 different laboratories.
Eur J Pharm Sci 2008.
36. Braun A, Hammerle S, Suda K, Rothen-Rutishauser B, Gunthert M, Kramer SD, et al. Cell
cultures as tools in biopharmacy. Eur J Pharm Sci 2000;11 Suppl 2:S51-60.
37. Behrens I, Kissel T. Do cell culture conditions influence the carrier-mediated transport of
peptides in Caco-2 cell monolayers? Eur J Pharm Sci 2003;19(5):433-42.
38. Volpe DA. Variability in Caco-2 and MDCK cell-based intestinal permeability assays. J Pharm
Sci 2008;97(2):712-25.
39. Anderle P, Niederer E, Rubas W, Hilgendorf C, Spahn-Langguth H, Wunderli-Allenspach H, et
al. P-Glycoprotein (P-gp) mediated efflux in Caco-2 cell monolayers: the influence of culturing
conditions and drug exposure on P-gp expression levels. J Pharm Sci 1998;87(6):757-62.
40. Lentz KA, Polli JW, Wring SA, Humphreys JE, Polli JE. Influence of passive permeability on
apparent P-glycoprotein kinetics. Pharm Res 2000;17(12):1456-60.
41. Aungst BJ, Nguyen NH, Bulgarelli JP, Oates-Lenz K. The influence of donor and reservoir
additives on Caco-2 permeability and secretory transport of HIV protease inhibitors and other lipophilic
compounds. Pharm Res 2000;17(10):1175-80.
42. Krishna G, Chen K, Lin C, Nomeir AA. Permeability of lipophilic compounds in drug discovery
using in-vitro human absorption model, Caco-2. Int J Pharm 2001;222(1):77-89.
43. Yamashita S, Furubayashi T, Kataoka M, Sakane T, Sezaki H, Tokuda H. Optimized
conditions for prediction of intestinal drug permeability using Caco-2 cells. Eur J Pharm Sci
2000;10(3):195-204.
44. Ingels F, Deferme S, Destexhe E, Oth M, Van den Mooter G, Augustijns P. Simulated
intestinal fluid as transport medium in the Caco-2 cell culture model. Int J Pharm 2002;232(1-2):183-
92.
45. Fossati L, Dechaume R, Hardillier E, Chevillon D, Prevost C, Bolze S, et al. Use of simulated
intestinal fluid for Caco-2 permeability assay of lipophilic drugs. Int J Pharm 2008;360(1-2):148-55.
Marcel Schneider Page 162 of 172 University of Basel, 2008
46. Ingels FM, Augustijns PF. Biological, pharmaceutical, and analytical considerations with
respect to the transport media used in the absorption screening system, Caco-2. J Pharm Sci
2003;92(8):1545-58.
47. Ingels F, Beck B, Oth M, Augustijns P. Effect of simulated intestinal fluid on drug permeability
estimation across Caco-2 monolayers. Int J Pharm 2004;274(1-2):221-32.
48. Sha X, Yan G, Wu Y, Li J, Fang X. Effect of self-microemulsifying drug delivery systems
containing Labrasol on tight junctions in Caco-2 cells. Eur J Pharm Sci 2005;24(5):477-86.
49. Prabhu S, Ortega M, Ma C. Novel lipid-based formulations enhancing the in vitro dissolution
and permeability characteristics of a poorly water-soluble model drug, piroxicam. Int J Pharm
2005;301(1-2):209-16.
50. Dahan A, Hoffman A. The effect of different lipid based formulations on the oral absorption of
lipophilic drugs: the ability of in vitro lipolysis and consecutive ex vivo intestinal permeability data to
predict in vivo bioavailability in rats. Eur J Pharm Biopharm 2007;67(1):96-105.
51. Spernath A, Aserin A, Ziserman L, Danino D, Garti N. Phosphatidylcholine embedded
microemulsions: physical properties and improved Caco-2 cell permeability. J Control Release
2007;119(3):279-90.
52. Brusewitz C, Schendler A, Funke A, Wagner T, Lipp R. Novel poloxamer-based
nanoemulsions to enhance the intestinal absorption of active compounds. Int J Pharm 2007;329(1-
2):173-81.
53. Kataoka M, Masaoka Y, Sakuma S, Yamashita S. Effect of food intake on the oral absorption
of poorly water-soluble drugs: in vitro assessment of drug dissolution and permeation assay system. J
Pharm Sci 2006;95(9):2051-61.
54. Rowland M, Tozer TN. Clinical Pharmacokinetics: Concepts and Applications. In. 3rd ed:
Lippincott Williams and Wilkins; 1995.
55. Shargel L, A Y. Applied Biopharmaceutics and Pharmacocinetics. In. Stamford: Appleton&
Lange; 1999.
56. (FDA) FaDA. Waiver of in Vivo Bioavailability and Bioequivalence Studies for Immediate-
Release Solid Oral Dosage Forms Based on a Biopharmaceutics Classification System. In: (CDER)
CfDEaR, editor. Guidance for Industry; 2000.
57. Raaflaub J. Pharmakokinetik Ein Leitfaden für Autodidakten. 1999 ed. Basel: Editiones Roche;
1985.
58. Khanvilkar K, Donovan MD, Flanagan DR. Drug transfer through mucus. Adv Drug Deliv Rev
2001;48(2-3):173-93.
59. Amidon GL, Lee PI, Topp EM. Transport Processes in Pharmaceutical Systems. New York:
Marcel dekker; 2000.
60. Camenisch G, Alsenz J, van de Waterbeemd H, Folkers G. Estimation of permeability by
passive diffusion through Caco-2 cell monolayers using the drugs' lipophilicity and molecular weight.
Eur J Pharm Sci 1998;6(4):317-24.
61. Singer SJ, Nicolson GL. The fluid mosaic model of the structure of cell membranes. Science
1972;175(23):720-31.
62. Simons K, Ikonen E. Functional rafts in cell membranes. Nature 1997;387(6633):569-72.
Marcel Schneider Page 163 of 172 University of Basel, 2008
63. Shaw AS. Lipid rafts: now you see them, now you don't. Nat Immunol 2006;7(11):1139-42.
64. van Meer G, Simons K. Lipid polarity and sorting in epithelial cells. J Cell Biochem
1988;36(1):51-8.
65. van 't Hof W, van Meer G. Generation of lipid polarity in intestinal epithelial (Caco-2) cells:
sphingolipid synthesis in the Golgi complex and sorting before vesicular traffic to the plasma
membrane. J Cell Biol 1990;111(3):977-86.
66. Hidalgo IJ. Assessing the absorption of new pharmaceuticals. Curr Top Med Chem
2001;1(5):385-401.
67. Shin K, Fogg VC, Margolis B. Tight junctions and cell polarity. Annu Rev Cell Dev Biol
2006;22:207-35.
68. Salama NN, Eddington ND, Fasano A. Tight junction modulation and its relationship to drug
delivery. Adv Drug Deliv Rev 2006;58(1):15-28.
69. Smith DA, van de Waterbeemd H, Walker DK. Pharmacokinetics and Metabolism in Drug
Design, Chapter 3: Absorption: Wiley-VCH; 2006.
70. Artursson P, Palm K, Luthman K. Caco-2 monolayers in experimental and theoretical
predictions of drug transport. Adv Drug Deliv Rev 2001;46(1-3):27-43.
71. Swaan PW, Stehouwer MC, Tukker JJ. Molecular mechanism for the relative binding affinity to
the intestinal peptide carrier. Comparison of three ACE-inhibitors: enalapril, enalaprilat, and lisinopril.
Biochim Biophys Acta 1995;1236(1):31-8.
72. Smith P, Mirabelli C, Fondacaro J, Ryan F, Dent J. Intestinal 5-fluorouracil absorption: use of
Ussing chambers to assess transport and metabolism. Pharm Res 1988;5(9):598-603.
73. Barthe L, Woodley J, Houin G. Gastrointestinal absorption of drugs: methods and studies.
Fundam Clin Pharmacol 1999;13(2):154-68.
74. Acra SA, Ghishan FK. Methods of investigating intestinal transport. JPEN J Parenter Enteral
Nutr 1991;15(3):93S-98S.
75. Wikman A, Karlsson J, Carlstedt I, Artursson P. A drug absorption model based on the mucus
layer producing human intestinal goblet cell line HT29-H. Pharm Res 1993;10(6):843-52.
76. Ward PD, Tippin TK, Thakker DR. Enhancing paracellular permeability by modulating
epithelial tight junctions. Pharm Sci Technolo Today 2000;3(10):346-358.
77. Artursson P, Karlsson J. Correlation between oral drug absorption in humans and apparent
drug permeability coefficients in human intestinal epithelial (Caco-2) cells. Biochem Biophys Res
Commun 1991;175(3):880-5.
78. Hu M, Li Y, Davitt CM, Huang SM, Thummel K, Penman BW, et al. Transport and metabolic
characterization of Caco-2 cells expressing CYP3A4 and CYP3A4 plus oxidoreductase. Pharm Res
1999;16(9):1352-9.
79. Schmiedlin-Ren P, Thummel KE, Fisher JM, Paine MF, Lown KS, Watkins PB. Expression of
enzymatically active CYP3A4 by Caco-2 cells grown on extracellular matrix-coated permeable
supports in the presence of 1alpha,25-dihydroxyvitamin D3. Mol Pharmacol 1997;51(5):741-54.
80. Artursson P, Borchardt RT. Intestinal drug absorption and metabolism in cell cultures: Caco-2
and beyond. Pharm Res 1997;14(12):1655-8.
Marcel Schneider Page 164 of 172 University of Basel, 2008
81. Yamashita S, Konishi K, Yamazaki Y, Taki Y, Sakane T, Sezaki H, et al. New and better
protocols for a short-term Caco-2 cell culture system. J Pharm Sci 2002;91(3):669-79.
82. Avdeef A, Artursson P, Neuhoff S, Lazorova L, Grasjo J, Tavelin S. Caco-2 permeability of
weakly basic drugs predicted with the double-sink PAMPA pKa(flux) method. Eur J Pharm Sci
2005;24(4):333-49.
83. Bermejo M, Avdeef A, Ruiz A, Nalda R, Ruell JA, Tsinman O, et al. PAMPA--a drug absorption
in vitro model 7. Comparing rat in situ, Caco-2, and PAMPA permeability of fluoroquinolones. Eur J
Pharm Sci 2004;21(4):429-41.
84. Kerns EH, Di L, Petusky S, Farris M, Ley R, Jupp P. Combined application of parallel artificial
membrane permeability assay and Caco-2 permeability assays in drug discovery. J Pharm Sci
2004;93(6):1440-53.
85. Youdim KA, Avdeef A, Abbott NJ. In vitro trans-monolayer permeability calculations: often
forgotten assumptions. Drug Discov Today 2003;8(21):997-1003.
86. Tran TT, Mittal A, Gales T, Maleeff B, Aldinger T, Polli JW, et al. Exact kinetic analysis of
passive transport across a polarized confluent MDCK cell monolayer modeled as a single barrier. J
Pharm Sci 2004;93(8):2108-23.
87. Sawada G, Ho N, Williams L, Barsuhn C, Raub T. Transcellular permeability of
chlorpromazine demonstrating the roles of protein binding and membrane partitioning. Pharm Res
1994;11(5):665-73.
88. Raub TJ, Barsuhn CL, Williams LR, Decker DE, Sawada GA, Ho NF. Use of a biophysical-
kinetic model to understand the roles of protein binding and membrane partitioning on passive
diffusion of highly lipophilic molecules across cellular barriers. J Drug Target 1993;1(4):269-86.
89. Charman WN, Porter CJ, Mithani S, Dressman JB. Physiochemical and physiological
mechanisms for the effects of food on drug absorption: the role of lipids and pH. J Pharm Sci
1997;86(3):269-82.
90. Aungst BJ. Intestinal permeation enhancers. J Pharm Sci 2000;89(4):429-42.
91. Sawai T, Drongowski RA, Lampman RW, Coran AG, Harmon CM. The effect of phospholipids
and fatty acids on tight-junction permeability and bacterial translocation. Pediatr Surg Int
2001;17(4):269-74.
92. Constantinides PP, Wasan KM. Lipid formulation strategies for enhancing intestinal transport
and absorption of P-glycoprotein (P-gp) substrate drugs: in vitro/in vivo case studies. J Pharm Sci
2007;96(2):235-48.
93. Hugger ED, Audus KL, Borchardt RT. Effects of poly(ethylene glycol) on efflux transporter
activity in Caco-2 cell monolayers. J Pharm Sci 2002;91(9):1980-90.
94. Nerurkar MM, Burton PS, Borchardt RT. The use of surfactants to enhance the permeability of
peptides through Caco-2 cells by inhibition of an apically polarized efflux system. Pharm Res
1996;13(4):528-34.
95. Rege BD, Kao JP, Polli JE. Effects of nonionic surfactants on membrane transporters in Caco-
2 cell monolayers. Eur J Pharm Sci 2002;16(4-5):237-46.
Marcel Schneider Page 165 of 172 University of Basel, 2008
96. Regev R, Assaraf YG, Eytan GD. Membrane fluidization by ether, other anesthetics, and
certain agents abolishes P-glycoprotein ATPase activity and modulates efflux from multidrug-resistant
cells. Eur J Biochem 1999;259(1-2):18-24.
97. Batrakova EV, Li S, Vinogradov SV, Alakhov VY, Miller DW, Kabanov AV. Mechanism of
pluronic effect on P-glycoprotein efflux system in blood-brain barrier: contributions of energy depletion
and membrane fluidization. J Pharmacol Exp Ther 2001;299(2):483-93.
98. Batrakova EV, Li S, Miller DW, Kabanov AV. Pluronic P85 increases permeability of a broad
spectrum of drugs in polarized BBMEC and Caco-2 cell monolayers. Pharm Res 1999;16(9):1366-72.
99. Bogman K, Zysset Y, Degen L, Hopfgartner G, Gutmann H, Alsenz J, et al. P-glycoprotein and
surfactants: effect on intestinal talinolol absorption. Clin Pharmacol Ther 2005;77(1):24-32.
100. Dintaman JM, Silverman JA. Inhibition of P-glycoprotein by D-alpha-tocopheryl polyethylene
glycol 1000 succinate (TPGS). Pharm Res 1999;16(10):1550-6.
101. Werner U, Kissel T, Reers M. Effects of permeation enhancers on the transport of a
peptidomimetic thrombin inhibitor (CRC 220) in a human intestinal cell line (Caco-2). Pharm Res
1996;13(8):1219-27.
102. Constantinides PP. LIPID MICROEMULSIONS FOR IMPROVING DRUG DISSOLUTION
AND ORAL ABSORPTION - PHYSICAL AND BIOPHARMACEUTICAL ASPECTS. Pharmaceutical
Research 1995;12(11):1561-1572.
103. Shah NH, Carvajal MT, Patel CI, Infeld MH, Malick AW. SELF-EMULSIFYING DRUG-
DELIVERY SYSTEMS (SEDDS) WITH POLYGLYCOLYZED GLYCERIDES FOR IMPROVING IN-
VITRO DISSOLUTION AND ORAL ABSORPTION OF LIPOPHILIC DRUGS. International Journal of
Pharmaceutics 1994;106(1):15-23.
104. Porter CJ, Pouton CW, Cuine JF, Charman WN. Enhancing intestinal drug solubilisation using
lipid-based delivery systems. Adv Drug Deliv Rev 2008;60(6):673-91.
105. Humberstone AJ, Charman WN. Lipid-based vehicles for the oral delivery of poorly water
soluble drugs. Advanced Drug Delivery Reviews 1997;25(1):103-128.
106. Gershanik T, Benita S. Self-dispersing lipid formulations for improving oral absorption of
lipophilic drugs. European Journal of Pharmaceutics and Biopharmaceutics 2000;50(1):179-188.
107. Pouton CW. Lipid formulations for oral administration of drugs: non-emulsifying, self-
emulsifying and 'self-microemulsifying' drug delivery systems. Eur J Pharm Sci 2000;11 Suppl 2:S93-
8.
108. Torchilin VP. Recent advances with liposomes as pharmaceutical carriers. Nat Rev Drug
Discov 2005;4(2):145-60.
109. McLean LR, Phillips MC. Mechanism of cholesterol and phosphatidylcholine exchange or
transfer between unilamellar vesicles. Biochemistry 1981;20(10):2893-900.
110. Ho MT, Pownall HJ, Hollyfield JG. Spontaneous transfer of retinoic acid, retinyl acetate, and
retinyl palmitate between single unilamellar vesicles. J Biol Chem 1989;264(30):17759-63.
111. Jones JD, Thompson TE. Spontaneous phosphatidylcholine transfer by collision between
vesicles at high lipid concentration. Biochemistry 1989;28(1):129-34.
Marcel Schneider Page 166 of 172 University of Basel, 2008
112. Fahr A, van Hoogevest P, May S, Bergstrand N, ML SL. Transfer of lipophilic drugs between
liposomal membranes and biological interfaces: consequences for drug delivery. Eur J Pharm Sci
2005;26(3-4):251-65.
113. Faassen F, Kelder J, Lenders J, Onderwater R, Vromans H. Physicochemical properties and
transport of steroids across Caco-2 cells. Pharm Res 2003;20(2):177-86.
114. Brennan GP, Fairweather I, Trudgett A, Hoey E, McCoy, McConville M, et al. Understanding
triclabendazole resistance. Exp Mol Pathol 2007;82(2):104-9.
115. Kapitza SB, Michel BR, van Hoogevest P, Leigh MLS, Imanidis G. Absorption of poorly water
soluble drugs subject to apical efflux using phospholipids as solubilizers in the Caco-2 cell model.
European Journal of Pharmaceutics and Biopharmaceutics 2007;66(1):146-158.
116. Kim AE, Dintaman JM, Waddell DS, Silverman JA. Saquinavir, an HIV protease inhibitor, is
transported by P-glycoprotein. J Pharmacol Exp Ther 1998;286(3):1439-45.
117. Reitbauer S. Einfluss pharmazeutischer Hilfsstoffe auf die Plasmamembran von Caco-2
Zellmonolayern ermittelt durch Fluoreszenzdepolarisation. Basel: University of Basel; 2005.
118. Batrakova EV, Li S, Elmquist WF, Miller DW, Alakhov VY, Kabanov AV. Mechanism of
sensitization of MDR cancer cells by Pluronic block copolymers: Selective energy depletion. Br J
Cancer 2001;85(12):1987-97.
119. Imanidis G, Waldner C, Mettler C, Leuenberger H. An improved diffusion cell design for
determining drug transport parameters across cultured cell monolayers. J Pharm Sci
1996;85(11):1196-203.
120. Nerurkar MM, Ho NF, Burton PS, Vidmar TJ, Borchardt RT. Mechanistic roles of neutral
surfactants on concurrent polarized and passive membrane transport of a model peptide in Caco-2
cells. J Pharm Sci 1997;86(7):813-21.
121. Kastelova A, Dimova S, Nemery B. Effects of propranolol on xenobiotic enzyme activities in rat
type II pneumocytes and alveolar macrophages in vivo. Methods Find Exp Clin Pharmacol
2003;25(10):797-802.
122. Mottier L, Moreno L, Alvarez L, Virkel G, Lanusse C. Measurement of triclabendazole and its
metabolites in liver flukes: method development and full validation. J Pharm Biomed Anal
2004;35(5):991-9.
123. Virkel G, Lifschitz A, Sallovitz J, Pis A, Lanusse C. Assessment of the main metabolism
pathways for the flukicidal compound triclabendazole in sheep. J Vet Pharmacol Ther 2006;29(3):213-
23.
124. Liang E, Chessic K, Yazdanian M. Evaluation of an accelerated Caco-2 cell permeability
model. J Pharm Sci 2000;89(3):336-45.
125. Hugger ED, Novak BL, Burton PS, Audus KL, Borchardt RT. A comparison of commonly used
polyethoxylated pharmaceutical excipients on their ability to inhibit P-glycoprotein activity in vitro. J
Pharm Sci 2002;91(9):1991-2002.
126. Herbette L, Katz AM, Sturtevant JM. Comparisons of the interaction of propranolol and timolol
with model and biological membrane systems. Mol Pharmacol 1983;24(2):259-69.
Marcel Schneider Page 167 of 172 University of Basel, 2008
127. Lecaillon JB, Godbillon J, Campestrini J, Naquira C, Miranda L, Pacheco R, et al. Effect of
food on the bioavailability of triclabendazole in patients with fascioliasis. Br J Clin Pharmacol
1998;45(6):601-4.
128. Sugano K. Estimation of effective intestinal membrane permeability considering bile micelle
solubilisation. International Journal of Pharmaceutics 2008;doi:10.1016/j.ijpharm.2008.10.001.
129. Avdeef A, Bendels S, Di L, Faller B, Kansy M, Sugano K, et al. Parallel artificial membrane
permeability assay (PAMPA)-critical factors for better predictions of absorption. J Pharm Sci
2007;96(11):2893-2909.
130. Fagerholm U, Lennernaes H. Experimental estimation of the effective unstirred water layer
thickness in the human jejunum, and its importance in oral drug absorption. European Journal of
Pharmaceutical Sciences 1995;3(5):247-53.
131. Obata K, Sugano K, Saitoh R, Higashida A, Nabuchi Y, Machida M, et al. Prediction of oral
drug absorption in humans by theoretical passive absorption model. International journal of
pharmaceutics 2005;293(1-2):183-92. .
132. Sugano K, Nabuchi Y, Machida M, Aso Y. Prediction of human intestinal permeability using
artificial membrane permeability. Int J Pharm 2003;257(1-2):245-51.
133. Larhed AW, Artursson P, Bjork E. The influence of intestinal mucus components on the
diffusion of drugs. Pharm Res 1998;15(1):66-71.
134. Lai SK, O'Hanlon DE, Harrold S, Man ST, Wang YY, Cone R, et al. Rapid transport of large
polymeric nanoparticles in fresh undiluted human mucus. Proc Natl Acad Sci U S A 2007;104(5):1482-
7.
135. Norris DA, Sinko PJ. Effect of size, surface charge, and hydrophobicity on the translocation of
polystyrene microspheres through gastrointestinal mucin. J. Appl. Polym. Sci. 1997;63(11):1481-1492.
136. Sanders NN, De Smedt SC, Demeester J. The physical properties of biogels and their
permeability for macromolecular drugs and colloidal drug carriers. J Pharm Sci 2000;89(7):835-49.
137. Faassen F, Vogel G, Spanings H, Vromans H. Caco-2 permeability, P-glycoprotein transport
ratios and brain penetration of heterocyclic drugs. Int J Pharm 2003;263(1-2):113-22.
138. Varma MV, Sateesh K, Panchagnula R. Functional role of P-glycoprotein in limiting intestinal
absorption of drugs: contribution of passive permeability to P-glycoprotein mediated efflux transport.
Mol Pharm 2005;2(1):12-21.
139. Shono Y, Nishihara H, Matsuda Y, Furukawa S, Okada N, Fujita T, et al. Modulation of
intestinal P-glycoprotein function by cremophor EL and other surfactants by an in vitro diffusion
chamber method using the isolated rat intestinal membranes. J Pharm Sci 2004;93(4):877-85.
140. Berginc K, Zakelj S, Levstik L, Ursic D, Kristl A. Fluorescein transport properties across
artificial lipid membranes, Caco-2 cell monolayers and rat jejunum. Eur J Pharm Biopharm
2007;66(2):281-5.
141. Lee KJ, Johnson N, Castelo J, Sinko PJ, Grass G, Holme K, et al. Effect of experimental pH
on the in vitro permeability in intact rabbit intestines and Caco-2 monolayer. Eur J Pharm Sci
2005;25(2-3):193-200.
Marcel Schneider Page 168 of 172 University of Basel, 2008
142. Mahler HC, Printz M, Kopf R, Schuller R, Muller R. Behaviour of polysorbate 20 during
dialysis, concentration and filtration using membrane separation techniques. J Pharm Sci
2008;97(2):764-74.
143. Van Veldhoven PP, Mannaerts GP. Inorganic and organic phosphate measurements in the
nanomolar range. Anal Biochem 1987;161(1):45-8.
Marcel Schneider Page 169 of 172 University of Basel, 2008
RESUME
Schneider Marcel Pharmacist
Personal Details
Name: Schneider Marcel
Date and place of birth: 29 April 1979, Langenthal
Nationality: Swiss
Marital status: Single
Current address: Hauptstrasse 34, 4127 Birsfelden, Switzerland
Cell phone: +41 79 729 26 80
Office phone: +41 61 467 47 56
Phone : +41 61 301 50 82
E-Mail: [email protected]
PhD Study
January 2005 – actual Date PhD study at Institute of Pharmaceutical Technology
(University of Basel) and at Institute Pharma Technology
(University of Applied Sciences FHNW, Muttenz) under
the supervision of Prof. Dr. Georgios Imanidis. Topic:
Influence of lipid containing dosage forms on the
absorption of lipophilic drugs in the Caco-2 cell model.
Lectureship in practical courses of liquid and sterile
dosage forms
Marcel Schneider Page 170 of 172 University of Basel, 2008
Supervision of the following master theses
February 2007 – July 2007 „Einfluss von lipidhaltigen oralen Darreichungsformen
auf die Absorption schwerlöslicher Wirkstoffe in Caco-2
Zellen“ (Sabrina Toscano).
January 2008 – June 2008 „Einfluss von lipidhaltigen oralen Darreichungsformen
auf die Absorption schwerlöslicher Wirkstoffe in Caco-2
Zellen“ (Daniela Murer).
Presentations
September 9 – 12 2008 7th biennial GPEN conference, GPEN 2008, at the
University of Leuven (Leuven, Belgium)
Podia presentation
October 25 – 27 2006 6th biennial GPEN conference, GPEN 2006, at the
University of Kansas (Lawrence, Kansas)
Poster presentation
Education
October 1999 – November 2004 Pharmacy studies at University of Basel, Basel,
Switzerland
Master in Pharmaceutical Sciences and federal diploma
as Pharmacist
Final result state examination: 5.38 (maximum 6.00)
February 2004 – July 2004 Diploma thesis at Pentapharm Gmbh, Aesch,
Switzerland, under Supervision of Dr. Frank Gafner.
Topic: „Antikoagulative Wirkung pflanzlicher Extrakte am
Beispiel von Hypericum perforatum L.“
Final result practical diploma thesis: 5.5
September 2002 3rd state examination (“Assistentenprüfung für
Apotheker”)
August 2001 2nd state examination (“Pharmazeutische
Grundfächerprüfung”)
August 2000 1st state examination („Naturwissenschaftliche Prüfung
für Apotheker“)
Marcel Schneider Page 171 of 172 University of Basel, 2008
August 1995 – July 1999 High school diploma (“Matura”) at Gymnasium
Langenthal (specialization in latin “Typus B”). Final
result: 4.23
Work Experience
December 2004 Temporary replacement at Apotheke Oensingen, S.
Münch, Oensingen, Switzerland
September 2002 – March 2004 Temporary replacements at City Apotheke, Dr. D. Meier,
Basel, Switzerland
March and September 2003 Temporary replacements at Dorfapotheke Meiringen, J.
Schneider, Meiringen, Switzerland
September 2001 – September 2002 Practical year at City Apotheke, Dr. D. Meier, Basel,
Switzerland
Additional Skills
Trainings
Spring Semester 2008 Seminar about scientific writing with Silvia Rogers,
University of Basel
March 2007 Quality and GMP. Continuing education course of the
Pharmacenter Basel-Zürich, Switzerland
March 2005 Method Development for GC und HPLC, Agilent
Technologies (Schweiz) AG, Basel
Languages German (native speaker)
English (fluent)
French (basic to good command)
PC Literacy Proficient user
Applications Good command of Microsoft Office applications
Marcel Schneider Page 172 of 172 University of Basel, 2008
As a student and PhD student I have attended lectures and courses given by
Edwin Constable, Andreas Zuberbühler, Peter Strazewski, Urs Séquin, Peter C. Hauser,
Peter C. Oelhafen, Gian Reto Plattner, Udo M. Spornitz, Konstantin Beier, Uwe Otten, Lukas
Landmann, Daniel Haag- Wackernagel, Hansjakob Müller, Heinz Durrer, Alfred Fahr, Ruth U.
Leu Marseiler, Peter Erb, Christoph Moroni, Alfons Hädener, Willi Hunziker, Niggi Iberg,
Michael Kessler, Rudolf Bruppacher, Kurt Hersberger, Peter Huber, Axel Regeniter, Andre
Scholer, Jürgen Drewe, Stefan Krähenbühl, Raymond Schlienger, Markus Lampert, Chritoph
R. Meier, Stefan Mühlebach, Beat Ernst, Gert Folkers, Angelo Vedani, Jörg Huwyler, Willi
Schaffner, Beat Meier, Karin Berger-Büter, Anna Seelig, Joachim Seelig, Hans Leuenberger,
Georgios Imanidis, Dario Neri, Silvia Rogers, Theodor W. Güntert