Lambda Spectrophotometer Operation Manual - … · 4. Es ist jederzeit auf die...
132
Lambda Spectrophotometer Operation Manual PCRmax rev A.3
Transcript of Lambda Spectrophotometer Operation Manual - … · 4. Es ist jederzeit auf die...

Lambda Spectrophotometer Operation ManualPCRmax rev A.3


3
Safety
Please read this information carefully prior to installing or using this equipment.
1. The unit described in this manual is designed be operated only by trained personnel. Any adjustments, maintenance and repair must be carried out as defined in this manual, by a person qualified to be aware of the hazards involved.
2. It is essential that both operating and service personnel employ a safe system of work, in addition to the detailed instructions specified in this manual.
3. Other than for those items defined in the maintenance procedures herein there are no user serviceable items in this instrument. Removal of covers and attempted adjustment or service by unqualified personnel will invalidate the warranty and may incur additional charges for repair.
4. References should always be made to the Health and Safety data supplied with any chemicals used. Generally accepted laboratory procedures for safe handling of chemicals should be employed.
5. If it is suspected that safety protection has been impaired in any way, the unit must be made inoperative and secured against any intended operation. The fault condition should immediately be reported to the appropriate servicing authority.
Merci de lire attentivement ces informations avant d’installer ou d’utiliser cet appareil.
1. L’appareil décrit dans ce manuel est conçu pour être utilisé uniquement par des personnes formées. Tout réglage, maintenance ou réparation doit être effectué comme décrit dans ce manuel, par une personne qualifiée consciente des risques encourus.
2. Il est essentiel que les personnes utilisant et intervenant sur cet appareil respectent les règles de sécurité de travail, en plus des instructions détaillées précisées dans ce manuel.
3. En-dehors des éléments décrits dans les procédures de maintenance ci-incluses, cet appareil ne contient aucun élément réparable par l’utilisateur. L’enlèvement des capots et les tentatives de réglage ou de réparation par des personnes non qualifiées invalide toute garantie et entraîne un risque de frais de réparation supplémentaires.
4. Toujours se référer aux fiches techniques de santé et de sécurité accompagnant tout produit chimique utilisé. Respecter les procédures de laboratoire généralement acceptées pour la manipulation en toute sécurité des produits chimiques.
5. Si l’utilisateur suspecte qu’un problème quelconque puisse mettre en cause la sécurité, l’appareil doit être rendu inopérant en empêchant son utilisation. Communiquer la défaillance constatée au service de maintenance compétent.
Bitte lesen Sie diese Hinweise vor Installation oder Gebrauch dieser Ausrüstung sorgfältig durch.
1. Das in diesem Handbuch beschriebene Gerät darf nur von geschultem Personal bedient werden. Alle Anpassungen, Wartungsarbeiten und Reparaturen müssen entsprechend der Vorgaben in diesem Handbuch und von einer kompetenten Person, die mit den damit verbundenen Gefahren vertraut ist, durchgeführt werden.
2. Es ist wichtig, dass sowohl das Bedienungs- als auch das Service-Personal zusätzlich zu den detaillierten Anweisungen in diesem Handbuch ein sicheres Arbeitssystem einsetzen.
3. Mit Ausnahme der Teile, deren Wartungsverfahren in diesem Handbuch beschrieben sind, enthält dieses Gerät keine weiteren Teile, die vom Benutzer gewartet werden können. Das Entfernen von Abdeckungen und Versuche von hierfür unqualifiziertem Personal, Anpassungen oder Wartungsarbeiten durchzuführen, haben zur Folge, dass die Garantie verfällt und können zusätzliche Reparaturkosten auslösen.

4. Es ist jederzeit auf die sicherheitsrelevanten Daten sämtlicher verwendeter Chemikalien Bezug zu nehmen. Allgemein anerkannte Labormethoden zum sicheren Umgang mit Chemikalien sollten eingesetzt werden.
5. Besteht der Verdacht, dass die Sicherheitsvorrichtungen in irgendeiner Weise beschädigt wurden, muss das Gerät außer Betrieb genommen und gegen weiteren Gebrauch gesichert werden. Die Störung sollte der zuständigen Serviceeinrichtung unverzüglich gemeldet werden.
Leggere attentamente queste istruzioni prima di installare o utilizzare il dispositivo.
1. L’unità descritta nel presente manuale è stata realizzata per essere utilizzata solo da personale che ha ricevuto l’apposita formazione. Qualsiasi operazione di regolazione, manutenzione e riparazione deve essere effettuata sulla base di quanto indicato nel presente manuale da personale qualificato consapevole dei rischi connessi.
2. È fondamentale che il personale operativo e il personale addetto alla manutenzione utilizzino un sistema di lavoro sicuro, oltre a seguire le istruzioni specificate nel presente manuale.
3. Oltre a quelli indicati nelle procedure di manutenzione, all’interno di questo dispositivo non sono presenti altri elementi sui quali è possibile effettuare interventi. La rimozione delle protezioni e qualsiasi tentativo di regolazione o di manutenzione posto in essere da personale non qualificato invaliderà la garanzia. In questi casi, sarà necessario pagare un importo per le riparazioni effettuate.
4. È sempre necessario fare riferimento ai dati sulla salute e sulla sicurezza forniti con le sostanze chimiche utilizzate. Adottare le procedure di laboratorio generalmente accettate per la gestione delle sostanze chimiche.
5. Nel caso in cui si sospetti che la salute possa essere pregiudicata in qualsiasi modo, disattivare l’unità per renderla inutilizzabile. Qualsiasi condizione di errore deve essere immediatamente segnalata al responsabile per la manutenzione.
Lea esta información atentamente antes de instalar o utilizar este equipo.
1. La unidad descrita en este manual está diseñada para que solamente la utilice personal con formación. Cualquier operación de ajuste, mantenimiento y reparación debe llevarse a cabo del modo indicado en este manual y debe realizarla una persona cualificada que sea consciente de los peligros que implica.
2. Es fundamental que tanto los operarios como el personal de servicio utilicen un sistema de trabajo seguro, así como las instrucciones detalladas que se especifican en este manual.
3. Cualquier elemento que no se encuentre entre los definidos en los procedimientos de mantenimiento aquí descritos no podrá utilizarse en este instrumento. La extracción de las tapas y los intentos de ajuste o reparación por parte de personal no cualificado invalidarán la garantía y pueden incurrir en cargos adicionales por reparación.
4. Siempre deberían consultarse los datos sobre Salud y Seguridad que se suministran con cualquier producto químico que se utilice. Es necesario llevar a cabo los procedimientos de laboratorio de aceptación generalizada para la manipulación segura de productos químicos.
5. Si existe la sospecha de que las medidas protectoras de seguridad han quedado dañadas en cualquier modo, la unidad debe inutilizarse y protegerse contra toda operación que se intente llevar a cabo. El estado de fallo debe comunicarse inmediatamente a la autoridad de servicio de mantenimiento y reparación pertinente.
4

Contents
Page
Safety 3
SECTION 1 - INTrOduCTION 101.1 INSTRUMENT DESCRIPTION 101.2 INSTRUMENT SPECIFICATION 10
SECTION 2 – ACCESSOry LAyOuT ANd INSTALLATION 122.1 ACCESSORY LAYOUT 122.2 ACCESSORY REMOVAL 122.3 ACCESSORY INSTALLATION 142.4 INITIALISATION 14
SECTION 3 – ACCESSOry SETTINGS 163.1 ACCESSING THE MICRO VOLUME ACCESSORY SETTINGS 163.2 PATH LENGTH SELECTION 17
SECTION 4 – PErFOrMING MICrO VOLuME MEASurEMENTS 184.1 PIPETTING SAMPLES ONTO THE MICRO VOLUME READ HEAD 184.2 SAMPLE RECOVERY OR REMOVAL 19
SECTION 5 – TOP 10 TIPS FOr SAMPLE MEASurEMENT 21
SECTION 6 – INTrOduCTION 216.1 INSTRUMENT DESCRIPTION 216.2 INSTRUMENT SPECIFICATION 21
SECTION 7 – INSTALLATION 247.1 UNPACKING 247.2 INSTALLATION 247.3 DISPLAY 257.4 CONTROLS 267.5 REAR PANEL 277.6 FRONT PANEL 27
SECTION 8 – SPECTrOSCOPy MEASurEMENTS 288.1 THEORY OF SPECTROSCOPY MEASUREMENT 288.2 NUCLEIC ACID DETERMINATION 288.3 SPECTROSCOPY MEASUREMENT 298.4 GOOD PRACTICE GUIDELINES 30
SECTION 9 – INSTruMENT SETuP 329.1 NAVIGATING AND SCREEN SETUP 329.2 TIME AND DATE 339.3 INSTRUMENT SETTINGS MENU 349.4 SECURITY AND SETTING PASSWORDS 349.5 MODE SELECTION 369.6 GLP SETTINGS 369.7 SCREEN CONTRAST 36
SECTION 10 – PHOTOMETrICS 3710.1 MODE SPECIFIC PARAMETERS 3710.2 METHOD SET UP 3710.3 CALIBRATION 3810.4 SAMPLE MEASUREMENT 38
5

SECTION 11 – CONCENTrATION 3911.1 MODE SPECIFIC PARAMETERS 3911.2 METHOD SETUP 3911.2.1 Selecting a Wavelength 3911.2.2 Settings 4011.2.2.1 Selecting Concentration Units 4011.2.2.2 Changing the Resolution 4111.2.2.3 Using a Standard 4111.2.2.4 Using a Factor 4111.3 CALIBRATION 4211.3.1 Calibrating to a Standard 4211.3.2 Calibrating to a Factor 4211.4 SAMPLE MEASUREMENT 4311.4.1 Measuring a Sample After Calibrating to a Standard 4311.4.2 Measuring a Sample After Calibrating to a Factor 43
SECTION 12 – SPECTruM 4412.1 MODE SPECIFIC PARAMETERS 4412.2 METHOD SET UP 4412.2.1 Scan Settings 4512.2.1.1 Selecting Absorbance or % Transmittance 4512.2.1.2 Setting Start and End Wavelengths 4512.2.1.3 Setting the Scan Interval 4612.2.1.4 Y-Axis Scaling 4612.3 CALIBRATION 4712.4 SAMPLE MEASUREMENT 4812.5 DATA ANALYSIS 4812.5.1 Peaks and Valleys Threshold 4912.5.2 Peaks and Valleys Table 4912.5.3 Spectral Points Analysis 50
SECTION 13 – QuANTITATION 5213.1 MODE SPECIFIC PARAMETERS 5213.2 METHOD SETUP 5213.2.1 Quantitation Settings 5313.2.1.1 Selecting Absorbance or % Transmittance 5313.2.1.2 Selecting a Wavelength 5313.2.1.3 Selecting Concentration Units 5313.2.1.4 Changing the Resolution 5413.2.1.5 Selecting the Number of Replicate Standard Measurements 5413.2.1.6 Selecting Automatic or Manual Replicate Measurements 5413.2.1.7 Selecting Number of Standards 5413.2.2 Quantitation Table 5413.2.2.1 Editing Standard Data 5513.2.2.2 Creating a New Standard Curve 5513.2.3 Standard Curve 5713.3 CALIBRATION 5813.4 SAMPLE MEASUREMENT 5813.5 DATA ANALYSIS 58
6

SECTION 14 – KINETICS 5914.1 MODE SPECIFIC PARAMETERS 5914.2 METHOD SETUP 5914.2.1 Kinetics Settings 6014.2.1.1 Y-Axis Scaling 6014.2.1.2 Setting Lag Time or Start on Level 6114.2.1.3 Selecting Absorbance or % Transmittance 6214.2.1.4 Changing the Resolution 6214.2.1.5 Selecting Concentration Units 6214.2.1.6 Using a Standard 6214.2.1.7 Using a Factor 6214.2.1.8 Selecting a Wavelength 6314.2.1.9 Setting the Kinetics Measurement Time 6314.3 CALIBRATION 6314.4 SAMPLE MEASUREMENT 64 14.5 DATA ANALYSIS 65
SECTION 15 – MuLTI-WAVELENGTH 6715.1 MODE SPECIFIC PARAMETERS 6715.2 METHOD SET UP 6715.2.1 Multi-Wavelength Settings 6815.2.1.1 Setting the Number of Wavelengths 6815.2.1.2 Setting the Measurement Wavelengths 6815.2.1.3 Changing the Resolution 6815.2.1.4 Selecting Concentration Units 6815.2.1.5 Setting the Concentration Calculation Equation and Factors 6915.3 CALIBRATION 6915.4 SAMPLE MEASUREMENT 70
SECTION 16 – CONCENTrATION PLuS 7116.1 MODE SPECIFIC PARAMETERS 7116.2 METHOD SETUP 7116.2.1 Selecting a Wavelength – Operating Menu 7116.2.2 Concentration Plus Settings 7216.2.2.1 Selecting a Wavelength – Concentration Plus Settings 7216.2.2.2 Selecting Concentration Units 7216.2.2.3 Changing the Resolution 7316.2.2.4 Using a Standard 7316.2.2.5 Using a Factor 7316.2.2.6 Setting the Dilution Factor 7416.3 CALIBRATION 7416.3.1 Calibrating to a Standard 7516.3.2 Calibrating to a Factor 7516.4 SAMPLE MEASUREMENT 7516.4.1 Measuring a Sample After Calibrating to a Standard 7516.4.2 Measuring a Sample After Calibrating to a Factor 76
SECTION 17 – PurITy SCAN 77
SECTION 18 – MuLTI-WAVELENGTH PLuS 7818.1 MODE SPECIFIC PARAMETERS 7818.2 METHOD SET UP 7818.2.1 Multi-wavelength Plus Settings 7918.2.1.1 Setting the Measurement Wavelengths 79
7

18.2.1.2 Changing the Resolution 7918.2.1.3 Selecting Concentration Units 7918.2.1.4 Setting the Dilution Factor 8018.2.1.5 Setting the Reference Wavelength 8018.2.1.6 Setting the Concentration Calculation Equation and Factors 8018.3 CALIBRATION 8118.4 SAMPLE MEASUREMENT 81
SECTION 19 – dNA 8219.1 DNA MENU OPTIONS 8219.2 dsDNA 8219.3 ssDNA 8219.4 RNA 8319.5 OLIGONUCLEOTIDES 8319.6 260 / 280 8419.7 260 / 230 8419.8 VARIABLE RATIO 8519.9 CALIBRATION AND SAMPLE MEASUREMENT 85
SECTION 20 – PrOTEIN 8620.1 PROTEIN MENU OPTIONS 8620.2 PIERCE 660 ASSAY 8620.3 BCA ASSAY 8620.4 BRADFORD ASSAY 8720.5 LOWRY ASSAY 8720.6 BIURET ASSAY 8820.7 DIRECT UV 8820.8 CALIBRATION AND SAMPLE MEASUREMENT 88
SECTION 21 – Od 600 8921.1 MODE SPECIFIC PARAMETERS 8921.2 METHOD SETUP 8921.2.2 Selecting a Wavelength 8921.2.2 Settings 9021.2.2.1 Using a Standard 9021.2.2.2 Using a Factor 9121.2.2.3 Using an Instrument Factor 9121.2.2.4 Setting the Dilution Factor 9221.3 CALIBRATION 9221.3.1 Calibrating to a Standard 9321.3.2 Calibrating to a Factor 9321.4 SAMPLE MEASUREMENT 9321.4.1 Measuring a Sample After Calibrating to a Standard 9321.4.2 Measuring a Sample After Calibrating to a Factor 94
SECTION 22 – SAVING, PrINTING ANd AuTOLOGGING 9522.1 SAVING METHODS 9522.1.1 Saving Methods To Internal Memory 9522.1.2 Saving Methods to USB Memory Stick 9622.2 OPENING METHODS 9722.2.1 Opening Methods From Internal Memory 9722.2.2 Opening Methods From USB Memory Stick 9722.3 DELETING METHODS 9822.4 SAVING RESULTS 98
68

22.5 OPENING RESULTS 9922.6 DELETING RESULTS 10022.7 PRINTING 10022.7.1 Print Setup 10022.7.1.1 Print Setup – PHOTOMETRICS, CONCENTRATION, MULTIWAVELENGTH AND OD 600 10122.7.1.3 Print Setup – QUANTITATION AND PROTEINS 10122.7.1.4 Print Setup – KINETICS 10122.7.2 Printing Results 10222.8 AUTOLOGGING 10222.8.1 Setting the Number of Sample Repetitions 10222.8.2 Selecting Result’s Destination 10422.9 LOCKED METHODS 10422.10 CONNECTING TO A PC 104
SECTION 23 – GuIdE TO MAKING A dNA MEASurEMENT 10523.1 dsDNA Mode 10523.2 A260/280 Mode 10523.3 Multi-wavelength Mode 106
SECTION 24 – CALIBrATION OF THE MICrO VOLuME ACCESSOry 10724.1 CALIBRATION SOLUTIONS (035 092) 10724.2.3 Accessory Calibration and Verification 108
SECTION 25 – CLEANING ANd dECONTAMINATION 11125.1 ACCESSORY CLEANING 11125.2 ACCESSORY DECONTAMINATION 11125.3 READ HEAD RECONDITIONING 111
SECTION 26 – ACCESSOrIES 11226.1 ACCESSORIES 112
SECTION 27 – MAINTENANCE ANd SErVICE 11327.1 ROUTINE MAINTENANCE 11227.2 SERVICE 112
SECTION 28 – TrOuBLESHOOTING 11428.1 CALIBRATION ERROR CODES 11428.2 TROUBLESHOOTING GUIDE 11528.3 TECHNICAL SUPPORT 115
SECTION 29 – GLOSSAry OF ICONS 116
SECTION 30 – CHEMICAL COMPATIBILITy 117
SECTION 31 – MAINTENANCE ANd SErVICE 11831.1 ROUTINE MAINTENANCE 11831.2 LAMP REPLACEMENT 11831.3 FIRMWARE UPDATE PROCEDURE 11831.4 SERVICE 118
SECTION 32 – TrOuBLESHOOTING 11932.1 ERROR CODES 11932.2 TROUBLESHOOTING GUIDE 12132.3 TECHNICAL SUPPORT 121
SECTION 33 – dECLArATION OF CONFOrMITy 122
9

SECTION 1 - Introduction
1.1 MICrO VOLuME ACCESSOry dESCrIPTION
The Lambda is a UV/visible spectrophotometer dedicated to life science analysis. This spectrophotometer incorporates a micro volume sample measurement accessory that allows sample volumes as low as 0.5μl to be analysed. In addition to the standard measurement modes: photometrics, concentration, multi-wavelength, spectrum scanning, quantitation and kinetics, the Lambda spectrophotometer is pre-programmed with methods to determine DNA concentration and purity ratios using wavelengths recorded at 260, 280 and 230nm, with an optional correction at 320nm. In addition there are pre-programmed methods for protein analysis such as the Bradford, Lowry, Biuret, BCA and Direct UV methods.
10
1.2 LAMBdA WITH MICrO VOLuME ACCESSOry SPECIFICATION
Wavelength Range 198 to 1000nm Resolution 1nm Accuracy ± 2nm Repeatability ± 0.5nm Spectral bandwidth 5nm
Photometrics Absorbance range -0.300 to 2.500A (10mm path length equivalent = -15.0 to 125.0A) Accuracy ±2% @ 1A Absorbance Precision Between 0 and 1A = <0.005, 1 to 2A = 2%, above 2A = 4%. dsDNA Detection Limit (0.5mm) 2.0 ng/μl dsDNA Maximum Concentration (0.2mm) 6000 ng/μl Stray light <0.5% at 340nm and 220nm
Other Weight 7.7kg Path lengths 0.2mm and 0.5mm Measurement time <6.5s Sample size 0.5 to 5.0μl Operating Temperature 0 to 80% non-condensing

1.3 uNPACKING
Please check that the following items are included in the packaging:
• Lambda spectrophotometer
• 10x10mm cuvette holder
• 4GB USB memory stick
• Universal power supply 24V, 65W
• Calibration standards with certificate
• Lambda instruction manual
• Lambda instruction manual
The Lambda is delivered with the micro volume accessory pre-installed and securely packaged in the spectrophotometers sample chamber.
Note: The protective packaging must be removed before the instrument is first initialised.
Fig 1.3 – Micro Volume Accessory Unpacking
11
Micro volume protective packaging (Remove)

SECTION 2 – ACCESSOry LAyOuT ANd INSTALLATION
12
2.1 ACCESSOry LAyOuT
Fig 2.1 – Micro Volume Accessory Layout
2.2 ACCESSOry rEMOVAL
The micro volume accessory is pre-installed when purchased as part of the Lambda spectrophotometer. The accessory is optically matched to the spectrophotometer in which it is originally installed. Users are therefore advised not to transfer the micro volume accessory to other Lambda/Nano spectrophotometers without the assistance of trained service personnel.
The micro volume accessory should not be removed or re-installed un-necessarily as this may affect the accuracy of the optical alignment.
The following steps must be followed to remove and re-install the micro volume accessory into the Lambda spectrophotometer.
Remove the front panel from the sample chamber by loosening screws 1 and 2 until the front panel can be lifted out in the forward direction.
Linkage Connection
Upper Read Head
Read Head Cover
Path Length Drive Motor
Side Covers
Lower Read Head
Remove front panel
1 2
▼
1113
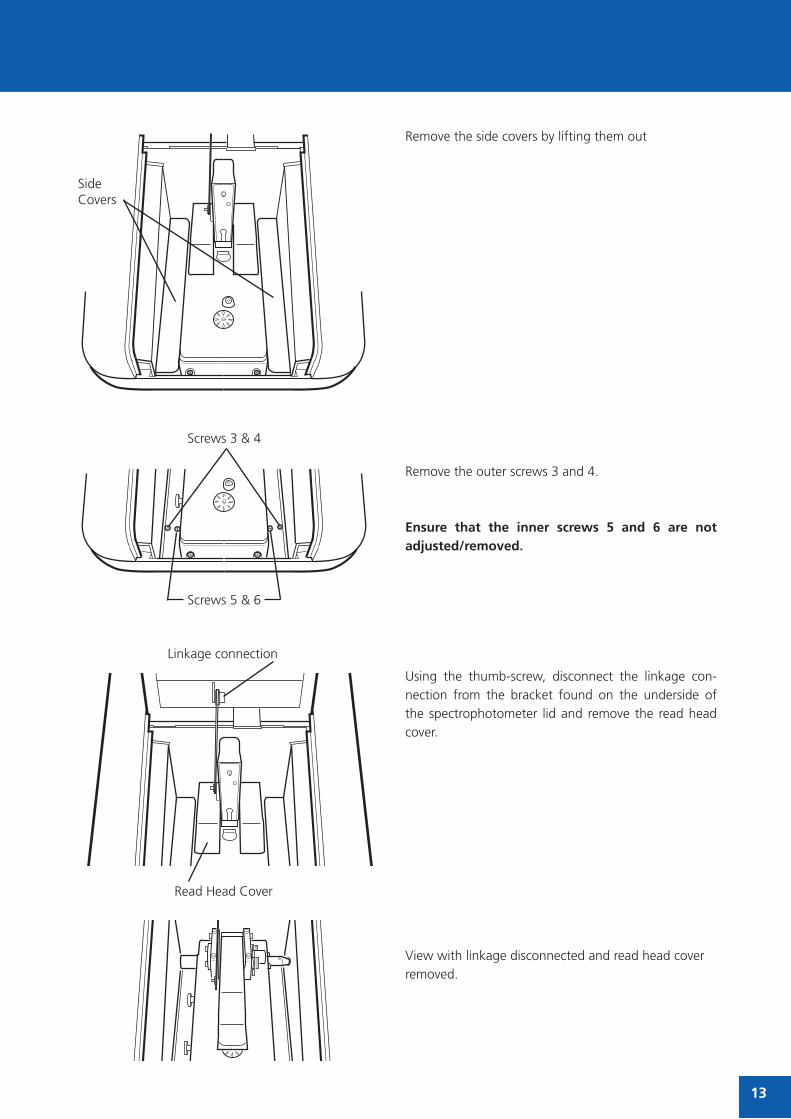
Remove the side covers by lifting them out
Remove the outer screws 3 and 4.
Ensure that the inner screws 5 and 6 are not adjusted/removed.
Using the thumb-screw, disconnect the linkage con-nection from the bracket found on the underside of the spectrophotometer lid and remove the read head cover.
View with linkage disconnected and read head cover removed.
Screws 3 & 4
Side Covers
Screws 5 & 6
Read Head Cover
Linkage connection
1214
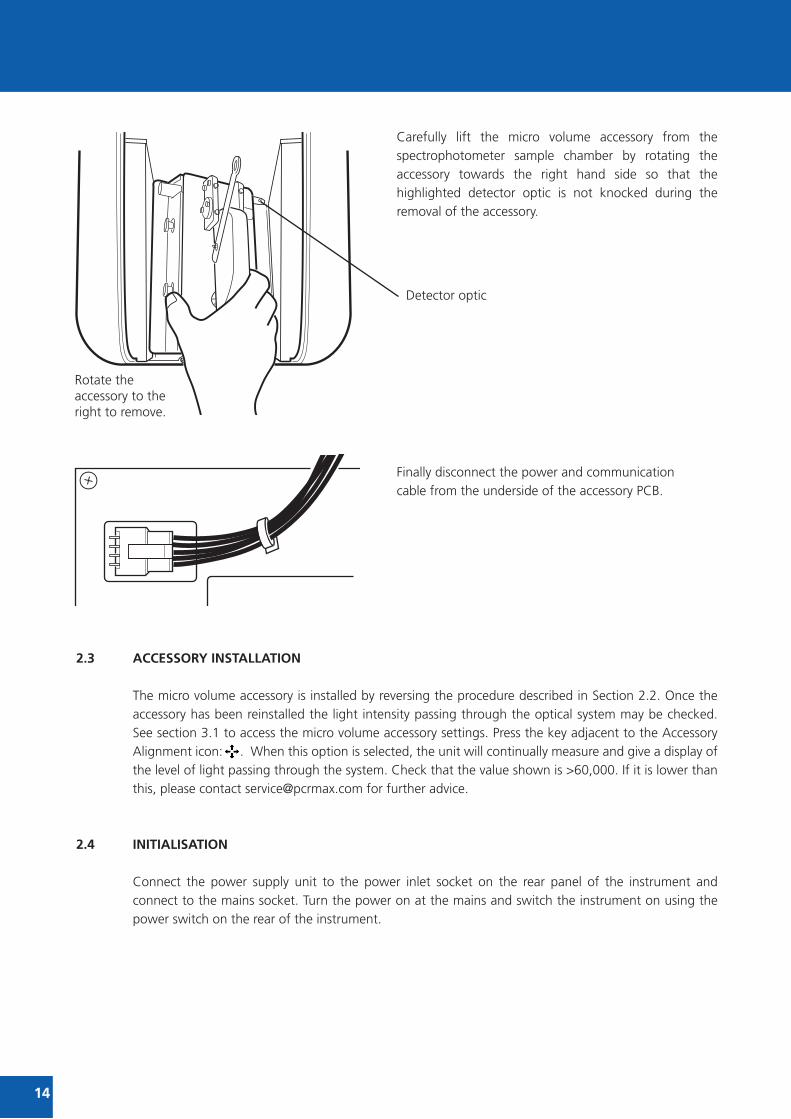
Carefully lift the micro volume accessory from the spectrophotometer sample chamber by rotating the accessory towards the right hand side so that the highlighted detector optic is not knocked during the removal of the accessory.
Finally disconnect the power and communication cable from the underside of the accessory PCB.
2.3 ACCESSOry INSTALLATION
The micro volume accessory is installed by reversing the procedure described in Section 2.2. Once the accessory has been reinstalled the light intensity passing through the optical system may be checked. See section 3.1 to access the micro volume accessory settings. Press the key adjacent to the Accessory Alignment icon: . When this option is selected, the unit will continually measure and give a display of the level of light passing through the system. Check that the value shown is >60,000. If it is lower than this, please contact [email protected] for further advice.
2.4 INITIALISATION
Connect the power supply unit to the power inlet socket on the rear panel of the instrument and connect to the mains socket. Turn the power on at the mains and switch the instrument on using the power switch on the rear of the instrument.
Rotate the accessory to the right to remove.
Detector optic

1315
The instrument will initially check for firmware updates and then perform several power-on tests before displaying the main menu:
Fig 2.2 – Lambda Main Menu
Note: The instrument will return to the last main menu used.
11
Finally disconnect the power and communication cable
from the underside of the accessory PCB.
2.3 ACCESSORY INSTALLATION
The micro volume accessory is installed by reversing the procedure described in Section 2.2.
2.4 INITIALISATION
Connect the power supply unit to the power inlet socket on the rear panel of the instrument and
connect to the mains socket. Turn the power on at the mains and switch the instrument on using the
power switch on the rear of the instrument.
The instrument will initially check for firmware updates and then perform several power-on tests
before displaying the main menu:
Fig 2.2 – Genova Nano Main Menu
16
SECTION 3 – ACCESSOry SETTINGS
3.1 ACCESSING THE MICrO VOLuME ACCESSOry SETTINGS
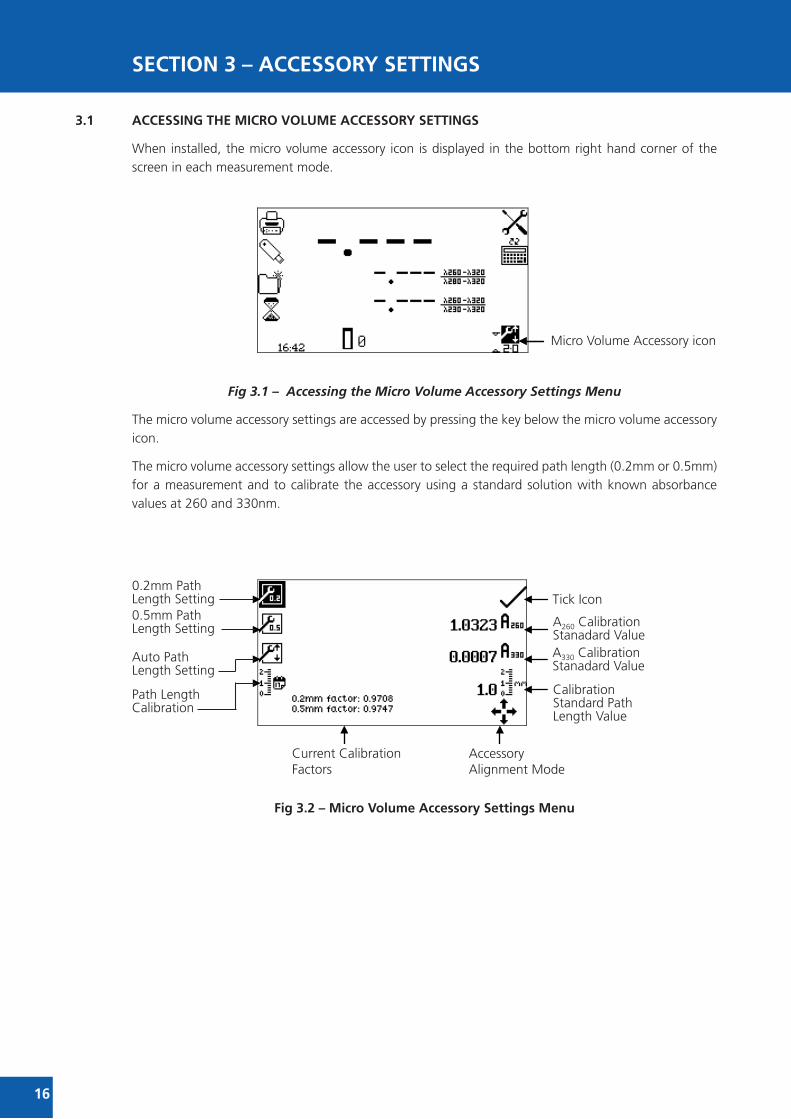
When installed, the micro volume accessory icon is displayed in the bottom right hand corner of the screen in each measurement mode.
Fig 3.1 – Accessing the Micro Volume Accessory Settings Menu
The micro volume accessory settings are accessed by pressing the key below the micro volume accessory icon.
The micro volume accessory settings allow the user to select the required path length (0.2mm or 0.5mm) for a measurement and to calibrate the accessory using a standard solution with known absorbance values at 260 and 330nm.
Fig 3.2 – Micro Volume Accessory Settings Menu
12
SECTION 3 – ACCESSORY SETTINGS
3.1 ACCESSING THE MICRO VOLUME ACCESSORY SETTINGS
When installed, the micro volume accessory icon is displayed in the bottom right hand corner of the
screen in each measurement mode.
The micro volume accessory settings are accessed by pressing the key below the micro volume
accessory icon.
The micro volume accessory settings allow the user to select the required path length for a
measurement and calibrate the accessory using a standard solution with known absorbance values at
260 and 330nm.
Fig 3.1 – Micro Volume Accessory Settings Menu
0.2mm Path Length Setting A260 Calibration
Standard Value
Tick icon
0.5mm Path Length SettingAuto Path Length Setting
Path LengthCalibration
Micro Volume Accessoryicon
Current Calibration Factors
Accessory Alignment Mode
A330 Calibration Standard ValueCalibration Standard Path Length Value
Micro Volume Accessory icon
12
SECTION 3 – ACCESSORY SETTINGS
3.1 ACCESSING THE MICRO VOLUME ACCESSORY SETTINGS
When installed, the micro volume accessory icon is displayed in the bottom right hand corner of the
screen in each measurement mode.
The micro volume accessory settings are accessed by pressing the key below the micro volume
accessory icon.
The micro volume accessory settings allow the user to select the required path length for a
measurement and calibrate the accessory using a standard solution with known absorbance values at
260 and 330nm.
Fig 3.1 – Micro Volume Accessory Settings Menu
0.2mm Path Length Setting A260 Calibration
Standard Value
Tick icon
0.5mm Path Length SettingAuto Path Length Setting
Path LengthCalibration
Micro Volume Accessoryicon
Current Calibration Factors
Accessory Alignment Mode
A330 Calibration Standard ValueCalibration Standard Path Length Value
0.2mm Path Length Setting0.5mm Path Length Setting
Auto Path Length Setting
Path LengthCalibration
Current CalibrationFactors
AccessoryAlignment Mode
Tick Icon
A260 CalibrationStanadard ValueA330 CalibrationStanadard Value
CalibrationStandard Path Length Value

1517
3.2 PATH LENGTH SELECTION
3.2.1 Known Path Length Measurements
If the required measurement path length is known it can be selected by pressing the button adjacent to the 0.2mm or 0.5mm path length setting icons. The selected setting is indicated by an icon with a black background. Once the required path length setting has been selected press the button adjacent to the tick icon to confirm.
3.2.2 unknown Path Length Measurements
If the required measurement path length is not known in selected modes the auto path length setting can be selected by pressing the button adjacent to the auto path length setting icon. Once the auto path length setting has been selected press the button adjacent to the tick icon to confirm.
The auto path length measurement setting will firstly measure a sample using the 0.5mm path length setting. If the measured photometric value is within range, the value will be displayed on screen and no more measurements are taken. If however the measured value is over-range, the sample will be re-measured using the 0.2mm path length setting.
3.2.3 Auto Path Length Availability
Mode Auto path length availability
Photometrics Available
Spectrum, purity scan Not available
Concentration, concentration plus Available
Kinetics Not available
Multi wavelength, multi wavelength plus Available
Quantitation Not available
Protein (quantitative assay modes) Not available
Protein (direct uV) Available
dNA (all modes) Available
Od 600 Available
13
3.2 PATH LENGTH SELECTION
3.2.1 Known Path Length Measurements
If the required measurement path length is known it
can be selected by pressing the button adjacent to
the 0.2mm or 0.5mm path length setting icons. The
selected setting is indicated by an icon with a black
background. Once the required path length setting
has been selected press the button adjacent to the
tick icon to confirm.
3.2.2 Unknown Path Length Measurements
If the required measurement path length is not
known the auto path length setting can be selected
by pressing the button adjacent to the auto path
length setting icon. Once the auto path length setting
has been selected press the button adjacent to the
tick icon to confirm.
The auto path length measurement setting will firstly measure a sample using the 0.5mm path length
setting. If the measured photometric value is within range, the value will be displayed on screen and
no more measurements are taken. If however the measured value is over-range, the sample will be
re-measured using the 0.2mm path length setting.
18
SECTION 4 – PErFOrMING MICrO VOLuME MEASurEMENTS
For detailed descriptions of the measurement modes that are available on the Lambda spectrophotometer please refer to the supplied Lambda operating manual.
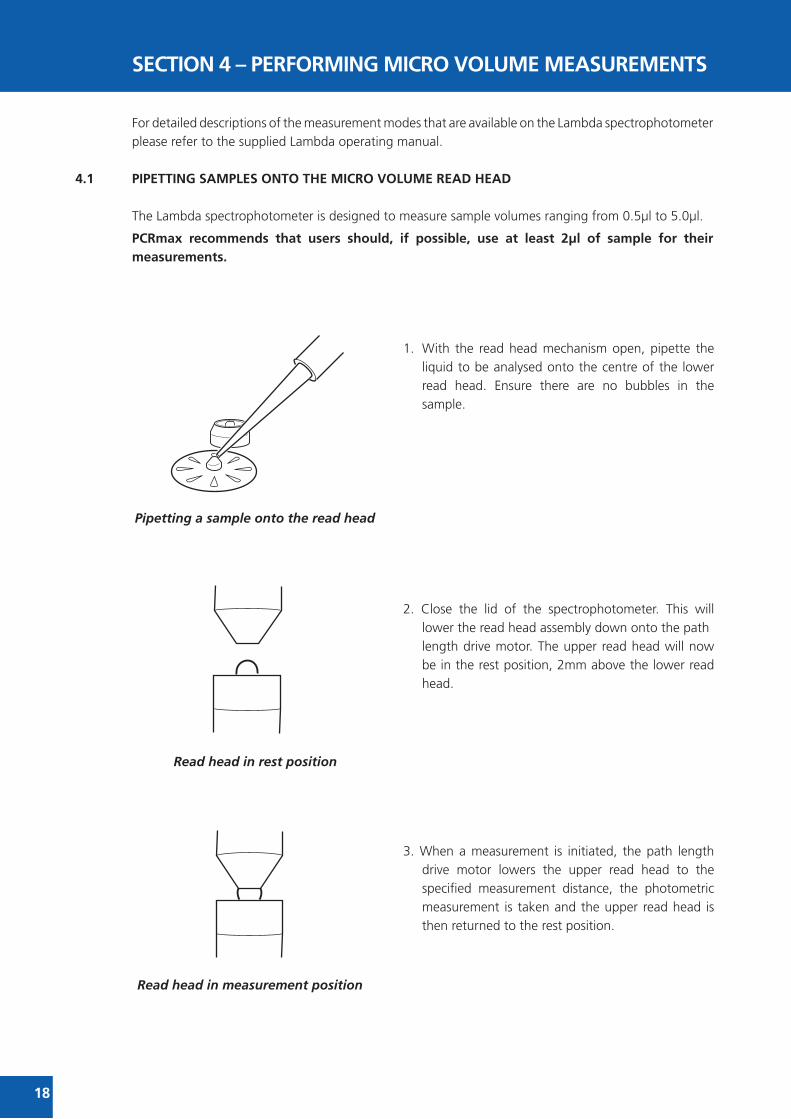
4.1 PIPETTING SAMPLES ONTO THE MICrO VOLuME rEAd HEAd
The Lambda spectrophotometer is designed to measure sample volumes ranging from 0.5μl to 5.0μl.
PCrmax recommends that users should, if possible, use at least 2μl of sample for their measurements.
Pipetting a sample onto the read head
Read head in rest position
1. With the read head mechanism open, pipette the liquid to be analysed onto the centre of the lower read head. Ensure there are no bubbles in the sample.
2. Close the lid of the spectrophotometer. This will lower the read head assembly down onto the path length drive motor. The upper read head will now be in the rest position, 2mm above the lower read head.
3. When a measurement is initiated, the path length drive motor lowers the upper read head to the specified measurement distance, the photometric measurement is taken and the upper read head is then returned to the rest position.
Read head in measurement position

19
4.2 SAMPLE rECOVEry Or rEMOVAL
Once a measurement is complete, the sample solution can be recovered from the lower read head with a suitable pipette or removed from the read heads by cleaning with a suitable lint free cloth.
1. Open the lid of the spectrophotometer. The read head mechanism will open to allow access to the upper and lower read heads.
2. The sample can be recovered by carefully drawing the liquid that is retained on the lower read head into a clean pipette tip.
3. Both read heads should then be wiped with a lint free cloth.
4. More rigorous cleaning may be required after the measurement of high concentration samples or
samples that pose a contamination risk. See section 25 for further details.

20
SECTION 5 – TOP 10 TIPS FOr SAMPLE MEASurEMENT
1. Ensure the read heads are clean. Wipe both the upper and lower read heads with a lint-free cloth wetted with deionised water to remove any residues of previous samples. Dry with a fresh cloth.
2. If a stable droplet does not form, “buff” the read head surfaces by rubbing aggressively with a dry laboratory wipe 30-40 times. This will “re-condition” the surface.
3. Make sure that the sample is well mixed and free of air bubbles or particles. If a bubble is created when pipetting the sample, remove the sample and repeat the application.
4. If possible use at least 2μl of sample for measurement. When measuring at 0.2mm path length, a minimum of 0.5μl can be used.
5. Read each sample droplet only once. The read head moves into a default position after the sample has been measured. This means that if the sample is measured a second time, contact of the droplet with the read heads could be lost and the subsequent reading will not give a valid result.
6. Use a sample of sufficient concentration. Remember that the short path length creates a “virtual dilution” of the sample of 1 in 20 at 0.5mm and 1 in 50 at 0.2mm. This means that a sample which would normally read an absorbance of 1.0 in a standard 10mm cuvette will only give a value of 0.05 at 0.5mm or 0.02 at 0.2mm.
7. To minimise any factors which may interfere with a reading such as sample turbidity or contaminants carried over from sample preparation, it is recommended that a background reading is also made at a second reference wavelength (where the absorbance of the sample is very low and unchanging). In the nucleic acid and protein direct UV modes this option is defaulted to ON at a wavelength of 320nm; this can be deactivated if required.
8. Use the same measurement mode if comparing the concentrations of samples. Different modes use different equations to calculate the final sample concentration.
9. Be aware that when measuring micro volume samples, very small changes in absorbance can lead to much greater differences in calculated concentration values due to the inherent “dilution” factor of the small path length. For example, when measuring dsDNA, an absorbance change of just 0.001 equates to a derived concentration change of 1μg/ml at 0.5mm path length (based on 1 A260 unit of dsDNA = 50μg/ml).
10. PCRmax recommends that the micro volume accessory is calibrated every 6 months A set of calibration solutions are supplied with the Lambda spectrophotometer for this purpose. Full instructions are given in Section 24.

21
SECTION 6 – INTrOduCTION
6.1 INSTruMENT dESCrIPTION
The Lambda is a UV/visible spectrophotometer dedicated to life science analysis. This spectrophotometer allows the measurement of DNA concentrations and purity ratios using wavelengths recorded at 260, 280 and 230nm, with an optional correction at 320nm.The Lambda is pre-programmed with Bradford, Lowry, Biuret, BCA and Direct UV methods for protein analysis. The Lambda has an OD measurement mode enabling users to measure optical density at 600nm for cell harvesting. The purity scan across the entire wavelength range from 198 to 1000nm displays any distorted peaks enabling impurities to be easily identified. This life science spectrophotometer uses icon driven software and has an improved navigation system for easy and intuitive usability. As well as the dedicated life science measurement modes this instrument can also be used as a standard spectrophotometer with measurement modes for photometrics, concentration, multi-wavelength, spectrum scanning, quantitation and kinetics.
6.2 INSTruMENT SPECIFICATION
Lambda
Wavelength
Range 198 to 1000nm Resolution 1nm Accuracy ± 2nm Repeatability ± 0.5nm Spectral bandwidth 5nm
Photometrics Transmittance 0 to 199.9% Absorbance -0.300 to 2.500A Accuracy* ±1%T, ±0.01Abs at 1.000 Absorbance Resolution 0.1%T, 0.001A Stray light* <0.5% at 340nm and 220nm
Concentration/Concentration Plus Range 0 to 9999 Resolution Selectable 1/0.1/0.01/0.001 Calibration Blank with a single standard or factor Units No units, %, ppm, EBC, SRM, mEq/l, mEq, M, mM, μM, nM, U, U/l, U/ml, g/l, mg/l, μg/l, ng/l, g/dl, mg/dl, μg/dl, mg/ml, μg/ml, ng/ml, μg/μl, ng/μl, mol/l, mmol/l, Factor 0.001 to 10000 Standard 0.001 to 1000
Quantitation Range 0 to 9999 Resolution Selectable 1/0.1/0.01/0.001 Calibration Blank with up to 12 standards
*Assessment must be performed with a 10 x 10mm path length cuvette holder installed.
2022
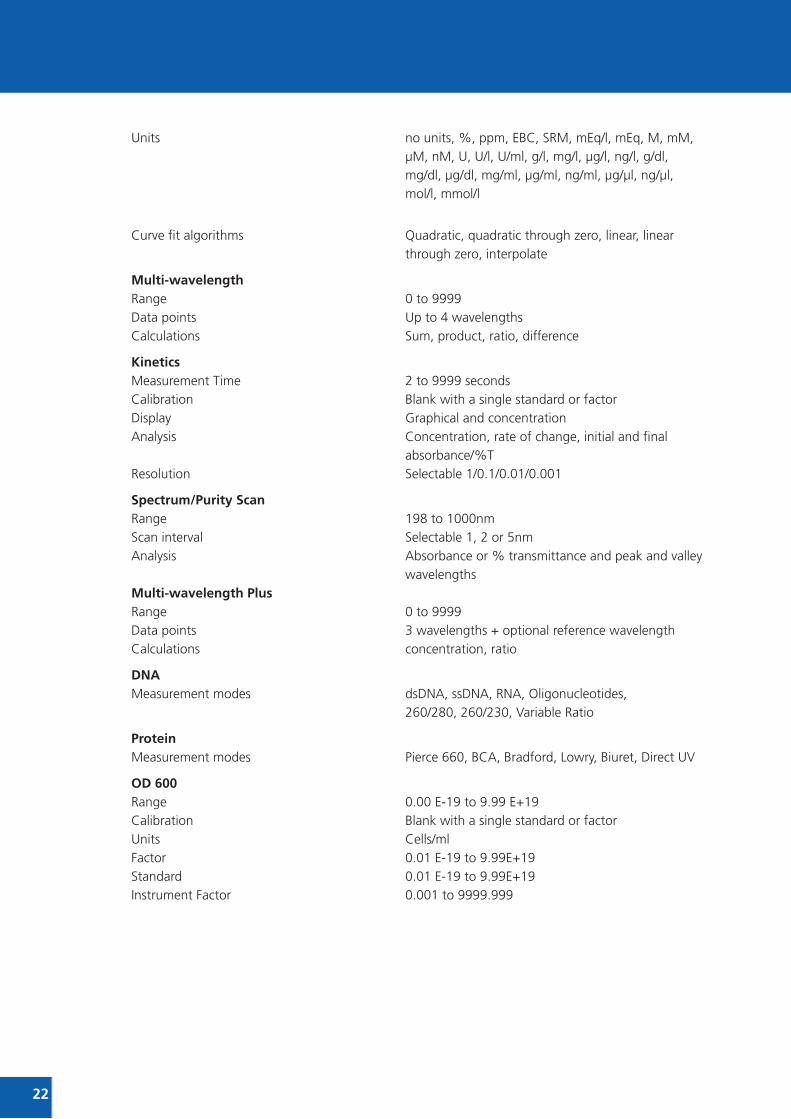
Curve fit algorithms Quadratic, quadratic through zero, linear, linear through zero, interpolate
Multi-wavelength Range 0 to 9999 Data points Up to 4 wavelengths Calculations Sum, product, ratio, difference
Kinetics Measurement Time 2 to 9999 seconds Calibration Blank with a single standard or factor Display Graphical and concentration Analysis Concentration, rate of change, initial and final absorbance/%T Resolution Selectable 1/0.1/0.01/0.001
Spectrum/Purity Scan Range 198 to 1000nm Scan interval Selectable 1, 2 or 5nm Analysis Absorbance or % transmittance and peak and valley wavelengths Multi-wavelength Plus Range 0 to 9999 Data points 3 wavelengths + optional reference wavelength Calculations concentration, ratio
dNA Measurement modes dsDNA, ssDNA, RNA, Oligonucleotides, 260/280, 260/230, Variable Ratio
Protein Measurement modes Pierce 660, BCA, Bradford, Lowry, Biuret, Direct UV
Od 600 Range 0.00 E-19 to 9.99 E+19 Calibration Blank with a single standard or factor Units Cells/ml Factor 0.01 E-19 to 9.99E+19 Standard 0.01 E-19 to 9.99E+19 Instrument Factor 0.001 to 9999.999
Units no units, %, ppm, EBC, SRM, mEq/l, mEq, M, mM, μM, nM, U, U/l, U/ml, g/l, mg/l, μg/l, ng/l, g/dl, mg/dl, μg/dl, mg/ml, μg/ml, ng/ml, μg/μl, ng/μl, mol/l, mmol/l

Other Beam height 15mm Light source Xenon lamp GLP Current time and date, user ID, settings lock and method lock Number of users 999 Methods memory 312 (including pre-programmed methods) Results memory Limited by attached mass storage device Removable media USB (supplied) Outputs USB, Analogue, RS232, Internal printer Power 24V Size (w x d x h) 275 x 400 x 220mm Weight 6kg
23
222024
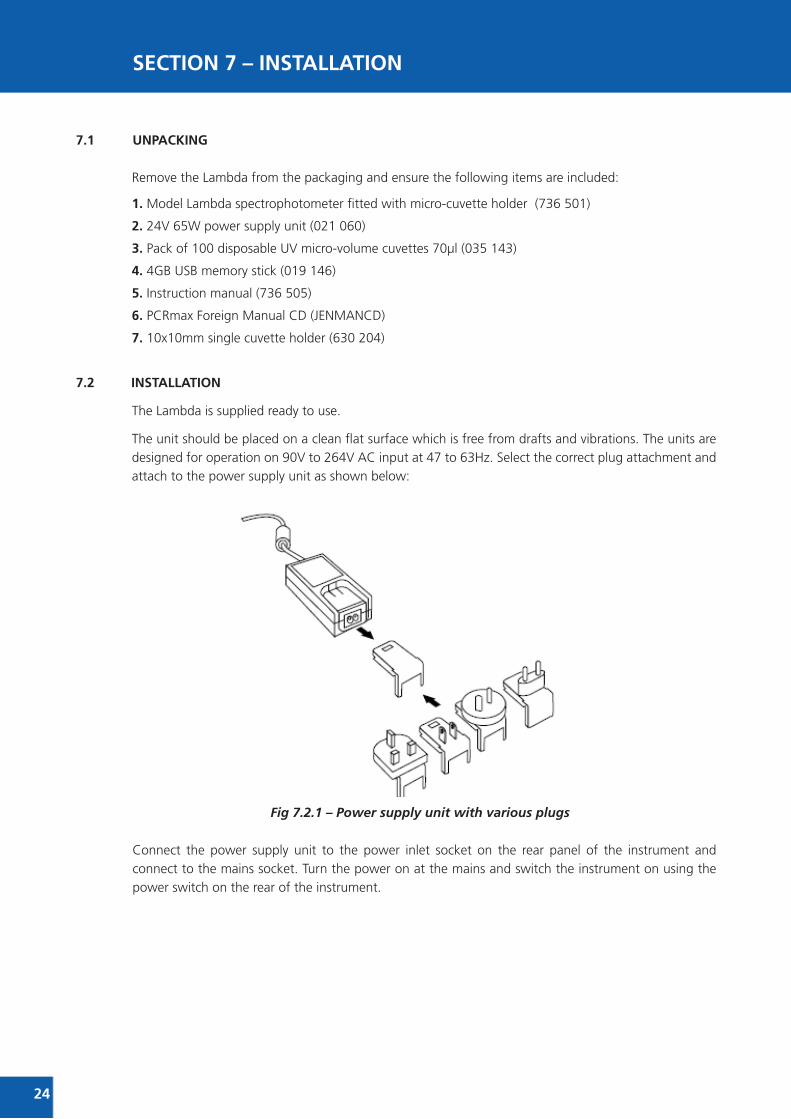
SECTION 7 – INSTALLATION
7.1 uNPACKING
Remove the Lambda from the packaging and ensure the following items are included:
1. Model Lambda spectrophotometer fitted with micro-cuvette holder (736 501)
2. 24V 65W power supply unit (021 060)
3. Pack of 100 disposable UV micro-volume cuvettes 70μl (035 143)
4. 4GB USB memory stick (019 146)
5. Instruction manual (736 505)
6. PCRmax Foreign Manual CD (JENMANCD)
7. 10x10mm single cuvette holder (630 204)
7.2 INSTALLATION
The Lambda is supplied ready to use.
The unit should be placed on a clean flat surface which is free from drafts and vibrations. The units are designed for operation on 90V to 264V AC input at 47 to 63Hz. Select the correct plug attachment and attach to the power supply unit as shown below:
Fig 7.2.1 – Power supply unit with various plugs
Connect the power supply unit to the power inlet socket on the rear panel of the instrument and connect to the mains socket. Turn the power on at the mains and switch the instrument on using the power switch on the rear of the instrument.

The instrument will initially check for firmware updates (Section 31.3) and then perform several power-on tests before displaying the main menu:
Fig 7.2.2 – All Power On Tests Complete
1. Instrument check – ensures the validity of the saved parameters
2. Dark test
3. Checks for the accessory fitted. If an active accessory is found the instrument verifies communication and response
4. Self calibration of wavelengths
5. Checks communication between USB memory stick port and the instrument
7.3 dISPLAy
The instrument has a dot matrix display which enables icons and graphs to be displayed clearly. Following successful completion of the power on tests the main menu screen will be displayed:
Fig. 7.3.1 – Display
1
2
3
4
5
25
Life Science/Spectrophotometer menu options
1. Purity/Spectrum measurement mode
2. Concentration plus/Concentration measurement mode
3. Back key
4. Time and date toggle and settings
5. Multi-wavelength plus/Multi-wavelength measurement mode
6. Toggle between Life Science and Spectrophotometer modes
7. Protein/Photometrics measurement mode
8. Instrument settings menu
9. DNA/Quantitation measurement mode
10. OD 600/Kinetics measurement mode
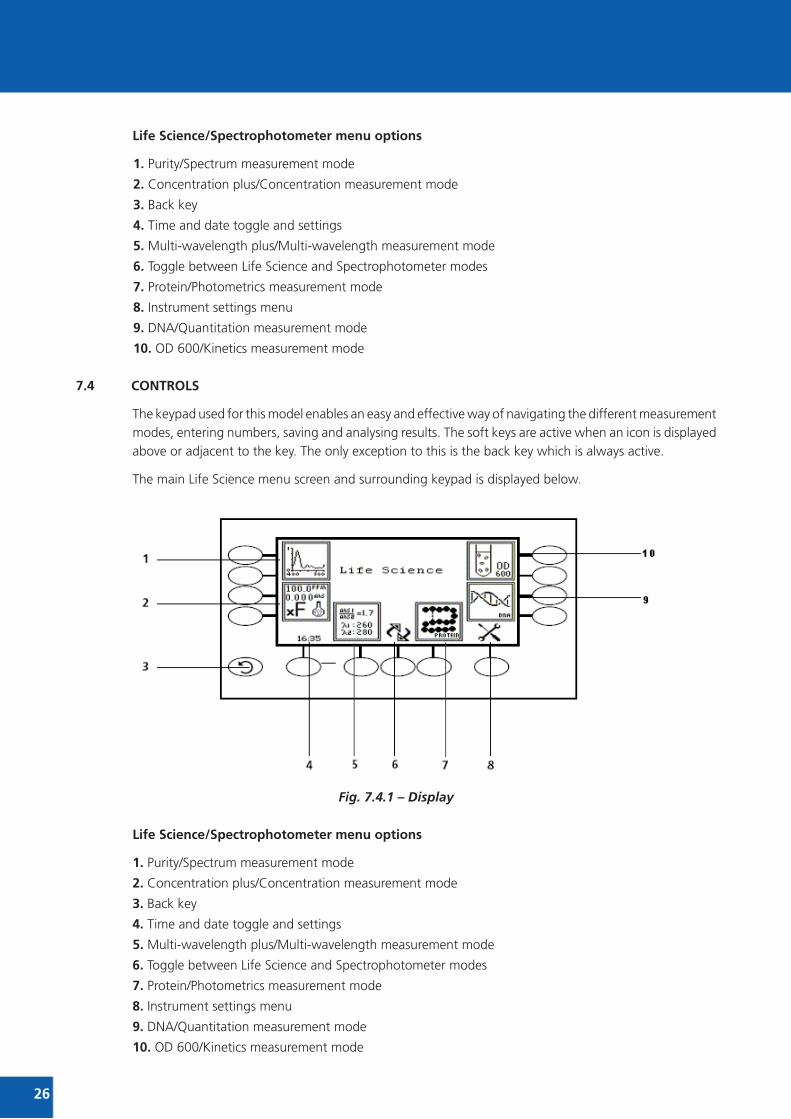
7.4 CONTrOLS
The keypad used for this model enables an easy and effective way of navigating the different measurement modes, entering numbers, saving and analysing results. The soft keys are active when an icon is displayed above or adjacent to the key. The only exception to this is the back key which is always active.
The main Life Science menu screen and surrounding keypad is displayed below.
Fig. 7.4.1 – Display
Life Science/Spectrophotometer menu options
1. Purity/Spectrum measurement mode
2. Concentration plus/Concentration measurement mode
3. Back key
4. Time and date toggle and settings
5. Multi-wavelength plus/Multi-wavelength measurement mode
6. Toggle between Life Science and Spectrophotometer modes
7. Protein/Photometrics measurement mode
8. Instrument settings menu
9. DNA/Quantitation measurement mode
10. OD 600/Kinetics measurement mode
222026

27
7.5 rEAr PANEL
The image below shows the rear panel on the instrument:
Fig. 7.5.1 – Rear Panel
1. Lamp access panel Allows access to lamp when replacement is necessary 2. Power switch On/off switch for the unit3. Power in socket Connection socket for power supply unit4. RS232 serial port Connection to a PC or external serial printer5. Output sockets Analogue output
7.6 FrONT PANEL
The image below shows the front panel of the instrument:
Fig. 7.6.1 – Front Panel
1. Integral printer (optional accessory) 4. Instrument lid 2. Keypad 5. Display3. USB memory stick slot
1
5
4
3
2

26222028
SECTION 8 – SPECTrOSCOPy MEASurEMENTS
8.1 THEOry OF SPECTrOSCOPy MEASurEMENT
UV-visible spectroscopy is the measurement of the absorbance of light at a specific wavelength in a sample. This is used to identify the presence and concentration of molecular entities within the sample. The Beer-Lambert law is used to relate the absorption of light to the properties of the sample through which the light is travelling through. The Beer-Lambert law states that:
A is the absorbance
is the molar absorption coefficient (l mol-1cm-1)
c is the concentration (mol l-1)
l is the path length (cm)
This law shows that absorbance is linear to concentration but this is only true for low concentrations. For absorbance levels above 3 the concentration starts to move away from the linear relationship.
Transmittance is the proportion of the light which passes through the sample:
Therefore: T = It Absorbance is inversely related to transmittance:
Io A = log 1
T
8.2 NuCLEIC ACId dETErMINATION
DNA, RNA and oligonucleotides can be measured directly in aqueous solutions in a diluted or undiluted form. Aqueous buffers with low ion concentrations (e.g. TE buffer) are ideal for this method. The concentration is commonly determined by measuring at 260nm against a blank and then evaluating against a factor.
The Lambda has pre-defined methods installed which assume that absorption of 1 OD (A) is equivalent to approximately: 50μg/ml dsDNA, 37μg/ml ssDNA, 40μg/ml RNA and 30μg/ml for oligonucleotides.
DNA interference by contaminants can be assessed by the calculation of an absorption ratio. The ratios A260/A280 and A260/A230 are used to estimate the purity of nucleic acids, since proteins absorb at 280nm and substances such as peptides, phenols, aromatic compounds or carbohydrates absorb at 230nm. Pure DNA should have an A260/A280 ratio of approximately 1.8 and pure RNA 2.0. In pure nucleic acid samples the A260/A230 ratio should be approximately 2.2.
Nucleic acid concentration can also be estimated with the following calculations:
Conc (μg/ml) = (Abs@260nm x 62.9) - (Abs@280nm x 36.0) Conc (μg/ml) = (Abs@260nm x 49.1) - (Abs@230nm x 3.48)
Referring to a blank value where no absorption should occur is commonly required. On the Lambda the default reference wavelength is 320nm and the user can include the measured absorbance value in all nucleic acid calculations. The default wavelength can be modified from 320nm if required.
Io It
Where:
Io is the incident light
lt is the transmitted light
L is the path length
L

2729
8.3 SPECTrOSCOPy MEASurEMENT
There are four main components of a spectrophotometer. These are a light source to emit a high and constant amount of energy over the full wavelength range; a method for separating the light into discreet wavelengths; a sample holder and a light detector.
The optical layout of the Lambda spectrophotometer is shown below:
Figure 8.3.1 – diagram of light path
The light from the pre-aligned xenon lamp is focused onto the grating, with 1200 lines per millimeter, which separates the light into discrete wavelengths. The diffracted spectrum of light then passes through a further slit and lens arrangement before passing through the sample in the sample chamber from left to right. The light which is not absorbed by the sample is transmitted through a collecting lens and onto the signal detector. The photo-diode detector used is mounted directly onto the detector PCB and the output is used to calculate the % transmittance. The result is displayed either as % transmittance or absorbance on the instrument display.

28
8.4 GOOd PrACTICE GuIdELINES
1. For optimum performance all spectrophotometers should be sited in a clean, dry, dust free atmosphere. When in use ambient temperature and light levels should remain as constant as possible.
2. If required adherence to Standard Operating Procedures (SOP) and Good Laboratory Practice (GLP) should be monitored with regular calibration checks and a suitable Quality Control (QC) programme.
3. The sample chamber lid must be fully closed during measurement and before any readings are recorded or printed.
4. The correct selection of sample containers is imperative for accurate and reproducible results:
a) Check that the material of the sample container is compatible with the wavelengths to be used for measurement. In general glass can only be used down to 360nm or 320nm depending on quality. Standard plastic cuvettes can be used down to 320nm. Special UV versions can be used down to 260nm. Below this level quartz cuvettes must be used.
b) Plastic disposable cuvettes should only be used ONCE.
c) Glass cuvettes should be thoroughly cleaned after use. Discard when scratches become evident on optical surfaces.
d) Care should be taken when selecting semi-micro or micro cuvettes. The cuvette window on the inner chamber (the area filled with sample) must be wider than the aperture in the sample holder or light will reach the detector without passing through the sample. In this case, semi-micro or micro cuvettes with self-screening black surrounds must be used or, alternative holders for these cuvettes should be used.
e) Glass test tubes and other sample tubes should be used with care. Where possible, matched tubes should be used and any index mark set to the correct position before measurements are made.
f) Ensure any sample containers used are compatible with the constituents of both the samples and standards they are to hold. Plastic cuvettes are not compatible with organic solvents.
g) All sample containers must be handled with care; by the top, bottom and non-optical surfaces only. Any finger marks evident must be removed by a suitable cleaning process.
h) Flow-through cuvettes must be selected with care and consideration for the sample type, sample volume, pumping system, rinse, sample and waste handling to be used.
5. Samples and standards should not be stored in open cuvettes or sample containers as evaporation will change the value and lead to staining of the walls which may be irreversible. If stored in stoppered and sealed cuvettes, they should be filled with little or no air space and the values regularly checked against a reference standard or quality control material.
6. Samples should be allowed to equilibrate to ambient temperature before measurement (unless a suitable temperature controlled sample holder is in use). Temperature change during measurement may cause air bubbles to form on the walls of the sample holder. This is a common cause of drift during measurement.
7. In the preparation of samples and standards high grade borosilicate glass and AR grade chemicals and reagents must be used. Good quality deionised water or other suitable solvents must be used for dissolving or diluting samples, chemicals and reagents.
26222030

29
8. All measurements require calibration to a blank, for maximum accuracy this should be prepared with care using the same deionised water or solvent used for dissolving or diluting the sample. Where reagents are added to the sample to produce a colour proportional to its concentration a ‘sample based’ blank should be used. In this case the blank should consist of all reagents or chemicals to be used, except the sample which will produce the colour to be measured.
9. Deviations from the Beer-Lambert Law may occur at high and low concentrations giving non-linear response during sample concentration measurements. For all new methods a linear range should be defined by the preparation of a calibration curve. The quantitation mode may be used to construct such a curve against which sample results are automatically measured.
10. Cuvettes and sample holders must be filled to a minimum level which covers the light path. All PCRmax spectrophotometers have a beam height of 15mm.
11. The instrument must be calibrated to zero absorbance/100% transmittance prior to taking readings. In the spectrum measurement mode a baseline scan must be performed before performing a sample scan.
2731
2826222032
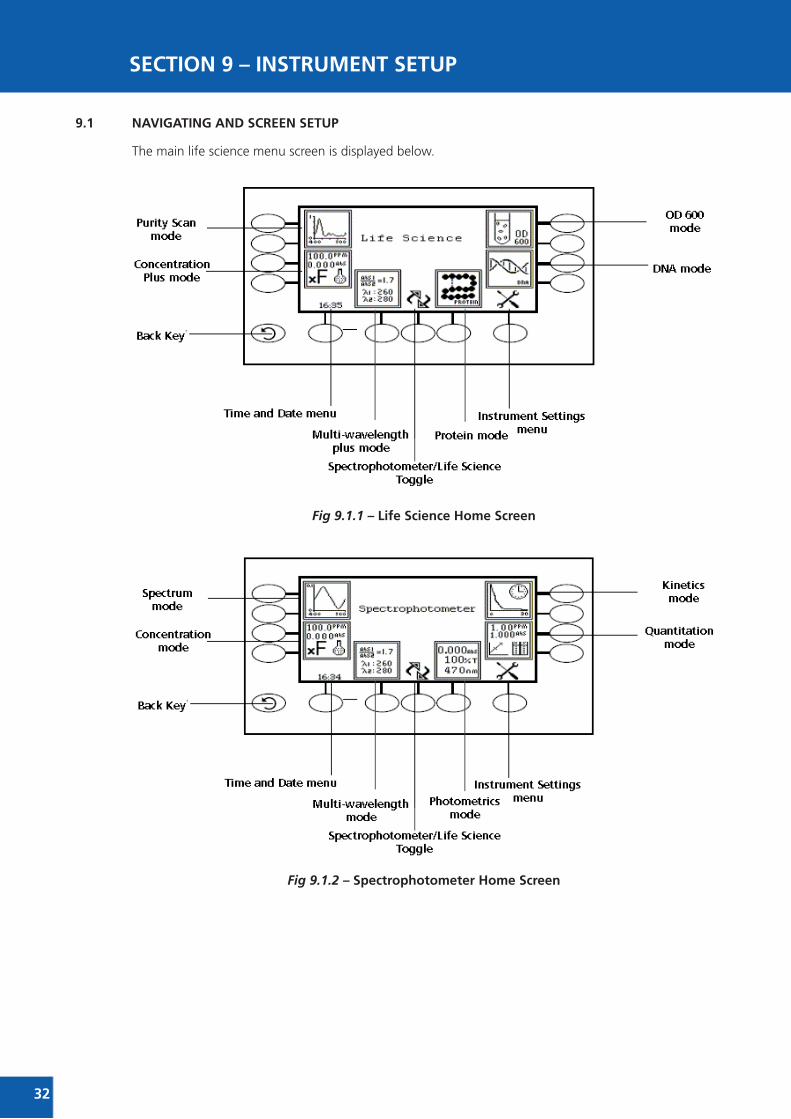
SECTION 9 – INSTruMENT SETuP
9.1 NAVIGATING ANd SCrEEN SETuP
The main life science menu screen is displayed below.
Fig 9.1.1 – Life Science Home Screen
Fig 9.1.2 – Spectrophotometer Home Screen

292733
To navigate around the spectrophotometer screen press the soft keys adjacent to icons displayed on the screen. There is a back key which returns to the previous menu without saving any changes.
The main menu screens provide access to all measurement modes, the time and date menu and the instrument settings menu. The measurement modes are specific to each of the instrument’s two home screens. The life science home screen gives access to the purity scan, concentration plus, multi-wavelength plus, protein, DNA and OD 600 modes, whereas the spectrophotometer home screen gives access to the spectrum, photometrics, quantitation, concentration, multi-wavelength and kinetics modes. The instrument settings menu enables access to settings lock, security codes, method lock, mode selection, user ID and screen contrast menus.
When a measurement mode is opened the operating
menu enables changes to measurement parameters
and settings to be made. Depending on the mode, the
measurement parameters can be accessed through the
settings menu which is displayed in the top right hand
corner of the screen. The only mode where this function
is not available is the photometrics mode; instead a toggle
icon is displayed which is used to change the primary and
secondary displays. The DNA and protein modes require
the user to initially select a method before the operating
menu option is available.
The utility toolbar is displayed on the left hand side of the operating menu and provides the same
functions in all of the measurement modes. This toolbar enables access to printing, print setup options,
opening, saving and deleting results and methods and autologging options. For more details on the
different functions of the utility toolbar refer to section 22.
9.2 TIME ANd dATE
The time and date menu enables the current time and date
to be set. This information will be saved on all results and
displayed on printouts. The time and date menu can be
accessed from the main menu by holding the key below
the time and date icon for 2 seconds. Pressing the key
once cycles the display between time and date.
In the time and date menu to set the time press the key
adjacent to the clock icon. Select the digit to be changed
using the keys at the bottom of the screen. Use the keys
adjacent to the arrow icons to increase or decrease the
number. The clock function uses a 24 hour format.
Operating Menu(Photometrics measurement mode)

In the time and date menu to set the date press the
key adjacent to the calendar icon. Select the digit to be
changed using the keys at the bottom of the screen.
Use the keys adjacent to the arrow icons to increase or
decrease the number. The date format can be displayed as
either European dd/mm/yy or American mm/dd/yy.
To change between the two formats press the key below
the toggle icon. Once the current time and date have
been set press the key adjacent to the tick icon to save the
changes. To exit this menu without saving any changes
press the back key and the screen will return to the main
menu.
2826222034
9.3 INSTruMENT SETTINGS MENu
The instrument settings menu is accessed by pressing the key below the instrument settings icon in the
main menu. This menu enables access to settings lock, security code, method lock, mode selection, user
ID and screen contrast menus. The tick icon saves any changes made and returns to the main menu.
Fig 9.3.1 - Settings Menu
9.4 SECurITy ANd SETTING PASSWOrdS
9.4.1 Setting Security Codes
The security code function enables a security code to
be set to lock the instrument settings and measurement
mode settings. The security code is not specific to the user
ID but is designed to enable an administrator to control
either the instrument or protocols. The security code menu
is accessed through the instrument settings menu.
In the instrument settings menu press the key adjacent
to the security code icon. Using the keys at the bottom
of the screen select the digit to be changed. Use the keys
adjacent to the arrow icons to increase or decrease the
selected number. Once the preferred code has been set
press the key adjacent to the tick icon to save the security
code.
Settings lock
Security code
Method lock
Mode selection
Tick icon
User ID
Screen contrast

9.4.2 Settings lock
The settings lock function enables the instrument and measurement mode settings to be locked to
prevent any changes to the measurement parameters or instrument settings. The only exceptions to this
are that the user ID and contrast can be changed when the settings lock is active.
The settings lock function is accessed through the
instrument settings menu by pressing the key adjacent to
the open padlock icon. One press will lock the settings
instantly. To unlock the settings press the key again.
This will open the security code menu as detailed in
section 9.4.1. The previously set security code must
be entered to unlock the settings. When the settings
lock is active methods can still be opened, deleted and
saved but the method parameters cannot be changed.
To enter the security code, use the keys at the bottom of
the screen to select the digit to be changed. Use the keys
adjacent to the arrow icons to increase or decrease the
selected number. Once the correct security code has been
entered press the key adjacent to the tick icon. The settings
are now unlocked.
If the settings are locked before the security code has been set a default code of 660 will unlock the
settings.
9.4.3 Method Lock
When the method lock is active the method selection
menu is disabled in all the measurement modes therefore
methods cannot be opened, deleted or saved. However the
measurement parameters of the currently loaded method
can be changed. The method lock function is accessed
through the instrument settings menu by pressing the
key adjacent to the method lock icon. One press will lock
the methods instantly. To unlock the methods press the
key adjacent to the method lock icon again. The methods are now unlocked. If the settings lock is active
this must be disabled before the method lock can be activated or deactivated.
In all the measurement modes if a user tries to save changes to a method when the method lock is active
the padlock icon flashes on the screen and changes cannot be saved.
292735

9.5 MOdE SELECTION
The mode selection function enables access to the various
measurement modes to be restricted. The required modes
can be selected and the settings lock activated to prevent
other users from accessing the deactivated modes. The
mode selection function can be accessed through the
instrument settings menu by pressing the key adjacent to
the mode selection icon. The measurement mode icons
which are displayed on the main menu are identified with a
mode shown icon. The mode icons which are not displayed
on the main menu are identified with a mode not shown
icon. To change a mode from displayed to restricted or vice
versa press the key adjacent to the measurement mode
icon. Once the required modes have been selected press
the key adjacent to the tick icon to save the changes. The
selected measurement modes will be displayed on the
main menu.
The same procedure can be used to restrict the mode
access in the spectrophotometer home screen.
2826222036
9.6 GLP SETTINGS
In addition to the time and date settings this instrument also has a user ID function. This function enables
an individual three digit ID number to be set. This will be displayed on all printouts and saved results.
The user ID function can be accessed through the
instrument settings menu by pressing the key adjacent to
the user ID icon. Use the keys at the bottom of the screen
to select the digit to be changed. Use the keys adjacent to
the arrow icons to increase or decrease the number. Once
the preferred user ID has been set press the key adjacent to
the tick icon to save and return to the instrument settings
menu.
9.7 SCrEEN CONTrAST
The screen contrast function enables the brightness of the
screen to be set. In the instrument settings menu press
the key adjacent to the screen contrast icon. Use the
keys below the arrow icons to increase or decrease the
screen contrast. Once the required contrast level has been
reached press the key adjacent to the tick icon to save and
return to the instrument settings menu.

292737
SECTION 10 – PHOTOMETrICS
The photometrics measurement mode enables simple measurements of absorbance and % transmittance to be performed. The sample is measured at one wavelength and at one point in time. There are no post measurement calculations available in this measurement mode.
10.1 MOdE SPECIFIC PArAMETErS
The photometrics operating menu enables measurement
parameters to be changed. The utility toolbar on the left
hand side of the screen enables access to printing, print
setup options, results, methods and autologging options.
For more details on the different functions of the utility
toolbar refer to section 22.
Fig 10.1.1 - Operating Menu
10.2 METHOd SET uP
This measurement mode is very simple and the only
parameters which can be adjusted are the wavelength and
the display format.
The toggle icon enables the large primary display to be set
to show the absorbance or % transmittance.
To change the primary and secondary displays press the
key adjacent to the toggle icon. Repeat presses will cycle
the display between absorbance and % transmittance.
10.2.1 Selecting a Wavelength
The wavelength can be adjusted by using the keys adjacent to the arrow icons to increase or decrease the wavelength. Once the required wavelength has been selected a calibration can be performed.
Operating Menu
Print/print settings
Results selection menu
Method selection menu
Autolog menu
Calibrate to zero
Measure sample
Toggle
Increase wavelength
Decrease wavelength

2826222038
10.3 CALIBrATION
The calibration must be performed at the same wavelength
at which the sample will be measured. Insert a cuvette
containing the blank solution into the sample chamber and
close the instrument lid. Press the key below the calibrate
to zero absorbance icon. This sets the instrument to zero
absorbance and 100% transmittance.
Once the calibration is complete the measure sample icon appears and the sample can be measured. If the
wavelength is adjusted before a sample is measured the measure sample icon will disappear and the instrument
must be calibrated again at the new wavelength.
10.4 SAMPLE MEASurEMENT
It is not possible to measure a sample before the instrument
has been calibrated at the selected wavelength. Once the
calibration has been performed the measure sample icon
is displayed and a sample can be measured. Remove the
cuvette containing the blank solution and place a cuvette
containing the sample to be measured in the sample
holder. Close the instrument lid and press the key below the
measure sample icon. Once the measurement is complete
the photometric result will be shown on the screen.
Subsequent samples can be measured in the same way. If the wavelength is adjusted between sample
measurements then the instrument must be calibrated again before more samples can be measured.

292739
SECTION 11 – CONCENTrATION
Operating Menu
The concentration measurement mode enables simple measurements of absorbance and concentration to be performed. In this measurement mode it is possible to calibrate against a standard of a known concentration or use a known factor. The sample is measured at one wavelength at one point in time. There are no post measurement calculations available in this measurement mode.
11.1 MOdE SPECIFIC PArAMETErS
The concentration operating menu enables measurement
parameters to be changed. The utility toolbar on the left
hand side of the screen enables access to printing, print
setup options, results, methods and autologging options.
For more details on the different functions of the utility
toolbar refer to section 22. The settings icon enables the
wavelength, units, resolution, standard or factor to be
set.
Fig 11.1.1 - Operating Menu
11.2 METHOd SETuP
11.2.1 Selecting a Wavelength
The wavelength can be adjusted in the operating menu
or in the settings menu. To adjust the wavelength, in the
operating menu, use the keys adjacent to the arrow icons
to increase or decrease the wavelength.
The settings menu is accessed through the operating menu
by pressing the key adjacent to the settings icon. In the
settings menu press the key below the wavelength icon.
Print/print settings
Results selection menu
Method selection menu
Autolog menu
Calibrate to zero or standard
Measure to factor
Settings
Increase wavelength
Decrease wavelength
2826222040
This will open a number entry screen. Use the keys at the
bottom of the screen to select the digit to be adjusted.
Use the keys adjacent to the arrow icons to increase or
decrease the wavelength to the required number. Press
the key adjacent to the tick icon to save the changes and
return to the settings menu.
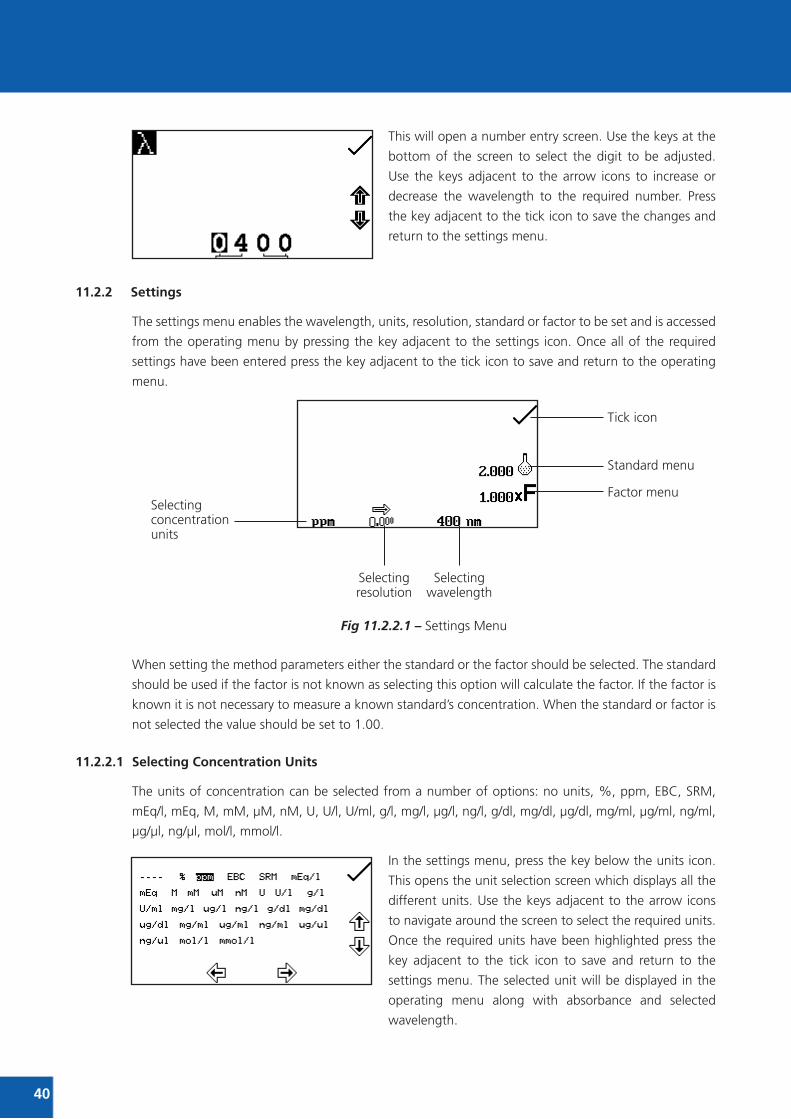
11.2.2 Settings
The settings menu enables the wavelength, units, resolution, standard or factor to be set and is accessed
from the operating menu by pressing the key adjacent to the settings icon. Once all of the required
settings have been entered press the key adjacent to the tick icon to save and return to the operating
menu.
Fig 11.2.2.1 – Settings Menu
When setting the method parameters either the standard or the factor should be selected. The standard
should be used if the factor is not known as selecting this option will calculate the factor. If the factor is
known it is not necessary to measure a known standard’s concentration. When the standard or factor is
not selected the value should be set to 1.00.
11.2.2.1 Selecting Concentration units
The units of concentration can be selected from a number of options: no units, %, ppm, EBC, SRM,
mEq/l, mEq, M, mM, μM, nM, U, U/l, U/ml, g/l, mg/l, μg/l, ng/l, g/dl, mg/dl, μg/dl, mg/ml, μg/ml, ng/ml,
μg/μl, ng/μl, mol/l, mmol/l.
In the settings menu, press the key below the units icon.
This opens the unit selection screen which displays all the
different units. Use the keys adjacent to the arrow icons
to navigate around the screen to select the required units.
Once the required units have been highlighted press the
key adjacent to the tick icon to save and return to the
settings menu. The selected unit will be displayed in the
operating menu along with absorbance and selected
wavelength.
Selecting concentration units
Selectingresolution
Selecting wavelength
Tick icon
Standard menu
Factor menu

39
11.2.2.2 Changing the resolution
The resolution that the concentration is displayed as can be selected from 1, 0.1, 0.01 or 0.001 by repeat presses of the key below the resolution icon in the settings menu.
11.2.2.3 using a Standard
The standard menu enables the value of a standard to
be entered. This function is accessed by pressing the key
adjacent to the standard icon. This opens the extended
number entry screen. Use the keys at the bottom of the
screen to select the digit to be changed. The key below the
digits must be pressed twice to select the adjacent digit.
For example 00 the first press of the key alters 10, the second press alters 01. Use the keys adjacent to
the arrow icons to increase or decrease the selected number. Standard values from 0.001 to 1000 can be
entered. The standard value can be reset to one by pressing the key adjacent to the 001 icon. Once the
standard value has been entered press the key adjacent to the tick icon to save and return to the settings
menu. The entered value is displayed in the settings menu adjacent to the standard icon.
A standard value should only be entered if the factor is not known. If the factor is known the standard
value should be set to 1.000.
11.2.2.4 using a Factor
The factor menu enables a factor to be entered. This
function is accessed by pressing the key adjacent to the
factor icon. This opens the extended number entry screen.
Use the keys at the bottom of the screen to select the digit
to be changed. The key below the digits must be pressed
twice to select the adjacent digit.
For example 00 the first press of the key alters 10, the second press alters 01. Use the keys adjacent to
the arrow icons to increase or decrease the selected number. Factor values of 0.001 to 10,000 can be
entered. The factor value can be reset to one by pressing the key adjacent to the 001 icon. Once the
factor has been entered press the key adjacent to the tick icon to save and return to the settings menu.
The entered value is displayed in the settings menu adjacent to the factor icon.
If the factor is not known a standard should be measured in order to calculate the factor. If a standard is
used the factor value should be set to 1.000.
292741

11.3 CALIBrATION
In the concentration measurement mode calibrations
against a standard or a factor can be performed following
a zero calibration. If the factor is not known calibration
against a known standard is performed in order to calculate
the factor. However if the factor is known there is no need
to calibrate using a standard.
The calibration must be performed at the same wavelength at which the sample will be measured.
11.3.1 Calibrating to a Standard
Insert a cuvette containing the blank solution into the sample chamber and close the instrument lid. Press
the key below the calibrate to zero absorbance icon. The instrument will calibrate to zero absorbance.
Insert a cuvette containing the standard concentration sample solution into the sample chamber and
close the instrument lid.
Press the key below the calibrate to zero absorbance or
standard icon, this will open another menu with the option
to re-calibrate to zero absorbance or to calibrate to the
previously entered standard value. Press the key adjacent
to the calibrate to standard icon.
If the standard selected requires a factor beyond the
range of the instrument the check standard icon will be
displayed.
The instrument will take a reading and calibrate to the
standard concentration. Once the calibration is complete
the sample can be measured using the measure to standard
icon.
11.3.2 Calibrating to a Factor
Insert a cuvette containing the blank solution into the
sample chamber and close the instrument lid. Press the
key below the calibrate to zero absorbance icon. The
instrument will calibrate to zero absorbance. Once the
calibration is complete the sample can be measured using
the measure to factor icon.
2826222042

4139292743
11.4 SAMPLE MEASurEMENT
It is not possible to perform sample measurements before the instrument has been calibrated at the selected wavelength. In this operating mode the type of sample measurement performed depends on the calibration which has been carried out.
11.4.1 Measuring a Sample After Calibrating to a Standard
Remove the cuvette containing the standard sample and
place a cuvette containing the sample to be measured
in the sample chamber. Close the instrument lid and
press the key below the measure to standard icon. Once
the measurement is complete the concentration and
absorbance values are displayed.
11.4.2 Measuring a Sample After Calibrating to a Factor
Remove the cuvette containing the blank solution and place
a cuvette containing the sample to be measured in the
sample chamber. Close the instrument lid and press the key
below the measure to factor icon. Once the measurement
is complete the concentration and absorbance values are
displayed.
In order to measure a sample based on a known factor the value for the factor must be entered in the
settings menu before commencing measurement of the sample.

2826222044
SECTION 12 – SPECTruM
The spectrum measurement mode enables measurements of absorbance or % transmittance over a range of wavelengths to be performed. The absorbance or % transmittance at each wavelength is plotted graphically. Post measurement tools such as peaks and valleys analysis and spectral points analysis can be performed. This operating mode can be used to partially characterise a sample.
12.1 MOdE SPECIFIC PArAMETErS
The spectrum operating menu enables measurement
parameters to be changed. The utility toolbar on the left
hand side of the screen enables access to printing, print
setup options, results, methods and autologging options.
For more details on the different functions of the utility
toolbar refer to section 22.
The scan settings icon enables the graph y-axis, absorbance or % transmittance operating mode, start
and end wavelengths and scan interval to be set. The peaks and valleys threshold icon enables the peaks
and valleys threshold to be set. The peaks and valleys table icon enables the peaks and valleys of the
scan to be viewed in tabular form. The spectral points analysis icon enables points to be selected from
the scan for post measurement analysis.
Fig 12.1.1 - Operating Menu – Post Measurement
12.2 METHOd SETuP
In this measurement mode all of the method setup
parameters are accessed through the scan settings menu.
To open the scan settings menu press the key adjacent to
the scan settings icon in the operating menu.
Operating Menu
Print/print settings
Results selection menu
Methods selection menu
Autolog menu
Baselinescan
Scan sample
Scan settings
Peaks and valleys threshold
Peaks and valleys table
Peaks and valleys threshold
4139292745
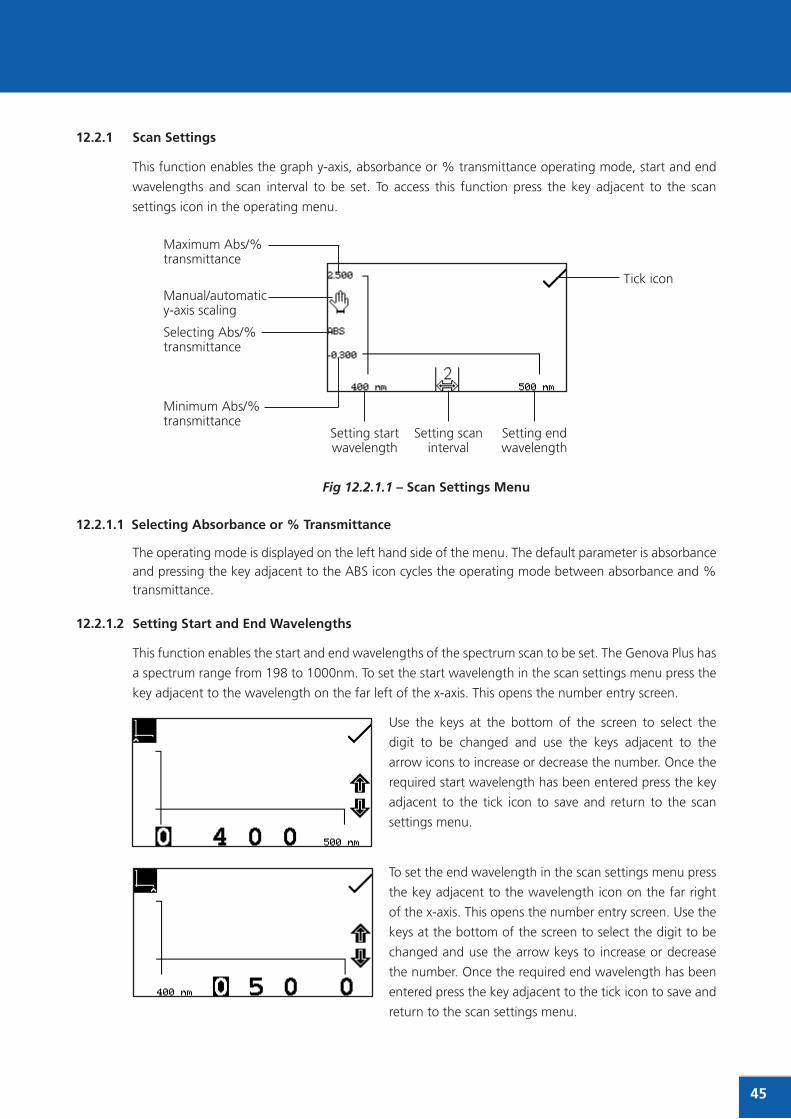
12.2.1 Scan Settings
This function enables the graph y-axis, absorbance or % transmittance operating mode, start and end
wavelengths and scan interval to be set. To access this function press the key adjacent to the scan
settings icon in the operating menu.
Fig 12.2.1.1 – Scan Settings Menu
12.2.1.1 Selecting Absorbance or % Transmittance
The operating mode is displayed on the left hand side of the menu. The default parameter is absorbance and pressing the key adjacent to the ABS icon cycles the operating mode between absorbance and % transmittance.
12.2.1.2 Setting Start and End Wavelengths
This function enables the start and end wavelengths of the spectrum scan to be set. The Genova Plus has
a spectrum range from 198 to 1000nm. To set the start wavelength in the scan settings menu press the
key adjacent to the wavelength on the far left of the x-axis. This opens the number entry screen.
Use the keys at the bottom of the screen to select the
digit to be changed and use the keys adjacent to the
arrow icons to increase or decrease the number. Once the
required start wavelength has been entered press the key
adjacent to the tick icon to save and return to the scan
settings menu.
To set the end wavelength in the scan settings menu press
the key adjacent to the wavelength icon on the far right
of the x-axis. This opens the number entry screen. Use the
keys at the bottom of the screen to select the digit to be
changed and use the arrow keys to increase or decrease
the number. Once the required end wavelength has been
entered press the key adjacent to the tick icon to save and
return to the scan settings menu.
Maximum Abs/% transmittance
Manual/automatic y-axis scaling
Selecting Abs/% transmittance
Minimum Abs/% transmittance
Tick icon
Setting start wavelength
Setting scan interval
Setting end wavelength
If the start wavelength entered is the same as the end wavelength the end wavelength will automatically
be set to be one times the scan interval. For example, if the start wavelength is entered as 500nm but
the end wavelength is already set to 500nm and the scan interval is 2nm, the end wavelength will be
automatically adjusted to 502nm. If the end wavelength entered is the same as the start wavelength
the start wavelength will automatically be set to be one times the scan interval. For example, if the end
wavelength is entered as 500nm but the start wavelength is already set to 500nm and the scan interval
is 2nm, the start wavelength will be automatically adjusted to 498nm.
12.2.1.3 Setting the Scan Interval
This function enables the interval between wavelengths measured in the spectrum scan to be set. The scan interval can be altered to 1, 2 or 5nm by pressing the key below the scan interval icon. Repeat pressing of the key cycles the interval between 1, 2 or 5nm. The scan interval can only be selected if the wavelength range is divisible by this number. For example a scan interval of 5nm cannot be selected for a wavelength range of 400 to 503nm.
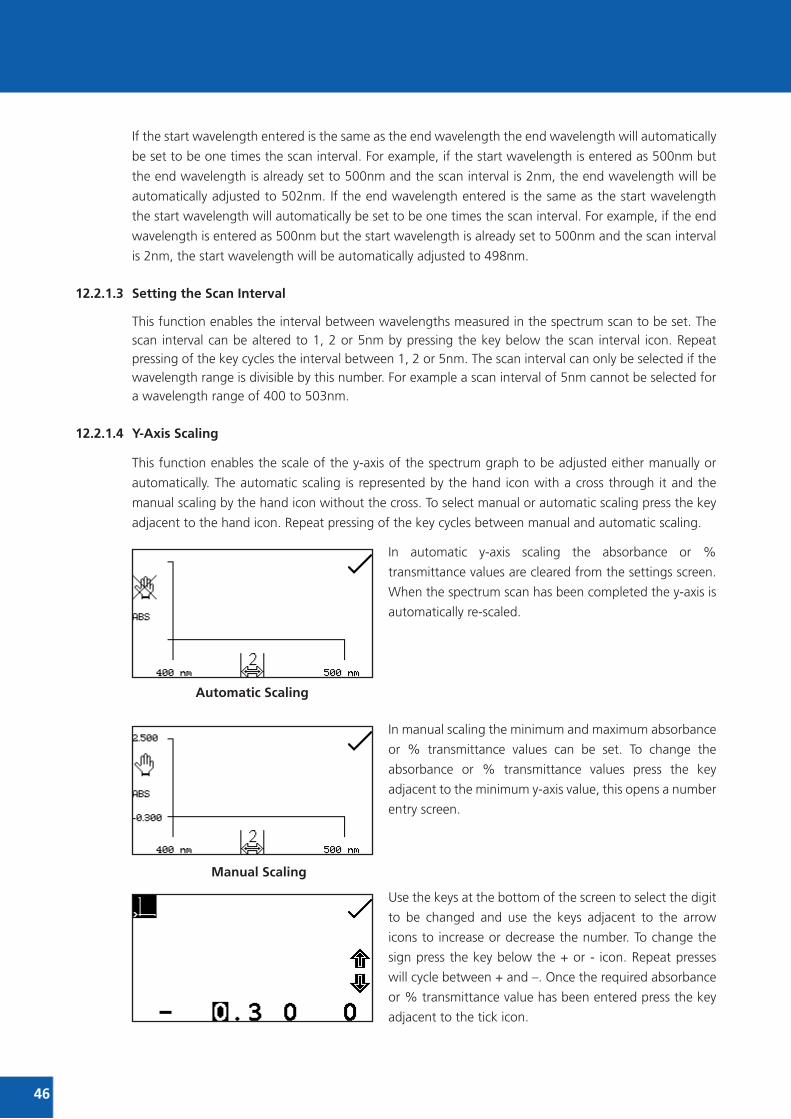
12.2.1.4 y-Axis Scaling
This function enables the scale of the y-axis of the spectrum graph to be adjusted either manually or
automatically. The automatic scaling is represented by the hand icon with a cross through it and the
manual scaling by the hand icon without the cross. To select manual or automatic scaling press the key
adjacent to the hand icon. Repeat pressing of the key cycles between manual and automatic scaling.
In automatic y-axis scaling the absorbance or %
transmittance values are cleared from the settings screen.
When the spectrum scan has been completed the y-axis is
automatically re-scaled.
In manual scaling the minimum and maximum absorbance
or % transmittance values can be set. To change the
absorbance or % transmittance values press the key
adjacent to the minimum y-axis value, this opens a number
entry screen.
Use the keys at the bottom of the screen to select the digit
to be changed and use the keys adjacent to the arrow
icons to increase or decrease the number. To change the
sign press the key below the + or - icon. Repeat presses
will cycle between + and –. Once the required absorbance
or % transmittance value has been entered press the key
adjacent to the tick icon.
2826222046
Automatic Scaling
Manual Scaling

To change the maximum absorbance or % transmittance
value press the key adjacent to the maximum y-axis value,
this opens a number entry screen. Use the keys adjacent
to the arrow icons to increase or decrease the number.
To change the sign press the key below the + or - icon.
Repeat presses will cycle between + and –. Once the
required absorbance or % transmittance value has been
entered press the key adjacent to the tick icon.
12.3 CALIBrATION
In the spectrum measurement mode the calibration is a
baseline scan which is performed across the selected
wavelength range at the selected scan interval. Insert a
cuvette containing the blank solution into the sample
chamber and close the instrument lid. Press the key below
the baseline scan icon to initiate the baseline scan. The
baseline icon will change to show baseline scan in progress
icon and a progress bar will be displayed.
To stop the baseline scan before completion press the key
below the baseline scan in progress icon. Confirmation
will be needed to stop the baseline scan. Press the key
adjacent to the tick icon to confirm stopping the baseline
scan and return to the operating menu.
Press the key adjacent to the cross icon to continue the
baseline scan. Once the baseline scan has been completed
the scan sample icon is displayed and a sample can be
measured.
If the wavelength range, or the scan interval, is changed before a sample scan is performed a new
baseline scan must be performed across the new wavelength range, at the new scan interval, before a
sample can be measured.
4139292747

12.4 SAMPLE MEASurEMENT
It is not possible to measure a sample before a baseline
scan has been performed. Insert a cuvette containing the
sample to be measured in the sample chamber and close
the instrument lid. Press the key below the scan sample
icon to start the spectrum scan of the sample.
The instrument will perform a scan across the wavelength range and scan interval previously selected.
The scan sample icon will change to show the spectrum scan is in progress icon.
To stop the scan before completion, press the key below
the scan in progress icon. Confirmation will be needed to
stop the sample scan. Press the key adjacent to the cross
icon to continue with the scan of the sample or press
the key adjacent to the tick icon to confirm stopping the
scan.
Depending on how many data points have been measured either a partial scan and all the post
measurement tools will be displayed, or the instrument will return to the operating menu with no
measurements saved.
Once the scan is completed the spectrum will be shown on
the screen. If automatic scaling was selected the y-axis will
automatically be re-scaled.
12.5 dATA ANALySIS
The post measurement tools icons are displayed on the
screen following the completion of the scan. The tools
include peaks and valleys threshold, peaks and valleys
table and spectral points analysis. The peaks and valleys
table displays all the detected peaks and valleys above the
selected threshold value.
The spectral points analysis function enables points to be selected from the scan to analyse absorbance
or % transmittance at selected wavelengths.
2826222048
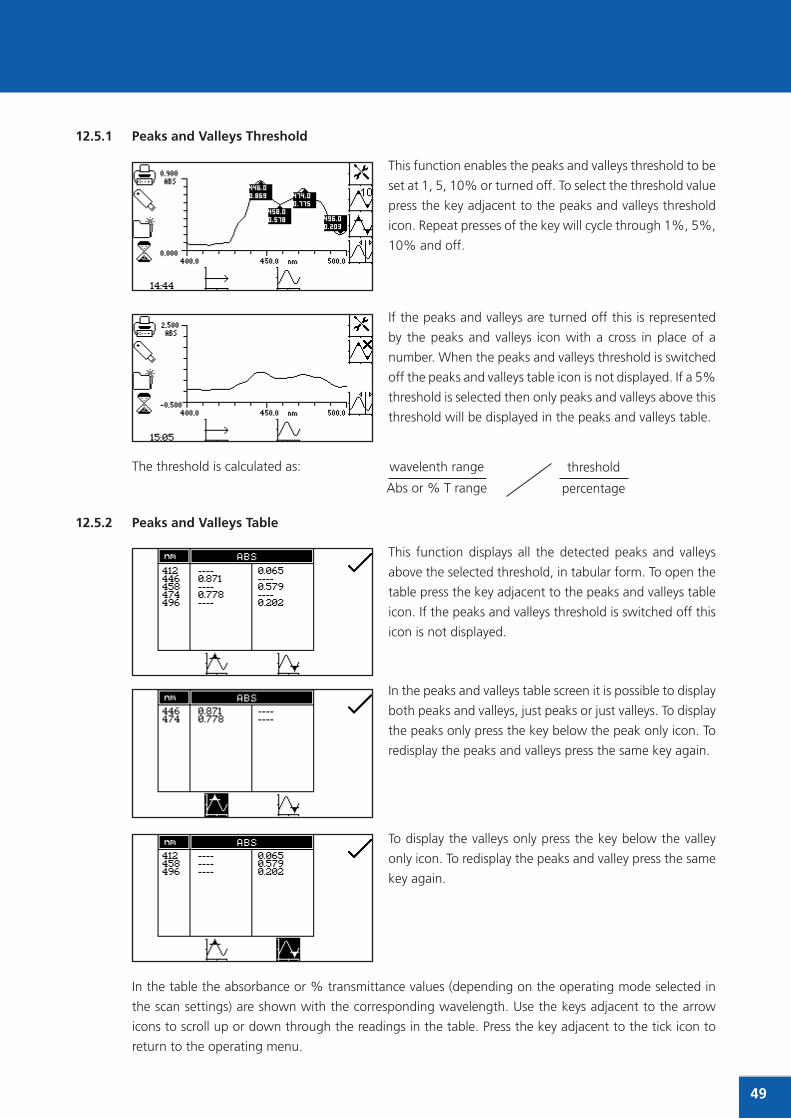
4139292749
12.5.1 Peaks and Valleys Threshold
This function enables the peaks and valleys threshold to be
set at 1, 5, 10% or turned off. To select the threshold value
press the key adjacent to the peaks and valleys threshold
icon. Repeat presses of the key will cycle through 1%, 5%,
10% and off.
If the peaks and valleys are turned off this is represented
by the peaks and valleys icon with a cross in place of a
number. When the peaks and valleys threshold is switched
off the peaks and valleys table icon is not displayed. If a 5%
threshold is selected then only peaks and valleys above this
threshold will be displayed in the peaks and valleys table.
The threshold is calculated as:
12.5.2 Peaks and Valleys Table
This function displays all the detected peaks and valleys
above the selected threshold, in tabular form. To open the
table press the key adjacent to the peaks and valleys table
icon. If the peaks and valleys threshold is switched off this
icon is not displayed.
In the peaks and valleys table screen it is possible to display
both peaks and valleys, just peaks or just valleys. To display
the peaks only press the key below the peak only icon. To
redisplay the peaks and valleys press the same key again.
To display the valleys only press the key below the valley
only icon. To redisplay the peaks and valley press the same
key again.
In the table the absorbance or % transmittance values (depending on the operating mode selected in
the scan settings) are shown with the corresponding wavelength. Use the keys adjacent to the arrow
icons to scroll up or down through the readings in the table. Press the key adjacent to the tick icon to
return to the operating menu.
wavelenth range
Abs or % T range
threshold
percentage
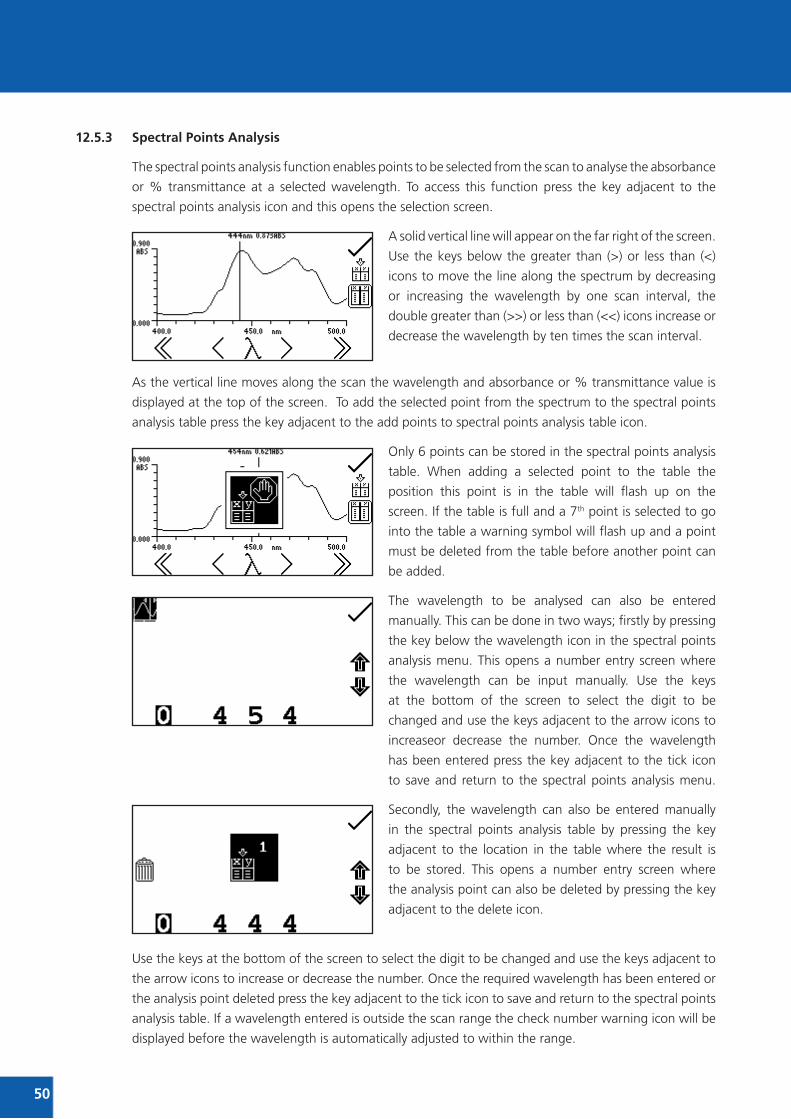
2826222050
12.5.3 Spectral Points Analysis
The spectral points analysis function enables points to be selected from the scan to analyse the absorbance
or % transmittance at a selected wavelength. To access this function press the key adjacent to the
spectral points analysis icon and this opens the selection screen.
A solid vertical line will appear on the far right of the screen.
Use the keys below the greater than (>) or less than (<)
icons to move the line along the spectrum by decreasing
or increasing the wavelength by one scan interval, the
double greater than (>>) or less than (<<) icons increase or
decrease the wavelength by ten times the scan interval.
As the vertical line moves along the scan the wavelength and absorbance or % transmittance value is
displayed at the top of the screen. To add the selected point from the spectrum to the spectral points
analysis table press the key adjacent to the add points to spectral points analysis table icon.
Only 6 points can be stored in the spectral points analysis
table. When adding a selected point to the table the
position this point is in the table will flash up on the
screen. If the table is full and a 7th point is selected to go
into the table a warning symbol will flash up and a point
must be deleted from the table before another point can
be added.
The wavelength to be analysed can also be entered
manually. This can be done in two ways; firstly by pressing
the key below the wavelength icon in the spectral points
analysis menu. This opens a number entry screen where
the wavelength can be input manually. Use the keys
at the bottom of the screen to select the digit to be
changed and use the keys adjacent to the arrow icons to
increaseor decrease the number. Once the wavelength
has been entered press the key adjacent to the tick icon
to save and return to the spectral points analysis menu.
Secondly, the wavelength can also be entered manually
in the spectral points analysis table by pressing the key
adjacent to the location in the table where the result is
to be stored. This opens a number entry screen where
the analysis point can also be deleted by pressing the key
adjacent to the delete icon.
Use the keys at the bottom of the screen to select the digit to be changed and use the keys adjacent to
the arrow icons to increase or decrease the number. Once the required wavelength has been entered or
the analysis point deleted press the key adjacent to the tick icon to save and return to the spectral points
analysis table. If a wavelength entered is outside the scan range the check number warning icon will be
displayed before the wavelength is automatically adjusted to within the range.

4139292751
To view the points in the spectral points analysis table
press the key adjacent to the spectral points analysis
table icon. Only three points can be displayed on the
screen at one time; to view the other points in the table
press the key below the down arrow icon. To view the
first three points again press the key below the up arrow
icon. The table displays the wavelength and either the
corresponding absorbance or % transmittance, as well as
the order in which the points were selected or entered.
To change the photometric value between absorbance
and % transmittance press the key below the ABS icon
or %T icon. Pressing the key adjacent to the tick icon will
save any changes made and return to the spectral points
analysis menu.
It is possible to access spectral points analysis before a scan is performed. Points to be analysed can be
pre-selected from the blank axis, or entered manually in the spectral points analysis table. When the
scan has been performed the points for analysis will already be in the table with the corresponding
absorbance or % transmittance values.

2826222052
SECTION 13 – QuANTITATION
The quantitation measurement mode enables sample concentrations to be calculated using a standard curve. In this mode a number of standard solutions covering a range of known concentrations are measured at a set wavelength. The absorbance or % transmittance of these solutions is plotted to create a standard curve with replicate standards measurements, if required. Once the standard curve has been created a sample of unknown concentration can be measured and the concentration calculated using the standard curve.
13.1 MOdE SPECIFIC PArAMETErS
The quantitation operating menu enables measurement
parameters to be changed. The utility toolbar on the left
hand side of the screen enables access to printing, print
setup options, results, methods and autologging options.
For more details on the different functions of the utility
toolbar refer to section 22.
The quantitation settings menu enables the absorbance or % transmittance operating mode, wavelength,
units, resolution, number of replicate measurements (manual or automatic) and number of calibration
standards to be set. The quantitation table menu enables the quantitation standard data to be viewed,
edited and allows a new curve to be created. The standard curve menu enables a standard curve to be
created, viewed and edited.
Fig 13.1.1 - Operating Menu – Post Calibration
13.2 METHOd SETuP
In this measurement mode the method setup parameters
are accessed through the quantitation settings menu. To
open the quantitation settings menu press the key adjacent
to the quantitation settings icon in the operating menu.
Operating Menu
Print/print settings
Results selection menu
Method selection menu
Autolog menu
Calibrate to zero
Measure sample
Quantitation settings
Quantitation table
Standard curve

4139292753
13.2.1 Quantitation Settings
This function enables the absorbance or % transmittance operating mode, wavelength, units, resolution,
number of replicate measurements (manual or automatic) and number of calibration standards to be set.
To access this function press the key adjacent to the quantitation settings icon in the operating menu.
Fig 13.2.1.1 – Quantitation Settings Menu
13.2.1.1 Selecting Absorbance or % Transmittance
The operating mode can be changed between absorbance and % transmittance by pressing the key below the Abs or %T icon. Repeat presses will cycle between absorbance and % transmittance.
13.2.1.2 Selecting a Wavelength
To adjust the wavelength, press the key adjacent to the
wavelength icon. This will open the number entry screen.
Use the keys at the bottom of the screen to select the digit
to be changed, pressing the key twice to select the second
digit. The keys adjacent to the arrow icons are then used
to increase or decrease the number.
Once the required wavelength has been entered press the key adjacent to the tick icon to save the
changes and return to the settings menu screen.
13.2.1.3 Selecting Concentration units
The units of concentration can be selected from a number of options: no units, %, ppm, EBC, SRM,
mEq/l, mEq, M, mM, μM, nM, U, U/l, U/ml, g/l, mg/l, μg/l, ng/l, g/dl, mg/dl, μg/dl, mg/ml, μg/ml, ng/ml,
μg/μl, ng/μl, mol/l, mmol/l.
Press the key below the units icon and use the keys
adjacent to the arrow icons to navigate round the screen
to select the required units. Once the required units have
been selected press the key adjacent to the tick icon to
save and return to the settings menu screen.
Replicate measurements On/Off
Replicate measurements Manual/Automatic
Setting concentration units
Setting results resolution
Setting number of standards
Setting abs/%transmittance
Tick icon
Select wavelength

13.2.1.4 Changing the resolution
The resolution of the concentration can be selected from 1, 0.1, 0.01 or 0.001 by repeat presses of the key below the resolution icon.
13.2.1.5 Selecting the Number of replicate Standard Measurements
The number of replicate measurements made for each standard that is used to construct the calibration curve is set by pressing the key next to the replicate measurements icon. The number of replicates can be set to 1 or 3. When 3 replicates measurements are made, the average reading is used to construct the calibration curve. If 1 is selected, no additional measurements are performed.
13.2.1.6 Selecting Automatic or Manual replicate Measurements
The replicate measurements of a standard are performed automatically when the automatic measurement icon is shown in the instrument settings. The replicate measurements will be repeated automatically one after another on the same standard sample. Pressing the key next to this icon changes it to the manual measurement icon where the unit will require the user to manually commence each replicate standard measurement. This feature allows users to use three independently prepared standard solutions for each data point in the calibration curve.
13.2.1.7 Selecting Number of Standards
The number of standards used to create a standard curve
can be changed from 2 to 12 standards. To change the
number of standards, press the key below the number of
standards icon. Repeat presses cycle the number between
2, 3, 4, 5, 6, 7, 8, 9, 10, 11 and 12. If there is only one
standard available the concentration measurement mode
should be used.
13.2.2 Quantitation Table
The quantitation table enables the quantitation standards
to be viewed and edited and allows a new calibration
curve to be created. To access the quantitation table screen
press the key adjacent to the quantitation table icon in the
operating menu.
Only three standards can be displayed on the screen at
one time; to view the other standards in the table press
the key below the down arrow icon. The quantitation
table displays the standard concentration on the left hand
side of the table with the corresponding absorbance or
% transmittance on the right hand side of the table. The
standard curve can also be accessed from this screen by
pressing the key adjacent to the standard curve icon.
To change the number of standards, press the key below the number of standards icon. Repeat presses
cycle the number between 2, 3, 4, 5, 6, 7, 8, 9, 10, 11 and 12.
2826222054
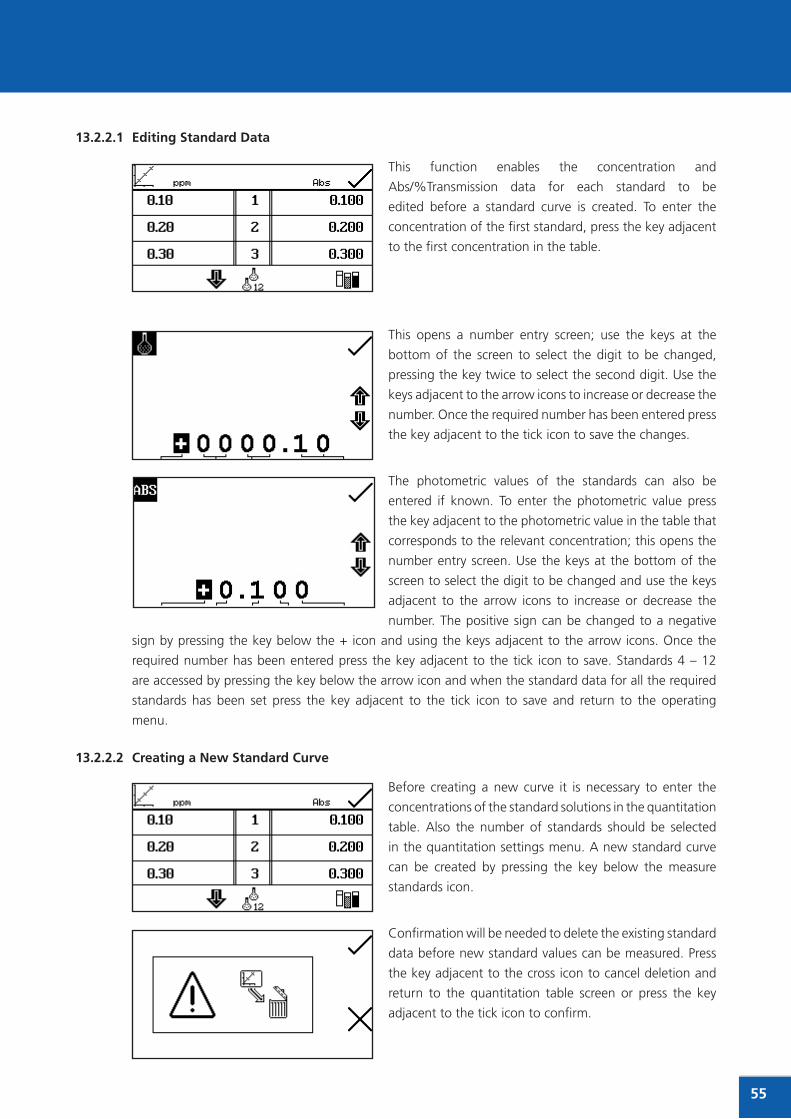
13.2.2.1 Editing Standard data
This function enables the concentration and
Abs/%Transmission data for each standard to be
edited before a standard curve is created. To enter the
concentration of the first standard, press the key adjacent
to the first concentration in the table.
This opens a number entry screen; use the keys at the
bottom of the screen to select the digit to be changed,
pressing the key twice to select the second digit. Use the
keys adjacent to the arrow icons to increase or decrease the
number. Once the required number has been entered press
the key adjacent to the tick icon to save the changes.
The photometric values of the standards can also be
entered if known. To enter the photometric value press
the key adjacent to the photometric value in the table that
corresponds to the relevant concentration; this opens the
number entry screen. Use the keys at the bottom of the
screen to select the digit to be changed and use the keys
adjacent to the arrow icons to increase or decrease the
number. The positive sign can be changed to a negative
sign by pressing the key below the + icon and using the keys adjacent to the arrow icons. Once the
required number has been entered press the key adjacent to the tick icon to save. Standards 4 – 12
are accessed by pressing the key below the arrow icon and when the standard data for all the required
standards has been set press the key adjacent to the tick icon to save and return to the operating
menu.
13.2.2.2 Creating a New Standard Curve
Before creating a new curve it is necessary to enter the
concentrations of the standard solutions in the quantitation
table. Also the number of standards should be selected
in the quantitation settings menu. A new standard curve
can be created by pressing the key below the measure
standards icon.
Confirmation will be needed to delete the existing standard
data before new standard values can be measured. Press
the key adjacent to the cross icon to cancel deletion and
return to the quantitation table screen or press the key
adjacent to the tick icon to confirm.
4139292755

This will open the standard measurement screen. The first
sample to be measured should be a blank sample as this
will be used to calibrate the instrument to zero absorbance.
Place the cuvette containing the blank solution into the
sample chamber and close the instrument lid. Press the key
adjacent to the tick icon to perform an initial calibration
to zero absorbance. Once this measurement has been
performed the standard concentration samples can be
measured.
Remove the cuvette containing the blank solution from
the sample chamber and insert the cuvette containing
the first standardised solution to be measured. Close the
instrument lid and press the key adjacent to the tick icon
to take a reading of the standard.
The concentration along with the photometric value will
then be displayed. This standard can be re-measured by
pressing the key adjacent to the back icon.
If replicate measurements have been selected in the
quantitation settings menu, a summary of the replicate
measurements and the final average reading are displayed
on the screen. If the manual replicate measurements
setting was selected, the user is required to press the
key adjacent to the tick icon to measure each replicate
standard reading.
To measure the next standard remove the current standard from the sample chamber and insert the
cuvette containing the second standardised solution. Press the key adjacent to the tick icon to take a
reading of the standard. Repeat this procedure until all the standards (up to a maximum of twelve) have
been measured. Once all the standards have been measured the instrument returns to the quantitation
table screen where the photometric values for all of the newly added standards can be viewed.
To abort the creation of the new standard curve before all the standards have been measured, press the
key adjacent to the cross icon at any time.
2826222056

55
13.2.3 Standard Curve
This function enables the current standard curve to be
viewed, a new standard curve to be created, the curve fit
to be adjusted and the curve statistics to be displayed. To
access this function press the key adjacent to the standard
curve icon in the operating menu.
When the current standard curve is displayed the
concentration and photometric value of the last sample
measured is also displayed on the curve. The curve fit
algorithm can be changed by pressing the key below the
curve fit icon.
Repeat presses of the key cycles the curve fit between
1. Linear regression Concentration = Abs x A + B
2. Linear regression Through Zero Concentration = Abs x A
3. Quadratic regression Concentration = A x Abs2 + B x Abs + C
4. Quadratic regression Through Zero Concentration = A x Abs2 + B x Abs
5. Interpolate Concentration(n) = Abs x A(n) + B(n)
The curve statistics can be displayed by pressing the
key below the S icon; this opens a screen on top of the
existing curve displaying statistics for the curve fit chosen.
For example if the curve fit is Conc = Abs x A + B the
curve statistics displayed will be the gradient of the line
(A), constant (B) and correlation coefficient (r2). To exit
this screen press the key adjacent to the tick icon. The
quantitation table can also be viewed from this screen by
pressing the key adjacent to the quantitation table icon.
A new standard curve can be created by pressing the key below the measure standards icon. See section
8.2.2.2 for details on creating a new standard curve.
Once the curve has been created press the key adjacent to the tick icon and the screen will return to the
operating menu where unknown samples can be measured.
4139292757

2826222058
13.3 CALIBrATION
The zero calibration must be performed at the same
wavelength as the standards were measured at and the
unknown samples will be measured at. Insert a cuvette
containing the blank solution into the sample chamber and
close the instrument lid. Press the key below the calibrate to
zero absorbance icon. The instrument will calibrate to zero
absorbance. Once the calibration is complete the measure
sample icon appears and the sample can be measured. If
the wavelength is adjusted before a sample is measured the measure sample icon will disappear and the
instrument must be calibrated again at the new wavelength.
13.4 SAMPLE MEASurEMENT
Once a calibration has been performed the measure
sample icon appears. A standard curve should either be
created or loaded from a previously saved method before
carrying out a measurement of an unknown sample. Place
the cuvette containing the sample in the sample chamber
and close the instrument lid.
Press the key below the measure sample icon and the instrument will take a reading and the concentration
and photometric values will be displayed on the screen. To view the position of this sample on the
standard curve open the standard curve screen.
13.5 dATA ANALySIS
In quantitation the data analysis examines the statistics of
the standard curve and algorithm of the curve fit. The curve
statistics function is accessed by pressing the key below
the S icon in the quantitation curve menu. The algorithm
of the curve fit can be changed by pressing the key below
the curve fit icon. For more information regarding curve fit
and statistics refer to section 13.2.3.

554139292759
SECTION 14 – KINETICS
The kinetics measurement mode enables the absorbance or % transmittance of an active molecule to be measured over a period of time; for example enzyme analysis of horseradish peroxidase. The absorbance or % transmittance is measured at regular time intervals at a set wavelength over a period of time. The results are plotted on a graph to show the change in absorbance or % transmittance over time. Following sample measurement statistical analysis of all or part of the experiment can be performed.
14.1 MOdE SPECIFIC PArAMETErS
The kinetics operating menu enables measurement
parameters to be changed. The utility toolbar on the left
hand side of the screen enables access to printing, print
setup options, results, methods and autologging options.
For more details on the different functions of the utility
toolbar refer to section 22.
The settings icon enables the wavelength, units, resolution, graph y-axis, absorbance or % transmittance
operating mode, standard, factor, measurement time, lag time and start on level to be set. Following
the completion of a set of kinetics measurements the statistics for all or part of the kinetics run can be
analysed. The kinetics moving line function enables the initial and final points of the curve to be selected,
so that analysis of the area between these two points can be performed.
Fig 14.1.1 - Expanded Operating Menu – Post Measurement
14.2 METHOd SET uP
In this measurement mode all the method set up parameters
are accessed through the settings menu. To open the
settings menu press the key adjacent to the settings icon
in the operating menu.
Operating Menu
Print/print settings
Results selection menu
Methods selection menu
Autolog menu
Calibrated to zero
Start kinetics measurements
Settings
Kinetics moving line
Statistics

2826222060
14.2.1 Kinetics Settings
The settings menu enables the wavelength, units, resolution, graph y-axis, operating mode, standard,
factor, measurement time, lag time and start on level to be set. Once all of the required settings have
been entered press the key adjacent to the tick icon to save and return to the operating menu.
Fig 14.2.1.1 - Settings Menu
14.2.1.1 y-Axis Scaling
This function enables the scale of the y-axis of the kinetics graph to be adjusted either manually or
automatically. The automatic scaling is represented by the hand icon with a cross through it and the
manual scaling by the hand icon without the cross. To select manual or automatic scaling press the key
adjacent to the hand icon. Repeat pressing of the key cycles between manual and automatic scaling.
In automatic y-axis scaling the absorbance or %
transmittance values are cleared from the settings screen.
When the kinetics measurement is complete the y-axis is
automatically re-scaled.
In manual scaling the minimum and maximum absorbance
or % transmittance values can be set. To change the
absorbance or % transmittance values press the key
adjacent to the minimum y-axis value, this opens a number
entry screen.
Maximum Abs/%T
Manual/automatic scaling
Abs/% transmittance
Minimum Abs/%T
Tick icon
Select wavelength
Standard menu
Factor menu
Selectingunits
Selectingresolution
Setting the measurement time
Setting lag time/start on level
Automatic Scaling
Manual Scaling

59
Use the keys at the bottom of the screen to select the digit
to be changed and use the keys adjacent to the arrow
icons to increase or decrease the number. To change the
sign press the key below the + or - icon. Repeat presses
will cycle between + and –. Once the required absorbance
or % transmittance value has been entered press the key
adjacent to the tick icon.
To change the maximum absorbance or % transmittance
value press the key adjacent to the maximum y-axis value
and this opens a number entry screen. Use the keys
adjacent to the arrow icons to increase or decrease the
number. To change the sign press the key below the + or -
icon. Repeat presses will cycle between + and –. Once the
required absorbance or % transmittance has been entered
press the key adjacent to the tick icon.
14.2.1.2 Setting Lag Time or Start on Level
In this measurement mode starting the kinetics measurements can be delayed by setting a lag time or
a start on level. The lag time is the amount of time that the instrument will wait before starting the
kinetics measurements. The start on level is the absorbance level that must be reached before starting
the kinetics measurements. Both options can be set using the set lag time/start on menu. This function is
accessed by pressing the key below the start time pause icon on the far left side of the x-axis. This opens
the lag time/start on level menu.
To set the lag time press the key adjacent to the clock icon.
Use the keys at the bottom of the screen to select the digit
to be changed and the keys adjacent to the arrow icons to
increase or decrease the number. The lag time can be reset
to zero by pressing the key adjacent to the 000 icon.
Once the required lag time has been entered in seconds press the key adjacent to the tick icon to save
and return to the settings menu.
To set the start on level press the key adjacent to the
Abs/%T icon. Use the keys at the bottom of the screen
to select the digit to be changed and the keys adjacent to
the arrow icons to increase or decrease the number. The
positive sign can be changed to a negative sign by pressing
the key below the symbol + icon.
On the left hand side of the screen the symbol can be changed to read greater than (>) or less than (<)
the absorbance level that has been entered. The start on level can also be turned off (</>). Once the
required absorbance or % transmittance level (depending on the operating mode selected) has been
entered press the key adjacent to the tick icon to save and return to the settings menu.
554139292761

2826222062
14.2.1.3 Selecting Absorbance or % Transmittance
The operating mode is displayed on the left hand side of the screen. The default parameter is absorbance and pressing the key adjacent to the ABS icon cycles the operating mode between the absorbance and % transmittance.
14.2.1.4 Changing the resolution
The resolution of the concentration can be selected from 1, 0.1, 0.01 or 0.001 by repeat presses of the key below the resolution icon.
14.2.1.5 Selecting Concentration units
The concentration units can be selected from a number of options: no units, %, ppm, EBC, SRM, mEq/l,
mEq, M, mM, μM, nM, U, U/l, U/ml, g/l, mg/l, μg/l, ng/l, g/dl, mg/dl, μg/dl, mg/ml, μg/ml, ng/ml, μg/μl,
ng/μl, mol/l, mmol/l.
In the settings menu press the key below the units icon
to open the unit selection screen which displays all the
different unit options. Use the keys adjacent to the arrow
icons to navigate around the screen to select the required
units. Once the required units have been highlighted press
the key adjacent to the tick icon to save and return to the
settings menu.
14.2.1.6 using a Standard
The standard menu enables the value for a standard to
be entered. This function is accessed by pressing the key
adjacent to the standard icon. This opens the extended
number entry screen. Use the keys at the bottom of the
screen to select the digit to be changed. The key below the
digit must be pressed twice to select the adjacent digit. For
example 00, the first press of the key alters 10, the second
press alters 01. Use the keys adjacent to the arrow icons to
increase or decrease the selected number. Standard values of 0.001 to 1000 can be entered. The standard
value can be reset to one by pressing the key adjacent to the 001 icon. Once the standard value has
been entered press the key adjacent to the tick icon to save and return to the settings menu screen. The
entered value is now displayed in the settings menu adjacent to the standard icon.
A standard value should only be entered if the factor is not known. If the factor is known the standard
value should be set to 1.000.
14.2.1.7 using a Factor
The factor menu enables a factor to be entered. This
function is accessed by pressing the key adjacent to the
factor icon. This opens the extended number entry screen.
Use the keys at the bottom of the screen to select the digit
to be changed. The key below the digit must be pressed
twice to select the adjacent digit.

59554139292763
For example 00, the first press of the key alters 10, the second press alters 01. Use the keys adjacent to
the arrow icons to increase or decrease the selected number. Factor values of 0.001 to 10,000 can be
entered. The factor value can be reset to one by pressing the key adjacent to the 001 icon. Once the
factor has been entered press the key adjacent to the tick icon to save and return to the settings menu
screen. The entered value is now displayed in the settings menu adjacent to the factor icon. If the factor
is not known a standard should be measured in order to calculate the factor. If a standard is used the
factor value should be set to 1.000.
14.2.1.8 Selecting a Wavelength
To adjust the wavelength press the key adjacent to the
wavelength icon. This will open the number entry screen.
Use the keys at the bottom of the screen to select the digit
to be changed, pressing the key twice to select the second
digit. The keys adjacent to the arrow icons can be used
to increase or decrease the number. Once the required
wavelength has been entered press the key adjacent to
the tick icon to save the changes and return to the settings
menu screen.
14.2.1.9 Setting the Kinetics Measurement Time
This function enables the measurement time for the
kinetics scan to be set. To access this function press the
key below the time displayed on the far right of the x-axis;
this will open a number entry screen. Use the keys at the
bottom of the screen to select the digit to be changed
and use the keys adjacent to the arrow icons to increase
or decrease the number. Once the required measurement
time in seconds has been entered press the key adjacent to
the tick icon to save and return to the settings menu.
14.3 CALIBrATION
The calibration must be performed at the same wavelength
at which the sample will be measured. Insert a cuvette
containing the blank solution into the sample chamber and
close the instrument lid. Press the key below the calibrate
to zero absorbance icon. The instrument will calibrate to
0.000 absorbance.
Once the calibration is complete the start kinetics measurement icon will be displayed and a sample can
be measured. If the wavelength is adjusted before the sample is measured the start kinetics measurements
icon will disappear and the instrument must be calibrated again at the new wavelength.

2826222064
14.4 SAMPLE MEASurEMENT
Insert a cuvette containing the sample to be analysed
into the sample chamber and press the key below the
start kinetics measurements icon. If a start on level or
lag time has not been set the instrument begins taking
a photometric reading every second. As each reading is
taken it is plotted on the graph.
If a lag time has been set a progress bar will be displayed
showing the lag time counting down. Once the lag time is
complete the instrument will begin taking readings.
If a start on level has been set the Abs/%T icon is displayed
in the centre of the screen. The instrument will take
photometric readings until the start on level is reached.
Once the absorbance/% transmittance level has been
reached the readings will be plotted on the graph.
Once the measurement has commenced it can be aborted by pressing the key below the kinetics
measurement in progress icon.
Depending on how many data points have been recorded,
the instrument will either return to the pre-measurement
screen or display a partial scan.
Once the measurement time is reached the experiment is complete and the post measurement icons are
displayed. If the automatic scaling was selected the y-axis will automatically be re-scaled.

14.5 dATA ANALySIS
Following the completion of the kinetics measurements the post measurement icons are displayed on
the screen. These include the statistics for the kinetics experiment and the kinetics moving line. The post
measurement statistics include rate of change, start and end absorbance levels and concentration of the
sample. The kinetics moving line function enables the initial and final points of the experiment to be set
and the statistics for this part of the experiment to be analysed.
To access the statistics for the whole of the kinetics
experiment press the key adjacent to the S icon which
opens the statistics menu over the top of the expanded
operating menu.
The information displayed includes concentration,
absorbance per minute (rate of change), correlation
coefficient (r2), start time absorbance and end time
absorbance. If the operating mode selected was %
transmittance then the statistics displayed will be %
transmittance instead of absorbance.
In this menu the factor can be updated by pressing the key adjacent to the factor icon. The instrument
calculates the factor and saves the value in the settings. Therefore the factor value calculated can be
used in subsequent measurements to calculate the concentration of unknown samples.
To exit the statistics menu press the key adjacent to the tick icon.
The kinetics moving line screen can also be accessed from this menu by pressing the key adjacent to
the kinetics moving line icon. The kinetics moving line function enables the initial and final points of
the kinetics experiment to be set, allowing the statistics for this part of the experiment to be analysed
specifically. This function can be accessed from the statistics menu or from the operating menu by
pressing the key adjacent to the kinetics moving line icon.
In the kinetics moving line screen the initial and final time
lines appear as two vertical lines. The line which is selected
is represented by a dashed line ---- and can be moved
using the keys below the greater than (>) or less than (<)
icons at the bottom of the screen.
59554139292765

2826222066
Move the dashed line to the point on the x-axis which
is to be the initial time. To select the final time press the
key adjacent to the toggle icon. This will change the initial
line from a dashed line to a solid line. The final time line
will change from a solid line to a dashed line. Use the
keys below the greater than (>) or less than (<) icons to
move the line to the final time on the x-axis by reducing or
increasing in 1 second time intervals.
The double greater than (>>) or double less than (<<) icons move the line in 5 second time intervals.
Once the required initial and final times have been selected
press the key adjacent to the S icon to display the statistics
menu for that portion of the experiment. The information
displayed includes concentration, absorbance per minute
(rate of change), correlation coefficient (r2), start time
absorbance and end time absorbance. If the operating
mode selected was % transmittance then the statistics
will be % transmittance instead of absorbance. To exit the
statistics menu press the key adjacent to the tick icon.

59554139292767
SECTION 15 – MuLTI-WAVELENGTH
The multi-wavelength measurement mode allows the user to measure a sample’s photometric absorbance or %transmittance at two, three or four wavelengths. The mode allows the user to select from a number of pre-set equations to add, subtract, multiply or divide the photometric readings. Following sample measurement, the photometric readings and the selected equation’s result are displayed on the operating menu screen.
15.1 MOdE SPECIFIC PArAMETErS
The multi-wavelength operating menu enables
measurement parameters to be changed. The utility
toolbar on the left hand side of the screen enables access
to printing, print setup options, results, methods and
autologging options. For more details on the different
functions of the utility toolbar refer to section 22.
The Abs/%T icon enables the display to be set to show the absorbance or % transmittance. To change
the display press the key adjacent to the Abs/%T icon. Repeat presses will cycle the display between
absorbance and % transmittance.
The settings icon enables the wavelengths, number of wavelengths, units, resolution, concentration
calculation equation and concentration equation factors to be set.
Fig 15.1.1 - Operating Menu
15.2 METHOd SET uP
In this measurement mode all the method set up parameters
are accessed through the settings menu. To open the
settings menu press the key adjacent to the settings icon
in the operating menu.
Operating Menu
Print/print settings
Results selection menu
Method selection menu
Autolog menu
Calibrate to zero
Measure sample
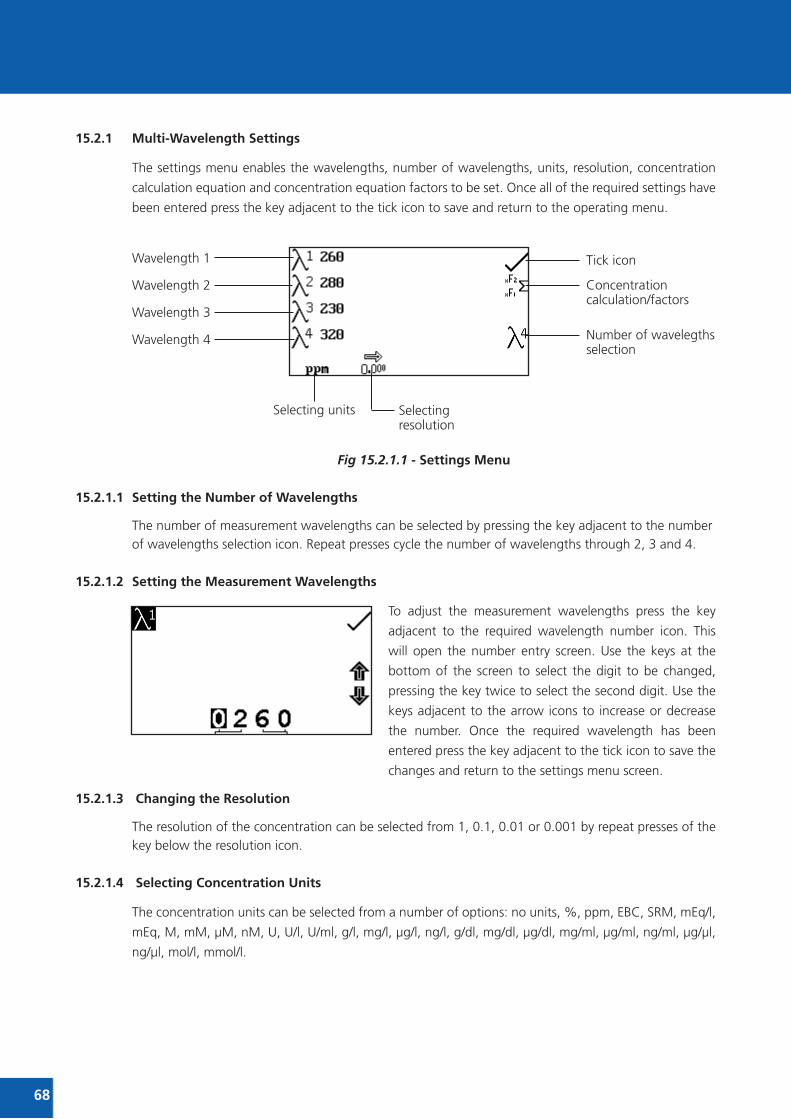
2826222068
15.2.1 Multi-Wavelength Settings
The settings menu enables the wavelengths, number of wavelengths, units, resolution, concentration
calculation equation and concentration equation factors to be set. Once all of the required settings have
been entered press the key adjacent to the tick icon to save and return to the operating menu.
Fig 15.2.1.1 - Settings Menu
15.2.1.1 Setting the Number of Wavelengths
The number of measurement wavelengths can be selected by pressing the key adjacent to the number of wavelengths selection icon. Repeat presses cycle the number of wavelengths through 2, 3 and 4.
15.2.1.2 Setting the Measurement Wavelengths
To adjust the measurement wavelengths press the key
adjacent to the required wavelength number icon. This
will open the number entry screen. Use the keys at the
bottom of the screen to select the digit to be changed,
pressing the key twice to select the second digit. Use the
keys adjacent to the arrow icons to increase or decrease
the number. Once the required wavelength has been
entered press the key adjacent to the tick icon to save the
changes and return to the settings menu screen.
15.2.1.3 Changing the resolution
The resolution of the concentration can be selected from 1, 0.1, 0.01 or 0.001 by repeat presses of the key below the resolution icon.
15.2.1.4 Selecting Concentration units
The concentration units can be selected from a number of options: no units, %, ppm, EBC, SRM, mEq/l,
mEq, M, mM, μM, nM, U, U/l, U/ml, g/l, mg/l, μg/l, ng/l, g/dl, mg/dl, μg/dl, mg/ml, μg/ml, ng/ml, μg/μl,
ng/μl, mol/l, mmol/l.
Wavelength 1
Concentration calculation/factors
Number of wavelegths selection
Tick icon
Selecting resolution
Selecting units
Wavelength 2
Wavelength 3
Wavelength 4

In the settings menu press the key below the units icon
to open the unit selection screen which displays all the
different unit options. Use the keys adjacent to the arrow
icons to navigate around the screen to select the required
units. Once the required units have been highlighted press
the key adjacent to the tick icon to save and return to the
settings menu.
15.2.1.5 Setting the Concentration Calculation Equation and Factors
In the settings menu press the key adjacent to the
concentration calculation/factors icon. This screen allows
the user to select the required concentration calculation
equation from the following list of options.
1. ∑ = ((xF1*l1) + (x F2*l2))*xF3
2. ∑ = ((xF1*l1) - (x F2*l2))*xF3
3. ∑ = ((xF1*l1) * (x F2*l2))*xF3
4. ∑ = ((xF1*l1) / (x F2*l2))*xF3
Repeat presses of the key adjacent to concentration
calculation icon the will cycle between the options.
The concentration equation factors can be edited by
pressing the key adjacent to the concentration factor icons.
This opens the extended number entry screen. Use the
keys at the bottom of the screen to select the digit to be
changed. The key below the digits must be pressed twice
to select the adjacent digit. For example 00 the first press
of the key alters 10, the second press alters 01. Use the
keys adjacent to the arrow icons to increase or decrease
the selected number. Factor values of 0.001 to 9999.999 can be entered. The factor value can be reset
to one by pressing the key adjacent to the 001 icon. Once the factor has been entered press the key
adjacent to the tick icon to save and return to the settings menu. The entered value is displayed in the
settings menu adjacent to the factor icon.
15.3 CALIBrATION
Insert a cuvette containing the blank solution into the
sample chamber and close the instrument lid. Press the
key below the calibrate to zero absorbance icon. This
will measure the zero absorbance level at each of the
wavelengths specified in the method settings.
Once the calibration is complete the measure sample icon appears and the sample can be measured.
If one or more wavelengths are adjusted before a sample is measured, the measure sample icon will
disappear and the instrument must be calibrated again at the new wavelengths.
59554139292769

2826222070
15.4 SAMPLE MEASurEMENT
Insert a cuvette containing the sample to be analysed into
the sample chamber and press the key below the sample
measurement icon. The instrument will take a reading
at each of the specified wavelengths, the operating
menu screen will then display the result of the selected
measurement calculation and the photometric readings
for each of the measured wavelengths.
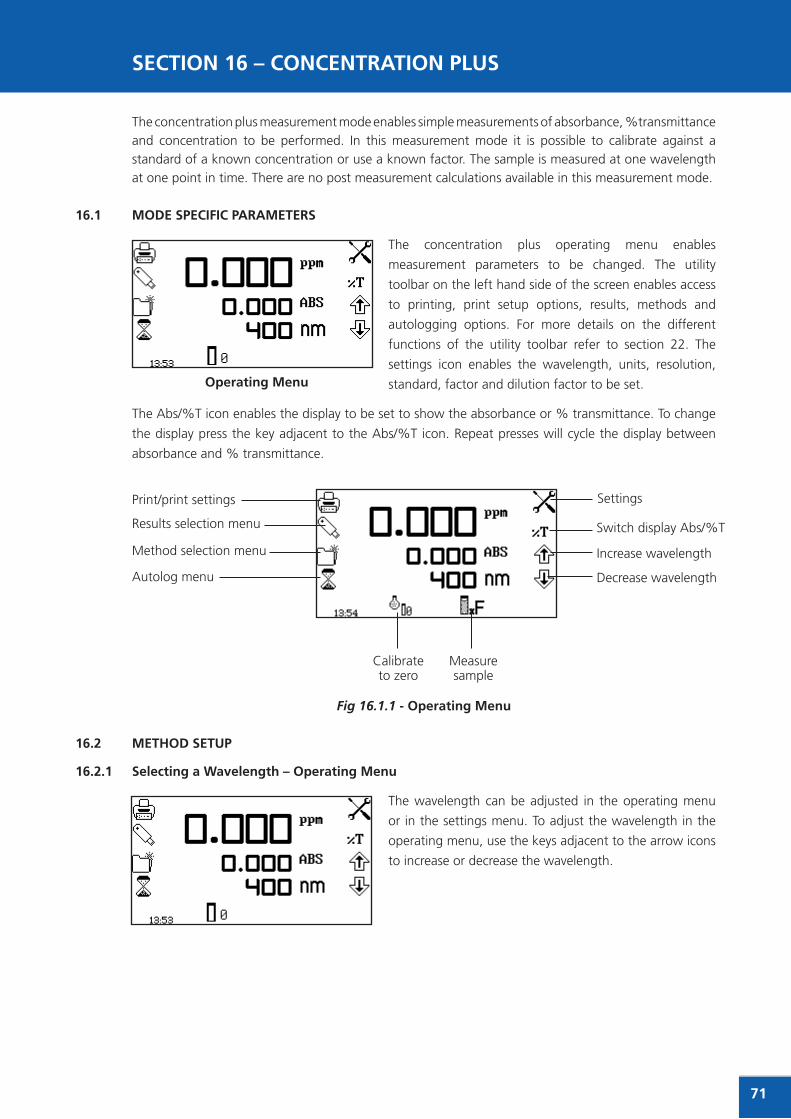
59554139292771
SECTION 16 – CONCENTrATION PLuS
The concentration plus measurement mode enables simple measurements of absorbance, %transmittance and concentration to be performed. In this measurement mode it is possible to calibrate against a standard of a known concentration or use a known factor. The sample is measured at one wavelength at one point in time. There are no post measurement calculations available in this measurement mode.
16.1 MOdE SPECIFIC PArAMETErS
The concentration plus operating menu enables
measurement parameters to be changed. The utility
toolbar on the left hand side of the screen enables access
to printing, print setup options, results, methods and
autologging options. For more details on the different
functions of the utility toolbar refer to section 22. The
settings icon enables the wavelength, units, resolution,
standard, factor and dilution factor to be set.
The Abs/%T icon enables the display to be set to show the absorbance or % transmittance. To change
the display press the key adjacent to the Abs/%T icon. Repeat presses will cycle the display between
absorbance and % transmittance.
Fig 16.1.1 - Operating Menu
16.2 METHOd SETuP
16.2.1 Selecting a Wavelength – Operating Menu
The wavelength can be adjusted in the operating menu
or in the settings menu. To adjust the wavelength in the
operating menu, use the keys adjacent to the arrow icons
to increase or decrease the wavelength.
Operating Menu
Print/print settings
Results selection menu
Method selection menu
Autolog menu
Calibrate to zero
Measure sample
Settings
Switch display Abs/%T
Increase wavelength
Decrease wavelength

2826222072
16.2.2 Concentration Plus Settings
The concentration plus settings menu enables the wavelength, units, resolution, standard, factor and
dilution factor to be set and is accessed from the operating menu by pressing the key adjacent to the
settings icon. Once all of the required settings have been entered press the key adjacent to the tick icon
to save and return to the operating menu.
Fig 16.2.2.1 – Settings Menu
When setting the method parameters either the standard value or a factor should be entered. The
standard should be used if the factor is not known as selecting this option will calculate the factor. If the
factor is known it is not necessary to measure a known standard’s concentration. When the standard or
factor is not being used the value should be set to 1.00.
16.2.2.1 Selecting a Wavelength – Concentration Plus Settings
The wavelength can be adjusted in the settings menu by
pressing the key below the wavelength icon. This will open
a number entry screen.
Use the keys at the bottom of the screen to select the digit
to be adjusted. The key below the digits must be pressed
twice to select the adjacent digit. Use the keys adjacent to
the arrow icons to increase or decrease the wavelength to
the required number. Press the key adjacent to the tick icon
to save the changes and return to the settings menu.
16.2.2.2 Selecting Concentration units
The units of concentration can be selected from a number of options: no units, %, ppm, EBC, SRM,
mEq/l, mEq, M, mM, μM, nM, U, U/l, U/ml, g/l, mg/l, μg/l, ng/l, g/dl, mg/dl, μg/dl, mg/ml, μg/ml, ng/ml,
μg/μl, ng/μl, mol/l, mmol/l.
Setting the dilution factor
Tick icon
Standard menu
Factor menu
Selectingresolution
Selecting a wavelength
Selecting concentration units

59554139292773
In the settings menu press the key below the units icon. This opens the unit selection screen which displays all the different units. Use the keys adjacent to the arrow icons to navigate around the screen to select the required units. Once the required units have been highlighted press the key adjacent to the tick icon to save and return to the settings menu. The selected unit will be displayed in the operating menu along with absorbance and selected wavelength.
16.2.2.3 Changing the resolution
The resolution that the concentration is displayed as can be selected from 1, 0.1, 0.01 or 0.001 by repeat presses of the key below the resolution icon in the settings menu.
16.2.2.4 using a Standard
The standard menu enables the value of a standard to be entered. This function is accessed by pressing the key adjacent to the standard icon. This opens the extended number entry screen. Use the keys at the bottom of the screen to select the digit to be changed. The key below the digits must be pressed twice to select the adjacent digit.
For example 00 the first press of the key alters 10, the second press alters 01. Use the keys adjacent to the arrow icons to increase or decrease the selected number. Standard values from 0.001 to 1000 can be entered. The standard value can be reset to one by pressing the key adjacent to the 001 icon. Once the standard value has been entered press the key adjacent to the tick icon to save and return to the settings menu. The entered value is displayed in the settings menu adjacent to the standard icon.
A standard value should only be entered if the factor is not known. If the factor is known the standard value should be set to 1.000.
16.2.2.5 using a Factor
The factor menu enables a factor to be entered. This function is accessed by pressing the key adjacent to the factor icon. This opens the extended number entry screen. Use the keys at the bottom of the screen to select the digit to be changed. The key below the digits must be pressed twice to select the adjacent digit.
For example 00 the first press of the key alters 10, the second press alters 01. Use the keys adjacent to the arrow icons to increase or decrease the selected number. Factor values of 0.001 to 10,000 can be entered. The factor value can be reset to one by pressing the key adjacent to the 001 icon. Once the factor has been entered press the key adjacent to the tick icon to save and return to the settings menu. The entered value is displayed in the settings menu adjacent to the factor icon.
If the factor is not known a standard should be measured in order to calculate the factor. If a standard is used the factor value should be set to 1.000.

2826222074
16.2.2.6 Setting the dilution Factor
In the settings menu press the key adjacent the dilution icon. This screen allows the user to input the relative sample and diluent volumes which have been used to prepare the sample being measured. Using this information, the instrument calculates a dilution factor which allows the instrument to determine and display the concentration of the original undiluted sample.
The volume of sample is entered by pressing the key adjacent to the sample volume icon. This will open the number entry screen. Use the keys at the bottom of the screen to select the digit to be changed and use the keys adjacent to the arrow icons to increase or decrease the number. The value can be reset to one by pressing the key adjacent to the 001 icon. Once the required volume has been entered press the key adjacent to the tick icon to save the changes and return to the settings.
The volume of diluent is entered by pressing the key adjacent to the diluent volume icon. This will open the number entry screen. Use the keys at the bottom of the screen to select the digit to be changed and use the keys adjacent to the arrow icons to increase or decrease the number. The value can be reset to zero by pressing the key adjacent to the 000 icon. Once the required volume has been entered press the key adjacent to the tick icon to save the changes and return to the settings.
After the sample and diluent volumes have been entered the dilution factor screen will show a summary of the dilution information entered.
16.3 CALIBrATION
In the concentration plus measurement mode calibrations against a standard or a factor can be performed following a zero calibration. If the factor is not known calibration against a known standard is performed in order to calculate the factor. However if the factor is known there is no need to calibrate using a standard.
The calibration must be performed at the same wavelength at which the sample will be measured.

16.3.1 Calibrating to a Standard
Insert a cuvette containing the blank solution into the sample chamber and close the instrument lid. Press the key below the calibrate to zero absorbance icon. The instrument will calibrate to zero absorbance.
Insert a cuvette containing the standard concentration sample solution into the sample chamber and
close the instrument lid.
Press the key below the calibrate to zero absorbance or
standard icon, this will open another menu with the option
to re-calibrate to zero absorbance or to calibrate to the
previously entered standard value. Press the key adjacent
to the calibrate to standard icon.
If the standard selected requires a factor beyond the range of the instrument the check standard icon
will be displayed.
The instrument will take a reading and calibrate to the
standard concentration. Once the calibration is complete
the sample can be measured using the measure to
standards icon.
16.3.2 Calibrating to a Factor
Insert a cuvette containing the blank solution into the
sample chamber and close the instrument lid. Press the
key below the calibrate to zero absorbance icon. The
instrument will calibrate to zero absorbance. Once the
calibration is complete the sample can be measured using
the measure to factor icon.
16.4 SAMPLE MEASurEMENT
It is not possible to perform sample measurements before the instrument has been calibrated at the selected wavelength. In this operating mode the type of sample measurement performed depends on the calibration which has been carried out.
16.4.1 Measuring a Sample After Calibrating to a Standard
Remove the cuvette containing the standard sample and
place a cuvette containing the sample to be measured
in the sample chamber. Close the instrument lid and
press the key below the measure to standard icon. Once
the measurement is complete the concentration and
absorbance values are displayed.
59554139292775
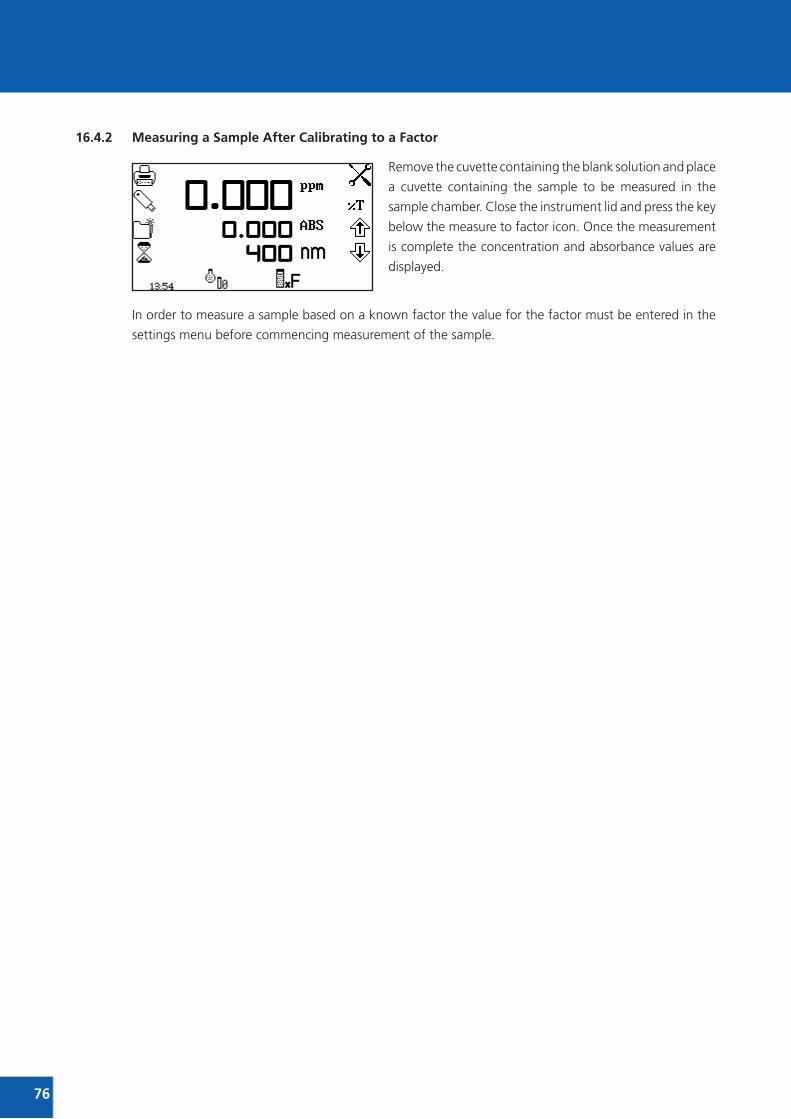
2826222076
16.4.2 Measuring a Sample After Calibrating to a Factor
Remove the cuvette containing the blank solution and place
a cuvette containing the sample to be measured in the
sample chamber. Close the instrument lid and press the key
below the measure to factor icon. Once the measurement
is complete the concentration and absorbance values are
displayed.
In order to measure a sample based on a known factor the value for the factor must be entered in the
settings menu before commencing measurement of the sample.

59554139292777
SECTION 17 – PurITy SCAN
The purity scan measurement mode enables measurements of absorbance or % transmittance over a range of wavelengths to be performed. The absorbance or % transmittance at each wavelength is plotted graphically. Post measurement tools such as peaks and valleys analysis and spectral points analysis can be performed. This operating mode can be used to check the peak purity of a nucleic acid sample. This measurement mode’s setup and operations are described in Section 12 of this manual.

2826222078
SECTION 18 – MuLTI-WAVELENGTH PLuS
The multi-wavelength plus measurement mode allows the user to determine the concentration of a sample using photometric readings at more than one wavelength. The mode will also show the ratio of two readings; a reading that is commonly used to indicate the purity nucleic acids. The mode includes an option to include a reference wavelength measurement in the available calculations. Following sample measurement, the concentration and ratio calculations are displayed on the operating menu screen.
18.1 MOdE SPECIFIC PArAMETErS
The multi-wavelength plus operating menu enables
measurement parameters to be changed. The utility
toolbar on the left hand side of the screen enables access
to printing, print setup options, results, methods and
autologging options. For more details on the different
functions of the utility toolbar refer to section 22.
The settings icon enables the wavelengths, number of wavelengths, units, resolution, dilution factor,
concentration calculation equation and concentration equation factors to be set. Following the completion
of a multi-wavelength measurement the calculation icon will display the expanded calculations for the
results shown on the operating menu screen and the individual photometric readings.
Fig 18.1.1 - Operating Menu
18.2 METHOd SET uP
In this measurement mode all the method set up parameters
are accessed through the settings menu. To open the
settings menu press the key adjacent to the settings icon
in the operating menu.
Operating Menu
Print/print settings
Results selection menu
Method selection menu
Autolog menu
Calibrate to zero
Measure sample
Settings
Extended calculation screen

59554139292779
18.2.1 Multi-wavelength Plus Settings
The settings menu enables the wavelengths, number of wavelengths, units, resolution, dilution factor,
concentration calculation equation and concentration equation factors to be set. Once all of the required
settings have been entered press the key adjacent to the tick icon to save and return to the operating
menu.
Fig 18.2.1.1 - Settings Menu
18.2.1.1 Setting the Measurement Wavelengths
To adjust the measurement wavelengths press the key
adjacent to the required wavelength number icon. This
will open the number entry screen. Use the keys at the
bottom of the screen to select the digit to be changed,
pressing the key twice to select the second digit. Use the
keys adjacent to the arrow icons to increase or decrease
the number. Once the required wavelength has been
entered press the key adjacent to the tick icon to save the
changes and return to the settings menu screen.
18.2.1.2 Changing the resolution
The resolution of the concentration can be selected from 1, 0.1, 0.01 or 0.001 by repeat presses of the key below the resolution icon.
18.2.1.3 Selecting Concentration units
The concentration units can be selected from a number of options: no units, %, ppm, EBC, SRM, mEq/l,
mEq, M, mM, μM, nM, U, U/l, U/ml, g/l, mg/l, μg/l, ng/l, g/dl, mg/dl, μg/dl, mg/ml, μg/ml, ng/ml, μg/μl,
ng/μl, mol/l, mmol/l.
In the settings menu press the key below the units icon
to open the unit selection screen which displays all the
different unit options. Use the keys adjacent to the arrow
icons to navigate around the screen to select the required
units. Once the required units have been highlighted press
the key adjacent to the tick icon to save and return to the
settings menu.
Wavelength 1
Concentration calculation/factors
Reference wavelength On/Off
Tick icon
Selection resolution
Selecting units
Wavelength 2
Wavelength 3
Wavelength 4
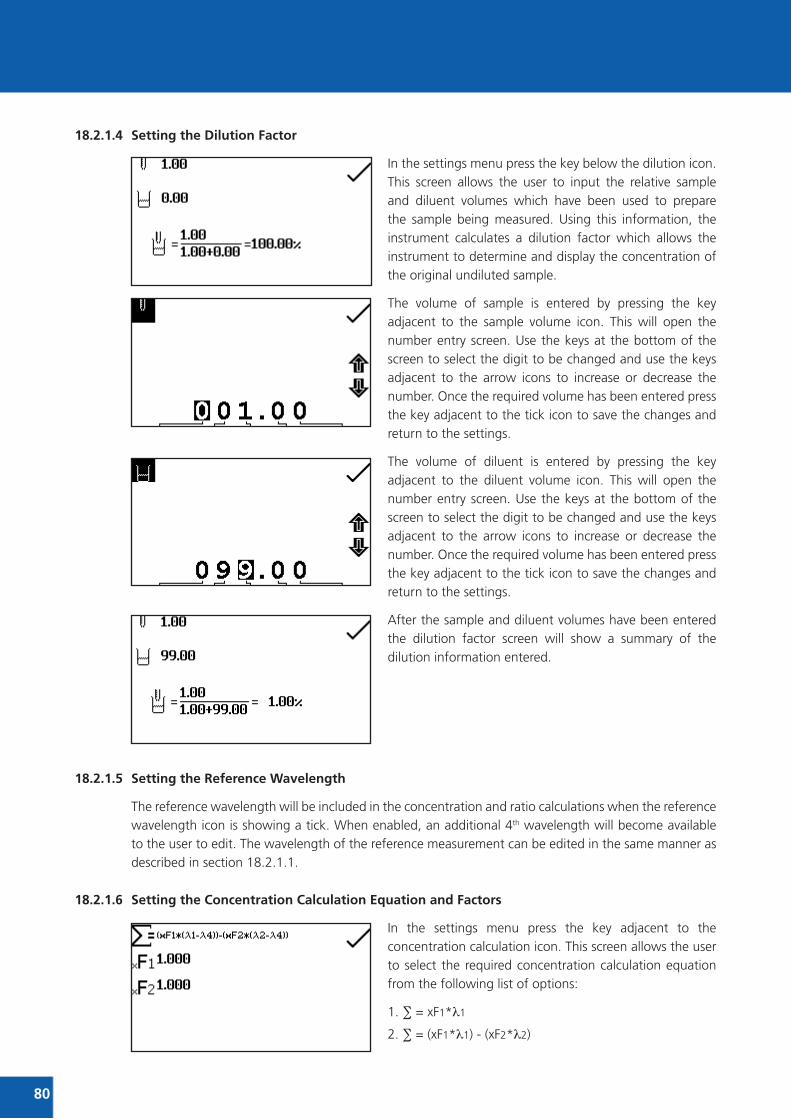
2826222080
18.2.1.4 Setting the dilution Factor
In the settings menu press the key below the dilution icon. This screen allows the user to input the relative sample and diluent volumes which have been used to prepare the sample being measured. Using this information, the instrument calculates a dilution factor which allows the instrument to determine and display the concentration of the original undiluted sample.
The volume of sample is entered by pressing the key adjacent to the sample volume icon. This will open the number entry screen. Use the keys at the bottom of the screen to select the digit to be changed and use the keys adjacent to the arrow icons to increase or decrease the number. Once the required volume has been entered press the key adjacent to the tick icon to save the changes and return to the settings.
The volume of diluent is entered by pressing the key adjacent to the diluent volume icon. This will open the number entry screen. Use the keys at the bottom of the screen to select the digit to be changed and use the keys adjacent to the arrow icons to increase or decrease the number. Once the required volume has been entered press the key adjacent to the tick icon to save the changes and return to the settings.
After the sample and diluent volumes have been entered the dilution factor screen will show a summary of the dilution information entered.
18.2.1.5 Setting the reference Wavelength
The reference wavelength will be included in the concentration and ratio calculations when the reference wavelength icon is showing a tick. When enabled, an additional 4th wavelength will become available to the user to edit. The wavelength of the reference measurement can be edited in the same manner as described in section 18.2.1.1.
18.2.1.6 Setting the Concentration Calculation Equation and Factors
In the settings menu press the key adjacent to the concentration calculation icon. This screen allows the user to select the required concentration calculation equation from the following list of options:
1. ∑ = xF1*l1
2. ∑ = (xF1*l1) - (xF2*l2)

59554139292781
When a reference wavelength is included these equations are modified as follows:
1. ∑ = xF1*(l1-l4)
2. ∑ = (xF1*(l1-l4)) - (xF2*l2)
Repeat presses will cycle through the options available.
The concentration equation factors can be edited by pressing the key adjacent to the concentration factor icons. This opens the extended number entry screen. Use the keys at the bottom of the screen to select the digit to be changed. The key below the digits must be pressed twice to select the adjacent digit. For example 00 the first press of the key alters 10, the second press alters 01. Use the keys adjacent to the arrow icons to increase or decrease
the selected number. Factor values of 0.001 to 9999.999 can be entered. The factor value can be reset to one by pressing the key adjacent to the 001 icon. Once the factor has been entered press the key adjacent to the tick icon to save and return to the settings menu. The entered value is displayed in the settings menu adjacent to the factor icon.
18.3 CALIBrATION
Insert a cuvette containing the blank solution into the sample chamber and close the instrument lid. Press the key below the calibrate to zero absorbance icon. This will measure the zero absorbance level at each of the wavelengths specified in the method settings.
Once the calibration is complete the measure sample icon appears and the sample can be measured. If the wavelength is adjusted before a sample is measured the measure sample icon will disappear and the instrument must be calibrated again at the new wavelength.
18.4 SAMPLE MEASurEMENT
Insert a cuvette containing the sample to be analysed into the sample chamber and press the key below the sample measurement icon. The instrument will take a reading at each of the specified wavelengths and will then show the calculated concentration and ratio values on the operating menu screen.
Additional information can be viewed by pressing the key adjacent to the calculation icon. The screen will show the photometric readings at each of the specified wavelengths and the full concentration and ratio calculations.

2826222082
SECTION 19 – dNA
The DNA measurement mode allows the user to select a method from a list of common nucleic acid measurement tests, including single wavelength concentration measurements for dsDNA, ssDNA, RNA and Oligonucleotides and methods that use absorbance ratios for estimating nucleic acid purity, such as 260nm/280nm and 260nm/230nm.
19.1 dNA MENu OPTIONS
The DNA menu allows the user to select the required
pre-defined method from the list of on-screen options by
pressing the key adjacent to the measurement method that
is required. The dsDNA, ssDNA, RNA and Oligo options
are used to determine the concentration of nucleic acid
samples and the 260/280, 260/230 and VarRatio methods
are used to assess both the purity and concentration of
nucleic acids.
19.2 dsdNA
The dsDNA operating menu enables the concentration of
double stranded DNA to be determined according to the
equation:-
Concentration (μg/ml) = Abs@260nm x 50.0.
The dsDNA settings menu allows the user to adjust
measurement specific parameters such as the dilution
factor and resolution. Other method settings can be altered
if required, but the concentration units are limited to μg/ml
and mg/ml only.
The dsDNA method settings are locked and any changes
will be lost after exiting the mode. See Section 16 for full
instructions on altering the dsDNA menu options and
settings.
19.3 ssdNA
The ssDNA operating menu enables the concentration of
single stranded DNA to be determined according to the
equation:-
Concentration (μg/ml) = Abs@260nm x 37.0.
Operating Menu
Menu Options

59554139292783
The ssDNA settings menu allows the user to adjust measurement specific parameters such as the dilution factor and resolution. Other method settings can be altered if required, but the concentration units are limited to μg/ml and mg/ml only.
The ssDNA method settings are locked and any changes will be lost after exiting the mode. See Section 16 for full instructions on altering the ssDNA menu options and settings.
19.4 rNA
The RNA operating menu enables the concentration of RNA to be determined according to the equation:-
Concentration (μg/ml) = Abs@260nm x 40.0.
The RNA settings menu allows the user to adjust measurement specific parameters such as the dilution factor and resolution. Other method settings can be altered if required, but the concentration units are limited to μg/ml and mg/ml only.
The RNA method settings are locked and any changes will be lost after exiting the mode. See Section 16 for full instructions on altering the RNA method options and settings.
19.5 OLIGONuCLEOTIdES
The oligonucleotide operating menu enables the concentration of a typical oligonucleotide to be determined according to the equation:-
Concentration (μg/ml) = Abs@260nm x 30.0.
The oligonucleotide settings menu allows the user to adjust measurement specific parameters such as the dilution factor and resolution. Other method settings can be altered if required, but the concentration units are limited to μg/ml and mg/ml only.
The oligonucleotide method settings are locked and any changes will be lost after exiting the mode. See Section 16 for full instructions on altering the oligonucleotide method
options and settings.
Operating Menu
Operating Menu

2826222084
19.6 260 / 280
The 260/280 operating menu enables the purity and concentration of DNA to be estimated according to the following equations:-
Purity ratio = Abs@260nm / Abs@280nm
Conc (μg/ml) = (Abs@260nm x 62.9) - (Abs@280nm x 36.0)
The 260/280 settings menu allows the user to adjust measurement specific parameters such as the dilution factor and resolution but the concentration units are limited to μg/ml and mg/ml only. Other method settings, such as the inclusion of a reference wavelength and the concentration equation and factors can be altered if required, but the 260/280 method settings are locked and any changes will be lost after exiting the mode. See Section 18 for full instructions on altering the 260/280 method options and settings.
19.7 260 / 230
The 260/230 operating menu enables the purity and concentration of DNA to be estimated according to the following equations:-
Purity ratio = Abs@260nm / Abs@230nm
Conc (μg/ml) = (Abs@260nm x 49.1) - (Abs@230nm x 3.48)
The 260/230 settings menu allows the user to adjust measurement specific parameters such as the dilution factor and resolution but the concentration units are limited to μg/ml and mg/ml only. Other method settings, such as the inclusion of a reference wavelength and the concentration equation and factors can be altered if required, but the 260/280 method settings are locked and any changes will be lost after exiting the mode. See Section 18 for full instructions on altering the 260/230 method options and settings.
Operating Menu
Operating Menu
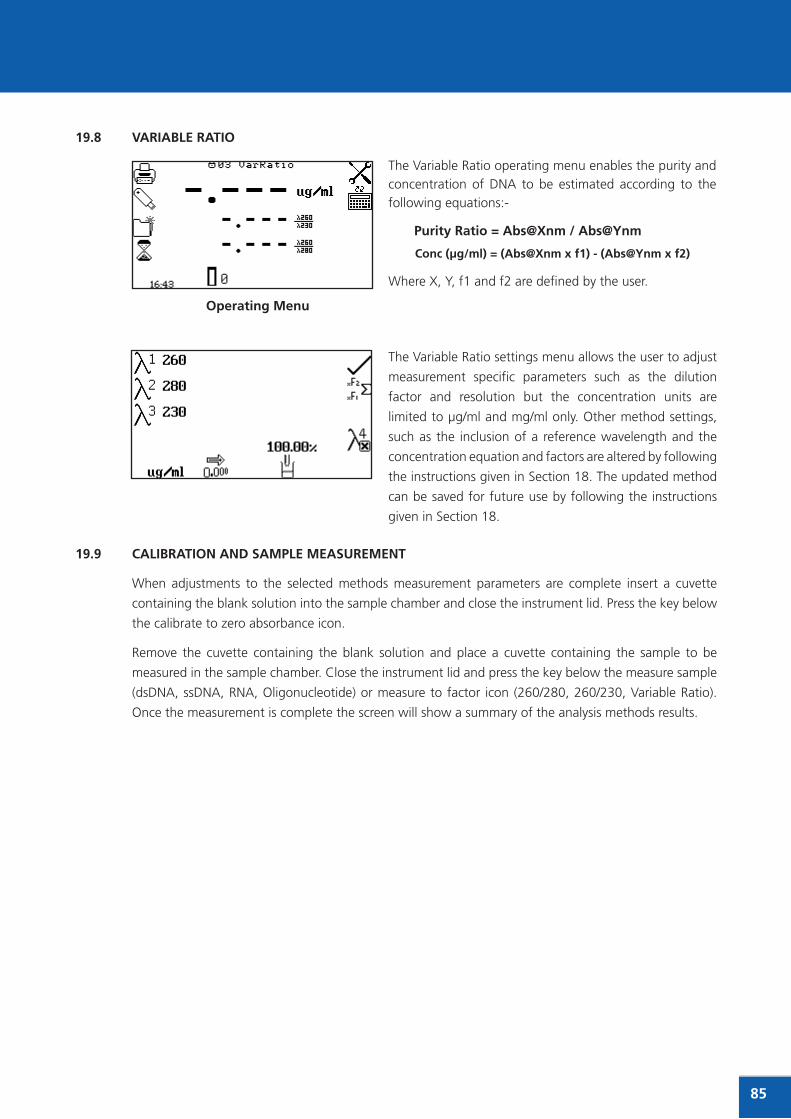
Operating Menu
19.8 VArIABLE rATIO
The Variable Ratio operating menu enables the purity and concentration of DNA to be estimated according to the following equations:-
Purity ratio = Abs@Xnm / Abs@ynm
Conc (μg/ml) = (Abs@Xnm x f1) - (Abs@ynm x f2)
Where X, Y, f1 and f2 are defined by the user.
59554139292785
The Variable Ratio settings menu allows the user to adjust
measurement specific parameters such as the dilution
factor and resolution but the concentration units are
limited to μg/ml and mg/ml only. Other method settings,
such as the inclusion of a reference wavelength and the
concentration equation and factors are altered by following
the instructions given in Section 18. The updated method
can be saved for future use by following the instructions
given in Section 18.
19.9 CALIBrATION ANd SAMPLE MEASurEMENT
When adjustments to the selected methods measurement parameters are complete insert a cuvette
containing the blank solution into the sample chamber and close the instrument lid. Press the key below
the calibrate to zero absorbance icon.
Remove the cuvette containing the blank solution and place a cuvette containing the sample to be
measured in the sample chamber. Close the instrument lid and press the key below the measure sample
(dsDNA, ssDNA, RNA, Oligonucleotide) or measure to factor icon (260/280, 260/230, Variable Ratio).
Once the measurement is complete the screen will show a summary of the analysis methods results.
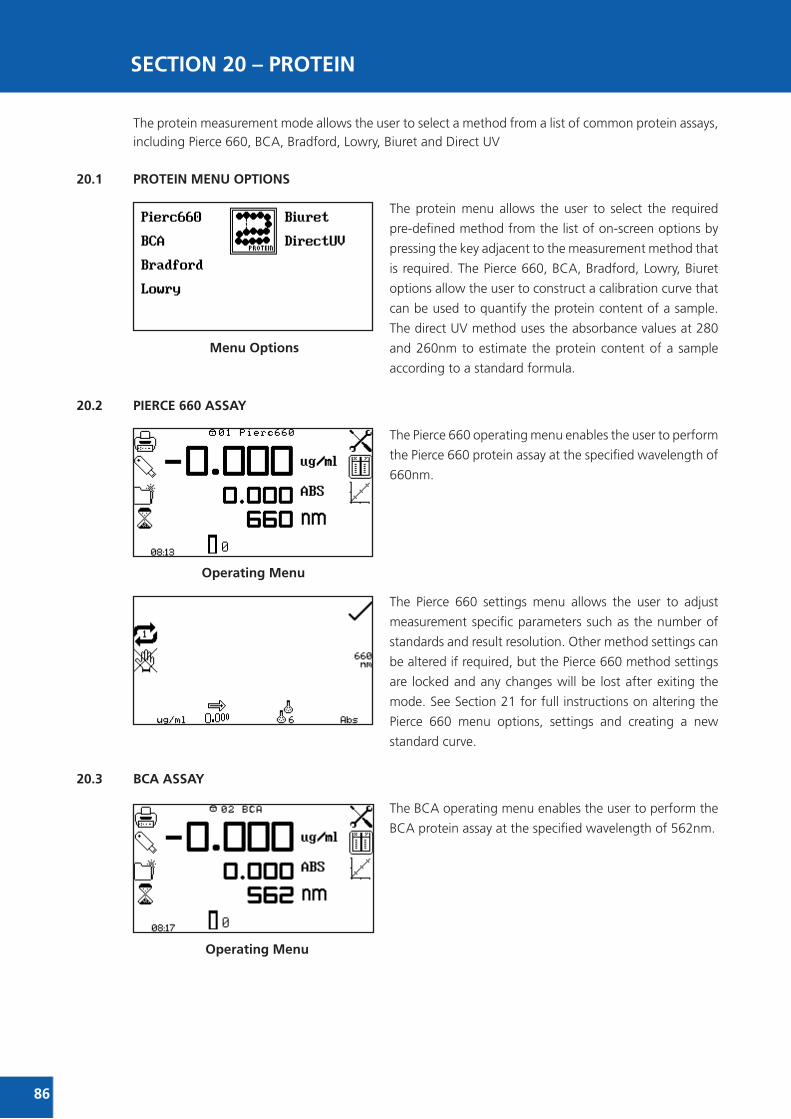
2826222086
SECTION 20 – PrOTEIN
The protein measurement mode allows the user to select a method from a list of common protein assays, including Pierce 660, BCA, Bradford, Lowry, Biuret and Direct UV
20.1 PrOTEIN MENu OPTIONS
The protein menu allows the user to select the required
pre-defined method from the list of on-screen options by
pressing the key adjacent to the measurement method that
is required. The Pierce 660, BCA, Bradford, Lowry, Biuret
options allow the user to construct a calibration curve that
can be used to quantify the protein content of a sample.
The direct UV method uses the absorbance values at 280
and 260nm to estimate the protein content of a sample
according to a standard formula.
20.2 PIErCE 660 ASSAy
The Pierce 660 operating menu enables the user to perform
the Pierce 660 protein assay at the specified wavelength of
660nm.
The Pierce 660 settings menu allows the user to adjust
measurement specific parameters such as the number of
standards and result resolution. Other method settings can
be altered if required, but the Pierce 660 method settings
are locked and any changes will be lost after exiting the
mode. See Section 21 for full instructions on altering the
Pierce 660 menu options, settings and creating a new
standard curve.
20.3 BCA ASSAy
The BCA operating menu enables the user to perform the
BCA protein assay at the specified wavelength of 562nm.
Menu Options
Operating Menu
Operating Menu
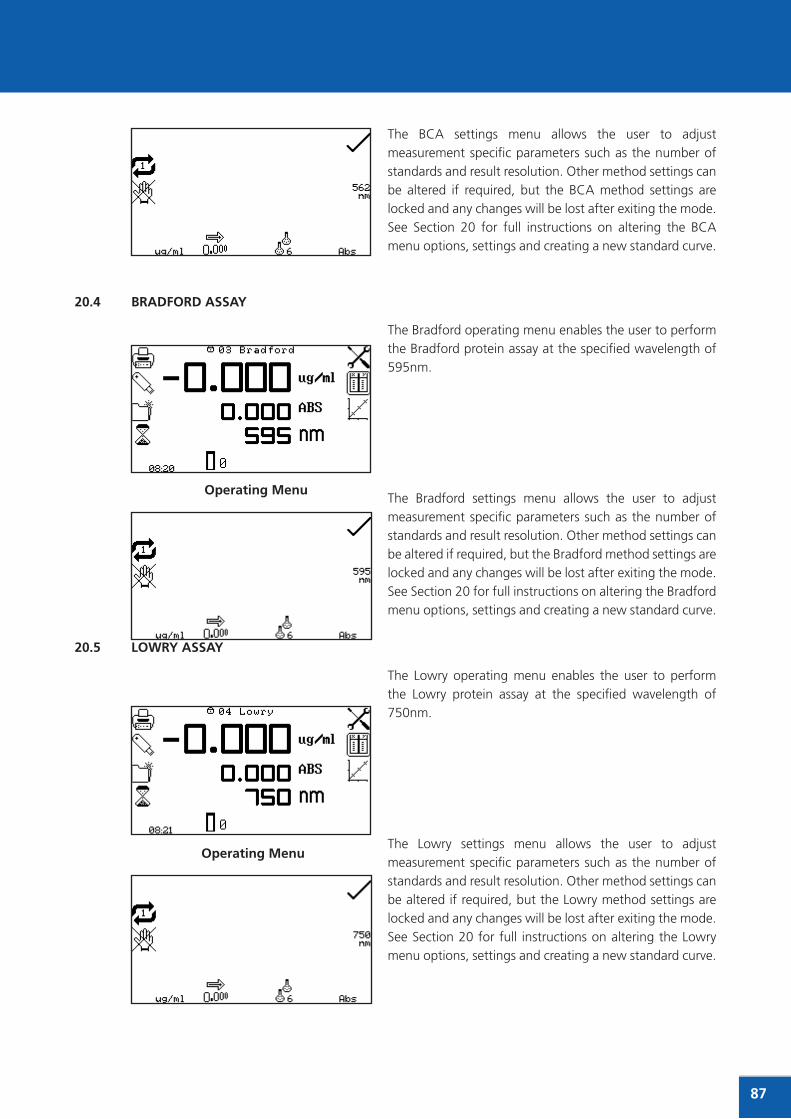
59554139292787
The BCA settings menu allows the user to adjust measurement specific parameters such as the number of standards and result resolution. Other method settings can be altered if required, but the BCA method settings are locked and any changes will be lost after exiting the mode. See Section 20 for full instructions on altering the BCA menu options, settings and creating a new standard curve.
20.4 BrAdFOrd ASSAy
The Bradford operating menu enables the user to perform the Bradford protein assay at the specified wavelength of 595nm.
The Bradford settings menu allows the user to adjust measurement specific parameters such as the number of standards and result resolution. Other method settings can be altered if required, but the Bradford method settings are locked and any changes will be lost after exiting the mode. See Section 20 for full instructions on altering the Bradford menu options, settings and creating a new standard curve.
20.5 LOWry ASSAy
The Lowry operating menu enables the user to perform the Lowry protein assay at the specified wavelength of 750nm.
The Lowry settings menu allows the user to adjust measurement specific parameters such as the number of standards and result resolution. Other method settings can be altered if required, but the Lowry method settings are locked and any changes will be lost after exiting the mode. See Section 20 for full instructions on altering the Lowry menu options, settings and creating a new standard curve.
Operating Menu
Operating Menu

2826222088
20.6 BIurET ASSAy
The Biuret operating menu enables the user to perform the Biuret protein assay at the specified wavelength of 540nm.
The Biuret settings menu allows the user to adjust measurement specific parameters such as the number of standards and result resolution. Other method settings can be altered if required, but the Biuret method settings are locked and any changes will be lost after exiting the mode. See Section 20 for full instructions on altering the Biuret menu options, settings and creating a new standard curve.
20.7 dIrECT uV
The direct UV operating menu enables the concentration and purity of a protein sample to be estimated according to the following equations:-
Purity ratio = Abs@280nm / Abs@260nm
Conc(μg/ml) = (Abs@280nm x 1550) - (Abs@260nm x 760)
The Direct UV settings menu allows the user to adjust measurement specific parameters such as the dilution factor and result resolution. Other method settings, such as the inclusion of a reference wavelength and the concentration equation/factors can be altered if required, but the Direct UV method settings are locked and any changes will be lost after exiting the mode.
20.8 CALIBrATION ANd SAMPLE MEASurEMENT
When adjustments to the selected methods measurement parameters are complete insert a cuvette containing the blank solution into the sample chamber and close the instrument lid. Press the key below the calibrate to zero absorbance icon.
Remove the cuvette containing the blank solution and place a cuvette containing the sample to be measured in the sample chamber. Close the instrument lid and press the key below the measure sample icon. Once the measurement is complete the screen will show a summary of the results.
Operating Menu
Operating Menu

59554139292789
SECTION 21 – Od 600
The OD 600 measurement mode enables optical density measurements of cell cultures and broths to be performed. In this measurement mode it is possible to use a known factor to estimate the number of cells or the user can determine the factor to be used by measuring a standard solution containing a pre-determined number of cells. An instrument normalisation factor can also be applied to equate the results obtained on different spectrophotometers. The sample solution is measured at one wavelength at one point in time. There are no post measurement calculations available in this measurement mode.
21.1 MOdE SPECIFIC PArAMETErS
The OD 600 operating menu enables measurement
parameters to be changed. The utility toolbar on the left
hand side of the screen enables access to printing, print
setup options, results, methods and autologging options.
For more details on the different functions of the utility
toolbar refer to section 22q.
The settings icon enables the wavelength, units, resolution, standard concentration, concentration factor,
instrument factor and dilution factor to be set.
Fig 16.1.1 - Operating Menu – After Calibration
21.2 METHOd SETuP
21.2.2 Selecting a Wavelength
The wavelength can be adjusted in the operating menu
or in the settings menu. To adjust the wavelength in the
operating menu use the keys adjacent to the arrow icons
to increase or decrease the wavelength.
Operating Menu
Print/print settings
Results selection menu
Method selection menu
Autolog menu
Calibrate Measure sample
Settings
Increase wavelength
Decrease wavelength
Switch display Abs/%T
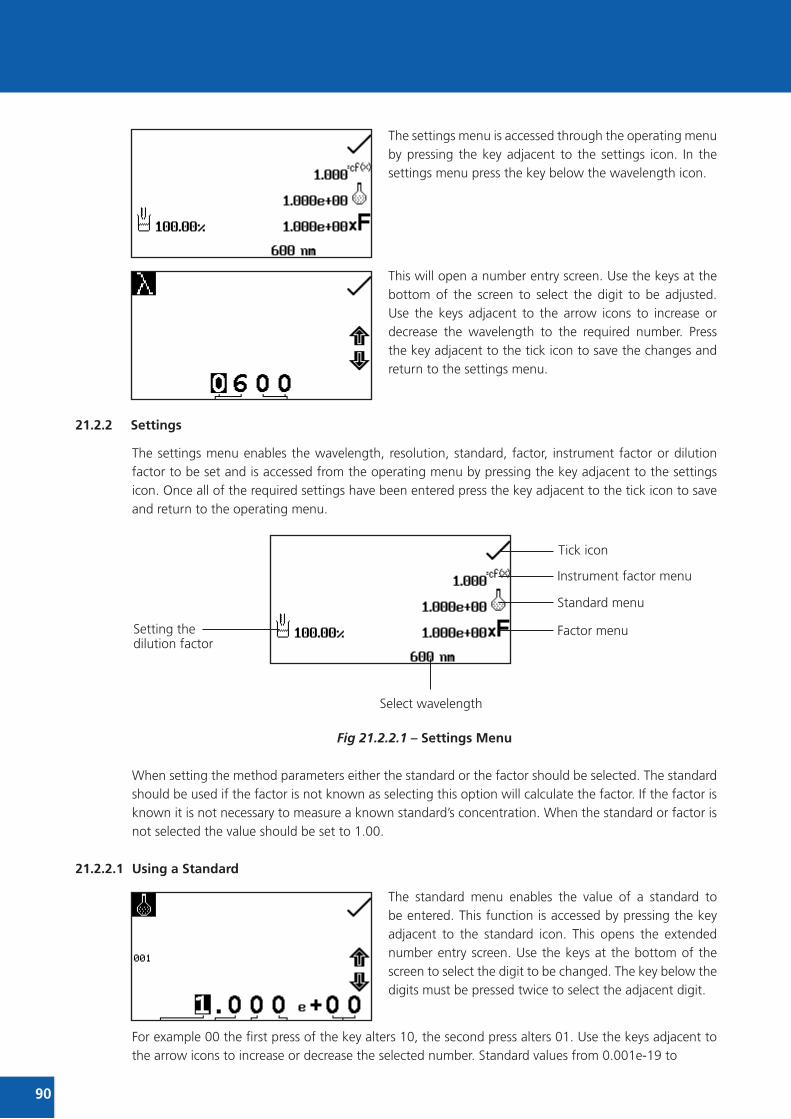
2826222090
The settings menu is accessed through the operating menu by pressing the key adjacent to the settings icon. In the settings menu press the key below the wavelength icon.
This will open a number entry screen. Use the keys at the bottom of the screen to select the digit to be adjusted. Use the keys adjacent to the arrow icons to increase or decrease the wavelength to the required number. Press the key adjacent to the tick icon to save the changes and return to the settings menu.
21.2.2 Settings
The settings menu enables the wavelength, resolution, standard, factor, instrument factor or dilution factor to be set and is accessed from the operating menu by pressing the key adjacent to the settings icon. Once all of the required settings have been entered press the key adjacent to the tick icon to save and return to the operating menu.
Fig 21.2.2.1 – Settings Menu
When setting the method parameters either the standard or the factor should be selected. The standard should be used if the factor is not known as selecting this option will calculate the factor. If the factor is known it is not necessary to measure a known standard’s concentration. When the standard or factor is not selected the value should be set to 1.00.
21.2.2.1 using a Standard
The standard menu enables the value of a standard to be entered. This function is accessed by pressing the key adjacent to the standard icon. This opens the extended number entry screen. Use the keys at the bottom of the screen to select the digit to be changed. The key below the digits must be pressed twice to select the adjacent digit.
For example 00 the first press of the key alters 10, the second press alters 01. Use the keys adjacent to the arrow icons to increase or decrease the selected number. Standard values from 0.001e-19 to
Setting the dilution factor
Tick icon
Standard menu
Instrument factor menu
Factor menu
Select wavelength

59554139292791
9.999e+19 can be entered. The standard value can be reset to 1.000e+00 by pressing the key adjacent
to the 001 icon. Once the standard value has been entered press the key adjacent to the tick icon to
save and return to the settings menu. The entered value is displayed in the settings menu adjacent to
the standard icon.
A standard value should only be entered if the factor is not known. If the factor is known the standard
value should be set to 1.000e+00.
21.2.2.2 using a Factor
The factor menu enables a factor to be entered. This
function is accessed by pressing the key adjacent to the
factor icon. This opens the extended number entry screen.
Use the keys at the bottom of the screen to select the digit
to be changed. The key below the digits must be pressed
twice to select the adjacent digit.
For example 00 the first press of the key alters 10, the second press alters 01. Use the keys adjacent to
the arrow icons to increase or decrease the selected number. Factor values of 0.01e-19 to 9.999e+19
can be entered. The factor value can be reset to 1.000e+00 by pressing the key adjacent to the 001
icon. Once the factor has been entered press the key adjacent to the tick icon to save and return to the
settings menu. The entered value is displayed in the settings menu adjacent to the factor icon.
If the factor is not known a standard should be measured in order to calculate the factor. If a standard is
used the factor value should be set to 1.000e+00.
21.2.2.3 using an Instrument Factor
The instrument factor menu enables an instrument
factor to be entered to allow results from different
spectrophotometers to be normalised. This function is
accessed by pressing the key adjacent to the instrument
factor icon. This opens the extended number entry screen.
Use the keys at the bottom of the screen to select the digit
to be changed. The key below the digits must be pressed
twice to select the adjacent digit.
For example 00 the first press of the key alters 10, the second press alters 01. Use the keys adjacent to
the arrow icons to increase or decrease the selected number. Instrument factor values from 0.001 to
9999.999 can be entered. Once the instrument factor value has been entered press the key adjacent to
the tick icon to save and return to the settings menu. The entered value is displayed in the settings menu
adjacent to the instrument factor icon.
An instrument factor should only be entered if the factor is known. If the factor is not known the
instrument factor should be set to 1.000.
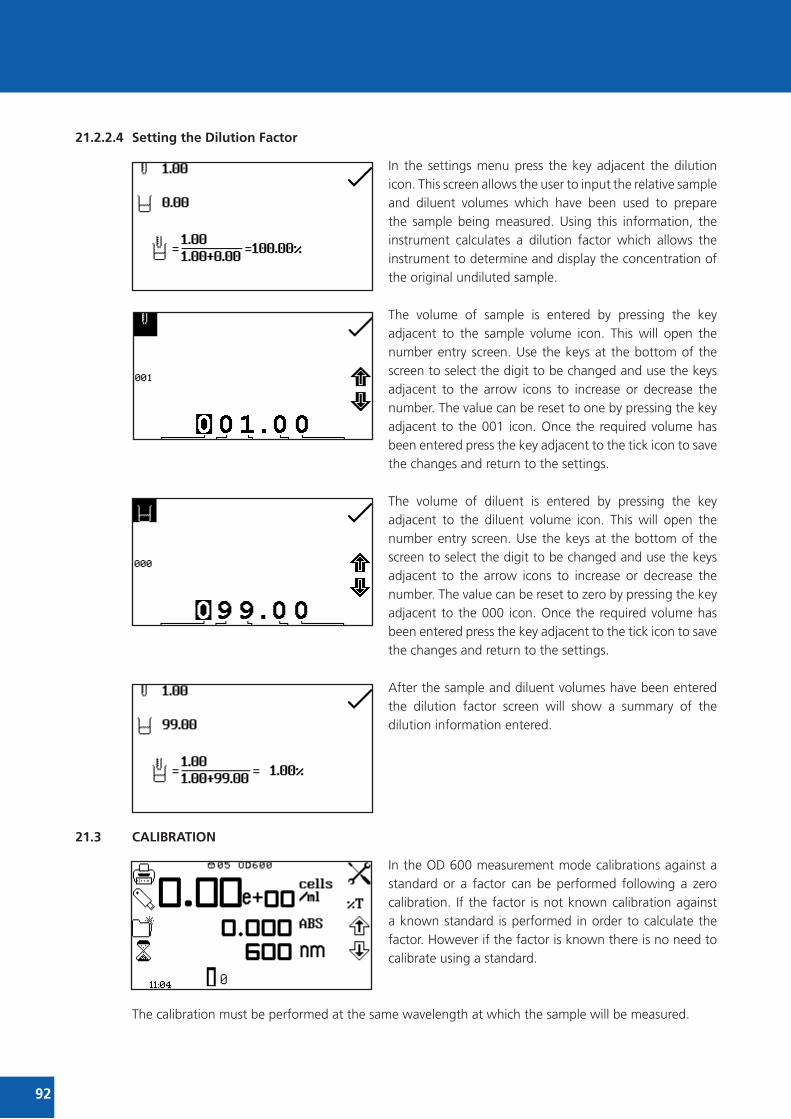
2826222092
21.2.2.4 Setting the dilution Factor
In the settings menu press the key adjacent the dilution icon. This screen allows the user to input the relative sample and diluent volumes which have been used to prepare the sample being measured. Using this information, the instrument calculates a dilution factor which allows the instrument to determine and display the concentration of the original undiluted sample.
The volume of sample is entered by pressing the key adjacent to the sample volume icon. This will open the number entry screen. Use the keys at the bottom of the screen to select the digit to be changed and use the keys adjacent to the arrow icons to increase or decrease the number. The value can be reset to one by pressing the key adjacent to the 001 icon. Once the required volume has been entered press the key adjacent to the tick icon to save the changes and return to the settings.
The volume of diluent is entered by pressing the key adjacent to the diluent volume icon. This will open the number entry screen. Use the keys at the bottom of the screen to select the digit to be changed and use the keys adjacent to the arrow icons to increase or decrease the number. The value can be reset to zero by pressing the key adjacent to the 000 icon. Once the required volume has been entered press the key adjacent to the tick icon to save the changes and return to the settings.
After the sample and diluent volumes have been entered the dilution factor screen will show a summary of the dilution information entered.
21.3 CALIBrATION
In the OD 600 measurement mode calibrations against a standard or a factor can be performed following a zero calibration. If the factor is not known calibration against a known standard is performed in order to calculate the factor. However if the factor is known there is no need to calibrate using a standard.
The calibration must be performed at the same wavelength at which the sample will be measured.

59554139292793
21.3.1 Calibrating to a Standard
Insert a cuvette containing the blank solution into the sample chamber and close the instrument lid. Press
the key below the calibrate to zero absorbance icon. The instrument will calibrate to zero absorbance.
Insert a cuvette containing the standard concentration sample solution into the sample chamber and
close the instrument lid.
Press the key below the calibrate to zero absorbance or
standard icon, this will open another menu with the option
to re-calibrate to zero absorbance or to calibrate to the
previously entered standard value. Press the key adjacent
to the calibrate to standard icon.
If the standard selected requires a factor beyond the range of the instrument the check standard icon
will be displayed.
The instrument will take a reading and calibrate to the
standard concentration. Once the calibration is complete
the sample can be measured using the measure to standard
icon.
21.3.2 Calibrating to a Factor
Insert a cuvette containing the blank solution into the
sample chamber and close the instrument lid. Press the
key below the calibrate to zero absorbance icon. The
instrument will calibrate to zero absorbance. Once the
calibration is complete the sample can be measured using
the measure to factor icon.
21.4 SAMPLE MEASurEMENT
It is not possible to perform sample measurements before the instrument has been calibrated at the selected wavelength. In this operating mode the type of sample measurement performed depends on the calibration which has been carried out.
21.4.1 Measuring a Sample After Calibrating to a Standard
Remove the cuvette containing the standard sample and
place a cuvette containing the sample to be measured
in the sample chamber. Close the instrument lid and
press the key below the measure to standard icon. Once
the measurement is complete the concentration and
absorbance values are displayed.

2826222094
21.4.2 Measuring a Sample After Calibrating to a Factor
Remove the cuvette containing the blank solution and place
a cuvette containing the sample to be measured in the
sample chamber. Close the instrument lid and press the key
below the measure to factor icon. Once the measurement
is complete the concentration and absorbance values are
displayed.
In order to measure a sample based on a known factor the value for the factor must be entered in the
settings menu before commencing measurement of the sample.

59554139292795
SECTION 22 – SAVING, PrINTING ANd AuTOLOGGING
The utility toolbar in the operating menu provides access to printing, print setup options, opening, saving
and deleting results and methods and autologging options.
If the method lock has been activated the method selection menu is disabled.
Fig 22.1 - Operating Menu
22.1 SAVING METHOdS
The number of methods that can be saved to the internal memory of the instrument is given in table
22.1. Once the method has been saved to the internal memory the method can be saved directly to a
USB memory stick and opened on another instrument.
Table 22.1 – Method storage capacity (Internal Memory)
22.1.1 Saving Methods To Internal Memory
In the operating menu press the key adjacent to the
method icon to open the method selection menu. Select
the location to save the method by pressing the key
adjacent to the location. Use the keys below the arrow
icons to move page up or down. Press the key below the
save icon to open the method naming menu.
Print/print settings
Results selection menu
Method selection menu
Autolog menu
Operating Mode Number of Methods
Photometrics 16
Concentration 16
Quantitation 16
Spectrum 16
Kinetics 16
Multi-wavelength 16
Multi-wavelength Plus 48
Concentration Plus 48
Protein 48
Purity Scan 48

2826222096
The default method name will be displayed. To save the method under the default name press the key adjacent to the tick icon. To change the name of the method press the key below the eraser icon. One press of the key will delete one letter, holding the key for 2 seconds will delete the name completely.
To select letters use the keys adjacent to the arrow icons to move around the menu. Once the required letter is highlighted press the key below the pencil icon to select the letter. Up to eight characters can be selected. To change the letter case or to use numbers in the method name press the key below the AB icon. Repeat pressing of this key will cycle between upper case, lower case and numbers. Once the required name for the method has been entered press the key adjacent to the tick icon to save the method and return to the method selection menu.
If there is already a method saved in the chosen location confirmation will be needed to replace the existing method with the new one; press the key adjacent to the tick icon to confirm replacement. Press the key adjacent to the cross icon to cancel and return to the method naming menu.
To exit the method naming menu without saving the method press the back key.
22.1.2 Saving Methods to uSB Memory Stick
In the operating menu press the key adjacent to the method icon to open the method selection menu. Select the method to save to USB memory stick by pressing the key adjacent to the method location. Use the keys below the arrow icons to move page up or down. Hold the key below the save icon for 2 seconds to open the save to USB memory stick menu.
Either the single method selected or all 16 (or 48) methods can be saved to USB memory stick. To save a single method press the key adjacent to the single method save icon. To save all 16 (or 48) methods press the key adjacent to the 1 - 16 (or 48) method save icon. Press the key adjacent to the tick icon to confirm saving the method(s) to USB memory stick. Press the key adjacent to the cross icon to cancel saving the method(s) to USB memory stick and return to the method selection screen.
Confirmation will be needed to save the methods to USB memory stick. Press the key adjacent to the tick icon to confirm saving the method(s). Press the key adjacent to the cross icon to cancel and return to the option of saving one or all of the methods to USB memory stick.

59554139292797
22.2 OPENING METHOdS
Methods can be opened from the internal memory of the instrument or from a USB memory stick. Before a method can be opened from a USB memory stick it must be saved to the internal memory of the instrument first.
22.2.1 Opening Methods From Internal Memory
In the operating menu press the key adjacent to the method icon to open the method selection menu and use the keys below the arrow icons to move page up or down. Select the method to open by pressing the key adjacent to the method location. Press the key below the open icon.
The instrument will return to the current measurement mode and the method name will be displayed at the top of the operating menu.
If a method hasn’t been selected it is still possible to calibrate the instrument and take measurements.
22.2.2 Opening Methods From uSB Memory Stick
In the operating menu press the key adjacent to the method icon to open the method selection menu and use the keys below the arrow icons to move page up or down. Select an empty location to save the method by pressing the key adjacent to the location. Hold the key below the open icon for 2 seconds.
Either a single method or all 16 methods can be opened from the USB memory stick. Select one method by pressing the key adjacent to the single method open icon. To open all methods press the key adjacent to the 1 – 16 (or 48) method open icon. Press the key adjacent to the tick icon to confirm selection.
Or press the key adjacent to the cross icon to cancel and return to the method selection screen.
Confirmation will be needed to open the method(s) as any existing methods in this measurement mode will be overwritten. Press the key adjacent to the tick icon to save over the existing methods. Press the key adjacent to the cross icon to cancel and return to the option of opening one or all methods from the USB memory stick. If a single method is selected to be opened, this method will be stored in the same location that is was saved in when it was originally saved to the USB memory stick.

2826222098
22.3 dELETING METHOdS
In the operating menu press the key adjacent to the method icon to open the method selection menu and use the keys adjacent to the arrow icons to move page up or down. Select the method to be deleted by pressing the key adjacent to the method location and press the key below the delete icon.
Confirmation will be needed to delete the selected method; press the key adjacent to the tick icon to confirm deletion. Press the key adjacent to the cross icon to cancel deletion and return to the method selection menu.
22.4 SAVING rESuLTS
Results can only be saved if there is a valid USB memory stick inserted into the front of the instrument. The instruments are supplied with a USB memory stick but other types which may be used include: the PNY Attache Premium, the Emtec C250, The Kingston Data Traveler G2, the Sony Pocket Bit and the Integral Flexi.
In the operating menu press the key adjacent to the USB memory stick icon to open the results selection menu.
If the USB memory stick doesn’t have any results stored on it only the save icon will be displayed. To save a result press the key below the save icon. This will open the results naming menu.
The default result name will be displayed. To save the result under the default name press the key adjacent to the tick icon. To change the name of the result press the key below the eraser icon. One press of the key will delete one letter, holding the key for 2 seconds will delete the name completely.
To select letters use the keys adjacent to the arrow icons to move around the menu. Once the required letter is highlighted press the key below the pencil icon to select the letter. Up to eight characters can be selected. To use numbers in the results name press the key below the AB icon. Repeat pressing of this key will cycle between upper case and numbers. Once the required name for the result has been entered press the key adjacent to the tick icon to save and return to the results selection menu.
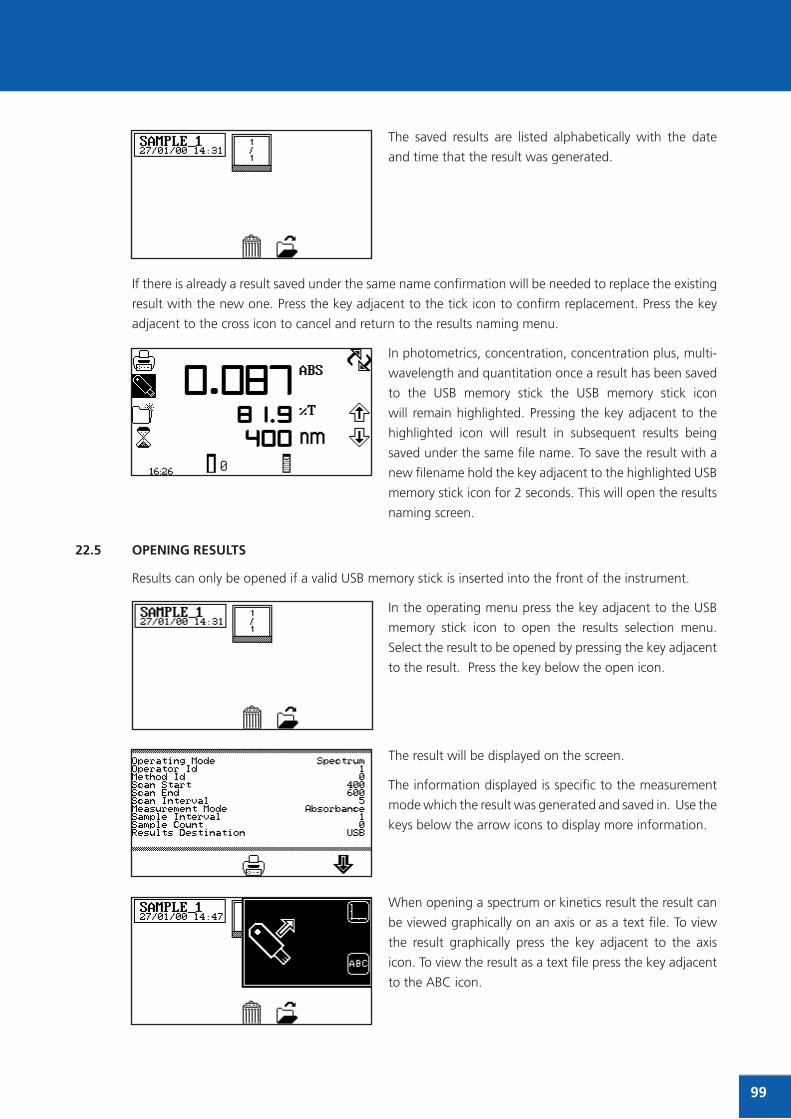
59554139292799
The saved results are listed alphabetically with the date
and time that the result was generated.
If there is already a result saved under the same name confirmation will be needed to replace the existing
result with the new one. Press the key adjacent to the tick icon to confirm replacement. Press the key
adjacent to the cross icon to cancel and return to the results naming menu.
In photometrics, concentration, concentration plus, multi-
wavelength and quantitation once a result has been saved
to the USB memory stick the USB memory stick icon
will remain highlighted. Pressing the key adjacent to the
highlighted icon will result in subsequent results being
saved under the same file name. To save the result with a
new filename hold the key adjacent to the highlighted USB
memory stick icon for 2 seconds. This will open the results
naming screen.
22.5 OPENING rESuLTS
Results can only be opened if a valid USB memory stick is inserted into the front of the instrument.
In the operating menu press the key adjacent to the USB
memory stick icon to open the results selection menu.
Select the result to be opened by pressing the key adjacent
to the result. Press the key below the open icon.
The result will be displayed on the screen.
The information displayed is specific to the measurement
mode which the result was generated and saved in. Use the
keys below the arrow icons to display more information.
When opening a spectrum or kinetics result the result can
be viewed graphically on an axis or as a text file. To view
the result graphically press the key adjacent to the axis
icon. To view the result as a text file press the key adjacent
to the ABC icon.
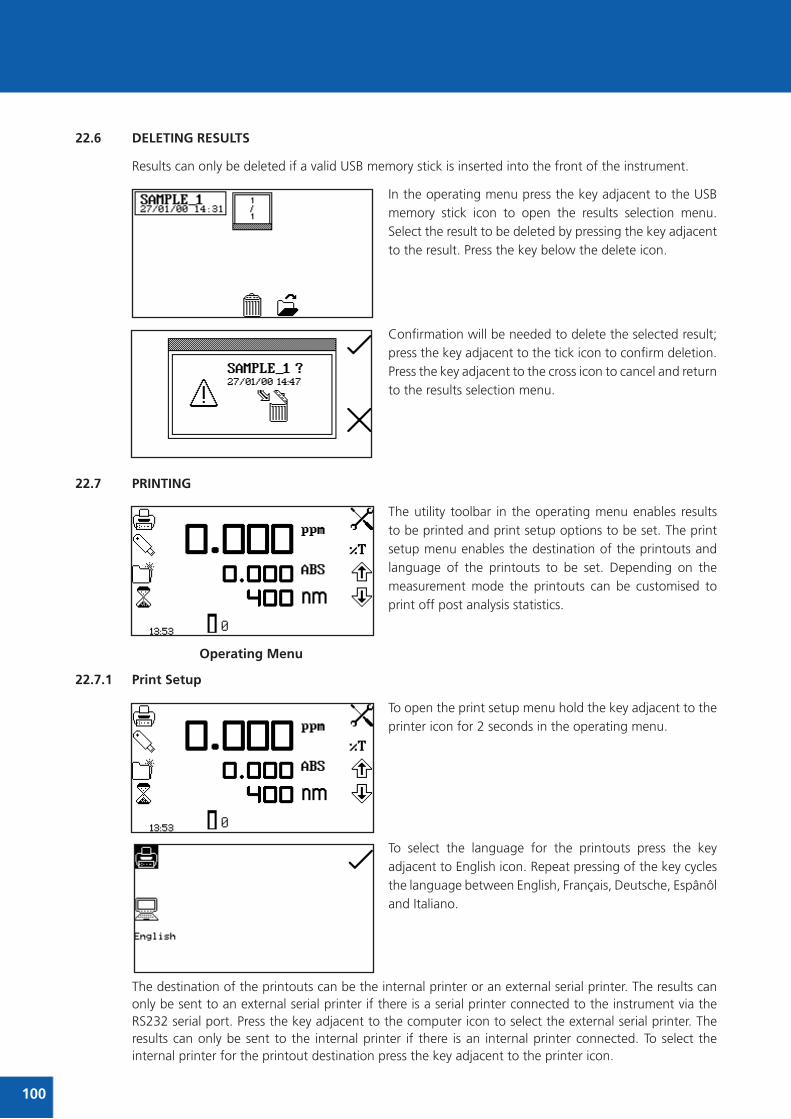
28262220100
22.6 dELETING rESuLTS
Results can only be deleted if a valid USB memory stick is inserted into the front of the instrument.
In the operating menu press the key adjacent to the USB memory stick icon to open the results selection menu. Select the result to be deleted by pressing the key adjacent to the result. Press the key below the delete icon.
Confirmation will be needed to delete the selected result; press the key adjacent to the tick icon to confirm deletion. Press the key adjacent to the cross icon to cancel and return to the results selection menu.
22.7 PrINTING
The utility toolbar in the operating menu enables results to be printed and print setup options to be set. The print setup menu enables the destination of the printouts and language of the printouts to be set. Depending on the measurement mode the printouts can be customised to print off post analysis statistics.
22.7.1 Print Setup
To open the print setup menu hold the key adjacent to the printer icon for 2 seconds in the operating menu.
To select the language for the printouts press the key adjacent to English icon. Repeat pressing of the key cycles the language between English, Français, Deutsche, Espânôl and Italiano.
The destination of the printouts can be the internal printer or an external serial printer. The results can only be sent to an external serial printer if there is a serial printer connected to the instrument via the RS232 serial port. Press the key adjacent to the computer icon to select the external serial printer. The results can only be sent to the internal printer if there is an internal printer connected. To select the internal printer for the printout destination press the key adjacent to the printer icon.
Operating Menu

595541392927101
Once the required printout destination and language has been selected press the key adjacent to the tick icon to save and return to the operating menu.
22.7.1.1 Print Setup – PHOTOMETrICS, CONCENTrATION, MuLTIWAVELENGTH ANd Od 600
In the photometrics, concentration, multiwavelength and OD 600 measurement modes the print setup menu does not contain any additional post analysis statistics.
22.7.1.2 Print Setup - SPECTruM ANd PurITy
In the spectrum and purity measurement mode print setup menu it is possible to print off the spectral points analysis table, peaks and valleys data and absorbance or %T values recorded at certain data intervals. If the data interval is set to 5 every 5th data point recorded is reported. If no data is required the data interval can be set to zero.
To select the spectral points analysis table to be printed press the key adjacent to the spectral table icon. Repeat presses of the key will cycle between a tick and a cross icon for selected or deselected. To select the peaks and valleys data to be printed press the key adjacent to the peaks and valleys icon. To select the data interval press the key adjacent to the data interval icon. Repeat presses will cycle between 0, 1, 2, 5, 10 or 50. Once the required options have been selected press the key adjacent to the tick icon to save and exit print setup.
22.7.1.3 Print Setup – QuANTITATION ANd PrOTEINS
In the quantitation and proteins measurement mode print setup menu it is possible to print off the statistics for the standard curve. To select the curve statistics press the key adjacent to the curve statistics icon. Repeat presses of the key will cycle between a tick and a cross icon for selected or deselected. Once the required options have been selected press the key adjacent to the tick icon to save and exit print setup.
22.7.1.4 Print Setup – KINETICS
In the kinetics measurement mode print setup menu it is possible to print off the statistics for the whole kinetics experiment and the absorbance or % transmittance values recorded at certain data intervals. If the data interval is set to 10 every 10th data point recorded is reported. If no data is required the data interval can be set to zero. To select the statistics to be printed press the key adjacent to the S
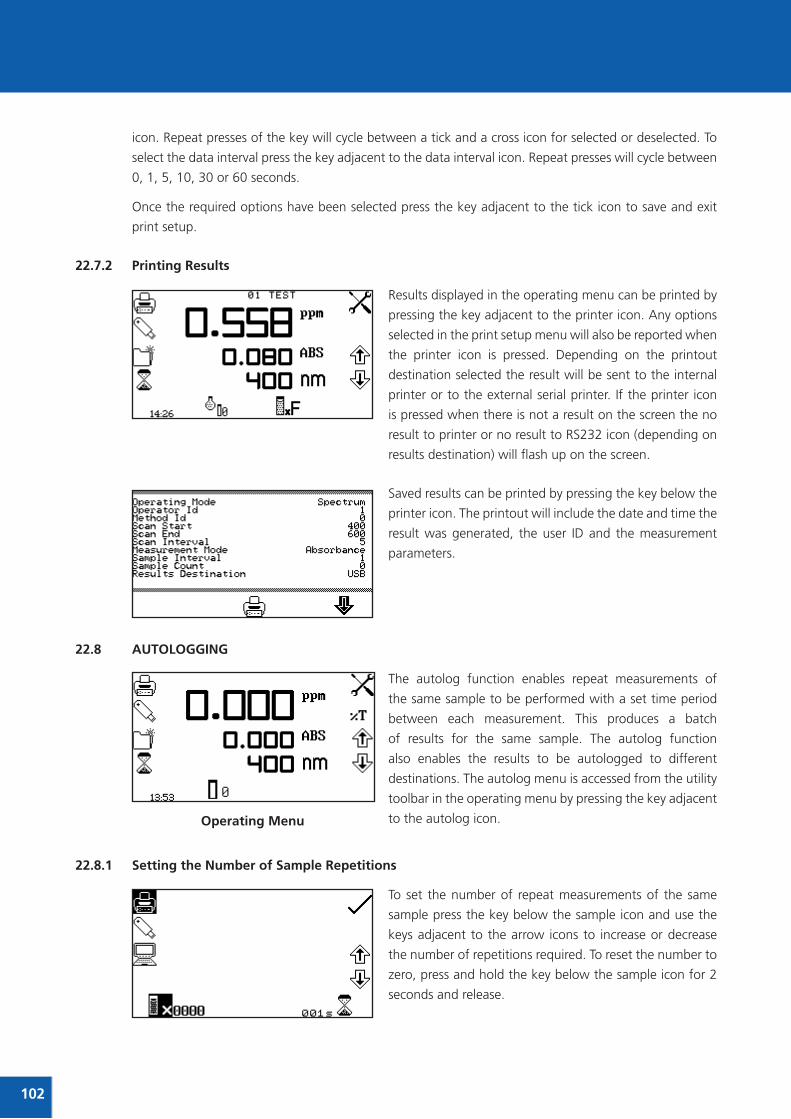
28262220102
icon. Repeat presses of the key will cycle between a tick and a cross icon for selected or deselected. To
select the data interval press the key adjacent to the data interval icon. Repeat presses will cycle between
0, 1, 5, 10, 30 or 60 seconds.
Once the required options have been selected press the key adjacent to the tick icon to save and exit
print setup.
22.7.2 Printing results
Results displayed in the operating menu can be printed by
pressing the key adjacent to the printer icon. Any options
selected in the print setup menu will also be reported when
the printer icon is pressed. Depending on the printout
destination selected the result will be sent to the internal
printer or to the external serial printer. If the printer icon
is pressed when there is not a result on the screen the no
result to printer or no result to RS232 icon (depending on
results destination) will flash up on the screen.
Saved results can be printed by pressing the key below the
printer icon. The printout will include the date and time the
result was generated, the user ID and the measurement
parameters.
22.8 AuTOLOGGING
The autolog function enables repeat measurements of
the same sample to be performed with a set time period
between each measurement. This produces a batch
of results for the same sample. The autolog function
also enables the results to be autologged to different
destinations. The autolog menu is accessed from the utility
toolbar in the operating menu by pressing the key adjacent
to the autolog icon.
22.8.1 Setting the Number of Sample repetitions
To set the number of repeat measurements of the same
sample press the key below the sample icon and use the
keys adjacent to the arrow icons to increase or decrease
the number of repetitions required. To reset the number to
zero, press and hold the key below the sample icon for 2
seconds and release.
Operating Menu

595541392927103
Once the number of repetitions is increased above zero, if the results are autologged to a USB memory stick, the batch ABC icon will be displayed. To assign a batch name for the repeated measurements press the key below the batch ABC icon to open the batch naming menu.
The default batch name will be displayed. To save the batch name under the default name press the key adjacent to the tick icon. To change the name, press the key below the eraser icon. One press of the key will delete one letter, holding the key for 2 seconds will delete the name completely. To select letters use the keys adjacent to the arrow icons to move around the menu. Once the required letter is highlighted press the key below the pencil icon to
select the letter. Up to eight characters can be selected. To use numbers in the batch name press the key below the AB icon. Repeat pressing of this key will cycle between upper case and numbers. Once the required name for the batch has been entered press the key adjacent to the tick icon to save and return to the autolog menu.
To set the time period between each measurement press the key below the timer icon and use the keys adjacent to the arrow icons to increase or decrease the time in 1 second intervals. To reset the time to one second press and hold the key below the timer icon for 2 seconds.
Once the required number of repetitions and time period has been selected press the key adjacent to the tick icon to save the changes and return to the operating menu.
The number of repetitions and time period will be displayed below the autolog icon. To commence autologging press the key below the measure sample icon. Once the first measurement has been performed the time period starts counting down until it reaches zero and then the next measurement will be taken. This will reduce the repetition number by one. When the number of repetitions reaches zero autologging is complete. Autologging can be stopped
before all the measurements have been completed by pressing the key adjacent to the autolog icon. Confirmation will be needed to stop autologging. Press the key adjacent to the tick icon to confirm stopping autologging or press the key adjacent to the cross icon to continue autologging. If autologging is stopped before completion the measurements already recorded will be saved under the previously entered batch name.
Once a set of results has been autologged to the USB memory stick when the measure sample key is pressed again the batch append/delete screen is displayed. Pressing the key adjacent to the batch append icon enables the next set of results to be added to the existing batch of results. Pressing the key adjacent to the batch delete icon will delete the first set of results and replace them with

28262220104
the results that are going to be recorded. Press the key adjacent to the tick icon to confirm selection.
Press the key adjacent to the cross icon to cancel and return to the operating menu.
22.8.2 Selecting result’s destination
The autolog menu enables the result’s destination to be
set. To select the internal printer press the key adjacent to
the printer icon. This option is only available if an internal
printer is connected. To select the USB memory stick press
the key adjacent to the USB memory stick icon. This option
is only available if a valid USB memory stick is connected
to the instrument. To send the results to an external
instrument such as a PC or a serial printer press the key
adjacent to the computer icon.
22.9 LOCKEd METHOdS
The Genova Plus spectrophotometer contains a number of
standard measurement methods that cannot be deleted
from the instrument. These methods are indicated by a
padlock symbol before the method name.
22.10 CONNECTING TO A PC
Connect the interface cable to the RS232 serial port on the rear of the instrument and connect to the
serial port on the PC. The connecting serial port should be configured with the following settings:
9600 baud
8 data bits
No parity
1 stop bit

595541392927105
SECTION 23 – GuIdE TO MAKING A dNA MEASurEMENT
The DNA measurement mode of the Lambda allows the user to select a method from a list of common
nucleic acid measurement tests, including single wavelength concentration measurements for dsDNA,
ssDNA, RNA and Oligonucleotides and methods that use absorbance ratios for estimating nucleic acid
purity, such as 260nm/280nm and 260nm/230nm. Section 19 of this manual gives further details of the
DNA measurement modes.
23.1 dsdNA Mode
This mode simply multiplies the A260 reading by a factor of 50 for dsDNA to calculate the concentration
in μg/ml. An additional factor for the path length is also included automatically by the instrument.
1. From the Life Science screen select the dNA mode: , followed by dsdNA.
2. Press the button next to the Settings Menu icon: and check that the wavelength is set to
260nm, the units are μg/ml and F1 = 50.
3. Lift the lid of the Lambda and pipette 2μl of water onto the read head. Close the lid. Perform the
Blank reading:
4. Lift the lid and wipe the water from both the upper and lower read heads.
5. Pipette 2μl of the DNA sample onto the read head. Close the lid and perform the
Sample reading: . Record the results.
23.2 A260/280 Mode
This method uses the equation:
Concentration (μg/ml) = (Abs@260nm x 62.9) - (Abs@280nm x 36.0).
This equation takes into account any contamination present which may absorb at 280nm (e.g. protein).
1. From the Life Science screen select the DNA mode: , followed by 260/280.
2. Press the button next to the Settings Menu icon: . Check that the settings are as follows:
Wavelength 1: 260; Wavelength 2: 280; Wavelength 3: 230; units, μg/ml.
3. Touch the button next to the Calculation Factors icon: and check that Factor 1 = 62.9;
Factor 2 = 36.0; Sum,=(xF1*A1)-(xF2*A2).
4. Press the button next to the Tick icon twice to return to the measurement screen.
5. Lift the lid of the Lambda and pipette 2μl of water onto the read head. Close the lid. Perform the
blank reading.
6. Lift the lid and wipe the water from both the upper and lower read heads.
7. Pipette 2μl of the DNA sample onto the read head. Close the lid and perform the DNA reading.
Record the results.
28262220106
23.3 Multi-wavelength Mode
This mode simply calculates the DNA concentration by multiplying by the factor 50 for dsDNA but also
allows correction by a reference wavelength at 320nm.
1. From the Life Science screen select the Multiwavelength mode: .
2. Press the button next to the Settings Menu icon: . Check that the settings are as follows:
Wavelength 1: 260; Wavelength 2: 280; Wavelength 3: 230. Activate the reference Wavelength 4,
320nm. The units are μg/ml.
3. Touch the button next to the Calculation Factors icon: and check that Factor 1 = 50; Factor
2 = 0 and the Sum = (xF1*(A1-A4))-(xF2*(A2-A4)).
4. Press the button next to the Tick icon twice to confirm and return to the measurement screen.
5. Set the path length to 0.5mm. Press the button next to the Tick icon to confirm.
6. Lift the lid of the Lambda and pipette 2μl of water onto the read head. Close the lid. Perform the
blank reading.
7. Lift the lid and wipe the water from both the upper and lower read heads.
8. Pipette 2μl of the DNA sample onto the read head. Close the lid and perform the DNA reading.
Record the results.

595541392927107
SECTION 24 – CALIBrATION OF THE MICrO VOLuME ACCESSOry
PCRmax recommends that the micro volume accessory is calibrated every 6 months. A set of calibration solutions are supplied with the Lambda spectrophotometer.
24.1 CALIBrATION SOLuTIONS
The supplied calibration solution set consists of two vials.
1. Matrix Blank (White)
2. 10x ref - Calibration Standard (Blue)
A calibration certificate is supplied that details the certified absorbance values of the calibration standard and the path length at which these values were determined.
24.2 ACCESSOry CALIBrATION PrOCEdurE
24.2.1 Micro Volume Accessory Settings
The micro volume accessory settings can be accessed by pressing the key below the Micro Volume Accessory icon in any of the Lambda’s operating modes.
24.2.2 Calibration Standard - data Entry
1. Enter the A260 and A330 DNA standard solution values from the supplied calibration certificate into the accessory settings by pressing the key adjacent to the Calibration Standard Value icon.
16
SECTION 5 – CALIBRATION OF THE MICRO VOLUME ACCESSORY
Jenway recommends that the micro volume accessory is calibrated every 6 months. A set of
calibration solutions (Part code 035 092) are supplied with the Genova Nano spectrophotometer.
5.1 CALIBRATION SOLUTIONS (035 092)
The supplied calibration solution set consists of
two vials.
1. Matrix Blank (White)
2. 10x ref - Calibration Standard (Blue)
A calibration certificate is supplied that details the
certified absorbance values of the calibration
standard and the path length at which these values
were determined.
5.2 ACCESSORY CALIBRATION PROCEDURE
5.2.1 Micro Volume Accessory Settings
The micro volume accessory settings can be
accessed by pressing the key below the Micro
Volume Accessory icon in any of the Genova
Nano’s operating modes.
5.2.2 Calibration Standard - Data Entry
1. Enter the A260 and A330 DNA standard
solution values from the supplied calibration
certificate into the accessory settings by
pressing the key adjacent to the Calibration
Standard Value icon.
Micro Volume Accessory icon
1 2
Bluelabel
Whitelabel

28262220108
4. Select the digit to be changed using the keys at the bottom of the screen. Use the keys adjacent to the Arrow icons to increase or decrease the number. Press the key adjacent to the Tick icon to save any changes.
24.2.3 Accessory Calibration and Verification
If an error message is displayed during the accessory calibration and verification procedure, refer to Section 28 for further details.
17
2. Select the digit to be changed using the keys
at the bottom of the screen. Use the keys
adjacent to the arrow icons to increase or
decrease the number. Press the key adjacent
to the tick icon to save any changes.
3. Enter the stated path length (1.0mm for the
supplied calibration standard solution set) for
the DNA standard solution values, in mm, into
the accessory settings by pressing the key
adjacent to the Calibration Standard Path
Length Value icon.
4. Select the digit to be changed using the keys at the bottom of the screen. Use the keys
adjacent to the arrow icons to increase or decrease the number. Press the key adjacent to the
tick icon to save any changes.
5.2.3 Accessory Calibration and Verification
If an error message is displayed during the accessory calibration and verification procedure,
refer to Section 9 for further details.
1. The accessory calibration sequence is initiated
by pressing the key adjacent to the Path
Length Calibration icon.
2. The Air Measurement icon will be displayed.
Use a lint free cloth to clean the upper and
lower read heads, close the instrument lid and
press the key adjacent to the tick icon to
continue. Pressing the key adjacent to the
cross icon will return the instrument to the
micro volume accessory settings menu screen.
2. Select the digit to be changed using the keys at the bottom of the screen. Use the keys adjacent to the Arrow icons to increase or decrease the number. Press the key adjacent to the Tick icon to save any changes.
3. Enter the stated path length in mm (1.0mm for the supplied calibration standard solution set) for the DNA standard solution into the accessory settings by pressing the key adjacent to the Calibration Standard Path Length Value icon.
1. The accessory calibration sequence is initiated by pressing the key adjacent to the Path Length Calibration icon.
2. The Air Measurement icon will be displayed. Use a lint free cloth to clean the upper and lower read heads, close the instrument lid and press the key adjacent to the Tick icon to continue. Pressing the key adjacent to the Cross icon will return the instrument to the micro volume accessory settings menu screen.
The unit takes five dark and light readings at 260 and 330nm, at both 0.5mm and 0.2mm path lengths.

595541392927109
18
The unit takes five dark and light readings at
260 and 330nm, at both the 0.5 and 0.2mm
pathlengths.
3. The Blank Solution Measurement icon will be
displayed. Open the instrument lid and pipette
a 2.0μl aliquot of the matrix blank solution onto
the lower read head. Close the instrument lid
and press the key adjacent to the tick icon to
initiate the blank measurement.
4. The unit takes five readings at 260 and 330nm,
at both the 0.5 and 0.2mm pathlengths.
5. If the measured values are within the required tolerances, the Passes Test icon will be
displayed. Press the button adjacent to the Tick icon to continue or the button adjacent to the
Cross icon to cancel the calibration process.
6. The Calibration Solution Measurement icon will
be displayed. Open the instrument lid and use
a lint free cloth to clean the read heads.
7. Pipette a 2.0μl aliquot of the calibration solution
onto the lower read head. Close the instrument
lid and press the key adjacent to the tick icon to
initiate the calibration solution measurement.
8. The unit takes five readings at 260 and 330nm,
at both the 0.5 and 0.2mm pathlengths.
9. If the measured values are within the required tolerances, the Passes Test icon will be
displayed. Press the button adjacent to the Tick icon to continue or the button adjacent to the
Cross icon to cancel the calibration process.
10. The Calibration Solution Measurement icon will
be displayed for a second time. Open the
instrument lid and use a lint free cloth to clean
the read heads.
11. Pipette a 2.0μl aliquot of the calibration solution
onto the lower read head. Close the instrument
lid and press the key adjacent to the tick icon to
initiate the calibration solution measurement.18
The unit takes five dark and light readings at
260 and 330nm, at both the 0.5 and 0.2mm
pathlengths.
3. The Blank Solution Measurement icon will be
displayed. Open the instrument lid and pipette
a 2.0μl aliquot of the matrix blank solution onto
the lower read head. Close the instrument lid
and press the key adjacent to the tick icon to
initiate the blank measurement.
4. The unit takes five readings at 260 and 330nm,
at both the 0.5 and 0.2mm pathlengths.
5. If the measured values are within the required tolerances, the Passes Test icon will be
displayed. Press the button adjacent to the Tick icon to continue or the button adjacent to the
Cross icon to cancel the calibration process.
6. The Calibration Solution Measurement icon will
be displayed. Open the instrument lid and use
a lint free cloth to clean the read heads.
7. Pipette a 2.0μl aliquot of the calibration solution
onto the lower read head. Close the instrument
lid and press the key adjacent to the tick icon to
initiate the calibration solution measurement.
8. The unit takes five readings at 260 and 330nm,
at both the 0.5 and 0.2mm pathlengths.
9. If the measured values are within the required tolerances, the Passes Test icon will be
displayed. Press the button adjacent to the Tick icon to continue or the button adjacent to the
Cross icon to cancel the calibration process.
10. The Calibration Solution Measurement icon will
be displayed for a second time. Open the
instrument lid and use a lint free cloth to clean
the read heads.
11. Pipette a 2.0μl aliquot of the calibration solution
onto the lower read head. Close the instrument
lid and press the key adjacent to the tick icon to
initiate the calibration solution measurement.
18
The unit takes five dark and light readings at
260 and 330nm, at both the 0.5 and 0.2mm
pathlengths.
3. The Blank Solution Measurement icon will be
displayed. Open the instrument lid and pipette
a 2.0μl aliquot of the matrix blank solution onto
the lower read head. Close the instrument lid
and press the key adjacent to the tick icon to
initiate the blank measurement.
4. The unit takes five readings at 260 and 330nm,
at both the 0.5 and 0.2mm pathlengths.
5. If the measured values are within the required tolerances, the Passes Test icon will be
displayed. Press the button adjacent to the Tick icon to continue or the button adjacent to the
Cross icon to cancel the calibration process.
6. The Calibration Solution Measurement icon will
be displayed. Open the instrument lid and use
a lint free cloth to clean the read heads.
7. Pipette a 2.0μl aliquot of the calibration solution
onto the lower read head. Close the instrument
lid and press the key adjacent to the tick icon to
initiate the calibration solution measurement.
8. The unit takes five readings at 260 and 330nm,
at both the 0.5 and 0.2mm pathlengths.
9. If the measured values are within the required tolerances, the Passes Test icon will be
displayed. Press the button adjacent to the Tick icon to continue or the button adjacent to the
Cross icon to cancel the calibration process.
10. The Calibration Solution Measurement icon will
be displayed for a second time. Open the
instrument lid and use a lint free cloth to clean
the read heads.
11. Pipette a 2.0μl aliquot of the calibration solution
onto the lower read head. Close the instrument
lid and press the key adjacent to the tick icon to
initiate the calibration solution measurement.
3. The Blank Solution Measurement icon will be displayed. Open the instrument lid and pipette a 2.0μl aliquot of the matrix blank solution onto the lower read head. Close the instrument lid and press the key adjacent to the Tick icon to initiate the blank measurement.
4. The unit takes five readings at 260 and 330nm, at both the 0.5 and 0.2mm pathlengths.
6. The Calibration Solution Measurement icon will be displayed. Open the instrument lid and use a lint free cloth to clean the read heads.
7. Pipette a 2.0μl aliquot of the calibration solution onto the lower read head. Close the instrument lid and press the key adjacent to the Tick icon to initiate the calibration solution measurement.
8. The unit takes five readings at 260 and 330nm, at both 0.5mm and 0.2mm path lengths.
10. The Calibration Solution Measurement icon will be displayed for a second time. Open the instrument lid and use a lint free cloth to clean the read heads.
11. Pipette a 2.0μl aliquot of the calibration solution onto the lower read head. Close the instrument lid and press the key adjacent to the Tick icon to initiate the calibration solution measurement.
5. If the measured values are within the required tolerances, the Passes Test icon will be displayed. Press the button adjacent to the Tick icon to continue or the button adjacent to the Cross icon to cancel the calibration process.
9. If the measured values are within the required tolerances, the Passes Test icon will be displayed. Press the button adjacent to the Tick icon to continue or the button adjacent to the Cross icon to abort the calibration process.
12. The unit takes five readings at 260 and 330nm, at both 0.5mm and 0.2mm path lengths.
13. If the measured values are within the required tolerances, the Passes Test icon will be displayed and the instrument will calculate the new path length calibration factors. Press the button adjacent to the Tick icon to continue or the button adjacent to the Cross icon to abort the calibration process.
14. The new calibration factor values must now be verified by re-measuring the air, blank and standard values.

28262220110
19
12. The unit takes five readings at 260 and 330nm, at both the 0.5 and 0.2mm path lengths.
13. If the measured values are within the required tolerances, the Passes Test icon will be
displayed and the instrument will calculate the new path length calibration factors. Press the
button adjacent to the Tick icon to continue or the button adjacent to the Cross icon to cancel
the calibration process.
14. The new calibration factor values must now be verified by re-measuring the air, blank and
standard values.
15. The Air Measurement icon will be displayed.
Open the instrument lid and use a lint free
cloth to clean the read heads. Close the
instrument lid and press the key adjacent to
the tick icon to initiate the blank
measurement.
16. The unit takes three dark and light readings at
260 and 330nm, at both the 0.5 and 0.2mm
pathlengths.
17. The Blank Solution Measurement icon will be
displayed. Open the instrument lid and pipette
a 2.0μl aliquot of the matrix blank solution
onto the lower read head. Close the
instrument lid and press the key adjacent to
the tick icon to initiate the blank
measurement.
18. The unit takes three readings at 260 and
330nm, at both the 0.5 and 0.2mm
pathlengths.
19. If the measured values are within the required tolerances, the Passes Test icon will be
displayed. Press the button adjacent to the Tick icon to continue or the button adjacent to the
Cross icon to cancel the calibration process.
15. The Air Measurement icon will be displayed. Open the instrument lid and use a lint free cloth to clean the read heads. Close the instrument lid and press the key adjacent to the Tick icon to initiate the blank measurement.
16. The unit takes three dark and light readings at 260 and 330nm, at both 0.5mm and 0.2mm path lengths.
17. The Blank Solution Measurement icon will be displayed. Open the instrument lid and pipette a 2.0μl aliquot of the matrix blank solution onto the lower read head. Close the instrument lid and press the key adjacent to the Tick icon to initiate the blank measurement.
18. The unit takes three readings at 260 and 330nm, at both 0.5mm and 0.2mm path lengths.
19. If the measured values are within the required tolerances, the Passes Test icon will be displayed. Press the button adjacent to the Tick icon to continue or the button adjacent to the Cross icon to abort the calibration process.
21. The unit takes three readings at 260 and 330nm, at both 0.5mm and 0.2mm path lengths.
22. If the measured values are within the required tolerances, the Passes Test icon will be displayed. Press the button adjacent to the Tick icon to continue or the button adjacent to the Cross icon to abort the calibration process.
20
20. The Calibration Solution Measurement icon
will be displayed. Open the instrument lid and
use a lint free cloth to clean the read heads
Open the instrument lid and pipette a 2.0μl
aliquot of the calibration solution onto the
lower read head. Close the instrument lid and
press the key adjacent to the tick icon to
initiate the calibration solution measurement.
21. The unit takes three readings at 260 and 330nm, at both the 0.5 and 0.2mm pathlengths.
22. If the measured values are within the required tolerances, the Passes Test icon will be
displayed. Press the button adjacent to the Tick icon to continue or the button adjacent to the
Cross icon to cancel the calibration process
23. The instrument display will return to the micro
volume accessory settings screen and the
new path length calibration factors will be
shown.
20. The Calibration Solution Measurement icon will be displayed. Open the instrument lid and use a lint free cloth to clean the read heads Open the instrument lid and pipette a 2.0μl aliquot of the calibration solution onto the lower read head. Close the instrument lid and press the key adjacent to the Tick icon to initiate the calibration solution measurement.
23. Following successful calibration, the instrument display will return to the micro volume accessory settings screen and the new path length calibration factors will be shown.

595541392927111
SECTION 25 – CLEANING ANd dECONTAMINATION
25.1 ACCESSOry CLEANING
Wiping the sample from both the upper and lower read heads upon completion of each sample measurement with a lint free cloth is usually sufficient to prevent sample carryover and avoid residue buildup. Although generally not necessary, water aliquots can be used to clean the measurement surfaces after the measurement of particularly highly concentrated samples to ensure no residual sample is retained on either read head. After measuring a large number of samples, it is recommended that the areas around the upper and lower pedestals are cleaned thoroughly. This will prevent spread of contamination from previous samples onto the measurement pedestals which could affect subsequent low-level measurements. A final cleaning of all surfaces with deionised water is also recommended after the last measurement.
25.2 ACCESSOry dECONTAMINATION
If decontamination is necessary, a sanitising solution, such as a 0.5% solution of sodium hypochlorite (1:10 dilution of common commercial bleach solutions – freshly prepared), can be used to ensure that no biologically active material is present on the measurement read heads. The read head fittings are made from stainless steel and are resistant to most common laboratory solvents. See Section 30 - Chemical Compatibility for full details.
25.3 rEAd HEAd rECONdITIONING
Reagents containing surfactants can “un-condition” the measurement read head surfaces so that the liquid does not form a stable sample droplet. If this occurs, “buff” the read head surfaces by rubbing each measurement surface aggressively with a dry laboratory wipe 30-40 times. This will “re-condition” the surface allowing the sample droplet to form.
28262220112
SECTION 26 – ACCESSOrIES
26.1 ACCESSOrIES
Please contact your local distributor for full list of available accessories.
595541392927113
SECTION 27 – MAINTENANCE ANd SErVICE
27.1 rOuTINE MAINTENANCE
Ensure the external surfaces of the unit are clean and free from dust. The sample area should always be kept clean and any accidental spillage should be wiped away immediately.
27.2 SErVICE
Our dedicated service team are on hand to help in the unlikely event that your PCRmax equipment de-velops a fault. Please contact them by one of the following means stating the serial number of the unit and a clear description of the problem:
E-mail: [email protected]: +44 (0) 1785 810475
On occasion it may be necessary for your equipment to be sent back to our Service Department for repair. In this case please contact the Service Department for a reference number which you should include with your faulty equipment. Please also ensure you include a clear description of the fault and a completed copy of our Decontamination Certificate. This is available as a downloadable pdf file at www.PCRmax.com or contact us and we will send a copy to you. Please clearly mark the package for the at-tention of the Service Department and post to the following address:
PCRmax Ltd Beacon RoadStoneStaffordshireST15 0SAUnited Kingdom
All replacement parts are guaranteed for 1 year and wherever possible, returned equipment is turned around in 10 working days.

28262220114
SECTION 28 – TrOuBLESHOOTING
28.1 CALIBrATION ErrOr COdES
If an error code is displayed during calibration it will be accompanied by a Clipboard icon and a number to indicate the cause of the error. The first time that an error is displayed, it will be possible to repeat the erroneous measurement. If the same error message is shown after the repeat measurement, the com-plete calibration process will need to be repeated. The table below shows the error codes
28.1.1 Calibration Procedure Error Codes
Error Code Symbol Issue
1 Blank solution reading outside of acceptable range
3 Calibration solution reading outside of acceptable range
5 Duplicate calibration solution readings outside of acceptable range
7 0.2mm path length factor outside of acceptable range
8 0.5mm path length factor outside of acceptable range
28.1.2 Verification Check Error Codes
9 Blank solution reading outside of acceptable range
11 Calibration solution reading outside of acceptable range
23
SECTION 9 – TROUBLESHOOTING
9.1 ACCESSORY ERROR CODES
If an error code is displayed it will be accompanied by a clipboard icon and a number to indicate the
cause of the error. The first time that an error is displayed, it will be possible to repeat the erroneous
measurement. If the same error message is shown after the repeat measurement, the complete
calibration process will need to be repeated. The table below shows the error codes:
9.1.1 Calibration Procedure Error Codes
Error Code Symbol Issue1 Blank solution reading, 0.5mm path length, outside of
acceptable range
2 Blank solution reading, 0.2mm path length, outside of acceptable range
3 Calibration solution reading, 0.5mm path length, outside of acceptable range
4 Calibration solution reading, 0.2mm path length, outside of acceptable range
5 Duplicate calibration solution readings, 0.5mm path length, outside of acceptable range
6 Duplicate calibration solution readings, 0.2mm path length, outside of acceptable range
7 0.2mm path length factor outside of acceptable range
8 0.5mm path length factor outside of acceptable range
9.1.2 Verification Check Error Codes
9 Blank solution reading, 0.5mm path length, outside of acceptable range
10 Blank solution reading, 0.2mm path length, outside of acceptable range
11 Calibration solution reading, 0.5mm path length, outside of acceptable range
12 Calibration solution reading, 0.2mm path length, outside of acceptable range
595541392927115
28.2 TrOuBLESHOOTING GuIdE
Issue Solution Unable to achieve zero absorbance or Ensure that there is not a sample on the micro volume 100% transmittance when calibrating accessories read head.
Ensure the instrument lid is closed before and during the calibration.
Ensure the lamp is working – if the lamp has failed please request service assistance.
Unable to achieve a reading Ensure the correct path length is being used. when measuring a sample Ensure the sample isn’t too dense so that light is not transmitted through the sample.
Ensure the lamp is working.
28.3 TECHNICAL SuPPOrT
Jenway have a dedicated Technical Support team made up of experienced scientists who are on hand to help with any applications advice and questions you may have about our products and how to use them. If you require any technical or application assistance please contact the team at:E-mail: [email protected]: +44 (0)1785 812121Fax: +44 (0)1785 810405

28262220116
SECTION 29 – GLOSSAry OF ICONS
Mode ICON description
Common Back key
Common Tick icon - Done/yes
Common Cross icon – Cancel/no
Common Arrow icon – Move down, decrease
Common Arrow icon – Move up, increase
Settings 0.2mm path length setting / selected
Settings 0.5mm path length setting / selected
Settings Auto path length setting / selected
Settings Path length calibration
Settings 260nm Calibration standard absorbance value
Settings 330nm Calibration standard absorbance value
Settings Calibration standard path length value
Settings Micro volume accessory alignment
Calibration Air measurement
Calibration Blank solution measurement
Calibration Calibration solution measurement
Calibration Passes test
Calibration Fails test

595541392927117
SECTION 30 – CHEMICAL COMPATIBILITy
Assay Chemical Concentration
BCA Sodium bicinchoninate 1%*
BCA Sodium carbonate 2%*
BCA Sodium tartrate 0.16%*
BCA Sodium hydroxide 0.1M*
BCA Sodium bicarbonate 0.95%*
BCA Copper (II) sulphate 0.08%
Biuret Sodium potassium tartrate 0.9%*
Biuret Copper (II) sulphate 0.3%*
Biuret Potassium iodide 0.5%*
Biuret Sodium hydroxide 0.08M
Lowry Sodium carbonate 1.6%
Lowry Copper (II) sulphate 0.032%
Lowry Sodium potassium tartrate 0.016%
Lowry Sodium dodecyl sulphate 0.08%
Lowry Sodium hydroxide 0.08M
Lowry Folin reagent (lithium and sodium 0.04N*
molybdotungstophosphate solution)
Bradford Coomassie brilliant Blue G-250 0.01%*
Bradford Ethanol 4.75%*
Bradford Phosphoric acid 8.5%*
Bradford Sodium hydroxide 0.1M
DMSO 10%
Acetonitrile OK
Methanol OK
2-Propanol OK
*Highest concentration

28262220118
SECTION 31 – MAINTENANCE ANd SErVICE
31.1 rOuTINE MAINTENANCE
Ensure the external surfaces of the unit are clean and free from dust. The sample area should always be kept clean and any accidental spillage should be wiped away immediately. To give added protection when not in use, the unit should be disconnected from the mains supply and covered with the optional dust cover.
31.2 LAMP rEPLACEMENT
31.2.1 Xenon Lamp Module replacement
This must be done by an accredited service engineer. Refer to section 31.4 for more details.
31.3 FIrMWArE uPdATE PrOCEdurE
The Lambda spectrophotometer allows users to update the instrument’s firmware using a USB flash drive using the following procedure:
1. Download the latest version of the instrument’s firmware from the PCRmax website at www.PCRmax.com/Software.asp and copy the file to a USB flash drive.
2. With the instrument switched off, insert the USB flash drive into the USB memory stick slot of the instrument.
3. Switch on the power to the instrument.
4. The instrument will indicate that a firmware update file has been found and the progress of the update process will be indicated on the instrument’s screen.
5. When the update is complete, the instrument will continue with its normal power on procedure.
31.4 SErVICE
Our dedicated service team are on hand to help in the unlikely event that your PCRmax equipment develops a fault. Please contact them by one of the following means with a clear description of the problem:
E-mail: [email protected]
Tel: +44 (0) 1785 812121
Fax: +44 (0) 1785 810405
On occasion it may be necessary for your equipment to be sent back to our Service Department for repair. In this case please contact the Service Department for a reference number which you should include with your faulty equipment. Please also ensure you include a clear description of the fault and a completed copy of our Decontamination Certificate. This is available as a downloadable pdf file at www.PCRmax.com or contact us and we will send a copy to you. Please clearly mark the package for the at-tention of the Service Department and post to the following address:
PCRmax Ltd Beacon RoadStoneStaffordshireST15 0SAUnited Kingdom
All replacement parts are guaranteed for 1 year and wherever possible, returned equipment is turned around in 10 working days.

595541392927119
SECTION 32 – TrOuBLESHOOTING
32.1 ErrOr COdES
If an error code is displayed it will be accompanied by a spanner icon and a symbol to indicate if the error is a warning (caution icon) or fatal (stop icon). If the error is fatal contact your local distributor or PCRmax service department (refer to section 31.4). If the error is a warning it may be possible to retry the test. In this case a back icon will also be displayed. The table below shows the error codes:
Error Code Symbol Issue
Err 1 System Parameters Failure
This error indicates that the essential system parameters are corrupt.
The most likely causes of this error are:
1. Fram chip failure.
Solution:
Restart the unit, if the problem persists contact a service technician.
Err 2 Operating Parameters Failure
This error is a warning that the method and other user parameters have been reset.
The most likely causes of this error are:
1. The methods were reset by pressing the top left button during the power on tests performed when the instrument is turned on.
2. The parameters have been corrupted so the instrument has reset itself.
Solution:
Press the key adjacent to the tick icon to action.
Err 3 dark Calibration Error
This error indicates that the dark level is too high during calibration. In normal operation the lamp is switched off during an operator initiated calibration sequence to ensure that the detector output is below a threshold level. The calibration is aborted and Err 3 is displayed if the detector output is above the threshold level.
The most likely causes of this error are:
1. The sample chamber lid has been left open during the calibration sequence.
2. The sample chamber lid was opened during the calibration sequence.
3. There is a fault on the detector PCB.
Solution:
Ensure the sample chamber is closed completely. Press the key adjacent to the back icon to retry the dark calibration.
Fatal
Warning
Warning
redo

28262220120
Err 4 Microswitch Failure (service only)
This error indicates that the microswitch was not found.
The most likely causes of this error are:
1. The microswitch is broken.
Solution:
Contact a service technician.
Err 5 Light Saturation Not Found
This error indicates that the peak light hasn’t been found at zero.
The most likely causes of this error are:
1. Lamp failure.
2. Deteriorating lamp signal.
3. Sample or cuvette in the sample holder.
Solution:
Ensure the sample holder is empty. Restart the unit, if the problem persists contact a service technician.
Err 7 uSB Module Failure
This error indicates the instrument is unable to detect a response from the UBS module.
The most likely causes of this error are:
1. USB port failure.
Solution:
Press the key adjacent to the tick icon to carry on using the instrument. Restart the unit, if the problem persists contact a service technician.
Err 8 unable to find Vane on Turret
This error indicates that the vane position zero on the turret cannot be found.
The most likely causes for this error are:
1. The turret carousel has been removed and not replaced.
Solution:
Check if the turret is in the sample chamber and inserted properly. Press the key adjacent to the back icon to try rechecking.
Fatal
Warning
Warning
Warning
redo

595541392927121
32.2 TrOuBLESHOOTING GuIdE
Issue Solution
Unable to achieve zero absorbance or 100% transmittance when calibrating
Unable to achieve a reading when measuring a sample
Unable to add additional points to the spectral points analysis table
Unable to print results using the internal printer
Unable to save results to the USB memory stick
Unable to continue kinetics measurement after cancelling abort action
The peaks and valleys table icon is not displayed following a spectrum scan
The measure sample icon disappears after changing the wavelength
Unable to save methods
32.3 TECHNICAL SuPPOrT
PCRmax have a dedicated Technical Support team made up of experienced scientists who are on hand to help with any applications advice and questions you may have about our products and how to use them. If you require any technical or application assistance please contact the team at:
E-mail: [email protected]
Phone: +44 (0)1785 812121
Fax: +44 (0)1785 810405
Ensure that there is not a sample in the sample chamber.Ensure the instrument lid is closed before and during the calibration.Ensure the lamp is working – if the lamp has failed please request service assistance.
Ensure the correct cuvette is being used so that light isn’t being absorbed by the cuvette.Ensure the sample isn’t too dense that light is not transmitted through the sample.Ensure the lamp is working.
The table can only hold 6 points. Delete one or more points before selecting additional points to add to the table.
Ensure internal printer selected in autolog menu.Ensure there is paper in the unit.Ensure there is a result displayed on the screen.
Ensure the USB stick is inserted into the front of the unit.Ensure the USB memory stick has free capacity.Ensure there is a result displayed on the screen.
Due to the nature of the kinetics measurements stopping the measurement before completion will result in some measurement time being lost. Therefore the experiment cannot be continued. It must be restarted.
The peaks and valleys threshold is turned off. Change this value to 1%, 5% or 10% and the peaks and valleys table icon will be displayed.
A calibration must be performed at the new wavelength. When the calibration is complete the measure sample icon will be displayed.
Ensure the method lock is not active.Ensure the method is not a pre-loaded locked method.

28262220122
SECTION 33 – dECLArATION OF CONFOrMITy

595541392927123
SECTION 34 – GLOSSAry OF ICONS
Mode ICON description
Common Back key
Common Tick icon - Done/yes
Common Cross icon – Cancel/no
Common Printer icon - Print/open printer settings
Common No results to send to printer
Common Computer icon - RS232 serial port for connection to an external serial printer or a computer
Common No results to send to RS232
Common English English icon - Language selection
Common USB memory stick
Common Save to USB memory stick
Common Load from USB memory stick
Common Result already saved to USB memory stick
Common Single method save icon
Common 1 – 16 (or 48) method save icon
Common Single method open icon
Common 1 – 16 (or 48) method open icon
Common Axis icon – View the result graphically
Common ABC icon – View the results as a text file
Common Arrow icon - Results page down, move left, decrease
Common Arrow icon - Results page up, move right, increase
Common Arrow icon – Move down, decrease
Common Arrow icon – Move up, increase
Common Calibrate to zero icon
Common Pencil icon - Select letter/number
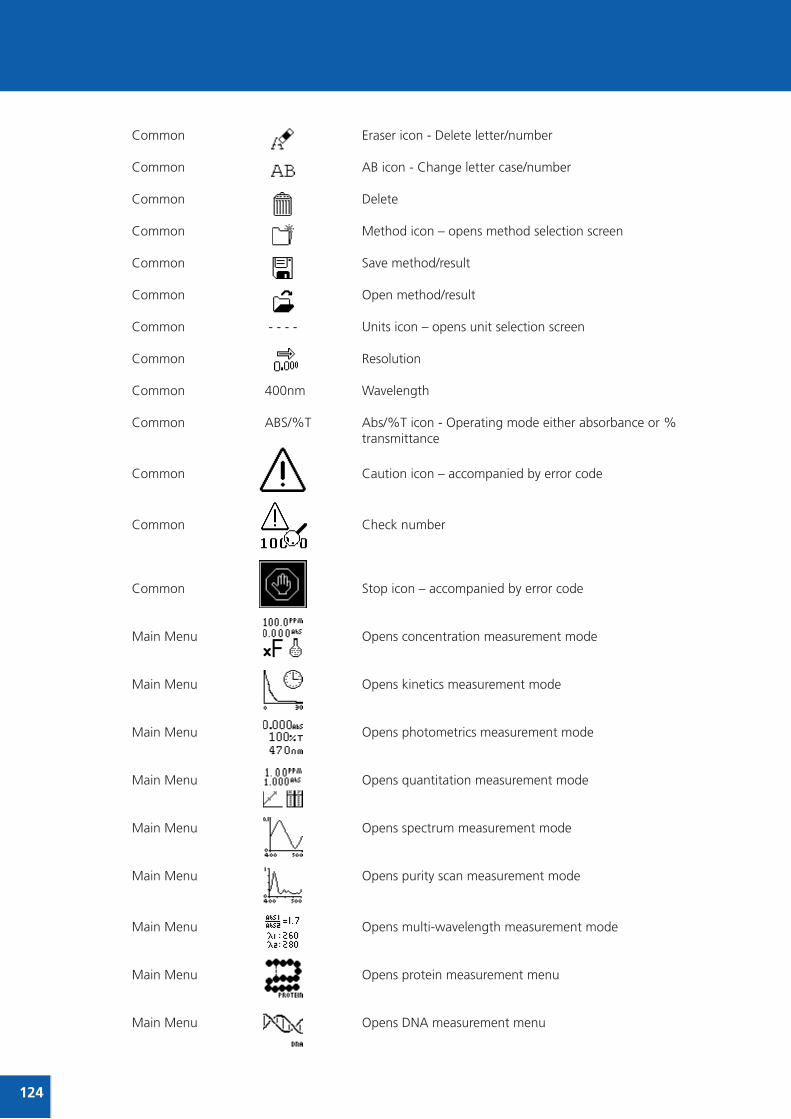
28262220124
Common Eraser icon - Delete letter/number
Common AB icon - Change letter case/number
Common Delete
Common Method icon – opens method selection screen
Common Save method/result
Common Open method/result
Common - - - - Units icon – opens unit selection screen
Common Resolution
Common 400nm Wavelength
Common ABS/%T Abs/%T icon - Operating mode either absorbance or % transmittance
Common Caution icon – accompanied by error code
Common Check number
Common Stop icon – accompanied by error code
Main Menu Opens concentration measurement mode
Main Menu Opens kinetics measurement mode
Main Menu Opens photometrics measurement mode
Main Menu Opens quantitation measurement mode
Main Menu Opens spectrum measurement mode
Main Menu Opens purity scan measurement mode
Main Menu Opens multi-wavelength measurement mode
Main Menu Opens protein measurement menu
Main Menu Opens DNA measurement menu
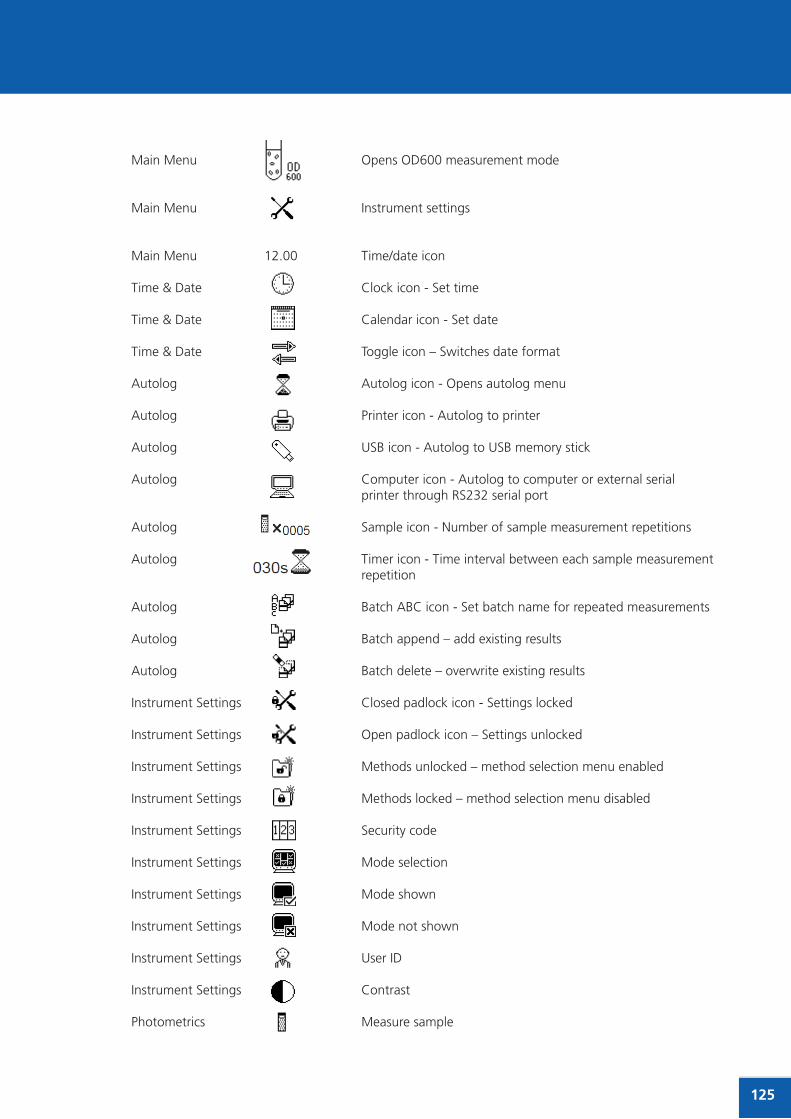
Main Menu Opens OD600 measurement mode
Main Menu Instrument settings
Main Menu 12.00 Time/date icon
Time & Date Clock icon - Set time
Time & Date Calendar icon - Set date
Time & Date Toggle icon – Switches date format
Autolog Autolog icon - Opens autolog menu
Autolog Printer icon - Autolog to printer
Autolog USB icon - Autolog to USB memory stick
Autolog Computer icon - Autolog to computer or external serial printer through RS232 serial port
Autolog Sample icon - Number of sample measurement repetitions
Autolog Timer icon - Time interval between each sample measurement repetition
Autolog Batch ABC icon - Set batch name for repeated measurements
Autolog Batch append – add existing results
Autolog Batch delete – overwrite existing results
Instrument Settings Closed padlock icon - Settings locked
Instrument Settings Open padlock icon – Settings unlocked
Instrument Settings Methods unlocked – method selection menu enabled
Instrument Settings Methods locked – method selection menu disabled
Instrument Settings Security code
Instrument Settings Mode selection
Instrument Settings Mode shown
Instrument Settings Mode not shown
Instrument Settings User ID
Instrument Settings Contrast
Photometrics Measure sample
595541392927125

Photometrics Toggle icon – switches between ABS/%T
Concentration Settings menu
Concentration Measure to a factor
Concentration Measure to a standard
Concentration 0.000 ABS Calibrate to zero absorbance
Concentration 0.000 Calibrate to a standard
Concentration Calibrate to zero absorbance or standard
Concentration Factor menu
Concentration Standard menu
Concentration 001 Resets value to one
Concentration Check standard
Spectrum Scan settings menu
Spectrum Hand icon – Manual y-axis scaling
Spectrum Hand icon with cross through it - Auto y-axis scaling
Spectrum Scan interval
Spectrum Baseline scan
Spectrum Baseline scan in progress
Spectrum Scan sample
Spectrum Sample scan in progress
Spectrum Peaks and valleys threshold turned off
Spectrum Peaks and valleys above threshold 5% are shown
Spectrum Peaks and valleys table
Spectrum Show peaks only
Spectrum Show valleys only
Spectrum Spectral points analysis
Spectrum Double less than icon- decrease the wavelength by 10 times scan interval
Spectrum Single less than icon - decrease the wavelength by 1 times scan interval
28262220126

Spectrum Double greater than icon - increase the wavelength by 10 times scan interval
Spectrum Single greater than icon - increase the wavelength by 1 times scan interval
Spectrum Wavelength icon - manually enter the wavelength
Spectrum Add points to the spectral points analysis table
Spectrum View spectral points analysis table
Spectrum Data point interval – used in print setup
Quantitation Measure sample
Quantitation Quantitation table – Opens quantitation table
Quantitation Number of standards
Quantitation View standard curve
Quantitation Curve fit – enables the curve fit to be adjusted
Quantitation Sigma icon – Displays curve statistics
Quantitation Measure standards
Quantitation Replicate measurement selection
Quantitation Tick icon - Read Standard
Quantitation Back icon – Re-measure previous standard
Quantitation Cross icon – Cancel creation of new standard curve
Quantitation Curve statistics – used in print setup
Quantitation Hand icon – Manual replicates
Quantitation Hand icon with cross through it – Automatic replicates
Kinetics Settings menu
Kinetics Hand icon – Manual y-axis scaling
Kinetics Hand icon with cross through it - Auto y-axis scaling
Kinetics 0000s Start time pause – Opens lag time/start on level menu
Kinetics 000 000 - Resets lag time, standard or factor values to zero
Kinetics Clock icon - Set the lag time
Kinetics ABS/%T icon - Set the start on level
Kinetics Greater than - Start above
595541392927127
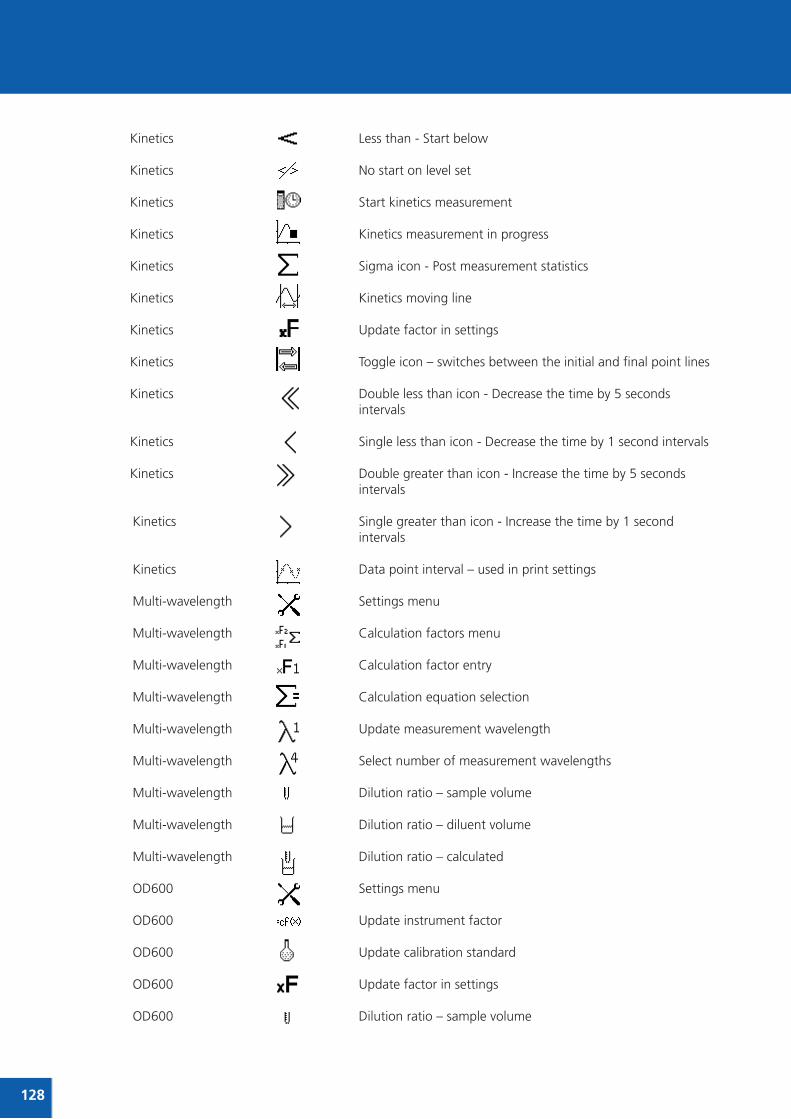
Kinetics Less than - Start below
Kinetics No start on level set
Kinetics Start kinetics measurement
Kinetics Kinetics measurement in progress
Kinetics Sigma icon - Post measurement statistics
Kinetics Kinetics moving line
Kinetics Update factor in settings
Kinetics Toggle icon – switches between the initial and final point lines
Kinetics Double less than icon - Decrease the time by 5 seconds intervals
Kinetics Single less than icon - Decrease the time by 1 second intervals
Kinetics Double greater than icon - Increase the time by 5 seconds intervals
Kinetics Single greater than icon - Increase the time by 1 second intervals
Kinetics Data point interval – used in print settings
Multi-wavelength Settings menu
Multi-wavelength Calculation factors menu
Multi-wavelength Calculation factor entry
Multi-wavelength Calculation equation selection
Multi-wavelength Update measurement wavelength
Multi-wavelength Select number of measurement wavelengths
Multi-wavelength Dilution ratio – sample volume
Multi-wavelength Dilution ratio – diluent volume
Multi-wavelength Dilution ratio – calculated
OD600 Settings menu
OD600 Update instrument factor
OD600 Update calibration standard
OD600 Update factor in settings
OD600 Dilution ratio – sample volume
28262220128
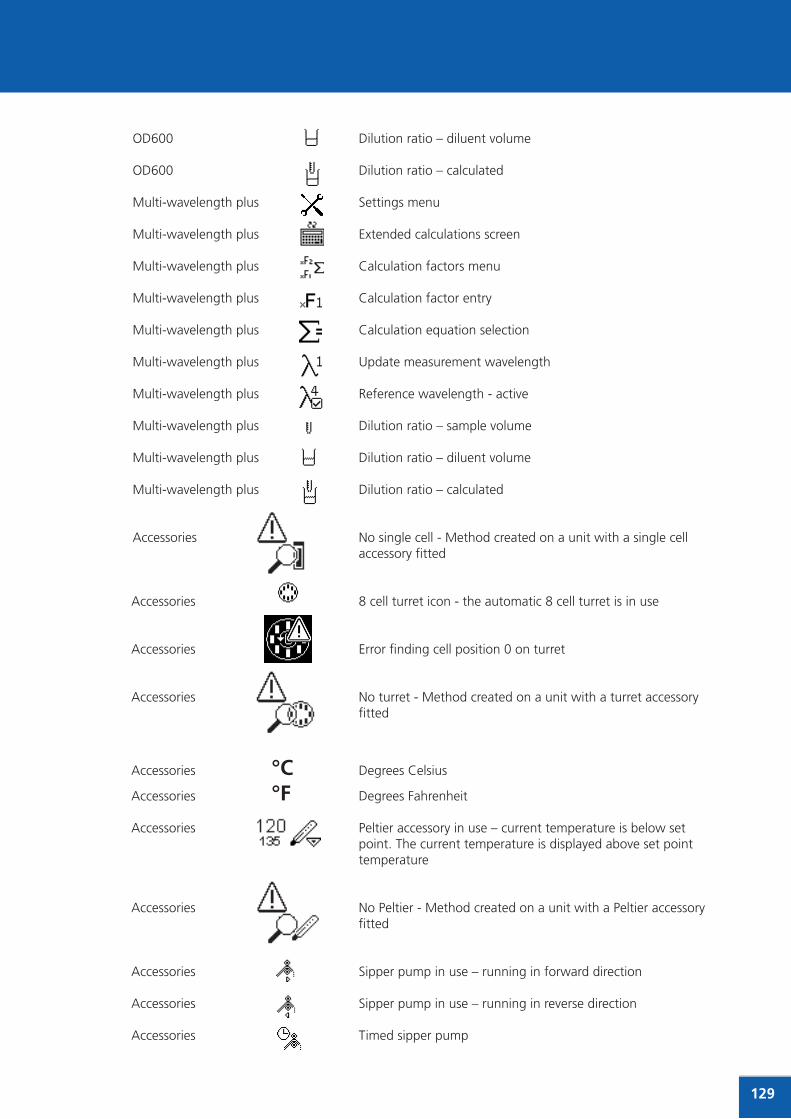
595541392927129
OD600 Dilution ratio – diluent volume
OD600 Dilution ratio – calculated
Multi-wavelength plus Settings menu
Multi-wavelength plus Extended calculations screen
Multi-wavelength plus Calculation factors menu
Multi-wavelength plus Calculation factor entry
Multi-wavelength plus Calculation equation selection
Multi-wavelength plus Update measurement wavelength
Multi-wavelength plus Reference wavelength - active
Multi-wavelength plus Dilution ratio – sample volume
Multi-wavelength plus Dilution ratio – diluent volume
Multi-wavelength plus Dilution ratio – calculated
Accessories No single cell - Method created on a unit with a single cell accessory fitted
Accessories 8 cell turret icon - the automatic 8 cell turret is in use
Accessories Error finding cell position 0 on turret
Accessories No turret - Method created on a unit with a turret accessory fitted
Accessories °C Degrees Celsius
Accessories °F Degrees Fahrenheit
Accessories Peltier accessory in use – current temperature is below set point. The current temperature is displayed above set point temperature
Accessories No Peltier - Method created on a unit with a Peltier accessory fitted
Accessories Sipper pump in use – running in forward direction
Accessories Sipper pump in use – running in reverse direction
Accessories Timed sipper pump

28262220130
Accessories Timed sipper pump calibration sequence
Accessories Start sipper pump – enables take up time to be set
Accessories Skip take up time – uses the previously set take up time
Accessories 000 000 – sets air gap to zero
Accessories Stop sipper pump
Accessories Reduce sample uptake/reduce air gap
Accessories Increase sample uptake/increase air gap
Accessories No sipper - Method created on a unit with a sipper accessory fitted
Accessories Sipper Peltier pump in use
Accessories No sipper Peltier - Method created on a unit with a sipper Peltier accessory fitted
Error Spanner – refer to section 30


PCrmax LimitedBeacon Road Stone Staffordshire ST15 0SAUnited KingdomTel: +44 (0)1785 812121 Fax: +44 (0)1785 813748 e-mail: [email protected]