Lithium Potential in Namibia
60
Lithium Potential in Namibia – Evaluation of Economic Suitability
Transcript of Lithium Potential in Namibia
Lithium Potential in Namibia ndash Evaluation of Economic Suitability
Imprint
Editor Bundesanstalt fuumlr Geowissenschaften und Rohstoffe (Federal Institute for Geosciences and Natural Resources)Stilleweg 2 30655 Hannover Deutschland
Author Michael Schmidt
Contribution Frans Amupolo Eliaser Iiyambo Yolanda Kavetuna Aphary Muyongo Lilian Ntema Elkan Utoni
Contact Michael Schmidt Deutsche Rohstoffagentur (DERA)
in der Bundesanstalt fuumlr Geowissenschaften und Rohstoffe (BGR) Dienstbereich Berlin Wilhelmstraszlige 25-30 13593 Berlin-Spandau michaelschmidtbgrde
Aphary Muyongo Geological Survey of Namibia Ministry of Mines and Energy 6 Aviation Road Private Bag 13297 Windhoek Namibia ApharyMuyongommegovna
Date December 2020
ISBN 978-3-948532-29-1 (Print) 978-3-948532-30-7 (PDF)
Cover photo copy BGR-GSN-Project Weathered spodumene outcrop at the De Rust pegmatite
Copyright copy BGR-GSN-Project
Lithium Potential in Namibia ndash Evaluation of Economic Suitability
Lithium Potential in Namibia
5
Table of Contents
List of Abbreviations 6
1 Introduction 7
2 What is lithium 821 Lithium deposits 8
3 Application 12
4 Chemical requirements 15
5 Mining and trade of lithium in the SADC 2051 Lithium production 2052 Trade data 2153 Export 2254 Import 23
6 Lithium occurrences in Namibia 24
7 Lithium mining in Namibia 2671 Current mining activities and projects 27
8 Analysed lithium samples 46
9 Interpretation 47
10 Conclusions 48
References 52
Lithium Potential in Namibia
6
List of AbbreviationsBGR Bundesanstalt fuumlr Geowissenschaften und Rohstoffe
(Federal Institute for Geosciences and Natural Resources)
BGS British Geological Survey
BMZ Bundesministerium fuumlr wirtschaftli-che Zusammenarbeit und Entwicklung (Federal Ministry of Economic Cooperation and Development)
EGD Economic Geology Division
GSN Geological Survey of Namibia
RTS Reverse trade statistics
SADC Southern African Development Community
USGS United States Geological Survey
Lithium Potential in Namibia
7
1 IntroductionIn 2019 mining contributed 93 to the Namibian gross domestic product and more than 50 to its export revenues The mining industry also has a significant impact on Namibian society through its potential to enhance local value addition and job creation However as in other sectors of the Namibian industry the mining sector faces a number of challenges and there remain untapped opportunities to bolster the Namibian economy notably concerning non-metallic commodities other than diamonds
In order to push its growth potential the Namibian Government launched the ldquoGrowth at Homerdquo strategy for industrialisation in 2015 ldquoGrowth at Homerdquo focusses on domestic value addition and mineral beneficiation figures pro-minently within this strategy It is against this background that the Federal Institute for Geosciences and Natural Resources (BGR) on behalf of the Federal Ministry of Economic Cooperation and Development (BMZ) of Ger-many cooperates with the Geological Survey of Namibia (GSN)
In 2017 BGR and GSN jointly implemented a project entitled ldquoSustainable Use of Namibiarsquos Mineral Potentialrdquo that contributes to the ldquoGrowth at Homerdquo stra-tegy by focussing on non-metallic commodities The objective of this ongoing project is to support the Economic Geology Division (EGD) staff in taking custody and exploring potentials of local value addition of Namibiarsquos non-me-tallic minerals These include industrial minerals with lithium being one facet among this wide spectrum of commodities
The GSN-BGR-Project investigated various pegmatites in central and southern Namibia regarding their mineral potential during several field cam-paigns During a field campaign in 2019 lithium grab samples were taken from selected pegmatite occurrences for subsequent chemical analysis and inter-pretation regarding their suitability for different economic application There is considerable economic potential for lithium as a precursor material in various applications
This study aims to illustrate the potential of lithium occurrences in Namibia and thus promote local value addition It shall be of value to the Namibian government to potential investors to mining and exploration companies as well as to the general public
Lithium Potential in Namibia
8
2 What is lithiumLithium (from Greek Lithos) is a chemical element (ie alkali metal) with the atomic number three located in the second period and in the first main group of the periodic table of elements Estimates for the Earthlsquos crustal content are around 6 middot 10-3 by weight
In elemental form lithium is a soft silvery-white alkali metal Under standard conditions it is the lightest of all solid elements Among the alkali metals lithium has the highest specific heat capacity in addition to the highest melting and boiling point (Table 1) In elemental state it has the strongest enthalpy of hydration of all alkali metals and thus attracts water very strongly Like all alkali metals lithium is very reactive and reacts with many elements Due to its reactivity elemental lithium is stored in paraffin oil or petroleum Upon contact with oxygen lithium reacts violently to lithium oxide
Scientific publications company reports and presentations usually provide lithium content as LCE (Lithium Carbonate Equivalent) units or Li2O content 1000 t of lithium metal equate to 5323 t LiCO3 (LCE) or 2153 t Li2O
21 Lithium deposits
The economically most important sources of lithium are hardrock deposits and brine deposits With the current market situation pegmatite deposits account for more than 55 of global lithium supply in 2019
Besides those two-deposit types lithium is also found in oilfield brines geo-thermal brines clays (ie hectorite) and lithium-containing minerals such as jadarite (ie type locality Serbia) or zinnwaldite (type locality Germany) There are about 200 minerals that contain lithium in concentrations gt 0002 Li2O About 25 of them contain lithium in concentrations gt 2 Li2O (Garrett 2004) However only a few of them are economically viable (Table 1)
Hard rock deposits Due to its chemical properties lithium is considered an incompatible element and remains for a very long time in the fluidic phases of a magma Therefore primary lithium hard rock occurrences are located primarily in pegmatites as late stage magmatic events
Lithium Potential in Namibia
9
Pegmatites or aplites are very coarse or finer grained felsic dikes respec-tively They intrude into the country rock as highly differentiated magma crys-tallizing either very slowly (pegmatites) or relatively fast (aplites) Pegmatites are usually of limited three-dimensional extent ranging from a few meters to several hundred meters or even kilometers in length and depth Besides quartz feldspar and mica lithium bearing pegmatites may also carry other valuable minerals that contain rare elements such as tantalum niobium tin tungsten cesium rubidium boron fluorine and others Those potential by-products may be of economic importance to some projects and mines The most important minerals in these deposits are spodumene petalite and lepidolite
Table 1 Important lithium bearing minerals (Source BGS 2016 Roskill 2016a Garret 2004)
Mineral Formula Li-Content ()
Oslash Li-Content Ores ()
Spodumene LiAlSi2O6 19 ndash 37 135 ndash 36
Petalite LiAlSi4O10 16 ndash 227 14 ndash 22
Lepidolite K(LiAl)3(SiAl)4O10(FOH)2 139 ndash 36 14 ndash 19
Amblygonite (LiNa)AlPO4(FOH) 34 ndash 47 n A
Eucryptite LiAlSiO4 21 ndash 553 21 ndash 44
Bikitaite LiAlSi2O6 bull H2O 34 n A
Hektorite Na03(MgLi)3Si4O10(OH)2 024 ndash 054 n A
Salitolite (LiNa)Al3(AlSi3O10)(OH5) 077 n A
Swinefordite Li(AlLiMg)4((SiAl)4O10)2 (OHF)4 bull nH2O
174 n A
Zinnwaldite K(LiFe2+Al)3[(FOH)2|AlSi3Ol0] 092 ndash 185 n A
Polylithionite KLi2AlSi4O10(FOH)2 n A n A
Jadarite LiNaSiB3O7(OH) 73 n A
Important pegmatite occurrences are found in Western Australia Canada and Sub-Sahara Africa (ie in Zimbabwe Democratic Republic of Congo and Mozambique) There are also pegmatite occurrences in Namibia that are lithium-bearing
Other mineral occurrences Lithium-containing clays form during the weathering of lithium-containing volcanic intrusive rocks Further enrichment can take place by hydrothermal processes The most important of these clay minerals hectorite belongs to the group of smectites (Table 1) Hectorite con-tains between 024 and 054 lithium Important occurrences are found in the USA (Roskill 2016)
Lithium may also occur in zinnwaldite which is the name for the mixed series siderophyllite ndash polylithionite (end members) They belong to the phlogopite
group Zinnwaldite has a relatively low lithium content of about 092 to 185 but relatively high levels of iron (approx 11 FeO) as well as fluorine (approx 6 F) which limits the suitability for certain applications In addition to the sources mentioned above lithium also occurs in a mineral named jadarite (Table 1) It is a sodium-lithium-boron-silicate hydroxide which can contain as much as 73 lithium
Fig 1 De Rust pegmatite swarm (Brandberg West ndash Goantagab tin belt) (Photo BGR-GSN-Project 2019)
Lithium Potential in Namibia
12
3 ApplicationMany products contain lithium due to its very specific properties By far the most important use of lithium is in the field of rechargeable batteries
In 2019 this area accounted already for 65 of total demand compa-red to 37 in 2015 (Fig 2) Lithium is an essential component in modern lithium-ion-batteries since it has the highest electrochemical potential of all metals and the highest specific capacity Compared to other battery types lithium-ion battery technology has currently the highest energy density the longest cycle life the widest temperature range tolerance and the lowest self-discharge rates (Bauer 2017)
Classical 3C applications such as laptops tablets smartphones and smart watches use lithium-ion-batteries (Fig 3) E-mobility as well as off-grid energy storage (ESS) for renewable energies are the major applications of such bat-teries with the highest projected annual growth rates Power tools play a minor role However products such as e-bikes e-trikes and especially e-scooters are gaining momentum
374
650
305
180
0
10
20
30
40
50
60
70
80
90
100
2015 2020
[]
Rechargeable Batteries Ceramics Greases Polymers
Metallurgical Powders Air Treatment Other
Fig 2 Lithium demand 2015 (left) vs lithium demand 2019 (right) (Source Roskill 2016 Statista 2020)
Lithium Potential in Namibia
13
The second important application of lithium is in the field of glass and cera-mics Cumulatively this area accounts for 18 of demand in 2019 (Fig 2) In the ceramic industry for the production of glazes and ceramic products (tiles sanitary items dishes etc) pure chemical grade lithium carbonate spodumene-concentrate or petalitelepidolite-concentrate is used as lithium source Positive effects of lithium are increase in gloss increase in luminosity increase of chemical and abrasion resistance and reduction of glaze viscosity In ceramic bodies the use of lithium lowers the firing temperature shortens the firing time and thus reduces overall CO2 emissions In addition the use of lithium has a positive effect on the expansion behavior and the mechanical resistance of products
In lubricants lithium is used as lithium-stearate or lithium-12-hydroxy-stea-rate primarily produced from lithium carbonate or lithium hydroxide and stea-rin-acid Di-Lithium-Azelate Lithium-Docosanoate and Lithium-Stearate are also used in lubricants (Roskill 2016) Overall lithium content is usually below 04
In the steel casting industry fluxes are used to optimize the casting pro-cess or to minimize the risk of faulty goods Lithium is used in the form of spodumene or petalite which reduces the viscosity of the melt As a result the flow rate and thus the productivity can be increased The flux also acts as a tempera ture barrier between the mold and the molten steel In addition the surface of the continuous cast body is protected from oxidation and impurities such as Al2O3 are removed (Roskill 2016) In traditional casting lithium oxide prevents the formation of defects in the finished casting Typically these fluxes contain up to 5 Li2O Lithium is added to the flux as either lithium oxide or lithium carbonate The addition of spodumene or petalite is also possible
In polymers Butyllithium (n-butyllithium = n-BuLi) is used as reagent or cata-lyst for the production of natural rubber compounds Depending on the rubber compound different amounts of n-BuLi are required (3 ndash 14 kg per ton rubber compound)
Different air treatment applications also use lithium Lithium bromide solu-tions are used in combination with water in bdquowater-lithium-bromide absorption chillersldquo (AKM) (Roskill 2016) Absorption based air de-humidifiers use lithium chloride (LiCl) This compound has the ability to absorb ten times its
Lithium Potential in Namibia
14
own weight in water Lithium is also used in air purification By means of lithium hydroxide CO2 can be removed from the air
Primary batteries also use lithium due to its electrochemical properties The-se cells are used in watches calculators pacemakers etc They are charac-terized by small size high energy density low weight long storage capacity low self-discharge and high cell voltage
Fig 3b Ceramic stove top (Source SCHOTT AG 2017)
Fig 3a Pouch-Lithium-Ion Cell (Source BGR)
Lithium Potential in Namibia
15
4 Chemical requirementsLithium is not a typically mined metal and the quality requirements are very specific and stringent depending on the field of application and thus vary from end-user to end-user
The first products that enter the value chains are usually the intermediates lithium carbonate andor lithium hydroxide produced from either brine sources or hard rock deposits ie currently mostly pegmatite sources (Fig 4)
Lithium from pegmatite sources is primarily sold as concentrates of either spodumene petalite or lepidolite with minor quantities of amblygonite in the market Each industry has unique requirements in terms of desired chemical composition particle size and tolerable values of impurities Concentrates are usually graded and priced according to their Li2O content impurity levels and aimed mainly at the growing battery industry as well as glassceramics industry
Concentrates for the battery industry are rated ldquochemical graderdquo and concen-trates for the glass industry are rated ldquotechnical graderdquo In general the glass industry has tighter limits on certain impurities as the battery industry due to the direct usage of the concentrates in the respective product flow sheets
The current industry standard for lithium concentrates in the battery indus-try is called SC-6 a chemical grade spodumene-concentrate that contains approx 6 Li2O Higher values of lithium are uncommon as concentrating them beyond 6 Li2O increases the cost of production exponentially
Petalite lepidolite zinnwaldite amblygonite and other lithium bearing miner-als are not used in this industry yet However there are processes in develop-ment for the extraction of lithium from these sources
Some companies especially in Australia sell spodumene-concentrates with lower Li2O contents (22 ndash 5 ) at lower prices per ton A special case are so-called DSO-concentrates (ldquodirect shipping orerdquo) with Li2O contents of only 12 ndash 14 DSO shippingrsquos out of Australia decreased significantly as the monetary value is quite low with lt 150 US$t and higher qualities are available
Lithium Potential in Namibia
16
Mica (muscovite) is an unwanted impurity in these concentrates as it disturbs the converting steps Heavy minerals are usually also extracted from the sources as they may represent by-product value (eg tantalum) Wall-rock impurities may cause problems in the further processing steps (basalt etc) Fe2O3 content is also an issue as it may also pose problems in the converters (clogging)
Technical grade lithium concentrates for the glass industry may have the same values of lithium in terms of Li2O but more stringent requirements in terms of iron content and some other elements such as fluorine
This industry usually uses petalite concentrates which can be used directly in the production process The advantage of petalite over spodumene-con-centrates is the generally lower iron content which is a crucial impurity even though these concentrates have lower lithium contents Fe2O3 content above a certain threshold (gt 015 ) will lead to unwanted discoloration in the final glass or ceramic products thus low values are needed
Fluorine-bearing lithium concentrates of lepidolite amblygonite and zinnwal-dite are not used in the glass and ceramics industry as this impurity is highly unwanted Besides fluorine the high Fe2O3 content of zinnwaldite is an issue as mentioned above
Particle size of the concentrates is also an issue as very fine material may lower the melt temperature due to a higher specific surface Therefore concen-trates for this industry are either tailor-made or mixtures of different sources
The glass and ceramics industry also uses pure lithium carbonate to a certain extent based on pricing
Lithium carbonate and lithium hydroxide are the first semi-finished products apart from lithium-concentrates used in the various industries for direct use or further downstream precursors There is a distinction between battery grade and technical (other) grade for lithium-carbonate and lithium-hydroxide The main differences lie within the lithium content level of impurities and particle sizes
Lithium Potential in Namibia
17
Commercial extraction of lithium takes place from lithium-containing brines and from hard rock (ie pegmatitic) deposits A simplified schematic repre-sentation of conventional production steps and key intermediates is shown in Figure 4
For the extraction of lithium from hard rock deposits the raw ores (eg pegma-tites) mined in open-pit or underground mines are processed into lithium-con-taining concentrates by sorting crushing grinding gravity separation mag-netic separation flotation washing filtering and drying The exact production steps vary depending on occurrence (ie locality) mineralogy company and the intended use of the produced concentrates
As of 2020 more than 95 of the conversion from spodumene-concentrates into lithium carbonate andor lithium hydroxide takes place in China The most widely used process in the industry is the acid-roast process (Fig 5)
In this process spodumene-concentrate is ground and heated to 1075 ‒ 1150degC in a rotary kiln (Fig 5) This converts α-spodumene into β-spodumene which is soluble in hot acids After mixing with hot sulfuric acid lithium sulfate solution is mixed with water As a result lithium sulfate dissolves The solution is mixed with calcium carbonate to remove impurities such as iron manganese and aluminum In addition the pH is raised After a first filtering process Na2CO3 and CaO are added to obtain an alkaline soluti-
Lithium Hydroxide
LithiumperoxidLithium Peroxide
Lithium-BrineLithium-Minerals
Lithium ChlorideLithium Bromide Lithium Sulfate
Lithium Acetate Lithium Metal
Lithium Carbonate
Fig 4 Simplified production scheme of lithium and important lithium com-pounds (modified after Roskill 2016)
Lithium Potential in Namibia
18
on Impurities such as calcium and manganese are removed The solution is then neutralized with sulfuric acid and heated to increase the concentration of Li2SO4 to about 200 ‒ 250 gl The addition of Na2CO3 and heating the solution to about 100degC triggers the precipitation of lithium carbonate The carbon-ate produced in this way has purities of up to 993 The battery industry however requires purities of min 995 obtained through ion exchange and extraction of impurities The produced lithium carbonate can then also be used for the production of lithium hydroxide
Common understanding was that the production of lithium carbonate was much cheaper from brines compared to hard rock sources Due to many developments in the brine industry mostly related to a recently introduced royalty system in Chile this is no longer the case On the contrary the cost advantage of brines is lost
Fig 5 Simplified production scheme of lithium carbonate derived from spodu-mene-concentrates via acid-roast-process (modified after Garret 2004)
Solution
MillingCooling
Thickener
Filtration
1075 - 1150oCCalcinationSpodumene Concentrate
Mixing
H2SO4
Leaching
H2O amp CaCO3
Gasscrubber
Solids to Tailings
Mixing
Na2CO3 amp CaO
Thickener
Filtration
Solids to Tailings
Neutralisation
H2SO4
Evaporation
90 - 100oCHeating
Filtering WashingDrying
Na2SO4Lithium carbonate
Lithium Potential in Namibia
19
The production of lithium hydroxide which is a fast growing market and a higher priced intermediate product appears to become cheaper when sourced directly from high quality hard rock conversion relative to sourcing from brines via an intermediate step (lithium carbonate) As the cost advantage of brine deposits compared to hard rock deposits is fading the industry has shifted its focus towards hard rock deposits all over the world
In addition to the acid-roast process there are new technological approaches to recover lithium carbonate and lithium hydroxide directly from high quality spodumene-concentrates as well as other mineralogies
Lithium Potential in Namibia
20
5 Mining and trade of lithium in the SADC
51 Lithium production
Each year every mining country of the world is urged to share production statistics regarding their mining activity These statistics are compiled and published by different entities such as the British Geological Survey (BGS) and the United States Geological Survey (USGS) among others
If a country does not appear in these statistics there was either no mining activity for this specific commodity the country did not publish any statistics or the production data is unknown
Table 2 Mine production of lithium (Source BGR 2020 Roskill 2016 USGS 2020 Geoscience Australia 2020)
Mine production [t Li-Content]
Years 2014 2015 2016 2017 2018 2019e Share 2018 []
Australia1) 12333 13160 15590 21000 57000 42000 647
Chile2) 11640 11787 14526 16584 15886 18000 175
Argentina2) 3388 3515 5767 575 6241 6400 69
China3) 1895 2002 2293 3 7376 7500 81
Zimbabwe1) 1024 1025 974 994 700 1600 08
USA2) 846 846 900 900 567 n A 06
Portugal1) 470 470 299 763 700 1200 08
Brazil1) 186 186 195 154 153 300 02
Namibia1) n d nd n d n d 500 n d 05
Other 3) 19 19 18 18 18 500 lt01
Global4) 31801 33011 40562 49012 90941 77000 1001) Hardrock 2) Brine 3) HardrockBrine 4) Deviation due to rounding e estimated
Lithium Potential in Namibia
21
In 2018 global mine output of lithium was around 91000 t Li-content of which only 1200 t originated from the Southern African Development Community (SADC) namely Zimbabwe and Namibia
52 Trade data
Trade data is retrieved from the commercially available Global Trade Atlasreg (IHS Global SA) The database provides both import and export data for more than 90 countries based on customs data of individual countries Data is primarily classified through Harmonised System (HS) product codes by the WCO (World Customs Organization) The HS nomenclature consists of approximately 5000 product groups identified by a 6-digit code
There are limitations to trade data The most prominent issue arises with data availability since many countries do not publish trade data Especially export data is an issue among many countries
There may also be issues with mislabeled products (wrong HS) product bas-kets data entry errors or missing data in general Were export data is not available so-called reverse trade data (RTS) is an option
If a country does not state any exports cumulative global imports from that particular country may be used as a rough yet incomplete estimate of exports It should be noted that these statistics do not represent absolute but rather minimum values as trade between two non-reporting countries will not be reflected The majority of the SADC countries do not report their import and export statistics
The most important lithium products that are globally traded in significant amounts are lithium-carbonate lithium-oxide (hydroxide) lithium-chloride and lithium-mineral-concentrates
Lithium Potential in Namibia
22
53 Export
The most important intermediate product in the lithium market is lithium carbonate In 2019 global exports amounted to approx 117743 t with Chile being the largest exporter (82344 t 70 ) There are no listed exports from the SADC region except minor quantities from South Africa to the Democratic Republic of Congo (9 t) and Zambia (2 t)
Lithium oxides and lithium hydroxides are grouped together under one HS code hence an individual consideration of both products on a country basis is not possible due to the lack of country-specific commodity codes
In 2019 global exports of HS 282520 stood at approx 97550 t with China being the largest exporting country (49800 t 51 )There are no exports published for the SADC region except South Africa with small quantities (28 t) which are considered to be trade through only
Assessment of lithium chloride global trade flows is also difficult as this prod-uct is listed together with many other chemical products under HS 282739 Global trade can only be investigated using country-specific commodity codes (8-digits and above) if available Only three countries list this product under specific trade codes namely China (28273910) Chile (28273930) and Argentina (28273960) SADC countries including Namibia do not publish any data under HS 282739 Based on the available data global exports in 2019 stood at 2254 t with Chile being the largest exporter (2101 t 89 )
Lithium-containing mineral concentrates are among other non-lithium related products listed in a product basket under HS 253090 Only two coun-tries provide information on this product namely Australia as the largest and hence most important producing and exporting country by far and Brazil as a minor exporter (25309010)
No other country including member states of the SADC specifies lithium-con-taining concentrates as such The currently only producing and exporting country in the SADC is Zimbabwe which does not specify exports at all Thus exports are derived from RTS (global imports)
Lithium Potential in Namibia
23
A general problem with HS 253090 is that only information on quantity is avail-able but no information on lithium content which can vary between 12 and 6 Li2O thus the margin of possible errors in terms of total contained lithium is large
In 2019 Australia exported about 16 million tons of spodumene-concentrate down from 35 million tons in 2018 More than 95 destined to China
Inferred exports (RTS) of Zimbabwe were approx 93300 t for HS 253090 About 62000 t of that quantity are listed as imports by South Africa and are unrelated to lithium The remaining quantity is much more in line with production figures of Zimbabwe as well as the known downstream industries of the destination coun-tries within Europe
There are no export records published by Namibia In general and across all traded lithium products South Africa appears to act as an importexport hub within the SADC Also some of the traded products may be used in the glass and ceramic industry of South Africa
54 Import
For most of the SADC countries the statistics retrieved though the Global Trade Atlas do not necessarily represent reliable trade data due to above-mentioned reasons This is especially true when only small import numbers (usually in tons) are listed as these are supposedly artefacts or errors in declaration
Global imports of lithium-carbonate amounted to approx 142965 t with South Korea being the largest importer (38578 t 27 ) There are no listed imports for the SADC region except South Africa (72 t)
Global imports of lithium-oxides (hydroxides) amounted to approx 84900 t with Japan being the largest importer (37300 t 44 ) In analogy to lithium carbonate there are no published imports into the SADC except for South Africa (428 t)
There is no information for imports of lithium-choride or lithium-mineral-con-centrates into the SADC The largest importer of lithium-choride is China with approx 253 t The largest importer of lithium-mineral-concentrates is also China (gt 95 )
Lithium Potential in Namibia
24
Fig 6 Simplified geology of Namibia with major towns as well as railway and tar roads Blue polygons indicate pegmatite belts and districts in central and southern Namibia (Data source Geological Survey of Namibia 2020)
6 Lithium occurrences in NamibiaIn Namibia significant lithium occurrences are found only within pegmatites These Precambrian and early Namibian pegmatites are restricted to two dif-ferent areas respectively the Damara Orogen in north-central Namibia and the Namaqua Metamorphic Complex in southern Namibia (Fig 6)
Lithium Potential in Namibia
25
Within the Damara Orogen four linear pegmatite belts are found all of which strike northeast ndash southwest (Fig 7) Brandberg West ndash Goantagab Cape Cross ndash Uis Nainais ndash Kohero and Sandamap ndash Erongo with the latter connected to the Karibib Pegmatite District (Schneider 1992)
Each of these pegmatite belts exhibit numerous individual pegmatite swarms that occur zoned or unzoned and may carry significant amounts of rare metals or semi-precious stones In the south Lithium-Caesium-Tantalum (LCT) peg-matites occur in two areas Tantalite-Valley south of Warmbad in close prox-imity to the northwest-trending Tantalite Valley Shear Belt and the Sandfon-tein-Ramansdrift area close to the Orange River
Fig 7 Pegmatite belts in north-central Namibia from west to east Brandberg West ndash Goantagab Cape Cross ndash Uis Nainais ndash Kohero and Sandamap ndash Erongo as well as the Karibib Pegmatite District (after Geological Suvey of Namibia 2002)
Lithium Potential in Namibia
26
7 Lithium mining in NamibiaData for historic lithium mine production is available for the period 1939 ndash 1998 (Fig 8) After 1998 all mining activities ceased due to product quality issues and overall market environment
Until the mid-1950s lepidolite was the most important mined lithium mineral of the country (Fig 8) As mine output of lepidolite decreased output of petalite increased However quantity on a year-to-year basis was quite variable and fluctuated between 1000 ndash 10000 t Since the early 1980s production of petalite was quite stable and ranged between 1000 ndash 2500 t Production fell sharply in 1997 and 1998 after which it ceased Mining of amblygonite has always been small compared to lepidolite and petalite and never exceeded 1000 t per annum
According to the USGS (2020) 500 t of lithium were mined in Namibia in 2018 This is most likely stockpiled lepidolite material from the Rubicon mine
0
2000
4000
6000
8000
10000
12000
1939
1941
1943
1945
1947
1949
1951
1953
1955
1957
1959
1961
1963
1965
1967
1969
1971
1973
1975
1977
1979
1981
1983
1985
1987
1989
1991
1993
1995
1997
[Ton
nes]
Petalite (t)Amblygonite (t)Lepidolite (t)
Fig 8 Lithium production in Namibia in [t] per year (after Schneider 1992 BGR 2020)
Lithium Potential in Namibia
27
Currently there is no active consecutive mining for lithium in substantial quan-tities in Namibia although there are prospects and projects under develop-ment
71 Current mining activities and projects
Soris The Soris project is located in the De Rust pegmatite swarm which is part of the ldquoBrandberg West ndash Goantagab tin beltrdquo (Fig 7) This belt stretches to the northeast of the Brandberg massif over a length of 60 km and a width of 25 km This belt was previously mined for cassiterite on a larger scale Some of the pegmatites in this belt may carry substantial amounts of lithium such as pegmatites in the De Rust pegmatite swarm
The De Rust pegmatite itself is a Li-rich rare metal pegmatite that was mined for cassiterite and tantalite but also for minor quantities of spodumene be ween 1960 and 1990 (Diehl 1990) It intruded into metasediments of the Amis River Formation Lower Ugab Group of the Southern Kaoko Zone
It is the largest pegmatite of the De Rust pegmatite swarm within the Brandberg West ndash Goantagab pegmatite belt (Diehl 1992c) Outcrops are 100 ‒ 470 m long up to 30 m wide and can be followed over a length of roughly 24 km
The pegmatite shows well-developed zonation with a border zone (quartz alkali feldspar muscovite) outer (quartz microcline-perthite muscovite altered petalite) and inner (quartzo-feldspathic rock with spodumene crystals with accessory apatite lepidolite eucryptite zircon and monazite) intermedi-ate zone as well as a core zone (quartz subordinate microcline muscovite sporadic tantalite) Spodumene crystals may reach up to 80 cm in length (Fig 12) Towards the core zone spodumene carries rounded nodules of lithi-um phosphates (amblygonite ndash montebrasite series)
It is located northwest of the nearest town of Uis in the Kunene region of Namibia about 6km to the east of farm De Rust 532 and about 25 km north of the Ugab River The nearest railhead is located in the town of Karibib and the deep-water port of Walvis Bay is 120 km to the southwest Windhoek is about 180 km to the southeast
Lithium Potential in Namibia
28
The project can be reached via paved but mostly unpaved roads from the town of Uis From White Lady Lodge which is about 38 km northwest from Uis a 35 km gravel road leads towards the project 15 km of which are in the riverbed of the Ugab River There is currently no electricity and water supply at the project location site
According to SampP Global (022020) current owner of the Soris project is Mon-tero Mining amp Exploration Ltd (TSXV MON) which holds 80 interest of the property Another 20 are allocated to an unnamed private owner Based on data from the Namibia Mining Cadastre Portal (092020) multiple entries for mining licence applications exist for the area where the main De Rust pegmatite is located (Fig 9)
Resource estimateDue to the early stage of the Soris project no resource estimate is avail-able However Montero Mining claims the project to be drill ready targeting a resource of 10 Mt 1 Li2O with tantalum and tin by-product credits This would equate to 46400 t of lithium or 247000 t LCE
Grab samples of the deposit showed lithium contents of 007 to 532 aver-aging 137 Channel samples showed average lithium contents of 076 and values up to 366 (Montero 032019) The company also re-assessed 1097 previously tested RC drill samples The main lithium-bearing mineral is spodumene
Remnants of historic intermittent mining activities like old foundations and quartzo-feldspathic tailings are still visible east to the main pegmatite (Fig 10 ‒ 11)
Lithium Potential in Namibia
29
Fig 10 Remnants of historic open pit mining (upper) and tailings of De Rust pegmatite (lower) northwest of the Brandberg massif (Photo BGR-GSN 2019)
Fig 9 Satellite image of the De Rust project including the outlined mining license Main pegmatite coordinates 20deg57prime48primeprimeS ‒ 14deg30prime12primeprimeE (Source httpportalsflexicadastrecomnamibia 092020)
Main pegmatite
Lithium Potential in Namibia
30
Fig 12 Weathered spodumene chrystals at the historic open pit mine (Photo BGR-GSN 2019)
Fig 11 Historic open pit of the De Rust pegmatite (Photo BGR-GSN 2019)
Lithium Potential in Namibia
31
Uis The Uis projects (former mine and tailings) are located in the northern part of the ldquoCape Cross Uis pegmatite beltrdquo east of the town of Uis on the farm Uis Townlands No 215 in the Erongo region of Namibia
The Cape Cross-Uis belt is approx 120 km long and up to 40 km wide and extends in a NE direction (Fig 7) It comprises three distinct pegmatite swarms the Strathmore swarm Karlowa swarm and Uis pegmatite swarm In general lithium-bearing pegmatites (Li-Nb-Ta-Sn-Be and Li-Nb-Ta-Sn) are the least common in this belt (Fuchsloch et al 2018)
The Uis swarm field consists of more than 120 individual pegmatites each with a northeasterly to easterly strike direction and northwesterly down dip (30deg ‒ 70deg) This field is accompanied by a peripheral pegmatite field of approx 25 individual pegmatites
Some of the main pegmatites especially around the formerly worldrsquos largest tin mine at Uis are exceedingly large Some of them are up to 1 km long and some 50 m wide
In terms of lithium petalite amblygonite and minor spodumene mineralization occurs in the various pegmatites but no lepidolite Most common lithium bear-ing minerals in the eight pegmatites that were mined at Uis are amblygonite petalite and spodumene
Currently the Uis tailings project and the Uis tin mine are owned by two differ-ent companies As of 2020 the tin mine is operating a pilot processing plant and aims to ramp up the production of lithium in the near future The current ownership of the tailings project as of September 2020 is unclear
The nearest commercial deep-water port to the projects is Walvis Bay 220 km to the southeast The town of Omaruru is 130 km to the east and Henties Bay lies about 120 km to the southwest The nearest railhead is located in Omaruru The area is accessible year-round by paved and un-paved roads NamPower provides electricity and the town of Uis is connected to the Nam-Water pipeline
Lithium Potential in Namibia
32
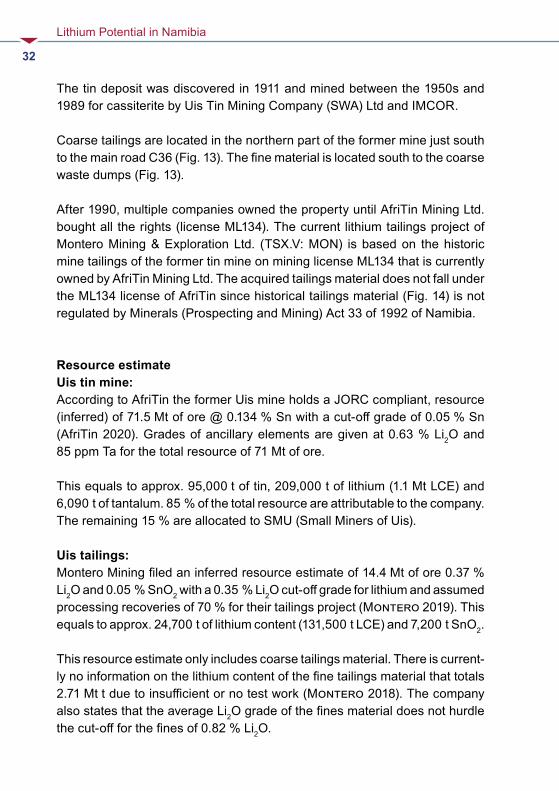
The tin deposit was discovered in 1911 and mined between the 1950s and 1989 for cassiterite by Uis Tin Mining Company (SWA) Ltd and IMCOR
Coarse tailings are located in the northern part of the former mine just south to the main road C36 (Fig 13) The fine material is located south to the coarse waste dumps (Fig 13)
After 1990 multiple companies owned the property until AfriTin Mining Ltd bought all the rights (license ML134) The current lithium tailings project of Montero Mining amp Exploration Ltd (TSXV MON) is based on the historic mine tailings of the former tin mine on mining license ML134 that is currently owned by AfriTin Mining Ltd The acquired tailings material does not fall under the ML134 license of AfriTin since historical tailings material (Fig 14) is not regulated by Minerals (Prospecting and Mining) Act 33 of 1992 of Namibia
Resource estimateUis tin mineAccording to AfriTin the former Uis mine holds a JORC compliant resource (inferred) of 715 Mt of ore 0134 Sn with a cut-off grade of 005 Sn (AfriTin 2020) Grades of ancillary elements are given at 063 Li2O and 85 ppm Ta for the total resource of 71 Mt of ore
This equals to approx 95000 t of tin 209000 t of lithium (11 Mt LCE) and 6090 t of tantalum 85 of the total resource are attributable to the company The remaining 15 are allocated to SMU (Small Miners of Uis)
Uis tailingsMontero Mining filed an inferred resource estimate of 144 Mt of ore 037 Li2O and 005 SnO2 with a 035 Li2O cut-off grade for lithium and assumed processing recoveries of 70 for their tailings project (Montero 2019) This equals to approx 24700 t of lithium content (131500 t LCE) and 7200 t SnO2
This resource estimate only includes coarse tailings material There is current-ly no information on the lithium content of the fine tailings material that totals 271 Mt t due to insufficient or no test work (Montero 2018) The company also states that the average Li2O grade of the fines material does not hurdle the cut-off for the fines of 082 Li2O
Lithium Potential in Namibia
33
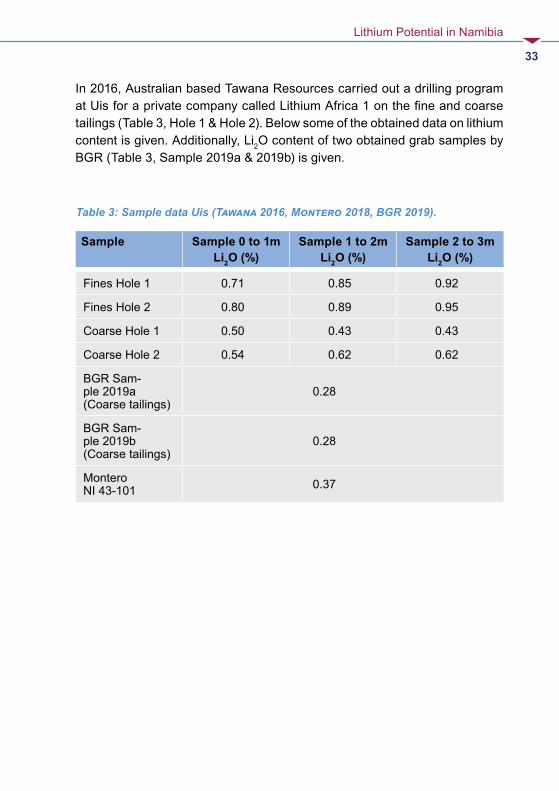
In 2016 Australian based Tawana Resources carried out a drilling program at Uis for a private company called Lithium Africa 1 on the fine and coarse tailings (Table 3 Hole 1 amp Hole 2) Below some of the obtained data on lithium content is given Additionally Li2O content of two obtained grab samples by BGR (Table 3 Sample 2019a amp 2019b) is given
Table 3 Sample data Uis (Tawana 2016 Montero 2018 BGR 2019)
Sample Sample 0 to 1m Li2O ()
Sample 1 to 2m Li2O ()
Sample 2 to 3m Li2O ()
Fines Hole 1 071 085 092
Fines Hole 2 080 089 095
Coarse Hole 1 050 043 043
Coarse Hole 2 054 062 062
BGR Sam-ple 2019a (Coarse tailings)
028
BGR Sam-ple 2019b (Coarse tailings)
028
Montero NI 43-101 037
Lithium Potential in Namibia
34
Fig 14 Tailings of the historic Uis Tin Mine (Photo BGR-GSN 2019 with kind permission of AfriTin Mining Limited)
Fig 13 Former Uis tin mine Uis tailings project with coarse tailings Tailings coordina-tes (center) 21deg13prime31primeprimeS ‒ 14deg52prime44primeprimeE (Source httpportalsflexicadastrecomnamibia 092020)
Uis Tailings (coarse)
Uis Tailings (fine)
Historic Uis mine
Lithium Potential in Namibia
35
Karibib Lepidolite ProjectThe Karibib Lepidolite brownfield project is located in the ldquoKaribib ndash Usakos Pegmatite Districtrdquo southeast of the town of Karibib on the farm Okongava Ost No 72 in central Namibia (Fig 15 ‒ 16)
This pegmatite district which is of Damaran age hosts the most important pegmatite occurrence (Rubicon swarm) in terms of lithium in Namibia In addi-tion numerous other different pegmatite swarms some of which have previ-ously been relevant in terms of lithium are know from this district These are Dernburg Karlsbrunn Albrechtshoumlhe Berger Kaliombo Gamikaubmund Okatjimukuju Etusis Daheim Friedrichsfelde and Etiro (Diehl 1992a)
The Rubicon pegmatite itself is the largest of the individual pegmatites that occur in this field and has been the prime source of lithium until mining seized in the early 1990s The Helikon pegmatites are part of the Rubicon pegmatite swarm and are located northeast to the Rubicon pegmatite They have previ-ously been mined for lepidolite amblygonite petalite and muscovite beryll pollucite quartz and columbite-tantalite as valuable by-products (Fig 18 ‒ 19)
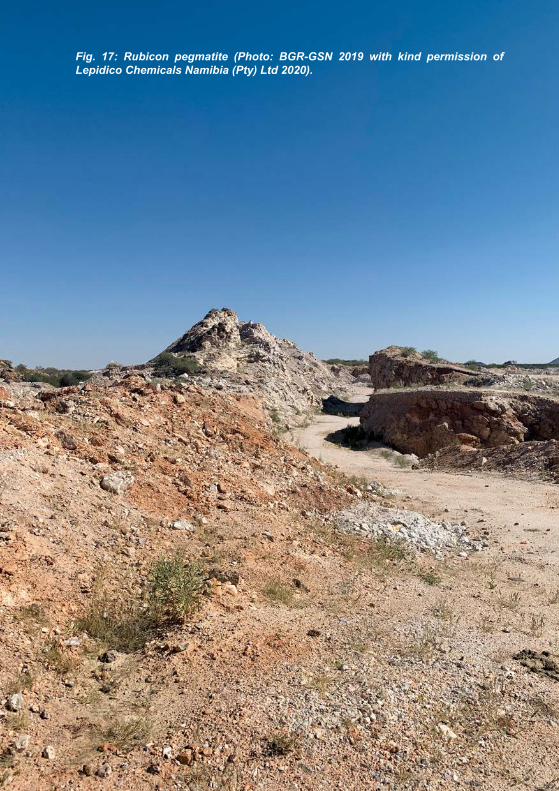
The pegmatite itself consist of two ellipsoidal well zoned Li-mineralized ore-bodies The larger one is about 320 m long and 25 ndash 35 m wide It dips at 46deg to the northeast and has a northwesterly strike The second orebody is about 230 m long and about 10 m wide It is dipping with 30deg to the northeast and has a northwesterly strike In total the outcrop of the Rubicon pegmatite is about 600 m long with a maximum width of 65 m (Fig 17)
A very prominent feature is the presence of a very well developed concen-tric shell and zones from the footwall to the inner core of the pegmatite Both orebodies exhibit a border- wall- intermediate- and core-zone
Border-zone wall-zone and outer intermediate zone of the larger orebody do not contain Li-bearing minerals of economic importance The inner interme-diate zone does contain lepidolite The outer core zone may be sub-divided into a petalite zone low-grade lepidolite zone and a high-grade lepidolite zone The inner core zone also contains a petalite zone Mining occurred pre-viously in the later named zones The zonation of the smaller orebody to the northwest is less pronounced but Li-mineralization and style are equal to the
Lithium Potential in Namibia
36
larger orebody There is no spodumene mineralization within the orebodies and respectively zones of the Rubicon pegmatite
The Helikon I pegmatite is also a lens-shaped pegmatite with a length of roughly 400 m and a width of approx 66 m It dips to the north with about 60deg ndash 70deg Helikon I also consists of well-defined zones The main Li-bearing minerals are lepidolite and petalite According to Roering (1963) the lepidolite is difficult to separate from the intergrown albite and hence of low grade and quality
The Helikon II pegmatite is approx 17 km long and only 9 ndash 15 m wide It lies a bit north of Helikon I and dips steeply to the north with 55deg ndash 80deg striking east west The main Li-bearing minerals are lepidolite and petalite According to Diehl (1990) the westernmost portion of the pegmatite has historically been the economically most important A massive up to 6 m wide petalite zone was mined here according to Diehl (1990)
The nearest railhead to the project is 17 km away in Karibib and the deep-water port of Walvis Bay is 220 km to the southwest Windhoek is about 180 km to the southeast NamPower connects the town of Karibib to electricity and the project currently utilizes generators There is a 7 km long 22 kV power line spur to grid connection pending (Lepidico 2020) Water is available via on-site boreholes
The project was previously owned by Desert Lion Energy Inc (TSVX DLI) Lepidico Ltd (ASX LPD) bought into the project and currently holds 80 interest which comprises Mining License 204 (69 km2) as well as three Exclu-sive Prospecting Licenses (EPLs) namely 5439 5555 and 5781 (Lepidico 2020)
Lepidico will cover mining from multiple sources as well as chemical conver-sion by utilizing their proprietary lithium processing technologies L-Maxreg LOH-Maxreg and S-Maxreg (Lepidico 052019) The company aims to produce high purity lithium chemicals such as lithium carbonate and lithium hydroxide
The takeover also included a nonbinding offtake agreement between the for-mer owner Desert Lion Energy Inc and German chemical company BASF On April 2nd 2019 Desert Lion Energy Inc announced this offtake agreement
Lithium Potential in Namibia
37
which at the time was valid through to December 31 2019 On December 20th
2019 Lepidico announced that the LOI with BASF was extended to Decem-ber 31st 2020 (Lepidico 122019)
The feasibility study criteria of Lepidico are as follows
- Throughput of the concentrator on-site of 035 Mtpa- Expansion of throughput after year five to 05 Mtpa- Chemical plant in the industrial city of Abu Dabi (ICAD)- Plant design for 58000 tpa of concentrate (4 LiO2) for the production of
up to 5500 tpa LiOH- Utilization of L-Maxreg and LOH-MaxTM- Non-binding off-take MOU with BASF for LiOH only- Targeting for project commissioning to commence late 2021 for commer-
cial production in 2022
The preliminary mine plan indicates a strip ratio of 03 ndash 1 for the first two years The ratio will then go up to 1 ndash 14 In the first four years elevated grades of 06 LiO2 will be mined
Resource estimateA JORC 2012 compliant resource estimate for the deposit is given in Table 4 (Lepidico 2020) The deposit currently holds 23200 t of lithium (Indicated amp Inferred) based on a cut-off grade of 015 Li2O This resource estimate is based solely on the lepidolite occurrences at the mine site
Table 4 Resource estimate Karibib Lepidolite Project (Source Lepidico 2020)
Deposit Resource Category
Cut-off (Li2O)
Ore (Mt)
Li2O ()
Li (t)
Li (LCE)
Rubicon Measured
015
22 057 5819 30974
Rubicon Indicated 666 038 11637 61943
Rubicon Inferred 237 043 4728 25167
Helikon
Total 015 1124 043 22184 118086
Lithium Potential in Namibia
38
Fig 16 Satellite image of the Karibib Lepidolite project Helikon 1 coordinates (center) 22deg2prime49primeprimeS ‒ 16deg1prime13primeprimeE Helikon 4 coordinates (center) 22deg2prime24primeprimeS ‒ 16deg1prime41primeprimeE (Source httpportalsflexicadastrecomnamibia 092020)
Fig 15 Satellite image of the Karibib Lepidolite project Rubicon coordinates (center) 22deg6prime11primeprimeS ‒ 15deg59prime44primeprimeE (Source httpportalsflexicadastrecomnamibia 092020)
Historic Rubicon mine
Helikon 1
Helikon 4
Lithium Potential in Namibia
39Fig 17 Rubicon pegmatite (Photo BGR-GSN 2019 with kind permission of Lepidico Chemicals Namibia (Pty) Ltd 2020)
Lithium Potential in Namibia
40 Fig 18 Lepidolite sample from Rubicon pegmatite (Photo BGR-GSN 2019 with kind permission of Lepidico Chemicals Namibia (Pty) Ltd 2020)
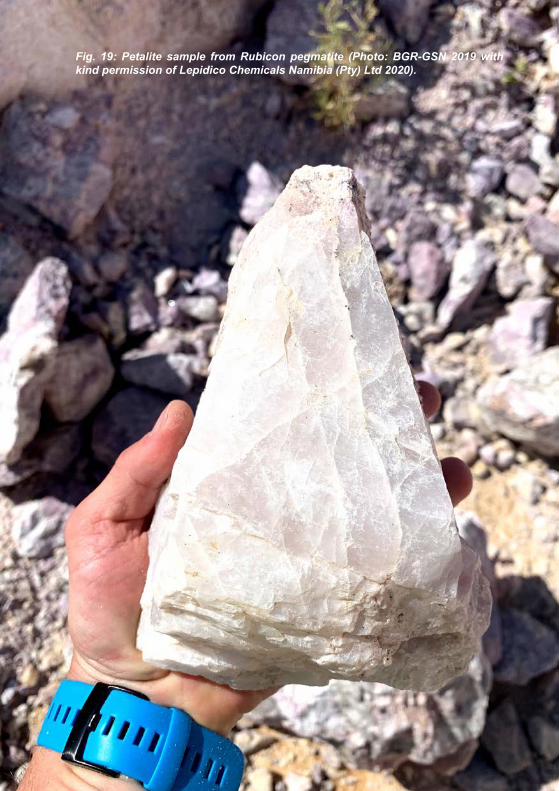
Fig 19 Petalite sample from Rubicon pegmatite (Photo BGR-GSN 2019 with kind permission of Lepidico Chemicals Namibia (Pty) Ltd 2020)
Lithium Potential in Namibia
42
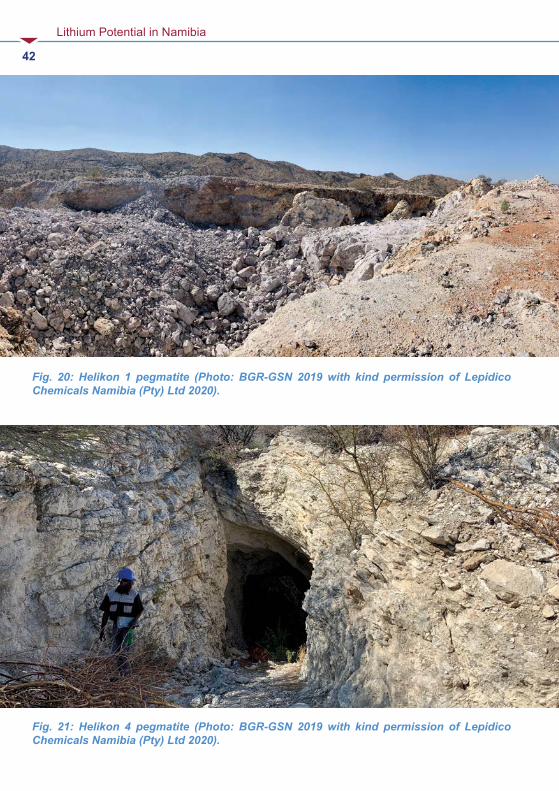
Fig 21 Helikon 4 pegmatite (Photo BGR-GSN 2019 with kind permission of Lepidico Chemicals Namibia (Pty) Ltd 2020)
Fig 20 Helikon 1 pegmatite (Photo BGR-GSN 2019 with kind permission of Lepidico Chemicals Namibia (Pty) Ltd 2020)
Lithium Potential in Namibia
43
Tantalite ValleyThe Tantalite Valley Project lies within the ldquoNamaqua Metamorphic Complexrdquo in Southern Namibia Within this complex Lithium-Caesium-Tantalum (LCT) pegmatites occur in two main areas Tantalite-Valley south of Warmbad in close proximity to the northwest-trending Tantalite Valley Shear Belt and the Sandfontein-Ramansdrift area close to the Orange River
The area were the pegmatites of the Tantalite Valley occur is primarily com-posed of a large ovoid gabbro intrusion (71 km by 33 km in extent) within paragneiss units of the Namaqua Complex The gabbro outcrop forms a large dome shaped mountain that rises about 500 m above the surrounding topo-graphy
The pegmatites belong to the Kenhardt and Gordonia pegmatite districts in Namaqualand but only the younger group of them carry accessory ore miner-als such as tantalite beryl REE minerals and lithium
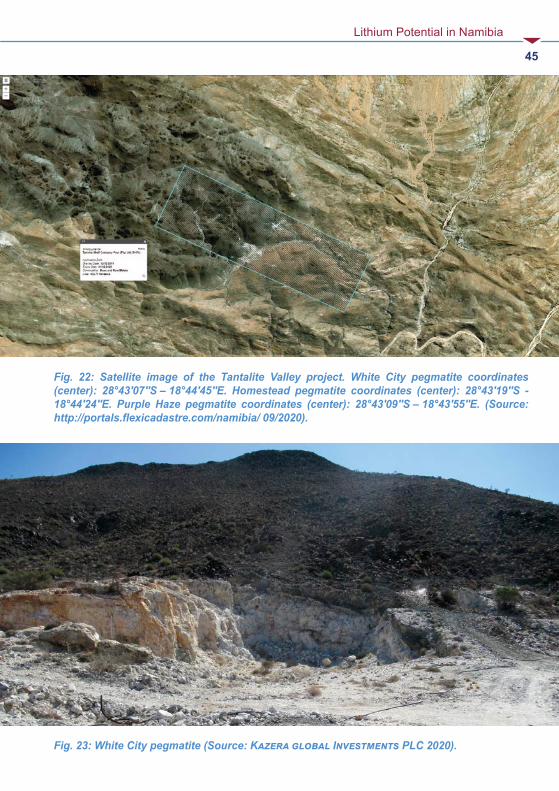
The Tantalite Valley pegmatites include several individual subhorizonal dikes that are up to 1000 m long and 02 to 40 m wide plunging towards southeast (Diehl 1992b) Four of those are of economic interest Homestead Whitkop White City and the Lepidolite pegmatites (ie Purple Haze) (Fig 22)
They are all well zoned (quartz core inner and outer intermediate zones wall zone) and were predominantly targeted for beryl columbite-tantalite as well as lithium and bismuth minerals
The project is located on the farms Umeis 110 and Kinderzitt 132 between the Farms 109 131 129 308 and 473 in the magisterial district of Karas It currently comprises Mining License (ML-77) fully owned by Tameka Shelf Co Four (Pty) Ltd which is a 100 subsidiary of African Tantalite Pty Ltd (AFTAN) Above all Kazera Global Investments PLC holds a 75 stake in AFTAN (Kazera 2019) with the other 25 of local farmer ownership
The project is accessible via gravel road from Karasburg which is about 80 km to the north The nearest railhead is also located in Karasburg Electricity is currently supplied by generators and water is recovered from multiple drill holes The Orange River is about 15 km to the south of the project Mining
Lithium Potential in Namibia
44
infrastructure as well as equipment are on site as well as a plant for the pro-duction of tantalite concentrate
NTI is working on an extensive exploration program with a clear focus on revi-ving tantalite mining in Namibia with a possible by-product stream of lithium bearing minerals The company will focus primarily on the pegmatites Homes-tead Purple Haze Signaalberg and White City (Fig 23)
The area is known for its tantalum occurrences and since the late 1940s tantalite and other minerals have been recovered at Tantalite Valley until 1981 when mining ceased Initially alluvial deposits were mined followed by the pegmatites themselves Grades of the concentrates produced prior to the closure of the mine were quite high with 65 ‒ 70 Ta2O5 with very low U3O8
and ThO2 values of 025 max
Resource estimateAccording to SampP Global (092020) Measured and amp Indicated resources at Tantalite Valley are 104800 t of ore 0042 Ta2O5 and 0653 Li2O as of 112019 This would equate to 315 t of lithium or 1690 t LCE Total inferred resources are 517400 t of ore 0018 Ta2O5 and 0144 Li2O This equals to approx 91 t of tantalum and 750 t of lithium (3535 t LCE)
Lithium Potential in Namibia
45
Fig 23 White City pegmatite (Source Kazera global Investments PLC 2020)
Fig 22 Satellite image of the Tantalite Valley project White City pegmatite coordinates (center) 28deg43prime07primeprimeS ‒ 18deg44prime45primeprimeE Homestead pegmatite coordinates (center) 28deg43prime19primeprimeS - 18deg44prime24primeprimeE Purple Haze pegmatite coordinates (center) 28deg43prime09primeprimeS ‒ 18deg43prime55primeprimeE (Source httpportalsflexicadastrecomnamibia 092020)
Lithium Potential in Namibia
46
8 Analysed lithium samplesDuring the course of the cooperation project between the Economic Geology Division (EGD) of the Geological Survey of Namibia (GSN) and the Ger-man Federal Institute of Geosciences and Natural Resources (BGR) several sampling campaigns to southern and central pegmatites took place
The field trips were preceded by literature and data research regarding infor-mation on lithium occurrences andor previous lithium mining activity to iden-tify specific target areas
During a campaign in 2019 16 lithium-bearing mixed mineral samples were taken from five different locations and subsequently analyzed Two of the samples originate from the Uis Tin Mine Tailings of the former tin mine All remaining samples were taken either from stripped outcrops for future mine activities or from previous mine sites (ie pits)
All 16 samples were analyzed at BGR labs in Hanover Germany through qualitative XRD XRF and ICP-MS Given data shall be understood as a first indicator for the sampled lithium occurrences
Most if not all sampled occurrences have previously been analyzed or are cur-rently being assessed by the property owners or current licensees Detailed information of these sampling and analytical campaigns remain confidential and are thus not available for comparison
Appendix A lists the identified qualitative mineralogy of the samples as well as the major element analysis Additional samples from previous campaigns are also given
Interpretation of the results are based on their applicability in the various lithium-consuming industries for which information is available
Most of the current lithium applications require a chemical intermediate product such as lithium carbonate or lithium-hydroxide The glass and cera-mic industry does use lithium-bearing mineral concentrates depending on the prices of these materials when compared to LiCO3
Lithium Potential in Namibia
47
Since the main applications require an intermediate or downstream chemical product lithium content as well as impurity values are the main criteria for the suitability of the sampled occurrences Other quality criteria are particle size and surface areastructure
9 InterpretationAs previously stated all obtained grab samples are mixtures of lithium- bearing minerals (ie spodumene petalite lepidolite) feldspars quartz micas as well as secondary minerals Therefore all given analytical data has to be taken with caution and will not be representative for the individual outcrops or deposits
The evaluation of the economic suitability for various economic applications of the analysed lithium samples is based on the chemical specifications in Chapter 4
Lithium content gt 1 Li2O Fe2O3 content lt 015 as well as F content lt 01 are individually highlighted (Appendix A) as these three values are the most important
Based on the chemical analysis nine of the 16 samples showed Li2O contents of more than 1 (range 117 ‒ 327 ) Seven of those nine samples also exhibited low Fe2O3 content (range 004 ‒ 008 ) (Appendix A) Three of those seven samples also had fluorine values below 005
Of the ten additionally included samples from previous campaigns four showed Li2O contents of more than 1 (range 126 ‒ 199 ) Three of those samples also exhibited low Fe2O3 content (range 004 ‒ 007 ) (Appendix A) One of the three samples had fluorine values below 005
The mentioned samples (sources) could be of potential use but for further interpretation statistical sampling will be required
Lithium Potential in Namibia
48
10 ConclusionsThere is currently no lithium industry established in Namibia This accounts to both mining and processing of ores into commercial lithium-bearing con-centrates as well as the production of downstream products such as lithium carbonate andor lithium hydroxide In order to evaluate the potential for a lithium industry in Namibia the current global market and price developments need to be addressed
Currently the main application for lithium is in the chemical industry as lithium carbonate andor hydroxide for the manufacturing of lithium-ion batteries There is currently no domestic market (supply) or demand for this industry in Southern Africa or Namibia in specific Processing of lithium-bearing ores into these highly specific downstream products is economically more viable in close proximity to the demanding industries It also requires large investments (double-digit million dollars per 10000t of capacity) Additionally there is already huge capacity and strong capacity build up in Asia at rather low cost
The second most important application lies in the glass and ceramics industry This industry uses lithium either as lithium-bearing concentrates or lithium carbonate depending on current market price and processproduct require-ments There is currently no such industry established in Namibia but potential plans There is glass and ceramics manufacturing in South Africa and thus a potential market for lithium bearing products (concentrates) should this indus-try require it depending on product
The 20182019 primary lithium supply based on spodumene-bearing mineral concentrates was dominated by Australia with a market share of well over 95 On an annual basis the country exports more than three million tons of lithium-bearing concentrates to China To put this into perspective Lepidico plans to export just 58 ktpa of concentrate to Abu Dhabi for refinement from their project annually Therefore potential production in Namibia will always be rather small scale when compared to peer producing countriescompanies
As of late 2020 the concentrate market is in strong oversupply with strong competition Thus prices have eroded quite substantially for a standard SC6 concentrate (Fig 24) In general prices vary significantly based on lithium content and impurities of the concentrates Lithium bearing mineral concen-
Lithium Potential in Namibia
49
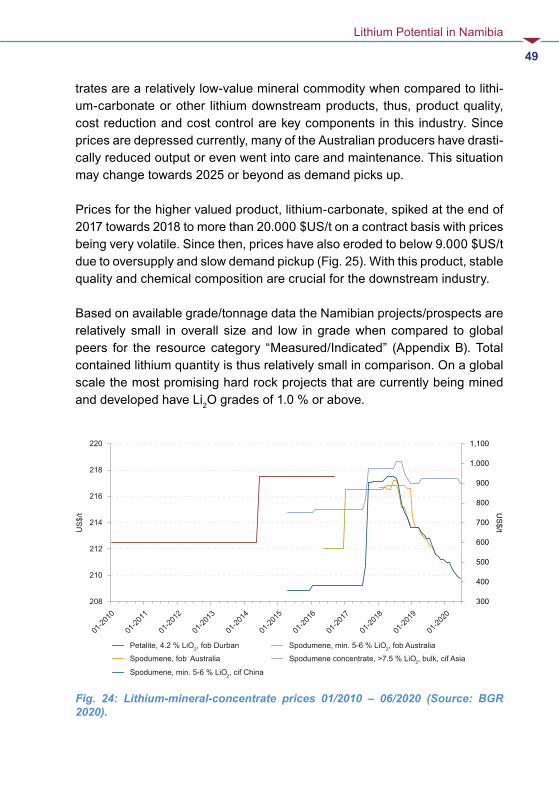
trates are a relatively low-value mineral commodity when compared to lithi-um-carbonate or other lithium downstream products thus product quality cost reduction and cost control are key components in this industry Since prices are depressed currently many of the Australian producers have drasti-cally reduced output or even went into care and maintenance This situation may change towards 2025 or beyond as demand picks up
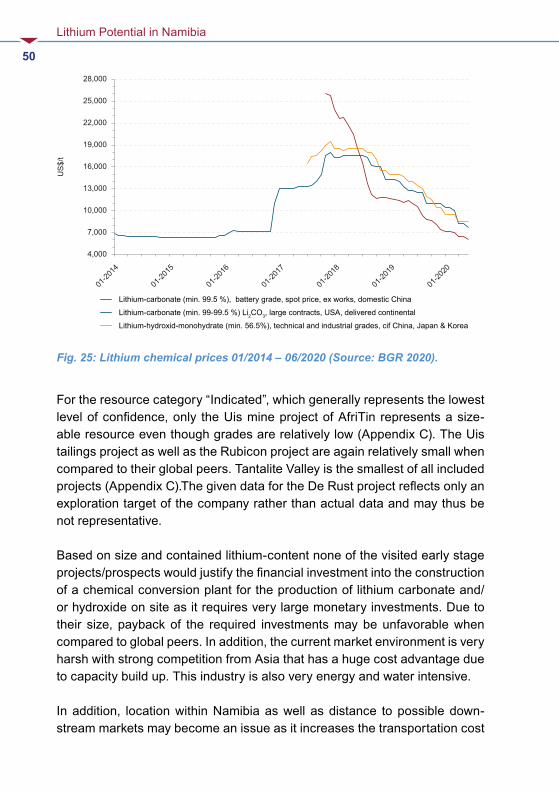
Prices for the higher valued product lithium-carbonate spiked at the end of 2017 towards 2018 to more than 20000 $USt on a contract basis with prices being very volatile Since then prices have also eroded to below 9000 $USt due to oversupply and slow demand pickup (Fig 25) With this product stable quality and chemical composition are crucial for the downstream industry
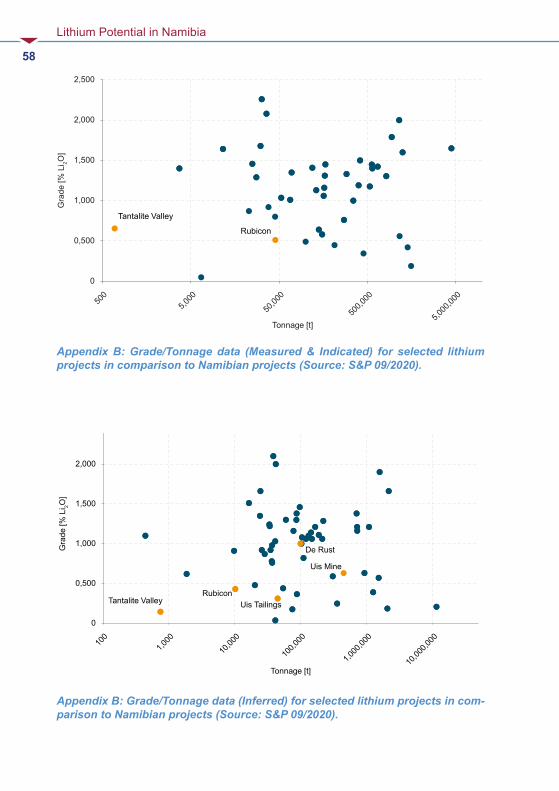
Based on available gradetonnage data the Namibian projectsprospects are relatively small in overall size and low in grade when compared to global peers for the resource category ldquoMeasuredIndicatedrdquo (Appendix B) Total contained lithium quantity is thus relatively small in comparison On a global scale the most promising hard rock projects that are currently being mined and developed have Li2O grades of 10 or above
Fig 24 Lithium-mineral-concentrate prices 012010 ‒ 062020 (Source BGR 2020)
300
400
500
600
700
800
900
1000
1100
208
210
212
214
216
218
220
US$
t US$t
01-20
14
01-20
15
01-20
16
01-20
17
01-20
18
01-20
19
01-20
20
01-20
10
01-20
11
01-20
12
01-20
13
Spodumene min 5-6 LiO2 fob Australia
Spodumene concentrate gt75 LiO2 bulk cif Asia
Petalite 42 LiO2 fob Durban
Spodumene fob Australia
Spodumene min 5-6 LiO2 cif China
Lithium Potential in Namibia
50
For the resource category ldquoIndicatedrdquo which generally represents the lowest level of confidence only the Uis mine project of AfriTin represents a size-able resource even though grades are relatively low (Appendix C) The Uis tailings project as well as the Rubicon project are again relatively small when compared to their global peers Tantalite Valley is the smallest of all included projects (Appendix C)The given data for the De Rust project reflects only an exploration target of the company rather than actual data and may thus be not representative
Based on size and contained lithium-content none of the visited early stage projectsprospects would justify the financial investment into the construction of a chemical conversion plant for the production of lithium carbonate andor hydroxide on site as it requires very large monetary investments Due to their size payback of the required investments may be unfavorable when compared to global peers In addition the current market environment is very harsh with strong competition from Asia that has a huge cost advantage due to capacity build up This industry is also very energy and water intensive
In addition location within Namibia as well as distance to possible down-stream markets may become an issue as it increases the transportation cost
4000
7000
10000
13000
16000
19000
22000
25000
28000
01-20
14
01-20
15
01-20
16
01-20
17
01-20
18
01-20
19
01-20
20
US$
t
Lithium-carbonate (min 995 ) battery grade spot price ex works domestic ChinaLithium-carbonate (min 99-995 ) Li2CO3 large contracts USA delivered continentalLithium-hydroxid-monohydrate (min 565) technical and industrial grades cif China Japan amp Korea
Fig 25 Lithium chemical prices 012014 ndash 062020 (Source BGR 2020)
Lithium Potential in Namibia
51
immensely This is especially true for the SorisDe Rust pegmatite which is in a remote location without any allocated infrastructure The projects Karibib Uis and Tantalite Valley are much easier to access
The approach of Lepidico to produce a lithium bearing concentrate on site seems plausible approach Since this will already require a skilled workforce mining and beneficiation equipment in order to produce a high quality lithium-bearing concentrate it may already be considered ldquoadded valuerdquo for the indus-try of the country This approach may also be suitable for the other mentioned and visited projects
Lithium Potential in Namibia
52
ReferencesAfriTin Mining (2020) Uis Tin Project ndash Company Information ndash URL httpafritinminingcomuis-project [as of 092020]
Australian Government Geoscience Australia (2019) Australiarsquos Identi-fied Mineral Resources 2019 ndash URL httpswwwgagovauscientific-topicsmineralsmineral-resources-and-adviceaimr [as of 092020]
BGR ndash Bundesanstalt fuumlr Geowissenschaften und Rohstoffe (2020) Fachinformationssystem Rohstoffe ndash unpubl Hannover [as of 082020]
BGS ndash British Geological Survey (2016) Lithium Definitions mineralo-gy and deposits ndash URL httpswwwbgsacukdownloadsstartcfmid=3100 [as of 062016]
Diehl B J M (1990) Pegmatites of the Cape Cross Uis ndash Pegmatite Belt Namibia Geology mineralisation Rubidium Strontium characteristics and petrogenesis of rare metal pegmatites Open File Report EG 083 Economic Geology Series Geological Survey of Namibia 39 pp Windhoek
Diehl B J M (1992a) Lithium Caesium Beryllium Open File Report Mineral Resource Series Geological Survey of Namibia 18 pp Windhoek
Diehl B J M (1992b) Niobium and Tantalum Open File Report Mineral Resource Series Geological Survey of Namibia 20 pp Windhoek
Diehl B J M (1992c) Tin Open File Report Mineral Resource Series Geological Survey of Namibia 30 pp Windhoek
Diehl B J M amp Schneider G I C (1990) Geology and mineralisation of the Rubicon Pegmatite Namibia Open File Report Geol Surv Namibia 20 pp Windhoek
Fuchsloch et al (2018) Classification mineralogical and geochemical vari-ations in pegmatites of the Cape Cross-Uis pegmatite belt Namibia Lithos 296 ndash 299 79-95 elsevier
Lithium Potential in Namibia
53
Garret D E (2004) Handbook Of Lithium And Natural Calcium Chloride Their Deposits Processing Uses and Properties ndash 467 S Oxford (Elsevier B V)
Geological Survey of Namibia (2002) Mineral Resources of Namibia Summary of Mineral Deposits and Occurrences Omaruru Sheet 2114 Volume I ndash Complete Descriptions 119 pp Windhoek
IHS Global SA (2020) Global Trade Atlas ndash Commercial Online-Databa-se ndashURL httpsmyihscomConnectcallingUrl=https3a2f2fconnectihsmarkitcom2f [as of 062017]
Kazera Global Investments PLC (2020) Company Information ndash URL httpskazeraglobalcominvestmentsnamibia-tantalite-investment-mine [as of 092020]
Lepidico (2019) LOI with BASF extended to 31 December 2020 ndash News Release ndash URL httpswwwlepidicocomwp-contentuploads201910LPD-191220-LOI-with-BASF-extended-to-31-December-2020pdf [as of 122019]
Lepidico (2019) Corporate Presentation ndash URL httpswwwlepidicocomwp-contentuploads201907LPD-190509-Corporate-Presentati-on-May-2019pdf [as of 052019]
Lepidico (2020) Company Information ndash URL httpswwwlepidicocomprojectskaribib [as of 092020]
Montero Mining amp Exploration Ltd (2018) Exploring Battery Metals in Namibia ndash Company Presentation ndash URL httpswwwproactiveinvestorscomauuploadSponsorFileFile2018_031520244941_MON-CorporatePre-sentationMarch2018pdf [as of 072018]
Montero Mining amp Exploration Ltd (2019) Montero Files NI 43-101 Resource Estimate On The Uis Lithium-Tin Tailings Project In Namibia On Sedar ndash News Announcement ndash URL httpsmonterominingcommontero-files-ni-43-101-resource-estimate-on-the-uis-lithium-tin-tailings-project-in-namibia-on-sedar [as of 032019]
Lithium Potential in Namibia
54
Namibia Mining Cadastre Portal (2020) Online-Database ndashURL httpsportalslandfoliocomnamibia [as of 092020]
Roskill Information Services Ltd (2016) Lithium Global Industry Mar-kets amp Outlook ndash 386 S London Groszligbritannien
Schneider G I C (1992) Feldspar Open File Report MRS 08 Mineral Resource Series Geological Survey of Namibia 2 pp Windhoek
Schmidt M (2017) Rohstoffrisikobewertung ndash Lithium ndash DERA Rohstoffin-formationen 33 Berlin
S amp P Global Market Intelligence (2020) Lithium - Metals amp Mining Properties URL httpsplatformmarketintelligencespglobalcomwebcli-entauth=inheritindustryminingProjects [as of 092020]
Statista (2020) Distribution of lithium end-usage worldwide in 2019 by area application ndash URL httpswwwstatistacomstatistics268787lithium-usa-ge-in-the-world-market [as of 062020]
Tawana Resources NL (2016) Tawana acquires second lithium pro-ject ndash News Release ndash URL httpsmstrademomentumcozajsepdfSENS_20160923_S376505pdf [as of 092016]
USGS ndash United States Geological Survey (multiple years) Lithium ndash Minerals Commodity Summaries ndash URL httpswwwusgsgovcentersnmiclithium-statistics-and-information [as of 082020]
Appendix
Sam
ple I
DFa
rmLa
titud
eLo
ngitu
deSa
mpl
e des
crip
tion
(XRD
qu
al)
LiO 2
()
SiO 2
Ti
O 2
Al2O 3
Fe2O 3
Mn
O Mg
O Ca
O Na
2O
K 2O P 2O 5
SO
3
Cl
F
LOI
Su
m
2015
-03
previous sample campaignsHelik
on
n A
Felds
parQ
uartz
Lepid
olite
025
6871
lt000
119
0500
200
2900
505
3292
806
7905
59lt0
01lt0
002
lt005
093
9985
2016
-12
Rubic
onwe
ather
ed P
etalite
126
6473
lt000
118
0600
703
2718
607
9507
805
2500
62lt0
01lt0
002
lt005
1146
9871
2016
-17
Rubic
onLe
pidoli
te +
Quar
tz13
063
6700
219
9316
0929
003
0054
029
6218
0052
lt001
lt000
226
232
798
67
2016
-20
Helik
onLe
pidoli
te + A
lbite
176
5514
lt000
126
8700
401
2100
700
2123
970
3900
45lt0
01lt0
002
156
369
9698
2016
-21
Helik
onLe
pidoli
te19
954
32lt0
001
2627
004
0224
006
0038
266
714
0069
lt001
lt000
240
628
997
77
FN20
19_0
4De
Rus
tFe
ldspa
rAmb
lygon
iteP
etalite
(n
on X
RD)
003
6513
lt000
118
82lt0
0100
0200
101
0924
311
4105
75lt0
0100
04lt0
0503
898
84
2015
-09
Molop
oPe
talite
(non
XRD
)00
952
85lt0
001
1672
lt001
0002
487
0323
342
0352
lt000
100
400
3403
621
1310
012
2016
-14
Molop
oPe
talite
wea
there
d (no
n XRD
)00
752
1600
0316
5100
200
5147
805
8923
406
4500
6900
200
8602
222
6310
013
2016
-15
Molop
oFe
ldspa
r (no
n XRD
)00
664
02lt0
001
1937
003
0004
003
0151
216
1249
0796
lt001
lt000
2lt0
0505
399
55
2016
-23
Molop
oZin
nwald
ite (n
on X
RD)
006
5044
0068
3307
048
0011
012
0426
261
7674
0181
lt001
lt000
2lt0
0542
9925
1909
249
2019Uis
Tailin
gs
Quar
tzFe
ldspa
rPeta
lite
Musc
ovite
028
7293
0045
1479
051
0062
0212
9830
927
6613
6200
2lt00
02lt0
0523
399
38
1909
250
Uis
Tailin
gsQu
artz
Felds
parP
etalite
Mu
scov
ite02
872
6900
4314
8205
0059
019
1306
313
2794
1347
002lt
0002
lt005
251
9937
1909
251
Helik
on 4
22deg02prime4
8primeprimeS1
6deg01prime30
primeprimeEQu
artz
Felds
parP
etalite
Le
pidoli
te16
464
4400
0319
4200
301
2100
408
8325
345
6806
800
400
0727
228
998
38
1909
252
Helik
on 1
22deg02prime2
0primeprimeS1
6deg01prime19
primeprimeEPe
talite
Lepid
olite
Quar
tz29
576
9200
0116
6800
300
0304
101
7301
106
8100
01lt0
01lt0
002
lt005
205
97
App
endi
x A
Ana
lytic
al d
ata
of li
thiu
m s
ampl
es c
olle
cted
in N
amib
ia T
hres
hold
val
ues
high
light
ed in
gre
en
Lithium Potential in Namibia
57
Sam
ple I
DFa
rmLa
titud
eLo
ngitu
deSa
mpl
e des
crip
tion
(XRD
qu
al)
LiO 2
()
SiO 2
Ti
O 2
Al2O 3
Fe2O 3
Mn
O Mg
O Ca
O Na
2O
K 2O P 2O 5
SO
3
Cl
F
LOI
Su
m
1909
253
2019Rubic
on22deg06prime1
3primeprimeS1
5deg59prime45
primeprimeEPe
talite
Lepid
olite
Quar
tz32
778
73lt0
001
1687
002
0006
002
0157
011
003
0002
003
0003
lt005
075
9663
1909
254
Rubic
on22deg06prime1
0primeprimeS1
5deg59prime41
primeprimeEFe
ldspa
rQua
rtzM
usco
vite
004
682
lt000
119
3500
300
2400
205
0610
0808
6804
3lt0
01lt0
002
lt005
041
9985
1909
255
Rubic
on22deg06prime1
0primeprimeS1
5deg59prime41
primeprimeEFe
ldspa
rLep
idolite
Mus
co-
viteK
aolin
026
6104
0004
2318
022
0136
006
0119
367
8411
0159
lt001
lt000
2lt0
0522
299
15
1909
256
Rubic
on22deg06prime1
0primeprimeS1
5deg59prime41
primeprimeELe
pidoli
te 27
249
8700
129
3400
408
0500
400
704
697
3100
31lt0
01lt0
002
087
441
9569
1909
257
Rubic
on22deg06prime1
3primeprimeS1
5deg59prime45
primeprimeEPe
talite
Lepid
olite
Quar
tz30
670
0900
0320
2600
801
0901
502
9901
926
800
15lt0
0100
04lt0
0526
596
48
1909
258
Rubic
on22deg06prime1
0primeprimeS1
5deg59prime41
primeprimeELe
pidoli
teFe
ldspa
rQua
rtz20
659
7800
0224
100
505
2400
300
513
7247
0051
lt001
0002
265
388
9966
1909
259
Tanta
lite
Valle
y28deg43prime0
9primeprimeS1
8deg43prime55
primeprimeEFe
ldspa
rLep
idolite
Mus
covit
e11
762
64lt0
001
2139
004
0161
lt001
0399
7731
2401
0900
200
119
912
698
85
1909
260
Tanta
lite
Valle
y28deg43prime0
9primeprimeS1
8deg43prime55
primeprimeEFe
ldspa
rLep
idolite
Mus
covit
e03
059
8600
1425
1301
604
2200
302
2860
547
2201
3900
200
0904
123
799
56
1909
261
Tanta
lite
Valle
y28deg43prime0
9primeprimeS1
8deg43prime55
primeprimeEFe
ldspa
rQua
rtzM
usco
vite
003
636
0005
2218
022
0122
002
0381
727
3809
0272
lt001
lt000
2lt0
0513
199
17
1909
262
Tanta
lite
Valle
y28deg43prime2
0primeprimeS1
8deg44prime23
primeprimeEQu
artzSp
odum
eneM
us-
covit
e13
180
5100
0415
8903
401
2401
301
9502
604
0400
0500
200
03lt0
0507
398
56
1909
263
De R
ust
20deg57prime4
8primeprimeS1
4deg30prime13
primeprimeEFelsd
parS
podume
neQuartz
074
7313
0006
2048
007
015
005
0154
398
0831
0073
001
0003
lt005
082
9974
1909
264
De R
ust
20deg57prime4
8primeprimeS1
4deg30prime13
primeprimeESp
odum
eneF
eldsparQuartz
230
6924
0006
2602
801
0200
301
0510
102
1400
68lt0
0100
03lt0
0504
897
53
(Con
tinue
d) A
ppen
dix
A A
naly
tical
dat
a of
lith
ium
sam
ples
col
lect
ed in
Nam
ibia
Thr
esho
ld v
alue
s hi
ghlig
hted
in g
reen
Lithium Potential in Namibia
58
Appendix B GradeTonnage data (Measured amp Indicated) for selected lithium projects in comparison to Namibian projects (Source SampP 092020)
0
0500
1000
1500
2000
2500
500
5000
5000
0
5000
00
5000
000
Gra
de [
Li 2O
]
Tonnage [t]
Tantalite Valley
Rubicon
Appendix B GradeTonnage data (Inferred) for selected lithium projects in com-parison to Namibian projects (Source SampP 092020)
0
0500
1000
1500
2000
2500
100
1000
1000
0
1000
00
1000
000
1000
0000
Gra
de [
Li 2O
]
Tonnage [t]
Tantalite ValleyRubicon
Uis Tailings
Uis Mine
De Rust
A product of the technical cooperation project between Bundesanstalt fuumlr Geowissenschaften und Rohstoffe (BGR)(Federal Institute for Geosciences and Natural Resources)
andGeological Survey of Namibia within the Ministry of Mines and Energy
ISBN 978-3-948532-29-1 (Print) 978-3-948532-30-7 (PDF)
- List of Abbreviations
- 1 Introduction
- 2 What is lithium
-
- 21 Lithium deposits
-
- 3 Application
- 4 Chemical requirements
- 5 Mining and trade of lithium in the SADC
-
- 51 Lithium production
- 52 Trade data
- 53 Export
- 54Import
-
- 6 Lithium occurrences in Namibia
- 7 Lithium mining in Namibia
-
- 71 Current mining activities and projects
-
- 8 Analysed lithium samples
- 9 Interpretation
- 10 Conclusions
- References
-

Imprint
Editor Bundesanstalt fuumlr Geowissenschaften und Rohstoffe (Federal Institute for Geosciences and Natural Resources)Stilleweg 2 30655 Hannover Deutschland
Author Michael Schmidt
Contribution Frans Amupolo Eliaser Iiyambo Yolanda Kavetuna Aphary Muyongo Lilian Ntema Elkan Utoni
Contact Michael Schmidt Deutsche Rohstoffagentur (DERA)
in der Bundesanstalt fuumlr Geowissenschaften und Rohstoffe (BGR) Dienstbereich Berlin Wilhelmstraszlige 25-30 13593 Berlin-Spandau michaelschmidtbgrde
Aphary Muyongo Geological Survey of Namibia Ministry of Mines and Energy 6 Aviation Road Private Bag 13297 Windhoek Namibia ApharyMuyongommegovna
Date December 2020
ISBN 978-3-948532-29-1 (Print) 978-3-948532-30-7 (PDF)
Cover photo copy BGR-GSN-Project Weathered spodumene outcrop at the De Rust pegmatite
Copyright copy BGR-GSN-Project
Lithium Potential in Namibia ndash Evaluation of Economic Suitability
Lithium Potential in Namibia
5
Table of Contents
List of Abbreviations 6
1 Introduction 7
2 What is lithium 821 Lithium deposits 8
3 Application 12
4 Chemical requirements 15
5 Mining and trade of lithium in the SADC 2051 Lithium production 2052 Trade data 2153 Export 2254 Import 23
6 Lithium occurrences in Namibia 24
7 Lithium mining in Namibia 2671 Current mining activities and projects 27
8 Analysed lithium samples 46
9 Interpretation 47
10 Conclusions 48
References 52
Lithium Potential in Namibia
6
List of AbbreviationsBGR Bundesanstalt fuumlr Geowissenschaften und Rohstoffe
(Federal Institute for Geosciences and Natural Resources)
BGS British Geological Survey
BMZ Bundesministerium fuumlr wirtschaftli-che Zusammenarbeit und Entwicklung (Federal Ministry of Economic Cooperation and Development)
EGD Economic Geology Division
GSN Geological Survey of Namibia
RTS Reverse trade statistics
SADC Southern African Development Community
USGS United States Geological Survey
Lithium Potential in Namibia
7
1 IntroductionIn 2019 mining contributed 93 to the Namibian gross domestic product and more than 50 to its export revenues The mining industry also has a significant impact on Namibian society through its potential to enhance local value addition and job creation However as in other sectors of the Namibian industry the mining sector faces a number of challenges and there remain untapped opportunities to bolster the Namibian economy notably concerning non-metallic commodities other than diamonds
In order to push its growth potential the Namibian Government launched the ldquoGrowth at Homerdquo strategy for industrialisation in 2015 ldquoGrowth at Homerdquo focusses on domestic value addition and mineral beneficiation figures pro-minently within this strategy It is against this background that the Federal Institute for Geosciences and Natural Resources (BGR) on behalf of the Federal Ministry of Economic Cooperation and Development (BMZ) of Ger-many cooperates with the Geological Survey of Namibia (GSN)
In 2017 BGR and GSN jointly implemented a project entitled ldquoSustainable Use of Namibiarsquos Mineral Potentialrdquo that contributes to the ldquoGrowth at Homerdquo stra-tegy by focussing on non-metallic commodities The objective of this ongoing project is to support the Economic Geology Division (EGD) staff in taking custody and exploring potentials of local value addition of Namibiarsquos non-me-tallic minerals These include industrial minerals with lithium being one facet among this wide spectrum of commodities
The GSN-BGR-Project investigated various pegmatites in central and southern Namibia regarding their mineral potential during several field cam-paigns During a field campaign in 2019 lithium grab samples were taken from selected pegmatite occurrences for subsequent chemical analysis and inter-pretation regarding their suitability for different economic application There is considerable economic potential for lithium as a precursor material in various applications
This study aims to illustrate the potential of lithium occurrences in Namibia and thus promote local value addition It shall be of value to the Namibian government to potential investors to mining and exploration companies as well as to the general public
Lithium Potential in Namibia
8
2 What is lithiumLithium (from Greek Lithos) is a chemical element (ie alkali metal) with the atomic number three located in the second period and in the first main group of the periodic table of elements Estimates for the Earthlsquos crustal content are around 6 middot 10-3 by weight
In elemental form lithium is a soft silvery-white alkali metal Under standard conditions it is the lightest of all solid elements Among the alkali metals lithium has the highest specific heat capacity in addition to the highest melting and boiling point (Table 1) In elemental state it has the strongest enthalpy of hydration of all alkali metals and thus attracts water very strongly Like all alkali metals lithium is very reactive and reacts with many elements Due to its reactivity elemental lithium is stored in paraffin oil or petroleum Upon contact with oxygen lithium reacts violently to lithium oxide
Scientific publications company reports and presentations usually provide lithium content as LCE (Lithium Carbonate Equivalent) units or Li2O content 1000 t of lithium metal equate to 5323 t LiCO3 (LCE) or 2153 t Li2O
21 Lithium deposits
The economically most important sources of lithium are hardrock deposits and brine deposits With the current market situation pegmatite deposits account for more than 55 of global lithium supply in 2019
Besides those two-deposit types lithium is also found in oilfield brines geo-thermal brines clays (ie hectorite) and lithium-containing minerals such as jadarite (ie type locality Serbia) or zinnwaldite (type locality Germany) There are about 200 minerals that contain lithium in concentrations gt 0002 Li2O About 25 of them contain lithium in concentrations gt 2 Li2O (Garrett 2004) However only a few of them are economically viable (Table 1)
Hard rock deposits Due to its chemical properties lithium is considered an incompatible element and remains for a very long time in the fluidic phases of a magma Therefore primary lithium hard rock occurrences are located primarily in pegmatites as late stage magmatic events
Lithium Potential in Namibia
9
Pegmatites or aplites are very coarse or finer grained felsic dikes respec-tively They intrude into the country rock as highly differentiated magma crys-tallizing either very slowly (pegmatites) or relatively fast (aplites) Pegmatites are usually of limited three-dimensional extent ranging from a few meters to several hundred meters or even kilometers in length and depth Besides quartz feldspar and mica lithium bearing pegmatites may also carry other valuable minerals that contain rare elements such as tantalum niobium tin tungsten cesium rubidium boron fluorine and others Those potential by-products may be of economic importance to some projects and mines The most important minerals in these deposits are spodumene petalite and lepidolite
Table 1 Important lithium bearing minerals (Source BGS 2016 Roskill 2016a Garret 2004)
Mineral Formula Li-Content ()
Oslash Li-Content Ores ()
Spodumene LiAlSi2O6 19 ndash 37 135 ndash 36
Petalite LiAlSi4O10 16 ndash 227 14 ndash 22
Lepidolite K(LiAl)3(SiAl)4O10(FOH)2 139 ndash 36 14 ndash 19
Amblygonite (LiNa)AlPO4(FOH) 34 ndash 47 n A
Eucryptite LiAlSiO4 21 ndash 553 21 ndash 44
Bikitaite LiAlSi2O6 bull H2O 34 n A
Hektorite Na03(MgLi)3Si4O10(OH)2 024 ndash 054 n A
Salitolite (LiNa)Al3(AlSi3O10)(OH5) 077 n A
Swinefordite Li(AlLiMg)4((SiAl)4O10)2 (OHF)4 bull nH2O
174 n A
Zinnwaldite K(LiFe2+Al)3[(FOH)2|AlSi3Ol0] 092 ndash 185 n A
Polylithionite KLi2AlSi4O10(FOH)2 n A n A
Jadarite LiNaSiB3O7(OH) 73 n A
Important pegmatite occurrences are found in Western Australia Canada and Sub-Sahara Africa (ie in Zimbabwe Democratic Republic of Congo and Mozambique) There are also pegmatite occurrences in Namibia that are lithium-bearing
Other mineral occurrences Lithium-containing clays form during the weathering of lithium-containing volcanic intrusive rocks Further enrichment can take place by hydrothermal processes The most important of these clay minerals hectorite belongs to the group of smectites (Table 1) Hectorite con-tains between 024 and 054 lithium Important occurrences are found in the USA (Roskill 2016)
Lithium may also occur in zinnwaldite which is the name for the mixed series siderophyllite ndash polylithionite (end members) They belong to the phlogopite
group Zinnwaldite has a relatively low lithium content of about 092 to 185 but relatively high levels of iron (approx 11 FeO) as well as fluorine (approx 6 F) which limits the suitability for certain applications In addition to the sources mentioned above lithium also occurs in a mineral named jadarite (Table 1) It is a sodium-lithium-boron-silicate hydroxide which can contain as much as 73 lithium
Fig 1 De Rust pegmatite swarm (Brandberg West ndash Goantagab tin belt) (Photo BGR-GSN-Project 2019)
Lithium Potential in Namibia
12
3 ApplicationMany products contain lithium due to its very specific properties By far the most important use of lithium is in the field of rechargeable batteries
In 2019 this area accounted already for 65 of total demand compa-red to 37 in 2015 (Fig 2) Lithium is an essential component in modern lithium-ion-batteries since it has the highest electrochemical potential of all metals and the highest specific capacity Compared to other battery types lithium-ion battery technology has currently the highest energy density the longest cycle life the widest temperature range tolerance and the lowest self-discharge rates (Bauer 2017)
Classical 3C applications such as laptops tablets smartphones and smart watches use lithium-ion-batteries (Fig 3) E-mobility as well as off-grid energy storage (ESS) for renewable energies are the major applications of such bat-teries with the highest projected annual growth rates Power tools play a minor role However products such as e-bikes e-trikes and especially e-scooters are gaining momentum
374
650
305
180
0
10
20
30
40
50
60
70
80
90
100
2015 2020
[]
Rechargeable Batteries Ceramics Greases Polymers
Metallurgical Powders Air Treatment Other
Fig 2 Lithium demand 2015 (left) vs lithium demand 2019 (right) (Source Roskill 2016 Statista 2020)
Lithium Potential in Namibia
13
The second important application of lithium is in the field of glass and cera-mics Cumulatively this area accounts for 18 of demand in 2019 (Fig 2) In the ceramic industry for the production of glazes and ceramic products (tiles sanitary items dishes etc) pure chemical grade lithium carbonate spodumene-concentrate or petalitelepidolite-concentrate is used as lithium source Positive effects of lithium are increase in gloss increase in luminosity increase of chemical and abrasion resistance and reduction of glaze viscosity In ceramic bodies the use of lithium lowers the firing temperature shortens the firing time and thus reduces overall CO2 emissions In addition the use of lithium has a positive effect on the expansion behavior and the mechanical resistance of products
In lubricants lithium is used as lithium-stearate or lithium-12-hydroxy-stea-rate primarily produced from lithium carbonate or lithium hydroxide and stea-rin-acid Di-Lithium-Azelate Lithium-Docosanoate and Lithium-Stearate are also used in lubricants (Roskill 2016) Overall lithium content is usually below 04
In the steel casting industry fluxes are used to optimize the casting pro-cess or to minimize the risk of faulty goods Lithium is used in the form of spodumene or petalite which reduces the viscosity of the melt As a result the flow rate and thus the productivity can be increased The flux also acts as a tempera ture barrier between the mold and the molten steel In addition the surface of the continuous cast body is protected from oxidation and impurities such as Al2O3 are removed (Roskill 2016) In traditional casting lithium oxide prevents the formation of defects in the finished casting Typically these fluxes contain up to 5 Li2O Lithium is added to the flux as either lithium oxide or lithium carbonate The addition of spodumene or petalite is also possible
In polymers Butyllithium (n-butyllithium = n-BuLi) is used as reagent or cata-lyst for the production of natural rubber compounds Depending on the rubber compound different amounts of n-BuLi are required (3 ndash 14 kg per ton rubber compound)
Different air treatment applications also use lithium Lithium bromide solu-tions are used in combination with water in bdquowater-lithium-bromide absorption chillersldquo (AKM) (Roskill 2016) Absorption based air de-humidifiers use lithium chloride (LiCl) This compound has the ability to absorb ten times its
Lithium Potential in Namibia
14
own weight in water Lithium is also used in air purification By means of lithium hydroxide CO2 can be removed from the air
Primary batteries also use lithium due to its electrochemical properties The-se cells are used in watches calculators pacemakers etc They are charac-terized by small size high energy density low weight long storage capacity low self-discharge and high cell voltage
Fig 3b Ceramic stove top (Source SCHOTT AG 2017)
Fig 3a Pouch-Lithium-Ion Cell (Source BGR)
Lithium Potential in Namibia
15
4 Chemical requirementsLithium is not a typically mined metal and the quality requirements are very specific and stringent depending on the field of application and thus vary from end-user to end-user
The first products that enter the value chains are usually the intermediates lithium carbonate andor lithium hydroxide produced from either brine sources or hard rock deposits ie currently mostly pegmatite sources (Fig 4)
Lithium from pegmatite sources is primarily sold as concentrates of either spodumene petalite or lepidolite with minor quantities of amblygonite in the market Each industry has unique requirements in terms of desired chemical composition particle size and tolerable values of impurities Concentrates are usually graded and priced according to their Li2O content impurity levels and aimed mainly at the growing battery industry as well as glassceramics industry
Concentrates for the battery industry are rated ldquochemical graderdquo and concen-trates for the glass industry are rated ldquotechnical graderdquo In general the glass industry has tighter limits on certain impurities as the battery industry due to the direct usage of the concentrates in the respective product flow sheets
The current industry standard for lithium concentrates in the battery indus-try is called SC-6 a chemical grade spodumene-concentrate that contains approx 6 Li2O Higher values of lithium are uncommon as concentrating them beyond 6 Li2O increases the cost of production exponentially
Petalite lepidolite zinnwaldite amblygonite and other lithium bearing miner-als are not used in this industry yet However there are processes in develop-ment for the extraction of lithium from these sources
Some companies especially in Australia sell spodumene-concentrates with lower Li2O contents (22 ndash 5 ) at lower prices per ton A special case are so-called DSO-concentrates (ldquodirect shipping orerdquo) with Li2O contents of only 12 ndash 14 DSO shippingrsquos out of Australia decreased significantly as the monetary value is quite low with lt 150 US$t and higher qualities are available
Lithium Potential in Namibia
16
Mica (muscovite) is an unwanted impurity in these concentrates as it disturbs the converting steps Heavy minerals are usually also extracted from the sources as they may represent by-product value (eg tantalum) Wall-rock impurities may cause problems in the further processing steps (basalt etc) Fe2O3 content is also an issue as it may also pose problems in the converters (clogging)
Technical grade lithium concentrates for the glass industry may have the same values of lithium in terms of Li2O but more stringent requirements in terms of iron content and some other elements such as fluorine
This industry usually uses petalite concentrates which can be used directly in the production process The advantage of petalite over spodumene-con-centrates is the generally lower iron content which is a crucial impurity even though these concentrates have lower lithium contents Fe2O3 content above a certain threshold (gt 015 ) will lead to unwanted discoloration in the final glass or ceramic products thus low values are needed
Fluorine-bearing lithium concentrates of lepidolite amblygonite and zinnwal-dite are not used in the glass and ceramics industry as this impurity is highly unwanted Besides fluorine the high Fe2O3 content of zinnwaldite is an issue as mentioned above
Particle size of the concentrates is also an issue as very fine material may lower the melt temperature due to a higher specific surface Therefore concen-trates for this industry are either tailor-made or mixtures of different sources
The glass and ceramics industry also uses pure lithium carbonate to a certain extent based on pricing
Lithium carbonate and lithium hydroxide are the first semi-finished products apart from lithium-concentrates used in the various industries for direct use or further downstream precursors There is a distinction between battery grade and technical (other) grade for lithium-carbonate and lithium-hydroxide The main differences lie within the lithium content level of impurities and particle sizes
Lithium Potential in Namibia
17
Commercial extraction of lithium takes place from lithium-containing brines and from hard rock (ie pegmatitic) deposits A simplified schematic repre-sentation of conventional production steps and key intermediates is shown in Figure 4
For the extraction of lithium from hard rock deposits the raw ores (eg pegma-tites) mined in open-pit or underground mines are processed into lithium-con-taining concentrates by sorting crushing grinding gravity separation mag-netic separation flotation washing filtering and drying The exact production steps vary depending on occurrence (ie locality) mineralogy company and the intended use of the produced concentrates
As of 2020 more than 95 of the conversion from spodumene-concentrates into lithium carbonate andor lithium hydroxide takes place in China The most widely used process in the industry is the acid-roast process (Fig 5)
In this process spodumene-concentrate is ground and heated to 1075 ‒ 1150degC in a rotary kiln (Fig 5) This converts α-spodumene into β-spodumene which is soluble in hot acids After mixing with hot sulfuric acid lithium sulfate solution is mixed with water As a result lithium sulfate dissolves The solution is mixed with calcium carbonate to remove impurities such as iron manganese and aluminum In addition the pH is raised After a first filtering process Na2CO3 and CaO are added to obtain an alkaline soluti-
Lithium Hydroxide
LithiumperoxidLithium Peroxide
Lithium-BrineLithium-Minerals
Lithium ChlorideLithium Bromide Lithium Sulfate
Lithium Acetate Lithium Metal
Lithium Carbonate
Fig 4 Simplified production scheme of lithium and important lithium com-pounds (modified after Roskill 2016)
Lithium Potential in Namibia
18
on Impurities such as calcium and manganese are removed The solution is then neutralized with sulfuric acid and heated to increase the concentration of Li2SO4 to about 200 ‒ 250 gl The addition of Na2CO3 and heating the solution to about 100degC triggers the precipitation of lithium carbonate The carbon-ate produced in this way has purities of up to 993 The battery industry however requires purities of min 995 obtained through ion exchange and extraction of impurities The produced lithium carbonate can then also be used for the production of lithium hydroxide
Common understanding was that the production of lithium carbonate was much cheaper from brines compared to hard rock sources Due to many developments in the brine industry mostly related to a recently introduced royalty system in Chile this is no longer the case On the contrary the cost advantage of brines is lost
Fig 5 Simplified production scheme of lithium carbonate derived from spodu-mene-concentrates via acid-roast-process (modified after Garret 2004)
Solution
MillingCooling
Thickener
Filtration
1075 - 1150oCCalcinationSpodumene Concentrate
Mixing
H2SO4
Leaching
H2O amp CaCO3
Gasscrubber
Solids to Tailings
Mixing
Na2CO3 amp CaO
Thickener
Filtration
Solids to Tailings
Neutralisation
H2SO4
Evaporation
90 - 100oCHeating
Filtering WashingDrying
Na2SO4Lithium carbonate
Lithium Potential in Namibia
19
The production of lithium hydroxide which is a fast growing market and a higher priced intermediate product appears to become cheaper when sourced directly from high quality hard rock conversion relative to sourcing from brines via an intermediate step (lithium carbonate) As the cost advantage of brine deposits compared to hard rock deposits is fading the industry has shifted its focus towards hard rock deposits all over the world
In addition to the acid-roast process there are new technological approaches to recover lithium carbonate and lithium hydroxide directly from high quality spodumene-concentrates as well as other mineralogies
Lithium Potential in Namibia
20
5 Mining and trade of lithium in the SADC
51 Lithium production
Each year every mining country of the world is urged to share production statistics regarding their mining activity These statistics are compiled and published by different entities such as the British Geological Survey (BGS) and the United States Geological Survey (USGS) among others
If a country does not appear in these statistics there was either no mining activity for this specific commodity the country did not publish any statistics or the production data is unknown
Table 2 Mine production of lithium (Source BGR 2020 Roskill 2016 USGS 2020 Geoscience Australia 2020)
Mine production [t Li-Content]
Years 2014 2015 2016 2017 2018 2019e Share 2018 []
Australia1) 12333 13160 15590 21000 57000 42000 647
Chile2) 11640 11787 14526 16584 15886 18000 175
Argentina2) 3388 3515 5767 575 6241 6400 69
China3) 1895 2002 2293 3 7376 7500 81
Zimbabwe1) 1024 1025 974 994 700 1600 08
USA2) 846 846 900 900 567 n A 06
Portugal1) 470 470 299 763 700 1200 08
Brazil1) 186 186 195 154 153 300 02
Namibia1) n d nd n d n d 500 n d 05
Other 3) 19 19 18 18 18 500 lt01
Global4) 31801 33011 40562 49012 90941 77000 1001) Hardrock 2) Brine 3) HardrockBrine 4) Deviation due to rounding e estimated
Lithium Potential in Namibia
21
In 2018 global mine output of lithium was around 91000 t Li-content of which only 1200 t originated from the Southern African Development Community (SADC) namely Zimbabwe and Namibia
52 Trade data
Trade data is retrieved from the commercially available Global Trade Atlasreg (IHS Global SA) The database provides both import and export data for more than 90 countries based on customs data of individual countries Data is primarily classified through Harmonised System (HS) product codes by the WCO (World Customs Organization) The HS nomenclature consists of approximately 5000 product groups identified by a 6-digit code
There are limitations to trade data The most prominent issue arises with data availability since many countries do not publish trade data Especially export data is an issue among many countries
There may also be issues with mislabeled products (wrong HS) product bas-kets data entry errors or missing data in general Were export data is not available so-called reverse trade data (RTS) is an option
If a country does not state any exports cumulative global imports from that particular country may be used as a rough yet incomplete estimate of exports It should be noted that these statistics do not represent absolute but rather minimum values as trade between two non-reporting countries will not be reflected The majority of the SADC countries do not report their import and export statistics
The most important lithium products that are globally traded in significant amounts are lithium-carbonate lithium-oxide (hydroxide) lithium-chloride and lithium-mineral-concentrates
Lithium Potential in Namibia
22
53 Export
The most important intermediate product in the lithium market is lithium carbonate In 2019 global exports amounted to approx 117743 t with Chile being the largest exporter (82344 t 70 ) There are no listed exports from the SADC region except minor quantities from South Africa to the Democratic Republic of Congo (9 t) and Zambia (2 t)
Lithium oxides and lithium hydroxides are grouped together under one HS code hence an individual consideration of both products on a country basis is not possible due to the lack of country-specific commodity codes
In 2019 global exports of HS 282520 stood at approx 97550 t with China being the largest exporting country (49800 t 51 )There are no exports published for the SADC region except South Africa with small quantities (28 t) which are considered to be trade through only
Assessment of lithium chloride global trade flows is also difficult as this prod-uct is listed together with many other chemical products under HS 282739 Global trade can only be investigated using country-specific commodity codes (8-digits and above) if available Only three countries list this product under specific trade codes namely China (28273910) Chile (28273930) and Argentina (28273960) SADC countries including Namibia do not publish any data under HS 282739 Based on the available data global exports in 2019 stood at 2254 t with Chile being the largest exporter (2101 t 89 )
Lithium-containing mineral concentrates are among other non-lithium related products listed in a product basket under HS 253090 Only two coun-tries provide information on this product namely Australia as the largest and hence most important producing and exporting country by far and Brazil as a minor exporter (25309010)
No other country including member states of the SADC specifies lithium-con-taining concentrates as such The currently only producing and exporting country in the SADC is Zimbabwe which does not specify exports at all Thus exports are derived from RTS (global imports)
Lithium Potential in Namibia
23
A general problem with HS 253090 is that only information on quantity is avail-able but no information on lithium content which can vary between 12 and 6 Li2O thus the margin of possible errors in terms of total contained lithium is large
In 2019 Australia exported about 16 million tons of spodumene-concentrate down from 35 million tons in 2018 More than 95 destined to China
Inferred exports (RTS) of Zimbabwe were approx 93300 t for HS 253090 About 62000 t of that quantity are listed as imports by South Africa and are unrelated to lithium The remaining quantity is much more in line with production figures of Zimbabwe as well as the known downstream industries of the destination coun-tries within Europe
There are no export records published by Namibia In general and across all traded lithium products South Africa appears to act as an importexport hub within the SADC Also some of the traded products may be used in the glass and ceramic industry of South Africa
54 Import
For most of the SADC countries the statistics retrieved though the Global Trade Atlas do not necessarily represent reliable trade data due to above-mentioned reasons This is especially true when only small import numbers (usually in tons) are listed as these are supposedly artefacts or errors in declaration
Global imports of lithium-carbonate amounted to approx 142965 t with South Korea being the largest importer (38578 t 27 ) There are no listed imports for the SADC region except South Africa (72 t)
Global imports of lithium-oxides (hydroxides) amounted to approx 84900 t with Japan being the largest importer (37300 t 44 ) In analogy to lithium carbonate there are no published imports into the SADC except for South Africa (428 t)
There is no information for imports of lithium-choride or lithium-mineral-con-centrates into the SADC The largest importer of lithium-choride is China with approx 253 t The largest importer of lithium-mineral-concentrates is also China (gt 95 )
Lithium Potential in Namibia
24
Fig 6 Simplified geology of Namibia with major towns as well as railway and tar roads Blue polygons indicate pegmatite belts and districts in central and southern Namibia (Data source Geological Survey of Namibia 2020)
6 Lithium occurrences in NamibiaIn Namibia significant lithium occurrences are found only within pegmatites These Precambrian and early Namibian pegmatites are restricted to two dif-ferent areas respectively the Damara Orogen in north-central Namibia and the Namaqua Metamorphic Complex in southern Namibia (Fig 6)
Lithium Potential in Namibia
25
Within the Damara Orogen four linear pegmatite belts are found all of which strike northeast ndash southwest (Fig 7) Brandberg West ndash Goantagab Cape Cross ndash Uis Nainais ndash Kohero and Sandamap ndash Erongo with the latter connected to the Karibib Pegmatite District (Schneider 1992)
Each of these pegmatite belts exhibit numerous individual pegmatite swarms that occur zoned or unzoned and may carry significant amounts of rare metals or semi-precious stones In the south Lithium-Caesium-Tantalum (LCT) peg-matites occur in two areas Tantalite-Valley south of Warmbad in close prox-imity to the northwest-trending Tantalite Valley Shear Belt and the Sandfon-tein-Ramansdrift area close to the Orange River
Fig 7 Pegmatite belts in north-central Namibia from west to east Brandberg West ndash Goantagab Cape Cross ndash Uis Nainais ndash Kohero and Sandamap ndash Erongo as well as the Karibib Pegmatite District (after Geological Suvey of Namibia 2002)
Lithium Potential in Namibia
26
7 Lithium mining in NamibiaData for historic lithium mine production is available for the period 1939 ndash 1998 (Fig 8) After 1998 all mining activities ceased due to product quality issues and overall market environment
Until the mid-1950s lepidolite was the most important mined lithium mineral of the country (Fig 8) As mine output of lepidolite decreased output of petalite increased However quantity on a year-to-year basis was quite variable and fluctuated between 1000 ndash 10000 t Since the early 1980s production of petalite was quite stable and ranged between 1000 ndash 2500 t Production fell sharply in 1997 and 1998 after which it ceased Mining of amblygonite has always been small compared to lepidolite and petalite and never exceeded 1000 t per annum
According to the USGS (2020) 500 t of lithium were mined in Namibia in 2018 This is most likely stockpiled lepidolite material from the Rubicon mine
0
2000
4000
6000
8000
10000
12000
1939
1941
1943
1945
1947
1949
1951
1953
1955
1957
1959
1961
1963
1965
1967
1969
1971
1973
1975
1977
1979
1981
1983
1985
1987
1989
1991
1993
1995
1997
[Ton
nes]
Petalite (t)Amblygonite (t)Lepidolite (t)
Fig 8 Lithium production in Namibia in [t] per year (after Schneider 1992 BGR 2020)
Lithium Potential in Namibia
27
Currently there is no active consecutive mining for lithium in substantial quan-tities in Namibia although there are prospects and projects under develop-ment
71 Current mining activities and projects
Soris The Soris project is located in the De Rust pegmatite swarm which is part of the ldquoBrandberg West ndash Goantagab tin beltrdquo (Fig 7) This belt stretches to the northeast of the Brandberg massif over a length of 60 km and a width of 25 km This belt was previously mined for cassiterite on a larger scale Some of the pegmatites in this belt may carry substantial amounts of lithium such as pegmatites in the De Rust pegmatite swarm
The De Rust pegmatite itself is a Li-rich rare metal pegmatite that was mined for cassiterite and tantalite but also for minor quantities of spodumene be ween 1960 and 1990 (Diehl 1990) It intruded into metasediments of the Amis River Formation Lower Ugab Group of the Southern Kaoko Zone
It is the largest pegmatite of the De Rust pegmatite swarm within the Brandberg West ndash Goantagab pegmatite belt (Diehl 1992c) Outcrops are 100 ‒ 470 m long up to 30 m wide and can be followed over a length of roughly 24 km
The pegmatite shows well-developed zonation with a border zone (quartz alkali feldspar muscovite) outer (quartz microcline-perthite muscovite altered petalite) and inner (quartzo-feldspathic rock with spodumene crystals with accessory apatite lepidolite eucryptite zircon and monazite) intermedi-ate zone as well as a core zone (quartz subordinate microcline muscovite sporadic tantalite) Spodumene crystals may reach up to 80 cm in length (Fig 12) Towards the core zone spodumene carries rounded nodules of lithi-um phosphates (amblygonite ndash montebrasite series)
It is located northwest of the nearest town of Uis in the Kunene region of Namibia about 6km to the east of farm De Rust 532 and about 25 km north of the Ugab River The nearest railhead is located in the town of Karibib and the deep-water port of Walvis Bay is 120 km to the southwest Windhoek is about 180 km to the southeast
Lithium Potential in Namibia
28
The project can be reached via paved but mostly unpaved roads from the town of Uis From White Lady Lodge which is about 38 km northwest from Uis a 35 km gravel road leads towards the project 15 km of which are in the riverbed of the Ugab River There is currently no electricity and water supply at the project location site
According to SampP Global (022020) current owner of the Soris project is Mon-tero Mining amp Exploration Ltd (TSXV MON) which holds 80 interest of the property Another 20 are allocated to an unnamed private owner Based on data from the Namibia Mining Cadastre Portal (092020) multiple entries for mining licence applications exist for the area where the main De Rust pegmatite is located (Fig 9)
Resource estimateDue to the early stage of the Soris project no resource estimate is avail-able However Montero Mining claims the project to be drill ready targeting a resource of 10 Mt 1 Li2O with tantalum and tin by-product credits This would equate to 46400 t of lithium or 247000 t LCE
Grab samples of the deposit showed lithium contents of 007 to 532 aver-aging 137 Channel samples showed average lithium contents of 076 and values up to 366 (Montero 032019) The company also re-assessed 1097 previously tested RC drill samples The main lithium-bearing mineral is spodumene
Remnants of historic intermittent mining activities like old foundations and quartzo-feldspathic tailings are still visible east to the main pegmatite (Fig 10 ‒ 11)
Lithium Potential in Namibia
29
Fig 10 Remnants of historic open pit mining (upper) and tailings of De Rust pegmatite (lower) northwest of the Brandberg massif (Photo BGR-GSN 2019)
Fig 9 Satellite image of the De Rust project including the outlined mining license Main pegmatite coordinates 20deg57prime48primeprimeS ‒ 14deg30prime12primeprimeE (Source httpportalsflexicadastrecomnamibia 092020)
Main pegmatite
Lithium Potential in Namibia
30
Fig 12 Weathered spodumene chrystals at the historic open pit mine (Photo BGR-GSN 2019)
Fig 11 Historic open pit of the De Rust pegmatite (Photo BGR-GSN 2019)
Lithium Potential in Namibia
31
Uis The Uis projects (former mine and tailings) are located in the northern part of the ldquoCape Cross Uis pegmatite beltrdquo east of the town of Uis on the farm Uis Townlands No 215 in the Erongo region of Namibia
The Cape Cross-Uis belt is approx 120 km long and up to 40 km wide and extends in a NE direction (Fig 7) It comprises three distinct pegmatite swarms the Strathmore swarm Karlowa swarm and Uis pegmatite swarm In general lithium-bearing pegmatites (Li-Nb-Ta-Sn-Be and Li-Nb-Ta-Sn) are the least common in this belt (Fuchsloch et al 2018)
The Uis swarm field consists of more than 120 individual pegmatites each with a northeasterly to easterly strike direction and northwesterly down dip (30deg ‒ 70deg) This field is accompanied by a peripheral pegmatite field of approx 25 individual pegmatites
Some of the main pegmatites especially around the formerly worldrsquos largest tin mine at Uis are exceedingly large Some of them are up to 1 km long and some 50 m wide
In terms of lithium petalite amblygonite and minor spodumene mineralization occurs in the various pegmatites but no lepidolite Most common lithium bear-ing minerals in the eight pegmatites that were mined at Uis are amblygonite petalite and spodumene
Currently the Uis tailings project and the Uis tin mine are owned by two differ-ent companies As of 2020 the tin mine is operating a pilot processing plant and aims to ramp up the production of lithium in the near future The current ownership of the tailings project as of September 2020 is unclear
The nearest commercial deep-water port to the projects is Walvis Bay 220 km to the southeast The town of Omaruru is 130 km to the east and Henties Bay lies about 120 km to the southwest The nearest railhead is located in Omaruru The area is accessible year-round by paved and un-paved roads NamPower provides electricity and the town of Uis is connected to the Nam-Water pipeline
Lithium Potential in Namibia
32
The tin deposit was discovered in 1911 and mined between the 1950s and 1989 for cassiterite by Uis Tin Mining Company (SWA) Ltd and IMCOR
Coarse tailings are located in the northern part of the former mine just south to the main road C36 (Fig 13) The fine material is located south to the coarse waste dumps (Fig 13)
After 1990 multiple companies owned the property until AfriTin Mining Ltd bought all the rights (license ML134) The current lithium tailings project of Montero Mining amp Exploration Ltd (TSXV MON) is based on the historic mine tailings of the former tin mine on mining license ML134 that is currently owned by AfriTin Mining Ltd The acquired tailings material does not fall under the ML134 license of AfriTin since historical tailings material (Fig 14) is not regulated by Minerals (Prospecting and Mining) Act 33 of 1992 of Namibia
Resource estimateUis tin mineAccording to AfriTin the former Uis mine holds a JORC compliant resource (inferred) of 715 Mt of ore 0134 Sn with a cut-off grade of 005 Sn (AfriTin 2020) Grades of ancillary elements are given at 063 Li2O and 85 ppm Ta for the total resource of 71 Mt of ore
This equals to approx 95000 t of tin 209000 t of lithium (11 Mt LCE) and 6090 t of tantalum 85 of the total resource are attributable to the company The remaining 15 are allocated to SMU (Small Miners of Uis)
Uis tailingsMontero Mining filed an inferred resource estimate of 144 Mt of ore 037 Li2O and 005 SnO2 with a 035 Li2O cut-off grade for lithium and assumed processing recoveries of 70 for their tailings project (Montero 2019) This equals to approx 24700 t of lithium content (131500 t LCE) and 7200 t SnO2
This resource estimate only includes coarse tailings material There is current-ly no information on the lithium content of the fine tailings material that totals 271 Mt t due to insufficient or no test work (Montero 2018) The company also states that the average Li2O grade of the fines material does not hurdle the cut-off for the fines of 082 Li2O
Lithium Potential in Namibia
33
In 2016 Australian based Tawana Resources carried out a drilling program at Uis for a private company called Lithium Africa 1 on the fine and coarse tailings (Table 3 Hole 1 amp Hole 2) Below some of the obtained data on lithium content is given Additionally Li2O content of two obtained grab samples by BGR (Table 3 Sample 2019a amp 2019b) is given
Table 3 Sample data Uis (Tawana 2016 Montero 2018 BGR 2019)
Sample Sample 0 to 1m Li2O ()
Sample 1 to 2m Li2O ()
Sample 2 to 3m Li2O ()
Fines Hole 1 071 085 092
Fines Hole 2 080 089 095
Coarse Hole 1 050 043 043
Coarse Hole 2 054 062 062
BGR Sam-ple 2019a (Coarse tailings)
028
BGR Sam-ple 2019b (Coarse tailings)
028
Montero NI 43-101 037
Lithium Potential in Namibia
34
Fig 14 Tailings of the historic Uis Tin Mine (Photo BGR-GSN 2019 with kind permission of AfriTin Mining Limited)
Fig 13 Former Uis tin mine Uis tailings project with coarse tailings Tailings coordina-tes (center) 21deg13prime31primeprimeS ‒ 14deg52prime44primeprimeE (Source httpportalsflexicadastrecomnamibia 092020)
Uis Tailings (coarse)
Uis Tailings (fine)
Historic Uis mine
Lithium Potential in Namibia
35
Karibib Lepidolite ProjectThe Karibib Lepidolite brownfield project is located in the ldquoKaribib ndash Usakos Pegmatite Districtrdquo southeast of the town of Karibib on the farm Okongava Ost No 72 in central Namibia (Fig 15 ‒ 16)
This pegmatite district which is of Damaran age hosts the most important pegmatite occurrence (Rubicon swarm) in terms of lithium in Namibia In addi-tion numerous other different pegmatite swarms some of which have previ-ously been relevant in terms of lithium are know from this district These are Dernburg Karlsbrunn Albrechtshoumlhe Berger Kaliombo Gamikaubmund Okatjimukuju Etusis Daheim Friedrichsfelde and Etiro (Diehl 1992a)
The Rubicon pegmatite itself is the largest of the individual pegmatites that occur in this field and has been the prime source of lithium until mining seized in the early 1990s The Helikon pegmatites are part of the Rubicon pegmatite swarm and are located northeast to the Rubicon pegmatite They have previ-ously been mined for lepidolite amblygonite petalite and muscovite beryll pollucite quartz and columbite-tantalite as valuable by-products (Fig 18 ‒ 19)
The pegmatite itself consist of two ellipsoidal well zoned Li-mineralized ore-bodies The larger one is about 320 m long and 25 ndash 35 m wide It dips at 46deg to the northeast and has a northwesterly strike The second orebody is about 230 m long and about 10 m wide It is dipping with 30deg to the northeast and has a northwesterly strike In total the outcrop of the Rubicon pegmatite is about 600 m long with a maximum width of 65 m (Fig 17)
A very prominent feature is the presence of a very well developed concen-tric shell and zones from the footwall to the inner core of the pegmatite Both orebodies exhibit a border- wall- intermediate- and core-zone
Border-zone wall-zone and outer intermediate zone of the larger orebody do not contain Li-bearing minerals of economic importance The inner interme-diate zone does contain lepidolite The outer core zone may be sub-divided into a petalite zone low-grade lepidolite zone and a high-grade lepidolite zone The inner core zone also contains a petalite zone Mining occurred pre-viously in the later named zones The zonation of the smaller orebody to the northwest is less pronounced but Li-mineralization and style are equal to the
Lithium Potential in Namibia
36
larger orebody There is no spodumene mineralization within the orebodies and respectively zones of the Rubicon pegmatite
The Helikon I pegmatite is also a lens-shaped pegmatite with a length of roughly 400 m and a width of approx 66 m It dips to the north with about 60deg ndash 70deg Helikon I also consists of well-defined zones The main Li-bearing minerals are lepidolite and petalite According to Roering (1963) the lepidolite is difficult to separate from the intergrown albite and hence of low grade and quality
The Helikon II pegmatite is approx 17 km long and only 9 ndash 15 m wide It lies a bit north of Helikon I and dips steeply to the north with 55deg ndash 80deg striking east west The main Li-bearing minerals are lepidolite and petalite According to Diehl (1990) the westernmost portion of the pegmatite has historically been the economically most important A massive up to 6 m wide petalite zone was mined here according to Diehl (1990)
The nearest railhead to the project is 17 km away in Karibib and the deep-water port of Walvis Bay is 220 km to the southwest Windhoek is about 180 km to the southeast NamPower connects the town of Karibib to electricity and the project currently utilizes generators There is a 7 km long 22 kV power line spur to grid connection pending (Lepidico 2020) Water is available via on-site boreholes
The project was previously owned by Desert Lion Energy Inc (TSVX DLI) Lepidico Ltd (ASX LPD) bought into the project and currently holds 80 interest which comprises Mining License 204 (69 km2) as well as three Exclu-sive Prospecting Licenses (EPLs) namely 5439 5555 and 5781 (Lepidico 2020)
Lepidico will cover mining from multiple sources as well as chemical conver-sion by utilizing their proprietary lithium processing technologies L-Maxreg LOH-Maxreg and S-Maxreg (Lepidico 052019) The company aims to produce high purity lithium chemicals such as lithium carbonate and lithium hydroxide
The takeover also included a nonbinding offtake agreement between the for-mer owner Desert Lion Energy Inc and German chemical company BASF On April 2nd 2019 Desert Lion Energy Inc announced this offtake agreement
Lithium Potential in Namibia
37
which at the time was valid through to December 31 2019 On December 20th
2019 Lepidico announced that the LOI with BASF was extended to Decem-ber 31st 2020 (Lepidico 122019)
The feasibility study criteria of Lepidico are as follows
- Throughput of the concentrator on-site of 035 Mtpa- Expansion of throughput after year five to 05 Mtpa- Chemical plant in the industrial city of Abu Dabi (ICAD)- Plant design for 58000 tpa of concentrate (4 LiO2) for the production of
up to 5500 tpa LiOH- Utilization of L-Maxreg and LOH-MaxTM- Non-binding off-take MOU with BASF for LiOH only- Targeting for project commissioning to commence late 2021 for commer-
cial production in 2022
The preliminary mine plan indicates a strip ratio of 03 ndash 1 for the first two years The ratio will then go up to 1 ndash 14 In the first four years elevated grades of 06 LiO2 will be mined
Resource estimateA JORC 2012 compliant resource estimate for the deposit is given in Table 4 (Lepidico 2020) The deposit currently holds 23200 t of lithium (Indicated amp Inferred) based on a cut-off grade of 015 Li2O This resource estimate is based solely on the lepidolite occurrences at the mine site
Table 4 Resource estimate Karibib Lepidolite Project (Source Lepidico 2020)
Deposit Resource Category
Cut-off (Li2O)
Ore (Mt)
Li2O ()
Li (t)
Li (LCE)
Rubicon Measured
015
22 057 5819 30974
Rubicon Indicated 666 038 11637 61943
Rubicon Inferred 237 043 4728 25167
Helikon
Total 015 1124 043 22184 118086
Lithium Potential in Namibia
38
Fig 16 Satellite image of the Karibib Lepidolite project Helikon 1 coordinates (center) 22deg2prime49primeprimeS ‒ 16deg1prime13primeprimeE Helikon 4 coordinates (center) 22deg2prime24primeprimeS ‒ 16deg1prime41primeprimeE (Source httpportalsflexicadastrecomnamibia 092020)
Fig 15 Satellite image of the Karibib Lepidolite project Rubicon coordinates (center) 22deg6prime11primeprimeS ‒ 15deg59prime44primeprimeE (Source httpportalsflexicadastrecomnamibia 092020)
Historic Rubicon mine
Helikon 1
Helikon 4
Lithium Potential in Namibia
39Fig 17 Rubicon pegmatite (Photo BGR-GSN 2019 with kind permission of Lepidico Chemicals Namibia (Pty) Ltd 2020)
Lithium Potential in Namibia
40 Fig 18 Lepidolite sample from Rubicon pegmatite (Photo BGR-GSN 2019 with kind permission of Lepidico Chemicals Namibia (Pty) Ltd 2020)
Fig 19 Petalite sample from Rubicon pegmatite (Photo BGR-GSN 2019 with kind permission of Lepidico Chemicals Namibia (Pty) Ltd 2020)
Lithium Potential in Namibia
42
Fig 21 Helikon 4 pegmatite (Photo BGR-GSN 2019 with kind permission of Lepidico Chemicals Namibia (Pty) Ltd 2020)
Fig 20 Helikon 1 pegmatite (Photo BGR-GSN 2019 with kind permission of Lepidico Chemicals Namibia (Pty) Ltd 2020)
Lithium Potential in Namibia
43
Tantalite ValleyThe Tantalite Valley Project lies within the ldquoNamaqua Metamorphic Complexrdquo in Southern Namibia Within this complex Lithium-Caesium-Tantalum (LCT) pegmatites occur in two main areas Tantalite-Valley south of Warmbad in close proximity to the northwest-trending Tantalite Valley Shear Belt and the Sandfontein-Ramansdrift area close to the Orange River
The area were the pegmatites of the Tantalite Valley occur is primarily com-posed of a large ovoid gabbro intrusion (71 km by 33 km in extent) within paragneiss units of the Namaqua Complex The gabbro outcrop forms a large dome shaped mountain that rises about 500 m above the surrounding topo-graphy
The pegmatites belong to the Kenhardt and Gordonia pegmatite districts in Namaqualand but only the younger group of them carry accessory ore miner-als such as tantalite beryl REE minerals and lithium
The Tantalite Valley pegmatites include several individual subhorizonal dikes that are up to 1000 m long and 02 to 40 m wide plunging towards southeast (Diehl 1992b) Four of those are of economic interest Homestead Whitkop White City and the Lepidolite pegmatites (ie Purple Haze) (Fig 22)
They are all well zoned (quartz core inner and outer intermediate zones wall zone) and were predominantly targeted for beryl columbite-tantalite as well as lithium and bismuth minerals
The project is located on the farms Umeis 110 and Kinderzitt 132 between the Farms 109 131 129 308 and 473 in the magisterial district of Karas It currently comprises Mining License (ML-77) fully owned by Tameka Shelf Co Four (Pty) Ltd which is a 100 subsidiary of African Tantalite Pty Ltd (AFTAN) Above all Kazera Global Investments PLC holds a 75 stake in AFTAN (Kazera 2019) with the other 25 of local farmer ownership
The project is accessible via gravel road from Karasburg which is about 80 km to the north The nearest railhead is also located in Karasburg Electricity is currently supplied by generators and water is recovered from multiple drill holes The Orange River is about 15 km to the south of the project Mining
Lithium Potential in Namibia
44
infrastructure as well as equipment are on site as well as a plant for the pro-duction of tantalite concentrate
NTI is working on an extensive exploration program with a clear focus on revi-ving tantalite mining in Namibia with a possible by-product stream of lithium bearing minerals The company will focus primarily on the pegmatites Homes-tead Purple Haze Signaalberg and White City (Fig 23)
The area is known for its tantalum occurrences and since the late 1940s tantalite and other minerals have been recovered at Tantalite Valley until 1981 when mining ceased Initially alluvial deposits were mined followed by the pegmatites themselves Grades of the concentrates produced prior to the closure of the mine were quite high with 65 ‒ 70 Ta2O5 with very low U3O8
and ThO2 values of 025 max
Resource estimateAccording to SampP Global (092020) Measured and amp Indicated resources at Tantalite Valley are 104800 t of ore 0042 Ta2O5 and 0653 Li2O as of 112019 This would equate to 315 t of lithium or 1690 t LCE Total inferred resources are 517400 t of ore 0018 Ta2O5 and 0144 Li2O This equals to approx 91 t of tantalum and 750 t of lithium (3535 t LCE)
Lithium Potential in Namibia
45
Fig 23 White City pegmatite (Source Kazera global Investments PLC 2020)
Fig 22 Satellite image of the Tantalite Valley project White City pegmatite coordinates (center) 28deg43prime07primeprimeS ‒ 18deg44prime45primeprimeE Homestead pegmatite coordinates (center) 28deg43prime19primeprimeS - 18deg44prime24primeprimeE Purple Haze pegmatite coordinates (center) 28deg43prime09primeprimeS ‒ 18deg43prime55primeprimeE (Source httpportalsflexicadastrecomnamibia 092020)
Lithium Potential in Namibia
46
8 Analysed lithium samplesDuring the course of the cooperation project between the Economic Geology Division (EGD) of the Geological Survey of Namibia (GSN) and the Ger-man Federal Institute of Geosciences and Natural Resources (BGR) several sampling campaigns to southern and central pegmatites took place
The field trips were preceded by literature and data research regarding infor-mation on lithium occurrences andor previous lithium mining activity to iden-tify specific target areas
During a campaign in 2019 16 lithium-bearing mixed mineral samples were taken from five different locations and subsequently analyzed Two of the samples originate from the Uis Tin Mine Tailings of the former tin mine All remaining samples were taken either from stripped outcrops for future mine activities or from previous mine sites (ie pits)
All 16 samples were analyzed at BGR labs in Hanover Germany through qualitative XRD XRF and ICP-MS Given data shall be understood as a first indicator for the sampled lithium occurrences
Most if not all sampled occurrences have previously been analyzed or are cur-rently being assessed by the property owners or current licensees Detailed information of these sampling and analytical campaigns remain confidential and are thus not available for comparison
Appendix A lists the identified qualitative mineralogy of the samples as well as the major element analysis Additional samples from previous campaigns are also given
Interpretation of the results are based on their applicability in the various lithium-consuming industries for which information is available
Most of the current lithium applications require a chemical intermediate product such as lithium carbonate or lithium-hydroxide The glass and cera-mic industry does use lithium-bearing mineral concentrates depending on the prices of these materials when compared to LiCO3
Lithium Potential in Namibia
47
Since the main applications require an intermediate or downstream chemical product lithium content as well as impurity values are the main criteria for the suitability of the sampled occurrences Other quality criteria are particle size and surface areastructure
9 InterpretationAs previously stated all obtained grab samples are mixtures of lithium- bearing minerals (ie spodumene petalite lepidolite) feldspars quartz micas as well as secondary minerals Therefore all given analytical data has to be taken with caution and will not be representative for the individual outcrops or deposits
The evaluation of the economic suitability for various economic applications of the analysed lithium samples is based on the chemical specifications in Chapter 4
Lithium content gt 1 Li2O Fe2O3 content lt 015 as well as F content lt 01 are individually highlighted (Appendix A) as these three values are the most important
Based on the chemical analysis nine of the 16 samples showed Li2O contents of more than 1 (range 117 ‒ 327 ) Seven of those nine samples also exhibited low Fe2O3 content (range 004 ‒ 008 ) (Appendix A) Three of those seven samples also had fluorine values below 005
Of the ten additionally included samples from previous campaigns four showed Li2O contents of more than 1 (range 126 ‒ 199 ) Three of those samples also exhibited low Fe2O3 content (range 004 ‒ 007 ) (Appendix A) One of the three samples had fluorine values below 005
The mentioned samples (sources) could be of potential use but for further interpretation statistical sampling will be required
Lithium Potential in Namibia
48
10 ConclusionsThere is currently no lithium industry established in Namibia This accounts to both mining and processing of ores into commercial lithium-bearing con-centrates as well as the production of downstream products such as lithium carbonate andor lithium hydroxide In order to evaluate the potential for a lithium industry in Namibia the current global market and price developments need to be addressed
Currently the main application for lithium is in the chemical industry as lithium carbonate andor hydroxide for the manufacturing of lithium-ion batteries There is currently no domestic market (supply) or demand for this industry in Southern Africa or Namibia in specific Processing of lithium-bearing ores into these highly specific downstream products is economically more viable in close proximity to the demanding industries It also requires large investments (double-digit million dollars per 10000t of capacity) Additionally there is already huge capacity and strong capacity build up in Asia at rather low cost
The second most important application lies in the glass and ceramics industry This industry uses lithium either as lithium-bearing concentrates or lithium carbonate depending on current market price and processproduct require-ments There is currently no such industry established in Namibia but potential plans There is glass and ceramics manufacturing in South Africa and thus a potential market for lithium bearing products (concentrates) should this indus-try require it depending on product
The 20182019 primary lithium supply based on spodumene-bearing mineral concentrates was dominated by Australia with a market share of well over 95 On an annual basis the country exports more than three million tons of lithium-bearing concentrates to China To put this into perspective Lepidico plans to export just 58 ktpa of concentrate to Abu Dhabi for refinement from their project annually Therefore potential production in Namibia will always be rather small scale when compared to peer producing countriescompanies
As of late 2020 the concentrate market is in strong oversupply with strong competition Thus prices have eroded quite substantially for a standard SC6 concentrate (Fig 24) In general prices vary significantly based on lithium content and impurities of the concentrates Lithium bearing mineral concen-
Lithium Potential in Namibia
49
trates are a relatively low-value mineral commodity when compared to lithi-um-carbonate or other lithium downstream products thus product quality cost reduction and cost control are key components in this industry Since prices are depressed currently many of the Australian producers have drasti-cally reduced output or even went into care and maintenance This situation may change towards 2025 or beyond as demand picks up
Prices for the higher valued product lithium-carbonate spiked at the end of 2017 towards 2018 to more than 20000 $USt on a contract basis with prices being very volatile Since then prices have also eroded to below 9000 $USt due to oversupply and slow demand pickup (Fig 25) With this product stable quality and chemical composition are crucial for the downstream industry
Based on available gradetonnage data the Namibian projectsprospects are relatively small in overall size and low in grade when compared to global peers for the resource category ldquoMeasuredIndicatedrdquo (Appendix B) Total contained lithium quantity is thus relatively small in comparison On a global scale the most promising hard rock projects that are currently being mined and developed have Li2O grades of 10 or above
Fig 24 Lithium-mineral-concentrate prices 012010 ‒ 062020 (Source BGR 2020)
300
400
500
600
700
800
900
1000
1100
208
210
212
214
216
218
220
US$
t US$t
01-20
14
01-20
15
01-20
16
01-20
17
01-20
18
01-20
19
01-20
20
01-20
10
01-20
11
01-20
12
01-20
13
Spodumene min 5-6 LiO2 fob Australia
Spodumene concentrate gt75 LiO2 bulk cif Asia
Petalite 42 LiO2 fob Durban
Spodumene fob Australia
Spodumene min 5-6 LiO2 cif China
Lithium Potential in Namibia
50
For the resource category ldquoIndicatedrdquo which generally represents the lowest level of confidence only the Uis mine project of AfriTin represents a size-able resource even though grades are relatively low (Appendix C) The Uis tailings project as well as the Rubicon project are again relatively small when compared to their global peers Tantalite Valley is the smallest of all included projects (Appendix C)The given data for the De Rust project reflects only an exploration target of the company rather than actual data and may thus be not representative
Based on size and contained lithium-content none of the visited early stage projectsprospects would justify the financial investment into the construction of a chemical conversion plant for the production of lithium carbonate andor hydroxide on site as it requires very large monetary investments Due to their size payback of the required investments may be unfavorable when compared to global peers In addition the current market environment is very harsh with strong competition from Asia that has a huge cost advantage due to capacity build up This industry is also very energy and water intensive
In addition location within Namibia as well as distance to possible down-stream markets may become an issue as it increases the transportation cost
4000
7000
10000
13000
16000
19000
22000
25000
28000
01-20
14
01-20
15
01-20
16
01-20
17
01-20
18
01-20
19
01-20
20
US$
t
Lithium-carbonate (min 995 ) battery grade spot price ex works domestic ChinaLithium-carbonate (min 99-995 ) Li2CO3 large contracts USA delivered continentalLithium-hydroxid-monohydrate (min 565) technical and industrial grades cif China Japan amp Korea
Fig 25 Lithium chemical prices 012014 ndash 062020 (Source BGR 2020)
Lithium Potential in Namibia
51
immensely This is especially true for the SorisDe Rust pegmatite which is in a remote location without any allocated infrastructure The projects Karibib Uis and Tantalite Valley are much easier to access
The approach of Lepidico to produce a lithium bearing concentrate on site seems plausible approach Since this will already require a skilled workforce mining and beneficiation equipment in order to produce a high quality lithium-bearing concentrate it may already be considered ldquoadded valuerdquo for the indus-try of the country This approach may also be suitable for the other mentioned and visited projects
Lithium Potential in Namibia
52
ReferencesAfriTin Mining (2020) Uis Tin Project ndash Company Information ndash URL httpafritinminingcomuis-project [as of 092020]
Australian Government Geoscience Australia (2019) Australiarsquos Identi-fied Mineral Resources 2019 ndash URL httpswwwgagovauscientific-topicsmineralsmineral-resources-and-adviceaimr [as of 092020]
BGR ndash Bundesanstalt fuumlr Geowissenschaften und Rohstoffe (2020) Fachinformationssystem Rohstoffe ndash unpubl Hannover [as of 082020]
BGS ndash British Geological Survey (2016) Lithium Definitions mineralo-gy and deposits ndash URL httpswwwbgsacukdownloadsstartcfmid=3100 [as of 062016]
Diehl B J M (1990) Pegmatites of the Cape Cross Uis ndash Pegmatite Belt Namibia Geology mineralisation Rubidium Strontium characteristics and petrogenesis of rare metal pegmatites Open File Report EG 083 Economic Geology Series Geological Survey of Namibia 39 pp Windhoek
Diehl B J M (1992a) Lithium Caesium Beryllium Open File Report Mineral Resource Series Geological Survey of Namibia 18 pp Windhoek
Diehl B J M (1992b) Niobium and Tantalum Open File Report Mineral Resource Series Geological Survey of Namibia 20 pp Windhoek
Diehl B J M (1992c) Tin Open File Report Mineral Resource Series Geological Survey of Namibia 30 pp Windhoek
Diehl B J M amp Schneider G I C (1990) Geology and mineralisation of the Rubicon Pegmatite Namibia Open File Report Geol Surv Namibia 20 pp Windhoek
Fuchsloch et al (2018) Classification mineralogical and geochemical vari-ations in pegmatites of the Cape Cross-Uis pegmatite belt Namibia Lithos 296 ndash 299 79-95 elsevier
Lithium Potential in Namibia
53
Garret D E (2004) Handbook Of Lithium And Natural Calcium Chloride Their Deposits Processing Uses and Properties ndash 467 S Oxford (Elsevier B V)
Geological Survey of Namibia (2002) Mineral Resources of Namibia Summary of Mineral Deposits and Occurrences Omaruru Sheet 2114 Volume I ndash Complete Descriptions 119 pp Windhoek
IHS Global SA (2020) Global Trade Atlas ndash Commercial Online-Databa-se ndashURL httpsmyihscomConnectcallingUrl=https3a2f2fconnectihsmarkitcom2f [as of 062017]
Kazera Global Investments PLC (2020) Company Information ndash URL httpskazeraglobalcominvestmentsnamibia-tantalite-investment-mine [as of 092020]
Lepidico (2019) LOI with BASF extended to 31 December 2020 ndash News Release ndash URL httpswwwlepidicocomwp-contentuploads201910LPD-191220-LOI-with-BASF-extended-to-31-December-2020pdf [as of 122019]
Lepidico (2019) Corporate Presentation ndash URL httpswwwlepidicocomwp-contentuploads201907LPD-190509-Corporate-Presentati-on-May-2019pdf [as of 052019]
Lepidico (2020) Company Information ndash URL httpswwwlepidicocomprojectskaribib [as of 092020]
Montero Mining amp Exploration Ltd (2018) Exploring Battery Metals in Namibia ndash Company Presentation ndash URL httpswwwproactiveinvestorscomauuploadSponsorFileFile2018_031520244941_MON-CorporatePre-sentationMarch2018pdf [as of 072018]
Montero Mining amp Exploration Ltd (2019) Montero Files NI 43-101 Resource Estimate On The Uis Lithium-Tin Tailings Project In Namibia On Sedar ndash News Announcement ndash URL httpsmonterominingcommontero-files-ni-43-101-resource-estimate-on-the-uis-lithium-tin-tailings-project-in-namibia-on-sedar [as of 032019]
Lithium Potential in Namibia
54
Namibia Mining Cadastre Portal (2020) Online-Database ndashURL httpsportalslandfoliocomnamibia [as of 092020]
Roskill Information Services Ltd (2016) Lithium Global Industry Mar-kets amp Outlook ndash 386 S London Groszligbritannien
Schneider G I C (1992) Feldspar Open File Report MRS 08 Mineral Resource Series Geological Survey of Namibia 2 pp Windhoek
Schmidt M (2017) Rohstoffrisikobewertung ndash Lithium ndash DERA Rohstoffin-formationen 33 Berlin
S amp P Global Market Intelligence (2020) Lithium - Metals amp Mining Properties URL httpsplatformmarketintelligencespglobalcomwebcli-entauth=inheritindustryminingProjects [as of 092020]
Statista (2020) Distribution of lithium end-usage worldwide in 2019 by area application ndash URL httpswwwstatistacomstatistics268787lithium-usa-ge-in-the-world-market [as of 062020]
Tawana Resources NL (2016) Tawana acquires second lithium pro-ject ndash News Release ndash URL httpsmstrademomentumcozajsepdfSENS_20160923_S376505pdf [as of 092016]
USGS ndash United States Geological Survey (multiple years) Lithium ndash Minerals Commodity Summaries ndash URL httpswwwusgsgovcentersnmiclithium-statistics-and-information [as of 082020]
Appendix
Sam
ple I
DFa
rmLa
titud
eLo
ngitu
deSa
mpl
e des
crip
tion
(XRD
qu
al)
LiO 2
()
SiO 2
Ti
O 2
Al2O 3
Fe2O 3
Mn
O Mg
O Ca
O Na
2O
K 2O P 2O 5
SO
3
Cl
F
LOI
Su
m
2015
-03
previous sample campaignsHelik
on
n A
Felds
parQ
uartz
Lepid
olite
025
6871
lt000
119
0500
200
2900
505
3292
806
7905
59lt0
01lt0
002
lt005
093
9985
2016
-12
Rubic
onwe
ather
ed P
etalite
126
6473
lt000
118
0600
703
2718
607
9507
805
2500
62lt0
01lt0
002
lt005
1146
9871
2016
-17
Rubic
onLe
pidoli
te +
Quar
tz13
063
6700
219
9316
0929
003
0054
029
6218
0052
lt001
lt000
226
232
798
67
2016
-20
Helik
onLe
pidoli
te + A
lbite
176
5514
lt000
126
8700
401
2100
700
2123
970
3900
45lt0
01lt0
002
156
369
9698
2016
-21
Helik
onLe
pidoli
te19
954
32lt0
001
2627
004
0224
006
0038
266
714
0069
lt001
lt000
240
628
997
77
FN20
19_0
4De
Rus
tFe
ldspa
rAmb
lygon
iteP
etalite
(n
on X
RD)
003
6513
lt000
118
82lt0
0100
0200
101
0924
311
4105
75lt0
0100
04lt0
0503
898
84
2015
-09
Molop
oPe
talite
(non
XRD
)00
952
85lt0
001
1672
lt001
0002
487
0323
342
0352
lt000
100
400
3403
621
1310
012
2016
-14
Molop
oPe
talite
wea
there
d (no
n XRD
)00
752
1600
0316
5100
200
5147
805
8923
406
4500
6900
200
8602
222
6310
013
2016
-15
Molop
oFe
ldspa
r (no
n XRD
)00
664
02lt0
001
1937
003
0004
003
0151
216
1249
0796
lt001
lt000
2lt0
0505
399
55
2016
-23
Molop
oZin
nwald
ite (n
on X
RD)
006
5044
0068
3307
048
0011
012
0426
261
7674
0181
lt001
lt000
2lt0
0542
9925
1909
249
2019Uis
Tailin
gs
Quar
tzFe
ldspa
rPeta
lite
Musc
ovite
028
7293
0045
1479
051
0062
0212
9830
927
6613
6200
2lt00
02lt0
0523
399
38
1909
250
Uis
Tailin
gsQu
artz
Felds
parP
etalite
Mu
scov
ite02
872
6900
4314
8205
0059
019
1306
313
2794
1347
002lt
0002
lt005
251
9937
1909
251
Helik
on 4
22deg02prime4
8primeprimeS1
6deg01prime30
primeprimeEQu
artz
Felds
parP
etalite
Le
pidoli
te16
464
4400
0319
4200
301
2100
408
8325
345
6806
800
400
0727
228
998
38
1909
252
Helik
on 1
22deg02prime2
0primeprimeS1
6deg01prime19
primeprimeEPe
talite
Lepid
olite
Quar
tz29
576
9200
0116
6800
300
0304
101
7301
106
8100
01lt0
01lt0
002
lt005
205
97
App
endi
x A
Ana
lytic
al d
ata
of li
thiu
m s
ampl
es c
olle
cted
in N
amib
ia T
hres
hold
val
ues
high
light
ed in
gre
en
Lithium Potential in Namibia
57
Sam
ple I
DFa
rmLa
titud
eLo
ngitu
deSa
mpl
e des
crip
tion
(XRD
qu
al)
LiO 2
()
SiO 2
Ti
O 2
Al2O 3
Fe2O 3
Mn
O Mg
O Ca
O Na
2O
K 2O P 2O 5
SO
3
Cl
F
LOI
Su
m
1909
253
2019Rubic
on22deg06prime1
3primeprimeS1
5deg59prime45
primeprimeEPe
talite
Lepid
olite
Quar
tz32
778
73lt0
001
1687
002
0006
002
0157
011
003
0002
003
0003
lt005
075
9663
1909
254
Rubic
on22deg06prime1
0primeprimeS1
5deg59prime41
primeprimeEFe
ldspa
rQua
rtzM
usco
vite
004
682
lt000
119
3500
300
2400
205
0610
0808
6804
3lt0
01lt0
002
lt005
041
9985
1909
255
Rubic
on22deg06prime1
0primeprimeS1
5deg59prime41
primeprimeEFe
ldspa
rLep
idolite
Mus
co-
viteK
aolin
026
6104
0004
2318
022
0136
006
0119
367
8411
0159
lt001
lt000
2lt0
0522
299
15
1909
256
Rubic
on22deg06prime1
0primeprimeS1
5deg59prime41
primeprimeELe
pidoli
te 27
249
8700
129
3400
408
0500
400
704
697
3100
31lt0
01lt0
002
087
441
9569
1909
257
Rubic
on22deg06prime1
3primeprimeS1
5deg59prime45
primeprimeEPe
talite
Lepid
olite
Quar
tz30
670
0900
0320
2600
801
0901
502
9901
926
800
15lt0
0100
04lt0
0526
596
48
1909
258
Rubic
on22deg06prime1
0primeprimeS1
5deg59prime41
primeprimeELe
pidoli
teFe
ldspa
rQua
rtz20
659
7800
0224
100
505
2400
300
513
7247
0051
lt001
0002
265
388
9966
1909
259
Tanta
lite
Valle
y28deg43prime0
9primeprimeS1
8deg43prime55
primeprimeEFe
ldspa
rLep
idolite
Mus
covit
e11
762
64lt0
001
2139
004
0161
lt001
0399
7731
2401
0900
200
119
912
698
85
1909
260
Tanta
lite
Valle
y28deg43prime0
9primeprimeS1
8deg43prime55
primeprimeEFe
ldspa
rLep
idolite
Mus
covit
e03
059
8600
1425
1301
604
2200
302
2860
547
2201
3900
200
0904
123
799
56
1909
261
Tanta
lite
Valle
y28deg43prime0
9primeprimeS1
8deg43prime55
primeprimeEFe
ldspa
rQua
rtzM
usco
vite
003
636
0005
2218
022
0122
002
0381
727
3809
0272
lt001
lt000
2lt0
0513
199
17
1909
262
Tanta
lite
Valle
y28deg43prime2
0primeprimeS1
8deg44prime23
primeprimeEQu
artzSp
odum
eneM
us-
covit
e13
180
5100
0415
8903
401
2401
301
9502
604
0400
0500
200
03lt0
0507
398
56
1909
263
De R
ust
20deg57prime4
8primeprimeS1
4deg30prime13
primeprimeEFelsd
parS
podume
neQuartz
074
7313
0006
2048
007
015
005
0154
398
0831
0073
001
0003
lt005
082
9974
1909
264
De R
ust
20deg57prime4
8primeprimeS1
4deg30prime13
primeprimeESp
odum
eneF
eldsparQuartz
230
6924
0006
2602
801
0200
301
0510
102
1400
68lt0
0100
03lt0
0504
897
53
(Con
tinue
d) A
ppen
dix
A A
naly
tical
dat
a of
lith
ium
sam
ples
col
lect
ed in
Nam
ibia
Thr
esho
ld v
alue
s hi
ghlig
hted
in g
reen
Lithium Potential in Namibia
58
Appendix B GradeTonnage data (Measured amp Indicated) for selected lithium projects in comparison to Namibian projects (Source SampP 092020)
0
0500
1000
1500
2000
2500
500
5000
5000
0
5000
00
5000
000
Gra
de [
Li 2O
]
Tonnage [t]
Tantalite Valley
Rubicon
Appendix B GradeTonnage data (Inferred) for selected lithium projects in com-parison to Namibian projects (Source SampP 092020)
0
0500
1000
1500
2000
2500
100
1000
1000
0
1000
00
1000
000
1000
0000
Gra
de [
Li 2O
]
Tonnage [t]
Tantalite ValleyRubicon
Uis Tailings
Uis Mine
De Rust
A product of the technical cooperation project between Bundesanstalt fuumlr Geowissenschaften und Rohstoffe (BGR)(Federal Institute for Geosciences and Natural Resources)
andGeological Survey of Namibia within the Ministry of Mines and Energy
ISBN 978-3-948532-29-1 (Print) 978-3-948532-30-7 (PDF)
- List of Abbreviations
- 1 Introduction
- 2 What is lithium
-
- 21 Lithium deposits
-
- 3 Application
- 4 Chemical requirements
- 5 Mining and trade of lithium in the SADC
-
- 51 Lithium production
- 52 Trade data
- 53 Export
- 54Import
-
- 6 Lithium occurrences in Namibia
- 7 Lithium mining in Namibia
-
- 71 Current mining activities and projects
-
- 8 Analysed lithium samples
- 9 Interpretation
- 10 Conclusions
- References
-

Lithium Potential in Namibia
9
Pegmatites or aplites are very coarse or finer grained felsic dikes respec-tively They intrude into the country rock as highly differentiated magma crys-tallizing either very slowly (pegmatites) or relatively fast (aplites) Pegmatites are usually of limited three-dimensional extent ranging from a few meters to several hundred meters or even kilometers in length and depth Besides quartz feldspar and mica lithium bearing pegmatites may also carry other valuable minerals that contain rare elements such as tantalum niobium tin tungsten cesium rubidium boron fluorine and others Those potential by-products may be of economic importance to some projects and mines The most important minerals in these deposits are spodumene petalite and lepidolite
Table 1 Important lithium bearing minerals (Source BGS 2016 Roskill 2016a Garret 2004)
Mineral Formula Li-Content ()
Oslash Li-Content Ores ()
Spodumene LiAlSi2O6 19 ndash 37 135 ndash 36
Petalite LiAlSi4O10 16 ndash 227 14 ndash 22
Lepidolite K(LiAl)3(SiAl)4O10(FOH)2 139 ndash 36 14 ndash 19
Amblygonite (LiNa)AlPO4(FOH) 34 ndash 47 n A
Eucryptite LiAlSiO4 21 ndash 553 21 ndash 44
Bikitaite LiAlSi2O6 bull H2O 34 n A
Hektorite Na03(MgLi)3Si4O10(OH)2 024 ndash 054 n A
Salitolite (LiNa)Al3(AlSi3O10)(OH5) 077 n A
Swinefordite Li(AlLiMg)4((SiAl)4O10)2 (OHF)4 bull nH2O
174 n A
Zinnwaldite K(LiFe2+Al)3[(FOH)2|AlSi3Ol0] 092 ndash 185 n A
Polylithionite KLi2AlSi4O10(FOH)2 n A n A
Jadarite LiNaSiB3O7(OH) 73 n A
Important pegmatite occurrences are found in Western Australia Canada and Sub-Sahara Africa (ie in Zimbabwe Democratic Republic of Congo and Mozambique) There are also pegmatite occurrences in Namibia that are lithium-bearing
Other mineral occurrences Lithium-containing clays form during the weathering of lithium-containing volcanic intrusive rocks Further enrichment can take place by hydrothermal processes The most important of these clay minerals hectorite belongs to the group of smectites (Table 1) Hectorite con-tains between 024 and 054 lithium Important occurrences are found in the USA (Roskill 2016)
Lithium may also occur in zinnwaldite which is the name for the mixed series siderophyllite ndash polylithionite (end members) They belong to the phlogopite
group Zinnwaldite has a relatively low lithium content of about 092 to 185 but relatively high levels of iron (approx 11 FeO) as well as fluorine (approx 6 F) which limits the suitability for certain applications In addition to the sources mentioned above lithium also occurs in a mineral named jadarite (Table 1) It is a sodium-lithium-boron-silicate hydroxide which can contain as much as 73 lithium
Fig 1 De Rust pegmatite swarm (Brandberg West ndash Goantagab tin belt) (Photo BGR-GSN-Project 2019)
Lithium Potential in Namibia
12
3 ApplicationMany products contain lithium due to its very specific properties By far the most important use of lithium is in the field of rechargeable batteries
In 2019 this area accounted already for 65 of total demand compa-red to 37 in 2015 (Fig 2) Lithium is an essential component in modern lithium-ion-batteries since it has the highest electrochemical potential of all metals and the highest specific capacity Compared to other battery types lithium-ion battery technology has currently the highest energy density the longest cycle life the widest temperature range tolerance and the lowest self-discharge rates (Bauer 2017)
Classical 3C applications such as laptops tablets smartphones and smart watches use lithium-ion-batteries (Fig 3) E-mobility as well as off-grid energy storage (ESS) for renewable energies are the major applications of such bat-teries with the highest projected annual growth rates Power tools play a minor role However products such as e-bikes e-trikes and especially e-scooters are gaining momentum
374
650
305
180
0
10
20
30
40
50
60
70
80
90
100
2015 2020
[]
Rechargeable Batteries Ceramics Greases Polymers
Metallurgical Powders Air Treatment Other
Fig 2 Lithium demand 2015 (left) vs lithium demand 2019 (right) (Source Roskill 2016 Statista 2020)
Lithium Potential in Namibia
13
The second important application of lithium is in the field of glass and cera-mics Cumulatively this area accounts for 18 of demand in 2019 (Fig 2) In the ceramic industry for the production of glazes and ceramic products (tiles sanitary items dishes etc) pure chemical grade lithium carbonate spodumene-concentrate or petalitelepidolite-concentrate is used as lithium source Positive effects of lithium are increase in gloss increase in luminosity increase of chemical and abrasion resistance and reduction of glaze viscosity In ceramic bodies the use of lithium lowers the firing temperature shortens the firing time and thus reduces overall CO2 emissions In addition the use of lithium has a positive effect on the expansion behavior and the mechanical resistance of products
In lubricants lithium is used as lithium-stearate or lithium-12-hydroxy-stea-rate primarily produced from lithium carbonate or lithium hydroxide and stea-rin-acid Di-Lithium-Azelate Lithium-Docosanoate and Lithium-Stearate are also used in lubricants (Roskill 2016) Overall lithium content is usually below 04
In the steel casting industry fluxes are used to optimize the casting pro-cess or to minimize the risk of faulty goods Lithium is used in the form of spodumene or petalite which reduces the viscosity of the melt As a result the flow rate and thus the productivity can be increased The flux also acts as a tempera ture barrier between the mold and the molten steel In addition the surface of the continuous cast body is protected from oxidation and impurities such as Al2O3 are removed (Roskill 2016) In traditional casting lithium oxide prevents the formation of defects in the finished casting Typically these fluxes contain up to 5 Li2O Lithium is added to the flux as either lithium oxide or lithium carbonate The addition of spodumene or petalite is also possible
In polymers Butyllithium (n-butyllithium = n-BuLi) is used as reagent or cata-lyst for the production of natural rubber compounds Depending on the rubber compound different amounts of n-BuLi are required (3 ndash 14 kg per ton rubber compound)
Different air treatment applications also use lithium Lithium bromide solu-tions are used in combination with water in bdquowater-lithium-bromide absorption chillersldquo (AKM) (Roskill 2016) Absorption based air de-humidifiers use lithium chloride (LiCl) This compound has the ability to absorb ten times its
Lithium Potential in Namibia
14
own weight in water Lithium is also used in air purification By means of lithium hydroxide CO2 can be removed from the air
Primary batteries also use lithium due to its electrochemical properties The-se cells are used in watches calculators pacemakers etc They are charac-terized by small size high energy density low weight long storage capacity low self-discharge and high cell voltage
Fig 3b Ceramic stove top (Source SCHOTT AG 2017)
Fig 3a Pouch-Lithium-Ion Cell (Source BGR)
Lithium Potential in Namibia
15
4 Chemical requirementsLithium is not a typically mined metal and the quality requirements are very specific and stringent depending on the field of application and thus vary from end-user to end-user
The first products that enter the value chains are usually the intermediates lithium carbonate andor lithium hydroxide produced from either brine sources or hard rock deposits ie currently mostly pegmatite sources (Fig 4)
Lithium from pegmatite sources is primarily sold as concentrates of either spodumene petalite or lepidolite with minor quantities of amblygonite in the market Each industry has unique requirements in terms of desired chemical composition particle size and tolerable values of impurities Concentrates are usually graded and priced according to their Li2O content impurity levels and aimed mainly at the growing battery industry as well as glassceramics industry
Concentrates for the battery industry are rated ldquochemical graderdquo and concen-trates for the glass industry are rated ldquotechnical graderdquo In general the glass industry has tighter limits on certain impurities as the battery industry due to the direct usage of the concentrates in the respective product flow sheets
The current industry standard for lithium concentrates in the battery indus-try is called SC-6 a chemical grade spodumene-concentrate that contains approx 6 Li2O Higher values of lithium are uncommon as concentrating them beyond 6 Li2O increases the cost of production exponentially
Petalite lepidolite zinnwaldite amblygonite and other lithium bearing miner-als are not used in this industry yet However there are processes in develop-ment for the extraction of lithium from these sources
Some companies especially in Australia sell spodumene-concentrates with lower Li2O contents (22 ndash 5 ) at lower prices per ton A special case are so-called DSO-concentrates (ldquodirect shipping orerdquo) with Li2O contents of only 12 ndash 14 DSO shippingrsquos out of Australia decreased significantly as the monetary value is quite low with lt 150 US$t and higher qualities are available
Lithium Potential in Namibia
16
Mica (muscovite) is an unwanted impurity in these concentrates as it disturbs the converting steps Heavy minerals are usually also extracted from the sources as they may represent by-product value (eg tantalum) Wall-rock impurities may cause problems in the further processing steps (basalt etc) Fe2O3 content is also an issue as it may also pose problems in the converters (clogging)
Technical grade lithium concentrates for the glass industry may have the same values of lithium in terms of Li2O but more stringent requirements in terms of iron content and some other elements such as fluorine
This industry usually uses petalite concentrates which can be used directly in the production process The advantage of petalite over spodumene-con-centrates is the generally lower iron content which is a crucial impurity even though these concentrates have lower lithium contents Fe2O3 content above a certain threshold (gt 015 ) will lead to unwanted discoloration in the final glass or ceramic products thus low values are needed
Fluorine-bearing lithium concentrates of lepidolite amblygonite and zinnwal-dite are not used in the glass and ceramics industry as this impurity is highly unwanted Besides fluorine the high Fe2O3 content of zinnwaldite is an issue as mentioned above
Particle size of the concentrates is also an issue as very fine material may lower the melt temperature due to a higher specific surface Therefore concen-trates for this industry are either tailor-made or mixtures of different sources
The glass and ceramics industry also uses pure lithium carbonate to a certain extent based on pricing
Lithium carbonate and lithium hydroxide are the first semi-finished products apart from lithium-concentrates used in the various industries for direct use or further downstream precursors There is a distinction between battery grade and technical (other) grade for lithium-carbonate and lithium-hydroxide The main differences lie within the lithium content level of impurities and particle sizes
Lithium Potential in Namibia
17
Commercial extraction of lithium takes place from lithium-containing brines and from hard rock (ie pegmatitic) deposits A simplified schematic repre-sentation of conventional production steps and key intermediates is shown in Figure 4
For the extraction of lithium from hard rock deposits the raw ores (eg pegma-tites) mined in open-pit or underground mines are processed into lithium-con-taining concentrates by sorting crushing grinding gravity separation mag-netic separation flotation washing filtering and drying The exact production steps vary depending on occurrence (ie locality) mineralogy company and the intended use of the produced concentrates
As of 2020 more than 95 of the conversion from spodumene-concentrates into lithium carbonate andor lithium hydroxide takes place in China The most widely used process in the industry is the acid-roast process (Fig 5)
In this process spodumene-concentrate is ground and heated to 1075 ‒ 1150degC in a rotary kiln (Fig 5) This converts α-spodumene into β-spodumene which is soluble in hot acids After mixing with hot sulfuric acid lithium sulfate solution is mixed with water As a result lithium sulfate dissolves The solution is mixed with calcium carbonate to remove impurities such as iron manganese and aluminum In addition the pH is raised After a first filtering process Na2CO3 and CaO are added to obtain an alkaline soluti-
Lithium Hydroxide
LithiumperoxidLithium Peroxide
Lithium-BrineLithium-Minerals
Lithium ChlorideLithium Bromide Lithium Sulfate
Lithium Acetate Lithium Metal
Lithium Carbonate
Fig 4 Simplified production scheme of lithium and important lithium com-pounds (modified after Roskill 2016)
Lithium Potential in Namibia
18
on Impurities such as calcium and manganese are removed The solution is then neutralized with sulfuric acid and heated to increase the concentration of Li2SO4 to about 200 ‒ 250 gl The addition of Na2CO3 and heating the solution to about 100degC triggers the precipitation of lithium carbonate The carbon-ate produced in this way has purities of up to 993 The battery industry however requires purities of min 995 obtained through ion exchange and extraction of impurities The produced lithium carbonate can then also be used for the production of lithium hydroxide
Common understanding was that the production of lithium carbonate was much cheaper from brines compared to hard rock sources Due to many developments in the brine industry mostly related to a recently introduced royalty system in Chile this is no longer the case On the contrary the cost advantage of brines is lost
Fig 5 Simplified production scheme of lithium carbonate derived from spodu-mene-concentrates via acid-roast-process (modified after Garret 2004)
Solution
MillingCooling
Thickener
Filtration
1075 - 1150oCCalcinationSpodumene Concentrate
Mixing
H2SO4
Leaching
H2O amp CaCO3
Gasscrubber
Solids to Tailings
Mixing
Na2CO3 amp CaO
Thickener
Filtration
Solids to Tailings
Neutralisation
H2SO4
Evaporation
90 - 100oCHeating
Filtering WashingDrying
Na2SO4Lithium carbonate
Lithium Potential in Namibia
19
The production of lithium hydroxide which is a fast growing market and a higher priced intermediate product appears to become cheaper when sourced directly from high quality hard rock conversion relative to sourcing from brines via an intermediate step (lithium carbonate) As the cost advantage of brine deposits compared to hard rock deposits is fading the industry has shifted its focus towards hard rock deposits all over the world
In addition to the acid-roast process there are new technological approaches to recover lithium carbonate and lithium hydroxide directly from high quality spodumene-concentrates as well as other mineralogies
Lithium Potential in Namibia
20
5 Mining and trade of lithium in the SADC
51 Lithium production
Each year every mining country of the world is urged to share production statistics regarding their mining activity These statistics are compiled and published by different entities such as the British Geological Survey (BGS) and the United States Geological Survey (USGS) among others
If a country does not appear in these statistics there was either no mining activity for this specific commodity the country did not publish any statistics or the production data is unknown
Table 2 Mine production of lithium (Source BGR 2020 Roskill 2016 USGS 2020 Geoscience Australia 2020)
Mine production [t Li-Content]
Years 2014 2015 2016 2017 2018 2019e Share 2018 []
Australia1) 12333 13160 15590 21000 57000 42000 647
Chile2) 11640 11787 14526 16584 15886 18000 175
Argentina2) 3388 3515 5767 575 6241 6400 69
China3) 1895 2002 2293 3 7376 7500 81
Zimbabwe1) 1024 1025 974 994 700 1600 08
USA2) 846 846 900 900 567 n A 06
Portugal1) 470 470 299 763 700 1200 08
Brazil1) 186 186 195 154 153 300 02
Namibia1) n d nd n d n d 500 n d 05
Other 3) 19 19 18 18 18 500 lt01
Global4) 31801 33011 40562 49012 90941 77000 1001) Hardrock 2) Brine 3) HardrockBrine 4) Deviation due to rounding e estimated
Lithium Potential in Namibia
21
In 2018 global mine output of lithium was around 91000 t Li-content of which only 1200 t originated from the Southern African Development Community (SADC) namely Zimbabwe and Namibia
52 Trade data
Trade data is retrieved from the commercially available Global Trade Atlasreg (IHS Global SA) The database provides both import and export data for more than 90 countries based on customs data of individual countries Data is primarily classified through Harmonised System (HS) product codes by the WCO (World Customs Organization) The HS nomenclature consists of approximately 5000 product groups identified by a 6-digit code
There are limitations to trade data The most prominent issue arises with data availability since many countries do not publish trade data Especially export data is an issue among many countries
There may also be issues with mislabeled products (wrong HS) product bas-kets data entry errors or missing data in general Were export data is not available so-called reverse trade data (RTS) is an option
If a country does not state any exports cumulative global imports from that particular country may be used as a rough yet incomplete estimate of exports It should be noted that these statistics do not represent absolute but rather minimum values as trade between two non-reporting countries will not be reflected The majority of the SADC countries do not report their import and export statistics
The most important lithium products that are globally traded in significant amounts are lithium-carbonate lithium-oxide (hydroxide) lithium-chloride and lithium-mineral-concentrates
Lithium Potential in Namibia
22
53 Export
The most important intermediate product in the lithium market is lithium carbonate In 2019 global exports amounted to approx 117743 t with Chile being the largest exporter (82344 t 70 ) There are no listed exports from the SADC region except minor quantities from South Africa to the Democratic Republic of Congo (9 t) and Zambia (2 t)
Lithium oxides and lithium hydroxides are grouped together under one HS code hence an individual consideration of both products on a country basis is not possible due to the lack of country-specific commodity codes
In 2019 global exports of HS 282520 stood at approx 97550 t with China being the largest exporting country (49800 t 51 )There are no exports published for the SADC region except South Africa with small quantities (28 t) which are considered to be trade through only
Assessment of lithium chloride global trade flows is also difficult as this prod-uct is listed together with many other chemical products under HS 282739 Global trade can only be investigated using country-specific commodity codes (8-digits and above) if available Only three countries list this product under specific trade codes namely China (28273910) Chile (28273930) and Argentina (28273960) SADC countries including Namibia do not publish any data under HS 282739 Based on the available data global exports in 2019 stood at 2254 t with Chile being the largest exporter (2101 t 89 )
Lithium-containing mineral concentrates are among other non-lithium related products listed in a product basket under HS 253090 Only two coun-tries provide information on this product namely Australia as the largest and hence most important producing and exporting country by far and Brazil as a minor exporter (25309010)
No other country including member states of the SADC specifies lithium-con-taining concentrates as such The currently only producing and exporting country in the SADC is Zimbabwe which does not specify exports at all Thus exports are derived from RTS (global imports)
Lithium Potential in Namibia
23
A general problem with HS 253090 is that only information on quantity is avail-able but no information on lithium content which can vary between 12 and 6 Li2O thus the margin of possible errors in terms of total contained lithium is large
In 2019 Australia exported about 16 million tons of spodumene-concentrate down from 35 million tons in 2018 More than 95 destined to China
Inferred exports (RTS) of Zimbabwe were approx 93300 t for HS 253090 About 62000 t of that quantity are listed as imports by South Africa and are unrelated to lithium The remaining quantity is much more in line with production figures of Zimbabwe as well as the known downstream industries of the destination coun-tries within Europe
There are no export records published by Namibia In general and across all traded lithium products South Africa appears to act as an importexport hub within the SADC Also some of the traded products may be used in the glass and ceramic industry of South Africa
54 Import
For most of the SADC countries the statistics retrieved though the Global Trade Atlas do not necessarily represent reliable trade data due to above-mentioned reasons This is especially true when only small import numbers (usually in tons) are listed as these are supposedly artefacts or errors in declaration
Global imports of lithium-carbonate amounted to approx 142965 t with South Korea being the largest importer (38578 t 27 ) There are no listed imports for the SADC region except South Africa (72 t)
Global imports of lithium-oxides (hydroxides) amounted to approx 84900 t with Japan being the largest importer (37300 t 44 ) In analogy to lithium carbonate there are no published imports into the SADC except for South Africa (428 t)
There is no information for imports of lithium-choride or lithium-mineral-con-centrates into the SADC The largest importer of lithium-choride is China with approx 253 t The largest importer of lithium-mineral-concentrates is also China (gt 95 )
Lithium Potential in Namibia
24
Fig 6 Simplified geology of Namibia with major towns as well as railway and tar roads Blue polygons indicate pegmatite belts and districts in central and southern Namibia (Data source Geological Survey of Namibia 2020)
6 Lithium occurrences in NamibiaIn Namibia significant lithium occurrences are found only within pegmatites These Precambrian and early Namibian pegmatites are restricted to two dif-ferent areas respectively the Damara Orogen in north-central Namibia and the Namaqua Metamorphic Complex in southern Namibia (Fig 6)
Lithium Potential in Namibia
25
Within the Damara Orogen four linear pegmatite belts are found all of which strike northeast ndash southwest (Fig 7) Brandberg West ndash Goantagab Cape Cross ndash Uis Nainais ndash Kohero and Sandamap ndash Erongo with the latter connected to the Karibib Pegmatite District (Schneider 1992)
Each of these pegmatite belts exhibit numerous individual pegmatite swarms that occur zoned or unzoned and may carry significant amounts of rare metals or semi-precious stones In the south Lithium-Caesium-Tantalum (LCT) peg-matites occur in two areas Tantalite-Valley south of Warmbad in close prox-imity to the northwest-trending Tantalite Valley Shear Belt and the Sandfon-tein-Ramansdrift area close to the Orange River
Fig 7 Pegmatite belts in north-central Namibia from west to east Brandberg West ndash Goantagab Cape Cross ndash Uis Nainais ndash Kohero and Sandamap ndash Erongo as well as the Karibib Pegmatite District (after Geological Suvey of Namibia 2002)
Lithium Potential in Namibia
26
7 Lithium mining in NamibiaData for historic lithium mine production is available for the period 1939 ndash 1998 (Fig 8) After 1998 all mining activities ceased due to product quality issues and overall market environment
Until the mid-1950s lepidolite was the most important mined lithium mineral of the country (Fig 8) As mine output of lepidolite decreased output of petalite increased However quantity on a year-to-year basis was quite variable and fluctuated between 1000 ndash 10000 t Since the early 1980s production of petalite was quite stable and ranged between 1000 ndash 2500 t Production fell sharply in 1997 and 1998 after which it ceased Mining of amblygonite has always been small compared to lepidolite and petalite and never exceeded 1000 t per annum
According to the USGS (2020) 500 t of lithium were mined in Namibia in 2018 This is most likely stockpiled lepidolite material from the Rubicon mine
0
2000
4000
6000
8000
10000
12000
1939
1941
1943
1945
1947
1949
1951
1953
1955
1957
1959
1961
1963
1965
1967
1969
1971
1973
1975
1977
1979
1981
1983
1985
1987
1989
1991
1993
1995
1997
[Ton
nes]
Petalite (t)Amblygonite (t)Lepidolite (t)
Fig 8 Lithium production in Namibia in [t] per year (after Schneider 1992 BGR 2020)
Lithium Potential in Namibia
27
Currently there is no active consecutive mining for lithium in substantial quan-tities in Namibia although there are prospects and projects under develop-ment
71 Current mining activities and projects
Soris The Soris project is located in the De Rust pegmatite swarm which is part of the ldquoBrandberg West ndash Goantagab tin beltrdquo (Fig 7) This belt stretches to the northeast of the Brandberg massif over a length of 60 km and a width of 25 km This belt was previously mined for cassiterite on a larger scale Some of the pegmatites in this belt may carry substantial amounts of lithium such as pegmatites in the De Rust pegmatite swarm
The De Rust pegmatite itself is a Li-rich rare metal pegmatite that was mined for cassiterite and tantalite but also for minor quantities of spodumene be ween 1960 and 1990 (Diehl 1990) It intruded into metasediments of the Amis River Formation Lower Ugab Group of the Southern Kaoko Zone
It is the largest pegmatite of the De Rust pegmatite swarm within the Brandberg West ndash Goantagab pegmatite belt (Diehl 1992c) Outcrops are 100 ‒ 470 m long up to 30 m wide and can be followed over a length of roughly 24 km
The pegmatite shows well-developed zonation with a border zone (quartz alkali feldspar muscovite) outer (quartz microcline-perthite muscovite altered petalite) and inner (quartzo-feldspathic rock with spodumene crystals with accessory apatite lepidolite eucryptite zircon and monazite) intermedi-ate zone as well as a core zone (quartz subordinate microcline muscovite sporadic tantalite) Spodumene crystals may reach up to 80 cm in length (Fig 12) Towards the core zone spodumene carries rounded nodules of lithi-um phosphates (amblygonite ndash montebrasite series)
It is located northwest of the nearest town of Uis in the Kunene region of Namibia about 6km to the east of farm De Rust 532 and about 25 km north of the Ugab River The nearest railhead is located in the town of Karibib and the deep-water port of Walvis Bay is 120 km to the southwest Windhoek is about 180 km to the southeast
Lithium Potential in Namibia
28
The project can be reached via paved but mostly unpaved roads from the town of Uis From White Lady Lodge which is about 38 km northwest from Uis a 35 km gravel road leads towards the project 15 km of which are in the riverbed of the Ugab River There is currently no electricity and water supply at the project location site
According to SampP Global (022020) current owner of the Soris project is Mon-tero Mining amp Exploration Ltd (TSXV MON) which holds 80 interest of the property Another 20 are allocated to an unnamed private owner Based on data from the Namibia Mining Cadastre Portal (092020) multiple entries for mining licence applications exist for the area where the main De Rust pegmatite is located (Fig 9)
Resource estimateDue to the early stage of the Soris project no resource estimate is avail-able However Montero Mining claims the project to be drill ready targeting a resource of 10 Mt 1 Li2O with tantalum and tin by-product credits This would equate to 46400 t of lithium or 247000 t LCE
Grab samples of the deposit showed lithium contents of 007 to 532 aver-aging 137 Channel samples showed average lithium contents of 076 and values up to 366 (Montero 032019) The company also re-assessed 1097 previously tested RC drill samples The main lithium-bearing mineral is spodumene
Remnants of historic intermittent mining activities like old foundations and quartzo-feldspathic tailings are still visible east to the main pegmatite (Fig 10 ‒ 11)
Lithium Potential in Namibia
29
Fig 10 Remnants of historic open pit mining (upper) and tailings of De Rust pegmatite (lower) northwest of the Brandberg massif (Photo BGR-GSN 2019)
Fig 9 Satellite image of the De Rust project including the outlined mining license Main pegmatite coordinates 20deg57prime48primeprimeS ‒ 14deg30prime12primeprimeE (Source httpportalsflexicadastrecomnamibia 092020)
Main pegmatite
Lithium Potential in Namibia
30
Fig 12 Weathered spodumene chrystals at the historic open pit mine (Photo BGR-GSN 2019)
Fig 11 Historic open pit of the De Rust pegmatite (Photo BGR-GSN 2019)
Lithium Potential in Namibia
31
Uis The Uis projects (former mine and tailings) are located in the northern part of the ldquoCape Cross Uis pegmatite beltrdquo east of the town of Uis on the farm Uis Townlands No 215 in the Erongo region of Namibia
The Cape Cross-Uis belt is approx 120 km long and up to 40 km wide and extends in a NE direction (Fig 7) It comprises three distinct pegmatite swarms the Strathmore swarm Karlowa swarm and Uis pegmatite swarm In general lithium-bearing pegmatites (Li-Nb-Ta-Sn-Be and Li-Nb-Ta-Sn) are the least common in this belt (Fuchsloch et al 2018)
The Uis swarm field consists of more than 120 individual pegmatites each with a northeasterly to easterly strike direction and northwesterly down dip (30deg ‒ 70deg) This field is accompanied by a peripheral pegmatite field of approx 25 individual pegmatites
Some of the main pegmatites especially around the formerly worldrsquos largest tin mine at Uis are exceedingly large Some of them are up to 1 km long and some 50 m wide
In terms of lithium petalite amblygonite and minor spodumene mineralization occurs in the various pegmatites but no lepidolite Most common lithium bear-ing minerals in the eight pegmatites that were mined at Uis are amblygonite petalite and spodumene
Currently the Uis tailings project and the Uis tin mine are owned by two differ-ent companies As of 2020 the tin mine is operating a pilot processing plant and aims to ramp up the production of lithium in the near future The current ownership of the tailings project as of September 2020 is unclear
The nearest commercial deep-water port to the projects is Walvis Bay 220 km to the southeast The town of Omaruru is 130 km to the east and Henties Bay lies about 120 km to the southwest The nearest railhead is located in Omaruru The area is accessible year-round by paved and un-paved roads NamPower provides electricity and the town of Uis is connected to the Nam-Water pipeline
Lithium Potential in Namibia
32
The tin deposit was discovered in 1911 and mined between the 1950s and 1989 for cassiterite by Uis Tin Mining Company (SWA) Ltd and IMCOR
Coarse tailings are located in the northern part of the former mine just south to the main road C36 (Fig 13) The fine material is located south to the coarse waste dumps (Fig 13)
After 1990 multiple companies owned the property until AfriTin Mining Ltd bought all the rights (license ML134) The current lithium tailings project of Montero Mining amp Exploration Ltd (TSXV MON) is based on the historic mine tailings of the former tin mine on mining license ML134 that is currently owned by AfriTin Mining Ltd The acquired tailings material does not fall under the ML134 license of AfriTin since historical tailings material (Fig 14) is not regulated by Minerals (Prospecting and Mining) Act 33 of 1992 of Namibia
Resource estimateUis tin mineAccording to AfriTin the former Uis mine holds a JORC compliant resource (inferred) of 715 Mt of ore 0134 Sn with a cut-off grade of 005 Sn (AfriTin 2020) Grades of ancillary elements are given at 063 Li2O and 85 ppm Ta for the total resource of 71 Mt of ore
This equals to approx 95000 t of tin 209000 t of lithium (11 Mt LCE) and 6090 t of tantalum 85 of the total resource are attributable to the company The remaining 15 are allocated to SMU (Small Miners of Uis)
Uis tailingsMontero Mining filed an inferred resource estimate of 144 Mt of ore 037 Li2O and 005 SnO2 with a 035 Li2O cut-off grade for lithium and assumed processing recoveries of 70 for their tailings project (Montero 2019) This equals to approx 24700 t of lithium content (131500 t LCE) and 7200 t SnO2
This resource estimate only includes coarse tailings material There is current-ly no information on the lithium content of the fine tailings material that totals 271 Mt t due to insufficient or no test work (Montero 2018) The company also states that the average Li2O grade of the fines material does not hurdle the cut-off for the fines of 082 Li2O
Lithium Potential in Namibia
33
In 2016 Australian based Tawana Resources carried out a drilling program at Uis for a private company called Lithium Africa 1 on the fine and coarse tailings (Table 3 Hole 1 amp Hole 2) Below some of the obtained data on lithium content is given Additionally Li2O content of two obtained grab samples by BGR (Table 3 Sample 2019a amp 2019b) is given
Table 3 Sample data Uis (Tawana 2016 Montero 2018 BGR 2019)
Sample Sample 0 to 1m Li2O ()
Sample 1 to 2m Li2O ()
Sample 2 to 3m Li2O ()
Fines Hole 1 071 085 092
Fines Hole 2 080 089 095
Coarse Hole 1 050 043 043
Coarse Hole 2 054 062 062
BGR Sam-ple 2019a (Coarse tailings)
028
BGR Sam-ple 2019b (Coarse tailings)
028
Montero NI 43-101 037
Lithium Potential in Namibia
34
Fig 14 Tailings of the historic Uis Tin Mine (Photo BGR-GSN 2019 with kind permission of AfriTin Mining Limited)
Fig 13 Former Uis tin mine Uis tailings project with coarse tailings Tailings coordina-tes (center) 21deg13prime31primeprimeS ‒ 14deg52prime44primeprimeE (Source httpportalsflexicadastrecomnamibia 092020)
Uis Tailings (coarse)
Uis Tailings (fine)
Historic Uis mine
Lithium Potential in Namibia
35
Karibib Lepidolite ProjectThe Karibib Lepidolite brownfield project is located in the ldquoKaribib ndash Usakos Pegmatite Districtrdquo southeast of the town of Karibib on the farm Okongava Ost No 72 in central Namibia (Fig 15 ‒ 16)
This pegmatite district which is of Damaran age hosts the most important pegmatite occurrence (Rubicon swarm) in terms of lithium in Namibia In addi-tion numerous other different pegmatite swarms some of which have previ-ously been relevant in terms of lithium are know from this district These are Dernburg Karlsbrunn Albrechtshoumlhe Berger Kaliombo Gamikaubmund Okatjimukuju Etusis Daheim Friedrichsfelde and Etiro (Diehl 1992a)
The Rubicon pegmatite itself is the largest of the individual pegmatites that occur in this field and has been the prime source of lithium until mining seized in the early 1990s The Helikon pegmatites are part of the Rubicon pegmatite swarm and are located northeast to the Rubicon pegmatite They have previ-ously been mined for lepidolite amblygonite petalite and muscovite beryll pollucite quartz and columbite-tantalite as valuable by-products (Fig 18 ‒ 19)
The pegmatite itself consist of two ellipsoidal well zoned Li-mineralized ore-bodies The larger one is about 320 m long and 25 ndash 35 m wide It dips at 46deg to the northeast and has a northwesterly strike The second orebody is about 230 m long and about 10 m wide It is dipping with 30deg to the northeast and has a northwesterly strike In total the outcrop of the Rubicon pegmatite is about 600 m long with a maximum width of 65 m (Fig 17)
A very prominent feature is the presence of a very well developed concen-tric shell and zones from the footwall to the inner core of the pegmatite Both orebodies exhibit a border- wall- intermediate- and core-zone
Border-zone wall-zone and outer intermediate zone of the larger orebody do not contain Li-bearing minerals of economic importance The inner interme-diate zone does contain lepidolite The outer core zone may be sub-divided into a petalite zone low-grade lepidolite zone and a high-grade lepidolite zone The inner core zone also contains a petalite zone Mining occurred pre-viously in the later named zones The zonation of the smaller orebody to the northwest is less pronounced but Li-mineralization and style are equal to the
Lithium Potential in Namibia
36
larger orebody There is no spodumene mineralization within the orebodies and respectively zones of the Rubicon pegmatite
The Helikon I pegmatite is also a lens-shaped pegmatite with a length of roughly 400 m and a width of approx 66 m It dips to the north with about 60deg ndash 70deg Helikon I also consists of well-defined zones The main Li-bearing minerals are lepidolite and petalite According to Roering (1963) the lepidolite is difficult to separate from the intergrown albite and hence of low grade and quality
The Helikon II pegmatite is approx 17 km long and only 9 ndash 15 m wide It lies a bit north of Helikon I and dips steeply to the north with 55deg ndash 80deg striking east west The main Li-bearing minerals are lepidolite and petalite According to Diehl (1990) the westernmost portion of the pegmatite has historically been the economically most important A massive up to 6 m wide petalite zone was mined here according to Diehl (1990)
The nearest railhead to the project is 17 km away in Karibib and the deep-water port of Walvis Bay is 220 km to the southwest Windhoek is about 180 km to the southeast NamPower connects the town of Karibib to electricity and the project currently utilizes generators There is a 7 km long 22 kV power line spur to grid connection pending (Lepidico 2020) Water is available via on-site boreholes
The project was previously owned by Desert Lion Energy Inc (TSVX DLI) Lepidico Ltd (ASX LPD) bought into the project and currently holds 80 interest which comprises Mining License 204 (69 km2) as well as three Exclu-sive Prospecting Licenses (EPLs) namely 5439 5555 and 5781 (Lepidico 2020)
Lepidico will cover mining from multiple sources as well as chemical conver-sion by utilizing their proprietary lithium processing technologies L-Maxreg LOH-Maxreg and S-Maxreg (Lepidico 052019) The company aims to produce high purity lithium chemicals such as lithium carbonate and lithium hydroxide
The takeover also included a nonbinding offtake agreement between the for-mer owner Desert Lion Energy Inc and German chemical company BASF On April 2nd 2019 Desert Lion Energy Inc announced this offtake agreement
Lithium Potential in Namibia
37
which at the time was valid through to December 31 2019 On December 20th
2019 Lepidico announced that the LOI with BASF was extended to Decem-ber 31st 2020 (Lepidico 122019)
The feasibility study criteria of Lepidico are as follows
- Throughput of the concentrator on-site of 035 Mtpa- Expansion of throughput after year five to 05 Mtpa- Chemical plant in the industrial city of Abu Dabi (ICAD)- Plant design for 58000 tpa of concentrate (4 LiO2) for the production of
up to 5500 tpa LiOH- Utilization of L-Maxreg and LOH-MaxTM- Non-binding off-take MOU with BASF for LiOH only- Targeting for project commissioning to commence late 2021 for commer-
cial production in 2022
The preliminary mine plan indicates a strip ratio of 03 ndash 1 for the first two years The ratio will then go up to 1 ndash 14 In the first four years elevated grades of 06 LiO2 will be mined
Resource estimateA JORC 2012 compliant resource estimate for the deposit is given in Table 4 (Lepidico 2020) The deposit currently holds 23200 t of lithium (Indicated amp Inferred) based on a cut-off grade of 015 Li2O This resource estimate is based solely on the lepidolite occurrences at the mine site
Table 4 Resource estimate Karibib Lepidolite Project (Source Lepidico 2020)
Deposit Resource Category
Cut-off (Li2O)
Ore (Mt)
Li2O ()
Li (t)
Li (LCE)
Rubicon Measured
015
22 057 5819 30974
Rubicon Indicated 666 038 11637 61943
Rubicon Inferred 237 043 4728 25167
Helikon
Total 015 1124 043 22184 118086
Lithium Potential in Namibia
38
Fig 16 Satellite image of the Karibib Lepidolite project Helikon 1 coordinates (center) 22deg2prime49primeprimeS ‒ 16deg1prime13primeprimeE Helikon 4 coordinates (center) 22deg2prime24primeprimeS ‒ 16deg1prime41primeprimeE (Source httpportalsflexicadastrecomnamibia 092020)
Fig 15 Satellite image of the Karibib Lepidolite project Rubicon coordinates (center) 22deg6prime11primeprimeS ‒ 15deg59prime44primeprimeE (Source httpportalsflexicadastrecomnamibia 092020)
Historic Rubicon mine
Helikon 1
Helikon 4
Lithium Potential in Namibia
39Fig 17 Rubicon pegmatite (Photo BGR-GSN 2019 with kind permission of Lepidico Chemicals Namibia (Pty) Ltd 2020)
Lithium Potential in Namibia
40 Fig 18 Lepidolite sample from Rubicon pegmatite (Photo BGR-GSN 2019 with kind permission of Lepidico Chemicals Namibia (Pty) Ltd 2020)
Fig 19 Petalite sample from Rubicon pegmatite (Photo BGR-GSN 2019 with kind permission of Lepidico Chemicals Namibia (Pty) Ltd 2020)
Lithium Potential in Namibia
42
Fig 21 Helikon 4 pegmatite (Photo BGR-GSN 2019 with kind permission of Lepidico Chemicals Namibia (Pty) Ltd 2020)
Fig 20 Helikon 1 pegmatite (Photo BGR-GSN 2019 with kind permission of Lepidico Chemicals Namibia (Pty) Ltd 2020)
Lithium Potential in Namibia
43
Tantalite ValleyThe Tantalite Valley Project lies within the ldquoNamaqua Metamorphic Complexrdquo in Southern Namibia Within this complex Lithium-Caesium-Tantalum (LCT) pegmatites occur in two main areas Tantalite-Valley south of Warmbad in close proximity to the northwest-trending Tantalite Valley Shear Belt and the Sandfontein-Ramansdrift area close to the Orange River
The area were the pegmatites of the Tantalite Valley occur is primarily com-posed of a large ovoid gabbro intrusion (71 km by 33 km in extent) within paragneiss units of the Namaqua Complex The gabbro outcrop forms a large dome shaped mountain that rises about 500 m above the surrounding topo-graphy
The pegmatites belong to the Kenhardt and Gordonia pegmatite districts in Namaqualand but only the younger group of them carry accessory ore miner-als such as tantalite beryl REE minerals and lithium
The Tantalite Valley pegmatites include several individual subhorizonal dikes that are up to 1000 m long and 02 to 40 m wide plunging towards southeast (Diehl 1992b) Four of those are of economic interest Homestead Whitkop White City and the Lepidolite pegmatites (ie Purple Haze) (Fig 22)
They are all well zoned (quartz core inner and outer intermediate zones wall zone) and were predominantly targeted for beryl columbite-tantalite as well as lithium and bismuth minerals
The project is located on the farms Umeis 110 and Kinderzitt 132 between the Farms 109 131 129 308 and 473 in the magisterial district of Karas It currently comprises Mining License (ML-77) fully owned by Tameka Shelf Co Four (Pty) Ltd which is a 100 subsidiary of African Tantalite Pty Ltd (AFTAN) Above all Kazera Global Investments PLC holds a 75 stake in AFTAN (Kazera 2019) with the other 25 of local farmer ownership
The project is accessible via gravel road from Karasburg which is about 80 km to the north The nearest railhead is also located in Karasburg Electricity is currently supplied by generators and water is recovered from multiple drill holes The Orange River is about 15 km to the south of the project Mining
Lithium Potential in Namibia
44
infrastructure as well as equipment are on site as well as a plant for the pro-duction of tantalite concentrate
NTI is working on an extensive exploration program with a clear focus on revi-ving tantalite mining in Namibia with a possible by-product stream of lithium bearing minerals The company will focus primarily on the pegmatites Homes-tead Purple Haze Signaalberg and White City (Fig 23)
The area is known for its tantalum occurrences and since the late 1940s tantalite and other minerals have been recovered at Tantalite Valley until 1981 when mining ceased Initially alluvial deposits were mined followed by the pegmatites themselves Grades of the concentrates produced prior to the closure of the mine were quite high with 65 ‒ 70 Ta2O5 with very low U3O8
and ThO2 values of 025 max
Resource estimateAccording to SampP Global (092020) Measured and amp Indicated resources at Tantalite Valley are 104800 t of ore 0042 Ta2O5 and 0653 Li2O as of 112019 This would equate to 315 t of lithium or 1690 t LCE Total inferred resources are 517400 t of ore 0018 Ta2O5 and 0144 Li2O This equals to approx 91 t of tantalum and 750 t of lithium (3535 t LCE)
Lithium Potential in Namibia
45
Fig 23 White City pegmatite (Source Kazera global Investments PLC 2020)
Fig 22 Satellite image of the Tantalite Valley project White City pegmatite coordinates (center) 28deg43prime07primeprimeS ‒ 18deg44prime45primeprimeE Homestead pegmatite coordinates (center) 28deg43prime19primeprimeS - 18deg44prime24primeprimeE Purple Haze pegmatite coordinates (center) 28deg43prime09primeprimeS ‒ 18deg43prime55primeprimeE (Source httpportalsflexicadastrecomnamibia 092020)
Lithium Potential in Namibia
46
8 Analysed lithium samplesDuring the course of the cooperation project between the Economic Geology Division (EGD) of the Geological Survey of Namibia (GSN) and the Ger-man Federal Institute of Geosciences and Natural Resources (BGR) several sampling campaigns to southern and central pegmatites took place
The field trips were preceded by literature and data research regarding infor-mation on lithium occurrences andor previous lithium mining activity to iden-tify specific target areas
During a campaign in 2019 16 lithium-bearing mixed mineral samples were taken from five different locations and subsequently analyzed Two of the samples originate from the Uis Tin Mine Tailings of the former tin mine All remaining samples were taken either from stripped outcrops for future mine activities or from previous mine sites (ie pits)
All 16 samples were analyzed at BGR labs in Hanover Germany through qualitative XRD XRF and ICP-MS Given data shall be understood as a first indicator for the sampled lithium occurrences
Most if not all sampled occurrences have previously been analyzed or are cur-rently being assessed by the property owners or current licensees Detailed information of these sampling and analytical campaigns remain confidential and are thus not available for comparison
Appendix A lists the identified qualitative mineralogy of the samples as well as the major element analysis Additional samples from previous campaigns are also given
Interpretation of the results are based on their applicability in the various lithium-consuming industries for which information is available
Most of the current lithium applications require a chemical intermediate product such as lithium carbonate or lithium-hydroxide The glass and cera-mic industry does use lithium-bearing mineral concentrates depending on the prices of these materials when compared to LiCO3
Lithium Potential in Namibia
47
Since the main applications require an intermediate or downstream chemical product lithium content as well as impurity values are the main criteria for the suitability of the sampled occurrences Other quality criteria are particle size and surface areastructure
9 InterpretationAs previously stated all obtained grab samples are mixtures of lithium- bearing minerals (ie spodumene petalite lepidolite) feldspars quartz micas as well as secondary minerals Therefore all given analytical data has to be taken with caution and will not be representative for the individual outcrops or deposits
The evaluation of the economic suitability for various economic applications of the analysed lithium samples is based on the chemical specifications in Chapter 4
Lithium content gt 1 Li2O Fe2O3 content lt 015 as well as F content lt 01 are individually highlighted (Appendix A) as these three values are the most important
Based on the chemical analysis nine of the 16 samples showed Li2O contents of more than 1 (range 117 ‒ 327 ) Seven of those nine samples also exhibited low Fe2O3 content (range 004 ‒ 008 ) (Appendix A) Three of those seven samples also had fluorine values below 005
Of the ten additionally included samples from previous campaigns four showed Li2O contents of more than 1 (range 126 ‒ 199 ) Three of those samples also exhibited low Fe2O3 content (range 004 ‒ 007 ) (Appendix A) One of the three samples had fluorine values below 005
The mentioned samples (sources) could be of potential use but for further interpretation statistical sampling will be required
Lithium Potential in Namibia
48
10 ConclusionsThere is currently no lithium industry established in Namibia This accounts to both mining and processing of ores into commercial lithium-bearing con-centrates as well as the production of downstream products such as lithium carbonate andor lithium hydroxide In order to evaluate the potential for a lithium industry in Namibia the current global market and price developments need to be addressed
Currently the main application for lithium is in the chemical industry as lithium carbonate andor hydroxide for the manufacturing of lithium-ion batteries There is currently no domestic market (supply) or demand for this industry in Southern Africa or Namibia in specific Processing of lithium-bearing ores into these highly specific downstream products is economically more viable in close proximity to the demanding industries It also requires large investments (double-digit million dollars per 10000t of capacity) Additionally there is already huge capacity and strong capacity build up in Asia at rather low cost
The second most important application lies in the glass and ceramics industry This industry uses lithium either as lithium-bearing concentrates or lithium carbonate depending on current market price and processproduct require-ments There is currently no such industry established in Namibia but potential plans There is glass and ceramics manufacturing in South Africa and thus a potential market for lithium bearing products (concentrates) should this indus-try require it depending on product
The 20182019 primary lithium supply based on spodumene-bearing mineral concentrates was dominated by Australia with a market share of well over 95 On an annual basis the country exports more than three million tons of lithium-bearing concentrates to China To put this into perspective Lepidico plans to export just 58 ktpa of concentrate to Abu Dhabi for refinement from their project annually Therefore potential production in Namibia will always be rather small scale when compared to peer producing countriescompanies
As of late 2020 the concentrate market is in strong oversupply with strong competition Thus prices have eroded quite substantially for a standard SC6 concentrate (Fig 24) In general prices vary significantly based on lithium content and impurities of the concentrates Lithium bearing mineral concen-
Lithium Potential in Namibia
49
trates are a relatively low-value mineral commodity when compared to lithi-um-carbonate or other lithium downstream products thus product quality cost reduction and cost control are key components in this industry Since prices are depressed currently many of the Australian producers have drasti-cally reduced output or even went into care and maintenance This situation may change towards 2025 or beyond as demand picks up
Prices for the higher valued product lithium-carbonate spiked at the end of 2017 towards 2018 to more than 20000 $USt on a contract basis with prices being very volatile Since then prices have also eroded to below 9000 $USt due to oversupply and slow demand pickup (Fig 25) With this product stable quality and chemical composition are crucial for the downstream industry
Based on available gradetonnage data the Namibian projectsprospects are relatively small in overall size and low in grade when compared to global peers for the resource category ldquoMeasuredIndicatedrdquo (Appendix B) Total contained lithium quantity is thus relatively small in comparison On a global scale the most promising hard rock projects that are currently being mined and developed have Li2O grades of 10 or above
Fig 24 Lithium-mineral-concentrate prices 012010 ‒ 062020 (Source BGR 2020)
300
400
500
600
700
800
900
1000
1100
208
210
212
214
216
218
220
US$
t US$t
01-20
14
01-20
15
01-20
16
01-20
17
01-20
18
01-20
19
01-20
20
01-20
10
01-20
11
01-20
12
01-20
13
Spodumene min 5-6 LiO2 fob Australia
Spodumene concentrate gt75 LiO2 bulk cif Asia
Petalite 42 LiO2 fob Durban
Spodumene fob Australia
Spodumene min 5-6 LiO2 cif China
Lithium Potential in Namibia
50
For the resource category ldquoIndicatedrdquo which generally represents the lowest level of confidence only the Uis mine project of AfriTin represents a size-able resource even though grades are relatively low (Appendix C) The Uis tailings project as well as the Rubicon project are again relatively small when compared to their global peers Tantalite Valley is the smallest of all included projects (Appendix C)The given data for the De Rust project reflects only an exploration target of the company rather than actual data and may thus be not representative
Based on size and contained lithium-content none of the visited early stage projectsprospects would justify the financial investment into the construction of a chemical conversion plant for the production of lithium carbonate andor hydroxide on site as it requires very large monetary investments Due to their size payback of the required investments may be unfavorable when compared to global peers In addition the current market environment is very harsh with strong competition from Asia that has a huge cost advantage due to capacity build up This industry is also very energy and water intensive
In addition location within Namibia as well as distance to possible down-stream markets may become an issue as it increases the transportation cost
4000
7000
10000
13000
16000
19000
22000
25000
28000
01-20
14
01-20
15
01-20
16
01-20
17
01-20
18
01-20
19
01-20
20
US$
t
Lithium-carbonate (min 995 ) battery grade spot price ex works domestic ChinaLithium-carbonate (min 99-995 ) Li2CO3 large contracts USA delivered continentalLithium-hydroxid-monohydrate (min 565) technical and industrial grades cif China Japan amp Korea
Fig 25 Lithium chemical prices 012014 ndash 062020 (Source BGR 2020)
Lithium Potential in Namibia
51
immensely This is especially true for the SorisDe Rust pegmatite which is in a remote location without any allocated infrastructure The projects Karibib Uis and Tantalite Valley are much easier to access
The approach of Lepidico to produce a lithium bearing concentrate on site seems plausible approach Since this will already require a skilled workforce mining and beneficiation equipment in order to produce a high quality lithium-bearing concentrate it may already be considered ldquoadded valuerdquo for the indus-try of the country This approach may also be suitable for the other mentioned and visited projects
Lithium Potential in Namibia
52
ReferencesAfriTin Mining (2020) Uis Tin Project ndash Company Information ndash URL httpafritinminingcomuis-project [as of 092020]
Australian Government Geoscience Australia (2019) Australiarsquos Identi-fied Mineral Resources 2019 ndash URL httpswwwgagovauscientific-topicsmineralsmineral-resources-and-adviceaimr [as of 092020]
BGR ndash Bundesanstalt fuumlr Geowissenschaften und Rohstoffe (2020) Fachinformationssystem Rohstoffe ndash unpubl Hannover [as of 082020]
BGS ndash British Geological Survey (2016) Lithium Definitions mineralo-gy and deposits ndash URL httpswwwbgsacukdownloadsstartcfmid=3100 [as of 062016]
Diehl B J M (1990) Pegmatites of the Cape Cross Uis ndash Pegmatite Belt Namibia Geology mineralisation Rubidium Strontium characteristics and petrogenesis of rare metal pegmatites Open File Report EG 083 Economic Geology Series Geological Survey of Namibia 39 pp Windhoek
Diehl B J M (1992a) Lithium Caesium Beryllium Open File Report Mineral Resource Series Geological Survey of Namibia 18 pp Windhoek
Diehl B J M (1992b) Niobium and Tantalum Open File Report Mineral Resource Series Geological Survey of Namibia 20 pp Windhoek
Diehl B J M (1992c) Tin Open File Report Mineral Resource Series Geological Survey of Namibia 30 pp Windhoek
Diehl B J M amp Schneider G I C (1990) Geology and mineralisation of the Rubicon Pegmatite Namibia Open File Report Geol Surv Namibia 20 pp Windhoek
Fuchsloch et al (2018) Classification mineralogical and geochemical vari-ations in pegmatites of the Cape Cross-Uis pegmatite belt Namibia Lithos 296 ndash 299 79-95 elsevier
Lithium Potential in Namibia
53
Garret D E (2004) Handbook Of Lithium And Natural Calcium Chloride Their Deposits Processing Uses and Properties ndash 467 S Oxford (Elsevier B V)
Geological Survey of Namibia (2002) Mineral Resources of Namibia Summary of Mineral Deposits and Occurrences Omaruru Sheet 2114 Volume I ndash Complete Descriptions 119 pp Windhoek
IHS Global SA (2020) Global Trade Atlas ndash Commercial Online-Databa-se ndashURL httpsmyihscomConnectcallingUrl=https3a2f2fconnectihsmarkitcom2f [as of 062017]
Kazera Global Investments PLC (2020) Company Information ndash URL httpskazeraglobalcominvestmentsnamibia-tantalite-investment-mine [as of 092020]
Lepidico (2019) LOI with BASF extended to 31 December 2020 ndash News Release ndash URL httpswwwlepidicocomwp-contentuploads201910LPD-191220-LOI-with-BASF-extended-to-31-December-2020pdf [as of 122019]
Lepidico (2019) Corporate Presentation ndash URL httpswwwlepidicocomwp-contentuploads201907LPD-190509-Corporate-Presentati-on-May-2019pdf [as of 052019]
Lepidico (2020) Company Information ndash URL httpswwwlepidicocomprojectskaribib [as of 092020]
Montero Mining amp Exploration Ltd (2018) Exploring Battery Metals in Namibia ndash Company Presentation ndash URL httpswwwproactiveinvestorscomauuploadSponsorFileFile2018_031520244941_MON-CorporatePre-sentationMarch2018pdf [as of 072018]
Montero Mining amp Exploration Ltd (2019) Montero Files NI 43-101 Resource Estimate On The Uis Lithium-Tin Tailings Project In Namibia On Sedar ndash News Announcement ndash URL httpsmonterominingcommontero-files-ni-43-101-resource-estimate-on-the-uis-lithium-tin-tailings-project-in-namibia-on-sedar [as of 032019]
Lithium Potential in Namibia
54
Namibia Mining Cadastre Portal (2020) Online-Database ndashURL httpsportalslandfoliocomnamibia [as of 092020]
Roskill Information Services Ltd (2016) Lithium Global Industry Mar-kets amp Outlook ndash 386 S London Groszligbritannien
Schneider G I C (1992) Feldspar Open File Report MRS 08 Mineral Resource Series Geological Survey of Namibia 2 pp Windhoek
Schmidt M (2017) Rohstoffrisikobewertung ndash Lithium ndash DERA Rohstoffin-formationen 33 Berlin
S amp P Global Market Intelligence (2020) Lithium - Metals amp Mining Properties URL httpsplatformmarketintelligencespglobalcomwebcli-entauth=inheritindustryminingProjects [as of 092020]
Statista (2020) Distribution of lithium end-usage worldwide in 2019 by area application ndash URL httpswwwstatistacomstatistics268787lithium-usa-ge-in-the-world-market [as of 062020]
Tawana Resources NL (2016) Tawana acquires second lithium pro-ject ndash News Release ndash URL httpsmstrademomentumcozajsepdfSENS_20160923_S376505pdf [as of 092016]
USGS ndash United States Geological Survey (multiple years) Lithium ndash Minerals Commodity Summaries ndash URL httpswwwusgsgovcentersnmiclithium-statistics-and-information [as of 082020]
Appendix
Sam
ple I
DFa
rmLa
titud
eLo
ngitu
deSa
mpl
e des
crip
tion
(XRD
qu
al)
LiO 2
()
SiO 2
Ti
O 2
Al2O 3
Fe2O 3
Mn
O Mg
O Ca
O Na
2O
K 2O P 2O 5
SO
3
Cl
F
LOI
Su
m
2015
-03
previous sample campaignsHelik
on
n A
Felds
parQ
uartz
Lepid
olite
025
6871
lt000
119
0500
200
2900
505
3292
806
7905
59lt0
01lt0
002
lt005
093
9985
2016
-12
Rubic
onwe
ather
ed P
etalite
126
6473
lt000
118
0600
703
2718
607
9507
805
2500
62lt0
01lt0
002
lt005
1146
9871
2016
-17
Rubic
onLe
pidoli
te +
Quar
tz13
063
6700
219
9316
0929
003
0054
029
6218
0052
lt001
lt000
226
232
798
67
2016
-20
Helik
onLe
pidoli
te + A
lbite
176
5514
lt000
126
8700
401
2100
700
2123
970
3900
45lt0
01lt0
002
156
369
9698
2016
-21
Helik
onLe
pidoli
te19
954
32lt0
001
2627
004
0224
006
0038
266
714
0069
lt001
lt000
240
628
997
77
FN20
19_0
4De
Rus
tFe
ldspa
rAmb
lygon
iteP
etalite
(n
on X
RD)
003
6513
lt000
118
82lt0
0100
0200
101
0924
311
4105
75lt0
0100
04lt0
0503
898
84
2015
-09
Molop
oPe
talite
(non
XRD
)00
952
85lt0
001
1672
lt001
0002
487
0323
342
0352
lt000
100
400
3403
621
1310
012
2016
-14
Molop
oPe
talite
wea
there
d (no
n XRD
)00
752
1600
0316
5100
200
5147
805
8923
406
4500
6900
200
8602
222
6310
013
2016
-15
Molop
oFe
ldspa
r (no
n XRD
)00
664
02lt0
001
1937
003
0004
003
0151
216
1249
0796
lt001
lt000
2lt0
0505
399
55
2016
-23
Molop
oZin
nwald
ite (n
on X
RD)
006
5044
0068
3307
048
0011
012
0426
261
7674
0181
lt001
lt000
2lt0
0542
9925
1909
249
2019Uis
Tailin
gs
Quar
tzFe
ldspa
rPeta
lite
Musc
ovite
028
7293
0045
1479
051
0062
0212
9830
927
6613
6200
2lt00
02lt0
0523
399
38
1909
250
Uis
Tailin
gsQu
artz
Felds
parP
etalite
Mu
scov
ite02
872
6900
4314
8205
0059
019
1306
313
2794
1347
002lt
0002
lt005
251
9937
1909
251
Helik
on 4
22deg02prime4
8primeprimeS1
6deg01prime30
primeprimeEQu
artz
Felds
parP
etalite
Le
pidoli
te16
464
4400
0319
4200
301
2100
408
8325
345
6806
800
400
0727
228
998
38
1909
252
Helik
on 1
22deg02prime2
0primeprimeS1
6deg01prime19
primeprimeEPe
talite
Lepid
olite
Quar
tz29
576
9200
0116
6800
300
0304
101
7301
106
8100
01lt0
01lt0
002
lt005
205
97
App
endi
x A
Ana
lytic
al d
ata
of li
thiu
m s
ampl
es c
olle
cted
in N
amib
ia T
hres
hold
val
ues
high
light
ed in
gre
en
Lithium Potential in Namibia
57
Sam
ple I
DFa
rmLa
titud
eLo
ngitu
deSa
mpl
e des
crip
tion
(XRD
qu
al)
LiO 2
()
SiO 2
Ti
O 2
Al2O 3
Fe2O 3
Mn
O Mg
O Ca
O Na
2O
K 2O P 2O 5
SO
3
Cl
F
LOI
Su
m
1909
253
2019Rubic
on22deg06prime1
3primeprimeS1
5deg59prime45
primeprimeEPe
talite
Lepid
olite
Quar
tz32
778
73lt0
001
1687
002
0006
002
0157
011
003
0002
003
0003
lt005
075
9663
1909
254
Rubic
on22deg06prime1
0primeprimeS1
5deg59prime41
primeprimeEFe
ldspa
rQua
rtzM
usco
vite
004
682
lt000
119
3500
300
2400
205
0610
0808
6804
3lt0
01lt0
002
lt005
041
9985
1909
255
Rubic
on22deg06prime1
0primeprimeS1
5deg59prime41
primeprimeEFe
ldspa
rLep
idolite
Mus
co-
viteK
aolin
026
6104
0004
2318
022
0136
006
0119
367
8411
0159
lt001
lt000
2lt0
0522
299
15
1909
256
Rubic
on22deg06prime1
0primeprimeS1
5deg59prime41
primeprimeELe
pidoli
te 27
249
8700
129
3400
408
0500
400
704
697
3100
31lt0
01lt0
002
087
441
9569
1909
257
Rubic
on22deg06prime1
3primeprimeS1
5deg59prime45
primeprimeEPe
talite
Lepid
olite
Quar
tz30
670
0900
0320
2600
801
0901
502
9901
926
800
15lt0
0100
04lt0
0526
596
48
1909
258
Rubic
on22deg06prime1
0primeprimeS1
5deg59prime41
primeprimeELe
pidoli
teFe
ldspa
rQua
rtz20
659
7800
0224
100
505
2400
300
513
7247
0051
lt001
0002
265
388
9966
1909
259
Tanta
lite
Valle
y28deg43prime0
9primeprimeS1
8deg43prime55
primeprimeEFe
ldspa
rLep
idolite
Mus
covit
e11
762
64lt0
001
2139
004
0161
lt001
0399
7731
2401
0900
200
119
912
698
85
1909
260
Tanta
lite
Valle
y28deg43prime0
9primeprimeS1
8deg43prime55
primeprimeEFe
ldspa
rLep
idolite
Mus
covit
e03
059
8600
1425
1301
604
2200
302
2860
547
2201
3900
200
0904
123
799
56
1909
261
Tanta
lite
Valle
y28deg43prime0
9primeprimeS1
8deg43prime55
primeprimeEFe
ldspa
rQua
rtzM
usco
vite
003
636
0005
2218
022
0122
002
0381
727
3809
0272
lt001
lt000
2lt0
0513
199
17
1909
262
Tanta
lite
Valle
y28deg43prime2
0primeprimeS1
8deg44prime23
primeprimeEQu
artzSp
odum
eneM
us-
covit
e13
180
5100
0415
8903
401
2401
301
9502
604
0400
0500
200
03lt0
0507
398
56
1909
263
De R
ust
20deg57prime4
8primeprimeS1
4deg30prime13
primeprimeEFelsd
parS
podume
neQuartz
074
7313
0006
2048
007
015
005
0154
398
0831
0073
001
0003
lt005
082
9974
1909
264
De R
ust
20deg57prime4
8primeprimeS1
4deg30prime13
primeprimeESp
odum
eneF
eldsparQuartz
230
6924
0006
2602
801
0200
301
0510
102
1400
68lt0
0100
03lt0
0504
897
53
(Con
tinue
d) A
ppen
dix
A A
naly
tical
dat
a of
lith
ium
sam
ples
col
lect
ed in
Nam
ibia
Thr
esho
ld v
alue
s hi
ghlig
hted
in g
reen
Lithium Potential in Namibia
58
Appendix B GradeTonnage data (Measured amp Indicated) for selected lithium projects in comparison to Namibian projects (Source SampP 092020)
0
0500
1000
1500
2000
2500
500
5000
5000
0
5000
00
5000
000
Gra
de [
Li 2O
]
Tonnage [t]
Tantalite Valley
Rubicon
Appendix B GradeTonnage data (Inferred) for selected lithium projects in com-parison to Namibian projects (Source SampP 092020)
0
0500
1000
1500
2000
2500
100
1000
1000
0
1000
00
1000
000
1000
0000
Gra
de [
Li 2O
]
Tonnage [t]
Tantalite ValleyRubicon
Uis Tailings
Uis Mine
De Rust
A product of the technical cooperation project between Bundesanstalt fuumlr Geowissenschaften und Rohstoffe (BGR)(Federal Institute for Geosciences and Natural Resources)
andGeological Survey of Namibia within the Ministry of Mines and Energy
ISBN 978-3-948532-29-1 (Print) 978-3-948532-30-7 (PDF)
- List of Abbreviations
- 1 Introduction
- 2 What is lithium
-
- 21 Lithium deposits
-
- 3 Application
- 4 Chemical requirements
- 5 Mining and trade of lithium in the SADC
-
- 51 Lithium production
- 52 Trade data
- 53 Export
- 54Import
-
- 6 Lithium occurrences in Namibia
- 7 Lithium mining in Namibia
-
- 71 Current mining activities and projects
-
- 8 Analysed lithium samples
- 9 Interpretation
- 10 Conclusions
- References
-
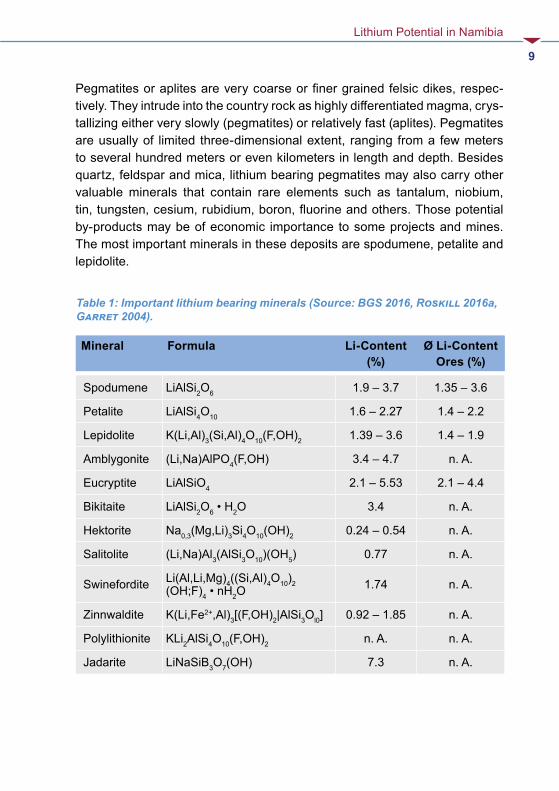
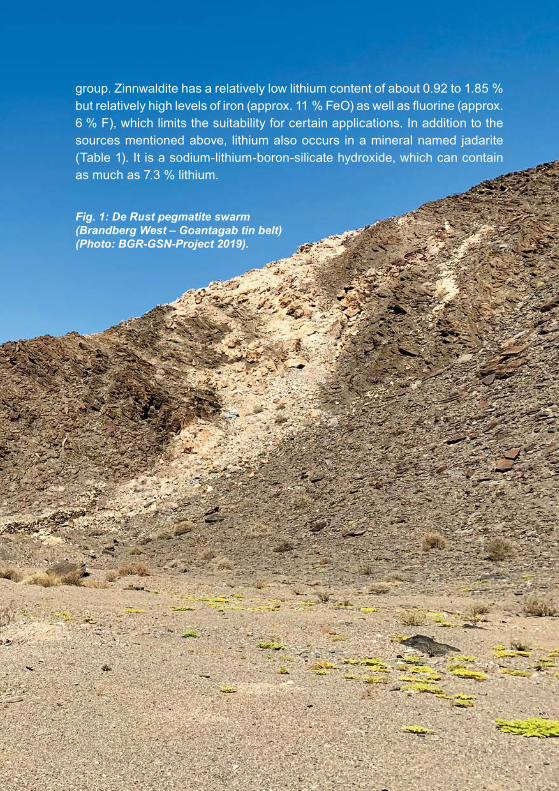
Lithium Potential in Namibia
12
3 ApplicationMany products contain lithium due to its very specific properties By far the most important use of lithium is in the field of rechargeable batteries
In 2019 this area accounted already for 65 of total demand compa-red to 37 in 2015 (Fig 2) Lithium is an essential component in modern lithium-ion-batteries since it has the highest electrochemical potential of all metals and the highest specific capacity Compared to other battery types lithium-ion battery technology has currently the highest energy density the longest cycle life the widest temperature range tolerance and the lowest self-discharge rates (Bauer 2017)
Classical 3C applications such as laptops tablets smartphones and smart watches use lithium-ion-batteries (Fig 3) E-mobility as well as off-grid energy storage (ESS) for renewable energies are the major applications of such bat-teries with the highest projected annual growth rates Power tools play a minor role However products such as e-bikes e-trikes and especially e-scooters are gaining momentum
374
650
305
180
0
10
20
30
40
50
60
70
80
90
100
2015 2020
[]
Rechargeable Batteries Ceramics Greases Polymers
Metallurgical Powders Air Treatment Other
Fig 2 Lithium demand 2015 (left) vs lithium demand 2019 (right) (Source Roskill 2016 Statista 2020)
Lithium Potential in Namibia
13
The second important application of lithium is in the field of glass and cera-mics Cumulatively this area accounts for 18 of demand in 2019 (Fig 2) In the ceramic industry for the production of glazes and ceramic products (tiles sanitary items dishes etc) pure chemical grade lithium carbonate spodumene-concentrate or petalitelepidolite-concentrate is used as lithium source Positive effects of lithium are increase in gloss increase in luminosity increase of chemical and abrasion resistance and reduction of glaze viscosity In ceramic bodies the use of lithium lowers the firing temperature shortens the firing time and thus reduces overall CO2 emissions In addition the use of lithium has a positive effect on the expansion behavior and the mechanical resistance of products
In lubricants lithium is used as lithium-stearate or lithium-12-hydroxy-stea-rate primarily produced from lithium carbonate or lithium hydroxide and stea-rin-acid Di-Lithium-Azelate Lithium-Docosanoate and Lithium-Stearate are also used in lubricants (Roskill 2016) Overall lithium content is usually below 04
In the steel casting industry fluxes are used to optimize the casting pro-cess or to minimize the risk of faulty goods Lithium is used in the form of spodumene or petalite which reduces the viscosity of the melt As a result the flow rate and thus the productivity can be increased The flux also acts as a tempera ture barrier between the mold and the molten steel In addition the surface of the continuous cast body is protected from oxidation and impurities such as Al2O3 are removed (Roskill 2016) In traditional casting lithium oxide prevents the formation of defects in the finished casting Typically these fluxes contain up to 5 Li2O Lithium is added to the flux as either lithium oxide or lithium carbonate The addition of spodumene or petalite is also possible
In polymers Butyllithium (n-butyllithium = n-BuLi) is used as reagent or cata-lyst for the production of natural rubber compounds Depending on the rubber compound different amounts of n-BuLi are required (3 ndash 14 kg per ton rubber compound)
Different air treatment applications also use lithium Lithium bromide solu-tions are used in combination with water in bdquowater-lithium-bromide absorption chillersldquo (AKM) (Roskill 2016) Absorption based air de-humidifiers use lithium chloride (LiCl) This compound has the ability to absorb ten times its
Lithium Potential in Namibia
14
own weight in water Lithium is also used in air purification By means of lithium hydroxide CO2 can be removed from the air
Primary batteries also use lithium due to its electrochemical properties The-se cells are used in watches calculators pacemakers etc They are charac-terized by small size high energy density low weight long storage capacity low self-discharge and high cell voltage
Fig 3b Ceramic stove top (Source SCHOTT AG 2017)
Fig 3a Pouch-Lithium-Ion Cell (Source BGR)
Lithium Potential in Namibia
15
4 Chemical requirementsLithium is not a typically mined metal and the quality requirements are very specific and stringent depending on the field of application and thus vary from end-user to end-user
The first products that enter the value chains are usually the intermediates lithium carbonate andor lithium hydroxide produced from either brine sources or hard rock deposits ie currently mostly pegmatite sources (Fig 4)
Lithium from pegmatite sources is primarily sold as concentrates of either spodumene petalite or lepidolite with minor quantities of amblygonite in the market Each industry has unique requirements in terms of desired chemical composition particle size and tolerable values of impurities Concentrates are usually graded and priced according to their Li2O content impurity levels and aimed mainly at the growing battery industry as well as glassceramics industry
Concentrates for the battery industry are rated ldquochemical graderdquo and concen-trates for the glass industry are rated ldquotechnical graderdquo In general the glass industry has tighter limits on certain impurities as the battery industry due to the direct usage of the concentrates in the respective product flow sheets
The current industry standard for lithium concentrates in the battery indus-try is called SC-6 a chemical grade spodumene-concentrate that contains approx 6 Li2O Higher values of lithium are uncommon as concentrating them beyond 6 Li2O increases the cost of production exponentially
Petalite lepidolite zinnwaldite amblygonite and other lithium bearing miner-als are not used in this industry yet However there are processes in develop-ment for the extraction of lithium from these sources
Some companies especially in Australia sell spodumene-concentrates with lower Li2O contents (22 ndash 5 ) at lower prices per ton A special case are so-called DSO-concentrates (ldquodirect shipping orerdquo) with Li2O contents of only 12 ndash 14 DSO shippingrsquos out of Australia decreased significantly as the monetary value is quite low with lt 150 US$t and higher qualities are available
Lithium Potential in Namibia
16
Mica (muscovite) is an unwanted impurity in these concentrates as it disturbs the converting steps Heavy minerals are usually also extracted from the sources as they may represent by-product value (eg tantalum) Wall-rock impurities may cause problems in the further processing steps (basalt etc) Fe2O3 content is also an issue as it may also pose problems in the converters (clogging)
Technical grade lithium concentrates for the glass industry may have the same values of lithium in terms of Li2O but more stringent requirements in terms of iron content and some other elements such as fluorine
This industry usually uses petalite concentrates which can be used directly in the production process The advantage of petalite over spodumene-con-centrates is the generally lower iron content which is a crucial impurity even though these concentrates have lower lithium contents Fe2O3 content above a certain threshold (gt 015 ) will lead to unwanted discoloration in the final glass or ceramic products thus low values are needed
Fluorine-bearing lithium concentrates of lepidolite amblygonite and zinnwal-dite are not used in the glass and ceramics industry as this impurity is highly unwanted Besides fluorine the high Fe2O3 content of zinnwaldite is an issue as mentioned above
Particle size of the concentrates is also an issue as very fine material may lower the melt temperature due to a higher specific surface Therefore concen-trates for this industry are either tailor-made or mixtures of different sources
The glass and ceramics industry also uses pure lithium carbonate to a certain extent based on pricing
Lithium carbonate and lithium hydroxide are the first semi-finished products apart from lithium-concentrates used in the various industries for direct use or further downstream precursors There is a distinction between battery grade and technical (other) grade for lithium-carbonate and lithium-hydroxide The main differences lie within the lithium content level of impurities and particle sizes
Lithium Potential in Namibia
17
Commercial extraction of lithium takes place from lithium-containing brines and from hard rock (ie pegmatitic) deposits A simplified schematic repre-sentation of conventional production steps and key intermediates is shown in Figure 4
For the extraction of lithium from hard rock deposits the raw ores (eg pegma-tites) mined in open-pit or underground mines are processed into lithium-con-taining concentrates by sorting crushing grinding gravity separation mag-netic separation flotation washing filtering and drying The exact production steps vary depending on occurrence (ie locality) mineralogy company and the intended use of the produced concentrates
As of 2020 more than 95 of the conversion from spodumene-concentrates into lithium carbonate andor lithium hydroxide takes place in China The most widely used process in the industry is the acid-roast process (Fig 5)
In this process spodumene-concentrate is ground and heated to 1075 ‒ 1150degC in a rotary kiln (Fig 5) This converts α-spodumene into β-spodumene which is soluble in hot acids After mixing with hot sulfuric acid lithium sulfate solution is mixed with water As a result lithium sulfate dissolves The solution is mixed with calcium carbonate to remove impurities such as iron manganese and aluminum In addition the pH is raised After a first filtering process Na2CO3 and CaO are added to obtain an alkaline soluti-
Lithium Hydroxide
LithiumperoxidLithium Peroxide
Lithium-BrineLithium-Minerals
Lithium ChlorideLithium Bromide Lithium Sulfate
Lithium Acetate Lithium Metal
Lithium Carbonate
Fig 4 Simplified production scheme of lithium and important lithium com-pounds (modified after Roskill 2016)
Lithium Potential in Namibia
18
on Impurities such as calcium and manganese are removed The solution is then neutralized with sulfuric acid and heated to increase the concentration of Li2SO4 to about 200 ‒ 250 gl The addition of Na2CO3 and heating the solution to about 100degC triggers the precipitation of lithium carbonate The carbon-ate produced in this way has purities of up to 993 The battery industry however requires purities of min 995 obtained through ion exchange and extraction of impurities The produced lithium carbonate can then also be used for the production of lithium hydroxide
Common understanding was that the production of lithium carbonate was much cheaper from brines compared to hard rock sources Due to many developments in the brine industry mostly related to a recently introduced royalty system in Chile this is no longer the case On the contrary the cost advantage of brines is lost
Fig 5 Simplified production scheme of lithium carbonate derived from spodu-mene-concentrates via acid-roast-process (modified after Garret 2004)
Solution
MillingCooling
Thickener
Filtration
1075 - 1150oCCalcinationSpodumene Concentrate
Mixing
H2SO4
Leaching
H2O amp CaCO3
Gasscrubber
Solids to Tailings
Mixing
Na2CO3 amp CaO
Thickener
Filtration
Solids to Tailings
Neutralisation
H2SO4
Evaporation
90 - 100oCHeating
Filtering WashingDrying
Na2SO4Lithium carbonate
Lithium Potential in Namibia
19
The production of lithium hydroxide which is a fast growing market and a higher priced intermediate product appears to become cheaper when sourced directly from high quality hard rock conversion relative to sourcing from brines via an intermediate step (lithium carbonate) As the cost advantage of brine deposits compared to hard rock deposits is fading the industry has shifted its focus towards hard rock deposits all over the world
In addition to the acid-roast process there are new technological approaches to recover lithium carbonate and lithium hydroxide directly from high quality spodumene-concentrates as well as other mineralogies
Lithium Potential in Namibia
20
5 Mining and trade of lithium in the SADC
51 Lithium production
Each year every mining country of the world is urged to share production statistics regarding their mining activity These statistics are compiled and published by different entities such as the British Geological Survey (BGS) and the United States Geological Survey (USGS) among others
If a country does not appear in these statistics there was either no mining activity for this specific commodity the country did not publish any statistics or the production data is unknown
Table 2 Mine production of lithium (Source BGR 2020 Roskill 2016 USGS 2020 Geoscience Australia 2020)
Mine production [t Li-Content]
Years 2014 2015 2016 2017 2018 2019e Share 2018 []
Australia1) 12333 13160 15590 21000 57000 42000 647
Chile2) 11640 11787 14526 16584 15886 18000 175
Argentina2) 3388 3515 5767 575 6241 6400 69
China3) 1895 2002 2293 3 7376 7500 81
Zimbabwe1) 1024 1025 974 994 700 1600 08
USA2) 846 846 900 900 567 n A 06
Portugal1) 470 470 299 763 700 1200 08
Brazil1) 186 186 195 154 153 300 02
Namibia1) n d nd n d n d 500 n d 05
Other 3) 19 19 18 18 18 500 lt01
Global4) 31801 33011 40562 49012 90941 77000 1001) Hardrock 2) Brine 3) HardrockBrine 4) Deviation due to rounding e estimated
Lithium Potential in Namibia
21
In 2018 global mine output of lithium was around 91000 t Li-content of which only 1200 t originated from the Southern African Development Community (SADC) namely Zimbabwe and Namibia
52 Trade data
Trade data is retrieved from the commercially available Global Trade Atlasreg (IHS Global SA) The database provides both import and export data for more than 90 countries based on customs data of individual countries Data is primarily classified through Harmonised System (HS) product codes by the WCO (World Customs Organization) The HS nomenclature consists of approximately 5000 product groups identified by a 6-digit code
There are limitations to trade data The most prominent issue arises with data availability since many countries do not publish trade data Especially export data is an issue among many countries
There may also be issues with mislabeled products (wrong HS) product bas-kets data entry errors or missing data in general Were export data is not available so-called reverse trade data (RTS) is an option
If a country does not state any exports cumulative global imports from that particular country may be used as a rough yet incomplete estimate of exports It should be noted that these statistics do not represent absolute but rather minimum values as trade between two non-reporting countries will not be reflected The majority of the SADC countries do not report their import and export statistics
The most important lithium products that are globally traded in significant amounts are lithium-carbonate lithium-oxide (hydroxide) lithium-chloride and lithium-mineral-concentrates
Lithium Potential in Namibia
22
53 Export
The most important intermediate product in the lithium market is lithium carbonate In 2019 global exports amounted to approx 117743 t with Chile being the largest exporter (82344 t 70 ) There are no listed exports from the SADC region except minor quantities from South Africa to the Democratic Republic of Congo (9 t) and Zambia (2 t)
Lithium oxides and lithium hydroxides are grouped together under one HS code hence an individual consideration of both products on a country basis is not possible due to the lack of country-specific commodity codes
In 2019 global exports of HS 282520 stood at approx 97550 t with China being the largest exporting country (49800 t 51 )There are no exports published for the SADC region except South Africa with small quantities (28 t) which are considered to be trade through only
Assessment of lithium chloride global trade flows is also difficult as this prod-uct is listed together with many other chemical products under HS 282739 Global trade can only be investigated using country-specific commodity codes (8-digits and above) if available Only three countries list this product under specific trade codes namely China (28273910) Chile (28273930) and Argentina (28273960) SADC countries including Namibia do not publish any data under HS 282739 Based on the available data global exports in 2019 stood at 2254 t with Chile being the largest exporter (2101 t 89 )
Lithium-containing mineral concentrates are among other non-lithium related products listed in a product basket under HS 253090 Only two coun-tries provide information on this product namely Australia as the largest and hence most important producing and exporting country by far and Brazil as a minor exporter (25309010)
No other country including member states of the SADC specifies lithium-con-taining concentrates as such The currently only producing and exporting country in the SADC is Zimbabwe which does not specify exports at all Thus exports are derived from RTS (global imports)
Lithium Potential in Namibia
23
A general problem with HS 253090 is that only information on quantity is avail-able but no information on lithium content which can vary between 12 and 6 Li2O thus the margin of possible errors in terms of total contained lithium is large
In 2019 Australia exported about 16 million tons of spodumene-concentrate down from 35 million tons in 2018 More than 95 destined to China
Inferred exports (RTS) of Zimbabwe were approx 93300 t for HS 253090 About 62000 t of that quantity are listed as imports by South Africa and are unrelated to lithium The remaining quantity is much more in line with production figures of Zimbabwe as well as the known downstream industries of the destination coun-tries within Europe
There are no export records published by Namibia In general and across all traded lithium products South Africa appears to act as an importexport hub within the SADC Also some of the traded products may be used in the glass and ceramic industry of South Africa
54 Import
For most of the SADC countries the statistics retrieved though the Global Trade Atlas do not necessarily represent reliable trade data due to above-mentioned reasons This is especially true when only small import numbers (usually in tons) are listed as these are supposedly artefacts or errors in declaration
Global imports of lithium-carbonate amounted to approx 142965 t with South Korea being the largest importer (38578 t 27 ) There are no listed imports for the SADC region except South Africa (72 t)
Global imports of lithium-oxides (hydroxides) amounted to approx 84900 t with Japan being the largest importer (37300 t 44 ) In analogy to lithium carbonate there are no published imports into the SADC except for South Africa (428 t)
There is no information for imports of lithium-choride or lithium-mineral-con-centrates into the SADC The largest importer of lithium-choride is China with approx 253 t The largest importer of lithium-mineral-concentrates is also China (gt 95 )
Lithium Potential in Namibia
24
Fig 6 Simplified geology of Namibia with major towns as well as railway and tar roads Blue polygons indicate pegmatite belts and districts in central and southern Namibia (Data source Geological Survey of Namibia 2020)
6 Lithium occurrences in NamibiaIn Namibia significant lithium occurrences are found only within pegmatites These Precambrian and early Namibian pegmatites are restricted to two dif-ferent areas respectively the Damara Orogen in north-central Namibia and the Namaqua Metamorphic Complex in southern Namibia (Fig 6)
Lithium Potential in Namibia
25
Within the Damara Orogen four linear pegmatite belts are found all of which strike northeast ndash southwest (Fig 7) Brandberg West ndash Goantagab Cape Cross ndash Uis Nainais ndash Kohero and Sandamap ndash Erongo with the latter connected to the Karibib Pegmatite District (Schneider 1992)
Each of these pegmatite belts exhibit numerous individual pegmatite swarms that occur zoned or unzoned and may carry significant amounts of rare metals or semi-precious stones In the south Lithium-Caesium-Tantalum (LCT) peg-matites occur in two areas Tantalite-Valley south of Warmbad in close prox-imity to the northwest-trending Tantalite Valley Shear Belt and the Sandfon-tein-Ramansdrift area close to the Orange River
Fig 7 Pegmatite belts in north-central Namibia from west to east Brandberg West ndash Goantagab Cape Cross ndash Uis Nainais ndash Kohero and Sandamap ndash Erongo as well as the Karibib Pegmatite District (after Geological Suvey of Namibia 2002)
Lithium Potential in Namibia
26
7 Lithium mining in NamibiaData for historic lithium mine production is available for the period 1939 ndash 1998 (Fig 8) After 1998 all mining activities ceased due to product quality issues and overall market environment
Until the mid-1950s lepidolite was the most important mined lithium mineral of the country (Fig 8) As mine output of lepidolite decreased output of petalite increased However quantity on a year-to-year basis was quite variable and fluctuated between 1000 ndash 10000 t Since the early 1980s production of petalite was quite stable and ranged between 1000 ndash 2500 t Production fell sharply in 1997 and 1998 after which it ceased Mining of amblygonite has always been small compared to lepidolite and petalite and never exceeded 1000 t per annum
According to the USGS (2020) 500 t of lithium were mined in Namibia in 2018 This is most likely stockpiled lepidolite material from the Rubicon mine
0
2000
4000
6000
8000
10000
12000
1939
1941
1943
1945
1947
1949
1951
1953
1955
1957
1959
1961
1963
1965
1967
1969
1971
1973
1975
1977
1979
1981
1983
1985
1987
1989
1991
1993
1995
1997
[Ton
nes]
Petalite (t)Amblygonite (t)Lepidolite (t)
Fig 8 Lithium production in Namibia in [t] per year (after Schneider 1992 BGR 2020)
Lithium Potential in Namibia
27
Currently there is no active consecutive mining for lithium in substantial quan-tities in Namibia although there are prospects and projects under develop-ment
71 Current mining activities and projects
Soris The Soris project is located in the De Rust pegmatite swarm which is part of the ldquoBrandberg West ndash Goantagab tin beltrdquo (Fig 7) This belt stretches to the northeast of the Brandberg massif over a length of 60 km and a width of 25 km This belt was previously mined for cassiterite on a larger scale Some of the pegmatites in this belt may carry substantial amounts of lithium such as pegmatites in the De Rust pegmatite swarm
The De Rust pegmatite itself is a Li-rich rare metal pegmatite that was mined for cassiterite and tantalite but also for minor quantities of spodumene be ween 1960 and 1990 (Diehl 1990) It intruded into metasediments of the Amis River Formation Lower Ugab Group of the Southern Kaoko Zone
It is the largest pegmatite of the De Rust pegmatite swarm within the Brandberg West ndash Goantagab pegmatite belt (Diehl 1992c) Outcrops are 100 ‒ 470 m long up to 30 m wide and can be followed over a length of roughly 24 km
The pegmatite shows well-developed zonation with a border zone (quartz alkali feldspar muscovite) outer (quartz microcline-perthite muscovite altered petalite) and inner (quartzo-feldspathic rock with spodumene crystals with accessory apatite lepidolite eucryptite zircon and monazite) intermedi-ate zone as well as a core zone (quartz subordinate microcline muscovite sporadic tantalite) Spodumene crystals may reach up to 80 cm in length (Fig 12) Towards the core zone spodumene carries rounded nodules of lithi-um phosphates (amblygonite ndash montebrasite series)
It is located northwest of the nearest town of Uis in the Kunene region of Namibia about 6km to the east of farm De Rust 532 and about 25 km north of the Ugab River The nearest railhead is located in the town of Karibib and the deep-water port of Walvis Bay is 120 km to the southwest Windhoek is about 180 km to the southeast
Lithium Potential in Namibia
28
The project can be reached via paved but mostly unpaved roads from the town of Uis From White Lady Lodge which is about 38 km northwest from Uis a 35 km gravel road leads towards the project 15 km of which are in the riverbed of the Ugab River There is currently no electricity and water supply at the project location site
According to SampP Global (022020) current owner of the Soris project is Mon-tero Mining amp Exploration Ltd (TSXV MON) which holds 80 interest of the property Another 20 are allocated to an unnamed private owner Based on data from the Namibia Mining Cadastre Portal (092020) multiple entries for mining licence applications exist for the area where the main De Rust pegmatite is located (Fig 9)
Resource estimateDue to the early stage of the Soris project no resource estimate is avail-able However Montero Mining claims the project to be drill ready targeting a resource of 10 Mt 1 Li2O with tantalum and tin by-product credits This would equate to 46400 t of lithium or 247000 t LCE
Grab samples of the deposit showed lithium contents of 007 to 532 aver-aging 137 Channel samples showed average lithium contents of 076 and values up to 366 (Montero 032019) The company also re-assessed 1097 previously tested RC drill samples The main lithium-bearing mineral is spodumene
Remnants of historic intermittent mining activities like old foundations and quartzo-feldspathic tailings are still visible east to the main pegmatite (Fig 10 ‒ 11)
Lithium Potential in Namibia
29
Fig 10 Remnants of historic open pit mining (upper) and tailings of De Rust pegmatite (lower) northwest of the Brandberg massif (Photo BGR-GSN 2019)
Fig 9 Satellite image of the De Rust project including the outlined mining license Main pegmatite coordinates 20deg57prime48primeprimeS ‒ 14deg30prime12primeprimeE (Source httpportalsflexicadastrecomnamibia 092020)
Main pegmatite
Lithium Potential in Namibia
30
Fig 12 Weathered spodumene chrystals at the historic open pit mine (Photo BGR-GSN 2019)
Fig 11 Historic open pit of the De Rust pegmatite (Photo BGR-GSN 2019)
Lithium Potential in Namibia
31
Uis The Uis projects (former mine and tailings) are located in the northern part of the ldquoCape Cross Uis pegmatite beltrdquo east of the town of Uis on the farm Uis Townlands No 215 in the Erongo region of Namibia
The Cape Cross-Uis belt is approx 120 km long and up to 40 km wide and extends in a NE direction (Fig 7) It comprises three distinct pegmatite swarms the Strathmore swarm Karlowa swarm and Uis pegmatite swarm In general lithium-bearing pegmatites (Li-Nb-Ta-Sn-Be and Li-Nb-Ta-Sn) are the least common in this belt (Fuchsloch et al 2018)
The Uis swarm field consists of more than 120 individual pegmatites each with a northeasterly to easterly strike direction and northwesterly down dip (30deg ‒ 70deg) This field is accompanied by a peripheral pegmatite field of approx 25 individual pegmatites
Some of the main pegmatites especially around the formerly worldrsquos largest tin mine at Uis are exceedingly large Some of them are up to 1 km long and some 50 m wide
In terms of lithium petalite amblygonite and minor spodumene mineralization occurs in the various pegmatites but no lepidolite Most common lithium bear-ing minerals in the eight pegmatites that were mined at Uis are amblygonite petalite and spodumene
Currently the Uis tailings project and the Uis tin mine are owned by two differ-ent companies As of 2020 the tin mine is operating a pilot processing plant and aims to ramp up the production of lithium in the near future The current ownership of the tailings project as of September 2020 is unclear
The nearest commercial deep-water port to the projects is Walvis Bay 220 km to the southeast The town of Omaruru is 130 km to the east and Henties Bay lies about 120 km to the southwest The nearest railhead is located in Omaruru The area is accessible year-round by paved and un-paved roads NamPower provides electricity and the town of Uis is connected to the Nam-Water pipeline
Lithium Potential in Namibia
32
The tin deposit was discovered in 1911 and mined between the 1950s and 1989 for cassiterite by Uis Tin Mining Company (SWA) Ltd and IMCOR
Coarse tailings are located in the northern part of the former mine just south to the main road C36 (Fig 13) The fine material is located south to the coarse waste dumps (Fig 13)
After 1990 multiple companies owned the property until AfriTin Mining Ltd bought all the rights (license ML134) The current lithium tailings project of Montero Mining amp Exploration Ltd (TSXV MON) is based on the historic mine tailings of the former tin mine on mining license ML134 that is currently owned by AfriTin Mining Ltd The acquired tailings material does not fall under the ML134 license of AfriTin since historical tailings material (Fig 14) is not regulated by Minerals (Prospecting and Mining) Act 33 of 1992 of Namibia
Resource estimateUis tin mineAccording to AfriTin the former Uis mine holds a JORC compliant resource (inferred) of 715 Mt of ore 0134 Sn with a cut-off grade of 005 Sn (AfriTin 2020) Grades of ancillary elements are given at 063 Li2O and 85 ppm Ta for the total resource of 71 Mt of ore
This equals to approx 95000 t of tin 209000 t of lithium (11 Mt LCE) and 6090 t of tantalum 85 of the total resource are attributable to the company The remaining 15 are allocated to SMU (Small Miners of Uis)
Uis tailingsMontero Mining filed an inferred resource estimate of 144 Mt of ore 037 Li2O and 005 SnO2 with a 035 Li2O cut-off grade for lithium and assumed processing recoveries of 70 for their tailings project (Montero 2019) This equals to approx 24700 t of lithium content (131500 t LCE) and 7200 t SnO2
This resource estimate only includes coarse tailings material There is current-ly no information on the lithium content of the fine tailings material that totals 271 Mt t due to insufficient or no test work (Montero 2018) The company also states that the average Li2O grade of the fines material does not hurdle the cut-off for the fines of 082 Li2O
Lithium Potential in Namibia
33
In 2016 Australian based Tawana Resources carried out a drilling program at Uis for a private company called Lithium Africa 1 on the fine and coarse tailings (Table 3 Hole 1 amp Hole 2) Below some of the obtained data on lithium content is given Additionally Li2O content of two obtained grab samples by BGR (Table 3 Sample 2019a amp 2019b) is given
Table 3 Sample data Uis (Tawana 2016 Montero 2018 BGR 2019)
Sample Sample 0 to 1m Li2O ()
Sample 1 to 2m Li2O ()
Sample 2 to 3m Li2O ()
Fines Hole 1 071 085 092
Fines Hole 2 080 089 095
Coarse Hole 1 050 043 043
Coarse Hole 2 054 062 062
BGR Sam-ple 2019a (Coarse tailings)
028
BGR Sam-ple 2019b (Coarse tailings)
028
Montero NI 43-101 037
Lithium Potential in Namibia
34
Fig 14 Tailings of the historic Uis Tin Mine (Photo BGR-GSN 2019 with kind permission of AfriTin Mining Limited)
Fig 13 Former Uis tin mine Uis tailings project with coarse tailings Tailings coordina-tes (center) 21deg13prime31primeprimeS ‒ 14deg52prime44primeprimeE (Source httpportalsflexicadastrecomnamibia 092020)
Uis Tailings (coarse)
Uis Tailings (fine)
Historic Uis mine
Lithium Potential in Namibia
35
Karibib Lepidolite ProjectThe Karibib Lepidolite brownfield project is located in the ldquoKaribib ndash Usakos Pegmatite Districtrdquo southeast of the town of Karibib on the farm Okongava Ost No 72 in central Namibia (Fig 15 ‒ 16)
This pegmatite district which is of Damaran age hosts the most important pegmatite occurrence (Rubicon swarm) in terms of lithium in Namibia In addi-tion numerous other different pegmatite swarms some of which have previ-ously been relevant in terms of lithium are know from this district These are Dernburg Karlsbrunn Albrechtshoumlhe Berger Kaliombo Gamikaubmund Okatjimukuju Etusis Daheim Friedrichsfelde and Etiro (Diehl 1992a)
The Rubicon pegmatite itself is the largest of the individual pegmatites that occur in this field and has been the prime source of lithium until mining seized in the early 1990s The Helikon pegmatites are part of the Rubicon pegmatite swarm and are located northeast to the Rubicon pegmatite They have previ-ously been mined for lepidolite amblygonite petalite and muscovite beryll pollucite quartz and columbite-tantalite as valuable by-products (Fig 18 ‒ 19)
The pegmatite itself consist of two ellipsoidal well zoned Li-mineralized ore-bodies The larger one is about 320 m long and 25 ndash 35 m wide It dips at 46deg to the northeast and has a northwesterly strike The second orebody is about 230 m long and about 10 m wide It is dipping with 30deg to the northeast and has a northwesterly strike In total the outcrop of the Rubicon pegmatite is about 600 m long with a maximum width of 65 m (Fig 17)
A very prominent feature is the presence of a very well developed concen-tric shell and zones from the footwall to the inner core of the pegmatite Both orebodies exhibit a border- wall- intermediate- and core-zone
Border-zone wall-zone and outer intermediate zone of the larger orebody do not contain Li-bearing minerals of economic importance The inner interme-diate zone does contain lepidolite The outer core zone may be sub-divided into a petalite zone low-grade lepidolite zone and a high-grade lepidolite zone The inner core zone also contains a petalite zone Mining occurred pre-viously in the later named zones The zonation of the smaller orebody to the northwest is less pronounced but Li-mineralization and style are equal to the
Lithium Potential in Namibia
36
larger orebody There is no spodumene mineralization within the orebodies and respectively zones of the Rubicon pegmatite
The Helikon I pegmatite is also a lens-shaped pegmatite with a length of roughly 400 m and a width of approx 66 m It dips to the north with about 60deg ndash 70deg Helikon I also consists of well-defined zones The main Li-bearing minerals are lepidolite and petalite According to Roering (1963) the lepidolite is difficult to separate from the intergrown albite and hence of low grade and quality
The Helikon II pegmatite is approx 17 km long and only 9 ndash 15 m wide It lies a bit north of Helikon I and dips steeply to the north with 55deg ndash 80deg striking east west The main Li-bearing minerals are lepidolite and petalite According to Diehl (1990) the westernmost portion of the pegmatite has historically been the economically most important A massive up to 6 m wide petalite zone was mined here according to Diehl (1990)
The nearest railhead to the project is 17 km away in Karibib and the deep-water port of Walvis Bay is 220 km to the southwest Windhoek is about 180 km to the southeast NamPower connects the town of Karibib to electricity and the project currently utilizes generators There is a 7 km long 22 kV power line spur to grid connection pending (Lepidico 2020) Water is available via on-site boreholes
The project was previously owned by Desert Lion Energy Inc (TSVX DLI) Lepidico Ltd (ASX LPD) bought into the project and currently holds 80 interest which comprises Mining License 204 (69 km2) as well as three Exclu-sive Prospecting Licenses (EPLs) namely 5439 5555 and 5781 (Lepidico 2020)
Lepidico will cover mining from multiple sources as well as chemical conver-sion by utilizing their proprietary lithium processing technologies L-Maxreg LOH-Maxreg and S-Maxreg (Lepidico 052019) The company aims to produce high purity lithium chemicals such as lithium carbonate and lithium hydroxide
The takeover also included a nonbinding offtake agreement between the for-mer owner Desert Lion Energy Inc and German chemical company BASF On April 2nd 2019 Desert Lion Energy Inc announced this offtake agreement
Lithium Potential in Namibia
37
which at the time was valid through to December 31 2019 On December 20th
2019 Lepidico announced that the LOI with BASF was extended to Decem-ber 31st 2020 (Lepidico 122019)
The feasibility study criteria of Lepidico are as follows
- Throughput of the concentrator on-site of 035 Mtpa- Expansion of throughput after year five to 05 Mtpa- Chemical plant in the industrial city of Abu Dabi (ICAD)- Plant design for 58000 tpa of concentrate (4 LiO2) for the production of
up to 5500 tpa LiOH- Utilization of L-Maxreg and LOH-MaxTM- Non-binding off-take MOU with BASF for LiOH only- Targeting for project commissioning to commence late 2021 for commer-
cial production in 2022
The preliminary mine plan indicates a strip ratio of 03 ndash 1 for the first two years The ratio will then go up to 1 ndash 14 In the first four years elevated grades of 06 LiO2 will be mined
Resource estimateA JORC 2012 compliant resource estimate for the deposit is given in Table 4 (Lepidico 2020) The deposit currently holds 23200 t of lithium (Indicated amp Inferred) based on a cut-off grade of 015 Li2O This resource estimate is based solely on the lepidolite occurrences at the mine site
Table 4 Resource estimate Karibib Lepidolite Project (Source Lepidico 2020)
Deposit Resource Category
Cut-off (Li2O)
Ore (Mt)
Li2O ()
Li (t)
Li (LCE)
Rubicon Measured
015
22 057 5819 30974
Rubicon Indicated 666 038 11637 61943
Rubicon Inferred 237 043 4728 25167
Helikon
Total 015 1124 043 22184 118086
Lithium Potential in Namibia
38
Fig 16 Satellite image of the Karibib Lepidolite project Helikon 1 coordinates (center) 22deg2prime49primeprimeS ‒ 16deg1prime13primeprimeE Helikon 4 coordinates (center) 22deg2prime24primeprimeS ‒ 16deg1prime41primeprimeE (Source httpportalsflexicadastrecomnamibia 092020)
Fig 15 Satellite image of the Karibib Lepidolite project Rubicon coordinates (center) 22deg6prime11primeprimeS ‒ 15deg59prime44primeprimeE (Source httpportalsflexicadastrecomnamibia 092020)
Historic Rubicon mine
Helikon 1
Helikon 4
Lithium Potential in Namibia
39Fig 17 Rubicon pegmatite (Photo BGR-GSN 2019 with kind permission of Lepidico Chemicals Namibia (Pty) Ltd 2020)
Lithium Potential in Namibia
40 Fig 18 Lepidolite sample from Rubicon pegmatite (Photo BGR-GSN 2019 with kind permission of Lepidico Chemicals Namibia (Pty) Ltd 2020)
Fig 19 Petalite sample from Rubicon pegmatite (Photo BGR-GSN 2019 with kind permission of Lepidico Chemicals Namibia (Pty) Ltd 2020)
Lithium Potential in Namibia
42
Fig 21 Helikon 4 pegmatite (Photo BGR-GSN 2019 with kind permission of Lepidico Chemicals Namibia (Pty) Ltd 2020)
Fig 20 Helikon 1 pegmatite (Photo BGR-GSN 2019 with kind permission of Lepidico Chemicals Namibia (Pty) Ltd 2020)
Lithium Potential in Namibia
43
Tantalite ValleyThe Tantalite Valley Project lies within the ldquoNamaqua Metamorphic Complexrdquo in Southern Namibia Within this complex Lithium-Caesium-Tantalum (LCT) pegmatites occur in two main areas Tantalite-Valley south of Warmbad in close proximity to the northwest-trending Tantalite Valley Shear Belt and the Sandfontein-Ramansdrift area close to the Orange River
The area were the pegmatites of the Tantalite Valley occur is primarily com-posed of a large ovoid gabbro intrusion (71 km by 33 km in extent) within paragneiss units of the Namaqua Complex The gabbro outcrop forms a large dome shaped mountain that rises about 500 m above the surrounding topo-graphy
The pegmatites belong to the Kenhardt and Gordonia pegmatite districts in Namaqualand but only the younger group of them carry accessory ore miner-als such as tantalite beryl REE minerals and lithium
The Tantalite Valley pegmatites include several individual subhorizonal dikes that are up to 1000 m long and 02 to 40 m wide plunging towards southeast (Diehl 1992b) Four of those are of economic interest Homestead Whitkop White City and the Lepidolite pegmatites (ie Purple Haze) (Fig 22)
They are all well zoned (quartz core inner and outer intermediate zones wall zone) and were predominantly targeted for beryl columbite-tantalite as well as lithium and bismuth minerals
The project is located on the farms Umeis 110 and Kinderzitt 132 between the Farms 109 131 129 308 and 473 in the magisterial district of Karas It currently comprises Mining License (ML-77) fully owned by Tameka Shelf Co Four (Pty) Ltd which is a 100 subsidiary of African Tantalite Pty Ltd (AFTAN) Above all Kazera Global Investments PLC holds a 75 stake in AFTAN (Kazera 2019) with the other 25 of local farmer ownership
The project is accessible via gravel road from Karasburg which is about 80 km to the north The nearest railhead is also located in Karasburg Electricity is currently supplied by generators and water is recovered from multiple drill holes The Orange River is about 15 km to the south of the project Mining
Lithium Potential in Namibia
44
infrastructure as well as equipment are on site as well as a plant for the pro-duction of tantalite concentrate
NTI is working on an extensive exploration program with a clear focus on revi-ving tantalite mining in Namibia with a possible by-product stream of lithium bearing minerals The company will focus primarily on the pegmatites Homes-tead Purple Haze Signaalberg and White City (Fig 23)
The area is known for its tantalum occurrences and since the late 1940s tantalite and other minerals have been recovered at Tantalite Valley until 1981 when mining ceased Initially alluvial deposits were mined followed by the pegmatites themselves Grades of the concentrates produced prior to the closure of the mine were quite high with 65 ‒ 70 Ta2O5 with very low U3O8
and ThO2 values of 025 max
Resource estimateAccording to SampP Global (092020) Measured and amp Indicated resources at Tantalite Valley are 104800 t of ore 0042 Ta2O5 and 0653 Li2O as of 112019 This would equate to 315 t of lithium or 1690 t LCE Total inferred resources are 517400 t of ore 0018 Ta2O5 and 0144 Li2O This equals to approx 91 t of tantalum and 750 t of lithium (3535 t LCE)
Lithium Potential in Namibia
45
Fig 23 White City pegmatite (Source Kazera global Investments PLC 2020)
Fig 22 Satellite image of the Tantalite Valley project White City pegmatite coordinates (center) 28deg43prime07primeprimeS ‒ 18deg44prime45primeprimeE Homestead pegmatite coordinates (center) 28deg43prime19primeprimeS - 18deg44prime24primeprimeE Purple Haze pegmatite coordinates (center) 28deg43prime09primeprimeS ‒ 18deg43prime55primeprimeE (Source httpportalsflexicadastrecomnamibia 092020)
Lithium Potential in Namibia
46
8 Analysed lithium samplesDuring the course of the cooperation project between the Economic Geology Division (EGD) of the Geological Survey of Namibia (GSN) and the Ger-man Federal Institute of Geosciences and Natural Resources (BGR) several sampling campaigns to southern and central pegmatites took place
The field trips were preceded by literature and data research regarding infor-mation on lithium occurrences andor previous lithium mining activity to iden-tify specific target areas
During a campaign in 2019 16 lithium-bearing mixed mineral samples were taken from five different locations and subsequently analyzed Two of the samples originate from the Uis Tin Mine Tailings of the former tin mine All remaining samples were taken either from stripped outcrops for future mine activities or from previous mine sites (ie pits)
All 16 samples were analyzed at BGR labs in Hanover Germany through qualitative XRD XRF and ICP-MS Given data shall be understood as a first indicator for the sampled lithium occurrences
Most if not all sampled occurrences have previously been analyzed or are cur-rently being assessed by the property owners or current licensees Detailed information of these sampling and analytical campaigns remain confidential and are thus not available for comparison
Appendix A lists the identified qualitative mineralogy of the samples as well as the major element analysis Additional samples from previous campaigns are also given
Interpretation of the results are based on their applicability in the various lithium-consuming industries for which information is available
Most of the current lithium applications require a chemical intermediate product such as lithium carbonate or lithium-hydroxide The glass and cera-mic industry does use lithium-bearing mineral concentrates depending on the prices of these materials when compared to LiCO3
Lithium Potential in Namibia
47
Since the main applications require an intermediate or downstream chemical product lithium content as well as impurity values are the main criteria for the suitability of the sampled occurrences Other quality criteria are particle size and surface areastructure
9 InterpretationAs previously stated all obtained grab samples are mixtures of lithium- bearing minerals (ie spodumene petalite lepidolite) feldspars quartz micas as well as secondary minerals Therefore all given analytical data has to be taken with caution and will not be representative for the individual outcrops or deposits
The evaluation of the economic suitability for various economic applications of the analysed lithium samples is based on the chemical specifications in Chapter 4
Lithium content gt 1 Li2O Fe2O3 content lt 015 as well as F content lt 01 are individually highlighted (Appendix A) as these three values are the most important
Based on the chemical analysis nine of the 16 samples showed Li2O contents of more than 1 (range 117 ‒ 327 ) Seven of those nine samples also exhibited low Fe2O3 content (range 004 ‒ 008 ) (Appendix A) Three of those seven samples also had fluorine values below 005
Of the ten additionally included samples from previous campaigns four showed Li2O contents of more than 1 (range 126 ‒ 199 ) Three of those samples also exhibited low Fe2O3 content (range 004 ‒ 007 ) (Appendix A) One of the three samples had fluorine values below 005
The mentioned samples (sources) could be of potential use but for further interpretation statistical sampling will be required
Lithium Potential in Namibia
48
10 ConclusionsThere is currently no lithium industry established in Namibia This accounts to both mining and processing of ores into commercial lithium-bearing con-centrates as well as the production of downstream products such as lithium carbonate andor lithium hydroxide In order to evaluate the potential for a lithium industry in Namibia the current global market and price developments need to be addressed
Currently the main application for lithium is in the chemical industry as lithium carbonate andor hydroxide for the manufacturing of lithium-ion batteries There is currently no domestic market (supply) or demand for this industry in Southern Africa or Namibia in specific Processing of lithium-bearing ores into these highly specific downstream products is economically more viable in close proximity to the demanding industries It also requires large investments (double-digit million dollars per 10000t of capacity) Additionally there is already huge capacity and strong capacity build up in Asia at rather low cost
The second most important application lies in the glass and ceramics industry This industry uses lithium either as lithium-bearing concentrates or lithium carbonate depending on current market price and processproduct require-ments There is currently no such industry established in Namibia but potential plans There is glass and ceramics manufacturing in South Africa and thus a potential market for lithium bearing products (concentrates) should this indus-try require it depending on product
The 20182019 primary lithium supply based on spodumene-bearing mineral concentrates was dominated by Australia with a market share of well over 95 On an annual basis the country exports more than three million tons of lithium-bearing concentrates to China To put this into perspective Lepidico plans to export just 58 ktpa of concentrate to Abu Dhabi for refinement from their project annually Therefore potential production in Namibia will always be rather small scale when compared to peer producing countriescompanies
As of late 2020 the concentrate market is in strong oversupply with strong competition Thus prices have eroded quite substantially for a standard SC6 concentrate (Fig 24) In general prices vary significantly based on lithium content and impurities of the concentrates Lithium bearing mineral concen-
Lithium Potential in Namibia
49
trates are a relatively low-value mineral commodity when compared to lithi-um-carbonate or other lithium downstream products thus product quality cost reduction and cost control are key components in this industry Since prices are depressed currently many of the Australian producers have drasti-cally reduced output or even went into care and maintenance This situation may change towards 2025 or beyond as demand picks up
Prices for the higher valued product lithium-carbonate spiked at the end of 2017 towards 2018 to more than 20000 $USt on a contract basis with prices being very volatile Since then prices have also eroded to below 9000 $USt due to oversupply and slow demand pickup (Fig 25) With this product stable quality and chemical composition are crucial for the downstream industry
Based on available gradetonnage data the Namibian projectsprospects are relatively small in overall size and low in grade when compared to global peers for the resource category ldquoMeasuredIndicatedrdquo (Appendix B) Total contained lithium quantity is thus relatively small in comparison On a global scale the most promising hard rock projects that are currently being mined and developed have Li2O grades of 10 or above
Fig 24 Lithium-mineral-concentrate prices 012010 ‒ 062020 (Source BGR 2020)
300
400
500
600
700
800
900
1000
1100
208
210
212
214
216
218
220
US$
t US$t
01-20
14
01-20
15
01-20
16
01-20
17
01-20
18
01-20
19
01-20
20
01-20
10
01-20
11
01-20
12
01-20
13
Spodumene min 5-6 LiO2 fob Australia
Spodumene concentrate gt75 LiO2 bulk cif Asia
Petalite 42 LiO2 fob Durban
Spodumene fob Australia
Spodumene min 5-6 LiO2 cif China
Lithium Potential in Namibia
50
For the resource category ldquoIndicatedrdquo which generally represents the lowest level of confidence only the Uis mine project of AfriTin represents a size-able resource even though grades are relatively low (Appendix C) The Uis tailings project as well as the Rubicon project are again relatively small when compared to their global peers Tantalite Valley is the smallest of all included projects (Appendix C)The given data for the De Rust project reflects only an exploration target of the company rather than actual data and may thus be not representative
Based on size and contained lithium-content none of the visited early stage projectsprospects would justify the financial investment into the construction of a chemical conversion plant for the production of lithium carbonate andor hydroxide on site as it requires very large monetary investments Due to their size payback of the required investments may be unfavorable when compared to global peers In addition the current market environment is very harsh with strong competition from Asia that has a huge cost advantage due to capacity build up This industry is also very energy and water intensive
In addition location within Namibia as well as distance to possible down-stream markets may become an issue as it increases the transportation cost
4000
7000
10000
13000
16000
19000
22000
25000
28000
01-20
14
01-20
15
01-20
16
01-20
17
01-20
18
01-20
19
01-20
20
US$
t
Lithium-carbonate (min 995 ) battery grade spot price ex works domestic ChinaLithium-carbonate (min 99-995 ) Li2CO3 large contracts USA delivered continentalLithium-hydroxid-monohydrate (min 565) technical and industrial grades cif China Japan amp Korea
Fig 25 Lithium chemical prices 012014 ndash 062020 (Source BGR 2020)
Lithium Potential in Namibia
51
immensely This is especially true for the SorisDe Rust pegmatite which is in a remote location without any allocated infrastructure The projects Karibib Uis and Tantalite Valley are much easier to access
The approach of Lepidico to produce a lithium bearing concentrate on site seems plausible approach Since this will already require a skilled workforce mining and beneficiation equipment in order to produce a high quality lithium-bearing concentrate it may already be considered ldquoadded valuerdquo for the indus-try of the country This approach may also be suitable for the other mentioned and visited projects
Lithium Potential in Namibia
52
ReferencesAfriTin Mining (2020) Uis Tin Project ndash Company Information ndash URL httpafritinminingcomuis-project [as of 092020]
Australian Government Geoscience Australia (2019) Australiarsquos Identi-fied Mineral Resources 2019 ndash URL httpswwwgagovauscientific-topicsmineralsmineral-resources-and-adviceaimr [as of 092020]
BGR ndash Bundesanstalt fuumlr Geowissenschaften und Rohstoffe (2020) Fachinformationssystem Rohstoffe ndash unpubl Hannover [as of 082020]
BGS ndash British Geological Survey (2016) Lithium Definitions mineralo-gy and deposits ndash URL httpswwwbgsacukdownloadsstartcfmid=3100 [as of 062016]
Diehl B J M (1990) Pegmatites of the Cape Cross Uis ndash Pegmatite Belt Namibia Geology mineralisation Rubidium Strontium characteristics and petrogenesis of rare metal pegmatites Open File Report EG 083 Economic Geology Series Geological Survey of Namibia 39 pp Windhoek
Diehl B J M (1992a) Lithium Caesium Beryllium Open File Report Mineral Resource Series Geological Survey of Namibia 18 pp Windhoek
Diehl B J M (1992b) Niobium and Tantalum Open File Report Mineral Resource Series Geological Survey of Namibia 20 pp Windhoek
Diehl B J M (1992c) Tin Open File Report Mineral Resource Series Geological Survey of Namibia 30 pp Windhoek
Diehl B J M amp Schneider G I C (1990) Geology and mineralisation of the Rubicon Pegmatite Namibia Open File Report Geol Surv Namibia 20 pp Windhoek
Fuchsloch et al (2018) Classification mineralogical and geochemical vari-ations in pegmatites of the Cape Cross-Uis pegmatite belt Namibia Lithos 296 ndash 299 79-95 elsevier
Lithium Potential in Namibia
53
Garret D E (2004) Handbook Of Lithium And Natural Calcium Chloride Their Deposits Processing Uses and Properties ndash 467 S Oxford (Elsevier B V)
Geological Survey of Namibia (2002) Mineral Resources of Namibia Summary of Mineral Deposits and Occurrences Omaruru Sheet 2114 Volume I ndash Complete Descriptions 119 pp Windhoek
IHS Global SA (2020) Global Trade Atlas ndash Commercial Online-Databa-se ndashURL httpsmyihscomConnectcallingUrl=https3a2f2fconnectihsmarkitcom2f [as of 062017]
Kazera Global Investments PLC (2020) Company Information ndash URL httpskazeraglobalcominvestmentsnamibia-tantalite-investment-mine [as of 092020]
Lepidico (2019) LOI with BASF extended to 31 December 2020 ndash News Release ndash URL httpswwwlepidicocomwp-contentuploads201910LPD-191220-LOI-with-BASF-extended-to-31-December-2020pdf [as of 122019]
Lepidico (2019) Corporate Presentation ndash URL httpswwwlepidicocomwp-contentuploads201907LPD-190509-Corporate-Presentati-on-May-2019pdf [as of 052019]
Lepidico (2020) Company Information ndash URL httpswwwlepidicocomprojectskaribib [as of 092020]
Montero Mining amp Exploration Ltd (2018) Exploring Battery Metals in Namibia ndash Company Presentation ndash URL httpswwwproactiveinvestorscomauuploadSponsorFileFile2018_031520244941_MON-CorporatePre-sentationMarch2018pdf [as of 072018]
Montero Mining amp Exploration Ltd (2019) Montero Files NI 43-101 Resource Estimate On The Uis Lithium-Tin Tailings Project In Namibia On Sedar ndash News Announcement ndash URL httpsmonterominingcommontero-files-ni-43-101-resource-estimate-on-the-uis-lithium-tin-tailings-project-in-namibia-on-sedar [as of 032019]
Lithium Potential in Namibia
54
Namibia Mining Cadastre Portal (2020) Online-Database ndashURL httpsportalslandfoliocomnamibia [as of 092020]
Roskill Information Services Ltd (2016) Lithium Global Industry Mar-kets amp Outlook ndash 386 S London Groszligbritannien
Schneider G I C (1992) Feldspar Open File Report MRS 08 Mineral Resource Series Geological Survey of Namibia 2 pp Windhoek
Schmidt M (2017) Rohstoffrisikobewertung ndash Lithium ndash DERA Rohstoffin-formationen 33 Berlin
S amp P Global Market Intelligence (2020) Lithium - Metals amp Mining Properties URL httpsplatformmarketintelligencespglobalcomwebcli-entauth=inheritindustryminingProjects [as of 092020]
Statista (2020) Distribution of lithium end-usage worldwide in 2019 by area application ndash URL httpswwwstatistacomstatistics268787lithium-usa-ge-in-the-world-market [as of 062020]
Tawana Resources NL (2016) Tawana acquires second lithium pro-ject ndash News Release ndash URL httpsmstrademomentumcozajsepdfSENS_20160923_S376505pdf [as of 092016]
USGS ndash United States Geological Survey (multiple years) Lithium ndash Minerals Commodity Summaries ndash URL httpswwwusgsgovcentersnmiclithium-statistics-and-information [as of 082020]
Appendix
Sam
ple I
DFa
rmLa
titud
eLo
ngitu
deSa
mpl
e des
crip
tion
(XRD
qu
al)
LiO 2
()
SiO 2
Ti
O 2
Al2O 3
Fe2O 3
Mn
O Mg
O Ca
O Na
2O
K 2O P 2O 5
SO
3
Cl
F
LOI
Su
m
2015
-03
previous sample campaignsHelik
on
n A
Felds
parQ
uartz
Lepid
olite
025
6871
lt000
119
0500
200
2900
505
3292
806
7905
59lt0
01lt0
002
lt005
093
9985
2016
-12
Rubic
onwe
ather
ed P
etalite
126
6473
lt000
118
0600
703
2718
607
9507
805
2500
62lt0
01lt0
002
lt005
1146
9871
2016
-17
Rubic
onLe
pidoli
te +
Quar
tz13
063
6700
219
9316
0929
003
0054
029
6218
0052
lt001
lt000
226
232
798
67
2016
-20
Helik
onLe
pidoli
te + A
lbite
176
5514
lt000
126
8700
401
2100
700
2123
970
3900
45lt0
01lt0
002
156
369
9698
2016
-21
Helik
onLe
pidoli
te19
954
32lt0
001
2627
004
0224
006
0038
266
714
0069
lt001
lt000
240
628
997
77
FN20
19_0
4De
Rus
tFe
ldspa
rAmb
lygon
iteP
etalite
(n
on X
RD)
003
6513
lt000
118
82lt0
0100
0200
101
0924
311
4105
75lt0
0100
04lt0
0503
898
84
2015
-09
Molop
oPe
talite
(non
XRD
)00
952
85lt0
001
1672
lt001
0002
487
0323
342
0352
lt000
100
400
3403
621
1310
012
2016
-14
Molop
oPe
talite
wea
there
d (no
n XRD
)00
752
1600
0316
5100
200
5147
805
8923
406
4500
6900
200
8602
222
6310
013
2016
-15
Molop
oFe
ldspa
r (no
n XRD
)00
664
02lt0
001
1937
003
0004
003
0151
216
1249
0796
lt001
lt000
2lt0
0505
399
55
2016
-23
Molop
oZin
nwald
ite (n
on X
RD)
006
5044
0068
3307
048
0011
012
0426
261
7674
0181
lt001
lt000
2lt0
0542
9925
1909
249
2019Uis
Tailin
gs
Quar
tzFe
ldspa
rPeta
lite
Musc
ovite
028
7293
0045
1479
051
0062
0212
9830
927
6613
6200
2lt00
02lt0
0523
399
38
1909
250
Uis
Tailin
gsQu
artz
Felds
parP
etalite
Mu
scov
ite02
872
6900
4314
8205
0059
019
1306
313
2794
1347
002lt
0002
lt005
251
9937
1909
251
Helik
on 4
22deg02prime4
8primeprimeS1
6deg01prime30
primeprimeEQu
artz
Felds
parP
etalite
Le
pidoli
te16
464
4400
0319
4200
301
2100
408
8325
345
6806
800
400
0727
228
998
38
1909
252
Helik
on 1
22deg02prime2
0primeprimeS1
6deg01prime19
primeprimeEPe
talite
Lepid
olite
Quar
tz29
576
9200
0116
6800
300
0304
101
7301
106
8100
01lt0
01lt0
002
lt005
205
97
App
endi
x A
Ana
lytic
al d
ata
of li
thiu
m s
ampl
es c
olle
cted
in N
amib
ia T
hres
hold
val
ues
high
light
ed in
gre
en
Lithium Potential in Namibia
57
Sam
ple I
DFa
rmLa
titud
eLo
ngitu
deSa
mpl
e des
crip
tion
(XRD
qu
al)
LiO 2
()
SiO 2
Ti
O 2
Al2O 3
Fe2O 3
Mn
O Mg
O Ca
O Na
2O
K 2O P 2O 5
SO
3
Cl
F
LOI
Su
m
1909
253
2019Rubic
on22deg06prime1
3primeprimeS1
5deg59prime45
primeprimeEPe
talite
Lepid
olite
Quar
tz32
778
73lt0
001
1687
002
0006
002
0157
011
003
0002
003
0003
lt005
075
9663
1909
254
Rubic
on22deg06prime1
0primeprimeS1
5deg59prime41
primeprimeEFe
ldspa
rQua
rtzM
usco
vite
004
682
lt000
119
3500
300
2400
205
0610
0808
6804
3lt0
01lt0
002
lt005
041
9985
1909
255
Rubic
on22deg06prime1
0primeprimeS1
5deg59prime41
primeprimeEFe
ldspa
rLep
idolite
Mus
co-
viteK
aolin
026
6104
0004
2318
022
0136
006
0119
367
8411
0159
lt001
lt000
2lt0
0522
299
15
1909
256
Rubic
on22deg06prime1
0primeprimeS1
5deg59prime41
primeprimeELe
pidoli
te 27
249
8700
129
3400
408
0500
400
704
697
3100
31lt0
01lt0
002
087
441
9569
1909
257
Rubic
on22deg06prime1
3primeprimeS1
5deg59prime45
primeprimeEPe
talite
Lepid
olite
Quar
tz30
670
0900
0320
2600
801
0901
502
9901
926
800
15lt0
0100
04lt0
0526
596
48
1909
258
Rubic
on22deg06prime1
0primeprimeS1
5deg59prime41
primeprimeELe
pidoli
teFe
ldspa
rQua
rtz20
659
7800
0224
100
505
2400
300
513
7247
0051
lt001
0002
265
388
9966
1909
259
Tanta
lite
Valle
y28deg43prime0
9primeprimeS1
8deg43prime55
primeprimeEFe
ldspa
rLep
idolite
Mus
covit
e11
762
64lt0
001
2139
004
0161
lt001
0399
7731
2401
0900
200
119
912
698
85
1909
260
Tanta
lite
Valle
y28deg43prime0
9primeprimeS1
8deg43prime55
primeprimeEFe
ldspa
rLep
idolite
Mus
covit
e03
059
8600
1425
1301
604
2200
302
2860
547
2201
3900
200
0904
123
799
56
1909
261
Tanta
lite
Valle
y28deg43prime0
9primeprimeS1
8deg43prime55
primeprimeEFe
ldspa
rQua
rtzM
usco
vite
003
636
0005
2218
022
0122
002
0381
727
3809
0272
lt001
lt000
2lt0
0513
199
17
1909
262
Tanta
lite
Valle
y28deg43prime2
0primeprimeS1
8deg44prime23
primeprimeEQu
artzSp
odum
eneM
us-
covit
e13
180
5100
0415
8903
401
2401
301
9502
604
0400
0500
200
03lt0
0507
398
56
1909
263
De R
ust
20deg57prime4
8primeprimeS1
4deg30prime13
primeprimeEFelsd
parS
podume
neQuartz
074
7313
0006
2048
007
015
005
0154
398
0831
0073
001
0003
lt005
082
9974
1909
264
De R
ust
20deg57prime4
8primeprimeS1
4deg30prime13
primeprimeESp
odum
eneF
eldsparQuartz
230
6924
0006
2602
801
0200
301
0510
102
1400
68lt0
0100
03lt0
0504
897
53
(Con
tinue
d) A
ppen
dix
A A
naly
tical
dat
a of
lith
ium
sam
ples
col
lect
ed in
Nam
ibia
Thr
esho
ld v
alue
s hi
ghlig
hted
in g
reen
Lithium Potential in Namibia
58
Appendix B GradeTonnage data (Measured amp Indicated) for selected lithium projects in comparison to Namibian projects (Source SampP 092020)
0
0500
1000
1500
2000
2500
500
5000
5000
0
5000
00
5000
000
Gra
de [
Li 2O
]
Tonnage [t]
Tantalite Valley
Rubicon
Appendix B GradeTonnage data (Inferred) for selected lithium projects in com-parison to Namibian projects (Source SampP 092020)
0
0500
1000
1500
2000
2500
100
1000
1000
0
1000
00
1000
000
1000
0000
Gra
de [
Li 2O
]
Tonnage [t]
Tantalite ValleyRubicon
Uis Tailings
Uis Mine
De Rust
A product of the technical cooperation project between Bundesanstalt fuumlr Geowissenschaften und Rohstoffe (BGR)(Federal Institute for Geosciences and Natural Resources)
andGeological Survey of Namibia within the Ministry of Mines and Energy
ISBN 978-3-948532-29-1 (Print) 978-3-948532-30-7 (PDF)
- List of Abbreviations
- 1 Introduction
- 2 What is lithium
-
- 21 Lithium deposits
-
- 3 Application
- 4 Chemical requirements
- 5 Mining and trade of lithium in the SADC
-
- 51 Lithium production
- 52 Trade data
- 53 Export
- 54Import
-
- 6 Lithium occurrences in Namibia
- 7 Lithium mining in Namibia
-
- 71 Current mining activities and projects
-
- 8 Analysed lithium samples
- 9 Interpretation
- 10 Conclusions
- References
-

Lithium Potential in Namibia
13
The second important application of lithium is in the field of glass and cera-mics Cumulatively this area accounts for 18 of demand in 2019 (Fig 2) In the ceramic industry for the production of glazes and ceramic products (tiles sanitary items dishes etc) pure chemical grade lithium carbonate spodumene-concentrate or petalitelepidolite-concentrate is used as lithium source Positive effects of lithium are increase in gloss increase in luminosity increase of chemical and abrasion resistance and reduction of glaze viscosity In ceramic bodies the use of lithium lowers the firing temperature shortens the firing time and thus reduces overall CO2 emissions In addition the use of lithium has a positive effect on the expansion behavior and the mechanical resistance of products
In lubricants lithium is used as lithium-stearate or lithium-12-hydroxy-stea-rate primarily produced from lithium carbonate or lithium hydroxide and stea-rin-acid Di-Lithium-Azelate Lithium-Docosanoate and Lithium-Stearate are also used in lubricants (Roskill 2016) Overall lithium content is usually below 04
In the steel casting industry fluxes are used to optimize the casting pro-cess or to minimize the risk of faulty goods Lithium is used in the form of spodumene or petalite which reduces the viscosity of the melt As a result the flow rate and thus the productivity can be increased The flux also acts as a tempera ture barrier between the mold and the molten steel In addition the surface of the continuous cast body is protected from oxidation and impurities such as Al2O3 are removed (Roskill 2016) In traditional casting lithium oxide prevents the formation of defects in the finished casting Typically these fluxes contain up to 5 Li2O Lithium is added to the flux as either lithium oxide or lithium carbonate The addition of spodumene or petalite is also possible
In polymers Butyllithium (n-butyllithium = n-BuLi) is used as reagent or cata-lyst for the production of natural rubber compounds Depending on the rubber compound different amounts of n-BuLi are required (3 ndash 14 kg per ton rubber compound)
Different air treatment applications also use lithium Lithium bromide solu-tions are used in combination with water in bdquowater-lithium-bromide absorption chillersldquo (AKM) (Roskill 2016) Absorption based air de-humidifiers use lithium chloride (LiCl) This compound has the ability to absorb ten times its
Lithium Potential in Namibia
14
own weight in water Lithium is also used in air purification By means of lithium hydroxide CO2 can be removed from the air
Primary batteries also use lithium due to its electrochemical properties The-se cells are used in watches calculators pacemakers etc They are charac-terized by small size high energy density low weight long storage capacity low self-discharge and high cell voltage
Fig 3b Ceramic stove top (Source SCHOTT AG 2017)
Fig 3a Pouch-Lithium-Ion Cell (Source BGR)
Lithium Potential in Namibia
15
4 Chemical requirementsLithium is not a typically mined metal and the quality requirements are very specific and stringent depending on the field of application and thus vary from end-user to end-user
The first products that enter the value chains are usually the intermediates lithium carbonate andor lithium hydroxide produced from either brine sources or hard rock deposits ie currently mostly pegmatite sources (Fig 4)
Lithium from pegmatite sources is primarily sold as concentrates of either spodumene petalite or lepidolite with minor quantities of amblygonite in the market Each industry has unique requirements in terms of desired chemical composition particle size and tolerable values of impurities Concentrates are usually graded and priced according to their Li2O content impurity levels and aimed mainly at the growing battery industry as well as glassceramics industry
Concentrates for the battery industry are rated ldquochemical graderdquo and concen-trates for the glass industry are rated ldquotechnical graderdquo In general the glass industry has tighter limits on certain impurities as the battery industry due to the direct usage of the concentrates in the respective product flow sheets
The current industry standard for lithium concentrates in the battery indus-try is called SC-6 a chemical grade spodumene-concentrate that contains approx 6 Li2O Higher values of lithium are uncommon as concentrating them beyond 6 Li2O increases the cost of production exponentially
Petalite lepidolite zinnwaldite amblygonite and other lithium bearing miner-als are not used in this industry yet However there are processes in develop-ment for the extraction of lithium from these sources
Some companies especially in Australia sell spodumene-concentrates with lower Li2O contents (22 ndash 5 ) at lower prices per ton A special case are so-called DSO-concentrates (ldquodirect shipping orerdquo) with Li2O contents of only 12 ndash 14 DSO shippingrsquos out of Australia decreased significantly as the monetary value is quite low with lt 150 US$t and higher qualities are available
Lithium Potential in Namibia
16
Mica (muscovite) is an unwanted impurity in these concentrates as it disturbs the converting steps Heavy minerals are usually also extracted from the sources as they may represent by-product value (eg tantalum) Wall-rock impurities may cause problems in the further processing steps (basalt etc) Fe2O3 content is also an issue as it may also pose problems in the converters (clogging)
Technical grade lithium concentrates for the glass industry may have the same values of lithium in terms of Li2O but more stringent requirements in terms of iron content and some other elements such as fluorine
This industry usually uses petalite concentrates which can be used directly in the production process The advantage of petalite over spodumene-con-centrates is the generally lower iron content which is a crucial impurity even though these concentrates have lower lithium contents Fe2O3 content above a certain threshold (gt 015 ) will lead to unwanted discoloration in the final glass or ceramic products thus low values are needed
Fluorine-bearing lithium concentrates of lepidolite amblygonite and zinnwal-dite are not used in the glass and ceramics industry as this impurity is highly unwanted Besides fluorine the high Fe2O3 content of zinnwaldite is an issue as mentioned above
Particle size of the concentrates is also an issue as very fine material may lower the melt temperature due to a higher specific surface Therefore concen-trates for this industry are either tailor-made or mixtures of different sources
The glass and ceramics industry also uses pure lithium carbonate to a certain extent based on pricing
Lithium carbonate and lithium hydroxide are the first semi-finished products apart from lithium-concentrates used in the various industries for direct use or further downstream precursors There is a distinction between battery grade and technical (other) grade for lithium-carbonate and lithium-hydroxide The main differences lie within the lithium content level of impurities and particle sizes
Lithium Potential in Namibia
17
Commercial extraction of lithium takes place from lithium-containing brines and from hard rock (ie pegmatitic) deposits A simplified schematic repre-sentation of conventional production steps and key intermediates is shown in Figure 4
For the extraction of lithium from hard rock deposits the raw ores (eg pegma-tites) mined in open-pit or underground mines are processed into lithium-con-taining concentrates by sorting crushing grinding gravity separation mag-netic separation flotation washing filtering and drying The exact production steps vary depending on occurrence (ie locality) mineralogy company and the intended use of the produced concentrates
As of 2020 more than 95 of the conversion from spodumene-concentrates into lithium carbonate andor lithium hydroxide takes place in China The most widely used process in the industry is the acid-roast process (Fig 5)
In this process spodumene-concentrate is ground and heated to 1075 ‒ 1150degC in a rotary kiln (Fig 5) This converts α-spodumene into β-spodumene which is soluble in hot acids After mixing with hot sulfuric acid lithium sulfate solution is mixed with water As a result lithium sulfate dissolves The solution is mixed with calcium carbonate to remove impurities such as iron manganese and aluminum In addition the pH is raised After a first filtering process Na2CO3 and CaO are added to obtain an alkaline soluti-
Lithium Hydroxide
LithiumperoxidLithium Peroxide
Lithium-BrineLithium-Minerals
Lithium ChlorideLithium Bromide Lithium Sulfate
Lithium Acetate Lithium Metal
Lithium Carbonate
Fig 4 Simplified production scheme of lithium and important lithium com-pounds (modified after Roskill 2016)
Lithium Potential in Namibia
18
on Impurities such as calcium and manganese are removed The solution is then neutralized with sulfuric acid and heated to increase the concentration of Li2SO4 to about 200 ‒ 250 gl The addition of Na2CO3 and heating the solution to about 100degC triggers the precipitation of lithium carbonate The carbon-ate produced in this way has purities of up to 993 The battery industry however requires purities of min 995 obtained through ion exchange and extraction of impurities The produced lithium carbonate can then also be used for the production of lithium hydroxide
Common understanding was that the production of lithium carbonate was much cheaper from brines compared to hard rock sources Due to many developments in the brine industry mostly related to a recently introduced royalty system in Chile this is no longer the case On the contrary the cost advantage of brines is lost
Fig 5 Simplified production scheme of lithium carbonate derived from spodu-mene-concentrates via acid-roast-process (modified after Garret 2004)
Solution
MillingCooling
Thickener
Filtration
1075 - 1150oCCalcinationSpodumene Concentrate
Mixing
H2SO4
Leaching
H2O amp CaCO3
Gasscrubber
Solids to Tailings
Mixing
Na2CO3 amp CaO
Thickener
Filtration
Solids to Tailings
Neutralisation
H2SO4
Evaporation
90 - 100oCHeating
Filtering WashingDrying
Na2SO4Lithium carbonate
Lithium Potential in Namibia
19
The production of lithium hydroxide which is a fast growing market and a higher priced intermediate product appears to become cheaper when sourced directly from high quality hard rock conversion relative to sourcing from brines via an intermediate step (lithium carbonate) As the cost advantage of brine deposits compared to hard rock deposits is fading the industry has shifted its focus towards hard rock deposits all over the world
In addition to the acid-roast process there are new technological approaches to recover lithium carbonate and lithium hydroxide directly from high quality spodumene-concentrates as well as other mineralogies
Lithium Potential in Namibia
20
5 Mining and trade of lithium in the SADC
51 Lithium production
Each year every mining country of the world is urged to share production statistics regarding their mining activity These statistics are compiled and published by different entities such as the British Geological Survey (BGS) and the United States Geological Survey (USGS) among others
If a country does not appear in these statistics there was either no mining activity for this specific commodity the country did not publish any statistics or the production data is unknown
Table 2 Mine production of lithium (Source BGR 2020 Roskill 2016 USGS 2020 Geoscience Australia 2020)
Mine production [t Li-Content]
Years 2014 2015 2016 2017 2018 2019e Share 2018 []
Australia1) 12333 13160 15590 21000 57000 42000 647
Chile2) 11640 11787 14526 16584 15886 18000 175
Argentina2) 3388 3515 5767 575 6241 6400 69
China3) 1895 2002 2293 3 7376 7500 81
Zimbabwe1) 1024 1025 974 994 700 1600 08
USA2) 846 846 900 900 567 n A 06
Portugal1) 470 470 299 763 700 1200 08
Brazil1) 186 186 195 154 153 300 02
Namibia1) n d nd n d n d 500 n d 05
Other 3) 19 19 18 18 18 500 lt01
Global4) 31801 33011 40562 49012 90941 77000 1001) Hardrock 2) Brine 3) HardrockBrine 4) Deviation due to rounding e estimated
Lithium Potential in Namibia
21
In 2018 global mine output of lithium was around 91000 t Li-content of which only 1200 t originated from the Southern African Development Community (SADC) namely Zimbabwe and Namibia
52 Trade data
Trade data is retrieved from the commercially available Global Trade Atlasreg (IHS Global SA) The database provides both import and export data for more than 90 countries based on customs data of individual countries Data is primarily classified through Harmonised System (HS) product codes by the WCO (World Customs Organization) The HS nomenclature consists of approximately 5000 product groups identified by a 6-digit code
There are limitations to trade data The most prominent issue arises with data availability since many countries do not publish trade data Especially export data is an issue among many countries
There may also be issues with mislabeled products (wrong HS) product bas-kets data entry errors or missing data in general Were export data is not available so-called reverse trade data (RTS) is an option
If a country does not state any exports cumulative global imports from that particular country may be used as a rough yet incomplete estimate of exports It should be noted that these statistics do not represent absolute but rather minimum values as trade between two non-reporting countries will not be reflected The majority of the SADC countries do not report their import and export statistics
The most important lithium products that are globally traded in significant amounts are lithium-carbonate lithium-oxide (hydroxide) lithium-chloride and lithium-mineral-concentrates
Lithium Potential in Namibia
22
53 Export
The most important intermediate product in the lithium market is lithium carbonate In 2019 global exports amounted to approx 117743 t with Chile being the largest exporter (82344 t 70 ) There are no listed exports from the SADC region except minor quantities from South Africa to the Democratic Republic of Congo (9 t) and Zambia (2 t)
Lithium oxides and lithium hydroxides are grouped together under one HS code hence an individual consideration of both products on a country basis is not possible due to the lack of country-specific commodity codes
In 2019 global exports of HS 282520 stood at approx 97550 t with China being the largest exporting country (49800 t 51 )There are no exports published for the SADC region except South Africa with small quantities (28 t) which are considered to be trade through only
Assessment of lithium chloride global trade flows is also difficult as this prod-uct is listed together with many other chemical products under HS 282739 Global trade can only be investigated using country-specific commodity codes (8-digits and above) if available Only three countries list this product under specific trade codes namely China (28273910) Chile (28273930) and Argentina (28273960) SADC countries including Namibia do not publish any data under HS 282739 Based on the available data global exports in 2019 stood at 2254 t with Chile being the largest exporter (2101 t 89 )
Lithium-containing mineral concentrates are among other non-lithium related products listed in a product basket under HS 253090 Only two coun-tries provide information on this product namely Australia as the largest and hence most important producing and exporting country by far and Brazil as a minor exporter (25309010)
No other country including member states of the SADC specifies lithium-con-taining concentrates as such The currently only producing and exporting country in the SADC is Zimbabwe which does not specify exports at all Thus exports are derived from RTS (global imports)
Lithium Potential in Namibia
23
A general problem with HS 253090 is that only information on quantity is avail-able but no information on lithium content which can vary between 12 and 6 Li2O thus the margin of possible errors in terms of total contained lithium is large
In 2019 Australia exported about 16 million tons of spodumene-concentrate down from 35 million tons in 2018 More than 95 destined to China
Inferred exports (RTS) of Zimbabwe were approx 93300 t for HS 253090 About 62000 t of that quantity are listed as imports by South Africa and are unrelated to lithium The remaining quantity is much more in line with production figures of Zimbabwe as well as the known downstream industries of the destination coun-tries within Europe
There are no export records published by Namibia In general and across all traded lithium products South Africa appears to act as an importexport hub within the SADC Also some of the traded products may be used in the glass and ceramic industry of South Africa
54 Import
For most of the SADC countries the statistics retrieved though the Global Trade Atlas do not necessarily represent reliable trade data due to above-mentioned reasons This is especially true when only small import numbers (usually in tons) are listed as these are supposedly artefacts or errors in declaration
Global imports of lithium-carbonate amounted to approx 142965 t with South Korea being the largest importer (38578 t 27 ) There are no listed imports for the SADC region except South Africa (72 t)
Global imports of lithium-oxides (hydroxides) amounted to approx 84900 t with Japan being the largest importer (37300 t 44 ) In analogy to lithium carbonate there are no published imports into the SADC except for South Africa (428 t)
There is no information for imports of lithium-choride or lithium-mineral-con-centrates into the SADC The largest importer of lithium-choride is China with approx 253 t The largest importer of lithium-mineral-concentrates is also China (gt 95 )
Lithium Potential in Namibia
24
Fig 6 Simplified geology of Namibia with major towns as well as railway and tar roads Blue polygons indicate pegmatite belts and districts in central and southern Namibia (Data source Geological Survey of Namibia 2020)
6 Lithium occurrences in NamibiaIn Namibia significant lithium occurrences are found only within pegmatites These Precambrian and early Namibian pegmatites are restricted to two dif-ferent areas respectively the Damara Orogen in north-central Namibia and the Namaqua Metamorphic Complex in southern Namibia (Fig 6)
Lithium Potential in Namibia
25
Within the Damara Orogen four linear pegmatite belts are found all of which strike northeast ndash southwest (Fig 7) Brandberg West ndash Goantagab Cape Cross ndash Uis Nainais ndash Kohero and Sandamap ndash Erongo with the latter connected to the Karibib Pegmatite District (Schneider 1992)
Each of these pegmatite belts exhibit numerous individual pegmatite swarms that occur zoned or unzoned and may carry significant amounts of rare metals or semi-precious stones In the south Lithium-Caesium-Tantalum (LCT) peg-matites occur in two areas Tantalite-Valley south of Warmbad in close prox-imity to the northwest-trending Tantalite Valley Shear Belt and the Sandfon-tein-Ramansdrift area close to the Orange River
Fig 7 Pegmatite belts in north-central Namibia from west to east Brandberg West ndash Goantagab Cape Cross ndash Uis Nainais ndash Kohero and Sandamap ndash Erongo as well as the Karibib Pegmatite District (after Geological Suvey of Namibia 2002)
Lithium Potential in Namibia
26
7 Lithium mining in NamibiaData for historic lithium mine production is available for the period 1939 ndash 1998 (Fig 8) After 1998 all mining activities ceased due to product quality issues and overall market environment
Until the mid-1950s lepidolite was the most important mined lithium mineral of the country (Fig 8) As mine output of lepidolite decreased output of petalite increased However quantity on a year-to-year basis was quite variable and fluctuated between 1000 ndash 10000 t Since the early 1980s production of petalite was quite stable and ranged between 1000 ndash 2500 t Production fell sharply in 1997 and 1998 after which it ceased Mining of amblygonite has always been small compared to lepidolite and petalite and never exceeded 1000 t per annum
According to the USGS (2020) 500 t of lithium were mined in Namibia in 2018 This is most likely stockpiled lepidolite material from the Rubicon mine
0
2000
4000
6000
8000
10000
12000
1939
1941
1943
1945
1947
1949
1951
1953
1955
1957
1959
1961
1963
1965
1967
1969
1971
1973
1975
1977
1979
1981
1983
1985
1987
1989
1991
1993
1995
1997
[Ton
nes]
Petalite (t)Amblygonite (t)Lepidolite (t)
Fig 8 Lithium production in Namibia in [t] per year (after Schneider 1992 BGR 2020)
Lithium Potential in Namibia
27
Currently there is no active consecutive mining for lithium in substantial quan-tities in Namibia although there are prospects and projects under develop-ment
71 Current mining activities and projects
Soris The Soris project is located in the De Rust pegmatite swarm which is part of the ldquoBrandberg West ndash Goantagab tin beltrdquo (Fig 7) This belt stretches to the northeast of the Brandberg massif over a length of 60 km and a width of 25 km This belt was previously mined for cassiterite on a larger scale Some of the pegmatites in this belt may carry substantial amounts of lithium such as pegmatites in the De Rust pegmatite swarm
The De Rust pegmatite itself is a Li-rich rare metal pegmatite that was mined for cassiterite and tantalite but also for minor quantities of spodumene be ween 1960 and 1990 (Diehl 1990) It intruded into metasediments of the Amis River Formation Lower Ugab Group of the Southern Kaoko Zone
It is the largest pegmatite of the De Rust pegmatite swarm within the Brandberg West ndash Goantagab pegmatite belt (Diehl 1992c) Outcrops are 100 ‒ 470 m long up to 30 m wide and can be followed over a length of roughly 24 km
The pegmatite shows well-developed zonation with a border zone (quartz alkali feldspar muscovite) outer (quartz microcline-perthite muscovite altered petalite) and inner (quartzo-feldspathic rock with spodumene crystals with accessory apatite lepidolite eucryptite zircon and monazite) intermedi-ate zone as well as a core zone (quartz subordinate microcline muscovite sporadic tantalite) Spodumene crystals may reach up to 80 cm in length (Fig 12) Towards the core zone spodumene carries rounded nodules of lithi-um phosphates (amblygonite ndash montebrasite series)
It is located northwest of the nearest town of Uis in the Kunene region of Namibia about 6km to the east of farm De Rust 532 and about 25 km north of the Ugab River The nearest railhead is located in the town of Karibib and the deep-water port of Walvis Bay is 120 km to the southwest Windhoek is about 180 km to the southeast
Lithium Potential in Namibia
28
The project can be reached via paved but mostly unpaved roads from the town of Uis From White Lady Lodge which is about 38 km northwest from Uis a 35 km gravel road leads towards the project 15 km of which are in the riverbed of the Ugab River There is currently no electricity and water supply at the project location site
According to SampP Global (022020) current owner of the Soris project is Mon-tero Mining amp Exploration Ltd (TSXV MON) which holds 80 interest of the property Another 20 are allocated to an unnamed private owner Based on data from the Namibia Mining Cadastre Portal (092020) multiple entries for mining licence applications exist for the area where the main De Rust pegmatite is located (Fig 9)
Resource estimateDue to the early stage of the Soris project no resource estimate is avail-able However Montero Mining claims the project to be drill ready targeting a resource of 10 Mt 1 Li2O with tantalum and tin by-product credits This would equate to 46400 t of lithium or 247000 t LCE
Grab samples of the deposit showed lithium contents of 007 to 532 aver-aging 137 Channel samples showed average lithium contents of 076 and values up to 366 (Montero 032019) The company also re-assessed 1097 previously tested RC drill samples The main lithium-bearing mineral is spodumene
Remnants of historic intermittent mining activities like old foundations and quartzo-feldspathic tailings are still visible east to the main pegmatite (Fig 10 ‒ 11)
Lithium Potential in Namibia
29
Fig 10 Remnants of historic open pit mining (upper) and tailings of De Rust pegmatite (lower) northwest of the Brandberg massif (Photo BGR-GSN 2019)
Fig 9 Satellite image of the De Rust project including the outlined mining license Main pegmatite coordinates 20deg57prime48primeprimeS ‒ 14deg30prime12primeprimeE (Source httpportalsflexicadastrecomnamibia 092020)
Main pegmatite
Lithium Potential in Namibia
30
Fig 12 Weathered spodumene chrystals at the historic open pit mine (Photo BGR-GSN 2019)
Fig 11 Historic open pit of the De Rust pegmatite (Photo BGR-GSN 2019)
Lithium Potential in Namibia
31
Uis The Uis projects (former mine and tailings) are located in the northern part of the ldquoCape Cross Uis pegmatite beltrdquo east of the town of Uis on the farm Uis Townlands No 215 in the Erongo region of Namibia
The Cape Cross-Uis belt is approx 120 km long and up to 40 km wide and extends in a NE direction (Fig 7) It comprises three distinct pegmatite swarms the Strathmore swarm Karlowa swarm and Uis pegmatite swarm In general lithium-bearing pegmatites (Li-Nb-Ta-Sn-Be and Li-Nb-Ta-Sn) are the least common in this belt (Fuchsloch et al 2018)
The Uis swarm field consists of more than 120 individual pegmatites each with a northeasterly to easterly strike direction and northwesterly down dip (30deg ‒ 70deg) This field is accompanied by a peripheral pegmatite field of approx 25 individual pegmatites
Some of the main pegmatites especially around the formerly worldrsquos largest tin mine at Uis are exceedingly large Some of them are up to 1 km long and some 50 m wide
In terms of lithium petalite amblygonite and minor spodumene mineralization occurs in the various pegmatites but no lepidolite Most common lithium bear-ing minerals in the eight pegmatites that were mined at Uis are amblygonite petalite and spodumene
Currently the Uis tailings project and the Uis tin mine are owned by two differ-ent companies As of 2020 the tin mine is operating a pilot processing plant and aims to ramp up the production of lithium in the near future The current ownership of the tailings project as of September 2020 is unclear
The nearest commercial deep-water port to the projects is Walvis Bay 220 km to the southeast The town of Omaruru is 130 km to the east and Henties Bay lies about 120 km to the southwest The nearest railhead is located in Omaruru The area is accessible year-round by paved and un-paved roads NamPower provides electricity and the town of Uis is connected to the Nam-Water pipeline
Lithium Potential in Namibia
32
The tin deposit was discovered in 1911 and mined between the 1950s and 1989 for cassiterite by Uis Tin Mining Company (SWA) Ltd and IMCOR
Coarse tailings are located in the northern part of the former mine just south to the main road C36 (Fig 13) The fine material is located south to the coarse waste dumps (Fig 13)
After 1990 multiple companies owned the property until AfriTin Mining Ltd bought all the rights (license ML134) The current lithium tailings project of Montero Mining amp Exploration Ltd (TSXV MON) is based on the historic mine tailings of the former tin mine on mining license ML134 that is currently owned by AfriTin Mining Ltd The acquired tailings material does not fall under the ML134 license of AfriTin since historical tailings material (Fig 14) is not regulated by Minerals (Prospecting and Mining) Act 33 of 1992 of Namibia
Resource estimateUis tin mineAccording to AfriTin the former Uis mine holds a JORC compliant resource (inferred) of 715 Mt of ore 0134 Sn with a cut-off grade of 005 Sn (AfriTin 2020) Grades of ancillary elements are given at 063 Li2O and 85 ppm Ta for the total resource of 71 Mt of ore
This equals to approx 95000 t of tin 209000 t of lithium (11 Mt LCE) and 6090 t of tantalum 85 of the total resource are attributable to the company The remaining 15 are allocated to SMU (Small Miners of Uis)
Uis tailingsMontero Mining filed an inferred resource estimate of 144 Mt of ore 037 Li2O and 005 SnO2 with a 035 Li2O cut-off grade for lithium and assumed processing recoveries of 70 for their tailings project (Montero 2019) This equals to approx 24700 t of lithium content (131500 t LCE) and 7200 t SnO2
This resource estimate only includes coarse tailings material There is current-ly no information on the lithium content of the fine tailings material that totals 271 Mt t due to insufficient or no test work (Montero 2018) The company also states that the average Li2O grade of the fines material does not hurdle the cut-off for the fines of 082 Li2O
Lithium Potential in Namibia
33
In 2016 Australian based Tawana Resources carried out a drilling program at Uis for a private company called Lithium Africa 1 on the fine and coarse tailings (Table 3 Hole 1 amp Hole 2) Below some of the obtained data on lithium content is given Additionally Li2O content of two obtained grab samples by BGR (Table 3 Sample 2019a amp 2019b) is given
Table 3 Sample data Uis (Tawana 2016 Montero 2018 BGR 2019)
Sample Sample 0 to 1m Li2O ()
Sample 1 to 2m Li2O ()
Sample 2 to 3m Li2O ()
Fines Hole 1 071 085 092
Fines Hole 2 080 089 095
Coarse Hole 1 050 043 043
Coarse Hole 2 054 062 062
BGR Sam-ple 2019a (Coarse tailings)
028
BGR Sam-ple 2019b (Coarse tailings)
028
Montero NI 43-101 037
Lithium Potential in Namibia
34
Fig 14 Tailings of the historic Uis Tin Mine (Photo BGR-GSN 2019 with kind permission of AfriTin Mining Limited)
Fig 13 Former Uis tin mine Uis tailings project with coarse tailings Tailings coordina-tes (center) 21deg13prime31primeprimeS ‒ 14deg52prime44primeprimeE (Source httpportalsflexicadastrecomnamibia 092020)
Uis Tailings (coarse)
Uis Tailings (fine)
Historic Uis mine
Lithium Potential in Namibia
35
Karibib Lepidolite ProjectThe Karibib Lepidolite brownfield project is located in the ldquoKaribib ndash Usakos Pegmatite Districtrdquo southeast of the town of Karibib on the farm Okongava Ost No 72 in central Namibia (Fig 15 ‒ 16)
This pegmatite district which is of Damaran age hosts the most important pegmatite occurrence (Rubicon swarm) in terms of lithium in Namibia In addi-tion numerous other different pegmatite swarms some of which have previ-ously been relevant in terms of lithium are know from this district These are Dernburg Karlsbrunn Albrechtshoumlhe Berger Kaliombo Gamikaubmund Okatjimukuju Etusis Daheim Friedrichsfelde and Etiro (Diehl 1992a)
The Rubicon pegmatite itself is the largest of the individual pegmatites that occur in this field and has been the prime source of lithium until mining seized in the early 1990s The Helikon pegmatites are part of the Rubicon pegmatite swarm and are located northeast to the Rubicon pegmatite They have previ-ously been mined for lepidolite amblygonite petalite and muscovite beryll pollucite quartz and columbite-tantalite as valuable by-products (Fig 18 ‒ 19)
The pegmatite itself consist of two ellipsoidal well zoned Li-mineralized ore-bodies The larger one is about 320 m long and 25 ndash 35 m wide It dips at 46deg to the northeast and has a northwesterly strike The second orebody is about 230 m long and about 10 m wide It is dipping with 30deg to the northeast and has a northwesterly strike In total the outcrop of the Rubicon pegmatite is about 600 m long with a maximum width of 65 m (Fig 17)
A very prominent feature is the presence of a very well developed concen-tric shell and zones from the footwall to the inner core of the pegmatite Both orebodies exhibit a border- wall- intermediate- and core-zone
Border-zone wall-zone and outer intermediate zone of the larger orebody do not contain Li-bearing minerals of economic importance The inner interme-diate zone does contain lepidolite The outer core zone may be sub-divided into a petalite zone low-grade lepidolite zone and a high-grade lepidolite zone The inner core zone also contains a petalite zone Mining occurred pre-viously in the later named zones The zonation of the smaller orebody to the northwest is less pronounced but Li-mineralization and style are equal to the
Lithium Potential in Namibia
36
larger orebody There is no spodumene mineralization within the orebodies and respectively zones of the Rubicon pegmatite
The Helikon I pegmatite is also a lens-shaped pegmatite with a length of roughly 400 m and a width of approx 66 m It dips to the north with about 60deg ndash 70deg Helikon I also consists of well-defined zones The main Li-bearing minerals are lepidolite and petalite According to Roering (1963) the lepidolite is difficult to separate from the intergrown albite and hence of low grade and quality
The Helikon II pegmatite is approx 17 km long and only 9 ndash 15 m wide It lies a bit north of Helikon I and dips steeply to the north with 55deg ndash 80deg striking east west The main Li-bearing minerals are lepidolite and petalite According to Diehl (1990) the westernmost portion of the pegmatite has historically been the economically most important A massive up to 6 m wide petalite zone was mined here according to Diehl (1990)
The nearest railhead to the project is 17 km away in Karibib and the deep-water port of Walvis Bay is 220 km to the southwest Windhoek is about 180 km to the southeast NamPower connects the town of Karibib to electricity and the project currently utilizes generators There is a 7 km long 22 kV power line spur to grid connection pending (Lepidico 2020) Water is available via on-site boreholes
The project was previously owned by Desert Lion Energy Inc (TSVX DLI) Lepidico Ltd (ASX LPD) bought into the project and currently holds 80 interest which comprises Mining License 204 (69 km2) as well as three Exclu-sive Prospecting Licenses (EPLs) namely 5439 5555 and 5781 (Lepidico 2020)
Lepidico will cover mining from multiple sources as well as chemical conver-sion by utilizing their proprietary lithium processing technologies L-Maxreg LOH-Maxreg and S-Maxreg (Lepidico 052019) The company aims to produce high purity lithium chemicals such as lithium carbonate and lithium hydroxide
The takeover also included a nonbinding offtake agreement between the for-mer owner Desert Lion Energy Inc and German chemical company BASF On April 2nd 2019 Desert Lion Energy Inc announced this offtake agreement
Lithium Potential in Namibia
37
which at the time was valid through to December 31 2019 On December 20th
2019 Lepidico announced that the LOI with BASF was extended to Decem-ber 31st 2020 (Lepidico 122019)
The feasibility study criteria of Lepidico are as follows
- Throughput of the concentrator on-site of 035 Mtpa- Expansion of throughput after year five to 05 Mtpa- Chemical plant in the industrial city of Abu Dabi (ICAD)- Plant design for 58000 tpa of concentrate (4 LiO2) for the production of
up to 5500 tpa LiOH- Utilization of L-Maxreg and LOH-MaxTM- Non-binding off-take MOU with BASF for LiOH only- Targeting for project commissioning to commence late 2021 for commer-
cial production in 2022
The preliminary mine plan indicates a strip ratio of 03 ndash 1 for the first two years The ratio will then go up to 1 ndash 14 In the first four years elevated grades of 06 LiO2 will be mined
Resource estimateA JORC 2012 compliant resource estimate for the deposit is given in Table 4 (Lepidico 2020) The deposit currently holds 23200 t of lithium (Indicated amp Inferred) based on a cut-off grade of 015 Li2O This resource estimate is based solely on the lepidolite occurrences at the mine site
Table 4 Resource estimate Karibib Lepidolite Project (Source Lepidico 2020)
Deposit Resource Category
Cut-off (Li2O)
Ore (Mt)
Li2O ()
Li (t)
Li (LCE)
Rubicon Measured
015
22 057 5819 30974
Rubicon Indicated 666 038 11637 61943
Rubicon Inferred 237 043 4728 25167
Helikon
Total 015 1124 043 22184 118086
Lithium Potential in Namibia
38
Fig 16 Satellite image of the Karibib Lepidolite project Helikon 1 coordinates (center) 22deg2prime49primeprimeS ‒ 16deg1prime13primeprimeE Helikon 4 coordinates (center) 22deg2prime24primeprimeS ‒ 16deg1prime41primeprimeE (Source httpportalsflexicadastrecomnamibia 092020)
Fig 15 Satellite image of the Karibib Lepidolite project Rubicon coordinates (center) 22deg6prime11primeprimeS ‒ 15deg59prime44primeprimeE (Source httpportalsflexicadastrecomnamibia 092020)
Historic Rubicon mine
Helikon 1
Helikon 4
Lithium Potential in Namibia
39Fig 17 Rubicon pegmatite (Photo BGR-GSN 2019 with kind permission of Lepidico Chemicals Namibia (Pty) Ltd 2020)
Lithium Potential in Namibia
40 Fig 18 Lepidolite sample from Rubicon pegmatite (Photo BGR-GSN 2019 with kind permission of Lepidico Chemicals Namibia (Pty) Ltd 2020)
Fig 19 Petalite sample from Rubicon pegmatite (Photo BGR-GSN 2019 with kind permission of Lepidico Chemicals Namibia (Pty) Ltd 2020)
Lithium Potential in Namibia
42
Fig 21 Helikon 4 pegmatite (Photo BGR-GSN 2019 with kind permission of Lepidico Chemicals Namibia (Pty) Ltd 2020)
Fig 20 Helikon 1 pegmatite (Photo BGR-GSN 2019 with kind permission of Lepidico Chemicals Namibia (Pty) Ltd 2020)
Lithium Potential in Namibia
43
Tantalite ValleyThe Tantalite Valley Project lies within the ldquoNamaqua Metamorphic Complexrdquo in Southern Namibia Within this complex Lithium-Caesium-Tantalum (LCT) pegmatites occur in two main areas Tantalite-Valley south of Warmbad in close proximity to the northwest-trending Tantalite Valley Shear Belt and the Sandfontein-Ramansdrift area close to the Orange River
The area were the pegmatites of the Tantalite Valley occur is primarily com-posed of a large ovoid gabbro intrusion (71 km by 33 km in extent) within paragneiss units of the Namaqua Complex The gabbro outcrop forms a large dome shaped mountain that rises about 500 m above the surrounding topo-graphy
The pegmatites belong to the Kenhardt and Gordonia pegmatite districts in Namaqualand but only the younger group of them carry accessory ore miner-als such as tantalite beryl REE minerals and lithium
The Tantalite Valley pegmatites include several individual subhorizonal dikes that are up to 1000 m long and 02 to 40 m wide plunging towards southeast (Diehl 1992b) Four of those are of economic interest Homestead Whitkop White City and the Lepidolite pegmatites (ie Purple Haze) (Fig 22)
They are all well zoned (quartz core inner and outer intermediate zones wall zone) and were predominantly targeted for beryl columbite-tantalite as well as lithium and bismuth minerals
The project is located on the farms Umeis 110 and Kinderzitt 132 between the Farms 109 131 129 308 and 473 in the magisterial district of Karas It currently comprises Mining License (ML-77) fully owned by Tameka Shelf Co Four (Pty) Ltd which is a 100 subsidiary of African Tantalite Pty Ltd (AFTAN) Above all Kazera Global Investments PLC holds a 75 stake in AFTAN (Kazera 2019) with the other 25 of local farmer ownership
The project is accessible via gravel road from Karasburg which is about 80 km to the north The nearest railhead is also located in Karasburg Electricity is currently supplied by generators and water is recovered from multiple drill holes The Orange River is about 15 km to the south of the project Mining
Lithium Potential in Namibia
44
infrastructure as well as equipment are on site as well as a plant for the pro-duction of tantalite concentrate
NTI is working on an extensive exploration program with a clear focus on revi-ving tantalite mining in Namibia with a possible by-product stream of lithium bearing minerals The company will focus primarily on the pegmatites Homes-tead Purple Haze Signaalberg and White City (Fig 23)
The area is known for its tantalum occurrences and since the late 1940s tantalite and other minerals have been recovered at Tantalite Valley until 1981 when mining ceased Initially alluvial deposits were mined followed by the pegmatites themselves Grades of the concentrates produced prior to the closure of the mine were quite high with 65 ‒ 70 Ta2O5 with very low U3O8
and ThO2 values of 025 max
Resource estimateAccording to SampP Global (092020) Measured and amp Indicated resources at Tantalite Valley are 104800 t of ore 0042 Ta2O5 and 0653 Li2O as of 112019 This would equate to 315 t of lithium or 1690 t LCE Total inferred resources are 517400 t of ore 0018 Ta2O5 and 0144 Li2O This equals to approx 91 t of tantalum and 750 t of lithium (3535 t LCE)
Lithium Potential in Namibia
45
Fig 23 White City pegmatite (Source Kazera global Investments PLC 2020)
Fig 22 Satellite image of the Tantalite Valley project White City pegmatite coordinates (center) 28deg43prime07primeprimeS ‒ 18deg44prime45primeprimeE Homestead pegmatite coordinates (center) 28deg43prime19primeprimeS - 18deg44prime24primeprimeE Purple Haze pegmatite coordinates (center) 28deg43prime09primeprimeS ‒ 18deg43prime55primeprimeE (Source httpportalsflexicadastrecomnamibia 092020)
Lithium Potential in Namibia
46
8 Analysed lithium samplesDuring the course of the cooperation project between the Economic Geology Division (EGD) of the Geological Survey of Namibia (GSN) and the Ger-man Federal Institute of Geosciences and Natural Resources (BGR) several sampling campaigns to southern and central pegmatites took place
The field trips were preceded by literature and data research regarding infor-mation on lithium occurrences andor previous lithium mining activity to iden-tify specific target areas
During a campaign in 2019 16 lithium-bearing mixed mineral samples were taken from five different locations and subsequently analyzed Two of the samples originate from the Uis Tin Mine Tailings of the former tin mine All remaining samples were taken either from stripped outcrops for future mine activities or from previous mine sites (ie pits)
All 16 samples were analyzed at BGR labs in Hanover Germany through qualitative XRD XRF and ICP-MS Given data shall be understood as a first indicator for the sampled lithium occurrences
Most if not all sampled occurrences have previously been analyzed or are cur-rently being assessed by the property owners or current licensees Detailed information of these sampling and analytical campaigns remain confidential and are thus not available for comparison
Appendix A lists the identified qualitative mineralogy of the samples as well as the major element analysis Additional samples from previous campaigns are also given
Interpretation of the results are based on their applicability in the various lithium-consuming industries for which information is available
Most of the current lithium applications require a chemical intermediate product such as lithium carbonate or lithium-hydroxide The glass and cera-mic industry does use lithium-bearing mineral concentrates depending on the prices of these materials when compared to LiCO3
Lithium Potential in Namibia
47
Since the main applications require an intermediate or downstream chemical product lithium content as well as impurity values are the main criteria for the suitability of the sampled occurrences Other quality criteria are particle size and surface areastructure
9 InterpretationAs previously stated all obtained grab samples are mixtures of lithium- bearing minerals (ie spodumene petalite lepidolite) feldspars quartz micas as well as secondary minerals Therefore all given analytical data has to be taken with caution and will not be representative for the individual outcrops or deposits
The evaluation of the economic suitability for various economic applications of the analysed lithium samples is based on the chemical specifications in Chapter 4
Lithium content gt 1 Li2O Fe2O3 content lt 015 as well as F content lt 01 are individually highlighted (Appendix A) as these three values are the most important
Based on the chemical analysis nine of the 16 samples showed Li2O contents of more than 1 (range 117 ‒ 327 ) Seven of those nine samples also exhibited low Fe2O3 content (range 004 ‒ 008 ) (Appendix A) Three of those seven samples also had fluorine values below 005
Of the ten additionally included samples from previous campaigns four showed Li2O contents of more than 1 (range 126 ‒ 199 ) Three of those samples also exhibited low Fe2O3 content (range 004 ‒ 007 ) (Appendix A) One of the three samples had fluorine values below 005
The mentioned samples (sources) could be of potential use but for further interpretation statistical sampling will be required
Lithium Potential in Namibia
48
10 ConclusionsThere is currently no lithium industry established in Namibia This accounts to both mining and processing of ores into commercial lithium-bearing con-centrates as well as the production of downstream products such as lithium carbonate andor lithium hydroxide In order to evaluate the potential for a lithium industry in Namibia the current global market and price developments need to be addressed
Currently the main application for lithium is in the chemical industry as lithium carbonate andor hydroxide for the manufacturing of lithium-ion batteries There is currently no domestic market (supply) or demand for this industry in Southern Africa or Namibia in specific Processing of lithium-bearing ores into these highly specific downstream products is economically more viable in close proximity to the demanding industries It also requires large investments (double-digit million dollars per 10000t of capacity) Additionally there is already huge capacity and strong capacity build up in Asia at rather low cost
The second most important application lies in the glass and ceramics industry This industry uses lithium either as lithium-bearing concentrates or lithium carbonate depending on current market price and processproduct require-ments There is currently no such industry established in Namibia but potential plans There is glass and ceramics manufacturing in South Africa and thus a potential market for lithium bearing products (concentrates) should this indus-try require it depending on product
The 20182019 primary lithium supply based on spodumene-bearing mineral concentrates was dominated by Australia with a market share of well over 95 On an annual basis the country exports more than three million tons of lithium-bearing concentrates to China To put this into perspective Lepidico plans to export just 58 ktpa of concentrate to Abu Dhabi for refinement from their project annually Therefore potential production in Namibia will always be rather small scale when compared to peer producing countriescompanies
As of late 2020 the concentrate market is in strong oversupply with strong competition Thus prices have eroded quite substantially for a standard SC6 concentrate (Fig 24) In general prices vary significantly based on lithium content and impurities of the concentrates Lithium bearing mineral concen-
Lithium Potential in Namibia
49
trates are a relatively low-value mineral commodity when compared to lithi-um-carbonate or other lithium downstream products thus product quality cost reduction and cost control are key components in this industry Since prices are depressed currently many of the Australian producers have drasti-cally reduced output or even went into care and maintenance This situation may change towards 2025 or beyond as demand picks up
Prices for the higher valued product lithium-carbonate spiked at the end of 2017 towards 2018 to more than 20000 $USt on a contract basis with prices being very volatile Since then prices have also eroded to below 9000 $USt due to oversupply and slow demand pickup (Fig 25) With this product stable quality and chemical composition are crucial for the downstream industry
Based on available gradetonnage data the Namibian projectsprospects are relatively small in overall size and low in grade when compared to global peers for the resource category ldquoMeasuredIndicatedrdquo (Appendix B) Total contained lithium quantity is thus relatively small in comparison On a global scale the most promising hard rock projects that are currently being mined and developed have Li2O grades of 10 or above
Fig 24 Lithium-mineral-concentrate prices 012010 ‒ 062020 (Source BGR 2020)
300
400
500
600
700
800
900
1000
1100
208
210
212
214
216
218
220
US$
t US$t
01-20
14
01-20
15
01-20
16
01-20
17
01-20
18
01-20
19
01-20
20
01-20
10
01-20
11
01-20
12
01-20
13
Spodumene min 5-6 LiO2 fob Australia
Spodumene concentrate gt75 LiO2 bulk cif Asia
Petalite 42 LiO2 fob Durban
Spodumene fob Australia
Spodumene min 5-6 LiO2 cif China
Lithium Potential in Namibia
50
For the resource category ldquoIndicatedrdquo which generally represents the lowest level of confidence only the Uis mine project of AfriTin represents a size-able resource even though grades are relatively low (Appendix C) The Uis tailings project as well as the Rubicon project are again relatively small when compared to their global peers Tantalite Valley is the smallest of all included projects (Appendix C)The given data for the De Rust project reflects only an exploration target of the company rather than actual data and may thus be not representative
Based on size and contained lithium-content none of the visited early stage projectsprospects would justify the financial investment into the construction of a chemical conversion plant for the production of lithium carbonate andor hydroxide on site as it requires very large monetary investments Due to their size payback of the required investments may be unfavorable when compared to global peers In addition the current market environment is very harsh with strong competition from Asia that has a huge cost advantage due to capacity build up This industry is also very energy and water intensive
In addition location within Namibia as well as distance to possible down-stream markets may become an issue as it increases the transportation cost
4000
7000
10000
13000
16000
19000
22000
25000
28000
01-20
14
01-20
15
01-20
16
01-20
17
01-20
18
01-20
19
01-20
20
US$
t
Lithium-carbonate (min 995 ) battery grade spot price ex works domestic ChinaLithium-carbonate (min 99-995 ) Li2CO3 large contracts USA delivered continentalLithium-hydroxid-monohydrate (min 565) technical and industrial grades cif China Japan amp Korea
Fig 25 Lithium chemical prices 012014 ndash 062020 (Source BGR 2020)
Lithium Potential in Namibia
51
immensely This is especially true for the SorisDe Rust pegmatite which is in a remote location without any allocated infrastructure The projects Karibib Uis and Tantalite Valley are much easier to access
The approach of Lepidico to produce a lithium bearing concentrate on site seems plausible approach Since this will already require a skilled workforce mining and beneficiation equipment in order to produce a high quality lithium-bearing concentrate it may already be considered ldquoadded valuerdquo for the indus-try of the country This approach may also be suitable for the other mentioned and visited projects
Lithium Potential in Namibia
52
ReferencesAfriTin Mining (2020) Uis Tin Project ndash Company Information ndash URL httpafritinminingcomuis-project [as of 092020]
Australian Government Geoscience Australia (2019) Australiarsquos Identi-fied Mineral Resources 2019 ndash URL httpswwwgagovauscientific-topicsmineralsmineral-resources-and-adviceaimr [as of 092020]
BGR ndash Bundesanstalt fuumlr Geowissenschaften und Rohstoffe (2020) Fachinformationssystem Rohstoffe ndash unpubl Hannover [as of 082020]
BGS ndash British Geological Survey (2016) Lithium Definitions mineralo-gy and deposits ndash URL httpswwwbgsacukdownloadsstartcfmid=3100 [as of 062016]
Diehl B J M (1990) Pegmatites of the Cape Cross Uis ndash Pegmatite Belt Namibia Geology mineralisation Rubidium Strontium characteristics and petrogenesis of rare metal pegmatites Open File Report EG 083 Economic Geology Series Geological Survey of Namibia 39 pp Windhoek
Diehl B J M (1992a) Lithium Caesium Beryllium Open File Report Mineral Resource Series Geological Survey of Namibia 18 pp Windhoek
Diehl B J M (1992b) Niobium and Tantalum Open File Report Mineral Resource Series Geological Survey of Namibia 20 pp Windhoek
Diehl B J M (1992c) Tin Open File Report Mineral Resource Series Geological Survey of Namibia 30 pp Windhoek
Diehl B J M amp Schneider G I C (1990) Geology and mineralisation of the Rubicon Pegmatite Namibia Open File Report Geol Surv Namibia 20 pp Windhoek
Fuchsloch et al (2018) Classification mineralogical and geochemical vari-ations in pegmatites of the Cape Cross-Uis pegmatite belt Namibia Lithos 296 ndash 299 79-95 elsevier
Lithium Potential in Namibia
53
Garret D E (2004) Handbook Of Lithium And Natural Calcium Chloride Their Deposits Processing Uses and Properties ndash 467 S Oxford (Elsevier B V)
Geological Survey of Namibia (2002) Mineral Resources of Namibia Summary of Mineral Deposits and Occurrences Omaruru Sheet 2114 Volume I ndash Complete Descriptions 119 pp Windhoek
IHS Global SA (2020) Global Trade Atlas ndash Commercial Online-Databa-se ndashURL httpsmyihscomConnectcallingUrl=https3a2f2fconnectihsmarkitcom2f [as of 062017]
Kazera Global Investments PLC (2020) Company Information ndash URL httpskazeraglobalcominvestmentsnamibia-tantalite-investment-mine [as of 092020]
Lepidico (2019) LOI with BASF extended to 31 December 2020 ndash News Release ndash URL httpswwwlepidicocomwp-contentuploads201910LPD-191220-LOI-with-BASF-extended-to-31-December-2020pdf [as of 122019]
Lepidico (2019) Corporate Presentation ndash URL httpswwwlepidicocomwp-contentuploads201907LPD-190509-Corporate-Presentati-on-May-2019pdf [as of 052019]
Lepidico (2020) Company Information ndash URL httpswwwlepidicocomprojectskaribib [as of 092020]
Montero Mining amp Exploration Ltd (2018) Exploring Battery Metals in Namibia ndash Company Presentation ndash URL httpswwwproactiveinvestorscomauuploadSponsorFileFile2018_031520244941_MON-CorporatePre-sentationMarch2018pdf [as of 072018]
Montero Mining amp Exploration Ltd (2019) Montero Files NI 43-101 Resource Estimate On The Uis Lithium-Tin Tailings Project In Namibia On Sedar ndash News Announcement ndash URL httpsmonterominingcommontero-files-ni-43-101-resource-estimate-on-the-uis-lithium-tin-tailings-project-in-namibia-on-sedar [as of 032019]
Lithium Potential in Namibia
54
Namibia Mining Cadastre Portal (2020) Online-Database ndashURL httpsportalslandfoliocomnamibia [as of 092020]
Roskill Information Services Ltd (2016) Lithium Global Industry Mar-kets amp Outlook ndash 386 S London Groszligbritannien
Schneider G I C (1992) Feldspar Open File Report MRS 08 Mineral Resource Series Geological Survey of Namibia 2 pp Windhoek
Schmidt M (2017) Rohstoffrisikobewertung ndash Lithium ndash DERA Rohstoffin-formationen 33 Berlin
S amp P Global Market Intelligence (2020) Lithium - Metals amp Mining Properties URL httpsplatformmarketintelligencespglobalcomwebcli-entauth=inheritindustryminingProjects [as of 092020]
Statista (2020) Distribution of lithium end-usage worldwide in 2019 by area application ndash URL httpswwwstatistacomstatistics268787lithium-usa-ge-in-the-world-market [as of 062020]
Tawana Resources NL (2016) Tawana acquires second lithium pro-ject ndash News Release ndash URL httpsmstrademomentumcozajsepdfSENS_20160923_S376505pdf [as of 092016]
USGS ndash United States Geological Survey (multiple years) Lithium ndash Minerals Commodity Summaries ndash URL httpswwwusgsgovcentersnmiclithium-statistics-and-information [as of 082020]
Appendix
Sam
ple I
DFa
rmLa
titud
eLo
ngitu
deSa
mpl
e des
crip
tion
(XRD
qu
al)
LiO 2
()
SiO 2
Ti
O 2
Al2O 3
Fe2O 3
Mn
O Mg
O Ca
O Na
2O
K 2O P 2O 5
SO
3
Cl
F
LOI
Su
m
2015
-03
previous sample campaignsHelik
on
n A
Felds
parQ
uartz
Lepid
olite
025
6871
lt000
119
0500
200
2900
505
3292
806
7905
59lt0
01lt0
002
lt005
093
9985
2016
-12
Rubic
onwe
ather
ed P
etalite
126
6473
lt000
118
0600
703
2718
607
9507
805
2500
62lt0
01lt0
002
lt005
1146
9871
2016
-17
Rubic
onLe
pidoli
te +
Quar
tz13
063
6700
219
9316
0929
003
0054
029
6218
0052
lt001
lt000
226
232
798
67
2016
-20
Helik
onLe
pidoli
te + A
lbite
176
5514
lt000
126
8700
401
2100
700
2123
970
3900
45lt0
01lt0
002
156
369
9698
2016
-21
Helik
onLe
pidoli
te19
954
32lt0
001
2627
004
0224
006
0038
266
714
0069
lt001
lt000
240
628
997
77
FN20
19_0
4De
Rus
tFe
ldspa
rAmb
lygon
iteP
etalite
(n
on X
RD)
003
6513
lt000
118
82lt0
0100
0200
101
0924
311
4105
75lt0
0100
04lt0
0503
898
84
2015
-09
Molop
oPe
talite
(non
XRD
)00
952
85lt0
001
1672
lt001
0002
487
0323
342
0352
lt000
100
400
3403
621
1310
012
2016
-14
Molop
oPe
talite
wea
there
d (no
n XRD
)00
752
1600
0316
5100
200
5147
805
8923
406
4500
6900
200
8602
222
6310
013
2016
-15
Molop
oFe
ldspa
r (no
n XRD
)00
664
02lt0
001
1937
003
0004
003
0151
216
1249
0796
lt001
lt000
2lt0
0505
399
55
2016
-23
Molop
oZin
nwald
ite (n
on X
RD)
006
5044
0068
3307
048
0011
012
0426
261
7674
0181
lt001
lt000
2lt0
0542
9925
1909
249
2019Uis
Tailin
gs
Quar
tzFe
ldspa
rPeta
lite
Musc
ovite
028
7293
0045
1479
051
0062
0212
9830
927
6613
6200
2lt00
02lt0
0523
399
38
1909
250
Uis
Tailin
gsQu
artz
Felds
parP
etalite
Mu
scov
ite02
872
6900
4314
8205
0059
019
1306
313
2794
1347
002lt
0002
lt005
251
9937
1909
251
Helik
on 4
22deg02prime4
8primeprimeS1
6deg01prime30
primeprimeEQu
artz
Felds
parP
etalite
Le
pidoli
te16
464
4400
0319
4200
301
2100
408
8325
345
6806
800
400
0727
228
998
38
1909
252
Helik
on 1
22deg02prime2
0primeprimeS1
6deg01prime19
primeprimeEPe
talite
Lepid
olite
Quar
tz29
576
9200
0116
6800
300
0304
101
7301
106
8100
01lt0
01lt0
002
lt005
205
97
App
endi
x A
Ana
lytic
al d
ata
of li
thiu
m s
ampl
es c
olle
cted
in N
amib
ia T
hres
hold
val
ues
high
light
ed in
gre
en
Lithium Potential in Namibia
57
Sam
ple I
DFa
rmLa
titud
eLo
ngitu
deSa
mpl
e des
crip
tion
(XRD
qu
al)
LiO 2
()
SiO 2
Ti
O 2
Al2O 3
Fe2O 3
Mn
O Mg
O Ca
O Na
2O
K 2O P 2O 5
SO
3
Cl
F
LOI
Su
m
1909
253
2019Rubic
on22deg06prime1
3primeprimeS1
5deg59prime45
primeprimeEPe
talite
Lepid
olite
Quar
tz32
778
73lt0
001
1687
002
0006
002
0157
011
003
0002
003
0003
lt005
075
9663
1909
254
Rubic
on22deg06prime1
0primeprimeS1
5deg59prime41
primeprimeEFe
ldspa
rQua
rtzM
usco
vite
004
682
lt000
119
3500
300
2400
205
0610
0808
6804
3lt0
01lt0
002
lt005
041
9985
1909
255
Rubic
on22deg06prime1
0primeprimeS1
5deg59prime41
primeprimeEFe
ldspa
rLep
idolite
Mus
co-
viteK
aolin
026
6104
0004
2318
022
0136
006
0119
367
8411
0159
lt001
lt000
2lt0
0522
299
15
1909
256
Rubic
on22deg06prime1
0primeprimeS1
5deg59prime41
primeprimeELe
pidoli
te 27
249
8700
129
3400
408
0500
400
704
697
3100
31lt0
01lt0
002
087
441
9569
1909
257
Rubic
on22deg06prime1
3primeprimeS1
5deg59prime45
primeprimeEPe
talite
Lepid
olite
Quar
tz30
670
0900
0320
2600
801
0901
502
9901
926
800
15lt0
0100
04lt0
0526
596
48
1909
258
Rubic
on22deg06prime1
0primeprimeS1
5deg59prime41
primeprimeELe
pidoli
teFe
ldspa
rQua
rtz20
659
7800
0224
100
505
2400
300
513
7247
0051
lt001
0002
265
388
9966
1909
259
Tanta
lite
Valle
y28deg43prime0
9primeprimeS1
8deg43prime55
primeprimeEFe
ldspa
rLep
idolite
Mus
covit
e11
762
64lt0
001
2139
004
0161
lt001
0399
7731
2401
0900
200
119
912
698
85
1909
260
Tanta
lite
Valle
y28deg43prime0
9primeprimeS1
8deg43prime55
primeprimeEFe
ldspa
rLep
idolite
Mus
covit
e03
059
8600
1425
1301
604
2200
302
2860
547
2201
3900
200
0904
123
799
56
1909
261
Tanta
lite
Valle
y28deg43prime0
9primeprimeS1
8deg43prime55
primeprimeEFe
ldspa
rQua
rtzM
usco
vite
003
636
0005
2218
022
0122
002
0381
727
3809
0272
lt001
lt000
2lt0
0513
199
17
1909
262
Tanta
lite
Valle
y28deg43prime2
0primeprimeS1
8deg44prime23
primeprimeEQu
artzSp
odum
eneM
us-
covit
e13
180
5100
0415
8903
401
2401
301
9502
604
0400
0500
200
03lt0
0507
398
56
1909
263
De R
ust
20deg57prime4
8primeprimeS1
4deg30prime13
primeprimeEFelsd
parS
podume
neQuartz
074
7313
0006
2048
007
015
005
0154
398
0831
0073
001
0003
lt005
082
9974
1909
264
De R
ust
20deg57prime4
8primeprimeS1
4deg30prime13
primeprimeESp
odum
eneF
eldsparQuartz
230
6924
0006
2602
801
0200
301
0510
102
1400
68lt0
0100
03lt0
0504
897
53
(Con
tinue
d) A
ppen
dix
A A
naly
tical
dat
a of
lith
ium
sam
ples
col
lect
ed in
Nam
ibia
Thr
esho
ld v
alue
s hi
ghlig
hted
in g
reen
Lithium Potential in Namibia
58
Appendix B GradeTonnage data (Measured amp Indicated) for selected lithium projects in comparison to Namibian projects (Source SampP 092020)
0
0500
1000
1500
2000
2500
500
5000
5000
0
5000
00
5000
000
Gra
de [
Li 2O
]
Tonnage [t]
Tantalite Valley
Rubicon
Appendix B GradeTonnage data (Inferred) for selected lithium projects in com-parison to Namibian projects (Source SampP 092020)
0
0500
1000
1500
2000
2500
100
1000
1000
0
1000
00
1000
000
1000
0000
Gra
de [
Li 2O
]
Tonnage [t]
Tantalite ValleyRubicon
Uis Tailings
Uis Mine
De Rust
A product of the technical cooperation project between Bundesanstalt fuumlr Geowissenschaften und Rohstoffe (BGR)(Federal Institute for Geosciences and Natural Resources)
andGeological Survey of Namibia within the Ministry of Mines and Energy
ISBN 978-3-948532-29-1 (Print) 978-3-948532-30-7 (PDF)
- List of Abbreviations
- 1 Introduction
- 2 What is lithium
-
- 21 Lithium deposits
-
- 3 Application
- 4 Chemical requirements
- 5 Mining and trade of lithium in the SADC
-
- 51 Lithium production
- 52 Trade data
- 53 Export
- 54Import
-
- 6 Lithium occurrences in Namibia
- 7 Lithium mining in Namibia
-
- 71 Current mining activities and projects
-
- 8 Analysed lithium samples
- 9 Interpretation
- 10 Conclusions
- References
-
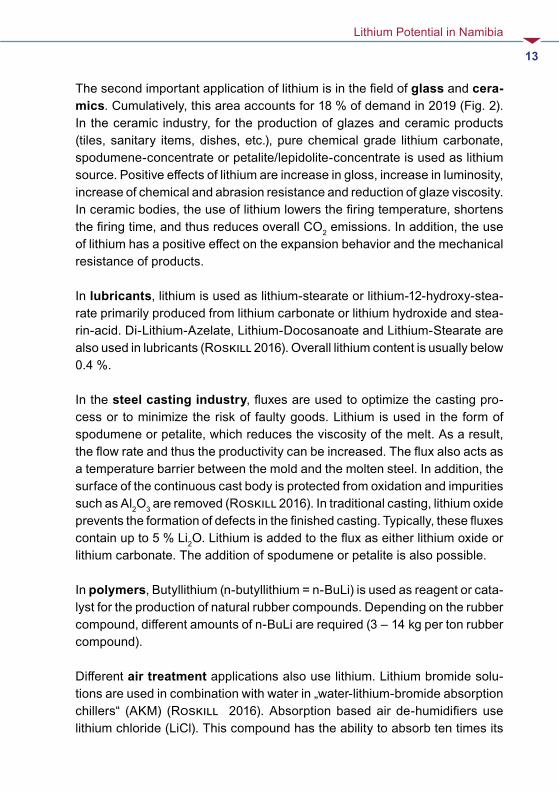
Lithium Potential in Namibia
14
own weight in water Lithium is also used in air purification By means of lithium hydroxide CO2 can be removed from the air
Primary batteries also use lithium due to its electrochemical properties The-se cells are used in watches calculators pacemakers etc They are charac-terized by small size high energy density low weight long storage capacity low self-discharge and high cell voltage
Fig 3b Ceramic stove top (Source SCHOTT AG 2017)
Fig 3a Pouch-Lithium-Ion Cell (Source BGR)
Lithium Potential in Namibia
15
4 Chemical requirementsLithium is not a typically mined metal and the quality requirements are very specific and stringent depending on the field of application and thus vary from end-user to end-user
The first products that enter the value chains are usually the intermediates lithium carbonate andor lithium hydroxide produced from either brine sources or hard rock deposits ie currently mostly pegmatite sources (Fig 4)
Lithium from pegmatite sources is primarily sold as concentrates of either spodumene petalite or lepidolite with minor quantities of amblygonite in the market Each industry has unique requirements in terms of desired chemical composition particle size and tolerable values of impurities Concentrates are usually graded and priced according to their Li2O content impurity levels and aimed mainly at the growing battery industry as well as glassceramics industry
Concentrates for the battery industry are rated ldquochemical graderdquo and concen-trates for the glass industry are rated ldquotechnical graderdquo In general the glass industry has tighter limits on certain impurities as the battery industry due to the direct usage of the concentrates in the respective product flow sheets
The current industry standard for lithium concentrates in the battery indus-try is called SC-6 a chemical grade spodumene-concentrate that contains approx 6 Li2O Higher values of lithium are uncommon as concentrating them beyond 6 Li2O increases the cost of production exponentially
Petalite lepidolite zinnwaldite amblygonite and other lithium bearing miner-als are not used in this industry yet However there are processes in develop-ment for the extraction of lithium from these sources
Some companies especially in Australia sell spodumene-concentrates with lower Li2O contents (22 ndash 5 ) at lower prices per ton A special case are so-called DSO-concentrates (ldquodirect shipping orerdquo) with Li2O contents of only 12 ndash 14 DSO shippingrsquos out of Australia decreased significantly as the monetary value is quite low with lt 150 US$t and higher qualities are available
Lithium Potential in Namibia
16
Mica (muscovite) is an unwanted impurity in these concentrates as it disturbs the converting steps Heavy minerals are usually also extracted from the sources as they may represent by-product value (eg tantalum) Wall-rock impurities may cause problems in the further processing steps (basalt etc) Fe2O3 content is also an issue as it may also pose problems in the converters (clogging)
Technical grade lithium concentrates for the glass industry may have the same values of lithium in terms of Li2O but more stringent requirements in terms of iron content and some other elements such as fluorine
This industry usually uses petalite concentrates which can be used directly in the production process The advantage of petalite over spodumene-con-centrates is the generally lower iron content which is a crucial impurity even though these concentrates have lower lithium contents Fe2O3 content above a certain threshold (gt 015 ) will lead to unwanted discoloration in the final glass or ceramic products thus low values are needed
Fluorine-bearing lithium concentrates of lepidolite amblygonite and zinnwal-dite are not used in the glass and ceramics industry as this impurity is highly unwanted Besides fluorine the high Fe2O3 content of zinnwaldite is an issue as mentioned above
Particle size of the concentrates is also an issue as very fine material may lower the melt temperature due to a higher specific surface Therefore concen-trates for this industry are either tailor-made or mixtures of different sources
The glass and ceramics industry also uses pure lithium carbonate to a certain extent based on pricing
Lithium carbonate and lithium hydroxide are the first semi-finished products apart from lithium-concentrates used in the various industries for direct use or further downstream precursors There is a distinction between battery grade and technical (other) grade for lithium-carbonate and lithium-hydroxide The main differences lie within the lithium content level of impurities and particle sizes
Lithium Potential in Namibia
17
Commercial extraction of lithium takes place from lithium-containing brines and from hard rock (ie pegmatitic) deposits A simplified schematic repre-sentation of conventional production steps and key intermediates is shown in Figure 4
For the extraction of lithium from hard rock deposits the raw ores (eg pegma-tites) mined in open-pit or underground mines are processed into lithium-con-taining concentrates by sorting crushing grinding gravity separation mag-netic separation flotation washing filtering and drying The exact production steps vary depending on occurrence (ie locality) mineralogy company and the intended use of the produced concentrates
As of 2020 more than 95 of the conversion from spodumene-concentrates into lithium carbonate andor lithium hydroxide takes place in China The most widely used process in the industry is the acid-roast process (Fig 5)
In this process spodumene-concentrate is ground and heated to 1075 ‒ 1150degC in a rotary kiln (Fig 5) This converts α-spodumene into β-spodumene which is soluble in hot acids After mixing with hot sulfuric acid lithium sulfate solution is mixed with water As a result lithium sulfate dissolves The solution is mixed with calcium carbonate to remove impurities such as iron manganese and aluminum In addition the pH is raised After a first filtering process Na2CO3 and CaO are added to obtain an alkaline soluti-
Lithium Hydroxide
LithiumperoxidLithium Peroxide
Lithium-BrineLithium-Minerals
Lithium ChlorideLithium Bromide Lithium Sulfate
Lithium Acetate Lithium Metal
Lithium Carbonate
Fig 4 Simplified production scheme of lithium and important lithium com-pounds (modified after Roskill 2016)
Lithium Potential in Namibia
18
on Impurities such as calcium and manganese are removed The solution is then neutralized with sulfuric acid and heated to increase the concentration of Li2SO4 to about 200 ‒ 250 gl The addition of Na2CO3 and heating the solution to about 100degC triggers the precipitation of lithium carbonate The carbon-ate produced in this way has purities of up to 993 The battery industry however requires purities of min 995 obtained through ion exchange and extraction of impurities The produced lithium carbonate can then also be used for the production of lithium hydroxide
Common understanding was that the production of lithium carbonate was much cheaper from brines compared to hard rock sources Due to many developments in the brine industry mostly related to a recently introduced royalty system in Chile this is no longer the case On the contrary the cost advantage of brines is lost
Fig 5 Simplified production scheme of lithium carbonate derived from spodu-mene-concentrates via acid-roast-process (modified after Garret 2004)
Solution
MillingCooling
Thickener
Filtration
1075 - 1150oCCalcinationSpodumene Concentrate
Mixing
H2SO4
Leaching
H2O amp CaCO3
Gasscrubber
Solids to Tailings
Mixing
Na2CO3 amp CaO
Thickener
Filtration
Solids to Tailings
Neutralisation
H2SO4
Evaporation
90 - 100oCHeating
Filtering WashingDrying
Na2SO4Lithium carbonate
Lithium Potential in Namibia
19
The production of lithium hydroxide which is a fast growing market and a higher priced intermediate product appears to become cheaper when sourced directly from high quality hard rock conversion relative to sourcing from brines via an intermediate step (lithium carbonate) As the cost advantage of brine deposits compared to hard rock deposits is fading the industry has shifted its focus towards hard rock deposits all over the world
In addition to the acid-roast process there are new technological approaches to recover lithium carbonate and lithium hydroxide directly from high quality spodumene-concentrates as well as other mineralogies
Lithium Potential in Namibia
20
5 Mining and trade of lithium in the SADC
51 Lithium production
Each year every mining country of the world is urged to share production statistics regarding their mining activity These statistics are compiled and published by different entities such as the British Geological Survey (BGS) and the United States Geological Survey (USGS) among others
If a country does not appear in these statistics there was either no mining activity for this specific commodity the country did not publish any statistics or the production data is unknown
Table 2 Mine production of lithium (Source BGR 2020 Roskill 2016 USGS 2020 Geoscience Australia 2020)
Mine production [t Li-Content]
Years 2014 2015 2016 2017 2018 2019e Share 2018 []
Australia1) 12333 13160 15590 21000 57000 42000 647
Chile2) 11640 11787 14526 16584 15886 18000 175
Argentina2) 3388 3515 5767 575 6241 6400 69
China3) 1895 2002 2293 3 7376 7500 81
Zimbabwe1) 1024 1025 974 994 700 1600 08
USA2) 846 846 900 900 567 n A 06
Portugal1) 470 470 299 763 700 1200 08
Brazil1) 186 186 195 154 153 300 02
Namibia1) n d nd n d n d 500 n d 05
Other 3) 19 19 18 18 18 500 lt01
Global4) 31801 33011 40562 49012 90941 77000 1001) Hardrock 2) Brine 3) HardrockBrine 4) Deviation due to rounding e estimated
Lithium Potential in Namibia
21
In 2018 global mine output of lithium was around 91000 t Li-content of which only 1200 t originated from the Southern African Development Community (SADC) namely Zimbabwe and Namibia
52 Trade data
Trade data is retrieved from the commercially available Global Trade Atlasreg (IHS Global SA) The database provides both import and export data for more than 90 countries based on customs data of individual countries Data is primarily classified through Harmonised System (HS) product codes by the WCO (World Customs Organization) The HS nomenclature consists of approximately 5000 product groups identified by a 6-digit code
There are limitations to trade data The most prominent issue arises with data availability since many countries do not publish trade data Especially export data is an issue among many countries
There may also be issues with mislabeled products (wrong HS) product bas-kets data entry errors or missing data in general Were export data is not available so-called reverse trade data (RTS) is an option
If a country does not state any exports cumulative global imports from that particular country may be used as a rough yet incomplete estimate of exports It should be noted that these statistics do not represent absolute but rather minimum values as trade between two non-reporting countries will not be reflected The majority of the SADC countries do not report their import and export statistics
The most important lithium products that are globally traded in significant amounts are lithium-carbonate lithium-oxide (hydroxide) lithium-chloride and lithium-mineral-concentrates
Lithium Potential in Namibia
22
53 Export
The most important intermediate product in the lithium market is lithium carbonate In 2019 global exports amounted to approx 117743 t with Chile being the largest exporter (82344 t 70 ) There are no listed exports from the SADC region except minor quantities from South Africa to the Democratic Republic of Congo (9 t) and Zambia (2 t)
Lithium oxides and lithium hydroxides are grouped together under one HS code hence an individual consideration of both products on a country basis is not possible due to the lack of country-specific commodity codes
In 2019 global exports of HS 282520 stood at approx 97550 t with China being the largest exporting country (49800 t 51 )There are no exports published for the SADC region except South Africa with small quantities (28 t) which are considered to be trade through only
Assessment of lithium chloride global trade flows is also difficult as this prod-uct is listed together with many other chemical products under HS 282739 Global trade can only be investigated using country-specific commodity codes (8-digits and above) if available Only three countries list this product under specific trade codes namely China (28273910) Chile (28273930) and Argentina (28273960) SADC countries including Namibia do not publish any data under HS 282739 Based on the available data global exports in 2019 stood at 2254 t with Chile being the largest exporter (2101 t 89 )
Lithium-containing mineral concentrates are among other non-lithium related products listed in a product basket under HS 253090 Only two coun-tries provide information on this product namely Australia as the largest and hence most important producing and exporting country by far and Brazil as a minor exporter (25309010)
No other country including member states of the SADC specifies lithium-con-taining concentrates as such The currently only producing and exporting country in the SADC is Zimbabwe which does not specify exports at all Thus exports are derived from RTS (global imports)
Lithium Potential in Namibia
23
A general problem with HS 253090 is that only information on quantity is avail-able but no information on lithium content which can vary between 12 and 6 Li2O thus the margin of possible errors in terms of total contained lithium is large
In 2019 Australia exported about 16 million tons of spodumene-concentrate down from 35 million tons in 2018 More than 95 destined to China
Inferred exports (RTS) of Zimbabwe were approx 93300 t for HS 253090 About 62000 t of that quantity are listed as imports by South Africa and are unrelated to lithium The remaining quantity is much more in line with production figures of Zimbabwe as well as the known downstream industries of the destination coun-tries within Europe
There are no export records published by Namibia In general and across all traded lithium products South Africa appears to act as an importexport hub within the SADC Also some of the traded products may be used in the glass and ceramic industry of South Africa
54 Import
For most of the SADC countries the statistics retrieved though the Global Trade Atlas do not necessarily represent reliable trade data due to above-mentioned reasons This is especially true when only small import numbers (usually in tons) are listed as these are supposedly artefacts or errors in declaration
Global imports of lithium-carbonate amounted to approx 142965 t with South Korea being the largest importer (38578 t 27 ) There are no listed imports for the SADC region except South Africa (72 t)
Global imports of lithium-oxides (hydroxides) amounted to approx 84900 t with Japan being the largest importer (37300 t 44 ) In analogy to lithium carbonate there are no published imports into the SADC except for South Africa (428 t)
There is no information for imports of lithium-choride or lithium-mineral-con-centrates into the SADC The largest importer of lithium-choride is China with approx 253 t The largest importer of lithium-mineral-concentrates is also China (gt 95 )
Lithium Potential in Namibia
24
Fig 6 Simplified geology of Namibia with major towns as well as railway and tar roads Blue polygons indicate pegmatite belts and districts in central and southern Namibia (Data source Geological Survey of Namibia 2020)
6 Lithium occurrences in NamibiaIn Namibia significant lithium occurrences are found only within pegmatites These Precambrian and early Namibian pegmatites are restricted to two dif-ferent areas respectively the Damara Orogen in north-central Namibia and the Namaqua Metamorphic Complex in southern Namibia (Fig 6)
Lithium Potential in Namibia
25
Within the Damara Orogen four linear pegmatite belts are found all of which strike northeast ndash southwest (Fig 7) Brandberg West ndash Goantagab Cape Cross ndash Uis Nainais ndash Kohero and Sandamap ndash Erongo with the latter connected to the Karibib Pegmatite District (Schneider 1992)
Each of these pegmatite belts exhibit numerous individual pegmatite swarms that occur zoned or unzoned and may carry significant amounts of rare metals or semi-precious stones In the south Lithium-Caesium-Tantalum (LCT) peg-matites occur in two areas Tantalite-Valley south of Warmbad in close prox-imity to the northwest-trending Tantalite Valley Shear Belt and the Sandfon-tein-Ramansdrift area close to the Orange River
Fig 7 Pegmatite belts in north-central Namibia from west to east Brandberg West ndash Goantagab Cape Cross ndash Uis Nainais ndash Kohero and Sandamap ndash Erongo as well as the Karibib Pegmatite District (after Geological Suvey of Namibia 2002)
Lithium Potential in Namibia
26
7 Lithium mining in NamibiaData for historic lithium mine production is available for the period 1939 ndash 1998 (Fig 8) After 1998 all mining activities ceased due to product quality issues and overall market environment
Until the mid-1950s lepidolite was the most important mined lithium mineral of the country (Fig 8) As mine output of lepidolite decreased output of petalite increased However quantity on a year-to-year basis was quite variable and fluctuated between 1000 ndash 10000 t Since the early 1980s production of petalite was quite stable and ranged between 1000 ndash 2500 t Production fell sharply in 1997 and 1998 after which it ceased Mining of amblygonite has always been small compared to lepidolite and petalite and never exceeded 1000 t per annum
According to the USGS (2020) 500 t of lithium were mined in Namibia in 2018 This is most likely stockpiled lepidolite material from the Rubicon mine
0
2000
4000
6000
8000
10000
12000
1939
1941
1943
1945
1947
1949
1951
1953
1955
1957
1959
1961
1963
1965
1967
1969
1971
1973
1975
1977
1979
1981
1983
1985
1987
1989
1991
1993
1995
1997
[Ton
nes]
Petalite (t)Amblygonite (t)Lepidolite (t)
Fig 8 Lithium production in Namibia in [t] per year (after Schneider 1992 BGR 2020)
Lithium Potential in Namibia
27
Currently there is no active consecutive mining for lithium in substantial quan-tities in Namibia although there are prospects and projects under develop-ment
71 Current mining activities and projects
Soris The Soris project is located in the De Rust pegmatite swarm which is part of the ldquoBrandberg West ndash Goantagab tin beltrdquo (Fig 7) This belt stretches to the northeast of the Brandberg massif over a length of 60 km and a width of 25 km This belt was previously mined for cassiterite on a larger scale Some of the pegmatites in this belt may carry substantial amounts of lithium such as pegmatites in the De Rust pegmatite swarm
The De Rust pegmatite itself is a Li-rich rare metal pegmatite that was mined for cassiterite and tantalite but also for minor quantities of spodumene be ween 1960 and 1990 (Diehl 1990) It intruded into metasediments of the Amis River Formation Lower Ugab Group of the Southern Kaoko Zone
It is the largest pegmatite of the De Rust pegmatite swarm within the Brandberg West ndash Goantagab pegmatite belt (Diehl 1992c) Outcrops are 100 ‒ 470 m long up to 30 m wide and can be followed over a length of roughly 24 km
The pegmatite shows well-developed zonation with a border zone (quartz alkali feldspar muscovite) outer (quartz microcline-perthite muscovite altered petalite) and inner (quartzo-feldspathic rock with spodumene crystals with accessory apatite lepidolite eucryptite zircon and monazite) intermedi-ate zone as well as a core zone (quartz subordinate microcline muscovite sporadic tantalite) Spodumene crystals may reach up to 80 cm in length (Fig 12) Towards the core zone spodumene carries rounded nodules of lithi-um phosphates (amblygonite ndash montebrasite series)
It is located northwest of the nearest town of Uis in the Kunene region of Namibia about 6km to the east of farm De Rust 532 and about 25 km north of the Ugab River The nearest railhead is located in the town of Karibib and the deep-water port of Walvis Bay is 120 km to the southwest Windhoek is about 180 km to the southeast
Lithium Potential in Namibia
28
The project can be reached via paved but mostly unpaved roads from the town of Uis From White Lady Lodge which is about 38 km northwest from Uis a 35 km gravel road leads towards the project 15 km of which are in the riverbed of the Ugab River There is currently no electricity and water supply at the project location site
According to SampP Global (022020) current owner of the Soris project is Mon-tero Mining amp Exploration Ltd (TSXV MON) which holds 80 interest of the property Another 20 are allocated to an unnamed private owner Based on data from the Namibia Mining Cadastre Portal (092020) multiple entries for mining licence applications exist for the area where the main De Rust pegmatite is located (Fig 9)
Resource estimateDue to the early stage of the Soris project no resource estimate is avail-able However Montero Mining claims the project to be drill ready targeting a resource of 10 Mt 1 Li2O with tantalum and tin by-product credits This would equate to 46400 t of lithium or 247000 t LCE
Grab samples of the deposit showed lithium contents of 007 to 532 aver-aging 137 Channel samples showed average lithium contents of 076 and values up to 366 (Montero 032019) The company also re-assessed 1097 previously tested RC drill samples The main lithium-bearing mineral is spodumene
Remnants of historic intermittent mining activities like old foundations and quartzo-feldspathic tailings are still visible east to the main pegmatite (Fig 10 ‒ 11)
Lithium Potential in Namibia
29
Fig 10 Remnants of historic open pit mining (upper) and tailings of De Rust pegmatite (lower) northwest of the Brandberg massif (Photo BGR-GSN 2019)
Fig 9 Satellite image of the De Rust project including the outlined mining license Main pegmatite coordinates 20deg57prime48primeprimeS ‒ 14deg30prime12primeprimeE (Source httpportalsflexicadastrecomnamibia 092020)
Main pegmatite
Lithium Potential in Namibia
30
Fig 12 Weathered spodumene chrystals at the historic open pit mine (Photo BGR-GSN 2019)
Fig 11 Historic open pit of the De Rust pegmatite (Photo BGR-GSN 2019)
Lithium Potential in Namibia
31
Uis The Uis projects (former mine and tailings) are located in the northern part of the ldquoCape Cross Uis pegmatite beltrdquo east of the town of Uis on the farm Uis Townlands No 215 in the Erongo region of Namibia
The Cape Cross-Uis belt is approx 120 km long and up to 40 km wide and extends in a NE direction (Fig 7) It comprises three distinct pegmatite swarms the Strathmore swarm Karlowa swarm and Uis pegmatite swarm In general lithium-bearing pegmatites (Li-Nb-Ta-Sn-Be and Li-Nb-Ta-Sn) are the least common in this belt (Fuchsloch et al 2018)
The Uis swarm field consists of more than 120 individual pegmatites each with a northeasterly to easterly strike direction and northwesterly down dip (30deg ‒ 70deg) This field is accompanied by a peripheral pegmatite field of approx 25 individual pegmatites
Some of the main pegmatites especially around the formerly worldrsquos largest tin mine at Uis are exceedingly large Some of them are up to 1 km long and some 50 m wide
In terms of lithium petalite amblygonite and minor spodumene mineralization occurs in the various pegmatites but no lepidolite Most common lithium bear-ing minerals in the eight pegmatites that were mined at Uis are amblygonite petalite and spodumene
Currently the Uis tailings project and the Uis tin mine are owned by two differ-ent companies As of 2020 the tin mine is operating a pilot processing plant and aims to ramp up the production of lithium in the near future The current ownership of the tailings project as of September 2020 is unclear
The nearest commercial deep-water port to the projects is Walvis Bay 220 km to the southeast The town of Omaruru is 130 km to the east and Henties Bay lies about 120 km to the southwest The nearest railhead is located in Omaruru The area is accessible year-round by paved and un-paved roads NamPower provides electricity and the town of Uis is connected to the Nam-Water pipeline
Lithium Potential in Namibia
32
The tin deposit was discovered in 1911 and mined between the 1950s and 1989 for cassiterite by Uis Tin Mining Company (SWA) Ltd and IMCOR
Coarse tailings are located in the northern part of the former mine just south to the main road C36 (Fig 13) The fine material is located south to the coarse waste dumps (Fig 13)
After 1990 multiple companies owned the property until AfriTin Mining Ltd bought all the rights (license ML134) The current lithium tailings project of Montero Mining amp Exploration Ltd (TSXV MON) is based on the historic mine tailings of the former tin mine on mining license ML134 that is currently owned by AfriTin Mining Ltd The acquired tailings material does not fall under the ML134 license of AfriTin since historical tailings material (Fig 14) is not regulated by Minerals (Prospecting and Mining) Act 33 of 1992 of Namibia
Resource estimateUis tin mineAccording to AfriTin the former Uis mine holds a JORC compliant resource (inferred) of 715 Mt of ore 0134 Sn with a cut-off grade of 005 Sn (AfriTin 2020) Grades of ancillary elements are given at 063 Li2O and 85 ppm Ta for the total resource of 71 Mt of ore
This equals to approx 95000 t of tin 209000 t of lithium (11 Mt LCE) and 6090 t of tantalum 85 of the total resource are attributable to the company The remaining 15 are allocated to SMU (Small Miners of Uis)
Uis tailingsMontero Mining filed an inferred resource estimate of 144 Mt of ore 037 Li2O and 005 SnO2 with a 035 Li2O cut-off grade for lithium and assumed processing recoveries of 70 for their tailings project (Montero 2019) This equals to approx 24700 t of lithium content (131500 t LCE) and 7200 t SnO2
This resource estimate only includes coarse tailings material There is current-ly no information on the lithium content of the fine tailings material that totals 271 Mt t due to insufficient or no test work (Montero 2018) The company also states that the average Li2O grade of the fines material does not hurdle the cut-off for the fines of 082 Li2O
Lithium Potential in Namibia
33
In 2016 Australian based Tawana Resources carried out a drilling program at Uis for a private company called Lithium Africa 1 on the fine and coarse tailings (Table 3 Hole 1 amp Hole 2) Below some of the obtained data on lithium content is given Additionally Li2O content of two obtained grab samples by BGR (Table 3 Sample 2019a amp 2019b) is given
Table 3 Sample data Uis (Tawana 2016 Montero 2018 BGR 2019)
Sample Sample 0 to 1m Li2O ()
Sample 1 to 2m Li2O ()
Sample 2 to 3m Li2O ()
Fines Hole 1 071 085 092
Fines Hole 2 080 089 095
Coarse Hole 1 050 043 043
Coarse Hole 2 054 062 062
BGR Sam-ple 2019a (Coarse tailings)
028
BGR Sam-ple 2019b (Coarse tailings)
028
Montero NI 43-101 037
Lithium Potential in Namibia
34
Fig 14 Tailings of the historic Uis Tin Mine (Photo BGR-GSN 2019 with kind permission of AfriTin Mining Limited)
Fig 13 Former Uis tin mine Uis tailings project with coarse tailings Tailings coordina-tes (center) 21deg13prime31primeprimeS ‒ 14deg52prime44primeprimeE (Source httpportalsflexicadastrecomnamibia 092020)
Uis Tailings (coarse)
Uis Tailings (fine)
Historic Uis mine
Lithium Potential in Namibia
35
Karibib Lepidolite ProjectThe Karibib Lepidolite brownfield project is located in the ldquoKaribib ndash Usakos Pegmatite Districtrdquo southeast of the town of Karibib on the farm Okongava Ost No 72 in central Namibia (Fig 15 ‒ 16)
This pegmatite district which is of Damaran age hosts the most important pegmatite occurrence (Rubicon swarm) in terms of lithium in Namibia In addi-tion numerous other different pegmatite swarms some of which have previ-ously been relevant in terms of lithium are know from this district These are Dernburg Karlsbrunn Albrechtshoumlhe Berger Kaliombo Gamikaubmund Okatjimukuju Etusis Daheim Friedrichsfelde and Etiro (Diehl 1992a)
The Rubicon pegmatite itself is the largest of the individual pegmatites that occur in this field and has been the prime source of lithium until mining seized in the early 1990s The Helikon pegmatites are part of the Rubicon pegmatite swarm and are located northeast to the Rubicon pegmatite They have previ-ously been mined for lepidolite amblygonite petalite and muscovite beryll pollucite quartz and columbite-tantalite as valuable by-products (Fig 18 ‒ 19)
The pegmatite itself consist of two ellipsoidal well zoned Li-mineralized ore-bodies The larger one is about 320 m long and 25 ndash 35 m wide It dips at 46deg to the northeast and has a northwesterly strike The second orebody is about 230 m long and about 10 m wide It is dipping with 30deg to the northeast and has a northwesterly strike In total the outcrop of the Rubicon pegmatite is about 600 m long with a maximum width of 65 m (Fig 17)
A very prominent feature is the presence of a very well developed concen-tric shell and zones from the footwall to the inner core of the pegmatite Both orebodies exhibit a border- wall- intermediate- and core-zone
Border-zone wall-zone and outer intermediate zone of the larger orebody do not contain Li-bearing minerals of economic importance The inner interme-diate zone does contain lepidolite The outer core zone may be sub-divided into a petalite zone low-grade lepidolite zone and a high-grade lepidolite zone The inner core zone also contains a petalite zone Mining occurred pre-viously in the later named zones The zonation of the smaller orebody to the northwest is less pronounced but Li-mineralization and style are equal to the
Lithium Potential in Namibia
36
larger orebody There is no spodumene mineralization within the orebodies and respectively zones of the Rubicon pegmatite
The Helikon I pegmatite is also a lens-shaped pegmatite with a length of roughly 400 m and a width of approx 66 m It dips to the north with about 60deg ndash 70deg Helikon I also consists of well-defined zones The main Li-bearing minerals are lepidolite and petalite According to Roering (1963) the lepidolite is difficult to separate from the intergrown albite and hence of low grade and quality
The Helikon II pegmatite is approx 17 km long and only 9 ndash 15 m wide It lies a bit north of Helikon I and dips steeply to the north with 55deg ndash 80deg striking east west The main Li-bearing minerals are lepidolite and petalite According to Diehl (1990) the westernmost portion of the pegmatite has historically been the economically most important A massive up to 6 m wide petalite zone was mined here according to Diehl (1990)
The nearest railhead to the project is 17 km away in Karibib and the deep-water port of Walvis Bay is 220 km to the southwest Windhoek is about 180 km to the southeast NamPower connects the town of Karibib to electricity and the project currently utilizes generators There is a 7 km long 22 kV power line spur to grid connection pending (Lepidico 2020) Water is available via on-site boreholes
The project was previously owned by Desert Lion Energy Inc (TSVX DLI) Lepidico Ltd (ASX LPD) bought into the project and currently holds 80 interest which comprises Mining License 204 (69 km2) as well as three Exclu-sive Prospecting Licenses (EPLs) namely 5439 5555 and 5781 (Lepidico 2020)
Lepidico will cover mining from multiple sources as well as chemical conver-sion by utilizing their proprietary lithium processing technologies L-Maxreg LOH-Maxreg and S-Maxreg (Lepidico 052019) The company aims to produce high purity lithium chemicals such as lithium carbonate and lithium hydroxide
The takeover also included a nonbinding offtake agreement between the for-mer owner Desert Lion Energy Inc and German chemical company BASF On April 2nd 2019 Desert Lion Energy Inc announced this offtake agreement
Lithium Potential in Namibia
37
which at the time was valid through to December 31 2019 On December 20th
2019 Lepidico announced that the LOI with BASF was extended to Decem-ber 31st 2020 (Lepidico 122019)
The feasibility study criteria of Lepidico are as follows
- Throughput of the concentrator on-site of 035 Mtpa- Expansion of throughput after year five to 05 Mtpa- Chemical plant in the industrial city of Abu Dabi (ICAD)- Plant design for 58000 tpa of concentrate (4 LiO2) for the production of
up to 5500 tpa LiOH- Utilization of L-Maxreg and LOH-MaxTM- Non-binding off-take MOU with BASF for LiOH only- Targeting for project commissioning to commence late 2021 for commer-
cial production in 2022
The preliminary mine plan indicates a strip ratio of 03 ndash 1 for the first two years The ratio will then go up to 1 ndash 14 In the first four years elevated grades of 06 LiO2 will be mined
Resource estimateA JORC 2012 compliant resource estimate for the deposit is given in Table 4 (Lepidico 2020) The deposit currently holds 23200 t of lithium (Indicated amp Inferred) based on a cut-off grade of 015 Li2O This resource estimate is based solely on the lepidolite occurrences at the mine site
Table 4 Resource estimate Karibib Lepidolite Project (Source Lepidico 2020)
Deposit Resource Category
Cut-off (Li2O)
Ore (Mt)
Li2O ()
Li (t)
Li (LCE)
Rubicon Measured
015
22 057 5819 30974
Rubicon Indicated 666 038 11637 61943
Rubicon Inferred 237 043 4728 25167
Helikon
Total 015 1124 043 22184 118086
Lithium Potential in Namibia
38
Fig 16 Satellite image of the Karibib Lepidolite project Helikon 1 coordinates (center) 22deg2prime49primeprimeS ‒ 16deg1prime13primeprimeE Helikon 4 coordinates (center) 22deg2prime24primeprimeS ‒ 16deg1prime41primeprimeE (Source httpportalsflexicadastrecomnamibia 092020)
Fig 15 Satellite image of the Karibib Lepidolite project Rubicon coordinates (center) 22deg6prime11primeprimeS ‒ 15deg59prime44primeprimeE (Source httpportalsflexicadastrecomnamibia 092020)
Historic Rubicon mine
Helikon 1
Helikon 4
Lithium Potential in Namibia
39Fig 17 Rubicon pegmatite (Photo BGR-GSN 2019 with kind permission of Lepidico Chemicals Namibia (Pty) Ltd 2020)
Lithium Potential in Namibia
40 Fig 18 Lepidolite sample from Rubicon pegmatite (Photo BGR-GSN 2019 with kind permission of Lepidico Chemicals Namibia (Pty) Ltd 2020)
Fig 19 Petalite sample from Rubicon pegmatite (Photo BGR-GSN 2019 with kind permission of Lepidico Chemicals Namibia (Pty) Ltd 2020)
Lithium Potential in Namibia
42
Fig 21 Helikon 4 pegmatite (Photo BGR-GSN 2019 with kind permission of Lepidico Chemicals Namibia (Pty) Ltd 2020)
Fig 20 Helikon 1 pegmatite (Photo BGR-GSN 2019 with kind permission of Lepidico Chemicals Namibia (Pty) Ltd 2020)
Lithium Potential in Namibia
43
Tantalite ValleyThe Tantalite Valley Project lies within the ldquoNamaqua Metamorphic Complexrdquo in Southern Namibia Within this complex Lithium-Caesium-Tantalum (LCT) pegmatites occur in two main areas Tantalite-Valley south of Warmbad in close proximity to the northwest-trending Tantalite Valley Shear Belt and the Sandfontein-Ramansdrift area close to the Orange River
The area were the pegmatites of the Tantalite Valley occur is primarily com-posed of a large ovoid gabbro intrusion (71 km by 33 km in extent) within paragneiss units of the Namaqua Complex The gabbro outcrop forms a large dome shaped mountain that rises about 500 m above the surrounding topo-graphy
The pegmatites belong to the Kenhardt and Gordonia pegmatite districts in Namaqualand but only the younger group of them carry accessory ore miner-als such as tantalite beryl REE minerals and lithium
The Tantalite Valley pegmatites include several individual subhorizonal dikes that are up to 1000 m long and 02 to 40 m wide plunging towards southeast (Diehl 1992b) Four of those are of economic interest Homestead Whitkop White City and the Lepidolite pegmatites (ie Purple Haze) (Fig 22)
They are all well zoned (quartz core inner and outer intermediate zones wall zone) and were predominantly targeted for beryl columbite-tantalite as well as lithium and bismuth minerals
The project is located on the farms Umeis 110 and Kinderzitt 132 between the Farms 109 131 129 308 and 473 in the magisterial district of Karas It currently comprises Mining License (ML-77) fully owned by Tameka Shelf Co Four (Pty) Ltd which is a 100 subsidiary of African Tantalite Pty Ltd (AFTAN) Above all Kazera Global Investments PLC holds a 75 stake in AFTAN (Kazera 2019) with the other 25 of local farmer ownership
The project is accessible via gravel road from Karasburg which is about 80 km to the north The nearest railhead is also located in Karasburg Electricity is currently supplied by generators and water is recovered from multiple drill holes The Orange River is about 15 km to the south of the project Mining
Lithium Potential in Namibia
44
infrastructure as well as equipment are on site as well as a plant for the pro-duction of tantalite concentrate
NTI is working on an extensive exploration program with a clear focus on revi-ving tantalite mining in Namibia with a possible by-product stream of lithium bearing minerals The company will focus primarily on the pegmatites Homes-tead Purple Haze Signaalberg and White City (Fig 23)
The area is known for its tantalum occurrences and since the late 1940s tantalite and other minerals have been recovered at Tantalite Valley until 1981 when mining ceased Initially alluvial deposits were mined followed by the pegmatites themselves Grades of the concentrates produced prior to the closure of the mine were quite high with 65 ‒ 70 Ta2O5 with very low U3O8
and ThO2 values of 025 max
Resource estimateAccording to SampP Global (092020) Measured and amp Indicated resources at Tantalite Valley are 104800 t of ore 0042 Ta2O5 and 0653 Li2O as of 112019 This would equate to 315 t of lithium or 1690 t LCE Total inferred resources are 517400 t of ore 0018 Ta2O5 and 0144 Li2O This equals to approx 91 t of tantalum and 750 t of lithium (3535 t LCE)
Lithium Potential in Namibia
45
Fig 23 White City pegmatite (Source Kazera global Investments PLC 2020)
Fig 22 Satellite image of the Tantalite Valley project White City pegmatite coordinates (center) 28deg43prime07primeprimeS ‒ 18deg44prime45primeprimeE Homestead pegmatite coordinates (center) 28deg43prime19primeprimeS - 18deg44prime24primeprimeE Purple Haze pegmatite coordinates (center) 28deg43prime09primeprimeS ‒ 18deg43prime55primeprimeE (Source httpportalsflexicadastrecomnamibia 092020)
Lithium Potential in Namibia
46
8 Analysed lithium samplesDuring the course of the cooperation project between the Economic Geology Division (EGD) of the Geological Survey of Namibia (GSN) and the Ger-man Federal Institute of Geosciences and Natural Resources (BGR) several sampling campaigns to southern and central pegmatites took place
The field trips were preceded by literature and data research regarding infor-mation on lithium occurrences andor previous lithium mining activity to iden-tify specific target areas
During a campaign in 2019 16 lithium-bearing mixed mineral samples were taken from five different locations and subsequently analyzed Two of the samples originate from the Uis Tin Mine Tailings of the former tin mine All remaining samples were taken either from stripped outcrops for future mine activities or from previous mine sites (ie pits)
All 16 samples were analyzed at BGR labs in Hanover Germany through qualitative XRD XRF and ICP-MS Given data shall be understood as a first indicator for the sampled lithium occurrences
Most if not all sampled occurrences have previously been analyzed or are cur-rently being assessed by the property owners or current licensees Detailed information of these sampling and analytical campaigns remain confidential and are thus not available for comparison
Appendix A lists the identified qualitative mineralogy of the samples as well as the major element analysis Additional samples from previous campaigns are also given
Interpretation of the results are based on their applicability in the various lithium-consuming industries for which information is available
Most of the current lithium applications require a chemical intermediate product such as lithium carbonate or lithium-hydroxide The glass and cera-mic industry does use lithium-bearing mineral concentrates depending on the prices of these materials when compared to LiCO3
Lithium Potential in Namibia
47
Since the main applications require an intermediate or downstream chemical product lithium content as well as impurity values are the main criteria for the suitability of the sampled occurrences Other quality criteria are particle size and surface areastructure
9 InterpretationAs previously stated all obtained grab samples are mixtures of lithium- bearing minerals (ie spodumene petalite lepidolite) feldspars quartz micas as well as secondary minerals Therefore all given analytical data has to be taken with caution and will not be representative for the individual outcrops or deposits
The evaluation of the economic suitability for various economic applications of the analysed lithium samples is based on the chemical specifications in Chapter 4
Lithium content gt 1 Li2O Fe2O3 content lt 015 as well as F content lt 01 are individually highlighted (Appendix A) as these three values are the most important
Based on the chemical analysis nine of the 16 samples showed Li2O contents of more than 1 (range 117 ‒ 327 ) Seven of those nine samples also exhibited low Fe2O3 content (range 004 ‒ 008 ) (Appendix A) Three of those seven samples also had fluorine values below 005
Of the ten additionally included samples from previous campaigns four showed Li2O contents of more than 1 (range 126 ‒ 199 ) Three of those samples also exhibited low Fe2O3 content (range 004 ‒ 007 ) (Appendix A) One of the three samples had fluorine values below 005
The mentioned samples (sources) could be of potential use but for further interpretation statistical sampling will be required
Lithium Potential in Namibia
48
10 ConclusionsThere is currently no lithium industry established in Namibia This accounts to both mining and processing of ores into commercial lithium-bearing con-centrates as well as the production of downstream products such as lithium carbonate andor lithium hydroxide In order to evaluate the potential for a lithium industry in Namibia the current global market and price developments need to be addressed
Currently the main application for lithium is in the chemical industry as lithium carbonate andor hydroxide for the manufacturing of lithium-ion batteries There is currently no domestic market (supply) or demand for this industry in Southern Africa or Namibia in specific Processing of lithium-bearing ores into these highly specific downstream products is economically more viable in close proximity to the demanding industries It also requires large investments (double-digit million dollars per 10000t of capacity) Additionally there is already huge capacity and strong capacity build up in Asia at rather low cost
The second most important application lies in the glass and ceramics industry This industry uses lithium either as lithium-bearing concentrates or lithium carbonate depending on current market price and processproduct require-ments There is currently no such industry established in Namibia but potential plans There is glass and ceramics manufacturing in South Africa and thus a potential market for lithium bearing products (concentrates) should this indus-try require it depending on product
The 20182019 primary lithium supply based on spodumene-bearing mineral concentrates was dominated by Australia with a market share of well over 95 On an annual basis the country exports more than three million tons of lithium-bearing concentrates to China To put this into perspective Lepidico plans to export just 58 ktpa of concentrate to Abu Dhabi for refinement from their project annually Therefore potential production in Namibia will always be rather small scale when compared to peer producing countriescompanies
As of late 2020 the concentrate market is in strong oversupply with strong competition Thus prices have eroded quite substantially for a standard SC6 concentrate (Fig 24) In general prices vary significantly based on lithium content and impurities of the concentrates Lithium bearing mineral concen-
Lithium Potential in Namibia
49
trates are a relatively low-value mineral commodity when compared to lithi-um-carbonate or other lithium downstream products thus product quality cost reduction and cost control are key components in this industry Since prices are depressed currently many of the Australian producers have drasti-cally reduced output or even went into care and maintenance This situation may change towards 2025 or beyond as demand picks up
Prices for the higher valued product lithium-carbonate spiked at the end of 2017 towards 2018 to more than 20000 $USt on a contract basis with prices being very volatile Since then prices have also eroded to below 9000 $USt due to oversupply and slow demand pickup (Fig 25) With this product stable quality and chemical composition are crucial for the downstream industry
Based on available gradetonnage data the Namibian projectsprospects are relatively small in overall size and low in grade when compared to global peers for the resource category ldquoMeasuredIndicatedrdquo (Appendix B) Total contained lithium quantity is thus relatively small in comparison On a global scale the most promising hard rock projects that are currently being mined and developed have Li2O grades of 10 or above
Fig 24 Lithium-mineral-concentrate prices 012010 ‒ 062020 (Source BGR 2020)
300
400
500
600
700
800
900
1000
1100
208
210
212
214
216
218
220
US$
t US$t
01-20
14
01-20
15
01-20
16
01-20
17
01-20
18
01-20
19
01-20
20
01-20
10
01-20
11
01-20
12
01-20
13
Spodumene min 5-6 LiO2 fob Australia
Spodumene concentrate gt75 LiO2 bulk cif Asia
Petalite 42 LiO2 fob Durban
Spodumene fob Australia
Spodumene min 5-6 LiO2 cif China
Lithium Potential in Namibia
50
For the resource category ldquoIndicatedrdquo which generally represents the lowest level of confidence only the Uis mine project of AfriTin represents a size-able resource even though grades are relatively low (Appendix C) The Uis tailings project as well as the Rubicon project are again relatively small when compared to their global peers Tantalite Valley is the smallest of all included projects (Appendix C)The given data for the De Rust project reflects only an exploration target of the company rather than actual data and may thus be not representative
Based on size and contained lithium-content none of the visited early stage projectsprospects would justify the financial investment into the construction of a chemical conversion plant for the production of lithium carbonate andor hydroxide on site as it requires very large monetary investments Due to their size payback of the required investments may be unfavorable when compared to global peers In addition the current market environment is very harsh with strong competition from Asia that has a huge cost advantage due to capacity build up This industry is also very energy and water intensive
In addition location within Namibia as well as distance to possible down-stream markets may become an issue as it increases the transportation cost
4000
7000
10000
13000
16000
19000
22000
25000
28000
01-20
14
01-20
15
01-20
16
01-20
17
01-20
18
01-20
19
01-20
20
US$
t
Lithium-carbonate (min 995 ) battery grade spot price ex works domestic ChinaLithium-carbonate (min 99-995 ) Li2CO3 large contracts USA delivered continentalLithium-hydroxid-monohydrate (min 565) technical and industrial grades cif China Japan amp Korea
Fig 25 Lithium chemical prices 012014 ndash 062020 (Source BGR 2020)
Lithium Potential in Namibia
51
immensely This is especially true for the SorisDe Rust pegmatite which is in a remote location without any allocated infrastructure The projects Karibib Uis and Tantalite Valley are much easier to access
The approach of Lepidico to produce a lithium bearing concentrate on site seems plausible approach Since this will already require a skilled workforce mining and beneficiation equipment in order to produce a high quality lithium-bearing concentrate it may already be considered ldquoadded valuerdquo for the indus-try of the country This approach may also be suitable for the other mentioned and visited projects
Lithium Potential in Namibia
52
ReferencesAfriTin Mining (2020) Uis Tin Project ndash Company Information ndash URL httpafritinminingcomuis-project [as of 092020]
Australian Government Geoscience Australia (2019) Australiarsquos Identi-fied Mineral Resources 2019 ndash URL httpswwwgagovauscientific-topicsmineralsmineral-resources-and-adviceaimr [as of 092020]
BGR ndash Bundesanstalt fuumlr Geowissenschaften und Rohstoffe (2020) Fachinformationssystem Rohstoffe ndash unpubl Hannover [as of 082020]
BGS ndash British Geological Survey (2016) Lithium Definitions mineralo-gy and deposits ndash URL httpswwwbgsacukdownloadsstartcfmid=3100 [as of 062016]
Diehl B J M (1990) Pegmatites of the Cape Cross Uis ndash Pegmatite Belt Namibia Geology mineralisation Rubidium Strontium characteristics and petrogenesis of rare metal pegmatites Open File Report EG 083 Economic Geology Series Geological Survey of Namibia 39 pp Windhoek
Diehl B J M (1992a) Lithium Caesium Beryllium Open File Report Mineral Resource Series Geological Survey of Namibia 18 pp Windhoek
Diehl B J M (1992b) Niobium and Tantalum Open File Report Mineral Resource Series Geological Survey of Namibia 20 pp Windhoek
Diehl B J M (1992c) Tin Open File Report Mineral Resource Series Geological Survey of Namibia 30 pp Windhoek
Diehl B J M amp Schneider G I C (1990) Geology and mineralisation of the Rubicon Pegmatite Namibia Open File Report Geol Surv Namibia 20 pp Windhoek
Fuchsloch et al (2018) Classification mineralogical and geochemical vari-ations in pegmatites of the Cape Cross-Uis pegmatite belt Namibia Lithos 296 ndash 299 79-95 elsevier
Lithium Potential in Namibia
53
Garret D E (2004) Handbook Of Lithium And Natural Calcium Chloride Their Deposits Processing Uses and Properties ndash 467 S Oxford (Elsevier B V)
Geological Survey of Namibia (2002) Mineral Resources of Namibia Summary of Mineral Deposits and Occurrences Omaruru Sheet 2114 Volume I ndash Complete Descriptions 119 pp Windhoek
IHS Global SA (2020) Global Trade Atlas ndash Commercial Online-Databa-se ndashURL httpsmyihscomConnectcallingUrl=https3a2f2fconnectihsmarkitcom2f [as of 062017]
Kazera Global Investments PLC (2020) Company Information ndash URL httpskazeraglobalcominvestmentsnamibia-tantalite-investment-mine [as of 092020]
Lepidico (2019) LOI with BASF extended to 31 December 2020 ndash News Release ndash URL httpswwwlepidicocomwp-contentuploads201910LPD-191220-LOI-with-BASF-extended-to-31-December-2020pdf [as of 122019]
Lepidico (2019) Corporate Presentation ndash URL httpswwwlepidicocomwp-contentuploads201907LPD-190509-Corporate-Presentati-on-May-2019pdf [as of 052019]
Lepidico (2020) Company Information ndash URL httpswwwlepidicocomprojectskaribib [as of 092020]
Montero Mining amp Exploration Ltd (2018) Exploring Battery Metals in Namibia ndash Company Presentation ndash URL httpswwwproactiveinvestorscomauuploadSponsorFileFile2018_031520244941_MON-CorporatePre-sentationMarch2018pdf [as of 072018]
Montero Mining amp Exploration Ltd (2019) Montero Files NI 43-101 Resource Estimate On The Uis Lithium-Tin Tailings Project In Namibia On Sedar ndash News Announcement ndash URL httpsmonterominingcommontero-files-ni-43-101-resource-estimate-on-the-uis-lithium-tin-tailings-project-in-namibia-on-sedar [as of 032019]
Lithium Potential in Namibia
54
Namibia Mining Cadastre Portal (2020) Online-Database ndashURL httpsportalslandfoliocomnamibia [as of 092020]
Roskill Information Services Ltd (2016) Lithium Global Industry Mar-kets amp Outlook ndash 386 S London Groszligbritannien
Schneider G I C (1992) Feldspar Open File Report MRS 08 Mineral Resource Series Geological Survey of Namibia 2 pp Windhoek
Schmidt M (2017) Rohstoffrisikobewertung ndash Lithium ndash DERA Rohstoffin-formationen 33 Berlin
S amp P Global Market Intelligence (2020) Lithium - Metals amp Mining Properties URL httpsplatformmarketintelligencespglobalcomwebcli-entauth=inheritindustryminingProjects [as of 092020]
Statista (2020) Distribution of lithium end-usage worldwide in 2019 by area application ndash URL httpswwwstatistacomstatistics268787lithium-usa-ge-in-the-world-market [as of 062020]
Tawana Resources NL (2016) Tawana acquires second lithium pro-ject ndash News Release ndash URL httpsmstrademomentumcozajsepdfSENS_20160923_S376505pdf [as of 092016]
USGS ndash United States Geological Survey (multiple years) Lithium ndash Minerals Commodity Summaries ndash URL httpswwwusgsgovcentersnmiclithium-statistics-and-information [as of 082020]
Appendix
Sam
ple I
DFa
rmLa
titud
eLo
ngitu
deSa
mpl
e des
crip
tion
(XRD
qu
al)
LiO 2
()
SiO 2
Ti
O 2
Al2O 3
Fe2O 3
Mn
O Mg
O Ca
O Na
2O
K 2O P 2O 5
SO
3
Cl
F
LOI
Su
m
2015
-03
previous sample campaignsHelik
on
n A
Felds
parQ
uartz
Lepid
olite
025
6871
lt000
119
0500
200
2900
505
3292
806
7905
59lt0
01lt0
002
lt005
093
9985
2016
-12
Rubic
onwe
ather
ed P
etalite
126
6473
lt000
118
0600
703
2718
607
9507
805
2500
62lt0
01lt0
002
lt005
1146
9871
2016
-17
Rubic
onLe
pidoli
te +
Quar
tz13
063
6700
219
9316
0929
003
0054
029
6218
0052
lt001
lt000
226
232
798
67
2016
-20
Helik
onLe
pidoli
te + A
lbite
176
5514
lt000
126
8700
401
2100
700
2123
970
3900
45lt0
01lt0
002
156
369
9698
2016
-21
Helik
onLe
pidoli
te19
954
32lt0
001
2627
004
0224
006
0038
266
714
0069
lt001
lt000
240
628
997
77
FN20
19_0
4De
Rus
tFe
ldspa
rAmb
lygon
iteP
etalite
(n
on X
RD)
003
6513
lt000
118
82lt0
0100
0200
101
0924
311
4105
75lt0
0100
04lt0
0503
898
84
2015
-09
Molop
oPe
talite
(non
XRD
)00
952
85lt0
001
1672
lt001
0002
487
0323
342
0352
lt000
100
400
3403
621
1310
012
2016
-14
Molop
oPe
talite
wea
there
d (no
n XRD
)00
752
1600
0316
5100
200
5147
805
8923
406
4500
6900
200
8602
222
6310
013
2016
-15
Molop
oFe
ldspa
r (no
n XRD
)00
664
02lt0
001
1937
003
0004
003
0151
216
1249
0796
lt001
lt000
2lt0
0505
399
55
2016
-23
Molop
oZin
nwald
ite (n
on X
RD)
006
5044
0068
3307
048
0011
012
0426
261
7674
0181
lt001
lt000
2lt0
0542
9925
1909
249
2019Uis
Tailin
gs
Quar
tzFe
ldspa
rPeta
lite
Musc
ovite
028
7293
0045
1479
051
0062
0212
9830
927
6613
6200
2lt00
02lt0
0523
399
38
1909
250
Uis
Tailin
gsQu
artz
Felds
parP
etalite
Mu
scov
ite02
872
6900
4314
8205
0059
019
1306
313
2794
1347
002lt
0002
lt005
251
9937
1909
251
Helik
on 4
22deg02prime4
8primeprimeS1
6deg01prime30
primeprimeEQu
artz
Felds
parP
etalite
Le
pidoli
te16
464
4400
0319
4200
301
2100
408
8325
345
6806
800
400
0727
228
998
38
1909
252
Helik
on 1
22deg02prime2
0primeprimeS1
6deg01prime19
primeprimeEPe
talite
Lepid
olite
Quar
tz29
576
9200
0116
6800
300
0304
101
7301
106
8100
01lt0
01lt0
002
lt005
205
97
App
endi
x A
Ana
lytic
al d
ata
of li
thiu
m s
ampl
es c
olle
cted
in N
amib
ia T
hres
hold
val
ues
high
light
ed in
gre
en
Lithium Potential in Namibia
57
Sam
ple I
DFa
rmLa
titud
eLo
ngitu
deSa
mpl
e des
crip
tion
(XRD
qu
al)
LiO 2
()
SiO 2
Ti
O 2
Al2O 3
Fe2O 3
Mn
O Mg
O Ca
O Na
2O
K 2O P 2O 5
SO
3
Cl
F
LOI
Su
m
1909
253
2019Rubic
on22deg06prime1
3primeprimeS1
5deg59prime45
primeprimeEPe
talite
Lepid
olite
Quar
tz32
778
73lt0
001
1687
002
0006
002
0157
011
003
0002
003
0003
lt005
075
9663
1909
254
Rubic
on22deg06prime1
0primeprimeS1
5deg59prime41
primeprimeEFe
ldspa
rQua
rtzM
usco
vite
004
682
lt000
119
3500
300
2400
205
0610
0808
6804
3lt0
01lt0
002
lt005
041
9985
1909
255
Rubic
on22deg06prime1
0primeprimeS1
5deg59prime41
primeprimeEFe
ldspa
rLep
idolite
Mus
co-
viteK
aolin
026
6104
0004
2318
022
0136
006
0119
367
8411
0159
lt001
lt000
2lt0
0522
299
15
1909
256
Rubic
on22deg06prime1
0primeprimeS1
5deg59prime41
primeprimeELe
pidoli
te 27
249
8700
129
3400
408
0500
400
704
697
3100
31lt0
01lt0
002
087
441
9569
1909
257
Rubic
on22deg06prime1
3primeprimeS1
5deg59prime45
primeprimeEPe
talite
Lepid
olite
Quar
tz30
670
0900
0320
2600
801
0901
502
9901
926
800
15lt0
0100
04lt0
0526
596
48
1909
258
Rubic
on22deg06prime1
0primeprimeS1
5deg59prime41
primeprimeELe
pidoli
teFe
ldspa
rQua
rtz20
659
7800
0224
100
505
2400
300
513
7247
0051
lt001
0002
265
388
9966
1909
259
Tanta
lite
Valle
y28deg43prime0
9primeprimeS1
8deg43prime55
primeprimeEFe
ldspa
rLep
idolite
Mus
covit
e11
762
64lt0
001
2139
004
0161
lt001
0399
7731
2401
0900
200
119
912
698
85
1909
260
Tanta
lite
Valle
y28deg43prime0
9primeprimeS1
8deg43prime55
primeprimeEFe
ldspa
rLep
idolite
Mus
covit
e03
059
8600
1425
1301
604
2200
302
2860
547
2201
3900
200
0904
123
799
56
1909
261
Tanta
lite
Valle
y28deg43prime0
9primeprimeS1
8deg43prime55
primeprimeEFe
ldspa
rQua
rtzM
usco
vite
003
636
0005
2218
022
0122
002
0381
727
3809
0272
lt001
lt000
2lt0
0513
199
17
1909
262
Tanta
lite
Valle
y28deg43prime2
0primeprimeS1
8deg44prime23
primeprimeEQu
artzSp
odum
eneM
us-
covit
e13
180
5100
0415
8903
401
2401
301
9502
604
0400
0500
200
03lt0
0507
398
56
1909
263
De R
ust
20deg57prime4
8primeprimeS1
4deg30prime13
primeprimeEFelsd
parS
podume
neQuartz
074
7313
0006
2048
007
015
005
0154
398
0831
0073
001
0003
lt005
082
9974
1909
264
De R
ust
20deg57prime4
8primeprimeS1
4deg30prime13
primeprimeESp
odum
eneF
eldsparQuartz
230
6924
0006
2602
801
0200
301
0510
102
1400
68lt0
0100
03lt0
0504
897
53
(Con
tinue
d) A
ppen
dix
A A
naly
tical
dat
a of
lith
ium
sam
ples
col
lect
ed in
Nam
ibia
Thr
esho
ld v
alue
s hi
ghlig
hted
in g
reen
Lithium Potential in Namibia
58
Appendix B GradeTonnage data (Measured amp Indicated) for selected lithium projects in comparison to Namibian projects (Source SampP 092020)
0
0500
1000
1500
2000
2500
500
5000
5000
0
5000
00
5000
000
Gra
de [
Li 2O
]
Tonnage [t]
Tantalite Valley
Rubicon
Appendix B GradeTonnage data (Inferred) for selected lithium projects in com-parison to Namibian projects (Source SampP 092020)
0
0500
1000
1500
2000
2500
100
1000
1000
0
1000
00
1000
000
1000
0000
Gra
de [
Li 2O
]
Tonnage [t]
Tantalite ValleyRubicon
Uis Tailings
Uis Mine
De Rust
A product of the technical cooperation project between Bundesanstalt fuumlr Geowissenschaften und Rohstoffe (BGR)(Federal Institute for Geosciences and Natural Resources)
andGeological Survey of Namibia within the Ministry of Mines and Energy
ISBN 978-3-948532-29-1 (Print) 978-3-948532-30-7 (PDF)
- List of Abbreviations
- 1 Introduction
- 2 What is lithium
-
- 21 Lithium deposits
-
- 3 Application
- 4 Chemical requirements
- 5 Mining and trade of lithium in the SADC
-
- 51 Lithium production
- 52 Trade data
- 53 Export
- 54Import
-
- 6 Lithium occurrences in Namibia
- 7 Lithium mining in Namibia
-
- 71 Current mining activities and projects
-
- 8 Analysed lithium samples
- 9 Interpretation
- 10 Conclusions
- References
-
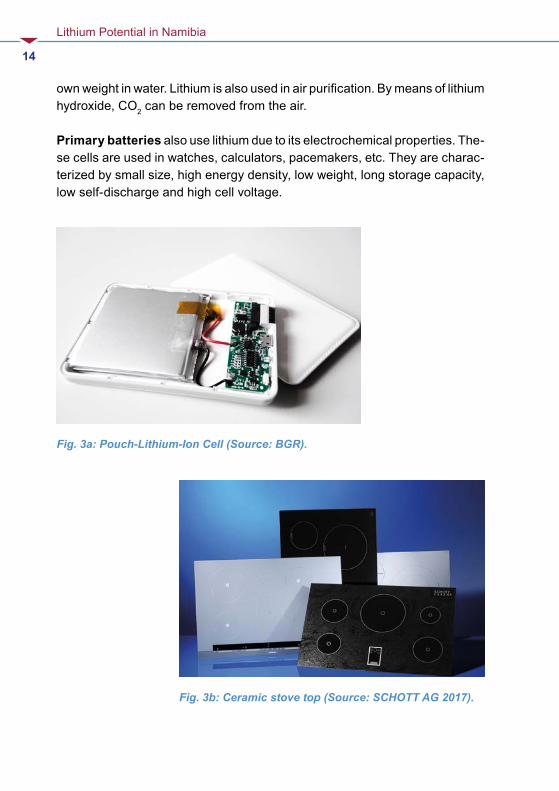
Lithium Potential in Namibia
15
4 Chemical requirementsLithium is not a typically mined metal and the quality requirements are very specific and stringent depending on the field of application and thus vary from end-user to end-user
The first products that enter the value chains are usually the intermediates lithium carbonate andor lithium hydroxide produced from either brine sources or hard rock deposits ie currently mostly pegmatite sources (Fig 4)
Lithium from pegmatite sources is primarily sold as concentrates of either spodumene petalite or lepidolite with minor quantities of amblygonite in the market Each industry has unique requirements in terms of desired chemical composition particle size and tolerable values of impurities Concentrates are usually graded and priced according to their Li2O content impurity levels and aimed mainly at the growing battery industry as well as glassceramics industry
Concentrates for the battery industry are rated ldquochemical graderdquo and concen-trates for the glass industry are rated ldquotechnical graderdquo In general the glass industry has tighter limits on certain impurities as the battery industry due to the direct usage of the concentrates in the respective product flow sheets
The current industry standard for lithium concentrates in the battery indus-try is called SC-6 a chemical grade spodumene-concentrate that contains approx 6 Li2O Higher values of lithium are uncommon as concentrating them beyond 6 Li2O increases the cost of production exponentially
Petalite lepidolite zinnwaldite amblygonite and other lithium bearing miner-als are not used in this industry yet However there are processes in develop-ment for the extraction of lithium from these sources
Some companies especially in Australia sell spodumene-concentrates with lower Li2O contents (22 ndash 5 ) at lower prices per ton A special case are so-called DSO-concentrates (ldquodirect shipping orerdquo) with Li2O contents of only 12 ndash 14 DSO shippingrsquos out of Australia decreased significantly as the monetary value is quite low with lt 150 US$t and higher qualities are available
Lithium Potential in Namibia
16
Mica (muscovite) is an unwanted impurity in these concentrates as it disturbs the converting steps Heavy minerals are usually also extracted from the sources as they may represent by-product value (eg tantalum) Wall-rock impurities may cause problems in the further processing steps (basalt etc) Fe2O3 content is also an issue as it may also pose problems in the converters (clogging)
Technical grade lithium concentrates for the glass industry may have the same values of lithium in terms of Li2O but more stringent requirements in terms of iron content and some other elements such as fluorine
This industry usually uses petalite concentrates which can be used directly in the production process The advantage of petalite over spodumene-con-centrates is the generally lower iron content which is a crucial impurity even though these concentrates have lower lithium contents Fe2O3 content above a certain threshold (gt 015 ) will lead to unwanted discoloration in the final glass or ceramic products thus low values are needed
Fluorine-bearing lithium concentrates of lepidolite amblygonite and zinnwal-dite are not used in the glass and ceramics industry as this impurity is highly unwanted Besides fluorine the high Fe2O3 content of zinnwaldite is an issue as mentioned above
Particle size of the concentrates is also an issue as very fine material may lower the melt temperature due to a higher specific surface Therefore concen-trates for this industry are either tailor-made or mixtures of different sources
The glass and ceramics industry also uses pure lithium carbonate to a certain extent based on pricing
Lithium carbonate and lithium hydroxide are the first semi-finished products apart from lithium-concentrates used in the various industries for direct use or further downstream precursors There is a distinction between battery grade and technical (other) grade for lithium-carbonate and lithium-hydroxide The main differences lie within the lithium content level of impurities and particle sizes
Lithium Potential in Namibia
17
Commercial extraction of lithium takes place from lithium-containing brines and from hard rock (ie pegmatitic) deposits A simplified schematic repre-sentation of conventional production steps and key intermediates is shown in Figure 4
For the extraction of lithium from hard rock deposits the raw ores (eg pegma-tites) mined in open-pit or underground mines are processed into lithium-con-taining concentrates by sorting crushing grinding gravity separation mag-netic separation flotation washing filtering and drying The exact production steps vary depending on occurrence (ie locality) mineralogy company and the intended use of the produced concentrates
As of 2020 more than 95 of the conversion from spodumene-concentrates into lithium carbonate andor lithium hydroxide takes place in China The most widely used process in the industry is the acid-roast process (Fig 5)
In this process spodumene-concentrate is ground and heated to 1075 ‒ 1150degC in a rotary kiln (Fig 5) This converts α-spodumene into β-spodumene which is soluble in hot acids After mixing with hot sulfuric acid lithium sulfate solution is mixed with water As a result lithium sulfate dissolves The solution is mixed with calcium carbonate to remove impurities such as iron manganese and aluminum In addition the pH is raised After a first filtering process Na2CO3 and CaO are added to obtain an alkaline soluti-
Lithium Hydroxide
LithiumperoxidLithium Peroxide
Lithium-BrineLithium-Minerals
Lithium ChlorideLithium Bromide Lithium Sulfate
Lithium Acetate Lithium Metal
Lithium Carbonate
Fig 4 Simplified production scheme of lithium and important lithium com-pounds (modified after Roskill 2016)
Lithium Potential in Namibia
18
on Impurities such as calcium and manganese are removed The solution is then neutralized with sulfuric acid and heated to increase the concentration of Li2SO4 to about 200 ‒ 250 gl The addition of Na2CO3 and heating the solution to about 100degC triggers the precipitation of lithium carbonate The carbon-ate produced in this way has purities of up to 993 The battery industry however requires purities of min 995 obtained through ion exchange and extraction of impurities The produced lithium carbonate can then also be used for the production of lithium hydroxide
Common understanding was that the production of lithium carbonate was much cheaper from brines compared to hard rock sources Due to many developments in the brine industry mostly related to a recently introduced royalty system in Chile this is no longer the case On the contrary the cost advantage of brines is lost
Fig 5 Simplified production scheme of lithium carbonate derived from spodu-mene-concentrates via acid-roast-process (modified after Garret 2004)
Solution
MillingCooling
Thickener
Filtration
1075 - 1150oCCalcinationSpodumene Concentrate
Mixing
H2SO4
Leaching
H2O amp CaCO3
Gasscrubber
Solids to Tailings
Mixing
Na2CO3 amp CaO
Thickener
Filtration
Solids to Tailings
Neutralisation
H2SO4
Evaporation
90 - 100oCHeating
Filtering WashingDrying
Na2SO4Lithium carbonate
Lithium Potential in Namibia
19
The production of lithium hydroxide which is a fast growing market and a higher priced intermediate product appears to become cheaper when sourced directly from high quality hard rock conversion relative to sourcing from brines via an intermediate step (lithium carbonate) As the cost advantage of brine deposits compared to hard rock deposits is fading the industry has shifted its focus towards hard rock deposits all over the world
In addition to the acid-roast process there are new technological approaches to recover lithium carbonate and lithium hydroxide directly from high quality spodumene-concentrates as well as other mineralogies
Lithium Potential in Namibia
20
5 Mining and trade of lithium in the SADC
51 Lithium production
Each year every mining country of the world is urged to share production statistics regarding their mining activity These statistics are compiled and published by different entities such as the British Geological Survey (BGS) and the United States Geological Survey (USGS) among others
If a country does not appear in these statistics there was either no mining activity for this specific commodity the country did not publish any statistics or the production data is unknown
Table 2 Mine production of lithium (Source BGR 2020 Roskill 2016 USGS 2020 Geoscience Australia 2020)
Mine production [t Li-Content]
Years 2014 2015 2016 2017 2018 2019e Share 2018 []
Australia1) 12333 13160 15590 21000 57000 42000 647
Chile2) 11640 11787 14526 16584 15886 18000 175
Argentina2) 3388 3515 5767 575 6241 6400 69
China3) 1895 2002 2293 3 7376 7500 81
Zimbabwe1) 1024 1025 974 994 700 1600 08
USA2) 846 846 900 900 567 n A 06
Portugal1) 470 470 299 763 700 1200 08
Brazil1) 186 186 195 154 153 300 02
Namibia1) n d nd n d n d 500 n d 05
Other 3) 19 19 18 18 18 500 lt01
Global4) 31801 33011 40562 49012 90941 77000 1001) Hardrock 2) Brine 3) HardrockBrine 4) Deviation due to rounding e estimated
Lithium Potential in Namibia
21
In 2018 global mine output of lithium was around 91000 t Li-content of which only 1200 t originated from the Southern African Development Community (SADC) namely Zimbabwe and Namibia
52 Trade data
Trade data is retrieved from the commercially available Global Trade Atlasreg (IHS Global SA) The database provides both import and export data for more than 90 countries based on customs data of individual countries Data is primarily classified through Harmonised System (HS) product codes by the WCO (World Customs Organization) The HS nomenclature consists of approximately 5000 product groups identified by a 6-digit code
There are limitations to trade data The most prominent issue arises with data availability since many countries do not publish trade data Especially export data is an issue among many countries
There may also be issues with mislabeled products (wrong HS) product bas-kets data entry errors or missing data in general Were export data is not available so-called reverse trade data (RTS) is an option
If a country does not state any exports cumulative global imports from that particular country may be used as a rough yet incomplete estimate of exports It should be noted that these statistics do not represent absolute but rather minimum values as trade between two non-reporting countries will not be reflected The majority of the SADC countries do not report their import and export statistics
The most important lithium products that are globally traded in significant amounts are lithium-carbonate lithium-oxide (hydroxide) lithium-chloride and lithium-mineral-concentrates
Lithium Potential in Namibia
22
53 Export
The most important intermediate product in the lithium market is lithium carbonate In 2019 global exports amounted to approx 117743 t with Chile being the largest exporter (82344 t 70 ) There are no listed exports from the SADC region except minor quantities from South Africa to the Democratic Republic of Congo (9 t) and Zambia (2 t)
Lithium oxides and lithium hydroxides are grouped together under one HS code hence an individual consideration of both products on a country basis is not possible due to the lack of country-specific commodity codes
In 2019 global exports of HS 282520 stood at approx 97550 t with China being the largest exporting country (49800 t 51 )There are no exports published for the SADC region except South Africa with small quantities (28 t) which are considered to be trade through only
Assessment of lithium chloride global trade flows is also difficult as this prod-uct is listed together with many other chemical products under HS 282739 Global trade can only be investigated using country-specific commodity codes (8-digits and above) if available Only three countries list this product under specific trade codes namely China (28273910) Chile (28273930) and Argentina (28273960) SADC countries including Namibia do not publish any data under HS 282739 Based on the available data global exports in 2019 stood at 2254 t with Chile being the largest exporter (2101 t 89 )
Lithium-containing mineral concentrates are among other non-lithium related products listed in a product basket under HS 253090 Only two coun-tries provide information on this product namely Australia as the largest and hence most important producing and exporting country by far and Brazil as a minor exporter (25309010)
No other country including member states of the SADC specifies lithium-con-taining concentrates as such The currently only producing and exporting country in the SADC is Zimbabwe which does not specify exports at all Thus exports are derived from RTS (global imports)
Lithium Potential in Namibia
23
A general problem with HS 253090 is that only information on quantity is avail-able but no information on lithium content which can vary between 12 and 6 Li2O thus the margin of possible errors in terms of total contained lithium is large
In 2019 Australia exported about 16 million tons of spodumene-concentrate down from 35 million tons in 2018 More than 95 destined to China
Inferred exports (RTS) of Zimbabwe were approx 93300 t for HS 253090 About 62000 t of that quantity are listed as imports by South Africa and are unrelated to lithium The remaining quantity is much more in line with production figures of Zimbabwe as well as the known downstream industries of the destination coun-tries within Europe
There are no export records published by Namibia In general and across all traded lithium products South Africa appears to act as an importexport hub within the SADC Also some of the traded products may be used in the glass and ceramic industry of South Africa
54 Import
For most of the SADC countries the statistics retrieved though the Global Trade Atlas do not necessarily represent reliable trade data due to above-mentioned reasons This is especially true when only small import numbers (usually in tons) are listed as these are supposedly artefacts or errors in declaration
Global imports of lithium-carbonate amounted to approx 142965 t with South Korea being the largest importer (38578 t 27 ) There are no listed imports for the SADC region except South Africa (72 t)
Global imports of lithium-oxides (hydroxides) amounted to approx 84900 t with Japan being the largest importer (37300 t 44 ) In analogy to lithium carbonate there are no published imports into the SADC except for South Africa (428 t)
There is no information for imports of lithium-choride or lithium-mineral-con-centrates into the SADC The largest importer of lithium-choride is China with approx 253 t The largest importer of lithium-mineral-concentrates is also China (gt 95 )
Lithium Potential in Namibia
24
Fig 6 Simplified geology of Namibia with major towns as well as railway and tar roads Blue polygons indicate pegmatite belts and districts in central and southern Namibia (Data source Geological Survey of Namibia 2020)
6 Lithium occurrences in NamibiaIn Namibia significant lithium occurrences are found only within pegmatites These Precambrian and early Namibian pegmatites are restricted to two dif-ferent areas respectively the Damara Orogen in north-central Namibia and the Namaqua Metamorphic Complex in southern Namibia (Fig 6)
Lithium Potential in Namibia
25
Within the Damara Orogen four linear pegmatite belts are found all of which strike northeast ndash southwest (Fig 7) Brandberg West ndash Goantagab Cape Cross ndash Uis Nainais ndash Kohero and Sandamap ndash Erongo with the latter connected to the Karibib Pegmatite District (Schneider 1992)
Each of these pegmatite belts exhibit numerous individual pegmatite swarms that occur zoned or unzoned and may carry significant amounts of rare metals or semi-precious stones In the south Lithium-Caesium-Tantalum (LCT) peg-matites occur in two areas Tantalite-Valley south of Warmbad in close prox-imity to the northwest-trending Tantalite Valley Shear Belt and the Sandfon-tein-Ramansdrift area close to the Orange River
Fig 7 Pegmatite belts in north-central Namibia from west to east Brandberg West ndash Goantagab Cape Cross ndash Uis Nainais ndash Kohero and Sandamap ndash Erongo as well as the Karibib Pegmatite District (after Geological Suvey of Namibia 2002)
Lithium Potential in Namibia
26
7 Lithium mining in NamibiaData for historic lithium mine production is available for the period 1939 ndash 1998 (Fig 8) After 1998 all mining activities ceased due to product quality issues and overall market environment
Until the mid-1950s lepidolite was the most important mined lithium mineral of the country (Fig 8) As mine output of lepidolite decreased output of petalite increased However quantity on a year-to-year basis was quite variable and fluctuated between 1000 ndash 10000 t Since the early 1980s production of petalite was quite stable and ranged between 1000 ndash 2500 t Production fell sharply in 1997 and 1998 after which it ceased Mining of amblygonite has always been small compared to lepidolite and petalite and never exceeded 1000 t per annum
According to the USGS (2020) 500 t of lithium were mined in Namibia in 2018 This is most likely stockpiled lepidolite material from the Rubicon mine
0
2000
4000
6000
8000
10000
12000
1939
1941
1943
1945
1947
1949
1951
1953
1955
1957
1959
1961
1963
1965
1967
1969
1971
1973
1975
1977
1979
1981
1983
1985
1987
1989
1991
1993
1995
1997
[Ton
nes]
Petalite (t)Amblygonite (t)Lepidolite (t)
Fig 8 Lithium production in Namibia in [t] per year (after Schneider 1992 BGR 2020)
Lithium Potential in Namibia
27
Currently there is no active consecutive mining for lithium in substantial quan-tities in Namibia although there are prospects and projects under develop-ment
71 Current mining activities and projects
Soris The Soris project is located in the De Rust pegmatite swarm which is part of the ldquoBrandberg West ndash Goantagab tin beltrdquo (Fig 7) This belt stretches to the northeast of the Brandberg massif over a length of 60 km and a width of 25 km This belt was previously mined for cassiterite on a larger scale Some of the pegmatites in this belt may carry substantial amounts of lithium such as pegmatites in the De Rust pegmatite swarm
The De Rust pegmatite itself is a Li-rich rare metal pegmatite that was mined for cassiterite and tantalite but also for minor quantities of spodumene be ween 1960 and 1990 (Diehl 1990) It intruded into metasediments of the Amis River Formation Lower Ugab Group of the Southern Kaoko Zone
It is the largest pegmatite of the De Rust pegmatite swarm within the Brandberg West ndash Goantagab pegmatite belt (Diehl 1992c) Outcrops are 100 ‒ 470 m long up to 30 m wide and can be followed over a length of roughly 24 km
The pegmatite shows well-developed zonation with a border zone (quartz alkali feldspar muscovite) outer (quartz microcline-perthite muscovite altered petalite) and inner (quartzo-feldspathic rock with spodumene crystals with accessory apatite lepidolite eucryptite zircon and monazite) intermedi-ate zone as well as a core zone (quartz subordinate microcline muscovite sporadic tantalite) Spodumene crystals may reach up to 80 cm in length (Fig 12) Towards the core zone spodumene carries rounded nodules of lithi-um phosphates (amblygonite ndash montebrasite series)
It is located northwest of the nearest town of Uis in the Kunene region of Namibia about 6km to the east of farm De Rust 532 and about 25 km north of the Ugab River The nearest railhead is located in the town of Karibib and the deep-water port of Walvis Bay is 120 km to the southwest Windhoek is about 180 km to the southeast
Lithium Potential in Namibia
28
The project can be reached via paved but mostly unpaved roads from the town of Uis From White Lady Lodge which is about 38 km northwest from Uis a 35 km gravel road leads towards the project 15 km of which are in the riverbed of the Ugab River There is currently no electricity and water supply at the project location site
According to SampP Global (022020) current owner of the Soris project is Mon-tero Mining amp Exploration Ltd (TSXV MON) which holds 80 interest of the property Another 20 are allocated to an unnamed private owner Based on data from the Namibia Mining Cadastre Portal (092020) multiple entries for mining licence applications exist for the area where the main De Rust pegmatite is located (Fig 9)
Resource estimateDue to the early stage of the Soris project no resource estimate is avail-able However Montero Mining claims the project to be drill ready targeting a resource of 10 Mt 1 Li2O with tantalum and tin by-product credits This would equate to 46400 t of lithium or 247000 t LCE
Grab samples of the deposit showed lithium contents of 007 to 532 aver-aging 137 Channel samples showed average lithium contents of 076 and values up to 366 (Montero 032019) The company also re-assessed 1097 previously tested RC drill samples The main lithium-bearing mineral is spodumene
Remnants of historic intermittent mining activities like old foundations and quartzo-feldspathic tailings are still visible east to the main pegmatite (Fig 10 ‒ 11)
Lithium Potential in Namibia
29
Fig 10 Remnants of historic open pit mining (upper) and tailings of De Rust pegmatite (lower) northwest of the Brandberg massif (Photo BGR-GSN 2019)
Fig 9 Satellite image of the De Rust project including the outlined mining license Main pegmatite coordinates 20deg57prime48primeprimeS ‒ 14deg30prime12primeprimeE (Source httpportalsflexicadastrecomnamibia 092020)
Main pegmatite
Lithium Potential in Namibia
30
Fig 12 Weathered spodumene chrystals at the historic open pit mine (Photo BGR-GSN 2019)
Fig 11 Historic open pit of the De Rust pegmatite (Photo BGR-GSN 2019)
Lithium Potential in Namibia
31
Uis The Uis projects (former mine and tailings) are located in the northern part of the ldquoCape Cross Uis pegmatite beltrdquo east of the town of Uis on the farm Uis Townlands No 215 in the Erongo region of Namibia
The Cape Cross-Uis belt is approx 120 km long and up to 40 km wide and extends in a NE direction (Fig 7) It comprises three distinct pegmatite swarms the Strathmore swarm Karlowa swarm and Uis pegmatite swarm In general lithium-bearing pegmatites (Li-Nb-Ta-Sn-Be and Li-Nb-Ta-Sn) are the least common in this belt (Fuchsloch et al 2018)
The Uis swarm field consists of more than 120 individual pegmatites each with a northeasterly to easterly strike direction and northwesterly down dip (30deg ‒ 70deg) This field is accompanied by a peripheral pegmatite field of approx 25 individual pegmatites
Some of the main pegmatites especially around the formerly worldrsquos largest tin mine at Uis are exceedingly large Some of them are up to 1 km long and some 50 m wide
In terms of lithium petalite amblygonite and minor spodumene mineralization occurs in the various pegmatites but no lepidolite Most common lithium bear-ing minerals in the eight pegmatites that were mined at Uis are amblygonite petalite and spodumene
Currently the Uis tailings project and the Uis tin mine are owned by two differ-ent companies As of 2020 the tin mine is operating a pilot processing plant and aims to ramp up the production of lithium in the near future The current ownership of the tailings project as of September 2020 is unclear
The nearest commercial deep-water port to the projects is Walvis Bay 220 km to the southeast The town of Omaruru is 130 km to the east and Henties Bay lies about 120 km to the southwest The nearest railhead is located in Omaruru The area is accessible year-round by paved and un-paved roads NamPower provides electricity and the town of Uis is connected to the Nam-Water pipeline
Lithium Potential in Namibia
32
The tin deposit was discovered in 1911 and mined between the 1950s and 1989 for cassiterite by Uis Tin Mining Company (SWA) Ltd and IMCOR
Coarse tailings are located in the northern part of the former mine just south to the main road C36 (Fig 13) The fine material is located south to the coarse waste dumps (Fig 13)
After 1990 multiple companies owned the property until AfriTin Mining Ltd bought all the rights (license ML134) The current lithium tailings project of Montero Mining amp Exploration Ltd (TSXV MON) is based on the historic mine tailings of the former tin mine on mining license ML134 that is currently owned by AfriTin Mining Ltd The acquired tailings material does not fall under the ML134 license of AfriTin since historical tailings material (Fig 14) is not regulated by Minerals (Prospecting and Mining) Act 33 of 1992 of Namibia
Resource estimateUis tin mineAccording to AfriTin the former Uis mine holds a JORC compliant resource (inferred) of 715 Mt of ore 0134 Sn with a cut-off grade of 005 Sn (AfriTin 2020) Grades of ancillary elements are given at 063 Li2O and 85 ppm Ta for the total resource of 71 Mt of ore
This equals to approx 95000 t of tin 209000 t of lithium (11 Mt LCE) and 6090 t of tantalum 85 of the total resource are attributable to the company The remaining 15 are allocated to SMU (Small Miners of Uis)
Uis tailingsMontero Mining filed an inferred resource estimate of 144 Mt of ore 037 Li2O and 005 SnO2 with a 035 Li2O cut-off grade for lithium and assumed processing recoveries of 70 for their tailings project (Montero 2019) This equals to approx 24700 t of lithium content (131500 t LCE) and 7200 t SnO2
This resource estimate only includes coarse tailings material There is current-ly no information on the lithium content of the fine tailings material that totals 271 Mt t due to insufficient or no test work (Montero 2018) The company also states that the average Li2O grade of the fines material does not hurdle the cut-off for the fines of 082 Li2O
Lithium Potential in Namibia
33
In 2016 Australian based Tawana Resources carried out a drilling program at Uis for a private company called Lithium Africa 1 on the fine and coarse tailings (Table 3 Hole 1 amp Hole 2) Below some of the obtained data on lithium content is given Additionally Li2O content of two obtained grab samples by BGR (Table 3 Sample 2019a amp 2019b) is given
Table 3 Sample data Uis (Tawana 2016 Montero 2018 BGR 2019)
Sample Sample 0 to 1m Li2O ()
Sample 1 to 2m Li2O ()
Sample 2 to 3m Li2O ()
Fines Hole 1 071 085 092
Fines Hole 2 080 089 095
Coarse Hole 1 050 043 043
Coarse Hole 2 054 062 062
BGR Sam-ple 2019a (Coarse tailings)
028
BGR Sam-ple 2019b (Coarse tailings)
028
Montero NI 43-101 037
Lithium Potential in Namibia
34
Fig 14 Tailings of the historic Uis Tin Mine (Photo BGR-GSN 2019 with kind permission of AfriTin Mining Limited)
Fig 13 Former Uis tin mine Uis tailings project with coarse tailings Tailings coordina-tes (center) 21deg13prime31primeprimeS ‒ 14deg52prime44primeprimeE (Source httpportalsflexicadastrecomnamibia 092020)
Uis Tailings (coarse)
Uis Tailings (fine)
Historic Uis mine
Lithium Potential in Namibia
35
Karibib Lepidolite ProjectThe Karibib Lepidolite brownfield project is located in the ldquoKaribib ndash Usakos Pegmatite Districtrdquo southeast of the town of Karibib on the farm Okongava Ost No 72 in central Namibia (Fig 15 ‒ 16)
This pegmatite district which is of Damaran age hosts the most important pegmatite occurrence (Rubicon swarm) in terms of lithium in Namibia In addi-tion numerous other different pegmatite swarms some of which have previ-ously been relevant in terms of lithium are know from this district These are Dernburg Karlsbrunn Albrechtshoumlhe Berger Kaliombo Gamikaubmund Okatjimukuju Etusis Daheim Friedrichsfelde and Etiro (Diehl 1992a)
The Rubicon pegmatite itself is the largest of the individual pegmatites that occur in this field and has been the prime source of lithium until mining seized in the early 1990s The Helikon pegmatites are part of the Rubicon pegmatite swarm and are located northeast to the Rubicon pegmatite They have previ-ously been mined for lepidolite amblygonite petalite and muscovite beryll pollucite quartz and columbite-tantalite as valuable by-products (Fig 18 ‒ 19)
The pegmatite itself consist of two ellipsoidal well zoned Li-mineralized ore-bodies The larger one is about 320 m long and 25 ndash 35 m wide It dips at 46deg to the northeast and has a northwesterly strike The second orebody is about 230 m long and about 10 m wide It is dipping with 30deg to the northeast and has a northwesterly strike In total the outcrop of the Rubicon pegmatite is about 600 m long with a maximum width of 65 m (Fig 17)
A very prominent feature is the presence of a very well developed concen-tric shell and zones from the footwall to the inner core of the pegmatite Both orebodies exhibit a border- wall- intermediate- and core-zone
Border-zone wall-zone and outer intermediate zone of the larger orebody do not contain Li-bearing minerals of economic importance The inner interme-diate zone does contain lepidolite The outer core zone may be sub-divided into a petalite zone low-grade lepidolite zone and a high-grade lepidolite zone The inner core zone also contains a petalite zone Mining occurred pre-viously in the later named zones The zonation of the smaller orebody to the northwest is less pronounced but Li-mineralization and style are equal to the
Lithium Potential in Namibia
36
larger orebody There is no spodumene mineralization within the orebodies and respectively zones of the Rubicon pegmatite
The Helikon I pegmatite is also a lens-shaped pegmatite with a length of roughly 400 m and a width of approx 66 m It dips to the north with about 60deg ndash 70deg Helikon I also consists of well-defined zones The main Li-bearing minerals are lepidolite and petalite According to Roering (1963) the lepidolite is difficult to separate from the intergrown albite and hence of low grade and quality
The Helikon II pegmatite is approx 17 km long and only 9 ndash 15 m wide It lies a bit north of Helikon I and dips steeply to the north with 55deg ndash 80deg striking east west The main Li-bearing minerals are lepidolite and petalite According to Diehl (1990) the westernmost portion of the pegmatite has historically been the economically most important A massive up to 6 m wide petalite zone was mined here according to Diehl (1990)
The nearest railhead to the project is 17 km away in Karibib and the deep-water port of Walvis Bay is 220 km to the southwest Windhoek is about 180 km to the southeast NamPower connects the town of Karibib to electricity and the project currently utilizes generators There is a 7 km long 22 kV power line spur to grid connection pending (Lepidico 2020) Water is available via on-site boreholes
The project was previously owned by Desert Lion Energy Inc (TSVX DLI) Lepidico Ltd (ASX LPD) bought into the project and currently holds 80 interest which comprises Mining License 204 (69 km2) as well as three Exclu-sive Prospecting Licenses (EPLs) namely 5439 5555 and 5781 (Lepidico 2020)
Lepidico will cover mining from multiple sources as well as chemical conver-sion by utilizing their proprietary lithium processing technologies L-Maxreg LOH-Maxreg and S-Maxreg (Lepidico 052019) The company aims to produce high purity lithium chemicals such as lithium carbonate and lithium hydroxide
The takeover also included a nonbinding offtake agreement between the for-mer owner Desert Lion Energy Inc and German chemical company BASF On April 2nd 2019 Desert Lion Energy Inc announced this offtake agreement
Lithium Potential in Namibia
37
which at the time was valid through to December 31 2019 On December 20th
2019 Lepidico announced that the LOI with BASF was extended to Decem-ber 31st 2020 (Lepidico 122019)
The feasibility study criteria of Lepidico are as follows
- Throughput of the concentrator on-site of 035 Mtpa- Expansion of throughput after year five to 05 Mtpa- Chemical plant in the industrial city of Abu Dabi (ICAD)- Plant design for 58000 tpa of concentrate (4 LiO2) for the production of
up to 5500 tpa LiOH- Utilization of L-Maxreg and LOH-MaxTM- Non-binding off-take MOU with BASF for LiOH only- Targeting for project commissioning to commence late 2021 for commer-
cial production in 2022
The preliminary mine plan indicates a strip ratio of 03 ndash 1 for the first two years The ratio will then go up to 1 ndash 14 In the first four years elevated grades of 06 LiO2 will be mined
Resource estimateA JORC 2012 compliant resource estimate for the deposit is given in Table 4 (Lepidico 2020) The deposit currently holds 23200 t of lithium (Indicated amp Inferred) based on a cut-off grade of 015 Li2O This resource estimate is based solely on the lepidolite occurrences at the mine site
Table 4 Resource estimate Karibib Lepidolite Project (Source Lepidico 2020)
Deposit Resource Category
Cut-off (Li2O)
Ore (Mt)
Li2O ()
Li (t)
Li (LCE)
Rubicon Measured
015
22 057 5819 30974
Rubicon Indicated 666 038 11637 61943
Rubicon Inferred 237 043 4728 25167
Helikon
Total 015 1124 043 22184 118086
Lithium Potential in Namibia
38
Fig 16 Satellite image of the Karibib Lepidolite project Helikon 1 coordinates (center) 22deg2prime49primeprimeS ‒ 16deg1prime13primeprimeE Helikon 4 coordinates (center) 22deg2prime24primeprimeS ‒ 16deg1prime41primeprimeE (Source httpportalsflexicadastrecomnamibia 092020)
Fig 15 Satellite image of the Karibib Lepidolite project Rubicon coordinates (center) 22deg6prime11primeprimeS ‒ 15deg59prime44primeprimeE (Source httpportalsflexicadastrecomnamibia 092020)
Historic Rubicon mine
Helikon 1
Helikon 4
Lithium Potential in Namibia
39Fig 17 Rubicon pegmatite (Photo BGR-GSN 2019 with kind permission of Lepidico Chemicals Namibia (Pty) Ltd 2020)
Lithium Potential in Namibia
40 Fig 18 Lepidolite sample from Rubicon pegmatite (Photo BGR-GSN 2019 with kind permission of Lepidico Chemicals Namibia (Pty) Ltd 2020)
Fig 19 Petalite sample from Rubicon pegmatite (Photo BGR-GSN 2019 with kind permission of Lepidico Chemicals Namibia (Pty) Ltd 2020)
Lithium Potential in Namibia
42
Fig 21 Helikon 4 pegmatite (Photo BGR-GSN 2019 with kind permission of Lepidico Chemicals Namibia (Pty) Ltd 2020)
Fig 20 Helikon 1 pegmatite (Photo BGR-GSN 2019 with kind permission of Lepidico Chemicals Namibia (Pty) Ltd 2020)
Lithium Potential in Namibia
43
Tantalite ValleyThe Tantalite Valley Project lies within the ldquoNamaqua Metamorphic Complexrdquo in Southern Namibia Within this complex Lithium-Caesium-Tantalum (LCT) pegmatites occur in two main areas Tantalite-Valley south of Warmbad in close proximity to the northwest-trending Tantalite Valley Shear Belt and the Sandfontein-Ramansdrift area close to the Orange River
The area were the pegmatites of the Tantalite Valley occur is primarily com-posed of a large ovoid gabbro intrusion (71 km by 33 km in extent) within paragneiss units of the Namaqua Complex The gabbro outcrop forms a large dome shaped mountain that rises about 500 m above the surrounding topo-graphy
The pegmatites belong to the Kenhardt and Gordonia pegmatite districts in Namaqualand but only the younger group of them carry accessory ore miner-als such as tantalite beryl REE minerals and lithium
The Tantalite Valley pegmatites include several individual subhorizonal dikes that are up to 1000 m long and 02 to 40 m wide plunging towards southeast (Diehl 1992b) Four of those are of economic interest Homestead Whitkop White City and the Lepidolite pegmatites (ie Purple Haze) (Fig 22)
They are all well zoned (quartz core inner and outer intermediate zones wall zone) and were predominantly targeted for beryl columbite-tantalite as well as lithium and bismuth minerals
The project is located on the farms Umeis 110 and Kinderzitt 132 between the Farms 109 131 129 308 and 473 in the magisterial district of Karas It currently comprises Mining License (ML-77) fully owned by Tameka Shelf Co Four (Pty) Ltd which is a 100 subsidiary of African Tantalite Pty Ltd (AFTAN) Above all Kazera Global Investments PLC holds a 75 stake in AFTAN (Kazera 2019) with the other 25 of local farmer ownership
The project is accessible via gravel road from Karasburg which is about 80 km to the north The nearest railhead is also located in Karasburg Electricity is currently supplied by generators and water is recovered from multiple drill holes The Orange River is about 15 km to the south of the project Mining
Lithium Potential in Namibia
44
infrastructure as well as equipment are on site as well as a plant for the pro-duction of tantalite concentrate
NTI is working on an extensive exploration program with a clear focus on revi-ving tantalite mining in Namibia with a possible by-product stream of lithium bearing minerals The company will focus primarily on the pegmatites Homes-tead Purple Haze Signaalberg and White City (Fig 23)
The area is known for its tantalum occurrences and since the late 1940s tantalite and other minerals have been recovered at Tantalite Valley until 1981 when mining ceased Initially alluvial deposits were mined followed by the pegmatites themselves Grades of the concentrates produced prior to the closure of the mine were quite high with 65 ‒ 70 Ta2O5 with very low U3O8
and ThO2 values of 025 max
Resource estimateAccording to SampP Global (092020) Measured and amp Indicated resources at Tantalite Valley are 104800 t of ore 0042 Ta2O5 and 0653 Li2O as of 112019 This would equate to 315 t of lithium or 1690 t LCE Total inferred resources are 517400 t of ore 0018 Ta2O5 and 0144 Li2O This equals to approx 91 t of tantalum and 750 t of lithium (3535 t LCE)
Lithium Potential in Namibia
45
Fig 23 White City pegmatite (Source Kazera global Investments PLC 2020)
Fig 22 Satellite image of the Tantalite Valley project White City pegmatite coordinates (center) 28deg43prime07primeprimeS ‒ 18deg44prime45primeprimeE Homestead pegmatite coordinates (center) 28deg43prime19primeprimeS - 18deg44prime24primeprimeE Purple Haze pegmatite coordinates (center) 28deg43prime09primeprimeS ‒ 18deg43prime55primeprimeE (Source httpportalsflexicadastrecomnamibia 092020)
Lithium Potential in Namibia
46
8 Analysed lithium samplesDuring the course of the cooperation project between the Economic Geology Division (EGD) of the Geological Survey of Namibia (GSN) and the Ger-man Federal Institute of Geosciences and Natural Resources (BGR) several sampling campaigns to southern and central pegmatites took place
The field trips were preceded by literature and data research regarding infor-mation on lithium occurrences andor previous lithium mining activity to iden-tify specific target areas
During a campaign in 2019 16 lithium-bearing mixed mineral samples were taken from five different locations and subsequently analyzed Two of the samples originate from the Uis Tin Mine Tailings of the former tin mine All remaining samples were taken either from stripped outcrops for future mine activities or from previous mine sites (ie pits)
All 16 samples were analyzed at BGR labs in Hanover Germany through qualitative XRD XRF and ICP-MS Given data shall be understood as a first indicator for the sampled lithium occurrences
Most if not all sampled occurrences have previously been analyzed or are cur-rently being assessed by the property owners or current licensees Detailed information of these sampling and analytical campaigns remain confidential and are thus not available for comparison
Appendix A lists the identified qualitative mineralogy of the samples as well as the major element analysis Additional samples from previous campaigns are also given
Interpretation of the results are based on their applicability in the various lithium-consuming industries for which information is available
Most of the current lithium applications require a chemical intermediate product such as lithium carbonate or lithium-hydroxide The glass and cera-mic industry does use lithium-bearing mineral concentrates depending on the prices of these materials when compared to LiCO3
Lithium Potential in Namibia
47
Since the main applications require an intermediate or downstream chemical product lithium content as well as impurity values are the main criteria for the suitability of the sampled occurrences Other quality criteria are particle size and surface areastructure
9 InterpretationAs previously stated all obtained grab samples are mixtures of lithium- bearing minerals (ie spodumene petalite lepidolite) feldspars quartz micas as well as secondary minerals Therefore all given analytical data has to be taken with caution and will not be representative for the individual outcrops or deposits
The evaluation of the economic suitability for various economic applications of the analysed lithium samples is based on the chemical specifications in Chapter 4
Lithium content gt 1 Li2O Fe2O3 content lt 015 as well as F content lt 01 are individually highlighted (Appendix A) as these three values are the most important
Based on the chemical analysis nine of the 16 samples showed Li2O contents of more than 1 (range 117 ‒ 327 ) Seven of those nine samples also exhibited low Fe2O3 content (range 004 ‒ 008 ) (Appendix A) Three of those seven samples also had fluorine values below 005
Of the ten additionally included samples from previous campaigns four showed Li2O contents of more than 1 (range 126 ‒ 199 ) Three of those samples also exhibited low Fe2O3 content (range 004 ‒ 007 ) (Appendix A) One of the three samples had fluorine values below 005
The mentioned samples (sources) could be of potential use but for further interpretation statistical sampling will be required
Lithium Potential in Namibia
48
10 ConclusionsThere is currently no lithium industry established in Namibia This accounts to both mining and processing of ores into commercial lithium-bearing con-centrates as well as the production of downstream products such as lithium carbonate andor lithium hydroxide In order to evaluate the potential for a lithium industry in Namibia the current global market and price developments need to be addressed
Currently the main application for lithium is in the chemical industry as lithium carbonate andor hydroxide for the manufacturing of lithium-ion batteries There is currently no domestic market (supply) or demand for this industry in Southern Africa or Namibia in specific Processing of lithium-bearing ores into these highly specific downstream products is economically more viable in close proximity to the demanding industries It also requires large investments (double-digit million dollars per 10000t of capacity) Additionally there is already huge capacity and strong capacity build up in Asia at rather low cost
The second most important application lies in the glass and ceramics industry This industry uses lithium either as lithium-bearing concentrates or lithium carbonate depending on current market price and processproduct require-ments There is currently no such industry established in Namibia but potential plans There is glass and ceramics manufacturing in South Africa and thus a potential market for lithium bearing products (concentrates) should this indus-try require it depending on product
The 20182019 primary lithium supply based on spodumene-bearing mineral concentrates was dominated by Australia with a market share of well over 95 On an annual basis the country exports more than three million tons of lithium-bearing concentrates to China To put this into perspective Lepidico plans to export just 58 ktpa of concentrate to Abu Dhabi for refinement from their project annually Therefore potential production in Namibia will always be rather small scale when compared to peer producing countriescompanies
As of late 2020 the concentrate market is in strong oversupply with strong competition Thus prices have eroded quite substantially for a standard SC6 concentrate (Fig 24) In general prices vary significantly based on lithium content and impurities of the concentrates Lithium bearing mineral concen-
Lithium Potential in Namibia
49
trates are a relatively low-value mineral commodity when compared to lithi-um-carbonate or other lithium downstream products thus product quality cost reduction and cost control are key components in this industry Since prices are depressed currently many of the Australian producers have drasti-cally reduced output or even went into care and maintenance This situation may change towards 2025 or beyond as demand picks up
Prices for the higher valued product lithium-carbonate spiked at the end of 2017 towards 2018 to more than 20000 $USt on a contract basis with prices being very volatile Since then prices have also eroded to below 9000 $USt due to oversupply and slow demand pickup (Fig 25) With this product stable quality and chemical composition are crucial for the downstream industry
Based on available gradetonnage data the Namibian projectsprospects are relatively small in overall size and low in grade when compared to global peers for the resource category ldquoMeasuredIndicatedrdquo (Appendix B) Total contained lithium quantity is thus relatively small in comparison On a global scale the most promising hard rock projects that are currently being mined and developed have Li2O grades of 10 or above
Fig 24 Lithium-mineral-concentrate prices 012010 ‒ 062020 (Source BGR 2020)
300
400
500
600
700
800
900
1000
1100
208
210
212
214
216
218
220
US$
t US$t
01-20
14
01-20
15
01-20
16
01-20
17
01-20
18
01-20
19
01-20
20
01-20
10
01-20
11
01-20
12
01-20
13
Spodumene min 5-6 LiO2 fob Australia
Spodumene concentrate gt75 LiO2 bulk cif Asia
Petalite 42 LiO2 fob Durban
Spodumene fob Australia
Spodumene min 5-6 LiO2 cif China
Lithium Potential in Namibia
50
For the resource category ldquoIndicatedrdquo which generally represents the lowest level of confidence only the Uis mine project of AfriTin represents a size-able resource even though grades are relatively low (Appendix C) The Uis tailings project as well as the Rubicon project are again relatively small when compared to their global peers Tantalite Valley is the smallest of all included projects (Appendix C)The given data for the De Rust project reflects only an exploration target of the company rather than actual data and may thus be not representative
Based on size and contained lithium-content none of the visited early stage projectsprospects would justify the financial investment into the construction of a chemical conversion plant for the production of lithium carbonate andor hydroxide on site as it requires very large monetary investments Due to their size payback of the required investments may be unfavorable when compared to global peers In addition the current market environment is very harsh with strong competition from Asia that has a huge cost advantage due to capacity build up This industry is also very energy and water intensive
In addition location within Namibia as well as distance to possible down-stream markets may become an issue as it increases the transportation cost
4000
7000
10000
13000
16000
19000
22000
25000
28000
01-20
14
01-20
15
01-20
16
01-20
17
01-20
18
01-20
19
01-20
20
US$
t
Lithium-carbonate (min 995 ) battery grade spot price ex works domestic ChinaLithium-carbonate (min 99-995 ) Li2CO3 large contracts USA delivered continentalLithium-hydroxid-monohydrate (min 565) technical and industrial grades cif China Japan amp Korea
Fig 25 Lithium chemical prices 012014 ndash 062020 (Source BGR 2020)
Lithium Potential in Namibia
51
immensely This is especially true for the SorisDe Rust pegmatite which is in a remote location without any allocated infrastructure The projects Karibib Uis and Tantalite Valley are much easier to access
The approach of Lepidico to produce a lithium bearing concentrate on site seems plausible approach Since this will already require a skilled workforce mining and beneficiation equipment in order to produce a high quality lithium-bearing concentrate it may already be considered ldquoadded valuerdquo for the indus-try of the country This approach may also be suitable for the other mentioned and visited projects
Lithium Potential in Namibia
52
ReferencesAfriTin Mining (2020) Uis Tin Project ndash Company Information ndash URL httpafritinminingcomuis-project [as of 092020]
Australian Government Geoscience Australia (2019) Australiarsquos Identi-fied Mineral Resources 2019 ndash URL httpswwwgagovauscientific-topicsmineralsmineral-resources-and-adviceaimr [as of 092020]
BGR ndash Bundesanstalt fuumlr Geowissenschaften und Rohstoffe (2020) Fachinformationssystem Rohstoffe ndash unpubl Hannover [as of 082020]
BGS ndash British Geological Survey (2016) Lithium Definitions mineralo-gy and deposits ndash URL httpswwwbgsacukdownloadsstartcfmid=3100 [as of 062016]
Diehl B J M (1990) Pegmatites of the Cape Cross Uis ndash Pegmatite Belt Namibia Geology mineralisation Rubidium Strontium characteristics and petrogenesis of rare metal pegmatites Open File Report EG 083 Economic Geology Series Geological Survey of Namibia 39 pp Windhoek
Diehl B J M (1992a) Lithium Caesium Beryllium Open File Report Mineral Resource Series Geological Survey of Namibia 18 pp Windhoek
Diehl B J M (1992b) Niobium and Tantalum Open File Report Mineral Resource Series Geological Survey of Namibia 20 pp Windhoek
Diehl B J M (1992c) Tin Open File Report Mineral Resource Series Geological Survey of Namibia 30 pp Windhoek
Diehl B J M amp Schneider G I C (1990) Geology and mineralisation of the Rubicon Pegmatite Namibia Open File Report Geol Surv Namibia 20 pp Windhoek
Fuchsloch et al (2018) Classification mineralogical and geochemical vari-ations in pegmatites of the Cape Cross-Uis pegmatite belt Namibia Lithos 296 ndash 299 79-95 elsevier
Lithium Potential in Namibia
53
Garret D E (2004) Handbook Of Lithium And Natural Calcium Chloride Their Deposits Processing Uses and Properties ndash 467 S Oxford (Elsevier B V)
Geological Survey of Namibia (2002) Mineral Resources of Namibia Summary of Mineral Deposits and Occurrences Omaruru Sheet 2114 Volume I ndash Complete Descriptions 119 pp Windhoek
IHS Global SA (2020) Global Trade Atlas ndash Commercial Online-Databa-se ndashURL httpsmyihscomConnectcallingUrl=https3a2f2fconnectihsmarkitcom2f [as of 062017]
Kazera Global Investments PLC (2020) Company Information ndash URL httpskazeraglobalcominvestmentsnamibia-tantalite-investment-mine [as of 092020]
Lepidico (2019) LOI with BASF extended to 31 December 2020 ndash News Release ndash URL httpswwwlepidicocomwp-contentuploads201910LPD-191220-LOI-with-BASF-extended-to-31-December-2020pdf [as of 122019]
Lepidico (2019) Corporate Presentation ndash URL httpswwwlepidicocomwp-contentuploads201907LPD-190509-Corporate-Presentati-on-May-2019pdf [as of 052019]
Lepidico (2020) Company Information ndash URL httpswwwlepidicocomprojectskaribib [as of 092020]
Montero Mining amp Exploration Ltd (2018) Exploring Battery Metals in Namibia ndash Company Presentation ndash URL httpswwwproactiveinvestorscomauuploadSponsorFileFile2018_031520244941_MON-CorporatePre-sentationMarch2018pdf [as of 072018]
Montero Mining amp Exploration Ltd (2019) Montero Files NI 43-101 Resource Estimate On The Uis Lithium-Tin Tailings Project In Namibia On Sedar ndash News Announcement ndash URL httpsmonterominingcommontero-files-ni-43-101-resource-estimate-on-the-uis-lithium-tin-tailings-project-in-namibia-on-sedar [as of 032019]
Lithium Potential in Namibia
54
Namibia Mining Cadastre Portal (2020) Online-Database ndashURL httpsportalslandfoliocomnamibia [as of 092020]
Roskill Information Services Ltd (2016) Lithium Global Industry Mar-kets amp Outlook ndash 386 S London Groszligbritannien
Schneider G I C (1992) Feldspar Open File Report MRS 08 Mineral Resource Series Geological Survey of Namibia 2 pp Windhoek
Schmidt M (2017) Rohstoffrisikobewertung ndash Lithium ndash DERA Rohstoffin-formationen 33 Berlin
S amp P Global Market Intelligence (2020) Lithium - Metals amp Mining Properties URL httpsplatformmarketintelligencespglobalcomwebcli-entauth=inheritindustryminingProjects [as of 092020]
Statista (2020) Distribution of lithium end-usage worldwide in 2019 by area application ndash URL httpswwwstatistacomstatistics268787lithium-usa-ge-in-the-world-market [as of 062020]
Tawana Resources NL (2016) Tawana acquires second lithium pro-ject ndash News Release ndash URL httpsmstrademomentumcozajsepdfSENS_20160923_S376505pdf [as of 092016]
USGS ndash United States Geological Survey (multiple years) Lithium ndash Minerals Commodity Summaries ndash URL httpswwwusgsgovcentersnmiclithium-statistics-and-information [as of 082020]
Appendix
Sam
ple I
DFa
rmLa
titud
eLo
ngitu
deSa
mpl
e des
crip
tion
(XRD
qu
al)
LiO 2
()
SiO 2
Ti
O 2
Al2O 3
Fe2O 3
Mn
O Mg
O Ca
O Na
2O
K 2O P 2O 5
SO
3
Cl
F
LOI
Su
m
2015
-03
previous sample campaignsHelik
on
n A
Felds
parQ
uartz
Lepid
olite
025
6871
lt000
119
0500
200
2900
505
3292
806
7905
59lt0
01lt0
002
lt005
093
9985
2016
-12
Rubic
onwe
ather
ed P
etalite
126
6473
lt000
118
0600
703
2718
607
9507
805
2500
62lt0
01lt0
002
lt005
1146
9871
2016
-17
Rubic
onLe
pidoli
te +
Quar
tz13
063
6700
219
9316
0929
003
0054
029
6218
0052
lt001
lt000
226
232
798
67
2016
-20
Helik
onLe
pidoli
te + A
lbite
176
5514
lt000
126
8700
401
2100
700
2123
970
3900
45lt0
01lt0
002
156
369
9698
2016
-21
Helik
onLe
pidoli
te19
954
32lt0
001
2627
004
0224
006
0038
266
714
0069
lt001
lt000
240
628
997
77
FN20
19_0
4De
Rus
tFe
ldspa
rAmb
lygon
iteP
etalite
(n
on X
RD)
003
6513
lt000
118
82lt0
0100
0200
101
0924
311
4105
75lt0
0100
04lt0
0503
898
84
2015
-09
Molop
oPe
talite
(non
XRD
)00
952
85lt0
001
1672
lt001
0002
487
0323
342
0352
lt000
100
400
3403
621
1310
012
2016
-14
Molop
oPe
talite
wea
there
d (no
n XRD
)00
752
1600
0316
5100
200
5147
805
8923
406
4500
6900
200
8602
222
6310
013
2016
-15
Molop
oFe
ldspa
r (no
n XRD
)00
664
02lt0
001
1937
003
0004
003
0151
216
1249
0796
lt001
lt000
2lt0
0505
399
55
2016
-23
Molop
oZin
nwald
ite (n
on X
RD)
006
5044
0068
3307
048
0011
012
0426
261
7674
0181
lt001
lt000
2lt0
0542
9925
1909
249
2019Uis
Tailin
gs
Quar
tzFe
ldspa
rPeta
lite
Musc
ovite
028
7293
0045
1479
051
0062
0212
9830
927
6613
6200
2lt00
02lt0
0523
399
38
1909
250
Uis
Tailin
gsQu
artz
Felds
parP
etalite
Mu
scov
ite02
872
6900
4314
8205
0059
019
1306
313
2794
1347
002lt
0002
lt005
251
9937
1909
251
Helik
on 4
22deg02prime4
8primeprimeS1
6deg01prime30
primeprimeEQu
artz
Felds
parP
etalite
Le
pidoli
te16
464
4400
0319
4200
301
2100
408
8325
345
6806
800
400
0727
228
998
38
1909
252
Helik
on 1
22deg02prime2
0primeprimeS1
6deg01prime19
primeprimeEPe
talite
Lepid
olite
Quar
tz29
576
9200
0116
6800
300
0304
101
7301
106
8100
01lt0
01lt0
002
lt005
205
97
App
endi
x A
Ana
lytic
al d
ata
of li
thiu
m s
ampl
es c
olle
cted
in N
amib
ia T
hres
hold
val
ues
high
light
ed in
gre
en
Lithium Potential in Namibia
57
Sam
ple I
DFa
rmLa
titud
eLo
ngitu
deSa
mpl
e des
crip
tion
(XRD
qu
al)
LiO 2
()
SiO 2
Ti
O 2
Al2O 3
Fe2O 3
Mn
O Mg
O Ca
O Na
2O
K 2O P 2O 5
SO
3
Cl
F
LOI
Su
m
1909
253
2019Rubic
on22deg06prime1
3primeprimeS1
5deg59prime45
primeprimeEPe
talite
Lepid
olite
Quar
tz32
778
73lt0
001
1687
002
0006
002
0157
011
003
0002
003
0003
lt005
075
9663
1909
254
Rubic
on22deg06prime1
0primeprimeS1
5deg59prime41
primeprimeEFe
ldspa
rQua
rtzM
usco
vite
004
682
lt000
119
3500
300
2400
205
0610
0808
6804
3lt0
01lt0
002
lt005
041
9985
1909
255
Rubic
on22deg06prime1
0primeprimeS1
5deg59prime41
primeprimeEFe
ldspa
rLep
idolite
Mus
co-
viteK
aolin
026
6104
0004
2318
022
0136
006
0119
367
8411
0159
lt001
lt000
2lt0
0522
299
15
1909
256
Rubic
on22deg06prime1
0primeprimeS1
5deg59prime41
primeprimeELe
pidoli
te 27
249
8700
129
3400
408
0500
400
704
697
3100
31lt0
01lt0
002
087
441
9569
1909
257
Rubic
on22deg06prime1
3primeprimeS1
5deg59prime45
primeprimeEPe
talite
Lepid
olite
Quar
tz30
670
0900
0320
2600
801
0901
502
9901
926
800
15lt0
0100
04lt0
0526
596
48
1909
258
Rubic
on22deg06prime1
0primeprimeS1
5deg59prime41
primeprimeELe
pidoli
teFe
ldspa
rQua
rtz20
659
7800
0224
100
505
2400
300
513
7247
0051
lt001
0002
265
388
9966
1909
259
Tanta
lite
Valle
y28deg43prime0
9primeprimeS1
8deg43prime55
primeprimeEFe
ldspa
rLep
idolite
Mus
covit
e11
762
64lt0
001
2139
004
0161
lt001
0399
7731
2401
0900
200
119
912
698
85
1909
260
Tanta
lite
Valle
y28deg43prime0
9primeprimeS1
8deg43prime55
primeprimeEFe
ldspa
rLep
idolite
Mus
covit
e03
059
8600
1425
1301
604
2200
302
2860
547
2201
3900
200
0904
123
799
56
1909
261
Tanta
lite
Valle
y28deg43prime0
9primeprimeS1
8deg43prime55
primeprimeEFe
ldspa
rQua
rtzM
usco
vite
003
636
0005
2218
022
0122
002
0381
727
3809
0272
lt001
lt000
2lt0
0513
199
17
1909
262
Tanta
lite
Valle
y28deg43prime2
0primeprimeS1
8deg44prime23
primeprimeEQu
artzSp
odum
eneM
us-
covit
e13
180
5100
0415
8903
401
2401
301
9502
604
0400
0500
200
03lt0
0507
398
56
1909
263
De R
ust
20deg57prime4
8primeprimeS1
4deg30prime13
primeprimeEFelsd
parS
podume
neQuartz
074
7313
0006
2048
007
015
005
0154
398
0831
0073
001
0003
lt005
082
9974
1909
264
De R
ust
20deg57prime4
8primeprimeS1
4deg30prime13
primeprimeESp
odum
eneF
eldsparQuartz
230
6924
0006
2602
801
0200
301
0510
102
1400
68lt0
0100
03lt0
0504
897
53
(Con
tinue
d) A
ppen
dix
A A
naly
tical
dat
a of
lith
ium
sam
ples
col
lect
ed in
Nam
ibia
Thr
esho
ld v
alue
s hi
ghlig
hted
in g
reen
Lithium Potential in Namibia
58
Appendix B GradeTonnage data (Measured amp Indicated) for selected lithium projects in comparison to Namibian projects (Source SampP 092020)
0
0500
1000
1500
2000
2500
500
5000
5000
0
5000
00
5000
000
Gra
de [
Li 2O
]
Tonnage [t]
Tantalite Valley
Rubicon
Appendix B GradeTonnage data (Inferred) for selected lithium projects in com-parison to Namibian projects (Source SampP 092020)
0
0500
1000
1500
2000
2500
100
1000
1000
0
1000
00
1000
000
1000
0000
Gra
de [
Li 2O
]
Tonnage [t]
Tantalite ValleyRubicon
Uis Tailings
Uis Mine
De Rust
A product of the technical cooperation project between Bundesanstalt fuumlr Geowissenschaften und Rohstoffe (BGR)(Federal Institute for Geosciences and Natural Resources)
andGeological Survey of Namibia within the Ministry of Mines and Energy
ISBN 978-3-948532-29-1 (Print) 978-3-948532-30-7 (PDF)
- List of Abbreviations
- 1 Introduction
- 2 What is lithium
-
- 21 Lithium deposits
-
- 3 Application
- 4 Chemical requirements
- 5 Mining and trade of lithium in the SADC
-
- 51 Lithium production
- 52 Trade data
- 53 Export
- 54Import
-
- 6 Lithium occurrences in Namibia
- 7 Lithium mining in Namibia
-
- 71 Current mining activities and projects
-
- 8 Analysed lithium samples
- 9 Interpretation
- 10 Conclusions
- References
-
Lithium Potential in Namibia
16
Mica (muscovite) is an unwanted impurity in these concentrates as it disturbs the converting steps Heavy minerals are usually also extracted from the sources as they may represent by-product value (eg tantalum) Wall-rock impurities may cause problems in the further processing steps (basalt etc) Fe2O3 content is also an issue as it may also pose problems in the converters (clogging)
Technical grade lithium concentrates for the glass industry may have the same values of lithium in terms of Li2O but more stringent requirements in terms of iron content and some other elements such as fluorine
This industry usually uses petalite concentrates which can be used directly in the production process The advantage of petalite over spodumene-con-centrates is the generally lower iron content which is a crucial impurity even though these concentrates have lower lithium contents Fe2O3 content above a certain threshold (gt 015 ) will lead to unwanted discoloration in the final glass or ceramic products thus low values are needed
Fluorine-bearing lithium concentrates of lepidolite amblygonite and zinnwal-dite are not used in the glass and ceramics industry as this impurity is highly unwanted Besides fluorine the high Fe2O3 content of zinnwaldite is an issue as mentioned above
Particle size of the concentrates is also an issue as very fine material may lower the melt temperature due to a higher specific surface Therefore concen-trates for this industry are either tailor-made or mixtures of different sources
The glass and ceramics industry also uses pure lithium carbonate to a certain extent based on pricing
Lithium carbonate and lithium hydroxide are the first semi-finished products apart from lithium-concentrates used in the various industries for direct use or further downstream precursors There is a distinction between battery grade and technical (other) grade for lithium-carbonate and lithium-hydroxide The main differences lie within the lithium content level of impurities and particle sizes
Lithium Potential in Namibia
17
Commercial extraction of lithium takes place from lithium-containing brines and from hard rock (ie pegmatitic) deposits A simplified schematic repre-sentation of conventional production steps and key intermediates is shown in Figure 4
For the extraction of lithium from hard rock deposits the raw ores (eg pegma-tites) mined in open-pit or underground mines are processed into lithium-con-taining concentrates by sorting crushing grinding gravity separation mag-netic separation flotation washing filtering and drying The exact production steps vary depending on occurrence (ie locality) mineralogy company and the intended use of the produced concentrates
As of 2020 more than 95 of the conversion from spodumene-concentrates into lithium carbonate andor lithium hydroxide takes place in China The most widely used process in the industry is the acid-roast process (Fig 5)
In this process spodumene-concentrate is ground and heated to 1075 ‒ 1150degC in a rotary kiln (Fig 5) This converts α-spodumene into β-spodumene which is soluble in hot acids After mixing with hot sulfuric acid lithium sulfate solution is mixed with water As a result lithium sulfate dissolves The solution is mixed with calcium carbonate to remove impurities such as iron manganese and aluminum In addition the pH is raised After a first filtering process Na2CO3 and CaO are added to obtain an alkaline soluti-
Lithium Hydroxide
LithiumperoxidLithium Peroxide
Lithium-BrineLithium-Minerals
Lithium ChlorideLithium Bromide Lithium Sulfate
Lithium Acetate Lithium Metal
Lithium Carbonate
Fig 4 Simplified production scheme of lithium and important lithium com-pounds (modified after Roskill 2016)
Lithium Potential in Namibia
18
on Impurities such as calcium and manganese are removed The solution is then neutralized with sulfuric acid and heated to increase the concentration of Li2SO4 to about 200 ‒ 250 gl The addition of Na2CO3 and heating the solution to about 100degC triggers the precipitation of lithium carbonate The carbon-ate produced in this way has purities of up to 993 The battery industry however requires purities of min 995 obtained through ion exchange and extraction of impurities The produced lithium carbonate can then also be used for the production of lithium hydroxide
Common understanding was that the production of lithium carbonate was much cheaper from brines compared to hard rock sources Due to many developments in the brine industry mostly related to a recently introduced royalty system in Chile this is no longer the case On the contrary the cost advantage of brines is lost
Fig 5 Simplified production scheme of lithium carbonate derived from spodu-mene-concentrates via acid-roast-process (modified after Garret 2004)
Solution
MillingCooling
Thickener
Filtration
1075 - 1150oCCalcinationSpodumene Concentrate
Mixing
H2SO4
Leaching
H2O amp CaCO3
Gasscrubber
Solids to Tailings
Mixing
Na2CO3 amp CaO
Thickener
Filtration
Solids to Tailings
Neutralisation
H2SO4
Evaporation
90 - 100oCHeating
Filtering WashingDrying
Na2SO4Lithium carbonate
Lithium Potential in Namibia
19
The production of lithium hydroxide which is a fast growing market and a higher priced intermediate product appears to become cheaper when sourced directly from high quality hard rock conversion relative to sourcing from brines via an intermediate step (lithium carbonate) As the cost advantage of brine deposits compared to hard rock deposits is fading the industry has shifted its focus towards hard rock deposits all over the world
In addition to the acid-roast process there are new technological approaches to recover lithium carbonate and lithium hydroxide directly from high quality spodumene-concentrates as well as other mineralogies
Lithium Potential in Namibia
20
5 Mining and trade of lithium in the SADC
51 Lithium production
Each year every mining country of the world is urged to share production statistics regarding their mining activity These statistics are compiled and published by different entities such as the British Geological Survey (BGS) and the United States Geological Survey (USGS) among others
If a country does not appear in these statistics there was either no mining activity for this specific commodity the country did not publish any statistics or the production data is unknown
Table 2 Mine production of lithium (Source BGR 2020 Roskill 2016 USGS 2020 Geoscience Australia 2020)
Mine production [t Li-Content]
Years 2014 2015 2016 2017 2018 2019e Share 2018 []
Australia1) 12333 13160 15590 21000 57000 42000 647
Chile2) 11640 11787 14526 16584 15886 18000 175
Argentina2) 3388 3515 5767 575 6241 6400 69
China3) 1895 2002 2293 3 7376 7500 81
Zimbabwe1) 1024 1025 974 994 700 1600 08
USA2) 846 846 900 900 567 n A 06
Portugal1) 470 470 299 763 700 1200 08
Brazil1) 186 186 195 154 153 300 02
Namibia1) n d nd n d n d 500 n d 05
Other 3) 19 19 18 18 18 500 lt01
Global4) 31801 33011 40562 49012 90941 77000 1001) Hardrock 2) Brine 3) HardrockBrine 4) Deviation due to rounding e estimated
Lithium Potential in Namibia
21
In 2018 global mine output of lithium was around 91000 t Li-content of which only 1200 t originated from the Southern African Development Community (SADC) namely Zimbabwe and Namibia
52 Trade data
Trade data is retrieved from the commercially available Global Trade Atlasreg (IHS Global SA) The database provides both import and export data for more than 90 countries based on customs data of individual countries Data is primarily classified through Harmonised System (HS) product codes by the WCO (World Customs Organization) The HS nomenclature consists of approximately 5000 product groups identified by a 6-digit code
There are limitations to trade data The most prominent issue arises with data availability since many countries do not publish trade data Especially export data is an issue among many countries
There may also be issues with mislabeled products (wrong HS) product bas-kets data entry errors or missing data in general Were export data is not available so-called reverse trade data (RTS) is an option
If a country does not state any exports cumulative global imports from that particular country may be used as a rough yet incomplete estimate of exports It should be noted that these statistics do not represent absolute but rather minimum values as trade between two non-reporting countries will not be reflected The majority of the SADC countries do not report their import and export statistics
The most important lithium products that are globally traded in significant amounts are lithium-carbonate lithium-oxide (hydroxide) lithium-chloride and lithium-mineral-concentrates
Lithium Potential in Namibia
22
53 Export
The most important intermediate product in the lithium market is lithium carbonate In 2019 global exports amounted to approx 117743 t with Chile being the largest exporter (82344 t 70 ) There are no listed exports from the SADC region except minor quantities from South Africa to the Democratic Republic of Congo (9 t) and Zambia (2 t)
Lithium oxides and lithium hydroxides are grouped together under one HS code hence an individual consideration of both products on a country basis is not possible due to the lack of country-specific commodity codes
In 2019 global exports of HS 282520 stood at approx 97550 t with China being the largest exporting country (49800 t 51 )There are no exports published for the SADC region except South Africa with small quantities (28 t) which are considered to be trade through only
Assessment of lithium chloride global trade flows is also difficult as this prod-uct is listed together with many other chemical products under HS 282739 Global trade can only be investigated using country-specific commodity codes (8-digits and above) if available Only three countries list this product under specific trade codes namely China (28273910) Chile (28273930) and Argentina (28273960) SADC countries including Namibia do not publish any data under HS 282739 Based on the available data global exports in 2019 stood at 2254 t with Chile being the largest exporter (2101 t 89 )
Lithium-containing mineral concentrates are among other non-lithium related products listed in a product basket under HS 253090 Only two coun-tries provide information on this product namely Australia as the largest and hence most important producing and exporting country by far and Brazil as a minor exporter (25309010)
No other country including member states of the SADC specifies lithium-con-taining concentrates as such The currently only producing and exporting country in the SADC is Zimbabwe which does not specify exports at all Thus exports are derived from RTS (global imports)
Lithium Potential in Namibia
23
A general problem with HS 253090 is that only information on quantity is avail-able but no information on lithium content which can vary between 12 and 6 Li2O thus the margin of possible errors in terms of total contained lithium is large
In 2019 Australia exported about 16 million tons of spodumene-concentrate down from 35 million tons in 2018 More than 95 destined to China
Inferred exports (RTS) of Zimbabwe were approx 93300 t for HS 253090 About 62000 t of that quantity are listed as imports by South Africa and are unrelated to lithium The remaining quantity is much more in line with production figures of Zimbabwe as well as the known downstream industries of the destination coun-tries within Europe
There are no export records published by Namibia In general and across all traded lithium products South Africa appears to act as an importexport hub within the SADC Also some of the traded products may be used in the glass and ceramic industry of South Africa
54 Import
For most of the SADC countries the statistics retrieved though the Global Trade Atlas do not necessarily represent reliable trade data due to above-mentioned reasons This is especially true when only small import numbers (usually in tons) are listed as these are supposedly artefacts or errors in declaration
Global imports of lithium-carbonate amounted to approx 142965 t with South Korea being the largest importer (38578 t 27 ) There are no listed imports for the SADC region except South Africa (72 t)
Global imports of lithium-oxides (hydroxides) amounted to approx 84900 t with Japan being the largest importer (37300 t 44 ) In analogy to lithium carbonate there are no published imports into the SADC except for South Africa (428 t)
There is no information for imports of lithium-choride or lithium-mineral-con-centrates into the SADC The largest importer of lithium-choride is China with approx 253 t The largest importer of lithium-mineral-concentrates is also China (gt 95 )
Lithium Potential in Namibia
24
Fig 6 Simplified geology of Namibia with major towns as well as railway and tar roads Blue polygons indicate pegmatite belts and districts in central and southern Namibia (Data source Geological Survey of Namibia 2020)
6 Lithium occurrences in NamibiaIn Namibia significant lithium occurrences are found only within pegmatites These Precambrian and early Namibian pegmatites are restricted to two dif-ferent areas respectively the Damara Orogen in north-central Namibia and the Namaqua Metamorphic Complex in southern Namibia (Fig 6)
Lithium Potential in Namibia
25
Within the Damara Orogen four linear pegmatite belts are found all of which strike northeast ndash southwest (Fig 7) Brandberg West ndash Goantagab Cape Cross ndash Uis Nainais ndash Kohero and Sandamap ndash Erongo with the latter connected to the Karibib Pegmatite District (Schneider 1992)
Each of these pegmatite belts exhibit numerous individual pegmatite swarms that occur zoned or unzoned and may carry significant amounts of rare metals or semi-precious stones In the south Lithium-Caesium-Tantalum (LCT) peg-matites occur in two areas Tantalite-Valley south of Warmbad in close prox-imity to the northwest-trending Tantalite Valley Shear Belt and the Sandfon-tein-Ramansdrift area close to the Orange River
Fig 7 Pegmatite belts in north-central Namibia from west to east Brandberg West ndash Goantagab Cape Cross ndash Uis Nainais ndash Kohero and Sandamap ndash Erongo as well as the Karibib Pegmatite District (after Geological Suvey of Namibia 2002)
Lithium Potential in Namibia
26
7 Lithium mining in NamibiaData for historic lithium mine production is available for the period 1939 ndash 1998 (Fig 8) After 1998 all mining activities ceased due to product quality issues and overall market environment
Until the mid-1950s lepidolite was the most important mined lithium mineral of the country (Fig 8) As mine output of lepidolite decreased output of petalite increased However quantity on a year-to-year basis was quite variable and fluctuated between 1000 ndash 10000 t Since the early 1980s production of petalite was quite stable and ranged between 1000 ndash 2500 t Production fell sharply in 1997 and 1998 after which it ceased Mining of amblygonite has always been small compared to lepidolite and petalite and never exceeded 1000 t per annum
According to the USGS (2020) 500 t of lithium were mined in Namibia in 2018 This is most likely stockpiled lepidolite material from the Rubicon mine
0
2000
4000
6000
8000
10000
12000
1939
1941
1943
1945
1947
1949
1951
1953
1955
1957
1959
1961
1963
1965
1967
1969
1971
1973
1975
1977
1979
1981
1983
1985
1987
1989
1991
1993
1995
1997
[Ton
nes]
Petalite (t)Amblygonite (t)Lepidolite (t)
Fig 8 Lithium production in Namibia in [t] per year (after Schneider 1992 BGR 2020)
Lithium Potential in Namibia
27
Currently there is no active consecutive mining for lithium in substantial quan-tities in Namibia although there are prospects and projects under develop-ment
71 Current mining activities and projects
Soris The Soris project is located in the De Rust pegmatite swarm which is part of the ldquoBrandberg West ndash Goantagab tin beltrdquo (Fig 7) This belt stretches to the northeast of the Brandberg massif over a length of 60 km and a width of 25 km This belt was previously mined for cassiterite on a larger scale Some of the pegmatites in this belt may carry substantial amounts of lithium such as pegmatites in the De Rust pegmatite swarm
The De Rust pegmatite itself is a Li-rich rare metal pegmatite that was mined for cassiterite and tantalite but also for minor quantities of spodumene be ween 1960 and 1990 (Diehl 1990) It intruded into metasediments of the Amis River Formation Lower Ugab Group of the Southern Kaoko Zone
It is the largest pegmatite of the De Rust pegmatite swarm within the Brandberg West ndash Goantagab pegmatite belt (Diehl 1992c) Outcrops are 100 ‒ 470 m long up to 30 m wide and can be followed over a length of roughly 24 km
The pegmatite shows well-developed zonation with a border zone (quartz alkali feldspar muscovite) outer (quartz microcline-perthite muscovite altered petalite) and inner (quartzo-feldspathic rock with spodumene crystals with accessory apatite lepidolite eucryptite zircon and monazite) intermedi-ate zone as well as a core zone (quartz subordinate microcline muscovite sporadic tantalite) Spodumene crystals may reach up to 80 cm in length (Fig 12) Towards the core zone spodumene carries rounded nodules of lithi-um phosphates (amblygonite ndash montebrasite series)
It is located northwest of the nearest town of Uis in the Kunene region of Namibia about 6km to the east of farm De Rust 532 and about 25 km north of the Ugab River The nearest railhead is located in the town of Karibib and the deep-water port of Walvis Bay is 120 km to the southwest Windhoek is about 180 km to the southeast
Lithium Potential in Namibia
28
The project can be reached via paved but mostly unpaved roads from the town of Uis From White Lady Lodge which is about 38 km northwest from Uis a 35 km gravel road leads towards the project 15 km of which are in the riverbed of the Ugab River There is currently no electricity and water supply at the project location site
According to SampP Global (022020) current owner of the Soris project is Mon-tero Mining amp Exploration Ltd (TSXV MON) which holds 80 interest of the property Another 20 are allocated to an unnamed private owner Based on data from the Namibia Mining Cadastre Portal (092020) multiple entries for mining licence applications exist for the area where the main De Rust pegmatite is located (Fig 9)
Resource estimateDue to the early stage of the Soris project no resource estimate is avail-able However Montero Mining claims the project to be drill ready targeting a resource of 10 Mt 1 Li2O with tantalum and tin by-product credits This would equate to 46400 t of lithium or 247000 t LCE
Grab samples of the deposit showed lithium contents of 007 to 532 aver-aging 137 Channel samples showed average lithium contents of 076 and values up to 366 (Montero 032019) The company also re-assessed 1097 previously tested RC drill samples The main lithium-bearing mineral is spodumene
Remnants of historic intermittent mining activities like old foundations and quartzo-feldspathic tailings are still visible east to the main pegmatite (Fig 10 ‒ 11)
Lithium Potential in Namibia
29
Fig 10 Remnants of historic open pit mining (upper) and tailings of De Rust pegmatite (lower) northwest of the Brandberg massif (Photo BGR-GSN 2019)
Fig 9 Satellite image of the De Rust project including the outlined mining license Main pegmatite coordinates 20deg57prime48primeprimeS ‒ 14deg30prime12primeprimeE (Source httpportalsflexicadastrecomnamibia 092020)
Main pegmatite
Lithium Potential in Namibia
30
Fig 12 Weathered spodumene chrystals at the historic open pit mine (Photo BGR-GSN 2019)
Fig 11 Historic open pit of the De Rust pegmatite (Photo BGR-GSN 2019)
Lithium Potential in Namibia
31
Uis The Uis projects (former mine and tailings) are located in the northern part of the ldquoCape Cross Uis pegmatite beltrdquo east of the town of Uis on the farm Uis Townlands No 215 in the Erongo region of Namibia
The Cape Cross-Uis belt is approx 120 km long and up to 40 km wide and extends in a NE direction (Fig 7) It comprises three distinct pegmatite swarms the Strathmore swarm Karlowa swarm and Uis pegmatite swarm In general lithium-bearing pegmatites (Li-Nb-Ta-Sn-Be and Li-Nb-Ta-Sn) are the least common in this belt (Fuchsloch et al 2018)
The Uis swarm field consists of more than 120 individual pegmatites each with a northeasterly to easterly strike direction and northwesterly down dip (30deg ‒ 70deg) This field is accompanied by a peripheral pegmatite field of approx 25 individual pegmatites
Some of the main pegmatites especially around the formerly worldrsquos largest tin mine at Uis are exceedingly large Some of them are up to 1 km long and some 50 m wide
In terms of lithium petalite amblygonite and minor spodumene mineralization occurs in the various pegmatites but no lepidolite Most common lithium bear-ing minerals in the eight pegmatites that were mined at Uis are amblygonite petalite and spodumene
Currently the Uis tailings project and the Uis tin mine are owned by two differ-ent companies As of 2020 the tin mine is operating a pilot processing plant and aims to ramp up the production of lithium in the near future The current ownership of the tailings project as of September 2020 is unclear
The nearest commercial deep-water port to the projects is Walvis Bay 220 km to the southeast The town of Omaruru is 130 km to the east and Henties Bay lies about 120 km to the southwest The nearest railhead is located in Omaruru The area is accessible year-round by paved and un-paved roads NamPower provides electricity and the town of Uis is connected to the Nam-Water pipeline
Lithium Potential in Namibia
32
The tin deposit was discovered in 1911 and mined between the 1950s and 1989 for cassiterite by Uis Tin Mining Company (SWA) Ltd and IMCOR
Coarse tailings are located in the northern part of the former mine just south to the main road C36 (Fig 13) The fine material is located south to the coarse waste dumps (Fig 13)
After 1990 multiple companies owned the property until AfriTin Mining Ltd bought all the rights (license ML134) The current lithium tailings project of Montero Mining amp Exploration Ltd (TSXV MON) is based on the historic mine tailings of the former tin mine on mining license ML134 that is currently owned by AfriTin Mining Ltd The acquired tailings material does not fall under the ML134 license of AfriTin since historical tailings material (Fig 14) is not regulated by Minerals (Prospecting and Mining) Act 33 of 1992 of Namibia
Resource estimateUis tin mineAccording to AfriTin the former Uis mine holds a JORC compliant resource (inferred) of 715 Mt of ore 0134 Sn with a cut-off grade of 005 Sn (AfriTin 2020) Grades of ancillary elements are given at 063 Li2O and 85 ppm Ta for the total resource of 71 Mt of ore
This equals to approx 95000 t of tin 209000 t of lithium (11 Mt LCE) and 6090 t of tantalum 85 of the total resource are attributable to the company The remaining 15 are allocated to SMU (Small Miners of Uis)
Uis tailingsMontero Mining filed an inferred resource estimate of 144 Mt of ore 037 Li2O and 005 SnO2 with a 035 Li2O cut-off grade for lithium and assumed processing recoveries of 70 for their tailings project (Montero 2019) This equals to approx 24700 t of lithium content (131500 t LCE) and 7200 t SnO2
This resource estimate only includes coarse tailings material There is current-ly no information on the lithium content of the fine tailings material that totals 271 Mt t due to insufficient or no test work (Montero 2018) The company also states that the average Li2O grade of the fines material does not hurdle the cut-off for the fines of 082 Li2O
Lithium Potential in Namibia
33
In 2016 Australian based Tawana Resources carried out a drilling program at Uis for a private company called Lithium Africa 1 on the fine and coarse tailings (Table 3 Hole 1 amp Hole 2) Below some of the obtained data on lithium content is given Additionally Li2O content of two obtained grab samples by BGR (Table 3 Sample 2019a amp 2019b) is given
Table 3 Sample data Uis (Tawana 2016 Montero 2018 BGR 2019)
Sample Sample 0 to 1m Li2O ()
Sample 1 to 2m Li2O ()
Sample 2 to 3m Li2O ()
Fines Hole 1 071 085 092
Fines Hole 2 080 089 095
Coarse Hole 1 050 043 043
Coarse Hole 2 054 062 062
BGR Sam-ple 2019a (Coarse tailings)
028
BGR Sam-ple 2019b (Coarse tailings)
028
Montero NI 43-101 037
Lithium Potential in Namibia
34
Fig 14 Tailings of the historic Uis Tin Mine (Photo BGR-GSN 2019 with kind permission of AfriTin Mining Limited)
Fig 13 Former Uis tin mine Uis tailings project with coarse tailings Tailings coordina-tes (center) 21deg13prime31primeprimeS ‒ 14deg52prime44primeprimeE (Source httpportalsflexicadastrecomnamibia 092020)
Uis Tailings (coarse)
Uis Tailings (fine)
Historic Uis mine
Lithium Potential in Namibia
35
Karibib Lepidolite ProjectThe Karibib Lepidolite brownfield project is located in the ldquoKaribib ndash Usakos Pegmatite Districtrdquo southeast of the town of Karibib on the farm Okongava Ost No 72 in central Namibia (Fig 15 ‒ 16)
This pegmatite district which is of Damaran age hosts the most important pegmatite occurrence (Rubicon swarm) in terms of lithium in Namibia In addi-tion numerous other different pegmatite swarms some of which have previ-ously been relevant in terms of lithium are know from this district These are Dernburg Karlsbrunn Albrechtshoumlhe Berger Kaliombo Gamikaubmund Okatjimukuju Etusis Daheim Friedrichsfelde and Etiro (Diehl 1992a)
The Rubicon pegmatite itself is the largest of the individual pegmatites that occur in this field and has been the prime source of lithium until mining seized in the early 1990s The Helikon pegmatites are part of the Rubicon pegmatite swarm and are located northeast to the Rubicon pegmatite They have previ-ously been mined for lepidolite amblygonite petalite and muscovite beryll pollucite quartz and columbite-tantalite as valuable by-products (Fig 18 ‒ 19)
The pegmatite itself consist of two ellipsoidal well zoned Li-mineralized ore-bodies The larger one is about 320 m long and 25 ndash 35 m wide It dips at 46deg to the northeast and has a northwesterly strike The second orebody is about 230 m long and about 10 m wide It is dipping with 30deg to the northeast and has a northwesterly strike In total the outcrop of the Rubicon pegmatite is about 600 m long with a maximum width of 65 m (Fig 17)
A very prominent feature is the presence of a very well developed concen-tric shell and zones from the footwall to the inner core of the pegmatite Both orebodies exhibit a border- wall- intermediate- and core-zone
Border-zone wall-zone and outer intermediate zone of the larger orebody do not contain Li-bearing minerals of economic importance The inner interme-diate zone does contain lepidolite The outer core zone may be sub-divided into a petalite zone low-grade lepidolite zone and a high-grade lepidolite zone The inner core zone also contains a petalite zone Mining occurred pre-viously in the later named zones The zonation of the smaller orebody to the northwest is less pronounced but Li-mineralization and style are equal to the
Lithium Potential in Namibia
36
larger orebody There is no spodumene mineralization within the orebodies and respectively zones of the Rubicon pegmatite
The Helikon I pegmatite is also a lens-shaped pegmatite with a length of roughly 400 m and a width of approx 66 m It dips to the north with about 60deg ndash 70deg Helikon I also consists of well-defined zones The main Li-bearing minerals are lepidolite and petalite According to Roering (1963) the lepidolite is difficult to separate from the intergrown albite and hence of low grade and quality
The Helikon II pegmatite is approx 17 km long and only 9 ndash 15 m wide It lies a bit north of Helikon I and dips steeply to the north with 55deg ndash 80deg striking east west The main Li-bearing minerals are lepidolite and petalite According to Diehl (1990) the westernmost portion of the pegmatite has historically been the economically most important A massive up to 6 m wide petalite zone was mined here according to Diehl (1990)
The nearest railhead to the project is 17 km away in Karibib and the deep-water port of Walvis Bay is 220 km to the southwest Windhoek is about 180 km to the southeast NamPower connects the town of Karibib to electricity and the project currently utilizes generators There is a 7 km long 22 kV power line spur to grid connection pending (Lepidico 2020) Water is available via on-site boreholes
The project was previously owned by Desert Lion Energy Inc (TSVX DLI) Lepidico Ltd (ASX LPD) bought into the project and currently holds 80 interest which comprises Mining License 204 (69 km2) as well as three Exclu-sive Prospecting Licenses (EPLs) namely 5439 5555 and 5781 (Lepidico 2020)
Lepidico will cover mining from multiple sources as well as chemical conver-sion by utilizing their proprietary lithium processing technologies L-Maxreg LOH-Maxreg and S-Maxreg (Lepidico 052019) The company aims to produce high purity lithium chemicals such as lithium carbonate and lithium hydroxide
The takeover also included a nonbinding offtake agreement between the for-mer owner Desert Lion Energy Inc and German chemical company BASF On April 2nd 2019 Desert Lion Energy Inc announced this offtake agreement
Lithium Potential in Namibia
37
which at the time was valid through to December 31 2019 On December 20th
2019 Lepidico announced that the LOI with BASF was extended to Decem-ber 31st 2020 (Lepidico 122019)
The feasibility study criteria of Lepidico are as follows
- Throughput of the concentrator on-site of 035 Mtpa- Expansion of throughput after year five to 05 Mtpa- Chemical plant in the industrial city of Abu Dabi (ICAD)- Plant design for 58000 tpa of concentrate (4 LiO2) for the production of
up to 5500 tpa LiOH- Utilization of L-Maxreg and LOH-MaxTM- Non-binding off-take MOU with BASF for LiOH only- Targeting for project commissioning to commence late 2021 for commer-
cial production in 2022
The preliminary mine plan indicates a strip ratio of 03 ndash 1 for the first two years The ratio will then go up to 1 ndash 14 In the first four years elevated grades of 06 LiO2 will be mined
Resource estimateA JORC 2012 compliant resource estimate for the deposit is given in Table 4 (Lepidico 2020) The deposit currently holds 23200 t of lithium (Indicated amp Inferred) based on a cut-off grade of 015 Li2O This resource estimate is based solely on the lepidolite occurrences at the mine site
Table 4 Resource estimate Karibib Lepidolite Project (Source Lepidico 2020)
Deposit Resource Category
Cut-off (Li2O)
Ore (Mt)
Li2O ()
Li (t)
Li (LCE)
Rubicon Measured
015
22 057 5819 30974
Rubicon Indicated 666 038 11637 61943
Rubicon Inferred 237 043 4728 25167
Helikon
Total 015 1124 043 22184 118086
Lithium Potential in Namibia
38
Fig 16 Satellite image of the Karibib Lepidolite project Helikon 1 coordinates (center) 22deg2prime49primeprimeS ‒ 16deg1prime13primeprimeE Helikon 4 coordinates (center) 22deg2prime24primeprimeS ‒ 16deg1prime41primeprimeE (Source httpportalsflexicadastrecomnamibia 092020)
Fig 15 Satellite image of the Karibib Lepidolite project Rubicon coordinates (center) 22deg6prime11primeprimeS ‒ 15deg59prime44primeprimeE (Source httpportalsflexicadastrecomnamibia 092020)
Historic Rubicon mine
Helikon 1
Helikon 4
Lithium Potential in Namibia
39Fig 17 Rubicon pegmatite (Photo BGR-GSN 2019 with kind permission of Lepidico Chemicals Namibia (Pty) Ltd 2020)
Lithium Potential in Namibia
40 Fig 18 Lepidolite sample from Rubicon pegmatite (Photo BGR-GSN 2019 with kind permission of Lepidico Chemicals Namibia (Pty) Ltd 2020)
Fig 19 Petalite sample from Rubicon pegmatite (Photo BGR-GSN 2019 with kind permission of Lepidico Chemicals Namibia (Pty) Ltd 2020)
Lithium Potential in Namibia
42
Fig 21 Helikon 4 pegmatite (Photo BGR-GSN 2019 with kind permission of Lepidico Chemicals Namibia (Pty) Ltd 2020)
Fig 20 Helikon 1 pegmatite (Photo BGR-GSN 2019 with kind permission of Lepidico Chemicals Namibia (Pty) Ltd 2020)
Lithium Potential in Namibia
43
Tantalite ValleyThe Tantalite Valley Project lies within the ldquoNamaqua Metamorphic Complexrdquo in Southern Namibia Within this complex Lithium-Caesium-Tantalum (LCT) pegmatites occur in two main areas Tantalite-Valley south of Warmbad in close proximity to the northwest-trending Tantalite Valley Shear Belt and the Sandfontein-Ramansdrift area close to the Orange River
The area were the pegmatites of the Tantalite Valley occur is primarily com-posed of a large ovoid gabbro intrusion (71 km by 33 km in extent) within paragneiss units of the Namaqua Complex The gabbro outcrop forms a large dome shaped mountain that rises about 500 m above the surrounding topo-graphy
The pegmatites belong to the Kenhardt and Gordonia pegmatite districts in Namaqualand but only the younger group of them carry accessory ore miner-als such as tantalite beryl REE minerals and lithium
The Tantalite Valley pegmatites include several individual subhorizonal dikes that are up to 1000 m long and 02 to 40 m wide plunging towards southeast (Diehl 1992b) Four of those are of economic interest Homestead Whitkop White City and the Lepidolite pegmatites (ie Purple Haze) (Fig 22)
They are all well zoned (quartz core inner and outer intermediate zones wall zone) and were predominantly targeted for beryl columbite-tantalite as well as lithium and bismuth minerals
The project is located on the farms Umeis 110 and Kinderzitt 132 between the Farms 109 131 129 308 and 473 in the magisterial district of Karas It currently comprises Mining License (ML-77) fully owned by Tameka Shelf Co Four (Pty) Ltd which is a 100 subsidiary of African Tantalite Pty Ltd (AFTAN) Above all Kazera Global Investments PLC holds a 75 stake in AFTAN (Kazera 2019) with the other 25 of local farmer ownership
The project is accessible via gravel road from Karasburg which is about 80 km to the north The nearest railhead is also located in Karasburg Electricity is currently supplied by generators and water is recovered from multiple drill holes The Orange River is about 15 km to the south of the project Mining
Lithium Potential in Namibia
44
infrastructure as well as equipment are on site as well as a plant for the pro-duction of tantalite concentrate
NTI is working on an extensive exploration program with a clear focus on revi-ving tantalite mining in Namibia with a possible by-product stream of lithium bearing minerals The company will focus primarily on the pegmatites Homes-tead Purple Haze Signaalberg and White City (Fig 23)
The area is known for its tantalum occurrences and since the late 1940s tantalite and other minerals have been recovered at Tantalite Valley until 1981 when mining ceased Initially alluvial deposits were mined followed by the pegmatites themselves Grades of the concentrates produced prior to the closure of the mine were quite high with 65 ‒ 70 Ta2O5 with very low U3O8
and ThO2 values of 025 max
Resource estimateAccording to SampP Global (092020) Measured and amp Indicated resources at Tantalite Valley are 104800 t of ore 0042 Ta2O5 and 0653 Li2O as of 112019 This would equate to 315 t of lithium or 1690 t LCE Total inferred resources are 517400 t of ore 0018 Ta2O5 and 0144 Li2O This equals to approx 91 t of tantalum and 750 t of lithium (3535 t LCE)
Lithium Potential in Namibia
45
Fig 23 White City pegmatite (Source Kazera global Investments PLC 2020)
Fig 22 Satellite image of the Tantalite Valley project White City pegmatite coordinates (center) 28deg43prime07primeprimeS ‒ 18deg44prime45primeprimeE Homestead pegmatite coordinates (center) 28deg43prime19primeprimeS - 18deg44prime24primeprimeE Purple Haze pegmatite coordinates (center) 28deg43prime09primeprimeS ‒ 18deg43prime55primeprimeE (Source httpportalsflexicadastrecomnamibia 092020)
Lithium Potential in Namibia
46
8 Analysed lithium samplesDuring the course of the cooperation project between the Economic Geology Division (EGD) of the Geological Survey of Namibia (GSN) and the Ger-man Federal Institute of Geosciences and Natural Resources (BGR) several sampling campaigns to southern and central pegmatites took place
The field trips were preceded by literature and data research regarding infor-mation on lithium occurrences andor previous lithium mining activity to iden-tify specific target areas
During a campaign in 2019 16 lithium-bearing mixed mineral samples were taken from five different locations and subsequently analyzed Two of the samples originate from the Uis Tin Mine Tailings of the former tin mine All remaining samples were taken either from stripped outcrops for future mine activities or from previous mine sites (ie pits)
All 16 samples were analyzed at BGR labs in Hanover Germany through qualitative XRD XRF and ICP-MS Given data shall be understood as a first indicator for the sampled lithium occurrences
Most if not all sampled occurrences have previously been analyzed or are cur-rently being assessed by the property owners or current licensees Detailed information of these sampling and analytical campaigns remain confidential and are thus not available for comparison
Appendix A lists the identified qualitative mineralogy of the samples as well as the major element analysis Additional samples from previous campaigns are also given
Interpretation of the results are based on their applicability in the various lithium-consuming industries for which information is available
Most of the current lithium applications require a chemical intermediate product such as lithium carbonate or lithium-hydroxide The glass and cera-mic industry does use lithium-bearing mineral concentrates depending on the prices of these materials when compared to LiCO3
Lithium Potential in Namibia
47
Since the main applications require an intermediate or downstream chemical product lithium content as well as impurity values are the main criteria for the suitability of the sampled occurrences Other quality criteria are particle size and surface areastructure
9 InterpretationAs previously stated all obtained grab samples are mixtures of lithium- bearing minerals (ie spodumene petalite lepidolite) feldspars quartz micas as well as secondary minerals Therefore all given analytical data has to be taken with caution and will not be representative for the individual outcrops or deposits
The evaluation of the economic suitability for various economic applications of the analysed lithium samples is based on the chemical specifications in Chapter 4
Lithium content gt 1 Li2O Fe2O3 content lt 015 as well as F content lt 01 are individually highlighted (Appendix A) as these three values are the most important
Based on the chemical analysis nine of the 16 samples showed Li2O contents of more than 1 (range 117 ‒ 327 ) Seven of those nine samples also exhibited low Fe2O3 content (range 004 ‒ 008 ) (Appendix A) Three of those seven samples also had fluorine values below 005
Of the ten additionally included samples from previous campaigns four showed Li2O contents of more than 1 (range 126 ‒ 199 ) Three of those samples also exhibited low Fe2O3 content (range 004 ‒ 007 ) (Appendix A) One of the three samples had fluorine values below 005
The mentioned samples (sources) could be of potential use but for further interpretation statistical sampling will be required
Lithium Potential in Namibia
48
10 ConclusionsThere is currently no lithium industry established in Namibia This accounts to both mining and processing of ores into commercial lithium-bearing con-centrates as well as the production of downstream products such as lithium carbonate andor lithium hydroxide In order to evaluate the potential for a lithium industry in Namibia the current global market and price developments need to be addressed
Currently the main application for lithium is in the chemical industry as lithium carbonate andor hydroxide for the manufacturing of lithium-ion batteries There is currently no domestic market (supply) or demand for this industry in Southern Africa or Namibia in specific Processing of lithium-bearing ores into these highly specific downstream products is economically more viable in close proximity to the demanding industries It also requires large investments (double-digit million dollars per 10000t of capacity) Additionally there is already huge capacity and strong capacity build up in Asia at rather low cost
The second most important application lies in the glass and ceramics industry This industry uses lithium either as lithium-bearing concentrates or lithium carbonate depending on current market price and processproduct require-ments There is currently no such industry established in Namibia but potential plans There is glass and ceramics manufacturing in South Africa and thus a potential market for lithium bearing products (concentrates) should this indus-try require it depending on product
The 20182019 primary lithium supply based on spodumene-bearing mineral concentrates was dominated by Australia with a market share of well over 95 On an annual basis the country exports more than three million tons of lithium-bearing concentrates to China To put this into perspective Lepidico plans to export just 58 ktpa of concentrate to Abu Dhabi for refinement from their project annually Therefore potential production in Namibia will always be rather small scale when compared to peer producing countriescompanies
As of late 2020 the concentrate market is in strong oversupply with strong competition Thus prices have eroded quite substantially for a standard SC6 concentrate (Fig 24) In general prices vary significantly based on lithium content and impurities of the concentrates Lithium bearing mineral concen-
Lithium Potential in Namibia
49
trates are a relatively low-value mineral commodity when compared to lithi-um-carbonate or other lithium downstream products thus product quality cost reduction and cost control are key components in this industry Since prices are depressed currently many of the Australian producers have drasti-cally reduced output or even went into care and maintenance This situation may change towards 2025 or beyond as demand picks up
Prices for the higher valued product lithium-carbonate spiked at the end of 2017 towards 2018 to more than 20000 $USt on a contract basis with prices being very volatile Since then prices have also eroded to below 9000 $USt due to oversupply and slow demand pickup (Fig 25) With this product stable quality and chemical composition are crucial for the downstream industry
Based on available gradetonnage data the Namibian projectsprospects are relatively small in overall size and low in grade when compared to global peers for the resource category ldquoMeasuredIndicatedrdquo (Appendix B) Total contained lithium quantity is thus relatively small in comparison On a global scale the most promising hard rock projects that are currently being mined and developed have Li2O grades of 10 or above
Fig 24 Lithium-mineral-concentrate prices 012010 ‒ 062020 (Source BGR 2020)
300
400
500
600
700
800
900
1000
1100
208
210
212
214
216
218
220
US$
t US$t
01-20
14
01-20
15
01-20
16
01-20
17
01-20
18
01-20
19
01-20
20
01-20
10
01-20
11
01-20
12
01-20
13
Spodumene min 5-6 LiO2 fob Australia
Spodumene concentrate gt75 LiO2 bulk cif Asia
Petalite 42 LiO2 fob Durban
Spodumene fob Australia
Spodumene min 5-6 LiO2 cif China
Lithium Potential in Namibia
50
For the resource category ldquoIndicatedrdquo which generally represents the lowest level of confidence only the Uis mine project of AfriTin represents a size-able resource even though grades are relatively low (Appendix C) The Uis tailings project as well as the Rubicon project are again relatively small when compared to their global peers Tantalite Valley is the smallest of all included projects (Appendix C)The given data for the De Rust project reflects only an exploration target of the company rather than actual data and may thus be not representative
Based on size and contained lithium-content none of the visited early stage projectsprospects would justify the financial investment into the construction of a chemical conversion plant for the production of lithium carbonate andor hydroxide on site as it requires very large monetary investments Due to their size payback of the required investments may be unfavorable when compared to global peers In addition the current market environment is very harsh with strong competition from Asia that has a huge cost advantage due to capacity build up This industry is also very energy and water intensive
In addition location within Namibia as well as distance to possible down-stream markets may become an issue as it increases the transportation cost
4000
7000
10000
13000
16000
19000
22000
25000
28000
01-20
14
01-20
15
01-20
16
01-20
17
01-20
18
01-20
19
01-20
20
US$
t
Lithium-carbonate (min 995 ) battery grade spot price ex works domestic ChinaLithium-carbonate (min 99-995 ) Li2CO3 large contracts USA delivered continentalLithium-hydroxid-monohydrate (min 565) technical and industrial grades cif China Japan amp Korea
Fig 25 Lithium chemical prices 012014 ndash 062020 (Source BGR 2020)
Lithium Potential in Namibia
51
immensely This is especially true for the SorisDe Rust pegmatite which is in a remote location without any allocated infrastructure The projects Karibib Uis and Tantalite Valley are much easier to access
The approach of Lepidico to produce a lithium bearing concentrate on site seems plausible approach Since this will already require a skilled workforce mining and beneficiation equipment in order to produce a high quality lithium-bearing concentrate it may already be considered ldquoadded valuerdquo for the indus-try of the country This approach may also be suitable for the other mentioned and visited projects
Lithium Potential in Namibia
52
ReferencesAfriTin Mining (2020) Uis Tin Project ndash Company Information ndash URL httpafritinminingcomuis-project [as of 092020]
Australian Government Geoscience Australia (2019) Australiarsquos Identi-fied Mineral Resources 2019 ndash URL httpswwwgagovauscientific-topicsmineralsmineral-resources-and-adviceaimr [as of 092020]
BGR ndash Bundesanstalt fuumlr Geowissenschaften und Rohstoffe (2020) Fachinformationssystem Rohstoffe ndash unpubl Hannover [as of 082020]
BGS ndash British Geological Survey (2016) Lithium Definitions mineralo-gy and deposits ndash URL httpswwwbgsacukdownloadsstartcfmid=3100 [as of 062016]
Diehl B J M (1990) Pegmatites of the Cape Cross Uis ndash Pegmatite Belt Namibia Geology mineralisation Rubidium Strontium characteristics and petrogenesis of rare metal pegmatites Open File Report EG 083 Economic Geology Series Geological Survey of Namibia 39 pp Windhoek
Diehl B J M (1992a) Lithium Caesium Beryllium Open File Report Mineral Resource Series Geological Survey of Namibia 18 pp Windhoek
Diehl B J M (1992b) Niobium and Tantalum Open File Report Mineral Resource Series Geological Survey of Namibia 20 pp Windhoek
Diehl B J M (1992c) Tin Open File Report Mineral Resource Series Geological Survey of Namibia 30 pp Windhoek
Diehl B J M amp Schneider G I C (1990) Geology and mineralisation of the Rubicon Pegmatite Namibia Open File Report Geol Surv Namibia 20 pp Windhoek
Fuchsloch et al (2018) Classification mineralogical and geochemical vari-ations in pegmatites of the Cape Cross-Uis pegmatite belt Namibia Lithos 296 ndash 299 79-95 elsevier
Lithium Potential in Namibia
53
Garret D E (2004) Handbook Of Lithium And Natural Calcium Chloride Their Deposits Processing Uses and Properties ndash 467 S Oxford (Elsevier B V)
Geological Survey of Namibia (2002) Mineral Resources of Namibia Summary of Mineral Deposits and Occurrences Omaruru Sheet 2114 Volume I ndash Complete Descriptions 119 pp Windhoek
IHS Global SA (2020) Global Trade Atlas ndash Commercial Online-Databa-se ndashURL httpsmyihscomConnectcallingUrl=https3a2f2fconnectihsmarkitcom2f [as of 062017]
Kazera Global Investments PLC (2020) Company Information ndash URL httpskazeraglobalcominvestmentsnamibia-tantalite-investment-mine [as of 092020]
Lepidico (2019) LOI with BASF extended to 31 December 2020 ndash News Release ndash URL httpswwwlepidicocomwp-contentuploads201910LPD-191220-LOI-with-BASF-extended-to-31-December-2020pdf [as of 122019]
Lepidico (2019) Corporate Presentation ndash URL httpswwwlepidicocomwp-contentuploads201907LPD-190509-Corporate-Presentati-on-May-2019pdf [as of 052019]
Lepidico (2020) Company Information ndash URL httpswwwlepidicocomprojectskaribib [as of 092020]
Montero Mining amp Exploration Ltd (2018) Exploring Battery Metals in Namibia ndash Company Presentation ndash URL httpswwwproactiveinvestorscomauuploadSponsorFileFile2018_031520244941_MON-CorporatePre-sentationMarch2018pdf [as of 072018]
Montero Mining amp Exploration Ltd (2019) Montero Files NI 43-101 Resource Estimate On The Uis Lithium-Tin Tailings Project In Namibia On Sedar ndash News Announcement ndash URL httpsmonterominingcommontero-files-ni-43-101-resource-estimate-on-the-uis-lithium-tin-tailings-project-in-namibia-on-sedar [as of 032019]
Lithium Potential in Namibia
54
Namibia Mining Cadastre Portal (2020) Online-Database ndashURL httpsportalslandfoliocomnamibia [as of 092020]
Roskill Information Services Ltd (2016) Lithium Global Industry Mar-kets amp Outlook ndash 386 S London Groszligbritannien
Schneider G I C (1992) Feldspar Open File Report MRS 08 Mineral Resource Series Geological Survey of Namibia 2 pp Windhoek
Schmidt M (2017) Rohstoffrisikobewertung ndash Lithium ndash DERA Rohstoffin-formationen 33 Berlin
S amp P Global Market Intelligence (2020) Lithium - Metals amp Mining Properties URL httpsplatformmarketintelligencespglobalcomwebcli-entauth=inheritindustryminingProjects [as of 092020]
Statista (2020) Distribution of lithium end-usage worldwide in 2019 by area application ndash URL httpswwwstatistacomstatistics268787lithium-usa-ge-in-the-world-market [as of 062020]
Tawana Resources NL (2016) Tawana acquires second lithium pro-ject ndash News Release ndash URL httpsmstrademomentumcozajsepdfSENS_20160923_S376505pdf [as of 092016]
USGS ndash United States Geological Survey (multiple years) Lithium ndash Minerals Commodity Summaries ndash URL httpswwwusgsgovcentersnmiclithium-statistics-and-information [as of 082020]
Appendix
Sam
ple I
DFa
rmLa
titud
eLo
ngitu
deSa
mpl
e des
crip
tion
(XRD
qu
al)
LiO 2
()
SiO 2
Ti
O 2
Al2O 3
Fe2O 3
Mn
O Mg
O Ca
O Na
2O
K 2O P 2O 5
SO
3
Cl
F
LOI
Su
m
2015
-03
previous sample campaignsHelik
on
n A
Felds
parQ
uartz
Lepid
olite
025
6871
lt000
119
0500
200
2900
505
3292
806
7905
59lt0
01lt0
002
lt005
093
9985
2016
-12
Rubic
onwe
ather
ed P
etalite
126
6473
lt000
118
0600
703
2718
607
9507
805
2500
62lt0
01lt0
002
lt005
1146
9871
2016
-17
Rubic
onLe
pidoli
te +
Quar
tz13
063
6700
219
9316
0929
003
0054
029
6218
0052
lt001
lt000
226
232
798
67
2016
-20
Helik
onLe
pidoli
te + A
lbite
176
5514
lt000
126
8700
401
2100
700
2123
970
3900
45lt0
01lt0
002
156
369
9698
2016
-21
Helik
onLe
pidoli
te19
954
32lt0
001
2627
004
0224
006
0038
266
714
0069
lt001
lt000
240
628
997
77
FN20
19_0
4De
Rus
tFe
ldspa
rAmb
lygon
iteP
etalite
(n
on X
RD)
003
6513
lt000
118
82lt0
0100
0200
101
0924
311
4105
75lt0
0100
04lt0
0503
898
84
2015
-09
Molop
oPe
talite
(non
XRD
)00
952
85lt0
001
1672
lt001
0002
487
0323
342
0352
lt000
100
400
3403
621
1310
012
2016
-14
Molop
oPe
talite
wea
there
d (no
n XRD
)00
752
1600
0316
5100
200
5147
805
8923
406
4500
6900
200
8602
222
6310
013
2016
-15
Molop
oFe
ldspa
r (no
n XRD
)00
664
02lt0
001
1937
003
0004
003
0151
216
1249
0796
lt001
lt000
2lt0
0505
399
55
2016
-23
Molop
oZin
nwald
ite (n
on X
RD)
006
5044
0068
3307
048
0011
012
0426
261
7674
0181
lt001
lt000
2lt0
0542
9925
1909
249
2019Uis
Tailin
gs
Quar
tzFe
ldspa
rPeta
lite
Musc
ovite
028
7293
0045
1479
051
0062
0212
9830
927
6613
6200
2lt00
02lt0
0523
399
38
1909
250
Uis
Tailin
gsQu
artz
Felds
parP
etalite
Mu
scov
ite02
872
6900
4314
8205
0059
019
1306
313
2794
1347
002lt
0002
lt005
251
9937
1909
251
Helik
on 4
22deg02prime4
8primeprimeS1
6deg01prime30
primeprimeEQu
artz
Felds
parP
etalite
Le
pidoli
te16
464
4400
0319
4200
301
2100
408
8325
345
6806
800
400
0727
228
998
38
1909
252
Helik
on 1
22deg02prime2
0primeprimeS1
6deg01prime19
primeprimeEPe
talite
Lepid
olite
Quar
tz29
576
9200
0116
6800
300
0304
101
7301
106
8100
01lt0
01lt0
002
lt005
205
97
App
endi
x A
Ana
lytic
al d
ata
of li
thiu
m s
ampl
es c
olle
cted
in N
amib
ia T
hres
hold
val
ues
high
light
ed in
gre
en
Lithium Potential in Namibia
57
Sam
ple I
DFa
rmLa
titud
eLo
ngitu
deSa
mpl
e des
crip
tion
(XRD
qu
al)
LiO 2
()
SiO 2
Ti
O 2
Al2O 3
Fe2O 3
Mn
O Mg
O Ca
O Na
2O
K 2O P 2O 5
SO
3
Cl
F
LOI
Su
m
1909
253
2019Rubic
on22deg06prime1
3primeprimeS1
5deg59prime45
primeprimeEPe
talite
Lepid
olite
Quar
tz32
778
73lt0
001
1687
002
0006
002
0157
011
003
0002
003
0003
lt005
075
9663
1909
254
Rubic
on22deg06prime1
0primeprimeS1
5deg59prime41
primeprimeEFe
ldspa
rQua
rtzM
usco
vite
004
682
lt000
119
3500
300
2400
205
0610
0808
6804
3lt0
01lt0
002
lt005
041
9985
1909
255
Rubic
on22deg06prime1
0primeprimeS1
5deg59prime41
primeprimeEFe
ldspa
rLep
idolite
Mus
co-
viteK
aolin
026
6104
0004
2318
022
0136
006
0119
367
8411
0159
lt001
lt000
2lt0
0522
299
15
1909
256
Rubic
on22deg06prime1
0primeprimeS1
5deg59prime41
primeprimeELe
pidoli
te 27
249
8700
129
3400
408
0500
400
704
697
3100
31lt0
01lt0
002
087
441
9569
1909
257
Rubic
on22deg06prime1
3primeprimeS1
5deg59prime45
primeprimeEPe
talite
Lepid
olite
Quar
tz30
670
0900
0320
2600
801
0901
502
9901
926
800
15lt0
0100
04lt0
0526
596
48
1909
258
Rubic
on22deg06prime1
0primeprimeS1
5deg59prime41
primeprimeELe
pidoli
teFe
ldspa
rQua
rtz20
659
7800
0224
100
505
2400
300
513
7247
0051
lt001
0002
265
388
9966
1909
259
Tanta
lite
Valle
y28deg43prime0
9primeprimeS1
8deg43prime55
primeprimeEFe
ldspa
rLep
idolite
Mus
covit
e11
762
64lt0
001
2139
004
0161
lt001
0399
7731
2401
0900
200
119
912
698
85
1909
260
Tanta
lite
Valle
y28deg43prime0
9primeprimeS1
8deg43prime55
primeprimeEFe
ldspa
rLep
idolite
Mus
covit
e03
059
8600
1425
1301
604
2200
302
2860
547
2201
3900
200
0904
123
799
56
1909
261
Tanta
lite
Valle
y28deg43prime0
9primeprimeS1
8deg43prime55
primeprimeEFe
ldspa
rQua
rtzM
usco
vite
003
636
0005
2218
022
0122
002
0381
727
3809
0272
lt001
lt000
2lt0
0513
199
17
1909
262
Tanta
lite
Valle
y28deg43prime2
0primeprimeS1
8deg44prime23
primeprimeEQu
artzSp
odum
eneM
us-
covit
e13
180
5100
0415
8903
401
2401
301
9502
604
0400
0500
200
03lt0
0507
398
56
1909
263
De R
ust
20deg57prime4
8primeprimeS1
4deg30prime13
primeprimeEFelsd
parS
podume
neQuartz
074
7313
0006
2048
007
015
005
0154
398
0831
0073
001
0003
lt005
082
9974
1909
264
De R
ust
20deg57prime4
8primeprimeS1
4deg30prime13
primeprimeESp
odum
eneF
eldsparQuartz
230
6924
0006
2602
801
0200
301
0510
102
1400
68lt0
0100
03lt0
0504
897
53
(Con
tinue
d) A
ppen
dix
A A
naly
tical
dat
a of
lith
ium
sam
ples
col
lect
ed in
Nam
ibia
Thr
esho
ld v
alue
s hi
ghlig
hted
in g
reen
Lithium Potential in Namibia
58
Appendix B GradeTonnage data (Measured amp Indicated) for selected lithium projects in comparison to Namibian projects (Source SampP 092020)
0
0500
1000
1500
2000
2500
500
5000
5000
0
5000
00
5000
000
Gra
de [
Li 2O
]
Tonnage [t]
Tantalite Valley
Rubicon
Appendix B GradeTonnage data (Inferred) for selected lithium projects in com-parison to Namibian projects (Source SampP 092020)
0
0500
1000
1500
2000
2500
100
1000
1000
0
1000
00
1000
000
1000
0000
Gra
de [
Li 2O
]
Tonnage [t]
Tantalite ValleyRubicon
Uis Tailings
Uis Mine
De Rust
A product of the technical cooperation project between Bundesanstalt fuumlr Geowissenschaften und Rohstoffe (BGR)(Federal Institute for Geosciences and Natural Resources)
andGeological Survey of Namibia within the Ministry of Mines and Energy
ISBN 978-3-948532-29-1 (Print) 978-3-948532-30-7 (PDF)
- List of Abbreviations
- 1 Introduction
- 2 What is lithium
-
- 21 Lithium deposits
-
- 3 Application
- 4 Chemical requirements
- 5 Mining and trade of lithium in the SADC
-
- 51 Lithium production
- 52 Trade data
- 53 Export
- 54Import
-
- 6 Lithium occurrences in Namibia
- 7 Lithium mining in Namibia
-
- 71 Current mining activities and projects
-
- 8 Analysed lithium samples
- 9 Interpretation
- 10 Conclusions
- References
-
Lithium Potential in Namibia
17
Commercial extraction of lithium takes place from lithium-containing brines and from hard rock (ie pegmatitic) deposits A simplified schematic repre-sentation of conventional production steps and key intermediates is shown in Figure 4
For the extraction of lithium from hard rock deposits the raw ores (eg pegma-tites) mined in open-pit or underground mines are processed into lithium-con-taining concentrates by sorting crushing grinding gravity separation mag-netic separation flotation washing filtering and drying The exact production steps vary depending on occurrence (ie locality) mineralogy company and the intended use of the produced concentrates
As of 2020 more than 95 of the conversion from spodumene-concentrates into lithium carbonate andor lithium hydroxide takes place in China The most widely used process in the industry is the acid-roast process (Fig 5)
In this process spodumene-concentrate is ground and heated to 1075 ‒ 1150degC in a rotary kiln (Fig 5) This converts α-spodumene into β-spodumene which is soluble in hot acids After mixing with hot sulfuric acid lithium sulfate solution is mixed with water As a result lithium sulfate dissolves The solution is mixed with calcium carbonate to remove impurities such as iron manganese and aluminum In addition the pH is raised After a first filtering process Na2CO3 and CaO are added to obtain an alkaline soluti-
Lithium Hydroxide
LithiumperoxidLithium Peroxide
Lithium-BrineLithium-Minerals
Lithium ChlorideLithium Bromide Lithium Sulfate
Lithium Acetate Lithium Metal
Lithium Carbonate
Fig 4 Simplified production scheme of lithium and important lithium com-pounds (modified after Roskill 2016)
Lithium Potential in Namibia
18
on Impurities such as calcium and manganese are removed The solution is then neutralized with sulfuric acid and heated to increase the concentration of Li2SO4 to about 200 ‒ 250 gl The addition of Na2CO3 and heating the solution to about 100degC triggers the precipitation of lithium carbonate The carbon-ate produced in this way has purities of up to 993 The battery industry however requires purities of min 995 obtained through ion exchange and extraction of impurities The produced lithium carbonate can then also be used for the production of lithium hydroxide
Common understanding was that the production of lithium carbonate was much cheaper from brines compared to hard rock sources Due to many developments in the brine industry mostly related to a recently introduced royalty system in Chile this is no longer the case On the contrary the cost advantage of brines is lost
Fig 5 Simplified production scheme of lithium carbonate derived from spodu-mene-concentrates via acid-roast-process (modified after Garret 2004)
Solution
MillingCooling
Thickener
Filtration
1075 - 1150oCCalcinationSpodumene Concentrate
Mixing
H2SO4
Leaching
H2O amp CaCO3
Gasscrubber
Solids to Tailings
Mixing
Na2CO3 amp CaO
Thickener
Filtration
Solids to Tailings
Neutralisation
H2SO4
Evaporation
90 - 100oCHeating
Filtering WashingDrying
Na2SO4Lithium carbonate
Lithium Potential in Namibia
19
The production of lithium hydroxide which is a fast growing market and a higher priced intermediate product appears to become cheaper when sourced directly from high quality hard rock conversion relative to sourcing from brines via an intermediate step (lithium carbonate) As the cost advantage of brine deposits compared to hard rock deposits is fading the industry has shifted its focus towards hard rock deposits all over the world
In addition to the acid-roast process there are new technological approaches to recover lithium carbonate and lithium hydroxide directly from high quality spodumene-concentrates as well as other mineralogies
Lithium Potential in Namibia
20
5 Mining and trade of lithium in the SADC
51 Lithium production
Each year every mining country of the world is urged to share production statistics regarding their mining activity These statistics are compiled and published by different entities such as the British Geological Survey (BGS) and the United States Geological Survey (USGS) among others
If a country does not appear in these statistics there was either no mining activity for this specific commodity the country did not publish any statistics or the production data is unknown
Table 2 Mine production of lithium (Source BGR 2020 Roskill 2016 USGS 2020 Geoscience Australia 2020)
Mine production [t Li-Content]
Years 2014 2015 2016 2017 2018 2019e Share 2018 []
Australia1) 12333 13160 15590 21000 57000 42000 647
Chile2) 11640 11787 14526 16584 15886 18000 175
Argentina2) 3388 3515 5767 575 6241 6400 69
China3) 1895 2002 2293 3 7376 7500 81
Zimbabwe1) 1024 1025 974 994 700 1600 08
USA2) 846 846 900 900 567 n A 06
Portugal1) 470 470 299 763 700 1200 08
Brazil1) 186 186 195 154 153 300 02
Namibia1) n d nd n d n d 500 n d 05
Other 3) 19 19 18 18 18 500 lt01
Global4) 31801 33011 40562 49012 90941 77000 1001) Hardrock 2) Brine 3) HardrockBrine 4) Deviation due to rounding e estimated
Lithium Potential in Namibia
21
In 2018 global mine output of lithium was around 91000 t Li-content of which only 1200 t originated from the Southern African Development Community (SADC) namely Zimbabwe and Namibia
52 Trade data
Trade data is retrieved from the commercially available Global Trade Atlasreg (IHS Global SA) The database provides both import and export data for more than 90 countries based on customs data of individual countries Data is primarily classified through Harmonised System (HS) product codes by the WCO (World Customs Organization) The HS nomenclature consists of approximately 5000 product groups identified by a 6-digit code
There are limitations to trade data The most prominent issue arises with data availability since many countries do not publish trade data Especially export data is an issue among many countries
There may also be issues with mislabeled products (wrong HS) product bas-kets data entry errors or missing data in general Were export data is not available so-called reverse trade data (RTS) is an option
If a country does not state any exports cumulative global imports from that particular country may be used as a rough yet incomplete estimate of exports It should be noted that these statistics do not represent absolute but rather minimum values as trade between two non-reporting countries will not be reflected The majority of the SADC countries do not report their import and export statistics
The most important lithium products that are globally traded in significant amounts are lithium-carbonate lithium-oxide (hydroxide) lithium-chloride and lithium-mineral-concentrates
Lithium Potential in Namibia
22
53 Export
The most important intermediate product in the lithium market is lithium carbonate In 2019 global exports amounted to approx 117743 t with Chile being the largest exporter (82344 t 70 ) There are no listed exports from the SADC region except minor quantities from South Africa to the Democratic Republic of Congo (9 t) and Zambia (2 t)
Lithium oxides and lithium hydroxides are grouped together under one HS code hence an individual consideration of both products on a country basis is not possible due to the lack of country-specific commodity codes
In 2019 global exports of HS 282520 stood at approx 97550 t with China being the largest exporting country (49800 t 51 )There are no exports published for the SADC region except South Africa with small quantities (28 t) which are considered to be trade through only
Assessment of lithium chloride global trade flows is also difficult as this prod-uct is listed together with many other chemical products under HS 282739 Global trade can only be investigated using country-specific commodity codes (8-digits and above) if available Only three countries list this product under specific trade codes namely China (28273910) Chile (28273930) and Argentina (28273960) SADC countries including Namibia do not publish any data under HS 282739 Based on the available data global exports in 2019 stood at 2254 t with Chile being the largest exporter (2101 t 89 )
Lithium-containing mineral concentrates are among other non-lithium related products listed in a product basket under HS 253090 Only two coun-tries provide information on this product namely Australia as the largest and hence most important producing and exporting country by far and Brazil as a minor exporter (25309010)
No other country including member states of the SADC specifies lithium-con-taining concentrates as such The currently only producing and exporting country in the SADC is Zimbabwe which does not specify exports at all Thus exports are derived from RTS (global imports)
Lithium Potential in Namibia
23
A general problem with HS 253090 is that only information on quantity is avail-able but no information on lithium content which can vary between 12 and 6 Li2O thus the margin of possible errors in terms of total contained lithium is large
In 2019 Australia exported about 16 million tons of spodumene-concentrate down from 35 million tons in 2018 More than 95 destined to China
Inferred exports (RTS) of Zimbabwe were approx 93300 t for HS 253090 About 62000 t of that quantity are listed as imports by South Africa and are unrelated to lithium The remaining quantity is much more in line with production figures of Zimbabwe as well as the known downstream industries of the destination coun-tries within Europe
There are no export records published by Namibia In general and across all traded lithium products South Africa appears to act as an importexport hub within the SADC Also some of the traded products may be used in the glass and ceramic industry of South Africa
54 Import
For most of the SADC countries the statistics retrieved though the Global Trade Atlas do not necessarily represent reliable trade data due to above-mentioned reasons This is especially true when only small import numbers (usually in tons) are listed as these are supposedly artefacts or errors in declaration
Global imports of lithium-carbonate amounted to approx 142965 t with South Korea being the largest importer (38578 t 27 ) There are no listed imports for the SADC region except South Africa (72 t)
Global imports of lithium-oxides (hydroxides) amounted to approx 84900 t with Japan being the largest importer (37300 t 44 ) In analogy to lithium carbonate there are no published imports into the SADC except for South Africa (428 t)
There is no information for imports of lithium-choride or lithium-mineral-con-centrates into the SADC The largest importer of lithium-choride is China with approx 253 t The largest importer of lithium-mineral-concentrates is also China (gt 95 )
Lithium Potential in Namibia
24
Fig 6 Simplified geology of Namibia with major towns as well as railway and tar roads Blue polygons indicate pegmatite belts and districts in central and southern Namibia (Data source Geological Survey of Namibia 2020)
6 Lithium occurrences in NamibiaIn Namibia significant lithium occurrences are found only within pegmatites These Precambrian and early Namibian pegmatites are restricted to two dif-ferent areas respectively the Damara Orogen in north-central Namibia and the Namaqua Metamorphic Complex in southern Namibia (Fig 6)
Lithium Potential in Namibia
25
Within the Damara Orogen four linear pegmatite belts are found all of which strike northeast ndash southwest (Fig 7) Brandberg West ndash Goantagab Cape Cross ndash Uis Nainais ndash Kohero and Sandamap ndash Erongo with the latter connected to the Karibib Pegmatite District (Schneider 1992)
Each of these pegmatite belts exhibit numerous individual pegmatite swarms that occur zoned or unzoned and may carry significant amounts of rare metals or semi-precious stones In the south Lithium-Caesium-Tantalum (LCT) peg-matites occur in two areas Tantalite-Valley south of Warmbad in close prox-imity to the northwest-trending Tantalite Valley Shear Belt and the Sandfon-tein-Ramansdrift area close to the Orange River
Fig 7 Pegmatite belts in north-central Namibia from west to east Brandberg West ndash Goantagab Cape Cross ndash Uis Nainais ndash Kohero and Sandamap ndash Erongo as well as the Karibib Pegmatite District (after Geological Suvey of Namibia 2002)
Lithium Potential in Namibia
26
7 Lithium mining in NamibiaData for historic lithium mine production is available for the period 1939 ndash 1998 (Fig 8) After 1998 all mining activities ceased due to product quality issues and overall market environment
Until the mid-1950s lepidolite was the most important mined lithium mineral of the country (Fig 8) As mine output of lepidolite decreased output of petalite increased However quantity on a year-to-year basis was quite variable and fluctuated between 1000 ndash 10000 t Since the early 1980s production of petalite was quite stable and ranged between 1000 ndash 2500 t Production fell sharply in 1997 and 1998 after which it ceased Mining of amblygonite has always been small compared to lepidolite and petalite and never exceeded 1000 t per annum
According to the USGS (2020) 500 t of lithium were mined in Namibia in 2018 This is most likely stockpiled lepidolite material from the Rubicon mine
0
2000
4000
6000
8000
10000
12000
1939
1941
1943
1945
1947
1949
1951
1953
1955
1957
1959
1961
1963
1965
1967
1969
1971
1973
1975
1977
1979
1981
1983
1985
1987
1989
1991
1993
1995
1997
[Ton
nes]
Petalite (t)Amblygonite (t)Lepidolite (t)
Fig 8 Lithium production in Namibia in [t] per year (after Schneider 1992 BGR 2020)
Lithium Potential in Namibia
27
Currently there is no active consecutive mining for lithium in substantial quan-tities in Namibia although there are prospects and projects under develop-ment
71 Current mining activities and projects
Soris The Soris project is located in the De Rust pegmatite swarm which is part of the ldquoBrandberg West ndash Goantagab tin beltrdquo (Fig 7) This belt stretches to the northeast of the Brandberg massif over a length of 60 km and a width of 25 km This belt was previously mined for cassiterite on a larger scale Some of the pegmatites in this belt may carry substantial amounts of lithium such as pegmatites in the De Rust pegmatite swarm
The De Rust pegmatite itself is a Li-rich rare metal pegmatite that was mined for cassiterite and tantalite but also for minor quantities of spodumene be ween 1960 and 1990 (Diehl 1990) It intruded into metasediments of the Amis River Formation Lower Ugab Group of the Southern Kaoko Zone
It is the largest pegmatite of the De Rust pegmatite swarm within the Brandberg West ndash Goantagab pegmatite belt (Diehl 1992c) Outcrops are 100 ‒ 470 m long up to 30 m wide and can be followed over a length of roughly 24 km
The pegmatite shows well-developed zonation with a border zone (quartz alkali feldspar muscovite) outer (quartz microcline-perthite muscovite altered petalite) and inner (quartzo-feldspathic rock with spodumene crystals with accessory apatite lepidolite eucryptite zircon and monazite) intermedi-ate zone as well as a core zone (quartz subordinate microcline muscovite sporadic tantalite) Spodumene crystals may reach up to 80 cm in length (Fig 12) Towards the core zone spodumene carries rounded nodules of lithi-um phosphates (amblygonite ndash montebrasite series)
It is located northwest of the nearest town of Uis in the Kunene region of Namibia about 6km to the east of farm De Rust 532 and about 25 km north of the Ugab River The nearest railhead is located in the town of Karibib and the deep-water port of Walvis Bay is 120 km to the southwest Windhoek is about 180 km to the southeast
Lithium Potential in Namibia
28
The project can be reached via paved but mostly unpaved roads from the town of Uis From White Lady Lodge which is about 38 km northwest from Uis a 35 km gravel road leads towards the project 15 km of which are in the riverbed of the Ugab River There is currently no electricity and water supply at the project location site
According to SampP Global (022020) current owner of the Soris project is Mon-tero Mining amp Exploration Ltd (TSXV MON) which holds 80 interest of the property Another 20 are allocated to an unnamed private owner Based on data from the Namibia Mining Cadastre Portal (092020) multiple entries for mining licence applications exist for the area where the main De Rust pegmatite is located (Fig 9)
Resource estimateDue to the early stage of the Soris project no resource estimate is avail-able However Montero Mining claims the project to be drill ready targeting a resource of 10 Mt 1 Li2O with tantalum and tin by-product credits This would equate to 46400 t of lithium or 247000 t LCE
Grab samples of the deposit showed lithium contents of 007 to 532 aver-aging 137 Channel samples showed average lithium contents of 076 and values up to 366 (Montero 032019) The company also re-assessed 1097 previously tested RC drill samples The main lithium-bearing mineral is spodumene
Remnants of historic intermittent mining activities like old foundations and quartzo-feldspathic tailings are still visible east to the main pegmatite (Fig 10 ‒ 11)
Lithium Potential in Namibia
29
Fig 10 Remnants of historic open pit mining (upper) and tailings of De Rust pegmatite (lower) northwest of the Brandberg massif (Photo BGR-GSN 2019)
Fig 9 Satellite image of the De Rust project including the outlined mining license Main pegmatite coordinates 20deg57prime48primeprimeS ‒ 14deg30prime12primeprimeE (Source httpportalsflexicadastrecomnamibia 092020)
Main pegmatite
Lithium Potential in Namibia
30
Fig 12 Weathered spodumene chrystals at the historic open pit mine (Photo BGR-GSN 2019)
Fig 11 Historic open pit of the De Rust pegmatite (Photo BGR-GSN 2019)
Lithium Potential in Namibia
31
Uis The Uis projects (former mine and tailings) are located in the northern part of the ldquoCape Cross Uis pegmatite beltrdquo east of the town of Uis on the farm Uis Townlands No 215 in the Erongo region of Namibia
The Cape Cross-Uis belt is approx 120 km long and up to 40 km wide and extends in a NE direction (Fig 7) It comprises three distinct pegmatite swarms the Strathmore swarm Karlowa swarm and Uis pegmatite swarm In general lithium-bearing pegmatites (Li-Nb-Ta-Sn-Be and Li-Nb-Ta-Sn) are the least common in this belt (Fuchsloch et al 2018)
The Uis swarm field consists of more than 120 individual pegmatites each with a northeasterly to easterly strike direction and northwesterly down dip (30deg ‒ 70deg) This field is accompanied by a peripheral pegmatite field of approx 25 individual pegmatites
Some of the main pegmatites especially around the formerly worldrsquos largest tin mine at Uis are exceedingly large Some of them are up to 1 km long and some 50 m wide
In terms of lithium petalite amblygonite and minor spodumene mineralization occurs in the various pegmatites but no lepidolite Most common lithium bear-ing minerals in the eight pegmatites that were mined at Uis are amblygonite petalite and spodumene
Currently the Uis tailings project and the Uis tin mine are owned by two differ-ent companies As of 2020 the tin mine is operating a pilot processing plant and aims to ramp up the production of lithium in the near future The current ownership of the tailings project as of September 2020 is unclear
The nearest commercial deep-water port to the projects is Walvis Bay 220 km to the southeast The town of Omaruru is 130 km to the east and Henties Bay lies about 120 km to the southwest The nearest railhead is located in Omaruru The area is accessible year-round by paved and un-paved roads NamPower provides electricity and the town of Uis is connected to the Nam-Water pipeline
Lithium Potential in Namibia
32
The tin deposit was discovered in 1911 and mined between the 1950s and 1989 for cassiterite by Uis Tin Mining Company (SWA) Ltd and IMCOR
Coarse tailings are located in the northern part of the former mine just south to the main road C36 (Fig 13) The fine material is located south to the coarse waste dumps (Fig 13)
After 1990 multiple companies owned the property until AfriTin Mining Ltd bought all the rights (license ML134) The current lithium tailings project of Montero Mining amp Exploration Ltd (TSXV MON) is based on the historic mine tailings of the former tin mine on mining license ML134 that is currently owned by AfriTin Mining Ltd The acquired tailings material does not fall under the ML134 license of AfriTin since historical tailings material (Fig 14) is not regulated by Minerals (Prospecting and Mining) Act 33 of 1992 of Namibia
Resource estimateUis tin mineAccording to AfriTin the former Uis mine holds a JORC compliant resource (inferred) of 715 Mt of ore 0134 Sn with a cut-off grade of 005 Sn (AfriTin 2020) Grades of ancillary elements are given at 063 Li2O and 85 ppm Ta for the total resource of 71 Mt of ore
This equals to approx 95000 t of tin 209000 t of lithium (11 Mt LCE) and 6090 t of tantalum 85 of the total resource are attributable to the company The remaining 15 are allocated to SMU (Small Miners of Uis)
Uis tailingsMontero Mining filed an inferred resource estimate of 144 Mt of ore 037 Li2O and 005 SnO2 with a 035 Li2O cut-off grade for lithium and assumed processing recoveries of 70 for their tailings project (Montero 2019) This equals to approx 24700 t of lithium content (131500 t LCE) and 7200 t SnO2
This resource estimate only includes coarse tailings material There is current-ly no information on the lithium content of the fine tailings material that totals 271 Mt t due to insufficient or no test work (Montero 2018) The company also states that the average Li2O grade of the fines material does not hurdle the cut-off for the fines of 082 Li2O
Lithium Potential in Namibia
33
In 2016 Australian based Tawana Resources carried out a drilling program at Uis for a private company called Lithium Africa 1 on the fine and coarse tailings (Table 3 Hole 1 amp Hole 2) Below some of the obtained data on lithium content is given Additionally Li2O content of two obtained grab samples by BGR (Table 3 Sample 2019a amp 2019b) is given
Table 3 Sample data Uis (Tawana 2016 Montero 2018 BGR 2019)
Sample Sample 0 to 1m Li2O ()
Sample 1 to 2m Li2O ()
Sample 2 to 3m Li2O ()
Fines Hole 1 071 085 092
Fines Hole 2 080 089 095
Coarse Hole 1 050 043 043
Coarse Hole 2 054 062 062
BGR Sam-ple 2019a (Coarse tailings)
028
BGR Sam-ple 2019b (Coarse tailings)
028
Montero NI 43-101 037
Lithium Potential in Namibia
34
Fig 14 Tailings of the historic Uis Tin Mine (Photo BGR-GSN 2019 with kind permission of AfriTin Mining Limited)
Fig 13 Former Uis tin mine Uis tailings project with coarse tailings Tailings coordina-tes (center) 21deg13prime31primeprimeS ‒ 14deg52prime44primeprimeE (Source httpportalsflexicadastrecomnamibia 092020)
Uis Tailings (coarse)
Uis Tailings (fine)
Historic Uis mine
Lithium Potential in Namibia
35
Karibib Lepidolite ProjectThe Karibib Lepidolite brownfield project is located in the ldquoKaribib ndash Usakos Pegmatite Districtrdquo southeast of the town of Karibib on the farm Okongava Ost No 72 in central Namibia (Fig 15 ‒ 16)
This pegmatite district which is of Damaran age hosts the most important pegmatite occurrence (Rubicon swarm) in terms of lithium in Namibia In addi-tion numerous other different pegmatite swarms some of which have previ-ously been relevant in terms of lithium are know from this district These are Dernburg Karlsbrunn Albrechtshoumlhe Berger Kaliombo Gamikaubmund Okatjimukuju Etusis Daheim Friedrichsfelde and Etiro (Diehl 1992a)
The Rubicon pegmatite itself is the largest of the individual pegmatites that occur in this field and has been the prime source of lithium until mining seized in the early 1990s The Helikon pegmatites are part of the Rubicon pegmatite swarm and are located northeast to the Rubicon pegmatite They have previ-ously been mined for lepidolite amblygonite petalite and muscovite beryll pollucite quartz and columbite-tantalite as valuable by-products (Fig 18 ‒ 19)
The pegmatite itself consist of two ellipsoidal well zoned Li-mineralized ore-bodies The larger one is about 320 m long and 25 ndash 35 m wide It dips at 46deg to the northeast and has a northwesterly strike The second orebody is about 230 m long and about 10 m wide It is dipping with 30deg to the northeast and has a northwesterly strike In total the outcrop of the Rubicon pegmatite is about 600 m long with a maximum width of 65 m (Fig 17)
A very prominent feature is the presence of a very well developed concen-tric shell and zones from the footwall to the inner core of the pegmatite Both orebodies exhibit a border- wall- intermediate- and core-zone
Border-zone wall-zone and outer intermediate zone of the larger orebody do not contain Li-bearing minerals of economic importance The inner interme-diate zone does contain lepidolite The outer core zone may be sub-divided into a petalite zone low-grade lepidolite zone and a high-grade lepidolite zone The inner core zone also contains a petalite zone Mining occurred pre-viously in the later named zones The zonation of the smaller orebody to the northwest is less pronounced but Li-mineralization and style are equal to the
Lithium Potential in Namibia
36
larger orebody There is no spodumene mineralization within the orebodies and respectively zones of the Rubicon pegmatite
The Helikon I pegmatite is also a lens-shaped pegmatite with a length of roughly 400 m and a width of approx 66 m It dips to the north with about 60deg ndash 70deg Helikon I also consists of well-defined zones The main Li-bearing minerals are lepidolite and petalite According to Roering (1963) the lepidolite is difficult to separate from the intergrown albite and hence of low grade and quality
The Helikon II pegmatite is approx 17 km long and only 9 ndash 15 m wide It lies a bit north of Helikon I and dips steeply to the north with 55deg ndash 80deg striking east west The main Li-bearing minerals are lepidolite and petalite According to Diehl (1990) the westernmost portion of the pegmatite has historically been the economically most important A massive up to 6 m wide petalite zone was mined here according to Diehl (1990)
The nearest railhead to the project is 17 km away in Karibib and the deep-water port of Walvis Bay is 220 km to the southwest Windhoek is about 180 km to the southeast NamPower connects the town of Karibib to electricity and the project currently utilizes generators There is a 7 km long 22 kV power line spur to grid connection pending (Lepidico 2020) Water is available via on-site boreholes
The project was previously owned by Desert Lion Energy Inc (TSVX DLI) Lepidico Ltd (ASX LPD) bought into the project and currently holds 80 interest which comprises Mining License 204 (69 km2) as well as three Exclu-sive Prospecting Licenses (EPLs) namely 5439 5555 and 5781 (Lepidico 2020)
Lepidico will cover mining from multiple sources as well as chemical conver-sion by utilizing their proprietary lithium processing technologies L-Maxreg LOH-Maxreg and S-Maxreg (Lepidico 052019) The company aims to produce high purity lithium chemicals such as lithium carbonate and lithium hydroxide
The takeover also included a nonbinding offtake agreement between the for-mer owner Desert Lion Energy Inc and German chemical company BASF On April 2nd 2019 Desert Lion Energy Inc announced this offtake agreement
Lithium Potential in Namibia
37
which at the time was valid through to December 31 2019 On December 20th
2019 Lepidico announced that the LOI with BASF was extended to Decem-ber 31st 2020 (Lepidico 122019)
The feasibility study criteria of Lepidico are as follows
- Throughput of the concentrator on-site of 035 Mtpa- Expansion of throughput after year five to 05 Mtpa- Chemical plant in the industrial city of Abu Dabi (ICAD)- Plant design for 58000 tpa of concentrate (4 LiO2) for the production of
up to 5500 tpa LiOH- Utilization of L-Maxreg and LOH-MaxTM- Non-binding off-take MOU with BASF for LiOH only- Targeting for project commissioning to commence late 2021 for commer-
cial production in 2022
The preliminary mine plan indicates a strip ratio of 03 ndash 1 for the first two years The ratio will then go up to 1 ndash 14 In the first four years elevated grades of 06 LiO2 will be mined
Resource estimateA JORC 2012 compliant resource estimate for the deposit is given in Table 4 (Lepidico 2020) The deposit currently holds 23200 t of lithium (Indicated amp Inferred) based on a cut-off grade of 015 Li2O This resource estimate is based solely on the lepidolite occurrences at the mine site
Table 4 Resource estimate Karibib Lepidolite Project (Source Lepidico 2020)
Deposit Resource Category
Cut-off (Li2O)
Ore (Mt)
Li2O ()
Li (t)
Li (LCE)
Rubicon Measured
015
22 057 5819 30974
Rubicon Indicated 666 038 11637 61943
Rubicon Inferred 237 043 4728 25167
Helikon
Total 015 1124 043 22184 118086
Lithium Potential in Namibia
38
Fig 16 Satellite image of the Karibib Lepidolite project Helikon 1 coordinates (center) 22deg2prime49primeprimeS ‒ 16deg1prime13primeprimeE Helikon 4 coordinates (center) 22deg2prime24primeprimeS ‒ 16deg1prime41primeprimeE (Source httpportalsflexicadastrecomnamibia 092020)
Fig 15 Satellite image of the Karibib Lepidolite project Rubicon coordinates (center) 22deg6prime11primeprimeS ‒ 15deg59prime44primeprimeE (Source httpportalsflexicadastrecomnamibia 092020)
Historic Rubicon mine
Helikon 1
Helikon 4
Lithium Potential in Namibia
39Fig 17 Rubicon pegmatite (Photo BGR-GSN 2019 with kind permission of Lepidico Chemicals Namibia (Pty) Ltd 2020)
Lithium Potential in Namibia
40 Fig 18 Lepidolite sample from Rubicon pegmatite (Photo BGR-GSN 2019 with kind permission of Lepidico Chemicals Namibia (Pty) Ltd 2020)
Fig 19 Petalite sample from Rubicon pegmatite (Photo BGR-GSN 2019 with kind permission of Lepidico Chemicals Namibia (Pty) Ltd 2020)
Lithium Potential in Namibia
42
Fig 21 Helikon 4 pegmatite (Photo BGR-GSN 2019 with kind permission of Lepidico Chemicals Namibia (Pty) Ltd 2020)
Fig 20 Helikon 1 pegmatite (Photo BGR-GSN 2019 with kind permission of Lepidico Chemicals Namibia (Pty) Ltd 2020)
Lithium Potential in Namibia
43
Tantalite ValleyThe Tantalite Valley Project lies within the ldquoNamaqua Metamorphic Complexrdquo in Southern Namibia Within this complex Lithium-Caesium-Tantalum (LCT) pegmatites occur in two main areas Tantalite-Valley south of Warmbad in close proximity to the northwest-trending Tantalite Valley Shear Belt and the Sandfontein-Ramansdrift area close to the Orange River
The area were the pegmatites of the Tantalite Valley occur is primarily com-posed of a large ovoid gabbro intrusion (71 km by 33 km in extent) within paragneiss units of the Namaqua Complex The gabbro outcrop forms a large dome shaped mountain that rises about 500 m above the surrounding topo-graphy
The pegmatites belong to the Kenhardt and Gordonia pegmatite districts in Namaqualand but only the younger group of them carry accessory ore miner-als such as tantalite beryl REE minerals and lithium
The Tantalite Valley pegmatites include several individual subhorizonal dikes that are up to 1000 m long and 02 to 40 m wide plunging towards southeast (Diehl 1992b) Four of those are of economic interest Homestead Whitkop White City and the Lepidolite pegmatites (ie Purple Haze) (Fig 22)
They are all well zoned (quartz core inner and outer intermediate zones wall zone) and were predominantly targeted for beryl columbite-tantalite as well as lithium and bismuth minerals
The project is located on the farms Umeis 110 and Kinderzitt 132 between the Farms 109 131 129 308 and 473 in the magisterial district of Karas It currently comprises Mining License (ML-77) fully owned by Tameka Shelf Co Four (Pty) Ltd which is a 100 subsidiary of African Tantalite Pty Ltd (AFTAN) Above all Kazera Global Investments PLC holds a 75 stake in AFTAN (Kazera 2019) with the other 25 of local farmer ownership
The project is accessible via gravel road from Karasburg which is about 80 km to the north The nearest railhead is also located in Karasburg Electricity is currently supplied by generators and water is recovered from multiple drill holes The Orange River is about 15 km to the south of the project Mining
Lithium Potential in Namibia
44
infrastructure as well as equipment are on site as well as a plant for the pro-duction of tantalite concentrate
NTI is working on an extensive exploration program with a clear focus on revi-ving tantalite mining in Namibia with a possible by-product stream of lithium bearing minerals The company will focus primarily on the pegmatites Homes-tead Purple Haze Signaalberg and White City (Fig 23)
The area is known for its tantalum occurrences and since the late 1940s tantalite and other minerals have been recovered at Tantalite Valley until 1981 when mining ceased Initially alluvial deposits were mined followed by the pegmatites themselves Grades of the concentrates produced prior to the closure of the mine were quite high with 65 ‒ 70 Ta2O5 with very low U3O8
and ThO2 values of 025 max
Resource estimateAccording to SampP Global (092020) Measured and amp Indicated resources at Tantalite Valley are 104800 t of ore 0042 Ta2O5 and 0653 Li2O as of 112019 This would equate to 315 t of lithium or 1690 t LCE Total inferred resources are 517400 t of ore 0018 Ta2O5 and 0144 Li2O This equals to approx 91 t of tantalum and 750 t of lithium (3535 t LCE)
Lithium Potential in Namibia
45
Fig 23 White City pegmatite (Source Kazera global Investments PLC 2020)
Fig 22 Satellite image of the Tantalite Valley project White City pegmatite coordinates (center) 28deg43prime07primeprimeS ‒ 18deg44prime45primeprimeE Homestead pegmatite coordinates (center) 28deg43prime19primeprimeS - 18deg44prime24primeprimeE Purple Haze pegmatite coordinates (center) 28deg43prime09primeprimeS ‒ 18deg43prime55primeprimeE (Source httpportalsflexicadastrecomnamibia 092020)
Lithium Potential in Namibia
46
8 Analysed lithium samplesDuring the course of the cooperation project between the Economic Geology Division (EGD) of the Geological Survey of Namibia (GSN) and the Ger-man Federal Institute of Geosciences and Natural Resources (BGR) several sampling campaigns to southern and central pegmatites took place
The field trips were preceded by literature and data research regarding infor-mation on lithium occurrences andor previous lithium mining activity to iden-tify specific target areas
During a campaign in 2019 16 lithium-bearing mixed mineral samples were taken from five different locations and subsequently analyzed Two of the samples originate from the Uis Tin Mine Tailings of the former tin mine All remaining samples were taken either from stripped outcrops for future mine activities or from previous mine sites (ie pits)
All 16 samples were analyzed at BGR labs in Hanover Germany through qualitative XRD XRF and ICP-MS Given data shall be understood as a first indicator for the sampled lithium occurrences
Most if not all sampled occurrences have previously been analyzed or are cur-rently being assessed by the property owners or current licensees Detailed information of these sampling and analytical campaigns remain confidential and are thus not available for comparison
Appendix A lists the identified qualitative mineralogy of the samples as well as the major element analysis Additional samples from previous campaigns are also given
Interpretation of the results are based on their applicability in the various lithium-consuming industries for which information is available
Most of the current lithium applications require a chemical intermediate product such as lithium carbonate or lithium-hydroxide The glass and cera-mic industry does use lithium-bearing mineral concentrates depending on the prices of these materials when compared to LiCO3
Lithium Potential in Namibia
47
Since the main applications require an intermediate or downstream chemical product lithium content as well as impurity values are the main criteria for the suitability of the sampled occurrences Other quality criteria are particle size and surface areastructure
9 InterpretationAs previously stated all obtained grab samples are mixtures of lithium- bearing minerals (ie spodumene petalite lepidolite) feldspars quartz micas as well as secondary minerals Therefore all given analytical data has to be taken with caution and will not be representative for the individual outcrops or deposits
The evaluation of the economic suitability for various economic applications of the analysed lithium samples is based on the chemical specifications in Chapter 4
Lithium content gt 1 Li2O Fe2O3 content lt 015 as well as F content lt 01 are individually highlighted (Appendix A) as these three values are the most important
Based on the chemical analysis nine of the 16 samples showed Li2O contents of more than 1 (range 117 ‒ 327 ) Seven of those nine samples also exhibited low Fe2O3 content (range 004 ‒ 008 ) (Appendix A) Three of those seven samples also had fluorine values below 005
Of the ten additionally included samples from previous campaigns four showed Li2O contents of more than 1 (range 126 ‒ 199 ) Three of those samples also exhibited low Fe2O3 content (range 004 ‒ 007 ) (Appendix A) One of the three samples had fluorine values below 005
The mentioned samples (sources) could be of potential use but for further interpretation statistical sampling will be required
Lithium Potential in Namibia
48
10 ConclusionsThere is currently no lithium industry established in Namibia This accounts to both mining and processing of ores into commercial lithium-bearing con-centrates as well as the production of downstream products such as lithium carbonate andor lithium hydroxide In order to evaluate the potential for a lithium industry in Namibia the current global market and price developments need to be addressed
Currently the main application for lithium is in the chemical industry as lithium carbonate andor hydroxide for the manufacturing of lithium-ion batteries There is currently no domestic market (supply) or demand for this industry in Southern Africa or Namibia in specific Processing of lithium-bearing ores into these highly specific downstream products is economically more viable in close proximity to the demanding industries It also requires large investments (double-digit million dollars per 10000t of capacity) Additionally there is already huge capacity and strong capacity build up in Asia at rather low cost
The second most important application lies in the glass and ceramics industry This industry uses lithium either as lithium-bearing concentrates or lithium carbonate depending on current market price and processproduct require-ments There is currently no such industry established in Namibia but potential plans There is glass and ceramics manufacturing in South Africa and thus a potential market for lithium bearing products (concentrates) should this indus-try require it depending on product
The 20182019 primary lithium supply based on spodumene-bearing mineral concentrates was dominated by Australia with a market share of well over 95 On an annual basis the country exports more than three million tons of lithium-bearing concentrates to China To put this into perspective Lepidico plans to export just 58 ktpa of concentrate to Abu Dhabi for refinement from their project annually Therefore potential production in Namibia will always be rather small scale when compared to peer producing countriescompanies
As of late 2020 the concentrate market is in strong oversupply with strong competition Thus prices have eroded quite substantially for a standard SC6 concentrate (Fig 24) In general prices vary significantly based on lithium content and impurities of the concentrates Lithium bearing mineral concen-
Lithium Potential in Namibia
49
trates are a relatively low-value mineral commodity when compared to lithi-um-carbonate or other lithium downstream products thus product quality cost reduction and cost control are key components in this industry Since prices are depressed currently many of the Australian producers have drasti-cally reduced output or even went into care and maintenance This situation may change towards 2025 or beyond as demand picks up
Prices for the higher valued product lithium-carbonate spiked at the end of 2017 towards 2018 to more than 20000 $USt on a contract basis with prices being very volatile Since then prices have also eroded to below 9000 $USt due to oversupply and slow demand pickup (Fig 25) With this product stable quality and chemical composition are crucial for the downstream industry
Based on available gradetonnage data the Namibian projectsprospects are relatively small in overall size and low in grade when compared to global peers for the resource category ldquoMeasuredIndicatedrdquo (Appendix B) Total contained lithium quantity is thus relatively small in comparison On a global scale the most promising hard rock projects that are currently being mined and developed have Li2O grades of 10 or above
Fig 24 Lithium-mineral-concentrate prices 012010 ‒ 062020 (Source BGR 2020)
300
400
500
600
700
800
900
1000
1100
208
210
212
214
216
218
220
US$
t US$t
01-20
14
01-20
15
01-20
16
01-20
17
01-20
18
01-20
19
01-20
20
01-20
10
01-20
11
01-20
12
01-20
13
Spodumene min 5-6 LiO2 fob Australia
Spodumene concentrate gt75 LiO2 bulk cif Asia
Petalite 42 LiO2 fob Durban
Spodumene fob Australia
Spodumene min 5-6 LiO2 cif China
Lithium Potential in Namibia
50
For the resource category ldquoIndicatedrdquo which generally represents the lowest level of confidence only the Uis mine project of AfriTin represents a size-able resource even though grades are relatively low (Appendix C) The Uis tailings project as well as the Rubicon project are again relatively small when compared to their global peers Tantalite Valley is the smallest of all included projects (Appendix C)The given data for the De Rust project reflects only an exploration target of the company rather than actual data and may thus be not representative
Based on size and contained lithium-content none of the visited early stage projectsprospects would justify the financial investment into the construction of a chemical conversion plant for the production of lithium carbonate andor hydroxide on site as it requires very large monetary investments Due to their size payback of the required investments may be unfavorable when compared to global peers In addition the current market environment is very harsh with strong competition from Asia that has a huge cost advantage due to capacity build up This industry is also very energy and water intensive
In addition location within Namibia as well as distance to possible down-stream markets may become an issue as it increases the transportation cost
4000
7000
10000
13000
16000
19000
22000
25000
28000
01-20
14
01-20
15
01-20
16
01-20
17
01-20
18
01-20
19
01-20
20
US$
t
Lithium-carbonate (min 995 ) battery grade spot price ex works domestic ChinaLithium-carbonate (min 99-995 ) Li2CO3 large contracts USA delivered continentalLithium-hydroxid-monohydrate (min 565) technical and industrial grades cif China Japan amp Korea
Fig 25 Lithium chemical prices 012014 ndash 062020 (Source BGR 2020)
Lithium Potential in Namibia
51
immensely This is especially true for the SorisDe Rust pegmatite which is in a remote location without any allocated infrastructure The projects Karibib Uis and Tantalite Valley are much easier to access
The approach of Lepidico to produce a lithium bearing concentrate on site seems plausible approach Since this will already require a skilled workforce mining and beneficiation equipment in order to produce a high quality lithium-bearing concentrate it may already be considered ldquoadded valuerdquo for the indus-try of the country This approach may also be suitable for the other mentioned and visited projects
Lithium Potential in Namibia
52
ReferencesAfriTin Mining (2020) Uis Tin Project ndash Company Information ndash URL httpafritinminingcomuis-project [as of 092020]
Australian Government Geoscience Australia (2019) Australiarsquos Identi-fied Mineral Resources 2019 ndash URL httpswwwgagovauscientific-topicsmineralsmineral-resources-and-adviceaimr [as of 092020]
BGR ndash Bundesanstalt fuumlr Geowissenschaften und Rohstoffe (2020) Fachinformationssystem Rohstoffe ndash unpubl Hannover [as of 082020]
BGS ndash British Geological Survey (2016) Lithium Definitions mineralo-gy and deposits ndash URL httpswwwbgsacukdownloadsstartcfmid=3100 [as of 062016]
Diehl B J M (1990) Pegmatites of the Cape Cross Uis ndash Pegmatite Belt Namibia Geology mineralisation Rubidium Strontium characteristics and petrogenesis of rare metal pegmatites Open File Report EG 083 Economic Geology Series Geological Survey of Namibia 39 pp Windhoek
Diehl B J M (1992a) Lithium Caesium Beryllium Open File Report Mineral Resource Series Geological Survey of Namibia 18 pp Windhoek
Diehl B J M (1992b) Niobium and Tantalum Open File Report Mineral Resource Series Geological Survey of Namibia 20 pp Windhoek
Diehl B J M (1992c) Tin Open File Report Mineral Resource Series Geological Survey of Namibia 30 pp Windhoek
Diehl B J M amp Schneider G I C (1990) Geology and mineralisation of the Rubicon Pegmatite Namibia Open File Report Geol Surv Namibia 20 pp Windhoek
Fuchsloch et al (2018) Classification mineralogical and geochemical vari-ations in pegmatites of the Cape Cross-Uis pegmatite belt Namibia Lithos 296 ndash 299 79-95 elsevier
Lithium Potential in Namibia
53
Garret D E (2004) Handbook Of Lithium And Natural Calcium Chloride Their Deposits Processing Uses and Properties ndash 467 S Oxford (Elsevier B V)
Geological Survey of Namibia (2002) Mineral Resources of Namibia Summary of Mineral Deposits and Occurrences Omaruru Sheet 2114 Volume I ndash Complete Descriptions 119 pp Windhoek
IHS Global SA (2020) Global Trade Atlas ndash Commercial Online-Databa-se ndashURL httpsmyihscomConnectcallingUrl=https3a2f2fconnectihsmarkitcom2f [as of 062017]
Kazera Global Investments PLC (2020) Company Information ndash URL httpskazeraglobalcominvestmentsnamibia-tantalite-investment-mine [as of 092020]
Lepidico (2019) LOI with BASF extended to 31 December 2020 ndash News Release ndash URL httpswwwlepidicocomwp-contentuploads201910LPD-191220-LOI-with-BASF-extended-to-31-December-2020pdf [as of 122019]
Lepidico (2019) Corporate Presentation ndash URL httpswwwlepidicocomwp-contentuploads201907LPD-190509-Corporate-Presentati-on-May-2019pdf [as of 052019]
Lepidico (2020) Company Information ndash URL httpswwwlepidicocomprojectskaribib [as of 092020]
Montero Mining amp Exploration Ltd (2018) Exploring Battery Metals in Namibia ndash Company Presentation ndash URL httpswwwproactiveinvestorscomauuploadSponsorFileFile2018_031520244941_MON-CorporatePre-sentationMarch2018pdf [as of 072018]
Montero Mining amp Exploration Ltd (2019) Montero Files NI 43-101 Resource Estimate On The Uis Lithium-Tin Tailings Project In Namibia On Sedar ndash News Announcement ndash URL httpsmonterominingcommontero-files-ni-43-101-resource-estimate-on-the-uis-lithium-tin-tailings-project-in-namibia-on-sedar [as of 032019]
Lithium Potential in Namibia
54
Namibia Mining Cadastre Portal (2020) Online-Database ndashURL httpsportalslandfoliocomnamibia [as of 092020]
Roskill Information Services Ltd (2016) Lithium Global Industry Mar-kets amp Outlook ndash 386 S London Groszligbritannien
Schneider G I C (1992) Feldspar Open File Report MRS 08 Mineral Resource Series Geological Survey of Namibia 2 pp Windhoek
Schmidt M (2017) Rohstoffrisikobewertung ndash Lithium ndash DERA Rohstoffin-formationen 33 Berlin
S amp P Global Market Intelligence (2020) Lithium - Metals amp Mining Properties URL httpsplatformmarketintelligencespglobalcomwebcli-entauth=inheritindustryminingProjects [as of 092020]
Statista (2020) Distribution of lithium end-usage worldwide in 2019 by area application ndash URL httpswwwstatistacomstatistics268787lithium-usa-ge-in-the-world-market [as of 062020]
Tawana Resources NL (2016) Tawana acquires second lithium pro-ject ndash News Release ndash URL httpsmstrademomentumcozajsepdfSENS_20160923_S376505pdf [as of 092016]
USGS ndash United States Geological Survey (multiple years) Lithium ndash Minerals Commodity Summaries ndash URL httpswwwusgsgovcentersnmiclithium-statistics-and-information [as of 082020]
Appendix
Sam
ple I
DFa
rmLa
titud
eLo
ngitu
deSa
mpl
e des
crip
tion
(XRD
qu
al)
LiO 2
()
SiO 2
Ti
O 2
Al2O 3
Fe2O 3
Mn
O Mg
O Ca
O Na
2O
K 2O P 2O 5
SO
3
Cl
F
LOI
Su
m
2015
-03
previous sample campaignsHelik
on
n A
Felds
parQ
uartz
Lepid
olite
025
6871
lt000
119
0500
200
2900
505
3292
806
7905
59lt0
01lt0
002
lt005
093
9985
2016
-12
Rubic
onwe
ather
ed P
etalite
126
6473
lt000
118
0600
703
2718
607
9507
805
2500
62lt0
01lt0
002
lt005
1146
9871
2016
-17
Rubic
onLe
pidoli
te +
Quar
tz13
063
6700
219
9316
0929
003
0054
029
6218
0052
lt001
lt000
226
232
798
67
2016
-20
Helik
onLe
pidoli
te + A
lbite
176
5514
lt000
126
8700
401
2100
700
2123
970
3900
45lt0
01lt0
002
156
369
9698
2016
-21
Helik
onLe
pidoli
te19
954
32lt0
001
2627
004
0224
006
0038
266
714
0069
lt001
lt000
240
628
997
77
FN20
19_0
4De
Rus
tFe
ldspa
rAmb
lygon
iteP
etalite
(n
on X
RD)
003
6513
lt000
118
82lt0
0100
0200
101
0924
311
4105
75lt0
0100
04lt0
0503
898
84
2015
-09
Molop
oPe
talite
(non
XRD
)00
952
85lt0
001
1672
lt001
0002
487
0323
342
0352
lt000
100
400
3403
621
1310
012
2016
-14
Molop
oPe
talite
wea
there
d (no
n XRD
)00
752
1600
0316
5100
200
5147
805
8923
406
4500
6900
200
8602
222
6310
013
2016
-15
Molop
oFe
ldspa
r (no
n XRD
)00
664
02lt0
001
1937
003
0004
003
0151
216
1249
0796
lt001
lt000
2lt0
0505
399
55
2016
-23
Molop
oZin
nwald
ite (n
on X
RD)
006
5044
0068
3307
048
0011
012
0426
261
7674
0181
lt001
lt000
2lt0
0542
9925
1909
249
2019Uis
Tailin
gs
Quar
tzFe
ldspa
rPeta
lite
Musc
ovite
028
7293
0045
1479
051
0062
0212
9830
927
6613
6200
2lt00
02lt0
0523
399
38
1909
250
Uis
Tailin
gsQu
artz
Felds
parP
etalite
Mu
scov
ite02
872
6900
4314
8205
0059
019
1306
313
2794
1347
002lt
0002
lt005
251
9937
1909
251
Helik
on 4
22deg02prime4
8primeprimeS1
6deg01prime30
primeprimeEQu
artz
Felds
parP
etalite
Le
pidoli
te16
464
4400
0319
4200
301
2100
408
8325
345
6806
800
400
0727
228
998
38
1909
252
Helik
on 1
22deg02prime2
0primeprimeS1
6deg01prime19
primeprimeEPe
talite
Lepid
olite
Quar
tz29
576
9200
0116
6800
300
0304
101
7301
106
8100
01lt0
01lt0
002
lt005
205
97
App
endi
x A
Ana
lytic
al d
ata
of li
thiu
m s
ampl
es c
olle
cted
in N
amib
ia T
hres
hold
val
ues
high
light
ed in
gre
en
Lithium Potential in Namibia
57
Sam
ple I
DFa
rmLa
titud
eLo
ngitu
deSa
mpl
e des
crip
tion
(XRD
qu
al)
LiO 2
()
SiO 2
Ti
O 2
Al2O 3
Fe2O 3
Mn
O Mg
O Ca
O Na
2O
K 2O P 2O 5
SO
3
Cl
F
LOI
Su
m
1909
253
2019Rubic
on22deg06prime1
3primeprimeS1
5deg59prime45
primeprimeEPe
talite
Lepid
olite
Quar
tz32
778
73lt0
001
1687
002
0006
002
0157
011
003
0002
003
0003
lt005
075
9663
1909
254
Rubic
on22deg06prime1
0primeprimeS1
5deg59prime41
primeprimeEFe
ldspa
rQua
rtzM
usco
vite
004
682
lt000
119
3500
300
2400
205
0610
0808
6804
3lt0
01lt0
002
lt005
041
9985
1909
255
Rubic
on22deg06prime1
0primeprimeS1
5deg59prime41
primeprimeEFe
ldspa
rLep
idolite
Mus
co-
viteK
aolin
026
6104
0004
2318
022
0136
006
0119
367
8411
0159
lt001
lt000
2lt0
0522
299
15
1909
256
Rubic
on22deg06prime1
0primeprimeS1
5deg59prime41
primeprimeELe
pidoli
te 27
249
8700
129
3400
408
0500
400
704
697
3100
31lt0
01lt0
002
087
441
9569
1909
257
Rubic
on22deg06prime1
3primeprimeS1
5deg59prime45
primeprimeEPe
talite
Lepid
olite
Quar
tz30
670
0900
0320
2600
801
0901
502
9901
926
800
15lt0
0100
04lt0
0526
596
48
1909
258
Rubic
on22deg06prime1
0primeprimeS1
5deg59prime41
primeprimeELe
pidoli
teFe
ldspa
rQua
rtz20
659
7800
0224
100
505
2400
300
513
7247
0051
lt001
0002
265
388
9966
1909
259
Tanta
lite
Valle
y28deg43prime0
9primeprimeS1
8deg43prime55
primeprimeEFe
ldspa
rLep
idolite
Mus
covit
e11
762
64lt0
001
2139
004
0161
lt001
0399
7731
2401
0900
200
119
912
698
85
1909
260
Tanta
lite
Valle
y28deg43prime0
9primeprimeS1
8deg43prime55
primeprimeEFe
ldspa
rLep
idolite
Mus
covit
e03
059
8600
1425
1301
604
2200
302
2860
547
2201
3900
200
0904
123
799
56
1909
261
Tanta
lite
Valle
y28deg43prime0
9primeprimeS1
8deg43prime55
primeprimeEFe
ldspa
rQua
rtzM
usco
vite
003
636
0005
2218
022
0122
002
0381
727
3809
0272
lt001
lt000
2lt0
0513
199
17
1909
262
Tanta
lite
Valle
y28deg43prime2
0primeprimeS1
8deg44prime23
primeprimeEQu
artzSp
odum
eneM
us-
covit
e13
180
5100
0415
8903
401
2401
301
9502
604
0400
0500
200
03lt0
0507
398
56
1909
263
De R
ust
20deg57prime4
8primeprimeS1
4deg30prime13
primeprimeEFelsd
parS
podume
neQuartz
074
7313
0006
2048
007
015
005
0154
398
0831
0073
001
0003
lt005
082
9974
1909
264
De R
ust
20deg57prime4
8primeprimeS1
4deg30prime13
primeprimeESp
odum
eneF
eldsparQuartz
230
6924
0006
2602
801
0200
301
0510
102
1400
68lt0
0100
03lt0
0504
897
53
(Con
tinue
d) A
ppen
dix
A A
naly
tical
dat
a of
lith
ium
sam
ples
col
lect
ed in
Nam
ibia
Thr
esho
ld v
alue
s hi
ghlig
hted
in g
reen
Lithium Potential in Namibia
58
Appendix B GradeTonnage data (Measured amp Indicated) for selected lithium projects in comparison to Namibian projects (Source SampP 092020)
0
0500
1000
1500
2000
2500
500
5000
5000
0
5000
00
5000
000
Gra
de [
Li 2O
]
Tonnage [t]
Tantalite Valley
Rubicon
Appendix B GradeTonnage data (Inferred) for selected lithium projects in com-parison to Namibian projects (Source SampP 092020)
0
0500
1000
1500
2000
2500
100
1000
1000
0
1000
00
1000
000
1000
0000
Gra
de [
Li 2O
]
Tonnage [t]
Tantalite ValleyRubicon
Uis Tailings
Uis Mine
De Rust
A product of the technical cooperation project between Bundesanstalt fuumlr Geowissenschaften und Rohstoffe (BGR)(Federal Institute for Geosciences and Natural Resources)
andGeological Survey of Namibia within the Ministry of Mines and Energy
ISBN 978-3-948532-29-1 (Print) 978-3-948532-30-7 (PDF)
- List of Abbreviations
- 1 Introduction
- 2 What is lithium
-
- 21 Lithium deposits
-
- 3 Application
- 4 Chemical requirements
- 5 Mining and trade of lithium in the SADC
-
- 51 Lithium production
- 52 Trade data
- 53 Export
- 54Import
-
- 6 Lithium occurrences in Namibia
- 7 Lithium mining in Namibia
-
- 71 Current mining activities and projects
-
- 8 Analysed lithium samples
- 9 Interpretation
- 10 Conclusions
- References
-
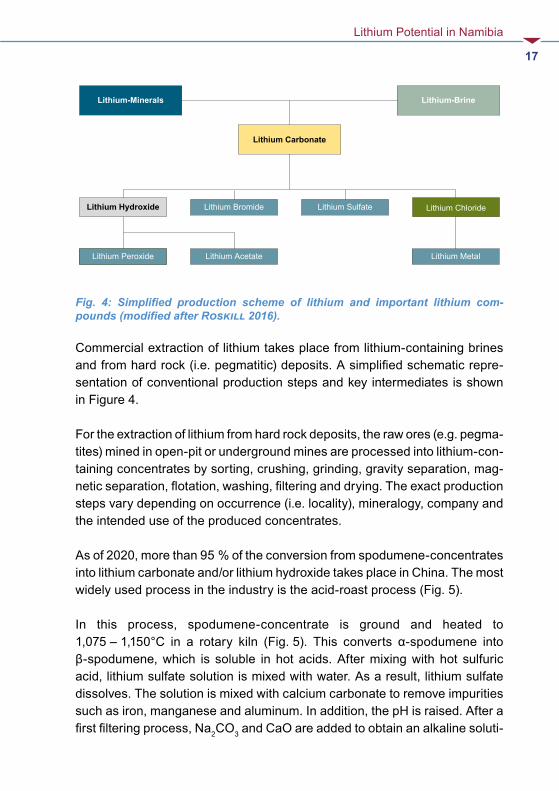
Lithium Potential in Namibia
18
on Impurities such as calcium and manganese are removed The solution is then neutralized with sulfuric acid and heated to increase the concentration of Li2SO4 to about 200 ‒ 250 gl The addition of Na2CO3 and heating the solution to about 100degC triggers the precipitation of lithium carbonate The carbon-ate produced in this way has purities of up to 993 The battery industry however requires purities of min 995 obtained through ion exchange and extraction of impurities The produced lithium carbonate can then also be used for the production of lithium hydroxide
Common understanding was that the production of lithium carbonate was much cheaper from brines compared to hard rock sources Due to many developments in the brine industry mostly related to a recently introduced royalty system in Chile this is no longer the case On the contrary the cost advantage of brines is lost
Fig 5 Simplified production scheme of lithium carbonate derived from spodu-mene-concentrates via acid-roast-process (modified after Garret 2004)
Solution
MillingCooling
Thickener
Filtration
1075 - 1150oCCalcinationSpodumene Concentrate
Mixing
H2SO4
Leaching
H2O amp CaCO3
Gasscrubber
Solids to Tailings
Mixing
Na2CO3 amp CaO
Thickener
Filtration
Solids to Tailings
Neutralisation
H2SO4
Evaporation
90 - 100oCHeating
Filtering WashingDrying
Na2SO4Lithium carbonate
Lithium Potential in Namibia
19
The production of lithium hydroxide which is a fast growing market and a higher priced intermediate product appears to become cheaper when sourced directly from high quality hard rock conversion relative to sourcing from brines via an intermediate step (lithium carbonate) As the cost advantage of brine deposits compared to hard rock deposits is fading the industry has shifted its focus towards hard rock deposits all over the world
In addition to the acid-roast process there are new technological approaches to recover lithium carbonate and lithium hydroxide directly from high quality spodumene-concentrates as well as other mineralogies
Lithium Potential in Namibia
20
5 Mining and trade of lithium in the SADC
51 Lithium production
Each year every mining country of the world is urged to share production statistics regarding their mining activity These statistics are compiled and published by different entities such as the British Geological Survey (BGS) and the United States Geological Survey (USGS) among others
If a country does not appear in these statistics there was either no mining activity for this specific commodity the country did not publish any statistics or the production data is unknown
Table 2 Mine production of lithium (Source BGR 2020 Roskill 2016 USGS 2020 Geoscience Australia 2020)
Mine production [t Li-Content]
Years 2014 2015 2016 2017 2018 2019e Share 2018 []
Australia1) 12333 13160 15590 21000 57000 42000 647
Chile2) 11640 11787 14526 16584 15886 18000 175
Argentina2) 3388 3515 5767 575 6241 6400 69
China3) 1895 2002 2293 3 7376 7500 81
Zimbabwe1) 1024 1025 974 994 700 1600 08
USA2) 846 846 900 900 567 n A 06
Portugal1) 470 470 299 763 700 1200 08
Brazil1) 186 186 195 154 153 300 02
Namibia1) n d nd n d n d 500 n d 05
Other 3) 19 19 18 18 18 500 lt01
Global4) 31801 33011 40562 49012 90941 77000 1001) Hardrock 2) Brine 3) HardrockBrine 4) Deviation due to rounding e estimated
Lithium Potential in Namibia
21
In 2018 global mine output of lithium was around 91000 t Li-content of which only 1200 t originated from the Southern African Development Community (SADC) namely Zimbabwe and Namibia
52 Trade data
Trade data is retrieved from the commercially available Global Trade Atlasreg (IHS Global SA) The database provides both import and export data for more than 90 countries based on customs data of individual countries Data is primarily classified through Harmonised System (HS) product codes by the WCO (World Customs Organization) The HS nomenclature consists of approximately 5000 product groups identified by a 6-digit code
There are limitations to trade data The most prominent issue arises with data availability since many countries do not publish trade data Especially export data is an issue among many countries
There may also be issues with mislabeled products (wrong HS) product bas-kets data entry errors or missing data in general Were export data is not available so-called reverse trade data (RTS) is an option
If a country does not state any exports cumulative global imports from that particular country may be used as a rough yet incomplete estimate of exports It should be noted that these statistics do not represent absolute but rather minimum values as trade between two non-reporting countries will not be reflected The majority of the SADC countries do not report their import and export statistics
The most important lithium products that are globally traded in significant amounts are lithium-carbonate lithium-oxide (hydroxide) lithium-chloride and lithium-mineral-concentrates
Lithium Potential in Namibia
22
53 Export
The most important intermediate product in the lithium market is lithium carbonate In 2019 global exports amounted to approx 117743 t with Chile being the largest exporter (82344 t 70 ) There are no listed exports from the SADC region except minor quantities from South Africa to the Democratic Republic of Congo (9 t) and Zambia (2 t)
Lithium oxides and lithium hydroxides are grouped together under one HS code hence an individual consideration of both products on a country basis is not possible due to the lack of country-specific commodity codes
In 2019 global exports of HS 282520 stood at approx 97550 t with China being the largest exporting country (49800 t 51 )There are no exports published for the SADC region except South Africa with small quantities (28 t) which are considered to be trade through only
Assessment of lithium chloride global trade flows is also difficult as this prod-uct is listed together with many other chemical products under HS 282739 Global trade can only be investigated using country-specific commodity codes (8-digits and above) if available Only three countries list this product under specific trade codes namely China (28273910) Chile (28273930) and Argentina (28273960) SADC countries including Namibia do not publish any data under HS 282739 Based on the available data global exports in 2019 stood at 2254 t with Chile being the largest exporter (2101 t 89 )
Lithium-containing mineral concentrates are among other non-lithium related products listed in a product basket under HS 253090 Only two coun-tries provide information on this product namely Australia as the largest and hence most important producing and exporting country by far and Brazil as a minor exporter (25309010)
No other country including member states of the SADC specifies lithium-con-taining concentrates as such The currently only producing and exporting country in the SADC is Zimbabwe which does not specify exports at all Thus exports are derived from RTS (global imports)
Lithium Potential in Namibia
23
A general problem with HS 253090 is that only information on quantity is avail-able but no information on lithium content which can vary between 12 and 6 Li2O thus the margin of possible errors in terms of total contained lithium is large
In 2019 Australia exported about 16 million tons of spodumene-concentrate down from 35 million tons in 2018 More than 95 destined to China
Inferred exports (RTS) of Zimbabwe were approx 93300 t for HS 253090 About 62000 t of that quantity are listed as imports by South Africa and are unrelated to lithium The remaining quantity is much more in line with production figures of Zimbabwe as well as the known downstream industries of the destination coun-tries within Europe
There are no export records published by Namibia In general and across all traded lithium products South Africa appears to act as an importexport hub within the SADC Also some of the traded products may be used in the glass and ceramic industry of South Africa
54 Import
For most of the SADC countries the statistics retrieved though the Global Trade Atlas do not necessarily represent reliable trade data due to above-mentioned reasons This is especially true when only small import numbers (usually in tons) are listed as these are supposedly artefacts or errors in declaration
Global imports of lithium-carbonate amounted to approx 142965 t with South Korea being the largest importer (38578 t 27 ) There are no listed imports for the SADC region except South Africa (72 t)
Global imports of lithium-oxides (hydroxides) amounted to approx 84900 t with Japan being the largest importer (37300 t 44 ) In analogy to lithium carbonate there are no published imports into the SADC except for South Africa (428 t)
There is no information for imports of lithium-choride or lithium-mineral-con-centrates into the SADC The largest importer of lithium-choride is China with approx 253 t The largest importer of lithium-mineral-concentrates is also China (gt 95 )
Lithium Potential in Namibia
24
Fig 6 Simplified geology of Namibia with major towns as well as railway and tar roads Blue polygons indicate pegmatite belts and districts in central and southern Namibia (Data source Geological Survey of Namibia 2020)
6 Lithium occurrences in NamibiaIn Namibia significant lithium occurrences are found only within pegmatites These Precambrian and early Namibian pegmatites are restricted to two dif-ferent areas respectively the Damara Orogen in north-central Namibia and the Namaqua Metamorphic Complex in southern Namibia (Fig 6)
Lithium Potential in Namibia
25
Within the Damara Orogen four linear pegmatite belts are found all of which strike northeast ndash southwest (Fig 7) Brandberg West ndash Goantagab Cape Cross ndash Uis Nainais ndash Kohero and Sandamap ndash Erongo with the latter connected to the Karibib Pegmatite District (Schneider 1992)
Each of these pegmatite belts exhibit numerous individual pegmatite swarms that occur zoned or unzoned and may carry significant amounts of rare metals or semi-precious stones In the south Lithium-Caesium-Tantalum (LCT) peg-matites occur in two areas Tantalite-Valley south of Warmbad in close prox-imity to the northwest-trending Tantalite Valley Shear Belt and the Sandfon-tein-Ramansdrift area close to the Orange River
Fig 7 Pegmatite belts in north-central Namibia from west to east Brandberg West ndash Goantagab Cape Cross ndash Uis Nainais ndash Kohero and Sandamap ndash Erongo as well as the Karibib Pegmatite District (after Geological Suvey of Namibia 2002)
Lithium Potential in Namibia
26
7 Lithium mining in NamibiaData for historic lithium mine production is available for the period 1939 ndash 1998 (Fig 8) After 1998 all mining activities ceased due to product quality issues and overall market environment
Until the mid-1950s lepidolite was the most important mined lithium mineral of the country (Fig 8) As mine output of lepidolite decreased output of petalite increased However quantity on a year-to-year basis was quite variable and fluctuated between 1000 ndash 10000 t Since the early 1980s production of petalite was quite stable and ranged between 1000 ndash 2500 t Production fell sharply in 1997 and 1998 after which it ceased Mining of amblygonite has always been small compared to lepidolite and petalite and never exceeded 1000 t per annum
According to the USGS (2020) 500 t of lithium were mined in Namibia in 2018 This is most likely stockpiled lepidolite material from the Rubicon mine
0
2000
4000
6000
8000
10000
12000
1939
1941
1943
1945
1947
1949
1951
1953
1955
1957
1959
1961
1963
1965
1967
1969
1971
1973
1975
1977
1979
1981
1983
1985
1987
1989
1991
1993
1995
1997
[Ton
nes]
Petalite (t)Amblygonite (t)Lepidolite (t)
Fig 8 Lithium production in Namibia in [t] per year (after Schneider 1992 BGR 2020)
Lithium Potential in Namibia
27
Currently there is no active consecutive mining for lithium in substantial quan-tities in Namibia although there are prospects and projects under develop-ment
71 Current mining activities and projects
Soris The Soris project is located in the De Rust pegmatite swarm which is part of the ldquoBrandberg West ndash Goantagab tin beltrdquo (Fig 7) This belt stretches to the northeast of the Brandberg massif over a length of 60 km and a width of 25 km This belt was previously mined for cassiterite on a larger scale Some of the pegmatites in this belt may carry substantial amounts of lithium such as pegmatites in the De Rust pegmatite swarm
The De Rust pegmatite itself is a Li-rich rare metal pegmatite that was mined for cassiterite and tantalite but also for minor quantities of spodumene be ween 1960 and 1990 (Diehl 1990) It intruded into metasediments of the Amis River Formation Lower Ugab Group of the Southern Kaoko Zone
It is the largest pegmatite of the De Rust pegmatite swarm within the Brandberg West ndash Goantagab pegmatite belt (Diehl 1992c) Outcrops are 100 ‒ 470 m long up to 30 m wide and can be followed over a length of roughly 24 km
The pegmatite shows well-developed zonation with a border zone (quartz alkali feldspar muscovite) outer (quartz microcline-perthite muscovite altered petalite) and inner (quartzo-feldspathic rock with spodumene crystals with accessory apatite lepidolite eucryptite zircon and monazite) intermedi-ate zone as well as a core zone (quartz subordinate microcline muscovite sporadic tantalite) Spodumene crystals may reach up to 80 cm in length (Fig 12) Towards the core zone spodumene carries rounded nodules of lithi-um phosphates (amblygonite ndash montebrasite series)
It is located northwest of the nearest town of Uis in the Kunene region of Namibia about 6km to the east of farm De Rust 532 and about 25 km north of the Ugab River The nearest railhead is located in the town of Karibib and the deep-water port of Walvis Bay is 120 km to the southwest Windhoek is about 180 km to the southeast
Lithium Potential in Namibia
28
The project can be reached via paved but mostly unpaved roads from the town of Uis From White Lady Lodge which is about 38 km northwest from Uis a 35 km gravel road leads towards the project 15 km of which are in the riverbed of the Ugab River There is currently no electricity and water supply at the project location site
According to SampP Global (022020) current owner of the Soris project is Mon-tero Mining amp Exploration Ltd (TSXV MON) which holds 80 interest of the property Another 20 are allocated to an unnamed private owner Based on data from the Namibia Mining Cadastre Portal (092020) multiple entries for mining licence applications exist for the area where the main De Rust pegmatite is located (Fig 9)
Resource estimateDue to the early stage of the Soris project no resource estimate is avail-able However Montero Mining claims the project to be drill ready targeting a resource of 10 Mt 1 Li2O with tantalum and tin by-product credits This would equate to 46400 t of lithium or 247000 t LCE
Grab samples of the deposit showed lithium contents of 007 to 532 aver-aging 137 Channel samples showed average lithium contents of 076 and values up to 366 (Montero 032019) The company also re-assessed 1097 previously tested RC drill samples The main lithium-bearing mineral is spodumene
Remnants of historic intermittent mining activities like old foundations and quartzo-feldspathic tailings are still visible east to the main pegmatite (Fig 10 ‒ 11)
Lithium Potential in Namibia
29
Fig 10 Remnants of historic open pit mining (upper) and tailings of De Rust pegmatite (lower) northwest of the Brandberg massif (Photo BGR-GSN 2019)
Fig 9 Satellite image of the De Rust project including the outlined mining license Main pegmatite coordinates 20deg57prime48primeprimeS ‒ 14deg30prime12primeprimeE (Source httpportalsflexicadastrecomnamibia 092020)
Main pegmatite
Lithium Potential in Namibia
30
Fig 12 Weathered spodumene chrystals at the historic open pit mine (Photo BGR-GSN 2019)
Fig 11 Historic open pit of the De Rust pegmatite (Photo BGR-GSN 2019)
Lithium Potential in Namibia
31
Uis The Uis projects (former mine and tailings) are located in the northern part of the ldquoCape Cross Uis pegmatite beltrdquo east of the town of Uis on the farm Uis Townlands No 215 in the Erongo region of Namibia
The Cape Cross-Uis belt is approx 120 km long and up to 40 km wide and extends in a NE direction (Fig 7) It comprises three distinct pegmatite swarms the Strathmore swarm Karlowa swarm and Uis pegmatite swarm In general lithium-bearing pegmatites (Li-Nb-Ta-Sn-Be and Li-Nb-Ta-Sn) are the least common in this belt (Fuchsloch et al 2018)
The Uis swarm field consists of more than 120 individual pegmatites each with a northeasterly to easterly strike direction and northwesterly down dip (30deg ‒ 70deg) This field is accompanied by a peripheral pegmatite field of approx 25 individual pegmatites
Some of the main pegmatites especially around the formerly worldrsquos largest tin mine at Uis are exceedingly large Some of them are up to 1 km long and some 50 m wide
In terms of lithium petalite amblygonite and minor spodumene mineralization occurs in the various pegmatites but no lepidolite Most common lithium bear-ing minerals in the eight pegmatites that were mined at Uis are amblygonite petalite and spodumene
Currently the Uis tailings project and the Uis tin mine are owned by two differ-ent companies As of 2020 the tin mine is operating a pilot processing plant and aims to ramp up the production of lithium in the near future The current ownership of the tailings project as of September 2020 is unclear
The nearest commercial deep-water port to the projects is Walvis Bay 220 km to the southeast The town of Omaruru is 130 km to the east and Henties Bay lies about 120 km to the southwest The nearest railhead is located in Omaruru The area is accessible year-round by paved and un-paved roads NamPower provides electricity and the town of Uis is connected to the Nam-Water pipeline
Lithium Potential in Namibia
32
The tin deposit was discovered in 1911 and mined between the 1950s and 1989 for cassiterite by Uis Tin Mining Company (SWA) Ltd and IMCOR
Coarse tailings are located in the northern part of the former mine just south to the main road C36 (Fig 13) The fine material is located south to the coarse waste dumps (Fig 13)
After 1990 multiple companies owned the property until AfriTin Mining Ltd bought all the rights (license ML134) The current lithium tailings project of Montero Mining amp Exploration Ltd (TSXV MON) is based on the historic mine tailings of the former tin mine on mining license ML134 that is currently owned by AfriTin Mining Ltd The acquired tailings material does not fall under the ML134 license of AfriTin since historical tailings material (Fig 14) is not regulated by Minerals (Prospecting and Mining) Act 33 of 1992 of Namibia
Resource estimateUis tin mineAccording to AfriTin the former Uis mine holds a JORC compliant resource (inferred) of 715 Mt of ore 0134 Sn with a cut-off grade of 005 Sn (AfriTin 2020) Grades of ancillary elements are given at 063 Li2O and 85 ppm Ta for the total resource of 71 Mt of ore
This equals to approx 95000 t of tin 209000 t of lithium (11 Mt LCE) and 6090 t of tantalum 85 of the total resource are attributable to the company The remaining 15 are allocated to SMU (Small Miners of Uis)
Uis tailingsMontero Mining filed an inferred resource estimate of 144 Mt of ore 037 Li2O and 005 SnO2 with a 035 Li2O cut-off grade for lithium and assumed processing recoveries of 70 for their tailings project (Montero 2019) This equals to approx 24700 t of lithium content (131500 t LCE) and 7200 t SnO2
This resource estimate only includes coarse tailings material There is current-ly no information on the lithium content of the fine tailings material that totals 271 Mt t due to insufficient or no test work (Montero 2018) The company also states that the average Li2O grade of the fines material does not hurdle the cut-off for the fines of 082 Li2O
Lithium Potential in Namibia
33
In 2016 Australian based Tawana Resources carried out a drilling program at Uis for a private company called Lithium Africa 1 on the fine and coarse tailings (Table 3 Hole 1 amp Hole 2) Below some of the obtained data on lithium content is given Additionally Li2O content of two obtained grab samples by BGR (Table 3 Sample 2019a amp 2019b) is given
Table 3 Sample data Uis (Tawana 2016 Montero 2018 BGR 2019)
Sample Sample 0 to 1m Li2O ()
Sample 1 to 2m Li2O ()
Sample 2 to 3m Li2O ()
Fines Hole 1 071 085 092
Fines Hole 2 080 089 095
Coarse Hole 1 050 043 043
Coarse Hole 2 054 062 062
BGR Sam-ple 2019a (Coarse tailings)
028
BGR Sam-ple 2019b (Coarse tailings)
028
Montero NI 43-101 037
Lithium Potential in Namibia
34
Fig 14 Tailings of the historic Uis Tin Mine (Photo BGR-GSN 2019 with kind permission of AfriTin Mining Limited)
Fig 13 Former Uis tin mine Uis tailings project with coarse tailings Tailings coordina-tes (center) 21deg13prime31primeprimeS ‒ 14deg52prime44primeprimeE (Source httpportalsflexicadastrecomnamibia 092020)
Uis Tailings (coarse)
Uis Tailings (fine)
Historic Uis mine
Lithium Potential in Namibia
35
Karibib Lepidolite ProjectThe Karibib Lepidolite brownfield project is located in the ldquoKaribib ndash Usakos Pegmatite Districtrdquo southeast of the town of Karibib on the farm Okongava Ost No 72 in central Namibia (Fig 15 ‒ 16)
This pegmatite district which is of Damaran age hosts the most important pegmatite occurrence (Rubicon swarm) in terms of lithium in Namibia In addi-tion numerous other different pegmatite swarms some of which have previ-ously been relevant in terms of lithium are know from this district These are Dernburg Karlsbrunn Albrechtshoumlhe Berger Kaliombo Gamikaubmund Okatjimukuju Etusis Daheim Friedrichsfelde and Etiro (Diehl 1992a)
The Rubicon pegmatite itself is the largest of the individual pegmatites that occur in this field and has been the prime source of lithium until mining seized in the early 1990s The Helikon pegmatites are part of the Rubicon pegmatite swarm and are located northeast to the Rubicon pegmatite They have previ-ously been mined for lepidolite amblygonite petalite and muscovite beryll pollucite quartz and columbite-tantalite as valuable by-products (Fig 18 ‒ 19)
The pegmatite itself consist of two ellipsoidal well zoned Li-mineralized ore-bodies The larger one is about 320 m long and 25 ndash 35 m wide It dips at 46deg to the northeast and has a northwesterly strike The second orebody is about 230 m long and about 10 m wide It is dipping with 30deg to the northeast and has a northwesterly strike In total the outcrop of the Rubicon pegmatite is about 600 m long with a maximum width of 65 m (Fig 17)
A very prominent feature is the presence of a very well developed concen-tric shell and zones from the footwall to the inner core of the pegmatite Both orebodies exhibit a border- wall- intermediate- and core-zone
Border-zone wall-zone and outer intermediate zone of the larger orebody do not contain Li-bearing minerals of economic importance The inner interme-diate zone does contain lepidolite The outer core zone may be sub-divided into a petalite zone low-grade lepidolite zone and a high-grade lepidolite zone The inner core zone also contains a petalite zone Mining occurred pre-viously in the later named zones The zonation of the smaller orebody to the northwest is less pronounced but Li-mineralization and style are equal to the
Lithium Potential in Namibia
36
larger orebody There is no spodumene mineralization within the orebodies and respectively zones of the Rubicon pegmatite
The Helikon I pegmatite is also a lens-shaped pegmatite with a length of roughly 400 m and a width of approx 66 m It dips to the north with about 60deg ndash 70deg Helikon I also consists of well-defined zones The main Li-bearing minerals are lepidolite and petalite According to Roering (1963) the lepidolite is difficult to separate from the intergrown albite and hence of low grade and quality
The Helikon II pegmatite is approx 17 km long and only 9 ndash 15 m wide It lies a bit north of Helikon I and dips steeply to the north with 55deg ndash 80deg striking east west The main Li-bearing minerals are lepidolite and petalite According to Diehl (1990) the westernmost portion of the pegmatite has historically been the economically most important A massive up to 6 m wide petalite zone was mined here according to Diehl (1990)
The nearest railhead to the project is 17 km away in Karibib and the deep-water port of Walvis Bay is 220 km to the southwest Windhoek is about 180 km to the southeast NamPower connects the town of Karibib to electricity and the project currently utilizes generators There is a 7 km long 22 kV power line spur to grid connection pending (Lepidico 2020) Water is available via on-site boreholes
The project was previously owned by Desert Lion Energy Inc (TSVX DLI) Lepidico Ltd (ASX LPD) bought into the project and currently holds 80 interest which comprises Mining License 204 (69 km2) as well as three Exclu-sive Prospecting Licenses (EPLs) namely 5439 5555 and 5781 (Lepidico 2020)
Lepidico will cover mining from multiple sources as well as chemical conver-sion by utilizing their proprietary lithium processing technologies L-Maxreg LOH-Maxreg and S-Maxreg (Lepidico 052019) The company aims to produce high purity lithium chemicals such as lithium carbonate and lithium hydroxide
The takeover also included a nonbinding offtake agreement between the for-mer owner Desert Lion Energy Inc and German chemical company BASF On April 2nd 2019 Desert Lion Energy Inc announced this offtake agreement
Lithium Potential in Namibia
37
which at the time was valid through to December 31 2019 On December 20th
2019 Lepidico announced that the LOI with BASF was extended to Decem-ber 31st 2020 (Lepidico 122019)
The feasibility study criteria of Lepidico are as follows
- Throughput of the concentrator on-site of 035 Mtpa- Expansion of throughput after year five to 05 Mtpa- Chemical plant in the industrial city of Abu Dabi (ICAD)- Plant design for 58000 tpa of concentrate (4 LiO2) for the production of
up to 5500 tpa LiOH- Utilization of L-Maxreg and LOH-MaxTM- Non-binding off-take MOU with BASF for LiOH only- Targeting for project commissioning to commence late 2021 for commer-
cial production in 2022
The preliminary mine plan indicates a strip ratio of 03 ndash 1 for the first two years The ratio will then go up to 1 ndash 14 In the first four years elevated grades of 06 LiO2 will be mined
Resource estimateA JORC 2012 compliant resource estimate for the deposit is given in Table 4 (Lepidico 2020) The deposit currently holds 23200 t of lithium (Indicated amp Inferred) based on a cut-off grade of 015 Li2O This resource estimate is based solely on the lepidolite occurrences at the mine site
Table 4 Resource estimate Karibib Lepidolite Project (Source Lepidico 2020)
Deposit Resource Category
Cut-off (Li2O)
Ore (Mt)
Li2O ()
Li (t)
Li (LCE)
Rubicon Measured
015
22 057 5819 30974
Rubicon Indicated 666 038 11637 61943
Rubicon Inferred 237 043 4728 25167
Helikon
Total 015 1124 043 22184 118086
Lithium Potential in Namibia
38
Fig 16 Satellite image of the Karibib Lepidolite project Helikon 1 coordinates (center) 22deg2prime49primeprimeS ‒ 16deg1prime13primeprimeE Helikon 4 coordinates (center) 22deg2prime24primeprimeS ‒ 16deg1prime41primeprimeE (Source httpportalsflexicadastrecomnamibia 092020)
Fig 15 Satellite image of the Karibib Lepidolite project Rubicon coordinates (center) 22deg6prime11primeprimeS ‒ 15deg59prime44primeprimeE (Source httpportalsflexicadastrecomnamibia 092020)
Historic Rubicon mine
Helikon 1
Helikon 4
Lithium Potential in Namibia
39Fig 17 Rubicon pegmatite (Photo BGR-GSN 2019 with kind permission of Lepidico Chemicals Namibia (Pty) Ltd 2020)
Lithium Potential in Namibia
40 Fig 18 Lepidolite sample from Rubicon pegmatite (Photo BGR-GSN 2019 with kind permission of Lepidico Chemicals Namibia (Pty) Ltd 2020)
Fig 19 Petalite sample from Rubicon pegmatite (Photo BGR-GSN 2019 with kind permission of Lepidico Chemicals Namibia (Pty) Ltd 2020)
Lithium Potential in Namibia
42
Fig 21 Helikon 4 pegmatite (Photo BGR-GSN 2019 with kind permission of Lepidico Chemicals Namibia (Pty) Ltd 2020)
Fig 20 Helikon 1 pegmatite (Photo BGR-GSN 2019 with kind permission of Lepidico Chemicals Namibia (Pty) Ltd 2020)
Lithium Potential in Namibia
43
Tantalite ValleyThe Tantalite Valley Project lies within the ldquoNamaqua Metamorphic Complexrdquo in Southern Namibia Within this complex Lithium-Caesium-Tantalum (LCT) pegmatites occur in two main areas Tantalite-Valley south of Warmbad in close proximity to the northwest-trending Tantalite Valley Shear Belt and the Sandfontein-Ramansdrift area close to the Orange River
The area were the pegmatites of the Tantalite Valley occur is primarily com-posed of a large ovoid gabbro intrusion (71 km by 33 km in extent) within paragneiss units of the Namaqua Complex The gabbro outcrop forms a large dome shaped mountain that rises about 500 m above the surrounding topo-graphy
The pegmatites belong to the Kenhardt and Gordonia pegmatite districts in Namaqualand but only the younger group of them carry accessory ore miner-als such as tantalite beryl REE minerals and lithium
The Tantalite Valley pegmatites include several individual subhorizonal dikes that are up to 1000 m long and 02 to 40 m wide plunging towards southeast (Diehl 1992b) Four of those are of economic interest Homestead Whitkop White City and the Lepidolite pegmatites (ie Purple Haze) (Fig 22)
They are all well zoned (quartz core inner and outer intermediate zones wall zone) and were predominantly targeted for beryl columbite-tantalite as well as lithium and bismuth minerals
The project is located on the farms Umeis 110 and Kinderzitt 132 between the Farms 109 131 129 308 and 473 in the magisterial district of Karas It currently comprises Mining License (ML-77) fully owned by Tameka Shelf Co Four (Pty) Ltd which is a 100 subsidiary of African Tantalite Pty Ltd (AFTAN) Above all Kazera Global Investments PLC holds a 75 stake in AFTAN (Kazera 2019) with the other 25 of local farmer ownership
The project is accessible via gravel road from Karasburg which is about 80 km to the north The nearest railhead is also located in Karasburg Electricity is currently supplied by generators and water is recovered from multiple drill holes The Orange River is about 15 km to the south of the project Mining
Lithium Potential in Namibia
44
infrastructure as well as equipment are on site as well as a plant for the pro-duction of tantalite concentrate
NTI is working on an extensive exploration program with a clear focus on revi-ving tantalite mining in Namibia with a possible by-product stream of lithium bearing minerals The company will focus primarily on the pegmatites Homes-tead Purple Haze Signaalberg and White City (Fig 23)
The area is known for its tantalum occurrences and since the late 1940s tantalite and other minerals have been recovered at Tantalite Valley until 1981 when mining ceased Initially alluvial deposits were mined followed by the pegmatites themselves Grades of the concentrates produced prior to the closure of the mine were quite high with 65 ‒ 70 Ta2O5 with very low U3O8
and ThO2 values of 025 max
Resource estimateAccording to SampP Global (092020) Measured and amp Indicated resources at Tantalite Valley are 104800 t of ore 0042 Ta2O5 and 0653 Li2O as of 112019 This would equate to 315 t of lithium or 1690 t LCE Total inferred resources are 517400 t of ore 0018 Ta2O5 and 0144 Li2O This equals to approx 91 t of tantalum and 750 t of lithium (3535 t LCE)
Lithium Potential in Namibia
45
Fig 23 White City pegmatite (Source Kazera global Investments PLC 2020)
Fig 22 Satellite image of the Tantalite Valley project White City pegmatite coordinates (center) 28deg43prime07primeprimeS ‒ 18deg44prime45primeprimeE Homestead pegmatite coordinates (center) 28deg43prime19primeprimeS - 18deg44prime24primeprimeE Purple Haze pegmatite coordinates (center) 28deg43prime09primeprimeS ‒ 18deg43prime55primeprimeE (Source httpportalsflexicadastrecomnamibia 092020)
Lithium Potential in Namibia
46
8 Analysed lithium samplesDuring the course of the cooperation project between the Economic Geology Division (EGD) of the Geological Survey of Namibia (GSN) and the Ger-man Federal Institute of Geosciences and Natural Resources (BGR) several sampling campaigns to southern and central pegmatites took place
The field trips were preceded by literature and data research regarding infor-mation on lithium occurrences andor previous lithium mining activity to iden-tify specific target areas
During a campaign in 2019 16 lithium-bearing mixed mineral samples were taken from five different locations and subsequently analyzed Two of the samples originate from the Uis Tin Mine Tailings of the former tin mine All remaining samples were taken either from stripped outcrops for future mine activities or from previous mine sites (ie pits)
All 16 samples were analyzed at BGR labs in Hanover Germany through qualitative XRD XRF and ICP-MS Given data shall be understood as a first indicator for the sampled lithium occurrences
Most if not all sampled occurrences have previously been analyzed or are cur-rently being assessed by the property owners or current licensees Detailed information of these sampling and analytical campaigns remain confidential and are thus not available for comparison
Appendix A lists the identified qualitative mineralogy of the samples as well as the major element analysis Additional samples from previous campaigns are also given
Interpretation of the results are based on their applicability in the various lithium-consuming industries for which information is available
Most of the current lithium applications require a chemical intermediate product such as lithium carbonate or lithium-hydroxide The glass and cera-mic industry does use lithium-bearing mineral concentrates depending on the prices of these materials when compared to LiCO3
Lithium Potential in Namibia
47
Since the main applications require an intermediate or downstream chemical product lithium content as well as impurity values are the main criteria for the suitability of the sampled occurrences Other quality criteria are particle size and surface areastructure
9 InterpretationAs previously stated all obtained grab samples are mixtures of lithium- bearing minerals (ie spodumene petalite lepidolite) feldspars quartz micas as well as secondary minerals Therefore all given analytical data has to be taken with caution and will not be representative for the individual outcrops or deposits
The evaluation of the economic suitability for various economic applications of the analysed lithium samples is based on the chemical specifications in Chapter 4
Lithium content gt 1 Li2O Fe2O3 content lt 015 as well as F content lt 01 are individually highlighted (Appendix A) as these three values are the most important
Based on the chemical analysis nine of the 16 samples showed Li2O contents of more than 1 (range 117 ‒ 327 ) Seven of those nine samples also exhibited low Fe2O3 content (range 004 ‒ 008 ) (Appendix A) Three of those seven samples also had fluorine values below 005
Of the ten additionally included samples from previous campaigns four showed Li2O contents of more than 1 (range 126 ‒ 199 ) Three of those samples also exhibited low Fe2O3 content (range 004 ‒ 007 ) (Appendix A) One of the three samples had fluorine values below 005
The mentioned samples (sources) could be of potential use but for further interpretation statistical sampling will be required
Lithium Potential in Namibia
48
10 ConclusionsThere is currently no lithium industry established in Namibia This accounts to both mining and processing of ores into commercial lithium-bearing con-centrates as well as the production of downstream products such as lithium carbonate andor lithium hydroxide In order to evaluate the potential for a lithium industry in Namibia the current global market and price developments need to be addressed
Currently the main application for lithium is in the chemical industry as lithium carbonate andor hydroxide for the manufacturing of lithium-ion batteries There is currently no domestic market (supply) or demand for this industry in Southern Africa or Namibia in specific Processing of lithium-bearing ores into these highly specific downstream products is economically more viable in close proximity to the demanding industries It also requires large investments (double-digit million dollars per 10000t of capacity) Additionally there is already huge capacity and strong capacity build up in Asia at rather low cost
The second most important application lies in the glass and ceramics industry This industry uses lithium either as lithium-bearing concentrates or lithium carbonate depending on current market price and processproduct require-ments There is currently no such industry established in Namibia but potential plans There is glass and ceramics manufacturing in South Africa and thus a potential market for lithium bearing products (concentrates) should this indus-try require it depending on product
The 20182019 primary lithium supply based on spodumene-bearing mineral concentrates was dominated by Australia with a market share of well over 95 On an annual basis the country exports more than three million tons of lithium-bearing concentrates to China To put this into perspective Lepidico plans to export just 58 ktpa of concentrate to Abu Dhabi for refinement from their project annually Therefore potential production in Namibia will always be rather small scale when compared to peer producing countriescompanies
As of late 2020 the concentrate market is in strong oversupply with strong competition Thus prices have eroded quite substantially for a standard SC6 concentrate (Fig 24) In general prices vary significantly based on lithium content and impurities of the concentrates Lithium bearing mineral concen-
Lithium Potential in Namibia
49
trates are a relatively low-value mineral commodity when compared to lithi-um-carbonate or other lithium downstream products thus product quality cost reduction and cost control are key components in this industry Since prices are depressed currently many of the Australian producers have drasti-cally reduced output or even went into care and maintenance This situation may change towards 2025 or beyond as demand picks up
Prices for the higher valued product lithium-carbonate spiked at the end of 2017 towards 2018 to more than 20000 $USt on a contract basis with prices being very volatile Since then prices have also eroded to below 9000 $USt due to oversupply and slow demand pickup (Fig 25) With this product stable quality and chemical composition are crucial for the downstream industry
Based on available gradetonnage data the Namibian projectsprospects are relatively small in overall size and low in grade when compared to global peers for the resource category ldquoMeasuredIndicatedrdquo (Appendix B) Total contained lithium quantity is thus relatively small in comparison On a global scale the most promising hard rock projects that are currently being mined and developed have Li2O grades of 10 or above
Fig 24 Lithium-mineral-concentrate prices 012010 ‒ 062020 (Source BGR 2020)
300
400
500
600
700
800
900
1000
1100
208
210
212
214
216
218
220
US$
t US$t
01-20
14
01-20
15
01-20
16
01-20
17
01-20
18
01-20
19
01-20
20
01-20
10
01-20
11
01-20
12
01-20
13
Spodumene min 5-6 LiO2 fob Australia
Spodumene concentrate gt75 LiO2 bulk cif Asia
Petalite 42 LiO2 fob Durban
Spodumene fob Australia
Spodumene min 5-6 LiO2 cif China
Lithium Potential in Namibia
50
For the resource category ldquoIndicatedrdquo which generally represents the lowest level of confidence only the Uis mine project of AfriTin represents a size-able resource even though grades are relatively low (Appendix C) The Uis tailings project as well as the Rubicon project are again relatively small when compared to their global peers Tantalite Valley is the smallest of all included projects (Appendix C)The given data for the De Rust project reflects only an exploration target of the company rather than actual data and may thus be not representative
Based on size and contained lithium-content none of the visited early stage projectsprospects would justify the financial investment into the construction of a chemical conversion plant for the production of lithium carbonate andor hydroxide on site as it requires very large monetary investments Due to their size payback of the required investments may be unfavorable when compared to global peers In addition the current market environment is very harsh with strong competition from Asia that has a huge cost advantage due to capacity build up This industry is also very energy and water intensive
In addition location within Namibia as well as distance to possible down-stream markets may become an issue as it increases the transportation cost
4000
7000
10000
13000
16000
19000
22000
25000
28000
01-20
14
01-20
15
01-20
16
01-20
17
01-20
18
01-20
19
01-20
20
US$
t
Lithium-carbonate (min 995 ) battery grade spot price ex works domestic ChinaLithium-carbonate (min 99-995 ) Li2CO3 large contracts USA delivered continentalLithium-hydroxid-monohydrate (min 565) technical and industrial grades cif China Japan amp Korea
Fig 25 Lithium chemical prices 012014 ndash 062020 (Source BGR 2020)
Lithium Potential in Namibia
51
immensely This is especially true for the SorisDe Rust pegmatite which is in a remote location without any allocated infrastructure The projects Karibib Uis and Tantalite Valley are much easier to access
The approach of Lepidico to produce a lithium bearing concentrate on site seems plausible approach Since this will already require a skilled workforce mining and beneficiation equipment in order to produce a high quality lithium-bearing concentrate it may already be considered ldquoadded valuerdquo for the indus-try of the country This approach may also be suitable for the other mentioned and visited projects
Lithium Potential in Namibia
52
ReferencesAfriTin Mining (2020) Uis Tin Project ndash Company Information ndash URL httpafritinminingcomuis-project [as of 092020]
Australian Government Geoscience Australia (2019) Australiarsquos Identi-fied Mineral Resources 2019 ndash URL httpswwwgagovauscientific-topicsmineralsmineral-resources-and-adviceaimr [as of 092020]
BGR ndash Bundesanstalt fuumlr Geowissenschaften und Rohstoffe (2020) Fachinformationssystem Rohstoffe ndash unpubl Hannover [as of 082020]
BGS ndash British Geological Survey (2016) Lithium Definitions mineralo-gy and deposits ndash URL httpswwwbgsacukdownloadsstartcfmid=3100 [as of 062016]
Diehl B J M (1990) Pegmatites of the Cape Cross Uis ndash Pegmatite Belt Namibia Geology mineralisation Rubidium Strontium characteristics and petrogenesis of rare metal pegmatites Open File Report EG 083 Economic Geology Series Geological Survey of Namibia 39 pp Windhoek
Diehl B J M (1992a) Lithium Caesium Beryllium Open File Report Mineral Resource Series Geological Survey of Namibia 18 pp Windhoek
Diehl B J M (1992b) Niobium and Tantalum Open File Report Mineral Resource Series Geological Survey of Namibia 20 pp Windhoek
Diehl B J M (1992c) Tin Open File Report Mineral Resource Series Geological Survey of Namibia 30 pp Windhoek
Diehl B J M amp Schneider G I C (1990) Geology and mineralisation of the Rubicon Pegmatite Namibia Open File Report Geol Surv Namibia 20 pp Windhoek
Fuchsloch et al (2018) Classification mineralogical and geochemical vari-ations in pegmatites of the Cape Cross-Uis pegmatite belt Namibia Lithos 296 ndash 299 79-95 elsevier
Lithium Potential in Namibia
53
Garret D E (2004) Handbook Of Lithium And Natural Calcium Chloride Their Deposits Processing Uses and Properties ndash 467 S Oxford (Elsevier B V)
Geological Survey of Namibia (2002) Mineral Resources of Namibia Summary of Mineral Deposits and Occurrences Omaruru Sheet 2114 Volume I ndash Complete Descriptions 119 pp Windhoek
IHS Global SA (2020) Global Trade Atlas ndash Commercial Online-Databa-se ndashURL httpsmyihscomConnectcallingUrl=https3a2f2fconnectihsmarkitcom2f [as of 062017]
Kazera Global Investments PLC (2020) Company Information ndash URL httpskazeraglobalcominvestmentsnamibia-tantalite-investment-mine [as of 092020]
Lepidico (2019) LOI with BASF extended to 31 December 2020 ndash News Release ndash URL httpswwwlepidicocomwp-contentuploads201910LPD-191220-LOI-with-BASF-extended-to-31-December-2020pdf [as of 122019]
Lepidico (2019) Corporate Presentation ndash URL httpswwwlepidicocomwp-contentuploads201907LPD-190509-Corporate-Presentati-on-May-2019pdf [as of 052019]
Lepidico (2020) Company Information ndash URL httpswwwlepidicocomprojectskaribib [as of 092020]
Montero Mining amp Exploration Ltd (2018) Exploring Battery Metals in Namibia ndash Company Presentation ndash URL httpswwwproactiveinvestorscomauuploadSponsorFileFile2018_031520244941_MON-CorporatePre-sentationMarch2018pdf [as of 072018]
Montero Mining amp Exploration Ltd (2019) Montero Files NI 43-101 Resource Estimate On The Uis Lithium-Tin Tailings Project In Namibia On Sedar ndash News Announcement ndash URL httpsmonterominingcommontero-files-ni-43-101-resource-estimate-on-the-uis-lithium-tin-tailings-project-in-namibia-on-sedar [as of 032019]
Lithium Potential in Namibia
54
Namibia Mining Cadastre Portal (2020) Online-Database ndashURL httpsportalslandfoliocomnamibia [as of 092020]
Roskill Information Services Ltd (2016) Lithium Global Industry Mar-kets amp Outlook ndash 386 S London Groszligbritannien
Schneider G I C (1992) Feldspar Open File Report MRS 08 Mineral Resource Series Geological Survey of Namibia 2 pp Windhoek
Schmidt M (2017) Rohstoffrisikobewertung ndash Lithium ndash DERA Rohstoffin-formationen 33 Berlin
S amp P Global Market Intelligence (2020) Lithium - Metals amp Mining Properties URL httpsplatformmarketintelligencespglobalcomwebcli-entauth=inheritindustryminingProjects [as of 092020]
Statista (2020) Distribution of lithium end-usage worldwide in 2019 by area application ndash URL httpswwwstatistacomstatistics268787lithium-usa-ge-in-the-world-market [as of 062020]
Tawana Resources NL (2016) Tawana acquires second lithium pro-ject ndash News Release ndash URL httpsmstrademomentumcozajsepdfSENS_20160923_S376505pdf [as of 092016]
USGS ndash United States Geological Survey (multiple years) Lithium ndash Minerals Commodity Summaries ndash URL httpswwwusgsgovcentersnmiclithium-statistics-and-information [as of 082020]
Appendix
Sam
ple I
DFa
rmLa
titud
eLo
ngitu
deSa
mpl
e des
crip
tion
(XRD
qu
al)
LiO 2
()
SiO 2
Ti
O 2
Al2O 3
Fe2O 3
Mn
O Mg
O Ca
O Na
2O
K 2O P 2O 5
SO
3
Cl
F
LOI
Su
m
2015
-03
previous sample campaignsHelik
on
n A
Felds
parQ
uartz
Lepid
olite
025
6871
lt000
119
0500
200
2900
505
3292
806
7905
59lt0
01lt0
002
lt005
093
9985
2016
-12
Rubic
onwe
ather
ed P
etalite
126
6473
lt000
118
0600
703
2718
607
9507
805
2500
62lt0
01lt0
002
lt005
1146
9871
2016
-17
Rubic
onLe
pidoli
te +
Quar
tz13
063
6700
219
9316
0929
003
0054
029
6218
0052
lt001
lt000
226
232
798
67
2016
-20
Helik
onLe
pidoli
te + A
lbite
176
5514
lt000
126
8700
401
2100
700
2123
970
3900
45lt0
01lt0
002
156
369
9698
2016
-21
Helik
onLe
pidoli
te19
954
32lt0
001
2627
004
0224
006
0038
266
714
0069
lt001
lt000
240
628
997
77
FN20
19_0
4De
Rus
tFe
ldspa
rAmb
lygon
iteP
etalite
(n
on X
RD)
003
6513
lt000
118
82lt0
0100
0200
101
0924
311
4105
75lt0
0100
04lt0
0503
898
84
2015
-09
Molop
oPe
talite
(non
XRD
)00
952
85lt0
001
1672
lt001
0002
487
0323
342
0352
lt000
100
400
3403
621
1310
012
2016
-14
Molop
oPe
talite
wea
there
d (no
n XRD
)00
752
1600
0316
5100
200
5147
805
8923
406
4500
6900
200
8602
222
6310
013
2016
-15
Molop
oFe
ldspa
r (no
n XRD
)00
664
02lt0
001
1937
003
0004
003
0151
216
1249
0796
lt001
lt000
2lt0
0505
399
55
2016
-23
Molop
oZin
nwald
ite (n
on X
RD)
006
5044
0068
3307
048
0011
012
0426
261
7674
0181
lt001
lt000
2lt0
0542
9925
1909
249
2019Uis
Tailin
gs
Quar
tzFe
ldspa
rPeta
lite
Musc
ovite
028
7293
0045
1479
051
0062
0212
9830
927
6613
6200
2lt00
02lt0
0523
399
38
1909
250
Uis
Tailin
gsQu
artz
Felds
parP
etalite
Mu
scov
ite02
872
6900
4314
8205
0059
019
1306
313
2794
1347
002lt
0002
lt005
251
9937
1909
251
Helik
on 4
22deg02prime4
8primeprimeS1
6deg01prime30
primeprimeEQu
artz
Felds
parP
etalite
Le
pidoli
te16
464
4400
0319
4200
301
2100
408
8325
345
6806
800
400
0727
228
998
38
1909
252
Helik
on 1
22deg02prime2
0primeprimeS1
6deg01prime19
primeprimeEPe
talite
Lepid
olite
Quar
tz29
576
9200
0116
6800
300
0304
101
7301
106
8100
01lt0
01lt0
002
lt005
205
97
App
endi
x A
Ana
lytic
al d
ata
of li
thiu
m s
ampl
es c
olle
cted
in N
amib
ia T
hres
hold
val
ues
high
light
ed in
gre
en
Lithium Potential in Namibia
57
Sam
ple I
DFa
rmLa
titud
eLo
ngitu
deSa
mpl
e des
crip
tion
(XRD
qu
al)
LiO 2
()
SiO 2
Ti
O 2
Al2O 3
Fe2O 3
Mn
O Mg
O Ca
O Na
2O
K 2O P 2O 5
SO
3
Cl
F
LOI
Su
m
1909
253
2019Rubic
on22deg06prime1
3primeprimeS1
5deg59prime45
primeprimeEPe
talite
Lepid
olite
Quar
tz32
778
73lt0
001
1687
002
0006
002
0157
011
003
0002
003
0003
lt005
075
9663
1909
254
Rubic
on22deg06prime1
0primeprimeS1
5deg59prime41
primeprimeEFe
ldspa
rQua
rtzM
usco
vite
004
682
lt000
119
3500
300
2400
205
0610
0808
6804
3lt0
01lt0
002
lt005
041
9985
1909
255
Rubic
on22deg06prime1
0primeprimeS1
5deg59prime41
primeprimeEFe
ldspa
rLep
idolite
Mus
co-
viteK
aolin
026
6104
0004
2318
022
0136
006
0119
367
8411
0159
lt001
lt000
2lt0
0522
299
15
1909
256
Rubic
on22deg06prime1
0primeprimeS1
5deg59prime41
primeprimeELe
pidoli
te 27
249
8700
129
3400
408
0500
400
704
697
3100
31lt0
01lt0
002
087
441
9569
1909
257
Rubic
on22deg06prime1
3primeprimeS1
5deg59prime45
primeprimeEPe
talite
Lepid
olite
Quar
tz30
670
0900
0320
2600
801
0901
502
9901
926
800
15lt0
0100
04lt0
0526
596
48
1909
258
Rubic
on22deg06prime1
0primeprimeS1
5deg59prime41
primeprimeELe
pidoli
teFe
ldspa
rQua
rtz20
659
7800
0224
100
505
2400
300
513
7247
0051
lt001
0002
265
388
9966
1909
259
Tanta
lite
Valle
y28deg43prime0
9primeprimeS1
8deg43prime55
primeprimeEFe
ldspa
rLep
idolite
Mus
covit
e11
762
64lt0
001
2139
004
0161
lt001
0399
7731
2401
0900
200
119
912
698
85
1909
260
Tanta
lite
Valle
y28deg43prime0
9primeprimeS1
8deg43prime55
primeprimeEFe
ldspa
rLep
idolite
Mus
covit
e03
059
8600
1425
1301
604
2200
302
2860
547
2201
3900
200
0904
123
799
56
1909
261
Tanta
lite
Valle
y28deg43prime0
9primeprimeS1
8deg43prime55
primeprimeEFe
ldspa
rQua
rtzM
usco
vite
003
636
0005
2218
022
0122
002
0381
727
3809
0272
lt001
lt000
2lt0
0513
199
17
1909
262
Tanta
lite
Valle
y28deg43prime2
0primeprimeS1
8deg44prime23
primeprimeEQu
artzSp
odum
eneM
us-
covit
e13
180
5100
0415
8903
401
2401
301
9502
604
0400
0500
200
03lt0
0507
398
56
1909
263
De R
ust
20deg57prime4
8primeprimeS1
4deg30prime13
primeprimeEFelsd
parS
podume
neQuartz
074
7313
0006
2048
007
015
005
0154
398
0831
0073
001
0003
lt005
082
9974
1909
264
De R
ust
20deg57prime4
8primeprimeS1
4deg30prime13
primeprimeESp
odum
eneF
eldsparQuartz
230
6924
0006
2602
801
0200
301
0510
102
1400
68lt0
0100
03lt0
0504
897
53
(Con
tinue
d) A
ppen
dix
A A
naly
tical
dat
a of
lith
ium
sam
ples
col
lect
ed in
Nam
ibia
Thr
esho
ld v
alue
s hi
ghlig
hted
in g
reen
Lithium Potential in Namibia
58
Appendix B GradeTonnage data (Measured amp Indicated) for selected lithium projects in comparison to Namibian projects (Source SampP 092020)
0
0500
1000
1500
2000
2500
500
5000
5000
0
5000
00
5000
000
Gra
de [
Li 2O
]
Tonnage [t]
Tantalite Valley
Rubicon
Appendix B GradeTonnage data (Inferred) for selected lithium projects in com-parison to Namibian projects (Source SampP 092020)
0
0500
1000
1500
2000
2500
100
1000
1000
0
1000
00
1000
000
1000
0000
Gra
de [
Li 2O
]
Tonnage [t]
Tantalite ValleyRubicon
Uis Tailings
Uis Mine
De Rust
A product of the technical cooperation project between Bundesanstalt fuumlr Geowissenschaften und Rohstoffe (BGR)(Federal Institute for Geosciences and Natural Resources)
andGeological Survey of Namibia within the Ministry of Mines and Energy
ISBN 978-3-948532-29-1 (Print) 978-3-948532-30-7 (PDF)
- List of Abbreviations
- 1 Introduction
- 2 What is lithium
-
- 21 Lithium deposits
-
- 3 Application
- 4 Chemical requirements
- 5 Mining and trade of lithium in the SADC
-
- 51 Lithium production
- 52 Trade data
- 53 Export
- 54Import
-
- 6 Lithium occurrences in Namibia
- 7 Lithium mining in Namibia
-
- 71 Current mining activities and projects
-
- 8 Analysed lithium samples
- 9 Interpretation
- 10 Conclusions
- References
-
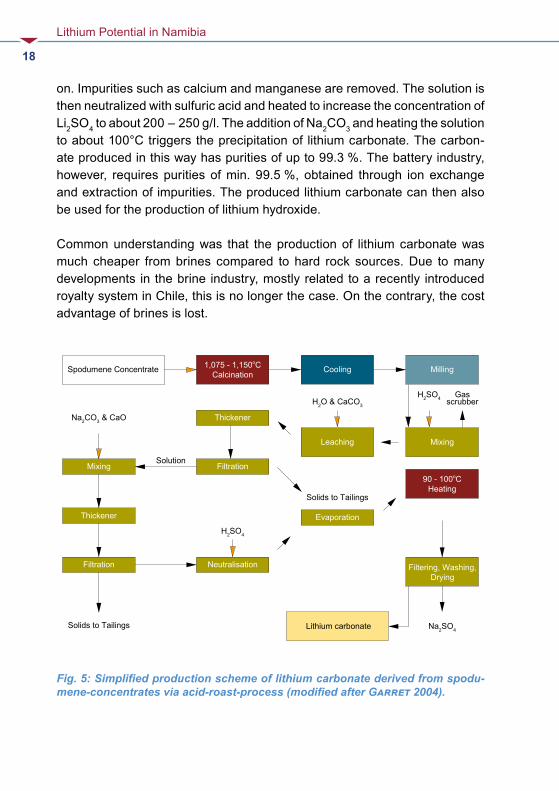
Lithium Potential in Namibia
19
The production of lithium hydroxide which is a fast growing market and a higher priced intermediate product appears to become cheaper when sourced directly from high quality hard rock conversion relative to sourcing from brines via an intermediate step (lithium carbonate) As the cost advantage of brine deposits compared to hard rock deposits is fading the industry has shifted its focus towards hard rock deposits all over the world
In addition to the acid-roast process there are new technological approaches to recover lithium carbonate and lithium hydroxide directly from high quality spodumene-concentrates as well as other mineralogies
Lithium Potential in Namibia
20
5 Mining and trade of lithium in the SADC
51 Lithium production
Each year every mining country of the world is urged to share production statistics regarding their mining activity These statistics are compiled and published by different entities such as the British Geological Survey (BGS) and the United States Geological Survey (USGS) among others
If a country does not appear in these statistics there was either no mining activity for this specific commodity the country did not publish any statistics or the production data is unknown
Table 2 Mine production of lithium (Source BGR 2020 Roskill 2016 USGS 2020 Geoscience Australia 2020)
Mine production [t Li-Content]
Years 2014 2015 2016 2017 2018 2019e Share 2018 []
Australia1) 12333 13160 15590 21000 57000 42000 647
Chile2) 11640 11787 14526 16584 15886 18000 175
Argentina2) 3388 3515 5767 575 6241 6400 69
China3) 1895 2002 2293 3 7376 7500 81
Zimbabwe1) 1024 1025 974 994 700 1600 08
USA2) 846 846 900 900 567 n A 06
Portugal1) 470 470 299 763 700 1200 08
Brazil1) 186 186 195 154 153 300 02
Namibia1) n d nd n d n d 500 n d 05
Other 3) 19 19 18 18 18 500 lt01
Global4) 31801 33011 40562 49012 90941 77000 1001) Hardrock 2) Brine 3) HardrockBrine 4) Deviation due to rounding e estimated
Lithium Potential in Namibia
21
In 2018 global mine output of lithium was around 91000 t Li-content of which only 1200 t originated from the Southern African Development Community (SADC) namely Zimbabwe and Namibia
52 Trade data
Trade data is retrieved from the commercially available Global Trade Atlasreg (IHS Global SA) The database provides both import and export data for more than 90 countries based on customs data of individual countries Data is primarily classified through Harmonised System (HS) product codes by the WCO (World Customs Organization) The HS nomenclature consists of approximately 5000 product groups identified by a 6-digit code
There are limitations to trade data The most prominent issue arises with data availability since many countries do not publish trade data Especially export data is an issue among many countries
There may also be issues with mislabeled products (wrong HS) product bas-kets data entry errors or missing data in general Were export data is not available so-called reverse trade data (RTS) is an option
If a country does not state any exports cumulative global imports from that particular country may be used as a rough yet incomplete estimate of exports It should be noted that these statistics do not represent absolute but rather minimum values as trade between two non-reporting countries will not be reflected The majority of the SADC countries do not report their import and export statistics
The most important lithium products that are globally traded in significant amounts are lithium-carbonate lithium-oxide (hydroxide) lithium-chloride and lithium-mineral-concentrates
Lithium Potential in Namibia
22
53 Export
The most important intermediate product in the lithium market is lithium carbonate In 2019 global exports amounted to approx 117743 t with Chile being the largest exporter (82344 t 70 ) There are no listed exports from the SADC region except minor quantities from South Africa to the Democratic Republic of Congo (9 t) and Zambia (2 t)
Lithium oxides and lithium hydroxides are grouped together under one HS code hence an individual consideration of both products on a country basis is not possible due to the lack of country-specific commodity codes
In 2019 global exports of HS 282520 stood at approx 97550 t with China being the largest exporting country (49800 t 51 )There are no exports published for the SADC region except South Africa with small quantities (28 t) which are considered to be trade through only
Assessment of lithium chloride global trade flows is also difficult as this prod-uct is listed together with many other chemical products under HS 282739 Global trade can only be investigated using country-specific commodity codes (8-digits and above) if available Only three countries list this product under specific trade codes namely China (28273910) Chile (28273930) and Argentina (28273960) SADC countries including Namibia do not publish any data under HS 282739 Based on the available data global exports in 2019 stood at 2254 t with Chile being the largest exporter (2101 t 89 )
Lithium-containing mineral concentrates are among other non-lithium related products listed in a product basket under HS 253090 Only two coun-tries provide information on this product namely Australia as the largest and hence most important producing and exporting country by far and Brazil as a minor exporter (25309010)
No other country including member states of the SADC specifies lithium-con-taining concentrates as such The currently only producing and exporting country in the SADC is Zimbabwe which does not specify exports at all Thus exports are derived from RTS (global imports)
Lithium Potential in Namibia
23
A general problem with HS 253090 is that only information on quantity is avail-able but no information on lithium content which can vary between 12 and 6 Li2O thus the margin of possible errors in terms of total contained lithium is large
In 2019 Australia exported about 16 million tons of spodumene-concentrate down from 35 million tons in 2018 More than 95 destined to China
Inferred exports (RTS) of Zimbabwe were approx 93300 t for HS 253090 About 62000 t of that quantity are listed as imports by South Africa and are unrelated to lithium The remaining quantity is much more in line with production figures of Zimbabwe as well as the known downstream industries of the destination coun-tries within Europe
There are no export records published by Namibia In general and across all traded lithium products South Africa appears to act as an importexport hub within the SADC Also some of the traded products may be used in the glass and ceramic industry of South Africa
54 Import
For most of the SADC countries the statistics retrieved though the Global Trade Atlas do not necessarily represent reliable trade data due to above-mentioned reasons This is especially true when only small import numbers (usually in tons) are listed as these are supposedly artefacts or errors in declaration
Global imports of lithium-carbonate amounted to approx 142965 t with South Korea being the largest importer (38578 t 27 ) There are no listed imports for the SADC region except South Africa (72 t)
Global imports of lithium-oxides (hydroxides) amounted to approx 84900 t with Japan being the largest importer (37300 t 44 ) In analogy to lithium carbonate there are no published imports into the SADC except for South Africa (428 t)
There is no information for imports of lithium-choride or lithium-mineral-con-centrates into the SADC The largest importer of lithium-choride is China with approx 253 t The largest importer of lithium-mineral-concentrates is also China (gt 95 )
Lithium Potential in Namibia
24
Fig 6 Simplified geology of Namibia with major towns as well as railway and tar roads Blue polygons indicate pegmatite belts and districts in central and southern Namibia (Data source Geological Survey of Namibia 2020)
6 Lithium occurrences in NamibiaIn Namibia significant lithium occurrences are found only within pegmatites These Precambrian and early Namibian pegmatites are restricted to two dif-ferent areas respectively the Damara Orogen in north-central Namibia and the Namaqua Metamorphic Complex in southern Namibia (Fig 6)
Lithium Potential in Namibia
25
Within the Damara Orogen four linear pegmatite belts are found all of which strike northeast ndash southwest (Fig 7) Brandberg West ndash Goantagab Cape Cross ndash Uis Nainais ndash Kohero and Sandamap ndash Erongo with the latter connected to the Karibib Pegmatite District (Schneider 1992)
Each of these pegmatite belts exhibit numerous individual pegmatite swarms that occur zoned or unzoned and may carry significant amounts of rare metals or semi-precious stones In the south Lithium-Caesium-Tantalum (LCT) peg-matites occur in two areas Tantalite-Valley south of Warmbad in close prox-imity to the northwest-trending Tantalite Valley Shear Belt and the Sandfon-tein-Ramansdrift area close to the Orange River
Fig 7 Pegmatite belts in north-central Namibia from west to east Brandberg West ndash Goantagab Cape Cross ndash Uis Nainais ndash Kohero and Sandamap ndash Erongo as well as the Karibib Pegmatite District (after Geological Suvey of Namibia 2002)
Lithium Potential in Namibia
26
7 Lithium mining in NamibiaData for historic lithium mine production is available for the period 1939 ndash 1998 (Fig 8) After 1998 all mining activities ceased due to product quality issues and overall market environment
Until the mid-1950s lepidolite was the most important mined lithium mineral of the country (Fig 8) As mine output of lepidolite decreased output of petalite increased However quantity on a year-to-year basis was quite variable and fluctuated between 1000 ndash 10000 t Since the early 1980s production of petalite was quite stable and ranged between 1000 ndash 2500 t Production fell sharply in 1997 and 1998 after which it ceased Mining of amblygonite has always been small compared to lepidolite and petalite and never exceeded 1000 t per annum
According to the USGS (2020) 500 t of lithium were mined in Namibia in 2018 This is most likely stockpiled lepidolite material from the Rubicon mine
0
2000
4000
6000
8000
10000
12000
1939
1941
1943
1945
1947
1949
1951
1953
1955
1957
1959
1961
1963
1965
1967
1969
1971
1973
1975
1977
1979
1981
1983
1985
1987
1989
1991
1993
1995
1997
[Ton
nes]
Petalite (t)Amblygonite (t)Lepidolite (t)
Fig 8 Lithium production in Namibia in [t] per year (after Schneider 1992 BGR 2020)
Lithium Potential in Namibia
27
Currently there is no active consecutive mining for lithium in substantial quan-tities in Namibia although there are prospects and projects under develop-ment
71 Current mining activities and projects
Soris The Soris project is located in the De Rust pegmatite swarm which is part of the ldquoBrandberg West ndash Goantagab tin beltrdquo (Fig 7) This belt stretches to the northeast of the Brandberg massif over a length of 60 km and a width of 25 km This belt was previously mined for cassiterite on a larger scale Some of the pegmatites in this belt may carry substantial amounts of lithium such as pegmatites in the De Rust pegmatite swarm
The De Rust pegmatite itself is a Li-rich rare metal pegmatite that was mined for cassiterite and tantalite but also for minor quantities of spodumene be ween 1960 and 1990 (Diehl 1990) It intruded into metasediments of the Amis River Formation Lower Ugab Group of the Southern Kaoko Zone
It is the largest pegmatite of the De Rust pegmatite swarm within the Brandberg West ndash Goantagab pegmatite belt (Diehl 1992c) Outcrops are 100 ‒ 470 m long up to 30 m wide and can be followed over a length of roughly 24 km
The pegmatite shows well-developed zonation with a border zone (quartz alkali feldspar muscovite) outer (quartz microcline-perthite muscovite altered petalite) and inner (quartzo-feldspathic rock with spodumene crystals with accessory apatite lepidolite eucryptite zircon and monazite) intermedi-ate zone as well as a core zone (quartz subordinate microcline muscovite sporadic tantalite) Spodumene crystals may reach up to 80 cm in length (Fig 12) Towards the core zone spodumene carries rounded nodules of lithi-um phosphates (amblygonite ndash montebrasite series)
It is located northwest of the nearest town of Uis in the Kunene region of Namibia about 6km to the east of farm De Rust 532 and about 25 km north of the Ugab River The nearest railhead is located in the town of Karibib and the deep-water port of Walvis Bay is 120 km to the southwest Windhoek is about 180 km to the southeast
Lithium Potential in Namibia
28
The project can be reached via paved but mostly unpaved roads from the town of Uis From White Lady Lodge which is about 38 km northwest from Uis a 35 km gravel road leads towards the project 15 km of which are in the riverbed of the Ugab River There is currently no electricity and water supply at the project location site
According to SampP Global (022020) current owner of the Soris project is Mon-tero Mining amp Exploration Ltd (TSXV MON) which holds 80 interest of the property Another 20 are allocated to an unnamed private owner Based on data from the Namibia Mining Cadastre Portal (092020) multiple entries for mining licence applications exist for the area where the main De Rust pegmatite is located (Fig 9)
Resource estimateDue to the early stage of the Soris project no resource estimate is avail-able However Montero Mining claims the project to be drill ready targeting a resource of 10 Mt 1 Li2O with tantalum and tin by-product credits This would equate to 46400 t of lithium or 247000 t LCE
Grab samples of the deposit showed lithium contents of 007 to 532 aver-aging 137 Channel samples showed average lithium contents of 076 and values up to 366 (Montero 032019) The company also re-assessed 1097 previously tested RC drill samples The main lithium-bearing mineral is spodumene
Remnants of historic intermittent mining activities like old foundations and quartzo-feldspathic tailings are still visible east to the main pegmatite (Fig 10 ‒ 11)
Lithium Potential in Namibia
29
Fig 10 Remnants of historic open pit mining (upper) and tailings of De Rust pegmatite (lower) northwest of the Brandberg massif (Photo BGR-GSN 2019)
Fig 9 Satellite image of the De Rust project including the outlined mining license Main pegmatite coordinates 20deg57prime48primeprimeS ‒ 14deg30prime12primeprimeE (Source httpportalsflexicadastrecomnamibia 092020)
Main pegmatite
Lithium Potential in Namibia
30
Fig 12 Weathered spodumene chrystals at the historic open pit mine (Photo BGR-GSN 2019)
Fig 11 Historic open pit of the De Rust pegmatite (Photo BGR-GSN 2019)
Lithium Potential in Namibia
31
Uis The Uis projects (former mine and tailings) are located in the northern part of the ldquoCape Cross Uis pegmatite beltrdquo east of the town of Uis on the farm Uis Townlands No 215 in the Erongo region of Namibia
The Cape Cross-Uis belt is approx 120 km long and up to 40 km wide and extends in a NE direction (Fig 7) It comprises three distinct pegmatite swarms the Strathmore swarm Karlowa swarm and Uis pegmatite swarm In general lithium-bearing pegmatites (Li-Nb-Ta-Sn-Be and Li-Nb-Ta-Sn) are the least common in this belt (Fuchsloch et al 2018)
The Uis swarm field consists of more than 120 individual pegmatites each with a northeasterly to easterly strike direction and northwesterly down dip (30deg ‒ 70deg) This field is accompanied by a peripheral pegmatite field of approx 25 individual pegmatites
Some of the main pegmatites especially around the formerly worldrsquos largest tin mine at Uis are exceedingly large Some of them are up to 1 km long and some 50 m wide
In terms of lithium petalite amblygonite and minor spodumene mineralization occurs in the various pegmatites but no lepidolite Most common lithium bear-ing minerals in the eight pegmatites that were mined at Uis are amblygonite petalite and spodumene
Currently the Uis tailings project and the Uis tin mine are owned by two differ-ent companies As of 2020 the tin mine is operating a pilot processing plant and aims to ramp up the production of lithium in the near future The current ownership of the tailings project as of September 2020 is unclear
The nearest commercial deep-water port to the projects is Walvis Bay 220 km to the southeast The town of Omaruru is 130 km to the east and Henties Bay lies about 120 km to the southwest The nearest railhead is located in Omaruru The area is accessible year-round by paved and un-paved roads NamPower provides electricity and the town of Uis is connected to the Nam-Water pipeline
Lithium Potential in Namibia
32
The tin deposit was discovered in 1911 and mined between the 1950s and 1989 for cassiterite by Uis Tin Mining Company (SWA) Ltd and IMCOR
Coarse tailings are located in the northern part of the former mine just south to the main road C36 (Fig 13) The fine material is located south to the coarse waste dumps (Fig 13)
After 1990 multiple companies owned the property until AfriTin Mining Ltd bought all the rights (license ML134) The current lithium tailings project of Montero Mining amp Exploration Ltd (TSXV MON) is based on the historic mine tailings of the former tin mine on mining license ML134 that is currently owned by AfriTin Mining Ltd The acquired tailings material does not fall under the ML134 license of AfriTin since historical tailings material (Fig 14) is not regulated by Minerals (Prospecting and Mining) Act 33 of 1992 of Namibia
Resource estimateUis tin mineAccording to AfriTin the former Uis mine holds a JORC compliant resource (inferred) of 715 Mt of ore 0134 Sn with a cut-off grade of 005 Sn (AfriTin 2020) Grades of ancillary elements are given at 063 Li2O and 85 ppm Ta for the total resource of 71 Mt of ore
This equals to approx 95000 t of tin 209000 t of lithium (11 Mt LCE) and 6090 t of tantalum 85 of the total resource are attributable to the company The remaining 15 are allocated to SMU (Small Miners of Uis)
Uis tailingsMontero Mining filed an inferred resource estimate of 144 Mt of ore 037 Li2O and 005 SnO2 with a 035 Li2O cut-off grade for lithium and assumed processing recoveries of 70 for their tailings project (Montero 2019) This equals to approx 24700 t of lithium content (131500 t LCE) and 7200 t SnO2
This resource estimate only includes coarse tailings material There is current-ly no information on the lithium content of the fine tailings material that totals 271 Mt t due to insufficient or no test work (Montero 2018) The company also states that the average Li2O grade of the fines material does not hurdle the cut-off for the fines of 082 Li2O
Lithium Potential in Namibia
33
In 2016 Australian based Tawana Resources carried out a drilling program at Uis for a private company called Lithium Africa 1 on the fine and coarse tailings (Table 3 Hole 1 amp Hole 2) Below some of the obtained data on lithium content is given Additionally Li2O content of two obtained grab samples by BGR (Table 3 Sample 2019a amp 2019b) is given
Table 3 Sample data Uis (Tawana 2016 Montero 2018 BGR 2019)
Sample Sample 0 to 1m Li2O ()
Sample 1 to 2m Li2O ()
Sample 2 to 3m Li2O ()
Fines Hole 1 071 085 092
Fines Hole 2 080 089 095
Coarse Hole 1 050 043 043
Coarse Hole 2 054 062 062
BGR Sam-ple 2019a (Coarse tailings)
028
BGR Sam-ple 2019b (Coarse tailings)
028
Montero NI 43-101 037
Lithium Potential in Namibia
34
Fig 14 Tailings of the historic Uis Tin Mine (Photo BGR-GSN 2019 with kind permission of AfriTin Mining Limited)
Fig 13 Former Uis tin mine Uis tailings project with coarse tailings Tailings coordina-tes (center) 21deg13prime31primeprimeS ‒ 14deg52prime44primeprimeE (Source httpportalsflexicadastrecomnamibia 092020)
Uis Tailings (coarse)
Uis Tailings (fine)
Historic Uis mine
Lithium Potential in Namibia
35
Karibib Lepidolite ProjectThe Karibib Lepidolite brownfield project is located in the ldquoKaribib ndash Usakos Pegmatite Districtrdquo southeast of the town of Karibib on the farm Okongava Ost No 72 in central Namibia (Fig 15 ‒ 16)
This pegmatite district which is of Damaran age hosts the most important pegmatite occurrence (Rubicon swarm) in terms of lithium in Namibia In addi-tion numerous other different pegmatite swarms some of which have previ-ously been relevant in terms of lithium are know from this district These are Dernburg Karlsbrunn Albrechtshoumlhe Berger Kaliombo Gamikaubmund Okatjimukuju Etusis Daheim Friedrichsfelde and Etiro (Diehl 1992a)
The Rubicon pegmatite itself is the largest of the individual pegmatites that occur in this field and has been the prime source of lithium until mining seized in the early 1990s The Helikon pegmatites are part of the Rubicon pegmatite swarm and are located northeast to the Rubicon pegmatite They have previ-ously been mined for lepidolite amblygonite petalite and muscovite beryll pollucite quartz and columbite-tantalite as valuable by-products (Fig 18 ‒ 19)
The pegmatite itself consist of two ellipsoidal well zoned Li-mineralized ore-bodies The larger one is about 320 m long and 25 ndash 35 m wide It dips at 46deg to the northeast and has a northwesterly strike The second orebody is about 230 m long and about 10 m wide It is dipping with 30deg to the northeast and has a northwesterly strike In total the outcrop of the Rubicon pegmatite is about 600 m long with a maximum width of 65 m (Fig 17)
A very prominent feature is the presence of a very well developed concen-tric shell and zones from the footwall to the inner core of the pegmatite Both orebodies exhibit a border- wall- intermediate- and core-zone
Border-zone wall-zone and outer intermediate zone of the larger orebody do not contain Li-bearing minerals of economic importance The inner interme-diate zone does contain lepidolite The outer core zone may be sub-divided into a petalite zone low-grade lepidolite zone and a high-grade lepidolite zone The inner core zone also contains a petalite zone Mining occurred pre-viously in the later named zones The zonation of the smaller orebody to the northwest is less pronounced but Li-mineralization and style are equal to the
Lithium Potential in Namibia
36
larger orebody There is no spodumene mineralization within the orebodies and respectively zones of the Rubicon pegmatite
The Helikon I pegmatite is also a lens-shaped pegmatite with a length of roughly 400 m and a width of approx 66 m It dips to the north with about 60deg ndash 70deg Helikon I also consists of well-defined zones The main Li-bearing minerals are lepidolite and petalite According to Roering (1963) the lepidolite is difficult to separate from the intergrown albite and hence of low grade and quality
The Helikon II pegmatite is approx 17 km long and only 9 ndash 15 m wide It lies a bit north of Helikon I and dips steeply to the north with 55deg ndash 80deg striking east west The main Li-bearing minerals are lepidolite and petalite According to Diehl (1990) the westernmost portion of the pegmatite has historically been the economically most important A massive up to 6 m wide petalite zone was mined here according to Diehl (1990)
The nearest railhead to the project is 17 km away in Karibib and the deep-water port of Walvis Bay is 220 km to the southwest Windhoek is about 180 km to the southeast NamPower connects the town of Karibib to electricity and the project currently utilizes generators There is a 7 km long 22 kV power line spur to grid connection pending (Lepidico 2020) Water is available via on-site boreholes
The project was previously owned by Desert Lion Energy Inc (TSVX DLI) Lepidico Ltd (ASX LPD) bought into the project and currently holds 80 interest which comprises Mining License 204 (69 km2) as well as three Exclu-sive Prospecting Licenses (EPLs) namely 5439 5555 and 5781 (Lepidico 2020)
Lepidico will cover mining from multiple sources as well as chemical conver-sion by utilizing their proprietary lithium processing technologies L-Maxreg LOH-Maxreg and S-Maxreg (Lepidico 052019) The company aims to produce high purity lithium chemicals such as lithium carbonate and lithium hydroxide
The takeover also included a nonbinding offtake agreement between the for-mer owner Desert Lion Energy Inc and German chemical company BASF On April 2nd 2019 Desert Lion Energy Inc announced this offtake agreement
Lithium Potential in Namibia
37
which at the time was valid through to December 31 2019 On December 20th
2019 Lepidico announced that the LOI with BASF was extended to Decem-ber 31st 2020 (Lepidico 122019)
The feasibility study criteria of Lepidico are as follows
- Throughput of the concentrator on-site of 035 Mtpa- Expansion of throughput after year five to 05 Mtpa- Chemical plant in the industrial city of Abu Dabi (ICAD)- Plant design for 58000 tpa of concentrate (4 LiO2) for the production of
up to 5500 tpa LiOH- Utilization of L-Maxreg and LOH-MaxTM- Non-binding off-take MOU with BASF for LiOH only- Targeting for project commissioning to commence late 2021 for commer-
cial production in 2022
The preliminary mine plan indicates a strip ratio of 03 ndash 1 for the first two years The ratio will then go up to 1 ndash 14 In the first four years elevated grades of 06 LiO2 will be mined
Resource estimateA JORC 2012 compliant resource estimate for the deposit is given in Table 4 (Lepidico 2020) The deposit currently holds 23200 t of lithium (Indicated amp Inferred) based on a cut-off grade of 015 Li2O This resource estimate is based solely on the lepidolite occurrences at the mine site
Table 4 Resource estimate Karibib Lepidolite Project (Source Lepidico 2020)
Deposit Resource Category
Cut-off (Li2O)
Ore (Mt)
Li2O ()
Li (t)
Li (LCE)
Rubicon Measured
015
22 057 5819 30974
Rubicon Indicated 666 038 11637 61943
Rubicon Inferred 237 043 4728 25167
Helikon
Total 015 1124 043 22184 118086
Lithium Potential in Namibia
38
Fig 16 Satellite image of the Karibib Lepidolite project Helikon 1 coordinates (center) 22deg2prime49primeprimeS ‒ 16deg1prime13primeprimeE Helikon 4 coordinates (center) 22deg2prime24primeprimeS ‒ 16deg1prime41primeprimeE (Source httpportalsflexicadastrecomnamibia 092020)
Fig 15 Satellite image of the Karibib Lepidolite project Rubicon coordinates (center) 22deg6prime11primeprimeS ‒ 15deg59prime44primeprimeE (Source httpportalsflexicadastrecomnamibia 092020)
Historic Rubicon mine
Helikon 1
Helikon 4
Lithium Potential in Namibia
39Fig 17 Rubicon pegmatite (Photo BGR-GSN 2019 with kind permission of Lepidico Chemicals Namibia (Pty) Ltd 2020)
Lithium Potential in Namibia
40 Fig 18 Lepidolite sample from Rubicon pegmatite (Photo BGR-GSN 2019 with kind permission of Lepidico Chemicals Namibia (Pty) Ltd 2020)
Fig 19 Petalite sample from Rubicon pegmatite (Photo BGR-GSN 2019 with kind permission of Lepidico Chemicals Namibia (Pty) Ltd 2020)
Lithium Potential in Namibia
42
Fig 21 Helikon 4 pegmatite (Photo BGR-GSN 2019 with kind permission of Lepidico Chemicals Namibia (Pty) Ltd 2020)
Fig 20 Helikon 1 pegmatite (Photo BGR-GSN 2019 with kind permission of Lepidico Chemicals Namibia (Pty) Ltd 2020)
Lithium Potential in Namibia
43
Tantalite ValleyThe Tantalite Valley Project lies within the ldquoNamaqua Metamorphic Complexrdquo in Southern Namibia Within this complex Lithium-Caesium-Tantalum (LCT) pegmatites occur in two main areas Tantalite-Valley south of Warmbad in close proximity to the northwest-trending Tantalite Valley Shear Belt and the Sandfontein-Ramansdrift area close to the Orange River
The area were the pegmatites of the Tantalite Valley occur is primarily com-posed of a large ovoid gabbro intrusion (71 km by 33 km in extent) within paragneiss units of the Namaqua Complex The gabbro outcrop forms a large dome shaped mountain that rises about 500 m above the surrounding topo-graphy
The pegmatites belong to the Kenhardt and Gordonia pegmatite districts in Namaqualand but only the younger group of them carry accessory ore miner-als such as tantalite beryl REE minerals and lithium
The Tantalite Valley pegmatites include several individual subhorizonal dikes that are up to 1000 m long and 02 to 40 m wide plunging towards southeast (Diehl 1992b) Four of those are of economic interest Homestead Whitkop White City and the Lepidolite pegmatites (ie Purple Haze) (Fig 22)
They are all well zoned (quartz core inner and outer intermediate zones wall zone) and were predominantly targeted for beryl columbite-tantalite as well as lithium and bismuth minerals
The project is located on the farms Umeis 110 and Kinderzitt 132 between the Farms 109 131 129 308 and 473 in the magisterial district of Karas It currently comprises Mining License (ML-77) fully owned by Tameka Shelf Co Four (Pty) Ltd which is a 100 subsidiary of African Tantalite Pty Ltd (AFTAN) Above all Kazera Global Investments PLC holds a 75 stake in AFTAN (Kazera 2019) with the other 25 of local farmer ownership
The project is accessible via gravel road from Karasburg which is about 80 km to the north The nearest railhead is also located in Karasburg Electricity is currently supplied by generators and water is recovered from multiple drill holes The Orange River is about 15 km to the south of the project Mining
Lithium Potential in Namibia
44
infrastructure as well as equipment are on site as well as a plant for the pro-duction of tantalite concentrate
NTI is working on an extensive exploration program with a clear focus on revi-ving tantalite mining in Namibia with a possible by-product stream of lithium bearing minerals The company will focus primarily on the pegmatites Homes-tead Purple Haze Signaalberg and White City (Fig 23)
The area is known for its tantalum occurrences and since the late 1940s tantalite and other minerals have been recovered at Tantalite Valley until 1981 when mining ceased Initially alluvial deposits were mined followed by the pegmatites themselves Grades of the concentrates produced prior to the closure of the mine were quite high with 65 ‒ 70 Ta2O5 with very low U3O8
and ThO2 values of 025 max
Resource estimateAccording to SampP Global (092020) Measured and amp Indicated resources at Tantalite Valley are 104800 t of ore 0042 Ta2O5 and 0653 Li2O as of 112019 This would equate to 315 t of lithium or 1690 t LCE Total inferred resources are 517400 t of ore 0018 Ta2O5 and 0144 Li2O This equals to approx 91 t of tantalum and 750 t of lithium (3535 t LCE)
Lithium Potential in Namibia
45
Fig 23 White City pegmatite (Source Kazera global Investments PLC 2020)
Fig 22 Satellite image of the Tantalite Valley project White City pegmatite coordinates (center) 28deg43prime07primeprimeS ‒ 18deg44prime45primeprimeE Homestead pegmatite coordinates (center) 28deg43prime19primeprimeS - 18deg44prime24primeprimeE Purple Haze pegmatite coordinates (center) 28deg43prime09primeprimeS ‒ 18deg43prime55primeprimeE (Source httpportalsflexicadastrecomnamibia 092020)
Lithium Potential in Namibia
46
8 Analysed lithium samplesDuring the course of the cooperation project between the Economic Geology Division (EGD) of the Geological Survey of Namibia (GSN) and the Ger-man Federal Institute of Geosciences and Natural Resources (BGR) several sampling campaigns to southern and central pegmatites took place
The field trips were preceded by literature and data research regarding infor-mation on lithium occurrences andor previous lithium mining activity to iden-tify specific target areas
During a campaign in 2019 16 lithium-bearing mixed mineral samples were taken from five different locations and subsequently analyzed Two of the samples originate from the Uis Tin Mine Tailings of the former tin mine All remaining samples were taken either from stripped outcrops for future mine activities or from previous mine sites (ie pits)
All 16 samples were analyzed at BGR labs in Hanover Germany through qualitative XRD XRF and ICP-MS Given data shall be understood as a first indicator for the sampled lithium occurrences
Most if not all sampled occurrences have previously been analyzed or are cur-rently being assessed by the property owners or current licensees Detailed information of these sampling and analytical campaigns remain confidential and are thus not available for comparison
Appendix A lists the identified qualitative mineralogy of the samples as well as the major element analysis Additional samples from previous campaigns are also given
Interpretation of the results are based on their applicability in the various lithium-consuming industries for which information is available
Most of the current lithium applications require a chemical intermediate product such as lithium carbonate or lithium-hydroxide The glass and cera-mic industry does use lithium-bearing mineral concentrates depending on the prices of these materials when compared to LiCO3
Lithium Potential in Namibia
47
Since the main applications require an intermediate or downstream chemical product lithium content as well as impurity values are the main criteria for the suitability of the sampled occurrences Other quality criteria are particle size and surface areastructure
9 InterpretationAs previously stated all obtained grab samples are mixtures of lithium- bearing minerals (ie spodumene petalite lepidolite) feldspars quartz micas as well as secondary minerals Therefore all given analytical data has to be taken with caution and will not be representative for the individual outcrops or deposits
The evaluation of the economic suitability for various economic applications of the analysed lithium samples is based on the chemical specifications in Chapter 4
Lithium content gt 1 Li2O Fe2O3 content lt 015 as well as F content lt 01 are individually highlighted (Appendix A) as these three values are the most important
Based on the chemical analysis nine of the 16 samples showed Li2O contents of more than 1 (range 117 ‒ 327 ) Seven of those nine samples also exhibited low Fe2O3 content (range 004 ‒ 008 ) (Appendix A) Three of those seven samples also had fluorine values below 005
Of the ten additionally included samples from previous campaigns four showed Li2O contents of more than 1 (range 126 ‒ 199 ) Three of those samples also exhibited low Fe2O3 content (range 004 ‒ 007 ) (Appendix A) One of the three samples had fluorine values below 005
The mentioned samples (sources) could be of potential use but for further interpretation statistical sampling will be required
Lithium Potential in Namibia
48
10 ConclusionsThere is currently no lithium industry established in Namibia This accounts to both mining and processing of ores into commercial lithium-bearing con-centrates as well as the production of downstream products such as lithium carbonate andor lithium hydroxide In order to evaluate the potential for a lithium industry in Namibia the current global market and price developments need to be addressed
Currently the main application for lithium is in the chemical industry as lithium carbonate andor hydroxide for the manufacturing of lithium-ion batteries There is currently no domestic market (supply) or demand for this industry in Southern Africa or Namibia in specific Processing of lithium-bearing ores into these highly specific downstream products is economically more viable in close proximity to the demanding industries It also requires large investments (double-digit million dollars per 10000t of capacity) Additionally there is already huge capacity and strong capacity build up in Asia at rather low cost
The second most important application lies in the glass and ceramics industry This industry uses lithium either as lithium-bearing concentrates or lithium carbonate depending on current market price and processproduct require-ments There is currently no such industry established in Namibia but potential plans There is glass and ceramics manufacturing in South Africa and thus a potential market for lithium bearing products (concentrates) should this indus-try require it depending on product
The 20182019 primary lithium supply based on spodumene-bearing mineral concentrates was dominated by Australia with a market share of well over 95 On an annual basis the country exports more than three million tons of lithium-bearing concentrates to China To put this into perspective Lepidico plans to export just 58 ktpa of concentrate to Abu Dhabi for refinement from their project annually Therefore potential production in Namibia will always be rather small scale when compared to peer producing countriescompanies
As of late 2020 the concentrate market is in strong oversupply with strong competition Thus prices have eroded quite substantially for a standard SC6 concentrate (Fig 24) In general prices vary significantly based on lithium content and impurities of the concentrates Lithium bearing mineral concen-
Lithium Potential in Namibia
49
trates are a relatively low-value mineral commodity when compared to lithi-um-carbonate or other lithium downstream products thus product quality cost reduction and cost control are key components in this industry Since prices are depressed currently many of the Australian producers have drasti-cally reduced output or even went into care and maintenance This situation may change towards 2025 or beyond as demand picks up
Prices for the higher valued product lithium-carbonate spiked at the end of 2017 towards 2018 to more than 20000 $USt on a contract basis with prices being very volatile Since then prices have also eroded to below 9000 $USt due to oversupply and slow demand pickup (Fig 25) With this product stable quality and chemical composition are crucial for the downstream industry
Based on available gradetonnage data the Namibian projectsprospects are relatively small in overall size and low in grade when compared to global peers for the resource category ldquoMeasuredIndicatedrdquo (Appendix B) Total contained lithium quantity is thus relatively small in comparison On a global scale the most promising hard rock projects that are currently being mined and developed have Li2O grades of 10 or above
Fig 24 Lithium-mineral-concentrate prices 012010 ‒ 062020 (Source BGR 2020)
300
400
500
600
700
800
900
1000
1100
208
210
212
214
216
218
220
US$
t US$t
01-20
14
01-20
15
01-20
16
01-20
17
01-20
18
01-20
19
01-20
20
01-20
10
01-20
11
01-20
12
01-20
13
Spodumene min 5-6 LiO2 fob Australia
Spodumene concentrate gt75 LiO2 bulk cif Asia
Petalite 42 LiO2 fob Durban
Spodumene fob Australia
Spodumene min 5-6 LiO2 cif China
Lithium Potential in Namibia
50
For the resource category ldquoIndicatedrdquo which generally represents the lowest level of confidence only the Uis mine project of AfriTin represents a size-able resource even though grades are relatively low (Appendix C) The Uis tailings project as well as the Rubicon project are again relatively small when compared to their global peers Tantalite Valley is the smallest of all included projects (Appendix C)The given data for the De Rust project reflects only an exploration target of the company rather than actual data and may thus be not representative
Based on size and contained lithium-content none of the visited early stage projectsprospects would justify the financial investment into the construction of a chemical conversion plant for the production of lithium carbonate andor hydroxide on site as it requires very large monetary investments Due to their size payback of the required investments may be unfavorable when compared to global peers In addition the current market environment is very harsh with strong competition from Asia that has a huge cost advantage due to capacity build up This industry is also very energy and water intensive
In addition location within Namibia as well as distance to possible down-stream markets may become an issue as it increases the transportation cost
4000
7000
10000
13000
16000
19000
22000
25000
28000
01-20
14
01-20
15
01-20
16
01-20
17
01-20
18
01-20
19
01-20
20
US$
t
Lithium-carbonate (min 995 ) battery grade spot price ex works domestic ChinaLithium-carbonate (min 99-995 ) Li2CO3 large contracts USA delivered continentalLithium-hydroxid-monohydrate (min 565) technical and industrial grades cif China Japan amp Korea
Fig 25 Lithium chemical prices 012014 ndash 062020 (Source BGR 2020)
Lithium Potential in Namibia
51
immensely This is especially true for the SorisDe Rust pegmatite which is in a remote location without any allocated infrastructure The projects Karibib Uis and Tantalite Valley are much easier to access
The approach of Lepidico to produce a lithium bearing concentrate on site seems plausible approach Since this will already require a skilled workforce mining and beneficiation equipment in order to produce a high quality lithium-bearing concentrate it may already be considered ldquoadded valuerdquo for the indus-try of the country This approach may also be suitable for the other mentioned and visited projects
Lithium Potential in Namibia
52
ReferencesAfriTin Mining (2020) Uis Tin Project ndash Company Information ndash URL httpafritinminingcomuis-project [as of 092020]
Australian Government Geoscience Australia (2019) Australiarsquos Identi-fied Mineral Resources 2019 ndash URL httpswwwgagovauscientific-topicsmineralsmineral-resources-and-adviceaimr [as of 092020]
BGR ndash Bundesanstalt fuumlr Geowissenschaften und Rohstoffe (2020) Fachinformationssystem Rohstoffe ndash unpubl Hannover [as of 082020]
BGS ndash British Geological Survey (2016) Lithium Definitions mineralo-gy and deposits ndash URL httpswwwbgsacukdownloadsstartcfmid=3100 [as of 062016]
Diehl B J M (1990) Pegmatites of the Cape Cross Uis ndash Pegmatite Belt Namibia Geology mineralisation Rubidium Strontium characteristics and petrogenesis of rare metal pegmatites Open File Report EG 083 Economic Geology Series Geological Survey of Namibia 39 pp Windhoek
Diehl B J M (1992a) Lithium Caesium Beryllium Open File Report Mineral Resource Series Geological Survey of Namibia 18 pp Windhoek
Diehl B J M (1992b) Niobium and Tantalum Open File Report Mineral Resource Series Geological Survey of Namibia 20 pp Windhoek
Diehl B J M (1992c) Tin Open File Report Mineral Resource Series Geological Survey of Namibia 30 pp Windhoek
Diehl B J M amp Schneider G I C (1990) Geology and mineralisation of the Rubicon Pegmatite Namibia Open File Report Geol Surv Namibia 20 pp Windhoek
Fuchsloch et al (2018) Classification mineralogical and geochemical vari-ations in pegmatites of the Cape Cross-Uis pegmatite belt Namibia Lithos 296 ndash 299 79-95 elsevier
Lithium Potential in Namibia
53
Garret D E (2004) Handbook Of Lithium And Natural Calcium Chloride Their Deposits Processing Uses and Properties ndash 467 S Oxford (Elsevier B V)
Geological Survey of Namibia (2002) Mineral Resources of Namibia Summary of Mineral Deposits and Occurrences Omaruru Sheet 2114 Volume I ndash Complete Descriptions 119 pp Windhoek
IHS Global SA (2020) Global Trade Atlas ndash Commercial Online-Databa-se ndashURL httpsmyihscomConnectcallingUrl=https3a2f2fconnectihsmarkitcom2f [as of 062017]
Kazera Global Investments PLC (2020) Company Information ndash URL httpskazeraglobalcominvestmentsnamibia-tantalite-investment-mine [as of 092020]
Lepidico (2019) LOI with BASF extended to 31 December 2020 ndash News Release ndash URL httpswwwlepidicocomwp-contentuploads201910LPD-191220-LOI-with-BASF-extended-to-31-December-2020pdf [as of 122019]
Lepidico (2019) Corporate Presentation ndash URL httpswwwlepidicocomwp-contentuploads201907LPD-190509-Corporate-Presentati-on-May-2019pdf [as of 052019]
Lepidico (2020) Company Information ndash URL httpswwwlepidicocomprojectskaribib [as of 092020]
Montero Mining amp Exploration Ltd (2018) Exploring Battery Metals in Namibia ndash Company Presentation ndash URL httpswwwproactiveinvestorscomauuploadSponsorFileFile2018_031520244941_MON-CorporatePre-sentationMarch2018pdf [as of 072018]
Montero Mining amp Exploration Ltd (2019) Montero Files NI 43-101 Resource Estimate On The Uis Lithium-Tin Tailings Project In Namibia On Sedar ndash News Announcement ndash URL httpsmonterominingcommontero-files-ni-43-101-resource-estimate-on-the-uis-lithium-tin-tailings-project-in-namibia-on-sedar [as of 032019]
Lithium Potential in Namibia
54
Namibia Mining Cadastre Portal (2020) Online-Database ndashURL httpsportalslandfoliocomnamibia [as of 092020]
Roskill Information Services Ltd (2016) Lithium Global Industry Mar-kets amp Outlook ndash 386 S London Groszligbritannien
Schneider G I C (1992) Feldspar Open File Report MRS 08 Mineral Resource Series Geological Survey of Namibia 2 pp Windhoek
Schmidt M (2017) Rohstoffrisikobewertung ndash Lithium ndash DERA Rohstoffin-formationen 33 Berlin
S amp P Global Market Intelligence (2020) Lithium - Metals amp Mining Properties URL httpsplatformmarketintelligencespglobalcomwebcli-entauth=inheritindustryminingProjects [as of 092020]
Statista (2020) Distribution of lithium end-usage worldwide in 2019 by area application ndash URL httpswwwstatistacomstatistics268787lithium-usa-ge-in-the-world-market [as of 062020]
Tawana Resources NL (2016) Tawana acquires second lithium pro-ject ndash News Release ndash URL httpsmstrademomentumcozajsepdfSENS_20160923_S376505pdf [as of 092016]
USGS ndash United States Geological Survey (multiple years) Lithium ndash Minerals Commodity Summaries ndash URL httpswwwusgsgovcentersnmiclithium-statistics-and-information [as of 082020]
Appendix
Sam
ple I
DFa
rmLa
titud
eLo
ngitu
deSa
mpl
e des
crip
tion
(XRD
qu
al)
LiO 2
()
SiO 2
Ti
O 2
Al2O 3
Fe2O 3
Mn
O Mg
O Ca
O Na
2O
K 2O P 2O 5
SO
3
Cl
F
LOI
Su
m
2015
-03
previous sample campaignsHelik
on
n A
Felds
parQ
uartz
Lepid
olite
025
6871
lt000
119
0500
200
2900
505
3292
806
7905
59lt0
01lt0
002
lt005
093
9985
2016
-12
Rubic
onwe
ather
ed P
etalite
126
6473
lt000
118
0600
703
2718
607
9507
805
2500
62lt0
01lt0
002
lt005
1146
9871
2016
-17
Rubic
onLe
pidoli
te +
Quar
tz13
063
6700
219
9316
0929
003
0054
029
6218
0052
lt001
lt000
226
232
798
67
2016
-20
Helik
onLe
pidoli
te + A
lbite
176
5514
lt000
126
8700
401
2100
700
2123
970
3900
45lt0
01lt0
002
156
369
9698
2016
-21
Helik
onLe
pidoli
te19
954
32lt0
001
2627
004
0224
006
0038
266
714
0069
lt001
lt000
240
628
997
77
FN20
19_0
4De
Rus
tFe
ldspa
rAmb
lygon
iteP
etalite
(n
on X
RD)
003
6513
lt000
118
82lt0
0100
0200
101
0924
311
4105
75lt0
0100
04lt0
0503
898
84
2015
-09
Molop
oPe
talite
(non
XRD
)00
952
85lt0
001
1672
lt001
0002
487
0323
342
0352
lt000
100
400
3403
621
1310
012
2016
-14
Molop
oPe
talite
wea
there
d (no
n XRD
)00
752
1600
0316
5100
200
5147
805
8923
406
4500
6900
200
8602
222
6310
013
2016
-15
Molop
oFe
ldspa
r (no
n XRD
)00
664
02lt0
001
1937
003
0004
003
0151
216
1249
0796
lt001
lt000
2lt0
0505
399
55
2016
-23
Molop
oZin
nwald
ite (n
on X
RD)
006
5044
0068
3307
048
0011
012
0426
261
7674
0181
lt001
lt000
2lt0
0542
9925
1909
249
2019Uis
Tailin
gs
Quar
tzFe
ldspa
rPeta
lite
Musc
ovite
028
7293
0045
1479
051
0062
0212
9830
927
6613
6200
2lt00
02lt0
0523
399
38
1909
250
Uis
Tailin
gsQu
artz
Felds
parP
etalite
Mu
scov
ite02
872
6900
4314
8205
0059
019
1306
313
2794
1347
002lt
0002
lt005
251
9937
1909
251
Helik
on 4
22deg02prime4
8primeprimeS1
6deg01prime30
primeprimeEQu
artz
Felds
parP
etalite
Le
pidoli
te16
464
4400
0319
4200
301
2100
408
8325
345
6806
800
400
0727
228
998
38
1909
252
Helik
on 1
22deg02prime2
0primeprimeS1
6deg01prime19
primeprimeEPe
talite
Lepid
olite
Quar
tz29
576
9200
0116
6800
300
0304
101
7301
106
8100
01lt0
01lt0
002
lt005
205
97
App
endi
x A
Ana
lytic
al d
ata
of li
thiu
m s
ampl
es c
olle
cted
in N
amib
ia T
hres
hold
val
ues
high
light
ed in
gre
en
Lithium Potential in Namibia
57
Sam
ple I
DFa
rmLa
titud
eLo
ngitu
deSa
mpl
e des
crip
tion
(XRD
qu
al)
LiO 2
()
SiO 2
Ti
O 2
Al2O 3
Fe2O 3
Mn
O Mg
O Ca
O Na
2O
K 2O P 2O 5
SO
3
Cl
F
LOI
Su
m
1909
253
2019Rubic
on22deg06prime1
3primeprimeS1
5deg59prime45
primeprimeEPe
talite
Lepid
olite
Quar
tz32
778
73lt0
001
1687
002
0006
002
0157
011
003
0002
003
0003
lt005
075
9663
1909
254
Rubic
on22deg06prime1
0primeprimeS1
5deg59prime41
primeprimeEFe
ldspa
rQua
rtzM
usco
vite
004
682
lt000
119
3500
300
2400
205
0610
0808
6804
3lt0
01lt0
002
lt005
041
9985
1909
255
Rubic
on22deg06prime1
0primeprimeS1
5deg59prime41
primeprimeEFe
ldspa
rLep
idolite
Mus
co-
viteK
aolin
026
6104
0004
2318
022
0136
006
0119
367
8411
0159
lt001
lt000
2lt0
0522
299
15
1909
256
Rubic
on22deg06prime1
0primeprimeS1
5deg59prime41
primeprimeELe
pidoli
te 27
249
8700
129
3400
408
0500
400
704
697
3100
31lt0
01lt0
002
087
441
9569
1909
257
Rubic
on22deg06prime1
3primeprimeS1
5deg59prime45
primeprimeEPe
talite
Lepid
olite
Quar
tz30
670
0900
0320
2600
801
0901
502
9901
926
800
15lt0
0100
04lt0
0526
596
48
1909
258
Rubic
on22deg06prime1
0primeprimeS1
5deg59prime41
primeprimeELe
pidoli
teFe
ldspa
rQua
rtz20
659
7800
0224
100
505
2400
300
513
7247
0051
lt001
0002
265
388
9966
1909
259
Tanta
lite
Valle
y28deg43prime0
9primeprimeS1
8deg43prime55
primeprimeEFe
ldspa
rLep
idolite
Mus
covit
e11
762
64lt0
001
2139
004
0161
lt001
0399
7731
2401
0900
200
119
912
698
85
1909
260
Tanta
lite
Valle
y28deg43prime0
9primeprimeS1
8deg43prime55
primeprimeEFe
ldspa
rLep
idolite
Mus
covit
e03
059
8600
1425
1301
604
2200
302
2860
547
2201
3900
200
0904
123
799
56
1909
261
Tanta
lite
Valle
y28deg43prime0
9primeprimeS1
8deg43prime55
primeprimeEFe
ldspa
rQua
rtzM
usco
vite
003
636
0005
2218
022
0122
002
0381
727
3809
0272
lt001
lt000
2lt0
0513
199
17
1909
262
Tanta
lite
Valle
y28deg43prime2
0primeprimeS1
8deg44prime23
primeprimeEQu
artzSp
odum
eneM
us-
covit
e13
180
5100
0415
8903
401
2401
301
9502
604
0400
0500
200
03lt0
0507
398
56
1909
263
De R
ust
20deg57prime4
8primeprimeS1
4deg30prime13
primeprimeEFelsd
parS
podume
neQuartz
074
7313
0006
2048
007
015
005
0154
398
0831
0073
001
0003
lt005
082
9974
1909
264
De R
ust
20deg57prime4
8primeprimeS1
4deg30prime13
primeprimeESp
odum
eneF
eldsparQuartz
230
6924
0006
2602
801
0200
301
0510
102
1400
68lt0
0100
03lt0
0504
897
53
(Con
tinue
d) A
ppen
dix
A A
naly
tical
dat
a of
lith
ium
sam
ples
col
lect
ed in
Nam
ibia
Thr
esho
ld v
alue
s hi
ghlig
hted
in g
reen
Lithium Potential in Namibia
58
Appendix B GradeTonnage data (Measured amp Indicated) for selected lithium projects in comparison to Namibian projects (Source SampP 092020)
0
0500
1000
1500
2000
2500
500
5000
5000
0
5000
00
5000
000
Gra
de [
Li 2O
]
Tonnage [t]
Tantalite Valley
Rubicon
Appendix B GradeTonnage data (Inferred) for selected lithium projects in com-parison to Namibian projects (Source SampP 092020)
0
0500
1000
1500
2000
2500
100
1000
1000
0
1000
00
1000
000
1000
0000
Gra
de [
Li 2O
]
Tonnage [t]
Tantalite ValleyRubicon
Uis Tailings
Uis Mine
De Rust
A product of the technical cooperation project between Bundesanstalt fuumlr Geowissenschaften und Rohstoffe (BGR)(Federal Institute for Geosciences and Natural Resources)
andGeological Survey of Namibia within the Ministry of Mines and Energy
ISBN 978-3-948532-29-1 (Print) 978-3-948532-30-7 (PDF)
- List of Abbreviations
- 1 Introduction
- 2 What is lithium
-
- 21 Lithium deposits
-
- 3 Application
- 4 Chemical requirements
- 5 Mining and trade of lithium in the SADC
-
- 51 Lithium production
- 52 Trade data
- 53 Export
- 54Import
-
- 6 Lithium occurrences in Namibia
- 7 Lithium mining in Namibia
-
- 71 Current mining activities and projects
-
- 8 Analysed lithium samples
- 9 Interpretation
- 10 Conclusions
- References
-

Lithium Potential in Namibia
20
5 Mining and trade of lithium in the SADC
51 Lithium production
Each year every mining country of the world is urged to share production statistics regarding their mining activity These statistics are compiled and published by different entities such as the British Geological Survey (BGS) and the United States Geological Survey (USGS) among others
If a country does not appear in these statistics there was either no mining activity for this specific commodity the country did not publish any statistics or the production data is unknown
Table 2 Mine production of lithium (Source BGR 2020 Roskill 2016 USGS 2020 Geoscience Australia 2020)
Mine production [t Li-Content]
Years 2014 2015 2016 2017 2018 2019e Share 2018 []
Australia1) 12333 13160 15590 21000 57000 42000 647
Chile2) 11640 11787 14526 16584 15886 18000 175
Argentina2) 3388 3515 5767 575 6241 6400 69
China3) 1895 2002 2293 3 7376 7500 81
Zimbabwe1) 1024 1025 974 994 700 1600 08
USA2) 846 846 900 900 567 n A 06
Portugal1) 470 470 299 763 700 1200 08
Brazil1) 186 186 195 154 153 300 02
Namibia1) n d nd n d n d 500 n d 05
Other 3) 19 19 18 18 18 500 lt01
Global4) 31801 33011 40562 49012 90941 77000 1001) Hardrock 2) Brine 3) HardrockBrine 4) Deviation due to rounding e estimated
Lithium Potential in Namibia
21
In 2018 global mine output of lithium was around 91000 t Li-content of which only 1200 t originated from the Southern African Development Community (SADC) namely Zimbabwe and Namibia
52 Trade data
Trade data is retrieved from the commercially available Global Trade Atlasreg (IHS Global SA) The database provides both import and export data for more than 90 countries based on customs data of individual countries Data is primarily classified through Harmonised System (HS) product codes by the WCO (World Customs Organization) The HS nomenclature consists of approximately 5000 product groups identified by a 6-digit code
There are limitations to trade data The most prominent issue arises with data availability since many countries do not publish trade data Especially export data is an issue among many countries
There may also be issues with mislabeled products (wrong HS) product bas-kets data entry errors or missing data in general Were export data is not available so-called reverse trade data (RTS) is an option
If a country does not state any exports cumulative global imports from that particular country may be used as a rough yet incomplete estimate of exports It should be noted that these statistics do not represent absolute but rather minimum values as trade between two non-reporting countries will not be reflected The majority of the SADC countries do not report their import and export statistics
The most important lithium products that are globally traded in significant amounts are lithium-carbonate lithium-oxide (hydroxide) lithium-chloride and lithium-mineral-concentrates
Lithium Potential in Namibia
22
53 Export
The most important intermediate product in the lithium market is lithium carbonate In 2019 global exports amounted to approx 117743 t with Chile being the largest exporter (82344 t 70 ) There are no listed exports from the SADC region except minor quantities from South Africa to the Democratic Republic of Congo (9 t) and Zambia (2 t)
Lithium oxides and lithium hydroxides are grouped together under one HS code hence an individual consideration of both products on a country basis is not possible due to the lack of country-specific commodity codes
In 2019 global exports of HS 282520 stood at approx 97550 t with China being the largest exporting country (49800 t 51 )There are no exports published for the SADC region except South Africa with small quantities (28 t) which are considered to be trade through only
Assessment of lithium chloride global trade flows is also difficult as this prod-uct is listed together with many other chemical products under HS 282739 Global trade can only be investigated using country-specific commodity codes (8-digits and above) if available Only three countries list this product under specific trade codes namely China (28273910) Chile (28273930) and Argentina (28273960) SADC countries including Namibia do not publish any data under HS 282739 Based on the available data global exports in 2019 stood at 2254 t with Chile being the largest exporter (2101 t 89 )
Lithium-containing mineral concentrates are among other non-lithium related products listed in a product basket under HS 253090 Only two coun-tries provide information on this product namely Australia as the largest and hence most important producing and exporting country by far and Brazil as a minor exporter (25309010)
No other country including member states of the SADC specifies lithium-con-taining concentrates as such The currently only producing and exporting country in the SADC is Zimbabwe which does not specify exports at all Thus exports are derived from RTS (global imports)
Lithium Potential in Namibia
23
A general problem with HS 253090 is that only information on quantity is avail-able but no information on lithium content which can vary between 12 and 6 Li2O thus the margin of possible errors in terms of total contained lithium is large
In 2019 Australia exported about 16 million tons of spodumene-concentrate down from 35 million tons in 2018 More than 95 destined to China
Inferred exports (RTS) of Zimbabwe were approx 93300 t for HS 253090 About 62000 t of that quantity are listed as imports by South Africa and are unrelated to lithium The remaining quantity is much more in line with production figures of Zimbabwe as well as the known downstream industries of the destination coun-tries within Europe
There are no export records published by Namibia In general and across all traded lithium products South Africa appears to act as an importexport hub within the SADC Also some of the traded products may be used in the glass and ceramic industry of South Africa
54 Import
For most of the SADC countries the statistics retrieved though the Global Trade Atlas do not necessarily represent reliable trade data due to above-mentioned reasons This is especially true when only small import numbers (usually in tons) are listed as these are supposedly artefacts or errors in declaration
Global imports of lithium-carbonate amounted to approx 142965 t with South Korea being the largest importer (38578 t 27 ) There are no listed imports for the SADC region except South Africa (72 t)
Global imports of lithium-oxides (hydroxides) amounted to approx 84900 t with Japan being the largest importer (37300 t 44 ) In analogy to lithium carbonate there are no published imports into the SADC except for South Africa (428 t)
There is no information for imports of lithium-choride or lithium-mineral-con-centrates into the SADC The largest importer of lithium-choride is China with approx 253 t The largest importer of lithium-mineral-concentrates is also China (gt 95 )
Lithium Potential in Namibia
24
Fig 6 Simplified geology of Namibia with major towns as well as railway and tar roads Blue polygons indicate pegmatite belts and districts in central and southern Namibia (Data source Geological Survey of Namibia 2020)
6 Lithium occurrences in NamibiaIn Namibia significant lithium occurrences are found only within pegmatites These Precambrian and early Namibian pegmatites are restricted to two dif-ferent areas respectively the Damara Orogen in north-central Namibia and the Namaqua Metamorphic Complex in southern Namibia (Fig 6)
Lithium Potential in Namibia
25
Within the Damara Orogen four linear pegmatite belts are found all of which strike northeast ndash southwest (Fig 7) Brandberg West ndash Goantagab Cape Cross ndash Uis Nainais ndash Kohero and Sandamap ndash Erongo with the latter connected to the Karibib Pegmatite District (Schneider 1992)
Each of these pegmatite belts exhibit numerous individual pegmatite swarms that occur zoned or unzoned and may carry significant amounts of rare metals or semi-precious stones In the south Lithium-Caesium-Tantalum (LCT) peg-matites occur in two areas Tantalite-Valley south of Warmbad in close prox-imity to the northwest-trending Tantalite Valley Shear Belt and the Sandfon-tein-Ramansdrift area close to the Orange River
Fig 7 Pegmatite belts in north-central Namibia from west to east Brandberg West ndash Goantagab Cape Cross ndash Uis Nainais ndash Kohero and Sandamap ndash Erongo as well as the Karibib Pegmatite District (after Geological Suvey of Namibia 2002)
Lithium Potential in Namibia
26
7 Lithium mining in NamibiaData for historic lithium mine production is available for the period 1939 ndash 1998 (Fig 8) After 1998 all mining activities ceased due to product quality issues and overall market environment
Until the mid-1950s lepidolite was the most important mined lithium mineral of the country (Fig 8) As mine output of lepidolite decreased output of petalite increased However quantity on a year-to-year basis was quite variable and fluctuated between 1000 ndash 10000 t Since the early 1980s production of petalite was quite stable and ranged between 1000 ndash 2500 t Production fell sharply in 1997 and 1998 after which it ceased Mining of amblygonite has always been small compared to lepidolite and petalite and never exceeded 1000 t per annum
According to the USGS (2020) 500 t of lithium were mined in Namibia in 2018 This is most likely stockpiled lepidolite material from the Rubicon mine
0
2000
4000
6000
8000
10000
12000
1939
1941
1943
1945
1947
1949
1951
1953
1955
1957
1959
1961
1963
1965
1967
1969
1971
1973
1975
1977
1979
1981
1983
1985
1987
1989
1991
1993
1995
1997
[Ton
nes]
Petalite (t)Amblygonite (t)Lepidolite (t)
Fig 8 Lithium production in Namibia in [t] per year (after Schneider 1992 BGR 2020)
Lithium Potential in Namibia
27
Currently there is no active consecutive mining for lithium in substantial quan-tities in Namibia although there are prospects and projects under develop-ment
71 Current mining activities and projects
Soris The Soris project is located in the De Rust pegmatite swarm which is part of the ldquoBrandberg West ndash Goantagab tin beltrdquo (Fig 7) This belt stretches to the northeast of the Brandberg massif over a length of 60 km and a width of 25 km This belt was previously mined for cassiterite on a larger scale Some of the pegmatites in this belt may carry substantial amounts of lithium such as pegmatites in the De Rust pegmatite swarm
The De Rust pegmatite itself is a Li-rich rare metal pegmatite that was mined for cassiterite and tantalite but also for minor quantities of spodumene be ween 1960 and 1990 (Diehl 1990) It intruded into metasediments of the Amis River Formation Lower Ugab Group of the Southern Kaoko Zone
It is the largest pegmatite of the De Rust pegmatite swarm within the Brandberg West ndash Goantagab pegmatite belt (Diehl 1992c) Outcrops are 100 ‒ 470 m long up to 30 m wide and can be followed over a length of roughly 24 km
The pegmatite shows well-developed zonation with a border zone (quartz alkali feldspar muscovite) outer (quartz microcline-perthite muscovite altered petalite) and inner (quartzo-feldspathic rock with spodumene crystals with accessory apatite lepidolite eucryptite zircon and monazite) intermedi-ate zone as well as a core zone (quartz subordinate microcline muscovite sporadic tantalite) Spodumene crystals may reach up to 80 cm in length (Fig 12) Towards the core zone spodumene carries rounded nodules of lithi-um phosphates (amblygonite ndash montebrasite series)
It is located northwest of the nearest town of Uis in the Kunene region of Namibia about 6km to the east of farm De Rust 532 and about 25 km north of the Ugab River The nearest railhead is located in the town of Karibib and the deep-water port of Walvis Bay is 120 km to the southwest Windhoek is about 180 km to the southeast
Lithium Potential in Namibia
28
The project can be reached via paved but mostly unpaved roads from the town of Uis From White Lady Lodge which is about 38 km northwest from Uis a 35 km gravel road leads towards the project 15 km of which are in the riverbed of the Ugab River There is currently no electricity and water supply at the project location site
According to SampP Global (022020) current owner of the Soris project is Mon-tero Mining amp Exploration Ltd (TSXV MON) which holds 80 interest of the property Another 20 are allocated to an unnamed private owner Based on data from the Namibia Mining Cadastre Portal (092020) multiple entries for mining licence applications exist for the area where the main De Rust pegmatite is located (Fig 9)
Resource estimateDue to the early stage of the Soris project no resource estimate is avail-able However Montero Mining claims the project to be drill ready targeting a resource of 10 Mt 1 Li2O with tantalum and tin by-product credits This would equate to 46400 t of lithium or 247000 t LCE
Grab samples of the deposit showed lithium contents of 007 to 532 aver-aging 137 Channel samples showed average lithium contents of 076 and values up to 366 (Montero 032019) The company also re-assessed 1097 previously tested RC drill samples The main lithium-bearing mineral is spodumene
Remnants of historic intermittent mining activities like old foundations and quartzo-feldspathic tailings are still visible east to the main pegmatite (Fig 10 ‒ 11)
Lithium Potential in Namibia
29
Fig 10 Remnants of historic open pit mining (upper) and tailings of De Rust pegmatite (lower) northwest of the Brandberg massif (Photo BGR-GSN 2019)
Fig 9 Satellite image of the De Rust project including the outlined mining license Main pegmatite coordinates 20deg57prime48primeprimeS ‒ 14deg30prime12primeprimeE (Source httpportalsflexicadastrecomnamibia 092020)
Main pegmatite
Lithium Potential in Namibia
30
Fig 12 Weathered spodumene chrystals at the historic open pit mine (Photo BGR-GSN 2019)
Fig 11 Historic open pit of the De Rust pegmatite (Photo BGR-GSN 2019)
Lithium Potential in Namibia
31
Uis The Uis projects (former mine and tailings) are located in the northern part of the ldquoCape Cross Uis pegmatite beltrdquo east of the town of Uis on the farm Uis Townlands No 215 in the Erongo region of Namibia
The Cape Cross-Uis belt is approx 120 km long and up to 40 km wide and extends in a NE direction (Fig 7) It comprises three distinct pegmatite swarms the Strathmore swarm Karlowa swarm and Uis pegmatite swarm In general lithium-bearing pegmatites (Li-Nb-Ta-Sn-Be and Li-Nb-Ta-Sn) are the least common in this belt (Fuchsloch et al 2018)
The Uis swarm field consists of more than 120 individual pegmatites each with a northeasterly to easterly strike direction and northwesterly down dip (30deg ‒ 70deg) This field is accompanied by a peripheral pegmatite field of approx 25 individual pegmatites
Some of the main pegmatites especially around the formerly worldrsquos largest tin mine at Uis are exceedingly large Some of them are up to 1 km long and some 50 m wide
In terms of lithium petalite amblygonite and minor spodumene mineralization occurs in the various pegmatites but no lepidolite Most common lithium bear-ing minerals in the eight pegmatites that were mined at Uis are amblygonite petalite and spodumene
Currently the Uis tailings project and the Uis tin mine are owned by two differ-ent companies As of 2020 the tin mine is operating a pilot processing plant and aims to ramp up the production of lithium in the near future The current ownership of the tailings project as of September 2020 is unclear
The nearest commercial deep-water port to the projects is Walvis Bay 220 km to the southeast The town of Omaruru is 130 km to the east and Henties Bay lies about 120 km to the southwest The nearest railhead is located in Omaruru The area is accessible year-round by paved and un-paved roads NamPower provides electricity and the town of Uis is connected to the Nam-Water pipeline
Lithium Potential in Namibia
32
The tin deposit was discovered in 1911 and mined between the 1950s and 1989 for cassiterite by Uis Tin Mining Company (SWA) Ltd and IMCOR
Coarse tailings are located in the northern part of the former mine just south to the main road C36 (Fig 13) The fine material is located south to the coarse waste dumps (Fig 13)
After 1990 multiple companies owned the property until AfriTin Mining Ltd bought all the rights (license ML134) The current lithium tailings project of Montero Mining amp Exploration Ltd (TSXV MON) is based on the historic mine tailings of the former tin mine on mining license ML134 that is currently owned by AfriTin Mining Ltd The acquired tailings material does not fall under the ML134 license of AfriTin since historical tailings material (Fig 14) is not regulated by Minerals (Prospecting and Mining) Act 33 of 1992 of Namibia
Resource estimateUis tin mineAccording to AfriTin the former Uis mine holds a JORC compliant resource (inferred) of 715 Mt of ore 0134 Sn with a cut-off grade of 005 Sn (AfriTin 2020) Grades of ancillary elements are given at 063 Li2O and 85 ppm Ta for the total resource of 71 Mt of ore
This equals to approx 95000 t of tin 209000 t of lithium (11 Mt LCE) and 6090 t of tantalum 85 of the total resource are attributable to the company The remaining 15 are allocated to SMU (Small Miners of Uis)
Uis tailingsMontero Mining filed an inferred resource estimate of 144 Mt of ore 037 Li2O and 005 SnO2 with a 035 Li2O cut-off grade for lithium and assumed processing recoveries of 70 for their tailings project (Montero 2019) This equals to approx 24700 t of lithium content (131500 t LCE) and 7200 t SnO2
This resource estimate only includes coarse tailings material There is current-ly no information on the lithium content of the fine tailings material that totals 271 Mt t due to insufficient or no test work (Montero 2018) The company also states that the average Li2O grade of the fines material does not hurdle the cut-off for the fines of 082 Li2O
Lithium Potential in Namibia
33
In 2016 Australian based Tawana Resources carried out a drilling program at Uis for a private company called Lithium Africa 1 on the fine and coarse tailings (Table 3 Hole 1 amp Hole 2) Below some of the obtained data on lithium content is given Additionally Li2O content of two obtained grab samples by BGR (Table 3 Sample 2019a amp 2019b) is given
Table 3 Sample data Uis (Tawana 2016 Montero 2018 BGR 2019)
Sample Sample 0 to 1m Li2O ()
Sample 1 to 2m Li2O ()
Sample 2 to 3m Li2O ()
Fines Hole 1 071 085 092
Fines Hole 2 080 089 095
Coarse Hole 1 050 043 043
Coarse Hole 2 054 062 062
BGR Sam-ple 2019a (Coarse tailings)
028
BGR Sam-ple 2019b (Coarse tailings)
028
Montero NI 43-101 037
Lithium Potential in Namibia
34
Fig 14 Tailings of the historic Uis Tin Mine (Photo BGR-GSN 2019 with kind permission of AfriTin Mining Limited)
Fig 13 Former Uis tin mine Uis tailings project with coarse tailings Tailings coordina-tes (center) 21deg13prime31primeprimeS ‒ 14deg52prime44primeprimeE (Source httpportalsflexicadastrecomnamibia 092020)
Uis Tailings (coarse)
Uis Tailings (fine)
Historic Uis mine
Lithium Potential in Namibia
35
Karibib Lepidolite ProjectThe Karibib Lepidolite brownfield project is located in the ldquoKaribib ndash Usakos Pegmatite Districtrdquo southeast of the town of Karibib on the farm Okongava Ost No 72 in central Namibia (Fig 15 ‒ 16)
This pegmatite district which is of Damaran age hosts the most important pegmatite occurrence (Rubicon swarm) in terms of lithium in Namibia In addi-tion numerous other different pegmatite swarms some of which have previ-ously been relevant in terms of lithium are know from this district These are Dernburg Karlsbrunn Albrechtshoumlhe Berger Kaliombo Gamikaubmund Okatjimukuju Etusis Daheim Friedrichsfelde and Etiro (Diehl 1992a)
The Rubicon pegmatite itself is the largest of the individual pegmatites that occur in this field and has been the prime source of lithium until mining seized in the early 1990s The Helikon pegmatites are part of the Rubicon pegmatite swarm and are located northeast to the Rubicon pegmatite They have previ-ously been mined for lepidolite amblygonite petalite and muscovite beryll pollucite quartz and columbite-tantalite as valuable by-products (Fig 18 ‒ 19)
The pegmatite itself consist of two ellipsoidal well zoned Li-mineralized ore-bodies The larger one is about 320 m long and 25 ndash 35 m wide It dips at 46deg to the northeast and has a northwesterly strike The second orebody is about 230 m long and about 10 m wide It is dipping with 30deg to the northeast and has a northwesterly strike In total the outcrop of the Rubicon pegmatite is about 600 m long with a maximum width of 65 m (Fig 17)
A very prominent feature is the presence of a very well developed concen-tric shell and zones from the footwall to the inner core of the pegmatite Both orebodies exhibit a border- wall- intermediate- and core-zone
Border-zone wall-zone and outer intermediate zone of the larger orebody do not contain Li-bearing minerals of economic importance The inner interme-diate zone does contain lepidolite The outer core zone may be sub-divided into a petalite zone low-grade lepidolite zone and a high-grade lepidolite zone The inner core zone also contains a petalite zone Mining occurred pre-viously in the later named zones The zonation of the smaller orebody to the northwest is less pronounced but Li-mineralization and style are equal to the
Lithium Potential in Namibia
36
larger orebody There is no spodumene mineralization within the orebodies and respectively zones of the Rubicon pegmatite
The Helikon I pegmatite is also a lens-shaped pegmatite with a length of roughly 400 m and a width of approx 66 m It dips to the north with about 60deg ndash 70deg Helikon I also consists of well-defined zones The main Li-bearing minerals are lepidolite and petalite According to Roering (1963) the lepidolite is difficult to separate from the intergrown albite and hence of low grade and quality
The Helikon II pegmatite is approx 17 km long and only 9 ndash 15 m wide It lies a bit north of Helikon I and dips steeply to the north with 55deg ndash 80deg striking east west The main Li-bearing minerals are lepidolite and petalite According to Diehl (1990) the westernmost portion of the pegmatite has historically been the economically most important A massive up to 6 m wide petalite zone was mined here according to Diehl (1990)
The nearest railhead to the project is 17 km away in Karibib and the deep-water port of Walvis Bay is 220 km to the southwest Windhoek is about 180 km to the southeast NamPower connects the town of Karibib to electricity and the project currently utilizes generators There is a 7 km long 22 kV power line spur to grid connection pending (Lepidico 2020) Water is available via on-site boreholes
The project was previously owned by Desert Lion Energy Inc (TSVX DLI) Lepidico Ltd (ASX LPD) bought into the project and currently holds 80 interest which comprises Mining License 204 (69 km2) as well as three Exclu-sive Prospecting Licenses (EPLs) namely 5439 5555 and 5781 (Lepidico 2020)
Lepidico will cover mining from multiple sources as well as chemical conver-sion by utilizing their proprietary lithium processing technologies L-Maxreg LOH-Maxreg and S-Maxreg (Lepidico 052019) The company aims to produce high purity lithium chemicals such as lithium carbonate and lithium hydroxide
The takeover also included a nonbinding offtake agreement between the for-mer owner Desert Lion Energy Inc and German chemical company BASF On April 2nd 2019 Desert Lion Energy Inc announced this offtake agreement
Lithium Potential in Namibia
37
which at the time was valid through to December 31 2019 On December 20th
2019 Lepidico announced that the LOI with BASF was extended to Decem-ber 31st 2020 (Lepidico 122019)
The feasibility study criteria of Lepidico are as follows
- Throughput of the concentrator on-site of 035 Mtpa- Expansion of throughput after year five to 05 Mtpa- Chemical plant in the industrial city of Abu Dabi (ICAD)- Plant design for 58000 tpa of concentrate (4 LiO2) for the production of
up to 5500 tpa LiOH- Utilization of L-Maxreg and LOH-MaxTM- Non-binding off-take MOU with BASF for LiOH only- Targeting for project commissioning to commence late 2021 for commer-
cial production in 2022
The preliminary mine plan indicates a strip ratio of 03 ndash 1 for the first two years The ratio will then go up to 1 ndash 14 In the first four years elevated grades of 06 LiO2 will be mined
Resource estimateA JORC 2012 compliant resource estimate for the deposit is given in Table 4 (Lepidico 2020) The deposit currently holds 23200 t of lithium (Indicated amp Inferred) based on a cut-off grade of 015 Li2O This resource estimate is based solely on the lepidolite occurrences at the mine site
Table 4 Resource estimate Karibib Lepidolite Project (Source Lepidico 2020)
Deposit Resource Category
Cut-off (Li2O)
Ore (Mt)
Li2O ()
Li (t)
Li (LCE)
Rubicon Measured
015
22 057 5819 30974
Rubicon Indicated 666 038 11637 61943
Rubicon Inferred 237 043 4728 25167
Helikon
Total 015 1124 043 22184 118086
Lithium Potential in Namibia
38
Fig 16 Satellite image of the Karibib Lepidolite project Helikon 1 coordinates (center) 22deg2prime49primeprimeS ‒ 16deg1prime13primeprimeE Helikon 4 coordinates (center) 22deg2prime24primeprimeS ‒ 16deg1prime41primeprimeE (Source httpportalsflexicadastrecomnamibia 092020)
Fig 15 Satellite image of the Karibib Lepidolite project Rubicon coordinates (center) 22deg6prime11primeprimeS ‒ 15deg59prime44primeprimeE (Source httpportalsflexicadastrecomnamibia 092020)
Historic Rubicon mine
Helikon 1
Helikon 4
Lithium Potential in Namibia
39Fig 17 Rubicon pegmatite (Photo BGR-GSN 2019 with kind permission of Lepidico Chemicals Namibia (Pty) Ltd 2020)
Lithium Potential in Namibia
40 Fig 18 Lepidolite sample from Rubicon pegmatite (Photo BGR-GSN 2019 with kind permission of Lepidico Chemicals Namibia (Pty) Ltd 2020)
Fig 19 Petalite sample from Rubicon pegmatite (Photo BGR-GSN 2019 with kind permission of Lepidico Chemicals Namibia (Pty) Ltd 2020)
Lithium Potential in Namibia
42
Fig 21 Helikon 4 pegmatite (Photo BGR-GSN 2019 with kind permission of Lepidico Chemicals Namibia (Pty) Ltd 2020)
Fig 20 Helikon 1 pegmatite (Photo BGR-GSN 2019 with kind permission of Lepidico Chemicals Namibia (Pty) Ltd 2020)
Lithium Potential in Namibia
43
Tantalite ValleyThe Tantalite Valley Project lies within the ldquoNamaqua Metamorphic Complexrdquo in Southern Namibia Within this complex Lithium-Caesium-Tantalum (LCT) pegmatites occur in two main areas Tantalite-Valley south of Warmbad in close proximity to the northwest-trending Tantalite Valley Shear Belt and the Sandfontein-Ramansdrift area close to the Orange River
The area were the pegmatites of the Tantalite Valley occur is primarily com-posed of a large ovoid gabbro intrusion (71 km by 33 km in extent) within paragneiss units of the Namaqua Complex The gabbro outcrop forms a large dome shaped mountain that rises about 500 m above the surrounding topo-graphy
The pegmatites belong to the Kenhardt and Gordonia pegmatite districts in Namaqualand but only the younger group of them carry accessory ore miner-als such as tantalite beryl REE minerals and lithium
The Tantalite Valley pegmatites include several individual subhorizonal dikes that are up to 1000 m long and 02 to 40 m wide plunging towards southeast (Diehl 1992b) Four of those are of economic interest Homestead Whitkop White City and the Lepidolite pegmatites (ie Purple Haze) (Fig 22)
They are all well zoned (quartz core inner and outer intermediate zones wall zone) and were predominantly targeted for beryl columbite-tantalite as well as lithium and bismuth minerals
The project is located on the farms Umeis 110 and Kinderzitt 132 between the Farms 109 131 129 308 and 473 in the magisterial district of Karas It currently comprises Mining License (ML-77) fully owned by Tameka Shelf Co Four (Pty) Ltd which is a 100 subsidiary of African Tantalite Pty Ltd (AFTAN) Above all Kazera Global Investments PLC holds a 75 stake in AFTAN (Kazera 2019) with the other 25 of local farmer ownership
The project is accessible via gravel road from Karasburg which is about 80 km to the north The nearest railhead is also located in Karasburg Electricity is currently supplied by generators and water is recovered from multiple drill holes The Orange River is about 15 km to the south of the project Mining
Lithium Potential in Namibia
44
infrastructure as well as equipment are on site as well as a plant for the pro-duction of tantalite concentrate
NTI is working on an extensive exploration program with a clear focus on revi-ving tantalite mining in Namibia with a possible by-product stream of lithium bearing minerals The company will focus primarily on the pegmatites Homes-tead Purple Haze Signaalberg and White City (Fig 23)
The area is known for its tantalum occurrences and since the late 1940s tantalite and other minerals have been recovered at Tantalite Valley until 1981 when mining ceased Initially alluvial deposits were mined followed by the pegmatites themselves Grades of the concentrates produced prior to the closure of the mine were quite high with 65 ‒ 70 Ta2O5 with very low U3O8
and ThO2 values of 025 max
Resource estimateAccording to SampP Global (092020) Measured and amp Indicated resources at Tantalite Valley are 104800 t of ore 0042 Ta2O5 and 0653 Li2O as of 112019 This would equate to 315 t of lithium or 1690 t LCE Total inferred resources are 517400 t of ore 0018 Ta2O5 and 0144 Li2O This equals to approx 91 t of tantalum and 750 t of lithium (3535 t LCE)
Lithium Potential in Namibia
45
Fig 23 White City pegmatite (Source Kazera global Investments PLC 2020)
Fig 22 Satellite image of the Tantalite Valley project White City pegmatite coordinates (center) 28deg43prime07primeprimeS ‒ 18deg44prime45primeprimeE Homestead pegmatite coordinates (center) 28deg43prime19primeprimeS - 18deg44prime24primeprimeE Purple Haze pegmatite coordinates (center) 28deg43prime09primeprimeS ‒ 18deg43prime55primeprimeE (Source httpportalsflexicadastrecomnamibia 092020)
Lithium Potential in Namibia
46
8 Analysed lithium samplesDuring the course of the cooperation project between the Economic Geology Division (EGD) of the Geological Survey of Namibia (GSN) and the Ger-man Federal Institute of Geosciences and Natural Resources (BGR) several sampling campaigns to southern and central pegmatites took place
The field trips were preceded by literature and data research regarding infor-mation on lithium occurrences andor previous lithium mining activity to iden-tify specific target areas
During a campaign in 2019 16 lithium-bearing mixed mineral samples were taken from five different locations and subsequently analyzed Two of the samples originate from the Uis Tin Mine Tailings of the former tin mine All remaining samples were taken either from stripped outcrops for future mine activities or from previous mine sites (ie pits)
All 16 samples were analyzed at BGR labs in Hanover Germany through qualitative XRD XRF and ICP-MS Given data shall be understood as a first indicator for the sampled lithium occurrences
Most if not all sampled occurrences have previously been analyzed or are cur-rently being assessed by the property owners or current licensees Detailed information of these sampling and analytical campaigns remain confidential and are thus not available for comparison
Appendix A lists the identified qualitative mineralogy of the samples as well as the major element analysis Additional samples from previous campaigns are also given
Interpretation of the results are based on their applicability in the various lithium-consuming industries for which information is available
Most of the current lithium applications require a chemical intermediate product such as lithium carbonate or lithium-hydroxide The glass and cera-mic industry does use lithium-bearing mineral concentrates depending on the prices of these materials when compared to LiCO3
Lithium Potential in Namibia
47
Since the main applications require an intermediate or downstream chemical product lithium content as well as impurity values are the main criteria for the suitability of the sampled occurrences Other quality criteria are particle size and surface areastructure
9 InterpretationAs previously stated all obtained grab samples are mixtures of lithium- bearing minerals (ie spodumene petalite lepidolite) feldspars quartz micas as well as secondary minerals Therefore all given analytical data has to be taken with caution and will not be representative for the individual outcrops or deposits
The evaluation of the economic suitability for various economic applications of the analysed lithium samples is based on the chemical specifications in Chapter 4
Lithium content gt 1 Li2O Fe2O3 content lt 015 as well as F content lt 01 are individually highlighted (Appendix A) as these three values are the most important
Based on the chemical analysis nine of the 16 samples showed Li2O contents of more than 1 (range 117 ‒ 327 ) Seven of those nine samples also exhibited low Fe2O3 content (range 004 ‒ 008 ) (Appendix A) Three of those seven samples also had fluorine values below 005
Of the ten additionally included samples from previous campaigns four showed Li2O contents of more than 1 (range 126 ‒ 199 ) Three of those samples also exhibited low Fe2O3 content (range 004 ‒ 007 ) (Appendix A) One of the three samples had fluorine values below 005
The mentioned samples (sources) could be of potential use but for further interpretation statistical sampling will be required
Lithium Potential in Namibia
48
10 ConclusionsThere is currently no lithium industry established in Namibia This accounts to both mining and processing of ores into commercial lithium-bearing con-centrates as well as the production of downstream products such as lithium carbonate andor lithium hydroxide In order to evaluate the potential for a lithium industry in Namibia the current global market and price developments need to be addressed
Currently the main application for lithium is in the chemical industry as lithium carbonate andor hydroxide for the manufacturing of lithium-ion batteries There is currently no domestic market (supply) or demand for this industry in Southern Africa or Namibia in specific Processing of lithium-bearing ores into these highly specific downstream products is economically more viable in close proximity to the demanding industries It also requires large investments (double-digit million dollars per 10000t of capacity) Additionally there is already huge capacity and strong capacity build up in Asia at rather low cost
The second most important application lies in the glass and ceramics industry This industry uses lithium either as lithium-bearing concentrates or lithium carbonate depending on current market price and processproduct require-ments There is currently no such industry established in Namibia but potential plans There is glass and ceramics manufacturing in South Africa and thus a potential market for lithium bearing products (concentrates) should this indus-try require it depending on product
The 20182019 primary lithium supply based on spodumene-bearing mineral concentrates was dominated by Australia with a market share of well over 95 On an annual basis the country exports more than three million tons of lithium-bearing concentrates to China To put this into perspective Lepidico plans to export just 58 ktpa of concentrate to Abu Dhabi for refinement from their project annually Therefore potential production in Namibia will always be rather small scale when compared to peer producing countriescompanies
As of late 2020 the concentrate market is in strong oversupply with strong competition Thus prices have eroded quite substantially for a standard SC6 concentrate (Fig 24) In general prices vary significantly based on lithium content and impurities of the concentrates Lithium bearing mineral concen-
Lithium Potential in Namibia
49
trates are a relatively low-value mineral commodity when compared to lithi-um-carbonate or other lithium downstream products thus product quality cost reduction and cost control are key components in this industry Since prices are depressed currently many of the Australian producers have drasti-cally reduced output or even went into care and maintenance This situation may change towards 2025 or beyond as demand picks up
Prices for the higher valued product lithium-carbonate spiked at the end of 2017 towards 2018 to more than 20000 $USt on a contract basis with prices being very volatile Since then prices have also eroded to below 9000 $USt due to oversupply and slow demand pickup (Fig 25) With this product stable quality and chemical composition are crucial for the downstream industry
Based on available gradetonnage data the Namibian projectsprospects are relatively small in overall size and low in grade when compared to global peers for the resource category ldquoMeasuredIndicatedrdquo (Appendix B) Total contained lithium quantity is thus relatively small in comparison On a global scale the most promising hard rock projects that are currently being mined and developed have Li2O grades of 10 or above
Fig 24 Lithium-mineral-concentrate prices 012010 ‒ 062020 (Source BGR 2020)
300
400
500
600
700
800
900
1000
1100
208
210
212
214
216
218
220
US$
t US$t
01-20
14
01-20
15
01-20
16
01-20
17
01-20
18
01-20
19
01-20
20
01-20
10
01-20
11
01-20
12
01-20
13
Spodumene min 5-6 LiO2 fob Australia
Spodumene concentrate gt75 LiO2 bulk cif Asia
Petalite 42 LiO2 fob Durban
Spodumene fob Australia
Spodumene min 5-6 LiO2 cif China
Lithium Potential in Namibia
50
For the resource category ldquoIndicatedrdquo which generally represents the lowest level of confidence only the Uis mine project of AfriTin represents a size-able resource even though grades are relatively low (Appendix C) The Uis tailings project as well as the Rubicon project are again relatively small when compared to their global peers Tantalite Valley is the smallest of all included projects (Appendix C)The given data for the De Rust project reflects only an exploration target of the company rather than actual data and may thus be not representative
Based on size and contained lithium-content none of the visited early stage projectsprospects would justify the financial investment into the construction of a chemical conversion plant for the production of lithium carbonate andor hydroxide on site as it requires very large monetary investments Due to their size payback of the required investments may be unfavorable when compared to global peers In addition the current market environment is very harsh with strong competition from Asia that has a huge cost advantage due to capacity build up This industry is also very energy and water intensive
In addition location within Namibia as well as distance to possible down-stream markets may become an issue as it increases the transportation cost
4000
7000
10000
13000
16000
19000
22000
25000
28000
01-20
14
01-20
15
01-20
16
01-20
17
01-20
18
01-20
19
01-20
20
US$
t
Lithium-carbonate (min 995 ) battery grade spot price ex works domestic ChinaLithium-carbonate (min 99-995 ) Li2CO3 large contracts USA delivered continentalLithium-hydroxid-monohydrate (min 565) technical and industrial grades cif China Japan amp Korea
Fig 25 Lithium chemical prices 012014 ndash 062020 (Source BGR 2020)
Lithium Potential in Namibia
51
immensely This is especially true for the SorisDe Rust pegmatite which is in a remote location without any allocated infrastructure The projects Karibib Uis and Tantalite Valley are much easier to access
The approach of Lepidico to produce a lithium bearing concentrate on site seems plausible approach Since this will already require a skilled workforce mining and beneficiation equipment in order to produce a high quality lithium-bearing concentrate it may already be considered ldquoadded valuerdquo for the indus-try of the country This approach may also be suitable for the other mentioned and visited projects
Lithium Potential in Namibia
52
ReferencesAfriTin Mining (2020) Uis Tin Project ndash Company Information ndash URL httpafritinminingcomuis-project [as of 092020]
Australian Government Geoscience Australia (2019) Australiarsquos Identi-fied Mineral Resources 2019 ndash URL httpswwwgagovauscientific-topicsmineralsmineral-resources-and-adviceaimr [as of 092020]
BGR ndash Bundesanstalt fuumlr Geowissenschaften und Rohstoffe (2020) Fachinformationssystem Rohstoffe ndash unpubl Hannover [as of 082020]
BGS ndash British Geological Survey (2016) Lithium Definitions mineralo-gy and deposits ndash URL httpswwwbgsacukdownloadsstartcfmid=3100 [as of 062016]
Diehl B J M (1990) Pegmatites of the Cape Cross Uis ndash Pegmatite Belt Namibia Geology mineralisation Rubidium Strontium characteristics and petrogenesis of rare metal pegmatites Open File Report EG 083 Economic Geology Series Geological Survey of Namibia 39 pp Windhoek
Diehl B J M (1992a) Lithium Caesium Beryllium Open File Report Mineral Resource Series Geological Survey of Namibia 18 pp Windhoek
Diehl B J M (1992b) Niobium and Tantalum Open File Report Mineral Resource Series Geological Survey of Namibia 20 pp Windhoek
Diehl B J M (1992c) Tin Open File Report Mineral Resource Series Geological Survey of Namibia 30 pp Windhoek
Diehl B J M amp Schneider G I C (1990) Geology and mineralisation of the Rubicon Pegmatite Namibia Open File Report Geol Surv Namibia 20 pp Windhoek
Fuchsloch et al (2018) Classification mineralogical and geochemical vari-ations in pegmatites of the Cape Cross-Uis pegmatite belt Namibia Lithos 296 ndash 299 79-95 elsevier
Lithium Potential in Namibia
53
Garret D E (2004) Handbook Of Lithium And Natural Calcium Chloride Their Deposits Processing Uses and Properties ndash 467 S Oxford (Elsevier B V)
Geological Survey of Namibia (2002) Mineral Resources of Namibia Summary of Mineral Deposits and Occurrences Omaruru Sheet 2114 Volume I ndash Complete Descriptions 119 pp Windhoek
IHS Global SA (2020) Global Trade Atlas ndash Commercial Online-Databa-se ndashURL httpsmyihscomConnectcallingUrl=https3a2f2fconnectihsmarkitcom2f [as of 062017]
Kazera Global Investments PLC (2020) Company Information ndash URL httpskazeraglobalcominvestmentsnamibia-tantalite-investment-mine [as of 092020]
Lepidico (2019) LOI with BASF extended to 31 December 2020 ndash News Release ndash URL httpswwwlepidicocomwp-contentuploads201910LPD-191220-LOI-with-BASF-extended-to-31-December-2020pdf [as of 122019]
Lepidico (2019) Corporate Presentation ndash URL httpswwwlepidicocomwp-contentuploads201907LPD-190509-Corporate-Presentati-on-May-2019pdf [as of 052019]
Lepidico (2020) Company Information ndash URL httpswwwlepidicocomprojectskaribib [as of 092020]
Montero Mining amp Exploration Ltd (2018) Exploring Battery Metals in Namibia ndash Company Presentation ndash URL httpswwwproactiveinvestorscomauuploadSponsorFileFile2018_031520244941_MON-CorporatePre-sentationMarch2018pdf [as of 072018]
Montero Mining amp Exploration Ltd (2019) Montero Files NI 43-101 Resource Estimate On The Uis Lithium-Tin Tailings Project In Namibia On Sedar ndash News Announcement ndash URL httpsmonterominingcommontero-files-ni-43-101-resource-estimate-on-the-uis-lithium-tin-tailings-project-in-namibia-on-sedar [as of 032019]
Lithium Potential in Namibia
54
Namibia Mining Cadastre Portal (2020) Online-Database ndashURL httpsportalslandfoliocomnamibia [as of 092020]
Roskill Information Services Ltd (2016) Lithium Global Industry Mar-kets amp Outlook ndash 386 S London Groszligbritannien
Schneider G I C (1992) Feldspar Open File Report MRS 08 Mineral Resource Series Geological Survey of Namibia 2 pp Windhoek
Schmidt M (2017) Rohstoffrisikobewertung ndash Lithium ndash DERA Rohstoffin-formationen 33 Berlin
S amp P Global Market Intelligence (2020) Lithium - Metals amp Mining Properties URL httpsplatformmarketintelligencespglobalcomwebcli-entauth=inheritindustryminingProjects [as of 092020]
Statista (2020) Distribution of lithium end-usage worldwide in 2019 by area application ndash URL httpswwwstatistacomstatistics268787lithium-usa-ge-in-the-world-market [as of 062020]
Tawana Resources NL (2016) Tawana acquires second lithium pro-ject ndash News Release ndash URL httpsmstrademomentumcozajsepdfSENS_20160923_S376505pdf [as of 092016]
USGS ndash United States Geological Survey (multiple years) Lithium ndash Minerals Commodity Summaries ndash URL httpswwwusgsgovcentersnmiclithium-statistics-and-information [as of 082020]
Appendix
Sam
ple I
DFa
rmLa
titud
eLo
ngitu
deSa
mpl
e des
crip
tion
(XRD
qu
al)
LiO 2
()
SiO 2
Ti
O 2
Al2O 3
Fe2O 3
Mn
O Mg
O Ca
O Na
2O
K 2O P 2O 5
SO
3
Cl
F
LOI
Su
m
2015
-03
previous sample campaignsHelik
on
n A
Felds
parQ
uartz
Lepid
olite
025
6871
lt000
119
0500
200
2900
505
3292
806
7905
59lt0
01lt0
002
lt005
093
9985
2016
-12
Rubic
onwe
ather
ed P
etalite
126
6473
lt000
118
0600
703
2718
607
9507
805
2500
62lt0
01lt0
002
lt005
1146
9871
2016
-17
Rubic
onLe
pidoli
te +
Quar
tz13
063
6700
219
9316
0929
003
0054
029
6218
0052
lt001
lt000
226
232
798
67
2016
-20
Helik
onLe
pidoli
te + A
lbite
176
5514
lt000
126
8700
401
2100
700
2123
970
3900
45lt0
01lt0
002
156
369
9698
2016
-21
Helik
onLe
pidoli
te19
954
32lt0
001
2627
004
0224
006
0038
266
714
0069
lt001
lt000
240
628
997
77
FN20
19_0
4De
Rus
tFe
ldspa
rAmb
lygon
iteP
etalite
(n
on X
RD)
003
6513
lt000
118
82lt0
0100
0200
101
0924
311
4105
75lt0
0100
04lt0
0503
898
84
2015
-09
Molop
oPe
talite
(non
XRD
)00
952
85lt0
001
1672
lt001
0002
487
0323
342
0352
lt000
100
400
3403
621
1310
012
2016
-14
Molop
oPe
talite
wea
there
d (no
n XRD
)00
752
1600
0316
5100
200
5147
805
8923
406
4500
6900
200
8602
222
6310
013
2016
-15
Molop
oFe
ldspa
r (no
n XRD
)00
664
02lt0
001
1937
003
0004
003
0151
216
1249
0796
lt001
lt000
2lt0
0505
399
55
2016
-23
Molop
oZin
nwald
ite (n
on X
RD)
006
5044
0068
3307
048
0011
012
0426
261
7674
0181
lt001
lt000
2lt0
0542
9925
1909
249
2019Uis
Tailin
gs
Quar
tzFe
ldspa
rPeta
lite
Musc
ovite
028
7293
0045
1479
051
0062
0212
9830
927
6613
6200
2lt00
02lt0
0523
399
38
1909
250
Uis
Tailin
gsQu
artz
Felds
parP
etalite
Mu
scov
ite02
872
6900
4314
8205
0059
019
1306
313
2794
1347
002lt
0002
lt005
251
9937
1909
251
Helik
on 4
22deg02prime4
8primeprimeS1
6deg01prime30
primeprimeEQu
artz
Felds
parP
etalite
Le
pidoli
te16
464
4400
0319
4200
301
2100
408
8325
345
6806
800
400
0727
228
998
38
1909
252
Helik
on 1
22deg02prime2
0primeprimeS1
6deg01prime19
primeprimeEPe
talite
Lepid
olite
Quar
tz29
576
9200
0116
6800
300
0304
101
7301
106
8100
01lt0
01lt0
002
lt005
205
97
App
endi
x A
Ana
lytic
al d
ata
of li
thiu
m s
ampl
es c
olle
cted
in N
amib
ia T
hres
hold
val
ues
high
light
ed in
gre
en
Lithium Potential in Namibia
57
Sam
ple I
DFa
rmLa
titud
eLo
ngitu
deSa
mpl
e des
crip
tion
(XRD
qu
al)
LiO 2
()
SiO 2
Ti
O 2
Al2O 3
Fe2O 3
Mn
O Mg
O Ca
O Na
2O
K 2O P 2O 5
SO
3
Cl
F
LOI
Su
m
1909
253
2019Rubic
on22deg06prime1
3primeprimeS1
5deg59prime45
primeprimeEPe
talite
Lepid
olite
Quar
tz32
778
73lt0
001
1687
002
0006
002
0157
011
003
0002
003
0003
lt005
075
9663
1909
254
Rubic
on22deg06prime1
0primeprimeS1
5deg59prime41
primeprimeEFe
ldspa
rQua
rtzM
usco
vite
004
682
lt000
119
3500
300
2400
205
0610
0808
6804
3lt0
01lt0
002
lt005
041
9985
1909
255
Rubic
on22deg06prime1
0primeprimeS1
5deg59prime41
primeprimeEFe
ldspa
rLep
idolite
Mus
co-
viteK
aolin
026
6104
0004
2318
022
0136
006
0119
367
8411
0159
lt001
lt000
2lt0
0522
299
15
1909
256
Rubic
on22deg06prime1
0primeprimeS1
5deg59prime41
primeprimeELe
pidoli
te 27
249
8700
129
3400
408
0500
400
704
697
3100
31lt0
01lt0
002
087
441
9569
1909
257
Rubic
on22deg06prime1
3primeprimeS1
5deg59prime45
primeprimeEPe
talite
Lepid
olite
Quar
tz30
670
0900
0320
2600
801
0901
502
9901
926
800
15lt0
0100
04lt0
0526
596
48
1909
258
Rubic
on22deg06prime1
0primeprimeS1
5deg59prime41
primeprimeELe
pidoli
teFe
ldspa
rQua
rtz20
659
7800
0224
100
505
2400
300
513
7247
0051
lt001
0002
265
388
9966
1909
259
Tanta
lite
Valle
y28deg43prime0
9primeprimeS1
8deg43prime55
primeprimeEFe
ldspa
rLep
idolite
Mus
covit
e11
762
64lt0
001
2139
004
0161
lt001
0399
7731
2401
0900
200
119
912
698
85
1909
260
Tanta
lite
Valle
y28deg43prime0
9primeprimeS1
8deg43prime55
primeprimeEFe
ldspa
rLep
idolite
Mus
covit
e03
059
8600
1425
1301
604
2200
302
2860
547
2201
3900
200
0904
123
799
56
1909
261
Tanta
lite
Valle
y28deg43prime0
9primeprimeS1
8deg43prime55
primeprimeEFe
ldspa
rQua
rtzM
usco
vite
003
636
0005
2218
022
0122
002
0381
727
3809
0272
lt001
lt000
2lt0
0513
199
17
1909
262
Tanta
lite
Valle
y28deg43prime2
0primeprimeS1
8deg44prime23
primeprimeEQu
artzSp
odum
eneM
us-
covit
e13
180
5100
0415
8903
401
2401
301
9502
604
0400
0500
200
03lt0
0507
398
56
1909
263
De R
ust
20deg57prime4
8primeprimeS1
4deg30prime13
primeprimeEFelsd
parS
podume
neQuartz
074
7313
0006
2048
007
015
005
0154
398
0831
0073
001
0003
lt005
082
9974
1909
264
De R
ust
20deg57prime4
8primeprimeS1
4deg30prime13
primeprimeESp
odum
eneF
eldsparQuartz
230
6924
0006
2602
801
0200
301
0510
102
1400
68lt0
0100
03lt0
0504
897
53
(Con
tinue
d) A
ppen
dix
A A
naly
tical
dat
a of
lith
ium
sam
ples
col
lect
ed in
Nam
ibia
Thr
esho
ld v
alue
s hi
ghlig
hted
in g
reen
Lithium Potential in Namibia
58
Appendix B GradeTonnage data (Measured amp Indicated) for selected lithium projects in comparison to Namibian projects (Source SampP 092020)
0
0500
1000
1500
2000
2500
500
5000
5000
0
5000
00
5000
000
Gra
de [
Li 2O
]
Tonnage [t]
Tantalite Valley
Rubicon
Appendix B GradeTonnage data (Inferred) for selected lithium projects in com-parison to Namibian projects (Source SampP 092020)
0
0500
1000
1500
2000
2500
100
1000
1000
0
1000
00
1000
000
1000
0000
Gra
de [
Li 2O
]
Tonnage [t]
Tantalite ValleyRubicon
Uis Tailings
Uis Mine
De Rust
A product of the technical cooperation project between Bundesanstalt fuumlr Geowissenschaften und Rohstoffe (BGR)(Federal Institute for Geosciences and Natural Resources)
andGeological Survey of Namibia within the Ministry of Mines and Energy
ISBN 978-3-948532-29-1 (Print) 978-3-948532-30-7 (PDF)
- List of Abbreviations
- 1 Introduction
- 2 What is lithium
-
- 21 Lithium deposits
-
- 3 Application
- 4 Chemical requirements
- 5 Mining and trade of lithium in the SADC
-
- 51 Lithium production
- 52 Trade data
- 53 Export
- 54Import
-
- 6 Lithium occurrences in Namibia
- 7 Lithium mining in Namibia
-
- 71 Current mining activities and projects
-
- 8 Analysed lithium samples
- 9 Interpretation
- 10 Conclusions
- References
-
Lithium Potential in Namibia
21
In 2018 global mine output of lithium was around 91000 t Li-content of which only 1200 t originated from the Southern African Development Community (SADC) namely Zimbabwe and Namibia
52 Trade data
Trade data is retrieved from the commercially available Global Trade Atlasreg (IHS Global SA) The database provides both import and export data for more than 90 countries based on customs data of individual countries Data is primarily classified through Harmonised System (HS) product codes by the WCO (World Customs Organization) The HS nomenclature consists of approximately 5000 product groups identified by a 6-digit code
There are limitations to trade data The most prominent issue arises with data availability since many countries do not publish trade data Especially export data is an issue among many countries
There may also be issues with mislabeled products (wrong HS) product bas-kets data entry errors or missing data in general Were export data is not available so-called reverse trade data (RTS) is an option
If a country does not state any exports cumulative global imports from that particular country may be used as a rough yet incomplete estimate of exports It should be noted that these statistics do not represent absolute but rather minimum values as trade between two non-reporting countries will not be reflected The majority of the SADC countries do not report their import and export statistics
The most important lithium products that are globally traded in significant amounts are lithium-carbonate lithium-oxide (hydroxide) lithium-chloride and lithium-mineral-concentrates
Lithium Potential in Namibia
22
53 Export
The most important intermediate product in the lithium market is lithium carbonate In 2019 global exports amounted to approx 117743 t with Chile being the largest exporter (82344 t 70 ) There are no listed exports from the SADC region except minor quantities from South Africa to the Democratic Republic of Congo (9 t) and Zambia (2 t)
Lithium oxides and lithium hydroxides are grouped together under one HS code hence an individual consideration of both products on a country basis is not possible due to the lack of country-specific commodity codes
In 2019 global exports of HS 282520 stood at approx 97550 t with China being the largest exporting country (49800 t 51 )There are no exports published for the SADC region except South Africa with small quantities (28 t) which are considered to be trade through only
Assessment of lithium chloride global trade flows is also difficult as this prod-uct is listed together with many other chemical products under HS 282739 Global trade can only be investigated using country-specific commodity codes (8-digits and above) if available Only three countries list this product under specific trade codes namely China (28273910) Chile (28273930) and Argentina (28273960) SADC countries including Namibia do not publish any data under HS 282739 Based on the available data global exports in 2019 stood at 2254 t with Chile being the largest exporter (2101 t 89 )
Lithium-containing mineral concentrates are among other non-lithium related products listed in a product basket under HS 253090 Only two coun-tries provide information on this product namely Australia as the largest and hence most important producing and exporting country by far and Brazil as a minor exporter (25309010)
No other country including member states of the SADC specifies lithium-con-taining concentrates as such The currently only producing and exporting country in the SADC is Zimbabwe which does not specify exports at all Thus exports are derived from RTS (global imports)
Lithium Potential in Namibia
23
A general problem with HS 253090 is that only information on quantity is avail-able but no information on lithium content which can vary between 12 and 6 Li2O thus the margin of possible errors in terms of total contained lithium is large
In 2019 Australia exported about 16 million tons of spodumene-concentrate down from 35 million tons in 2018 More than 95 destined to China
Inferred exports (RTS) of Zimbabwe were approx 93300 t for HS 253090 About 62000 t of that quantity are listed as imports by South Africa and are unrelated to lithium The remaining quantity is much more in line with production figures of Zimbabwe as well as the known downstream industries of the destination coun-tries within Europe
There are no export records published by Namibia In general and across all traded lithium products South Africa appears to act as an importexport hub within the SADC Also some of the traded products may be used in the glass and ceramic industry of South Africa
54 Import
For most of the SADC countries the statistics retrieved though the Global Trade Atlas do not necessarily represent reliable trade data due to above-mentioned reasons This is especially true when only small import numbers (usually in tons) are listed as these are supposedly artefacts or errors in declaration
Global imports of lithium-carbonate amounted to approx 142965 t with South Korea being the largest importer (38578 t 27 ) There are no listed imports for the SADC region except South Africa (72 t)
Global imports of lithium-oxides (hydroxides) amounted to approx 84900 t with Japan being the largest importer (37300 t 44 ) In analogy to lithium carbonate there are no published imports into the SADC except for South Africa (428 t)
There is no information for imports of lithium-choride or lithium-mineral-con-centrates into the SADC The largest importer of lithium-choride is China with approx 253 t The largest importer of lithium-mineral-concentrates is also China (gt 95 )
Lithium Potential in Namibia
24
Fig 6 Simplified geology of Namibia with major towns as well as railway and tar roads Blue polygons indicate pegmatite belts and districts in central and southern Namibia (Data source Geological Survey of Namibia 2020)
6 Lithium occurrences in NamibiaIn Namibia significant lithium occurrences are found only within pegmatites These Precambrian and early Namibian pegmatites are restricted to two dif-ferent areas respectively the Damara Orogen in north-central Namibia and the Namaqua Metamorphic Complex in southern Namibia (Fig 6)
Lithium Potential in Namibia
25
Within the Damara Orogen four linear pegmatite belts are found all of which strike northeast ndash southwest (Fig 7) Brandberg West ndash Goantagab Cape Cross ndash Uis Nainais ndash Kohero and Sandamap ndash Erongo with the latter connected to the Karibib Pegmatite District (Schneider 1992)
Each of these pegmatite belts exhibit numerous individual pegmatite swarms that occur zoned or unzoned and may carry significant amounts of rare metals or semi-precious stones In the south Lithium-Caesium-Tantalum (LCT) peg-matites occur in two areas Tantalite-Valley south of Warmbad in close prox-imity to the northwest-trending Tantalite Valley Shear Belt and the Sandfon-tein-Ramansdrift area close to the Orange River
Fig 7 Pegmatite belts in north-central Namibia from west to east Brandberg West ndash Goantagab Cape Cross ndash Uis Nainais ndash Kohero and Sandamap ndash Erongo as well as the Karibib Pegmatite District (after Geological Suvey of Namibia 2002)
Lithium Potential in Namibia
26
7 Lithium mining in NamibiaData for historic lithium mine production is available for the period 1939 ndash 1998 (Fig 8) After 1998 all mining activities ceased due to product quality issues and overall market environment
Until the mid-1950s lepidolite was the most important mined lithium mineral of the country (Fig 8) As mine output of lepidolite decreased output of petalite increased However quantity on a year-to-year basis was quite variable and fluctuated between 1000 ndash 10000 t Since the early 1980s production of petalite was quite stable and ranged between 1000 ndash 2500 t Production fell sharply in 1997 and 1998 after which it ceased Mining of amblygonite has always been small compared to lepidolite and petalite and never exceeded 1000 t per annum
According to the USGS (2020) 500 t of lithium were mined in Namibia in 2018 This is most likely stockpiled lepidolite material from the Rubicon mine
0
2000
4000
6000
8000
10000
12000
1939
1941
1943
1945
1947
1949
1951
1953
1955
1957
1959
1961
1963
1965
1967
1969
1971
1973
1975
1977
1979
1981
1983
1985
1987
1989
1991
1993
1995
1997
[Ton
nes]
Petalite (t)Amblygonite (t)Lepidolite (t)
Fig 8 Lithium production in Namibia in [t] per year (after Schneider 1992 BGR 2020)
Lithium Potential in Namibia
27
Currently there is no active consecutive mining for lithium in substantial quan-tities in Namibia although there are prospects and projects under develop-ment
71 Current mining activities and projects
Soris The Soris project is located in the De Rust pegmatite swarm which is part of the ldquoBrandberg West ndash Goantagab tin beltrdquo (Fig 7) This belt stretches to the northeast of the Brandberg massif over a length of 60 km and a width of 25 km This belt was previously mined for cassiterite on a larger scale Some of the pegmatites in this belt may carry substantial amounts of lithium such as pegmatites in the De Rust pegmatite swarm
The De Rust pegmatite itself is a Li-rich rare metal pegmatite that was mined for cassiterite and tantalite but also for minor quantities of spodumene be ween 1960 and 1990 (Diehl 1990) It intruded into metasediments of the Amis River Formation Lower Ugab Group of the Southern Kaoko Zone
It is the largest pegmatite of the De Rust pegmatite swarm within the Brandberg West ndash Goantagab pegmatite belt (Diehl 1992c) Outcrops are 100 ‒ 470 m long up to 30 m wide and can be followed over a length of roughly 24 km
The pegmatite shows well-developed zonation with a border zone (quartz alkali feldspar muscovite) outer (quartz microcline-perthite muscovite altered petalite) and inner (quartzo-feldspathic rock with spodumene crystals with accessory apatite lepidolite eucryptite zircon and monazite) intermedi-ate zone as well as a core zone (quartz subordinate microcline muscovite sporadic tantalite) Spodumene crystals may reach up to 80 cm in length (Fig 12) Towards the core zone spodumene carries rounded nodules of lithi-um phosphates (amblygonite ndash montebrasite series)
It is located northwest of the nearest town of Uis in the Kunene region of Namibia about 6km to the east of farm De Rust 532 and about 25 km north of the Ugab River The nearest railhead is located in the town of Karibib and the deep-water port of Walvis Bay is 120 km to the southwest Windhoek is about 180 km to the southeast
Lithium Potential in Namibia
28
The project can be reached via paved but mostly unpaved roads from the town of Uis From White Lady Lodge which is about 38 km northwest from Uis a 35 km gravel road leads towards the project 15 km of which are in the riverbed of the Ugab River There is currently no electricity and water supply at the project location site
According to SampP Global (022020) current owner of the Soris project is Mon-tero Mining amp Exploration Ltd (TSXV MON) which holds 80 interest of the property Another 20 are allocated to an unnamed private owner Based on data from the Namibia Mining Cadastre Portal (092020) multiple entries for mining licence applications exist for the area where the main De Rust pegmatite is located (Fig 9)
Resource estimateDue to the early stage of the Soris project no resource estimate is avail-able However Montero Mining claims the project to be drill ready targeting a resource of 10 Mt 1 Li2O with tantalum and tin by-product credits This would equate to 46400 t of lithium or 247000 t LCE
Grab samples of the deposit showed lithium contents of 007 to 532 aver-aging 137 Channel samples showed average lithium contents of 076 and values up to 366 (Montero 032019) The company also re-assessed 1097 previously tested RC drill samples The main lithium-bearing mineral is spodumene
Remnants of historic intermittent mining activities like old foundations and quartzo-feldspathic tailings are still visible east to the main pegmatite (Fig 10 ‒ 11)
Lithium Potential in Namibia
29
Fig 10 Remnants of historic open pit mining (upper) and tailings of De Rust pegmatite (lower) northwest of the Brandberg massif (Photo BGR-GSN 2019)
Fig 9 Satellite image of the De Rust project including the outlined mining license Main pegmatite coordinates 20deg57prime48primeprimeS ‒ 14deg30prime12primeprimeE (Source httpportalsflexicadastrecomnamibia 092020)
Main pegmatite
Lithium Potential in Namibia
30
Fig 12 Weathered spodumene chrystals at the historic open pit mine (Photo BGR-GSN 2019)
Fig 11 Historic open pit of the De Rust pegmatite (Photo BGR-GSN 2019)
Lithium Potential in Namibia
31
Uis The Uis projects (former mine and tailings) are located in the northern part of the ldquoCape Cross Uis pegmatite beltrdquo east of the town of Uis on the farm Uis Townlands No 215 in the Erongo region of Namibia
The Cape Cross-Uis belt is approx 120 km long and up to 40 km wide and extends in a NE direction (Fig 7) It comprises three distinct pegmatite swarms the Strathmore swarm Karlowa swarm and Uis pegmatite swarm In general lithium-bearing pegmatites (Li-Nb-Ta-Sn-Be and Li-Nb-Ta-Sn) are the least common in this belt (Fuchsloch et al 2018)
The Uis swarm field consists of more than 120 individual pegmatites each with a northeasterly to easterly strike direction and northwesterly down dip (30deg ‒ 70deg) This field is accompanied by a peripheral pegmatite field of approx 25 individual pegmatites
Some of the main pegmatites especially around the formerly worldrsquos largest tin mine at Uis are exceedingly large Some of them are up to 1 km long and some 50 m wide
In terms of lithium petalite amblygonite and minor spodumene mineralization occurs in the various pegmatites but no lepidolite Most common lithium bear-ing minerals in the eight pegmatites that were mined at Uis are amblygonite petalite and spodumene
Currently the Uis tailings project and the Uis tin mine are owned by two differ-ent companies As of 2020 the tin mine is operating a pilot processing plant and aims to ramp up the production of lithium in the near future The current ownership of the tailings project as of September 2020 is unclear
The nearest commercial deep-water port to the projects is Walvis Bay 220 km to the southeast The town of Omaruru is 130 km to the east and Henties Bay lies about 120 km to the southwest The nearest railhead is located in Omaruru The area is accessible year-round by paved and un-paved roads NamPower provides electricity and the town of Uis is connected to the Nam-Water pipeline
Lithium Potential in Namibia
32
The tin deposit was discovered in 1911 and mined between the 1950s and 1989 for cassiterite by Uis Tin Mining Company (SWA) Ltd and IMCOR
Coarse tailings are located in the northern part of the former mine just south to the main road C36 (Fig 13) The fine material is located south to the coarse waste dumps (Fig 13)
After 1990 multiple companies owned the property until AfriTin Mining Ltd bought all the rights (license ML134) The current lithium tailings project of Montero Mining amp Exploration Ltd (TSXV MON) is based on the historic mine tailings of the former tin mine on mining license ML134 that is currently owned by AfriTin Mining Ltd The acquired tailings material does not fall under the ML134 license of AfriTin since historical tailings material (Fig 14) is not regulated by Minerals (Prospecting and Mining) Act 33 of 1992 of Namibia
Resource estimateUis tin mineAccording to AfriTin the former Uis mine holds a JORC compliant resource (inferred) of 715 Mt of ore 0134 Sn with a cut-off grade of 005 Sn (AfriTin 2020) Grades of ancillary elements are given at 063 Li2O and 85 ppm Ta for the total resource of 71 Mt of ore
This equals to approx 95000 t of tin 209000 t of lithium (11 Mt LCE) and 6090 t of tantalum 85 of the total resource are attributable to the company The remaining 15 are allocated to SMU (Small Miners of Uis)
Uis tailingsMontero Mining filed an inferred resource estimate of 144 Mt of ore 037 Li2O and 005 SnO2 with a 035 Li2O cut-off grade for lithium and assumed processing recoveries of 70 for their tailings project (Montero 2019) This equals to approx 24700 t of lithium content (131500 t LCE) and 7200 t SnO2
This resource estimate only includes coarse tailings material There is current-ly no information on the lithium content of the fine tailings material that totals 271 Mt t due to insufficient or no test work (Montero 2018) The company also states that the average Li2O grade of the fines material does not hurdle the cut-off for the fines of 082 Li2O
Lithium Potential in Namibia
33
In 2016 Australian based Tawana Resources carried out a drilling program at Uis for a private company called Lithium Africa 1 on the fine and coarse tailings (Table 3 Hole 1 amp Hole 2) Below some of the obtained data on lithium content is given Additionally Li2O content of two obtained grab samples by BGR (Table 3 Sample 2019a amp 2019b) is given
Table 3 Sample data Uis (Tawana 2016 Montero 2018 BGR 2019)
Sample Sample 0 to 1m Li2O ()
Sample 1 to 2m Li2O ()
Sample 2 to 3m Li2O ()
Fines Hole 1 071 085 092
Fines Hole 2 080 089 095
Coarse Hole 1 050 043 043
Coarse Hole 2 054 062 062
BGR Sam-ple 2019a (Coarse tailings)
028
BGR Sam-ple 2019b (Coarse tailings)
028
Montero NI 43-101 037
Lithium Potential in Namibia
34
Fig 14 Tailings of the historic Uis Tin Mine (Photo BGR-GSN 2019 with kind permission of AfriTin Mining Limited)
Fig 13 Former Uis tin mine Uis tailings project with coarse tailings Tailings coordina-tes (center) 21deg13prime31primeprimeS ‒ 14deg52prime44primeprimeE (Source httpportalsflexicadastrecomnamibia 092020)
Uis Tailings (coarse)
Uis Tailings (fine)
Historic Uis mine
Lithium Potential in Namibia
35
Karibib Lepidolite ProjectThe Karibib Lepidolite brownfield project is located in the ldquoKaribib ndash Usakos Pegmatite Districtrdquo southeast of the town of Karibib on the farm Okongava Ost No 72 in central Namibia (Fig 15 ‒ 16)
This pegmatite district which is of Damaran age hosts the most important pegmatite occurrence (Rubicon swarm) in terms of lithium in Namibia In addi-tion numerous other different pegmatite swarms some of which have previ-ously been relevant in terms of lithium are know from this district These are Dernburg Karlsbrunn Albrechtshoumlhe Berger Kaliombo Gamikaubmund Okatjimukuju Etusis Daheim Friedrichsfelde and Etiro (Diehl 1992a)
The Rubicon pegmatite itself is the largest of the individual pegmatites that occur in this field and has been the prime source of lithium until mining seized in the early 1990s The Helikon pegmatites are part of the Rubicon pegmatite swarm and are located northeast to the Rubicon pegmatite They have previ-ously been mined for lepidolite amblygonite petalite and muscovite beryll pollucite quartz and columbite-tantalite as valuable by-products (Fig 18 ‒ 19)
The pegmatite itself consist of two ellipsoidal well zoned Li-mineralized ore-bodies The larger one is about 320 m long and 25 ndash 35 m wide It dips at 46deg to the northeast and has a northwesterly strike The second orebody is about 230 m long and about 10 m wide It is dipping with 30deg to the northeast and has a northwesterly strike In total the outcrop of the Rubicon pegmatite is about 600 m long with a maximum width of 65 m (Fig 17)
A very prominent feature is the presence of a very well developed concen-tric shell and zones from the footwall to the inner core of the pegmatite Both orebodies exhibit a border- wall- intermediate- and core-zone
Border-zone wall-zone and outer intermediate zone of the larger orebody do not contain Li-bearing minerals of economic importance The inner interme-diate zone does contain lepidolite The outer core zone may be sub-divided into a petalite zone low-grade lepidolite zone and a high-grade lepidolite zone The inner core zone also contains a petalite zone Mining occurred pre-viously in the later named zones The zonation of the smaller orebody to the northwest is less pronounced but Li-mineralization and style are equal to the
Lithium Potential in Namibia
36
larger orebody There is no spodumene mineralization within the orebodies and respectively zones of the Rubicon pegmatite
The Helikon I pegmatite is also a lens-shaped pegmatite with a length of roughly 400 m and a width of approx 66 m It dips to the north with about 60deg ndash 70deg Helikon I also consists of well-defined zones The main Li-bearing minerals are lepidolite and petalite According to Roering (1963) the lepidolite is difficult to separate from the intergrown albite and hence of low grade and quality
The Helikon II pegmatite is approx 17 km long and only 9 ndash 15 m wide It lies a bit north of Helikon I and dips steeply to the north with 55deg ndash 80deg striking east west The main Li-bearing minerals are lepidolite and petalite According to Diehl (1990) the westernmost portion of the pegmatite has historically been the economically most important A massive up to 6 m wide petalite zone was mined here according to Diehl (1990)
The nearest railhead to the project is 17 km away in Karibib and the deep-water port of Walvis Bay is 220 km to the southwest Windhoek is about 180 km to the southeast NamPower connects the town of Karibib to electricity and the project currently utilizes generators There is a 7 km long 22 kV power line spur to grid connection pending (Lepidico 2020) Water is available via on-site boreholes
The project was previously owned by Desert Lion Energy Inc (TSVX DLI) Lepidico Ltd (ASX LPD) bought into the project and currently holds 80 interest which comprises Mining License 204 (69 km2) as well as three Exclu-sive Prospecting Licenses (EPLs) namely 5439 5555 and 5781 (Lepidico 2020)
Lepidico will cover mining from multiple sources as well as chemical conver-sion by utilizing their proprietary lithium processing technologies L-Maxreg LOH-Maxreg and S-Maxreg (Lepidico 052019) The company aims to produce high purity lithium chemicals such as lithium carbonate and lithium hydroxide
The takeover also included a nonbinding offtake agreement between the for-mer owner Desert Lion Energy Inc and German chemical company BASF On April 2nd 2019 Desert Lion Energy Inc announced this offtake agreement
Lithium Potential in Namibia
37
which at the time was valid through to December 31 2019 On December 20th
2019 Lepidico announced that the LOI with BASF was extended to Decem-ber 31st 2020 (Lepidico 122019)
The feasibility study criteria of Lepidico are as follows
- Throughput of the concentrator on-site of 035 Mtpa- Expansion of throughput after year five to 05 Mtpa- Chemical plant in the industrial city of Abu Dabi (ICAD)- Plant design for 58000 tpa of concentrate (4 LiO2) for the production of
up to 5500 tpa LiOH- Utilization of L-Maxreg and LOH-MaxTM- Non-binding off-take MOU with BASF for LiOH only- Targeting for project commissioning to commence late 2021 for commer-
cial production in 2022
The preliminary mine plan indicates a strip ratio of 03 ndash 1 for the first two years The ratio will then go up to 1 ndash 14 In the first four years elevated grades of 06 LiO2 will be mined
Resource estimateA JORC 2012 compliant resource estimate for the deposit is given in Table 4 (Lepidico 2020) The deposit currently holds 23200 t of lithium (Indicated amp Inferred) based on a cut-off grade of 015 Li2O This resource estimate is based solely on the lepidolite occurrences at the mine site
Table 4 Resource estimate Karibib Lepidolite Project (Source Lepidico 2020)
Deposit Resource Category
Cut-off (Li2O)
Ore (Mt)
Li2O ()
Li (t)
Li (LCE)
Rubicon Measured
015
22 057 5819 30974
Rubicon Indicated 666 038 11637 61943
Rubicon Inferred 237 043 4728 25167
Helikon
Total 015 1124 043 22184 118086
Lithium Potential in Namibia
38
Fig 16 Satellite image of the Karibib Lepidolite project Helikon 1 coordinates (center) 22deg2prime49primeprimeS ‒ 16deg1prime13primeprimeE Helikon 4 coordinates (center) 22deg2prime24primeprimeS ‒ 16deg1prime41primeprimeE (Source httpportalsflexicadastrecomnamibia 092020)
Fig 15 Satellite image of the Karibib Lepidolite project Rubicon coordinates (center) 22deg6prime11primeprimeS ‒ 15deg59prime44primeprimeE (Source httpportalsflexicadastrecomnamibia 092020)
Historic Rubicon mine
Helikon 1
Helikon 4
Lithium Potential in Namibia
39Fig 17 Rubicon pegmatite (Photo BGR-GSN 2019 with kind permission of Lepidico Chemicals Namibia (Pty) Ltd 2020)
Lithium Potential in Namibia
40 Fig 18 Lepidolite sample from Rubicon pegmatite (Photo BGR-GSN 2019 with kind permission of Lepidico Chemicals Namibia (Pty) Ltd 2020)
Fig 19 Petalite sample from Rubicon pegmatite (Photo BGR-GSN 2019 with kind permission of Lepidico Chemicals Namibia (Pty) Ltd 2020)
Lithium Potential in Namibia
42
Fig 21 Helikon 4 pegmatite (Photo BGR-GSN 2019 with kind permission of Lepidico Chemicals Namibia (Pty) Ltd 2020)
Fig 20 Helikon 1 pegmatite (Photo BGR-GSN 2019 with kind permission of Lepidico Chemicals Namibia (Pty) Ltd 2020)
Lithium Potential in Namibia
43
Tantalite ValleyThe Tantalite Valley Project lies within the ldquoNamaqua Metamorphic Complexrdquo in Southern Namibia Within this complex Lithium-Caesium-Tantalum (LCT) pegmatites occur in two main areas Tantalite-Valley south of Warmbad in close proximity to the northwest-trending Tantalite Valley Shear Belt and the Sandfontein-Ramansdrift area close to the Orange River
The area were the pegmatites of the Tantalite Valley occur is primarily com-posed of a large ovoid gabbro intrusion (71 km by 33 km in extent) within paragneiss units of the Namaqua Complex The gabbro outcrop forms a large dome shaped mountain that rises about 500 m above the surrounding topo-graphy
The pegmatites belong to the Kenhardt and Gordonia pegmatite districts in Namaqualand but only the younger group of them carry accessory ore miner-als such as tantalite beryl REE minerals and lithium
The Tantalite Valley pegmatites include several individual subhorizonal dikes that are up to 1000 m long and 02 to 40 m wide plunging towards southeast (Diehl 1992b) Four of those are of economic interest Homestead Whitkop White City and the Lepidolite pegmatites (ie Purple Haze) (Fig 22)
They are all well zoned (quartz core inner and outer intermediate zones wall zone) and were predominantly targeted for beryl columbite-tantalite as well as lithium and bismuth minerals
The project is located on the farms Umeis 110 and Kinderzitt 132 between the Farms 109 131 129 308 and 473 in the magisterial district of Karas It currently comprises Mining License (ML-77) fully owned by Tameka Shelf Co Four (Pty) Ltd which is a 100 subsidiary of African Tantalite Pty Ltd (AFTAN) Above all Kazera Global Investments PLC holds a 75 stake in AFTAN (Kazera 2019) with the other 25 of local farmer ownership
The project is accessible via gravel road from Karasburg which is about 80 km to the north The nearest railhead is also located in Karasburg Electricity is currently supplied by generators and water is recovered from multiple drill holes The Orange River is about 15 km to the south of the project Mining
Lithium Potential in Namibia
44
infrastructure as well as equipment are on site as well as a plant for the pro-duction of tantalite concentrate
NTI is working on an extensive exploration program with a clear focus on revi-ving tantalite mining in Namibia with a possible by-product stream of lithium bearing minerals The company will focus primarily on the pegmatites Homes-tead Purple Haze Signaalberg and White City (Fig 23)
The area is known for its tantalum occurrences and since the late 1940s tantalite and other minerals have been recovered at Tantalite Valley until 1981 when mining ceased Initially alluvial deposits were mined followed by the pegmatites themselves Grades of the concentrates produced prior to the closure of the mine were quite high with 65 ‒ 70 Ta2O5 with very low U3O8
and ThO2 values of 025 max
Resource estimateAccording to SampP Global (092020) Measured and amp Indicated resources at Tantalite Valley are 104800 t of ore 0042 Ta2O5 and 0653 Li2O as of 112019 This would equate to 315 t of lithium or 1690 t LCE Total inferred resources are 517400 t of ore 0018 Ta2O5 and 0144 Li2O This equals to approx 91 t of tantalum and 750 t of lithium (3535 t LCE)
Lithium Potential in Namibia
45
Fig 23 White City pegmatite (Source Kazera global Investments PLC 2020)
Fig 22 Satellite image of the Tantalite Valley project White City pegmatite coordinates (center) 28deg43prime07primeprimeS ‒ 18deg44prime45primeprimeE Homestead pegmatite coordinates (center) 28deg43prime19primeprimeS - 18deg44prime24primeprimeE Purple Haze pegmatite coordinates (center) 28deg43prime09primeprimeS ‒ 18deg43prime55primeprimeE (Source httpportalsflexicadastrecomnamibia 092020)
Lithium Potential in Namibia
46
8 Analysed lithium samplesDuring the course of the cooperation project between the Economic Geology Division (EGD) of the Geological Survey of Namibia (GSN) and the Ger-man Federal Institute of Geosciences and Natural Resources (BGR) several sampling campaigns to southern and central pegmatites took place
The field trips were preceded by literature and data research regarding infor-mation on lithium occurrences andor previous lithium mining activity to iden-tify specific target areas
During a campaign in 2019 16 lithium-bearing mixed mineral samples were taken from five different locations and subsequently analyzed Two of the samples originate from the Uis Tin Mine Tailings of the former tin mine All remaining samples were taken either from stripped outcrops for future mine activities or from previous mine sites (ie pits)
All 16 samples were analyzed at BGR labs in Hanover Germany through qualitative XRD XRF and ICP-MS Given data shall be understood as a first indicator for the sampled lithium occurrences
Most if not all sampled occurrences have previously been analyzed or are cur-rently being assessed by the property owners or current licensees Detailed information of these sampling and analytical campaigns remain confidential and are thus not available for comparison
Appendix A lists the identified qualitative mineralogy of the samples as well as the major element analysis Additional samples from previous campaigns are also given
Interpretation of the results are based on their applicability in the various lithium-consuming industries for which information is available
Most of the current lithium applications require a chemical intermediate product such as lithium carbonate or lithium-hydroxide The glass and cera-mic industry does use lithium-bearing mineral concentrates depending on the prices of these materials when compared to LiCO3
Lithium Potential in Namibia
47
Since the main applications require an intermediate or downstream chemical product lithium content as well as impurity values are the main criteria for the suitability of the sampled occurrences Other quality criteria are particle size and surface areastructure
9 InterpretationAs previously stated all obtained grab samples are mixtures of lithium- bearing minerals (ie spodumene petalite lepidolite) feldspars quartz micas as well as secondary minerals Therefore all given analytical data has to be taken with caution and will not be representative for the individual outcrops or deposits
The evaluation of the economic suitability for various economic applications of the analysed lithium samples is based on the chemical specifications in Chapter 4
Lithium content gt 1 Li2O Fe2O3 content lt 015 as well as F content lt 01 are individually highlighted (Appendix A) as these three values are the most important
Based on the chemical analysis nine of the 16 samples showed Li2O contents of more than 1 (range 117 ‒ 327 ) Seven of those nine samples also exhibited low Fe2O3 content (range 004 ‒ 008 ) (Appendix A) Three of those seven samples also had fluorine values below 005
Of the ten additionally included samples from previous campaigns four showed Li2O contents of more than 1 (range 126 ‒ 199 ) Three of those samples also exhibited low Fe2O3 content (range 004 ‒ 007 ) (Appendix A) One of the three samples had fluorine values below 005
The mentioned samples (sources) could be of potential use but for further interpretation statistical sampling will be required
Lithium Potential in Namibia
48
10 ConclusionsThere is currently no lithium industry established in Namibia This accounts to both mining and processing of ores into commercial lithium-bearing con-centrates as well as the production of downstream products such as lithium carbonate andor lithium hydroxide In order to evaluate the potential for a lithium industry in Namibia the current global market and price developments need to be addressed
Currently the main application for lithium is in the chemical industry as lithium carbonate andor hydroxide for the manufacturing of lithium-ion batteries There is currently no domestic market (supply) or demand for this industry in Southern Africa or Namibia in specific Processing of lithium-bearing ores into these highly specific downstream products is economically more viable in close proximity to the demanding industries It also requires large investments (double-digit million dollars per 10000t of capacity) Additionally there is already huge capacity and strong capacity build up in Asia at rather low cost
The second most important application lies in the glass and ceramics industry This industry uses lithium either as lithium-bearing concentrates or lithium carbonate depending on current market price and processproduct require-ments There is currently no such industry established in Namibia but potential plans There is glass and ceramics manufacturing in South Africa and thus a potential market for lithium bearing products (concentrates) should this indus-try require it depending on product
The 20182019 primary lithium supply based on spodumene-bearing mineral concentrates was dominated by Australia with a market share of well over 95 On an annual basis the country exports more than three million tons of lithium-bearing concentrates to China To put this into perspective Lepidico plans to export just 58 ktpa of concentrate to Abu Dhabi for refinement from their project annually Therefore potential production in Namibia will always be rather small scale when compared to peer producing countriescompanies
As of late 2020 the concentrate market is in strong oversupply with strong competition Thus prices have eroded quite substantially for a standard SC6 concentrate (Fig 24) In general prices vary significantly based on lithium content and impurities of the concentrates Lithium bearing mineral concen-
Lithium Potential in Namibia
49
trates are a relatively low-value mineral commodity when compared to lithi-um-carbonate or other lithium downstream products thus product quality cost reduction and cost control are key components in this industry Since prices are depressed currently many of the Australian producers have drasti-cally reduced output or even went into care and maintenance This situation may change towards 2025 or beyond as demand picks up
Prices for the higher valued product lithium-carbonate spiked at the end of 2017 towards 2018 to more than 20000 $USt on a contract basis with prices being very volatile Since then prices have also eroded to below 9000 $USt due to oversupply and slow demand pickup (Fig 25) With this product stable quality and chemical composition are crucial for the downstream industry
Based on available gradetonnage data the Namibian projectsprospects are relatively small in overall size and low in grade when compared to global peers for the resource category ldquoMeasuredIndicatedrdquo (Appendix B) Total contained lithium quantity is thus relatively small in comparison On a global scale the most promising hard rock projects that are currently being mined and developed have Li2O grades of 10 or above
Fig 24 Lithium-mineral-concentrate prices 012010 ‒ 062020 (Source BGR 2020)
300
400
500
600
700
800
900
1000
1100
208
210
212
214
216
218
220
US$
t US$t
01-20
14
01-20
15
01-20
16
01-20
17
01-20
18
01-20
19
01-20
20
01-20
10
01-20
11
01-20
12
01-20
13
Spodumene min 5-6 LiO2 fob Australia
Spodumene concentrate gt75 LiO2 bulk cif Asia
Petalite 42 LiO2 fob Durban
Spodumene fob Australia
Spodumene min 5-6 LiO2 cif China
Lithium Potential in Namibia
50
For the resource category ldquoIndicatedrdquo which generally represents the lowest level of confidence only the Uis mine project of AfriTin represents a size-able resource even though grades are relatively low (Appendix C) The Uis tailings project as well as the Rubicon project are again relatively small when compared to their global peers Tantalite Valley is the smallest of all included projects (Appendix C)The given data for the De Rust project reflects only an exploration target of the company rather than actual data and may thus be not representative
Based on size and contained lithium-content none of the visited early stage projectsprospects would justify the financial investment into the construction of a chemical conversion plant for the production of lithium carbonate andor hydroxide on site as it requires very large monetary investments Due to their size payback of the required investments may be unfavorable when compared to global peers In addition the current market environment is very harsh with strong competition from Asia that has a huge cost advantage due to capacity build up This industry is also very energy and water intensive
In addition location within Namibia as well as distance to possible down-stream markets may become an issue as it increases the transportation cost
4000
7000
10000
13000
16000
19000
22000
25000
28000
01-20
14
01-20
15
01-20
16
01-20
17
01-20
18
01-20
19
01-20
20
US$
t
Lithium-carbonate (min 995 ) battery grade spot price ex works domestic ChinaLithium-carbonate (min 99-995 ) Li2CO3 large contracts USA delivered continentalLithium-hydroxid-monohydrate (min 565) technical and industrial grades cif China Japan amp Korea
Fig 25 Lithium chemical prices 012014 ndash 062020 (Source BGR 2020)
Lithium Potential in Namibia
51
immensely This is especially true for the SorisDe Rust pegmatite which is in a remote location without any allocated infrastructure The projects Karibib Uis and Tantalite Valley are much easier to access
The approach of Lepidico to produce a lithium bearing concentrate on site seems plausible approach Since this will already require a skilled workforce mining and beneficiation equipment in order to produce a high quality lithium-bearing concentrate it may already be considered ldquoadded valuerdquo for the indus-try of the country This approach may also be suitable for the other mentioned and visited projects
Lithium Potential in Namibia
52
ReferencesAfriTin Mining (2020) Uis Tin Project ndash Company Information ndash URL httpafritinminingcomuis-project [as of 092020]
Australian Government Geoscience Australia (2019) Australiarsquos Identi-fied Mineral Resources 2019 ndash URL httpswwwgagovauscientific-topicsmineralsmineral-resources-and-adviceaimr [as of 092020]
BGR ndash Bundesanstalt fuumlr Geowissenschaften und Rohstoffe (2020) Fachinformationssystem Rohstoffe ndash unpubl Hannover [as of 082020]
BGS ndash British Geological Survey (2016) Lithium Definitions mineralo-gy and deposits ndash URL httpswwwbgsacukdownloadsstartcfmid=3100 [as of 062016]
Diehl B J M (1990) Pegmatites of the Cape Cross Uis ndash Pegmatite Belt Namibia Geology mineralisation Rubidium Strontium characteristics and petrogenesis of rare metal pegmatites Open File Report EG 083 Economic Geology Series Geological Survey of Namibia 39 pp Windhoek
Diehl B J M (1992a) Lithium Caesium Beryllium Open File Report Mineral Resource Series Geological Survey of Namibia 18 pp Windhoek
Diehl B J M (1992b) Niobium and Tantalum Open File Report Mineral Resource Series Geological Survey of Namibia 20 pp Windhoek
Diehl B J M (1992c) Tin Open File Report Mineral Resource Series Geological Survey of Namibia 30 pp Windhoek
Diehl B J M amp Schneider G I C (1990) Geology and mineralisation of the Rubicon Pegmatite Namibia Open File Report Geol Surv Namibia 20 pp Windhoek
Fuchsloch et al (2018) Classification mineralogical and geochemical vari-ations in pegmatites of the Cape Cross-Uis pegmatite belt Namibia Lithos 296 ndash 299 79-95 elsevier
Lithium Potential in Namibia
53
Garret D E (2004) Handbook Of Lithium And Natural Calcium Chloride Their Deposits Processing Uses and Properties ndash 467 S Oxford (Elsevier B V)
Geological Survey of Namibia (2002) Mineral Resources of Namibia Summary of Mineral Deposits and Occurrences Omaruru Sheet 2114 Volume I ndash Complete Descriptions 119 pp Windhoek
IHS Global SA (2020) Global Trade Atlas ndash Commercial Online-Databa-se ndashURL httpsmyihscomConnectcallingUrl=https3a2f2fconnectihsmarkitcom2f [as of 062017]
Kazera Global Investments PLC (2020) Company Information ndash URL httpskazeraglobalcominvestmentsnamibia-tantalite-investment-mine [as of 092020]
Lepidico (2019) LOI with BASF extended to 31 December 2020 ndash News Release ndash URL httpswwwlepidicocomwp-contentuploads201910LPD-191220-LOI-with-BASF-extended-to-31-December-2020pdf [as of 122019]
Lepidico (2019) Corporate Presentation ndash URL httpswwwlepidicocomwp-contentuploads201907LPD-190509-Corporate-Presentati-on-May-2019pdf [as of 052019]
Lepidico (2020) Company Information ndash URL httpswwwlepidicocomprojectskaribib [as of 092020]
Montero Mining amp Exploration Ltd (2018) Exploring Battery Metals in Namibia ndash Company Presentation ndash URL httpswwwproactiveinvestorscomauuploadSponsorFileFile2018_031520244941_MON-CorporatePre-sentationMarch2018pdf [as of 072018]
Montero Mining amp Exploration Ltd (2019) Montero Files NI 43-101 Resource Estimate On The Uis Lithium-Tin Tailings Project In Namibia On Sedar ndash News Announcement ndash URL httpsmonterominingcommontero-files-ni-43-101-resource-estimate-on-the-uis-lithium-tin-tailings-project-in-namibia-on-sedar [as of 032019]
Lithium Potential in Namibia
54
Namibia Mining Cadastre Portal (2020) Online-Database ndashURL httpsportalslandfoliocomnamibia [as of 092020]
Roskill Information Services Ltd (2016) Lithium Global Industry Mar-kets amp Outlook ndash 386 S London Groszligbritannien
Schneider G I C (1992) Feldspar Open File Report MRS 08 Mineral Resource Series Geological Survey of Namibia 2 pp Windhoek
Schmidt M (2017) Rohstoffrisikobewertung ndash Lithium ndash DERA Rohstoffin-formationen 33 Berlin
S amp P Global Market Intelligence (2020) Lithium - Metals amp Mining Properties URL httpsplatformmarketintelligencespglobalcomwebcli-entauth=inheritindustryminingProjects [as of 092020]
Statista (2020) Distribution of lithium end-usage worldwide in 2019 by area application ndash URL httpswwwstatistacomstatistics268787lithium-usa-ge-in-the-world-market [as of 062020]
Tawana Resources NL (2016) Tawana acquires second lithium pro-ject ndash News Release ndash URL httpsmstrademomentumcozajsepdfSENS_20160923_S376505pdf [as of 092016]
USGS ndash United States Geological Survey (multiple years) Lithium ndash Minerals Commodity Summaries ndash URL httpswwwusgsgovcentersnmiclithium-statistics-and-information [as of 082020]
Appendix
Sam
ple I
DFa
rmLa
titud
eLo
ngitu
deSa
mpl
e des
crip
tion
(XRD
qu
al)
LiO 2
()
SiO 2
Ti
O 2
Al2O 3
Fe2O 3
Mn
O Mg
O Ca
O Na
2O
K 2O P 2O 5
SO
3
Cl
F
LOI
Su
m
2015
-03
previous sample campaignsHelik
on
n A
Felds
parQ
uartz
Lepid
olite
025
6871
lt000
119
0500
200
2900
505
3292
806
7905
59lt0
01lt0
002
lt005
093
9985
2016
-12
Rubic
onwe
ather
ed P
etalite
126
6473
lt000
118
0600
703
2718
607
9507
805
2500
62lt0
01lt0
002
lt005
1146
9871
2016
-17
Rubic
onLe
pidoli
te +
Quar
tz13
063
6700
219
9316
0929
003
0054
029
6218
0052
lt001
lt000
226
232
798
67
2016
-20
Helik
onLe
pidoli
te + A
lbite
176
5514
lt000
126
8700
401
2100
700
2123
970
3900
45lt0
01lt0
002
156
369
9698
2016
-21
Helik
onLe
pidoli
te19
954
32lt0
001
2627
004
0224
006
0038
266
714
0069
lt001
lt000
240
628
997
77
FN20
19_0
4De
Rus
tFe
ldspa
rAmb
lygon
iteP
etalite
(n
on X
RD)
003
6513
lt000
118
82lt0
0100
0200
101
0924
311
4105
75lt0
0100
04lt0
0503
898
84
2015
-09
Molop
oPe
talite
(non
XRD
)00
952
85lt0
001
1672
lt001
0002
487
0323
342
0352
lt000
100
400
3403
621
1310
012
2016
-14
Molop
oPe
talite
wea
there
d (no
n XRD
)00
752
1600
0316
5100
200
5147
805
8923
406
4500
6900
200
8602
222
6310
013
2016
-15
Molop
oFe
ldspa
r (no
n XRD
)00
664
02lt0
001
1937
003
0004
003
0151
216
1249
0796
lt001
lt000
2lt0
0505
399
55
2016
-23
Molop
oZin
nwald
ite (n
on X
RD)
006
5044
0068
3307
048
0011
012
0426
261
7674
0181
lt001
lt000
2lt0
0542
9925
1909
249
2019Uis
Tailin
gs
Quar
tzFe
ldspa
rPeta
lite
Musc
ovite
028
7293
0045
1479
051
0062
0212
9830
927
6613
6200
2lt00
02lt0
0523
399
38
1909
250
Uis
Tailin
gsQu
artz
Felds
parP
etalite
Mu
scov
ite02
872
6900
4314
8205
0059
019
1306
313
2794
1347
002lt
0002
lt005
251
9937
1909
251
Helik
on 4
22deg02prime4
8primeprimeS1
6deg01prime30
primeprimeEQu
artz
Felds
parP
etalite
Le
pidoli
te16
464
4400
0319
4200
301
2100
408
8325
345
6806
800
400
0727
228
998
38
1909
252
Helik
on 1
22deg02prime2
0primeprimeS1
6deg01prime19
primeprimeEPe
talite
Lepid
olite
Quar
tz29
576
9200
0116
6800
300
0304
101
7301
106
8100
01lt0
01lt0
002
lt005
205
97
App
endi
x A
Ana
lytic
al d
ata
of li
thiu
m s
ampl
es c
olle
cted
in N
amib
ia T
hres
hold
val
ues
high
light
ed in
gre
en
Lithium Potential in Namibia
57
Sam
ple I
DFa
rmLa
titud
eLo
ngitu
deSa
mpl
e des
crip
tion
(XRD
qu
al)
LiO 2
()
SiO 2
Ti
O 2
Al2O 3
Fe2O 3
Mn
O Mg
O Ca
O Na
2O
K 2O P 2O 5
SO
3
Cl
F
LOI
Su
m
1909
253
2019Rubic
on22deg06prime1
3primeprimeS1
5deg59prime45
primeprimeEPe
talite
Lepid
olite
Quar
tz32
778
73lt0
001
1687
002
0006
002
0157
011
003
0002
003
0003
lt005
075
9663
1909
254
Rubic
on22deg06prime1
0primeprimeS1
5deg59prime41
primeprimeEFe
ldspa
rQua
rtzM
usco
vite
004
682
lt000
119
3500
300
2400
205
0610
0808
6804
3lt0
01lt0
002
lt005
041
9985
1909
255
Rubic
on22deg06prime1
0primeprimeS1
5deg59prime41
primeprimeEFe
ldspa
rLep
idolite
Mus
co-
viteK
aolin
026
6104
0004
2318
022
0136
006
0119
367
8411
0159
lt001
lt000
2lt0
0522
299
15
1909
256
Rubic
on22deg06prime1
0primeprimeS1
5deg59prime41
primeprimeELe
pidoli
te 27
249
8700
129
3400
408
0500
400
704
697
3100
31lt0
01lt0
002
087
441
9569
1909
257
Rubic
on22deg06prime1
3primeprimeS1
5deg59prime45
primeprimeEPe
talite
Lepid
olite
Quar
tz30
670
0900
0320
2600
801
0901
502
9901
926
800
15lt0
0100
04lt0
0526
596
48
1909
258
Rubic
on22deg06prime1
0primeprimeS1
5deg59prime41
primeprimeELe
pidoli
teFe
ldspa
rQua
rtz20
659
7800
0224
100
505
2400
300
513
7247
0051
lt001
0002
265
388
9966
1909
259
Tanta
lite
Valle
y28deg43prime0
9primeprimeS1
8deg43prime55
primeprimeEFe
ldspa
rLep
idolite
Mus
covit
e11
762
64lt0
001
2139
004
0161
lt001
0399
7731
2401
0900
200
119
912
698
85
1909
260
Tanta
lite
Valle
y28deg43prime0
9primeprimeS1
8deg43prime55
primeprimeEFe
ldspa
rLep
idolite
Mus
covit
e03
059
8600
1425
1301
604
2200
302
2860
547
2201
3900
200
0904
123
799
56
1909
261
Tanta
lite
Valle
y28deg43prime0
9primeprimeS1
8deg43prime55
primeprimeEFe
ldspa
rQua
rtzM
usco
vite
003
636
0005
2218
022
0122
002
0381
727
3809
0272
lt001
lt000
2lt0
0513
199
17
1909
262
Tanta
lite
Valle
y28deg43prime2
0primeprimeS1
8deg44prime23
primeprimeEQu
artzSp
odum
eneM
us-
covit
e13
180
5100
0415
8903
401
2401
301
9502
604
0400
0500
200
03lt0
0507
398
56
1909
263
De R
ust
20deg57prime4
8primeprimeS1
4deg30prime13
primeprimeEFelsd
parS
podume
neQuartz
074
7313
0006
2048
007
015
005
0154
398
0831
0073
001
0003
lt005
082
9974
1909
264
De R
ust
20deg57prime4
8primeprimeS1
4deg30prime13
primeprimeESp
odum
eneF
eldsparQuartz
230
6924
0006
2602
801
0200
301
0510
102
1400
68lt0
0100
03lt0
0504
897
53
(Con
tinue
d) A
ppen
dix
A A
naly
tical
dat
a of
lith
ium
sam
ples
col
lect
ed in
Nam
ibia
Thr
esho
ld v
alue
s hi
ghlig
hted
in g
reen
Lithium Potential in Namibia
58
Appendix B GradeTonnage data (Measured amp Indicated) for selected lithium projects in comparison to Namibian projects (Source SampP 092020)
0
0500
1000
1500
2000
2500
500
5000
5000
0
5000
00
5000
000
Gra
de [
Li 2O
]
Tonnage [t]
Tantalite Valley
Rubicon
Appendix B GradeTonnage data (Inferred) for selected lithium projects in com-parison to Namibian projects (Source SampP 092020)
0
0500
1000
1500
2000
2500
100
1000
1000
0
1000
00
1000
000
1000
0000
Gra
de [
Li 2O
]
Tonnage [t]
Tantalite ValleyRubicon
Uis Tailings
Uis Mine
De Rust
A product of the technical cooperation project between Bundesanstalt fuumlr Geowissenschaften und Rohstoffe (BGR)(Federal Institute for Geosciences and Natural Resources)
andGeological Survey of Namibia within the Ministry of Mines and Energy
ISBN 978-3-948532-29-1 (Print) 978-3-948532-30-7 (PDF)
- List of Abbreviations
- 1 Introduction
- 2 What is lithium
-
- 21 Lithium deposits
-
- 3 Application
- 4 Chemical requirements
- 5 Mining and trade of lithium in the SADC
-
- 51 Lithium production
- 52 Trade data
- 53 Export
- 54Import
-
- 6 Lithium occurrences in Namibia
- 7 Lithium mining in Namibia
-
- 71 Current mining activities and projects
-
- 8 Analysed lithium samples
- 9 Interpretation
- 10 Conclusions
- References
-

Lithium Potential in Namibia
23
A general problem with HS 253090 is that only information on quantity is avail-able but no information on lithium content which can vary between 12 and 6 Li2O thus the margin of possible errors in terms of total contained lithium is large
In 2019 Australia exported about 16 million tons of spodumene-concentrate down from 35 million tons in 2018 More than 95 destined to China
Inferred exports (RTS) of Zimbabwe were approx 93300 t for HS 253090 About 62000 t of that quantity are listed as imports by South Africa and are unrelated to lithium The remaining quantity is much more in line with production figures of Zimbabwe as well as the known downstream industries of the destination coun-tries within Europe
There are no export records published by Namibia In general and across all traded lithium products South Africa appears to act as an importexport hub within the SADC Also some of the traded products may be used in the glass and ceramic industry of South Africa
54 Import
For most of the SADC countries the statistics retrieved though the Global Trade Atlas do not necessarily represent reliable trade data due to above-mentioned reasons This is especially true when only small import numbers (usually in tons) are listed as these are supposedly artefacts or errors in declaration
Global imports of lithium-carbonate amounted to approx 142965 t with South Korea being the largest importer (38578 t 27 ) There are no listed imports for the SADC region except South Africa (72 t)
Global imports of lithium-oxides (hydroxides) amounted to approx 84900 t with Japan being the largest importer (37300 t 44 ) In analogy to lithium carbonate there are no published imports into the SADC except for South Africa (428 t)
There is no information for imports of lithium-choride or lithium-mineral-con-centrates into the SADC The largest importer of lithium-choride is China with approx 253 t The largest importer of lithium-mineral-concentrates is also China (gt 95 )
Lithium Potential in Namibia
24
Fig 6 Simplified geology of Namibia with major towns as well as railway and tar roads Blue polygons indicate pegmatite belts and districts in central and southern Namibia (Data source Geological Survey of Namibia 2020)
6 Lithium occurrences in NamibiaIn Namibia significant lithium occurrences are found only within pegmatites These Precambrian and early Namibian pegmatites are restricted to two dif-ferent areas respectively the Damara Orogen in north-central Namibia and the Namaqua Metamorphic Complex in southern Namibia (Fig 6)
Lithium Potential in Namibia
25
Within the Damara Orogen four linear pegmatite belts are found all of which strike northeast ndash southwest (Fig 7) Brandberg West ndash Goantagab Cape Cross ndash Uis Nainais ndash Kohero and Sandamap ndash Erongo with the latter connected to the Karibib Pegmatite District (Schneider 1992)
Each of these pegmatite belts exhibit numerous individual pegmatite swarms that occur zoned or unzoned and may carry significant amounts of rare metals or semi-precious stones In the south Lithium-Caesium-Tantalum (LCT) peg-matites occur in two areas Tantalite-Valley south of Warmbad in close prox-imity to the northwest-trending Tantalite Valley Shear Belt and the Sandfon-tein-Ramansdrift area close to the Orange River
Fig 7 Pegmatite belts in north-central Namibia from west to east Brandberg West ndash Goantagab Cape Cross ndash Uis Nainais ndash Kohero and Sandamap ndash Erongo as well as the Karibib Pegmatite District (after Geological Suvey of Namibia 2002)
Lithium Potential in Namibia
26
7 Lithium mining in NamibiaData for historic lithium mine production is available for the period 1939 ndash 1998 (Fig 8) After 1998 all mining activities ceased due to product quality issues and overall market environment
Until the mid-1950s lepidolite was the most important mined lithium mineral of the country (Fig 8) As mine output of lepidolite decreased output of petalite increased However quantity on a year-to-year basis was quite variable and fluctuated between 1000 ndash 10000 t Since the early 1980s production of petalite was quite stable and ranged between 1000 ndash 2500 t Production fell sharply in 1997 and 1998 after which it ceased Mining of amblygonite has always been small compared to lepidolite and petalite and never exceeded 1000 t per annum
According to the USGS (2020) 500 t of lithium were mined in Namibia in 2018 This is most likely stockpiled lepidolite material from the Rubicon mine
0
2000
4000
6000
8000
10000
12000
1939
1941
1943
1945
1947
1949
1951
1953
1955
1957
1959
1961
1963
1965
1967
1969
1971
1973
1975
1977
1979
1981
1983
1985
1987
1989
1991
1993
1995
1997
[Ton
nes]
Petalite (t)Amblygonite (t)Lepidolite (t)
Fig 8 Lithium production in Namibia in [t] per year (after Schneider 1992 BGR 2020)
Lithium Potential in Namibia
27
Currently there is no active consecutive mining for lithium in substantial quan-tities in Namibia although there are prospects and projects under develop-ment
71 Current mining activities and projects
Soris The Soris project is located in the De Rust pegmatite swarm which is part of the ldquoBrandberg West ndash Goantagab tin beltrdquo (Fig 7) This belt stretches to the northeast of the Brandberg massif over a length of 60 km and a width of 25 km This belt was previously mined for cassiterite on a larger scale Some of the pegmatites in this belt may carry substantial amounts of lithium such as pegmatites in the De Rust pegmatite swarm
The De Rust pegmatite itself is a Li-rich rare metal pegmatite that was mined for cassiterite and tantalite but also for minor quantities of spodumene be ween 1960 and 1990 (Diehl 1990) It intruded into metasediments of the Amis River Formation Lower Ugab Group of the Southern Kaoko Zone
It is the largest pegmatite of the De Rust pegmatite swarm within the Brandberg West ndash Goantagab pegmatite belt (Diehl 1992c) Outcrops are 100 ‒ 470 m long up to 30 m wide and can be followed over a length of roughly 24 km
The pegmatite shows well-developed zonation with a border zone (quartz alkali feldspar muscovite) outer (quartz microcline-perthite muscovite altered petalite) and inner (quartzo-feldspathic rock with spodumene crystals with accessory apatite lepidolite eucryptite zircon and monazite) intermedi-ate zone as well as a core zone (quartz subordinate microcline muscovite sporadic tantalite) Spodumene crystals may reach up to 80 cm in length (Fig 12) Towards the core zone spodumene carries rounded nodules of lithi-um phosphates (amblygonite ndash montebrasite series)
It is located northwest of the nearest town of Uis in the Kunene region of Namibia about 6km to the east of farm De Rust 532 and about 25 km north of the Ugab River The nearest railhead is located in the town of Karibib and the deep-water port of Walvis Bay is 120 km to the southwest Windhoek is about 180 km to the southeast
Lithium Potential in Namibia
28
The project can be reached via paved but mostly unpaved roads from the town of Uis From White Lady Lodge which is about 38 km northwest from Uis a 35 km gravel road leads towards the project 15 km of which are in the riverbed of the Ugab River There is currently no electricity and water supply at the project location site
According to SampP Global (022020) current owner of the Soris project is Mon-tero Mining amp Exploration Ltd (TSXV MON) which holds 80 interest of the property Another 20 are allocated to an unnamed private owner Based on data from the Namibia Mining Cadastre Portal (092020) multiple entries for mining licence applications exist for the area where the main De Rust pegmatite is located (Fig 9)
Resource estimateDue to the early stage of the Soris project no resource estimate is avail-able However Montero Mining claims the project to be drill ready targeting a resource of 10 Mt 1 Li2O with tantalum and tin by-product credits This would equate to 46400 t of lithium or 247000 t LCE
Grab samples of the deposit showed lithium contents of 007 to 532 aver-aging 137 Channel samples showed average lithium contents of 076 and values up to 366 (Montero 032019) The company also re-assessed 1097 previously tested RC drill samples The main lithium-bearing mineral is spodumene
Remnants of historic intermittent mining activities like old foundations and quartzo-feldspathic tailings are still visible east to the main pegmatite (Fig 10 ‒ 11)
Lithium Potential in Namibia
29
Fig 10 Remnants of historic open pit mining (upper) and tailings of De Rust pegmatite (lower) northwest of the Brandberg massif (Photo BGR-GSN 2019)
Fig 9 Satellite image of the De Rust project including the outlined mining license Main pegmatite coordinates 20deg57prime48primeprimeS ‒ 14deg30prime12primeprimeE (Source httpportalsflexicadastrecomnamibia 092020)
Main pegmatite
Lithium Potential in Namibia
30
Fig 12 Weathered spodumene chrystals at the historic open pit mine (Photo BGR-GSN 2019)
Fig 11 Historic open pit of the De Rust pegmatite (Photo BGR-GSN 2019)
Lithium Potential in Namibia
31
Uis The Uis projects (former mine and tailings) are located in the northern part of the ldquoCape Cross Uis pegmatite beltrdquo east of the town of Uis on the farm Uis Townlands No 215 in the Erongo region of Namibia
The Cape Cross-Uis belt is approx 120 km long and up to 40 km wide and extends in a NE direction (Fig 7) It comprises three distinct pegmatite swarms the Strathmore swarm Karlowa swarm and Uis pegmatite swarm In general lithium-bearing pegmatites (Li-Nb-Ta-Sn-Be and Li-Nb-Ta-Sn) are the least common in this belt (Fuchsloch et al 2018)
The Uis swarm field consists of more than 120 individual pegmatites each with a northeasterly to easterly strike direction and northwesterly down dip (30deg ‒ 70deg) This field is accompanied by a peripheral pegmatite field of approx 25 individual pegmatites
Some of the main pegmatites especially around the formerly worldrsquos largest tin mine at Uis are exceedingly large Some of them are up to 1 km long and some 50 m wide
In terms of lithium petalite amblygonite and minor spodumene mineralization occurs in the various pegmatites but no lepidolite Most common lithium bear-ing minerals in the eight pegmatites that were mined at Uis are amblygonite petalite and spodumene
Currently the Uis tailings project and the Uis tin mine are owned by two differ-ent companies As of 2020 the tin mine is operating a pilot processing plant and aims to ramp up the production of lithium in the near future The current ownership of the tailings project as of September 2020 is unclear
The nearest commercial deep-water port to the projects is Walvis Bay 220 km to the southeast The town of Omaruru is 130 km to the east and Henties Bay lies about 120 km to the southwest The nearest railhead is located in Omaruru The area is accessible year-round by paved and un-paved roads NamPower provides electricity and the town of Uis is connected to the Nam-Water pipeline
Lithium Potential in Namibia
32
The tin deposit was discovered in 1911 and mined between the 1950s and 1989 for cassiterite by Uis Tin Mining Company (SWA) Ltd and IMCOR
Coarse tailings are located in the northern part of the former mine just south to the main road C36 (Fig 13) The fine material is located south to the coarse waste dumps (Fig 13)
After 1990 multiple companies owned the property until AfriTin Mining Ltd bought all the rights (license ML134) The current lithium tailings project of Montero Mining amp Exploration Ltd (TSXV MON) is based on the historic mine tailings of the former tin mine on mining license ML134 that is currently owned by AfriTin Mining Ltd The acquired tailings material does not fall under the ML134 license of AfriTin since historical tailings material (Fig 14) is not regulated by Minerals (Prospecting and Mining) Act 33 of 1992 of Namibia
Resource estimateUis tin mineAccording to AfriTin the former Uis mine holds a JORC compliant resource (inferred) of 715 Mt of ore 0134 Sn with a cut-off grade of 005 Sn (AfriTin 2020) Grades of ancillary elements are given at 063 Li2O and 85 ppm Ta for the total resource of 71 Mt of ore
This equals to approx 95000 t of tin 209000 t of lithium (11 Mt LCE) and 6090 t of tantalum 85 of the total resource are attributable to the company The remaining 15 are allocated to SMU (Small Miners of Uis)
Uis tailingsMontero Mining filed an inferred resource estimate of 144 Mt of ore 037 Li2O and 005 SnO2 with a 035 Li2O cut-off grade for lithium and assumed processing recoveries of 70 for their tailings project (Montero 2019) This equals to approx 24700 t of lithium content (131500 t LCE) and 7200 t SnO2
This resource estimate only includes coarse tailings material There is current-ly no information on the lithium content of the fine tailings material that totals 271 Mt t due to insufficient or no test work (Montero 2018) The company also states that the average Li2O grade of the fines material does not hurdle the cut-off for the fines of 082 Li2O
Lithium Potential in Namibia
33
In 2016 Australian based Tawana Resources carried out a drilling program at Uis for a private company called Lithium Africa 1 on the fine and coarse tailings (Table 3 Hole 1 amp Hole 2) Below some of the obtained data on lithium content is given Additionally Li2O content of two obtained grab samples by BGR (Table 3 Sample 2019a amp 2019b) is given
Table 3 Sample data Uis (Tawana 2016 Montero 2018 BGR 2019)
Sample Sample 0 to 1m Li2O ()
Sample 1 to 2m Li2O ()
Sample 2 to 3m Li2O ()
Fines Hole 1 071 085 092
Fines Hole 2 080 089 095
Coarse Hole 1 050 043 043
Coarse Hole 2 054 062 062
BGR Sam-ple 2019a (Coarse tailings)
028
BGR Sam-ple 2019b (Coarse tailings)
028
Montero NI 43-101 037
Lithium Potential in Namibia
34
Fig 14 Tailings of the historic Uis Tin Mine (Photo BGR-GSN 2019 with kind permission of AfriTin Mining Limited)
Fig 13 Former Uis tin mine Uis tailings project with coarse tailings Tailings coordina-tes (center) 21deg13prime31primeprimeS ‒ 14deg52prime44primeprimeE (Source httpportalsflexicadastrecomnamibia 092020)
Uis Tailings (coarse)
Uis Tailings (fine)
Historic Uis mine
Lithium Potential in Namibia
35
Karibib Lepidolite ProjectThe Karibib Lepidolite brownfield project is located in the ldquoKaribib ndash Usakos Pegmatite Districtrdquo southeast of the town of Karibib on the farm Okongava Ost No 72 in central Namibia (Fig 15 ‒ 16)
This pegmatite district which is of Damaran age hosts the most important pegmatite occurrence (Rubicon swarm) in terms of lithium in Namibia In addi-tion numerous other different pegmatite swarms some of which have previ-ously been relevant in terms of lithium are know from this district These are Dernburg Karlsbrunn Albrechtshoumlhe Berger Kaliombo Gamikaubmund Okatjimukuju Etusis Daheim Friedrichsfelde and Etiro (Diehl 1992a)
The Rubicon pegmatite itself is the largest of the individual pegmatites that occur in this field and has been the prime source of lithium until mining seized in the early 1990s The Helikon pegmatites are part of the Rubicon pegmatite swarm and are located northeast to the Rubicon pegmatite They have previ-ously been mined for lepidolite amblygonite petalite and muscovite beryll pollucite quartz and columbite-tantalite as valuable by-products (Fig 18 ‒ 19)
The pegmatite itself consist of two ellipsoidal well zoned Li-mineralized ore-bodies The larger one is about 320 m long and 25 ndash 35 m wide It dips at 46deg to the northeast and has a northwesterly strike The second orebody is about 230 m long and about 10 m wide It is dipping with 30deg to the northeast and has a northwesterly strike In total the outcrop of the Rubicon pegmatite is about 600 m long with a maximum width of 65 m (Fig 17)
A very prominent feature is the presence of a very well developed concen-tric shell and zones from the footwall to the inner core of the pegmatite Both orebodies exhibit a border- wall- intermediate- and core-zone
Border-zone wall-zone and outer intermediate zone of the larger orebody do not contain Li-bearing minerals of economic importance The inner interme-diate zone does contain lepidolite The outer core zone may be sub-divided into a petalite zone low-grade lepidolite zone and a high-grade lepidolite zone The inner core zone also contains a petalite zone Mining occurred pre-viously in the later named zones The zonation of the smaller orebody to the northwest is less pronounced but Li-mineralization and style are equal to the
Lithium Potential in Namibia
36
larger orebody There is no spodumene mineralization within the orebodies and respectively zones of the Rubicon pegmatite
The Helikon I pegmatite is also a lens-shaped pegmatite with a length of roughly 400 m and a width of approx 66 m It dips to the north with about 60deg ndash 70deg Helikon I also consists of well-defined zones The main Li-bearing minerals are lepidolite and petalite According to Roering (1963) the lepidolite is difficult to separate from the intergrown albite and hence of low grade and quality
The Helikon II pegmatite is approx 17 km long and only 9 ndash 15 m wide It lies a bit north of Helikon I and dips steeply to the north with 55deg ndash 80deg striking east west The main Li-bearing minerals are lepidolite and petalite According to Diehl (1990) the westernmost portion of the pegmatite has historically been the economically most important A massive up to 6 m wide petalite zone was mined here according to Diehl (1990)
The nearest railhead to the project is 17 km away in Karibib and the deep-water port of Walvis Bay is 220 km to the southwest Windhoek is about 180 km to the southeast NamPower connects the town of Karibib to electricity and the project currently utilizes generators There is a 7 km long 22 kV power line spur to grid connection pending (Lepidico 2020) Water is available via on-site boreholes
The project was previously owned by Desert Lion Energy Inc (TSVX DLI) Lepidico Ltd (ASX LPD) bought into the project and currently holds 80 interest which comprises Mining License 204 (69 km2) as well as three Exclu-sive Prospecting Licenses (EPLs) namely 5439 5555 and 5781 (Lepidico 2020)
Lepidico will cover mining from multiple sources as well as chemical conver-sion by utilizing their proprietary lithium processing technologies L-Maxreg LOH-Maxreg and S-Maxreg (Lepidico 052019) The company aims to produce high purity lithium chemicals such as lithium carbonate and lithium hydroxide
The takeover also included a nonbinding offtake agreement between the for-mer owner Desert Lion Energy Inc and German chemical company BASF On April 2nd 2019 Desert Lion Energy Inc announced this offtake agreement
Lithium Potential in Namibia
37
which at the time was valid through to December 31 2019 On December 20th
2019 Lepidico announced that the LOI with BASF was extended to Decem-ber 31st 2020 (Lepidico 122019)
The feasibility study criteria of Lepidico are as follows
- Throughput of the concentrator on-site of 035 Mtpa- Expansion of throughput after year five to 05 Mtpa- Chemical plant in the industrial city of Abu Dabi (ICAD)- Plant design for 58000 tpa of concentrate (4 LiO2) for the production of
up to 5500 tpa LiOH- Utilization of L-Maxreg and LOH-MaxTM- Non-binding off-take MOU with BASF for LiOH only- Targeting for project commissioning to commence late 2021 for commer-
cial production in 2022
The preliminary mine plan indicates a strip ratio of 03 ndash 1 for the first two years The ratio will then go up to 1 ndash 14 In the first four years elevated grades of 06 LiO2 will be mined
Resource estimateA JORC 2012 compliant resource estimate for the deposit is given in Table 4 (Lepidico 2020) The deposit currently holds 23200 t of lithium (Indicated amp Inferred) based on a cut-off grade of 015 Li2O This resource estimate is based solely on the lepidolite occurrences at the mine site
Table 4 Resource estimate Karibib Lepidolite Project (Source Lepidico 2020)
Deposit Resource Category
Cut-off (Li2O)
Ore (Mt)
Li2O ()
Li (t)
Li (LCE)
Rubicon Measured
015
22 057 5819 30974
Rubicon Indicated 666 038 11637 61943
Rubicon Inferred 237 043 4728 25167
Helikon
Total 015 1124 043 22184 118086
Lithium Potential in Namibia
38
Fig 16 Satellite image of the Karibib Lepidolite project Helikon 1 coordinates (center) 22deg2prime49primeprimeS ‒ 16deg1prime13primeprimeE Helikon 4 coordinates (center) 22deg2prime24primeprimeS ‒ 16deg1prime41primeprimeE (Source httpportalsflexicadastrecomnamibia 092020)
Fig 15 Satellite image of the Karibib Lepidolite project Rubicon coordinates (center) 22deg6prime11primeprimeS ‒ 15deg59prime44primeprimeE (Source httpportalsflexicadastrecomnamibia 092020)
Historic Rubicon mine
Helikon 1
Helikon 4
Lithium Potential in Namibia
39Fig 17 Rubicon pegmatite (Photo BGR-GSN 2019 with kind permission of Lepidico Chemicals Namibia (Pty) Ltd 2020)
Lithium Potential in Namibia
40 Fig 18 Lepidolite sample from Rubicon pegmatite (Photo BGR-GSN 2019 with kind permission of Lepidico Chemicals Namibia (Pty) Ltd 2020)
Fig 19 Petalite sample from Rubicon pegmatite (Photo BGR-GSN 2019 with kind permission of Lepidico Chemicals Namibia (Pty) Ltd 2020)
Lithium Potential in Namibia
42
Fig 21 Helikon 4 pegmatite (Photo BGR-GSN 2019 with kind permission of Lepidico Chemicals Namibia (Pty) Ltd 2020)
Fig 20 Helikon 1 pegmatite (Photo BGR-GSN 2019 with kind permission of Lepidico Chemicals Namibia (Pty) Ltd 2020)
Lithium Potential in Namibia
43
Tantalite ValleyThe Tantalite Valley Project lies within the ldquoNamaqua Metamorphic Complexrdquo in Southern Namibia Within this complex Lithium-Caesium-Tantalum (LCT) pegmatites occur in two main areas Tantalite-Valley south of Warmbad in close proximity to the northwest-trending Tantalite Valley Shear Belt and the Sandfontein-Ramansdrift area close to the Orange River
The area were the pegmatites of the Tantalite Valley occur is primarily com-posed of a large ovoid gabbro intrusion (71 km by 33 km in extent) within paragneiss units of the Namaqua Complex The gabbro outcrop forms a large dome shaped mountain that rises about 500 m above the surrounding topo-graphy
The pegmatites belong to the Kenhardt and Gordonia pegmatite districts in Namaqualand but only the younger group of them carry accessory ore miner-als such as tantalite beryl REE minerals and lithium
The Tantalite Valley pegmatites include several individual subhorizonal dikes that are up to 1000 m long and 02 to 40 m wide plunging towards southeast (Diehl 1992b) Four of those are of economic interest Homestead Whitkop White City and the Lepidolite pegmatites (ie Purple Haze) (Fig 22)
They are all well zoned (quartz core inner and outer intermediate zones wall zone) and were predominantly targeted for beryl columbite-tantalite as well as lithium and bismuth minerals
The project is located on the farms Umeis 110 and Kinderzitt 132 between the Farms 109 131 129 308 and 473 in the magisterial district of Karas It currently comprises Mining License (ML-77) fully owned by Tameka Shelf Co Four (Pty) Ltd which is a 100 subsidiary of African Tantalite Pty Ltd (AFTAN) Above all Kazera Global Investments PLC holds a 75 stake in AFTAN (Kazera 2019) with the other 25 of local farmer ownership
The project is accessible via gravel road from Karasburg which is about 80 km to the north The nearest railhead is also located in Karasburg Electricity is currently supplied by generators and water is recovered from multiple drill holes The Orange River is about 15 km to the south of the project Mining
Lithium Potential in Namibia
44
infrastructure as well as equipment are on site as well as a plant for the pro-duction of tantalite concentrate
NTI is working on an extensive exploration program with a clear focus on revi-ving tantalite mining in Namibia with a possible by-product stream of lithium bearing minerals The company will focus primarily on the pegmatites Homes-tead Purple Haze Signaalberg and White City (Fig 23)
The area is known for its tantalum occurrences and since the late 1940s tantalite and other minerals have been recovered at Tantalite Valley until 1981 when mining ceased Initially alluvial deposits were mined followed by the pegmatites themselves Grades of the concentrates produced prior to the closure of the mine were quite high with 65 ‒ 70 Ta2O5 with very low U3O8
and ThO2 values of 025 max
Resource estimateAccording to SampP Global (092020) Measured and amp Indicated resources at Tantalite Valley are 104800 t of ore 0042 Ta2O5 and 0653 Li2O as of 112019 This would equate to 315 t of lithium or 1690 t LCE Total inferred resources are 517400 t of ore 0018 Ta2O5 and 0144 Li2O This equals to approx 91 t of tantalum and 750 t of lithium (3535 t LCE)
Lithium Potential in Namibia
45
Fig 23 White City pegmatite (Source Kazera global Investments PLC 2020)
Fig 22 Satellite image of the Tantalite Valley project White City pegmatite coordinates (center) 28deg43prime07primeprimeS ‒ 18deg44prime45primeprimeE Homestead pegmatite coordinates (center) 28deg43prime19primeprimeS - 18deg44prime24primeprimeE Purple Haze pegmatite coordinates (center) 28deg43prime09primeprimeS ‒ 18deg43prime55primeprimeE (Source httpportalsflexicadastrecomnamibia 092020)
Lithium Potential in Namibia
46
8 Analysed lithium samplesDuring the course of the cooperation project between the Economic Geology Division (EGD) of the Geological Survey of Namibia (GSN) and the Ger-man Federal Institute of Geosciences and Natural Resources (BGR) several sampling campaigns to southern and central pegmatites took place
The field trips were preceded by literature and data research regarding infor-mation on lithium occurrences andor previous lithium mining activity to iden-tify specific target areas
During a campaign in 2019 16 lithium-bearing mixed mineral samples were taken from five different locations and subsequently analyzed Two of the samples originate from the Uis Tin Mine Tailings of the former tin mine All remaining samples were taken either from stripped outcrops for future mine activities or from previous mine sites (ie pits)
All 16 samples were analyzed at BGR labs in Hanover Germany through qualitative XRD XRF and ICP-MS Given data shall be understood as a first indicator for the sampled lithium occurrences
Most if not all sampled occurrences have previously been analyzed or are cur-rently being assessed by the property owners or current licensees Detailed information of these sampling and analytical campaigns remain confidential and are thus not available for comparison
Appendix A lists the identified qualitative mineralogy of the samples as well as the major element analysis Additional samples from previous campaigns are also given
Interpretation of the results are based on their applicability in the various lithium-consuming industries for which information is available
Most of the current lithium applications require a chemical intermediate product such as lithium carbonate or lithium-hydroxide The glass and cera-mic industry does use lithium-bearing mineral concentrates depending on the prices of these materials when compared to LiCO3
Lithium Potential in Namibia
47
Since the main applications require an intermediate or downstream chemical product lithium content as well as impurity values are the main criteria for the suitability of the sampled occurrences Other quality criteria are particle size and surface areastructure
9 InterpretationAs previously stated all obtained grab samples are mixtures of lithium- bearing minerals (ie spodumene petalite lepidolite) feldspars quartz micas as well as secondary minerals Therefore all given analytical data has to be taken with caution and will not be representative for the individual outcrops or deposits
The evaluation of the economic suitability for various economic applications of the analysed lithium samples is based on the chemical specifications in Chapter 4
Lithium content gt 1 Li2O Fe2O3 content lt 015 as well as F content lt 01 are individually highlighted (Appendix A) as these three values are the most important
Based on the chemical analysis nine of the 16 samples showed Li2O contents of more than 1 (range 117 ‒ 327 ) Seven of those nine samples also exhibited low Fe2O3 content (range 004 ‒ 008 ) (Appendix A) Three of those seven samples also had fluorine values below 005
Of the ten additionally included samples from previous campaigns four showed Li2O contents of more than 1 (range 126 ‒ 199 ) Three of those samples also exhibited low Fe2O3 content (range 004 ‒ 007 ) (Appendix A) One of the three samples had fluorine values below 005
The mentioned samples (sources) could be of potential use but for further interpretation statistical sampling will be required
Lithium Potential in Namibia
48
10 ConclusionsThere is currently no lithium industry established in Namibia This accounts to both mining and processing of ores into commercial lithium-bearing con-centrates as well as the production of downstream products such as lithium carbonate andor lithium hydroxide In order to evaluate the potential for a lithium industry in Namibia the current global market and price developments need to be addressed
Currently the main application for lithium is in the chemical industry as lithium carbonate andor hydroxide for the manufacturing of lithium-ion batteries There is currently no domestic market (supply) or demand for this industry in Southern Africa or Namibia in specific Processing of lithium-bearing ores into these highly specific downstream products is economically more viable in close proximity to the demanding industries It also requires large investments (double-digit million dollars per 10000t of capacity) Additionally there is already huge capacity and strong capacity build up in Asia at rather low cost
The second most important application lies in the glass and ceramics industry This industry uses lithium either as lithium-bearing concentrates or lithium carbonate depending on current market price and processproduct require-ments There is currently no such industry established in Namibia but potential plans There is glass and ceramics manufacturing in South Africa and thus a potential market for lithium bearing products (concentrates) should this indus-try require it depending on product
The 20182019 primary lithium supply based on spodumene-bearing mineral concentrates was dominated by Australia with a market share of well over 95 On an annual basis the country exports more than three million tons of lithium-bearing concentrates to China To put this into perspective Lepidico plans to export just 58 ktpa of concentrate to Abu Dhabi for refinement from their project annually Therefore potential production in Namibia will always be rather small scale when compared to peer producing countriescompanies
As of late 2020 the concentrate market is in strong oversupply with strong competition Thus prices have eroded quite substantially for a standard SC6 concentrate (Fig 24) In general prices vary significantly based on lithium content and impurities of the concentrates Lithium bearing mineral concen-
Lithium Potential in Namibia
49
trates are a relatively low-value mineral commodity when compared to lithi-um-carbonate or other lithium downstream products thus product quality cost reduction and cost control are key components in this industry Since prices are depressed currently many of the Australian producers have drasti-cally reduced output or even went into care and maintenance This situation may change towards 2025 or beyond as demand picks up
Prices for the higher valued product lithium-carbonate spiked at the end of 2017 towards 2018 to more than 20000 $USt on a contract basis with prices being very volatile Since then prices have also eroded to below 9000 $USt due to oversupply and slow demand pickup (Fig 25) With this product stable quality and chemical composition are crucial for the downstream industry
Based on available gradetonnage data the Namibian projectsprospects are relatively small in overall size and low in grade when compared to global peers for the resource category ldquoMeasuredIndicatedrdquo (Appendix B) Total contained lithium quantity is thus relatively small in comparison On a global scale the most promising hard rock projects that are currently being mined and developed have Li2O grades of 10 or above
Fig 24 Lithium-mineral-concentrate prices 012010 ‒ 062020 (Source BGR 2020)
300
400
500
600
700
800
900
1000
1100
208
210
212
214
216
218
220
US$
t US$t
01-20
14
01-20
15
01-20
16
01-20
17
01-20
18
01-20
19
01-20
20
01-20
10
01-20
11
01-20
12
01-20
13
Spodumene min 5-6 LiO2 fob Australia
Spodumene concentrate gt75 LiO2 bulk cif Asia
Petalite 42 LiO2 fob Durban
Spodumene fob Australia
Spodumene min 5-6 LiO2 cif China
Lithium Potential in Namibia
50
For the resource category ldquoIndicatedrdquo which generally represents the lowest level of confidence only the Uis mine project of AfriTin represents a size-able resource even though grades are relatively low (Appendix C) The Uis tailings project as well as the Rubicon project are again relatively small when compared to their global peers Tantalite Valley is the smallest of all included projects (Appendix C)The given data for the De Rust project reflects only an exploration target of the company rather than actual data and may thus be not representative
Based on size and contained lithium-content none of the visited early stage projectsprospects would justify the financial investment into the construction of a chemical conversion plant for the production of lithium carbonate andor hydroxide on site as it requires very large monetary investments Due to their size payback of the required investments may be unfavorable when compared to global peers In addition the current market environment is very harsh with strong competition from Asia that has a huge cost advantage due to capacity build up This industry is also very energy and water intensive
In addition location within Namibia as well as distance to possible down-stream markets may become an issue as it increases the transportation cost
4000
7000
10000
13000
16000
19000
22000
25000
28000
01-20
14
01-20
15
01-20
16
01-20
17
01-20
18
01-20
19
01-20
20
US$
t
Lithium-carbonate (min 995 ) battery grade spot price ex works domestic ChinaLithium-carbonate (min 99-995 ) Li2CO3 large contracts USA delivered continentalLithium-hydroxid-monohydrate (min 565) technical and industrial grades cif China Japan amp Korea
Fig 25 Lithium chemical prices 012014 ndash 062020 (Source BGR 2020)
Lithium Potential in Namibia
51
immensely This is especially true for the SorisDe Rust pegmatite which is in a remote location without any allocated infrastructure The projects Karibib Uis and Tantalite Valley are much easier to access
The approach of Lepidico to produce a lithium bearing concentrate on site seems plausible approach Since this will already require a skilled workforce mining and beneficiation equipment in order to produce a high quality lithium-bearing concentrate it may already be considered ldquoadded valuerdquo for the indus-try of the country This approach may also be suitable for the other mentioned and visited projects
Lithium Potential in Namibia
52
ReferencesAfriTin Mining (2020) Uis Tin Project ndash Company Information ndash URL httpafritinminingcomuis-project [as of 092020]
Australian Government Geoscience Australia (2019) Australiarsquos Identi-fied Mineral Resources 2019 ndash URL httpswwwgagovauscientific-topicsmineralsmineral-resources-and-adviceaimr [as of 092020]
BGR ndash Bundesanstalt fuumlr Geowissenschaften und Rohstoffe (2020) Fachinformationssystem Rohstoffe ndash unpubl Hannover [as of 082020]
BGS ndash British Geological Survey (2016) Lithium Definitions mineralo-gy and deposits ndash URL httpswwwbgsacukdownloadsstartcfmid=3100 [as of 062016]
Diehl B J M (1990) Pegmatites of the Cape Cross Uis ndash Pegmatite Belt Namibia Geology mineralisation Rubidium Strontium characteristics and petrogenesis of rare metal pegmatites Open File Report EG 083 Economic Geology Series Geological Survey of Namibia 39 pp Windhoek
Diehl B J M (1992a) Lithium Caesium Beryllium Open File Report Mineral Resource Series Geological Survey of Namibia 18 pp Windhoek
Diehl B J M (1992b) Niobium and Tantalum Open File Report Mineral Resource Series Geological Survey of Namibia 20 pp Windhoek
Diehl B J M (1992c) Tin Open File Report Mineral Resource Series Geological Survey of Namibia 30 pp Windhoek
Diehl B J M amp Schneider G I C (1990) Geology and mineralisation of the Rubicon Pegmatite Namibia Open File Report Geol Surv Namibia 20 pp Windhoek
Fuchsloch et al (2018) Classification mineralogical and geochemical vari-ations in pegmatites of the Cape Cross-Uis pegmatite belt Namibia Lithos 296 ndash 299 79-95 elsevier
Lithium Potential in Namibia
53
Garret D E (2004) Handbook Of Lithium And Natural Calcium Chloride Their Deposits Processing Uses and Properties ndash 467 S Oxford (Elsevier B V)
Geological Survey of Namibia (2002) Mineral Resources of Namibia Summary of Mineral Deposits and Occurrences Omaruru Sheet 2114 Volume I ndash Complete Descriptions 119 pp Windhoek
IHS Global SA (2020) Global Trade Atlas ndash Commercial Online-Databa-se ndashURL httpsmyihscomConnectcallingUrl=https3a2f2fconnectihsmarkitcom2f [as of 062017]
Kazera Global Investments PLC (2020) Company Information ndash URL httpskazeraglobalcominvestmentsnamibia-tantalite-investment-mine [as of 092020]
Lepidico (2019) LOI with BASF extended to 31 December 2020 ndash News Release ndash URL httpswwwlepidicocomwp-contentuploads201910LPD-191220-LOI-with-BASF-extended-to-31-December-2020pdf [as of 122019]
Lepidico (2019) Corporate Presentation ndash URL httpswwwlepidicocomwp-contentuploads201907LPD-190509-Corporate-Presentati-on-May-2019pdf [as of 052019]
Lepidico (2020) Company Information ndash URL httpswwwlepidicocomprojectskaribib [as of 092020]
Montero Mining amp Exploration Ltd (2018) Exploring Battery Metals in Namibia ndash Company Presentation ndash URL httpswwwproactiveinvestorscomauuploadSponsorFileFile2018_031520244941_MON-CorporatePre-sentationMarch2018pdf [as of 072018]
Montero Mining amp Exploration Ltd (2019) Montero Files NI 43-101 Resource Estimate On The Uis Lithium-Tin Tailings Project In Namibia On Sedar ndash News Announcement ndash URL httpsmonterominingcommontero-files-ni-43-101-resource-estimate-on-the-uis-lithium-tin-tailings-project-in-namibia-on-sedar [as of 032019]
Lithium Potential in Namibia
54
Namibia Mining Cadastre Portal (2020) Online-Database ndashURL httpsportalslandfoliocomnamibia [as of 092020]
Roskill Information Services Ltd (2016) Lithium Global Industry Mar-kets amp Outlook ndash 386 S London Groszligbritannien
Schneider G I C (1992) Feldspar Open File Report MRS 08 Mineral Resource Series Geological Survey of Namibia 2 pp Windhoek
Schmidt M (2017) Rohstoffrisikobewertung ndash Lithium ndash DERA Rohstoffin-formationen 33 Berlin
S amp P Global Market Intelligence (2020) Lithium - Metals amp Mining Properties URL httpsplatformmarketintelligencespglobalcomwebcli-entauth=inheritindustryminingProjects [as of 092020]
Statista (2020) Distribution of lithium end-usage worldwide in 2019 by area application ndash URL httpswwwstatistacomstatistics268787lithium-usa-ge-in-the-world-market [as of 062020]
Tawana Resources NL (2016) Tawana acquires second lithium pro-ject ndash News Release ndash URL httpsmstrademomentumcozajsepdfSENS_20160923_S376505pdf [as of 092016]
USGS ndash United States Geological Survey (multiple years) Lithium ndash Minerals Commodity Summaries ndash URL httpswwwusgsgovcentersnmiclithium-statistics-and-information [as of 082020]
Appendix
Sam
ple I
DFa
rmLa
titud
eLo
ngitu
deSa
mpl
e des
crip
tion
(XRD
qu
al)
LiO 2
()
SiO 2
Ti
O 2
Al2O 3
Fe2O 3
Mn
O Mg
O Ca
O Na
2O
K 2O P 2O 5
SO
3
Cl
F
LOI
Su
m
2015
-03
previous sample campaignsHelik
on
n A
Felds
parQ
uartz
Lepid
olite
025
6871
lt000
119
0500
200
2900
505
3292
806
7905
59lt0
01lt0
002
lt005
093
9985
2016
-12
Rubic
onwe
ather
ed P
etalite
126
6473
lt000
118
0600
703
2718
607
9507
805
2500
62lt0
01lt0
002
lt005
1146
9871
2016
-17
Rubic
onLe
pidoli
te +
Quar
tz13
063
6700
219
9316
0929
003
0054
029
6218
0052
lt001
lt000
226
232
798
67
2016
-20
Helik
onLe
pidoli
te + A
lbite
176
5514
lt000
126
8700
401
2100
700
2123
970
3900
45lt0
01lt0
002
156
369
9698
2016
-21
Helik
onLe
pidoli
te19
954
32lt0
001
2627
004
0224
006
0038
266
714
0069
lt001
lt000
240
628
997
77
FN20
19_0
4De
Rus
tFe
ldspa
rAmb
lygon
iteP
etalite
(n
on X
RD)
003
6513
lt000
118
82lt0
0100
0200
101
0924
311
4105
75lt0
0100
04lt0
0503
898
84
2015
-09
Molop
oPe
talite
(non
XRD
)00
952
85lt0
001
1672
lt001
0002
487
0323
342
0352
lt000
100
400
3403
621
1310
012
2016
-14
Molop
oPe
talite
wea
there
d (no
n XRD
)00
752
1600
0316
5100
200
5147
805
8923
406
4500
6900
200
8602
222
6310
013
2016
-15
Molop
oFe
ldspa
r (no
n XRD
)00
664
02lt0
001
1937
003
0004
003
0151
216
1249
0796
lt001
lt000
2lt0
0505
399
55
2016
-23
Molop
oZin
nwald
ite (n
on X
RD)
006
5044
0068
3307
048
0011
012
0426
261
7674
0181
lt001
lt000
2lt0
0542
9925
1909
249
2019Uis
Tailin
gs
Quar
tzFe
ldspa
rPeta
lite
Musc
ovite
028
7293
0045
1479
051
0062
0212
9830
927
6613
6200
2lt00
02lt0
0523
399
38
1909
250
Uis
Tailin
gsQu
artz
Felds
parP
etalite
Mu
scov
ite02
872
6900
4314
8205
0059
019
1306
313
2794
1347
002lt
0002
lt005
251
9937
1909
251
Helik
on 4
22deg02prime4
8primeprimeS1
6deg01prime30
primeprimeEQu
artz
Felds
parP
etalite
Le
pidoli
te16
464
4400
0319
4200
301
2100
408
8325
345
6806
800
400
0727
228
998
38
1909
252
Helik
on 1
22deg02prime2
0primeprimeS1
6deg01prime19
primeprimeEPe
talite
Lepid
olite
Quar
tz29
576
9200
0116
6800
300
0304
101
7301
106
8100
01lt0
01lt0
002
lt005
205
97
App
endi
x A
Ana
lytic
al d
ata
of li
thiu
m s
ampl
es c
olle
cted
in N
amib
ia T
hres
hold
val
ues
high
light
ed in
gre
en
Lithium Potential in Namibia
57
Sam
ple I
DFa
rmLa
titud
eLo
ngitu
deSa
mpl
e des
crip
tion
(XRD
qu
al)
LiO 2
()
SiO 2
Ti
O 2
Al2O 3
Fe2O 3
Mn
O Mg
O Ca
O Na
2O
K 2O P 2O 5
SO
3
Cl
F
LOI
Su
m
1909
253
2019Rubic
on22deg06prime1
3primeprimeS1
5deg59prime45
primeprimeEPe
talite
Lepid
olite
Quar
tz32
778
73lt0
001
1687
002
0006
002
0157
011
003
0002
003
0003
lt005
075
9663
1909
254
Rubic
on22deg06prime1
0primeprimeS1
5deg59prime41
primeprimeEFe
ldspa
rQua
rtzM
usco
vite
004
682
lt000
119
3500
300
2400
205
0610
0808
6804
3lt0
01lt0
002
lt005
041
9985
1909
255
Rubic
on22deg06prime1
0primeprimeS1
5deg59prime41
primeprimeEFe
ldspa
rLep
idolite
Mus
co-
viteK
aolin
026
6104
0004
2318
022
0136
006
0119
367
8411
0159
lt001
lt000
2lt0
0522
299
15
1909
256
Rubic
on22deg06prime1
0primeprimeS1
5deg59prime41
primeprimeELe
pidoli
te 27
249
8700
129
3400
408
0500
400
704
697
3100
31lt0
01lt0
002
087
441
9569
1909
257
Rubic
on22deg06prime1
3primeprimeS1
5deg59prime45
primeprimeEPe
talite
Lepid
olite
Quar
tz30
670
0900
0320
2600
801
0901
502
9901
926
800
15lt0
0100
04lt0
0526
596
48
1909
258
Rubic
on22deg06prime1
0primeprimeS1
5deg59prime41
primeprimeELe
pidoli
teFe
ldspa
rQua
rtz20
659
7800
0224
100
505
2400
300
513
7247
0051
lt001
0002
265
388
9966
1909
259
Tanta
lite
Valle
y28deg43prime0
9primeprimeS1
8deg43prime55
primeprimeEFe
ldspa
rLep
idolite
Mus
covit
e11
762
64lt0
001
2139
004
0161
lt001
0399
7731
2401
0900
200
119
912
698
85
1909
260
Tanta
lite
Valle
y28deg43prime0
9primeprimeS1
8deg43prime55
primeprimeEFe
ldspa
rLep
idolite
Mus
covit
e03
059
8600
1425
1301
604
2200
302
2860
547
2201
3900
200
0904
123
799
56
1909
261
Tanta
lite
Valle
y28deg43prime0
9primeprimeS1
8deg43prime55
primeprimeEFe
ldspa
rQua
rtzM
usco
vite
003
636
0005
2218
022
0122
002
0381
727
3809
0272
lt001
lt000
2lt0
0513
199
17
1909
262
Tanta
lite
Valle
y28deg43prime2
0primeprimeS1
8deg44prime23
primeprimeEQu
artzSp
odum
eneM
us-
covit
e13
180
5100
0415
8903
401
2401
301
9502
604
0400
0500
200
03lt0
0507
398
56
1909
263
De R
ust
20deg57prime4
8primeprimeS1
4deg30prime13
primeprimeEFelsd
parS
podume
neQuartz
074
7313
0006
2048
007
015
005
0154
398
0831
0073
001
0003
lt005
082
9974
1909
264
De R
ust
20deg57prime4
8primeprimeS1
4deg30prime13
primeprimeESp
odum
eneF
eldsparQuartz
230
6924
0006
2602
801
0200
301
0510
102
1400
68lt0
0100
03lt0
0504
897
53
(Con
tinue
d) A
ppen
dix
A A
naly
tical
dat
a of
lith
ium
sam
ples
col
lect
ed in
Nam
ibia
Thr
esho
ld v
alue
s hi
ghlig
hted
in g
reen
Lithium Potential in Namibia
58
Appendix B GradeTonnage data (Measured amp Indicated) for selected lithium projects in comparison to Namibian projects (Source SampP 092020)
0
0500
1000
1500
2000
2500
500
5000
5000
0
5000
00
5000
000
Gra
de [
Li 2O
]
Tonnage [t]
Tantalite Valley
Rubicon
Appendix B GradeTonnage data (Inferred) for selected lithium projects in com-parison to Namibian projects (Source SampP 092020)
0
0500
1000
1500
2000
2500
100
1000
1000
0
1000
00
1000
000
1000
0000
Gra
de [
Li 2O
]
Tonnage [t]
Tantalite ValleyRubicon
Uis Tailings
Uis Mine
De Rust
A product of the technical cooperation project between Bundesanstalt fuumlr Geowissenschaften und Rohstoffe (BGR)(Federal Institute for Geosciences and Natural Resources)
andGeological Survey of Namibia within the Ministry of Mines and Energy
ISBN 978-3-948532-29-1 (Print) 978-3-948532-30-7 (PDF)
- List of Abbreviations
- 1 Introduction
- 2 What is lithium
-
- 21 Lithium deposits
-
- 3 Application
- 4 Chemical requirements
- 5 Mining and trade of lithium in the SADC
-
- 51 Lithium production
- 52 Trade data
- 53 Export
- 54Import
-
- 6 Lithium occurrences in Namibia
- 7 Lithium mining in Namibia
-
- 71 Current mining activities and projects
-
- 8 Analysed lithium samples
- 9 Interpretation
- 10 Conclusions
- References
-
Lithium Potential in Namibia
24
Fig 6 Simplified geology of Namibia with major towns as well as railway and tar roads Blue polygons indicate pegmatite belts and districts in central and southern Namibia (Data source Geological Survey of Namibia 2020)
6 Lithium occurrences in NamibiaIn Namibia significant lithium occurrences are found only within pegmatites These Precambrian and early Namibian pegmatites are restricted to two dif-ferent areas respectively the Damara Orogen in north-central Namibia and the Namaqua Metamorphic Complex in southern Namibia (Fig 6)
Lithium Potential in Namibia
25
Within the Damara Orogen four linear pegmatite belts are found all of which strike northeast ndash southwest (Fig 7) Brandberg West ndash Goantagab Cape Cross ndash Uis Nainais ndash Kohero and Sandamap ndash Erongo with the latter connected to the Karibib Pegmatite District (Schneider 1992)
Each of these pegmatite belts exhibit numerous individual pegmatite swarms that occur zoned or unzoned and may carry significant amounts of rare metals or semi-precious stones In the south Lithium-Caesium-Tantalum (LCT) peg-matites occur in two areas Tantalite-Valley south of Warmbad in close prox-imity to the northwest-trending Tantalite Valley Shear Belt and the Sandfon-tein-Ramansdrift area close to the Orange River
Fig 7 Pegmatite belts in north-central Namibia from west to east Brandberg West ndash Goantagab Cape Cross ndash Uis Nainais ndash Kohero and Sandamap ndash Erongo as well as the Karibib Pegmatite District (after Geological Suvey of Namibia 2002)
Lithium Potential in Namibia
26
7 Lithium mining in NamibiaData for historic lithium mine production is available for the period 1939 ndash 1998 (Fig 8) After 1998 all mining activities ceased due to product quality issues and overall market environment
Until the mid-1950s lepidolite was the most important mined lithium mineral of the country (Fig 8) As mine output of lepidolite decreased output of petalite increased However quantity on a year-to-year basis was quite variable and fluctuated between 1000 ndash 10000 t Since the early 1980s production of petalite was quite stable and ranged between 1000 ndash 2500 t Production fell sharply in 1997 and 1998 after which it ceased Mining of amblygonite has always been small compared to lepidolite and petalite and never exceeded 1000 t per annum
According to the USGS (2020) 500 t of lithium were mined in Namibia in 2018 This is most likely stockpiled lepidolite material from the Rubicon mine
0
2000
4000
6000
8000
10000
12000
1939
1941
1943
1945
1947
1949
1951
1953
1955
1957
1959
1961
1963
1965
1967
1969
1971
1973
1975
1977
1979
1981
1983
1985
1987
1989
1991
1993
1995
1997
[Ton
nes]
Petalite (t)Amblygonite (t)Lepidolite (t)
Fig 8 Lithium production in Namibia in [t] per year (after Schneider 1992 BGR 2020)
Lithium Potential in Namibia
27
Currently there is no active consecutive mining for lithium in substantial quan-tities in Namibia although there are prospects and projects under develop-ment
71 Current mining activities and projects
Soris The Soris project is located in the De Rust pegmatite swarm which is part of the ldquoBrandberg West ndash Goantagab tin beltrdquo (Fig 7) This belt stretches to the northeast of the Brandberg massif over a length of 60 km and a width of 25 km This belt was previously mined for cassiterite on a larger scale Some of the pegmatites in this belt may carry substantial amounts of lithium such as pegmatites in the De Rust pegmatite swarm
The De Rust pegmatite itself is a Li-rich rare metal pegmatite that was mined for cassiterite and tantalite but also for minor quantities of spodumene be ween 1960 and 1990 (Diehl 1990) It intruded into metasediments of the Amis River Formation Lower Ugab Group of the Southern Kaoko Zone
It is the largest pegmatite of the De Rust pegmatite swarm within the Brandberg West ndash Goantagab pegmatite belt (Diehl 1992c) Outcrops are 100 ‒ 470 m long up to 30 m wide and can be followed over a length of roughly 24 km
The pegmatite shows well-developed zonation with a border zone (quartz alkali feldspar muscovite) outer (quartz microcline-perthite muscovite altered petalite) and inner (quartzo-feldspathic rock with spodumene crystals with accessory apatite lepidolite eucryptite zircon and monazite) intermedi-ate zone as well as a core zone (quartz subordinate microcline muscovite sporadic tantalite) Spodumene crystals may reach up to 80 cm in length (Fig 12) Towards the core zone spodumene carries rounded nodules of lithi-um phosphates (amblygonite ndash montebrasite series)
It is located northwest of the nearest town of Uis in the Kunene region of Namibia about 6km to the east of farm De Rust 532 and about 25 km north of the Ugab River The nearest railhead is located in the town of Karibib and the deep-water port of Walvis Bay is 120 km to the southwest Windhoek is about 180 km to the southeast
Lithium Potential in Namibia
28
The project can be reached via paved but mostly unpaved roads from the town of Uis From White Lady Lodge which is about 38 km northwest from Uis a 35 km gravel road leads towards the project 15 km of which are in the riverbed of the Ugab River There is currently no electricity and water supply at the project location site
According to SampP Global (022020) current owner of the Soris project is Mon-tero Mining amp Exploration Ltd (TSXV MON) which holds 80 interest of the property Another 20 are allocated to an unnamed private owner Based on data from the Namibia Mining Cadastre Portal (092020) multiple entries for mining licence applications exist for the area where the main De Rust pegmatite is located (Fig 9)
Resource estimateDue to the early stage of the Soris project no resource estimate is avail-able However Montero Mining claims the project to be drill ready targeting a resource of 10 Mt 1 Li2O with tantalum and tin by-product credits This would equate to 46400 t of lithium or 247000 t LCE
Grab samples of the deposit showed lithium contents of 007 to 532 aver-aging 137 Channel samples showed average lithium contents of 076 and values up to 366 (Montero 032019) The company also re-assessed 1097 previously tested RC drill samples The main lithium-bearing mineral is spodumene
Remnants of historic intermittent mining activities like old foundations and quartzo-feldspathic tailings are still visible east to the main pegmatite (Fig 10 ‒ 11)
Lithium Potential in Namibia
29
Fig 10 Remnants of historic open pit mining (upper) and tailings of De Rust pegmatite (lower) northwest of the Brandberg massif (Photo BGR-GSN 2019)
Fig 9 Satellite image of the De Rust project including the outlined mining license Main pegmatite coordinates 20deg57prime48primeprimeS ‒ 14deg30prime12primeprimeE (Source httpportalsflexicadastrecomnamibia 092020)
Main pegmatite
Lithium Potential in Namibia
30
Fig 12 Weathered spodumene chrystals at the historic open pit mine (Photo BGR-GSN 2019)
Fig 11 Historic open pit of the De Rust pegmatite (Photo BGR-GSN 2019)
Lithium Potential in Namibia
31
Uis The Uis projects (former mine and tailings) are located in the northern part of the ldquoCape Cross Uis pegmatite beltrdquo east of the town of Uis on the farm Uis Townlands No 215 in the Erongo region of Namibia
The Cape Cross-Uis belt is approx 120 km long and up to 40 km wide and extends in a NE direction (Fig 7) It comprises three distinct pegmatite swarms the Strathmore swarm Karlowa swarm and Uis pegmatite swarm In general lithium-bearing pegmatites (Li-Nb-Ta-Sn-Be and Li-Nb-Ta-Sn) are the least common in this belt (Fuchsloch et al 2018)
The Uis swarm field consists of more than 120 individual pegmatites each with a northeasterly to easterly strike direction and northwesterly down dip (30deg ‒ 70deg) This field is accompanied by a peripheral pegmatite field of approx 25 individual pegmatites
Some of the main pegmatites especially around the formerly worldrsquos largest tin mine at Uis are exceedingly large Some of them are up to 1 km long and some 50 m wide
In terms of lithium petalite amblygonite and minor spodumene mineralization occurs in the various pegmatites but no lepidolite Most common lithium bear-ing minerals in the eight pegmatites that were mined at Uis are amblygonite petalite and spodumene
Currently the Uis tailings project and the Uis tin mine are owned by two differ-ent companies As of 2020 the tin mine is operating a pilot processing plant and aims to ramp up the production of lithium in the near future The current ownership of the tailings project as of September 2020 is unclear
The nearest commercial deep-water port to the projects is Walvis Bay 220 km to the southeast The town of Omaruru is 130 km to the east and Henties Bay lies about 120 km to the southwest The nearest railhead is located in Omaruru The area is accessible year-round by paved and un-paved roads NamPower provides electricity and the town of Uis is connected to the Nam-Water pipeline
Lithium Potential in Namibia
32
The tin deposit was discovered in 1911 and mined between the 1950s and 1989 for cassiterite by Uis Tin Mining Company (SWA) Ltd and IMCOR
Coarse tailings are located in the northern part of the former mine just south to the main road C36 (Fig 13) The fine material is located south to the coarse waste dumps (Fig 13)
After 1990 multiple companies owned the property until AfriTin Mining Ltd bought all the rights (license ML134) The current lithium tailings project of Montero Mining amp Exploration Ltd (TSXV MON) is based on the historic mine tailings of the former tin mine on mining license ML134 that is currently owned by AfriTin Mining Ltd The acquired tailings material does not fall under the ML134 license of AfriTin since historical tailings material (Fig 14) is not regulated by Minerals (Prospecting and Mining) Act 33 of 1992 of Namibia
Resource estimateUis tin mineAccording to AfriTin the former Uis mine holds a JORC compliant resource (inferred) of 715 Mt of ore 0134 Sn with a cut-off grade of 005 Sn (AfriTin 2020) Grades of ancillary elements are given at 063 Li2O and 85 ppm Ta for the total resource of 71 Mt of ore
This equals to approx 95000 t of tin 209000 t of lithium (11 Mt LCE) and 6090 t of tantalum 85 of the total resource are attributable to the company The remaining 15 are allocated to SMU (Small Miners of Uis)
Uis tailingsMontero Mining filed an inferred resource estimate of 144 Mt of ore 037 Li2O and 005 SnO2 with a 035 Li2O cut-off grade for lithium and assumed processing recoveries of 70 for their tailings project (Montero 2019) This equals to approx 24700 t of lithium content (131500 t LCE) and 7200 t SnO2
This resource estimate only includes coarse tailings material There is current-ly no information on the lithium content of the fine tailings material that totals 271 Mt t due to insufficient or no test work (Montero 2018) The company also states that the average Li2O grade of the fines material does not hurdle the cut-off for the fines of 082 Li2O
Lithium Potential in Namibia
33
In 2016 Australian based Tawana Resources carried out a drilling program at Uis for a private company called Lithium Africa 1 on the fine and coarse tailings (Table 3 Hole 1 amp Hole 2) Below some of the obtained data on lithium content is given Additionally Li2O content of two obtained grab samples by BGR (Table 3 Sample 2019a amp 2019b) is given
Table 3 Sample data Uis (Tawana 2016 Montero 2018 BGR 2019)
Sample Sample 0 to 1m Li2O ()
Sample 1 to 2m Li2O ()
Sample 2 to 3m Li2O ()
Fines Hole 1 071 085 092
Fines Hole 2 080 089 095
Coarse Hole 1 050 043 043
Coarse Hole 2 054 062 062
BGR Sam-ple 2019a (Coarse tailings)
028
BGR Sam-ple 2019b (Coarse tailings)
028
Montero NI 43-101 037
Lithium Potential in Namibia
34
Fig 14 Tailings of the historic Uis Tin Mine (Photo BGR-GSN 2019 with kind permission of AfriTin Mining Limited)
Fig 13 Former Uis tin mine Uis tailings project with coarse tailings Tailings coordina-tes (center) 21deg13prime31primeprimeS ‒ 14deg52prime44primeprimeE (Source httpportalsflexicadastrecomnamibia 092020)
Uis Tailings (coarse)
Uis Tailings (fine)
Historic Uis mine
Lithium Potential in Namibia
35
Karibib Lepidolite ProjectThe Karibib Lepidolite brownfield project is located in the ldquoKaribib ndash Usakos Pegmatite Districtrdquo southeast of the town of Karibib on the farm Okongava Ost No 72 in central Namibia (Fig 15 ‒ 16)
This pegmatite district which is of Damaran age hosts the most important pegmatite occurrence (Rubicon swarm) in terms of lithium in Namibia In addi-tion numerous other different pegmatite swarms some of which have previ-ously been relevant in terms of lithium are know from this district These are Dernburg Karlsbrunn Albrechtshoumlhe Berger Kaliombo Gamikaubmund Okatjimukuju Etusis Daheim Friedrichsfelde and Etiro (Diehl 1992a)
The Rubicon pegmatite itself is the largest of the individual pegmatites that occur in this field and has been the prime source of lithium until mining seized in the early 1990s The Helikon pegmatites are part of the Rubicon pegmatite swarm and are located northeast to the Rubicon pegmatite They have previ-ously been mined for lepidolite amblygonite petalite and muscovite beryll pollucite quartz and columbite-tantalite as valuable by-products (Fig 18 ‒ 19)
The pegmatite itself consist of two ellipsoidal well zoned Li-mineralized ore-bodies The larger one is about 320 m long and 25 ndash 35 m wide It dips at 46deg to the northeast and has a northwesterly strike The second orebody is about 230 m long and about 10 m wide It is dipping with 30deg to the northeast and has a northwesterly strike In total the outcrop of the Rubicon pegmatite is about 600 m long with a maximum width of 65 m (Fig 17)
A very prominent feature is the presence of a very well developed concen-tric shell and zones from the footwall to the inner core of the pegmatite Both orebodies exhibit a border- wall- intermediate- and core-zone
Border-zone wall-zone and outer intermediate zone of the larger orebody do not contain Li-bearing minerals of economic importance The inner interme-diate zone does contain lepidolite The outer core zone may be sub-divided into a petalite zone low-grade lepidolite zone and a high-grade lepidolite zone The inner core zone also contains a petalite zone Mining occurred pre-viously in the later named zones The zonation of the smaller orebody to the northwest is less pronounced but Li-mineralization and style are equal to the
Lithium Potential in Namibia
36
larger orebody There is no spodumene mineralization within the orebodies and respectively zones of the Rubicon pegmatite
The Helikon I pegmatite is also a lens-shaped pegmatite with a length of roughly 400 m and a width of approx 66 m It dips to the north with about 60deg ndash 70deg Helikon I also consists of well-defined zones The main Li-bearing minerals are lepidolite and petalite According to Roering (1963) the lepidolite is difficult to separate from the intergrown albite and hence of low grade and quality
The Helikon II pegmatite is approx 17 km long and only 9 ndash 15 m wide It lies a bit north of Helikon I and dips steeply to the north with 55deg ndash 80deg striking east west The main Li-bearing minerals are lepidolite and petalite According to Diehl (1990) the westernmost portion of the pegmatite has historically been the economically most important A massive up to 6 m wide petalite zone was mined here according to Diehl (1990)
The nearest railhead to the project is 17 km away in Karibib and the deep-water port of Walvis Bay is 220 km to the southwest Windhoek is about 180 km to the southeast NamPower connects the town of Karibib to electricity and the project currently utilizes generators There is a 7 km long 22 kV power line spur to grid connection pending (Lepidico 2020) Water is available via on-site boreholes
The project was previously owned by Desert Lion Energy Inc (TSVX DLI) Lepidico Ltd (ASX LPD) bought into the project and currently holds 80 interest which comprises Mining License 204 (69 km2) as well as three Exclu-sive Prospecting Licenses (EPLs) namely 5439 5555 and 5781 (Lepidico 2020)
Lepidico will cover mining from multiple sources as well as chemical conver-sion by utilizing their proprietary lithium processing technologies L-Maxreg LOH-Maxreg and S-Maxreg (Lepidico 052019) The company aims to produce high purity lithium chemicals such as lithium carbonate and lithium hydroxide
The takeover also included a nonbinding offtake agreement between the for-mer owner Desert Lion Energy Inc and German chemical company BASF On April 2nd 2019 Desert Lion Energy Inc announced this offtake agreement
Lithium Potential in Namibia
37
which at the time was valid through to December 31 2019 On December 20th
2019 Lepidico announced that the LOI with BASF was extended to Decem-ber 31st 2020 (Lepidico 122019)
The feasibility study criteria of Lepidico are as follows
- Throughput of the concentrator on-site of 035 Mtpa- Expansion of throughput after year five to 05 Mtpa- Chemical plant in the industrial city of Abu Dabi (ICAD)- Plant design for 58000 tpa of concentrate (4 LiO2) for the production of
up to 5500 tpa LiOH- Utilization of L-Maxreg and LOH-MaxTM- Non-binding off-take MOU with BASF for LiOH only- Targeting for project commissioning to commence late 2021 for commer-
cial production in 2022
The preliminary mine plan indicates a strip ratio of 03 ndash 1 for the first two years The ratio will then go up to 1 ndash 14 In the first four years elevated grades of 06 LiO2 will be mined
Resource estimateA JORC 2012 compliant resource estimate for the deposit is given in Table 4 (Lepidico 2020) The deposit currently holds 23200 t of lithium (Indicated amp Inferred) based on a cut-off grade of 015 Li2O This resource estimate is based solely on the lepidolite occurrences at the mine site
Table 4 Resource estimate Karibib Lepidolite Project (Source Lepidico 2020)
Deposit Resource Category
Cut-off (Li2O)
Ore (Mt)
Li2O ()
Li (t)
Li (LCE)
Rubicon Measured
015
22 057 5819 30974
Rubicon Indicated 666 038 11637 61943
Rubicon Inferred 237 043 4728 25167
Helikon
Total 015 1124 043 22184 118086
Lithium Potential in Namibia
38
Fig 16 Satellite image of the Karibib Lepidolite project Helikon 1 coordinates (center) 22deg2prime49primeprimeS ‒ 16deg1prime13primeprimeE Helikon 4 coordinates (center) 22deg2prime24primeprimeS ‒ 16deg1prime41primeprimeE (Source httpportalsflexicadastrecomnamibia 092020)
Fig 15 Satellite image of the Karibib Lepidolite project Rubicon coordinates (center) 22deg6prime11primeprimeS ‒ 15deg59prime44primeprimeE (Source httpportalsflexicadastrecomnamibia 092020)
Historic Rubicon mine
Helikon 1
Helikon 4
Lithium Potential in Namibia
39Fig 17 Rubicon pegmatite (Photo BGR-GSN 2019 with kind permission of Lepidico Chemicals Namibia (Pty) Ltd 2020)
Lithium Potential in Namibia
40 Fig 18 Lepidolite sample from Rubicon pegmatite (Photo BGR-GSN 2019 with kind permission of Lepidico Chemicals Namibia (Pty) Ltd 2020)
Fig 19 Petalite sample from Rubicon pegmatite (Photo BGR-GSN 2019 with kind permission of Lepidico Chemicals Namibia (Pty) Ltd 2020)
Lithium Potential in Namibia
42
Fig 21 Helikon 4 pegmatite (Photo BGR-GSN 2019 with kind permission of Lepidico Chemicals Namibia (Pty) Ltd 2020)
Fig 20 Helikon 1 pegmatite (Photo BGR-GSN 2019 with kind permission of Lepidico Chemicals Namibia (Pty) Ltd 2020)
Lithium Potential in Namibia
43
Tantalite ValleyThe Tantalite Valley Project lies within the ldquoNamaqua Metamorphic Complexrdquo in Southern Namibia Within this complex Lithium-Caesium-Tantalum (LCT) pegmatites occur in two main areas Tantalite-Valley south of Warmbad in close proximity to the northwest-trending Tantalite Valley Shear Belt and the Sandfontein-Ramansdrift area close to the Orange River
The area were the pegmatites of the Tantalite Valley occur is primarily com-posed of a large ovoid gabbro intrusion (71 km by 33 km in extent) within paragneiss units of the Namaqua Complex The gabbro outcrop forms a large dome shaped mountain that rises about 500 m above the surrounding topo-graphy
The pegmatites belong to the Kenhardt and Gordonia pegmatite districts in Namaqualand but only the younger group of them carry accessory ore miner-als such as tantalite beryl REE minerals and lithium
The Tantalite Valley pegmatites include several individual subhorizonal dikes that are up to 1000 m long and 02 to 40 m wide plunging towards southeast (Diehl 1992b) Four of those are of economic interest Homestead Whitkop White City and the Lepidolite pegmatites (ie Purple Haze) (Fig 22)
They are all well zoned (quartz core inner and outer intermediate zones wall zone) and were predominantly targeted for beryl columbite-tantalite as well as lithium and bismuth minerals
The project is located on the farms Umeis 110 and Kinderzitt 132 between the Farms 109 131 129 308 and 473 in the magisterial district of Karas It currently comprises Mining License (ML-77) fully owned by Tameka Shelf Co Four (Pty) Ltd which is a 100 subsidiary of African Tantalite Pty Ltd (AFTAN) Above all Kazera Global Investments PLC holds a 75 stake in AFTAN (Kazera 2019) with the other 25 of local farmer ownership
The project is accessible via gravel road from Karasburg which is about 80 km to the north The nearest railhead is also located in Karasburg Electricity is currently supplied by generators and water is recovered from multiple drill holes The Orange River is about 15 km to the south of the project Mining
Lithium Potential in Namibia
44
infrastructure as well as equipment are on site as well as a plant for the pro-duction of tantalite concentrate
NTI is working on an extensive exploration program with a clear focus on revi-ving tantalite mining in Namibia with a possible by-product stream of lithium bearing minerals The company will focus primarily on the pegmatites Homes-tead Purple Haze Signaalberg and White City (Fig 23)
The area is known for its tantalum occurrences and since the late 1940s tantalite and other minerals have been recovered at Tantalite Valley until 1981 when mining ceased Initially alluvial deposits were mined followed by the pegmatites themselves Grades of the concentrates produced prior to the closure of the mine were quite high with 65 ‒ 70 Ta2O5 with very low U3O8
and ThO2 values of 025 max
Resource estimateAccording to SampP Global (092020) Measured and amp Indicated resources at Tantalite Valley are 104800 t of ore 0042 Ta2O5 and 0653 Li2O as of 112019 This would equate to 315 t of lithium or 1690 t LCE Total inferred resources are 517400 t of ore 0018 Ta2O5 and 0144 Li2O This equals to approx 91 t of tantalum and 750 t of lithium (3535 t LCE)
Lithium Potential in Namibia
45
Fig 23 White City pegmatite (Source Kazera global Investments PLC 2020)
Fig 22 Satellite image of the Tantalite Valley project White City pegmatite coordinates (center) 28deg43prime07primeprimeS ‒ 18deg44prime45primeprimeE Homestead pegmatite coordinates (center) 28deg43prime19primeprimeS - 18deg44prime24primeprimeE Purple Haze pegmatite coordinates (center) 28deg43prime09primeprimeS ‒ 18deg43prime55primeprimeE (Source httpportalsflexicadastrecomnamibia 092020)
Lithium Potential in Namibia
46
8 Analysed lithium samplesDuring the course of the cooperation project between the Economic Geology Division (EGD) of the Geological Survey of Namibia (GSN) and the Ger-man Federal Institute of Geosciences and Natural Resources (BGR) several sampling campaigns to southern and central pegmatites took place
The field trips were preceded by literature and data research regarding infor-mation on lithium occurrences andor previous lithium mining activity to iden-tify specific target areas
During a campaign in 2019 16 lithium-bearing mixed mineral samples were taken from five different locations and subsequently analyzed Two of the samples originate from the Uis Tin Mine Tailings of the former tin mine All remaining samples were taken either from stripped outcrops for future mine activities or from previous mine sites (ie pits)
All 16 samples were analyzed at BGR labs in Hanover Germany through qualitative XRD XRF and ICP-MS Given data shall be understood as a first indicator for the sampled lithium occurrences
Most if not all sampled occurrences have previously been analyzed or are cur-rently being assessed by the property owners or current licensees Detailed information of these sampling and analytical campaigns remain confidential and are thus not available for comparison
Appendix A lists the identified qualitative mineralogy of the samples as well as the major element analysis Additional samples from previous campaigns are also given
Interpretation of the results are based on their applicability in the various lithium-consuming industries for which information is available
Most of the current lithium applications require a chemical intermediate product such as lithium carbonate or lithium-hydroxide The glass and cera-mic industry does use lithium-bearing mineral concentrates depending on the prices of these materials when compared to LiCO3
Lithium Potential in Namibia
47
Since the main applications require an intermediate or downstream chemical product lithium content as well as impurity values are the main criteria for the suitability of the sampled occurrences Other quality criteria are particle size and surface areastructure
9 InterpretationAs previously stated all obtained grab samples are mixtures of lithium- bearing minerals (ie spodumene petalite lepidolite) feldspars quartz micas as well as secondary minerals Therefore all given analytical data has to be taken with caution and will not be representative for the individual outcrops or deposits
The evaluation of the economic suitability for various economic applications of the analysed lithium samples is based on the chemical specifications in Chapter 4
Lithium content gt 1 Li2O Fe2O3 content lt 015 as well as F content lt 01 are individually highlighted (Appendix A) as these three values are the most important
Based on the chemical analysis nine of the 16 samples showed Li2O contents of more than 1 (range 117 ‒ 327 ) Seven of those nine samples also exhibited low Fe2O3 content (range 004 ‒ 008 ) (Appendix A) Three of those seven samples also had fluorine values below 005
Of the ten additionally included samples from previous campaigns four showed Li2O contents of more than 1 (range 126 ‒ 199 ) Three of those samples also exhibited low Fe2O3 content (range 004 ‒ 007 ) (Appendix A) One of the three samples had fluorine values below 005
The mentioned samples (sources) could be of potential use but for further interpretation statistical sampling will be required
Lithium Potential in Namibia
48
10 ConclusionsThere is currently no lithium industry established in Namibia This accounts to both mining and processing of ores into commercial lithium-bearing con-centrates as well as the production of downstream products such as lithium carbonate andor lithium hydroxide In order to evaluate the potential for a lithium industry in Namibia the current global market and price developments need to be addressed
Currently the main application for lithium is in the chemical industry as lithium carbonate andor hydroxide for the manufacturing of lithium-ion batteries There is currently no domestic market (supply) or demand for this industry in Southern Africa or Namibia in specific Processing of lithium-bearing ores into these highly specific downstream products is economically more viable in close proximity to the demanding industries It also requires large investments (double-digit million dollars per 10000t of capacity) Additionally there is already huge capacity and strong capacity build up in Asia at rather low cost
The second most important application lies in the glass and ceramics industry This industry uses lithium either as lithium-bearing concentrates or lithium carbonate depending on current market price and processproduct require-ments There is currently no such industry established in Namibia but potential plans There is glass and ceramics manufacturing in South Africa and thus a potential market for lithium bearing products (concentrates) should this indus-try require it depending on product
The 20182019 primary lithium supply based on spodumene-bearing mineral concentrates was dominated by Australia with a market share of well over 95 On an annual basis the country exports more than three million tons of lithium-bearing concentrates to China To put this into perspective Lepidico plans to export just 58 ktpa of concentrate to Abu Dhabi for refinement from their project annually Therefore potential production in Namibia will always be rather small scale when compared to peer producing countriescompanies
As of late 2020 the concentrate market is in strong oversupply with strong competition Thus prices have eroded quite substantially for a standard SC6 concentrate (Fig 24) In general prices vary significantly based on lithium content and impurities of the concentrates Lithium bearing mineral concen-
Lithium Potential in Namibia
49
trates are a relatively low-value mineral commodity when compared to lithi-um-carbonate or other lithium downstream products thus product quality cost reduction and cost control are key components in this industry Since prices are depressed currently many of the Australian producers have drasti-cally reduced output or even went into care and maintenance This situation may change towards 2025 or beyond as demand picks up
Prices for the higher valued product lithium-carbonate spiked at the end of 2017 towards 2018 to more than 20000 $USt on a contract basis with prices being very volatile Since then prices have also eroded to below 9000 $USt due to oversupply and slow demand pickup (Fig 25) With this product stable quality and chemical composition are crucial for the downstream industry
Based on available gradetonnage data the Namibian projectsprospects are relatively small in overall size and low in grade when compared to global peers for the resource category ldquoMeasuredIndicatedrdquo (Appendix B) Total contained lithium quantity is thus relatively small in comparison On a global scale the most promising hard rock projects that are currently being mined and developed have Li2O grades of 10 or above
Fig 24 Lithium-mineral-concentrate prices 012010 ‒ 062020 (Source BGR 2020)
300
400
500
600
700
800
900
1000
1100
208
210
212
214
216
218
220
US$
t US$t
01-20
14
01-20
15
01-20
16
01-20
17
01-20
18
01-20
19
01-20
20
01-20
10
01-20
11
01-20
12
01-20
13
Spodumene min 5-6 LiO2 fob Australia
Spodumene concentrate gt75 LiO2 bulk cif Asia
Petalite 42 LiO2 fob Durban
Spodumene fob Australia
Spodumene min 5-6 LiO2 cif China
Lithium Potential in Namibia
50
For the resource category ldquoIndicatedrdquo which generally represents the lowest level of confidence only the Uis mine project of AfriTin represents a size-able resource even though grades are relatively low (Appendix C) The Uis tailings project as well as the Rubicon project are again relatively small when compared to their global peers Tantalite Valley is the smallest of all included projects (Appendix C)The given data for the De Rust project reflects only an exploration target of the company rather than actual data and may thus be not representative
Based on size and contained lithium-content none of the visited early stage projectsprospects would justify the financial investment into the construction of a chemical conversion plant for the production of lithium carbonate andor hydroxide on site as it requires very large monetary investments Due to their size payback of the required investments may be unfavorable when compared to global peers In addition the current market environment is very harsh with strong competition from Asia that has a huge cost advantage due to capacity build up This industry is also very energy and water intensive
In addition location within Namibia as well as distance to possible down-stream markets may become an issue as it increases the transportation cost
4000
7000
10000
13000
16000
19000
22000
25000
28000
01-20
14
01-20
15
01-20
16
01-20
17
01-20
18
01-20
19
01-20
20
US$
t
Lithium-carbonate (min 995 ) battery grade spot price ex works domestic ChinaLithium-carbonate (min 99-995 ) Li2CO3 large contracts USA delivered continentalLithium-hydroxid-monohydrate (min 565) technical and industrial grades cif China Japan amp Korea
Fig 25 Lithium chemical prices 012014 ndash 062020 (Source BGR 2020)
Lithium Potential in Namibia
51
immensely This is especially true for the SorisDe Rust pegmatite which is in a remote location without any allocated infrastructure The projects Karibib Uis and Tantalite Valley are much easier to access
The approach of Lepidico to produce a lithium bearing concentrate on site seems plausible approach Since this will already require a skilled workforce mining and beneficiation equipment in order to produce a high quality lithium-bearing concentrate it may already be considered ldquoadded valuerdquo for the indus-try of the country This approach may also be suitable for the other mentioned and visited projects
Lithium Potential in Namibia
52
ReferencesAfriTin Mining (2020) Uis Tin Project ndash Company Information ndash URL httpafritinminingcomuis-project [as of 092020]
Australian Government Geoscience Australia (2019) Australiarsquos Identi-fied Mineral Resources 2019 ndash URL httpswwwgagovauscientific-topicsmineralsmineral-resources-and-adviceaimr [as of 092020]
BGR ndash Bundesanstalt fuumlr Geowissenschaften und Rohstoffe (2020) Fachinformationssystem Rohstoffe ndash unpubl Hannover [as of 082020]
BGS ndash British Geological Survey (2016) Lithium Definitions mineralo-gy and deposits ndash URL httpswwwbgsacukdownloadsstartcfmid=3100 [as of 062016]
Diehl B J M (1990) Pegmatites of the Cape Cross Uis ndash Pegmatite Belt Namibia Geology mineralisation Rubidium Strontium characteristics and petrogenesis of rare metal pegmatites Open File Report EG 083 Economic Geology Series Geological Survey of Namibia 39 pp Windhoek
Diehl B J M (1992a) Lithium Caesium Beryllium Open File Report Mineral Resource Series Geological Survey of Namibia 18 pp Windhoek
Diehl B J M (1992b) Niobium and Tantalum Open File Report Mineral Resource Series Geological Survey of Namibia 20 pp Windhoek
Diehl B J M (1992c) Tin Open File Report Mineral Resource Series Geological Survey of Namibia 30 pp Windhoek
Diehl B J M amp Schneider G I C (1990) Geology and mineralisation of the Rubicon Pegmatite Namibia Open File Report Geol Surv Namibia 20 pp Windhoek
Fuchsloch et al (2018) Classification mineralogical and geochemical vari-ations in pegmatites of the Cape Cross-Uis pegmatite belt Namibia Lithos 296 ndash 299 79-95 elsevier
Lithium Potential in Namibia
53
Garret D E (2004) Handbook Of Lithium And Natural Calcium Chloride Their Deposits Processing Uses and Properties ndash 467 S Oxford (Elsevier B V)
Geological Survey of Namibia (2002) Mineral Resources of Namibia Summary of Mineral Deposits and Occurrences Omaruru Sheet 2114 Volume I ndash Complete Descriptions 119 pp Windhoek
IHS Global SA (2020) Global Trade Atlas ndash Commercial Online-Databa-se ndashURL httpsmyihscomConnectcallingUrl=https3a2f2fconnectihsmarkitcom2f [as of 062017]
Kazera Global Investments PLC (2020) Company Information ndash URL httpskazeraglobalcominvestmentsnamibia-tantalite-investment-mine [as of 092020]
Lepidico (2019) LOI with BASF extended to 31 December 2020 ndash News Release ndash URL httpswwwlepidicocomwp-contentuploads201910LPD-191220-LOI-with-BASF-extended-to-31-December-2020pdf [as of 122019]
Lepidico (2019) Corporate Presentation ndash URL httpswwwlepidicocomwp-contentuploads201907LPD-190509-Corporate-Presentati-on-May-2019pdf [as of 052019]
Lepidico (2020) Company Information ndash URL httpswwwlepidicocomprojectskaribib [as of 092020]
Montero Mining amp Exploration Ltd (2018) Exploring Battery Metals in Namibia ndash Company Presentation ndash URL httpswwwproactiveinvestorscomauuploadSponsorFileFile2018_031520244941_MON-CorporatePre-sentationMarch2018pdf [as of 072018]
Montero Mining amp Exploration Ltd (2019) Montero Files NI 43-101 Resource Estimate On The Uis Lithium-Tin Tailings Project In Namibia On Sedar ndash News Announcement ndash URL httpsmonterominingcommontero-files-ni-43-101-resource-estimate-on-the-uis-lithium-tin-tailings-project-in-namibia-on-sedar [as of 032019]
Lithium Potential in Namibia
54
Namibia Mining Cadastre Portal (2020) Online-Database ndashURL httpsportalslandfoliocomnamibia [as of 092020]
Roskill Information Services Ltd (2016) Lithium Global Industry Mar-kets amp Outlook ndash 386 S London Groszligbritannien
Schneider G I C (1992) Feldspar Open File Report MRS 08 Mineral Resource Series Geological Survey of Namibia 2 pp Windhoek
Schmidt M (2017) Rohstoffrisikobewertung ndash Lithium ndash DERA Rohstoffin-formationen 33 Berlin
S amp P Global Market Intelligence (2020) Lithium - Metals amp Mining Properties URL httpsplatformmarketintelligencespglobalcomwebcli-entauth=inheritindustryminingProjects [as of 092020]
Statista (2020) Distribution of lithium end-usage worldwide in 2019 by area application ndash URL httpswwwstatistacomstatistics268787lithium-usa-ge-in-the-world-market [as of 062020]
Tawana Resources NL (2016) Tawana acquires second lithium pro-ject ndash News Release ndash URL httpsmstrademomentumcozajsepdfSENS_20160923_S376505pdf [as of 092016]
USGS ndash United States Geological Survey (multiple years) Lithium ndash Minerals Commodity Summaries ndash URL httpswwwusgsgovcentersnmiclithium-statistics-and-information [as of 082020]
Appendix
Sam
ple I
DFa
rmLa
titud
eLo
ngitu
deSa
mpl
e des
crip
tion
(XRD
qu
al)
LiO 2
()
SiO 2
Ti
O 2
Al2O 3
Fe2O 3
Mn
O Mg
O Ca
O Na
2O
K 2O P 2O 5
SO
3
Cl
F
LOI
Su
m
2015
-03
previous sample campaignsHelik
on
n A
Felds
parQ
uartz
Lepid
olite
025
6871
lt000
119
0500
200
2900
505
3292
806
7905
59lt0
01lt0
002
lt005
093
9985
2016
-12
Rubic
onwe
ather
ed P
etalite
126
6473
lt000
118
0600
703
2718
607
9507
805
2500
62lt0
01lt0
002
lt005
1146
9871
2016
-17
Rubic
onLe
pidoli
te +
Quar
tz13
063
6700
219
9316
0929
003
0054
029
6218
0052
lt001
lt000
226
232
798
67
2016
-20
Helik
onLe
pidoli
te + A
lbite
176
5514
lt000
126
8700
401
2100
700
2123
970
3900
45lt0
01lt0
002
156
369
9698
2016
-21
Helik
onLe
pidoli
te19
954
32lt0
001
2627
004
0224
006
0038
266
714
0069
lt001
lt000
240
628
997
77
FN20
19_0
4De
Rus
tFe
ldspa
rAmb
lygon
iteP
etalite
(n
on X
RD)
003
6513
lt000
118
82lt0
0100
0200
101
0924
311
4105
75lt0
0100
04lt0
0503
898
84
2015
-09
Molop
oPe
talite
(non
XRD
)00
952
85lt0
001
1672
lt001
0002
487
0323
342
0352
lt000
100
400
3403
621
1310
012
2016
-14
Molop
oPe
talite
wea
there
d (no
n XRD
)00
752
1600
0316
5100
200
5147
805
8923
406
4500
6900
200
8602
222
6310
013
2016
-15
Molop
oFe
ldspa
r (no
n XRD
)00
664
02lt0
001
1937
003
0004
003
0151
216
1249
0796
lt001
lt000
2lt0
0505
399
55
2016
-23
Molop
oZin
nwald
ite (n
on X
RD)
006
5044
0068
3307
048
0011
012
0426
261
7674
0181
lt001
lt000
2lt0
0542
9925
1909
249
2019Uis
Tailin
gs
Quar
tzFe
ldspa
rPeta
lite
Musc
ovite
028
7293
0045
1479
051
0062
0212
9830
927
6613
6200
2lt00
02lt0
0523
399
38
1909
250
Uis
Tailin
gsQu
artz
Felds
parP
etalite
Mu
scov
ite02
872
6900
4314
8205
0059
019
1306
313
2794
1347
002lt
0002
lt005
251
9937
1909
251
Helik
on 4
22deg02prime4
8primeprimeS1
6deg01prime30
primeprimeEQu
artz
Felds
parP
etalite
Le
pidoli
te16
464
4400
0319
4200
301
2100
408
8325
345
6806
800
400
0727
228
998
38
1909
252
Helik
on 1
22deg02prime2
0primeprimeS1
6deg01prime19
primeprimeEPe
talite
Lepid
olite
Quar
tz29
576
9200
0116
6800
300
0304
101
7301
106
8100
01lt0
01lt0
002
lt005
205
97
App
endi
x A
Ana
lytic
al d
ata
of li
thiu
m s
ampl
es c
olle
cted
in N
amib
ia T
hres
hold
val
ues
high
light
ed in
gre
en
Lithium Potential in Namibia
57
Sam
ple I
DFa
rmLa
titud
eLo
ngitu
deSa
mpl
e des
crip
tion
(XRD
qu
al)
LiO 2
()
SiO 2
Ti
O 2
Al2O 3
Fe2O 3
Mn
O Mg
O Ca
O Na
2O
K 2O P 2O 5
SO
3
Cl
F
LOI
Su
m
1909
253
2019Rubic
on22deg06prime1
3primeprimeS1
5deg59prime45
primeprimeEPe
talite
Lepid
olite
Quar
tz32
778
73lt0
001
1687
002
0006
002
0157
011
003
0002
003
0003
lt005
075
9663
1909
254
Rubic
on22deg06prime1
0primeprimeS1
5deg59prime41
primeprimeEFe
ldspa
rQua
rtzM
usco
vite
004
682
lt000
119
3500
300
2400
205
0610
0808
6804
3lt0
01lt0
002
lt005
041
9985
1909
255
Rubic
on22deg06prime1
0primeprimeS1
5deg59prime41
primeprimeEFe
ldspa
rLep
idolite
Mus
co-
viteK
aolin
026
6104
0004
2318
022
0136
006
0119
367
8411
0159
lt001
lt000
2lt0
0522
299
15
1909
256
Rubic
on22deg06prime1
0primeprimeS1
5deg59prime41
primeprimeELe
pidoli
te 27
249
8700
129
3400
408
0500
400
704
697
3100
31lt0
01lt0
002
087
441
9569
1909
257
Rubic
on22deg06prime1
3primeprimeS1
5deg59prime45
primeprimeEPe
talite
Lepid
olite
Quar
tz30
670
0900
0320
2600
801
0901
502
9901
926
800
15lt0
0100
04lt0
0526
596
48
1909
258
Rubic
on22deg06prime1
0primeprimeS1
5deg59prime41
primeprimeELe
pidoli
teFe
ldspa
rQua
rtz20
659
7800
0224
100
505
2400
300
513
7247
0051
lt001
0002
265
388
9966
1909
259
Tanta
lite
Valle
y28deg43prime0
9primeprimeS1
8deg43prime55
primeprimeEFe
ldspa
rLep
idolite
Mus
covit
e11
762
64lt0
001
2139
004
0161
lt001
0399
7731
2401
0900
200
119
912
698
85
1909
260
Tanta
lite
Valle
y28deg43prime0
9primeprimeS1
8deg43prime55
primeprimeEFe
ldspa
rLep
idolite
Mus
covit
e03
059
8600
1425
1301
604
2200
302
2860
547
2201
3900
200
0904
123
799
56
1909
261
Tanta
lite
Valle
y28deg43prime0
9primeprimeS1
8deg43prime55
primeprimeEFe
ldspa
rQua
rtzM
usco
vite
003
636
0005
2218
022
0122
002
0381
727
3809
0272
lt001
lt000
2lt0
0513
199
17
1909
262
Tanta
lite
Valle
y28deg43prime2
0primeprimeS1
8deg44prime23
primeprimeEQu
artzSp
odum
eneM
us-
covit
e13
180
5100
0415
8903
401
2401
301
9502
604
0400
0500
200
03lt0
0507
398
56
1909
263
De R
ust
20deg57prime4
8primeprimeS1
4deg30prime13
primeprimeEFelsd
parS
podume
neQuartz
074
7313
0006
2048
007
015
005
0154
398
0831
0073
001
0003
lt005
082
9974
1909
264
De R
ust
20deg57prime4
8primeprimeS1
4deg30prime13
primeprimeESp
odum
eneF
eldsparQuartz
230
6924
0006
2602
801
0200
301
0510
102
1400
68lt0
0100
03lt0
0504
897
53
(Con
tinue
d) A
ppen
dix
A A
naly
tical
dat
a of
lith
ium
sam
ples
col
lect
ed in
Nam
ibia
Thr
esho
ld v
alue
s hi
ghlig
hted
in g
reen
Lithium Potential in Namibia
58
Appendix B GradeTonnage data (Measured amp Indicated) for selected lithium projects in comparison to Namibian projects (Source SampP 092020)
0
0500
1000
1500
2000
2500
500
5000
5000
0
5000
00
5000
000
Gra
de [
Li 2O
]
Tonnage [t]
Tantalite Valley
Rubicon
Appendix B GradeTonnage data (Inferred) for selected lithium projects in com-parison to Namibian projects (Source SampP 092020)
0
0500
1000
1500
2000
2500
100
1000
1000
0
1000
00
1000
000
1000
0000
Gra
de [
Li 2O
]
Tonnage [t]
Tantalite ValleyRubicon
Uis Tailings
Uis Mine
De Rust
A product of the technical cooperation project between Bundesanstalt fuumlr Geowissenschaften und Rohstoffe (BGR)(Federal Institute for Geosciences and Natural Resources)
andGeological Survey of Namibia within the Ministry of Mines and Energy
ISBN 978-3-948532-29-1 (Print) 978-3-948532-30-7 (PDF)
- List of Abbreviations
- 1 Introduction
- 2 What is lithium
-
- 21 Lithium deposits
-
- 3 Application
- 4 Chemical requirements
- 5 Mining and trade of lithium in the SADC
-
- 51 Lithium production
- 52 Trade data
- 53 Export
- 54Import
-
- 6 Lithium occurrences in Namibia
- 7 Lithium mining in Namibia
-
- 71 Current mining activities and projects
-
- 8 Analysed lithium samples
- 9 Interpretation
- 10 Conclusions
- References
-

Lithium Potential in Namibia
26
7 Lithium mining in NamibiaData for historic lithium mine production is available for the period 1939 ndash 1998 (Fig 8) After 1998 all mining activities ceased due to product quality issues and overall market environment
Until the mid-1950s lepidolite was the most important mined lithium mineral of the country (Fig 8) As mine output of lepidolite decreased output of petalite increased However quantity on a year-to-year basis was quite variable and fluctuated between 1000 ndash 10000 t Since the early 1980s production of petalite was quite stable and ranged between 1000 ndash 2500 t Production fell sharply in 1997 and 1998 after which it ceased Mining of amblygonite has always been small compared to lepidolite and petalite and never exceeded 1000 t per annum
According to the USGS (2020) 500 t of lithium were mined in Namibia in 2018 This is most likely stockpiled lepidolite material from the Rubicon mine
0
2000
4000
6000
8000
10000
12000
1939
1941
1943
1945
1947
1949
1951
1953
1955
1957
1959
1961
1963
1965
1967
1969
1971
1973
1975
1977
1979
1981
1983
1985
1987
1989
1991
1993
1995
1997
[Ton
nes]
Petalite (t)Amblygonite (t)Lepidolite (t)
Fig 8 Lithium production in Namibia in [t] per year (after Schneider 1992 BGR 2020)
Lithium Potential in Namibia
27
Currently there is no active consecutive mining for lithium in substantial quan-tities in Namibia although there are prospects and projects under develop-ment
71 Current mining activities and projects
Soris The Soris project is located in the De Rust pegmatite swarm which is part of the ldquoBrandberg West ndash Goantagab tin beltrdquo (Fig 7) This belt stretches to the northeast of the Brandberg massif over a length of 60 km and a width of 25 km This belt was previously mined for cassiterite on a larger scale Some of the pegmatites in this belt may carry substantial amounts of lithium such as pegmatites in the De Rust pegmatite swarm
The De Rust pegmatite itself is a Li-rich rare metal pegmatite that was mined for cassiterite and tantalite but also for minor quantities of spodumene be ween 1960 and 1990 (Diehl 1990) It intruded into metasediments of the Amis River Formation Lower Ugab Group of the Southern Kaoko Zone
It is the largest pegmatite of the De Rust pegmatite swarm within the Brandberg West ndash Goantagab pegmatite belt (Diehl 1992c) Outcrops are 100 ‒ 470 m long up to 30 m wide and can be followed over a length of roughly 24 km
The pegmatite shows well-developed zonation with a border zone (quartz alkali feldspar muscovite) outer (quartz microcline-perthite muscovite altered petalite) and inner (quartzo-feldspathic rock with spodumene crystals with accessory apatite lepidolite eucryptite zircon and monazite) intermedi-ate zone as well as a core zone (quartz subordinate microcline muscovite sporadic tantalite) Spodumene crystals may reach up to 80 cm in length (Fig 12) Towards the core zone spodumene carries rounded nodules of lithi-um phosphates (amblygonite ndash montebrasite series)
It is located northwest of the nearest town of Uis in the Kunene region of Namibia about 6km to the east of farm De Rust 532 and about 25 km north of the Ugab River The nearest railhead is located in the town of Karibib and the deep-water port of Walvis Bay is 120 km to the southwest Windhoek is about 180 km to the southeast
Lithium Potential in Namibia
28
The project can be reached via paved but mostly unpaved roads from the town of Uis From White Lady Lodge which is about 38 km northwest from Uis a 35 km gravel road leads towards the project 15 km of which are in the riverbed of the Ugab River There is currently no electricity and water supply at the project location site
According to SampP Global (022020) current owner of the Soris project is Mon-tero Mining amp Exploration Ltd (TSXV MON) which holds 80 interest of the property Another 20 are allocated to an unnamed private owner Based on data from the Namibia Mining Cadastre Portal (092020) multiple entries for mining licence applications exist for the area where the main De Rust pegmatite is located (Fig 9)
Resource estimateDue to the early stage of the Soris project no resource estimate is avail-able However Montero Mining claims the project to be drill ready targeting a resource of 10 Mt 1 Li2O with tantalum and tin by-product credits This would equate to 46400 t of lithium or 247000 t LCE
Grab samples of the deposit showed lithium contents of 007 to 532 aver-aging 137 Channel samples showed average lithium contents of 076 and values up to 366 (Montero 032019) The company also re-assessed 1097 previously tested RC drill samples The main lithium-bearing mineral is spodumene
Remnants of historic intermittent mining activities like old foundations and quartzo-feldspathic tailings are still visible east to the main pegmatite (Fig 10 ‒ 11)
Lithium Potential in Namibia
29
Fig 10 Remnants of historic open pit mining (upper) and tailings of De Rust pegmatite (lower) northwest of the Brandberg massif (Photo BGR-GSN 2019)
Fig 9 Satellite image of the De Rust project including the outlined mining license Main pegmatite coordinates 20deg57prime48primeprimeS ‒ 14deg30prime12primeprimeE (Source httpportalsflexicadastrecomnamibia 092020)
Main pegmatite
Lithium Potential in Namibia
30
Fig 12 Weathered spodumene chrystals at the historic open pit mine (Photo BGR-GSN 2019)
Fig 11 Historic open pit of the De Rust pegmatite (Photo BGR-GSN 2019)
Lithium Potential in Namibia
31
Uis The Uis projects (former mine and tailings) are located in the northern part of the ldquoCape Cross Uis pegmatite beltrdquo east of the town of Uis on the farm Uis Townlands No 215 in the Erongo region of Namibia
The Cape Cross-Uis belt is approx 120 km long and up to 40 km wide and extends in a NE direction (Fig 7) It comprises three distinct pegmatite swarms the Strathmore swarm Karlowa swarm and Uis pegmatite swarm In general lithium-bearing pegmatites (Li-Nb-Ta-Sn-Be and Li-Nb-Ta-Sn) are the least common in this belt (Fuchsloch et al 2018)
The Uis swarm field consists of more than 120 individual pegmatites each with a northeasterly to easterly strike direction and northwesterly down dip (30deg ‒ 70deg) This field is accompanied by a peripheral pegmatite field of approx 25 individual pegmatites
Some of the main pegmatites especially around the formerly worldrsquos largest tin mine at Uis are exceedingly large Some of them are up to 1 km long and some 50 m wide
In terms of lithium petalite amblygonite and minor spodumene mineralization occurs in the various pegmatites but no lepidolite Most common lithium bear-ing minerals in the eight pegmatites that were mined at Uis are amblygonite petalite and spodumene
Currently the Uis tailings project and the Uis tin mine are owned by two differ-ent companies As of 2020 the tin mine is operating a pilot processing plant and aims to ramp up the production of lithium in the near future The current ownership of the tailings project as of September 2020 is unclear
The nearest commercial deep-water port to the projects is Walvis Bay 220 km to the southeast The town of Omaruru is 130 km to the east and Henties Bay lies about 120 km to the southwest The nearest railhead is located in Omaruru The area is accessible year-round by paved and un-paved roads NamPower provides electricity and the town of Uis is connected to the Nam-Water pipeline
Lithium Potential in Namibia
32
The tin deposit was discovered in 1911 and mined between the 1950s and 1989 for cassiterite by Uis Tin Mining Company (SWA) Ltd and IMCOR
Coarse tailings are located in the northern part of the former mine just south to the main road C36 (Fig 13) The fine material is located south to the coarse waste dumps (Fig 13)
After 1990 multiple companies owned the property until AfriTin Mining Ltd bought all the rights (license ML134) The current lithium tailings project of Montero Mining amp Exploration Ltd (TSXV MON) is based on the historic mine tailings of the former tin mine on mining license ML134 that is currently owned by AfriTin Mining Ltd The acquired tailings material does not fall under the ML134 license of AfriTin since historical tailings material (Fig 14) is not regulated by Minerals (Prospecting and Mining) Act 33 of 1992 of Namibia
Resource estimateUis tin mineAccording to AfriTin the former Uis mine holds a JORC compliant resource (inferred) of 715 Mt of ore 0134 Sn with a cut-off grade of 005 Sn (AfriTin 2020) Grades of ancillary elements are given at 063 Li2O and 85 ppm Ta for the total resource of 71 Mt of ore
This equals to approx 95000 t of tin 209000 t of lithium (11 Mt LCE) and 6090 t of tantalum 85 of the total resource are attributable to the company The remaining 15 are allocated to SMU (Small Miners of Uis)
Uis tailingsMontero Mining filed an inferred resource estimate of 144 Mt of ore 037 Li2O and 005 SnO2 with a 035 Li2O cut-off grade for lithium and assumed processing recoveries of 70 for their tailings project (Montero 2019) This equals to approx 24700 t of lithium content (131500 t LCE) and 7200 t SnO2
This resource estimate only includes coarse tailings material There is current-ly no information on the lithium content of the fine tailings material that totals 271 Mt t due to insufficient or no test work (Montero 2018) The company also states that the average Li2O grade of the fines material does not hurdle the cut-off for the fines of 082 Li2O
Lithium Potential in Namibia
33
In 2016 Australian based Tawana Resources carried out a drilling program at Uis for a private company called Lithium Africa 1 on the fine and coarse tailings (Table 3 Hole 1 amp Hole 2) Below some of the obtained data on lithium content is given Additionally Li2O content of two obtained grab samples by BGR (Table 3 Sample 2019a amp 2019b) is given
Table 3 Sample data Uis (Tawana 2016 Montero 2018 BGR 2019)
Sample Sample 0 to 1m Li2O ()
Sample 1 to 2m Li2O ()
Sample 2 to 3m Li2O ()
Fines Hole 1 071 085 092
Fines Hole 2 080 089 095
Coarse Hole 1 050 043 043
Coarse Hole 2 054 062 062
BGR Sam-ple 2019a (Coarse tailings)
028
BGR Sam-ple 2019b (Coarse tailings)
028
Montero NI 43-101 037
Lithium Potential in Namibia
34
Fig 14 Tailings of the historic Uis Tin Mine (Photo BGR-GSN 2019 with kind permission of AfriTin Mining Limited)
Fig 13 Former Uis tin mine Uis tailings project with coarse tailings Tailings coordina-tes (center) 21deg13prime31primeprimeS ‒ 14deg52prime44primeprimeE (Source httpportalsflexicadastrecomnamibia 092020)
Uis Tailings (coarse)
Uis Tailings (fine)
Historic Uis mine
Lithium Potential in Namibia
35
Karibib Lepidolite ProjectThe Karibib Lepidolite brownfield project is located in the ldquoKaribib ndash Usakos Pegmatite Districtrdquo southeast of the town of Karibib on the farm Okongava Ost No 72 in central Namibia (Fig 15 ‒ 16)
This pegmatite district which is of Damaran age hosts the most important pegmatite occurrence (Rubicon swarm) in terms of lithium in Namibia In addi-tion numerous other different pegmatite swarms some of which have previ-ously been relevant in terms of lithium are know from this district These are Dernburg Karlsbrunn Albrechtshoumlhe Berger Kaliombo Gamikaubmund Okatjimukuju Etusis Daheim Friedrichsfelde and Etiro (Diehl 1992a)
The Rubicon pegmatite itself is the largest of the individual pegmatites that occur in this field and has been the prime source of lithium until mining seized in the early 1990s The Helikon pegmatites are part of the Rubicon pegmatite swarm and are located northeast to the Rubicon pegmatite They have previ-ously been mined for lepidolite amblygonite petalite and muscovite beryll pollucite quartz and columbite-tantalite as valuable by-products (Fig 18 ‒ 19)
The pegmatite itself consist of two ellipsoidal well zoned Li-mineralized ore-bodies The larger one is about 320 m long and 25 ndash 35 m wide It dips at 46deg to the northeast and has a northwesterly strike The second orebody is about 230 m long and about 10 m wide It is dipping with 30deg to the northeast and has a northwesterly strike In total the outcrop of the Rubicon pegmatite is about 600 m long with a maximum width of 65 m (Fig 17)
A very prominent feature is the presence of a very well developed concen-tric shell and zones from the footwall to the inner core of the pegmatite Both orebodies exhibit a border- wall- intermediate- and core-zone
Border-zone wall-zone and outer intermediate zone of the larger orebody do not contain Li-bearing minerals of economic importance The inner interme-diate zone does contain lepidolite The outer core zone may be sub-divided into a petalite zone low-grade lepidolite zone and a high-grade lepidolite zone The inner core zone also contains a petalite zone Mining occurred pre-viously in the later named zones The zonation of the smaller orebody to the northwest is less pronounced but Li-mineralization and style are equal to the
Lithium Potential in Namibia
36
larger orebody There is no spodumene mineralization within the orebodies and respectively zones of the Rubicon pegmatite
The Helikon I pegmatite is also a lens-shaped pegmatite with a length of roughly 400 m and a width of approx 66 m It dips to the north with about 60deg ndash 70deg Helikon I also consists of well-defined zones The main Li-bearing minerals are lepidolite and petalite According to Roering (1963) the lepidolite is difficult to separate from the intergrown albite and hence of low grade and quality
The Helikon II pegmatite is approx 17 km long and only 9 ndash 15 m wide It lies a bit north of Helikon I and dips steeply to the north with 55deg ndash 80deg striking east west The main Li-bearing minerals are lepidolite and petalite According to Diehl (1990) the westernmost portion of the pegmatite has historically been the economically most important A massive up to 6 m wide petalite zone was mined here according to Diehl (1990)
The nearest railhead to the project is 17 km away in Karibib and the deep-water port of Walvis Bay is 220 km to the southwest Windhoek is about 180 km to the southeast NamPower connects the town of Karibib to electricity and the project currently utilizes generators There is a 7 km long 22 kV power line spur to grid connection pending (Lepidico 2020) Water is available via on-site boreholes
The project was previously owned by Desert Lion Energy Inc (TSVX DLI) Lepidico Ltd (ASX LPD) bought into the project and currently holds 80 interest which comprises Mining License 204 (69 km2) as well as three Exclu-sive Prospecting Licenses (EPLs) namely 5439 5555 and 5781 (Lepidico 2020)
Lepidico will cover mining from multiple sources as well as chemical conver-sion by utilizing their proprietary lithium processing technologies L-Maxreg LOH-Maxreg and S-Maxreg (Lepidico 052019) The company aims to produce high purity lithium chemicals such as lithium carbonate and lithium hydroxide
The takeover also included a nonbinding offtake agreement between the for-mer owner Desert Lion Energy Inc and German chemical company BASF On April 2nd 2019 Desert Lion Energy Inc announced this offtake agreement
Lithium Potential in Namibia
37
which at the time was valid through to December 31 2019 On December 20th
2019 Lepidico announced that the LOI with BASF was extended to Decem-ber 31st 2020 (Lepidico 122019)
The feasibility study criteria of Lepidico are as follows
- Throughput of the concentrator on-site of 035 Mtpa- Expansion of throughput after year five to 05 Mtpa- Chemical plant in the industrial city of Abu Dabi (ICAD)- Plant design for 58000 tpa of concentrate (4 LiO2) for the production of
up to 5500 tpa LiOH- Utilization of L-Maxreg and LOH-MaxTM- Non-binding off-take MOU with BASF for LiOH only- Targeting for project commissioning to commence late 2021 for commer-
cial production in 2022
The preliminary mine plan indicates a strip ratio of 03 ndash 1 for the first two years The ratio will then go up to 1 ndash 14 In the first four years elevated grades of 06 LiO2 will be mined
Resource estimateA JORC 2012 compliant resource estimate for the deposit is given in Table 4 (Lepidico 2020) The deposit currently holds 23200 t of lithium (Indicated amp Inferred) based on a cut-off grade of 015 Li2O This resource estimate is based solely on the lepidolite occurrences at the mine site
Table 4 Resource estimate Karibib Lepidolite Project (Source Lepidico 2020)
Deposit Resource Category
Cut-off (Li2O)
Ore (Mt)
Li2O ()
Li (t)
Li (LCE)
Rubicon Measured
015
22 057 5819 30974
Rubicon Indicated 666 038 11637 61943
Rubicon Inferred 237 043 4728 25167
Helikon
Total 015 1124 043 22184 118086
Lithium Potential in Namibia
38
Fig 16 Satellite image of the Karibib Lepidolite project Helikon 1 coordinates (center) 22deg2prime49primeprimeS ‒ 16deg1prime13primeprimeE Helikon 4 coordinates (center) 22deg2prime24primeprimeS ‒ 16deg1prime41primeprimeE (Source httpportalsflexicadastrecomnamibia 092020)
Fig 15 Satellite image of the Karibib Lepidolite project Rubicon coordinates (center) 22deg6prime11primeprimeS ‒ 15deg59prime44primeprimeE (Source httpportalsflexicadastrecomnamibia 092020)
Historic Rubicon mine
Helikon 1
Helikon 4
Lithium Potential in Namibia
39Fig 17 Rubicon pegmatite (Photo BGR-GSN 2019 with kind permission of Lepidico Chemicals Namibia (Pty) Ltd 2020)
Lithium Potential in Namibia
40 Fig 18 Lepidolite sample from Rubicon pegmatite (Photo BGR-GSN 2019 with kind permission of Lepidico Chemicals Namibia (Pty) Ltd 2020)
Fig 19 Petalite sample from Rubicon pegmatite (Photo BGR-GSN 2019 with kind permission of Lepidico Chemicals Namibia (Pty) Ltd 2020)
Lithium Potential in Namibia
42
Fig 21 Helikon 4 pegmatite (Photo BGR-GSN 2019 with kind permission of Lepidico Chemicals Namibia (Pty) Ltd 2020)
Fig 20 Helikon 1 pegmatite (Photo BGR-GSN 2019 with kind permission of Lepidico Chemicals Namibia (Pty) Ltd 2020)
Lithium Potential in Namibia
43
Tantalite ValleyThe Tantalite Valley Project lies within the ldquoNamaqua Metamorphic Complexrdquo in Southern Namibia Within this complex Lithium-Caesium-Tantalum (LCT) pegmatites occur in two main areas Tantalite-Valley south of Warmbad in close proximity to the northwest-trending Tantalite Valley Shear Belt and the Sandfontein-Ramansdrift area close to the Orange River
The area were the pegmatites of the Tantalite Valley occur is primarily com-posed of a large ovoid gabbro intrusion (71 km by 33 km in extent) within paragneiss units of the Namaqua Complex The gabbro outcrop forms a large dome shaped mountain that rises about 500 m above the surrounding topo-graphy
The pegmatites belong to the Kenhardt and Gordonia pegmatite districts in Namaqualand but only the younger group of them carry accessory ore miner-als such as tantalite beryl REE minerals and lithium
The Tantalite Valley pegmatites include several individual subhorizonal dikes that are up to 1000 m long and 02 to 40 m wide plunging towards southeast (Diehl 1992b) Four of those are of economic interest Homestead Whitkop White City and the Lepidolite pegmatites (ie Purple Haze) (Fig 22)
They are all well zoned (quartz core inner and outer intermediate zones wall zone) and were predominantly targeted for beryl columbite-tantalite as well as lithium and bismuth minerals
The project is located on the farms Umeis 110 and Kinderzitt 132 between the Farms 109 131 129 308 and 473 in the magisterial district of Karas It currently comprises Mining License (ML-77) fully owned by Tameka Shelf Co Four (Pty) Ltd which is a 100 subsidiary of African Tantalite Pty Ltd (AFTAN) Above all Kazera Global Investments PLC holds a 75 stake in AFTAN (Kazera 2019) with the other 25 of local farmer ownership
The project is accessible via gravel road from Karasburg which is about 80 km to the north The nearest railhead is also located in Karasburg Electricity is currently supplied by generators and water is recovered from multiple drill holes The Orange River is about 15 km to the south of the project Mining
Lithium Potential in Namibia
44
infrastructure as well as equipment are on site as well as a plant for the pro-duction of tantalite concentrate
NTI is working on an extensive exploration program with a clear focus on revi-ving tantalite mining in Namibia with a possible by-product stream of lithium bearing minerals The company will focus primarily on the pegmatites Homes-tead Purple Haze Signaalberg and White City (Fig 23)
The area is known for its tantalum occurrences and since the late 1940s tantalite and other minerals have been recovered at Tantalite Valley until 1981 when mining ceased Initially alluvial deposits were mined followed by the pegmatites themselves Grades of the concentrates produced prior to the closure of the mine were quite high with 65 ‒ 70 Ta2O5 with very low U3O8
and ThO2 values of 025 max
Resource estimateAccording to SampP Global (092020) Measured and amp Indicated resources at Tantalite Valley are 104800 t of ore 0042 Ta2O5 and 0653 Li2O as of 112019 This would equate to 315 t of lithium or 1690 t LCE Total inferred resources are 517400 t of ore 0018 Ta2O5 and 0144 Li2O This equals to approx 91 t of tantalum and 750 t of lithium (3535 t LCE)
Lithium Potential in Namibia
45
Fig 23 White City pegmatite (Source Kazera global Investments PLC 2020)
Fig 22 Satellite image of the Tantalite Valley project White City pegmatite coordinates (center) 28deg43prime07primeprimeS ‒ 18deg44prime45primeprimeE Homestead pegmatite coordinates (center) 28deg43prime19primeprimeS - 18deg44prime24primeprimeE Purple Haze pegmatite coordinates (center) 28deg43prime09primeprimeS ‒ 18deg43prime55primeprimeE (Source httpportalsflexicadastrecomnamibia 092020)
Lithium Potential in Namibia
46
8 Analysed lithium samplesDuring the course of the cooperation project between the Economic Geology Division (EGD) of the Geological Survey of Namibia (GSN) and the Ger-man Federal Institute of Geosciences and Natural Resources (BGR) several sampling campaigns to southern and central pegmatites took place
The field trips were preceded by literature and data research regarding infor-mation on lithium occurrences andor previous lithium mining activity to iden-tify specific target areas
During a campaign in 2019 16 lithium-bearing mixed mineral samples were taken from five different locations and subsequently analyzed Two of the samples originate from the Uis Tin Mine Tailings of the former tin mine All remaining samples were taken either from stripped outcrops for future mine activities or from previous mine sites (ie pits)
All 16 samples were analyzed at BGR labs in Hanover Germany through qualitative XRD XRF and ICP-MS Given data shall be understood as a first indicator for the sampled lithium occurrences
Most if not all sampled occurrences have previously been analyzed or are cur-rently being assessed by the property owners or current licensees Detailed information of these sampling and analytical campaigns remain confidential and are thus not available for comparison
Appendix A lists the identified qualitative mineralogy of the samples as well as the major element analysis Additional samples from previous campaigns are also given
Interpretation of the results are based on their applicability in the various lithium-consuming industries for which information is available
Most of the current lithium applications require a chemical intermediate product such as lithium carbonate or lithium-hydroxide The glass and cera-mic industry does use lithium-bearing mineral concentrates depending on the prices of these materials when compared to LiCO3
Lithium Potential in Namibia
47
Since the main applications require an intermediate or downstream chemical product lithium content as well as impurity values are the main criteria for the suitability of the sampled occurrences Other quality criteria are particle size and surface areastructure
9 InterpretationAs previously stated all obtained grab samples are mixtures of lithium- bearing minerals (ie spodumene petalite lepidolite) feldspars quartz micas as well as secondary minerals Therefore all given analytical data has to be taken with caution and will not be representative for the individual outcrops or deposits
The evaluation of the economic suitability for various economic applications of the analysed lithium samples is based on the chemical specifications in Chapter 4
Lithium content gt 1 Li2O Fe2O3 content lt 015 as well as F content lt 01 are individually highlighted (Appendix A) as these three values are the most important
Based on the chemical analysis nine of the 16 samples showed Li2O contents of more than 1 (range 117 ‒ 327 ) Seven of those nine samples also exhibited low Fe2O3 content (range 004 ‒ 008 ) (Appendix A) Three of those seven samples also had fluorine values below 005
Of the ten additionally included samples from previous campaigns four showed Li2O contents of more than 1 (range 126 ‒ 199 ) Three of those samples also exhibited low Fe2O3 content (range 004 ‒ 007 ) (Appendix A) One of the three samples had fluorine values below 005
The mentioned samples (sources) could be of potential use but for further interpretation statistical sampling will be required
Lithium Potential in Namibia
48
10 ConclusionsThere is currently no lithium industry established in Namibia This accounts to both mining and processing of ores into commercial lithium-bearing con-centrates as well as the production of downstream products such as lithium carbonate andor lithium hydroxide In order to evaluate the potential for a lithium industry in Namibia the current global market and price developments need to be addressed
Currently the main application for lithium is in the chemical industry as lithium carbonate andor hydroxide for the manufacturing of lithium-ion batteries There is currently no domestic market (supply) or demand for this industry in Southern Africa or Namibia in specific Processing of lithium-bearing ores into these highly specific downstream products is economically more viable in close proximity to the demanding industries It also requires large investments (double-digit million dollars per 10000t of capacity) Additionally there is already huge capacity and strong capacity build up in Asia at rather low cost
The second most important application lies in the glass and ceramics industry This industry uses lithium either as lithium-bearing concentrates or lithium carbonate depending on current market price and processproduct require-ments There is currently no such industry established in Namibia but potential plans There is glass and ceramics manufacturing in South Africa and thus a potential market for lithium bearing products (concentrates) should this indus-try require it depending on product
The 20182019 primary lithium supply based on spodumene-bearing mineral concentrates was dominated by Australia with a market share of well over 95 On an annual basis the country exports more than three million tons of lithium-bearing concentrates to China To put this into perspective Lepidico plans to export just 58 ktpa of concentrate to Abu Dhabi for refinement from their project annually Therefore potential production in Namibia will always be rather small scale when compared to peer producing countriescompanies
As of late 2020 the concentrate market is in strong oversupply with strong competition Thus prices have eroded quite substantially for a standard SC6 concentrate (Fig 24) In general prices vary significantly based on lithium content and impurities of the concentrates Lithium bearing mineral concen-
Lithium Potential in Namibia
49
trates are a relatively low-value mineral commodity when compared to lithi-um-carbonate or other lithium downstream products thus product quality cost reduction and cost control are key components in this industry Since prices are depressed currently many of the Australian producers have drasti-cally reduced output or even went into care and maintenance This situation may change towards 2025 or beyond as demand picks up
Prices for the higher valued product lithium-carbonate spiked at the end of 2017 towards 2018 to more than 20000 $USt on a contract basis with prices being very volatile Since then prices have also eroded to below 9000 $USt due to oversupply and slow demand pickup (Fig 25) With this product stable quality and chemical composition are crucial for the downstream industry
Based on available gradetonnage data the Namibian projectsprospects are relatively small in overall size and low in grade when compared to global peers for the resource category ldquoMeasuredIndicatedrdquo (Appendix B) Total contained lithium quantity is thus relatively small in comparison On a global scale the most promising hard rock projects that are currently being mined and developed have Li2O grades of 10 or above
Fig 24 Lithium-mineral-concentrate prices 012010 ‒ 062020 (Source BGR 2020)
300
400
500
600
700
800
900
1000
1100
208
210
212
214
216
218
220
US$
t US$t
01-20
14
01-20
15
01-20
16
01-20
17
01-20
18
01-20
19
01-20
20
01-20
10
01-20
11
01-20
12
01-20
13
Spodumene min 5-6 LiO2 fob Australia
Spodumene concentrate gt75 LiO2 bulk cif Asia
Petalite 42 LiO2 fob Durban
Spodumene fob Australia
Spodumene min 5-6 LiO2 cif China
Lithium Potential in Namibia
50
For the resource category ldquoIndicatedrdquo which generally represents the lowest level of confidence only the Uis mine project of AfriTin represents a size-able resource even though grades are relatively low (Appendix C) The Uis tailings project as well as the Rubicon project are again relatively small when compared to their global peers Tantalite Valley is the smallest of all included projects (Appendix C)The given data for the De Rust project reflects only an exploration target of the company rather than actual data and may thus be not representative
Based on size and contained lithium-content none of the visited early stage projectsprospects would justify the financial investment into the construction of a chemical conversion plant for the production of lithium carbonate andor hydroxide on site as it requires very large monetary investments Due to their size payback of the required investments may be unfavorable when compared to global peers In addition the current market environment is very harsh with strong competition from Asia that has a huge cost advantage due to capacity build up This industry is also very energy and water intensive
In addition location within Namibia as well as distance to possible down-stream markets may become an issue as it increases the transportation cost
4000
7000
10000
13000
16000
19000
22000
25000
28000
01-20
14
01-20
15
01-20
16
01-20
17
01-20
18
01-20
19
01-20
20
US$
t
Lithium-carbonate (min 995 ) battery grade spot price ex works domestic ChinaLithium-carbonate (min 99-995 ) Li2CO3 large contracts USA delivered continentalLithium-hydroxid-monohydrate (min 565) technical and industrial grades cif China Japan amp Korea
Fig 25 Lithium chemical prices 012014 ndash 062020 (Source BGR 2020)
Lithium Potential in Namibia
51
immensely This is especially true for the SorisDe Rust pegmatite which is in a remote location without any allocated infrastructure The projects Karibib Uis and Tantalite Valley are much easier to access
The approach of Lepidico to produce a lithium bearing concentrate on site seems plausible approach Since this will already require a skilled workforce mining and beneficiation equipment in order to produce a high quality lithium-bearing concentrate it may already be considered ldquoadded valuerdquo for the indus-try of the country This approach may also be suitable for the other mentioned and visited projects
Lithium Potential in Namibia
52
ReferencesAfriTin Mining (2020) Uis Tin Project ndash Company Information ndash URL httpafritinminingcomuis-project [as of 092020]
Australian Government Geoscience Australia (2019) Australiarsquos Identi-fied Mineral Resources 2019 ndash URL httpswwwgagovauscientific-topicsmineralsmineral-resources-and-adviceaimr [as of 092020]
BGR ndash Bundesanstalt fuumlr Geowissenschaften und Rohstoffe (2020) Fachinformationssystem Rohstoffe ndash unpubl Hannover [as of 082020]
BGS ndash British Geological Survey (2016) Lithium Definitions mineralo-gy and deposits ndash URL httpswwwbgsacukdownloadsstartcfmid=3100 [as of 062016]
Diehl B J M (1990) Pegmatites of the Cape Cross Uis ndash Pegmatite Belt Namibia Geology mineralisation Rubidium Strontium characteristics and petrogenesis of rare metal pegmatites Open File Report EG 083 Economic Geology Series Geological Survey of Namibia 39 pp Windhoek
Diehl B J M (1992a) Lithium Caesium Beryllium Open File Report Mineral Resource Series Geological Survey of Namibia 18 pp Windhoek
Diehl B J M (1992b) Niobium and Tantalum Open File Report Mineral Resource Series Geological Survey of Namibia 20 pp Windhoek
Diehl B J M (1992c) Tin Open File Report Mineral Resource Series Geological Survey of Namibia 30 pp Windhoek
Diehl B J M amp Schneider G I C (1990) Geology and mineralisation of the Rubicon Pegmatite Namibia Open File Report Geol Surv Namibia 20 pp Windhoek
Fuchsloch et al (2018) Classification mineralogical and geochemical vari-ations in pegmatites of the Cape Cross-Uis pegmatite belt Namibia Lithos 296 ndash 299 79-95 elsevier
Lithium Potential in Namibia
53
Garret D E (2004) Handbook Of Lithium And Natural Calcium Chloride Their Deposits Processing Uses and Properties ndash 467 S Oxford (Elsevier B V)
Geological Survey of Namibia (2002) Mineral Resources of Namibia Summary of Mineral Deposits and Occurrences Omaruru Sheet 2114 Volume I ndash Complete Descriptions 119 pp Windhoek
IHS Global SA (2020) Global Trade Atlas ndash Commercial Online-Databa-se ndashURL httpsmyihscomConnectcallingUrl=https3a2f2fconnectihsmarkitcom2f [as of 062017]
Kazera Global Investments PLC (2020) Company Information ndash URL httpskazeraglobalcominvestmentsnamibia-tantalite-investment-mine [as of 092020]
Lepidico (2019) LOI with BASF extended to 31 December 2020 ndash News Release ndash URL httpswwwlepidicocomwp-contentuploads201910LPD-191220-LOI-with-BASF-extended-to-31-December-2020pdf [as of 122019]
Lepidico (2019) Corporate Presentation ndash URL httpswwwlepidicocomwp-contentuploads201907LPD-190509-Corporate-Presentati-on-May-2019pdf [as of 052019]
Lepidico (2020) Company Information ndash URL httpswwwlepidicocomprojectskaribib [as of 092020]
Montero Mining amp Exploration Ltd (2018) Exploring Battery Metals in Namibia ndash Company Presentation ndash URL httpswwwproactiveinvestorscomauuploadSponsorFileFile2018_031520244941_MON-CorporatePre-sentationMarch2018pdf [as of 072018]
Montero Mining amp Exploration Ltd (2019) Montero Files NI 43-101 Resource Estimate On The Uis Lithium-Tin Tailings Project In Namibia On Sedar ndash News Announcement ndash URL httpsmonterominingcommontero-files-ni-43-101-resource-estimate-on-the-uis-lithium-tin-tailings-project-in-namibia-on-sedar [as of 032019]
Lithium Potential in Namibia
54
Namibia Mining Cadastre Portal (2020) Online-Database ndashURL httpsportalslandfoliocomnamibia [as of 092020]
Roskill Information Services Ltd (2016) Lithium Global Industry Mar-kets amp Outlook ndash 386 S London Groszligbritannien
Schneider G I C (1992) Feldspar Open File Report MRS 08 Mineral Resource Series Geological Survey of Namibia 2 pp Windhoek
Schmidt M (2017) Rohstoffrisikobewertung ndash Lithium ndash DERA Rohstoffin-formationen 33 Berlin
S amp P Global Market Intelligence (2020) Lithium - Metals amp Mining Properties URL httpsplatformmarketintelligencespglobalcomwebcli-entauth=inheritindustryminingProjects [as of 092020]
Statista (2020) Distribution of lithium end-usage worldwide in 2019 by area application ndash URL httpswwwstatistacomstatistics268787lithium-usa-ge-in-the-world-market [as of 062020]
Tawana Resources NL (2016) Tawana acquires second lithium pro-ject ndash News Release ndash URL httpsmstrademomentumcozajsepdfSENS_20160923_S376505pdf [as of 092016]
USGS ndash United States Geological Survey (multiple years) Lithium ndash Minerals Commodity Summaries ndash URL httpswwwusgsgovcentersnmiclithium-statistics-and-information [as of 082020]
Appendix
Sam
ple I
DFa
rmLa
titud
eLo
ngitu
deSa
mpl
e des
crip
tion
(XRD
qu
al)
LiO 2
()
SiO 2
Ti
O 2
Al2O 3
Fe2O 3
Mn
O Mg
O Ca
O Na
2O
K 2O P 2O 5
SO
3
Cl
F
LOI
Su
m
2015
-03
previous sample campaignsHelik
on
n A
Felds
parQ
uartz
Lepid
olite
025
6871
lt000
119
0500
200
2900
505
3292
806
7905
59lt0
01lt0
002
lt005
093
9985
2016
-12
Rubic
onwe
ather
ed P
etalite
126
6473
lt000
118
0600
703
2718
607
9507
805
2500
62lt0
01lt0
002
lt005
1146
9871
2016
-17
Rubic
onLe
pidoli
te +
Quar
tz13
063
6700
219
9316
0929
003
0054
029
6218
0052
lt001
lt000
226
232
798
67
2016
-20
Helik
onLe
pidoli
te + A
lbite
176
5514
lt000
126
8700
401
2100
700
2123
970
3900
45lt0
01lt0
002
156
369
9698
2016
-21
Helik
onLe
pidoli
te19
954
32lt0
001
2627
004
0224
006
0038
266
714
0069
lt001
lt000
240
628
997
77
FN20
19_0
4De
Rus
tFe
ldspa
rAmb
lygon
iteP
etalite
(n
on X
RD)
003
6513
lt000
118
82lt0
0100
0200
101
0924
311
4105
75lt0
0100
04lt0
0503
898
84
2015
-09
Molop
oPe
talite
(non
XRD
)00
952
85lt0
001
1672
lt001
0002
487
0323
342
0352
lt000
100
400
3403
621
1310
012
2016
-14
Molop
oPe
talite
wea
there
d (no
n XRD
)00
752
1600
0316
5100
200
5147
805
8923
406
4500
6900
200
8602
222
6310
013
2016
-15
Molop
oFe
ldspa
r (no
n XRD
)00
664
02lt0
001
1937
003
0004
003
0151
216
1249
0796
lt001
lt000
2lt0
0505
399
55
2016
-23
Molop
oZin
nwald
ite (n
on X
RD)
006
5044
0068
3307
048
0011
012
0426
261
7674
0181
lt001
lt000
2lt0
0542
9925
1909
249
2019Uis
Tailin
gs
Quar
tzFe
ldspa
rPeta
lite
Musc
ovite
028
7293
0045
1479
051
0062
0212
9830
927
6613
6200
2lt00
02lt0
0523
399
38
1909
250
Uis
Tailin
gsQu
artz
Felds
parP
etalite
Mu
scov
ite02
872
6900
4314
8205
0059
019
1306
313
2794
1347
002lt
0002
lt005
251
9937
1909
251
Helik
on 4
22deg02prime4
8primeprimeS1
6deg01prime30
primeprimeEQu
artz
Felds
parP
etalite
Le
pidoli
te16
464
4400
0319
4200
301
2100
408
8325
345
6806
800
400
0727
228
998
38
1909
252
Helik
on 1
22deg02prime2
0primeprimeS1
6deg01prime19
primeprimeEPe
talite
Lepid
olite
Quar
tz29
576
9200
0116
6800
300
0304
101
7301
106
8100
01lt0
01lt0
002
lt005
205
97
App
endi
x A
Ana
lytic
al d
ata
of li
thiu
m s
ampl
es c
olle
cted
in N
amib
ia T
hres
hold
val
ues
high
light
ed in
gre
en
Lithium Potential in Namibia
57
Sam
ple I
DFa
rmLa
titud
eLo
ngitu
deSa
mpl
e des
crip
tion
(XRD
qu
al)
LiO 2
()
SiO 2
Ti
O 2
Al2O 3
Fe2O 3
Mn
O Mg
O Ca
O Na
2O
K 2O P 2O 5
SO
3
Cl
F
LOI
Su
m
1909
253
2019Rubic
on22deg06prime1
3primeprimeS1
5deg59prime45
primeprimeEPe
talite
Lepid
olite
Quar
tz32
778
73lt0
001
1687
002
0006
002
0157
011
003
0002
003
0003
lt005
075
9663
1909
254
Rubic
on22deg06prime1
0primeprimeS1
5deg59prime41
primeprimeEFe
ldspa
rQua
rtzM
usco
vite
004
682
lt000
119
3500
300
2400
205
0610
0808
6804
3lt0
01lt0
002
lt005
041
9985
1909
255
Rubic
on22deg06prime1
0primeprimeS1
5deg59prime41
primeprimeEFe
ldspa
rLep
idolite
Mus
co-
viteK
aolin
026
6104
0004
2318
022
0136
006
0119
367
8411
0159
lt001
lt000
2lt0
0522
299
15
1909
256
Rubic
on22deg06prime1
0primeprimeS1
5deg59prime41
primeprimeELe
pidoli
te 27
249
8700
129
3400
408
0500
400
704
697
3100
31lt0
01lt0
002
087
441
9569
1909
257
Rubic
on22deg06prime1
3primeprimeS1
5deg59prime45
primeprimeEPe
talite
Lepid
olite
Quar
tz30
670
0900
0320
2600
801
0901
502
9901
926
800
15lt0
0100
04lt0
0526
596
48
1909
258
Rubic
on22deg06prime1
0primeprimeS1
5deg59prime41
primeprimeELe
pidoli
teFe
ldspa
rQua
rtz20
659
7800
0224
100
505
2400
300
513
7247
0051
lt001
0002
265
388
9966
1909
259
Tanta
lite
Valle
y28deg43prime0
9primeprimeS1
8deg43prime55
primeprimeEFe
ldspa
rLep
idolite
Mus
covit
e11
762
64lt0
001
2139
004
0161
lt001
0399
7731
2401
0900
200
119
912
698
85
1909
260
Tanta
lite
Valle
y28deg43prime0
9primeprimeS1
8deg43prime55
primeprimeEFe
ldspa
rLep
idolite
Mus
covit
e03
059
8600
1425
1301
604
2200
302
2860
547
2201
3900
200
0904
123
799
56
1909
261
Tanta
lite
Valle
y28deg43prime0
9primeprimeS1
8deg43prime55
primeprimeEFe
ldspa
rQua
rtzM
usco
vite
003
636
0005
2218
022
0122
002
0381
727
3809
0272
lt001
lt000
2lt0
0513
199
17
1909
262
Tanta
lite
Valle
y28deg43prime2
0primeprimeS1
8deg44prime23
primeprimeEQu
artzSp
odum
eneM
us-
covit
e13
180
5100
0415
8903
401
2401
301
9502
604
0400
0500
200
03lt0
0507
398
56
1909
263
De R
ust
20deg57prime4
8primeprimeS1
4deg30prime13
primeprimeEFelsd
parS
podume
neQuartz
074
7313
0006
2048
007
015
005
0154
398
0831
0073
001
0003
lt005
082
9974
1909
264
De R
ust
20deg57prime4
8primeprimeS1
4deg30prime13
primeprimeESp
odum
eneF
eldsparQuartz
230
6924
0006
2602
801
0200
301
0510
102
1400
68lt0
0100
03lt0
0504
897
53
(Con
tinue
d) A
ppen
dix
A A
naly
tical
dat
a of
lith
ium
sam
ples
col
lect
ed in
Nam
ibia
Thr
esho
ld v
alue
s hi
ghlig
hted
in g
reen
Lithium Potential in Namibia
58
Appendix B GradeTonnage data (Measured amp Indicated) for selected lithium projects in comparison to Namibian projects (Source SampP 092020)
0
0500
1000
1500
2000
2500
500
5000
5000
0
5000
00
5000
000
Gra
de [
Li 2O
]
Tonnage [t]
Tantalite Valley
Rubicon
Appendix B GradeTonnage data (Inferred) for selected lithium projects in com-parison to Namibian projects (Source SampP 092020)
0
0500
1000
1500
2000
2500
100
1000
1000
0
1000
00
1000
000
1000
0000
Gra
de [
Li 2O
]
Tonnage [t]
Tantalite ValleyRubicon
Uis Tailings
Uis Mine
De Rust
A product of the technical cooperation project between Bundesanstalt fuumlr Geowissenschaften und Rohstoffe (BGR)(Federal Institute for Geosciences and Natural Resources)
andGeological Survey of Namibia within the Ministry of Mines and Energy
ISBN 978-3-948532-29-1 (Print) 978-3-948532-30-7 (PDF)
- List of Abbreviations
- 1 Introduction
- 2 What is lithium
-
- 21 Lithium deposits
-
- 3 Application
- 4 Chemical requirements
- 5 Mining and trade of lithium in the SADC
-
- 51 Lithium production
- 52 Trade data
- 53 Export
- 54Import
-
- 6 Lithium occurrences in Namibia
- 7 Lithium mining in Namibia
-
- 71 Current mining activities and projects
-
- 8 Analysed lithium samples
- 9 Interpretation
- 10 Conclusions
- References
-
Lithium Potential in Namibia
27
Currently there is no active consecutive mining for lithium in substantial quan-tities in Namibia although there are prospects and projects under develop-ment
71 Current mining activities and projects
Soris The Soris project is located in the De Rust pegmatite swarm which is part of the ldquoBrandberg West ndash Goantagab tin beltrdquo (Fig 7) This belt stretches to the northeast of the Brandberg massif over a length of 60 km and a width of 25 km This belt was previously mined for cassiterite on a larger scale Some of the pegmatites in this belt may carry substantial amounts of lithium such as pegmatites in the De Rust pegmatite swarm
The De Rust pegmatite itself is a Li-rich rare metal pegmatite that was mined for cassiterite and tantalite but also for minor quantities of spodumene be ween 1960 and 1990 (Diehl 1990) It intruded into metasediments of the Amis River Formation Lower Ugab Group of the Southern Kaoko Zone
It is the largest pegmatite of the De Rust pegmatite swarm within the Brandberg West ndash Goantagab pegmatite belt (Diehl 1992c) Outcrops are 100 ‒ 470 m long up to 30 m wide and can be followed over a length of roughly 24 km
The pegmatite shows well-developed zonation with a border zone (quartz alkali feldspar muscovite) outer (quartz microcline-perthite muscovite altered petalite) and inner (quartzo-feldspathic rock with spodumene crystals with accessory apatite lepidolite eucryptite zircon and monazite) intermedi-ate zone as well as a core zone (quartz subordinate microcline muscovite sporadic tantalite) Spodumene crystals may reach up to 80 cm in length (Fig 12) Towards the core zone spodumene carries rounded nodules of lithi-um phosphates (amblygonite ndash montebrasite series)
It is located northwest of the nearest town of Uis in the Kunene region of Namibia about 6km to the east of farm De Rust 532 and about 25 km north of the Ugab River The nearest railhead is located in the town of Karibib and the deep-water port of Walvis Bay is 120 km to the southwest Windhoek is about 180 km to the southeast
Lithium Potential in Namibia
28
The project can be reached via paved but mostly unpaved roads from the town of Uis From White Lady Lodge which is about 38 km northwest from Uis a 35 km gravel road leads towards the project 15 km of which are in the riverbed of the Ugab River There is currently no electricity and water supply at the project location site
According to SampP Global (022020) current owner of the Soris project is Mon-tero Mining amp Exploration Ltd (TSXV MON) which holds 80 interest of the property Another 20 are allocated to an unnamed private owner Based on data from the Namibia Mining Cadastre Portal (092020) multiple entries for mining licence applications exist for the area where the main De Rust pegmatite is located (Fig 9)
Resource estimateDue to the early stage of the Soris project no resource estimate is avail-able However Montero Mining claims the project to be drill ready targeting a resource of 10 Mt 1 Li2O with tantalum and tin by-product credits This would equate to 46400 t of lithium or 247000 t LCE
Grab samples of the deposit showed lithium contents of 007 to 532 aver-aging 137 Channel samples showed average lithium contents of 076 and values up to 366 (Montero 032019) The company also re-assessed 1097 previously tested RC drill samples The main lithium-bearing mineral is spodumene
Remnants of historic intermittent mining activities like old foundations and quartzo-feldspathic tailings are still visible east to the main pegmatite (Fig 10 ‒ 11)
Lithium Potential in Namibia
29
Fig 10 Remnants of historic open pit mining (upper) and tailings of De Rust pegmatite (lower) northwest of the Brandberg massif (Photo BGR-GSN 2019)
Fig 9 Satellite image of the De Rust project including the outlined mining license Main pegmatite coordinates 20deg57prime48primeprimeS ‒ 14deg30prime12primeprimeE (Source httpportalsflexicadastrecomnamibia 092020)
Main pegmatite
Lithium Potential in Namibia
30
Fig 12 Weathered spodumene chrystals at the historic open pit mine (Photo BGR-GSN 2019)
Fig 11 Historic open pit of the De Rust pegmatite (Photo BGR-GSN 2019)
Lithium Potential in Namibia
31
Uis The Uis projects (former mine and tailings) are located in the northern part of the ldquoCape Cross Uis pegmatite beltrdquo east of the town of Uis on the farm Uis Townlands No 215 in the Erongo region of Namibia
The Cape Cross-Uis belt is approx 120 km long and up to 40 km wide and extends in a NE direction (Fig 7) It comprises three distinct pegmatite swarms the Strathmore swarm Karlowa swarm and Uis pegmatite swarm In general lithium-bearing pegmatites (Li-Nb-Ta-Sn-Be and Li-Nb-Ta-Sn) are the least common in this belt (Fuchsloch et al 2018)
The Uis swarm field consists of more than 120 individual pegmatites each with a northeasterly to easterly strike direction and northwesterly down dip (30deg ‒ 70deg) This field is accompanied by a peripheral pegmatite field of approx 25 individual pegmatites
Some of the main pegmatites especially around the formerly worldrsquos largest tin mine at Uis are exceedingly large Some of them are up to 1 km long and some 50 m wide
In terms of lithium petalite amblygonite and minor spodumene mineralization occurs in the various pegmatites but no lepidolite Most common lithium bear-ing minerals in the eight pegmatites that were mined at Uis are amblygonite petalite and spodumene
Currently the Uis tailings project and the Uis tin mine are owned by two differ-ent companies As of 2020 the tin mine is operating a pilot processing plant and aims to ramp up the production of lithium in the near future The current ownership of the tailings project as of September 2020 is unclear
The nearest commercial deep-water port to the projects is Walvis Bay 220 km to the southeast The town of Omaruru is 130 km to the east and Henties Bay lies about 120 km to the southwest The nearest railhead is located in Omaruru The area is accessible year-round by paved and un-paved roads NamPower provides electricity and the town of Uis is connected to the Nam-Water pipeline
Lithium Potential in Namibia
32
The tin deposit was discovered in 1911 and mined between the 1950s and 1989 for cassiterite by Uis Tin Mining Company (SWA) Ltd and IMCOR
Coarse tailings are located in the northern part of the former mine just south to the main road C36 (Fig 13) The fine material is located south to the coarse waste dumps (Fig 13)
After 1990 multiple companies owned the property until AfriTin Mining Ltd bought all the rights (license ML134) The current lithium tailings project of Montero Mining amp Exploration Ltd (TSXV MON) is based on the historic mine tailings of the former tin mine on mining license ML134 that is currently owned by AfriTin Mining Ltd The acquired tailings material does not fall under the ML134 license of AfriTin since historical tailings material (Fig 14) is not regulated by Minerals (Prospecting and Mining) Act 33 of 1992 of Namibia
Resource estimateUis tin mineAccording to AfriTin the former Uis mine holds a JORC compliant resource (inferred) of 715 Mt of ore 0134 Sn with a cut-off grade of 005 Sn (AfriTin 2020) Grades of ancillary elements are given at 063 Li2O and 85 ppm Ta for the total resource of 71 Mt of ore
This equals to approx 95000 t of tin 209000 t of lithium (11 Mt LCE) and 6090 t of tantalum 85 of the total resource are attributable to the company The remaining 15 are allocated to SMU (Small Miners of Uis)
Uis tailingsMontero Mining filed an inferred resource estimate of 144 Mt of ore 037 Li2O and 005 SnO2 with a 035 Li2O cut-off grade for lithium and assumed processing recoveries of 70 for their tailings project (Montero 2019) This equals to approx 24700 t of lithium content (131500 t LCE) and 7200 t SnO2
This resource estimate only includes coarse tailings material There is current-ly no information on the lithium content of the fine tailings material that totals 271 Mt t due to insufficient or no test work (Montero 2018) The company also states that the average Li2O grade of the fines material does not hurdle the cut-off for the fines of 082 Li2O
Lithium Potential in Namibia
33
In 2016 Australian based Tawana Resources carried out a drilling program at Uis for a private company called Lithium Africa 1 on the fine and coarse tailings (Table 3 Hole 1 amp Hole 2) Below some of the obtained data on lithium content is given Additionally Li2O content of two obtained grab samples by BGR (Table 3 Sample 2019a amp 2019b) is given
Table 3 Sample data Uis (Tawana 2016 Montero 2018 BGR 2019)
Sample Sample 0 to 1m Li2O ()
Sample 1 to 2m Li2O ()
Sample 2 to 3m Li2O ()
Fines Hole 1 071 085 092
Fines Hole 2 080 089 095
Coarse Hole 1 050 043 043
Coarse Hole 2 054 062 062
BGR Sam-ple 2019a (Coarse tailings)
028
BGR Sam-ple 2019b (Coarse tailings)
028
Montero NI 43-101 037
Lithium Potential in Namibia
34
Fig 14 Tailings of the historic Uis Tin Mine (Photo BGR-GSN 2019 with kind permission of AfriTin Mining Limited)
Fig 13 Former Uis tin mine Uis tailings project with coarse tailings Tailings coordina-tes (center) 21deg13prime31primeprimeS ‒ 14deg52prime44primeprimeE (Source httpportalsflexicadastrecomnamibia 092020)
Uis Tailings (coarse)
Uis Tailings (fine)
Historic Uis mine
Lithium Potential in Namibia
35
Karibib Lepidolite ProjectThe Karibib Lepidolite brownfield project is located in the ldquoKaribib ndash Usakos Pegmatite Districtrdquo southeast of the town of Karibib on the farm Okongava Ost No 72 in central Namibia (Fig 15 ‒ 16)
This pegmatite district which is of Damaran age hosts the most important pegmatite occurrence (Rubicon swarm) in terms of lithium in Namibia In addi-tion numerous other different pegmatite swarms some of which have previ-ously been relevant in terms of lithium are know from this district These are Dernburg Karlsbrunn Albrechtshoumlhe Berger Kaliombo Gamikaubmund Okatjimukuju Etusis Daheim Friedrichsfelde and Etiro (Diehl 1992a)
The Rubicon pegmatite itself is the largest of the individual pegmatites that occur in this field and has been the prime source of lithium until mining seized in the early 1990s The Helikon pegmatites are part of the Rubicon pegmatite swarm and are located northeast to the Rubicon pegmatite They have previ-ously been mined for lepidolite amblygonite petalite and muscovite beryll pollucite quartz and columbite-tantalite as valuable by-products (Fig 18 ‒ 19)
The pegmatite itself consist of two ellipsoidal well zoned Li-mineralized ore-bodies The larger one is about 320 m long and 25 ndash 35 m wide It dips at 46deg to the northeast and has a northwesterly strike The second orebody is about 230 m long and about 10 m wide It is dipping with 30deg to the northeast and has a northwesterly strike In total the outcrop of the Rubicon pegmatite is about 600 m long with a maximum width of 65 m (Fig 17)
A very prominent feature is the presence of a very well developed concen-tric shell and zones from the footwall to the inner core of the pegmatite Both orebodies exhibit a border- wall- intermediate- and core-zone
Border-zone wall-zone and outer intermediate zone of the larger orebody do not contain Li-bearing minerals of economic importance The inner interme-diate zone does contain lepidolite The outer core zone may be sub-divided into a petalite zone low-grade lepidolite zone and a high-grade lepidolite zone The inner core zone also contains a petalite zone Mining occurred pre-viously in the later named zones The zonation of the smaller orebody to the northwest is less pronounced but Li-mineralization and style are equal to the
Lithium Potential in Namibia
36
larger orebody There is no spodumene mineralization within the orebodies and respectively zones of the Rubicon pegmatite
The Helikon I pegmatite is also a lens-shaped pegmatite with a length of roughly 400 m and a width of approx 66 m It dips to the north with about 60deg ndash 70deg Helikon I also consists of well-defined zones The main Li-bearing minerals are lepidolite and petalite According to Roering (1963) the lepidolite is difficult to separate from the intergrown albite and hence of low grade and quality
The Helikon II pegmatite is approx 17 km long and only 9 ndash 15 m wide It lies a bit north of Helikon I and dips steeply to the north with 55deg ndash 80deg striking east west The main Li-bearing minerals are lepidolite and petalite According to Diehl (1990) the westernmost portion of the pegmatite has historically been the economically most important A massive up to 6 m wide petalite zone was mined here according to Diehl (1990)
The nearest railhead to the project is 17 km away in Karibib and the deep-water port of Walvis Bay is 220 km to the southwest Windhoek is about 180 km to the southeast NamPower connects the town of Karibib to electricity and the project currently utilizes generators There is a 7 km long 22 kV power line spur to grid connection pending (Lepidico 2020) Water is available via on-site boreholes
The project was previously owned by Desert Lion Energy Inc (TSVX DLI) Lepidico Ltd (ASX LPD) bought into the project and currently holds 80 interest which comprises Mining License 204 (69 km2) as well as three Exclu-sive Prospecting Licenses (EPLs) namely 5439 5555 and 5781 (Lepidico 2020)
Lepidico will cover mining from multiple sources as well as chemical conver-sion by utilizing their proprietary lithium processing technologies L-Maxreg LOH-Maxreg and S-Maxreg (Lepidico 052019) The company aims to produce high purity lithium chemicals such as lithium carbonate and lithium hydroxide
The takeover also included a nonbinding offtake agreement between the for-mer owner Desert Lion Energy Inc and German chemical company BASF On April 2nd 2019 Desert Lion Energy Inc announced this offtake agreement
Lithium Potential in Namibia
37
which at the time was valid through to December 31 2019 On December 20th
2019 Lepidico announced that the LOI with BASF was extended to Decem-ber 31st 2020 (Lepidico 122019)
The feasibility study criteria of Lepidico are as follows
- Throughput of the concentrator on-site of 035 Mtpa- Expansion of throughput after year five to 05 Mtpa- Chemical plant in the industrial city of Abu Dabi (ICAD)- Plant design for 58000 tpa of concentrate (4 LiO2) for the production of
up to 5500 tpa LiOH- Utilization of L-Maxreg and LOH-MaxTM- Non-binding off-take MOU with BASF for LiOH only- Targeting for project commissioning to commence late 2021 for commer-
cial production in 2022
The preliminary mine plan indicates a strip ratio of 03 ndash 1 for the first two years The ratio will then go up to 1 ndash 14 In the first four years elevated grades of 06 LiO2 will be mined
Resource estimateA JORC 2012 compliant resource estimate for the deposit is given in Table 4 (Lepidico 2020) The deposit currently holds 23200 t of lithium (Indicated amp Inferred) based on a cut-off grade of 015 Li2O This resource estimate is based solely on the lepidolite occurrences at the mine site
Table 4 Resource estimate Karibib Lepidolite Project (Source Lepidico 2020)
Deposit Resource Category
Cut-off (Li2O)
Ore (Mt)
Li2O ()
Li (t)
Li (LCE)
Rubicon Measured
015
22 057 5819 30974
Rubicon Indicated 666 038 11637 61943
Rubicon Inferred 237 043 4728 25167
Helikon
Total 015 1124 043 22184 118086
Lithium Potential in Namibia
38
Fig 16 Satellite image of the Karibib Lepidolite project Helikon 1 coordinates (center) 22deg2prime49primeprimeS ‒ 16deg1prime13primeprimeE Helikon 4 coordinates (center) 22deg2prime24primeprimeS ‒ 16deg1prime41primeprimeE (Source httpportalsflexicadastrecomnamibia 092020)
Fig 15 Satellite image of the Karibib Lepidolite project Rubicon coordinates (center) 22deg6prime11primeprimeS ‒ 15deg59prime44primeprimeE (Source httpportalsflexicadastrecomnamibia 092020)
Historic Rubicon mine
Helikon 1
Helikon 4
Lithium Potential in Namibia
39Fig 17 Rubicon pegmatite (Photo BGR-GSN 2019 with kind permission of Lepidico Chemicals Namibia (Pty) Ltd 2020)
Lithium Potential in Namibia
40 Fig 18 Lepidolite sample from Rubicon pegmatite (Photo BGR-GSN 2019 with kind permission of Lepidico Chemicals Namibia (Pty) Ltd 2020)
Fig 19 Petalite sample from Rubicon pegmatite (Photo BGR-GSN 2019 with kind permission of Lepidico Chemicals Namibia (Pty) Ltd 2020)
Lithium Potential in Namibia
42
Fig 21 Helikon 4 pegmatite (Photo BGR-GSN 2019 with kind permission of Lepidico Chemicals Namibia (Pty) Ltd 2020)
Fig 20 Helikon 1 pegmatite (Photo BGR-GSN 2019 with kind permission of Lepidico Chemicals Namibia (Pty) Ltd 2020)
Lithium Potential in Namibia
43
Tantalite ValleyThe Tantalite Valley Project lies within the ldquoNamaqua Metamorphic Complexrdquo in Southern Namibia Within this complex Lithium-Caesium-Tantalum (LCT) pegmatites occur in two main areas Tantalite-Valley south of Warmbad in close proximity to the northwest-trending Tantalite Valley Shear Belt and the Sandfontein-Ramansdrift area close to the Orange River
The area were the pegmatites of the Tantalite Valley occur is primarily com-posed of a large ovoid gabbro intrusion (71 km by 33 km in extent) within paragneiss units of the Namaqua Complex The gabbro outcrop forms a large dome shaped mountain that rises about 500 m above the surrounding topo-graphy
The pegmatites belong to the Kenhardt and Gordonia pegmatite districts in Namaqualand but only the younger group of them carry accessory ore miner-als such as tantalite beryl REE minerals and lithium
The Tantalite Valley pegmatites include several individual subhorizonal dikes that are up to 1000 m long and 02 to 40 m wide plunging towards southeast (Diehl 1992b) Four of those are of economic interest Homestead Whitkop White City and the Lepidolite pegmatites (ie Purple Haze) (Fig 22)
They are all well zoned (quartz core inner and outer intermediate zones wall zone) and were predominantly targeted for beryl columbite-tantalite as well as lithium and bismuth minerals
The project is located on the farms Umeis 110 and Kinderzitt 132 between the Farms 109 131 129 308 and 473 in the magisterial district of Karas It currently comprises Mining License (ML-77) fully owned by Tameka Shelf Co Four (Pty) Ltd which is a 100 subsidiary of African Tantalite Pty Ltd (AFTAN) Above all Kazera Global Investments PLC holds a 75 stake in AFTAN (Kazera 2019) with the other 25 of local farmer ownership
The project is accessible via gravel road from Karasburg which is about 80 km to the north The nearest railhead is also located in Karasburg Electricity is currently supplied by generators and water is recovered from multiple drill holes The Orange River is about 15 km to the south of the project Mining
Lithium Potential in Namibia
44
infrastructure as well as equipment are on site as well as a plant for the pro-duction of tantalite concentrate
NTI is working on an extensive exploration program with a clear focus on revi-ving tantalite mining in Namibia with a possible by-product stream of lithium bearing minerals The company will focus primarily on the pegmatites Homes-tead Purple Haze Signaalberg and White City (Fig 23)
The area is known for its tantalum occurrences and since the late 1940s tantalite and other minerals have been recovered at Tantalite Valley until 1981 when mining ceased Initially alluvial deposits were mined followed by the pegmatites themselves Grades of the concentrates produced prior to the closure of the mine were quite high with 65 ‒ 70 Ta2O5 with very low U3O8
and ThO2 values of 025 max
Resource estimateAccording to SampP Global (092020) Measured and amp Indicated resources at Tantalite Valley are 104800 t of ore 0042 Ta2O5 and 0653 Li2O as of 112019 This would equate to 315 t of lithium or 1690 t LCE Total inferred resources are 517400 t of ore 0018 Ta2O5 and 0144 Li2O This equals to approx 91 t of tantalum and 750 t of lithium (3535 t LCE)
Lithium Potential in Namibia
45
Fig 23 White City pegmatite (Source Kazera global Investments PLC 2020)
Fig 22 Satellite image of the Tantalite Valley project White City pegmatite coordinates (center) 28deg43prime07primeprimeS ‒ 18deg44prime45primeprimeE Homestead pegmatite coordinates (center) 28deg43prime19primeprimeS - 18deg44prime24primeprimeE Purple Haze pegmatite coordinates (center) 28deg43prime09primeprimeS ‒ 18deg43prime55primeprimeE (Source httpportalsflexicadastrecomnamibia 092020)
Lithium Potential in Namibia
46
8 Analysed lithium samplesDuring the course of the cooperation project between the Economic Geology Division (EGD) of the Geological Survey of Namibia (GSN) and the Ger-man Federal Institute of Geosciences and Natural Resources (BGR) several sampling campaigns to southern and central pegmatites took place
The field trips were preceded by literature and data research regarding infor-mation on lithium occurrences andor previous lithium mining activity to iden-tify specific target areas
During a campaign in 2019 16 lithium-bearing mixed mineral samples were taken from five different locations and subsequently analyzed Two of the samples originate from the Uis Tin Mine Tailings of the former tin mine All remaining samples were taken either from stripped outcrops for future mine activities or from previous mine sites (ie pits)
All 16 samples were analyzed at BGR labs in Hanover Germany through qualitative XRD XRF and ICP-MS Given data shall be understood as a first indicator for the sampled lithium occurrences
Most if not all sampled occurrences have previously been analyzed or are cur-rently being assessed by the property owners or current licensees Detailed information of these sampling and analytical campaigns remain confidential and are thus not available for comparison
Appendix A lists the identified qualitative mineralogy of the samples as well as the major element analysis Additional samples from previous campaigns are also given
Interpretation of the results are based on their applicability in the various lithium-consuming industries for which information is available
Most of the current lithium applications require a chemical intermediate product such as lithium carbonate or lithium-hydroxide The glass and cera-mic industry does use lithium-bearing mineral concentrates depending on the prices of these materials when compared to LiCO3
Lithium Potential in Namibia
47
Since the main applications require an intermediate or downstream chemical product lithium content as well as impurity values are the main criteria for the suitability of the sampled occurrences Other quality criteria are particle size and surface areastructure
9 InterpretationAs previously stated all obtained grab samples are mixtures of lithium- bearing minerals (ie spodumene petalite lepidolite) feldspars quartz micas as well as secondary minerals Therefore all given analytical data has to be taken with caution and will not be representative for the individual outcrops or deposits
The evaluation of the economic suitability for various economic applications of the analysed lithium samples is based on the chemical specifications in Chapter 4
Lithium content gt 1 Li2O Fe2O3 content lt 015 as well as F content lt 01 are individually highlighted (Appendix A) as these three values are the most important
Based on the chemical analysis nine of the 16 samples showed Li2O contents of more than 1 (range 117 ‒ 327 ) Seven of those nine samples also exhibited low Fe2O3 content (range 004 ‒ 008 ) (Appendix A) Three of those seven samples also had fluorine values below 005
Of the ten additionally included samples from previous campaigns four showed Li2O contents of more than 1 (range 126 ‒ 199 ) Three of those samples also exhibited low Fe2O3 content (range 004 ‒ 007 ) (Appendix A) One of the three samples had fluorine values below 005
The mentioned samples (sources) could be of potential use but for further interpretation statistical sampling will be required
Lithium Potential in Namibia
48
10 ConclusionsThere is currently no lithium industry established in Namibia This accounts to both mining and processing of ores into commercial lithium-bearing con-centrates as well as the production of downstream products such as lithium carbonate andor lithium hydroxide In order to evaluate the potential for a lithium industry in Namibia the current global market and price developments need to be addressed
Currently the main application for lithium is in the chemical industry as lithium carbonate andor hydroxide for the manufacturing of lithium-ion batteries There is currently no domestic market (supply) or demand for this industry in Southern Africa or Namibia in specific Processing of lithium-bearing ores into these highly specific downstream products is economically more viable in close proximity to the demanding industries It also requires large investments (double-digit million dollars per 10000t of capacity) Additionally there is already huge capacity and strong capacity build up in Asia at rather low cost
The second most important application lies in the glass and ceramics industry This industry uses lithium either as lithium-bearing concentrates or lithium carbonate depending on current market price and processproduct require-ments There is currently no such industry established in Namibia but potential plans There is glass and ceramics manufacturing in South Africa and thus a potential market for lithium bearing products (concentrates) should this indus-try require it depending on product
The 20182019 primary lithium supply based on spodumene-bearing mineral concentrates was dominated by Australia with a market share of well over 95 On an annual basis the country exports more than three million tons of lithium-bearing concentrates to China To put this into perspective Lepidico plans to export just 58 ktpa of concentrate to Abu Dhabi for refinement from their project annually Therefore potential production in Namibia will always be rather small scale when compared to peer producing countriescompanies
As of late 2020 the concentrate market is in strong oversupply with strong competition Thus prices have eroded quite substantially for a standard SC6 concentrate (Fig 24) In general prices vary significantly based on lithium content and impurities of the concentrates Lithium bearing mineral concen-
Lithium Potential in Namibia
49
trates are a relatively low-value mineral commodity when compared to lithi-um-carbonate or other lithium downstream products thus product quality cost reduction and cost control are key components in this industry Since prices are depressed currently many of the Australian producers have drasti-cally reduced output or even went into care and maintenance This situation may change towards 2025 or beyond as demand picks up
Prices for the higher valued product lithium-carbonate spiked at the end of 2017 towards 2018 to more than 20000 $USt on a contract basis with prices being very volatile Since then prices have also eroded to below 9000 $USt due to oversupply and slow demand pickup (Fig 25) With this product stable quality and chemical composition are crucial for the downstream industry
Based on available gradetonnage data the Namibian projectsprospects are relatively small in overall size and low in grade when compared to global peers for the resource category ldquoMeasuredIndicatedrdquo (Appendix B) Total contained lithium quantity is thus relatively small in comparison On a global scale the most promising hard rock projects that are currently being mined and developed have Li2O grades of 10 or above
Fig 24 Lithium-mineral-concentrate prices 012010 ‒ 062020 (Source BGR 2020)
300
400
500
600
700
800
900
1000
1100
208
210
212
214
216
218
220
US$
t US$t
01-20
14
01-20
15
01-20
16
01-20
17
01-20
18
01-20
19
01-20
20
01-20
10
01-20
11
01-20
12
01-20
13
Spodumene min 5-6 LiO2 fob Australia
Spodumene concentrate gt75 LiO2 bulk cif Asia
Petalite 42 LiO2 fob Durban
Spodumene fob Australia
Spodumene min 5-6 LiO2 cif China
Lithium Potential in Namibia
50
For the resource category ldquoIndicatedrdquo which generally represents the lowest level of confidence only the Uis mine project of AfriTin represents a size-able resource even though grades are relatively low (Appendix C) The Uis tailings project as well as the Rubicon project are again relatively small when compared to their global peers Tantalite Valley is the smallest of all included projects (Appendix C)The given data for the De Rust project reflects only an exploration target of the company rather than actual data and may thus be not representative
Based on size and contained lithium-content none of the visited early stage projectsprospects would justify the financial investment into the construction of a chemical conversion plant for the production of lithium carbonate andor hydroxide on site as it requires very large monetary investments Due to their size payback of the required investments may be unfavorable when compared to global peers In addition the current market environment is very harsh with strong competition from Asia that has a huge cost advantage due to capacity build up This industry is also very energy and water intensive
In addition location within Namibia as well as distance to possible down-stream markets may become an issue as it increases the transportation cost
4000
7000
10000
13000
16000
19000
22000
25000
28000
01-20
14
01-20
15
01-20
16
01-20
17
01-20
18
01-20
19
01-20
20
US$
t
Lithium-carbonate (min 995 ) battery grade spot price ex works domestic ChinaLithium-carbonate (min 99-995 ) Li2CO3 large contracts USA delivered continentalLithium-hydroxid-monohydrate (min 565) technical and industrial grades cif China Japan amp Korea
Fig 25 Lithium chemical prices 012014 ndash 062020 (Source BGR 2020)
Lithium Potential in Namibia
51
immensely This is especially true for the SorisDe Rust pegmatite which is in a remote location without any allocated infrastructure The projects Karibib Uis and Tantalite Valley are much easier to access
The approach of Lepidico to produce a lithium bearing concentrate on site seems plausible approach Since this will already require a skilled workforce mining and beneficiation equipment in order to produce a high quality lithium-bearing concentrate it may already be considered ldquoadded valuerdquo for the indus-try of the country This approach may also be suitable for the other mentioned and visited projects
Lithium Potential in Namibia
52
ReferencesAfriTin Mining (2020) Uis Tin Project ndash Company Information ndash URL httpafritinminingcomuis-project [as of 092020]
Australian Government Geoscience Australia (2019) Australiarsquos Identi-fied Mineral Resources 2019 ndash URL httpswwwgagovauscientific-topicsmineralsmineral-resources-and-adviceaimr [as of 092020]
BGR ndash Bundesanstalt fuumlr Geowissenschaften und Rohstoffe (2020) Fachinformationssystem Rohstoffe ndash unpubl Hannover [as of 082020]
BGS ndash British Geological Survey (2016) Lithium Definitions mineralo-gy and deposits ndash URL httpswwwbgsacukdownloadsstartcfmid=3100 [as of 062016]
Diehl B J M (1990) Pegmatites of the Cape Cross Uis ndash Pegmatite Belt Namibia Geology mineralisation Rubidium Strontium characteristics and petrogenesis of rare metal pegmatites Open File Report EG 083 Economic Geology Series Geological Survey of Namibia 39 pp Windhoek
Diehl B J M (1992a) Lithium Caesium Beryllium Open File Report Mineral Resource Series Geological Survey of Namibia 18 pp Windhoek
Diehl B J M (1992b) Niobium and Tantalum Open File Report Mineral Resource Series Geological Survey of Namibia 20 pp Windhoek
Diehl B J M (1992c) Tin Open File Report Mineral Resource Series Geological Survey of Namibia 30 pp Windhoek
Diehl B J M amp Schneider G I C (1990) Geology and mineralisation of the Rubicon Pegmatite Namibia Open File Report Geol Surv Namibia 20 pp Windhoek
Fuchsloch et al (2018) Classification mineralogical and geochemical vari-ations in pegmatites of the Cape Cross-Uis pegmatite belt Namibia Lithos 296 ndash 299 79-95 elsevier
Lithium Potential in Namibia
53
Garret D E (2004) Handbook Of Lithium And Natural Calcium Chloride Their Deposits Processing Uses and Properties ndash 467 S Oxford (Elsevier B V)
Geological Survey of Namibia (2002) Mineral Resources of Namibia Summary of Mineral Deposits and Occurrences Omaruru Sheet 2114 Volume I ndash Complete Descriptions 119 pp Windhoek
IHS Global SA (2020) Global Trade Atlas ndash Commercial Online-Databa-se ndashURL httpsmyihscomConnectcallingUrl=https3a2f2fconnectihsmarkitcom2f [as of 062017]
Kazera Global Investments PLC (2020) Company Information ndash URL httpskazeraglobalcominvestmentsnamibia-tantalite-investment-mine [as of 092020]
Lepidico (2019) LOI with BASF extended to 31 December 2020 ndash News Release ndash URL httpswwwlepidicocomwp-contentuploads201910LPD-191220-LOI-with-BASF-extended-to-31-December-2020pdf [as of 122019]
Lepidico (2019) Corporate Presentation ndash URL httpswwwlepidicocomwp-contentuploads201907LPD-190509-Corporate-Presentati-on-May-2019pdf [as of 052019]
Lepidico (2020) Company Information ndash URL httpswwwlepidicocomprojectskaribib [as of 092020]
Montero Mining amp Exploration Ltd (2018) Exploring Battery Metals in Namibia ndash Company Presentation ndash URL httpswwwproactiveinvestorscomauuploadSponsorFileFile2018_031520244941_MON-CorporatePre-sentationMarch2018pdf [as of 072018]
Montero Mining amp Exploration Ltd (2019) Montero Files NI 43-101 Resource Estimate On The Uis Lithium-Tin Tailings Project In Namibia On Sedar ndash News Announcement ndash URL httpsmonterominingcommontero-files-ni-43-101-resource-estimate-on-the-uis-lithium-tin-tailings-project-in-namibia-on-sedar [as of 032019]
Lithium Potential in Namibia
54
Namibia Mining Cadastre Portal (2020) Online-Database ndashURL httpsportalslandfoliocomnamibia [as of 092020]
Roskill Information Services Ltd (2016) Lithium Global Industry Mar-kets amp Outlook ndash 386 S London Groszligbritannien
Schneider G I C (1992) Feldspar Open File Report MRS 08 Mineral Resource Series Geological Survey of Namibia 2 pp Windhoek
Schmidt M (2017) Rohstoffrisikobewertung ndash Lithium ndash DERA Rohstoffin-formationen 33 Berlin
S amp P Global Market Intelligence (2020) Lithium - Metals amp Mining Properties URL httpsplatformmarketintelligencespglobalcomwebcli-entauth=inheritindustryminingProjects [as of 092020]
Statista (2020) Distribution of lithium end-usage worldwide in 2019 by area application ndash URL httpswwwstatistacomstatistics268787lithium-usa-ge-in-the-world-market [as of 062020]
Tawana Resources NL (2016) Tawana acquires second lithium pro-ject ndash News Release ndash URL httpsmstrademomentumcozajsepdfSENS_20160923_S376505pdf [as of 092016]
USGS ndash United States Geological Survey (multiple years) Lithium ndash Minerals Commodity Summaries ndash URL httpswwwusgsgovcentersnmiclithium-statistics-and-information [as of 082020]
Appendix
Sam
ple I
DFa
rmLa
titud
eLo
ngitu
deSa
mpl
e des
crip
tion
(XRD
qu
al)
LiO 2
()
SiO 2
Ti
O 2
Al2O 3
Fe2O 3
Mn
O Mg
O Ca
O Na
2O
K 2O P 2O 5
SO
3
Cl
F
LOI
Su
m
2015
-03
previous sample campaignsHelik
on
n A
Felds
parQ
uartz
Lepid
olite
025
6871
lt000
119
0500
200
2900
505
3292
806
7905
59lt0
01lt0
002
lt005
093
9985
2016
-12
Rubic
onwe
ather
ed P
etalite
126
6473
lt000
118
0600
703
2718
607
9507
805
2500
62lt0
01lt0
002
lt005
1146
9871
2016
-17
Rubic
onLe
pidoli
te +
Quar
tz13
063
6700
219
9316
0929
003
0054
029
6218
0052
lt001
lt000
226
232
798
67
2016
-20
Helik
onLe
pidoli
te + A
lbite
176
5514
lt000
126
8700
401
2100
700
2123
970
3900
45lt0
01lt0
002
156
369
9698
2016
-21
Helik
onLe
pidoli
te19
954
32lt0
001
2627
004
0224
006
0038
266
714
0069
lt001
lt000
240
628
997
77
FN20
19_0
4De
Rus
tFe
ldspa
rAmb
lygon
iteP
etalite
(n
on X
RD)
003
6513
lt000
118
82lt0
0100
0200
101
0924
311
4105
75lt0
0100
04lt0
0503
898
84
2015
-09
Molop
oPe
talite
(non
XRD
)00
952
85lt0
001
1672
lt001
0002
487
0323
342
0352
lt000
100
400
3403
621
1310
012
2016
-14
Molop
oPe
talite
wea
there
d (no
n XRD
)00
752
1600
0316
5100
200
5147
805
8923
406
4500
6900
200
8602
222
6310
013
2016
-15
Molop
oFe
ldspa
r (no
n XRD
)00
664
02lt0
001
1937
003
0004
003
0151
216
1249
0796
lt001
lt000
2lt0
0505
399
55
2016
-23
Molop
oZin
nwald
ite (n
on X
RD)
006
5044
0068
3307
048
0011
012
0426
261
7674
0181
lt001
lt000
2lt0
0542
9925
1909
249
2019Uis
Tailin
gs
Quar
tzFe
ldspa
rPeta
lite
Musc
ovite
028
7293
0045
1479
051
0062
0212
9830
927
6613
6200
2lt00
02lt0
0523
399
38
1909
250
Uis
Tailin
gsQu
artz
Felds
parP
etalite
Mu
scov
ite02
872
6900
4314
8205
0059
019
1306
313
2794
1347
002lt
0002
lt005
251
9937
1909
251
Helik
on 4
22deg02prime4
8primeprimeS1
6deg01prime30
primeprimeEQu
artz
Felds
parP
etalite
Le
pidoli
te16
464
4400
0319
4200
301
2100
408
8325
345
6806
800
400
0727
228
998
38
1909
252
Helik
on 1
22deg02prime2
0primeprimeS1
6deg01prime19
primeprimeEPe
talite
Lepid
olite
Quar
tz29
576
9200
0116
6800
300
0304
101
7301
106
8100
01lt0
01lt0
002
lt005
205
97
App
endi
x A
Ana
lytic
al d
ata
of li
thiu
m s
ampl
es c
olle
cted
in N
amib
ia T
hres
hold
val
ues
high
light
ed in
gre
en
Lithium Potential in Namibia
57
Sam
ple I
DFa
rmLa
titud
eLo
ngitu
deSa
mpl
e des
crip
tion
(XRD
qu
al)
LiO 2
()
SiO 2
Ti
O 2
Al2O 3
Fe2O 3
Mn
O Mg
O Ca
O Na
2O
K 2O P 2O 5
SO
3
Cl
F
LOI
Su
m
1909
253
2019Rubic
on22deg06prime1
3primeprimeS1
5deg59prime45
primeprimeEPe
talite
Lepid
olite
Quar
tz32
778
73lt0
001
1687
002
0006
002
0157
011
003
0002
003
0003
lt005
075
9663
1909
254
Rubic
on22deg06prime1
0primeprimeS1
5deg59prime41
primeprimeEFe
ldspa
rQua
rtzM
usco
vite
004
682
lt000
119
3500
300
2400
205
0610
0808
6804
3lt0
01lt0
002
lt005
041
9985
1909
255
Rubic
on22deg06prime1
0primeprimeS1
5deg59prime41
primeprimeEFe
ldspa
rLep
idolite
Mus
co-
viteK
aolin
026
6104
0004
2318
022
0136
006
0119
367
8411
0159
lt001
lt000
2lt0
0522
299
15
1909
256
Rubic
on22deg06prime1
0primeprimeS1
5deg59prime41
primeprimeELe
pidoli
te 27
249
8700
129
3400
408
0500
400
704
697
3100
31lt0
01lt0
002
087
441
9569
1909
257
Rubic
on22deg06prime1
3primeprimeS1
5deg59prime45
primeprimeEPe
talite
Lepid
olite
Quar
tz30
670
0900
0320
2600
801
0901
502
9901
926
800
15lt0
0100
04lt0
0526
596
48
1909
258
Rubic
on22deg06prime1
0primeprimeS1
5deg59prime41
primeprimeELe
pidoli
teFe
ldspa
rQua
rtz20
659
7800
0224
100
505
2400
300
513
7247
0051
lt001
0002
265
388
9966
1909
259
Tanta
lite
Valle
y28deg43prime0
9primeprimeS1
8deg43prime55
primeprimeEFe
ldspa
rLep
idolite
Mus
covit
e11
762
64lt0
001
2139
004
0161
lt001
0399
7731
2401
0900
200
119
912
698
85
1909
260
Tanta
lite
Valle
y28deg43prime0
9primeprimeS1
8deg43prime55
primeprimeEFe
ldspa
rLep
idolite
Mus
covit
e03
059
8600
1425
1301
604
2200
302
2860
547
2201
3900
200
0904
123
799
56
1909
261
Tanta
lite
Valle
y28deg43prime0
9primeprimeS1
8deg43prime55
primeprimeEFe
ldspa
rQua
rtzM
usco
vite
003
636
0005
2218
022
0122
002
0381
727
3809
0272
lt001
lt000
2lt0
0513
199
17
1909
262
Tanta
lite
Valle
y28deg43prime2
0primeprimeS1
8deg44prime23
primeprimeEQu
artzSp
odum
eneM
us-
covit
e13
180
5100
0415
8903
401
2401
301
9502
604
0400
0500
200
03lt0
0507
398
56
1909
263
De R
ust
20deg57prime4
8primeprimeS1
4deg30prime13
primeprimeEFelsd
parS
podume
neQuartz
074
7313
0006
2048
007
015
005
0154
398
0831
0073
001
0003
lt005
082
9974
1909
264
De R
ust
20deg57prime4
8primeprimeS1
4deg30prime13
primeprimeESp
odum
eneF
eldsparQuartz
230
6924
0006
2602
801
0200
301
0510
102
1400
68lt0
0100
03lt0
0504
897
53
(Con
tinue
d) A
ppen
dix
A A
naly
tical
dat
a of
lith
ium
sam
ples
col
lect
ed in
Nam
ibia
Thr
esho
ld v
alue
s hi
ghlig
hted
in g
reen
Lithium Potential in Namibia
58
Appendix B GradeTonnage data (Measured amp Indicated) for selected lithium projects in comparison to Namibian projects (Source SampP 092020)
0
0500
1000
1500
2000
2500
500
5000
5000
0
5000
00
5000
000
Gra
de [
Li 2O
]
Tonnage [t]
Tantalite Valley
Rubicon
Appendix B GradeTonnage data (Inferred) for selected lithium projects in com-parison to Namibian projects (Source SampP 092020)
0
0500
1000
1500
2000
2500
100
1000
1000
0
1000
00
1000
000
1000
0000
Gra
de [
Li 2O
]
Tonnage [t]
Tantalite ValleyRubicon
Uis Tailings
Uis Mine
De Rust
A product of the technical cooperation project between Bundesanstalt fuumlr Geowissenschaften und Rohstoffe (BGR)(Federal Institute for Geosciences and Natural Resources)
andGeological Survey of Namibia within the Ministry of Mines and Energy
ISBN 978-3-948532-29-1 (Print) 978-3-948532-30-7 (PDF)
- List of Abbreviations
- 1 Introduction
- 2 What is lithium
-
- 21 Lithium deposits
-
- 3 Application
- 4 Chemical requirements
- 5 Mining and trade of lithium in the SADC
-
- 51 Lithium production
- 52 Trade data
- 53 Export
- 54Import
-
- 6 Lithium occurrences in Namibia
- 7 Lithium mining in Namibia
-
- 71 Current mining activities and projects
-
- 8 Analysed lithium samples
- 9 Interpretation
- 10 Conclusions
- References
-

Lithium Potential in Namibia
28
The project can be reached via paved but mostly unpaved roads from the town of Uis From White Lady Lodge which is about 38 km northwest from Uis a 35 km gravel road leads towards the project 15 km of which are in the riverbed of the Ugab River There is currently no electricity and water supply at the project location site
According to SampP Global (022020) current owner of the Soris project is Mon-tero Mining amp Exploration Ltd (TSXV MON) which holds 80 interest of the property Another 20 are allocated to an unnamed private owner Based on data from the Namibia Mining Cadastre Portal (092020) multiple entries for mining licence applications exist for the area where the main De Rust pegmatite is located (Fig 9)
Resource estimateDue to the early stage of the Soris project no resource estimate is avail-able However Montero Mining claims the project to be drill ready targeting a resource of 10 Mt 1 Li2O with tantalum and tin by-product credits This would equate to 46400 t of lithium or 247000 t LCE
Grab samples of the deposit showed lithium contents of 007 to 532 aver-aging 137 Channel samples showed average lithium contents of 076 and values up to 366 (Montero 032019) The company also re-assessed 1097 previously tested RC drill samples The main lithium-bearing mineral is spodumene
Remnants of historic intermittent mining activities like old foundations and quartzo-feldspathic tailings are still visible east to the main pegmatite (Fig 10 ‒ 11)
Lithium Potential in Namibia
29
Fig 10 Remnants of historic open pit mining (upper) and tailings of De Rust pegmatite (lower) northwest of the Brandberg massif (Photo BGR-GSN 2019)
Fig 9 Satellite image of the De Rust project including the outlined mining license Main pegmatite coordinates 20deg57prime48primeprimeS ‒ 14deg30prime12primeprimeE (Source httpportalsflexicadastrecomnamibia 092020)
Main pegmatite
Lithium Potential in Namibia
30
Fig 12 Weathered spodumene chrystals at the historic open pit mine (Photo BGR-GSN 2019)
Fig 11 Historic open pit of the De Rust pegmatite (Photo BGR-GSN 2019)
Lithium Potential in Namibia
31
Uis The Uis projects (former mine and tailings) are located in the northern part of the ldquoCape Cross Uis pegmatite beltrdquo east of the town of Uis on the farm Uis Townlands No 215 in the Erongo region of Namibia
The Cape Cross-Uis belt is approx 120 km long and up to 40 km wide and extends in a NE direction (Fig 7) It comprises three distinct pegmatite swarms the Strathmore swarm Karlowa swarm and Uis pegmatite swarm In general lithium-bearing pegmatites (Li-Nb-Ta-Sn-Be and Li-Nb-Ta-Sn) are the least common in this belt (Fuchsloch et al 2018)
The Uis swarm field consists of more than 120 individual pegmatites each with a northeasterly to easterly strike direction and northwesterly down dip (30deg ‒ 70deg) This field is accompanied by a peripheral pegmatite field of approx 25 individual pegmatites
Some of the main pegmatites especially around the formerly worldrsquos largest tin mine at Uis are exceedingly large Some of them are up to 1 km long and some 50 m wide
In terms of lithium petalite amblygonite and minor spodumene mineralization occurs in the various pegmatites but no lepidolite Most common lithium bear-ing minerals in the eight pegmatites that were mined at Uis are amblygonite petalite and spodumene
Currently the Uis tailings project and the Uis tin mine are owned by two differ-ent companies As of 2020 the tin mine is operating a pilot processing plant and aims to ramp up the production of lithium in the near future The current ownership of the tailings project as of September 2020 is unclear
The nearest commercial deep-water port to the projects is Walvis Bay 220 km to the southeast The town of Omaruru is 130 km to the east and Henties Bay lies about 120 km to the southwest The nearest railhead is located in Omaruru The area is accessible year-round by paved and un-paved roads NamPower provides electricity and the town of Uis is connected to the Nam-Water pipeline
Lithium Potential in Namibia
32
The tin deposit was discovered in 1911 and mined between the 1950s and 1989 for cassiterite by Uis Tin Mining Company (SWA) Ltd and IMCOR
Coarse tailings are located in the northern part of the former mine just south to the main road C36 (Fig 13) The fine material is located south to the coarse waste dumps (Fig 13)
After 1990 multiple companies owned the property until AfriTin Mining Ltd bought all the rights (license ML134) The current lithium tailings project of Montero Mining amp Exploration Ltd (TSXV MON) is based on the historic mine tailings of the former tin mine on mining license ML134 that is currently owned by AfriTin Mining Ltd The acquired tailings material does not fall under the ML134 license of AfriTin since historical tailings material (Fig 14) is not regulated by Minerals (Prospecting and Mining) Act 33 of 1992 of Namibia
Resource estimateUis tin mineAccording to AfriTin the former Uis mine holds a JORC compliant resource (inferred) of 715 Mt of ore 0134 Sn with a cut-off grade of 005 Sn (AfriTin 2020) Grades of ancillary elements are given at 063 Li2O and 85 ppm Ta for the total resource of 71 Mt of ore
This equals to approx 95000 t of tin 209000 t of lithium (11 Mt LCE) and 6090 t of tantalum 85 of the total resource are attributable to the company The remaining 15 are allocated to SMU (Small Miners of Uis)
Uis tailingsMontero Mining filed an inferred resource estimate of 144 Mt of ore 037 Li2O and 005 SnO2 with a 035 Li2O cut-off grade for lithium and assumed processing recoveries of 70 for their tailings project (Montero 2019) This equals to approx 24700 t of lithium content (131500 t LCE) and 7200 t SnO2
This resource estimate only includes coarse tailings material There is current-ly no information on the lithium content of the fine tailings material that totals 271 Mt t due to insufficient or no test work (Montero 2018) The company also states that the average Li2O grade of the fines material does not hurdle the cut-off for the fines of 082 Li2O
Lithium Potential in Namibia
33
In 2016 Australian based Tawana Resources carried out a drilling program at Uis for a private company called Lithium Africa 1 on the fine and coarse tailings (Table 3 Hole 1 amp Hole 2) Below some of the obtained data on lithium content is given Additionally Li2O content of two obtained grab samples by BGR (Table 3 Sample 2019a amp 2019b) is given
Table 3 Sample data Uis (Tawana 2016 Montero 2018 BGR 2019)
Sample Sample 0 to 1m Li2O ()
Sample 1 to 2m Li2O ()
Sample 2 to 3m Li2O ()
Fines Hole 1 071 085 092
Fines Hole 2 080 089 095
Coarse Hole 1 050 043 043
Coarse Hole 2 054 062 062
BGR Sam-ple 2019a (Coarse tailings)
028
BGR Sam-ple 2019b (Coarse tailings)
028
Montero NI 43-101 037
Lithium Potential in Namibia
34
Fig 14 Tailings of the historic Uis Tin Mine (Photo BGR-GSN 2019 with kind permission of AfriTin Mining Limited)
Fig 13 Former Uis tin mine Uis tailings project with coarse tailings Tailings coordina-tes (center) 21deg13prime31primeprimeS ‒ 14deg52prime44primeprimeE (Source httpportalsflexicadastrecomnamibia 092020)
Uis Tailings (coarse)
Uis Tailings (fine)
Historic Uis mine
Lithium Potential in Namibia
35
Karibib Lepidolite ProjectThe Karibib Lepidolite brownfield project is located in the ldquoKaribib ndash Usakos Pegmatite Districtrdquo southeast of the town of Karibib on the farm Okongava Ost No 72 in central Namibia (Fig 15 ‒ 16)
This pegmatite district which is of Damaran age hosts the most important pegmatite occurrence (Rubicon swarm) in terms of lithium in Namibia In addi-tion numerous other different pegmatite swarms some of which have previ-ously been relevant in terms of lithium are know from this district These are Dernburg Karlsbrunn Albrechtshoumlhe Berger Kaliombo Gamikaubmund Okatjimukuju Etusis Daheim Friedrichsfelde and Etiro (Diehl 1992a)
The Rubicon pegmatite itself is the largest of the individual pegmatites that occur in this field and has been the prime source of lithium until mining seized in the early 1990s The Helikon pegmatites are part of the Rubicon pegmatite swarm and are located northeast to the Rubicon pegmatite They have previ-ously been mined for lepidolite amblygonite petalite and muscovite beryll pollucite quartz and columbite-tantalite as valuable by-products (Fig 18 ‒ 19)
The pegmatite itself consist of two ellipsoidal well zoned Li-mineralized ore-bodies The larger one is about 320 m long and 25 ndash 35 m wide It dips at 46deg to the northeast and has a northwesterly strike The second orebody is about 230 m long and about 10 m wide It is dipping with 30deg to the northeast and has a northwesterly strike In total the outcrop of the Rubicon pegmatite is about 600 m long with a maximum width of 65 m (Fig 17)
A very prominent feature is the presence of a very well developed concen-tric shell and zones from the footwall to the inner core of the pegmatite Both orebodies exhibit a border- wall- intermediate- and core-zone
Border-zone wall-zone and outer intermediate zone of the larger orebody do not contain Li-bearing minerals of economic importance The inner interme-diate zone does contain lepidolite The outer core zone may be sub-divided into a petalite zone low-grade lepidolite zone and a high-grade lepidolite zone The inner core zone also contains a petalite zone Mining occurred pre-viously in the later named zones The zonation of the smaller orebody to the northwest is less pronounced but Li-mineralization and style are equal to the
Lithium Potential in Namibia
36
larger orebody There is no spodumene mineralization within the orebodies and respectively zones of the Rubicon pegmatite
The Helikon I pegmatite is also a lens-shaped pegmatite with a length of roughly 400 m and a width of approx 66 m It dips to the north with about 60deg ndash 70deg Helikon I also consists of well-defined zones The main Li-bearing minerals are lepidolite and petalite According to Roering (1963) the lepidolite is difficult to separate from the intergrown albite and hence of low grade and quality
The Helikon II pegmatite is approx 17 km long and only 9 ndash 15 m wide It lies a bit north of Helikon I and dips steeply to the north with 55deg ndash 80deg striking east west The main Li-bearing minerals are lepidolite and petalite According to Diehl (1990) the westernmost portion of the pegmatite has historically been the economically most important A massive up to 6 m wide petalite zone was mined here according to Diehl (1990)
The nearest railhead to the project is 17 km away in Karibib and the deep-water port of Walvis Bay is 220 km to the southwest Windhoek is about 180 km to the southeast NamPower connects the town of Karibib to electricity and the project currently utilizes generators There is a 7 km long 22 kV power line spur to grid connection pending (Lepidico 2020) Water is available via on-site boreholes
The project was previously owned by Desert Lion Energy Inc (TSVX DLI) Lepidico Ltd (ASX LPD) bought into the project and currently holds 80 interest which comprises Mining License 204 (69 km2) as well as three Exclu-sive Prospecting Licenses (EPLs) namely 5439 5555 and 5781 (Lepidico 2020)
Lepidico will cover mining from multiple sources as well as chemical conver-sion by utilizing their proprietary lithium processing technologies L-Maxreg LOH-Maxreg and S-Maxreg (Lepidico 052019) The company aims to produce high purity lithium chemicals such as lithium carbonate and lithium hydroxide
The takeover also included a nonbinding offtake agreement between the for-mer owner Desert Lion Energy Inc and German chemical company BASF On April 2nd 2019 Desert Lion Energy Inc announced this offtake agreement
Lithium Potential in Namibia
37
which at the time was valid through to December 31 2019 On December 20th
2019 Lepidico announced that the LOI with BASF was extended to Decem-ber 31st 2020 (Lepidico 122019)
The feasibility study criteria of Lepidico are as follows
- Throughput of the concentrator on-site of 035 Mtpa- Expansion of throughput after year five to 05 Mtpa- Chemical plant in the industrial city of Abu Dabi (ICAD)- Plant design for 58000 tpa of concentrate (4 LiO2) for the production of
up to 5500 tpa LiOH- Utilization of L-Maxreg and LOH-MaxTM- Non-binding off-take MOU with BASF for LiOH only- Targeting for project commissioning to commence late 2021 for commer-
cial production in 2022
The preliminary mine plan indicates a strip ratio of 03 ndash 1 for the first two years The ratio will then go up to 1 ndash 14 In the first four years elevated grades of 06 LiO2 will be mined
Resource estimateA JORC 2012 compliant resource estimate for the deposit is given in Table 4 (Lepidico 2020) The deposit currently holds 23200 t of lithium (Indicated amp Inferred) based on a cut-off grade of 015 Li2O This resource estimate is based solely on the lepidolite occurrences at the mine site
Table 4 Resource estimate Karibib Lepidolite Project (Source Lepidico 2020)
Deposit Resource Category
Cut-off (Li2O)
Ore (Mt)
Li2O ()
Li (t)
Li (LCE)
Rubicon Measured
015
22 057 5819 30974
Rubicon Indicated 666 038 11637 61943
Rubicon Inferred 237 043 4728 25167
Helikon
Total 015 1124 043 22184 118086
Lithium Potential in Namibia
38
Fig 16 Satellite image of the Karibib Lepidolite project Helikon 1 coordinates (center) 22deg2prime49primeprimeS ‒ 16deg1prime13primeprimeE Helikon 4 coordinates (center) 22deg2prime24primeprimeS ‒ 16deg1prime41primeprimeE (Source httpportalsflexicadastrecomnamibia 092020)
Fig 15 Satellite image of the Karibib Lepidolite project Rubicon coordinates (center) 22deg6prime11primeprimeS ‒ 15deg59prime44primeprimeE (Source httpportalsflexicadastrecomnamibia 092020)
Historic Rubicon mine
Helikon 1
Helikon 4
Lithium Potential in Namibia
39Fig 17 Rubicon pegmatite (Photo BGR-GSN 2019 with kind permission of Lepidico Chemicals Namibia (Pty) Ltd 2020)
Lithium Potential in Namibia
40 Fig 18 Lepidolite sample from Rubicon pegmatite (Photo BGR-GSN 2019 with kind permission of Lepidico Chemicals Namibia (Pty) Ltd 2020)
Fig 19 Petalite sample from Rubicon pegmatite (Photo BGR-GSN 2019 with kind permission of Lepidico Chemicals Namibia (Pty) Ltd 2020)
Lithium Potential in Namibia
42
Fig 21 Helikon 4 pegmatite (Photo BGR-GSN 2019 with kind permission of Lepidico Chemicals Namibia (Pty) Ltd 2020)
Fig 20 Helikon 1 pegmatite (Photo BGR-GSN 2019 with kind permission of Lepidico Chemicals Namibia (Pty) Ltd 2020)
Lithium Potential in Namibia
43
Tantalite ValleyThe Tantalite Valley Project lies within the ldquoNamaqua Metamorphic Complexrdquo in Southern Namibia Within this complex Lithium-Caesium-Tantalum (LCT) pegmatites occur in two main areas Tantalite-Valley south of Warmbad in close proximity to the northwest-trending Tantalite Valley Shear Belt and the Sandfontein-Ramansdrift area close to the Orange River
The area were the pegmatites of the Tantalite Valley occur is primarily com-posed of a large ovoid gabbro intrusion (71 km by 33 km in extent) within paragneiss units of the Namaqua Complex The gabbro outcrop forms a large dome shaped mountain that rises about 500 m above the surrounding topo-graphy
The pegmatites belong to the Kenhardt and Gordonia pegmatite districts in Namaqualand but only the younger group of them carry accessory ore miner-als such as tantalite beryl REE minerals and lithium
The Tantalite Valley pegmatites include several individual subhorizonal dikes that are up to 1000 m long and 02 to 40 m wide plunging towards southeast (Diehl 1992b) Four of those are of economic interest Homestead Whitkop White City and the Lepidolite pegmatites (ie Purple Haze) (Fig 22)
They are all well zoned (quartz core inner and outer intermediate zones wall zone) and were predominantly targeted for beryl columbite-tantalite as well as lithium and bismuth minerals
The project is located on the farms Umeis 110 and Kinderzitt 132 between the Farms 109 131 129 308 and 473 in the magisterial district of Karas It currently comprises Mining License (ML-77) fully owned by Tameka Shelf Co Four (Pty) Ltd which is a 100 subsidiary of African Tantalite Pty Ltd (AFTAN) Above all Kazera Global Investments PLC holds a 75 stake in AFTAN (Kazera 2019) with the other 25 of local farmer ownership
The project is accessible via gravel road from Karasburg which is about 80 km to the north The nearest railhead is also located in Karasburg Electricity is currently supplied by generators and water is recovered from multiple drill holes The Orange River is about 15 km to the south of the project Mining
Lithium Potential in Namibia
44
infrastructure as well as equipment are on site as well as a plant for the pro-duction of tantalite concentrate
NTI is working on an extensive exploration program with a clear focus on revi-ving tantalite mining in Namibia with a possible by-product stream of lithium bearing minerals The company will focus primarily on the pegmatites Homes-tead Purple Haze Signaalberg and White City (Fig 23)
The area is known for its tantalum occurrences and since the late 1940s tantalite and other minerals have been recovered at Tantalite Valley until 1981 when mining ceased Initially alluvial deposits were mined followed by the pegmatites themselves Grades of the concentrates produced prior to the closure of the mine were quite high with 65 ‒ 70 Ta2O5 with very low U3O8
and ThO2 values of 025 max
Resource estimateAccording to SampP Global (092020) Measured and amp Indicated resources at Tantalite Valley are 104800 t of ore 0042 Ta2O5 and 0653 Li2O as of 112019 This would equate to 315 t of lithium or 1690 t LCE Total inferred resources are 517400 t of ore 0018 Ta2O5 and 0144 Li2O This equals to approx 91 t of tantalum and 750 t of lithium (3535 t LCE)
Lithium Potential in Namibia
45
Fig 23 White City pegmatite (Source Kazera global Investments PLC 2020)
Fig 22 Satellite image of the Tantalite Valley project White City pegmatite coordinates (center) 28deg43prime07primeprimeS ‒ 18deg44prime45primeprimeE Homestead pegmatite coordinates (center) 28deg43prime19primeprimeS - 18deg44prime24primeprimeE Purple Haze pegmatite coordinates (center) 28deg43prime09primeprimeS ‒ 18deg43prime55primeprimeE (Source httpportalsflexicadastrecomnamibia 092020)
Lithium Potential in Namibia
46
8 Analysed lithium samplesDuring the course of the cooperation project between the Economic Geology Division (EGD) of the Geological Survey of Namibia (GSN) and the Ger-man Federal Institute of Geosciences and Natural Resources (BGR) several sampling campaigns to southern and central pegmatites took place
The field trips were preceded by literature and data research regarding infor-mation on lithium occurrences andor previous lithium mining activity to iden-tify specific target areas
During a campaign in 2019 16 lithium-bearing mixed mineral samples were taken from five different locations and subsequently analyzed Two of the samples originate from the Uis Tin Mine Tailings of the former tin mine All remaining samples were taken either from stripped outcrops for future mine activities or from previous mine sites (ie pits)
All 16 samples were analyzed at BGR labs in Hanover Germany through qualitative XRD XRF and ICP-MS Given data shall be understood as a first indicator for the sampled lithium occurrences
Most if not all sampled occurrences have previously been analyzed or are cur-rently being assessed by the property owners or current licensees Detailed information of these sampling and analytical campaigns remain confidential and are thus not available for comparison
Appendix A lists the identified qualitative mineralogy of the samples as well as the major element analysis Additional samples from previous campaigns are also given
Interpretation of the results are based on their applicability in the various lithium-consuming industries for which information is available
Most of the current lithium applications require a chemical intermediate product such as lithium carbonate or lithium-hydroxide The glass and cera-mic industry does use lithium-bearing mineral concentrates depending on the prices of these materials when compared to LiCO3
Lithium Potential in Namibia
47
Since the main applications require an intermediate or downstream chemical product lithium content as well as impurity values are the main criteria for the suitability of the sampled occurrences Other quality criteria are particle size and surface areastructure
9 InterpretationAs previously stated all obtained grab samples are mixtures of lithium- bearing minerals (ie spodumene petalite lepidolite) feldspars quartz micas as well as secondary minerals Therefore all given analytical data has to be taken with caution and will not be representative for the individual outcrops or deposits
The evaluation of the economic suitability for various economic applications of the analysed lithium samples is based on the chemical specifications in Chapter 4
Lithium content gt 1 Li2O Fe2O3 content lt 015 as well as F content lt 01 are individually highlighted (Appendix A) as these three values are the most important
Based on the chemical analysis nine of the 16 samples showed Li2O contents of more than 1 (range 117 ‒ 327 ) Seven of those nine samples also exhibited low Fe2O3 content (range 004 ‒ 008 ) (Appendix A) Three of those seven samples also had fluorine values below 005
Of the ten additionally included samples from previous campaigns four showed Li2O contents of more than 1 (range 126 ‒ 199 ) Three of those samples also exhibited low Fe2O3 content (range 004 ‒ 007 ) (Appendix A) One of the three samples had fluorine values below 005
The mentioned samples (sources) could be of potential use but for further interpretation statistical sampling will be required
Lithium Potential in Namibia
48
10 ConclusionsThere is currently no lithium industry established in Namibia This accounts to both mining and processing of ores into commercial lithium-bearing con-centrates as well as the production of downstream products such as lithium carbonate andor lithium hydroxide In order to evaluate the potential for a lithium industry in Namibia the current global market and price developments need to be addressed
Currently the main application for lithium is in the chemical industry as lithium carbonate andor hydroxide for the manufacturing of lithium-ion batteries There is currently no domestic market (supply) or demand for this industry in Southern Africa or Namibia in specific Processing of lithium-bearing ores into these highly specific downstream products is economically more viable in close proximity to the demanding industries It also requires large investments (double-digit million dollars per 10000t of capacity) Additionally there is already huge capacity and strong capacity build up in Asia at rather low cost
The second most important application lies in the glass and ceramics industry This industry uses lithium either as lithium-bearing concentrates or lithium carbonate depending on current market price and processproduct require-ments There is currently no such industry established in Namibia but potential plans There is glass and ceramics manufacturing in South Africa and thus a potential market for lithium bearing products (concentrates) should this indus-try require it depending on product
The 20182019 primary lithium supply based on spodumene-bearing mineral concentrates was dominated by Australia with a market share of well over 95 On an annual basis the country exports more than three million tons of lithium-bearing concentrates to China To put this into perspective Lepidico plans to export just 58 ktpa of concentrate to Abu Dhabi for refinement from their project annually Therefore potential production in Namibia will always be rather small scale when compared to peer producing countriescompanies
As of late 2020 the concentrate market is in strong oversupply with strong competition Thus prices have eroded quite substantially for a standard SC6 concentrate (Fig 24) In general prices vary significantly based on lithium content and impurities of the concentrates Lithium bearing mineral concen-
Lithium Potential in Namibia
49
trates are a relatively low-value mineral commodity when compared to lithi-um-carbonate or other lithium downstream products thus product quality cost reduction and cost control are key components in this industry Since prices are depressed currently many of the Australian producers have drasti-cally reduced output or even went into care and maintenance This situation may change towards 2025 or beyond as demand picks up
Prices for the higher valued product lithium-carbonate spiked at the end of 2017 towards 2018 to more than 20000 $USt on a contract basis with prices being very volatile Since then prices have also eroded to below 9000 $USt due to oversupply and slow demand pickup (Fig 25) With this product stable quality and chemical composition are crucial for the downstream industry
Based on available gradetonnage data the Namibian projectsprospects are relatively small in overall size and low in grade when compared to global peers for the resource category ldquoMeasuredIndicatedrdquo (Appendix B) Total contained lithium quantity is thus relatively small in comparison On a global scale the most promising hard rock projects that are currently being mined and developed have Li2O grades of 10 or above
Fig 24 Lithium-mineral-concentrate prices 012010 ‒ 062020 (Source BGR 2020)
300
400
500
600
700
800
900
1000
1100
208
210
212
214
216
218
220
US$
t US$t
01-20
14
01-20
15
01-20
16
01-20
17
01-20
18
01-20
19
01-20
20
01-20
10
01-20
11
01-20
12
01-20
13
Spodumene min 5-6 LiO2 fob Australia
Spodumene concentrate gt75 LiO2 bulk cif Asia
Petalite 42 LiO2 fob Durban
Spodumene fob Australia
Spodumene min 5-6 LiO2 cif China
Lithium Potential in Namibia
50
For the resource category ldquoIndicatedrdquo which generally represents the lowest level of confidence only the Uis mine project of AfriTin represents a size-able resource even though grades are relatively low (Appendix C) The Uis tailings project as well as the Rubicon project are again relatively small when compared to their global peers Tantalite Valley is the smallest of all included projects (Appendix C)The given data for the De Rust project reflects only an exploration target of the company rather than actual data and may thus be not representative
Based on size and contained lithium-content none of the visited early stage projectsprospects would justify the financial investment into the construction of a chemical conversion plant for the production of lithium carbonate andor hydroxide on site as it requires very large monetary investments Due to their size payback of the required investments may be unfavorable when compared to global peers In addition the current market environment is very harsh with strong competition from Asia that has a huge cost advantage due to capacity build up This industry is also very energy and water intensive
In addition location within Namibia as well as distance to possible down-stream markets may become an issue as it increases the transportation cost
4000
7000
10000
13000
16000
19000
22000
25000
28000
01-20
14
01-20
15
01-20
16
01-20
17
01-20
18
01-20
19
01-20
20
US$
t
Lithium-carbonate (min 995 ) battery grade spot price ex works domestic ChinaLithium-carbonate (min 99-995 ) Li2CO3 large contracts USA delivered continentalLithium-hydroxid-monohydrate (min 565) technical and industrial grades cif China Japan amp Korea
Fig 25 Lithium chemical prices 012014 ndash 062020 (Source BGR 2020)
Lithium Potential in Namibia
51
immensely This is especially true for the SorisDe Rust pegmatite which is in a remote location without any allocated infrastructure The projects Karibib Uis and Tantalite Valley are much easier to access
The approach of Lepidico to produce a lithium bearing concentrate on site seems plausible approach Since this will already require a skilled workforce mining and beneficiation equipment in order to produce a high quality lithium-bearing concentrate it may already be considered ldquoadded valuerdquo for the indus-try of the country This approach may also be suitable for the other mentioned and visited projects
Lithium Potential in Namibia
52
ReferencesAfriTin Mining (2020) Uis Tin Project ndash Company Information ndash URL httpafritinminingcomuis-project [as of 092020]
Australian Government Geoscience Australia (2019) Australiarsquos Identi-fied Mineral Resources 2019 ndash URL httpswwwgagovauscientific-topicsmineralsmineral-resources-and-adviceaimr [as of 092020]
BGR ndash Bundesanstalt fuumlr Geowissenschaften und Rohstoffe (2020) Fachinformationssystem Rohstoffe ndash unpubl Hannover [as of 082020]
BGS ndash British Geological Survey (2016) Lithium Definitions mineralo-gy and deposits ndash URL httpswwwbgsacukdownloadsstartcfmid=3100 [as of 062016]
Diehl B J M (1990) Pegmatites of the Cape Cross Uis ndash Pegmatite Belt Namibia Geology mineralisation Rubidium Strontium characteristics and petrogenesis of rare metal pegmatites Open File Report EG 083 Economic Geology Series Geological Survey of Namibia 39 pp Windhoek
Diehl B J M (1992a) Lithium Caesium Beryllium Open File Report Mineral Resource Series Geological Survey of Namibia 18 pp Windhoek
Diehl B J M (1992b) Niobium and Tantalum Open File Report Mineral Resource Series Geological Survey of Namibia 20 pp Windhoek
Diehl B J M (1992c) Tin Open File Report Mineral Resource Series Geological Survey of Namibia 30 pp Windhoek
Diehl B J M amp Schneider G I C (1990) Geology and mineralisation of the Rubicon Pegmatite Namibia Open File Report Geol Surv Namibia 20 pp Windhoek
Fuchsloch et al (2018) Classification mineralogical and geochemical vari-ations in pegmatites of the Cape Cross-Uis pegmatite belt Namibia Lithos 296 ndash 299 79-95 elsevier
Lithium Potential in Namibia
53
Garret D E (2004) Handbook Of Lithium And Natural Calcium Chloride Their Deposits Processing Uses and Properties ndash 467 S Oxford (Elsevier B V)
Geological Survey of Namibia (2002) Mineral Resources of Namibia Summary of Mineral Deposits and Occurrences Omaruru Sheet 2114 Volume I ndash Complete Descriptions 119 pp Windhoek
IHS Global SA (2020) Global Trade Atlas ndash Commercial Online-Databa-se ndashURL httpsmyihscomConnectcallingUrl=https3a2f2fconnectihsmarkitcom2f [as of 062017]
Kazera Global Investments PLC (2020) Company Information ndash URL httpskazeraglobalcominvestmentsnamibia-tantalite-investment-mine [as of 092020]
Lepidico (2019) LOI with BASF extended to 31 December 2020 ndash News Release ndash URL httpswwwlepidicocomwp-contentuploads201910LPD-191220-LOI-with-BASF-extended-to-31-December-2020pdf [as of 122019]
Lepidico (2019) Corporate Presentation ndash URL httpswwwlepidicocomwp-contentuploads201907LPD-190509-Corporate-Presentati-on-May-2019pdf [as of 052019]
Lepidico (2020) Company Information ndash URL httpswwwlepidicocomprojectskaribib [as of 092020]
Montero Mining amp Exploration Ltd (2018) Exploring Battery Metals in Namibia ndash Company Presentation ndash URL httpswwwproactiveinvestorscomauuploadSponsorFileFile2018_031520244941_MON-CorporatePre-sentationMarch2018pdf [as of 072018]
Montero Mining amp Exploration Ltd (2019) Montero Files NI 43-101 Resource Estimate On The Uis Lithium-Tin Tailings Project In Namibia On Sedar ndash News Announcement ndash URL httpsmonterominingcommontero-files-ni-43-101-resource-estimate-on-the-uis-lithium-tin-tailings-project-in-namibia-on-sedar [as of 032019]
Lithium Potential in Namibia
54
Namibia Mining Cadastre Portal (2020) Online-Database ndashURL httpsportalslandfoliocomnamibia [as of 092020]
Roskill Information Services Ltd (2016) Lithium Global Industry Mar-kets amp Outlook ndash 386 S London Groszligbritannien
Schneider G I C (1992) Feldspar Open File Report MRS 08 Mineral Resource Series Geological Survey of Namibia 2 pp Windhoek
Schmidt M (2017) Rohstoffrisikobewertung ndash Lithium ndash DERA Rohstoffin-formationen 33 Berlin
S amp P Global Market Intelligence (2020) Lithium - Metals amp Mining Properties URL httpsplatformmarketintelligencespglobalcomwebcli-entauth=inheritindustryminingProjects [as of 092020]
Statista (2020) Distribution of lithium end-usage worldwide in 2019 by area application ndash URL httpswwwstatistacomstatistics268787lithium-usa-ge-in-the-world-market [as of 062020]
Tawana Resources NL (2016) Tawana acquires second lithium pro-ject ndash News Release ndash URL httpsmstrademomentumcozajsepdfSENS_20160923_S376505pdf [as of 092016]
USGS ndash United States Geological Survey (multiple years) Lithium ndash Minerals Commodity Summaries ndash URL httpswwwusgsgovcentersnmiclithium-statistics-and-information [as of 082020]
Appendix
Sam
ple I
DFa
rmLa
titud
eLo
ngitu
deSa
mpl
e des
crip
tion
(XRD
qu
al)
LiO 2
()
SiO 2
Ti
O 2
Al2O 3
Fe2O 3
Mn
O Mg
O Ca
O Na
2O
K 2O P 2O 5
SO
3
Cl
F
LOI
Su
m
2015
-03
previous sample campaignsHelik
on
n A
Felds
parQ
uartz
Lepid
olite
025
6871
lt000
119
0500
200
2900
505
3292
806
7905
59lt0
01lt0
002
lt005
093
9985
2016
-12
Rubic
onwe
ather
ed P
etalite
126
6473
lt000
118
0600
703
2718
607
9507
805
2500
62lt0
01lt0
002
lt005
1146
9871
2016
-17
Rubic
onLe
pidoli
te +
Quar
tz13
063
6700
219
9316
0929
003
0054
029
6218
0052
lt001
lt000
226
232
798
67
2016
-20
Helik
onLe
pidoli
te + A
lbite
176
5514
lt000
126
8700
401
2100
700
2123
970
3900
45lt0
01lt0
002
156
369
9698
2016
-21
Helik
onLe
pidoli
te19
954
32lt0
001
2627
004
0224
006
0038
266
714
0069
lt001
lt000
240
628
997
77
FN20
19_0
4De
Rus
tFe
ldspa
rAmb
lygon
iteP
etalite
(n
on X
RD)
003
6513
lt000
118
82lt0
0100
0200
101
0924
311
4105
75lt0
0100
04lt0
0503
898
84
2015
-09
Molop
oPe
talite
(non
XRD
)00
952
85lt0
001
1672
lt001
0002
487
0323
342
0352
lt000
100
400
3403
621
1310
012
2016
-14
Molop
oPe
talite
wea
there
d (no
n XRD
)00
752
1600
0316
5100
200
5147
805
8923
406
4500
6900
200
8602
222
6310
013
2016
-15
Molop
oFe
ldspa
r (no
n XRD
)00
664
02lt0
001
1937
003
0004
003
0151
216
1249
0796
lt001
lt000
2lt0
0505
399
55
2016
-23
Molop
oZin
nwald
ite (n
on X
RD)
006
5044
0068
3307
048
0011
012
0426
261
7674
0181
lt001
lt000
2lt0
0542
9925
1909
249
2019Uis
Tailin
gs
Quar
tzFe
ldspa
rPeta
lite
Musc
ovite
028
7293
0045
1479
051
0062
0212
9830
927
6613
6200
2lt00
02lt0
0523
399
38
1909
250
Uis
Tailin
gsQu
artz
Felds
parP
etalite
Mu
scov
ite02
872
6900
4314
8205
0059
019
1306
313
2794
1347
002lt
0002
lt005
251
9937
1909
251
Helik
on 4
22deg02prime4
8primeprimeS1
6deg01prime30
primeprimeEQu
artz
Felds
parP
etalite
Le
pidoli
te16
464
4400
0319
4200
301
2100
408
8325
345
6806
800
400
0727
228
998
38
1909
252
Helik
on 1
22deg02prime2
0primeprimeS1
6deg01prime19
primeprimeEPe
talite
Lepid
olite
Quar
tz29
576
9200
0116
6800
300
0304
101
7301
106
8100
01lt0
01lt0
002
lt005
205
97
App
endi
x A
Ana
lytic
al d
ata
of li
thiu
m s
ampl
es c
olle
cted
in N
amib
ia T
hres
hold
val
ues
high
light
ed in
gre
en
Lithium Potential in Namibia
57
Sam
ple I
DFa
rmLa
titud
eLo
ngitu
deSa
mpl
e des
crip
tion
(XRD
qu
al)
LiO 2
()
SiO 2
Ti
O 2
Al2O 3
Fe2O 3
Mn
O Mg
O Ca
O Na
2O
K 2O P 2O 5
SO
3
Cl
F
LOI
Su
m
1909
253
2019Rubic
on22deg06prime1
3primeprimeS1
5deg59prime45
primeprimeEPe
talite
Lepid
olite
Quar
tz32
778
73lt0
001
1687
002
0006
002
0157
011
003
0002
003
0003
lt005
075
9663
1909
254
Rubic
on22deg06prime1
0primeprimeS1
5deg59prime41
primeprimeEFe
ldspa
rQua
rtzM
usco
vite
004
682
lt000
119
3500
300
2400
205
0610
0808
6804
3lt0
01lt0
002
lt005
041
9985
1909
255
Rubic
on22deg06prime1
0primeprimeS1
5deg59prime41
primeprimeEFe
ldspa
rLep
idolite
Mus
co-
viteK
aolin
026
6104
0004
2318
022
0136
006
0119
367
8411
0159
lt001
lt000
2lt0
0522
299
15
1909
256
Rubic
on22deg06prime1
0primeprimeS1
5deg59prime41
primeprimeELe
pidoli
te 27
249
8700
129
3400
408
0500
400
704
697
3100
31lt0
01lt0
002
087
441
9569
1909
257
Rubic
on22deg06prime1
3primeprimeS1
5deg59prime45
primeprimeEPe
talite
Lepid
olite
Quar
tz30
670
0900
0320
2600
801
0901
502
9901
926
800
15lt0
0100
04lt0
0526
596
48
1909
258
Rubic
on22deg06prime1
0primeprimeS1
5deg59prime41
primeprimeELe
pidoli
teFe
ldspa
rQua
rtz20
659
7800
0224
100
505
2400
300
513
7247
0051
lt001
0002
265
388
9966
1909
259
Tanta
lite
Valle
y28deg43prime0
9primeprimeS1
8deg43prime55
primeprimeEFe
ldspa
rLep
idolite
Mus
covit
e11
762
64lt0
001
2139
004
0161
lt001
0399
7731
2401
0900
200
119
912
698
85
1909
260
Tanta
lite
Valle
y28deg43prime0
9primeprimeS1
8deg43prime55
primeprimeEFe
ldspa
rLep
idolite
Mus
covit
e03
059
8600
1425
1301
604
2200
302
2860
547
2201
3900
200
0904
123
799
56
1909
261
Tanta
lite
Valle
y28deg43prime0
9primeprimeS1
8deg43prime55
primeprimeEFe
ldspa
rQua
rtzM
usco
vite
003
636
0005
2218
022
0122
002
0381
727
3809
0272
lt001
lt000
2lt0
0513
199
17
1909
262
Tanta
lite
Valle
y28deg43prime2
0primeprimeS1
8deg44prime23
primeprimeEQu
artzSp
odum
eneM
us-
covit
e13
180
5100
0415
8903
401
2401
301
9502
604
0400
0500
200
03lt0
0507
398
56
1909
263
De R
ust
20deg57prime4
8primeprimeS1
4deg30prime13
primeprimeEFelsd
parS
podume
neQuartz
074
7313
0006
2048
007
015
005
0154
398
0831
0073
001
0003
lt005
082
9974
1909
264
De R
ust
20deg57prime4
8primeprimeS1
4deg30prime13
primeprimeESp
odum
eneF
eldsparQuartz
230
6924
0006
2602
801
0200
301
0510
102
1400
68lt0
0100
03lt0
0504
897
53
(Con
tinue
d) A
ppen
dix
A A
naly
tical
dat
a of
lith
ium
sam
ples
col
lect
ed in
Nam
ibia
Thr
esho
ld v
alue
s hi
ghlig
hted
in g
reen
Lithium Potential in Namibia
58
Appendix B GradeTonnage data (Measured amp Indicated) for selected lithium projects in comparison to Namibian projects (Source SampP 092020)
0
0500
1000
1500
2000
2500
500
5000
5000
0
5000
00
5000
000
Gra
de [
Li 2O
]
Tonnage [t]
Tantalite Valley
Rubicon
Appendix B GradeTonnage data (Inferred) for selected lithium projects in com-parison to Namibian projects (Source SampP 092020)
0
0500
1000
1500
2000
2500
100
1000
1000
0
1000
00
1000
000
1000
0000
Gra
de [
Li 2O
]
Tonnage [t]
Tantalite ValleyRubicon
Uis Tailings
Uis Mine
De Rust
A product of the technical cooperation project between Bundesanstalt fuumlr Geowissenschaften und Rohstoffe (BGR)(Federal Institute for Geosciences and Natural Resources)
andGeological Survey of Namibia within the Ministry of Mines and Energy
ISBN 978-3-948532-29-1 (Print) 978-3-948532-30-7 (PDF)
- List of Abbreviations
- 1 Introduction
- 2 What is lithium
-
- 21 Lithium deposits
-
- 3 Application
- 4 Chemical requirements
- 5 Mining and trade of lithium in the SADC
-
- 51 Lithium production
- 52 Trade data
- 53 Export
- 54Import
-
- 6 Lithium occurrences in Namibia
- 7 Lithium mining in Namibia
-
- 71 Current mining activities and projects
-
- 8 Analysed lithium samples
- 9 Interpretation
- 10 Conclusions
- References
-
Lithium Potential in Namibia
29
Fig 10 Remnants of historic open pit mining (upper) and tailings of De Rust pegmatite (lower) northwest of the Brandberg massif (Photo BGR-GSN 2019)
Fig 9 Satellite image of the De Rust project including the outlined mining license Main pegmatite coordinates 20deg57prime48primeprimeS ‒ 14deg30prime12primeprimeE (Source httpportalsflexicadastrecomnamibia 092020)
Main pegmatite
Lithium Potential in Namibia
30
Fig 12 Weathered spodumene chrystals at the historic open pit mine (Photo BGR-GSN 2019)
Fig 11 Historic open pit of the De Rust pegmatite (Photo BGR-GSN 2019)
Lithium Potential in Namibia
31
Uis The Uis projects (former mine and tailings) are located in the northern part of the ldquoCape Cross Uis pegmatite beltrdquo east of the town of Uis on the farm Uis Townlands No 215 in the Erongo region of Namibia
The Cape Cross-Uis belt is approx 120 km long and up to 40 km wide and extends in a NE direction (Fig 7) It comprises three distinct pegmatite swarms the Strathmore swarm Karlowa swarm and Uis pegmatite swarm In general lithium-bearing pegmatites (Li-Nb-Ta-Sn-Be and Li-Nb-Ta-Sn) are the least common in this belt (Fuchsloch et al 2018)
The Uis swarm field consists of more than 120 individual pegmatites each with a northeasterly to easterly strike direction and northwesterly down dip (30deg ‒ 70deg) This field is accompanied by a peripheral pegmatite field of approx 25 individual pegmatites
Some of the main pegmatites especially around the formerly worldrsquos largest tin mine at Uis are exceedingly large Some of them are up to 1 km long and some 50 m wide
In terms of lithium petalite amblygonite and minor spodumene mineralization occurs in the various pegmatites but no lepidolite Most common lithium bear-ing minerals in the eight pegmatites that were mined at Uis are amblygonite petalite and spodumene
Currently the Uis tailings project and the Uis tin mine are owned by two differ-ent companies As of 2020 the tin mine is operating a pilot processing plant and aims to ramp up the production of lithium in the near future The current ownership of the tailings project as of September 2020 is unclear
The nearest commercial deep-water port to the projects is Walvis Bay 220 km to the southeast The town of Omaruru is 130 km to the east and Henties Bay lies about 120 km to the southwest The nearest railhead is located in Omaruru The area is accessible year-round by paved and un-paved roads NamPower provides electricity and the town of Uis is connected to the Nam-Water pipeline
Lithium Potential in Namibia
32
The tin deposit was discovered in 1911 and mined between the 1950s and 1989 for cassiterite by Uis Tin Mining Company (SWA) Ltd and IMCOR
Coarse tailings are located in the northern part of the former mine just south to the main road C36 (Fig 13) The fine material is located south to the coarse waste dumps (Fig 13)
After 1990 multiple companies owned the property until AfriTin Mining Ltd bought all the rights (license ML134) The current lithium tailings project of Montero Mining amp Exploration Ltd (TSXV MON) is based on the historic mine tailings of the former tin mine on mining license ML134 that is currently owned by AfriTin Mining Ltd The acquired tailings material does not fall under the ML134 license of AfriTin since historical tailings material (Fig 14) is not regulated by Minerals (Prospecting and Mining) Act 33 of 1992 of Namibia
Resource estimateUis tin mineAccording to AfriTin the former Uis mine holds a JORC compliant resource (inferred) of 715 Mt of ore 0134 Sn with a cut-off grade of 005 Sn (AfriTin 2020) Grades of ancillary elements are given at 063 Li2O and 85 ppm Ta for the total resource of 71 Mt of ore
This equals to approx 95000 t of tin 209000 t of lithium (11 Mt LCE) and 6090 t of tantalum 85 of the total resource are attributable to the company The remaining 15 are allocated to SMU (Small Miners of Uis)
Uis tailingsMontero Mining filed an inferred resource estimate of 144 Mt of ore 037 Li2O and 005 SnO2 with a 035 Li2O cut-off grade for lithium and assumed processing recoveries of 70 for their tailings project (Montero 2019) This equals to approx 24700 t of lithium content (131500 t LCE) and 7200 t SnO2
This resource estimate only includes coarse tailings material There is current-ly no information on the lithium content of the fine tailings material that totals 271 Mt t due to insufficient or no test work (Montero 2018) The company also states that the average Li2O grade of the fines material does not hurdle the cut-off for the fines of 082 Li2O
Lithium Potential in Namibia
33
In 2016 Australian based Tawana Resources carried out a drilling program at Uis for a private company called Lithium Africa 1 on the fine and coarse tailings (Table 3 Hole 1 amp Hole 2) Below some of the obtained data on lithium content is given Additionally Li2O content of two obtained grab samples by BGR (Table 3 Sample 2019a amp 2019b) is given
Table 3 Sample data Uis (Tawana 2016 Montero 2018 BGR 2019)
Sample Sample 0 to 1m Li2O ()
Sample 1 to 2m Li2O ()
Sample 2 to 3m Li2O ()
Fines Hole 1 071 085 092
Fines Hole 2 080 089 095
Coarse Hole 1 050 043 043
Coarse Hole 2 054 062 062
BGR Sam-ple 2019a (Coarse tailings)
028
BGR Sam-ple 2019b (Coarse tailings)
028
Montero NI 43-101 037
Lithium Potential in Namibia
34
Fig 14 Tailings of the historic Uis Tin Mine (Photo BGR-GSN 2019 with kind permission of AfriTin Mining Limited)
Fig 13 Former Uis tin mine Uis tailings project with coarse tailings Tailings coordina-tes (center) 21deg13prime31primeprimeS ‒ 14deg52prime44primeprimeE (Source httpportalsflexicadastrecomnamibia 092020)
Uis Tailings (coarse)
Uis Tailings (fine)
Historic Uis mine
Lithium Potential in Namibia
35
Karibib Lepidolite ProjectThe Karibib Lepidolite brownfield project is located in the ldquoKaribib ndash Usakos Pegmatite Districtrdquo southeast of the town of Karibib on the farm Okongava Ost No 72 in central Namibia (Fig 15 ‒ 16)
This pegmatite district which is of Damaran age hosts the most important pegmatite occurrence (Rubicon swarm) in terms of lithium in Namibia In addi-tion numerous other different pegmatite swarms some of which have previ-ously been relevant in terms of lithium are know from this district These are Dernburg Karlsbrunn Albrechtshoumlhe Berger Kaliombo Gamikaubmund Okatjimukuju Etusis Daheim Friedrichsfelde and Etiro (Diehl 1992a)
The Rubicon pegmatite itself is the largest of the individual pegmatites that occur in this field and has been the prime source of lithium until mining seized in the early 1990s The Helikon pegmatites are part of the Rubicon pegmatite swarm and are located northeast to the Rubicon pegmatite They have previ-ously been mined for lepidolite amblygonite petalite and muscovite beryll pollucite quartz and columbite-tantalite as valuable by-products (Fig 18 ‒ 19)
The pegmatite itself consist of two ellipsoidal well zoned Li-mineralized ore-bodies The larger one is about 320 m long and 25 ndash 35 m wide It dips at 46deg to the northeast and has a northwesterly strike The second orebody is about 230 m long and about 10 m wide It is dipping with 30deg to the northeast and has a northwesterly strike In total the outcrop of the Rubicon pegmatite is about 600 m long with a maximum width of 65 m (Fig 17)
A very prominent feature is the presence of a very well developed concen-tric shell and zones from the footwall to the inner core of the pegmatite Both orebodies exhibit a border- wall- intermediate- and core-zone
Border-zone wall-zone and outer intermediate zone of the larger orebody do not contain Li-bearing minerals of economic importance The inner interme-diate zone does contain lepidolite The outer core zone may be sub-divided into a petalite zone low-grade lepidolite zone and a high-grade lepidolite zone The inner core zone also contains a petalite zone Mining occurred pre-viously in the later named zones The zonation of the smaller orebody to the northwest is less pronounced but Li-mineralization and style are equal to the
Lithium Potential in Namibia
36
larger orebody There is no spodumene mineralization within the orebodies and respectively zones of the Rubicon pegmatite
The Helikon I pegmatite is also a lens-shaped pegmatite with a length of roughly 400 m and a width of approx 66 m It dips to the north with about 60deg ndash 70deg Helikon I also consists of well-defined zones The main Li-bearing minerals are lepidolite and petalite According to Roering (1963) the lepidolite is difficult to separate from the intergrown albite and hence of low grade and quality
The Helikon II pegmatite is approx 17 km long and only 9 ndash 15 m wide It lies a bit north of Helikon I and dips steeply to the north with 55deg ndash 80deg striking east west The main Li-bearing minerals are lepidolite and petalite According to Diehl (1990) the westernmost portion of the pegmatite has historically been the economically most important A massive up to 6 m wide petalite zone was mined here according to Diehl (1990)
The nearest railhead to the project is 17 km away in Karibib and the deep-water port of Walvis Bay is 220 km to the southwest Windhoek is about 180 km to the southeast NamPower connects the town of Karibib to electricity and the project currently utilizes generators There is a 7 km long 22 kV power line spur to grid connection pending (Lepidico 2020) Water is available via on-site boreholes
The project was previously owned by Desert Lion Energy Inc (TSVX DLI) Lepidico Ltd (ASX LPD) bought into the project and currently holds 80 interest which comprises Mining License 204 (69 km2) as well as three Exclu-sive Prospecting Licenses (EPLs) namely 5439 5555 and 5781 (Lepidico 2020)
Lepidico will cover mining from multiple sources as well as chemical conver-sion by utilizing their proprietary lithium processing technologies L-Maxreg LOH-Maxreg and S-Maxreg (Lepidico 052019) The company aims to produce high purity lithium chemicals such as lithium carbonate and lithium hydroxide
The takeover also included a nonbinding offtake agreement between the for-mer owner Desert Lion Energy Inc and German chemical company BASF On April 2nd 2019 Desert Lion Energy Inc announced this offtake agreement
Lithium Potential in Namibia
37
which at the time was valid through to December 31 2019 On December 20th
2019 Lepidico announced that the LOI with BASF was extended to Decem-ber 31st 2020 (Lepidico 122019)
The feasibility study criteria of Lepidico are as follows
- Throughput of the concentrator on-site of 035 Mtpa- Expansion of throughput after year five to 05 Mtpa- Chemical plant in the industrial city of Abu Dabi (ICAD)- Plant design for 58000 tpa of concentrate (4 LiO2) for the production of
up to 5500 tpa LiOH- Utilization of L-Maxreg and LOH-MaxTM- Non-binding off-take MOU with BASF for LiOH only- Targeting for project commissioning to commence late 2021 for commer-
cial production in 2022
The preliminary mine plan indicates a strip ratio of 03 ndash 1 for the first two years The ratio will then go up to 1 ndash 14 In the first four years elevated grades of 06 LiO2 will be mined
Resource estimateA JORC 2012 compliant resource estimate for the deposit is given in Table 4 (Lepidico 2020) The deposit currently holds 23200 t of lithium (Indicated amp Inferred) based on a cut-off grade of 015 Li2O This resource estimate is based solely on the lepidolite occurrences at the mine site
Table 4 Resource estimate Karibib Lepidolite Project (Source Lepidico 2020)
Deposit Resource Category
Cut-off (Li2O)
Ore (Mt)
Li2O ()
Li (t)
Li (LCE)
Rubicon Measured
015
22 057 5819 30974
Rubicon Indicated 666 038 11637 61943
Rubicon Inferred 237 043 4728 25167
Helikon
Total 015 1124 043 22184 118086
Lithium Potential in Namibia
38
Fig 16 Satellite image of the Karibib Lepidolite project Helikon 1 coordinates (center) 22deg2prime49primeprimeS ‒ 16deg1prime13primeprimeE Helikon 4 coordinates (center) 22deg2prime24primeprimeS ‒ 16deg1prime41primeprimeE (Source httpportalsflexicadastrecomnamibia 092020)
Fig 15 Satellite image of the Karibib Lepidolite project Rubicon coordinates (center) 22deg6prime11primeprimeS ‒ 15deg59prime44primeprimeE (Source httpportalsflexicadastrecomnamibia 092020)
Historic Rubicon mine
Helikon 1
Helikon 4
Lithium Potential in Namibia
39Fig 17 Rubicon pegmatite (Photo BGR-GSN 2019 with kind permission of Lepidico Chemicals Namibia (Pty) Ltd 2020)
Lithium Potential in Namibia
40 Fig 18 Lepidolite sample from Rubicon pegmatite (Photo BGR-GSN 2019 with kind permission of Lepidico Chemicals Namibia (Pty) Ltd 2020)
Fig 19 Petalite sample from Rubicon pegmatite (Photo BGR-GSN 2019 with kind permission of Lepidico Chemicals Namibia (Pty) Ltd 2020)
Lithium Potential in Namibia
42
Fig 21 Helikon 4 pegmatite (Photo BGR-GSN 2019 with kind permission of Lepidico Chemicals Namibia (Pty) Ltd 2020)
Fig 20 Helikon 1 pegmatite (Photo BGR-GSN 2019 with kind permission of Lepidico Chemicals Namibia (Pty) Ltd 2020)
Lithium Potential in Namibia
43
Tantalite ValleyThe Tantalite Valley Project lies within the ldquoNamaqua Metamorphic Complexrdquo in Southern Namibia Within this complex Lithium-Caesium-Tantalum (LCT) pegmatites occur in two main areas Tantalite-Valley south of Warmbad in close proximity to the northwest-trending Tantalite Valley Shear Belt and the Sandfontein-Ramansdrift area close to the Orange River
The area were the pegmatites of the Tantalite Valley occur is primarily com-posed of a large ovoid gabbro intrusion (71 km by 33 km in extent) within paragneiss units of the Namaqua Complex The gabbro outcrop forms a large dome shaped mountain that rises about 500 m above the surrounding topo-graphy
The pegmatites belong to the Kenhardt and Gordonia pegmatite districts in Namaqualand but only the younger group of them carry accessory ore miner-als such as tantalite beryl REE minerals and lithium
The Tantalite Valley pegmatites include several individual subhorizonal dikes that are up to 1000 m long and 02 to 40 m wide plunging towards southeast (Diehl 1992b) Four of those are of economic interest Homestead Whitkop White City and the Lepidolite pegmatites (ie Purple Haze) (Fig 22)
They are all well zoned (quartz core inner and outer intermediate zones wall zone) and were predominantly targeted for beryl columbite-tantalite as well as lithium and bismuth minerals
The project is located on the farms Umeis 110 and Kinderzitt 132 between the Farms 109 131 129 308 and 473 in the magisterial district of Karas It currently comprises Mining License (ML-77) fully owned by Tameka Shelf Co Four (Pty) Ltd which is a 100 subsidiary of African Tantalite Pty Ltd (AFTAN) Above all Kazera Global Investments PLC holds a 75 stake in AFTAN (Kazera 2019) with the other 25 of local farmer ownership
The project is accessible via gravel road from Karasburg which is about 80 km to the north The nearest railhead is also located in Karasburg Electricity is currently supplied by generators and water is recovered from multiple drill holes The Orange River is about 15 km to the south of the project Mining
Lithium Potential in Namibia
44
infrastructure as well as equipment are on site as well as a plant for the pro-duction of tantalite concentrate
NTI is working on an extensive exploration program with a clear focus on revi-ving tantalite mining in Namibia with a possible by-product stream of lithium bearing minerals The company will focus primarily on the pegmatites Homes-tead Purple Haze Signaalberg and White City (Fig 23)
The area is known for its tantalum occurrences and since the late 1940s tantalite and other minerals have been recovered at Tantalite Valley until 1981 when mining ceased Initially alluvial deposits were mined followed by the pegmatites themselves Grades of the concentrates produced prior to the closure of the mine were quite high with 65 ‒ 70 Ta2O5 with very low U3O8
and ThO2 values of 025 max
Resource estimateAccording to SampP Global (092020) Measured and amp Indicated resources at Tantalite Valley are 104800 t of ore 0042 Ta2O5 and 0653 Li2O as of 112019 This would equate to 315 t of lithium or 1690 t LCE Total inferred resources are 517400 t of ore 0018 Ta2O5 and 0144 Li2O This equals to approx 91 t of tantalum and 750 t of lithium (3535 t LCE)
Lithium Potential in Namibia
45
Fig 23 White City pegmatite (Source Kazera global Investments PLC 2020)
Fig 22 Satellite image of the Tantalite Valley project White City pegmatite coordinates (center) 28deg43prime07primeprimeS ‒ 18deg44prime45primeprimeE Homestead pegmatite coordinates (center) 28deg43prime19primeprimeS - 18deg44prime24primeprimeE Purple Haze pegmatite coordinates (center) 28deg43prime09primeprimeS ‒ 18deg43prime55primeprimeE (Source httpportalsflexicadastrecomnamibia 092020)
Lithium Potential in Namibia
46
8 Analysed lithium samplesDuring the course of the cooperation project between the Economic Geology Division (EGD) of the Geological Survey of Namibia (GSN) and the Ger-man Federal Institute of Geosciences and Natural Resources (BGR) several sampling campaigns to southern and central pegmatites took place
The field trips were preceded by literature and data research regarding infor-mation on lithium occurrences andor previous lithium mining activity to iden-tify specific target areas
During a campaign in 2019 16 lithium-bearing mixed mineral samples were taken from five different locations and subsequently analyzed Two of the samples originate from the Uis Tin Mine Tailings of the former tin mine All remaining samples were taken either from stripped outcrops for future mine activities or from previous mine sites (ie pits)
All 16 samples were analyzed at BGR labs in Hanover Germany through qualitative XRD XRF and ICP-MS Given data shall be understood as a first indicator for the sampled lithium occurrences
Most if not all sampled occurrences have previously been analyzed or are cur-rently being assessed by the property owners or current licensees Detailed information of these sampling and analytical campaigns remain confidential and are thus not available for comparison
Appendix A lists the identified qualitative mineralogy of the samples as well as the major element analysis Additional samples from previous campaigns are also given
Interpretation of the results are based on their applicability in the various lithium-consuming industries for which information is available
Most of the current lithium applications require a chemical intermediate product such as lithium carbonate or lithium-hydroxide The glass and cera-mic industry does use lithium-bearing mineral concentrates depending on the prices of these materials when compared to LiCO3
Lithium Potential in Namibia
47
Since the main applications require an intermediate or downstream chemical product lithium content as well as impurity values are the main criteria for the suitability of the sampled occurrences Other quality criteria are particle size and surface areastructure
9 InterpretationAs previously stated all obtained grab samples are mixtures of lithium- bearing minerals (ie spodumene petalite lepidolite) feldspars quartz micas as well as secondary minerals Therefore all given analytical data has to be taken with caution and will not be representative for the individual outcrops or deposits
The evaluation of the economic suitability for various economic applications of the analysed lithium samples is based on the chemical specifications in Chapter 4
Lithium content gt 1 Li2O Fe2O3 content lt 015 as well as F content lt 01 are individually highlighted (Appendix A) as these three values are the most important
Based on the chemical analysis nine of the 16 samples showed Li2O contents of more than 1 (range 117 ‒ 327 ) Seven of those nine samples also exhibited low Fe2O3 content (range 004 ‒ 008 ) (Appendix A) Three of those seven samples also had fluorine values below 005
Of the ten additionally included samples from previous campaigns four showed Li2O contents of more than 1 (range 126 ‒ 199 ) Three of those samples also exhibited low Fe2O3 content (range 004 ‒ 007 ) (Appendix A) One of the three samples had fluorine values below 005
The mentioned samples (sources) could be of potential use but for further interpretation statistical sampling will be required
Lithium Potential in Namibia
48
10 ConclusionsThere is currently no lithium industry established in Namibia This accounts to both mining and processing of ores into commercial lithium-bearing con-centrates as well as the production of downstream products such as lithium carbonate andor lithium hydroxide In order to evaluate the potential for a lithium industry in Namibia the current global market and price developments need to be addressed
Currently the main application for lithium is in the chemical industry as lithium carbonate andor hydroxide for the manufacturing of lithium-ion batteries There is currently no domestic market (supply) or demand for this industry in Southern Africa or Namibia in specific Processing of lithium-bearing ores into these highly specific downstream products is economically more viable in close proximity to the demanding industries It also requires large investments (double-digit million dollars per 10000t of capacity) Additionally there is already huge capacity and strong capacity build up in Asia at rather low cost
The second most important application lies in the glass and ceramics industry This industry uses lithium either as lithium-bearing concentrates or lithium carbonate depending on current market price and processproduct require-ments There is currently no such industry established in Namibia but potential plans There is glass and ceramics manufacturing in South Africa and thus a potential market for lithium bearing products (concentrates) should this indus-try require it depending on product
The 20182019 primary lithium supply based on spodumene-bearing mineral concentrates was dominated by Australia with a market share of well over 95 On an annual basis the country exports more than three million tons of lithium-bearing concentrates to China To put this into perspective Lepidico plans to export just 58 ktpa of concentrate to Abu Dhabi for refinement from their project annually Therefore potential production in Namibia will always be rather small scale when compared to peer producing countriescompanies
As of late 2020 the concentrate market is in strong oversupply with strong competition Thus prices have eroded quite substantially for a standard SC6 concentrate (Fig 24) In general prices vary significantly based on lithium content and impurities of the concentrates Lithium bearing mineral concen-
Lithium Potential in Namibia
49
trates are a relatively low-value mineral commodity when compared to lithi-um-carbonate or other lithium downstream products thus product quality cost reduction and cost control are key components in this industry Since prices are depressed currently many of the Australian producers have drasti-cally reduced output or even went into care and maintenance This situation may change towards 2025 or beyond as demand picks up
Prices for the higher valued product lithium-carbonate spiked at the end of 2017 towards 2018 to more than 20000 $USt on a contract basis with prices being very volatile Since then prices have also eroded to below 9000 $USt due to oversupply and slow demand pickup (Fig 25) With this product stable quality and chemical composition are crucial for the downstream industry
Based on available gradetonnage data the Namibian projectsprospects are relatively small in overall size and low in grade when compared to global peers for the resource category ldquoMeasuredIndicatedrdquo (Appendix B) Total contained lithium quantity is thus relatively small in comparison On a global scale the most promising hard rock projects that are currently being mined and developed have Li2O grades of 10 or above
Fig 24 Lithium-mineral-concentrate prices 012010 ‒ 062020 (Source BGR 2020)
300
400
500
600
700
800
900
1000
1100
208
210
212
214
216
218
220
US$
t US$t
01-20
14
01-20
15
01-20
16
01-20
17
01-20
18
01-20
19
01-20
20
01-20
10
01-20
11
01-20
12
01-20
13
Spodumene min 5-6 LiO2 fob Australia
Spodumene concentrate gt75 LiO2 bulk cif Asia
Petalite 42 LiO2 fob Durban
Spodumene fob Australia
Spodumene min 5-6 LiO2 cif China
Lithium Potential in Namibia
50
For the resource category ldquoIndicatedrdquo which generally represents the lowest level of confidence only the Uis mine project of AfriTin represents a size-able resource even though grades are relatively low (Appendix C) The Uis tailings project as well as the Rubicon project are again relatively small when compared to their global peers Tantalite Valley is the smallest of all included projects (Appendix C)The given data for the De Rust project reflects only an exploration target of the company rather than actual data and may thus be not representative
Based on size and contained lithium-content none of the visited early stage projectsprospects would justify the financial investment into the construction of a chemical conversion plant for the production of lithium carbonate andor hydroxide on site as it requires very large monetary investments Due to their size payback of the required investments may be unfavorable when compared to global peers In addition the current market environment is very harsh with strong competition from Asia that has a huge cost advantage due to capacity build up This industry is also very energy and water intensive
In addition location within Namibia as well as distance to possible down-stream markets may become an issue as it increases the transportation cost
4000
7000
10000
13000
16000
19000
22000
25000
28000
01-20
14
01-20
15
01-20
16
01-20
17
01-20
18
01-20
19
01-20
20
US$
t
Lithium-carbonate (min 995 ) battery grade spot price ex works domestic ChinaLithium-carbonate (min 99-995 ) Li2CO3 large contracts USA delivered continentalLithium-hydroxid-monohydrate (min 565) technical and industrial grades cif China Japan amp Korea
Fig 25 Lithium chemical prices 012014 ndash 062020 (Source BGR 2020)
Lithium Potential in Namibia
51
immensely This is especially true for the SorisDe Rust pegmatite which is in a remote location without any allocated infrastructure The projects Karibib Uis and Tantalite Valley are much easier to access
The approach of Lepidico to produce a lithium bearing concentrate on site seems plausible approach Since this will already require a skilled workforce mining and beneficiation equipment in order to produce a high quality lithium-bearing concentrate it may already be considered ldquoadded valuerdquo for the indus-try of the country This approach may also be suitable for the other mentioned and visited projects
Lithium Potential in Namibia
52
ReferencesAfriTin Mining (2020) Uis Tin Project ndash Company Information ndash URL httpafritinminingcomuis-project [as of 092020]
Australian Government Geoscience Australia (2019) Australiarsquos Identi-fied Mineral Resources 2019 ndash URL httpswwwgagovauscientific-topicsmineralsmineral-resources-and-adviceaimr [as of 092020]
BGR ndash Bundesanstalt fuumlr Geowissenschaften und Rohstoffe (2020) Fachinformationssystem Rohstoffe ndash unpubl Hannover [as of 082020]
BGS ndash British Geological Survey (2016) Lithium Definitions mineralo-gy and deposits ndash URL httpswwwbgsacukdownloadsstartcfmid=3100 [as of 062016]
Diehl B J M (1990) Pegmatites of the Cape Cross Uis ndash Pegmatite Belt Namibia Geology mineralisation Rubidium Strontium characteristics and petrogenesis of rare metal pegmatites Open File Report EG 083 Economic Geology Series Geological Survey of Namibia 39 pp Windhoek
Diehl B J M (1992a) Lithium Caesium Beryllium Open File Report Mineral Resource Series Geological Survey of Namibia 18 pp Windhoek
Diehl B J M (1992b) Niobium and Tantalum Open File Report Mineral Resource Series Geological Survey of Namibia 20 pp Windhoek
Diehl B J M (1992c) Tin Open File Report Mineral Resource Series Geological Survey of Namibia 30 pp Windhoek
Diehl B J M amp Schneider G I C (1990) Geology and mineralisation of the Rubicon Pegmatite Namibia Open File Report Geol Surv Namibia 20 pp Windhoek
Fuchsloch et al (2018) Classification mineralogical and geochemical vari-ations in pegmatites of the Cape Cross-Uis pegmatite belt Namibia Lithos 296 ndash 299 79-95 elsevier
Lithium Potential in Namibia
53
Garret D E (2004) Handbook Of Lithium And Natural Calcium Chloride Their Deposits Processing Uses and Properties ndash 467 S Oxford (Elsevier B V)
Geological Survey of Namibia (2002) Mineral Resources of Namibia Summary of Mineral Deposits and Occurrences Omaruru Sheet 2114 Volume I ndash Complete Descriptions 119 pp Windhoek
IHS Global SA (2020) Global Trade Atlas ndash Commercial Online-Databa-se ndashURL httpsmyihscomConnectcallingUrl=https3a2f2fconnectihsmarkitcom2f [as of 062017]
Kazera Global Investments PLC (2020) Company Information ndash URL httpskazeraglobalcominvestmentsnamibia-tantalite-investment-mine [as of 092020]
Lepidico (2019) LOI with BASF extended to 31 December 2020 ndash News Release ndash URL httpswwwlepidicocomwp-contentuploads201910LPD-191220-LOI-with-BASF-extended-to-31-December-2020pdf [as of 122019]
Lepidico (2019) Corporate Presentation ndash URL httpswwwlepidicocomwp-contentuploads201907LPD-190509-Corporate-Presentati-on-May-2019pdf [as of 052019]
Lepidico (2020) Company Information ndash URL httpswwwlepidicocomprojectskaribib [as of 092020]
Montero Mining amp Exploration Ltd (2018) Exploring Battery Metals in Namibia ndash Company Presentation ndash URL httpswwwproactiveinvestorscomauuploadSponsorFileFile2018_031520244941_MON-CorporatePre-sentationMarch2018pdf [as of 072018]
Montero Mining amp Exploration Ltd (2019) Montero Files NI 43-101 Resource Estimate On The Uis Lithium-Tin Tailings Project In Namibia On Sedar ndash News Announcement ndash URL httpsmonterominingcommontero-files-ni-43-101-resource-estimate-on-the-uis-lithium-tin-tailings-project-in-namibia-on-sedar [as of 032019]
Lithium Potential in Namibia
54
Namibia Mining Cadastre Portal (2020) Online-Database ndashURL httpsportalslandfoliocomnamibia [as of 092020]
Roskill Information Services Ltd (2016) Lithium Global Industry Mar-kets amp Outlook ndash 386 S London Groszligbritannien
Schneider G I C (1992) Feldspar Open File Report MRS 08 Mineral Resource Series Geological Survey of Namibia 2 pp Windhoek
Schmidt M (2017) Rohstoffrisikobewertung ndash Lithium ndash DERA Rohstoffin-formationen 33 Berlin
S amp P Global Market Intelligence (2020) Lithium - Metals amp Mining Properties URL httpsplatformmarketintelligencespglobalcomwebcli-entauth=inheritindustryminingProjects [as of 092020]
Statista (2020) Distribution of lithium end-usage worldwide in 2019 by area application ndash URL httpswwwstatistacomstatistics268787lithium-usa-ge-in-the-world-market [as of 062020]
Tawana Resources NL (2016) Tawana acquires second lithium pro-ject ndash News Release ndash URL httpsmstrademomentumcozajsepdfSENS_20160923_S376505pdf [as of 092016]
USGS ndash United States Geological Survey (multiple years) Lithium ndash Minerals Commodity Summaries ndash URL httpswwwusgsgovcentersnmiclithium-statistics-and-information [as of 082020]
Appendix
Sam
ple I
DFa
rmLa
titud
eLo
ngitu
deSa
mpl
e des
crip
tion
(XRD
qu
al)
LiO 2
()
SiO 2
Ti
O 2
Al2O 3
Fe2O 3
Mn
O Mg
O Ca
O Na
2O
K 2O P 2O 5
SO
3
Cl
F
LOI
Su
m
2015
-03
previous sample campaignsHelik
on
n A
Felds
parQ
uartz
Lepid
olite
025
6871
lt000
119
0500
200
2900
505
3292
806
7905
59lt0
01lt0
002
lt005
093
9985
2016
-12
Rubic
onwe
ather
ed P
etalite
126
6473
lt000
118
0600
703
2718
607
9507
805
2500
62lt0
01lt0
002
lt005
1146
9871
2016
-17
Rubic
onLe
pidoli
te +
Quar
tz13
063
6700
219
9316
0929
003
0054
029
6218
0052
lt001
lt000
226
232
798
67
2016
-20
Helik
onLe
pidoli
te + A
lbite
176
5514
lt000
126
8700
401
2100
700
2123
970
3900
45lt0
01lt0
002
156
369
9698
2016
-21
Helik
onLe
pidoli
te19
954
32lt0
001
2627
004
0224
006
0038
266
714
0069
lt001
lt000
240
628
997
77
FN20
19_0
4De
Rus
tFe
ldspa
rAmb
lygon
iteP
etalite
(n
on X
RD)
003
6513
lt000
118
82lt0
0100
0200
101
0924
311
4105
75lt0
0100
04lt0
0503
898
84
2015
-09
Molop
oPe
talite
(non
XRD
)00
952
85lt0
001
1672
lt001
0002
487
0323
342
0352
lt000
100
400
3403
621
1310
012
2016
-14
Molop
oPe
talite
wea
there
d (no
n XRD
)00
752
1600
0316
5100
200
5147
805
8923
406
4500
6900
200
8602
222
6310
013
2016
-15
Molop
oFe
ldspa
r (no
n XRD
)00
664
02lt0
001
1937
003
0004
003
0151
216
1249
0796
lt001
lt000
2lt0
0505
399
55
2016
-23
Molop
oZin
nwald
ite (n
on X
RD)
006
5044
0068
3307
048
0011
012
0426
261
7674
0181
lt001
lt000
2lt0
0542
9925
1909
249
2019Uis
Tailin
gs
Quar
tzFe
ldspa
rPeta
lite
Musc
ovite
028
7293
0045
1479
051
0062
0212
9830
927
6613
6200
2lt00
02lt0
0523
399
38
1909
250
Uis
Tailin
gsQu
artz
Felds
parP
etalite
Mu
scov
ite02
872
6900
4314
8205
0059
019
1306
313
2794
1347
002lt
0002
lt005
251
9937
1909
251
Helik
on 4
22deg02prime4
8primeprimeS1
6deg01prime30
primeprimeEQu
artz
Felds
parP
etalite
Le
pidoli
te16
464
4400
0319
4200
301
2100
408
8325
345
6806
800
400
0727
228
998
38
1909
252
Helik
on 1
22deg02prime2
0primeprimeS1
6deg01prime19
primeprimeEPe
talite
Lepid
olite
Quar
tz29
576
9200
0116
6800
300
0304
101
7301
106
8100
01lt0
01lt0
002
lt005
205
97
App
endi
x A
Ana
lytic
al d
ata
of li
thiu
m s
ampl
es c
olle
cted
in N
amib
ia T
hres
hold
val
ues
high
light
ed in
gre
en
Lithium Potential in Namibia
57
Sam
ple I
DFa
rmLa
titud
eLo
ngitu
deSa
mpl
e des
crip
tion
(XRD
qu
al)
LiO 2
()
SiO 2
Ti
O 2
Al2O 3
Fe2O 3
Mn
O Mg
O Ca
O Na
2O
K 2O P 2O 5
SO
3
Cl
F
LOI
Su
m
1909
253
2019Rubic
on22deg06prime1
3primeprimeS1
5deg59prime45
primeprimeEPe
talite
Lepid
olite
Quar
tz32
778
73lt0
001
1687
002
0006
002
0157
011
003
0002
003
0003
lt005
075
9663
1909
254
Rubic
on22deg06prime1
0primeprimeS1
5deg59prime41
primeprimeEFe
ldspa
rQua
rtzM
usco
vite
004
682
lt000
119
3500
300
2400
205
0610
0808
6804
3lt0
01lt0
002
lt005
041
9985
1909
255
Rubic
on22deg06prime1
0primeprimeS1
5deg59prime41
primeprimeEFe
ldspa
rLep
idolite
Mus
co-
viteK
aolin
026
6104
0004
2318
022
0136
006
0119
367
8411
0159
lt001
lt000
2lt0
0522
299
15
1909
256
Rubic
on22deg06prime1
0primeprimeS1
5deg59prime41
primeprimeELe
pidoli
te 27
249
8700
129
3400
408
0500
400
704
697
3100
31lt0
01lt0
002
087
441
9569
1909
257
Rubic
on22deg06prime1
3primeprimeS1
5deg59prime45
primeprimeEPe
talite
Lepid
olite
Quar
tz30
670
0900
0320
2600
801
0901
502
9901
926
800
15lt0
0100
04lt0
0526
596
48
1909
258
Rubic
on22deg06prime1
0primeprimeS1
5deg59prime41
primeprimeELe
pidoli
teFe
ldspa
rQua
rtz20
659
7800
0224
100
505
2400
300
513
7247
0051
lt001
0002
265
388
9966
1909
259
Tanta
lite
Valle
y28deg43prime0
9primeprimeS1
8deg43prime55
primeprimeEFe
ldspa
rLep
idolite
Mus
covit
e11
762
64lt0
001
2139
004
0161
lt001
0399
7731
2401
0900
200
119
912
698
85
1909
260
Tanta
lite
Valle
y28deg43prime0
9primeprimeS1
8deg43prime55
primeprimeEFe
ldspa
rLep
idolite
Mus
covit
e03
059
8600
1425
1301
604
2200
302
2860
547
2201
3900
200
0904
123
799
56
1909
261
Tanta
lite
Valle
y28deg43prime0
9primeprimeS1
8deg43prime55
primeprimeEFe
ldspa
rQua
rtzM
usco
vite
003
636
0005
2218
022
0122
002
0381
727
3809
0272
lt001
lt000
2lt0
0513
199
17
1909
262
Tanta
lite
Valle
y28deg43prime2
0primeprimeS1
8deg44prime23
primeprimeEQu
artzSp
odum
eneM
us-
covit
e13
180
5100
0415
8903
401
2401
301
9502
604
0400
0500
200
03lt0
0507
398
56
1909
263
De R
ust
20deg57prime4
8primeprimeS1
4deg30prime13
primeprimeEFelsd
parS
podume
neQuartz
074
7313
0006
2048
007
015
005
0154
398
0831
0073
001
0003
lt005
082
9974
1909
264
De R
ust
20deg57prime4
8primeprimeS1
4deg30prime13
primeprimeESp
odum
eneF
eldsparQuartz
230
6924
0006
2602
801
0200
301
0510
102
1400
68lt0
0100
03lt0
0504
897
53
(Con
tinue
d) A
ppen
dix
A A
naly
tical
dat
a of
lith
ium
sam
ples
col
lect
ed in
Nam
ibia
Thr
esho
ld v
alue
s hi
ghlig
hted
in g
reen
Lithium Potential in Namibia
58
Appendix B GradeTonnage data (Measured amp Indicated) for selected lithium projects in comparison to Namibian projects (Source SampP 092020)
0
0500
1000
1500
2000
2500
500
5000
5000
0
5000
00
5000
000
Gra
de [
Li 2O
]
Tonnage [t]
Tantalite Valley
Rubicon
Appendix B GradeTonnage data (Inferred) for selected lithium projects in com-parison to Namibian projects (Source SampP 092020)
0
0500
1000
1500
2000
2500
100
1000
1000
0
1000
00
1000
000
1000
0000
Gra
de [
Li 2O
]
Tonnage [t]
Tantalite ValleyRubicon
Uis Tailings
Uis Mine
De Rust
A product of the technical cooperation project between Bundesanstalt fuumlr Geowissenschaften und Rohstoffe (BGR)(Federal Institute for Geosciences and Natural Resources)
andGeological Survey of Namibia within the Ministry of Mines and Energy
ISBN 978-3-948532-29-1 (Print) 978-3-948532-30-7 (PDF)
- List of Abbreviations
- 1 Introduction
- 2 What is lithium
-
- 21 Lithium deposits
-
- 3 Application
- 4 Chemical requirements
- 5 Mining and trade of lithium in the SADC
-
- 51 Lithium production
- 52 Trade data
- 53 Export
- 54Import
-
- 6 Lithium occurrences in Namibia
- 7 Lithium mining in Namibia
-
- 71 Current mining activities and projects
-
- 8 Analysed lithium samples
- 9 Interpretation
- 10 Conclusions
- References
-
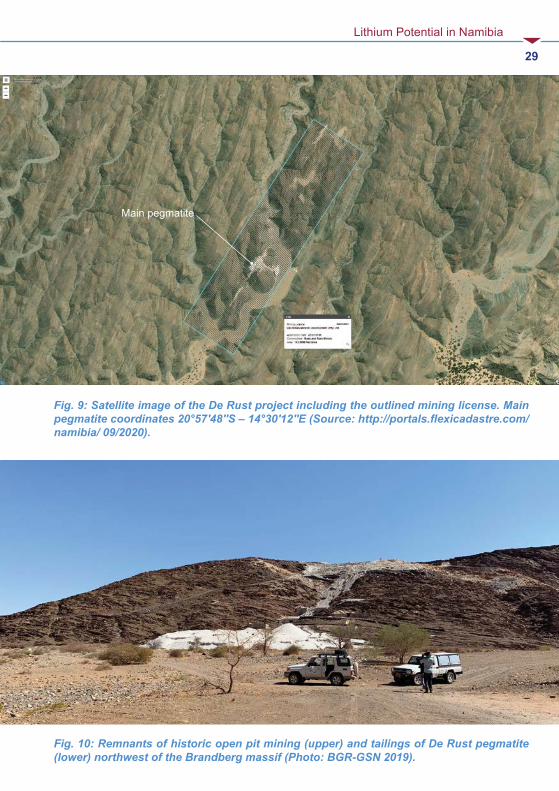
Lithium Potential in Namibia
32
The tin deposit was discovered in 1911 and mined between the 1950s and 1989 for cassiterite by Uis Tin Mining Company (SWA) Ltd and IMCOR
Coarse tailings are located in the northern part of the former mine just south to the main road C36 (Fig 13) The fine material is located south to the coarse waste dumps (Fig 13)
After 1990 multiple companies owned the property until AfriTin Mining Ltd bought all the rights (license ML134) The current lithium tailings project of Montero Mining amp Exploration Ltd (TSXV MON) is based on the historic mine tailings of the former tin mine on mining license ML134 that is currently owned by AfriTin Mining Ltd The acquired tailings material does not fall under the ML134 license of AfriTin since historical tailings material (Fig 14) is not regulated by Minerals (Prospecting and Mining) Act 33 of 1992 of Namibia
Resource estimateUis tin mineAccording to AfriTin the former Uis mine holds a JORC compliant resource (inferred) of 715 Mt of ore 0134 Sn with a cut-off grade of 005 Sn (AfriTin 2020) Grades of ancillary elements are given at 063 Li2O and 85 ppm Ta for the total resource of 71 Mt of ore
This equals to approx 95000 t of tin 209000 t of lithium (11 Mt LCE) and 6090 t of tantalum 85 of the total resource are attributable to the company The remaining 15 are allocated to SMU (Small Miners of Uis)
Uis tailingsMontero Mining filed an inferred resource estimate of 144 Mt of ore 037 Li2O and 005 SnO2 with a 035 Li2O cut-off grade for lithium and assumed processing recoveries of 70 for their tailings project (Montero 2019) This equals to approx 24700 t of lithium content (131500 t LCE) and 7200 t SnO2
This resource estimate only includes coarse tailings material There is current-ly no information on the lithium content of the fine tailings material that totals 271 Mt t due to insufficient or no test work (Montero 2018) The company also states that the average Li2O grade of the fines material does not hurdle the cut-off for the fines of 082 Li2O
Lithium Potential in Namibia
33
In 2016 Australian based Tawana Resources carried out a drilling program at Uis for a private company called Lithium Africa 1 on the fine and coarse tailings (Table 3 Hole 1 amp Hole 2) Below some of the obtained data on lithium content is given Additionally Li2O content of two obtained grab samples by BGR (Table 3 Sample 2019a amp 2019b) is given
Table 3 Sample data Uis (Tawana 2016 Montero 2018 BGR 2019)
Sample Sample 0 to 1m Li2O ()
Sample 1 to 2m Li2O ()
Sample 2 to 3m Li2O ()
Fines Hole 1 071 085 092
Fines Hole 2 080 089 095
Coarse Hole 1 050 043 043
Coarse Hole 2 054 062 062
BGR Sam-ple 2019a (Coarse tailings)
028
BGR Sam-ple 2019b (Coarse tailings)
028
Montero NI 43-101 037
Lithium Potential in Namibia
34
Fig 14 Tailings of the historic Uis Tin Mine (Photo BGR-GSN 2019 with kind permission of AfriTin Mining Limited)
Fig 13 Former Uis tin mine Uis tailings project with coarse tailings Tailings coordina-tes (center) 21deg13prime31primeprimeS ‒ 14deg52prime44primeprimeE (Source httpportalsflexicadastrecomnamibia 092020)
Uis Tailings (coarse)
Uis Tailings (fine)
Historic Uis mine
Lithium Potential in Namibia
35
Karibib Lepidolite ProjectThe Karibib Lepidolite brownfield project is located in the ldquoKaribib ndash Usakos Pegmatite Districtrdquo southeast of the town of Karibib on the farm Okongava Ost No 72 in central Namibia (Fig 15 ‒ 16)
This pegmatite district which is of Damaran age hosts the most important pegmatite occurrence (Rubicon swarm) in terms of lithium in Namibia In addi-tion numerous other different pegmatite swarms some of which have previ-ously been relevant in terms of lithium are know from this district These are Dernburg Karlsbrunn Albrechtshoumlhe Berger Kaliombo Gamikaubmund Okatjimukuju Etusis Daheim Friedrichsfelde and Etiro (Diehl 1992a)
The Rubicon pegmatite itself is the largest of the individual pegmatites that occur in this field and has been the prime source of lithium until mining seized in the early 1990s The Helikon pegmatites are part of the Rubicon pegmatite swarm and are located northeast to the Rubicon pegmatite They have previ-ously been mined for lepidolite amblygonite petalite and muscovite beryll pollucite quartz and columbite-tantalite as valuable by-products (Fig 18 ‒ 19)
The pegmatite itself consist of two ellipsoidal well zoned Li-mineralized ore-bodies The larger one is about 320 m long and 25 ndash 35 m wide It dips at 46deg to the northeast and has a northwesterly strike The second orebody is about 230 m long and about 10 m wide It is dipping with 30deg to the northeast and has a northwesterly strike In total the outcrop of the Rubicon pegmatite is about 600 m long with a maximum width of 65 m (Fig 17)
A very prominent feature is the presence of a very well developed concen-tric shell and zones from the footwall to the inner core of the pegmatite Both orebodies exhibit a border- wall- intermediate- and core-zone
Border-zone wall-zone and outer intermediate zone of the larger orebody do not contain Li-bearing minerals of economic importance The inner interme-diate zone does contain lepidolite The outer core zone may be sub-divided into a petalite zone low-grade lepidolite zone and a high-grade lepidolite zone The inner core zone also contains a petalite zone Mining occurred pre-viously in the later named zones The zonation of the smaller orebody to the northwest is less pronounced but Li-mineralization and style are equal to the
Lithium Potential in Namibia
36
larger orebody There is no spodumene mineralization within the orebodies and respectively zones of the Rubicon pegmatite
The Helikon I pegmatite is also a lens-shaped pegmatite with a length of roughly 400 m and a width of approx 66 m It dips to the north with about 60deg ndash 70deg Helikon I also consists of well-defined zones The main Li-bearing minerals are lepidolite and petalite According to Roering (1963) the lepidolite is difficult to separate from the intergrown albite and hence of low grade and quality
The Helikon II pegmatite is approx 17 km long and only 9 ndash 15 m wide It lies a bit north of Helikon I and dips steeply to the north with 55deg ndash 80deg striking east west The main Li-bearing minerals are lepidolite and petalite According to Diehl (1990) the westernmost portion of the pegmatite has historically been the economically most important A massive up to 6 m wide petalite zone was mined here according to Diehl (1990)
The nearest railhead to the project is 17 km away in Karibib and the deep-water port of Walvis Bay is 220 km to the southwest Windhoek is about 180 km to the southeast NamPower connects the town of Karibib to electricity and the project currently utilizes generators There is a 7 km long 22 kV power line spur to grid connection pending (Lepidico 2020) Water is available via on-site boreholes
The project was previously owned by Desert Lion Energy Inc (TSVX DLI) Lepidico Ltd (ASX LPD) bought into the project and currently holds 80 interest which comprises Mining License 204 (69 km2) as well as three Exclu-sive Prospecting Licenses (EPLs) namely 5439 5555 and 5781 (Lepidico 2020)
Lepidico will cover mining from multiple sources as well as chemical conver-sion by utilizing their proprietary lithium processing technologies L-Maxreg LOH-Maxreg and S-Maxreg (Lepidico 052019) The company aims to produce high purity lithium chemicals such as lithium carbonate and lithium hydroxide
The takeover also included a nonbinding offtake agreement between the for-mer owner Desert Lion Energy Inc and German chemical company BASF On April 2nd 2019 Desert Lion Energy Inc announced this offtake agreement
Lithium Potential in Namibia
37
which at the time was valid through to December 31 2019 On December 20th
2019 Lepidico announced that the LOI with BASF was extended to Decem-ber 31st 2020 (Lepidico 122019)
The feasibility study criteria of Lepidico are as follows
- Throughput of the concentrator on-site of 035 Mtpa- Expansion of throughput after year five to 05 Mtpa- Chemical plant in the industrial city of Abu Dabi (ICAD)- Plant design for 58000 tpa of concentrate (4 LiO2) for the production of
up to 5500 tpa LiOH- Utilization of L-Maxreg and LOH-MaxTM- Non-binding off-take MOU with BASF for LiOH only- Targeting for project commissioning to commence late 2021 for commer-
cial production in 2022
The preliminary mine plan indicates a strip ratio of 03 ndash 1 for the first two years The ratio will then go up to 1 ndash 14 In the first four years elevated grades of 06 LiO2 will be mined
Resource estimateA JORC 2012 compliant resource estimate for the deposit is given in Table 4 (Lepidico 2020) The deposit currently holds 23200 t of lithium (Indicated amp Inferred) based on a cut-off grade of 015 Li2O This resource estimate is based solely on the lepidolite occurrences at the mine site
Table 4 Resource estimate Karibib Lepidolite Project (Source Lepidico 2020)
Deposit Resource Category
Cut-off (Li2O)
Ore (Mt)
Li2O ()
Li (t)
Li (LCE)
Rubicon Measured
015
22 057 5819 30974
Rubicon Indicated 666 038 11637 61943
Rubicon Inferred 237 043 4728 25167
Helikon
Total 015 1124 043 22184 118086
Lithium Potential in Namibia
38
Fig 16 Satellite image of the Karibib Lepidolite project Helikon 1 coordinates (center) 22deg2prime49primeprimeS ‒ 16deg1prime13primeprimeE Helikon 4 coordinates (center) 22deg2prime24primeprimeS ‒ 16deg1prime41primeprimeE (Source httpportalsflexicadastrecomnamibia 092020)
Fig 15 Satellite image of the Karibib Lepidolite project Rubicon coordinates (center) 22deg6prime11primeprimeS ‒ 15deg59prime44primeprimeE (Source httpportalsflexicadastrecomnamibia 092020)
Historic Rubicon mine
Helikon 1
Helikon 4
Lithium Potential in Namibia
39Fig 17 Rubicon pegmatite (Photo BGR-GSN 2019 with kind permission of Lepidico Chemicals Namibia (Pty) Ltd 2020)
Lithium Potential in Namibia
40 Fig 18 Lepidolite sample from Rubicon pegmatite (Photo BGR-GSN 2019 with kind permission of Lepidico Chemicals Namibia (Pty) Ltd 2020)
Fig 19 Petalite sample from Rubicon pegmatite (Photo BGR-GSN 2019 with kind permission of Lepidico Chemicals Namibia (Pty) Ltd 2020)
Lithium Potential in Namibia
42
Fig 21 Helikon 4 pegmatite (Photo BGR-GSN 2019 with kind permission of Lepidico Chemicals Namibia (Pty) Ltd 2020)
Fig 20 Helikon 1 pegmatite (Photo BGR-GSN 2019 with kind permission of Lepidico Chemicals Namibia (Pty) Ltd 2020)
Lithium Potential in Namibia
43
Tantalite ValleyThe Tantalite Valley Project lies within the ldquoNamaqua Metamorphic Complexrdquo in Southern Namibia Within this complex Lithium-Caesium-Tantalum (LCT) pegmatites occur in two main areas Tantalite-Valley south of Warmbad in close proximity to the northwest-trending Tantalite Valley Shear Belt and the Sandfontein-Ramansdrift area close to the Orange River
The area were the pegmatites of the Tantalite Valley occur is primarily com-posed of a large ovoid gabbro intrusion (71 km by 33 km in extent) within paragneiss units of the Namaqua Complex The gabbro outcrop forms a large dome shaped mountain that rises about 500 m above the surrounding topo-graphy
The pegmatites belong to the Kenhardt and Gordonia pegmatite districts in Namaqualand but only the younger group of them carry accessory ore miner-als such as tantalite beryl REE minerals and lithium
The Tantalite Valley pegmatites include several individual subhorizonal dikes that are up to 1000 m long and 02 to 40 m wide plunging towards southeast (Diehl 1992b) Four of those are of economic interest Homestead Whitkop White City and the Lepidolite pegmatites (ie Purple Haze) (Fig 22)
They are all well zoned (quartz core inner and outer intermediate zones wall zone) and were predominantly targeted for beryl columbite-tantalite as well as lithium and bismuth minerals
The project is located on the farms Umeis 110 and Kinderzitt 132 between the Farms 109 131 129 308 and 473 in the magisterial district of Karas It currently comprises Mining License (ML-77) fully owned by Tameka Shelf Co Four (Pty) Ltd which is a 100 subsidiary of African Tantalite Pty Ltd (AFTAN) Above all Kazera Global Investments PLC holds a 75 stake in AFTAN (Kazera 2019) with the other 25 of local farmer ownership
The project is accessible via gravel road from Karasburg which is about 80 km to the north The nearest railhead is also located in Karasburg Electricity is currently supplied by generators and water is recovered from multiple drill holes The Orange River is about 15 km to the south of the project Mining
Lithium Potential in Namibia
44
infrastructure as well as equipment are on site as well as a plant for the pro-duction of tantalite concentrate
NTI is working on an extensive exploration program with a clear focus on revi-ving tantalite mining in Namibia with a possible by-product stream of lithium bearing minerals The company will focus primarily on the pegmatites Homes-tead Purple Haze Signaalberg and White City (Fig 23)
The area is known for its tantalum occurrences and since the late 1940s tantalite and other minerals have been recovered at Tantalite Valley until 1981 when mining ceased Initially alluvial deposits were mined followed by the pegmatites themselves Grades of the concentrates produced prior to the closure of the mine were quite high with 65 ‒ 70 Ta2O5 with very low U3O8
and ThO2 values of 025 max
Resource estimateAccording to SampP Global (092020) Measured and amp Indicated resources at Tantalite Valley are 104800 t of ore 0042 Ta2O5 and 0653 Li2O as of 112019 This would equate to 315 t of lithium or 1690 t LCE Total inferred resources are 517400 t of ore 0018 Ta2O5 and 0144 Li2O This equals to approx 91 t of tantalum and 750 t of lithium (3535 t LCE)
Lithium Potential in Namibia
45
Fig 23 White City pegmatite (Source Kazera global Investments PLC 2020)
Fig 22 Satellite image of the Tantalite Valley project White City pegmatite coordinates (center) 28deg43prime07primeprimeS ‒ 18deg44prime45primeprimeE Homestead pegmatite coordinates (center) 28deg43prime19primeprimeS - 18deg44prime24primeprimeE Purple Haze pegmatite coordinates (center) 28deg43prime09primeprimeS ‒ 18deg43prime55primeprimeE (Source httpportalsflexicadastrecomnamibia 092020)
Lithium Potential in Namibia
46
8 Analysed lithium samplesDuring the course of the cooperation project between the Economic Geology Division (EGD) of the Geological Survey of Namibia (GSN) and the Ger-man Federal Institute of Geosciences and Natural Resources (BGR) several sampling campaigns to southern and central pegmatites took place
The field trips were preceded by literature and data research regarding infor-mation on lithium occurrences andor previous lithium mining activity to iden-tify specific target areas
During a campaign in 2019 16 lithium-bearing mixed mineral samples were taken from five different locations and subsequently analyzed Two of the samples originate from the Uis Tin Mine Tailings of the former tin mine All remaining samples were taken either from stripped outcrops for future mine activities or from previous mine sites (ie pits)
All 16 samples were analyzed at BGR labs in Hanover Germany through qualitative XRD XRF and ICP-MS Given data shall be understood as a first indicator for the sampled lithium occurrences
Most if not all sampled occurrences have previously been analyzed or are cur-rently being assessed by the property owners or current licensees Detailed information of these sampling and analytical campaigns remain confidential and are thus not available for comparison
Appendix A lists the identified qualitative mineralogy of the samples as well as the major element analysis Additional samples from previous campaigns are also given
Interpretation of the results are based on their applicability in the various lithium-consuming industries for which information is available
Most of the current lithium applications require a chemical intermediate product such as lithium carbonate or lithium-hydroxide The glass and cera-mic industry does use lithium-bearing mineral concentrates depending on the prices of these materials when compared to LiCO3
Lithium Potential in Namibia
47
Since the main applications require an intermediate or downstream chemical product lithium content as well as impurity values are the main criteria for the suitability of the sampled occurrences Other quality criteria are particle size and surface areastructure
9 InterpretationAs previously stated all obtained grab samples are mixtures of lithium- bearing minerals (ie spodumene petalite lepidolite) feldspars quartz micas as well as secondary minerals Therefore all given analytical data has to be taken with caution and will not be representative for the individual outcrops or deposits
The evaluation of the economic suitability for various economic applications of the analysed lithium samples is based on the chemical specifications in Chapter 4
Lithium content gt 1 Li2O Fe2O3 content lt 015 as well as F content lt 01 are individually highlighted (Appendix A) as these three values are the most important
Based on the chemical analysis nine of the 16 samples showed Li2O contents of more than 1 (range 117 ‒ 327 ) Seven of those nine samples also exhibited low Fe2O3 content (range 004 ‒ 008 ) (Appendix A) Three of those seven samples also had fluorine values below 005
Of the ten additionally included samples from previous campaigns four showed Li2O contents of more than 1 (range 126 ‒ 199 ) Three of those samples also exhibited low Fe2O3 content (range 004 ‒ 007 ) (Appendix A) One of the three samples had fluorine values below 005
The mentioned samples (sources) could be of potential use but for further interpretation statistical sampling will be required
Lithium Potential in Namibia
48
10 ConclusionsThere is currently no lithium industry established in Namibia This accounts to both mining and processing of ores into commercial lithium-bearing con-centrates as well as the production of downstream products such as lithium carbonate andor lithium hydroxide In order to evaluate the potential for a lithium industry in Namibia the current global market and price developments need to be addressed
Currently the main application for lithium is in the chemical industry as lithium carbonate andor hydroxide for the manufacturing of lithium-ion batteries There is currently no domestic market (supply) or demand for this industry in Southern Africa or Namibia in specific Processing of lithium-bearing ores into these highly specific downstream products is economically more viable in close proximity to the demanding industries It also requires large investments (double-digit million dollars per 10000t of capacity) Additionally there is already huge capacity and strong capacity build up in Asia at rather low cost
The second most important application lies in the glass and ceramics industry This industry uses lithium either as lithium-bearing concentrates or lithium carbonate depending on current market price and processproduct require-ments There is currently no such industry established in Namibia but potential plans There is glass and ceramics manufacturing in South Africa and thus a potential market for lithium bearing products (concentrates) should this indus-try require it depending on product
The 20182019 primary lithium supply based on spodumene-bearing mineral concentrates was dominated by Australia with a market share of well over 95 On an annual basis the country exports more than three million tons of lithium-bearing concentrates to China To put this into perspective Lepidico plans to export just 58 ktpa of concentrate to Abu Dhabi for refinement from their project annually Therefore potential production in Namibia will always be rather small scale when compared to peer producing countriescompanies
As of late 2020 the concentrate market is in strong oversupply with strong competition Thus prices have eroded quite substantially for a standard SC6 concentrate (Fig 24) In general prices vary significantly based on lithium content and impurities of the concentrates Lithium bearing mineral concen-
Lithium Potential in Namibia
49
trates are a relatively low-value mineral commodity when compared to lithi-um-carbonate or other lithium downstream products thus product quality cost reduction and cost control are key components in this industry Since prices are depressed currently many of the Australian producers have drasti-cally reduced output or even went into care and maintenance This situation may change towards 2025 or beyond as demand picks up
Prices for the higher valued product lithium-carbonate spiked at the end of 2017 towards 2018 to more than 20000 $USt on a contract basis with prices being very volatile Since then prices have also eroded to below 9000 $USt due to oversupply and slow demand pickup (Fig 25) With this product stable quality and chemical composition are crucial for the downstream industry
Based on available gradetonnage data the Namibian projectsprospects are relatively small in overall size and low in grade when compared to global peers for the resource category ldquoMeasuredIndicatedrdquo (Appendix B) Total contained lithium quantity is thus relatively small in comparison On a global scale the most promising hard rock projects that are currently being mined and developed have Li2O grades of 10 or above
Fig 24 Lithium-mineral-concentrate prices 012010 ‒ 062020 (Source BGR 2020)
300
400
500
600
700
800
900
1000
1100
208
210
212
214
216
218
220
US$
t US$t
01-20
14
01-20
15
01-20
16
01-20
17
01-20
18
01-20
19
01-20
20
01-20
10
01-20
11
01-20
12
01-20
13
Spodumene min 5-6 LiO2 fob Australia
Spodumene concentrate gt75 LiO2 bulk cif Asia
Petalite 42 LiO2 fob Durban
Spodumene fob Australia
Spodumene min 5-6 LiO2 cif China
Lithium Potential in Namibia
50
For the resource category ldquoIndicatedrdquo which generally represents the lowest level of confidence only the Uis mine project of AfriTin represents a size-able resource even though grades are relatively low (Appendix C) The Uis tailings project as well as the Rubicon project are again relatively small when compared to their global peers Tantalite Valley is the smallest of all included projects (Appendix C)The given data for the De Rust project reflects only an exploration target of the company rather than actual data and may thus be not representative
Based on size and contained lithium-content none of the visited early stage projectsprospects would justify the financial investment into the construction of a chemical conversion plant for the production of lithium carbonate andor hydroxide on site as it requires very large monetary investments Due to their size payback of the required investments may be unfavorable when compared to global peers In addition the current market environment is very harsh with strong competition from Asia that has a huge cost advantage due to capacity build up This industry is also very energy and water intensive
In addition location within Namibia as well as distance to possible down-stream markets may become an issue as it increases the transportation cost
4000
7000
10000
13000
16000
19000
22000
25000
28000
01-20
14
01-20
15
01-20
16
01-20
17
01-20
18
01-20
19
01-20
20
US$
t
Lithium-carbonate (min 995 ) battery grade spot price ex works domestic ChinaLithium-carbonate (min 99-995 ) Li2CO3 large contracts USA delivered continentalLithium-hydroxid-monohydrate (min 565) technical and industrial grades cif China Japan amp Korea
Fig 25 Lithium chemical prices 012014 ndash 062020 (Source BGR 2020)
Lithium Potential in Namibia
51
immensely This is especially true for the SorisDe Rust pegmatite which is in a remote location without any allocated infrastructure The projects Karibib Uis and Tantalite Valley are much easier to access
The approach of Lepidico to produce a lithium bearing concentrate on site seems plausible approach Since this will already require a skilled workforce mining and beneficiation equipment in order to produce a high quality lithium-bearing concentrate it may already be considered ldquoadded valuerdquo for the indus-try of the country This approach may also be suitable for the other mentioned and visited projects
Lithium Potential in Namibia
52
ReferencesAfriTin Mining (2020) Uis Tin Project ndash Company Information ndash URL httpafritinminingcomuis-project [as of 092020]
Australian Government Geoscience Australia (2019) Australiarsquos Identi-fied Mineral Resources 2019 ndash URL httpswwwgagovauscientific-topicsmineralsmineral-resources-and-adviceaimr [as of 092020]
BGR ndash Bundesanstalt fuumlr Geowissenschaften und Rohstoffe (2020) Fachinformationssystem Rohstoffe ndash unpubl Hannover [as of 082020]
BGS ndash British Geological Survey (2016) Lithium Definitions mineralo-gy and deposits ndash URL httpswwwbgsacukdownloadsstartcfmid=3100 [as of 062016]
Diehl B J M (1990) Pegmatites of the Cape Cross Uis ndash Pegmatite Belt Namibia Geology mineralisation Rubidium Strontium characteristics and petrogenesis of rare metal pegmatites Open File Report EG 083 Economic Geology Series Geological Survey of Namibia 39 pp Windhoek
Diehl B J M (1992a) Lithium Caesium Beryllium Open File Report Mineral Resource Series Geological Survey of Namibia 18 pp Windhoek
Diehl B J M (1992b) Niobium and Tantalum Open File Report Mineral Resource Series Geological Survey of Namibia 20 pp Windhoek
Diehl B J M (1992c) Tin Open File Report Mineral Resource Series Geological Survey of Namibia 30 pp Windhoek
Diehl B J M amp Schneider G I C (1990) Geology and mineralisation of the Rubicon Pegmatite Namibia Open File Report Geol Surv Namibia 20 pp Windhoek
Fuchsloch et al (2018) Classification mineralogical and geochemical vari-ations in pegmatites of the Cape Cross-Uis pegmatite belt Namibia Lithos 296 ndash 299 79-95 elsevier
Lithium Potential in Namibia
53
Garret D E (2004) Handbook Of Lithium And Natural Calcium Chloride Their Deposits Processing Uses and Properties ndash 467 S Oxford (Elsevier B V)
Geological Survey of Namibia (2002) Mineral Resources of Namibia Summary of Mineral Deposits and Occurrences Omaruru Sheet 2114 Volume I ndash Complete Descriptions 119 pp Windhoek
IHS Global SA (2020) Global Trade Atlas ndash Commercial Online-Databa-se ndashURL httpsmyihscomConnectcallingUrl=https3a2f2fconnectihsmarkitcom2f [as of 062017]
Kazera Global Investments PLC (2020) Company Information ndash URL httpskazeraglobalcominvestmentsnamibia-tantalite-investment-mine [as of 092020]
Lepidico (2019) LOI with BASF extended to 31 December 2020 ndash News Release ndash URL httpswwwlepidicocomwp-contentuploads201910LPD-191220-LOI-with-BASF-extended-to-31-December-2020pdf [as of 122019]
Lepidico (2019) Corporate Presentation ndash URL httpswwwlepidicocomwp-contentuploads201907LPD-190509-Corporate-Presentati-on-May-2019pdf [as of 052019]
Lepidico (2020) Company Information ndash URL httpswwwlepidicocomprojectskaribib [as of 092020]
Montero Mining amp Exploration Ltd (2018) Exploring Battery Metals in Namibia ndash Company Presentation ndash URL httpswwwproactiveinvestorscomauuploadSponsorFileFile2018_031520244941_MON-CorporatePre-sentationMarch2018pdf [as of 072018]
Montero Mining amp Exploration Ltd (2019) Montero Files NI 43-101 Resource Estimate On The Uis Lithium-Tin Tailings Project In Namibia On Sedar ndash News Announcement ndash URL httpsmonterominingcommontero-files-ni-43-101-resource-estimate-on-the-uis-lithium-tin-tailings-project-in-namibia-on-sedar [as of 032019]
Lithium Potential in Namibia
54
Namibia Mining Cadastre Portal (2020) Online-Database ndashURL httpsportalslandfoliocomnamibia [as of 092020]
Roskill Information Services Ltd (2016) Lithium Global Industry Mar-kets amp Outlook ndash 386 S London Groszligbritannien
Schneider G I C (1992) Feldspar Open File Report MRS 08 Mineral Resource Series Geological Survey of Namibia 2 pp Windhoek
Schmidt M (2017) Rohstoffrisikobewertung ndash Lithium ndash DERA Rohstoffin-formationen 33 Berlin
S amp P Global Market Intelligence (2020) Lithium - Metals amp Mining Properties URL httpsplatformmarketintelligencespglobalcomwebcli-entauth=inheritindustryminingProjects [as of 092020]
Statista (2020) Distribution of lithium end-usage worldwide in 2019 by area application ndash URL httpswwwstatistacomstatistics268787lithium-usa-ge-in-the-world-market [as of 062020]
Tawana Resources NL (2016) Tawana acquires second lithium pro-ject ndash News Release ndash URL httpsmstrademomentumcozajsepdfSENS_20160923_S376505pdf [as of 092016]
USGS ndash United States Geological Survey (multiple years) Lithium ndash Minerals Commodity Summaries ndash URL httpswwwusgsgovcentersnmiclithium-statistics-and-information [as of 082020]
Appendix
Sam
ple I
DFa
rmLa
titud
eLo
ngitu
deSa
mpl
e des
crip
tion
(XRD
qu
al)
LiO 2
()
SiO 2
Ti
O 2
Al2O 3
Fe2O 3
Mn
O Mg
O Ca
O Na
2O
K 2O P 2O 5
SO
3
Cl
F
LOI
Su
m
2015
-03
previous sample campaignsHelik
on
n A
Felds
parQ
uartz
Lepid
olite
025
6871
lt000
119
0500
200
2900
505
3292
806
7905
59lt0
01lt0
002
lt005
093
9985
2016
-12
Rubic
onwe
ather
ed P
etalite
126
6473
lt000
118
0600
703
2718
607
9507
805
2500
62lt0
01lt0
002
lt005
1146
9871
2016
-17
Rubic
onLe
pidoli
te +
Quar
tz13
063
6700
219
9316
0929
003
0054
029
6218
0052
lt001
lt000
226
232
798
67
2016
-20
Helik
onLe
pidoli
te + A
lbite
176
5514
lt000
126
8700
401
2100
700
2123
970
3900
45lt0
01lt0
002
156
369
9698
2016
-21
Helik
onLe
pidoli
te19
954
32lt0
001
2627
004
0224
006
0038
266
714
0069
lt001
lt000
240
628
997
77
FN20
19_0
4De
Rus
tFe
ldspa
rAmb
lygon
iteP
etalite
(n
on X
RD)
003
6513
lt000
118
82lt0
0100
0200
101
0924
311
4105
75lt0
0100
04lt0
0503
898
84
2015
-09
Molop
oPe
talite
(non
XRD
)00
952
85lt0
001
1672
lt001
0002
487
0323
342
0352
lt000
100
400
3403
621
1310
012
2016
-14
Molop
oPe
talite
wea
there
d (no
n XRD
)00
752
1600
0316
5100
200
5147
805
8923
406
4500
6900
200
8602
222
6310
013
2016
-15
Molop
oFe
ldspa
r (no
n XRD
)00
664
02lt0
001
1937
003
0004
003
0151
216
1249
0796
lt001
lt000
2lt0
0505
399
55
2016
-23
Molop
oZin
nwald
ite (n
on X
RD)
006
5044
0068
3307
048
0011
012
0426
261
7674
0181
lt001
lt000
2lt0
0542
9925
1909
249
2019Uis
Tailin
gs
Quar
tzFe
ldspa
rPeta
lite
Musc
ovite
028
7293
0045
1479
051
0062
0212
9830
927
6613
6200
2lt00
02lt0
0523
399
38
1909
250
Uis
Tailin
gsQu
artz
Felds
parP
etalite
Mu
scov
ite02
872
6900
4314
8205
0059
019
1306
313
2794
1347
002lt
0002
lt005
251
9937
1909
251
Helik
on 4
22deg02prime4
8primeprimeS1
6deg01prime30
primeprimeEQu
artz
Felds
parP
etalite
Le
pidoli
te16
464
4400
0319
4200
301
2100
408
8325
345
6806
800
400
0727
228
998
38
1909
252
Helik
on 1
22deg02prime2
0primeprimeS1
6deg01prime19
primeprimeEPe
talite
Lepid
olite
Quar
tz29
576
9200
0116
6800
300
0304
101
7301
106
8100
01lt0
01lt0
002
lt005
205
97
App
endi
x A
Ana
lytic
al d
ata
of li
thiu
m s
ampl
es c
olle
cted
in N
amib
ia T
hres
hold
val
ues
high
light
ed in
gre
en
Lithium Potential in Namibia
57
Sam
ple I
DFa
rmLa
titud
eLo
ngitu
deSa
mpl
e des
crip
tion
(XRD
qu
al)
LiO 2
()
SiO 2
Ti
O 2
Al2O 3
Fe2O 3
Mn
O Mg
O Ca
O Na
2O
K 2O P 2O 5
SO
3
Cl
F
LOI
Su
m
1909
253
2019Rubic
on22deg06prime1
3primeprimeS1
5deg59prime45
primeprimeEPe
talite
Lepid
olite
Quar
tz32
778
73lt0
001
1687
002
0006
002
0157
011
003
0002
003
0003
lt005
075
9663
1909
254
Rubic
on22deg06prime1
0primeprimeS1
5deg59prime41
primeprimeEFe
ldspa
rQua
rtzM
usco
vite
004
682
lt000
119
3500
300
2400
205
0610
0808
6804
3lt0
01lt0
002
lt005
041
9985
1909
255
Rubic
on22deg06prime1
0primeprimeS1
5deg59prime41
primeprimeEFe
ldspa
rLep
idolite
Mus
co-
viteK
aolin
026
6104
0004
2318
022
0136
006
0119
367
8411
0159
lt001
lt000
2lt0
0522
299
15
1909
256
Rubic
on22deg06prime1
0primeprimeS1
5deg59prime41
primeprimeELe
pidoli
te 27
249
8700
129
3400
408
0500
400
704
697
3100
31lt0
01lt0
002
087
441
9569
1909
257
Rubic
on22deg06prime1
3primeprimeS1
5deg59prime45
primeprimeEPe
talite
Lepid
olite
Quar
tz30
670
0900
0320
2600
801
0901
502
9901
926
800
15lt0
0100
04lt0
0526
596
48
1909
258
Rubic
on22deg06prime1
0primeprimeS1
5deg59prime41
primeprimeELe
pidoli
teFe
ldspa
rQua
rtz20
659
7800
0224
100
505
2400
300
513
7247
0051
lt001
0002
265
388
9966
1909
259
Tanta
lite
Valle
y28deg43prime0
9primeprimeS1
8deg43prime55
primeprimeEFe
ldspa
rLep
idolite
Mus
covit
e11
762
64lt0
001
2139
004
0161
lt001
0399
7731
2401
0900
200
119
912
698
85
1909
260
Tanta
lite
Valle
y28deg43prime0
9primeprimeS1
8deg43prime55
primeprimeEFe
ldspa
rLep
idolite
Mus
covit
e03
059
8600
1425
1301
604
2200
302
2860
547
2201
3900
200
0904
123
799
56
1909
261
Tanta
lite
Valle
y28deg43prime0
9primeprimeS1
8deg43prime55
primeprimeEFe
ldspa
rQua
rtzM
usco
vite
003
636
0005
2218
022
0122
002
0381
727
3809
0272
lt001
lt000
2lt0
0513
199
17
1909
262
Tanta
lite
Valle
y28deg43prime2
0primeprimeS1
8deg44prime23
primeprimeEQu
artzSp
odum
eneM
us-
covit
e13
180
5100
0415
8903
401
2401
301
9502
604
0400
0500
200
03lt0
0507
398
56
1909
263
De R
ust
20deg57prime4
8primeprimeS1
4deg30prime13
primeprimeEFelsd
parS
podume
neQuartz
074
7313
0006
2048
007
015
005
0154
398
0831
0073
001
0003
lt005
082
9974
1909
264
De R
ust
20deg57prime4
8primeprimeS1
4deg30prime13
primeprimeESp
odum
eneF
eldsparQuartz
230
6924
0006
2602
801
0200
301
0510
102
1400
68lt0
0100
03lt0
0504
897
53
(Con
tinue
d) A
ppen
dix
A A
naly
tical
dat
a of
lith
ium
sam
ples
col
lect
ed in
Nam
ibia
Thr
esho
ld v
alue
s hi
ghlig
hted
in g
reen
Lithium Potential in Namibia
58
Appendix B GradeTonnage data (Measured amp Indicated) for selected lithium projects in comparison to Namibian projects (Source SampP 092020)
0
0500
1000
1500
2000
2500
500
5000
5000
0
5000
00
5000
000
Gra
de [
Li 2O
]
Tonnage [t]
Tantalite Valley
Rubicon
Appendix B GradeTonnage data (Inferred) for selected lithium projects in com-parison to Namibian projects (Source SampP 092020)
0
0500
1000
1500
2000
2500
100
1000
1000
0
1000
00
1000
000
1000
0000
Gra
de [
Li 2O
]
Tonnage [t]
Tantalite ValleyRubicon
Uis Tailings
Uis Mine
De Rust
A product of the technical cooperation project between Bundesanstalt fuumlr Geowissenschaften und Rohstoffe (BGR)(Federal Institute for Geosciences and Natural Resources)
andGeological Survey of Namibia within the Ministry of Mines and Energy
ISBN 978-3-948532-29-1 (Print) 978-3-948532-30-7 (PDF)
- List of Abbreviations
- 1 Introduction
- 2 What is lithium
-
- 21 Lithium deposits
-
- 3 Application
- 4 Chemical requirements
- 5 Mining and trade of lithium in the SADC
-
- 51 Lithium production
- 52 Trade data
- 53 Export
- 54Import
-
- 6 Lithium occurrences in Namibia
- 7 Lithium mining in Namibia
-
- 71 Current mining activities and projects
-
- 8 Analysed lithium samples
- 9 Interpretation
- 10 Conclusions
- References
-