Logistics & Industrial Market Germany and Austria 2021
2
AAA excellent AA very good A good BBB slightly above average BB average B slightly below average CCC moderate CC poor C very poor Logistics & Industrial Market Germany and Austria 2021 Regions in Germany * Median rent per sqm Prime net yield Munich Stuttgart Frankfurt Hamburg Mannheim/Heidelberg Regensburg Dusseldorf Berlin Cologne Augsburg/Ulm Freiburg Duisburg Koblenz Nuremberg Dresden Kassel Bremen Muenster/Osnabrück Wurzburg Dortmund Hanover Leipzig Saarbrücken Magdeburg Erfurt 7.35 € 6.55 € 6.30 € 6.20 € 5.85 € 5.70 € 5.70 € 5.55 € 5.45 € 5.20 € 5.10 € 4.90 € 4.90 € 4.90 € 4.65 € 4.60 € 4.55 € 4.55 € 4.45 € 4.40 € 4.30 € 4.30 € 4.00 € 3.95 € 3.70 € 3.50% 3.60% 3.70% 3.70% 4.20% 4.10% 3.70% 3.30% 3.70% 4.10% 4.90% 4.00% 4.50% 4.00% 4.50% 4.40% 3.70% 3.70% 5.00% 4.30% 3.70% 3.90% 4.90% 4.70% 3.90% Regions in Austria * Median rent per sqm Prime net yield Vienna Innsbruck Graz Salzburg Linz 6.00 € 5.50 € 5.10 € 5.10 € 5.00 € 4.20% 5.40% 5.30% 5.00% 4.90% * sorted by descending median rent The calculation essentially takes into account: and provided by IndustrialPort: Median rent: Prime yield: Source: Catella Research 2021, IndustrialPort Real Estate MANNHEIM/ HEIDELBERG LEIPZIG AUSTRIA GERMANY Median rent in €/sqm Prime yield in % 5.50 4.15 BERLIN 5.55 3.30 BREMEN 4.55 3.70 REGENSBURG 5.70 4.10 DRESDEN 4.65 4.50 DUISBURG 4.90 4.00 ERFURT 3.70 3.90 HAMBURG 6.20 3.70 4.30 3.70 KOBLENZ 4.90 4.50 5.70 3.70 4.30 3.90 MAGDEBURG 3.95 4.70 4.60 4.40 KASSEL DORTMUND 4.40 4.30 STUTTGART 6.55 3.60 6.00 4.20 SALZBURG 5.10 4.90 LINZ 5.00 4.90 MUNICH 7.35 3.50 FRANKFURT 6.30 3.70 WURZBURG 4.45 5.00 GRAZ 5.10 5.30 INNSBRUCK 5.50 5.40 4.55 3.70 5.85 4.20 NUREMBERG 4.90 4.00 SAARBRÜCKEN 4.00 4.90 5.20 4.10 AUGSBURG/ ULM FREIBURG 5.10 4.90 5.45 3.70 DUSSELDORF COLOGNE VIENNA The logistics property markets in Germany and Austria have proved resilient in the pandemic year 2021 and are continuing their price trend. Investor demand has increased significantly since last year, and the asset class "logistics" continues to rank third on the popularity scale - after office and residential. This thematic map provides a detailed overview of the regional rental and investment markets and the basic geographical classification into regions or functional cluster & transport corridors. The basis for the heat map is the IndustrialScore. This provides a comparable statement regarding its suitability as a location for industrial real estate. For this purpose, data from IndustrialPort was integrated with publicly available data and weighted. This was used to develop a scoring model for determining site suitability. Population forecast Net migration Accessibility model of: – Upper, middle and urban centres – motorways – airports – railways Development of the unemployment rate Purchasing power per inhabitant GDP at county level Transaction data (sales, rentals) Halls per municipality (number and area according to measurement) Standard land values Rents per municipality All data were checked for interdependencies and weighted (econometric approach) to ensure comparability. Subsequently, objective scoring values were derived per municipality and classified into the ranges AAA to C using the Pareto analysis. By choosing a utility value analysis, a statically selected divison into different categories, the large number of municipalities and the weighted para- meters, the individual scores of the municipalities are very close to each other. For this reason, a ranking of the individual municipalities was dispensed, and instead they were assigned to the individual areas. The industrial score maps the spatial division of the IWIP index, which IndustrialPort calculates together with the German Economic Institute (see figure 2, page 2). The median rent is reported for pure logistics properties and is based on actual transactions. Top rents are not recorded. The prime yield corresponds to the yield for a logistics property with very high-quality standards in a prime location within a market area. The property should be 100 % let and have a long-term lease. Demand/market movement on site MUENSTER/ OSNABRÜCK HANOVER
Transcript of Logistics & Industrial Market Germany and Austria 2021
AAA excellent
AA very good
A good
BBB slightly above average
BB average
B slightly below average
CCC moderate
CC poor
C very poor
Logistics & Industrial Market Germany and Austria 2021
Regions in Germany * Median rentper sqm
Prime net yield
MunichStuttgartFrankfurtHamburgMannheim/HeidelbergRegensburgDusseldorfBerlinCologneAugsburg/UlmFreiburgDuisburgKoblenzNurembergDresdenKasselBremenMuenster/OsnabrückWurzburgDortmundHanoverLeipzigSaarbrückenMagdeburgErfurt
7.35 €6.55 €6.30 €6.20 €5.85 €5.70 €5.70 €5.55 €5.45 €5.20 €5.10 €4.90 €4.90 €4.90 €4.65 €4.60 €4.55 €4.55 €4.45 €4.40 €4.30 €4.30 €4.00 €3.95 €3.70 €
3.50%3.60%3.70%3.70%4.20%4.10%3.70%3.30%3.70%4.10%4.90%4.00%4.50%4.00%4.50%4.40%3.70%3.70%5.00%4.30%3.70%3.90%4.90%4.70%3.90%
Regions in Austria * Median rentper sqm
Prime net yield
ViennaInnsbruckGrazSalzburgLinz
6.00 €5.50 €5.10 €5.10 €5.00 €
4.20%5.40%5.30%5.00%4.90%
* sorted by descending median rent
The calculation essentially takes into account: and provided by IndustrialPort:
Median rent:
Prime yield:
Source: Catella Research 2021, IndustrialPort Real Estate
MANNHEIM/HEIDELBERG
LEIPZIG
AUSTRIA
GERMANY
Median rent in €/sqmPrime yield in %
5.504.15
BERLIN5.553.30
BREMEN4.553.70
REGENSBURG5.704.10
DRESDEN4.654.50
DUISBURG4.904.00
ERFURT3.703.90
HAMBURG6.203.70
4.303.70
KOBLENZ4.904.50
5.703.70
4.303.90
MAGDEBURG3.954.70
4.604.40
KASSEL
DORTMUND4.404.30
STUTTGART6.553.60
6.004.20
SALZBURG5.104.90
LINZ5.004.90
MUNICH7.353.50
FRANKFURT6.303.70 WURZBURG
4.455.00
GRAZ5.105.30
INNSBRUCK5.505.40
4.553.70
5.854.20
NUREMBERG4.904.00SAARBRÜCKEN
4.004.90
5.204.10
AUGSBURG/ULM
FREIBURG5.104.90
5.453.70
DUSSELDORF
COLOGNE
VIENNA
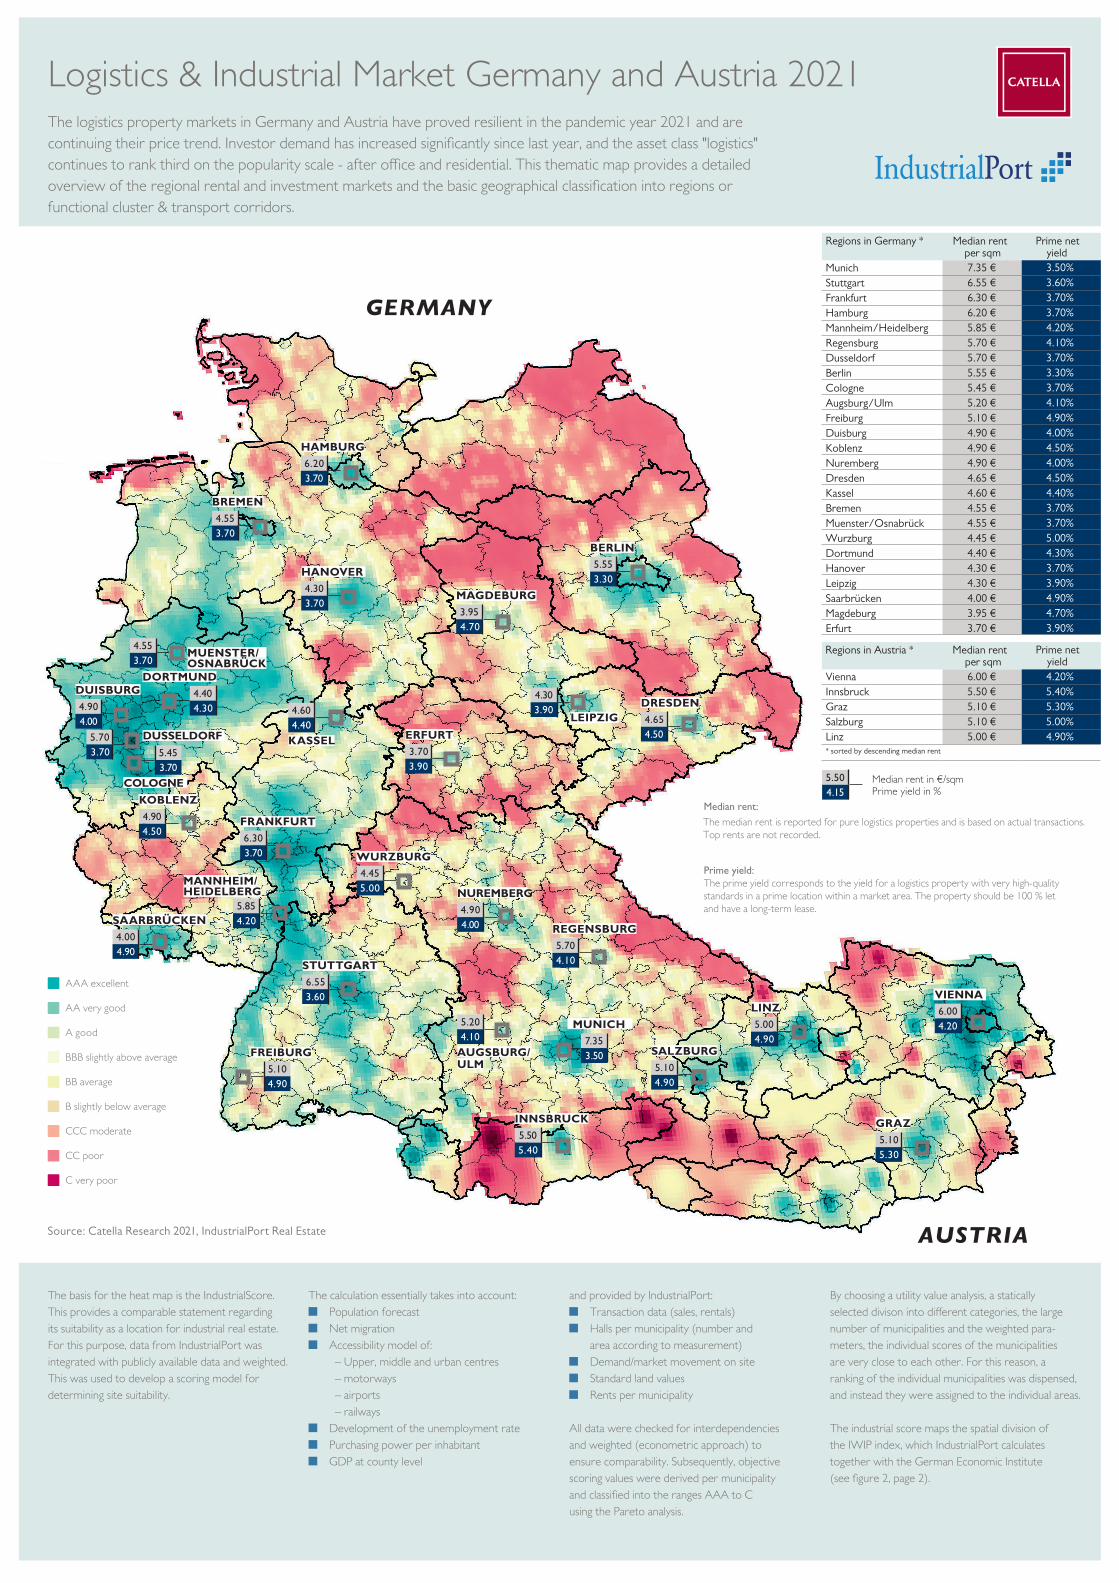
The logistics property markets in Germany and Austria have proved resilient in the pandemic year 2021 and are continuing their price trend. Investor demand has increased significantly since last year, and the asset class "logistics" continues to rank third on the popularity scale - after o�ce and residential. This thematic map provides a detailed overview of the regional rental and investment markets and the basic geographical classification into regions or functional cluster & transport corridors.
The basis for the heat map is the IndustrialScore. This provides a comparable statement regarding its suitability as a location for industrial real estate. For this purpose, data from IndustrialPort was integrated with publicly available data and weighted. This was used to develop a scoring model for determining site suitability.
Population forecast Net migration Accessibility model of:
– Upper, middle and urban centres– motorways– airports– railways
Development of the unemployment rate Purchasing power per inhabitant GDP at county level
Transaction data (sales, rentals) Halls per municipality (number and
area according to measurement) Standard land values Rents per municipality
All data were checked for interdependencies and weighted (econometric approach) to ensure comparability. Subsequently, objective scoring values were derived per municipality and classified into the ranges AAA to C using the Pareto analysis.
By choosing a utility value analysis, a statically selected divison into di�erent categories, the large number of municipalities and the weighted para-meters, the individual scores of the municipalities are very close to each other. For this reason, a ranking of the individual municipalities was dispensed, and instead they were assigned to the individual areas.
The industrial score maps the spatial division of the IWIP index, which IndustrialPort calculates together with the German Economic Institute (see figure 2, page 2).
The median rent is reported for pure logistics properties and is based on actual transactions. Top rents are not recorded.
The prime yield corresponds to the yield for a logistics property with very high-quality standards in a prime location within a market area. The property should be 100 % let and have a long-term lease.
Demand/market movement on site
MUENSTER/OSNABRÜCK
HANOVER

KEYFACTS RENTS AND YIELDS
About IndustrialPort
IndustrialPort Real Estate GmbH & Co. KGPeter Salostowitz. [email protected]+49 6126 97 69 619www.industrialport.net
About CATELLA Research:Prof. Dr. Thomas [email protected]+49 30 31 01 93 220www.catella.com
Carsten [email protected]+49 30 31 01 93 242www.catella.com
As of 07/2021 Contact: [email protected] and [email protected] Source: Catella Research 2021. IndustrialPort Real Estate
Logistics & Industrial Market Germany and Austria 2021
Source: IndustrialPort Real Estate
in %
AUSTRIA Ø 4.96% yield
Source: Catella Research 2021, IndustrialPort Real Estate
GERMANYØ 4.04% yieldØ €5.10/sqm rent
max. Munich €7.35/sqmmin. Erfurt €3.70/sqm
max. Vienna €6.00/sqmmin. Linz €5.00/sqm
Fig. 2: Industrial Real Estate Index. IWIP (2012=100)
95
105
115
125
135
145
155
165
175
2012 2013 2014 2015 2016 2017 2018 2019 2020
total warehouse logistics industrial
Fig. 1: unfilled orders vs. productionindex 2015=100 (seasonally and calendar adjusted)
stock of orders in manufacturingproduction index for the industrySource: Destatis
2015
-01
2015
-04
2015
-07
2015
-10
2016
-01
2016
-04
2016
-07
2016
-10
2017
-01
2017
-04
2017
-07
2017
-10
2018
-01
2018
-04
2018
-07
2018
-10
2019
-01
2019
-04
2019
-07
2019
-10
2020
-01
2020
-04
2020
-07
2020
-10
2021
-01
2021
-04
60
70
80
90
100
110
120
130
Ø €5.34/sqm rent
IndustrialPort is an independent consulting company with decades of real estate market experience, with a focus on warehouses, logistics, and industrial buildings in Germany. Its consultancy is based on a comprehensive database with all essential information on logistics and industrial real estate in the national market.
Catella is a leading specialist in property investments and fund management, with operations in 13 countries. The group has assets under management amounted to approximately EUR 11 billion at the end of the first quarter of 2021. Catella is listed on Nasdaq Stockholm in the Mid Cap segment. Read more online at catella.com.
The pandemic as a trend accelerator has created extraordinary momentum in the logistics property market and will have long-lasting repercussions: A disruptive collapse of global supply chains and production facilities, including border closures and reshoring tendencies, supported by an unprecedented structural boom in e-commerce, is clearly visible. A near complete freeze in letting market during the lockdown in many places, coupled with a simultaneous rise in vacant warehouses in suburban areas, contrasts with a surge in demand for warehouse space in the food retail sector. This mix, coupled with unprecedented excess liquidity in the financial markets and the hunt for yield in the negative interest rate environment, makes logistics a "pandemic winner" with unbroken yield compression dynamics.
For the industrial real estate index (IWIP), data from around 25,000 properties with 180 million square meters of hall space were analysed for the period from 2012 to 2020.
The dataset contains a lot of information for the individual properties such as annual rent per square metre, operating costs, size, various specific quality features, as well as site and location, based on the above-mentioned location scoring.
To calculate the index, data from publicly available statistics were added, so that finally 40 central variables per hall could be included in the evaluation.
Urban logistic concepts for the last mileThe integration of e�cient and sustainable logistics concepts on the last mile is gaining importance due to the incessantly increasing parcel volume (to end customers) and the sustainability debate and is be-coming established especially in urban areas.Modal shifting strategies of freight transport via micro-hubs to cargo bikes, which are currently the focus of courier, express and package services (CEP), are considered an e�ective and sustainable solution.This is driving demand and pricing for "city logistics properties", which are establishing themselves as a new asset class and show parallels to traditional logistics properties, but tend more towards o�ce proper-ties in terms of pricing.
With the economic recovery picking up pace, full order books and the renewed bottleneck of international sea routes (through which 90% of global trade takes place), sea freight rates are sky-rocketing and causing supply bottlenecks.Despite rising order books, production cannot pick up, which again makes us aware of the vulnerability of the global supply chain and highlights the systemic relevance of functioning logistics (Fig. 1).
The situation is also worsening in construction, with hoarding and problems in the procurement of raw materials.The contrasts described above are reflected in the three use categories of warehousing, logistics and production in the IWIP index, which are characterised by strongly diverging rental trends. The quality-adjusted rents for production halls fall sharply by 12.9% last year, but dynamics in the previous years were also extra-ordinary, with rent increases of a remarkable 14-15% per year.
A decline of 3.9% was also recorded in the warehouse sector, while logistics properties increased by 5.4%, a much stronger increase than in previous years. This is mainly due to the high demand for city logistics and last-mile properties in the conur-bations, while price declines were observed in many suburban areas. Despite the significant shifts in supply in 2020, the average annual growth rates for logistics and production properties have increased in the last three years to the same extent as in the longer time comparison since 2012; only in the case of warehouses has the average growth rate halved.
The median rent for logistics properties in Germany rose to an average of €5.1/sqm as of the second quarter of 2021, an increase of around 2% compared to 2019. In contrast, the average rent level in Austria is €5.34/sqm. A total of five logistic regions records prime rents above the €6 mark: these include Munich (7.35), Stuttgart (6.55), Frankfurt (6.30), Hamburg (6.30) and Vienna (6.00).The growing demand for logistics in Germany, not least by institu-tional investors, is also reflected in record transaction volume of almost €8.3 billion in 2020.
The first quarter started strong into 2021 recording €1.8 billion, just the limited supply has prevented even higher transaction volumes. Austria also set a new record with just under €600 million.
High investment pressure results in an ongoing yield compression of logistics properties in our 25 surveyed locations in Germany, which fell in the past 24 months by an average of 69 basis points to just 4.04%, further approaching the peak values of the other asset classes.
Berlin is still the most expensive location, with a top yield of 3.3%, followed by Stuttgart (3.6%). In Austria, Vienna still ranks at the top, standing at 4.2%.