Massimiliano Bratti - core.ac.uk · 2 266 64.-4,6,73,8. DISCUSSION PAPER SERIES ... the “Brucchi...
40
econstor www.econstor.eu Der Open-Access-Publikationsserver der ZBW – Leibniz-Informationszentrum Wirtschaft The Open Access Publication Server of the ZBW – Leibniz Information Centre for Economics Standard-Nutzungsbedingungen: Die Dokumente auf EconStor dürfen zu eigenen wissenschaftlichen Zwecken und zum Privatgebrauch gespeichert und kopiert werden. Sie dürfen die Dokumente nicht für öffentliche oder kommerzielle Zwecke vervielfältigen, öffentlich ausstellen, öffentlich zugänglich machen, vertreiben oder anderweitig nutzen. Sofern die Verfasser die Dokumente unter Open-Content-Lizenzen (insbesondere CC-Lizenzen) zur Verfügung gestellt haben sollten, gelten abweichend von diesen Nutzungsbedingungen die in der dort genannten Lizenz gewährten Nutzungsrechte. Terms of use: Documents in EconStor may be saved and copied for your personal and scholarly purposes. You are not to copy documents for public or commercial purposes, to exhibit the documents publicly, to make them publicly available on the internet, or to distribute or otherwise use the documents in public. If the documents have been made available under an Open Content Licence (especially Creative Commons Licences), you may exercise further usage rights as specified in the indicated licence. zbw Leibniz-Informationszentrum Wirtschaft Leibniz Information Centre for Economics Bernardi, Martino; Bratti, Massimiliano; De Simone, Gianfranco Working Paper "I wish I knew ..." - Misperceived Ability, School Track Counseling Services and Performances in Upper Secondary Education IZA Discussion Paper, No. 7940 Provided in Cooperation with: Institute for the Study of Labor (IZA) Suggested Citation: Bernardi, Martino; Bratti, Massimiliano; De Simone, Gianfranco (2014) : "I wish I knew ..." - Misperceived Ability, School Track Counseling Services and Performances in Upper Secondary Education, IZA Discussion Paper, No. 7940 This Version is available at: http://hdl.handle.net/10419/93298
Transcript of Massimiliano Bratti - core.ac.uk · 2 266 64.-4,6,73,8. DISCUSSION PAPER SERIES ... the “Brucchi...
econstor www.econstor.eu
Der Open-Access-Publikationsserver der ZBW – Leibniz-Informationszentrum WirtschaftThe Open Access Publication Server of the ZBW – Leibniz Information Centre for Economics
Standard-Nutzungsbedingungen:
Die Dokumente auf EconStor dürfen zu eigenen wissenschaftlichenZwecken und zum Privatgebrauch gespeichert und kopiert werden.
Sie dürfen die Dokumente nicht für öffentliche oder kommerzielleZwecke vervielfältigen, öffentlich ausstellen, öffentlich zugänglichmachen, vertreiben oder anderweitig nutzen.
Sofern die Verfasser die Dokumente unter Open-Content-Lizenzen(insbesondere CC-Lizenzen) zur Verfügung gestellt haben sollten,gelten abweichend von diesen Nutzungsbedingungen die in der dortgenannten Lizenz gewährten Nutzungsrechte.
Terms of use:
Documents in EconStor may be saved and copied for yourpersonal and scholarly purposes.
You are not to copy documents for public or commercialpurposes, to exhibit the documents publicly, to make thempublicly available on the internet, or to distribute or otherwiseuse the documents in public.
If the documents have been made available under an OpenContent Licence (especially Creative Commons Licences), youmay exercise further usage rights as specified in the indicatedlicence.
zbw Leibniz-Informationszentrum WirtschaftLeibniz Information Centre for Economics
Bernardi, Martino; Bratti, Massimiliano; De Simone, Gianfranco
Working Paper
"I wish I knew ..." - Misperceived Ability, SchoolTrack Counseling Services and Performances inUpper Secondary Education
IZA Discussion Paper, No. 7940
Provided in Cooperation with:Institute for the Study of Labor (IZA)
Suggested Citation: Bernardi, Martino; Bratti, Massimiliano; De Simone, Gianfranco (2014) : "Iwish I knew ..." - Misperceived Ability, School Track Counseling Services and Performances inUpper Secondary Education, IZA Discussion Paper, No. 7940
This Version is available at:http://hdl.handle.net/10419/93298

DI
SC
US
SI
ON
P
AP
ER
S
ER
IE
S
Forschungsinstitut zur Zukunft der ArbeitInstitute for the Study of Labor
“I wish I knew ...” – Misperceived Ability, School Track Counseling Services and Performances in Upper Secondary Education
IZA DP No. 7940
January 2014
Martino BernardiMassimiliano BrattiGianfranco De Simone
“I wish I knew ...” – Misperceived Ability, School Track Counseling Services and
Performances in Upper Secondary Education
Martino Bernardi Fondazione Giovanni Agnelli
Massimiliano Bratti
DEMM, Università degli Studi di Milano, IZA and Centro Studi Luca d’Agliano (LdA)
Gianfranco De Simone
Fondazione Giovanni Agnelli and Centro Studi Luca d’Agliano (LdA)
Discussion Paper No. 7940 January 2014
IZA
P.O. Box 7240 53072 Bonn
Germany
Phone: +49-228-3894-0 Fax: +49-228-3894-180
E-mail: [email protected]
Any opinions expressed here are those of the author(s) and not those of IZA. Research published in this series may include views on policy, but the institute itself takes no institutional policy positions. The IZA research network is committed to the IZA Guiding Principles of Research Integrity. The Institute for the Study of Labor (IZA) in Bonn is a local and virtual international research center and a place of communication between science, politics and business. IZA is an independent nonprofit organization supported by Deutsche Post Foundation. The center is associated with the University of Bonn and offers a stimulating research environment through its international network, workshops and conferences, data service, project support, research visits and doctoral program. IZA engages in (i) original and internationally competitive research in all fields of labor economics, (ii) development of policy concepts, and (iii) dissemination of research results and concepts to the interested public. IZA Discussion Papers often represent preliminary work and are circulated to encourage discussion. Citation of such a paper should account for its provisional character. A revised version may be available directly from the author.
IZA Discussion Paper No. 7940 January 2014
ABSTRACT
“I wish I knew ...” – Misperceived Ability, School Track Counseling Services and Performances in Upper Secondary Education*
Previous research shows that, in tracked school systems, enrollment decisions are strongly associated with future outcomes both in education and on the labour market. Yet few studies explicitly investigate whether students (and their parents) have all the relevant information they need to make proper decisions. We address this issue by exploiting the data collected within the Arianna Project, an independent school track counseling service run by the municipality of a large city in Northern Italy (Turin). Virtually all students in the final year of lower secondary education participate into the program and they receive advices based on standardized cognitive and non-cognitive tests. Our dataset is uniquely enriched by information on students’ pre-test enrollment intentions, their final track choices and their performances in the upper secondary school. We show that students’ enrollment intentions are very often inconsistent with their actual potential as revealed by Arianna. However, students (and their parents) are likely to revise their initial choice when new information on their true abilities is made available to them. Moreover, we find that students who eventually make track choices in line with Arianna’s suggestions are less likely to be retained in the first year of the upper secondary education. JEL Classification: I21, I24 Keywords: ability, information, school track choice, grade retention Corresponding author: Massimiliano Bratti DEMM Università degli Studi di Milano Via Conservatorio 7 20122 Milan Italy E-mail: [email protected]
* The present version has benefited from comments received at the annual meeting of the Italian Association of Labour Economics (2013, Rome), at the Workshop on Empirical Research in Economics of Education held by the QURE research group (2013, Reus, Spain), at YOUTH Workshop (2013, Salerno, Italy), the “Brucchi Luchino” Labour Economics Workshop (2013, Rome) and at Fondazione Giovanni Agnelli. The authors are grateful to the Municipality of Turin (Italy) for making the data available. The usual disclaimer applies.

IZA Discussion Paper No. 7940 January 2014
NON-TECHNICAL SUMMARY In tracked educational systems the choice of the school track is one of the most crucial decisions in students’ lives. It has been shown that those who choose academic (or more selective) tracks tend to have a higher probability of continuing and succeeding in tertiary education, better employment opportunities and higher earnings. But do students’ and their family have all the relevant information they need to make a conscious choice? This paper tries to provide an answer to such a question. The starting point are data collected by an independent school track counseling service called Arianna created by the municipality of Turin, the second largest city in Northern Italy. Arianna consists of a battery of tests able to measure cognitive and non-cognitive abilities of students in the final year of lower secondary school. Test scores along with other information collected from students and schools are used to give a piece of advice to students on the upper secondary school track that best matches their ability profile. This study shows that the information and the recommendations provided by Arianna are indeed useful to students and parents. In fact, very often students tend to misperceive their actual ability, overestimating or underestimating their potential. As a result, students often choose tracks that stress their weaknesses instead of promoting their strengths. However, students and their families show an inclination to revise their initial enrollment intentions once new credible information is made available to them. When the Arianna program gives an indication of enrollment intentions not in line with the actual potential of the individual, the student and her family tend to change their initial choice accordingly and they opt for a different track. Furthermore, this paper shows that those who make choices in line with the suggestions of the counseling services face a lower risk of retaining grades in the upper secondary education. Hence, providing better information through counseling services may help to prevent failure and drop out in upper secondary education.
1. Introduction
In some educational systems students are tracked by ability in schools of different types
(e.g., academic vs. vocational schools). There are various reasons why tracking may be an
effective way of organizing secondary education. Advocates of tracking maintain that mixing
students that have too different levels of abilities may create very heterogeneous groups, and
teaching would become more difficult. A teacher will have to target instruction on the “av-
erage” student in a class, a level which might be too difficult for the low-ability and too easy
for the high-ability student. This may lead to levels of student achievement which are lower
than those that could be potentially obtained in a tracked system. Moreover, the absence of
tracking (i.e. a comprehensive high school) may also induce some of the least academically
oriented students not to continue in secondary education, in case it is not compulsory. De-
tractors of tracking have opposite thoughts. Their view is that segregating low ability students
in “worse” schools in terms of quality of both the peer group and the teacher body may limit
their academic potential, and raise social inequality. Cross-sectional evidence shows that both
arguments are valid. Brunello and Checchi (2007) find, for instance, that “reducing the extent
of student tracking, either by raising the age of first selection or by reducing the number of
tracks available, may be appropriate for increasing intergenerational mobility in educational
attainment, but may increase social exclusion for people from disadvantaged backgrounds”.
As a matter of fact, in tracked educational systems the choice of school track is a powerful
predictor of an individual’s labour market outcomes. Students who choose academic (or more
selective) tracks tend to fare better later on in their lives than those who enroll in vocational
tracks: they have a higher probability of continuing and succeeding in tertiary education (Cap-
pellari and Lucifora 2009, Bratti et al. 2012), better employment opportunities and higher earn-
ings (Dustmann 2004). Even if part of these benefits do not reflect a genuine effect of tracks
but students’ unobserved characteristics—first of all, innate ability—a fundamental problem
emerges in tracked educational systems: how to implement an efficient system of allocation of
students to tracks?1 To put it in other terms, from a social point of view, the problem is how to
1This represents an interesting issue only if individuals’ outcomes in the labour market are not fully determinedby their level of ability, but school tracks produce a “value added”, or, to put it in other words, tracks have a truecausal effect. In this respect, few studies have made an attempt to address the endogeneity of school track’seffects, and the evidence is mixed. Figlio and Page (2002) find that tracking does not hurt (but benefit) low-abilitychildren using an instrumental variables strategy. However, they explicitly recognizes that their instruments may
2

minimize the risk of mismatch between an individual’s ability and the level of ability required
by the track she chooses.
In spite of the high relevance of this issue, there is relatively little work on the determinants
of school track choices. By means of cross-country comparisons, some authors have shown that
when teacher suggestions are less binding and more freedom is left to parents, track choices
reflect a steeper socio-economic gradient (Checchi and Flabbi 2007, Bratti et al. 2012). Other
studies stressed the role of parents’ risk aversion, wealth and household income. Evidence on
the role of risk aversion is mixed. Wölfel and Heineck (2012) show that in Germany risk ad-
verse mothers are more likely to have their children enrolled in vocational secondary schools
compared to risk-neutral counterparts, while the opposite is found for risk-averse fathers. By
contrast, Leonardi (2007) does not find any role for risk aversion on the choice of secondary
school in the Italian context, but parents’ wealth is shown to be positively associated with the
choice of the academic track, especially in liquidity constrained households. Tamm (2008)
suggests that income has no effect on school choices and that differences between high and
low-income families mainly reflect unobserved heterogeneity. Another stream of the literature
is mainly concerned with the potential shortcomings of teachers’ recommendations, which in
many educational systems are the primary driver of school track choice. Ochsen (2011) con-
siders the German case and reports that parents’ upgrading choices (i.e. choosing more presti-
gious tracks) with respect to teachers’ recommendations are positively associated with higher
child education, especially when they are taken by highly educated parents. Cinnirella et al.
(2011) report that taller students are more likely to receive recommendations for the academic
track even controlling for past school performance and parental background, and authors re-
late this evidence mainly to the positive association between height and non-cognitive (social)
skills, although they do not completely discard the pure discrimination hypothesis. Jürges and
Schneider (2011) observe relative-age effects in teachers’ recommendations: younger children
be weak. Guyon et al. (2012) exploit a natural experiment provided by a reform introduced in Northern Irelandin 1989 which introduced a rise in quotas applied to grammar school intakes. The authors find that the net effectof the “detracking” consisted in a very significant increase in examination results both at the end of compulsoryschooling and at the end of “high school”. Similar results on the positive effect of detracking are provided by Kerret al. (2013) using the Finnish comprehensive school reform. The authors find small positive effects on verbalscores and for children of low educated parents. Hanushek and Wössmann (2006) report cross-country evidencethat school tracking is associated with higher educational inequality, while the effect on mean performance is lessclear.
3

are less likely to receive recommendations for the academic track. They conclude that teachers
weight too much current with respect to (future) expected performance.
In this paper, we look at the process of school track choice from a different angle. In
particular, we try to understand whether the availability of new reliable information on students’
cognitive and non-cognitive individual abilities provided by an independent counseling service
allows students and their families to make better school track choices, improving students’
performances in the upper secondary school.
We take advantage of a unique dataset that, along with students’ personal characteris-
tics (gender, nationality, socio-cultural background), brings together information on: i) pre-
enrollment students’ upper secondary track preferences as stated during lower secondary school-
ing (grades 7 and 8); ii) students’ cognitive and non-cognitive abilities as measured by a set of
standardized tests which are used to provide them with a piece of advice on the school track
that best matches their potential; iii) the actual track choice made by students as they move on
from lower to upper secondary education; iv) the educational performance of students during
the first year of the upper secondary education (grade 9). Data come from a student counseling
service called Arianna created by the municipality Turin, the second largest city in Nothern
Italy, that administer tests to virtually all lower secondary school leavers in Turin each year
(95% of schools, i.e. 92% of students).
The choice of the upper secondary track is a truly crucial point on the educational ladder
for Italian students and it has been shown to be little meritocratic and extremely sensitive to
the role played by family background and expectations (Checchi and Flabbi 2007, Checchi
et al. 2013). De Simone (2013) shows that disparities in learning opportunities across socio-
economic groups of Italian students are magnified during middle school years and that this
translates into a social tracking along the upper secondary’s tracks (academic, technical, voca-
tional).
In line with previous research, we are able to show that both pre-test enrollment intentions
and the actual enrollment decisions are affected by family background and other student char-
acteristics. However, we add to the literature with three main findings. First, we are able to
isolate factors that increase the probability for a student to declare enrollment intentions not
supported by her actual potential as revealed by test scores. Second, we show that, when a stu-
dent receives a signal of inconsistency between her enrollment intentions and her true academic
4
potential as assessed by the external counseling services, she tends to revise the final choice of
school track accordingly. In this respect, our paper differs from previous contributions which
have mainly investigated how newly available information induces a revision of subjective ex-
pectations on economic returns attached to either schooling levels or major choices in college
(e.g., Jensen 2010, Zafar 2011). Third, we find that the signals received by the counseling ser-
vice can act as a “protection factor” against failure in the upper secondary school: those who
follow (do not follow) the advice received are less (more) likely to experience grade retention
in the first year of the upper secondary school (grade 9).
The persistence of family influences on students choices and achievements suggests that
policies aiming at expanding the educational opportunities for students with disadvantaged
backgrounds are still needed in the Italian education system. On the other hand, our results
imply that promoting services and activities aiming at relaxing the information constraints that
impinge on students’ choices and performances can also be a fruitful way to improve opportu-
nities to succeed in the upper secondary education and eventually prevent students’ dropout.
We organize our contribution as follows. The next section describes the main features of
Arianna, the counseling service, and sketches the timeline of the decision process of lower sec-
ondary school students that are moving forward to upper secondary education. We then present
our data in section 3, with a particular focus on the cognitive and non-cognitive measures pro-
vided Arianna. Section 4 investigates the characteristics associated with the pre-test school
track preferences. Section 5 represents the heart of our analysis as it studies the determinants
of the mismatch between pre-test school enrollment intentions and the Arianna’s advice, and
investigates whether students receiving a signal of mismatch do use the new information to re-
vise their initial intentions. Section 6 analyzes how the probability of grade retention in the first
year of upper secondary education varies with the choice made and whether those who ignored
Arianna’s advice are exposed to a greater risk of failure. In the same section we provide a
theoretical rationalization of our results. The last section briefly summarizes our main findings.
5
2. The Arianna Project: measuring cognitive and non-cognitive abilities to support stu-dent enrollment choices
Since the early 1990s the Municipality of Turin, one of the largest Italian cities located in the
North-Western part of the country, offers to all students in the final year of the lower-secondary
education the opportunity to access a guidance counseling service external to schools. Within
the Arianna project, students are asked to take a set of computer based standardized tests aim-
ing at assessing their cognitive and non-cognitive abilities to highlight their strengths and weak-
nesses. Although questionnaires are invariant from wave to wave, students are not familiar with
them as no samples of questions have been released to lower secondary schools over the years.
In this respect ’teaching to the test’ is less likely than for other types of standardized tests.
Tests aim at capturing the proficiency of students along the full spectrum of cognitive abili-
ties: a) Language; b) Logic; c) Symbolic calculus; d) Spatiality; e) Strategy. Although the tests
on cognitive abilities are tailored to lower secondary students (typically aged 12-13 when they
are assessed), questions are not curriculum based. This makes test scores comparable across
schools and waves. As regards non-cognitive abilities, a personality test allows to characterize
students’ inclinations with respect to three dichotomies: i) Erratic / Intentional; ii) Risk Lover
/ Risk Adverse; iii) Competitive / Collaborative. Apart from test scores, for each student, the
Arianna project gathers information on the family background, on the school and the class at-
tended, on the choice of upper secondary school track they would make at the moment they
take the tests.
All these pieces of information together with results from cognitive and non cognitive tests
are then used to support families in their choice of the upper secondary track and career path-
way. A personal card containing an overview of students’ results and the Arianna counselors’
suggestion is returned to parents who can further arrange a meeting in order to ask clarifications
and discuss about the best track choice for their child.
The final decision will be made only a few months later and the observation of the track in
which the students is enrolled will reveal whether she has followed Arianna’s suggestion. The
timing of the process is depicted in Figure 1.
6
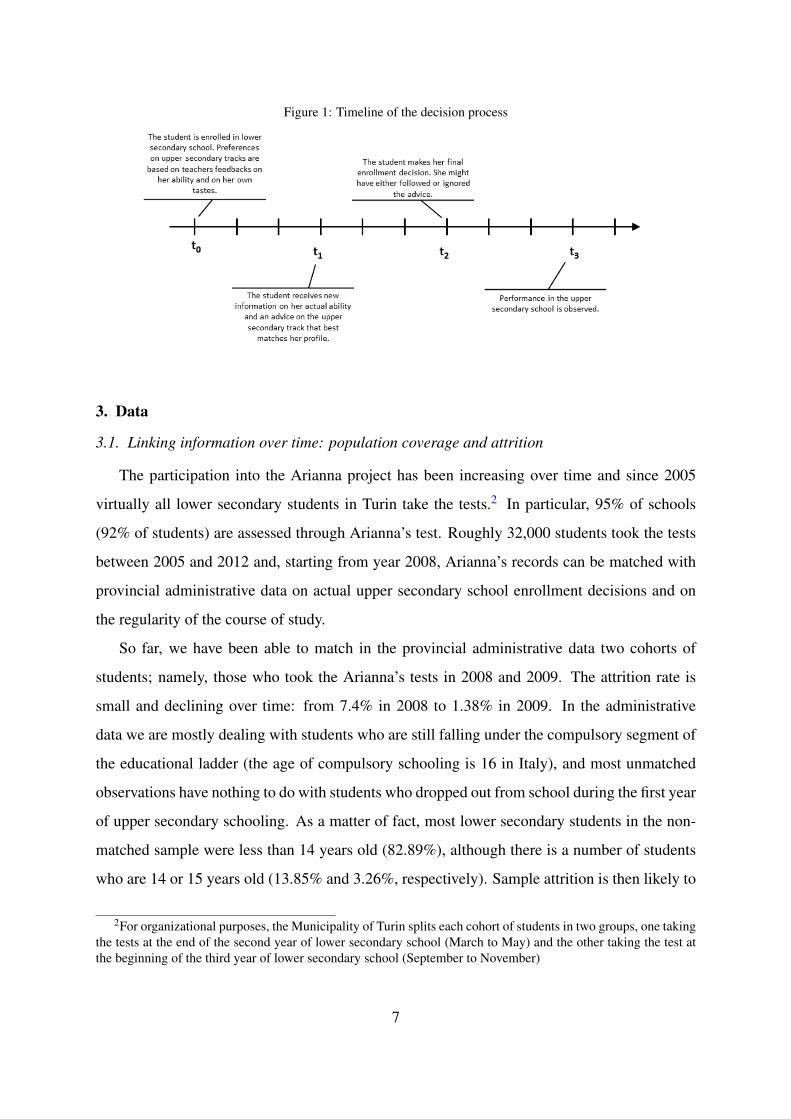
Figure 1: Timeline of the decision process
3. Data
3.1. Linking information over time: population coverage and attrition
The participation into the Arianna project has been increasing over time and since 2005
virtually all lower secondary students in Turin take the tests.2 In particular, 95% of schools
(92% of students) are assessed through Arianna’s test. Roughly 32,000 students took the tests
between 2005 and 2012 and, starting from year 2008, Arianna’s records can be matched with
provincial administrative data on actual upper secondary school enrollment decisions and on
the regularity of the course of study.
So far, we have been able to match in the provincial administrative data two cohorts of
students; namely, those who took the Arianna’s tests in 2008 and 2009. The attrition rate is
small and declining over time: from 7.4% in 2008 to 1.38% in 2009. In the administrative
data we are mostly dealing with students who are still falling under the compulsory segment of
the educational ladder (the age of compulsory schooling is 16 in Italy), and most unmatched
observations have nothing to do with students who dropped out from school during the first year
of upper secondary schooling. As a matter of fact, most lower secondary students in the non-
matched sample were less than 14 years old (82.89%), although there is a number of students
who are 14 or 15 years old (13.85% and 3.26%, respectively). Sample attrition is then likely to
2For organizational purposes, the Municipality of Turin splits each cohort of students in two groups, one takingthe tests at the end of the second year of lower secondary school (March to May) and the other taking the test atthe beginning of the third year of lower secondary school (September to November)
7
be partly related to older students not continuing in post-compulsory education and to students
migrating to other provinces with their families.
In order to validate such hypotheses for sample attrition and to rule out potential sample
selection bias, we estimate a probit model where the dependent variable takes value one when
the student is not matched in provincial administrative data and zero otherwise (see Table A.1 in
Appendix). As expected, the only significant predictors of attrition are students’ age and foreign
status: older students are more likely to have complied with the obligations of compulsory
education (age 16) and the families of immigrant workers have a higher geographic mobility
with respect to those of natives. Interestingly enough, we do not find significant differences by
parents’ education and Arianna’s cognitive test scores, and our matched dataset does not seem
to overrepresent abler (as measured by Arianna’s tests) or less deprived students. Results are
robust to the inclusion of school fixed effects in our specification (column 2, Table A.1).
For matched students we can assemble a unique dataset where available information covers
the whole process depicted in the timeline of Figure 1 above. See Tab A.2 in the Appendix for
summary statistics.
3.2. Students’ characteristics and cognitive ability
To shed light on the features of Arianna’s tests on cognitive abilities we run a set of plain
OLS regressions that aim at explaining score variations on the basis of observable students’
characteristics. Results reported in Table A.3 in Appendix align with those revealed by other
national and international assessments of the Italian students’ knowledge, competences and
cognitive abilities such as the OECD Programme for International Student Assessment and the
IEA Trends in Mathematics and Science Study.
Girls lag behind boys in domains related to logic, spatiality and strategy; whereas boys are
outperformed by girls in domains such as language and symbolic calculus.
Cognitive abilities are unevenly distributed across socioeconomic groups of students; such
groups are defined along two dimensions: parents’ educational attainment on one side and the
immigrant status combined with the delay in the course of study on the other side. Indeed,
in the Italian schooling system the immigrant status (native / born abroad) and the delay in
the course of study are strongly linked owing to the existence of an exception for students
of foreign origin to the otherwise strict age-grade rule. Newly arrived foreign students enter
schools at lower grades whenever their competence is evaluated to be inadequate to fruitfully
8
join peers in the regular path. On a representative sample of 44,490 Italian students aged 11
and 13, Berchialla et al. (2011) show that, in the final year of lower secondary education, the
probability of a delay in the course of study for a first-generation immigrant student is 19.32
times higher with respect to that of a native peer. As a consequence, a delay of one year in
the course of study may not be necessarily intended as a grade repetition for 1st generation
immigrant students. For this reason we combine two variables and we tell apart seven different
groups: natives with a regular path, native delayers (grade repeaters), 2nd generation immigrant
students with a regular path, 2nd generation immigrant students delayers (grade repeaters), 1st
generation immigrant students with a regular path, 1st generation immigrant students with a
one-year delay (not necessarily grade repeaters), 1st generation immigrant students with 2 or
more years of delay (surely grade repeaters).
Results in cognitive tests tend to increase with the educational attainment of parents. Abil-
ities of students who are not able to report the educational attainment level of their parents
(“Don’t know”) are somewhere in between students from poorly educated families (“Up to
lower-sec. education”) and those from families with secondary schooling qualifications (“Up-
per secondary education”); hence, they are likely to be a mix of these two groups.
As for our combined variable of immigrant status and delay in the course of study, we
observe that children with foreign parents lag behind their peers with Italian parents, with an
additional gap if students are born abroad (1st generation immigrants). As expected, for the
latter category, we find that cognitive abilities are not much different between 1st generation
immigrant students with a regular course of study and their peers with a one-year lag, with
the only remarkable difference found in the domain of language. Thus, we maintain that in
the group of 1st generation immigrant students with a one-year delay there are very few actual
grade repeaters.
Finally, intentionality in decision making, risk aversion and collaborative attitudes are all
positively associated with cognitive abilities, although it is hard to infer the direction of causal-
ity between personality traits and test scores.
4. Pre-test student enrollment intentions
The upper secondary school (5 years, scuola secondaria di secondo grado) in Italy con-
sists of three tracks: the academic track (licei), the technical track and the vocational track.
9
A residual option to complete compulsory education that spans from 6 up to 16 years of age
is to access the vocational and training system falling under the responsibility of the Regions
and offered by the recognized formative agencies operating nationwide (vocational training).
Thanks to the information collected within the Arianna Project we can investigate how observ-
able characteristics of students, including their cognitive and non-cognitive abilities, relate with
their declared intentions as regards the choice of the upper secondary school track. It is worth
stressing that intentions will not necessarily translate into actual enrollment choices as school
and family pressure and newly available information on ability (test scores, school grades) may
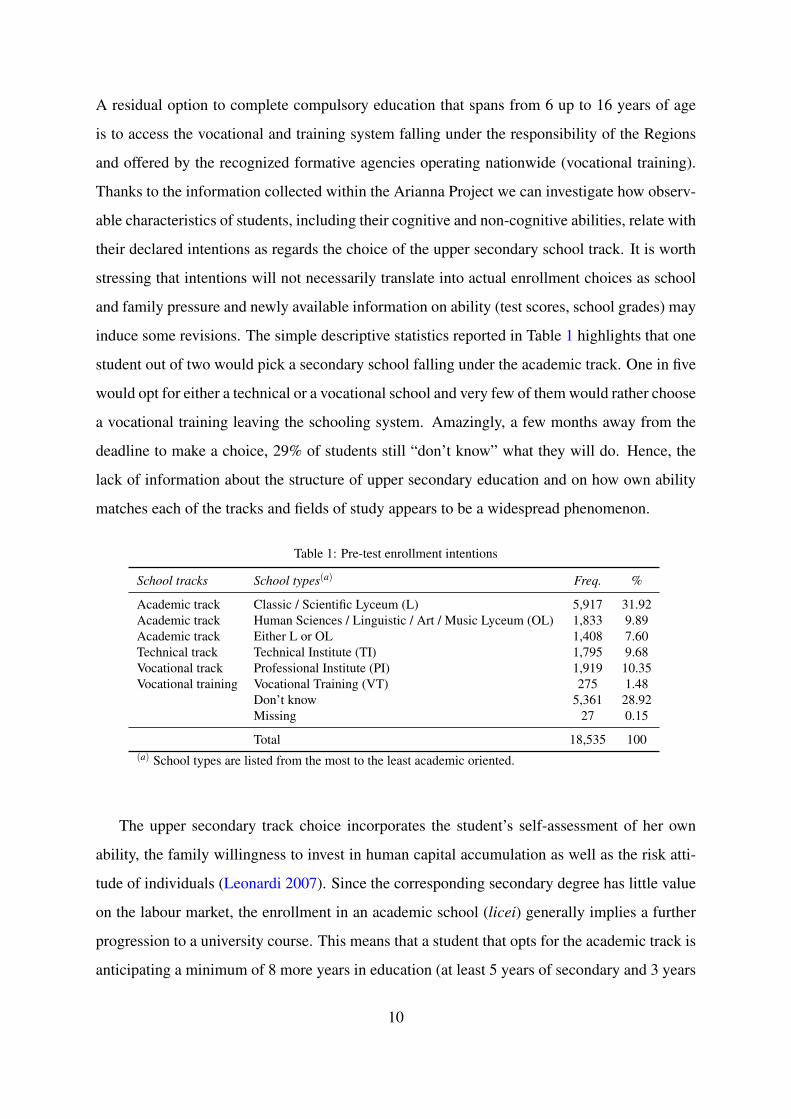
induce some revisions. The simple descriptive statistics reported in Table 1 highlights that one
student out of two would pick a secondary school falling under the academic track. One in five
would opt for either a technical or a vocational school and very few of them would rather choose
a vocational training leaving the schooling system. Amazingly, a few months away from the
deadline to make a choice, 29% of students still “don’t know” what they will do. Hence, the
lack of information about the structure of upper secondary education and on how own ability
matches each of the tracks and fields of study appears to be a widespread phenomenon.
Table 1: Pre-test enrollment intentions
School tracks School types(a) Freq. %
Academic track Classic / Scientific Lyceum (L) 5,917 31.92Academic track Human Sciences / Linguistic / Art / Music Lyceum (OL) 1,833 9.89Academic track Either L or OL 1,408 7.60Technical track Technical Institute (TI) 1,795 9.68Vocational track Professional Institute (PI) 1,919 10.35Vocational training Vocational Training (VT) 275 1.48
Don’t know 5,361 28.92Missing 27 0.15
Total 18,535 100(a) School types are listed from the most to the least academic oriented.
The upper secondary track choice incorporates the student’s self-assessment of her own
ability, the family willingness to invest in human capital accumulation as well as the risk atti-
tude of individuals (Leonardi 2007). Since the corresponding secondary degree has little value
on the labour market, the enrollment in an academic school (licei) generally implies a further
progression to a university course. This means that a student that opts for the academic track is
anticipating a minimum of 8 more years in education (at least 5 years of secondary and 3 years
10
of first-level university degree). On the other hand, technical and vocational schools allow for
either a progression to the tertiary education or an entrance in the labour market right after the
high school completion. Hence, a student that chooses either the technical or the vocational
track knows she could stop after the attainment of the secondary school degree (5 years). Fi-
nally, a student that opts for the vocational training concludes her course of study in 3 years,
but she is not entitled to access tertiary education.
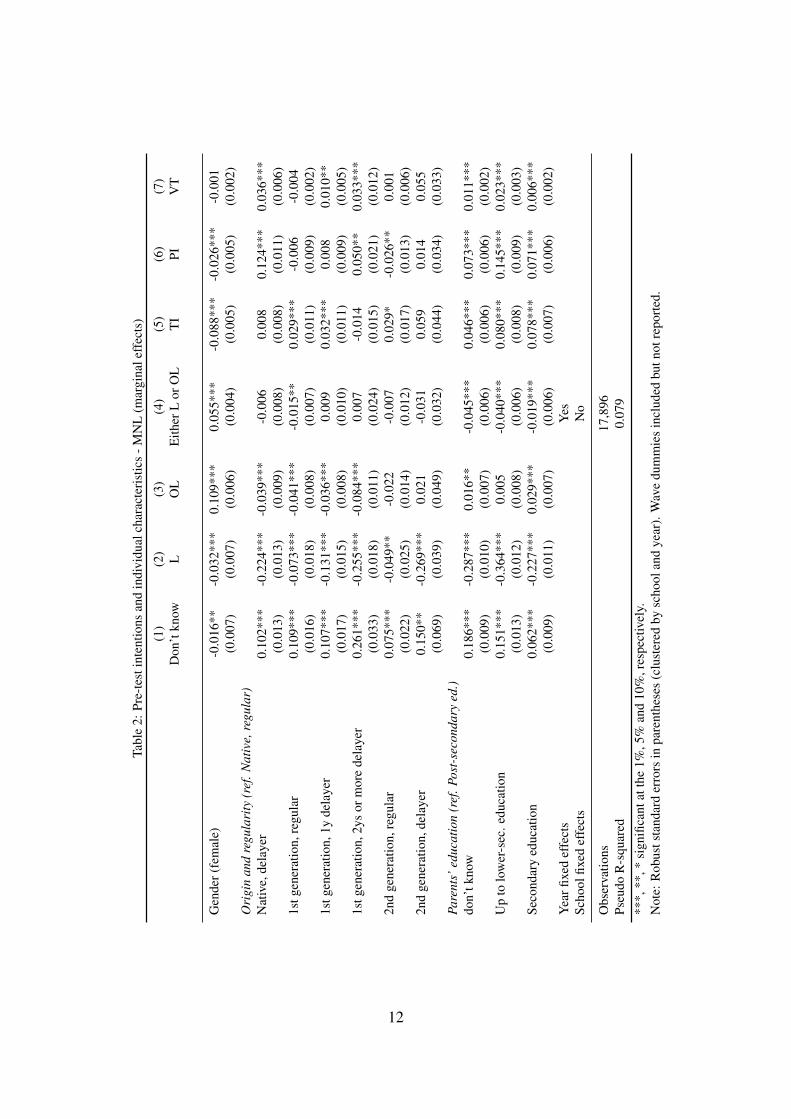
Individual observable characteristics may capture a lot of variation in intentions, prefer-
ences and uncertainty about upper secondary school choice. Hence, in order to disentangle the
independent effect of single variables, we take to the data a multinomial logit (MNL, hereafter)
model that allows us to single out the prevailing features for each group of students stating a
specific intention.3 Marginal effects are reported in Table 2.
Estimates in column 1 reveal that male students, grade repeaters, students of foreign origin
and those with disadvantaged socio-cultural background tend to be more uncertain about their
future. This may reflect both doubts on their own abilities and information constraints that limit
the familiarity of foreign parents and children of poorly educated parents with secondary educa-
tion tracks. The well known social stratification of upper secondary tracks in Italy (Checchi and
Flabbi 2007, Bratti et al. 2012, Checchi et al. 2013) is mirrored by the intentions of students.
Students with university-educated parents cluster in the traditional academic schools (L), those
with parents that attained secondary education spread over the other academic schools (OL)
and the technical and vocational tracks (TI, PI), those with poorly educated parents tend to be
overrepresented in the technical and vocational track (TI, PI) and training (VT). On a general
basis, those who experienced an irregular course of study tend to state a preference for non-
academic schools and training. Apparently, the same happens for students of foreign origin (1st
and 2nd generations). Girls are more uncertain than boys on the kind of academic school they
want to enroll in (column 4). However, they show a strong preference for academic schools
with courses related to humanities, pedagogy, foreign languages and arts (column 3).
All the considerations drawn so far on pre-test enrollment intentions could be taken at their
face value if we assumed that students have no clue on their cognitive and non-cognitive abili-
ties. Although we can rule out that students are aware of Arianna’s test results when they state
3We also estimated Multinomial Probit Models and obtained very close marginal effects.
11
Tabl
e2:
Pre-
test
inte
ntio
nsan
din
divi
dual
char
acte
rist
ics
-MN
L(m
argi
nale
ffec
ts)
(1)
(2)
(3)
(4)
(5)
(6)
(7)
Don
’tkn
owL
OL
Eith
erL
orO
LT
IPI
VT
Gen
der(
fem
ale)
-0.0
16**
-0.0
32**
*0.
109*
**0.
055*
**-0
.088
***
-0.0
26**
*-0
.001
(0.0
07)
(0.0
07)
(0.0
06)
(0.0
04)
(0.0
05)
(0.0
05)
(0.0
02)
Ori
gin
and
regu
lari
ty(r
ef.N
ativ
e,re
gula
r)N
ativ
e,de
laye
r0.
102*
**-0
.224
***
-0.0
39**
*-0
.006
0.00
80.
124*
**0.
036*
**(0
.013
)(0
.013
)(0
.009
)(0
.008
)(0
.008
)(0
.011
)(0
.006
)1s
tgen
erat
ion,
regu
lar
0.10
9***
-0.0
73**
*-0
.041
***
-0.0
15**
0.02
9***
-0.0
06-0
.004
(0.0
16)
(0.0
18)
(0.0
08)
(0.0
07)
(0.0
11)
(0.0
09)
(0.0
02)
1stg
ener
atio
n,1y
dela
yer
0.10
7***
-0.1
31**
*-0
.036
***
0.00
90.
032*
**0.
008
0.01
0**
(0.0
17)
(0.0
15)
(0.0
08)
(0.0
10)
(0.0
11)
(0.0
09)
(0.0
05)
1stg
ener
atio
n,2y
sor
mor
ede
laye
r0.
261*
**-0
.255
***
-0.0
84**
*0.
007
-0.0
140.
050*
*0.
033*
**(0
.033
)(0
.018
)(0
.011
)(0
.024
)(0
.015
)(0
.021
)(0
.012
)2n
dge
nera
tion,
regu
lar
0.07
5***
-0.0
49**
-0.0
22-0
.007
0.02
9*-0
.026
**0.
001
(0.0
22)
(0.0
25)
(0.0
14)
(0.0
12)
(0.0
17)
(0.0
13)
(0.0
06)
2nd
gene
ratio
n,de
laye
r0.
150*
*-0
.269
***
0.02
1-0
.031
0.05
90.
014
0.05
5(0
.069
)(0
.039
)(0
.049
)(0
.032
)(0
.044
)(0
.034
)(0
.033
)Pa
rent
s’ed
ucat
ion
(ref
.Pos
t-se
cond
ary
ed.)
don’
tkno
w0.
186*
**-0
.287
***
0.01
6**
-0.0
45**
*0.
046*
**0.
073*
**0.
011*
**(0
.009
)(0
.010
)(0
.007
)(0
.006
)(0
.006
)(0
.006
)(0
.002
)U
pto
low
er-s
ec.e
duca
tion
0.15
1***
-0.3
64**
*0.
005
-0.0
40**
*0.
080*
**0.
145*
**0.
023*
**(0
.013
)(0
.012
)(0
.008
)(0
.006
)(0
.008
)(0
.009
)(0
.003
)Se
cond
ary
educ
atio
n0.
062*
**-0
.227
***
0.02
9***
-0.0
19**
*0.
078*
**0.
071*
**0.
006*
**(0
.009
)(0
.011
)(0
.007
)(0
.006
)(0
.007
)(0
.006
)(0
.002
)Y
earfi
xed
effe
cts
Yes
Scho
olfix
edef
fect
sN
o
Obs
erva
tions
17,8
96Ps
eudo
R-s
quar
ed0.
079
***,
**,*
sign
ifica
ntat
the
1%,5
%an
d10
%,r
espe
ctiv
ely.
Not
e:R
obus
tsta
ndar
der
rors
inpa
rent
hese
s(c
lust
ered
bysc
hool
and
year
).W
ave
dum
mie
sin
clud
edbu
tnot
repo
rted
.
12
their intentions, we can expect that they have been receiving relevant signals during their school
career (grades, teacher feedbacks, etc.). In such a case, results in Table 2 could be significantly
biased by the omission of a control for student ability. To investigate this issue we replicated
the estimation of the MNL model described in the previous section by introducing the scores
on both cognitive and non-cognitive tests as controls. Marginal effects of variables are reported
in Table A.4 in Appendix.
The fact that students with stronger cognitive and non-cognitive abilities are overrepre-
sented among those who intend to enroll into the academic track does not come as a surprise.
We also observe that, when abilities are taken into account, the preferences of 2nd generation
immigrant students seem to be more aligned with those of their Italian peers. However, the
rest of the picture remains largely unaffected, and both immigrant and socio-economic status
continue to significantly correlate with students’ choices.
In the following section we try to go deeper in exploring why intentions (and actual choices)
are so loosely associated with students’ actual potential.
5. Perception, reality and the revision of intentions
Students’ perception of their own academic potential can be flawed because of poor signals
received by schools or because of an uneven distribution of discerning abilities in the popula-
tion. In this section we investigate the factors associated with the likelihood that pre-test student
preferences on upper secondary school tracks are concordant with Arianna’s advices. Further-
more, thanks to our unique database that combines pre-test preferences and actual choices,
we verify to what extent the “reality check” provided by Arianna induces a revision of initial
enrollment intentions.
We also investigate the choices of those with no initial preferences and see whether they
trust Arianna’s advice and eventually choose a track in line with Arianna’s indications.
5.1. When students’ preferences do not fit with Arianna’s suggestions
Simple descriptive statistics reveal that slightly more than a half of students in our sample
(56%) make a proper self-assessment and are willing to choose an upper secondary track in
accordance with their true inclinations and talents as measured by Arianna (Table 3). The re-
maining 44% of individuals show intentions which do not concur with Arianna’s suggestions.
Individuals with more optimistic views of their academic ability tend to prevail on those who
13
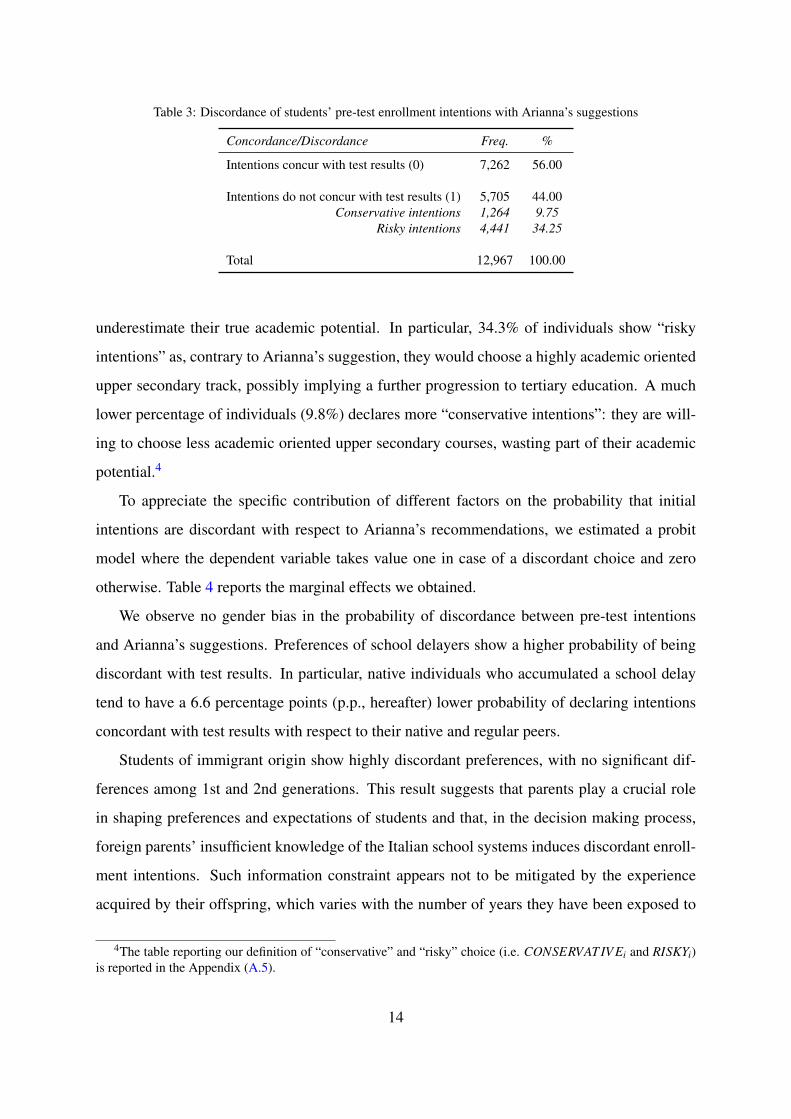
Table 3: Discordance of students’ pre-test enrollment intentions with Arianna’s suggestions
Concordance/Discordance Freq. %
Intentions concur with test results (0) 7,262 56.00
Intentions do not concur with test results (1) 5,705 44.00Conservative intentions 1,264 9.75
Risky intentions 4,441 34.25
Total 12,967 100.00
underestimate their true academic potential. In particular, 34.3% of individuals show “risky
intentions” as, contrary to Arianna’s suggestion, they would choose a highly academic oriented
upper secondary track, possibly implying a further progression to tertiary education. A much
lower percentage of individuals (9.8%) declares more “conservative intentions”: they are will-
ing to choose less academic oriented upper secondary courses, wasting part of their academic
potential.4
To appreciate the specific contribution of different factors on the probability that initial
intentions are discordant with respect to Arianna’s recommendations, we estimated a probit
model where the dependent variable takes value one in case of a discordant choice and zero
otherwise. Table 4 reports the marginal effects we obtained.
We observe no gender bias in the probability of discordance between pre-test intentions
and Arianna’s suggestions. Preferences of school delayers show a higher probability of being
discordant with test results. In particular, native individuals who accumulated a school delay
tend to have a 6.6 percentage points (p.p., hereafter) lower probability of declaring intentions
concordant with test results with respect to their native and regular peers.
Students of immigrant origin show highly discordant preferences, with no significant dif-
ferences among 1st and 2nd generations. This result suggests that parents play a crucial role
in shaping preferences and expectations of students and that, in the decision making process,
foreign parents’ insufficient knowledge of the Italian school systems induces discordant enroll-
ment intentions. Such information constraint appears not to be mitigated by the experience
acquired by their offspring, which varies with the number of years they have been exposed to
4The table reporting our definition of “conservative” and “risky” choice (i.e. CONSERVAT IV Ei and RISKYi)is reported in the Appendix (A.5).
14
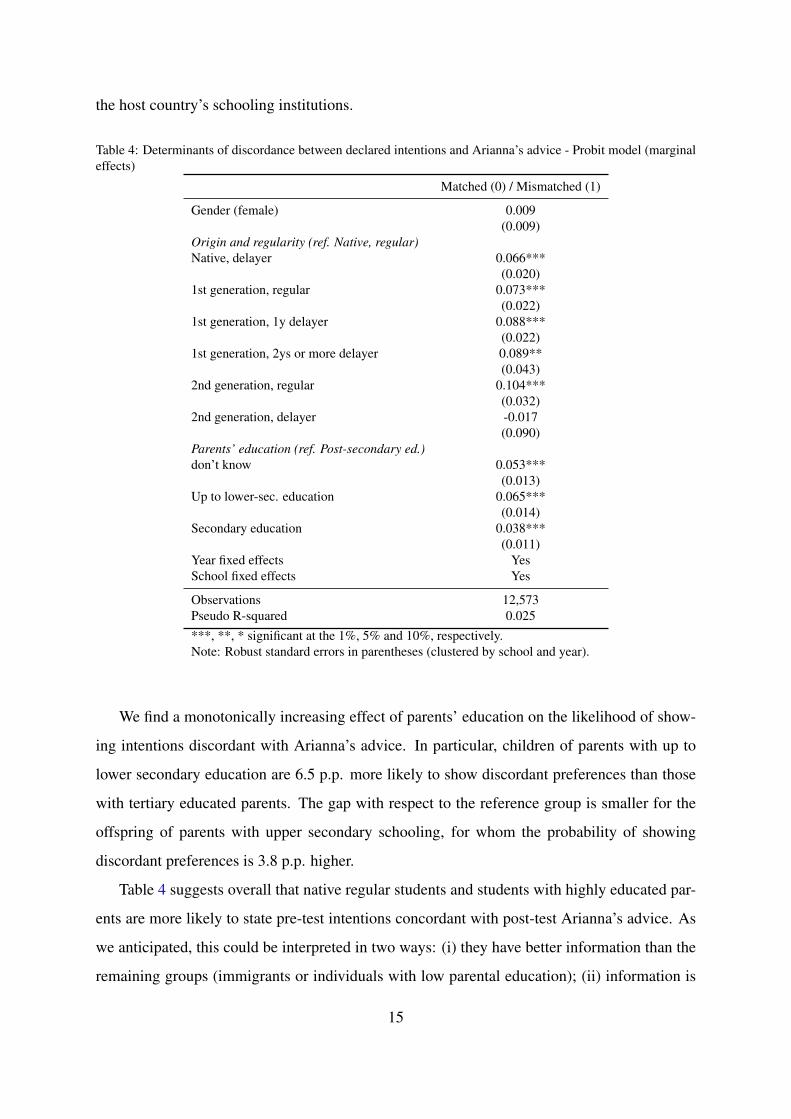
the host country’s schooling institutions.
Table 4: Determinants of discordance between declared intentions and Arianna’s advice - Probit model (marginaleffects)
Matched (0) / Mismatched (1)
Gender (female) 0.009(0.009)
Origin and regularity (ref. Native, regular)Native, delayer 0.066***
(0.020)1st generation, regular 0.073***
(0.022)1st generation, 1y delayer 0.088***
(0.022)1st generation, 2ys or more delayer 0.089**
(0.043)2nd generation, regular 0.104***
(0.032)2nd generation, delayer -0.017
(0.090)Parents’ education (ref. Post-secondary ed.)don’t know 0.053***
(0.013)Up to lower-sec. education 0.065***
(0.014)Secondary education 0.038***
(0.011)Year fixed effects YesSchool fixed effects Yes
Observations 12,573Pseudo R-squared 0.025***, **, * significant at the 1%, 5% and 10%, respectively.Note: Robust standard errors in parentheses (clustered by school and year).
We find a monotonically increasing effect of parents’ education on the likelihood of show-
ing intentions discordant with Arianna’s advice. In particular, children of parents with up to
lower secondary education are 6.5 p.p. more likely to show discordant preferences than those
with tertiary educated parents. The gap with respect to the reference group is smaller for the
offspring of parents with upper secondary schooling, for whom the probability of showing
discordant preferences is 3.8 p.p. higher.
Table 4 suggests overall that native regular students and students with highly educated par-
ents are more likely to state pre-test intentions concordant with post-test Arianna’s advice. As
we anticipated, this could be interpreted in two ways: (i) they have better information than the
remaining groups (immigrants or individuals with low parental education); (ii) information is
15
equally available to all groups, but some of them make better use of it or are less constrained in
their choices by other factors (e.g. liquidity or credit constraints).
Students whose preferences are in line with the suggestions of the counseling service are
likely to persist in their intentions as they receive a signal that corroborates the validity of
their choice. On the other hand, students who receive a signal of discordance might be willing
to revise their initial intentions and to scale down (up) the academic ambition of their initial
choice in case of risky (conservative) preferences. To understand whether families consider the
Arianna’s advice a valuable and previously unknown piece of information and revise enrollment
decisions according to the signal received, we can estimate a probit model like the one that
follows:
yi = α0 +α1DISCORDANCEi +α2xi + εi (1)
where yi is a dichotomous variable taking value one in case the individual mantained her choice
and zero otherwise, DISCORDANCEi is our main independent variable of interest, indicating
whether the individual’s initial choice was in contrast with Arianna’s advice (in this case it
takes value one and zero otherwise), xi are control variables and εi an idiosyncratic error term,
which is assumed to be standard normally distributed. The αs are parameters to be estimates
using Maximum Likelihood estimation, and α1 gives us some insights into whether individuals
“react” to new information provided by Arianna or not.
Marginal effects obtained through the estimation of equation (3) are reported in column
(1) of Table 5. We observe that individuals whose initial intentions were not in line with
Arianna’s advice have a 11.1 p.p. lower probability of maintaining their initial choice. This
is certainly a non-negligible effect, yet our results suggest strong persistence in individuals’
choices even in the presence of new information. Ideally, if individuals were constrained only
by the availability of information we would have expected a much larger effect. From column
(1) of Table 5 we also observe that the choice of track is in “flux”. Indeed, some student
characteristics predict choice updating over and above the information provided by Arianna.
Interestingly enough almost all categories of immigrant students are more likely than natives to
revise their pre-test choices. A similar pattern is also observed by parents’ education: students
with low educated parents are more likely to change their initial choice. The fact that students
of foreign origin and those with less privileged background are overrepresented among those
16
who revise the initial intention certainly couples with the fact that the same groups of students
are overrepresented among those who are less able to properly assess their own potential (see
Table 4). However, an additional explanation could be related to the possibility that students
with more advantaged backgrounds are brought to think earlier about their future and approach
the test with a clearer idea of their own potential. But the picture is compatible also with an
alternative explanation: on a general basis, students tend to overrate their own potential (see
Table 3), but those with a privileged background can persist in their initial choice, although not
in line with their actual potential, as long as their family can provide additional educational
inputs to cope with the demand of more academic oriented tracks.
From the model in equation (3) it is not possible to know in what direction individuals do
revise their pre-enrollment intentions. In fact, in terms of the academic content of courses,
they could revise “upward” or “downward” their initial track choice.5 Thus, we considered two
pairwise comparisons: (i) an upward revision of the initial choice, that is moving towards a
more academic track, vs. maintaining the initial choice; (ii) a downward revision of the initial
choice, that is moving towards a less academic track, vs. maintaining the initial choice. We
estimated accordingly the following model
yi = β0 +β1CONSERVAT IV Ei +β2RISKYi +β3xi + εi (2)
where now yi is in column (2) of table 5 a dichotomous variable taking value one in case of
upward revision and zero in case individuals persisted in their initial intentions, and in column
(3) a dichotomous variable taking on value one in case of downward revision and zero if they
confirmed their initial choice. On the right-hand-side of the equation, the discordance variable
(DISCORDANCEi) is now split into two distinct dummy variables: CONSERVAT IV Ei which
is equal to one in case the individual received a signal of “conservative intentions” (see above)
and zero otherwise, and RISKY which is equal to one in case the individual received a signal
of “risky intentions” and zero otherwise. The reference group are individuals who, according
to Arianna, show intentions concordant with their actual potential. It is worth stressing that
column (2) uses only the sample of individuals who are “at risk” of revising downward their
5The table reporting our definition of “upward” and “downward” revision of choices is reported in the Ap-pendix (A.6).
17
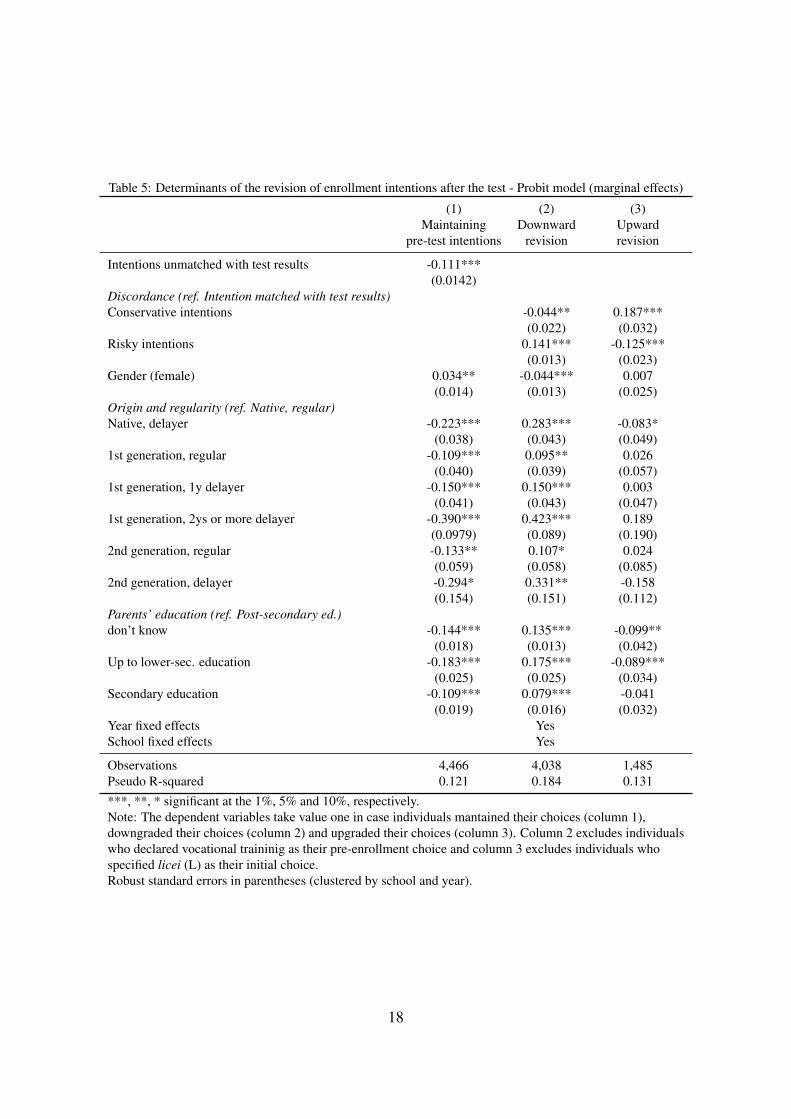
Table 5: Determinants of the revision of enrollment intentions after the test - Probit model (marginal effects)
(1) (2) (3)Maintaining Downward Upward
pre-test intentions revision revision
Intentions unmatched with test results -0.111***(0.0142)
Discordance (ref. Intention matched with test results)Conservative intentions -0.044** 0.187***
(0.022) (0.032)Risky intentions 0.141*** -0.125***
(0.013) (0.023)Gender (female) 0.034** -0.044*** 0.007
(0.014) (0.013) (0.025)Origin and regularity (ref. Native, regular)Native, delayer -0.223*** 0.283*** -0.083*
(0.038) (0.043) (0.049)1st generation, regular -0.109*** 0.095** 0.026
(0.040) (0.039) (0.057)1st generation, 1y delayer -0.150*** 0.150*** 0.003
(0.041) (0.043) (0.047)1st generation, 2ys or more delayer -0.390*** 0.423*** 0.189
(0.0979) (0.089) (0.190)2nd generation, regular -0.133** 0.107* 0.024
(0.059) (0.058) (0.085)2nd generation, delayer -0.294* 0.331** -0.158
(0.154) (0.151) (0.112)Parents’ education (ref. Post-secondary ed.)don’t know -0.144*** 0.135*** -0.099**
(0.018) (0.013) (0.042)Up to lower-sec. education -0.183*** 0.175*** -0.089***
(0.025) (0.025) (0.034)Secondary education -0.109*** 0.079*** -0.041
(0.019) (0.016) (0.032)Year fixed effects YesSchool fixed effects Yes
Observations 4,466 4,038 1,485Pseudo R-squared 0.121 0.184 0.131***, **, * significant at the 1%, 5% and 10%, respectively.Note: The dependent variables take value one in case individuals mantained their choices (column 1),downgraded their choices (column 2) and upgraded their choices (column 3). Column 2 excludes individualswho declared vocational traininig as their pre-enrollment choice and column 3 excludes individuals whospecified licei (L) as their initial choice.Robust standard errors in parentheses (clustered by school and year).
18
choices, that is it excludes individuals whose initial intentions were to enroll in vocational
training. Column (3), by contrast, includes only the individuals who are “at risk” of revising
upward their choices, that is it excludes students who initially planned to enroll in licei (L) or
are in the mixed category either L or OL, for which an upward revision cannot be defined.
As expected, column (2) of table 5 shows that individuals who received an advice of “risky
intentions” are 14.1 p.p. more likely to revise downward their choice while those who were
signaled as “conservative” are 4.4 p.p. less likely to further scale down their ambitions. Col-
umn (3) shows instead that receiving an advice of “risky intentions” is associated with a 12.5
p.p. lower probability of revising further upward the initial choice and receiving an advice of
“conservative intentions” is associated with a 18.7 p.p. higher probability of scaling the ambi-
tions up. Thus, this result seems to confirm that individuals are sensitive to the newly provided
information in both directions, regardless of how optimistic or pessimistic their intentions were.
Moreover, these two subgroup estimations confirm that, independently of Arianna’s advice,
students with disadvantaged backgrounds and those with a foreign origin tend to scale their am-
bition down. Instead, students with highly educated parents are overrepresented among those
who scale the ambition up and choose more academic oriented tracks. These are further con-
firmations that, despite the availability of information on true ability and proper track choice,
students’ final choices may still discount family factors such as risk aversion, credit constraints,
the accessibility of domestic educational support and other additional inputs.
5.2. The choices of students with no initial preferences
In the previous section we have seen that about 3 students out of 10 state no pre-test prefer-
ence on which upper secondary school track they would enroll in (answer: “Don’t know”). In
theory, the information provided by Arianna should be much more valuable to these students
than to those who state a specific intention. However, data on final decisions reveal that only
38% of students with no pre-test preferences will make a track choice in line with Arianna’s
suggestion. The remaining 62% will make either risky (47% of cases) or conservative (15% of
cases) choices.
In Table 6 we try to describe the characteristics of students following the advice as com-
pared to those who make risky or conservative choices. We observe that there is no gender
bias in the final decision and that family background plays a crucial role in this case, as well.
In fact, the marginal effects of a MNL model show that, with respect to students with highly
19
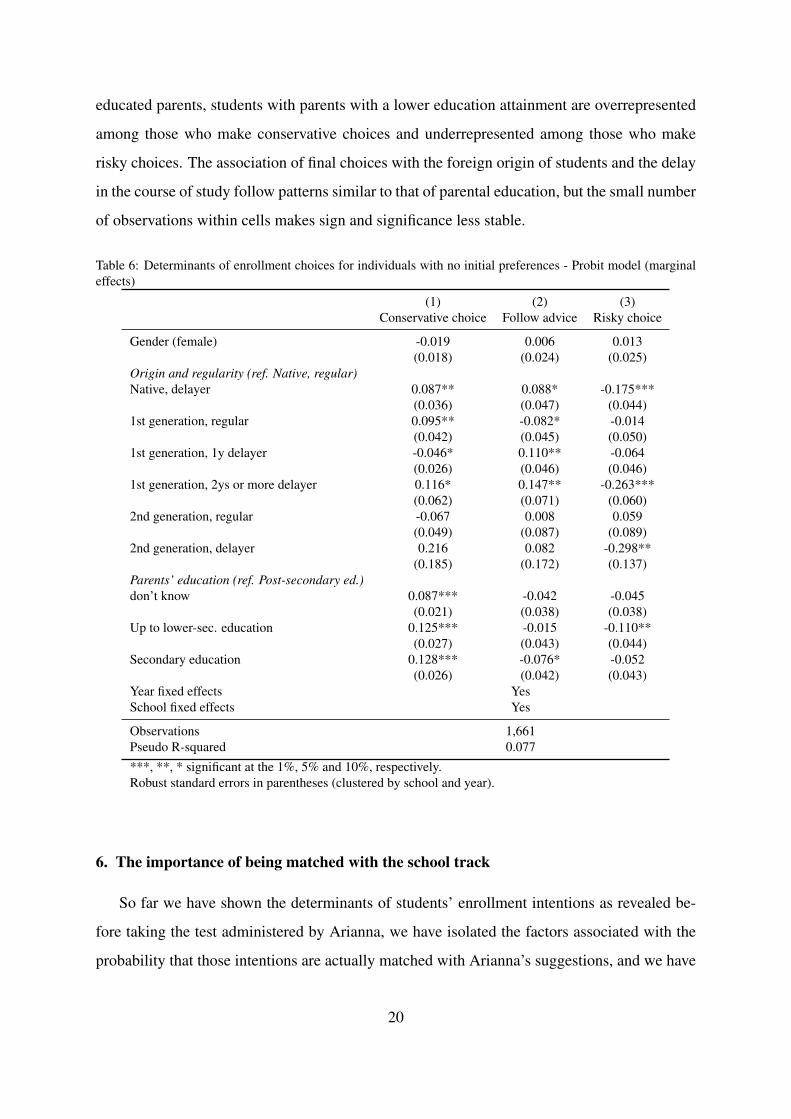
educated parents, students with parents with a lower education attainment are overrepresented
among those who make conservative choices and underrepresented among those who make
risky choices. The association of final choices with the foreign origin of students and the delay
in the course of study follow patterns similar to that of parental education, but the small number
of observations within cells makes sign and significance less stable.
Table 6: Determinants of enrollment choices for individuals with no initial preferences - Probit model (marginaleffects)
(1) (2) (3)Conservative choice Follow advice Risky choice
Gender (female) -0.019 0.006 0.013(0.018) (0.024) (0.025)
Origin and regularity (ref. Native, regular)Native, delayer 0.087** 0.088* -0.175***
(0.036) (0.047) (0.044)1st generation, regular 0.095** -0.082* -0.014
(0.042) (0.045) (0.050)1st generation, 1y delayer -0.046* 0.110** -0.064
(0.026) (0.046) (0.046)1st generation, 2ys or more delayer 0.116* 0.147** -0.263***
(0.062) (0.071) (0.060)2nd generation, regular -0.067 0.008 0.059
(0.049) (0.087) (0.089)2nd generation, delayer 0.216 0.082 -0.298**
(0.185) (0.172) (0.137)Parents’ education (ref. Post-secondary ed.)don’t know 0.087*** -0.042 -0.045
(0.021) (0.038) (0.038)Up to lower-sec. education 0.125*** -0.015 -0.110**
(0.027) (0.043) (0.044)Secondary education 0.128*** -0.076* -0.052
(0.026) (0.042) (0.043)Year fixed effects YesSchool fixed effects Yes
Observations 1,661Pseudo R-squared 0.077***, **, * significant at the 1%, 5% and 10%, respectively.Robust standard errors in parentheses (clustered by school and year).
6. The importance of being matched with the school track
So far we have shown the determinants of students’ enrollment intentions as revealed be-
fore taking the test administered by Arianna, we have isolated the factors associated with the
probability that those intentions are actually matched with Arianna’s suggestions, and we have
20
shown how signals of mismatch can induce a revision of students’ initial intentions. Yet some
crucial questions are left to be answered. Are Arianna’s pieces of advice beneficial to students?
Does Arianna show any sensible predictive power as regards student performances in the upper
secondary school? What is the cost of being mismatched with the school track suggested by
Arianna?
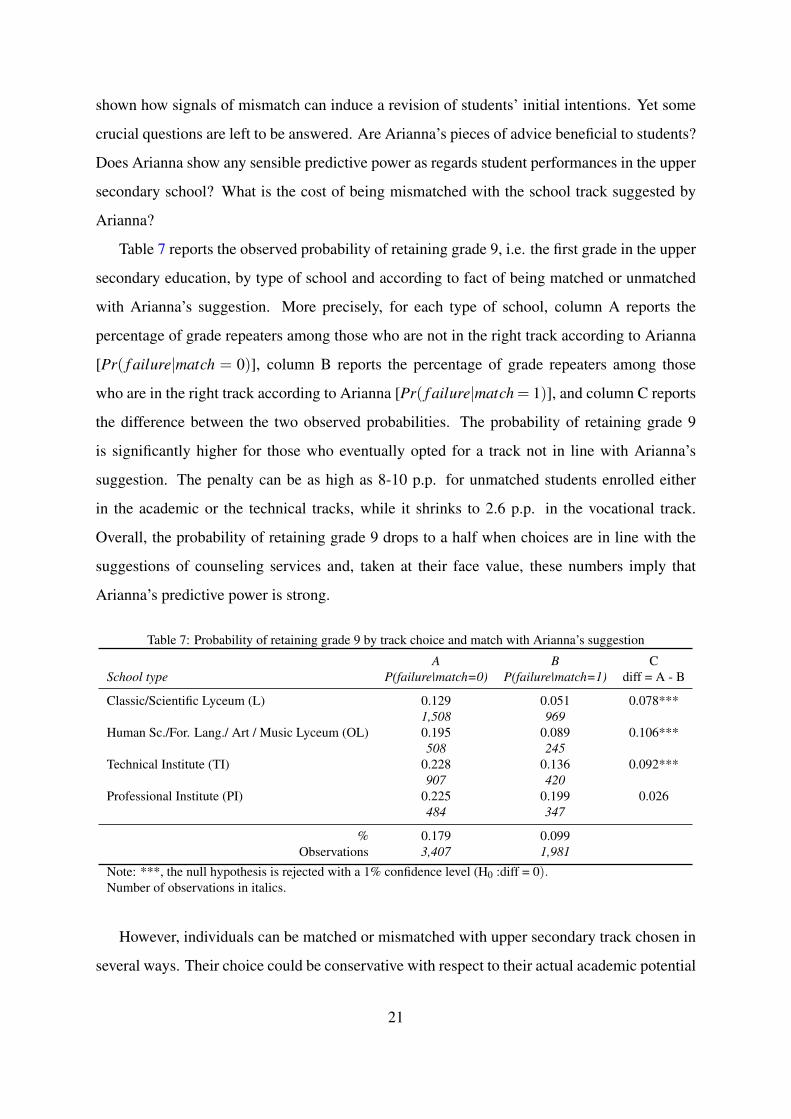
Table 7 reports the observed probability of retaining grade 9, i.e. the first grade in the upper
secondary education, by type of school and according to fact of being matched or unmatched
with Arianna’s suggestion. More precisely, for each type of school, column A reports the
percentage of grade repeaters among those who are not in the right track according to Arianna
[Pr( f ailure|match = 0)], column B reports the percentage of grade repeaters among those
who are in the right track according to Arianna [Pr( f ailure|match = 1)], and column C reports
the difference between the two observed probabilities. The probability of retaining grade 9
is significantly higher for those who eventually opted for a track not in line with Arianna’s
suggestion. The penalty can be as high as 8-10 p.p. for unmatched students enrolled either
in the academic or the technical tracks, while it shrinks to 2.6 p.p. in the vocational track.
Overall, the probability of retaining grade 9 drops to a half when choices are in line with the
suggestions of counseling services and, taken at their face value, these numbers imply that
Arianna’s predictive power is strong.
Table 7: Probability of retaining grade 9 by track choice and match with Arianna’s suggestion
A B CSchool type P(failure|match=0) P(failure|match=1) diff = A - B
Classic/Scientific Lyceum (L) 0.129 0.051 0.078***1,508 969
Human Sc./For. Lang./ Art / Music Lyceum (OL) 0.195 0.089 0.106***508 245
Technical Institute (TI) 0.228 0.136 0.092***907 420
Professional Institute (PI) 0.225 0.199 0.026484 347
% 0.179 0.099Observations 3,407 1,981
Note: ***, the null hypothesis is rejected with a 1% confidence level (H0 :diff = 0).Number of observations in italics.
However, individuals can be matched or mismatched with upper secondary track chosen in
several ways. Their choice could be conservative with respect to their actual academic potential
21
or risky. Furthermore, students’ personal characteristics as well as school-level factors can play
an autonomous role in affecting individual performance. To address these issues we take to the
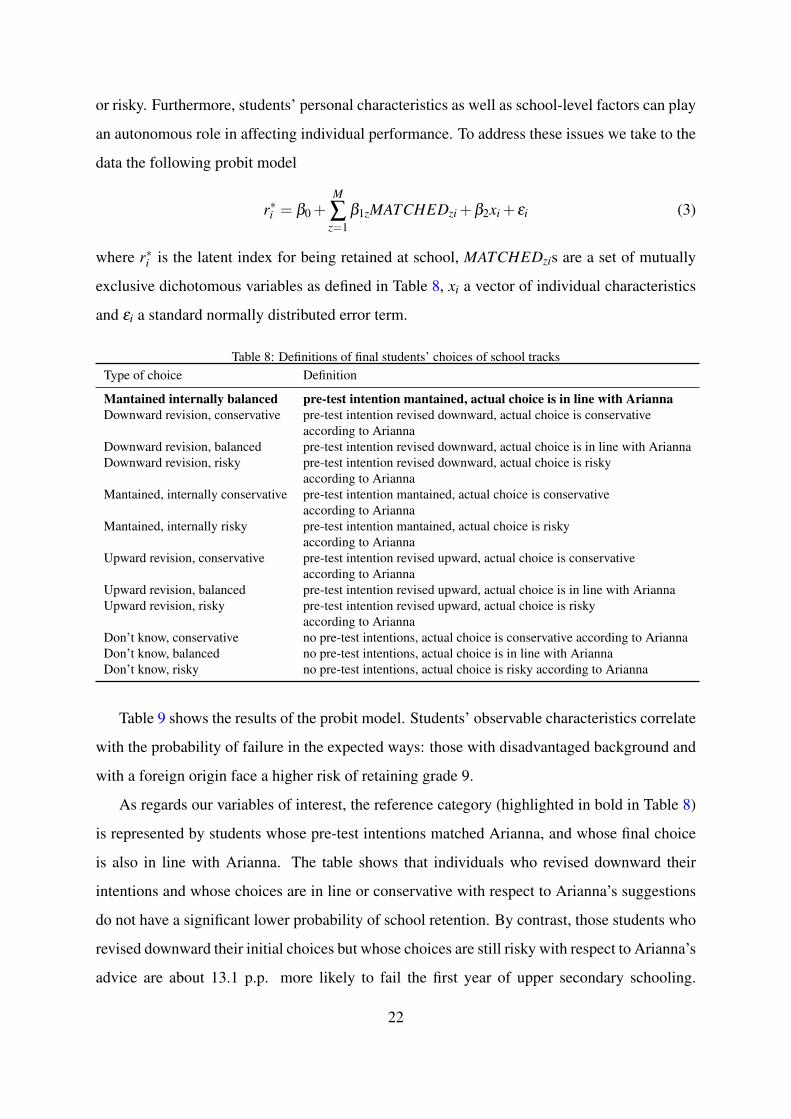
data the following probit model
r∗i = β0 +M
∑z=1
β1zMATCHEDzi +β2xi + εi (3)
where r∗i is the latent index for being retained at school, MATCHEDzis are a set of mutually
exclusive dichotomous variables as defined in Table 8, xi a vector of individual characteristics
and εi a standard normally distributed error term.
Table 8: Definitions of final students’ choices of school tracksType of choice Definition
Mantained internally balanced pre-test intention mantained, actual choice is in line with AriannaDownward revision, conservative pre-test intention revised downward, actual choice is conservative
according to AriannaDownward revision, balanced pre-test intention revised downward, actual choice is in line with AriannaDownward revision, risky pre-test intention revised downward, actual choice is risky
according to AriannaMantained, internally conservative pre-test intention mantained, actual choice is conservative
according to AriannaMantained, internally risky pre-test intention mantained, actual choice is risky
according to AriannaUpward revision, conservative pre-test intention revised upward, actual choice is conservative
according to AriannaUpward revision, balanced pre-test intention revised upward, actual choice is in line with AriannaUpward revision, risky pre-test intention revised upward, actual choice is risky
according to AriannaDon’t know, conservative no pre-test intentions, actual choice is conservative according to AriannaDon’t know, balanced no pre-test intentions, actual choice is in line with AriannaDon’t know, risky no pre-test intentions, actual choice is risky according to Arianna
Table 9 shows the results of the probit model. Students’ observable characteristics correlate
with the probability of failure in the expected ways: those with disadvantaged background and
with a foreign origin face a higher risk of retaining grade 9.
As regards our variables of interest, the reference category (highlighted in bold in Table 8)
is represented by students whose pre-test intentions matched Arianna, and whose final choice
is also in line with Arianna. The table shows that individuals who revised downward their
intentions and whose choices are in line or conservative with respect to Arianna’s suggestions
do not have a significant lower probability of school retention. By contrast, those students who
revised downward their initial choices but whose choices are still risky with respect to Arianna’s
advice are about 13.1 p.p. more likely to fail the first year of upper secondary schooling.
22
Among those who mantained their pre-test intentions, we observe that sticking to a conservative
choice with respect to Arianna does not have a protective effect on the likelihood of school
retention with respect to our reference group. On the contrary, those students who persisted in
their risky choice, according to Arianna, are about 10 p.p. more likely to be retained during the
9th grade. Those who revised upward their pre-test choice, which is however still conservative,
are not significantly different from the reference group in their likelihood of failing the first
year. Interestingly, students who revised upward their intentions and made a choice in line
with Arianna are about 9 p.p. more likely to be retained during the 9th grade. This means
that, in some cases, Arianna’s advice may induce individuals to be more ambitious than what
would be optimal: relying too much on the academic potential and neglecting other factors -
like the actual interest of students for the subjects taught in specific tracks or the fact that pre-
adolescents’ motivation can be volatile at times - can have perverse effects on performances. A
similar explanation can hold also for the 5 p.p higher probability of grade retention found for
those who did not have a clear idea about their preferred track before taking the tests, and then
followed Arianna’s advice. As expected, those who revised upward the initial intention picking
too risky a track show a 20 p.p. higher probability of failure. The same happens for the risky
choices of those with no clear pre-test intentions (+ 15 p.p.).
To summarize, we find that making risky choices with respect to Arianna—i.e. picking
a track which is above one’s own potential—is significantly associated to a greater risk of
grade retention. We obtain a result with the same sign for those upgrading from conservative
intentions and that are currently matched with respect to Arianna’s advice. Hence, it seems that
the counseling service is right in signaling the risky intentions of students, but sometimes is
wrong in trying to avoid what appears as a waste of potential. However, we recall from Table 3
above, that 85% of mismatched students are showing pre-test risky intentions.
23
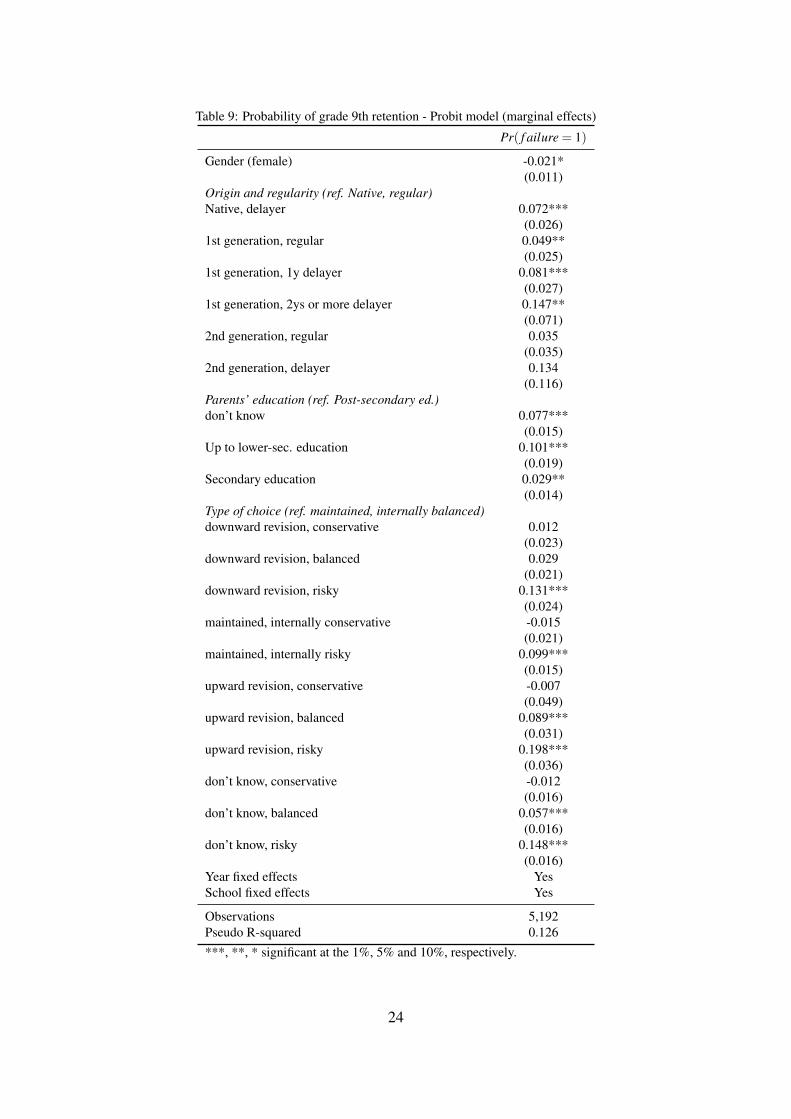
Table 9: Probability of grade 9th retention - Probit model (marginal effects)
Pr( f ailure = 1)
Gender (female) -0.021*(0.011)
Origin and regularity (ref. Native, regular)Native, delayer 0.072***
(0.026)1st generation, regular 0.049**
(0.025)1st generation, 1y delayer 0.081***
(0.027)1st generation, 2ys or more delayer 0.147**
(0.071)2nd generation, regular 0.035
(0.035)2nd generation, delayer 0.134
(0.116)Parents’ education (ref. Post-secondary ed.)don’t know 0.077***
(0.015)Up to lower-sec. education 0.101***
(0.019)Secondary education 0.029**
(0.014)Type of choice (ref. maintained, internally balanced)downward revision, conservative 0.012
(0.023)downward revision, balanced 0.029
(0.021)downward revision, risky 0.131***
(0.024)maintained, internally conservative -0.015
(0.021)maintained, internally risky 0.099***
(0.015)upward revision, conservative -0.007
(0.049)upward revision, balanced 0.089***
(0.031)upward revision, risky 0.198***
(0.036)don’t know, conservative -0.012
(0.016)don’t know, balanced 0.057***
(0.016)don’t know, risky 0.148***
(0.016)Year fixed effects YesSchool fixed effects Yes
Observations 5,192Pseudo R-squared 0.126***, **, * significant at the 1%, 5% and 10%, respectively.
24
6.1. Perceived Ability and student choices: a rationalization of results
In order to rationalize the results of our empirical analysis, we propose a simple conceptual
framework. We know that individuals enrolled in lower secondary school at time t, and still
compulsory school-aged at time t + 1, have to choose a specific track of upper secondary ed-
ucation. Each student i can choose among N different options indexed with j. Tracks can be
ordered in terms of their academic content, where track j has less academic content than track
j+1. Individual perceived ability is defined as
ai = aTi + εi (4)
where aTi is individual i true ability and εi an error (misperception). The error term may be a
function of the information set available to students and their parents, which includes informa-
tion about past school performance and lower secondary school teachers’ suggestions. Given
the individual perceived ability, the track-specific utilities have the following form:
Vi j = Pr j(ai)U j− (c j− c(ai)) (5)
where ai varies in the [a,a] support, Pr j(ai) is the track-specific probability of succeeding in
the first grade of upper secondary schooling, which is an increasing function of ability, U j a
constant which depends on the academic content of the track (i.e. increasing in j). The cost
of enrolling track j consists of a constant part, which is track specific (c j) and is increasing
in the academic content of the track, and a variable part c(ai) which is decreasing and convex
in ability and that to simplify the graphical representation of the problem is assumed to be
the same across all tracks. We assume that in each track the probability of succeeding is zero
if ability is below a given level, then increases monotonically with ability before reaching an
upper limit above which it is practically one. This means that in each track we will have some
individuals who are at risk of failing and others who are not subject to this risk, depending on
their level of ability. It is worth noticing at this stage that there might be a difference between
an individual’s perceived probability of success Pr j(ai), which will contribute to shaping her
optimal track choice, and the actual probability of success, which is a function of her true ability
(Pr j(aTi )).
In Figure 2 we represent the utility functions in the case of three available tracks (0, 1
and 2). Let us start from the least academic track (track 0). For ability levels below a0 (by
25
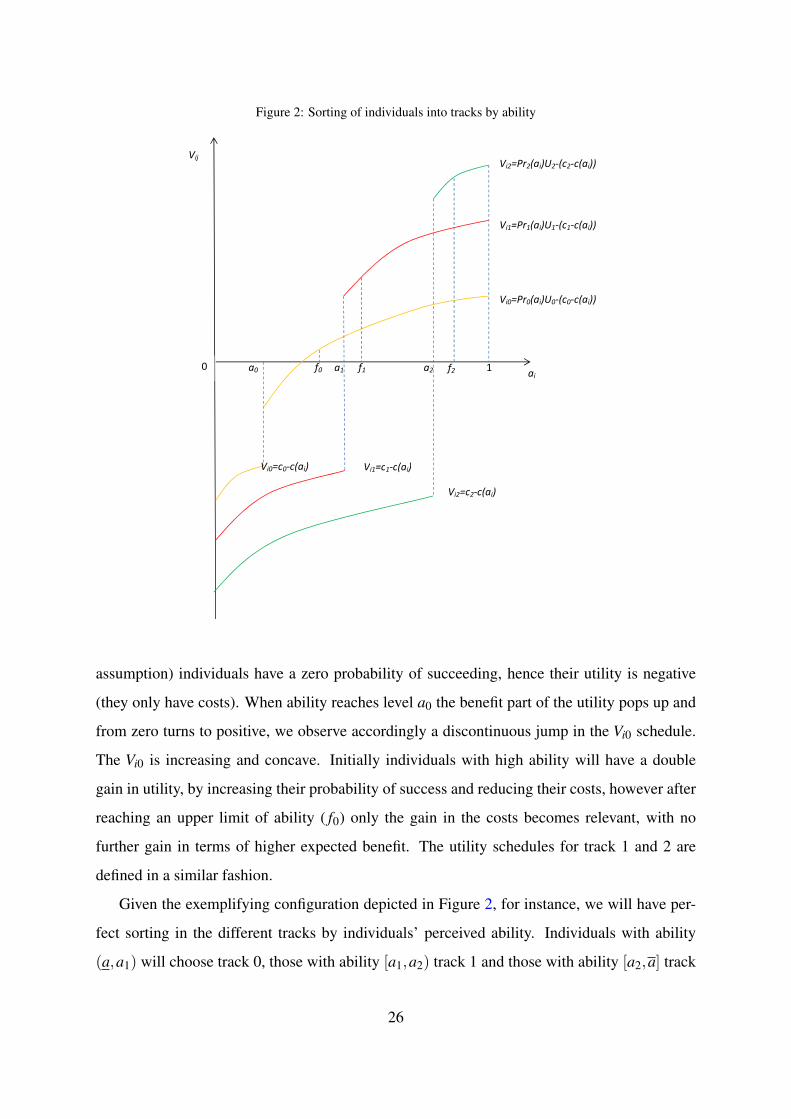
Figure 2: Sorting of individuals into tracks by ability
Vij
1 0 ai
Vi2=c2-c(ai)
a1 a2
Vi0=Pr0(ai)U0-(c0-c(ai))
Vi1=Pr1(ai)U1-(c1-c(ai))
Vi2=Pr2(ai)U2-(c2-c(ai))
a0
Vi1=c1-c(ai) Vi0=c0-c(ai)
f0 f1 f2
assumption) individuals have a zero probability of succeeding, hence their utility is negative
(they only have costs). When ability reaches level a0 the benefit part of the utility pops up and
from zero turns to positive, we observe accordingly a discontinuous jump in the Vi0 schedule.
The Vi0 is increasing and concave. Initially individuals with high ability will have a double
gain in utility, by increasing their probability of success and reducing their costs, however after
reaching an upper limit of ability ( f0) only the gain in the costs becomes relevant, with no
further gain in terms of higher expected benefit. The utility schedules for track 1 and 2 are
defined in a similar fashion.
Given the exemplifying configuration depicted in Figure 2, for instance, we will have per-
fect sorting in the different tracks by individuals’ perceived ability. Individuals with ability
(a,a1) will choose track 0, those with ability [a1,a2) track 1 and those with ability [a2,a] track
26
2. Some individuals in track 0 would have preferred not to continue in education (they have a
negative utility) but they have to enroll upper secondary schooling since they have to comply
with the compulsory schooling obligation. These will be the choices (declared preferences)
elicited while students are still in lower secondary education.
Following the decision process time-line depicted in Figure 1, let us now assume that at
time t + 1 individuals are administered a standardized tests by an external counseling service.
These tests provide students and their families with another assessment of a student’s ability:
aAi = aT
i +ui (6)
(where A stands for Arianna) which we assume to be more accurate than the self-assessment.
In other words, on average the assessment made by Arianna will be closer to individuals’ true
abilities than their own assessment (i.e., the mean of ui is lower than the mean of εi in absolute
value), although this may not necessarily happen for every and each individual. We abstract
here from the reasons why some households may not follow the Arianna’s advice in their actual
choices. Some families may not trust the external counseling advice or may have idiosyncratic
preferences for some specific tracks. The main goal of our conceptual framework is to analyze
the potential implications of following vs. not following Arianna’s advice, and accordingly of
beign matched or mismatched with Arianna in the track actually chosen.
At time t + 2 we observe the actual choices made by students. Students and their families
who learn from Arianna’s ability assessment will review their initial choices.6 Figure 3 depicts
some potential situations and describes the main implications in terms of the probability of
success (failure), which is observed at time t+3, i.e. the first year of upper secondary education.
Subfigure (a) shows the case in which a student is judged as mismatched by Arianna, since
she made a ‘risky’ choice. If she makes a downward revision of her initial choice, by choosing
track 1 instead of track 2, she will reduce her actual probability of failing (which would be one
in track 2). Subfigure (b) shows a similar situation in which, however, the reduction in the actual
probability of failing after downgrading the initial choice is higher than in subfigure (a) since
the individual’s true ability falls in the region in which the probability of failing is zero in track
6Evidence that students’ learning about their own abilities play a crucial role on educational decisions is pro-vided by Stinebrickner and Stinebrickner (2012). The authors show that a substantial amount of college dropoutbetween first and second years is explained by students’ learning about their grade peformance/academic ability.
27
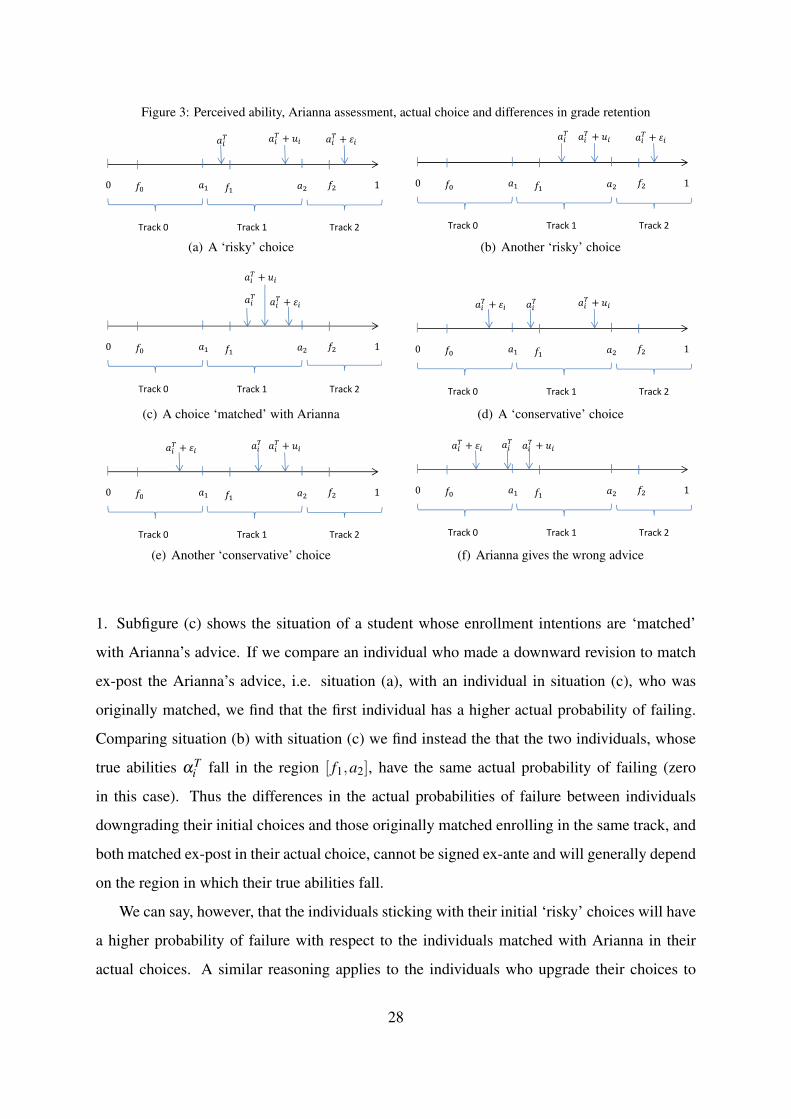
Figure 3: Perceived ability, Arianna assessment, actual choice and differences in grade retention
0 1 �� �� �� �� ��
�� + �� ��
+ �� ��
Track 0
(
Track 1 Track 2
(a) A ‘risky’ choice
0 1 �� �� �� �� ��
�� + �� ��
+ �� ��
Track 0
(
Track 1 Track 2
(b) Another ‘risky’ choice
0 1 �� �� �� �� ��
�� + ��
�� + �� ��
Track 0
(
Track 1 Track 2
(c) A choice ‘matched’ with Arianna
0 1 �� �� �� �� ��
�� + �� ��
+ �� ��
Track 0
(
Track 1 Track 2
(d) A ‘conservative’ choice
0 1 �� �� �� �� ��
�� + �� ��
+ �� ��
Track 0
(
Track 1 Track 2
(e) Another ‘conservative’ choice
0 1 �� �� �� �� ��
�� + �� ��
+ �� ��
Track 0
(
Track 1 Track 2
(f) Arianna gives the wrong advice
1. Subfigure (c) shows the situation of a student whose enrollment intentions are ‘matched’
with Arianna’s advice. If we compare an individual who made a downward revision to match
ex-post the Arianna’s advice, i.e. situation (a), with an individual in situation (c), who was
originally matched, we find that the first individual has a higher actual probability of failing.
Comparing situation (b) with situation (c) we find instead the that the two individuals, whose
true abilities αTi fall in the region [ f1,a2], have the same actual probability of failing (zero
in this case). Thus the differences in the actual probabilities of failure between individuals
downgrading their initial choices and those originally matched enrolling in the same track, and
both matched ex-post in their actual choice, cannot be signed ex-ante and will generally depend
on the region in which their true abilities fall.
We can say, however, that the individuals sticking with their initial ‘risky’ choices will have
a higher probability of failure with respect to the individuals matched with Arianna in their
actual choices. A similar reasoning applies to the individuals who upgrade their choices to
28
match with Arianna’s advice. Comparison of subfigure (d) with subfigure (c) shows the case
in which upgrading one’s choice raises the probability of failure with respect to the originally
matched individuals. Comparison of subfigure (e) with subfigure (c) shows instead a situation
in which upgrading the choice does not raise the probability of failure. Also in this case the
sign of the effect (positive or null) is mainly an empirical issue. In all the examples made
until now we have assumed that Arianna’s advice falls in the same region (track) as the true
individual ability. However, as we already said, Arianna’s advice may also be affected by
errors (ui). Subfigure (f) shows, for instance, the situation in which Arianna would make a
wrong recommendation for upgrading the initial choice, which if followed by the individual
will entail a higher probability of failure.
7. Concluding remarks
In tracked educational systems, the choice of school track is a crucial moment of a student’s
career, as it is strongly associated with her future labour market outcomes. Yet there are few
studies explicitly analyzing the process through which students and their parents make this
choice, and whether they have all the relevant information they need.
Thanks to a unique dataset coming from an independent school track counseling service
set up by one of the largest Italian municipalities (Turin), we can simultaneously exploit infor-
mation on students’ and parents’ characteristics, students’ track preferences as declared during
lower secondary schooling and their final actual choices, standardized measures of students’
cognitive and non-cognitive skills assessed through a battery of tests.
Such a wealth of information enables us to investigate the factors associated with the stu-
dents’ pre-test enrollement intentions and with the likelihood that these intentions are mis-
matched with respect to counselors’ advices on the proper track choice (derived by tests re-
sults). Furthermore, we are able to verify whether students (and their families) update their
initial intentions in response to the newly available information on their actual potential.
Our analysis shows that the information provided by the counseling service is indeed valu-
able to students and their parents. Students who were judged to have too conservative (risky)
intentions with respect to their actual potential are more likely to change their minds and opt
for a track with higher (lower) academic contents. We do not observe full adjustment as indi-
vidual characteristics (i.e. the socio-economic status and the foreign origin) tend to exert a lot
29
of influence on final choices, hence calling for policies able to promote the equality of oppor-
tunities among students. However, our findings suggest overall that counseling services based
on standardized tests do not simply replicate the signals that students and parents receive by
teachers, and they seem to provide new useful information on students’ ability.
These services may be particularly valuable to increase the efficiency of the school track
choice and to promote students’ achievement. In fact, we find that individuals who ignore a
signal of risky intentions, enrolling into tracks with a greater than optimal academic content,
have a higher probability of failing in the first year of upper secondary school.
References
Berchialla, P., Cavallo, F., Colombini, S., Lemma, P., De Simone, G., 2011. Associazione delle
caratteristiche individuali, del benessere psico-fisico e del clima di classe con gli outcomes
scolastici a 11 e 13 anni. Programma Education, FGA Working Paper No. 41.
Bratti, M., Cappellari, L., Groh-Samberg, O., Lohmann, H., 2012. School tracking and inter-
generational transmission of education. In: Ermisch, J., Jäntti, M., Smeeding, T. M. (Eds.),
From Parents to Children, The Intergenerational Transmission of Advantage. Russell Sage
Foundation, Ch. 13.
Brunello, G., Checchi, D., 2007. Does school tracking affect equality of opportunity? New
international evidence. Economic Policy 22 (52), 781–861.
Cappellari, L., Lucifora, C., 2009. The “Bologna Process” and college enrollment decisions.
Labour Economics 16 (6), 638–647.
Checchi, D., Fiorio, C. V., Leonardi, M., 2013. Intergenerational persistence of educational
attainment in Italy. Economics Letters 118 (1), 229–232.
Checchi, D., Flabbi, L., 2007. Intergenerational mobility and schooling decisions in Germany
and Italy: The impact of secondary school tracks. IZA Discussion Paper No. 2876.
Cinnirella, F., Piopiunik, M., Winter, J., 2011. Why does height matter for educational attain-
ment? Evidence from German children. Economics & Human Biology 9 (4), 407–418.
30
De Simone, G., 2013. Render unto primary the things which are primary’s: Inherited and fresh
learning divides in Italian lower secondary education. Economics of Education Review 35,
12–23.
Dustmann, C., 2004. Parental background, secondary school track choice, and wages. Oxford
Economic Papers 56 (2), 209–30.
Figlio, D. N., Page, M. E., 2002. School choice and the distributional effects of ability tracking:
Does separation increase inequality? Journal of Urban Economics 51 (3), 497–514.
Guyon, N., Maurin, E., McNally, S., 2012. The effect of tracking students by ability into dif-
ferent schools: A natural experiment. Journal of Human Resources 47 (3), 684–721.
Hanushek, E. A., Wössmann, L., 2006. Does educational tracking affect performance and in-
equality? differences- in-differences evidence across countries. Economic Journal 116 (510),
C63–C7.
Jensen, R., 2010. The (perceived) returns to education and the demand for schooling. The
Quarterly Journal of Economics 125 (2), 515–548.
Jürges, H., Schneider, K., November 2011. Why young boys stumble: Early tracking, age and
gender bias in the german school system. German Economic Review 12 (4), 371–394.
Kerr, S. P., Pekkarinen, T., Uusitalo, R., 2013. School tracking and development of cognitive
skills. Journal of Labor Economics 31 (3), 577–602.
Leonardi, M., 2007. Do parents’ risk aversion and wealth explain secondary school choice?
Giornale degli Economisti 66 (2), 177–206.
Ochsen, C., 2011. Recommendation, class repeating, and children’s ability: German school
tracking experiences. Applied Economics 43 (27), 4127–4133.
Stinebrickner, T., Stinebrickner, R., 2012. Learning about academic ability and the college
dropout decision. Journal of Labor Economics 30 (4), 707–748.
Tamm, M., 2008. Does money buy higher schooling?: Evidence from secondary school track
choice in Germany. Economics of Education Review 27 (5), 536–545.
31

Wölfel, O., Heineck, G., 2012. Parental risk attitudes and children’s secondary school track
choice. Economics of Education Review 31 (5), 727–743.
Zafar, B., 2011. How do college students form expectations? Journal of Labor Economics
29 (2), 301 – 348.
Appendix A. Supplementary tables
Table A.1: Determinants of sample attrition, Probit model (marginal effects)
(1) (2)Missing (1) / Not missing (0) Missing (1) / Not missing (0)
Gender (female) 0.005 0.006(0.004) (0.005)
Students’ age (ref. 13)12 -0.001 -0.003
(0.007) (0.007)14 0.169*** 0.214***
(0.016) (0.020)15 0.328*** 0.420***
(0.035) (0.039)Origin (immigrant) 0.018** 0.016*
(0.007) (0.008)Parents’ education (ref. Post-secondary ed.)don’t know 0.005 0.001
(0.006) (0.008)Up to lower-sec. education -0.002 -0.005
(0.006) (0.008)Secondary education -0.004 -0.009
(0.006) (0.008)Std. Test score - Overall 0.001 0.004
(0.002) (0.003)Casual vs Intentional 0.001 0.002
(0.002) (0.002)Risk Lover vs Risk Adverse 0.000 0.001
(0.001) (0.002)Competitive vs Collaborative -0.001 -0.002
(0.002) (0.002)Year fixed effects Yes YesSchool fixed effects No Yes
Observations 7,187 5,704Pseudo R-squared 0.394 0.408***, **, * significant at the 1%, 5% and 10%, respectively.Note: The dependent variable takes value one in case an individual does not appear in the matched dataset(attrition) and zero otherwise.
32
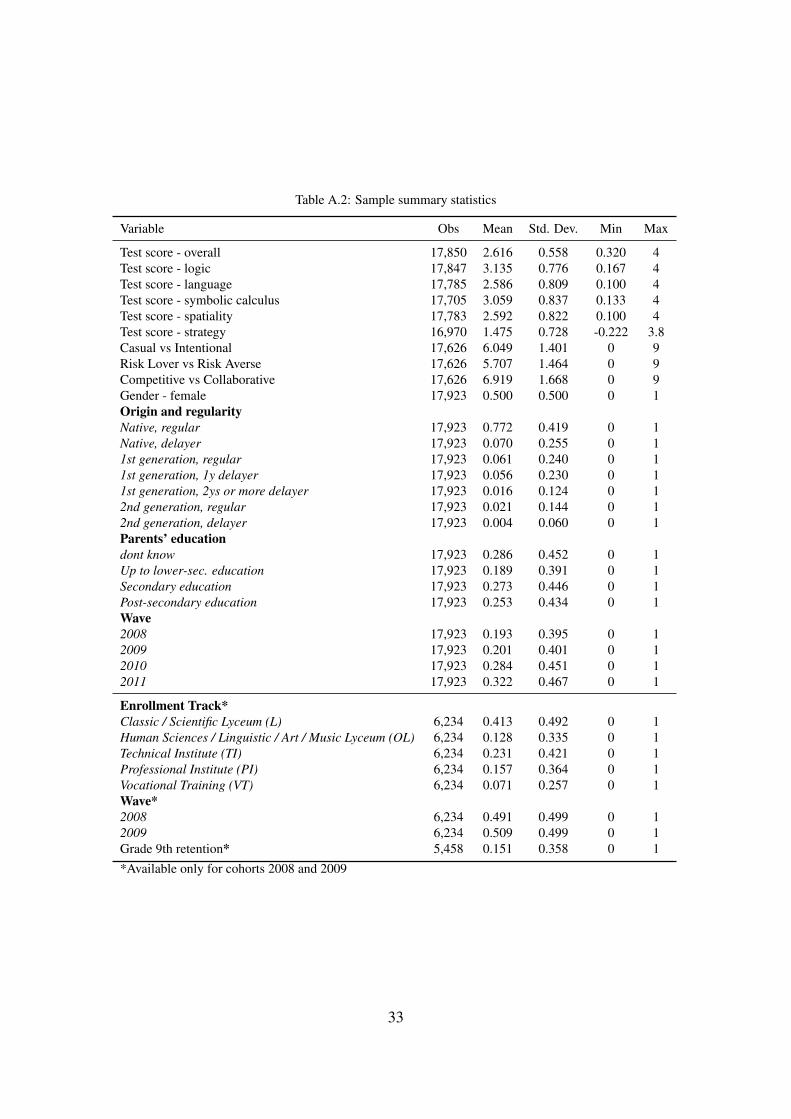
Table A.2: Sample summary statistics
Variable Obs Mean Std. Dev. Min Max
Test score - overall 17,850 2.616 0.558 0.320 4Test score - logic 17,847 3.135 0.776 0.167 4Test score - language 17,785 2.586 0.809 0.100 4Test score - symbolic calculus 17,705 3.059 0.837 0.133 4Test score - spatiality 17,783 2.592 0.822 0.100 4Test score - strategy 16,970 1.475 0.728 -0.222 3.8Casual vs Intentional 17,626 6.049 1.401 0 9Risk Lover vs Risk Averse 17,626 5.707 1.464 0 9Competitive vs Collaborative 17,626 6.919 1.668 0 9Gender - female 17,923 0.500 0.500 0 1Origin and regularityNative, regular 17,923 0.772 0.419 0 1Native, delayer 17,923 0.070 0.255 0 11st generation, regular 17,923 0.061 0.240 0 11st generation, 1y delayer 17,923 0.056 0.230 0 11st generation, 2ys or more delayer 17,923 0.016 0.124 0 12nd generation, regular 17,923 0.021 0.144 0 12nd generation, delayer 17,923 0.004 0.060 0 1Parents’ educationdont know 17,923 0.286 0.452 0 1Up to lower-sec. education 17,923 0.189 0.391 0 1Secondary education 17,923 0.273 0.446 0 1Post-secondary education 17,923 0.253 0.434 0 1Wave2008 17,923 0.193 0.395 0 12009 17,923 0.201 0.401 0 12010 17,923 0.284 0.451 0 12011 17,923 0.322 0.467 0 1
Enrollment Track*Classic / Scientific Lyceum (L) 6,234 0.413 0.492 0 1Human Sciences / Linguistic / Art / Music Lyceum (OL) 6,234 0.128 0.335 0 1Technical Institute (TI) 6,234 0.231 0.421 0 1Professional Institute (PI) 6,234 0.157 0.364 0 1Vocational Training (VT) 6,234 0.071 0.257 0 1Wave*2008 6,234 0.491 0.499 0 12009 6,234 0.509 0.499 0 1Grade 9th retention* 5,458 0.151 0.358 0 1*Available only for cohorts 2008 and 2009
33
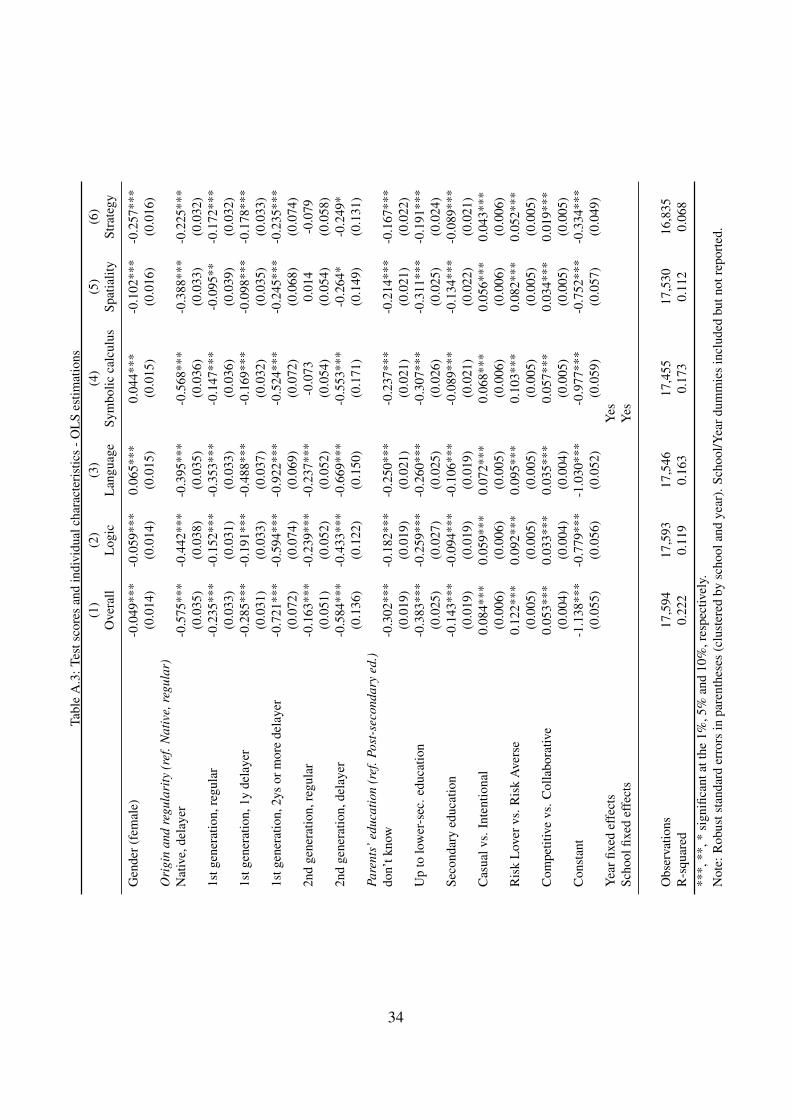
Tabl
eA
.3:T
ests
core
san
din
divi
dual
char
acte
rist
ics
-OL
Ses
timat
ions
(1)
(2)
(3)
(4)
(5)
(6)
Ove
rall
Log
icL
angu
age
Sym
bolic
calc
ulus
Spat
ialit
ySt
rate
gy
Gen
der(
fem
ale)
-0.0
49**
*-0
.059
***
0.06
5***
0.04
4***
-0.1
02**
*-0
.257
***
(0.0
14)
(0.0
14)
(0.0
15)
(0.0
15)
(0.0
16)
(0.0
16)
Ori
gin
and
regu
lari
ty(r
ef.N
ativ
e,re
gula
r)N
ativ
e,de
laye
r-0
.575
***
-0.4
42**
*-0
.395
***
-0.5
68**
*-0
.388
***
-0.2
25**
*(0
.035
)(0
.038
)(0
.035
)(0
.036
)(0
.033
)(0
.032
)1s
tgen
erat
ion,
regu
lar
-0.2
35**
*-0
.152
***
-0.3
53**
*-0
.147
***
-0.0
95**
-0.1
72**
*(0
.033
)(0
.031
)(0
.033
)(0
.036
)(0
.039
)(0
.032
)1s
tgen
erat
ion,
1yde
laye
r-0
.285
***
-0.1
91**
*-0
.488
***
-0.1
69**
*-0
.098
***
-0.1
78**
*(0
.031
)(0
.033
)(0
.037
)(0
.032
)(0
.035
)(0
.033
)1s
tgen
erat
ion,
2ys
orm
ore
dela
yer
-0.7
21**
*-0
.594
***
-0.9
22**
*-0
.524
***
-0.2
45**
*-0
.235
***
(0.0
72)
(0.0
74)
(0.0
69)
(0.0
72)
(0.0
68)
(0.0
74)
2nd
gene
ratio
n,re
gula
r-0
.163
***
-0.2
39**
*-0
.237
***
-0.0
730.
014
-0.0
79(0
.051
)(0
.052
)(0
.052
)(0
.054
)(0
.054
)(0
.058
)2n
dge
nera
tion,
dela
yer
-0.5
84**
*-0
.433
***
-0.6
69**
*-0
.553
***
-0.2
64*
-0.2
49*
(0.1
36)
(0.1
22)
(0.1
50)
(0.1
71)
(0.1
49)
(0.1
31)
Pare
nts’
educ
atio
n(r
ef.P
ost-
seco
ndar
yed
.)do
n’tk
now
-0.3
02**
*-0
.182
***
-0.2
50**
*-0
.237
***
-0.2
14**
*-0
.167
***
(0.0
19)
(0.0
19)
(0.0
21)
(0.0
21)
(0.0
21)
(0.0
22)
Up
tolo
wer
-sec
.edu
catio
n-0
.383
***
-0.2
59**
*-0
.260
***
-0.3
07**
*-0
.311
***
-0.1
91**
*(0
.025
)(0
.027
)(0
.025
)(0
.026
)(0
.025
)(0
.024
)Se
cond
ary
educ
atio
n-0
.143
***
-0.0
94**
*-0
.106
***
-0.0
89**
*-0
.134
***
-0.0
89**
*(0
.019
)(0
.019
)(0
.019
)(0
.021
)(0
.022
)(0
.021
)C
asua
lvs.
Inte
ntio
nal
0.08
4***
0.05
9***
0.07
2***
0.06
8***
0.05
6***
0.04
3***
(0.0
06)
(0.0
06)
(0.0
05)
(0.0
06)
(0.0
06)
(0.0
06)
Ris
kL
over
vs.R
isk
Ave
rse
0.12
2***
0.09
2***
0.09
5***
0.10
3***
0.08
2***
0.05
2***
(0.0
05)
(0.0
05)
(0.0
05)
(0.0
05)
(0.0
05)
(0.0
05)
Com
petit
ive
vs.C
olla
bora
tive
0.05
3***
0.03
3***
0.03
5***
0.05
7***
0.03
4***
0.01
9***
(0.0
04)
(0.0
04)
(0.0
04)
(0.0
05)
(0.0
05)
(0.0
05)
Con
stan
t-1
.138
***
-0.7
79**
*-1
.030
***
-0.9
77**
*-0
.752
***
-0.3
34**
*(0
.055
)(0
.056
)(0
.052
)(0
.059
)(0
.057
)(0
.049
)Y
earfi
xed
effe
cts
Yes
Scho
olfix
edef
fect
sY
es
Obs
erva
tions
17,5
9417
,593
17,5
4617
,455
17,5
3016
,835
R-s
quar
ed0.
222
0.11
90.
163
0.17
30.
112
0.06
8**
*,**
,*si
gnifi
cant
atth
e1%
,5%
and
10%
,res
pect
ivel
y.N
ote:
Rob
usts
tand
ard
erro
rsin
pare
nthe
ses
(clu
ster
edby
scho
olan
dye
ar).
Scho
ol/Y
eard
umm
ies
incl
uded
butn
otre
port
ed.
34

Tabl
eA
.4:P
re-t
esti
nten
tions
and
cogn
itive
/non
cogn
itive
ablit
ies
-MN
L(m
argi
nale
ffec
ts)
(1)
(2)
(3)
(4)
(5)
(6)
(7)
Don
’tkn
owL
OL
Eith
erL
orO
LT
IPI
VT
Gen
der(
fem
ale)
-0.0
16**
-0.0
35**
*0.
110*
**0.
056*
**-0
.089
***
-0.0
25**
*-0
.000
(0.0
07)
(0.0
07)
(0.0
06)
(0.0
04)
(0.0
05)
(0.0
05)
(0.0
02)
Ori
gin
and
regu
lari
ty(r
ef.N
ativ
e,re
gula
r)N
ativ
e,de
leye
r0.
079*
**-0
.167
***
-0.0
39**
*0.
004
0.01
6*0.
084*
**0.
023*
**(0
.013
)(0
.014
)(0
.009
)(0
.009
)(0
.009
)(0
.010
)(0
.005
)1s
tgen
erat
ion,
regu
lar
0.06
9***
-0.0
15-0
.044
***
-0.0
128*
0.03
1***
-0.0
23**
*-0
.005
**(0
.015
)(0
.017
)(0
.008
)(0
.008
)(0
.012
)(0
.009
)(0
.002
)1s
tgen
erat
ion,
1yde
laye
r0.
062*
**-0
.071
***
-0.0
37**
*0.
011
0.03
5***
-0.0
040.
005
(0.0
17)
(0.0
17)
(0.0
09)
(0.0
11)
(0.0
12)
(0.0
09)
(0.0
04)
1stg
ener
atio
n,2y
sor
mor
ede
laye
r0.
202*
**-0
.186
***
-0.0
89**
*0.
021
0.00
30.
029
0.02
0**
(0.0
36)
(0.0
28)
(0.0
11)
(0.0
29)
(0.0
19)
(0.0
20)
(0.0
10)
2nd
gene
ratio
n,re
gula
r0.
051*
*-0
.005
-0.0
27*
-0.0
070.
026
-0.0
37**
*-0
.000
(0.0
21)
(0.0
24)
(0.0
14)
(0.0
12)
(0.0
16)
(0.0
12)
(0.0
06)
2nd
gene
ratio
n,de
laye
r0.
092
-0.2
02**
*0.
040
-0.0
460.
085*
-0.0
010.
032
(0.0
68)
(0.0
54)
(0.0
55)
(0.0
29)
(0.0
49)
(0.0
34)
(0.0
26)
Pare
nts’
educ
atio
n(r
ef.P
ost-
seco
ndar
yed
.)do
n’tk
now
0.15
2***
-0.2
26**
*0.
008
-0.0
45**
*0.
043*
**0.
058*
**0.
009*
**(0
.009
)(0
.010
)(0
.007
)(0
.006
)(0
.006
)(0
.007
)(0
.002
)U
pto
low
er-s
ec.e
duca
tion
0.11
2***
-0.2
89**
*-0
.003
-0.0
39**
*0.
082*
**0.
119*
**0.
018*
**(0
.012
)(0
.012
)(0
.008
)(0
.007
)(0
.008
)(0
.008
)(0
.003
)Se
cond
ary
educ
atio
n0.
041*
**-0
.189
***
0.02
3***
-0.0
22**
*0.
076*
**0.
066*
**0.
006*
*(0
.010
)(0
.009
)(0
.007
)(0
.006
)(0
.007
)(0
.007
)(0
.002
)St
d.Te
stsc
ore
-Ove
rall
-0.0
56**
*0.
117*
**-0
.013
***
-0.0
000.
001
-0.0
42**
*-0
.007
***
(0.0
04)
(0.0
04)
(0.0
02)
(0.0
02)
(0.0
02)
(0.0
02)
(0.0
01)
Cas
ualv
s.In
tent
iona
l-0
.008
***
0.01
1***
0.00
4**
0.00
2-0
.004
**-0
.003
-0.0
02**
(0.0
02)
(0.0
03)
(0.0
02)
(0.0
01)
(0.0
02)
(0.0
02)
(0.0
01)
Ris
kL
over
vs.R
isk
Adv
erse
-0.0
07**
*0.
009*
**-0
.001
0.00
2-0
.002
-0.0
00-0
.001
(0.0
03)
(0.0
02)
(0.0
01)
(0.0
01)
(0.0
02)
(0.0
02)
(0.0
01)
Com
petit
ive
vs.C
olla
bora
tive
0.00
30.
002
-0.0
03*
-0.0
02*
0.00
1-0
.001
0.00
0(0
.002
)(0
.002
)(0
.002
)(0
.001
)(0
.001
)(0
.002
)(0
.000
)Y
earfi
xed
effe
cts
Yes
Scho
olfix
edef
fect
sN
o
Obs
erva
tions
17,5
67Ps
eudo
R-s
quar
ed0.
104
***,
**,*
sign
ifica
ntat
the
1%,5
%an
d10
%,r
espe
ctiv
ely.
Not
e:R
obus
tsta
ndar
der
rors
inpa
rent
hese
s(c
lust
ered
bysc
hool
and
year
).W
ave
dum
mie
sin
clud
edbu
tnot
repo
rted
.
35
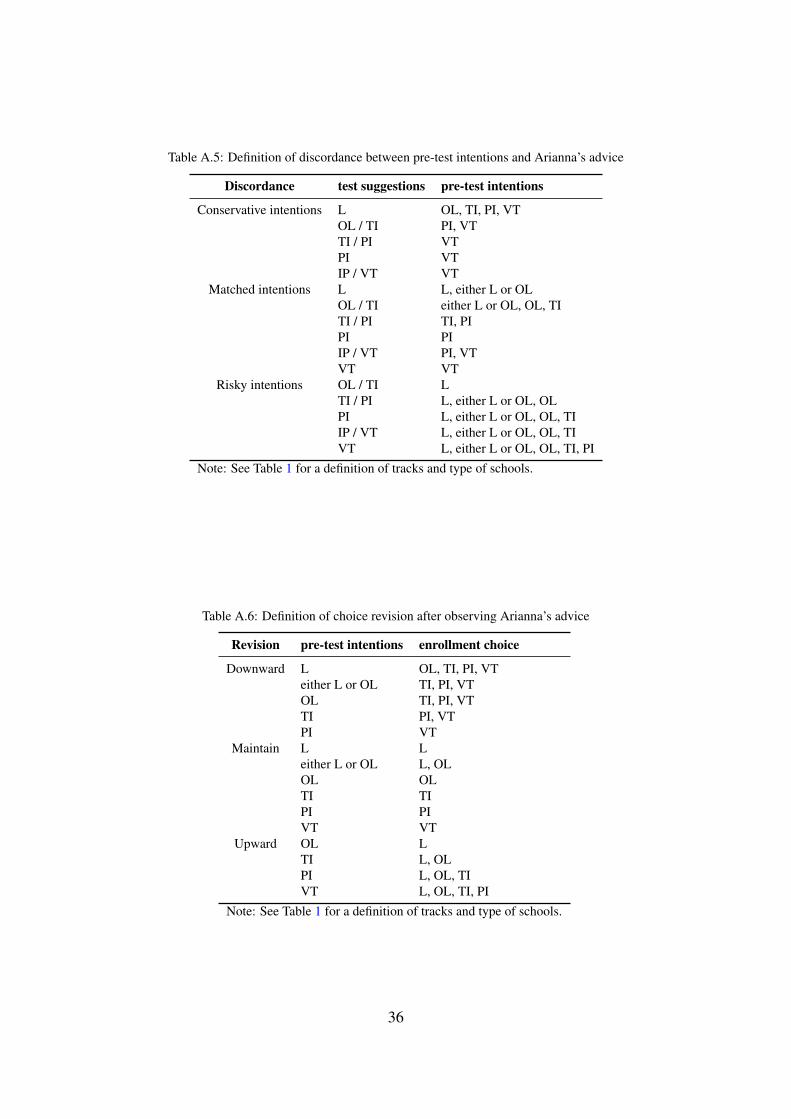
Table A.5: Definition of discordance between pre-test intentions and Arianna’s advice
Discordance test suggestions pre-test intentions
Conservative intentions L OL, TI, PI, VTOL / TI PI, VTTI / PI VTPI VTIP / VT VT
Matched intentions L L, either L or OLOL / TI either L or OL, OL, TITI / PI TI, PIPI PIIP / VT PI, VTVT VT
Risky intentions OL / TI LTI / PI L, either L or OL, OLPI L, either L or OL, OL, TIIP / VT L, either L or OL, OL, TIVT L, either L or OL, OL, TI, PI
Note: See Table 1 for a definition of tracks and type of schools.
Table A.6: Definition of choice revision after observing Arianna’s advice
Revision pre-test intentions enrollment choice
Downward L OL, TI, PI, VTeither L or OL TI, PI, VTOL TI, PI, VTTI PI, VTPI VT
Maintain L Leither L or OL L, OLOL OLTI TIPI PIVT VT
Upward OL LTI L, OLPI L, OL, TIVT L, OL, TI, PI
Note: See Table 1 for a definition of tracks and type of schools.
36