Messtechnik fuer die Software-Qualitätssicherung
26
Messtechnik fuer die Software- Qualitätssicherung GI-Fachtreffen Jena 22. Januar 2013 Harry M. Sneed Jena-2013
-
Upload
jessica-mcgowan -
Category
Documents
-
view
24 -
download
1
description
Jena-2013. Messtechnik fuer die Software-Qualitätssicherung. GI-Fachtreffen Jena 22. Januar 2013 Harry M. Sneed. Entwicklungsaufwand - Anpassungsaufwand. Entwicklungsaufwand - Änderungsaufwand. Testfälle - Fehlerhafte Testfälle. - PowerPoint PPT Presentation
Transcript of Messtechnik fuer die Software-Qualitätssicherung

Messtechnik fuer die Software-Qualitätssicherung
GI-Fachtreffen Jena
22. Januar 2013
Harry M. Sneed
Jena-2013
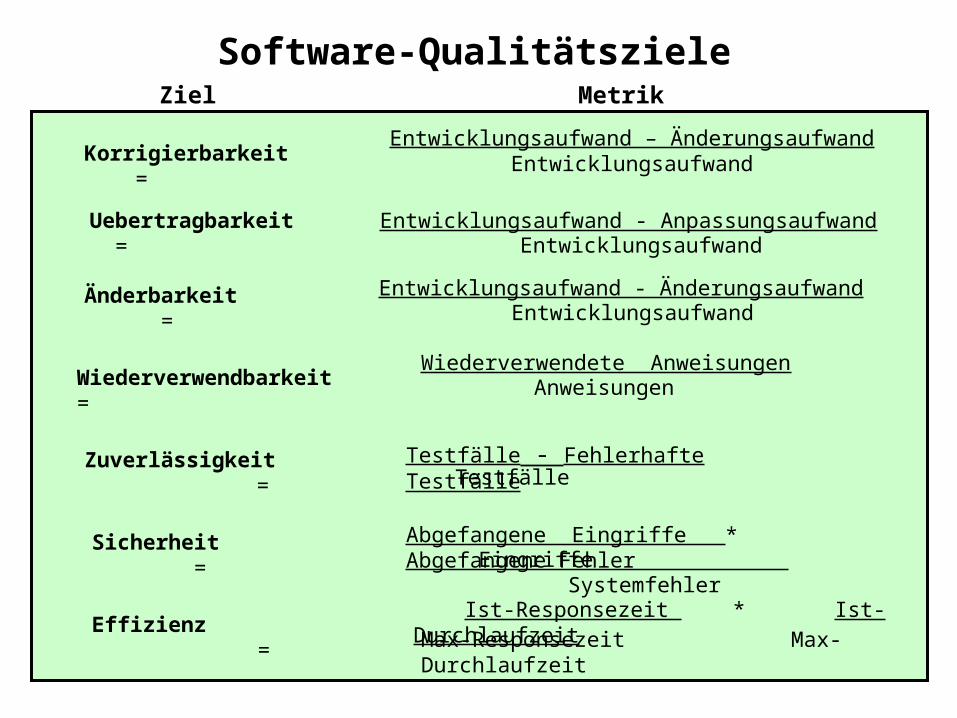
Entwicklungsaufwand – Änderungsaufwand Entwicklungsaufwand
Entwicklungsaufwand - AnpassungsaufwandEntwicklungsaufwand
Entwicklungsaufwand - ÄnderungsaufwandEntwicklungsaufwand
Testfälle - Fehlerhafte TestfälleTestfälle
Abgefangene Eingriffe * Abgefangene Fehler Eingriffe Systemfehler
Effizienz =
Sicherheit =
Zuverlässigkeit =
Änderbarkeit =
Uebertragbarkeit =
Korrigierbarkeit =
Wiederverwendbarkeit =Wiederverwendete Anweisungen
Anweisungen
Ist-Responsezeit * Ist-Durchlaufzeit
Max-Responsezeit Max-Durchlaufzeit
Software-QualitätszieleZiel Metrik
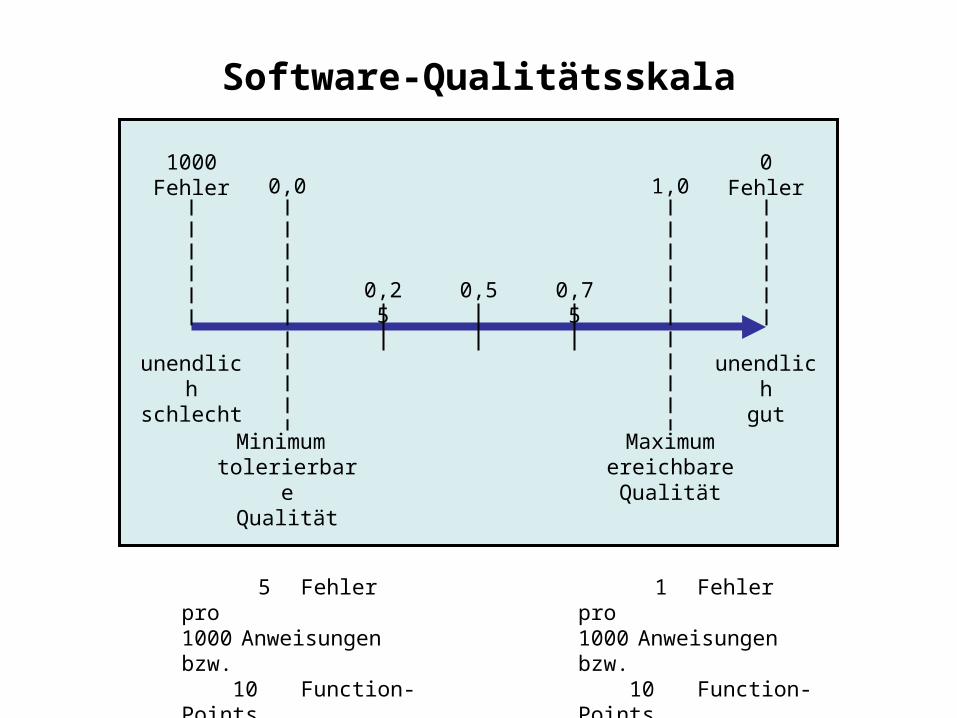
0,25 0,750,5
0,0 1,01000
Fehler0
Fehler
unendlichschlecht
unendlichgut
Minimum tolerierbare
Qualität
Maximumereichbare
Qualität
5 Fehler pro1000 Anweisungen bzw. 10 Function-Points 50 Data-Points
1 Fehler pro1000 Anweisungen bzw. 10 Function-Points 50 Data-Points
Software-Qualitätsskala
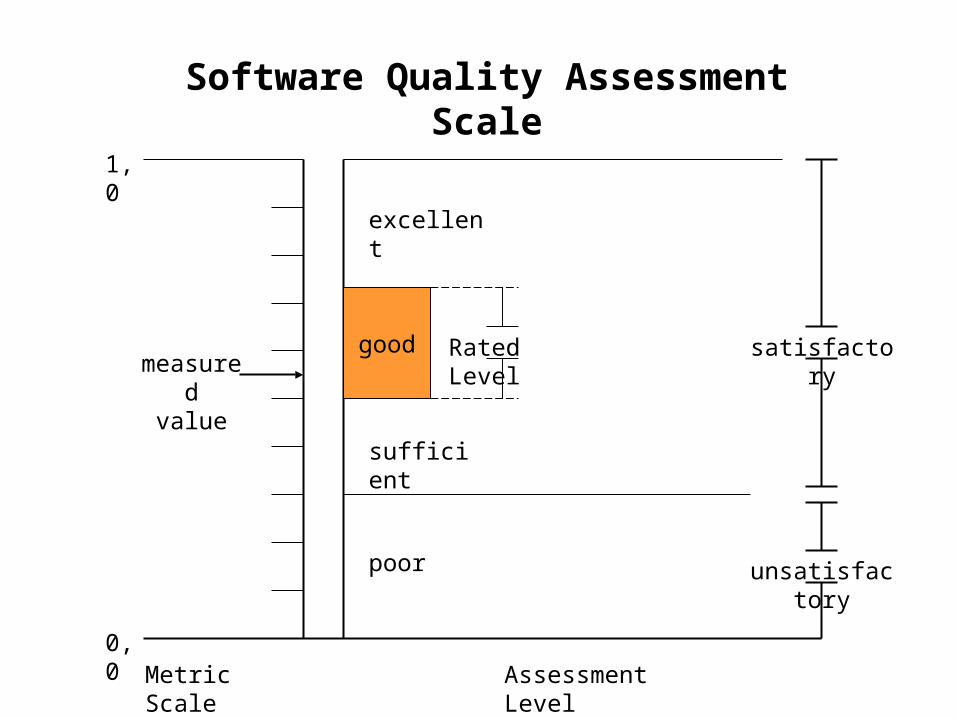
Metric Scale0,0
1,0
good
Assessment Level
Rated Level satisfactory
unsatisfactorypoor
sufficient
excellent
measuredvalue
Software Quality Assessment Scale
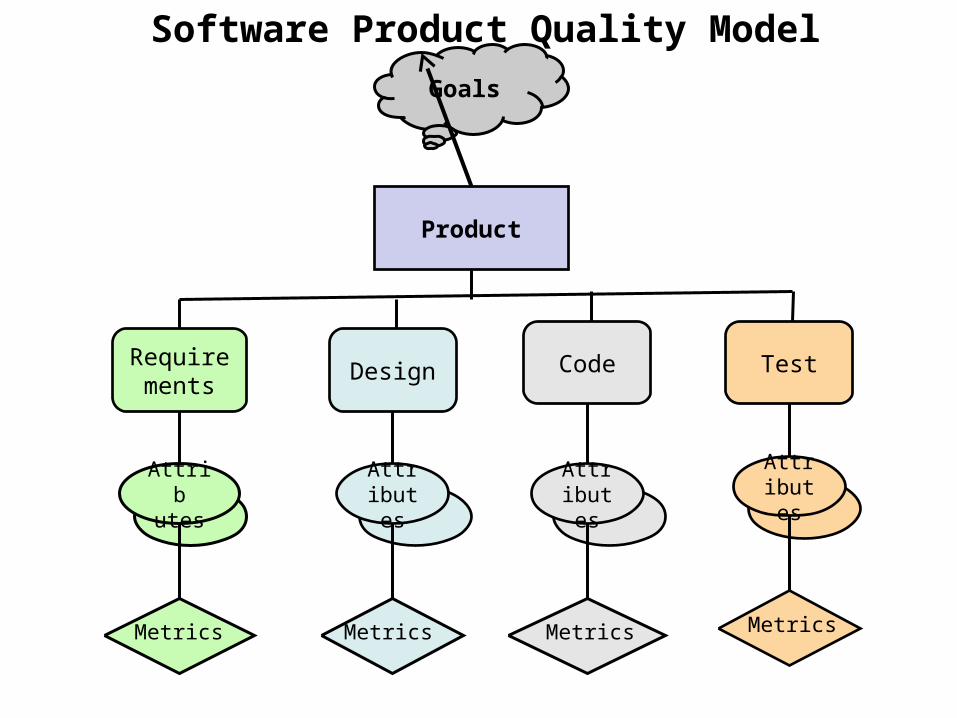
Goals
Product
Requirements
Design Code Test
Attributes
Attributes
Attributes
Attributes
MetricsMetrics Metrics Metrics
Software Product Quality Model
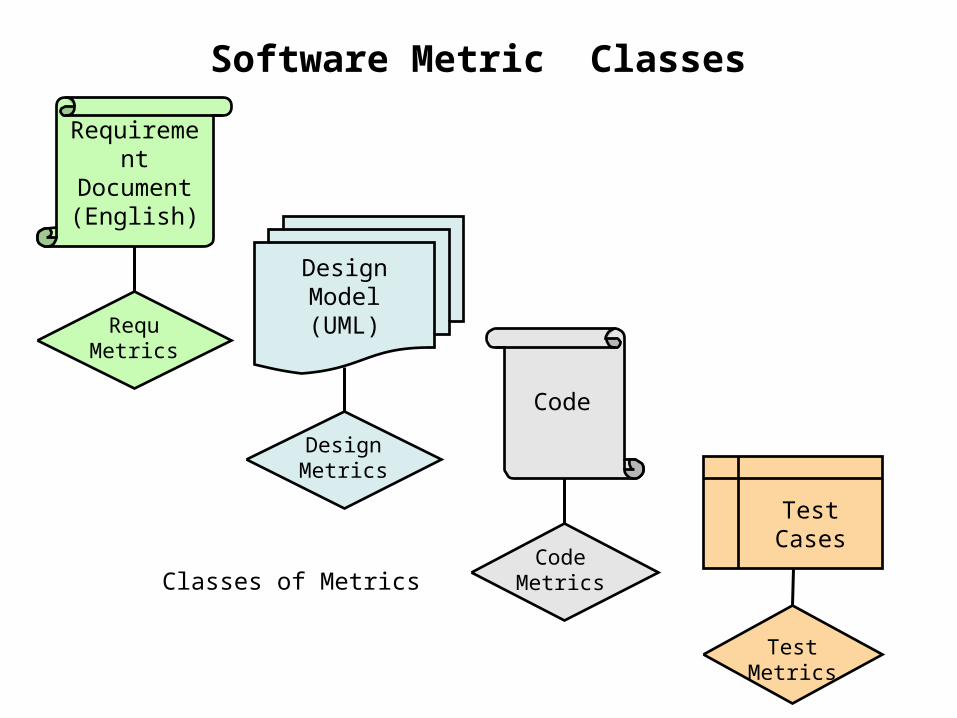
RequirementDocument(English)
DesignModel(UML)
Code
TestCases
DesignMetrics
CodeMetrics
RequMetrics
TestMetrics
Software Metric Classes
Classes of Metrics
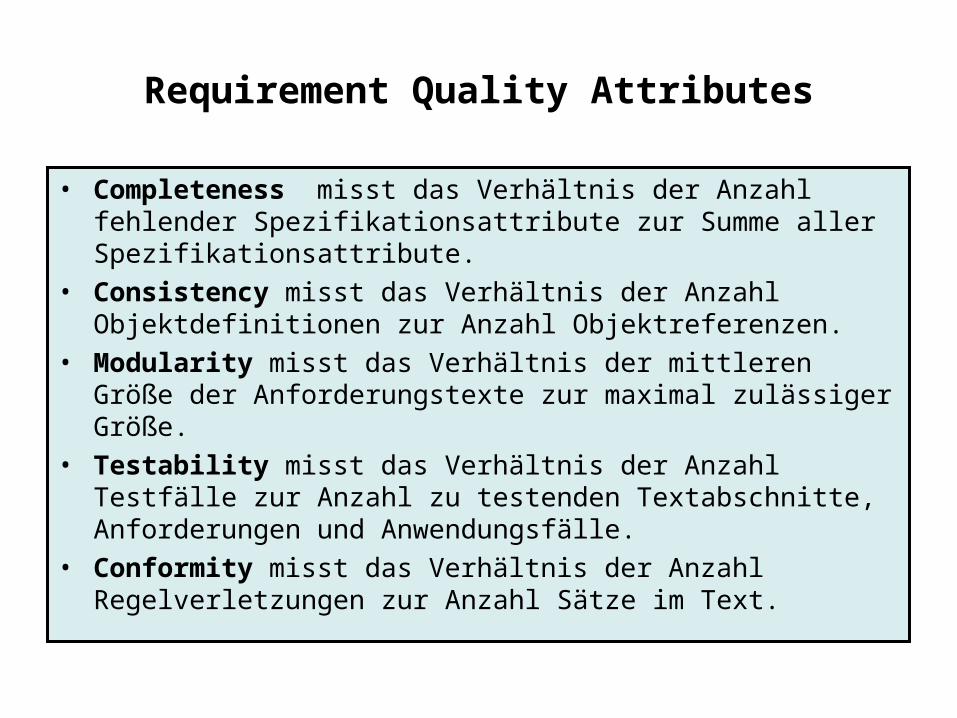
Requirement Quality Attributes
• Completeness misst das Verhältnis der Anzahl fehlender Spezifikationsattribute zur Summe aller Spezifikationsattribute.
• Consistency misst das Verhältnis der Anzahl Objektdefinitionen zur Anzahl Objektreferenzen.
• Modularity misst das Verhältnis der mittleren Größe der Anforderungstexte zur maximal zulässiger Größe.
• Testability misst das Verhältnis der Anzahl Testfälle zur Anzahl zu testenden Textabschnitte, Anforderungen und Anwendungsfälle.
• Conformity misst das Verhältnis der Anzahl Regelverletzungen zur Anzahl Sätze im Text.
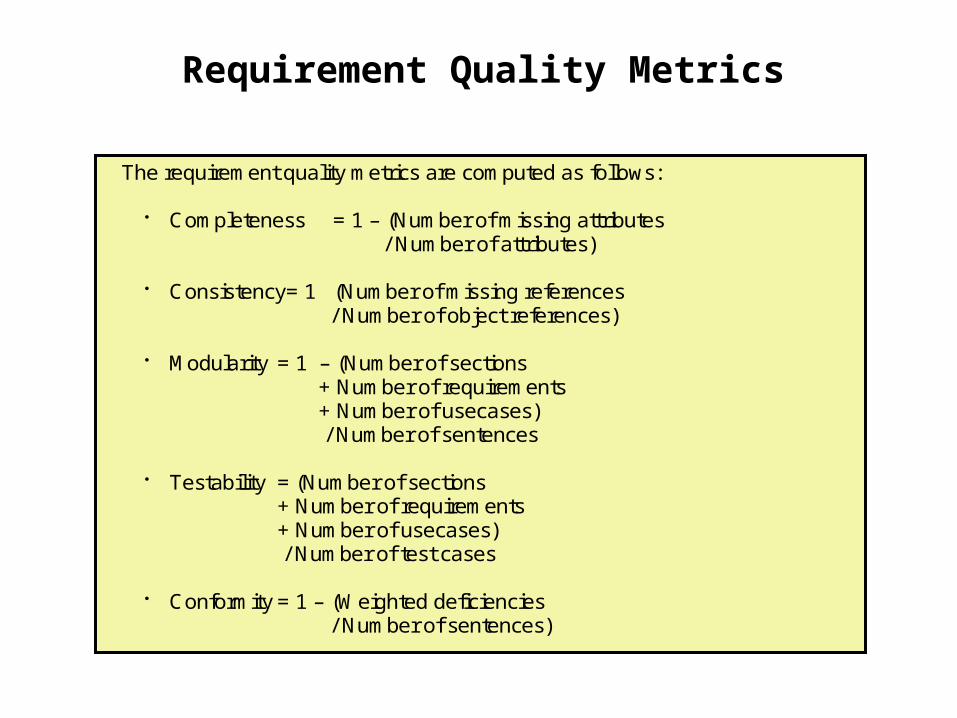
The requirement quality metrics are computed as follows:
Completeness = 1 – (Number of missing attributes / Number of attributes)
Consistency= 1 (Number of missing references / Number of object references)
Modularity = 1 – (Number of sections + Number of requirements + Number of usecases) / Number of sentences
Testability = (Number of sections+ Number of requirements+ Number of usecases) / Number of test cases
Conformity = 1 – (Weighted deficiencies / Number of sentences)
Requirement Quality Metrics
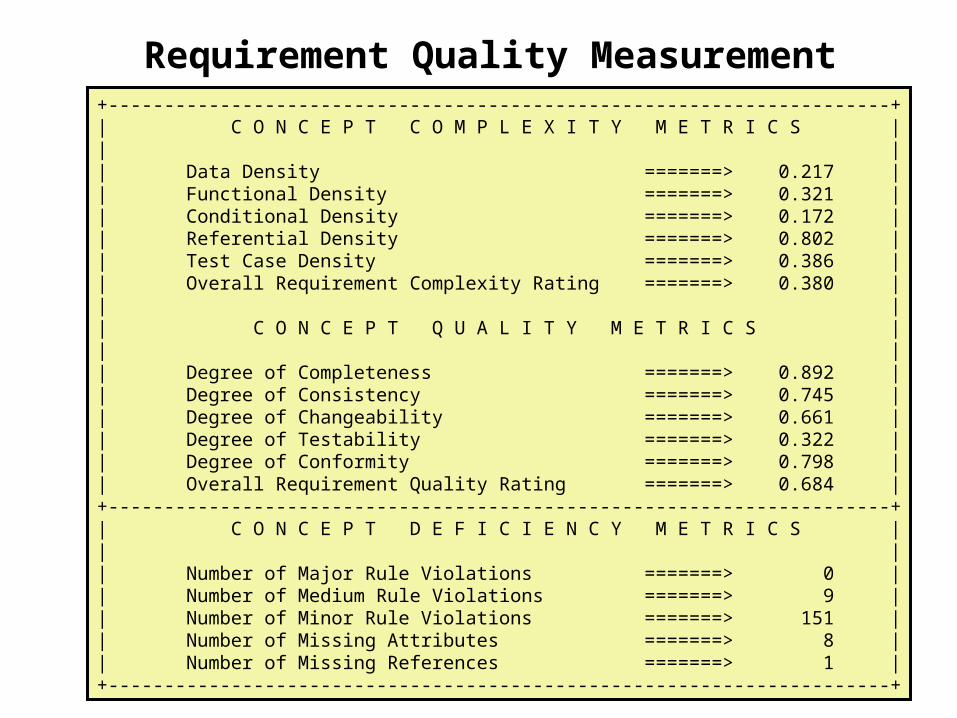
+----------------------------------------------------------------------+| C O N C E P T C O M P L E X I T Y M E T R I C S || || Data Density =======> 0.217 || Functional Density =======> 0.321 || Conditional Density =======> 0.172 || Referential Density =======> 0.802 || Test Case Density =======> 0.386 || Overall Requirement Complexity Rating =======> 0.380 || || C O N C E P T Q U A L I T Y M E T R I C S || || Degree of Completeness =======> 0.892 || Degree of Consistency =======> 0.745 || Degree of Changeability =======> 0.661 || Degree of Testability =======> 0.322 || Degree of Conformity =======> 0.798 || Overall Requirement Quality Rating =======> 0.684 |+----------------------------------------------------------------------+| C O N C E P T D E F I C I E N C Y M E T R I C S || || Number of Major Rule Violations =======> 0 || Number of Medium Rule Violations =======> 9 || Number of Minor Rule Violations =======> 151 || Number of Missing Attributes =======> 8 || Number of Missing References =======> 1 |+----------------------------------------------------------------------+
Requirement Quality Measurement
Requirement AnalysisDemonstration
Lastenheftmessung
mit dem Tool GerAudit
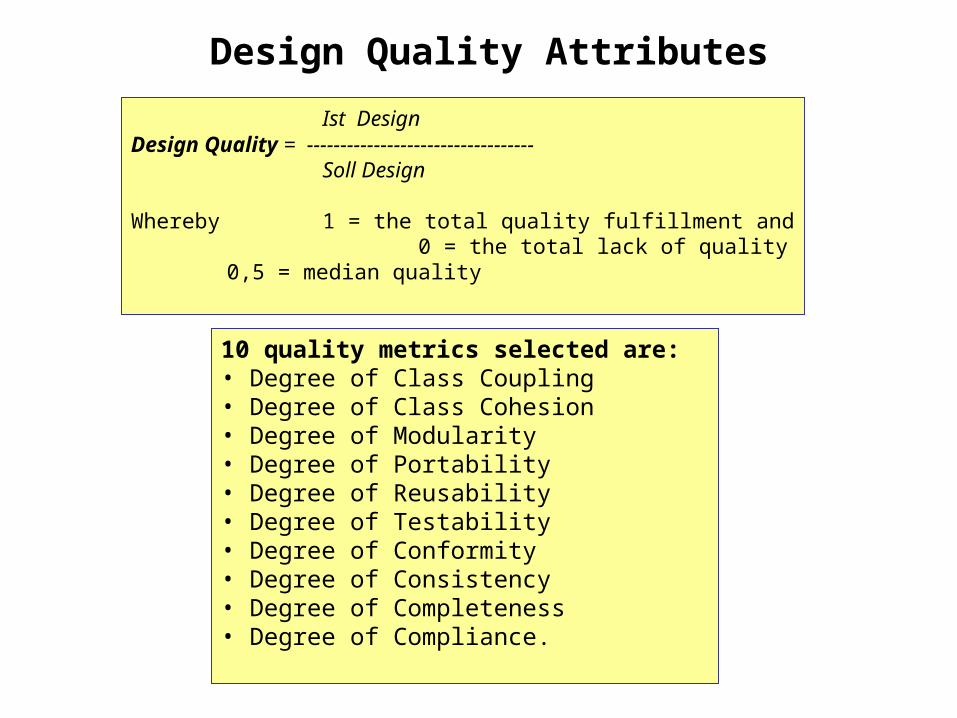
Ist Design Design Quality = ----------------------------------
Soll Design Whereby 1 = the total quality fulfillment and 0 = the total lack of quality 0,5 = median quality
10 quality metrics selected are: • Degree of Class Coupling• Degree of Class Cohesion• Degree of Modularity• Degree of Portability• Degree of Reusability• Degree of Testability• Degree of Conformity• Degree of Consistency• Degree of Completeness• Degree of Compliance.
Design Quality Attributes
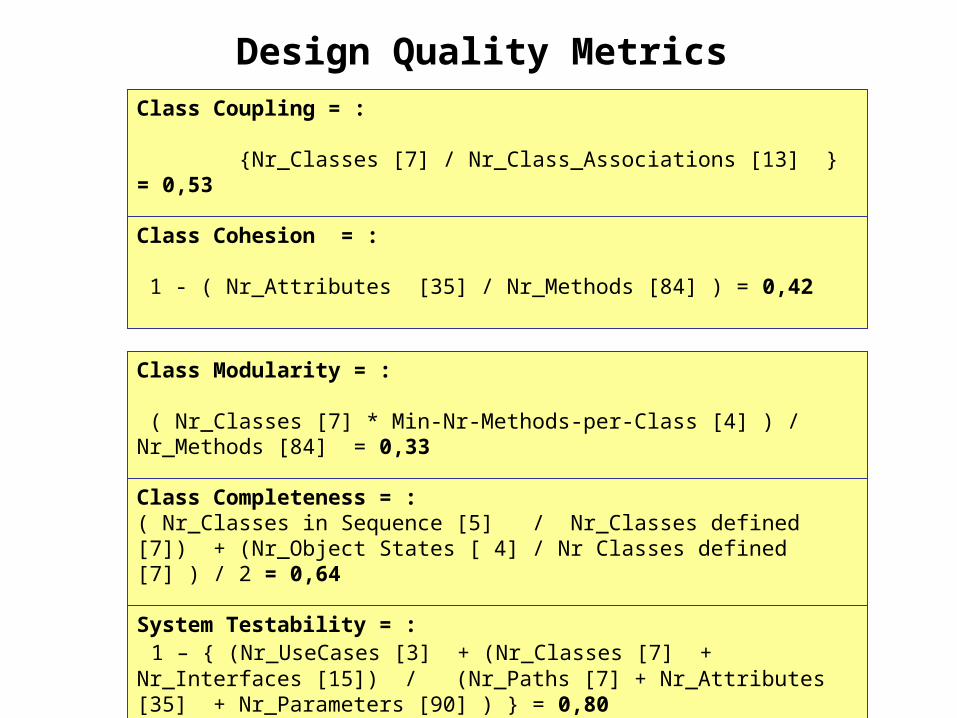
Class Coupling = : {Nr_Classes [7] / Nr_Class_Associations [13] } = 0,53
Class Cohesion = : 1 - ( Nr_Attributes [35] / Nr_Methods [84] ) = 0,42
Class Modularity = : ( Nr_Classes [7] * Min-Nr-Methods-per-Class [4] ) / Nr_Methods [84] = 0,33
Class Completeness = : ( Nr_Classes in Sequence [5] / Nr_Classes defined [7]) + (Nr_Object States [ 4] / Nr Classes defined [7] ) / 2 = 0,64
System Testability = : 1 – { (Nr_UseCases [3] + (Nr_Classes [7] + Nr_Interfaces [15]) / (Nr_Paths [7] + Nr_Attributes [35] + Nr_Parameters [90] ) } = 0,80
Design Quality Metrics
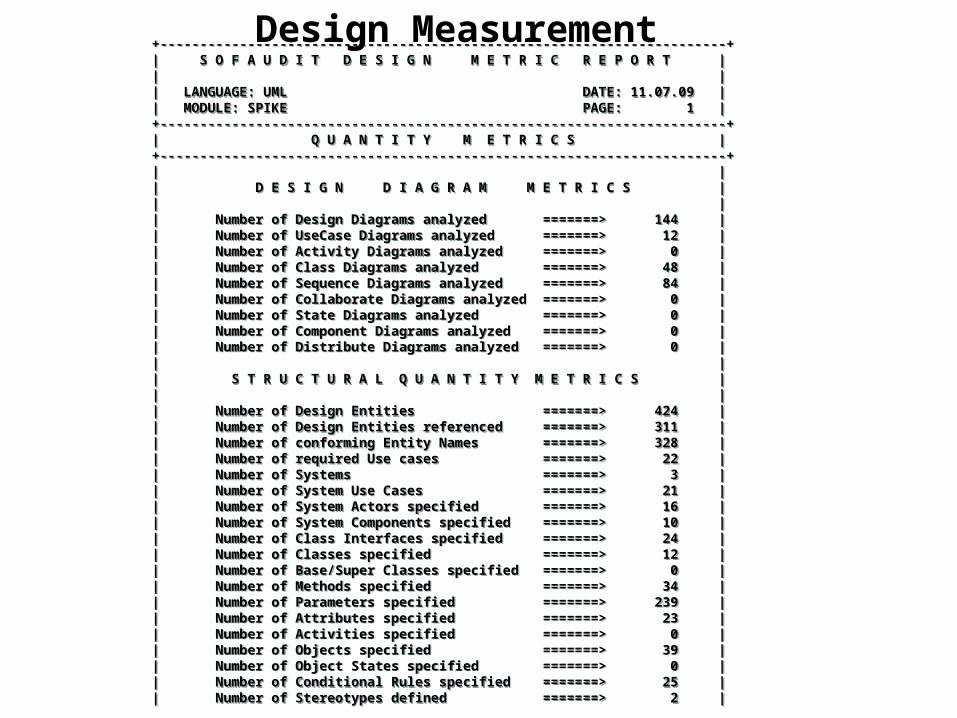
+-----------------------------------------------------------------------+| S O F A U D I T D E S I G N M E T R I C R E P O R T || || LANGUAGE: UML DATE: 11.07.09 || MODULE: SPIKE PAGE: 1 |+-----------------------------------------------------------------------+| Q U A N T I T Y M E T R I C S |+-----------------------------------------------------------------------+| || D E S I G N D I A G R A M M E T R I C S || || Number of Design Diagrams analyzed =======> 144 || Number of UseCase Diagrams analyzed =======> 12 || Number of Activity Diagrams analyzed =======> 0 || Number of Class Diagrams analyzed =======> 48 || Number of Sequence Diagrams analyzed =======> 84 || Number of Collaborate Diagrams analyzed =======> 0 || Number of State Diagrams analyzed =======> 0 || Number of Component Diagrams analyzed =======> 0 || Number of Distribute Diagrams analyzed =======> 0 || || S T R U C T U R A L Q U A N T I T Y M E T R I C S || || Number of Design Entities =======> 424 || Number of Design Entities referenced =======> 311 || Number of conforming Entity Names =======> 328 || Number of required Use cases =======> 22 || Number of Systems =======> 3 || Number of System Use Cases =======> 21 || Number of System Actors specified =======> 16 || Number of System Components specified =======> 10 || Number of Class Interfaces specified =======> 24 || Number of Classes specified =======> 12 || Number of Base/Super Classes specified =======> 0 || Number of Methods specified =======> 34 || Number of Parameters specified =======> 239 || Number of Attributes specified =======> 23 || Number of Activities specified =======> 0 || Number of Objects specified =======> 39 || Number of Object States specified =======> 0 || Number of Conditional Rules specified =======> 25 || Number of Stereotypes defined =======> 2 |
+-----------------------------------------------------------------------+| S O F A U D I T D E S I G N M E T R I C R E P O R T || || LANGUAGE: UML DATE: 11.07.09 || MODULE: SPIKE PAGE: 1 |+-----------------------------------------------------------------------+| Q U A N T I T Y M E T R I C S |+-----------------------------------------------------------------------+| || D E S I G N D I A G R A M M E T R I C S || || Number of Design Diagrams analyzed =======> 144 || Number of UseCase Diagrams analyzed =======> 12 || Number of Activity Diagrams analyzed =======> 0 || Number of Class Diagrams analyzed =======> 48 || Number of Sequence Diagrams analyzed =======> 84 || Number of Collaborate Diagrams analyzed =======> 0 || Number of State Diagrams analyzed =======> 0 || Number of Component Diagrams analyzed =======> 0 || Number of Distribute Diagrams analyzed =======> 0 || || S T R U C T U R A L Q U A N T I T Y M E T R I C S || || Number of Design Entities =======> 424 || Number of Design Entities referenced =======> 311 || Number of conforming Entity Names =======> 328 || Number of required Use cases =======> 22 || Number of Systems =======> 3 || Number of System Use Cases =======> 21 || Number of System Actors specified =======> 16 || Number of System Components specified =======> 10 || Number of Class Interfaces specified =======> 24 || Number of Classes specified =======> 12 || Number of Base/Super Classes specified =======> 0 || Number of Methods specified =======> 34 || Number of Parameters specified =======> 239 || Number of Attributes specified =======> 23 || Number of Activities specified =======> 0 || Number of Objects specified =======> 39 || Number of Object States specified =======> 0 || Number of Conditional Rules specified =======> 25 || Number of Stereotypes defined =======> 2 |
Design Measurement
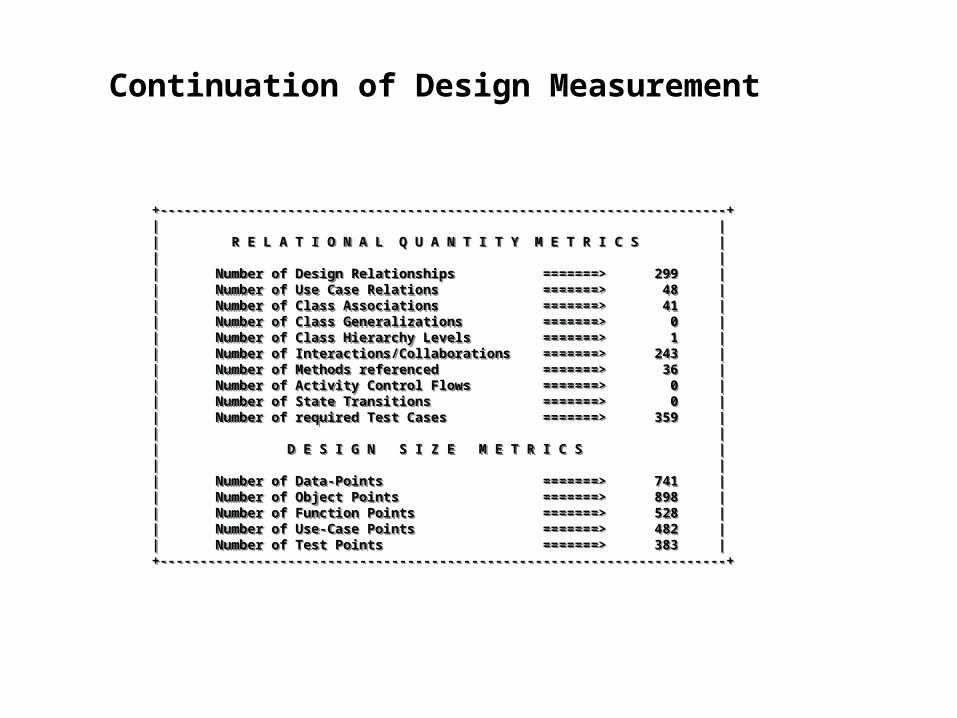
+-----------------------------------------------------------------------+| || R E L A T I O N A L Q U A N T I T Y M E T R I C S || || Number of Design Relationships =======> 299 || Number of Use Case Relations =======> 48 || Number of Class Associations =======> 41 || Number of Class Generalizations =======> 0 || Number of Class Hierarchy Levels =======> 1 || Number of Interactions/Collaborations =======> 243 || Number of Methods referenced =======> 36 || Number of Activity Control Flows =======> 0 || Number of State Transitions =======> 0 || Number of required Test Cases =======> 359 || || D E S I G N S I Z E M E T R I C S || || Number of Data-Points =======> 741 || Number of Object Points =======> 898 || Number of Function Points =======> 528 || Number of Use-Case Points =======> 482 || Number of Test Points =======> 383 |+-----------------------------------------------------------------------+
+-----------------------------------------------------------------------+| || R E L A T I O N A L Q U A N T I T Y M E T R I C S || || Number of Design Relationships =======> 299 || Number of Use Case Relations =======> 48 || Number of Class Associations =======> 41 || Number of Class Generalizations =======> 0 || Number of Class Hierarchy Levels =======> 1 || Number of Interactions/Collaborations =======> 243 || Number of Methods referenced =======> 36 || Number of Activity Control Flows =======> 0 || Number of State Transitions =======> 0 || Number of required Test Cases =======> 359 || || D E S I G N S I Z E M E T R I C S || || Number of Data-Points =======> 741 || Number of Object Points =======> 898 || Number of Function Points =======> 528 || Number of Use-Case Points =======> 482 || Number of Test Points =======> 383 |+-----------------------------------------------------------------------+
Continuation of Design Measurement
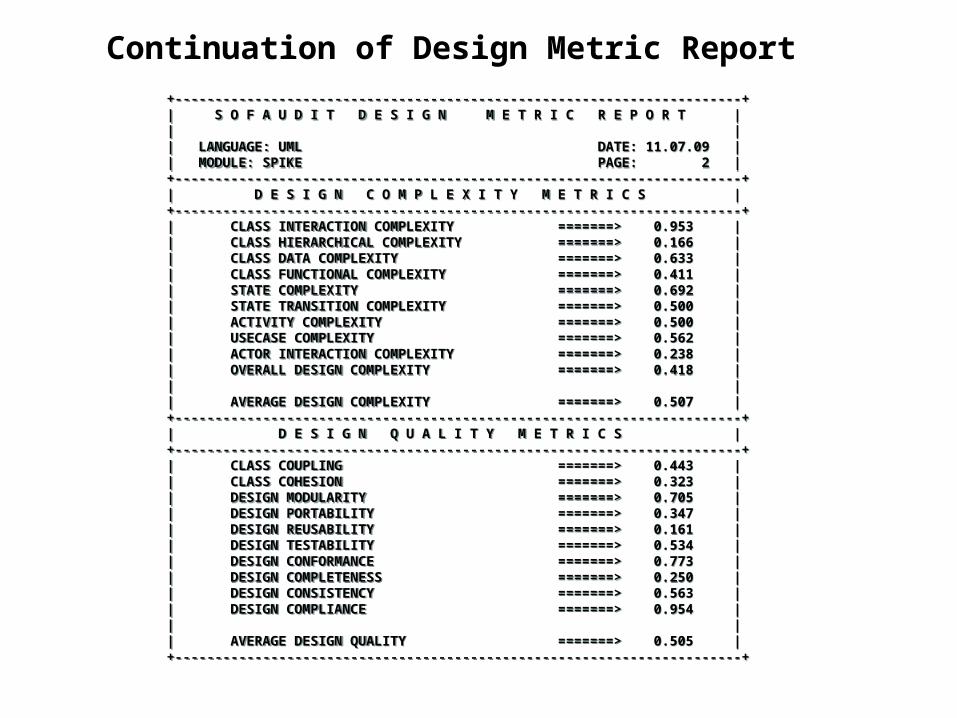
+-----------------------------------------------------------------------+| S O F A U D I T D E S I G N M E T R I C R E P O R T || || LANGUAGE: UML DATE: 11.07.09 || MODULE: SPIKE PAGE: 2 |+-----------------------------------------------------------------------+| D E S I G N C O M P L E X I T Y M E T R I C S |+-----------------------------------------------------------------------+| CLASS INTERACTION COMPLEXITY =======> 0.953 || CLASS HIERARCHICAL COMPLEXITY =======> 0.166 || CLASS DATA COMPLEXITY =======> 0.633 || CLASS FUNCTIONAL COMPLEXITY =======> 0.411 || STATE COMPLEXITY =======> 0.692 || STATE TRANSITION COMPLEXITY =======> 0.500 || ACTIVITY COMPLEXITY =======> 0.500 || USECASE COMPLEXITY =======> 0.562 || ACTOR INTERACTION COMPLEXITY =======> 0.238 || OVERALL DESIGN COMPLEXITY =======> 0.418 || || AVERAGE DESIGN COMPLEXITY =======> 0.507 |+-----------------------------------------------------------------------+| D E S I G N Q U A L I T Y M E T R I C S |+-----------------------------------------------------------------------+| CLASS COUPLING =======> 0.443 || CLASS COHESION =======> 0.323 || DESIGN MODULARITY =======> 0.705 || DESIGN PORTABILITY =======> 0.347 || DESIGN REUSABILITY =======> 0.161 || DESIGN TESTABILITY =======> 0.534 || DESIGN CONFORMANCE =======> 0.773 || DESIGN COMPLETENESS =======> 0.250 || DESIGN CONSISTENCY =======> 0.563 || DESIGN COMPLIANCE =======> 0.954 || || AVERAGE DESIGN QUALITY =======> 0.505 |+-----------------------------------------------------------------------+
+-----------------------------------------------------------------------+| S O F A U D I T D E S I G N M E T R I C R E P O R T || || LANGUAGE: UML DATE: 11.07.09 || MODULE: SPIKE PAGE: 2 |+-----------------------------------------------------------------------+| D E S I G N C O M P L E X I T Y M E T R I C S |+-----------------------------------------------------------------------+| CLASS INTERACTION COMPLEXITY =======> 0.953 || CLASS HIERARCHICAL COMPLEXITY =======> 0.166 || CLASS DATA COMPLEXITY =======> 0.633 || CLASS FUNCTIONAL COMPLEXITY =======> 0.411 || STATE COMPLEXITY =======> 0.692 || STATE TRANSITION COMPLEXITY =======> 0.500 || ACTIVITY COMPLEXITY =======> 0.500 || USECASE COMPLEXITY =======> 0.562 || ACTOR INTERACTION COMPLEXITY =======> 0.238 || OVERALL DESIGN COMPLEXITY =======> 0.418 || || AVERAGE DESIGN COMPLEXITY =======> 0.507 |+-----------------------------------------------------------------------+| D E S I G N Q U A L I T Y M E T R I C S |+-----------------------------------------------------------------------+| CLASS COUPLING =======> 0.443 || CLASS COHESION =======> 0.323 || DESIGN MODULARITY =======> 0.705 || DESIGN PORTABILITY =======> 0.347 || DESIGN REUSABILITY =======> 0.161 || DESIGN TESTABILITY =======> 0.534 || DESIGN CONFORMANCE =======> 0.773 || DESIGN COMPLETENESS =======> 0.250 || DESIGN CONSISTENCY =======> 0.563 || DESIGN COMPLIANCE =======> 0.954 || || AVERAGE DESIGN QUALITY =======> 0.505 |+-----------------------------------------------------------------------+
Continuation of Design Metric Report
Design Model AnalysisDemonstration
UML-Modellmessung
mit dem Tool UMLAudit
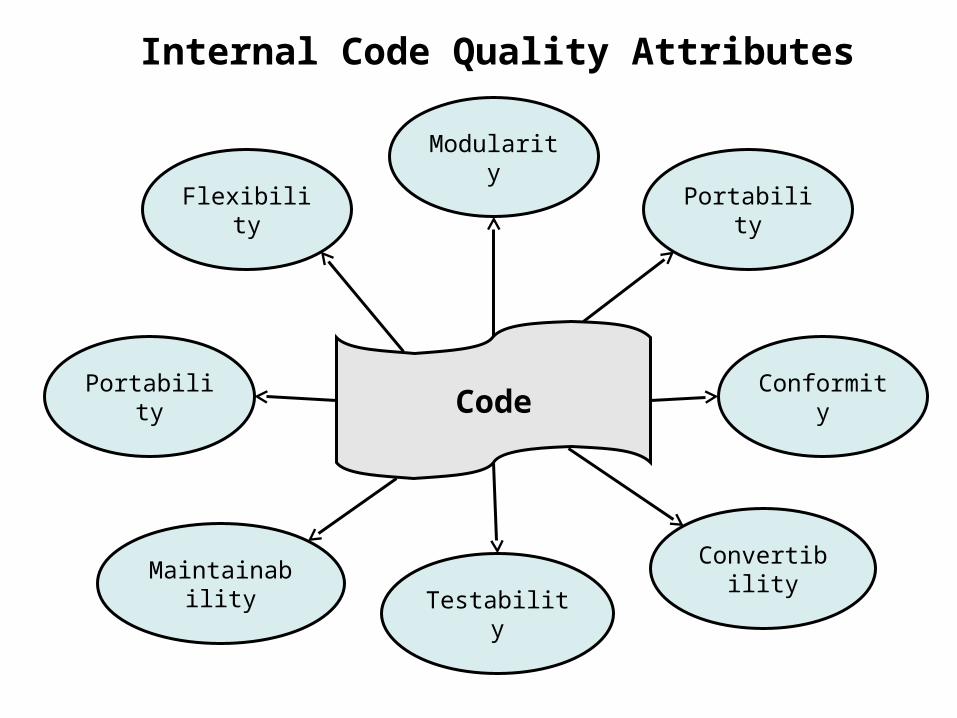
Code
Flexibility
Maintainability
Portability Conformity
Convertibility
Portability
Testability
Modularity
Internal Code Quality Attributes
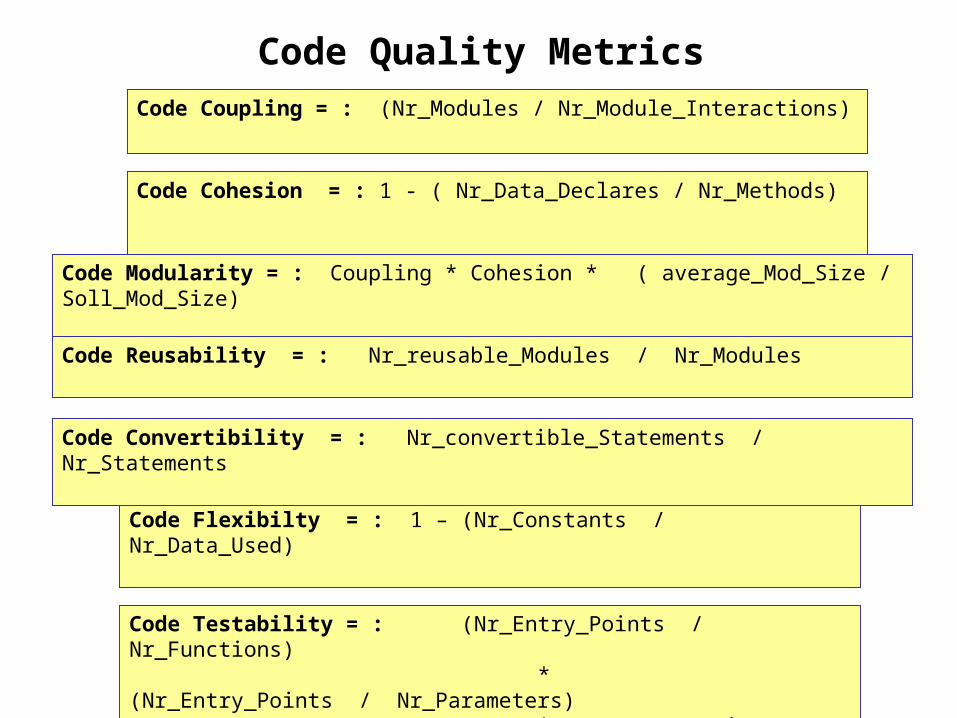
Code Coupling = : (Nr_Modules / Nr_Module_Interactions)
Code Cohesion = : 1 - ( Nr_Data_Declares / Nr_Methods)
Code Modularity = : Coupling * Cohesion * ( average_Mod_Size / Soll_Mod_Size)
Code Flexibilty = : 1 – (Nr_Constants / Nr_Data_Used)
Code Testability = : (Nr_Entry_Points / Nr_Functions) * (Nr_Entry_Points / Nr_Parameters) * (Nr_Branches / Nr_Statements)
Code Quality Metrics
Code Reusability = : Nr_reusable_Modules / Nr_Modules
Code Convertibility = : Nr_convertible_Statements / Nr_Statements
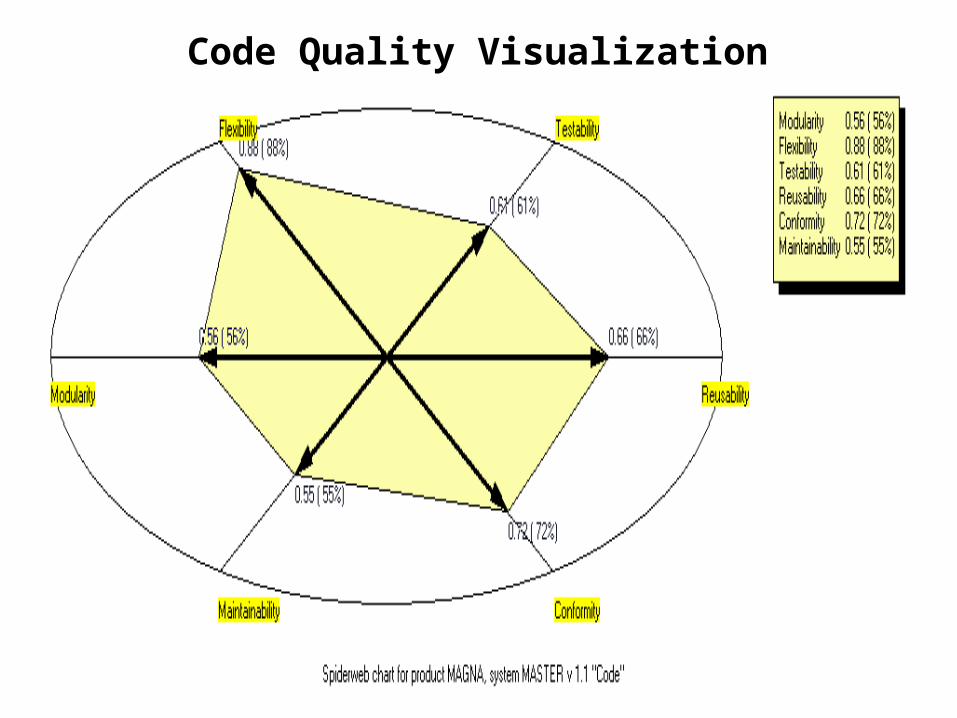
Code Quality Visualization
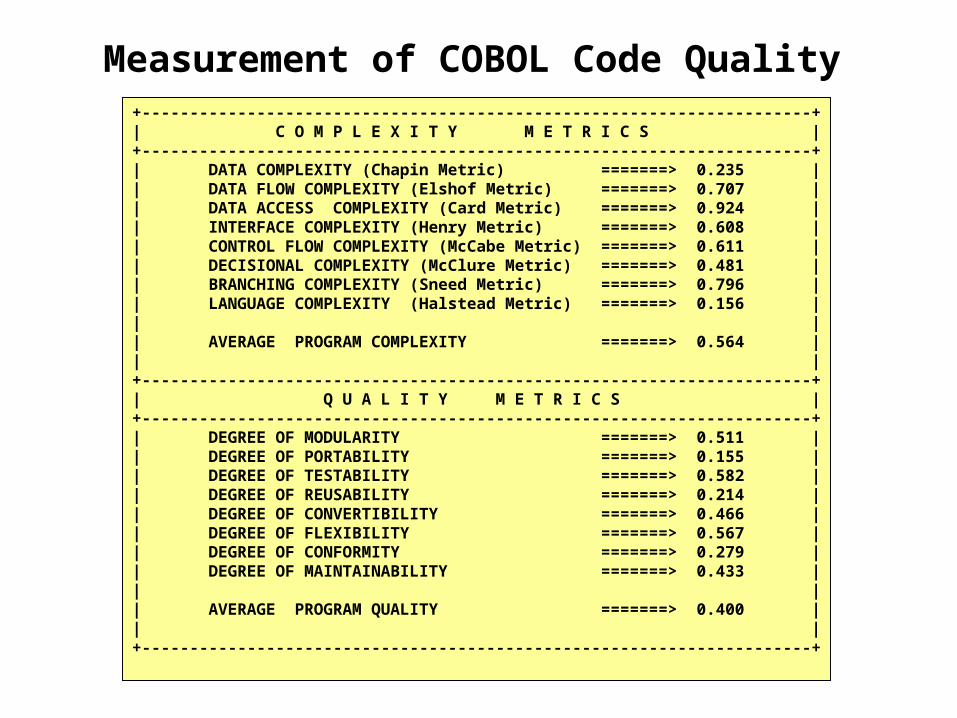
+----------------------------------------------------------------------+| C O M P L E X I T Y M E T R I C S |+----------------------------------------------------------------------+| DATA COMPLEXITY (Chapin Metric) =======> 0.235 || DATA FLOW COMPLEXITY (Elshof Metric) =======> 0.707 || DATA ACCESS COMPLEXITY (Card Metric) =======> 0.924 || INTERFACE COMPLEXITY (Henry Metric) =======> 0.608 || CONTROL FLOW COMPLEXITY (McCabe Metric) =======> 0.611 || DECISIONAL COMPLEXITY (McClure Metric) =======> 0.481 || BRANCHING COMPLEXITY (Sneed Metric) =======> 0.796 || LANGUAGE COMPLEXITY (Halstead Metric) =======> 0.156 || || AVERAGE PROGRAM COMPLEXITY =======> 0.564 || |+----------------------------------------------------------------------+| Q U A L I T Y M E T R I C S |+----------------------------------------------------------------------+| DEGREE OF MODULARITY =======> 0.511 || DEGREE OF PORTABILITY =======> 0.155 || DEGREE OF TESTABILITY =======> 0.582 || DEGREE OF REUSABILITY =======> 0.214 || DEGREE OF CONVERTIBILITY =======> 0.466 || DEGREE OF FLEXIBILITY =======> 0.567 || DEGREE OF CONFORMITY =======> 0.279 || DEGREE OF MAINTAINABILITY =======> 0.433 || || AVERAGE PROGRAM QUALITY =======> 0.400 || |+----------------------------------------------------------------------+
Measurement of COBOL Code Quality
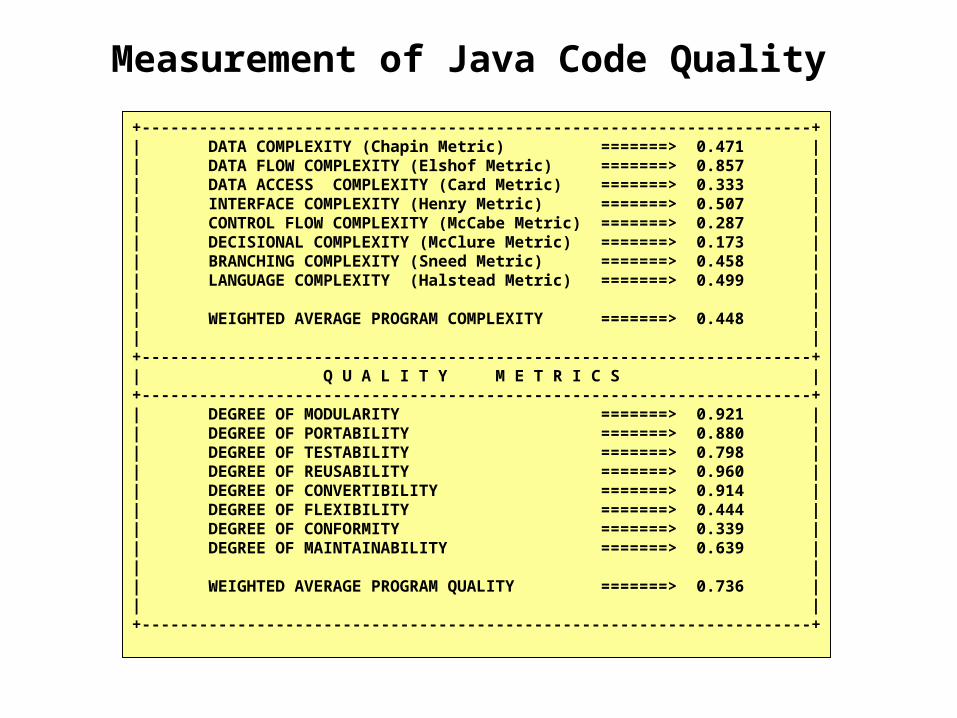
+----------------------------------------------------------------------+| DATA COMPLEXITY (Chapin Metric) =======> 0.471 || DATA FLOW COMPLEXITY (Elshof Metric) =======> 0.857 || DATA ACCESS COMPLEXITY (Card Metric) =======> 0.333 || INTERFACE COMPLEXITY (Henry Metric) =======> 0.507 || CONTROL FLOW COMPLEXITY (McCabe Metric) =======> 0.287 || DECISIONAL COMPLEXITY (McClure Metric) =======> 0.173 || BRANCHING COMPLEXITY (Sneed Metric) =======> 0.458 || LANGUAGE COMPLEXITY (Halstead Metric) =======> 0.499 || || WEIGHTED AVERAGE PROGRAM COMPLEXITY =======> 0.448 || |+----------------------------------------------------------------------+| Q U A L I T Y M E T R I C S |+----------------------------------------------------------------------+| DEGREE OF MODULARITY =======> 0.921 || DEGREE OF PORTABILITY =======> 0.880 || DEGREE OF TESTABILITY =======> 0.798 || DEGREE OF REUSABILITY =======> 0.960 || DEGREE OF CONVERTIBILITY =======> 0.914 || DEGREE OF FLEXIBILITY =======> 0.444 || DEGREE OF CONFORMITY =======> 0.339 || DEGREE OF MAINTAINABILITY =======> 0.639 || || WEIGHTED AVERAGE PROGRAM QUALITY =======> 0.736 || |+----------------------------------------------------------------------+
Measurement of Java Code Quality
Java Code AnalysisDemonstration
Codemessung
mit dem Tool JavAudit
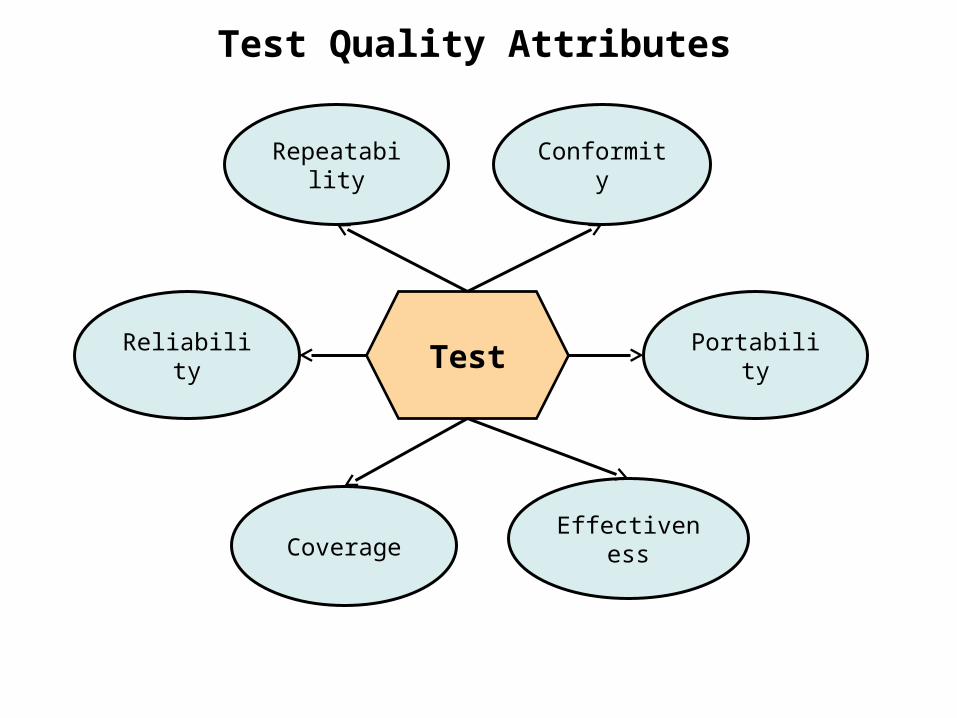
Test
Repeatability
Reliability
Coverage Effectiveness
Portability
Test Quality Attributes
Conformity
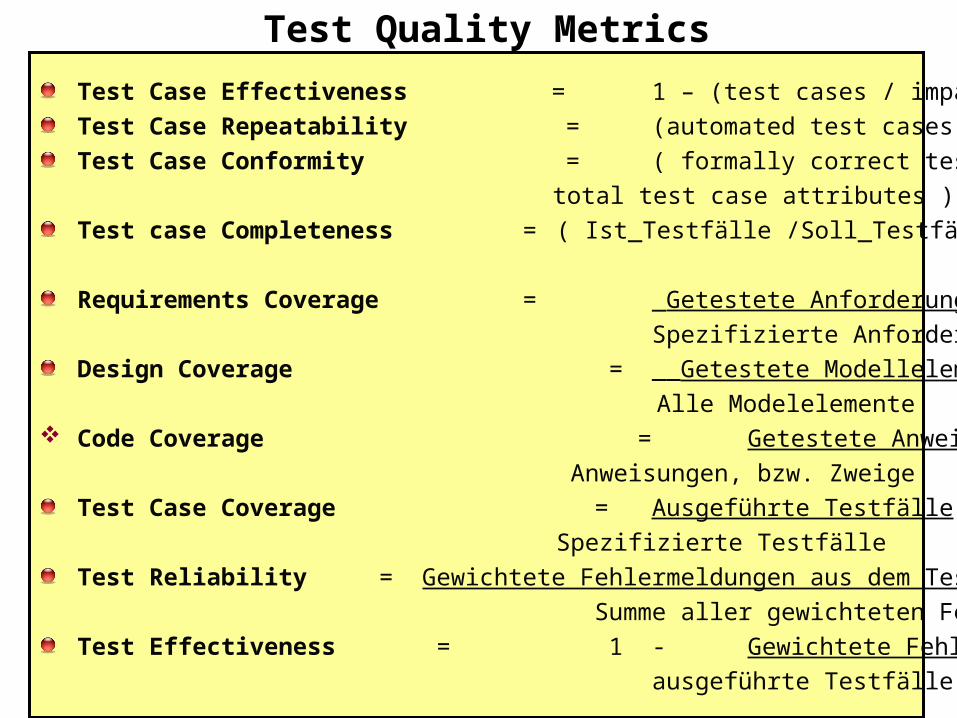
Test Case Effectiveness = 1 – (test cases / impacted functions)
Test Case Repeatability = (automated test cases / test cases )
Test Case Conformity = ( formally correct test attributes /
total test case attributes )
Test case Completeness = ( Ist_Testfälle /Soll_Testfälle)
Requirements Coverage = _Getestete Anforderungen_
Spezifizierte Anforderungen
Design Coverage = __Getestete Modellelemente__
Alle Modelelemente Code Coverage = Getestete Anweisungen, bzw. Zweige
Anweisungen, bzw. Zweige
Test Case Coverage = Ausgeführte Testfälle
Spezifizierte Testfälle
Test Reliability = Gewichtete Fehlermeldungen aus dem Testbetrieb
Summe aller gewichteten Fehlermeldungen
Test Effectiveness = 1 - Gewichtete Fehler x Überdeckung
ausgeführte Testfälle
Test Quality Metrics
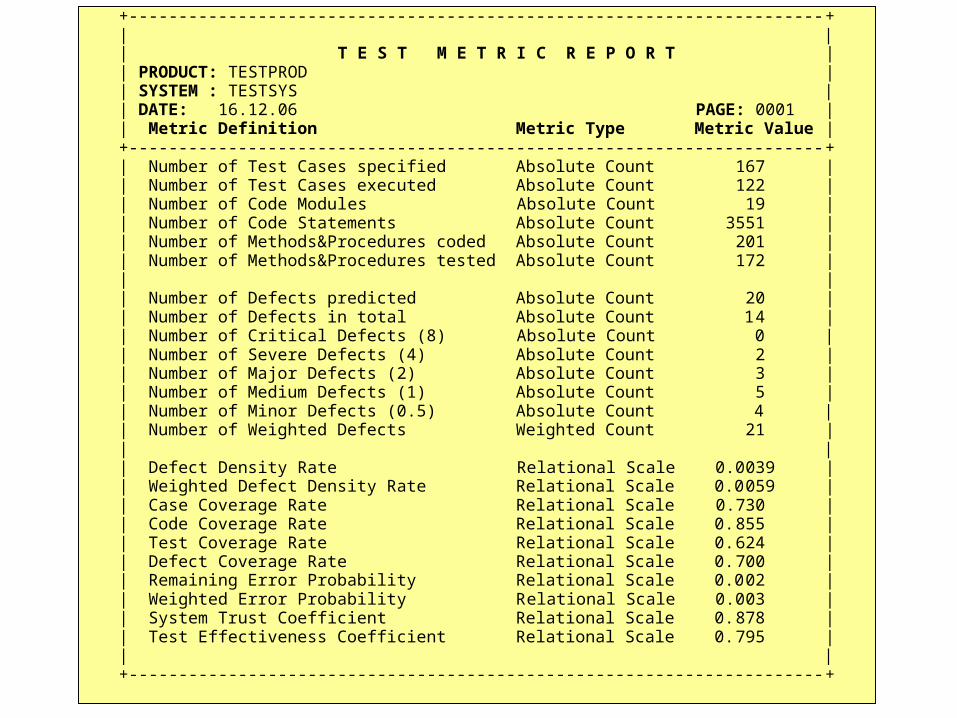
+----------------------------------------------------------------------+ | | | T E S T M E T R I C R E P O R T | | PRODUCT: TESTPROD | | SYSTEM : TESTSYS | | DATE: 16.12.06 PAGE: 0001 | | Metric Definition Metric Type Metric Value | +----------------------------------------------------------------------+ | Number of Test Cases specified Absolute Count 167 | | Number of Test Cases executed Absolute Count 122 | | Number of Code Modules Absolute Count 19 | | Number of Code Statements Absolute Count 3551 | | Number of Methods&Procedures coded Absolute Count 201 | | Number of Methods&Procedures tested Absolute Count 172 | | | | Number of Defects predicted Absolute Count 20 | | Number of Defects in total Absolute Count 14 | | Number of Critical Defects (8) Absolute Count 0 | | Number of Severe Defects (4) Absolute Count 2 | | Number of Major Defects (2) Absolute Count 3 | | Number of Medium Defects (1) Absolute Count 5 | | Number of Minor Defects (0.5) Absolute Count 4 | | Number of Weighted Defects Weighted Count 21 | | | | Defect Density Rate Relational Scale 0.0039 | | Weighted Defect Density Rate Relational Scale 0.0059 | | Case Coverage Rate Relational Scale 0.730 | | Code Coverage Rate Relational Scale 0.855 | | Test Coverage Rate Relational Scale 0.624 | | Defect Coverage Rate Relational Scale 0.700 | | Remaining Error Probability Relational Scale 0.002 | | Weighted Error Probability Relational Scale 0.003 | | System Trust Coefficient Relational Scale 0.878 | | Test Effectiveness Coefficient Relational Scale 0.795 | | | +----------------------------------------------------------------------+
Test AnalysisDemonstration
Testmessung
mit dem Tool TestDoc