Microchip electrophoresis bioanalytical applications · 2013-10-03 · Microchip electrophoresis...
127
Microchip electrophoresis bioanalytical applications Inauguraldissertation zur Erlangung der Würde eines Doktors der Philosophie vorgelegt der Philosophisch-Naturwissenschaftlichen Fakultät der Universität Basel von Markéta Vlčková aus Brno (Tschechische Republik) Basel, 2008
Transcript of Microchip electrophoresis bioanalytical applications · 2013-10-03 · Microchip electrophoresis...
Microchip electrophoresis
bioanalytical applications
Inauguraldissertation
zur
Erlangung der Würde eines Doktors der Philosophie
vorgelegt der
Philosophisch-Naturwissenschaftlichen Fakultät
der Universität Basel
von
Markéta Vlčková
aus Brno (Tschechische Republik)
Basel, 2008
Genehmigt von der Philosophischen-Naturwissenschaftlichen Fakultät der Universität
Basel auf Antrag von:
Prof. Dr. Wolfgang Meier
PD Dr. rer. nat. Maria A. Schwarz
Prof. Dr. Edwin Constable
Basel, den 22.04.2008
Prof. Dr. Hans-Jakob Wirz
(Dekan)
“The science of today is the technology of tomorrow”.
Edward Teller

Acknowledgements: Above all I would like to thank to my supervisor, PD Dr. Maria A. Schwarz not only for
giving me the opportunity to work on my PhD in her research group but also for her
invaluable help and support during the whole studies.
I would also like to thank my past colleagues Dr. Alexandra R. Stettler and Dr. Pavel
Kuban for their big efforts to make me feel comfortable in Switzerland.
Further I would like to express my thanks to Prof. Edwin Constable, Prof. Catherine
Housecroft and Prof. Peter Hauser for their concerns regarding my research and for the
aid they have provided me.
I am also grateful to the Analytical department of Solvias AG (Basel, Switzerland) for
providing time, measurement equipment and conditions allowing a fruitful collaboration
with Dr. Dora Bolyan, Dr. Franka Kalman, as well as PD Dr. Maria A. Schwarz.
Next I would like to gratefully acknowledge the financial support from Swiss National
Science Foundation, grants Nr. 200020-112190 and 200021-13812/1.
Finally, I would like to thank all my colleagues, friends and all other people who
contributed in any way to creation of this thesis. Special thanks belong to my partner,
Miroslav Melichar for his everlasting support and encouragement.
Abstract
Microchip electrophoresis (MCE) is a novel analytical technique resulting from
miniaturization of capillary electrophoresis (CE) to a planar microfabricated separation
device. The consequences of the transfer of CE to MCE in terms of benefits and
drawbacks have been identified and commented. The strategies developed to overcome
the unfavourable features of the chip with respect to the capillary are briefly described.
A method for simultaneous separation of catecholamines and their cationic metabolites
has been developed on the microchip. The addition of three modifiers was required to
resolve all analytes. The sensitivity of on-chip amperometric detection has been
improved by employing an enzyme-catalyzed reaction on the amperometric electrode,
as well as by using a carbon nanotube-modified electrode. The developed analytical
methodology has been successfully applied for a direct on-chip determination of
catecholamines and their metabolites in a mouse brain homogenate. The feasibility of
performing affinity measurements as well as isoelectric focusing on the microchip has
been demonstrated and available applications of these two electrophoretic modes on a
chip have been reviewed. A commercial Shimadzu microchip station has for the first
time been applied for high-throughput microchip isoelectric focusing of therapeutic
proteins and obtained results have been compared to conventional capillary isoelectric
focusing.
List of abbreviations:
5-HT serotonin
A adrenaline
ACE affinity capillary electrophoresis
CE capillary electrophoresis
cIEF capillary isoelectric focusing
CNT carbon nanotube
D dopamine
DMF N,N’-dimethylformamide
EOF electroosmotic flow
EPO erythropoietin
FAD flavin adenine dinucleotide
G glucose
GOx glucose oxidase
HPCE high performance capillary electrophoresis
HPLC high performance liquid
chromatography
HVA homovanillic acid
IEF isoelectric focusing
LIF laser-induced fluorescence
LOD limit of detection
MAB monoclonal antibody MALDI matrix-assisted laser
desorption ionization
MCE microchip electrophoresis
MC-ACE microchip affinity capillary electrophoresis
MC-IEF microchip isoelectric focusing
ME metanephrine
MEKC micellar electrokinetic chromatography
MHPG 4-hydroxy-3- methoxyphenylglycol
MT methoxytyramine
µ-TAS micro-total analysis system
MWNT multi-wall carbon nanotubes
NA noradrenaline
NAD(H) nicotinamide dinucleotide
(in reduced form)
NME normetanephrine
PAMAM polyamidoamine
pI isoelectric point
SDS sodium dodecyl sulfate
SWNT single-wall carbon nanotubes
VMA vanillylmandelic acid
WCID whole-column imaging detection
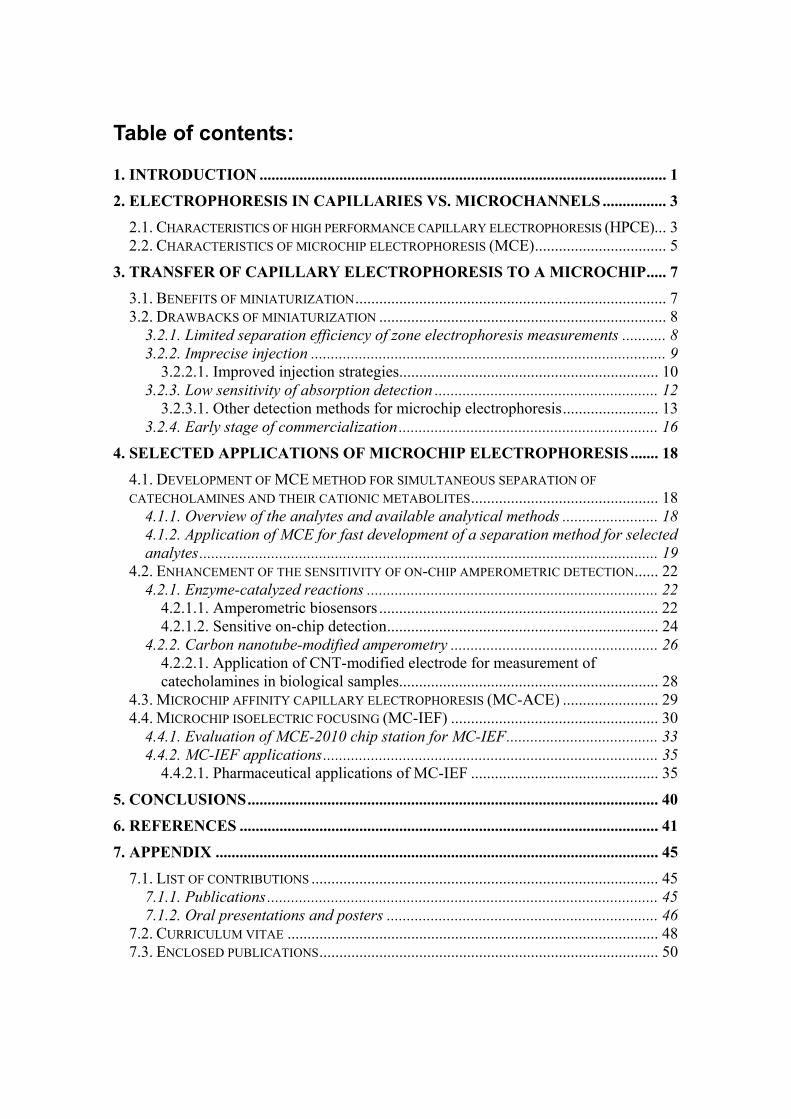
Table of contents:
1. INTRODUCTION ...................................................................................................... 1
2. ELECTROPHORESIS IN CAPILLARIES VS. MICROCHANNELS ................ 3 2.1. CHARACTERISTICS OF HIGH PERFORMANCE CAPILLARY ELECTROPHORESIS (HPCE)... 3 2.2. CHARACTERISTICS OF MICROCHIP ELECTROPHORESIS (MCE)................................. 5
3. TRANSFER OF CAPILLARY ELECTROPHORESIS TO A MICROCHIP..... 7 3.1. BENEFITS OF MINIATURIZATION.............................................................................. 7 3.2. DRAWBACKS OF MINIATURIZATION ........................................................................ 8
3.2.1. Limited separation efficiency of zone electrophoresis measurements ........... 8 3.2.2. Imprecise injection ......................................................................................... 9
3.2.2.1. Improved injection strategies................................................................. 10 3.2.3. Low sensitivity of absorption detection ........................................................ 12
3.2.3.1. Other detection methods for microchip electrophoresis........................ 13 3.2.4. Early stage of commercialization ................................................................. 16
4. SELECTED APPLICATIONS OF MICROCHIP ELECTROPHORESIS ....... 18 4.1. DEVELOPMENT OF MCE METHOD FOR SIMULTANEOUS SEPARATION OF CATECHOLAMINES AND THEIR CATIONIC METABOLITES............................................... 18
4.1.1. Overview of the analytes and available analytical methods ........................ 18 4.1.2. Application of MCE for fast development of a separation method for selected analytes................................................................................................................... 19
4.2. ENHANCEMENT OF THE SENSITIVITY OF ON-CHIP AMPEROMETRIC DETECTION...... 22 4.2.1. Enzyme-catalyzed reactions ......................................................................... 22
4.2.1.1. Amperometric biosensors ...................................................................... 22 4.2.1.2. Sensitive on-chip detection.................................................................... 24
4.2.2. Carbon nanotube-modified amperometry .................................................... 26 4.2.2.1. Application of CNT-modified electrode for measurement of catecholamines in biological samples................................................................. 28
4.3. MICROCHIP AFFINITY CAPILLARY ELECTROPHORESIS (MC-ACE) ........................ 29 4.4. MICROCHIP ISOELECTRIC FOCUSING (MC-IEF) .................................................... 30
4.4.1. Evaluation of MCE-2010 chip station for MC-IEF...................................... 33 4.4.2. MC-IEF applications.................................................................................... 35
4.4.2.1. Pharmaceutical applications of MC-IEF ............................................... 35
5. CONCLUSIONS....................................................................................................... 40
6. REFERENCES ......................................................................................................... 41
7. APPENDIX ............................................................................................................... 45
7.1. LIST OF CONTRIBUTIONS ....................................................................................... 45 7.1.1. Publications .................................................................................................. 45 7.1.2. Oral presentations and posters .................................................................... 46
7.2. CURRICULUM VITAE ............................................................................................. 48 7.3. ENCLOSED PUBLICATIONS..................................................................................... 50

1
1. Introduction
Electrophoresis is a general term, which covers a variety of separation
techniques based on different migration of ions and/or charged particles under the
influence of an electric field. The migration velocity of an ion is determined by the
intensity of the electric field and by the electrophoretic mobility, which is a constant
characteristic of the ion for a given medium. Since the discovery of electrophoretic
process in 1937 by Tiselius, electrophoresis developed into one of the most widely used
analytical separation techniques in chemistry.
Together with the progress in the theoretical knowledge and technical
development, attention has been paid mainly to capillary versions of electrophoretic
methods, which employ narrow bore capillaries to perform high performance
electrophoretic separations. Capillary electrophoresis (CE), or more precisely high
performance capillary electrophoresis (HPCE), can be operated in numerous separation
modes with different separation mechanisms and selectivities. This makes the technique
applicable for separations of virtually all analytes, ranging from small inorganic ions to
large biopolymers and even whole cells.
Whereas CE has become a well established technique, a lot of effort in the
development is currently devoted to the transfer of CE applications to planar
microfabricated separation devices, in other words microchips or simply chips. The
process of miniaturization of CE to the chip is facilitated by its relatively simple
technical arrangement and by the high efficiency of electrophoretic separations. The
main objective of these efforts is to develop so-called micro-total analysis systems (µ-
TAS), which will integrate different steps of an analytical process into one miniaturized
flow system enabling much faster, fully automated analysis. Even though the
development of µ-TAS is still in its early stage, the ultrahigh throughput makes this
concept highly attractive in various fields of biosciences, especially in genomics and
proteomics, as well as in the pharmaceutical applications.
The two main objectives of this thesis are (i) to provide the theoretical
background of microchip electrophoresis (MCE) and (ii) to give an overview of the
addressed applications of MCE. Within the theoretical part, the first section is devoted
to the description of the differences between the configurations of CE vs. MCE. The
2
second part of the theoretical section is aimed at characterization of the transfer of CE to
the planar microfabricated devices in terms of benefits and drawbacks associated with
the miniaturization process. At the same time, the current status of the strategies, that
have been developed to overcome the unfavorable features of MCE, is presented. The
selected MCE applications cover: (i) a development of a MCE method for simultaneous
separation of catecholamines and their metabolites; (ii) approaches to enhance the
sensitivity of amperometric on-chip detection of these compounds present in biological
samples; (iii) an overview of affinity measurements on the microchip; (iv) a
characterization of microchip isoelectric focusing, including a brief summary of
microchip isoelectric focusing measurements from the literature.
3
2. Electrophoresis in capillaries vs. microchannels
2.1. Characteristics of high performance capillary
electrophoresis (HPCE)
HPCE is an instrumental analytical technique where the electrophoretic
separation is performed in narrow bore capillaries with the internal diameter typically
between 10-100 µm. The use of capillary has numerous advantages, particularly with
respect to the detrimental effects of Joule heating. The high electric resistance of the
capillary enables application of high electric fields with only minimal heat generation,
which is furthermore efficiently dissipated because of the large surface area-to-volume
ratio of the capillary. The use of high electric fields results in short analysis time and
high efficiency and resolution. Moreover, a number of separation modes is available in
CE to vary the selectivity, which makes the technique applicable to a wide range of
analytes.
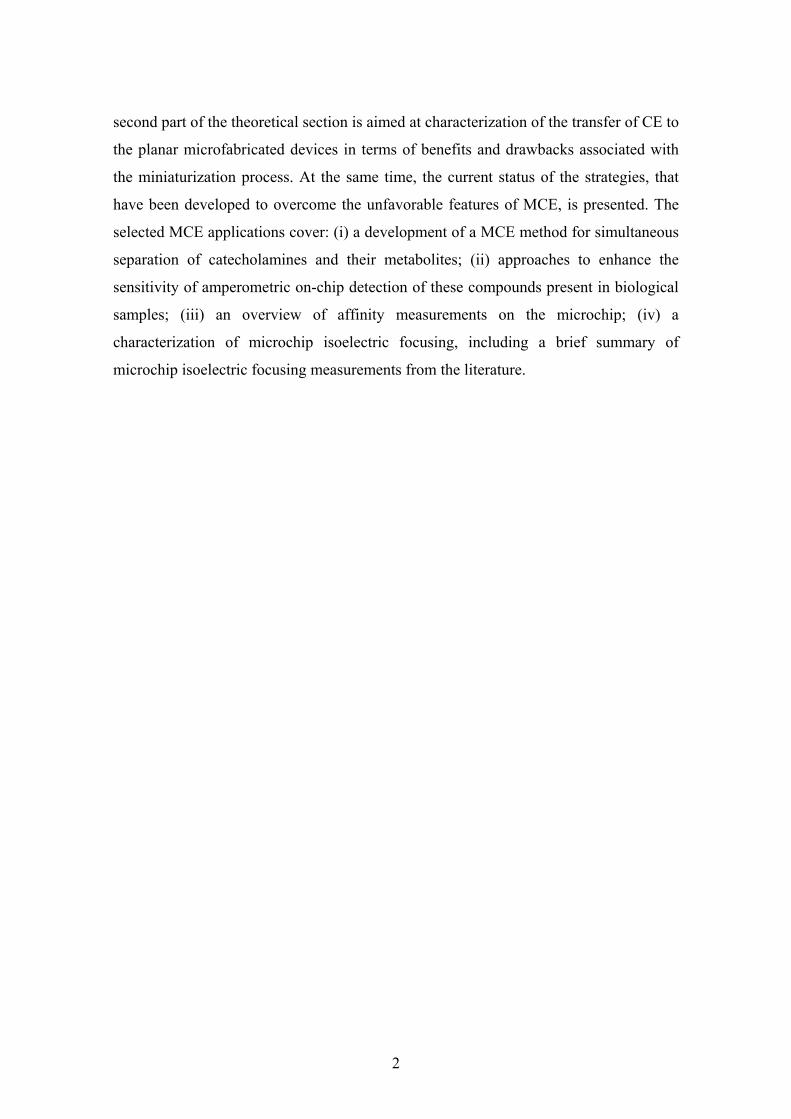
The instrumentation of HPCE is uncomplicated and is schematically drawn in
Fig. 1. Briefly, both ends of a narrow-bore fused silica capillary are immersed into two
reservoirs containing a buffer solution that fills also the capillary. The reservoirs also
contain electrodes that provide electrical contact between the high voltage power supply
and the capillary. The sample is loaded onto the capillary by replacing one of the buffer
reservoirs by a sample reservoir and applying external pressure (hydrodynamic
injection) or electric field (electrokinetic injection). After the injection the reservoirs are
replaced again, the electric field is applied and the separation starts. The detection is
usually performed at the opposite end of the capillary. UV/Vis detection is by far the
most common detection technique in CE and is made directly through the capillary wall.
Other detection techniques include fluorescence, amperometry, conductivity and mass
spectrometry. The modern HPCE instruments are fully automated and thereby allow
easy operation and precise quantitative analysis.
4
High voltage supply
capillary
detectorelectrode electrode
buffer sample buffer
Figure 1. Schematic drawing of an experimental set-up of capillary electrophoresis.
An important feature of CE is the so-called electroosmotic flow (EOF). EOF is
the bulk flow of liquid in the capillary, which causes movement of most of the species
(regardless of their charge and the hydrodynamic radius) in the same direction and
thereby allows a simultaneous separation of cations and anions. The EOF originates
from the dissociation of the silanol groups of the capillary wall made from fused silica.
The negatively charged capillary wall attracts ions of opposite charge and a solution
double layer is formed. The applied electric field causes movement of the cations of the
diffuse part of this double layer and attracts them to the cathode. Due to the solvatation
of the cations, water molecules are dragged with them and cause the movement of the
bulk solution – the EOF. The magnitude of EOF (expressed as EOF mobility) is
affected by a number of parameters such as pH of the buffer, its ionic strength,
temperature, the intensity of the electric field, and presence of some additives.
Suppression or even reversal of EOF can be achieved through capillary wall
modifications, either permanent or dynamic. Permanent modification of the capillary
wall is realized by covalently bonded or physically adhered phases. The most common
approach for these permanent wall modifications represents silylation followed by
deactivation with a suitable functional group (such as polyacrylamide, polyethylene
glycol, or polysaccharides). Nowadays, different capillaries with a stable permanent
coating are commercially available. On the other hand, a common uncoated capillary is
employed in the dynamic modification approach, which is based on addition of an
5
appropriate modifier to the background electrolyte. This modifier interacts with the
capillary wall and in this way affects the EOF. The potential disadvantage of this
approach is the sacrifice of the biological-type of conditions, and relatively long
equilibration time needed to obtain a reproducible surface.
2.2. Characteristics of microchip electrophoresis (MCE)
MCE results from miniaturization of CE and thus the separation process on the
chip is based on the same principle as in the capillary. Both techniques have also a lot of
common features, such as high electric resistance enabling application of high electric
fields or existence of EOF. Microchip, as well as capillary, offers different separation
modes for separation of a wide range of analytes. However, in some aspects the
microfluidic separation device has distinctive characteristics resulting from its planar
miniaturized format.
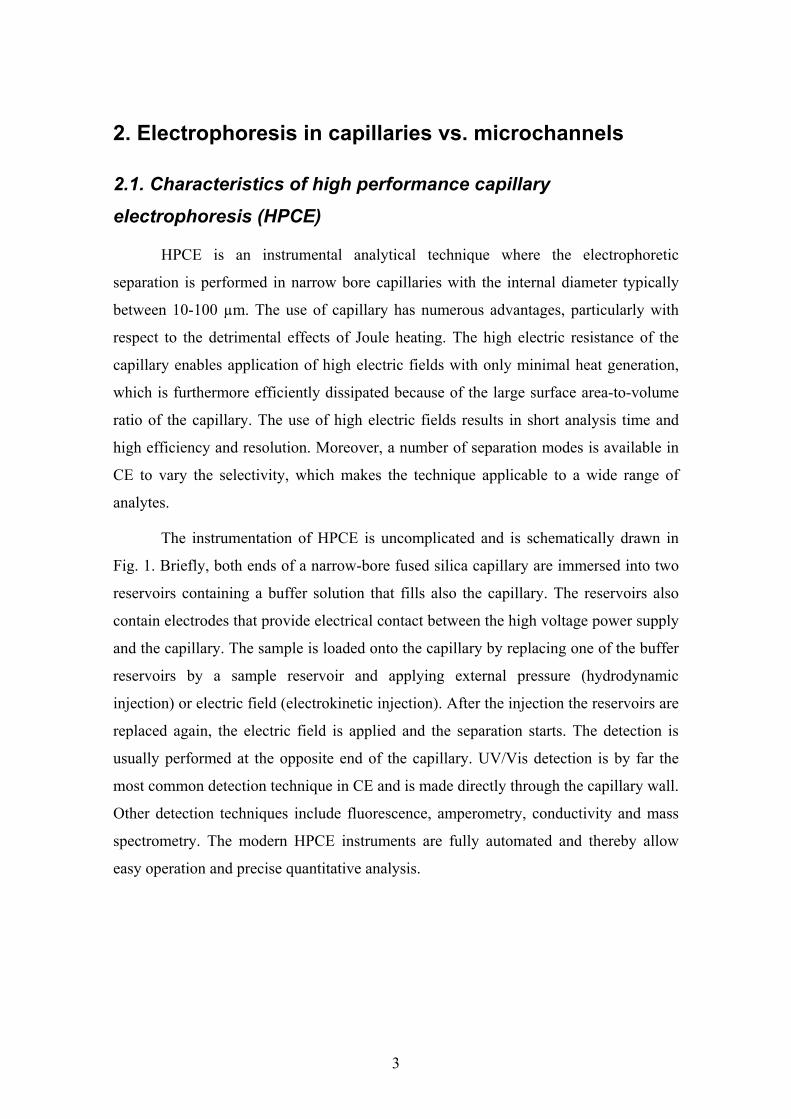
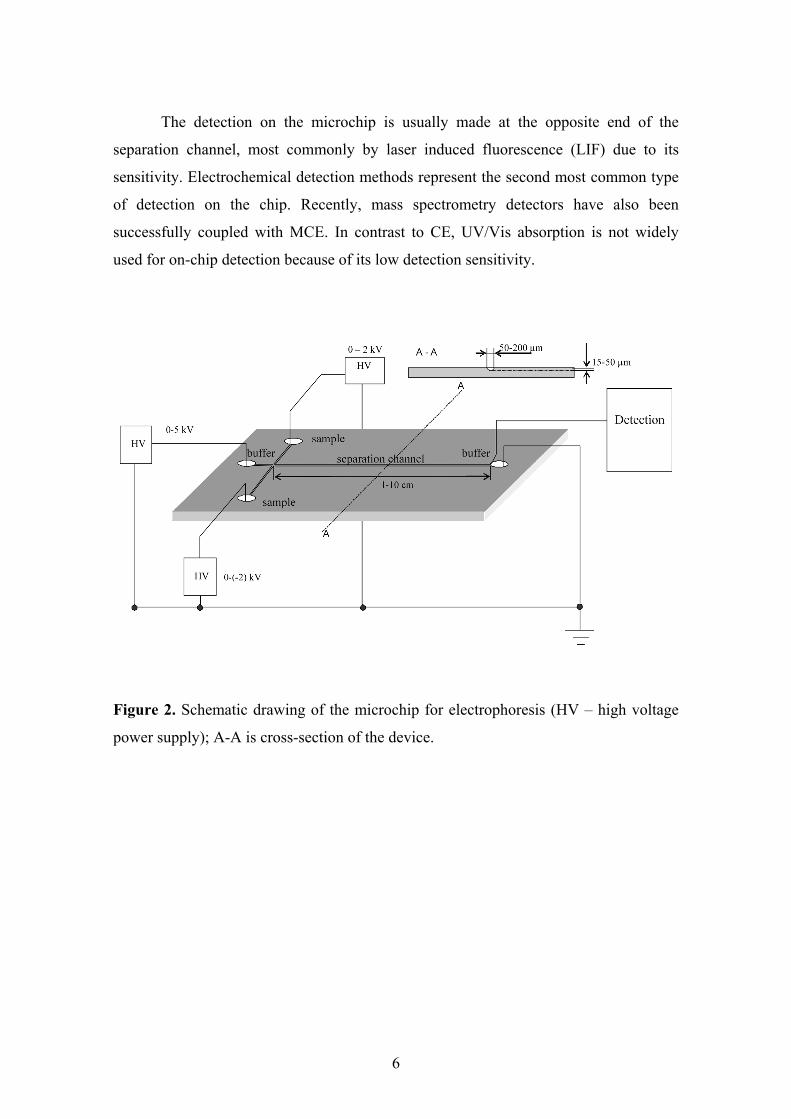
The typical microchip design consists of microchannels arranged into a cross
shape with one elongated limb (so-called separation channel), where the separation
process takes place (Fig. 2). The typical channel depths are 15-50 µm, widths are 50-
200µm, and the lengths of the separation channel are 1-10 cm. Four fluid reservoirs are
positioned at the ends of the channels; two for introduction of sample and background
electrolyte (buffer solution), the other two serving as waste reservoirs. Electrodes
present in all reservoirs provide connection to a high voltage power supply.
In contrast to capillary, the injection on the microchip is realized through the
intersection of the microchannels, which serves as an integrated injector. The
intersection has a form of a simple cross or, alternatively, the form of so-called double
tee, where the two arms of the sample channel are offset to form a larger injector region.
The sample is usually injected electrokinetically, by applying an electric field across the
sample channel. The portion of the sample present in the intersection represents the
injection plug, which is subjected to separation when the electric field is applied across
the separation channel. The injection and separation steps are often controlled by
independent high voltage power supplies.
6
The detection on the microchip is usually made at the opposite end of the
separation channel, most commonly by laser induced fluorescence (LIF) due to its
sensitivity. Electrochemical detection methods represent the second most common type
of detection on the chip. Recently, mass spectrometry detectors have also been
successfully coupled with MCE. In contrast to CE, UV/Vis absorption is not widely
used for on-chip detection because of its low detection sensitivity.
Figure 2. Schematic drawing of the microchip for electrophoresis (HV – high voltage
power supply); A-A is cross-section of the device.
7
3. Transfer of capillary electrophoresis to a microchip
The miniaturization of CE to a microchip is a new promising technology in
analytical chemistry, since MCE possesses several advantages above CE. However, the
transition from CE to MCE brings along with the benefits also some drawbacks. The
overview of advantages and disadvantages associated with miniaturization of
electrophoresis is presented in Table 1. The listed items are further described in the
following subchapters. In case of drawbacks, a potential solution to overcome the
particular limitation is discussed.
Table 1. Overview of the outcomes of miniaturization process
ADVANTAGES DISADVANTAGES
Reduced analysis time and time for
development of a separation method
Limited separation efficiency of zone
electrophoretic measurements
Lower consumption of reagents and
samples Imprecise injection
On-line coupling of various processes Low sensitivity of absorption detection
Potential of parallel measurements Early stage of commercialization
3.1. Benefits of miniaturization
Obviously, reduced analysis time and lower consumption of reagents and
samples are the benefits directly derived from the size reduction of the analytical
separation device. The separation on the microchip is completed within a few minutes at
most, which leads to a higher sample throughput compared to CE. The rapid analysis
also accelerates the development of a separation method because any change in the
conditions manifests itself quickly on a chip. Furthermore, the microchip requires only
8
picoliters of samples and microliters of other reagents and thereby enables utilization of
cost-intensive and rare substances.
On-line coupling of various processes to a single device forms the basis of µ-
TAS concept, which proposes the integration of the different steps of an analytical
process into one miniaturized flow system [1]. Even though the µ-TAS is a new
emerging technology and in many ways still in its infancy, the interest in it is growing
explosively. A true µ-TAS should contain all of the following elements: a sample
preparation component, such as extraction or purification; means to manipulate with the
sample, including mixing and reacting with other reagents; a separation step; and a
detection component to measure the analytes of interest [2]. Electrophoresis on the
microchip proved to be the most practical separation method for the separation step in
the µ-TAS concept, since it does not require pumps or moving parts to induce the flow
of the fluids [2].
The high sample throughput of the microchip can be further drastically increased
using microchip array, as the fabrication of the multiple units, rather than a single unit,
does not significantly raise the cost of production. The parallel analyses of tenths or
even hundreds of samples have been reported using microchip arrays [3,4].
3.2. Drawbacks of miniaturization
3.2.1. Limited separation efficiency of zone electrophoresis measurements
The separation efficiency can be defined as the ability of a separation system of
a given selectivity to resolve the zones of two separated analytes. In zone
electrophoresis, the separation is based on differences in mobility of the analytes. The
mobility difference necessary to resolve two zones (so-called resolution of the zones) is
in zone electrophoresis primarily driven by separation efficiency, which is determined
by the zone lengths. The length of the zone is affected by various dispersive effects,
which cause the zone broadening (zone dispersion). Under ideal conditions the sole
contribution to zone broadening is the diffusion along the migration path (so-called
longitudinal diffusion). From this point of view, the short migration paths are favorable
9
for efficiency, since analytes reach the detector in a shorter time and have therefore less
time to diffuse. However, in practice other sources of dispersion are often present and if
the contribution of any of them becomes significant, the efficiency and resolution will
be sacrificed.
On the microchip, the injection plug length often exceeds the diffusion-
controlled zone length and thus becomes the dominant source of dispersion [5]. That is
why the separation efficiency of the zone electrophoresis measurements on the
microchip is very often much lower than would be theoretically achievable with the
short migration paths.
In order to suppress the dispersion contribution caused by the long injection
plugs, the width of the injected zone should be minimized. This can be achieved by
reducing the dimensions of the cross section of the microchip, which serves as an
injector. An example of this strategy is the application of a narrow sample channel
having the width five times smaller than the width of separation channel for increasing
the separation efficiency [6]. On the other hand, shorter injection plugs require using of
more concentrated samples or their effective on-line pre-concentration to achieve the
same detection sensitivity.
However, there is a more critical problem associated with the injection, which
needs to be solved before the efforts to shorten the injection plugs become truly
meaningful. It is the non-reproducible injection procedure resulting from the cross
geometry of the injector. This drawback is further discussed in the following section.
3.2.2. Imprecise injection
Electrokinetic injection is by far the most commonly used injection method on
the microchips as it does not require an additional mechanic device to move the sample
fluid. Using this injection method, the sample is introduced into the intersection by
applying the electric field along the sample channel. When the electric field is switched
to the separation channel, the portion of the sample present in the intersection is injected
and the separation begins. The injection plug length depends principally on the injection
time and on the geometry of the cross-section. However, the exact amount of the
injected sample cannot be determined since uncontrolled sample leakage occurs during
10
injection as well as separation step [7]. As the short, well-defined sample plug is crucial
for achieving high separation efficiency, various strategies have been developed to
improve the injection reproducibility.
3.2.2.1. Improved injection strategies
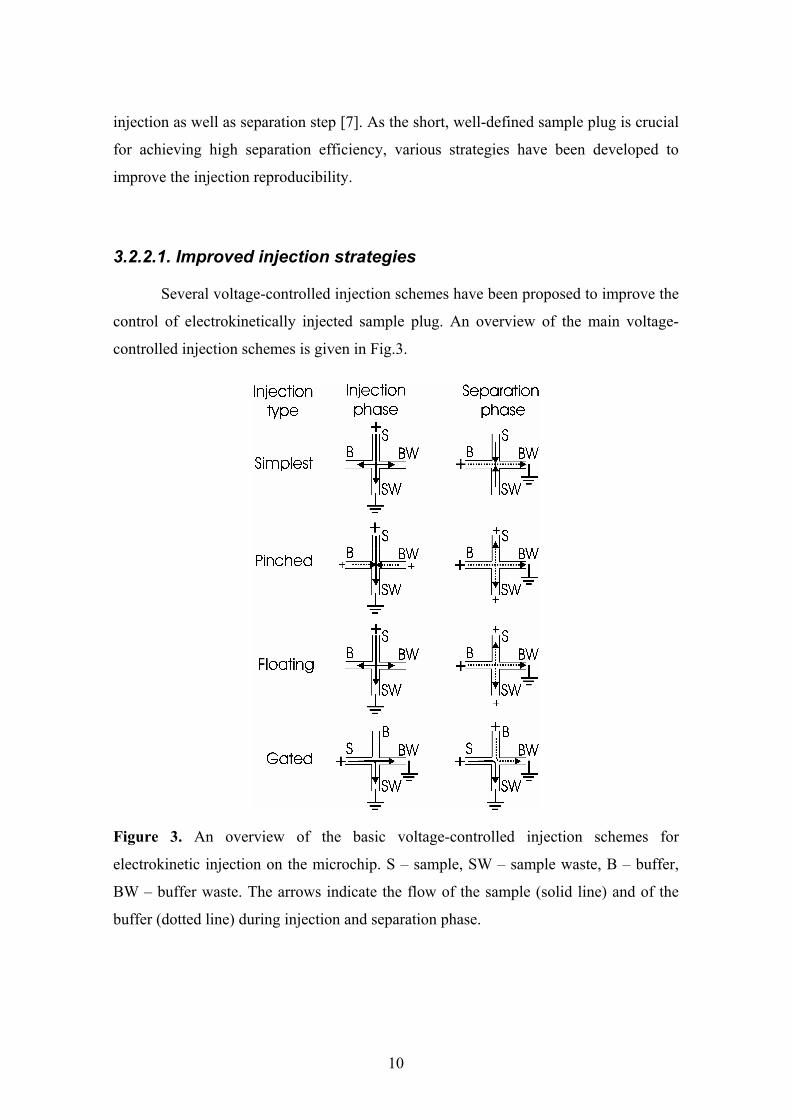
Several voltage-controlled injection schemes have been proposed to improve the
control of electrokinetically injected sample plug. An overview of the main voltage-
controlled injection schemes is given in Fig.3.
Figure 3. An overview of the basic voltage-controlled injection schemes for
electrokinetic injection on the microchip. S – sample, SW – sample waste, B – buffer,
BW – buffer waste. The arrows indicate the flow of the sample (solid line) and of the
buffer (dotted line) during injection and separation phase.
11
The most commonly used injection strategy is so-called pinched injection [6].
In this injection scheme, pinching voltages are applied at the buffer inlet and outlet
during the injection phase. Thereby, a buffer flow toward the sample waste (SW)
reservoir is induced to counteract the diffusion of analytes into the separation channel.
In the same time, the sample flow is focused enabling an injection of a very narrow
sample zone. In the following separation phase, back voltages are applied at the sample
inlet (SI) and SW reservoirs to draw the analytes flows back to the reservoirs,
preventing sample leakage into the separation channel during the measurement [8].
Even though the pinched injection has a good reproducibility, the exact amount of the
injected sample is difficult to determine. In a detailed study [9], it was found out that the
injected amount strongly depends on the potentials applied to each reservoir during
injection as well as separation phase. Generally, the detection limits of the analytes
injected by the pinched injection are much higher compared to the uncontrolled simple
injection, as significantly lower amount of the sample is introduced by the pinched
injection scheme [2]. On the other hand, the injection of a narrow sample zone has the
advantage of enabling a high efficiency on-chip electrophoretic separation.
As a compromise between the injection reproducibility and detection sensitivity,
so-called floating injection has been proposed [8]. In this approach, the injection phase
is carried out without the voltage control and only the subsequent separation phase is
controlled by applying the back voltage to the SI and SW reservoirs. The final
concentration of the sample, injected using the floating injection, is increased by
diffusion of the sample into the separation channel during the injection phase.
Obviously, the injection time plays an important role in this injection scheme.
A different approach to the voltage control of the electrokinetic injection
represents so-called gated injection [10]. In contrast to pinched or floating injection, in
the gated injection scheme, the sample flows permanently, making a 90 degree turn at
the injection cross toward the SW. Simultaneously, a continuous buffer stream is
generated toward the SW and buffer waste (BW) reservoirs, preventing sample leakage
into the separation channel. During sample injection phase, the buffer flow is
interrupted allowing a plug of the sample to move into the separation channel. The
ability of periodical sampling from a continuous flow of the analytes is advantageous
12
especially for coupling the electrophoresis process with pre-column derivatization [11]
or for pre-concentration [12].
However, a general well-known drawback of the electrokinetic injection is the
electrophoretic bias in the composition of the injected sample. Discrimination among
the analytes occurs during the electrokinetic injection, as the quantity of the injected
analytes depends on their electrophoretic mobilites (analytes with higher mobilities will
be injected in greater extent than analytes with lower mobilites). The discrimination is
prevented in the pressure-driven sample injection, which has been recently introduced
for MCE [13]. The sample plug is injected either by applying external pressure [14] or
using hydrostatic pressure [15]. In addition to it, the injection based on a combination of
hydrodynamic (or hydrostatic) and electrokinetic forces has been developed [16,17].
The combined injection is less demanding for the fabrication of the device and
substantially reduces the injection bias.
Nevertheless, none of the injection procedures proposed to increase the
reproducibility is ideal in terms of a precise control of the injected amount of the sample
and total elimination of the sample leakage, as revealed by extensive experimental
testing [16] and computer simulations [18]. Consequently, a lot of effort is still put into
the technical improvement of the injection for microchips.
3.2.3. Low sensitivity of absorption detection
The UV/Vis absorption detection is the most common detection method used
with modern chromatographic and electrophoretic separation techniques. This detection
method is quite selective and applicable for majority of organic compounds. Moreover,
the UV/Vis detector is inexpensive and its implementation is relatively simple. Besides
single-wavelength UV/Vis detectors, multiple-wavelength detectors and also diode
array detectors are available. Detection of the analytes at several wavelengths is helpful
to minimize the absorption of non-relevant peaks. Diode array detectors can be
additionally utilized for identification of unknown analytes by comparing the recorded
UV/Vis absorption spectrum with spectral libraries.
13
The sensitivity of the UV/Vis detection depends on molar absorptivity of a given
analyte (ε), which is an intrinsic property of that analyte, and on the optical path length.
The short optical path length is the principal reason for the low sensitivity of UV/Vis
absorption detection on the microchip (due to the small channel depths normally used
with the device). The sensitivity of UV/Vis detection on the chip has been enhanced by
extending the optical path length by employing Z-shaped cell [19] or using a multi-
reflection detection cell with patterned metal mirrors [20]. However, the fabrication of
these special detection cells is complicated. Therefore, other detection methods are
preferred with the microchip.
3.2.3.1. Other detection methods for microchip electrophoresis
Laser induced fluorescence (LIF) is the most commonly used detection method
on-chip because of its high sensitivity. The coherence of the laser beam makes it easy to
focus on the small detection cell and to obtain very high irradiation, providing in some
applications even single molecule detection limit [21]. Unfortunately, most of the
analytes are not native fluorophores and have to be derivatized to be detected by LIF.
Moreover, LIF, as well as UV/Vis absorption detection system, is much larger than the
microfabricated separation device, which is unfavorable for the development of portable
analytical devices.
Electrochemical detection is generally well suited to miniaturized analytical
systems and is therefore an attractive detection alternative for MCE, exhibiting a good
sensitivity and selectivity. There are several advantages of electrochemical detection
over other detection methods, including the ability to miniaturize both the detector and
control instrumentation and the fact that many compounds may be detected without
derivatization [22]. Four different detection modes can be distinguished in the
electrochemical detection: amperometry, voltammetry, conductometry, and
potentiometry.
Among these available detection modes, amperometric detection remains the
most popular electrochemical detection method for MCE due to its easy operation and
minimal background-current contributions [22,23]. This detection method is based on
14
measuring oxidation or reduction currents of the analytes on a working electrode and is
therefore restricted to electroactive species [24]. The redox reaction of an electroactive
analyte is facilitated by applying constant potential to the working electrode and the
generated current is recorded as a function of time. For the coupling of amperometric
detection to electrophoretic separation it is important to eliminate the interference
resulting from the high separation voltage. Three different approaches have been
developed in MCE to isolate the separation electric field. These approaches differ in the
location of the working electrode with respect to the separation channel and have been
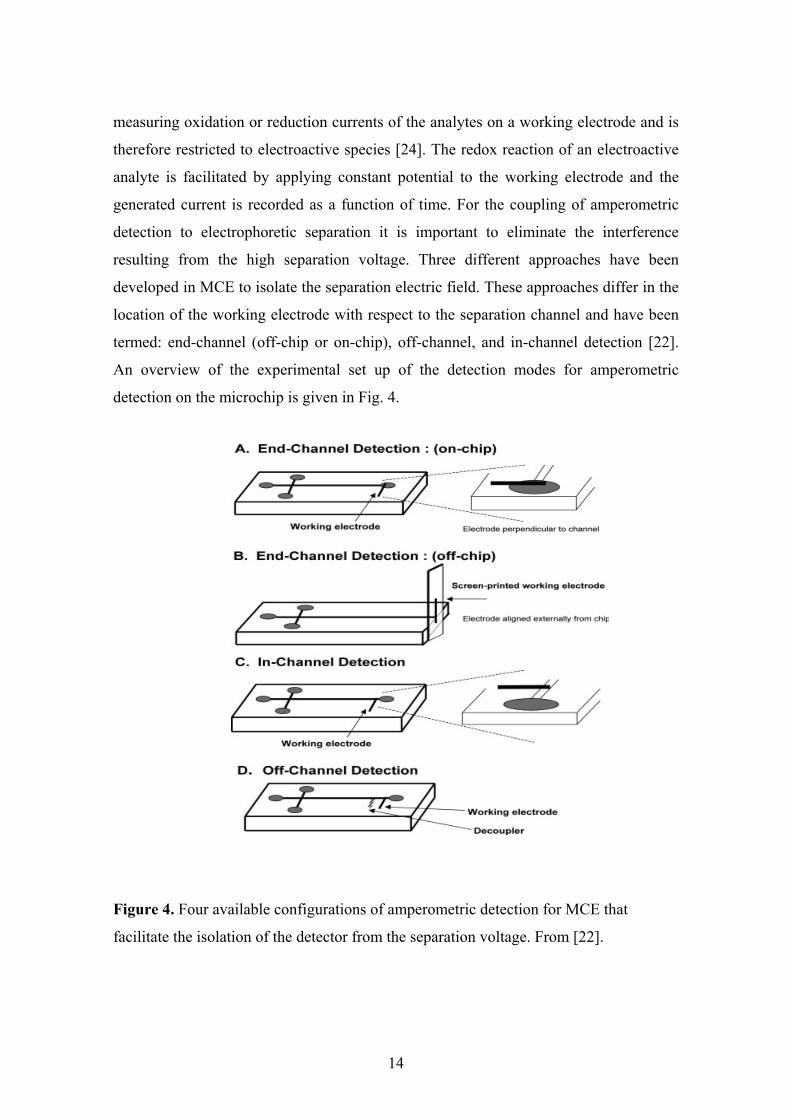
termed: end-channel (off-chip or on-chip), off-channel, and in-channel detection [22].
An overview of the experimental set up of the detection modes for amperometric
detection on the microchip is given in Fig. 4.
Figure 4. Four available configurations of amperometric detection for MCE that
facilitate the isolation of the detector from the separation voltage. From [22].
15
End-channel detection is the most often used amperometric detection mode for
MCE because of its simple experimental set-up [25]. In this configuration, the working
electrode is positioned tenths of micrometers from the exit of the separation channel,
which allows sufficient decoupling of the separation voltage from the electrode. There
are two alignment modes of the end-channel detection, off-chip and on-chip [26]. The
former has been prevalent for its convenient replacing and easy cleaning; the latter
needs utilization of modern microfabrication techniques to incorporate the electrodes on
the microchip. In the on-chip mode of the end-channel detection, the electrode is not
exchangeable and this mode is therefore suitable for single-use disposable microchips.
Off-channel detection grounds the separation channel prior to the detection cell
by means of decoupler. The decoupler effectively shunts the separation voltage to
ground and an electrophoresis-free region is created, where the analytes are pushed past
the working electrode by EOF. In-channel detection employs an electrically-isolated
potentiostat, which enables placing the working electrode directly into the separation
channel. Off- and in-channel detection modes eliminate the peak broadening that is
characteristic for end-channel detection due to the analyte diffusion occurring in the
area between the exit of the separation channel and the electrode.
The conventional potentiostats for amperometric detection need three electrodes
for construction of the electrochemical detector cell: working, counter, and reference
electrode. Thus, in total four electrodes (three from the potentiostat plus an
electrophoretic ground electrode) have to be present at the end of the separation channel
in the conventional end-channel detection approach for MCE. However, placing four
electrodes at the detector end represents a technical challenge for the miniaturized
separation devices, in particular with respect to reference electrode (as it requires
internal electrolyte and liquid junction, which is difficult to miniaturize). Therefore, a
simplified detection arrangement has been developed, which requires in total only two
electrodes – the working electrode and the electrophoretic ground electrode [27]. The
latter electrode acts also as a counter to the detector and as a pseudo-reference. A
special electronic circuitry is needed for the simplified two-electrode amperometric
detector [28]. The two-electrode detection arrangement is applicable to a variety of
analytes, but the optimum detection potential for each analyte has to be determined
experimentally. This is because the detection potential in this arrangement is measured
16
relative to the pseudo-reference electrophoretic ground electrode, which yields a
sufficiently stable potential but its exact value depends on the separation voltage used
for the electrophoretic separation [27].
From the other detection methods implemented for MCE, it is important to
mention mass spectrometry, which is generally a powerful tool in analytical chemistry.
The coupling of microfabricated separation devices with mass spectrometric detector is
a new emerging technology especially in the area of proteomics. Microchips for MCE
have been successfully coupled with mass spectrometer using either electrospray or,
newly, matrix-assisted laser desorption ionization (MALDI) interfaces [29]. However,
the fabrication of the interfaces is complicated and continues to be a technical challenge.
Nevertheless, a lot of progress in this field has been made in recent years and
commercialized microchips with mass spectrometric detection for high-throughput
proteomics can be expected within the next decade [30].
In all above mentioned detection methods for MCE, the detection is performed
at one point of the migration path (located at or close to the outlet end of the separation
channel) and the detection signal is plotted against the migration time. In addition to it,
whole-column imaging detection (WCID) concept has been proposed for specific
electrophoretic applications [31,32]. WCID detectors measure absorbance or
fluorescence simultaneously along the entire length of the separation channel and in this
way may provide detailed insight into the separation process [33]. The separation
channel is imaged by the WCID detector often in the real time and the detection signal
is plotted against separation length in the course of the separation, thereby allowing
concurrently tracing the optimal separation time.
3.2.4. Early stage of commercialization
Commercialization of microscale separation and analysis technology for high
throughput applications in genomics, proteomics, drug discovery and medical
diagnostics is the main driving force behind the development of the microfabricated
separation devices [34]. Even though several commercial systems for MCE analysis
have recently become available (for overview see [35]), their application for routine
17
analyses is still in the test stage. Further improvements in automation and an increase in
sample throughput, along with the enhancement of detection sensitivity for analytes
present in trace concentrations, can be expected in the near future, which will make
MCE technology more widely accepted in commercial laboratories.
18
4. Selected applications of microchip electrophoresis
4.1. Development of MCE method for simultaneous separation
of catecholamines and their cationic metabolites
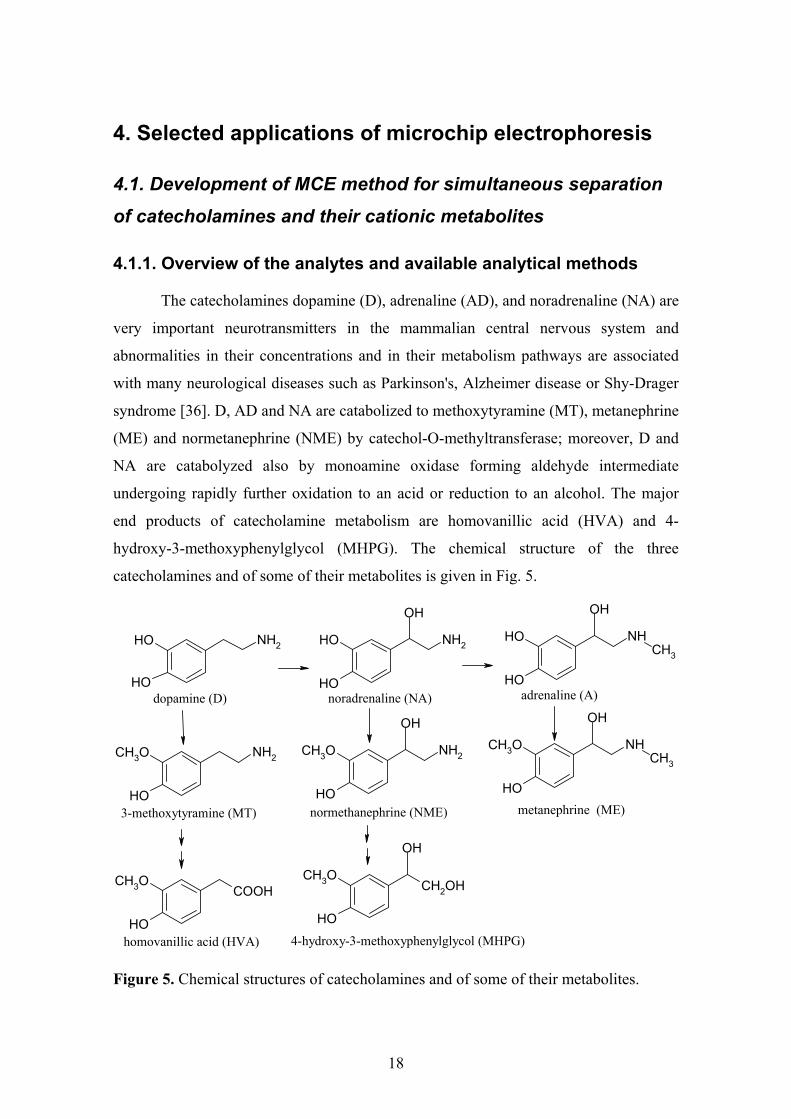
4.1.1. Overview of the analytes and available analytical methods
The catecholamines dopamine (D), adrenaline (AD), and noradrenaline (NA) are
very important neurotransmitters in the mammalian central nervous system and
abnormalities in their concentrations and in their metabolism pathways are associated
with many neurological diseases such as Parkinson's, Alzheimer disease or Shy-Drager
syndrome [36]. D, AD and NA are catabolized to methoxytyramine (MT), metanephrine
(ME) and normetanephrine (NME) by catechol-O-methyltransferase; moreover, D and
NA are catabolyzed also by monoamine oxidase forming aldehyde intermediate
undergoing rapidly further oxidation to an acid or reduction to an alcohol. The major
end products of catecholamine metabolism are homovanillic acid (HVA) and 4-
hydroxy-3-methoxyphenylglycol (MHPG). The chemical structure of the three
catecholamines and of some of their metabolites is given in Fig. 5.
OH
OH
NH2 OH
OH
NH2
OH
OH
OH
NH
OH
CH3
CH3O
OH
NH2CH3O
OH
NH2
OHCH3O
OH
NH
OH
CH3
CH3O
OH
COOHCH3O
OH
CH2OH
OH
dopamine (D) noradrenaline (NA) adrenaline (A)
3-methoxytyramine (MT) normethanephrine (NME) metanephrine (ME)
homovanillic acid (HVA) 4-hydroxy-3-methoxyphenylglycol (MHPG)
Figure 5. Chemical structures of catecholamines and of some of their metabolites.
19
Analytical methods are required for the direct simultaneous determination of the
catecholamines and/or their metabolites in brain liquid samples, urine as well as blood
samples not only for diagnostics of various diseases but also for the investigation of the
effect of drugs on the dopaminergic system [37]. Moreover, the measurement of the
level of these compounds in the brain homogenates of experimental animals is an
important strategy for studying the reactions of the autonomic nervous system [38].
Up to date mainly HPLC (high performance liquid chromatography) methods
with electrochemical [39,40] or fluorescence [41,42] detection have been employed for
the quantitative determination of catecholamines and their metabolites in clinical
samples. Even though chromatographic methods provide low detection limits and good
reproducibility, they suffer from high costs, elaborateness and long analysis times.
CE is in general an attractive alternative to HPLC for separation of complex
biological samples as it does not require laborious sample clean-up. The direct injection
of a biological sample together with a typically faster separation reduces the total
analysis time, elaborateness and costs considerably. However, the applicability of CE
for simultaneous determination of catecholamines and their metabolites is limited by
similar electrophoretic behaviour of these species and by lower detection limits. Despite
numerous publications dealing with CE separation of catecholamines and/or their
metabolites (for review see [43]), all three catecholamines (D, NA, A) have never been
determined along with their cationic metabolites (MT, NME, ME), with solely one
exception reported by Peterson et al. [44]. Long, polyvinyl alcohol coated capillary and
low pH together with correspondingly long separation time was required for the
published separation of all six analytes yet with moderate resolution [44]. Consequently,
an effective separation method for fast simultaneous separation of catecholamines and
their cationic metabolites for application in clinical laboratories is still being sought.
4.1.2. Application of MCE for fast development of a separation method for selected analytes
One of the attractive application areas of MCE is a cost- and time-saving
development of separation methods for complex sample mixtures. Owing to
20
substantially reduced migration times (about 10-50 times) and to a low consumption of
reagents and the sample, new methods, as well as new buffer components, can be
effectively tested using MCE. Even though the full separation might not be achievable
on the microchip, reasonable predictions on separation selectivity and on the optimal
migration times can be made and subsequently transferred to classic CE. Thus, MCE
has been applied for fast development of an electrophoretic separation of
catecholamines and their O-methoxylated (cationic) metabolites. The separation of these
species is a demanding task due to their very similar chemical structure (see Fig. 5)
leading to nearly identical electrophoretic behavior of these compounds.
The separation of catecholamines and their cationic metabolites on a short
migration path (used on a microchip) is impossible without suitable buffer additives,
which selectively modify the migration of the analytes. As the conditions of the
measurement can be changed promptly on the chip, various modifiers have been tested
with the aim to achieve the MCE separation of all selected compounds (for a detailed
description see P1 in the Appendix, section 7.3.). A combination of three additives was
necessary to resolve all six analytes; the optimized separation system consisted of 5 mM
borate-phosphate buffer (pH 7) containing 10 mM sodium dodecyl sulfate (SDS) and
0.5% (v/v) polyamidoamine (PAMAM) dendrimer of generation 1.5 (Fig. 3 in P1). The
optimized separation conditions were successfully transferred to CE separation of
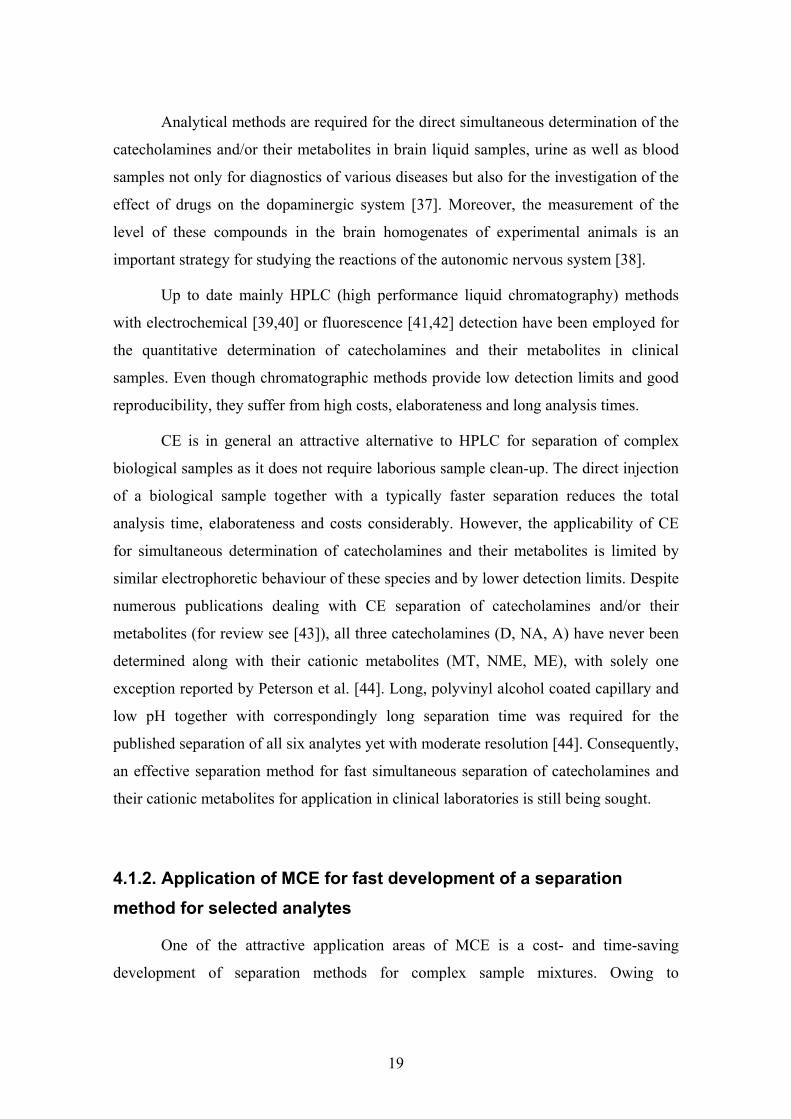
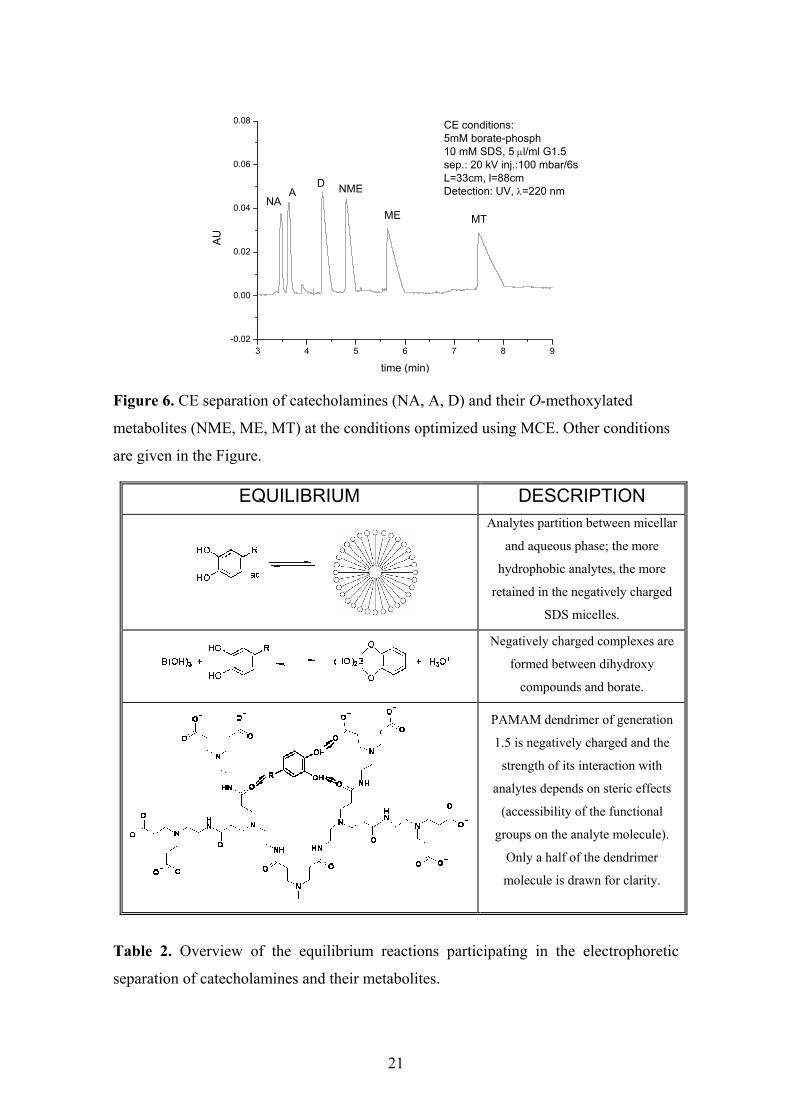
catecholamines and their cationic metabolites (Fig. 6).
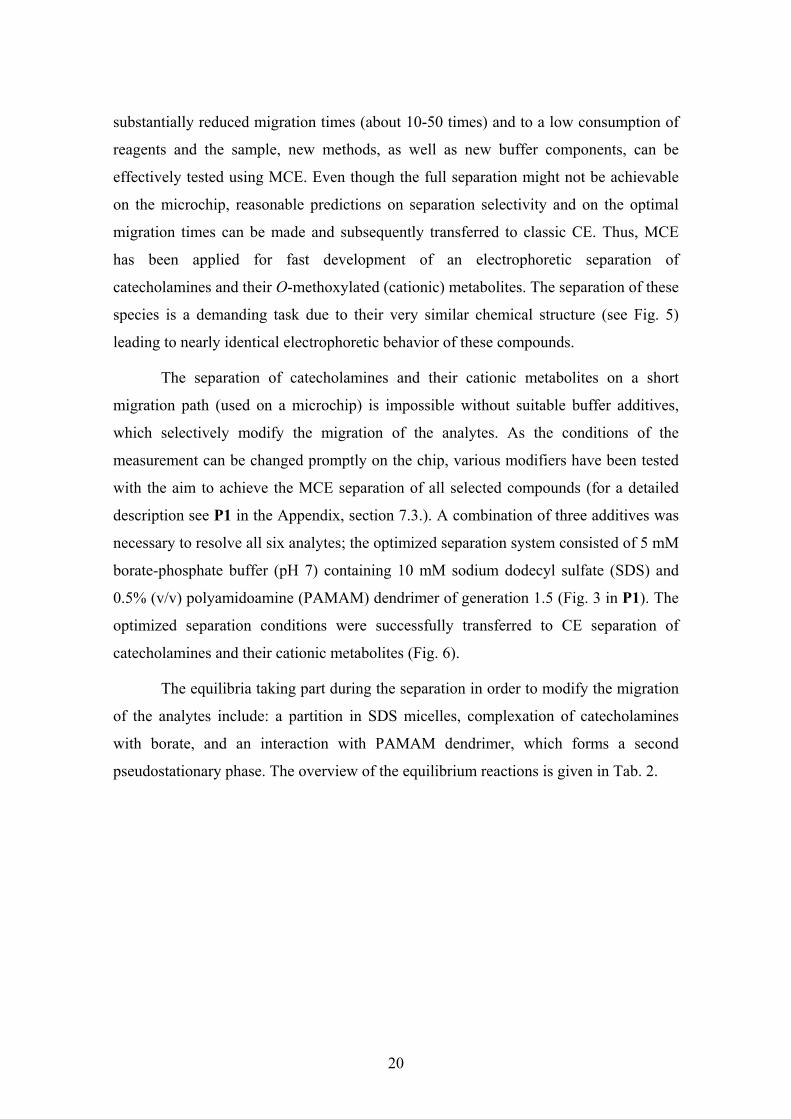
The equilibria taking part during the separation in order to modify the migration
of the analytes include: a partition in SDS micelles, complexation of catecholamines
with borate, and an interaction with PAMAM dendrimer, which forms a second
pseudostationary phase. The overview of the equilibrium reactions is given in Tab. 2.
21
3 4 5 6 7 8 9-0.02
0.00
0.02
0.04
0.06
0.08 CE conditions: 5mM borate-phosph10 mM SDS, 5 µl/ml G1.5sep.: 20 kV inj.:100 mbar/6s L=33cm, l=88cmDetection: UV, λ=220 nm
MTME
NMEDA
NAA
U
time (min)
Figure 6. CE separation of catecholamines (NA, A, D) and their O-methoxylated
metabolites (NME, ME, MT) at the conditions optimized using MCE. Other conditions
are given in the Figure.
EQUILIBRIUM DESCRIPTION
Analytes partition between micellar
and aqueous phase; the more
hydrophobic analytes, the more
retained in the negatively charged
SDS micelles.
Negatively charged complexes are
formed between dihydroxy
compounds and borate.
PAMAM dendrimer of generation
1.5 is negatively charged and the
strength of its interaction with
analytes depends on steric effects
(accessibility of the functional
groups on the analyte molecule).
Only a half of the dendrimer
molecule is drawn for clarity.
Table 2. Overview of the equilibrium reactions participating in the electrophoretic
separation of catecholamines and their metabolites.
22
4.2. Enhancement of the sensitivity of on-chip amperometric
detection
Another useful application area of MCE is the development of highly selective
and sensitive on-chip amperometric detection by means of chemically modified working
electrode or using enzyme-catalyzed reactions. Coupling of MCE separation with
specifically designed sensitive amperometric detection is an attractive approach to the
development of a high throughput analytical device for determination of trace amounts
of a selected analyte in clinical samples.
Catecholamines and their metabolites belong to those analytes, which are
present in biological samples in very low concentrations. Urine and brain samples
contain these compounds in micromolar or submicromolar concentrations; in blood
samples is the concentration of catecholamines even in subnanomolar range [36]. Thus,
sensitive detection methods are required for the analysis of these species in clinical
samples (for review see [43]).
4.2.1. Enzyme-catalyzed reactions
4.2.1.1. Amperometric biosensors
The application of enzyme-catalyzed reactions at the amperometric electrode
can amplify the detection signal considerably and thus represents an effective strategy
for improving sensitivity of amperometric detection. This concept has been successfully
utilized for selective and sensitive measurements of catecholamines and their
derivatives in many amperometric biosensors. In such a biosensor, a suitable enzyme is
immobilized at the surface of the amperometric electrode and the detection signal is
amplified by cycling of the oxidized/reduced analyte between the electrode and the
enzyme. Several enzymes (cellobiose dehydrogenase [45], glucose dehydrogenase [46],
glucose oxidase (GOx) [47], laccase [48], and tyrosinase [49], respectively) have
already been employed in the amperometric biosensors for sensitive detection of
catecholamines and related compounds. Two different groups of these enzymes might
be distinguished according to the substrate of the enzyme reaction.
23
First group of the enzymes, so-called reducing enzymes (cellobiose
dehydrogenase, glucose dehydrogenase, and GOx), reacts with the oxidation products of
catecholamines produced at the working electrode and reduce them back to the original
compounds. The original catecholamines are then repeatedly oxidized at the electrode
and in this way an amplified oxidation current is recorded by the amperometric detector.
The reducing enzymes are then regenerated by a coupled reaction with the natural
substrate (cellobiose or glucose), which is added in large excess.
The second group of the enzymes, so-called oxidizing enzymes (laccase and
tyrosinase), reacts with catecholamines and oxidizes them to the corresponding o-
quinones. These are then reduced back at the working electrode, held at a negative
potential. The original compounds produced at the electrode are then substrates for the
repeated enzyme oxidation. Thus, the reduction current registered by the detector is
amplified in these biosensors. The oxidizing enzymes are then regenerated by a coupled
reaction with dissolved oxygen.
A further possibility is the use of bienzyme amplification systems, in which both
groups of enzymes (reducing and oxidizing) are co-immobilized on the membrane of an
oxygen electrode. The cycling of the catecholamine between both enzymes causes the
consumption of dissolved oxygen, which is monitored by the detector and is
proportional to the concentration of the analyte [46,50].
Except of cellobiose dehydrogenase, all the enzymes employed in these
biosensors are incapable of direct electron transfer from the enzyme to the electrode at
the working conditions. This is a necessary prerequisite for their successful utilization
for sensitive detection of catecholamines and related compounds, because these
compounds act as so-called mediators facilitating the electron transfer between the
enzyme and the electrode. In the cellobiose dehydrogenase-based sensors a careful
adjustment of working conditions is required to suppress the direct electron transfer in
favor of mediated electron transfer [45].
24
4.2.1.2. Sensitive on-chip detection
The concept of enzyme-catalyzed reaction has been successfully adapted for
sensitive amperometric detection of catecholamines and their metabolites after their
electrophoretic separation on the microchip. By adding GOx enzyme and a large excess
of glucose (G) to the background electrolyte, the response of amperometric detector for
catecholamines and their metabolites has been amplified by means of cyclic oxidation
induced at the working electrode [51]. The limits of detection (LOD) in the range of 10-7
M have been reached with the system G/GOx under the optimized conditions.
The active redox component of the GOx enzyme, responsible for cyclic
oxidation of catecholamines, is the flavine adenine dinucleotide coenzyme (FAD).
Unfortunately, FAD coenzyme is tightly bound to enzymatic protein and incapable of
independent existence. The inevitable presence of the protein structure in the separation
system however causes lowering of the separation efficiency in time due to the protein
adsorption to the walls of the separation channel. In contrast to FAD coenzyme,
nicotinamide dinucleotide (NAD) coenzyme can exist independently of the enzymatic
protein and as a pure coenzyme might be added to the separation system in a large
excess without a detrimental effect on the separation efficiency.
We have demonstrated that the response of amperometric detection of
catecholamines and their metabolites can be amplified by adding of the reduced form of
NAD coenzyme (NADH) to the background electrolyte (for detailed description see P2
in the Appendix, section 7.3.). The amplification of the detection signal by NADH is
comparable to GOx/G system but NADH-induced cyclic oxidation is applicable at
higher detection potentials and hence provides lower absolute LOD. Both amplification
systems (G/GOx and NADH) can also be used concurrently and such a combined
enzyme system leads to the LOD in the order of 10-8 M (Fig. 4 in P2). The direct
comparison of the detection signals of methoxytyramine (MT) at two different detection
voltages (1000 mV and 1200 mV vs. pseudoreference electrode) without any
amplification, in presence of NADH, and in presence of combined enzyme system
(G/GOx and NADH), respectively, is depicted in Fig. 7.
The amplification principle of the combined enzyme system is schematically
given in the inset of Fig. 7. According to our investigations, the two amplification
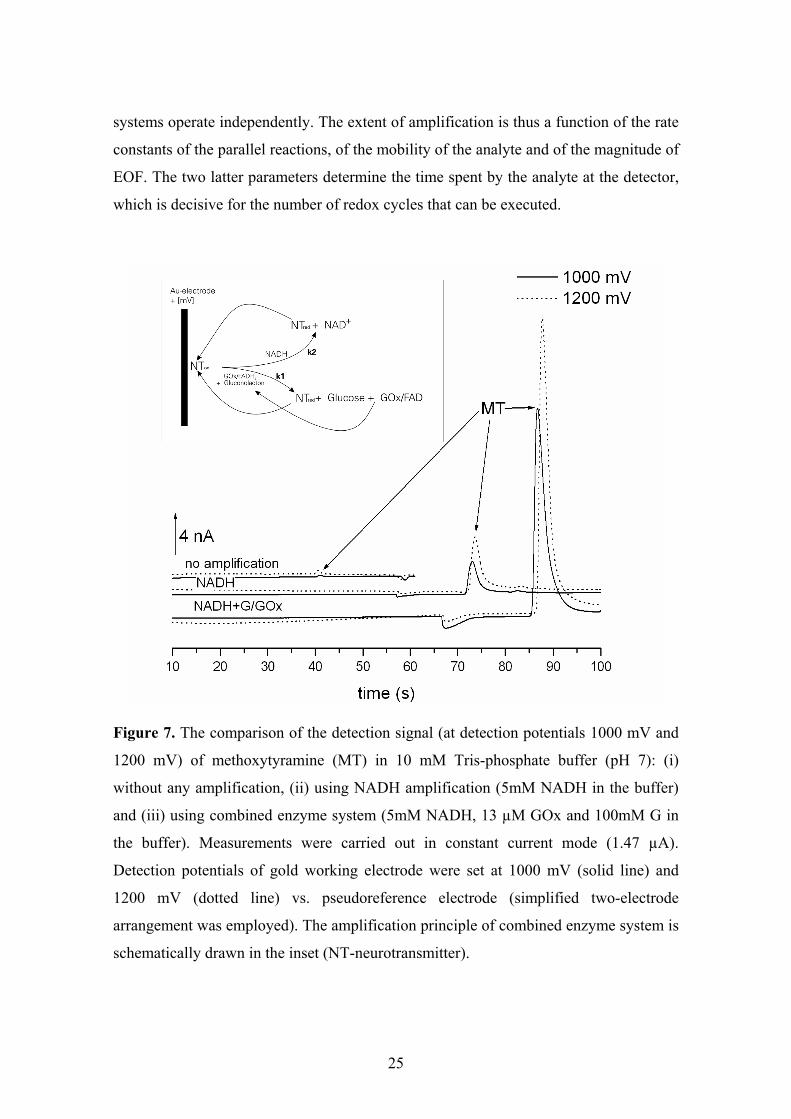
25
systems operate independently. The extent of amplification is thus a function of the rate
constants of the parallel reactions, of the mobility of the analyte and of the magnitude of
EOF. The two latter parameters determine the time spent by the analyte at the detector,
which is decisive for the number of redox cycles that can be executed.
Figure 7. The comparison of the detection signal (at detection potentials 1000 mV and
1200 mV) of methoxytyramine (MT) in 10 mM Tris-phosphate buffer (pH 7): (i)
without any amplification, (ii) using NADH amplification (5mM NADH in the buffer)
and (iii) using combined enzyme system (5mM NADH, 13 µM GOx and 100mM G in
the buffer). Measurements were carried out in constant current mode (1.47 µA).
Detection potentials of gold working electrode were set at 1000 mV (solid line) and
1200 mV (dotted line) vs. pseudoreference electrode (simplified two-electrode
arrangement was employed). The amplification principle of combined enzyme system is
schematically drawn in the inset (NT-neurotransmitter).
26
4.2.2. Carbon nanotube-modified amperometry
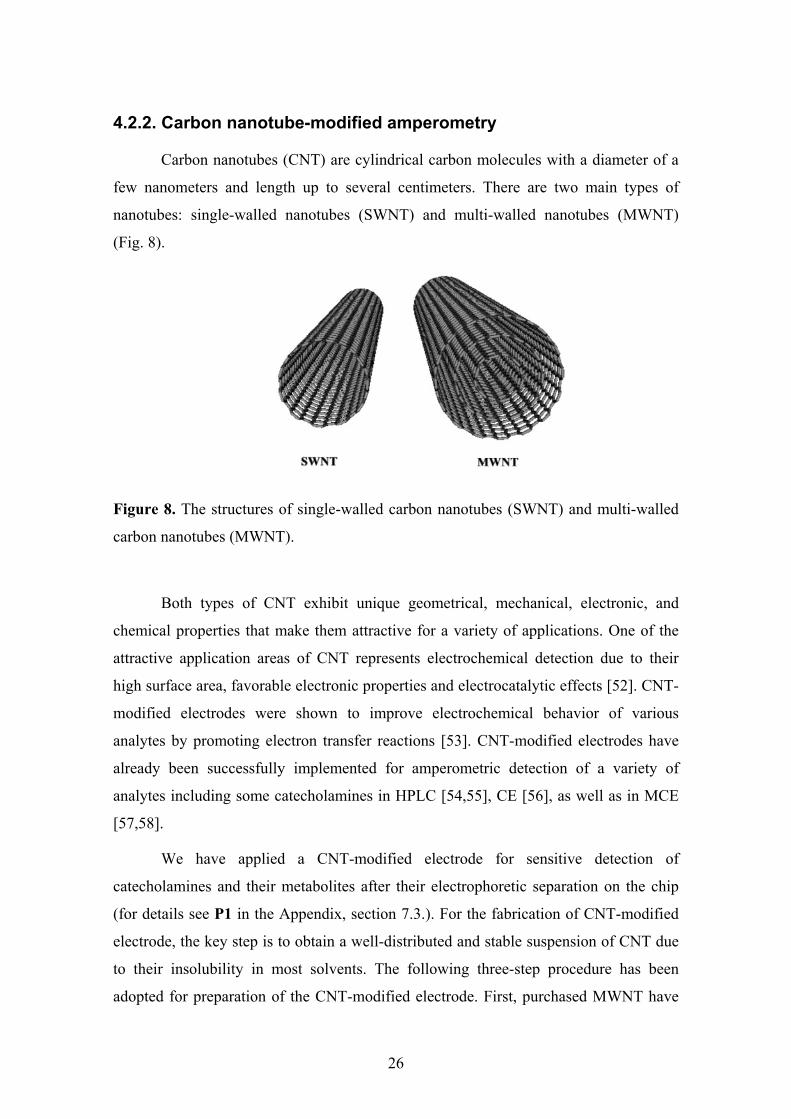
Carbon nanotubes (CNT) are cylindrical carbon molecules with a diameter of a
few nanometers and length up to several centimeters. There are two main types of
nanotubes: single-walled nanotubes (SWNT) and multi-walled nanotubes (MWNT)
(Fig. 8).
Figure 8. The structures of single-walled carbon nanotubes (SWNT) and multi-walled
carbon nanotubes (MWNT).
Both types of CNT exhibit unique geometrical, mechanical, electronic, and
chemical properties that make them attractive for a variety of applications. One of the
attractive application areas of CNT represents electrochemical detection due to their
high surface area, favorable electronic properties and electrocatalytic effects [52]. CNT-
modified electrodes were shown to improve electrochemical behavior of various
analytes by promoting electron transfer reactions [53]. CNT-modified electrodes have
already been successfully implemented for amperometric detection of a variety of
analytes including some catecholamines in HPLC [54,55], CE [56], as well as in MCE
[57,58].
We have applied a CNT-modified electrode for sensitive detection of
catecholamines and their metabolites after their electrophoretic separation on the chip
(for details see P1 in the Appendix, section 7.3.). For the fabrication of CNT-modified
electrode, the key step is to obtain a well-distributed and stable suspension of CNT due
to their insolubility in most solvents. The following three-step procedure has been
adopted for preparation of the CNT-modified electrode. First, purchased MWNT have
27
been functionalized and purified by refluxing with concentrated nitric acid [53,55]. The
functionalization led to the formation of carboxyl moieties on the surface of nanotubes
[52]. Second, a stable suspension of CNT has been obtained in N,N’-
dimethylformamide (DMF) [54,58,59]. Third, the gold working electrode has been
covered by DMF suspension by simply immersing the electrode into the suspension
followed by drying the electrode in the oven. The last covering step was repeated ten
times because it was found out that the amplification of the detection signal, as well as
the background noise of the CNT-modified electrode, rose up with the increasing
thickness of the CNT layer. Consequently, ten CNT layers was a reasonable
compromise between the amplification of the detection response and an acceptable
background noise (Fig. 4 in P1).
The amplification factors obtained by CNT-modified electrode are generally
lower than those obtained by enzyme-catalyzed reactions. However, this concept of
sensitivity enhancement is independent of the composition of the background electrolyte
and of its pH (in contrast to enzymes that are sensitive to working conditions).
Moreover, the CNT-modified electrode preparation is simple and the electrode exhibits
a rapid response, catalytic activity, and sufficient stability for multiple runs.
The CNT-modified electrodes are also considered as attractive materials for the
immobilization of various biomolecules to create biosensors [60]. GOx has already been
successfully immobilized onto CNT by different procedures: physical adsorption
[61,62], entrapment in the polymeric matrix [63] or covalent binding [64,65]. However,
our attempts to further increase the detection sensitivity for catecholamines and related
compounds by immobilizing GOx enzyme on CNT-modified electrode failed. All
immobilization procedures (physical adsorption, entrapment in the polymeric matrix, as
well as covalent binding) resulted in a direct electron transfer from the enzyme to the
electrode via CNT. The constructed biosensor responded directly to the glucose present
in the solution and was therefore inapplicable for the sensitive detection of a mediator
(in our case catecholamine or its metabolite).
28
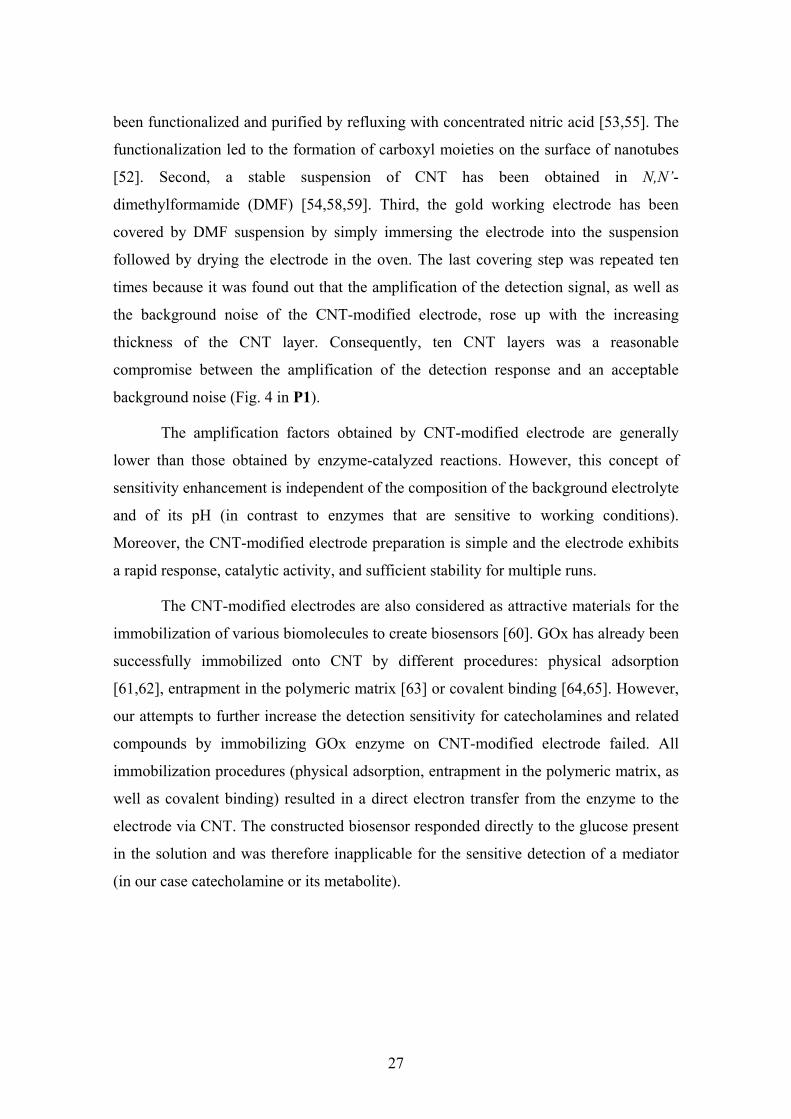
4.2.2.1. Application of CNT-modified electrode for measurement of catecholamines in biological samples
By employing the CNT-modified electrode to enhance the sensitivity of
amperometric detection, the method developed for simultaneous separation of
catecholamines and their cationic metabolites has been successfully applied for
determination of these compounds in biological samples, such as urine and brain
samples (for details see P1 in the Appendix, section 7.3.). The comparison of the MCE
separation of standards with direct analysis of the brain homogenate on the microchip is
given in Fig. 9. The shift in the migration time of MT can be attributed to the presence
of proteins in the brain sample. The peaks detected in the brain sample besides all
catecholamines and their cationic metabolites have been ascribed to other metabolites
(HVA, and vanillylmandelic acid (VMA)) as well as to another neurotransmitter
serotonin (5-HT).
Figure 9. The electropherograms of a standard solution (containing all 3 catecholamines
(D,A, NA) and 3 cationic metabolites (MT, ME, NME) at the concentration of 100 µM)
and of a mouse brain homogenate (brain sample homogenized in 0.2M HClO4
containing 0.1% (w/v) solution of Na2EDTA, homogenate was centrifuged, and
supernatant was diluted 1:4 with running buffer). Other conditions are given in the
Figure.
29
Unfortunately, the attempt to utilize enzyme-catalyzed reaction for the sensitive
determination of catecholamines and metabolites in biological samples was
unsuccessful due to the enzyme instability in the complex separation system needed for
the simultaneous separation of these compounds.
4.3. Microchip affinity capillary electrophoresis (MC-ACE)
Affinity capillary electrophoresis (ACE) is a term used for CE-based methods
for studying interactions. In ACE, a substance migrating in the electric field undergoes
an interaction that changes its electrophoretic behavior. This effect can be used for
characterization of an interaction or, simply, for enhancing separation selectivity. On the
microchip, ACE has been mainly used to enable the separation of mixtures containing
substances with very similar to identical electrophoretic mobility.
Typical MC-ACE applications with the objective to enhance separation
selectivity are chiral separations and micellar electrokinetic chromatography (MEKC)
separations. In chiral separations, a specific compound that interacts differently with the
enantiomers of a chiral molecule is employed for the enantiomeric separation. MEKC
utilizes micelles, which form a pseudostationary phase, for altering the migration of
analytes. Depending on the chemical structure, the electrophoretic behavior of an
analyte is more or less affected by its partition between the aqueous and the micellar
phase. Mostly, negatively charged SDS micelles are employed for microchip MEKC.
An illustrative example of MC-ACE application for separation of a mixture of
compounds with nearly identical electrophoretic behavior represents the method
developed for simultaneous microchip separation of catecholamines and their cationic
metabolites, which employs micelles and other buffer additives to alter the migration of
the compounds (see chapter 4.1.).
In the literature, there are only few MC-ACE applications aimed at the
characterization of equilibrium presumably due to the imprecise cross injection and
limitations of detection systems available for planar systems (see chapter 3.2.). Mostly,
specific binding of an enzyme to its substrate and of an antibody to its antigen is
30
investigated on the chip. The overview of all MC-ACE applications, including the
principles of ACE methodology, is provided in P3 in the Appendix, section 7.3.
4.4. Microchip isoelectric focusing (MC-IEF)
Isoelectric focusing (IEF) is an electrophoretic method developed for separation
of amphoteric substances, i.e. substances which can behave as either an acid or a base
depending on the surrounding. At certain pH (at so-called isoelectric point, pI), the
overall charge of an amphoteric substance, and thus also its electrophoretic mobility,
equals zero. This characteristic feature of amphoteric substances serves for their
separation by IEF.
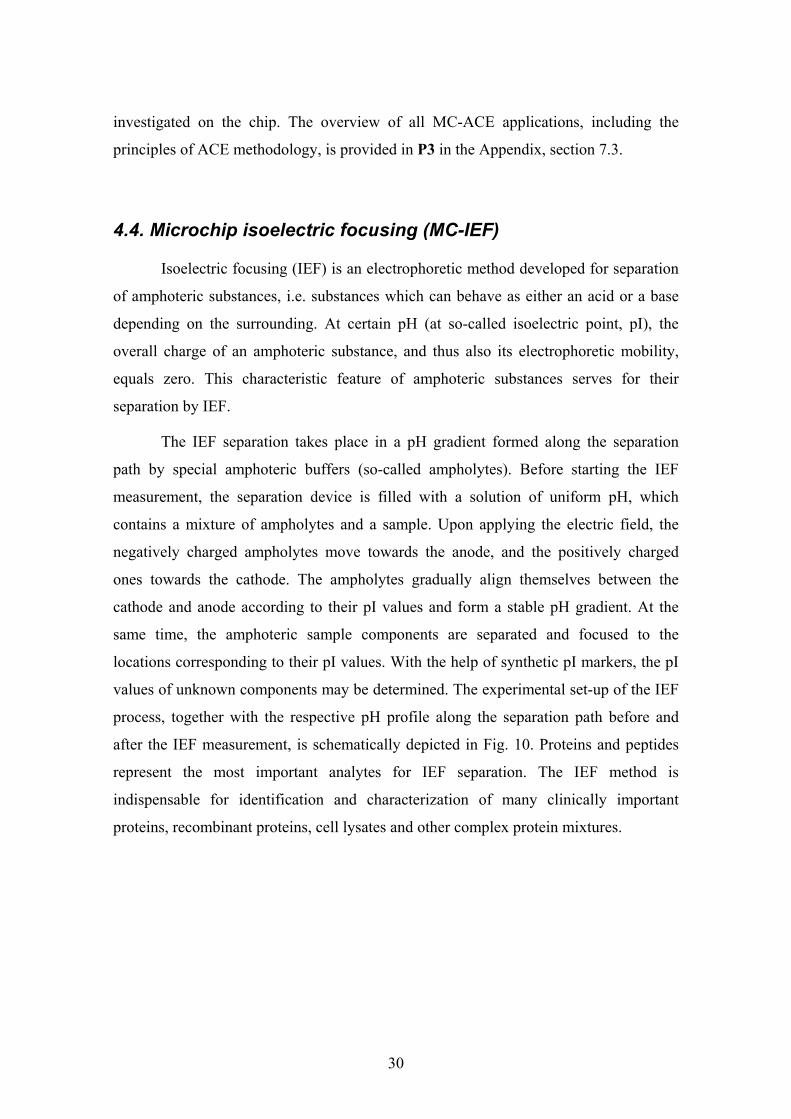
The IEF separation takes place in a pH gradient formed along the separation
path by special amphoteric buffers (so-called ampholytes). Before starting the IEF
measurement, the separation device is filled with a solution of uniform pH, which
contains a mixture of ampholytes and a sample. Upon applying the electric field, the
negatively charged ampholytes move towards the anode, and the positively charged
ones towards the cathode. The ampholytes gradually align themselves between the
cathode and anode according to their pI values and form a stable pH gradient. At the
same time, the amphoteric sample components are separated and focused to the
locations corresponding to their pI values. With the help of synthetic pI markers, the pI
values of unknown components may be determined. The experimental set-up of the IEF
process, together with the respective pH profile along the separation path before and
after the IEF measurement, is schematically depicted in Fig. 10. Proteins and peptides
represent the most important analytes for IEF separation. The IEF method is
indispensable for identification and characterization of many clinically important
proteins, recombinant proteins, cell lysates and other complex protein mixtures.
31
Figure 10. Schematic drawing of the arrangement of IEF separation and the respective
pH profiles.
Traditionally, IEF separation is performed in slab gel, which is a time-
consuming laborious procedure and provides only approximate results. Capillary IEF
(cIEF) offers many advantages over gel-based IEF, such as ease of automation,
quantitation, lower consumption of reagents and faster analysis. However, a subsequent
mobilization step after finishing IEF process is usually required in cIEF since capillary
electrophoresis instruments are mostly equipped with single-point detector. The
mobilization prolongs the analysis time substantially and often leads to distortion of pH
gradient and thus to poorer reproducibility [66]. MC-IEF results from miniaturization of
cIEF to planar microchip format and thus the amount of reagents is further reduced.
Also in MC-IEF the mobilization step is necessary if standard single-point detector is
employed.
Whole-column imaging detector (WCID) eliminates the need for mobilization
and is therefore ideal detector type for cIEF and MC-IEF [67]. A charge-coupled
camera of WCID images the entire separation path, and thereby enables a dynamic
monitoring of the focusing process. Several kinds of WCID for cIEF as well as MC-IEF
have been developed (for review see [33]). Fluorescent imaging detectors are most
commonly used WCID because of their sensitivity. UV absorption imaging detectors
32
are in general less sensitive but can be used for most analytes without labeling reaction.
Recently, a commercial instrument for cIEF equipped with UV-WCID (iCE280
Analyzer) has been launched [68]. On the microchip, the realization of WCID is even
less demanding compared to capillary due to the planar arrangement and the short
migration paths. Consequently, WCID is the prevailing detection mode for MC-IEF
applications, even though a specialized instrument for MC-IEF-WCID is not
commercially available yet.
In contrast to zone electrophoresis, IEF is an end-point electrophoretic method.
Once the proteins get to the positions corresponding to theirs pI values, a steady-state is
reached. Because of the focusing effect, sharp protein zones and a high resolution is
obtained. Furthermore, the high resolution of IEF is not sacrificed by miniaturizing IEF
to the microchip. This characteristic feature makes the MC-IEF applications very
promising because the resolution is not compromised by the miniaturization (unlike
zone MCE measurements where the miniaturization often leads to lower resolution
compared to CE due to limited separation efficiency).
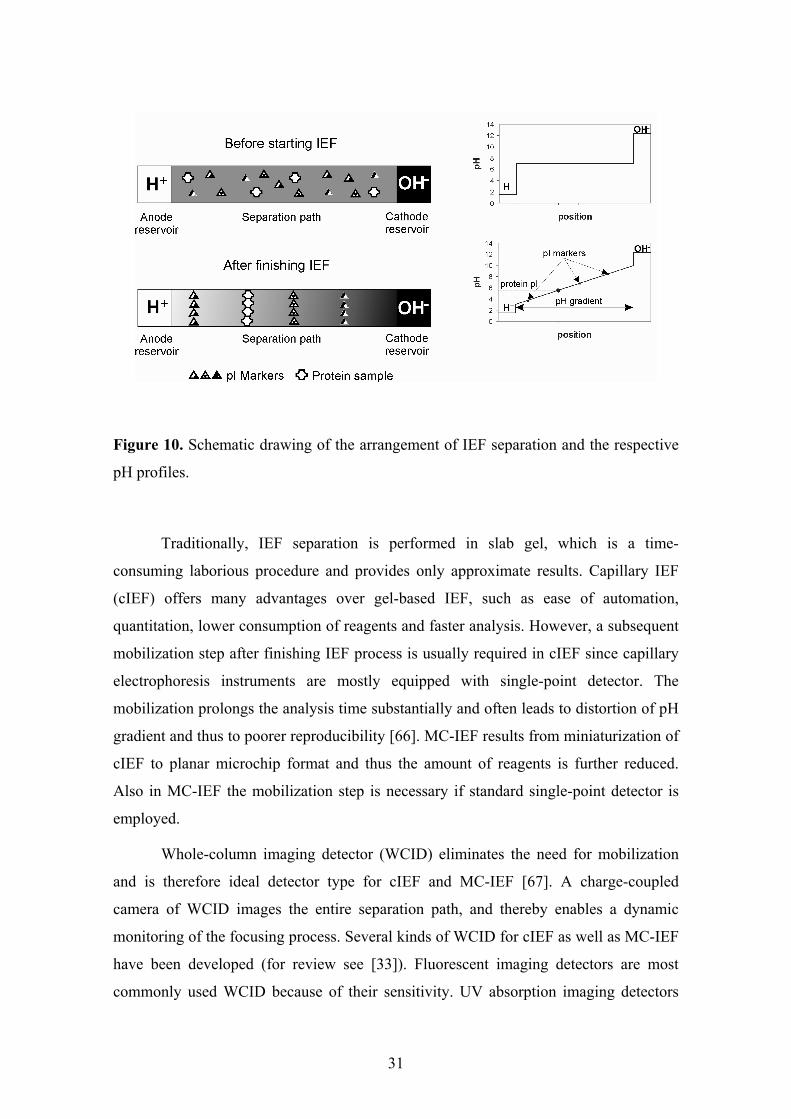
The resolution independency of the separation length in IEF measurements has
been proved experimentally as well as theoretically [69-71]. The minimum difference in
pI values required for two proteins to be separated (∆(pI)min) is expressed by the
following equation first reported by Vesterberg and Svensson [72]:
))pH(d/d(E)dx/)pH(d(D3)pI( min µ−⋅
⋅=∆ Eq. 1
where D is the diffusion constant of the protein, d(pH)/dx is the pH gradient, E is
electric field strength, and dµ/d(pH) is the mobility slope at each pI value. The
following assumptions have been used in the derivation of Eq. 1. First, pH gradient is
continuous and the applied electric field is constant. Second, both proteins have the
same diffusion coefficient. Third, the two adjacent proteins are considered separated
when the positions of their peak maximums differ by 3 standard deviations. Forth, there
are no effects resulting from EOF, hydrodynamic siphoning, and other such movements.
Finally, there is no Joule heating due to high electric currents.
33
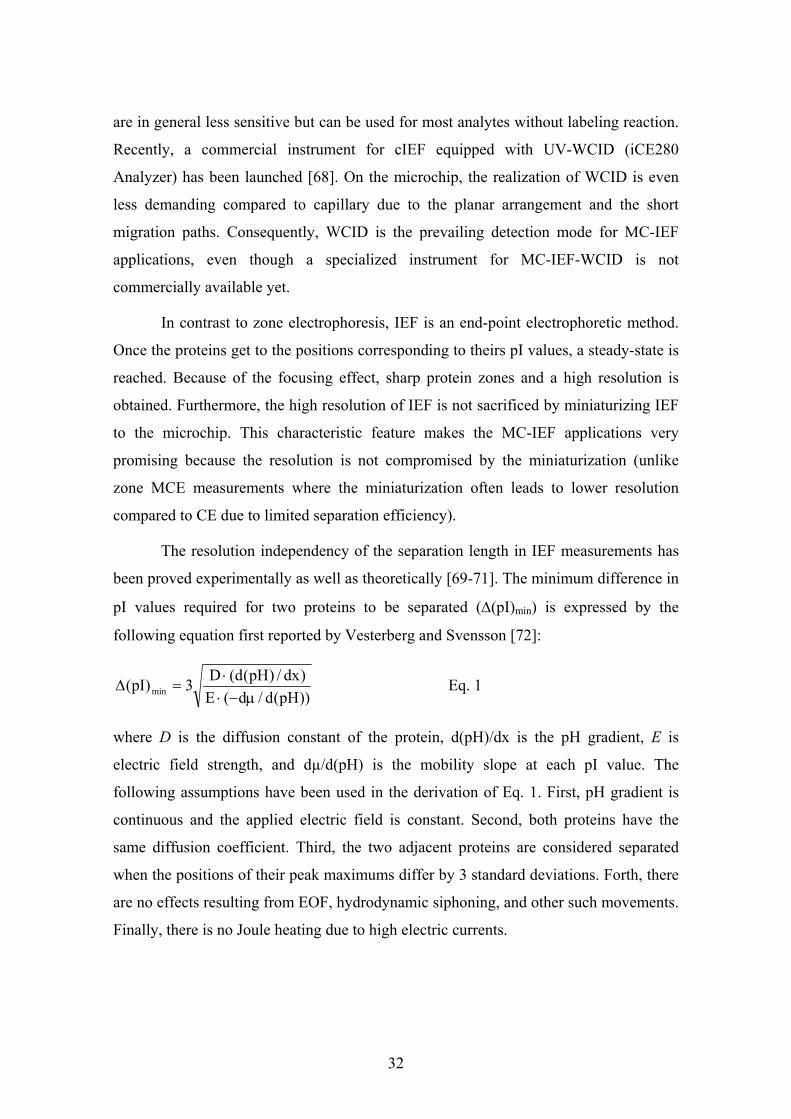
When a constant voltage, V, is applied and a uniform pH gradient is used, then E
= V/L and d(pH)/dx = ∆pH/L, where L is separation length. Consequently, Eq. 1 can be
simplified to Eq. 2:
))pH(d/d(VpHD3)pI( mjn µ−⋅
∆⋅=∆ Eq. 2
in which, there is no term related to the distance. By shortening the channel length, a
higher electric field is applied when the voltage remains the same and the peaks become
sharper. The resolution achieved at certain separation voltage is thus maintained even at
ultra-short separation paths used on the microchip. The absence of one of the drawbacks
associated with the miniaturization of CE to the chip makes MC-IEF probably the most
attractive application area of MCE.
4.4.1. Evaluation of MCE-2010 chip station for MC-IEF
Shimadzu microchip electrophoresis system MCE-2010 is a commercial
instrument equipped with linear imaging UV photodiode detector, which has been
originally developed for high-throughput DNA analysis. The combination of high
throughput and the linear imaging detector makes the MCE-2010 chip station useful
also for MC-IEF separations. However, the instrument has not been applied to MC-IEF
measurements so far. The applications of MCE-2010 from the literature cover chiral
separations [73,74], zone electrophoretic analyses [75-77], and affinity measurements
[5].
We have demonstrated that MCE-2010 is applicable to MC-IEF separations (for
details see P4 in the Appendix, section 7.3.). However, certain adjustments are required
to adapt the MCE-2010 apparatus to MC-IEF measurements. The Shimadzu microchip
has been designed for zone electrophoresis measurements (Fig. 11) and thus has some
features, which are unfavorable for MC-IEF. The cross injector of the microchip is not
well suited for IEF measurements, since the sample present in sample reservoir and
sample channel can enter the separation channel during the focusing and thereby disturb
the focusing process. Nevertheless, the undesired flow of the sample during focusing
could be prevented by applying a pinched voltage to both sample reservoirs (SI and SO)
34
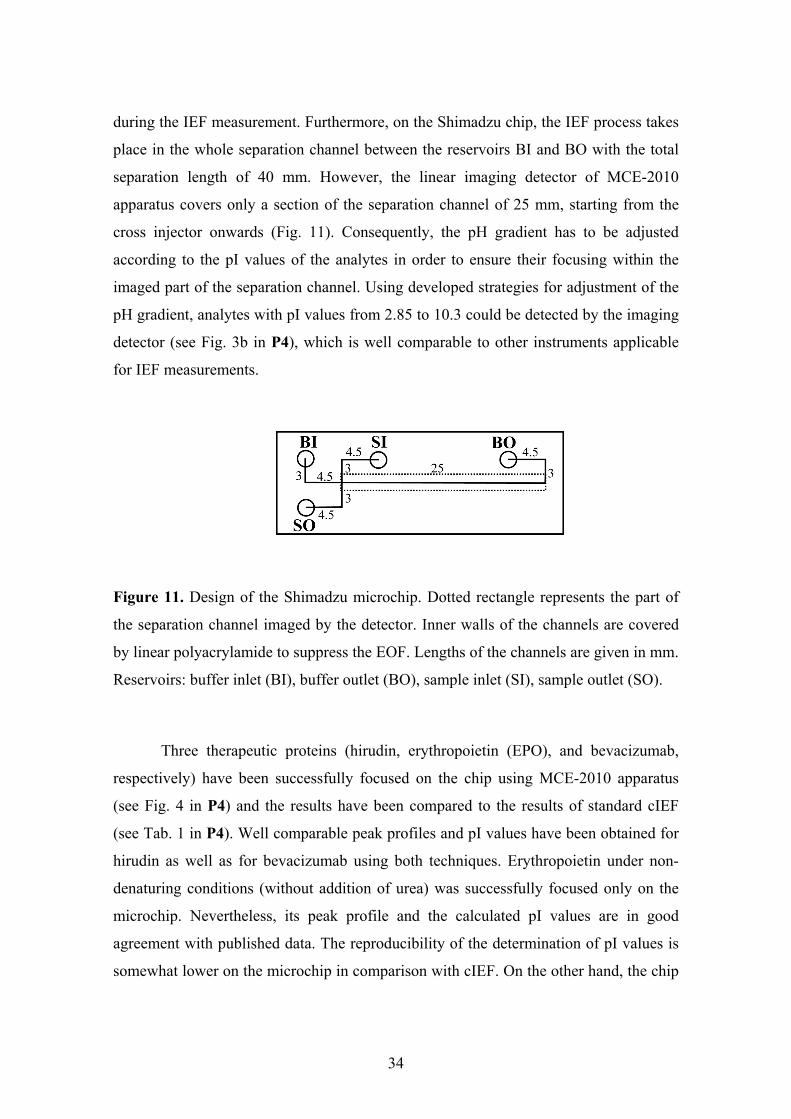
during the IEF measurement. Furthermore, on the Shimadzu chip, the IEF process takes
place in the whole separation channel between the reservoirs BI and BO with the total
separation length of 40 mm. However, the linear imaging detector of MCE-2010
apparatus covers only a section of the separation channel of 25 mm, starting from the
cross injector onwards (Fig. 11). Consequently, the pH gradient has to be adjusted
according to the pI values of the analytes in order to ensure their focusing within the
imaged part of the separation channel. Using developed strategies for adjustment of the
pH gradient, analytes with pI values from 2.85 to 10.3 could be detected by the imaging
detector (see Fig. 3b in P4), which is well comparable to other instruments applicable
for IEF measurements.
Figure 11. Design of the Shimadzu microchip. Dotted rectangle represents the part of
the separation channel imaged by the detector. Inner walls of the channels are covered
by linear polyacrylamide to suppress the EOF. Lengths of the channels are given in mm.
Reservoirs: buffer inlet (BI), buffer outlet (BO), sample inlet (SI), sample outlet (SO).
Three therapeutic proteins (hirudin, erythropoietin (EPO), and bevacizumab,
respectively) have been successfully focused on the chip using MCE-2010 apparatus
(see Fig. 4 in P4) and the results have been compared to the results of standard cIEF
(see Tab. 1 in P4). Well comparable peak profiles and pI values have been obtained for
hirudin as well as for bevacizumab using both techniques. Erythropoietin under non-
denaturing conditions (without addition of urea) was successfully focused only on the
microchip. Nevertheless, its peak profile and the calculated pI values are in good
agreement with published data. The reproducibility of the determination of pI values is
somewhat lower on the microchip in comparison with cIEF. On the other hand, the chip
35
measurement is much faster, as it does not require the tedious mobilization step (unlike
conventional cIEF).
4.4.2. MC-IEF applications
An overview of all available MC-IEF applications from the literature is given in
P5 in the Appendix, section 7.3. The feasibility of performing IEF on microchip has
been demonstrated and MC-IEF has become a new emerging analytical technology with
a number of applications. Compared to miniaturization of other electrophoretic
techniques, the adaptation of IEF to microchip has several advantages. First, the
resolution of IEF separation is independent of the separation length, which is a unique
feature among the electrophoretic separation techniques. Second, the problematic cross
injection commonly employed for electrophoresis miniaturized to the chip is avoided in
case of MC-IEF. Finally, the planar arrangement of the microchip facilitates the
implementation of WCID, which is the most suitable detection for IEF separation.
MC-IEF has been successfully coupled to another separation technique as well
as to MS detection, which clearly demonstrates the potential of this technique for
development of integrated µ-TAS. In addition to standard arrangement of MC-IEF
separation, various non-standard approaches to MC-IEF have been developed. The
alternative approaches to MC-IEF differ in terms of unusual sample introduction, kinds
of support used for IEF separation (see Fig. 2 in P5), and in the manner in which the pH
gradient is generated (see Fig. 3 in P5).
4.4.2.1. Pharmaceutical applications of MC-IEF
Protein medications are the most rapidly expanding class of therapeutics, serving
nowadays patients with broad range of diseases [78]. Consequently, suitable analytical
methods for characterization of active proteins and for quality control of drug
substances as well as drug products are essential in the pharmaceutical industry from the
development through final lot manufacturing to ensure the pharmaceutical efficacy and
safety of the protein-based drugs [79]. IEF serves for separation of proteins and peptides
on the basis of their isoelectric points and can therefore be applied for testing the
36
identity, purity, size/charge heterogeneity, as well as the stability of active proteins in
pharmaceutical formulations.
The monoclonal antibodies (MAB) produced from a single cell clone are
initially homogeneous but in fact they are heterogeneous due to various enzymatic and
nonenzymatic modifications taking place after the synthesis. The most common
modifications result from incomplete formation of disulfide bonds, glycosylation, N-
terminal pyroglutamine cyclization, C-terminal lysine processing, deamidation,
isomerization, and oxidation [80]. Most of these modifications can be monitored by IEF
as they induce a shift in the pI value of the individual isoforms.
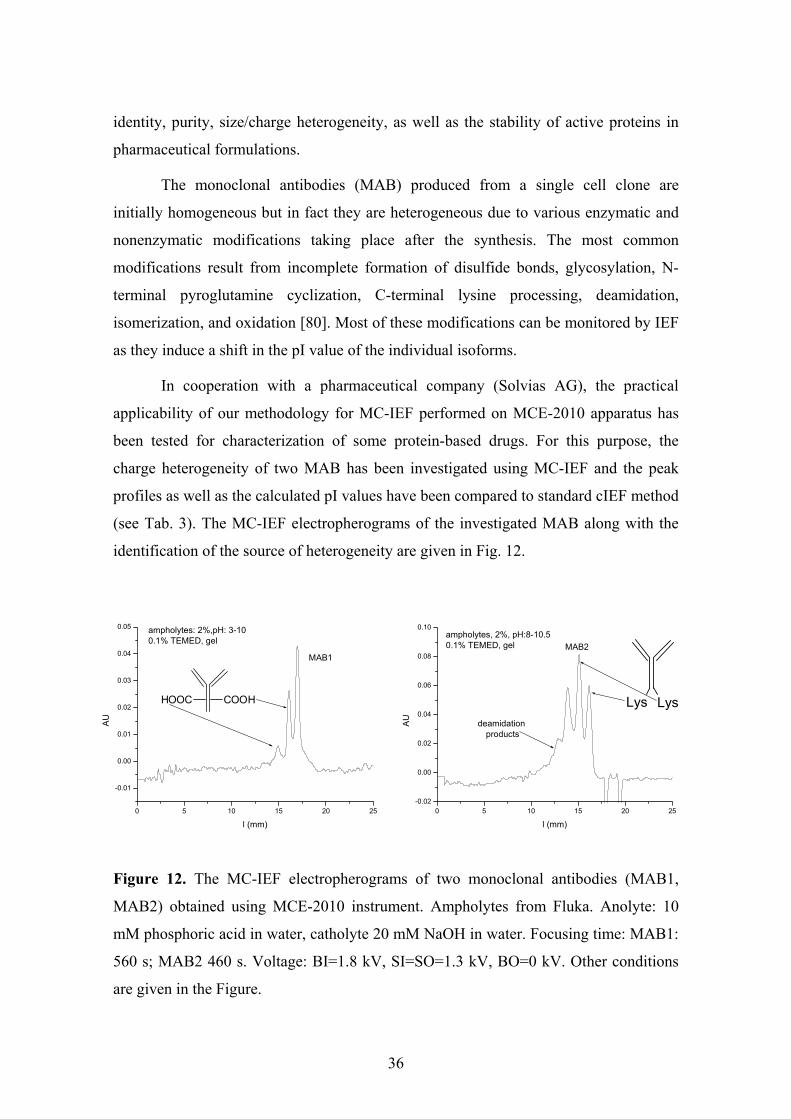
In cooperation with a pharmaceutical company (Solvias AG), the practical
applicability of our methodology for MC-IEF performed on MCE-2010 apparatus has
been tested for characterization of some protein-based drugs. For this purpose, the
charge heterogeneity of two MAB has been investigated using MC-IEF and the peak
profiles as well as the calculated pI values have been compared to standard cIEF method
(see Tab. 3). The MC-IEF electropherograms of the investigated MAB along with the
identification of the source of heterogeneity are given in Fig. 12.
Figure 12. The MC-IEF electropherograms of two monoclonal antibodies (MAB1,
MAB2) obtained using MCE-2010 instrument. Ampholytes from Fluka. Anolyte: 10
mM phosphoric acid in water, catholyte 20 mM NaOH in water. Focusing time: MAB1:
560 s; MAB2 460 s. Voltage: BI=1.8 kV, SI=SO=1.3 kV, BO=0 kV. Other conditions
are given in the Figure.
0 5 10 15 20 25
-0.01
0.00
0.01
0.02
0.03
0.04
0.05
HOOC COOH
ampholytes: 2%,pH: 3-10 0.1% TEMED, gel
MAB1
AU
l (mm)0 5 10 15 20 25
-0.02
0.00
0.02
0.04
0.06
0.08
0.10
MAB2
deamidation products
Lys Lys
ampholytes, 2%, pH:8-10.50.1% TEMED, gel
AU
l (mm)
37
Deamidation of side chains of asparagine and glutamine residues has been
identified as a source of charge heterogeneity of MAB1. Since an additional charge is
introduced to the protein per one deamidation, two deamidation products derived from
MAB1 have been detected (Fig. 12, left). An incomplete removal of C-terminal lysine
residues from immunoglobulin G heavy chains is the cause of charge heterogeneity of
MAB2, where variants containing none, one, and two lysine residues have been
separated by MC-IEF (Fig. 12, right). In addition to the three main peaks, small peaks
resulting from deamidation of the MAB2 protein have been detected as well.
Charge heterogeneity of proteins variants can also result from modifications in
the glycosylation. Variations in the oligosaccharide chain structure present on
glycoproteins can significantly affect many protein properties such as solubility,
specific activity, circulatory half-life, antigenicity, resistance to protease attack, and
thermal denaturation [79]. On the example of a glycoprotein EPO, the effect of stressed
conditions (kept at pH 3 and temperature 40 ºC for 166 hours) on the glycoforms’
profile was investigated. In contrast to previous MC-IEF separation of EPO under non-
denaturing conditions (see Fig. 4b in P4), a urea has been added for MC-IEF
measurement at this time in order to enable a direct comparison of the results with
standard cIEF (where the IEF separation under non-denaturing conditions failed). The
pI values of non-stressed EPO from the MC-IEF separation have again been compared
to standard cIEF (see Tab. 3). The comparison of electropherograms of EPO as well as
stressed EPO is depicted in Fig. 13. The treatment of EPO with an acid under elevated
temperature has led to hydrolyzation of sialic acid residues and, thus, to a marked shift
in pI values of the isoforms. Evidently, MC-IEF can also be successfully used for
monitoring of the stability of protein-based drugs.
The overview of the pI values of EPO, MAB1 and MAB2 calculated from MC-
IEF measurements as well as from cIEF measurements, along with the relative standard
deviations (RSD), is given in Table 3. Even though the reproducibility of pI values
determination from MC-IEF separations is somewhat lower than in case of cIEF, the
calculated pI values are well comparable, which supports the credibility of the MC-IEF
measurements. A clear advantage of MC-IEF over cIEF is the short separation time (4-7
min compared to up to 60 min using cIEF).
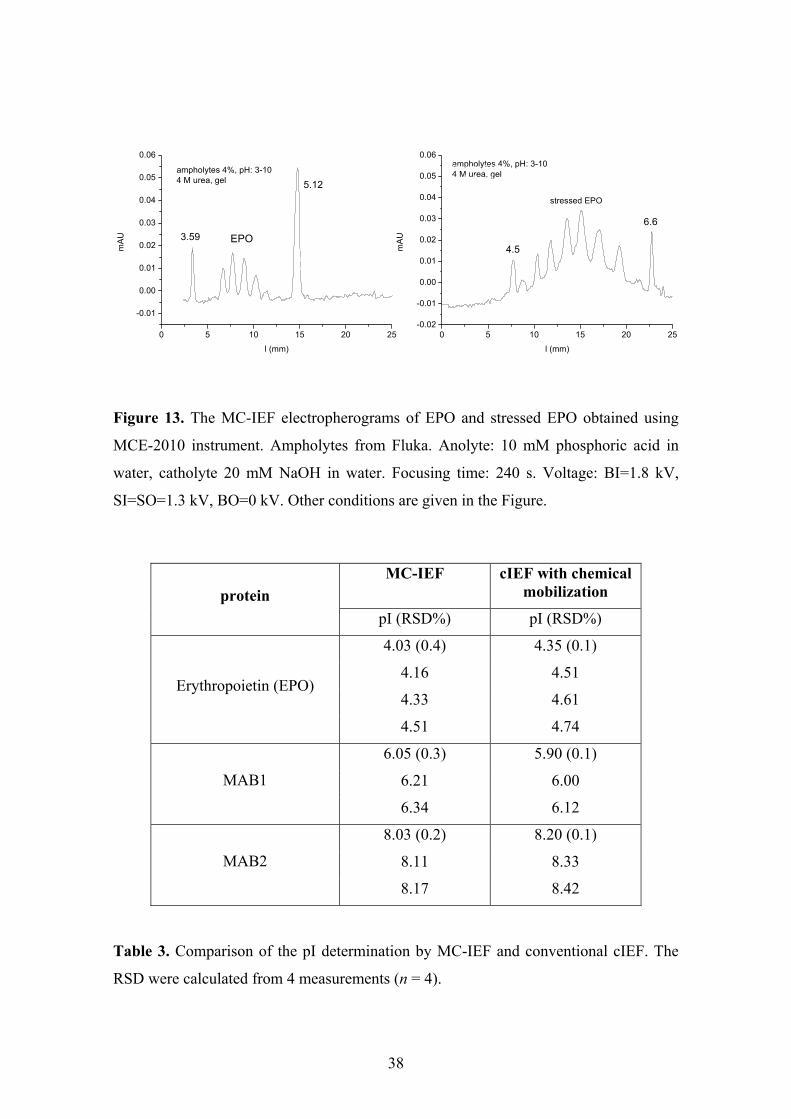
38
Figure 13. The MC-IEF electropherograms of EPO and stressed EPO obtained using
MCE-2010 instrument. Ampholytes from Fluka. Anolyte: 10 mM phosphoric acid in
water, catholyte 20 mM NaOH in water. Focusing time: 240 s. Voltage: BI=1.8 kV,
SI=SO=1.3 kV, BO=0 kV. Other conditions are given in the Figure.
MC-IEF cIEF with chemical mobilization protein
pI (RSD%) pI (RSD%)
4.03 (0.4) 4.35 (0.1)
4.16 4.51
4.33 4.61 Erythropoietin (EPO)
4.51 4.74
6.05 (0.3) 5.90 (0.1)
6.21 6.00 MAB1
6.34 6.12
8.03 (0.2) 8.20 (0.1)
8.11 8.33 MAB2
8.17 8.42
Table 3. Comparison of the pI determination by MC-IEF and conventional cIEF. The
RSD were calculated from 4 measurements (n = 4).
0 5 10 15 20 25-0.02
-0.01
0.00
0.01
0.02
0.03
0.04
0.05
0.06ampholytes 4%, pH: 3-104 M urea, gel
stressed EPO
6.6
4.5
ampholyte: 3-10 (4%),4 M urea, gel, 240 s, 1800 V
Desialo-EPO:hydrolysed(pH=3.0, 40°C, 166h)
mAU
l (mm)
0 5 10 15 20 25
-0.01
0.00
0.01
0.02
0.03
0.04
0.05
0.06
ampholytes 4%, pH: 3-104 M urea, gel
EPO
m
AU
l (mm)
5.12
3.59ampholyte: 3-10 (4%),anolyte: 50 mM, catholyte: 20 4 M urea, gel
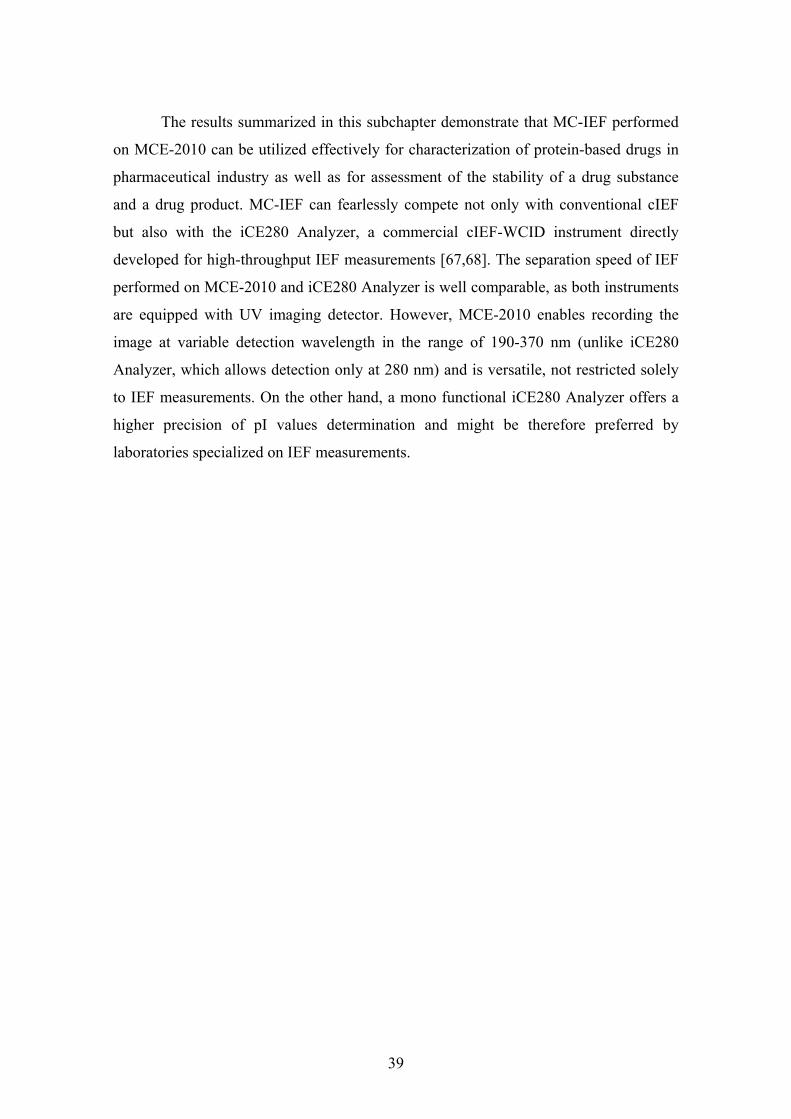
39
The results summarized in this subchapter demonstrate that MC-IEF performed
on MCE-2010 can be utilized effectively for characterization of protein-based drugs in
pharmaceutical industry as well as for assessment of the stability of a drug substance
and a drug product. MC-IEF can fearlessly compete not only with conventional cIEF
but also with the iCE280 Analyzer, a commercial cIEF-WCID instrument directly
developed for high-throughput IEF measurements [67,68]. The separation speed of IEF
performed on MCE-2010 and iCE280 Analyzer is well comparable, as both instruments
are equipped with UV imaging detector. However, MCE-2010 enables recording the
image at variable detection wavelength in the range of 190-370 nm (unlike iCE280
Analyzer, which allows detection only at 280 nm) and is versatile, not restricted solely
to IEF measurements. On the other hand, a mono functional iCE280 Analyzer offers a
higher precision of pI values determination and might be therefore preferred by
laboratories specialized on IEF measurements.
40
5. Conclusions
MCE was shown as promising analytical technology that can in many aspects
successfully compete with traditional CE. Enormous analytical potential of MCE is
distinctly demonstrated by its ultra high throughput, reduced costs, and easy integration
of multiple analytical steps leading eventually to the development of a true µ-TAS. The
transfer of CE to the planar microfabricated devices is now well established and the
consequences of the miniaturization are well documented. Numerous strategies have
been developed to overcome the potential drawbacks associated with the miniaturization
process. The commercialization of easily operable disposable microchips for routine
analyses can be expected in the near future, which will revolutionize the analytics in
many laboratories, especially in pharmaceutics, medicine, and life sciences.
On the example of presented simultaneous separation of catecholamines and
their cationic metabolites, MCE was demonstrated as an attractive tool for cost- and
time-saving development of a separation method for complex sample mixtures.
Moreover, MCE can also be effectively applied for highly selective and sensitive on-
chip amperometric detection of catecholamines and their derivatives. The detector
response on the chip has been amplified by employing an enzyme-catalyzed reaction, as
well as a CNT-modified working electrode. The enhanced detection sensitivity enables
direct measurement of the level of these compounds in biological samples (urine, brain
samples) without any pretreatment. Furthermore, specific investigations such as affinity
measurements and isoelectric focusing can be easily performed on the microchip as
evidenced from the reviews on available MC-ACE as well as MC-IEF applications.
Additionally, the feasibility of performing MC-IEF measurements on a commercial
MCE instrument made by Shimadzu (MCE-2010) has been demonstrated for the first
time. Last but not least, the practical applicability of MCE-2010 for MC-IEF of
pharmaceuticals has been proved by direct comparison of MC-IEF analyses of protein-
based substances and drugs with conventional cIEF analyses carried out in a
pharmaceutical company.
41
6. References
[1] G.J.M. Bruin, Electrophoresis 21 (2000) 3931.
[2] E.S. Roddy, H.W. Xu, A.G. Ewing, Electrophoresis 25 (2004) 229.
[3] C.A. Emrich, H.J. Tian, I.L. Medintz, R.A. Mathies, Anal. Chem. 74 (2002)
5076.
[4] I.L. Medintz, B.M. Paegel, R.G. Blazej, C.A. Emrich, L. Berti, J.R. Scherer,
R.A. Mathies, Electrophoresis 22 (2001) 3845.
[5] A.R. Stettler, M.A. Schwarz, J. Chromatogr. A 1063 (2005) 217.
[6] C.-X. Zhang, A. Manz, Anal. Chem. 73 (2001) 2656.
[7] H.J. Crabtree, E.C.S. Cheong, D.A. Tilroe, C.J. Backhouse, Anal. Chem. 73
(2001) 4079.
[8] S.C. Jacobson, R. Hergenroder, L.B. Koutny, R.J. Warmack, J.M. Ramsey,
Anal. Chem. 66 (1994) 1107.
[9] J.P. Alarie, S.C. Jacobson, C.T. Culbertson, J.M. Ramsey, Electrophoresis 21
(2000) 100.
[10] S.C. Jacobson, L.B. Koutny, R. Hergenroder, A.W. Moore, J.M. Ramsey, Anal.
Chem. 66 (1994) 3472.
[11] S.C. Jacobson, R. Hergenroder, A.W. Moore, J.M. Ramsey, Anal. Chem. 66
(1994) 4127.
[12] J.P. Kutter, R.S. Ramsey, S.C. Jacobson, J.M. Ramsey, J. Microcolumn Sep. 10
(1998) 313.
[13] N.Y. Lee, M. Yamada, M. Seki, Anal. Sci. 20 (2004) 483.
[14] F. Lacharme, M.A.M. Gijs, Electrophoresis 27 (2006) 2924.
[15] Y. Luo, D.P. Wu, S.J. Zeng, H.W. Gai, Z.C. Long, Z. Shen, Z.P. Dai, J.H. Qin,
B.C. Lin, Anal. Chem. 78 (2006) 6074.
[16] L. Zhang, X.F. Yin, Z.L. Fang, Lab Chip 6 (2006) 258.
[17] H.W. Gai, L.F. Yu, Z.P. Dai, Y.F. Ma, B.C. Lin, Electrophoresis 25 (2004)
1888.
[18] G.S. Zhuang, G. Li, Q.H. Jin, J.L. Zhao, M.S. Yang, Electrophoresis 27 (2006)
5009.
[19] K.W. Ro, K. Lim, B.C. Shim, J.H. Hahn, Anal. Chem. 77 (2005) 5160.
42
[20] H. Salimi-Moosavi, Y.T. Jiang, L. Lester, G. McKinnon, D.J. Harrison,
Electrophoresis 21 (2000) 1291.
[21] S. Gotz, U. Karst, Anal. Bioanal. Chem. 387 (2007) 183.
[22] W.R. Vandaveer, S.A. Pasas-Farmer, D.J. Fischer, C.N. Frankenfeld, S.M.
Lunte, Electrophoresis 25 (2004) 3528.
[23] J. Wang, Electroanalysis 17 (2005) 1133.
[24] M.A. Schwarz, P.C. Hauser, Lab Chip 1 (2001) 1.
[25] Y. Wu, Lin, J.M., Su, R., Qu, F., Cai, Z.,, Talanta 64 (2004) 338.
[26] J.J. Xu, A.J. Wang, H.Y. Chen, TrAC, Trends Anal. Chem. 26 (2007) 125.
[27] M.A. Schwarz, B. Galliker, K. Fluri, T. Kappes, P.C. Hauser, Analyst 126
(2001) 147.
[28] T. Kappes, P.C. Hauser, Analyst 124 (1999) 1035.
[29] I.M. Lazar, J. Grym, F. Foret, Mass Spectrom. Rev. 25 (2006) 573.
[30] S.L.S. Freire, A.R. Wheeler, Lab Chip 6 (2006) 1415.
[31] Q.L. Mao, J. Pawliszyn, Analyst 124 (1999) 637.
[32] A.E. Herr, J.I. Molho, K.A. Drouvalakis, J.C. Mikkelsen, P.J. Utz, J.G. Santiago,
T.W. Kenny, Anal. Chem. 75 (2003) 1180.
[33] X.Z. Wu, T.M. Huang, Z. Liu, J. Pawliszyn, TrAC, Trends Anal. Chem. 24
(2005) 369.
[34] J. Khandurina, A. Guttman, Curr. Opin. Chem. Biol. 7 (2003) 595.
[35] S.F.Y. Li, L.J. Kricka, Clin. Chem. 52 (2006) 37.
[36] H. Wisser, in L. Thomas (Editor), Labor und Diagnose: Indikation und
Bewertung von Laborbefunden für medizinische Diagnostik, TH-Books,
Frankfurt, Germany, 2000, p. 1062.
[37] J. Bergquist, A. Sciubisz, A. Kaczor, J. Silberring, J. Neurosci. Methods 113
(2002) 1.
[38] J.C. Alvarez, D. Bothua, I. Collignon, C. Advenier, O. Spreux-Varoquaux,
Biomed. Chromatogr. 13 (1999) 293.
[39] S. Sarre, Y. Michotte, P. Herregodts, D. Deleu, N.D. Klippel, G. Ebinger, J.
Chromatogr. B 575 (1992) 207.
[40] K.A. Sagar, M.R. Smyth, Journal of Pharmaceutical and Biomedical Analysis 22
(2000) 613.
43
[41] X.S. Zhu, P. N.; Barrett, D. A., Anal. Chim. Acta 478 (2003) 259.
[42] M.A. Fotopoulou, Ioannou, P. C., Anal. Chim. Acta 462 (2002) 179.
[43] M. Tsunoda, Anal. Bioanal. Chem. 386 (2006) 506.
[44] Z.D. Peterson, D.C. Collins, C.R. Bowerbank, M.L. Lee, S.W. Graves, J.
Chromatogr. B 776 (2002) 221.
[45] L. Stoica, A. Lindgren-Sjolander, T. Ruzgas, L. Gorton, Anal. Chem. 76 (2004)
4690.
[46] F. Lisdat, U. Wollenberger, A. Makower, H. Hortnagl, D. Pfeiffer, F.W.
Scheller, Biosens. Bioelectron. 12 (1997) 1199.
[47] F. Mizutani, S. Yabuki, M. Asai, Biosens. Bioelectron. 6 (1991) 305.
[48] O.D. Leite, O. Fatibello, A.D. Barbosa, J. Braz. Chem. Soc. 14 (2003) 297.
[49] T. Yao, C.O. Ho, Bunseki Kagaku 51 (2002) 469.
[50] A.L. Ghindilis, A. Makower, C.G. Bauer, F.F. Bier, F.W. Scheller, Anal. Chim.
Acta 304 (1995) 25.
[51] M.A. Schwarz, Electrophoresis 25 (2004) 1916.
[52] J. Wang, Electroanalysis 17 (2005) 7.
[53] K. Wu, S. Hu, Microchim. Acta 144 (2004) 131.
[54] W. Zhang, Wan, F., Xie, Y., Gu, J.,Wang, J., Yamamoto, K, Jin, L., Anal. Chim.
Acta 512 (2004) 207.
[55] W. Zhang, Y. Xie, S. Ai, F. Wan, J. Wang, L. Jin, J. Jin, J. Chromatogr. B 791
(2003) 217.
[56] M. Chicharro, A. Sanchez, E. Bermejo, A. Zapardiel, M.D. Rubianes, G.A.
Rivas, Anal. Chim. Acta 543 (2005) 84.
[57] J. Wang, G. Chen, M.P. Chatrathi, M. Musameh, Anal. Chem. 76 (2004) 298.
[58] M. Pumera, X. Llopis, A. Merkoci, S. Alegret, Microchim. Acta 152 (2006) 261.
[59] C. Hu, W. Wang, K. Liao, G. Liu, Y. Wang, J. Phys. Chem. Solids 65 (2004)
1731.
[60] M. Pumera, S. Sanchez, I. Ichinose, J. Tang, Sens. Actuators, B 123 (2007)
1195.
[61] A. Guiseppi-Elie, L. Chenghong, R.H. Baughman, Nanotechnology 13 (2002)
559.
[62] L. Wang, Z. Yuan, Sensors 3 (2003) 544.
44
[63] D. Pan, J. Chen, S. Yao, W. Tao, L. Nie, Anal. Sci. 21 (2005) 367.
[64] F. Patolsky, Y. Weizmann, I. Willner, Angew. Chem. Int. Ed. 43 (2004) 2113.
[65] H. Xue, W. Sun, B. He, Z. Shen, Synthetic Metlas 135-136 (2003) 831.
[66] J.Q. Wu, S.C. Li, A. Watson, J. Chromatogr. A 817 (1998) 163.
[67] X.Z. Wu, J.Q. Wu, J. Pawliszyn, LC-GC 19 (2001) 527.
[68] N. Li, K. Kessler, L. Bass, D. Zeng, J. Pharm. Biomed. Anal. 43 (2007) 963.
[69] W. Tan, Z.H. Fan, C.X. Qiu, A.J. Ricco, I. Gibbons, Electrophoresis 23 (2002)
3638.
[70] J. Han, A.K. Singh, J. Chromatogr. A 1049 (2004) 205.
[71] C. Das, Z.H. Fan, Electrophoresis 27 (2006) 3619.
[72] O. Vesterbe, H. Svensson, Acta Chem. Scand. 20 (1966) 820.
[73] F. Kitagawa, S. Aizawa, K. Otsuka, Anal. Sci. 21 (2005) 61.
[74] M. Ludwig, F. Kohler, D. Belder, Electrophoresis 24 (2003) 3233.
[75] E. Guihen, G.D. Sisk, N.M. Scully, J.D. Glennon, Electrophoresis 27 (2006)
2338.
[76] T. Miyado, Y. Tanaka, H. Nagai, S. Takeda, K. Saito, K. Fukushi, Y. Yoshida,
S. Wakida, E. Niki, J. Chromatogr. A 1109 (2006) 174.
[77] Z.Q. Xu, Y. Nakamura, T. Hirokawa, Electrophoresis 26 (2005) 383.
[78] B. Leader, Q.J. Baca, D.E. Golan, 7 (2008) 21.
[79] K. Ahrer, A. Jungbauer, J. Chromatogr. B 841 (2006) 110.
[80] H. Liu, G. Gaza-Bulseco, D. Faldu, C. Chumsae, J. Sun, J. Pharm. Sci. (2008)
doi:10.1002/jps.21180.
45
7. Appendix
7.1. List of contributions
7.1.1. Publications (those marked bold are cited in this thesis)
1. Barták, P., Šimánek V., Vlčková, M., Ulrichová, J.,Vespalec, R.: Interactions of
sanguinarine and chelerythrine with molecules containing mercapto group, J. Phys.
Org. Chem. 2003, 16 (10), 803-810.
2. Vespalec, R., Barták, P., Šimánek V., Vlčková, M.: Electrophoretic Investigation
of interactions of sanguinarine and chelerythrine with molecules containing
mercapto group, J. Chromatogr. B 2003, 797 (1-2), 357-366.
3. Vlčková, M., Barták, P., Kubáň, V.: Electrophoretic studies of acid-base properties
of sanguinarine and chelerythrine alkaloids, J. Chromatogr. A 2004, 1040 (1), 141-
145.
4. Vespalec, R., Vlčková, M., Horáková, H.: Aggregation and other intermolecular
interactions of biological buffers observed by capillary electrophoresis and UV-
photometry, J. Chromatogr. A 2004, 1051 (1-2), 75-84.
5. Vespalec, R., Vlčková, M., Kubáň, V.: Effects of the limited analyte solubility on
its mobility and zone shape: Electrophoretic behavior of sanguinarine and
chelerythrine around pH 7, Electrophoresis 2005, 26 (17): 3265-3272.
6. Vlčková, M., Kubáň, V., Vičar, J., Šimánek, V.: Capillary zone electrophoretic
studies of interactions of some quaternary isoquinoline alkaloids with DNA
constituents and DNA, Electrophoresis 2005, 26 (9): 1673-1679.
7. Vlčková, M., Schwarz, M.A.: Enzymatic sensitivity enhancement of biogenic
monoamines on a chip, Electrophoresis 2005, 26 (14), 2701-2707.
8. Vlčková, M., Stettler, A., Schwarz M.A.: Microchip Affinity Capillary
Electrophoresis Applications and Recent Advances, J. Liq. Chromatogr.
Relat. Technol. 2006, 29 (7-8), 1047-1076.
46
9. Vlčková, M., Schwarz, M.A.: Determination of cationic neurotransmitters and
metabolites in brain homogenates by microchip electrophoresis and carbon
nanotube-modified amperometry, J. Chromatogr. A 2007, 1142 (2), 214-221.
10. Vlčková, M., Kalman, F., Schwarz, M.A.: Pharmaceutical applications of
isoelectric focusing on microchip with imaged UV detection, J. Chromatogr. A
2008, 1181, 145-152.
11. Vlčková, M., Schwarz, M.A.: Microchip isoelectric focusing applications,
accepted, Chimia 2008.
7.1.2. Oral presentations and posters (presenting author marked bold)
Oral presentations: Vlčková, M., Vespalec, R.: Studies of electrophoretic properties of sanguinarine and
chelerythrine (in Czech); Proceedings from 30th Conference on Synthesis and analysis
of drugs, 2001, Brno, Czech Republic.
Vlčková, M., Barták, P., Vespalec, R.: Electrophoretic behaviour and properties of
sanguinarine and chelerythrine; 14th International Conference Chromatographic
methods and Human Health Proceedings, 12.-15.11.2001, Piešťany, Slovak Republic.
Vlčková, M., Barták, P., Vespalec, R.: pK determination of sparingly soluble weak
bases; Proceedings from the Conference on Advances in chromatography and
electrophoresis & Chiranal 2002, 24.-27.6.2002, Olomouc, Czech Republic.
Vlčková, M., Schwarz, M.A.: Sensitive enzyme based amperometric detection of
neurotransmitters on a chip, The abstract book of the 4th International Symposium on
Separations in BioSciences, 18.-21.9.2005, Utrecht, The Netherlands.
Vlčková, M., Schwarz, M.A.: Sensitive determination of neurotransmitters and their
metabolites in biological samples using microchip electrophoresis, The abstract book of
the 5th Swiss Snow symposium, 2.-4.3.2007, Fiesch, Switzerland.
Vlčková, M., Schwarz, M.A.: Microchip electrophoresis bioanalytical applications, The
abstract book of the international symposium Advances in Chromatography and
Electrophoresis 2007 & Chiranal 2007, 24.-27.6.2007, Olomouc, Czech Republic.
47
Vlčková, M., Schwarz, M.A.: Microchip electrophoresis bioanalytical applications,
Abstracts from Fall meeting of the Swiss chemical society 2007, Chimia 2007, 61 (7/8),
418, 12.9.2007, Lausanne, Switzerland.
Posters: Vlčková, M., Barták, P., Vespalec, R.: Determination of pK values of alkaloids
sanguinarine and chelerythrine by capillary zone electrophoresis, Abstracts from the
54th Congress of Chemical Societies, Chemické Listy 2002, 96, S196-S197; 30.6.-
4.7.2002, Brno, Czech Republic.
Vlčková, M., Barták, P., Vespalec, R.: Knowledge from measurement of pK values of
alkaloids sanguinarine and chelerythrine by capillary zone electrophoresis, Advance in
separation sciences on the day before the 100 years anniversary of chromatography
disover, The abstract book of the 8th International Symposium on Separation Sciences,
8.-12.9.2002, Toruń, Poland.
Vlčková, M., Barták, P., Vespalec, R.: Determination of pKR+ constants and water-
solubility of alkaloids sanguinarine and chelerythrine by capillary zone electrophoresis,
Sigma-Aldrich Conference Abstracts, Chemické Listy 2003, 97, 319; 4.-7.6.2003, Devět
Skal, Žďárské vrchy, Czech Republic.
Bolyan, D., Kalman, F., Schwarz, M.A., Vlčková, M.: Comparison of conventional
capillary IEF and microchip IEF equipped with an imaged detection system for the
analysis of therapeutic proteins, The abstract book of the CE in the Biotechnology and
Pharmaceutical Industries: 9th symposium on the Practical applications for the analysis
of proteins, nucleotides and small molecules, 14.-18.10.2007, Miami, Florida, U.S.A.
48
7.2. Curriculum vitae
Name: Markéta Vlčková
Born: 28th May 1977
Citizenship: Czech Republic
Marital status: single
Qualifications: 2004 – till now
1995 – 2000
Assistant/PhD. student in the Department of Chemistry,
University of Basel, Switzerland
MSc. degree, Faculty of Chemistry, Department of
Food Chemistry and Biotechnology, Brno University of
Technology, Czech Republic
Summary of praxis:
2002 – 2004
2000 – 2002
Research worker in the Department of Chemistry and
Biochemistry, Mendel University of Agriculture and
Forestry, Brno, Czech Republic
Research worker in the Institute of Analytical
Chemistry, Academy of Sciences of the Czech
Republic, Brno, Czech Republic
Research and work activities:
Microchip electrophoresis bioanalytical applications – dissertation thesis
Teaching students in theoretical and practical courses in analytical chemistry
(theoretical calculations, CE, IEC)
Investigation of interactions of alkaloids with DNA and DNA constituents by CE
Development of a method for isolation and characterization of peptides from various
types of cheeses – diploma thesis (used techniques: HPLC, SEC and UV/VIS
spectrophotometry)
49
Presentations: 4 posters and 7 oral presentations on the international scientific meetings, co-author of
11 publications
Awards: 2000
2002
2003
2007
Master’s diploma with distinction
Presentation award of the Institute of analytical chemistry for
attending a conference (8th International Symposium on Separation
Sciences, Toruń, Poland)
Award for attending 5th Interdisciplinary Conference for Young
Biologists, Biochemists and Chemists paid by Sigma-Aldrich
Best oral presentation (Mettler Toledo award)
Certificates: Zertifikat Deutsch als fremd Sprache (1995)
Certificate in chemometrics (2004)
Other skills:
Fluent knowledge of German, C1/C2 level
Fluent knowledge of English, C1/C2 level
Conversational knowledge of French, B1/B2 level
Driving licence B
User of PC (Windows, Office, Internet, Isis Draw, Photoshop)
Hobbies:
Reading books, travelling, playing piano, electronic music, sports (aerobics, fitness).
50
7.3. Enclosed publications
P1 Vlčková, M., Schwarz, M.A.: Determination of cationic neurotransmitters and
metabolites in brain homogenates by microchip electrophoresis and carbon
nanotube-modified amperometry, J. Chromatogr. A 2007, 1142 (2), 214-221.
P2 Vlčková, M., Schwarz, M.A.: Enzymatic sensitivity enhancement of biogenic
monoamines on a chip, Electrophoresis 2005, 26 (14), 2701-2707.
P3 Vlčková, M., Stettler, A., Schwarz M.A.: Microchip Affinity Capillary
Electrophoresis Applications and Recent Advances, J. Liq. Chromatogr. Relat.
Technol. 2006, 29 (7-8), 1047-1076.
P4 Vlčková, M., Kalman, F., Schwarz, M.A.: Pharmaceutical applications of
isoelectric focusing on microchip with imaged UV detection, J. Chromatogr. A
2008, 1181, 145-152.
P5 Vlčková, M., Schwarz, M.A.: Microchip isoelectric focusing applications,
Chimia 2008, 62, 244-248.
Publication 1 Determination of cationic neurotransmitters and metabolites in brain homogenates by
microchip electrophoresis and carbon nanotube-modified amperometry
Vlčková, M., Schwarz, M.A.
J. Chromatogr. A 2007, 1142 (2), 214-221

Journal of Chromatography A, 1142 (2007) 214–221
Determination of cationic neurotransmitters and metabolites in brainhomogenates by microchip electrophoresis and carbon
nanotube-modified amperometry
Marketa Vlckova, Maria A. Schwarz ∗Department of Chemistry, University of Basel, Spitalstrasse 51, 4056 Basel, Switzerland
Received 2 November 2006; received in revised form 1 December 2006; accepted 11 December 2006Available online 17 December 2006
Abstract
An electrophoretic method for simultaneous determination of catecholamines and their O-methoxylated metabolites on the microchip as wellas in the capillary is presented. A complex separation system employing sodium dodecyl sulfate (SDS) micelles, dendrimers forming a secondpseudostationary phase and borate complexation is needed for the satisfactory separation of the selected compounds on the short migration length.A carbon nanotube-modified working electrode has been applied for the sensitive amperometric detection with submicromolar detection limits.The applicability of this new method for the analytics of real samples is demonstrated by analysis of mouse brain homogenate on the microchipand human urine by capillary electrophoresis.© 2006 Elsevier B.V. All rights reserved.
Keywords: Neurotransmitter; Metabolite; Microchip; Brain homogenate; Carbon nanotube; Amperometry
1. Introduction
The measurement of the level of catecholamines (dopamine,noradrenaline, and adrenaline) in biological fluids has an essen-tial role in the diagnostics of diseases. In particular, varioustumours of the sympatho-adrenal system, such as pheochro-matocytoma or neuroblastoma are diagnosed by determinationof the catecholamines and/or their metabolites in urine andblood [1]. Furthermore, the measurement of the level of cat-echolamines and their metabolites in the cerebrospinal fluid(CSF) is used in diagnostics of hypertension, multiple sclerosis,or Parkinson’s disease [2]. In animal models, the measurementof these compounds in the brain homogenates is an importantresearch strategy for studying the role of the autonomic nervoussystem in various physiological or pathophysiological condi-tions [3]. Last but not least, the quantification of catecholaminesand their metabolites in various biological samples is also veryuseful for the investigation of drug action on the dopaminergicsystem.
∗ Corresponding author. Tel.: +41 61 2671002; fax: +41 61 2671005.E-mail addresses: [email protected],
[email protected] (M.A. Schwarz).
The prevailing analytical method employed for quantita-tive determination of these compounds is high-performanceliquid chromatography (HPLC) equipped with sensitive electro-chemical [4,5] or fluorimetric detection [6,7]. Although HPLCprovides low detection limits and good reproducibility, it suffersfrom cost, labour, and long analysis times. Moreover, the purifi-cation and preconcentration of the sample is often required priorto analysis [2,8].
Capillary electrophoresis (CE) often allows faster analysesthan HPLC, but its applicability for the analysis of complex mix-tures of catecholamines and/or their metabolites in biologicalfluids is limited by lower detection limits and similar elec-trophoretic behaviour of these compounds. Despite numerousreports on this topic available in the literature, see e.g. Refs.[9–12], many applications are restricted to a few compounds ofthe complex mixture present in biological samples. Structurallysimilar compounds, such as catecholamines [9,13], cationicmetabolites [11], or anionic metabolites (e.g. vanillylmandelicacid or homovanillic acid) [14,15], are often analysed indepen-dently or particular analytes of interest are selected from thecomplex biological samples for their determination [10,12,16].Regardless of the selection of the compounds for analysis, acareful adjustment of the separation conditions is required to
0021-9673/$ – see front matter © 2006 Elsevier B.V. All rights reserved.doi:10.1016/j.chroma.2006.12.040
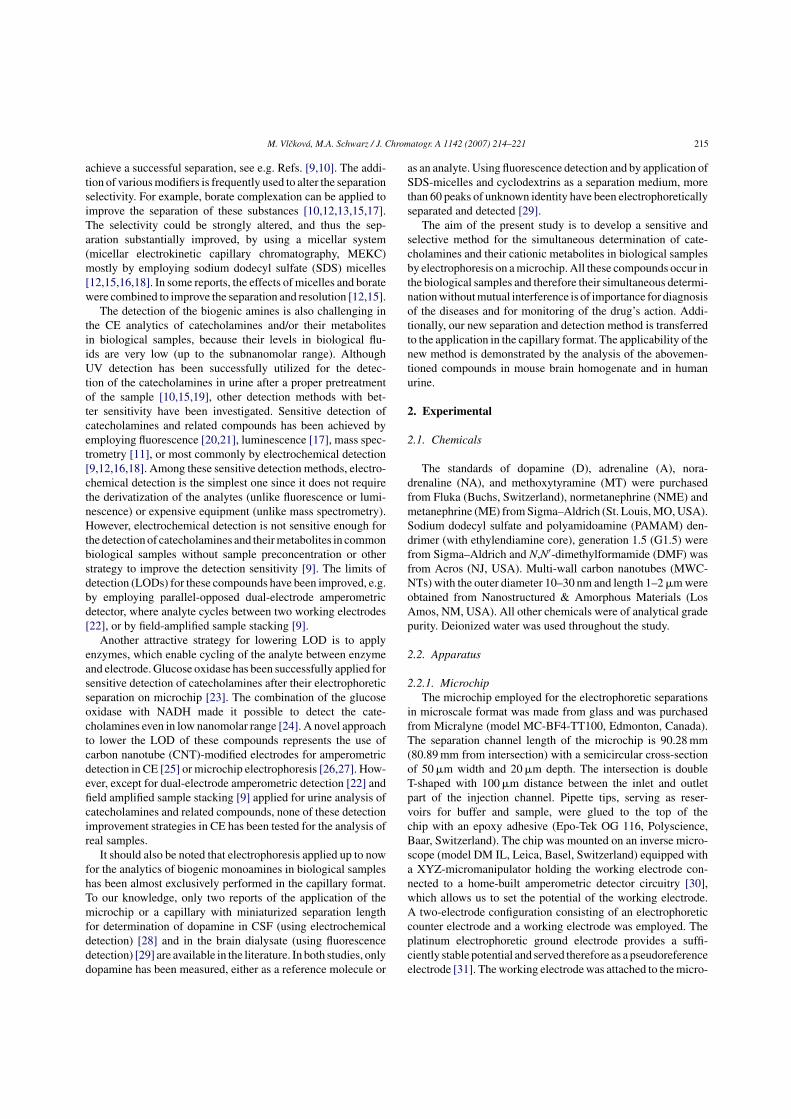
M. Vlckova, M.A. Schwarz / J. Chromatogr. A 1142 (2007) 214–221 215
achieve a successful separation, see e.g. Refs. [9,10]. The addi-tion of various modifiers is frequently used to alter the separationselectivity. For example, borate complexation can be applied toimprove the separation of these substances [10,12,13,15,17].The selectivity could be strongly altered, and thus the sep-aration substantially improved, by using a micellar system(micellar electrokinetic capillary chromatography, MEKC)mostly by employing sodium dodecyl sulfate (SDS) micelles[12,15,16,18]. In some reports, the effects of micelles and boratewere combined to improve the separation and resolution [12,15].
The detection of the biogenic amines is also challenging inthe CE analytics of catecholamines and/or their metabolitesin biological samples, because their levels in biological flu-ids are very low (up to the subnanomolar range). AlthoughUV detection has been successfully utilized for the detec-tion of the catecholamines in urine after a proper pretreatmentof the sample [10,15,19], other detection methods with bet-ter sensitivity have been investigated. Sensitive detection ofcatecholamines and related compounds has been achieved byemploying fluorescence [20,21], luminescence [17], mass spec-trometry [11], or most commonly by electrochemical detection[9,12,16,18]. Among these sensitive detection methods, electro-chemical detection is the simplest one since it does not requirethe derivatization of the analytes (unlike fluorescence or lumi-nescence) or expensive equipment (unlike mass spectrometry).However, electrochemical detection is not sensitive enough forthe detection of catecholamines and their metabolites in commonbiological samples without sample preconcentration or otherstrategy to improve the detection sensitivity [9]. The limits ofdetection (LODs) for these compounds have been improved, e.g.by employing parallel-opposed dual-electrode amperometricdetector, where analyte cycles between two working electrodes[22], or by field-amplified sample stacking [9].
Another attractive strategy for lowering LOD is to applyenzymes, which enable cycling of the analyte between enzymeand electrode. Glucose oxidase has been successfully applied forsensitive detection of catecholamines after their electrophoreticseparation on microchip [23]. The combination of the glucoseoxidase with NADH made it possible to detect the cate-cholamines even in low nanomolar range [24]. A novel approachto lower the LOD of these compounds represents the use ofcarbon nanotube (CNT)-modified electrodes for amperometricdetection in CE [25] or microchip electrophoresis [26,27]. How-ever, except for dual-electrode amperometric detection [22] andfield amplified sample stacking [9] applied for urine analysis ofcatecholamines and related compounds, none of these detectionimprovement strategies in CE has been tested for the analysis ofreal samples.
It should also be noted that electrophoresis applied up to nowfor the analytics of biogenic monoamines in biological sampleshas been almost exclusively performed in the capillary format.To our knowledge, only two reports of the application of themicrochip or a capillary with miniaturized separation lengthfor determination of dopamine in CSF (using electrochemicaldetection) [28] and in the brain dialysate (using fluorescencedetection) [29] are available in the literature. In both studies, onlydopamine has been measured, either as a reference molecule or
as an analyte. Using fluorescence detection and by application ofSDS-micelles and cyclodextrins as a separation medium, morethan 60 peaks of unknown identity have been electrophoreticallyseparated and detected [29].
The aim of the present study is to develop a sensitive andselective method for the simultaneous determination of cate-cholamines and their cationic metabolites in biological samplesby electrophoresis on a microchip. All these compounds occur inthe biological samples and therefore their simultaneous determi-nation without mutual interference is of importance for diagnosisof the diseases and for monitoring of the drug’s action. Addi-tionally, our new separation and detection method is transferredto the application in the capillary format. The applicability of thenew method is demonstrated by the analysis of the abovemen-tioned compounds in mouse brain homogenate and in humanurine.
2. Experimental
2.1. Chemicals
The standards of dopamine (D), adrenaline (A), nora-drenaline (NA), and methoxytyramine (MT) were purchasedfrom Fluka (Buchs, Switzerland), normetanephrine (NME) andmetanephrine (ME) from Sigma–Aldrich (St. Louis, MO, USA).Sodium dodecyl sulfate and polyamidoamine (PAMAM) den-drimer (with ethylendiamine core), generation 1.5 (G1.5) werefrom Sigma–Aldrich and N,N′-dimethylformamide (DMF) wasfrom Acros (NJ, USA). Multi-wall carbon nanotubes (MWC-NTs) with the outer diameter 10–30 nm and length 1–2 �m wereobtained from Nanostructured & Amorphous Materials (LosAmos, NM, USA). All other chemicals were of analytical gradepurity. Deionized water was used throughout the study.
2.2. Apparatus
2.2.1. MicrochipThe microchip employed for the electrophoretic separations
in microscale format was made from glass and was purchasedfrom Micralyne (model MC-BF4-TT100, Edmonton, Canada).The separation channel length of the microchip is 90.28 mm(80.89 mm from intersection) with a semicircular cross-sectionof 50 �m width and 20 �m depth. The intersection is doubleT-shaped with 100 �m distance between the inlet and outletpart of the injection channel. Pipette tips, serving as reser-voirs for buffer and sample, were glued to the top of thechip with an epoxy adhesive (Epo-Tek OG 116, Polyscience,Baar, Switzerland). The chip was mounted on an inverse micro-scope (model DM IL, Leica, Basel, Switzerland) equipped witha XYZ-micromanipulator holding the working electrode con-nected to a home-built amperometric detector circuitry [30],which allows us to set the potential of the working electrode.A two-electrode configuration consisting of an electrophoreticcounter electrode and a working electrode was employed. Theplatinum electrophoretic ground electrode provides a suffi-ciently stable potential and served therefore as a pseudoreferenceelectrode [31]. The working electrode was attached to the micro-
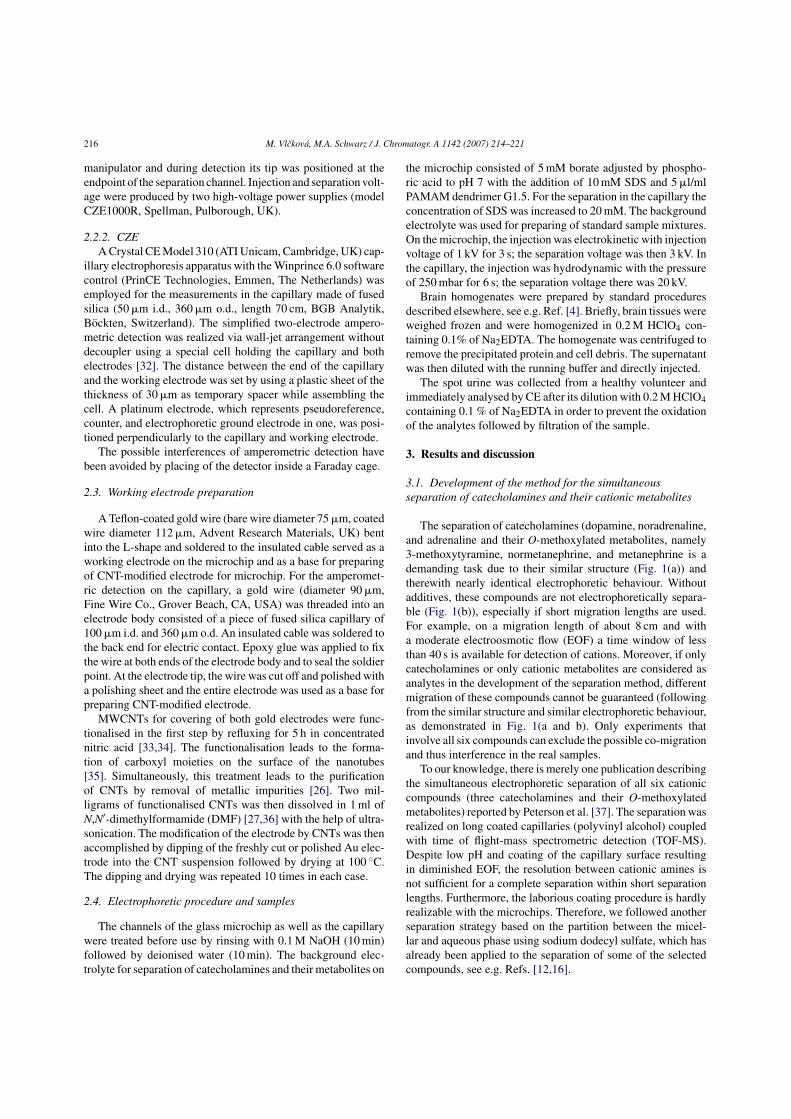
216 M. Vlckova, M.A. Schwarz / J. Chromatogr. A 1142 (2007) 214–221
manipulator and during detection its tip was positioned at theendpoint of the separation channel. Injection and separation volt-age were produced by two high-voltage power supplies (modelCZE1000R, Spellman, Pulborough, UK).
2.2.2. CZEA Crystal CE Model 310 (ATI Unicam, Cambridge, UK) cap-
illary electrophoresis apparatus with the Winprince 6.0 softwarecontrol (PrinCE Technologies, Emmen, The Netherlands) wasemployed for the measurements in the capillary made of fusedsilica (50 �m i.d., 360 �m o.d., length 70 cm, BGB Analytik,Bockten, Switzerland). The simplified two-electrode ampero-metric detection was realized via wall-jet arrangement withoutdecoupler using a special cell holding the capillary and bothelectrodes [32]. The distance between the end of the capillaryand the working electrode was set by using a plastic sheet of thethickness of 30 �m as temporary spacer while assembling thecell. A platinum electrode, which represents pseudoreference,counter, and electrophoretic ground electrode in one, was posi-tioned perpendicularly to the capillary and working electrode.
The possible interferences of amperometric detection havebeen avoided by placing of the detector inside a Faraday cage.
2.3. Working electrode preparation
A Teflon-coated gold wire (bare wire diameter 75 �m, coatedwire diameter 112 �m, Advent Research Materials, UK) bentinto the L-shape and soldered to the insulated cable served as aworking electrode on the microchip and as a base for preparingof CNT-modified electrode for microchip. For the amperomet-ric detection on the capillary, a gold wire (diameter 90 �m,Fine Wire Co., Grover Beach, CA, USA) was threaded into anelectrode body consisted of a piece of fused silica capillary of100 �m i.d. and 360 �m o.d. An insulated cable was soldered tothe back end for electric contact. Epoxy glue was applied to fixthe wire at both ends of the electrode body and to seal the soldierpoint. At the electrode tip, the wire was cut off and polished witha polishing sheet and the entire electrode was used as a base forpreparing CNT-modified electrode.
MWCNTs for covering of both gold electrodes were func-tionalised in the first step by refluxing for 5 h in concentratednitric acid [33,34]. The functionalisation leads to the forma-tion of carboxyl moieties on the surface of the nanotubes[35]. Simultaneously, this treatment leads to the purificationof CNTs by removal of metallic impurities [26]. Two mil-ligrams of functionalised CNTs was then dissolved in 1 ml ofN,N′-dimethylformamide (DMF) [27,36] with the help of ultra-sonication. The modification of the electrode by CNTs was thenaccomplished by dipping of the freshly cut or polished Au elec-trode into the CNT suspension followed by drying at 100 ◦C.The dipping and drying was repeated 10 times in each case.
2.4. Electrophoretic procedure and samples
The channels of the glass microchip as well as the capillarywere treated before use by rinsing with 0.1 M NaOH (10 min)followed by deionised water (10 min). The background elec-trolyte for separation of catecholamines and their metabolites on
the microchip consisted of 5 mM borate adjusted by phospho-ric acid to pH 7 with the addition of 10 mM SDS and 5 �l/mlPAMAM dendrimer G1.5. For the separation in the capillary theconcentration of SDS was increased to 20 mM. The backgroundelectrolyte was used for preparing of standard sample mixtures.On the microchip, the injection was electrokinetic with injectionvoltage of 1 kV for 3 s; the separation voltage was then 3 kV. Inthe capillary, the injection was hydrodynamic with the pressureof 250 mbar for 6 s; the separation voltage there was 20 kV.
Brain homogenates were prepared by standard proceduresdescribed elsewhere, see e.g. Ref. [4]. Briefly, brain tissues wereweighed frozen and were homogenized in 0.2 M HClO4 con-taining 0.1% of Na2EDTA. The homogenate was centrifuged toremove the precipitated protein and cell debris. The supernatantwas then diluted with the running buffer and directly injected.
The spot urine was collected from a healthy volunteer andimmediately analysed by CE after its dilution with 0.2 M HClO4containing 0.1 % of Na2EDTA in order to prevent the oxidationof the analytes followed by filtration of the sample.
3. Results and discussion
3.1. Development of the method for the simultaneousseparation of catecholamines and their cationic metabolites
The separation of catecholamines (dopamine, noradrenaline,and adrenaline and their O-methoxylated metabolites, namely3-methoxytyramine, normetanephrine, and metanephrine is ademanding task due to their similar structure (Fig. 1(a)) andtherewith nearly identical electrophoretic behaviour. Withoutadditives, these compounds are not electrophoretically separa-ble (Fig. 1(b)), especially if short migration lengths are used.For example, on a migration length of about 8 cm and witha moderate electroosmotic flow (EOF) a time window of lessthan 40 s is available for detection of cations. Moreover, if onlycatecholamines or only cationic metabolites are considered asanalytes in the development of the separation method, differentmigration of these compounds cannot be guaranteed (followingfrom the similar structure and similar electrophoretic behaviour,as demonstrated in Fig. 1(a and b). Only experiments thatinvolve all six compounds can exclude the possible co-migrationand thus interference in the real samples.
To our knowledge, there is merely one publication describingthe simultaneous electrophoretic separation of all six cationiccompounds (three catecholamines and their O-methoxylatedmetabolites) reported by Peterson et al. [37]. The separation wasrealized on long coated capillaries (polyvinyl alcohol) coupledwith time of flight-mass spectrometric detection (TOF-MS).Despite low pH and coating of the capillary surface resultingin diminished EOF, the resolution between cationic amines isnot sufficient for a complete separation within short separationlengths. Furthermore, the laborious coating procedure is hardlyrealizable with the microchips. Therefore, we followed anotherseparation strategy based on the partition between the micel-lar and aqueous phase using sodium dodecyl sulfate, which hasalready been applied to the separation of some of the selectedcompounds, see e.g. Refs. [12,16].
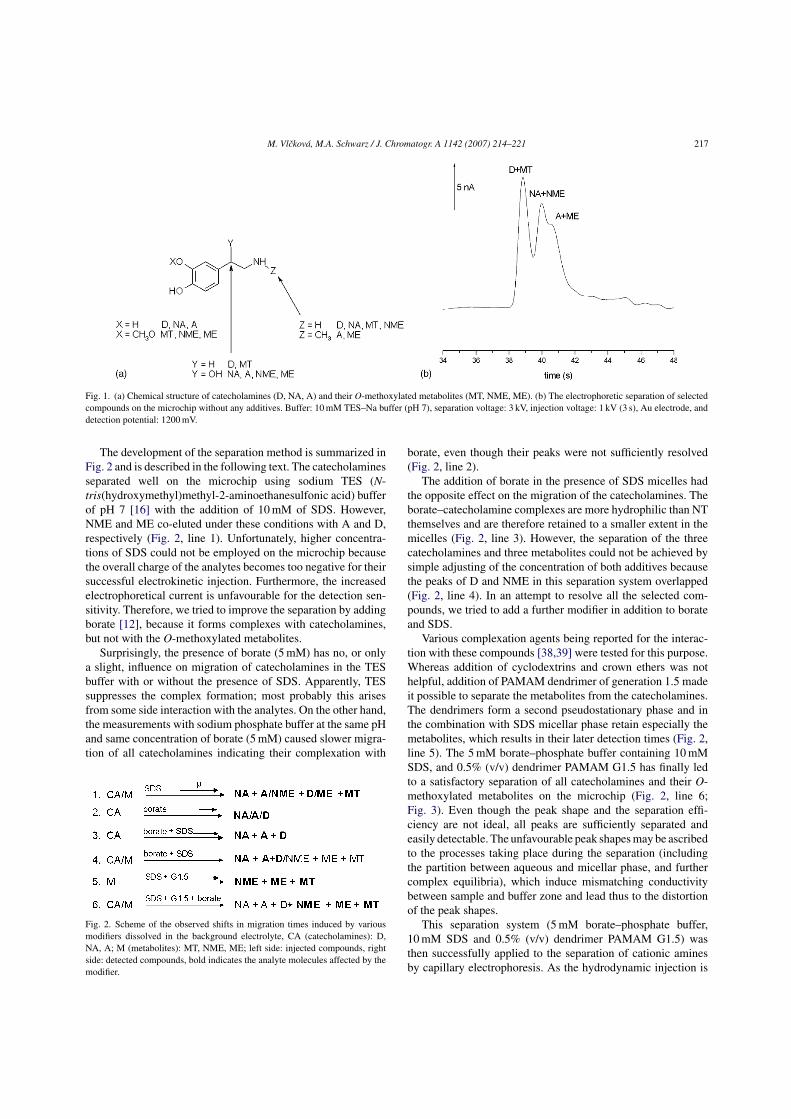
M. Vlckova, M.A. Schwarz / J. Chromatogr. A 1142 (2007) 214–221 217
Fig. 1. (a) Chemical structure of catecholamines (D, NA, A) and their O-methoxylated metabolites (MT, NME, ME). (b) The electrophoretic separation of selectedcompounds on the microchip without any additives. Buffer: 10 mM TES–Na buffer (pH 7), separation voltage: 3 kV, injection voltage: 1 kV (3 s), Au electrode, anddetection potential: 1200 mV.
The development of the separation method is summarized inFig. 2 and is described in the following text. The catecholaminesseparated well on the microchip using sodium TES (N-tris(hydroxymethyl)methyl-2-aminoethanesulfonic acid) bufferof pH 7 [16] with the addition of 10 mM of SDS. However,NME and ME co-eluted under these conditions with A and D,respectively (Fig. 2, line 1). Unfortunately, higher concentra-tions of SDS could not be employed on the microchip becausethe overall charge of the analytes becomes too negative for theirsuccessful electrokinetic injection. Furthermore, the increasedelectrophoretical current is unfavourable for the detection sen-sitivity. Therefore, we tried to improve the separation by addingborate [12], because it forms complexes with catecholamines,but not with the O-methoxylated metabolites.
Surprisingly, the presence of borate (5 mM) has no, or onlya slight, influence on migration of catecholamines in the TESbuffer with or without the presence of SDS. Apparently, TESsuppresses the complex formation; most probably this arisesfrom some side interaction with the analytes. On the other hand,the measurements with sodium phosphate buffer at the same pHand same concentration of borate (5 mM) caused slower migra-tion of all catecholamines indicating their complexation with
Fig. 2. Scheme of the observed shifts in migration times induced by variousmodifiers dissolved in the background electrolyte, CA (catecholamines): D,NA, A; M (metabolites): MT, NME, ME; left side: injected compounds, rightside: detected compounds, bold indicates the analyte molecules affected by themodifier.
borate, even though their peaks were not sufficiently resolved(Fig. 2, line 2).
The addition of borate in the presence of SDS micelles hadthe opposite effect on the migration of the catecholamines. Theborate–catecholamine complexes are more hydrophilic than NTthemselves and are therefore retained to a smaller extent in themicelles (Fig. 2, line 3). However, the separation of the threecatecholamines and three metabolites could not be achieved bysimple adjusting of the concentration of both additives becausethe peaks of D and NME in this separation system overlapped(Fig. 2, line 4). In an attempt to resolve all the selected com-pounds, we tried to add a further modifier in addition to borateand SDS.
Various complexation agents being reported for the interac-tion with these compounds [38,39] were tested for this purpose.Whereas addition of cyclodextrins and crown ethers was nothelpful, addition of PAMAM dendrimer of generation 1.5 madeit possible to separate the metabolites from the catecholamines.The dendrimers form a second pseudostationary phase and inthe combination with SDS micellar phase retain especially themetabolites, which results in their later detection times (Fig. 2,line 5). The 5 mM borate–phosphate buffer containing 10 mMSDS, and 0.5% (v/v) dendrimer PAMAM G1.5 has finally ledto a satisfactory separation of all catecholamines and their O-methoxylated metabolites on the microchip (Fig. 2, line 6;Fig. 3). Even though the peak shape and the separation effi-ciency are not ideal, all peaks are sufficiently separated andeasily detectable. The unfavourable peak shapes may be ascribedto the processes taking place during the separation (includingthe partition between aqueous and micellar phase, and furthercomplex equilibria), which induce mismatching conductivitybetween sample and buffer zone and lead thus to the distortionof the peak shapes.
This separation system (5 mM borate–phosphate buffer,10 mM SDS and 0.5% (v/v) dendrimer PAMAM G1.5) wasthen successfully applied to the separation of cationic aminesby capillary electrophoresis. As the hydrodynamic injection is
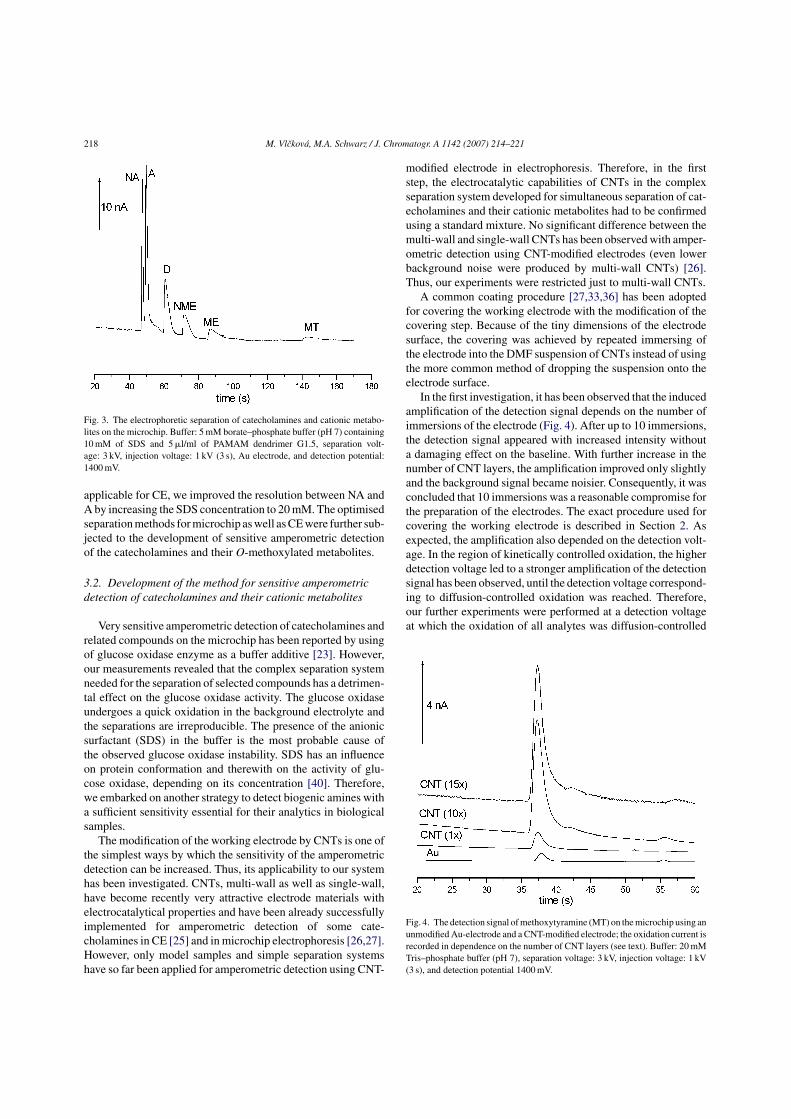
218 M. Vlckova, M.A. Schwarz / J. Chromatogr. A 1142 (2007) 214–221
Fig. 3. The electrophoretic separation of catecholamines and cationic metabo-lites on the microchip. Buffer: 5 mM borate–phosphate buffer (pH 7) containing10 mM of SDS and 5 �l/ml of PAMAM dendrimer G1.5, separation volt-age: 3 kV, injection voltage: 1 kV (3 s), Au electrode, and detection potential:1400 mV.
applicable for CE, we improved the resolution between NA andA by increasing the SDS concentration to 20 mM. The optimisedseparation methods for microchip as well as CE were further sub-jected to the development of sensitive amperometric detectionof the catecholamines and their O-methoxylated metabolites.
3.2. Development of the method for sensitive amperometricdetection of catecholamines and their cationic metabolites
Very sensitive amperometric detection of catecholamines andrelated compounds on the microchip has been reported by usingof glucose oxidase enzyme as a buffer additive [23]. However,our measurements revealed that the complex separation systemneeded for the separation of selected compounds has a detrimen-tal effect on the glucose oxidase activity. The glucose oxidaseundergoes a quick oxidation in the background electrolyte andthe separations are irreproducible. The presence of the anionicsurfactant (SDS) in the buffer is the most probable cause ofthe observed glucose oxidase instability. SDS has an influenceon protein conformation and therewith on the activity of glu-cose oxidase, depending on its concentration [40]. Therefore,we embarked on another strategy to detect biogenic amines witha sufficient sensitivity essential for their analytics in biologicalsamples.
The modification of the working electrode by CNTs is one ofthe simplest ways by which the sensitivity of the amperometricdetection can be increased. Thus, its applicability to our systemhas been investigated. CNTs, multi-wall as well as single-wall,have become recently very attractive electrode materials withelectrocatalytical properties and have been already successfullyimplemented for amperometric detection of some cate-cholamines in CE [25] and in microchip electrophoresis [26,27].However, only model samples and simple separation systemshave so far been applied for amperometric detection using CNT-
modified electrode in electrophoresis. Therefore, in the firststep, the electrocatalytic capabilities of CNTs in the complexseparation system developed for simultaneous separation of cat-echolamines and their cationic metabolites had to be confirmedusing a standard mixture. No significant difference between themulti-wall and single-wall CNTs has been observed with amper-ometric detection using CNT-modified electrodes (even lowerbackground noise were produced by multi-wall CNTs) [26].Thus, our experiments were restricted just to multi-wall CNTs.
A common coating procedure [27,33,36] has been adoptedfor covering the working electrode with the modification of thecovering step. Because of the tiny dimensions of the electrodesurface, the covering was achieved by repeated immersing ofthe electrode into the DMF suspension of CNTs instead of usingthe more common method of dropping the suspension onto theelectrode surface.
In the first investigation, it has been observed that the inducedamplification of the detection signal depends on the number ofimmersions of the electrode (Fig. 4). After up to 10 immersions,the detection signal appeared with increased intensity withouta damaging effect on the baseline. With further increase in thenumber of CNT layers, the amplification improved only slightlyand the background signal became noisier. Consequently, it wasconcluded that 10 immersions was a reasonable compromise forthe preparation of the electrodes. The exact procedure used forcovering the working electrode is described in Section 2. Asexpected, the amplification also depended on the detection volt-age. In the region of kinetically controlled oxidation, the higherdetection voltage led to a stronger amplification of the detectionsignal has been observed, until the detection voltage correspond-ing to diffusion-controlled oxidation was reached. Therefore,our further experiments were performed at a detection voltageat which the oxidation of all analytes was diffusion-controlled
Fig. 4. The detection signal of methoxytyramine (MT) on the microchip using anunmodified Au-electrode and a CNT-modified electrode; the oxidation current isrecorded in dependence on the number of CNT layers (see text). Buffer: 20 mMTris–phosphate buffer (pH 7), separation voltage: 3 kV, injection voltage: 1 kV(3 s), and detection potential 1400 mV.
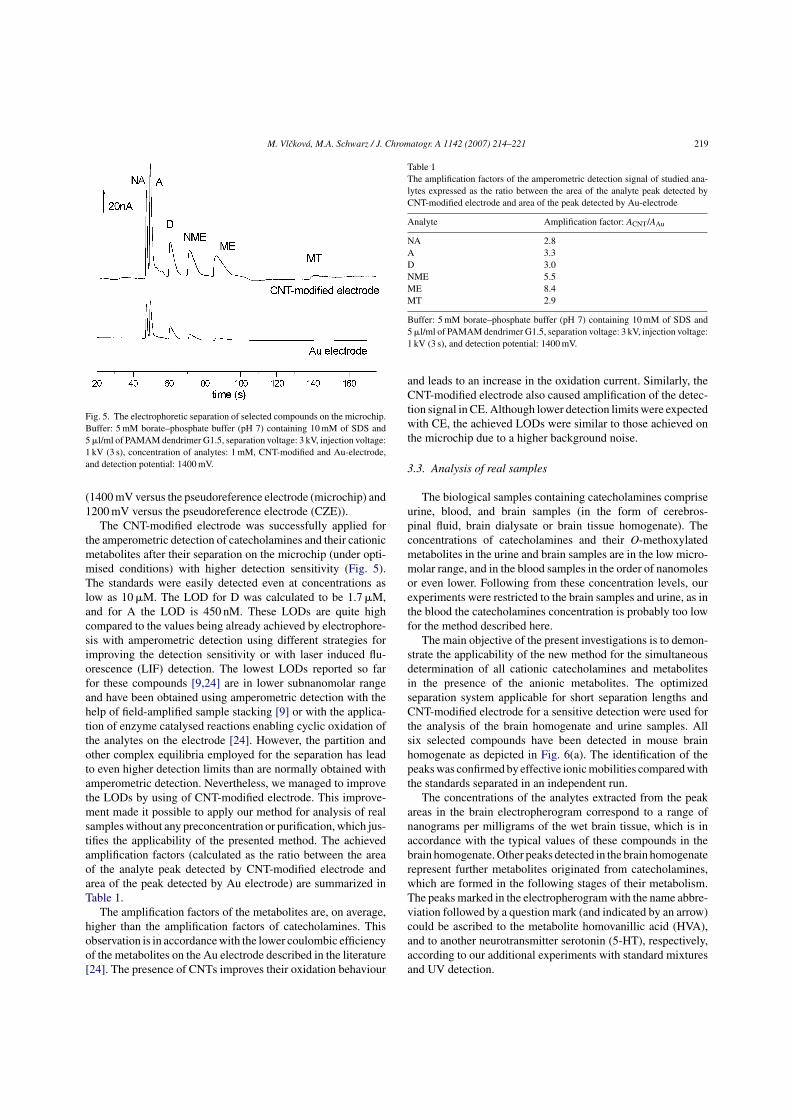
M. Vlckova, M.A. Schwarz / J. Chromatogr. A 1142 (2007) 214–221 219
Fig. 5. The electrophoretic separation of selected compounds on the microchip.Buffer: 5 mM borate–phosphate buffer (pH 7) containing 10 mM of SDS and5 �l/ml of PAMAM dendrimer G1.5, separation voltage: 3 kV, injection voltage:1 kV (3 s), concentration of analytes: 1 mM, CNT-modified and Au-electrode,and detection potential: 1400 mV.
(1400 mV versus the pseudoreference electrode (microchip) and1200 mV versus the pseudoreference electrode (CZE)).
The CNT-modified electrode was successfully applied forthe amperometric detection of catecholamines and their cationicmetabolites after their separation on the microchip (under opti-mised conditions) with higher detection sensitivity (Fig. 5).The standards were easily detected even at concentrations aslow as 10 �M. The LOD for D was calculated to be 1.7 �M,and for A the LOD is 450 nM. These LODs are quite highcompared to the values being already achieved by electrophore-sis with amperometric detection using different strategies forimproving the detection sensitivity or with laser induced flu-orescence (LIF) detection. The lowest LODs reported so farfor these compounds [9,24] are in lower subnanomolar rangeand have been obtained using amperometric detection with thehelp of field-amplified sample stacking [9] or with the applica-tion of enzyme catalysed reactions enabling cyclic oxidation ofthe analytes on the electrode [24]. However, the partition andother complex equilibria employed for the separation has leadto even higher detection limits than are normally obtained withamperometric detection. Nevertheless, we managed to improvethe LODs by using of CNT-modified electrode. This improve-ment made it possible to apply our method for analysis of realsamples without any preconcentration or purification, which jus-tifies the applicability of the presented method. The achievedamplification factors (calculated as the ratio between the areaof the analyte peak detected by CNT-modified electrode andarea of the peak detected by Au electrode) are summarized inTable 1.
The amplification factors of the metabolites are, on average,higher than the amplification factors of catecholamines. Thisobservation is in accordance with the lower coulombic efficiencyof the metabolites on the Au electrode described in the literature[24]. The presence of CNTs improves their oxidation behaviour
Table 1The amplification factors of the amperometric detection signal of studied ana-lytes expressed as the ratio between the area of the analyte peak detected byCNT-modified electrode and area of the peak detected by Au-electrode
Analyte Amplification factor: ACNT/AAu
NA 2.8A 3.3D 3.0NME 5.5ME 8.4MT 2.9
Buffer: 5 mM borate–phosphate buffer (pH 7) containing 10 mM of SDS and5 �l/ml of PAMAM dendrimer G1.5, separation voltage: 3 kV, injection voltage:1 kV (3 s), and detection potential: 1400 mV.
and leads to an increase in the oxidation current. Similarly, theCNT-modified electrode also caused amplification of the detec-tion signal in CE. Although lower detection limits were expectedwith CE, the achieved LODs were similar to those achieved onthe microchip due to a higher background noise.
3.3. Analysis of real samples
The biological samples containing catecholamines compriseurine, blood, and brain samples (in the form of cerebros-pinal fluid, brain dialysate or brain tissue homogenate). Theconcentrations of catecholamines and their O-methoxylatedmetabolites in the urine and brain samples are in the low micro-molar range, and in the blood samples in the order of nanomolesor even lower. Following from these concentration levels, ourexperiments were restricted to the brain samples and urine, as inthe blood the catecholamines concentration is probably too lowfor the method described here.
The main objective of the present investigations is to demon-strate the applicability of the new method for the simultaneousdetermination of all cationic catecholamines and metabolitesin the presence of the anionic metabolites. The optimizedseparation system applicable for short separation lengths andCNT-modified electrode for a sensitive detection were used forthe analysis of the brain homogenate and urine samples. Allsix selected compounds have been detected in mouse brainhomogenate as depicted in Fig. 6(a). The identification of thepeaks was confirmed by effective ionic mobilities compared withthe standards separated in an independent run.
The concentrations of the analytes extracted from the peakareas in the brain electropherogram correspond to a range ofnanograms per milligrams of the wet brain tissue, which is inaccordance with the typical values of these compounds in thebrain homogenate. Other peaks detected in the brain homogenaterepresent further metabolites originated from catecholamines,which are formed in the following stages of their metabolism.The peaks marked in the electropherogram with the name abbre-viation followed by a question mark (and indicated by an arrow)could be ascribed to the metabolite homovanillic acid (HVA),and to another neurotransmitter serotonin (5-HT), respectively,according to our additional experiments with standard mixturesand UV detection.
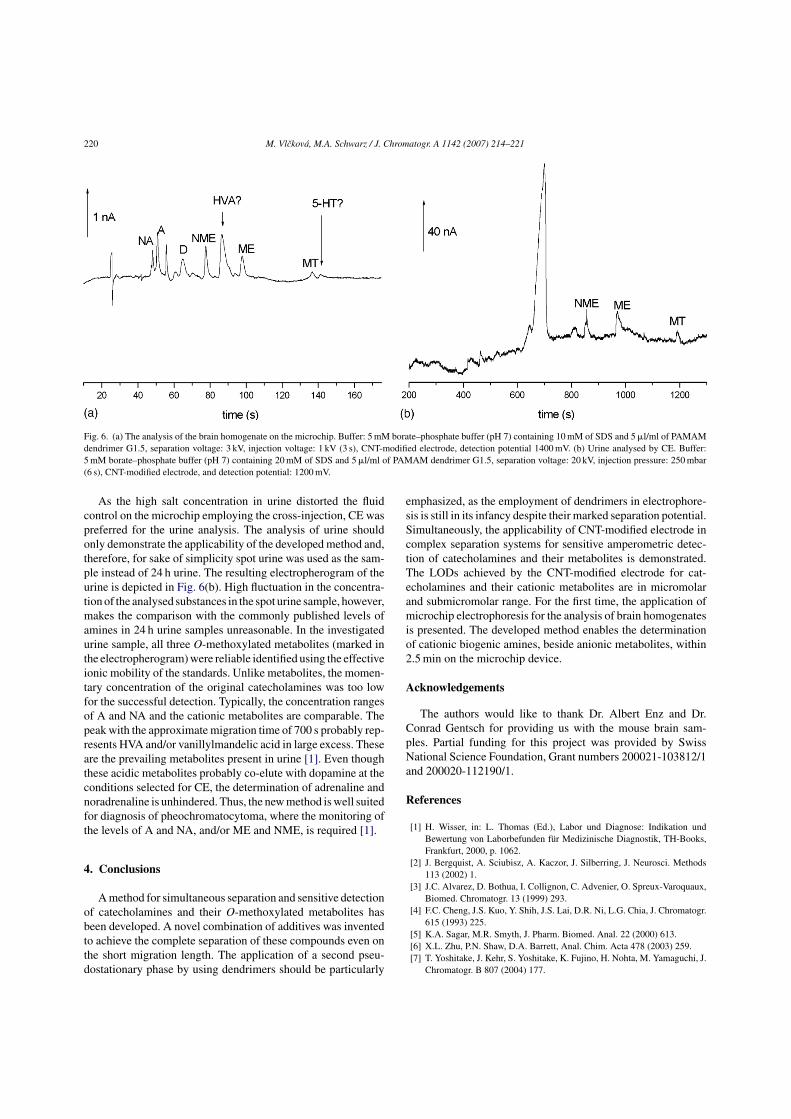
220 M. Vlckova, M.A. Schwarz / J. Chromatogr. A 1142 (2007) 214–221
Fig. 6. (a) The analysis of the brain homogenate on the microchip. Buffer: 5 mM borate–phosphate buffer (pH 7) containing 10 mM of SDS and 5 �l/ml of PAMAMdendrimer G1.5, separation voltage: 3 kV, injection voltage: 1 kV (3 s), CNT-modified electrode, detection potential 1400 mV. (b) Urine analysed by CE. Buffer:5 mM borate–phosphate buffer (pH 7) containing 20 mM of SDS and 5 �l/ml of PAMAM dendrimer G1.5, separation voltage: 20 kV, injection pressure: 250 mbar(6 s), CNT-modified electrode, and detection potential: 1200 mV.
As the high salt concentration in urine distorted the fluidcontrol on the microchip employing the cross-injection, CE waspreferred for the urine analysis. The analysis of urine shouldonly demonstrate the applicability of the developed method and,therefore, for sake of simplicity spot urine was used as the sam-ple instead of 24 h urine. The resulting electropherogram of theurine is depicted in Fig. 6(b). High fluctuation in the concentra-tion of the analysed substances in the spot urine sample, however,makes the comparison with the commonly published levels ofamines in 24 h urine samples unreasonable. In the investigatedurine sample, all three O-methoxylated metabolites (marked inthe electropherogram) were reliable identified using the effectiveionic mobility of the standards. Unlike metabolites, the momen-tary concentration of the original catecholamines was too lowfor the successful detection. Typically, the concentration rangesof A and NA and the cationic metabolites are comparable. Thepeak with the approximate migration time of 700 s probably rep-resents HVA and/or vanillylmandelic acid in large excess. Theseare the prevailing metabolites present in urine [1]. Even thoughthese acidic metabolites probably co-elute with dopamine at theconditions selected for CE, the determination of adrenaline andnoradrenaline is unhindered. Thus, the new method is well suitedfor diagnosis of pheochromatocytoma, where the monitoring ofthe levels of A and NA, and/or ME and NME, is required [1].
4. Conclusions
A method for simultaneous separation and sensitive detectionof catecholamines and their O-methoxylated metabolites hasbeen developed. A novel combination of additives was inventedto achieve the complete separation of these compounds even onthe short migration length. The application of a second pseu-dostationary phase by using dendrimers should be particularly
emphasized, as the employment of dendrimers in electrophore-sis is still in its infancy despite their marked separation potential.Simultaneously, the applicability of CNT-modified electrode incomplex separation systems for sensitive amperometric detec-tion of catecholamines and their metabolites is demonstrated.The LODs achieved by the CNT-modified electrode for cat-echolamines and their cationic metabolites are in micromolarand submicromolar range. For the first time, the application ofmicrochip electrophoresis for the analysis of brain homogenatesis presented. The developed method enables the determinationof cationic biogenic amines, beside anionic metabolites, within2.5 min on the microchip device.
Acknowledgements
The authors would like to thank Dr. Albert Enz and Dr.Conrad Gentsch for providing us with the mouse brain sam-ples. Partial funding for this project was provided by SwissNational Science Foundation, Grant numbers 200021-103812/1and 200020-112190/1.
References
[1] H. Wisser, in: L. Thomas (Ed.), Labor und Diagnose: Indikation undBewertung von Laborbefunden fur Medizinische Diagnostik, TH-Books,Frankfurt, 2000, p. 1062.
[2] J. Bergquist, A. Sciubisz, A. Kaczor, J. Silberring, J. Neurosci. Methods113 (2002) 1.
[3] J.C. Alvarez, D. Bothua, I. Collignon, C. Advenier, O. Spreux-Varoquaux,Biomed. Chromatogr. 13 (1999) 293.
[4] F.C. Cheng, J.S. Kuo, Y. Shih, J.S. Lai, D.R. Ni, L.G. Chia, J. Chromatogr.615 (1993) 225.
[5] K.A. Sagar, M.R. Smyth, J. Pharm. Biomed. Anal. 22 (2000) 613.[6] X.L. Zhu, P.N. Shaw, D.A. Barrett, Anal. Chim. Acta 478 (2003) 259.[7] T. Yoshitake, J. Kehr, S. Yoshitake, K. Fujino, H. Nohta, M. Yamaguchi, J.
Chromatogr. B 807 (2004) 177.
M. Vlckova, M.A. Schwarz / J. Chromatogr. A 1142 (2007) 214–221 221
[8] R.P.H. Nikolajsen, A.M. Hansen, Anal. Chim. Acta 449 (2001) 1.[9] Q.F. Weng, G.W. Xu, K.L. Yuan, P. Tang, J. Chromatogr. B 835 (2006) 55.
[10] H. Siren, U. Karjalainen, J. Chromatogr. A 853 (1999) 527.[11] K. Vuorensola, H. Siren, U. Karjalainen, J. Chromatogr. B 788 (2003) 277.[12] T.L. Paxon, P.R. Powell, H.-G. Lee, K.-A. Han, A.G. Ewing, Anal. Chem.
77 (2005) 5349.[13] S. Tanaka, T. Kaneta, H. Yoshida, Anal. Sci. 6 (1990) 467.[14] X. Li, W. Jin, Q. Weng, Anal. Chim. Acta 461 (2002) 123.[15] H. Siren, M. Mielonen, M. Herlevi, J. Chromatogr. A 1032 (2004) 289.[16] P.J. Ream, S.W. Suljak, A.G. Ewing, K.-A. Han, Anal. Chem. 75 (2003)
3972.[17] R.H. Zhu, W.T. Kok, Anal. Chem. 69 (1997) 4010.[18] S.W. Suljak, F.D. Swanek, P.F. Gavin, A.G. Ewing, J. Sep. Sci. 26 (2003)
61.[19] K. Vuorensola, H. Siren, J. Chromatogr. A 895 (2000) 317.[20] H.T. Chang, E.S. Yeung, Anal. Chem. 67 (1995) 1079.[21] M. Du, V. Flanigan, Y.F. Ma, Electrophoresis 25 (2004) 1496.[22] D. Chen, D. Zhan, C. Cheng, A. Liu, C. Chen, J. Chromatogr. B 750 (2001)
33.[23] M.A. Schwarz, Electrophoresis 25 (2004) 1916.[24] M. Vlckova, M.A. Schwarz, Electrophoresis 26 (2005) 2701.[25] M. Chicharro, A. Sanchez, E. Bermejo, A. Zapardiel, M.D. Rubianes, G.A.
Rivas, Anal. Chim. Acta 543 (2005) 84.
[26] J. Wang, G. Chen, M.P. Chatrathi, M. Musameh, Anal. Chem. 76 (2004)298.
[27] M. Pumera, X. Llopis, A. Merkoci, S. Alegret, Microchim. Acta 152 (2006)261.
[28] J.A. Lapos, D.P. Manica, A.G. Ewing, Anal. Chem. 74 (2002) 3348.[29] M.S. Shou, C.R. Ferrario, K.N. Schultz, T.E. Robinson, R.T. Kennedy,
Anal. Chem. 78 (2006) 6717.[30] T. Kappes, P.C. Hauser, Analyst 124 (1999) 1035.[31] M.A. Schwarz, B. Galliker, K. Fluri, T. Kappes, P.C. Hauser, Analyst 126
(2001) 145.[32] T. Kappes, B. Galliker, M.A. Schwarz, P.C. Hauser, Trends Anal. Chem.
20 (2001) 133.[33] W. Zhang, Y. Xie, S. Ai, F. Wan, J. Wang, L. Jin, J. Jin, J. Chromatogr. B
791 (2003) 217.[34] K. Wu, S. Hu, Microchim. Acta 144 (2004) 131.[35] J. Wang, Electranalysis 17 (2005) 7.[36] C. Hu, W. Wang, K. Liao, G. Liu, Y. Wang, J. Phys. Chem. Solids 65 (2004)
1731.[37] Z.D. Peterson, D.C. Collins, C.R. Bowerbank, M.L. Lee, S.W. Graves, J.
Chromatogr. B 776 (2002) 221.[38] M.A. Schwarz, P.C. Hauser, Anal. Chem. 75 (2003) 4691.[39] M.A. Schwarz, P.C. Hauser, J. Chromatogr. A 928 (2001) 225.[40] A.A. Moosavi-Movahedi, J. Iran. Chem. Soc. 2 (2005) 189.
Publication 2
Enzymatic sensitivity enhancement of biogenic monoamines on a chip
Vlčková, M., Schwarz, M.A.
Electrophoresis 2005, 26 (14), 2701-2707

Markéta VlckováMaria A. Schwarz
Department of Chemistry,University of Basel,Basel, Switzerland
Enzymatic sensitivity enhancement of biogenicmonoamines on a chip
Detection of biogenic monoamines in nanomolar concentrations is of great importancefor probing the brain chemistry and for their analytics in biological fluids. The sensitivityenhancement of amperometric detection of neurotransmitters (NTs) and their metab-olites after their electrophoretic separation on a microchip is presented and is basedon coupled enzymatic reactions. The current response of the analyte is amplified bycyclic oxidation on a gold electrode mediated by reduced nicotinamide dinucleotidecoenzyme and glucose oxidase enzyme present in the electrophoresis buffer. Usingthis approach, detection limits of about 10 nM for NTs and their metabolites can bereached.
Keywords: Amperometry / Chip-capillary electrophoresis / Enzyme-catalyzed oxidation /Glucose oxidase / NADH DOI 10.1002/elps.200410396
1 Introduction
The neurotransmitters (NTs) dopamine (D), adrenaline(AD) and noradrenaline (NA) are very important catecho-lamines (biological monoamines) in the mammalian cen-tral nervous system and their main metabolites are meth-oxytyramine (MT), normetanephrine (NME) and meta-nephrine (ME). Abnormalities in NTs and thus metaboliteconcentration levels are important indications of manydiseases. Therefore, direct simultaneous determination ofthese species in the nanomolar range is desirable for theanalysis of brain dialysates, urine or blood samples ofpatients. To date, mostly HPLC methods with electro-chemical [1, 2] or fluorescence [3, 4] detection have beenemployed for the analytics of monoamines in biologicalsamples. Despite low detection limits of these chromato-graphic methods, long analytical times are often required(up to 60 min). Only relatively few applications of CE havebeen reported for the separation of catecholamines andrelated compounds. UV [5–8], fluorescence [9–12], lumi-nescence [13] and also electrochemical [14, 15] detectionhas been used for these separations but here also, longseparation times (about 30 min) are typically required.
In general, a drastic reduction in analysis time can beachieved by employing electrophoretic separation onmicromachined separation devices [16]. However, detec-tion sensitivity is one of the few performance parametersthat does not directly benefit from system miniaturization,particularly in the case of optical detection systems.Electrochemical detection offers several unique andattractive features for CE of small dimensions includingremarkable sensitivity and selectivity. A number of re-search groups have recently reported the implementationof amperometric detectors on microchip electrophoresis[17, 18]. Microchip-CZE with amperometric detection ofNTs in conventional background buffers has beendemonstrated and detection limits (LODs) for standardsolutions of 1026–1027 mol/L have been achieved [19].The lowest LOD reported so far is 1.2 6 1027 M [20](decoupling device) and 1.0 6 1027 M [21] (withoutdecoupler) and was observed for D.
The use of enzyme-catalyzed reactions on the ampero-metric electrode can influence the oxidation current ofNTs in a simple way and is a useful tool for selective andsensitive measurements of biogenic monoamines. Sev-eral electrochemical biosensors based on this approachhave been described in the literature. Cellobiose dehy-drogenase [22], glucose dehydrogenase [23], laccase [24]and tyrosinase [25] are the examples of enzymes beingimmobilised on an electrode surface in these biosensors.Recently, we have demonstrated that the electro-generated form of biogenic monoamines, after an elec-trophoretic separation, reacts with the reduced form ofglucose oxidase (GOx) in the presence of glucose (G) [26].LODs in the range of 1027 M have been reached with thesystem G/GOx.
Correspondence: Dr. Maria A. Schwarz, Department of Che-mistry, University of Basel, Spitalstrasse 51, CH-4056 Basel,SwitzerlandE-mail: [email protected]: 141-61-267-1005
Abbreviations: AD, adrenaline; D, dopamine; FAD, flavine ade-nine dinucleotide; G, glucose; GOx, glucose oxidase; ME, meta-nephrine; MT, methoxytyramine; NA, noradrenaline; NADH,nicotinamide dinucleotide reduced form; NME, normetanephr-ine; NT, neurotransmitter
Electrophoresis 2005, 26, 2701–2707 2701
© 2005 WILEY-VCH Verlag GmbH & Co. KGaA, Weinheim
Min
iatu
riza
tio
n
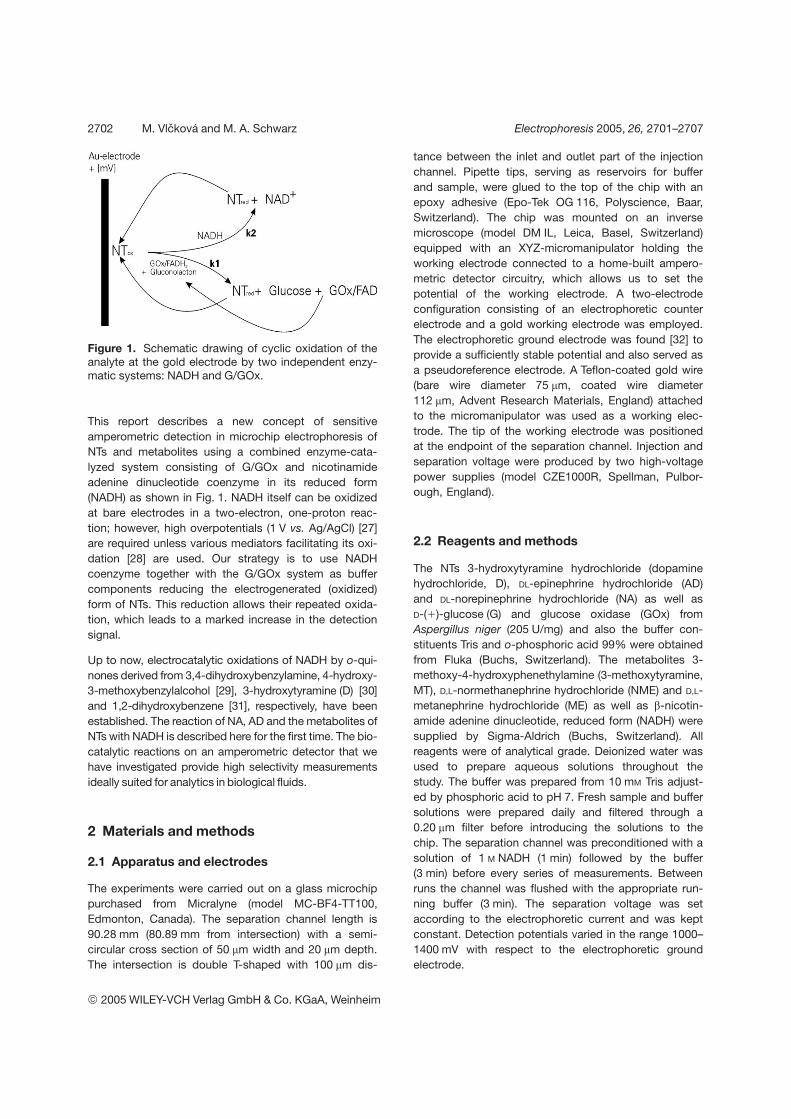
2702 M. Vlcková and M. A. Schwarz Electrophoresis 2005, 26, 2701–2707
Figure 1. Schematic drawing of cyclic oxidation of theanalyte at the gold electrode by two independent enzy-matic systems: NADH and G/GOx.
This report describes a new concept of sensitiveamperometric detection in microchip electrophoresis ofNTs and metabolites using a combined enzyme-cata-lyzed system consisting of G/GOx and nicotinamideadenine dinucleotide coenzyme in its reduced form(NADH) as shown in Fig. 1. NADH itself can be oxidizedat bare electrodes in a two-electron, one-proton reac-tion; however, high overpotentials (1 V vs. Ag/AgCl) [27]are required unless various mediators facilitating its oxi-dation [28] are used. Our strategy is to use NADHcoenzyme together with the G/GOx system as buffercomponents reducing the electrogenerated (oxidized)form of NTs. This reduction allows their repeated oxida-tion, which leads to a marked increase in the detectionsignal.
Up to now, electrocatalytic oxidations of NADH by o-qui-nones derived from 3,4-dihydroxybenzylamine, 4-hydroxy-3-methoxybenzylalcohol [29], 3-hydroxytyramine (D) [30]and 1,2-dihydroxybenzene [31], respectively, have beenestablished. The reaction of NA, AD and the metabolites ofNTs with NADH is described here for the first time. The bio-catalytic reactions on an amperometric detector that wehave investigated provide high selectivity measurementsideally suited for analytics in biological fluids.
2 Materials and methods
2.1 Apparatus and electrodes
The experiments were carried out on a glass microchippurchased from Micralyne (model MC-BF4-TT100,Edmonton, Canada). The separation channel length is90.28 mm (80.89 mm from intersection) with a semi-circular cross section of 50 mm width and 20 mm depth.The intersection is double T-shaped with 100 mm dis-
tance between the inlet and outlet part of the injectionchannel. Pipette tips, serving as reservoirs for bufferand sample, were glued to the top of the chip with anepoxy adhesive (Epo-Tek OG 116, Polyscience, Baar,Switzerland). The chip was mounted on an inversemicroscope (model DM IL, Leica, Basel, Switzerland)equipped with an XYZ-micromanipulator holding theworking electrode connected to a home-built ampero-metric detector circuitry, which allows us to set thepotential of the working electrode. A two-electrodeconfiguration consisting of an electrophoretic counterelectrode and a gold working electrode was employed.The electrophoretic ground electrode was found [32] toprovide a sufficiently stable potential and also served asa pseudoreference electrode. A Teflon-coated gold wire(bare wire diameter 75 mm, coated wire diameter112 mm, Advent Research Materials, England) attachedto the micromanipulator was used as a working elec-trode. The tip of the working electrode was positionedat the endpoint of the separation channel. Injection andseparation voltage were produced by two high-voltagepower supplies (model CZE1000R, Spellman, Pulbor-ough, England).
2.2 Reagents and methods
The NTs 3-hydroxytyramine hydrochloride (dopaminehydrochloride, D), DL-epinephrine hydrochloride (AD)and DL-norepinephrine hydrochloride (NA) as well asD-(1)-glucose (G) and glucose oxidase (GOx) fromAspergillus niger (205 U/mg) and also the buffer con-stituents Tris and o-phosphoric acid 99% were obtainedfrom Fluka (Buchs, Switzerland). The metabolites 3-methoxy-4-hydroxyphenethylamine (3-methoxytyramine,MT), D,L-normethanephrine hydrochloride (NME) and D,L-metanephrine hydrochloride (ME) as well as b-nicotin-amide adenine dinucleotide, reduced form (NADH) weresupplied by Sigma-Aldrich (Buchs, Switzerland). Allreagents were of analytical grade. Deionized water wasused to prepare aqueous solutions throughout thestudy. The buffer was prepared from 10 mM Tris adjust-ed by phosphoric acid to pH 7. Fresh sample and buffersolutions were prepared daily and filtered through a0.20 mm filter before introducing the solutions to thechip. The separation channel was preconditioned with asolution of 1 M NADH (1 min) followed by the buffer(3 min) before every series of measurements. Betweenruns the channel was flushed with the appropriate run-ning buffer (3 min). The separation voltage was setaccording to the electrophoretic current and was keptconstant. Detection potentials varied in the range 1000–1400 mV with respect to the electrophoretic groundelectrode.
© 2005 WILEY-VCH Verlag GmbH & Co. KGaA, Weinheim
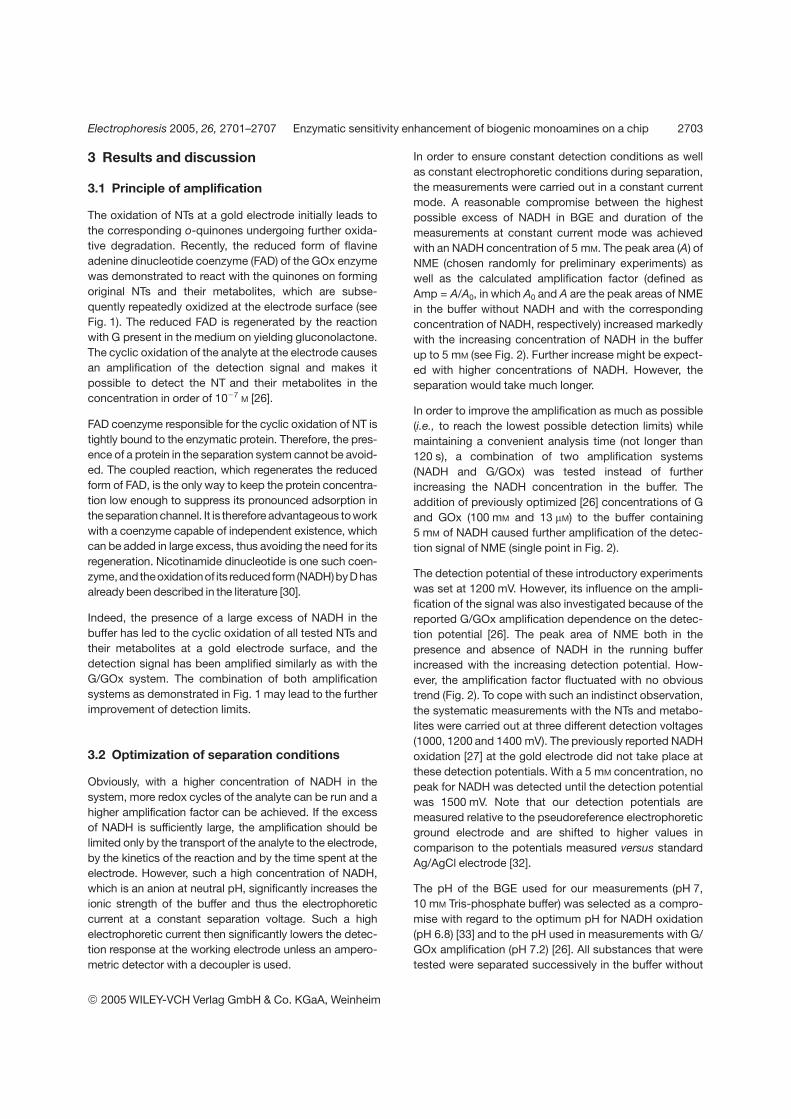
Electrophoresis 2005, 26, 2701–2707 Enzymatic sensitivity enhancement of biogenic monoamines on a chip 2703
3 Results and discussion
3.1 Principle of amplification
The oxidation of NTs at a gold electrode initially leads tothe corresponding o-quinones undergoing further oxida-tive degradation. Recently, the reduced form of flavineadenine dinucleotide coenzyme (FAD) of the GOx enzymewas demonstrated to react with the quinones on formingoriginal NTs and their metabolites, which are subse-quently repeatedly oxidized at the electrode surface (seeFig. 1). The reduced FAD is regenerated by the reactionwith G present in the medium on yielding gluconolactone.The cyclic oxidation of the analyte at the electrode causesan amplification of the detection signal and makes itpossible to detect the NT and their metabolites in theconcentration in order of 1027 M [26].
FAD coenzyme responsible for the cyclic oxidation of NT istightly bound to the enzymatic protein. Therefore, the pres-ence of a protein in the separation system cannot be avoid-ed. The coupled reaction, which regenerates the reducedform of FAD, is the only way to keep the protein concentra-tion low enough to suppress its pronounced adsorption inthe separation channel. It is therefore advantageous to workwith a coenzyme capable of independent existence, whichcan be added in large excess, thus avoiding the need for itsregeneration. Nicotinamide dinucleotide is one such coen-zyme,andtheoxidationof its reduced form (NADH)byD hasalready been described in the literature [30].
Indeed, the presence of a large excess of NADH in thebuffer has led to the cyclic oxidation of all tested NTs andtheir metabolites at a gold electrode surface, and thedetection signal has been amplified similarly as with theG/GOx system. The combination of both amplificationsystems as demonstrated in Fig. 1 may lead to the furtherimprovement of detection limits.
3.2 Optimization of separation conditions
Obviously, with a higher concentration of NADH in thesystem, more redox cycles of the analyte can be run and ahigher amplification factor can be achieved. If the excessof NADH is sufficiently large, the amplification should belimited only by the transport of the analyte to the electrode,by the kinetics of the reaction and by the time spent at theelectrode. However, such a high concentration of NADH,which is an anion at neutral pH, significantly increases theionic strength of the buffer and thus the electrophoreticcurrent at a constant separation voltage. Such a highelectrophoretic current then significantly lowers the detec-tion response at the working electrode unless an ampero-metric detector with a decoupler is used.
In order to ensure constant detection conditions as wellas constant electrophoretic conditions during separation,the measurements were carried out in a constant currentmode. A reasonable compromise between the highestpossible excess of NADH in BGE and duration of themeasurements at constant current mode was achievedwith an NADH concentration of 5 mM. The peak area (A) ofNME (chosen randomly for preliminary experiments) aswell as the calculated amplification factor (defined asAmp = A/A0, in which A0 and A are the peak areas of NMEin the buffer without NADH and with the correspondingconcentration of NADH, respectively) increased markedlywith the increasing concentration of NADH in the bufferup to 5 mM (see Fig. 2). Further increase might be expect-ed with higher concentrations of NADH. However, theseparation would take much longer.
In order to improve the amplification as much as possible(i.e., to reach the lowest possible detection limits) whilemaintaining a convenient analysis time (not longer than120 s), a combination of two amplification systems(NADH and G/GOx) was tested instead of furtherincreasing the NADH concentration in the buffer. Theaddition of previously optimized [26] concentrations of Gand GOx (100 mM and 13 mM) to the buffer containing5 mM of NADH caused further amplification of the detec-tion signal of NME (single point in Fig. 2).
The detection potential of these introductory experimentswas set at 1200 mV. However, its influence on the ampli-fication of the signal was also investigated because of thereported G/GOx amplification dependence on the detec-tion potential [26]. The peak area of NME both in thepresence and absence of NADH in the running bufferincreased with the increasing detection potential. How-ever, the amplification factor fluctuated with no obvioustrend (Fig. 2). To cope with such an indistinct observation,the systematic measurements with the NTs and metabo-lites were carried out at three different detection voltages(1000, 1200 and 1400 mV). The previously reported NADHoxidation [27] at the gold electrode did not take place atthese detection potentials. With a 5 mM concentration, nopeak for NADH was detected until the detection potentialwas 1500 mV. Note that our detection potentials aremeasured relative to the pseudoreference electrophoreticground electrode and are shifted to higher values incomparison to the potentials measured versus standardAg/AgCl electrode [32].
The pH of the BGE used for our measurements (pH 7,10 mM Tris-phosphate buffer) was selected as a compro-mise with regard to the optimum pH for NADH oxidation(pH 6.8) [33] and to the pH used in measurements with G/GOx amplification (pH 7.2) [26]. All substances that weretested were separated successively in the buffer without
© 2005 WILEY-VCH Verlag GmbH & Co. KGaA, Weinheim
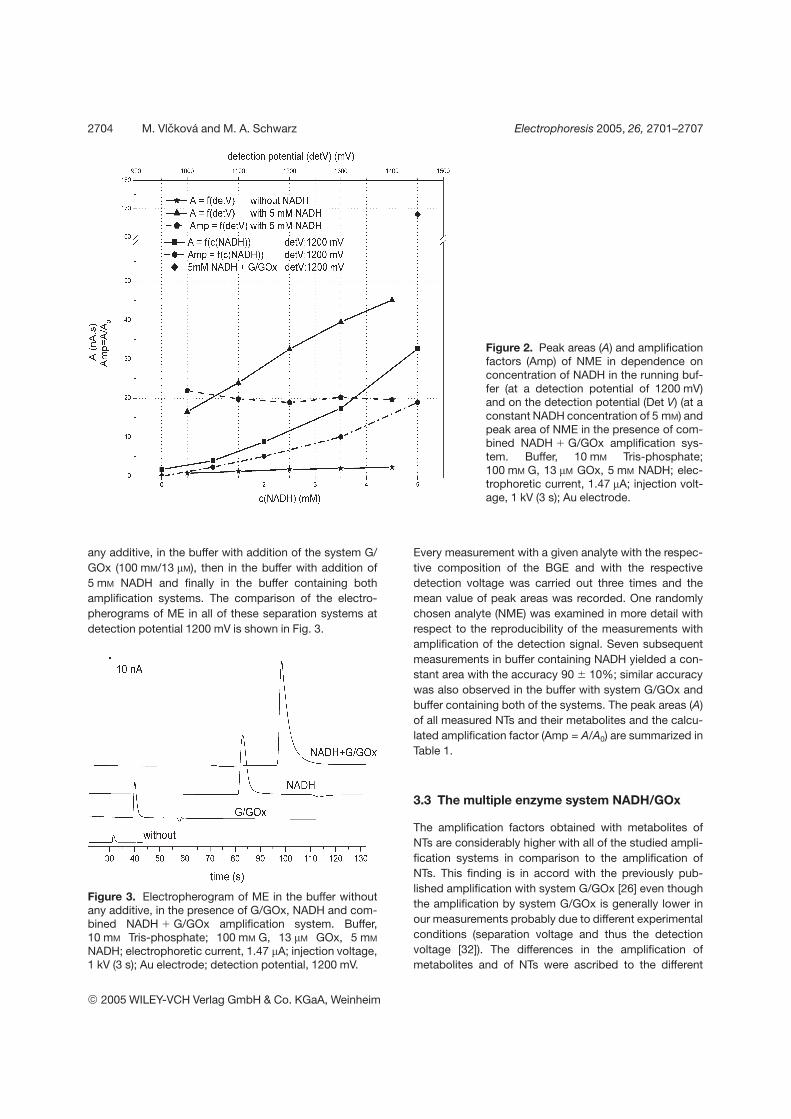
2704 M. Vlcková and M. A. Schwarz Electrophoresis 2005, 26, 2701–2707
Figure 2. Peak areas (A) and amplificationfactors (Amp) of NME in dependence onconcentration of NADH in the running buf-fer (at a detection potential of 1200 mV)and on the detection potential (Det V) (at aconstant NADH concentration of 5 mM) andpeak area of NME in the presence of com-bined NADH 1 G/GOx amplification sys-tem. Buffer, 10 mM Tris-phosphate;100 mM G, 13 mM GOx, 5 mM NADH; elec-trophoretic current, 1.47 mA; injection volt-age, 1 kV (3 s); Au electrode.
any additive, in the buffer with addition of the system G/GOx (100 mM/13 mM), then in the buffer with addition of5 mM NADH and finally in the buffer containing bothamplification systems. The comparison of the electro-pherograms of ME in all of these separation systems atdetection potential 1200 mV is shown in Fig. 3.
Figure 3. Electropherogram of ME in the buffer withoutany additive, in the presence of G/GOx, NADH and com-bined NADH 1 G/GOx amplification system. Buffer,10 mM Tris-phosphate; 100 mM G, 13 mM GOx, 5 mM
NADH; electrophoretic current, 1.47 mA; injection voltage,1 kV (3 s); Au electrode; detection potential, 1200 mV.
Every measurement with a given analyte with the respec-tive composition of the BGE and with the respectivedetection voltage was carried out three times and themean value of peak areas was recorded. One randomlychosen analyte (NME) was examined in more detail withrespect to the reproducibility of the measurements withamplification of the detection signal. Seven subsequentmeasurements in buffer containing NADH yielded a con-stant area with the accuracy 90 6 10%; similar accuracywas also observed in the buffer with system G/GOx andbuffer containing both of the systems. The peak areas (A)of all measured NTs and their metabolites and the calcu-lated amplification factor (Amp = A/A0) are summarized inTable 1.
3.3 The multiple enzyme system NADH/GOx
The amplification factors obtained with metabolites ofNTs are considerably higher with all of the studied ampli-fication systems in comparison to the amplification ofNTs. This finding is in accord with the previously pub-lished amplification with system G/GOx [26] even thoughthe amplification by system G/GOx is generally lower inour measurements probably due to different experimentalconditions (separation voltage and thus the detectionvoltage [32]). The differences in the amplification ofmetabolites and of NTs were ascribed to the different
© 2005 WILEY-VCH Verlag GmbH & Co. KGaA, Weinheim
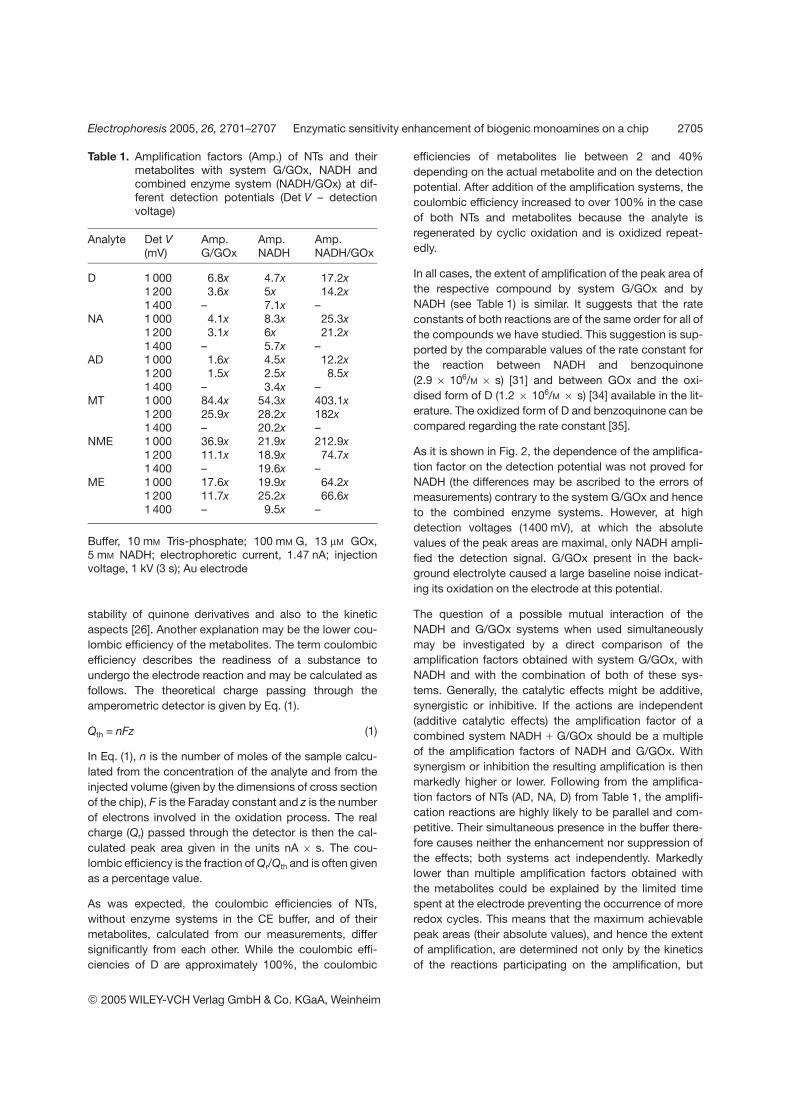
Electrophoresis 2005, 26, 2701–2707 Enzymatic sensitivity enhancement of biogenic monoamines on a chip 2705
Table 1. Amplification factors (Amp.) of NTs and theirmetabolites with system G/GOx, NADH andcombined enzyme system (NADH/GOx) at dif-ferent detection potentials (Det V – detectionvoltage)
Analyte Det V(mV)
Amp.G/GOx
Amp.NADH
Amp.NADH/GOx
D 1 000 6.8x 4.7x 17.2x1 200 3.6x 5x 14.2x1 400 – 7.1x –
NA 1 000 4.1x 8.3x 25.3x1 200 3.1x 6x 21.2x1 400 – 5.7x –
AD 1 000 1.6x 4.5x 12.2x1 200 1.5x 2.5x 8.5x1 400 – 3.4x –
MT 1 000 84.4x 54.3x 403.1x1 200 25.9x 28.2x 182x1 400 – 20.2x –
NME 1 000 36.9x 21.9x 212.9x1 200 11.1x 18.9x 74.7x1 400 – 19.6x –
ME 1 000 17.6x 19.9x 64.2x1 200 11.7x 25.2x 66.6x1 400 – 9.5x –
Buffer, 10 mM Tris-phosphate; 100 mM G, 13 mM GOx,5 mM NADH; electrophoretic current, 1.47 nA; injectionvoltage, 1 kV (3 s); Au electrode
stability of quinone derivatives and also to the kineticaspects [26]. Another explanation may be the lower cou-lombic efficiency of the metabolites. The term coulombicefficiency describes the readiness of a substance toundergo the electrode reaction and may be calculated asfollows. The theoretical charge passing through theamperometric detector is given by Eq. (1).
Qth = nFz (1)
In Eq. (1), n is the number of moles of the sample calcu-lated from the concentration of the analyte and from theinjected volume (given by the dimensions of cross sectionof the chip), F is the Faraday constant and z is the numberof electrons involved in the oxidation process. The realcharge (Qr) passed through the detector is then the cal-culated peak area given in the units nA 6 s. The cou-lombic efficiency is the fraction of Qr/Qth and is often givenas a percentage value.
As was expected, the coulombic efficiencies of NTs,without enzyme systems in the CE buffer, and of theirmetabolites, calculated from our measurements, differsignificantly from each other. While the coulombic effi-ciencies of D are approximately 100%, the coulombic
efficiencies of metabolites lie between 2 and 40%depending on the actual metabolite and on the detectionpotential. After addition of the amplification systems, thecoulombic efficiency increased to over 100% in the caseof both NTs and metabolites because the analyte isregenerated by cyclic oxidation and is oxidized repeat-edly.
In all cases, the extent of amplification of the peak area ofthe respective compound by system G/GOx and byNADH (see Table 1) is similar. It suggests that the rateconstants of both reactions are of the same order for all ofthe compounds we have studied. This suggestion is sup-ported by the comparable values of the rate constant forthe reaction between NADH and benzoquinone(2.9 6 106/M 6 s) [31] and between GOx and the oxi-dised form of D (1.2 6 106/M 6 s) [34] available in the lit-erature. The oxidized form of D and benzoquinone can becompared regarding the rate constant [35].
As it is shown in Fig. 2, the dependence of the amplifica-tion factor on the detection potential was not proved forNADH (the differences may be ascribed to the errors ofmeasurements) contrary to the system G/GOx and henceto the combined enzyme systems. However, at highdetection voltages (1400 mV), at which the absolutevalues of the peak areas are maximal, only NADH ampli-fied the detection signal. G/GOx present in the back-ground electrolyte caused a large baseline noise indicat-ing its oxidation on the electrode at this potential.
The question of a possible mutual interaction of theNADH and G/GOx systems when used simultaneouslymay be investigated by a direct comparison of theamplification factors obtained with system G/GOx, withNADH and with the combination of both of these sys-tems. Generally, the catalytic effects might be additive,synergistic or inhibitive. If the actions are independent(additive catalytic effects) the amplification factor of acombined system NADH 1 G/GOx should be a multipleof the amplification factors of NADH and G/GOx. Withsynergism or inhibition the resulting amplification is thenmarkedly higher or lower. Following from the amplifica-tion factors of NTs (AD, NA, D) from Table 1, the amplifi-cation reactions are highly likely to be parallel and com-petitive. Their simultaneous presence in the buffer there-fore causes neither the enhancement nor suppression ofthe effects; both systems act independently. Markedlylower than multiple amplification factors obtained withthe metabolites could be explained by the limited timespent at the electrode preventing the occurrence of moreredox cycles. This means that the maximum achievablepeak areas (their absolute values), and hence the extentof amplification, are determined not only by the kineticsof the reactions participating on the amplification, but
© 2005 WILEY-VCH Verlag GmbH & Co. KGaA, Weinheim
2706 M. Vlcková and M. A. Schwarz Electrophoresis 2005, 26, 2701–2707
also by the velocity of the analyte during passing thedetector and by the dispersion of the zone. These pa-rameters determine the time spent by the analyte at thedetector, which is decisive in determining the number ofredox cycles, and the time is given by the mobility of theanalyte and by the EOF. In the case of our independentmultiple enzyme systems NADH and G/GOx, the ampli-fication is thus a function of the rate constants of bothparallel reactions, the mobility of the analyte and themobility of the EOF, mathematically expressed asAmp = f(k1, k2, m, mEOF).
The LOD achieved with a combination of NADH with G/GOx has been determined for methoxytyramine, whichyields the highest amplification factor (Table 1). The low-est detected concentration of MT with the combined en-zyme system was 47 nM (Fig. 4) and LOD calculated froman S/N of 3/1 is even lower and is equal to 12 nM (absoluteamount of analyte: 0.97 fmol). For a comparison, the LODof MT in the same buffer without any additive calculatedfrom S/N = 3 has been determined to be 80 mM. Thus, theapplication of combined enzyme system causes a drasticfall in LOD through more than three orders of magnitude.The LODs in the low nanomolar range are expected for allof the studied compounds because the absolute peakareas obtained are well comparable. This is to our knowl-edge the lowest LOD for NTs published yet. The detectorresponse (at the detection potential 1200 mV) was linearin the whole studied range from 50 nM to 50 mM
(A = 0.45 6 c 1 1.09, R2 = 0.9952).
Figure 4. Electropherogram of MT (47 nM) in the pres-ence of combined NADH 1 G/GOx amplification system.Buffer, 10 mM Tris-phosphate, 100 mM G, 13 mM GOx,5 mM NADH, electrophoretic current 1.47 mA, injectionvoltage 1 kV (3 s), Au electrode, detection potential1200 mV.
Addition of Ca21 or Mg21 ions (which are reported in [36]to enhance the catalytic NADH oxidation) to the BGEcontaining NADH was also examined. However, noincreased amplification was observed. The observedpeak was even smaller. These ions probably facilitate theoxidation of NADH at the electrode and in this way de-crease the amount of NADH available for reaction with theoxidised analyte.
4 Concluding remarks
It has been demonstrated that NTs and their metabolitescould be detected in a nanomolar concentration aftertheir electrophoretic analysis on a microchip equippedwith an amperometric detector in the presence of twoenzymatic systems in the background electrolyte, NADHand G/GOx. According to our results, the systems act in-dependently and amplify the detector response of thecompounds by regeneration of the analytes after theiroxidation at the electrode. The rates of both reactions arecomparable and amplification is reproducible. The meth-od described in this paper is therefore well suited for theselective and sensitive determination of NTs and theirmetabolites in clinical samples, such as urine or plasma.The oxidation of NADH by AD, NA and all of the metabo-lites involved in the study is described herein for the firsttime. In particular, it should be highlighted that the LOD ofmetabolites are in the range of the good oxidizable mole-cules D, AD and NA. This is an important fact for themonitoring of the concentration of certain species inpatients according to the metabolic pathway of mono-amines in the human brain [37]. The application of thiscoupled enzymatic system is suitable for any separationprocedure coupled with amperometric detection.
This work was supported by the Swiss National ScienceFoundation, Grant number 200021-103812/1.
Received December 14, 2004
5 References
[1] Sarre, S., Michotte, Y., Herregodts, P., Deleu, D., Klippel, N.D., Ebinger, G., J. Chromatogr. 1992, 575, 207–212.
[2] Sagar, K. A., Smyth, M. R., J. Pharm. Biomed. Anal. 2000, 22,613–624.
[3] Zhu, X., Shaw, P. N., Barrett, D. A., Anal. Chim. Acta 2003,478, 259–269.
[4] Fotopoulou, M. A., Ioannou, P. C., Anal. Chim. Acta 2002,462, 179–185.
[5] Kartsova, L. A., Sidorova, A. A., Kazakov, V. A., Bessonova, E.A., Yashin, A. Y., J. Anal. Chem. 2004, 59, 737–741.
[6] Siren, H., Karjalainen, U., J. Chromatogr. A 1999, 853, 527–533.
© 2005 WILEY-VCH Verlag GmbH & Co. KGaA, Weinheim
Electrophoresis 2005, 26, 2701–2707 Enzymatic sensitivity enhancement of biogenic monoamines on a chip 2707
[7] Garcia, A., Heinaenen, M., Jimenez, L. M., Barbas, C., J.Chromatogr. A 2000, 871, 341–350.
[8] Siren, H., Mielonen, M., Herlevi, M., J. Chromatogr. A 2004,1032, 289–297.
[9] Park, Y., Zhang, X., Rubakhin, S., Sweedler, J., Anal. Chem.1999, 71, 4997–5002.
[10] Chang, H. T., Yeung, E. S., Anal. Chem. 1995, 67, 1079–1083.
[11] Du, M., Flanigan, V., Ma, Y., Electrophoresis 2004, 25, 1496–1502.
[12] Parrot, S., Sauvinet, V., Riban, V., Depaulis, A., Renaud, B.,Denoroy, L., J. Neurosci. Methods 2004, 140, 29–38.
[13] Zhu, R., Kok, W. T., Anal. Chem. 1997, 69, 4010–4016.
[14] Zhang, L., Qv, S., Wang, Z., Cheng, J., J. Chromatogr. B2003, 792, 381–385.
[15] Li, X., Jin, W., Weng, Q., Anal. Chim. Acta 2002, 461, 123–130.
[16] Schwarz, M. A., Hauser, P. C., Anal. Chem. 2003, 75, 4691–4695.
[17] Lacher, N. A., Garrison, K. E., Martin, R. S., Lunte, S. M.,Electrophoresis 2001, 22, 2526–2536.
[18] Vandaveer, W. R., Pasas, S. A., Martin, R. S., Lunte, S. M.,Electrophoresis 2002, 23, 3667–3677.
[19] Schwarz, M. A., Hauser, P. C., J. Chromatogr. A 2001, 928,225–232.
[20] Wu, C.-C., Wu, R.-G., Huang, J.-G., Chang, H.-C., Anal.Chem. 2003, 75, 947–952.
[21] Liu, Y., Vickers, J. A., Henry, C. S., Anal. Chem. 2004, 76,1513–1517.
[22] Stoica, L., Lindgren-Sjolander, A., Ruzgas, T., Gorton, L.,Anal. Chem. 2004, 76, 4690–4696.
[23] Lisdat, F., Wollenberger, U., Makower, A., Hortnagl, H.,Pfeiffer, D., Scheller, F. W., Biosens. Bioelectron. 1997, 12,1199–1211.
[24] Leite, O. D., Fatibello, O., Barbosa, A. D., J. Braz. Chem.Soc. 2003, 14, 297–303.
[25] Yao, T., Ho, C. O., Bunseki Kagaku 2002, 51, 469–472.
[26] Schwarz, M. A., Electrophoresis 2004, 25, 1916–1922.
[27] Pariente, F., Tobalina, F., Moreno, G., Hernandez, L., Lo-renzo, E., Abruna, H. D., Anal. Chem. 1997, 69, 4065–4075.
[28] Prieto-Simon, B., Fabregas, E., Biosens. Bioelectron. 2004,19, 1131–1138.
[29] Ueda, C., Tse, D. C.-S., Kuwana, T., Anal. Chem. 1982, 54,850–856.
[30] Tse, D. C.-S., Kuwana, T., Anal. Chem. 1978, 50, 1315–1318.
[31] Murthy, A. S. N., Sharma, J., Talanta 1998, 45, 951–956.
[32] Schwarz, M. A., Galliker, B., Fluri, K., Kappes, T., Hauser, P.C., Analyst 2001, 126, 145–151.
[33] Chen, J., Bao, J., Cai, C., Lu, T., Anal. Chim. Acta 2004, 516,29–34.
[34] Battaglini, F., Koutroumanis, M., English, A. M., Mikkelsen,S. R., Bioconjug. Chem. 1994, 5, 430–435.
[35] Mizutani, F., Yabuki, S., Asai, M., Biosens. Bioelectron. 1991,6, 305–310.
[36] Mano, N., Kuhn, A., Menu, S., Dufourc, E. J., Phys. Chem.Chem. Phys. 2003, 5, 2082–2088.
[37] Maruyama, W., Naoi, M., Narabayashi, H., J. Neurolog. Sci.1996, 139, 141–148.
© 2005 WILEY-VCH Verlag GmbH & Co. KGaA, Weinheim

Publication 3
Microchip Affinity Capillary Electrophoresis Applications and Recent Advances
Vlčková, M., Stettler, A., Schwarz, M.A.
J. Liq. Chromatogr. Relat. Technol. 2006, 29 (7-8), 1047-1076

Microchip Affinity CapillaryElectrophoresis: Applications
and Recent Advances
Marketa Vlckova, Alexandra R. Stettler,
and Maria A. Schwarz
Universitat Basel, Departement Chemie, Basel, Switzerland
Abstract: This review gives the basic principle of affinity capillary electrophoresis
(ACE) and examines its utilization in bioscience on microchips. ACE on chip is
used as a separation tool as well as for study of molecular interactions. MEKC and
chiral separations on microfluidic systems are described. Applications for measuring
bioaffinity are focused on enzyme assay and immunoassay that demonstrate a further
development of classical ACE in capillaries.
Keywords: Affinity capillary electrophoresis, Chip, Interactions, Electrochromato-
graphy, Micellar electrokinetic chromatography, Chiral separation, Enzyme assays,
Immunoassay, Biomolecules
INTRODUCTION
Up to now, a variety of capillary electrophoresis based methods for studying
interactions have been established. Preferentially, diverse biomolecular inter-
actions are investigated in order to better understand the functioning of living
systems. These investigations are crucial for genomic and proteomic research,
but also beneficial for other fields of biosciences. Electrophoresis based
methods for studying interactions use various experimental approaches and
are sometimes summarily termed affinity capillary electrophoresis (ACE).
However, no unifying definition of ACE exists in the literature and some
Address correspondence to Maria A. Schwarz, Universitat Basel, Departement
Chemie, Spitalstrasse 51, CH-4056 Basel, Switzerland. E-mail: maria.schwarz@
unibas.ch
Journal of Liquid Chromatography & Related Technologiesw, 29: 1047–1076, 2006
Copyright # Taylor & Francis Group, LLC
ISSN 1082-6076 print/1520-572X online
DOI: 10.1080/10826070600574754
1047
authors refer ACE to one concrete method for studying interactions.
Throughout this review, however, the term ACE is used in its general
meaning, which means for all of capillary electrophoresis based methods
studying interactions.
An immense number of investigations using ACE methods in capillaries
have been published. Since 1995, more than 300 applications for the study of
nonspecific and specific interacting equilibrium, including several reviews,
have appeared in the literature. On the contrary, only a few articles performing
ACE analysis in microfluidic devices, so called microchips or chips, have been
published so far.
In ACE, the substances migrating in an electrical field undergo an inter-
action, which changes their electrophoretical behavior. This effect can be used
for the identification and also partly for the quantification of specific binding,
or simply for enhancing the separation selectivity. The identification and
quantification of an interaction is based on the evaluation of the altered
behavior of the substance. Partly, an estimation of the association constant
of the interaction is feasible. Affinity interactions, with the objective to
enhance separation selectivity, serve mainly for the separation of mixtures
of substances with very similar or identical electrophoretical behavior.
Typical applications are micellar electrokinetic chromatography (MEKC)
and chiral separations.
Since the first description of an electrophoretical separation on a chip
(1992), ACE on the chips has mainly been used as a separation tool. Both
micellar and chiral separations on microfluidic systems are investigated. On
the other hand, only very few applications aimed at the characterization of
partition and/or complexation equilibria have been performed on microchips
until the present time. One reason for such shortness of publications is the dif-
ficulty in electrokinetical control of the sample plug by the simple cross, tee,
or double-tee injector, respectively. Another reason is the limitation of
detection systems available for planar systems. Most applications deal with
fluorescence detection, which has inherently good sensitivity and is,
therefore, well suited for the small channel cross-sections. However, most
analyte species are not native fluorophores. Such analytes have to be deriva-
tized with a suitable reagent or detected indirectly via displacement of a
fluorescent ion. Both the derivatization and the addition of a fluorophore to
the background buffer may distort the equilibrium in question, as the
molecular parameters can be changed. Therefore, fluorescence-labeling-
based detection is not well suited for affinity measurements unless the
binding is very specific. If the binding occurs between specific regions of
the molecules, other parts of these molecules can be labeled without detrimen-
tal effects on the interactions. The binding of an enzyme to its substrate, or of
an antibody to its antigen, is the typical example of such specific interactions.
For general affinity measurements on microchips, electrochemical
detection methods are advantageous due to their easy miniaturization and
ability to perform direct detection. UV/VIS absorption is not commonly
M. Vlckova, A. R. Stettler, and M. A. Schwarz1048
used for on-chip detection because the short optical path lengths allow only
limited sensitivity. Nevertheless, for analytes available in higher concen-
trations (0.5-1mM), UV/VIS detection is still very useful because of its
versatility and simplicity.
Both participants of the equilibrium can be injected as sample or rather
added to the background buffer. In many cases, the detectability of the
compound is decisive for the judgment. Here, we term S for solute (usually
in the sample) and L for ligand (usually in the buffer), whereas S and L
could be all types of molecules as proteins, enzymes, inorganic ions etc.
The review presented here gives an overview of all possible applications
of affinity measurements on microfluidic devices published so far. Always, a
brief description of the principle of the method including references on review
articles is provided. Applications of affinity measurements are divided into
two groups according to the goal of the affinity measurement. Affinity
measurements serving as a separation tool include chiral separation, MEKC,
and chip electrochromatography. Affinity measurements for the characteriz-
ation of equilibria are comprised of general affinity measurements and
special assays, namely enzyme assays and immunoassays.
THEORY
In addition to interactions serving for achieving the separation of complicated
sample mixtures and interaction for proper investigation of the equilibrium,
some experiments serve only for recognizing an interaction. The result of
such experiments is a yes/no answer with regard to the presence of an inter-
action. Disregarding the purpose of the affinity measurement, three different
interaction phases can be distinguished in affinity electrophoresis.[1]
Affinity measurements in free solutions: If the ligand is simply dissolved
in the background electrolyte, the interaction takes place in a homogenous
solution, which can model the biological conditions inside living organisms.
This kind of measurements is, therefore, most widely used for the character-
ization of the equilibrium. However, certain affinity measurements aimed at
the separation of species (such as chiral separations) are also performed in
free solutions.
Affinity measurements with pseudostationary phases: The pseudostation-
ary phase is a phase with different physicochemical properties, which is, in
contrast to the stationary phase, still in movement with regard to the
channel. Interactions taking place in these pseudostationary phases serve
mainly for the separation of sample mixtures, but recognition of an interaction
(yes/no answer) is also possible. Typical examples of a pseudostationary
phase are micelles, dendrimers, or liposomes.
Affinity measurements with stationary phases: Measurements performed
in devices containing a solid stationary phase are aimed at separations of
mixtures or at the recognition of an interaction. In this concept, features of
Microchip Affinity Capillary Electrophoresis 1049
both electrophoresis and liquid chromatography are combined and the
technique is, therefore, denoted as electrochromatography. The sample com-
ponents are driven through the device electrokinetically and are separated
due to a difference in both electrophoretic mobility (for ionized analytes)
and specific interaction with the stationary phase.
Characterization of Equilibria
The characterization of an interaction represents an important tool for a deeper
understanding of biological events triggered by specific receptor-ligand inter-
actions. However, the information on an interaction may be useful in many
fields of chemistry and other sciences.
In general, interactions are characterized by association constants (fre-
quently also called binding constants) and by the number of ligands that
bind to the same class of binding sites present on the solute. For the sake of
simplicity, the binding sites within one class are considered identical and
the classes are considered independent in the majority of binding studies.[2]
Mathematically, the binding isotherm of such an interaction is commonly
expressed by the following equation:
r ¼ ½LS�cS
¼Xm
j¼1
njKj½L�
1þ Kj½L� ð1Þ
where r is the fraction of bound ligand per receptor or the concentration of
ligand bound by one mole of solute; [LS] and [L] are the equilibrium concen-
trations of bound and free ligand, respectively; cS is the total (analytical) con-
centration of the solute; nj is the number of binding sites of class j, and Kj is the
corresponding association constant.
The more classes of binding sites are present on the solute, the more com-
plicated is the calculation of binding parameters. Therefore, the common first
approximation is a 1:1 association.[3] The simplified form of Eq. (1) can then
be linearized and the respective association constant is thereby calculated. If
there is a deviation from linearity observed using this simplification, multiple
equilibria have to be considered and non linear models according to Eq. (1)
should be used for the calculation of the binding parameters.
Methods for the Characterization of Equilibria
At present there are six affinity electrophoresis modes developed for capil-
laries, for measuring binding constants. Most of these modes also allow the
determination of the number of ligand molecules that bind to the different
classes of binding sites.
M. Vlckova, A. R. Stettler, and M. A. Schwarz1050
Methods for the calculation of binding parameters can be divided into
three groups according to the way of acquiring binding parameters. The
binding parameters can be extracted from the mobility changes, from the
peak area of the species, or from the plateau of the elution profile.[2].
Elution profiles of available affinity measurement methods, including the
measured parameter of the particular measurement for the calculation of the
association constant, are schematically depicted in Figure 1. For explanation
see the test below.
Mobility-Shift Assays (Affinity Capillary Electrophoresis)
The mobility-shift assay is sometimes denoted as ACE. Note that this is the
narrower meaning of ACE; in this review ACE means any of electrophoretic
based methods for studying interactions. Mobility-shift assay is the favorite
method in capillary zone electrophoresis (CZE) for the investigation of
simple 1:1 equilibria, and it has been recently successfully implemented also
for free solution affinity measurements on chips.[4] The separation channel is
filled with a buffer containing the ligand in varying concentrations; the
solute is injected as a sample. Since the equilibrium is established during the
separation, the apparent mobility of the solute depends on the association
constant and themobility difference between ligand and solute. The association
constant is thus calculated from the change in the mobility of the solute inde-
pendent of the concentration of the ligand in the buffer according to Eq. (2).
m ¼ f ð½L�Þ ¼ mS þ K½L�mSL
1þ K½L� ð2Þ
The equilibrium concentration of the free ligand is approximated by the
total concentration of the ligand. Obviously, the necessary prerequisite of
this method is the difference in the mobilities of the ligand and the solute.
This prerequisite is even more demanding if the measurements are realized
on a microchip because the separation length is limited to several centimeters
at maximum.[4] Small mobility differences cannot manifest in such a short
distance. Moreover, short and well defined sample plugs are crucial for high
resolution separations. Beside the necessity of small sample plugs in
relation to the separation length, a reference compound that does not
interact with any type of involved molecule is essential. The mobility
change is then referred to the mobility of this compound, a so-called
internal standard.
A related method being established only in capillary format so far is the so
called vacancy affinity capillary electrophoresis (VACE).[5] In this method,
the capillary is filled with a solution, which contains buffer, fixed amount of
solute, and varying amount of ligand. A small buffer plug is then injected
as a sample and two negative peaks corresponding to the solute and the
ligand, respectively, are obtained. The shift in the negative peak mobility of
the solute is monitored independent of the concentration of the ligand in the
Microchip Affinity Capillary Electrophoresis 1051
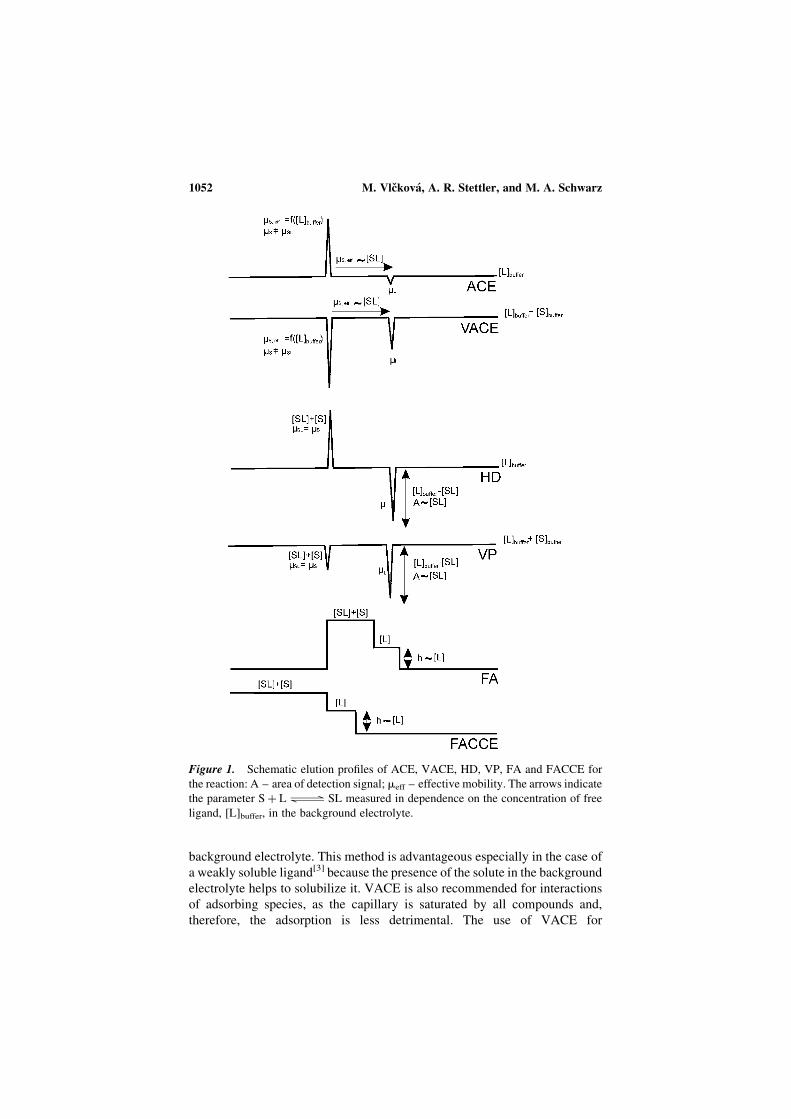
background electrolyte. This method is advantageous especially in the case of
a weakly soluble ligand[3] because the presence of the solute in the background
electrolyte helps to solubilize it. VACE is also recommended for interactions
of adsorbing species, as the capillary is saturated by all compounds and,
therefore, the adsorption is less detrimental. The use of VACE for
Figure 1. Schematic elution profiles of ACE, VACE, HD, VP, FA and FACCE for
the reaction: A – area of detection signal; meff – effective mobility. The arrows indicate
the parameter Sþ LOSL measured in dependence on the concentration of free
ligand, [L]buffer, in the background electrolyte.
M. Vlckova, A. R. Stettler, and M. A. Schwarz1052
adsorbing species and weakly soluble ligands can, therefore, also be suitable
for mobility-shift measurements on a chip.
The shift in the mobility of the solute in the absence and presence of the
ligand is often used as a proof of interaction, also by affinity measurements
with ligands in pseudostationary or stationary phase. The association
constant cannot be calculated from these measurements.
Peak-Area-Changes Assays
In free solution methods using peak-area-changes of the solute for the calcu-
lation of binding parameters, two different approaches are used depending on
the stability of the complex formed by the interaction.
In the case of strong interactions, a direct separation of free and
complexed solute is possible and the method is commonly called pre-
equilibrium capillary electrophoresis.[6] The solute is pre-equilibrated with
different concentrations of the ligand and then injected into the channel
filled with buffer. Upon applying high voltage, the free solute is separated
from the free ligand and the complex. Peak areas are used for the determi-
nation of the equilibrium concentration of free and bound ligand, and the
association constant is calculated according to Eq. (1). Calibration measure-
ments are required to relate the concentration to the peak area. This method
is applicable to interactions yielding sufficiently stabile complexes with
slow dissociation kinetics. Pre-equilibrium electrophoresis on chips is prefer-
entially used in immunoassays where the interaction is strong enough for a
direct separation.
In the second approach, the equilibrium is established during the separ-
ation, similar to mobility shift assays. Peak-area-changes assays based on
this approach are applicable to weaker interactions with fast kinetics and
have been established only in capillary eletrophoresis so far. Two methods
are available, Hummel-Dreyer method (HD) with the experimental setup
identical to mobility-shift assay, and vacancy peak method (VP) with the
same setup as in VACE.[7] The peak-area-changes of the ligand, which is
added to the background electrolyte in varying concentration, are always
evaluated (see Fig. 1).
Generally, the reproducibility of the detection signal is crucial for the
ACE methods based on measuring peak-area-changes. In traditional
capillary electrophoresis, this is easily accomplished by hydrodynamic
injection. On the contrary, microchips rely on electrokinetically driven injec-
tions using intersecting channels[8] where the diffusion of the analyte into the
separation channel impairs the reproducibility significantly. Several injection
strategies such as pinched or gated injections,[9,10] based on applying different
voltages during the injection and separation step have been developed to
improve the reproducibility, but the voltage control is complicated.
However, a pressure driven injection with high reproducibility was recently
introduced to microfluidic devices.[11,12] The fast development of affinity
Microchip Affinity Capillary Electrophoresis 1053
measurements based on peak-area-changes is, therefore, expected in the near
future.
Elution-Profile-Changes Assays
Methods evaluating elution-profile-change for the characterization of an equi-
librium works with pre-equilibrated samples, which are injected in a large plug
(frontal analysis, FA[13]) or continuously (frontal analysis continuous capillary
electrophoresis, FACCE[14] to the buffer (see Fig. 1). It is assumed that the
mobility of the complex is close to the mobility of the solute and that the
mobility of the ligand differs from it sufficiently. Free ligand leaks out from
the sample plug because of its different mobility and makes its own plateau.
The concentration of free ligand is extracted from the height of the free
ligand plateau by means of calibration. Elution-profile-changes assays are
employed in capillary electrophoresis so far; the only description of this
method on a microchip, however performed in sieving matrix, is given by
Backhouse et al.[15] In the publication, DNA (PCR product and primer) was
successfully separated in polyacrylimide sieving medium on microchip by
using both CZE and FACCE. Even though FACCEwas not used for the charac-
terization of any equilibrium there, it clearly shows that frontal analysis with its
simple experimental setup could easily be realized on a microchip.
APPLICATIONS OF AFFINITY MEASUREMENTS
AS A SEPARATION TOOL
Micellar Electrokinetic Chromatography (MEKC)
MEKC is basically a separation method, which allows a simultaneous analysis
of uncharged and charged molecules in untreated capillaries. However, it can
be considered as a special case of ACE because it is based on affinity inter-
actions of analytes with micelles. MEKC can easily be used not only for the
separation but also for the study of distribution behavior of the analyte. In
the latter case, the effect of the micellar composition and the concentration
of the surfactant on the alteration of the analyte mobility are investigated. A
wide range of applications in pharmaceutics for characterizing partition equi-
libria between a surfactant and a drug are described. These investigations are
focused on the development of effective transport systems for the drugs with
respect to their bioavailability. However, all of these studies have been
performed in capillaries. Up to the present day, no application dealing with
the study of partition equilibria and estimation of partition coefficient can
be found for planar microanalytical systems.
MEKC in chip format is not applied very often and uses micelles only for
controlling the selectivity and the migration of analytes. The solubilization of
the analyte in the micellar phase alters its properties in a significant manner.
M. Vlckova, A. R. Stettler, and M. A. Schwarz1054
Migration times, selectivity, and resolution result from the partitioning of the
analytes between micelle and the buffer phase and can strongly be influenced
by addition of modifiers. The electrophoretic migration behavior is then deter-
mined by the sum of interactions, which the analyte undergoes during the sep-
aration process.
Mainly anionic surface-active compounds, in particular sodium dodecyl
sulfate (SDS), are used in MEKC.[16–23] SDS and all other anionic surfactants
have a net negative charge dependent on the pH value. Therefore, SDS
micelles migrate towards the anode, which means in opposite direction to
the electroosmotic flow (EOF). Moreover, SDS, similarly as any anionic
species, does not interact with the negatively charged surface of the
capillary/channels, which is favorable especially in ACE measurements.
Applications of MEKC on a chip are aimed at the improvement of three
different goals: separation, partitioning of the analytes, and sensitivity.
Separation
A micellar separation of eight biogenic amines derivatized by fluorescein iso-
thiocyanate (FITC) has been shown with approximately 15 shorter separation
times compared to fused silica capillaries.[19] Detection limits satisfactory for
analysis in food samples have been reached on a microchip in less than 1min
with the biogenic amines histamine, tyramine, putrescine, and tryptamine.[21]
An integrated postcolumn reaction of these amines with o-phthaldialdehyde
served for their sensitive fluorescent detection. It is demonstrated that SDS
stabilizes the EOF in the channels of a cheap plastic chip (made from poly(-
dimethylsiloxane)–PDMS) and the separations compare well to glass chips.
MEKC separations of explosives on a glass microchip are presented by Wal-
lenborg et al.[22] Also, here SDS micelles are used. Indirect laser-induced-
fluorescence served for the detection of the explosives. The resolution
enhancement of neurotransmitters by addition of surfactants to the running
buffer is demonstrated by Suljak et al.[23] MEKC with amperometric
detection has been applied to the separation of these compounds. Here, the
sample is continuously introduced into the channel of a microchip with sub-
micrometer internal height. Garcia et al.[24] demonstrated the use of anionic
surfactants (SDS, sodium deoxycholate, and phosphatidic acid, respectively)
in order to increase the EOF, and to enhance the detection signal for a
PDMS-microchip. Anionic surfactants adsorbed to the surface of PDMS
and affected the zeta potential of the surface and, thereby, the EOF. Also,
the electrochemical response for several biomolecules is improved by the
presence of anionic surfactants.
Partition Process Adjustment
Microchips are very suitable for precise fluidic mixing and manipulation.
Thereby, a solvent gradient for MEKC can be realized in a simple way.
Microchip Affinity Capillary Electrophoresis 1055
A microchip device, presented by Kutter et al.[16] allows on-chip adjustment
of the elution strength of the buffer by the electroosmotic fluid control and
by the mobility of micelles. Isocratic and gradient solvent changes on the
MEKC separation are controlled by proper setting of voltages applied to the
buffer reservoirs of the microchip.
Sensitivity
A sensitivity improvement of lipophilic dyes by on-line enrichment with a
sweeping process is demonstrated by Sera et al.[25] The profile of the concen-
tration process and the diffusion during the sweeping was investigated by
changing the migration length. Between 90 fold and 1500 fold enhancement
in detection sensitivity compared to the normal MEKC mode was achieved
for different dyes. The enrichment process is strongly dependent on the
partition behavior of analyte and on its migration.
Chiral Separation
Chiral separations represent affinity measurements in free solutions serving
for the separation of the enantiomers of an optically active compound. The
different interactions of enantiomers present in the sample, in the form of a
racemate, with a chiral selector, is the only way to discriminate between
them. The chiral selector is dissolved in the buffer and the racemic sample
is injected. During the separation, weak complexes between the respective
enantiomers and chiral selector are formed and cause the change of the
apparent mobilities of the enantiomers. This leads to their separation
because the interaction of a chiral selector with each enantiomer is
different. The concentration of the chiral selector is varied in order to
achieve sufficient separation between the enantiomers. In some applications,
the mobility changes of the enantiomers are plotted against the concentra-
tion of the chiral selector in the buffer, in order to calculate the association
constants of their interaction with the selector.[26] These association constants
then serve for the determination of the optimal chiral selector concentration
following from the equation:
copt ¼ ðKRKSÞ�0:5 ð3Þ
Enantiomeric separations on micromachined electrophoretic devices are
achievable and have been reviewed recently.[27] The applications of chiral
separations, performed on a microchip so far (summarized in Table 1), are
restricted to the chiral separation of amino acids and biogenic amino
compounds. However, the fast development of other chiral separations in
micro/nano-channels is expected in the next few years. The main motivation
M. Vlckova, A. R. Stettler, and M. A. Schwarz1056
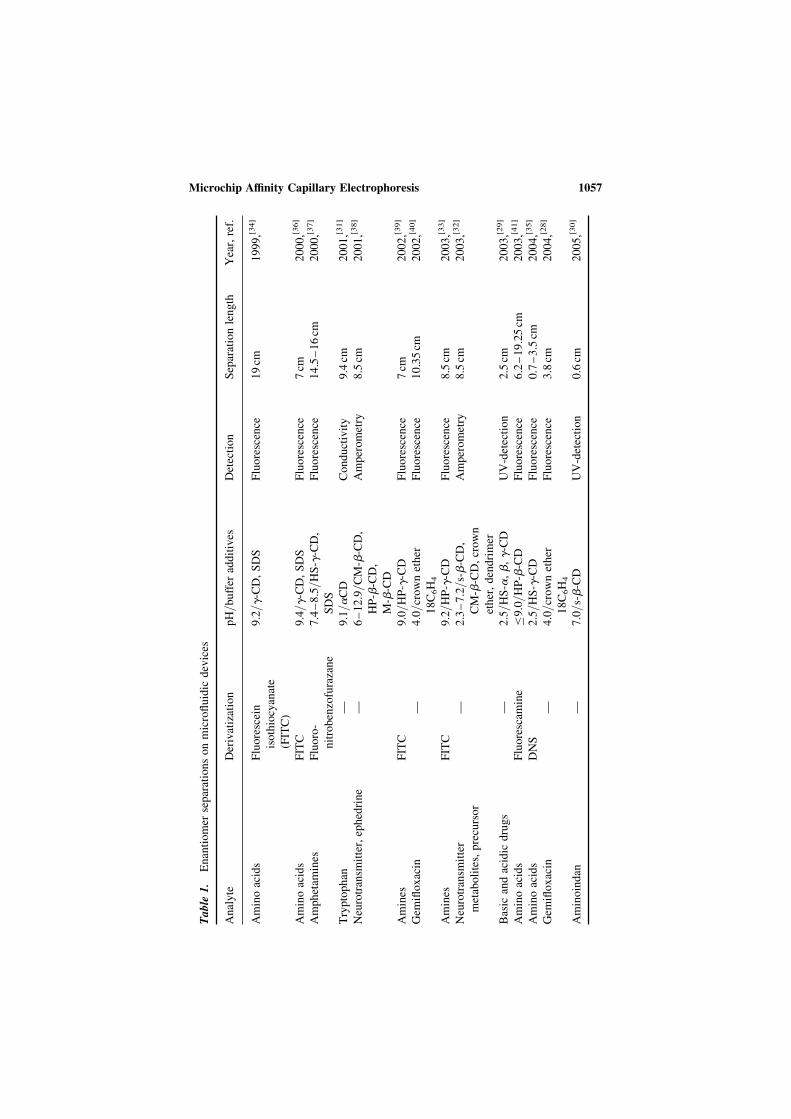
Table
1.
Enantiomer
separationsonmicrofluidic
devices
Analyte
Derivatization
pH/buffer
additives
Detection
Separationlength
Year,ref.
Aminoacids
Fluorescein
isothiocyanate
(FITC)
9.2/g
-CD,SDS
Fluorescence
19cm
1999,[34]
Aminoacids
FITC
9.4/g
-CD,SDS
Fluorescence
7cm
2000,[36]
Amphetam
ines
Fluoro-
nitrobenzofurazane
7.4–8.5/H
S-g-CD,
SDS
Fluorescence
14.5–16cm
2000,[37]
Tryptophan
—9.1/a
CD
Conductivity
9.4cm
2001,[31]
Neurotransm
itter,ephedrine
—6–12.9/C
M-b-CD,
HP- b-CD,
M- b-CD
Amperometry
8.5cm
2001,[38]
Amines
FITC
9.0/H
P-g-CD
Fluorescence
7cm
2002,[39]
Gem
ifloxacin
—4.0/crownether
18C6H4
Fluorescence
10.35cm
2002,[40]
Amines
FITC
9.2/H
P-g-CD
Fluorescence
8.5cm
2003,[33]
Neurotransm
itter
metabolites,precursor
—2.3–7.2/s-b-CD,
CM- b-CD,crown
ether,dendrimer
Amperometry
8.5cm
2003,[32]
Basic
andacidic
drugs
—2.5/H
S-a,b,g-CD
UV-detection
2.5cm
2003,[29]
Aminoacids
Fluorescam
ine
�9.0/H
P-b-CD
Fluorescence
6.2–19.25cm
2003,[41]
Aminoacids
DNS
2.5/H
S-g-CD
Fluorescence
0.7–3.5cm
2004,[35]
Gem
ifloxacin
—4.0/crownether
18C6H4
Fluorescence
3.8cm
2004,[28]
Aminoindan
—7.0/s-b-CD
UV-detection
0.6cm
2005,[30]
Microchip Affinity Capillary Electrophoresis 1057
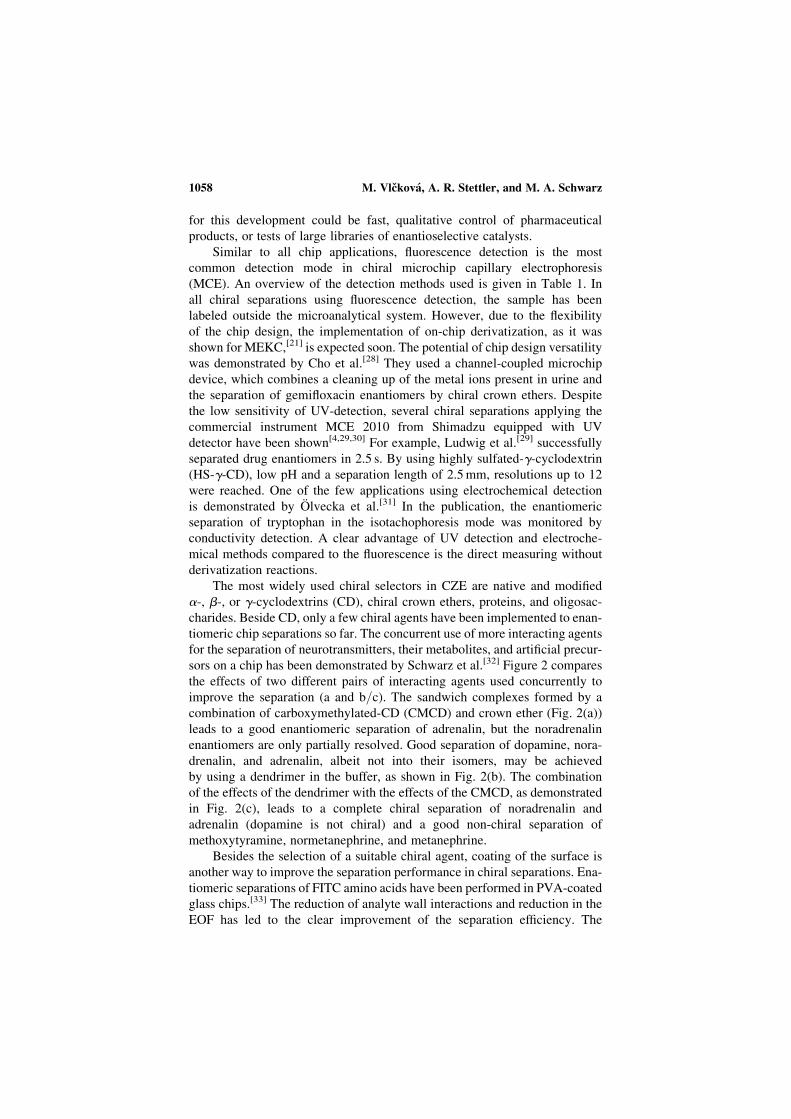
for this development could be fast, qualitative control of pharmaceutical
products, or tests of large libraries of enantioselective catalysts.
Similar to all chip applications, fluorescence detection is the most
common detection mode in chiral microchip capillary electrophoresis
(MCE). An overview of the detection methods used is given in Table 1. In
all chiral separations using fluorescence detection, the sample has been
labeled outside the microanalytical system. However, due to the flexibility
of the chip design, the implementation of on-chip derivatization, as it was
shown for MEKC,[21] is expected soon. The potential of chip design versatility
was demonstrated by Cho et al.[28] They used a channel-coupled microchip
device, which combines a cleaning up of the metal ions present in urine and
the separation of gemifloxacin enantiomers by chiral crown ethers. Despite
the low sensitivity of UV-detection, several chiral separations applying the
commercial instrument MCE 2010 from Shimadzu equipped with UV
detector have been shown[4,29,30] For example, Ludwig et al.[29] successfully
separated drug enantiomers in 2.5 s. By using highly sulfated-g-cyclodextrin(HS-g-CD), low pH and a separation length of 2.5mm, resolutions up to 12
were reached. One of the few applications using electrochemical detection
is demonstrated by Olvecka et al.[31] In the publication, the enantiomeric
separation of tryptophan in the isotachophoresis mode was monitored by
conductivity detection. A clear advantage of UV detection and electroche-
mical methods compared to the fluorescence is the direct measuring without
derivatization reactions.
The most widely used chiral selectors in CZE are native and modified
a-, b-, or g-cyclodextrins (CD), chiral crown ethers, proteins, and oligosac-
charides. Beside CD, only a few chiral agents have been implemented to enan-
tiomeric chip separations so far. The concurrent use of more interacting agents
for the separation of neurotransmitters, their metabolites, and artificial precur-
sors on a chip has been demonstrated by Schwarz et al.[32] Figure 2 compares
the effects of two different pairs of interacting agents used concurrently to
improve the separation (a and b/c). The sandwich complexes formed by a
combination of carboxymethylated-CD (CMCD) and crown ether (Fig. 2(a))
leads to a good enantiomeric separation of adrenalin, but the noradrenalin
enantiomers are only partially resolved. Good separation of dopamine, nora-
drenalin, and adrenalin, albeit not into their isomers, may be achieved
by using a dendrimer in the buffer, as shown in Fig. 2(b). The combination
of the effects of the dendrimer with the effects of the CMCD, as demonstrated
in Fig. 2(c), leads to a complete chiral separation of noradrenalin and
adrenalin (dopamine is not chiral) and a good non-chiral separation of
methoxytyramine, normetanephrine, and metanephrine.
Besides the selection of a suitable chiral agent, coating of the surface is
another way to improve the separation performance in chiral separations. Ena-
tiomeric separations of FITC amino acids have been performed in PVA-coated
glass chips.[33] The reduction of analyte wall interactions and reduction in the
EOF has led to the clear improvement of the separation efficiency. The
M. Vlckova, A. R. Stettler, and M. A. Schwarz1058
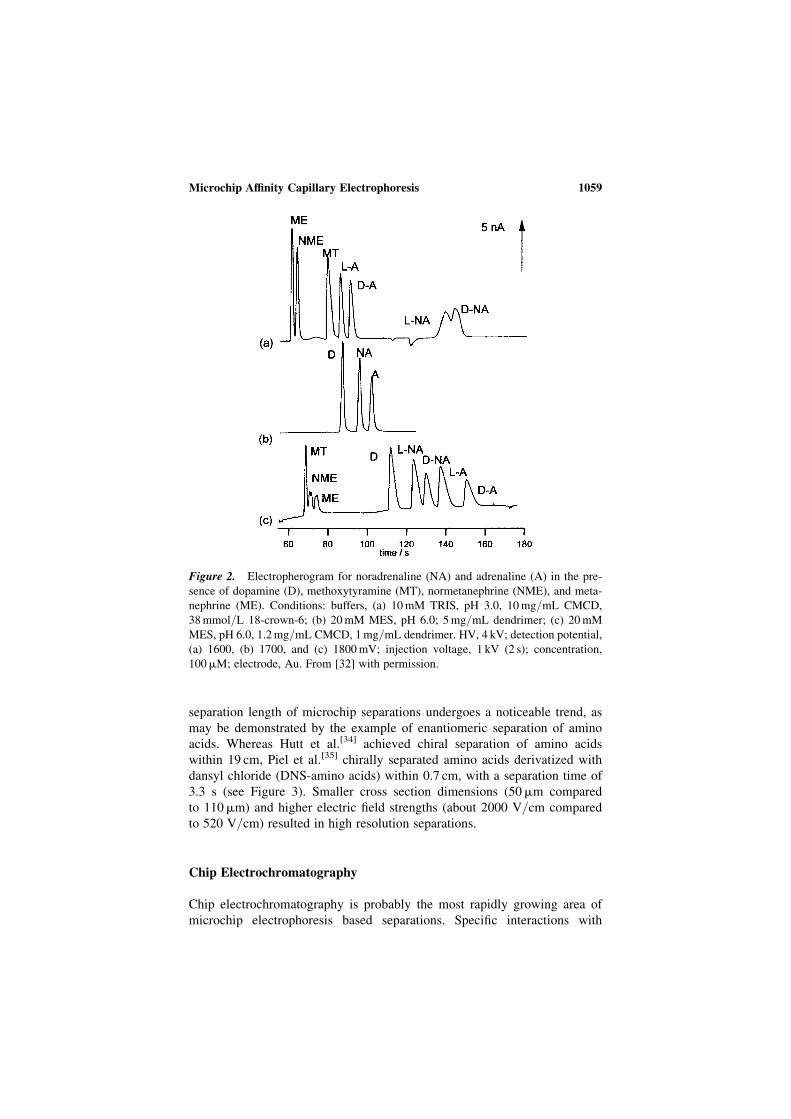
separation length of microchip separations undergoes a noticeable trend, as
may be demonstrated by the example of enantiomeric separation of amino
acids. Whereas Hutt et al.[34] achieved chiral separation of amino acids
within 19 cm, Piel et al.[35] chirally separated amino acids derivatized with
dansyl chloride (DNS-amino acids) within 0.7 cm, with a separation time of
3.3 s (see Figure 3). Smaller cross section dimensions (50mm compared
to 110mm) and higher electric field strengths (about 2000 V/cm compared
to 520 V/cm) resulted in high resolution separations.
Chip Electrochromatography
Chip electrochromatography is probably the most rapidly growing area of
microchip electrophoresis based separations. Specific interactions with
Figure 2. Electropherogram for noradrenaline (NA) and adrenaline (A) in the pre-
sence of dopamine (D), methoxytyramine (MT), normetanephrine (NME), and meta-
nephrine (ME). Conditions: buffers, (a) 10mM TRIS, pH 3.0, 10mg/mL CMCD,
38mmol/L 18-crown-6; (b) 20mM MES, pH 6.0; 5mg/mL dendrimer; (c) 20mM
MES, pH 6.0, 1.2mg/mL CMCD, 1mg/mL dendrimer. HV, 4 kV; detection potential,
(a) 1600, (b) 1700, and (c) 1800mV; injection voltage, 1 kV (2 s); concentration,
100mM; electrode, Au. From [32] with permission.
Microchip Affinity Capillary Electrophoresis 1059
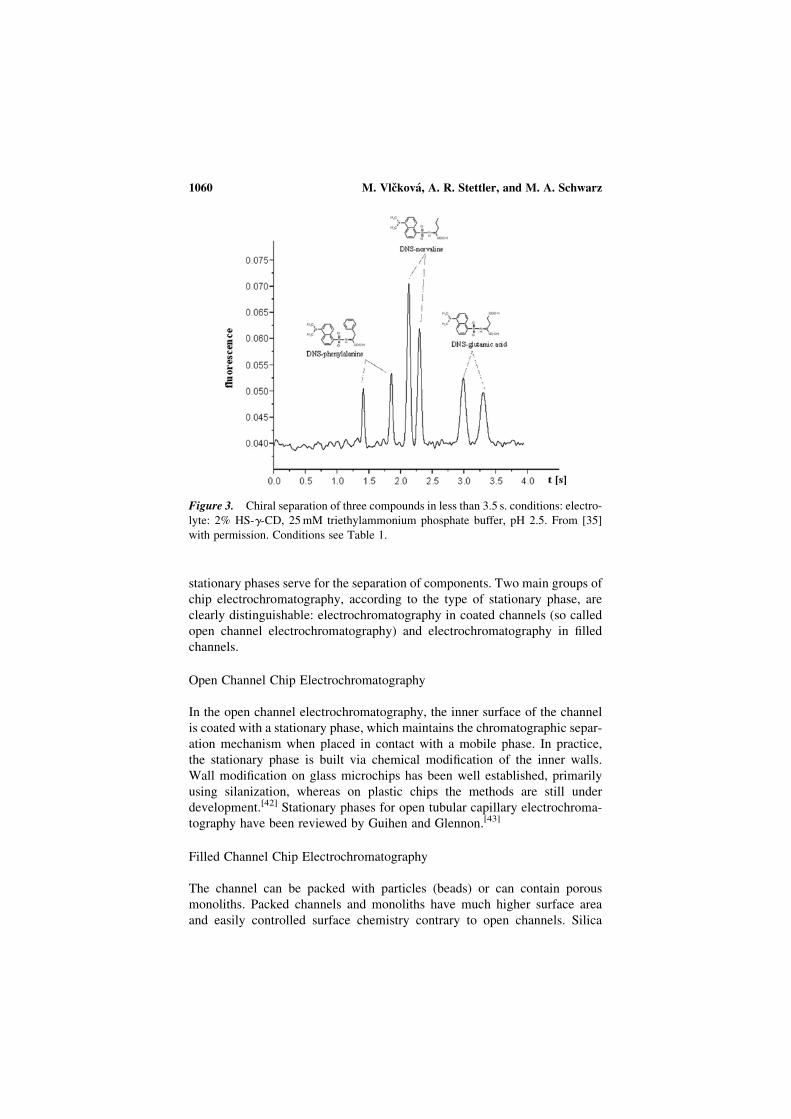
stationary phases serve for the separation of components. Two main groups of
chip electrochromatography, according to the type of stationary phase, are
clearly distinguishable: electrochromatography in coated channels (so called
open channel electrochromatography) and electrochromatography in filled
channels.
Open Channel Chip Electrochromatography
In the open channel electrochromatography, the inner surface of the channel
is coated with a stationary phase, which maintains the chromatographic separ-
ation mechanism when placed in contact with a mobile phase. In practice,
the stationary phase is built via chemical modification of the inner walls.
Wall modification on glass microchips has been well established, primarily
using silanization, whereas on plastic chips the methods are still under
development.[42] Stationary phases for open tubular capillary electrochroma-
tography have been reviewed by Guihen and Glennon.[43]
Filled Channel Chip Electrochromatography
The channel can be packed with particles (beads) or can contain porous
monoliths. Packed channels and monoliths have much higher surface area
and easily controlled surface chemistry contrary to open channels. Silica
Figure 3. Chiral separation of three compounds in less than 3.5 s. conditions: electro-
lyte: 2% HS-g-CD, 25mM triethylammonium phosphate buffer, pH 2.5. From [35]
with permission. Conditions see Table 1.
M. Vlckova, A. R. Stettler, and M. A. Schwarz1060
beads are well characterized and easily functionalized; however, uniform and
reproducible packing and retaining the beads in miniaturized scale represent a
technical challenge.
On the other hand, monolithic stationary phases can be prepared easily
and rapidly via free radical polymerization within the channel without need
of frits or other retaining structures. Polymer monoliths can posses various
functionalities given by the selection of monomers and eventually by their
further functionalization. The porosity, the surface area, and the pore size of
the monolith are controlled by the composition of the initial monomer
solution and by the polymerization conditions. Monoliths, therefore,
represent an attractive alternative among stationary phases for microfluidic
devices, especially due to its easy preparation in miniaturized formats, and
are gaining popularity in the last years.[44] In addition to various porous
polymer monoliths, silica based monoliths have been recently introduced as
a stationary phase for electrochromatography on microchips.[42] Solid
support preparation and their applications on a chip have been recently
reviewed by Peterson.[45]
Between open and filled channel stationary phases lie the so called
collocated monolith support structures (developed by Regnier and
coworkers),[46] a tightly packed array of posts fabricated directly in
the channel. These posts divide the channel into a bundle of interconnecting
capillaries with frequent mixing nodes, which leads to an increase in
surface area compared to open channel stationary phases. Advantages of
these support structures are precise dimensions and geometry, and controlled
extent of mixing.
Because of the easy preparation of most of the stationary phases in min-
iaturized formats, a lot of applications for chip electrochromatography either
in open tubular or filled channel format can be found in the literature. These
applications are not listed in this review because they have been extensively
reviewed by Stachowiak et al.[42] in 2004 and most recently by Pumera.[48]
For an overview of the applications and a more detailed description of the
method, including available technologies, please refer to these reviews
dedicated entirely to chip electrochromatography.
In both formats of electrochromatography, albeit in the capillary format,
special stationary phases, so called molecularly imprinted polymers (MIPs),
have been developed. Molecular imprinting is based on creating a three
dimensional cross-linked polymer network containing cavities complemen-
tary to the template molecule in terms of size, shape, and chemical function-
ality. The template is present during the polymerization in situ and after its
extraction leaves behind a cavity, which is then able to rebind the template
(analyte) during separation. MIPs phases are used either in open or in filled
channel format, either as a coating, as particles, or as monoliths. MIP
phases for capillary electrochromatography have been reviewed by
Schweitz et al.[47] MIP stationary phases have not been transferred from the
capillary to the chip format to our knowledge so far, probably due to the
Microchip Affinity Capillary Electrophoresis 1061
short existence of the MIP-technology. Anyway, microfluidic devices based
on MIP phases seem to have a promising future.[47]
APPLICATIONS OF AFFINITY MEASUREMENTS FOR THE
STUDY OF INTERACTIONS
The most important applications for studying interactions are of biochemical
origin. The detailed investigation of chemical reactions and processes inside
the cells can provide better understanding of living systems, which is
necessary to be able to control and regulate their functioning. In capillary elec-
trophoresis, classical binding studies concerning various drugs, biomolecules,
and biomacromolecules are routinely performed and binding parameters are
calculated. On the contrary, with microchips, very specific bioassays, such
as enzyme assays and immunoassays are most frequently studied. The
output of these bioassays is rather different and will be briefly discussed in
following sub-chapters. For more detailed insight to enzyme assays and
immunoassays performed on microchips, the authors recommend the review
from the year 2002 given by Guijt et al.[49]
The only microchip application of classical affinity measurement,
including the calculation of binding constants, is a study of the interaction
between neurotransmitters as solutes and sulfated b-CD as ligand by
Stettler and Schwarz.[4] This paper compares affinity measurements,
including calculation of association constants, carried out in microchip and
in capillary. The obtained results are shown in Figure 4. Microchip ACE
was demonstrated to provide comparable data to the capillary ACE, even
though less precise. Affinity measurements on microchips were shown as a
low-cost, rapid, and simple screening alternative to capillary.
Enzyme Assays
Enzymes are highly specific catalysts of every reaction inside a living
organism. In enzyme assays, the kinetics of the enzymatic reaction is
studied and provides information about the affinity of the substrate to the
enzyme. The substrate affinity is commonly described by the Michaelis-
Menten constant (Km). However, Km constant is not equal to the association
constant calculated in classical binding studies because it is not measured in
the equilibrium state. In case of slow conversion of the substrate-enzyme
complex to the final product, the Km value is numerically equal to the dis-
sociation constant of the enzyme-substrate complex, which is reciprocal to
the association constant of the complex. In addition to the kinetics of the
enzyme-substrate reaction, the kinetics in presence of different inhibitors is
often included in the study and the respective inhibition constants (Ki) are
M. Vlckova, A. R. Stettler, and M. A. Schwarz1062
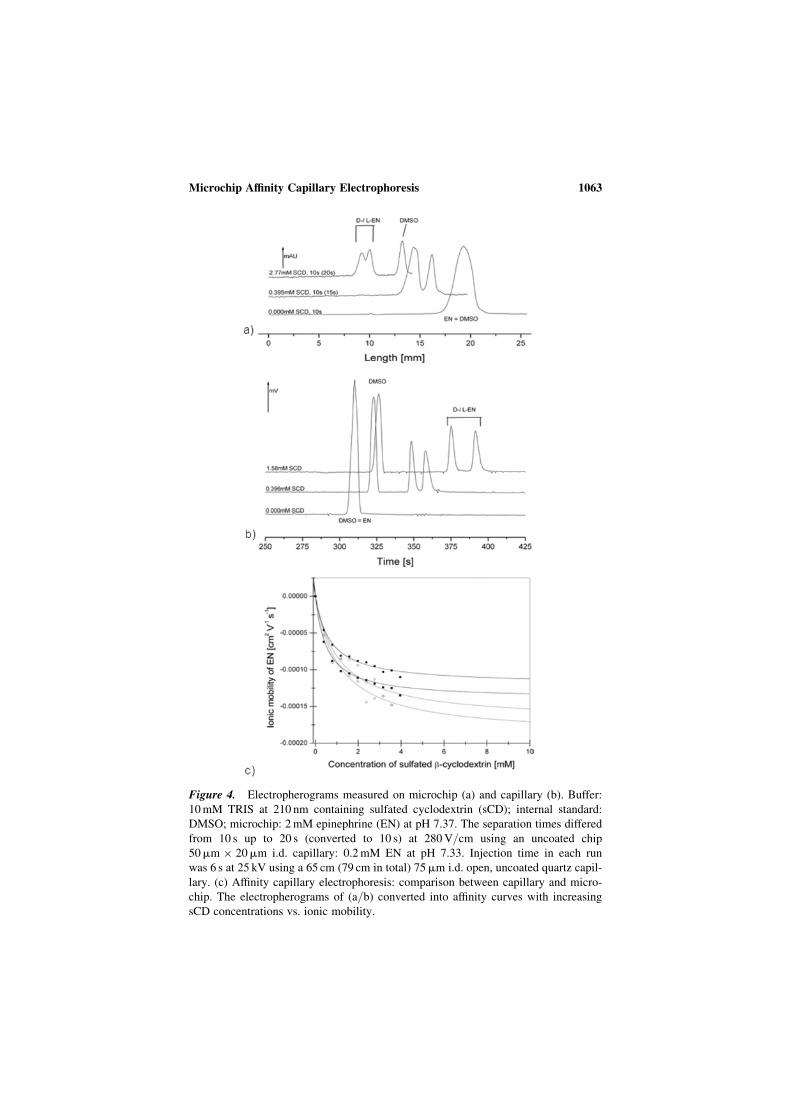
Figure 4. Electropherograms measured on microchip (a) and capillary (b). Buffer:
10mM TRIS at 210 nm containing sulfated cyclodextrin (sCD); internal standard:
DMSO; microchip: 2mM epinephrine (EN) at pH 7.37. The separation times differed
from 10 s up to 20 s (converted to 10 s) at 280V/cm using an uncoated chip
50mm � 20mm i.d. capillary: 0.2mM EN at pH 7.33. Injection time in each run
was 6 s at 25 kV using a 65 cm (79 cm in total) 75mm i.d. open, uncoated quartz capil-
lary. (c) Affinity capillary electrophoresis: comparison between capillary and micro-
chip. The electropherograms of (a/b) converted into affinity curves with increasing
sCD concentrations vs. ionic mobility.
Microchip Affinity Capillary Electrophoresis 1063
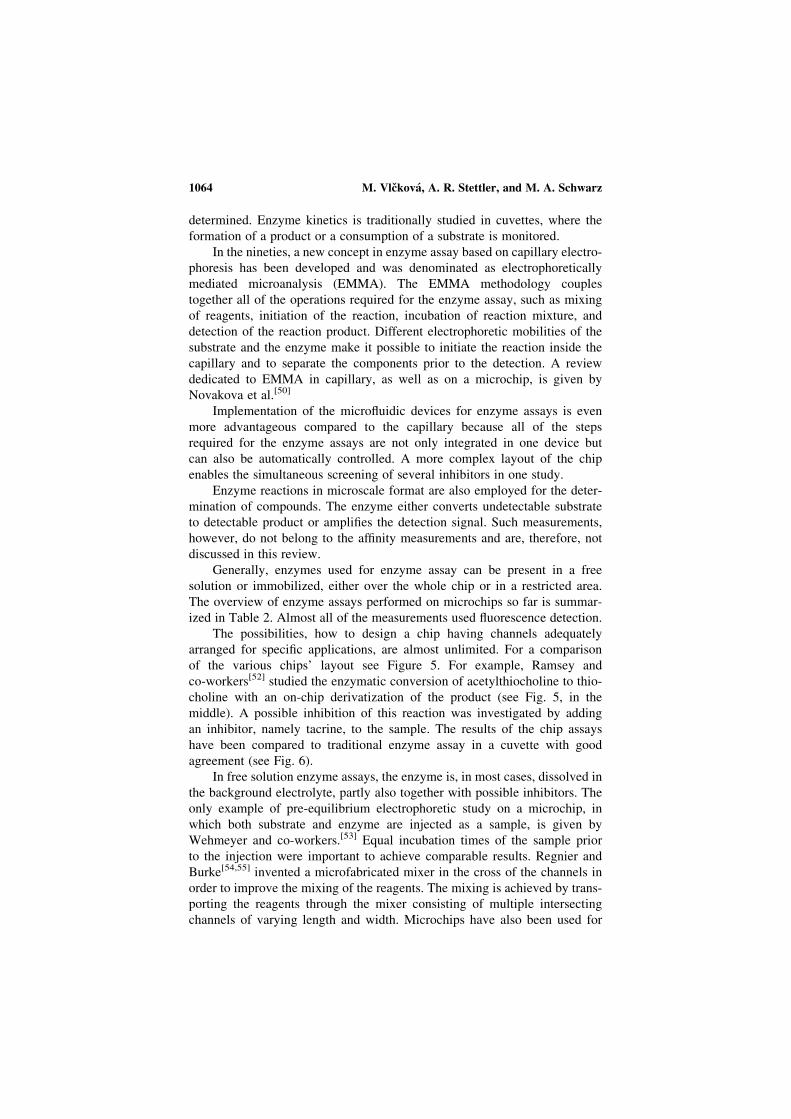
determined. Enzyme kinetics is traditionally studied in cuvettes, where the
formation of a product or a consumption of a substrate is monitored.
In the nineties, a new concept in enzyme assay based on capillary electro-
phoresis has been developed and was denominated as electrophoretically
mediated microanalysis (EMMA). The EMMA methodology couples
together all of the operations required for the enzyme assay, such as mixing
of reagents, initiation of the reaction, incubation of reaction mixture, and
detection of the reaction product. Different electrophoretic mobilities of the
substrate and the enzyme make it possible to initiate the reaction inside the
capillary and to separate the components prior to the detection. A review
dedicated to EMMA in capillary, as well as on a microchip, is given by
Novakova et al.[50]
Implementation of the microfluidic devices for enzyme assays is even
more advantageous compared to the capillary because all of the steps
required for the enzyme assays are not only integrated in one device but
can also be automatically controlled. A more complex layout of the chip
enables the simultaneous screening of several inhibitors in one study.
Enzyme reactions in microscale format are also employed for the deter-
mination of compounds. The enzyme either converts undetectable substrate
to detectable product or amplifies the detection signal. Such measurements,
however, do not belong to the affinity measurements and are, therefore, not
discussed in this review.
Generally, enzymes used for enzyme assay can be present in a free
solution or immobilized, either over the whole chip or in a restricted area.
The overview of enzyme assays performed on microchips so far is summar-
ized in Table 2. Almost all of the measurements used fluorescence detection.
The possibilities, how to design a chip having channels adequately
arranged for specific applications, are almost unlimited. For a comparison
of the various chips’ layout see Figure 5. For example, Ramsey and
co-workers[52] studied the enzymatic conversion of acetylthiocholine to thio-
choline with an on-chip derivatization of the product (see Fig. 5, in the
middle). A possible inhibition of this reaction was investigated by adding
an inhibitor, namely tacrine, to the sample. The results of the chip assays
have been compared to traditional enzyme assay in a cuvette with good
agreement (see Fig. 6).
In free solution enzyme assays, the enzyme is, in most cases, dissolved in
the background electrolyte, partly also together with possible inhibitors. The
only example of pre-equilibrium electrophoretic study on a microchip, in
which both substrate and enzyme are injected as a sample, is given by
Wehmeyer and co-workers.[53] Equal incubation times of the sample prior
to the injection were important to achieve comparable results. Regnier and
Burke[54,55] invented a microfabricated mixer in the cross of the channels in
order to improve the mixing of the reagents. The mixing is achieved by trans-
porting the reagents through the mixer consisting of multiple intersecting
channels of varying length and width. Microchips have also been used for
M. Vlckova, A. R. Stettler, and M. A. Schwarz1064
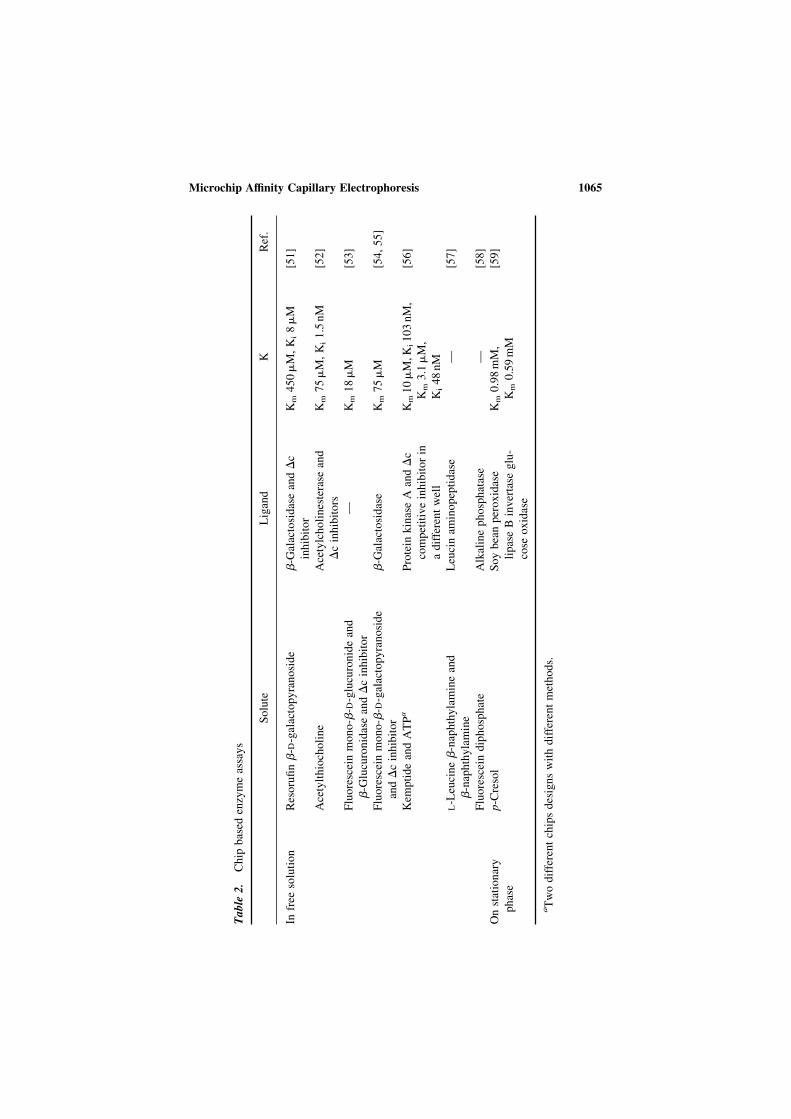
Table
2.
Chip
based
enzymeassays
Solute
Ligand
KRef.
Infree
solution
Resorufinb-D-galactopyranoside
b-G
alactosidaseandDc
inhibitor
Km450mM,Ki8mM
[51]
Acetylthiocholine
Acetylcholinesterase
and
Dcinhibitors
Km75mM,Ki1.5nM
[52]
Fluoresceinmono-b-D-glucuronideand
b-G
lucuronidaseandDcinhibitor
—Km18mM
[53]
Fluoresceinmono- b-D-galactopyranoside
andDcinhibitor
b-G
alactosidase
Km75mM
[54,55]
Kem
ptideandATPa
Protein
kinaseA
andDc
competitiveinhibitorin
adifferentwell
Km10mM,K
i103nM,
Km3.1mM,
Ki48nM
[56]
L-Leucineb-naphthylamineand
b-naphthylamine
Leucinam
inopeptidase
—[57]
Fluoresceindiphosphate
Alkalinephosphatase
—[58]
Onstationary
phase
p-Cresol
Soybeanperoxidase
lipaseBinvertase
glu-
cose
oxidase
Km0.98mM,
Km0.59mM
[59]
aTwodifferentchipsdesignswithdifferentmethods.
Microchip Affinity Capillary Electrophoresis 1065
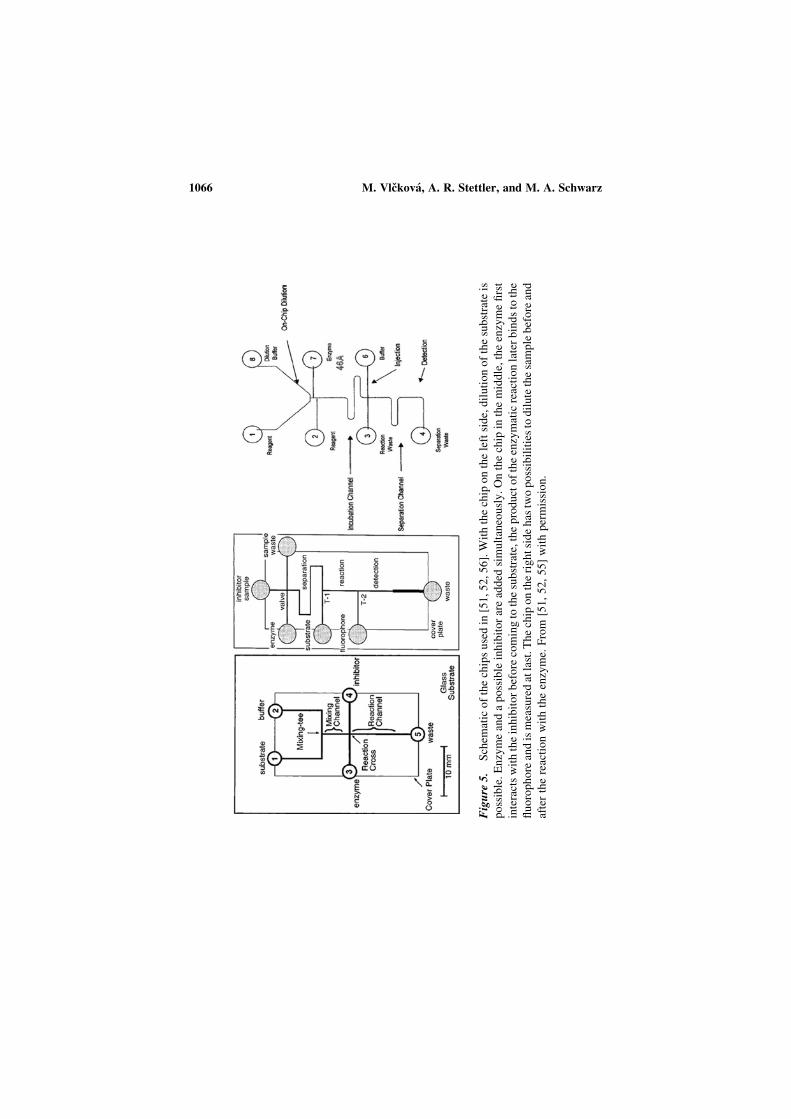
Figure
5.
Schem
aticofthechipsusedin
[51,52,56].Withthechip
ontheleftside,dilutionofthesubstrateis
possible.Enzymeandapossibleinhibitorareadded
simultaneously.Onthechip
inthemiddle,theenzymefirst
interactswiththeinhibitorbefore
comingto
thesubstrate,theproductoftheenzymaticreactionlaterbindstothe
fluorophoreandismeasuredatlast.T
hechipontherightsidehas
twopossibilitiestodilutethesamplebeforeand
afterthereactionwiththeenzyme.From
[51,52,55]withpermission.
M. Vlckova, A. R. Stettler, and M. A. Schwarz1066
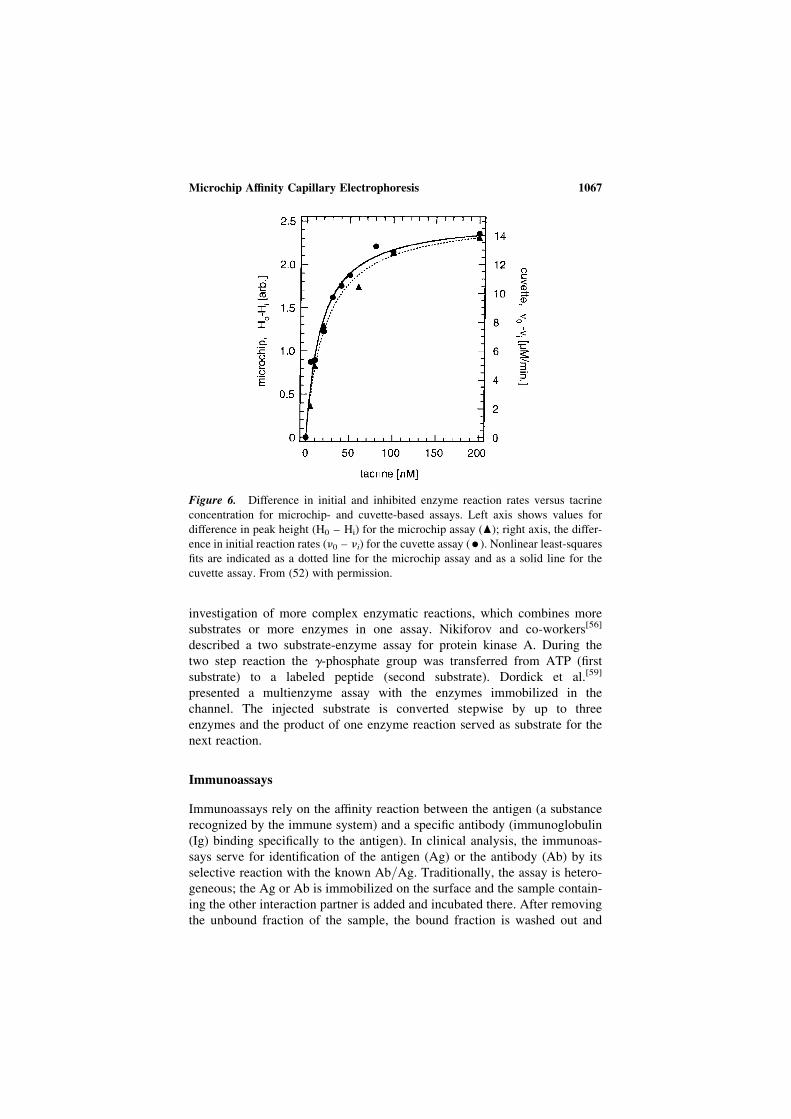
investigation of more complex enzymatic reactions, which combines more
substrates or more enzymes in one assay. Nikiforov and co-workers[56]
described a two substrate-enzyme assay for protein kinase A. During the
two step reaction the g-phosphate group was transferred from ATP (first
substrate) to a labeled peptide (second substrate). Dordick et al.[59]
presented a multienzyme assay with the enzymes immobilized in the
channel. The injected substrate is converted stepwise by up to three
enzymes and the product of one enzyme reaction served as substrate for the
next reaction.
Immunoassays
Immunoassays rely on the affinity reaction between the antigen (a substance
recognized by the immune system) and a specific antibody (immunoglobulin
(Ig) binding specifically to the antigen). In clinical analysis, the immunoas-
says serve for identification of the antigen (Ag) or the antibody (Ab) by its
selective reaction with the known Ab/Ag. Traditionally, the assay is hetero-
geneous; the Ag or Ab is immobilized on the surface and the sample contain-
ing the other interaction partner is added and incubated there. After removing
the unbound fraction of the sample, the bound fraction is washed out and
Figure 6. Difference in initial and inhibited enzyme reaction rates versus tacrine
concentration for microchip- and cuvette-based assays. Left axis shows values for
difference in peak height (H0 – Hi) for the microchip assay (O); right axis, the differ-
ence in initial reaction rates (n0 – ni) for the cuvette assay (†). Nonlinear least-squares
fits are indicated as a dotted line for the microchip assay and as a solid line for the
cuvette assay. From (52) with permission.
Microchip Affinity Capillary Electrophoresis 1067
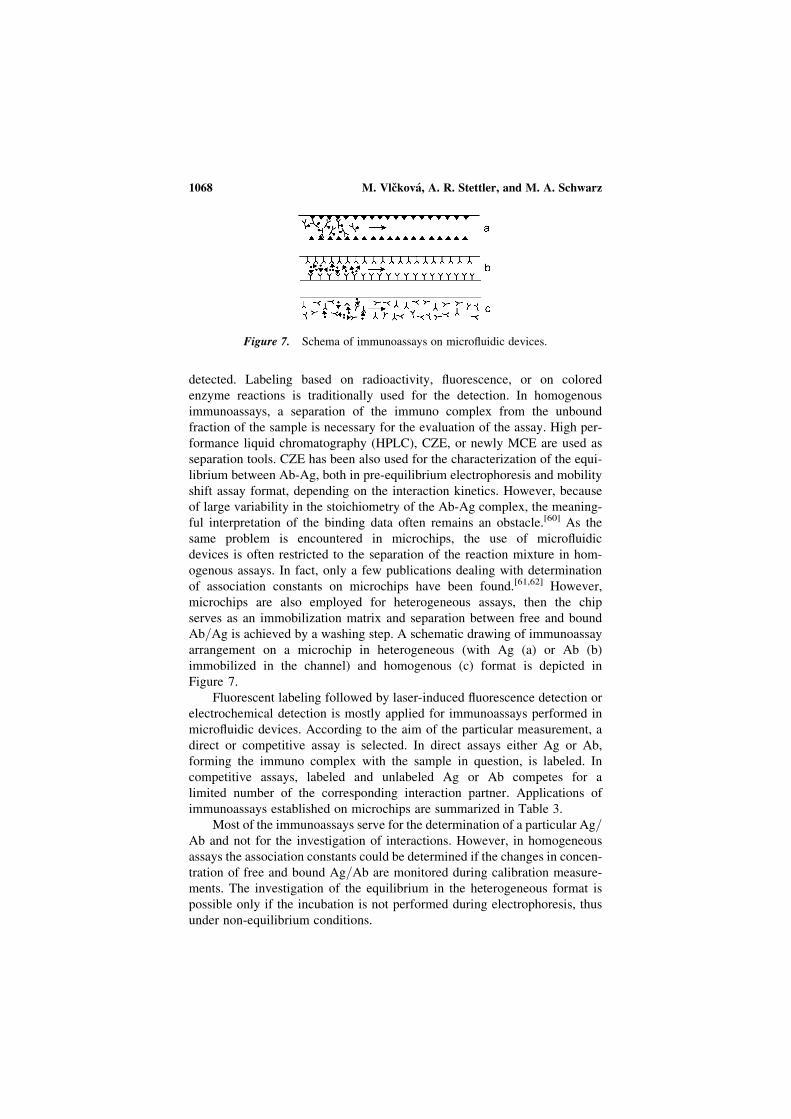
detected. Labeling based on radioactivity, fluorescence, or on colored
enzyme reactions is traditionally used for the detection. In homogenous
immunoassays, a separation of the immuno complex from the unbound
fraction of the sample is necessary for the evaluation of the assay. High per-
formance liquid chromatography (HPLC), CZE, or newly MCE are used as
separation tools. CZE has been also used for the characterization of the equi-
librium between Ab-Ag, both in pre-equilibrium electrophoresis and mobility
shift assay format, depending on the interaction kinetics. However, because
of large variability in the stoichiometry of the Ab-Ag complex, the meaning-
ful interpretation of the binding data often remains an obstacle.[60] As the
same problem is encountered in microchips, the use of microfluidic
devices is often restricted to the separation of the reaction mixture in hom-
ogenous assays. In fact, only a few publications dealing with determination
of association constants on microchips have been found.[61,62] However,
microchips are also employed for heterogeneous assays, then the chip
serves as an immobilization matrix and separation between free and bound
Ab/Ag is achieved by a washing step. A schematic drawing of immunoassay
arrangement on a microchip in heterogeneous (with Ag (a) or Ab (b)
immobilized in the channel) and homogenous (c) format is depicted in
Figure 7.
Fluorescent labeling followed by laser-induced fluorescence detection or
electrochemical detection is mostly applied for immunoassays performed in
microfluidic devices. According to the aim of the particular measurement, a
direct or competitive assay is selected. In direct assays either Ag or Ab,
forming the immuno complex with the sample in question, is labeled. In
competitive assays, labeled and unlabeled Ag or Ab competes for a
limited number of the corresponding interaction partner. Applications of
immunoassays established on microchips are summarized in Table 3.
Most of the immunoassays serve for the determination of a particular Ag/Ab and not for the investigation of interactions. However, in homogeneous
assays the association constants could be determined if the changes in concen-
tration of free and bound Ag/Ab are monitored during calibration measure-
ments. The investigation of the equilibrium in the heterogeneous format is
possible only if the incubation is not performed during electrophoresis, thus
under non-equilibrium conditions.
Figure 7. Schema of immunoassays on microfluidic devices.
M. Vlckova, A. R. Stettler, and M. A. Schwarz1068
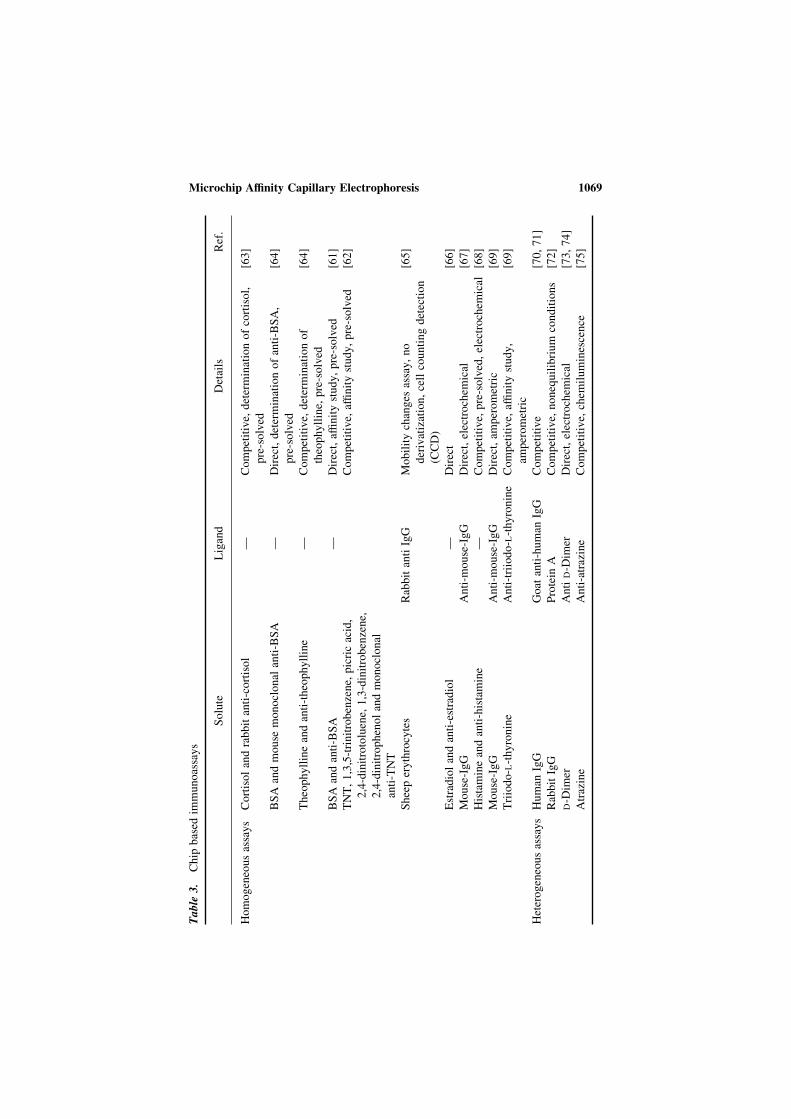
Table
3.
Chip
based
immunoassays
Solute
Ligand
Details
Ref.
Homogeneousassays
Cortisolandrabbitanti-cortisol
—Competitive,determinationofcortisol,
pre-solved
[63]
BSA
andmouse
monoclonal
anti-BSA
—Direct,determinationofanti-BSA,
pre-solved
[64]
Theophyllineandanti-theophylline
—Competitive,determinationof
theophylline,pre-solved
[64]
BSA
andanti-BSA
—Direct,affinitystudy,pre-solved
[61]
TNT,1,3,5-trinitrobenzene,
picricacid,
2,4-dinitrotoluene,1,3-dinitrobenzene,
2,4-dinitrophenolandmonoclonal
anti-TNT
Competitive,affinitystudy,pre-solved
[62]
Sheeperythrocytes
RabbitantiIgG
Mobilitychanges
assay,no
derivatization,cellcountingdetection
(CCD)
[65]
Estradiolandanti-estradiol
—Direct
[66]
Mouse-IgG
Anti-m
ouse-IgG
Direct,electrochem
ical
[67]
Histamineandanti-histamine
—Competitive,pre-solved,electrochem
ical
[68]
Mouse-IgG
Anti-m
ouse-IgG
Direct,am
perometric
[69]
Triiodo- L-thyronine
Anti-triiodo-L-thyronine
Competitive,affinitystudy,
amperometric
[69]
Heterogeneousassays
Human
IgG
Goat
anti-human
IgG
Competitive
[70,71]
RabbitIgG
Protein
ACompetitive,nonequilibrium
conditions
[72]
D-D
imer
Anti
D-D
imer
Direct,electrochem
ical
[73,74]
Atrazine
Anti-atrazine
Competitive,chem
iluminescence
[75]
Microchip Affinity Capillary Electrophoresis 1069
The determination of the Ag or Ab by an immunoassay is very selective,
sensitive, and is often used in clinical measurements. In general, clinical
assays have to be simple, fast, and sufficiently sensitive for detecting the sub-
stances in human liquids. Some of published microchip immunoassays[63,64]
were shown to fulfill the criteria for the clinical use. Similar to all chip appli-
cations, various chip arrangements have been developed for homogenous chip
immunoassays. For example, Mathies and Bromberg[62] worked with a special
folded channel with several detection points. Harrison and co-workers[66,67]
developed a multichannel immunoassay analysis system for measuring up
to six independent reactions at the same time. A galvano scanner, moving
across the channels, was used for the fluorescence detection. A rather
special homogenous immunoassay was performed by Ichiki and co-
workers.[65] They have investigated an immunoreaction between sheep red
blood cells and rabbit anti-IgG on a microchip coated by gelatine to prevent
the cell adsorption. For the detection of the cells a CCD camera, based on
counting of the cells, was used. Enzyme mediated detection for microchip
immunoassays has been demonstrated, too. An indirect electrochemical
detection of Ab and Ag-Ab complex is possible by labeling the Ab with
alkaline phosphatase enzyme converting the substrate to aminophenol,
which is then oxidized at the electrode.[67] A direct detection mechanism
using amperometry for investigations of immunological reactions is
described by Wang et al.[69] The principle is based on a ferrocen redox
labeling of Ab/Ag and can be applied to a variety of clinical and pharma-
ceutical immunoassays.
A single use chip with electrochemical detector for the determination of
d-dimer in a heterogeneous immunoassay has been developed by Girault
and co-workers.[73] A complex immobilization strategy for a heterogeneous
immunoassay was published by Thormann and co-workers.[70,71] They
covered the channel successively with three layers consisting of biotin-
conjugated goat anti-human IgG, neutravidin, and biotin-conjugated dextran,
respectively. Labeled human IgG was then shown to bind to the first layer.
FUTURE PROSPECTS
The broadening of the range of application areas and the quantity of utiliz-
ations is associated with the commercialization of high performance electro-
phoretical microchip systems. Such systems represent planar electrophoresis
chips with narrow channels of nm dimensions with reliable control of
sample and buffer flux equipped with a sensitive detection. Small channel
dimensions and high electric field strengths are the most important features
for high resolution electrophoresis and are, therefore, substantial for a
sensitive recording of mobility shifts. On the other hand, powerful detection
systems are indispensable for identifying minor changes in peak area. The
main motivation is given by high throughput analysis, coupling various
M. Vlckova, A. R. Stettler, and M. A. Schwarz1070

processes to one system such as pre- and post-channel reactions and the possi-
bility to do parallel measurements in an easy way. The miniaturization, as
compared to the ACE in capillaries, enables utilization, cost intensive and
uncommon samples, and ligands.
Generally, the transfer of knownACE processes to theminiaturized format
is becoming more and more common. Since the basic concept of affinity
measurement is derived from capillary measurements, the applicability of
microchip investigations depends mainly on the efforts in technology develop-
ments as mentioned above. In addition to the transfers of known investigation
from the capillary tomicrochip, a lot of novelmicrochip applications, including
the use of so far unknown ligands for better separation efficiencies and new
kinds of noncovalent interactions are, therefore, expected in the near future.
ABBREVIATIONS
A adrenaline
A area
Ab antibody
ACE affinity capillary electrophoresis
Ag antigen
BSA bovine serum albumin
CCD cell counting detection
CD cyclodextrin
CMCD carboxymethyl-cyclodextrin
CZE capillary zone electrophoresis
D dopamine
DNS dimethylamino-naphthalensulfonyl-
EMMA electrophoretically mediated microanalysis
EN epinephrine
EOF electro osmotic flow
FA frontal analysis
FACCE frontal analysis continuous capillary electrophoresis
FITC fluorescein isothiocyanate
H peak height
HD Hummel-Dreyer
HS highly sulfated
HP hydroxypropyl
HPLC high performance liquid chromatography
Ig immunoglobulin
K association constant
Ki inhibition constant
Km Michaelis-Menten constant
L ligand
meff effective mobility
Microchip Affinity Capillary Electrophoresis 1071
MCE microchip capillary electrophoresis
ME metanephrine
MEKC micellar electrokinetic chromatography
MIP molecular imprinted polymer
MT methoxytyramine
NA noradrenaline
NME normetanephrine
PDMS polydimethylsiloxane
PVA poly(vinyl-alcohol)
S solute
s sulfated
sCD sulfated cyclodextrin
SDS sodium dodecyl sulfate
VACE vacancy affinity capillary electrophoresis
VP vacancy peak
n reaction rate
REFERENCES
1. Guijt, R.M.; Frank, J.; van Dedem, G.W.K.; Baltussen, E. Recent advances inaffinity capillary electrophoresis. Electrophoresis 2000, 21, 3905–3918.
2. Busch, M.H.A.; Carels, L.B.; Boelens, H.F.M.; Kraak, J.C.; Poppe, H. Comparisonof five methods for the study of drug-protein binding in affinity capillary electro-phoresis. J. Chromatogr. A 1997, 777, 311–328.
3. Tanaka, Y.; Terabe, S. Estimation of binding constants by capillary electrophor-esis. J. Chromatogr. B 2002, 768, 81–92.
4. Stettler, A.R.; Schwarz, M.A. Affinity capillary electrophoresis on microchips.J. Chromatogr. A 2005, 1063, 217–225.
5. Busch, M.H.A.; Boelens, H.F.M.; Kraak, J.C.; Poppe, H. Vacancy affinity capillaryelectrophoresis, a new method for measuring association constants. J. Chromatogr.A 1997, 775, 313–326.
6. Rundlett, K.L.; Armstrong, D.W. Methods for the determination of bindingconstants by capillary electrophoresis. Electrophoresis 2001, 22, 1419–1427.
7. Busch, M.H.A.; Kraak, J.C.; Poppe, H. Principles and limitations of methodsavailable for the determination of binding constants with affinity capillary electro-phoresis. J. Chromatogr. A 1997, 777, 329–353.
8. Alarie, J.P.; Jacobson, S.C.; Ramsey, J.M. Electrophoretic injection bias in amicrochip valving scheme. Electrophoresis 2001, 22, 312–317.
9. Ermakov, S.V.; Jacobson, S.C.; Ramsey, J.M. Computer simulations ofelectrokinetic injection techniques in microfluidic devices. Anal. Chem. 2000,72, 3512–3517.
10. Zhang, C.-X.; Manz, A. Narrow sample channel injectors for capillary electrophor-esis on microchips. Anal. Chem. 2001, 73, 2656–2662.
11. Lee, N.Y.; Yamada, M.; Seki, M. Pressure-driven sample injection with quantitat-ive liquid dispensing for on-chip electrophoresis. Anal. Sci. 2004, 20, 483–487.
12. Solignac, D.; Gijs, M.A.M. Pressure pulse injection: a powerful alternative toelectrokinetic sample loading in electrophoresis microchips. Anal. Chem. 2003,75, 1652–1657.
M. Vlckova, A. R. Stettler, and M. A. Schwarz1072
13. Ostergaard, J.; Heegard, N.H.H. Capillary electrophoresis frontal analysis:
Principles and applications for the study of drug-plasma protein binding-
Electrophoresis 2003, 24, 2903–2913.
14. Gao, J.Y.; Dubin, P.L.; Muhoberac, B.B. Measurement of the binding of proteins
to polyelectrolytes by frontal analysis continuous capillary electrophoresis. Anal.
Chem. 1997, 69, 2945–2951.
15. Backhouse, C.J.; Crabtree, H.J.; Glerum, D.M. Frontal analysis on a microchip.
Analyst 2002, 127, 1169–1175.
16. Kutter, J.P.; Jacobson, S.C.; Ramsey, J.M. Integrated microchip device with elec-
trokinetically controlled solvent mixing for isocratic and gradient elution in
micellar electrokinetic chromatography. Anal. Chem. 1997, 69, 5165–5171.
17. Moore, A.W.; Jacobson, S.C.; Ramsey, J.M. Microchip separations of neutral
species via micellar electrokinetic capillary chromatography. Anal. Chem. 1995,
67, 4184–4189.
18. vonHeeren, F.; Verpoorte, E.; Manz, A.; Thormann, W. Micellar electrokinetic
chromatography separations and analyses of biological samples on a cyclic
planar microstructure. Anal. Chem. 1996, 68, 2044–2053.19. Rodriguez, I.; Lee, H.K.; Li, S.F.Y. Microchannel electrophoretic separation of
biogenic amines by micellar electrokinetic chromatography. Electrophoresis
1999, 20, 118–126.20. Culbertson, C.T.; Jacobson, S.C.; Ramsey, J.M. Microchip devices for high-
efficiency separations. Anal. Chem. 2000, 72, 5814–5819.
21. Ro, K.W.; Lim, K.; Kim, H.; Hahn, J.H. Poly(dimethylsiloxane) microchip for
precolumn reaction and micellar electrokinetic chromatography of biogenic
amines. Electrophoresis 2002, 23, 1129–1137.22. Wallenborg, S.R.; Bailey, C.G. Separation and detection of explosives on a
microchip using micellar electrokinetic chromatography and indirect laser-
induced fluorescence. Anal. Chem. 2000, 72, 1872–1878.23. Suljak, S.W.; Thompson, L.A.; Ewing, A.G. Improving resolution for channel-
format chip-based electrophoresis with electrochemical array detection J. Sepn.
Sci. 2004, 27, 13–20.
24. Garcia, C.D.; Dressen, B.M.; Henderson, A.; Henry, C.S. Comparison of surfac-
tants for dynamic surface modification of poly(dimethylsiloxane) microchips.
Electrophoresis 2005, 26, 703–709.
25. Sera, Y.; Matsubara, N.; Otsuka, K.; Terabe, S. Sweeping on a microchip: Concen-
tration profiles of the focused zone in micellar electrokinetic chromatography.
Electrophoresis 2001, 22, 3509–3513.
26. Vespalec, R.; Bocek, P. Calculation of stability constants for the chiral selector-
enantiomer interactions from electrophoretic mobilities. J. Chromatogr. A 2000,
875, 431–445.
27. Belder, D.; Ludwig, M. Microchip electrophoresis for chiral separations. Electro-
phoresis 2003, 24, 2422–2430.
28. Il Cho, S.; Shim, J.; Kim,M.S.; Kim,Y.K.; Chung, D.S. On-line sample cleanup and
chiral separation of gemifloxacin in a urinary solution using chiral crown ether as a
chiral selector inmicrochip electrophoresis. J.Chromatogr.A2004,1055, 241–245.
29. Ludwig, M.; Kohler, F.; Belder, D. High-speed chiral separations on microchip
with UV-detection. Electrophoresis 2003, 24, 3233–3238.
30. Kitagawa, F.; Aizawa, S.; Otsuka, K. Rapid enantioseparation of 1-aminoindan by
microchip electrophoresis with linear-imaging UV detection. Anal. Sci. 2005, 21,
61–65.
Microchip Affinity Capillary Electrophoresis 1073
31. Olvecka, E.; Masar, M.; Kaniansky, D.; Johnck, M.; Stanislawski, B. Isotacho-
phoresis separations of enantiomers on a planar chip with coupled separation
channels. Electrophoresis 2001, 22, 3347–3353.32. Schwarz, M.A.; Hauser, P.C. Chiral on-chip separations of neurotransmitters.
Anal. Chem. 2003, 75, 4691–4695.33. Ludwig, M.; Belder, D. Coated microfluidic devices for improved chiral separ-
ations in microchip electrophoresis. Electrophoresis 2003, 24, 2481–2486.34. Hutt, L.D.; Glavin, D.P.; Bada, J.L.; Mathies, R.A. Microfabricated capillary elec-
trophoresis amino acid chirality analyser for extraterrestrial exploration. Anal.
Chem. 1999, 71, 4000–4006.35. Piehl, N.; Ludwig, M.; Belder, D. Subsecond chiral separations on a microchip.
Electrophoresis 2004, 25, 3848–3852.36. Rodriguez, I.; Jin, L.J.; Li, S.F.Y. High-speed chiral separations on microchip
electrophoresis devices. Electrophoresis 2000, 21, 211–219.37. Wallenborg, S.R.; Lurie, I.S.; Arnold, D.W.; Bailey, C.G. On-chip chiral and
achiral separation of amphetamine and related compounds labeled with 4-fluoro-
7-nitrobenzofurazene. Electrophoresis 2000, 21, 3257–3263.38. Schwarz, M.A.; Hauser, P.C. Rapid chiral on-chip separation with simplified
amperometric detection. J. Chromatgr. A 2001, 928, 225–232.39. Belder, D.; Deege, A.; Maass, M.; Ludwig, M. Design and performance of
microchip electrophoresis instrument with sensitive variable-wavelength fluor-
escence detection. Electrophoresis 2002, 23, 2355–2361.40. Il Cho, S.; Lee, K.N.; Kim, Y.K.; Jang, J.H.; Chung, D.S. Chiral separation of
gemifloxacin in sodium-containing media using chiral crown ether as a chiralselector by capillary and microchip electrophoresis. Electrophoresis 2002, 23,972–977.
41. Skelley, A.M.; Mathies, R.A. Chiral separation of fluorescamine-labeled amino
acids using microfabricated capillary electrophoresis devices for extraterrestrial
exploration. J. Chromatogr. A 2003, 1021, 191–199.42. Stachowiak, T.B.; Svec, F.; Frechet, J.M.J. Chip electrochromatography.
J. Chromatogr. A 2004, 1044, 97–111.43. Guihen, E.; Glennon, J.D. Recent highlights in stationary phase design for open-
tubular capillary electrochromatography. J. Chromatogr. A 2004, 1044, 67–81.44. Svec, F. Recent developments in the field of monolithic stationary phases for
capillary electrochromatography. J. Sepn. Sci. 2005, 28, 729–745.45. Peterson, D. Solid supports for micro analytical systems. Lab On A Chip 2005, 5,
132–139.
46. He, B. Fabrication of nanocolumns for liquid chromatography. Anal. Chem. 1998,70, 3790–3797.
47. Schweitz, L. Approaches to molecular imprinting based selectivity in capillary
electrochromatography. Electrophoresis 2001, 22, 4053–4063.48. Pumera, M. Microchip-based electrochromatography: designs and applications.
Talanta 2005, 66, 1048–1062.49. Guijt, R.M.; Baltussen, E.; van Demen, G.W.K. Use of bioaffinity interactions in
electrokinetically controlled assays on microfabricated devices. Electrophoresis
2002, 23, 823–825.50. Novakova, S.; Van Dyck, S.; Van Schepdael, A.; Hoogmartens, J.; Glatz, Z. Elec-
trophoretically mediated microanalysis. J. Chromatogr. A 2004, 1032, 173–184.51. Hadd, A.G.; Raymond, D.E.; Halliwell, J.W.; Jacobson, S.C.; Ramsey, J.M.
Microchip device for performing enzyme assays. Anal. Chem. 1997, 69,
3407–3412.
M. Vlckova, A. R. Stettler, and M. A. Schwarz1074
52. Hadd, A.G.; Jacobson, S.C.; Ramsey, J.M. Microfluidic Assays of Acetylcholin-
esterase Inhibitors. Anal. Chem. 1999, 71, 5206–5212.53. Starkey, D.E.; Han, A.; Bao, J.J.; Ahn, C.H.; Wehmeyer, K.R.; Prenger, M.C.;
Halsall, H.B.; Heineman, W.R. Fluorogenic assay for b-glucuronidase using
microchip-based capillary electrophoresis. J. Chromatogr. B 2001, 762, 33–41.54. Burke, B.J.; Regnier, F.E. Stopped-flow enzyme assays on a chip using a microfab-
ricated mixer. Anal. Chem. 2003, 75, 1786–1791.55. Burke, B.J.; Regnier, F.E. Electrophoretically mediated microanalysis of b-galac-
tosidase on microchips. Electrophoresis 2001, 22, 3744–3751.56. Cohen, C.B.; Chin-Dixon, E.; Jeong, S.; Nikiforov, T.T.A. Microchip-based
enzyme assay for protein kinase A. Anal. Biochem. 1999, 273, 89–97.57. Zugel, S.A.; Burke, B.J.; Regnier, F.E.; Lytle, F.E. Electrophoretically mediated
microanalysis of leucine aminopeptidase using two-photon excited fluorescence
detection on a microchip. Anal. Chem. 2000, 72, 5731–5735.58. Murakami, Y.; Morita, T.; Kanekiyo, T.; Tamiya, E. On-chip capillary electro-
phoresis for alkaline phosphatase testing. Biosens. Bioelectron. 2001, 16,
1009–1014.
59. Lee, M.-Y.; Srinivasan, A.; Ku, B.; Dordick, J.S. Multienzyme catalysis in micro-
fluidic biochips. Biotechnol. Bioeng. 2003, 83, 20–28.60. Tseng, W.-L.; Chang, H.-T.; Hsu, S.-M.; Chen, R.-J.; Lin, S. Immunoaffinity
capillary electrophoresis: Determination of binding constant and stoichiometry
for antibody-antigen recognition. Electrophoresis 2002, 23, 836–846.61. Chen, S.-H.; Lin, Y.-H.; Wang, L.-Y.; Lin, C.-C.; Lee, G.-B. Flow-through
sampling for electrophoresis-based microchips and their applications for proteinanalysis. Anal. Chem. 2002, 74, 5146–5153.
62. Bromberg, A.; Mathies, R.A. Homogeneous immunoassay for detection of TNT
and its analogues on a microfabricated capillary electrophoresis chip. Anal.
Chem. 2003, 75, 1188–1195.63. Koutny, L.B.; Schmalzing, D.; Taylor, T.A.; Fuchs, M. Microchip electrophoretic
immunoassay for serum cortisol. Anal. Chem. 1996, 68, 18–22.64. Chiem, N.; Harrison, D.J. Microchip-based capillary electrophoresis for immu-
noassays: Analysis of monoclonal antibodies and theophylline. Anal. Chem.
1997, 69, 373–378.65. Ichiki, T.; Ujiie, T.; Shinbashi, S.; Okuda, T.; Horiike, Y. Immunoelectrophoresis
of red blood cells performed on microcapillary chips. Electrophoresis 2002, 23,2029–2034.
66. Cheng, S.B.; Skinner, C.D.; Taylor, J.; Attiya, S.; Lee, W.E.; Picelli, G.;
Harrison, D.J. Development of a multichannel microfluidic analysis system
employing affinity capillary electrophoresis for immunoassay. Anal. Chem.
2001, 73, 1472–1479.67. Wang, J.; Ibanez, A.; Chatrathi, M.P.; Escarpa, A. Electrochemical enzyme immu-
noassays on microchip platforms. Anal. Chem. 2001, 73, 5323–5327.68. Lim, T.-K.; Ohta, H.; Matsunaga, T. Microfabricated on-chip-type electrochemical
flow immunoassay system for the detection of histamine released in whole blood
samples. Anal. Chem. 2003, 75, 3316–3321.69. Wang, J.; Ibanez, A.; Chatrathi, M.P. Microchip-based amperometric immunoas-
says using redox tracers. Electrophoresis 2002, 23, 3744–3749.70. Linder, V.; Verpoorte, E.; Thormann, W.; de Rooij, N.F.; Sigrist, H. Surface
biopassivation of replicated poly(dimethylsiloxane) microfluidic channels and
application to heterogeneous immunoreaction with on-chip fluorescence
detection. Anal. Chem. 2001, 73, 4181–4189.
Microchip Affinity Capillary Electrophoresis 1075
71. Linder, V.; Verpoorte, E.; de Rooij, N.F.; Sigrist, H.; Thormann, W. Applicationof surface biopassivated disposable poly(dimethylsiloxane)/glass chips to aheterogeneous competitive human serum immunoglobulin G immunoassay withincorporated internal standard. Electrophoresis 2002, 23, 740–749.
72. Dodge, A.; Fluri, K.; Verpoorte, E.; de Rooij, N.F. Electrokinetically drivenmicrofluidic chips with surface-modified chambers for heterogeneous immunoas-says. Anal. Chem. 2001, 73, 3400–3409.
73. Rossier, J.S.; Schwarz, A.; Reymond, F.; Ferrigno, R.; Bianchi, F.; Girault, H.H.Microchannel networks for electrophoretic separations, Electrophoresis 1999,20, 727–731.
74. Rossier, J.S.; Girault, H.H. Enzyme linked immunosorbent assay on a microchipwith electrochemical detection. Lab On A Chip 2001, 1, 153–157.
75. Yakovleva, J.; Davidsson, R.; Lobanova, A.; Bengtsson, M.; Eremin, S.;Laurell, T.; Emneus, J. Microfluidic enzyme immunoassay using siliconmicrochip with immobilized antibodies and chemiluminescence detection. Anal.Chem. 2002, 74, 2994–3004.
76. Jiang, G.; Attiya, S.; Ocvirk, G.; Lee, W.E.; Harrison, D.J. Red diode laser inducedfluorescence detection with a confocal microscope on a microchip for capillaryelectrophoresis. Biosens. Bioelectron. 2000, 14, 861–869.
Received September 1, 2005
Accepted December 14, 2005
Manuscript 6770B
M. Vlckova, A. R. Stettler, and M. A. Schwarz1076
Publication 4
Pharmaceutical applications of isoelectric focusing on microchip with imaged UV
detection
Vlčková, M., Kalman, F., Schwarz, M.A.
J. Chromatogr. A 2008, 1181, 145-152

Available online at www.sciencedirect.com
Journal of Chromatography A, 1181 (2008) 145–152
Pharmaceutical applications of isoelectric focusing on microchipwith imaged UV detection
Marketa Vlckova a, Franka Kalman b, Maria A. Schwarz a,b,∗a Department of Chemistry, University of Basel, Spitalstrasse 51, 4056 Basel, Switzerland
b Solvias AG, WKL-127.2.40, Klybeckstrasse 191, Postfach, 4002 Basel, Switzerland
Received 4 October 2007; received in revised form 20 November 2007; accepted 18 December 2007Available online 24 December 2007
Abstract
For the first time, the application of a commercial Shimadzu microchip electrophoresis system MCE-2010 equipped with an imaging UV detectorfor isoelectric focusing (IEF) of therapeutic proteins is reported. By proper adjustment of the pH gradient, samples with pI values ranging from2.85 to 10.3 can be focused to the imaged part of the separation channel. Three therapeutic proteins (hirudin, erythropoietin, and bevacizumab)have been successfully focused on the microchip, and the results have been compared to conventional capillary IEF in terms of peak profile, pIvalues, and reproducibility.© 2007 Elsevier B.V. All rights reserved.
Keywords: Isoelectric focusing; Microfluidics; Whole-column imaging; Therapeutic proteins; cIEF
1. Introduction
Isoelectric focusing (IEF) is considered to be an attrac-tive separation technique for biologically important amphotericcompounds (e.g. proteins and peptides) due to the high-resolution power and spontaneous focusing of analytes. Theanalytes are separated on the basis of their isoelectric point(pI), either in a pH gradient formed along the separation pathby special amphoteric buffers (so-called carrier ampholytes),or, alternatively, in the immobilized pH gradient [1]. Dur-ing the measurement the sample components are separatedand focused at the locations corresponding to their pI values.Thereby, the determination of the substance specific pI valuesof the compounds of interest is possible. Thus, this techniqueis quite often applied to identity tests in pharmaceutical qual-ity control and to the characterization of complex biologicalsamples. Traditionally, IEF is performed in a slab gel, whichis a time-consuming and labor-intensive procedure providing
∗ Corresponding author at: Department of Chemistry, University of Basel,Spitalstrasse 51, 4056 Basel, Switzerland. Tel.: +41 61 6866523;fax: +41 61 2671005.
E-mail addresses: [email protected],[email protected] (M.A. Schwarz).
only approximate results. However, it remains popular due tothe simple technical requirements [1].
Capillary isoelectric focusing (cIEF) offers many advantagesover gel-based IEF, for example, ease of automation, quanti-tation, low consumption of reagents, and fast analysis speed[2–4]. Microchip isoelectric focusing (MC-IEF) is the resultof the miniaturization of the cIEF and thus the focusing timeand the amount of reagents are further reduced [5]. Since mostcapillary electrophoretic (CE) instruments and electrophoreticmicrochip systems are equipped with a single-point, on-columnoptical detection (UV/vis absorption, fluorescence), all proteinbands focused inside the capillary or the microchannel mustbe mobilized to pass the detection point. Thus, a mobilizationstep is necessary following the focusing process [6]. Alterna-tively, the mobilization can commence during focusing if cIEFis performed in uncoated capillaries/channels, but in this case theproteins may be eluted before being focused [7]. Moreover, theadsorption of the proteins to the surface of an uncoated capillaryis a severe problem associated with a one-step cIEF method. Onthe other hand, in the two-step approach, the mobilization stepinevitably leads to distortion of the pH gradient resulting in poorreproducibility, longer analysis time and poorer resolution [8].
Whole-column imaging detectors (WCID) proved to be idealfor the detection of focused zones by cIEF as they eliminate the
0021-9673/$ – see front matter © 2007 Elsevier B.V. All rights reserved.doi:10.1016/j.chroma.2007.12.046
146 M. Vlckova et al. / J. Chromatogr. A 1181 (2008) 145–152
need for mobilization. Since the introduction of WCID conceptfor cIEF, reported by Pawliszyn and coworkers [9], several typesof WCID have been developed (for review see [10]). Fluorescentimaging detectors are the most commonly used WCID becauseof their sensitivity. Besides laser (laser-induced fluorescence,LIF), also organic light emitting diode (OLED) array was used asa light source for WCID [11]. Newly, also a liquid-core waveg-uide LIF version of WCID, which offers very high detectionsensitivity, has been introduced for cIEF [12]. UV absorptionimaging detectors are in general less sensitive but can be usedfor most proteins without a labeling reaction. Recently, a com-mercial instrument for cIEF equipped with UV–WCID has beenlaunched [13,14]. The WCID concept has also been successfullyadapted for microchip format, based on measuring fluores-cence [15–17] as well as the UV absorption [5]. In addition toglass chips [5,15], cheaper plastic chips [16,17] have also beenapplied for MC-IEF–WCID. Furthermore, a microfluidic car-tridge suitable for cIEF with WCID has been recently preparedby screen-printing [18] as a novel microfabrication technique.Another benefit of imaged IEF is the possibility of dynamicmonitoring the focusing process which provides valuable addi-tional information. Consequently, WCID–IEF has been appliedfor numerous dynamic measurements, such as for monitoringprotein reactions [19,20], for characterization of biomolecularinteractions [19,21,22] as well as for measurement of diffusioncoefficients [23] or dissociation rate constants of complexes [24].
A commercial Shimadzu microchip electrophoresis systemMCE-2010, originally developed for high-throughput DNAanalysis, is equipped with a linear imaging UV photodiode arraydetector. The combination of high throughput and the linearimaging detector makes the instrument attractive for IEF anal-yses. In spite of this feature, to the best of our knowledge, theinstrument has not so far been applied to MC-IEF measurements.The published applications of the MCE-2010 system cover chi-ral separations [25,26], various analyses (e.g. determination ofdrugs [27], inorganic metabolites [28], or separation of DNAfragments [29]), and affinity measurements [30,31].
Our goal was to test the suitability of the MCE-2010 systemfor the fast development of IEF of selected therapeutic proteins,and thus to evaluate the apparatus as a potential high-throughputtool for protein-based formulations. In the pharmaceutical indus-try, the purity, heterogeneity and identity of the protein-baseddrugs has to be monitored from development through final lotmanufacturing in order to ensure their therapeutic efficacy [32].
Three therapeutic proteins (Revasc Canyon PharmaceuticalsLimited, UK), erythropoietin, and Avastin (Roche Pharma AG,Switzerland)), accepted for treatment of diseases, have been cho-sen for assessment of the applicability of the MCE-2010 systemfor MC-IEF measurements. The anticoagulant drug Revasc isa genetically engineered recombinant form of hirudin, which isa natural anticoagulant polypeptide present in leech saliva witha biological effect based on thrombin inhibition [33]. Usually,IEF is used for testing the identity and purity of this therapeuticprotein in the quality control. Erythropoietin (EPO) is a glyco-protein hormone that promotes the formation of red blood cellsin the bone marrow. This hormone is produced by recombinantDNA technology in mammalian cell culture for treating anemia
resulting from chronic renal failure or from cancer chemother-apy. However, the cell line used for EPO production influencesits glycosylation, which plays an important role in its biologicalactivity. IEF is a suitable method for measuring the relative pro-portions of the isoforms present in the EPO sample, as the degreeof sialic acid content is reflected by the pI value [34,35]. Avastinis trade name of bevacizumab, a humanized monoclonal IgG1antibody, which is the first commercially available angiogenesisinhibitor. It is used in the treatment of cancer, where it inhibitstumor growth by blocking the formation of new blood vessels byinhibiting the vascular endothelial growth factor [36]. IEF is oneof the main methods used in the pharmaceutical industry for theidentification of charge variants of monoclonal antibodies suchas bevacizumab.
The scope of the present work covers: (i) the evaluation ofthe applicability of the Shimadzu microchip station MC-2010for MC-IEF; (ii) the development of the MC-IEF of selectedproteins of pharmaceutical interest; (iii) the comparison of theresults of MC-IEF with those of conventional cIEF.
2. Experimental
2.1. Chemicals and reagents
The carrier ampholytes BioChemika (pH 3–10) and Pharma-lyte (pH 2.5–5) were obtained from Fluka (Buchs, Switzerland).The carrier ampholytes Bio-Lyte, (pH 3–10, pH 6–8, and pH8–10) were purchased from Bio-Rad Labs. (Reinach, Switzer-land). pI markers from two sources, from Fluka and fromIsogen Life Sciences (IJsselstein, The Netherlands), have beenused in the study. Commercial cIEF gel was purchased fromBeckman Coulter (Fullerton, CA, USA, ordering no. 477497).All other chemicals used in the experiments were of ana-lytical grade and all aqueous solutions were prepared usingdeionized water. Solutions of 10 mM and 50 mM phosphoricacid and 20 mM sodium hydroxide, prepared using water aswell as gel as a solvent, served as anolytes and catholytes,respectively, for MC-IEF. Commercially available solutions ofcatholyte (40 mM sodium hydroxide, ordering no. 148-5028),anolyte (20 mM phosphoric acid, ordering no. 148-5029), andcathodic mobilizer (ordering no.148-5030) from Bio-Rad Labs.were used in the cIEF experiments. One percent aqueous solu-tion of hydroxypropylmethylcellulose (HPMC) was used as themedium for cIEF instead of commercial cIEF gel. N,N,N′,N′-tetramethylethylenediamine (TEMED) was applied to extent themeasurable range of the pH gradient on the basic side in someexperiments by acting as a spacer.
2.2. Samples
Drugs (Revasc, and Avastin) were bought in the pharmacy.Erythropoietin was provided by the European Pharmacopoeiaas biological reference product (BRP). The drug Revasc (batchno. H4007A) is supplied as a pure powder together with asolvent for preparing solution for injection. The powder wasdiluted by deionized water to final concentration 2 mg/ml andthis solution was directly used as a protein sample. Erythropoi-
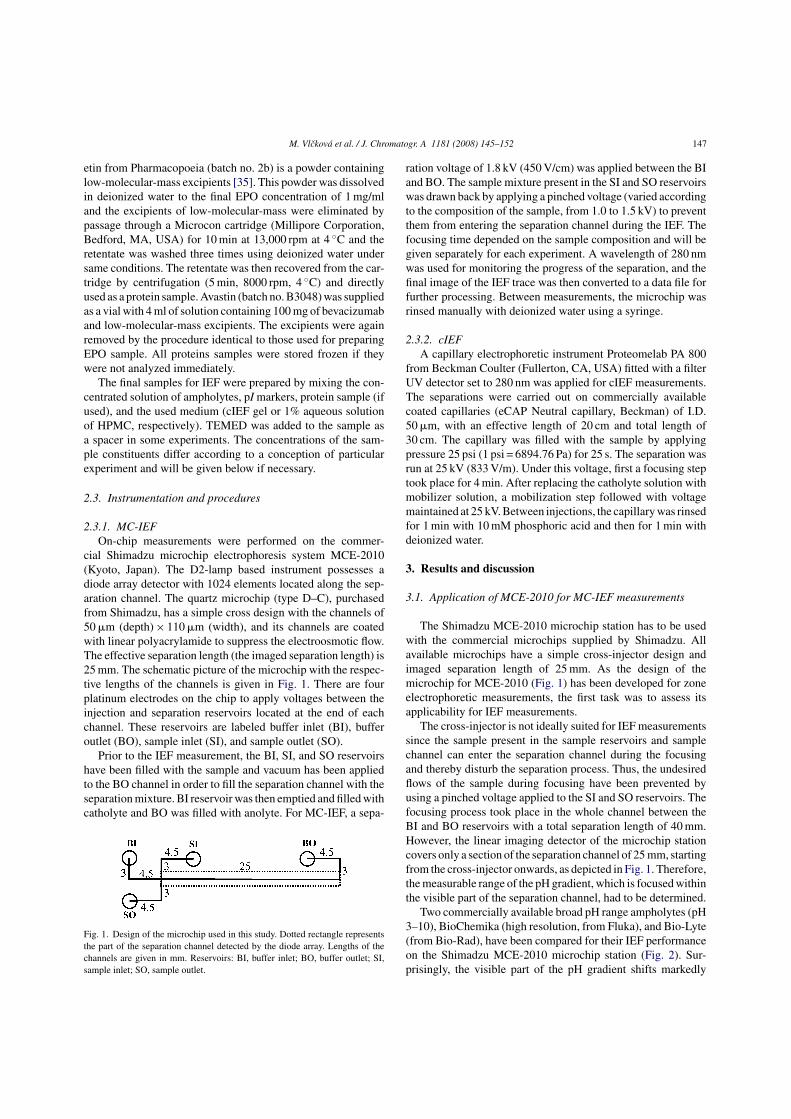
M. Vlckova et al. / J. Chromatogr. A 1181 (2008) 145–152 147
etin from Pharmacopoeia (batch no. 2b) is a powder containinglow-molecular-mass excipients [35]. This powder was dissolvedin deionized water to the final EPO concentration of 1 mg/mland the excipients of low-molecular-mass were eliminated bypassage through a Microcon cartridge (Millipore Corporation,Bedford, MA, USA) for 10 min at 13,000 rpm at 4 ◦C and theretentate was washed three times using deionized water undersame conditions. The retentate was then recovered from the car-tridge by centrifugation (5 min, 8000 rpm, 4 ◦C) and directlyused as a protein sample. Avastin (batch no. B3048) was suppliedas a vial with 4 ml of solution containing 100 mg of bevacizumaband low-molecular-mass excipients. The excipients were againremoved by the procedure identical to those used for preparingEPO sample. All proteins samples were stored frozen if theywere not analyzed immediately.
The final samples for IEF were prepared by mixing the con-centrated solution of ampholytes, pI markers, protein sample (ifused), and the used medium (cIEF gel or 1% aqueous solutionof HPMC, respectively). TEMED was added to the sample asa spacer in some experiments. The concentrations of the sam-ple constituents differ according to a conception of particularexperiment and will be given below if necessary.
2.3. Instrumentation and procedures
2.3.1. MC-IEFOn-chip measurements were performed on the commer-
cial Shimadzu microchip electrophoresis system MCE-2010(Kyoto, Japan). The D2-lamp based instrument possesses adiode array detector with 1024 elements located along the sep-aration channel. The quartz microchip (type D–C), purchasedfrom Shimadzu, has a simple cross design with the channels of50 �m (depth) × 110 �m (width), and its channels are coatedwith linear polyacrylamide to suppress the electroosmotic flow.The effective separation length (the imaged separation length) is25 mm. The schematic picture of the microchip with the respec-tive lengths of the channels is given in Fig. 1. There are fourplatinum electrodes on the chip to apply voltages between theinjection and separation reservoirs located at the end of eachchannel. These reservoirs are labeled buffer inlet (BI), bufferoutlet (BO), sample inlet (SI), and sample outlet (SO).
Prior to the IEF measurement, the BI, SI, and SO reservoirshave been filled with the sample and vacuum has been appliedto the BO channel in order to fill the separation channel with theseparation mixture. BI reservoir was then emptied and filled withcatholyte and BO was filled with anolyte. For MC-IEF, a sepa-
Fig. 1. Design of the microchip used in this study. Dotted rectangle representsthe part of the separation channel detected by the diode array. Lengths of thechannels are given in mm. Reservoirs: BI, buffer inlet; BO, buffer outlet; SI,sample inlet; SO, sample outlet.
ration voltage of 1.8 kV (450 V/cm) was applied between the BIand BO. The sample mixture present in the SI and SO reservoirswas drawn back by applying a pinched voltage (varied accordingto the composition of the sample, from 1.0 to 1.5 kV) to preventthem from entering the separation channel during the IEF. Thefocusing time depended on the sample composition and will begiven separately for each experiment. A wavelength of 280 nmwas used for monitoring the progress of the separation, and thefinal image of the IEF trace was then converted to a data file forfurther processing. Between measurements, the microchip wasrinsed manually with deionized water using a syringe.
2.3.2. cIEFA capillary electrophoretic instrument Proteomelab PA 800
from Beckman Coulter (Fullerton, CA, USA) fitted with a filterUV detector set to 280 nm was applied for cIEF measurements.The separations were carried out on commercially availablecoated capillaries (eCAP Neutral capillary, Beckman) of I.D.50 �m, with an effective length of 20 cm and total length of30 cm. The capillary was filled with the sample by applyingpressure 25 psi (1 psi = 6894.76 Pa) for 25 s. The separation wasrun at 25 kV (833 V/m). Under this voltage, first a focusing steptook place for 4 min. After replacing the catholyte solution withmobilizer solution, a mobilization step followed with voltagemaintained at 25 kV. Between injections, the capillary was rinsedfor 1 min with 10 mM phosphoric acid and then for 1 min withdeionized water.
3. Results and discussion
3.1. Application of MCE-2010 for MC-IEF measurements
The Shimadzu MCE-2010 microchip station has to be usedwith the commercial microchips supplied by Shimadzu. Allavailable microchips have a simple cross-injector design andimaged separation length of 25 mm. As the design of themicrochip for MCE-2010 (Fig. 1) has been developed for zoneelectrophoretic measurements, the first task was to assess itsapplicability for IEF measurements.
The cross-injector is not ideally suited for IEF measurementssince the sample present in the sample reservoirs and samplechannel can enter the separation channel during the focusingand thereby disturb the separation process. Thus, the undesiredflows of the sample during focusing have been prevented byusing a pinched voltage applied to the SI and SO reservoirs. Thefocusing process took place in the whole channel between theBI and BO reservoirs with a total separation length of 40 mm.However, the linear imaging detector of the microchip stationcovers only a section of the separation channel of 25 mm, startingfrom the cross-injector onwards, as depicted in Fig. 1. Therefore,the measurable range of the pH gradient, which is focused withinthe visible part of the separation channel, had to be determined.
Two commercially available broad pH range ampholytes (pH3–10), BioChemika (high resolution, from Fluka), and Bio-Lyte(from Bio-Rad), have been compared for their IEF performanceon the Shimadzu MCE-2010 microchip station (Fig. 2). Sur-prisingly, the visible part of the pH gradient shifts markedly
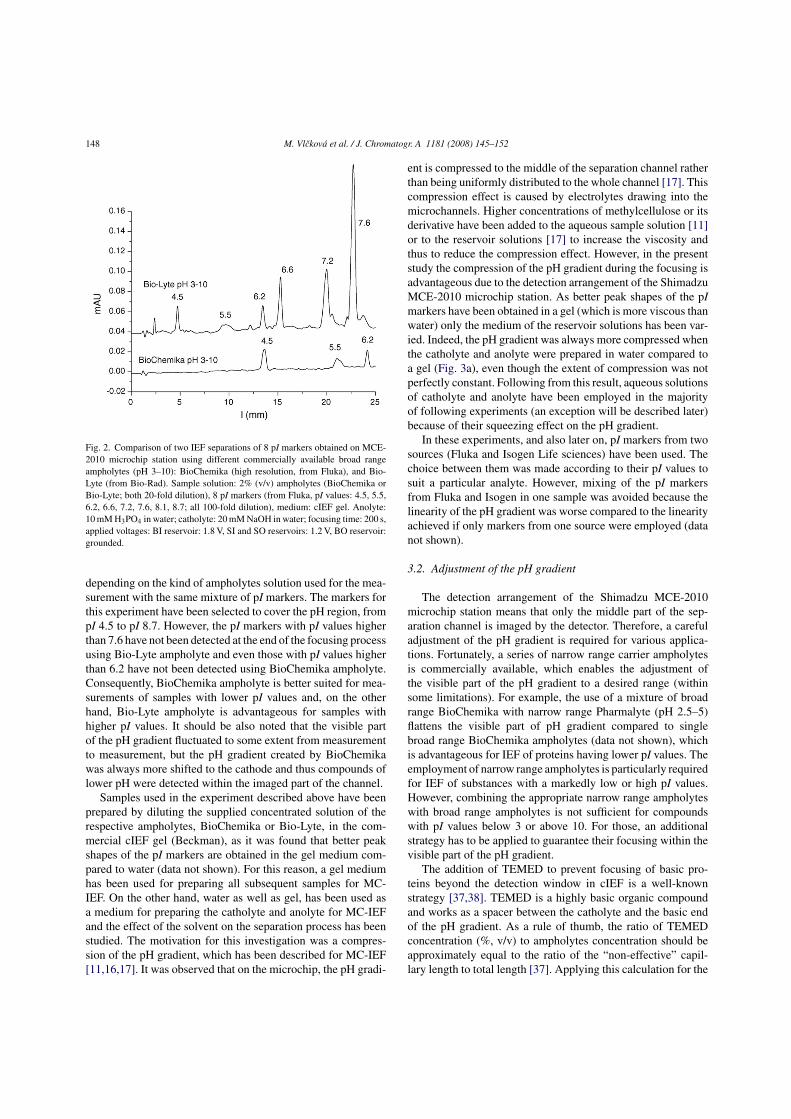
148 M. Vlckova et al. / J. Chromatogr. A 1181 (2008) 145–152
Fig. 2. Comparison of two IEF separations of 8 pI markers obtained on MCE-2010 microchip station using different commercially available broad rangeampholytes (pH 3–10): BioChemika (high resolution, from Fluka), and Bio-Lyte (from Bio-Rad). Sample solution: 2% (v/v) ampholytes (BioChemika orBio-Lyte; both 20-fold dilution), 8 pI markers (from Fluka, pI values: 4.5, 5.5,6.2, 6.6, 7.2, 7.6, 8.1, 8.7; all 100-fold dilution), medium: cIEF gel. Anolyte:10 mM H3PO4 in water; catholyte: 20 mM NaOH in water; focusing time: 200 s,applied voltages: BI reservoir: 1.8 V, SI and SO reservoirs: 1.2 V, BO reservoir:grounded.
depending on the kind of ampholytes solution used for the mea-surement with the same mixture of pI markers. The markers forthis experiment have been selected to cover the pH region, frompI 4.5 to pI 8.7. However, the pI markers with pI values higherthan 7.6 have not been detected at the end of the focusing processusing Bio-Lyte ampholyte and even those with pI values higherthan 6.2 have not been detected using BioChemika ampholyte.Consequently, BioChemika ampholyte is better suited for mea-surements of samples with lower pI values and, on the otherhand, Bio-Lyte ampholyte is advantageous for samples withhigher pI values. It should be also noted that the visible partof the pH gradient fluctuated to some extent from measurementto measurement, but the pH gradient created by BioChemikawas always more shifted to the cathode and thus compounds oflower pH were detected within the imaged part of the channel.
Samples used in the experiment described above have beenprepared by diluting the supplied concentrated solution of therespective ampholytes, BioChemika or Bio-Lyte, in the com-mercial cIEF gel (Beckman), as it was found that better peakshapes of the pI markers are obtained in the gel medium com-pared to water (data not shown). For this reason, a gel mediumhas been used for preparing all subsequent samples for MC-IEF. On the other hand, water as well as gel, has been used asa medium for preparing the catholyte and anolyte for MC-IEFand the effect of the solvent on the separation process has beenstudied. The motivation for this investigation was a compres-sion of the pH gradient, which has been described for MC-IEF[11,16,17]. It was observed that on the microchip, the pH gradi-
ent is compressed to the middle of the separation channel ratherthan being uniformly distributed to the whole channel [17]. Thiscompression effect is caused by electrolytes drawing into themicrochannels. Higher concentrations of methylcellulose or itsderivative have been added to the aqueous sample solution [11]or to the reservoir solutions [17] to increase the viscosity andthus to reduce the compression effect. However, in the presentstudy the compression of the pH gradient during the focusing isadvantageous due to the detection arrangement of the ShimadzuMCE-2010 microchip station. As better peak shapes of the pImarkers have been obtained in a gel (which is more viscous thanwater) only the medium of the reservoir solutions has been var-ied. Indeed, the pH gradient was always more compressed whenthe catholyte and anolyte were prepared in water compared toa gel (Fig. 3a), even though the extent of compression was notperfectly constant. Following from this result, aqueous solutionsof catholyte and anolyte have been employed in the majorityof following experiments (an exception will be described later)because of their squeezing effect on the pH gradient.
In these experiments, and also later on, pI markers from twosources (Fluka and Isogen Life sciences) have been used. Thechoice between them was made according to their pI values tosuit a particular analyte. However, mixing of the pI markersfrom Fluka and Isogen in one sample was avoided because thelinearity of the pH gradient was worse compared to the linearityachieved if only markers from one source were employed (datanot shown).
3.2. Adjustment of the pH gradient
The detection arrangement of the Shimadzu MCE-2010microchip station means that only the middle part of the sep-aration channel is imaged by the detector. Therefore, a carefuladjustment of the pH gradient is required for various applica-tions. Fortunately, a series of narrow range carrier ampholytesis commercially available, which enables the adjustment ofthe visible part of the pH gradient to a desired range (withinsome limitations). For example, the use of a mixture of broadrange BioChemika with narrow range Pharmalyte (pH 2.5–5)flattens the visible part of pH gradient compared to singlebroad range BioChemika ampholytes (data not shown), whichis advantageous for IEF of proteins having lower pI values. Theemployment of narrow range ampholytes is particularly requiredfor IEF of substances with a markedly low or high pI values.However, combining the appropriate narrow range ampholyteswith broad range ampholytes is not sufficient for compoundswith pI values below 3 or above 10. For those, an additionalstrategy has to be applied to guarantee their focusing within thevisible part of the pH gradient.
The addition of TEMED to prevent focusing of basic pro-teins beyond the detection window in cIEF is a well-knownstrategy [37,38]. TEMED is a highly basic organic compoundand works as a spacer between the catholyte and the basic endof the pH gradient. As a rule of thumb, the ratio of TEMEDconcentration (%, v/v) to ampholytes concentration should beapproximately equal to the ratio of the “non-effective” capil-lary length to total length [37]. Applying this calculation for the
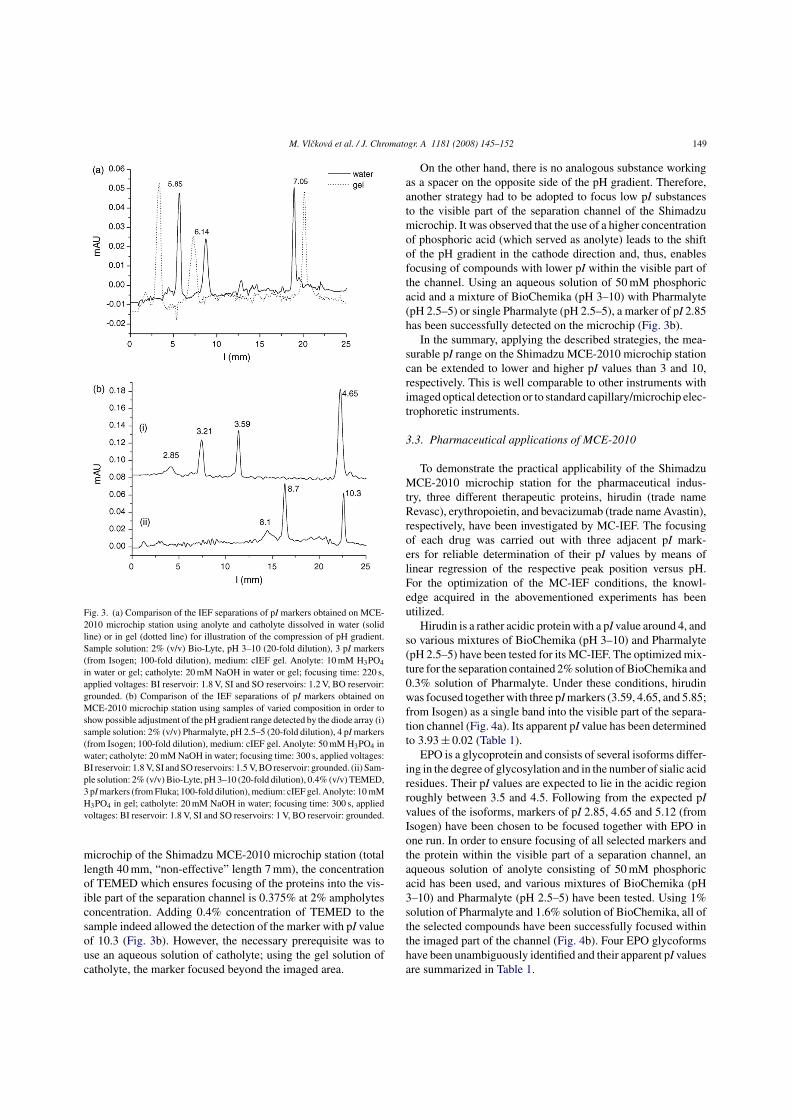
M. Vlckova et al. / J. Chromatogr. A 1181 (2008) 145–152 149
Fig. 3. (a) Comparison of the IEF separations of pI markers obtained on MCE-2010 microchip station using anolyte and catholyte dissolved in water (solidline) or in gel (dotted line) for illustration of the compression of pH gradient.Sample solution: 2% (v/v) Bio-Lyte, pH 3–10 (20-fold dilution), 3 pI markers(from Isogen; 100-fold dilution), medium: cIEF gel. Anolyte: 10 mM H3PO4
in water or gel; catholyte: 20 mM NaOH in water or gel; focusing time: 220 s,applied voltages: BI reservoir: 1.8 V, SI and SO reservoirs: 1.2 V, BO reservoir:grounded. (b) Comparison of the IEF separations of pI markers obtained onMCE-2010 microchip station using samples of varied composition in order toshow possible adjustment of the pH gradient range detected by the diode array (i)sample solution: 2% (v/v) Pharmalyte, pH 2.5–5 (20-fold dilution), 4 pI markers(from Isogen; 100-fold dilution), medium: cIEF gel. Anolyte: 50 mM H3PO4 inwater; catholyte: 20 mM NaOH in water; focusing time: 300 s, applied voltages:BI reservoir: 1.8 V, SI and SO reservoirs: 1.5 V, BO reservoir: grounded. (ii) Sam-ple solution: 2% (v/v) Bio-Lyte, pH 3–10 (20-fold dilution), 0.4% (v/v) TEMED,3 pI markers (from Fluka; 100-fold dilution), medium: cIEF gel. Anolyte: 10 mMH3PO4 in gel; catholyte: 20 mM NaOH in water; focusing time: 300 s, appliedvoltages: BI reservoir: 1.8 V, SI and SO reservoirs: 1 V, BO reservoir: grounded.
microchip of the Shimadzu MCE-2010 microchip station (totallength 40 mm, “non-effective” length 7 mm), the concentrationof TEMED which ensures focusing of the proteins into the vis-ible part of the separation channel is 0.375% at 2% ampholytesconcentration. Adding 0.4% concentration of TEMED to thesample indeed allowed the detection of the marker with pI valueof 10.3 (Fig. 3b). However, the necessary prerequisite was touse an aqueous solution of catholyte; using the gel solution ofcatholyte, the marker focused beyond the imaged area.
On the other hand, there is no analogous substance workingas a spacer on the opposite side of the pH gradient. Therefore,another strategy had to be adopted to focus low pI substancesto the visible part of the separation channel of the Shimadzumicrochip. It was observed that the use of a higher concentrationof phosphoric acid (which served as anolyte) leads to the shiftof the pH gradient in the cathode direction and, thus, enablesfocusing of compounds with lower pI within the visible part ofthe channel. Using an aqueous solution of 50 mM phosphoricacid and a mixture of BioChemika (pH 3–10) with Pharmalyte(pH 2.5–5) or single Pharmalyte (pH 2.5–5), a marker of pI 2.85has been successfully detected on the microchip (Fig. 3b).
In the summary, applying the described strategies, the mea-surable pI range on the Shimadzu MCE-2010 microchip stationcan be extended to lower and higher pI values than 3 and 10,respectively. This is well comparable to other instruments withimaged optical detection or to standard capillary/microchip elec-trophoretic instruments.
3.3. Pharmaceutical applications of MCE-2010
To demonstrate the practical applicability of the ShimadzuMCE-2010 microchip station for the pharmaceutical indus-try, three different therapeutic proteins, hirudin (trade nameRevasc), erythropoietin, and bevacizumab (trade name Avastin),respectively, have been investigated by MC-IEF. The focusingof each drug was carried out with three adjacent pI mark-ers for reliable determination of their pI values by means oflinear regression of the respective peak position versus pH.For the optimization of the MC-IEF conditions, the knowl-edge acquired in the abovementioned experiments has beenutilized.
Hirudin is a rather acidic protein with a pI value around 4, andso various mixtures of BioChemika (pH 3–10) and Pharmalyte(pH 2.5–5) have been tested for its MC-IEF. The optimized mix-ture for the separation contained 2% solution of BioChemika and0.3% solution of Pharmalyte. Under these conditions, hirudinwas focused together with three pI markers (3.59, 4.65, and 5.85;from Isogen) as a single band into the visible part of the separa-tion channel (Fig. 4a). Its apparent pI value has been determinedto 3.93 ± 0.02 (Table 1).
EPO is a glycoprotein and consists of several isoforms differ-ing in the degree of glycosylation and in the number of sialic acidresidues. Their pI values are expected to lie in the acidic regionroughly between 3.5 and 4.5. Following from the expected pIvalues of the isoforms, markers of pI 2.85, 4.65 and 5.12 (fromIsogen) have been chosen to be focused together with EPO inone run. In order to ensure focusing of all selected markers andthe protein within the visible part of a separation channel, anaqueous solution of anolyte consisting of 50 mM phosphoricacid has been used, and various mixtures of BioChemika (pH3–10) and Pharmalyte (pH 2.5–5) have been tested. Using 1%solution of Pharmalyte and 1.6% solution of BioChemika, all ofthe selected compounds have been successfully focused withinthe imaged part of the channel (Fig. 4b). Four EPO glycoformshave been unambiguously identified and their apparent pI valuesare summarized in Table 1.
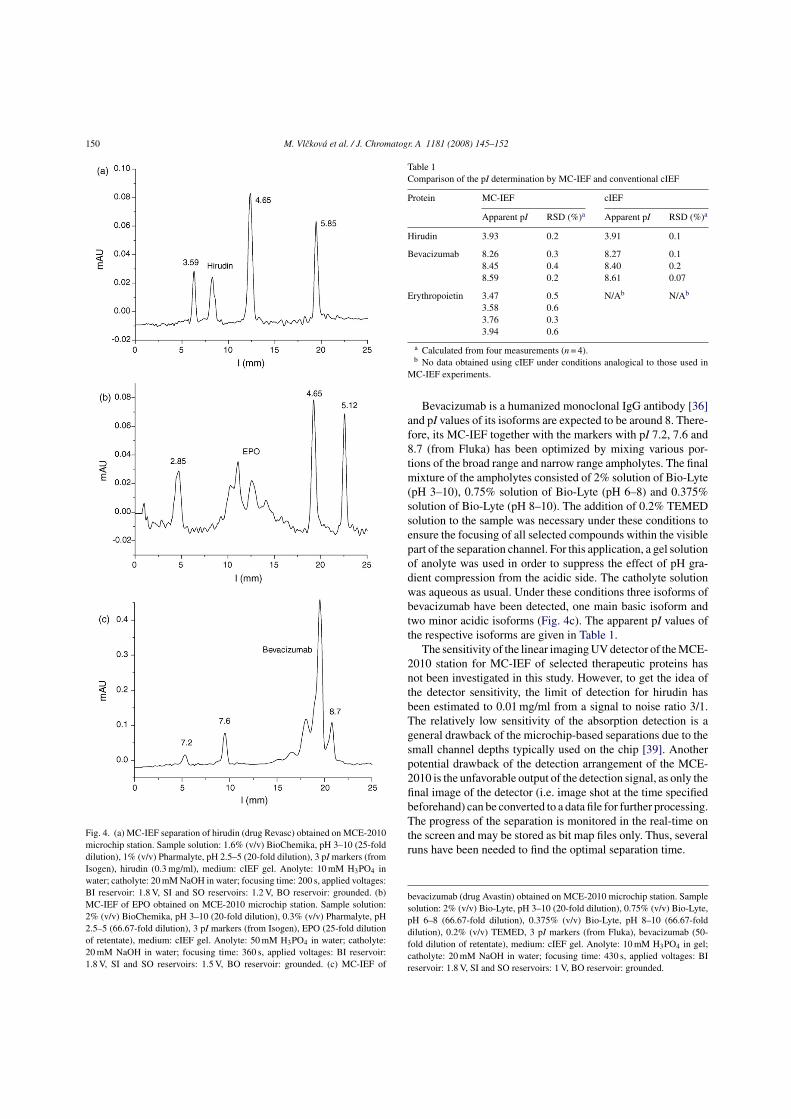
150 M. Vlckova et al. / J. Chromatogr. A 1181 (2008) 145–152
Fig. 4. (a) MC-IEF separation of hirudin (drug Revasc) obtained on MCE-2010microchip station. Sample solution: 1.6% (v/v) BioChemika, pH 3–10 (25-folddilution), 1% (v/v) Pharmalyte, pH 2.5–5 (20-fold dilution), 3 pI markers (fromIsogen), hirudin (0.3 mg/ml), medium: cIEF gel. Anolyte: 10 mM H3PO4 inwater; catholyte: 20 mM NaOH in water; focusing time: 200 s, applied voltages:BI reservoir: 1.8 V, SI and SO reservoirs: 1.2 V, BO reservoir: grounded. (b)MC-IEF of EPO obtained on MCE-2010 microchip station. Sample solution:2% (v/v) BioChemika, pH 3–10 (20-fold dilution), 0.3% (v/v) Pharmalyte, pH2.5–5 (66.67-fold dilution), 3 pI markers (from Isogen), EPO (25-fold dilutionof retentate), medium: cIEF gel. Anolyte: 50 mM H3PO4 in water; catholyte:20 mM NaOH in water; focusing time: 360 s, applied voltages: BI reservoir:1.8 V, SI and SO reservoirs: 1.5 V, BO reservoir: grounded. (c) MC-IEF of
Table 1Comparison of the pI determination by MC-IEF and conventional cIEF
Protein MC-IEF cIEF
Apparent pI RSD (%)a Apparent pI RSD (%)a
Hirudin 3.93 0.2 3.91 0.1
Bevacizumab 8.26 0.3 8.27 0.18.45 0.4 8.40 0.28.59 0.2 8.61 0.07
Erythropoietin 3.47 0.5 N/Ab N/Ab
3.58 0.63.76 0.33.94 0.6
a Calculated from four measurements (n = 4).b No data obtained using cIEF under conditions analogical to those used in
MC-IEF experiments.
Bevacizumab is a humanized monoclonal IgG antibody [36]and pI values of its isoforms are expected to be around 8. There-fore, its MC-IEF together with the markers with pI 7.2, 7.6 and8.7 (from Fluka) has been optimized by mixing various por-tions of the broad range and narrow range ampholytes. The finalmixture of the ampholytes consisted of 2% solution of Bio-Lyte(pH 3–10), 0.75% solution of Bio-Lyte (pH 6–8) and 0.375%solution of Bio-Lyte (pH 8–10). The addition of 0.2% TEMEDsolution to the sample was necessary under these conditions toensure the focusing of all selected compounds within the visiblepart of the separation channel. For this application, a gel solutionof anolyte was used in order to suppress the effect of pH gra-dient compression from the acidic side. The catholyte solutionwas aqueous as usual. Under these conditions three isoforms ofbevacizumab have been detected, one main basic isoform andtwo minor acidic isoforms (Fig. 4c). The apparent pI values ofthe respective isoforms are given in Table 1.
The sensitivity of the linear imaging UV detector of the MCE-2010 station for MC-IEF of selected therapeutic proteins hasnot been investigated in this study. However, to get the idea ofthe detector sensitivity, the limit of detection for hirudin hasbeen estimated to 0.01 mg/ml from a signal to noise ratio 3/1.The relatively low sensitivity of the absorption detection is ageneral drawback of the microchip-based separations due to thesmall channel depths typically used on the chip [39]. Anotherpotential drawback of the detection arrangement of the MCE-2010 is the unfavorable output of the detection signal, as only thefinal image of the detector (i.e. image shot at the time specifiedbeforehand) can be converted to a data file for further processing.The progress of the separation is monitored in the real-time onthe screen and may be stored as bit map files only. Thus, severalruns have been needed to find the optimal separation time.
bevacizumab (drug Avastin) obtained on MCE-2010 microchip station. Samplesolution: 2% (v/v) Bio-Lyte, pH 3–10 (20-fold dilution), 0.75% (v/v) Bio-Lyte,pH 6–8 (66.67-fold dilution), 0.375% (v/v) Bio-Lyte, pH 8–10 (66.67-folddilution), 0.2% (v/v) TEMED, 3 pI markers (from Fluka), bevacizumab (50-fold dilution of retentate), medium: cIEF gel. Anolyte: 10 mM H3PO4 in gel;catholyte: 20 mM NaOH in water; focusing time: 430 s, applied voltages: BIreservoir: 1.8 V, SI and SO reservoirs: 1 V, BO reservoir: grounded.
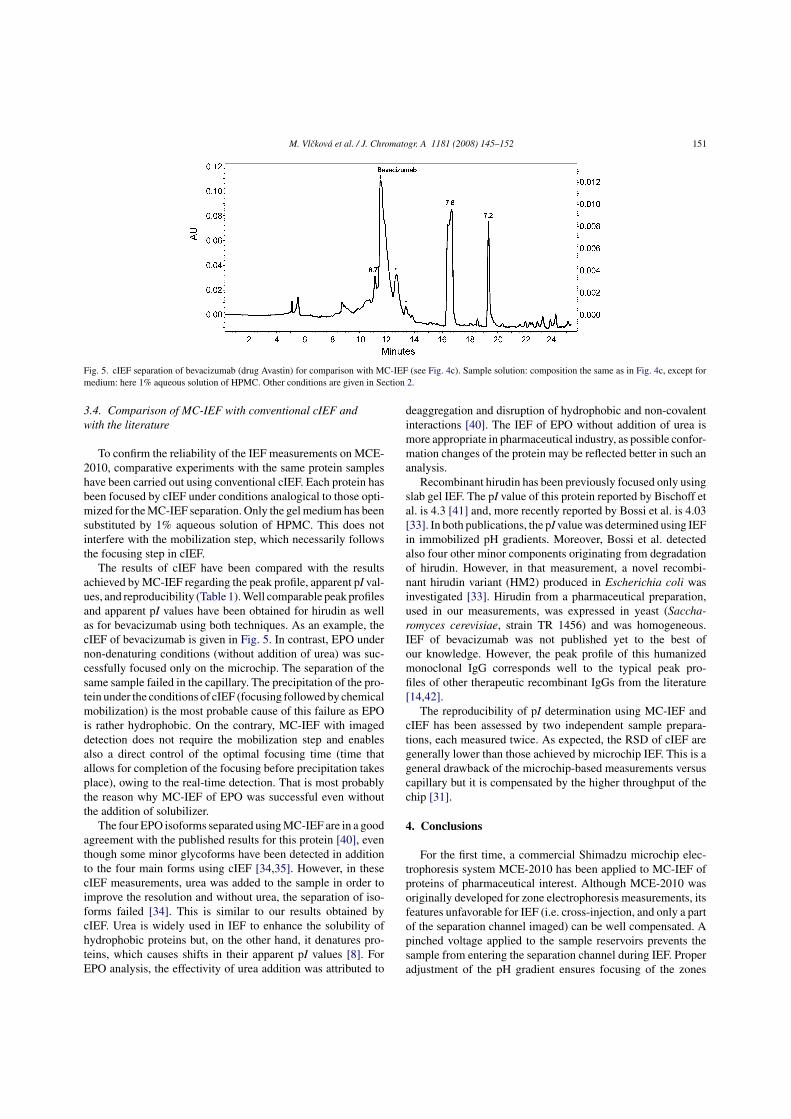
M. Vlckova et al. / J. Chromatogr. A 1181 (2008) 145–152 151
Fig. 5. cIEF separation of bevacizumab (drug Avastin) for comparison with MC-IEF (see Fig. 4c). Sample solution: composition the same as in Fig. 4c, except formedium: here 1% aqueous solution of HPMC. Other conditions are given in Section 2.
3.4. Comparison of MC-IEF with conventional cIEF andwith the literature
To confirm the reliability of the IEF measurements on MCE-2010, comparative experiments with the same protein sampleshave been carried out using conventional cIEF. Each protein hasbeen focused by cIEF under conditions analogical to those opti-mized for the MC-IEF separation. Only the gel medium has beensubstituted by 1% aqueous solution of HPMC. This does notinterfere with the mobilization step, which necessarily followsthe focusing step in cIEF.
The results of cIEF have been compared with the resultsachieved by MC-IEF regarding the peak profile, apparent pI val-ues, and reproducibility (Table 1). Well comparable peak profilesand apparent pI values have been obtained for hirudin as wellas for bevacizumab using both techniques. As an example, thecIEF of bevacizumab is given in Fig. 5. In contrast, EPO undernon-denaturing conditions (without addition of urea) was suc-cessfully focused only on the microchip. The separation of thesame sample failed in the capillary. The precipitation of the pro-tein under the conditions of cIEF (focusing followed by chemicalmobilization) is the most probable cause of this failure as EPOis rather hydrophobic. On the contrary, MC-IEF with imageddetection does not require the mobilization step and enablesalso a direct control of the optimal focusing time (time thatallows for completion of the focusing before precipitation takesplace), owing to the real-time detection. That is most probablythe reason why MC-IEF of EPO was successful even withoutthe addition of solubilizer.
The four EPO isoforms separated using MC-IEF are in a goodagreement with the published results for this protein [40], eventhough some minor glycoforms have been detected in additionto the four main forms using cIEF [34,35]. However, in thesecIEF measurements, urea was added to the sample in order toimprove the resolution and without urea, the separation of iso-forms failed [34]. This is similar to our results obtained bycIEF. Urea is widely used in IEF to enhance the solubility ofhydrophobic proteins but, on the other hand, it denatures pro-teins, which causes shifts in their apparent pI values [8]. ForEPO analysis, the effectivity of urea addition was attributed to
deaggregation and disruption of hydrophobic and non-covalentinteractions [40]. The IEF of EPO without addition of urea ismore appropriate in pharmaceutical industry, as possible confor-mation changes of the protein may be reflected better in such ananalysis.
Recombinant hirudin has been previously focused only usingslab gel IEF. The pI value of this protein reported by Bischoff etal. is 4.3 [41] and, more recently reported by Bossi et al. is 4.03[33]. In both publications, the pI value was determined using IEFin immobilized pH gradients. Moreover, Bossi et al. detectedalso four other minor components originating from degradationof hirudin. However, in that measurement, a novel recombi-nant hirudin variant (HM2) produced in Escherichia coli wasinvestigated [33]. Hirudin from a pharmaceutical preparation,used in our measurements, was expressed in yeast (Saccha-romyces cerevisiae, strain TR 1456) and was homogeneous.IEF of bevacizumab was not published yet to the best ofour knowledge. However, the peak profile of this humanizedmonoclonal IgG corresponds well to the typical peak pro-files of other therapeutic recombinant IgGs from the literature[14,42].
The reproducibility of pI determination using MC-IEF andcIEF has been assessed by two independent sample prepara-tions, each measured twice. As expected, the RSD of cIEF aregenerally lower than those achieved by microchip IEF. This is ageneral drawback of the microchip-based measurements versuscapillary but it is compensated by the higher throughput of thechip [31].
4. Conclusions
For the first time, a commercial Shimadzu microchip elec-trophoresis system MCE-2010 has been applied to MC-IEF ofproteins of pharmaceutical interest. Although MCE-2010 wasoriginally developed for zone electrophoresis measurements, itsfeatures unfavorable for IEF (i.e. cross-injection, and only a partof the separation channel imaged) can be well compensated. Apinched voltage applied to the sample reservoirs prevents thesample from entering the separation channel during IEF. Properadjustment of the pH gradient ensures focusing of the zones
152 M. Vlckova et al. / J. Chromatogr. A 1181 (2008) 145–152
with broad range of pI values (2.85–10.3) to the imaged part ofseparation channel.
On the one hand, the versatile utilization of the MCE-2010microchip station could be regarded as a benefit compared toother instruments with imaged detection developed for high-throughput IEF measurements (e.g. commercially availableiCE280 Analyzer [13,14]), which are mono functional. Onthe other hand, the necessary adjustment of the pH gradientfor various applications on the microchip station makes theoptimization of IEF method more complicated and time con-suming compared to the specialized instruments. To sum up,MCE-2010 apparatus may be a good choice for laboratoriesthat need to perform variety of electrophoretic measurements(including some IEF experiments). Certainly, a specializedapparatus, i.e. iCE280 Analyzer, is preferable for laboratoriesfocused on IEF measurements, because iCE280 Analyzer wasdirectly developed to meet all the demands of high-throughputIEF.
Three therapeutic proteins (hirudin, EPO, and bevacizumab)from pharmaceutical formulations have been successfullyfocused on the MCE-2010 microchip and the results have beencompared to conventional capillary IEF. pI values as well asthe peak profiles, which compare well using both techniques,have been obtained for hirudin and bevacizumab. Erythropoi-etin under non-denaturing conditions (without addition of urea)was successfully focused only on the microchip. Its peak pro-file, as well as the calculated apparent pI values are in a goodagreement with published data [34]. The reproducibility of thedetermination of pI values is somewhat lower on the microchipbut the analysis is much faster compared to conventional cIEF,which requires mobilization step after finishing focusing. More-over, a precise tuning of the focusing time is possible on themicrochip as the progress of the focusing could be monitoredon the real-time basis.
Acknowledgements
Partial funding for this project provided by Swiss NationalScience Foundation, grant number 200020-112190, is grate-fully acknowledged. The authors also thank the AnalyticalDepartment of Solvias AG for providing time and measurementequipment.
References
[1] R. Westermeier, Electrophoresis in Practice, Wiley-VCH Verlag, Wein-heim, 2001, p. 45.
[2] K. Shimura, Electrophoresis 23 (2002) 3847.[3] F. Kilar, Electrophoresis 24 (2003) 3908.[4] P.G. Righetti, C. Gelfi, M. Conti, J. Chromatogr. B 699 (1997) 91.[5] Q.L. Mao, J. Pawliszyn, Analyst 124 (1999) 637.[6] T.J. Pritchett, Electrophoresis 17 (1996) 1195.[7] X. Liu, Z. Sosic, I.S. Krull, J. Chromatogr. A 735 (1996) 165.[8] J.Q. Wu, S.C. Li, A. Watson, J. Chromatogr. A 817 (1998) 163.[9] J.Q. Wu, J. Pawliszyn, Anal. Chem. 64 (1992) 2934.
[10] X.Z. Wu, T.M. Huang, Z. Liu, J. Pawliszyn, TrAC, Trends Anal. Chem. 24(2005) 369.
[11] B. Yao, H.H. Yang, Q.L. Liang, G. Luo, L.D. Wang, K.N. Ren, Y.D. Gao,Y.M. Wang, Y. Qiu, Anal. Chem. 78 (2006) 5845.
[12] Z. Liu, J. Pawliszyn, Anal. Chem. 75 (2003) 4887.[13] X.Z. Wu, J.Q. Wu, J. Pawliszyn, LC–GC 19 (2001) 526.[14] N. Li, K. Kessler, L. Bass, D. Zeng, J. Pharm. Biomed. Anal. 43 (2007)
963.[15] C. Das, Z. Xia, A. Stoyanov, Z.H. Fan, Instrum. Sci. Technol. 33 (2005)
379.[16] C. Das, Z.H. Fan, Electrophoresis 27 (2006) 3619.[17] H.C. Cui, K. Horiuchi, P. Dutta, C.F. Ivory, Anal. Chem. 77 (2005) 1303.[18] T.M. Huang, P. Ertl, X.Z. Wu, S. Mikkelsen, J. Pawliszyn, Sens. Mater. 14
(2002) 141.[19] T. Bo, J. Pawliszyn, J. Sep. Sci. 29 (2006) 1018.[20] Z. Liu, J. Pawliszyn, J. Proteome Res. 3 (2004) 567.[21] T. Bo, J. Pawliszyn, J. Chromatogr. A 1105 (2006) 25.[22] T. Bo, J. Pawliszyn, Electrophoresis 27 (2006) 852.[23] Z. Liu, T. Lemma, J. Pawliszyn, J. Proteome Res. 5 (2006) 1246.[24] Z. Liu, A.P. Drabovich, S.N. Krylov, J. Pawliszyn, Anal. Chem. 79 (2007)
1097.[25] F. Kitagawa, S. Aizawa, K. Otsuka, Anal. Sci. 21 (2005) 61.[26] M. Ludwig, F. Kohler, D. Belder, Electrophoresis 24 (2003) 3233.[27] E. Guihen, G.D. Sisk, N.M. Scully, J.D. Glennon, Electrophoresis 27 (2006)
2338.[28] T. Miyado, Y. Tanaka, H. Nagai, S. Takeda, K. Saito, K. Fukushi, Y. Yoshida,
S. Wakida, E. Niki, J. Chromatogr. A 1109 (2006) 174.[29] Z.Q. Xu, Y. Nakamura, T. Hirokawa, Electrophoresis 26 (2005) 383.[30] T. Le Saux, H. Hisamoto, S. Terabe, J. Chromatogr. A 1104 (2006) 352.[31] A.R. Stettler, M.A. Schwarz, J. Chromatogr. A 1063 (2005) 217.[32] K. Ahrer, A. Jungbauer, J. Chromatogr. B 841 (2006) 110.[33] A. Bossi, P.G. Righetti, C. Visco, U. Breme, M. Mauriello, B. Valsasina,
G. Orsini, E. Wenisch, Electrophoresis 17 (1996) 932.[34] A. Cifuentes, M.V. Moreno-Arribas, M. de Frutos, J.C. Diez-Masa, J.
Chromatogr. A 830 (1999) 453.[35] P. Lopez-Soto-Yarritu, J.C. Diez-Masa, A. Cifuentes, M. de Frutos, J.
Chromatogr. A 968 (2002) 221.[36] W.C. Weinberg, M.R. Frazier-Jessen, W.J. Wu, A. Weir, M. Hartsough, P.
Keegan, C. Fuchs, Cancer Metastasis Rev. 24 (2005) 569.[37] D. Mohan, C.S. Lee, J. Chromatogr. A 979 (2002) 271.[38] T. Manabe, H. Miyamoto, K. Inoue, M. Nakatsu, M. Arai, Electrophoresis
20 (1999) 3677.[39] S. Gotz, U. Karst, Anal. Bioanal. Chem. 387 (2007) 183.[40] A. Pantazaki, M. Taverna, C. Vidal-Madjar, Anal. Chim. Acta 383 (1999)
137.[41] R. Bischoff, D. Roecklin, C. Roitsch, Electrophoresis 13 (1992) 214.[42] S. Tang, D.P. Nesta, L.R. Maneri, K.R. Anumula, J. Pharm. Biomed. Anal.
19 (1999) 569.
Publication 5
Microchip isoelectric focusing applications
Vlčková, M., Schwarz, M.A.
Chimia 2008, 62, 244-248

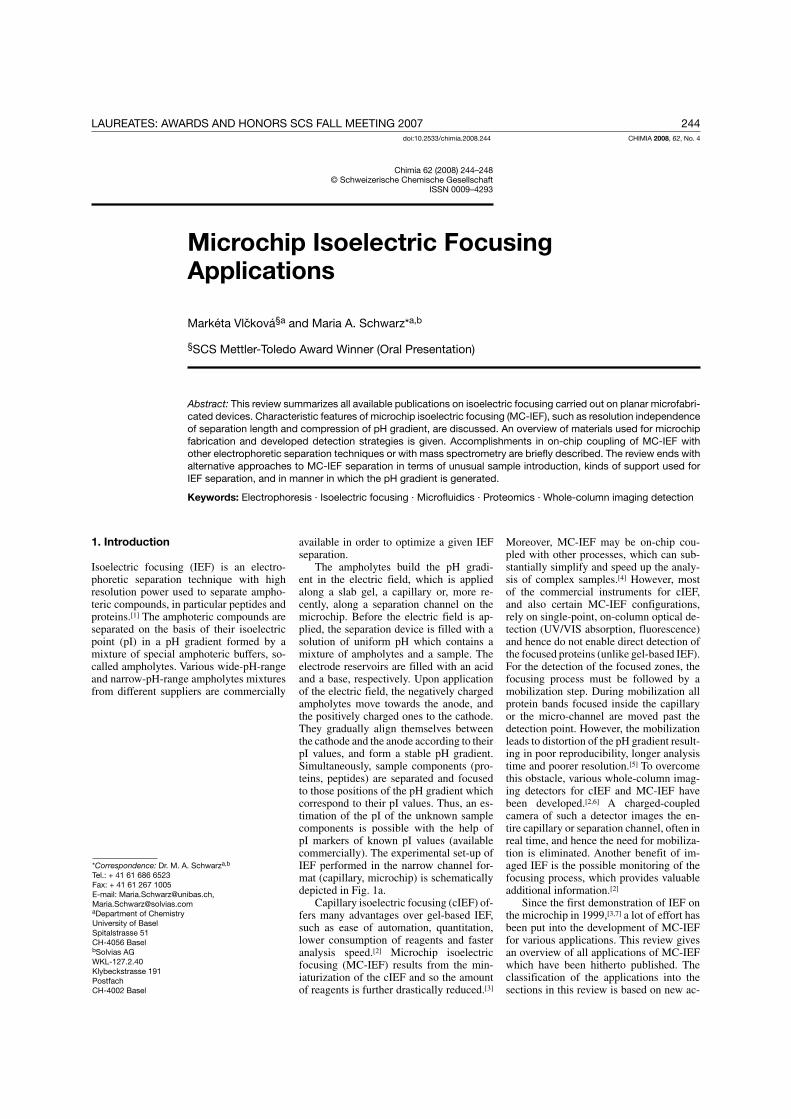
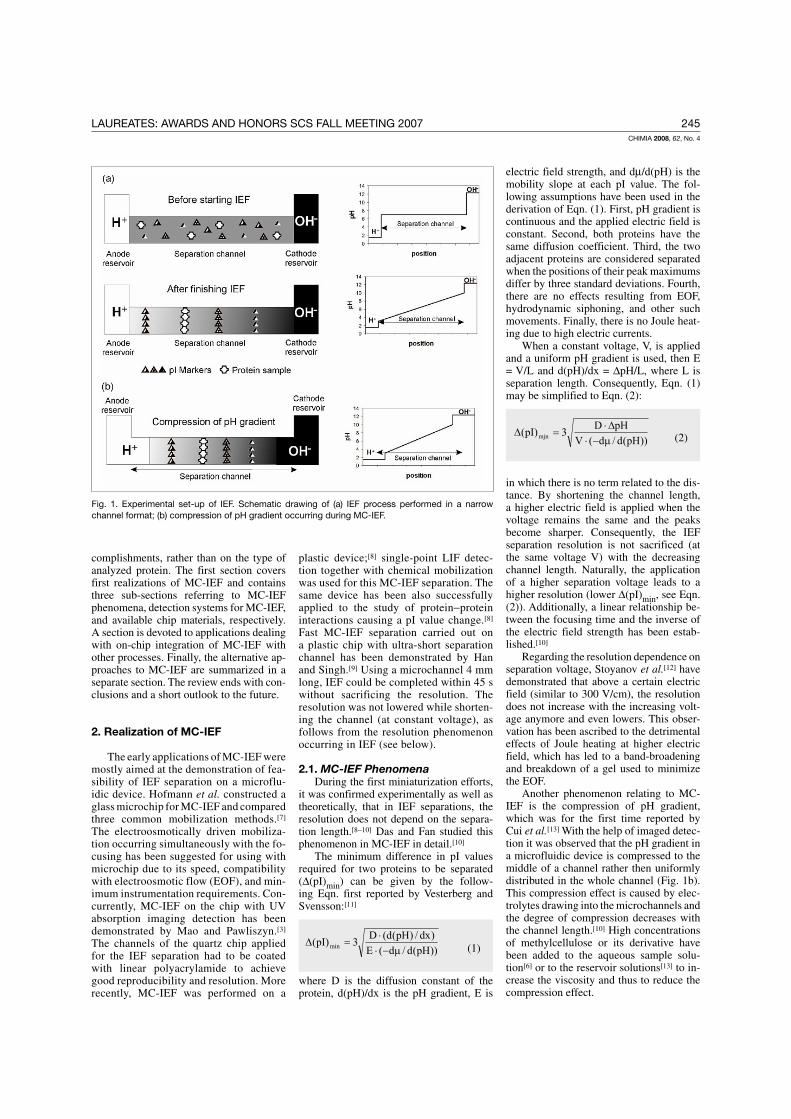
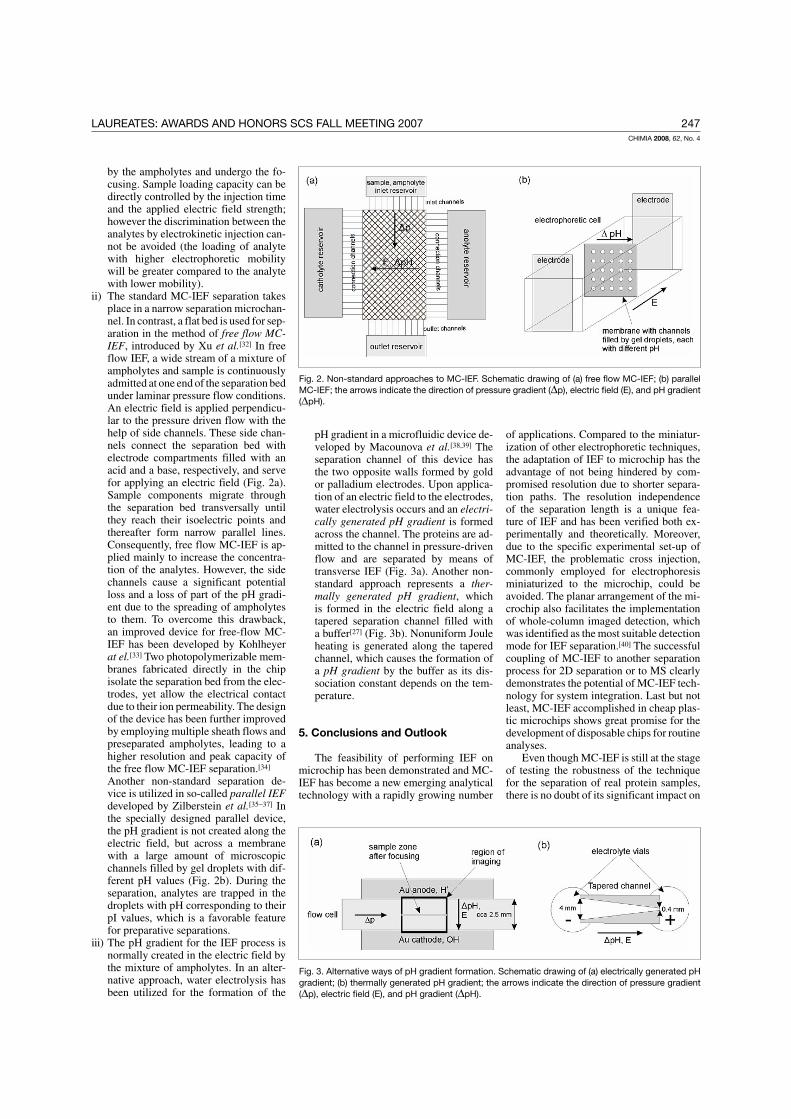
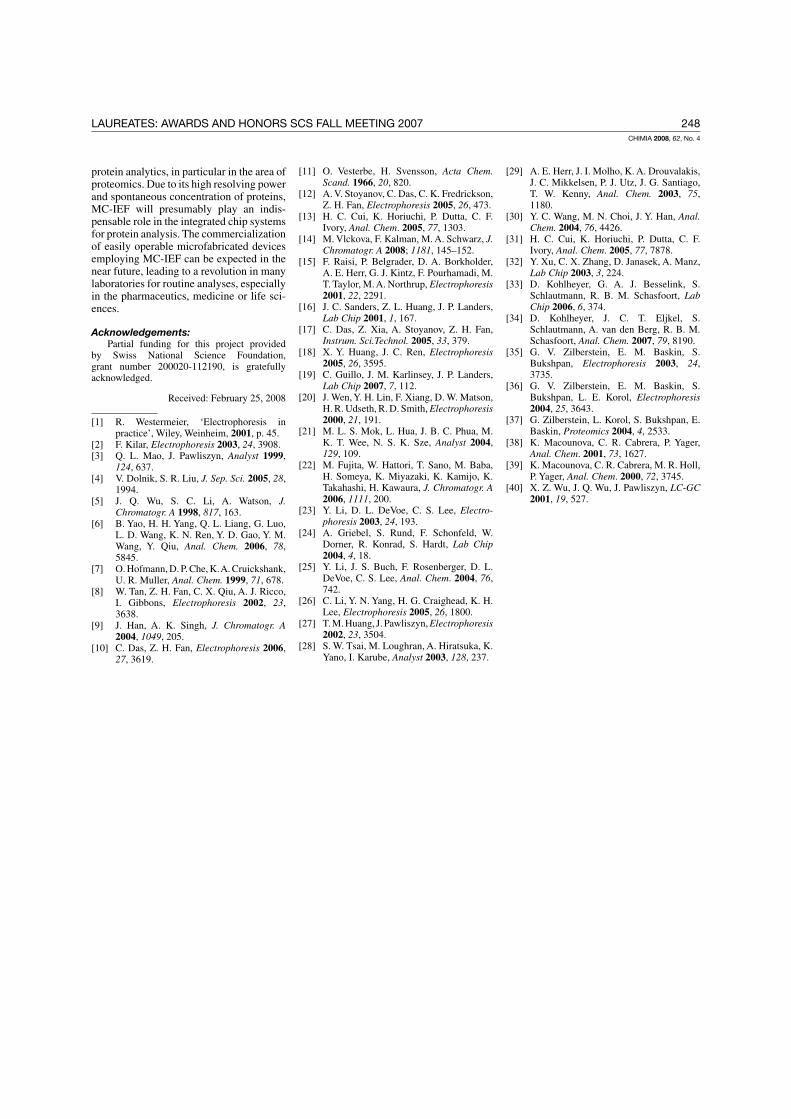


![Microchip Cat Flap - zooplus.ch Gebrauchsanleitung SureFlap... · *hulw lvw vr nrq]lslhuw gdvv hv vrzrko hlqhq ehuhlwv xqwhu glh +dxw ,kuhu .dw] ... 'dgxufk |iiqhw vlfk ghu $xwrpdwlnyhuvfkoxvv](https://static.fdokument.com/doc/165x107/5b188f607f8b9a41258be5c3/microchip-cat-flap-gebrauchsanleitung-sureflap-hulw-lvw-vr-nrqlslhuw.jpg)
![Investigation of Bioanalytical Methodologies for the ... · 5] to medicinal bioanalysis s chemistry [6] to model systems for cellular membranes 7, 8]. One of the main advantages of](https://static.fdokument.com/doc/165x107/5f5ce400da663f2fb8732ec5/investigation-of-bioanalytical-methodologies-for-the-5-to-medicinal-bioanalysis.jpg)