
Microcirculatory assessment of red blood cell transfusion ... · PDF file(ineffective...
103
Aus der Kinderklinik und Kinderpoliklinik im Dr. v. Haunerschen Kinderspital der Ludwig Maximilians Universität München Direktor: Prof. Dr. Dr. C. Klein Microcirculatory assessment of red blood cell transfusion in children with severe anemia Dissertation zum Erwerb des Doktorgrades der Medizin an der Medizinischen Fakultät der Ludwig Maximilian Universität München vorgelegt von Carina Madelen Schinagl aus Oslo 2015
Transcript of Microcirculatory assessment of red blood cell transfusion ... · PDF file(ineffective...

Aus der Kinderklinik und Kinderpoliklinik im Dr. v. Haunerschen Kinderspital der
Ludwig Maximilians Universität München
Direktor: Prof. Dr. Dr. C. Klein
Microcirculatory assessment of red blood cell transfusion inchildren with severe anemia
Dissertation
zum Erwerb des Doktorgrades der Medizin
an der Medizinischen Fakultät
der Ludwig Maximilian Universität München
vorgelegt von
Carina Madelen Schinagl
aus Oslo
2015

Index
1. INTRODUCTION 1
1.1. ANEMIA 11.1.1. DEFINITION 11.1.2. ETIOLOGY 11.1.3. EPIDEMIOLOGY ANDMORBIDITY 21.1.4. PHYSIOLOGY 21.1.5. SIGNS AND SYMPTOMS 31.1.6. THERAPY 31.2. DEFINITION OF PEDIATRIC INFECTION 51.3. MICROCIRCULATION 61.3.1. IN A NUTSHELL 61.3.2. STRUCTURE OF THE CAPILLARY SYSTEM 61.3.3. CHARACTERISTICS OF THE MICROCIRCULATION 71.3.4. DYSFUNCTION OF THE MICROCIRCULATION 101.3.5. MICROCIRCULATION OF THE PEDIATRIC PATIENT 131.3.6. THE EFFECT OF BLOOD TRANSFUSION ON THE MICROCIRCULATION 131.3.7. DIAGNOSTICS IN MICROCIRCULATORY ASSESSMENT 141.3.8. IMAGING TECHNIQUE 161.4. AIMS OF DISSERTATION 19
2. MATERIALS AND METHODS 20
2.1. PATIENT POPULATION 202.1.1. RECRUITMENT 202.1.2. INFORMED CONSENT 202.2. STUDY DESIGN 212.3. ASSESSMENT OF THE MICROCIRCULATION 222.3.1. FUNCTIONAL PRINCIPLE 222.3.2. EXPERIMENTAL SETUP 232.3.3. MEASUREMENT PROCEDURES 252.3.4. CLINICAL DATA 262.3.5. VIDEO RECORDINGS 262.4. ANALYZING DATA 272.4.1. SOFTWARE CONFIGURATION 272.4.2. ANALYSIS 272.4.3. STORING AND REVIEWING ANALYSIS RESULTS 292.4.4. STATISTICAL ANALYSIS 29
3. RESULTS 31
3.1. STUDY POPULATION 313.2. CLINICAL DATA – GROUP ANALYSIS 333.2.1. LABORATORY DATA 333.2.2. VITAL SIGNS 373.2.3. BLOOD UNITS 383.3. MICROCIRCULATORY RESULTS – GROUP ANALYSIS 393.3.1. FUNCTIONAL VESSEL DENSITY (FVD) 393.3.2. Δ FVD 43

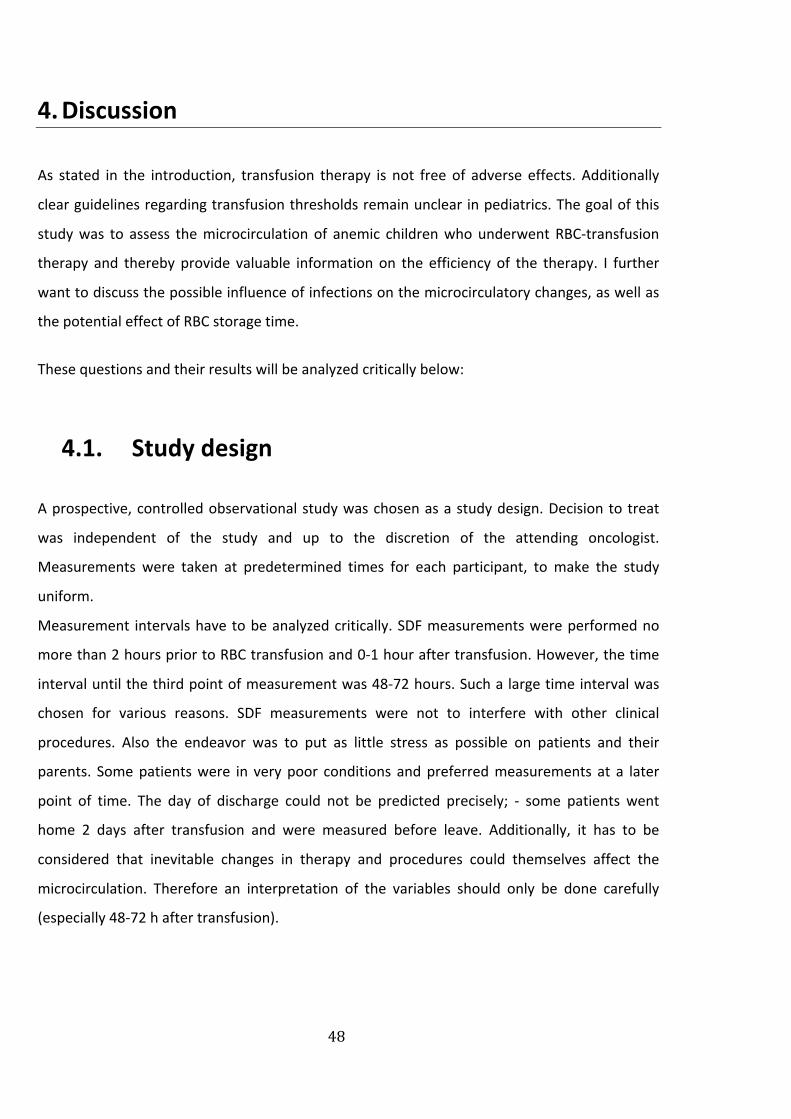
3.3.3. CORRELATION HB-‐FVD 463.3.4. CORRELATION ∆FVD -‐ AGE OF RBCS 47
4. DISCUSSION 48
4.1. STUDY DESIGN 484.1.1. STATISTICAL ANALYSIS 504.2. MATERIALS ANDMETHODS 514.2.1. MEASUREMENT 514.2.2. ANALYSIS 524.3. MICROCIRCULATORY CHANGES 544.3.1. DOES RBC-‐TX IMPROVE THE MICROCIRCULATION OF ANEMIC CHILDREN? 544.3.2. DOES INFECTION INFLUENCE THE MICROCIRCULATION? 574.3.3. DOES THE HB CORRELATE WITH THE FVD? 614.3.4. DO THE MIRCROCIRCUALTORY CHANGES CORRELATE WITH THE AGE OF RBCS? 624.4. OUTLOOK 65
5. CONCLUSION 66
6. SUMMARY 67
7. SUMMARY IN GERMAN/ DEUTSCHE ÜBERSETZUNG 69
8. ABSTRACT 71
9. APPENDIX 72
9.1. LIST OF ABBREVIATIONS 729.2. CLINICAL DATA 739.3. VESSEL LENGTH AND VESSEL SURFACE AREA 759.4. RBC VELOCITY 769.5. ΔFVD/VOLUME 79
10. LIST OF REFERENCES 81
11. ACKNOWLEDGEMENT 92
12. CURRICULUM VITAE 93
List of figures
1. Figure, Schematic representation of the microcirculation ...............................................7
2. Figure, Schematic representation of ATP dependent vasodilatation……………………....…...9
3. Figure, Principal mechanisms implicated in the development of microcirculatory
alterations…………………………………………………………………………………………………….…………...……11
4. Figure, Development of microcirculatory dysfunction…………………………………...….....….…12
5. Figure, Schematic representation of OPS imaging ...........................................................17
6. Figure, OPS imaging versus SDF imaging of the sublingual microcirculation….…….….…..18
7. Figure, The Sidestream Dark Field (SDF) imaging device…………………………………….....…….23
8. Figure, SDF device………………………………………………………………………………………….…....………23
9. Figure,Microscan……………………………………………………………………………………………….….…...24
10. Figure, Example of sublingual microcirculation with the SDF-‐imaging technique ….…..24
11. Figure, Overview of study groups ……………………………………………….……………….....…........32
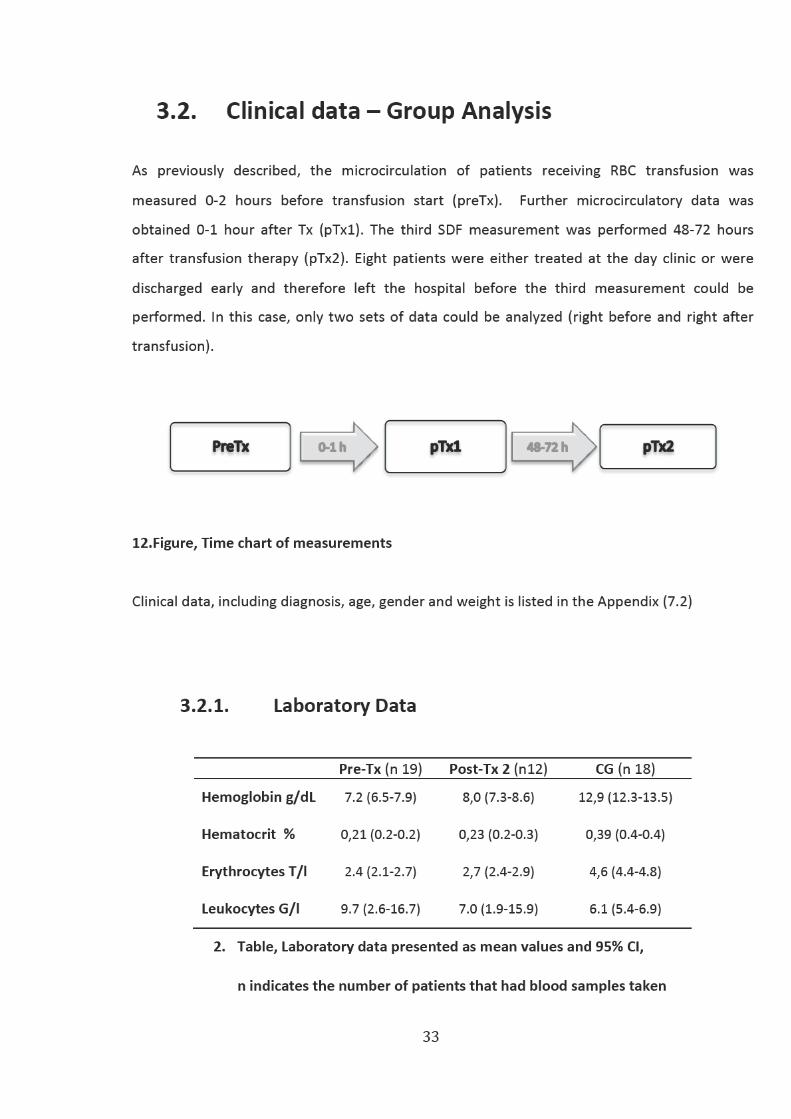
12. Figure, Time chart of measurements…………………………………………………………..…...……..…33
13. Figure, Hb values of the anemic study group before and 48-‐72h after transfusion in
comparison with Hb values of control group (..…………………………….………………………………..…34
14. Figure, Comparison of CRP values between anemic patients without infections and with
infection ………………………………………….………………..…………………………………………………...………..36
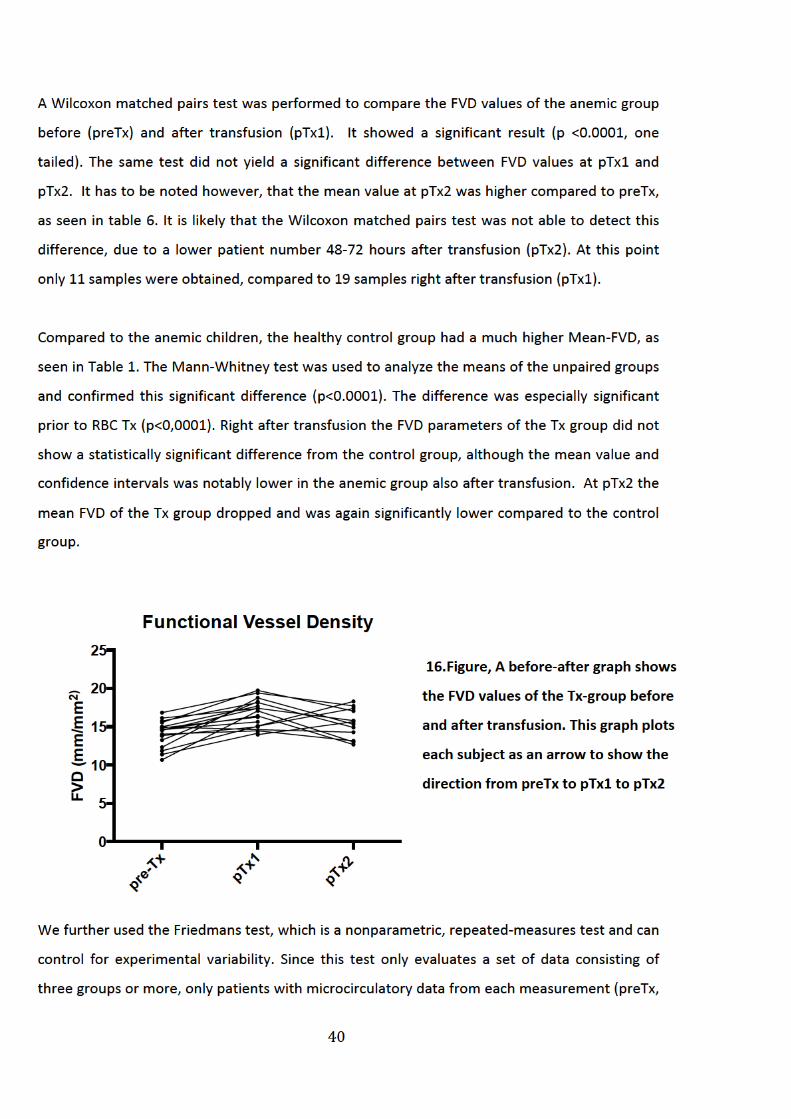
15. Figure, Comparison of FVD before and after RBC transfusion..…………..…………..….……….39
16. Figure, A before and after graph showing FVD values before and after transfusion …...40
17. Figure, FVD values of subgroups ………………………………………………………………….……..………42
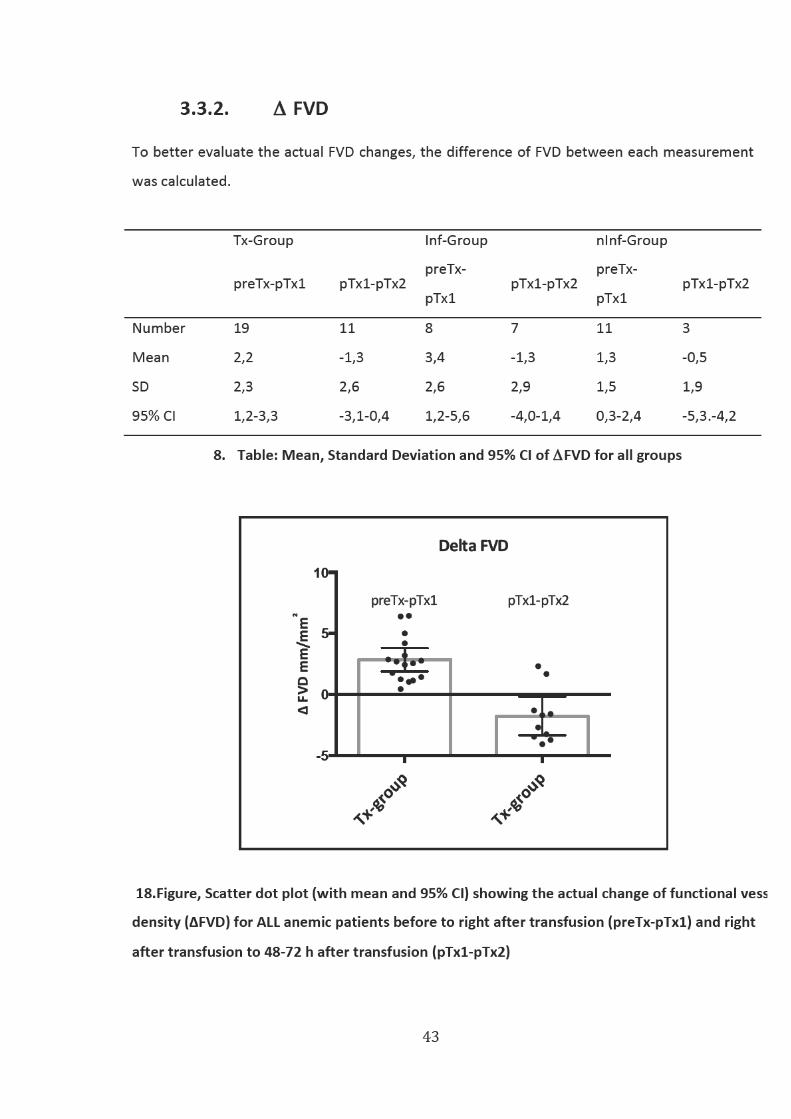
18. Figure, Scatter dot plot of ∆FVD……………………………………………………………........................43
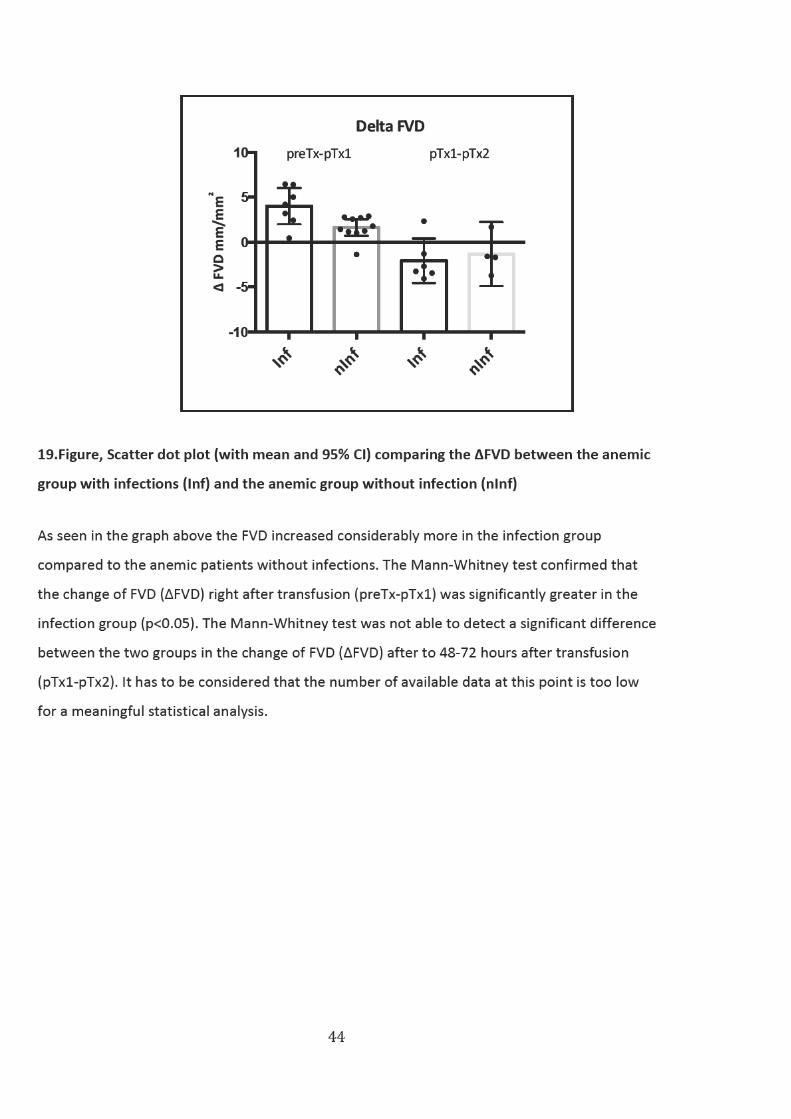
19. Figure, Scatter dot plot of ∆FVD (Inf vs nInf) …………………………………………………………..…..44
20. Figure, Image of the sublingual microcirculation prior to RBC-‐Tx....................................45
21. Figure, Image of the sublingual mircocirculation right after RBC-‐Tx................................45

22. Figure, Correlation of FVD and Hemoglobin…………………………………………….………….46
23. Figure, Correlation of ΔFVD and RBC age………………………………………….…………………47
24. Figure, Image of sublingual microcirculation before and after transfusion….………68
25. Figure, Velocity in medium and large vessels ……………………………………………………..76
26. Figure, Linear regression and correlation of ΔFVD (preTx-‐pTx1)/Vol………………..….79
27. Figure, Linear regression and correlation of ΔFVD (pTx1-‐pTx2)/Vol........................80

List of tables
1. Table, Patient characteristics ………………………………………………………………………………………………31
2. Table, Laboratory data presented as mean values and 95% CI ……………………………………………33
3. Table,Mean and 95% CI of hemoglobin values of subgroups ……………………………………………..35
4. Table,Mean and 95% CI of heart rate …………………………………………………………………………………37
5. Table,Mean and 95% CI of temperature in the Tx and subgroups ………………………………………37
6. Table, Mean, 95% CI and Standard Deviation (SD) of FVD ………………………………………………….39
7. Table,Mean FVD values and 95% CI for both groups (Inf and nInf) …………………………………….41
8. Table,Mean, Standard Deviation and 95% CI of ΔFVD for all Groups …….……………………………43
9. Table, Diagnosis, gender, age and weight of each anemic child…………………………………………..73
10. Table,Mean laboratory data of Tx-‐group …………………………………………………………………………74
11. Table,Mean and 95% CI of vessel length and vessel surface area…………………………………….75
12. Table, Velocity values of transfusion group before and after Tx ……………………………………….76
13. Table, Velocity values medium vessels (Inf vs nInf) …………………………………………………………..77
14. Table, Velocity values large vessels (Inf vs nInf) ………………………………………………………………..77

1
1. INTRODUCTION
1.1. Anemia
1.1.1. Definition
Anemia is classically defined as a deficiency of red blood cells or hemoglobin leading to a
reduction in the oxygen-‐carrying capacity of blood. 1
1.1.2. Etiology
Anemia occurs as a result of excessive blood loss (hemorrhage), impaired production
(ineffective hematopoesis) or blood cell destruction (hemolysis). 2
1.1.2.1. Cancer-‐related anemia
No consistent definition of what constitutes anemia in pediatric oncology exists.3 Children with
cancer frequently develop anemia both from the disease and chemo-‐ and radiotherapy.
Cancer-‐related anemia is multifactorial and often presents both acute and chronic
components.4,5 Impaired production may be caused by an infiltration of the marrow by
malignant cells, which produces a slow decrease in the hemoglobin level.
Suppression of erythropoiesis is often related to iron deficiency and to impaired use of iron
stores, but can also be a direct effect of chemotherapy or radiation treatment. Blood loss may
be due to hemorrhage (facilitated by concomitant thrombocytopenia), repetitive blood
sampling, infection and hemolysis. The anemia is usually normochromic and normocytic with a
low reticulocyte count. Children receiving immune suppressive therapies over longer periods of
time may experience chronic anemia with little possibility to recover fully between cycles of
chemotherapy or radiation.6
2
1.1.3. Epidemiology and Morbidity
A survey was conducted in Europe with the objective of determining the incidence of anemia in
pediatric oncology. Results showed that over 80% of patients were anemic (WHO: hemoglobin
<11 g/dL) regardless of tumor type; 97% of patients with leukemia, which is the most prevalent
type of cancer (34% of the total population), were anemic.
Death due to chronic anemia is extremely uncommon because the cardiovascular system can
adapt well to the respective condition. Morbidity is also extremely rare and is normally caused
by the primary disease rather than the anemia per se. 5
1.1.4. Physiology
In order to attain adequate tissue oxygenation, the delivery rate of oxygen transported from
the lungs to the peripheral tissues must satisfy the metabolic requirements. Oxygen is delivered
by hemoglobin, which is carried by red blood cells, erythrocytes, and transported via
bloodstream to the tissue. 7
Oxygen has a low solubility in plasma; therefore it is specifically RBC flow that determines
oxygen delivery. Consequently, the oxygen carrying capacity of the RBC plays a crucial role in
the convective transport of oxygen to the organs and tissue. Oxygen binds co-‐operatively with
hemoglobin within the RBC, in a way that changes its tetrameric conformation. As Hb
alternately binds oxygen and releases it to the local tissues, it switches from a relaxed, high
oxygen affinity structure, to a tense, low oxygen affinity structure. A hemoglobin molecule
binds up to four oxygen molecules in a reversible way.
The binding of the first molecule is difficult. However, as more oxygen molecules bind, the
affinity of hemoglobin for oxygen increases. When the fourth molecule binds to hemoglobin,
the affinity decreases again. The reason is on one hand the crowding of the hemoglobin
molecule, on the other hand the natural tendency of oxygen to dissociate. 8

3
1.1.5. Signs and Symptoms
The signs and symptoms of anemia depend on the amount of reduction in oxygen-‐carrying
capacity of the blood. More specifically on how much blood volume is lost and in what time
frame this changes occur and on how well the cardiovascular and hematopoetic systems are
able to compensate for this loss.
Chronic anemia primarily manifests itself with pallor and a gradual onset of fatigue. Fatigue is a
frequently unrecognized and untreated complication of anemia. Other symptoms are
headaches, dizziness, dyspnea, irritability, faintness, poor feeding, loss of appetite, inactivity,
loss of concentration, change in behavior and poor school performance.9 Cardiac enlargement
and signs of congestive heart failure can occur with either blood loss or chronic severe anemia.
Other clinical manifestations of modest to severe anemia include tachypnea, tachycardia,
prominent arterial pulses and bruits. The increase in cardiac output and heart rate associated
with decreased peripheral resistance and decreased blood viscosity may cause hemic murmurs.
Gallop rhythm may be present in a hemodynamically compromised state. Normally these signs
and symptoms respond quickly to treatment with transfusion.6
The longterm effects of chronic anemia in young patients are poorly understood but may
include neurocognitive impairment, as well as retardation of growth and development.10
1.1.6. Therapy
The most frequent treatment employed for children with severe or chronic anemia is red blood
cell transfusion (RBC Tx). Less than 5% of patients receive drug treatment (which consisted
mostly of folic acid or iron). Very few patients receive recombinant human erythropoietin
(rHuEPO, epoetin alfa) to treat anemia.5 The purpose of RBC-‐Tx is to increase the amount of
RBCs at the microcirculatory level and thus increase oxygen delivery to parenchymal cells.
However, transfusion practices remain controversial, considering its significant risks and limited
scientific background. The risks include transmission of infectious agents, immunologic
consequences, increased organ dysfunction and acute lung injury, as well as increased mortality.11 Due to a lack of scientific studies, guidelines for transfusion in infants and children have been
established, by taking standards from adult medicine and adapting them to the patient’s clinical
4
status.12 However, transfusions are given less frequent in pediatrics, because normal
hemoglobin values are lower in healthy children than in adults and children are better able to
compensate for RBC loss. Adolescents often do not tolerate the symptoms of anemia as well as
younger children. A hemoglobin level <7 g/dL with clinical symptoms usually needs an
intervention with transfusion support, whereas moderate anemia (>7 g/dL) may only require
close monitoring. However, assigning an absolute level at which to transfuse is difficult since
the requirement depends on various factors. The need for immediate red cell transfusion is
determined by the etiology and expected duration of the anemia. One also has to put in
consideration the patient’s ability to compensate for the decreased volume and resultant lack
of oxygen-‐carrying capacity. Considerations also include anticipated procedures and risk of
prolonged bleeding. Normally children compensate very well and may be asymptomatic despite
low hemoglobin values of even 4 to 5 g/dL. No evidence suggests that such low hemoglobin
concentrations pose any systemic problems, but low concentrations can be distressing to
children and families. 6 Some studies have shown that maintaining a higher hemoglobin level
during chemotherapy results in a better quality of life and may affect survival. 13–15
5
1.2. Definition of pediatric infection
• Infection
The International Pediatric Sepsis Consensus Conference in 2005, defined infection as: “A
suspected or proven (by positive culture, tissue stain, or polymerase chain reaction test)
infection caused by any pathogen OR a clinical syndrome associated with a high probability of
infection”.16 Strong evidence of infection includes positive clinical infectious signs, imaging, or
laboratory tests (e.g., white blood cells in a normally sterile body fluid, chest radiograph
consistent with pneumonia, petechial or purpuric rash).
The symptoms that result from these infections may be caused by a wide range of bacterial and
viral pathogens, their clinical manifestations however, are very similar.6
• Sepsis
The International Sepsis Definitions Conference 2001 defined sepsis as a systemic inflammatory
response syndrome (SIRS) in presence of a suspected or proven infection. This definition has
later been accepted for pediatric cases. 16,17
• Severe Sepsis
Severe sepsis is defined as sepsis plus one of the following criteria: cardiovascular organ
dysfunction or acute respiratory distress syndrome or two or more other organ dysfunctions.18
• Septic Shock
Septic shock is a sepsis that causes cardiovascular organ dysfunction, which results in
hypotension despite adequate fluid management and resuscitation. 16

6
1.3. Microcirculation
1.3.1. In a nutshell
Microcirculatory function is essential for adequate organ function. Although the
macrocirculation (compromised of the heart and large arteries) distributes blood flow globally
throughout the body, it is especially the microcirculation that coordinates blood flow to tissues
and is the principal area of tissue oxygen transportation. Thus, an intact and functional
microcirculation is not only a critical element of the cardiovascular system, but moreover it is
vital for effective tissue oxygen delivery. Furthermore its purpose also consists in transporting
nutrients to tissue cells, ensuring adequate immunological functions and, in disease, to deliver
therapeutic drugs to target cells. 19 20
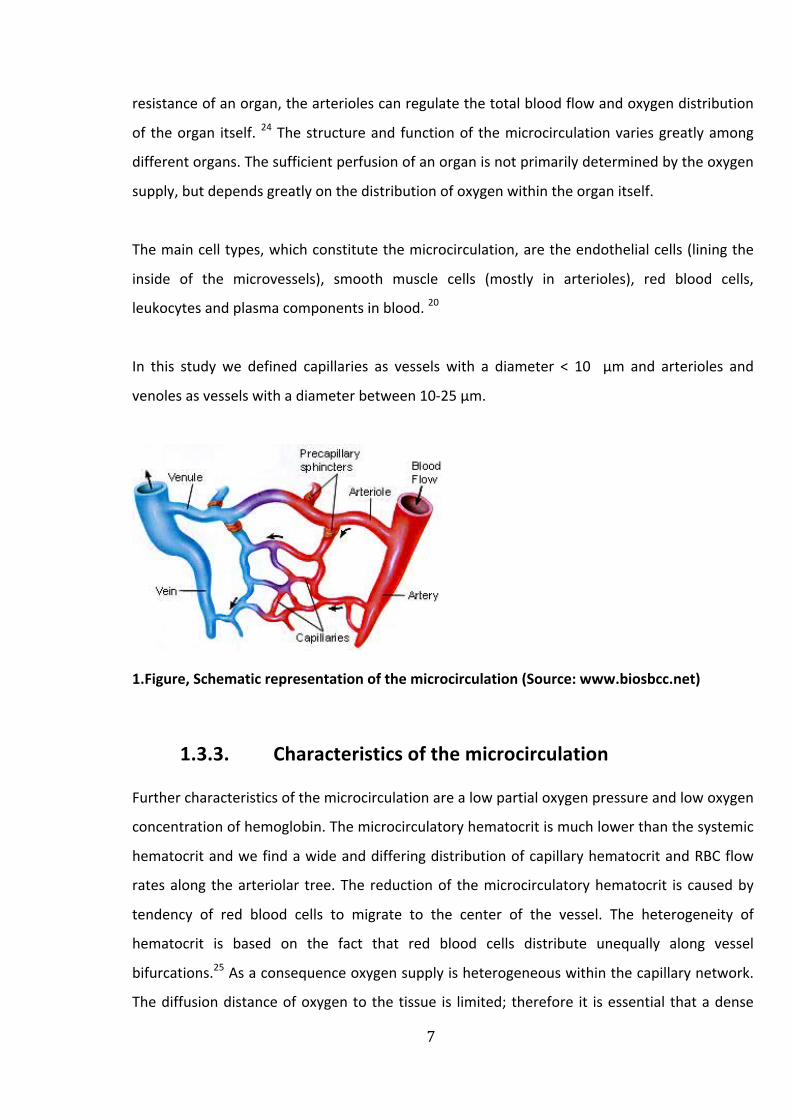
1.3.2. Structure of the capillary system
The microcirculation consists of the smallest blood vessels, the arterioles, capillaries and
venules. 20 The vessels on the arterial side of the microcirculation are called the arterioles.
Arterioles are well innervated, surrounded by smooth muscle cells, and are 10-‐100 µm in
diameter. Arterioles carry the blood to the capillaries. The capillaries are functionally the most
important part of the microcirculation, as it is here that oxygen exchange and distribution takes
place. Capillaries have a diameter of 6-‐12 µm, their wall consist of a thin endothelial layer and a
basal lamina. They are not innervated and are not surrounded by smooth muscle cells. Blood
flows out of the capillaries into the venules, which are 10-‐200 µm. The peripheral circulation of
the whole body consists of about 10 billion capillaries. Through branching and building multiple
three-‐dimensional networks the capillaries have a much bigger surface area compared to
arteries and veins. They make up the biggest endothelial surface of the body. This is an
important prerequisite for adequate oxygen exchange 21 22
Normally only 25 % of capillaries are perfused in a tissue region. When nutritient-‐ and oxygen
demand increases, more capillaries open. 23
Local blood flow within a tissue is regulated by precapillary arterioles. In contrast to bigger
vessels these are not controlled by the autonomous nervous system but rather by local
vasodilatatory metabolites, as discussed in the next section. Through change of vascular
7
resistance of an organ, the arterioles can regulate the total blood flow and oxygen distribution
of the organ itself. 24 The structure and function of the microcirculation varies greatly among
different organs. The sufficient perfusion of an organ is not primarily determined by the oxygen
supply, but depends greatly on the distribution of oxygen within the organ itself.
The main cell types, which constitute the microcirculation, are the endothelial cells (lining the
inside of the microvessels), smooth muscle cells (mostly in arterioles), red blood cells,
leukocytes and plasma components in blood. 20
In this study we defined capillaries as vessels with a diameter < 10 µm and arterioles and
venoles as vessels with a diameter between 10-‐25 µm.
1.Figure, Schematic representation of the microcirculation (Source: www.biosbcc.net)
1.3.3. Characteristics of the microcirculation
Further characteristics of the microcirculation are a low partial oxygen pressure and low oxygen
concentration of hemoglobin. The microcirculatory hematocrit is much lower than the systemic
hematocrit and we find a wide and differing distribution of capillary hematocrit and RBC flow
rates along the arteriolar tree. The reduction of the microcirculatory hematocrit is caused by
tendency of red blood cells to migrate to the center of the vessel. The heterogeneity of
hematocrit is based on the fact that red blood cells distribute unequally along vessel
bifurcations.25 As a consequence oxygen supply is heterogeneous within the capillary network.
The diffusion distance of oxygen to the tissue is limited; therefore it is essential that a dense
8
microcirculatory network controls the supply of nutrients. If tissue cells are not placed in
proximity to the oxygen source, the result would be a diffusion limitation of tissue oxygenation26,27
The above-‐mentioned characteristics show that blood flow by itself cannot be used as a good
parameter for adequate oxygen delivery to tissue and organs. 24 20
1.3.3.1. Regulation of microcirculation
The regulation of tissue perfusion occurs in the microcirculation. Arterioles control the blood
flow to the capillaries. They can contract and relax as the vascular smooth muscle cells respond
to diverse stimuli. As a consequence microcirculation blood flow is normally steady, despite a
wide range of systemic perfusion pressures. This is called autoregulation.28 At the arteriolar
level we find the greatest blood pressure gradient between the arterio-‐venous system. As
mentioned above only 25% of all capillaries are generally perfused, depending on the oxygen
and nutrition demands. The metabolic theory states that the degree of opening and closing of
the metarterioles and precapillary sphincters is mostly determined by nutrition demand of the
surrounding tissue.29 To achieve this degree of control, the entire microvasculature must be
highly sensitive to changing conditions (e.g. increased oxygen demand, reduced oxygen
delivery). 30
Another important component, which plays a crucial role in the regulation of the
microcirculatory network, is the endothelium. The endothelial cells conduct and integrate
stimulatory signals, such as changes in vascular blood flow and local shear stress, via cell-‐to-‐cell
communication across the microvascular bed. 31,32 This means that the vascular endothelium
has the capacity to transfer a dilatory stimulus from one region of the capillary bed, to the
supplying arterioles of these capillaries and thereby increasing blood supply. Larger arterioles
respond to these changes by dilating and restoring local shear stress back to baseline and
thereby contribute in further reducing vascular resistance. 33 Vasodilation is achieved by the
vasodilatory molecule nitric oxide (NO), which is produced by the enzyme nitric oxide synthase
(eNOS) located in the endothelial cells. 34,35 There have been extensive reviews on the central
role and vital importance of nitric oxide in maintaining microcirculatory blood flow, especially
when the microcirculation is harmed (such as in sepsis), as discussed later on. 36

9
1.3.3.2. ATP, NO and the role of RBCs in regulation of oxygen delivery
Another important vasodilator is adenosine triphophosphate (ATP), which is released by RBCs
in hypoxic regions. When released, ATP causes vasodilation and thereby increases blood flow
and improves local oxygen delivery.37,38 ATP release is linearly related to hemoglobin oxygen
saturation. 39
Additionally RBCs play a crucial role in regulating oxygen delivery through the transport of nitric
oxide (NO). 40 NO is released by hemoglobin molecules when hemoglobin oxygen saturations
falls. It has been postulated that deoxygenated hemoglobin itself acts as an enzyme called
nitrite reductase that converts nitrite to NO. Through that mechanism it is possible for RBCs to
cause a vasodilatation of arterioles in response to local hypoxia. 41
Through the above-‐mentioned methods RBCs are able to monitor and regulate oxygen delivery
at a microcirculatory level. 42
2.Figure, Schematic representation of ATP
dependent vasodilation (Source: Bateman e
al.43)
Essentially RBCs and the endothelium of vessels play a crucial role in regulating and
coordinating the arteriolar response to changes in oxygen demand and delivery. As long as the
microvascular network is functional and capillary density is sufficient, oxygen will be delivered
properly within an organ. 24 The past few decades have shed great light on the flow regulation
of the microcirculatory network and highlighted the need for further mathematical and
computational approaches to this complex phenomenon. 28
10
1.3.4. Dysfunction of the microcirculation
In the critically ill patient there are different global parameters of hemodynamic and oxygen
transport that can be assessed and provide important information on the status of the
cardiovascular system. These include cardiac output, arterial pressure, vascular resistance,
blood gases, oxygen consumption, oxygen extraction and lactate. These parameters are easily
measured and therefore used to judge the circulatory function in clinical settings. However,
these parameters remain inadequate and unreliable when estimating the hemodynamic
situation, especially during critical illness, irrespective of the physician’s experience. 44,45 The
problem is, that global oxygen transport parameters, as named above, fail to evaluate the
status of the microcirculation, which is necessary for adequate organ function. It is on the
microcirculatory level that oxygen, nutrients and inflammatory, as well as coagulation factors
are delivered and distributed. It is the microcirculation that removes metabolic waste products,
heat and carbon dioxide. 43
The recent development of new medical imaging techniques, in combination with data from
clinical research, has helped to identify microcirculatory dysfunction as a key factor in the
pathophysiology of a variety of systemic pro-‐inflammatory states and shock etiologies including
septic shock, cardiogenic shock and ischemia/reperfusion injury. 46,47
Numerous experimental studies have investigated the microcirculation during sepsis and found
out that evaluation of sublingual microcirculatory blood flow is prognostic of outcome and may
provide important and specific physiological information that macrocirculatory parameters
cannot. They concluded that disturbance and alteration of microcirculatory blood flow appear
to be the critical pathogenic event in sepsis and has been linked to acute multiorgan failure and
mortality. 20,48–50
Microcirculatory alteration in sepsis is multifactorial in nature and includes: autoregulatory
dysfunction, heterogeneous expression of NO, increased RBC aggregation and impaired RBC
deformability, increased leukocyte expression, as well as formation of microthrombi and
capillary leakage.

11
Normally the microcirculation, with an intact regulatory system (such as vascular endothelium
and RBCs) and sufficient capillary density, can deliver oxygen to specific places where it is
needed within an organ. Microcirculatory dysfunction is characterized by decreased capillary
density and heterogeneous abnormalities in blood flow.43,51 The pathophysiological change and
critical factor in early sepsis is the inability of the microcirculatory network to compensate for
the loss of functional capillary density. The impaired ability to control local oxygen distribution
results in severe tissue hypoxia, even when oxygen supply to the organ is adequate. 24
Left uncorrected, microcirculatory dysfunction causes respiratory distress of parenchymal cells.
This in consequence leads to organ failure. 20 A study by Sakr. et al demonstrated that changes
in perfused microvessel density during the first 24 hours of sepsis were predictive of outcome
and mortality. 54 Other studies have shown that microcirculatory flow is more notably
deteriorated and more heterogeneous in sepsis nonsurvivors when compared with sepsis
survivors. 46
3.Figure, Principal mechanisms implicated in the development of microcirculatory alterations
(Source: de Backer et al. 55)
12
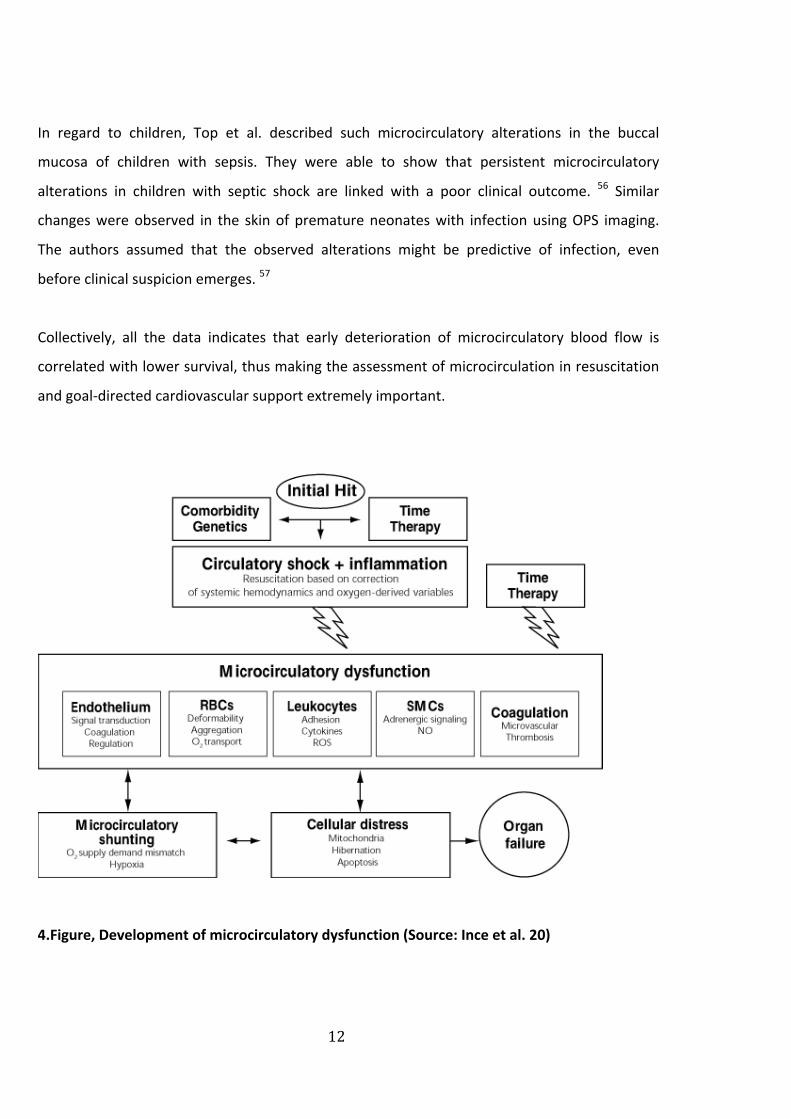
In regard to children, Top et al. described such microcirculatory alterations in the buccal
mucosa of children with sepsis. They were able to show that persistent microcirculatory
alterations in children with septic shock are linked with a poor clinical outcome. 56 Similar
changes were observed in the skin of premature neonates with infection using OPS imaging.
The authors assumed that the observed alterations might be predictive of infection, even
before clinical suspicion emerges. 57
Collectively, all the data indicates that early deterioration of microcirculatory blood flow is
correlated with lower survival, thus making the assessment of microcirculation in resuscitation
and goal-‐directed cardiovascular support extremely important.
4.Figure, Development of microcirculatory dysfunction (Source: Ince et al. 20)
13
1.3.5. Microcirculation of the pediatric patient
The structure of the microcirculation experiences great developmental changes within the first
few weeks of life in a healthy neonate. In the first month of life the capillary density decreases
significantly. The change in FCD correlates with the decrease of hemoglobin that happens
during this time period. 58,59 The microcirculation reaches an adult pattern at the age of
approximately 3 months. 60
1.3.6. The effect of blood transfusion on the
microcirculation
In clinical settings, global parameters of perfusion (such as blood pressure, base deficit,
hemoglobin and hematocrit) are usually measured to assess the response to transfusion.
However, only a few studies have investigated the effects of RBC transfusion on peripheral
microcirculation. Until now there have been no microcirculatory investigations in anemic
children and adolescents.
Sakr et al. found no consistent effect of blood transfusions on the sublingual microvascular
perfusion in a group of patients with severe sepsis, however considerable interindividual
variability. 61 In a cohort of trauma patients the microvascular results were quite variable and
depended greatly on the baseline perfusion.62 Yuruk and colleagues came to similar conclusions
using near-‐infrared spectroscopy (NIRS).63 Contrary to these results, SDF imaging after blood
transfusions in non-‐anemic cardiac surgery patients demonstrated improved microcirculatory
parameters and microcirculatory oxygen saturations.64 Genzel et al. found an improved
microvascular perfusion in anemic preterm infants after RBC transfusion.65
The contrasting results of these studies will be further evaluated in the “discussion” section of
this thesis and compared to the microcirculatory data of our study.

14
1.3.6.1. Transfusion of stored red blood cells
During the past few decades many researchers have tried to evaluate the effect of stored red
blood cells in transfusion therapy. Weinberg et al have repeatedly documented significant
correlation between RBC age and adverse clinical outcomes. In his studies the transfusion of
older RBCs was associated with an increased risk of mortality. 62,66,67
It has been shown that storage leads to a decreased RBC pH and ATP levels, which alters the
shape and rheological properties of the RBC. 68 The changes mainly involve a loss of
deformability, which again impact the flow in the microcirculatory network. 69,70 Additionally it
has been shown that stored RBCs can occlude the microcirculation by adhering to the
endothelium. 71,72
As stated above, Nitric oxide (NO) plays a fundamental role in maintaining normal vascular
function. Normally, the intact RBC membrane acts as a diffusion barrier and thereby restricts
NO scavenging by intra-‐erythrocyte hemoglobin, allowing sufficient NO escape for
vasodilatation. 73 During storage the integrity of the RBC membrane is reduced, which causes
the cells to break down (hemolysis) and consequently leads to the formation of cell free
hemoglobin. It has been postulated that this hemolysis of stored RBCs may be the most
fundamental storage lesion, causing disruption of the NO-‐mediated vasodilation and potentiate
vasoconstriction, in a manner similar to pathologic hemolytic conditions. 74–76
1.3.7. Diagnostics in microcirculatory assessment
Various diagnostic approaches can be used to assess perfusion within the capillary network:
Testing the capillary filling time is an easy tool to assess the microcirculatory function in any
setting. However, the information value is very limited, due to subjective evaluation and
external influences. Furthermore, an elevated level of lactate can be a good marker for an
anaerobic metabolic state and an indicator for disturbed oxygen supply to the tissue. 77 Thus,
blood lactate levels can be seen as an indicator for altered microvascular perfusion. However,
serum-‐lactate levels can be influenced, especially by liver-‐ and renal failures.78 Therefore, a
higher lactate level cannot be taken as a specific sign indicating tissue hypoxia.
15
The following modern technological developments have made the direct assessment of
microcirulatory parameters in patients possible 79,80 81:
§ Laser-‐ Duplex-‐ Fluxometer (LDF)
The LDF is a noninvasive method that emits laser light, which is scattered and reflected
in the tissue. Moving objects (e.g. red blood cells) cause a change in frequency through
doppler effect that is proportional to the amount of red blood cells and their velocity.
However, this method presents some major disadvantages, one being the lack of
penetration depth of laser light. Other shortcomings are the great variability of the
evaluated parameters and the lack of absolute values.
§ Venous compression-‐plethysmography
The circumference difference of an extremity after venous congestion can be measured
and consequently the hydrostatic microvasculatory pressure can be calculated. However
the long duration of this procedure and the likeliness of movement disturbances are
reasons why this method is not being used to evaluate a patient’s microcirculation in
clinical settings.
§ Near-‐Infrared Spectroscopy (NIRS)
This method measures the oxygen saturation in tissue through laser light. A major
disadvantage is the high variability of the calculated results.
§ “Invasive” intravital-‐microscopy
This is a method that requires the use of fluorescence light as a marker. Therefore it is
primarily used in animal experiments, e.g.: the dorsal skinfold of hamsters.
§ “Non-‐invasive” intravital-‐microscopy
Noninvasive devices for the measurement of the microcirculation include the newly
developed, hand-‐held microscopes with Orthogonal Polarization Spectral (OPS) Imaging
and Sidestream Dark Field (SDF) Imaging. These methods offer a great opportunity to
view the microcirculation in vivo without the use of contrast agents.
These novel techniques will be further discussed in the following section.

16
1.3.8. Imaging technique
A few decades ago, capillary microscopes were used to perform direct intravital observations of
the microcirculation in humans. These had to be applied to the nailfold capillary bed, thus
markedly hindering the microcirculatory investigation in clinical settings.82 Through the
introduction of Orthogonal Polarization Spectral (OPS) imaging by Slaaf et al., the investigation
of human microcirculation in exposed organ-‐ and tissue surfaces became possible. This method
provides a functional image of the microcirculation by using orthogonal polarized light.83
Compared to conventional, noninvasive capillary microscopes OPS imaging offers a
considerable improvement in image quality.84 Various studies have been performed in different
clinical scenarios where cardiovascular function is at risk, e.g. during cardiac surgery.85 Studies
have especially been made in exploring the microcirculation in emergency-‐ and intensive care
medicine20,46,48, as well as during sepsis, shock and resuscitation. 20,48,49,86 Different medical
centers and researches have shown that OPS imaging of sublingual perfusion can provide more
sensitive and specific information on outcome from sepsis and shock, when compared to
conventional hemodynamic parameters. 20,86
The OPS technique consists of a handheld device that illuminates an area of interest with
polarized light. Within the tissue the light is scattered and depolarized, only on the skin surface
the light remains polarized. The remitted light goes through a second polarizer (analyzer),
oriented orthogonal (90 degrees) to the area of illumination. This analyzer blocks the
undepolarized light, which is reflected by the tissue surface. By eliminating the reflected light,
the camera recognizes only the scattered, depolarized light in the depth of the tissue. By
blocking the reflected and polarized light, the reflections of skin and mucous membranes is
eliminated. The backscattered light can be imaged and subsurface structures, such as the
microcirculation, can be pictured.87 88 If one chooses a wavelength that lies within the
hemoglobin absorption spectrum (548nm), red blood cells will appear dark against a lighter
background. This happens because hemoglobin absorbs the reflection of green light, and only
the depolarized reflections of the surrounding tissue and vessels are captured by the video
camera. The pictures obtained are black and white, one-‐dimensional images and present a
“negative” image of the microcirculation. Through OPS imaging it is not possible to visualize
the vessel walls directly, their imaging depends on the presence of red blood cells in a vessel
lumen.50
17
5.Figure, Schematic representation of OPS imaging (Source: Vollmar et al. 89)
This method has been validated in animal models against intravital fluorescence
microscopy.83,90 A comparison of fluorescence intravital microscopy with OPS imaging in the
awake Syrian golden hamster showed equivalence in measured physiological parameters, such
as functional capillary density (FCD) and showed no significant difference in contrast between
the two methods.83,91,92 These results were also ratified through other experiments on liver
surfaces of rats93, on pancreatic glands of rats 94 and on the dorsal skinfold chamber of
hamsters.95
OPS imaging has contributed immensely in the field of intravital microcirculatory imaging,
however several shortcomings have been noted.87,88,96 Both reflected and emitted light pass
down the same light guide (mainstream), OPS imaging is therefore highly sensitive to internal
scatter of light. As a consequence this can lead to blurring and limited visualization of the
capillaries, and the measurement of blood cell velocities is hindered. The technique also
requires high-‐power bulky light sources, thereby reducing its applicability in difficult
circumstances, such as critical care or intensive care medicine.
Driven by the success of OPS imaging, Ince et al. developed a new imaging modality for the
microcirculation, which they named Sidestream Dark Field (SDF) imaging.88 This new approach
was directed at improving the above-‐named shortcomings of the OPS imaging. One thing they

18
changed was the lens system, by optically isolating it from the outer ring and adding
stroboscopic LED ring-‐based sidestream dark field (SDF) illumination to depict the capillary
network. Thus impaired images due to tissue surface reflections are minimized and better
image quality with more detail, capillary contrast and less motion blur is offered.
In the materials and method section (2.3.1) the Sidestream Dark Field technique and its
development and functioning principle will be further discussed in detail.
6.Figure (OPS imaging versus SDF imaging of the sublingual microcirculation) (Source :Goedhardt
et al. 88)
B e s ) a) y ntr st a p s (b) u r st p he
th m f be ee OPS d SDF d
I
qu
19
1.4. Aims of dissertation
In both children and adults, the main goal of red blood cell transfusion is to provide sufficient
cells to prevent or reverse tissue hypoxia due to limited oxygen delivery. The effects of blood
transfusions on the microcirculation and tissue oxygenation are still poorly defined.
To our knowledge, no studies have yet assessed the microcirculatory response to RBC
transfusion in anemic children outside of the neonatal period.
Until recently, evaluation of the microcirculation in clinical practice has not been possible and
was reserved for animal studies. However, the invention of novel noninvasive tools in the past
decade, such as SDF imaging, have helped clinicians and researchers to better understand the
microcirculatory network and have aided in shedding light on the pathologies of several disease
states. Through a better understanding of underlying principles and through the mentioned
new technologies the microcirculation can be monitored more intensively and tissue hypoxia
can possibly be detected and corrected earlier. The aim of this study is to better understand the
effect of RBC transfusion on the microcirculation and to thus possibly contribute valuable
information to ameliorate pediatric transfusion policies. The following questions, regarding the
microcirculatory response to RBC transfusion, will be analyzed and evaluated:
§ Do red blood cell transfusions improve microvascular perfusion of severely anemic
children?
§ How do concomitant infections influence the response to transfusion?
§ How do microcirculatory parameters of anemic children differ from the microcirculatory
parameters of a healthy control group with normal hemoglobin levels
§ Does the severity of anemia (hemoglobin level) correlate with the functional vascular
density?
§ What role does RBC storage time play? Does RBC age matter?
§ What are the implications of our studies regarding future approaches in transfusion
therapy?
20
2. MATERIALS AND METHODS
2.1. Patient population
2.1.1. Recruitment
The study population consisted of children < 18 years of age who were diagnosed with a
hematologic or oncologic disease and treated at the “Kinderklinik und Kinderpoliklinik des Dr.
von Haunerschen Kinderspitals” in Munich between August 2009 until July 2010. Nineteen
children who required red blood cell transfusion due to anemia were studied. The control
group consisted of children who underwent minor plastic or reconstructive surgeries at the
same clinic and could be considered healthy individuals. Exclusion criteria for the control group
were systemic diseases, congenital diseases or any other severe mental or physical disorders.
The study protocol was approved by the ethics committee of the medical faculty of the Ludwig-‐
Maximilians University in Munich prior to the implementation of the study.
2.1.2. Informed consent
The parents of the patients were informed and instructed extensively about the procedure
before participation. For this purpose a comprehensive brochure was given to the parents and
children that explained the scientific background of the study, as well as its practical
implementation. A written consent signed by one of the parents (or the patient >15 years of
age) was obtained prior to participation. Parents were allowed to be present during all the
measurement procedures. The patients took part in this study voluntarily. Therefore they were
allowed to brake off the measurements at any time and end the participation in case of
reconsideration.

21
2.2. Study design
The prospective, controlled, observational study used Sidestream-‐Darkfield Imaging (SDF) to
directly visualize the sublingual microcirculation in 19 children [Mean (95% CI) age: 10,2 years
(8,3-‐12,1years)] who required red blood cell transfusion due to anemia. One child received two
blood transfusions within one week and was measured twice, increasing the number of
transfusions to 20. Decision to treat was independent of the study and up to the discretion of
the attending oncologist. As such, the study had no protocol to interfere with the indication for
transfusion. The clinical condition of the child and the blood hemoglobin level was evaluated
prior to transfusion therapy. The general indications for RBC transfusion (RBC Tx) were an Hb
level <7 mg/dL in oncology patients and < 10mg/dL for children with hemoglobinopathies, who
received RBC-‐Tx at defined time periods. The measurements of the sublingual microcirculation
in the anemic children [Mean (95%CI) Hb: 7,2 g/dL (6,6-‐7,9)] were conducted before RBC
transfusion and right after the transfusion. To evaluate the long-‐term effects of transfusion on
the microcirculation, another measurement was performed 48-‐72 hours after RBC transfusion.
All children received a Tx of 200-‐300 ml [Mean (95%CI): 273 ml (252-‐293)] over 2-‐3 hours. A
control group of healthy individuals was introduced, to determine potential differences in the
microcirculation between anemic children and healthy children. This group included 18 children
[Mean (95%CI) age: 10,3 years (8,9-‐11,7 years)] with normal blood hemoglobin levels [Mean
(95%) Hb: 12,9 g/dL (12,3-‐13,5 g/dL)]. To answer the question whether concomitant infections
influence the response of RBC transfusion to the microcirculation, the anemic group was
further subdivided into 2 groups:
9 patients with clinical signs of infection and CRP levels > 3 mg/l (Inf Group)
11 patients without clinical signs of infection and CRP levels < 3mg/l (nInf Group)
All RBC units had undergone prestorage leukoreduction within 24h of collection by high-‐
efficiency filters. The storage duration (days) for each RBC unit transfused was noted.

22
2.3. Assessment of the microcirculation
2.3.1. Functional principle
Sidestream Dark Field (MicroScan, BV Meibergdreef 45, 1105 BA Amsterdam, Netherlands) is
an optical, hand-‐held imaging device that uses a probe with a 5x-‐magnifying lens to image the
tissue-‐embedded microcirculation. This new approach is similar to its forerunner model: OPS
imaging (as described in 1.3.8.), however it provides improved image quality. Due to lower
energy requirements the device can be powered by battery. Illumination is provided by
concentrically placed light emitting diodes (LEDs). The LEDs, placed at the tip of the probe and
protected by a disposable cap, send green light (530 nm) deeper into the tissue then OPS
illumination. This allows deeper sublingual arterioles and flowing blood cells to be observed
more clearly. As previously stated in the explanation of OPS imaging, the visualization of the
microcirculation is based on the fact that hemoglobin from the erythrocytes absorbs green light,
whereas the surrounding tissue scatters light. Blood cells are thereby depicted as dark moving
structures against a bright background. The light emitted by the diodes produces a wavelength
of 530 nm, which equals to the isosbestic point (wavelength at which the total absorbance does
not change during physical changes) of deoxy-‐ and oxyhemoglobin. This means that absorption
of the light I stable in both oxygenated and deoxygenated states of hemoglobin.
A clear advantage is that the LED lights offer a stroboscopic imaging by using pulsating
illumination in harmony with the CCD frame rate, thereby allowing moving structures to be
observed more clearly and preventing motion-‐induced blurring.
The SDF lens system is optically isolated from the illuminating outer ring, presenting another
clear advantage through sending illuminated light and reflected light via two independent
pathways. Thus, SDF imaging is able to prevent impaired images by tissue surface reflections
(which was a common problem of OPS-‐imaging). A 5 or 10 times magnifying lens is used to
project the image onto a video camera, providing clear images of the capillaries and allowing
for better computer automatic analysis of the images. Images are recorded using a digital
video recorder and visualized on a computer monitor. 88
23
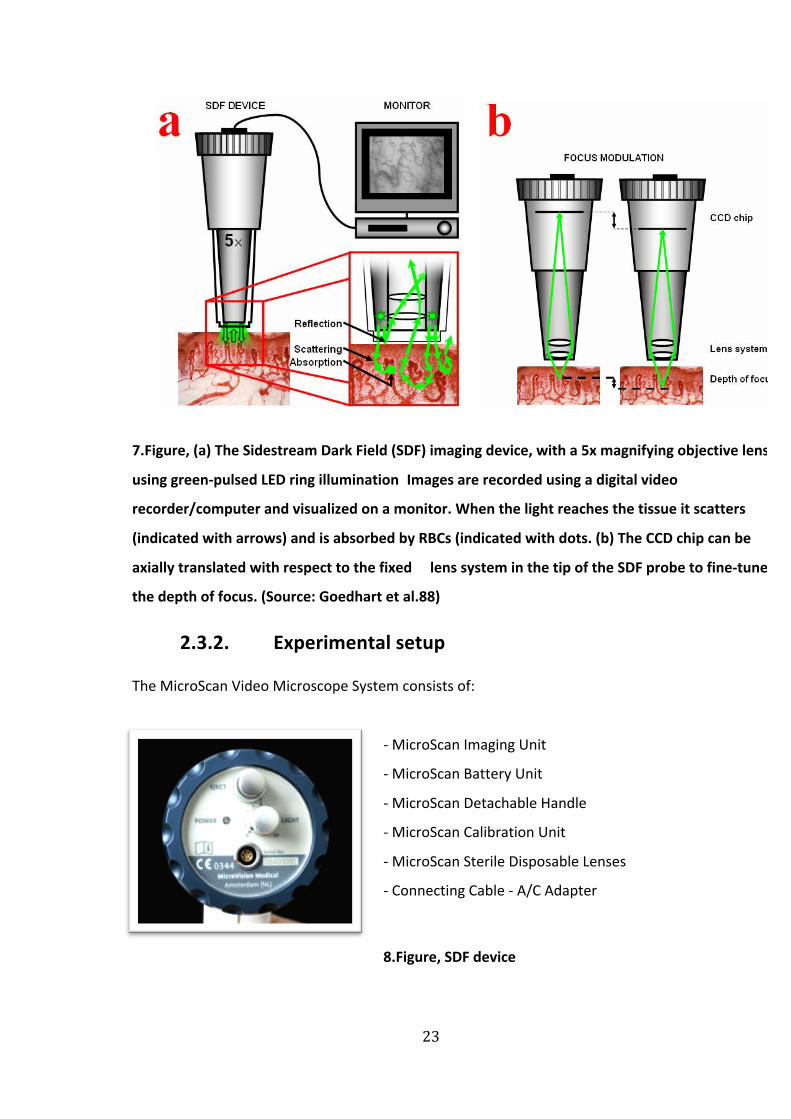
7.Figure, (a) The Sidestream Dark Field (SDF) imaging device, with a 5x magnifying objective lens
using green-‐pulsed LED ring illumination Images are recorded using a digital video
recorder/computer and visualized on a monitor. When the light reaches the tissue it scatters
(indicated with arrows) and is absorbed by RBCs (indicated with dots. (b) The CCD chip can be
axially translated with respect to the fixed lens system in the tip of the SDF probe to fine-‐tune
the depth of focus. (Source: Goedhart et al.88)
2.3.2. Experimental setup
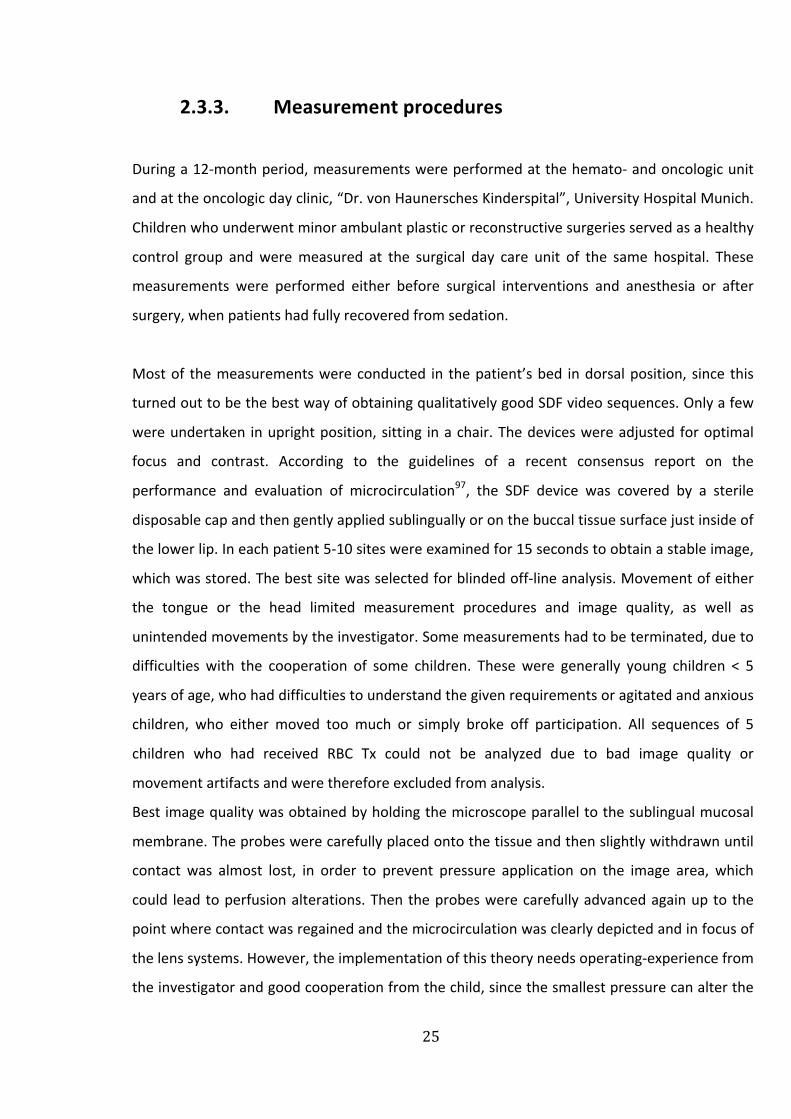
The MicroScan Video Microscope System consists of:
-‐ MicroScan Imaging Unit
-‐ MicroScan Battery Unit
-‐ MicroScan Detachable Handle
-‐ MicroScan Calibration Unit
-‐ MicroScan Sterile Disposable Lenses
-‐ Connecting Cable -‐ A/C Adapter
8.Figure, SDF device
magnifying objective ens system-contain ng probe imaging t e t ss e-embedded microcircu ation
video recorder/c mpu er and visualized on a monit r Lower r ght corner: After penetra
g
by (de)ox hemo lobin (indicated with dots) The SDF ens system s optical y iso a ed from he
D o o i
r ac reflect ns (b I the SDF d vi th CCD c ip a be a i lly t ans at d with spe t to he
y t t p t S b d p o u
Video outp t was visualized on a m
A I fi na l off l ne ana ysis of
d
007 revise 1 Oct 2007; accepted
2 N e 2 ,

25
2.3.3. Measurement procedures
During a 12-‐month period, measurements were performed at the hemato-‐ and oncologic unit
and at the oncologic day clinic, “Dr. von Haunersches Kinderspital”, University Hospital Munich.
Children who underwent minor ambulant plastic or reconstructive surgeries served as a healthy
control group and were measured at the surgical day care unit of the same hospital. These
measurements were performed either before surgical interventions and anesthesia or after
surgery, when patients had fully recovered from sedation.
Most of the measurements were conducted in the patient’s bed in dorsal position, since this
turned out to be the best way of obtaining qualitatively good SDF video sequences. Only a few
were undertaken in upright position, sitting in a chair. The devices were adjusted for optimal
focus and contrast. According to the guidelines of a recent consensus report on the
performance and evaluation of microcirculation97, the SDF device was covered by a sterile
disposable cap and then gently applied sublingually or on the buccal tissue surface just inside of
the lower lip. In each patient 5-‐10 sites were examined for 15 seconds to obtain a stable image,
which was stored. The best site was selected for blinded off-‐line analysis. Movement of either
the tongue or the head limited measurement procedures and image quality, as well as
unintended movements by the investigator. Some measurements had to be terminated, due to
difficulties with the cooperation of some children. These were generally young children < 5
years of age, who had difficulties to understand the given requirements or agitated and anxious
children, who either moved too much or simply broke off participation. All sequences of 5
children who had received RBC Tx could not be analyzed due to bad image quality or
movement artifacts and were therefore excluded from analysis.
Best image quality was obtained by holding the microscope parallel to the sublingual mucosal
membrane. The probes were carefully placed onto the tissue and then slightly withdrawn until
contact was almost lost, in order to prevent pressure application on the image area, which
could lead to perfusion alterations. Then the probes were carefully advanced again up to the
point where contact was regained and the microcirculation was clearly depicted and in focus of
the lens systems. However, the implementation of this theory needs operating-‐experience from
the investigator and good cooperation from the child, since the smallest pressure can alter the

26
sublingual blood flow. The best way of evaluating whether blood flowed regularly was by
looking at the capillary site on the screen, rather than fixing the attention solely on the SDF
probe. This way a stagnant blood flow could be detected immediately and consequently
moving the probe slightly from the site of interest reduced the pressure artifacts.
2.3.4. Clinical data
Clinical data was collected before RBC Tx, as well as 48-‐72 hours after RBC Tx. The data included
temperature, heart rate and blood pressure. Further clinical data, such as admission diagnose,
other co-‐morbidities, drugs and chemotherapies were also recorded retrospectively.
Laboratory data were extracted from the charts with no blood sampling solely for research
purposes. Therefore hemoglobin levels were only available before RBC Tx (pre Tx) and 48-‐72
hours after Tx (pTx2), since there was no routine blood sampling right after Tx (pTx1). The
following data were collected: hemoglobin, hematocrit, platelets, white blood cells, red blood
cells and C-‐reactive proteine (CRP) (the detailed parameters of each study patient can be found
in the appendix). At pTx2 clinical and microcirculatory data of only 13 out of 19 study subjects
could be collected.
2.3.5. Video recordings
The SDF images of all 38 patients were recorded directly with a Notebook (Fujitsu Siemens
Lifebook, Microsoft Windows Pofessional XP). Video output was visualized on a monitor and
connected to the computer via a signal converter.
The SDF sequences were stored to the notebook in Audio Video Interleaved (AVI) format. From
the sublingual microcirculation images, the best capillary site from each participant was
selected for further off-‐line analysis.
27
2.4. Analyzing data
2.4.1. Software configuration
AVA Software was used for image analysis. AVA is short for Automated Vascular Analysis and
can perform both quantitative and semi-‐quantitative analysis of various microcirculatory
parameters.
2.4.2. Analysis
Randomized numbers were given to the microcirculatory videos of each patient and analysis
was performed in a blinded manner. Subsequently, all videos were independently evaluated by
a single observer (to avoid inter-‐individual variability). The observer was blinded to both study
patient and image sequence (i.e. pre-‐transfusion vs. post-‐transfusion). Additionally, practicing
on multiple sequences prior to analysis-‐start minimized inter-‐individual variability.
Selected AVI-‐video-‐sequences were imported to the AVA program. Images were then stabilized
before doing microcirculatory measurements. Normally SDF images show a region of interest of
approximately 1000x750 µm. Due to such a small image scale and the use of hand-‐held
instruments, inter-‐image displacement occurs. AVA performs image registration by shifting
image-‐frames to a best-‐matching position (stabilization) and by cutting away the individual
image edges that do not coincide with others. Stabilized images are stored as new video files
(AVI) to disk. After stabilization, image-‐quality can be enhanced by correcting variations in the
background and by adjusting image-‐contrast. Automated vessel-‐segmentation was performed
with a certain single scale of analysis. In this procedure the program automatically detects
vessels in the given area and marks these with defined colors. The examiner then deleted
vessels manually, which were wrongfully detected by the program. Vessel segments that were
not recognized were added using local image analysis on a selectable scale. After automatic
vessel segmentation, quantitative velocity assessment was carried out. It has to be considered
that blood flow changes at a vessel bifurcation, thereby also causing changes in RBC velocity.
Therefore space-‐time diagrams have to be determined between vessel bifurcations. Such
vessels were selected and the examiner then manually drew characteristic lines in the time-‐
28
space diagram. The program automatically creates space-‐ time diagrams by tilting the
centerline intensity of a vessel as vertical lines. The line orientation is indicative for RBC velocity.
The user can overrule the result of automatic analysis by tracing lines in the space–time
diagram interactively. Finally, the acquired orientation is converted to an actual velocity value.98 In addition semi-‐quantitative velocity classification per vessel was performed. All vessels
were assigned to different categories and marked accordingly. Vessels are considered
“perfused” if they are assigned one of the following velocity classifications: sluggish flow,
continuous flow and hyperdynamic flow. Other classifications, such as “no flow” or
“intermittent flow” are not considered perfused. The reason for including this type of velocity
classification while a quantitative method is available, is to provide a method of classification in
case other classification fails, e.g. due to a very low image contrast.
The different vessel subgroups where allocated by their diameter and in this study defined as
the following:
-‐ 0 – 10 µm : SMALL
-‐ 10 – 20 µm : MEDIUM
-‐ 20 – 100 µm : LARGE
-‐ > 100 µm : VERY LARGE
At last the program presents the evaluated in a microcirculatory report.
The report generator shows all analysis parameters, sorted in tables. The following
microcirculatory parameters were evaluated in this study:
Consensus parameters
Included were Functional Vessel Density (FVD) (mm/mm2), the Perfused Vessel Density (PVD)
(mm/mm2), the Proportion of Perfused Vessels (PPV) (%)
Density distribution parameters
Flow classification per vessel
Number of vessel segments within a given diameter range and with a certain velocity
classification (semi-‐quantitative velocity result)
29
2.4.3. Storing and reviewing analysis results
The results in memory are automatically stored to disk as a logbook file, when the operator
switches files, starts segmenting a new image or erases the current results. Logbook files are
stored as text files with extension “TXT”, which makes them readable using an elementary text
editor, such as Notepad. Retrieving a logbook file can regenerate reports. This feature allows
the operator to review the total analysis results, both by visual inspection of the previous
results as well as by calling the report generators to get (semi-‐) quantitative results. It even
allows continuing analysis. If changes are made, e.g., by erasing misinterpreted vessels or by
adding vessel segments interactively, a new logbook file will be created when the analysis
session is closed.
2.4.4. Statistical analysis
Graph Pad Prism 5.0, Version, was used for statistical analysis of data. Descriptive analysis
compromised of means ± standard deviation (SD) and confidence intervals (CI) was performed.
Results were considered significant at p < 0.05. The increase of significance was marked the
following way: p=<0,05; p<0,005; p<0,0005; n.s: not significant.
The following statistical tests were used:
Column Statistics: descriptive statistics for evaluating mean, median and confidence intervals
for the various measured data
Normality test: we used a D´Agostino & Pearson omnibus normality test for evaluation of
normal distribution of a study population
Mann-‐Whitney test: The Mann-‐Whitney test, also called the Wilcoxon rank sum test, is a
nonparametric test that compares two unpaired groups
Wilcoxon matched pair signed-‐rank test: a nonparametric test that compares two paired
groups
Friedman test: a nonparametric test that compares three or more paired groups

30
Statistical data was graphically presented using Box-‐ and Whisker plot. The box indication the
first and third quartile and a bar indicating the median. The whiskers present the maximum and
minimum values. Outliers are presented as dots.
Descriptive statistics were performed for the full and subgroup samples to assess similarities in
patient characteristics, including age, gender, infection versus no infection and age of blood.
Changes in hemodynamic and other observed measurements taken before (pre), 1 hour after
(pTx1) and 48-‐72h after (pTx2) the transfusion were assessed by an unpaired t test. Mean,
standard deviation and p value were reported for each comparison. Analysis for the full sample
and subgroup were conducted separately.

31
3. RESULTS
3.1. Study population
Characteristics Tx-‐Group Control-‐Group
Age (years)
Sex (male:female)
10.2 (8.3-‐12.1)
12:7
10.3 (8.9-‐11.7)*
11:7*
1. Table, Patient characteristics, * n.s.
Forty-‐two children were recruited for the study. As previously described, the sublingual
microcirculation was recorded in all of these children. The video sequences of five children
were excluded due to bad image quality, leaving thirty-‐eight study subjects for further analysis.
In sections 2.2 and 2.3.3 the criteria for participation and the measurement procedure has
already been explained.
The Tx-‐Group consisted of 19 children with anemia, who received RBC transfusions. The patient
characteristics, including age and gender distribution are presented in chart 1 above. There was
no significant difference in the mean age or sex among the transfusion group and the control
group. Within both groups the youngest patient was 4 years of age and the oldest patient was
18 years of age.
One patient was newly diagnosed with leukemia and admitted to the hospital with a blood
hemoglobin level of 4,4 mg/dL. She was given a RBC Tx at admittance and subsequently
another RBC Tx the following day (increasing the number of transfusions given to 20). SDF
measurements were carried out before and after each of the subsequent transfusions. These
measurements were analyzed separately and consequently the results were counted as two
individual study observations. Among the Tx-‐Group 12 patients had cancer and 7 patients had
hemoglobinopathies.

34
(We did not include laboratory data at Post-‐Tx1 due to limited numbers. Blood samples were
only taken once a day, -‐usually in the morning. Only five children in the transfusion group had
blood samples taken within the first 12 hours after transfusion. Due to low patient number and
consequently low representative significance for the whole group, these values were not
further included in statistical analysis. Post-‐Tx 2: 48-‐72 hours after transfusion. )
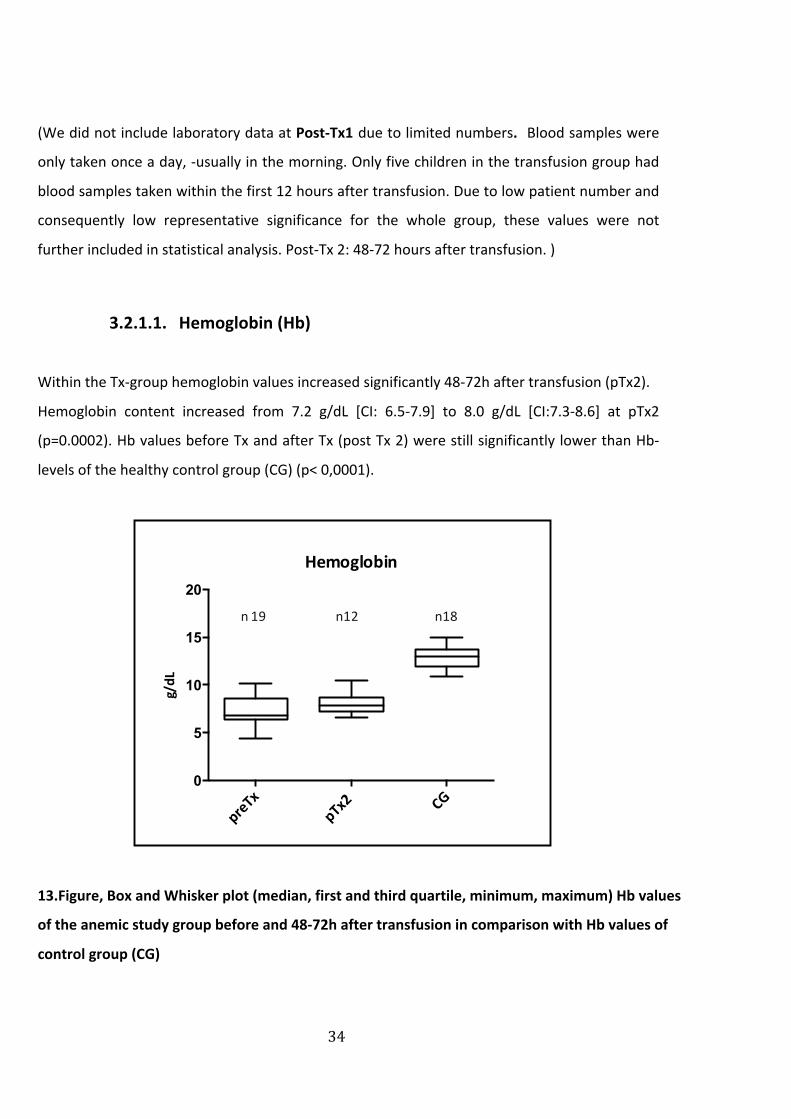
3.2.1.1. Hemoglobin (Hb)
Within the Tx-‐group hemoglobin values increased significantly 48-‐72h after transfusion (pTx2).
Hemoglobin content increased from 7.2 g/dL [CI: 6.5-‐7.9] to 8.0 g/dL [CI:7.3-‐8.6] at pTx2
(p=0.0002). Hb values before Tx and after Tx (post Tx 2) were still significantly lower than Hb-‐
levels of the healthy control group (CG) (p< 0,0001).
13.Figure, Box and Whisker plot (median, first and third quartile, minimum, maximum) Hb values
of the anemic study group before and 48-‐72h after transfusion in comparison with Hb values of
control group (CG)
preTx
pTx2 CG
0
5
10
15
20
Hemoglobin
g/dL
n 19 n12 n18

35
We further subdivided the Tx-‐ group into patients with infections and patients without
infection and found that hemoglobin levels before transfusion differed significantly between
the 2 groups. 48-‐72 h after transfusion values did not differ significantly between the two
subgroups. The increase of hemoglobin 48-‐72 hours after transfusion was not significant in the
subgroup without infection (nInf-‐group), however only 3 values were obtained from this group
at this point of time. Hemoglobin values of both groups differed significantly from the healthy
control group at all times of measurement (p<0.0001).
preTx pTx2
Infection 6.2 (5.5-‐6.9) 7.8 (7.2-‐8.4)
No Infection 8.2 (7.3-‐9.1) 8.9 (5.4-‐12.4)
3. Table, Mean and 95% CI of hemoglobin values of subgroups
* Hemoglobin values at pTx1 were not included because of low numbers
(This does not apply to microcirculatory imaging results, which were performed on all patients
at pTx1)
3.2.1.2. Hematocrit (Hct)
The Hematocrit (Hct) is a measure of the fractional level of red cells in the blood. Strictly
speaking, anemia is defined as a decrease in total body red cell mass and can therefore be
indicated by a low Hct. Consequently, when Hct is below normal, the erythrocyte count and
hemoglobin level will also be low. In our anemic study population both Hematocrit and
Erythrocyte count were significantly (p<0,0001) higher 48-‐72 hours after transfusion (postTx2).
However, these elevated values still differed significantly (p<0,0001) from the normal values of
the healthy control group (CG). (Comparable to Hb-‐values on Fig. 11)

36
3.2.1.3. CRP
As described in 2.2 the Tx-‐group was further divided into a group with elevated CRP levels
>3mg/dL and clinical signs of infection (Inf) and a group with normal CRP levels <3mg/dL and no
infection (nInf).
14.Figure, Box and Whisker plot (median, first and third quartile, minimum, maximum)
Comparison of CRP values between anemic patients without infections and with infection
With a mean CRP of 0,4 mg/dL (95%CI: -‐0,03-‐0,8 mg/dL) the nInf-‐group differed significantly
(p<0,0001) from the Inf-‐group where the mean CRP value was 5,7 mg/dL (95%CI: 3,6-‐7,8mg/dL)
prior to Tx. 48-‐72 hours after Tx values were still significantly different between the two groups
(p 0,0264). The patient number of the nInf-‐group was much lower at post Tx2. However it can
be assumed that the CRP levels of these patients did not increase after 48-‐72 hours. The reason
for this assumption is the following. The n-‐Inf consisted mainly of patients with
hemoglobinopathies, who received RBC transfusions at the day clinic at defined time periods.
Apart from the typical signs of anemia, as described in 1.2.3, these patients showed no clinical
signs of infections and were in good health. It is unlikely that their condition changed within 2
days.
preTx
pTx2
preTx
pTx2
0
5
10
15
20
CRP Inf vs nInf
mg/dL
n10 n8
n8 n4

37
3.2.2. Vital signs
3.2.2.1. Heart rate (HR)
preTx pTx1 pTx2
Heart rate (bpm) 100 (91-‐105) 86 (82-‐91) 85 (78-‐91)
4. Table, Mean and 95% CI of heart rate
The results of the sub-‐groups were similar and did not differ significantly (p>0,05, n.s.).
Therefore the whole Tx-‐group (without separating into Inf and nInf-‐Group) was included in the
statistical evaluation of vital signs. Within the whole Tx-‐group the mean heart rate before Tx
was 100 bpm (95% CI: 91-‐105). After Tx the HR decreased significantly (p<0,05). The mean HR
at pTx1 was 86 bpm (95% CI: 82-‐91) and did not change significantly at pTx2, where the mean
value was 85 bpm (95% CI: 78-‐91).
3.2.2.2. Temperature
preTx pTx2
Temperature
(C˚)
Tx-‐group Tx-‐group
37,1 36,8
nInf Inf nInf Inf
36.5
(36.2-‐36.8)
37.7
(37.2-‐38.1)
36,5
(36.2-‐36.9)
37.1
(36.2-‐37.9)
5. Table, Mean and 95% CI of temperature in the Tx and subgroups

38
Temperature was measured before RBC Tx and 48-‐72 hours after Tx. For statistical evaluation
the Tx-‐group was again divided. Individuals with elevated CRP levels (Inf) had a significantly
higher temperature than children without signs of infection (p<0,0001). The mean
temperatures within the infection group (Inf) and patient group without infections (nInf) are
presented in the table above. The temperature in the Inf-‐group decreased 48-‐72 hours after Tx.
At this point the values did not differ significantly (p=0,2797, n.s.) from the ones obtained of
patients without infection 48-‐72 hours after Tx.
3.2.3. Blood Units
Packed RBC units were obtained from the blood bank of the Red cross of Munich. Mean storage
time of the RBC units was 13.3 (95% CI 11,9-‐14,6) days. All children received 200-‐300 ml (Mean
273 ml, 95% CI 252-‐293) of packed, irradiated and leucocyte reduced RBCs over max. 3 hours.

39
3.3. Microcirculatory Results – Group Analysis
3.3.1. Functional Vessel Density (FVD)
3.3.1.1. Transfusion group (TxG) versus Control group (CG)
preTx (n 19) postTx1 (n 19) postTx2 (n 11) CG (n 18)
Mean 14,3 16,4 15 17,5
95% CI 13,5-‐15,0 15,5-‐17,4 13,7-‐16,2 16,5-‐18,1
SD 1,65 2 1,7 1,3
6. Table, Mean, 95% CI and Standard Deviation (SD) of FVD (mm/mm2)
(n indicates the number of patients for each subgroup)
15.Figure, Box and Whisker plot (median, first and third quartile, minimum, maximum) showing
the FVD values from the Tx-‐group before (preTx), 0-‐1 h after (pTx1) and 48-‐72 h after RBC
transfusion, compared to the FVD of the control group (CG)
pre$Tx pT
x1pTx2 CG
0
5
10
15
20
25
FVD
mm
/mm
2
Func0onal Vessel Density (FVD)
n19 n19 n11 n18
41
pTx1, pTx2) could be included in this analysis. Eleven patients had a complete set of data and
were further analyzed with the Friedman test. The results showed a significant difference in
means (p=0,0115).
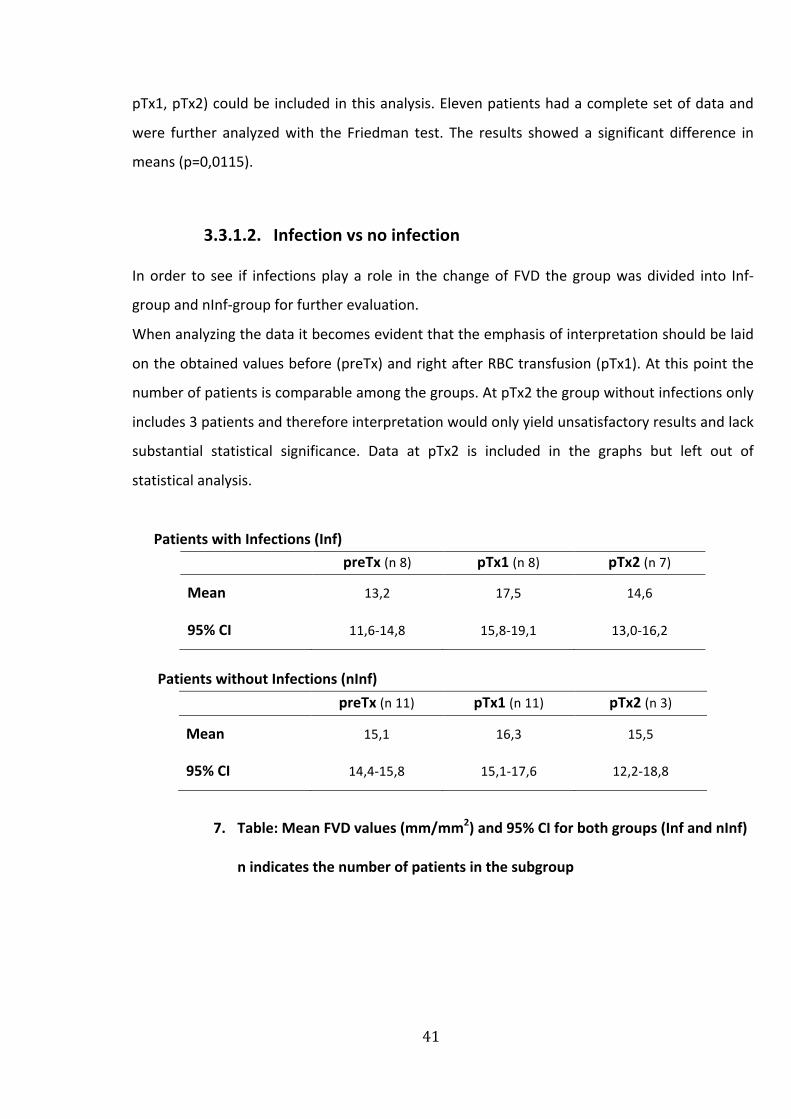
3.3.1.2. Infection vs no infection
In order to see if infections play a role in the change of FVD the group was divided into Inf-‐
group and nInf-‐group for further evaluation.
When analyzing the data it becomes evident that the emphasis of interpretation should be laid
on the obtained values before (preTx) and right after RBC transfusion (pTx1). At this point the
number of patients is comparable among the groups. At pTx2 the group without infections only
includes 3 patients and therefore interpretation would only yield unsatisfactory results and lack
substantial statistical significance. Data at pTx2 is included in the graphs but left out of
statistical analysis.
Patients with Infections (Inf)preTx (n 8) pTx1 (n 8) pTx2 (n 7)
Mean 13,2 17,5 14,6
95% CI 11,6-‐14,8 15,8-‐19,1 13,0-‐16,2
Patients without Infections (nInf)preTx (n 11) pTx1 (n 11) pTx2 (n 3)
Mean 15,1 16,3 15,5
95% CI 14,4-‐15,8 15,1-‐17,6 12,2-‐18,8
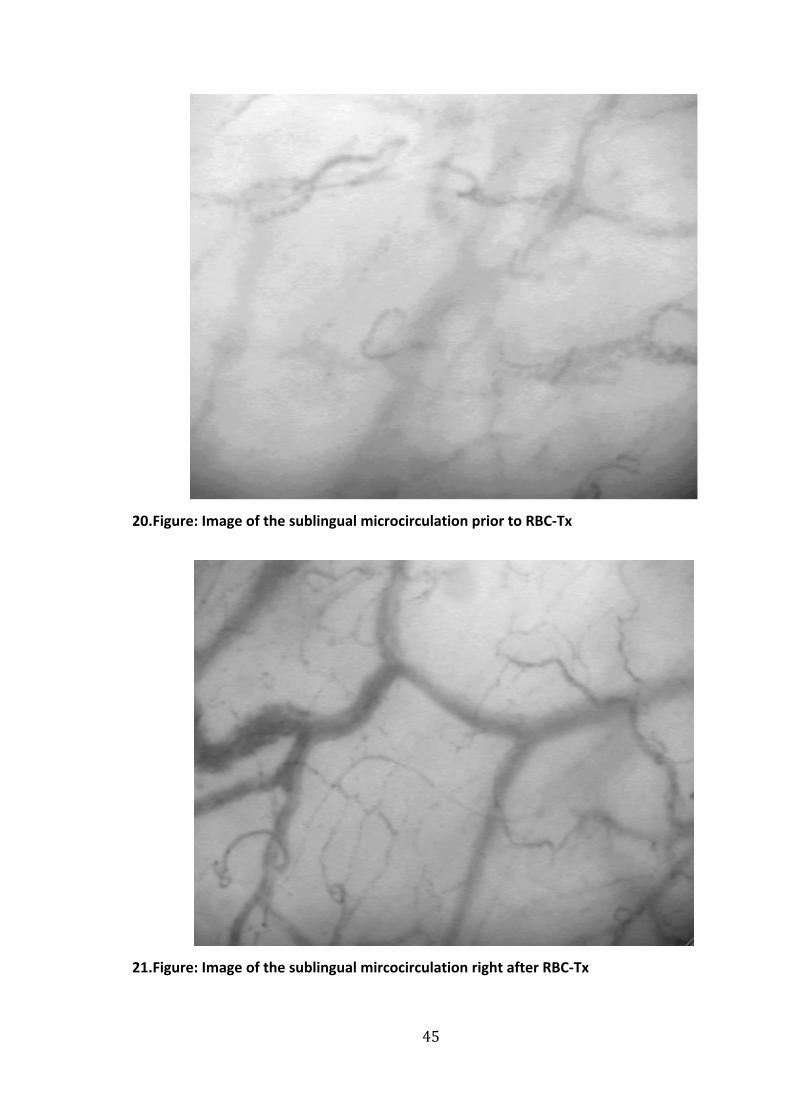
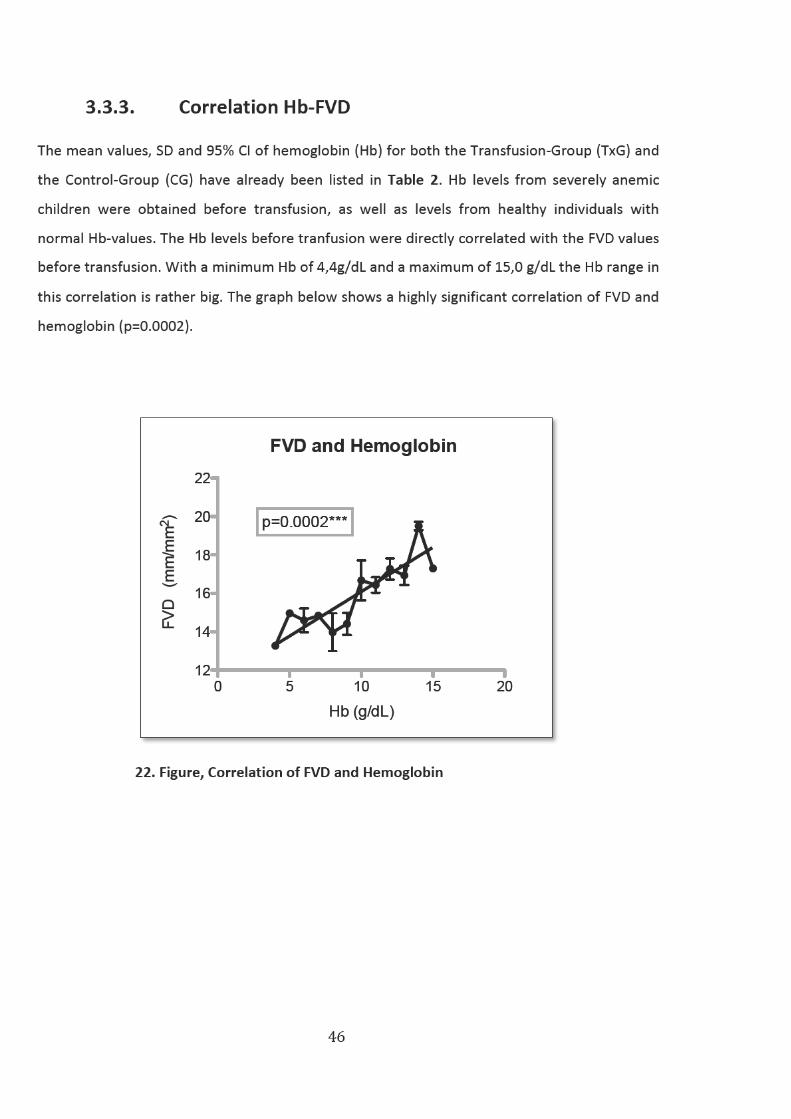
7. Table: Mean FVD values (mm/mm2) and 95% CI for both groups (Inf and nInf)
n indicates the number of patients in the subgroup

45
20.Figure: Image of the sublingual microcirculation prior to RBC-‐Tx
21.Figure: Image of the sublingual mircocirculation right after RBC-‐Tx

48
4. Discussion
As stated in the introduction, transfusion therapy is not free of adverse effects. Additionally
clear guidelines regarding transfusion thresholds remain unclear in pediatrics. The goal of this
study was to assess the microcirculation of anemic children who underwent RBC-‐transfusion
therapy and thereby provide valuable information on the efficiency of the therapy. I further
want to discuss the possible influence of infections on the microcirculatory changes, as well as
the potential effect of RBC storage time.
These questions and their results will be analyzed critically below:
4.1. Study design
A prospective, controlled observational study was chosen as a study design. Decision to treat
was independent of the study and up to the discretion of the attending oncologist.
Measurements were taken at predetermined times for each participant, to make the study
uniform.
Measurement intervals have to be analyzed critically. SDF measurements were performed no
more than 2 hours prior to RBC transfusion and 0-‐1 hour after transfusion. However, the time
interval until the third point of measurement was 48-‐72 hours. Such a large time interval was
chosen for various reasons. SDF measurements were not to interfere with other clinical
procedures. Also the endeavor was to put as little stress as possible on patients and their
parents. Some patients were in very poor conditions and preferred measurements at a later
point of time. The day of discharge could not be predicted precisely; -‐ some patients went
home 2 days after transfusion and were measured before leave. Additionally, it has to be
considered that inevitable changes in therapy and procedures could themselves affect the
microcirculation. Therefore an interpretation of the variables should only be done carefully
(especially 48-‐72 h after transfusion).

49
Another possible point for criticism could be the big age difference within the group. The age-‐
range was 4-‐18 years. Within both groups (Tx-‐Group and Control Group) the youngest
participant was 4 years old, whereas the oldest patients were 18 years old. However, as stated
earlier, the microcirculation develops an adult pattern at the age of 3 months. Therefore a
direct comparison of patients and microcirculatory variables seemed appropriate. The mean
age of the Tx-‐Group (10,2 years) did not differ significantly from the age of the control group
(10,28 years). Therefore a comparison of the microcirculatory parameters between the two
groups seemed reasonable.
As stated earlier, limited studies on SDF imaging in children exist. Paize and al. performed SDF
measurements on twenty children with severe meningococcal disease treated in the intensive
care unit, and compared these directly to a healthy control group. Their control group consisted
of anesthetized children between 6 months and 6 years of age that underwent routine surgery
and healthy volunteers over the age of 6 years. These were used as a direct control group,
similar to our study, with an age span similar to ours.
It has been shown that propofol can have a minor influence on microcirculatory measurements
in adults. 99 SDF imaging in our healthy control group was performed after complete recovery of
anesthesia and when propofol was likely to be eliminated of the circulatory system.
The process of recruiting participants proved to be rather difficult. Many children who received
blood transfusions at the hemato-‐, oncologic ward or at the day clinic were under the age of 5.
Although many measurements were attempted with these young patients, hardly any could be
completed or later included in analysis. One of the reasons was a lack of comprehension for the
requirements and consequently a poor participation in the measurement procedure. A
qualitatively good SDF-‐sequence is based on a good co-‐operation and requires the test subject
to hold very still while the SDF probe is placed under the tongue or on the lip for imaging. Even
slightest movements will cause image blurring and pressure artifacts. Most of the younger
children were agitated and anxious and made the recording of good microcirculatory videos
impossible.
5 children had to be excluded of the study due to either bad image quality, missed follow up
measurements or lacking participation, leaving 37 children for analysis of which one child was
analyzed at different points of time.

50
4.1.1. Statistical analysis
The statistical analysis was to some extent compromised. Other microcirculatory studies, which
have been conducted in similarly small patient groups, have used parametric test, such as a t-‐
test, that require a normal distribution of study subjects. 65 The D´Agostino Pearson normality
test was performed to test for normal distribution of data in our study. Although we did obtain
high p-‐values when testing for normality (which could indicate a normally distributed data) we
decided to use nonparametrical tests. A normality test cannot prove the data were sampled
from a Gaussian distribution; all you can say is that the data are not inconsistent with a
Gaussian distribution. Especially in smaller patient groups the normality test lacks power. 100 It
should be taken to account that it is likely that parametric testing could have been applied for
certain datasets in our study and yielded more significant results.
Patient-‐ and microcirculatory data showed noticeable differences and discrepancies and
included a few outliers that were mostly visualized in the corresponding graphs. Especially the
division of the anemic group into inf-‐group (with infections) and nInf-‐group (without infections)
was problematic. As accounted for in the results section, the difference at pTx2 between the
numbers of patients among the groups was large. The infection group included 7 study subjects
at this point, whereas the non-‐infection group only consisted of 3 study subjects. Statistical
testing for this subgroup (at pTx2 between inf-‐ and nInf group) is not reasonable. Other
statistical analysis between the whole transfusion group and control group, and between the
transfusion group itself (preTx-‐pTx1) showed similar patient numbers, although numbers were
relatively small. It becomes evident that statistical interpretation of microcirculatory findings
after 48-‐72 h (pTx2) is limited and therefore the emphasis of this study should especially be
placed on the immediate results of transfusion. Due to quite small samples within the different
subgroups of analysis, our methods of nonparametric statistical evaluation might not have had
the statistical power to detect differences that are really there.
An extension of the study with an inclusion of more study patients to increase statistical quality
and validity was unfortunately impossible due to time limitations. Due to the relatively small
number of patients and controls, it is only with great care that our results can be generalized.
51
It has to be emphasized that this study is useful in showing tendencies and raising questions,
rather than assessing severity of illness, evaluating therapies and predicting outcomes.
Our findings need to be confirmed in larger cohort prospective studies.
4.2. Materials and Methods
4.2.1. Measurement
Sidestream Dark Field (SDF) imaging, a stroboscopic LED-‐ring based image modality, was used
for the observation of the microcirculation. As described previously, the device uses green light
to illuminates a certain tissue area (up to 3 mm). The scattered light is then absorbed by
hemoglobin of red blood cells within vessels and depicted as a black-‐and white moving image
of the microcirculation. 88
In this study, the buccal or sublingual mucosa was chosen as the site of investigation. The
sublingual mucosa has become the most important site for microcirculatory studies and has
been used as a representative site for global microcirculation. It has not been proven clearly
whether sublingual flow alterations reflect similar microcirculatory disturbances elsewhere in
the body. However, it has been postulated that the sublingual or buccal mircrocirculatory
network shares similar embryonic origin with the splanchnic mucosa.101 This finding was
confirmed in a recent study by Verdant et al., which showed that sublingual images are a good
reflection of gut mucosal perfusion. 102 Transcutaneous measurements are of limited quality,
due to the thickness of the skin and based on the skins function as a thermoregulatory organ, a
function that isn’t shared by other microcirculatory sites. 103 Nearly all studies referred to in the
introduction section on microcirculation drew their conclusion on the basis of sublingually
measured microcirculatory parameters and showed it’s relevance especially in the study of
pathologic conditions. 47,54 In addition it is the only site, where investigation of the
microcirculation is easy accessible and practical in clinical scenarios.
De Backer et al. described five consensual key points for image acquisition: at least 3 sites per
organ should be obtained at evaluation; pressure artifacts should be avoided; adjustments of

52
contrast and right focusing have to be made; excess fluids between the microscope and tissue
should be eliminated; good image quality while capturing should be maintained. 88 All of these
criteria were considered in the sublingual SDF measurement. Therefore a good quality of
measurement and image acquisition can be assumed.
Video images were immediately captured on a computer using a dedicated video card, and the
images were stored at full size as DV-‐AVI files to allow computerized frame-‐by-‐frame image
analysis. Recording time was limited to 15 s because it was difficult to maintain a clear and
steady image for a longer period.
A possible reason for critique could be the change between indirect digitalization of video-‐
capturing and direct digitalization of measurements on the computer. By converting videos
into digital images a loss of information can occur. This error was minimized by only using
uncompressed video data for analysis. Thus the mentioned error can be disregarded and
should not be held accountable for the changes of microcirculation in our measurements. 97
4.2.2. Analysis
Different software packages have been developed, that perform FCD calculation and reliable
blood flow measurements in individual vessels: The Capiscope program, the grid method by De
Backer or by Boerma 50, the Microvision Analysis Software (MAS) and the Automated Vascular
Analysis (AVA).
The CapiScope software has been developed for analysis of OPS images. Vessels have to be
traced manually and thus FVD, diameters and velocities can be calculated. A clear disadvantage
of this method is the long time consumption, as well as the out-‐dated, slow and complex
program.
The method by de Backer and coworkers requires the user to draw three horizontal and vertical
lines on the screen, because the concept is based on the principle that vessel density is
proportional to the number of vessels crossing these lines. Vessel density can thus be
calculated as the number of vessels crossing the lines, divided by the total length of the lines.
Functional vessel density (FVD) can be measured by counting the number of grid lines that
intersect with the vessels. Another reliable way to measure FVD is by considering the total
vessel length, relative to image surface. 104 97 A clear disadvantage of the score is its

53
impreciseness and the fact that vessels can potentially cross a line multiple times. Additionally
it does not measure the velocity of red blood cells.
The MAS analysis system includes a stabilization image processing, a calculation of FVD and
blood flow investigation in individual vessels.
Unfortunately, these programs still require much user intervention, specifically in identifying
specific vessels of interest. In addition, the program does not allow for blood flow to be
calculated automatically and simultaneously in numerous vessels. Therefore blood flow
distribution histograms are difficult to obtain. It is especially difficult and challenging to obtain
blood flow in capillaries, which make up the main area of interest.
MAS was later optimized and given the name “Automated Vascular Analysis” (AVA). The
program supersedes it forerunners by its ability to reduce the time to determine vascular
parameters. A clear advantage is its semi-‐automatic quantitative vessel detection
(segmentation) program. After analysis a detailed report that includes the vessel length-‐
diameter distribution, an area diameter (density) distribution and microcirculatory blood-‐
velocity parameters is provided. The operator can correct falsely detected vessels by deleting
the marked artifacts or mark vessels that were not detected by the program. The objectivity of
evaluation, the accuracy of the results and the simplified analysis were reasons why AVA was
selected for this study.
The following microcirculatory parameters were analyzed in this study: Functional vessel
density (FVD), vessel length, vessel surface area and blood-‐velocity. The duration for image
analysis was approximately 40-‐60 min per video-‐sequence.
The analysis of further microcirculatory parameters did not seem reasonable. The
Microcirculatory Flow Indexes (MFI), which describes the quality of flow, was left out of
evaluation. Furthermore the retrospective assessment of flow quality turned out to be rather
difficult. The reason was that is seemed impossible to allot a certain etiology to the changes of
flow at that point of time. Apart from an impaired microcirculation, pressure artifacts can also
be the reason for an altered flow. The perfused vessel density (PVD) was also left out of analysis,
since nearly all obtained values were consistent with the functional vessel density (FVD), -‐
indicating a good perfusion throughout.
Offline-‐analysis is a time-‐consuming process and still requires lots of user interaction and know-‐
how. Therefore Bezemer et al have started a recent new development for the assessment of
54
microvascular density and perfusion in sidestream-‐darkfield (SDF) images, aiming at a fully
automatic and rapid analysis. They were able to improve the algorithms of microvascular
density assessment previously developed by the same group (AVA) and introduced this new
method, which they called tSICA. Although some limitations remain, this method can possibly
be used in future to directly analyze microvascular parameters and perfusion at bedside. 105
4.3. Microcirculatory changes
4.3.1. Does RBC-‐Tx improve the microcirculation of anemic
children?
The effects of blood transfusions on the microcirculation and tissue oxygenation have not yet
clearly been defined. To date, only a few clinical studies have evaluated the effect RBC Tx has
on the peripheral microcirculation. To our knowledge, no studies have yet assessed the
microcirculatory changes after RBC transfusion in anemic children outside of the neonatal
period. Yuruk et al. tested the hypothesis that RBC transfusion can improve FVD, perfusion and
oxygenation in a relatively healthy host microcirculation. They were able to show that blood
transfusions improve the sublingual microcirculatory density and microcirculatory oxygen
saturation in cardiac surgery patients and thus have significant impact on the systemic
circulation and oxygen-‐carrying capacity 64. Similarly we have previously reported that FVD
increases in anemic preterm infants after transfusion 65.
Sakr et al. used OPS imaging to assess the effect of transfusion sublingually in septic patients.
Contrary to the previously mentioned results, they found no universal changes in FVD and
perfusion after transfusion. Parallel to these findings, a recent study also reports no
improvement in the microcirculation after transfusion in septic patients. Sadaka et al
conducted a similar study in a small sample septic sample population. In their study,
microvascular reactivity and sublingual microcirculaton were globally unaltered by RBC
transfusion.106 Similarly, Creteur et al. found no consistent effect of RBC transfusion on
microcirculatory oxygenation, as assessed with near-‐infrared spectroscopy (brief description of
NIRS device in appendix-‐section) in septic and nonseptic intensive care patients. 63 Altogether
55
these three studies showed no global effect of RBC transfusion on the microcirculatory
variables. One reason for the varying results might be that the population in these clinical
studies consisted of patients with sepsis, or critically ill patients hospitalized in the intensive
care unit. It is therefore hard to distinguish between the results from RBC transfusion at the
microcirculatory level and the effects of sepsis itself. More detailed data of these studies and
possible explanations will be given in the next chapter.
When comparing the results to previous microcirculatory studies (performed in adults), it has
to be taken into account that children cannot be regarded as small adults and published data
can only carefully be extrapolated to children. The approach to critically ill children should be
made in a way that factors, which distinguish children’s physiology from adults, are taken into
account (such as different body proportions, a higher metabolic rate and lacking compensatory
reserves for respiratory or circulatory distress). 107
4.3.1.1. Functional vessel density (FVD)
One of the aims of this study was to determine whether RBC transfusions in anemic children
result in an improved microvascular perfusion, as indicated by a higher functional vessel density
(FVD). (As stated above, FVD is defined as the number of vessels with passage of RBC within a
microscopically observed tissue area) Functional vessel density is well validated and at this
moment seems to be one of the best quantitative indicators of microvascular perfusion. Kerger
at al. showed that a sufficient functional capillary density is the determining factor for survival
or non-‐survival in patients with hemorrhagic shock.108 Nolte et al. previously proved that the
functional vessel density could be used as an indicator for sufficient tissue oxygenation.
Furthermore they indicated independence of the parameter for various observers.104
Blood transfusion resulted in significant increase in FVD values immediately after transfusion in
the anemic study group. However, FVD decreased 48-‐72 hours after transfusion and did not
differ significantly from FVD values before transfusion. At all times the FVD values of the
anemic group were significantly lower than the FVD values of the healthy control group. Our

56
results thereby show a transfusion related tendency towards improved microcirculatory density
and oxygenation. The increased capillary density means that intercapillary diffusion distance is
minimized and thereby tissue oxygenation is facilitated and ameliorated. It is important to note
however, that there was great interindividual variability among the patients. Some had lower
FVD values at baseline than others; some showed improvement after transfusion whereas
others did not. A possible reason for this phenomenon, such as the presence of infection in
some anemic patients, will be discussed later.
In this study, as stated before, the anemic patient group was quite heterogeneous regarding
their underlying disease. The number of cases studied was restricted by the availability of
suitable patients that received blood transfusions in the study time period. In order to obtain
an adequate number of study patients, it was not reasonable to make selections based on the
same underlying cause for anemia, as that would have led to a small study population.
Especially within the oncologic group we encountered different disease entities (as outlined in
9.2.“Clinical data”). Some patients underwent chemotherapy during the same timeframe,
whereas others were currently not receiving any other therapy apart from blood transfusions.
To what extent concomitant therapy plays a role and could account for the interindividual
variability in microcirculatory observations was not possible to evaluate in this study. Another
factor that needs to be considered is that 2 patients were measured in the very beginning,
when the diagnosis of acute lymphatic leukemia was set. At this point of time they presented
with high leukocyte counts, which could have affected the microcirculatory findings. In these
samples leukocytes could be visualized with SDF, rolling along the venular wall, as described in
a SDF imaging report. 88 This higher density of filling can affect the microcirculation, and show a
static image in some vessels, as we observed in these patients.
One of the reasons for low FVD values in anemia is simply a reduced presence of RBCs at the
microcirculatory level. Because a “functional capillary” has at least one RBC flowing through it
in a period of 30 sec, at very low hematocrits the number of functional capillaries will be lower,
since too few RBCs are travelling through the small vessels. It has to be noted however, that the
parameter FVD does not measure the absolute perfusion of a capillary, since a capillary may
still be perfused with plasma, even without the presence of RBCs.

57
Apart from the pressure gradient, mainly the blood viscosity is responsible for the blood flow in
the microcirculatory region. 109 The viscosity mostly depends on the amount of solid particles
(hematocrit) and to a certain extent also on the amount of protein in the plasma. The
significant subjective improvement that is normally seen in anemia after a blood transfusion
may be partially caused by an increase in blood viscosity. Higher blood viscosity is responsible
for the production of shear stress-‐mediated endothelial factors. The augmented shear stress on
the endothelial further causes vasodilation of the arterioles and a distension of the capillaries
though the pressurized viscous plasma. 110
Saldivar et al. showed in their animal model that FVD was directly related to Hct and the oxygen
concentration of the inspired air.111 At the same oxygen level, the group with the highest Hct
had significantly greater FVD values. They furthermore highlighted the fact that higher oxygen
levels in the inspired air lead to an increased capillary density, mainly through a recruitment of
non-‐perfused capillaries. These findings would indicate that increased FVD values after
transfusion correlate with the improvement of Hct.
4.3.2. Does infection influence the microcirculation?
In human studies, the microcirculation has most broadly been investigated in septic patients.
The clinical condition of sepsis represents pathologic processes, which essentially reflect
dysfunction of the microcirculation. In sepsis, the microcirculatory endothelial cells loose their
ability to communicate through electrophysiological stimulation and loose smooth muscle
control, thereby giving up their function as a critical control system. 112 The nitric oxide (NO)
system, a critical component in the auto-‐regulatory control of microcirculatory function, as
described earlier in the introduction, is severely altered in sepsis. The disturbance of NO
production and release consequently results in pathological shunting of blood flow. Also red
blood cells become less deformable, aggregate more easily and experience an increased
adhesion to the endothelium. As stated previously, RBCs release NO in the presence of hypoxia
and cause vasodilation. This regulatory property of red blood cells may also be affected and
altered in sepsis. 113,114 24
58
These severe deficiencies, in combination with the disturbed coagulation during sepsis, further
influence and alter microcirculatory perfusion and function.
The multiple studies performed in septic patients have revealed highly heterogeneous
microcirculatory changes with clear evidence of arteriolar-‐venular shunting. 20,115,116
Few studies have been undertaken on children. In one of the few SDF-‐imaging studies
performed in children, Top and al. studied the microcirculation of 21 septic children in pediatric
intensive care. They discovered, that FVD increased significantly from day 1 to day 2 in
survivors of septic shock compared to nonsurvivors. Even though all patients normalized their
systemic hemodynamic parameters, in the nonsurvivors microcirculatory alterations persisted.
This was seen as low recruitment of the microcirculation, as indicated by a low capillary density.
Thus they concluded that persistent microcirculatory alterations might be prognostic for
survival in such a patient population. 56
An important finding in our study is that anemic patients with infections show significantly
better improvement in capillary perfusion after blood transfusion, compared to anemic
patients without concomitant infections. Various studies conducted in critically ill and septic
patients have shown no global improvement of microcirculation after transfusion.63,106,117
However, they revealed that the direct effects of blood transfusions are quite variable and
depend greatly on the baseline microvascular perfusion. Sakr et al. studied the sublingual
microcirculation in 35 severely septic patients using OPS imaging. The measurements were
performed right before transfusion and one hour after transfusion of one or two leukoreduced
RBC units, with a mean age of 24 days. The principal finding of their study was that patients
with an altered perfusion at baseline showed a greater improvement in microvascular
perfusion after transfusion than patients with preserved baseline perfusion.61 Other studies
have shown similar results. Sadaka and colleagues performed a prospective, observational
study in 21 severe septic patients, where they obtained NIRS derived (near-‐infrared
spectrometry, see appendix) and SDF derived parameters before and 1 hour after transfusion
of 1 unit of packed nonleukoreduced RBCs. They found that red blood cell transfusion did not
globally affect NIRS-‐variables or SDF-‐variables. However, they found that RBC transfusion can
improve muscle oxygen consumption in patients with deterioration of these parameters at
baseline, whereas the oxygen consumption in patients with preserved baseline tended to
decrease.106 Weinberg et al. found that patients with an altered proportion of perfused
59
capillaries in the beginning showed an improvement in perfusion after tranfusion, whereas
patients with relatively normal perfusion at baseline showed either no change, or even a
decline of perfused capillaries. 62
These statements support our findings. The patients with infections who experienced the
greatest improvement of their microcirculation after transfusion were characterized by a
significant difference in the baseline capillary perfusion. One critical factor may be the
replacement of dysfunctional, rigidified RBCs by cells with a more normal deformability, as
suggested by Friedlander et al., who showed that RBC transfusion is associated with a
significant improvement in the abnormally low RBC deformability as seen in critically ill patients
with systemic inflammatory response syndrome 118. Elevated concentrations of inflammatory
cytokines, as found in patients with inflammation or sepsis, can directly inhibit red cell
formation and influence oxygen transport.119 Reggiori and coworkers confirmed these finding
by stating that early alterations of red blood cell rheology are common in patients with critical
illness.120 Other studies support these conclusions. As described more in detail in the
introduction, RBC themselves can act as oxygen sensors. In a state of hypoxia RBC are able to
release vasodilators, nitric oxide and ATP and thereby modulate tissue oxygen flow variables.
As stated above, serious infection can cause a lack of RBC deformability and thereby limit the
release of vasodilators and cause an alteration of microvascular density.38,41
In summary, the low vessel density of anemic patients with concomitant infection prior to
transfusion (preTx) might be related to the impaired microcirculation (due to the above
mentioned mechanisms), compared to the other anemic subpopulation with a relatively
healthy microcirculation. Through the replacement of dysfunctional RBC in the microcirculatory
network in patients with infection, flow through the capillaries can acutely improve and thus
lead to an instant increase of vascular density.
Nine patients in our anemic study group presented with concomitant infections, characterized
by elevated CRP levels (< 3 g/L), elevated mean temperature and any of the following: myalgia,
pain, sore throat, night sweats, chills, headache and other symptoms of apparent infection.
Clinical experience and expertise was used to evaluate the patients’ condition in combination
with the objective clinical signs for infection. If the child fulfilled the criteria for infection, it was

60
thus allocated to the study population (Inf). No child fulfilled the criteria for severe sepsis.
When defining sepsis in pediatrics, physiological variables of the different developmental
stages should be incorporated: newborn, neonate, infant, child and adolescent. 16 The age of
our study patients varied markedly; therefore it was difficult to establish an objective, similar
threshold from when on to speak of infection and especially to asses the severity of it and the
possible impact on the microcirculation. However, the apparent clinical deterioration of the
patient’s status where infection was present made a subdivision of the anemic patients clear.
Although most microcirculatory studies were performed in septic patients, impaired
microcirculatory parameters have also been shown in adult patients who developed
nosocomial (hospital-‐acquired) infections after abdominal surgery. 121
Another crucial factor has to be noted when interpreting the microcirculatory results of our
study subpopulations: On the one hand anemic patients with concomitant infections had
significantly lower hemoglobin values at outset compared to the anemic group without
infections. As discussed further on, the low capillary density values (of the Inf-‐group) at
baseline may simply be explained through the positive correlation with the low hemoglobin and
hematocrit values at outset. Another important factor regarding the compensatory
mechanisms in chronic anemia has to be taken into account. The anemic patient population
without infections (nInf-‐group) consisted mostly of patients with chronic anemia due to
hemoglobinopathies, whereas the patients with infections mostly consisted of oncologic
patients with more acute onset of anemia. The patients with chronic hematologic illness
received blood transfusions regularly (once a month) to compensate for their low hemoglobin
values. The transfusion threshold was relatively high for these patients (approximately 10
mg/dL). In this respect, it has been shown that chronic anemia promotes compensatory
mechanisms. One mechanism worth noticing is the increased levels of 2,3-‐diphosphoglycerate
acid as seen in chronic anemia, which leas to increased release of oxygen. 122
Also through this study it is not possible to say to what extent additional therapies, such as
chemotherapy, could possibly affect the microcirculation.
61
4.3.3. Does the Hb correlate with the FVD?
One of the most important findings in our study is a statistically high correlation between
hemoglobin levels and functional vessel density (FVD). Hemoglobin (Hb) levels from severely
anemic children were obtained before transfusion, as well as levels from healthy individuals
with normal Hb-‐values and then compared to the corresponding FVD values. Kroth et al
performed OPS measurements in 25 preterm neonates from week 1 to week 4. They found a
decrease of FVD, which correlated directly with hemoglobin levels and incubator temperature.59 Previous studies have not been able to show this correlation. 65 Top et al. investigated the
microcirculatory development in healthy neonates up to children at the age of 3 year olds and
could not find a correlation between FVD and Hb levels.123 However, a clear advantage in our
study is the great range of hemoglobin values obtained, with 4,4 g/dL being the lowest value
and 15,0 g/dL the highest. Consequently a correlation is more likely to be detected. Other
studies support our findings. Saldivar et al. found that in an animal model, FVD was directly
related to Hct and the oxygen concentration in the inspired air.111 As mentioned previously, SDF
imaging uses hemoglobin absorption to visualize the red blood cells. Thus, the method could
fail at low hematocrits. Harris et al. tested this hypothesis by obtaining microcirculatory
parameters of nine awake Syrian golden hamsters during isovolemic hemodilution and low
hematocrits. They concluded that OPS imaging (the forerunner model of SDF-‐imaging) is well
validated to measure both diameter and FVD at a wide range of hematocrits. 124 Another study
confirms these findings by stating that although the technique is based on light absorption by
hemoglobin, it remains valid in anemia, as well as during acute changes in hemoglobin
concentration. 125
62
4.3.4. Do the mircrocircualtory changes correlate with the
age of RBCs?
The microcirculatory results in our study show great interindividual variations with no
consistent observable results. One reason for improvement in some patients and
microcirculatory deteroriation in other patients could be the effect of RBC storage. Various
laboratory studies and an increasing number of observational studies have shown that
biochemical changes in RBCs occur during storage (as described in the introduction section,
1.3.6.1.) These changes affect the RBC survival and their ability to deliver oxygen. These
changes happen mainly through an increased affinity of hemoglobin for oxygen, which
subsequently impairs offloading of oxygen and thus tissue perfusion.126,127 Other studies
postulate that RBC deformability changes during storage; leading to an increased vascular
adhesion.128 These deformed transfused RBCs can then cause microcirculatory occlusion in
some organs, which may lead to tissue ischemia.129 RBC-‐dependant vasoregulation, which is
important for regional O2 delivery, can be compromised by giving processed and stored
RBCs.128 A major problem caused by storage lesions is the increased hemolysis, which inhibits
NO dependent vasodilation. 74–76 Various other studies have tried to describe the interactions
between RBCs and free hemoglobin with nitric oxide pathways in normal and pathological
settings. Ultimately, vasodilation of blood vessels and microcirculatory flow is altered through
compromised NO bioavailability from medical storage or disease states. In a recent study
Stapley et al. tested the hypothesis that old, stored RBCs inhibit the nitric oxide (NO)-‐signaling
more so than younger cells. They found that NO-‐consumption rates increased ~40-‐fold and NO-‐
dependent vasodilation was inhibited 2-‐4 fold with 42-‐day old vs. 0-‐day old RBCs. 130 Gonzales
et al observed the intravital microcirculatory dynamics of rat muscle flaps after blood
transfusion. They discovered that functional capillary density was greater in the group that
received fresh blood, compared to the ones receiving 1-‐ and 2-‐week banked blood. 131
It has been suggested that these storage lesions may adversely affect clinical outcomes and
exacerbate transfusion associated morbidity and mortality. 132,133 Gauvin et al discovered that
stable critically ill children who were given RBC units older than 2 to 3 weeks were more likely
to develop new or progressive multiple organ dysfunction. 134 In another recent study on a

63
cohort of cardiovascular patients, Koch and colleagues suggest that transfusion of RBCs that
had been stored for more than 14 days may be associated with a significantly higher risk of
postoperative complications as well as a reduced short term and longterm survival. In addition
they stated that increased infectious complications in cancer patients might be the result of
longer storage times of RBC transfusions. 135
Other studies, however, have not demonstrated an association between RBC length of storage
and outcome. 128,136
In this study the mean age of RBC transfusion was 13,25 days. Nine patients received RBC with
an age of 12 days or lower. Eleven patients received blood transfusions with an age of 13 days
or more. Even though the correlation between RBC age and the microvascular perfusion (as
indicated by the functional vessel density) was not significant, the graph (Fig. 28) indicates that
the administration of fresher RBC (<12 days of age) resulted in a greater improvement of
microcirculatory variables, as indicated by a higher ΔFVD. We therefore conclude that a
tendency towards a RBC-‐age related improvement of microcirculation could be assumed in this
study.
However, too many limitations remain in this study for a valid conclusion to be drawn regarding
blood age and potential risks. The patient group was small and very heterogeneous, both in
diagnosis, age and therapy. Some patients received RBC transfusions due to
hemoglobinopathies, such as sickle cell disease or thalassemia. These underlying diseases may
also lead to abnormal red blood cell (RBC) adhesion to the vascular endothelium and alter
vasomotor tone regulation and microcirculatory flow. In these conditions, blood flow is
especially dependant on a functioning NO pathway. 137 It can be assumed therefore, that
additional transfusion of impaired RBC (potentially causing hemolysis and NO scavenging, as
stated earlier) may only exacerbate microcirculatory dysfunction. Another main area of concern
is that the study was not primarily conducted to find and evaluate blood age related risks. Only
retrospectively were blood age and microcirculatory parameters correlated, and age
distribution and underlying sickness was not taken into account.
More randomized, prospective studies are needed to determine the existence of adverse
effects from transfusing older, stored RBC. However, various challenges in conducting definitive

64
clinical trials in this area remain. One problem might be the lack of exposure to “old blood”,
since current policies stipulate a distribution of “ younger blood”. A randomization of patients
to fresh RBC (3-‐11 days) is viable, however trial strategies should be designed in way that “old”
blood is used as a comparator. 138
In summary it can be stated that transfusion of stored red cells could be harmful under some
circumstances. Further adequately powered, randomized controlled trials are needed to
answer the question whether storage age is clinically important.
Various trials are currently being conducted to determine the validity of choosing fresher blood
in some patients, as well as the mechanisms for the potential adverse effects. 139,140 If it is
possible to clearly demonstrate improved outcomes with delivering fresher blood, current
inventory management strategies may need to be revisited.

65
4.4. Outlook
The data we have provided in this study in combination with similar observations from other
studies, suggest the clinical potential for SDF-‐imaging at the bedside. It’s ability to detect subtle
perfusion defects and thereby asses the effects of therapies (such as RBC transfusion) make it a
valuable instrument.
At this time, however, analysis of the microcirculatory video sequences is relatively arduous
and time-‐consuming and not ideally suited for real-‐time clinical evaluation and decision making
at the bedside.141 Additionally, software-‐assisted analysis still requires input from a trained
operator. Although SDF microscopy might currently not be suited for clinical settings, it is,
however, anticipated that future developments in software-‐assisted image analysis will enable
clinicians to perform relatively rapid evaluation of the patient’s microcirculation at the bedside
and thus potentially be able to ameliorate subsequent therapies.
66
5. Conclusion
In conclusion we have shown that blood transfusions increase capillary density in anemic
children and thus decrease intercapillary diffusion distance. Consequently the capillary surface
area necessary for oxygen diffusion is enlarged and tissue oxygen availability increased. The
significant correlation of hemoglobin values with functional capillary density proves that high
viscosity seems to have a direct positive effect on peripheral perfusion. Moreover, our
observations suggest that anemic children with infections seem to profit most from red blood
cell transfusion and might benefit from earlier transfusion thresholds. We found a tendency
towards better tissue perfusion with red blood cells stored less than two weeks.
The clinical relevance of our observations regarding the microcirculation and its response to
transfusion remains unknown. However, our results highlight the potential for sublingual
microscopy to improve clinical decision-‐making and acknowledge the fact that, given further
upgrades in technology, SDF-‐imaging technique could become a useful tool for assessment of
perfusion and it’s response to therapy.
Further studies should investigate whether monitoring the sublingual or buccal microcirculation
may be useful to adapt transfusion policy and establish standardized guidelines in the
treatment of children with severe anemia.
67
6. Summary
Anemia is classically defined as a deficiency of red blood cells (RBC) or hemoglobin leading to a
reduction in the oxygen-‐carrying capacity of blood. Consequently the purpose of RBC
transfusion is to increase the amount of RBCs in the capillaries and to thus increase oxygen
delivery to parenchymal cells. However, transfusion thresholds remain controversial due to the
significant risks and limited scientific data. Since blindly transfusing to an arbitrarily set
hemoglobin threshold may be harmful, better means of identifying the need for transfusion are
needed. One way that might be helpful in ameliorating transfusion therapy is looking at its
effect on the microcirculation. The microcirculation plays a crucial role in the interaction
between blood and tissue, both in physiological and pathophysiological states. It is the
microcirculatory network that regulates tissue blood flow and is responsible for vital tissue
oxygenation. Analysis of microcirculatory alterations can therefore provide unique perspectives
of disease processes at a microscopic level and help to assess therapeutic strategies aimed to
improve blood flow through the capillary system.
Our goal was to assess the effect of blood transfusion on the microcirculation and to thus
provide valuable information on the quality of tissue perfusion. Only a few studies have
investigated the effects of blood transfusion on the microcirculation. We used Sidestream-‐
Darkfield Imaging to directly visualize the sublingual microcirculation in 20 anemic (Mean Hb:
7.2 g/dL, 95% CI 6.6-‐7.9) children who received red blood cell transfusion. Offline quantitative
data of microvascular perfusion was obtained and compared to data of a healthy control group.
We found a significant increase in functional vessel density (FVD) immediately after the
transfusion with a decrease after 48-‐72 hours, however with interindividual variation. Capillary
perfusion at baseline was lower in anemic patients with concomitant infections but with a
larger increase after transfusion compared to anemic children without infections (ΔFVD 3,4
mm/mm2, vs Δ FVD 1,3 mm/mm2). Hemoglobin levels and capillary density correlated directly.
Whereas conventional monitoring methods may not be able to assess the effect of therapies
aimed to improve tissue perfusion, SDF imaging can be helpful to evaluate current guidelines
and adapt transfusion policy.
68
24. Figure; Image of the sublingual microcirculation of an anemic child before and after red blood
cell transfusion, as assessed by the side-‐stream dark field (SDF) imaging technique. AVA Software
was used for image analysis. Automatic vessel segmentation and quantitative velocity assessment
was performed and presented in a microcirculatory report. Vessels not detected by the program
were manually drawn and analyzed. Emphasis was placed on measurement of functional vessel
density (FVD). FVD is defined as the length of RBC perfused vessels per observation area and
given as mm/mm2.
69
7. Summary in German/ Deutsche Übersetzung
Die Definition einer Anämie ist ein Mangel an roten Blutzellen, der zu einer Reduktion der
Sauerstoff-‐ Transportkapazität des Blutes führt. Der Zweck einer Bluttransfusion besteht darin,
die Menge an roten Blutzellen in den Kapillaren zu erhöhen, um eine verbesserte
Sauerstoffversorgung an Gewebszellen zu gewährleisten. Aufgrund der erheblichen Risiken und
begrenzten wissenschaftlichen Daten sind Transfusionskriterien umstritten, besonders in der
Pädiatrie. Da das Unterschreiten eines gewissen Hämoglobin Schwellenwertes als Kriterium für
das Verabreichen einer Bluttransfusion nicht ausreicht und in manchen Fällen sogar schädlich
sein kann, benötigt man ein besseres Mittel zur Identifizierung von Indikationen für eine
Transfusion von Erythrozyten Konzentraten.
Indem man den Effekt von Bluttransfusionen auf die Mikrozirkulation untersucht, könnte man
maßgeblich zur Verbesserung von Transfusionskriterien beitragen. Die Mikrozirkulation
reguliert den Blutfluss im Gewebe und ist damit verantwortlich für die lebenswichtige
Sauerstoffversorgung von Gewebszellen. Die Analyse mikrozirkulatorischer Veränderungen
ermöglicht uns wichtige Einblicke in pathophysiologische Vorgänge auf mikroskopischer Ebene
und kann somit neue therapeutische Strategien zur Verbesserung des kapillären Blutflusses
eröffnen.
Unser Ziel war es, durch die Untersuchung der Wirkung von Bluttransfusionen auf die
Mikrozirkulation, wertvolle Informationen über die Qualität der Gewebs-‐Durchblutung zu
gewinnen. Bisher haben nur wenige Studien die Wirkung von Bluttransfusionen auf die
Mikrozirkulation untersucht. Wir verwendeten Sidestream-‐Darkfield Imaging zur direkten
Visualisierung der sublinguale Mikrozirkulation von 20 anämischen Kindern (Durchschnittswert
Hemoglobin: 7,2 g / dL, 95% CI 6,6-‐7,9), die Bluttransfusionen erhielten. Die offline-‐
quantitativen Daten der mikrovaskulären Durchblutung wurden mit Daten einer gesunden
Kontrollgruppe verglichen. Wir fanden einen signifikanten Anstieg der funktionellen
Gefäßdichte (FVD) unmittelbar nach der Transfusion und eine signifikante Abnahme der FVD
48-‐72 Stunden nach Transfusion, mit interindividuellen Unterschieden. Die FVD anämischer
Patienten mit begleitenden Infektionen war vor Transfusion bedeutend niedriger als die von

70
anämischen Patienten ohne Infektion. Allerdings beobachteten wir in dieser Gruppe nach
Transfusion einen größeren Anstieg der FVD als bei anämischen Kindern ohne Infektionen (3,4
ΔFVD mm/mm2, vs Δ FVD 1,3 mm/mm2). Hämoglobinwerte und FVD korrelierten direkt.
Da die Wirkung von Therapien zur Förderung der Gewebsdurchblutung bisher nicht
ausreichend monitoriert werden konnten, stellt die SDF Bildgebung ein hilfreiches Tool dar, das
zur Evaluierung und Optimierung von aktuellen Transfusions-‐Richtlinien beitragen kann.
71
8. Abstract
Background:
Pediatric hematology patients frequently receive red blood all transfusions for severe anemia.
Our goal was to assess the effect of blood transfusion on the microcirculation and thus provide
information on the quality of tissue perfusion.
Methods and patients:
The sublingual microcirculation was visualized with Sidestream-‐Darkfield Imaging in 20 anemic
(Hb: 7.2 g/dL, 95% CI 6.6-‐7.9) children receiving red blood cell transfusions and in age matched
healthy non-‐anemic controls. Functional vessel density (FVD) was determined with a
semiautomatic program.
Results:
Immediately after transfusion FVD increased (13.4 versus 15 mm/mm2) and RBC velocity (696
(598-‐792) versus 628 (549-‐707) μm/s) decreased but FVD was always significantly lower and
RBC velocity was always higher than in the age matched control group (FVD 17 mm/mm2;RBC
velocity: 486 (441-‐530) μm/s). FVD at baseline was lower in patients with infections but with a
larger increase after transfusion compared to anemic children without infections (∆FVD 3.4
versus ∆FVD 1.3 mm/mm2). Hemoglobin levels and capillary density correlated well. We did see
a larger rise in FVD with transfusion of RBCs aged < 12 days.
Conclusion:
Whereas conventional monitoring methods may not be able to assess the effect of therapies
aimed to improve tissue perfusion, SDF imaging can demonstrate improvements after
transfusion but also continuous differences to non-‐anemic controls. In particular, the
microcirculation of anemic oncology patients with infection improves after transfusion.
Transfusion thresholds might need to be set higher in in such patients and fresh RBCs < 12 day
of storage should be used.

72
9. Appendix
9.1. List of Abbreviations
RBC-‐Tx red-‐blood-‐cell transfusion
SDF sidestream dark field
FVD functional vessel density
Tx-‐G transfusion group
CG control group
Inf-‐G anemic group with infections
nInf-‐G anemic group without infections
preTx before transfusion
pTx1 after transfusion
pTx2 48-‐72 hours after transfusion
73
9.2. Clinical Data
Patients Diagnosis Gender Age Weight
01 Leukemia (AML, CNS +) * m 5 17,8
02 Leukemia (Prä B-‐ALL) m 7 30,7
03 Ewing Sarcoma f 12 37,4
04 Leukemia (AML) m 5 16,6
05 Leukemia (ALL)
Leukemia (ALL)*
f
f
11
11
39,2
39,206
07 Congenitale anemia f 4 16
08 β-‐ Thalassemia m 8 38
09 Leukemia (ALL Relapse) m 13 53
10 β-‐Thallasemia m 8 65
11 Ewing Sarcoma m 7 79
12 Leukemia (ALL Relapse) f 17 50
13 Leukemia (ALL Relapse) m 12 51
14 Osteosarcoma m 17 64
15 Leukemia (AML Relapse) m 12 47
16 β-‐Thallassemia f 9 25
17 Hemolytic anemia m 15 50
18 homozygote sicklecell anemia m 18 45
19 β-‐Thallasemia f 8 21
20 Leukemia (Prä B-‐ALL) m 15 48
9. Table, Diagnosis, gender, age and weight of each anemic child
*Newly diagnosed (within 48 hours prior to study participation)


75
9.3. Vessel length and vessel surface area
preTx (n19) pTx1 (n19) pTx2 (n11) CG (n18)
Vessel length 11.3 (10.7-‐11.8) 12.5 (11.7-‐13.4) 12.1 (10.8-‐3.5) 13.2 (12.66-‐13.81)
Vessel surface area 20.9 (18.9-‐22.9) 26.7 (24.4-‐29.0) 22.9 (20.3-‐25.5) 25.8 (24.5-‐27.2)
11. Table, Mean and 95% CI of vessel length and vessel surface area
Vessel length is obtained using a drawing tool that allows manual tracing of vessels. As
described earlier in the method section, in SDF imaging vessels can only be observed under the
presence of RBCs. It is the hemoglobin in blood cells that absorbs the transmitted light from the
SDF probe and thereby contrasts the vessels from the background. The vessel walls themselves
are actually invisible.
Increased vessel length does not, as the word might suggest, mean that the vessels increase in
length. It is the visibility of perfused vessels that increases; therefore the SDF device recognizes
more vessels.
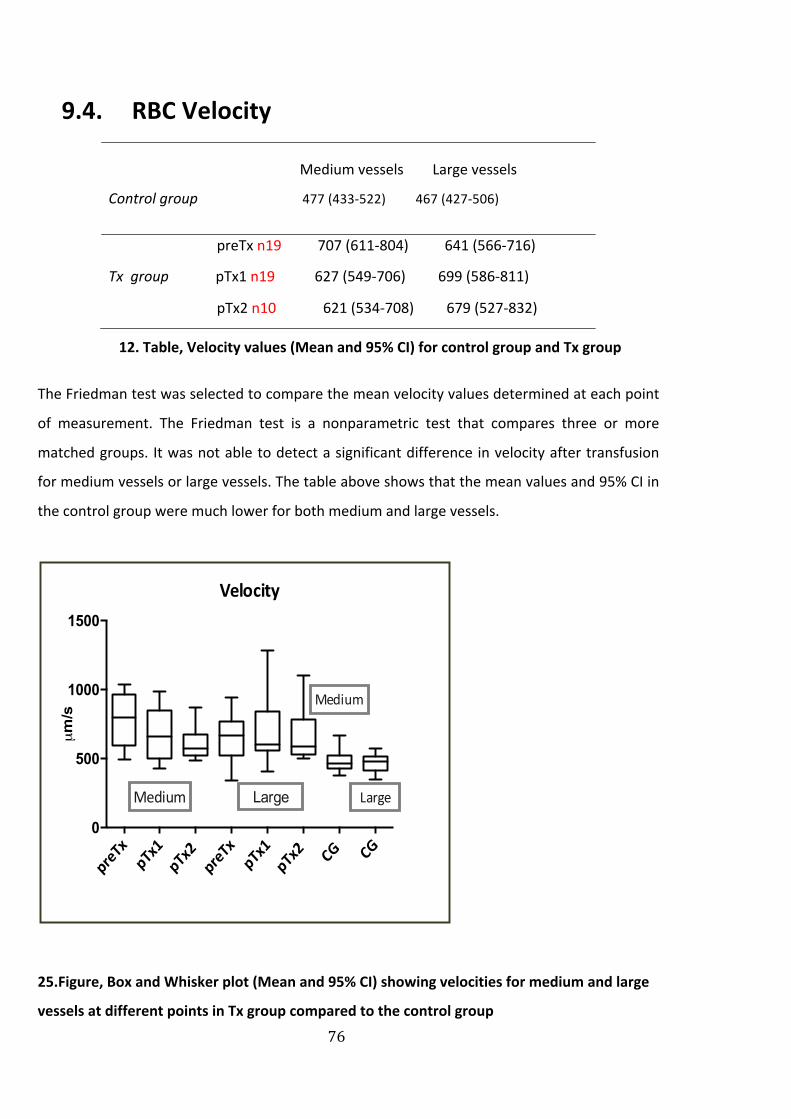
76
9.4. RBC Velocity
Medium vessels Large vessels
Control group 477 (433-‐522) 467 (427-‐506)
preTx n19 707 (611-‐804) 641 (566-‐716)
Tx group pTx1 n19 627 (549-‐706) 699 (586-‐811)
pTx2 n10 621 (534-‐708) 679 (527-‐832)
12. Table, Velocity values (Mean and 95% CI) for control group and Tx group
The Friedman test was selected to compare the mean velocity values determined at each point
of measurement. The Friedman test is a nonparametric test that compares three or more
matched groups. It was not able to detect a significant difference in velocity after transfusion
for medium vessels or large vessels. The table above shows that the mean values and 95% CI in
the control group were much lower for both medium and large vessels.
25.Figure, Box and Whisker plot (Mean and 95% CI) showing velocities for medium and large
vessels at different points in Tx group compared to the control group
preTx
pTx1
pTx2
preTx
pTx1
pTx2 CG CG
0
500
1000
1500
Velocity
µm/s
Medium
Medium
LargeLarge

77
9.4.1.1. Subgroup sample
For further analysis the whole Tx-‐Group was again divided into two groups (Inf and nInf), to see
if infections influence the microcirculatory velocity results. Statistical analysis with
nonparametric tools did not yield a significant difference between the Inf-‐ and nInf-‐Group.
non-‐infection (nInf) infection (Inf)
preTx 718 (556-‐880) n 11 694 (563-‐825) n 8
pTx1 632 (527-‐737) n 11 620 (459-‐780) n 8
pTx2 622 (496-‐748) n 3 603 (469-‐738) n 7
13. Table, Velocity values (um/s) for medium vessels (Mean and 95%CI)
non-‐infection (nInf) infection (Inf)
preTx 666 (530-‐801) n 11 652 (588-‐714) n 8
pTx1 622 (516-‐728) n 11 873 (495-‐1252) n 8
pTx2 594 (355-‐833) n 3 578 (483-‐673) n 7
14. Table, Velocity (um/s) for large vessels of subgroups (Mean and 95%CI)
9.4.1.1. How was velocity affected?
Vessels were classified according to their diameter into small (< 10 µm), medium (10-‐ 20 µm)
and large (> 20 µm). The AVA program is not able to analyze velocity values in small vessels, -‐
therefore only medium and large vessels are taken into consideration.
In this study it was not possible to draw substantial conclusions from the velocity assessments.
The clearest finding was that the anemic patients had greater velocity values than the control
group, even after RBC transfusion.
In a clinical study performed in pediatric sickle cell patients, the observers used intravital
microscopy to evaluate the real time effects of transfusion on the microcirculation. Transfusion
resulted in improved tissue perfusion, as indicated by augmented appearance of capillaries and
arterioles. They found a decrease in red cell velocity after transfusion. They further postulated
that the decrease in velocity might be due to the transfusion related rise in hematocrit and
78
blood viscosity. However, the decreased velocity might promote vasoocclusion in these
patients and thereby impair oxygen delivery.145 Yuruk et al. showed that perfusion velocity
remained unchanged in cardiac surgery patients who received blood transfusions, as analyzed
using microvascular flow index (MFI).64 They further documented the mechanisms by which
RBC transfusion improves oxygen transport to the tissue. Apparently the delivery of RBCs to the
tissue is not accomplished by increased flow velocities, but by filling “empty” capillaries and
thereby diminishing the oxygen diffusion distances among tissue cells. Nitric oxide scavenging
and altered RBC deformability might again play a major role in regulating flow velocities, as
further described by Horn et al. in an animal model. 146
Some authors reported that cells can regulate oxygen extraction even under conditions of
variable flow and thus the homogeneity of perfusion plays a greater role in assuring tissue
oxygenation than flow velocity does. 97
The patient group was too diverse and too small to lead to any applicable assertion in regards
to differing velocity tendencies among the patients. It is crucial to note that speed
determination of RBCs is uncertain.
One important drawback has to be considered when evaluating velocity scores. Excess pressure
applied to the microscope might easily collapse the microcirculation and therefore velocity
scores obtained from this area can become unreliable. Capillaries and venules are the most
collapsible and react sensitively to pressure. This can result in altered flow, especially in large
venules, which manifests itself as sluggish, absent, or alternate. Effort was made to avoid
pressure artifacts. However it was hard to distinguish altered or sluggish flow caused by
application error from flow alterations as a result of leukocytosis or hemoglobinopathies (e.g.
sickle cell anemia). Also movement of the subject or the hand-‐held imaging device can result in
unstable images that disturb vessel recognition and velocity measurements.
Another limitation is that venules and arterioles cannot be differentiated in SDF imaging. It is a
known physiological fact that different velocity values are present in arterioles and veins. The
observer tried to chose a vessel with fast visible blood flow; also multiple vessels were selected
in one image for velocity analysis and a mean value was obtained. It cannot, however, be
flawlessly stated which side of the capillary bed (arteriole or venule) was analyzed.
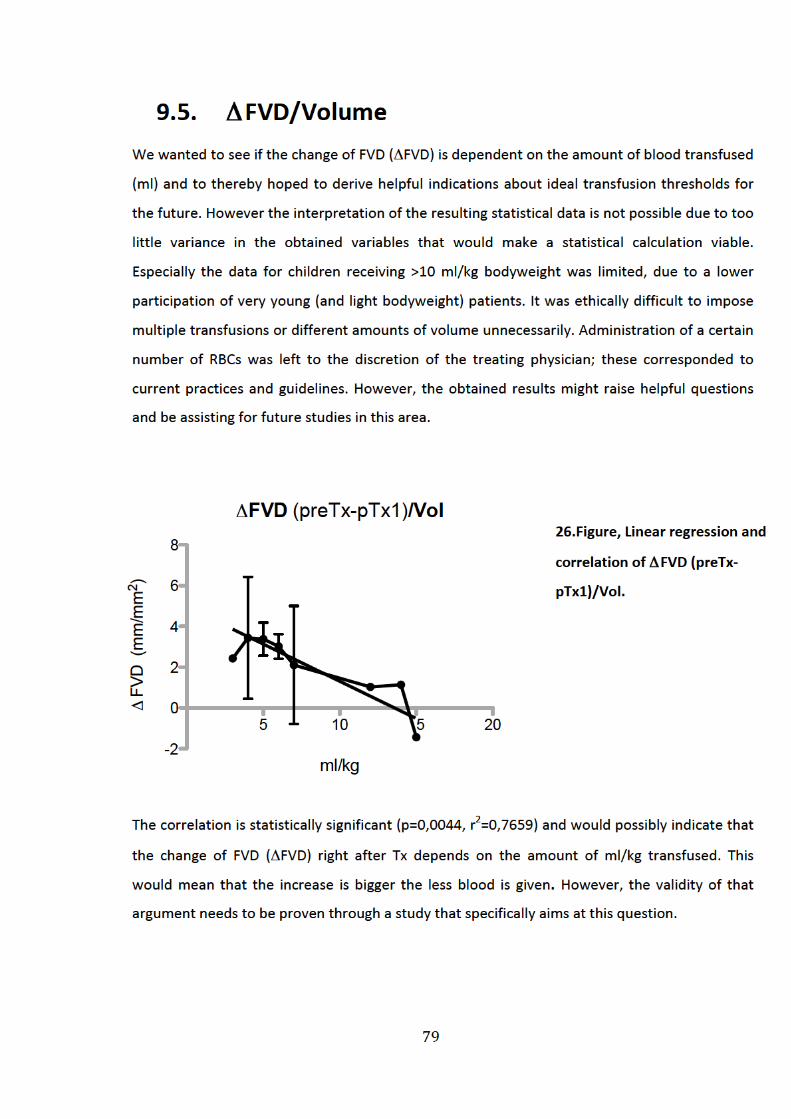
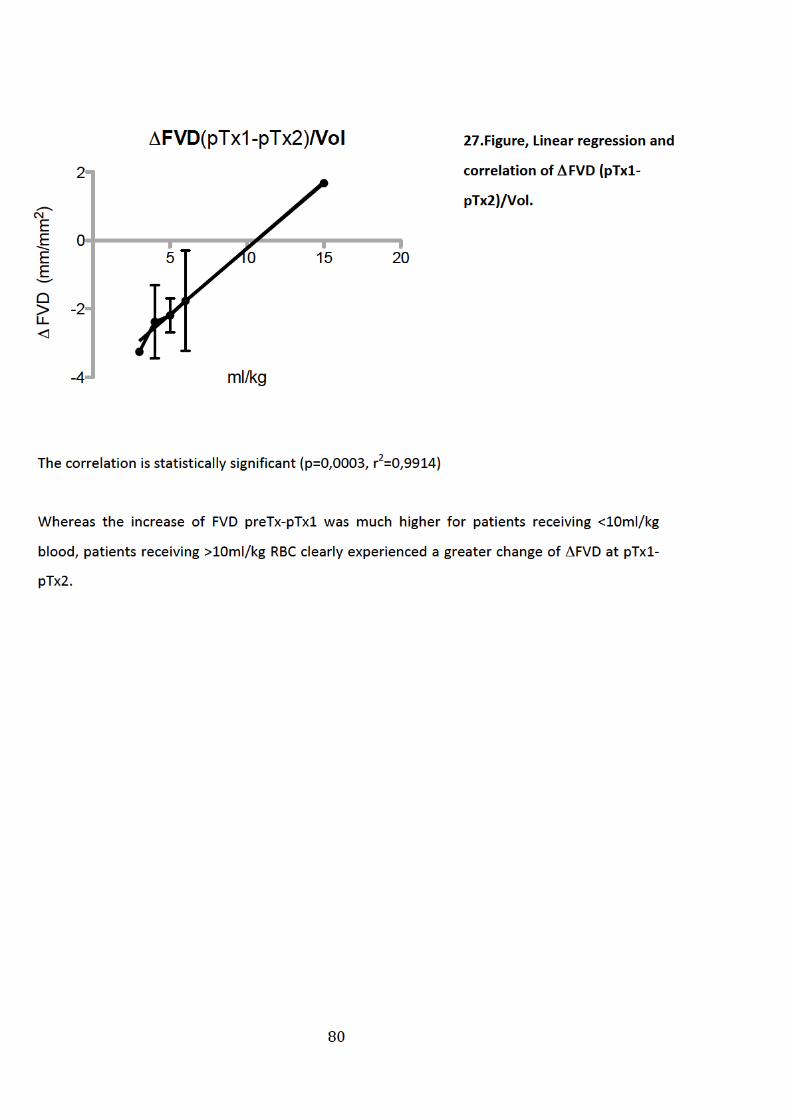

81
10. List of references
1. Greenburg, A. G. Pathophysiology of anemia. Am. J. Med. 101, 7S–11S (1996).
2. Wikipedia contributors. Anemia.Wikipedia, the free encyclopedia (2012). at
<http://en.wikipedia.org/w/index.php?title=Anemia&oldid=508660097>
3. Pizzo, P. A. & Poplack, D. G. Principles and Practice of Pediatric Oncology (Principles &
Practice of Pediatric Oncology. (Lippincott Williams & Wilkins, 2005).
4. Groopman, J. Chemotherapy-‐Induced Anemia in Adults: Incidence and Treatment.
Journal of the National Cancer Institute 91, 1616 (1999).
5. Michon, J. Incidence of anemia in pediatric cancer patients in Europe: results of a large,
international survey.Med Pediatr Oncol 39, 448–50 (2002).
6. MD, R. M. K., MD, R. E. B., MD, H. B. J. & MD, B. M. D. S. Nelson Textbook of Pediatrics e-‐
dition: Text with Continually Updated Online Reference (Nelson Textbook of Pediatrics.
(Saunders, 2007).
7. Uthman, M. D. E. Understanding Anemia. (University Press of Mississippi, 1998).
8. Blood: Physiology and Circulation. (Rosen Educational Publishing, 2010).
9. Sobrero, A. Fatigue: a main component of anemia symptomatology. Semin Oncol 28, 15–
8 (2001).
10. Hockenberry-‐Eaton, M. Fatigue in Children and Adolescents With Cancer: Evolution of a
Program of Study. Seminars in oncology nursing. 16, 261 (2000).
11. Gould, S., Cimino, M. J. & Gerber, D. R. Packed Red Blood Cell Transfusion in the
Intensive Care Unit: Limitations and Consequences. American Journal of Critical Care 16,
39 –48 (2007).
12. Roseff, S. D., Luban, N. L. C. & Manno, C. S. Guidelines for assessing appropriateness of
pediatric transfusion. Transfusion 42, 1398–1413 (2002).
13. Watine, J. Anemia as an independent prognostic factor for survival in patients with
cancer. Cancer 94, 2793–6; (2002).
14. Estrin, J. A retrospective review of blood transfusions in cancer patients with anemia.
Oncologist 4, 318–24 (1999).

82
15. Knight, K. Prevalence and outcomes of anemia in cancer: a systematic review of the
literature. The American journal of medicine. 116, 11 (2004).
16. Goldstein, B., Giroir, B. & Randolph, A. International pediatric sepsis consensus
conference: definitions for sepsis and organ dysfunction in pediatrics. Pediatr Crit Care
Med 6, 2–8 (2005).
17. Levy, M. M. et al. 2001 SCCM/ESICM/ACCP/ATS/SIS International Sepsis Definitions
Conference. Crit. Care Med. 31, 1250–1256 (2003).
18. Brilli, R. J. & Goldstein, B. Pediatric sepsis definitions: past, present, and future. Pediatr
Crit Care Med 6, S6–8 (2005).
19. Arnold, R. C. et al. Point-‐of-‐care assessment of microvascular blood flow in critically ill
patients. Intensive Care Med 35, 1761–1766 (2009).
20. Ince, C. The microcirculation is the motor of sepsis. Crit Care 9 Suppl 4, S13–19 (2005).
21. Verdant, C. & De Backer, D. How monitoring of the microcirculation may help us at the
bedside. Curr Opin Crit Care 11, 240–244 (2005).
22. Hall, J. E. Guyton and Hall Textbook of Medical Physiology. (Saunders, 2010).
23. Sobotta, J. & Welsch, U. Lehrbuch Histologie. (Urban & Fischer Bei Elsevier, 2003).
24. Ellis, C. G., Jagger, J. & Sharpe, M. The microcirculation as a functional system. Crit Care
9 Suppl 4, S3–8 (2005).
25. Pries, A. R., Secomb, T. W., Gaehtgens, P. & Gross, J. F. Blood flow in microvascular
networks. Experiments and simulation. Circ. Res 67, 826–834 (1990).
26. Krogh, A. The number and distribution of capillaries in muscles with calculations of the
oxygen pressure head necessary for supplying the tissue. J Physiol 52, 409–415 (1919).
27. Krogh, A. The supply of oxygen to the tissues and the regulation of the capillary
circulation. J. Physiol. (Lond.) 52, 457–474 (1919).
28. Secomb, T. W. Theoretical models for regulation of blood flow.Microcirculation 15,
765–775 (2008).
29. Hall, J. E. Guyton and Hall Textbook of Medical Physiology: with STUDENT CONSULT
Online Access. (Saunders, 2010).
30. Sobotta, J. Lehrbuch Histologie : Zytologie, Histologie, mikroskopische Anatomie mit 21
Tabellen [ mit dem plus im Web, Zugangscode im Buch, www.studentconsult.de].
(Elsevier Urban & Fischer, 2009).

83
31. Dietrich, H. Capillary as a communicating medium in the microvasculature.Microvasc
Res 43, 87–99 (1992).
32. Koller, A. Endothelial regulation of wall shear stress and blood flow in skeletal muscle
microcirculation. Am J Physiol 260, H862–8 (1991).
33. Segal, S. S. Regulation of blood flow in the microcirculation.Microcirculation 12, 33–45
(2005).
34. Michelakis, E. D. The role of the NO axis and its therapeutic implications in pulmonary
arterial hypertension. Heart Fail Rev 8, 5–21 (2003).
35. Hollenberg, S. M. & Cinel, I. Bench-‐to-‐bedside review: nitric oxide in critical illness-‐-‐
update 2008. Crit Care 13, 218 (2009).
36. Trzeciak, S. et al. Resuscitating the microcirculation in sepsis: the central role of nitric
oxide, emerging concepts for novel therapies, and challenges for clinical trials. Acad
Emerg Med 15, 399–413 (2008).
37. Bergfeld, G. Release of ATP from human erythrocytes in response to a brief period of
hypoxia and hypercapnia. Cardiovasc Res 26, 40–7 (1992).
38. Ellsworth, M. L. The red blood cell as an oxygen sensor: what is the evidence? Acta
Physiol. Scand. 168, 551–559 (2000).
39. Jagger, J. Role of erythrocyte in regulating local O2 delivery mediated by hemoglobin
oxygenation. Am J Physiol Heart Circ Physiol 280, H2833–9 (2001).
40. Jia, L. S-‐nitrosohaemoglobin: a dynamic activity of blood involved in vascular control.
Nature 380, 221–6 (1996).
41. Cosby, K. Nitrite reduction to nitric oxide by deoxyhemoglobin vasodilates the human
circulation. Nat Med 9, 1498–505 (2003).
42. Singel, D. Chemical Physiology of Blood Flow Regulation by Red Blood Cells: The Role of
Nitric Oxide and S-‐Nitrosohemoglobin. ANNUAL REVIEW OF PHYSIOLOGY 67, 99–146
(2005).
43. Bateman, R. Bench-‐to-‐bedside review: microvascular dysfunction in sepsis-‐-‐
hemodynamics, oxygen transport, and nitric oxide. Crit Care 7, 359–73 (2003).
44. Tibby, S. M., Hatherill, M., Marsh, M. J. & Murdoch, I. A. Clinicians’ abilities to estimate
cardiac index in ventilated children and infants. Arch. Dis. Child. 77, 516–518 (1997).
45. Egan, J. R. et al. Clinical assessment of cardiac performance in infants and children
following cardiac surgery. Intensive Care Med 31, 568–573 (2005).
84
46. Trzeciak, S. et al. Early microcirculatory perfusion derangements in patients with severe
sepsis and septic shock: relationship to hemodynamics, oxygen transport, and survival.
Ann Emerg Med 49, 88–98, 98.e1–2 (2007).
47. De Backer, D., Creteur, J., Dubois, M.-‐J., Sakr, Y. & Vincent, J.-‐L. Microvascular alterations
in patients with acute severe heart failure and cardiogenic shock. Am. Heart J 147, 91–
99 (2004).
48. Sakr, Y., Dubois, M.-‐J., De Backer, D., Creteur, J. & Vincent, J.-‐L. Persistent
microcirculatory alterations are associated with organ failure and death in patients with
septic shock. Crit. Care Med 32, 1825–1831 (2004).
49. Lehr, H. A., Bittinger, F. & Kirkpatrick, C. J. Microcirculatory dysfunction in sepsis: a
pathogenetic basis for therapy? J. Pathol 190, 373–386 (2000).
50. Boerma, E. C., Mathura, K. R., van der Voort, P. H. J., Spronk, P. E. & Ince, C. Quantifying
bedside-‐derived imaging of microcirculatory abnormalities in septic patients: a
prospective validation study. Crit Care 9, R601–606 (2005).
51. Lam, C. Microvascular perfusion is impaired in a rat model of normotensive sepsis. J Clin
Invest 94, 2077–83 (1994).
52. Cabrales, P., Vázquez, B. Y. S., Tsai, A. G. & Intaglietta, M. Microvascular and capillary
perfusion following glycocalyx degradation. J. Appl. Physiol. 102, 2251–2259 (2007).
53. Marechal, X. et al. Endothelial glycocalyx damage during endotoxemia coincides with
microcirculatory dysfunction and vascular oxidative stress. Shock 29, 572–576 (2008).
54. Sakr, Y. Persistent microcirculatory alterations are associated with organ failure and
death in patients with septic shock. CRITICAL CARE MEDICINE -‐BALTIMORE-‐ 32, 1825–
1831 (2004).
55. De Backer, D. et al.Microcirculatory alterations: potential mechanisms and implications
for therapy. Ann Intensive Care 1, 27 (2011).
56. Top, A. P. C., Ince, C., de Meij, N., van Dijk, M. & Tibboel, D. Persistent low
microcirculatory vessel density in nonsurvivors of sepsis in pediatric intensive care. Crit.
Care Med. 39, 8–13 (2011).
57. Weidlich, K. et al. Changes in microcirculation as early markers for infection in preterm
infants-‐-‐an observational prospective study. Pediatr. Res. 66, 461–465 (2009).
85
58. Top, A. P. C., van Dijk, M., van Velzen, J. E., Ince, C. & Tibboel, D. Functional capillary
density decreases after the first week of life in term neonates. Neonatology 99, 73–77
(2011).
59. Kroth, J. et al. Functional vessel density in the first month of life in preterm neonates.
Pediatr. Res. 64, 567–571 (2008).
60. Perera, P., Kurban, A. K. & Ryan, T. J. THE DEVELOPMENT OF THE CUTANEOUS
MICROVASCULAR SYSTEM IN THE NEWBORN. British Journal of Dermatology 82, 86–91
(1970).
61. Sakr, Y. et al.Microvascular response to red blood cell transfusion in patients with
severe sepsis. Crit. Care Med 35, 1639–1644 (2007).
62. Weinberg, J. A. et al.Microvascular response to red blood cell transfusion in trauma
patients. Shock 37, 276–281 (2012).
63. Creteur, J., Neves, A. P. & Vincent, J.-‐L. Near-‐infrared spectroscopy technique to
evaluate the effects of red blood cell transfusion on tissue oxygenation. Crit Care 13
Suppl 5, S11 (2009).
64. Yuruk, K. et al. Blood transfusions recruit the microcirculation during cardiac surgery.
Transfusion 51, 961–967 (2011).
65. Genzel-‐Boroviczény, O., Christ, F. & Glas, V. Blood transfusion increases functional
capillary density in the skin of anemic preterm infants. Pediatr. Res 56, 751–755 (2004).
66. Weinberg, J. A., Barnum, S. R. & Patel, R. P. RBC AGE AND POTENTIATION OF
TRANSFUSION RELATED PATHOLOGY IN TRAUMA PATIENTS. Transfusion 51, 867–873
(2011).
67. Weinberg, J. A. et al. Transfusions in the less severely injured: does age of transfused
blood affect outcomes? J Trauma 65, 794–798 (2008).
68. Berezina, T. L. et al. Influence of storage on red blood cell rheological properties. J. Surg.
Res. 102, 6–12 (2002).
69. Tsai, A. G., Cabrales, P. & Intaglietta, M. Microvascular perfusion upon exchange
transfusion with stored red blood cells in normovolemic anemic conditions. Transfusion
44, 1626–1634 (2004).
70. Relevy, H., Koshkaryev, A., Manny, N., Yedgar, S. & Barshtein, G. Blood banking-‐induced
alteration of red blood cell flow properties. Transfusion 48, 136–146 (2008).
86
71. Eichelbrönner, O., Sibbald, W. J. & Chin-‐Yee, I. H. Intermittent flow increases endotoxin-‐
induced adhesion of human erythrocytes to vascular endothelial cells. Intensive Care
Med 29, 709–714 (2003).
72. Ho, J., Sibbald, W. J. & Chin-‐Yee, I. H. Effects of storage on efficacy of red cell
transfusion: when is it not safe? Crit Care Med 31, S687–97 (2003).
73. Dejam, A., Hunter, C. J., Schechter, A. N. & Gladwin, M. T. Emerging role of nitrite in
human biology. Blood Cells Mol. Dis. 32, 423–429 (2004).
74. Donadee, C. et al. Nitric oxide scavenging by red blood cell microparticles and cell-‐free
hemoglobin as a mechanism for the red cell storage lesion. Circulation 124, 465–476
(2011).
75. Gladwin, M. T., Kanias, T. & Kim-‐Shapiro, D. B. Hemolysis and cell-‐free hemoglobin drive
an intrinsic mechanism for human disease. J. Clin. Invest. 122, 1205–1208 (2012).
76. Kim-‐Shapiro, D. B., Lee, J. & Gladwin, M. T. Storage lesion: role of red blood cell
breakdown. Transfusion 51, 844–851 (2011).
77. Bakker, J., Coffernils, M., Leon, M., Gris, P. & Vincent, J. L. Blood lactate levels are
superior to oxygen-‐derived variables in predicting outcome in human septic shock. Chest
99, 956–962 (1991).
78. Koch, T., Geiger, S. & Ragaller, M. J. Monitoring of organ dysfunction in sepsis/systemic
inflammatory response syndrome: novel strategies. J. Am. Soc. Nephrol. 12 Suppl 17,
S53–59 (2001).
79. Bauer, A., Bruegger, D. & Christ, F. [Microcirculatory monitoring of sepsis]. Anaesthesist
54, 1163–1175 (2005).
80. Christ, F., Bauer, A. & Brügger, D. Different optical methods for clinical monitoring of the
microcirculation. Eur Surg Res 34, 145–151 (2002).
81. Lima, A. & Bakker, J. Near-‐infrared spectroscopy for monitoring peripheral tissue
perfusion in critically ill patients. Rev Bras Ter Intensiva 23, 341–351 (2011).
82. Kaji, H. et al. Re-‐evaluation of capillaroscopy of finger nailfold in vibration-‐exposed
workers. Cent. Eur. J. Public Health 3 Suppl, 34–36 (1995).
83. Groner, W. et al. Orthogonal polarization spectral imaging: a new method for study of
the microcirculation. Nat. Med 5, 1209–1212 (1999).
84. Mathura, K. R. et al. Comparison of OPS imaging and conventional capillary microscopy
to study the human microcirculation. J. Appl. Physiol 91, 74–78 (2001).
87
85. Bauer, A., Kofler, S., Thiel, M., Eifert, S. & Christ, F. Monitoring of the sublingual
microcirculation in cardiac surgery using orthogonal polarization spectral imaging:
preliminary results. Anesthesiology 107, 939–945 (2007).
86. De Backer, D., Creteur, J., Preiser, J.-‐C., Dubois, M.-‐J. & Vincent, J.-‐L. Microvascular blood
flow is altered in patients with sepsis. Am. J. Respir. Crit. Care Med 166, 98–104 (2002).
87. Lindert, J. et al. OPS imaging of human microcirculation: a short technical report. J. Vasc.
Res 39, 368–372 (2002).
88. Goedhart, P. T., Khalilzada, M., Bezemer, R., Merza, J. & Ince, C. Sidestream Dark Field
(SDF) imaging: a novel stroboscopic LED ring-‐based imaging modality for clinical
assessment of the microcirculation. Opt Express 15, 15101–15114 (2007).
89. Vollmar, B. & Menger, M. D. The Hepatic Microcirculation: Mechanistic Contributions
and Therapeutic Targets in Liver Injury and Repair. Physiological Reviews 89, 1269–1339
(2009).
90. Harris, A. G., Sinitsina, I. & Messmer, K. The Cytoscan Model E-‐II, a new reflectance
microscope for intravital microscopy: comparison with the standard fluorescence
method. J. Vasc. Res 37, 469–476 (2000).
91. Harris, A. G., Hecht, R., Peer, F., Nolte, D. & Messmer, K. An improved intravital
microscopy system. Int J Microcirc Clin Exp 17, 322–327 (1997).
92. Harris, A. G., Leiderer, R., Peer, F. & Messmer, K. Skeletal muscle microvascular and
tissue injury after varying durations of ischemia. Am. J. Physiol 271, H2388–2398 (1996).
93. Nevière, R. R., Pitt-‐Hyde, M. L., Piper, R. D., Sibbald, W. J. & Potter, R. F. Microvascular
perfusion deficits are not a prerequisite for mucosal injury in septic rats. Am. J. Physiol
276, G933–940 (1999).
94. Von Dobschuetz, E. et al. Noninvasive in vivo assessment of the pancreatic
microcirculation: orthogonal polarization spectral imaging. Pancreas 26, 139–143 (2003).
95. Harris, A. G., Schropp, A., Schütze, E., Krombach, F. & Messmer, K. Implementation of
the microdialysis method in the hamster dorsal skinfold chamber. Res Exp Med (Berl)
199, 141–152 (1999).
96. De Backer, D. OPS techniques.Minerva Anestesiol 69, 388–391 (2003).
97. De Backer, D. et al. How to evaluate the microcirculation: report of a round table
conference. Crit Care 11, R101–R101 (2007).
88
98. Dobbe, J. G. G., Streekstra, G. J., Atasever, B., van Zijderveld, R. & Ince, C. Measurement
of functional microcirculatory geometry and velocity distributions using automated
image analysis.Med Biol Eng Comput 46, 659–670 (2008).
99. Koch, M. et al. Effects of propofol on human microcirculation. Br J Anaesth 101, 473–478
(2008).
100. Motulsky, H. Intuitive Biostatistics: A Nonmathematical Guide to Statistical Thinking.
(Oxford University Press, 2010).
101. Hubble, S. M. A., Kyte, H. L., Gooding, K. & Shore, A. C. Variability in sublingual
microvessel density and flow measurements in healthy volunteers.Microcirculation 16,
183–191 (2009).
102. Verdant, C. L. et al. Evaluation of sublingual and gut mucosal microcirculation in sepsis: a
quantitative analysis. Crit. Care Med. 37, 2875–2881 (2009).
103. Genzel-‐Boroviczény, O., Seidl, T., Rieger-‐Fackeldey, E., Abicht, J. & Christ, F. Impaired
microvascular perfusion improves with increased incubator temperature in preterm
infants. Pediatr. Res. 61, 239–242 (2007).
104. Nolte, D., Zeintl, H., Steinbauer, M., Pickelmann, S. & Messmer, K. Functional capillary
density: an indicator of tissue perfusion? Int J Microcirc Clin Exp 15, 244–249 (1995).
105. Bezemer, R. et al. Rapid automatic assessment of microvascular density in sidestream
dark field images.Med Biol Eng Comput 49, 1269–1278 (2011).
106. Sadaka, F. et al. The effect of red blood cell transfusion on tissue oxygenation and
microcirculation in severe septic patients. Ann Intensive Care 1, 46 (2011).
107. Top, A. P., Tasker, R. C. & Ince, C. The microcirculation of the critically ill pediatric
patient. Crit Care 15, 213 (2011).
108. Kerger, H., Saltzman, D. J., Menger, M. D., Messmer, K. & Intaglietta, M. Systemic and
subcutaneous microvascular Po2 dissociation during 4-‐h hemorrhagic shock in conscious
hamsters. Am. J. Physiol 270, H827–836 (1996).
109. Mueller-‐Eckhardt, C. & Kiefel, V. Transfusionsmedizin: Grundlagen -‐ Therapie -‐ Methodik.
(Springer-‐Verlag Gmbh, 2003).
110. Tsai, A. G., Friesenecker, B., McCarthy, M., Sakai, H. & Intaglietta, M. Plasma viscosity
regulates capillary perfusion during extreme hemodilution in hamster skinfold model.
Am J Physiol Heart Circ Physiol 275, H2170–2180 (1998).
89
111. Saldivar, E., Cabrales, P., Tsai, A. G. & Intaglietta, M. Microcirculatory changes during
chronic adaptation to hypoxia. Am J Physiol Heart Circ Physiol 285, H2064–2071 (2003).
112. Vallet, B. Endothelial cell dysfunction and abnormal tissue perfusion. Critical care
medicine. 30, S229 (2002).
113. Piagnerelli, M., Boudjeltia, K. Z., Vanhaeverbeek, M. & Vincent, J.-‐L. Red blood cell
rheology in sepsis. Intensive Care Med 29, 1052–1061 (2003).
114. Eichelbrönner, O., Sielenkämper, A., Cepinskas, G., Sibbald, W. J. & Chin-‐Yee, I. H.
Endotoxin promotes adhesion of human erythrocytes to human vascular endothelial
cells under conditions of flow. Crit. Care Med. 28, 1865–1870 (2000).
115. Spronk, P. E., Zandstra, D. F. & Ince, C. Bench-‐to-‐bedside review: sepsis is a disease of
the microcirculation. Crit Care 8, 462–468 (2004).
116. Ince, C. Microcirculatory oxygenation and shunting in sepsis and shock. CRITICAL CARE
MEDICINE -‐BALTIMORE-‐ 27, 1369–1377 (1999).
117. Sakr, Y. et al.Microvascular response to red blood cell transfusion in patients with
severe sepsis. Crit Care Med 35, 1639–44 (2007).
118. Friedlander, M. H., Simon, R. & Machiedo, G. W. The relationship of packed cell
transfusion to red blood cell deformability in systemic inflammatory response syndrome
patients. Shock 9, 84–88 (1998).
119. Walsh, T. S. & Saleh, E.-‐E.-‐D. Anaemia during critical illness. British Journal of
Anaesthesia 97, 278 –291 (2006).
120. Reggiori, G., Occhipinti, G., De Gasperi, A., Vincent, J.-‐L. & Piagnerelli, M. Early
alterations of red blood cell rheology in critically ill patients. Crit. Care Med. 37, 3041–
3046 (2009).
121. Jhanji, S., Lee, C., Watson, D., Hinds, C. & Pearse, R. M. Microvascular flow and tissue
oxygenation after major abdominal surgery: association with post-‐operative
complications. Intensive Care Med 35, 671–677 (2009).
122. Rossi, E. C. Red cell transfusion therapy in chronic anemia. Hematol. Oncol. Clin. North
Am. 8, 1045–1052 (1994).
123. Top, A. P. C., van Dijk, M., van Velzen, J. E., Ince, C. & Tibboel, D. Functional capillary
density decreases after the first week of life in term neonates. Neonatology 99, 73–77
(2011).

90
124. Harris, A. G., Sinitsina, I. & Messmer, K. Validation of OPS imaging for microvascular
measurements during isovolumic hemodilution and low hematocrits. Am. J. Physiol.
Heart Circ. Physiol 282, H1502–1509 (2002).
125. Wang, P., Hauptman, J. G. & Chaudry, I. H. Hemorrhage produces depression in
microvascular blood flow which persists despite fluid resuscitation. Circ. Shock 32, 307–
318 (1990).
126. Bosman, G. J. C. G. M., Werre, J. M., Willekens, F. L. A. & Novotný, V. M. J. Erythrocyte
ageing in vivo and in vitro: structural aspects and implications for transfusion. Transfus
Med 18, 335–347 (2008).
127. Zimrin, A. B. & Hess, J. R. Current issues relating to the transfusion of stored red blood
cells. Vox Sang 96, 93–103 (2009).
128. Tinmouth, A. & Chin-‐Yee, I. The clinical consequences of the red cell storage lesion.
Transfus Med Rev 15, 91–107 (2001).
129. Marik, P. E. & Sibbald, W. J. Effect of Stored-‐Blood Transfusion on Oxygen Delivery in
Patients With Sepsis. JAMA 269, 3024–3029 (1993).
130. Stapley, R. et al. Erythrocyte storage increases rates of NO-‐ and Nitrite scavenging:
Implications for transfusion related toxicity. The Biochemical Journal (2012).
doi:10.1042/BJ20120675
131. Gonzalez, A. M., Yazici, I., Kusza, K. & Siemionow, M. Effects of fresh versus banked
blood transfusions on microcirculatory hemodynamics and tissue oxygenation in the rat
cremaster model. Surgery 141, 630–639 (2007).
132. Mynster, T., Dybkjoer, E., Kronborg, G. & Nielsen, H. J. Immunomodulating effect of
blood transfusion: is storage time important? Vox Sang 74, 176–181 (1998).
133. Basran, S. et al. The association between duration of storage of transfused red blood
cells and morbidity and mortality after reoperative cardiac surgery. Anesth. Analg 103,
15–20, table of contents (2006).
134. Gauvin, F. et al. Association between length of storage of transfused red blood cells and
multiple organ dysfunction syndrome in pediatric intensive care patients. Transfusion 50,
1902–1913 (2010).
135. Koch, C. G. et al. Duration of red-‐cell storage and complications after cardiac surgery. N.
Engl. J. Med 358, 1229–1239 (2008).
91
136. Kneyber, M. C. J., Gazendam, R. P., Markhorst, D. G. & Plötz, F. B. Length of storage of
red blood cells does not affect outcome in critically ill children. Intensive Care Med 35,
179–180 (2009).
137. French, J. A., 2nd et al.Mechanisms of stroke in sickle cell disease: sickle erythrocytes
decrease cerebral blood flow in rats after nitric oxide synthase inhibition. Blood 89,
4591–4599 (1997).
138. Bennett-‐Guerrero, E. et al. A prospective, double-‐blind, randomized clinical feasibility
trial of controlling the storage age of red blood cells for transfusion in cardiac surgical
patients. Transfusion 49, 1375–1383 (2009).
139. Steiner, M. E. & Stowell, C. Does red blood cell storage affect clinical outcome? When in
doubt, do the experiment. Transfusion 49, 1286–1290 (2009).
140. Hod, E. A. & Spitalnik, S. L. Harmful effects of transfusion of older stored red blood cells:
iron and inflammation. Transfusion 51, 881–885 (2011).
141. De Backer, D. et al.Monitoring the microcirculation in the critically ill patient: current
methods and future approaches. Intensive Care Med 36, 1813–1825 (2010).
142. Skarda, D. E., Mulier, K. E., Myers, D. E., Taylor, J. H. & Beilman, G. J. Dynamic near-‐
infrared spectroscopy measurements in patients with severe sepsis. Shock 27, 348–353
(2007).
143. Mancini, D. M. et al. Validation of near-‐infrared spectroscopy in humans. J. Appl. Physiol.
77, 2740–2747 (1994).
144. Mulier, K. E. et al. Near-‐infrared spectroscopy in patients with severe sepsis: correlation
with invasive hemodynamic measurements. Surg Infect (Larchmt) 9, 515–519 (2008).
145. Cheung, A. T. W. et al. Exchange transfusion therapy and its effects on real-‐time
microcirculation in pediatric sickle cell anemia patients: an intravital microscopy study. J.
Pediatr. Hematol. Oncol. 34, 169–174 (2012).
146. Horn, P. et al. Nitric oxide influences red blood cell velocity independently of changes in
the vascular tone. Free Radic. Res. 45, 653–661 (2011).

92
11. Acknowledgement
It would not have been possible to write this doctoral thesis without the help of numerous kind
people around me, to only some of whom it is possible to give particular mention here.
First of all, I am very grateful for the support and guidance of my doctoral advisor, Prof. Dr.
Orsolya Genzel-‐Boroviczény, who introduced me to the field of research early in my medical
studies. From the very beginning she emphasized the importance of independency in my work,
which sometimes wracked both my brain and nerves, but retrospectively broadened my
professional experience and prepared me for future challenges.
I owe especial thanks to Zuzana Mormanova for her valuable help, consistent encouragement
and unconditional support, despite her busy schedule. Although my research vigor hit short-‐
term rock bottom when I heard of her relocation to another country, she nonetheless
continued her efforts to support my work. I am forever grateful for the three days I spent
locked up in her apartment in Prague, trying to master the mysteries of graph-‐pad. I would not
have survived statistics without her help.
The thesis would not have come to a successful completion, without the help I received from
the friendly staff of doctors and nurses at the “Intern 3”, the hemato-‐/oncology day ward and
the surgical day ward. They were kind enough to extend their help, whenever I approached
them. I want to thank PD Dr. Schmid for her support and kindness in letting me conduct this
study on her ward.
My biggest thank goes to all the children and their parents. Many of the little patients were
heavily burdened and wearied by their diagnosis and consecutive therapies and yet they
willingly volunteered and participated in this study. What I learned from them is more than
words can express.
Above all I would like to thank my family for their unequivocal support, unconditional love and
great patience at all times, for which my mere expression of thanks does not suffice. Mom and
Dad, thank you for being my role models throughout life. You have taught me resilience,
strength and character, -‐ all of which I had to summon multiple times during the conduct of this
study.

93
12. Curriculum vitae
CARINA MADELEN SCHINAGL
* 26.11.1986 in Oslo, Norway
Nationality: Norway, Austria
Languages: fluent in German, Norwegian, English, Conversational French
EDUCATION
11/2014 Submission of doctoral thesis at the Ludwig Maximilians University (LMU)
“Microcirculatory evaluation of red-‐blood-‐cell transfusion on severly anemic children, as
assessed with the Sidestream-‐Darkfield Imaging technique¨, under Prof. Genzel-‐Boroviczeny at
the Dr. von Haunersches Kinderspital, Munich
Since 09/14 Pediatric resident at Oslo University Hospital (OUS, Ullevål sykehus)
11/2012 Pediatric resident at Haugesund sykehus
-‐08/2014
2005-‐2012 Medical studies at Ludwig Maximilian University (LMU)
08/2007 First part of the state medical examination (Physikum)
06/2012 Second part of the state medical examination (Staatsexamen)
06/2005 General qualification for university entrance
2004-‐2005 Seminar Schloss Bogenhofen, Austria
2003-‐2004 Monterey Bay Academy, California, USA
1997-‐2003 BG/BRG Bruck an der Mur, Austria