MICU1 Controls Both the Threshold and Cooperative ...
12
Cell Metabolism Article MICU1 Controls Both the Threshold and Cooperative Activation of the Mitochondrial Ca 2+ Uniporter Gyo ¨ rgy Csorda ´ s, 1,8 Tu ¨ nde Golena ´ r, 1,8 Erin L. Seifert, 1,8 Kimberli J. Kamer, 2 Yasemin Sancak, 2,3 Fabiana Perocchi, 2,3,6 Cynthia Moffat, 1 David Weaver, 1 Sergio de la Fuente Perez, 1 Roman Bogorad, 4 Victor Koteliansky, 5,7 Jeffrey Adijanto, 1 Vamsi K. Mootha, 2,3, * and Gyo ¨ rgy Hajno ´ czky 1, * 1 Department of Pathology, Anatomy, and Cell Biology, Thomas Jefferson University, Philadelphia, PA 19107, USA 2 Department of Molecular Biology, Massachusetts General Hospital, Boston, MA 02114, USA 3 Department of Systems Biology, Harvard Medical School and Broad Institute, Cambridge, MA 02142, USA 4 Koch Institute for Integrative Cancer Research, Massachusetts Institute of Technology, Cambridge, MA 02139, USA 5 Alnylam Pharmaceuticals Inc., Cambridge, MA 02142, USA 6 Gene Center, Ludwig-Maximilians-Universita ¨ t, Munich D-81377, Germany 7 Present address: Koch Institute for Integrative Cancer Research, Massachusetts Institute of Technology, Cambridge, MA 02139, USA 8 These authors contributed equally to this work *Correspondence: [email protected] (V.K.M.), [email protected] (G.H.) http://dx.doi.org/10.1016/j.cmet.2013.04.020 SUMMARY Mitochondrial Ca 2+ uptake via the uniporter is central to cell metabolism, signaling, and survival. Recent studies identified MCU as the uniporter’s likely pore and MICU1, an EF-hand protein, as its critical regu- lator. How this complex decodes dynamic cyto- plasmic [Ca 2+ ] ([Ca 2+ ] c ) signals, to tune out small [Ca 2+ ] c increases yet permit pulse transmission, re- mains unknown. We report that loss of MICU1 in mouse liver and cultured cells causes mitochondrial Ca 2+ accumulation during small [Ca 2+ ] c elevations but an attenuated response to agonist-induced [Ca 2+ ] c pulses. The latter reflects loss of positive co- operativity, likely via the EF-hands. MICU1 faces the intermembrane space and responds to [Ca 2+ ] c changes. Prolonged MICU1 loss leads to an adaptive increase in matrix Ca 2+ binding, yet cells show impaired oxidative metabolism and sensitization to Ca 2+ overload. Collectively, the data indicate that MICU1 senses the [Ca 2+ ] c to establish the uniporter’s threshold and gain, thereby allowing mitochondria to properly decode different inputs. INTRODUCTION Measurements of mitochondrial matrix [Ca 2+ ] ([Ca 2+ ] m ) in intact cells have revealed that mitochondria respond to hormone- and neurotransmitter-induced [Ca 2+ ] c signals by robust in- creases in [Ca 2+ ] m , which, in turn, effectively stimulate oxidative metabolism (Hajno ´ czky et al., 1995; Jouaville et al., 1999; Pra- long et al., 1994; Rizzuto et al., 1994; Robb-Gaspers et al., 1998). Prolonged stimulation of mitochondrial Ca 2+ uptake in combination with other forms of cellular stress induces Ca 2+ overload and cell death (Pinton et al., 2001; Szalai et al., 1999). Thus, mitochondrial Ca 2+ import must be tightly controlled to avoid continuous uptake while also ensuring a rapid response to [Ca 2+ ] c spikes. Indeed, mitochondrial Ca 2+ uptake effectively decodes different signal patterns: it responds to frequency- modulated [Ca 2+ ] c oscillations and tunes out moderate [Ca 2+ ] c increases (Hajno ´ czky et al., 1995). One facet of the mitochondria’s ability to decode [Ca 2+ ] c sig- nals is their strategic localization close to ER/SR Ca 2+ channels, the source of [Ca 2+ ] c spikes and oscillations, where they are exposed to high [Ca 2+ ] c microdomains in the vicinity of activated IP 3 receptors (IP3R) and ryanodine receptors (RyRs). Indeed, favorably localized mitochondria seem to respond to spatially confined [Ca 2+ ] c sparks and puffs (Marchant et al., 2002; Pacher et al., 2002). The close associations and tethering between mito- chondria and ER/SR were demonstrated in both intact live cells and in ultrastructural studies (Csorda ´ s et al., 2006; de Brito and Scorrano, 2008; Rizzuto et al., 1998; Szabadkai et al., 2006; Tinel et al., 1999). Most recently, exposure of mitochondria to a local 10 mM [Ca 2+ ] c rise during IP3R-mediated ER Ca 2+ release was also documented (Csorda ´ s et al., 2010; Giacomello et al., 2010). However, the spatial coupling alone cannot explain the highly cooperative nature of mitochondrial Ca 2+ uptake. Indeed, Ca 2+ - and time-dependent activation of mitochondrial Ca 2+ up- take has been observed (Csorda ´ s and Hajno ´ czky, 2003; Kro ¨ ner, 1986), but the missing molecular identity of the mitochondrial Ca 2+ uniporter (mtCU) prevented a better understanding of the nonlinear behavior. A seminal patch-clamp study of mitoplasts provided evidence that the mtCU is a highly Ca 2+ -selective ion channel (I MiCa )(Kiri- chok et al., 2004). Early candidates for the mtCU were mitochon- dria-localized RyR1 (Beutner et al., 2005) and UCP2/3 (Trenker et al., 2007), but these proteins are not expressed in some tis- sues displaying robust mtCU activity. Recently, LETM1 was identified as a protein that imports Ca 2+ by Ca 2+ /H + exchange when [Ca 2+ ] m is low and is therefore unlikely to contribute to Ca 2+ uptake as a Ca 2+ channel (Jiang et al., 2009). A recent land- mark study identified and proposed MICU1 as a critical regulator of the mtCU (Perocchi et al., 2010), paving the way to the 976 Cell Metabolism 17, 976–987, June 4, 2013 ª2013 Elsevier Inc.
Transcript of MICU1 Controls Both the Threshold and Cooperative ...
Cell Metabolism
Article
MICU1 Controls Both the Thresholdand Cooperative Activationof the Mitochondrial Ca2+ UniporterGyorgy Csordas,1,8 Tunde Golenar,1,8 Erin L. Seifert,1,8 Kimberli J. Kamer,2 Yasemin Sancak,2,3 Fabiana Perocchi,2,3,6
Cynthia Moffat,1 David Weaver,1 Sergio de la Fuente Perez,1 Roman Bogorad,4 Victor Koteliansky,5,7 Jeffrey Adijanto,1
Vamsi K. Mootha,2,3,* and Gyorgy Hajnoczky1,*1Department of Pathology, Anatomy, and Cell Biology, Thomas Jefferson University, Philadelphia, PA 19107, USA2Department of Molecular Biology, Massachusetts General Hospital, Boston, MA 02114, USA3Department of Systems Biology, Harvard Medical School and Broad Institute, Cambridge, MA 02142, USA4Koch Institute for Integrative Cancer Research, Massachusetts Institute of Technology, Cambridge, MA 02139, USA5Alnylam Pharmaceuticals Inc., Cambridge, MA 02142, USA6Gene Center, Ludwig-Maximilians-Universitat, Munich D-81377, Germany7Present address: Koch Institute for Integrative Cancer Research, Massachusetts Institute of Technology, Cambridge, MA 02139, USA8These authors contributed equally to this work
*Correspondence: [email protected] (V.K.M.), [email protected] (G.H.)http://dx.doi.org/10.1016/j.cmet.2013.04.020
SUMMARY
Mitochondrial Ca2+ uptake via the uniporter is centralto cell metabolism, signaling, and survival. Recentstudies identified MCU as the uniporter’s likely poreand MICU1, an EF-hand protein, as its critical regu-lator. How this complex decodes dynamic cyto-plasmic [Ca2+] ([Ca2+]c) signals, to tune out small[Ca2+]c increases yet permit pulse transmission, re-mains unknown. We report that loss of MICU1 inmouse liver and cultured cells causes mitochondrialCa2+ accumulation during small [Ca2+]c elevationsbut an attenuated response to agonist-induced[Ca2+]c pulses. The latter reflects loss of positive co-operativity, likely via the EF-hands. MICU1 faces theintermembrane space and responds to [Ca2+]cchanges. ProlongedMICU1 loss leads to an adaptiveincrease in matrix Ca2+ binding, yet cells showimpaired oxidative metabolism and sensitization toCa2+ overload. Collectively, the data indicate thatMICU1 senses the [Ca2+]c to establish the uniporter’sthreshold and gain, thereby allowing mitochondria toproperly decode different inputs.
INTRODUCTION
Measurements of mitochondrial matrix [Ca2+] ([Ca2+]m) in intact
cells have revealed that mitochondria respond to hormone-
and neurotransmitter-induced [Ca2+]c signals by robust in-
creases in [Ca2+]m, which, in turn, effectively stimulate oxidative
metabolism (Hajnoczky et al., 1995; Jouaville et al., 1999; Pra-
long et al., 1994; Rizzuto et al., 1994; Robb-Gaspers et al.,
1998). Prolonged stimulation of mitochondrial Ca2+ uptake in
combination with other forms of cellular stress induces Ca2+
overload and cell death (Pinton et al., 2001; Szalai et al., 1999).
976 Cell Metabolism 17, 976–987, June 4, 2013 ª2013 Elsevier Inc.
Thus, mitochondrial Ca2+ import must be tightly controlled to
avoid continuous uptake while also ensuring a rapid response
to [Ca2+]c spikes. Indeed, mitochondrial Ca2+ uptake effectively
decodes different signal patterns: it responds to frequency-
modulated [Ca2+]c oscillations and tunes out moderate [Ca2+]cincreases (Hajnoczky et al., 1995).
One facet of the mitochondria’s ability to decode [Ca2+]c sig-
nals is their strategic localization close to ER/SR Ca2+ channels,
the source of [Ca2+]c spikes and oscillations, where they are
exposed to high [Ca2+]c microdomains in the vicinity of activated
IP3 receptors (IP3R) and ryanodine receptors (RyRs). Indeed,
favorably localized mitochondria seem to respond to spatially
confined [Ca2+]c sparks and puffs (Marchant et al., 2002; Pacher
et al., 2002). The close associations and tethering betweenmito-
chondria and ER/SR were demonstrated in both intact live cells
and in ultrastructural studies (Csordas et al., 2006; de Brito and
Scorrano, 2008; Rizzuto et al., 1998; Szabadkai et al., 2006; Tinel
et al., 1999). Most recently, exposure of mitochondria to a local
10 mM [Ca2+]c rise during IP3R-mediated ER Ca2+ release was
also documented (Csordas et al., 2010; Giacomello et al.,
2010). However, the spatial coupling alone cannot explain the
highly cooperative nature of mitochondrial Ca2+ uptake. Indeed,
Ca2+- and time-dependent activation of mitochondrial Ca2+ up-
take has been observed (Csordas and Hajnoczky, 2003; Kroner,
1986), but the missing molecular identity of the mitochondrial
Ca2+ uniporter (mtCU) prevented a better understanding of the
nonlinear behavior.
A seminal patch-clamp study of mitoplasts provided evidence
that the mtCU is a highly Ca2+-selective ion channel (IMiCa) (Kiri-
chok et al., 2004). Early candidates for themtCUwere mitochon-
dria-localized RyR1 (Beutner et al., 2005) and UCP2/3 (Trenker
et al., 2007), but these proteins are not expressed in some tis-
sues displaying robust mtCU activity. Recently, LETM1 was
identified as a protein that imports Ca2+ by Ca2+/H+ exchange
when [Ca2+]m is low and is therefore unlikely to contribute to
Ca2+ uptake as a Ca2+ channel (Jiang et al., 2009). A recent land-
mark study identified and proposedMICU1 as a critical regulator
of the mtCU (Perocchi et al., 2010), paving the way to the
Cell Metabolism
MICU1: Gatekeeper for Mitochondrial Ca2+ Uptake
molecular identification of MCU as the putative pore-forming
component (Baughman et al., 2011; De Stefani et al., 2011).
MCU is a transmembrane protein of the inner mitochondrial
membrane (IMM) with two predicted transmembrane domains
connected by a loop that seems to contribute to the selectivity
filter (Baughman et al., 2011; De Stefani et al., 2011). MCU likely
oligomerizes to form a pore. MICU1 resides within a complex
with MCU and contains a pair of Ca2+ binding EF-hand motifs
(Baughman et al., 2011; Perocchi et al., 2010). The two proteins
exhibit striking coevolution and coexpression (Baughman et al.,
2011; Bick et al., 2012) indicating a particularly close functional
relationship. Since MICU1 is likely a Ca2+-sensing component
of the mtCU, we set out to determine its exact role in the decod-
ing function of mitochondrial Ca2+ uptake and its physiological
relevance.
We show that upon MICU1 depletion, mitochondrial Ca2+ up-
take is sensitized to low [Ca2+]c levels, and the cooperativity of
uptake with rising [Ca2+]c is decreased. We show that MICU1
is associated with the IMM, facing the intermembrane space
(IMS) to sense outside Ca2+. Expression of an EF-hand mutant
restores the [Ca2+]c threshold, but not cooperativity. These re-
sults suggest thatMICU1 controls both [Ca2+]c threshold and co-
operativity of the mtCU, with the latter being dependent on Ca2+
binding to MICU1. Furthermore, MICU1-deficient mitochondria
fail to effectively respond to short-lasting high-[Ca2+]c microdo-
mains during calcium oscillations while also failing to ignore sub-
micromolar [Ca2+]c increases. As a result, MICU1-deficient cells
show dysregulation of oxidative metabolism and decreased cell
tolerance to stress.
RESULTS
Ca2+ Handling in MICU1-Deficient Primary Hepatocytesand HeLa CellsTo test the physiological relevance of MICU1 in calcium
signaling, we evaluated [Ca2+]c and [Ca2+]m homeostasis in
MICU1-deficient hepatocytes. In vivo silencing in mouse liver
effectively and specifically decreased MICU1 or MCU mRNA
and protein in hepatocytes (see Figure S1A online). Stimulation
of hepatocytes with Ca2+-mobilizing agonists elicits [Ca2+]cspikes and oscillations, which are effectively propagated tomito-
chondria due to local exposure of mitochondria to high [Ca2+]cmicrodomains by adjacent IP3Rs (Hajnoczky et al., 1995;
Robb-Gaspers et al., 1998). The [Ca2+]c rise stimulated by phen-
ylephrine (Figures 1A–1C) or vasopressin (Figure S1D) was unaf-
fected by MICU1 or MCU knockdown, whereas the correspond-
ing [Ca2+]m response was reduced by MICU1 and abolished by
MCU silencing (Figure 1B). At resting [Ca2+]c (%100 nM), the
[Ca2+]m was unaltered by depletion of MICU1 or MCU, as deter-
mined by a genetically targeted Ca2+ reporter (Figure 1C).
Furthermore, releasing mitochondrial Ca2+ by elimination of the
membrane potential (DJm) with an uncoupler (FCCP 5 mM)
caused a similar [Ca2+]c rise in control (Ctrl) and MICU1-deficient
cells (MICU1-KD) (Figure S1B).
[Ca2+]m signals stimulate oxidative metabolism that can be as-
sessed by measurements of the O2 consumption rate (JO2).
Consistent with an unaltered resting [Ca2+]m, resting JO2 was
found similar in both Ctrl and MICU1-KD (Figure 1D). However,
upon IP3-linked stimulation the increase in JO2 was relatively
C
small in MICU1-KD, reflecting the blunted [Ca2+]m rise
(Figure 1D).
In contrast to IP3-linked stimulation, wherein mitochondria are
exposed to high Ca2+ microdomains, during store-operated
Ca2+ entry (SOCE) most mitochondria respond to the bulk
[Ca2+]c increase (Hajnoczky et al., 1995). The SOCE-mediated
[Ca2+]m increase appeared early, but the maximum amplitude
was blunted in MICU1-KD, while it was greatly suppressed and
delayed in MCU-KD (Figure 1E). Plotting [Ca2+]m against
[Ca2+]c underscores that MICU1-KD cells show a significant
[Ca2+]m increase at lower [Ca2+]c than Ctrl and further reveals
the distinct effects of MICU1 and MCU depletion on the [Ca2+]csensitivity of mitochondria (Figure 1E, right).
Similar results were obtained in HeLa cells with stable MICU1-
KD (see verification of KD in Figure S1C), where the specificity of
the changes associated with MICU1 silencing was validated by
rescuing cells by re-expression of MICU1 (Figure 1F). Moreover,
simultaneous [Ca2+]c and [Ca2+]m measurements in single cells
further indicated that relatively low [Ca2+]c was sufficient to
evoke a [Ca2+]m increase in MICU1-KD (Figure 1G). Ctrl cells
showed the onset of the [Ca2+]m signal in the 0.5–1 mM range
of [Ca2+]c, but in most MICU1-KD cells a small [Ca2+]m increase
also occurred at [Ca2+]c <500 nM (Figure 1G). Consistently, when
extracellular [Ca2+] was kept low (0.2 mM CaCl2), the SOCE-
induced [Ca2+]c rise (300–400 nM) evoked a [Ca2+]m increase in
MICU1-KD, but not in Ctrl or MCU-KD (Figure 1H and data not
shown). An increase in JO2 was likewise observed only in the
MICU1-KD (Figure 1I, left; resting levels, Figure S1E). However,
when higher extracellular [Ca2+] was used to support SOCE,
the [Ca2+]m increase and JO2 response were larger in the Ctrl
(Figures 1F and 1I, right). Thus, stimulation of oxidative meta-
bolism closely follows the MICU1-KD-induced changes in the
[Ca2+]m signal.
The results obtained in both hepatocytes and HeLa cells using
several different approaches show that (1) when [Ca2+]c is main-
tained at <100 nM by high-affinity plasma membrane and ER
Ca2+ pumps, the [Ca2+]m and the amount of matrix Ca2+ mobi-
lized by DJm dissipation are not significantly affected by
MICU1 depletion; and (2) [Ca2+]m signals are attenuated in
MICU1-KD, as previously reported (Perocchi et al., 2010); but
(3) some [Ca2+]m rise can be evoked by small [Ca2+]c increases
in MICU1-KD.
[Ca2+]m reflects the combined contributions of mitochondrial
Ca2+ fluxes (mtCU-mediated uptake and exchanger-mediated
efflux) and Ca2+ chelation within the matrix. In intact cells, the
mitochondrial Ca2+ content can be estimated by the [Ca2+]c in-
crease evoked by a mitochondrial uncoupler. Addition of FCCP
after SOCE resulted in a larger [Ca2+]c increase in MICU1-KD
than in Ctrl (Figures 1J and 1L). The surplus Ca2+ is likely seques-
tered by mitochondria, as the ER Ca2+ store was depleted by
pretreatment with thapsigargin (Tg), and washout of extracellular
Ca2+ did not prevent the greater [Ca2+]c response to FCCP in
MICU1-KD versus Ctrl (n = 3, data not shown). Uncoupler-sensi-
tive Ca2+ storage must occur during SOCE, since FCCP added
before SOCE caused no [Ca2+]c increase in either MICU1-KD
or Ctrl (Figure S1B, Figure 1K). Notably, the SOCE-induced
[Ca2+]c increase after FCCP pretreatment was larger in MICU1-
KD than in Ctrl (Figure 1K), indicating an augmented SOCE.
The rapid decay of the FCCP-induced Ca2+ mobilization
ell Metabolism 17, 976–987, June 4, 2013 ª2013 Elsevier Inc. 977
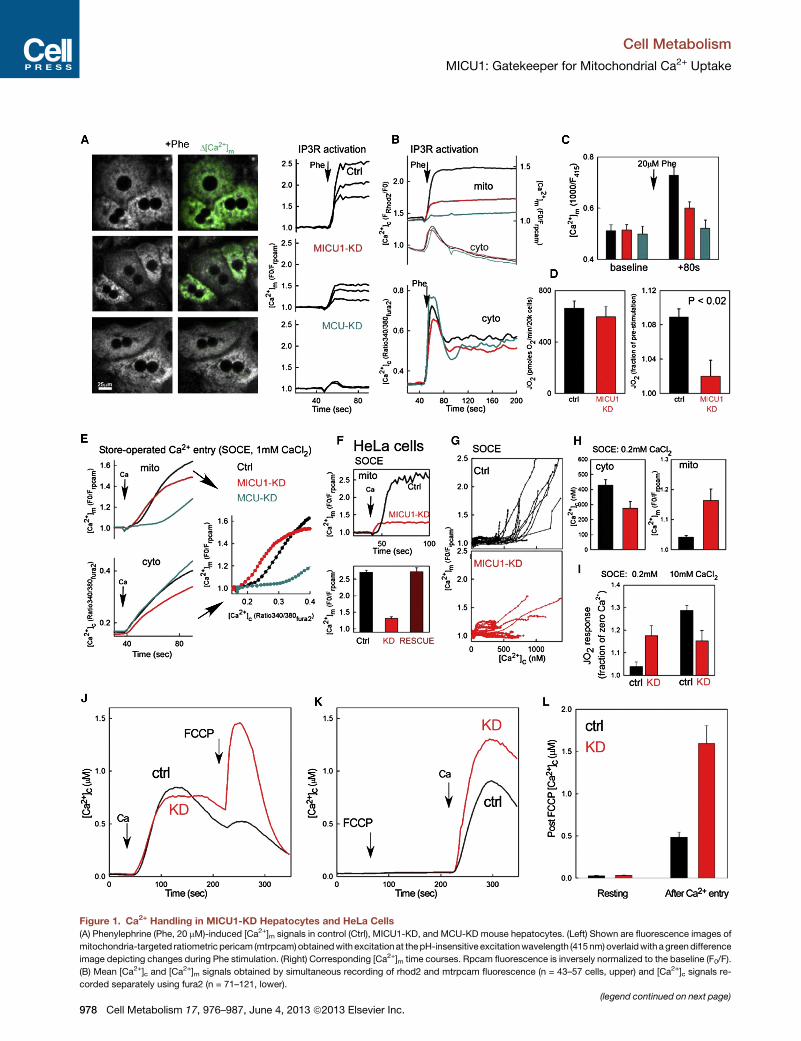
Figure 1. Ca2+ Handling in MICU1-KD Hepatocytes and HeLa Cells
(A) Phenylephrine (Phe, 20 mM)-induced [Ca2+]m signals in control (Ctrl), MICU1-KD, and MCU-KD mouse hepatocytes. (Left) Shown are fluorescence images of
mitochondria-targeted ratiometricpericam (mtrpcam)obtainedwithexcitationat thepH-insensitive excitationwavelength (415nm)overlaidwith agreendifference
image depicting changes during Phe stimulation. (Right) Corresponding [Ca2+]m time courses. Rpcam fluorescence is inversely normalized to the baseline (F0/F).
(B) Mean [Ca2+]c and [Ca2+]m signals obtained by simultaneous recording of rhod2 and mtrpcam fluorescence (n = 43–57 cells, upper) and [Ca2+]c signals re-
corded separately using fura2 (n = 71–121, lower).
(legend continued on next page)
Cell Metabolism
MICU1: Gatekeeper for Mitochondrial Ca2+ Uptake
978 Cell Metabolism 17, 976–987, June 4, 2013 ª2013 Elsevier Inc.
Cell Metabolism
MICU1: Gatekeeper for Mitochondrial Ca2+ Uptake
(Figure 1J) indicates that the plasma membrane Ca2+ pump re-
mains functional and therefore SOCE seems to be upregulated
as a consequence of MICU1 depletion. Importantly, inhibition
of mitochondrial Ca2+ uptake by FCCP pretreatment enhanced
the SOCE-induced [Ca2+]c rise in MICU1-KD, but not in Ctrl (Fig-
ure 1K versus Figure 1J), further suggesting that enhanced Ca2+
uptake by mitochondria effectively buffers [Ca2+]c during SOCE
in MICU1-KD. Thus MICU1-KD mitochondria avidly take up
Ca2+ during SOCE, whichmay be in part due to increased SOCE.
MICU1 Controls the Threshold of Mitochondrial Ca2+
UptakeTo directly monitor mitochondrial Ca2+ uptake, wemeasured the
ruthenium red (RuRed)-sensitive clearance of Ca2+ in the cyto-
plasmic buffer in suspensions of permeabilized HeLa cells (Fig-
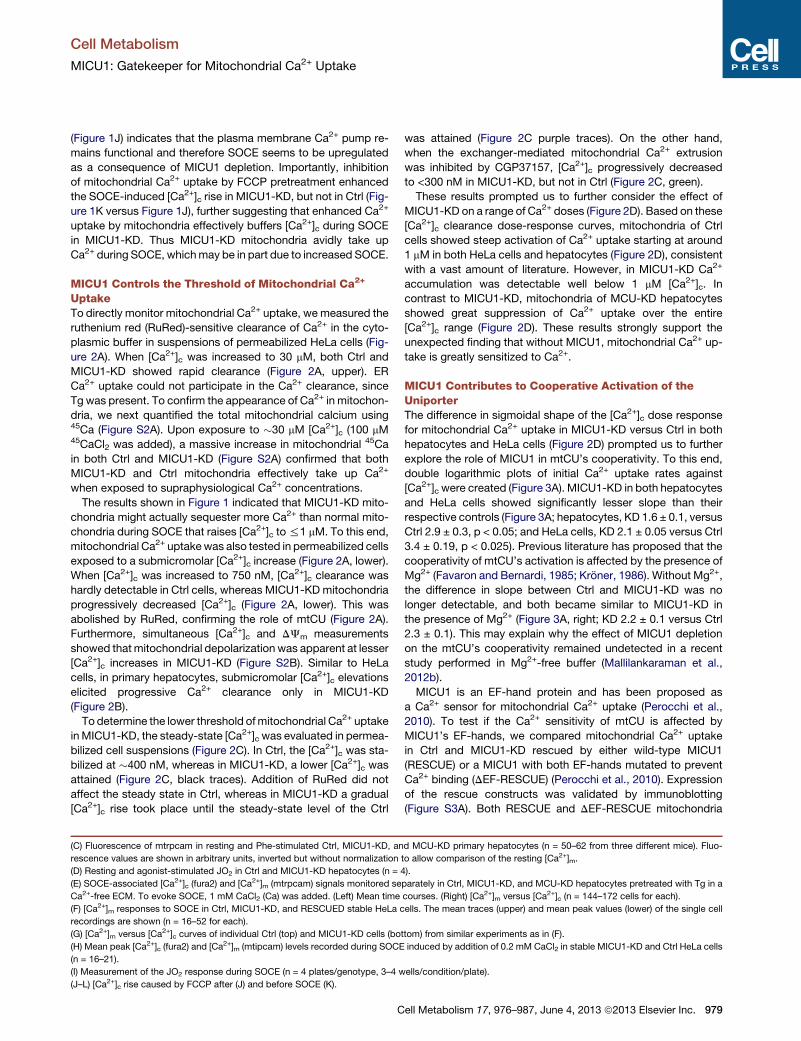
ure 2A). When [Ca2+]c was increased to 30 mM, both Ctrl and
MICU1-KD showed rapid clearance (Figure 2A, upper). ER
Ca2+ uptake could not participate in the Ca2+ clearance, since
Tg was present. To confirm the appearance of Ca2+ in mitochon-
dria, we next quantified the total mitochondrial calcium using45Ca (Figure S2A). Upon exposure to �30 mM [Ca2+]c (100 mM45CaCl2 was added), a massive increase in mitochondrial 45Ca
in both Ctrl and MICU1-KD (Figure S2A) confirmed that both
MICU1-KD and Ctrl mitochondria effectively take up Ca2+
when exposed to supraphysiological Ca2+ concentrations.
The results shown in Figure 1 indicated that MICU1-KD mito-
chondria might actually sequester more Ca2+ than normal mito-
chondria during SOCE that raises [Ca2+]c to%1 mM. To this end,
mitochondrial Ca2+ uptakewas also tested in permeabilized cells
exposed to a submicromolar [Ca2+]c increase (Figure 2A, lower).
When [Ca2+]c was increased to 750 nM, [Ca2+]c clearance was
hardly detectable in Ctrl cells, whereas MICU1-KD mitochondria
progressively decreased [Ca2+]c (Figure 2A, lower). This was
abolished by RuRed, confirming the role of mtCU (Figure 2A).
Furthermore, simultaneous [Ca2+]c and DJm measurements
showed thatmitochondrial depolarization was apparent at lesser
[Ca2+]c increases in MICU1-KD (Figure S2B). Similar to HeLa
cells, in primary hepatocytes, submicromolar [Ca2+]c elevations
elicited progressive Ca2+ clearance only in MICU1-KD
(Figure 2B).
To determine the lower threshold ofmitochondrial Ca2+ uptake
inMICU1-KD, the steady-state [Ca2+]c was evaluated in permea-
bilized cell suspensions (Figure 2C). In Ctrl, the [Ca2+]c was sta-
bilized at �400 nM, whereas in MICU1-KD, a lower [Ca2+]c was
attained (Figure 2C, black traces). Addition of RuRed did not
affect the steady state in Ctrl, whereas in MICU1-KD a gradual
[Ca2+]c rise took place until the steady-state level of the Ctrl
(C) Fluorescence of mtrpcam in resting and Phe-stimulated Ctrl, MICU1-KD, an
rescence values are shown in arbitrary units, inverted but without normalization
(D) Resting and agonist-stimulated JO2 in Ctrl and MICU1-KD hepatocytes (n =
(E) SOCE-associated [Ca2+]c (fura2) and [Ca2+]m (mtrpcam) signals monitored se
Ca2+-free ECM. To evoke SOCE, 1 mM CaCl2 (Ca) was added. (Left) Mean time
(F) [Ca2+]m responses to SOCE in Ctrl, MICU1-KD, and RESCUED stable HeLa c
recordings are shown (n = 16–52 for each).
(G) [Ca2+]m versus [Ca2+]c curves of individual Ctrl (top) and MICU1-KD cells (bo
(H) Mean peak [Ca2+]c (fura2) and [Ca2+]m (mtipcam) levels recorded during SOCE
(n = 16–21).
(I) Measurement of the JO2 response during SOCE (n = 4 plates/genotype, 3–4 w
(J–L) [Ca2+]c rise caused by FCCP after (J) and before SOCE (K).
C
was attained (Figure 2C purple traces). On the other hand,
when the exchanger-mediated mitochondrial Ca2+ extrusion
was inhibited by CGP37157, [Ca2+]c progressively decreased
to <300 nM in MICU1-KD, but not in Ctrl (Figure 2C, green).
These results prompted us to further consider the effect of
MICU1-KD on a range of Ca2+ doses (Figure 2D). Based on these
[Ca2+]c clearance dose-response curves, mitochondria of Ctrl
cells showed steep activation of Ca2+ uptake starting at around
1 mM in both HeLa cells and hepatocytes (Figure 2D), consistent
with a vast amount of literature. However, in MICU1-KD Ca2+
accumulation was detectable well below 1 mM [Ca2+]c. In
contrast to MICU1-KD, mitochondria of MCU-KD hepatocytes
showed great suppression of Ca2+ uptake over the entire
[Ca2+]c range (Figure 2D). These results strongly support the
unexpected finding that without MICU1, mitochondrial Ca2+ up-
take is greatly sensitized to Ca2+.
MICU1 Contributes to Cooperative Activation of theUniporterThe difference in sigmoidal shape of the [Ca2+]c dose response
for mitochondrial Ca2+ uptake in MICU1-KD versus Ctrl in both
hepatocytes and HeLa cells (Figure 2D) prompted us to further
explore the role of MICU1 in mtCU’s cooperativity. To this end,
double logarithmic plots of initial Ca2+ uptake rates against
[Ca2+]c were created (Figure 3A). MICU1-KD in both hepatocytes
and HeLa cells showed significantly lesser slope than their
respective controls (Figure 3A; hepatocytes, KD 1.6 ± 0.1, versus
Ctrl 2.9 ± 0.3, p < 0.05; and HeLa cells, KD 2.1 ± 0.05 versus Ctrl
3.4 ± 0.19, p < 0.025). Previous literature has proposed that the
cooperativity of mtCU’s activation is affected by the presence of
Mg2+ (Favaron and Bernardi, 1985; Kroner, 1986). Without Mg2+,
the difference in slope between Ctrl and MICU1-KD was no
longer detectable, and both became similar to MICU1-KD in
the presence of Mg2+ (Figure 3A, right; KD 2.2 ± 0.1 versus Ctrl
2.3 ± 0.1). This may explain why the effect of MICU1 depletion
on the mtCU’s cooperativity remained undetected in a recent
study performed in Mg2+-free buffer (Mallilankaraman et al.,
2012b).
MICU1 is an EF-hand protein and has been proposed as
a Ca2+ sensor for mitochondrial Ca2+ uptake (Perocchi et al.,
2010). To test if the Ca2+ sensitivity of mtCU is affected by
MICU1’s EF-hands, we compared mitochondrial Ca2+ uptake
in Ctrl and MICU1-KD rescued by either wild-type MICU1
(RESCUE) or a MICU1 with both EF-hands mutated to prevent
Ca2+ binding (DEF-RESCUE) (Perocchi et al., 2010). Expression
of the rescue constructs was validated by immunoblotting
(Figure S3A). Both RESCUE and DEF-RESCUE mitochondria
d MCU-KD primary hepatocytes (n = 50–62 from three different mice). Fluo-
to allow comparison of the resting [Ca2+]m.
4).
parately in Ctrl, MICU1-KD, and MCU-KD hepatocytes pretreated with Tg in a
courses. (Right) [Ca2+]m versus [Ca2+]c (n = 144–172 cells for each).
ells. The mean traces (upper) and mean peak values (lower) of the single cell
ttom) from similar experiments as in (F).
induced by addition of 0.2 mM CaCl2 in stable MICU1-KD and Ctrl HeLa cells
ells/condition/plate).
ell Metabolism 17, 976–987, June 4, 2013 ª2013 Elsevier Inc. 979
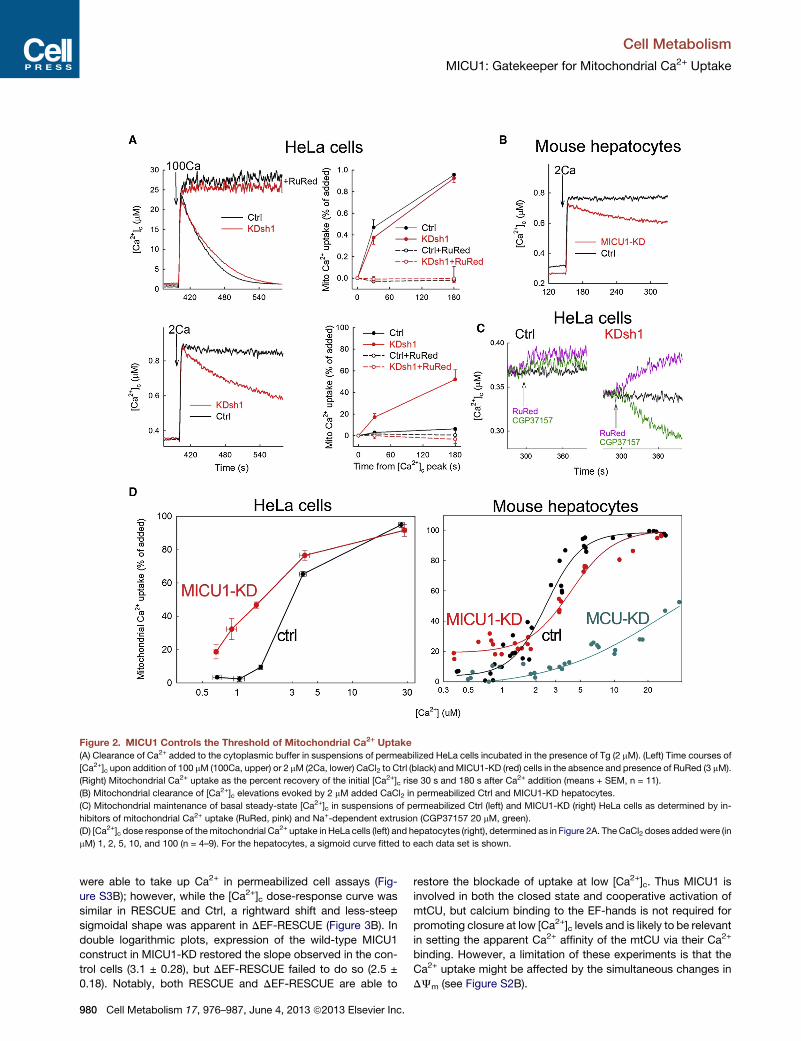
Figure 2. MICU1 Controls the Threshold of Mitochondrial Ca2+ Uptake
(A) Clearance of Ca2+ added to the cytoplasmic buffer in suspensions of permeabilized HeLa cells incubated in the presence of Tg (2 mM). (Left) Time courses of
[Ca2+]c upon addition of 100 mM (100Ca, upper) or 2 mM (2Ca, lower) CaCl2 to Ctrl (black) andMICU1-KD (red) cells in the absence and presence of RuRed (3 mM).
(Right) Mitochondrial Ca2+ uptake as the percent recovery of the initial [Ca2+]c rise 30 s and 180 s after Ca2+ addition (means + SEM, n = 11).
(B) Mitochondrial clearance of [Ca2+]c elevations evoked by 2 mM added CaCl2 in permeabilized Ctrl and MICU1-KD hepatocytes.
(C) Mitochondrial maintenance of basal steady-state [Ca2+]c in suspensions of permeabilized Ctrl (left) and MICU1-KD (right) HeLa cells as determined by in-
hibitors of mitochondrial Ca2+ uptake (RuRed, pink) and Na+-dependent extrusion (CGP37157 20 mM, green).
(D) [Ca2+]c dose response of themitochondrial Ca2+ uptake in HeLa cells (left) and hepatocytes (right), determined as in Figure 2A. The CaCl2 doses addedwere (in
mM) 1, 2, 5, 10, and 100 (n = 4–9). For the hepatocytes, a sigmoid curve fitted to each data set is shown.
Cell Metabolism
MICU1: Gatekeeper for Mitochondrial Ca2+ Uptake
were able to take up Ca2+ in permeabilized cell assays (Fig-
ure S3B); however, while the [Ca2+]c dose-response curve was
similar in RESCUE and Ctrl, a rightward shift and less-steep
sigmoidal shape was apparent in DEF-RESCUE (Figure 3B). In
double logarithmic plots, expression of the wild-type MICU1
construct in MICU1-KD restored the slope observed in the con-
trol cells (3.1 ± 0.28), but DEF-RESCUE failed to do so (2.5 ±
0.18). Notably, both RESCUE and DEF-RESCUE are able to
980 Cell Metabolism 17, 976–987, June 4, 2013 ª2013 Elsevier Inc.
restore the blockade of uptake at low [Ca2+]c. Thus MICU1 is
involved in both the closed state and cooperative activation of
mtCU, but calcium binding to the EF-hands is not required for
promoting closure at low [Ca2+]c levels and is likely to be relevant
in setting the apparent Ca2+ affinity of the mtCU via their Ca2+
binding. However, a limitation of these experiments is that the
Ca2+ uptake might be affected by the simultaneous changes in
DJm (see Figure S2B).
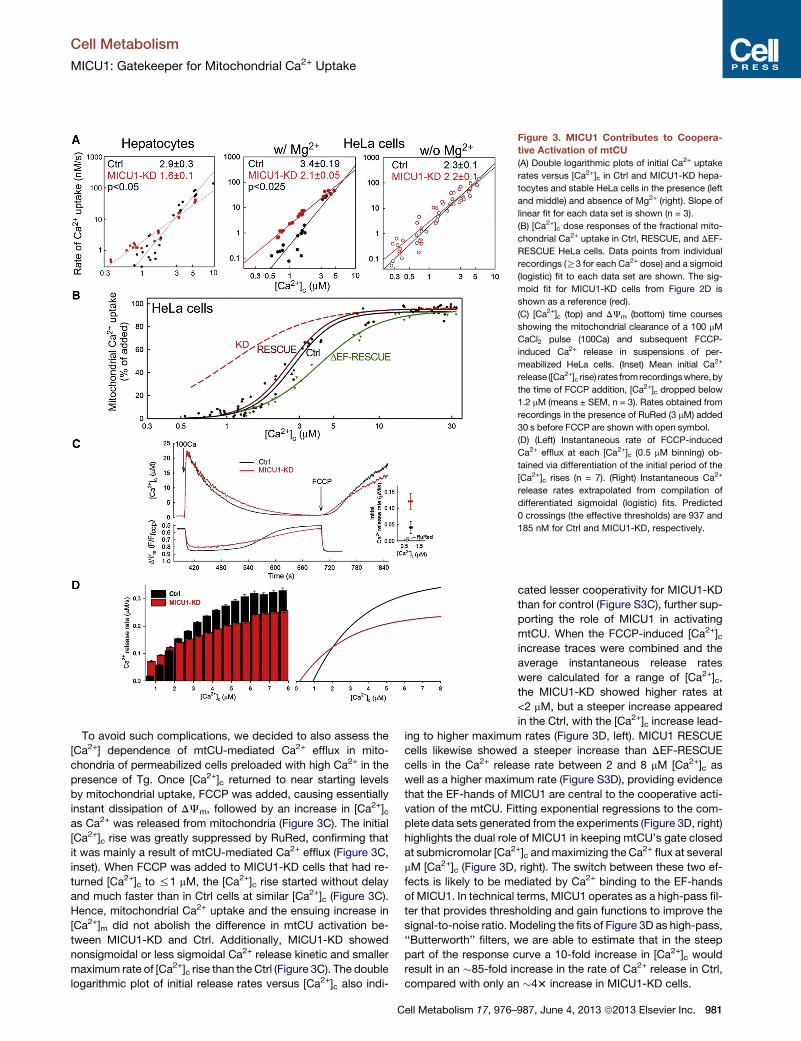
Figure 3. MICU1 Contributes to Coopera-
tive Activation of mtCU
(A) Double logarithmic plots of initial Ca2+ uptake
rates versus [Ca2+]c in Ctrl and MICU1-KD hepa-
tocytes and stable HeLa cells in the presence (left
and middle) and absence of Mg2+ (right). Slope of
linear fit for each data set is shown (n = 3).
(B) [Ca2+]c dose responses of the fractional mito-
chondrial Ca2+ uptake in Ctrl, RESCUE, and DEF-
RESCUE HeLa cells. Data points from individual
recordings (R3 for each Ca2+ dose) and a sigmoid
(logistic) fit to each data set are shown. The sig-
moid fit for MICU1-KD cells from Figure 2D is
shown as a reference (red).
(C) [Ca2+]c (top) and DJm (bottom) time courses
showing the mitochondrial clearance of a 100 mM
CaCl2 pulse (100Ca) and subsequent FCCP-
induced Ca2+ release in suspensions of per-
meabilized HeLa cells. (Inset) Mean initial Ca2+
release ([Ca2+]c rise) rates fromrecordingswhere,by
the time of FCCP addition, [Ca2+]c dropped below
1.2 mM (means ± SEM, n = 3). Rates obtained from
recordings in the presence of RuRed (3 mM) added
30 s before FCCP are shown with open symbol.
(D) (Left) Instantaneous rate of FCCP-induced
Ca2+ efflux at each [Ca2+]c (0.5 mM binning) ob-
tained via differentiation of the initial period of the
[Ca2+]c rises (n = 7). (Right) Instantaneous Ca2+
release rates extrapolated from compilation of
differentiated sigmoidal (logistic) fits. Predicted
0 crossings (the effective thresholds) are 937 and
185 nM for Ctrl and MICU1-KD, respectively.
Cell Metabolism
MICU1: Gatekeeper for Mitochondrial Ca2+ Uptake
To avoid such complications, we decided to also assess the
[Ca2+] dependence of mtCU-mediated Ca2+ efflux in mito-
chondria of permeabilized cells preloaded with high Ca2+ in the
presence of Tg. Once [Ca2+]c returned to near starting levels
by mitochondrial uptake, FCCP was added, causing essentially
instant dissipation of DJm, followed by an increase in [Ca2+]cas Ca2+ was released from mitochondria (Figure 3C). The initial
[Ca2+]c rise was greatly suppressed by RuRed, confirming that
it was mainly a result of mtCU-mediated Ca2+ efflux (Figure 3C,
inset). When FCCP was added to MICU1-KD cells that had re-
turned [Ca2+]c to %1 mM, the [Ca2+]c rise started without delay
and much faster than in Ctrl cells at similar [Ca2+]c (Figure 3C).
Hence, mitochondrial Ca2+ uptake and the ensuing increase in
[Ca2+]m did not abolish the difference in mtCU activation be-
tween MICU1-KD and Ctrl. Additionally, MICU1-KD showed
nonsigmoidal or less sigmoidal Ca2+ release kinetic and smaller
maximum rate of [Ca2+]c rise than the Ctrl (Figure 3C). The double
logarithmic plot of initial release rates versus [Ca2+]c also indi-
Cell Metabolism 17, 976–
cated lesser cooperativity for MICU1-KD
than for control (Figure S3C), further sup-
porting the role of MICU1 in activating
mtCU. When the FCCP-induced [Ca2+]cincrease traces were combined and the
average instantaneous release rates
were calculated for a range of [Ca2+]c,
the MICU1-KD showed higher rates at
<2 mM, but a steeper increase appeared
in the Ctrl, with the [Ca2+]c increase lead-
ing to higher maximum rates (Figure 3D, left). MICU1 RESCUE
cells likewise showed a steeper increase than DEF-RESCUE
cells in the Ca2+ release rate between 2 and 8 mM [Ca2+]c as
well as a higher maximum rate (Figure S3D), providing evidence
that the EF-hands of MICU1 are central to the cooperative acti-
vation of the mtCU. Fitting exponential regressions to the com-
plete data sets generated from the experiments (Figure 3D, right)
highlights the dual role of MICU1 in keeping mtCU’s gate closed
at submicromolar [Ca2+]c andmaximizing the Ca2+ flux at several
mM [Ca2+]c (Figure 3D, right). The switch between these two ef-
fects is likely to be mediated by Ca2+ binding to the EF-hands
of MICU1. In technical terms, MICU1 operates as a high-pass fil-
ter that provides thresholding and gain functions to improve the
signal-to-noise ratio. Modeling the fits of Figure 3D as high-pass,
‘‘Butterworth’’ filters, we are able to estimate that in the steep
part of the response curve a 10-fold increase in [Ca2+]c would
result in an �85-fold increase in the rate of Ca2+ release in Ctrl,
compared with only an �43 increase in MICU1-KD cells.
987, June 4, 2013 ª2013 Elsevier Inc. 981
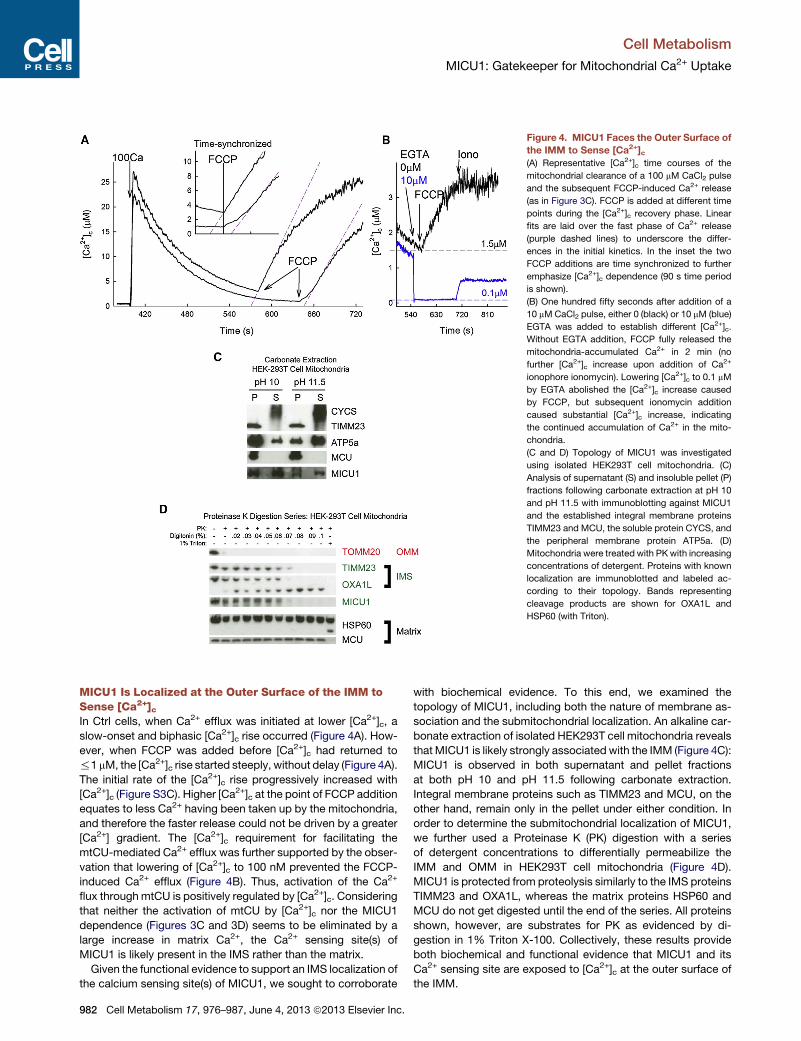
Figure 4. MICU1 Faces the Outer Surface of
the IMM to Sense [Ca2+]c(A) Representative [Ca2+]c time courses of the
mitochondrial clearance of a 100 mM CaCl2 pulse
and the subsequent FCCP-induced Ca2+ release
(as in Figure 3C). FCCP is added at different time
points during the [Ca2+]c recovery phase. Linear
fits are laid over the fast phase of Ca2+ release
(purple dashed lines) to underscore the differ-
ences in the initial kinetics. In the inset the two
FCCP additions are time synchronized to further
emphasize [Ca2+]c dependence (90 s time period
is shown).
(B) One hundred fifty seconds after addition of a
10 mMCaCl2 pulse, either 0 (black) or 10 mM (blue)
EGTA was added to establish different [Ca2+]c.
Without EGTA addition, FCCP fully released the
mitochondria-accumulated Ca2+ in 2 min (no
further [Ca2+]c increase upon addition of Ca2+
ionophore ionomycin). Lowering [Ca2+]c to 0.1 mM
by EGTA abolished the [Ca2+]c increase caused
by FCCP, but subsequent ionomycin addition
caused substantial [Ca2+]c increase, indicating
the continued accumulation of Ca2+ in the mito-
chondria.
(C and D) Topology of MICU1 was investigated
using isolated HEK293T cell mitochondria. (C)
Analysis of supernatant (S) and insoluble pellet (P)
fractions following carbonate extraction at pH 10
and pH 11.5 with immunoblotting against MICU1
and the established integral membrane proteins
TIMM23 and MCU, the soluble protein CYCS, and
the peripheral membrane protein ATP5a. (D)
Mitochondria were treated with PKwith increasing
concentrations of detergent. Proteins with known
localization are immunoblotted and labeled ac-
cording to their topology. Bands representing
cleavage products are shown for OXA1L and
HSP60 (with Triton).
Cell Metabolism
MICU1: Gatekeeper for Mitochondrial Ca2+ Uptake
MICU1 Is Localized at the Outer Surface of the IMM toSense [Ca2+]cIn Ctrl cells, when Ca2+ efflux was initiated at lower [Ca2+]c, a
slow-onset and biphasic [Ca2+]c rise occurred (Figure 4A). How-
ever, when FCCP was added before [Ca2+]c had returned to
%1 mM, the [Ca2+]c rise started steeply, without delay (Figure 4A).
The initial rate of the [Ca2+]c rise progressively increased with
[Ca2+]c (Figure S3C). Higher [Ca2+]c at the point of FCCP addition
equates to less Ca2+ having been taken up by the mitochondria,
and therefore the faster release could not be driven by a greater
[Ca2+] gradient. The [Ca2+]c requirement for facilitating the
mtCU-mediated Ca2+ efflux was further supported by the obser-
vation that lowering of [Ca2+]c to 100 nM prevented the FCCP-
induced Ca2+ efflux (Figure 4B). Thus, activation of the Ca2+
flux throughmtCU is positively regulated by [Ca2+]c. Considering
that neither the activation of mtCU by [Ca2+]c nor the MICU1
dependence (Figures 3C and 3D) seems to be eliminated by a
large increase in matrix Ca2+, the Ca2+ sensing site(s) of
MICU1 is likely present in the IMS rather than the matrix.
Given the functional evidence to support an IMS localization of
the calcium sensing site(s) of MICU1, we sought to corroborate
982 Cell Metabolism 17, 976–987, June 4, 2013 ª2013 Elsevier Inc.
with biochemical evidence. To this end, we examined the
topology of MICU1, including both the nature of membrane as-
sociation and the submitochondrial localization. An alkaline car-
bonate extraction of isolated HEK293T cell mitochondria reveals
thatMICU1 is likely strongly associated with the IMM (Figure 4C):
MICU1 is observed in both supernatant and pellet fractions
at both pH 10 and pH 11.5 following carbonate extraction.
Integral membrane proteins such as TIMM23 and MCU, on the
other hand, remain only in the pellet under either condition. In
order to determine the submitochondrial localization of MICU1,
we further used a Proteinase K (PK) digestion with a series
of detergent concentrations to differentially permeabilize the
IMM and OMM in HEK293T cell mitochondria (Figure 4D).
MICU1 is protected from proteolysis similarly to the IMS proteins
TIMM23 and OXA1L, whereas the matrix proteins HSP60 and
MCU do not get digested until the end of the series. All proteins
shown, however, are substrates for PK as evidenced by di-
gestion in 1% Triton X-100. Collectively, these results provide
both biochemical and functional evidence that MICU1 and its
Ca2+ sensing site are exposed to [Ca2+]c at the outer surface of
the IMM.
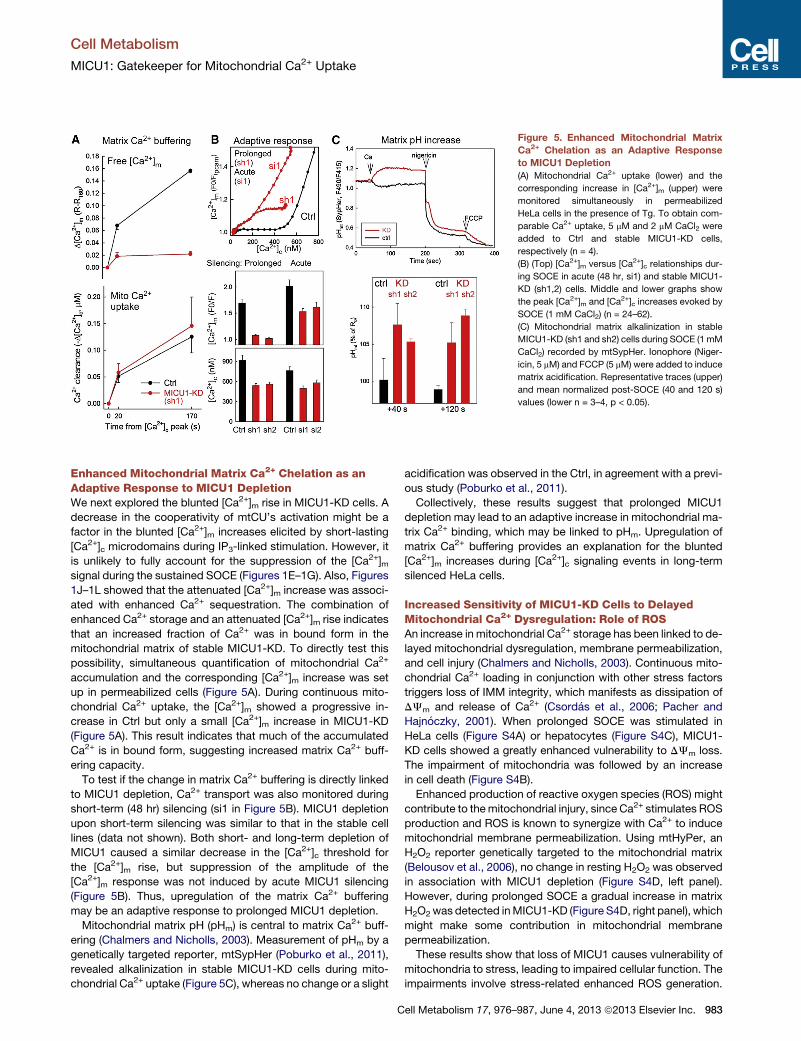
Figure 5. Enhanced Mitochondrial Matrix
Ca2+ Chelation as an Adaptive Response
to MICU1 Depletion
(A) Mitochondrial Ca2+ uptake (lower) and the
corresponding increase in [Ca2+]m (upper) were
monitored simultaneously in permeabilized
HeLa cells in the presence of Tg. To obtain com-
parable Ca2+ uptake, 5 mM and 2 mM CaCl2 were
added to Ctrl and stable MICU1-KD cells,
respectively (n = 4).
(B) (Top) [Ca2+]m versus [Ca2+]c relationships dur-
ing SOCE in acute (48 hr, si1) and stable MICU1-
KD (sh1,2) cells. Middle and lower graphs show
the peak [Ca2+]m and [Ca2+]c increases evoked by
SOCE (1 mM CaCl2) (n = 24–62).
(C) Mitochondrial matrix alkalinization in stable
MICU1-KD (sh1 and sh2) cells during SOCE (1 mM
CaCl2) recorded by mtSypHer. Ionophore (Niger-
icin, 5 mM) and FCCP (5 mM) were added to induce
matrix acidification. Representative traces (upper)
and mean normalized post-SOCE (40 and 120 s)
values (lower n = 3–4, p < 0.05).
Cell Metabolism
MICU1: Gatekeeper for Mitochondrial Ca2+ Uptake
Enhanced Mitochondrial Matrix Ca2+ Chelation as anAdaptive Response to MICU1 DepletionWe next explored the blunted [Ca2+]m rise in MICU1-KD cells. A
decrease in the cooperativity of mtCU’s activation might be a
factor in the blunted [Ca2+]m increases elicited by short-lasting
[Ca2+]c microdomains during IP3-linked stimulation. However, it
is unlikely to fully account for the suppression of the [Ca2+]msignal during the sustained SOCE (Figures 1E–1G). Also, Figures
1J–1L showed that the attenuated [Ca2+]m increase was associ-
ated with enhanced Ca2+ sequestration. The combination of
enhanced Ca2+ storage and an attenuated [Ca2+]m rise indicates
that an increased fraction of Ca2+ was in bound form in the
mitochondrial matrix of stable MICU1-KD. To directly test this
possibility, simultaneous quantification of mitochondrial Ca2+
accumulation and the corresponding [Ca2+]m increase was set
up in permeabilized cells (Figure 5A). During continuous mito-
chondrial Ca2+ uptake, the [Ca2+]m showed a progressive in-
crease in Ctrl but only a small [Ca2+]m increase in MICU1-KD
(Figure 5A). This result indicates that much of the accumulated
Ca2+ is in bound form, suggesting increased matrix Ca2+ buff-
ering capacity.
To test if the change in matrix Ca2+ buffering is directly linked
to MICU1 depletion, Ca2+ transport was also monitored during
short-term (48 hr) silencing (si1 in Figure 5B). MICU1 depletion
upon short-term silencing was similar to that in the stable cell
lines (data not shown). Both short- and long-term depletion of
MICU1 caused a similar decrease in the [Ca2+]c threshold for
the [Ca2+]m rise, but suppression of the amplitude of the
[Ca2+]m response was not induced by acute MICU1 silencing
(Figure 5B). Thus, upregulation of the matrix Ca2+ buffering
may be an adaptive response to prolonged MICU1 depletion.
Mitochondrial matrix pH (pHm) is central to matrix Ca2+ buff-
ering (Chalmers and Nicholls, 2003). Measurement of pHm by a
genetically targeted reporter, mtSypHer (Poburko et al., 2011),
revealed alkalinization in stable MICU1-KD cells during mito-
chondrial Ca2+ uptake (Figure 5C), whereas no change or a slight
C
acidification was observed in the Ctrl, in agreement with a previ-
ous study (Poburko et al., 2011).
Collectively, these results suggest that prolonged MICU1
depletion may lead to an adaptive increase in mitochondrial ma-
trix Ca2+ binding, which may be linked to pHm. Upregulation of
matrix Ca2+ buffering provides an explanation for the blunted
[Ca2+]m increases during [Ca2+]c signaling events in long-term
silenced HeLa cells.
Increased Sensitivity of MICU1-KD Cells to DelayedMitochondrial Ca2+ Dysregulation: Role of ROSAn increase in mitochondrial Ca2+ storage has been linked to de-
layed mitochondrial dysregulation, membrane permeabilization,
and cell injury (Chalmers and Nicholls, 2003). Continuous mito-
chondrial Ca2+ loading in conjunction with other stress factors
triggers loss of IMM integrity, which manifests as dissipation of
DJm and release of Ca2+ (Csordas et al., 2006; Pacher and
Hajnoczky, 2001). When prolonged SOCE was stimulated in
HeLa cells (Figure S4A) or hepatocytes (Figure S4C), MICU1-
KD cells showed a greatly enhanced vulnerability to DJm loss.
The impairment of mitochondria was followed by an increase
in cell death (Figure S4B).
Enhanced production of reactive oxygen species (ROS) might
contribute to themitochondrial injury, since Ca2+ stimulates ROS
production and ROS is known to synergize with Ca2+ to induce
mitochondrial membrane permeabilization. Using mtHyPer, an
H2O2 reporter genetically targeted to the mitochondrial matrix
(Belousov et al., 2006), no change in resting H2O2 was observed
in association with MICU1 depletion (Figure S4D, left panel).
However, during prolonged SOCE a gradual increase in matrix
H2O2was detected inMICU1-KD (Figure S4D, right panel), which
might make some contribution in mitochondrial membrane
permeabilization.
These results show that loss of MICU1 causes vulnerability of
mitochondria to stress, leading to impaired cellular function. The
impairments involve stress-related enhanced ROS generation.
ell Metabolism 17, 976–987, June 4, 2013 ª2013 Elsevier Inc. 983
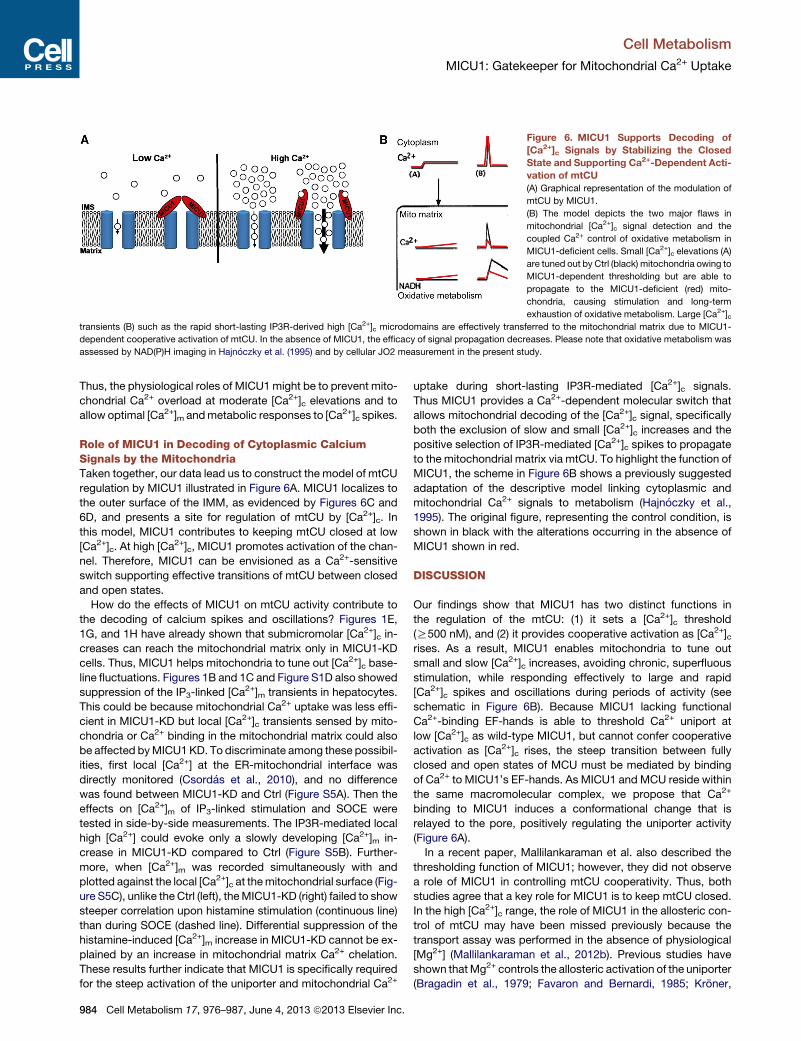
Figure 6. MICU1 Supports Decoding of
[Ca2+]c Signals by Stabilizing the Closed
State and Supporting Ca2+-Dependent Acti-
vation of mtCU
(A) Graphical representation of the modulation of
mtCU by MICU1.
(B) The model depicts the two major flaws in
mitochondrial [Ca2+]c signal detection and the
coupled Ca2+ control of oxidative metabolism in
MICU1-deficient cells. Small [Ca2+]c elevations (A)
are tuned out by Ctrl (black) mitochondria owing to
MICU1-dependent thresholding but are able to
propagate to the MICU1-deficient (red) mito-
chondria, causing stimulation and long-term
exhaustion of oxidative metabolism. Large [Ca2+]ctransients (B) such as the rapid short-lasting IP3R-derived high [Ca2+]c microdomains are effectively transferred to the mitochondrial matrix due to MICU1-
dependent cooperative activation of mtCU. In the absence of MICU1, the efficacy of signal propagation decreases. Please note that oxidative metabolism was
assessed by NAD(P)H imaging in Hajnoczky et al. (1995) and by cellular JO2 measurement in the present study.
Cell Metabolism
MICU1: Gatekeeper for Mitochondrial Ca2+ Uptake
Thus, the physiological roles of MICU1might be to prevent mito-
chondrial Ca2+ overload at moderate [Ca2+]c elevations and to
allow optimal [Ca2+]m andmetabolic responses to [Ca2+]c spikes.
Role of MICU1 in Decoding of Cytoplasmic CalciumSignals by the MitochondriaTaken together, our data lead us to construct the model of mtCU
regulation by MICU1 illustrated in Figure 6A. MICU1 localizes to
the outer surface of the IMM, as evidenced by Figures 6C and
6D, and presents a site for regulation of mtCU by [Ca2+]c. In
this model, MICU1 contributes to keeping mtCU closed at low
[Ca2+]c. At high [Ca2+]c, MICU1 promotes activation of the chan-
nel. Therefore, MICU1 can be envisioned as a Ca2+-sensitive
switch supporting effective transitions of mtCU between closed
and open states.
How do the effects of MICU1 on mtCU activity contribute to
the decoding of calcium spikes and oscillations? Figures 1E,
1G, and 1H have already shown that submicromolar [Ca2+]c in-
creases can reach the mitochondrial matrix only in MICU1-KD
cells. Thus, MICU1 helps mitochondria to tune out [Ca2+]c base-
line fluctuations. Figures 1B and 1C and Figure S1D also showed
suppression of the IP3-linked [Ca2+]m transients in hepatocytes.
This could be because mitochondrial Ca2+ uptake was less effi-
cient in MICU1-KD but local [Ca2+]c transients sensed by mito-
chondria or Ca2+ binding in the mitochondrial matrix could also
be affected byMICU1KD. To discriminate among these possibil-
ities, first local [Ca2+] at the ER-mitochondrial interface was
directly monitored (Csordas et al., 2010), and no difference
was found between MICU1-KD and Ctrl (Figure S5A). Then the
effects on [Ca2+]m of IP3-linked stimulation and SOCE were
tested in side-by-side measurements. The IP3R-mediated local
high [Ca2+] could evoke only a slowly developing [Ca2+]m in-
crease in MICU1-KD compared to Ctrl (Figure S5B). Further-
more, when [Ca2+]m was recorded simultaneously with and
plotted against the local [Ca2+]c at themitochondrial surface (Fig-
ure S5C), unlike the Ctrl (left), theMICU1-KD (right) failed to show
steeper correlation upon histamine stimulation (continuous line)
than during SOCE (dashed line). Differential suppression of the
histamine-induced [Ca2+]m increase in MICU1-KD cannot be ex-
plained by an increase in mitochondrial matrix Ca2+ chelation.
These results further indicate that MICU1 is specifically required
for the steep activation of the uniporter and mitochondrial Ca2+
984 Cell Metabolism 17, 976–987, June 4, 2013 ª2013 Elsevier Inc.
uptake during short-lasting IP3R-mediated [Ca2+]c signals.
Thus MICU1 provides a Ca2+-dependent molecular switch that
allows mitochondrial decoding of the [Ca2+]c signal, specifically
both the exclusion of slow and small [Ca2+]c increases and the
positive selection of IP3R-mediated [Ca2+]c spikes to propagate
to the mitochondrial matrix via mtCU. To highlight the function of
MICU1, the scheme in Figure 6B shows a previously suggested
adaptation of the descriptive model linking cytoplasmic and
mitochondrial Ca2+ signals to metabolism (Hajnoczky et al.,
1995). The original figure, representing the control condition, is
shown in black with the alterations occurring in the absence of
MICU1 shown in red.
DISCUSSION
Our findings show that MICU1 has two distinct functions in
the regulation of the mtCU: (1) it sets a [Ca2+]c threshold
(R500 nM), and (2) it provides cooperative activation as [Ca2+]crises. As a result, MICU1 enables mitochondria to tune out
small and slow [Ca2+]c increases, avoiding chronic, superfluous
stimulation, while responding effectively to large and rapid
[Ca2+]c spikes and oscillations during periods of activity (see
schematic in Figure 6B). Because MICU1 lacking functional
Ca2+-binding EF-hands is able to threshold Ca2+ uniport at
low [Ca2+]c as wild-type MICU1, but cannot confer cooperative
activation as [Ca2+]c rises, the steep transition between fully
closed and open states of MCU must be mediated by binding
of Ca2+ to MICU1’s EF-hands. As MICU1 and MCU reside within
the same macromolecular complex, we propose that Ca2+
binding to MICU1 induces a conformational change that is
relayed to the pore, positively regulating the uniporter activity
(Figure 6A).
In a recent paper, Mallilankaraman et al. also described the
thresholding function of MICU1; however, they did not observe
a role of MICU1 in controlling mtCU cooperativity. Thus, both
studies agree that a key role for MICU1 is to keep mtCU closed.
In the high [Ca2+]c range, the role of MICU1 in the allosteric con-
trol of mtCU may have been missed previously because the
transport assay was performed in the absence of physiological
[Mg2+] (Mallilankaraman et al., 2012b). Previous studies have
shown thatMg2+ controls the allosteric activation of the uniporter
(Bragadin et al., 1979; Favaron and Bernardi, 1985; Kroner,
Cell Metabolism
MICU1: Gatekeeper for Mitochondrial Ca2+ Uptake
1986), and we demonstrate here that Mg2+ is needed to support
the effect of MICU1 on mtCU cooperativity (Figure S3).
Our results show that resting [Ca2+]m is unaltered inMICU1-KD
cells, but the IP3R-mediated increase of [Ca2+]m is suppressed
(Figure 1). Previously, Perocchi et al. described suppression of
both resting and stimulated [Ca2+]m levels in HeLa cells (Perocchi
et al., 2010), and Mallilankaraman et al. reported an elevation of
the resting [Ca2+]m but no change in the IP3R-mediated increase
(Mallilankaraman et al., 2012b). The reasons for the differences
appear to be at least in part technical. Mallilankaraman et al.
used a nonratiometric dye-based assay (rhod2) to record
[Ca2+]m without calibration or confirmation of dye distribution.
This way, fluorescence intensity values may not equate to Ca2+
concentrations. MCU or MICU1 silencing may also change
rhod2 accumulation to the mitochondria and in other organelles.
To avoid these problems, we used genetically targeted Ca2+
sensors, as did Perocchi et al. However, these probes can be
influenced by pH, and we have documented alkalinization in
the mitochondrial matrix during SOCE in MICU1-KD (Figure 5).
Therefore, we used multiple probes, including ratiometric peri-
cam that is pH insensitive when excited at 415 nm (Jiang et al.,
2009) (Figure 1). Moreover, we estimated the resting mitochon-
drial Ca2+ by monitoring [Ca2+]c increase caused by uncoupling
in intact cells (Figure S1). All these results suggest that inMICU1-
KD cells, mitochondria do not take up Ca2+ at the resting [Ca2+]cwhich is set by high-affinity plasma membrane and ER Ca2+
pumps (%100 nM). However, when Ca2+ pumps are disabled,
mitochondria establish a steady state of [Ca2+]c <300 nM in
MICU1-KD (Figure 2C). Therefore a possible explanation for
any elevated basal [Ca2+]m by Mallilankaraman et al. can be
that the resting [Ca2+]c was somewhat higher or the Ca2+ pumps
were less active in their model.
The attenuated IP3R-mediated [Ca2+]m increase likely reflects
decreased uptake in response to the high [Ca2+]c microdomains
due to lessened cooperativity in mtCU activation. Furthermore,
we have shown that depletion of MICU1 induces adaptive re-
sponses that include an increase in the bound fraction of total
mitochondrial calcium (Figure 5). This adaptation is more
apparent in stable (long-term) than in short-term silencing (Fig-
ure 5B). Notably, we also observed some increase in
the exchanger-mediated mitochondrial Ca2+ efflux in stable
MICU1-KD (data not shown), which may contribute to lowering
the mitochondrial Ca2+ load. Thus, model-specific differences
in the compensatory responses might also contribute to the vari-
ability in suppression of the [Ca2+]m signal shown in the three
studies.
Mitochondria in most tissues and cell types effectively
respond to [Ca2+]c spikes and oscillations that involve elevation
of the global [Ca2+]c to �1 mM. This has been attributed to stra-
tegic localization of mitochondria close to Ca2+ release channels
of the ER/SR (Csordas et al., 1999; Hajnoczky et al., 1995; Lawrie
et al., 1996; Rizzuto et al., 1993; Rizzuto et al., 1998), because
these mitochondria are exposed to local [Ca2+] rises attaining
5–10 mM (Csordas et al., 2010; Giacomello et al., 2010). How-
ever, these local [Ca2+] increases are usually short-lasting.
Therefore, it is central to the mitochondrial sensing of the
[Ca2+]c spikes that mitochondrial Ca2+ uptake is rapidly and
steeply activated in the micromolar range of [Ca2+]c. Indeed, a
regulatory Ca2+-binding site has already been proposed (Csor-
C
das and Hajnoczky, 2003; Gunter and Pfeiffer, 1990; Kroner,
1986). However, the Ca2+ sensor remained elusive. Here, we
demonstrated that the cooperative activation of mtCU is sup-
pressed in cells lacking MICU1 or expressing MICU1 mutated
at both Ca2+ binding EF-hand domains. Thus, MICU1 represents
a molecular switch that binds Ca2+ to sharply enhance mtCU-
mediated Ca2+ influx in the micromolar [Ca2+]c range.
Previously, patch-clamp studies demonstrated that IMiCa
amplitude was not noticeably altered when pipette (intramito-
plast) [Ca2+] was varied from <10 nM to about 10 mM (Kirichok
et al., 2004). Furthermore, our results demonstrated that pre-
loading of mitochondria with Ca2+ (1) did not affect the biphasic
kinetic of mtCU-mediated Ca2+ flux (Figure 4A) and (2) did not
attenuate the MICU1-dependent difference in the Ca2+ flux if
submicromolar [Ca2+]c was restored (Figure 3). We further
show biochemical evidence that MICU1 faces the IMS, and not
the matrix as previously reported (Mallilankaraman et al.,
2012b), and probably its EF-hands form the proposed allosteric
Ca2+ regulatory site of mtCU in the IMS (Igbavboa and Pfeiffer,
1988).
Mitochondria isolated from various tissues and in a wide range
of cell lines display minimal Ca2+ uptake in the physiological
range of global [Ca2+]c (Gunter et al., 1994), though higher-affin-
ity mitochondrial Ca2+ uptake has been documented in some
hormone-producing cell types and cardiac muscle (Sparagna
et al., 1995; Spat et al., 2008). Similar to most tissues and cell
types, in primary hepatocytes and HeLa cells, mitochondrial
Ca2+ uptake is noticeable only in the micromolar [Ca2+]c range,
and a [Ca2+]m increase requires R500 nM [Ca2+]c in practically
every cell (Figure 1). By contrast, in MICU1-deficient cells mito-
chondrial Ca2+ uptake is detectable below 300 nM of [Ca2+]c(Figures 1 and 2). This difference does not seem to have much
effect onmitochondrial Ca2+ handlingwhen [Ca2+]c ismaintained
at the resting level (<100 nM) by the activity of the high-affinity
plasmamembrane and ER Ca2+ pumps. However, submicromo-
lar [Ca2+]c fluctuations that are normally ignored by the mito-
chondria in plain cells are routed to the mitochondria if MICU1
expression is decreased. Thus physiological changes in global
[Ca2+]c that are handled mostly by the plasma membrane and
ER Ca2+ pumps in normal cells are shifted toward mitochondria
if MICU1 is not expressed at normal levels.
MICU1 resides in a complex with MCU, which is hypothesized
to be the pore-forming component of mtCU, since it is sufficient
by itself to provide a current in planar bilayers similar to IMiCa
(Baughman et al., 2011; De Stefani et al., 2011; Kirichok et al.,
2004). At present we do not know whether MICU1 impacts the
ion selectivity of mtCU. Our data indicate that MICU1 without
bound Ca2+ helps to keep the gate closed at submicromolar
[Ca2+]c. At higher [Ca2+]c, mtCU activity increases even without
MICU1 or if the EF-hands are mutated, but a much steeper acti-
vation is seen with native MICU1. These results are in line with
earlier observations that the open probability for IMiCa in mito-
plasts, where MICU1 is expected to be present, is much higher
than that of the reconstituted MCU channel in lipid bilayer under
comparable electrical (�160 mV) and [Ca2+] (symmetrical
�100 mM) conditions (De Stefani et al., 2011; Kirichok et al.,
2004). Our prediction, then, is that binding of Ca2+ to MICU1 re-
sults in a conformational change sensed by the MCU and trans-
lated to positive cooperative gating of the channel by Ca2+. Many
ell Metabolism 17, 976–987, June 4, 2013 ª2013 Elsevier Inc. 985
Cell Metabolism
MICU1: Gatekeeper for Mitochondrial Ca2+ Uptake
ion channels of the plasmamembrane or ER/SR are regulated by
Ca2+ binding. In most cases the pore-forming component of the
channel contains a Ca2+ binding site(s) (e.g., L-type voltage-
gated Ca2+ channels, BK channels, TRPV5/6, IP3R, RyR). How-
ever, in some cases a separate Ca2+ sensing protein is employed
to control the gate, such as calmodulin for the SK potassium
channels and STIM1 for ORAI. Perhaps the closest analog to
our model of mtCU is the SK channel, where calmodulin is
permanently associated with the pore and upon binding of
Ca2+ triggers the opening of the gate (Fakler and Adelman, 2008).
The current study proposes a simple model that combines the
Ca2+-sensing activity of MICU1 and the pore-forming subunit
MCU (Figure 6); however, the mechanisms controlling mtCU dy-
namics are likely to bemore complicated. While our experiments
were performed in HeLa cells and in some cases hepatocytes as
well, we anticipate variation across cell and tissue types. MICU2,
a paralog of MICU1, resides within the MICU1/MCU complex
(Plovanich et al., 2013). MCU itself has a paralog, CCDC109b,
whose function is still not clear. Several other regulators,
including MCUR1 (Mallilankaraman et al., 2012a), have been
identified that may interact more indirectly. We anticipate that
the relationship between MICU1/2 and MCU is particularly inti-
mate, given the striking coevolution of these proteins (Baughman
et al., 2011; Bick et al., 2012), their strong coexpression (Baugh-
man et al., 2011), and their genomic adjacency (Bick et al., 2012).
Decoding of [Ca2+]c spikes and oscillations by mtCU was
shown to be central to cytoplasmic Ca2+ signaling (Hajnoczky
et al., 1999; Jouaville et al., 1995; Tinel et al., 1999), to control
of oxidative metabolism (Hajnoczky et al., 1995; Jouaville
et al., 1999; Robb-Gaspers et al., 1998), and even to induction
of apoptosis under conditions of cellular stress (Szalai et al.,
1999). All these functions of mtCU are severely disturbed when
MICU1 is depleted. Sensitization of mtCU to [Ca2+]c results in
mitochondrial suppression of both Ca2+ entry and IP3R-depen-
dent fluctuations in global [Ca2+]c. Attenuation of the agonist-
induced [Ca2+]m elevations leads to weakened activation of the
matrix dehydrogenases (Perocchi et al., 2010). The observed
dysregulation of respiration in the MICU1-depleted cells is also
likely caused by the altered mitochondrial Ca2+ handling. Finally,
the impairment of bioenergetics makes the cells vulnerable to
various stress factors, increasing the risk for cell death. Thus,
the MICU1-dependent control over the [Ca2+]c thresholding
and cooperativity of mtCU is critical for effective cytoplasmic
and mitochondrial calcium signaling and, in turn, for cell survival.
EXPERIMENTAL PROCEDURES
Detailed protocols are listed in the Supplemental Experimental Procedures.
DNA Constructs and Transient Expression
See the Supplemental Information.
Silencing of MICU1 or MCU
In vivo silencing inmouse liver was applied for 4weeks as described previously
(Baughman et al., 2011). Studieswere done in accordancewith the institutional
review board guidelines. Stable expression of shRNAs and wild-type and
mutant proteins has been described (Baughman et al., 2011; Perocchi et al.,
2010). For short-term silencing, HeLa cells were transfected with the siRNA
version of the same sh1 and sh2 hairpins used for stable cells (Ambion) or
with scrambled siRNA for 48 hr using Oligofectamine (Invitrogen).
986 Cell Metabolism 17, 976–987, June 4, 2013 ª2013 Elsevier Inc.
Live-Cell Imaging and Fluorometric Measurements
Live-cell imaging and fluorometric measurements of [Ca2+]c, [Ca2+]m, and
DJm, respectively, were performed as described earlier (Csordas and Haj-
noczky, 2003; Csordas et al., 2010). pHm was measured with mtSypHer
(Poburko et al., 2011). For SOCE experiments ER stores were depleted by
10 min pretreatment with 2 mM Tg in Ca2+-free buffer.
MICU1 Topology Analysis
Localization analysis and alkaline carbonate extraction were performed using
HEK293T mitochondria according to Sato and Mihara (2010) and Ryan et al.
(2001), respectively.
Measurement of Cellular Oxygen Consumption
JO2wasmeasured using an XF24 Extracellular Flux analyzer (Seahorse Biosci-
ences) at 37�C.
Statistics
Experiments were carried out with three ormore different cell preparations and
with each at least in triplicate. Data are presented as mean ± SE. Significance
of differences from the relevant controls was calculated by Student’s t test or
Tukey post hoc test following two-way ANOVA. Modeling is described in the
Supplemental Information.
SUPPLEMENTAL INFORMATION
Supplemental Information includes five figures, Supplemental Experimental
Procedures, and Supplemental References and can be found with this article
online at http://dx.doi.org/10.1016/j.cmet.2013.04.020.
ACKNOWLEDGMENTS
We thank Olga Goldberger for technical assistance, and B.R. Bettencourt, K.
Charisse, S. Kuchimanchi, and A. Akinc of Alnylam Pharmaceuticals for siRNA
design, synthesis, and formulation. This work was supported by NIH grants
DK080261 (to V.K.M.) and DK051526 (to G.H.). V.K. was formerly an employee
at and received compensation from Alnylam Pharmaceuticals.
Received: February 3, 2012
Revised: April 2, 2013
Accepted: April 26, 2013
Published: June 4, 2013
REFERENCES
Baughman, J.M., Perocchi, F., Girgis, H.S., Plovanich, M., Belcher-Timme,
C.A., Sancak, Y., Bao, X.R., Strittmatter, L., Goldberger, O., Bogorad, R.L.,
et al. (2011). Integrative genomics identifies MCU as an essential component
of the mitochondrial calcium uniporter. Nature 476, 341–345.
Belousov, V.V., Fradkov, A.F., Lukyanov, K.A., Staroverov, D.B., Shakhbazov,
K.S., Terskikh, A.V., and Lukyanov, S. (2006). Genetically encoded fluorescent
indicator for intracellular hydrogen peroxide. Nat. Methods 3, 281–286.
Beutner, G., Sharma, V.K., Lin, L., Ryu, S.Y., Dirksen, R.T., and Sheu, S.S.
(2005). Type 1 ryanodine receptor in cardiac mitochondria: transducer of exci-
tation-metabolism coupling. Biochim. Biophys. Acta 1717, 1–10.
Bick, A.G., Calvo, S.E., and Mootha, V.K. (2012). Evolutionary diversity of the
mitochondrial calcium uniporter. Science 336, 886.
Bragadin, M., Pozzan, T., and Azzone, G.F. (1979). Kinetics of Ca2+ carrier in
rat liver mitochondria. Biochemistry 18, 5972–5978.
Chalmers, S., and Nicholls, D.G. (2003). The relationship between free and to-
tal calcium concentrations in the matrix of liver and brain mitochondria. J. Biol.
Chem. 278, 19062–19070.
Csordas, G., and Hajnoczky, G. (2003). Plasticity of mitochondrial calcium
signaling. J. Biol. Chem. 278, 42273–42282.
Csordas, G., Thomas, A.P., and Hajnoczky, G. (1999). Quasi-synaptic calcium
signal transmission between endoplasmic reticulum and mitochondria. EMBO
J. 18, 96–108.
Cell Metabolism
MICU1: Gatekeeper for Mitochondrial Ca2+ Uptake
Csordas, G., Renken, C., Varnai, P., Walter, L., Weaver, D., Buttle, K.F., Balla,
T., Mannella, C.A., and Hajnoczky, G. (2006). Structural and functional features
and significance of the physical linkage between ER and mitochondria. J. Cell
Biol. 174, 915–921.
Csordas, G., Varnai, P., Golenar, T., Roy, S., Purkins, G., Schneider, T.G.,
Balla, T., and Hajnoczky, G. (2010). Imaging interorganelle contacts and local
calcium dynamics at the ER-mitochondrial interface. Mol. Cell 39, 121–132.
de Brito, O.M., and Scorrano, L. (2008). Mitofusin 2 tethers endoplasmic retic-
ulum to mitochondria. Nature 456, 605–610.
De Stefani, D., Raffaello, A., Teardo, E., Szabo, I., and Rizzuto, R. (2011). A
forty-kilodalton protein of the inner membrane is the mitochondrial calcium
uniporter. Nature 476, 336–340.
Fakler, B., and Adelman, J.P. (2008). Control of K(Ca) channels by calcium
nano/microdomains. Neuron 59, 873–881.
Favaron, M., and Bernardi, P. (1985). Tissue-specific modulation of the mito-
chondrial calcium uniporter by magnesium ions. FEBS Lett. 183, 260–264.
Giacomello, M., Drago, I., Bortolozzi, M., Scorzeto, M., Gianelle, A., Pizzo, P.,
and Pozzan, T. (2010). Ca2+ hot spots on the mitochondrial surface are gener-
ated by Ca2+ mobilization from stores, but not by activation of store-operated
Ca2+ channels. Mol. Cell 38, 280–290.
Gunter, T.E., and Pfeiffer, D.R. (1990). Mechanisms by which mitochondria
transport calcium. Am. J. Physiol. 258, C755–C786.
Gunter, T.E., Gunter, K.K., Sheu, S.S., and Gavin, C.E. (1994). Mitochondrial
calcium transport: physiological and pathological relevance. Am. J. Physiol.
267, C313–C339.
Hajnoczky, G., Robb-Gaspers, L.D., Seitz, M.B., and Thomas, A.P. (1995).
Decoding of cytosolic calcium oscillations in the mitochondria. Cell 82,
415–424.
Hajnoczky, G., Hager, R., and Thomas, A.P. (1999). Mitochondria suppress
local feedback activation of inositol 1,4, 5-trisphosphate receptors by Ca2+.
J. Biol. Chem. 274, 14157–14162.
Igbavboa, U., and Pfeiffer, D.R. (1988). EGTA inhibits reverse uniport-depen-
dent Ca2+ release from uncoupled mitochondria. Possible regulation of the
Ca2+ uniporter by a Ca2+ binding site on the cytoplasmic side of the inner
membrane. J. Biol. Chem. 263, 1405–1412.
Jiang, D., Zhao, L., and Clapham, D.E. (2009). Genome-wide RNAi screen
identifies Letm1 as a mitochondrial Ca2+/H+ antiporter. Science 326,
144–147.
Jouaville, L.S., Ichas, F., Holmuhamedov, E.L., Camacho, P., and Lechleiter,
J.D. (1995). Synchronization of calcium waves by mitochondrial substrates
in Xenopus laevis oocytes. Nature 377, 438–441.
Jouaville, L.S., Pinton, P., Bastianutto, C., Rutter, G.A., and Rizzuto, R. (1999).
Regulation of mitochondrial ATP synthesis by calcium: evidence for a long-
term metabolic priming. Proc. Natl. Acad. Sci. USA 96, 13807–13812.
Kirichok, Y., Krapivinsky, G., and Clapham, D.E. (2004). The mitochondrial cal-
cium uniporter is a highly selective ion channel. Nature 427, 360–364.
Kroner, H. (1986). ‘‘Allosteric regulation’’ of calcium-uptake in rat liver mito-
chondria. Biol. Chem. Hoppe Seyler 367, 483–493.
Lawrie, A.M., Rizzuto, R., Pozzan, T., and Simpson, A.W. (1996). A role for cal-
cium influx in the regulation of mitochondrial calcium in endothelial cells.
J. Biol. Chem. 271, 10753–10759.
Mallilankaraman, K., Cardenas, C., Doonan, P.J., Chandramoorthy, H.C.,
Irrinki, K.M., Golenar, T., Csordas, G., Madireddi, P., Yang, J., Muller, M.,
et al. (2012a). MCUR1 is an essential component of mitochondrial Ca2+ up-
take that regulates cellular metabolism. Nat. Cell Biol. 14, 1336–1343.
Mallilankaraman, K., Doonan, P., Cardenas, C., Chandramoorthy, H.C., Muller,
M., Miller, R., Hoffman, N.E., Gandhirajan, R.K., Molgo, J., Birnbaum, M.J.,
et al. (2012b). MICU1 is an essential gatekeeper for MCU-mediated mitochon-
drial Ca(2+) uptake that regulates cell survival. Cell 151, 630–644.
C
Marchant, J.S., Ramos, V., and Parker, I. (2002). Structural and functional re-
lationships between Ca2+ puffs and mitochondria in Xenopus oocytes. Am. J.
Physiol. Cell Physiol. 282, C1374–C1386.
Pacher, P., and Hajnoczky, G. (2001). Propagation of the apoptotic signal by
mitochondrial waves. EMBO J. 20, 4107–4121.
Pacher, P., Thomas, A.P., and Hajnoczky, G. (2002). Ca2+ marks: miniature
calcium signals in single mitochondria driven by ryanodine receptors. Proc.
Natl. Acad. Sci. USA 99, 2380–2385.
Perocchi, F., Gohil, V.M., Girgis, H.S., Bao, X.R., McCombs, J.E., Palmer, A.E.,
and Mootha, V.K. (2010). MICU1 encodes a mitochondrial EF hand protein
required for Ca(2+) uptake. Nature 467, 291–296.
Pinton, P., Ferrari, D., Rapizzi, E., Di Virgilio, F., Pozzan, T., and Rizzuto, R.
(2001). The Ca2+ concentration of the endoplasmic reticulum is a key determi-
nant of ceramide-induced apoptosis: significance for the molecular mecha-
nism of Bcl-2 action. EMBO J. 20, 2690–2701.
Plovanich, M., Bogorad, R.L., Sancak, Y., Kamer, K.J., Strittmatter, L., Li, A.A.,
Girgis, H.S., Kuchimanchi, S., De Groot, J., Speciner, L., et al. (2013). MICU2, a
paralog of MICU1, resides within the mitochondrial uniporter complex to regu-
late calcium handling. PLoSONE 8, e55785. http://dx.doi.org/10.1371/journal.
pone.0055785.
Poburko, D., Santo-Domingo, J., and Demaurex, N. (2011). Dynamic regula-
tion of the mitochondrial proton gradient during cytosolic calcium elevations.
J. Biol. Chem. 286, 11672–11684.
Pralong, W.F., Spat, A., and Wollheim, C.B. (1994). Dynamic pacing of cell
metabolism by intracellular Ca2+ transients. J. Biol. Chem. 269, 27310–27314.
Rizzuto, R., Brini, M., Murgia, M., and Pozzan, T. (1993). Microdomains with
high Ca2+ close to IP3-sensitive channels that are sensed by neighboring
mitochondria. Science 262, 744–747.
Rizzuto, R., Bastianutto, C., Brini, M., Murgia, M., and Pozzan, T. (1994).
Mitochondrial Ca2+ homeostasis in intact cells. J. Cell Biol. 126, 1183–1194.
Rizzuto, R., Pinton, P., Carrington, W., Fay, F.S., Fogarty, K.E., Lifshitz, L.M.,
Tuft, R.A., and Pozzan, T. (1998). Close contacts with the endoplasmic reticu-
lum as determinants of mitochondrial Ca2+ responses. Science 280, 1763–
1766.
Robb-Gaspers, L.D., Burnett, P., Rutter, G.A., Denton, R.M., Rizzuto, R., and
Thomas, A.P. (1998). Integrating cytosolic calcium signals into mitochondrial
metabolic responses. EMBO J. 17, 4987–5000.
Ryan, M.T., Voos, W., and Pfanner, N. (2001). Assaying protein import into
mitochondria. Methods Cell Biol. 65, 189–215.
Sato, T., and Mihara, K. (2010). Mammalian Oxa1 protein is useful for assess-
ment of submitochondrial protein localization and mitochondrial membrane
integrity. Anal. Biochem. 397, 250–252.
Sparagna, G.C., Gunter, K.K., Sheu, S.S., and Gunter, T.E. (1995).
Mitochondrial calcium uptake from physiological-type pulses of calcium. A
description of the rapid uptake mode. J. Biol. Chem. 270, 27510–27515.
Spat, A., Szanda, G., Csordas, G., and Hajnoczky, G. (2008). High- and low-
calcium-dependent mechanisms of mitochondrial calcium signalling. Cell
Calcium 44, 51–63.
Szabadkai, G., Bianchi, K., Varnai, P., De Stefani, D., Wieckowski, M.R.,
Cavagna, D., Nagy, A.I., Balla, T., and Rizzuto, R. (2006). Chaperone-mediated
coupling of endoplasmic reticulum and mitochondrial Ca2+ channels. J. Cell
Biol. 175, 901–911.
Szalai, G., Krishnamurthy, R., and Hajnoczky, G. (1999). Apoptosis driven by
IP(3)-linked mitochondrial calcium signals. EMBO J. 18, 6349–6361.
Tinel, H., Cancela, J.M., Mogami, H., Gerasimenko, J.V., Gerasimenko, O.V.,
Tepikin, A.V., and Petersen, O.H. (1999). Active mitochondria surrounding
the pancreatic acinar granule region prevent spreading of inositol trisphos-
phate-evoked local cytosolic Ca(2+) signals. EMBO J. 18, 4999–5008.
Trenker, M., Malli, R., Fertschai, I., Levak-Frank, S., and Graier, W.F. (2007).
Uncoupling proteins 2 and 3 are fundamental for mitochondrial Ca2+ uniport.
Nat. Cell Biol. 9, 445–452.
ell Metabolism 17, 976–987, June 4, 2013 ª2013 Elsevier Inc. 987