
Molecular evolution, phylogenetics and biogeography …hss.ulb.uni-bonn.de/2004/0481/0481.pdf ·...
206
Molecular evolution, phylogenetics and biogeography in southern hemispheric bryophytes with special focus on Chilean taxa. Dissertation zur Erlangung des Doktorgrades (Dr. rer. nat.) der Mathematisch-Naturwissenschaftlichen Fakultät der Rheinischen Friedrich-Wilhelms-Universität Bonn vorgelegt von Rolf Blöcher aus Biedenkopf/Lahn Bonn 2004
Transcript of Molecular evolution, phylogenetics and biogeography …hss.ulb.uni-bonn.de/2004/0481/0481.pdf ·...

Molecular evolution, phylogenetics and biogeography in southern hemispheric bryophytes with special focus on Chilean taxa.
Dissertation
zur
Erlangung des Doktorgrades (Dr. rer. nat.)
der Mathematisch-Naturwissenschaftlichen Fakultät
der
Rheinischen Friedrich-Wilhelms-Universität Bonn
vorgelegt von
Rolf Blöcher
aus
Biedenkopf/Lahn
Bonn 2004

Angefertigt mit Genehmigung der Mathematisch-Naturwissenschaftlichen Fakultät
der Rheinischen Friedrich-Wilhelms-Universität Bonn
1. Referent: Prof. Dr. Jan-Peter Frahm
2. Referent: Prof. Dr. Wilhelm Barthlott
Tag der Promotion: 20. Dezember 2004
Diese Dissertation ist auf dem Hochschulschriftenserver der ULB Bonn
http://hss.ulb.uni-bonn.de/diss_online elektronisch publiziert

meinen Eltern, Doris und Horst Blöcher

Contents
1 Introduction...........................................................................................................1
2 A comparison of the moss floras of Chile and New Zealand. ...............................9
2.1 Introduction ...................................................................................................9
2.2 Comparison.................................................................................................10
2.3 Results ........................................................................................................11
2.4 Discussion...................................................................................................12
3 A preliminary study on the phylogeny and molecular evolution of the
Ptychomniaceae M. Fleisch. (Bryopsida) with special emphasis on Ptychomnion
ptychocarpon and Dichelodontium. ...........................................................................21
3.1 Introduction .................................................................................................21
3.2 Material & Methods .....................................................................................25
3.3 Results ........................................................................................................30
3.3.1 Sequence Variation..............................................................................30
3.3.2 Genetic distances.................................................................................32
3.3.3 Phylogenetic analysis...........................................................................33
3.4 Discussion...................................................................................................37
4 The systematic affinities of selected Gondwanan bryophyte taxa based on
molecular sequence data ..........................................................................................42
4.1 Introduction .................................................................................................42
4.2 Material and Methods..................................................................................45
4.3 Results ........................................................................................................49
4.3.1 Sequence variation ..............................................................................49
4.3.2 Phylogenetic analysis...........................................................................49
4.3.3 Synthesis. ............................................................................................53
4.4 Discussion...................................................................................................54
5 Molecular evolution, phylogenetics and biogeography of the genus Lepyrodon
(Lepyrodontaceae, Bryopsida) ..................................................................................58
5.1 Introduction .................................................................................................58
5.1.1 The genus Lepyrodon ..........................................................................58
5.1.2 Morphological relationships within the genus.......................................58
5.1.3 The systematic position of Lepyrodontaceae .......................................59
5.2 Material & Methods .....................................................................................60
5.3 Results ........................................................................................................67
5.3.1 Sequence variation ..............................................................................67

Contents
5.3.2 Phylogenetic analysis...........................................................................70
5.4 Discussion...................................................................................................79
5.4.1 Genetic results .....................................................................................79
5.4.2 Phylogenetic and taxonomic results.....................................................82
5.4.3 Biogeographical implications................................................................86
6 Molecular circumscription and biogeography of the genus Acrocladium
(Bryopsida) ................................................................................................................89
6.1 The genus Acrocladium ..............................................................................89
6.1.1 Status of Acrocladium ..........................................................................89
6.1.2 Distribution of Acrocladium ..................................................................90
6.1.3 Ecology of Acrocladium........................................................................90
6.2 Material & Methods .....................................................................................91
6.3 Results ........................................................................................................98
6.3.1 Sequence variation ..............................................................................98
6.3.2 Genetic distances...............................................................................101
6.3.3 Phylogenetic analysis.........................................................................104
6.4 Discussion.................................................................................................106
6.4.1 The status of A. auriculatum and A. chlamydophyllum.......................106
6.4.2 Possible explanations for the disjunct distribution of Acrocladium .....108
7 Molecular evolution, phylogenetics and biogeography of the genus Catagonium
(Plagiotheciaceae, Bryopsida) .................................................................................111
7.1 Introduction ...............................................................................................111
7.1.1 Morphological characterisation ..........................................................112
7.2 Material & Methods ...................................................................................115
7.3 Results ......................................................................................................122
7.3.1 Phylogenetic results. ..........................................................................122
7.3.2 Indel matrix ........................................................................................130
7.3.3 Genetic distances...............................................................................131
7.4 Discussion.................................................................................................136
7.4.1 The ‘Northern South American’ species.............................................136
7.4.2 The systematic position of C. nitens ssp. maritimum .........................137
7.4.3 The relationship within Catagonium nitens.........................................137
8 The 'Gondwana connection' and their genetic patterns in bryophytes..............140
9 Summary..........................................................................................................146

Contents
10 Acknowledgements.......................................................................................149
11 References ...................................................................................................152
Index to tables
Index to figures
Appendix

1 Introduction 1
1 Introduction
Biologists have long been fascinated by the existence of disjunct distributions of
certain plant and animal taxa. Especially the southern temperate disjunctions
between southern South America and New Zealand have attracted their attention.
The taxa characterized by these distribution patterns are assumed to share a
common history. Generally two different hypotheses are used to explain their disjunct
distribution. The first can be described by the term ‘vicariance’ which refers to
disjunct distribution patterns as a result of the splitting of populations by e.g. the
fragmentation of landmasses (e.g. Croizat et al., 1974). The second hypothesis
explains the existing distribution patterns based on long distance dispersal events.
For the first explanation based on vicariance events an understanding of the past
fragmentation processes of the continental landmasses is necessary. The former
connection of the recent southern continents in a large landmass, the Gondwana
continent, is nowadays widely accepted. Over a period of c. 180 Myr mainly
continental drift led to the recent formation of the continents (e.g. McLoughlin, 2001).
During the Permian to Jurassic period the supercontinent Pangea consisted of a
northern land mass, Laurasia and a southern land mass Gondwana, that were partly
separated by an ocean, the Tethys. During that time Pangea extended from high
northern to high southern latitudes covering substantial climatic gradients
(McLoughlin, 2001). The early Cretaceous floras of Gondwana were conifer and
pteridosperm dominated and differed little from that of the Jurassic. By the mid-
Cretaceous angiosperms were already important elements of the cool temperate flora
of the southern Gondwana continent. These forest types appear to be quite similar to
that found in the temperate regions of the southern hemisphere today, possibly
offering good conditions for the ancestors of recent temperate rainforest taxa. The
breakup of the Gondwana continent started in the late Jurassic (c. 152 Myr BP) with
sea-floor spreading between Africa and Madagascar (2004; Scotese & McKerrow,
1990). The separation of Africa from a landmass comprising e.g. recent South
America, Antarctica, Australia and New Zealand was completed about 105 Myr BP.
New Zealand as part of the continental block ‘Tasmantia’ separated about 80 Myr BP
from Australia which was at the time still connected via Antarctica to South America.

1 Introduction 2
Lastly, the separation of the continents South America, Antarctica, and Australia was
completed about 30 Myr BP (McLoughlin, 2001).
Southern temperate disjunct taxa presumably once had a continuous distribution
range on the Gondwana continent, their recent distribution caused by separation of
populations concomitant with the breakup of Gondwana (e.g. Darlington, 1965; Du
Rietz, 1960; Godley, 1960; Skottsberg, 1960). The term 'vicariance' Recent taxa are
the result of evolutionary processes which since then have taken place since in the
disjunct populations. A southern hemispheric disjunction caused by vicariance is also
assumed for many bryophyte taxa (e.g. Schuster, 1969). In a later review of the
phytogeography of bryophytes, Schuster (1983) gives many examples of mosses and
liverworts with Gondwana distribution patterns (e.g. Dendroligotrichum,
Lepidoleanaceae, and Polytrichadelphus magellanicus). Matteri (1986), Seki (1973),
and most recently Villagrán (2003) give detailed information of phytogeographical
relationships of bryophytes from specific areas of southern South America. They
classify the bryophyte taxa according to their overall distribution pattern. A detailed
study about the evolution of the Gondwana relict moss family Hypopterygiaceae is
provided by Kruijer (2002).
The other hypothesis explaning the disjunct distribution of southern hemispheric taxa
is long distance dispersal defined by van Zanten & Pócs (1981) as dispersal over
more than 2,000 km distance. Van Zanten (1976) designed germination experiments
in which bryophyte spores received a treatment comparable to the conditions of long
distance disperal by wind (jet stream) in the southern hemisphere. Van Zanten (1978)
proved experimentally that especially widespread species had spores which were still
able to germinate after the experimental treatment and were therefore assumed able
to survive long distance dispersal. Species confined to a small distribution range, e.g.
Catharomnion ciliatum restricted to New Zealand/Australia, did not germinate after
two months of treatment.
Most recently Muñoz et al. (2004) tested the correlation between near-surface wind
direction and speed and floral similarity of certain areas in mosses, liverworts, lichens
and pteridophytes. They found a stronger correlation between floristic similarity and
maximum wind connectivity in mosses, liverworts and lichens than with geographic
proximity. They concluded that wind is the main force determining current plant
distribution.

1 Introduction 3
After introducing the two principal explanation models of southern hemispheric
disjunct distribution patterns, methods of phylogenetic reconstruction are presented.
Traditionally, morphological similarities are used as indicators of close relationship.
Decisions on which characters are regarded as conserved or derived are supported
by the analysis of fossils. Also, determination of the timing of evolutionary processes
is based on the fossil record. Fossil pollen has helped to reconstruct historical
distribution ranges, especially in trees. In the last 20 years the use of molecular
methods have gained more and more importance. Today, molecular data in
combination with the fossil record are used to estimate relative clade divergence or
calibrate data for age estimates of certain clades. In bryophytes molecular sequence
data have proven indispensable for phylogenetic analyses on different taxonomic
levels (for review see: Quandt & Stech, 2003). However, especially when fossils are
rare one relies on indicative methods for studying the time scale of evolution. For
instance, the breakup sequence of the Gondwana continent can be used as a time
sequence (McLoughlin, 2001) to fit the cladograms of phylogenetic analyses (e.g.
Frey et al., 1999; Schaumann et al., 2003). Additional geological events possibly
relevant for understanding the history of disjunct southern temperate rainforest taxa
are e.g. temporary flooding of parts of South America, the formation of the Andes, the
Isthmus of Panama and the Atacama desert.
The classical example of a disjunct distribution in the southern hemisphere is that of
the southern beech Nothofagus (e.g. van Steenis, 1971). There are contrasting
opinions on whether vicariance or dispersal events are responsible for the distribution
of Nothofagus. Manos (1997) analyses molecular sequence data and fossil records
and concludes that Nothofagus was widely distributed in the southern hemisphere
before the breakup of Gondwana. The disjunction of Nothofagus is interpreted by him
as vicariance, for the Australasian taxa in combination with multiple extinction events.
In contrast, Swenson et al. (2001) explained Australasian disjunctions by
colonization, i.e. long distance dispersal, and extinction events. The colonization
hypothesis is supported by findings of Pole (1994; 2001) who questions the
persistence of continous temperate forest in New Zealand during the Tertiary on the
basis of periodic ‘gaps’ in pollen records especially of plant taxa commonly
1 Introduction 4
associated with temperate rainforest vegetation. He therefore suggests that the New
Zealand flora is mainly a result of long distance dispersal.
Another example of a taxon with a mainly southern hemispheric disjunct distribution
range is the angiosperm genus Gunnera. This taxon has an even wider distribution
than Nothofagus, including Africa and extending into North America. Wanntorp &
Wanntorp (2003) based their reconstruction of Gunnera evolution on genetic as well
as on morphological analyses supported by fossil and pollen data. Most of the
phylogenetic results were in accordance with the chronology of the Gondwana
breakup. Only few phenomena were interpreted as dispersal events in the late
Tertiary.
In bryophytes only few of the recent taxa can be related to fossils in order to predict
their evolutionary age (e.g. Pallaviciniaceae, Frey, 1990; Schuster, 1982). Well
preserved fossils are very rare. The earliest moss fossils were reported from the
carboniferous (e.g. Goffinet & Hedderson, 2000; Krassilov & Schuster, 1984).
Muscites guescelini from the Triassic (South Africa) is sometimes regarded as the
earliest known representative of the pleurocarpous lineage in bryophytes (Krassilov &
Schuster, 1984). Most of the younger fossils originate from tertiary Baltic and Saxon
amber (e.g. Frahm, 2004). Only few examples were reported from the Early
Pleistocene (e.g. Weymouthia mollis, Jordan & Dalton, 1995) and from the Late
Pleistocene/Holocene (e.g. Hylocomiaceae, Willerslev et al., 2003).
The only example of DNA sequences of fossil mosses was reported only recently.
Willerslev et al. (2003; 2004) used samples from ice cores from Sibiria as template in
PCRs for animal and plant taxa. They successfully presented partial rbcL sequence
data of 300,000 to 400,000 year old bryophyte taxa related to the Hylocomiaceae
and Bryales, respectively. However, this is a rare case where very old plant material
is sufficiently well preserved for use in molecular phylogeny. Also, the fossils are
difficult to relate to living taxa and most of them do not provide a time record for
interpreting bryophyte evolution.
For disjunct southern hemispheric bryopyhte taxa few molecular based studies
addressing their distribution exist. An example is the liverwort genus Monoclea which
occurs in southern temperate rainforests of New Zealand and Chile and in tropical
rainforests in northern South to Central America. Analysis of cpDNA sequence data

1 Introduction 5
(Meißner et al., 1998) suggests that this genus is of Gondwana origin and its current
disjunct distribution is best explained as a result of vicariance. It is assumed that the
common ancestor was widely distributed in Gondwana and that the split of the
Gondwana continent resulted in the evolution of two geographically distinct species,
one occurring in South America and the other in New Zealand. According to Meißner
(1998) the South American populations extended their distribution range into the
tropical region resulting in two geographically and genetically distinct subspecies.
The genus Lopidium occurs in three regions which were formerly part of Gondwana:
South America, Africa and Australia/New Zealand. Based on corresponding
sequence data of cpDNA in Lopidium concinnum from South American and New
Zealand populations and restricted long distance spore dipersal ability, Frey et al.
(1999) regarded this species as an old Gondwanan relict of stenoevolutionary
character. A low genetic differention between New Zealand and Chilean taxa is also
reported by Pfeiffer (2000a) for Hypopterygium didictyon.
However, not all taxa show the pattern of low genetic differentiation between the
geographically distinct regions of Chile and New Zealand/Australia. The geographical
separation of the ancient taxon Polytrichadelphus magellanicus populations from
New Zealand and Chile for example was followed by divergent evolution. This
resulted according to Stech et al. (2002) in two morphologically and genetically
distinct subspecies of Polytrichadelphus magellanicus.
Based on cpDNA and nrDNA sequence data together with paleobotanical evidence
Schaumann et al. (2003) suggest that the dendroid liverworts of the genus
Symphyogyna had their origin on Gondwana well before the separation of Africa.
Schaumann et al. (2004) found low sequence variation (cpDNA, nrDNA) in the genus
Jensenia. They observed a regional pattern in which taxa from South America were
more closely related to each other than to the Australasian taxa. They proposed a
possible Gondwanan origin for the genus Jensenia.
McDaniel & Shaw (2003) found no morphological differentiation between populations
from different geographical origins (southern South America, northern South
America, Australia/New Zealand) but a high genetic differentiation (‘cryptic
speciation’) correlated with geographical patterns in the moss Pyrrhobryum mnioides.
Based on genetic separation of southern South American and northern South
American populations they used geological evidence (establishment of the Atacama

1 Introduction 6
dessert, 14 Myr BP) to calibrate a molecular clock, and concluded that the South
American and Australasian populations of Pyrrhobryum mnioides were fragmented
by the Gondwana breakup 80 Myr BP.
All the above mentioned authors used the breakup sequence of Gondwana and
further geological evidence together with the pattern of genetically based data to
explain the evolution of certain bryophyte taxa. There is yet no genetic evidence for
long-distance dispersal in bryophytes. Van Zanten & Pócs (1981) put forward the
example of subantarctic Marion Island situated in the southern Indian Ocean 2,300
km from Capetown whose moss flora was probably established by long-distance
dispersal as the island was nearly entirely covered by ice during the Riss-glaciation
(276,000 – 100,000 yr BP). Although the authors consider the possibility that some
species may have survived these extreme conditions on nunataks they suppose that
the majority of the species arrived on the island afterwards by long-distance
dispersal. Van Zanten (1978) also found a strong correlation between germination
rates of moss spores after they had been experimentally exposed to desiccation and
freezing and geographical distribution range: the greater the resistance to conditions
similar to those experienced in long-distance dispersal the larger the distribution
range. These results also indicate that long-distance dispersal may play a more
important part than commonly believed.
Study objectives. This study adresses phylogenetic relationships within four
southern hemispheric bryophyte taxa (two families, two genera) using molecular
genetic methods. The data are related to the timing of historical/geological processes
in order to test the hypothesis whether the recent distribution patterns of the taxa can
be attributed to a Gondwanan origin. Alternative explanation models, especially long
distance dispersal by wind are also discussed. In a first step similarities between the
moss flora of southern temperate rainforests of Chile and New Zealand were
identified in order to select appropriate taxa for closer study (chapter 2). For this
purpose existing taxa lists from Chile (He, 1998) and New Zealand (Fife, 1995) were
compared and analysed (Blöcher & Frahm, 2002). The Ptychomniaceae and
Lepyrondontaceae as well as the genera Acrocladium and Catagonium were chosen.
The family Lepyrodontaceae consists of two genera, the monotypic genus
Dichelodontium endemic to New Zealand and the genus Lepyrodon which consists of

1 Introduction 7
seven species, five of which are restricted to South America and two occurring only in
New Zealand/Australia. The genus Lepyrodon was studied because of its typical
southern temperate distribution range with outliers in Central America and southern
Mexico. The widespread South American species Lepyrodon tomentosus is reported
as a characteristic epiphyte of upper montane rainforests of tropical South America
(Gradstein et al., 2001) and is also widely distributed in temperate rainforests. During
my field studies in Chile Lepyrodon tomentosus also proved to be one of the
characteristic epiphytes in subandean Nothofagus forests. The genus Lepyrodon was
also an important element of the epiphytic bryophyte communities studied in New
Zealand by Lindlar & Frahm (2002).
The family Ptychomniaceae occurs in southern South America and is widely
distributed in the Australasian region. Its evolution is probably connected with the
genus Dichelodontium (Lepyrodontaceae). One aim of this study was to determine if
the genus Dichelodontium placed in the family Lepyrodontaceae by Allen (1999)
might be more closely related to the Ptychomniaceae, as indicated by Fleischer
(1908).
The genus Acrocladium was chosen because there are only two species described in
the genus, each geographically restricted to either southern South America or New
Zealand/Australia. By studying the genetic relationships of several specimens of
Acrocladium the author aimed at clarifying the doubtful status within the genus (e.g.
Karczmarz, 1966). The main question was if two genetically distinct species exist and
if the genetic distances between them as well as in relation to their closest relatives
indicate a Gondwanan origin.
The genus Catagonium was selected for this study because it occurs on three major
continents of Gondwanan origin, i.e. in South America, Australia/New Zealand and, in
contrast to the other taxa studied, also in Africa.
Most of the specimens used for this study were collected by the author on a field trip
to Chile (BryoAustral project) in temperate rainforests or originate from former field
work of colleagues within the BryoAustral and BryoTrop projects.
After the taxa were chosen it was then necessary to circumscribe their closest
relatives in order to find a reference for the results of molecular genetic analysis as
well as evolution. In chapters 3 and 4 the closest relatives of the taxa are identified by
phylogenetic analysis. Chapter 3 deals with the Ptychomniaceae focussing on the
status of Dichelodontium as well as on Ptychomnion ptychocarpon. In chapter 4 the

1 Introduction 8
systematic position of the genera Lepyrodon, Acrocladium, and Catagonium within
the Hypnales is analysed and presented with special emphasis on their relation to the
Plagiotheciaceae. Chapters 5 to 7 concentrate on the phylogenetic relationships
within the single genera (chapter 5: Lepyrodon, chapter 6: Acrocladium, chapter 7:
Catagonium). Within each taxon the genetic distances between disjunct taxa were
determined and the phylogeny was constructed based on molecular sequence data
obtained by using different molecular markers.
In chapter 8 the data of all taxa are brought together in order to find possible
common patterns as well as differences in their molecular evolution. The data are
placed in a wider biogeographical context.

2 A comparison of the moss floras of Chile and New Zealand 9
2 A comparison of the moss floras of Chile and New Zealand.
(Published in Tropical Bryology 2002, vol. 21, p. 81-92)
Summary: Chile and New Zealand share a common stock of 181 species of mosses
in 94 genera and 34 families. This number counts for 23.3 % of the Chilean and
34.6 % of the New Zealand moss flora. If only species with austral distribution are
taken into account, the number is reduced to 113 species in common, which is
14.5 % of the Chilean and 21.6 % of the New Zealand moss flora. This correlation is
interpreted in terms of long distance dispersal resp. the common phytogeographical
background of both countries as parts of the palaeoaustral floristic region and
compared with disjunct moss floras of other continents as well as the presently
available molecular data.
2.1 Introduction
Herzog (1926) called disjunctions the “most interesting problems in phytogeography
and their explanation the greatest importance for genetic aspects”. One of these
interesting disjunctions is that between the southern part of Chile, New Zealand (and
also southeastern Australia, Tasmania and southern Africa). Herzog (1926) wrote:
“The strange fact that the southern part of South America south of 40° S lat. is an
extraneous element as compared with the rest of South America and is more related
to the remote flora of the southeastern corner of Australia, Tasmania and New
Zealand, allows to include these regions into an floristic realm of its own”. Herzog
called it the austral-antarctic floristic realm.
Herzog (1926) made no attempts to explain the floristic similarity of these regions,
although Wegener (1915) had published his continental drift theory already 11 years
before the publication of Herzog´s textbook. This theory was, however, not accepted
by scientists and therefore not even discussed by Herzog but simply ignored. It took
50 more years until Wegener´s theory was confirmed by the results of the studies on

2 A comparison of the moss floras of Chile and New Zealand 10
sea floor spreading and successfully used for the explanation of disjunctions of
bryophytes.
Southern Chile and New Zealand share the same geological history: both were parts
of the Nothofagus province of the palaeoaustral region until about 82 mio years ago,
at a time, when Africa had already separated from the former Gondwana continent
(Hill, 1994; White, 1990). In contrast to other parts of this continent such as India,
Antarctica or Australia, Chile and New Zealand remained since in a humid-temperate
climate belt. Whereas in Australia the continental drift to the tropic of Capricorn
revealed in an explosive speciation of dry adapted species, Chile and New Zealand
preserved parts of the late cretaceous flora in their humid temperate forests. This
concerns Nothofagus forest as well as ancient conifer forest, which consist of genera
such as Agathis, Podocarpus, Libocedrus, Dacrydium, Dacrycarpus, Fitzroya,
Pilgerodendron among others. The floristic similarity between these former parts of
the Gondwana continent, does, however, not only concern flowering plants but also
bryophytes, which show much more affinities between Chile and New Zealand than
flowering plants. The disjunctions in flowering plants are on a genus level, which
demonstrates that even these ancient genera such as Nothofagus (Hill & Dettmann,
1996) have evolved new species in these separate parts of the world. In contrast,
bryophytes have a common stock of identical species. This raises the question
whether the species identical in both parts are remnants of late cretaceous forests
and have survived morphologically unchanged, or are identical because they have
genetic exchange through the west-wind drift, which could disperse spores from New
Zealand westwards over a distance of 10,000 km to Chile.
2.2 Comparison
A first estimation of the genera of bryophytes common in New Zealand and Chile was
presented by van Balgooy (1960), who indicated 128 genera (=75 %) as common to
both regions. Seki (1973) in an evaluation of his collections in Patagonia indicated
14.7 % of the mosses as circumsubantarctic (including S. Africa, Tasmania,
Australia, New Guinea highlands, northern Andes and Central America). Van Zanten
& Pócs (1981) calculated the relationship on the species level and indicated 122

2 A comparison of the moss floras of Chile and New Zealand 11
species (=27 %) in common. Matteri (1986) calculated the percentage of
circumsubantarctic species from collections along a transect through Patagonia with
15.4 %. An exact determination of the degree of conformity of the moss floras of New
Zealand and Chile was so far really impossible due to the lack of checklists.
However, in the past checklists of mosses were published by Fife (1995) for New
Zealand and He (1998) for Chile, which provided the base for the present more exact
comparison.
The moss flora of Chile (He, 1998) comprises 778 species and 88 subspecific taxa in
203 genera and 63 families. For New Zealand, Fife (1995) recorded 523 species and
23 varieties in 208 genera and 61 families. Both checklists were compared to identify
the
taxa identical in the floras of both regions.
2.3 Results
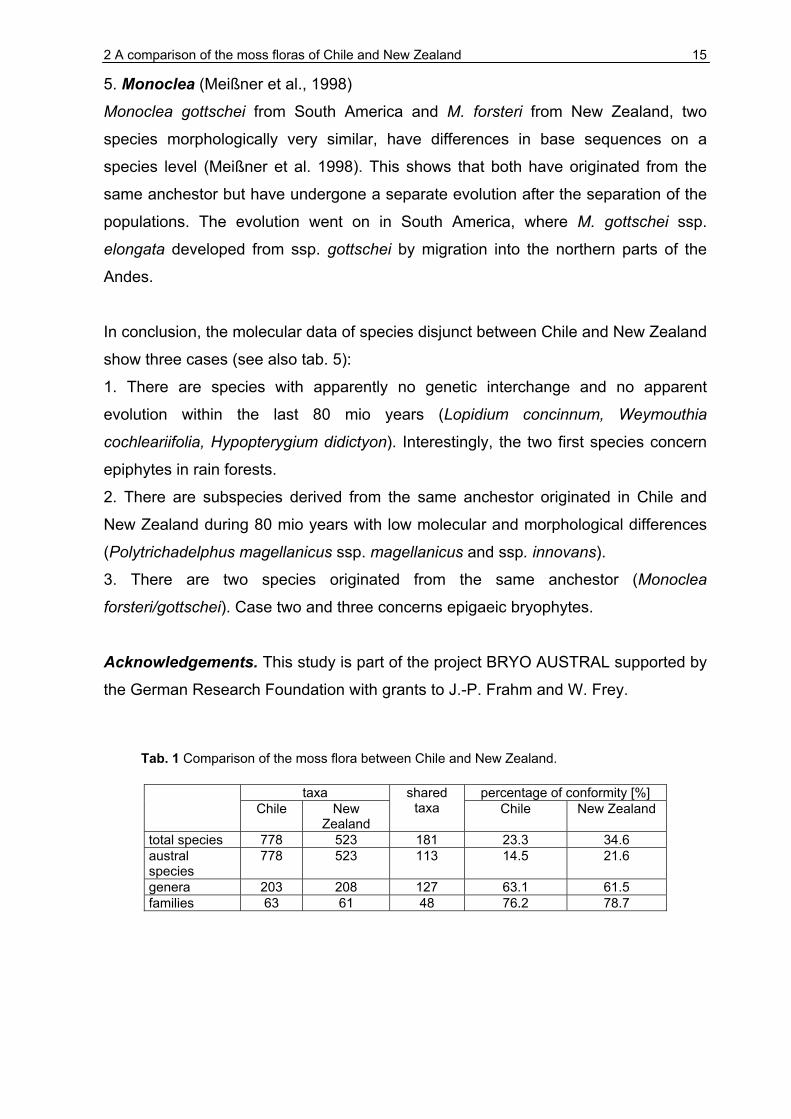
The comparison revealed that 181 species (+ 3 varieties) in 94 genera are identical in
Chile and New Zealand (see tab. 1). The species common in Chile and New Zealand
are listed in tab. 2. These are 23.3 % of the species and 63.1 % of the genera of the
Chilean moss flora. It is, however, better to base the comparison on the moss flora of
New Zealand, because Chile has also part of the neotropical flora. New Zealand
shares 34.6 % of its species and of 61.5 % genera with Chile. If the species are
excluded from this comparison, which are not confined to the austral region but are
cosmopolitan or also occur e.g. in the tropical mountains or the holarctic (marked with
asterix in tab. 1), the number of species disjunct between Chile and New Zealand is
reduced to 113, that are 21.6 % of the New Zealand moss flora and 14.5 % of the
Chilean moss flora. If the mosses of Chile would be reduced to austral region and the
neotropical species would not be taken into account, the percentage would probably
as high as in New Zealand. On the genus level, Chile and New Zealand have 127
genera in common, which are 63 % of the flora of Chile and 61 % of the flora of New
Zealand. Thirty-three of the 127 genera have no species in common.
The conformity is accordingly higher on the family level and concerns 76 % of the
genera of Chile and 78 % of the genera of New Zealand.

2 A comparison of the moss floras of Chile and New Zealand 12
The species in common belong to 34 families (tab. 3). Most of the species belong to
the Bryaceae, followed by Dicranaceae , Pottiaceae, Orthotrichaceae and
Amblystegiaceae.
2.4 Discussion
Bryophytes can absolutely not be compared with higher plants in terms of their
phytogeography. In a most recent comparison of the flora of New Zealand and the
southern Andes, Wardle et al. (2001) indicate the percentage of realm endemics of
both parts with 90 % of the species (465 species of the southern Andes and 522 of
New Zealand) and 30 % of the genera, however, only forty species or closely related
pairs of species are shared. Half of the number of species is not identical but closely
related, half of the rest belongs to the coastal vegetation, most of the remaining
species are ferns and others (Deschampsia cespitosa, Trisetum spicatum) may
ultimately be introduced from the northern hemisphere. It can therefore be
generalized that higher plants of the austral realm are disjunct on a genus level,
bryophytes on a species level.
The percentage of conformity of disjunct floras may be the result of long distance
dispersal or relicts of a former closed range. A detailed discussion of this topic is
given by van Zanten & Pócs (1981). It is still difficult to decide which factor is crucial.
A molecular analysis can only state whether base sequences of certain genes of
populations of the same species in disjunct populations are identical or not. Identical
base sequences can, however, be the result of gene exchange but also of relict
population, which have not undergone genetic changes since the separation of the
populations (stenoevolution sensu Frey et al., 1999). Additional arguments are
required to decide whether the species are able for long distance dispersal or not
tolerance to frost or UV-radiation, see van Zanten (1976; 1978; 1983; 1984), sterility
or rarety of sporulation, morphological arguments (spore size, cleistocarpy), habitats
(epiphytes in the understory of forests as opposed to species from open habitats), life
strategies (colonists vs. perennial stayers).
Nevertheless calculations of the degree of conformity of disjunct floras give an almost
perfect correlation with the duration of separation (tab. 4) and not with the distance. If
2 A comparison of the moss floras of Chile and New Zealand 13
long distance dispersal would be the essential factor for explaining these
disjunctions, tropical South America and tropical Africa would have more species in
common than Chile and New Zealand, because both continents are closer than Chile
and New Zealand. It could also be argued that tropical species are not as able for
long distance dispersal as cool temperate species.
A further tool for differentiating relicts from species with gene exchange could be the
interpretation of life strategies and habitats preferences. It could be argued that
agressive colonists colonizing roadside banks (Campylopus clavatus, C. introflexus)
are more likely dispersed by long distance dispersal than epiphytes in forests. About
30 species of the 187 common in Chile and New Zealand are epiphytic and therefore
candidates for species with relict status.
Attempts have been made to solve the question experimentally (van Zanten, 1976;
1978; 1983; 1984) and very recently by molecular studies (Frey et al., 1999; Meißner
et al., 1998; Pfeiffer, 2000b; Pfeiffer et al., 2000; Quandt et al., 2001; Quandt et al.,
2000; Stech et al., 1999; Stech et al., 2002).
Van Zanten (1976; 1978) tested 139 disjunct bryophyte species for their ability for
long distance dispersal (germination experiments with wet- and dry-freezing).
Amongst these species there were 38 species occurring in Chile and New Zealand.
Sixty-six species did not germinate, with a considerable high percentage (67 %) of
diocious species. This might give an estimation of the percentage of species disjunct
in Chile and New Zealand but with no genetic exchange. In contrast, only 23 % of the
48 tested species occurring “closer” in New Zealand and Australia did not germinate.
Of the 29 the species occurring in Chile and New Zealand und used in the
germination tests (van Zanten, 1978), most species were able to germinate after 1-3
years of desiccation. Only three species tolerated less than one year of desiccation:
Weymouthia mollis and Fissidens rigidulus half a year and Lopidium concinnum only
one month. Weymouthia and Lopidium are epiphytes, Fissidens is a hygrophyt.
It has, however, to be kept in mind that these spore germination experiments were
necessarily based on species which are producing sporophytes and a certain
percentage of species is only known in sterile condition. Therefore the percentage of
species with presumably no genetic exchange is in fact much higher than the results
of the germination experiments suggest.

2 A comparison of the moss floras of Chile and New Zealand 14
The molecular studies were all made with the BryoAustral project using the trnL
intron of cp DNA, which has proved to be most suitable for this purpose, with the
following results:
1. Hypopterygium (Pfeiffer, 2000b; Stech et al., 1999)
Hypopterygium "rotulatum" (Hedw.) Brid. from primary rain forests in New Zealand
shows 100 % sequence identity with H. didictyon from Chile. This disjunction is
interpreted as palaeoaustral origin. Long distance dispersal is regarded as less likely
because the species is dioiceous and has no vegetative reproduction. Even if the
comparably small spores (10-17µm) are dispersed, a population cannot be
established if not spores of both sexes land on the same spot. The existing stands
are all bisexual. In addition it is difficult that this species growing on the floor of rain
forests releases spores into higher air currents.
2. Polytrichadelphus (Stech et al., 2002)
Base sequences of Polytrichadelphus magellanicus from Chile and P. innovans from
New Zealand show only small differences. Both taxa are therefore regarded as
subspecies of P. magellanicus. The andine P. longisetus and P. umbrosus show a
higher sequence variation and maybe derived from the latter. Genetic exchange can
be excluded because the spores cannot tolerate dry or wet freezing (van Zanten
1978).
3. Lopidium (Frey et al., 1999)
A comparison of populations of the epiphytic Hypopterygiaceae Lopidium concinnum
from Chile and New Zealand showed no genetic differences. The relict status is
supported by van Zanten´s experiments (van Zanten 1978) which showed a
desiccation tolerance of the spores of less than one month.
4. Weymouthia (Quandt et al., 2001)
The sequences of Weymouthia cochleariifolia described from New Zealand and W.
billardieri described from Chile show no differences. The closely related species W.
mollis had a desiccation tolerance of spores of less than half a year (van Zanten
1978).
2 A comparison of the moss floras of Chile and New Zealand 15
5. Monoclea (Meißner et al., 1998)
Monoclea gottschei from South America and M. forsteri from New Zealand, two
species morphologically very similar, have differences in base sequences on a
species level (Meißner et al. 1998). This shows that both have originated from the
same anchestor but have undergone a separate evolution after the separation of the
populations. The evolution went on in South America, where M. gottschei ssp.
elongata developed from ssp. gottschei by migration into the northern parts of the
Andes.
In conclusion, the molecular data of species disjunct between Chile and New Zealand
show three cases (see also tab. 5):
1. There are species with apparently no genetic interchange and no apparent
evolution within the last 80 mio years (Lopidium concinnum, Weymouthia
cochleariifolia, Hypopterygium didictyon). Interestingly, the two first species concern
epiphytes in rain forests.
2. There are subspecies derived from the same anchestor originated in Chile and
New Zealand during 80 mio years with low molecular and morphological differences
(Polytrichadelphus magellanicus ssp. magellanicus and ssp. innovans).
3. There are two species originated from the same anchestor (Monoclea
forsteri/gottschei). Case two and three concerns epigaeic bryophytes.
Acknowledgements. This study is part of the project BRYO AUSTRAL supported by
the German Research Foundation with grants to J.-P. Frahm and W. Frey.
Tab. 1 Comparison of the moss flora between Chile and New Zealand.
taxa percentage of conformity [%] Chile New
Zealand
shared taxa Chile New Zealand
total species 778 523 181 23.3 34.6 austral species
778 523 113 14.5 21.6
genera 203 208 127 63.1 61.5 families 63 61 48 76.2 78.7

2 A comparison of the moss floras of Chile and New Zealand 16
Tab. 2 Moss species common in Chile and New Zealand according to He (1998) and Fife (1995). The nomenclature has been homologized to He (1998). The list includes 181 species and three varieties. Questionable records of Brachymenium exile, Bruchia hampeana, Bryum coronatum, Cyclodictyon sublimbatum and Ptychomnion aciculare are included. Species marked with * are not confined to the austral region but have wider ranges. Achrophyllum dentatum Hookeriaceae Acrocladium auriculatum Amblystegiaceae Amblystegium serpens * Amblystegiaceae Amblystegium varium * Amblystegiaceae Amphidium tortuosum Orthotrichaceae Andreaea acutifolia Andreaeaceae Andreaea mutabilis Andreaeaceae Andreaea nitida Andreaeaceae Andreaea subulata Andreaeaceae Aulacomnium palustre * Aulacomniaceae Barbula calycina Pottiaceae Barbula unguiculata* Pottiaceae Bartramia halleriana* Bartramiaceae Blindia contecta Seligeriaceae Blindia magellanica Seligeriaceae Blindia robusta Seligeriaceae Brachythecium albicans* Brachytheciaceae Brachythecium paradoxum Brachytheciaceae Brachythecium plumosum* Brachytheciaceae Brachythecium rutabulum * Brachytheciaceae Brachythecium subpilosum Brachytheciaceae Breutelia elongata Bartramiaceae Breutelia pendula Bartramiaceae Breutelia robusta Bartramiaceae Bryoerythrophyllum jamesonii Pottiaceae Bryum algovicum* Bryaceae Bryum amblyodon* Bryaceae Bryum argenteum* Bryaceae Bryum australe Bryaceae Bryum biliardieri Bryaceae Bryum caespiticium* Bryaceae Bryum campylothecium Bryaceae Bryum capillare* Bryaceae Bryum clavatum Bryaceae Bryum dichotomum Bryaceae Bryum laevigatum Bryaceae Bryum mucronatum Bryaceae Bryum muehlenbeckii* Bryaceae Bryum pachytheca Bryaceae Bryum pallescens * Bryaceae Bryum perlimbatum Bryaceae Bryum pseudotriquetrum* Bryaceae Bryum rubens* Bryaceae Calliergidium austro-stramineum Amblystegiaceae Calliergon stramineum* Amblystegiaceae Calliergonella cuspidata* Amblystegiaceae Calyptopogon mnioides Pottiaceae Calyptrochaeta apiculata Hookeriaceae Calyptrochaeta flexicollis Hookeriaceae Camptochaete gracilis Lembophyllaceae Campyliadelphus polygamum* Amblystegiaceae

2 A comparison of the moss floras of Chile and New Zealand 17
Campylopodium medium Dicranaceae Campylopus acuminatus Dicranaceae Campylopus clavatus Dicranaceae Campylopus incrassatus Dicranaceae Campylopus introflexus Dicranaceae Campylopus purpureocaulis Dicranaceae Campylopus pyriformis Dicranaceae Campylopus vesticaulis Dicranaceae Catagonium nitens ssp. nitens Phyllogoniaceae Ceratodon purpureus* Ditrichaceae Ceratodon purpureus ssp. convolutus Ditrichaceae Chorisodontium aciphyllum Dicranaceae Conostomum tetragonum Bartramiaceae Cratoneuron filicinum* Amblystegiaceae Cratoneuropsis relaxa Amblystegiaceae Dendrocryphaea lechleri Cryphaeaceae Dendroligotrichum dendroides Polytrichaceae Dicranella cardotii Dicranaceae Dicranella jamesonii Dicranaceae Dicranoloma billardieri Dicranaceae Dicranoloma menziesii Dicranaceae Dicranoloma robustum Dicranaceae Dicranoweisia antarctica Dicranaceae Didymodon australasiae Pottiaceae Distichium capillaceum Distichaceae Distichophyllum krausei Hookeriaceae Distichophyllum rotundifolium Hookeriaceae Ditrichum austro-georgicum Ditrichaceae Ditrichum brotherusii Ditrichaceae Ditrichum cylindricarpum Ditrichaceae Ditrichum difficile Ditrichaceae Ditrichum strictum Ditrichaceae Drepanocladus aduncus* Amblystegiaceae Drepnocladus exannulatus* Amblystegiaceae Drepanocladus fluitans* Amblystegiaceae Drepanocladus uncinatus* Amblystegiaceae Encalypta rhaptocarpa* Encalyptaceae Encalypta vulgaris * Encalyptaceae Entosthodon laxus Funariaceae Fissidens adianthoides* Fissidentaceae Fissidens asplenioides * Fissidentaceae Fissidens curvatus Fissidentaceae Fissidens oblongifolius Fissidentaceae Fissidens rigidulus Fissidentaceae Fissidens serratus Fissidentaceae Fissidens taxifolius* Fissidentaceae Funaria hygrometrica* Funariaceae Glyphothecium sciuroides Ptychomniaceae Goniobryum subbasilare Rhizogoniazeae Grimmia grisea Grimmiaceae Grimmia levigata* Grimmiaceae Grimmia pulvinata* Grimmiaceae Grimmia trichophylla* Grimmiaceae Gymnostomum calcareum* Pottiaceae Hedwigidium integrifolium* Hedwigiaceae Hennediella arenae Pottiaceae Hennediella heimii* Pottiaceae

2 A comparison of the moss floras of Chile and New Zealand 18
Hennediella serrulata Pottiaceae Hymenostylium recurvirostrum* Pottiaceae Hypnum chrysogaster Hypnaceae Hypnum cupressiforme Hedw. var. cupressiforme* Hypnaceae Hypnum cupressiforme var. filiforme* Hypnaceae Hypnum cupressiforme var. mossmanianum Hypnaceae Hypnum revolutum* Hypnaceae Hypopterygium didctyon Hypopterygiaceae Isopterygium pulchellum* Plagiotheciaceae Kiaeria pumila Dicranaceae Kindbergia praelonga * Brachytheciaceae Leptobryum piriforme* Bryaceae Leptodictyum riparium* Amblystegiaceae Leptodon smithii* Neckeraceae Leptotheca gaudichaudii Aulacomniaceae Lepyrodon lagurus Lepyrodontaceae Lopidium concinnum Hypopterygiaceae Macromitrium longirostre Orthotrichaceae Macromitrium microstomum Orthotrichaceae Muelleriella angustifolia Orthotrichaceae Muelleriella crassifolia Orthotrichaceae Oligotrichum canaliculatum Polytrichaceae Orthodontium lineare Byaceae Orthotrichum assimile Orthotrichaceae Orthotrichum cupulatum* Orthotrichaceae Orthotrichum hortense Orthotrichaceae Orthotrichum rupestre* Orthotrichaceae Papillaria flexicaulis Meteoriaceae Philonotis scabrifolia Bartramiaceae Plagiothecium denticulatum* Plagiotheciaceae Plagiothecium lucidum Plagiotheciaceae Pohlia cruda* Bryaceae Pohlia nutans* Bryaceae Pohlia wahlenbergii* Bryaceae Polytrichadelphus magellanicus Polytrichaceae Polytrichastrum alpinum* Polytrichaceae Polytrichastrum longisetum* Polytrichaceae Polytrichum juniperinum* Polytrichaceae Pseudocrossidium crinitum Pottiaceae Ptychomnion densifolium Ptychomniaceae Pyrrhobryum mnioides Rhizogoniaceae Racomitrium crispipilum Grimmiaceae Racomitrium crispulum Grimmiaceae Racomitrium lanuginosum* Grimmiaceae Racomitrium pruinosum Grimmiaceae Racomitrium ptychophyllum Grimmiaceae Rhacocarpus purpurascens* Hedwigiaceae Rhaphidorrhynchium amoenum Sematophyllaceae Rhizogonium novae-hollandiae Rhizogoniaceae Rhynchostegium tenuifolium Brachytheciaceae Sarmentypnum sarmentosum* Amblystegiaceae Sauloma tenella Hookeriaceae Schistidium apocarpum * Grimmiaceae Schistidium rivulare * Grimmiaceae Sematophyllum uncinatum Sematophyllaceae Sphagnum falcatulum Sphagnaceae Sphagnum subnitens * Sphagnaceae

2 A comparison of the moss floras of Chile and New Zealand 19
Syntrichia andersonii Pottiaceae Syntrichia papillosa * Pottiaceae Syntrichia princeps * Pottiaceae Syntrichia robusta Pottiaceae Tetrodontium brownianum* Tetraphidaceae Thuidium furfurosum Thuidiaceae Thuidium sparsum Thuidiaceae Tortula atrovirens * Pottiaceae Tortula muralis* Pottiaceae Trichostomum brachydontium* Pottiaceae Ulota rufula Orthotrichaceae Weissia controversa* Pottiaceae Weymouthia cochlearifolia Meteoriaceae Weymouthia mollis Meteoriaceae Zygodon gracillimus Orthotrichaceae Zygodon hookeri Orthotrichaceae Zygodon intermedius Orthotrichaceae Zygodon menziesii Orthotrichaceae Zygodon obtusifolius Orthotrichaceae
Tab. 3: Number of species per families occurring disjunct in Chile and New Zealand. Amblystegiaceae (14) Andreaeaceae (4) Aulacomniaceae (2) Bartramiaceae (5) Brachytheciaceae (7) Byaceae (23) Cryphaeaceae (1) Dicranaceae (20) Ditrichaceae (4) Encalyptaceae (2) Fissidentaceae (7) Funariaceae (2) Grimmiaceae (11) Hedwigiaceae (2) Hookeriaceae (6) Hypnaceae (6) Hypopterygiaceae (2) Lembophyllaceae (1) Lepyrodontaceae (1) Meteoriaceae (3) Neckeraceae (1) Orthotrichaceae (15) Phyllogoniaceae (1) Plagiotheciaceae (2) Polytrichaceae (6) Pottiaceae (20) Ptychomniaceae (2) Rhizogoniaceae (3) Seligeriaceae (3) Sematophyllaceae (2) Sphagnaceae (2) Tetraphidaceae (1) Thuidiaceae (2)

2 A comparison of the moss floras of Chile and New Zealand 20
Tab. 4 Degree of conformity of the mosses of various disjunct floras. The percentage is correlated with the time span of separation. Disjunction Percentage of
species in commonAuthor Age mio years Distance
(approx.) km Europe – North America
70 % of the species of North America
Frahm & Vitt (1991) 50 6,000
Africa – South America
8 % of the neotropical flora2
Delgadillo (1993) 180 6,000
Chile – New Zealand 33 % of the species of New Zealand1
this paper 80 10,0002
1 The percentage is calculated on the flora of New Zealand because Chile is also part of the neotropical flora. 2 The distance across the South Pacific Ocean is given, because it correlates with the prevailing wind systems.
Tab. 5 Genetic distances between disjunct populations or taxa in the austral temperate region using the trnL-Intron of cp DNA. differences in
trnL-Intron [%] Disjunction Separation
[Myr BP] Reference
Monoclea forsteri/gottschei 5.5 Chile – New
Zealand 80 Meißner et al,
1998 M gottschei ssp. gottschei/ ssp. elongata
1.0 S – N South America
? (<80) Meißner et al, 1998
Hypopterygium didictyon 0.0 Chile – New Zealand
80 Pfeiffer 2000
H. didictyon/debile 3.4 Pfeiffer et al, 2000 H. didictyon/muelleri 4.1 Pfeiffer et al, 2000 Lopidium concinnum 0.0 New Zealand – S
Brazil- Chile Frey et al. 1999
L. concinnum/struthiopteris 3.0 New Zealand/Chile – Zaire
Frey et al, 1999
Polytrichadelphus magellanicus ssp. m,/ssp. innovans
1.1 Chile – New Zealand
80 Stech et al, 2002 Polytrichadelphus magellanicus/ longisetus
2.3 Patagonia – N, Andes Stech et al, 2002
P. magellanicus/umbrosus 4.5 Patagonia N, Andes Stech et al, 2002
Weymouthia cochleariifolia 0.0 Chile – New Zealand 80 Quandt et al, 2001

3 A preliminary study on the phylogeny and molecular evolution of the Ptychomniaceae 21
3 A preliminary study on the phylogeny and molecular evolution of the Ptychomniaceae M. Fleisch. (Bryopsida) with special emphasis on Ptychomnion ptychocarpon and Dichelodontium.
3.1 Introduction
Systematics of the family Ptychomniaceae. During our field studies on bryophytes
in the temperate rainforest in Chile, one of the most remarkable species we
encountered was Ptychomnion ptychocarpon (Schwaegr.) Mitt., a member of the
Ptychomniaceae Fleisch. Because of its pendent life form, unique within the genus,
and its endemic status (southern temperate rainforests of Chile and Argentina) the
evolution of this species was of special interest to us.
Fleischer (1906-1908) established the family Ptychomniaceae based e.g. on the
character of the ribbed capsules. He separated the family into two tribes (‘tribus’),
based on the orientation of the capsule. The group with erect capsules, ‘tribus’
Cladomnieae, comprises Hampeella C. Müll., Glyphothecium Hamp., Dichelodontium
Hook.f. & Wils., Cladomniopsis Fleisch., and Cladomnion Hook.f. & Wils. The second
‘tribus’, Ptychomnieae, with inclined to curved capsules consists of the single genus
Ptychomnion.
Brotherus (1909b) describes fourteen species in seven genera for the
Ptychomniaceae, based on the same characters used by Fleischer (1908). In
contrast to Fleischer Brotherus (1909b) divides the family Ptychomniaceae into two
subfamilies (Cladomnioideae and Ptychomnioideae) and subsequently includes in his
later treatment of the family (Brotherus, 1925c) the newly established genus
Tetraphidopsis Broth. & Dix. in the Ptychomniaceae (Cladomnioideae).
According to Hattaway (1984) the family Ptychomniaceae consists of 16 species in
seven genera. He uses the two subdivisions already described in Fleischer (1908)

3 A preliminary study on the phylogeny and molecular evolution of the Ptychomniaceae 22
but adopts the rank ‘subfamily’ for the subdivisons made by Brotherus (1909b) to
divide the family Ptychomniaceae. He recognizes that several synapomorphic
characters unite the genera Ptychomnion and Cladomniopsis and transfers the latter
genus to the subfamily Ptychomnioidae which since then consists of the genera
Ptychomnion and Cladomniopsis. The synapomorphic characters uniting these
genera are among others that they are inclined to having suberect capsules and a
well developed basal membrane of the endostome.
The second subfamily Cladomnioidae consists of the genera Cladomnion,
Glyphothecium, Hampeella and Tetraphidopsis. According to Hattaway (1984) the
genus Dichelodontium does not belong to the Ptychomniaceae, but as he could not
define its most closely related taxa he provisionally included Dichelodontium in the
Ptychomniaceae (subfamily Cladomnioidae). The shared characters of the five
genera are e.g. the erect, straight and symmetric capsules and the special exostome
ornamentation.
Brotherus (1909b; 1925c) already recognizes the special status of Ptychomnion
ptychocarpon and separates it from the remaining species of Ptychomnion Hook.f. &
Wils., by placing the latter in the ‘section’ Eu-Ptychomnion and P. ptychocarpon in the
‘section’ Ptychomniella of the genus Ptychomnion.
Kühnemann & Carralves (1975) present a monography of the Ptychomniaceae of the
temperate rainforests of Chile and Argentina and list nine species of the family
occurring in this area. They share the view of Brotherus (1909b) and separate P.
ptychocarpon from the remaining species of the genus.
Morphological characterisation and systematics of Dichelodontium. As already
mentioned above, Hattaway (1984) only provisionally places the monospecific genus
Dichelodontium within the Ptychomniaceae but also states that further studies should
be made to determine its familial placement. Based on morphological studies using
characters of the gametophyte and the sporophyte Magill (1987) retains
Dichelodontium in the Ptychomniaceae whereas Allen (1999) transfers the New
Zealand endemic Dichelodontium nitidum (Hook. & Wilson) Broth. to the
Lepyrodontaceae. The shared characters which justify this placement are according
to Allen (1999) the single peristome of endostomial nature and rhizoids which arise
from initials around branch buds (or leaf axels). Both taxa have similar leaf cells,

3 A preliminary study on the phylogeny and molecular evolution of the Ptychomniaceae 23
weakly developed costae, sheathing perichaetial leaves, and a cucullate calyptra.
Also the branching pattern of Dichelodontium nitidum resembles that of some species
in Lepyrodon. As the status of Dichelodontium nitidum remains questionable we also
included it in our study.
Recent research studying Ptychomniaceae has mainly focussed on single taxa (e.g.
Ochyra, 2002; Tangney & Fife, 1997) or has included members of the family in
molecular phylogenetic studies in order to reveal relationships in pleurocarpous
mosses as a whole (e.g. Buck et al., 2000b). In 2003, Shaw et al. (2003) used the
term ‘Ptychomniales’ for a new order in pleurocarpous mosses but did not specify
which taxa belong to that order. A specification of this category can be expected from
Buck et al. (in press). Shaw and Renzaglia (2004) already mention some results of
this paper (Buck et al., in press) which suggest that based on molecular data the
Garovagliaceae are now included in the Ptychomniaceae which is the only family in
the order Ptychomniales of the suborder Ptychomnianae. For this reason,
representatives of the Garovagliaceae are included in the present study. The second
suborder Hypnanae according to Shaw and Renzaglia (2004) comprises the orders
Hookeriales and Hypnales.
Morphological characterisation of the Ptychomniaceae. The pleurocarpous
Ptychomniaceae are described by Beever (1992) as having leaves which are ‘often of
papery texture’. The leaves are erect spreading and usually plicate and/or rugose.
The leaf shape is ovate-lanceolate to broadly ovate with a slender leaf apex. The
costae are short and double. The most prominent sporophytic character is the
capsule carrying eight ribs when ripe. The peristome is usually double and the
endostome has a basal membrane.
Morphological characterisation and systematics of Ptychomnion. Characters of
the gametophyte and sporophyte which separate the genus from the remaining six
genera are e.g. a well developed primary stem, the lack of gemmae and a well
developed exostome with primary and secondary banding.
Brotherus (1909b; 1925c) distinguishes two ‘sections’ within the genus. Hattaway
(1984) gave these sections the rank of a subgenus. According to Hattaway (1984)
the subgenus Ptychomnion consists of the taxa P. aciculare (Brid.) Mitt., P.

3 A preliminary study on the phylogeny and molecular evolution of the Ptychomniaceae 24
cygnisetum (C. Müll.) Kindb., P. densifolium (Brid.) Jaeg., and P. falcatulum Broth.
The second subgenus ‘Ptychomniella’ consists of only one species Ptychomnion
ptychocarpon (Schwaegr.) Mitt.
The most important characters Brotherus (1909b; 1925c) describes to separate P.
ptychocarpon from the remaining species of the genus, are the moderate size, the
slender habitus and the long creeping stem which can be very long and pendent, the
curved secondary and irregularly branched stems as well as the more or less
spreading leaves. Hattaway (1984) adds three sporophytic characters to these
characters to justify the separation. He considered the genus Ptychomnion as the
ancestral genus within the family. The genus is restricted in its distribution to the
southern hemisphere.
Morphological characterisation and systematics of Cladomniopsis. The genus
is monotypic and its representative species Cladomniopsis crenato-obtusa Fleisch. is
endemic to southern South America. One of the outstanding characters of this
monotypic genus is the presence of a rudimentary central strand as reported in
Hattaway (1984).
Morphological characterisation and systematics of Cladomnion. This monotypic
genus is according to Hattaway (1984) closely related to the genus Ptychomnion
based on the plicate leaves, and incrassate porose laminal cells. Cladomnion
ericoides is endemic to New Zealand.
Morphological characterisation and systematics of Glyphothecium. There are
three species described within this genus (Hattaway, 1981) which occur in southern
South America and Australasia. The characters used to circumscribe the genus
Glyphothecium are the basal membrane in the peristome and the rhizoids which can
be both smooth and papillose within one plant.
The genus is one of two genera in the family Ptychomniaceae of which some species
occur north of the equator. Species belonging to this genus occur in Australasia from
New Zealand and southeast Australian temperate rainforests, to further north on the
Phillipines and Sri Lanka. In South America it is restricted to the southern temperate
forests of Chile and Patagonia.

3 A preliminary study on the phylogeny and molecular evolution of the Ptychomniaceae 25
Morphological characterisation and systematics of Hampeella. This genus,
comprising four species, has an Australasian distribution and follows mainly the same
distribution pattern as observed in Glyphothecium with the difference that it does not
occur in southeast Australia and Sri Lanka.
The genus is characterized by a double peristome (without cilia) and the absence of
paraphyllia. Unique within the family is its polymorphism in leave characters.
Morphological characterisation and systematics of Tetraphidopsis. The
monotypic genus occurs from New Zealand and Australia to Tasmania and Victoria.
The peristome in Tetraphidopsis lacks a basal membrane. Further characters to
distinguish this genus from the other genera of the family are the short single costa
and the presence of pseudoparaphyllia instead of paraphyllia.
Morphological characterisation and systematics of Garovagliaceae. Recent
phylogenetic analyses resolved representatives of the Garovagliaceae Buck & Vitt to
be closely allied with the Ptychomniaceae (e.g. Buck et al., 2000b). Therefore two
species representing the Garovagliaceae are included in this analysis.
This study is aimed at clarifying the familial relationship of Dichelodontium
(Lepyrodonataceae) and the relationship of P. ptychocarpon to other representatives
of the genus Ptychomnion.
3.2 Material & Methods
Plant material. Plant material of Lepyrodon tomentosus and Ptychomnion
ptychocarpon was collected by the author during a field trip of the BryoAustral project
to Chile in 2001. Material of Ptychomnion cygnisetum from Chile was kindly provided
by Dr. Friederike Schaumann (Freie Universität, Berlin). The remaining specimens
used in this study originate from herbarium specimens. Specimens of Acrocladium
chlamydophyllum and Lepyrodon pseudolagurus were collected during the
BryoAustral project expedition to New Zealand in 1998. Duplicates are preserved in
the herbaria in Christchurch (CHR), Bonn (BONN) and Berlin (B). We also used

3 A preliminary study on the phylogeny and molecular evolution of the Ptychomniaceae 26
sequences available in GenBank. All specimens used in our analyses are listed in
Appendix I including further voucher information.
Using cpDNA sequences of the trnL-Intron and the rps4-gene the phylogenetic
relationships of Dichelodontium (Lepyrodontaceae) and Ptychomnion ptychocarpon
and its relation to the species within the Ptychomniaceae sensu Hattaway (1984)
were analysed.
At least one species of each genus of the Ptychomniaceae as well as Dichelodontium
nitidum were included in this analysis. The following species of the Ptychomniaceae
were included in this study: Hampeella alaris, Ptychomnion cygnisetum, Ptychomnion
ptychocarpon, Cladomnion ericoides, Tetraphidopsis pusilla, Cladomniopsis crenato-
obtusa. Additionally, sequences from GenBank of all available taxa of the
Ptychomniaceae (Hampeella alaris, Hampeella pallens, Ptychomnion cygnisetum,
two specimens of Ptychomnion aciculare, Ptychomnion ptychocarpon, Cladomnion
ericoides, and Tetraphidopsis pusilla) and of Dichelodontium nitidum were used to
test the variability within a species.
The following taxa were chosen as outgroup taxa for this study: representative
species of the Lepyrodontaceae (Lepyrodon tomentosus, L. pseudolagurus), two
species of the genus Acrocladium (A. auriculatum, A. chlamydophyllum) belonging to
the Plagiotheciaceae according to Pedersen & Hedenäs (2002); two representatives
of the Hypopterygiacae (Hypopterygium didictyon, Lopidium concinnum), four
representatives of the core of the Hookeriales (Hookeria lucens, Schimperobryum
splendidissimum, Distichophyllum pulchellum and Daltonia gracilis) and two species
representing the Garovagliaceae (Garovaglia elegans, Euptychium robustum) as well
as Hypnum cupressiforme and Neckera crispa.
The Ptychomniaceae were represented in this study by at least one species of each
genus described by Hattaway (1984). The genus Hampeella is represented by two
species (H. alaris, H. pallens) out of the four described as belonging to the genus
(Hattaway, 1984). The genus Glyphothecium, comprising a total of three species, is
represented by G. sciuroides, and the genus Ptychomnion, comprising six species, is
represented by P. aciculare, P. cygnisetum and P. ptychocarpon. Also, one specimen
each of the monotypic genera Cladomnion, Cladomniopsis and Tetraphidopsis were
included.
Additional sequences of the genera of Ptychomniaceae (trnL region and rps4 gene)
were extracted from GenBank and used in the phylogenetic analysis as well as for

3 A preliminary study on the phylogeny and molecular evolution of the Ptychomniaceae 27
the calculation of genetic distances (p-distance) in order to analyse intrapecific
differences in the Ptychomniaceae.
DNA isolation, PCR and sequencing. Prior to DNA extraction the plant material
was thoroughly cleaned with distilled water and additionally treated by ultrasonic
waves for 2-4 minutes. Success of cleaning was checked by examining the plants
under a binocular microscope. Remaining contaminations e.g. with algae and fungi
were removed mechanically. Isolation of DNA was carried out following the CTAB
technique described in Doyle & Doyle (1990).
PCR amplifications (Biometra TriBlock thermocycler, PTC-100 MJ Research) were
performed in 50 µl–reactions containing 1.5 U Taq DNA polymerase (PeqLab), 1 mM
dNTPs-Mix, nucleotide concentration 0.25 mM each (PeqLab), 1x buffer (PeqLab),
1.5 mM MgCl2 (PeqLab) and 12.5 pmol of each amplification primer. PCR products
were purified using the QIAquick purification kit (Qiagen). Cycle sequencing reactions
(half reactions) were performed using a PTC-100 Thermocycler (MJ Research) in
combination with the ABI PrismTM Big Dye Terminator Cycle Sequencing Ready
Reaction Kit with Amplitaq-DNA polymerase FS (Perkin Elmer), applying a standard
protocol for all reactions. Extension products were precipitated with 40 µl 75 % (v/v)
isopropanol for 15 min at room temperature, centrifuged with 15.000 rpm at 25°C,
and washed with 250 µl of 75 % (v/v) isopropanol. These purified products were
loaded on an ABI 310 automated sequencer (Perkin Elmer) and electrophoresed. For
cycle sequencing 10 µl–reactions were used containing 3 µl of Big Dye Terminator
Cycle Sequencing premix. Sequencing reactions were performed on two
independent PCR products generated from each sample in order to verify the results.
Table 6: Primer sequences used for amplification and sequencing of the trnL region and rps4 gene. Underlined nucleotides represent changes (Quandt et al., 2000) with respect to the original primers of Taberlet (1991). Primer Sequence Data source trnS TAC CGA GGG TTC GAA TC Nadot et al. 1994 rps5 ATG TCC CGT TAT CGA GGA CCT Nadot et al. 1994 trnL-C_mosses CGR AAT TGG TAG ACG CTA CG Quandt et al. 2000 trnL-F ATT TGA ACT GGT GAC ACG AG Taberlet et al. 1991
All PCR products were sequenced using two primers. For amplifying and sequencing
the non-coding regions of the chloroplast DNA a modification of primer C (Quandt et

3 A preliminary study on the phylogeny and molecular evolution of the Ptychomniaceae 28
al., 2000) as well as primer F, originally designed by Taberlet et al. (1991) were
employed.
Primers used to amplify the rps4 gene were those described in Nadot et al. (1994),
‘trnS’ and ‘rps5’ (table 6).
For the trnL-F region and the rps4 gene the PCR program was performed with the
following settings: 2 min. 94ºC, 35 cycles (1 min. 94ºC, 1 min. 55ºC, 1 min. 72ºC) and
a 5 min. 72ºC extension time, cycle sequencing settings: 29 cycles (5 sec. 96ºC, 4
min. 50ºC).
All sequences will be deposited in EMBL, accession numbers are listed in Appendix
1, the alignments are available on request from the author.
Phylogenetic analyses. Heuristic searches under the parsimony criterion were
carried out under the following options: all characters unweighted and unordered,
multistate characters interpreted as uncertainties, gaps coded as missing data,
performing a tree bisection reconnection (TBR) branch swapping, collapse zero
branch length branches, MulTrees option in effect, random addition sequence with
1000 replicates.
Furthermore the data sets were analysed using winPAUP 4.0b10 (Swofford, 2002)
executing the command files generated by ‘PRAP’ (Parsimony Ratchet Analyses
using PAUP Müller, 2004), employing the implemented parsimony ratchet algorithm
(Nixon, 1999). For the parsimony ratchet the following settings were employed: 10
random addition cycles of 200 iterations each with a 40 % upweighting of the
characters in the PRAP iterations. Heuristic bootstrap searches (BS Felsenstein,
1985) under parsimony criterion were performed with 1000 replicates, 10 random
addition cycles per bootstrap replicate and the same options in effect as the heuristic
search for the most parsimonious tree (MPT). The consistency index (CI, Kluge &
Farris, 1969), retention index (RI), and rescaled consistency index (RC, Farris, 1989)
were calculated to assess homoplasy.
Maximum Likelihood analyses were executed assuming a general time reversible
model (GTR+G+I), and a rate variation among sites following a gamma distribution
(four categories represented by the mean), with the shape being estimated and the
molecular clock not enforced. According to Akaike Information Criterion (AIC, Akaike,
1974) GTR+G+I was chosen as the model that best fits the data by Modeltest v3.06
(Posada & Crandall, 1998), employing the windows front-end (Patti, 2002). The
3 A preliminary study on the phylogeny and molecular evolution of the Ptychomniaceae 29
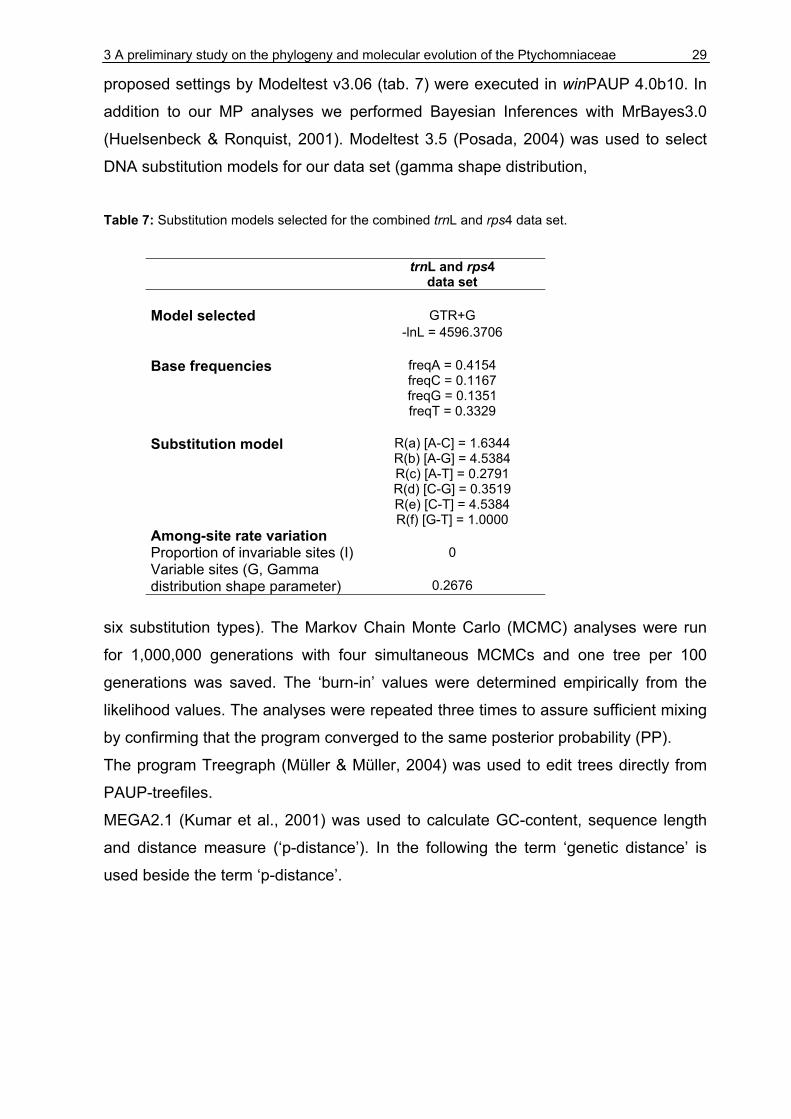
proposed settings by Modeltest v3.06 (tab. 7) were executed in winPAUP 4.0b10. In
addition to our MP analyses we performed Bayesian Inferences with MrBayes3.0
(Huelsenbeck & Ronquist, 2001). Modeltest 3.5 (Posada, 2004) was used to select
DNA substitution models for our data set (gamma shape distribution,
Table 7: Substitution models selected for the combined trnL and rps4 data set.
trnL and rps4 data set
Model selected GTR+G -lnL = 4596.3706 Base frequencies freqA = 0.4154
freqC = 0.1167 freqG = 0.1351 freqT = 0.3329
Substitution model R(a) [A-C] = 1.6344
R(b) [A-G] = 4.5384 R(c) [A-T] = 0.2791 R(d) [C-G] = 0.3519 R(e) [C-T] = 4.5384 R(f) [G-T] = 1.0000
Among-site rate variation Proportion of invariable sites (I) 0 Variable sites (G, Gamma distribution shape parameter)
0.2676
six substitution types). The Markov Chain Monte Carlo (MCMC) analyses were run
for 1,000,000 generations with four simultaneous MCMCs and one tree per 100
generations was saved. The ‘burn-in’ values were determined empirically from the
likelihood values. The analyses were repeated three times to assure sufficient mixing
by confirming that the program converged to the same posterior probability (PP).
The program Treegraph (Müller & Müller, 2004) was used to edit trees directly from
PAUP-treefiles.
MEGA2.1 (Kumar et al., 2001) was used to calculate GC-content, sequence length
and distance measure (‘p-distance’). In the following the term ‘genetic distance’ is
used beside the term ‘p-distance’.

3 A preliminary study on the phylogeny and molecular evolution of the Ptychomniaceae 30
3.3 Results
3.3.1 Sequence Variation
In this study eight species representing all genera of the Ptychomniaceae and
Dichelodontium nitidum were successfully sequenced for the trnL region and the rps4
gene. The GC-content and sequence length are listed for all taxa used in
phylogenetic analysis (tab. 8). The variability of the data sets are shown in table 9.
The length of the total sequence of the rps4 gene ranged between 547 basepairs
(bp) in Tetraphidopsis pusilla (specimen 126) and 592 bp in e.g. Ptychomnion
cygnisetum (sp. 130) and Cladomniopsis crenato-obtusa (sp. 127). The length of the
rps4 gene was on average 581 base pairs (standard deviation 13.2) for all taxa of the
Ptychomniaceae - Garovagliaceae included - and Dichelodontium. In the following
these 21 taxa are referred to as Ptychomniaceae s.l.
The average GC-content in the data set comprising the Ptychomniaceae s.l. was
27.4 % (standard deviation 0.8).
The average length in the trnL intron of the Ptychomniaceae s.l. (21 taxa) was 309 bp
(standard deviation 11.5). The shortest trnL intron sequence was found in
Cladomniopsis crenato-obtusa (sp. 127) with 267 bp, the longest sequence (314 bp)
was obtained for Tetraphidopsis pusilla (sp. 126), and three taxa where sequences
were extracted from GenBank.
The average GC-content in the trnL intron of the Ptychomniaceae s.l. was 31.1 %
(standard deviation 1.2).
The length of the trnL-trnF spacer varied considerably, as can be seen from a high
standard deviation (tab. 8). The average GC-content in the trnL-trnF spacer of the
Ptychomniaceae s.l. was 32.3 % (standard deviation 4.7).
Variability of the data set. Table 9 presents the information for the different regions
in the alignment. The data presented here were derived from all 34 taxa included in
the phylogenetic analysis.
The highest proportion of variable sites was found in the rps4 gene where 31.8 % of
the 595 aligned positions were variable within the data set including the outgroup.
The proportion of parsimony informative positions in this data set was 20.8 %.

3 A preliminary study on the phylogeny and molecular evolution of the Ptychomniaceae 31
The aligned trnL intron revealed 21.9 % variable sites for 424 aligned positions
(13.9 % parsimony informative positions). The lowest values of variable positions
(16.7) and parsimony informative position (9.6 %) were found within the 156 positions
of the trnL-trnF spacer. Table 8: Sequence lengths [base pairs, bp] of selected gene regions and GC-content [%] of the trnL intron, trnL-trnF spacer and rps4 gene studied for 34 bryophyte taxa. Average sequence lengths and standard deviations are also given. For origin of the data refer appendix 1. Abbreviations: n. d. = no data available.
Taxon
trnL intron
sequence length
[bp]
trnL intron
G/C content
[%]
trnL-trnF spacerLength
[bp]
trnL-trnF spacer
G/C content
rps4 Length
[bp]
rps4 G/C
content spacer
Hypnum cupressiforme 315 30.8 62 22.6 592 27.4Neckera crispa 258 29 n. d. n. d. 592 28.2Leucodon sciuroides 316 30.1 70 21.4 592 27.2Acrocladium auriculatum (sp.78) 314 30.2 64 20.3 558 26.3Acrocladium chlamydophyllum (sp.12) 315 30.8 64 25 570 26.7
Lepyrodon tomentosus (sp.64) 314 32.5 63 22.2 540 28.5Lepyrodon pseudolagurus (sp.67) 315 31.7 64 23.4 576 27.9Lopidium concinnum 304 21.4 n. d. n. d. 595 27.5Hypopterygium didictyon 296 23 n. d. n. d. 592 27.6Hookeria lucens 303 24.1 n. d. n. d. 592 27.4Schimperobryum splendidissimum 366 26.2 63 20.6 573 26.7Daltonia gracilis 347 27.4 46 19.6 587 24.9Distichophyllum pulchellum 378 25.9 62 19.4 585 25.3Hampeella pallens 308 31.2 42 19 587 26Hampeella alaris (sp.128) 307 31.6 n. d. n. d. 553 25.7Hampeella alaris (sp.2) 306 31.7 52 15.3 592 26.4Ptychomnion ptychocarpon (sp.132) 319 30.4 n. d. n. d. 559 27Ptychomnion ptychocarpon (sp.2) 320 30 53 28.3 587 27.2Cladomniopsis creanato-obscura (sp.127) 267 27.4 n. d. n. d. 592 26.7
Glyphothecium sciuroides (sp.158) 312 32 n. d. n. d. 571 28Ptychomnion cygnisetum (sp.130) 313 31.3 n. d. n. d. 592 27.9Ptychomnion cygnisetum (sp.2) 314 31.2 47 21.2 586 27.3Ptychomnion aciculare (sp.1) 314 30.8 47 23.4 586 27.6Ptychomnion aciculare (sp.2) 314 30.8 52 23.1 586 27.6Cladomnion ericiodes (sp.125) 313 32.2 47 25.5 586 27.3Cladomnion ericiodes (sp.2) 313 32.2 47 25.5 586 27.3Glyphothecium sciuroides (sp.123) 288 29.1 n. d. n. d. 570 28.2Glyphothecium sciuroides (sp.2) 311 31.8 47 23.4 586 28.1Euptychium robustum 313 31.3 53 22.6 592 27.7Garovaglia elegans 313 32.9 n. d. n. d. 587 28.5Dichelodontium nitens (sp.81) 308 32.5 47 25.5 586 28.5Dichelodontium nitidum (sp.2) 313 31.9 47 23.4 586 28.5
Average 312.2 29.7 54.2 22.4 581.7 27.3SD 21.6 3.0 8.4 2.9 13.4 0.9

3 A preliminary study on the phylogeny and molecular evolution of the Ptychomniaceae 32
Table 9: Number of taxa, total number of aligned characters; variable characters and number of parsimony informative sites and %-value of variable sites for the partial data sets of 34 taxa. (* includes part of the trnF and rps4-trnS spacer).
Com-bined*
Varia-bility
[%]
trnLintron
Varia-bility
[%]
trnL-F spacer
Varia-bility
[%]
rps4 Varia-bility
[%]
Number of sites 1.175 424 156 595 Variable sites 308 26.2 93 21.9 26 16.7 189 31.8Parsimony Informative 199 17.0 59 13.9 15 9.6 124 20.8
3.3.2 Genetic distances
Distance between Dichelodontium and Lepyrodon. The distance of
Dichelodontium nitidum (sp. 81) to the representative species of the
Lepyrodontaceae (Lepyrodon pseudolagurus and L. tomentosus) is 6.7 % in the trnL-
intron (Appendix 2) and between 9.5 and 9.6 % in the rps4 gene (Appendix 3). The
distance of the sequence of Dichelodontium nitidum (#2) obtained from GenBank to
both Lepyrodon species is 8.2 % for the trnL intron and between 9.5 and 9.6 % for
the rps4 gene.
Interspecific distances in the genus Ptychomnion. Sequence variation of P.
ptychocarpon (sp. 132, 2) and P. cygnisetum (sp. 130, 2) ranges from 4.2-4.5 % in
the intron (Appendix 2) and 6.3-6.8 % in the rps4 gene (Appendix 3). The p-distance
of P. ptychocarpon (sp. 132, 2) to P. aciculare (sp. 1, 2) is between 3.8 and 4.2 % in
the intron and between 6.8 and 7.3 % in the rps4 gene.
Intraspecific distances. No difference was detected between the two sequences of
Hampeella alaris, sp. 128 and 2, neither in the trnL nor in the rps4 sequences. This
same pattern was found for Ptychomnion cygnisetum, Ptychomnion aciculare and
Cladomnion ericoides.
The variation between the sequences of Ptychomnion ptychocarpon (sp. 132, 2) was
0.2 % in the rps4 gene (Appendix 3) and 0.3 % in the trnL intron. The same
differences were found between the two sequences of Glyphothecium sciuroides (sp.
123, 2). In Tetraphidopsis pusilla (sp. 126, 2) the two sequences differed in 0.3 % of

3 A preliminary study on the phylogeny and molecular evolution of the Ptychomniaceae 33
the positions within the trnL intron (Appendix 2). There was no difference detected
between specimens 126 and 2 in the rps4 gene.
The sequences of Dichelodontium nitidum (sp. 81, 2) differed in 1.6 % of the
positions within the trnL intron (Appendix 2). No difference was found between the
two obtained rps4 sequences (Appendix 3) of the different specimens of this species.
3.3.3 Phylogenetic analysis
In figure 1 the result of the Bayesian Inference (BI) analysis is presented as
cladogram with posterior probabilities (PP) indicated as percent values above
branches and bootstrap (BS) values below branches. The Maximum Parsimony (MP)
analysis with the parsimony ratchet revealed the same topology in the strict
consensus tree as the BI analysis with an exception discussed below.
Hypnum cupressiforme and Neckera crispa were used as outgroup taxa. A clade
consisting of Leucodon sciuroides (Leucodontaceae) and the specimens of
Acrocladium (Plagiotheciaceae) and Leucodon (Leucodontaceae) is sister to a clade
consisting of the remaining 27 taxa. In this study the genus Acrocladium (A.
auriculatum, A. chlamydophyllum) was identified as the closest relative to the
Lepyrodontaceae (represented by Lepyrodon pseudolagurus and L. tomentosus)
based on a posterior probability of 93 % (BS 65 %).
The monophyly of the clade with the remaining 27 taxa (clades labeled
‘Hypopterygiaceae’, ‘Hookeriales’, and ‘P’) had a posterior probability of 100 % (87 %
BS). The basal clade within this group consists of the members of the
Hypopterygiaceae. The monophyly of the remaining two clades, the Hookeriales and
‘P’ clade is supported with 98 % PP (72 % BS). The monophyly of the four species
representing the Hookeriales has a PP of 96 % (58 % BS). The terminal taxa is the
monophyletic ‘P’ clade with a posterior probability of 100 % (100 % BS).
The ‘P’ clade consists of Dichelodontium nitidum and the species representing the
Ptychomniaceae and Garovagliaceae. The most basal taxon within this clade is the
genus Hampeella. The genus is represented by two specimens of H. alarix and one
specimen of H. pallens. The next most basal clade within the ‘P’group consists of two
specimens of Ptychomnion ptychocarpon basal to the remaining taxa. The probability
of this clade including Ptychomnion ptychocarpon is 100 % (94 % BS).

3 A preliminary study on the phylogeny and molecular evolution of the Ptychomniaceae 34
Figure 1: Cladogram resulting from a Bayesian Inference analysis of the complete data set (rps4 and trnL sequence data). Numbers above branches indicate the posterior probabilities as a percentage value. A strict consensus cladogram of six trees found during the parsimony ratchet of the same data set revealed the same topology (Length= 554; CI: 0.671, RI: 0.829; RC: 0.557) and is not shown separately (see discussion in the text). Bootstrap values below branches are the result of a Maximum Parsimony analysis. For explanation of the clades referred to as ‘outgroup’, O, and P see text.

3 A preliminary study on the phylogeny and molecular evolution of the Ptychomniaceae 35
The following clade with the remaining fourteen specimens is supported by a 97 %
PP (56 % BS). The next taxon branching off is Cladomniopsis crenato-obscura. The
basal position of Tetraphidopsis pusilla to clade ‘O’ has a posterior probability of
72 % (BS 72 %).
Clade ‘O’ consists of thirteen taxa (100 % PP, BS 100 %). The basal position in this
clade is occupied by a specimen of Glyphothecium (specimen 158). The remaining
group consists of three clades. The first clade is that of Ptychomnion (100 % PP,
100 % BS) with the species Ptychomnion aciculare and P. cygnisetum, each
represented by two specimens. The relationship of Ptychomnion to the second clade
Cladomnion and third clade (consisting of six taxa) is ambiguous as the PP is only
36 % (BS < 50 %). The monophyly of the third clade within ‘O’ is well supported
(99 % PP, 62 % BS). Glyphothecium sciuroides retains a basal position in this clade,
followed by the two representatives of the Garovagliaceae, Euptychium robustum
(100 % PP, 71 % BS) and Garovaglia elegans, which is sister to Dichelodontium
nitidum (100 % PP, 94 % BS).
The phylogram of the Maximum Likelihood (ML) analysis (fig. 2) supports the main
clades of the topology as detected with the Bayesian Inference (BI) and Maximum
Parsimony (MP) analysis.
Based on the phylogenetic analyses conducted in this study the following
relationships remain ambiguous. Due to the low BS values neither the relationship of
Leucodon to the Plagiotheciaceae and Lepyrodontaceae nor the relationship
between Leucodon and clade ‘P’ were resolved.
Also the relationship between the clade compromising Ptychomnion aciculare/P.
cygnisetum to Cladomnion, as well as Glyphothecium, Dichelodontium and the
species representing the Garovagliaceae remains unresolved. This same result was
obtained in a strict consensus of six trees found in a MP analysis. Due to these
identical results this latter analysis is not presented in this study.
Furthermore, the analyses of this study show that the monotypic genus
Dichelodontium does not belong to the Lepyrodontaceae; the closest relative of
Lepyrodon is Acrocladium (Plagiotheciaceae) whereas Dichelodontium appears
within a clade of the representatives of the Ptychomniaceae and Garovagliaceae.
All analyses in this study indicate that the family Ptychomniaceae is polyphyletic as
the genus Glyphothecium is sister to a clade at the terminal end of phylogram, which

3 A preliminary study on the phylogeny and molecular evolution of the Ptychomniaceae 36
Figure 2: Maximum Likelihood (ML) phylogram of the combined data set of rps4 and trnL sequence data (L score = - 4596.3706). Branch lengths are proportional to genetic distance between taxa. Scale bar equals 1% distance under the assumed substitution model (GTR+G). For explanation of the clades referred to as ‘outgroup’, H, and A see text.

3 A preliminary study on the phylogeny and molecular evolution of the Ptychomniaceae 37
consists of representatives of the Garovagliaceae and Dichelodontium recently
transferred in the Lepyrodontaceae.
Ptychomnion ptychocarpon is more closely related to Hampeella and Cladomniopsis
than to the representative species of the genus Ptychomnion (P. aciculare, P.
cygnisetum).
In all analyses Hampeella was identified as the most basal taxon within
Ptychomniaceae s.l.
Furthermore, the genus Glyphothecium is polyphyletic, with respect to the position of
the unspecified specimen 158.
3.4 Discussion
The results of this study are based on a data set comprising 34 taxa, which represent
species of the orders Hypnales, Leucodontales and Hookeriales. The conducted
analyses with these 34 taxa revealed a higher variability in the rps4 (31.8 %) than in
the trnL intron (21.9 %). This stands in contrast to the pattern obtained by Buck et al.
(2000b) for a data set of 90 taxa, comprising representatives of Bryales, Hookeriales,
Leucodontales and Hypnales. Buck et al. (2000b) found a 51.86 % variability in the
trnL intron, 7.3 % variability in the trnL-trnF spacer, and 46.5 % in the rps4 gene. The
higher variabilities found by Buck et al. (2000b) can be explained by the higher
number of species involved as well as the broader taxonomic representation of the
taxa, i.e. that also representatives of the Bryales are included.
On the other hand this study here is the first to use species that represent all genera
of the Ptychomniaceae as well as Dichelodontium nitidum (Lepyrodontaceae) in an
analysis that addresses the systematic position and intrafamilial relationship of the
Ptychomniaceae as circumscribed by Hattaway (1984).
Since a common pattern reported for phylogenetic analyses is that the posterior
probability values resulting from Bayesian Inference analyses (Huelsenbeck &
Ronquist, 2001) are generally higher than values obtained from non-parametric
bootstrapping (e.g. Erixon et al., 2003; Felsenstein, 1985; Suzuki et al., 2002), we
chose to apply both methods. The lower bootstrap values compared with the higher
posterior probability support do not question the main results of this study.

3 A preliminary study on the phylogeny and molecular evolution of the Ptychomniaceae 38
The monophyly of the Hypopterygiaceae, Hookeriales and the Ptychomniaceae s.l.
(‘P’ clade) in this study comprising species representative of Ptychomniaceae and
Garovagliaceae, is highly supported by the results of both methods. The
monophyletic group of the Hookeriales has a posterior probability of 96 %, with only
58 % bootstrap support.
The sister relationship of the Hookeriales and the Ptychomniaceae s.l. is supported
by different values from the Bayesin Inference analysis (98 % PP) and non-
parametric bootstrapping (72 % BS). Based on characters derived from the
sporophyte already Robinson (1975) regarded the Ptychomniaceae as closely
related to the hookeroide taxa (Robinson, 1971). The sister relationship between
species representing the Ptychomniaceae and the Hookeriales is also obtained by
Kruijer & Blöcher (2004) who use a combined data set of cpDNA, nrDNA and
morphological data, by Buck et al. (2000b) using cpDNA, and by Buck et al. (in press;
cit in Shaw & Renzaglia, 2004) based on nrDNA, cpDNA and mtDNA sequence data.
In contrast, Kruijer (2002) suggests a closer relationship between Hypopterygiaceae
and Ptychomniaceae. However, the results of the study at hand resolve the clade of
Ptychomniaceae and Garovagliaceae as a monophyletic group with high support
values. This result confirms the placement of both families in a separate suborder
Ptychomniieae (order Hookeriales) as described by Buck & Goffinet (2000) which
they based on earlier molecular phylogenetic studies (Buck et al., 2000a; Buck et al.,
2000b).
Both specimens of each species investigated in this study were always resolved as a
monophyletic group in the phylogenetic analysis. The intraspecific variability was
quite low (0.0 to 0.3 %) and there were only slight differences (+/- 0.1 %) between the
trnL and rps4 region. This low variability within one species was expected as the
specimens of the same species used for the analyses were derived from similar
geographical regions and reported intraspecific sequence variation of the regions
used is commonly very low (Quandt & Stech, 2004). Only the two specimens of the
New Zealand endemic Dichelodontium nitidum had a high intraspecific variation for
the rps4 gene (1.6 %). There was no intraspecific differentiation between the two
specimens based on the trnL intron (0.0 %). A common pattern observed is, that
substitution rates between regions are quite variable (e.g. Clegg et al., 1994; Palmer,
1990; Quandt, 2002), although it is rather unusual that coding regions have a higher
variation than a group I intron as observed here.

3 A preliminary study on the phylogeny and molecular evolution of the Ptychomniaceae 39
However, the differences should be in proportion and if the rps4 shows a high
variability within one species compared to others one would expect that also the trnL
intron would show some genetic difference between the Dichelodontium nitidum
specimens. Therefore the large genetic distance between the rps4 gene of the two
Dichelodontium nitidum specimens might well by an artefact and needs justification
by additional sequences.
Earlier research on the Garovagliaceae (e.g. Buck & Vitt, 1986; During, 1977) and
Ptychomniaceae (e.g. Hattaway, 1984) does not mention any relationship between
the two taxa. The Garovagliaceae was considered to be closely related to the
Pterobryaceae (Buck & Vitt, 1986) or was placed within the Pterobryaceae (e.g.
During, 1977). More recent studies (e.g. Buck et al., 2000b), however, indicate a
closer relationship between the Garovagliaceae and the Ptychomniaceae. Results of
the study at hand confirm an affinity between the two groups. Due to the position of
Dichelodontium as sister to the representatives of the Garovagliaceae (Garovaglia
elegans and Euptychium robustum) in this analysis the family Ptychomniaceae is
paraphyletic.
Since based on the results of this study taxa of the Garovagliaceae appear within the
Ptychomniaceae and the genus Ptychomnion, subfamily Ptychomnioideae, shows a
closer relationship to taxa belonging to the subfamily Cladomnioideae (e.g.
Cladomnion and Garovaglia) than to its formerly allied Cladomniopsis
(Ptychomnioideae) (Hattaway, 1984), the subfamilial concept needs revision.
The most basal lineage of the Ptychomniaceae s.l. in this study is the genus
Hampeella. This is in contrast to Hattaway (1984) who suggests that the genus
Ptychomnion, based on morphological data and the wide geographical distribution of
P. aciculare, might be the most basal genus within the Ptychomniaceae.
Furthermore, the study at hand has indicated a close relationship between the genus
Hampeella and the species P. ptychocarpon. As Hampeella, identified as the most
basal taxon of the Ptychomniaceae s.l., is restricted to the Australasian region and P.
ptychocarpon is endemic to southern South America this may indicate an origin of the
Ptychomniaceae on the Gondwana continent as also suggested by e.g. Kruijer
(2002) for the Hypopterygiaceae. In addition, the epiphytic life form found in
Hampeella as well as in P. ptychocarpon (Hattaway, 1984) could be regarded as an
basal characteristic of the family.

3 A preliminary study on the phylogeny and molecular evolution of the Ptychomniaceae 40
The position of Ptychomnion aciculare and its sister species P. cygnisetum as closest
relatives to Cladomnion ericoides and to a clade consisting among others of
Glyphothecium sciuroides, Garovaglia elegans and Dichelodontium nitidum is
strongly supported by this analysis. In contrast, the southern South American
endemic P. ptychocarpon is one of the basal taxa of the Ptychomniaceae s.l. clade,
and thus separated from the other species of the same genus. The morphological
differences between P. ptychocarpon and the remaining species of Ptychomnion
have already been recognized by different authors (Brotherus, 1909b; Hattaway,
1984; Kühnemann, 1975). However, these morphological characters were not
regarded as valid in order to justify a generic separation of P. ptychocarpon.
As the type specimen of the genus Ptychomnion, P. aciculare (Brid.) Mitten (as
Hypnum aciculare S.E. Bridel), is sister to Ptychomnion cygnisetum, and P.
ptychocarpon does not indicate any affinity to another taxon included in this analysis,
it is suggested from the result of this study that P. ptychocarpon should be
transferred to a separate genus.
Based on this study Dichelodontium nitidum should be removed from the
Lepyrodontaceae, where it is placed by Allen (1999). According to our results this
species retains a terminal position within the Ptychomniaceae s.l. clade. The
observed strongly supported position of Dichelodontium as sister to Garovaglia
elegans should be examined with more taxa from the Garovagliaceae. The distinction
between the representatives of the Lepyrodonataceae and their sister taxon
Acrocladium is obvious from the phylogenetic results as well as the genetic
distances, separating Dichelodontium from the Lepyrodontaceae. The result of this
study stands in contrast to the view that Dichelodontium should be placed within the
former ‘Leucodontales’ as stated by Hattaway (1984) and the view on the
relationships within the Lepyrodontaceae as described by Allen (1999). Instead, our
results are in good concordance with Magill (1987) and the original description of the
Lepyrodontaceae by Fleischer (1908).
The results of this study put a question mark by the monophyletic status of the genus
Glyphothecium. Specimen 158 ‘Glyphothecium spec.’ could not be identified further
(as either G. gracile (Hampe) Broth. or G. sciuroides) as the voucher lacked
sporophytes (Hattaway, 1981; 1984). But to whatever species of Glyphothecium the
specimen no. 158 might belong, the genus Glyphothecium is polyphyletic according
to our study, as G. sciuroides is sister to a clade comprising the Garovagliaceae and

3 A preliminary study on the phylogeny and molecular evolution of the Ptychomniaceae 41
Dichelodontium with high branch support, whereas Glyphothecium specimen 158 is
at a basal position to a highly supported monophyletic group consisting of e.g.
Ptychomnium aciculare, Cladomnion ericoides, and the formerly mentioned
Glyphothecium-Garovagliaceae-Dichelodontium clade. Moreover, the genetic
distances support the outstanding position of Glyphothecium sp. 158. So far, no one
has questioned a close relationship between species within the genus
Glyphothecium since Hattaway revised it (Hattaway, 1981; 1984). We recommend
further studies including specimens of G. gracile, and G. pendulum Zant. to shet light
on the taxonomic status of Glyphothecium. Further molecular studies are also
needed to avoid the influence of e.g. lineage sorting and hybridization on the
phylogenetic results (e.g. Doyle, 1992; Hidalgo et al., 2004; Vanderpoorten et al.,
2004).

4 The systematic affinities of selected Gondwanan bryophyte taxa 42
4 The systematic affinities of selected Gondwanan bryophyte taxa based on molecular sequence data
4.1 Introduction
For studies on the Lepyrodontaceae as well as on the genera Catagonium and
Acrocladium it is indispensable to know the closest relatives of each of these taxa in
order to reduce the possibility of homoplasy in the phylogenetic constructions within
the family or genus.
A monophyletic group formed by Lepyrodon and representatives of the
Stereophyllaceae (Buck et al., 2000a; Buck et al., 2000b) as well as recent
phylogenetic studies indicating a closer relationship of the genus Lepyrodon with the
genus Acrocladium (Quandt et al., 2004b) suggest an ambiguous position of the
Lepyrodontaceae within the superorder Hypnanae.
Combined analyses of morphological and genetic sequence data show a basal
position of Acrocladium within the Plagiotheciaceae (Pedersen & Hedenäs, 2002).
The dataset used in this study consisted of species of the genera Lepyrodon,
Acrocladium, and Catagonium. Furthermore, the data comprised representative
species of the Plagiotheciaceae as described in Pedersen & Hedenäs (2002).
Rhizofabronia and Myurella were excluded, but Isopterygiopsis and Platydictya which
are considered their closest relatives, respectively, were included. Thus, the species
of the Plagiotheciaceae used in the analyses were: Platydictya jungermannioides,
Orthothecium chryseum, O. intricatum, Struckia zerovii, Plagiothecium denticulatum,
P. undulatum, Isopterygiopsis pulchella, I. muelleriana, Herzogia seligeri, and
Pseudotaxiphyllum elegans. One representative of the Pterobryaceae (Pterobryon
densum) was chosen as well as three species of the Stereophyllaceae
(Entodontopsis leucostega, Pilosium chlorophyllum, and Stereophyllum radiculosum).
Additional ingroup taxa covered a selection of the main clades within the Hypnanae
(e.g. Amblystegiaceae, Brachytheciaceae, Neckeraceae, Leucodontaceae,
Hypnaceae, Meteoriaceae, Lembophyllaceae).

4 The systematic affinities of selected Gondwanan bryophyte taxa 43
In addition to a broader taxon sampling with respect to possible relatives of
Lepyrodon, Catagonium and Acrocladium than in previous analyses (Buck et al.,
2000a; Pedersen & Hedenäs, 2002; Quandt et al., 2004b), in this study I also used a
wider range of molecular markers. A combined sequences of cpDNA (trnL-F, rps4,
psbT-H) and nrDNA (ITS region) was used.
A brief historical outline of the systematic placement of the taxa used in our analyses
Lepyrodontaceae. The genus Lepyrodon was established by Hampe in 1865 (cit in
Allen, 1999) and comprises diplolepideous moss species with a single peristome of
endostomial origin and a cucullate calyptra. He placed the genus within the
Leskeaceae. In 1908 Brotherus introduced the monotypic family Lepyrodontaceae
and placed it near the Neckeraceae. Since then the genus Lepyrodon is considered
to belong to either to the Ptychomniaceae (e.g. Brotherus, 1925b; Buck & Vitt, 1986;
Fleischer, 1915-1922) or the Pterobryaceae (Buck, 1998; Crum, 1994). Allen (1999)
revised the family Lepyrodontaceae and transferred the monotypic genus
Dichelodontium into the Lepyrodontaceae which since then consists of the genera
Lepyrodon and the monotypic genus Dichelodontium, with the New Zealand endemic
D. nitidum. Allen (1999) considered the Lepyrodontaceae as possibly related to the
Pterobryaceae based on morphological characters e.g. the reduced diplolepideous
peristom and the absence of an exostome. In his monographic study of Lepyrodon,
Allen (1999) considered seven species within this genus. These species are mostly
distributed in the southern hemisphere. The exception is L. tomentosus which occurs
from Mexico via Central America, to northern and even southern South America. L.
hexastichus, L. parvulus, L. lagurus and L. patagonicus occur only in southern South
America (Argentina, Chile, and the Juan Fernandez Islands) whereas the species L.
pseudolagurus and L. australis are restricted to Australia, Tasmania, New Zealand
and Campbell Island.
Catagoniaceae. As Catagonium nitens ssp. nitens is one of the prominent species of
the Chilean temperate rainforest, in this study a special interest was taken in the
evolution of this species and the relationship to its sister taxa.
4 The systematic affinities of selected Gondwanan bryophyte taxa 44
Earlier the genus Catagonium was placed either in or near the Plagiotheciaceae
(Brotherus, 1925c; Lin, 1984) or Phyllogoniaceae (Fleischer, 1915-1922; Vitt, 1984).
Then Buck (1985) revised the Plagiotheciaceae and transferred the genus
Catagonium in the monotypic family Catagoniaceae. Recently, based on cpDNA
sequences and morphological data, Pedersen & Hedenäs (2002) transferred the
genus back to the Plagiotheciaceae.
The genus Catagonium, comprising only four species, presents a distribution pattern
which implies a very old Gondwanan origin of the genus. The subspecies
Catagonium nitens ssp. maritimum occurs in South Africa, Catagonium nitens ssp.
nitens in eastern Africa, New Zealand/Australia, and southern South America as well
as on a few subantarctic islands. Catagonium nitidum is reported from southern
South America, the Falkland Islands and Tristan Da Cunha Island. Catagonium
brevicaudatum is known from Brazil, Bolivia, Columbia, Costa Rica, Ecuador,
Guatemala, Jamaica, Mexico, Peru and Venezuela, and Catagonium emarginatum
from Brazil and Bolivia (Lin, 1984).
Acrocladium. Brotherus (1925c) described two species in the genus Acrocladium: A.
auriculatum (Mont.) Mitt. from southern South America and A. chlamydophyllum
(Hook.f. & Wils.) Broth. from New Zealand, eastern Australia, Tasmania and some
adjacent islands. Since that time there has been disagreement among bryologists
whether the genus includes one or two species, and wether the populations in Chile
and Argentina are identical with those in New Zealand, Australia, and Tasmania.
Accordingly, collections of Acrocladium from Chile were either named A. auriculatum
(e.g. Brotherus, 1925c; Deguchi, 1991; Mitten, 1869) or A. chlamydophyllum (Cardot,
1908). Brotherus (1925c) distinguished two species, and Andrews (1949), Karczmarz
(1966) and Fife (1995) supported the view that the two taxa are different species. In
contrast, Dixon (1928), Sainsbury (1955) and He (1998) considered both taxa as
variations of the same species, using the name 'A. auriculatum' as the older
epitheton.
In fact, the variability of the Acrocladium specimens from southern South America
and Australia/New Zealand is quite high. Brotherus (1925c) differentiated both
species by leaf auricles and characters of the leaf costa. Karczmarz (1966) omitted
the character of the costa and distinguished both species by leaf shape and by
presence versus absence of auricles.
4 The systematic affinities of selected Gondwanan bryophyte taxa 45
Despite the early recognition of the genus Acrocladium (Mitten, 1869), its familial
position has been very much a subject of discussion. The genus was shifted from the
Lembophyllaceae (Brotherus, 1925a; Fleischer, 1915-1922) to the Amblystegiaceae
(Ochyra & Matteri, 2001; Vitt, 1984) and most recently to the Plagiotheciaceae
(Pedersen & Hedenäs, 2002).
Due to the problematic distinction of the two species based on anatomical and
morphological characters described above, an attempt has been made to evaluate
the differences based on molecular data.
Stereophyllaceae. The family Stereophyllaceae was formerly regarded as a
subfamily of the Plagiotheciaceae (Stereophylloidae, Fleischer, 1915-1922) with the
Plagiotheciaceae serving as ‘catch-all’ family for pleurocarpous mosses with
complanate habit and a hypnoid peristome (Buck & Ireland, 1985).
Buck & Ireland (1985) raised the Stereophyllaceae to family status. Therefore three
representatives of the family (Stereophyllum radiculosum, Entodontopsis leucostega
and Pilosium chlorophyllum) were included in this study. Furthermore, the data set
used included taxa of the genus Catagonium that was also considered closely related
to Plagiothecium (Fleischer, 1915-1922) before Buck & Ireland (1985) gave it the
rank of a family.
4.2 Material and Methods
Plant material. Plant material was either collected by the author during a field trip of
the BryoAustral project to Chile in 2001, or originatesfrom herbarium specimens.
Specimens of Acrocladium chlamydophyllum, Lepyrodon pseudolagurus, and
Catagonium nitens were collected during the BryoAustral project expedition to New
Zealand in 1998. Duplicates are preserved in the herbaria in Christchurch (CHR),
Bonn (BONN) and Berlin (B). We also used sequences available in GenBank. All
specimens used in our analyses are listed in (Appendix 4) including further voucher
information.

4 The systematic affinities of selected Gondwanan bryophyte taxa 46
DNA isolation, PCR and sequencing. Prior to DNA extraction the plant material
was thoroughly cleaned with distilled water and additionally treated by ultrasonic
waves for 2-4 minutes. Success of cleaning was checked by examining the plants
under a binocular microscope. Remaining contaminations e.g. with algae and fungi
were removed mechanically. Isolation of DNA was carried out following the CTAB
technique described in Doyle & Doyle (1990).
PCR amplifications (Biometra TriBlock thermocycler, PTC-100 MJ Research) were
performed in 50 µl–reactions containing 1.5 U Taq DNA polymerase (PeqLab), 1 mM
dNTPs-Mix, nucleotide concentration 0.25 mM each (PeqLab), 1x buffer (PeqLab),
1.5 mM MgCl2 (PeqLab) and 12.5 pmol of each amplification primer. PCR products
were purified using the QIAquick purification kit (Qiagen). Cycle sequencing reactions
(half reactions) were performed using a PTC-100 Thermocycler (MJ Research) in
combination with the ABI PrismTM Big Dye Terminator Cycle Sequencing Ready
Reaction Kit with Amplitaq-DNA polymerase FS (Perkin Elmer), applying a standard
protocol for all reactions. Extension products were precipitated with 40 µl 75 % (v/v)
isopropanol for 15 min at room temperature, centrifuged with 15,000 rpm at 25°C,
and washed with 250 µl of 75 % (v/v) isopropanol. These purified products were
loaded on an ABI 310 automated sequencer (Perkin Elmer) and electrophoresed. For
cycle sequencing 10 µl–reactions were used containing 3 µl of Big Dye Terminator
Cycle Sequencing premix. Sequencing reactions were performed on two
independent PCR products generated from each sample in order to verify the results.
All PCR products were sequenced using two primers. For amplifying and sequencing
the non-coding regions of the chloroplast DNA (table 10) a modification of primer C
(Quandt et al., 2000) as well as primer F, originally designed by Taberlet et al. (1991)
were employed. Primers used to amplify the rps4 gene (table 11) were those
described in Nadot et al. (1994), ‘trnS’ and ‘rps5’.
Table 10: Primer sequences used for amplification and sequencing of the trnL region and rps4 gene. Underlined nucleotides represent changes Quandt et al. 2000 with respect to the original primers of Taberlet et al 1999. Primer Sequence Data source trnS TAC CGA GGG TTC GAA TC Nadot et al. 1994 rps5 ATG TCC CGT TAT CGA GGA CCT Nadot et al. 1994 trnL-C_mosses CGR AAT TGG TAG ACG CTA CG Quandt et al. 2000 trnL-F ATT TGA ACT GGT GAC ACG AG Taberlet et al. 1991

4 The systematic affinities of selected Gondwanan bryophyte taxa 47
Table 11: Primer sequences used for amplification and sequencing of the ITS region. Underlined nucleotides represent changes with respect to the original primers of Blattner 1999. Primer Sequence Data source ITS-C bryo GCA ATT CAC ACT ACG TAT CGC Blattner 1999 ITS-D bryo CTC TCA GCA ACG GAT ATC TTG Blattner 1999 ITS4-bryo TCC TCC GCT TAG TGA TAT GC Stech 1999 ITS5-bryo GGA AGG AGA AGT CGT AAC AAG G Stech 1999 Table 12: Primer sequences used for amplification and sequencing of the adk gene. Primer Sequence Data source F GAA GAA GCC AGA AAA CTG GGC Vanderpoorten et al. 2004
R GTC ACC CCA TCT TCA GCA AC Vanderpoorten et al. 2004
1F AAG CTT TTC CCG TAA GT Vanderpoorten et al. 2004
2R ACT TAC GGG AAA AGC TT Vanderpoorten et al. 2004
3R GGT CCC CTG GGT AAT AAC Vanderpoorten et al. 2004
4F TTT CAT CCC ATC GGT GG Vanderpoorten et al. 2004
Primers for amplifying and sequencing the ITS region (ITS4-bryo and ITS5-bryo,
table 12) based upon the primers “ITS4” and “ITS5” respectively, designed and
named by White et al.(1990), were slightly modified with respect to bryophytes
(Stech, 1999).The primers ITS-C and ITS-D (Blattner, 1999) were modified for our
study (ITS-D_bryo and ITS-C_bryo) and additionally used for sequencing reactions.
For amplifying and sequencing the chloroplast and nuclear region different protocols
have been applied. For the trnL-F region and the rps4 gene the PCR program was
performed with the following settings: 2 min. 94ºC, 35 cycles (1 min. 94ºC, 1 min.
55ºC, 1 min. 72ºC) and a 5 min. 72ºC extension time, cycle sequencing settings: 29
cycles (5 sec. 96ºC, 4 min. 50ºC).
The ITS region was amplified using a protocol consisting of: 5 min. 94ºC, 35 cycles (1
min. 94ºC, 1 min. 48ºC, 1 min. 72ºC) and a 5 min. 72ºC extension time, cycle
sequencing settings: 25 cycles (30 sec. 96ºC, 15 sec. 50ºC, 4 min. 60ºC).
All sequences are deposited in EMBL, accession numbers are listed in Appendix 3,
the alignments are available on request from the author.
Phylogenetic analyses. Heuristic searches under the parsimony criterion were
carried out under the following options: all characters unweighted and unordered,
multistate characters interpreted as uncertainties, gaps coded as missing data,
performing a tree bisection reconnection (TBR) branch swapping, collapse zero

4 The systematic affinities of selected Gondwanan bryophyte taxa 48
branch length branches, MulTrees option in effect, random addition sequence with
1000 replicates.
Furthermore, the data sets were analysed using winPAUP 4.0b10 (Swofford, 2002)
executing the command files generated by ‘PRAP’ (Parsimony Ratchet Analyses
using PAUP Müller, 2004), employing the implemented parsimony ratchet algorithm
(Nixon, 1999). For the parsimony ratchet the following settings were employed: 10
random addition cycles of 200 iterations each with a 40 % upweighting of the
characters in the PRAP iterations. Heuristic bootstrap (BS Felsenstein, 1985)
searches under parsimony criterion were performed with 1000 replicates, 10 random
addition cycles per bootstrap replicate and the same options in effect as the heuristic
search for the most parsimonious tree (MPT). A further measurement of support, the
Bremer support (DC, Bremer, 1994), for the individual clades was obtained using
PRAP (Müller, 2004), employing the implemented parsimony ratchet algorithm
(Nixon, 1999).
The consistency index (CI, Kluge & Farris, 1969), retention index (RI), and rescaled
consistency index (RC, Farris, 1989) were calculated to assess homoplasy.
In addition to our MP analyses we performed Bayesian Inferences with MrBayes3.0
(Huelsenbeck & Ronquist, 2001). Modeltest 3.5 (Posada, 2004) was used to select a
DNA substitution model for our data set (gamma shape distribution, six substitution
types). The Markov Chain Monte Carlo (MCMC) analyses were run for 1,000,000
generations with four simultaneous MCMC and one tree per 100 generations was
saved. The ‘burn-in’ values were determined empirically from the likelihood values.
The analyses were repeated four times to assure sufficient mixing by confirming that
the program converged to the same posterior probability (PP). The program
Treegraph (Müller & Müller, 2004) was used to edit trees directly from PAUP-
treefiles. MEGA2.1 (Kumar et al., 2001) was used to calculate GC-content, sequence
length and distance measure (‘p-distance’). In the following the term ‘genetic
distance’ is used instead of ‘p-distance’.

4 The systematic affinities of selected Gondwanan bryophyte taxa 49
4.3 Results
4.3.1 Sequence variation
Results of the data set analysis are shown in Appendix 5. The alignment of a
combined data set of trnL, psbT-H, ITS and rps4 sequence data comprises 3,221
characters.
The GC-content is higher in the nrDNA regions than in the cpDNA regions. The
coding region in the nrDNA, the 5.8S, has a lower GC-content compared to the
spacers, ITS1 and ITS2. The average GC-content in the 32 sequences of the psbT-H
region is 28.2 %; that of the trnL-F region (N=53 species) is 29.0 % in average
(Appendix 5).
The average GC-content in the rps4-sequences (N=38 species) is 27.5 %. There are
striking differences in the GC-content when looking at the codon positions. For the
first codon position a GC-content of 8.5 % was calculated, for the second codon
position the GC-content is 41 % in average and for the third codon position 33 % in
average. The average GC-content in the intergenic spacer (IGS) of the trnS-rps4 is
20 % (N=27 taxa). In the nrDNA of the ITS1 region (N=17 species) the average GC-
content is 63 %. The 5.8S nrDNA (N=37 taxa) contains an average of 54 % of GC
nucleotides. In the nrDNA the ITS2 region (N=39 species) the average GC-content is
65 %.
4.3.2 Phylogenetic analysis.
Results of the parsimony analysis.
In the Maximum Parsimony (MP) analysis 1,223 most parsimonious trees (MPT)
were found. Each tree with a length of 1,686 steps (CI 0.643, RI 0.613, RC 0.394).
Figure 3 presents the strict consensus of all trees, with bootstrap support value (BS)
and Bremer support value (BO).
Using Pyrrhobryum latifolium, Orthotrichum anomalum and Orthotrichum stramineum
as outgroup taxa, the ingroup taxa form a well supported clade as shown in figure 3
(100 % BS, DC value 19). Trachyloma planifolium is the most basal taxon of the
ingroup, followed by a clade comprising Ctenidium molluscum and Myurium

4 The systematic affinities of selected Gondwanan bryophyte taxa 50
Figure 3: Strict consensus of 1223 most parsimonious trees (Length: 1,686, CI: 0.643, RI: 0.613, RC: 0.394) found during the parsimony ratchet of the combined data set. Values above branches (‘d-value’) are Bremer support values (DC). Values below branches are bootstrap (BS) support values (1000 repeats). For explanation of the clades referred to as ‘outgroup’, ALS, H1, H2, P-C, IH, P-O, and P-P see text.

4 The systematic affinities of selected Gondwanan bryophyte taxa 51
hochstetteri (fig. 3: BS: 99 %, DC: 9), then by Pseudotaxiphyllum laetevirens.
The next clade branching off consists of Acrocladium (two species), Lepyrodon (two
species) and three representative species of the Stereophyllaceae. This clade will be
referred to as ‘ALS’ clade in the following. The clade is weakly supported by a BS
value of 56 % and a DC value of one (fig. 3). This clade is sister to polytomous group
which consists of four clades and Pseudotaxiphyllum elegans. One clade comprises
nine representative species of the Plagiotheciaceae, here named clade P, a second
clade (P-O) is formed by two species of Orthothecium and Platydiction
jungermannioides. A third clade comprises Leucodon sciuroides and Pterobryum
densum and finally a clade here named H, which consists of further representatives
of the Hypnanae.
In clade P, the genus Catagonium retains a basal position among the core
representatives of the Plagiotheciceae. The Catagonium clade is followed by a clade
formed by Herzogiella seligeri and Isopterygiopsis pulchella (DC 2) and is sister to a
clade which consists of Isopterygiopsis muelleriana, Struckia zerovii and the two
included Plagiothecium species.
Orthothecium chryseum, O. intricatum and Platydictya jungermannioides form a well-
supported monophyletic group (BS: 92 %, DC: 2).
Lepyrodon sciuroides and Pterobryon densum form a clade which lacks branch
support (DC 1, BS 0 %) or bootstrap support. Clade H consists of two sister clades,
one with the representatives of the Amblystegiaceae, Hypnaceae,
Sematophyllaceae, Meteoriaceae and Brachytheciaceae, and a second comprising,
among others, representatives of the Lembophyllaceae, Neckeraceae, Leskeaceae
and Hypnaceae.
Results of the Bayesian approach.
A 50 % majority rule consensus tree of 9,501 trees generated with the settings as
described above resulted in the cladogram depicted in figure 4. Using Pyrrhobryum
latifolium, Orthotrichum anomalum and Orthotrichum stramineum as outgroup taxa,
the ingroup taxa form a well supported clade (100 %). Trachyloma planifolium is the
most basal taxon, next to it is the Ctenidium molluscum - Myurium hochstetteri clade
(100 %).
As with the Maximum Parsimony analysis also in the Bayesian analysis clades H and
ALS were obtained. The monophyly of clade P was not detected in the Bayesian

4 The systematic affinities of selected Gondwanan bryophyte taxa 52
Figure 4: 50%-majority rule consensus cladogram resulting from a Bayesian Inference analysis. Numbers above branches indicate the posterior probabilities support as a percentage value. For explanation of the clades referred to as ‘outgroup’, ALS, H1, H2, P-C, IH, P-O, and P-P see text.

4 The systematic affinities of selected Gondwanan bryophyte taxa 53
analysis. Instead this clade split into two, here referred to as clade, P-C, and P-P.
Furthermore the relationships of these clades to any other clade were not resolved.
This resulted in a polytomous branching pattern of five clearly discernible clades and
an additional four single taxa: Leucodon sciuroides, Pterobryon densum,
Pseudotaxiphyllum elegans, Pseudotaxiphyllum laetevirens. The clade formed by
Orthothecium chryseum, Orthothecium intricatum and Platydictya jungermannioides
(clade P-O) was found in 100 % of the 9,501 trees. Another group was obtained
consisting of Herzogiella seligeri, Isopterygiopsis pulchella, Isopterygiopsis
muelleriana, Struckia zerovii, Plagiothecium denticulatum and Plagiothecium
undulataum (clade P-P).
The monophyly of the representatives of the genus Catagonium (clade P-C) was
resolved in all cladograms. Also, the monophyly of Acrocladium, Lepyrodon and
Stereophyllaceae (clade ALS) was detected in all of the 9,501 cladograms. The rest
of the major clades of hypnalean mosses (clade H) was found as a monophyletic
group in 81 % of the trees.
4.3.3 Synthesis. According to the results of a combined data analysis of four different genetic markers
(trnL-F-, psbT-H-, rps4- and ITS- region) using Maximum Parsimony (MP) and
Bayesian Inference, the genera Acrocladium and Lepyrodon are more closely related
to the representatives of the Stereophyllaceae than either to the Plagiotheciaceae or
the Pterobryaceae. In both analyses the Plagiotheciaceae as circumscribed by
Pedersen & Hedenäs (2002) is polyphyletic. In the MP analysis the genera
Acrocladium (A. auriculatum, A. chlamydophyllum) and Pseudotaxiphyllum (P.
elegans, P. laetevirens) as well as a clade of the genera Orthothecium/Platydictya (P-
O) do not belong to the main Plagiotheciaceae clade (clade P). The Bayesian
analysis shows a polytomous branching pattern between a clade P-P, Catagonium
(P-C), Orthothecium/Platydictya (P-O) and two representatives of the genus
Pseudotaxiphyllum.
The genus Catagonium as indicated in the MP analysis retains a basal position in the
Plagiotheciaceae, but without support for this position in neither the parsimony trees
nor in the Bayesian analysis. The position of the remaining species of the
Plagiotheciaceae subject to Baysian analysis is left ambiguous due to the
polytomous character of the single clades. A main clade of the Plagiotheciaceae

4 The systematic affinities of selected Gondwanan bryophyte taxa 54
comprising six species was detected, with Herzogiella seligeri and Isopterygiopsis
pulchella forming a basal clade to Isopterygiopsis muelleriana, Struckia zerovii,
Plagiothecium denticulatum and Plagiothecium undulataum. A clade of
Orthothecium/Platydictya (P-O) is well resolved. However, its relation to any other
clade especially of the representatives of Plagiotheciaceae (P-P, P-C) is ambiguous.
The systematic position of Pseudotaxiphyllum elegans and Pseudotaxiphyllum
laetevirens, also remains unresolved in relation to the remaining Plagiotheciaceae.
4.4 Discussion
Based on the results of the sequence data analysis performed in this study the family
Plagiotheciaceae as circumscribed in Pedersen & Hedenäs (2002) appear to be
polyphyletic in the MP and Bayesian analyses. The results described above suggest
that the genus Acrocladium is sister to the monotypic the family of the
Lepyrodontaceae and both clades together are sister to the Stereophyllaceae.
Parts of the results were already suggested by the analyses by Buck et al. (2000a;
Buck et al., 2000b) and Quandt et al. (2004b). In the analysis by Buck et al. (2000a;
Buck et al., 2000b) based on rps4 and trnL sequence data the genus Lepyrodon was
closely related to representatives of the Stereophyllaceae whereas the
representatives of the Plagiotheciaceae were closely related to a clade comprising
representatives of the Brachytheciace. However, Acrocladium was not included in
their analysis. Quandt et al. (2004b) analysed the systematic position of the
Lembophyllaceae. They included Acrocladium and additionally representatives of the
Lepyrodontaceae and Plagiotheciaceae. Based on sequence data of three different
regions, the trnL-F, psbT-H and ITS2-regions the investigated species of
Plagiotheciaceae, Lepyrodontaceae and Acrocladium formed a moderately
supported monophyletic group.
Our evidence for a close relationship between Acrocladium and Lepyrodon and the
Stereophyllaceae is based on a synthesis of a broad taxon as well as data sampling.
The taxon sampling was aimed at detecting the closest relatives of Catagonium,
Acrocladium and the Lepyrodontaceae rather than to re-evaluate the
Plagiotheciaceae as defined by Pedersen & Hedenäs (2002).

4 The systematic affinities of selected Gondwanan bryophyte taxa 55
In the phylogenetic analysis of sequence data based on rps4- and trnL-sequences
Pedersen & Hedenäs (Pedersen & Hedenäs, 2002) resolved two sister clades with a
polyphyletic position of several genera of Plagiotheciaceae. The combined data set
analysis, including morphological, anatomical and genetic sequence data revealed
the genus Acrocladium as sister clade to the genera Catagonium, Herzogiella,
Isopterygiopsis, Rhizofabronia, Orthothecium, Myurella, Bardunovia, Platydictya,
Pseudotaxiphyllum, Plagiothecium, and Struckia. This clade was supported with a
bootstrap value of 64 %. Nevertheless, Pedersen & Hedenäs (2002) also included
the genus Acrocladium in the Plagiotheciaceae based on the fact that Acrocladium
and the remaining eleven genera of the Plagiotheciacea were resolved as a
monophyletic group in the strict consensus tree. Regarding morphological characters
the synapomorphies for the Plagiotheciaceae including the genus Acrocladium are
the absence of pseudoparaphyllia and of rhizoids on the stem; shared characters are
the lowermost abaxial costa, the purplish and granular-papillose axillary rhizoids and
an exostome with a whitish yellow basal part. However, some of these characters are
not shared by all taxa investigated in the study (Pedersen & Hedenäs, 2002).
The morphological characters of Acrocladium not shared with any representative
within the Plagiotheciceae are the firmly attached as opposed to easily detached
leaves, and the exostome margin which is dentate above but more or less entire in
the remaining genera of Plagiotheciaceae (Pedersen & Hedenäs, 2001).
In fact it occurs to me as rather difficult to find synapomorphies supporting the clade
consisting of Stereophyllaceae, Lepyrodontaceae and Acrocladium based on
morphological/anatomical characters. Ireland & Buck (1994) state that there seem to
be no morphological relationships between the Stereophyllaceae and
Plagiotheciaceae. In their opinion the family Brachytheciaceae is probably a close
relative of Stereophyllaceae based on shared morphological characters such as the
single costa, elongate median leaf cells and the hypnoid peristom. Buck (1998)
points out that the most possible relatives of Lepyrodontaceae, might well be found
within the Pterobryaceae based on the similar growth pattern shared between these
families and the presence of filamentous pseudoparaphyllia around branch primordial
in some species of Lepyrodon. Allen (1999) as well as Buck (1998) point towards the
Pterobryaceae as putative relatives of the Lepyrodontaceae but suggest a critical
revision of the Pterobryaceae before comparing the taxa. Although I included
Pterobryon densum as representative of the family Pterobryaceae in the analyses, no
4 The systematic affinities of selected Gondwanan bryophyte taxa 56
closer relationship of this taxon to the taxa investigated within the ALS clade was
found. However, a better resolution of the relationships between members of the ALS
clade and the Pterobryaceae can be expected if additional members of this large
familiy (24 genera) are studied.
The interpretation of both morphological characters and genetic sequence data can
lead to erroneous phylogenetic trees. Huttunen et al. (2004) demonstrate that
morphological adaptations to special habitat conditions in epiphytes, e.g. the
specialized or reduced exostomes (Hedenäs, 2001), which were formerly regarded
as synapopmorphic characters, have lead to a misplacement of certain taxa of
epiphytic mosses e.g. within the Meteoriaceae.
Even the use of sequence based data, especially in the order Hypnales, might cause
problems in resolving interfamilial relationships as this clade shows rapid radiation at
the beginning of its differentiation resulting in short or even unresolved branches at
deeper phylogenetic levels e.g. families (Shaw et al., 2003).
The morphological characters of the species found to form the ALS-clade in the study
at hand differ considerably according to Pedersen and Hedenäs (2002), not
suggesting a close relationship of these taxa. The Plagiotheciaceae, in contrast, form
a morphologically well-defined group. Only the genetic data cause polytomies within
the Plagiotheciaceae (Pedersen & Hedenäs, 2002). Unfortunately Lepyrodon was not
used in the morphological data analyses to trace possible synapomorphic characters
with the Plagiotheciaceae (Pedersen & Hedenäs, 2002). At least this study was
informative in so far as Acrocladium and the representative of the Stereophyllaceae
(Stereophyllum radiculosum) were in none of the analyses resolved as sister clades.
In contrast to the combined analysis and the cpDNA analyses the Plagiotheciaceae
described by Pedersen & Hedenäs (2002) are paraphyletic rather than polyphyletic. If
this result could be confirmed with at least one additional marker it would be
interesting to investigate morphological and anatomical characters in terms of
corresponding results. Only furthers studies can clarify whether the phylogenetic
position of Lepyrodon and Acrocladium as closest relatives of the Plagiotheciceae
can be justified.
In this study tried to minimize the problem that morphological and genetically based
data can give different evolutionary scenarios (e.g. Doyle, 1992) by using four
different regions (trnL, rps4, psbT-H and ITS) from two different genome types

4 The systematic affinities of selected Gondwanan bryophyte taxa 57
(nrDNA and cpDNA). Due to problems obtaining sequences for all four regions of
every species included in the analysis (compare appendix 4) the systematic position
of e.g. three Stereophyllaceae taxa and Acrocladium/Lepyrodon is based on only two
genes (trnL, rps4). That means there is in this respect no difference between data
sets used by Buck et al. (2000a; Buck et al., 2000b), Pedersen & Hedenäs (2002)
and the data set used in the study at hand. Although the analyses where cp and
nrDNA were analysed separately should be considered a preliminary result due to a
lack of a complete ITS data set for some of the taxa especially for taxa respresenting
the Stereophyllaceae or e.g. Herzogiella, the results of the cpDNA analysis gave an
ambiguous phylogenetic position which might be due to introgression for example
(Doyle, 1992) or an extremely low sequence divergence in the investigated
chloroplast markers as pointed out by (Shaw et al., 2003). It also might be useful to
investigate new markers which are more variable than the trnL, rps4 or psbT-H
regions like the nad5 region from the mtDNA, for example.

5 Molecular evolution, phylogenetics and biogeography of the genus Lepyrodon 58
5 Molecular evolution, phylogenetics and biogeography of the genus Lepyrodon (Lepyrodontaceae, Bryopsida)
5.1 Introduction
5.1.1 The genus Lepyrodon
The genus Lepyrodon was established by Hampe in 1865 (cit. Allen, 1999). It
comprises diplolepideous moss species with a single peristome of endostomial origin
and a cucullate calyptra. He placed the genus within the Leskeaceae. In 1908
Brotherus introduced the monotypic family Lepyrodontaceae and placed it near the
Neckeraceae. Since then the genus Lepyrodon has been considered to belong to
either the Ptychomniaceae (e.g. Brotherus, 1925b; Buck & Vitt, 1986; Fleischer,
1923a) or the Pterobryaceae (Buck, 1998; Crum, 1994). Allen (1999) revised the
family Lepyrodontaceae and transferred the monotypic genus Dichelodontium into
the Lepyrodontaceae which consists since then of the genera Lepyrodon and
Dichelodontium (D. nitidum endemic to New Zealand). He considered the
Lepyrodontaceae as possibly related to the Pterobryaceae based on morphological
characters e.g. the reduced diplolepideous peristome and the absence of an
exostome. In his monograph of Lepyrodon Allen (1999) placed seven species within
this genus. These species are mostly distributed in the southern hemisphere. The
exception is L. tomentosus that occurs from Mexico via Central America, to northern
and even southern South America. L. hexastichus, L. parvulus, L. lagurus and L.
patagonicus occur only in southern South America (Argentina, Chile, and Juan
Fernandez Islands) whereas the species L. pseudolagurus and L. australis are
restricted to Australia, Tasmania, New Zealand and Campbell Island.
5.1.2 Morphological relationships within the genus
Some of the species are morphologically difficult to separate from possibly related
species. In this study an attempt was therefore made to test the species concept

5 Molecular evolution, phylogenetics and biogeography of the genus Lepyrodon 59
proposed by Allen (1999) based on molecular data. According to Allen (1999)
Lepyrodon lagurus from Chile is a polymorphic species throughout its range. Plants
of higher elevations are generally smaller, having erect leaves and less tomentum
than those from lower elevations e.g. 'Tierra del Fuego'. The smaller plants from high
elevations resemble L. parvulus in size but are distinguishable by their longer leaves
that are stiffly erect rather than imbricate as in L. parvulus.
Allen (1999) distinguishes three morphological expressions in Lepyrodon
tomentosus, which are more or less geographically restricted, with intermediate
expressions where their areas of distribution overlap.
The type expression occurs in the Andean range of western South America as well
as in Mexico and northwest Argentina. The northern expression occurs in southern
Mexico, Panama, the Dominican Republic and southeast Brazil. This expression has
'lagurus'-type branches which often cover more than half of the plant According to
Allen (1999) this is especially the case in the type specimen of L. duellii which
consists almost entirely of lagurus-type branches. The third expression, the 'L.
gunckeli'-type expression, occurs in Chile and southwest Argentina.
5.1.3 The systematic position of Lepyrodontaceae
The systematic position of the Lepyrodontaceae and its genera Lepyrodon and
Dichelodontium were investigated in a previous study (compare chapters 3 and 4).
Results from chapters 3 and 4 based on cpDNA analysis identified the genus
Lepyrodon as a monophyletic group with high branch support (> 95 %) in all analyses
performed. Its closest relative is the genus Acrocladium. Furthermore, I identified
Dichelodontium nitidum as belonging to the Ptychomniaceae. According to analyses
described in previous chapters (3 & 4) the Ptychomniaceae are nested within a group
of taxa closely related to the Hookeriales, whereas the Lepyrodontaceae belong to
the Hypnales together with the genus Acrocladium. Based on these results the family
Lepyrodontaceae was treated as a monotypic family with the single genus
Lepyrodon.
This study aims at a) verifying the species concept within the genus Lepyrodon
b) bringing to light the evolution and the historical biogeography of Lepyrodon

5 Molecular evolution, phylogenetics and biogeography of the genus Lepyrodon 60
5.2 Material & Methods
Plant material. Plant material was either collected by the author during a field trip of
the BryoAustral project to Chile in 2001, or originates from herbarium specimens
(Appendix 6). Specimens of Acrocladium chlamydophyllum, Lepyrodon
pseudolagurus were collected during the BryoAustral project expedition to New
Zealand in 1998. Duplicates are preserved in the herbaria in Christchurch (CHR),
Bonn (BONN) and Berlin (B). Sequences available in GenBank were also used. All
specimens used in the analyses are listed in (Appendix 6) including further voucher
information.
The study includes 26 specimens from all of the seven Lepyrodon species recently
described as belonging to the genus (Allen, 1999). Each of the seven species was
represented by at least two specimens. Within each species, specimens were
selected to span a wide range of geographically distinct populations (e.g. including
specimens from the Juan Fernández Islands) and different morphological
expressions of the widespread species L. tomentosus (Allen, 1999). Unfortunately, I
was not able to gather enough DNA from all specimens (table 13) for successful PCR
and successive sequencing.
At least one specimen of every species described in the genus Lepyrodon (Allen,
1999) was investigated in this study. I analysed one specimen each of L. parvulus
and L. patagonicus, two specimens each of L. lagurus, L. pseudolagurus and L.
australis, and three specimens each of L. tomentosus and L. hexastichus. The
geographical origin of the specimens of Lepyrodon successfully sequenced is shown
in figure 5 on a global scale and in figure 6 (New Zealand) and figure 7 (South
America) on a regional scale.
In a previous study (chapter 4), the genus Acrocladium was identified as as sister
taxon to Lepyrodon. Therefore two species of Acrocladium, as closest relatives, were
selected as outgroup for the analysis within the genus Lepyrodon.

5 Molecular evolution, phylogenetics and biogeography of the genus Lepyrodon 61
Table 13: List of investigated specimens of Lepyrodon with EMBL accession numbers for the regions sequenced. Voucher numbers and the herbaria where the specimens are kept and country of origin are listed. ITS2 sequences of L. pseudolagurus and L. tomentosus were kindly provided by Dr. Dietmar Quandt (Dresden). For detailed voucher information see Appendix 6. No. taxon rps4 ITS complete adk country of
origin voucher label
herbarium
33 Lepyrodon lagurus (Hook.) Mitt.
AJ862336 AJ862513 submitted toEMBL
Chile BryoAustral Rolf Blöcher no. 90 det. Bruce Allen 01/2003
J.-P. Frahm,Bonn
64 Lepyrodon tomentosus (Hook.) Mitt.
AJ862337 AJ862688 (ITS1) AF509839 (ITS2)
AJ862663 Chile BryoAustral Rolf Blöcher no. 74 det. Bruce Allen 01/2003
J.-P. Frahm,Bonn
66 Lepyrodon lagurus (Hook.) Mitt.
AJ862514 AJ862669 Chile BryoAustral Rolf Blöcher no. 82 det. Bruce Allen 01/2003
J.-P. Frahm,Bonn
67 Lepyrodon pseudolagurus (Hook.) Mitt. [originally labelled Lepyrodon lagurus (Hook.) Mitt.]
AJ862335 AJ862687 (ITS1) AF188044 (ITS2)
AJ862664 New Zealand
BryoAustral J.-P. Frahm No. 10-12
J.-P. Frahm,Bonn
83 Lepyrodon australis Hpe ex Broth.
AJ862509 submitted toEMBL
New Zealand
Musci Australasiae Exsiccati H. Streimann 51277 det. J.Beever, 07/1993
J.-P. Frahm,Bonn
84 Lepyrodon patagonicus (Card. & Broth.) Allen [orig. labelled Lepyrodon implexus (Kze.) Paris]
AJ862516 AJ862668 Chile Plantae Chilenensis H. Roivainen 2934 det. Bruce Allen 1995
Berlin
85 Lepyrodon parvulus Mitt.
AJ862515 AJ862667 Chile Plantae Chilenensis H. Roivainen 3129 det. Bruce Allen 1995
Berlin
106 Lepyrodon hexastichus (Mont.) Wijk &Marg.
AJ862510 AJ862662 Chile BryoAustral Rolf Blöcher no. 77 det. Bruce Allen 01/2003
J.-P. Frahm,Bonn
107 Lepyrodon hexastichus
AJ862511 AJ862666 Chile BryoAustral Rolf Blöcher no. 87 det. Bruce Allen 01/2003
J.-P. Frahm,Bonn
112 Lepyrodon pseudolagurus (Hook.) Mitt. [originally labelled Lepyrodon lagurus (Hook.) Mitt.]
AJ862517 submitted toEMBL
New Zealand
Musci Australasiae Exsiccati H. Streimann 51045 det. H. Streimann
J.-P. Frahm,Bonn
113 Lepyrodon tomentosus (Hook.) Mitt. [originally labelled Lepyrodon lagurus (Hook.) Mitt.]
AJ862519 no data Mexico Düll 2/248
J.-P. Frahm,Bonn
207 Lepyrodon australis Hpe ex Broth.
AJ862508 AJ862670 New Zealand
H. Streimann 58133
Bot. Mus.Helsinki, Finland
208 Lepyrodon hexastichus (Mont.) Wijk &Marg.
AJ862512 AJ862661 Chile Marshall R. Crosby 11,631 det. B. H. Allen 1985
Leiden, Nat.Herb. Netherlands
214 Lepyrodon tomen-tosus (Hook.) Mitt.
AJ862520 AJ862665 Costa Rica J. Eggers CR 6,17
J.-P. Frahm,Bonn
Distribution map. Regional maps of the origin of Lepyrodon specimens were
constructed using the web-page www.planiglobe.com (Körsgen et al., 2004). Dots

5 Molecular evolution, phylogenetics and biogeography of the genus Lepyrodon 62
were generated by adding geographical coordinates of collection localities as
indicated on the voucher labels of the specimens.
Figure 5: Geographical origin of all Lepyrodon specimens used for this study. Numbers in brackets are specimen numbers. For detailed information of the collection localities see figures 6 & 7.
Figure 6: Geographical origin of the Lepyrodon specimens from New Zealand used for this study. Numbers in brackets are specimen numbers.

5 Molecular evolution, phylogenetics and biogeography of the genus Lepyrodon 63
Figure 7: Geographical origin of the Lepyrodon specimens from South and Central America used for this study. Numbers in brackets are specimen numbers.
DNA isolation, PCR and sequencing. Prior to DNA extraction the plant material
was thoroughly cleaned with distilled water and additionally treated by ultrasonic
waves for 2-4 minutes. Success of cleaning was checked by examining the plants
under a binocular microscope. Remaining contaminations e.g. with algae and fungi
were removed mechanically. Isolation of DNA was carried out following the CTAB
technique described in Doyle & Doyle (1990).
PCR amplifications (Biometra TriBlock thermocycler, PTC-100 MJ Research) were
performed in 50 µl–reactions containing 1.5 U Taq DNA polymerase (PeqLab), 1 mM
dNTPs-Mix, nucleotide concentration 0.25 mM each (PeqLab), 1x buffer (PeqLab),
1.5 mM MgCl2 (PeqLab) and 12.5 pmol of each amplification primer. PCR products
were purified using the QIAquick purification kit (Qiagen). Cycle sequencing reactions
(half reactions) were performed using a PTC-100 Thermocycler (MJ Research) in

5 Molecular evolution, phylogenetics and biogeography of the genus Lepyrodon 64
combination with the ABI PrismTM Big Dye Terminator Cycle Sequencing Ready
Reaction Kit with Amplitaq-DNA polymerase FS (Perkin Elmer), applying a standard
protocol for all reactions. Extension products were precipitated with 40 µl 75 % (v/v)
isopropanol for 15 min at room temperature, centrifuged with 15,000 rpm at 25°C,
and washed with 250 µl of 75 % (v/v) isopropanol. These purified products were
loaded on an ABI 310 automated sequencer (Perkin Elmer) and electrophoresed. For
cycle sequencing 10 µl–reactions were used containing 3 µl of Big Dye Terminator
Cycle Sequencing premix. Sequencing reactions were performed on two
independent PCR products generated from each sample in order to verify the results.
Primers for amplifying and sequencing the ITS region (ITS4-bryo and ITS5-bryo)
based upon the primers “ITS4” and “ITS5” respectively, designed and named by
White et al.(1990), were slightly modified with respect to bryophytes (Stech,
1999).The primers ITS-C and ITS-D (Blattner, 1999) were modified for this study
(ITS-D_bryo and ITS-C_bryo) and additionally used for sequencing reactions (table
14).
Table 14: Primer sequences used for amplification and sequencing of the ITS region. Underlined nucleotides represent changes with respect to the original primers of Blattner 1999. Primer Sequence Data source ITS-C bryo GCA ATT CAC ACT ACG TAT CGC Blattner 1999 ITS-D bryo CTC TCA GCA ACG GAT ATC TTG Blattner 1999 ITS4-bryo TCC TCC GCT TAG TGA TAT GC Stech 1999 ITS5-bryo GGA AGG AGA AGT CGT AAC AAG G Stech 1999 Table 15: Primer sequences used for amplification and sequencing of the adk gene. Primer Sequence Data source F GAA GAA GCC AGA AAA CTG GGC Vanderpoorten et al. 2004
R GTC ACC CCA TCT TCA GCA AC Vanderpoorten et al. 2004
1F AAG CTT TTC CCG TAA GT Vanderpoorten et al. 2004
2R ACT TAC GGG AAA AGC TT Vanderpoorten et al. 2004
3R GGT CCC CTG GGT AAT AAC Vanderpoorten et al. 2004
4F TTT CAT CCC ATC GGT GG Vanderpoorten et al. 2004
The amplified adk region started about 196 bp downstream of the 155th codon and
ended at the 257th codon of the adk gene isolated from the moss species
Physcomitrella patens (Y15430, Schwartzenberg et al., 1998). Coding and non-
coding regions were identified by comparison with moss sequences available from

5 Molecular evolution, phylogenetics and biogeography of the genus Lepyrodon 65
GenBank (e.g. Vanderpoorten et al., 2004). Primers used for amplification of the adk
gene (table 15) were those described in Vanderpoorten (2004).
For amplifying and sequencing the nuclear region different protocols have been
applied.
The ITS region was amplified using a protocol consisting of: 5 min. 94ºC, 35 cycles (1
min. 94ºC, 1 min. 48ºC, 1 min. 72ºC) and a 5 min. 72ºC extension time, cycle
sequencing settings: 25 cycles (30 sec. 96ºC, 15 sec. 50ºC, 4 min. 60ºC). According
to Vanderpoorten et al. (2004) the following PCR protocol was used to amplify parts
of the adk gene : 2 min. 97ºC, 30 cycles (1 min. 97ºC, 1 min. 50ºC, 3 min. 72ºC) and
a 7 min. 72ºC extension time. For more detailed information compare Vanderpoorten
et al.(2004).
All sequences will be deposited in EMBL, accession numbers are listed in Appendix
6, the alignments are available on request from the author.
Phylogenetic analyses. Heuristic searches under the parsimony criterion were
carried out under the following options: all characters unweighted and unordered,
multistate characters interpreted as uncertainties, gaps coded as missing data,
performing a tree bisection reconnection (TBR) branch swapping, collapse zero
branch length branches, MulTrees option in effect, random addition sequence with
1000 replicates.
Furthermore, the data sets were analysed using winPAUP 4.0b10 (Swofford, 2002)
executing the command files generated by ‘PRAP’ (Parsimony Ratchet Analyses
using PAUP Müller, 2004), employing the implemented parsimony ratchet algorithm
(Nixon, 1999). For the parsimony ratchet the following settings were employed: 10
random addition cycles of 200 iterations each with a 40 % upweighting of the
characters in the PRAP iterations. Heuristic bootstrap (BS Felsenstein, 1985)
searches under parsimony criterion were performed with 1000 replicates, 10 random
addition cycles per bootstrap replicate and the same options in effect as the heuristic
search for the most parsimonious tree (MPT). The consistency index (CI, Kluge &
Farris, 1969), retention index (RI), and rescaled consistency index (RC, Farris, 1989)
were calculated to assess homoplasy.
Maximum Likelihood analyses were executed assuming a general time reversible
model (GTR+G+I), and a rate variation among sites following a gamma distribution
(four categories represented by the mean), with the shape being estimated and the

5 Molecular evolution, phylogenetics and biogeography of the genus Lepyrodon 66
molecular clock not enforced. According to Akaike Information Criterion (AIC, Akaike,
1974) GTR+G+I was chosen as the model that best fits the data by Modeltest v3.06
(Posada & Crandall, 1998), employing the windows front-end (Patti, 2002). The
proposed settings by Modeltest v3.06 (table 16) were executed in winPAUP 4.0b10.
In addition to the MP analyses Bayesian Inferences with MrBayes3.0 (Huelsenbeck &
Ronquist, 2001) were performed. Modeltest 3.5 (Posada, 2004) was used to select
DNA substitution models for the data set (gamma shape distribution, six substitution
types). The Markov Chain Monte Carlo (MCMC) analyses were run for 2,000,000
generations with four simultaneous MCMCs and one tree per 100 generations was
saved. The ‘burn-in’ values were determined empirically from the likelihood values.
The analyses were repeated three times to assure sufficient mixing by confirming that
the program converged to the same posterior probability (PP).
Table 16: Substitution models selected for the different data sets in Maximum Likelihood analyses in the Lepyrodon data sets.
combined non-coding region in adk gene
Model selected GTR+G+I GTR+I -lnL = 3103.1511 -lnL = 1260.0568 Base frequencies freqA = 0.2066
freqC = 0.2588 freqG = 0.2527 freqT = 0.2818
freqA = 0.2112 freqC = 0.2167 freqG = 0.1933 freqT = 0.3788
Substitution model R(a) [A-C] = 1.0000
R(b) [A-G] = 1.8159 R(c) [A-T] = 0.6009 R(d) [C-G] = 0.6009 R(e) [C-T] = 1.8159 R(f) [G-T] = 1.0000
R(a) [A-C] = 1.0000 R(b) [A-G] = 1.0023 R(c) [A-T] = 0.4932 R(d) [C-G] = 0.5324 R(e) [C-T] = 1.0023 R(f) [G-T] = 1.0000
Among-site rate variation
Proportion of invariable sites (I) 0
0.5324
Variable sites (G, Gamma distribution shape parameter)
0.1410
equal rates for all sites
The program Treegraph (Müller & Müller, 2004) was used to edit trees directly from
PAUP-treefiles. MEGA2.1 (Kumar et al., 2001) was used to calculate GC-content,
sequence length and distance measure (‘p-distance’). In the following the term
‘genetic distance’ is used instead ‘p-distance’.

5 Molecular evolution, phylogenetics and biogeography of the genus Lepyrodon 67
5.3 Results
5.3.1 Sequence variation
Sequence length and GC-content of the ITS region. For this study fourteen
specimens of Lepyrodon and two specimens of Acrocladium were successfully
sequenced. The statistical data on the obtained sequences are depicted in table 17
for ITS1, ITS2 and the total adk sequence. The data for the coding and non-coding
regions in adk are presented in appendix 7.
The observed size of the total sequence of ITS1 ranged between 246 bp for
Lepyrodon tomentosus (sp. 64) and L. hexastichus (sp. 106 & 107) and 255 bp found
in the two outgroup species Acrocladium auriculatum and A. chlamydophyllum.
The obtained length for the ITS1 region was on average 248 base pairs (bp) with a
standard deviation of 3.2 bp. For two specimens only a partial sequence of the ITS1
was obtained. In Lepyrodon lagurus (sp. 33) only the first 134 bp and in the specimen
of Lepyrodon tomentosus from Mexico only 206 bp could be read. The average GC-
content in the data set was 64.1 % (standard deviation 1.2).
The entire ITS2 region was obtained for all 16 specimens. The average length was
260 bp (standard deviation 9.8). The shortest ITS2 sequence was found in both
outgroup specimens Acrocladium chlamydophyllum (233 bp) and A. auriculatum (236
bp). This difference in length, apart from several short indels, ranged from one to four
nucleotides, mainly due to an indel of 20 bp in length which was found in all
specimens of Lepyrodon but not in Acrocladium. The length of the ITS2 region within
Lepyrodon was between 260 and 266 bp. The average GC-content in the ITS2
region was 65.5 % (standard deviation 0.5).
Sequence length and GC-content of the adk gene. In the adk data set four of the
fifteen investigated specimens could only be partially sequenced (both species of
Acrocladium as well as two specimens of Lepyrodon hexastichus; specimens no. 106
& 208). These species were excluded from the total length presentation in the coding
as well as the non-coding region of the adk gene (appendix 7). For the remaining
thirteen species 312 bp were obtained in the coding region spanning the entire exons
1 to 3 and parts of exon 4. The GC-content was 48.9 % on average (standard

5 Molecular evolution, phylogenetics and biogeography of the genus Lepyrodon 68
deviation 1.7). The GC-content of the different codon positions differed
Table 17: Sequence lengths [base pairs, bp] and GC-content [%] of selected gene regions (ITS1, ITS2, and adk gene) of fourteen Lepyrodon specimens and two outgroup taxa. Average sequence lengths and standard deviations are also given. For origin of the data refer tab. xz. Abbreviations: n. d. = no data available. (* partial sequences were excluded when determining the average sequence length).
ITS1
sequence length [bp}
ITS1 GC-content
[%]
ITS2sequence
length [bp]
ITS2 GC-content
[%]
adk gene sequence
length [bp}
adk gene GC-content
[%]A. auriculatum (sp. 78) 255 64,3 236 64,9 689* 45,6
A. hlamydophyllum (sp. 12) 255 62,7 233 63,9 544* 41,5
L. australis (sp. 83) 249 63,8 266 65,5 866 42,4
L. australis (sp. 207) 249 63,8 266 65,5 835 42,7
L. hexastichus (sp. 107) 246 63,8 264 65,9 846 43,5
L. hexastichus (sp. 106) 246 63,8 260 65,8 588* 41,5
L. hexastichus (sp. 208) 247 64 265 65,3 511* 44,2
L. lagurus (sp. 66) 247 63,2 262 65,3 891 43,1
L. lagurus (sp. 33) 134* 68 265 65,7 874 43,0
L. parvulus (sp. 85) 247 64 265 65,7 866 43,1
L. patagonicus (sp. 84) 247 64 264 65,5 867 43,2
L. pseudolagurus (sp. 67) 249 64,6 264 65,9 871 42,6
L. pseudolagurus (sp. 112) 249 65 266 65,8 867 42,4
L. tomentosus (sp. 113) 206* 66 265 65,7 n. d. n. d.
L. tomentosus (sp. 64) 246 63,4 266 65,4 890 42,8
L. tomentosus (sp. 214) 247 64 264 65,9 868 42,9
Average 248.1 64,1 260,8 65,5 867,4 43,0S.D. 3.2 1.2 9.8 0,5 16,2 1,0
considerably. The lowest GC-content was found in the second codon position with
38.1 % (standard deviation 2.1) followed by the first codon position with 50.7 %
(standard deviation 1.7), and the highest GC-content in the third codon position with
57.9 % (standard deviation 2.4). The differences in sequence length resulted from
the exclusion of sites (character state “?” in the alignment) where different nucleotide
states were in conflict with each other.
In Lepyrodon australis, for example, the amplified region started at 196 bp
downstream of the 155th codon and ended at the 257th codon of the adk cDNA
compared to Physcomitrella patens (Y15430, Schwartzenberg et al., 1998).

5 Molecular evolution, phylogenetics and biogeography of the genus Lepyrodon 69
Table 18: Number of taxa, total number of aligned characters; variable characters and number of parsimony informative sites and %-value of variable sites for the partial data sets of Lepyrodon data set (* Including the outgroup taxa).
Data set Number of
taxa included
Total number of aligned
characters [bp]
Variable characters
[bp]
parsimony informative
[bp]
Variable sites [%]
adk 15* 897 90 30 10.1 adk 13 897 34 19 3.8
adk coding 15* 312 16 5 5.1 adk coding 13 312 2 2 0.6
adk non-coding 15* 585 74 25 12.6 adk non-coding 13 585 32 17 5.5
ITS 16* 694 40 27 5.8 ITS 14* 694 18 12 2.6
ITS1 16* 260 24 16 9.2 ITS1 14 260 13 7 5.0 5.8S 16* 160 0 0 0 5.8S 14 160 0 0 0 ITS2 16* 274 16 11 5.8 ITS2 14 274 5 5 1.8
Table 18 presents the information for the different regions in the alignment. The
highest proportion of variable sites was found in the adk non-coding region where
12.6 % of the 585 aligned positions were variable with the data set including the
outgroup (5.5 % variability within the specimens of Lepyrodon). The coding region of
the adk data set revealed only 5.1 % variable sites (0.6 % without outgroup) in the
alignment with 312 positions. Within the ITS region the ITS1 was the most variable
with 9.2 % of the characters in 260 positions. The variability of the ITS1 data set
without the two outgroup taxa was 5.0 %.The ITS2 region was less variable than
ITS1, i.e. 5.8 % when the outgroup was included, and only 1.8 % of its 274
characters when the outgroup was excluded.
Indel matrix. In the ITS1 region three indels of one bp length were detected within
the fourteen accessions of Lepyrodon (Table 19):
• both specimens of L. lagurus (sp. 33 and 66) share a C with L. australis (in 83
and 207) and claim another C of their own;
In the ITS2 region four one nucleotide indels were identified:
• the New Zealand/Australian distributed species L. australis and L.
pseudolagurus share a synapomorphic indel of a single C;
• a single T indel occurred in L. tomentosus from Costa Rica (sp. 214);

5 Molecular evolution, phylogenetics and biogeography of the genus Lepyrodon 70
• one indel , a single T, in the ITS2 region was observed in L. tomentosus from
Chile (sp. 64).
Table 19: Indelmatrix of 15 specimens of Lepyrodon of the ITS- and adk-region. Indel number 1-3 in the ITS1 region, no. 4-7 in the ITS2 region, and no. 8-11 is in the adk gene.
Indel no. 1 2 3 4 5 6 7 8 9 10 11L. australis sp. 83 C A C T CCTT L. australis sp. 207 C A C T CCTT L. hexastichus sp. 106 T TACT CCTT G T L. hexastichus sp. 107 T TACT L. hexastichus sp. 208 T TACT CCTT L. lagurus sp. 33 C C T TACT CCTT L. lagurus sp. 66 C C N T TACT CCTT L. parvulus sp. 85 T TACT CCTT L. patagonicus sp. 84 T TACT CCTT L. pseudolagurus sp. 67 C N TACT CCTT L. pseudolagurus sp. 112 C T TACT CCTT L. tomentosus sp. 64 T T TACT CCTT L. tomentosus sp. 113 T TACT CCTT L. tomentosus sp. 214 TACT CCTT
Indels in the adk-region occurred in non-coding regions only. Two indels of four
nucleotides and two of one nucleotide were identified within the sequenced part of
the region. The TACT indel occurred in all investigated specimens except both
specimens of L. australis. The second 4-base indel, CCTT, was only missing in L.
hexastichus (sp. 107) whereas the two single nucleotide indels G and T were only
found in one specimen of L. hexastichus (sp. 106).
5.3.2 Phylogenetic analysis
Maximum Parsimony and Maximum Likelihood analyses. The result of the
Maximum Likelihood (ML) as well as Maximum Parsimony (MP) analysis of the
combined (adk, ITS), data set with Acrocladium auriculatum and A. chlamydophyllum
as outgroup taxa is depicted in figure 8. The result of the Maximum Parsimony (MP)
analysis is not depicted separately as the resolution in the cladograms was quite low.
The clades with which the MP and ML analysis correspond are marked (#) in the ML
cladograms (fig. 8). The values above branches (fig. 8) are the result of a heuristic
bootstrap analysis (1000 repeats) of the combined data set with PAUP. The
phylogram of the ML analysis is depicted in figure 9.
One result of the statistical analyses of the combined data set was the striking
difference in variability between the single regions (tab. 19). Due to these large
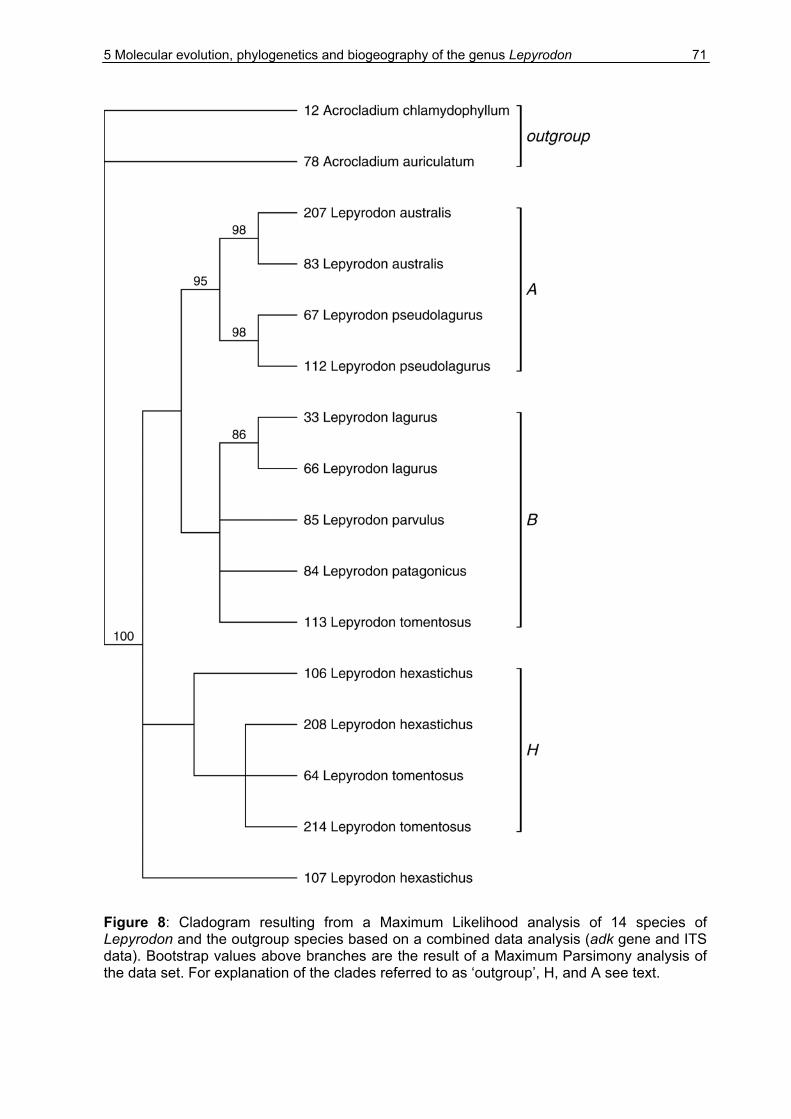
5 Molecular evolution, phylogenetics and biogeography of the genus Lepyrodon 71
Figure 8: Cladogram resulting from a Maximum Likelihood analysis of 14 species of Lepyrodon and the outgroup species based on a combined data analysis (adk gene and ITS data). Bootstrap values above branches are the result of a Maximum Parsimony analysis of the data set. For explanation of the clades referred to as ‘outgroup’, H, and A see text.

5 Molecular evolution, phylogenetics and biogeography of the genus Lepyrodon 72
differences in variability I analysed the adk non-coding region separately. The result
of this analysis of the adk is depicted in figure 10 as a cladogram resulting from the
ML analyses with bootstrap values taken from the MP analyses. The resulting
topologies of the ML and MP analysis were identical, therefore only the ML
cladograms of the analysis (fig. 10) are presented. The values above branches (fig.
10) are the result of a heuristic bootstrap analysis (1000 repeats) of the combined
data set with PAUP.
The fourteen ingroup taxa investigated in this study are a monophyletic group with
100 % bootstrap support in the analysis. The specimens investigated in this study are
separated in a polytomy consisting of three clades (fig. 8) named H, B, and A and a
single taxon (L. hexastichus, specimen 107). Clade H consists of two samples of L.
hexastichus (sp. 106 & 208) and two samples of L. tomentosus (sp. 64 & 214). Clade
A consists of two samples each of L. pseudolagurus (sp. 67 & 112) and L. australis
(sp. 83 & 207). This clade is sister to clade B which contains five specimens: L.
patagonicus (sp. 84), L. parvulus (sp. 85), two samples of L. lagurus and one sample
of L. tomentosus from Mexico. The relationships of the species in clade H do not
resolve the specimens of L. tomentosus or those of L. hexastichus as monophyletic.
L. hexastichus (sp. 106, Puerto Montt) is at the basal position of the clade whereas
the other sample of L. hexastichus (sp. 208, Valdivia) is sister to the specimens of L.
tomentosus from Costa Rica (sp. 214) and Chile (sp. 64).
Within clade B merely the close relationship between L. lagurus from Conquillio
National Park near Temuco (sp.66) and sample 33 from southern Chile near Punta
Arenas becomes obvious whereas the relationship of two further species from Chile,
L. patagonicus (sp. 84) and L. parvulus (sp. 85) and the Mexican specimen of
Lepyrodon tomentosus (sp. 113) remains unresolved among each other as well as in
relation to Lepyrodon lagurus. Clade A consists of the only two species which occur
in New Zealand and Australia, L. australis (sp. 83 & 207) and L. pseudolagurus. The
relationship within clade A, the sister clade to B, shows the two specimens of L.
australis (sp. 83 & 207) and of L. pseudolagurus (sp. 67 & 112) as a monophyletic
group, respectively. The monophyly of each species is supported with a 98 %
bootstrap value. Furthermore, the monophyly of this clade has a strong bootstrap
support of 95 %. The branch lengths in the phylogram of the ML analysis (fig. 9) are
very short at the base of clade H, A and B indicate a lower differentiation (supporting
autapomorphic characters).

5 Molecular evolution, phylogenetics and biogeography of the genus Lepyrodon 73
Figure 9: Maximum Likelihood (ML) phylogram of the combined data set of adk gene and ITS data (L score = -3103.1511). Branch lengths are proportional to genetic distance between taxa. Scale bar equals 1% distance under the assumed substitution model (GTR+G+I). For explanation of the clades referred to as ‘outgroup’, H, and A see text.

5 Molecular evolution, phylogenetics and biogeography of the genus Lepyrodon 74
The results of the ML and MP analyses based on the adk-intron are shown in figure
10. L. tomentosus was removed from the data set as sequence data were lacking for
this specimen. The analyses revealed three well-supported clades also strongly
supported in a succeeding bootstrap analysis. The main clades A and H are the
same clades as in the combined analysis. Clade B from the combined analysis (fig. 8,
9, 11) lacked L. tomentosus from Mexico for the reason described above. There are
differences in bootstrap support compared to the former analysis. The clade
consisting of L. hexastichus (sp. 106 & 208) and L. tomentosus (sp. 64 & 214) now
has a bootstrap support of 53 %. Within this clade the monophyly of the two L.
tomentosus specimens and L. hexastichus (sp. 208) is also supported with 53 %. A
bootstrap support for a clade consisting of L. lagurus (sp. 66), L. parvulus and L.
patagonicus was detected. The support for the species L. australis dropped to 82 %
and that of L. pseudolagurus to 52 %. The position of L. hexastichus (sp. 107)
remains ambiguous with respect to the three clades mentioned above.
Bayesian Inference analysis. Figure 11 presents the result of a Bayesian Inference
of molecular phylogenetic data. The data set included the combined ITS and adk
data of fourteen specimens of Lepyrodon and two outgroup taxa used in the ML
analysis depicted in figures 8 and 9. The values above branches are the posterior
probabilities supporting the corresponding clade.
The ‘east austral’ clade (clade A) consisting of the two species from New Zealand
has a probability of 100 %. Within this clade, the monophyly of the investigated
specimens of L. australis (sp. 83 & 207) and L. pseudolagurus (sp. 67 & 112) is
supported with 100 % probability.
A clade consisting of three species from Chile, Lepyrodon lagurus (sp. 33 & 66), L.
parvulus (sp. 85) and L. patagonicus (sp. 84) is supported with 90 %. The monophyly
of L. lagurus is supported with 100 % probability. Two specimens of L. hexastichus
(sp. 106 & 208) and L. tomentosus (sp. 64 & 214) form a clade H with 58 %
probability, within which the specimens 208, 64 and 214 are monophyletic with a
probability of 68 %, thus both clades lack significant support. The taxonomic status of
L. tomentosus from Mexico (sp. 113) and one specimen of L. hexastichus (sp. 107)
remains unresolved with respect to the former clades.
The investigated specimens of the seven species of the genus Lepyrodon indicate
polyphyletic cryptic relationships with respect to distribution and taxonomy. The

5 Molecular evolution, phylogenetics and biogeography of the genus Lepyrodon 75
Figure 10: Maximum Likelihood (ML) cladogram of the adk non-coding regions of thirteen species of Lepyrodon and the outgroup species (Lscore: -1260.0568). Bootstrap values above branches are the result of a Maximum Parsimony analysis. For explanation of the clades referred to as ‘outgroup’, A, and H see text.

5 Molecular evolution, phylogenetics and biogeography of the genus Lepyrodon 76
Figure 11: 50%-majority rule consensus cladogram resulting from a Bayesian Inference analysis of the complete data set (adk gene and ITS sequence data). Numbers above branches indicate the posterior probabilities as a percentage value. For explanation of the clades referred to as ‘outgroup’, H, and A see text.
5 Molecular evolution, phylogenetics and biogeography of the genus Lepyrodon 77
exception is the monophyly of the Austral distributed taxa of L. australis and L.
pseudolagurus.
The three specimens of L. hexastichus (sp. 106 Puerto Montt, sp. 107 Osorno, sp.
208 Valdivia) do not appear as a monophyletic group as one would expect. Two of
the specimens (sp. 106 & 208) show close relationships to L. tomentosus from Costa
Rica (sp. 214) and Chile (sp. 64). The third specimen (sp. 107) is in an ambiguous
position to all taxa investigated in this study. The specimen of L. tomentosus from
Mexico (sp. 113) does not appear in the group of the other two specimens of L.
tomentosus (sp. 64 & 214), but belongs to a clade consisting of L. lagurus (sp. 84 &
85), L. parvulus (sp. 85) and L. patagonicus (sp. 84), of which all specimens originate
from Chile (fig. 8 & 9).
Determining genetic distances. As mentioned above one result of the statistical
analyses of the combined data set (tab. 18) performed in this study were the striking
differences in variability between the single regions. Therefore I tested the variability
of the combined data set to the adk non-coding region as the most variable data set.
The genetic distance within the genus Lepyrodon and in relation to its outgroup are
depicted in appendix 8 and appendix 9. Results are listed as p-distances with
standard errors. In appendix 8 the distance was computed from the combined ITS1,
5.8S nrDNA, ITS2 and adk data sets. Appendix 9, in contrast, shows the p-distances
of the adk intron for the successfully sequenced specimens.
Combined data set. The genetic distances (p-distances) between the Lepyrodon
specimens as well as between the genus and the outgroup species as derived from
the phylogenetic analysis of the combined data set are described in the following
paragraph (also compare appendix 8 and appendix 9).
The genetic distance separating Acrocladium auriculatum (N=1) from Chile and
Acrocladium chlamydophyllum (N=1) is 1.40 %.
The genetic distance within L. australis from New Zealand (South Island, N=2) is
0.15 %.
The three specimens of L. hexastichus show a genetic distance of 0.15 % between
specimens 107 and 106 as well as between specimens 106 and 208; the distance
between specimens 107 and 208 is 0.30 %.

5 Molecular evolution, phylogenetics and biogeography of the genus Lepyrodon 78
No a genetic distance (0.00 %) was found between the two samples of L. lagurus
from southern Chile.
The difference within L. pseudolagurus from the South Island of New Zealand is
0.15 %.
The genetic distance within L. tomentosus is between 0.00 and 0.30 %. The genetic
distance between the specimens from Costa Rica and Mexico is 0.15 % (sp.113 vs.
sp. 214) and between the specimens from Costa Rica and Chile it is 0.30 %, whereas
the two specimens which are geographically most widely separated (Chile and
Mexico) were identical.
adk data set. The results of genetic distance of the separately analysed data set of
adk non-coding regions (appendix 9) differ from those of the combined (adk & ITS)
data set (appendix 8). The greatest genetic distances of all the pairs computed were
those between Acrocladium chlamydophyllum and the specimens of Lepyrodon,
ranging from 14.8 to 19.7 % (standard errors between 4.5 and 5.1 %). The genetic
distance separating the two outgroup taxa, the Chilean species Acrocladium
auriculatum and the New Zealand species A. chlamydophyllum, is 6.6 %. The
relatively high standard error (3.2 %) for this distance is possibly caused by the low
number of successfully sequenced nucleotides.
The genetic distances within the thirteen specimens of Lepyrodon ranged between
0.0 and 8.2 %. There was no infra-genomic variation within L. australis (0.0 %), L.
pseudolagurus (0.0 %), and L. lagurus (0.0 %). A low infra-genomic distance was
detected between the specimens of L. tomentosus (1.6 %) from Chile and Costa
Rica, whereas the variation between the three specimens of L. hexastichus from
Chile ranged between 1.6 and 3.3 %. No genetic distance was observed between the
specimens of L. parvulus and L. patagonicus.
With 8.2 %, the distance between either L. australis or L. pseudolagurus, the taxa
from New Zealand, to L. tomentosus from Costa Rica was the highest distance
observed in the data set. In general, the samples from New Zealand were genetically
quite distinct from the specimens from South America, pairs tested reaching mainly
between 4.9 and 6.6 % distance. Within the group formed by the species L. lagurus,
L. patagonicus and L. parvulus there was no difference detected between the four
specimens under study. Lepyrodon hexastichus from Lago Riñihue (Prov. Valdivia,

5 Molecular evolution, phylogenetics and biogeography of the genus Lepyrodon 79
specimen 208) was identical to L. tomentosus from Chile, and only a low variation to
the specimen from Costa Rica was observed.
Conclusion. The results of this study, based on adk and ITS data and subsequent
Maximum Likelihood (ML) analysis, show that the Australian/New Zealand species, L.
australis and L. pseudolagurus, are monophyletic and sister to a second clade
consisting of L. lagurus, L. patagonicus, L. parvulus from Chile and a specimen of
Lepyrodon tomentosus from Mexico. The relationships within this clade remained
unresolved. The third clade consists of two specimens of L. hexastichus from Chile,
one specimen of L. tomentosus from Costa Rica, and another specimen of this
species from southern Chile.
5.4 Discussion
5.4.1 Genetic results
When comparing the variability of the Lepyrodon data set in this study with the only
published investigation of the adk gene in bryophyte taxonomy so far (Vanderpoorten
et al., 2004), there are striking differences between the two studies.
In this study the same primers described in Vanderpoorten et al. (2004) were used to
amplify parts of the adk gene. Therefore, results concerning length variation and
variability should be comparable.
The data set of Vanderpoorten et al. (2004) comprised four outgroup species (7
accessions) and five ingroup species (25 accessions), whereas in the analysis
described here two outgroup species and seven ingroup species (13 accessions)
were used.
For the exons the Lepyrodon alignment revealed 312 nucleotides in length compared
to 291 in Hygroamblystegium as sequenced by Vanderpoorten et al. (2004). The
aligned intron sequences were 585 nucleotides in length in the Lepyrodon alignment
whereas Vanderpoorten et al. (2004) aligned 618 nucleotides. This difference in
intron length might be the result of several indels within the extremely variable data
set in Hygroamblystegium.

5 Molecular evolution, phylogenetics and biogeography of the genus Lepyrodon 80
There are big differences in variability between the data sets of Lepyrodon and
Hygroamblystegium. Vanderpoorten et al. (2004) found 47.5 % variability in the adk
gene, and, as expected, a higher variability in the introns (56.1 %) than in the exons
(29.2 %). Even without the outgroup taxa there was a high variability within the adk
data sets: 38.1 % for the adk and 22.0 and 45.6 % in the exon and intron alignment,
respectively. In contrast, the results obtained from the data set of Lepyrodon, subject
of this study, shows only 10.1 % variability in the adk region. Considering introns and
exons separately, 12.6 % of the positions in the intron are variable and 5.1 % of
those in the exon if a complete data set comprising all ingroup and outgroup taxa is
used. Within the genus Lepyrodon and its 13 accessions the variability in the intron is
5.5 %.
Vanderpoorten et al. (2004) identified multiple copies of the adk gene within all
individuals of Hygroamblystegium analysed. This is in contrast to the sequences of
the adk gene in other bryophytes e.g. Physcomitrella (Schwartzenberg et al., 1998).
Vanderpoorten et al. (2004) suggest that the high polyploid state of
Hygroamblystegium enables the DNA to evolve independently and therefore may
account for the presence of multiple copies of the adk gene within the individuals of
Hygroamblystegium.
Unfortunately, there is no information available on the polyploidy status of Lepyrodon.
An independent evolution of gene copies in Hygroamblystegium may well account for
the high variability in the data set when compared to Lepyrodon. In the original
sequences of the taxa used in this study only very few ambiguous positions
appeared. They were therefore not identified further but rated as 'N' in the following
analysis.
The ITS1 and ITS2 regions of Hygroamblystegium are also more variable including
outgroup taxa (11.2 and 15.2 %) as well as analysed separately (9.7 % and 10.1 %)
than in the data set of Lepyrodon with 9.2 % in ITS1 (ingroup alone 5.0 %) and 5.8 %
(ingroup alone 1.8 %) in the ITS2. In contrast to the results of the ITS1 and ITS2
sequence variation in Hygroamblystegium (Vanderpoorten et al., 2004) in the
Lepyrodon data set analysed here the ITS1 region revealed a higher degree of
variation than the ITS2.
The length of the ITS1 region as reported by Vanderpoorten et al. (2001) for a data
set of 39 species of pleurocarpous mosses, mainly representatives of the
Amblystegiaceae, ranged from 280-340 bp in length and was therefore larger than in

5 Molecular evolution, phylogenetics and biogeography of the genus Lepyrodon 81
the Lepyrodon data set. Also the variability in this region was higher in the data set of
Vanderpoorten et al. (2001) than in this study.
A comparison of the GC-content with other nuclear regions is no possible as
sequence data of other nuclear, especially non-coding regions, is lacking so far.
However, compared to non-coding cpDNA the ITS displays a GC-content twice as
high, similar to structural DNA such as tRNAs (compare Quandt & Stech, 2004), that
might be attributed to the functional constrains of the ITS region (see Hershkovitz &
Zimmer, 1996; Musters et al., 1990; van der Sande et al., 1992)
The length variation and GC-content in ITS2 sequences of Lepyrodon (compare tab.
17) as revealed by this study lies in the range reported by Quandt et al. (2004a) for a
data set consisting of 63 species representing major lineages of pleurocarpous
mosses. The authors describe length variations between 251 and 360 bp (mean
282.83) and a GC-content between 58.72 and 70.71 % (mean 65.53). The variability
of the ITS2 in the genus Lepyrodon (1.8 %) seems quite low compared to that found
e.g. in Papillaria (2.95 %) and Meteorium (4.27 %) by Quandt et al. (2004a). Taking
into account that the genus Lepyrodon actually represents the family
Lepyrodontaceae, the variability of the ITS2 appears even lower when compared to
the ITS2 alignments of other families (Quandt et al., 2004a). The taxa of
Brachytheciaceae investigated in their study revealed a variability of 9.83 %, the
Lembophyllaceae 5.16 %, and the Meteoriaceae 8.64 %. The Lepyrodontaceae,
however, are a very small family, comprising only seven species, compared to more
than 500 species in the Brachytheciaceae, approx. 100 species in the
Lembophyllaceae, and 100-150 species in the Meteoriaceae
In order to get an impression of the magnitude of the GC-content of the adk gene in
Lepyrodon, this content is compared to that of another protein coding gene, the rps4
gene (cpDNA) in the pleurocarpous moss family Hypopterygiaceae (Blöcher, 2000).
The GC-content of the coding regions of the adk in Lepyrodon is quite different from
that of the rps4 sequence data observed in the Hypopterygiaceae. The mean GC-
content in the rps4 gene of the Hypopterygiaceae comprising 612 bp was 28.3 %,
whereas the mean GC-content of the adk in Lepyrodon is considerably higher
reaching a value of 48.9 %. Also, the pattern in the GC-content is different in the two
genes compared. In the rps4 gene the GC-content of the first codon position was
highest with 42.0 %, that taking in the second position was 33.9 %, and the lowest
content was found in the third position with 8.9 % (Blöcher, 2000). In contrast to

5 Molecular evolution, phylogenetics and biogeography of the genus Lepyrodon 82
these results, the parts of the codons sequenced from the adk gene in the Lepyrodon
data set show their highest GC-content in third codon position. Both studies used a
comparable number of taxa.
5.4.2 Phylogenetic and taxonomic results
Lepyrodon australis. Hooker ( cit in Allen, 1999; 1867), Brotherus (1909a), Dixon (
cit in Allen, 1999; 1927), and Sainsbury (1955) considered L. australis as
morphologically closely related to L. hexastichus. L. hexastichus was formerly
described as L. implexus by Mitten (in Hooker, 1867). Allen (1999), in contrast, found
these two species L. australis and L. hexastichus distinguishable e.g. by characters
of the leaf apices as well as the occurrence of flagellate branches in L. australis.
Instead, Allen (1999) drew attention to the similarities between L. australis and the
widespread South American species L. tomentosus. He found that L. australis united
characters of the three expressions of L. tomentosus he described (Allen, 1999).
Allen (1999) justifies the separation of L. australis as a distinct species rather than as
a variety of L. tomentosus by endostome characters and a geographic isolation of the
taxa. Our genetic data, based on a combined data analysis of the ITS1 and 2 and the
adk gene as well as a separate analysis of the respective genes, revealed L. australis
as the closest relative of L. pseudolagurus with high bootstrap support for the
Australian/New Zealand clade.
Lepyrodon hexastichus. L. hexastichus was seen as a minor expression of L.
tomentosus by Mitten (1869). In Allen’s (1999) view L. hexastichus has more
morphological characters in common with L. patagonicus e.g. its short pointed
leaves. Especially some plants from the Juan Fernández Islands appeared unusually
large and therefore closely resembled some expressions of L. patagonicus and L.
tomentosus. However, according to Allen (1999) L. hexastichus is distinguished from
L. patagonicus by its smooth, narrow upper leaf cells and its plane to incurved leaf
margins. It is delimited from L. tomentosus by the lack of hair-points and by having
very strong leaf margin serrations. The three accessions of L. hexastichus from the
region Los Lagos (Chile) used in the study at hand showed genetically close affinities
to two accessions of L. tomentosus.
5 Molecular evolution, phylogenetics and biogeography of the genus Lepyrodon 83
Lepyrodon patagonicus. The newly described species L. patagonicus (Allen, 1999)
from Chile belongs to a group of species with plicate leaves. It was formerly regarded
as a variety of Lepyrodon tomentosus (L. tomentosus var. patagonicus Card. &
Broth) and shares some characters, e.g. leaf form, with the type expression of L.
tomentosus. L. patagonicus is distinguished from the other species, especially from
L. tomentosus, by the galeate leaf apex which has short, broad prorate leaf cells. The
robust colonies it forms in the area near its northern limit of distribution and on the
Juan Fernández Islands closely resemble those of L. tomentosus. In the phylogenetic
analysis at hand Lepyrodon patagonicus belongs to a clade consisting of two
representatives of the ‘smooth leaved’ species L. lagurus and L. parvulus. The
Maximum Likelihood analysis revealed no further relationship within this clade.
Lepyrodon tomentosus. Allen (1999) states that L. tomentosus is a remarkably
variable species. He distinguishes three morphological expressions of L. tomentosus
which are more or less separated geographically but with intermediate expressions
where their areas of distribution overlap.
The type expression of L. tomentosus occurs in the Andes of western South America
and is described as a robust plant with large, strongly plicate leaves but also with
‘smooth’ branch leaves like those found in L. lagurus (Allen, 1999). The accession
no. 214 from Costa Rica with strongly plicate leaves represents the type expression
in the study at hand.
The northern expression, L. tomentosus var. latifolius, occupies an area from
southern Mexico through Panama to southeast Brazil. The size of the plant is
moderate, and the “lagurus-type” branch leaves can occupy more than half of the
branch. An extreme expression of L. tomentosus var. latifolius (Allen, 1999) is the
expression identical to the type specimen of L. duellii as described by Crum (1984)
which is almost entirely covered with lagurus-type branches. This type is represented
in this study (sp. 113) by the isotype of L. duellii.
The distribution range of the southern type expression in L. tomentosus covers
southern Chile and southwestern Argentina. The plants are usually smaller than in
the other two expressions. The specimen no. 64 in the study at hand resembles this
southern type.

5 Molecular evolution, phylogenetics and biogeography of the genus Lepyrodon 84
Two specimens of L. tomentosus, one from Chile, the other from Costa Rica,
representing the type expression and the southern expression as described in Allen
(1999), are closely related on the base of the sequence data used in the analysis.
However, they form a clade together with two specimens of L. hexastichus that is not
well resolved concerning the monophyletic status of either one of the species.
The northern expression, L. tomentosus from Mexico, the type locality of L. duellii, is
within the clade of Lepyrodon lagurus, L. parvulus and L. patagonicus. That means
this specimen, which has entirely “lagurus type” branches as described by Allen
(1999), is closer related to L. lagurus than to L. tomentosus in this study
Lepyrodon lagurus, L. pseudolagurus. The group of smooth leaved Lepyrodon
species consists of three species, i.e. L. lagurus, L. pseudolagurus, and L. parvulus
(Allen, 1999).
L. lagurus plants from South America have formerly been considered conspecific with
specimens from New Zealand as plants from the two areas are difficult to distinguish
based on morphological characters. Justified by differences in peristomal characters
the material from New Zealand is treated as L. pseudolagurus by Allen (1999). L.
lagurus is polymorphic throughout its range, e.g. plants from higher elevations are in
general smaller and have less tomentum than those from lower elevations, e.g. Tierra
del Fuego. The separation of L. pseudolagurus with Australian/New Zealand
distribution from material of L. lagurus from Chile based on morphological and
anatomical data by Allen (1999) is supported by genetic data in this study.
Lepyrodon parvulus. The smaller high elevation plants of Lepyrodon lagurus
approach L. parvulus in size, but differ e.g. in leaf form. L. parvulus is mostly
stenotypic throughout its range and differs from the other smooth leaved species e.g.
by its smaller size, a more pronounced creeping habitus and by the existence of full
sized male plants. The smaller leaves almost always separate it from L. lagurus. L.
lagurus from high elevations in the northern part of its Chilean range occasionally has
similarly small leaves. These collections of L. lagurus, however, differ from L.
parvulus in having ovate leaves with inflexed upper leaf margins that are weakly
serrate. As in other species the specimens of L. parvulus found on the Juan
Fernández Islands were morphologically different from the mainland taxa (Allen,
1999).

5 Molecular evolution, phylogenetics and biogeography of the genus Lepyrodon 85
In this study, Lepyrodon parvulus appears within a monophyletic group of four
species which include two accessions of L. lagurus from Chile as well as one
accession each of L. patagonicus from Chile and L. tomentosus from Mexico. The
relationship within this group is not resolved, except for the monophyly of the L.
lagurus specimens. The geographical distance between the two samples of L.
lagurus investigated was quite high. Specimen no. 33 is from Punta Arenas at 53º 24’
S and specimen no. 66 from Parque Nacional Conquillio at 38º 39’ S, but they appear
still more closely related to each other than either of them to L. parvulus, L.
patagonicus or the Mexican specimen of L. tomentosus. Thus, the results of the
genetic analysis support the species status of L. patagonicus (Allen, 1999) and L.
parvulus. This is possibly also true for L. tomentosus, the holotype of L. duellii, but
this has to be confirmed by further investigations of at least one more genetic marker
and additional material of L. tomentosus from Mexico.
On “preliminary and superficial examination” (Buck, 1998) the Lepyrodontaceae split
into two clearly distinguishable groups, one represented by L. lagurus and the other
by L. tomentosus. According to Buck (1998) these groups might even deserve
consideration on a higher taxonomic level. These suggestions are not further
discussed by Allen (1999). However, when closely analysing Allen’s descriptions of
the Lepyrodon species and the affinities between them it is notable that
morphological similarities only occur within two distinct groups. Within the ‘plicate
leaved’ group, an overlapping of characters occurs between L. australis and L.
tomentosus, between L. tomentosus and L. hexastichus, between L. tomentosus and
L. patagonicus, and between L. hexastichus and L. patagonicus. Within the ‘smooth
leaved’ group Allen (1999) detected similarities between L. parvulus and L. lagurus
as well as between L. lagurus and L. pseudolagurus.
However, results of Hedenäs (2001), who investigated the relationship between
morphological characters and habitat, indicated that the character ‘plicate stem
leaves’ was highly significant for taxonomic grouping rather than related to
environmental factors. Similarly, this was one of the characters Buck (1998)
suggested as being useful for distinguishing taxonomic groups within Lepyrodon.
Allen (1999) described the occurrence of smooth leaves in the type expression of L.
tomentosus, a species with plicate leaves. This might reflect the morphological
transparency within Lepyrodon.

5 Molecular evolution, phylogenetics and biogeography of the genus Lepyrodon 86
Another character, ‘dwarf males’ as suggested in Buck (1998) valuable for grouping
within the genus Lepyrodon, turned out to be not significantly related to taxonomic
grouping nor to environmental factors in Hedenäs’ analysis (2001).
On the other hand the double peristome in L. pseudolagurus, proved to be valuable
to separate this taxon from L. lagurus (Allen, 1999). All other species in the genus
lack a double peristom, and have only the endostome left. The reduction of the
peristom is regarded as an adaption to epiphytism (Hedenäs, 2001). All species
including L. pseudolagurus grow epiphytically, also L. pseudolagurus is known to
grow as epiphyte as well as on soil and rock. L. lagurus and L. tomentosus are also
known to grow on rock and soil.
The genetic data are in contradiction with the species concept proposed for
Lepyrodon in Allen (1999) but this analysis also failed to resolve an unambiguous
phylogeny within Lepyrodon.
Genetic relationships were identified between rather than within the former
mentioned plicate and smooth leaved group. A monophyletic group consists of the
plicate L. australis and the smooth leaved L. pseudolagurus. Also the smooth leaved
species L. lagurus, L. parvulus and plicate leaved L. patagonicus form a well-
supported monophyletic group and perhaps include the isotype of the former
recognized species L. duellii Crum (Crum, 1984).
A correspondence between genetic and morphological data can be found between L.
hexastichus and L. tomentosus. Also on the basis of genetic data, so far the species
status of L. hexastichus could no be confirmed.
5.4.3 Biogeographical implications
The most obvious result of this study is the monophyly of the Australian/New Zealand
species L. pseudolagurus and L. australis. They form two well separated sister
species in an ‘east austral’ clade supported by high bootstrap values and low genetic
distances. The distribution of L. pseudolagurus, a species which is commonly found
with sporophytes (Allen, 1999), comprises a greater area (Tasmania, Victoria, New
Zealand, Campbell Island) than that of L. australis (Tasmania/ New Zealand)
suggesting that the distribution pattern of the former might be related to its ability of
spore dispersal. Germination data for L. australis from van Zanten (1978) suggests

5 Molecular evolution, phylogenetics and biogeography of the genus Lepyrodon 87
that this species is unable to tolerate any treatment correlated with long distance
dispersal (e.g. desiccation and freezing) for longer than seven months. This restricts
the species in extending its distribution range to South America. There were no data
available for any other species in the genus Lepyrodon, but possibly the fact that
there are different species in South America and Australia/New Zealand may be
explained by the restricted ability this genus hasin long distance dispersal. The same
pattern was found in the southern temperate Hypopterygium rotulatum s.l. (Pfeiffer,
2000b). Based on the inability of spore survival after long distance dispersal Frey et
al. (1999) concluded that Lopidium concinnum which occurs in southern South
America as well as in Australia/New Zealand was separated between these regions
since c. 80 Myr BP.
In contrast to the former vicariance based explanation for disjunct patterns in the
southern temperate hemisphere, Muñoz et al. (2004) tested with statistical methods if
the floristic affinities among southern hemispheric landmasses outside the tropics
could be better explained by near-surface wind transport (direction dependent) or
geographic proximity (direction independent). They used four different data sets:
mosses with 601 species, liverworts (461 species), lichens (597 species) and the
pteridophytes represented by 192 species. They found a stronger correlation
between floristic similarity and maximum wind connectivity, in mosses, liverworts and
lichens than with geographic proximity. From their analyses they concluded that wind
is the main force driving current plant distributions in these groups.
A recent analysis of the distribution of southern hemispheric plant taxa indicated that
most plant distribution patterns are not congruent with the geological sequence of
breakup history Gondwana (Africa(NZ(sSAM, AUS))) as most plant distribution
patterns (sSAM(AUS,NZ)) exhibit a closer relationship between Australia and New
Zealand (Sanmartín & Ronquist, 2004). This suggests dispersal events between
Australia and New Zealand as already discussed (Pole, 1994; Pole, 2001) but not
necessarily between southern South America and Australia/New Zealand.
The sister clade to the east austral clade comprises four species restricted to
southern Chile, and maybe also the isotype of L. duellii from southern Mexico. If the
specimen of L. duelli is included in this clade the clade would show a southern
temperate – northern tropical disjunct distribution pattern as also reported in e.g.
Pyrrhobryum (McDaniel & Shaw, 2003).

5 Molecular evolution, phylogenetics and biogeography of the genus Lepyrodon 88
Perhaps the forming of an ‘arid diagonal’ (Villagrán et al., 1998 and discussion
therein) separating southern and central Chile from tropical South America caused
the separation of the specimens of the L. lagurus-clade from L. duelli, resulting in a
distinct taxon L. duelli in the north.
One could conclude, that the clade consisting of the Australia/New Zealand
Lepyrodon species and its sister clade consisting of L. lagurus, L. patagonicus,
parvulus, (and perhaps to L. duellii) was separated by the breakup of Gondwana and
the separation of the fragments of the continent starting ca. 80 Myr BP (McLoughlin,
2001). Thus the distribution pattern can be seen as a result of vicariance.
As another specimen of L. duelli was reported from Honduras (specimen 109) a
survey of this specimen as well as a variety of L. tomentosus specimens is needed to
clarify its taxonomic position. Although dispersal events can account for the
similarities between e.g. the Central American and South American moss floras as
suggested by Delgadillo (2000).
An inclusion of L. duellii in the clade of L. tomentosus and L. hexastichus despite its
taxonomic status (low probabilities for this with Bayesian statistic), would be in
concordance with the existing distribution pattern of L. tomentosus occurring from
southern South America continuously along the Andes, central America to Mexico
with an outlier in southeast Brazil. The morphological differentiation within L.
tomentosus resulting in the description of morphological distinct expressions
(‘northern’, ‘southern’ and ‘type’ expressions, Allen, 1999) may well show a species
which is in the process of speciation. Intermediate forms in the area where the
morphological expressions overlap may account for speciation in progress. L.
tomentosus shows a similar distribution pattern as Monoclea gottschei in South
America (Meißner et al., 1998). A temperate ancestor may have spread north along
the Andean range and to southeast Brazil. The habitats in northern South America
are well above the lowland rainforest, in the upper montane forest and the
páramo/puna region (Gradstein et al., 2001). Thus the spread of L. tomentosus must
be related to the uplift of the Andes c. 10 Myr ago (Hartley, 2003) which provided a
suitable habitat for its spread to the north and L. tomentosus is the most recent taxon
within Lepyrodon. However the phylogenetic results show either a polyphyletic
relationship of the South American clades (L. tomentosus and L. lagurus) in the
Bayesian analysis or a starlike cladogram with five separate clades.

6 Molecular evolution, phylogenetics and biogeography of the genus Catagonium 89
6 Molecular circumscription and biogeography of the genus Acrocladium (Bryopsida)
6.1 The genus Acrocladium
6.1.1 Status of Acrocladium
Despite the early recognition of the genus Acrocladium (Mitten, 1869), its familial
position has been discussed controversially since. It has been shifted from the
Lembophyllaceae (Brotherus, 1925a; Fleischer, 1923a) to the Amblystegiaceae
(Ochyra & Matteri, 2001; Vitt, 1984) and most recently to the Plagiotheciaceae
(Pedersen & Hedenäs, 2002).
Brotherus (1925a) described two species in the genus Acrocladium: A. auriculatum
(Mont.) Mitt. from southern South America and A. chlamydophyllum (Hook.f. & Wils.)
Broth. from New Zealand, eastern Australia, Tasmania and adjacent islands. Since
then there has been disagreement among bryologists whether the genus includes
one or two species and whether the populations in Chile and Argentina are identical
with those in New Zealand, Australia, and Tasmania. Accordingly, collected
specimens of Acrocladium from Chile were either named A. auriculatum (e.g.
Brotherus, 1925a; Deguchi, 1991; Mitten, 1869) or A. chlamydophyllum (e.g. Cardot,
1908). Brotherus (1925a) distinguishes two species and Andrews (1949), Karczmarz
(1966) and Fife (1995) supported the view that the two taxa are different species. In
contrast, Dixon (1928), Sainsbury (1955) and He (1998) considered both taxa as
variations of the same species, using the name 'A. auriculatum' as the older
epitheton.
In fact, the variability of the specimens of Acrocladium from southern South America
and Australia/New Zealand is quite high. Brotherus (1925a) differentiated between
two species based on leaf auricles and characteristics of the leaf costa. Karczmarz
(1966) did not take into account the characteristics of the costa and distinguished two
species based on leaf shape and presence versus absence of auricles.

6 Molecular circumscription and biogeography of the genus Acrocladium 90
Due to the problematic distinction of the two species based on anatomical and
morphological characters described above, an attempt has been made in this study
to evaluate the differences based on molecular data.
6.1.2 Distribution of Acrocladium
When studying phylogenetic relationships, biogeography and historical dispersal
events also play an important part in understanding current conditions.
Acrocladium auriculatum occurs in Chile from the Cautín in the north to Magallanes in
the south as well as on the Juan Fernández Islands (Robinson, 1975). In Argentina
the species occurs from Neuquén toTierra del Fuego (Ochyra & Matteri, 2001). Van
Zanten (1971) and Gremmen (1981) additionally report a disjunct population of the
species from subantarctic Marion Island.
6.1.3 Ecology of Acrocladium
Acrocladium chlamydophyllum occurs epiphytically (on branches), epilithically (on
rocks) as well as on rotten logs and soil on the forest floor (e.g. Beever et al., 1992;
Sainsbury, 1955).
Pfeiffer (2001) describes an Acrocladium chlamydophyllum-dominated bryophyte
community on the South Island of New Zealand. She states that the species
dominates the forest floor at montane and subalpine altitudes “[…] on moderately
shaded sites on west-orientated slopes […]”.
On the subantarctic Macquarie Island the species occurs at altitudes between 10-
200 m (Seppelt, 2004). Voucher information from the selected specimens in Seppelt
(2004) e.g. “wet grassland”, “boggy herbfield”, suggests rather moist habitat
conditions.
Gremmen (1981) provides the following voucher information for the specimen of
Acrocladium (Gremmen 02.03; 19-12-1974) collected on Marion Island: “forming a
mat under herb layer of Acaena, sheltered”.
The locations where specimens of Acrocladium auriculatum were found and collected
by the author indicate that this species can take on epiphytic and epilithic growth
forms, and might as well grow on rotten logs and bare soil of the forest floor (own
observations, Karczmarz, 1966; Ochyra & Matteri, 2001; Robinson, 1975).

6 Molecular circumscription and biogeography of the genus Acrocladium 91
6.2 Material & Methods
Plant material. Plant material was either collected by the author during a field trip of
the BryoAustral project to Chile in 2001, or originates from herbarium specimens.
Specimens of Acrocladium chlamydophyllum as well as A. auriculatum, especially the
specimen from Marion Island were kindly provided by Dr. B. O. van Zanten
(Herbarium and University of Groningen). Specimens of Acrocladium
chlamydophyllum and Lepyrodon pseudolagurus were collected during the
BryoAustral project expedition to New Zealand in 1998. Duplicates are preserved in
the herbaria in Christchurch (CHR), Bonn (BONN) and Berlin (B). Sequences
available in GenBank were also used. All specimens used in the analyses are listed
in (Appendix 10) including further voucher information.
Twenty-four specimens of Acrocladium were selected. The selection consisted of
nine accessions from Chile, two from Argentina, five from Australia (two from New
South Wales, three from Tasmania) and six specimens that represent the North and
South Island of New Zealand. Furthermore, a specimen from Macquarie Island and a
specimen from Marion Island (1.800 km southeast of Africa) were included. Thus, the
taxon sampling took into account the geographical provenance of the genus with
respect to the description of two disjunctly distributed species, one from southern
South America and the second one from Australia and New Zealand (Andrews, 1949;
Brotherus, 1925a; Fife, 1995; Karczmarz, 1966).
The following six species were selected as outgroup to Acrocladium and were
included in the analyses: Herzogiella seligeri, Plagiothecium undulatum,
Plagiothecium denticulatum, Taxiphyllum taxirameum and two taxa of Lepyrodon, in
previous analyses identified as sister genus to Acrocladium (e.g. Quandt et al.,
2004b, own data compare chapter 4).
The sequences of the rps4 and trnL used in this analysis were extracted from
GenBank for the following taxa: Herzogiella seligeri, Plagiothecium undulatum,
Plagiothecium denticulatum, Taxiphyllum taxirameum. Furthermore, for the taxa
Acrocladium chlamydophyllum, A. auriculatum and Lepyrodon sequences of the trnL
and ITS2 were kindly provided by Dr. Dietmar Quandt, Dresden (table 20). The

6 Molecular circumscription and biogeography of the genus Acrocladium 92
geographical origin of the specimens of Acrocladiumn successfully sequenced is
shown in figure 12 on a global scale and in figure 13 (South America) and figure 14
(New Zealand) on a regional scale. Table 20: List of investigated specimens of Acrocladium with EMBL accession numbers for the regions sequenced. Voucher numbers and the herbaria where the specimens are kept and country of origin are listed. ITS2 sequences of A. auriculatum and A. chlamydophyllum were kindly provided by Dr. Dietmar Quandt (Dresden). For detailed voucher information see Appendix 10.
No. taxon trnL-trnF Rps4 ITS adk country of origin
Voucher label
herbarium
12 Acrocladium chlamydophyllum (Hook.f. & Wilson) Muell. Hal. & Broth.
AJ862339 AJ862495 (ITS1) AF509863 (ITS2)
AJ863571 New Zealand
BRYO AUSTRAL W. Frey 98-T154 B
W. Frey, Berlin
78 Acrocladium auriculatum (Mont.) Mitt.
AJ862338 AJ862491 (ITS1) AF543550 (ITS2)
AJ854491 Chile Rolf Blöcher No. 49
J.-P. Frahm, Bonn
162 Acrocladium chlamydophyllum (Hook.f. & Wilson) Muell. Hal. & Broth.
AJ862672 Australia R. D. Seppelt 15801
J.-P. Frahm, Bonn
165 Acrocladium auriculatum (Mont.) Mitt.
AJ862671 Argentina J. Eggers ARG 1/3
J.-P. Frahm, Bonn
171 Acrocladium cf. chlamydophyllum (Hook.f. & Wilson) Muell. Hal. & Broth.
AJ862676 AJ862690 New Zealand
Ben O. van Zanten 00 11 376
B. O. v. Zanten, Groningen, Netherlands
178 Acrocladium cf. chlamydophyllum (Hook.f. & Wilson) Muell. Hal. & Broth.
Submitted to EMBL
Australia Ben O. van Zanten 82.02.812A
B. O. v. Zanten, Groningen, Netherlands
185 Acrocladium auriculatum (Mont.) Mitt.
AJ862674 AJ862692 Chile BRYO AUSTRAL Rolf Blöcher no. 261
J.-P. Frahm, Bonn
186 Acrocladium auriculatum (Mont.) Mitt.
AJ862675 AJ862693 Chile BRYO AUSTRAL Rolf Blöcher no. 50
J.-P. Frahm, Bonn
189 Acrocladium auriculatum (Mont.) Mitt.
AJ862673 Chile BRYO AUSTRAL J.-P. Frahm no. 2-7
J.-P. Frahm, Bonn
Distribution maps. Regional maps of the origin of Acrocladium specimens were
constructed using the web-page www.planiglobe.com (Körsgen et al., 2004). Dots
were generated by adding geographical coordinates of collection localities as
indicated on the voucher labels of the specimens. The map showing the world wide
distribution of Acrocladium was constructed using ‘online map creation’ OMC
(www.aquarius.geomar.de) provided by M. Weinelt, (2004) which uses ‘The Generic
Mapping Tools’ (GMT, Wessel & Smith, 1995).

6 Molecular circumscription and biogeography of the genus Acrocladium 93
Figure 12: Geographical origin of all Acrocladium specimens used for this study. Specimens from South America are Acrocladium auriculatum, specimens from Australia, New Zealand and Macquarie Island are A. chlamydophyllum. Numbers are specimen numbers.

6 Molecular circumscription and biogeography of the genus Acrocladium 94
Figure 13: Geographical origin of the Acrocladium specimens from South America used for this study. Numbers in brackets are specimen numbers.
Figure 14: Geographical origin of the Acrocladium specimens from Australia, New Zealand and Macquarie Island used for this study. Numbers in brackets are specimen numbers.

6 Molecular circumscription and biogeography of the genus Acrocladium 95
DNA isolation, PCR and sequencing. Prior to DNA extraction the plant material
was thoroughly cleaned with distilled water and additionally treated by ultrasonic
waves for 2-4 minutes. Success of cleaning was checked by examining the plants
under a binocular microscope. Remaining contaminations e.g. with algae and fungi
were removed mechanically. Isolation of DNA was carried out following the CTAB
technique described in Doyle & Doyle (1990).
PCR amplifications (Biometra TriBlock thermocycler, PTC-100 MJ Research) were
performed in 50 µl–reactions containing 1.5 U Taq DNA polymerase (PeqLab), 1 mM
dNTPs-Mix, nucleotide concentration 0.25 mM each (PeqLab), 1x buffer (PeqLab),
1.5 mM MgCl2 (PeqLab) and 12.5 pmol of each amplification primer. PCR products
were purified using the QIAquick purification kit (Qiagen). Cycle sequencing reactions
(half reactions) were performed using a PTC-100 Thermocycler (MJ Research) in
combination with the ABI PrismTM Big Dye Terminator Cycle Sequencing Ready
Reaction Kit with Amplitaq-DNA polymerase FS (Perkin Elmer), applying a standard
protocol for all reactions. Extension products were precipitated with 40 µl 75 % (v/v)
isopropanol for 15 min at room temperature, centrifuged with 15,000 rpm at 25°C,
and washed with 250 µl of 75 % (v/v) isopropanol. These purified products were
loaded on an ABI 310 automated sequencer (Perkin Elmer) and electrophoresed. For
cycle sequencing 10 µl–reactions were used containing 3 µl of Big Dye Terminator
Cycle Sequencing premix. Sequencing reactions were performed on two
independent PCR products generated from each sample in order to verify the results.
All PCR products were sequenced using two primers. For amplifying and sequencing
the non-coding regions of the chloroplast DNA a modification of primer C (Quandt et
al., 2000) as well as primer F, originally designed by Taberlet et al. (1991) were
employed. Primers used to amplify the rps4 gene were those described in Nadot et
al. (1994), ‘trnS’ and ‘rps5’ (table 21). Primers for amplifying and sequencing the ITS
region (ITS4-bryo and ITS5-bryo) based upon the primers “ITS4” and “ITS5”
respectively, designed and named by White et al.(1990), were slightly modified with
respect to bryophytes (Stech, 1999). The primers ITS-C and ITS-D (Blattner, 1999)
were modified for this study (ITS-D_bryo and ITS-C_bryo) and additionally used for
sequencing reactions (table 22).
The amplified adk region started about 196 base pairs (bp) downstream of the 155th
codon and ended at the 257th codon of the adk gene isolated from the moss species

6 Molecular circumscription and biogeography of the genus Acrocladium 96
Physcomitrella patens (Y15430, Schwartzenberg et al., 1998). Coding and non-
coding regions were identified by comparison with moss sequences available from
GenBank (e.g. Vanderpoorten et al., 2004). Primers used for amplification of the adk
gene (table 23) were those described in Vanderpoorten (2004).
Table 21: Primer sequences used for amplification and sequencing of the trnL region and rps4 gene. Underlined nucleotides represent changes (Quandt et al., 2000) with respect to the original primers of Taberlet (1991). Primer Sequence Data source trnS TAC CGA GGG TTC GAA TC Nadot et al. 1994 rps5 ATG TCC CGT TAT CGA GGA CCT Nadot et al. 1994 trnL-C_mosses CGR AAT TGG TAG ACG CTA CG Quandt et al. 2000 trnL-F ATT TGA ACT GGT GAC ACG AG Taberlet et al. 1991 Table 22: Primer sequences used for amplification and sequencing of the ITS region. Underlined nucleotides represent changes with respect to the original primers of Blattner (1999). Primer Sequence Data source ITS-C bryo GCA ATT CAC ACT ACG TAT CGC Blattner 1999 ITS-D bryo CTC TCA GCA ACG GAT ATC TTG Blattner 1999 ITS4-bryo TCC TCC GCT TAG TGA TAT GC Stech 1999 ITS5-bryo GGA AGG AGA AGT CGT AAC AAG G Stech 1999 Table 23: Primer sequences used for amplification and sequencing of the adk gene. Primer Sequence Data source F GAA GAA GCC AGA AAA CTG GGC Vanderpoorten et al. 2004
R GTC ACC CCA TCT TCA GCA AC Vanderpoorten et al. 2004
1F AAG CTT TTC CCG TAA GT Vanderpoorten et al. 2004
2R ACT TAC GGG AAA AGC TT Vanderpoorten et al. 2004
3R GGT CCC CTG GGT AAT AAC Vanderpoorten et al. 2004
4F TTT CAT CCC ATC GGT GG Vanderpoorten et al. 2004
For amplifying and sequencing the chloroplast and nuclear region different protocols
have been applied. For the trnL-F region and the rps4 gene the PCR program was
performed with the following settings: 2 min. 94ºC, 35 cycles (1 min. 94ºC, 1 min.
55ºC, 1 min. 72ºC) and a 5 min. 72ºC extension time, cycle sequencing settings: 29
cycles (5 sec. 96ºC, 4 min. 50ºC).
The ITS region was amplified using a protocol consisting of: 5 min. 94ºC, 35 cycles (1
min. 94ºC, 1 min. 48ºC, 1 min. 72ºC) and a 5 min. 72ºC extension time, cycle
sequencing settings: 25 cycles (30 sec. 96ºC, 15 sec. 50ºC, 4 min. 60ºC). According
to Vanderpoorten et al. (2004) the following PCR protocol was used to amplify parts

6 Molecular circumscription and biogeography of the genus Acrocladium 97
of the adk gene : 2 min. 97ºC, 30 cycles (1 min. 97ºC, 1 min. 50ºC, 3 min. 72ºC) and
a 7 min. 72ºC extension time. For more detailed information compare Vanderpoorten
et al. (2004).
All sequences will be deposited in EMBL, accession numbers are listed in table 20,
the alignments are available on request from the author.
Phylogenetic analyses. Heuristic searches under the parsimony criterion were
carried out under the following options: all characters unweighted and unordered,
multistate characters interpreted as uncertainties, gaps coded as missing data,
performing a tree bisection reconnection (TBR) branch swapping, collapse zero
branch length branches, MulTrees option in effect, random addition sequence with
1000 replicates.
Furthermore the data sets were analysed using winPAUP 4.0b10 (Swofford, 2002)
executing the command files generated by ‘PRAP’ (Parsimony Ratchet Analyses
using PAUP Müller, 2004), employing the implemented parsimony ratchet algorithm
(Nixon, 1999). For the parsimony ratchet the following settings were employed: 10
random addition cycles of 200 iterations each with a 40 % upweighting of the
characters in the PRAP iterations. Heuristic bootstrap searches (BS Felsenstein,
1985) under parsimony criterion were performed with 1000 replicates, 10 random
addition cycles per bootstrap replicate and the same options in effect as the heuristic
search for the most parsimonious tree (MPT). The consistency index (CI, Kluge &
Farris, 1969), retention index (RI), and rescaled consistency index (RC, Farris, 1989)
were calculated to assess homoplasy.
In addition to MP analyses Bayesian Inferences with MrBayes3.0 (Huelsenbeck &
Ronquist, 2001) were performed. Modeltest 3.5 (Posada, 2004) was used to select
DNA substitution models for the data set (gamma shape distribution, six substitution
types). The Markov Chain Monte Carlo (MCMC) analyses were run for 1,000,000
generations with four simultaneous MCMCs and one tree per 100 generations was
saved. The ‘burn-in’ values were determined empirically from the likelihood values.
The analyses were repeated three times to assure sufficient mixing by confirming that
the program converged to the same posterior probability (PP).
The program Treegraph (Müller & Müller, 2004) was used to edit trees directly from
PAUP-treefiles.

6 Molecular circumscription and biogeography of the genus Acrocladium 98
MEGA2.1 (Kumar et al., 2001) was used to calculate GC-content, sequence length
and distance measure (‘p-distance’). In the following the term ‘genetic distance’ is
used beside the term ‘p-distance’.
6.3 Results
6.3.1 Sequence variation
Sequencing success. Results on sequence length and GC-content for ITS1, ITS2,
trnL intron, and rps4 are listed in table 24. Only partial sequences of Acrocladium
auriculatum (specimen 78) and A. chlamydophyllum (specimen 12) for the adk intron
as well as exon were obtained and are therefore not listed. We obtained the
complete sequence of the trnL intron for six of the 24 specimens of Acrocladium. As
the trnL-trnF spacer was sequenced only partially these results are not discussed in
detail (table 24).
Table 24: Sequence lengths [base pairs, bp] and GC-content [%] in the ITS1, ITS2, trnL intron and rps4 gene of eight Acrocladium specimens and six outgroup taxa. Average sequence lengths and standard deviations are also given. For origin of the data refer tab. xz. Abbreviations: n.d. = no data available, A.=Acrocladium.
Taxon
ITS1 sequence
length [bp}
ITS1GC-
content[%]
ITS2sequence
length [bp]
ITS2GC-
content[%]
trnL intron
sequence length
[bp]
trnL intron
GC-content
[%]
rps4 sequence
length [bp]
rps4 GC-content
[%]
Herzogiella seligeri (sp.120) 244 62.30 259 62.5 312 31.1 570 29.3
Plagiothecium undulatum 240 62.90 183 63.4 265 28.7 570 28
Plagiothecium denticulatum 248 62.50 255 64.7 315 31.4 570 28.2
Taxiphyllum taxirameum (sp.117) 286 65.40 250 67.2 318 31.2 571 26.9
Lepyrodon tomentosus (sp.64) 246 63.40 266 65.4 314 32.5 540 28.5
Lepyrodon pseudolagurus (sp.67) 249 64.60 264 65.9 315 31.7 571 27.9
A. chlamydophyllum (sp.12) 255 62.70 233 63.9 315 30.8 570 26.7
A. chlamydophyllum (sp.171) 255 62.70 234 64.1 315 30.8 n.d. n.d.
A. chlamydophyllum (sp.162) n.d. n.d. n.d. n.d. 315 30.8 n.d. n.d.
A. auriculatum (sp.165) n.d. n.d. n.d. n.d. 315 30.5 n.d. n.d.
A. auriculatum (sp.78) 255 64.30 236 64.9 314 30.2 558 26.3
A. chlamydophyllum (sp.185) 230 65.60 236 64.9 315 30.2 n.d. n.d.
A. auriculatum (sp.186) 255 64.30 236 64.9 315 30.2 n.d. n.d.
A. auriculatum (sp.189) n.d. n.d. n.d. n.d. 315 30.2 n.d. n.d.
Average 251 63.70 241 64.7 311 30.7 565 27.7
SD 13.9 1.2 23.0 1.3 12.9 0.9 11.0 1.0

6 Molecular circumscription and biogeography of the genus Acrocladium 99
Sequence lengths and GC-content. The sequence length of the complete trnL
intron in the genus Acrocladium ranged from 314 base pairs (bp; A. auriculatum, sp.
78) to 416 bp (A. chlamydophyllum, specimen 12). The GC-content ranged from 30.2
(all specimens from Chile) to 30.8 % (all specimens from New Zealand and
Macquarie Island).
We successfully sequenced the ITS1 region for five specimens of Acrocladium. The
sequence length of the ITS1 in the genus Acrocladium was 255 bp. At the 5’-end of
ITS1 of specimen 185 the signal from the sequencer was very low resulting in a
readable length of 230 bp only. The GC-content was 62.7 % for the specimens from
New Zealand and 64.3 % for two specimens from Chile. For specimen 185 from Chile
the GC-content was 65.6 %. The average GC-content within the genus Acrocladium
was 63.7 % (standard deviation 1.2). For five species of Acrocladium from Chile and
New Zealand the complete sequence of the ITS2 region was obtained. The
sequence length ranged between 233 bp (specimen 12) and 236 bp (all specimens
from Chile). The GC-content in the ITS2 region was 63.9 % in specimen 12 and 64.9
% (all specimens from Chile).
The length difference between the two successfully sequenced rps4 genes from
Acrocladium auriculatum (specimen 78) and A. chlamydophyllum (specimen 12) is
due to a low signal in the sequence analysis of these specimens, which prevented 12
bp from being read at the 3’-end of the rps4 gene of the former specimen.
Only the first adk exon (99 bp) and adk intron (124 bp) of the two Acrocladium
species were successfully sequenced. The length of both the exons and introns
differed considerably between the two species. For A. auriculatum from Chile (sp. 78)
more unambiguous positions in the sequences than for the specimen from New
Zealand (sp. 12) were obtained. In the sequences of A. auriculatum 26 bp at the 5’-
end of the second exon, 115 bp at the 3’-end of the second intron as well as 52 bp at
the 5’-end of the third exon were unambiguous. In both specimens 84 positions at the
3’end of the third intron as well as 43 bp of the fourth exon revealed signals of one
nucleotide.
Variability of the regions in the combined data set. Table 25 presents the
information on the different regions in the alignment. The highest proportion of
variable sites was found in the ITS2 region where 12.6 % of the 326 aligned positions

6 Molecular circumscription and biogeography of the genus Acrocladium 100
were variable within the data set including the outgroup (1.5 % variability between the
specimens of Acrocladium). In the ITS1 region the variability in the data set including
the outgroup taxa was 6.7 % for the 315 aligned positions. The variability of the ITS1
data set without the two outgroup taxa was 5.1 %. In the trnL region the variability of
the data set comprising 421 positions was 1.9 % (9.3 % including the outgroup),
whereas in the rps4 region (571 characters) it was only 0.7 % (8.1 % including the
outgroup). The adk gene had a variability of 2.5 % in the intron and 0.8 % in the
exon, in 476 and 241 aligned nucleotides respectively. The coding region of the adk
data set revealed only 5.1 % variable sites (0.6 % without outgroup) in 312 aligned
positions.
Table 25: Number of taxa, total number of aligned characters; variable characters and number of parsimony informative sites and %-value of variable sites for the partial data sets of Acrocladium. Numbers in brackets refers to the data set including the outgroup taxa.
Com-bined
trnL Varia-bility [%]
rps4 Varia-bility[%]
adk-intron
Varia-bility[%]
adk-exon
Varia-bility[%]
ITS1 Varia-bility [%]
ITS2 Varia-bility[%]
Number of sites
2698 421 571 476 241 315 326
Variable sites
35 (244)
8 (39)
1.9 (9.3)
4 (46)
0.7 (8.1)
12 2.5 2 0.8 16 (21)
5.1 (6.7)
5 (39)
1.5 (12.0)
Parsimony Informative
13 (97)
4 (15)
1.0 (3.7)
0 (20) (3.5)
12 (48)
3.8 (15.2)
5 (28)
1.5 (8.6)
Indel and substitution matrix.Within eight variable positions of the trnL intron five
substitutions (table 26) clearly support the genetic separation between the South
American (specimens 78, 165, 185, 186, 189) and New Zealand and Macquarie
Island (specimens 12, 171, 162) samples. Two substitutions different from the
remaining specimens group the specimen from Argentina (specimen 165) clearly with
those from New Zealand and Macquarie Island. One substitution event occurs only in
the specimen from Argentina.
The four substitutions found for the ITS1 as well as ITS2 region support the genetic
distinction between the two specimens from New Zealand (sp. 12, 171) and those
from Chile (specimens 78, 185, 186).
The most promising region concerning the variability is the adk gene. Within the 884
aligned base pairs thirteen positions and an additional ambiguous one, separate the
New Zealand specimen 12 from the Chilean specimen 78. Within the rps4 gene four
substitutions were identified which separate Chile (specimen 78) from New Zealand

6 Molecular circumscription and biogeography of the genus Acrocladium 101
(specimen 78). Overall 34 substitutions support the genetic differentiation of the two
geographical regions.
Additionally, three indels support the separation between these regions - two indels
from the ITS1 region, each consisting of one nucleotide and one indel in the ITS2
region consisting of two nucleotides (table 27). Table 26: Substitution matrix in the combined data set (trnL, ITS1, ITS2, adk, and rps4) within the genus Acrocladium. 35 sites were found to be variable. Substitutions in trnL: no. 1-8; in ITS1: no. 9-12; in ITS2: no. 13-17; in adk: 18-31; in rps4: 32-35. Abbreviations: A.a.: Acrcocladium auriculatum, A.c.: A. chlamydophyllum. Substituion no. 1 2 3 4 5 6 7 8 9 10 11 12 13 14 15 16 17 18 19 20A . c . 1 2 G C G C A C C C T T G A T T C T G A A C A . c . 1 7 1 G C G C A C C ? T T G A T T C T G ? ? ? A . c . 1 6 2 G C G C A C C C ? ? ? ? ? ? ? ? ? ? ? ? A . a . 1 6 5 G C A A G ? ? ? ? ? ? ? ? ? ? ? ? ? ? ? A . a . 7 8 A T A C G A T A C G C G C C T C A C G T A . a . 1 8 5 A T A C G ? ? ? C G C G C C T C A ? ? ? A . a . 1 8 6 A T A C G ? ? ? C G C G C C T C A ? ? ? A . a . 1 8 9 A T A C G ? ? ? ? ? ? ? ? ? ? ? ? ? ? ? Substituion no. 21 22 23 24 25 26 27 28 29 30 31 32 33 34 35A . c . 1 2 C A G T C G C A t G A A G C A A . c . 1 7 1 ? ? ? ? ? ? ? ? ? ? ? ? ? ? ? A . c . 1 6 2 ? ? ? ? ? ? ? ? ? ? ? ? ? ? ? A . a . 1 6 5 ? ? ? ? ? ? ? ? ? ? ? ? ? ? ? A . a . 7 8 A T A G G C A T C A G C A A G A . a . 1 8 5 ? ? ? ? ? ? ? ? ? ? ? ? ? ? ? A . a . 1 8 6 ? ? ? ? ? ? ? ? ? ? ? ? ? ? ? A . a . 1 8 9 ? ? ? ? ? ? ? ? ? ? ? ? ? ? ? Table 27: Indelmatrix of the combined data set of Acrocladium (Indel no. I and II from ITS1 region, indel no. III from ITS2 region). Position in the alignment [%]
491 (ITS1)
631 (ITS1)
900/1 (ITS2)
Indel no. I II III New Zealand 12 T New Zealand 171 T Chile 78 C CC Chile 185 C CC Chile 186 C CC 6.3.2 Genetic distances
Within the trnL data set (appendix 11) including outgroup the average genetic
distance (p-distance) was 2.3 % (standard error 0.4). Within the four specimens from
Chilean localities (specimens 189, 186, 185, 78) investigated in this study no genetic
variation in the trnL intron was detectable. Similarly the specimens from New Zealand

6 Molecular circumscription and biogeography of the genus Acrocladium 102
(sp. 12, 171) and Macquarie Island (sp. 162) were all identical. An equal distance of
1.0 % (standard error 0.5) separates the southern Argentinean specimen (specimen
165) from both the Chilean and New Zealand specimens .
The genetic distances in the trnL intron separating the Chilean specimens from those
from New Zealand was 1.3 % (standard error 0.6).
For the ITS1 (appendix 12) data set including outgroup an average genetic distance
of 6.0 % (standard error 0.9) was observed. No genetic variation was detected in the
ITS1 region within the three specimens from Chilean localities (specimens 186, 185,
78) nor within the two from New Zealand (specimens 12, 171).
In the ITS2 (appendix 13) region the sequence variation separating the Chilean
specimens from those collected in New Zealand range from 1.6 to 1.7 % (standard
error 0.9). The ITS2 data set including outgroup had an average genetic distance of
5.4 % (standard error 0.9).
The three specimens from Chilean localities (specimens 186, 185, 78) as well as
both specimens from New Zealand (specimens 12, 171) had identical ITS2 regions.
The genetic distances in the ITS2 region separating the Chilean specimens from
those in New Zealand was 2.1 % (standard error 0.9).
Within the rps4 data set (appendix 14) including outgroup the average genetic
distance was 2.7 % (standard error 0.4). The genetic distances in the rps4 region
separating the Chilean specimen from those in New Zealand was 0.7 % (standard
error 0.3).
Within the two partial sequences of the adk gene of Acrocladium sequence variation
was 3.3 % (standard error 0.9) in the intron and 1.2 % in the exon (standard error
0.8).
The complete data set including four sequenced regions reveals different values for
the p-distance between the geographical regions investigated. The reason is that this
data set includes the trnL-trnF spacer region (63 characters). Computing the p-
distance for three specimens (two specimens from New Zealand and one from Chile)
of which the complete trnL-trnF spacer region (60 bp) was successfully sequenced a
genetic distance of 4.9 % between the specimen 78 from Chile and specimen 12
from New Zealand was found. No difference was found between the specimens from
New Zealand and from Macquarie Island (specimen 162).
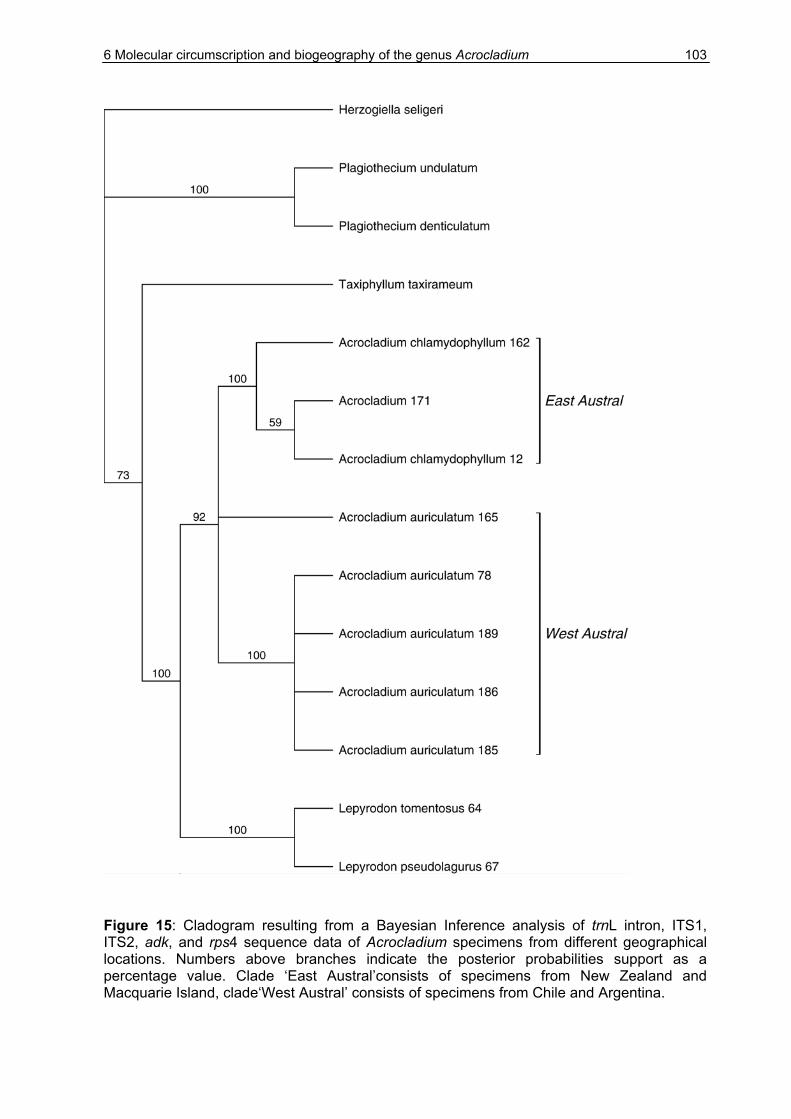
6 Molecular circumscription and biogeography of the genus Acrocladium 103
Figure 15: Cladogram resulting from a Bayesian Inference analysis of trnL intron, ITS1, ITS2, adk, and rps4 sequence data of Acrocladium specimens from different geographical locations. Numbers above branches indicate the posterior probabilities support as a percentage value. Clade ‘East Austral’consists of specimens from New Zealand and Macquarie Island, clade‘West Austral’ consists of specimens from Chile and Argentina.

6 Molecular circumscription and biogeography of the genus Acrocladium 104
6.3.3 Phylogenetic analysis
Figure 15 depicts the cladogram resulting from a Bayesian Inference analysis using
MrBayes (Huelsenbeck & Ronquist, 2001) resulting from 9,900 trees. The data set
includes six outgroup taxa and eight specimens of Acrocladium representing the two
geographical provenances, one covering southern South America (west austral) and
the other New Zealand, Australia and the ancient (subantarctic) islands (east austral).
The outgroup taxa comprise two species of the genus Lepyrodon, proposed as sister
taxon to the genus Acrocladium (chapter 4, Quandt et al., 2004b), three
representatives of the Plagiotheciaceae to which the genus Acrocladium belongs
according to Pedersen and Hedenäs (2002) and Taxiphyllum taxirameum.
Herzogiella seligeri is the most basal taxon in the cladograms. The clade comprising
two representatives of the genus Plagiothecium is supported with a posterior
probability of 100 %). The clade which has Taxiphyllum taxirameum as its most basal
taxon and also includes the representatives of Lepyrodon and Acrocladium has a
posterior probability of 73 %. The sistergroup relationship between the genera
Acrocladium and Lepyrodon is supported with a posterior probability of 100 %. The
monophyly of both genera Acrocladium and Lepyrodon is supported with a posterior
probability of 92 % and 100 % respectively. The specimens 171 and 12 derived from
New Zealand and the specimen from subantarctic Macquarie Island no. 162, here
referred to as ‘east austral’ clade are monophyletic with a 100 % probability. The
specimens from Chile (sp. 78, 189, 186, and 185) are also monophyletic (PP 100 %).
However, the relationship of the specimens from southern South America, here
referred to as ‘west austral’ clade, including the four taxa from Chile as well as one
taxon from east of the Andes in Argentina are polyphyletic.
The figure 16 depicts the 50 %-majority rule tree of 39 MPTs (length 282, CI 0.929,
RI 0.877, RC 0.815) as a phylogram. The phylogram was obtained with the branch
and bound search option based on the combined data set of the genus Acrocladium
including the outgroup taxa. Values above branches refer to bootstrap support (1,000
iterations), whereas numbers below branches indicate the number of characters
supporting each clade. A high bootstrap support (100 %) was found for the genus
Plagiothecium. Its monophyly is also supported by 20 autapomorphic characters. A
clade consisting of Herzogiella seligeri, a putative member of the Plagiotheciaceae

6 Molecular circumscription and biogeography of the genus Acrocladium 105
Figure 16: Phylogram of 39 MPTs (Length 282, CI 0.929, RI 0.877, RC 0.815) found during the parsimony ratchet of the combined sequence data (ITS, trnL, adk and rps4) of specimens the genus Acrocladium and outgroup taxa. Numbers above branches are bootstrap values (1000 iterations) numbers below branches is the number of characters supporting each clade. Length of the scale bar in the lower left corner of the phylogram equals 10 characters.
(Pedersen & Hedenäs, 2002) and Taxiphyllum taxirameum (Buck & Goffinet, 2000) is
indicated by five autapomorphic characters though weakly supported (BS 57 %).
Both species are characterised by a high amount of apomorphic characters,
Taxiphyllum taxirameum having 60 and Herzogiella seligeri 39 characters.

6 Molecular circumscription and biogeography of the genus Acrocladium 106
The clade of Lepyrodon and Acrocladium is supported by 22 characters and a
bootstrap value of 92 %. The two species of Lepyrodon are characterised by 47
characters and a 100 % bootstrap value supporting their monophyly.
The monophyletic position of the genus Acrocladium is supported by a bootstrap
value of 81 % and 26 autapomorphic characters. The taxonomic sovereignty of the
east austral clade is supported by 89 % BS and 22 autapomorphic characters. There
are 10 autapomorphic characters supporting the monophyly of the west austral clade
(66 % BS). In this clade the specimen from Argentina, no. 165 is the most basal one,
and also the only specimen of Acrocladium with a unique apomorphic character. The
four specimens from Chile are separated by two apomorphic characters and an 87 %
bootstrap support from the east Andean taxon.
6.4 Discussion
6.4.1 The status of A. auriculatum and A. chlamydophyllum As stated in the results there were problems involved in obtaining sequence data for
large parts of the exons and introns. A possible explanation is offered by
Vanderpoorten et al. (2004) who report high infra-genomic polymorphism in the adk
gene of Hygroamblystegium. Within-organism polymorphism is usually associated
with a divergent evolution of gene arrays, hybridization or formation of pseudogenes
(for a detailed discussion see e.g. Campbell et al., 1997; Doyle, 1992; Hugall et al.,
1999). In Hygroamblystegium as well as in related genera e.g. Amblystegium
polyploids are quite common (e.g. Fritsch, 1991). Vanderpoorten et al. (2004)
therefore suggest that “repeated events of gene duplication and losses may account
for the observed polymorphism of adk in Hygroamblystegium”. There are two
chromosome counts reported for Acrocladium chlamydophyllum (Ramsay, 1974, cit.
in Fritsch, 1991; Przywara et al., 1992). Ramsay (1974, cit. in Fritsch, 1991) report
n=11 (10+m) for material from Australia. According to Ramsay (1983) the loss or
addition of such m-chromosomes occurs together with aneuploidy which may lead to
polyploid taxa (Ramsay, 1983). On the other hand, the analysis of material from New
Zealand (Przywara et al., 1992) resulted in n=11, revealing no additional m-
chromosome.

6 Molecular circumscription and biogeography of the genus Acrocladium 107
Taking the above mentioned problems into account, the difficulties in obtaining
sequences in large parts of some introns and exons in the adk gene in this study may
be due to the existence of different copies of the adk gene with mutation events in
these regions which resulted in ambiguous sequencing signals. A possible solution
for this problem may be the cloning of the PCR products prior sequencing. The
obtained results would give insight into possible hybridization events or the
occurrence of pseudogenes.
There has been a lot of discussion on the status of the taxa described in the genus
Acrocladium based on morphological characters. The holotype of Acrocladium
auriculatum (Mont.) Mitt. was described by Montagne in 1843 as Hypnum
auriculatum Mont. based on material collected in southern South America
(Karczmarz, 1966). The holotype of Acrocladium chlamydophyllum (Hook.f. et Wils.)
Muell. Hal. & Brotherus was described as Hypnum chlamydophyllum Hook.f. et Wils.
based on material which originated from Campbell Island and Tasmania (Karczmarz,
1966). The genus Acrocladium first was established by Mitten (1869), and included
besides A. auriculatum (Mont.) Mitt. a second species Acrocladium politum (Hook.f. &
Wils.) Mitt., now known as Catagonium nitens (Brid.) Cardot. In 1879 Lindberg (cit. in
Andrews, 1949) united the northern Acrocladium cuspidatum (L.) Lindb. with the
southern hemisphere species of Acrocladium. Kindberg in 1897, included A.
cuspidatum in the genus Calliergon (Sull.). The east southern hemispheric A.
chlamydophyllum was established in 1900 by C. Müller and Brotherus (Karczmarz,
1966).
Brotherus (1909b) distinguishes three species in the genus Acrocladium, which he
classifies into two different systematic categories. In ‘section I’, ‘Eu-Acrocladium’ he
includes the southern hemispheric species A. auriculatum (Mont.) Mitt. from southern
South America and A. chlamydophyllum (Hook.f. & Wils.) Broth. from New Zealand,
eastern Australia, Tasmania and adjacent islands. ‘Section II’ contains the northern
hemispheric A. cuspidatum (L.) Lindb. Brotherus (1909b) distinguishes the two
sections among others based on form and shape of the perichaetal leaves and
differences in stem anatomy. The separation of A. auriculatum and A.
chlamydophyllum was based on the presence or absence of leaf auricles and the
extension of the leaf costa. In a later treatment of the genus Acrocladium Brotherus
(1925a) adopts the view that only the southern hemispheric species belong to the
genus Acrocladium.

6 Molecular circumscription and biogeography of the genus Acrocladium 108
Andrews (1949), Karczmarz (1966) and Fife (1995) support the view of Brotherus
(1909b; 1925c) that A. auriculatum (Mont.) Mitt. and A. chlamydophyllum (Hook.f. &
Wils.) Broth. are two morphologically well distinct taxa, where A. chlamydophyllum
deserves the rank of a species. Karczmarz (1966) omits the character of the costa
and distinguishes both species by leaf shape and by presence versus absence of
auricles. Furthermore, he states that each species is restricted in its distribution. A.
auriculatum occurs in the western part of the distribution range of the genus whereas
A. chlamydophyllum is restricted to the eastern part.
In contrast, Mitten ( cit. in Karczmarz, 1966; 1869), Dixon (1928), Sainsbury (1955)
and He (1998) consider both taxa as geographical variations of the same species,
using the name 'A. auriculatum' as the older epitheton.
Both the phylogenetic results as well as the genetic distances obtained in this study
clearly distinguish between the specimens labeled Acrocladium auriculatum,
originating from Chile and Argentina and the specimens representing A.
chlamydophyllum from New Zealand and Macquarie Island.
The specimens of A. auriculatum on the one hand and those of A. chlamydophyllum
on the other hand form two well supported monophyletic clades. The obtained
genetic distances between A. auriculatum and A. chlamydophyllum (e.g. 1.3 % in the
trnL intron) are comparable with the genetic distances used to distinguish between
the Gondwanan taxa Polytrichadelphus magellanicus and P. innovans (Stech et al.,
2002). Additionally, there were three indels found which separated between the
populations from New Zealand and Macquarie Island (A. chlamydophyllum) and
Chile/Argentina (A. auriculatum).
6.4.2 Possible explanations for the disjunct distribution of Acrocladium There are two possible explanations for the disjunct distribution of the two
Acrocladium species which are discussed in the following. On the one hand the
genus may have originally only occurred in one of the two disjunct areas: southern
South America or New Zealand/Australia. After a long distance dispersal event the
two species developped by divergent evolution. Regarding the high genetic
differentiation found in this study this putative event must have happened a very long
time ago. On the other hand a common ancestor of both species may originate from
the former Gondwana continent. After the continent broke apart two isolated
populations evolved independently resulting in two species.
6 Molecular circumscription and biogeography of the genus Acrocladium 109
Muñoz et al. (2004) test with statistical methods whether the floristic affinities among
southern hemispheric landmasses outside the tropics could be explained better by a
near-surface wind transport (direction dependent) or geographic proximity (direction
independent). They used four different data sets: a set with 601 species of mosses,
461 species of liverworts, 597 species of lichens, and 192 species of pteridophytes.
They found a stronger correlation between floristic similarity and maximum wind
connectivity than between floristic similarity and geographic proximity in mosses,
liverworts and lichens. From their analyses they concluded that wind is the main force
driving current plant distributions in these groups.
Van Zanten (1976; 1978) designed experiments to test for the ability of bryophyte
spores to germinate after being exposed to the same conditions as in a long distance
transport by jet streams. Acrocladium auriculatum was one of the taxa of which the
spores tolerated the experimental conditions of long distance dispersal for only one
year. Based on this result van Zanten (1978) ruled out long distance dispersal as an
option for this species and concluded that Acrocladium auriculatum may consist of
more than one taxon each occurring in different isolated areas.
Taking into account van Zanten’s results (1976; 1978) a long distance dispersal via
jet streams is rather unlikely, however a dispersal event via near-surface winds might
be possible according to the correlation found by Muñoz et al. (2004). However, a
comparison of the observed genetic variation with published values (e.g. Quandt et
al., 2001; Quandt & Stech, 2004; Stech et al., 2002) argues for the establishment of
two clearly separated species, as shown in the phylogenetic analyses. Hence the
large genetic differentiation between the species Acrocladium auriculatum and A.
chlamydophyllum found in the study at hand, indicates an early separation of the two
species, with a common ancestor of the two species on the Gondwana continent.
A possible example for long distance dispersal either in jet streams as tested in van
Zanten (1978) or by near-surface winds (Muñoz et al., 2004) is the occurrence of
Acrocladium along with other bryophytes on Marion Island (Gremmen, 1981; van
Zanten, 1971). As Marion Island was never part of the former Gondwanan landmass,
its recent flora must have different origins. Gremmen (1981) assumed long distance
dispersal by wind to be the most important factor for the establishment of the
cryptogamic flora on this island. The island is only c. 500,000 years old and probably
suffered several glaciation events during the Pleistocene probably destroying most of
the flora at the time (Gremmen, 1981). However, he stated that some of the

6 Molecular circumscription and biogeography of the genus Acrocladium 110
angiosperms were brought in accidentally by seal hunters during the last 300 years.
Therefore, it can not be ruled out that some bryophytes on Marion Island are of
anthropogenic origin, and given the habitat preferences of Acrocladium this scenario
represents a likely option. Unfortunately, no sequence data were obtained from
samples from Marion Island. Thus, the interesting question concerning the origin of
the genus Acrocladium on Marion Island remains unresolved.
7 The ‘Gondwanan connection’ and their genetic patterns in bryophytes 111
7 Molecular evolution, phylogenetics and biogeography of the genus Catagonium (Plagiotheciaceae, Bryopsida)
7.1 Introduction The genus Catagonium consists of four species described by Lin (1984). The plants
have a shiny appearance and the stems have complanate leaf orientation. The plants
form mats mainly on soil in tropical montane forest and temperate rain forests of the
southern hemisphere. On subantarctic islands they also occur in open, subantarctic
vegetation types. The distribution pattern implies an old Gondwanan origin of the
genus.
Within Catagonium nitens (Brid.) Card. two subspecies were described (Lin, 1984).
The subspecies Catagonium nitens (Brid.) Card. ssp. maritimum (Hook.) Lin is
restricted to South Africa, Catagonium nitens (Brid.) Card. ssp. nitens occurs in
eastern Africa, New Zealand, Australia, and southern South America as well as on
some subantarctic islands. There are two varieties of the subspecies nitens
described by Lin (1989), C. nitens (Brid.) Card. ssp. nitens var. myurum (Card. &
Thér.) S.-H. Lin occurring in Chile and C. nitens (Brid.) Card. ssp. nitens var. nitens. If
not stated otherwise in the text “C. nitens ssp. nitens” refers to the variety nitens.
Catagonium nitidum (Hook.f. & Wils.) Broth. is reported from southern South
America, the Falkland Islands and Tristan Da Cunha Island.
Catagonium brevicaudatum C. Müll. ex Broth. is known from Brazil, Bolivia,
Columbia, Costa Rica, Ecuador, Guatemala, Jamaica, Mexico, Peru and Venezuela,
and Catagonium emarginatum S.-H. Lin. from Brazil, Bolivia (Lin, 1984) and Peru
(Lin, 1989).
As Catagonium nitens ssp. nitens is one of the prominent species of the Chilean
temperate rainforest I took special interest in the evolution of this species and the
relationship to its sister taxa. First the molecular conditions within the Catagonium
nitens-group using ITS sequences were investigated in order to obtain the genetic
divergence between Catagonium nitens ssp. nitens from Chile and New Zealand as
well as the genetic divergence of these taxa to Catagonium nitens ssp. maritimum

7 Molecular evolution, phylogenetics and biogeography of the genus Catagonium 112
from South Africa. It was also tried to confirm the taxonomic status of the variety
Catagonium nitens ssp. nitens var. myurum in relation to Catagonium nitens ssp.
nitens var. nitens based on molecular data.
Secondly I aimed at understanding the biogeographical evolution of the genus by
investigating the genetic relationship between the four species Catagonium nitens,
Catagonium brevicaudatum, Catagonium emarginatum, and Catagonium nitidum and
possible related taxa using ITS data sets.
7.1.1 Morphological characterisation The genus Catagonium is characterised by its short creeping primary stem and a
secondary irregularly branched stem. Stems and branches are complanately to
teretely foliate. The plants are yellow-green to brown-green and form dense mats
over rocks and on the forest floor or grow epiphytically on bark. They are small to
medium sized, with branches between 1 and 5 cm in length. The leaves are
appressed on their dorsiventral faces and either erect spreading laterally or erect on
all sides. The costa is short, double or absent. The plants are dioicous.
Catagonium nitens (Brid.) Card. Lin (1984). described Catagonium nitens (Brid.)
Card. as a highly polymorphic species with respect to e.g. plant size, leaf shape, and
foliation. He recognized two subspecies within C. nitens, but stated that he also
found plants with intermediate characters. However, Lin (1984) found that the
morphological characters highly correlated with the geographical distribution of the
two subspecies.
The plants in the subspecies maritimum are between 5.5-10 cm long and generally
teretely foliate. The leaves are between 1.3-2.5 mm wide and concave. The apices of
the leaves are distinctly mucronate. The subspecies is restricted to South Africa.
The subspecies maritimum can be distinguished from the ssp. nitens by the concave,
mucronate leaves and the terete foliation.
The subspecies nitens is very variable in its appearance and has a wider distribution
range than the ssp. maritimum. It occurs in southern South America, some
subantarctic islands, southeastern Africa, Réunion, New Zealand, Australia and New
Guinea.
The plants are between 4-12 cm long and generally complanately foliate. The leaves
are between 2-3 mm wide, strongly conduplicate, cuspidate to acuminate and have a

7 Molecular evolution, phylogenetics and biogeography of the genus Catagonium 113
narrow, long, acute apex. Lin (1984) observed a correlation between plant size, size
and shape of the leaves and latitude in C. nitens ssp. nitens. In subantarctic areas
julaceous or minute plants with small leaves occur, whereas well developed plants
occur in southern South America, southeastern Africa, Réunion, Australia, New
Guinea, and New Zealand. Lin (1984) was also able to correlate these morphological
differences with altitude, i.e. the higher the elevation the smaller the plant.
According to Lin (1984) the type specimen of C. myurum Card. & Thér. (from Punta
Arenas) is characterized by minute, julaceous stems and branches with erect-
spreading, oblong lanceolate and gradually acuminate leaves. In 1989 Lin (1989)
pointed out that ‘intermediates between Catagonium nitens ssp. nitens and C.
myurum can occasionally be found on the same plant'. Because of the similarities of
the two he recognized C. myurum Card. & Thér. as a variety of the subspecies
nitens, C. nitens (Brid.) Card. ssp. nitens var. myurum (Card. & Thér.) S.-H. Lin. It is
separated from Catagonium nitens (Brid.) Card. ssp. nitens var. nitens by terete
branches, concave leaves, the attenuate leaf apex and shorter leaf cells. These
characters of C. nitens ssp. nitens var. myurum in Lin's view (Lin, 1989) might
express adaptations to the environment. Catagonium nitens (Brid.) Card. ssp. nitens
var. nitens, in contrast, is characterized e.g. by the complanate branches and
conduplicate leaves with recurved apices.
Lin (1984) described a close relationship of Catagonium nitens with C.
brevicaudatum based on the abruptly narrowed leave apices appearing in C. nitens
ssp. maritimum as well as in plants of the ssp. nitens from New Guinea and are also
a characteristic feature of C. brevicaudatum. The concave leaves found in C. nitens
and the absence of leaf auricles distinguish this species from C. brevicaudatum (Lin,
1984). Lin also found some plants belonging to the ssp. nitens which resembled C.
nitidum in their long and slender leaf apices. In contrast to C. nitidum, however, the
leaves in C. nitens ssp. nitens are complanate and conduplicate.
Catagonium nitidum (Hook.f. & Wilson) Broth. According to Lin (1984), the plants
of this species are up to 12 cm long, with 2.5-5 cm long branches, growing in dense
mats. Furthermore, they are characterized by julaceous foliation with few slender
branches. The leaves are strongly concave with erect and long-cuspidate apices. In
his investigation Lin (1984) found in some of the specimens dwarf vegetative plants
with long rhizoids on the adaxial surface of the leaves. He states that C. nitidum is

7 Molecular evolution, phylogenetics and biogeography of the genus Catagonium 114
very close to the dwarf forms of C. nitens ssp. nitens from subantarctic islands. Lin
(1984) distinguished the species by the oblong leaves with abruptly long-cuspidate
apices found in C. nitidum.
C. nitidum is found in Argentina, Chile, the Falkland Island, and Tristan da Cunha
Island. It occurs mainly on soil, rarely on bark.
Catagonium brevicaudatum C. Müll. ex Broth. The diagnostic characters of C.
brevicaudatum are the sparse and complanate foliation. The species has ovate-
oblong, distinctly and minutely auriculate, cucullate-concave leaves that are more or
less undulate, rounded to broadly obtuse. The apices of the leaves end in a short and
soft recurved hair (Lin, 1984).
According to Lin (1984), C. brevicaudatum occurs mainly on wet or shaded rocks or
soil in cloud forests at altitudes between 1,700 and 3,930 m. The species was
reported from Brazil, Bolivia, Columbia, Peru, Ecuador, Costa Rica, Guatemala,
Jamaica, and Mexico.
Catagonium emarginatum Lin is distinguishable from its closest relative C.
brevicaudatum by its emarginated leaf apices with recurved soft short hairs at the
terminal end of the leaves. The species was so far only reported from Brazil, Peru
and Bolivia.
Catagonium emarginatum occurs on soil at altitudes between 2,200 m (Brazil) and
3,900 m (Bolivia).
The systematic position of Catagonium. The genus Catagonium had been placed
either in or near the Plagiotheciaceae (Brotherus, 1925c; Fleischer, 1923b; Lin, 1984)
or Phyllogoniaceae (Vitt, 1984), before Buck & Ireland (1985) revised the
Plagiotheciaceae and transferred the genus Catagonium in the monotypic family
Catagoniaceae. Recently, based on cpDNA sequences and morphological data,
Pedersen & Hedenäs (2002) transferred the genus back to the Plagiotheciaceae.

7 Molecular evolution, phylogenetics and biogeography of the genus Catagonium 115
7.2 Material & Methods
Plant material. Plant material was either collected by the author during a field trip of
the BryoAustral project to Chile in 2001, or originates from herbarium specimens. The
specimen of Catagonium nitens ssp. nitens var. myurum was kindly provided by Dr.
Friederike Schaumann (Freie Universität Berlin) and a specimen of C. nitidum was
kindly provided by Dr. Frank Müller (Technische Universität Dresden). Specimens of
Acrocladium chlamydophyllum, Lepyrodon pseudolagurus, and Catagonium nitens
were collected during the BryoAustral project expedition to New Zealand in 1998.
Duplicates are preserved in the herbaria in Christchurch (CHR), Bonn (BONN) and
Berlin (B). Sequences available in GenBank were also used. All specimens used in
the analyses are listed in Appendix 15 including further voucher information.
The study included 20 specimens of all four Catagonium species described as
belonging to the genus including representatives of the two subspecies of C. nitens
(Lin, 1984). Each of the taxa was represented by at least one specimen. The
selection comprises four specimens of Catagonium brevicaudatum C. Müll. ex Broth.
from Venezuela and Columbia and three specimens of Catagonium emarginatum Lin
originating from Brazil, Bolivia, and Peru. Taking into account the wide geographical
range and morphological variation of Catagonium nitens (Brid.) Card. several
specimens of this species were selected. The subspecies Catagonium nitens (Brid.)
Card. ssp. maritimum (Hook.) Lin was represented by three specimens from South
Africa. The specimens of Catagonium nitens (Brid.) Card. ssp. nitens came from
Australia, Tanzania (2x), New Zealand and from Chile (four specimens) including the
variety Catagonium nitens (Brid.) Card. ssp. nitens var. myurum (Card. & Thér.) Lin.
The specimens of the fourth species, Catagonium nitidum (Hook.f. & Wilson) Broth.,
originated from Tierra de Fuego, the Falkland Islands and from southern Chile. The
geographical origin of the specimens of Catagonium successfully sequenced is
shown in figure 17 on a global scale and in figure 18 (South America), figuren 19
(Africa) and figure 20 (New Zealand) on a regional scale.
We selected the two species Lepyrodon pseudolagurus and L. tomentosus as
outgroup for the analysis and also included six species representing the family
Plagiotheciaceae as the closest relatives of Catagonium described in Pedersen &
Hedenäs (2002). The specimen selection within the genus Catagonium was based

7 Molecular evolution, phylogenetics and biogeography of the genus Catagonium 116
on the principle of different morphological expressions of a species as well as wide
spanning geographical derivation. Unfortunately, I was not able to gather enough
DNA from all of the specimens for successful PCR and successive sequencing.
Figure 17: Geographical origin of all Catagonium specimens used for this study. Numbers are specimen numbers.

7 Molecular evolution, phylogenetics and biogeography of the genus Catagonium 117
Figure 18: Geographical origin of the Catagonium specimens from South America used for this study. Numbers in brackets are specimen numbers.
Figure 19: Geographical origin of the Catagonium specimens from South Africa used for this study. Numbers in brackets are specimen numbers.
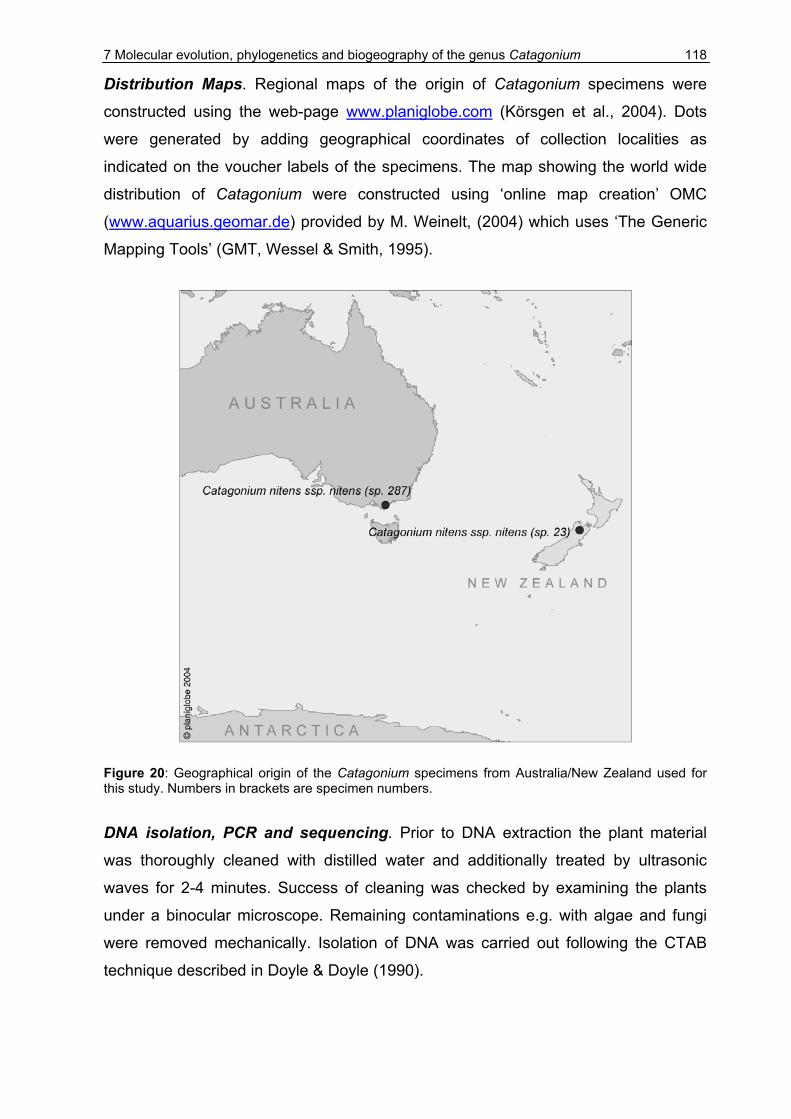
7 Molecular evolution, phylogenetics and biogeography of the genus Catagonium 118
Distribution Maps. Regional maps of the origin of Catagonium specimens were
constructed using the web-page www.planiglobe.com (Körsgen et al., 2004). Dots
were generated by adding geographical coordinates of collection localities as
indicated on the voucher labels of the specimens. The map showing the world wide
distribution of Catagonium were constructed using ‘online map creation’ OMC
(www.aquarius.geomar.de) provided by M. Weinelt, (2004) which uses ‘The Generic
Mapping Tools’ (GMT, Wessel & Smith, 1995).
Figure 20: Geographical origin of the Catagonium specimens from Australia/New Zealand used for this study. Numbers in brackets are specimen numbers.
DNA isolation, PCR and sequencing. Prior to DNA extraction the plant material
was thoroughly cleaned with distilled water and additionally treated by ultrasonic
waves for 2-4 minutes. Success of cleaning was checked by examining the plants
under a binocular microscope. Remaining contaminations e.g. with algae and fungi
were removed mechanically. Isolation of DNA was carried out following the CTAB
technique described in Doyle & Doyle (1990).

7 Molecular evolution, phylogenetics and biogeography of the genus Catagonium 119
PCR amplifications (Biometra TriBlock thermocycler, PTC-100 MJ Research) were
performed in 50 µl–reactions containing 1.5 U Taq DNA polymerase (PeqLab), 1 mM
dNTPs-Mix, nucleotide concentration 0.25 mM each (PeqLab), 1x buffer (PeqLab),
1.5 mM MgCl2 (PeqLab) and 12.5 pmol of each amplification primer. PCR products
were purified using the QIAquick purification kit (Qiagen). Cycle sequencing reactions
(half reactions) were performed using a PTC-100 Thermocycler (MJ Research) in
combination with the ABI PrismTM Big Dye Terminator Cycle Sequencing Ready
Reaction Kit with Amplitaq-DNA polymerase FS (Perkin Elmer), applying a standard
protocol for all reactions. Extension products were precipitated with 40 µl 75 % (v/v)
isopropanol for 15 min at room temperature, centrifuged with 15,000 rpm at 25°C,
and washed with 250 µl of 75 % (v/v) isopropanol. These purified products were
loaded on an ABI 310 automated sequencer (Perkin Elmer) and electrophoresed. For
cycle sequencing 10 µl–reactions were used containing 3 µl of Big Dye Terminator
Cycle Sequencing premix. Sequencing reactions were performed on two
independent PCR products generated from each sample in order to verify the results.
All PCR products were sequenced using two primers.
Primers for amplifying and sequencing the ITS region (ITS4-bryo and ITS5-bryo)
based upon the primers “ITS4” and “ITS5” respectively, designed and named by
White et al.(1990), were slightly modified with respect to bryophytes (Stech, 1999).
The primers ITS-C and ITS-D (Blattner, 1999) were modified for this study (ITS-
D_bryo and ITS-C_bryo) and additionally used for sequencing reactions (table 28).
Table 28: Primer sequences used for amplification and sequencing of the ITS region. Underlined nucleotides represent changes with respect to the original primers of Blattner (1999). Primer Sequence Data source ITS-C bryo GCA ATT CAC ACT ACG TAT CGC Blattner 1999 ITS-D bryo CTC TCA GCA ACG GAT ATC TTG Blattner 1999 ITS4-bryo TCC TCC GCT TAG TGA TAT GC Stech 1999 ITS5-bryo GGA AGG AGA AGT CGT AAC AAG G Stech 1999
The ITS region was amplified using a protocol consisting of: 5 min. 94ºC, 35 cycles (1
min. 94ºC, 1 min. 48ºC, 1 min. 72ºC) and a 5 min. 72ºC extension time, cycle
sequencing settings: 25 cycles (30 sec. 96ºC, 15 sec. 50ºC, 4 min. 60ºC). All
sequences will be deposited in EMBL, accession numbers are listed in table 29, the
alignments are available from the author on request.
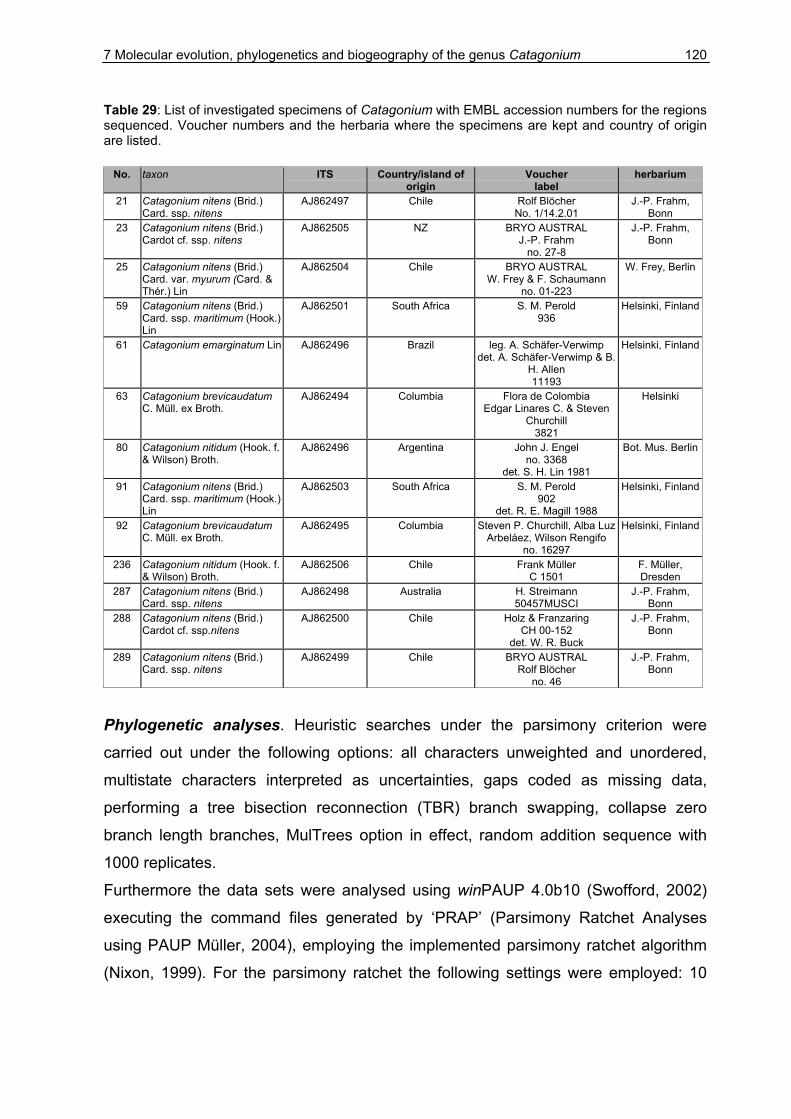
7 Molecular evolution, phylogenetics and biogeography of the genus Catagonium 120
Table 29: List of investigated specimens of Catagonium with EMBL accession numbers for the regions sequenced. Voucher numbers and the herbaria where the specimens are kept and country of origin are listed.
No. taxon ITS Country/island of origin
Voucher label
herbarium
21 Catagonium nitens (Brid.) Card. ssp. nitens
AJ862497 Chile Rolf Blöcher No. 1/14.2.01
J.-P. Frahm, Bonn
23 Catagonium nitens (Brid.) Cardot cf. ssp. nitens
AJ862505 NZ BRYO AUSTRAL J.-P. Frahm
no. 27-8
J.-P. Frahm, Bonn
25 Catagonium nitens (Brid.) Card. var. myurum (Card. & Thér.) Lin
AJ862504 Chile BRYO AUSTRAL W. Frey & F. Schaumann
no. 01-223
W. Frey, Berlin
59 Catagonium nitens (Brid.) Card. ssp. maritimum (Hook.) Lin
AJ862501 South Africa S. M. Perold 936
Helsinki, Finland
61 Catagonium emarginatum Lin AJ862496 Brazil leg. A. Schäfer-Verwimp det. A. Schäfer-Verwimp & B.
H. Allen 11193
Helsinki, Finland
63 Catagonium brevicaudatum C. Müll. ex Broth.
AJ862494 Columbia Flora de Colombia Edgar Linares C. & Steven
Churchill 3821
Helsinki
80 Catagonium nitidum (Hook. f. & Wilson) Broth.
AJ862496
Argentina John J. Engel no. 3368
det. S. H. Lin 1981
Bot. Mus. Berlin
91 Catagonium nitens (Brid.) Card. ssp. maritimum (Hook.) Lin
AJ862503 South Africa S. M. Perold 902
det. R. E. Magill 1988
Helsinki, Finland
92 Catagonium brevicaudatum C. Müll. ex Broth.
AJ862495 Columbia Steven P. Churchill, Alba Luz Arbeláez, Wilson Rengifo
no. 16297
Helsinki, Finland
236 Catagonium nitidum (Hook. f. & Wilson) Broth.
AJ862506 Chile Frank Müller C 1501
F. Müller, Dresden
287 Catagonium nitens (Brid.) Card. ssp. nitens
AJ862498 Australia H. Streimann 50457MUSCI
J.-P. Frahm, Bonn
288 Catagonium nitens (Brid.) Cardot cf. ssp.nitens
AJ862500 Chile Holz & Franzaring CH 00-152
det. W. R. Buck
J.-P. Frahm, Bonn
289 Catagonium nitens (Brid.) Card. ssp. nitens
AJ862499 Chile BRYO AUSTRAL Rolf Blöcher
no. 46
J.-P. Frahm, Bonn
Phylogenetic analyses. Heuristic searches under the parsimony criterion were
carried out under the following options: all characters unweighted and unordered,
multistate characters interpreted as uncertainties, gaps coded as missing data,
performing a tree bisection reconnection (TBR) branch swapping, collapse zero
branch length branches, MulTrees option in effect, random addition sequence with
1000 replicates.
Furthermore the data sets were analysed using winPAUP 4.0b10 (Swofford, 2002)
executing the command files generated by ‘PRAP’ (Parsimony Ratchet Analyses
using PAUP Müller, 2004), employing the implemented parsimony ratchet algorithm
(Nixon, 1999). For the parsimony ratchet the following settings were employed: 10

7 Molecular evolution, phylogenetics and biogeography of the genus Catagonium 121
random addition cycles of 200 iterations each with a 40 % upweighting of the
characters in the PRAP iterations. Heuristic bootstrap (BS Felsenstein, 1985)
searches under parsimony criterion were performed with 1000 replicates, 10 random
addition cycles per bootstrap replicate and the same options in effect as the heuristic
search for the most parsimonious tree (MPT). The consistency index (CI, Kluge &
Farris, 1969), retention index (RI), and rescaled consistency index (RC, Farris, 1989)
were calculated to assess homoplasy.
Maximum Likelihood analyses were executed assuming a general time reversible
model (GTR+G+I), and a rate variation among sites following a gamma distribution
(four categories represented by the mean), with the shape being estimated and the
molecular clock not enforced. According to Akaike Information Criterion (AIC, Akaike,
1974) GTR+G+I was chosen as the model that best fits the data by Modeltest v3.06
(Posada & Crandall, 1998), employing the windows front-end (Patti, 2002). The
proposed settings by Modeltest v3.06 (table 30) were executed in winPAUP 4.0b10.
Table 30: Substitution models selected for the ITS data set Catagonium data set and 8 outgroup taxa.
ITS data set Model selected GTR+I -lnL = 1921.4596 Substitution model R(a) [A-C] = 1.0000
R(b) [A-G] = 2.3445 R(c) [A-T] = 0.4343 R(d) [C-G] = 0.8075 R(e) [C-T] = 2.3445 R(f) [G-T] = 1.0000
Among-site rate variation Proportion of invariable sites (I) 0.8075 Variable sites (G, Gamma distribution shape parameter)
equal rates for all sites
In addition to the MP analyses Bayesian Inferences with MrBayes3.0 (Huelsenbeck &
Ronquist, 2001) were performed. Modeltest 3.5 (Posada, 2004) was used to select
DNA substitution models for the data set (gamma shape distribution, six substitution
types). The Markov Chain Monte Carlo (MCMC) analyses were run for 1,000,000
generations with four simultaneous MCMCs and one tree per 100 generations was
saved. The ‘burn-in’ values were determined empirically from the likelihood values.
The analyses were repeated three times to assure sufficient mixing by confirming that
the program converged to the same posterior probability (PP).

7 Molecular evolution, phylogenetics and biogeography of the genus Catagonium 122
The program Treegraph (Müller & Müller, 2004) was used to edit trees directly from
PAUP-treefiles.
MEGA2.1 (Kumar et al., 2001) was used to calculate sequence length and distance
measure (‘p-distance’). In the following the term ‘genetic distance’ is used besides
the term ‘p-distance’.
7.3 Results
7.3.1 Phylogenetic results.
The results of the Maximum Likelihood (ML) analysis are presented in figure 21 as a
phylogram where branch lengths are proportional to the number of substitutions per
site. The data set consists of 21 taxa. Thirteen taxa of Catagonium were successfully
sequenced and used in the analysis. Eight taxa were used as outgroup taxa, six of
them belong to the same family as Catagonium, the Plagiotheciaceae (Pedersen &
Hedenäs, 2002). Additionally, two species of the genus Lepyrodon
(Lepyrodontaceae) were chosen as phylogenetically more distant outgroup taxa.
The eight outgroup taxa are well separated from the monophyletic clade of
Catagonium (fig. 21). The most basal clade within the genus Catagonium consists of
two taxa, C. emarginatum and C. brevicaudatum, which occur in northern South
America and Brazil, here referred to as the ‘Northern South America’ clade. This
clade is sister to a clade consisting of the representatives of Catagonium nitidum and
two subspecies and one variety of C. nitens.
Within this clade the specimens of C. nitens ssp. maritimum from South Africa (sp.
51, 91) are the first to branch off. The specimens of this subspecies form the ‘South
African’ clade. The long branch leading to these two specimens indicates a higher
substitution rate compared to the following species (fig. 22).

7 Molecular evolution, phylogenetics and biogeography of the genus Catagonium 123
Figure 21: Maximum Likelihood (ML) cladogram of the ITS sequence data (L score = -1921.4596) of thirteen specimens of the genus Catagonium and two outgroup taxa. Bootstrap support values shown above branches result from a Maximum Parsimony analysis. For explanation of the clades referred to as ‘outgroup’, H, and A see text. Plagioth.*: Plagiotheciaceae sensu Pedersen & Hedenäs 2002.

7 Molecular evolution, phylogenetics and biogeography of the genus Catagonium 124
The following monophyletic group consists of three clades, the 'Valdivian' clade, the
'Australia/New Zealand' clade and the 'myurum' clade. The ‘Valdivian’ clade consists
of two specimens of C. nitens ssp. nitens from Chile, one specimen from the
Araucanian region (sp. 288), the second specimen from the Los Lagos region (sp.
289). The ‘Australia/New Zealand' clade consists of C. nitens ssp. nitens from
Australia (sp. 287) and a second specimen from New Zealand (sp. 23). The 'myurum'
clade consists of four specimens with an ambiguous relationship. It comprises two
specimens of C. nitens ssp. nitens (sp. 21, 25), including the variety ‘myurum‘
collected in the Araucanian region (sp. 25), and two specimens of C. nitidum (sp. 80,
236).
The Bayesian analysis (fig. 23) supports the monophyletic status of the genus
Catagonium with 94 % posterior probability (PP). The ‘Northern South America’ clade
is supported with 100 % PP, as well as the clade of the specimens of Catagonium
nitens ssp. maritimum (‘South African’ clade).
In contrast to the ML analysis, the specimen of C. nitidum (sp. 80) from the Falkland
Islands is the next taxon branching off. The following clade, supported with 91 % PP,
consists of two specimens of C. nitens ssp. nitens from Chile, one specimen from the
Araucanian region (sp. 288), the other from the Los Lagos region (sp. 289). The
monophyly of the ‘Australian/New Zealand’ clade of C. nitens ssp. nitens is supported
with 97 % PP. In contrast to the ML analyses the Bayesian Inference analyses
resolved a clade consisting of C. nitens ssp. nitens from the Magallanes region (sp.
21), C. nitens ssp. nitens var. myurum (sp. 25) from the Araucanian and C. nitidum
(sp. 236) from the Magallanes region. The specimen C. nitidum (sp. 80) from the
Falkland Islands is clearly separated from this monophyletic group. In contrast to the
other specimen of C. nitidum, specimen 80 from the Falkland Islands has a solitary
basal position within the entire C. nitens clade.
Maximum Parsimony analyses resulted in a polytomy of five clades within the genus
Catagonium (figure not shown). These clades were also resolved in a subsequent
bootstrap analysis (fig. 21). The first clade consists of the ‘Northern South America’
clade (compare fig. 21-23) with 90 % bootstrap support (BS). In this clade the
monophyly of the two specimens of C. brevicaudatum was weakly supported with

7 Molecular evolution, phylogenetics and biogeography of the genus Catagonium 125
Figure 22: Maximum Likelihood (ML) phylogram of the ITS sequence data (L score = -1921.4596) of thirteen specimens of the genus Catagonium and two outgroup taxa. Branch lengths are proportional to genetic distance between taxa. Scale bar equals 1% distance under the assumed substitution model (GTR+I).

7 Molecular evolution, phylogenetics and biogeography of the genus Catagonium 126
Figure 23: Cladogram resulting from a Bayesian Inference analysis of the ITS sequence data of thirteen specimens of the genus Catagonium and two outgroup taxa. Numbers above branches indicate the posterior probabilities as a percentage value. For explanation of the clades referred to as ‘outgroup’, ‘Northern South America’, ‘South African’, ‘Valdivian’, ‘nitidum’ and ‘Australia/New Zealand see text. Plagioth.*: Plagiotheciaceae sensu Pedersen & Hedenäs 2002.

7 Molecular evolution, phylogenetics and biogeography of the genus Catagonium 127
60 %. The second clade consists of the two specimens of C. nitens ssp. maritimum
(100 % BS). The ‘Valdivian’ clade, and the ‘New Zealand/Australia’ clade are
supported with 70 % BS each. A monophyletic group of C. nitens sp. 21, C. nitidum
sp. 236 and C. nitens var. myurum is weakly supported with 58 % BS. The
relationship of C. nitidum from the Falkland Islands to all these previously described
clades remains ambiguous.
Both analyses resulted in the following clades with high branch support:
The basal position of the ‘Northern South America’ clade was found with ML analyses
and with high support from Bayesian Inference (100 %) as well as bootstrap support
(90 %).
The position of the clade of C. nitens ssp. maritimum from South Africa, following the
‘Northern South America’ clade in the cladograms and the phylogram (fig. 21-23),
and as a sister group to a clade consisting of C. nitens and C. nitidum, has a
posterior probability of 71 %.
The monophyly of the specimens of C. nitens ssp. nitens from Australia/New Zealand
(sp. 23, 287) is supported with 97 % PP and the ‘Valdivian’ clade (sp. 288, 289) with
91 %. Each of the two clades is further supported with a bootstrap value of 70 %.
In this study the ITS region of 13 specimens of Catagonium was successfully
sequenced. For specimen 80 (Catagonium nitidum) only the ITS 1 and part of the
5.8S rRNA were obtained. For the other specimen of C. nitidum (sp. 236), however,
the full data set is available. ITS sequences of the specimens of Acrocladium,
Lepyrodon and Herzogiella seligeri were taken from the results described in chapters
4-6. The ITS sequence data for Plagiothecium undulatum, P. denticulatum and
Isopterygiopsis muelleriana were extracted from GenBank (table 29). The statistical
data on the obtained sequences are depicted in table 31 for ITS1, 5.8S rRNA, and
ITS2 sequences.
The observed sequence length of ITS1 within the genus Catagonium ranged
between 248 basepairs (bp) for Catagonium nitens ssp. nitens (specimen 21) and
252 bp in Catagonium nitens var. myurum (sp. 25), Catagonium nitidum (sp. 236),
and Catagonium brevicaudatum (sp. 63). The length of the ITS1 region was on
average 250.3 bp with a standard deviation of 1.4 for the thirteen specimens of
Catagonium. For the complete data set consisting of 21 taxa the average length of

7 Molecular evolution, phylogenetics and biogeography of the genus Catagonium 128
Table 31: Sequence lengths [base pairs, bp] and GC-content [%] for the ITS region of thirteen Catagonium specimens and eight outgroup taxa. Average sequence lengths and standard deviations are given for the data set with 21 species. Average sequence lengths and standard deviations are also given for the thirteen species separately (‘Average Cat.’). For origin of the data refer tab. xz. Abbreviations: A.: Acrocladium; C.: Catagonium; n. d. = no data available. (* partial sequences were excluded when determining the average sequence length)
Total sequence length[%]
ITS1 G/C content
ITS1
Total sequence length[%]
5.8SG/C content
5.8S
Total sequence length[%]
ITS2G/C content
ITS2Lepyrodon pseudolagurus (sp.67) 249 64.6 160.0 64.6 264.0 65.9Lepyrodon tomentosus (sp.64) 246 63.4 159.0 63.4 266.0 65.4A. chlamydophyllum (sp.12) 255 62.7 160.0 62.7 236.0 63.6
A. auriculatum (sp.78) 255 64.3 160.0 64.3 239.0 64.5Plagiothecium undulatum 240 62.9 n.d. n.d. 183.0 63.4
Plagiothecium denticulatum 248 62.5 94.0 62.5 258.0 64.4
Isopterygiopsis muelleriana 248 64.9 160.0 64.9 262.0 64.9
Herzogiella seligeri 244 62.3 160.0 62.3 262.0 62.2
C. brevicaudatum (sp. 92) 252 65.1 160.0 65.1 292.0 65.4
C. brevicaudatum (sp. 63) 252 65.1 160.0 65.1 292.0 65.4
C. emarginatum (sp. 61) 249 64.2 160.0 64.2 292.0 65.7
C. nitens (sp. 91) 249 64.6 160.0 64.6 303.0 65.3
C. nitens (sp. 59) 249 64.6 160.0 64.6 303.0 65.3
C. nitens (sp. 289) 250 64.0 160.0 64.0 299.0 65.9
C. nitens (sp. 21) 248 62.9 160.0 62.9 300.0 66.0
C. nitens (sp. 288) 250 64.0 160.0 64.0 300.0 66.0
C. nitens (sp. 287) 251 63.4 160.0 63.4 299.0 67.5
C. nitens (sp. 23) 249 63.4 160.0 63.4 299.0 67.2
C. nitens (sp. 25) 252 62.7 160.0 62.7 301.0 66.2
C. nitidum (sp. 236) 252 63.1 160.0 63.1 302.0 66.3
C. nitidum (sp. 80) 251 62.6 79.0 62.6 n.d. n.d.
Average 249.5 63.7 159.9 49.7 277.6 65.3
SD 3.4 0.9 0.2 1.9 31.4 1.3
Average Cat. 250.3 63.8 160.0 50.0 298.5 66.0
SD Cat. 1.4 0.9 0.0 0.0 4.2 0.7
the ITS1 region was 249.5 bp with a standard deviation of 3.4. For Plagiothecium
undulatum from GenBank only part of the ITS1 sequence was available.
The GC-content of the thirteen specimens of Catagonium ranged between 62.6 % in
Catagonium nitidum (sp. 80) and 65.1 % observed in both specimens of Catagonium
brevicaudatum (sp. 63, 92). The average GC-content in the data set was 63.8 %
(standard deviation 1.2). For the complete data set (21 taxa) the average GC-content
in the ITS1 was 63.7 % (standard deviation 0.9).

7 Molecular evolution, phylogenetics and biogeography of the genus Catagonium 129
The observed size of the sequence length of ITS2 within the genus Catagonium
ranged between 292 basepairs (bp) for Catagonium brevicaudatum (sp. 63, 92) and
Catagonium emarginatum (sp. 61) and 303 bp found in Catagonium nitens ssp.
maritimum (sp. 59, 91). The obtained length for the ITS2 region was on average
298.5 bp with a standard deviation of 4.2 for the thirteen specimens of Catagonium.
For the data set consisting of 20 taxa the average length of the ITS2 was 277.6 bp
with a standard deviation of 31.4. For Plagiothecium undulatum from GenBank only
part of the ITS2 sequence was available.
The GC-content of the thirteen specimens of Catagonium was between 65.4 % in
Catagonium brevicaudatum (sp. 63, 92) and 67.5 % observed in the specimens of
Catagonium nitens ssp. nitens from Australia (sp. 288). The average GC-content in
the data set was 66.0 % (standard deviation 0.7). For the complete data set (20 taxa)
the average GC-content in the ITS2 was 65.3 % (standard deviation 1.3).
Table 32 presents the information for the different regions in the alignment. The
complete data set of the entire ITS region of 21 taxa revealed a variability of 11.2 %
in 805 aligned positions (basepairs). Within the thirteen specimens of Catagonium,
the intrageneric variability was 4.8 %.
Table 32: Number of taxa, total number of aligned characters; variable characters and number of parsimony informative sites and %-value of variable sites for the partial data sets of Catagonium. (* Including the outgroup taxa).
Data set Number of taxa included
Total number of aligned
characters [bp]
Variable characters
[bp]
parsimony informative
[bp]
Variable sites[%]
ITS 21* 805 90 61 11.2ITS 13 805 39 25 4.8
ITS1 21* 273 40 23 14.7ITS1 13 273 15 8 5.55.8S 21* 160 1 1 0.65.8S 13 160 1 1 0.6ITS2 21* 371 49 38 13.2ITS2 13 371 23 17 6.2
The highest proportion of variable sites was found in the ITS1 region where 14.7 % of
the 273 aligned positions (basepairs) were variable in the data set including the
outgroup (intrageneric variability of Catagonium 5.5 %). The ITS2 region is less
variable than ITS1, bearing only 13.2 % variable positions within 371 aligned

7 Molecular evolution, phylogenetics and biogeography of the genus Catagonium 130
basepairs, but offers a higher degree of intrageneric variability of 6.2 % within the
genus Catagonium.
7.3.2 Indel matrix Table 33 lists a summary of the specific indels supporting single clades in the genus
Catagonium. 21 indels were recognized in the ITS region. Six were found in the ITS1
and fifteen in the ITS2 region. The length of these indels ranged from one to four
nucleotides. Fifteen indels were uniquely found in certain clades and can therefore
be interpreted as synapomorphies of these clades (figure 21 & 23).
Table 33: Indelmatrix for the ITS1 and ITS2 data set of thirteen specimens of Catagonium. Indels I to VI were found in the ITS1 region, Indels VII were found in the ITS2 region. Abbreviations: C.=Catagonium, brev.=brevicaudatum, emargin.=emarginatum. Indel no./ Species I II III IV V VI VII VIII IX X XI XII XIII XIV XV XVI
C. brevicaud .(sp. 92) CC TCG CTTT
C. brevicaud. (sp. 63) CC TCG CTTT
C. emargin. (sp. 61) CC TCG CTTT
C. nitens (sp. 91) CA GT A AGT CTTT GC CGTT GC
C. nitens (sp. 59) CA GT A AGT CTTT GC CGTT GC
C. nitens (sp. 289) GC CGTT GC G GC C T T
C. nitens (sp. 21) GC CGTT GC G GC C T T
C. nitens (sp. 288) GC CGTT GC G GC C T T
C. nitens (sp. 287) GC CGTT GC G GC C T T
C. nitens (sp. 23) GC CGTT GC G GC C T T
C. nitens (sp. 25) GC CGTT GC G GC C T T AAT
C. nitidum (sp. 236) GC CGTT GC G GC C T T AAT
C. nitidum (sp. 80) NN NNNN NN G NN N N N AAT
Two indels, with two and three nucleotides in length, respectively (I, II, table 33) are
found as synapomorphies of the three specimens from Brazil/northern South
America, C. brevicaudatum and C. emarginatum (sp. 61, 63, 92) investigated in this
study. Four indels (III-VI) are synapomorphic in the specimens of Catagonium nitens
ssp. maritimum from South Africa (sp. 91, 51). One indel (VII) with four nucleotides in
length is shared between the species from Brazil/northern South America (sp. 61, 63,
92) and South Africa (sp. 91, 51). Three indels (VIII-X, table 33) are synapomorphic
to the specimens of Catagonium nitens ssp. maritimum (sp. 91, 51) and those of
Catagonium nitens (sp. 21, 23, 25, 287, 288, 289) from southern South America,
Australia and New Zealand as well as Catagonium nitidum (sp. 80, 236) from the
Falkland Islands and from Chile. The lengths of these three indels are two and four

7 Molecular evolution, phylogenetics and biogeography of the genus Catagonium 131
nucleotides, respectively. Five indels (XI-XV), 1-2 nucleotides in length, are
synapomorphies for eight specimens comprising Catagonium nitens from southern
South America, Australia and New Zealand (sp. 21, 23, 25, 287, 288, 289) and
Catagonium nitidum from the Falkland Islands and Chile (sp. 80, 236). Another indel
(XVI) comprising 3 bp is syapomorphic to the clade 'myurum' in figure 23 comprising
Catagonium nitens (sp. 21) from southern Chile, C. nitens ssp. nitens var. myurum
(sp. 25) and a specimen of C. nitidum (sp. 236) from southern Chile.
7.3.3 Genetic distances
Genetic distance revealed by ITS1 sequence data. Results of the pairwise
distance comparison (model: ‘p-distance’) with MEGA (Kumar et al., 2001) are
depicted in appendix 16 for the ITS1 region and in appendix 17 for ITS2.
The average genetic distance in the data of the ITS1 region for 21 specimens is
3.4 % (standard error 0.6). The average genetic distance of the thirteen specimens of
the genus Catagonium is 1.6 % (standard error 0.5).
The highest genetic distances in the ITS1 were obtained separating Herzogiella
seligeri from Lepyrodon tomentosus (7.4 %) and representative species of the
Plagiotheciaceae (e.g. 7.4 % to Acrocladium auriculatum, 6.6 % to Isopterygiopsis
muelleri, 5.4 % to Plagiothecium denticulatum). Low values in the outgroup taxa
comprising the genus Lepyrodon and representatives of the Plagiotheciaceae were
obtained when comparing intrageneric distances. The genetic distance separating
the two species of Acrocladium is 1.6 %, Lepyrodon pseudolagurus and L.
tomentosus are separated by 1.6 % difference in substitutions, and between the two
species of Plagiothecium the difference is 0.8 %.
Genetic distance of Catagonium to the outgroup taxa. The genetic distance of
Catagonium to Acrocladium is between 2.4 % in Catagonium nitens ssp. nitens (sp.
21) and 6.1 % in Catagonium nitens ssp. maritimum (sp. 59, 91). The distance to
Acrocladium is between 4.1 % in Catagonium nitens ssp. nitens (sp. 21) and 6.9 % in
Catagonium nitens ssp. maritimum (sp. 59, 91). Catagonium nitens (sp. 288, 289)
and Catagonium nitidum (sp. 236) show the lowest genetic distance to the genus
Plagiothecium with 2.5 % each, and C. brevicaudatum (sp. 63, 92) the highest with
4.3 % each.

7 Molecular evolution, phylogenetics and biogeography of the genus Catagonium 132
Genetic distance to Isopterygiopsis muelleriana is lowest (2.4 %) in Catagonium
nitens (sp. 288, 289) and Catagonium nitidum (sp. 236). The greatest distance was
observed in relation to Catagonium nitens ssp. maritimum (sp. 59, 91) with 4.0 %.
The genetic distance of the species Herzogiella seligeri to Catagonium ranged
between 4.1 % (Catagonium nitens, sp. 288, 289 and Catagonium nitidum, sp. 236)
and 5.3 % (Catagonium emarginatum, sp. 61).
Genetic distances within the genus Catagonium
Catagonium brevicaudatum and C. emarginatum. The genetic distance between
C. brevicaudatum (sp. 63, 92) from Columbia and C. emarginatum from Brazil (sp.
61) is 0.4 %. There is no genetic difference between the two specimens of C.
brevicaudatum, i.e. between specimens 63 and 92.
The genetic distance of the ‘Northern South America’ species to C. nitens ssp. nitens
is between 1.2 (C. emarginatum) and 1.6 % (C. brevicaudatum) for the specimens of
C. nitens ssp. nitens from Chile and Australia (sp. 21, 288, 287, 289). The specimen
of C. nitens ssp. nitens from New Zealand (sp. 23) and the variety ‘myurum’ from
Chile (sp. 25) have a distance of 1.6 % (to C. emarginatum) and 2.0 % (to C.
brevicaudatum) to the ‘Northern South America’ species.
The two specimens of C. nitidum show different distances to the ‘Northern South
America’ species. C. nitidum from the Torres del Paine National Park shows the
same distance to C. emarginatum (1.2 %) and to C. brevicaudatum (1.6 %) as most
of the specimens of C. nitens ssp. nitens whereas C. nitidum from the Falkland
Islands (sp. 80) shows a higher distance with 2.0 and 2.4 % to C. emarginatum and
C. brevicaudatum, respectively.
The genetic distances between the ‘Northern South America’ specimens (C.
brevicaudatum, sp. 63, 92 and C. emarginatum, sp. 61) and the South African
specimens of Catagonium nitens ssp. maritimum (sp. 59, 91) is between 2.8 % (C.
brevicaudatum) and 3.2 % (C. emarginatum).
Catagonium nitens ssp. maritimum. Both specimens of C. nitens ssp. maritimum
were identical, whereas the genetic distance of the South African specimens of
Catagonium nitens ssp. maritimum to C. nitens ssp. nitens ranges from 2.0 % to
3.2 %.
7 Molecular evolution, phylogenetics and biogeography of the genus Catagonium 133
The distance of Catagonium nitens ssp. maritimum is lowest to the specimens 288
and 289 of C. nitens ssp. nitens from the Chilean Los Lagos and Araucanian region,
intermediate to the variety ‘myurum’ of C. nitens from Chile (sp. 25) with 2.4 %, to the
Australian specimen (sp. 287) and to the southern Chilean specimen (sp. 21). The
genetic distance is highest to the specimen from New Zealand (sp. 23) with 3.2 %.
The two specimens of C. nitidum show different distances to the South African
specimens. C. nitidum from the Torres del Paine National Park shows the same
distance to Catagonium nitens ssp. maritimum (2.0 %) as the specimens 288 and
299 of C. nitens ssp. nitens, whereas C. nitidum from the Falkland Islands (sp. 80)
shows a higher distance of 2.9 % to Catagonium nitens ssp. maritimum (sp. 59, 91).
Distances between the specimens of Catagonium nitens ssp. nitens. No
mutations were detected between the specimens of C. nitens ssp. nitens from the
Chilean Los Lagos and the Araucanian region, sp. 288 and 289, respectively. These
specimens showed a genetic distance of 0.8 % to specimen 21 from Punta Arenas
(Chile). The genetic distance of the C. nitens ssp. nitens specimens from Chile (sp.
21, 288, 289) showed a distance of 0.8 % to the specimen from Australia (sp. 287),
and a distance of 1.2 % to the specimen from New Zealand (sp. 23). The genetic
distance of C. nitens ssp. nitens var. myurum from the Araucanian region to the
specimens of C. nitens ssp. nitens var. nitens from Los Lagos and the Araucanian
region was 0.4 %. The distance of this variety is 1.2 % to the subspecies nitens from
Australia and that of Punta Arenas.
Catagonium nitidum. Catagonium nitidum (sp. 236) from the Torres del Paine
National Park and Catagonium nitidum (sp. 80) from the Falkland Islands show a
distance of 0.8 %.
There was no genetic distance (0.000 %) detected between specimen 236 of C.
nitidum and the specimens of C. nitens ssp. nitens from the Chilean Los Lagos and
Araucanian region. It is separated by a distance of 1.2 % from C. nitens ssp. nitens
from New Zealand (sp. 23).
The specimen from the Falkland Islands (sp. 80) shows highest distances to the
specimens of C. nitens from New Zealand (2.0 %) and Australia (1.6). The distance
of sp. 80 to the specimen of C. nitens from Punta Arenas (sp. 21) is 1.6 %. The

7 Molecular evolution, phylogenetics and biogeography of the genus Catagonium 134
distance to C. nitens ssp. nitens from the Chilean Los Lagos and Araucanian region
is 0.8 %.
Genetic distance as determined from ITS2 sequence data The average genetic distance in the data of the ITS2 region for 20 specimens is
5.0 % (standard error 0.8). The average genetic distance between the thirteen
specimens of the genus Catagonium is 2.6 % (standard error 0.6). Note that no
genetic sequences of the ITS2 region were obtained for the specimen of C. nitidum
from the Falkland Islands (sp. 80).
The highest genetic distances in the ITS2 were obtained separating Plagiothecium
denticulatum from Acrocladium chlamydophyllum (8.2 %) and A. auriculatum (7.7 %).
Low values in the outgroup taxa comprising Lepyrodon and representatives of the
Plagiotheciaceae were obtained when comparing intrageneric distances. The genetic
distance separating the two species of Acrocladium is 2.1 %, Lepyrodon
pseudolagurus and L. tomentosus are separated by 0.8 % differences in
substitutions, and between the two species of Plagiothecium the difference is 0.5 %.
The genetic distance of Catagonium to Acrocladium ranges from 6.1 % in C.
brevicaudatum (sp. 92) and C. emarginatum (sp. 61) to the Acrocladium species to
8.9 % in C. nitens ssp. nitens from southern Chile (sp. 21).
In relation to the genus Plagiothecium the species Catagonium brevicaudatum (sp.
92), Catagonium nitens ssp. nitens (sp. 23, 25, 287, 288, 289) and C. nitidum (sp.
236) show the lowest genetic distance with 3.4 %. Catagonium emarginatum (sp. 61)
and C. nitens ssp. maritimum (sp. 59, 91) show the highest distance to Plagiothecium
with 4.3 %.
Genetic distance to Isopterygiopsis muelleriana is lowest (5.3 %) in C. brevicaudatum
(sp. 92). The greatest difference was observed to C. nitens ssp. nitens from southern
Chile (sp. 21) with 8.2 %.
The genetic distance of the species Herzogiella seligeri to Catagonium ranged
between 3.7 % in C. brevicaudatum (sp. 92) and 6.1 % (Catagonium nitidum, sp. 236
and Catagonium nitens (sp. 25).

7 Molecular evolution, phylogenetics and biogeography of the genus Catagonium 135
Genetic distance within the genus Catagonium The genetic distance between the Andean specimens of C. brevicaudatum (sp. 63,
92) from Columbia and C. emarginatum from southeastern Brazil (sp. 61) is between
1.7 % (sp. 63) and 2.1 % (sp. 92). Genetic distance between the two specimens of C.
brevicaudatum is 0.3 %.
The genetic distance of the Andean specimens of C. brevicaudatum (sp. 63, 92) to C.
nitens ssp. nitens is between 2.5 % (sp. 23 from New Zealand) and 3.9 % (sp. 21
from southern Chile). The distance of C. emarginatum (sp. 61) to C. nitens is lowest
to C. nitens ssp. maritimum (sp. 59, 91) and C. nitens ssp. nitens from New Zealand
with 4.2 % whereas it is 4.6 % to all the other specimens.
The specimen of C. nitidum from the Torres del Paine National Park (sp. 236) shows
the same distance to C. emarginatum (2.8-3.2 %) and to C. brevicaudatum (4.6 %)
as the specimen of C. nitens ssp. nitens var. myurum.
The genetic distance between the specimens of the 'Northern South America' clade
(C. brevicaudatum, sp. 63, 92, and C. emarginatum, sp. 61) to the South African
specimens of Catagonium nitens ssp. maritimum (sp. 59, 91) is between 2.8 % (C.
brevicaudatum, sp. 92) and 4.2 % (C. emarginatum). The genetic distance between
the two specimens of C. nitens ssp. maritimum is 0.000 %.
The genetic distance of the South African specimens of Catagonium nitens ssp.
maritimum to C. nitens ssp. nitens ranges from 3.1 % to 4.4 %.
The distance of the subspecies maritimum is lowest to the specimens 288 and 289 of
ssp. nitens from the Chilean Los Lagos and Araucanian region (3.1 %), intermediate
to C. nitens ssp. nitens from New Zealand (sp. 23) with 3.4 %, to the Australian
specimen (sp. 287) and to the variety ‘myurum’ of C. nitens ssp. nitens from Chile
(sp. 25) with 3.7 %. The genetic distance is highest to the specimen from southern
Chile (sp. 21) with 4.4 %.
The specimen of C. nitidum (sp. 236) shows a difference of 3.7 % to Catagonium
nitens ssp. maritimum.
There was no genetic distance (0.000 %) detected between the specimens of C.
nitens ssp. nitens from the Chilean Los Lagos and Araucanian region, specimens
288 and 289, respectively. These specimens showed 2.0 % genetic distance to the
specimen from Punta Arenas (sp. 21).
The genetic distance of the C. nitens ssp. nitens specimens from the Chilean Los
Lagos (sp. 288) and Araucanian region (sp. 289) to the specimen from Australia sp.

7 Molecular evolution, phylogenetics and biogeography of the genus Catagonium 136
287, is 1.3 and 1.4 %, respectively. The distance of sp. 21 from Punta Arenas to the
Australian specimen is 2.0 %.
The genetic distance of the C. nitens ssp. nitens specimens from the Chilean Los
Lagos (sp. 288) and Araucanian (sp. 289) region to the specimen from New Zealand
(sp. 23) is 1.0 %. The distance of sp. 21 from Punta Arenas to the New Zealand
specimen is 1.7 %.
The genetic distance between Catagonium nitens ssp. nitens from New Zealand (sp.
23) and Australia (sp. 287) is 0.3 %.
The genetic distance of C. nitens ssp. nitens var. myurum (sp. 25) from the
Araucanian region to the specimens of C. nitens ssp. nitens from Los Lagos (sp.
288), the Araucanian region (sp. 289) and Australia (sp. 287) is 1.3 %. The distance
of this variety to C. nitens ssp. nitens from New Zealand (sp. 23) is 1.0 %, the
distance to ssp. nitens from Punta Arenas (sp. 21) is 0.7 %.
There was no genetic difference detected between C. nitens ssp. nitens var. myurum
from the Araucanian region and C. nitidum (sp. 236) from the Magallanes region.
Furthermore, the genetic difference of C. nitidum (sp. 236) to the specimens of C.
nitens ssp. nitens from Los Lagos (sp. 288), the Araucanian region (sp. 289),
Australia (sp. 287), New Zealand (sp. 23), and Punta Arenas (sp. 21) is the same as
described for C. nitens ssp. nitens var. myurum.
7.4 Discussion
Phylogenetic results.
7.4.1 The ‘Northern South American’ species Lin (1984) described a new species Catagonium emarginatum Lin from the Andes
and stated that this species is closely related but morphological quite distinct from C.
brevicaudatum. In the genetically based analysis presented here C. brevicaudatum is
represented by two specimens originating from Columbia (sp. 63, 92) and C.
emarginatum from southeastern Brazil (sp. 61). The two species are sister taxa in a
clade at the most basal position of the specimens of the genus Catagonium
investigated in this study. Although C. brevicaudatum and C. emarginatum are

7 Molecular evolution, phylogenetics and biogeography of the genus Catagonium 137
closely related as indicated in the phylogenetic analysis, they are genetically distinct
taxa. One could argue that the genetic differentiation between C. brevicaudatum and
C. emarginatum is caused by geographical variation of one species, as both
specimens of C. brevicaudatum originate from Columbia and that of C. emarginatum
from southeastern Brazil. An additional analysis of the two species using material
from the same area e.g. southeastern Brazil, might give further information about the
taxonomic status of the ‘Northern South America’ clade obtained in this study.
The closest relative to the ‘Northern South America’ taxa is C. nitens ssp. maritimum
in the next following clade.
7.4.2 The systematic position of C. nitens ssp. maritimum Lin (1984) described a close relationship of Catagonium nitens with C.
brevicaudatum based on the abruptly narrowed leaf apices appearing in the ssp.
maritimum as well as in plants of ssp. nitens from New Guinea and are also
characteristic for C. brevicaudatum. Unfortunately, no fresh material for DNA
extraction from New Guinea could be obtained for this study. The two specimens of
C. nitens ssp. maritimum from South Africa (sp. 51, 91) included in this study were
genetically distinct from the other specimens of C. nitens as well as from C. nitidum,
C. emarginatum, and C. brevicaudatum. However, according to Lin (1984) C. nitens
ssp. maritium is morphologically well separated from C. nitens ssp. nitens and also
from C. brevicaudatum. The characters separating C. nitens ssp. maritium from
subspecies nitens is e.g. the terete foliation and the mucronate leaf apex of the
subspecies from South Africa compared to the complanate foliation and the narrow,
acute leaf apex in C. nitens ssp. nitens. The concave leaves found in C. nitens and
the absence of leaf auricles distinguish this species from C. brevicaudatum (Lin,
1984).
Based on morphological as well as on the genetic evidence summarized above the
status of C. nitens ssp. maritium as a subspecies of C. nitens should be revised. The
data presented here and also the morphological data by Lin (1984) suggest that a
species status might be justified.
7.4.3 The relationship within Catagonium nitens In this study Catagonium nitens sensu Lin (1984) is paraphyletic with respect to the
position of C. nitidum (sp. 80).
7 Molecular evolution, phylogenetics and biogeography of the genus Catagonium 138
Both analyses resolve a clade comprising all representatives of C. nitens ssp. nitens
and of C. nitidum. Within this clade two geographically distinct clades are well
supported, one clade consisting of the specimens from Chile (‘Valdivian’ clade), the
other of the specimens from Australia and New Zealand (‘Australian/New Zealand’
clade). These two clades are genetically separated from the representatives of C.
nitidum as well as from the variety myurum.
The genetic data in this case give information not obtained by morphological
analysis. Lin (1984; 1989) did not detect any further separation of the variety nitens,
e.g. geographically.
The two clades were found in the ML analysis in an ambiguous position to each other
as well as to a third clade consisting of the two specimens of C. nitidum, C. nitens
ssp. nitens var. myurum and one more specimen of the variety nitens. The Bayesian
Inference (BI), in contrast, indicated a sister relationship between one specimen of C.
nitidum, and one specimen each of the varieties nitens and myurum. In fact even Lin
(1989), who was the first to describe the variety myurum of C. nitens ssp. nitens,
pointed out that the separation between the two varieties is not always clear and that
intermediate forms exist. In the species C. nitidum Lin (1984) observed dwarf plants
attached with rhizoids on the leaf surface of full sized plants. According to Lin (1984)
Catagonium nitidum is morphologically very close to the dwarf forms of C. nitens ssp.
nitens from subantarctic islands (which resembles C. myurum Card. & Thér.). C.
nitidum is separated by its oblong leaves with an abruptly long-cuspidate apices from
the dwarf forms of ssp. nitens which Lin (1989) described as the variety myurum.
The specimen 236 investigated in this study was a dwarf expression of either C.
nitidum as labelled or C. nitens ssp. nitens with which it shares characters of the leaf
apex and would in the later case represent another specimen of the variety myurum
(like sp. 25). Both specimens appear as sister taxa in the Bayesian analysis
(although with low probability), and show low genetic variability (0-0.4 %) between
the two specimens.
The ability to develop dwarf plants may reflect adaptations to the environment
(Hedenäs, 2001; Lin, 1989) and needs further investigation.
The specimen of C. nitidum from the Falkland Islands (sp. 80) is a normal sized plant
which was identified by Lin in 1981. In the BI analysis it retains a basal position to C.
nitens ssp. nitens implying that this taxon is genetically distinct from C. nitens.

7 Molecular evolution, phylogenetics and biogeography of the genus Catagonium 139
However, this position is based on ITS1 data only and more specimens are needed
for a final statement on the C. nitidum and C. nitens ssp. nitens clade.

8 The ‘Gondwanan connection’ and their genetic patterns in bryophytes 140
8 The 'Gondwana connection' and their genetic patterns in bryophytes
The expression ‚Gondwana connection’ as used for example on the title of vol. 49,
issue 3 of the Austral Journal of Botany in 2001 refers to the different areas formerly
connected in the ‘supercontinent’ Gondwana, which are now disjunct, i.e. South
America, Africa, Antarctica, and parts of Australasia.
The results of the phylogenetic analysis and the genetic distances are used to
circumscribe a scenario of evolution of the genus Catagonium. Furthermore, common
patterns between the evolution of the southern hemispheric disjunct distributed taxa
Acrocladium, Catagonium and Lepyrodon are pointed out.
For the genus Catagonium the phylogenetic results of this study resolved the
northern South American (C. brevicaudatum und C. emarginatum) and South African
taxa (C. nitens ssp. maritimum) as basal within the genus. The remaining clade
comprises taxa with specimens of the taxa C. nitens ssp. nitens var. nitens and C.
nitidum. The analysis showed ambiguous results concerning the taxonomic identity of
one C. nitidum specimen (sp. 236). The position of C. nitidum from the Falkland
Islands basal to C. nitens ssp.nitens is uncertain probably because of the missing
sequence data from the ITS2 region. The obtained phylogenetic results are in the
following used to explain the evolution within the genus Catagonium.
Many species occur disjunctly in northern South America and in Africa and there are
discussions whether the disjunct distribution patterns result from a vicariance event
such as the break-up of the Gondwana continent or whether they are the result of
dispersal events e.g. Calymperes venezuelanum, Squamidium brasiliense (Delgadillo
M., 1993; Orbán, 2000). In this analysis, the basal position of the South African clade
and South American clade is consistent with the break-up history of Gondwana
during which the first continental blocks to separate were those of Africa and South
America in the Early and late Cretaceous c. 105 Myr BP (e.g. McLoughlin, 2001;
Sanmartín & Ronquist, 2004). From this study it is concluded that the common

8 The ‘Gondwanan connection’ and their genetic patterns in bryophytes 141
ancestor of C. brevicaudatum/C. emarginatum and C. nitens ssp. maritimum
originated from the former Gondwana continent, and the split of the African and
South American landmasses as a vicariance event resulted in a divergent evolution
of the taxon in the geographically separated areas. The strong genetic separation, as
shown by the genetic distances, separating the northern South American taxa from
the South African taxa on the one hand as well as separating these two groups of
species from the remaining species C. nitidum and C. nitens ssp. nitens supports the
hypothesis that populations of a common ancestor of C. brevicaudatum/C.
emarginatum and C. nitens ssp. maritimum were separated by Gondwana vicariance
c. 105 Myr BP.
Evidence of vicariance events related to the early split of the landmasses of Africa
and South America as found here in Catagonium has also been found based on
molecular data of certain angiosperm taxa, e.g. in Gunnera (for a review also see
Sanmartín & Ronquist, 2004; data by Wanntorp & Wanntorp, 2003) as well as in
bryophytes, most recently e.g. in Campylopus pilifer (Dohrmann, 2003) and the
liverwort genus Symphyogyna (Schaumann et al., 2003). In Catagonium the northern
South American taxa were found to be evolutionary older than both the southern
South American species and the other specimens of the genus, the dispersal in
South America therefore supposed to have taken place from north to south. In
contrast there is the example of the liverwort genus Monoclea where the dispersal of
a taxon has started from the southern, temperate zone into the northern, tropical
zone of South America (Meißner et al., 1998).
Furthermore, the phylogenetic results of this study make a distinction between the
South African specimens on the one hand and the South American and New
Zealand/Australian specimens on the other hand. This pattern is well-known (e.g.
Frey et al., 1999; McDaniel & Shaw, 2003; Meißner et al., 1998; Schaumann et al.,
2004) and has been explained with a second Gondwanan break-up, during which
first South America and New Zealand were separated from the rest of Gondwana c.
80 Myr BP followed by the separation of Australia from South America c. 30 Myr BP.
Apart from the northern South American and South African taxa the remaining taxa
consist of the species C. nitens ssp. nitens that is widespread throughout the
southern hemisphere, and a second species, C. nitidum, which seems to be

8 The ‘Gondwanan connection’ and their genetic patterns in bryophytes 142
restricted to the southernmost islands of Chile and Argentina (Lin, 1984). The
performed analysis distinguishes two clades: one with the New Zealand/Australian
specimens, the other with the Chilean specimens of C. nitens ssp. nitens. The
genetic distances between the Chilean and New Zealand/Australian populations of C.
nitens ssp. nitens suggest a somewhat later split of these populations, and no recent
genetic exchange via long distance dispersal. Interestingly there is evidence for a
genetic separation between the populations from New Zealand and Australia.
Furthermore, the genetic distance between the Chilean and Australian populations is
lower than between the Chilean and New Zealand populations of C. nitens ssp.
nitens. In contrast to the close relationship of the New Zealand and Australian
Catagonium taxa found in the phylogenetic analysis, which contradicts the vicariance
hypothesis, the results of the genetic distances can be considered consistent with the
documented time sequence of the Gondwanan break-up. The strong genetic
differentiation of the New Zealand taxa from the Australian and Chilean taxa fits with
the early splitting off of the New Zealand landmass, c. 80 Myr BP, leading to a long
period of isolation. The smaller genetic distances between the Catagonium taxa from
Chile and Australia than between those from Chile and New Zealand could be
explained by the longer connection of South America to Australia via Antarctica. The
separation of these continents only took place c. 30 Myr BP.
The break-up sequence of Gondwana, with the early split of New Zealand and the
later separation of Australia and New Zealand is not consistently reflected in
phylogentic analyses in plants (Sanmartín & Ronquist, 2004). Instead, closer
relationships between the areas of New Zealand and Australia are recognized. This
frequently documented result should not be seen as a contradiction between
geological records and evolutionary history, but can be interpreted in terms of
evidence for dispersal events between New Zealand and Australia (e.g. Sanmartín &
Ronquist, 2004; Swenson et al., 2001). More data are needed to trace the possible
dispersal events within the evolutionary history of Catagonium.
Although the genetic distance data of this study are in concordance with the
geological history of Gondwana, using genetic distances to interpret sequences in
time remains methodologically problematic.
This phylogenetic analysis gives an ambiguous relationship within C. nitens ssp.
nitens as well as to C. nitidum from the Falkland Islands. With the inclusion of more

8 The ‘Gondwanan connection’ and their genetic patterns in bryophytes 143
specimens especially of C. nitens ssp. nitens from east Africa and from subantarctic
Marion Island, as well as of the variety myurum and of C. nitidum, more clearly
resolved relationships can be expected that allow to assess more accurately the role
of vicariance and dispersal events in the evolution of the genus. For example, the
occurrence of C. nitens ssp. nitens on the remote subantarctic Marion Island, situated
in the southern Indian Ocean halfway between South America and New
Zealand/Australia is best explained by long distance dispersal (Gremmen, 1981) as
this island is supposed to be only 500,000 years old, and its vegetation may have
repeatedly been influenced by glaciation events (Gremmen, 1981; van Zanten,
1971). This can be seen as evidence for the ability of C. nitens ssp. nitens to
disperse over long distances with the wind as vector.
Summarizing, the disjunct distribution of Catagonium in northern South America and
South Africa is best explained as a result of a vicariance event in the form of the
break-up of Gondwana, i.e. the separation of Africa from South America, c. 105 Myr
BP. Furthermore, from the results of the analysis presented here the wide distribution
of C. nitens ssp. nitens can be interpreted as a result of the further fragmentation of
the Gondwana continent as well as long distance dispersal by wind to subantarctic
islands e.g. the Kerguelen Islands and Marion Island.
The genus Acrocladium consists of only two taxa. It is evident from this analysis that
these are two genetically and geographically distinct species. One species, A.
auriculatum is confined to southern South America. The second species, A.
chlamydophylum occurs in Australia and New Zealand. Like in Catagonium nitens
ssp. nitens, one of the species occurs on remote subantarctic Marion Island, which
can be regarded as evidence for the ability of this species to disperse over long
distances.
The genus Acrocladium is genetically clearly separated from its sister genus
Lepyrodon, which may suggest an ancient age for Acrocladium and Lepyrodon. On
the one hand one cannot rule out that the disjunct distribution of the Acrocladium
species is caused by long distance dispersal. Regarding the strong genetic
differentiation between the two Acrocladium taxa it could be concluded that the
separation must have occurred a long time ago, perhaps during times when
Gondwana already was about to rift apart. Considering the results at hand vicariance

8 The ‘Gondwanan connection’ and their genetic patterns in bryophytes 144
is here seen as the most parsimonious solution (e.g. Ronquist, 1997; Wanntorp &
Wanntorp, 2003) for explaining the disjunct distribution pattern of Acrocladium.
The disjunct distribution of the genus Lepyrodon is restricted to New
Zealand/Australia and South America. The phylogenetic analysis revealed a sister
relationship between taxa from New Zealand/Australia and Chile. However, these
taxa are genetically clearly separated which could be interpreted as the result of an
extremely long separation time related to a vicariance event when the Gondwana
continent split apart c. 80 Myr BP. The specimens of taxa with an Australian/New
Zealand distribution analysed in this study all originate from New Zealand and
therefore the genetic relationship between the New Zealand and Australian region
cannot be discussed.
So far only a few bryophytes with a disjunct distribution in the temperate region of the
southern hemisphere have been investigated in molecular studies. For example,
Lopidium concinnum (Frey et al., 1999) and Hypopterygium didictyon (Pfeiffer,
2000b), are regarded as ancient Gondwana relict species within which no genetic
differentiation occurred. For most of the taxa with a disjunct distribution, however,
genetic differentiation is reported (e.g. Meißner et al., 1998; Schaumann et al., 2004;
Stech et al., 2002).
In the phylogenetic analysis presented here, there is one clade which comprises L.
hexastichus as well as the wide-spread taxon L. tomentosus which occurs throughout
South America up to Mexico. The relationships within this clade are not well-resolved.
The short branches found in the Maximum Likelihood analysis together with the
genetic distances suggest a low genetic differentiation of these taxa. The southern
South American populations of L. tomentosus are separated from the northern South
American populations by two arid areas. The Atacama desert separates the
temperate southern South America from northern South America and the Gran
Chaco east of the Andes forms a barrier to the populations in southeast Brazil. The
separation between temperate southern South America and southeast Brazil may
have already started in the Lower Miocene (24.7 – 15.3 Myr BP) when a sea
transgression of a former “atlantic” ocean flooded east Patagonia and roughly
separated the western and the eastern part of South America (Hinojosa & Villagran,
1997). The habitat of the species in northern South America where it is
characteristically an epiphyte in the subalpine rain forests (Gradstein et al., 2001)

8 The ‘Gondwanan connection’ and their genetic patterns in bryophytes 145
suggests a more recent spread into this region i.e. during the Tertiary along with the
proto Andean mountain ridge c. 10 Myr BP (Hartley, 2003) where there may have
been temperate conditions before the establishment of the hyperarid Atacama 5 Myr
BP (Hartley, 2003). The spread of populations of L. tomentosus into Mexico and the
establishment in Central America started later when the Isthmus of Panama had
formed 4.6 to 3.6 Myr BP (Haug & Tiedemann, 1998). Allen (1999) describes
morphologically and geographically distinct forms in this widespread species with
intermediate forms in overlapping areas. This may indicate that the separation
between the populations of the so called ‘expression’ (Allen, 1999) of L. tomentosus
took place in the Upper Miocene.
Common genetic patterns in the Gondwana connection
The disjunct distribution of the taxa under study is reflected in molecular phylogenetic
analyses as well as in genetic distances. The genetically based data mostly separate
between a southern South American temperate region on one side and an
Australian/New Zealand region on the other side resulting in a reciprocal monophyly
between these two areas in each of the taxa. Based on the high degree of genetic
distinction between the taxa the disjunct distribution patterns are interpreted as
vicariance events from the break-up of the former Gondwana continent.
However, ambiguous relationships between taxa and therefore area relationships in
phylogenetic analysis in C. nitens ssp. nitens suggest that a broader taxon sampling
considering underrepresented areas and taxa is needed as well as additional
molecular markers to get a better resolution of the clades in order to identify dispersal
events which probably occurred after the Gondwanan break-up. Dispersal might
especially explain the occurrence of C. nitens ssp. nitens and Acrocladium
auriculatum on remote subantarctic Marion Island.

9 Summary 146
9 Summary
Researchers have long been fascinated by disjunct distribution patterns of plant and
animal species. Especially the disjunctly distributed species occurring in the
temperate Chilean and New Zealand rainforests of the southern hemisphere are
considered interesting due to the common history these locations share. These areas
were originally part of the former Gondwana landmass. There are also moss species
from temperate forest habitats revealing such a disjunct distribution.
The native moss flora of Chile comprises about 780 species. According to a study on
the Chilean and New Zealand mosses 113 of these 780 species reveal a disjunct
austral distribution pattern and also occur in New Zealand. The majority of the
species common to both countries are inhabitants of temperate rainforests.
This study investigates phylogenetic relationships within four southern hemispheric
bryophyte taxa characteristic for the Chilean and New Zealand temperate rainforests.
These taxa consisted of the families Lepyrodontaceae and Ptychomniaceae as well
as the genera Acrocladium and Catagonium. The results are discussed within the
context of historical and geological processes in order to test the hypothesis whether
the distribution patterns can be attributed to a common Gondwanan origin or to long
distance dispersal as an alternative explanation.
Molecular phylogenetic analyses using molecular markers from nrDNA (ITS region,
adk gene) and cpDNA (trnL-trnF region, rps4 gene) were conducted for a large
number of specimens representing the taxa under study. Most of these specimens
originated from the BryoAustral and the BryoTrop projects. The resulting molecular
data set was used to reconstruct phylogenies. Additionally, genetic distances were
determined to compliment the phylogenetic results.
Firstly, phylogenetic relationships within the Ptychomniaceae and within a taxa group
consisting of the Plagiotheciaceae, Lepyrodontaceae and related taxa were
investigated. For this purpose phylogenetic analyses based on DNA sequence data
were conducted for several data sets. Concerning the family Ptychomniaceae the

9 Summary 147
results showed that the species Ptychomnion ptychocarpon, endemic to the Valdivian
rainforest, does not belong to the genus Ptychomnion. In contrast to the other
representatives of this genus Ptychomnion ptychocarpon occupies a basal position
within the family showing no close relationship to any of the other genera within the
family. Further results of this study placed the genus Dichelodontium in the family
Ptychomniaceae. This genus was formerly considered a member of the
Lepyrodontaceae.
Further analyses were performed using specimens of the southern hemispheric
genus Lepyrodon. This genus comprises seven species, two of which only occur in
New Zealand and Australia and another four which are only found in southern Chile
and southern Argentina. In contrast, Lepyrodon tomentosus has a distribution area
which covers the southernmost tip of the American continents and expands
northwards over Central America up to Mexico. The genetic analyses showed that
the two New Zealand-Australian species form a common clade and that the most
closely related species originate from Chile. Furthermore, based on the results of
both phylogenetic analyses and genetic distances it is concluded that populations of
Lepyrodon tomentosus occurring in southern and northern South America,
respectively, probably already became separated during the tertiary.
Analyses aimed at clarifying the phylogenetic relationships of the genus Acrocladium
revealed a close relationship between this genus and the genus Lepyrodon. There
has been much discussion on whether the genus Acrocladium comprises a single
species or whether a distinction can be made between two species. In this study
clear evidence was found for the existence of two genetically distinct species, a
Chilean-Argentinian species (A. auriculatum) and a New Zealand-Australian species
(A. chlamydophyllum).
The genus Catagonium occupies a very basal position within the family
Plagiotheciaceae. The study of this genus revealed a high genetic similarity between
two species only occurring in northern South America on the one hand and a taxon
only found in South Africa on the other hand. Based on this phylogenetic result the
conclusion is made that the recent taxa had a common ancestor which occurred on

9 Summary 148
the former Gondwana continent. When this landmass split apart the Catagonium
populations found on today’s African and South American continents were separated.
Not all phylogenetic relationships resulting from analyses of molecular markers found
in this study could be explained by vicariance events. Therefore, long distance
dispersal is discussed as an explanation for the disjunct distribution of specific taxa.

10 Acknowledgements 149
10 Acknowledgements
I would like to express a special thanks to Prof. Dr. Jan-Peter Frahm for all the
supervision he gave me and for always being open for a helpful discussion. He
offered me a position within the BryoAustral project of the German Research
Foundation which included financing of the laboratory analyses which were crucial for
my research.
I am also very grateful to Prof. Wilhelm Barthlott who kindly agreed to take the
Korreferat and offered numerous critical comments especially during the last phase
of the study.
A very special thank-you goes to Dr. Friederike Schaumann (Berlin), who sadly
recently passed away. Thanks a lot Friederike for the shared experiences we had
during the excursion to Chile and for the many motivating discussions and talks we
had during the past four years.
In particular, I would like to thank Dr. Dietmar Quandt (Dresden) for the valuable
comments he made and all the time he was willing to spend when critically reading
final versions of this manuscript. Thank-you.
A very warm thank-you is expressed to Dr. Hans Kruijer (Leiden) for his very helpful
comments and the interesting discussions we had on the evolution of bryophytes.
A sincere thank-you goes to the colleagues of the AG Bryologie, especially to Dr.
Dietmar Quandt and Dr. Andreas Solga for all the interesting discussions and
comments of the last four years. Thanks Dietmar and Andreas also for the fun shared
in life outside the institute.
A special thank-you goes to Dr. Thomas Borsch, Kim Govers, Conny Löhne, Kai
Müller and Andreas Worberg of the ‘Molecular Systematics Working Group’ at the
Nees-Institute for the very good cooperation we had in the molecular lab.

10 Acknowledgements 150
Furthermore, I am very grateful to the colleagues at the Nees-Institute for providing a
nice atmosphere and for always being helpful when I came along with various
problems.
Prof. Dr. Ingrid Essigmann-Capesius (Heidelberg) I would like to thank for all the time
and patience she had while introducing me to the molecular labwork.
It is with great pleasure that I remember the time I spent at the Botanical Museum in
Helsinki. I thank Dr. Sanna Huttunen (Helsinki) very much for her hospitality during
my stay there.
I also warmly thank Prof. Dr. Ben van Zanten for his hospitality during a visit to
Groningen. He kindly provided access to his personal as well as to the institutional
bryophyte collection.
Another very motivating trip for my research were the two weeks I spent at the
Institute of Biology in Berlin, enabled by Prof. Dr. Wolfgang Frey. I am very grateful to
him for this opportunity.
Additionally, I must express my thanks to Dr. Bruce Allen (Missouri Botanical Garden)
who identified my specimens of Lepyrodon from Chile.
Plant material was kindly provided by Volker Buchbender (Bonn), Prof. Dr. Frey
(Berlin), Dr. Frank Müller (Dresden), Dr. Friederike Schaumann (Berlin), Dr. Andreas
Solga (Bonn) and Prof. Dr. Ben van Zanten (Groningen).
A sincere appreciation is due to Dr. Dietmar Quandt (Dresden) and Dr. Sanna
Huttunen (Helsinki) for sharing some of the sequences with me.
I am indebted to the curators of the herbaria at the Botanical Museum Berlin Dr. H.
Nowak-Krawietz, from the Botanical Museum Helsinki, J. Heino, Dr. Viivi Virtanen
and Dr. Sanna Huttunen and from the National Herbarium Leiden Dr. Hans Kruijer,
for the loan of specimens and the permission for use in the molecular systematic
studies.

10 Acknowledgements 151
I wish to express my warmest thanks to Celia Nitardy (Marburg) and Petra Daniels
(Groningen) for being around during the last weeks and for all the support they
provided. Especially for carefully reading the manuscript and for all valuable
comments. Celia Nitardy and Nicole Scheifhacken (Konstanz) are also acknowledged
for the drawing of distribution maps.
Finally, I would like to express a very important thank-you to my parents who have
given me invaluable support and who have shown a patience that I greatly
appreciate.
This study was embedded in the BryoAustral project financed by the German
Research Foundation (DFG) which granted the project money to Prof. Dr. J.-P-
Frahm (481/9-2, 481/9-49) and to Prof. Dr. W. Frey (DFG 404/3-1), for which I am
grateful.

11 References 152
11 References
Akaike, H. 1974. A new look at the statistical model identification. IEEE Trans.
Autom. Contr., 19:716-723.
Allen, B. 1999. A revision of the moss genus Lepyrodon (Leucodontales,
Lepyrodontaceae). Bryobrothera, 5:23-48.
Andrews, A. L. 1949. Taxonomic notes. VIII. The genus Acrocladium. The Bryologist,
52:72-77.
Beever, J., K. W. Allison, and J. Child. 1992. The mosses of New Zealand. second
edition ed. University of Otago Press.
Blattner, F. R. 1999. Direct amplification of the entire ITS region from poorly
preserved plant material using recombinant PCR. BioTechniques, 27:1180-
1186.
Blöcher, R. 2000. Molekular-systematische Untersuchungen zur Stellung der
Hypopterygiaceae Mitt. s.l. (Musci) im System der Bryidae. Diplom thesis,
Philipps-Universität Marburg.
Blöcher, R., and I. Capesius. 2002. The systematic position of the Hpopterygiaceae
(Bryopsida) inferred from rps4 gene sequences. Cryptogamie Bryologie,
23:191-207.
Blöcher, R., and J.-P. Frahm. 2002. A comparison of the moss floras of Chile and
New Zealand. Studies in austral temperate rain forest bryophytes 17. Tropical
Bryology, 21:81-92.
Bremer, K. 1994. Branch support and tree stability. Cladistics, 10:295-304.
Brotherus, V. F. 1909a. Lepyrodontaceae. In A. Engler and K. Prantl (eds.), Die
natürlichen Pflanzenfamilien, Vol. I. Teil, Abteilung 3, II. Hälfte (=I.3b), pp.
771-773. W. Engelmann, Leipzig.
—. 1909b. Musci (Laubmoose). In A. Engler and K. Prantl (eds.), Die natürlichen
Pflanzenfamilien, Vol. 1. Teil, 3. Abteilung, 2. Hälfte, pp. 701-1246. W.
Engelmann, Leipzig.

11 References 153
—. 1925a. Lembophyllaceae. In A. Engler and K. Prantl (eds.), Die natürlichen
Pflanzenfamilien, Vol. 11. Band, 2. Hälfte, pp. 207-208. W. Engelmann,
Leipzig.
—. 1925b. Lepyrodontaceae. In A. Engler and K. Prantl (eds.), Die natürlichen
Pflanzenfamilien, Vol. 11. Band, 2. Hälfte, pp. 109-111. W. Engelmann,
Leipzig.
—. 1925c. Musci (Laubmoose). In A. Engler and K. Prantl (eds.), Die natürlichen
Pflanzenfamilien, Vol. 11. Band, 2. Hälfte, pp. 542 p. W. Engelmann, Leipzig.
Buck, W. R. 1998. Pleurocarpous mosses of the West Indies. Memoirs of the New
York Botanical Garden, 82:1-.
Buck, W. R., C. J. Cox, A. J. Shaw, and B. Goffinet. in press. Ordinal relationships of
pleurocarpous mosses, with special emphasis on the Hookeriales.
Systematics and Biodiversity.
Buck, W. R., and B. Goffinet. 2000. Morphology and classification of mosses. In A. J.
Shaw and B. Goffinet (eds.), Bryophyte Biology, pp. 71-123. Cambridge
University Press, Cambridge.
Buck, W. R., B. Goffinet, and A. J. Shaw. 2000a. Novel relationships in
pleurocarpous mosses as revealed by cpDNA sequences. The Bryologist,
103:774-789.
—. 2000b. Testing morphological concepts of orders of pleurocarpous mosses
(Bryophyta) using phylogenetic reconstructions based on trnL-trnF and rps4
sequences. Molecular Phylogenetics and Evolution, 16:180-198.
Buck, W. R., and R. R. Ireland. 1985. A reclassification of the Plagiotheciaceae. Nova
Hedwigia, 41:89-125.
Buck, W. R., and D. H. Vitt. 1986. Suggestions for a new familial classification of
pleurocarpous mosses. Taxon, 35:21-60.
Campbell, C. S., M. F. Wojciechowski, B. G. Baldwin, L. A. Alice, and M. J.
Donoghue. 1997. Persistent nuclear ribosomal DNA sequence polymorphism
in the Amelanchier agamic complex (Rosaceae). Molecular Biology and
Evolution, 14:81-90.
Cardot, J. 1908. La flore bryolologique des Terres Magellaniques, de la Géorgie du
Sud et de l'Antarctide., Wissenschaftliche Ergebnisse der Schwedischen
Südpolar-Expedition 1901-1903. Unter Leitung von Dr. O. Nordenskjöld, Vol.

11 References 154
4, Lieferung 8, pp. 1-298. Lithographisches Institut des Generalstabs,
Stockholm.
Clegg, M. T., B. S. Gaut, G. H. j. Learn, and B. R. Morton. 1994. Rates and patterns
of chloroplast DNA evolution. 91.
Croizat, L., G. J. Nelson, and D. E. Rosen. 1974. Centers of origin and related
concepts. Systematic Zoology, 23:265-287.
Crum, H. 1984. Notes on tropical American mosses. The Bryologist, 87:203-216.
—. 1994. Lepyrodontaceae. In A. J. Sharp and H. Crum (eds.), The moss flora of
Mexico, Vol. 2, pp. 703-704, Mem. New York Bot. Garden 69.
Darlington, P. J. J. 1965. Biogeography of the southern end of the world. Harvard
University Press, Cambridge, Massachusetts.
Deguchi, H. 1991. A list of moss collection made during the expeditions to Chile in
1981 and 1987 (1). Bull. Natn. Sci. Mus., Tokyo, Ser. B, 17:15-34.
Delgadillo M., C. 1993. The Neotropical-African moss disjunction. The Bryologist,
96:604-615.
—. 2000. Mosses and the Caribbean connection between North and South America.
The Bryologist, 103:82-86.
Dixon, H. N. 1927. Studies in the bryology of New Zealand with special reference to
the herbarium of Robert Brown. New Zealand Inst. Bull., 3:239-298.
—. 1928. Studies in the bryology of New Zealand part IV. Bull. New Zealand Inst.,
3:299-372.
Dohrmann, J. 2003. Molekulare Systematik und Biogeographie von Campylopus
pilifer Brid. (Dicranaceae, Bryopsida). Diplomarbeit thesis, Freie Universität
Berlin.
Doyle, J. J. 1992. Gene trees and species trees: molecular systematics as one-
character taxonomy. Systematic Botany, 17:144-163.
Doyle, J. J., and J. L. Doyle. 1990. Isolation of plant DNA from fresh tissues. Focus,
12:13-15.
Du Rietz, G. E. 1960. Remarks on the botany of the southern cold temperate zone.
Proceedings of the Royal Society London Series B, 152:500-507.
During, H. J. 1977. A taxonomic revision of the Garovaglioideae (Pterobryaceae,
Musci). Bryophytorum Bibliotheca, 12:244.

11 References 155
Erixon, P., B. Svennblad, T. Britton, and B. Oxelmann. 2003. Reliability of Bayesian
posterior probabilities and bootstrap frequencies in phylogenetics. Systematic
Biology, 52:665-673.
Farris, J. S. 1989. The retention index and the rescaled consistency index. Cladistics,
5:417-419.
Felsenstein, J. 1985. Confidence limits on phylogenies: an approach using the
bootstrap.
Fife, A. J. 1995. Checklist of the mosses of New Zealand. The Bryologist, 98:313-
337.
Fleischer, M. 1906-1908. Bryales Metacranaceales i. p. Isobryinae i. p., Hookerinae.
E.J. Brill, Leiden.
—. 1908. Bryales Metacranaceales i. p. Isobryinae i. p., Hookerinae. E.J. Brill,
Leiden.
—. 1915-1922. Bryales: Hypnobryales, Buybaumiales, Diphysciales, Polytrichales.
E.J. Brill, Leiden.
—. 1923a. Bryales: Hypnobryales, Buybaumiales, Diphysciales, Polytrichales. E.J.
Brill, Leiden.
—. 1923b. Plagiotheciaceae (Bryales: Hypnobryales, Buybaumiales, Diphysciales,
Polytrichales). E.J. Brill, Leiden.
Frahm, J.-P. 2004. A new contribution to the moss flora of baltic and saxon amber.
Review of Palaebotany and Palynology, 129:81-101.
Frey, W. 1990. Genoelemente prä-angiospermen Ursprungs bei bryophyten.
Botanische Jahrbücher für Systematik, 111:433-456.
Frey, W., M. Stech, and K. Meissner. 1999. Chloroplast DNA-relationship in
palaeoaustral Lopidium concinnum (Hypopterygiaceae, Musci). An example of
stenoevolution in mosses. Studies in austral temperate rain forest bryophytes
2. Plant Systematics and Evolution, 218:67-75.
Fritsch, R. 1991. Index to bryophyte chromosome counts. In J.-P. Frahm and S. R.
Gradstein (eds.), Bryophytorum Bibliotheca, Vol. 40, pp. 352. J. Cramer,
Berlin.
Godley, E. J. 1960. The botany of southern Chile in relation to New Zealand and the
Subantarctic. Proceedings of the Royal Society London Series B, 152:457-
475.

11 References 156
Goffinet, B., and T. A. J. Hedderson. 2000. Evolutionary Biology of the Bryopsida
(Mosses): A synthesis-introductory comments. Bryologist, 103: 185-186.
Gradstein, S. R., S. P. Churchill, and N. Salazar-Allen. 2001. Guide to the bryophytes
of tropical America. Memoirs of the New York Botanical Garden, 86:1-577.
Gremmen, N. J. M. 1981. The vegetation of the subantarctic islands Marion and
Prince Edward. W. Junk, The Hague.
Hartley, A. J. 2003. Andean uplift and climate change. Journal of the Geological
Society, London, 160:7-10.
Hattaway, R. A. 1981. Commentary on the genus Glyphothecium (Ptychomniaceae).
The Bryologist, 84:344-347.
—. 1984. A monograph of the Ptychomniaceae (Bryopsida). Pennsylvania State
University.
Haug, G. H., and R. Tiedemann. 1998. Effect of the formation of the Isthmus of
Panama on Atlantic Ocean thermohaline circulation. Nature, 393:673-676.
He, S. 1998. A checklist of the mosses of Chile. Journal of the Hattori Botanical
Laboratories, 85:103-189.
Hedenäs, L. 2001. Environmental factors potentially affecting character states in
pleurocarpous mosses. The Bryologist, 104:72-91.
Hershkovitz, M. A., and E. A. Zimmer. 1996. Conservation patterns in angiosperm
rDNA-ITS2 sequences. Nucleic Acids Research, 24:2857-2867.
Herzog, T. 1926. Geographie der Moose. Gustav Fischer Verlag, Jena.
Hidalgo, O., T. Garnatje, A. Susanna, and J. Mathez. 2004. Phylogeny of
Valerianaceae based on matK and ITS markers; with reference to matK
individual polymorphism. Annals of Botany, 93:283-293.
Hill, R. S. 1994. The history of selected Australian taxa. In R. S. Hill (ed.), History of
the Australian Vegetation: cretaceous to recent., pp. 390-419. Cambridge
University Press, Cambridge.
Hill, R. S., and M. E. Dettmann. 1996. Origin and diversification of the genus
Nothofagus. In T. T. Veblen, R.S. Hill & J. Read (ed.), The ecology and
biogeography of Nothofagus forests., pp. 11-24. Yale University Press, New
Haven.
Hinojosa, L. F., and C. Villagran. 1997. Historia de los bosques del sur de
Sudamerica, I.: antecedentes paleobotanicos, geologicos y climaticos del

11 References 157
Terciario del cono sur de America. Revista Chilena de Historia Natural,
70:225-239.
Hooker, J. D. 1867. Handbook of the New Zealand flora. Reeve & Co., London.
Huelsenbeck, J. P., and F. Ronquist. 2001. MrBayes: A program for the Bayesian
inference of phylogeny. Bioinformatics, 17:754-755.
Hugall, A., j. Stanton, and C. Moritz. 1999. Reticulate evolution and the origins of
ribosomal transcribed spacer diversity in apomictic Melaidogyne. Molecular
Biology and Evolution, 16:157-164.
Huttunen, S., and M. S. Ignatov. 2004. Phylogenetic analyses of Brachytheciaceae
(Bryophyta) based on morphology and sequence level data. Cladistics,
20:151-183.
Huttunen, S., M. S. Ignatov, K. Müller, and D. Quandt. 2004. Phylogeny and
evolution of epiphytism in the three moss families Meteoriaceae,
Brachytheciaceae and Lembophyllaceae. Monographs in Systematic Botany,
in press.
Ireland, R. R. W. R. B. 1994. Stereophyllaceae. In O. f. F. Neotropica (ed.), Flora
Neotropica, Vol. 65, pp. 49. The New York Botanical Garden, New York.
Jordan, G. J., and P. J. Dalton. 1995. Mosses from Early Pleistocene sediments in
western Tasmania. Alcheringa, 19:291-296.
Karczmarz, K. 1966. Taxonomic studies on the genus Acrocladium Mitt. Nova
Hedwigia, 11:499-505.
Kluge, A. G., and J. S. Farris. 1969. Quantitative phyletics and the evolution of
anurans. Systematic Zoology, 18:1-32.
Körsgen, S., R. Kantz, and M. Weinelt. 2004. Planiglobe - online map creation.
http://www.planiglobe.com.
Krassilov, and R. M. Schuster. 1984. Paleozoic and Mesozoic fossils. In R. M.
Schuster (ed.), New manual of bryology, Vol. 2, pp. 1172-1193. Nichinan,
Japan.
Kruijer, H. 2002. Hypopterygiaceae of the World. Blumea, Supplement 13:1-388.
Kruijer, H., and R. Blöcher. 2004. Re-evaluation of the phylogeny of the
Hypopterygiaceae (Bryophyta) based on morphological and molecular data. In
A. C. Newton, R. S. Tangney and E. DeLuna (eds.), Symposium 'Evolution of
the Pleurocarpous Mosses' , September 6-8, Cardiff.

11 References 158
Kühnemann, O. M. F. G. C. 1975. Monografia preliminar para la flora criptogamica
fueguina: Los musgos de la familia Ptychomniaceae (Bryophyta). Darwiniana,
19:583-617.
Kumar, S., K. Tamura, I. B. Jakobsen, and M. Nei. 2001. MEGA2.1: Molecular
Evolutionary Genetics Analysis software. Arizona State University, . Tempe,
Arizona, USA.
Lin, S.-H. 1984. A taxonomic revision of Phyllogoniaceae (Bryopsida). Part II. Journal
of the Taiwan Museum, 37:1-54.
—. 1989. Catagonium from Chile and Peru collected by Dr. H. Deguchi. Yushania,
6:19-22.
Lindlar, A., and J.-P. Frahm. 2002. Epiphytic bryophyte communities in New Zealand
temperate rainforests along selected altitudinal transects. Phytocoenologia,
32:251-316.
Magill, R. E. 1987. On the endostomial nature of the Dichelodontium
(Ptychomniaceae) peristome. Memoirs of the New York Botanical Garden,
45:87-94.
Manos, P. S. 1997. Systematics of Nothofagus (Nothofagaceae) based on rDNA
spacer sequences (ITS): taxonomic congruence with morphology and plastid
sequences. American Journal of Botany, 84:1137-1155.
Matteri, C. M. 1986. Overview on the phytogeography of the moss flora from
southern Patagonia, at 51º-52º south latitude. Journal of the Hattori Botanical
Laboratories, 60:171-174.
McDaniel, S. F., and A. J. Shaw. 2003. Phylogeographic structure and cryptic
speciation in the trans-antarctic moss Pyrrhobryum mnioides. Evolution,
57:205-215.
McLoughlin, S. 2001. The breakup history of Gondwana and its impact on pre-
Cenozoic floristic provincialism. Australian Journal of Botany, 49:271-300.
Meißner, K., J.-P. Frahm, M. Stech, and W. Frey. 1998. Molecular divergence
patterns and infrageneric relationship of Monoclea (Monocleales, Hepaticae).
Studies in austral temperate rainforest bryophytes 1. Nova Hedwigia, 67:289-
302.
Mitten, G. 1869. Musci Austro-Americani. Enumeratio Muscorum omnium Austro-
Americanorum auctori huiusque cognitorum. The Journal of the Linn. Soc.
Bot., 12:270-550.

11 References 159
Müller, J., and K. Müller. 2004. Treegraph: automated drawing of complex tree
figures using an extensible tree description format. Molecular Ecology Notes,
0:doi: 10.1111/j.1471-8286.2004.00813.x.
Müller, K. 2004. PRAP - calculation of Bremer support for large data sets. Molecular
Phylogenetics and Evolution, 31:780-782. http://www.botanik.uni-
bonn.de/system/downloads/.
Muñoz, J., A. M. Felicísimo, F. Cabezas, A. R. Burgaz, and I. Martínez. 2004. Wind
as along-distance dispersal vehicle in the southern hemisphere. Science,
304:1144-1147.
Musters, W., K. Boon, C. A. F. M. van der Sande, H. van Heerikhuizen, and R. J.
Planta. 1990. Functional analysis of transcribed spacers of yeast ribosomal
DNA. EMBO, 9:3989-3996.
Nadot, S., R. Bajon, and B. Lejeune. 1994. The chloroplast gene rps4 as a tool for
the study of Poaceae phylogeny. Plant Systematics and Evolution, 191:27-38.
Nixon, K. C. 1999. The parsimony ratchet, a new method for rapid parsimony
analysis. Cladistics, 15:407-414.
Ochyra, R. 2002. Ptychomnion ringianum Broth. & Kaal, synonymus with P.
densifolium (Brid. ) A.Jaeger (Ptychomniaceae). Journal of Bryology, 24:87-
88.
Ochyra, R., and C. M. Matteri. 2001. Bryophyta, Musci, Amblystegiaceae. Flora
Criptogámica de Tierra del Fuego, XIV:1-96.
Orbán, S. 2000. Calymperes venezuelanum, a newly discovered American-African
disjunct element in the flora of Madagascar. The Bryologist, 103:145-146.
Palmer, J. D. 1990. Contrasting modes and tempos of genome evolution in land plant
organelles. Trends in genetics, 6:115-120.
Patti, F. P. 2002. WinModeltest front-end v4b. Program distributed by the author,
Harvard.
Pedersen, N., and L. Hedenäs. 2001. Phylogenetic relationships within the
Plagiotheciaceae. Lindbergia, 26:62-76.
—. 2002. Phylogeny of the Plagiotheciaceae based on molecular and morphological
evidence. The Bryologist, 105:310-324.
Pfeiffer, T. 2000a. Molecular relationship of Hymenophyton species (Metzgeriidae,
Hepaticophytina) in New Zealand and tasmania. Studies in austral temperate
rain forest bryophytes 5. New Zealand Journal of Botany, 38:415-423.

11 References 160
—. 2000b. Relationships and divergence patterns in Hypopterygium 'rotulatum' s.l.
(Hypopterygiaceae, Bryopsida) inferred from trnL intron sequences. Studies in
austral temperate rainforest bryophytes 7. Edinburgh Journal of Botany,
57:291-307.
—. 2001. Terricolous bryophyte vegetation of New Zealand temperate rain forests-
Communities, adaptive strategies and divergence patterns, Freie Universität
Berlin.
Pfeiffer, T., J. D. Kruijer, W. Frey, and M. Stech. 2000. Systematics of the
Hypopterygium tamarisci complex (Hypopterygiaceae, Bryopsida): implications
of molecular and morphological data. Studies in austral temperate rain forest
bryophytes 9. Journal of the Hattori Botanical Laboratory, 89:55-70.
Pole, M. 1994. The New Zealand flora - entirely long-distance dispersal. Journal of
Biogeography, 21:625-635.
Pole, M. S. 2001. Can long-distance dispersal be inferred from the New Zealand
plant fossil record. Australian Journal of Botany, 49:357-366.
Posada, D. 2004. Modeltest 3.5, Free software. Available at
http://darwin.uvigo.es/software/modeltest.html. [email protected].
Posada, D., and K. A. Crandall. 1998. Modeltest: testing the model of DNA
substitution. Bioinformatics, 14:817-818.
Przywara, L., E. Kuta, and R. Ochyra. 1992. Chromosome numbers in some New
Zealand bryopyhtes: I. Fragmenta Floristica et Geobotanica, 37:395-405.
Quandt, D. 2002. Molecular evolution and phylogenetic utility of non-coding DNA:
addressing relationships among pleurocarpous mosses, RheinischeFriedrich-
Wilhelms-Universität.
Quandt, D., J.-P. Frahm, and W. Frey. 2001. Patterns of molecular divergence within
the palaeoaustral genus Weymouthia Broth. (Lembophyllaceae, Bryopsida).
Journal of Bryology, 23:305-311.
Quandt, D., S. Huttunen, H. Streimann, J.-P. Frahm, and W. Frey. 2004a. Molecular
phylogenetics of the Meteoriaceae s. str.: focusing on the genera Meteorium
and Papillaria. Molecular Phylogenetics and Evolution, 32:435-461.
Quandt, D., S. Huttunen, R. S. Tangney, and M. Stech. 2004b. A generic revision of
Lembophyllaceae based on molecular data. Systematic Botany, in press.
Quandt, D., and M. Stech. 2003. Molecular systematics of bryophytes in context of
land plant evolution. In A. K. Sharma and A. Sharma (eds.), Plant Genome:

11 References 161
Biodiversity and Evolution, Vol. 1, pp. 267-295. Science Publishers, Enfield,
New Hampshire.
—. 2004. Molecular evolution of the trnT(UGU)-trnF(GAA) region in bryophytes. Plant
Biology, 6:545-554.
Quandt, D., R. S. Tangney, J.-P. Frahm, and W. Frey. 2000. A molecular contribution
for understanding the Lembophyllaceae (Bryopsida) based on noncoding
Chloroplast regions (cpDNA) and ITS2 (nrDNA) sequence data. Journal of the
Hattori Botanical Laboratory, 89:71-92.
Ramsay, H. P. 1974. Cytological studies of Australian mosses. Australian Journal of
Botany, 22:293-348.
—. 1983. Cytology in mosses. In R. M. Schuster (ed.), New manual of bryology, Vol.
1, pp. 149-221. The Hattori Botanical Laboratory, Nichinan, Japan.
Robinson, H. 1971. A Revised classification for the orders and families of mosses.
Phytologia, 21: 289-293.
—. 1975. The mosses of Juan Fernandez Islands. Smithsonian Contributions to
Botany, 27:1-88.
Ronquist, F. 1997. Dispersal-vicariance analysis: a new approach to the
quantification of historical biogeography. Systematic Biology, 46:195-203.
Sainsbury, G. O. K. 1955. A handbook of the New Zealand mosses. Royal Society of
New Zealand Bulletin, 5:1-490.
Sanmartín, I., and F. Ronquist. 2004. Southern hemisphere biogeography inferred by
event-based models: plant versus animal patterns. Systematic Biology,
53:216-243.
Schaumann, F., W. Frey, G. G. Hässel de Menéndez, and T. Pfeiffer. 2003.
Geomolecular divergence in the Gondwanan dendroid Symphyogyna complex
(Pallaviciniaceae, Hepaticophytina, Bryophyta). Flora, 198:404-412.
Schaumann, F., T. Pfeiffer, and W. Frey. 2004. Molecular divergence patterns within
the gondwanan liverwort genus Jensenia (Pallaviciniaceae, Hepaticophytina,
Bryophyta). Studies in austral temperate rainforest bryophytes 25. Journal of
the Hattori Botanical Laboratory, 96:231-244.
Schuster, R. M. 1969. Problems of antipodal distribution in lower land plants. Taxon,
18:46-91.
—. 1982. Generic and familial endemism in the hepatic flora of gondwanaland: origin
and causes. Journ. Hattori Bot. Lab., 52:3-35.

11 References 162
—. 1983. Phytogeography of the bryophyta. In R. M. Schuster (ed.), New manual of
bryology, Vol. 1, pp. 463-626. Nichinan, Japan.
Schwartzenberg, K. v., S. Kruse, R. Reski, B. Moffatt, and M. Laloue. 1998. Cloning
and characterization of an adenosine kinase from Physcomitrella involved in
metabolism. The Plant Journal, 13:249-257.
Scotese, C. R. 2004. PALEOMAP Project. homepage: www.scotese.com.
Scotese, C. R., and W. S. McKerrow. 1990. Revised world maps and introduction. In
W. S. McKerrow and C. R. Scotese (eds.), Palaeozoic palaeogeography and
biogeography., Vol. 12, pp. 1-21.
Seki, T. 1973. Distributional patterns of the Patagonian mosses. Proceedings of the
Japan Society of plant taxonomists., 3:13-15.
Seppelt, R. D. 2004. The moss flora of Macquarie Island. In D. Bergstrom (ed.),
Antarctic Terrestrial Biodiversity Series, pp. 328. Australian Antarctic Division,
Kingston, Tasmania, Australia.
Shaw, A. J., C. J. Cox, B. Goffinet, W. R. Buck, and S. B. Boles. 2003. Phylogenetic
evidencen of a rapid radiation of pleurocarpous mosses (Bryophyta).
Evolution, 57:2226-2241.
Shaw, J., and K. Renzaglia. 2004. Phylogeny and diversification of bryophytes.
American Journal of Botany, 9:1557-1581.
Skottsberg, C. 1960. Remarks on the plant geography of the southern cold temperate
zone. Proceedings of the Royal Society London Series B, 152:447-457.
Stech, M. 1999. Molekulare Systematik haplolepider Laubmoose (Dicrananae,
Bryopsida). PhD thesis, Freie Universität Berlin.
Stech, M., T. Pfeiffer, and W. Frey. 1999. Molecular systematic relationship of
temperate austral Hypopterygiaceae (Bryopsida): implications for taxonomy
and biogeography. Studies in austral temperate rain forest bryophytes 3.
Haussknechtia, 9:359-367.
—. 2002. Chloroplast DNA relationship in palaeoaustral Polytrichadelphus
magellanicus (Hedw.) Mitt. (Polytrichaceae, Bryopsida). Botanisches Jahrbuch
für Systematik, 124:217-226.
Suzuki, Y., G. V. Glazko, and M. Nei. 2002. Overcredibility of molecular phylogenies
obtained by Bayesian phylogenetics. Proceedings of the American Academy
of Arts and Sciences, 99:16138-16143.

11 References 163
Swenson, U., A. Backlund, S. McLoughlin, and R. S. Hill. 2001. Nothofagus
biogeography revisited with special emphasis on the enigmatic distribution of
subgenus Brassospora in New Caledonia. Cladistics, 17:28-47.
Swofford, D. L. 2002. PAUP*4b10. Phylogenetic Analysis Using Parsimony (*and
other Methods). Sinauer Associates, Sunderland.
Taberlet, P., L. Gielly, G. Pautou, and J. Bouvet. 1991. Universal primers for
amplification of three non-coding regions of the chloroplast DNA. Plant
Molecular Biology, 17:1105-1109.
Tangney, R. S., and A. J. Fife. 1997. The occurence of Ptychomnion densifolium in
new Zealand. Journal of Bryology, 19:819-825.
van Balgooy, M. M. J. 1960. Preliminary plant geographical analysis of the Pacific.
Blumea, 10:385-430.
van der Sande, C. A. F. M., M. Kwa, R. W. van Nues, H. van Heerikhuizen, H. A.
Rauke, and R. J. Planta. 1992. Functional analysis of transcribed spacer 2
Saccharomyces cerevisiae ribosomal DNA. Journal of Molecular Biology,
223:899-910.
van Steenis, C. G. 1971. Nothofagus, key genus of plant geography, in time and
space, living and fossil, ecology and phylogeny. Blumea, 19:65-98.
van Zanten, B. O. 1971. Musci. In E. M. van Zinderen Bakker, J. M. Winterbottom
and R. A. Dyer (eds.), Marion and Prince Edward Islands, pp. 173-227.
Balkema, Cape Town.
—. 1976. Preliminary report on germination experiments designed to estimate the
survival chances of moss spores during aerial trans-oceanic long-range
dispersal in the southern hemisphere, with particular reference to New
Zealand. Journal of the Hattori Botanical Laboratory, 41:133-140.
—. 1978. Experimental studies on trans-oceanic long-range dispersal of moss spores
in the southern hemisphere. Journal of the Hattori Botanical Laboratory,
44:455-482.
—. 1983. Possibilities of long-range dispersal in bryophytes with special reference to
the Southern Hemisphere. Sonderbände des Naturwiss. Ver. Hamburg, 7:49-
64.
—. 1984. Some considerations on the feasibility of long-distance transport in
bryophytes. Acta Botanica Neerlandica, 33:231-232.

11 References 164
van Zanten, B. O., and T. Pócs. 1981. Distribution and dispersal of bryophytes,
Advances in Bryology, Vol. 1, pp. 479-561. J. Cramer.
Vanderpoorten, A., A. J. Shaw, and C. J. Cox. 2004. Evolution of multiple paralogous
adenosine kinase genes in the moss genus Hygroamblystegium: phylogenetic
implications. Molecular Phylogenetics and Evolution, 31:505-516.
Vanderpoorten, A., A. J. Shaw, and B. Goffinet. 2001. Testing controversial
alignments in Amblystegium and related genera (Amblystegiaceae:
Bryopsida). Evidence from rDNA ITS sequences. Systematic Botany, 26:470-
479.
Villagrán, C., E. Barrera, J. Cuvertino, and N. García 2003. Musgos de la Isla Grande
de Chiloé, X. región, Chile: lista de especies y rasgos fitogeográficos. Boletín
del Museo Nacional de Historia Natural, Chile, 52:17-44.
Villagrán, C., C. Le-Quesne, J. C. Aravena, H. Jiménez, and F. Hinojosa. 1998. El rol
de los cambios de clima del cuanternario en la distribucíon actual de la
vegetacíon de Chile central-sur. In K. Garleff and H. Stingl (eds.),
Landschaftsentwicklung, Paläoökologie und Klimageschichte der ariden
Diagonale Südamerikas im Jungquartär., Vol. 15, pp. 227-242. Selbstverlag
Fach Geographie, Universität Bamberg, Bamberg.
Vitt, D. H. 1984. Classification of Bryopsida. In R. M. Schuster (ed.), New manual of
bryology, Vol. 2, pp. 696-759. Nichinan, Japan.
Wanntorp, L., and H.-E. Wanntorp. 2003. The biogeography of Gunnera L.:
vicariance and dispersal. Journal of Biogeography, 30:979-987.
Wardle, P., C. Ezcurra, C. Ramírez, and S. Wagstaff. 2001. Comparison of the flora
and vegetation of the southern Andes and New Zealand. New Zealand Journal
of Botany, 39:69-108.
Wegener, A. 1915. Die Entstehung der Kontinente und Ozeane, Braunschweig.
Weinelt, M. 2004. OMC - Online map creation. http://www.aquarius.geomar.de.
Wessel, P., and W. H. F. Smith. 1995. New Version of the Generic Mapping Tools
Released, http://www.agu.org/eos_elec/95154e.html. Copyright 1995 by the
American Geophysical Union.
White, M. E. 1990. The Flowering of Gondwana. Princeton University Press,
Princeton.
White, T. J., T. Bruns, S. Lee, and J. Taylor. 1990. Amplification and direct
sequencing of fungal ribosomal RNA genes for phylogenetics. In M. Innis, D.

11 References 165
Gelfand, J. Sninsky and T. J. White (eds.), PCR protocols: a guide to methods
and applications, pp. 315-322. Academic Press, San Diego.
Willerslev, E., A. J. Hansen, J. Binladen, T. B. Brand, M. T. P. Gilbert, B. Shapiro, M.
Bunce, C. Wiuf, D. A. Gilichinsky, and A. Cooper. 2003. Diverse plant and
animal genetic records from Holocene and Pleistocene sediments. Science,
300:791-795.
Willerslev, E., A. J. Hansen, and H. N. Poinar. 2004. Isolation of nucleic acids and
cultures from fossil ice and permafrost. Trends in Ecology & Evolution, 19:141-
147.

Index to tables Tab. 1 Comparison of the moss flora between Chile and New Zealand. 15
Tab. 2 Moss species common in Chile and New Zealand according to He (1998) and Fife (1995).
16
Tab. 3 Number of species per families occurring disjunct in Chile and New Zealand. 19
Tab. 4 Degree of conformity of the mosses of various disjunct floras. The percentage is correlated with the time span of separation.
20
Tab. 5 Genetic distances between disjunct populations or taxain the austral temperate region using the trnL-Intron of cp DNA.
20
Tab. 6 Primer sequences used for amplification and sequencing of the trnL region and rps4 gene. Underlined nucleotides represent changes Quandt et al. 2000 with respect to the original primers of Taberlet et al.
27
Tab. 7 Substitution models selected for the combined trnL and rps4 data set. 29
Tab. 8 Sequence lengths [base pairs, bp] of selected gene regions and GC-content [%] of the trnL intron, trnL-trnF spacer and rps4 gene studied for 34 bryophyte taxa. Average sequence lengths and standard deviations are also given. For origin of the data refer appendix 1. Abbreviations: n. d. = no data available.
31
Tab. 9 Number of taxa, total number of aligned characters; variable characters and number of parsimony informative sites and %-value of variable sites for the partial data sets of 34 taxa. (* includes part of the trnF and rps4-trnS spacer).
32
Tab. 10 Primer sequences used for amplification and sequencing of the trnL region and rps4 gene. Underlined nucleotides represent changes Quandt et al. 2000 with respect to the original primers of Taberlet et al 1999.
46
Tab. 11 Primer sequences used for amplification and sequencing of the ITS region. Underlined nucleotides represent changes Stech 1999 with respect to the original primers of Blattner 1999.
47
Tab. 12 Primer sequences used for amplification and sequencing of the adk gene. 47
Tab. 13 List of investigated specimens of Lepyrodon with EMBL accession numbers for the regions sequenced. Voucher numbers and the herbaria where the specimens are kept and country of origin are listed. ITS2 sequences of L. pseudolagurus and L. tomentosus were kindly provided by Dr. Dietmar Quandt (Dresden). For detailed voucher information see Appendix 6.
61
Tab 14 Primer sequences used for amplification and sequencing of the ITS region. Underlined nucleotides represent changes Stech 1999 with respect to the original primers of Blattner 1999.
64
Tab. 15 Primer sequences used for amplification and sequencing of the adk gene. 64
Tab. 16 Substitution models selected for the different data sets in Maximum Likelihood analyses in the Lepyrodon data sets.
66
Tab. 17 Sequence lengths [base pairs, bp] and GC-content [%] of selected gene regions (ITS1, ITS2, and adk gene) of fourteen Lepyrodon specimens and two outgroup taxa. Average sequence lengths and standard deviations are also given. For origin of the data refer tab. xz. Abbreviations: n. d. = no data available. (* partial sequences were excluded when determining the average sequence length).
68
Tab. 18 Number of taxa, total number of aligned characters; variable characters and number of parsimony informative sites and %-value of variable sites for the partial data sets of Lepyrodon data set (* Including the outgroup taxa).
69
Tab. 19 Indelmatrix of 15 specimens of Lepyrodon of the ITS- and adk-region. Indel number 1-3 in the ITS1 region, no. 4-7 in the ITS2 region, and no. 8-11 is in the adk gene.
71

Tab. 20 List of investigated specimens of Acrocladium with EMBL accession numbers
for the regions sequenced. Voucher numbers and the herbaria where the specimens are kept and country of origin are listed. ITS2 sequences of A. auriculatum and A. chlamydophyllum were kindly provided by Dr. Dietmar Quandt (Dresden). For detailed voucher information see Appendix 10.
92
Tab. 21 Primer sequences used for amplification and sequencing of the trnL region and rps4 gene. Underlined nucleotides represent changes Quandt et al. (2000) with respect to the original primers of Taberlet et al. 1991.
96
Tab. 22 Primer sequences used for amplification and sequencing of the ITS region. Underlined nucleotides represent changes Stech (1999) with respect to the original primers of Blattner (1999).
96
Tab. 23 Primer sequences used for amplification and sequencing of the adk gene. 96
Tab. 24 Sequence lengths [base pairs, bp] and GC-content [%] in the ITS1, ITS2, trnL intron and rps4 gene of eight Acrocladium specimens and six outgroup taxa. Average sequence lengths and standard deviations are also given. For origin of the data refer tab. xz. Abbreviations: n.d. = no data available, A.=Acrocladium.
98
Tab. 25 Number of taxa, total number of aligned characters; variable characters and number of parsimony informative sites and %-value of variable sites for the partial data sets of Acrocladium. Numbers in brackets refers to the data set including the outgroup taxa.
100
Tab. 26 Substitution matrix in the combined data set (trnL, ITS1, ITS2, adk, and rps4) within the genus Acrocladium. 35 sites were found to be variable. Substitutions in trnL: no. 1-8; in ITS1: no. 9-12; in ITS2: no. 13-17; in adk: 18-31; in rps4: 32-35. Abbreviations: A.a.: Acrcocladium auriculatum, A.c.: A. chlamydophyllum.
101
Tab. 27 Indelmatrix of the combined data set of Acrocladium (Indel no. I and II from ITS1 region, indel no. III from ITS2 region).
101
Tab. 28 Primer sequences used for amplification and sequencing of the ITS region. Underlined nucleotides represent changes Stech (1999) with respect to the original primers of Blattner (1999).
119
Tab. 29 List of investigated specimens of Catagonium with EMBL accession numbers for the regions sequenced. Voucher numbers and the herbaria where the specimens are kept and country of origin are listed.
120
Tab. 30 Substitution models selected for the ITS data set Catagonium data set and 8 outgroup taxa.
121
Tab. 31 Sequence lengths [base pairs, bp] and GC-content [%] for the ITS region of thirteen Catagonium specimens and eight outgroup taxa. Average sequence lengths and standard deviations are given for the data set with 21 species. Average sequence lengths and standard deviations are also given for the thirteen species separately (‘Average Cat.’). For origin of the data refer tab. xz. Abbreviations: A.: Acrocladium; C.: Catagonium; n. d. = no data available. (* partial sequences were excluded when determining the average sequence length)
128
Tab. 32 Number of taxa, total number of aligned characters; variable characters and number of parsimony informative sites and %-value of variable sites for the partial data sets of Catagonium. (* Including the outgroup taxa).
129
Tab. 33 Indelmatrix for the ITS1 and ITS2 data set of thirteen specimens of Catagonium. Indels I to VI were found in the ITS1 region, Indels VII were found in the ITS2 region. Abbreviations: C.=Catagonium, brev.=brevicaudatum, emargin.=emarginatum.
130

Index to figures
Fig. 1 Cladogram resulting from a Bayesian Inference analysis of the complete data set (rps4 and trnL sequence data). Numbers above branches indicate the posterior probabilities as a percentage value. A strict consensus cladogram of six trees found during the parsimony ratchet of the same data set revealed the same topology (Length= 554; CI: 0.671, RI: 0.829; RC: 0.557) and is not shown separately (see discussion in the text). Bootstrap values below branches are the result of a Maximum Parsimony analysis. For explanation of the clades referred to as ‘outgroup’, O, and P see text.
34
Fig. 2 Maximum Likelihood (ML) phylogram of the combined data set of rps4 and trnL sequence data (L score = - 4596.3706). Branch lengths are proportional to genetic distance between taxa. Scale bar equals 1% distance under the assumed substitution model (GTR+G). For explanation of the clades referred to as ‘outgroup’, H, and A see text.
36
Fig. 3 Strict consensus of 1223 most parsimonious trees (Length: 1,686, CI: 0.643, RI: 0.613, RC: 0.394) found during the parsimony ratchet of the combined data set. Values above branches (‘d-value’) are Bremer support values (DC). Values below branches are bootstrap (BS) support values (1000 repeats). For explanation of the clades referred to as ‘outgroup’, ALS, H1, H2, P-C, IH, P-O, and P-P see text.
50
Fig. 4 50%-majority rule consensus cladogram resulting from a Bayesian Inference analysis. Numbers above branches indicate the posterior probabilities support as a percentage value. For explanation of the clades referred to as ‘outgroup’, ALS, H1, H2, P-C, IH, P-O, and P-P see text.
52
Fig. 5 Geographical origin of all Lepyrodon specimens used for this study. Numbers in brackets are specimen numbers. For detailed information of the collection localities see figures 6 & 7.
62
Fig. 6 Geographical origin of the Lepyrodon specimens from New Zealand used for this study. Numbers in brackets are specimen numbers.
62
Fig. 7 Geographical origin of the Lepyrodon specimens from South and Central America used for this study. Numbers in brackets are specimen numbers.
63
Fig. 8 Cladogram resulting from a Maximum Likelihood analysis of 14 species of Lepyrodon and the outgroup species based on a combined data analysis (adk gene and ITS data). Bootstrap values above branches are the result of a Maximum Parsimony analysis of the data set. For explanation of the clades referred to as ‘outgroup’, H, and A see text.
71
Fig. 9 Maximum Likelihood (ML) phylogram of the combined data set of adk gene and ITS data (L score = -3103.1511). Branch lengths are proportional to genetic distance between taxa. Scale bar equals 1% distance under the assumed substitution model (GTR+G+I). For explanation of the clades referred to as ‘outgroup’, H, and A see text.
73
Fig. 10 Maximum Likelihood (ML) cladogram of the adk non-coding regions of thirteen species of Lepyrodon and the outgroup species (Lscore: -1260.0568). Bootstrap values above branches are the result of a Maximum Parsimony analysis. For explanation of the clades referred to as ‘outgroup’, A, and H see text.
75

Fig. 11 50%-majority rule consensus cladogram resulting from a Bayesian Inference
analysis of the complete data set (adk gene and ITS sequence data). Numbers above branches indicate the posterior probabilities as a percentage value. For explanation of the clades referred to as ‘outgroup’, H, and A see text.
76
Fig. 12 Geographical origin of all Acrocladium specimens used for this study. Specimens from South America are Acrocladium auriculatum, specimens from Australia, New Zealand and Macquarie Island are A. chlamydophyllum. Numbers are specimen numbers.
93
Fig. 13 Geographical origin of the Acrocladium specimens from South America used for this study. Numbers in brackets are specimen numbers.
94
Fig. 14 Geographical origin of the Acrocladium specimens from Australia, New Zealand and Macquarie Island used for this study. Numbers in brackets are specimen numbers.
94
Fig. 15 Cladogram resulting from a Bayesian Inference analysis of trnL intron, ITS1, ITS2, adk, and rps4 sequence data of Acrocladium specimens from different geographical locations. Numbers above branches indicate the posterior probabilities support as a percentage value. Clade ‘East Austral’consists of specimens from New Zealand and Macquarie Island, clade‘West Austral’ consists of specimens from Chile and Argentina.
103
Fig. 16 Phylogram of 39 MPTs (Length 282, CI 0.929, RI 0.877, RC 0.815) found during the parsimony ratchet of the combined sequence data (ITS, trnL, adk and rps4) of specimens the genus Acrocladium and outgroup taxa. Numbers above branches are bootstrap values (1000 iterations) numbers below branches is the number of characters supporting each clade. Length of the scale bar in the lower left corner of the phylogram equals 10 characters.
105
Fig. 17 Geographical origin of all Catagonium specimens used for this study. Numbers are specimen numbers.
116
Fig. 18 Geographical origin of the Catagonium specimens from South America used for this study. Numbers in brackets are specimen numbers.
117
Fig. 19 Geographical origin of the Catagonium specimens from South Africa used for this study. Numbers in brackets are specimen numbers.
117
Fig. 20 Geographical origin of the Catagonium specimens from Australia/New Zealand used for this study. Numbers in brackets are specimen numbers.
118
Fig. 21 Maximum Likelihood (ML) cladogram of the ITS sequence data (L score = -1921.4596) of thirteen specimens of the genus Catagonium and two outgroup taxa. Bootstrap support values shown above branches result from a Maximum Parsimony analysis. For explanation of the clades referred to as ‘outgroup’, H, and A see text. Plagioth.*: Plagiotheciaceae sensu Pedersen & Hedenäs 2002.
123
Fig. 22 Maximum Likelihood (ML) phylogram of the ITS sequence data (L score = -1921.4596) of thirteen specimens of the genus Catagonium and two outgroup taxa. Branch lengths are proportional to genetic distance between taxa. Scale bar equals 1% distance under the assumed substitution model (GTR+I).
125
Fig. 23 Cladogram resulting from a Bayesian Inference analysis of the ITS sequence data of thirteen specimens of the genus Catagonium and two outgroup taxa. Numbers above branches indicate the posterior probabilities as a percentage value. For explanation of the clades referred to as ‘outgroup’, ‘Northern South America’, ‘South African’, ‘Valdivian’, ‘nitidum’ and ‘Australia/New Zealand see text. Plagioth.*: Plagiotheciaceae sensu Pedersen & Hedenäs 2002.
126


Appendix 1: List of investigated specimens, with EMBL accession numbers for the regions sequenced. Voucher numbers and the herbaria where the specimens are kept are listed only for those specimens where sequence was not downloaded from EMBL/GenBank. Accession numbers marked rb were especially sequenced for this analysis. The remaining sequences were obtained from GenBank.
Taxon family rps4 trnL-F
intron/spacer origin Voucher no. herbarium
Acrocladium auriculatum (Mont.) Mitt.
sp. 78
Plagiotheciaceae* AJ862338rb AF543546 Chile
BryoAustral
W. Frey
98-T154 B
W. Frey, Berlin
Acrocladium chlamydophyllum (Hook. f.
& Wilson) Müll. Hal. & Broth. sp. 12 Plagiotheciaceae* AJ862339rb AF509543 New Zealand
BryoAustral
Rolf Blöcher
No. 49
J.-P. Frahm, Bonn
Hypnum cupressiforme Hedw. Hypnaceae AJ269690 AF397812 Europe EMBL/GenBank
Lepyrodon pseudolagurus (Hook.) Mitt.
sp. 67
Lepyrodontaceae AJ862337rb AF187239/
AF187255 New Zealand
BryoAustral
J.-P. Frahm
no. 10-12
J.-P. Frahm, Bonn
Lepyrodon tomentosus (Hook.) Mitt. sp.
64
Lepyrodontaceae AJ862337rb AF509541 Chile
BryoAustral
Rolf Blöcher
no. 74
J.-P. Frahm, Bonn
Leucodon sciuroides (Hedw.) Schwägr. Leucodontaceae AJ269688 AF397786 Europe EMBL/GenBank
Neckera crispa Hedw.
Neckeraceae AJ269692 AY050280/
AY050287 Europe EMBL/GenBank
Dichelodontium nitidum (Hook.f. &
Wils.) Broth.#2 Lepyrodontaceae AY306917 AY306751 New Zealand EMBL/GenBank
Hampeella alaris (Dix. & Sainsb.)
Sainsb. #2 Ptychomniaceae AY306920 AY306754 New Zealand EMBL/GenBank

Appendix 1: continued
Taxon family rps4 trnL-F
intron/spacer origin Voucher no. herbarium
Ptychomnion cygnisetum (C. Müll..)
Kindb. #2 Ptychomniaceae AY306984 AY306818 Chile EMBL/GenBank
Ptychomnion ptychocarpon
(Schwaegr.) Mitt. #2 Ptychomniaceae AY 306985 AY306819 Chile EMBL/GenBank
Cladomnion ericoides (Hook.) Wils. in
Hook.f. #2 Ptychomniaceae AY 306884 AY306718 New Zealand EMBL/GenBank
Tetraphidopsis pusilla (Hook.f. & Wils.)
Dix. #2 Ptychomniaceae AY307001 AY306835 New Zealand EMBL/GenBank
Cladomniopsis crenato-obtusa Fleisch. Ptychomniaceae AY 306883 AY306717 Chile EMBL/GenBank
Glyphothecium sciuroides (Hook.)
Hamp. #2 Ptychomniaceae AY306919 AY306753 Australia EMBL/GenBank
Ptychomnion aciculare (Brid.) Mitt. #1 Ptychomniaceae AY306983 AY306817 Australia EMBL/GenBank
Hampeella pallens (Lac.) Fleisch. Ptychomniaceae AY306921 AY306755 Australia EMBL/GenBank
Dichelodontium nitidum (Hook.f. &
Wils.) Broth. Sp. 81 Lepyrodontaceae n.d. AJ862683rb New Zealand
Bryo 267448
(Sainsbury 5. Jan.
1942)
Berlin
Hampeella alaris (Dix. & Sainsb.)
Sainsb. sp. 128 Ptychomniaceae AJ862334 AJ862684rb New Zealand Zanten 93.10.1528
B. van Zanten,
Groningen
Ptychomnion cygnisetum (C. Müll..)
Kindb. sp. 131 Ptychomniaceae AJ862331 AJ862681 Chile
BryoAustral, Rolf
Blöcher 247 J.-P. Frahm, Bonn
Ptychomnion ptychocarpon
(Schwaegr.) Mitt. sp. 130 Ptychomniaceae AJ862330 AJ862682rb Chile
BryoAustral, Rolf
Blöcher 249 J.-P. Frahm, Bonn
Cladomnion ericoides (Hook.) Wils. sp.
125 Ptychomniaceae n.d. AJ862680rb New Zealand H. Streimann 51478 Helsinki
Tetraphidopsis pusilla (Hook.f. & Wils.)
Dix. sp. 126 Ptychomniaceae AJ862329 rb AJ862679rb New Zealand Zanten 00.11.712
B. van Zanten,
Groningen

Appendix 1: continued
Taxon family rps4 trnL-F intron/spacer origin Voucher no. herbarium
Cladomniopsis crenato-obtusa Fleisch. sp. 127 Ptychomniaceae submitted to EMBL submitted to EMBL Chile Matteri CM 2696 J.-P. Frahm, Bonn
Glyphothecium sciuroides (Hook.) Hamp. sp. 123 Ptychomniaceae AJ862333rb AJ862677rb Chile Zanten 00.11.378 B. van Zanten,
Groningen Glyphothecium sciuroides (Hook.) Hamp. sp. 158 Ptychomniaceae AJ862332rb AJ862677rb Chile BryoAustral,
Frahm 16-0 J.-P. Frahm, Bonn
Ptychomnion aciculare (Brid.) Mitt. #2 Ptychomniaceae AF143015 AF161108 New Zealand Schimperobryum splendidissimum Margad.
Hookeriaceae AJ315873 AJ507770 Chile
Daltonia gracilis Mitt. Daltoniaceae AY306894 AY306728 Ecuador
Distichophyllum pulchellum (Hampe) Mitt.
Daltoniaceae AY306902 AY306736 New Zealand
Hookeria lucens (Hedw.) Sm. Hookeriaceae AJ269689 AF152380 Europe
Lopidium concinnum (Hook.) Wilson Hypopterygiaceae AJ252289 AF033233 New Zealand Hypopterygium didictyon Müll.Hal. Hypopterygiaceae AJ252292 AF170592 Chile Euptychium robustum Hampe Garovagliaceae AY306907 AY306741 Australia Garovaglia elegans (Dozy & Molk) Bosch & Lac. Garovagliaceae AY306915 AY306749 Papua New
Guinea

Appendix 2: P-distances of the trnL intron of the successfully sequenced specimens of Ptychomniaceae including the outgroup, and standard errors. P-distances are shown in the lower left triangle, standard errors in the upper right triangle. The mean p-distance for the full dataset including the outgroup is 0.05 (SE 0.007). The mean p-distance for dataset comprising only the taxa of Ptychomniaceae s.l. (see text) is 0.05 (SE 0.007). Abbreviations: C. cr.-obscura=Cladomniopsis creanato-obscura, Clad.=Cladomnion, Dich.=Dichrlodontium, Gly.=Glyphothecium, Hamp.=Hampeella, Lep.=Lepyrodon, P.=Ptychomnion, Tet.=Tetraphidopsis. Specimens 1 2 3 4 5 6 7 8 9 10 11 12 13 14 15 16 17 18 19 20 21 22 23 24
1 Hookeria lucens 0.018 0.018 0.017 0.017 0.017 0.018 0.017 0.016 0.020 0.019 0.019 0.018 0.018 0.018 0.018 0.019 0.019 0.018 0.019 0.018 0.019 0.019 0.019
2 L. tomentosus (sp. 64) 0.086 0.005 0.015 0.015 0.015 0.015 0.015 0.016 0.016 0.016 0.015 0.015 0.015 0.015 0.015 0.015 0.015 0.015 0.015 0.016 0.017 0.014 0.016
3 L. pseudolagurus (sp. 67) 0.090 0.010 0.015 0.015 0.015 0.015 0.015 0.016 0.016 0.016 0.015 0.015 0.015 0.015 0.015 0.015 0.015 0.015 0.015 0.015 0.017 0.014 0.016
4 Hamp. pallens 0.080 0.070 0.069 0.006 0.007 0.012 0.012 0.012 0.014 0.014 0.012 0.012 0.012 0.011 0.011 0.011 0.011 0.012 0.012 0.012 0.013 0.012 0.013
5 Hamp. alaris (sp. 128) 0.076 0.076 0.076 0.013 0.000 0.013 0.012 0.013 0.015 0.015 0.013 0.013 0.013 0.013 0.013 0.012 0.012 0.012 0.012 0.012 0.014 0.012 0.013
6 Hamp. alaris (sp. 2) 0.076 0.077 0.076 0.013 0.000 0.013 0.012 0.014 0.015 0.014 0.013 0.013 0.013 0.013 0.013 0.012 0.012 0.013 0.012 0.012 0.014 0.012 0.013
7 P. ptychocarpon (sp.132) 0.086 0.076 0.076 0.049 0.052 0.053 0.003 0.012 0.012 0.012 0.011 0.012 0.012 0.011 0.011 0.010 0.010 0.010 0.011 0.011 0.013 0.010 0.011
8 P. ptychocarpon (sp. 2) 0.082 0.073 0.072 0.046 0.049 0.049 0.003 0.011 0.012 0.011 0.011 0.011 0.011 0.011 0.011 0.010 0.010 0.010 0.010 0.011 0.012 0.010 0.011
9 C. cr.-obscura (sp.127) 0.074 0.066 0.066 0.040 0.048 0.048 0.036 0.032 0.014 0.014 0.012 0.013 0.013 0.013 0.013 0.011 0.011 0.010 0.011 0.012 0.015 0.011 0.013
10 Tet. pusilla (sp. 126) 0.110 0.090 0.089 0.066 0.072 0.069 0.048 0.045 0.056 0.003 0.014 0.013 0.013 0.013 0.013 0.012 0.012 0.014 0.013 0.014 0.015 0.012 0.014
11 Tet. pusilla (sp. 2) 0.106 0.090 0.089 0.066 0.069 0.066 0.045 0.042 0.056 0.003 0.014 0.013 0.013 0.013 0.013 0.013 0.013 0.014 0.013 0.014 0.015 0.012 0.014
12 Gly. sciuroides (sp.158) 0.102 0.073 0.073 0.049 0.052 0.053 0.042 0.038 0.040 0.061 0.061 0.010 0.010 0.009 0.009 0.007 0.007 0.006 0.006 0.008 0.010 0.006 0.009
13 P. cygnisetum (sp. 130) 0.094 0.076 0.076 0.046 0.056 0.056 0.045 0.042 0.047 0.058 0.058 0.032 0.000 0.003 0.003 0.009 0.009 0.009 0.009 0.010 0.012 0.010 0.011
14 P. cygnisetum (sp. 2) 0.094 0.076 0.076 0.046 0.056 0.056 0.045 0.042 0.047 0.058 0.058 0.032 0.000 0.003 0.003 0.009 0.009 0.009 0.009 0.010 0.012 0.010 0.011
15 P. aciculare (sp. 1) 0.094 0.073 0.072 0.042 0.052 0.052 0.042 0.038 0.043 0.055 0.055 0.029 0.003 0.003 0.000 0.009 0.009 0.008 0.008 0.010 0.012 0.009 0.011
16 P. aciculare (sp. 2) 0.094 0.073 0.072 0.042 0.052 0.052 0.042 0.038 0.043 0.055 0.055 0.029 0.003 0.003 0.000 0.009 0.009 0.008 0.008 0.010 0.012 0.009 0.011
17 Clad. ericioides (sp. 125) 0.098 0.069 0.069 0.042 0.046 0.046 0.035 0.032 0.032 0.048 0.051 0.016 0.029 0.029 0.026 0.026 0.000 0.005 0.006 0.007 0.010 0.000 0.010
18 Clad. ericioides (sp. 2) 0.098 0.069 0.069 0.042 0.046 0.046 0.035 0.032 0.032 0.048 0.051 0.016 0.029 0.029 0.026 0.026 0.000 0.005 0.006 0.007 0.010 0.000 0.010
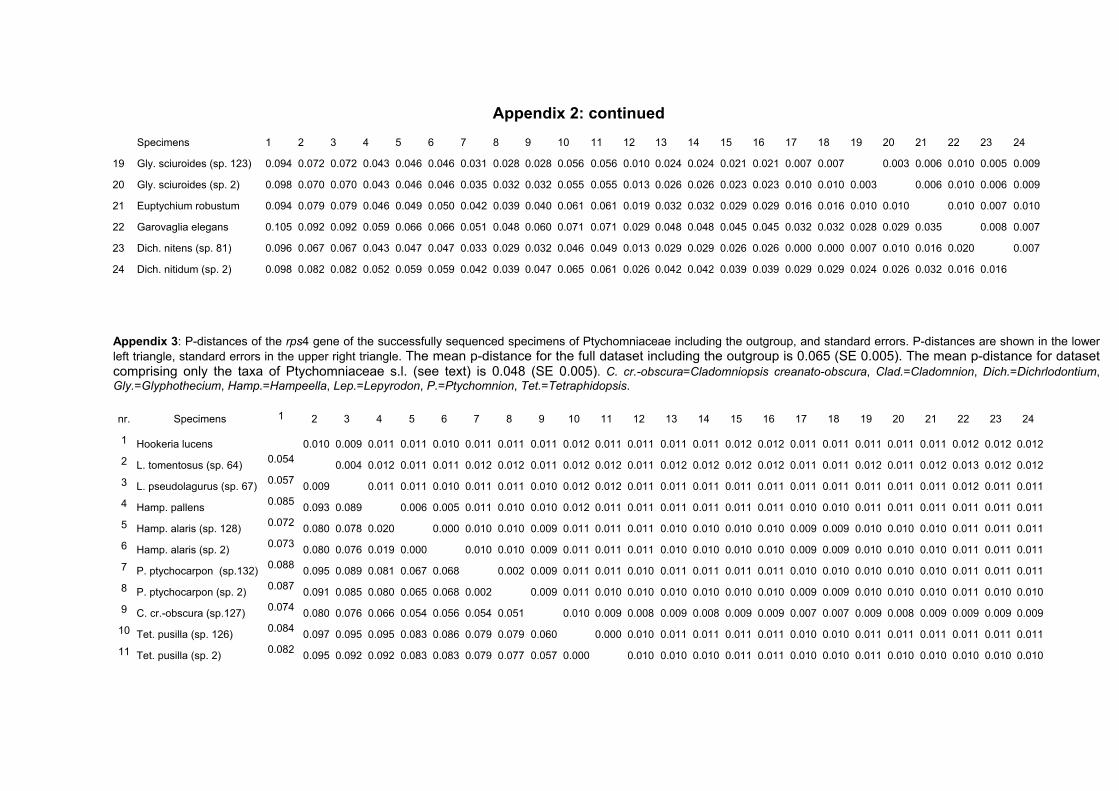
Appendix 2: continued Specimens 1 2 3 4 5 6 7 8 9 10 11 12 13 14 15 16 17 18 19 20 21 22 23 24
19 Gly. sciuroides (sp. 123) 0.094 0.072 0.072 0.043 0.046 0.046 0.031 0.028 0.028 0.056 0.056 0.010 0.024 0.024 0.021 0.021 0.007 0.007 0.003 0.006 0.010 0.005 0.009
20 Gly. sciuroides (sp. 2) 0.098 0.070 0.070 0.043 0.046 0.046 0.035 0.032 0.032 0.055 0.055 0.013 0.026 0.026 0.023 0.023 0.010 0.010 0.003 0.006 0.010 0.006 0.009
21 Euptychium robustum 0.094 0.079 0.079 0.046 0.049 0.050 0.042 0.039 0.040 0.061 0.061 0.019 0.032 0.032 0.029 0.029 0.016 0.016 0.010 0.010 0.010 0.007 0.010
22 Garovaglia elegans 0.105 0.092 0.092 0.059 0.066 0.066 0.051 0.048 0.060 0.071 0.071 0.029 0.048 0.048 0.045 0.045 0.032 0.032 0.028 0.029 0.035 0.008 0.007
23 Dich. nitens (sp. 81) 0.096 0.067 0.067 0.043 0.047 0.047 0.033 0.029 0.032 0.046 0.049 0.013 0.029 0.029 0.026 0.026 0.000 0.000 0.007 0.010 0.016 0.020 0.007
24 Dich. nitidum (sp. 2) 0.098 0.082 0.082 0.052 0.059 0.059 0.042 0.039 0.047 0.065 0.061 0.026 0.042 0.042 0.039 0.039 0.029 0.029 0.024 0.026 0.032 0.016 0.016
Appendix 3: P-distances of the rps4 gene of the successfully sequenced specimens of Ptychomniaceae including the outgroup, and standard errors. P-distances are shown in the lower left triangle, standard errors in the upper right triangle. The mean p-distance for the full dataset including the outgroup is 0.065 (SE 0.005). The mean p-distance for dataset comprising only the taxa of Ptychomniaceae s.l. (see text) is 0.048 (SE 0.005). C. cr.-obscura=Cladomniopsis creanato-obscura, Clad.=Cladomnion, Dich.=Dichrlodontium, Gly.=Glyphothecium, Hamp.=Hampeella, Lep.=Lepyrodon, P.=Ptychomnion, Tet.=Tetraphidopsis. nr. Specimens 1 2 3 4 5 6 7 8 9 10 11 12 13 14 15 16 17 18 19 20 21 22 23 24
1 Hookeria lucens 0.010 0.009 0.011 0.011 0.010 0.011 0.011 0.011 0.012 0.011 0.011 0.011 0.011 0.012 0.012 0.011 0.011 0.011 0.011 0.011 0.012 0.012 0.012 2 L. tomentosus (sp. 64) 0.054 0.004 0.012 0.011 0.011 0.012 0.012 0.011 0.012 0.012 0.011 0.012 0.012 0.012 0.012 0.011 0.011 0.012 0.011 0.012 0.013 0.012 0.012 3 L. pseudolagurus (sp. 67) 0.057 0.009 0.011 0.011 0.010 0.011 0.011 0.010 0.012 0.012 0.011 0.011 0.011 0.011 0.011 0.011 0.011 0.011 0.011 0.011 0.012 0.011 0.011 4 Hamp. pallens 0.085 0.093 0.089 0.006 0.005 0.011 0.010 0.010 0.012 0.011 0.011 0.011 0.011 0.011 0.011 0.010 0.010 0.011 0.011 0.011 0.011 0.011 0.011 5 Hamp. alaris (sp. 128) 0.072 0.080 0.078 0.020 0.000 0.010 0.010 0.009 0.011 0.011 0.011 0.010 0.010 0.010 0.010 0.009 0.009 0.010 0.010 0.010 0.011 0.011 0.011 6 Hamp. alaris (sp. 2) 0.073 0.080 0.076 0.019 0.000 0.010 0.010 0.009 0.011 0.011 0.011 0.010 0.010 0.010 0.010 0.009 0.009 0.010 0.010 0.010 0.011 0.011 0.011 7 P. ptychocarpon (sp.132) 0.088 0.095 0.089 0.081 0.067 0.068 0.002 0.009 0.011 0.011 0.010 0.011 0.011 0.011 0.011 0.010 0.010 0.010 0.010 0.010 0.011 0.011 0.011 8 P. ptychocarpon (sp. 2) 0.087 0.091 0.085 0.080 0.065 0.068 0.002 0.009 0.011 0.010 0.010 0.010 0.010 0.010 0.010 0.009 0.009 0.010 0.010 0.010 0.011 0.010 0.010 9 C. cr.-obscura (sp.127) 0.074 0.080 0.076 0.066 0.054 0.056 0.054 0.051 0.010 0.009 0.008 0.009 0.008 0.009 0.009 0.007 0.007 0.009 0.008 0.009 0.009 0.009 0.009
10 Tet. pusilla (sp. 126) 0.084 0.097 0.095 0.095 0.083 0.086 0.079 0.079 0.060 0.000 0.010 0.011 0.011 0.011 0.011 0.010 0.010 0.011 0.011 0.011 0.011 0.011 0.011 11 Tet. pusilla (sp. 2) 0.082 0.095 0.092 0.092 0.083 0.083 0.079 0.077 0.057 0.000 0.010 0.010 0.010 0.011 0.011 0.010 0.010 0.011 0.010 0.010 0.010 0.010 0.010

Appendix 3: continued nr. Specimens 1 2 3 4 5 6 7 8 9 10 11 12 13 14 15 16 17 18 19 20 21 22 23 24
12 Gly. sciuroides (sp.158) 0.089 0.091 0.091 0.081 0.067 0.068 0.063 0.060 0.044 0.068 0.066 0.008 0.008 0.008 0.008 0.007 0.007 0.007 0.007 0.008 0.009 0.008 0.008 13 P. cygnisetum (sp. 130) 0.090 0.091 0.089 0.078 0.063 0.068 0.068 0.063 0.049 0.069 0.068 0.037 0.000 0.003 0.003 0.006 0.006 0.007 0.006 0.007 0.007 0.007 0.007 14 P. cygnisetum (sp. 2) 0.089 0.091 0.089 0.078 0.063 0.067 0.068 0.063 0.048 0.069 0.068 0.037 0.000 0.003 0.003 0.006 0.006 0.007 0.006 0.007 0.007 0.007 0.007 15 P. aciculare (sp. 1) 0.094 0.094 0.092 0.085 0.071 0.073 0.073 0.068 0.055 0.077 0.075 0.044 0.007 0.007 0.000 0.007 0.007 0.008 0.007 0.008 0.008 0.007 0.007 16 P. aciculare (sp. 2) 0.094 0.094 0.092 0.085 0.071 0.073 0.073 0.068 0.055 0.077 0.075 0.044 0.007 0.007 0.000 0.007 0.007 0.008 0.007 0.008 0.008 0.007 0.007 17 Clad. ericioides (sp. 125) 0.085 0.087 0.087 0.073 0.056 0.061 0.063 0.060 0.038 0.066 0.066 0.039 0.026 0.026 0.032 0.032 0.000 0.006 0.006 0.007 0.007 0.007 0.007 18 Clad. ericioides (sp. 2) 0.085 0.087 0.087 0.073 0.056 0.061 0.063 0.060 0.038 0.066 0.066 0.039 0.026 0.026 0.032 0.032 0.000 0.006 0.006 0.007 0.007 0.007 0.007 19 Gly. sciuroides (sp. 123) 0.091 0.091 0.091 0.081 0.067 0.068 0.068 0.065 0.047 0.073 0.072 0.037 0.028 0.028 0.035 0.035 0.025 0.025 0.002 0.006 0.008 0.007 0.007 20 Gly. sciuroides (sp. 2) 0.090 0.089 0.089 0.080 0.065 0.068 0.066 0.061 0.046 0.071 0.070 0.035 0.026 0.026 0.032 0.032 0.024 0.024 0.002 0.006 0.007 0.006 0.006 21 Euptychium robustum 0.095 0.094 0.095 0.083 0.069 0.071 0.066 0.061 0.052 0.077 0.075 0.049 0.039 0.038 0.041 0.041 0.032 0.032 0.028 0.026 0.008 0.006 0.006 22 Garovaglia elegans 0.101 0.107 0.102 0.089 0.074 0.077 0.082 0.077 0.061 0.073 0.071 0.056 0.036 0.036 0.043 0.043 0.038 0.038 0.040 0.038 0.036 0.007 0.007 23 Dich. nitens (sp. 81) 0.097 0.096 0.095 0.082 0.069 0.072 0.073 0.068 0.053 0.073 0.071 0.049 0.032 0.032 0.039 0.039 0.027 0.027 0.026 0.024 0.022 0.027 0.000 24 Dich. nitidum (sp. 2) 0.097 0.096 0.095 0.082 0.069 0.072 0.073 0.068 0.053 0.073 0.071 0.049 0.032 0.032 0.039 0.039 0.027 0.027 0.026 0.024 0.022 0.027 0.000

Appendix 4: List of investigated specimens, with EMBL accession numbers for the regions sequenced. Voucher numbers and the herbaria where the specimens are kept are listed only for those
specimens where sequence was not downloaded from EMBL/GenBank. Accession numbers marked rb were especially sequenced for this analysis. The remaining sequences were obtained from
GenBank. Abbreviations: + Huttunen & Ignatov 2004; ++/ $$Quandt et al. 2004; * Shaw et al. 2003; ** Blöcher & Capeisus 2002; $ Stech et al 2003; §§ Pedersen, & Hedenäs 2002.
Taxon family trnL intron trnL-trnF region psbT-H ITS complete ITS1/ITS2 rps4 Pyrrhobryum latifolium (Bosch. & Lac.) Mitt. Rhizogoniaceae AY044077++/ AF417406++ AF395643++
Orthotrichum anomalum Hedw. Orthotrichaceae AF130314++/ AF129580++ AF508318++ AF144129++ Orthotrichum stramineum Hornsch. ex Brid. Orthotrichaceae AF127183++/ AF129579++ AF508317++ AF144130++
Acrocladium auriculatum (Mont.) Mitt. Plagiotheciaceae* AF543546++ AF543556++ AJ862695rb/ AF543550 AJ862338rb
Acrocladium chlamydophyllum (Hook. f. & Wilson) Müll. Hal. & Broth. Plagiotheciaceae* AF509543++ AF543555++ AJ862491rb/
AF509863 AJ862339rb
Amblystegium serpens (Hedw.) Schimp. Amblystegiaceae AF397836+ AF417420+ AF403633+ Calliergon stramineum (Dicks. ex Brid.) Kindb. Amblystegiaceae AY429495$$ AY429485$$ AY429501$$
Camptochaete arbuscula (Sm.) Reichdt. Lembophyllaceae AF187250++/ AF187266++ AF543559++ AF188056++ Catagonium nitidum (Hook. f. & Wilson) Broth. CH236b Plagiotheciaceae* AJ862506rb AJ862341rb
Catagonium nitens (Brid.) Cardot NZ23 Plagiotheciaceae* AF472449§§ AJ862505rb rb AF469810§§ Catagonium nitens (Brid.) Cardot MA91 Plagiotheciaceae* AF472450§§ AJ862503rb rb AF469811§§ Cratoneuropsis relaxa (Hook. & Wilson) M.Fleisch. Amblystegiaceae AY429494$$ AY429484$$ AF152391++
Ctenidium molluscum (Hedw.) Mitt. Hypnaceae -+ AF417414+ AF403632+ Entodontopsis leucostega (Brid.) W.R. Buck & Ireland Stereophyllaceae AF161153*/ #* AF143060*

Appendix 4: continued Taxon family trnL intron trnL-trnF region psbT-H ITS complete ITS1/ITS2 rps4
Eurhynchium pulchellum (Hedw.) Jenn. Brachytheciaceae AY044069+ AF417384+ AF395635+
Eurhynchium striatum (Hedw.) Schimp. Brachytheciaceae AY184788+ AY184769+ AF503538+
Fifea aciphylla (Dix. & Sainsb.) H.A.Crum Lembophyllaceae AF295041++/ AF295042++ -++ AF295043++
Herzogiella seligeri (Brid.) Z. Iwats. Plagiotheciaceae* AF472453§§/ AJ862507rb AF469814§§
Hypnum cupressiforme Hedw. Hypnaceae AF397812+ AF417361+ AF403607+ AJ269690**
Isopterygiopsis muelleriana (Schimp.) Z.
Iwats. Plagiotheciaceae AF472455§§/ AF469816§§
Isopterygiopsis pulchella (Hedw.) Z.
Iwats. Plagiotheciaceae AF472456§§/ AF469817§§
Isopterygium albescens (Hook.) A. Jaeger Hypnaceae AF472457§§/ AF469818§§
Isopterygium minutirameum (Müll. Hal.) A.
Jaeger Hypnaceae AF472458§§/ AF469819§§
Isopterygium tenerum (Sw.) Mitt. Hypnaceae AF161130*/ #* AF143037*
Isothecium alopecuroides (Dubois) Isov. Lembophyllaceae AY044065+ AF417353+ AF395636+
Lembophyllum divulsum (Hook.f. &
Wilson) Lindb. Lembophyllaceae AF187249++/ AF187265++ AF397887++ AF188055++ AY306936*
Lepyrodon pseudolagurus (Hook.) Mitt. Lepyrodontaceae AF187239++/ AF187255++ -++ AJ862687 rb/
AF188044++ AJ862335 rb
Lepyrodon tomentosus (Hook.) Mitt. Lepyrodontaceae AF509541++/ #++ AF509938++ AJ862688 rb/
AF509839++ AJ862337 rb
Leskea polycarpa Hedw. Leskeaceae AF397810+ AF417367+ AF403604+
Leucodon sciuroides (Hedw.) Schwägr. Leucodontaceae AF397786+ AF417398+ AF403634+ AJ269688**
Meteorium illecebrum (Hedw.) Broth. Meteoriaceae AF187241++/ AF187257++ AF508319++ AF188046++ AY306952*
Myurium hochstetteri (Schimp.) Kindb. Myuriaceae AF161111*/ #* AF143018*
Neckera crispa Hedw. Neckeraceae AY050280§/ AY050287§
(spacer) AY122283§ AY050296§ AJ269692**
Orthothecium chryseum (Schwägr.)
Schimp. Hypnaceae AF472462§§/ AF469823§§

Appendix 4: continued Taxon family trnL intron trnL-trnF region psbT-H ITS complete ITS1/ITS2 rps4
Orthothecium intricatum (Hartm.) Schimp. Hypnaceae AF472463§§/ AF469824§§
Pilosium chlorophyllum (Hornsch.) Müll.
Hal. Hookeriaceae AF161152* AF143059*
Plagiothecium denticulatum (Hedw.)
Schimp. Plagiotheciaceae AF397845+ AF417419+ AF403635+ AF469828§§
Plagiothecium undulatum (Hedw.)
Schimp. Plagiotheciaceae AF215905§§/ AJ251315§§
Platydictya jungermannioides (Brid.) H.A.
Crum Amblystegiaceae AF472472§§/ AF469833§§
Pseudotaxiphyllum elegans (Brid.) Z.
Iwats. Plagiotheciaceae AF472473§§/ AF469834§§
Pseudotaxiphyllum laetevirens (Dixon &
Luisier ex F. Koppe & Düll) Hedenas Plagiotheciaceae AF472474§§/ AF469835§§
Pterobryon densum Hornsch. Pterobryaceae AY050283§/ AY050291§
(spacer) AF417432§ AY050294§ AF143013*
Sematophyllaceae CH129 Sematophyllaceae AJ862343rb AJ862342rb
Sematophyllum homomallum (Hampe)
Broth. Sematophyllaceae AF509540++ AF509937++ AF509838++
Squamidium brasiliense (Hornsch.) Broth. Brachytheciaceae AY044063+ AF417393+ AF395637+ AY306991*
Stereophyllum radiculosum (Hook.) Mitt. Stereophyllaceae AF472484§§ AF469846§§
Struckia zerovii (Lazarenko) Hedenas Sematophyllaceae AF472478§§/ AF469839§§
Taxiphyllum taxirameum (Mitt.) M.
Fleisch. Hypnaceae AF472480§§/ AJ862522rb AF469841§§
Trachyloma planifolium (Hedw.) Brid. Trachylomataceae AF187238++/ AF187254++ AF543553++ AF188042++

Appendix 4: continued Taxon family trnL intron trnL-trnF region psbT-H ITS complete ITS1/ITS2 rps4
Tripterocladium leucocladulum (Müll. Hal.)
A. Jaeger Lembophyllaceae AY429492++
Weymouthia cochlearifolia (Hedw.) Broth. Lembophyllaceae AF187248++/ AF187264++ AF397883++ AJ862693rb/
AF188054++ AY307012*
Weymouthia mollis (Hedw.) Broth. Meteoriaceae AF187246/ AF417422 AJ862694rb/
AF188051 AY307013*
Zelometeorium patulum (Hedw.) Manuel Brachytheciaceae AF397787+ AF417362+ AF509862+ AY307016*
Appendix 5: Sequence lengths [base pairs, bp] of selected gene regions (trnL, rps4, rps4-trnS spacer, ITS region) and GC-content [%] of the regions studied for 53 bryophyte taxa. Average sequence lengths and standard deviations are also given. For origin of the data refer tab. xz. (n. d. = no data available) gene / gene region trnL rps4 rps4-trnS spacer ITS1 5.8S ITS2
Taxon
sequence length [bp]
GC-content [%]
sequence length [bp]
GC-content [%]
sequence length [bp]
GC-content [%]
sequence length [bp]
GC-content [%]
sequence length [bp]
GC-content [%]
sequence length [bp]
GC-content [%]
Pyrrhobryum latifolium 465 28.6 n. d. n. d. n. d. n. d. n. d. n. d. 83 55.4 368 66.3
Orthotrichum anomalum 441 27.4 587 28.1 60 26.6 n. d. n. d. 80 57.5 258 66.7
Orthotrichum stramineum 422 28.9 n. d. n. d. n. d. n. d. n. d. n. d. 80 56.3 250 64.4
Acrocladium auriculatum (sp. 78) 403 29.8 558 26.3 n. d. n. d. 259 63.3 156 51.2 245 64.5
Acrocladium chlamydophyllum (sp. 12) 416 31.2 570 26.7 n. d. n. d. 259 61.8 156 51.2 245 63.6
Amblystegium serpens 421 31.8 n. d. n. d. n. d. n. d. n. d. n. d. 83 56.6 272 69.5
Calliergon stramineum 421 31.6 n. d. n. d. n. d. n. d. n. d. n. d. 83 56.6 273 70.3
Camptochaete arbuscula 416 32.0 587 25.0 58 25.8 n. d. n. d. 83 55.4 278 64.1
Catagonium nitidum (sp. 236) 303 30.1 557 27.6 20 10.0 256 62.1 156 51.2 308 66.2
Catagonium nitens (sp. 23) 418 30.6 589 28.1 n. d. n. d. 253 62.4 156 51.2 307 67.1
Catagonium nitens (sp. 91) 430 30.0 592 27.7 51 25.4 253 63.6 156 51.2 311 65.3
Cratoneuropsis relaxa 422 31.9 n. d. n. d. n. d. n. d. n. d. n. d. 83 56.6 275 69.4
Ctenidium molluscum 275 27.3 n. d. n. d. n. d. n. d. n. d. n. d. 83 55.4 332 62.9
Entodontopsis leucostega 415 31.8 463 25.0 n. d. n. d. n. d. n. d. n. d. n. d. n. d. n. d.

Appendix 5: continued gene / gene region trnL rps4 rps4-trnS spacer ITS1 5.8S ITS2
Eurhynchium pulchellum 407 32.2 n. d. n. d. n. d. n. d. n. d. n. d. 83 56.6 296 64.2
Eurhynchium striatulum 409 31.8 n. d. n. d. n. d. n. d. n. d. n. d. 83 56.6 291 66.4
Fifea aciphylla 416 32.2 n. d. n. d. n. d. n. d. 247 63.5 156 51.2 280 64.3
Herzogiella seligeri 412 31.6 584 29.5 n. d. n. d. 248 61.2 156 51.2 270 62.2
Hypnum cupressiforme 414 31.9 592 27.9 78 26.9 n. d. n. d. 83 55.4 275 68.4
Isopterygiopsis muelleriana 416 32.0 591 28.6 60 23.4 252 63.9 156 51.3 270 64.8
Isopterygiopsis pulchella 415 31.3 591 27.9 60 21.6 n. d. n. d. n. d. n. d. n. d. n. d.
Isopterygium albescens 418 31.3 592 26.4 61 21.3 n. d. n. d. n. d. n. d. n. d. n. d.
Isopterygium minutirameum 414 29.7 584 28.3 57 17.5 n. d. n. d. n. d. n. d. n. d. n. d.
Isopterygium tenerum 415 30.6 576 27.4 43 9.4 n. d. n. d. n. d. n. d. n. d. n. d.
Isothecium alopecuroides 416 31.7 n. d. n. d. n. d. n. d. n. d. n. d. 83 55.4 269 65.5
Lembophyllum divulsum 416 32.0 573 26.7 55 10.9 n. d. n. d. 83 55.4 279 63.8
Lepyrodon tomentosus (sp. 64) 384 31.0 540 28.5 n. d. n. d. 250 62.4 155 51.6 277 65.0
Leskea polycarpa 416 32.9 n. d. n. d. n. d. n. d. n. d. n. d. 83 55.4 284 64.7
Leucodon sciuroides 423 30.1 592 27.2 59 27.1 n. d. n. d. 83 56.6 297 66.4
Meteorium illecebrum 416 30.8 574 25.8 52 15.4 n. d. n. d. 83 55.4 278 60.1
Myurium hochstetteri 423 30.2 587 27.9 60 26.6 n. d. n. d. n. d. n. d. 288 64.6
Neckera crispa 409 33.0 592 28.2 78 32.0 n. d. n. d. 83 55.4 267 64.8
Orthothecium chryseum 415 31.0 587 27.2 60 18.3 n. d. n. d. n. d. n. d. n. d. n. d.
Orthothecium intricatum 422 30.3 569 27.1 62 22.6 n. d. n. d. n. d. n. d. n. d. n. d.
Pilosium chlorophyllum 418 31.6 576 26.5 n. d. n. d. n. d. n. d. n. d. n. d. n. d. n. d.
Plagiothecium denticulatum 416 32.7 591 28.7 62 21.0 252 61.5 90 54.4 266 64.3
Plagiothecium undulatum 265 28.7 591 28.6 35 8.6 240 62.9 n. d. n. d. 183 63.4
Platydictya jungermannioides 414 30.9 587 27.1 51 23.5 n. d. n. d. n. d. n. d. n. d. n. d.
Pseudotaxiphyllum elegans 415 31.0 592 27.7 59 22.1 n. d. n. d. n. d. n. d. n. d. n. d.
Pseudotaxiphyllum laetevirens 412 31.3 588 28.4 62 20.9 n. d. n. d. n. d. n. d. n. d. n. d.
Pterobryon densum 395 32.2 n. d. n. d. n. d. n. d. 292 62.3 74 45.9 181 59.1

Appendix 5: continued gene / gene region trnL rps4 rps4-trnS spacer ITS1 5.8S ITS2
Sematophyllaceae 129 396 27.5 559 27.8 n. d. n. d. n. d. n. d. n. d. n. d. n. d. n. d.
Sematophyllum homomallum 423 28.9 n. d. n. d. n. d. n. d. n. d. n. d. 83 56.6 304 72.4
Squamidium brasiliense 416 31.5 567 28.2 31 13.0 n. d. n. d. 83 56.6 323 70.3
Stereophyllum radiculosum 415 32.3 592 26.9 62 21.0 n. d. n. d. n. d. n. d. n. d. n. d.
Struckia zerovii 406 33.2 592 28.2 n. d. n. d. n. d. n. d. n. d. n. d. n. d. n. d.
Taxiphyllum taxirameum 421 32.1 591 27.4 n. d. n. d. 290 64.5 156 51.2 261 66.7
Trachyloma planifolium 458 29.0 n. d. n. d. n. d. n. d. n. d. n. d. 83 56.6 290 71.4
Tripterocladium leucocladulum 417 31.6 n. d. n. d. n. d. n. d. n. d. n. d. 83 55.4 279 64.2
Weymouthia cochlearifolia 416 32.2 587 27.4 37 10.8 247 62.3 156 51.2 278 62.6
Weymouthia mollis 416 32.2 580 27.0 54 14.9 249 63.8 156 51.2 282 64.2
Zelometeorium patulum 416 31.5 589 28.5 29 13.8 293 65.5 156 51.9 288 70.5
Average 409.3 31.0 578.6 27.5 53.93 19.6 258.4 63.0 36.1 53.9 278.1 65.6
Standard deviation 34.2 1.4 23.0 1.0 13.61 6.5 16.5 1.1 110.4 2.7 32.7 2.9

Appendix 6: Lepyrodon species considered in this study. Species names, voucher information and the herbarium where the voucher is deposited are listed. Fourteen specimens were successfully sequenced. Accession numbers of the successfully sequenced specimens are listed in Appendix 1 in alphabetical order. No. taxon country of
origin collection locality habitat altitude grid decimal voucher
label herbarium
33 Lepyrodon lagurus (Hook.) Mitt. Chile XII. Región; Prov. Magallanes, R.N. Lago Parrillar, 50 km S of Punta Arenas
epiphytic 270 m 71° 15’ 44’’ W, 53° 24’ 25’’ S
-71.262, -53.407
BryoAustral Rolf Blöcher no. 90 det. Bruce Allen 01/2003
J.-P. Frahm, Bonn
64 Lepyrodon tomentosus (Hook.) Mitt. Chile IX. Región; P.N. Conquillio; path from Laguna Conquillio to Sierra Nevada
epiphytic 1565 m 71° 37’ 9.5’’ W, 38° 39’ 2.3’’ S
-71.619, -38.651
BryoAustral Rolf Blöcher no. 74 det. Bruce Allen 01/2003
J.-P. Frahm, Bonn
66 Lepyrodon lagurus (Hook.) Mitt. Chile IX. Región; P.N. Conquillio; path from Laguna Conquillio to Sierra Nevada
epiphytic 1420 m 71° 37’ 9.5’’ W, 38° 39’ 2.3’’ S
-71.619, -38.651
BryoAustral Rolf Blöcher no. 82 det. Bruce Allen 01/2003
J.-P. Frahm, Bonn
67 Lepyrodon pseudolagurus (Hook.) Mitt. [originally labelled Lepyrodon lagurus (Hook.) Mitt.]
NZ South Island: Haast Pass epiphytic 775 m 169° 21’ E 44° 07’ S
169.35, -44.117
BryoAustral J.-P. Frahm No. 10-12
J.-P. Frahm, Bonn
83 Lepyrodon australis Hpe ex Broth. NZ South Island: Track between Peel Ridge and Cobb Valley, North West Nelson Forest Reserve, 32 km W of Motueka
epiphytic 1090 m 172° 37’ E, 41° 08’ S
172.617, -41.133
Musci Australasiae Exsiccati H. Streimann 51277 det. J.Beever, 07/1993
J.-P. Frahm, Bonn
84 Lepyrodon patagonicus (Card. & Broth.) Allen [orig. labelled Lepyrodon implexus (Kze.) Paris]
Chile Prov. de Cautin, Temuco, Cerro Ñielol
epiphytic 250 m 72° 35’ W, 38° 43’S
-72.583, -38.717
Plantae Chilenensis H. Roivainen 2934 det. Bruce Allen 1995
Berlin
85 Lepyrodon parvulus Mitt. Chile Prov. de Cautin, Temuco, Cerro Ñielol
epiphytic 220 m 72° 35’ W, 38° 43’S
-72.583, -38.717
Plantae Chilenensis H. Roivainen 3129 det. Bruce Allen 1995
Berlin
106 Lepyrodon hexastichus (Mont.) Wijk &Marg.
Chile X. Región, R.N. de Llanquihue, 50 km WSW Puert Montt, Sector Rio Blanco, path to Calbuco volcano
epiphytic Relevé no.138
72° 38’ 7.4’’ W, 41° 20’ 41.3’’ S
-72.635, -41.345
BryoAustral Rolf Blöcher no. 77 det. Bruce Allen 01/2003
J.-P. Frahm, Bonn
107 Lepyrodon hexastichus Chile X. Región, P.N. Puyehue, 50 km E of Osorno, Sector Antillanca, Sendero El Pionero
epiphytic 610 m 72º 18’ 53.3’’ W, 40° 44’ 15.9’’ S
-72.315, -40.738
BryoAustral Rolf Blöcher no. 87 det. Bruce Allen 01/2003
J.-P. Frahm, Bonn
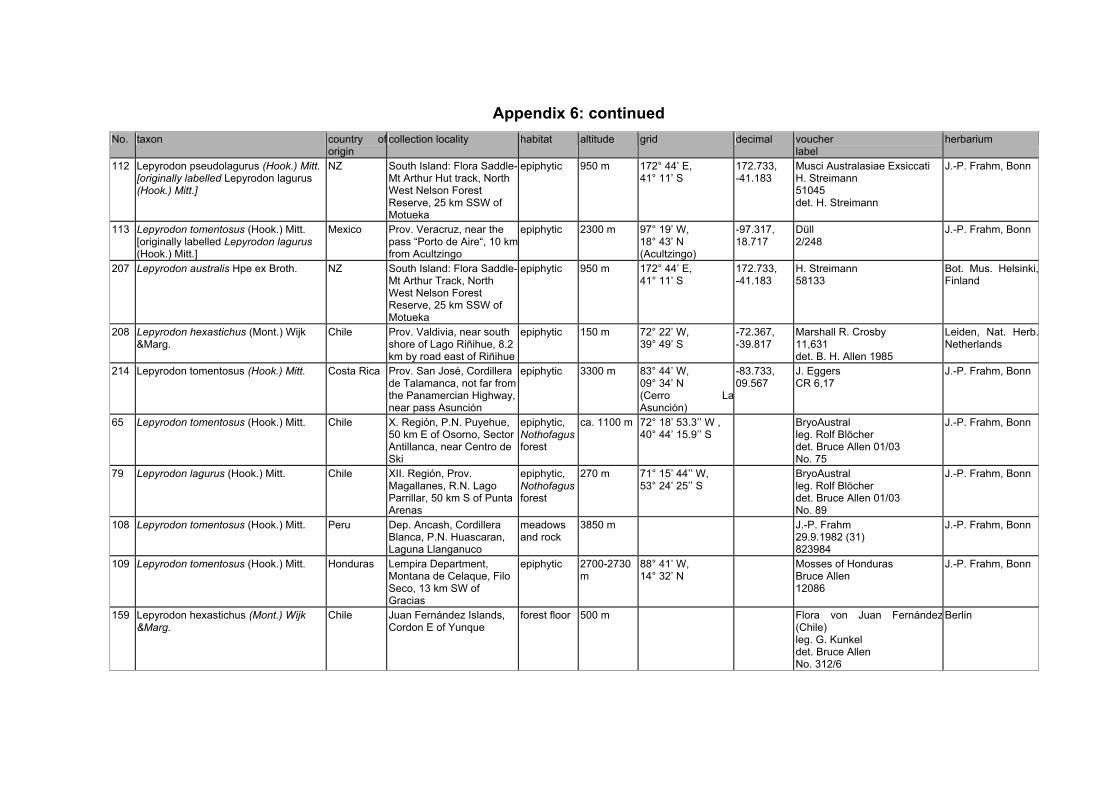
Appendix 6: continued No. taxon country of
origin collection locality habitat altitude grid decimal voucher
label herbarium
112 Lepyrodon pseudolagurus (Hook.) Mitt. [originally labelled Lepyrodon lagurus (Hook.) Mitt.]
NZ South Island: Flora Saddle-Mt Arthur Hut track, North West Nelson Forest Reserve, 25 km SSW of Motueka
epiphytic 950 m 172° 44’ E, 41° 11’ S
172.733, -41.183
Musci Australasiae Exsiccati H. Streimann 51045 det. H. Streimann
J.-P. Frahm, Bonn
113 Lepyrodon tomentosus (Hook.) Mitt. [originally labelled Lepyrodon lagurus (Hook.) Mitt.]
Mexico Prov. Veracruz, near the pass “Porto de Aire“, 10 kmfrom Acultzingo
epiphytic 2300 m 97° 19’ W, 18° 43’ N (Acultzingo)
-97.317, 18.717
Düll 2/248
J.-P. Frahm, Bonn
207 Lepyrodon australis Hpe ex Broth. NZ South Island: Flora Saddle-Mt Arthur Track, North West Nelson Forest Reserve, 25 km SSW of Motueka
epiphytic 950 m 172° 44’ E, 41° 11’ S
172.733, -41.183
H. Streimann 58133
Bot. Mus. Helsinki,Finland
208 Lepyrodon hexastichus (Mont.) Wijk &Marg.
Chile Prov. Valdivia, near south shore of Lago Riñihue, 8.2 km by road east of Riñihue
epiphytic 150 m 72° 22’ W, 39° 49’ S
-72.367, -39.817
Marshall R. Crosby 11,631 det. B. H. Allen 1985
Leiden, Nat. Herb.Netherlands
214 Lepyrodon tomentosus (Hook.) Mitt. Costa Rica Prov. San José, Cordillera de Talamanca, not far from the Panamercian Highway, near pass Asunción
epiphytic 3300 m 83° 44’ W, 09° 34’ N (Cerro LaAsunción)
-83.733, 09.567
J. Eggers CR 6,17
J.-P. Frahm, Bonn
65 Lepyrodon tomentosus (Hook.) Mitt. Chile X. Región, P.N. Puyehue, 50 km E of Osorno, Sector Antillanca, near Centro de Ski
epiphytic, Nothofagus forest
ca. 1100 m 72° 18’ 53.3’’ W , 40° 44’ 15.9’’ S
BryoAustral leg. Rolf Blöcher det. Bruce Allen 01/03 No. 75
J.-P. Frahm, Bonn
79 Lepyrodon lagurus (Hook.) Mitt. Chile XII. Región, Prov. Magallanes, R.N. Lago Parrillar, 50 km S of Punta Arenas
epiphytic, Nothofagus forest
270 m 71° 15’ 44’’ W, 53° 24’ 25’’ S
BryoAustral leg. Rolf Blöcher det. Bruce Allen 01/03 No. 89
J.-P. Frahm, Bonn
108 Lepyrodon tomentosus (Hook.) Mitt. Peru Dep. Ancash, Cordillera Blanca, P.N. Huascaran, Laguna Llanganuco
meadows and rock
3850 m J.-P. Frahm 29.9.1982 (31) 823984
J.-P. Frahm, Bonn
109 Lepyrodon tomentosus (Hook.) Mitt. Honduras Lempira Department, Montana de Celaque, Filo Seco, 13 km SW of Gracias
epiphytic 2700-2730 m
88° 41’ W, 14° 32’ N
Mosses of Honduras Bruce Allen 12086
J.-P. Frahm, Bonn
159 Lepyrodon hexastichus (Mont.) Wijk &Marg.
Chile Juan Fernández Islands, Cordon E of Yunque
forest floor 500 m Flora von Juan Fernández(Chile) leg. G. Kunkel det. Bruce Allen No. 312/6
Berlin

Appendix 6: continued No. taxon country of
origin collection locality habitat altitude grid decimal voucher
label herbarium
160 Lepyrodon parvulus Mitt. Chile Juan Fernández Islands, Quebrada E of Plazoleta
epiphytic 300 m Flora von Juan Fernández(Chile) leg. G. Kunkel det. Bruce Allen No. 322/15
Berlin
161 Lepyrodon patagonicus (Card. & Broth.) Allen
Chile Juan Fernández Islands, path to Camote
----- 500 m Flora von Juan Fernández(Chile) leg. G. Kunkel det. Bruce Allen No. 330/8
Berlin
209 Lepyrodon pseudolagurus B.H. Allen NZ South Island, Canterbury: Craigieburn Range
roots androcks
1200 m det. I. Froehlich (L. lagurus) revised Bruce Allen 1995
Leiden, Nat. Herb.Netherlands
210 Lepyrodon patagonicus (Card. & Broth.) Allen
Chile Juan Fernández Islands, path to Camote
----- 500 m Flora von Juan Fernández(Chile) leg. G. Kunkel det. Bruce Allen, 1995 No. 330/19
Berlin
211 Lepyrodon parvulus Mitt. Chile Juan Fernández Islands, Quebrada E of Plazoleta
epiphytic 300 m Flora von Juan Fernández(Chile) leg. G. Kunkel det. Bruce Allen, 1995 No. 322/15/1
Berlin
212 Lepyrodon parvulus Mitt. Chile Juan Fernández Islands, path to Camote
epiphytic 350-450 m Flora von Juan Fernández(Chile) leg. G. Kunkel det. Bruce Allen, 1995 No. 327/5
Berlin
213 Lepyrodon tomentosus (Hook.) Mitt. Brazil Rio de Janeiro, P.N. Itatiaia, Agulhas Negras
rock fissures
2500 m Bryophyta Brasiliensis J.-P. Frahm no. 1508
J.-P. Frahm, Bonn
R.N. = Reserva Nacional, Nature Reserve
P.N. = Parque Nacional, National Park

Appendix 7: Sequence lengths [base pairs, bp] and GC-content [%] in the coding (exon) and non-coding (intron) region of the adk gene of fourteen
Lepyrodon specimens and two outgroup taxa. Average sequence lengths and standard deviations are also given. For origin of the data refer tab. xz.
Abbreviations: n. d. = no data available. (* partial sequences were excluded when determining the average sequence length).
adk-intron sequence length [bp]
GC-content [%]
adk-exon sequence length [bp]
GC-content [%]
1st codon position sequence length [bp]
1st codon position GC-content [%]
2nd codon position sequence length [bp]
2nd codon position GC-content [%]
3rd codon position sequence length [bp]
3rd codon position GC-content [%]
A. auriculatum (sp. 78) 461* 63,5 231 52,8 78* 53,8 77* 42,9 76* 61,8
A. hlamydophyllum (sp. 12) 376* 59,8 171 48,5 58* 50 57* 40,3 56* 55,3
L. australis (sp. 83) 553 60,0 312 49 104 51 104 38,5 104 57,7
L. australis (sp. 207) 523 60,4 311 48,9 104 51 103 37,8 104 57,7
L. hexastichus (sp. 107) 537 60,9 309 49,9 103 51,4 103 38,8 103 59,2
L. hexastichus (sp. 106) 384* 60,7 204 44,1 68* 45,6 68* 33,8 68* 52,9
L. hexastichus (sp. 208) 298* 63,4 212 49 71* 49,3 70* 34,3 71* 63,4
L. lagurus (sp. 66) 578 60,4 312 49 104 51 104 38,5 104 57,7
L. lagurus (sp. 33) 562 60,5 311 48,9 104 51 103 37,8 104 57,7
L. parvulus(sp. 85) 554 60,6 311 48,9 104 51 103 37,8 104 57,7
L. patagonicus (sp. 84) 554 60,6 312 49 104 51 104 38,5 104 57,7
L. pseudolagurus (sp. 67) 558 60,2 312 49 104 51 104 38,5 104 57,7
L. pseudolagurus (sp. 112) 556 60,3 310 48,7 104 51 103 37,8 103 57,2
L. tomentosus (sp. 64) 577 60,4 312 49 104 51 104 38,5 104 57,7
L. tomentosus (sp. 214) 556 61,2 311 48,9 104 51 103 37,8 104 57,7
Avg, 555 60,8 311 48,9 104 50,7 103 38,1 104 57,9
S.D. 15.6 1,1 1.0 1,7 0.3 1,7 0.5 2,1 0.4 2,4

Appendix 8: P-distances of the complete data set of ITS1, ITS2 and adk gene of the successfully sequenced specimens of
Lepyrodon including the outgroup, and standard errors. P-distances are shown in the lower left triangle, standard errors in the upper
right triangle. Mean p-distances are 0.002 (SE 0.002) for the full dataset including the outgroup and 0.009 (SE 0.001) for the
ingroup only. Abbreviations: SE=standard error.
Specimens sp. 12 sp. 78 sp. 83 sp. 207 sp. 106 sp. 107 sp. 208 sp. 33 sp. 66 sp. 85 sp. 84 sp. 67 sp. 112 sp. 64 sp. 113 sp. 214
Acrocladium chlamydophyllum (sp. 12) 0.004 0.006 0.006 0.007 0.006 0.007 0.007 0.006 0.006 0.006 0.006 0.006 0.006 0.008 0.006
Acrocladium auriculatum (sp. 78) 0.020 0.006 0.006 0.007 0.006 0.008 0.007 0.006 0.006 0.006 0.006 0.006 0.006 0.007 0.006
Lepyrodon australis (sp. 83) 0.045 0.055 0.001 0.003 0.003 0.003 0.003 0.003 0.003 0.003 0.002 0.002 0.003 0.003 0.003
Lepyrodon australis (sp. 207) 0.046 0.056 0.001 0.003 0.003 0.003 0.004 0.003 0.003 0.003 0.002 0.002 0.003 0.003 0.003
Lepyrodon hexastichus (sp. 106) 0.048 0.055 0.010 0.011 0.002 0.002 0.003 0.003 0.002 0.003 0.003 0.003 0.002 0.002 0.003
Lepyrodon hexastichus (sp. 107) 0.045 0.051 0.011 0.011 0.005 0.002 0.003 0.003 0.002 0.002 0.003 0.003 0.002 0.000 0.002
Lepyrodon hexastichus (sp. 208) 0.046 0.061 0.012 0.013 0.004 0.004 0.004 0.003 0.003 0.002 0.003 0.003 0.002 0.002 0.002
Lepyrodon lagurus (sp. 33) 0.051 0.059 0.016 0.017 0.010 0.012 0.013 0.001 0.002 0.002 0.003 0.003 0.003 0.004 0.003
Lepyrodon lagurus (sp. 66) 0.045 0.053 0.016 0.017 0.012 0.012 0.013 0.002 0.002 0.002 0.003 0.003 0.003 0.004 0.003
Lepyrodon parvulus (sp. 85) 0.041 0.049 0.012 0.013 0.007 0.008 0.008 0.006 0.004 0.001 0.003 0.003 0.002 0.000 0.003
Lepyrodon patagonicus (sp. 84) 0.041 0.049 0.012 0.013 0.008 0.009 0.007 0.007 0.005 0.001 0.003 0.003 0.002 0.002 0.003
Lepyrodon pseudolagurus (sp. 67) 0.046 0.055 0.006 0.007 0.011 0.013 0.013 0.015 0.016 0.012 0.012 0.001 0.003 0.004 0.003
Lepyrodon pseudolagurus (sp. 112) 0.045 0.054 0.005 0.006 0.010 0.012 0.012 0.015 0.016 0.012 0.012 0.001 0.003 0.003 0.003
Lepyrodon tomentosus (sp. 64) 0.044 0.050 0.012 0.012 0.003 0.007 0.005 0.012 0.012 0.008 0.009 0.012 0.012 0.000 0.002
Lepyrodon tomentosus (sp. 113) 0.037 0.029 0.005 0.006 0.002 0.000 0.002 0.009 0.008 0.000 0.002 0.008 0.006 0.000 0.002
Lepyrodon tomentosus (sp. 214) 0.047 0.053 0.014 0.015 0.008 0.009 0.006 0.015 0.014 0.010 0.011 0.015 0.014 0.008 0.002
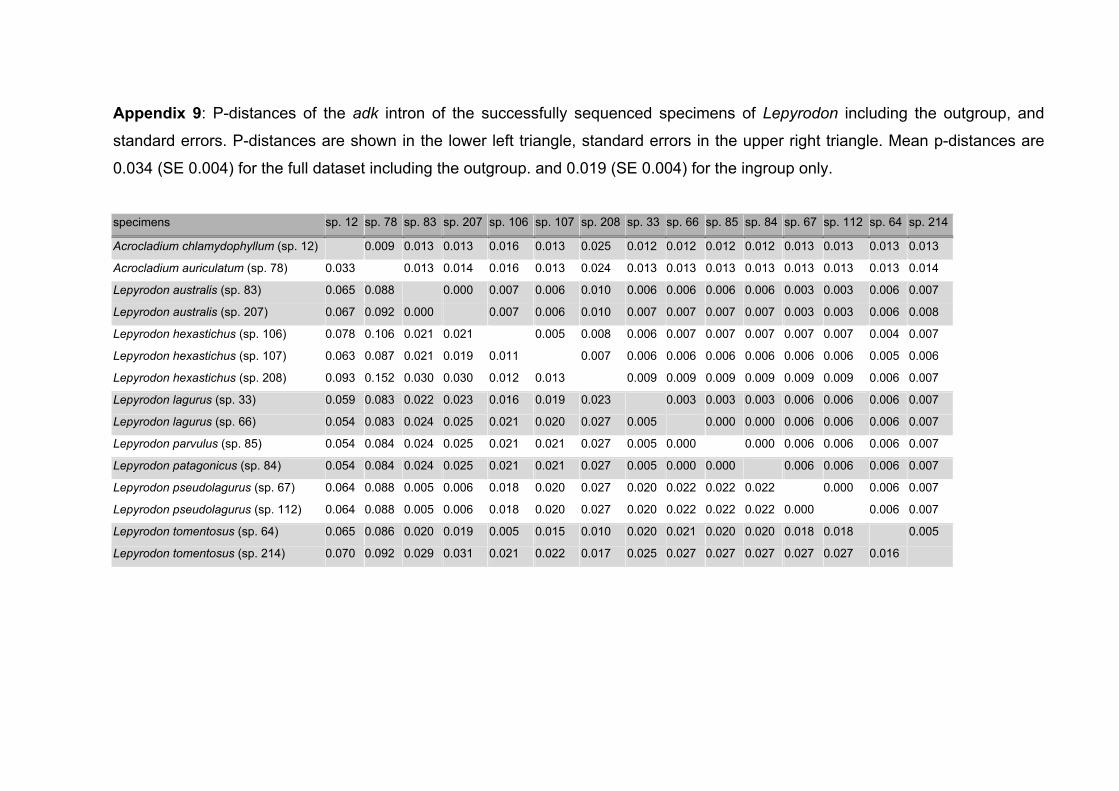
Appendix 9: P-distances of the adk intron of the successfully sequenced specimens of Lepyrodon including the outgroup, and
standard errors. P-distances are shown in the lower left triangle, standard errors in the upper right triangle. Mean p-distances are
0.034 (SE 0.004) for the full dataset including the outgroup. and 0.019 (SE 0.004) for the ingroup only.
specimens sp. 12 sp. 78 sp. 83 sp. 207 sp. 106 sp. 107 sp. 208 sp. 33 sp. 66 sp. 85 sp. 84 sp. 67 sp. 112 sp. 64 sp. 214
Acrocladium chlamydophyllum (sp. 12) 0.009 0.013 0.013 0.016 0.013 0.025 0.012 0.012 0.012 0.012 0.013 0.013 0.013 0.013
Acrocladium auriculatum (sp. 78) 0.033 0.013 0.014 0.016 0.013 0.024 0.013 0.013 0.013 0.013 0.013 0.013 0.013 0.014
Lepyrodon australis (sp. 83) 0.065 0.088 0.000 0.007 0.006 0.010 0.006 0.006 0.006 0.006 0.003 0.003 0.006 0.007
Lepyrodon australis (sp. 207) 0.067 0.092 0.000 0.007 0.006 0.010 0.007 0.007 0.007 0.007 0.003 0.003 0.006 0.008
Lepyrodon hexastichus (sp. 106) 0.078 0.106 0.021 0.021 0.005 0.008 0.006 0.007 0.007 0.007 0.007 0.007 0.004 0.007
Lepyrodon hexastichus (sp. 107) 0.063 0.087 0.021 0.019 0.011 0.007 0.006 0.006 0.006 0.006 0.006 0.006 0.005 0.006
Lepyrodon hexastichus (sp. 208) 0.093 0.152 0.030 0.030 0.012 0.013 0.009 0.009 0.009 0.009 0.009 0.009 0.006 0.007
Lepyrodon lagurus (sp. 33) 0.059 0.083 0.022 0.023 0.016 0.019 0.023 0.003 0.003 0.003 0.006 0.006 0.006 0.007
Lepyrodon lagurus (sp. 66) 0.054 0.083 0.024 0.025 0.021 0.020 0.027 0.005 0.000 0.000 0.006 0.006 0.006 0.007
Lepyrodon parvulus (sp. 85) 0.054 0.084 0.024 0.025 0.021 0.021 0.027 0.005 0.000 0.000 0.006 0.006 0.006 0.007
Lepyrodon patagonicus (sp. 84) 0.054 0.084 0.024 0.025 0.021 0.021 0.027 0.005 0.000 0.000 0.006 0.006 0.006 0.007
Lepyrodon pseudolagurus (sp. 67) 0.064 0.088 0.005 0.006 0.018 0.020 0.027 0.020 0.022 0.022 0.022 0.000 0.006 0.007
Lepyrodon pseudolagurus (sp. 112) 0.064 0.088 0.005 0.006 0.018 0.020 0.027 0.020 0.022 0.022 0.022 0.000 0.006 0.007
Lepyrodon tomentosus (sp. 64) 0.065 0.086 0.020 0.019 0.005 0.015 0.010 0.020 0.021 0.020 0.020 0.018 0.018 0.005
Lepyrodon tomentosus (sp. 214) 0.070 0.092 0.029 0.031 0.021 0.022 0.017 0.025 0.027 0.027 0.027 0.027 0.027 0.016

Appendix 10: Acrocladium species considered in this study. Species names, voucher information and the herbarium where the
voucher is deposited are listed. Nine specimens were successfully sequenced. Accession numbers of the successfully sequenced
specimens are listed in Appendix 1 in alphabetical order.
No. taxon country of
origin collection locality habitat altitude grid decimal Voucher
label herbarium
12 Acrocladium chlamydophyllum (Hook.f. & Wilson) Muell. Hal. & Broth.
NZ South Island, Nelson Lakes National Park, St. Arnaud, St. Arnaud Range track
800 m 41° 49’ S, 172° 52’ E 172.867, -41.817
BRYO AUSTRAL W. Frey 98-T154 B
W. Frey, Berlin
78 Acrocladium auriculatum (Mont.) Mitt. Chile X. Región, P.N. Puyehue, 50 km E of Osorno, Sector Antillanca, above Lago El Toro
epiphytic 750 m 40° 44’ 15.9’’ S, 72° 18’ 53.3’’ W
-72.315, -40.738
Rolf Blöcher No. 49
J.-P. Frahm, Bonn
162 Acrocladium chlamydophyllum (Hook.f. & Wilson) Muell. Hal. & Broth.
Australia Macquarie Island, NW side of Green Gorge, 150 m W of lake
wet grassland 54° 30’ S, 158° 57’ E 158.95, -54.5
R. D. Seppelt 15801
J.-P. Frahm, Bonn
165 Acrocladium auriculatum (Mont.) Mitt. Argentina Prov. Santa Cruz, 80 km WNW Calafate, P.N. Los Glaciares, Lago Argentino near Onelli-Gletscher
Nothofagus forest
220 m -73.30, -50.03,
J. Eggers ARG 1/3
J.-P. Frahm, Bonn
171 Acrocladium cf. chlamydophyllum (Hook.f. & Wilson) Muell. Hal. & Broth.
NZ South Island, Milford Track, Glade House
forest floor, on soil and rotten wood
200 m 167.91 -44.91
Ben O. van Zanten 00 11 376
B. O. v. Zanten, Groningen, Netherlands
178 Acrocladium cf. chlamydophyllum (Hook.f. & Wilson) Muell. Hal. & Broth.
Australia New South Wales, Kosciusko National Park, Wilson’s Valley
on stones along creek; shade, rather dry, gully in sclerophyll forest
approx. 1200 m
36° 30’ S, 148° 16’ E (central coordinates of Kosciusko National Park)
148.27, -36.50
Ben O. van Zanten 82.02.812A
B. O. v. Zanten, Groningen, Netherlands
185 Acrocladium auriculatum (Mont.) Mitt. Chile X. Región, Cordillera Pelada, S Valdivia, road from La Union to Puiculla
forest floor approx. 800 m 40° 10’ 13.4’’ S, 73° 27’ 17.2’’ W
-73.455, -40.17
BRYO AUSTRAL Rolf Blöcher no. 261
J.-P. Frahm, Bonn

Appendix 10: continued No. taxon country of
origin collection locality habitat altitude grid decimal Voucher
label herbarium
186 Acrocladium auriculatum (Mont.) Mitt. Chile X. Región, P.N. Alerce Andino, approx. 45 km WSW Puerto Montt, path to Laguna Sargazo
evergreen broad-leaf forest
350-400 m 41° 30’ 51’’ S, 72° 38’ 38’’ W
-72.644, -41.514
BRYO AUSTRAL Rolf Blöcher no. 50
J.-P. Frahm, Bonn
189 Acrocladium auriculatum (Mont.) Mitt. Chile XII. Región, P.N. Torres del Paine, 2 km NW Refugio Pingo at Rio Pingo
epiphytic 200 m 51° 06’ 28’’ S, 73° 06’ 28’’ W
-73.108, -51.108
BRYO AUSTRAL J.-P. Frahm no. 2-7
J.-P. Frahm, Bonn
163 Acrocladium chlamydophyllum (Hook.f. & Wilson) Muell. Hal. & Broth.
Australia Victoria, Binns Road, Aire River, Otway State Forest, 10 km NW of Apollo Bay
epiphytic 480 m 38° 41’ S, 143° 35’ E MUSCI AUSTRALASIAE EXSICCATI H. Streimann 58715
J.-P. Frahm, Bonn
164 Acrocladium auriculatum (Mont.) Mitt. Australia Tasmania, South of Devonport, King Soloman Cave
on soil and rock
41° 33’ S, 146° 15’ E Dale H. Vitt 29371
J.-P. Frahm, Bonn
172 Acrocladium cf. chlamydophyllum (Hook.f. & Wilson) Muell. Hal. & Broth.
NZ North Island, Bay of Plenty, Kaingaroa Plantation, forest SE of Rotorva
on soil 600 m B. O. van Zanten No. 1261
B. O. v. Zanten, Groningen, Netherlands
173 Acrocladium cf. chlamydophyllum (Hook.f. & Wilson) Muell. Hal. & Broth.
Australia Tasmania, King Soloman Cave
limestone H. Ramsay 9-12-1981/2
B. O. v. Zanten, Groningen, Netherlands
174 Acrocladium cf. chlamydophyllum (Hook.f. & Wilson) Muell. Hal. & Broth.
Australia N.S.W., Kosciusko N.P., Wilson’s Valley
rock ca. 1200 m B. O. van Zanten No. 82.02.819
B. O. v. Zanten, Groningen, Netherlands
175 Acrocladium cf. chlamydophyllum (Hook.f. & Wilson) Muell. Hal. & Broth.
Australia Tasmania Nothofagus forest
H. Ramsay No. 40
B. O. v. Zanten, Groningen, Netherlands
176 Acrocladium cf. chlamydophyllum (Hook.f. & Wilson) Muell. Hal. & Broth.
NZ North Island, Urevera N.P., near Ngaputaki
on bark B. O. van Zanten No. 82.02.244
B. O. v. Zanten, Groningen, Netherlands
177 Acrocladium cf. chlamydophyllum (Hook.f. & Wilson) Muell. Hal. & Broth.
NZ North Island, Taranaki, Mt. Egmont N.P. above Dawson Falls, Tourist Lodge
on branchlets on forest floor
B. O. van Zanten No. 82.02.170
B. O. v. Zanten, Groningen, Netherlands
179 Acrocladium cf. chlamydophyllum (Hook.f. & Wilson) Muell. Hal. & Broth.
NZ South Island, Jack’s Blowhole, ca. 60 km E of Invercargill along coast near Owaka
on rotten wood ca. 100 m B. O. van Zanten No. 00.11.155
B. O. v. Zanten, Groningen, Netherlands

Appendix 10: continued No. taxon country of
origin collection locality habitat altitude grid decimal Voucher
label herbarium
180 Acrocladium cf. auriculatum (Mont.) Mitt.
Chile Isla Navarino, near Puerto Williams, Camina a la Cascada
on stones and litter on forest floor
B. O. van Zanten No. 86.01.147
B. O. v. Zanten, Groningen, Netherlands
181 Acrocladium cf. auriculatum (Mont.) Mitt.
Argentina Tierra del Fuego, above Ushuaia
Nothofagus forest
ca. 200 m R. Krisai 5-1-1990/5
B. O. v. Zanten, Groningen, Netherlands
182 Acrocladium cf. auriculatum (Mont.) Mitt.
Marion Island, Black Haglett River near Kildalkey campsite
on soil 70 m N. J. M. Gremmen 02.03
B. O. v. Zanten, Groningen, Netherlands
183 Acrocladium cf. auriculatum (Mont.) Mitt.
Chile Patagonia, Laguna Parrillar, ca. 50 km S of Punta Arenas
Nothofagus forest
300 m B. O. van Zanten No. 86.01.674
B. O. v. Zanten, Groningen, Netherlands
184 Acrocladium cf. auriculatum (Mont.) Mitt.
Chile Puerto Montt area, Lago Todos los Santos, forest Cayutué
rotten wood on forest floor
200-250 m B. O. van Zanten No. 79.01.489
B. O. v. Zanten, Groningen, Netherlands
187 Acrocladium auriculatum (Mont.) Mitt. Chile XII. Región, Prov. Magallanes, Punta Arenas, Reserva Forestal Magallanes
Nothofagus forest
53° 09’ 10’’ S, 71° 01’ 34.9’’ W
J.-P. Frahm No. 1-12
J.-P. Frahm, Bonn
188 Acrocladium auriculatum (Mont.) Mitt. Chile XII. Región, Prov. Magallanes, Punta Arenas, Reserva Forestal Magallanes
Nothofagus forest
53° 09’ 10’’ S, 71° 01’ 34.9’’ W
J.-P. Frahm No. 1-11
J.-P. Frahm, Bonn
R.N. = Reserva Nacional, Nature Reserve
P.N. = Parque Nacional, National Park
N.P. = National Park

Appendix 11: P-distances of the trnL intron of the successfully sequenced specimens of Acrocladium including the outgroup, and standard errors. P-
distances are shown in the lower left triangle, standard errors in the upper right triangle. The mean p-distance for the full dataset including the outgroup is
0.023 (SE 0.004). The mean p-distance for dataset comprising only the eight taxa of Acrocladium is 0.008 (SE 0.004). Abbreviations: A.=Acrocladium,
H.=Herzogiella, L.=Lepyrodon, P.=Plagiothecium, T.=Taxiphyllum, A. chlamyd.=Acrocladium chlamydophyllum,
Specimens sp.120 P.und. P.den. sp.117 sp.64 sp.67 sp.12 sp.171 sp.162 sp.165 sp.78 sp.185 sp.186 sp.189
H. seligeri (sp.120) 0.012 0.009 0.010 0.010 0.010 0.008 0.008 0.008 0.009 0.010 0.009 0.009 0.009
P. undulatum 0.038 0.009 0.013 0.012 0.012 0.011 0.011 0.011 0.012 0.012 0.012 0.012 0.012
P. denticulatum 0.029 0.023 0.011 0.010 0.010 0.009 0.009 0.009 0.010 0.010 0.010 0.010 0.010
T. taxirameum (sp.117) 0.032 0.049 0.038 0.011 0.011 0.010 0.010 0.010 0.009 0.010 0.010 0.010 0.010
L. tomentosus (sp.64) 0.035 0.042 0.035 0.041 0.005 0.008 0.008 0.008 0.008 0.009 0.009 0.009 0.009
L. pseudolagurus (sp.67) 0.032 0.038 0.032 0.041 0.010 0.007 0.007 0.007 0.008 0.008 0.008 0.008 0.008
A. chlamyd. (sp.12) 0.019 0.034 0.029 0.032 0.019 0.016 0.000 0.000 0.005 0.006 0.006 0.006 0.006
A. chlamyd. (sp.171) 0.019 0.034 0.029 0.032 0.019 0.016 0.000 0.000 0.005 0.006 0.006 0.006 0.006
A. chlamyd. (sp.162) 0.019 0.034 0.029 0.032 0.019 0.016 0.000 0.000 0.005 0.006 0.006 0.006 0.006
A. auriculatum (sp.165) 0.026 0.038 0.032 0.029 0.022 0.019 0.010 0.010 0.010 0.005 0.005 0.005 0.005
A. auriculatum (sp.78) 0.029 0.042 0.035 0.032 0.026 0.022 0.013 0.013 0.013 0.010 0.000 0.000 0.000
A. auriculatum (sp.185) 0.029 0.042 0.035 0.032 0.025 0.022 0.013 0.013 0.013 0.010 0.000 0.000 0.000
A. auriculatum (sp.186) 0.029 0.042 0.035 0.032 0.025 0.022 0.013 0.013 0.013 0.010 0.000 0.000 0.000
A. auriculatum (sp.189) 0.029 0.042 0.035 0.032 0.025 0.022 0.013 0.013 0.013 0.010 0.000 0.000 0.000

Appendix 12: P-distances of the ITS1 region of the successfully sequenced specimens of Acrocladium including the outgroup, and
standard errors. P-distances are shown in the lower left triangle, standard errors in the upper right triangle. The mean p-distance for
the full dataset including the outgroup is 0.060 (SE 0.009). The mean p-distance for dataset comprising only the five taxa of
Acrocladium is 0.01 (SE 0.005). Abbreviations: A.=Acrocladium
Specimens sp. 120 P.und. P.den. sp. 117 sp. 64 sp. 67 sp. 12 sp. 171 sp. 78 sp. 185 sp. 186
Herzogiella seligeri (sp. 120) 0.015 0.015 0.023 0.016 0.017 0.017 0.017 0.017 0.018 0.017
Plagiothecium undulatum 0.056 0.006 0.022 0.013 0.015 0.016 0.016 0.015 0.016 0.015
Plagiothecium denticulatum 0.054 0.008 0.021 0.013 0.014 0.016 0.016 0.015 0.016 0.015
Taxiphyllum taxirameum (sp. 117) 0.137 0.129 0.120 0.021 0.022 0.022 0.022 0.021 0.023 0.021
Lepyrodon tomentosus (sp. 64) 0.062 0.043 0.041 0.112 0.008 0.013 0.013 0.012 0.013 0.012
Lepyrodon pseudolagurus (sp. 67) 0.074 0.055 0.049 0.124 0.016 0.015 0.015 0.014 0.015 0.014
A. chlamydophyllum (sp. 12) 0.074 0.068 0.066 0.129 0.045 0.061 0.000 0.008 0.009 0.008
A. chlamydophyllum (sp. 171) 0.074 0.068 0.066 0.129 0.045 0.061 0.000 0.008 0.009 0.008
A. auriculatum (sp. 78) 0.074 0.059 0.057 0.121 0.037 0.053 0.016 0.016 0.000 0.000
A. auriculatum (sp. 185) 0.078 0.059 0.059 0.130 0.041 0.054 0.017 0.017 0.000 0.000
A. auriculatum (sp. 186) 0.074 0.059 0.057 0.121 0.037 0.053 0.016 0.016 0.000 0.000
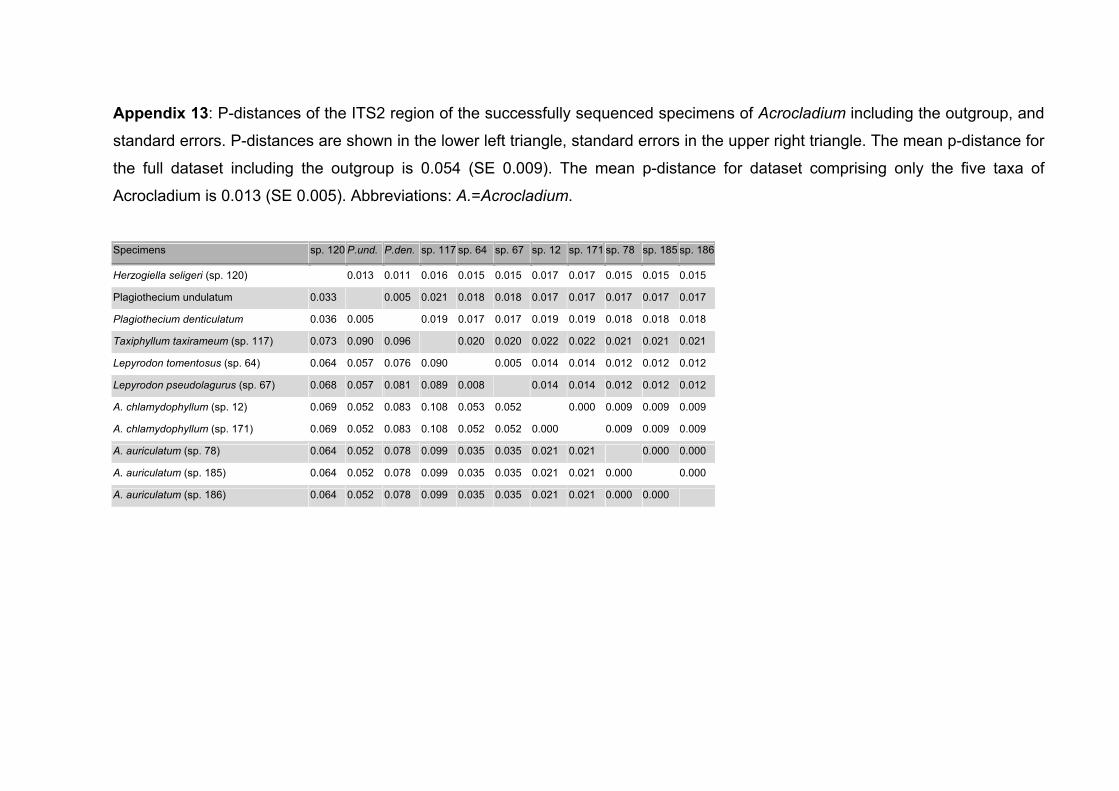
Appendix 13: P-distances of the ITS2 region of the successfully sequenced specimens of Acrocladium including the outgroup, and
standard errors. P-distances are shown in the lower left triangle, standard errors in the upper right triangle. The mean p-distance for
the full dataset including the outgroup is 0.054 (SE 0.009). The mean p-distance for dataset comprising only the five taxa of
Acrocladium is 0.013 (SE 0.005). Abbreviations: A.=Acrocladium.
Specimens sp. 120 P.und. P.den. sp. 117 sp. 64 sp. 67 sp. 12 sp. 171 sp. 78 sp. 185 sp. 186
Herzogiella seligeri (sp. 120) 0.013 0.011 0.016 0.015 0.015 0.017 0.017 0.015 0.015 0.015
Plagiothecium undulatum 0.033 0.005 0.021 0.018 0.018 0.017 0.017 0.017 0.017 0.017
Plagiothecium denticulatum 0.036 0.005 0.019 0.017 0.017 0.019 0.019 0.018 0.018 0.018
Taxiphyllum taxirameum (sp. 117) 0.073 0.090 0.096 0.020 0.020 0.022 0.022 0.021 0.021 0.021
Lepyrodon tomentosus (sp. 64) 0.064 0.057 0.076 0.090 0.005 0.014 0.014 0.012 0.012 0.012
Lepyrodon pseudolagurus (sp. 67) 0.068 0.057 0.081 0.089 0.008 0.014 0.014 0.012 0.012 0.012
A. chlamydophyllum (sp. 12) 0.069 0.052 0.083 0.108 0.053 0.052 0.000 0.009 0.009 0.009
A. chlamydophyllum (sp. 171) 0.069 0.052 0.083 0.108 0.052 0.052 0.000 0.009 0.009 0.009
A. auriculatum (sp. 78) 0.064 0.052 0.078 0.099 0.035 0.035 0.021 0.021 0.000 0.000
A. auriculatum (sp. 185) 0.064 0.052 0.078 0.099 0.035 0.035 0.021 0.021 0.000 0.000
A. auriculatum (sp. 186) 0.064 0.052 0.078 0.099 0.035 0.035 0.021 0.021 0.000 0.000

Appendix 14: P-distances of the rps4 gene of the successfully sequenced specimens of Acrocladium including the outgroup, and
standard errors. P-distances are shown in the lower left triangle, standard errors in the upper right triangle. The mean p-distance for
the full dataset including the outgroup is 0.027 (SE 0.004).
Specimens sp. 120 P.und. P.den. sp. 117 sp. 64 sp. 67 sp. 12 sp. 78
Herzogiella seligeri (sp. 120) 0.007 0.007 0.008 0.008 0.008 0.008 0.008
Plagiothecium undulatum 0.035 0.002 0.007 0.007 0.007 0.006 0.006
Plagiothecium denticulatum 0.032 0.002 0.007 0.007 0.007 0.006 0.007
Taxiphyllum taxirameum (sp. 117) 0.042 0.028 0.028 0.008 0.007 0.006 0.007
Lepyrodon tomentosus (sp. 64) 0.044 0.028 0.03 0.033 0.004 0.006 0.006
Lepyrodon pseudolagurus (sp. 67) 0.044 0.032 0.033 0.033 0.009 0.006 0.006
Acrocladium chlamydophyllum (sp. 12) 0.039 0.021 0.021 0.025 0.02 0.025 0.003
Acrocladium auriculatum (sp. 78) 0.041 0.022 0.023 0.027 0.02 0.025 0.007

Appendix 15: Catagonium species considered in this study. Species names, voucher information and the herbarium where the
voucher is deposited are listed. thirteen specimens were successfully sequenced. Accession numbers of the successfully
sequenced specimens are listed in Appendix 1 in alphabetical order.
No. taxon Country/island
of origin collection locality habitat altitude grid Voucher
label herbarium
21 Catagonium nitens (Brid.) Card. ssp. nitens
Chile Reg. Magallanes , NW Punta Arenas, Reserva Forestal Magallanes
Nothofagus pumilio- forest
350-430 m. 53° 09´ 10´´ S, 71° 01´ 34.9´´ W
Rolf Blöcher No. 1/14.2.01
J.-P. Frahm, Bonn
23 Catagonium nitens (Brid.) Cardot cf. ssp. nitens
New Zealand South Island, Nelson Lakes National Park, St. Arnaud, St. Arnaud Range track
Nothofagus fusca forest, in cave
800 m 41° 49’ S, 172° 52’ E BRYO AUSTRAL J.-P. Frahm no. 27-8
J.-P. Frahm, Bonn
25 Catagonium nitens (Brid.) Card. var. myurum (Card. & Thér.) Lin
Chile X. Región, P.N. Villarica, volcano Villarica, S Pucón, road to skiing area
on soil 1420 m 39° 23’ 50.3’’ S, 71° 58’ 3.9’’ W
BRYO AUSTRAL W. Frey & F. Schaumann no. 01-223
W. Frey, Berlin
59 Catagonium nitens (Brid.) Card. ssp. maritimum (Hook.) Lin
South Africa Cape Prov., near Fairy Knowe Railway Station
on rock wall 34° 03’ S, 23° 03’ E (Knysna)
S. M. Perold 936
Helsinki, Finland
61 Catagonium emarginatum Lin Brazil Minas Gerais, Mt. Itatiaia N.P., rain forest at Brejo da Lapa
on soil 2130 m 22° 22’ S, 44° 41’ W leg. A. Schäfer-Verwimp det. A. Schäfer-Verwimp & B. H. Allen 11193
Helsinki, Finland
63 Catagonium brevicaudatum C. Müll. ex Broth.
Columbia Departamento de Cundinamarca, Municipio de El Charquito, Salto del Tequendama, Portero al lado del Río Bogotá
rock 2420 m ca. 04° 34’ N, 74° 17’ W Flora de Colombia Edgar Linares C. & Steven Churchill 3821
Helsinki
80 Catagonium nitidum (Hook. f. & Wilson) Broth.
Argentina Falkland Islands, Weddell Island, rock dome on summit of peak NE of Mt. Weddell
on vegetation hanging over rock
approx. 350 m UTM Grid 21F TC 2941 John J. Engel no. 3368 det. S. H. Lin 1981
Bot. Mus. Berlin
91 Catagonium nitens (Brid.) Card. ssp. maritimum (Hook.) Lin
South Africa Cape Prov., Gouna Forest Reserve, N of Knysna
on earthwall next to road
33° 58’ S, 23° 02’ E (Gouna Forest Station)
S. M. Perold 902 det. R. E. Magill 1988
Helsinki, Finland

Appendix 15: continued No. taxon Country/island
of origin collection locality habitat altitude grid Voucher
label herbarium
92 Catagonium brevicaudatum C. Müll. ex Broth.
Columbia Department of Caldas, municipality Villamaria, road from Manizales to Bogotá
3920 m 04° 55’ N, 75° 21’ W Steven P. Churchill, Alba Luz Arbeláez, Wilson Rengifo no. 16297
Helsinki, Finland
236 Catagonium nitidum (Hook. f. & Wilson) Broth.
Chile P.N. Torres del Paine, eastern border of ‘Glaciar Grey’ at Campamento Paso
acidic rock approx. 600 m 50° 57’ S, 73° 15’ W Frank Müller C 1501
Frank Müller, Dresden
287 Catagonium nitens (Brid.) Card. ssp. nitens
Australia Victoria, Tarra National Park, 27 km S of Traralgon
Nothofagus roots ans track cutting
450 m 38° 27’ S, 146° 32’ E MUSCI AUSTRALASIAE EXSICCATIH. Streimann 50457
J.-P. Frahm, Bonn
288 Catagonium nitens (Brid.) Cardot cf. ssp.nitens
Chile X. Región de los Lagos, Osorno, between Lagos, Parque Nacional Puyehue Salto del Indio, Salto de la Princesa, RN 215
Trail in primary forest, waterfalls, rocks, small cave
40° 40’ 7.3’’ S, 72° 10’ 20.1’’ W
Holz & Franzaring CH 00-152 det. W. R. Buck
J.-P. Frahm, Bonn
289 Catagonium nitens (Brid.) Card. ssp. nitens
Chile IX. Región, P.N. Conquillio, path from Laguna Conquillio to Sierra Nevada
on soil 1200-1400 m 38° 39’ 2.3’’ S, 71° 37’ 9.5’’ W
BRYO AUSTRAL Rolf Blöcher no. 46
J.-P. Frahm, Bonn
18 Catagonium brevicaudatum C. Müll. ex Broth.
Venezuela Mérida, Teleférico, Loma Redonda
rock fissures 4100 m J.-P. Frahm febuary 1997
J.-P. Frahm, Bonn
19 Catagonium emarginatum Lin Bolivia Departmento La Paz, Prov. Inquisivi, Quime-Molinos road, 3 km W of Quime, waterfalls ‘Cascadas de Naranjani’
humus on dirt bank
3490-3570 m 16° 39’ S, 67° 14’ W Marko Lewis 87635
J.-P. Frahm, Bonn
20 Catagonium nitidum (Hook.fil. & Wils.) Broth.
Argentina Tierra del Fuego, Bahía buen Suceso, slope south of Monte Béccar
Nothofagus forest
200-300 m 54° 47’ S, 65° 15’ W leg. Matteri-Schiavone det. Matteri/86 CM no. 3622
J.-P. Frahm, Bonn
22 Catagonium nitens (Brid.) Card. ssp. nitens
Tanzania S-Uluguru Mts. Kilangala, top of the main ridge SE of Bunduki
epiphytic, on tree fern stem
1750-1950 m Flora of Tanzania leg. T. Pócs & P. Mwanjabe det. T. Pócs 6464/BI
J.-P. Frahm, Bonn
24 Catagonium nitens (Brid.) Card. ssp. maritimum (Hook.) Lin
South Africa Cape: Diep River picnic area, N of Buffels Neck Forest Station, on hills above road, just N of Kruis Valley
dry forest grid ref. 3323 CC South Africa R.E. Magill 5979
J.-P. Frahm, Bonn

Appendix 15 continued No. taxon Country/island
of origin collection locality habitat altitude grid Voucher
label herbarium
92 Catagonium brevicaudatum C. Müll. ex Broth.
Columbia Departamento de Caldas, Municipio de Villamaria, road Manizales-Bogotá, near the road leading to Nevado del Ruiz (km 213), wasteland
on the embankment
3920 m ca. 4° 55’ N, 75° 21’ W Flora de Colombia Steven P. Churchill, Alba Luz Arbeláez, Wilson Rengifo no. 16297
Helsinki
93 Catagonium emarginatum Lin Peru between Marcapata and Achubamba, Prov. Quispicanchis, Dept. Cuzco
on moist rocks ca. 2700 m Bryophyta Selecta Exsiccata leg. H. Inoue det. H. Deguchi (C. nitidum) revised Shan-Hsiung Lin 1989 no. 931
Helsinki
94 Catagonium nitens (Brid.) Card. Tanzania University Forest Reserve of Mazumbai, West Usambara Mts.
on moist soil 1620 m Bryophyta Selecta Exsiccata leg. T. Pócs, E. W. Jones & Mrs. Tanner det. T. Pócs 629
Berlin
R.N. = Reserva Nacional (Nature Reserve); P.N. = Parque Nacional (National Park) ; N.P. = National Park

Appendix 16: P-distances of the ITS1 region of the successfully sequenced specimens of Catagonium including the outgroup, and standard errors. P-distances are shown in the lower left triangle, standard errors in the upper right triangle. The mean p-distance for the full dataset including the outgroup is 0.034 (SE 0.006). The mean p-distance for dataset comprising only the taxa of Catagonium is 0.016 (SE 0.005).Abbreviations: Acro.=Acrocladium, Cat.=Catagonium, Lep.=Lepyrodon Specimens sp. 67 sp. 64 sp. 12 sp. 78 P.und. P.den. I.mue. H.sel. sp. 92 sp. 63 sp. 61 sp. 91 sp. 59 sp. 289 sp. 21 sp. 288 sp. 287 sp. 23 sp. 25 sp. 236 sp. 80
Lep. pseudolagurus (sp. 67) 0.008 0.015 0.014 0.015 0.014 0.015 0.017 0.014 0.014 0.014 0.015 0.015 0.013 0.012 0.013 0.013 0.014 0.014 0.013 0.014
Lep. tomentosus (sp. 64) 0.016 0.013 0.012 0.013 0.013 0.013 0.016 0.012 0.012 0.011 0.013 0.013 0.011 0.010 0.011 0.011 0.011 0.011 0.011 0.012
Acro. chlamydophyllum (sp. 12) 0.061 0.045 0.008 0.016 0.016 0.016 0.017 0.015 0.015 0.015 0.016 0.016 0.014 0.014 0.014 0.014 0.015 0.015 0.014 0.015
Acro. auriculatum (sp. 78) 0.053 0.037 0.016 0.015 0.015 0.015 0.017 0.014 0.014 0.014 0.015 0.015 0.013 0.013 0.013 0.013 0.014 0.014 0.013 0.014
Plagiothecium undulatum 0.055 0.043 0.068 0.059 0.006 0.013 0.015 0.013 0.013 0.013 0.013 0.013 0.010 0.011 0.010 0.012 0.013 0.011 0.010 0.012
Plagiothecium denticulatum 0.049 0.041 0.066 0.057 0.008 0.012 0.015 0.013 0.013 0.012 0.013 0.013 0.010 0.011 0.010 0.011 0.012 0.011 0.010 0.012
Isopterygiopsis muelleriana 0.061 0.045 0.069 0.061 0.038 0.037 0.016 0.011 0.011 0.011 0.013 0.013 0.010 0.011 0.010 0.011 0.011 0.011 0.010 0.011
Herzogiella seligeri 0.074 0.062 0.074 0.074 0.056 0.054 0.066 0.014 0.014 0.014 0.013 0.013 0.013 0.014 0.013 0.014 0.014 0.013 0.013 0.014
Cat. brevicaudatum (sp. 92) 0.052 0.037 0.057 0.049 0.043 0.041 0.033 0.049 0.000 0.004 0.011 0.011 0.008 0.008 0.008 0.008 0.009 0.009 0.008 0.010
Cat. brevicaudatum (sp. 63) 0.052 0.037 0.057 0.049 0.043 0.041 0.033 0.049 0.000 0.004 0.011 0.011 0.008 0.008 0.008 0.008 0.009 0.009 0.008 0.010
Cat. emarginatum (sp. 61) 0.049 0.033 0.057 0.049 0.038 0.037 0.029 0.053 0.004 0.004 0.011 0.011 0.007 0.007 0.007 0.007 0.008 0.008 0.007 0.009
Cat. nitens (sp. 91) 0.061 0.045 0.069 0.061 0.042 0.041 0.040 0.045 0.028 0.028 0.032 0.000 0.009 0.011 0.009 0.011 0.011 0.010 0.009 0.011
Cat. nitens (sp. 59) 0.061 0.045 0.069 0.061 0.042 0.041 0.040 0.045 0.028 0.028 0.032 0.000 0.009 0.011 0.009 0.011 0.011 0.010 0.009 0.011
Cat. nitens (sp. 289) 0.044 0.028 0.053 0.045 0.026 0.025 0.024 0.041 0.016 0.016 0.012 0.020 0.020 0.006 0.000 0.006 0.007 0.004 0.000 0.006
Cat. nitens (sp. 21) 0.040 0.024 0.049 0.041 0.030 0.029 0.029 0.049 0.016 0.016 0.012 0.028 0.028 0.008 0.006 0.006 0.007 0.007 0.006 0.008
Cat. nitens (sp. 288) 0.044 0.028 0.053 0.045 0.026 0.025 0.024 0.041 0.016 0.016 0.012 0.020 0.020 0.000 0.008 0.006 0.007 0.004 0.000 0.006
Cat. nitens (sp. 287) 0.044 0.028 0.053 0.045 0.034 0.033 0.033 0.049 0.016 0.016 0.012 0.028 0.028 0.008 0.008 0.008 0.007 0.007 0.006 0.008
Cat. nitens (sp. 23) 0.048 0.033 0.057 0.049 0.038 0.037 0.029 0.053 0.020 0.020 0.016 0.032 0.032 0.012 0.012 0.012 0.012 0.008 0.007 0.009
Cat. nitens (sp. 25) 0.048 0.033 0.057 0.049 0.030 0.029 0.029 0.045 0.020 0.020 0.016 0.024 0.024 0.004 0.012 0.004 0.012 0.016 0.004 0.007
Cat. nitidum (sp. 236) 0.044 0.028 0.053 0.045 0.026 0.025 0.024 0.041 0.016 0.016 0.012 0.020 0.020 0.000 0.008 0.000 0.008 0.012 0.004 0.006
Cat. nitidum (sp. 80) 0.053 0.037 0.062 0.053 0.034 0.033 0.033 0.050 0.024 0.024 0.020 0.029 0.029 0.008 0.016 0.008 0.016 0.020 0.012 0.008

Appendix 17: P-distances of the ITS2 region of the successfully sequenced specimens of Catagonium including the outgroup, and standard errors. P-distances are shown in the lower left triangle, standard errors in the upper right triangle. The mean p-distance for the full dataset including the outgroup is 0.050 (SE 0.008). The mean p-distance for dataset comprising only the taxa of Catagonium is 0.026 (SE 0.006). Abbreviations: Acro.=Acrocladium, Cat.=Catagonium Specimens sp. 67 sp. 64 sp. 12 sp. 78 P.und. P.den. I.mue. H.sel. sp. 92 sp. 63 sp. 61 sp. 91 sp. 59 sp. 289 sp. 21 sp. 288 sp. 287 sp. 23 sp. 25 sp. 236
Lepyrodon pseudolagurus (sp. 67) 0.005 0.014 0.012 0.017 0.018 0.015 0.016 0.015 0.016 0.015 0.018 0.018 0.018 0.017 0.018 0.018 0.018 0.017 0.017
Lepyrodon tomentosus (sp. 64) 0.008 0.015 0.012 0.017 0.018 0.015 0.016 0.015 0.016 0.016 0.018 0.018 0.018 0.017 0.018 0.018 0.017 0.017 0.017
Acro. chlamydophyllum (sp. 12) 0.052 0.053 0.009 0.016 0.018 0.017 0.017 0.016 0.017 0.017 0.018 0.018 0.018 0.018 0.018 0.019 0.019 0.018 0.018
Acro. auriculatum (sp. 78) 0.035 0.035 0.021 0.017 0.018 0.017 0.016 0.016 0.016 0.016 0.018 0.018 0.018 0.018 0.018 0.018 0.018 0.018 0.018
Plagiothecium undulatum 0.057 0.057 0.052 0.052 0.005 0.016 0.013 0.013 0.014 0.015 0.016 0.016 0.013 0.014 0.013 0.013 0.013 0.013 0.013
Plagiothecium denticulatum 0.081 0.076 0.082 0.077 0.005 0.014 0.012 0.013 0.014 0.015 0.015 0.015 0.013 0.014 0.013 0.013 0.013 0.013 0.013
Isopterygiopsis muelleriana 0.064 0.064 0.064 0.068 0.044 0.052 0.011 0.014 0.014 0.015 0.016 0.016 0.016 0.017 0.016 0.016 0.016 0.016 0.016
Herzogiella seligeri 0.068 0.064 0.068 0.063 0.033 0.036 0.035 0.012 0.012 0.014 0.015 0.015 0.015 0.015 0.015 0.015 0.015 0.015 0.015
Cat. brevicaudatum (sp. 92) 0.061 0.061 0.066 0.062 0.034 0.042 0.053 0.037 0.003 0.007 0.009 0.009 0.009 0.010 0.009 0.010 0.009 0.009 0.009
Cat. brevicaudatum (sp. 63) 0.065 0.065 0.071 0.066 0.04 0.046 0.057 0.041 0.003 0.008 0.010 0.010 0.010 0.011 0.010 0.010 0.010 0.010 0.010
Cat. emarginatum (sp. 61) 0.061 0.069 0.075 0.062 0.04 0.058 0.07 0.057 0.017 0.021 0.011 0.011 0.012 0.012 0.012 0.012 0.012 0.012 0.012
Cat. nitens (sp. 91) 0.085 0.085 0.088 0.084 0.052 0.058 0.066 0.057 0.028 0.031 0.042 0.000 0.009 0.011 0.009 0.011 0.010 0.010 0.010
Cat. nitens (sp. 59) 0.085 0.085 0.088 0.084 0.052 0.058 0.066 0.057 0.028 0.031 0.042 0.000 0.009 0.011 0.009 0.011 0.010 0.010 0.010
Cat. nitens (sp. 289) 0.081 0.081 0.084 0.079 0.034 0.042 0.07 0.057 0.028 0.032 0.046 0.031 0.031 0.008 0.000 0.006 0.006 0.006 0.006
Cat. nitens (sp. 21) 0.082 0.089 0.093 0.088 0.04 0.054 0.082 0.07 0.035 0.039 0.046 0.044 0.044 0.020 0.008 0.008 0.007 0.004 0.004
Cat. nitens (sp. 288) 0.081 0.081 0.084 0.079 0.034 0.042 0.07 0.057 0.028 0.032 0.046 0.031 0.031 0.000 0.020 0.006 0.006 0.006 0.006
Cat. nitens (sp. 287) 0.085 0.085 0.088 0.084 0.034 0.042 0.07 0.057 0.028 0.032 0.046 0.037 0.037 0.014 0.02 0.013 0.003 0.006 0.006
Cat. nitens (sp. 23) 0.081 0.081 0.088 0.084 0.034 0.042 0.07 0.057 0.025 0.028 0.042 0.034 0.034 0.01 0.017 0.010 0.003 0.006 0.006
Cat. nitens (sp. 25) 0.081 0.081 0.088 0.084 0.034 0.046 0.074 0.061 0.028 0.032 0.046 0.037 0.037 0.013 0.007 0.013 0.013 0.010 0.000
Cat. nitidum (sp. 236) 0.081 0.081 0.088 0.084 0.034 0.046 0.074 0.061 0.028 0.032 0.046 0.037 0.037 0.013 0.007 0.013 0.013 0.010 0.000