Monografie 160815 korr - mediaTUM · ACKNOWLEDGEMENTS ACKNOWLEDGEMENTS This thesis is the result of...
148
TECHNISCHE UNIVERSITÄT MÜNCHEN TUM SCHOOL OF MANAGEMENT LEHRSTUHL FÜR SPORT- UND GESUNDHEITSMANAGEMENT The impact of mega-sport events on host residents’ quality of life Rebecca Pfitzner Vollständiger Abdruck der von der Fakultät für Wirtschaftswissenschaften der Technischen Universität München zur Erlangung des akademischen Grades eines Doktors der Wirtschaftswissenschaften (Dr. rer. pol.) genehmigten Dissertation. Vorsitzender: Univ.-Prof. Dr. Frank-Martin Belz Prüfer der Dissertation: 1. Univ.-Prof. Dr. Jörg Königstorfer 2. Univ.-Prof. Jutta Roosen, Ph.D. Die Dissertation wurde am 08.06.2016 bei der Technischen Universität München eingereicht und durch die Fakultät für Wirtschaftswissenschaften am 15.07.2016 angenommen.
Transcript of Monografie 160815 korr - mediaTUM · ACKNOWLEDGEMENTS ACKNOWLEDGEMENTS This thesis is the result of...
TECHNISCHE UNIVERSITÄT MÜNCHEN
TUM SCHOOL OF MANAGEMENT
LEHRSTUHL FÜR SPORT- UND GESUNDHEITSMANAGEMENT
The impact of mega-sport events on host residents’
quality of life
Rebecca Pfitzner
Vollständiger Abdruck der von der Fakultät für Wirtschaftswissenschaften der
Technischen Universität München zur Erlangung des akademischen Grades eines
Doktors der Wirtschaftswissenschaften (Dr. rer. pol.) genehmigten Dissertation.
Vorsitzender: Univ.-Prof. Dr. Frank-Martin Belz
Prüfer der Dissertation: 1. Univ.-Prof. Dr. Jörg Königstorfer
2. Univ.-Prof. Jutta Roosen, Ph.D.
Die Dissertation wurde am 08.06.2016 bei der Technischen Universität München
eingereicht und durch die Fakultät für Wirtschaftswissenschaften am 15.07.2016
angenommen.

ACKNOWLEDGEMENTS
ACKNOWLEDGEMENTS
This thesis is the result of my post-graduate research at the Chair of Sport
and Health Management from 2013 to 2016. First and foremost, I would like
to express my gratitude to my Ph.D. supervisor Prof. Dr. Jörg Königstorfer for
the support, the close collaboration, and for giving me the opportunity to
pursue a Ph.D. at the Department of Sport and Health Management.
Especially, I appreciated your fast responses and feedback to all the
questions that I had. I also thank Prof. Dr. Jutta Roosen to be the second
advisor and Prof. Dr. Frank-Martin Belz to chair the board of examiners.
Further, I would like to thank my former and present colleagues. The great
team spirit and organizational climate were the reason work was enjoyable
every day. We had a great time abroad and a good cooperation in teaching.
Thank you for giving constructive feedback, having an open ear and the great
ideas.
Above all, I am deeply grateful to my family for their constant support,
motivation and encouragement. I thank my parents for my fulfilled and
protected childhood, the unconditional love, and encouragement to always
listen to my heart and to follow my own path. Thank you for always keeping
me centered and laughing. Thanks to my sister for always being there,
supporting me, and being my best friend for life.
I am deeply grateful to my partner, for his patience, his love and for inspiration
to think beyond familiar boundaries. Thank you for being a part of my life.
Rebecca Pfitzner
May 2016
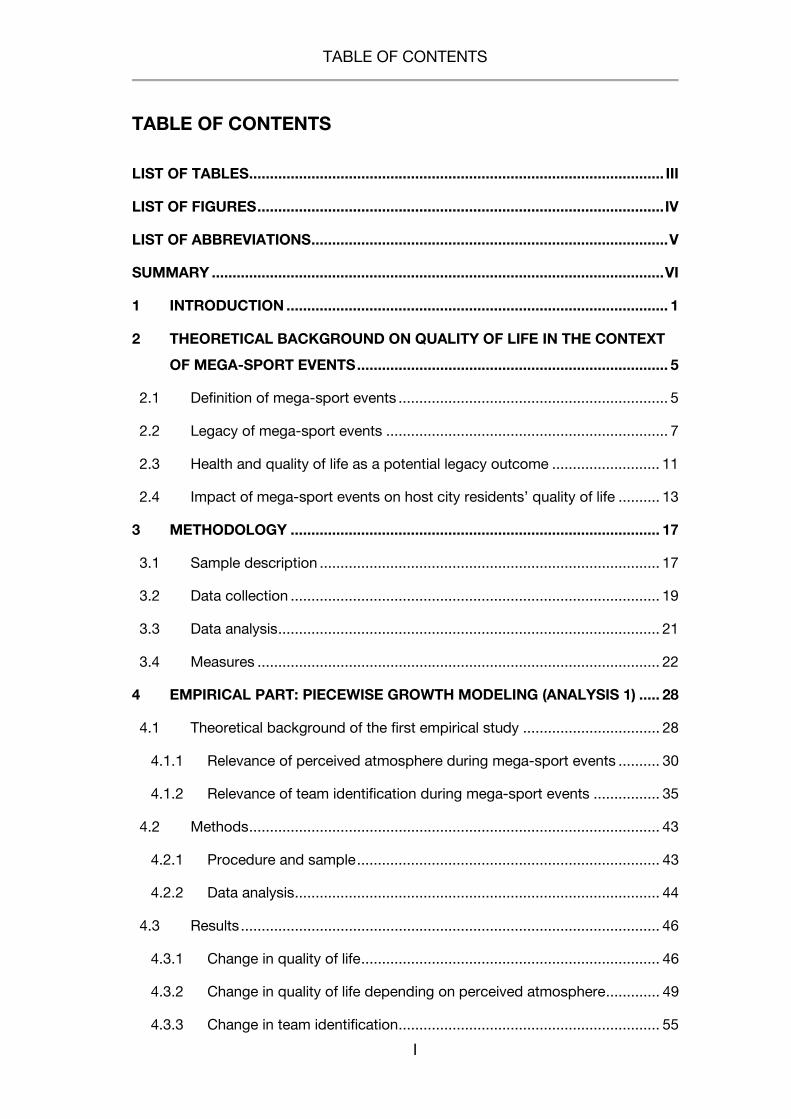
TABLE OF CONTENTS
I
TABLE OF CONTENTS
LIST OF TABLES .................................................................................................... III
LIST OF FIGURES .................................................................................................. IV
LIST OF ABBREVIATIONS ...................................................................................... V
SUMMARY ............................................................................................................. VI
1 INTRODUCTION ............................................................................................ 1
2 THEORETICAL BACKGROUND ON QUALITY OF LIFE IN THE CONTEXT
OF MEGA-SPORT EVENTS ........................................................................... 5
2.1 Definition of mega-sport events ................................................................. 5
2.2 Legacy of mega-sport events .................................................................... 7
2.3 Health and quality of life as a potential legacy outcome .......................... 11
2.4 Impact of mega-sport events on host city residents’ quality of life .......... 13
3 METHODOLOGY ......................................................................................... 17
3.1 Sample description .................................................................................. 17
3.2 Data collection ......................................................................................... 19
3.3 Data analysis ............................................................................................ 21
3.4 Measures ................................................................................................. 22
4 EMPIRICAL PART: PIECEWISE GROWTH MODELING (ANALYSIS 1) ..... 28
4.1 Theoretical background of the first empirical study ................................. 28
4.1.1 Relevance of perceived atmosphere during mega-sport events .......... 30
4.1.2 Relevance of team identification during mega-sport events ................ 35
4.2 Methods ................................................................................................... 43
4.2.1 Procedure and sample ......................................................................... 43
4.2.2 Data analysis ........................................................................................ 44
4.3 Results ..................................................................................................... 46
4.3.1 Change in quality of life ........................................................................ 46
4.3.2 Change in quality of life depending on perceived atmosphere ............. 49
4.3.3 Change in team identification ............................................................... 55
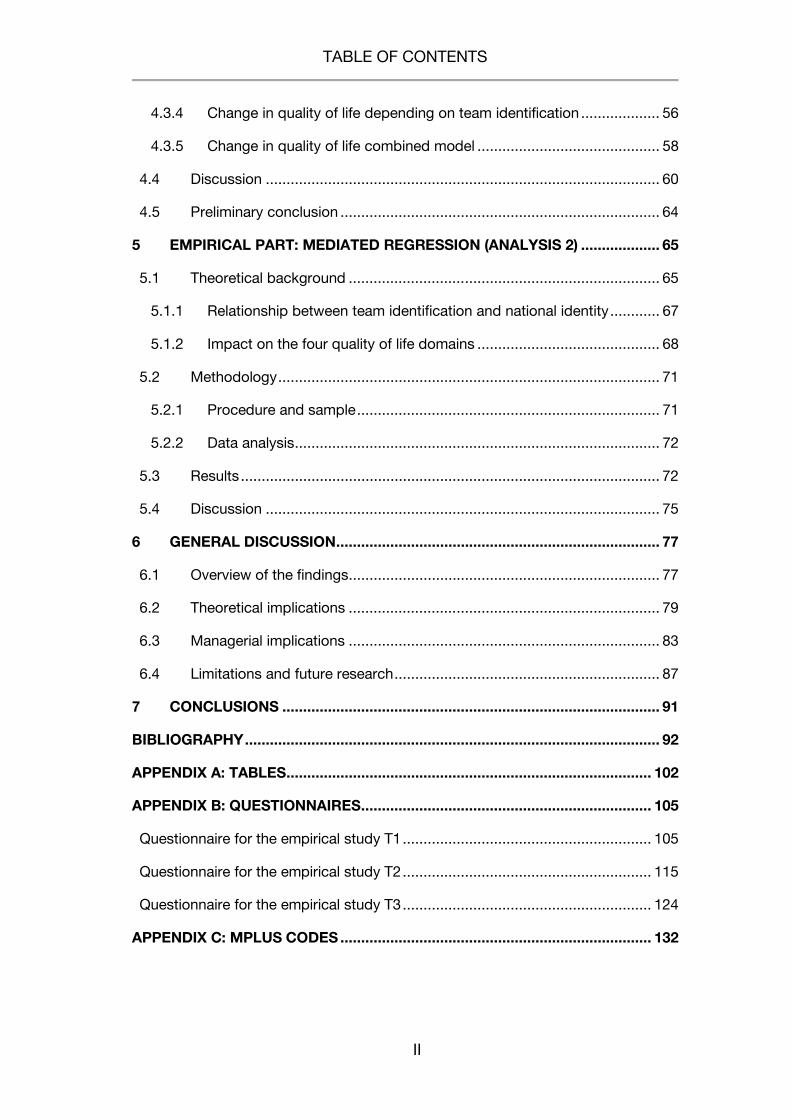
TABLE OF CONTENTS
II
4.3.4 Change in quality of life depending on team identification ................... 56
4.3.5 Change in quality of life combined model ............................................ 58
4.4 Discussion ............................................................................................... 60
4.5 Preliminary conclusion ............................................................................. 64
5 EMPIRICAL PART: MEDIATED REGRESSION (ANALYSIS 2) ................... 65
5.1 Theoretical background ........................................................................... 65
5.1.1 Relationship between team identification and national identity ............ 67
5.1.2 Impact on the four quality of life domains ............................................ 68
5.2 Methodology ............................................................................................ 71
5.2.1 Procedure and sample ......................................................................... 71
5.2.2 Data analysis ........................................................................................ 72
5.3 Results ..................................................................................................... 72
5.4 Discussion ............................................................................................... 75
6 GENERAL DISCUSSION .............................................................................. 77
6.1 Overview of the findings ........................................................................... 77
6.2 Theoretical implications ........................................................................... 79
6.3 Managerial implications ........................................................................... 83
6.4 Limitations and future research ................................................................ 87
7 CONCLUSIONS ........................................................................................... 91
BIBLIOGRAPHY .................................................................................................... 92
APPENDIX A: TABLES ........................................................................................ 102
APPENDIX B: QUESTIONNAIRES ...................................................................... 105
Questionnaire for the empirical study T1 ............................................................ 105
Questionnaire for the empirical study T2 ............................................................ 115
Questionnaire for the empirical study T3 ............................................................ 124
APPENDIX C: MPLUS CODES ........................................................................... 132
LIST OF TABLES
III
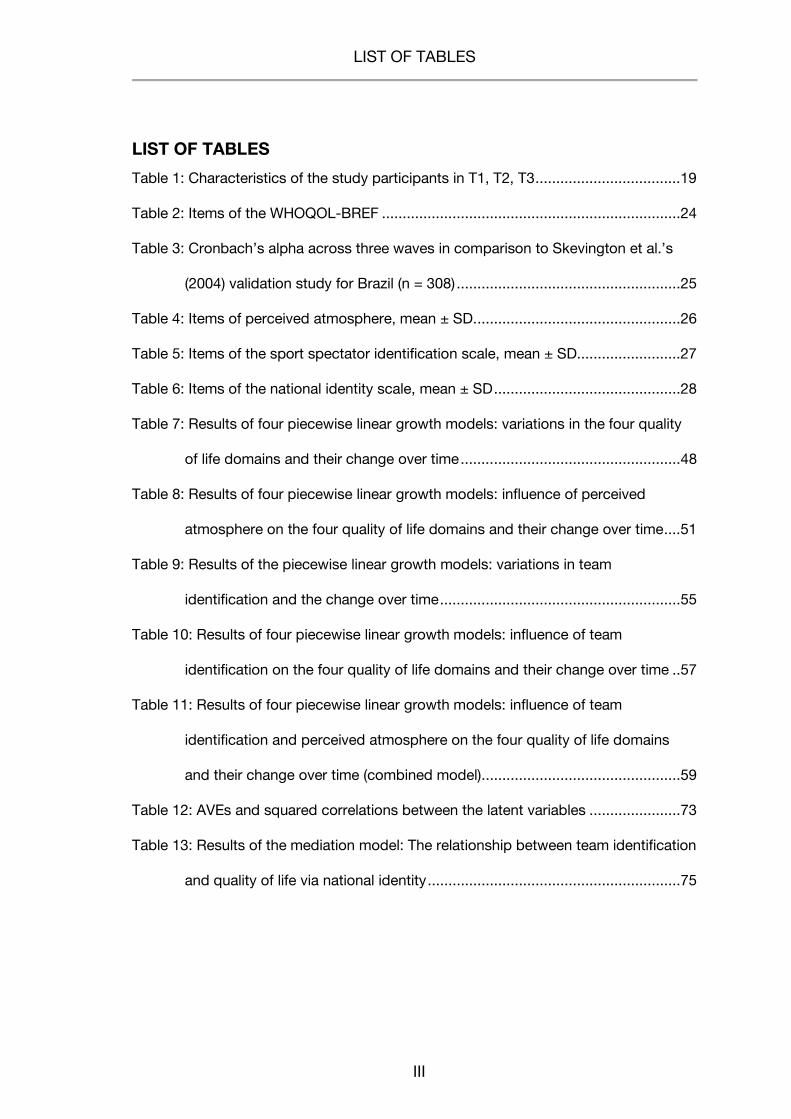
LIST OF TABLES
Table 1: Characteristics of the study participants in T1, T2, T3 ...................................19
Table 2: Items of the WHOQOL-BREF ........................................................................24
Table 3: Cronbach’s alpha across three waves in comparison to Skevington et al.’s
(2004) validation study for Brazil (n = 308) ......................................................25
Table 4: Items of perceived atmosphere, mean ± SD ..................................................26
Table 5: Items of the sport spectator identification scale, mean ± SD.........................27
Table 6: Items of the national identity scale, mean ± SD .............................................28
Table 7: Results of four piecewise linear growth models: variations in the four quality
of life domains and their change over time .....................................................48
Table 8: Results of four piecewise linear growth models: influence of perceived
atmosphere on the four quality of life domains and their change over time ....51
Table 9: Results of the piecewise linear growth models: variations in team
identification and the change over time ..........................................................55
Table 10: Results of four piecewise linear growth models: influence of team
identification on the four quality of life domains and their change over time ..57
Table 11: Results of four piecewise linear growth models: influence of team
identification and perceived atmosphere on the four quality of life domains
and their change over time (combined model) ................................................59
Table 12: AVEs and squared correlations between the latent variables ......................73
Table 13: Results of the mediation model: The relationship between team identification
and quality of life via national identity .............................................................75
LIST OF FIGURES
IV
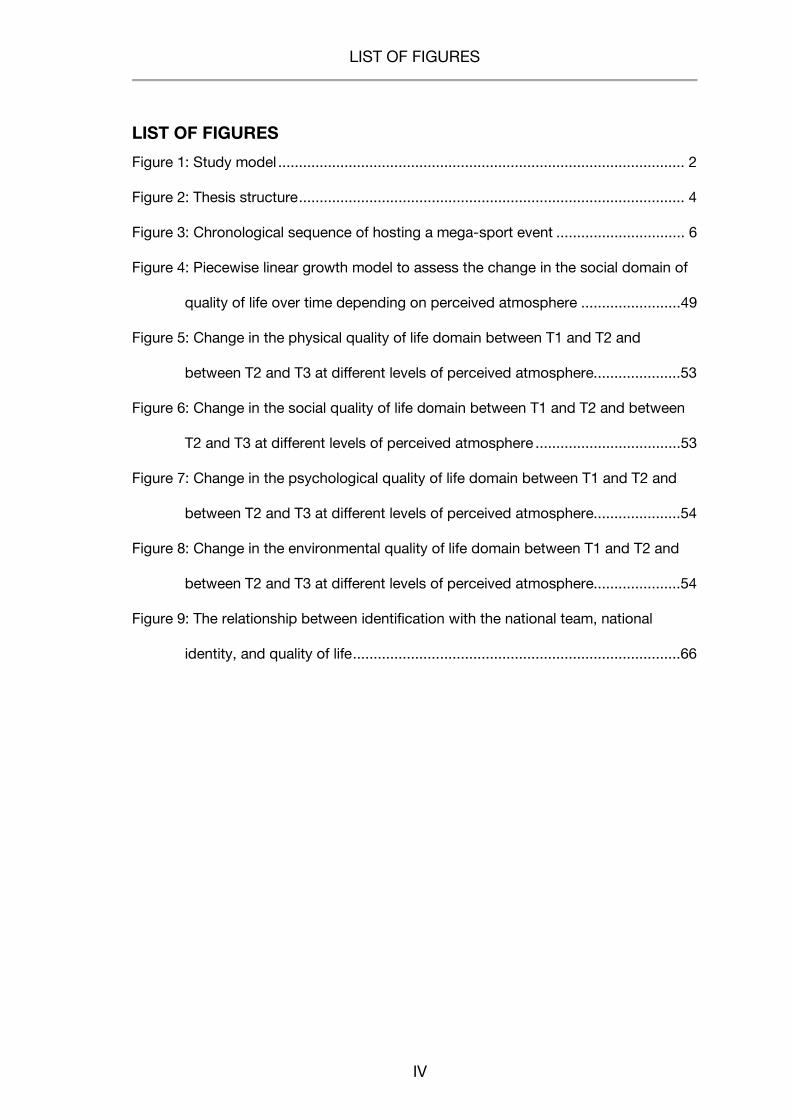
LIST OF FIGURES
Figure 1: Study model .................................................................................................. 2
Figure 2: Thesis structure ............................................................................................. 4
Figure 3: Chronological sequence of hosting a mega-sport event ............................... 6
Figure 4: Piecewise linear growth model to assess the change in the social domain of
quality of life over time depending on perceived atmosphere ........................49
Figure 5: Change in the physical quality of life domain between T1 and T2 and
between T2 and T3 at different levels of perceived atmosphere.....................53
Figure 6: Change in the social quality of life domain between T1 and T2 and between
T2 and T3 at different levels of perceived atmosphere ...................................53
Figure 7: Change in the psychological quality of life domain between T1 and T2 and
between T2 and T3 at different levels of perceived atmosphere.....................54
Figure 8: Change in the environmental quality of life domain between T1 and T2 and
between T2 and T3 at different levels of perceived atmosphere.....................54
Figure 9: The relationship between identification with the national team, national
identity, and quality of life ...............................................................................66
LIST OF ABBREVIATIONS
V
LIST OF ABBREVIATIONS
CFA Confirmatory factor analysis
FIFA Fédération Internationale de Football Association
SPSS Statistical Package for the Social Sciences
UEFA Union des Associations Européennes de Football
WHO World Health Organization
WHOQOL-BREF World Health Organization Quality of Life-BREF
SUMMARY
VI
SUMMARY
This thesis is devoted to an important, but previously under-researched topic:
the impact of hosting a mega-sport event on residents’ health outcomes. Sport
events are per definition mega-sport events if they attract a large international
audience. Even though these events are always hosted for a limited time over a
short period, they entail significant financial cost. For this reason, mostly
tangible outcomes such as economic impacts of event hosting are investigated.
The authors of a systematic review concluded that in the majority of the few
studies, which focus on intangible outcomes from mega-sport events such as
the health impact, the quality of the research is poor. This research focuses on
short-term impacts of hosting an event, assuming that emotions caused by
hosting an event can impact residents’ short-term health outcomes, e.g., being
proud of the national team and of the event hosting, or feeling that the city is
important due to the media attention and a growing number of international
visitors. These effects are considered to be short-term and, thus, they may not
be considered as “legacies” of mega-sport events, the latter meaning that these
effects are long-lasting (i.e., remaining for years after event hosting).
The aim of this thesis is to investigate the change in residents’ health outcomes
over the course of the 2014 FIFA World Cup as a short-term impact of the event
hosting, and the development three months after the event. Particularly, the
thesis addresses the following research questions: Do residents in a host city of
a mega-sport event experience a change in their short-term health outcomes per
se? Do contextual factors matter in the change of residents’ quality of life?
SUMMARY
VII
The questions are approached using three theories: First, Social Identity Theory
is used to explain the processes of inter-individual interactions with like-minded
individuals (i.e., fans) during event hosting. The next theory is Nation Building
Theory, which provides the basis to explain what happens to individuals when
interacting with others on a national level (Tilly, 1990). Lastly, Mehrabian and
Russell’s (1974) environmental psychology behavioral model is used to explain
the possible changes in quality of life impacted by the perceived event
atmosphere.
The data were collected from residents of Rio de Janeiro over three waves: at
the beginning of the 2014 FIFA World Cup (T1), at the end of the event (T2), and
three months after the end of the event (T3). The dependent variable, individuals’
health outcomes, was operationalized as the subjective evaluation of an
individual’s health status, using the twenty-four item scale WHOQOL-BREF
(WHOQOL Group, 1998). The scale measures quality of life, as a
multidimensional construct, on four dimensions: physical, social, psychological
and environmental quality of life. The questionnaire was distributed in Brazilian
Portuguese and scales were translated, when necessary.
To answer the research questions and to enhance theoretical and practical
knowledge, results are presented in two empirical parts. The results of the first
data analysis consist of longitudinal data analyses that examine the change in
quality of life over the course of the event. The data are analyzed applying
piecewise growth modeling in Mplus. In the second data analysis, data are
analyzed via mediated regression analyses, to gain further insights into the
mechanism behind team identification, national identity and its effect on the four
SUMMARY
VIII
quality of life domains. These analyses are performed using the PROCESS
macro in SPSS.
As predicted, the results revealed that there is no change in quality of life per se.
A next step in the analysis was to analyze the effect of two contextual factors,
which are perceived atmosphere and team identification. There was a significant
effect of perceived atmosphere on the change in the four quality of life
dimensions during the event, meaning the higher an individual perceived the
atmosphere, the higher the change in quality of life from the beginning to the end
of the event. The effect of team identification on quality of life was only
significant at the end of the event, while it was non-significant for the change in
quality of life from T1 to T2 and from T2 to T3. To analyze, which factor had the
greater impact on the construct and the change in quality of life, piecewise
growth models were measured, including the two factors simultaneously. The
results showed that the effect of perceived atmosphere on the change of quality
of life remained significant, while the effect of team identification on the construct
vanished. The second aim was to further investigate team identification and to
explain the mechanism behind team identification on quality of life. Therefore,
the mediated regression analysis was conducted to test if the effect of team
identification on quality of life is mediated via national identity. The indirect effect
of team identification on quality of life was significant for the four quality of life
domains. Thus, being identified with the national team increased national
identity, which in turn resulted in positive quality of life outcomes in all domains.
The contextual factor perceived atmosphere had an impact on the change in
quality of life from the beginning to the end of the event, while the effect for team
SUMMARY
IX
identification on the construct of quality of life was only significant when
mediated by national identity.
This is the first research that used a longitudinal study design and growth
modeling to analyze the health impact of hosting a mega-sport event with the
same individuals. This thesis uses a multidimensional health approach by
collecting data via the WHOQOL-BREF, covering four dimensions of quality of
life based on the WHO’s holistic approach on health. To ensure consistency and
comparability of impact studies, and to have a holistic assessment of the health
impact, the use of this scale should be considered in future impact studies.
Data were only collected in one of the 12 host cities, and the sample was well-
educated, therefore generalizability of the results may be limited. Future studies
may try to reach less-educated population groups (e.g., people residing in
favelas), as well as non-host cites. Further limitations and theoretical
implications as well as and managerial implications for event organizers, sports
foundations, health practitioners and the local tourism industry are formulated at
the end of this thesis.
INTRODUCTION
1
1 INTRODUCTION
The unique and energetic atmosphere that originated from hosting the
Fédération Internationale de Football Association (FIFA) World Cup 2006 in
Germany quickly scattered among the German population, even to those who
do not identify themselves as big fans of the national team. It seemed as though
the whole population was engrossed in the event hosting and thus, celebrated
with their team (Ohmann, Jones and Wilkes, 2006), indicating that an individual’s
identification with the national team is an important aspect. Every mega-sport
event has an impact on the population; a review on health and socioeconomic
impacts of these events summarized that most literature analyzes the economic
impact (n=18, 33%), while few studies (n=5, 9%) focus on residents’ health
outcomes (McCartney et al., 2010b). The main body of literature on mega-sport
events in this review was grey literature (n=25, 46%), and about half of the
studies were published in peer-reviewed journals. Most research findings on the
impact of mega-sport events are published as a report (e.g. London 2012 Post
Games Sustainability Report – A legacy of change published by the London
Organizing Committee of the Olympic Games). The disadvantage of these
articles is that the credibility is not clear, because, articles are not read and
approved by experts. Knowing this, the aim of this thesis is to contribute to the
scientific field of mega-sport impact research, more specifically, to investigate
the health impacts on residents living in cities hosting mega-sporting events. In
addressing aforementioned topics, the following first research question was
raised to guide the thesis: Do residents in a host city of a mega-sport event
experience a change in their short-term health outcomes per se?
INTRODUCTION
2
Literature suggests that positive health outcomes from hosting per se cannot be
expected (Kaplanidou et al., 2013). Instead, the impact of contextual factors on
these outcomes is important. These factors can act as determinants of health
and can therefore be more important than the direct impact on residents’ health
(Wellings, Datta, Wilkinson and Petticrew, 2012). This leads to the second
research question: Do contextual factors matter in the change of residents’
quality of life?
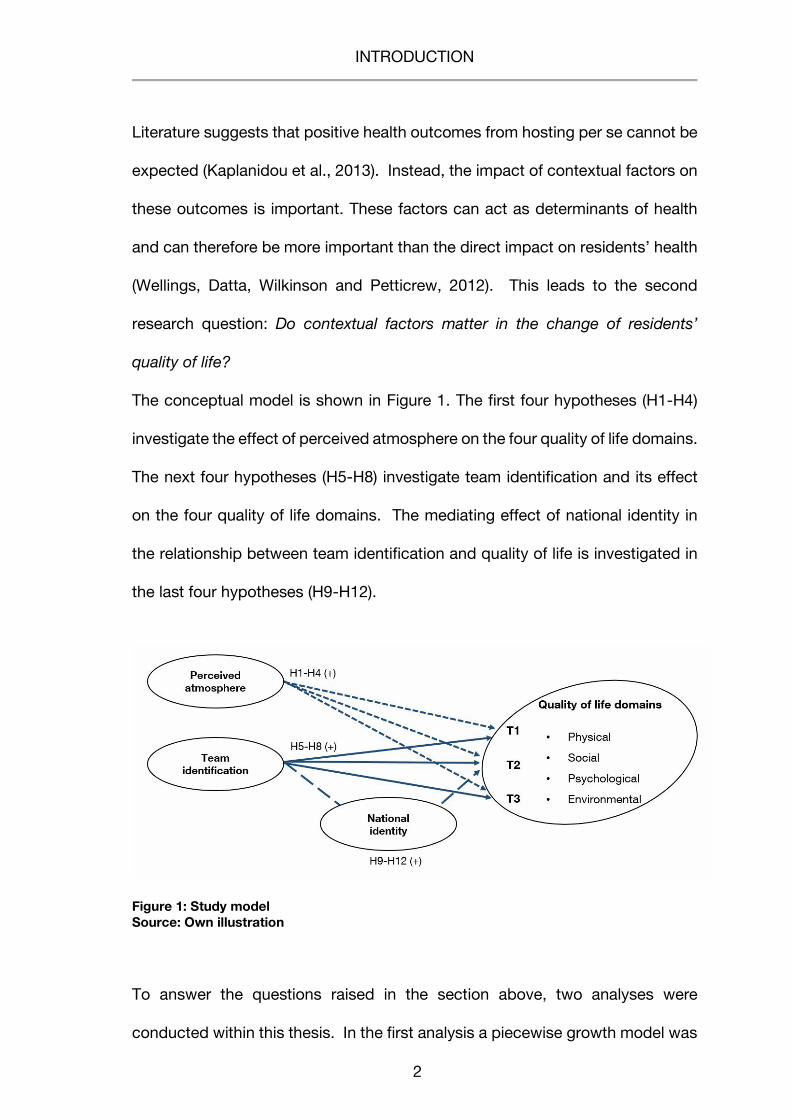
The conceptual model is shown in Figure 1. The first four hypotheses (H1-H4)
investigate the effect of perceived atmosphere on the four quality of life domains.
The next four hypotheses (H5-H8) investigate team identification and its effect
on the four quality of life domains. The mediating effect of national identity in
the relationship between team identification and quality of life is investigated in
the last four hypotheses (H9-H12).
Figure 1: Study model Source: Own illustration
To answer the questions raised in the section above, two analyses were
conducted within this thesis. In the first analysis a piecewise growth model was
INTRODUCTION
3
used to analyze the change in quality of life and team identification over three
time points. Using this data in further analyses the effect of event atmosphere
(measured during the event) and identification with the national team on the
aforementioned change was included in the respective model (i.e., at the
beginning of the event, in the end of the event, and three months after the end
of the event). In the second analysis, a regression-based mediation analysis was
run including team identification as the independent variable, national identity as
a mediator, both measured in the beginning of the 2014 FIFA World Cup (in T1)
and quality of life as the dependent variable, measured right after the 2014 World
Cup (in T2).
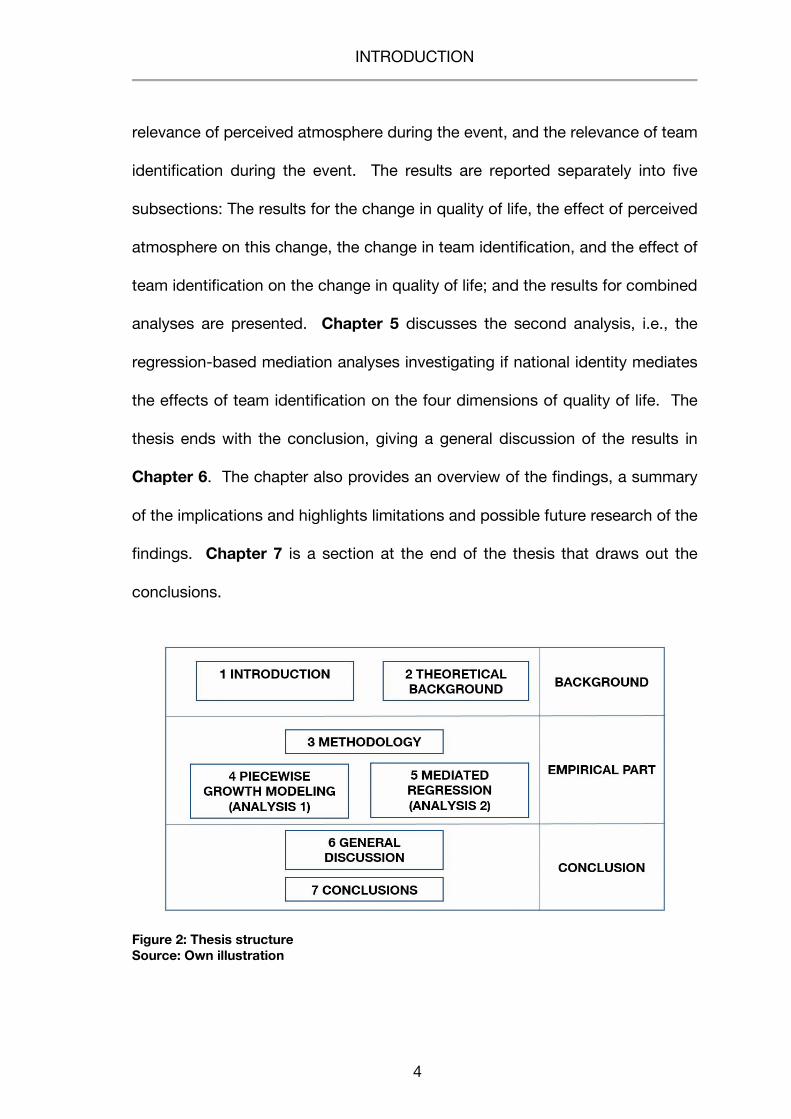
The remainder of this thesis is organized as follows (see Figure 2). The thesis
starts off with an introduction detailing the research questions and objectives of
the study, i.e. Chapter 1. Chapter 2 provides the theoretical background
including an introduction to the following subsections: mega-sport event
hosting, the legacy concept of mega-sport events, the conceptualization of
health and quality of life, and an introduction to the impact of mega-sport events
on host city residents’ quality of life.
The empirical part of this thesis starts with a description of the research
methodology in Chapter 3, including a description to growth modeling and
mediation analysis, the data collection, the measures used in the different
studies and a sample description over the three waves. Chapter 4 presents the
first analysis, i.e., the results of the piecewise growth modeling. First, the
theoretical background of this study is described, followed by: Subsections
introducing the concept of quality of life in the context of mega-sport events, the
INTRODUCTION
4
relevance of perceived atmosphere during the event, and the relevance of team
identification during the event. The results are reported separately into five
subsections: The results for the change in quality of life, the effect of perceived
atmosphere on this change, the change in team identification, and the effect of
team identification on the change in quality of life; and the results for combined
analyses are presented. Chapter 5 discusses the second analysis, i.e., the
regression-based mediation analyses investigating if national identity mediates
the effects of team identification on the four dimensions of quality of life. The
thesis ends with the conclusion, giving a general discussion of the results in
Chapter 6. The chapter also provides an overview of the findings, a summary
of the implications and highlights limitations and possible future research of the
findings. Chapter 7 is a section at the end of the thesis that draws out the
conclusions.
Figure 2: Thesis structure Source: Own illustration
THEORETICAL BACKGROUND ON QUALITY OF LIFE IN THE CONTEXT OF MEGA-SPORT EVENTS
5
2 THEORETICAL BACKGROUND ON QUALITY OF LIFE IN THE
CONTEXT OF MEGA-SPORT EVENTS
2.1 Definition of mega-sport events
Mega-sport events are international events with global reach, i.e. they are events
where numerous countries or cities compete in a specific sport. According to
an overview provided by Müller (2015), researchers did not agree on one single
definition of what mega-sport events are, but on several characterizing
requirements, including number of tickets sold, media reach, total costs and
capital investment. Dependent on the size of these four dimensions, an event
can be categorized as a major, mega or giga event (see APPENDIX A). In this
thesis, the term mega-sport event is used synonymously for any of these events.
Events can be defined as mega events if they are limited in time, not permanently
held within a defined and short period attracting a large international audience
who attend in person or follow the event via the media. These events are
associated with high costs, which among other things usually lead to an
improvement of the city’s infrastructure due to the fact that money is invested,
which eventually would otherwise not have been spent. On the other hand “the
same money could have been invested in integration projects that indirectly
reduce crime and also make a city more attractive for tourists” (Preuss, 2007, p.
212).
These events are further characterized by their competing multinational athletes
and can be aligned anywhere in the world in exactly the same manner and under
the same rules, regardless of the actual location of the local culture or the
political and economic system (Barclay, 2009; Fayos-Solá, 1998; Jago et al.,
THEORETICAL BACKGROUND ON QUALITY OF LIFE IN THE CONTEXT OF MEGA-SPORT EVENTS
6
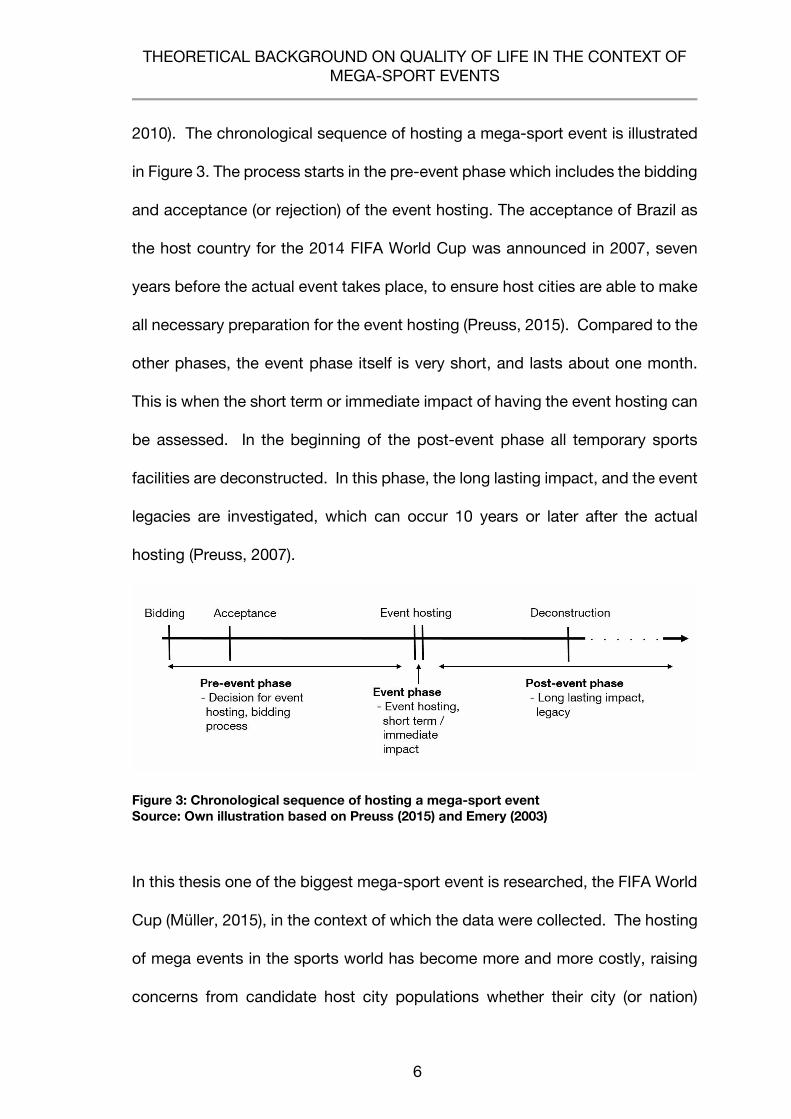
2010). The chronological sequence of hosting a mega-sport event is illustrated
in Figure 3. The process starts in the pre-event phase which includes the bidding
and acceptance (or rejection) of the event hosting. The acceptance of Brazil as
the host country for the 2014 FIFA World Cup was announced in 2007, seven
years before the actual event takes place, to ensure host cities are able to make
all necessary preparation for the event hosting (Preuss, 2015). Compared to the
other phases, the event phase itself is very short, and lasts about one month.
This is when the short term or immediate impact of having the event hosting can
be assessed. In the beginning of the post-event phase all temporary sports
facilities are deconstructed. In this phase, the long lasting impact, and the event
legacies are investigated, which can occur 10 years or later after the actual
hosting (Preuss, 2007).
Figure 3: Chronological sequence of hosting a mega-sport event Source: Own illustration based on Preuss (2015) and Emery (2003)
In this thesis one of the biggest mega-sport event is researched, the FIFA World
Cup (Müller, 2015), in the context of which the data were collected. The hosting
of mega events in the sports world has become more and more costly, raising
concerns from candidate host city populations whether their city (or nation)
THEORETICAL BACKGROUND ON QUALITY OF LIFE IN THE CONTEXT OF MEGA-SPORT EVENTS
7
should host such events at all. One of the main concerns raised by city residents
are the costs involved when hosting mega-sport events (Kim, Jun, Walker and
Drane, 2015). Some city residents even actively oppose to the candidature of
their city. For example, recent referendums made Munich, Oslo, and Hamburg
– potential Olympic Games host city candidates – withdraw their already planned
candidature for the 2022 and 2024 Olympic Games, respectively.
Thus, it is not surprising that the previous literature has mostly looked at the
economic consequences of hosting mega-sport events (McCartney et al.,
2010b). This thesis provides a different perspective of event hosting, one that
examines the health dimension of residents. The media reinforces the negative
mood in the population, e.g. with a recent article in the weekly newspaper The
Economist with the title “Just say no. Hosting the Olympics and the World Cup
is bad for a city’s health” (The Economist, 2015). The article mostly questions if
(long-term) benefits exceed construction and maintenance costs. To counteract
the pessimistic attitude against mega-sport events it could be an argument to
disprove this statement and to demonstrate how the residents themselves also
benefit from hosting these events. Therefore, beside the already investigated
economic, environmental, and social dimension of legacy (Preuss, 2007),
another argument would concern the potential positive health impacts, which
are investigated in this thesis.
2.2 Legacy of mega-sport events
Event legacy refers to the sustainable, long-lasting consequences that the
hosting of an event has on the society, long time after the event was hosted.
THEORETICAL BACKGROUND ON QUALITY OF LIFE IN THE CONTEXT OF MEGA-SPORT EVENTS
8
Aforementioned economic consequences belong to just one dimension of the
so-called legacy framework of the effects of the hosting of mega-sport events
(Cashman, 2006; Ritchie, 1984).
Event legacy can be described along three key dimensions: the economic, the
environmental, and the social dimension (Preuss, 2007). Legacies can further
be classified as being tangible and intangible. Examples for intangible outcomes
are the country image or health outcomes, i.e. outcome that are harder to
measure. Tangible outcomes on the other hand are clear to capture and include
economic measures such as employment rate or income (Kaplanidou and
Karadakis, 2010; Preuss, 2007). There are also positive and negative legacies.
An example for positive legacy is accelerated development, which benefits the
city’s infrastructure (Preuss, 2007); it can support the development of a host city
for example - such as seen in Munich, Germany, where the subway and Olympic
park were built after the city won the bid for hosting the Olympic Games in 1972.
Sports federations and event organizers take into consideration the
sustainability and long-lasting effects of mega-sport events. To ensure that the
society profits from a positive legacy, the International Olympic Committee
included the event legacy principle into their Olympic Charter; stating that their
goal was to “promote a positive legacy from the Olympic Games to the host city
and host country” (International Olympic Committee, 2003). Mega-sport event
property holders, such as FIFA and Union des Associations Européennes de
Football (UEFA), have similar mission statements. While the intentions of mega
events committees are true and positive in nature, it is possible that a negative
legacy occurs, which could be debts from construction costs or unneeded
THEORETICAL BACKGROUND ON QUALITY OF LIFE IN THE CONTEXT OF MEGA-SPORT EVENTS
9
infrastructure e.g. sport facilities (Preuss, 2007), although in practice, only
positive legacies are mentioned and focused in event planning processes by the
organizing committees (Cashman, 2006).
However, there are some limitations to the legacy conceptualization presented
above. First, the concept focuses on long-term consequences only and neglects
the short-term and (potentially fading) consequences. Mega-sport events
usually last for days or weeks (some even for one day) and have an immediate
impact on the host population. This is seen through the population, when people
feel inspired by the flair of their home town, feel proud when their home team (or
their national team) competes with the best teams (or athletes) in the world, and
have the feeling that their city is important due to the media attention from all
over the world (Gold and Gold, 2008; Kim and Walker, 2012). Thus, some impact
on the host population, such as host city residents’ emotions, may be immediate
rather than long-term in nature (Kavetsos and Szymanski, 2010). These
immediate impacts of positive emotions can lead to short-term improvements of
residents’ health outcomes (Howell, Kern and Lyubomirsky, 2007).
Second, the three key legacy dimensions do not specifically take into account
health-related aspects of individuals that live in the area where the event is
hosted. Although some authors have provided conceptual arguments that any
increase in these three dimensions can in turn have a positive impact on
residents’ health status (Preuss, 2015), thus looked upon as an indirect impact,
health outcomes are rarely mentioned as a possible direct outcome of the legacy
of a mega-sport event (Knott, Fyall and Jones, 2013). Therefore, it remains
THEORETICAL BACKGROUND ON QUALITY OF LIFE IN THE CONTEXT OF MEGA-SPORT EVENTS
10
unknown whether and when the hosting of mega-sport events increases the
health status of host city residents.
This thesis aims to partially fill the aforementioned research gaps and looks at
the short-term (and potentially fading) consequences of hosting a mega-sport
event on the quality of life of host city residents. That is, the subjective evaluation
of an individual’s health status (WHOQOL Group, 1995) – over the course of the
hosting of the event until three months after the event, depending on residents’
perception of the atmosphere in the city. The period of measurement before,
(during) and three month after the end of the event was chosen in previous
studies (Gursoy and Kendall, 2006; Kim, Gursoy and Lee, 2006; Kim and Petrick,
2005) and relates to the short-term impacts of the event, caused by the emotions
felt during the event, which can vanish after a short period (Kavetsos and
Szymanski, 2010). In the period three month after the event hosting, the
emotional arousal is expected to be no longer present.
A favorable atmosphere might be crucial in order to obtain positive subjective
health-related outcomes because city residents tend to get involved in the event
and experience the event with all senses (Slabbert and Thomas, 2012). For
example, German residents reported high enthusiasm in host cities during the
2006 FIFA World Cup due to the special atmosphere during the event hosting,
a feeling which they did not perceive prior to, or after, the event (Ohmann et al.,
2006). Kavetsos and Szymanski (2010, p. 167) note that based on their study of
the impact of mega-sport events on the host population’s happiness, the results
of their analysis “do not justify the inference that hosting events creates anything
more than a short term feelgood factor.”
THEORETICAL BACKGROUND ON QUALITY OF LIFE IN THE CONTEXT OF MEGA-SPORT EVENTS
11
Atmosphere and team identification are two constructs that might provide
explanations for these effects. The theoretical foundations of the studies are
introduced in the respective chapters.
2.3 Health and quality of life as a potential legacy outcome
The aim of this thesis is to investigate the impact of hosting a mega-sport event
on residents’ health, the dependent variable in this thesis. Therefore, the
constructs of health and quality of life are as follows: As defined by the World
Health Organization (WHO), “health is a state of complete physical, mental and
social well-being and not merely the absence of disease or infirmity” (World
Health Organization, 1946, p. 100). This broad definition does not only take into
account an individual’s morbidity or mortality, but considers health as a
multidimensional construct that includes a physical, psychological, and social
components. The definition has been criticized for including the word
“complete” because absolute health can hardly be achieved by most individuals
as people often suffer from at least some minor issues (Huber et al., 2011).
Despite this criticism, the definition provides a meaningful sub-classification of
health dimensions. The bio-psycho-social model likewise proposes a multi-
dimensional classification of health (Engel, 1977). The model, building upon the
WHO’s definition of health, considers health as having biological, psychological,
and social components. Subsequently to when this model was proposed,
researchers and practitioners have started looking at an individual’s health from
the perspective of these multiple domains (Eberst, 1984). The quality of life is
THEORETICAL BACKGROUND ON QUALITY OF LIFE IN THE CONTEXT OF MEGA-SPORT EVENTS
12
the subjective evaluation of one’s health status. Regarding positive quality of
life outcomes, these are indicators that an individual’s health is at high levels.
The WHO defines quality of life as “an individual’s perception of their position in
life in the context of the culture and value systems in which they live, and in
relation to their goals, expectations, standards and concerns” (WHOQOL Group,
1995, p. 1405). Quality of life reflects an individual’s health with all surrounding
aspects. Thus, in addition to the three health dimensions presented above a
fourth dimension was added, i.e., contextual factors, which covers the
environment in which people live, i.e. the surroundings of individuals (Ferrans,
Zerwic, Wilbur and Larson, 2005). The Institute of Medicine (1995) defines
environmental health (another term used for contextual factor) as “freedom from
illness or injury related to exposure to toxic agents and other environmental
conditions that are potentially detrimental to human health” (p. 3). These harmful
factors include exposure to physical, chemical, and biological stimuli, for
example. Also, aspects like safety of the environment, affordability, access to
information, access to transportation system, access to health services and
leisure activities, and the conditions of living places are included (WHOQOL
Group, 1998). The environmental health domain is important during the hosting
of mega-sport events because host cities typically invest in infrastructure to
guarantee an appealing appearance and provide a flexibility of commute during
the event (Preuss, 2007). To account for these findings, quality of life today is
most frequently measured using the WHO’s measurement tools, which proposes
a four-dimensional structure: physical, social, psychological, and environmental.
Generally, the measurement of an individual’s quality of life as a
THEORETICAL BACKGROUND ON QUALITY OF LIFE IN THE CONTEXT OF MEGA-SPORT EVENTS
13
multidimensional construct of health outcomes is now an established method in
health care across Europe and in the USA (Bowling, 1995). The literature on the
impact of mega-sport events on host city residents’ quality of life is presented
in the next subsection.
2.4 Impact of mega-sport events on host city residents’ quality of life
There are currently few empirical studies that have used the aforementioned
four-domain framework, reflecting the quality of life of an individual. As
described below, previous studies have looked at the health impact of mega-
sport events from different perspectives. These studies can be categorized into
three different types of studies. The first type focuses on one of the domains
only (and selected indicators within these domains) and its change over time.
The second type of studies uses a simple overall measure of health or health-
related aspects and assesses its change over time. The third type of studies
does not look at changes in health or health-related aspects over time, but
considers changes in the relationships between determinants of health or health-
related aspects and health outcomes at different points in time (e.g., before,
during or after the event). An overview of the primary studies on the health impact
of mega-sport events can be found in APPENDIX A.
The thesis will now address examples of each type of case study and how mega-
sport events impact health outcomes. As mentioned earlier, many previous
studies have considered one single health domain. In regards to the physical
domain of health, researchers assessed the impact of hosting a mega-sport
event on the number of hospital admissions from illicit drug use and childhood
THEORETICAL BACKGROUND ON QUALITY OF LIFE IN THE CONTEXT OF MEGA-SPORT EVENTS
14
asthma hospitalization in the host city (Friedman et al., 2001; Indig et al., 2003;
Lee, Son and Cho, 2007). Other research was conducted on the demand for
pediatric health services in the host city, using secondary data (Simon,
Stegelman and Button, 1998). The results from the studies are as follow:
Hospital admissions for adverse events due to illicit drug use increased during
the event, and there was a slightly increase in the demand for pediatric health
services. Hospitalization for childhood asthma decreased most likely due to
better air quality (because traffic could be reduced). There is also some evidence
for an increase in mortality from heart diseases during the hosting of mega-sport
events. For example, the relative risk to die from a heart disease for Dutch men
increased to 1.51 (no effect was found for women) when they followed the
Netherlands’ national soccer team during the 1996 European soccer
championship (Witte, Bots, Hoes and Grobbee, 2000). Another study reported
an increased relative risk for German spectators, 3.26 for men and 1.82 for
women, on days where the German national soccer team was playing (Wilbert-
Lampen et al., 2008). Another database study also reported an increase in
relative risk for hospital admission of 1.25 during event days (Carroll et al., 2002).
To conclude, the hosting of mega-sport events can lead to negative or positive
physical health outcomes, when referring to hospital admissions. However,
there is few evidence about changes in physical health from the subjective
perspective of individuals and outside hospital settings. Also, few studies
considered potential changes in social, or psychological, or environmental
health in response to the hosting of mega-sport events.
THEORETICAL BACKGROUND ON QUALITY OF LIFE IN THE CONTEXT OF MEGA-SPORT EVENTS
15
The second type of study, i.e., using a simple overall measure of health or health-
related aspects, has also been minimally researched. One example is provided
by Kavetsos and Szymanski, (2010) who assessed how hosting of a mega-sport
event can impact residents’ satisfaction with life; this was illustrated in twelve
European countries that hosted different mega-sport events over the course of
thirty years (from 1974 until 2004) using Eurobarometer Survey Series data.
Satisfaction with life (or “happiness,” as argued by the authors) may be
considered as an indicator of subjective health (or subjective psychological
health). The study showed that the hosting of the Olympic Games had either no
significant or even a negative effect on satisfaction with life, controlling for a
number of macro-level and personal factors, but that the hosting of a soccer
event can increase satisfaction with life independent of the success of the
national soccer team. Although the authors used secondary data only, this study
provides suggestive evidence that satisfaction with life (or [psychological] health)
may increase when nations host mega-sport events in soccer.
The third and last type of study looks at the relationship between determinants
of health or health-related aspects and health outcomes at different points in
time. Kaplanidou et al. (2013) identified predictors of satisfaction with quality of
life of the South African population before and after the 2010 FIFA World Cup.
The results indicate that three months before the event, political and
psychological impacts as well as social benefits were positive predictors of
satisfaction with quality of life. Eight months after the event, economic impacts
as well as the three determinants mentioned beforehand were significant and
positive predictors of satisfaction with quality of life of the South African
THEORETICAL BACKGROUND ON QUALITY OF LIFE IN THE CONTEXT OF MEGA-SPORT EVENTS
16
population (Kaplanidou et al., 2013). However, it remains unclear how the host
city residents rated their quality of life during the event. Also, the authors used
a simple overall measure of quality of life – the question asked in the survey was
“Overall, taking everything into account, I am very satisfied with my quality of
life”, that has some overlap with the concept of satisfaction with life. Another
limitation concerns the study design of a repeat cross-sectional study, which is
the use of different samples at the two time points. One has to expect that many
potential confounders can have an impact on an individual’s quality of life in that
period.
To conclude, there are no empirical studies that (1) use the four-domain
framework of quality of life in the context of the hosting of mega-sport events,
(2) assess the change in quality of life over time using the same sample (i.e., a
longitudinal study), and (3) collect primary data during the time when the event
actually took place. This thesis addresses all of these aspects as it considers
quality of life as a multidimensional construct (consisting of physical, social,
psychological, and environmental health). It further assesses the change in the
four domains of quality of life over time using the same sample, and measures
the four domains of quality of life during the event as opposed to reference
values (i.e., at the beginning of the event and three months after the end of the
event). Previous research provides suggestive evidence that there may be no
main effect on the quality of life of host city residents by merely hosting an event
(Kaplanidou et al., 2013). In this thesis, perceived atmosphere and team
identification are considered as variables that may influence how host city
residents respond to the hosting of mega-sport events as regards their quality
METHODOLOGY
17
of life. The theoretical background of these variables and their potential impact
on residents’ quality of life is described in Chapter 4.1.
3 METHODOLOGY
The present thesis is composed of two empirical parts, presented as analysis 1
(Chapter 4) and analysis 2 (Chapter 5). Each analysis addresses a specific
method used to analyze the determinants of residents’ quality of life. Because
each study deals with its own research question, the development of the
hypothesis as well as the research methodology is directly linked: Both studies
are presented separately with their own chapter. The applied measures and
methods for data collection and analysis, which are the same in both studies,
are indicated below. Analysis 1 was analyzed using piecewise growth modeling
(Chapter 3.1), while in analysis 2, a mediated regression analysis was used
(Chapter 3.2).
3.1 Sample description
Four hundred and ninety eight individuals from Rio de Janeiro participated in the
first wave of the study (i.e., pre-event). Of those, three hundred and sixty-one
took part in the second wave (i.e., end of the event). Lastly, two hundred and
eighty-one participants took part in the study in all the three waves (i.e.,
measurement three month after the event).
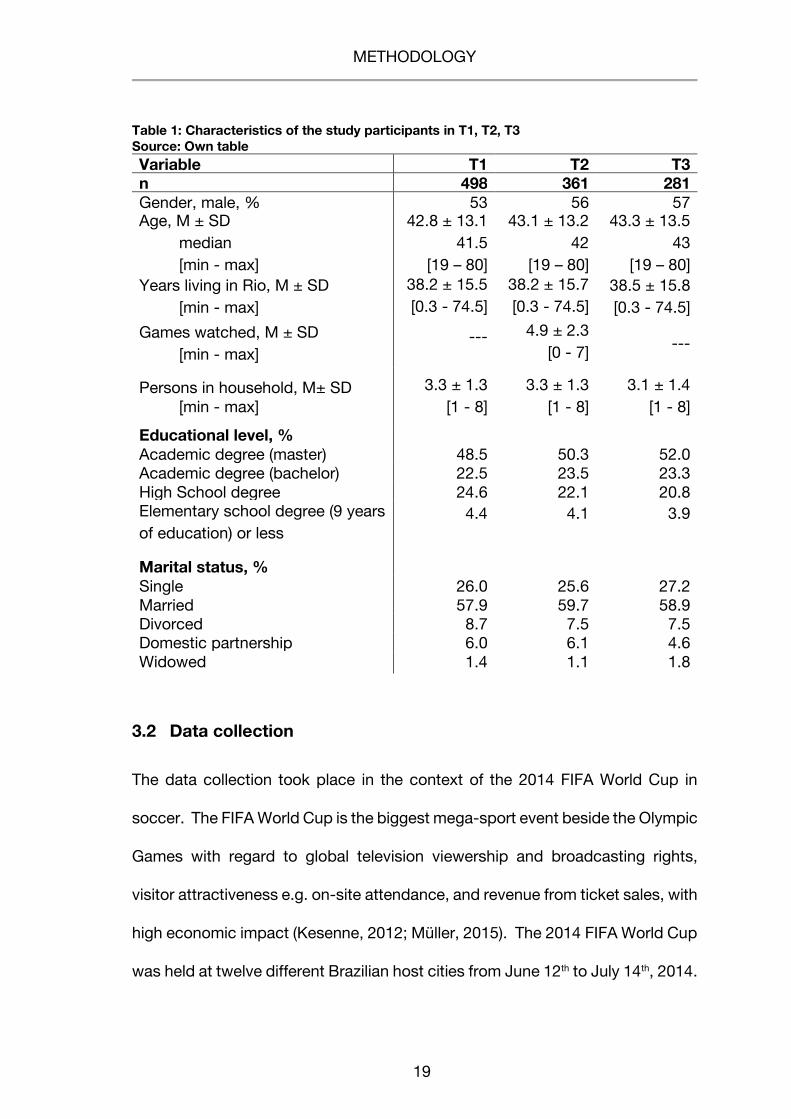
Table 1 provides an overview of the characteristics of the study participants at
T1, T2 and T3. In the first wave, fifty-one percent of the participants were male.
This proportion slightly increased to 57% in the third wave. In all waves,
METHODOLOGY
18
participants were between 19 and 80 years old. The mean age slightly increased
from 42.8 years (± 13.1; median 41.5) in T1 to 43.3 years (± 13.5; median = 43.0)
in T3. Participants had been living in Rio de Janeiro for 38.2 years (± 15.5) in T1,
and for 38.5 years (± 15.8) in T3. The majority of participants had earned a
bachelor’s degree or a higher degree (71% in the first wave, 75.3% in the third
wave). Twenty-one percent earned the equivalent of a high school degree, these
are indicators of a well-educated sample. The average size of the household
was 3.3 (± 1.4), which remained nearly constant in T3 (mean 3.1, ± 1.4). The
majority of participants in this sample was either married (57.9% in T1, 58.9% in
T3) or single (26.0% in T1, 27.2% in T3). Across the three waves, the sample
was slightly older compared to the general population of Rio de Janeiro,
because, according to IBGE (2010), about half of the population is 34 years old
or younger. Forty seven percent of the residents of Rio de Janeiro are male. In
2014, 13.0% of the general population in Brazil (25 - 64 years) had an academic
degree, and 55.0% of the Brazilians achieved the equivalent of a high school
degree (OECD, 2014). Thus, statistics indicate a well-educated sample
compared to the general population. This is reasonable, as more well-educated
Brazilians live in cities and they use the Internet more often (IBGE, 2013), and
thus are more likely to participate in Internet-based studies.
METHODOLOGY
19
Table 1: Characteristics of the study participants in T1, T2, T3 Source: Own table Variable T1 T2 T3 n 498 361 281 Gender, male, % 53 56 57 Age, M ± SD
median [min - max]
42.8 ± 13.1 41.5
[19 – 80]
43.1 ± 13.2 42
[19 – 80]
43.3 ± 13.5 43
[19 – 80] Years living in Rio, M ± SD
[min - max] 38.2 ± 15.5 [0.3 - 74.5]
38.2 ± 15.7 [0.3 - 74.5]
38.5 ± 15.8 [0.3 - 74.5]
Games watched, M ± SD [min - max]
--- 4.9 ± 2.3 [0 - 7] ---
Persons in household, M± SD [min - max]
3.3 ± 1.3 [1 - 8]
3.3 ± 1.3 [1 - 8]
3.1 ± 1.4 [1 - 8]
Educational level, % Academic degree (master) 48.5 50.3 52.0 Academic degree (bachelor) 22.5 23.5 23.3 High School degree 24.6 22.1 20.8 Elementary school degree (9 years of education) or less
4.4 4.1 3.9
Marital status, % Single 26.0 25.6 27.2 Married 57.9 59.7 58.9 Divorced 8.7 7.5 7.5 Domestic partnership 6.0 6.1 4.6 Widowed 1.4 1.1 1.8
3.2 Data collection
The data collection took place in the context of the 2014 FIFA World Cup in
soccer. The FIFA World Cup is the biggest mega-sport event beside the Olympic
Games with regard to global television viewership and broadcasting rights,
visitor attractiveness e.g. on-site attendance, and revenue from ticket sales, with
high economic impact (Kesenne, 2012; Müller, 2015). The 2014 FIFA World Cup
was held at twelve different Brazilian host cities from June 12th to July 14th, 2014.
METHODOLOGY
20
This study took place in Rio de Janeiro, the host city where the championship
final was held (among other games).
Data were collected during the first week of the World Cup (first wave; T1), during
the week right after the World Cup (second wave; T2), and during the week three
months after the end of the World Cup (third wave; T3). Individuals were only
allowed to participate in the study if they were permanent residents of Rio de
Janeiro, making sure that the study truly considered the host population of the
event, as recommended by Weed (2010). The software unipark by Globalpark
GmbH was used to construct an online survey (see survey questionnaire in
APPENDIX B).
City residents of Rio de Janeiro who were at least 18 years old were recruited
via a Brazilian market research agency, which distributed the survey link by email
to their panel members. The agency incentivized their panel members to take
part in the study. Those answering the first survey were contacted to take part
in the second and third survey, respectively. In the survey, participants were
first told that the study was about their well-being. After they gave their consent
of participation, they filled in the questionnaire. At the end of the survey,
participants were thanked for their participation and were invited to participate
in another survey three months later. Quality of life and team identification were
assessed in all three waves. In the second wave, participants were asked about
their experience during the World Cup (including perceived atmosphere) in
addition to the items that have been assessed in the surveys before and after.
In the third wave, participants were fully debriefed about the true nature of the
METHODOLOGY
21
study. The average amount of time required filling out the questionnaire was 23,
20, and 17 minutes, in T1, T2 and T3, respectively.
3.3 Data analysis
Growth modeling
Latent growth modeling is used as a structural equation modeling (SEM)
technique to estimate growth trajectory. When more than two time points are
measured, SEM bears the advantage to analyze the individual change over
several time points. A way to model non-linear growth is the piecewise linear
growth model. In this model each piece has its own slope growth factor but only
one intercept growth factor i (Muthén and Muthén, 2007). Thus, the model
allows the change in quality of life to vary from T1 to T2 and from T2 to T3 without
imposing a constant rate of change over time (Bollen and Curran, 2006, p. 103).
The use of such model is recommended when linear change is not anticipated
and/or does not fit the data (Flora, 2008). Piecewise linear growth models were
used for data analysis of the first study of this thesis. The exact model
specification will be described in Chapter 4.2.3.
Mediation analysis
Mediation is used to analyze to which extent the effect of a variable on an
outcome variable Y (the dependent variable) is mediated through another
variable (MacKenzie, Podsakoff and Podsakoff, 2011). In the past, mediation
has been analyzed using the approach described by Baron and Kenny (1986).
According to the authors, “full mediation” is the gold standard in mediation
METHODOLOGY
22
analysis, meaning there is an indirect effect but no direct effect. However, in
practice, most of the published articles report “partial mediation” in their results,
which is the occurrence of not only indirect, but also direct effects. Also the
method by Baron and Kenny is criticized (Zhao, Lynch and Chen, 2010) and
newer approaches for mediation analysis have been established. A useful
procedure for mediation analysis has been written as a macro for SPSS, called
PROCESS. This procedure is provided by Andrew F. Hayes (Hayes, 2013). The
significance of the indirect path in this method is not analyzed by the Sobel test
(as it was used in the past), which is only suitable to use in large samples (Sobel,
1982). As an alternative, bootstrapping has replaced the Sobel test (Bollen and
Stine, 1990; Shrout and Bolger, 2002), which bears some advantages. It is a
non-parametric method repeating the analysis with random samples, e.g., 1000
times. Because of this process, a confidence interval is computed. To test the
significance of the indirect effect bootstrapping procedures are implemented in
PROCESS (model 4, Hayes, 2013, p. 445). With regard to the bootstrapping,
mediation is significant if the confidence interval does not include zero (Preacher
and Hayes, 2008).
3.4 Measures
Valid and reliable scales were used to measure the dependent variable quality
of life, and the independent variables event atmosphere and team identification
as well as the mediator national identity. Quality of life was assessed in all three
waves. The construct was measured using the WHO’s quality of life instrument.
It is based on the WHO’s definition of quality of life and initially had 100 items
METHODOLOGY
23
(WHOQOL Group, 1995, 1998), while the shorter version WHOQOL-BREF
consists of 24 items (5-point rating scale; 1 = lowest rating, 5 = highest rating).
The use of the shorter version is recommended when time is restricted and
“where a brief assessment of quality of life is appropriate,” such as for
longitudinal studies (WHOQOL Group, 1998, p. 557). The WHOQOL-BREF has
been validated across different cultural groups (Skevington, Lotfy and O'Connell,
2004). It has also been validated in Brazilian Portuguese, the language that was
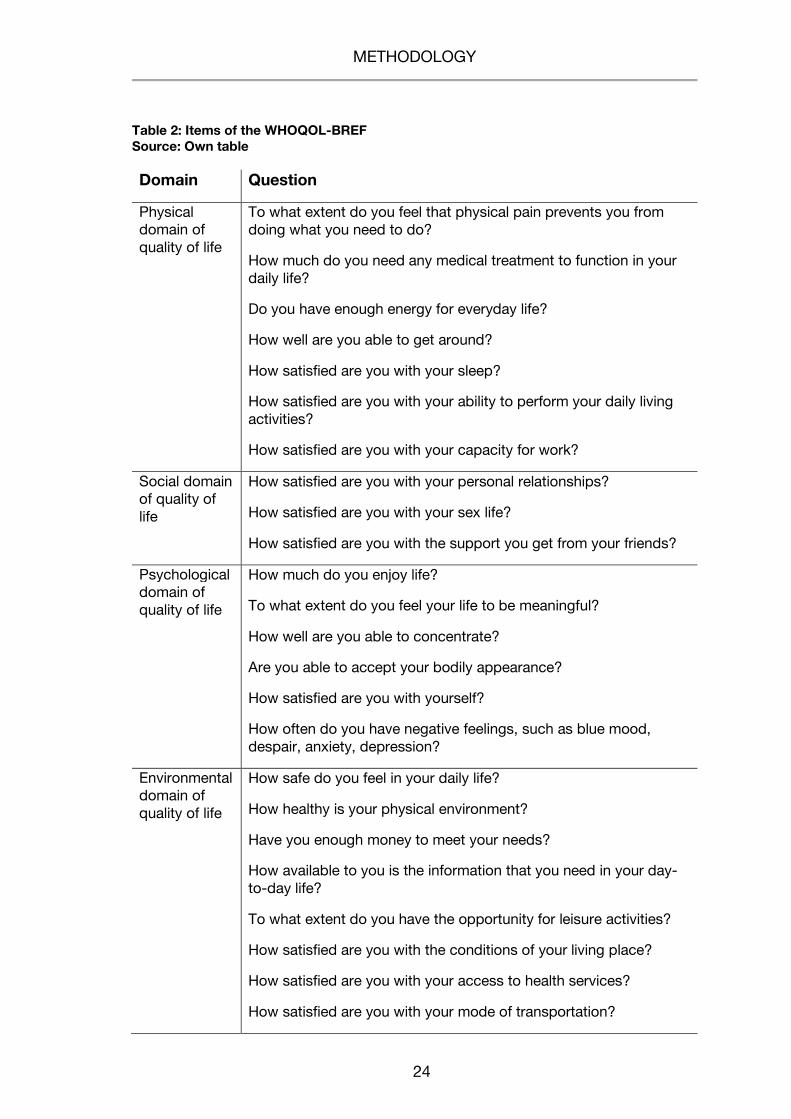
used in the survey (Fleck et al., 2000). The items of the four dimensions of the
WHOQOL-BREF (physical, social, psychological, and environmental domain) are
shown in Table 2.
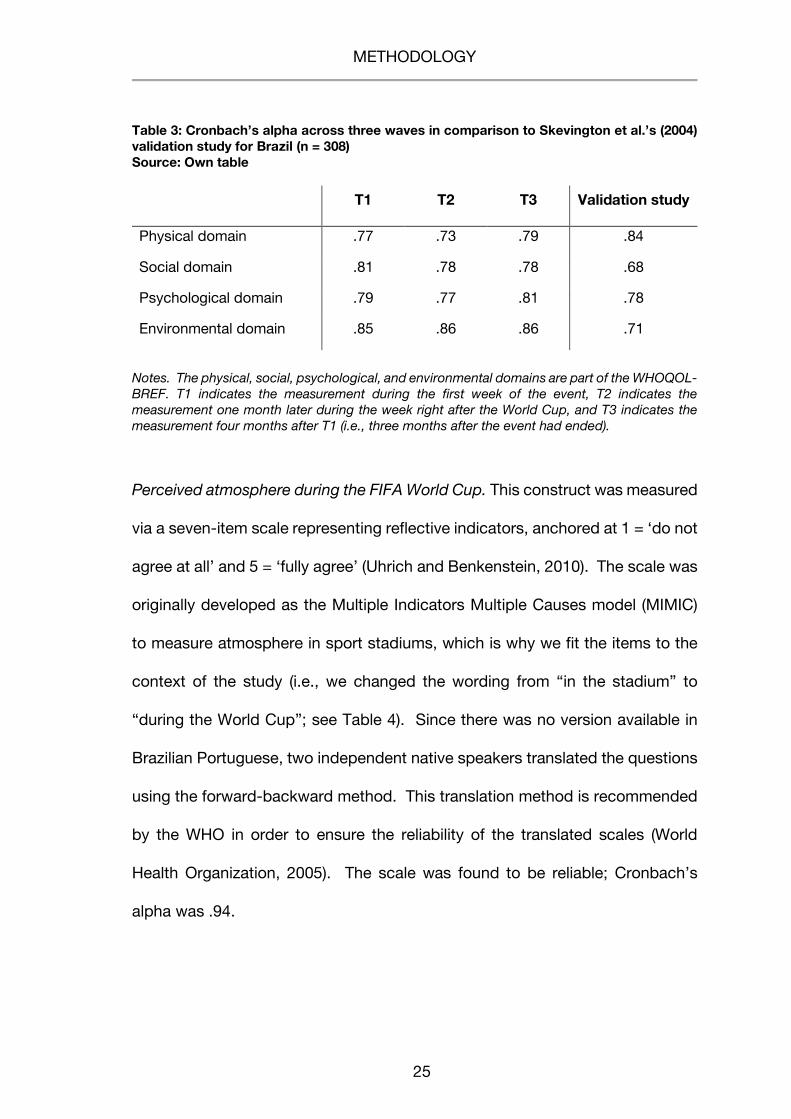
Cronbach’s alphas across the three waves are illustrated in Table 3. Compared
to the validation study (Skevington et al., 2004), in most cases, the scales had
similar or higher values of Cronbach’s alpha. The reason for this inconsistency
might be due to the heterogeneity of the questions in this scale, referring to pain,
medication needed, and limitations in everyday life. However, internal
consistency of the four domains of the WHOQOL-BREF was good, as indicated
by Cronbach’s alphas larger than 0.7 (Lance, Butts and Michels, 2006; Nunnally,
1978).
METHODOLOGY
24
Table 2: Items of the WHOQOL-BREF Source: Own table
Domain Question
Physical domain of quality of life
To what extent do you feel that physical pain prevents you from doing what you need to do?
How much do you need any medical treatment to function in your daily life?
Do you have enough energy for everyday life?
How well are you able to get around?
How satisfied are you with your sleep?
How satisfied are you with your ability to perform your daily living activities?
How satisfied are you with your capacity for work?
Social domain of quality of life
How satisfied are you with your personal relationships?
How satisfied are you with your sex life?
How satisfied are you with the support you get from your friends?
Psychological domain of quality of life
How much do you enjoy life?
To what extent do you feel your life to be meaningful?
How well are you able to concentrate?
Are you able to accept your bodily appearance?
How satisfied are you with yourself?
How often do you have negative feelings, such as blue mood, despair, anxiety, depression?
Environmental domain of quality of life
How safe do you feel in your daily life?
How healthy is your physical environment?
Have you enough money to meet your needs?
How available to you is the information that you need in your day-to-day life?
To what extent do you have the opportunity for leisure activities?
How satisfied are you with the conditions of your living place?
How satisfied are you with your access to health services?
How satisfied are you with your mode of transportation?
METHODOLOGY
25
Table 3: Cronbach’s alpha across three waves in comparison to Skevington et al.’s (2004) validation study for Brazil (n = 308) Source: Own table
T1 T2 T3 Validation study
Physical domain .77 .73 .79 .84
Social domain .81 .78 .78 .68
Psychological domain .79 .77 .81 .78
Environmental domain .85 .86 .86 .71
Notes. The physical, social, psychological, and environmental domains are part of the WHOQOL-BREF. T1 indicates the measurement during the first week of the event, T2 indicates the measurement one month later during the week right after the World Cup, and T3 indicates the measurement four months after T1 (i.e., three months after the event had ended).
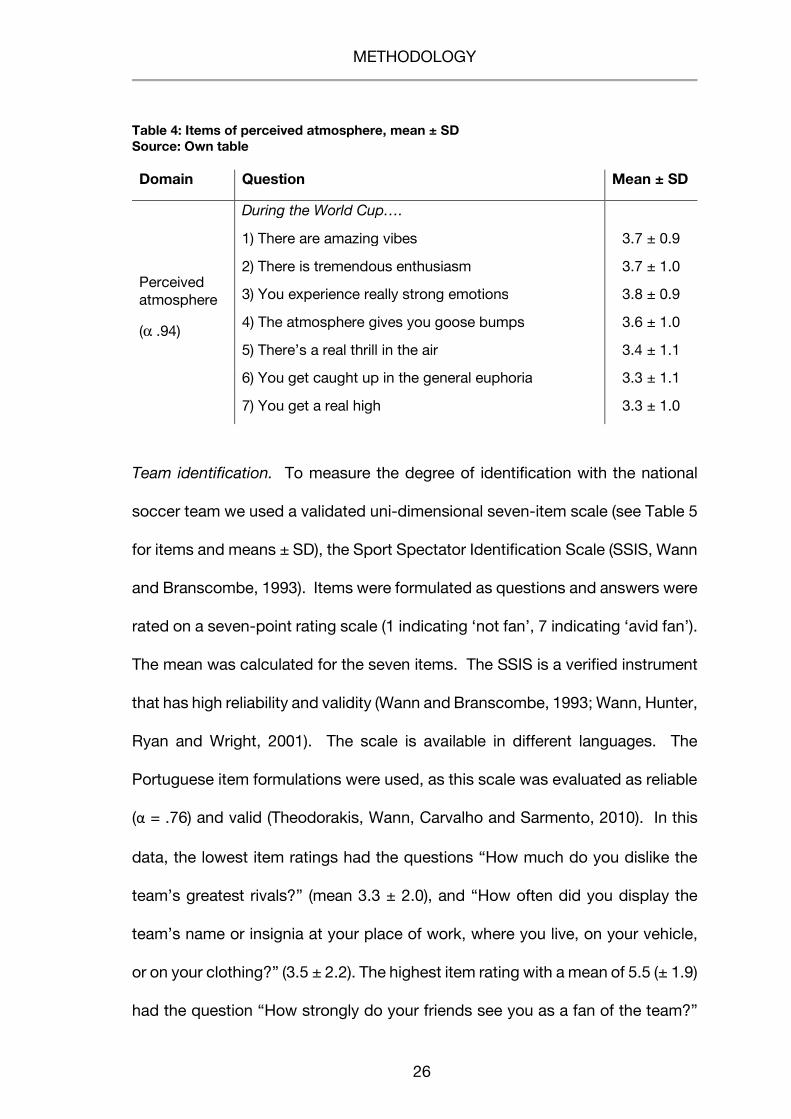
Perceived atmosphere during the FIFA World Cup. This construct was measured
via a seven-item scale representing reflective indicators, anchored at 1 = ‘do not
agree at all’ and 5 = ‘fully agree’ (Uhrich and Benkenstein, 2010). The scale was
originally developed as the Multiple Indicators Multiple Causes model (MIMIC)
to measure atmosphere in sport stadiums, which is why we fit the items to the
context of the study (i.e., we changed the wording from “in the stadium” to
“during the World Cup”; see Table 4). Since there was no version available in
Brazilian Portuguese, two independent native speakers translated the questions
using the forward-backward method. This translation method is recommended
by the WHO in order to ensure the reliability of the translated scales (World
Health Organization, 2005). The scale was found to be reliable; Cronbach’s
alpha was .94.
METHODOLOGY
26
Table 4: Items of perceived atmosphere, mean ± SD Source: Own table
Domain Question Mean ± SD
Perceived atmosphere
(α .94)
During the World Cup….
1) There are amazing vibes 3.7 ± 0.9
2) There is tremendous enthusiasm 3.7 ± 1.0
3) You experience really strong emotions 3.8 ± 0.9
4) The atmosphere gives you goose bumps 3.6 ± 1.0
5) There’s a real thrill in the air 3.4 ± 1.1
6) You get caught up in the general euphoria 3.3 ± 1.1
7) You get a real high 3.3 ± 1.0
Team identification. To measure the degree of identification with the national
soccer team we used a validated uni-dimensional seven-item scale (see Table 5
for items and means ± SD), the Sport Spectator Identification Scale (SSIS, Wann
and Branscombe, 1993). Items were formulated as questions and answers were
rated on a seven-point rating scale (1 indicating ‘not fan’, 7 indicating ‘avid fan’).
The mean was calculated for the seven items. The SSIS is a verified instrument
that has high reliability and validity (Wann and Branscombe, 1993; Wann, Hunter,
Ryan and Wright, 2001). The scale is available in different languages. The
Portuguese item formulations were used, as this scale was evaluated as reliable
(α = .76) and valid (Theodorakis, Wann, Carvalho and Sarmento, 2010). In this
data, the lowest item ratings had the questions “How much do you dislike the
team’s greatest rivals?” (mean 3.3 ± 2.0), and “How often did you display the
team’s name or insignia at your place of work, where you live, on your vehicle,
or on your clothing?” (3.5 ± 2.2). The highest item rating with a mean of 5.5 (± 1.9)
had the question “How strongly do your friends see you as a fan of the team?”

METHODOLOGY
27
For the other item means ranged between 4.8 (± 2.2) to 5.1 (two items: ± 2.2 and
± 2.3); Cronbach’s alpha of the scale was .91.
Table 5: Items of the sport spectator identification scale, mean ± SD Source: Own table
Question Mean ± SD
Sport spectator identity scale (α .91)
1) How important to you is it that the team wins? 5.1 ± 2.3
2) How strongly do you see yourself as a fan of the team?
4.9 ± 2.1
3) How strongly do your friends see you as a fan of the team?
5.5 ± 1.9
4) During the World Cup, how closely did you follow the team via the media?
5.1 ± 2.2
5) How important is being a fan of the team to you? 4.8 ± 2.2
6) How much do you dislike the team’s greatest rivals? 3.3 ± 2.0
7) How often did you display the team’s name or
insignia at your place of work, where you live, on
your vehicle, or on your clothing?
3.5 ± 2.2
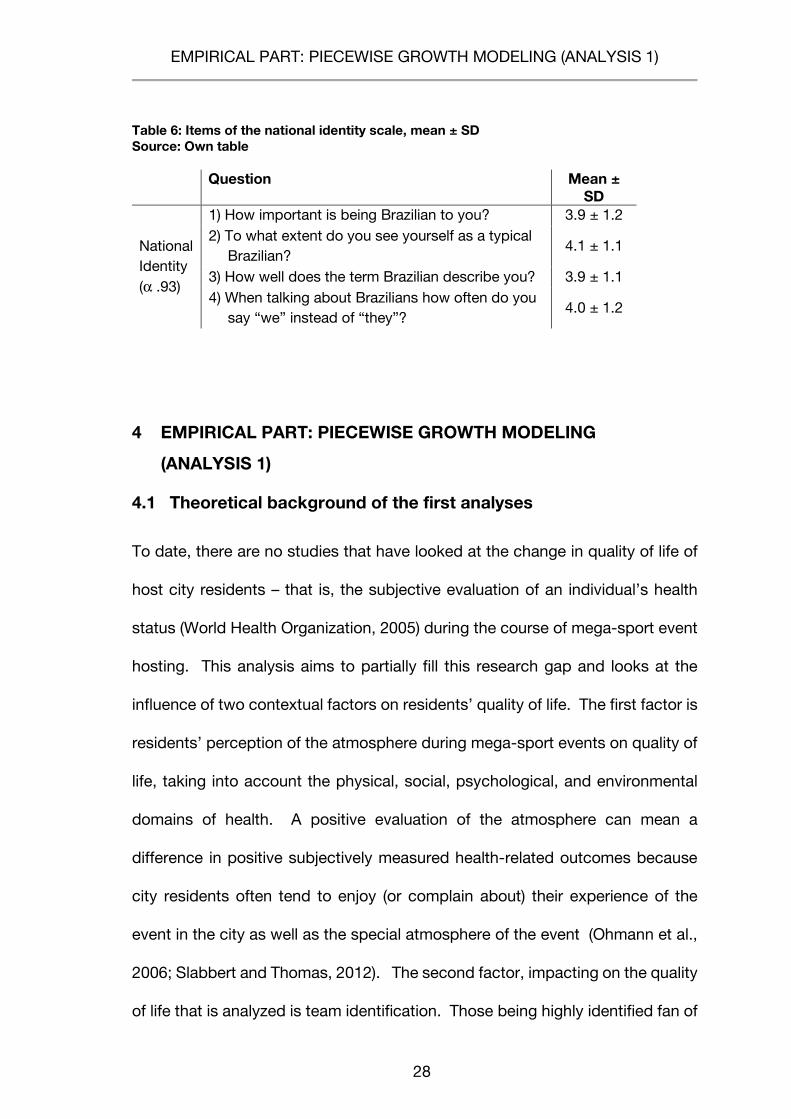
National identity. National identity was measured via a four-item scale (Huddy
and Khatib, 2007). Items are shown in Table 6. Each item is rated on a five-point
Likert scale anchored at 1 = ‘low national identity’, 5 = ‘high national identity’.
The items had very similar means, which ranged from 3.9 (± 1.1) to 4.1 (± 1.1);
Cronbach’s alpha of the four items was .93 (see Table 6). Items were translated,
using the forward-backward translation method by native speakers. The context
of the original scale was different, which is why the wording “American” of the
original scale was replaced with “Brazilian” (see above).
EMPIRICAL PART: PIECEWISE GROWTH MODELING (ANALYSIS 1)
28
Table 6: Items of the national identity scale, mean ± SD Source: Own table
Question Mean ± SD
National Identity (α .93)
1) How important is being Brazilian to you? 3.9 ± 1.2 2) To what extent do you see yourself as a typical
Brazilian? 4.1 ± 1.1
3) How well does the term Brazilian describe you? 3.9 ± 1.1 4) When talking about Brazilians how often do you
say “we” instead of “they”? 4.0 ± 1.2
4 EMPIRICAL PART: PIECEWISE GROWTH MODELING
(ANALYSIS 1)
4.1 Theoretical background of the first analyses
To date, there are no studies that have looked at the change in quality of life of
host city residents – that is, the subjective evaluation of an individual’s health
status (World Health Organization, 2005) during the course of mega-sport event
hosting. This analysis aims to partially fill this research gap and looks at the
influence of two contextual factors on residents’ quality of life. The first factor is
residents’ perception of the atmosphere during mega-sport events on quality of
life, taking into account the physical, social, psychological, and environmental
domains of health. A positive evaluation of the atmosphere can mean a
difference in positive subjectively measured health-related outcomes because
city residents often tend to enjoy (or complain about) their experience of the
event in the city as well as the special atmosphere of the event (Ohmann et al.,
2006; Slabbert and Thomas, 2012). The second factor, impacting on the quality
of life that is analyzed is team identification. Those being highly identified fan of
EMPIRICAL PART: PIECEWISE GROWTH MODELING (ANALYSIS 1)
29
the national team have a higher sense of belonging to the social group of fans,
which can be expected to lead to positive health outcomes. Evidence for higher
social psychological health outcomes in fans of a local team has been reported
before in Wann’s team Identification-Social Psychological Health Model (Wann,
2006).
In what follows, arguments are provided for how the different dimensions of
quality of life might change during (and after) the hosting of a mega-sport event
depending on the (1) atmosphere perceived and (2) team identification. The two
independent variables, event atmosphere and team identification differ in their
temporal occurrence. Event atmosphere occurs rather infrequently in a city and
only for a short period, this usually happens during the event. By comparison,
team identification is a construct that is not directly related to the event hosting,
but it forms over an extended period and persists over time, as it is “one of the
few constant things in your life, the team you support” (Lock, Taylor, Funk and
Darcy, 2012, p. 287). Researchers showed that the degree of identification with
a team is subject to change, as it depends on factors such as wins and losses
of the team (Stieger, Götz and Gehrig, 2015). Therefore, the change in team
identification and its effect on quality of life was analyzed over the three waves,
while event atmosphere was only measured during the event and thus it was
included in the model in one time point, measured in T2.
In what follows next, perceived atmosphere is conceptualized and arguments
are provided for how perceived atmosphere may affect the change in the four
quality of life domains during the course of the hosting of the event (and after
the event).
EMPIRICAL PART: PIECEWISE GROWTH MODELING (ANALYSIS 1)
30
4.1.1 Relevance of perceived atmosphere during mega-sport events
This study considers the atmosphere in the host city of a mega-sport event as
one factor that might affect the development of quality of life over time. Despite
the fact that atmospheric elements of sports are one central element of the
“service” that is provided to spectators (Uhrich and Benkenstein, 2010),
atmosphere is rarely mentioned as one of the features of hosting mega-sport
events (e.g. Fredline, 2005; Hall, 1992; Ritchie, 1984). In the marketing
discipline, the term “atmospherics” was first introduced by Kotler (1973) who
referred to atmospherics as the impact of environmental sensory stimuli, such
as sight, sound, smell, and touch, on consumers. Referring to this
conceptualization, atmosphere can be defined as “the totality of emotionally
appealing environmental stimuli in a defined place” (Wochnowski, 1996, p. 181).
Mehrabian and Russell’s (1974) environmental psychology behavioral model can
be used as a theoretical framework to assess the effects of atmosphere on the
emotional and behavioral reactions of individuals. The model postulates that
both environmental stimuli and personality factors influence three primary
emotional reactions of individuals: pleasure, arousal, and dominance. These
emotions then trigger behavioral reactions: approach and avoidance. Prior
studies have used the model to develop a research framework for the effects of
atmosphere at sport stadiums on spectators (Uhrich and Koenigstorfer, 2009).
In the context of mega-sport events that are staged by a host city, the city’s
atmosphere represents all emotionally appealing environmental stimuli that are
present during the hosting of the event. There is suggestive evidence that those
who live in host cities perceive a “special” atmosphere; they get a different
EMPIRICAL PART: PIECEWISE GROWTH MODELING (ANALYSIS 1)
31
perspective on their home city compared to how they have seen the city before
the event. For example, one study reported that residents in a host city
(compared to residents in a non-host city) were more involved in the event and
watched more matches (Slabbert and Thomas, 2012). Furthermore, residents
reported to experience a “party atmosphere” in the city and much more friendly
people in the city during mega-sport events, such as the 2006 FIFA World Cup
hosted in Germany (Ohmann et al., 2006). Brazil as a host city is special because
“no other cultural phenomenon appears to represent the Brazilian Soul better
than soccer” (Da Rosa Borges, Santos Silva and Da Silva Añaña, 2014, p. 27).
The World Cup and soccer is present all along the city, therefore, a positive effect
of event atmosphere on residents’ quality of life can be expected. In what
follows next, arguments are provided for why and how perceived atmosphere
may influence how host city residents rate their quality of life, referring to the
physical, social, psychological, and environmental domains.
First, city residents who perceive a positive atmosphere in the city during the
event should benefit from positive physical subjectively measured health
outcomes when a mega-sport event is hosted in their home city. Residents who
absorb the atmosphere, such as the music played at the fan fests and the
positive emotions spread by happy people celebrating the event, may
experience their surroundings as a healing environment (McCaffrey, 2008), i.e.
as a kind of distraction from normal life, which in turn can reduce physical pain
(Buhle, Stevens, Friedman and Wager, 2012). Furthermore, a positive outlook
may generate a more energetic life for the residents (Wann and Pierce, 2005).
EMPIRICAL PART: PIECEWISE GROWTH MODELING (ANALYSIS 1)
32
This leads to an increase in physical health (WHOQOL question “Do you have
enough energy for everyday life”). The first hypothesis of this thesis is:
H1: Perceived atmosphere increases the host city residents’ change in the
physical domain of quality of life from the beginning to the end of a mega-sport
event that is hosted in their home city.
Second, residents who perceive a positive atmosphere should benefit from
positive social health outcomes. Residents who like the atmosphere in the city
may be more likely to interact with their family, friends, and colleagues as well
as other residents and tourists from all over the world. Hall (1992, p. 69) argues
that “shared experience,” “expanding cultural perspectives,” “building
community pride and identity,” and “increased community participation” are
typical characteristics of mega-sport events; this of course in turn affects the
social domain of health of individuals. Fredline (2005, p. 268) argues that these
events provide many “opportunities for (…) community or family togetherness.”
Ohmann et al. (2006, p. 143) provide suggestive evidence that host city residents
who appreciate the “party atmosphere” in the city are more likely to appreciate
social relationships. Based on this evidence a positive impact on individuals
social health is expected, because those who perceive the atmosphere
positively engage in social gatherings and interact with fellow citizens leading to
higher perceptions of social health. Therefore, the second hypothesis of this
thesis is as follows:
EMPIRICAL PART: PIECEWISE GROWTH MODELING (ANALYSIS 1)
33
H2: Perceived atmosphere increases residents’ change in the social domain of
quality of life from the beginning to the end of a mega-sport event that is hosted
in their home city.
Third, residents who perceive a positive atmosphere should benefit from positive
psychological health outcomes. Being at a fan fest, in a bar, or on the streets
that have been closed down for traffic, while absorbing the party atmosphere in
the city may result in happiness and joy. Residents may also tend to forget any
life-related burdens or negative feelings if they perceive a positive atmosphere.
The feeling of becoming part of festivities and other activities that take place in
the city may make residents perceive that their quality of life increases, because
otherwise, “people may become stuck in everyday routines (…). This leads to a
search for activities that offer tension-excitement and emotional arousal”
(Coakley and Donnelly, 2009, p. 336; see also Ohmann et al., 2006; Reis et al.,
2010). It is clear that a positive perspective on a mega-sport event’s atmosphere
benefits residents’ psychological health because by attending the event and
watching the soccer matches residents experience an emotional arousal and a
distraction from their everyday life. As a result, the third hypothesis of this thesis
is:
H3: Perceived atmosphere increases residents’ change in the psychological
domain of quality of life from the beginning to the end of a mega-sport event that
is hosted in their home city.
EMPIRICAL PART: PIECEWISE GROWTH MODELING (ANALYSIS 1)
34
Lastly, residents who perceive a positive atmosphere should benefit from
positive environmental health outcomes. Due to the number of attendees
(visitors, athletes and spectators) during mega-sport events, infrastructure
conditions, e.g., available hotel rooms, public transportation or restaurants, are
improved to accommodate such a large number (Solberg and Preuss, 2007).
Host cities are often required to invest in infrastructure, such as building sport
stadiums and parks, improving public transportation, and improving security
standards (Kaplanidou, 2012). Residents are most likely to profit from these
investments if they perceive the atmosphere positively, that is, when they feel
that:
• their physical environment provides some health opportunities for them
(e.g., going for a walk in park),
• their environment is safer (e.g. feeling safer in public during the event
because of the presence of policemen), and
• their mode of transportation is easier (e.g., taking the metro instead of
cars or buses).
Those residents who perceive the atmosphere positively should also be less
concerned about the negative consequences that the hosting of a mega-sport
event may have, such as safety concerns, increase in prices, and traffic
congestion (Preuss, 2007). This leads to the fourth hypothesis of this thesis:
H4: Perceived atmosphere increases residents’ change in the environmental
domain of quality of life from the beginning to the end of a mega-sport event that
is hosted in their home city.
EMPIRICAL PART: PIECEWISE GROWTH MODELING (ANALYSIS 1)
35
To summarize, host city residents who perceive the atmosphere in their home
city during the event positively (vs. negatively) are expected to experience an
increase in the physical, social, psychological, and environmental domains of
quality of life during the course of the event (Hypotheses 1–4). No predictions
are made about the sustainability until three month after the event of a potential
increase in quality of life at high levels of perceived atmosphere because there
is little theoretical or empirical support for such predictions. One could argue
that perceived atmosphere keeps subjective health levels high because having
good memories about the hosting of the event in the city may have positive
effects on quality of life. But one could also argue that those who perceive a
positive atmosphere will miss the experience that they had during the event and
may then not be satisfied with going back to their day-to-day routine, and thus,
rate their quality of life more negatively some time after the event.
Another variable that might impact residents quality of life is team identification,
therefore arguments will be provided in the following subsection for why
identification may affect the change in the four quality of life domains during the
course of the hosting of the event (and after the event).
4.1.2 Relevance of team identification during mega-sport events
Team identification as a phenomenon in fans has already been researched for
many years. Team identification is defined as “the extent to which a fan feels a
psychological connection to a team” (Wann and Pierce, 2005, p. 117). The
association between team identification and individuals’ health was formulated
for the first time in 1929, when Brill specified, "are you a fan? It is altogether to
EMPIRICAL PART: PIECEWISE GROWTH MODELING (ANALYSIS 1)
36
be hoped, for your psychic health and well-being, that you are" (p. 429).
Identified fans (i.e., hard core fans that follow their national teams) were found
to differ from less identified fans (i.e., fans with a mild interest in their national
teams). Differences will be described in the following.
During mega-sport events where national teams compete, a large number of
spectators typically cheer for and identify with the national team. The interaction
between spectators and the actions of the national team can lead to improved
residents’ health outcomes, which is especially true for highly identified
spectators since the team they follow becomes a part of their social identity, as
predicted by Social Identity Theory (Tajfel and Turner, 1979). Being a highly
identified spectator has several consequences. First, economic consequences
result from team identification - those have a higher attendance at games and a
higher willingness to pay for tickets. They further buy the team sponsors’
products, and purchase more team merchandise (Gau, James and Kim, 2009;
Wakefield, 1995; Wann and Branscombe, 1993). These fans are more
successive for the game outcomes, as it has been shown that they feel more
satisfaction when game outcomes are positive (Madrigal, 1995). Second, if
highly identified spectators gather, group emotions are formed and this creates
a special feeling of togetherness. However, the consequences can also be of
negative valence. Team identification has also been related to aggression.
Some highly identified spectators may feel less control over their behavior at
games compared to moderately and lowly identified spectators, resulting in
aggressive behaviors (Dimmock and Grove, 2005).
EMPIRICAL PART: PIECEWISE GROWTH MODELING (ANALYSIS 1)
37
While it is obvious that aggressive spectators may harm another’s health, team
identification has also been related to positive subjective health effects. Highly
identified spectators have a strong feeling of belonging to a social group, which
can further lead to benefits for an individuals’ health. Wann and Pierce (2005)
showed that social connections mediated the effect of team identification on
social and psychological health. This effect was present for local fans but not
for visiting fans, of distant teams (Wann and Pierce, 2005). However, in a more
recent study, the authors report the direct effect of team identification on
spectators’ social and psychological health, while the mediating effect of social
connections was not significant for a sample of high school students (mean age
16.2 years) attending a public mid-sized high school (Wann, Waddill, Brasher
and Ladd, 2015). The study provides evidence for the influence of team
identification on at least two of the four health dimensions (but not their change),
although the evidence for this sample may not be transferable to a more
representative sample and the context of mega-sport events in this research.
Thus, evidence for the so-called Team Identification–Social Psychological
Health Model is mixed (Wann, 2006), and the model has only been tested for
local sports teams and not for national teams.
The reason why the social domain of quality of life increases by being identified
with the national team can be explained with the Social Identity Theory, which
was first described by Tajfel and Turner (1979). It examines the psychological
processes that occur in individuals during (inter-)group events; people tend to
categorize themselves and others into social groups, such as organizational
membership, religious affiliation, and age cohorts (Tajfel and Turner, 1985). The
EMPIRICAL PART: PIECEWISE GROWTH MODELING (ANALYSIS 1)
38
theory distinguishes between in-groups (“us”) and out-groups (“them”). The act
of individuals’ belonging to a group creates a sense of social identity with other
members of this group. Individuals identify with the members of their group (in-
group), and also distinguish their group from other groups (out-group).
Furthermore, the in-group is an important source of pride and self-esteem,
creating a “we” feeling. The person then behaves on the basis of his personal,
family or national “level of self” (Turner et al., 1987), which “makes group
behavior possible” (Tajfel, 1982, p. 21).
Residents who are highly identified with their team share the experience of going
to the stadium or watching the matches on television; in both contexts, they
cheer for the team and celebrate. These behaviors are described as collectively
adopted group behaviors increasing an individual’s sense of belonging, which
can lead to increased social health outcomes (Haslam et al., 2009).
Another reason for why those with higher social identity may rate their subjective
health more positively is the fact that highly identified individuals receive more
social support from their peers. According to House (1981), the support has four
different facets. One facet is emotional support, which occurs when individuals
share life experiences and feel emotionally close. In the case of a mega-sport
event, spectators may share the experience made during the attendance of
matches in the stadium or at public places such as fan fests for those who do
not have tickets. Another facet is the instrumental support. This occurs when
one person helps another person in need, such as when providing material
assistance or help. The attendance of sport games of disabled persons,
accompanied by a non-disabled person, is a good example for instrumental
EMPIRICAL PART: PIECEWISE GROWTH MODELING (ANALYSIS 1)
39
support at mega-sport events. It can also be observed that persons invite each
other to attend (or watch) games together, thus providing direct or indirect
instrumental support. Another facet is informational support. Informational
support can be given in the form of intangible help, such as advice, suggestion,
and information that is useful to solve a problem. During a mega-sport event,
this can be an important aspect because of infrastructural changes that occur
due to the event hosting (Preuss, 2007). Individuals can seek help due to road
blockings or changed opening hours. Also, highly identified fans can support
each other when they have information about the best places where they can
watch the matches, or how to purchase stadium tickets. Lastly, appraisal
support is a facet of support. It aims to support a person with information
needed to reflect his or her own behavior or situation, such as when feedback is
provided. The four different facets of support can be observed in highly
identified sport spectators and may thus contribute to subjective health, leading
to the fifth hypothesis:
H5: Team identification of host city residents increases in the social
domain of quality of life during the course of the event but not after the
event.
There is evidence for the positive impact of being a member of a social group
on physical health outcomes. Support for this claim is provided by Reblin and
Uchino (2008) who, in their review, found a positive impact of the social support
that individuals have, broadly defined as the belonging to a social network or
participation in a social network (such as nationality) on physical health. Another
EMPIRICAL PART: PIECEWISE GROWTH MODELING (ANALYSIS 1)
40
study found that Canadians who strongly identify with their community had more
positive (self-reported) overall health outcomes. This effect was present for
individuals across gender, age, and socio-economic factors (Shields, 2008).
One study found that peoples’ identification with a social group leads to a group-
based self-esteem, which was found to be a major protective factor against
chronic illness (Bailis, Chipperfield and Helgason, 2008). A literate review
including 81 studies found that social support is beneficial for physiological
processes in humans, such as the cardiovascular, endocrine, and immune
systems functioning (Uchino, Cacioppo and Kiecolt-Glaser, 1996).
Another aspect in better physical health outcomes is that individuals have more
informational support available (House, 1981). This aspect impacts their health-
related information such as availability of health services and in turn health-
seeking behaviors in the case of sickness (Cohen, 2004), leading to better
demanded care or consulting a doctor in the case of sickness. In the context of
the World Cup, highly identified fans go out and see friends, such as when
watching the games together. Therefore, these individuals are expected to have
more conversation in the case of help needed, leading to behavior beneficial for
their health.
On the other hand, not having social support has been found to lead to negative
health outcomes. Vanderhorst and McLaren (2005) report that older adults with
fewer social resources had an increased risk to commit suicide. People involved
in social conflict were found to have twice the risk to get a cold after exposure
to a virus (Cohen, 1988). In the case of team identification, both positive and
negative health outcomes can be expected. The group can be a resource for
EMPIRICAL PART: PIECEWISE GROWTH MODELING (ANALYSIS 1)
41
information in the case of sickness. However, being member of a social group
can also lead to sickness (e.g., infection) and unhealthy behaviors, such as
drinking beer or eating unhealthy food when following sporting games. A recent
review concluded that for adults with low levels of social integration, the relative
risk for mortality was comparable to that of smoking and alcohol consumption
(Holt-Lunstad, Smith and Layton, 2010). Due to the fact that individuals in host
cities have increased social connections which is a proactive factor for physical
health, positive health outcomes are expected for the residents. Those who are
highly identified with the national team go out to watch the matches, interact
with other fans and thus have a higher perception of support, which is beneficial
for physical health outcomes. This leads to the sixth hypothesis:
H6: Team identification of host city residents increases the physical
domain of quality of life during the course of the event but not after the
event.
One argument for the positive relationship between social identity and positive
psychological health outcomes is the stress-buffering hypothesis (Cohen and
Wills, 1985). According to the hypothesis, individuals who have social support
have a higher perceived ability to cope. Several authors showed that being part
of a social group helped individuals to handle stressful situations (Uchino,
Bowen, Carlisle and Birmingham, 2012; Uchino et al., 1996). These factors are
direct indicators of an individual’s psychological health. Vice versa, low social
identity in individuals can have negative psychological health outcomes
(Williams and Mohammed, 2009). Thus, those individuals who are highly
EMPIRICAL PART: PIECEWISE GROWTH MODELING (ANALYSIS 1)
42
identified with the national team have a better stress resistance, e.g., when there
is overcrowding in the city, leading to the following hypothesis:
H7: Team identification of host city residents increases the psychological
domain of quality of life during the course of the event but not after the
event.
Environmental health includes the aspects surrounding an individual’s life.
Those highly identified may more easily accept their environmental surrounding,
such as construction measures that are related to sporting events, because
these individuals perceive that they more directly profit from it (e.g., when
watching a game in the stadium). Lowly identified individuals are likely to be less
satisfied with their built environment, e.g. construction measures that occur
during the hosting of an event, such as road blockings, or traffic delays (Preuss,
2007), because they do not perceive the benefit of these environmental changes.
Further, they cannot understand why highly identified fans gather in pubs or bars
to watch matches together. Environmental psychology provides evidence for
these statements, which focuses on the interplay between individuals and their
surroundings. According to the congruence model, “a close fit between
environmental characteristics and individual preferences and needs should
contribute to a sense of well-being” (Kahana, 1982, p. 99). Thus, negative health
outcomes can be expected for those who are annoyed by the construction sites
or by other sport spectators being present at their city because they cannot
adapt to the changes that occur. This leads to the following hypothesis:
EMPIRICAL PART: PIECEWISE GROWTH MODELING (ANALYSIS 1)
43
H8: Team identification of host city residents increases the environmental
domain of quality of life during the course of the event but not after the
event.
4.2 Methods
4.2.1 Procedure and sample
The study took place in Rio de Janeiro, a host city of the 2014 FIFA World Cup
Brazil. Data were collected during the first week of the World Cup (first wave;
T1), during the week right after the World Cup (second wave; T2), and during a
week three months after the end of the World Cup (third wave; T3). City residents
of Rio de Janeiro who were at least 18 years old were invited to participate in
the study by a Brazilian market research agency, which recruited their panel
members to take part in the online survey.
In the survey, participants of the first wave were told that the study was about
their wellbeing. After they gave their consent to participate, they filled in a
questionnaire. At the end of the survey, participants were thanked for
participation and invited to participate again one (or three) month(s) later. Quality
of life was assessed in all three waves. In the second wave, participants were
asked about their experience during the World Cup (including perceived
atmosphere) in addition to the items assessed in the surveys before and after.
In the third wave, participants were fully debriefed after they had filled out the
survey.
EMPIRICAL PART: PIECEWISE GROWTH MODELING (ANALYSIS 1)
44
4.2.2 Data analysis
Data sets were created using the Statistical Package for the Social Sciences
(SPSS) version 23.0. Data modeling was performed with Mplus version 7.3
(Muthén and Muthén, 2007). The level of significance was set at p < .05,
marginal significance was set at p < .10. Piecewise linear growth models were
estimated via the full information maximum likelihood method (Enders and
Bandalos, 2001). To examine the distribution of missing values, Little’s (1988)
missing completely at random (MCAR) test was conducted. In this sample,
24.2% of the participants had missing values (M = .48 missing values per
participant referring to all variables across the three waves). Taking into account
all variables of the survey across the three waves, the test was not significant,
indicating that missing values are completely at random (χ²= 4,161.04; df, 4,144;
p = .42). Thus, missing values were imputed using full information maximum
likelihood estimate. The piecewise linear growth models were used to analyze
individual changes in the four quality of life domains over the three waves. Three
different models were used. In a first step, only the change in quality of life over
time was analyzed to receive information whether quality of life per se changes
over time. In a second step, the effect of the contextual factors, perceived
atmosphere and team identification, were included in separate models for
hypothesis testing purposes. A third model was measured to analyze the impact
of team identification and atmosphere, as simultaneous variables in the model.
The first type of model yields information about the mean of the intercept across
respondents (which in the present case is the mean quality of life at T2) and the
variation in intercepts across respondents, the mean slope (increase or decrease
EMPIRICAL PART: PIECEWISE GROWTH MODELING (ANALYSIS 1)
45
in quality of life) between T1 and T2 and the variation in this slope across
respondents, as well as the mean slope between T2 and T3 and the variation in
this slope across respondents. Thus, an intercept factor i and two slope factors
s1 and s2 to model the means and variances of, and the covariances between
the observed quality of life measures at the three points in time were specified.
The loadings of the three quality of life measures on i are fixed at 1, and the
loadings of the three quality of life measures on s1 are fixed at -1, 0, and 0
(indicating that the first wave took place one month before the end of the event
hosting in T2). The loadings of the three quality of life measures on s2 are fixed
at 0, 0, and 3 (indicating that the third wave took place three months after the
end of the event hosting in T2). Using this coding, the means of i, s1, and s2
show the average quality of life at T2, the average change in quality of life
between T1 and T2, and the average monthly change in quality of life between
T2 and T3 across respondents, respectively. The variances of i, s1, and s2 show
the variation in mean quality of life at T2, the variation in the change of quality of
life between T1 and T2, and the variation in the monthly change of quality of life
between T2 and T3 across respondents. Error variances at each time point were
set to be equal, and the covariance between s1 and s2 was set to zero. The
model is saturated and thus has zero degrees of freedom. Specifying the same
model as before, atmosphere was included as a determinant of both the
variation in intercepts and the variation in the two slopes. Both models will be
described in more detail in the results section.
Second, the first type of model was used to analyze the change in team
identification over the three waves. Then, a similar model as for quality of life and
EMPIRICAL PART: PIECEWISE GROWTH MODELING (ANALYSIS 1)
46
atmosphere was specified using team identification. The difference in this model
was that team identification was measured in all three waves. Therefore, this
analysis aimed to investigate if team identification was a determinant of the
variation in intercepts and the variation in the two slopes at the respective time
points.
Third, the change in quality of life was analyzed in a combined model, including
atmosphere and team identification simultaneously in the model. The Mplus
codes of all analyses are in APPENDIX C.
4.3 Results
4.3.1 Change in quality of life
Table 7 presents the results of the model testing for the change in the four quality
of life domains over time. The average quality of life for physical health (at T2)
was 3.59 (with 1 indicating lowest and 5 indicating highest ratings), and there
was significant variation in the scores across individuals (estimate = .233, p <
.001); the average monthly change between T1 to T2 was non-significant
(estimate = -.001, p = .98; since the variance of s1 was negative and non-
significant, it was set to zero), but negative and significant between T2 to T3
(estimate = -.027, p = .02; variation in s2: estimate = .005, p = .09).
The average quality of life for social health was 3.04, and there was significant
variation in the scores across individuals (estimate = .546, p < .001); the average
monthly changes were not significant (s1: estimate = .023, p = .71 with
significant variation in slope 1 [estimate = .352, p < .001]; s2: estimate = .014, p
EMPIRICAL PART: PIECEWISE GROWTH MODELING (ANALYSIS 1)
47
= .40; since the variance of s1 was negative and non-significant, it was set to
zero).
The average quality of life for psychological health was 3.75, and there was
significant variation in the scores across individuals (estimate = .252, p < .001);
the average monthly change was not significant from T1 to T2 (estimate = -.042,
p = .18; variation in s1: estimate = .048, p = .10), but negative and significant
from T2 to T3 (estimate = -.043, p < .01; variation in s2: estimate = .011, p =
.001).
The average quality of life for environmental health was 3.21, and there was
significant variation in the scores across individuals (estimate = .335, p < .001);
the average monthly changes were not significant (estimate = .058, p = .12 and
estimate = -.007, p = .57) and the variations in the changes were non-significant
(estimate = .034, p = .36 and estimate = .000, p = .97).
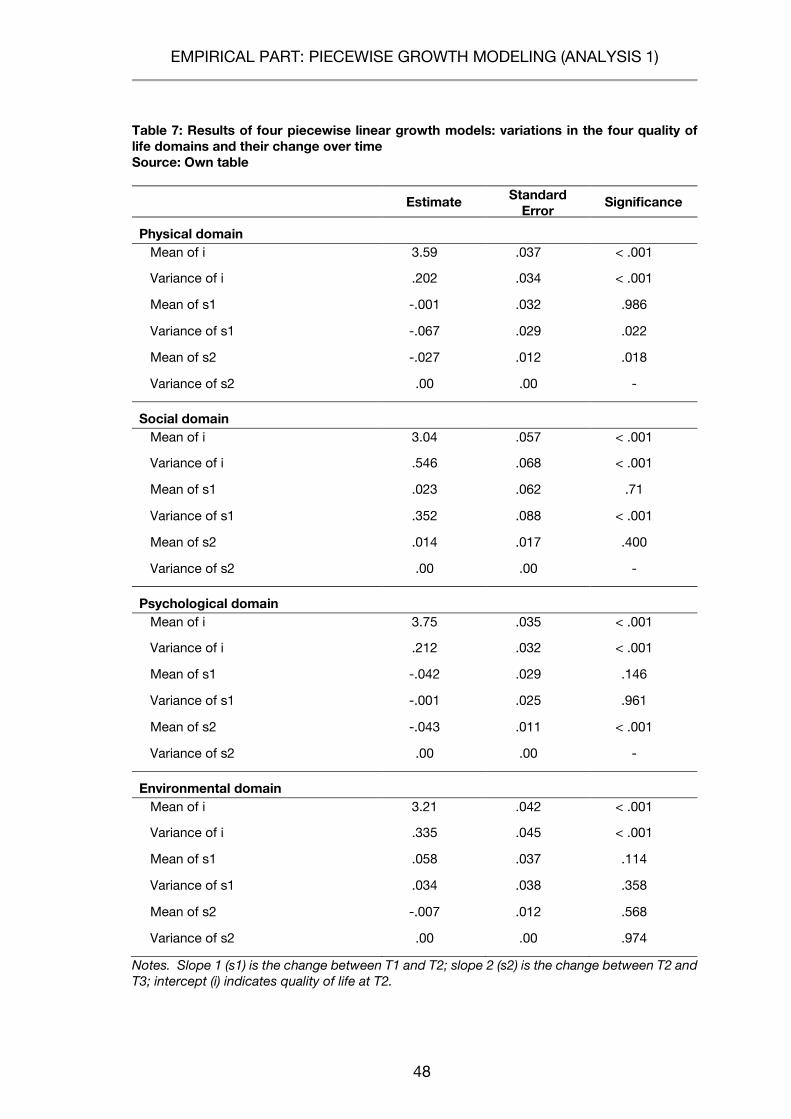
EMPIRICAL PART: PIECEWISE GROWTH MODELING (ANALYSIS 1)
48
Table 7: Results of four piecewise linear growth models: variations in the four quality of life domains and their change over time Source: Own table
Estimate Standard Error
Significance
Physical domain Mean of i 3.59 .037 < .001
Variance of i .202 .034 < .001
Mean of s1 -.001 .032 .986
Variance of s1 -.067 .029 .022
Mean of s2 -.027 .012 .018
Variance of s2 .00 .00 -
Social domain Mean of i 3.04 .057 < .001
Variance of i .546 .068 < .001
Mean of s1 .023 .062 .71
Variance of s1 .352 .088 < .001
Mean of s2 .014 .017 .400
Variance of s2 .00 .00 -
Psychological domain Mean of i 3.75 .035 < .001
Variance of i .212 .032 < .001
Mean of s1 -.042 .029 .146
Variance of s1 -.001 .025 .961
Mean of s2 -.043 .011 < .001
Variance of s2 .00 .00 -
Environmental domain Mean of i 3.21 .042 < .001
Variance of i .335 .045 < .001
Mean of s1 .058 .037 .114
Variance of s1 .034 .038 .358
Mean of s2 -.007 .012 .568
Variance of s2 .00 .00 .974
Notes. Slope 1 (s1) is the change between T1 and T2; slope 2 (s2) is the change between T2 and T3; intercept (i) indicates quality of life at T2.
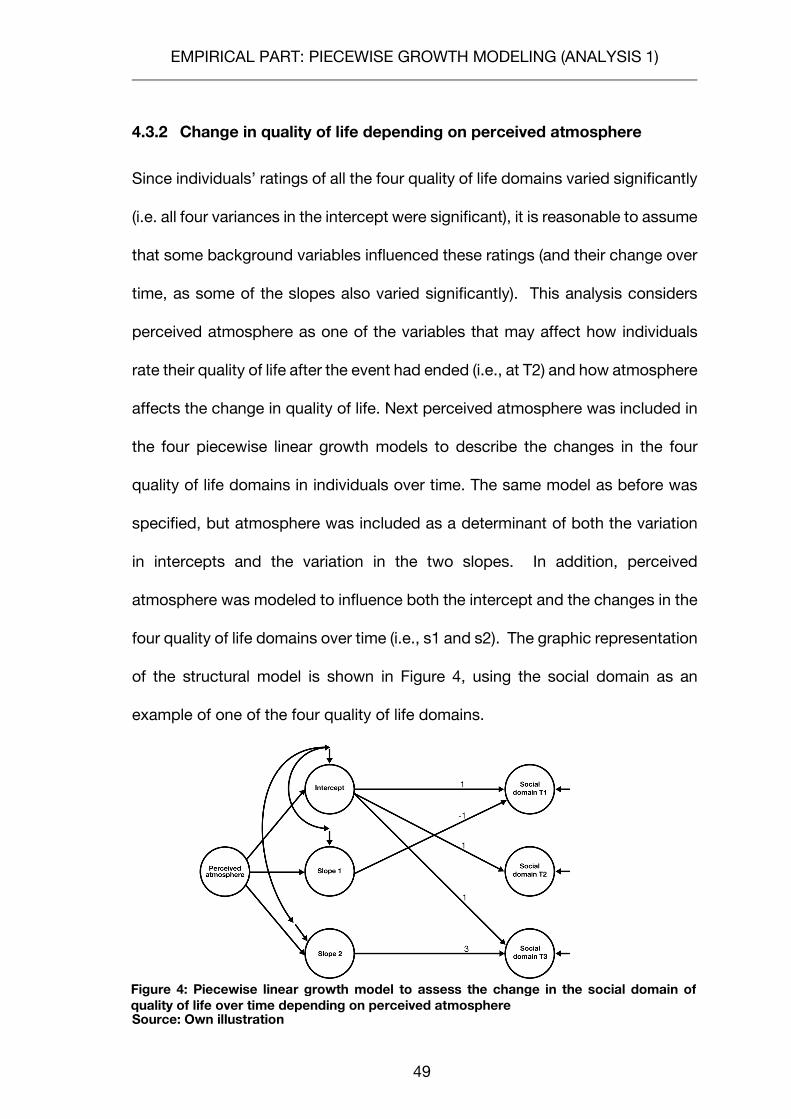
EMPIRICAL PART: PIECEWISE GROWTH MODELING (ANALYSIS 1)
49
Figure 4: Piecewise linear growth model to assess the change in the social domain of quality of life over time depending on perceived atmosphere
4.3.2 Change in quality of life depending on perceived atmosphere
Since individuals’ ratings of all the four quality of life domains varied significantly
(i.e. all four variances in the intercept were significant), it is reasonable to assume
that some background variables influenced these ratings (and their change over
time, as some of the slopes also varied significantly). This analysis considers
perceived atmosphere as one of the variables that may affect how individuals
rate their quality of life after the event had ended (i.e., at T2) and how atmosphere
affects the change in quality of life. Next perceived atmosphere was included in
the four piecewise linear growth models to describe the changes in the four
quality of life domains in individuals over time. The same model as before was
specified, but atmosphere was included as a determinant of both the variation
in intercepts and the variation in the two slopes. In addition, perceived
atmosphere was modeled to influence both the intercept and the changes in the
four quality of life domains over time (i.e., s1 and s2). The graphic representation
of the structural model is shown in Figure 4, using the social domain as an
example of one of the four quality of life domains.
Source: Own illustration
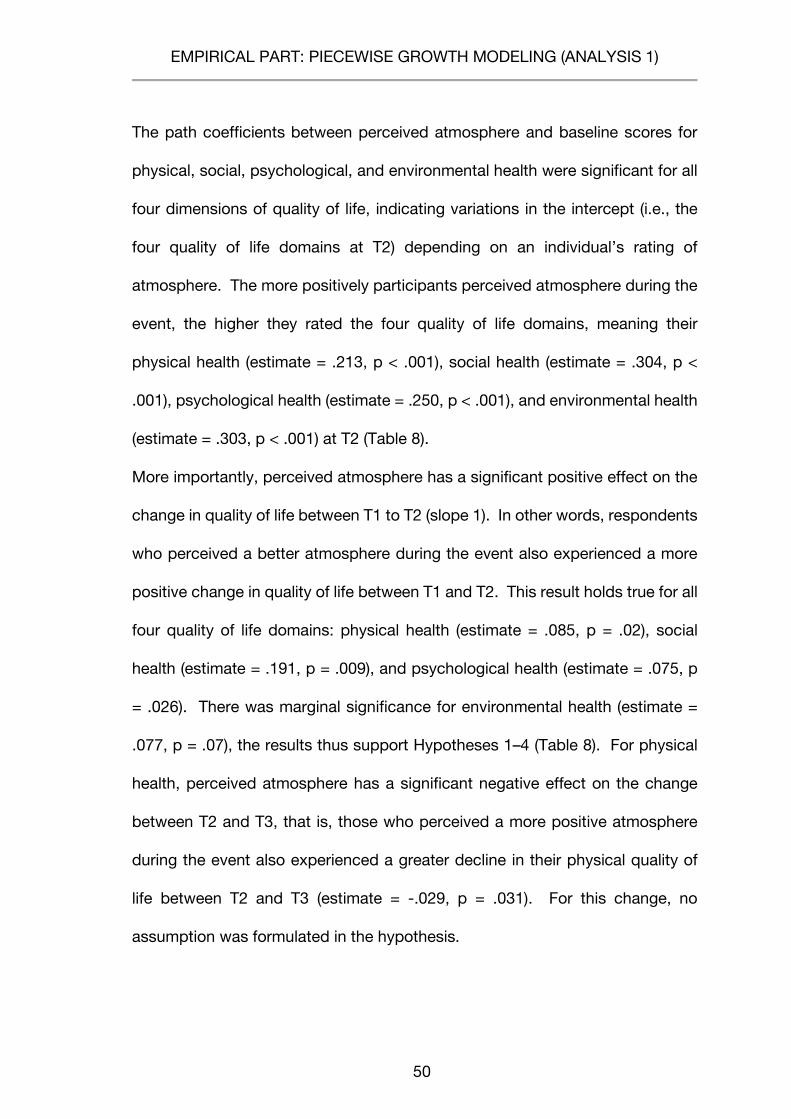
EMPIRICAL PART: PIECEWISE GROWTH MODELING (ANALYSIS 1)
50
The path coefficients between perceived atmosphere and baseline scores for
physical, social, psychological, and environmental health were significant for all
four dimensions of quality of life, indicating variations in the intercept (i.e., the
four quality of life domains at T2) depending on an individual’s rating of
atmosphere. The more positively participants perceived atmosphere during the
event, the higher they rated the four quality of life domains, meaning their
physical health (estimate = .213, p < .001), social health (estimate = .304, p <
.001), psychological health (estimate = .250, p < .001), and environmental health
(estimate = .303, p < .001) at T2 (Table 8).
More importantly, perceived atmosphere has a significant positive effect on the
change in quality of life between T1 to T2 (slope 1). In other words, respondents
who perceived a better atmosphere during the event also experienced a more
positive change in quality of life between T1 and T2. This result holds true for all
four quality of life domains: physical health (estimate = .085, p = .02), social
health (estimate = .191, p = .009), and psychological health (estimate = .075, p
= .026). There was marginal significance for environmental health (estimate =
.077, p = .07), the results thus support Hypotheses 1–4 (Table 8). For physical
health, perceived atmosphere has a significant negative effect on the change
between T2 and T3, that is, those who perceived a more positive atmosphere
during the event also experienced a greater decline in their physical quality of
life between T2 and T3 (estimate = -.029, p = .031). For this change, no
assumption was formulated in the hypothesis.

EMPIRICAL PART: PIECEWISE GROWTH MODELING (ANALYSIS 1)
51
Table 8: Results of four piecewise linear growth models: influence of perceived atmosphere on the four quality of life domains and their change over time Source: Own table
Estimate Standard Error Significance Hypothesis
supported?
Physical domain
Atmosphere → i .213 .042 < .001
! Atmosphere → s1 .085 .038 .023
Atmosphere → s2 -.029 .014 .037
Social domain
Atmosphere → i .304 .067 < .001
! Atmosphere → s1 .191 .073 .009
Atmosphere → s2 -.021 .022 .333
Psychological domain
Atmosphere → i .250 .039 < .001
! Atmosphere → s1 .075 .034 .026
Atmosphere → s2 -.007 .013 .586
Environmental domain
Atmosphere → i .303 .047 < .001
(!) Atmosphere → s1 .077 .043 .070
Atmosphere → s2 -.015 .014 .280
Notes. Slope 1 (s1) is the change between T1 and T2; slope 2 (s2) is the change between T2 and T3; intercept (i) indicates quality of life at T2.
To examine the effect of perceived atmosphere on the change of quality of life
between T1 and T2, which was significant for three domains and marginally
significant for environmental health, (relatively) high (+1 SD) and (relatively) low
(-1 SD) levels of perceived atmosphere were considered (M = 3.54 ± .85). Then
the (predicted) growth model slopes between T1 and T2 for participants at levels
of these selected values were described (Cohen, Cohen, West and Aiken, 2013).
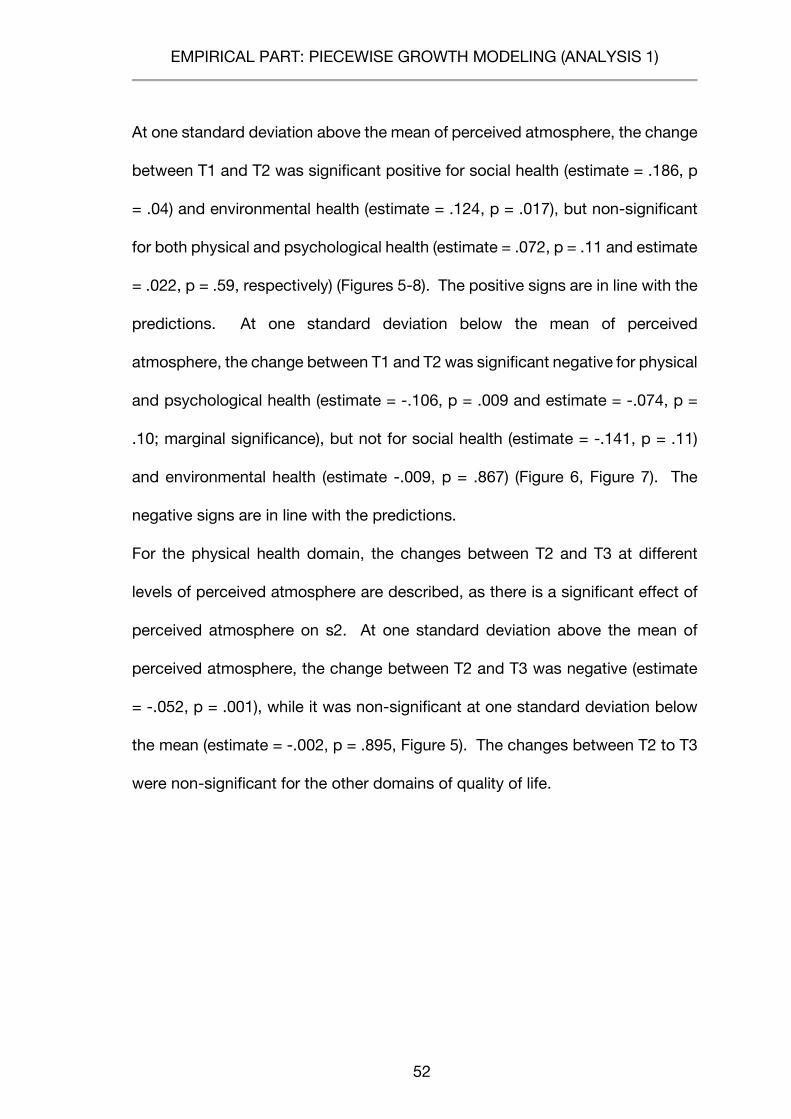
EMPIRICAL PART: PIECEWISE GROWTH MODELING (ANALYSIS 1)
52
At one standard deviation above the mean of perceived atmosphere, the change
between T1 and T2 was significant positive for social health (estimate = .186, p
= .04) and environmental health (estimate = .124, p = .017), but non-significant
for both physical and psychological health (estimate = .072, p = .11 and estimate
= .022, p = .59, respectively) (Figures 5-8). The positive signs are in line with the
predictions. At one standard deviation below the mean of perceived
atmosphere, the change between T1 and T2 was significant negative for physical
and psychological health (estimate = -.106, p = .009 and estimate = -.074, p =
.10; marginal significance), but not for social health (estimate = -.141, p = .11)
and environmental health (estimate -.009, p = .867) (Figure 6, Figure 7). The
negative signs are in line with the predictions.
For the physical health domain, the changes between T2 and T3 at different
levels of perceived atmosphere are described, as there is a significant effect of
perceived atmosphere on s2. At one standard deviation above the mean of
perceived atmosphere, the change between T2 and T3 was negative (estimate
= -.052, p = .001), while it was non-significant at one standard deviation below
the mean (estimate = -.002, p = .895, Figure 5). The changes between T2 to T3
were non-significant for the other domains of quality of life.
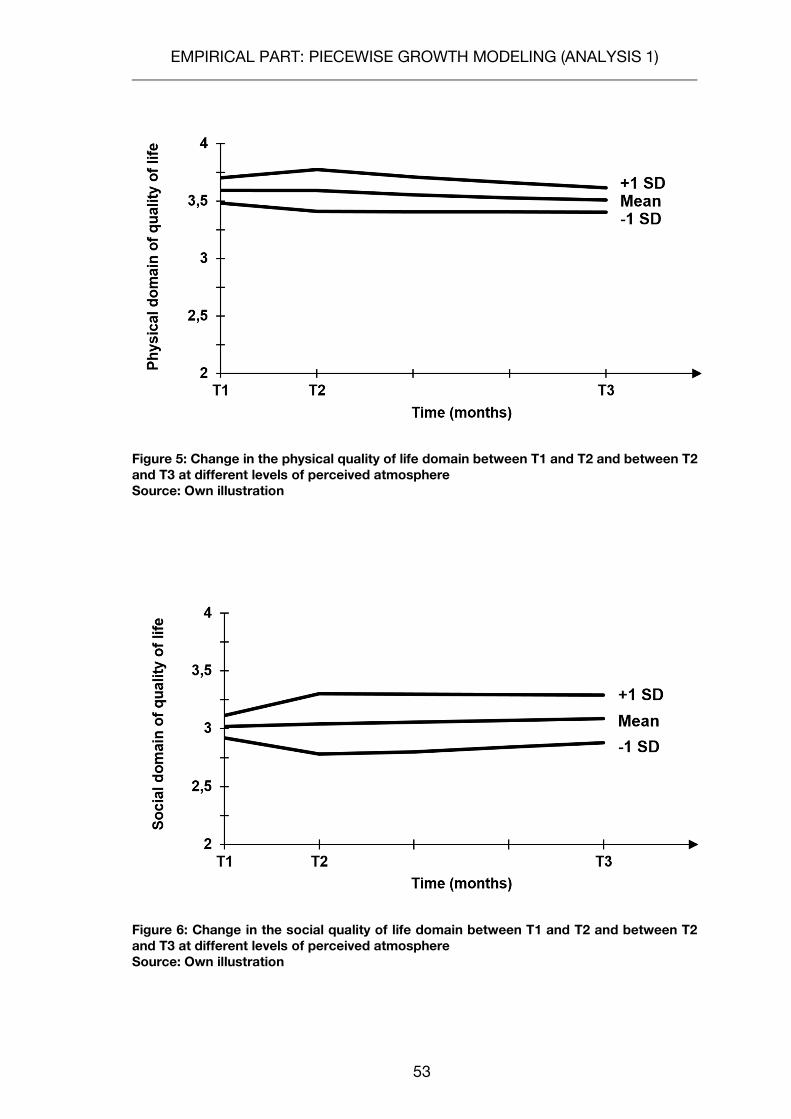
EMPIRICAL PART: PIECEWISE GROWTH MODELING (ANALYSIS 1)
53
Figure 5: Change in the physical quality of life domain between T1 and T2 and between T2 and T3 at different levels of perceived atmosphere Source: Own illustration
Figure 6: Change in the social quality of life domain between T1 and T2 and between T2 and T3 at different levels of perceived atmosphere Source: Own illustration
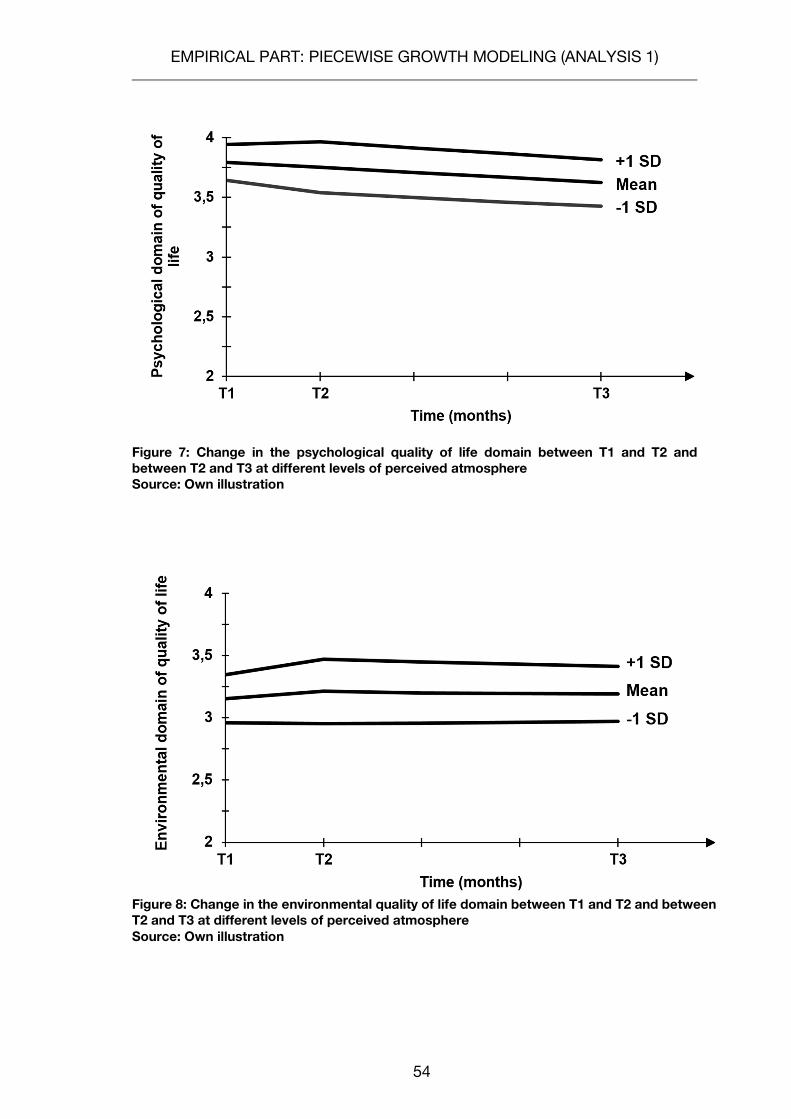
EMPIRICAL PART: PIECEWISE GROWTH MODELING (ANALYSIS 1)
54
Figure 7: Change in the psychological quality of life domain between T1 and T2 and between T2 and T3 at different levels of perceived atmosphere Source: Own illustration
Source: Own illustration
Figure 8: Change in the environmental quality of life domain between T1 and T2 and between T2 and T3 at different levels of perceived atmosphere
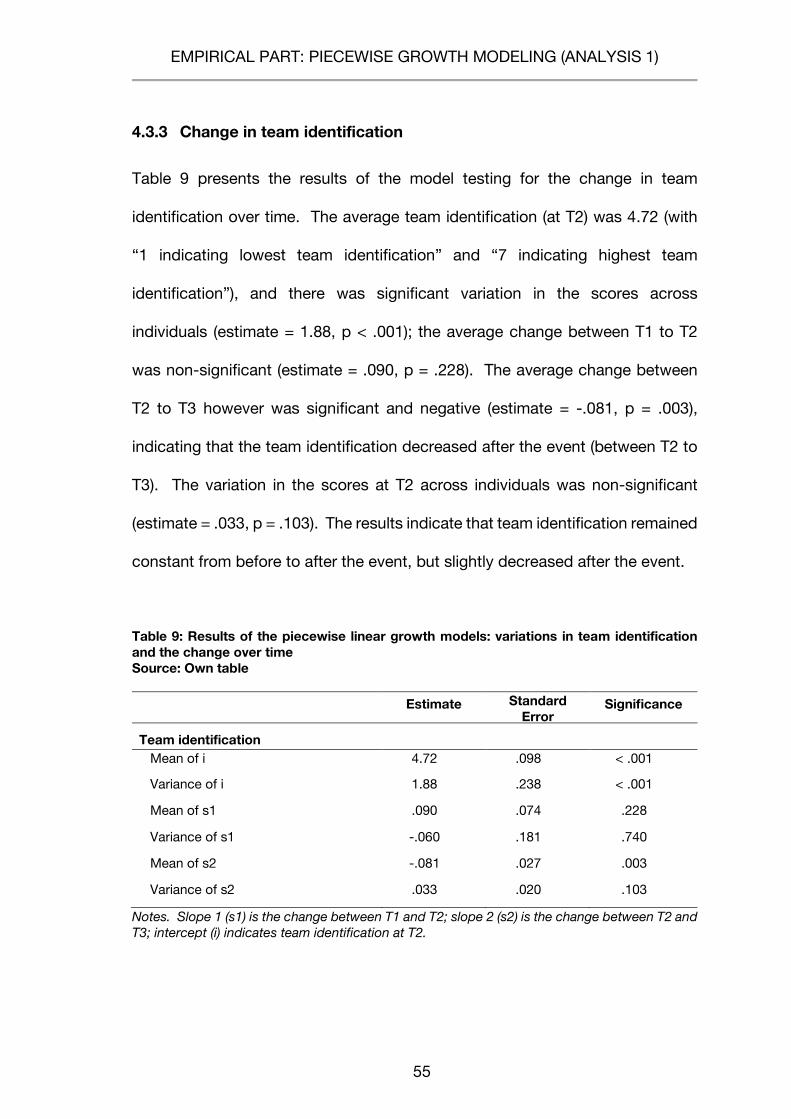
EMPIRICAL PART: PIECEWISE GROWTH MODELING (ANALYSIS 1)
55
4.3.3 Change in team identification
Table 9 presents the results of the model testing for the change in team
identification over time. The average team identification (at T2) was 4.72 (with
“1 indicating lowest team identification” and “7 indicating highest team
identification”), and there was significant variation in the scores across
individuals (estimate = 1.88, p < .001); the average change between T1 to T2
was non-significant (estimate = .090, p = .228). The average change between
T2 to T3 however was significant and negative (estimate = -.081, p = .003),
indicating that the team identification decreased after the event (between T2 to
T3). The variation in the scores at T2 across individuals was non-significant
(estimate = .033, p = .103). The results indicate that team identification remained
constant from before to after the event, but slightly decreased after the event.
Table 9: Results of the piecewise linear growth models: variations in team identification and the change over time Source: Own table
Estimate Standard Error
Significance
Team identification Mean of i 4.72 .098 < .001
Variance of i 1.88 .238 < .001
Mean of s1 .090 .074 .228
Variance of s1 -.060 .181 .740
Mean of s2 -.081 .027 .003
Variance of s2 .033 .020 .103
Notes. Slope 1 (s1) is the change between T1 and T2; slope 2 (s2) is the change between T2 and T3; intercept (i) indicates team identification at T2.
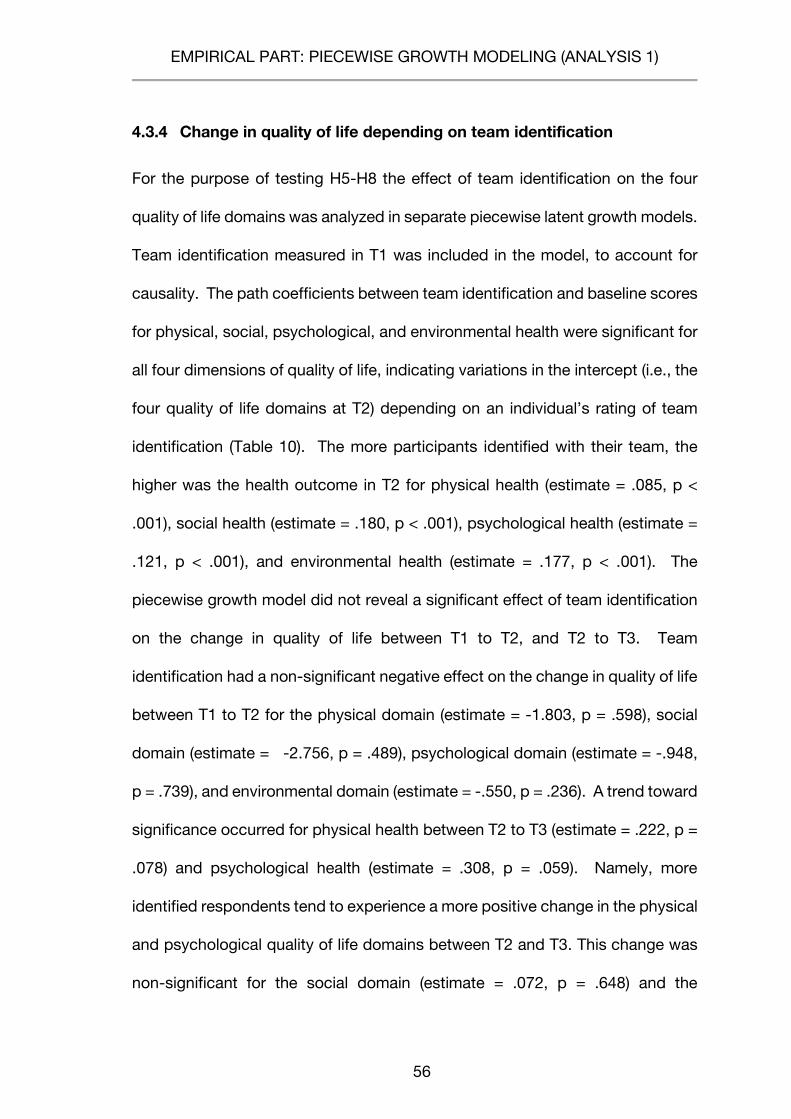
EMPIRICAL PART: PIECEWISE GROWTH MODELING (ANALYSIS 1)
56
4.3.4 Change in quality of life depending on team identification
For the purpose of testing H5-H8 the effect of team identification on the four
quality of life domains was analyzed in separate piecewise latent growth models.
Team identification measured in T1 was included in the model, to account for
causality. The path coefficients between team identification and baseline scores
for physical, social, psychological, and environmental health were significant for
all four dimensions of quality of life, indicating variations in the intercept (i.e., the
four quality of life domains at T2) depending on an individual’s rating of team
identification (Table 10). The more participants identified with their team, the
higher was the health outcome in T2 for physical health (estimate = .085, p <
.001), social health (estimate = .180, p < .001), psychological health (estimate =
.121, p < .001), and environmental health (estimate = .177, p < .001). The
piecewise growth model did not reveal a significant effect of team identification
on the change in quality of life between T1 to T2, and T2 to T3. Team
identification had a non-significant negative effect on the change in quality of life
between T1 to T2 for the physical domain (estimate = -1.803, p = .598), social
domain (estimate = -2.756, p = .489), psychological domain (estimate = -.948,
p = .739), and environmental domain (estimate = -.550, p = .236). A trend toward
significance occurred for physical health between T2 to T3 (estimate = .222, p =
.078) and psychological health (estimate = .308, p = .059). Namely, more
identified respondents tend to experience a more positive change in the physical
and psychological quality of life domains between T2 and T3. This change was
non-significant for the social domain (estimate = .072, p = .648) and the
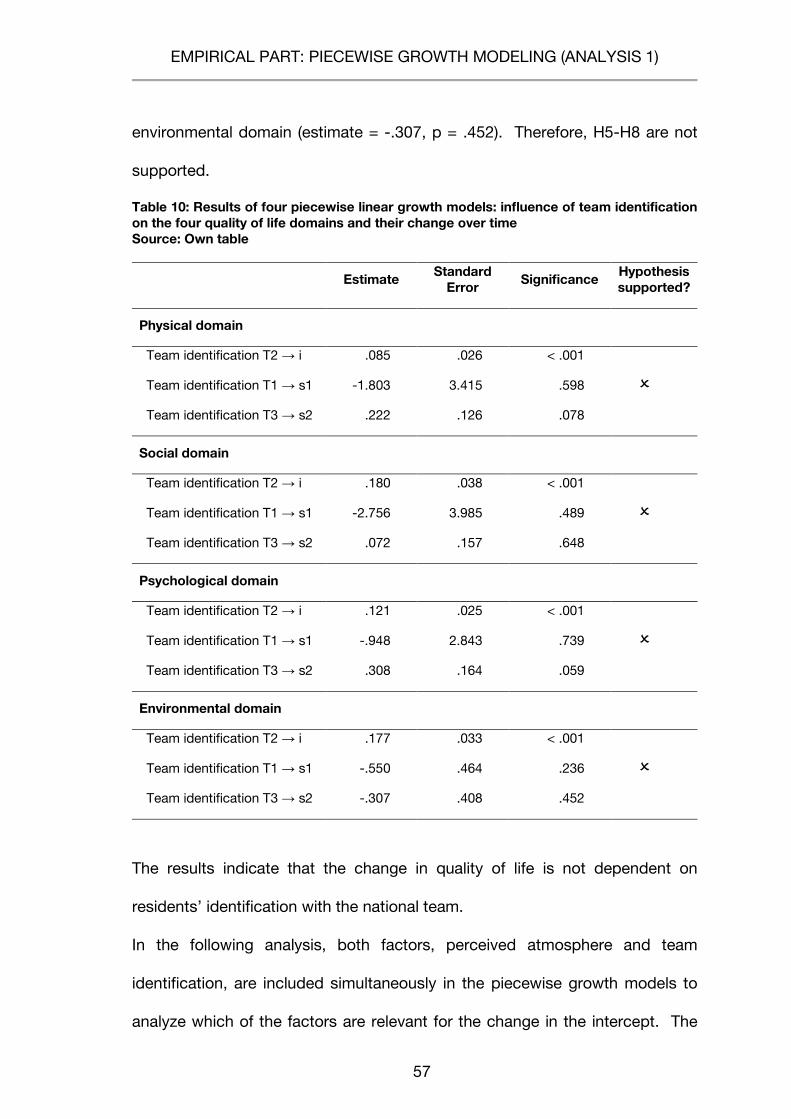
EMPIRICAL PART: PIECEWISE GROWTH MODELING (ANALYSIS 1)
57
environmental domain (estimate = -.307, p = .452). Therefore, H5-H8 are not
supported.
Table 10: Results of four piecewise linear growth models: influence of team identification on the four quality of life domains and their change over time Source: Own table
Estimate Standard Error Significance Hypothesis
supported?
Physical domain
Team identification T2 → i .085 .026 < .001
# Team identification T1 → s1 -1.803 3.415 .598
Team identification T3 → s2 .222 .126 .078
Social domain
Team identification T2 → i .180 .038 < .001
# Team identification T1 → s1 -2.756 3.985 .489
Team identification T3 → s2 .072 .157 .648
Psychological domain
Team identification T2 → i .121 .025 < .001
# Team identification T1 → s1 -.948 2.843 .739
Team identification T3 → s2 .308 .164 .059
Environmental domain
Team identification T2 → i .177 .033 < .001
# Team identification T1 → s1 -.550 .464 .236
Team identification T3 → s2 -.307 .408 .452
The results indicate that the change in quality of life is not dependent on
residents’ identification with the national team.
In the following analysis, both factors, perceived atmosphere and team
identification, are included simultaneously in the piecewise growth models to
analyze which of the factors are relevant for the change in the intercept. The
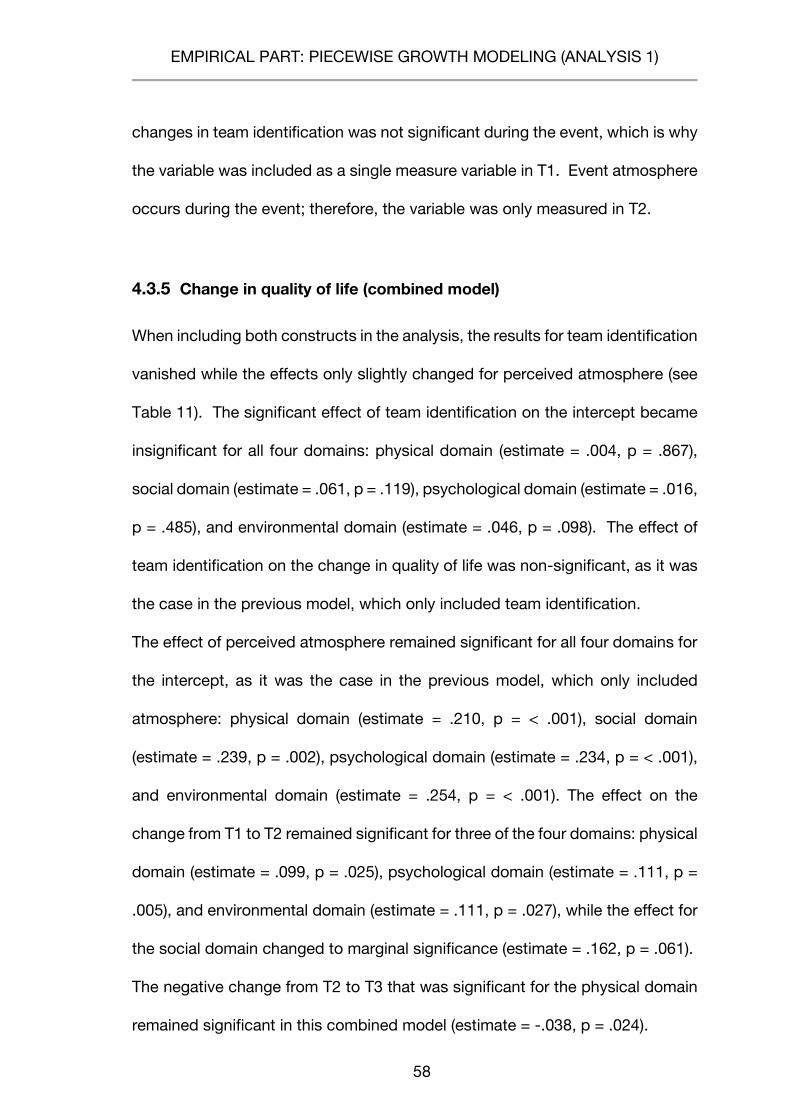
EMPIRICAL PART: PIECEWISE GROWTH MODELING (ANALYSIS 1)
58
changes in team identification was not significant during the event, which is why
the variable was included as a single measure variable in T1. Event atmosphere
occurs during the event; therefore, the variable was only measured in T2.
4.3.5 Change in quality of life (combined model)
When including both constructs in the analysis, the results for team identification
vanished while the effects only slightly changed for perceived atmosphere (see
Table 11). The significant effect of team identification on the intercept became
insignificant for all four domains: physical domain (estimate = .004, p = .867),
social domain (estimate = .061, p = .119), psychological domain (estimate = .016,
p = .485), and environmental domain (estimate = .046, p = .098). The effect of
team identification on the change in quality of life was non-significant, as it was
the case in the previous model, which only included team identification.
The effect of perceived atmosphere remained significant for all four domains for
the intercept, as it was the case in the previous model, which only included
atmosphere: physical domain (estimate = .210, p = < .001), social domain
(estimate = .239, p = .002), psychological domain (estimate = .234, p = < .001),
and environmental domain (estimate = .254, p = < .001). The effect on the
change from T1 to T2 remained significant for three of the four domains: physical
domain (estimate = .099, p = .025), psychological domain (estimate = .111, p =
.005), and environmental domain (estimate = .111, p = .027), while the effect for
the social domain changed to marginal significance (estimate = .162, p = .061).
The negative change from T2 to T3 that was significant for the physical domain
remained significant in this combined model (estimate = -.038, p = .024).
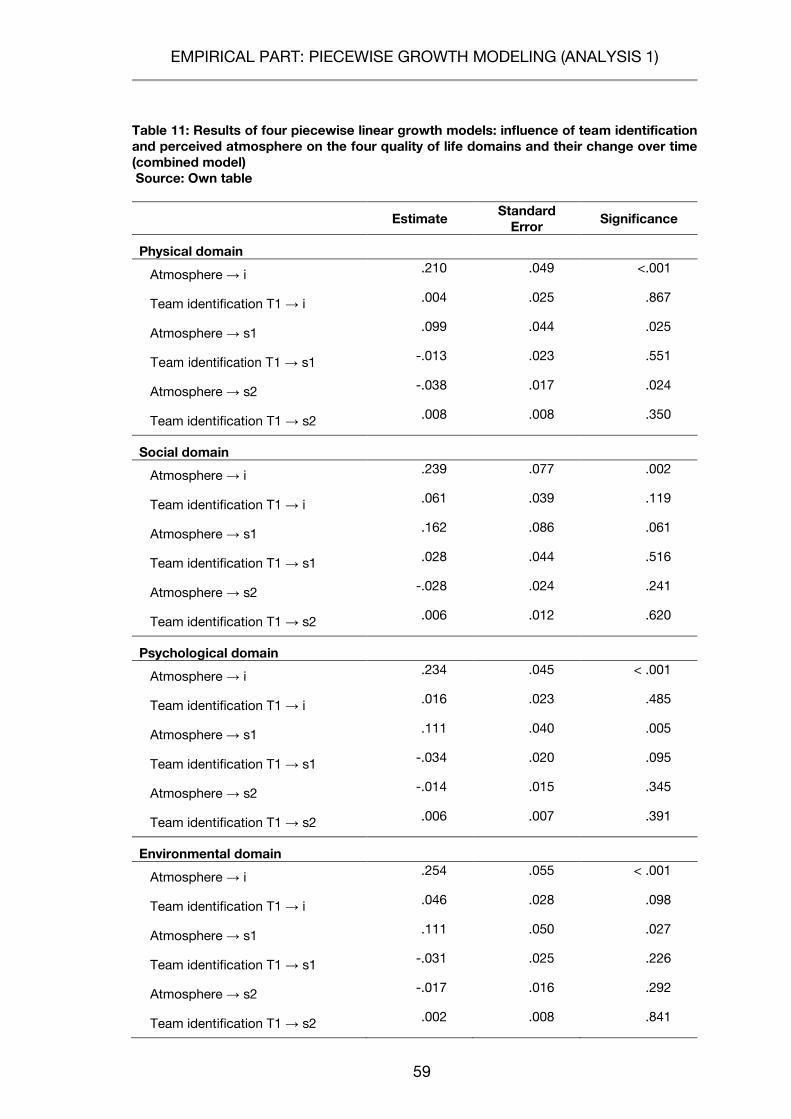
EMPIRICAL PART: PIECEWISE GROWTH MODELING (ANALYSIS 1)
59
Table 11: Results of four piecewise linear growth models: influence of team identification and perceived atmosphere on the four quality of life domains and their change over time (combined model) Source: Own table
Estimate Standard Error Significance
Physical domain
Atmosphere → i .210 .049 <.001
Team identification T1 → i .004 .025 .867
Atmosphere → s1 .099 .044 .025
Team identification T1 → s1 -.013 .023 .551
Atmosphere → s2 -.038 .017 .024
Team identification T1 → s2 .008 .008 .350
Social domain
Atmosphere → i .239 .077 .002
Team identification T1 → i .061 .039 .119
Atmosphere → s1 .162 .086 .061
Team identification T1 → s1 .028 .044 .516
Atmosphere → s2 -.028 .024 .241
Team identification T1 → s2 .006 .012 .620
Psychological domain
Atmosphere → i .234 .045 < .001
Team identification T1 → i .016 .023 .485
Atmosphere → s1 .111 .040 .005
Team identification T1 → s1 -.034 .020 .095
Atmosphere → s2 -.014 .015 .345
Team identification T1 → s2 .006 .007 .391
Environmental domain
Atmosphere → i .254 .055 < .001
Team identification T1 → i .046 .028 .098
Atmosphere → s1 .111 .050 .027
Team identification T1 → s1 -.031 .025 .226
Atmosphere → s2 -.017 .016 .292
Team identification T1 → s2 .002 .008 .841
EMPIRICAL PART: PIECEWISE GROWTH MODELING (ANALYSIS 1)
60
4.4 Discussion
The purpose of this first analysis was to assess the changes in host city
residents’ quality of life (physical, social, psychological, and environmental
health domains), and to analyze the change depending on both residents’
perception of atmosphere in the city during the hosting of the event and team
identification, until three months after the event.
The results of the first analysis showed that there was no overall change (from
T1 to T2) in quality of life (i.e., independent from perceived atmosphere and team
identification) during the event; a finding that is conform with another study that
found little support for a hosting effect (Kavetsos and Szymanski, 2010).
A tendency for a significant decrease was found in both physical and
psychological health from right after the event until three months after. As an
explanation for the decrease in psychological health the expectation
confirmation theory can be used, which originated in the field of consumer
behavior to explain post-purchase satisfaction (Oliver, 1980). In the case of a
mega-sport event, some residents might have a high expectation before the
event because “there is a sense that something important is happening" (Chalip,
2006, p. 110). If the perceived performance (outcome of the event) is lower than
an individual’s expectation, there is a negative disconfirmation, leading to
dissatisfaction. An unfulfilled expectation, e.g. if the outcome of the matches
were not as expected, can then lead to a decrease in psychological health,
because people’s expectations are dissatisfied and thus they are disappointed
which in turn generates negative feelings. The decrease in physical health may
EMPIRICAL PART: PIECEWISE GROWTH MODELING (ANALYSIS 1)
61
result from the sudden disappearance of distractors from physical pain and
stress relievers after the event has ended (Buhle et al., 2012).
On the one hand, the aim was to analyze the change in quality of life dependent
on perceived atmosphere. As predicted by the behavioral model by Mehrabian
and Russell (1974), the perception of a positive atmosphere increased quality of
life during the course of the event (supporting H1-H4). The special atmosphere
likely caused a positive emotional reaction (arousal and pleasure) in residents,
which further affected their quality of life. The effect was not present any more
after the event has ended (with one exception: physical health) because the
special event atmosphere was not present any more. Those with high levels of
perceived atmosphere (e.g. + 1 SD) appeared to profit most indicated by the
increase in the social and environmental domain of quality of life. These
individuals potentially attended the event, and thus interacted with other
spectators and made use of the infrastructural changes. Those with low levels
of perceived atmosphere (e.g. - 1 SD) had a decrease in the physical and
psychological domain of quality of life, which can be traced back to the fact that
the event hosting is perceived as a burden, leading to a higher perception of pain
and suffering as a burden, as well as a higher stress level, e.g., due to road
blockings, or traffic delays (Preuss, 2007).
On the other hand, the aim was to analyze the changes in team identification
over the course of the event and to relate team identification and potential
changes in team identification to residents’ change in quality of life. Over the
course of the World Cup, identification with the national team remained
constant, but slightly decreased after the event. These results confirm previous
EMPIRICAL PART: PIECEWISE GROWTH MODELING (ANALYSIS 1)
62
studies on individuals’ identification with local teams, which report that
identification with basketball and soccer teams remained constant during a
session, but was about to change during the off-season (Wann, 1996). Thus,
identification might have decreased due to the fact that the national team did
not play as frequently as they did during the World Cup. Another reason is the
reduced presence of the national team, as the national team is not playing in
Brazil, i.e. for their own country, any more.
Social Identity Theory was used to explain the process of group formation in
sport spectators and the positive effect of team identification on the changes of
quality of life in the four domains. H5-H8 could not be supported because team
identification was only significantly related to the construct of quality of life
(during the event, in T2) but not to the change in quality of life.
In the combined model, the effect of perceived atmosphere remained significant,
while the effect of team identification vanished, indicating that atmosphere is the
relevant factor on the change of quality of life. The potential mechanism of
environmental stimuli on individuals (such as perceived atmosphere) has already
been explained in Mehrabian and Russell’s (1974) environmental psychology
behavioral model. For the relationship between team identification and quality of
life, the team identification–social psychological health model provides first
evidence, explaining the mechanism linking team identification to social and
psychological health. However, for the context of the FIFA World Cup (where
individuals identify on a national level), this model is only partially applicable.
First, the model has a myopic perspective on an individual’s health. An
individual’s health measured via the concept of quality of life, according to the
EMPIRICAL PART: PIECEWISE GROWTH MODELING (ANALYSIS 1)
63
most recent definitions of the World Health Organization (WHO), includes four
health domains (psychological, physical, social, and environmental health). Only
the complete four dimensions (but not pre-selected single dimensions) are a
valid indicator of the subjective evaluation of an individual’s health status (World
Health Organization, 2005). The WHO quality of life scale provides a valid and
reliable measurement tool (WHOQOL Group, 1998).
Second, measuring the mediator as social connections gained through being a
fan of a local team, has a specific focus on those connections only, which are
made via the sport spectatorship. In the first study, the authors distinguished
defined social connections if a person targeted a local or distant team (Wann
and Pierce, 2005), indicating that those targeting the local team have a higher
sense of social connections and camaraderie. In a second study, to provide
evidence for the model, Wann and other authors measured social connection in
relation to being a fan of the team instead of social connections in general those
that are not related to being a fan of the team. An example of a question is:
“How many of your closest friends do you feel are strong and involved fans of
(name of team)?” (Wann et al., 2015). This can limit the view on a limited number
of friends because only those relationships with close friends are considered,
who are also highly identified. A person would be considered to not have close
friends, although these close friends are just not highly identified fans. Thus, so
far, the mechanism of team identification on health outcomes was only
insufficiently studied.
As the effect of team identification on quality of life was not significant regarding
both, the change and the intercept in the combined model, other factors might
EMPIRICAL PART: PIECEWISE GROWTH MODELING (ANALYSIS 1)
64
be important in the relationship between team identification and quality of life
that act as a mediator between these variables. Therefore, another analysis is
conducted within this thesis, where the possible mechanism of team
identification on all four quality of life domains via national identity as a mediator
is analyzed.
4.5 Preliminary conclusion
As a preliminary conclusion, perceived atmosphere in the city during the hosting
of mega-sport events enhances quality of life of host city residents at the time
of when the event is hosted. This analysis contributes to the ongoing discussion
(e.g. Gursoy, Chi, Ai and Chen, 2011; Kim et al., 2006; Kim and Petrick, 2005)
on the short-term impact of hosting mega-sport events on individuals’ health.
This study found no increase in the four dimensions of quality of life per se during
the hosting of the mega-sport event. The results also indicate that the physical
and psychological quality of life domains may decrease after the event has
ended.
To study team identification, it is interesting to look at the mechanism behind
the relationship between team identification and the construct of quality of life.
Therefore, the association between team identification and national identity
(measured in T1) and quality of life (measured in T2) is analyzed. The theoretical
background and the results of this analysis are presented and discussed in the
next chapter.
EMPIRICAL PART: MEDIATED REGRESSION (ANALYSIS 2)
65
5 EMPIRICAL PART: MEDIATED REGRESSION (ANALYSIS 2)
5.1 Theoretical background of the second analyses
To date, it remains unknown how team identification generates a positive
subjective health effect for the city population of mega-sport event hosts. This
is particularly true for mega events, where national teams compete. The
competitions are often followed by spectators all over the country and make
them feel proud of both their team and their nation, especially when the team is
successful (Elling, Van Hilvoorde and Van Den Dool, 2014). “Belonging to a
national form of life means being within a frame that offers meaning to people’s
choice between alternatives, thus enabling them to acquire an identity” (Margalit,
1997, p. 83). Thus, people with a high national identity have a feeling of
belonging and a purpose in life, which according to a recent review can then
lead to positive health outcomes and longevity (Cohen, Bavishi and Rozanski,
2016).
According to the Team Identification–Social Psychological Health Model (Wann,
2006), positive effects of team identification on subjective health result from an
increase in the social connections that spectators make through their common
interest in the team. Arguments for why this measure is not suitable in the
context of a mega-sport event have been described before (Chapter 4.4). In
short, the model does not represent the international character of these events.
Thus, national identity is a better measure of the mediator within the context of
this research. The association of team identification and national identity is
especially true for residents of Brazil, because soccer is considered to define an
individual’s national identity (Da Rosa Borges et al., 2014). The aim of analysis
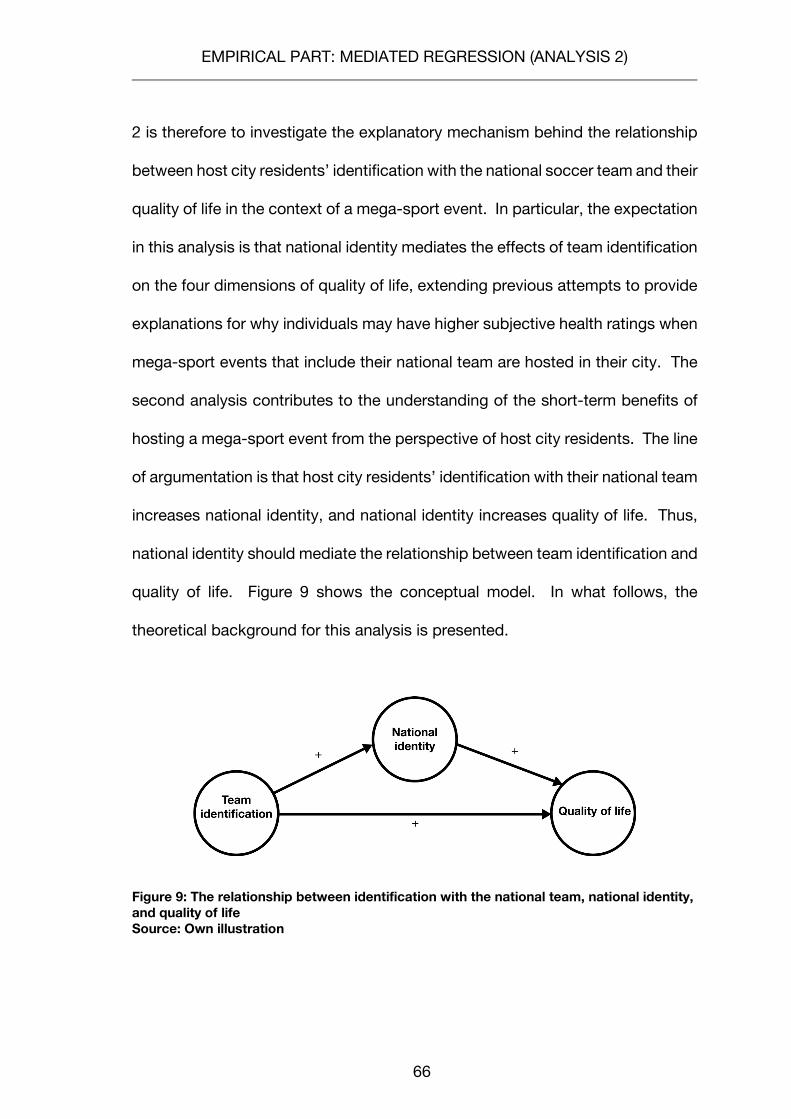
EMPIRICAL PART: MEDIATED REGRESSION (ANALYSIS 2)
66
2 is therefore to investigate the explanatory mechanism behind the relationship
between host city residents’ identification with the national soccer team and their
quality of life in the context of a mega-sport event. In particular, the expectation
in this analysis is that national identity mediates the effects of team identification
on the four dimensions of quality of life, extending previous attempts to provide
explanations for why individuals may have higher subjective health ratings when
mega-sport events that include their national team are hosted in their city. The
second analysis contributes to the understanding of the short-term benefits of
hosting a mega-sport event from the perspective of host city residents. The line
of argumentation is that host city residents’ identification with their national team
increases national identity, and national identity increases quality of life. Thus,
national identity should mediate the relationship between team identification and
quality of life. Figure 9 shows the conceptual model. In what follows, the
theoretical background for this analysis is presented.
Figure 9: The relationship between identification with the national team, national identity, and quality of life Source: Own illustration
EMPIRICAL PART: MEDIATED REGRESSION (ANALYSIS 2)
67
5.1.1 Relationship between team identification and national identity
Identification with a national team should positively relate to national identity,
because of collectively made experiences of the spectators that entail similar
behaviors and practices, such communal cheering and celebration, a collectively
adopted group behavior, as described in the Social Identity Theory (Tajfel and
Turner, 1979) – defined in detail earlier in this thesis (Chapter 4). As explained in
Social Identity Theory, being part of a spectator community becomes part of the
social identity of an individual, and the identity likely relates not only to the sports
team that is supported, but also to how individuals feel about one’s own nation
and identify with it. National identity can be defined as “a subjective or
internalized sense of belonging to the nation” (Huddy and Khatib, 2007, p. 65).
Both Nation Building Theory and Social Identity Theory support these claims.
Nation Building Theory describes the processes of nation building, meaning the
national integration and union that result in the creation of a modern nation-state.
Nation-states are those “whose people share a strong linguistic, religious, and
symbolic identity” (Tilly, 1990, p. 3). High team identification can contribute to
this process, such as: wearing the national team’s shirts strengthens the
symbolic identity; waving (or merely watching others wave) the national flag;
singing or hearing the national anthem during matches or at the award
ceremony; and seeing athletes wear the national uniform during a sporting game.
In sports, individuals can categorize themselves into groups according to their
favorite national teams. This group is the in-group, while fans of other teams are
out-groups. Group behaviors and practices may then reinforce team
identification and lead to an increase in national identity. Others often want to
EMPIRICAL PART: MEDIATED REGRESSION (ANALYSIS 2)
68
become part of the social group of highly identified spectators and also display
their identification with the team, such as wearing the team’s jerseys or waving
the team’s/country’s flag (Wann and Branscombe, 1993), which in the case of
the national team can lead to an increased national identity. During the 2010
World Cup in South Africa “residents perceived the World Cup as promoting a
sense of community and pride and bringing people together in celebration”
(Gibson et al., 2014, p. 119), this sense of community can also be measured as
an increase in national identity, supporting arguments that team identification
leads to an increase in national identity.
5.1.2 Impact on the four quality of life domains
Arguments for the association between team identification and quality of life
were already discussed in chapter 4. In this analysis, individuals with high
national identity are expected to rate their quality of life more positively
compared with individuals whose national identity is low. In the following
arguments for why national identity could mediate the relationship between team
identification and quality of life are presented. In this case, the identity refers to
the whole country because when national teams compete at mega-sport events,
the team represents the whole nation (not only a regional or small community).
Thus, national identity is an important form of identity building that gives
individual sense, and therefore the study expects an impact on all four quality of
life dimensions. The arguments provided above lead to the general hypothesis,
which is stated as follows: The higher the host city residents’ identification with
EMPIRICAL PART: MEDIATED REGRESSION (ANALYSIS 2)
69
the national team, the higher their national identity, which acts as a mediator on
quality of life during the hosting of a mega-sport event.
Since quality of life is a four-dimensional concept (WHOQOL Group, 1998), in
what follows next, arguments for the application of the above-mentioned
mediation chain on all four dimensions are provided: physical, social,
psychological, and environmental health.
National identity can lead to positive physical health outcomes, because
individuals care for and support each other in the wider in-group. It has been
shown that individuals put greater weight on the welfare of someone who is part
of one’s group than of someone who is an outsider (Vaughan and Hogg, 2005).
Being member of the social group of nationality can have an impact on physical
health outcomes. Similar to the processes in individuals with high team
identification, having a high feeling of nation identity gives individuals the
perception of belonging to a social network and a secure feeling of having social
support available when needed, aspects that can lead to better physical health
outcomes (Reblin and Uchino, 2008). Hypothesis 9 therefore states the
following:
H9: National identity mediates the relationship between host city
residents’ identification with the national team and the physical domain of
quality of life assessed at the end of the event.
Effects on social health are expected because being highly identified with a
social group is associated with having more social contact and receiving more
support (House, 1981). As described in Social Identity Theory (Tajfel and Turner,
EMPIRICAL PART: MEDIATED REGRESSION (ANALYSIS 2)
70
1979) individuals form groups, in this case individuals of Brazilian nationality.
These individuals can be expected to have the feeling of being part of a social
group and to experience more supported when they need it. This is directly
linked to social health outcomes, leading to hypothesis 10:
H10: National identity mediates the relationship between host city
residents’ identification with the national team and the social domain of
quality of life assessed at the end of the event.
As an argument for the psychological domain, the stress-buffering hypothesis
does not only apply to team identification but also to national identity (Cohen
and Wills, 1985). Individuals who get social support from their fellow citizens
have a higher perceived ability to cope. Being member of a social group such
as nationality can increase psychological health. Several authors showed that
being part of a social group such as nationality helped individuals to handle
stressful situations (Uchino et al., 2012; Uchino et al., 1996). Based on the
arguments provided above, H11 is derived:
H11: National identity mediates the relationship between host city
residents’ identification with the national team and the psychological
domain of quality of life assessed at the end of the event.
Environmental health includes the aspects surrounding an individual’s life.
Those with a high national identity will accept the built environment and
construction measures that occur due to the hosting of an event more easily
because they feel as a part of the nation and also as part of the city. In the case
EMPIRICAL PART: MEDIATED REGRESSION (ANALYSIS 2)
71
of Rio de Janeiro, those with a high national identity feel as cariocas (residents
of Rio de Janeiro) and thus they welcome the infrastructural changes, and
potential negative impacts such as road blockings, or traffic delays, that occur
in the city because they have a strong feeling of belonging to the to the nation
(Huddy and Khatib, 2007) and also to the city of Rio de Janeiro. These
individuals might even identify with the new built environment that was created
in the context of the event hosting, e.g., sports facilities, or green spaces. This
leads to the last hypothesis:
H12: National identity mediates the relationship between host city
residents’ identification with the national team and the environmental
domain of quality of life assessed at the end of the event.
5.2 Methodology
5.2.1 Procedure and sample
Data of the first two waves were used for the analysis (T1 and T2). The analysis
of the two waves instead of three waves increases the sample size to 361
participants. The data collection has been described before (Chapter 3.2). The
data that were considered for analysis 2 include the following: during the first
week of the World Cup (first wave; T1), and during the week right after the World
Cup (second wave; T2).
Three hundred sixty one participants (56.1% male; mean age of 43.1 years (±
13.2); median = 42.0) took part in the study. Again, the sample was slightly older
and included slightly more men compared to the general population of Rio de
EMPIRICAL PART: MEDIATED REGRESSION (ANALYSIS 2)
72
Janeiro (IBGE 2010). Participants had been living in Rio de Janeiro for a mean
of 38.2 years (± 15.7). Most of them had earned a bachelor’s degree or a higher
degree (73.8%) and 22.1% had completed the equivalent of a high school
degree, indicating a well-educated sample. The majority lived in a household
that consists of two people or more (90.8%). The majority of participants in this
sample were either married (59.7%) or single (25.6%).
5.2.2 Data analysis
Statistical analyses were performed using SPSS version 23.0 and Mplus. To test
for mediation, regression-based mediation analyses were conducted in SPSS
(Hayes, 2013). To test the significance of the indirect effect bootstrapping
procedures in PROCESS were used (model 4, Preacher and Hayes, 2008, p.
445). Confirmatory factor analysis (CFA) was computed with Mplus version 7.3
(Muthén and Muthén, 2007). Statistical significance was inferred at a value of p
< .05.
5.3 Results
In this analysis, the aim was to investigate if the effect of sport spectators’
identification with the national team (independent variable) on the four health
domains (dependent variable) could be explained by national identity (mediator).
Discriminant validity is a prerequisite for conducting a mediation analysis
(MacKenzie et al., 2011). Therefore, it was tested if team identification and
national identity were discriminant from each other. The results of a CFA
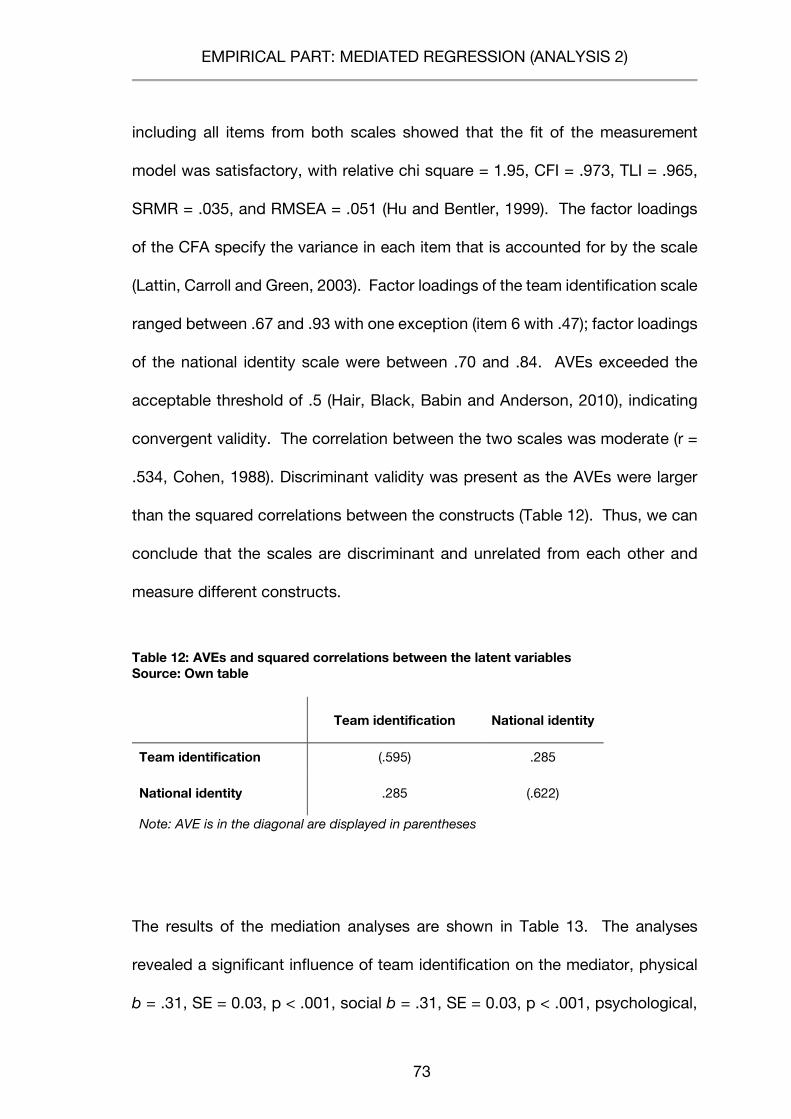
EMPIRICAL PART: MEDIATED REGRESSION (ANALYSIS 2)
73
including all items from both scales showed that the fit of the measurement
model was satisfactory, with relative chi square = 1.95, CFI = .973, TLI = .965,
SRMR = .035, and RMSEA = .051 (Hu and Bentler, 1999). The factor loadings
of the CFA specify the variance in each item that is accounted for by the scale
(Lattin, Carroll and Green, 2003). Factor loadings of the team identification scale
ranged between .67 and .93 with one exception (item 6 with .47); factor loadings
of the national identity scale were between .70 and .84. AVEs exceeded the
acceptable threshold of .5 (Hair, Black, Babin and Anderson, 2010), indicating
convergent validity. The correlation between the two scales was moderate (r =
.534, Cohen, 1988). Discriminant validity was present as the AVEs were larger
than the squared correlations between the constructs (Table 12). Thus, we can
conclude that the scales are discriminant and unrelated from each other and
measure different constructs.
Table 12: AVEs and squared correlations between the latent variables Source: Own table
Team identification National identity
Team identification (.595) .285
National identity .285 (.622)
Note: AVE is in the diagonal are displayed in parentheses
The results of the mediation analyses are shown in Table 13. The analyses
revealed a significant influence of team identification on the mediator, physical
b = .31, SE = 0.03, p < .001, social b = .31, SE = 0.03, p < .001, psychological,
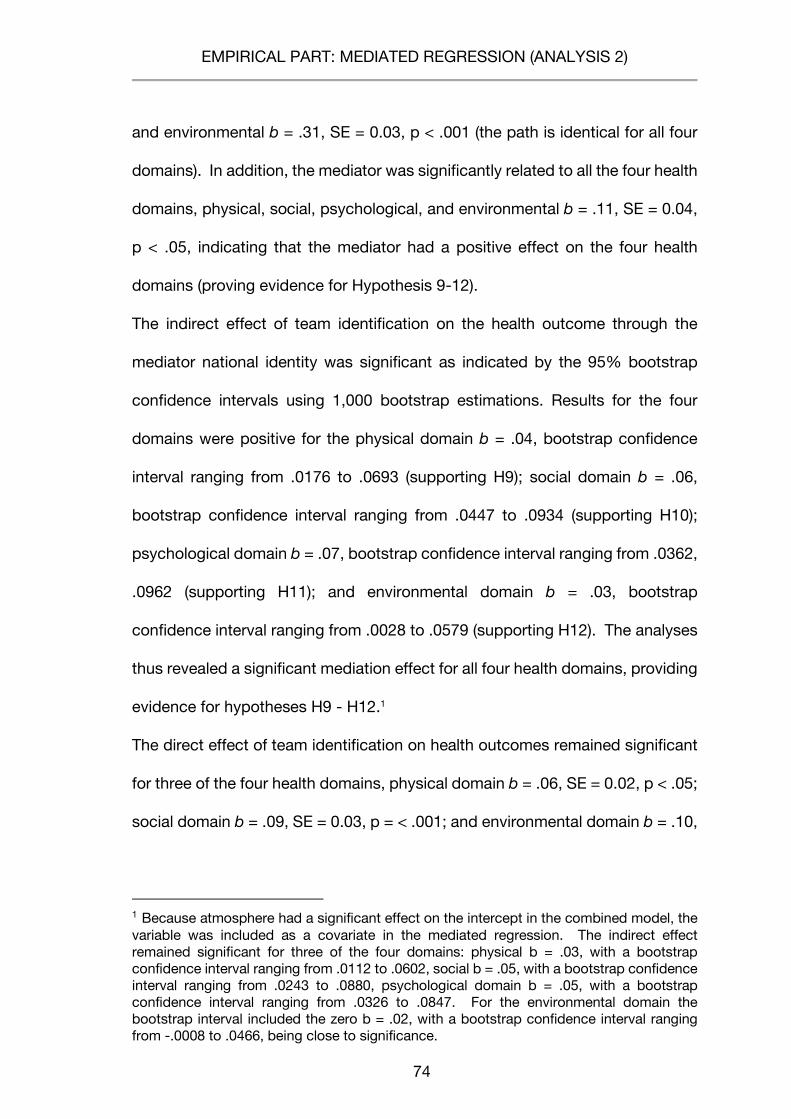
EMPIRICAL PART: MEDIATED REGRESSION (ANALYSIS 2)
74
and environmental b = .31, SE = 0.03, p < .001 (the path is identical for all four
domains). In addition, the mediator was significantly related to all the four health
domains, physical, social, psychological, and environmental b = .11, SE = 0.04,
p < .05, indicating that the mediator had a positive effect on the four health
domains (proving evidence for Hypothesis 9-12).
The indirect effect of team identification on the health outcome through the
mediator national identity was significant as indicated by the 95% bootstrap
confidence intervals using 1,000 bootstrap estimations. Results for the four
domains were positive for the physical domain b = .04, bootstrap confidence
interval ranging from .0176 to .0693 (supporting H9); social domain b = .06,
bootstrap confidence interval ranging from .0447 to .0934 (supporting H10);
psychological domain b = .07, bootstrap confidence interval ranging from .0362,
.0962 (supporting H11); and environmental domain b = .03, bootstrap
confidence interval ranging from .0028 to .0579 (supporting H12). The analyses
thus revealed a significant mediation effect for all four health domains, providing
evidence for hypotheses H9 - H12.1
The direct effect of team identification on health outcomes remained significant
for three of the four health domains, physical domain b = .06, SE = 0.02, p < .05;
social domain b = .09, SE = 0.03, p = < .001; and environmental domain b = .10,
1 Because atmosphere had a significant effect on the intercept in the combined model, the variable was included as a covariate in the mediated regression. The indirect effect remained significant for three of the four domains: physical b = .03, with a bootstrap confidence interval ranging from .0112 to .0602, social b = .05, with a bootstrap confidence interval ranging from .0243 to .0880, psychological domain b = .05, with a bootstrap confidence interval ranging from .0326 to .0847. For the environmental domain the bootstrap interval included the zero b = .02, with a bootstrap confidence interval ranging from -.0008 to .0466, being close to significance.
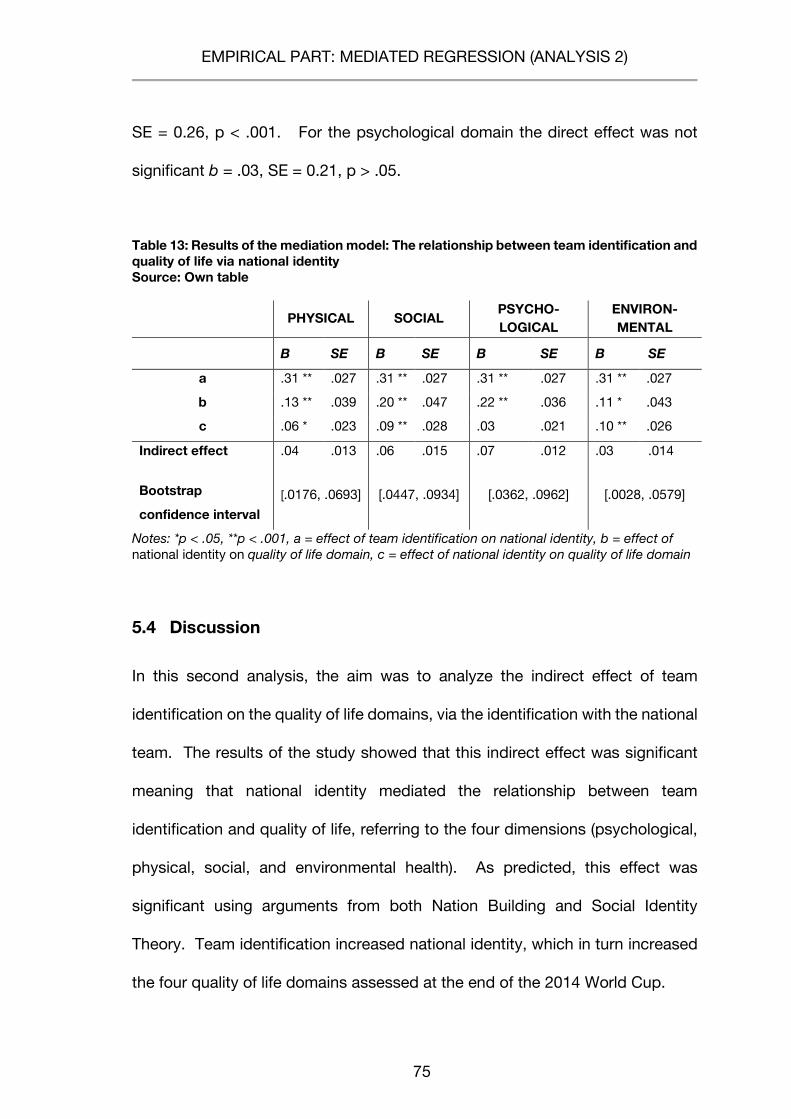
EMPIRICAL PART: MEDIATED REGRESSION (ANALYSIS 2)
75
SE = 0.26, p < .001. For the psychological domain the direct effect was not
significant b = .03, SE = 0.21, p > .05.
Table 13: Results of the mediation model: The relationship between team identification and quality of life via national identity Source: Own table
PHYSICAL SOCIAL
PSYCHO-LOGICAL
ENVIRON-MENTAL
B SE B SE B SE B SE
a .31 ** .027 .31 ** .027 .31 ** .027 .31 ** .027
b .13 ** .039 .20 ** .047 .22 ** .036 .11 * .043
c .06 * .023 .09 ** .028 .03 .021 .10 ** .026
Indirect effect .04 .013 .06 .015 .07 .012 .03 .014
Bootstrap
confidence interval [.0176, .0693] [.0447, .0934] [.0362, .0962] [.0028, .0579]
Notes: *p < .05, **p < .001, a = effect of team identification on national identity, b = effect of national identity on quality of life domain, c = effect of national identity on quality of life domain
5.4 Discussion
In this second analysis, the aim was to analyze the indirect effect of team
identification on the quality of life domains, via the identification with the national
team. The results of the study showed that this indirect effect was significant
meaning that national identity mediated the relationship between team
identification and quality of life, referring to the four dimensions (psychological,
physical, social, and environmental health). As predicted, this effect was
significant using arguments from both Nation Building and Social Identity
Theory. Team identification increased national identity, which in turn increased
the four quality of life domains assessed at the end of the 2014 World Cup.
EMPIRICAL PART: MEDIATED REGRESSION (ANALYSIS 2)
76
The findings contribute to the literature on team identification and quality of life
(Wann, 2006). The results extend the Team Identification-Social Psychological
Health Model by using another mediator that applies to the context of
international matches, national identity, and by using the multidimensional
approach to measure subjective health on the four dimensions.
Although the direct effect was not present for the psychological domain in this
analysis, the findings could generally be extended for the physical and
environmental domain of quality of life, when comparing with a previously
conducted study. In that study, the author found a direct effect of team
identification on the social-psychological health domain (Wann, 2006). The
occurrence of a direct and indirect effect in this study can be traced back to the
fact that the mediating variable accounts for some, but not all variance of the
relationship between team identification and quality of life. To conclude, there
may also be some other important factors, mediating the relationship between
team identification and quality of life, which cannot be explained by national
identity, and which affect an individual’s quality of life. Examples of these are a
team’s wins and losses (Stieger et al., 2015), socioeconomic conditions (Nichols,
Stitt and Giacopassi, 2002) or residents’ general support as well as negative and
positive emotions towards the event hosting beyond those associated with a
positive event atmosphere (Gursoy et al., 2015).
GENERAL DISCUSSION
77
6 GENERAL DISCUSSION
6.1 Overview of the findings
The aim of the thesis was to investigate the impact of hosting a mega-sport
event on the quality of life in host city residents and to identify population groups
that profit from hosting the event. The context of this research was the 2014
FIFA World Cup. In particular, the thesis aimed to investigate if residents’ health
changes during the hosting of a mega-sport event (first research question). The
WHO defines health as a multidimensional construct (World Health Organization,
1946). Based on this definition, health was conceptualized using the WHOQOL
questionnaire, which measures quality of life, an individual’s subjective
evaluation of the health status, conceptualized in four dimensions. Results of
the first analysis demonstrate that without considering contextual factors,
hosting of the 2014 FIFA World Cup did not directly lead to an increase in quality
of life during the event.
The thesis also looked at a second research question: Do contextual factors
matter in the change of residents’ quality of life? To answer the second research
question, the effects of two contextual factors were analyzed: event atmosphere
and residents’ identification with the national team. The results demonstrated
that only event atmosphere had an effect on the change in residents’ quality of
life, which supports H1-H4, H5-H8 were rejected. When comparing residents
with high and low levels of perceived atmosphere, those with a high level of
perceived atmosphere (e.g. + 1 SD) profited most in the social and environmental
domain of quality of life from the beginning to the end of the event, although
these residents also had a significant decrease in physical health three month
GENERAL DISCUSSION
78
after the event. In those with a low level of perceived atmosphere (e.g. - 1 SD),
the physical and psychological domain of quality of life even decreased from the
beginning to the end of the event.
Team identification had a significant effect on the construct of quality of life, but
not on the change in quality of life. When simultaneously including both factors
in the piecewise growth model, the effect of perceived atmosphere remained
significant while team identification became non-significant. Thus, when
comparing the effect of team identification and perceived atmosphere on quality
of life (but not change in quality of life), the latter has a greater impact. Looking
at changes in quality of life, the population group of residents who perceives the
event atmosphere positively was identified to profit from hosting the event, with
positive changes in quality of life from the beginning to the end of the event.
Team identification however did not impact the change in quality of life (rejecting
H5-H8).
To find an explanation for why team identification may not directly relate to
quality of life, a second analysis was conducted, using the data of the first and
second wave of the data collection. The aim was to investigate the
consequences of team identification in more detail. As predicted by Social
Identity Theory and Nation Building Theory, national identity mediated the
relationship between team identification and the four dimensions of quality of
life. Those with high team identification had a higher national identity, which in
turn lead to higher outcomes in the four quality of life domains at the end of the
World Cup. The hypotheses concerning the relationship between team
GENERAL DISCUSSION
79
identification, national identity and quality of life were therefore supported
(H9-H12).
6.2 Theoretical implications
This thesis contributes to the literature in several ways. First, the results revealed
no increase in the four dimensions of quality of life per se during the hosting of
the mega-sport event until three months after the event. This finding is in line
with two systematic reviews that conclude that there is little support for a
generally positive health impact of the hosting of mega-sport events on the host
population (Mahtani et al., 2013; McCartney et al., 2010b). Another study
investigated a single measure of quality of life not as the dependent variable but
as a mediating variable in the relationship between perceived event impacts and
residents’ event support three months before and eight months after the event.
The authors reported the means of quality of life before and after the event and
found no significant difference in the means of quality of life (Kaplanidou et al.,
2013).
Other studies used only one dimension of health as the dependent variable, e.g.
secondary data on physical health, and found some evidence for a positive effect
of hosting (e.g. Carroll et al., 2002; Lee et al., 2007) or single item measures, but,
found little support for a hosting effect (Kavetsos and Szymanski, 2010).
Comparability of studies that investigate the health outcomes from hosting an
event is limited, due to the inconsistent measures of the outcome variable and
the different periods of measurement in previous studies. So far, this research
can be a contribution to the investigation of intangible outcomes of event
GENERAL DISCUSSION
80
hosting. Because it uses a multidimensional approach to health (derived from
the WHO’s holistic approach to health), it may serve as a paradigm for studies
on the health outcomes of mega-sport events in future research. The
measurement in frequent waves including the period during the event is
important, as the findings of this research show that the effects of the factors on
quality of life change over time, underlining the importance of repeated
measurements.
Second, this research included two contextual factors, and identified perceived
event atmosphere during the hosting of the event as a driver of positive
subjectively measured health effects when mega-sport events are hosted. To
date, most research in the field of public health has focused on the impacts of
the hosting of mega events on health related dependent variables without taking
into account contextual factors (Lee et al., 2007; Wilbert-Lampen et al., 2008).
In this research, perceived atmosphere in the city was identified as a predictor
of a positive change in physical, social, and psychological domain of quality of
life, as well as the environmental domain of quality of life (marginal significance
for the latter). Thus, the perception of an exciting atmosphere does not only lead
to a more positive perception of sports services that are provided inside
stadiums (Koenigstorfer, Groeppel-Klein and Kunkel, 2010), but also influences
the host population’s quality of life during the hosting of mega-sport events.
Another contribution concerns the application of the scale in the context of a
mega-sport event because it was originally developed for the stadium context
(Uhrich and Benkenstein, 2010). By including a contextual factor in the analysis
GENERAL DISCUSSION
81
this research helps explain the previous non-significant main effects of event
hosting on quality of life (Kaplanidou et al., 2013).
The second contextual factor team identification did not have a significant
impact on the change in quality of life, but only a significant impact on the
construct of quality of life when analyzed in a separate model. The effect
vanished in the combined model, which is why the mediation of national identity
was tested. This findings of this model are comparable with previous research,
where a positive association of team identification with two domains of the
construct of quality of life were reported (Wann, 2006). However the relationship
has only been tested in the context of smaller sport events, e.g., local basketball
teams competing on a regional level (Wann and Pierce, 2005); therefore, another
contribution of this research is the application of the team identification measure
within the context of a mega-sport event.
The findings reported by Stieger et al. (2015) that identification depends on the
success of the team could not be tested in this analysis because information on
an individual’s perception of the success of the Brazil team was not included in
the analyses and questions on quality of life refer to an individual’s perception
within the last two week. Therefore, it is not possible to evaluate if the team’s
performance is perceived as a success or not.
Third, the findings contribute to Social Identity Theory and Nation Building
Theory. This research provides evidence that identification with the national
team is associated with an individual’s national identity, which is positively
related to residents’ quality of life. Those being identified with their team
experienced a higher connection to their fellow fans and increased identity with
GENERAL DISCUSSION
82
their nation e.g., caused by an increase in the symbolic identity, which according
to Margalit (1997) gives a special meaning to the individual. This provides
evidence for the postulated benefits of in-group formation in sport spectators of
the national team.
The research is also a contribution to environmental psychology as the study
demonstrated that environmental stimuli triggered by the event hosting act to
cause a positive emotional response, e.g., arousal, which has a positive impact
on individuals’ four domains of quality of life.
Fourth, this research makes several methodological contributions. The most
important aspect is the use of a growth model that allows the assessment of an
individual’s changes over time, surveying the same sample repeatedly.
Previously conducted studies used secondary data and repeated cross-
sectional study designs (see APPENDIX A). Repeated cross-sectional studies
have the disadvantage of not assessing causal relationship between two
variables (Carlson and Morrison, 2009). Longitudinal studies allow researchers
to assess changes within individuals, which was done in this thesis (with three
waves). In this sense, this research contributes to the understanding of quality
of life over the course of a mega-sport event hosting.
GENERAL DISCUSSION
83
6.3 Managerial implications
Based on the results of this research, event organizers, public health
practitioners, and city representatives can work together to promote a
stimulating and arousing event atmosphere throughout the city, as it can
increase residents’ quality of life during the course of hosting mega-sport events.
The factors that have been identified as part of a health impact assessment in
the context of mega-sport events (McCartney et al., 2010a) may also be
evaluated against the background of their contribution to the event’s
atmosphere. Furthermore, quality of life for residents of communities with low
levels of communication and mobilization capacities may use the leveraging
effect of hosting mega events to increase subjective health (Jung, Bigman-
Galimore and Viswanath, 2014).
Event organizers are recommended to promote a positive event atmosphere
throughout the city, as it can increase residents’ quality of life during the hosting
of mega-sport events. Given the positive influence of atmosphere and team
identification on host city residents’ quality of life during the hosting of mega-
sport events, event organizers should promote a positive event atmosphere and
try to increase residents’ national identity.
One way to do this would be to: decorate streets; allow people to gather at public
places (e.g., closing streets for parties); have other stakeholders become
involved in the event (e.g., sports clubs); and connect the mega-sport event to
other cultural happenings, such as music and dance performances.
Event organizers should also promote residents’ identification with their national
team and ensure that residents have a high national identity, which in turn results
GENERAL DISCUSSION
84
in health benefits. The identification can be increased by improving the
awareness for the national team, by, e.g., hanging up flags, bringing the team
closer to the residents, presenting the personal background of the players (place
of birth, age, family or hobbies). If residents find similarities between players and
their own (family) background, residents perceive that these national players are
authentic and just can therefore find a common ground, i.e. that they are average
members of the Brazilian society. Another aspect of how national identification
through team identification could also be strengthened is providing live television
coverage of matches on public screens and fan fests, so that residents are able
to follow their national team. This can promote the formation of in-groups, who
distance themselves from the out-groups, such as fans of other national teams.
Another possibility is showing and reporting about the national team in public
before and after the live television coverage. Another idea related to the fan fest
is a live animation on a stage to physical activity during the warming phase of
the players. Having the resulting health benefits for residents helps event
organizers find arguments for hosting of mega-sport events. This could change
the public attitude that exists against hosting mega-sport events.
Another recommendation for event organizers is to combat the (not
hypothesized) decrease in quality of life regarding physical and psychological
health that was observed from the end of the event until three months later.
Potential means to keep physical and psychological health levels high are to
organize societal gatherings that remind participants of the mega event, such as
mini soccer matches or other gatherings/events at the location where the FIFA
fan fest took place. Another idea would be an intervention at this mini-event that
GENERAL DISCUSSION
85
reminds residents of the benefits of participating in physical activity themselves.
This intervention would enclose the promotion of health with fun activities during
these mini-events, in which spectators participate to gain awareness of the
advantages of physical activity. An example of these fun activities from another
mega-sport event is a campaign to promote recycling, organized by a major
sponsor of the 2012 Olympic Games in London. Another way is to communicate
the success of the national team. If the perceived outcome of the played
matches meets or exceeds the expectations of the event outcome, the
disconfirmation is positive, which avoids an individual’s disappointment, which
in turn can lead to a reduced decrease in psychological health.
One recommendation for sports federations is to implement regulations that are
essential for the creation of a positive event atmosphere. An important aspect
is that residents feel safe in their city. Thus, the regulation should be formulated
for a good ratio of security in the stadium and for the fan fest, otherwise people
may decide to better not attend the event or even to leave the city or country for
the period of the event. However, if there is too much security, people might
feel intimidated.
Another regulation concerns a good infrastructure with sufficient kiosks for water
supply, toilets, and enough garbage bins. If it is too dirty, or if basic needs are
not fulfilled, residents would not feel comfortable and thus, could not enjoy the
event. Another idea is the provision of shuttle busses, which connect the
geographically segregated event clusters. By traveling with the official busses,
spectators can travel from one event location to the other in a safe manner, and
GENERAL DISCUSSION
86
could also be entertained on the bus. This is a good mean to make spectators
feel safe and to keep event atmosphere high.
Public health practitioners, e.g., those working at the federal, state, and local
health departments, can contribute to the creation of a positive event
atmosphere by being present at crowded places such as the fan fast, and being
available when help is needed. In the case of the World Cup the presence of
international organizations such as Doctors Without Borders, or those working
for the Red Cross, as well as local doctors and medical staff can contribute to
people’s perception of feeling safe and having medical support when needed.
They can further recommend policies focused on funding the built environment
of the local community (for example). Likewise, the government of the host
country should support these investments, as benefits in residents’ quality of life
lead back to economic benefits for the government.
Lastly, the tourism industry and local organizations, e.g., local restaurants, bars,
hotels or travel and sports agencies, can also contribute to the positive event
atmosphere. Team identification could be increased by: decorating the facilities
with the national flag, printing silhouettes or installing cardboard cutouts of the
players. Promoting a special experience with music before and after the live
television coverage in bars and restaurants around the city can only help
business, as well as contribute to the event atmosphere, as the population
celebrate the event on the street, together as a nation.
GENERAL DISCUSSION
87
6.4 Limitations and future research
As any empirical study, the present research has some limitations. First, one
may argue that trait and state constructs are theoretically different (Steyer,
Ferring and Schmitt, 1992). Some items of the WHOQOL-BREF instrument
reflect a state nature of quality of life. They might be less useful for measuring
changes in quality of life that can be attributed to the hosting of a mega-sport
event. For example, residents’ agreement with items referring to medical
treatments, and access to health services cannot be assumed to change
because of hosting the 2014 World Cup. It can rather be traced back to personal
circumstances that reflect the state of a person (and not as a result of the hosting
of a mega-sport event), such as when a person is in need for medication after a
surgery or when a person is in search for access to health care services after
having moved his or her home.
Second, the use of online surveys has some advantages (e.g., cost
effectiveness, low social desirability bias, access to panel members) but does
also has some disadvantages. Certain populations, especially highly educated
people and frequent Internet users, are more likely to participate in online
surveys compared to other survey techniques (Kraut et al., 2004; Reips, 2002).
In this research, the sample was well-educated and is not representative for the
host city population of Rio de Janeiro. Thus, future studies may try to reach
less-educated population groups (e.g., people residing in favelas) in order to
provide evidence whether the same relationships hold true for them.
Third, some limitation concerns the methodology of the research. The data
could have been collected in more waves to look more closely at the non-linear
GENERAL DISCUSSION
88
relationship of the change in quality of life that was found in this research. In
general, more waves increase the power of the study (Muthén and Curran, 1997).
Since the hosting of mega-sport events changes the infrastructure and the
legacy of mega-sport events has been reported to span generations (Preuss,
2007), further longitudinal research is needed, covering longer time periods than
four months, because population effect can be expected to occur from the day
of the candidature announcement (Sim, 2012). Preuss (2007, p. 13) also talks
about the “pregnancy effect”, meaning due to event preparations potential
impacts occur already one year before hosting. Intangible legacy, such as for
quality of life, may be at highest levels when the host population makes full use
of the infrastructure (Kaplanidou, 2012), such as when the Olympic park in
London has been rebuilt for the purpose of community use (which was about
one year after the Olympic Games had ended), arguing that environmental health
may be affected in the long-run by the hosting of a mega-sport event (HM
Government, 2014). To consider this, longitudinal studies are needed that
include measurement points over several years.
As an extension of this research, additional data on event atmosphere and
determinants of quality of life could be collected via a qualitative or mixed
method approach, to investigate the individual perceptions of the event
atmosphere.
Fourth, the performance of the national team may influence quality of life on a
short-term basis. Although some researchers found that the success of the
home team has little effect (Kavetsos and Szymanski, 2010), future studies may
measure quality of life right after wins and losses of the home team and relate
GENERAL DISCUSSION
89
these variables to the variables that were included in this model (Stieger et al.,
2015). The use of mobile devices to measure quality of life repeatedly and right
after wins and losses may be helpful in obtaining such data.
Fifth, the data were collected in only one of 12 host cities, the city, in which the
championship final was hosted. One may argue that the excitement was highest
in Rio de Janeiro due to the fact that it hosted the final game which actually
included the national Brazilian team. Thus, future studies should attempt to
identify if the results are replicable for all host cities (and contrast them with non-
host cities) to provide evidence for the generalizability of the results, and its
boundary conditions (Slabbert and Thomas, 2012). Another possibility is the
application within other contexts.
Sixth, future research could study means to keep team identification constantly
high, which might be of interest for event organizers as it influences an
individual’s probability to attend future games (Matsuoka, Chelladurai and
Harada, 2003). Because team identification did not have an impact on the
change in quality of life, it is unclear if identification with the team leads to a
group formation, as predicted in Social Identity Theory. To contribute to the
theory, future studies could investigate the processes of group formation and
behavior in highly identified sport spectators and if these differ from lowly
identified spectators.
Lastly, event atmosphere was measured at one time point only. The
measurement of event atmosphere should not only be during the event, but also
before and after the event. Using the same methodology as it was used for
quality of life and team identification the change in perceived atmosphere could
GENERAL DISCUSSION
90
be compared during the event hosting with the score of perceived atmosphere
in the city measured before the event. Items on atmosphere would relate to the
city, especially in Rio de Janeiro where events take place on a regular basis one
could argue that people perceive the atmosphere as already exciting, e.g., due
to the annual Carnival, or samba dancers around the city. Furthermore, Rio de
Janeiro is considered as one of the sensational cities because of “its distinctive
series of domed mountains and beaches” (Speake, 2007). Overall, the city
provides residents with numerous opportunities for leisure activities such as
cinemas and theatres, or clubs of all types, compared to smaller cities — even
lower social classes can enjoy such leisure activities as well (Gilbert, 1996). It
has been shown that the hosting of festivals and special events in a city lead to
an increased city image (Liu and Chen, 2007). A qualitative study revealed that
Brazilians from rural areas migrated to the city because “they wanted something
exciting and unknown, namely the big city, where the action (movimento) was”
(Perlman, 2005, p. 13). This statement and aforementioned aspects indicate that
even without hosting a mega event the atmosphere in the city of Rio de Janeiro,
as operationalized in this study, might generally be high, without an actual event
taking place. The city could be considered as an exciting city even without
hosting a mega event, which makes the change in the perceived atmosphere of
interest for future research. Such research would provide arguments for if there
was an increase in perceived atmosphere that can be attributed not to the event
hosting but to factors that are inherent to the city and its marketing efforts.
Future studies may further investigate if the effects are replicable or different for
other events that are hosted in the city of Rio de Janeiro, e.g., the
CONCLUSIONS
91
multidisciplinary sport event (such as the 2016 Olympic Games) or the annual
Carnival event.
7 CONCLUSIONS
This thesis aimed to 1) investigate the impact of hosting mega-sport events on
residents’ health and 2) identity potential influencing factors on residents’ health:
event atmosphere and identification with the national team. The hosting of the
2014 FIFA World Cup did not increase quality of life per se, but did affect
residents who evaluated the atmosphere in the city during the event positively.
Being highly identified with the national team was associated with higher national
identity and in consequence better quality of life. Thus, special emphasis should
be placed on creating a unique event atmosphere and residents’ national
identity.
Research so far only investigated single dimensions of health or used secondary
health data. Future research should consider using the multidimensional
approach of health to account for the holistic approach according to the WHO.
The literature on impact of mega-sport events is heterogenic in terms of the
outcome variables and period of measurement. Using a standardized and
multidimensional measurement for health outcomes could help get a more
consistent evaluation of the health impact of mega-sport events.
BIBLIOGRAPHY
92
BIBLIOGRAPHY
Bailis DS, Chipperfield JG, Helgason TR (2008). Collective self-esteem and the onset of chronic conditions and reduced activity in a longitudinal study of aging. Social Science & Medicine, 66(8), 1817-1827.
Barclay J (2009). Predicting the Costs and Benefits of Mega-Sporting Events: Misjudgement of Olympic Proportions? Economic Affairs, 29(2), 62-66.
Baron RM, Kenny DA (1986). The moderator–mediator variable distinction in social psychological research: Conceptual, strategic, and statistical considerations. Journal of Personality and Social Psychology, 51(6), 1173-1182.
Bollen KA, Curran PJ (2006). Latent curve models: A structural equation perspective (Vol. 467). Wiley, Hoboken, NJ.
Bollen KA, Stine R (1990). Direct and indirect effects: Classical and bootstrap estimates of variability. Sociological Methodology, 20(1), 15-140.
Bowling A (1995). Measuring disease: a review of disease-specific quality of life measurement scales. Open University Press, Milton Keynes.
Brill A (1929). The why of the fan. The North American Review, 228(4), 429-434.
Buhle JT, Stevens BL, Friedman JJ, Wager TD (2012). Distraction and Placebo: Two Separate Routes to Pain Control. Psychological Science, 23(3), 246-253.
Carlson MDA, Morrison RS (2009). Study Design, Precision, and Validity in Observational Studies. Journal of Palliative Medicine, 12(1), 77-82.
Carroll D, Ebrahim S, Tilling K, Macleod J, Smith GD (2002). Admissions for myocardial infarction and World Cup football: database survey. BMJ, 325(7378), 1439-1442.
Cashman R (2006). The bitter-sweet awakening: The legacy of the Sydney 2000 Olympic Games. Walla Walla Press, Sydney.
Chalip L (2006). Towards social leverage of sport events. Journal of Sport & Tourism, 11(2), 109-127.
Coakley JJ, Donnelly P (2009). Sport in society: Issues and controversie McGraw-Hill, Toronto.
Cohen J (1988). Statistical Power Analysis for the Behavioral Sciences (2nd edition). Lawrence Erlbaum Associates, Hillsdale, NJ.
Cohen J, Cohen P, West SG, Aiken LS (2013). Applied multiple regression/correlation analysis for the behavioral sciences. Routledge, Mahwah, NJ.
Cohen R, Bavishi C, Rozanski A (2016). Purpose in Life and Its Relationship to All-Cause Mortality and Cardiovascular Events: A Meta-Analysis. Psychosomatic Medicine, 78(2), 122-133.
BIBLIOGRAPHY
93
Cohen S (2004). Social relationships and health. American Psychologist, 59(8), 676-684.
Cohen S, Wills TA (1985). Stress, social support, and the buffering hypothesis. Psychological Bulletin, 98(2), 310-357.
Da Rosa Borges G, Santos Silva R, Da Silva Añaña E (2014). Understanding Fans Loyalty in Brazilian Soccer. Global Journals of Management and Business Research, 14(2), 27-34.
Dimmock JA, Grove JR (2005). Relationship of fan identification to determinants of aggression. Journal of Applied Sport Psychology, 17(1), 37-47.
Eberst RM (1984). Defining Health: A Multidimensional Model. Journal of School Health, 54(3), 99-104.
Elling A, Van Hilvoorde I, Van Den Dool R (2014). Creating or awakening national pride through sporting success: A longitudinal study on macro effects in the Netherlands. International Review for the Sociology of Sport, 49(2), 129-151.
Emery P (2003). Managing the Business of Sport. In L. Trenberth (Ed.). New Zealand: Dunmore Press.
Enders CK, Bandalos DL (2001). The relative performance of full information maximum likelihood estimation for missing data in structural equation models. Structural Equation Modeling, 8(3), 430-457.
Engel G (1977). The need for a new medical model: a challenge for biomedicine. Science, 196(4286), 129-136.
Fayos-Solá E (1998). The impact of mega events. Annals of Tourism Research, 25(1), 241-245.
Ferrans CE, Zerwic JJ, Wilbur JE, Larson JL (2005). Conceptual model of health-related quality of life. Journal of Nursing Scholarship, 37(4), 336-342.
Flora DB (2008). Specifying piecewise latent trajectory models for longitudinal data. Structural Equation Modeling, 15(3), 513-533.
Fredline E (2005). Host and Guest Relations and Sport Tourism. Sport in Society, 8(2), 263-279.
Friedman MS, Powell KE, Hutwagner L, Graham LM, Teague WG (2001). Impact of changes in transportation and commuting behaviors during the 1996 Summer Olympic Games in Atlanta on air quality and childhood asthma. Jama, 285(7), 897-905.
Gau LS, James JD, Kim JC (2009). Effects of team identification on motives, behavior outcomes, and perceived service quality. Asian Journal of Management and Humanity Sciences, 4(2-3), 76-90.
BIBLIOGRAPHY
94
Gibson HJ, Walker M, Thapa B, Kaplanidou K, Geldenhuys S, Coetzee W (2014). Psychic income and social capital among host nation residents: A pre–post analysis of the 2010 FIFA World Cup in South Africa. Tourism Management, 44, 113-122.
Gilbert A (1996). The Mega-city in Latin America. The United Nations University Press, Tokyo.
Gold JR, Gold MM (2008). Olympic cities: regeneration, city rebranding and changing urban agendas. Geography compass, 2(1), 300-318.
Gursoy D, Chi CG, Ai J, Chen BT (2011). Temporal change in resident perceptions of a mega-event: The Beijing 2008 Olympic Games. Tourism Geographies, 13(2), 299-324.
Gursoy D, Kendall K (2006). Hosting mega events: Modeling locals’ support. Annals of Tourism Research, 33(3), 603-623.
Gursoy D, Sharma B, Netto A, Riberio MA, Yolal M, Lee T. (2015). 2014 FIFA World Cup in Brazil: local residents' perceptions of impacts, emotions, attachment, and their support for the event. Paper presented at the 5th Advances in Hospitality & Tourism Marketing and Management (AHTMM) Conference, Beppu, Japan, 2015 (pp. 209-215).
Hair J, Black W, Babin B, Anderson R (2010). Multivariate Data Analysis Seventh Edition Prentice Hall.
Hall C (1992). Adventure, sport and health tourism. In C. M. Hall and B. Weiler (Eds.), Special Interest Tourism. London: Belhaven Press.
Haslam, SA, Jetten, J, Postmes, T, Haslam, C (2009). Social Identity, Health and Well-Being: An Emerging Agenda for Applied Psychology. Applied Psychology, 58(1), 1-23.
Hayes AF (2013). Introduction to mediation, moderation, and conditional process analysis: A regression-based approach. Guilford Press, New York, NY.
HM Government (2014). Inspired by 2012: The legacy from the Olympic and Paralympic Games Second annual report – A joint UK Government and Mayor of London report. London: HM Government.
Holt-Lunstad J, Smith TB, Layton JB (2010). Social Relationships and Mortality Risk: A Meta-analytic Review. PLOS Medicine, 7(7), e1000316.
House J (1981). Work stress and social support. Reading, Mass: Addison-Wesley Pub.
Howell RT, Kern ML, Lyubomirsky S (2007). Health benefits: Meta-analytically determining the impact of well-being on objective health outcomes. Health Psychology Review, 1(1), 83-136.
Hu L, Bentler PM (1999). Cutoff criteria for fit indexes in covariance structure analysis: Conventional criteria versus new alternatives. Structural equation modeling: a multidisciplinary journal, 6(1), 1-55.
BIBLIOGRAPHY
95
Huber M, Knottnerus JA, Green L, Horst Hvd, Jadad AR, Kromhout D, Leonard B, Lorig K, Loureiro MI, Meer JWMvd, Schnabel P, Smith R, Weel Cv, Smid H (2011). How should we define health? BMJ, 343.
Huddy L, Khatib N (2007). American Patriotism, National Identity, and Political Involvement. American Journal of Political Science, 51(1), 63-77.
IBGE (2010). Censo Demográfico 2010 (Publication no. 15/12/2015). from Instituto Brasileiro de Geografia e Estatística, available online: http://www.censo2010.ibge.gov.br/sinopse/index.php?dados=12 / 1 Accessed 15 December 2015.
IBGE (2013). Pesquisa Nacional por Amostra de Domicilios, Acesso à Internet e Posse de Telefone Móvel Celular para Uso Pessoal. Rio de Janeiro: Instituto Brasileiro de Geografia e Estatística.
Indig D, Thackway S, Jorm L, Salmon A, Owen T (2003). Illicit drug‐related harm during the Sydney 2000 Olympic Games: implications for public health surveillance and action. Addiction, 98(1), 97-102.
Institute of Medicine (1995). In Pope AM, Snyder MA, Mood LH (Eds.), Nursing Health, & Environment: Strengthening the Relationship to Improve the Public's Health. Washington (DC): National Academies Press.
International Olympic Committee (2003). Olympic charter. Lausanne: IOC.
Jago L, Dwyer L, Lipman G, van Lill D, Vorster S (2010). Optimising the potential of mega-events: an overview. International Journal of Event and Festival Management, 1(3), 220-237.
Jung M, Bigman-Galimore CA, Viswanath K (2014). Contextual effects of community mobilization and communication capacity as a positive factor for self-rated health status: a multi-level analysis. International Journal of Public Health, 59(2), 289-299.
Kahana E (1982). A congruence model of person-environment interaction. Aging and the Environment: Theoretical Approaches, 97-121.
Kaplanidou K (2012). The importance of legacy outcomes for Olympic Games four summer host cities residents' quality of life: 1996–2008. European Sport Management Quarterly, 12(4), 397-433.
Kaplanidou K, Karadakis K (2010). Understanding the Legacies of a Host Olympic City: The Case of the 2010 Vancouver Olympic Games. Sport Marketing Quarterly, 19(2), 110-117.
Kaplanidou K, Karadakis K, Gibson H, Thapa B, Walker M, Geldenhuys S, Coetzee W (2013). Quality of Life, Event Impacts, and Mega-Event Support among South African Residents before and after the 2010 FIFA World Cup. [Article]. Journal of Travel Research, 52(5), 631-645.
Kavetsos G, Szymanski S (2010). National well-being and international sports events. Journal of Economic Psychology, 31(2), 158-171.
BIBLIOGRAPHY
96
Kesenne S (2012). 16 The economic impact, costs and benefits of the FIFA World Cup and the Olympic Games: who wins, who loses? International handbook on the economics of mega sporting events, 270-279.
Kim HJ, Gursoy D, Lee S-B (2006). The impact of the 2002 World Cup on South Korea: comparisons of pre-and post-games. Tourism Management, 27(1), 86-96.
Kim SS, Petrick JF (2005). Residents’ perceptions on impacts of the FIFA 2002 World Cup: the case of Seoul as a host city. Tourism Management, 26(1), 25-38.
Kim W, Jun HM, Walker M, Drane D (2015). Evaluating the perceived social impacts of hosting large-scale sport tourism events: Scale development and validation. Tourism Management, 48, 21-32.
Kim W, Walker M (2012). Measuring the social impacts associated with Super Bowl XLIII: Preliminary development of a psychic income scale. Sport Management Review, 15(1), 91-108.
Knott B, Fyall A, Jones I (2013). The nation-branding legacy of the 2010 FIFA World Cup for South Africa. Journal of Hospitality Marketing & Management, 22(6), 569-595.
Koenigstorfer J, Groeppel-Klein A, Kunkel T (2010). The attractiveness of national and international football leagues: Perspectives of fans of “star clubs” and “underdogs”. European Sport Management Quarterly, 10(2), 127-163.
Kotler P (1973). Atmospherics as a marketing tool. Journal of Retailing, 49(4), 48-64.
Kraut R, Olson J, Banaji M, Bruckman A, Cohen J, Couper M (2004). Psychological research online: report of Board of Scientific Affairs' Advisory Group on the Conduct of Research on the Internet. American Psychologist, 59(2), 105-117.
Lance CE, Butts MM, Michels LC (2006). The sources of four commonly reported cutoff criteria what did they really say? Organizational Research Methods, 9(2), 202-220.
Lattin JM, Carroll JD, Green PE (2003). Analyzing multivariate data. Thomson Brooks/Cole Pacific Grove, CA.
Lee JT, Son JY, Cho YS (2007). Benefits of mitigated ambient air quality due to transportation control on childhood asthma hospitalization during the 2002 Summer Asian Games in Busan, Korea. Journal of the Air & Waste Management Association, 57(8), 968-973.
Little RJ (1988). A test of missing completely at random for multivariate data with missing values. Journal of the American Statistical Association, 83(404), 1198-1202.
Liu Y, Chen C (2007). The effects of festivals and special events on city image design. Frontiers of Architecture and Civil Engineering in China, 1(2), 255-259.
BIBLIOGRAPHY
97
Lock D, Taylor T, Funk D, Darcy S (2012). Exploring the development of team identification. Journal of Sport Management, 26(4), 283-294.
MacKenzie SB, Podsakoff PM, Podsakoff NP (2011). Construct measurement and validation procedures in MIS and behavioral research: Integrating new and existing techniques. MIS Quarterly, 35(2), 293-334.
Madrigal R (1995). Cognitive and affective determinants of fan satisfaction. Journal of Leisure Research, 27(3), 205-227.
Mahtani KR, Protheroe J, Slight SP, Demarzo MM, Blakeman T, Barton CA, Brijnath B, Roberts N (2013). Can the London 2012 Olympics 'inspire a generation' to do more physical or sporting activities? An overview of systematic reviews. BMJ Open, 3(1).
Margalit A (1997). The Moral Psychology of Nationalism. In R. McKim and J. McMahan (Eds.), The Morality of Nationalism (pp. 74-83). New York: Oxford University Press.
Matsuoka H, Chelladurai P, Harada M (2003). Direct and Interaction Effects of Team Identification and Satisfaction on Intention to Attend Games. Sport Marketing Quarterly, 12(4).
McCaffrey R (2008). Music listening: its effects in creating a healing environment. Journal of Psychosocial Nursing & Mental Health Services, 46(10), 39-44.
McCartney G, Palmer S, Winterbottom J, Jones R, Kendall R, Booker D (2010a). A health impact assessment of the 2014 Commonwealth Games in Glasgow. Public Health, 124(8), 444-451.
McCartney G, Thomas S, Thomson H, Scott J, Hamilton V, Hanlon P, Morrison DS, Bond L (2010b). The health and socioeconomic impacts of major multi-sport events: systematic review (1978-2008). BMJ, 340, c2369.
Mehrabian A, Russell JA (1974). An approach to environmental psychology. the MIT Press, Cambridge.
Müller M (2015). What makes an event a mega-event? Definitions and sizes. Leisure Studies, 34(6), 627-642.
Muthén BO, Curran PJ (1997). General longitudinal modeling of individual differences in experimental designs: A latent variable framework for analysis and power estimation. Psychological Methods, 2(4), 371-402.
Muthén LK, Muthén BO (2007). Mplus User's Guide (Sixth Edition). Muthén & Muthén, Los Angeles, CA.
Nichols M, Stitt BG, Giacopassi D (2002). Community assessment of the effects of casinos on quality of life. Social Indicators Research, 57(3), 229-262.
Nunnally JC (1978). Psychometric Theory. McGraw-Hill, New York.
BIBLIOGRAPHY
98
OECD (2014). Education at a Glance 2014: Country Notes. Retrieved 12/15/2015, available online: http://www.oecd.org/brazil/education-at-a-glance-2014-country-notes.htm
Ohmann S, Jones I, Wilkes K (2006). The Perceived Social Impacts of the 2006 Football World Cup on Munich Residents. Journal of Sport & Tourism, 11(2), 129-152.
Oliver RL (1980). A cognitive model of the antecedents and consequences of satisfaction decisions. Journal of Marketing Research, 460-469.
Preacher KJ, Hayes AF (2008). Asymptotic and resampling strategies for assessing and comparing indirect effects in multiple mediator models. Behavior Research Methods, 40(3), 879-891.
Preuss H (2007). The Conceptualisation and Measurement of Mega Sport Event Legacies. Journal of Sport & Tourism, 12(3-4), 207-228.
Preuss H (2015). A framework for identifying the legacies of a mega sport event. Leisure Studies, 34(6), 643-664.
Reblin M, Uchino BN (2008). Social and Emotional Support and its Implication for Health. Current Opinion in Psychiatry, 21(2), 201-205.
Reips U-D (2002). Standards for Internet-based experimenting. Experimental psychology, 49(4), 243-256.
Reis HT, Smith SM, Carmichael CL, Caprariello PA, Tsai FF, Rodrigues A, Maniaci MR (2010). Are you happy for me? How sharing positive events with others provides personal and interpersonal benefits. Journal of Personality and Social Psychology, 99(2), 311-329.
Ritchie JRB (1984). Assessing the impact of hallmark events: conceptual and research issues. Journal of Travel research, 23(1), 2-11.
Shields M (2008). Community belonging and self-perceived health. Health Reports (Vol. 19(2):, pp. 51-60): Statistics Canada.
Shrout PE, Bolger N (2002). Mediation in experimental and nonexperimental studies: new procedures and recommendations. Psychological Methods, 7(4), 422-445.
Sim F (2012). London 2012 - What health impact? Journal of Epidemiology & Community Health, 66(8), 667-669.
Simon HK, Stegelman M, Button T (1998). A prospective evaluation of pediatric emergency care during the 1996 Summer Olympic Games in Atlanta, Georgia. Pediatric Emergency Care, 14(1), 1-3.
Skevington SM, Lotfy M, O'Connell KA (2004). The World Health Organization's WHOQOL-BREF quality of life assessment: psychometric properties and results of the international field trial. A report from the WHOQOL group. Quality of Life Research, 13(2), 299-310.
BIBLIOGRAPHY
99
Slabbert E, Thomas P (2012). Host city and non-host city resident perceptions of the 2010 soccer World Cup. Tourism & Management Studies, 1127-1133.
Sobel ME (1982). Asymptotic confidence intervals for indirect effects in structural equation models. Sociological Methodology, 13(1982), 290-312.
Solberg HA, Preuss H (2007). Major sport events and long-term tourism impacts. Journal of Sport Management, 21(2), 213.
Speake J (2007). Sensational cities. Geography, 92(1), 3-12.
Steyer R, Ferring D, Schmitt MJ (1992). States and traits in psychological assessment. European Journal of Psychological Assessment, 8, 79-98.
Stieger S, Götz FM, Gehrig F (2015). Soccer results affect subjective well-being, but only briefly: a smartphone study during the 2014 FIFA World Cup. Frontiers in Psychology, 6(497).
Tajfel H (1982). Social psychology of intergroup relations. Annual Review of Psychology, 33(1), 1-39.
Tajfel H, Turner JC (1979). An integrative theory of intergroup conflict. In W. G. Austin and S. Worchel (Eds.), The Social Psychology of Intergroup Relations (pp. 33-47). Monterey, CA: Brooks-Cole.
Tajfel H, Turner JC (1985). The social identity theory of intergroup behavior. In S. Worchel and W. G. Austin (Eds.), Psychology of Intergroup Relations (Vol. 2, pp. 7-24). Chicago: Nelson-Hall.
The Economist (2015). Just say no. Hosting the Olympics and the World Cup is bad for a city’s health. February 28, 2015. available online: http://www.economist.com/news/books-and-arts/21645114-hosting-olympics-and-world-cup-bad-citys-health-just-say-no
Theodorakis ND, Wann DL, Carvalho M, Sarmento P (2010). Translation and initial validation of the Portuguese version of the Sport Spectator Identification Scale. North American Journal of Psychology, 12(1), 67-80.
Tilly C (1990). Coercion, Capital, and European States AD 990-1990. Blackwell, Oxford.
Turner JC, Hogg MA, Oakes PJ, Reicher SD, Wetherell MS (1987). Rediscovering the social group: A self-categorization theory. Basil Blackwell, Oxford.
Uchino BN, Bowen K, Carlisle M, Birmingham W (2012). Psychological pathways linking social support to health outcomes: A visit with the “ghosts” of research past, present, and future. Social Science & Medicine, 74(7), 949-957.
Uchino BN, Cacioppo JT, Kiecolt-Glaser JK (1996). The relationship between social support and physiological processes: a review with emphasis on underlying mechanisms and implications for health. Psychological Bulletin, 119(3), 488.
BIBLIOGRAPHY
100
Uhrich S, Benkenstein M (2010). Sport Stadium Atmosphere: Formative and Reflective Indicators for Operationalizing the Construct. Journal of Sport Management, 24(2), 211-237.
Uhrich S, Koenigstorfer J (2009). Effects of atmosphere at major sports events: A perspective from environmental psychology. International Journal of Sports Marketing & Sponsorship, 10(4), 325-344.
Vanderhorst RK, McLaren S (2005). Social relationships as predictors of depression and suicidal ideation in older adults. Aging & Mental Health, 9(6), 517-525.
Vaughan G, Hogg MA (2005). Introduction to Social Psychology. Pearson Education, Essex.
Wakefield KL (1995). The pervasive effects of social influence on sporting event attendance. Journal of Sport & Social Issues, 19(4), 335-351.
Wann DL (1996). Seasonal changes in spectators' identification and involvement with and evaluations of college basketball and football teams. The Psychological Record, 46(1), 201-215.
Wann DL (2006). Examining the potential causal relationship between sport team identification and psychological well-being. Journal of Sport Behavior, 29(1), 79-95.
Wann DL, Branscombe NR (1993). Sports fans: Measuring degree of identification with their team. International Journal of Sport Psychology, 24(1), 1-17.
Wann DL, Hunter JL, Ryan JA, Wright LA (2001). The relationship between team identification and willingness of sport fans to consider illegally assisting their team. Social Behavior and Personality: an international journal, 29(6), 531-536.
Wann DL, Pierce S (2005). The relationship between sport team identification and social well-being: Additional evidence supporting the Team Identification-Social Psychological Health Model. North American Journal of Psychology, 7(1), 117-124.
Wann DL, Waddill PJ, Brasher M, Ladd S (2015). Examining Sport Team Identification, Social Connections, and Social Well-being among High School Students. Journal of Amateur Sport, 1(2), 27-50.
Weed M (2010). How will we know if the London 2012 Olympics and Paralympics benefit health? BMJ, 340, c2202.
Wellings K, Datta J, Wilkinson P, Petticrew M (2012). The 2012 Olympics: assessing the public health effect. The Lancet, 378(9797), 1193-1195.
WHOQOL Group (1995). The World Health Organization quality of life assessment (WHOQOL): position paper from the World Health Organization. Social Science & Medicine, 41(10), 1403-1409.
BIBLIOGRAPHY
101
WHOQOL Group (1998). Development of the World Health Organization WHOQOL-BREF quality of life assessment. Psychological Medicine, 28(3), 551-558.
Wilbert-Lampen U, Leistner D, Greven S, Pohl T, Sper S, Völker C, Güthlin D, Plasse A, Knez A, Küchenhoff H, Steinbeck G (2008). Cardiovascular Events during World Cup Soccer. New England Journal of Medicine, 358(5), 475-483.
Williams DR, Mohammed SA (2009). Discrimination and racial disparities in health: evidence and needed research. Journal of Behavioral Medicine, 32(1), 20-47.
Witte DR, Bots ML, Hoes AW, Grobbee DE (2000). Cardiovascular mortality in Dutch men during 1996 European football championship: longitudinal population study. BMJ : British Medical Journal, 321(7276), 1552-1554.
Wochnowski H (1996). Event marketing [Veranstaltungsmarketing]. Doctoral dissertation at the University of Hannover, Series: Markt und Konsum.
World Health Organization (1946). WHO definition of Health, Preamble to the Constitution of the World Health Organization as adopted by the International Health Conference, New York.
World Health Organization (2005). Process of translation and adaptation of instruments. Retrieved 12/15/2015, available online: who.int/substance_abuse/research_tools/translation/en
Zhao X, Lynch JG, Chen Q (2010). Reconsidering Baron and Kenny: Myths and truths about mediation analysis. Journal of Consumer Research, 37(2), 197-206.
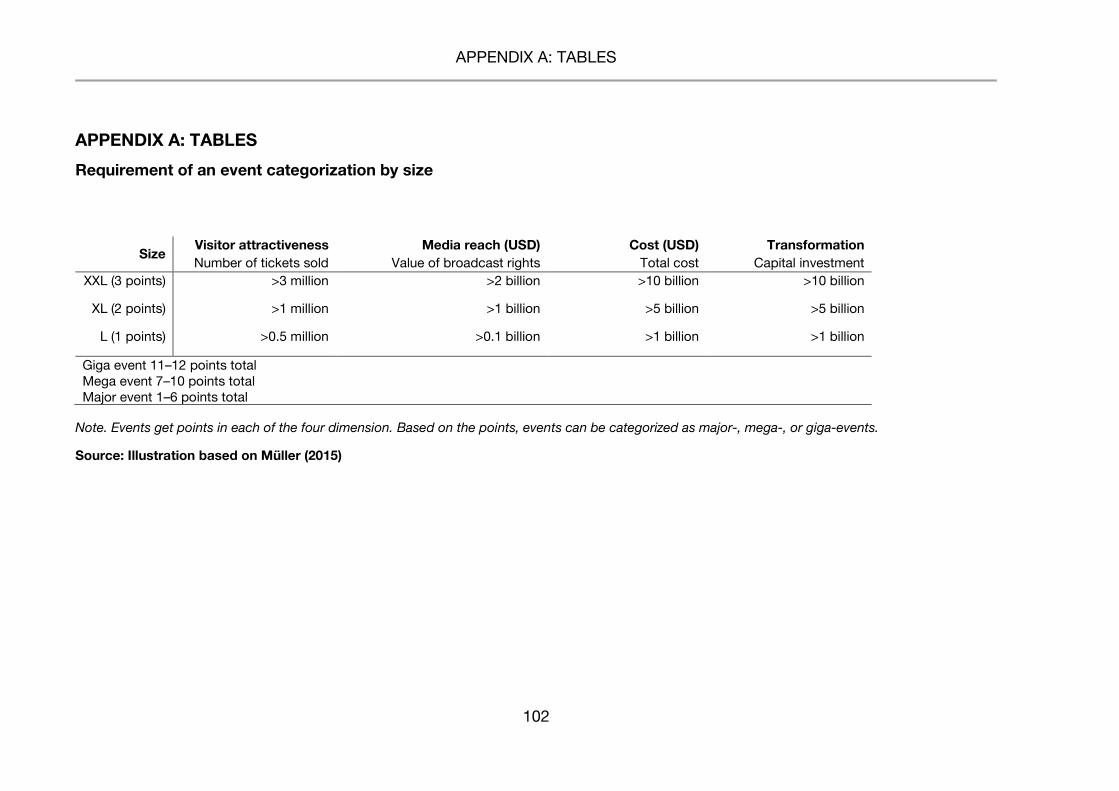
APPENDIX A: TABLES
102
APPENDIX A: TABLES
Requirement of an event categorization by size
Size Visitor attractiveness Media reach (USD) Cost (USD) Transformation Number of tickets sold Value of broadcast rights Total cost Capital investment
XXL (3 points) >3 million >2 billion >10 billion >10 billion
XL (2 points) >1 million >1 billion >5 billion >5 billion
L (1 points) >0.5 million >0.1 billion >1 billion >1 billion
Giga event 11–12 points total Mega event 7–10 points total Major event 1–6 points total
Note. Events get points in each of the four dimension. Based on the points, events can be categorized as major-, mega-, or giga-events.
Source: Illustration based on Müller (2015)
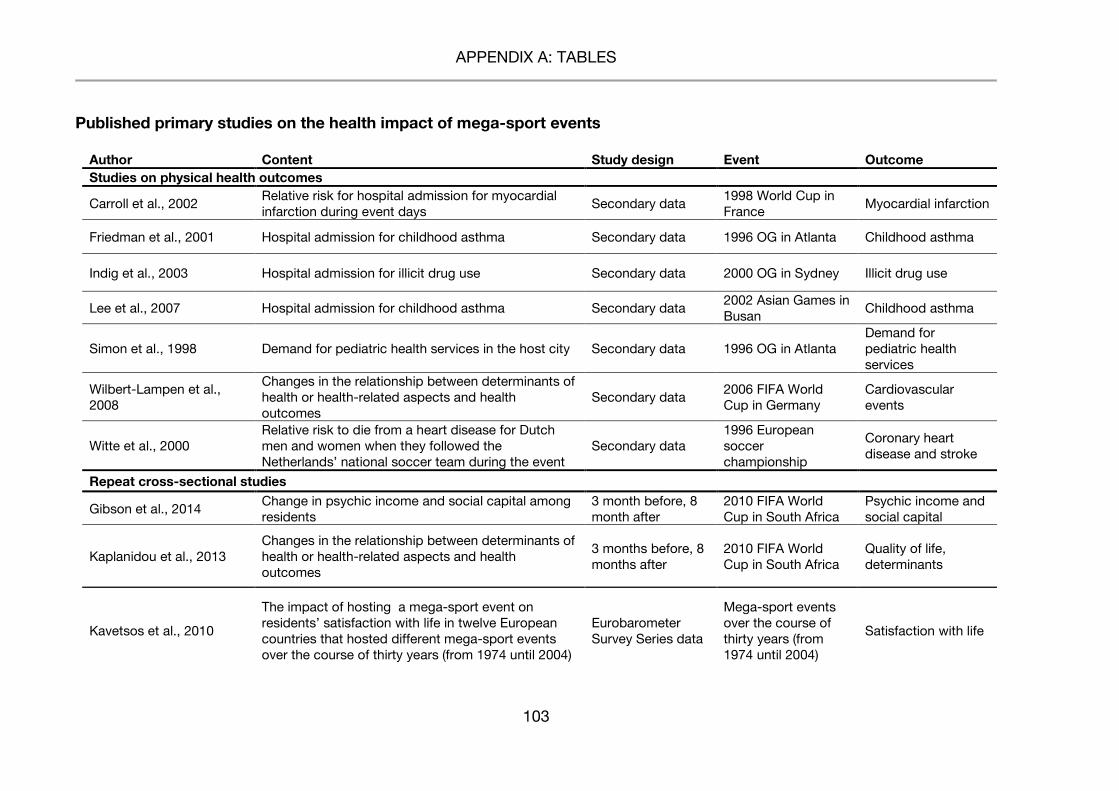
APPENDIX A: TABLES
103
Published primary studies on the health impact of mega-sport events
Author Content Study design Event Outcome Studies on physical health outcomes
Carroll et al., 2002 Relative risk for hospital admission for myocardial infarction during event days
Secondary data 1998 World Cup in France
Myocardial infarction
Friedman et al., 2001 Hospital admission for childhood asthma Secondary data 1996 OG in Atlanta Childhood asthma
Indig et al., 2003 Hospital admission for illicit drug use Secondary data 2000 OG in Sydney Illicit drug use
Lee et al., 2007 Hospital admission for childhood asthma Secondary data 2002 Asian Games in Busan
Childhood asthma
Simon et al., 1998 Demand for pediatric health services in the host city Secondary data 1996 OG in Atlanta Demand for pediatric health services
Wilbert-Lampen et al., 2008
Changes in the relationship between determinants of health or health-related aspects and health outcomes
Secondary data 2006 FIFA World Cup in Germany
Cardiovascular events
Witte et al., 2000 Relative risk to die from a heart disease for Dutch men and women when they followed the Netherlands’ national soccer team during the event
Secondary data 1996 European soccer championship
Coronary heart disease and stroke
Repeat cross-sectional studies
Gibson et al., 2014 Change in psychic income and social capital among residents
3 month before, 8 month after
2010 FIFA World Cup in South Africa
Psychic income and social capital
Kaplanidou et al., 2013 Changes in the relationship between determinants of health or health-related aspects and health outcomes
3 months before, 8 months after
2010 FIFA World Cup in South Africa
Quality of life, determinants
Kavetsos et al., 2010
The impact of hosting a mega-sport event on residents’ satisfaction with life in twelve European countries that hosted different mega-sport events over the course of thirty years (from 1974 until 2004)
Eurobarometer Survey Series data
Mega-sport events over the course of thirty years (from 1974 until 2004)
Satisfaction with life
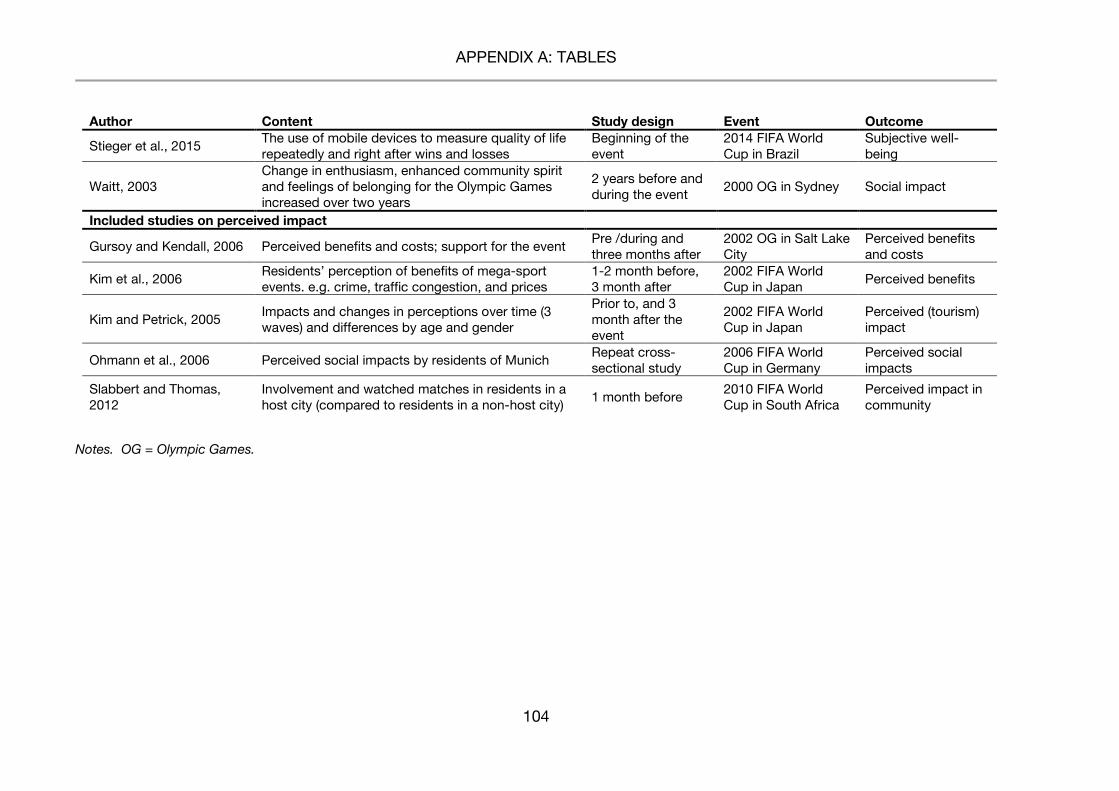
APPENDIX A: TABLES
104
Author Content Study design Event Outcome
Stieger et al., 2015 The use of mobile devices to measure quality of life repeatedly and right after wins and losses
Beginning of the event
2014 FIFA World Cup in Brazil
Subjective well-being
Waitt, 2003 Change in enthusiasm, enhanced community spirit and feelings of belonging for the Olympic Games increased over two years
2 years before and during the event
2000 OG in Sydney Social impact
Included studies on perceived impact
Gursoy and Kendall, 2006 Perceived benefits and costs; support for the event Pre /during and three months after
2002 OG in Salt Lake City
Perceived benefits and costs
Kim et al., 2006 Residents’ perception of benefits of mega-sport events. e.g. crime, traffic congestion, and prices
1-2 month before, 3 month after
2002 FIFA World Cup in Japan
Perceived benefits
Kim and Petrick, 2005 Impacts and changes in perceptions over time (3 waves) and differences by age and gender
Prior to, and 3 month after the event
2002 FIFA World Cup in Japan
Perceived (tourism) impact
Ohmann et al., 2006 Perceived social impacts by residents of Munich Repeat cross-sectional study
2006 FIFA World Cup in Germany
Perceived social impacts
Slabbert and Thomas, 2012
Involvement and watched matches in residents in a host city (compared to residents in a non-host city)
1 month before 2010 FIFA World Cup in South Africa
Perceived impact in community
Notes. OG = Olympic Games.
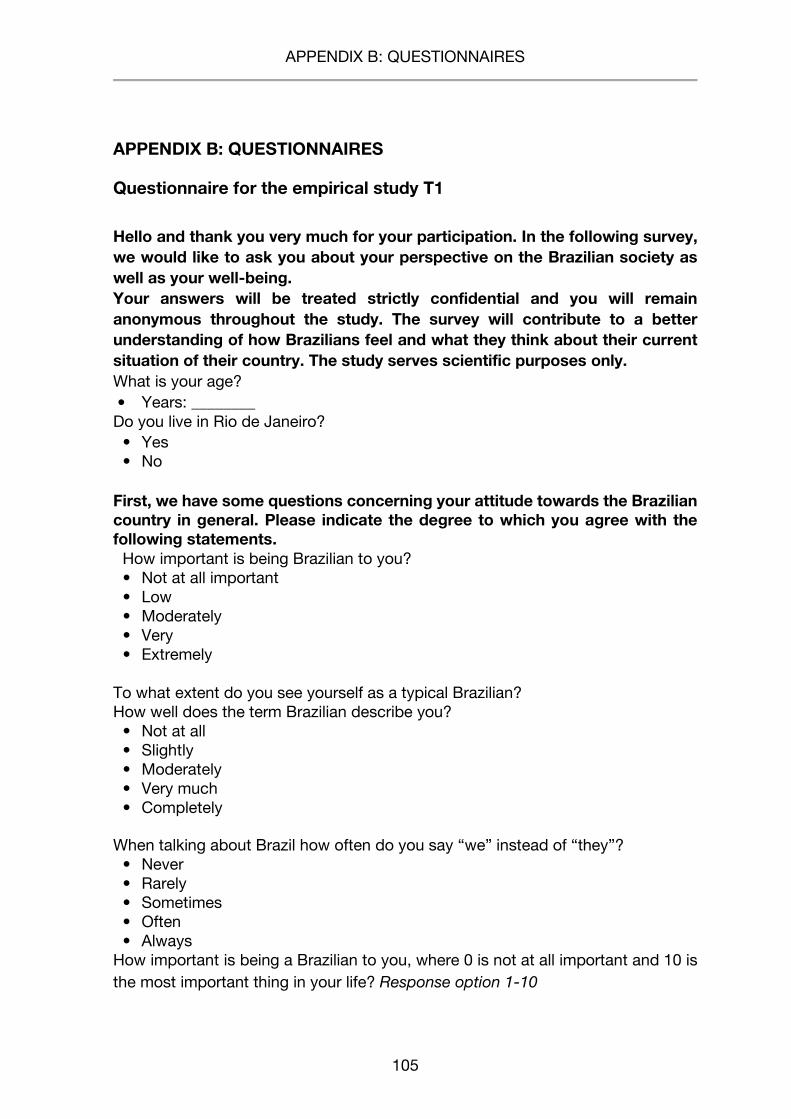
APPENDIX B: QUESTIONNAIRES
105
APPENDIX B: QUESTIONNAIRES
Questionnaire for the empirical study T1
Hello and thank you very much for your participation. In the following survey, we would like to ask you about your perspective on the Brazilian society as well as your well-being. Your answers will be treated strictly confidential and you will remain anonymous throughout the study. The survey will contribute to a better understanding of how Brazilians feel and what they think about their current situation of their country. The study serves scientific purposes only. What is your age? • Years: ________
Do you live in Rio de Janeiro? • Yes • No
First, we have some questions concerning your attitude towards the Brazilian country in general. Please indicate the degree to which you agree with the following statements.
How important is being Brazilian to you? • Not at all important • Low • Moderately • Very • Extremely
To what extent do you see yourself as a typical Brazilian? How well does the term Brazilian describe you?
• Not at all • Slightly • Moderately • Very much • Completely
When talking about Brazil how often do you say “we” instead of “they”?
• Never • Rarely • Sometimes • Often • Always
How important is being a Brazilian to you, where 0 is not at all important and 10 is the most important thing in your life? Response option 1-10
APPENDIX B: QUESTIONNAIRES
106
We have some questions about where you live: your neighborhood or village, your town or city, your county, and so on. How good does it make you feel when you see the Brazilian flag flying? How good does it make you feel when you hear the Brazilian national anthem?
• Unhappy • Slightly happy • Somewhat happy • Happy • Very happy
People should work hard to move Brazil in a positive direction. If I criticize Brazil, I do so out of love of country. I oppose some Brazilian policies because I care about my country and want to improve it. I express my attachment to Brazil by supporting efforts at positive change. I support Brazil’s leaders even if I disagree with their actions. People who do not wholeheartedly support Brazil should live elsewhere. For the most part, people who protest and demonstrate against Brazilian policy are good, upstanding, intelligent people. Brazil is virtually always right. I support Brazilian policies for the very reason that they are the policies of my country. There is too much criticism of Brazil in the world, and we as its citizens should not criticize it. I believe that Brazilian policies are almost always the morally correct ones.
• Strongly disagree • Disagree • Neither agree or disagree • Agree • Strongly agree
How close do you feel to Brazil?
• Not close • Little close • Moderately close • Close • Very close
The following questions ask you to say how good or satisfied you have felt about various aspects of your life over the last two weeks. How satisfied were you… …with your sleep? …with your ability to perform your daily living activities? …with your capacity for work? …with yourself? …with your personal relationships?
APPENDIX B: QUESTIONNAIRES
107
…with your sex life? …with the support you get from your friends? …with the conditions of your living place? …with your access to health services? …with your transport?
• Very dissatisfied • Dissatisfied • Neither satisfied or dissatisfied • Satisfied • Very satisfied
Following we are interested in your well being, please think of the last two weeks. How well are you able to get around? How would you rate your quality of life?
• Very poor • Poor • Neither poor nor good • Good • Very good
How satisfied are you with your health?
• Very dissatisfied • Dissatisfied • Neither satisfied or dissatisfied • Satisfied • Very satisfied
Please answer the following questions about your relationships with others. Do you feel happy about your relationship with your family members?
• Very unhappy • Unhappy • Neither happy nor unhappy • Happy • Very happy
How alone do you feel in your life?
• Not at all • Slightly • Moderately • Very much • Extremely
APPENDIX B: QUESTIONNAIRES
108
Do you get the kind of support from others that you need? To what extent can you count on your friends when you need them?
• Not at all • A little • Moderately • Mostly • Completely
Please explain your relationship with others. How satisfied are you with… ... with your personal relationships (friends, parents, acquaintances, colleagues)? ... with the support you get from your family? ... with the support you get from your friends? ... with your ability to provide for or support others?
• Very dissatisfied • Dissatisfied • Neither satisfied or dissatisfied • Satisfied • Very satisfied
In what follows next, we are interested in your perspective on intercultural communication. Please indicate the degree to which you agree or disagree with each of the statements.
I can be as sociable as I want to be when interacting with people from different
cultures. I enjoy interacting with people from different cultures. I think people from other cultures are narrow-minded. I find it very hard to talk in front of people from different cultures. I avoid those situations where I will have to deal with culturally-distinct persons. I don't like to be with people from different cultures. I often show my culturally-distinct counterpart my understanding through verbal
or nonverbal cues. I have a feeling of enjoyment towards differences between my culturally-distinct
counterpart and me. I respect the values of people from different cultures. I am pretty sure of myself in interacting with people from different cultures. I always know what to say when interacting with people from different cultures.
I get upset easily when interacting with people from different cultures. I feel confident when interacting with people from different cultures. I tend to wait before forming an impression of culturally-distinct counterparts. I often get discouraged when I am with people from different cultures.
• Strongly disagree • Disagree • Neither agree or disagree • Agree • Strongly agree
APPENDIX B: QUESTIONNAIRES
109
In what follows next, we are interested in your perspective on intercultural communication. Please indicate the degree to which you agree or disagree with each of the statements. I think my culture is better than other cultures. I often give positive responses to my culturally-different counterpart during our
interaction. I would not accept the opinions of people from different cultures. I am sensitive to my culturally-distinct counterpart's subtle meanings during
our interaction. I am open-minded to people from different cultures. I am very observant when interacting with people from different cultures. I often feel useless when interacting with people from different cultures. I respect the ways people from different cultures behave. I try to obtain as much information as I can when interacting with people from different cultures.
• Strongly disagree • Disagree • Neither agree or disagree • Agree • Strongly agree
Next, we are interested in your relationships with tourists during the last two weeks. How many tourists have you seen in your community during the past two weeks? ________ How much contact have you made with tourists during the past two weeks? ________ As In what comes next, we are interested in your everyday life during the last two weeks. Please rate how much you have experienced certain things in the last two weeks.
To what extent do you feel that physical pain prevents you from doing what you need to do? How much do you need any medical treatment to function in your daily life? How much do you enjoy life? To what extent do you feel your life to be meaningful? How well are you able to concentrate? How safe do you feel in your daily life? How healthy is your physical environment? • Never • Seldom • Quite often • Very often • Always

APPENDIX B: QUESTIONNAIRES
110
The following questions ask about how completely you experience or were able to do certain things in the last two weeks. Do you have enough energy for everyday life? Are you able to accept your bodily appearance? Have you enough money to meet your needs? How available to you is the information that you need in your day-to-day life? To what extent do you have the opportunity for leisure activities? • Not at all • A little • Moderately • Mostly • Completely
How often do you have negative feelings such as blue mood, despair, anxiety, depression?
• Never • Seldom • Quite often • Very often • Always
To what extent do you have the opportunity for leisure activities (as provided by the environment, in which you live)? …In public indoor sports facilities …In public outdoors sports facilities …In public parks …In sports clubs
• Not at all • A little • Moderately • Mostly • Completely
How important is sports in your community?
• Not important • A little important • Moderately important • Very important • Extremely important
The questions in this scale ask you about your feelings and thoughts during the last two weeks. In each case, you will be asked to indicate by circling how often you felt or thought a certain way during the past two weeks, How often have you… …been upset because of something that happened unexpectedly? …felt that you were unable to control the important things in your life?
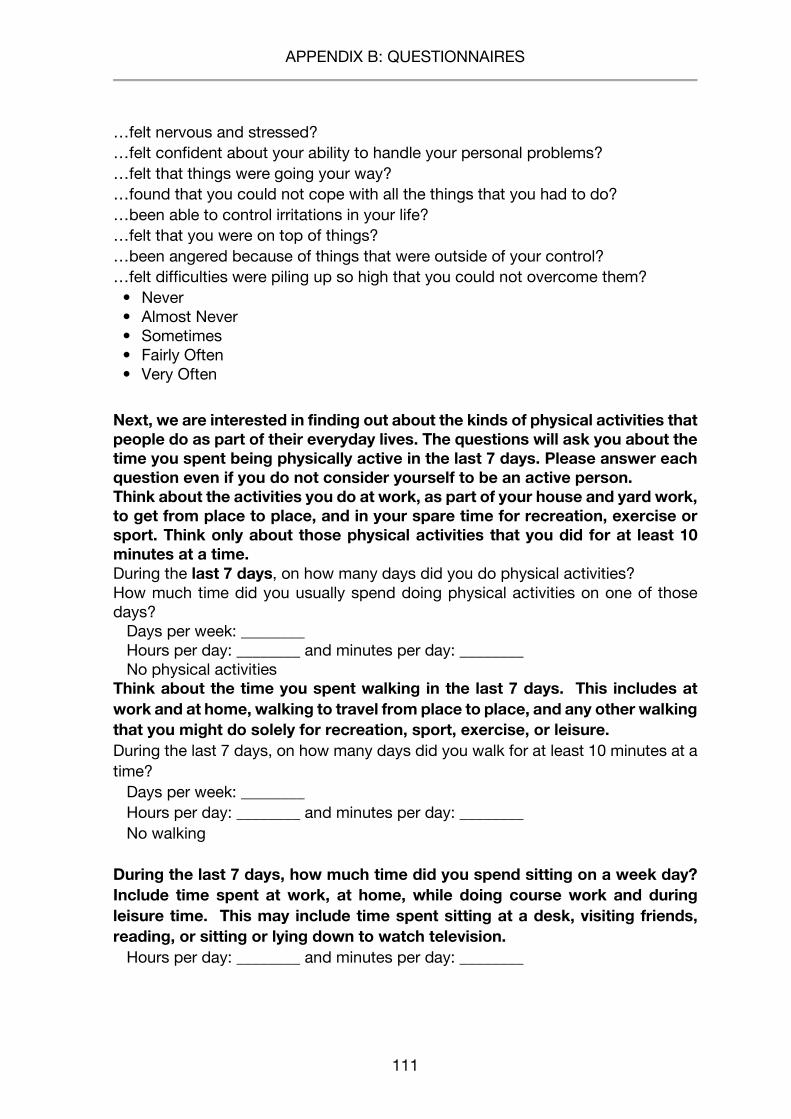
APPENDIX B: QUESTIONNAIRES
111
…felt nervous and stressed? …felt confident about your ability to handle your personal problems? …felt that things were going your way? …found that you could not cope with all the things that you had to do? …been able to control irritations in your life? …felt that you were on top of things? …been angered because of things that were outside of your control? …felt difficulties were piling up so high that you could not overcome them?
• Never • Almost Never • Sometimes • Fairly Often • Very Often
Next, we are interested in finding out about the kinds of physical activities that people do as part of their everyday lives. The questions will ask you about the time you spent being physically active in the last 7 days. Please answer each question even if you do not consider yourself to be an active person. Think about the activities you do at work, as part of your house and yard work, to get from place to place, and in your spare time for recreation, exercise or sport. Think only about those physical activities that you did for at least 10 minutes at a time. During the last 7 days, on how many days did you do physical activities? How much time did you usually spend doing physical activities on one of those days? Days per week: ________ Hours per day: ________ and minutes per day: ________ No physical activities Think about the time you spent walking in the last 7 days. This includes at work and at home, walking to travel from place to place, and any other walking that you might do solely for recreation, sport, exercise, or leisure. During the last 7 days, on how many days did you walk for at least 10 minutes at a time? Days per week: ________ Hours per day: ________ and minutes per day: ________ No walking During the last 7 days, how much time did you spend sitting on a week day? Include time spent at work, at home, while doing course work and during leisure time. This may include time spent sitting at a desk, visiting friends, reading, or sitting or lying down to watch television. Hours per day: ________ and minutes per day: ________

APPENDIX B: QUESTIONNAIRES
112
How much are you interested in soccer? Please indicate the degree to which you agree with the following statements. …I consider myself as a fan of soccer. …I love to follow the game of soccer. ...I am a huge fan of soccer in general.
• Strongly disagree • Disagree • Neither agree or disagree • Agree • Strongly agree
How much are you interested in the FIFA World Cup? Please indicate the degree to which you agree with the following statements. …I enjoy the highest excitement during the FIFA World Cup. …I always follow the FIFA World Cup. …I am highly interested in the FIFA World Cup.
• Strongly disagree • Disagree • Neither agree or disagree • Agree • Strongly agree
Please indicate your perspective on Brazil as the host country of the FIFA World Cup. The fact that Brazil is hosting the FIFA World Cup is … Response option 1-7
• Positive - negative • Good - bad • Favorable – unfavorable
Please indicate the degree to which you agree with the following statements.
I fully support that Brazil is hosting the FIFA World Cup. I give my very best to contribute to the success of hosting the FIFA World Cup in Brazil. I try to help have the FIFA World Cup in Brazil become a success story. • Strongly disagree • Disagree • Neither agree or disagree • Agree • Strongly agree
Which of the following teams is your favorite team? ________ How important to you is it that the team wins? Not important – Very important, Response option 1-7
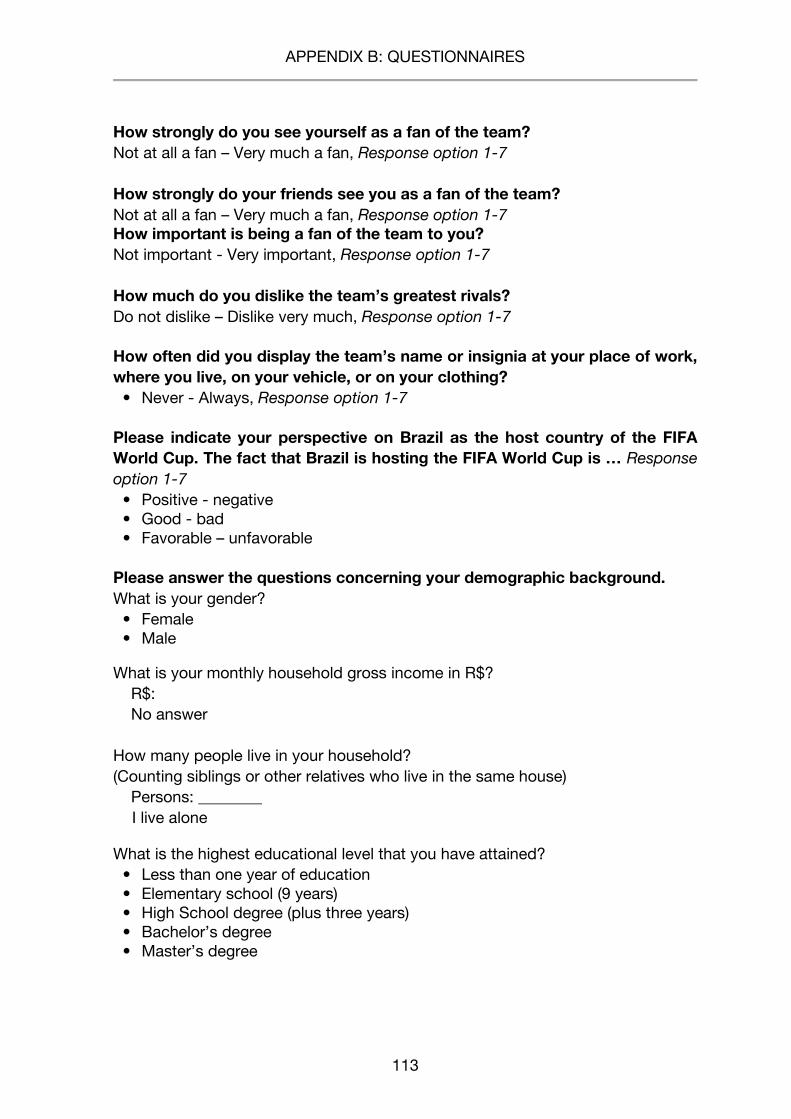
APPENDIX B: QUESTIONNAIRES
113
How strongly do you see yourself as a fan of the team? Not at all a fan – Very much a fan, Response option 1-7 How strongly do your friends see you as a fan of the team? Not at all a fan – Very much a fan, Response option 1-7 How important is being a fan of the team to you? Not important - Very important, Response option 1-7 How much do you dislike the team’s greatest rivals? Do not dislike – Dislike very much, Response option 1-7 How often did you display the team’s name or insignia at your place of work, where you live, on your vehicle, or on your clothing?
• Never - Always, Response option 1-7 Please indicate your perspective on Brazil as the host country of the FIFA World Cup. The fact that Brazil is hosting the FIFA World Cup is … Response option 1-7
• Positive - negative • Good - bad • Favorable – unfavorable
Please answer the questions concerning your demographic background. What is your gender?
• Female • Male
What is your monthly household gross income in R$? R$: No answer How many people live in your household? (Counting siblings or other relatives who live in the same house) Persons: ________
I live alone
What is the highest educational level that you have attained? • Less than one year of education • Elementary school (9 years) • High School degree (plus three years) • Bachelor’s degree • Master’s degree
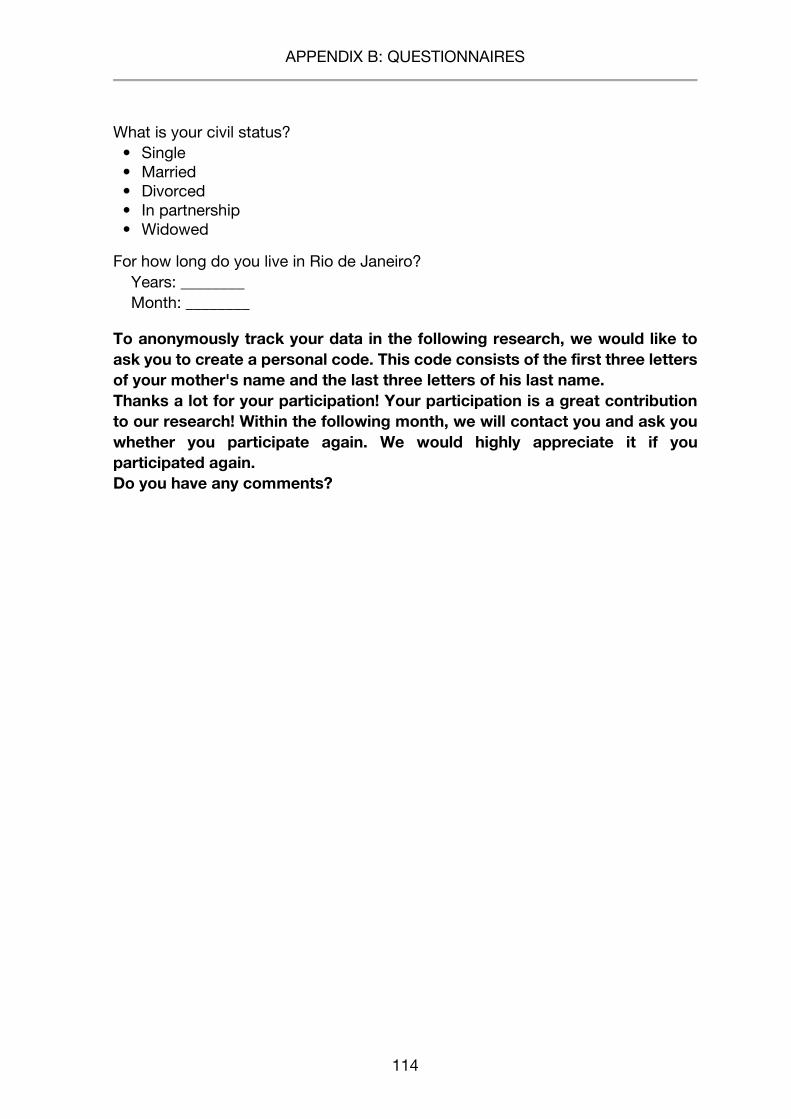
APPENDIX B: QUESTIONNAIRES
114
What is your civil status? • Single • Married • Divorced • In partnership • Widowed
For how long do you live in Rio de Janeiro? Years: ________ Month: ________
To anonymously track your data in the following research, we would like to ask you to create a personal code. This code consists of the first three letters of your mother's name and the last three letters of his last name. Thanks a lot for your participation! Your participation is a great contribution to our research! Within the following month, we will contact you and ask you whether you participate again. We would highly appreciate it if you participated again. Do you have any comments?
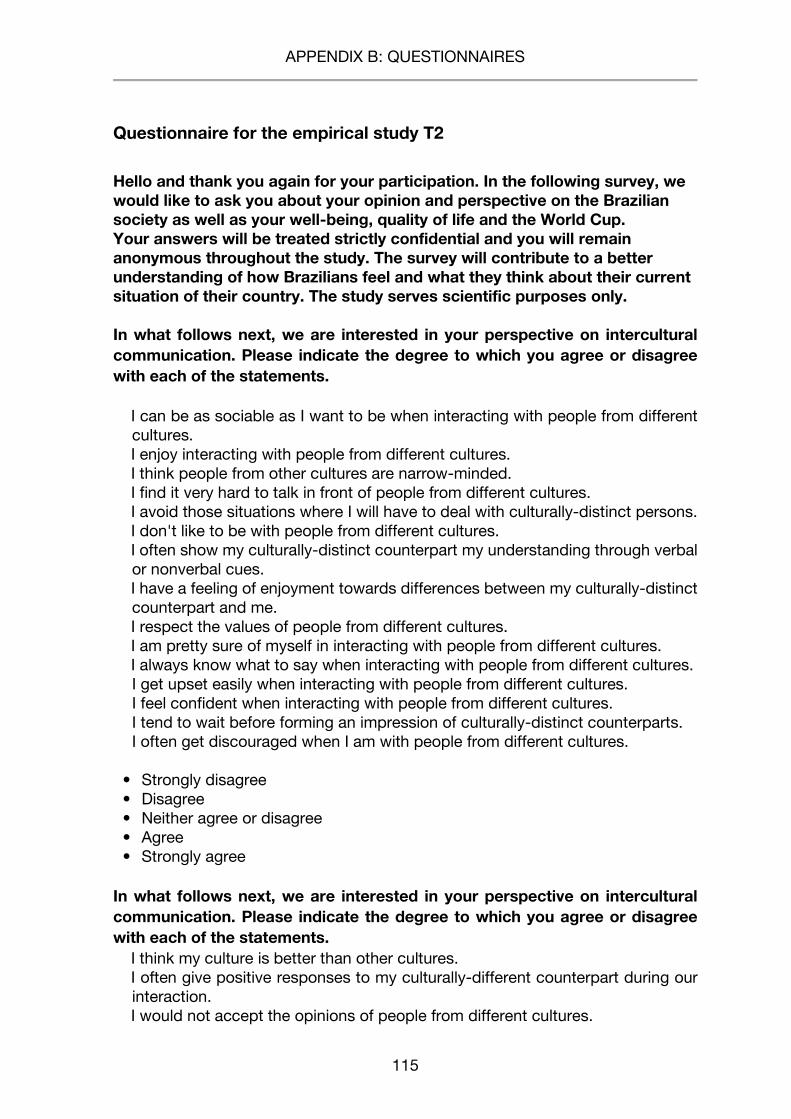
APPENDIX B: QUESTIONNAIRES
115
Questionnaire for the empirical study T2
Hello and thank you again for your participation. In the following survey, we would like to ask you about your opinion and perspective on the Brazilian society as well as your well-being, quality of life and the World Cup. Your answers will be treated strictly confidential and you will remain anonymous throughout the study. The survey will contribute to a better understanding of how Brazilians feel and what they think about their current situation of their country. The study serves scientific purposes only. In what follows next, we are interested in your perspective on intercultural communication. Please indicate the degree to which you agree or disagree with each of the statements.
I can be as sociable as I want to be when interacting with people from different
cultures. I enjoy interacting with people from different cultures. I think people from other cultures are narrow-minded. I find it very hard to talk in front of people from different cultures. I avoid those situations where I will have to deal with culturally-distinct persons. I don't like to be with people from different cultures. I often show my culturally-distinct counterpart my understanding through verbal
or nonverbal cues. I have a feeling of enjoyment towards differences between my culturally-distinct
counterpart and me. I respect the values of people from different cultures. I am pretty sure of myself in interacting with people from different cultures. I always know what to say when interacting with people from different cultures.
I get upset easily when interacting with people from different cultures. I feel confident when interacting with people from different cultures. I tend to wait before forming an impression of culturally-distinct counterparts. I often get discouraged when I am with people from different cultures.
• Strongly disagree • Disagree • Neither agree or disagree • Agree • Strongly agree
In what follows next, we are interested in your perspective on intercultural communication. Please indicate the degree to which you agree or disagree with each of the statements. I think my culture is better than other cultures. I often give positive responses to my culturally-different counterpart during our
interaction. I would not accept the opinions of people from different cultures.
APPENDIX B: QUESTIONNAIRES
116
I am sensitive to my culturally-distinct counterpart's subtle meanings during our interaction. I am open-minded to people from different cultures. I am very observant when interacting with people from different cultures. I often feel useless when interacting with people from different cultures. I respect the ways people from different cultures behave. I try to obtain as much information as I can when interacting with people from different cultures.
• Strongly disagree • Disagree • Neither agree or disagree • Agree • Strongly agree
Next, we are interested in your relationships with tourists during the last two weeks. How many tourists have you seen in your community during the past two weeks? ________ How much contact have you made with tourists during the past two weeks? ________
Please explain your relationship with others how satisfied are you … ... with your personal relationships (friends, parents, acquaintances, colleagues)? ... with the support you get from your family? ... with the support you get from your friends? ... with your ability to provide for or support others?
• Very dissatisfied • Dissatisfied • Neither satisfied or dissatisfied • Satisfied • Very satisfied
How important is being Brazilian to you? • Not at all important • Low • Moderately • Very • Extremely
APPENDIX B: QUESTIONNAIRES
117
To what extent do you see yourself as a typical Brazilian? How well does the term Brazilian describe you?
• Not at all • Slightly • Moderately • Very much • Completely
When talking about Brazil how often do you say “we” instead of “they”?
• Never • Rarely • Sometimes • Often • Always
How important is being a Brazilian to you, where 0 is not at all important and 10 is
the most important thing in your life? Response option 1-10
We have some questions about where you live: your neighborhood or village, your town or city, your county, and so on. How good does it make you feel when you see the Brazilian flag flying? How good does it make you feel when you hear the Brazilian national anthem?
• Unhappy • Slightly happy • Somewhat happy • Happy • Very happy
People should work hard to move Brazil in a positive direction. If I criticize Brazil, I do so out of love of country. I oppose some Brazilian policies because I care about my country and want to improve it. I express my attachment to Brazil by supporting efforts at positive change. I support Brazil’s leaders even if I disagree with their actions. People who do not wholeheartedly support Brazil should live elsewhere. For the most part, people who protest and demonstrate against Brazilian policy are good, upstanding, intelligent people. Brazil is virtually always right. I support Brazilian policies for the very reason that they are the policies of my country. There is too much criticism of Brazil in the world, and we as its citizens should not criticize it. I believe that Brazilian policies are almost always the morally correct ones.
APPENDIX B: QUESTIONNAIRES
118
• Strongly disagree • Disagree • Neither agree or disagree • Agree • Strongly agree
How close do you feel to Brazil?
• Not close • Little close • Moderately close • Close • Very close
Following we are interested in your well being, please think of the time during the World Cup. How well are you able to get around? How would you rate your quality of life?
• Very poor • Poor • Neither poor nor good • Good • Very good
How satisfied are you with your health?
• Very dissatisfied • Dissatisfied • Neither satisfied or dissatisfied • Satisfied • Very satisfied
Please answer the following questions about your relationships with others. Do you feel happy about your relationship with your family members?
• Very unhappy • Unhappy • Neither happy nor unhappy • Happy • Very happy
How alone do you feel in your life?
• Not at all • Slightly • Moderately • Very much • Extremely
APPENDIX B: QUESTIONNAIRES
119
Do you get the kind of support from others that you need? To what extent can you count on your friends when you need them?
• Not at all • A little • Moderately • Mostly • Completely
As in what comes next, we are interested in your everyday life during the World Cup. Please rate how much you have experienced certain things during the World Cup. To what extent do you feel that physical pain prevents you from doing what you need to do? How much do you need any medical treatment to function in your daily life? How much do you enjoy life? To what extent do you feel your life to be meaningful? How well are you able to concentrate? How safe do you feel in your daily life? How healthy is your physical environment?
• Never • Seldom • Quite often • Very often • Always
The following questions ask about how completely you experience or were able to do certain things in the last two weeks (during the World Cup). Do you have enough energy for everyday life? Are you able to accept your bodily appearance? Have you enough money to meet your needs? How available to you is the information that you need in your day-to-day life? To what extent do you have the opportunity for leisure activities?
• Not at all • A little • Moderately • Mostly • Completely
How often do you have negative feelings such as blue mood, despair, anxiety, depression?
• Never • Seldom • Quite often • Very often • Always
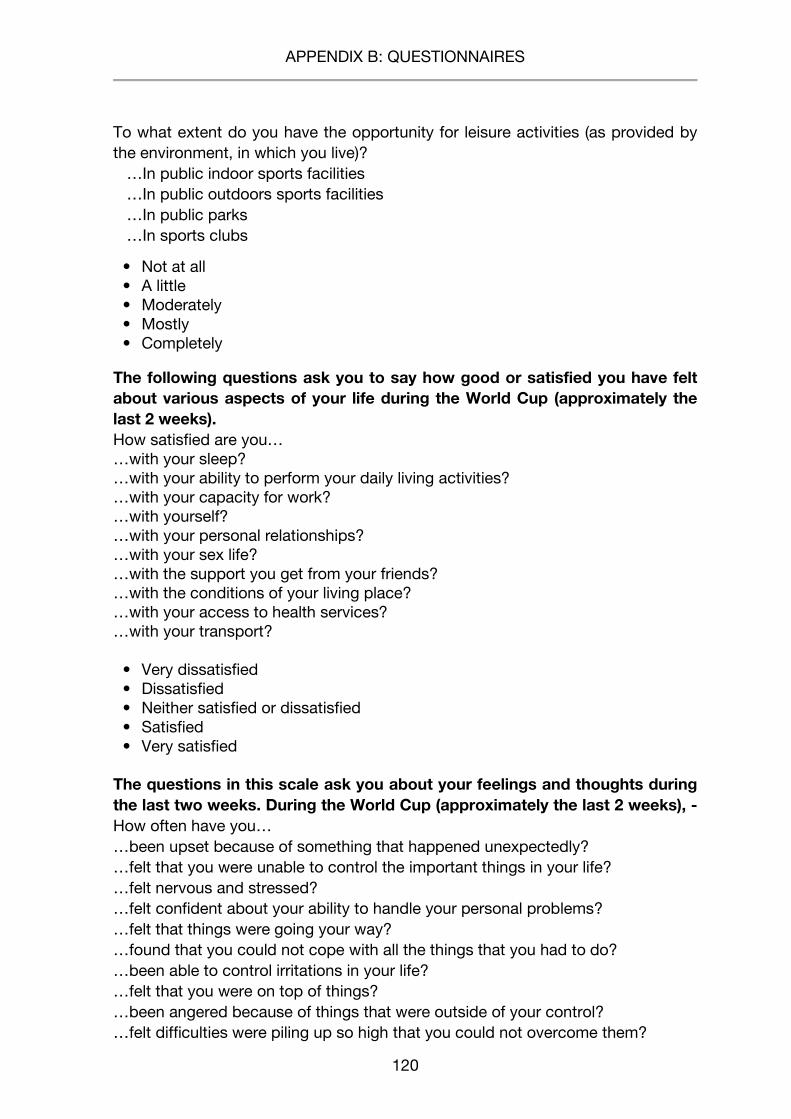
APPENDIX B: QUESTIONNAIRES
120
To what extent do you have the opportunity for leisure activities (as provided by the environment, in which you live)? …In public indoor sports facilities …In public outdoors sports facilities …In public parks …In sports clubs
• Not at all • A little • Moderately • Mostly • Completely
The following questions ask you to say how good or satisfied you have felt about various aspects of your life during the World Cup (approximately the last 2 weeks). How satisfied are you… …with your sleep? …with your ability to perform your daily living activities? …with your capacity for work? …with yourself? …with your personal relationships? …with your sex life? …with the support you get from your friends? …with the conditions of your living place? …with your access to health services? …with your transport?
• Very dissatisfied • Dissatisfied • Neither satisfied or dissatisfied • Satisfied • Very satisfied
The questions in this scale ask you about your feelings and thoughts during the last two weeks. During the World Cup (approximately the last 2 weeks), - How often have you… …been upset because of something that happened unexpectedly? …felt that you were unable to control the important things in your life? …felt nervous and stressed? …felt confident about your ability to handle your personal problems? …felt that things were going your way? …found that you could not cope with all the things that you had to do? …been able to control irritations in your life? …felt that you were on top of things? …been angered because of things that were outside of your control? …felt difficulties were piling up so high that you could not overcome them?
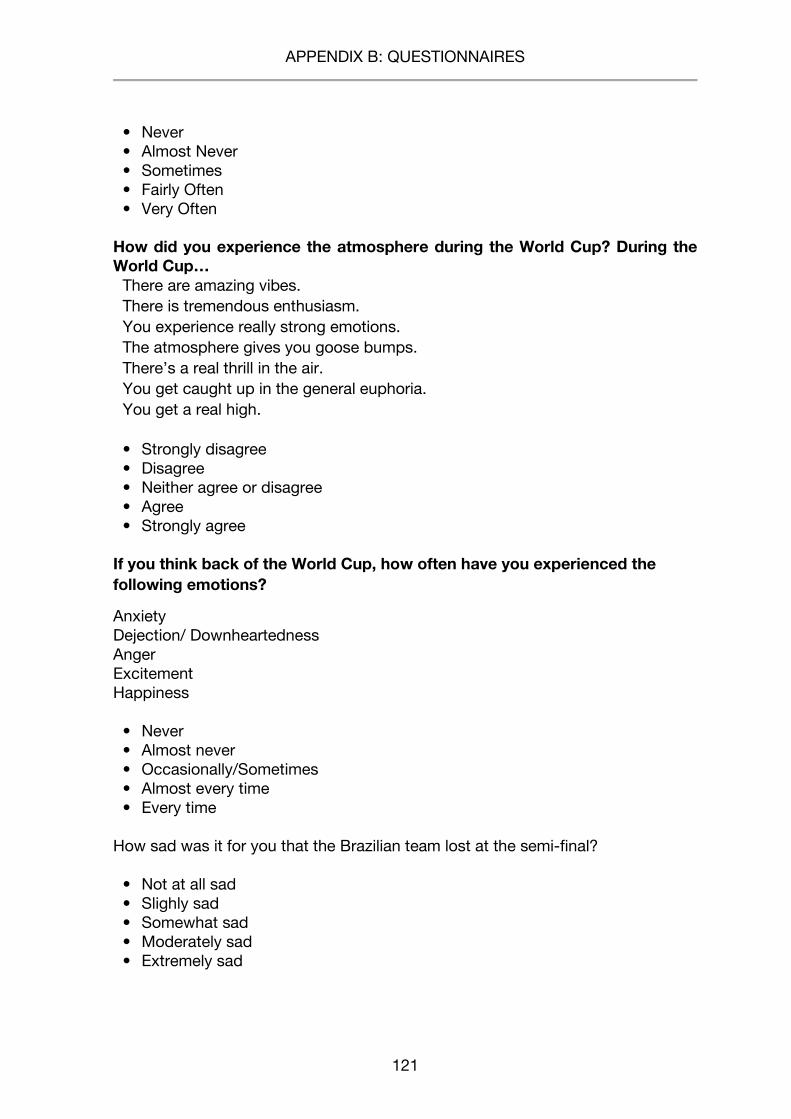
APPENDIX B: QUESTIONNAIRES
121
• Never • Almost Never • Sometimes • Fairly Often • Very Often
How did you experience the atmosphere during the World Cup? During the World Cup…
There are amazing vibes. There is tremendous enthusiasm. You experience really strong emotions. The atmosphere gives you goose bumps. There’s a real thrill in the air. You get caught up in the general euphoria. You get a real high.
• Strongly disagree • Disagree • Neither agree or disagree • Agree • Strongly agree
If you think back of the World Cup, how often have you experienced the following emotions?
Anxiety Dejection/ Downheartedness Anger Excitement Happiness
• Never • Almost never • Occasionally/Sometimes • Almost every time • Every time
How sad was it for you that the Brazilian team lost at the semi-final?
• Not at all sad • Slighly sad • Somewhat sad • Moderately sad • Extremely sad

APPENDIX B: QUESTIONNAIRES
122
Next, we are interested in finding out about the kinds of physical activities that people do as part of their everyday lives. The questions will ask you about the time you spent being physically active in the last 7 days. Please answer each question even if you do not consider yourself to be an active person. Think about the activities you do at work, as part of your house and yard work, to get from place to place, and in your spare time for recreation, exercise or sport. Think only about those physical activities that you did for at least 10 minutes at a time. During the last 7 days, on how many days did you do physical activities? How much time did you usually spend doing physical activities on one of those days? Days per week: ________ Hours per day: ________ and minutes per day: ________ No physical activities Think about the time you spent walking in the last 7 days. This includes at work and at home, walking to travel from place to place, and any other walking that you might do solely for recreation, sport, exercise, or leisure. During the last 7 days, on how many days did you walk for at least 10 minutes at a time? Days per week: ________ Hours per day: ________ and minutes per day: ________ No walking
During the last 7 days, how much time did you spend sitting on a week day? Include time spent at work, at home, while doing course work and during leisure time. This may include time spent sitting at a desk, visiting friends, reading, or sitting or lying down to watch television. Hours per day: ________ and minutes per day: ________ Please indicate your level of agreement or disagreement with the following statements. Brazil, as host, profited a lot from the World Cup. I give my very best to contribute to the success of hosting the FIFA World Cup in Brazil. I fully support that Brazil is hosting the FIFA World Cup. I tried to help have the FIFA World Cup in Brazil become a success story.
• Strongly disagree • Disagree • Neither agree or disagree • Agree • Strongly agree
How many soccer games of your favorite team have you watched?
In the stadium________ At a fan fest or public place________ At home________ In a restaurant or pub________

APPENDIX B: QUESTIONNAIRES
123
How many other soccer games of the World Cup have you watched? In the stadium________ At a fan fest or public place________ At home________ In a restaurant or pub________
Which of the following teams is your favorite team? ________ How important to you is it that the team wins? Not important – Very important, Response option 1-7 How strongly do you see yourself as a fan of the team? Not at all a fan – Very much a fan, Response option 1-7 How strongly do your friends see you as a fan of the team? Not at all a fan – Very much a fan, Response option 1-7 During the World Cup, how closely do you follow the team via the media, a) in person or on television, b) on the radio, c) television news or a newspaper, or d) the Internet? Never – Every day, Response option 1-7 How important is being a fan of the team to you? Not important - Very important, Response option 1-7 How much do you dislike the team’s greatest rivals? Do not dislike – Dislike very much, Response option 1-7 How often did you display the team’s name or insignia at your place of work, where you live, on your vehicle, or on your clothing? Never - Always, Response option 1-7
Please indicate your perspective on Brazil as the host country of the FIFA World Cup. The fact that Brazil was hosting the FIFA World Cup was …
• Positive - Negative • Good - Bad • Favorable - Unfavorable
To anonymously track your data in the following research, we would like to ask you to create a personal code. This code consists of the first three letters of your mother's name and the last three letters of his last name. Thanks a lot for your participation! Your participation is a great contribution to our research! Within the following month, we will contact you and ask you whether you participate again. We would highly appreciate it if you participated again.
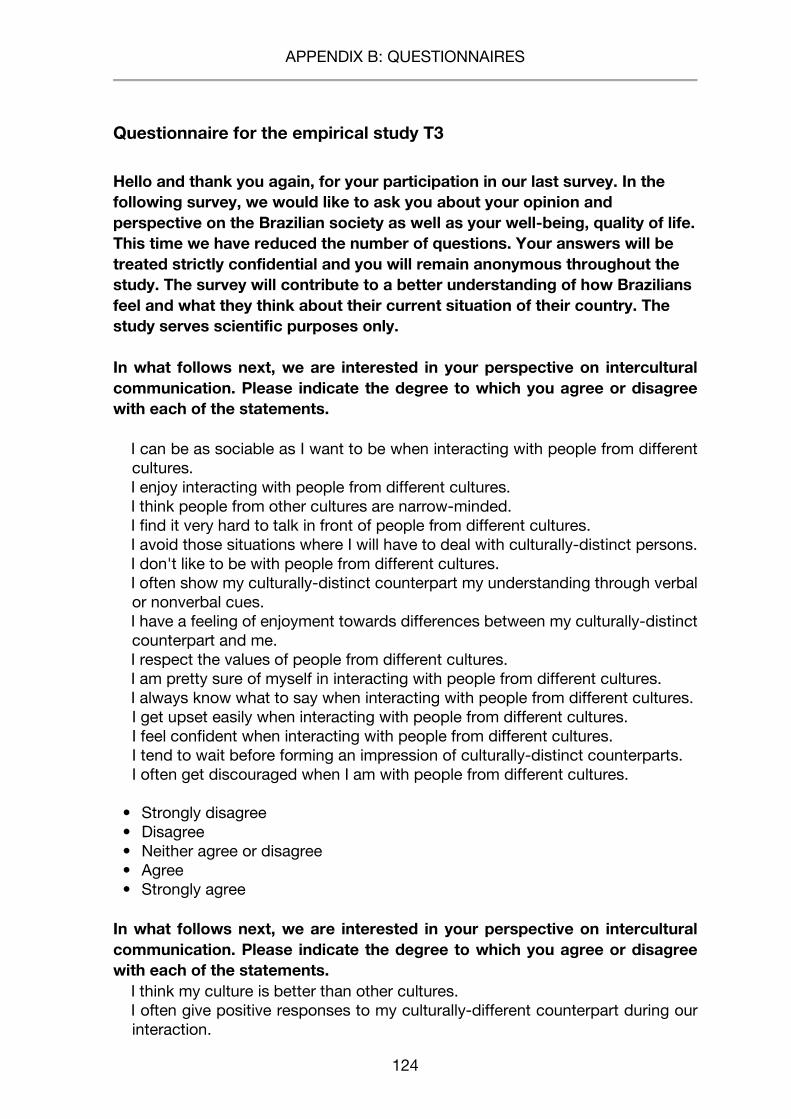
APPENDIX B: QUESTIONNAIRES
124
Questionnaire for the empirical study T3
Hello and thank you again, for your participation in our last survey. In the following survey, we would like to ask you about your opinion and perspective on the Brazilian society as well as your well-being, quality of life. This time we have reduced the number of questions. Your answers will be treated strictly confidential and you will remain anonymous throughout the study. The survey will contribute to a better understanding of how Brazilians feel and what they think about their current situation of their country. The study serves scientific purposes only. In what follows next, we are interested in your perspective on intercultural communication. Please indicate the degree to which you agree or disagree with each of the statements.
I can be as sociable as I want to be when interacting with people from different
cultures. I enjoy interacting with people from different cultures. I think people from other cultures are narrow-minded. I find it very hard to talk in front of people from different cultures. I avoid those situations where I will have to deal with culturally-distinct persons. I don't like to be with people from different cultures. I often show my culturally-distinct counterpart my understanding through verbal
or nonverbal cues. I have a feeling of enjoyment towards differences between my culturally-distinct
counterpart and me. I respect the values of people from different cultures. I am pretty sure of myself in interacting with people from different cultures. I always know what to say when interacting with people from different cultures.
I get upset easily when interacting with people from different cultures. I feel confident when interacting with people from different cultures. I tend to wait before forming an impression of culturally-distinct counterparts. I often get discouraged when I am with people from different cultures.
• Strongly disagree • Disagree • Neither agree or disagree • Agree • Strongly agree
In what follows next, we are interested in your perspective on intercultural communication. Please indicate the degree to which you agree or disagree with each of the statements. I think my culture is better than other cultures. I often give positive responses to my culturally-different counterpart during our
interaction.
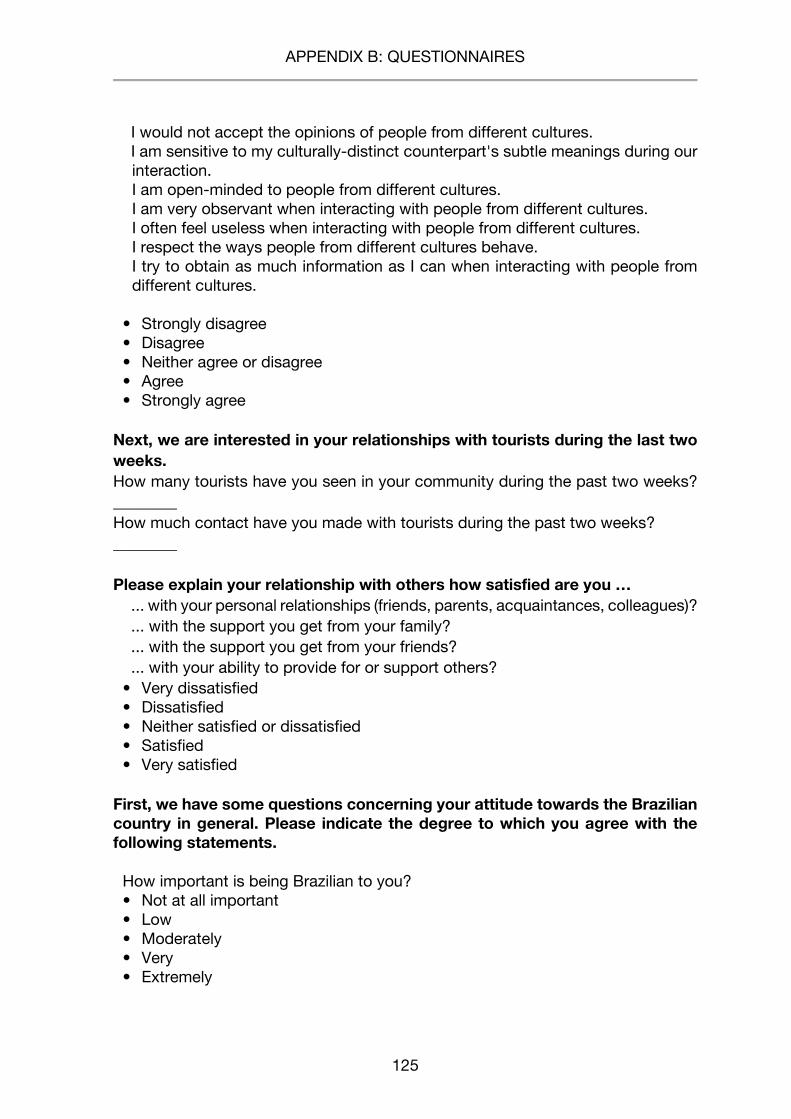
APPENDIX B: QUESTIONNAIRES
125
I would not accept the opinions of people from different cultures. I am sensitive to my culturally-distinct counterpart's subtle meanings during our
interaction. I am open-minded to people from different cultures. I am very observant when interacting with people from different cultures. I often feel useless when interacting with people from different cultures. I respect the ways people from different cultures behave. I try to obtain as much information as I can when interacting with people from different cultures.
• Strongly disagree • Disagree • Neither agree or disagree • Agree • Strongly agree
Next, we are interested in your relationships with tourists during the last two weeks. How many tourists have you seen in your community during the past two weeks? ________ How much contact have you made with tourists during the past two weeks? ________ Please explain your relationship with others how satisfied are you … ... with your personal relationships (friends, parents, acquaintances, colleagues)? ... with the support you get from your family? ... with the support you get from your friends? ... with your ability to provide for or support others?
• Very dissatisfied • Dissatisfied • Neither satisfied or dissatisfied • Satisfied • Very satisfied
First, we have some questions concerning your attitude towards the Brazilian country in general. Please indicate the degree to which you agree with the following statements.
How important is being Brazilian to you? • Not at all important • Low • Moderately • Very • Extremely
APPENDIX B: QUESTIONNAIRES
126
To what extent do you see yourself as a typical Brazilian? How well does the term Brazilian describe you?
• Not at all • Slightly • Moderately • Very much • Completely
When talking about Brazil how often do you say “we” instead of “they”?
• Never • Rarely • Sometimes • Often • Always
How important is being a Brazilian to you, where 0 is not at all important and 10 is the most important thing in your life? Response option 1-10 We have some questions about where you live: your neighborhood or village, your town or city, your county, and so on. How good does it make you feel when you see the Brazilian flag flying? How good does it make you feel when you hear the Brazilian national anthem?
• Unhappy • Slightly happy • Somewhat happy • Happy • Very happy
People should work hard to move Brazil in a positive direction.
If I criticize Brazil, I do so out of love of country.
I oppose some Brazilian policies because I care about my country and want to improve it.
I express my attachment to Brazil by supporting efforts at positive change.
I support Brazil’s leaders even if I disagree with their actions.
People who do not wholeheartedly support Brazil should live elsewhere.
For the most part, people who protest and demonstrate against Brazilian policy are good, upstanding, intelligent people.
Brazil is virtually always right.
I support Brazilian policies for the very reason that they are the policies of my country.
APPENDIX B: QUESTIONNAIRES
127
There is too much criticism of Brazil in the world, and we as its citizens should not criticize it.
I believe that Brazilian policies are almost always the morally correct ones. • Strongly disagree • Disagree • Neither agree or disagree • Agree • Strongly agree
How close do you feel to Brazil?
• Not close • Little close • Moderately close • Close • Very close
Following we are interested in your well being, please think of the last two weeks. How well are you able to get around? How would you rate your quality of life?
• Very poor • Poor • Neither poor nor good • Good • Very good
How satisfied are you with your health?
• Very dissatisfied • Dissatisfied • Neither satisfied or dissatisfied • Satisfied • Very satisfied
Please answer the following questions about your relationships with others. Do you feel happy about your relationship with your family members?
• Very unhappy • Unhappy • Neither happy nor unhappy • Happy • Very happy
How alone do you feel in your life? • Not at all • Slightly • Moderately • Very much • Extremely
APPENDIX B: QUESTIONNAIRES
128
Do you get the kind of support from others that you need? To what extent can you count on your friends when you need them?
• Not at all • A little • Moderately • Mostly • Completely
As In what comes next, we are interested in your everyday life during the last two weeks. Please rate how much you have experienced certain things in the last two weeks. To what extent do you feel that physical pain prevents you from doing what you need to do? How much do you need any medical treatment to function in your daily life? How much do you enjoy life? To what extent do you feel your life to be meaningful? How well are you able to concentrate? How safe do you feel in your daily life? How healthy is your physical environment?
• Never • Seldom • Quite often • Very often • Always
The following questions ask about how completely you experience or were able to do certain things in the last two weeks. Do you have enough energy for everyday life? Are you able to accept your bodily appearance? Have you enough money to meet your needs? How available to you is the information that you need in your day-to-day life? To what extent do you have the opportunity for leisure activities?
• Not at all • A little • Moderately • Mostly • Completely
How often do you have negative feelings such as blue mood, despair, anxiety, depression?
• Never • Seldom • Quite often • Very often • Always
APPENDIX B: QUESTIONNAIRES
129
The following questions ask you to say how good or satisfied you have felt about various aspects of your life over the last two weeks.
How satisfied are you… …with your sleep? …with your ability to perform your daily living activities? …with your capacity for work? …with yourself? …with your personal relationships? …with your sex life? …with the support you get from your friends? …with the conditions of your living place? …with your access to health services? …with your transport? • Very dissatisfied • Dissatisfied • Neither satisfied or dissatisfied • Satisfied • Very satisfied
The questions in this scale ask you about your feelings and thoughts during the last two weeks. In each case, you will be asked to indicate by circling how often you felt or thought a certain way during the past two weeks, How often have you… …been upset because of something that happened unexpectedly? …felt that you were unable to control the important things in your life? …felt nervous and stressed? …felt confident about your ability to handle your personal problems? …felt that things were going your way? …found that you could not cope with all the things that you had to do? …been able to control irritations in your life? …felt that you were on top of things? …been angered because of things that were outside of your control? …felt difficulties were piling up so high that you could not overcome them?
• Never • Almost Never • Sometimes • Fairly Often • Very Often
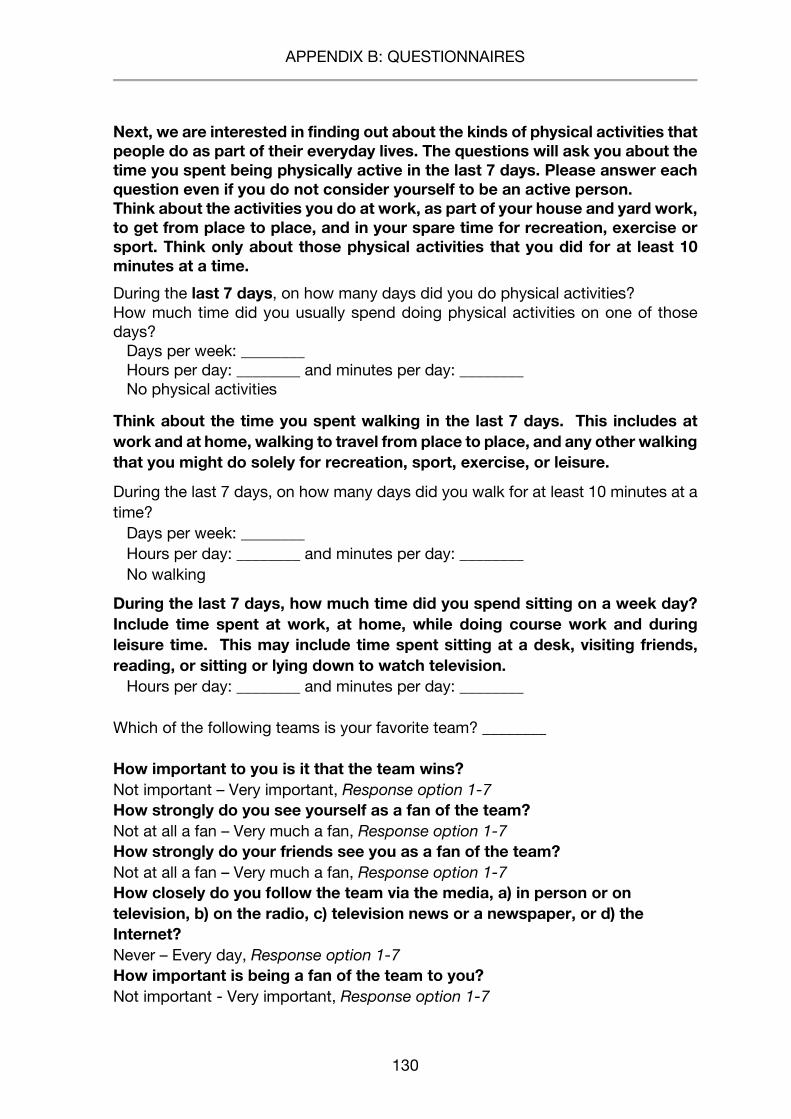
APPENDIX B: QUESTIONNAIRES
130
Next, we are interested in finding out about the kinds of physical activities that people do as part of their everyday lives. The questions will ask you about the time you spent being physically active in the last 7 days. Please answer each question even if you do not consider yourself to be an active person. Think about the activities you do at work, as part of your house and yard work, to get from place to place, and in your spare time for recreation, exercise or sport. Think only about those physical activities that you did for at least 10 minutes at a time.
During the last 7 days, on how many days did you do physical activities? How much time did you usually spend doing physical activities on one of those days? Days per week: ________ Hours per day: ________ and minutes per day: ________ No physical activities
Think about the time you spent walking in the last 7 days. This includes at work and at home, walking to travel from place to place, and any other walking that you might do solely for recreation, sport, exercise, or leisure.
During the last 7 days, on how many days did you walk for at least 10 minutes at a time? Days per week: ________ Hours per day: ________ and minutes per day: ________ No walking
During the last 7 days, how much time did you spend sitting on a week day? Include time spent at work, at home, while doing course work and during leisure time. This may include time spent sitting at a desk, visiting friends, reading, or sitting or lying down to watch television. Hours per day: ________ and minutes per day: ________ Which of the following teams is your favorite team? ________ How important to you is it that the team wins? Not important – Very important, Response option 1-7 How strongly do you see yourself as a fan of the team? Not at all a fan – Very much a fan, Response option 1-7 How strongly do your friends see you as a fan of the team? Not at all a fan – Very much a fan, Response option 1-7 How closely do you follow the team via the media, a) in person or on television, b) on the radio, c) television news or a newspaper, or d) the Internet? Never – Every day, Response option 1-7 How important is being a fan of the team to you? Not important - Very important, Response option 1-7
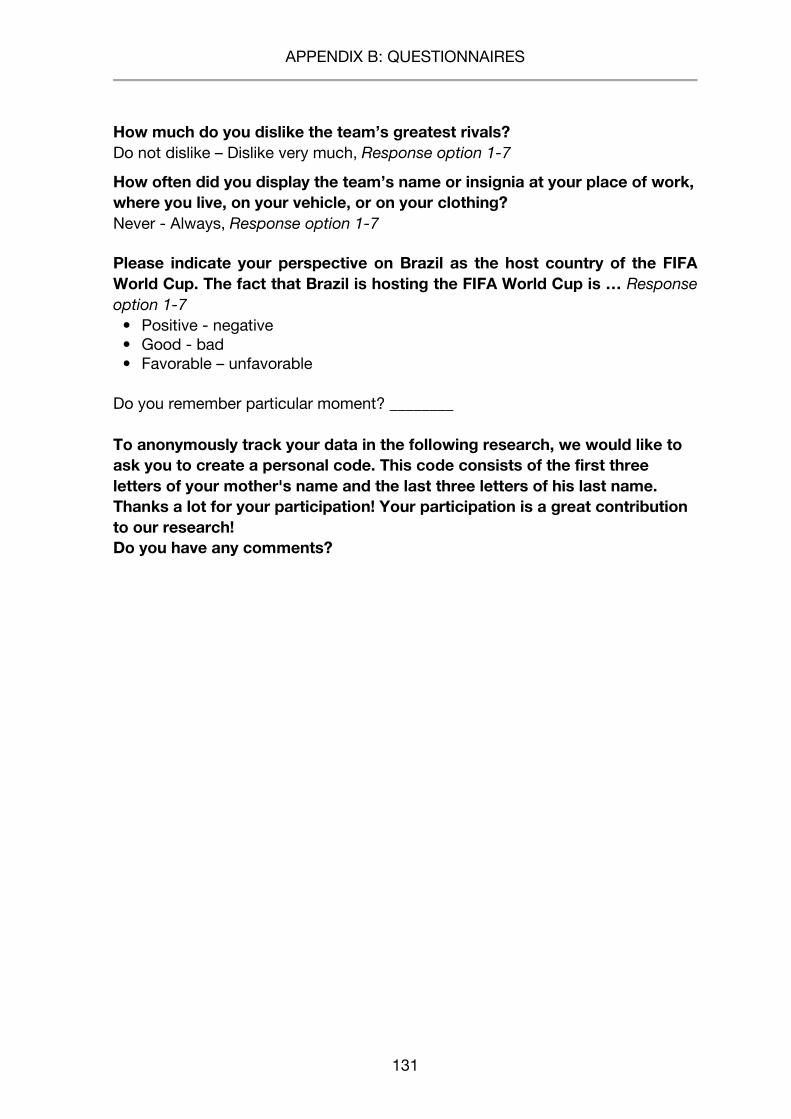
APPENDIX B: QUESTIONNAIRES
131
How much do you dislike the team’s greatest rivals? Do not dislike – Dislike very much, Response option 1-7
How often did you display the team’s name or insignia at your place of work, where you live, on your vehicle, or on your clothing? Never - Always, Response option 1-7
Please indicate your perspective on Brazil as the host country of the FIFA World Cup. The fact that Brazil is hosting the FIFA World Cup is … Response option 1-7
• Positive - negative • Good - bad • Favorable – unfavorable
Do you remember particular moment? ________ To anonymously track your data in the following research, we would like to ask you to create a personal code. This code consists of the first three letters of your mother's name and the last three letters of his last name. Thanks a lot for your participation! Your participation is a great contribution to our research! Do you have any comments?
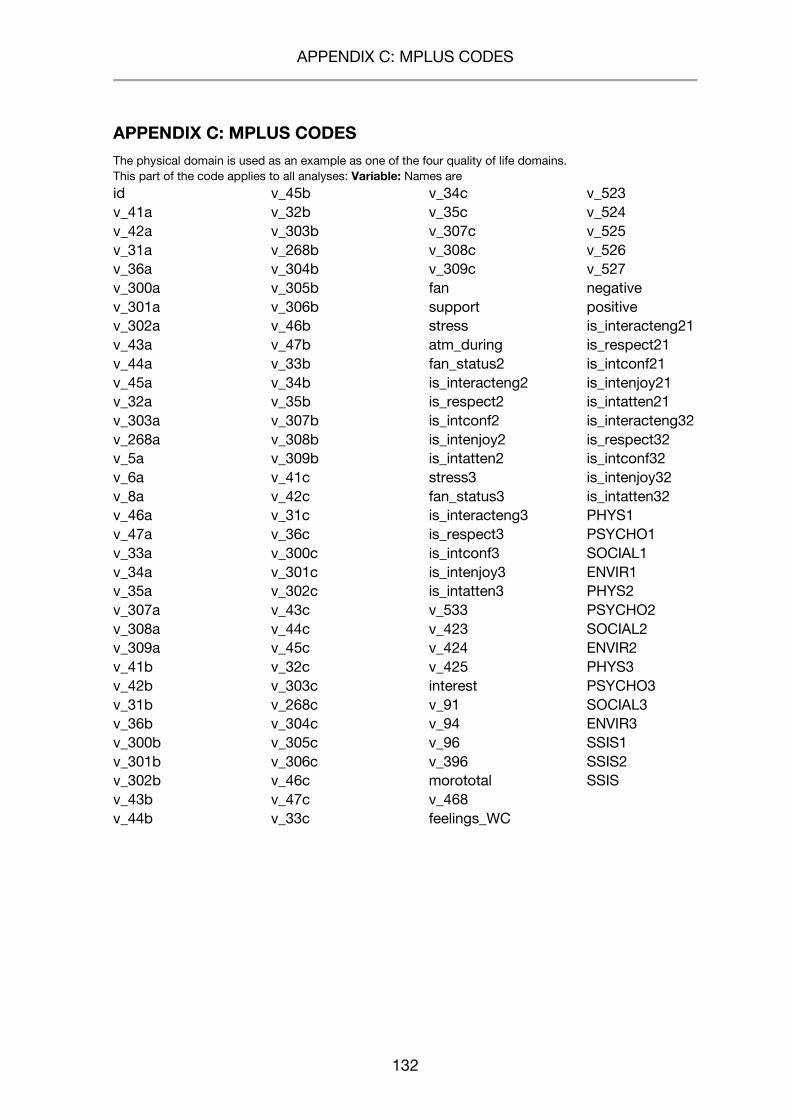
APPENDIX C: MPLUS CODES
132
APPENDIX C: MPLUS CODES The physical domain is used as an example as one of the four quality of life domains. This part of the code applies to all analyses: Variable: Names are
id v_41a v_42a v_31a v_36a v_300a v_301a v_302a v_43a v_44a v_45a v_32a v_303a v_268a v_5a v_6a v_8a v_46a v_47a v_33a v_34a v_35a v_307a v_308a v_309a v_41b v_42b v_31b v_36b v_300b v_301b v_302b v_43b v_44b
v_45b v_32b v_303b v_268b v_304b v_305b v_306b v_46b v_47b v_33b v_34b v_35b v_307b v_308b v_309b v_41c v_42c v_31c v_36c v_300c v_301c v_302c v_43c v_44c v_45c v_32c v_303c v_268c v_304c v_305c v_306c v_46c v_47c v_33c
v_34c v_35c v_307c v_308c v_309c fan support stress atm_during fan_status2 is_interacteng2 is_respect2 is_intconf2 is_intenjoy2 is_intatten2 stress3 fan_status3 is_interacteng3 is_respect3 is_intconf3 is_intenjoy3 is_intatten3 v_533 v_423 v_424 v_425 interest v_91 v_94 v_96 v_396 morototal v_468 feelings_WC
v_523 v_524 v_525 v_526 v_527 negative positive is_interacteng21 is_respect21 is_intconf21 is_intenjoy21 is_intatten21 is_interacteng32 is_respect32 is_intconf32 is_intenjoy32 is_intatten32 PHYS1 PSYCHO1 SOCIAL1 ENVIR1 PHYS2 PSYCHO2 SOCIAL2 ENVIR2 PHYS3 PSYCHO3 SOCIAL3 ENVIR3 SSIS1 SSIS2 SSIS
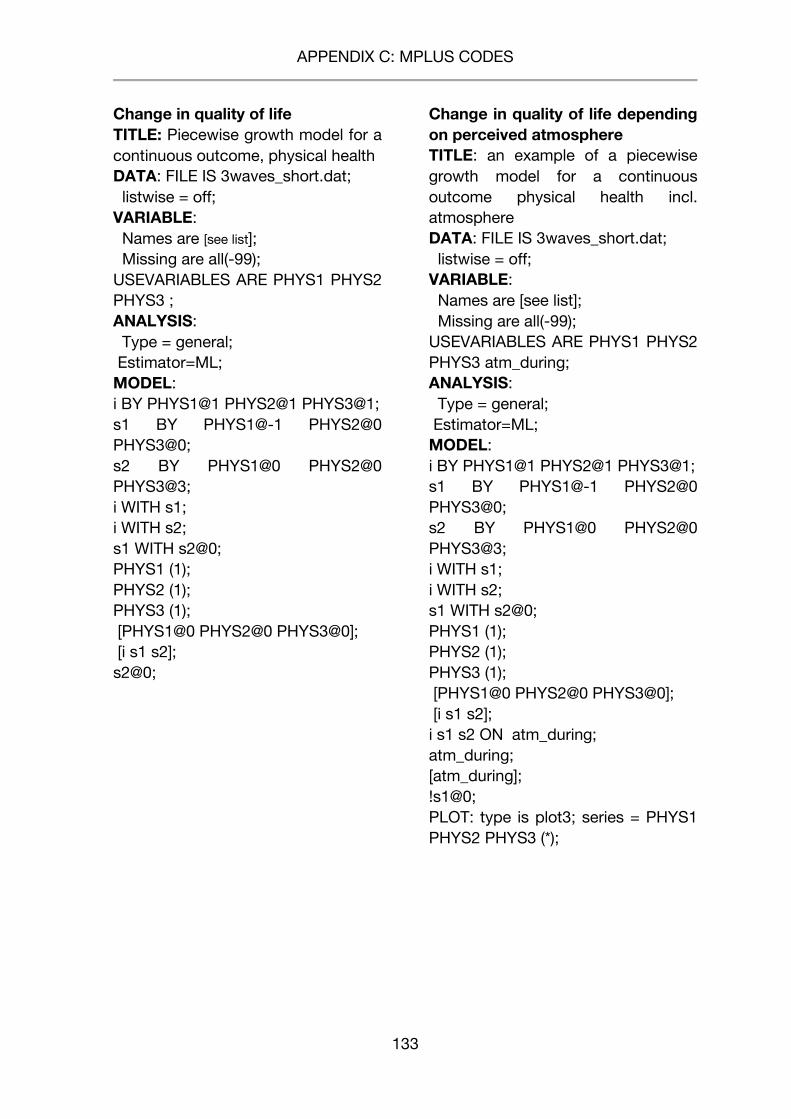
APPENDIX C: MPLUS CODES
133
Change in quality of life TITLE: Piecewise growth model for a continuous outcome, physical health DATA: FILE IS 3waves_short.dat; listwise = off; VARIABLE: Names are [see list]; Missing are all(-99); USEVARIABLES ARE PHYS1 PHYS2 PHYS3 ; ANALYSIS: Type = general; Estimator=ML; MODEL: i BY PHYS1@1 PHYS2@1 PHYS3@1; s1 BY PHYS1@-1 PHYS2@0 PHYS3@0; s2 BY PHYS1@0 PHYS2@0 PHYS3@3; i WITH s1; i WITH s2; s1 WITH s2@0; PHYS1 (1); PHYS2 (1); PHYS3 (1); [PHYS1@0 PHYS2@0 PHYS3@0]; [i s1 s2]; s2@0;
Change in quality of life depending on perceived atmosphere TITLE: an example of a piecewise growth model for a continuous outcome physical health incl. atmosphere DATA: FILE IS 3waves_short.dat; listwise = off; VARIABLE: Names are [see list]; Missing are all(-99); USEVARIABLES ARE PHYS1 PHYS2 PHYS3 atm_during; ANALYSIS: Type = general; Estimator=ML; MODEL: i BY PHYS1@1 PHYS2@1 PHYS3@1; s1 BY PHYS1@-1 PHYS2@0 PHYS3@0; s2 BY PHYS1@0 PHYS2@0 PHYS3@3; i WITH s1; i WITH s2; s1 WITH s2@0; PHYS1 (1); PHYS2 (1); PHYS3 (1); [PHYS1@0 PHYS2@0 PHYS3@0]; [i s1 s2]; i s1 s2 ON atm_during; atm_during; [atm_during]; !s1@0; PLOT: type is plot3; series = PHYS1 PHYS2 PHYS3 (*);
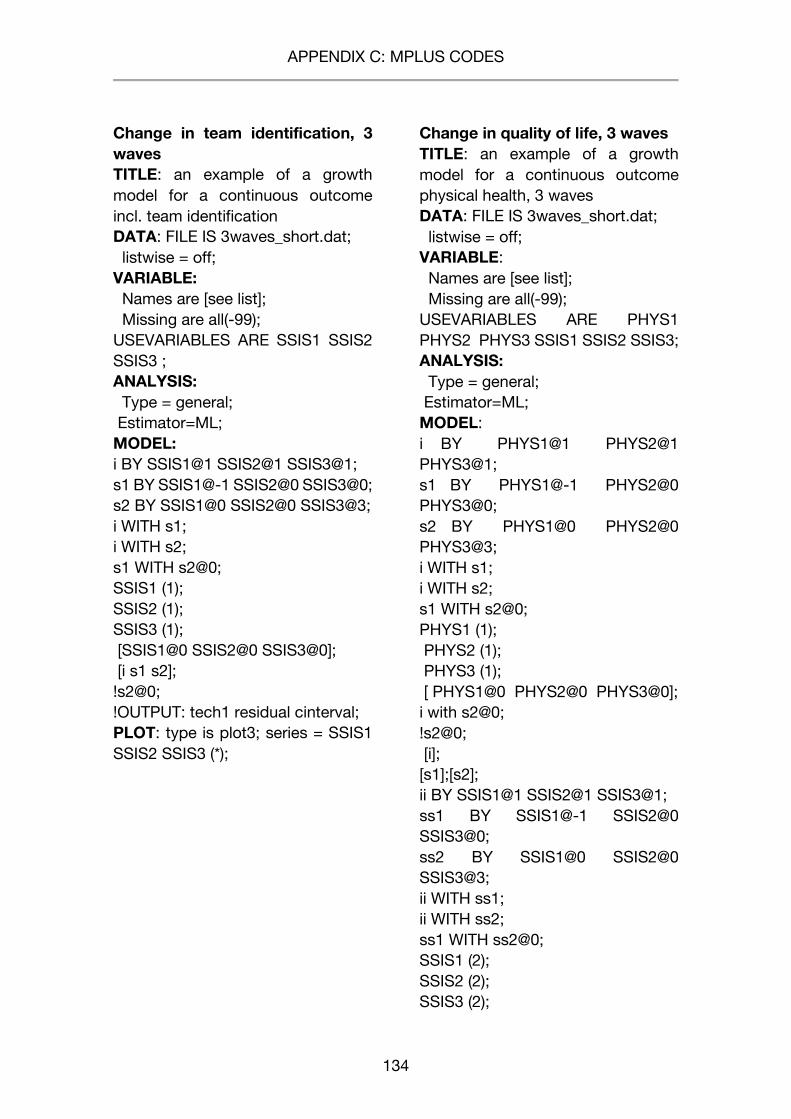
APPENDIX C: MPLUS CODES
134
Change in team identification, 3 waves TITLE: an example of a growth model for a continuous outcome incl. team identification DATA: FILE IS 3waves_short.dat; listwise = off; VARIABLE: Names are [see list]; Missing are all(-99); USEVARIABLES ARE SSIS1 SSIS2 SSIS3 ; ANALYSIS: Type = general; Estimator=ML; MODEL: i BY SSIS1@1 SSIS2@1 SSIS3@1; s1 BY SSIS1@-1 SSIS2@0 SSIS3@0; s2 BY SSIS1@0 SSIS2@0 SSIS3@3; i WITH s1; i WITH s2; s1 WITH s2@0; SSIS1 (1); SSIS2 (1); SSIS3 (1); [SSIS1@0 SSIS2@0 SSIS3@0]; [i s1 s2]; !s2@0; !OUTPUT: tech1 residual cinterval; PLOT: type is plot3; series = SSIS1 SSIS2 SSIS3 (*);
Change in quality of life, 3 waves TITLE: an example of a growth model for a continuous outcome physical health, 3 waves DATA: FILE IS 3waves_short.dat; listwise = off; VARIABLE: Names are [see list]; Missing are all(-99); USEVARIABLES ARE PHYS1 PHYS2 PHYS3 SSIS1 SSIS2 SSIS3; ANALYSIS: Type = general; Estimator=ML; MODEL: i BY PHYS1@1 PHYS2@1 PHYS3@1; s1 BY PHYS1@-1 PHYS2@0 PHYS3@0; s2 BY PHYS1@0 PHYS2@0 PHYS3@3; i WITH s1; i WITH s2; s1 WITH s2@0; PHYS1 (1); PHYS2 (1); PHYS3 (1); [ PHYS1@0 PHYS2@0 PHYS3@0]; i with s2@0; !s2@0; [i]; [s1];[s2]; ii BY SSIS1@1 SSIS2@1 SSIS3@1; ss1 BY SSIS1@-1 SSIS2@0 SSIS3@0; ss2 BY SSIS1@0 SSIS2@0 SSIS3@3; ii WITH ss1; ii WITH ss2; ss1 WITH ss2@0; SSIS1 (2); SSIS2 (2); SSIS3 (2);
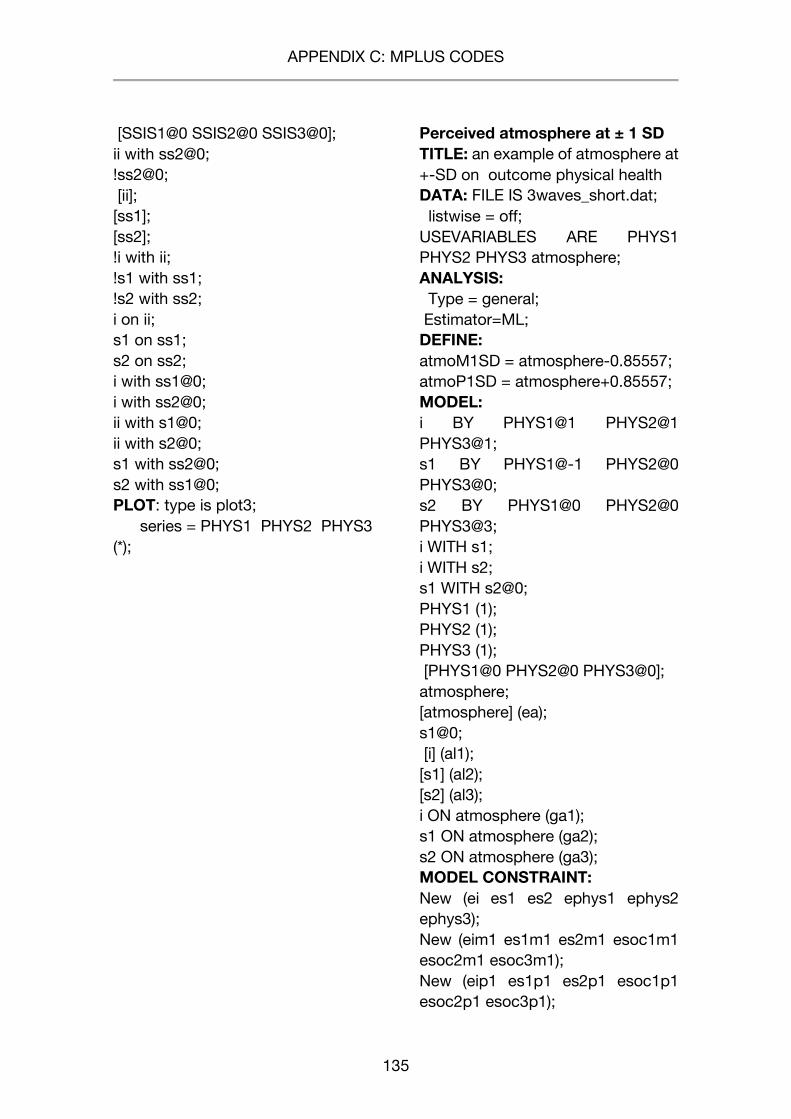
APPENDIX C: MPLUS CODES
135
[SSIS1@0 SSIS2@0 SSIS3@0]; ii with ss2@0; !ss2@0; [ii]; [ss1]; [ss2]; !i with ii; !s1 with ss1; !s2 with ss2; i on ii; s1 on ss1; s2 on ss2; i with ss1@0; i with ss2@0; ii with s1@0; ii with s2@0; s1 with ss2@0; s2 with ss1@0; PLOT: type is plot3; series = PHYS1 PHYS2 PHYS3 (*);
Perceived atmosphere at ± 1 SD TITLE: an example of atmosphere at +-SD on outcome physical health DATA: FILE IS 3waves_short.dat; listwise = off; USEVARIABLES ARE PHYS1 PHYS2 PHYS3 atmosphere; ANALYSIS: Type = general; Estimator=ML; DEFINE: atmoM1SD = atmosphere-0.85557; atmoP1SD = atmosphere+0.85557; MODEL: i BY PHYS1@1 PHYS2@1 PHYS3@1; s1 BY PHYS1@-1 PHYS2@0 PHYS3@0; s2 BY PHYS1@0 PHYS2@0 PHYS3@3; i WITH s1; i WITH s2; s1 WITH s2@0; PHYS1 (1); PHYS2 (1); PHYS3 (1); [PHYS1@0 PHYS2@0 PHYS3@0]; atmosphere; [atmosphere] (ea); s1@0; [i] (al1); [s1] (al2); [s2] (al3); i ON atmosphere (ga1); s1 ON atmosphere (ga2); s2 ON atmosphere (ga3); MODEL CONSTRAINT: New (ei es1 es2 ephys1 ephys2 ephys3); New (eim1 es1m1 es2m1 esoc1m1 esoc2m1 esoc3m1); New (eip1 es1p1 es2p1 esoc1p1 esoc2p1 esoc3p1);

APPENDIX C: MPLUS CODES
136
ei = al1 + ga1*ea; es1 = al2 + ga2*ea; es2 = al3 + ga3*ea; ephys1 = ei - es1; ephys2 = ei; ephys3 = ei + 3*es2; eim1 = al1 + ga1*2.6744; es1m1 = al2 + ga2*2.6744; es2m1 = al3 + ga3*2.6744; esoc1m1 = eim1 - es1m1; esoc2m1 = eim1; esoc3m1 = eim1 + 3*es2m1; eip1 = al1 + ga1*4.3856; es1p1 = al2 + ga2*4.3856; es2p1 = al3 + ga3*4.3856; esoc1p1 = eip1 - es1p1; esoc2p1 = eip1; esoc3p1 = eip1 + 3*es2p1; PLOT: type is plot3; series = PHYS1 PHYS2 PHYS3 (*); OUTPUT: tech1 residual cinterval sampstat standardized stdyx; TEch4;
Combined model, perceived atmosphere and team identification TITLE: an example of a growth model for the outcome physical health incl atmosphere and identification DATA: FILE IS 3waves_short.dat; listwise = off; USEVARIABLES ARE PHYS1 PHYS2 PHYS3 atmosphere SSIS1; ANALYSIS: Type = general; Estimator=ML; MODEL: i BY PHYS1@1 PHYS2@1 PHYS3@1; s1 BY PHYS1@-1 PHYS2@0 PHYS3@0; s2 BY PHYS1@0 PHYS2@0 PHYS3@3; i WITH s1; i WITH s2; s1 WITH s2@0; PHYS1 (1); PHYS2 (1); PHYS3 (1); [PHYS1@0 PHYS2@0 PHYS3@0]; [i s1 s2]; i s1 s2 ON atmosphere; i s1 s2 ON SSIS1; atmosphere; [atmosphere]; SSIS1; [SSIS1]; PLOT: type is plot3; series = PHYS1 PHYS2 PHYS3 (*); OUTPUT: tech1 residual cinterval sampstat standardized stdyx; modindices (all); TEch4;