
NatCatSERVICE, Jan Eichner
55
NatCatSERVICE Introduction and Methodology Jan Eichner, Geo Risks Research, Head of NatCatSERVICE October 2016
-
Upload
oecd-governance -
Category
Government & Nonprofit
-
view
105 -
download
0
Transcript of NatCatSERVICE, Jan Eichner

NatCatSERVICE
Introduction and Methodology
Jan Eichner,
Geo Risks Research, Head of NatCatSERVICE
October 2016
NatCatSERVICE
© 2016 Münchener Rückversicherungs-Gesellschaft, Geo Risks Research, NatCatSERVICE – As at October 2016
NatCatSERVICE
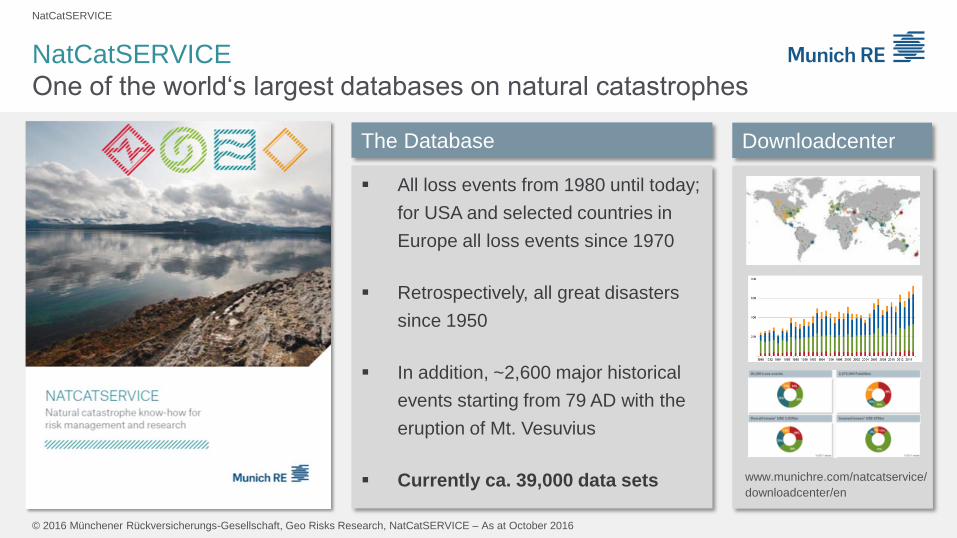
One of the world‘s largest databases on natural catastrophes
The Database
All loss events from 1980 until today;
for USA and selected countries in
Europe all loss events since 1970
Retrospectively, all great disasters
since 1950
In addition, ~2,600 major historical
events starting from 79 AD with the
eruption of Mt. Vesuvius
Currently ca. 39,000 data sets
Downloadcenter
www.munichre.com/natcatservice/
downloadcenter/en
NatCatSERVICE
© 2016 Münchener Rückversicherungs-Gesellschaft, Geo Risks Research, NatCatSERVICE – As at October 2016
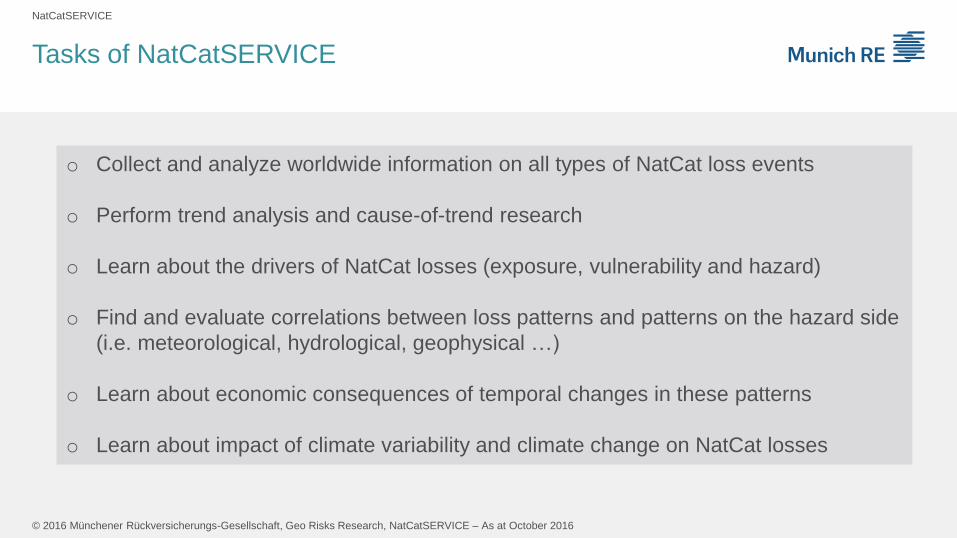
Tasks of NatCatSERVICE
o Collect and analyze worldwide information on all types of NatCat loss events
o Perform trend analysis and cause-of-trend research
o Learn about the drivers of NatCat losses (exposure, vulnerability and hazard)
o Find and evaluate correlations between loss patterns and patterns on the hazard side
(i.e. meteorological, hydrological, geophysical …)
o Learn about economic consequences of temporal changes in these patterns
o Learn about impact of climate variability and climate change on NatCat losses
NatCatSERVICE
© 2016 Münchener Rückversicherungs-Gesellschaft, Geo Risks Research, NatCatSERVICE – As at October 2016
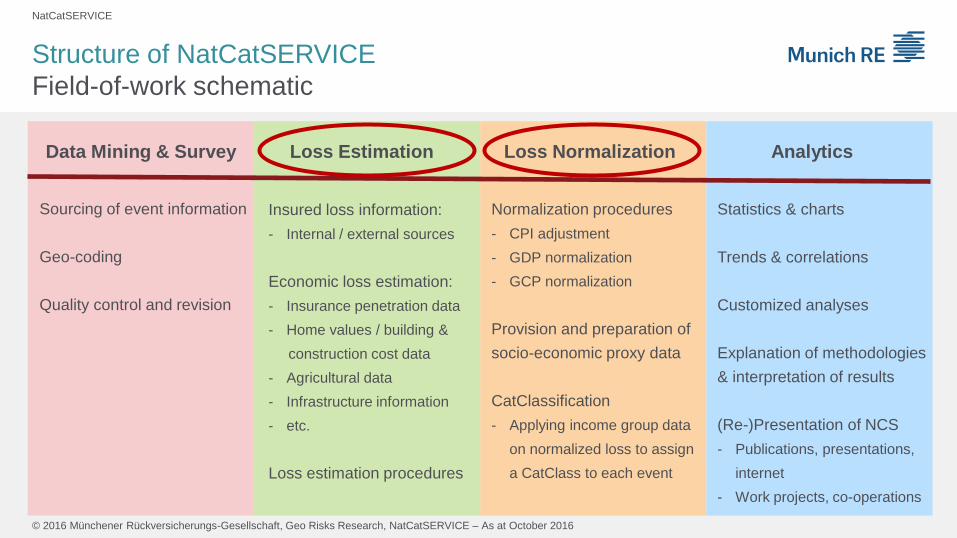
Structure of NatCatSERVICE
Field-of-work schematic
Data Mining & Survey Loss Estimation Loss Normalization Analytics
Sourcing of event information
Geo-coding
Quality control and revision
Insured loss information:
- Internal / external sources
Economic loss estimation:
- Insurance penetration data
- Home values / building &
construction cost data
- Agricultural data
- Infrastructure information
- etc.
Loss estimation procedures
Statistics & charts
Trends & correlations
Customized analyses
Explanation of methodologies
& interpretation of results
(Re-)Presentation of NCS
- Publications, presentations,
internet
- Work projects, co-operations
Normalization procedures
- CPI adjustment
- GDP normalization
- GCP normalization
Provision and preparation of
socio-economic proxy data
CatClassification
- Applying income group data
on normalized loss to assign
a CatClass to each event
NatCatSERVICE
© 2016 Münchener Rückversicherungs-Gesellschaft, Geo Risks Research, NatCatSERVICE – As at October 2016
Loss Estimation
© 2016 Münchener Rückversicherungs-Gesellschaft, Geo Risks Research, NatCatSERVICE – As at October 2016
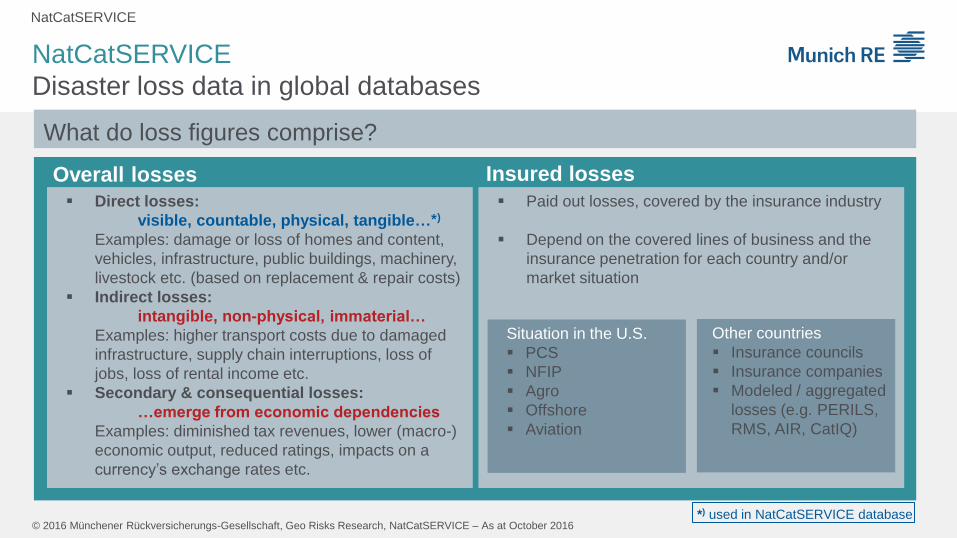
Overall losses
Direct losses:
visible, countable, physical, tangible…*)
Examples: damage or loss of homes and content,
vehicles, infrastructure, public buildings, machinery,
livestock etc. (based on replacement & repair costs)
Indirect losses:
intangible, non-physical, immaterial…
Examples: higher transport costs due to damaged
infrastructure, supply chain interruptions, loss of
jobs, loss of rental income etc.
Secondary & consequential losses:
…emerge from economic dependencies
Examples: diminished tax revenues, lower (macro-)
economic output, reduced ratings, impacts on a
currency’s exchange rates etc.
Paid out losses, covered by the insurance industry
Depend on the covered lines of business and the
insurance penetration for each country and/or
market situation
Situation in the U.S.
PCS
NFIP
Agro
Offshore
Aviation
Other countries
Insurance councils
Insurance companies
Modeled / aggregated
losses (e.g. PERILS,
RMS, AIR, CatIQ)
What do loss figures comprise?
NatCatSERVICE
NatCatSERVICE
Disaster loss data in global databases
Insured losses
*) used in NatCatSERVICE database
NatCatSERVICE
© 2016 Münchener Rückversicherungs-Gesellschaft, Geo Risks Research, NatCatSERVICE – As at October 2016
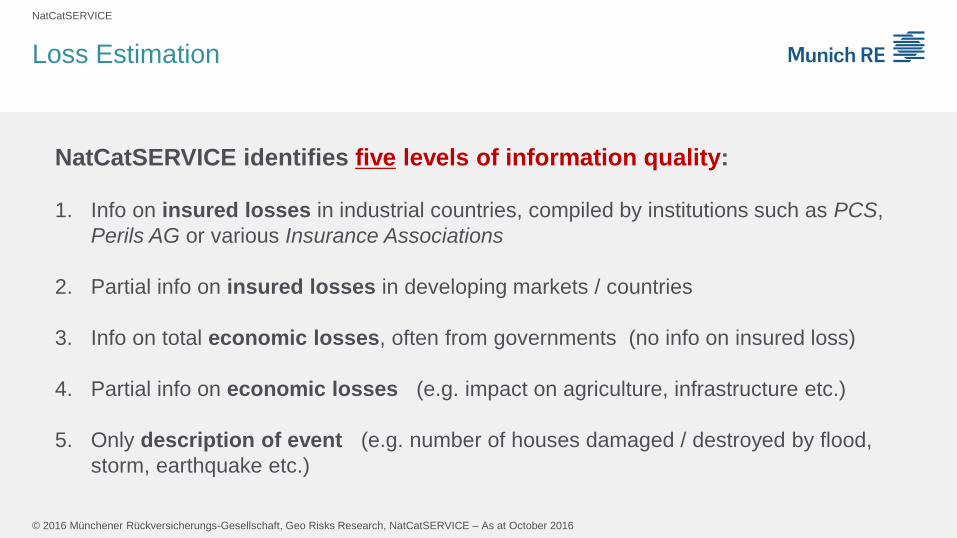
Loss Estimation
NatCatSERVICE identifies five levels of information quality:
1. Info on insured losses in industrial countries, compiled by institutions such as PCS,
Perils AG or various Insurance Associations
2. Partial info on insured losses in developing markets / countries
3. Info on total economic losses, often from governments (no info on insured loss)
4. Partial info on economic losses (e.g. impact on agriculture, infrastructure etc.)
5. Only description of event (e.g. number of houses damaged / destroyed by flood,
storm, earthquake etc.)
NatCatSERVICE
© 2016 Münchener Rückversicherungs-Gesellschaft, Geo Risks Research, NatCatSERVICE – As at October 2016
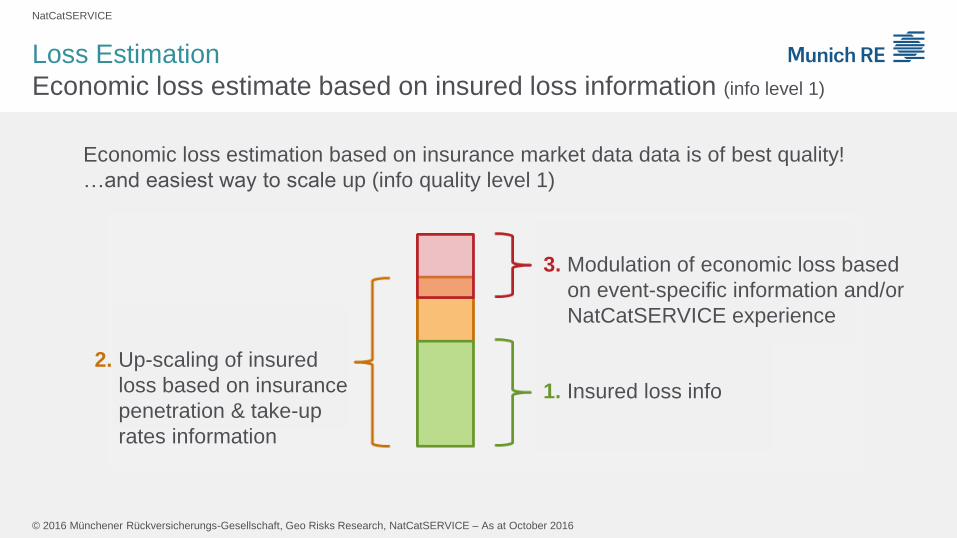
Loss Estimation
Economic loss estimate based on insured loss information (info level 1)
2. Up-scaling of insured
loss based on insurance
penetration & take-up
rates information
3. Modulation of economic loss based
on event-specific information and/or
NatCatSERVICE experience
1. Insured loss info
Economic loss estimation based on insurance market data data is of best quality!
…and easiest way to scale up (info quality level 1)
NatCatSERVICE
© 2016 Münchener Rückversicherungs-Gesellschaft, Geo Risks Research, NatCatSERVICE – As at October 2016
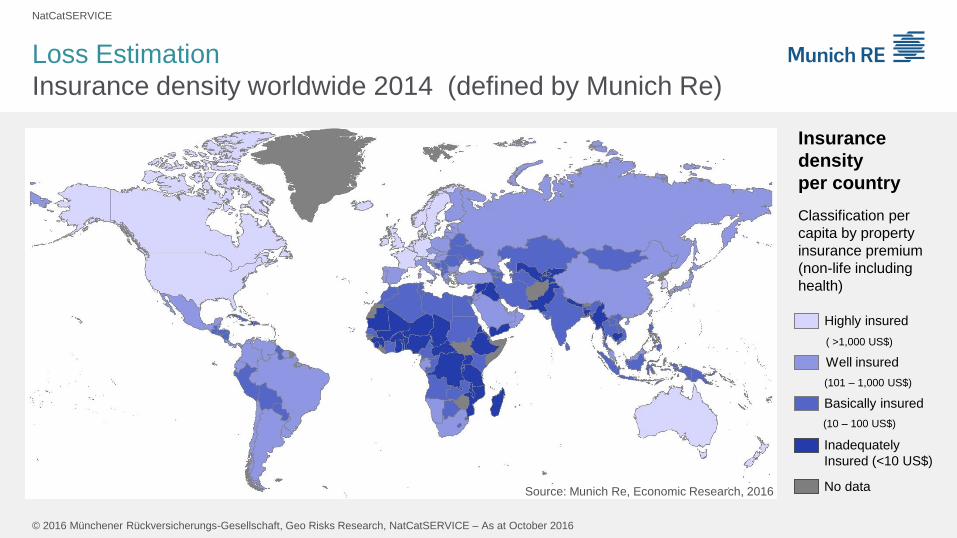
Loss Estimation
Insurance density worldwide 2014 (defined by Munich Re)
Insurance
density
per country
Classification per
capita by property
insurance premium
(non-life including
health)
Highly insured
( >1,000 US$)
Well insured
(101 – 1,000 US$)
Basically insured
(10 – 100 US$)
Inadequately
Insured (<10 US$)
No data Source: Munich Re, Economic Research, 2016
NatCatSERVICE
© 2016 Münchener Rückversicherungs-Gesellschaft, Geo Risks Research, NatCatSERVICE – As at October 2016
Loss Estimation
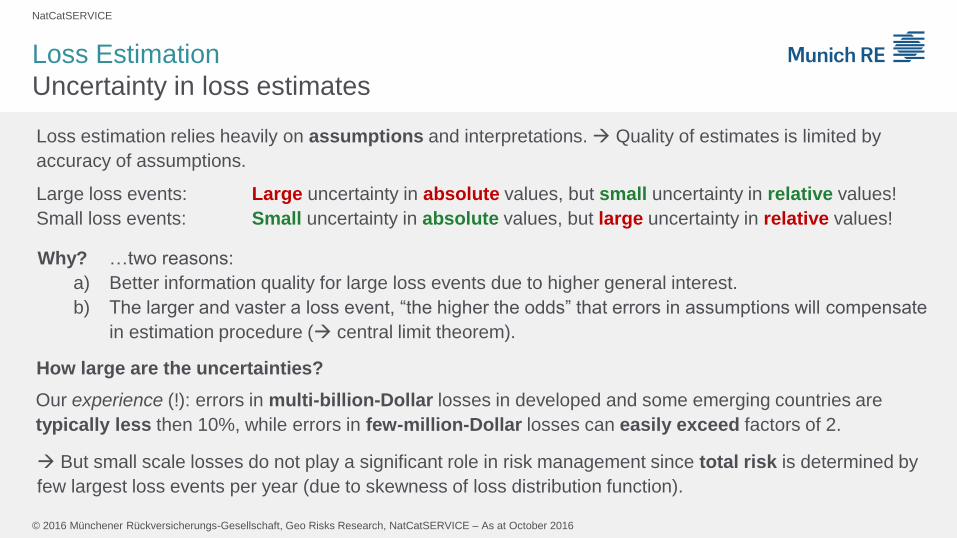
Uncertainty in loss estimates
Loss estimation relies heavily on assumptions and interpretations. Quality of estimates is limited by
accuracy of assumptions.
Large loss events: Large uncertainty in absolute values, but small uncertainty in relative values!
Small loss events: Small uncertainty in absolute values, but large uncertainty in relative values!
Why? …two reasons:
a) Better information quality for large loss events due to higher general interest.
b) The larger and vaster a loss event, “the higher the odds” that errors in assumptions will compensate
in estimation procedure ( central limit theorem).
How large are the uncertainties?
But small scale losses do not play a significant role in risk management since total risk is determined by
few largest loss events per year (due to skewness of loss distribution function).
Our experience (!): errors in multi-billion-Dollar losses in developed and some emerging countries are
typically less then 10%, while errors in few-million-Dollar losses can easily exceed factors of 2.
NatCatSERVICE
© 2016 Münchener Rückversicherungs-Gesellschaft, Geo Risks Research, NatCatSERVICE – As at October 2016
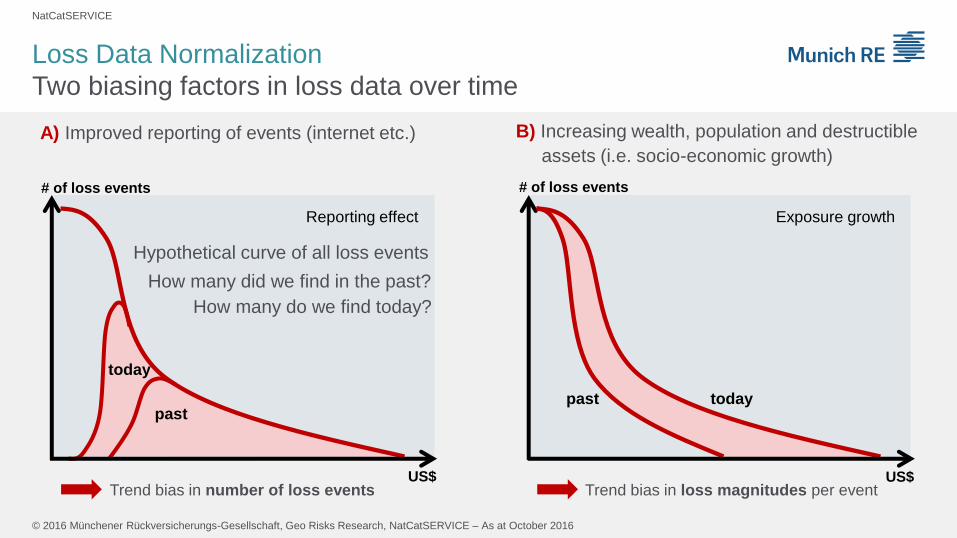
Loss Data Normalization
Two biasing factors in loss data over time
Reporting effect
US$
# of loss events
Trend bias in number of loss events
today
past
Exposure growth
US$
# of loss events
past today
Trend bias in loss magnitudes per event
A) Improved reporting of events (internet etc.) B) Increasing wealth, population and destructible
assets (i.e. socio-economic growth)
Hypothetical curve of all loss events
How many did we find in the past?
How many do we find today?
NatCatSERVICE
© 2016 Münchener Rückversicherungs-Gesellschaft, Geo Risks Research, NatCatSERVICE – As at October 2016
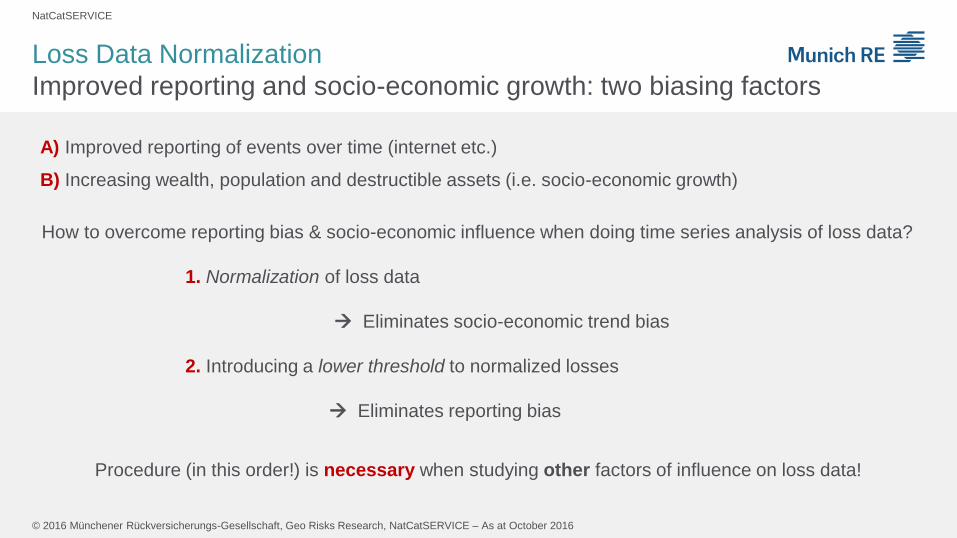
Loss Data Normalization
Improved reporting and socio-economic growth: two biasing factors
How to overcome reporting bias & socio-economic influence when doing time series analysis of loss data?
1. Normalization of loss data
Eliminates socio-economic trend bias
2. Introducing a lower threshold to normalized losses
Eliminates reporting bias
Procedure (in this order!) is necessary when studying other factors of influence on loss data!
A) Improved reporting of events over time (internet etc.)
B) Increasing wealth, population and destructible assets (i.e. socio-economic growth)
NatCatSERVICE
© 2016 Münchener Rückversicherungs-Gesellschaft, Geo Risks Research, NatCatSERVICE – As at October 2016
Loss Data Normalization
NatCatSERVICE
© 2016 Münchener Rückversicherungs-Gesellschaft, Geo Risks Research, NatCatSERVICE – As at October 2016
Loss Data Normalization
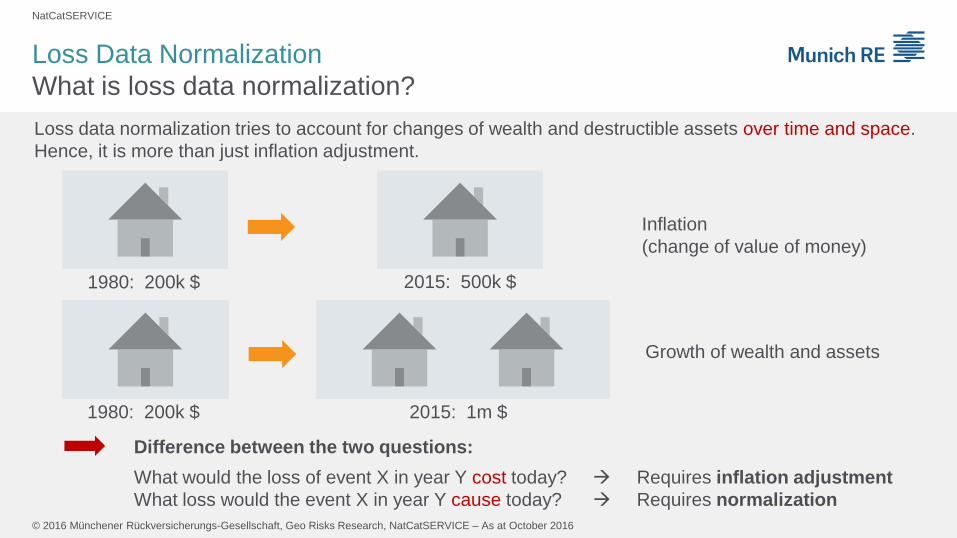
What is loss data normalization?
Loss data normalization tries to account for changes of wealth and destructible assets over time and space.
Hence, it is more than just inflation adjustment.
1980: 200k $ 2015: 500k $
Inflation
(change of value of money)
2015: 1m $ 1980: 200k $
Growth of wealth and assets
Difference between the two questions:
What would the loss of event X in year Y cost today? Requires inflation adjustment
What loss would the event X in year Y cause today? Requires normalization
NatCatSERVICE
© 2016 Münchener Rückversicherungs-Gesellschaft, Geo Risks Research, NatCatSERVICE – As at October 2016
Loss Data Normalization
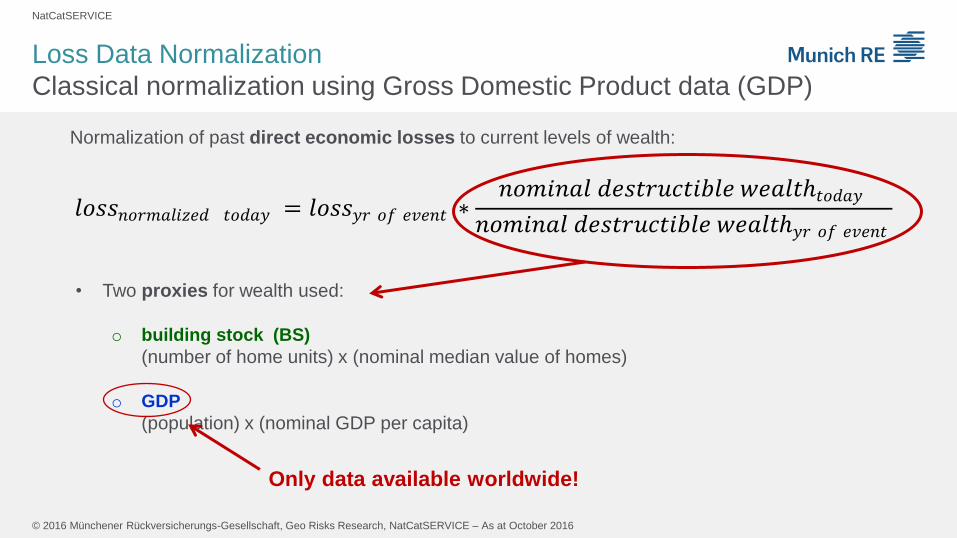
Classical normalization using Gross Domestic Product data (GDP)
• Two proxies for wealth used:
o building stock (BS)
(number of home units) x (nominal median value of homes)
o GDP
(population) x (nominal GDP per capita)
Normalization of past direct economic losses to current levels of wealth:
𝑙𝑜𝑠𝑠𝑛𝑜𝑟𝑚𝑎𝑙𝑖𝑧𝑒𝑑 𝑡𝑜𝑑𝑎𝑦 = 𝑙𝑜𝑠𝑠𝑦𝑟 𝑜𝑓 𝑒𝑣𝑒𝑛𝑡 ∗𝑛𝑜𝑚𝑖𝑛𝑎𝑙 𝑑𝑒𝑠𝑡𝑟𝑢𝑐𝑡𝑖𝑏𝑙𝑒 𝑤𝑒𝑎𝑙𝑡ℎ𝑡𝑜𝑑𝑎𝑦
𝑛𝑜𝑚𝑖𝑛𝑎𝑙 𝑑𝑒𝑠𝑡𝑟𝑢𝑐𝑡𝑖𝑏𝑙𝑒 𝑤𝑒𝑎𝑙𝑡ℎ𝑦𝑟 𝑜𝑓 𝑒𝑣𝑒𝑛𝑡 1
Only data available worldwide!
NatCatSERVICE
© 2016 Münchener Rückversicherungs-Gesellschaft, Geo Risks Research, NatCatSERVICE – As at October 2016
Loss Data Normalization
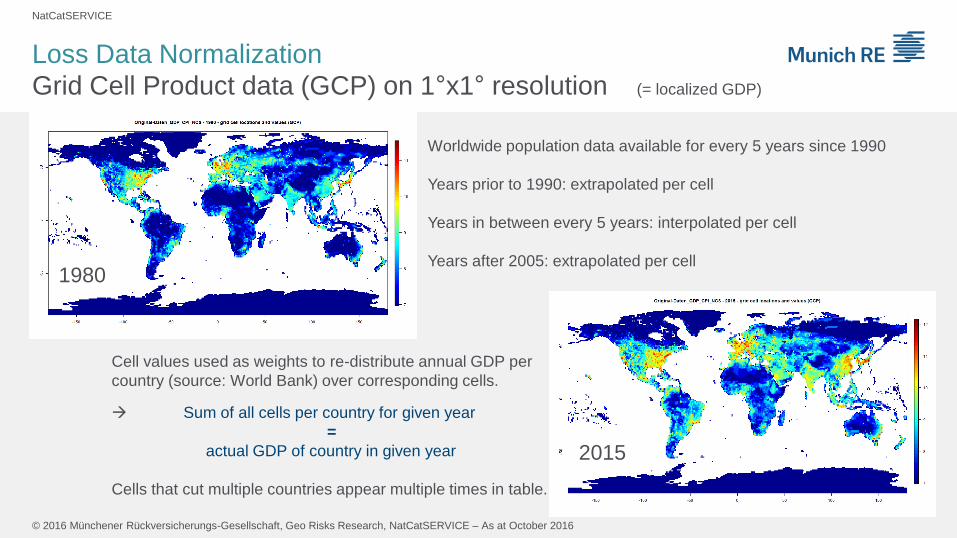
Grid Cell Product data (GCP) on 1°x1° resolution (= localized GDP)
1980
2015
Worldwide population data available for every 5 years since 1990
Years prior to 1990: extrapolated per cell
Years in between every 5 years: interpolated per cell
Years after 2005: extrapolated per cell
Cell values used as weights to re-distribute annual GDP per
country (source: World Bank) over corresponding cells.
Sum of all cells per country for given year
=
actual GDP of country in given year
Cells that cut multiple countries appear multiple times in table.
NatCatSERVICE
© 2016 Münchener Rückversicherungs-Gesellschaft, Geo Risks Research, NatCatSERVICE – As at October 2016
Loss Data Normalization
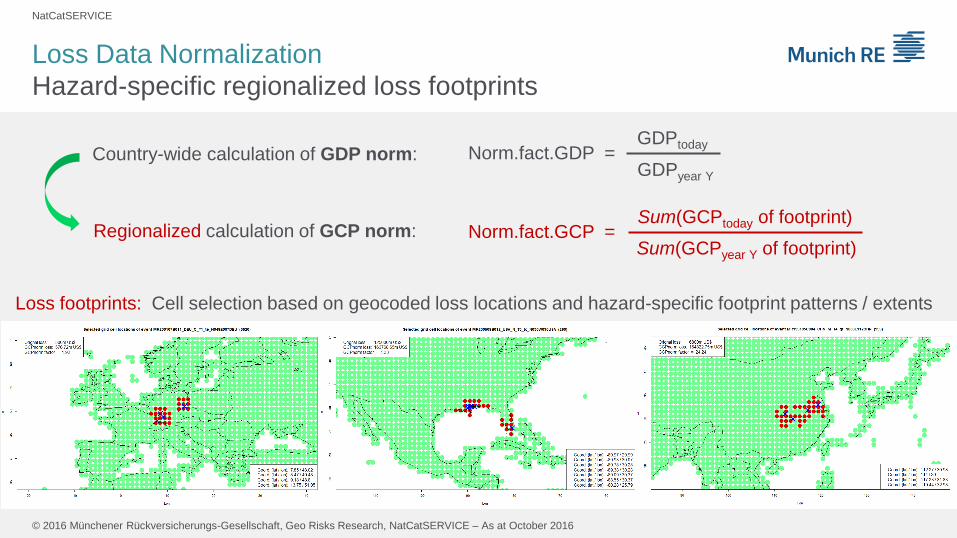
Hazard-specific regionalized loss footprints
Loss footprints: Cell selection based on geocoded loss locations and hazard-specific footprint patterns / extents
Norm.fact.GDP = GDPtoday
GDPyear Y
Country-wide calculation of GDP norm:
Norm.fact.GCP = Sum(GCPtoday of footprint)
Sum(GCPyear Y of footprint) Regionalized calculation of GCP norm:
NatCatSERVICE
© 2016 Münchener Rückversicherungs-Gesellschaft, Geo Risks Research, NatCatSERVICE – As at October 2016
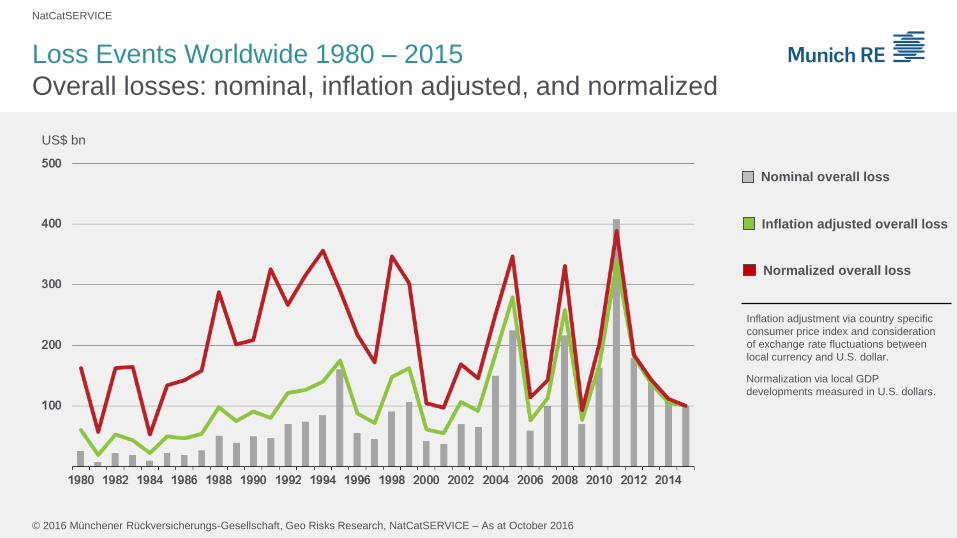
Loss Events Worldwide 1980 – 2015
Overall losses: nominal, inflation adjusted, and normalized
Nominal overall loss
Inflation adjusted overall loss
Normalized overall loss
Inflation adjustment via country specific
consumer price index and consideration
of exchange rate fluctuations between
local currency and U.S. dollar.
Normalization via local GDP
developments measured in U.S. dollars.
US$ bn
NatCatSERVICE
© 2016 Münchener Rückversicherungs-Gesellschaft, Geo Risks Research, NatCatSERVICE – As at October 2016
Classification of Loss Events
NatCatSERVICE
© 2016 Münchener Rückversicherungs-Gesellschaft, Geo Risks Research, NatCatSERVICE – As at October 2016
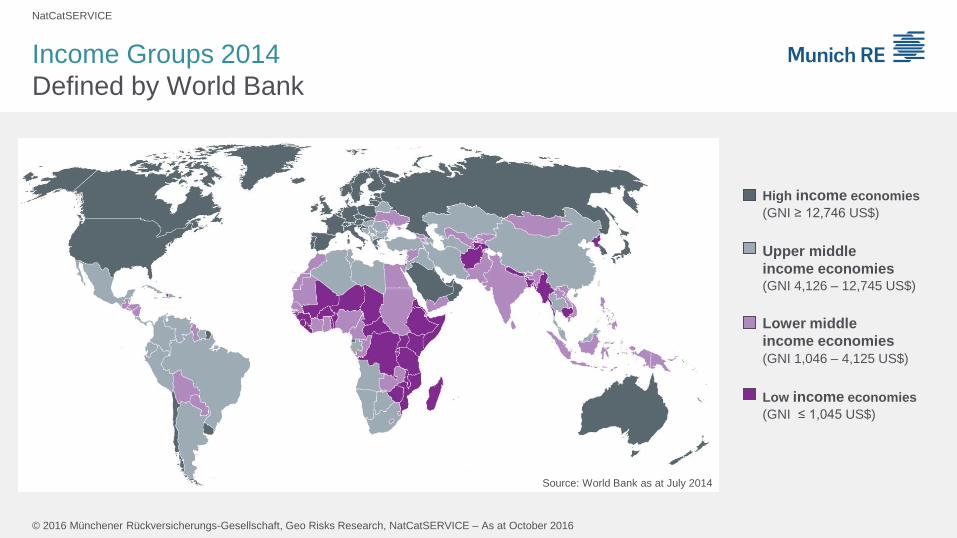
Income Groups 2014
Defined by World Bank
High income economies
Upper middle
income economies
Lower middle
income economies
Low income economies
(GNI ≥ 12,746 US$)
(GNI 4,126 – 12,745 US$)
(GNI 1,046 – 4,125 US$)
(GNI ≤ 1,045 US$)
Source: World Bank as at July 2014
NatCatSERVICE
© 2016 Münchener Rückversicherungs-Gesellschaft, Geo Risks Research, NatCatSERVICE – As at October 2016
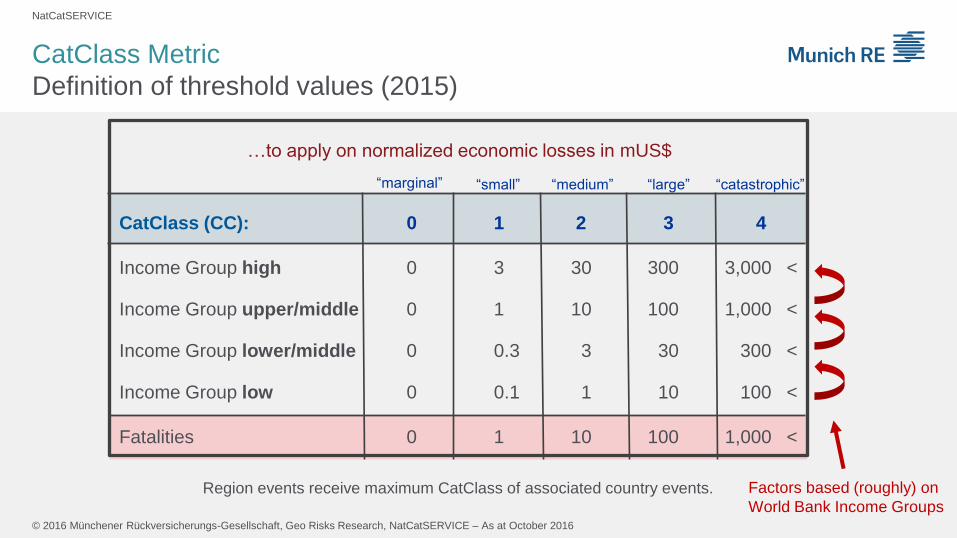
CatClass Metric
Definition of threshold values (2015)
Region events receive maximum CatClass of associated country events.
CatClass (CC): 0 1 2 3 4
Income Group high 0 3 30 300 3,000 <
Income Group upper/middle 0 1 10 100 1,000 <
Income Group lower/middle 0 0.3 3 30 300 <
Income Group low 0 0.1 1 10 100 <
Fatalities 0 1 10 100 1,000 <
Factors based (roughly) on
World Bank Income Groups
…to apply on normalized economic losses in mUS$
“marginal” “small” “medium” “large” “catastrophic”
NatCatSERVICE
© 2016 Münchener Rückversicherungs-Gesellschaft, Geo Risks Research, NatCatSERVICE – As at October 2016
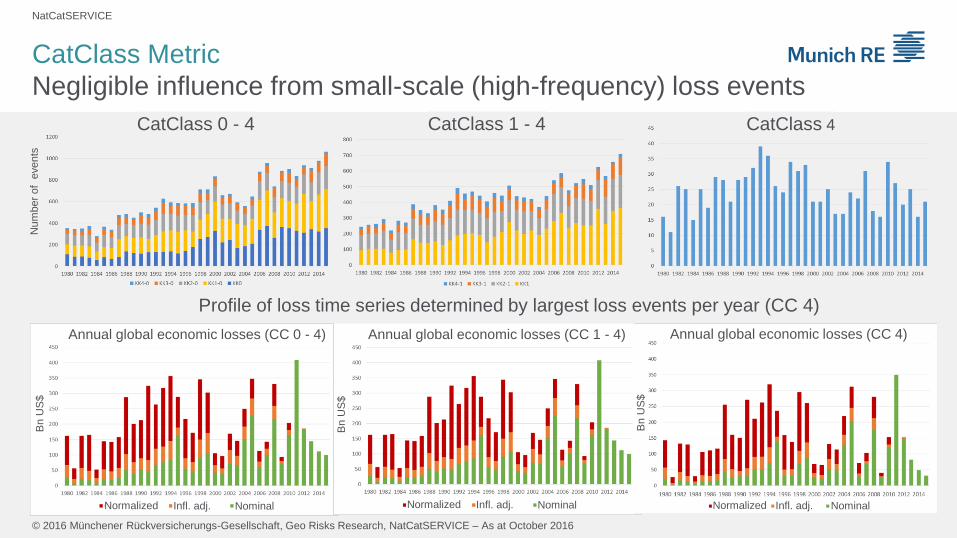
CatClass Metric
Negligible influence from small-scale (high-frequency) loss events
CatClass 0 - 4 CatClass 1 - 4 CatClass 4
Annual global economic losses (CC 0 - 4)
Bn U
S$
Normalized Infl. adj. Nominal
Annual global economic losses (CC 1 - 4) B
n U
S$
Normalized Infl. adj. Nominal
Profile of loss time series determined by largest loss events per year (CC 4)
Annual global economic losses (CC 4)
Normalized Infl. adj. Nominal
Bn U
S$
Num
ber
of
events
NatCatSERVICE
© 2016 Münchener Rückversicherungs-Gesellschaft, Geo Risks Research, NatCatSERVICE – As at October 2016
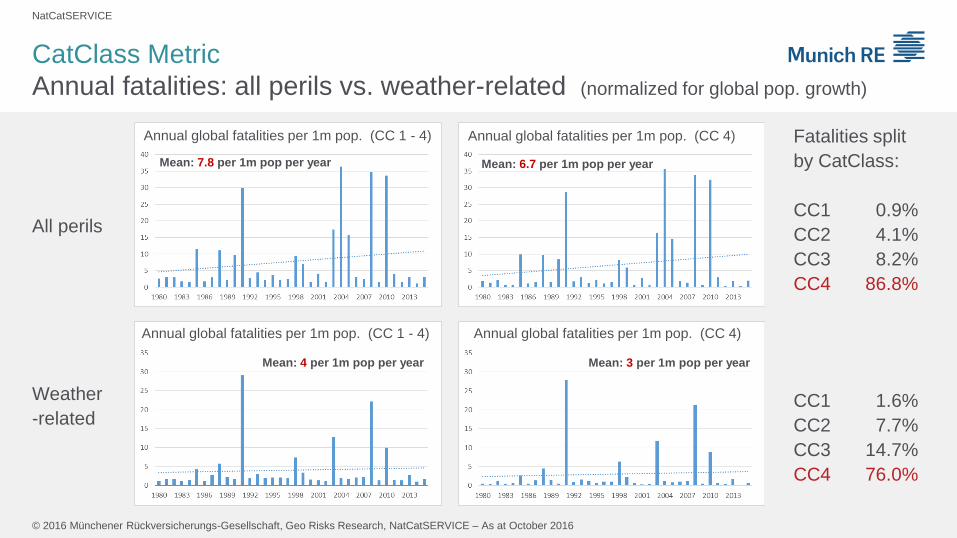
CatClass Metric
Annual fatalities: all perils vs. weather-related (normalized for global pop. growth)
Fatalities split
by CatClass:
CC1 0.9%
CC2 4.1%
CC3 8.2%
CC4 86.8%
Annual global fatalities per 1m pop. (CC 1 - 4)
Mean: 7.8 per 1m pop per year
Annual global fatalities per 1m pop. (CC 4)
Mean: 6.7 per 1m pop per year
All perils
Annual global fatalities per 1m pop. (CC 1 - 4) Annual global fatalities per 1m pop. (CC 4)
Mean: 4 per 1m pop per year Mean: 3 per 1m pop per year
Weather
-related CC1 1.6%
CC2 7.7%
CC3 14.7%
CC4 76.0%
NatCatSERVICE
© 2016 Münchener Rückversicherungs-Gesellschaft, Geo Risks Research, NatCatSERVICE – As at October 2016
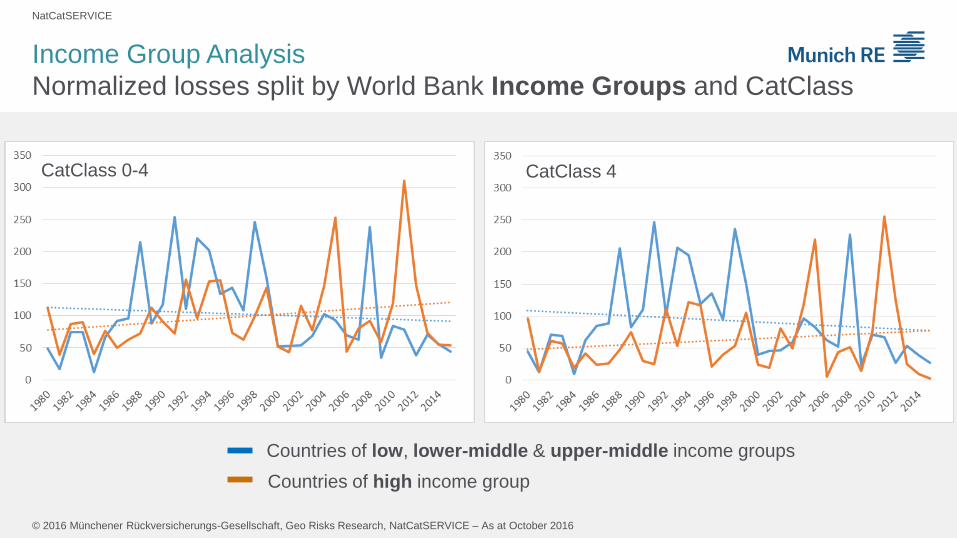
Income Group Analysis
Normalized losses split by World Bank Income Groups and CatClass
Countries of low, lower-middle & upper-middle income groups
Countries of high income group
CatClass 0-4 CatClass 4

NatCatSERVICE
© 2016 Münchener Rückversicherungs-Gesellschaft, Geo Risks Research, NatCatSERVICE – As at October 2016
Thank You!
NatCatSERVICE
© 2016 Münchener Rückversicherungs-Gesellschaft, Geo Risks Research, NatCatSERVICE – As at October 2016
Example: correlation with meteorological indices
Loss Data Analytics
NatCatSERVICE
© 2016 Münchener Rückversicherungs-Gesellschaft, Geo Risks Research, NatCatSERVICE – As at October 2016
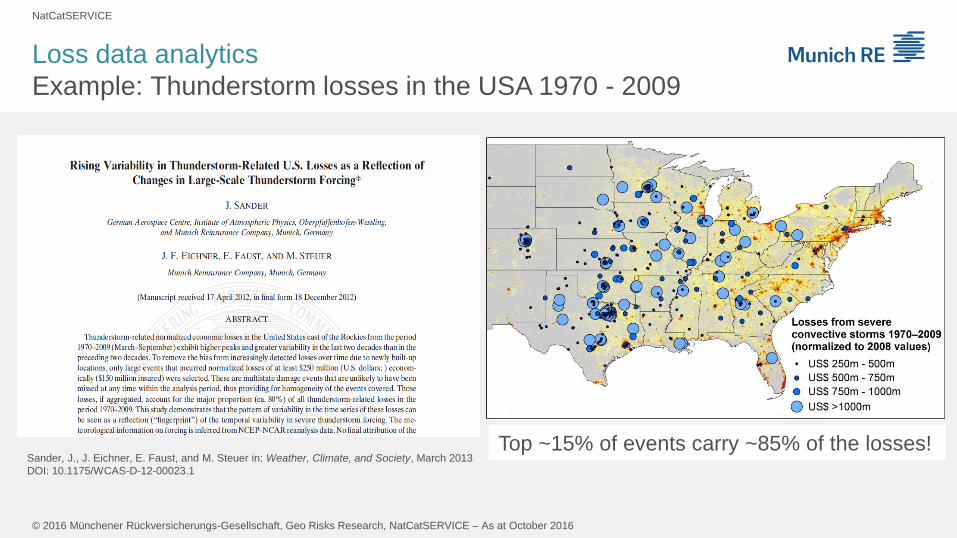
Sander, J., J. Eichner, E. Faust, and M. Steuer in: Weather, Climate, and Society, March 2013
DOI: 10.1175/WCAS-D-12-00023.1
Top ~15% of events carry ~85% of the losses!
Loss data analytics
Example: Thunderstorm losses in the USA 1970 - 2009
NatCatSERVICE
© 2016 Münchener Rückversicherungs-Gesellschaft, Geo Risks Research, NatCatSERVICE – As at October 2016
© M
unic
h R
e, 2
012
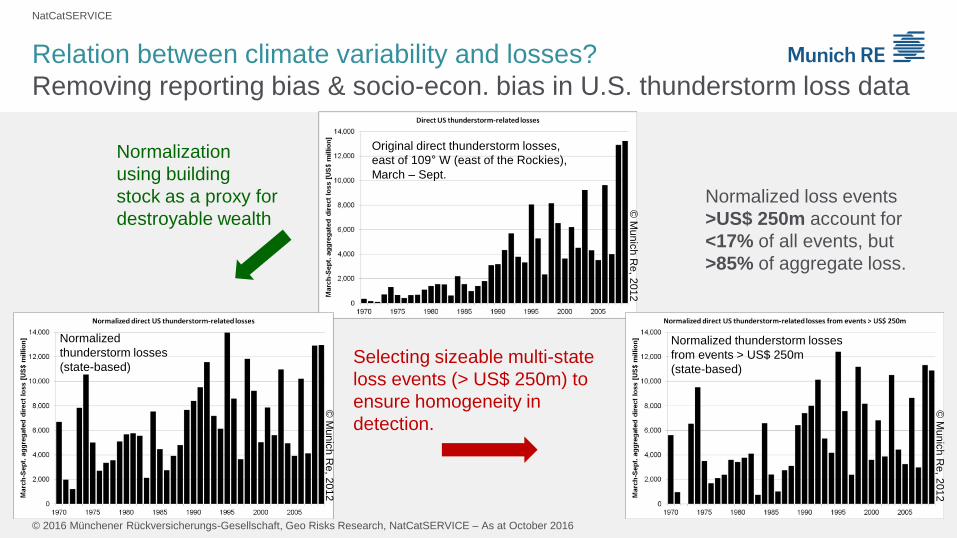
Original direct thunderstorm losses,
east of 109° W (east of the Rockies),
March – Sept.
© M
unic
h R
e, 2
012
Normalized
thunderstorm losses
(state-based)
© M
unic
h R
e, 2
012
Normalized thunderstorm losses
from events > US$ 250m
(state-based) Selecting sizeable multi-state
loss events (> US$ 250m) to
ensure homogeneity in
detection.
Normalization
using building
stock as a proxy for
destroyable wealth
Normalized loss events
>US$ 250m account for
<17% of all events, but
>85% of aggregate loss.
Relation between climate variability and losses?
Removing reporting bias & socio-econ. bias in U.S. thunderstorm loss data

NatCatSERVICE
© 2016 Münchener Rückversicherungs-Gesellschaft, Geo Risks Research, NatCatSERVICE – As at October 2016
Relation between climate variability and losses?
NCEP/NCAR reanalysis data
NCEP/NCAR reanalysis data: symbiosis of climate model and measurements
• Worldwide grid with 1.875° x 1.915° spatial and
6h temporal resolution
• Selected data: 1970 – 2009, March – September
Chosen grid points for analysis:
NatCatSERVICE
© 2016 Münchener Rückversicherungs-Gesellschaft, Geo Risks Research, NatCatSERVICE – As at October 2016
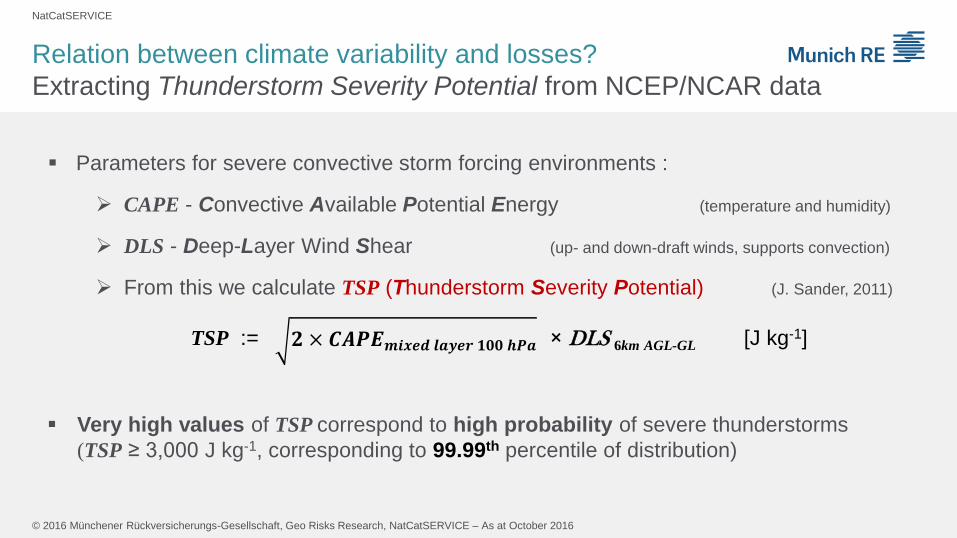
𝟐 × 𝑪𝑨𝑷𝑬𝒎𝒊𝒙𝒆𝒅 𝒍𝒂𝒚𝒆𝒓 𝟏𝟎𝟎 𝒉𝑷𝒂 1
Parameters for severe convective storm forcing environments :
CAPE - Convective Available Potential Energy (temperature and humidity)
DLS - Deep-Layer Wind Shear (up- and down-draft winds, supports convection)
From this we calculate TSP (Thunderstorm Severity Potential) (J. Sander, 2011)
TSP := × DLS 6km AGL-GL [J kg-1]
Very high values of TSP correspond to high probability of severe thunderstorms
(TSP ≥ 3,000 J kg-1, corresponding to 99.99th percentile of distribution)
Relation between climate variability and losses?
Extracting Thunderstorm Severity Potential from NCEP/NCAR data
NatCatSERVICE
© 2016 Münchener Rückversicherungs-Gesellschaft, Geo Risks Research, NatCatSERVICE – As at October 2016
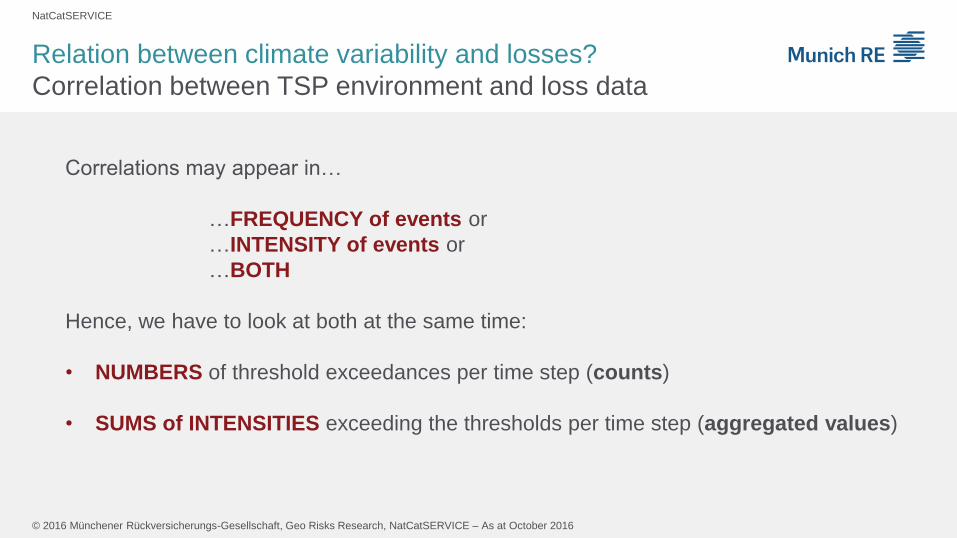
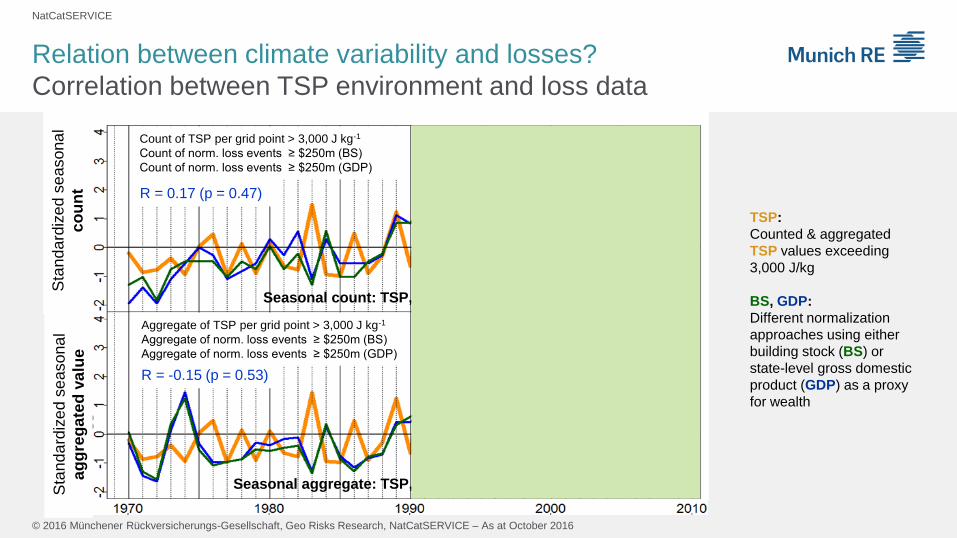
Correlations may appear in…
…FREQUENCY of events or
…INTENSITY of events or
…BOTH
Hence, we have to look at both at the same time:
• NUMBERS of threshold exceedances per time step (counts)
• SUMS of INTENSITIES exceeding the thresholds per time step (aggregated values)
Relation between climate variability and losses?
Correlation between TSP environment and loss data
NatCatSERVICE
© 2016 Münchener Rückversicherungs-Gesellschaft, Geo Risks Research, NatCatSERVICE – As at October 2016
Sta
nd
ard
ize
d s
easona
l
co
un
t
Sta
nd
ard
ize
d s
easona
l
ag
gre
gate
d v
alu
e
Seasonal count: TSP, norm. economic losses
Seasonal aggregate: TSP, norm. economic losses
Count of TSP per grid point > 3,000 J kg-1
Count of norm. loss events ≥ $250m (BS)
Count of norm. loss events ≥ $250m (GDP)
Aggregate of TSP per grid point > 3,000 J kg-1
Aggregate of norm. loss events ≥ $250m (BS)
Aggregate of norm. loss events ≥ $250m (GDP)
TSP:
Counted & aggregated
TSP values exceeding
3,000 J/kg
BS, GDP:
Different normalization
approaches using either
building stock (BS) or
state-level gross domestic
product (GDP) as a proxy
for wealth
Relation between climate variability and losses?
Correlation between TSP environment and loss data
R = 0.43 (p = 0.058)
R = 0.64 (p = 0.002)
R = 0.17 (p = 0.47)
R = -0.15 (p = 0.53)
NatCatSERVICE
© 2016 Münchener Rückversicherungs-Gesellschaft, Geo Risks Research, NatCatSERVICE – As at October 2016
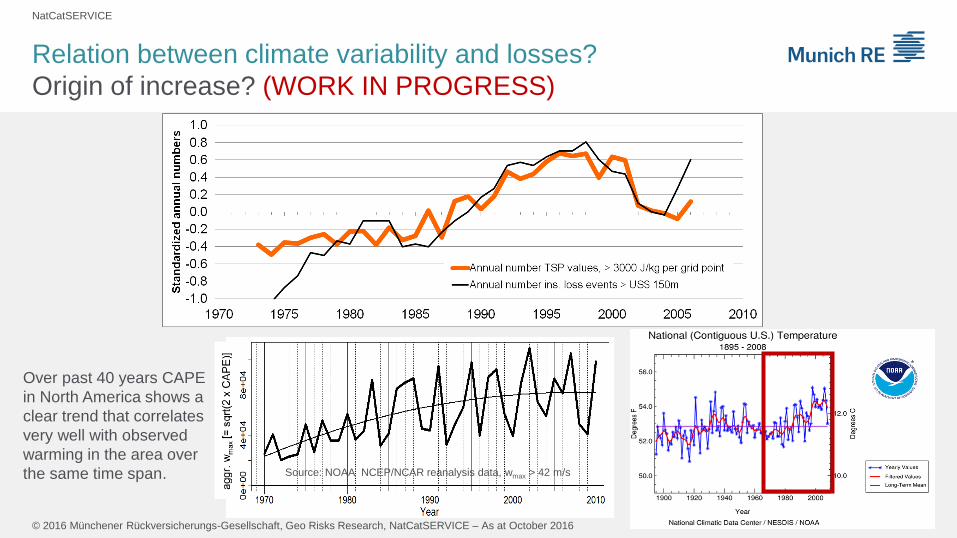
Over past 40 years CAPE
in North America shows a
clear trend that correlates
very well with observed
warming in the area over
the same time span. Source: NOAA NCEP/NCAR reanalysis data, wmax > 42 m/s
Relation between climate variability and losses?
Origin of increase? (WORK IN PROGRESS)
NatCatSERVICE
© 2016 Münchener Rückversicherungs-Gesellschaft, Geo Risks Research, NatCatSERVICE – As at October 2016
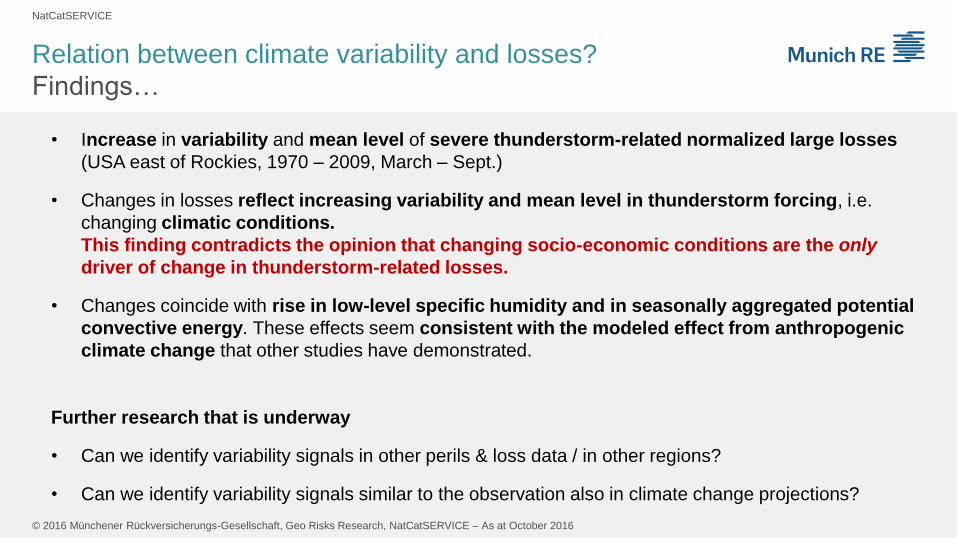
• Increase in variability and mean level of severe thunderstorm-related normalized large losses
(USA east of Rockies, 1970 – 2009, March – Sept.)
• Changes in losses reflect increasing variability and mean level in thunderstorm forcing, i.e.
changing climatic conditions.
This finding contradicts the opinion that changing socio-economic conditions are the only
driver of change in thunderstorm-related losses.
• Changes coincide with rise in low-level specific humidity and in seasonally aggregated potential
convective energy. These effects seem consistent with the modeled effect from anthropogenic
climate change that other studies have demonstrated.
Further research that is underway
• Can we identify variability signals in other perils & loss data / in other regions?
• Can we identify variability signals similar to the observation also in climate change projections?
Relation between climate variability and losses?
Findings…

NatCatSERVICE
© 2016 Münchener Rückversicherungs-Gesellschaft, Geo Risks Research, NatCatSERVICE – As at October 2016

NatCatSERVICE
© 2016 Münchener Rückversicherungs-Gesellschaft, Geo Risks Research, NatCatSERVICE – As at October 2016
Back-up slides
NatCatSERVICE
© 2016 Münchener Rückversicherungs-Gesellschaft, Geo Risks Research, NatCatSERVICE – As at October 2016
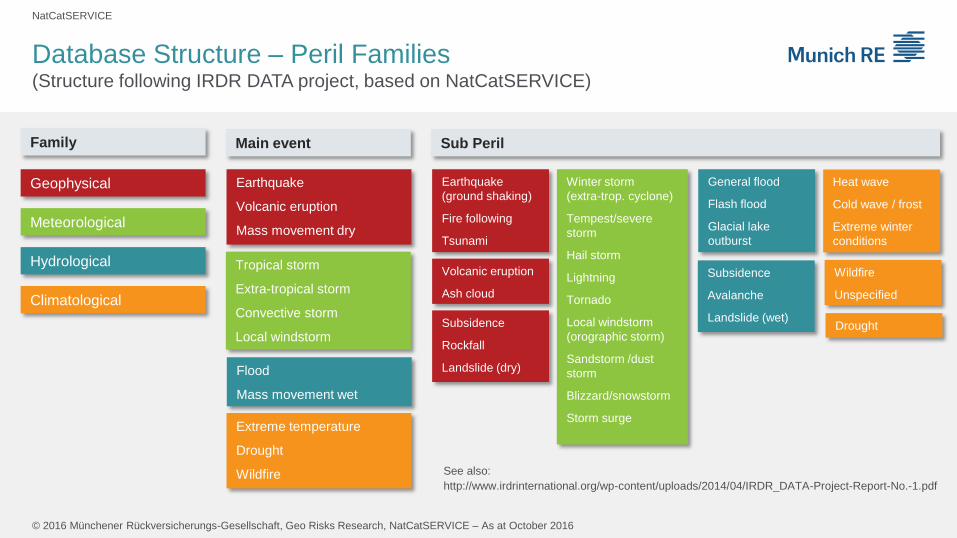
Database Structure – Peril Families (Structure following IRDR DATA project, based on NatCatSERVICE)
Geophysical
Meteorological
Hydrological
Climatological
Family Main event
Earthquake
Volcanic eruption
Mass movement dry
Tropical storm
Extra-tropical storm
Convective storm
Local windstorm
Flood
Mass movement wet
Extreme temperature
Drought
Wildfire
Sub Peril
Earthquake
(ground shaking)
Fire following
Tsunami
Volcanic eruption
Ash cloud
Subsidence
Rockfall
Landslide (dry)
Winter storm
(extra-trop. cyclone)
Tempest/severe
storm
Hail storm
Lightning
Tornado
Local windstorm
(orographic storm)
Sandstorm /dust
storm
Blizzard/snowstorm
Storm surge
General flood
Flash flood
Glacial lake
outburst
Subsidence
Avalanche
Landslide (wet)
Heat wave
Cold wave / frost
Extreme winter
conditions
Drought
Wildfire
Unspecified
See also:
http://www.irdrinternational.org/wp-content/uploads/2014/04/IRDR_DATA-Project-Report-No.-1.pdf
NatCatSERVICE
© 2016 Münchener Rückversicherungs-Gesellschaft, Geo Risks Research, NatCatSERVICE – As at October 2016
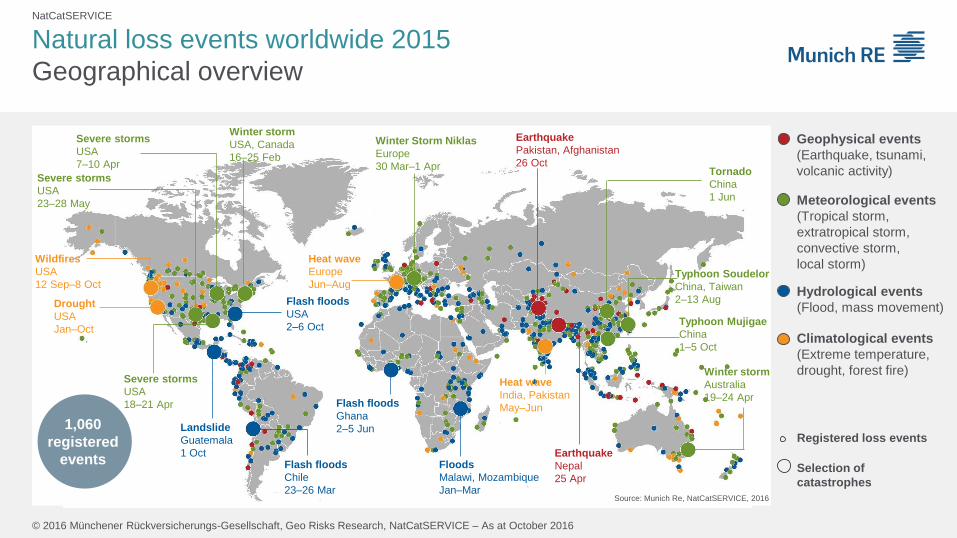
Natural loss events worldwide 2015
Geographical overview
1,060
registered
events
Source: Munich Re, NatCatSERVICE, 2016
Drought
USA
Jan–Oct
Earthquake
Nepal
25 Apr
Winter Storm Niklas
Europe
30 Mar–1 Apr
Severe storms
USA
7–10 Apr
Typhoon Mujigae
China
1–5 Oct
Severe storms
USA
23–28 May
Earthquake
Pakistan, Afghanistan
26 Oct
Heat wave
India, Pakistan
May–Jun
Tornado
China
1 Jun
Winter storm
Australia
19–24 Apr
Flash floods
Chile
23–26 Mar
Flash floods
Ghana
2–5 Jun
Floods
Malawi, Mozambique
Jan–Mar
Landslide
Guatemala
1 Oct
Flash floods
USA
2–6 Oct
Winter storm
USA, Canada
16–25 Feb
Severe storms
USA
18–21 Apr
Wildfires
USA
12 Sep–8 Oct
Heat wave
Europe
Jun–Aug Typhoon Soudelor
China, Taiwan
2–13 Aug
Meteorological events
(Tropical storm,
extratropical storm,
convective storm,
local storm)
Hydrological events
(Flood, mass movement)
Climatological events
(Extreme temperature,
drought, forest fire)
Geophysical events
(Earthquake, tsunami,
volcanic activity)
Selection of
catastrophes
Registered loss events
NatCatSERVICE
© 2016 Münchener Rückversicherungs-Gesellschaft, Geo Risks Research, NatCatSERVICE – As at October 2016
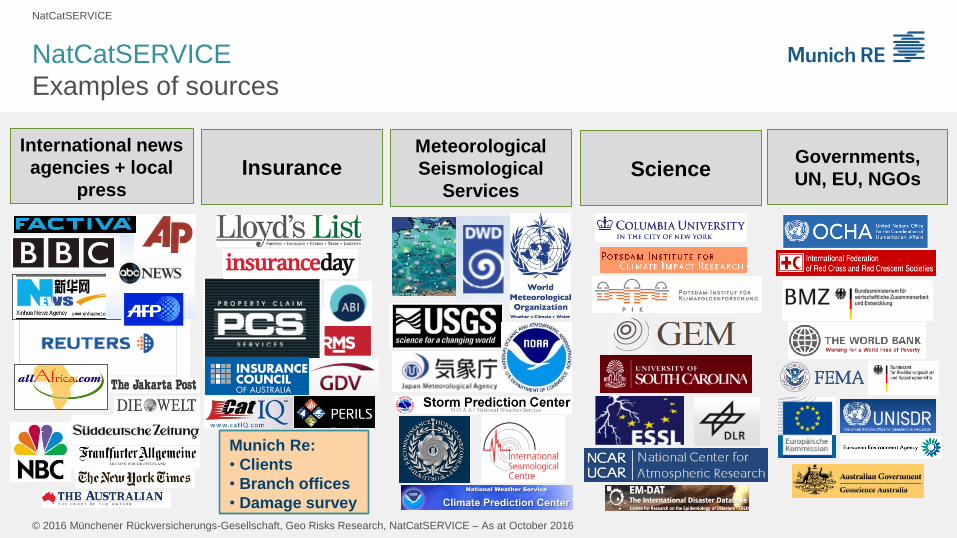
NatCatSERVICE
Examples of sources
Science Governments,
UN, EU, NGOs
International news
agencies + local
press
Meteorological
Seismological
Services
Insurance
Munich Re:
• Clients
• Branch offices
• Damage survey
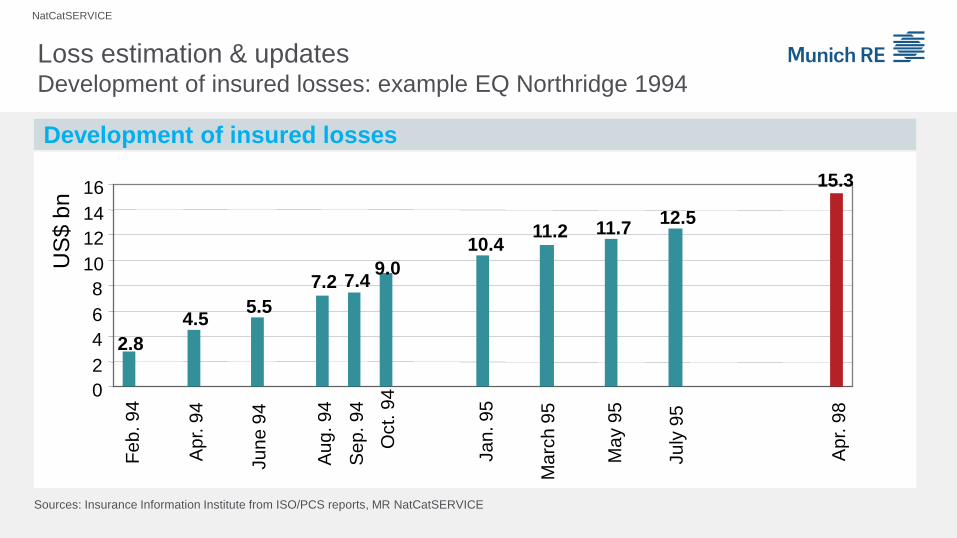
NatCatSERVICE
Loss estimation & updates Development of insured losses: example EQ Northridge 1994
Development of insured losses
Sources: Insurance Information Institute from ISO/PCS reports, MR NatCatSERVICE
2.8
7.2 7.4 9.0
11.2
15.3
4.5 5.5
10.4 11.7
12.5
0
2
4
6
8
10
12
14
16
Fe
b. 9
4
Ap
r. 9
4
Ju
ne
94
Au
g. 9
4
Se
p. 9
4
Oct.
94
Ja
n. 9
5
Ma
rch
95
May 9
5
Ju
ly 9
5
Ap
r. 9
8
US
$ b
n
NatCatSERVICE
© 2016 Münchener Rückversicherungs-Gesellschaft, Geo Risks Research, NatCatSERVICE – As at October 2016
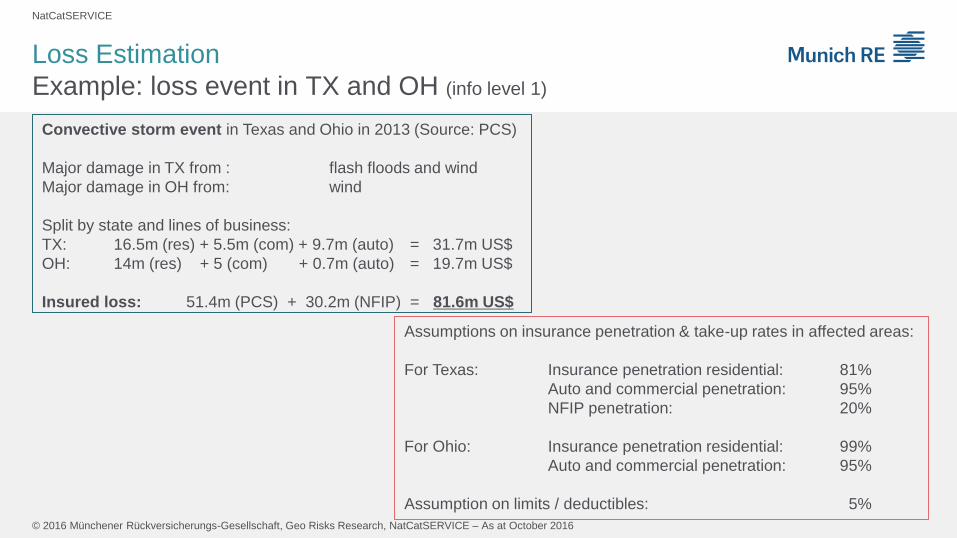
Convective storm event in Texas and Ohio in 2013 (Source: PCS)
Major damage in TX from : flash floods and wind
Major damage in OH from: wind
Split by state and lines of business:
TX: 16.5m (res) + 5.5m (com) + 9.7m (auto) = 31.7m US$
OH: 14m (res) + 5 (com) + 0.7m (auto) = 19.7m US$
Insured loss: 51.4m (PCS) + 30.2m (NFIP) = 81.6m US$
Assumptions on insurance penetration & take-up rates in affected areas:
For Texas: Insurance penetration residential: 81%
Auto and commercial penetration: 95%
NFIP penetration: 20%
For Ohio: Insurance penetration residential: 99%
Auto and commercial penetration: 95%
Assumption on limits / deductibles: 5%
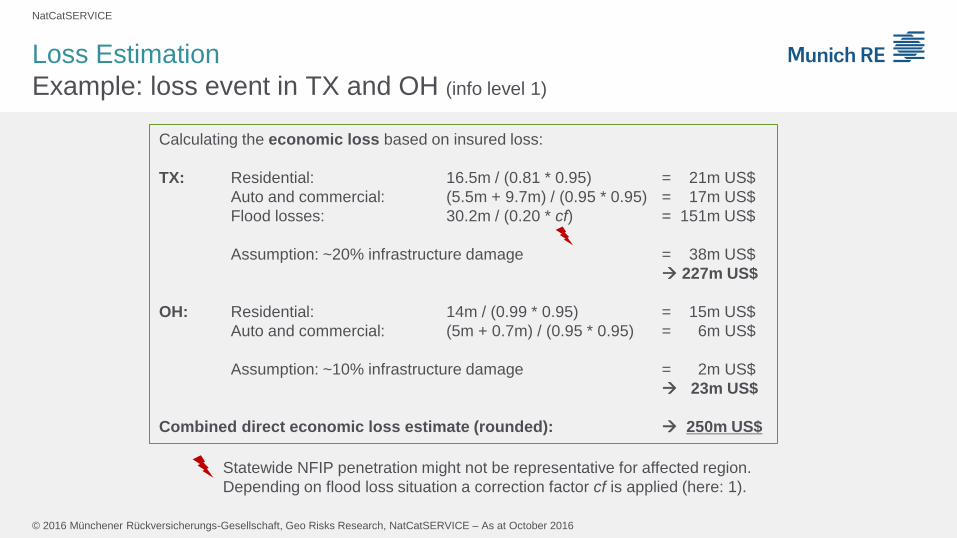
Loss Estimation
Example: loss event in TX and OH (info level 1)
NatCatSERVICE
© 2016 Münchener Rückversicherungs-Gesellschaft, Geo Risks Research, NatCatSERVICE – As at October 2016
Statewide NFIP penetration might not be representative for affected region.
Depending on flood loss situation a correction factor cf is applied (here: 1).
Calculating the economic loss based on insured loss:
TX: Residential: 16.5m / (0.81 * 0.95) = 21m US$
Auto and commercial: (5.5m + 9.7m) / (0.95 * 0.95) = 17m US$
Flood losses: 30.2m / (0.20 * cf) = 151m US$
Assumption: ~20% infrastructure damage = 38m US$
227m US$
OH: Residential: 14m / (0.99 * 0.95) = 15m US$
Auto and commercial: (5m + 0.7m) / (0.95 * 0.95) = 6m US$
Assumption: ~10% infrastructure damage = 2m US$
23m US$
Combined direct economic loss estimate (rounded): 250m US$
Loss Estimation
Example: loss event in TX and OH (info level 1)
NatCatSERVICE
© 2016 Münchener Rückversicherungs-Gesellschaft, Geo Risks Research, NatCatSERVICE – As at October 2016
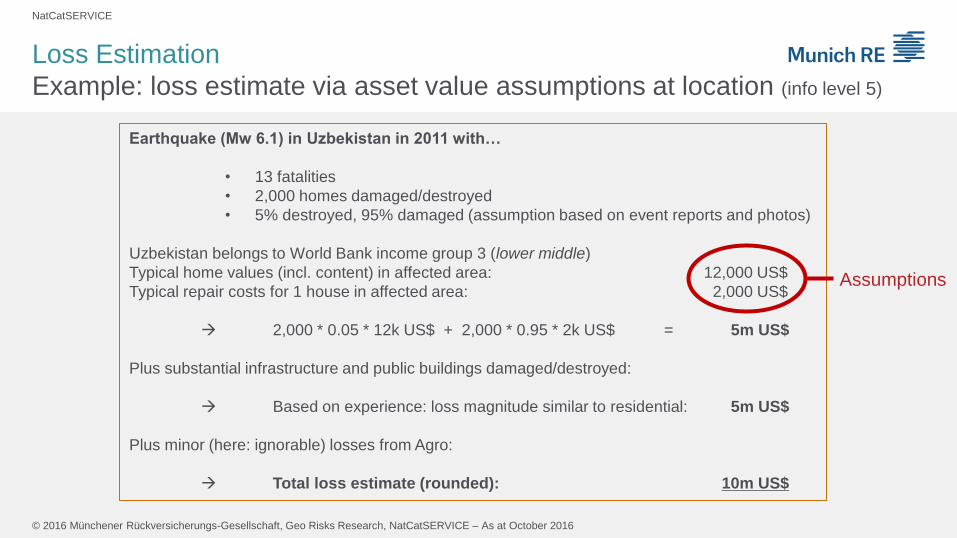
Earthquake (Mw 6.1) in Uzbekistan in 2011 with…
• 13 fatalities
• 2,000 homes damaged/destroyed
• 5% destroyed, 95% damaged (assumption based on event reports and photos)
Uzbekistan belongs to World Bank income group 3 (lower middle)
Typical home values (incl. content) in affected area: 12,000 US$
Typical repair costs for 1 house in affected area: 2,000 US$
2,000 * 0.05 * 12k US$ + 2,000 * 0.95 * 2k US$ = 5m US$
Plus substantial infrastructure and public buildings damaged/destroyed:
Based on experience: loss magnitude similar to residential: 5m US$
Plus minor (here: ignorable) losses from Agro:
Total loss estimate (rounded): 10m US$
Loss Estimation
Example: loss estimate via asset value assumptions at location (info level 5)
Assumptions
NatCatSERVICE
© 2016 Münchener Rückversicherungs-Gesellschaft, Geo Risks Research, NatCatSERVICE – As at October 2016
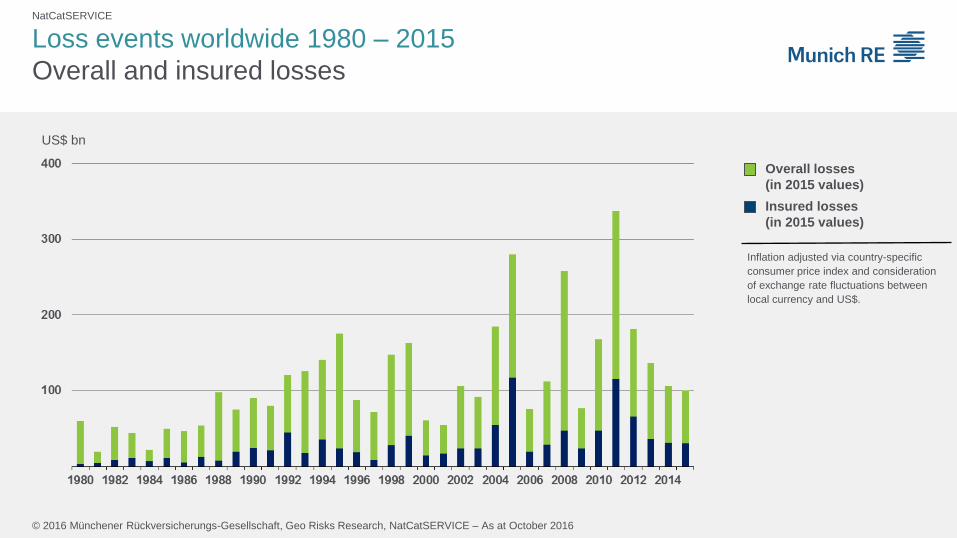
Loss events worldwide 1980 – 2015
Overall and insured losses
US$ bn
Overall losses
(in 2015 values)
Insured losses
(in 2015 values)
Inflation adjusted via country-specific
consumer price index and consideration
of exchange rate fluctuations between
local currency and US$.
NatCatSERVICE
© 2016 Münchener Rückversicherungs-Gesellschaft, Geo Risks Research, NatCatSERVICE – As at October 2016
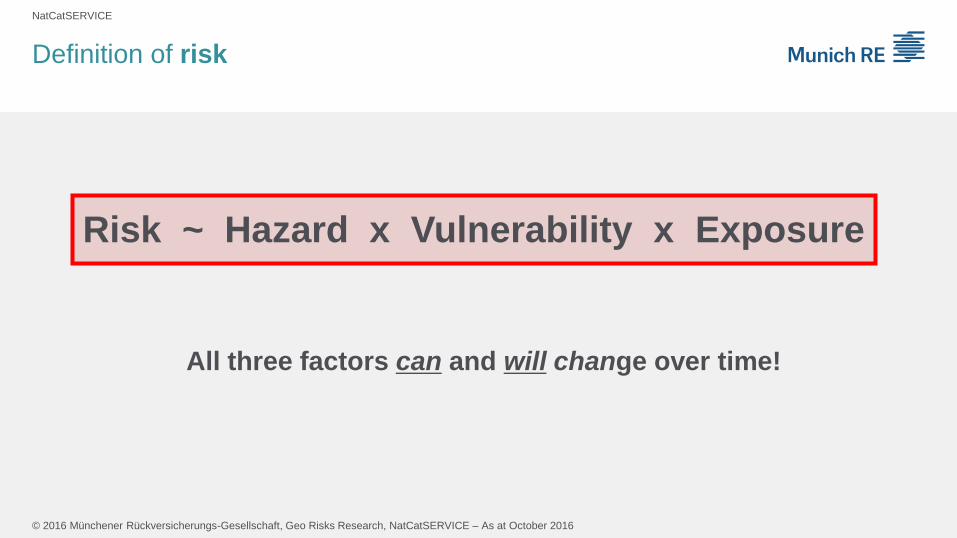
Definition of risk
All three factors can and will change over time!
Risk ~ Hazard x Vulnerability x Exposure
NatCatSERVICE
© 2016 Münchener Rückversicherungs-Gesellschaft, Geo Risks Research, NatCatSERVICE – As at October 2016
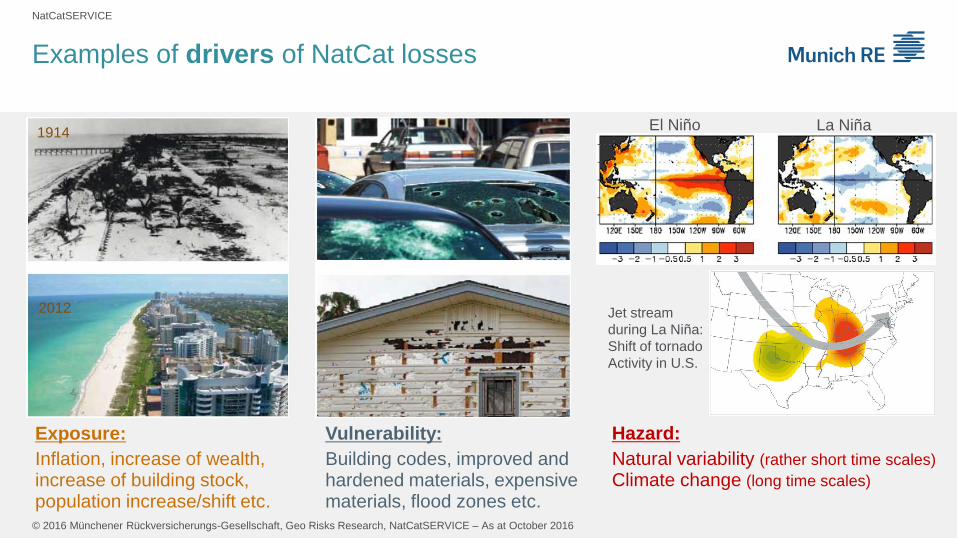
Examples of drivers of NatCat losses
Exposure:
Inflation, increase of wealth, increase of building stock, population increase/shift etc.
1914
2012
Vulnerability:
Building codes, improved and hardened materials, expensive materials, flood zones etc.
Hazard:
Natural variability (rather short time scales)
Climate change (long time scales)
El Niño La Niña
Jet stream
during La Niña:
Shift of tornado
Activity in U.S.
NatCatSERVICE
© 2016 Münchener Rückversicherungs-Gesellschaft, Geo Risks Research, NatCatSERVICE – As at October 2016
NatCatSERVICE
Limitations of GDP norm
“Natural hazards don’t know borders!”
Socio-economic development can be very different within the same country.
Economic disparity may lead to over-/under-normalization of losses because
macro-economic proxy data is not representative for regional / local conditions.
Strongest effects observed in China:
Most of the economic development in China has happened along coast lines and
major cities, and to a much lesser extent inland.
Loss data from many severe river flood events inland in the 1990s would be
normalized with economic proxy rather valid for the coastal areas.
NatCatSERVICE
© 2016 Münchener Rückversicherungs-Gesellschaft, Geo Risks Research, NatCatSERVICE – As at October 2016
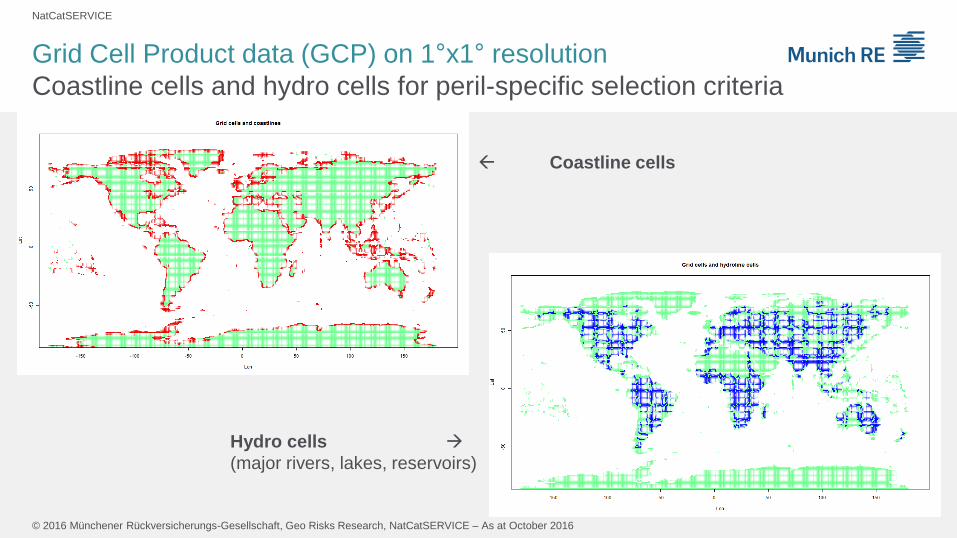
Grid Cell Product data (GCP) on 1°x1° resolution
Coastline cells and hydro cells for peril-specific selection criteria
Coastline cells
Hydro cells
(major rivers, lakes, reservoirs)
NatCatSERVICE
© 2016 Münchener Rückversicherungs-Gesellschaft, Geo Risks Research, NatCatSERVICE – As at October 2016
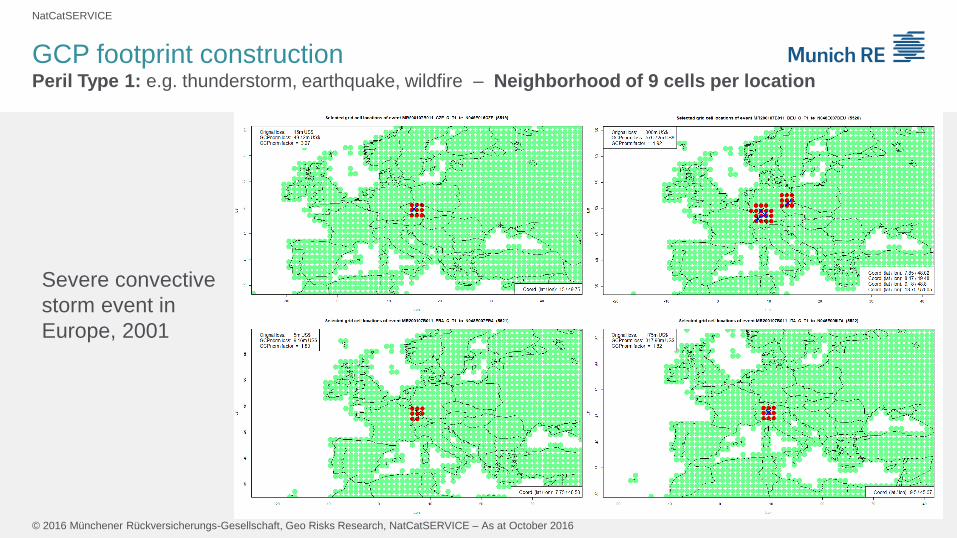
GCP footprint construction Peril Type 1: e.g. thunderstorm, earthquake, wildfire – Neighborhood of 9 cells per location
Severe convective
storm event in
Europe, 2001
NatCatSERVICE
© 2016 Münchener Rückversicherungs-Gesellschaft, Geo Risks Research, NatCatSERVICE – As at October 2016
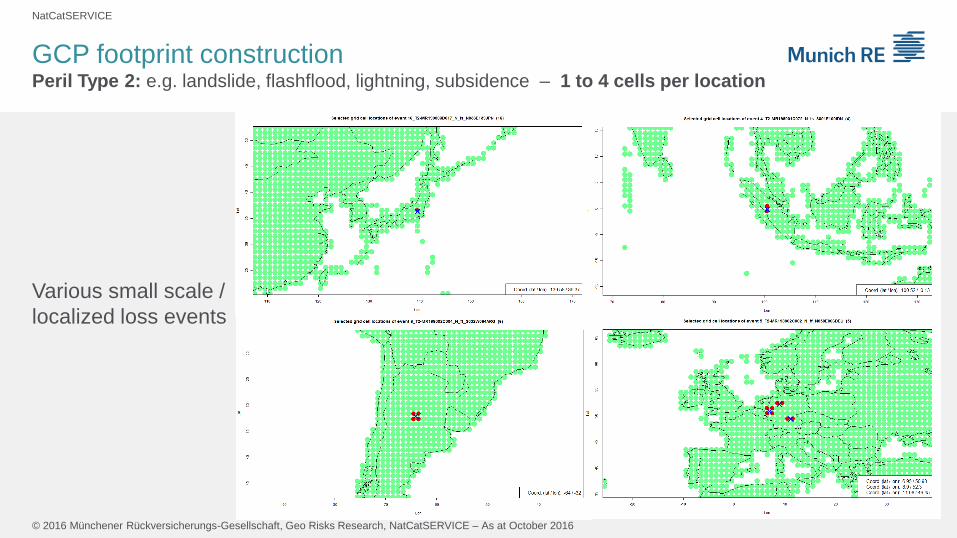
Various small scale /
localized loss events
GCP footprint construction Peril Type 2: e.g. landslide, flashflood, lightning, subsidence – 1 to 4 cells per location
NatCatSERVICE
© 2016 Münchener Rückversicherungs-Gesellschaft, Geo Risks Research, NatCatSERVICE – As at October 2016
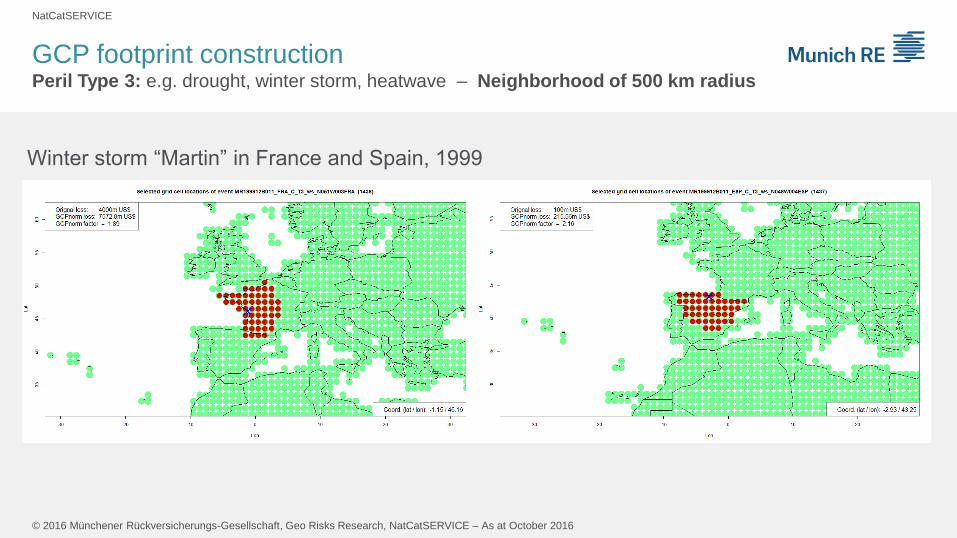
Winter storm “Martin” in France and Spain, 1999
GCP footprint construction Peril Type 3: e.g. drought, winter storm, heatwave – Neighborhood of 500 km radius
NatCatSERVICE
© 2016 Münchener Rückversicherungs-Gesellschaft, Geo Risks Research, NatCatSERVICE – As at October 2016
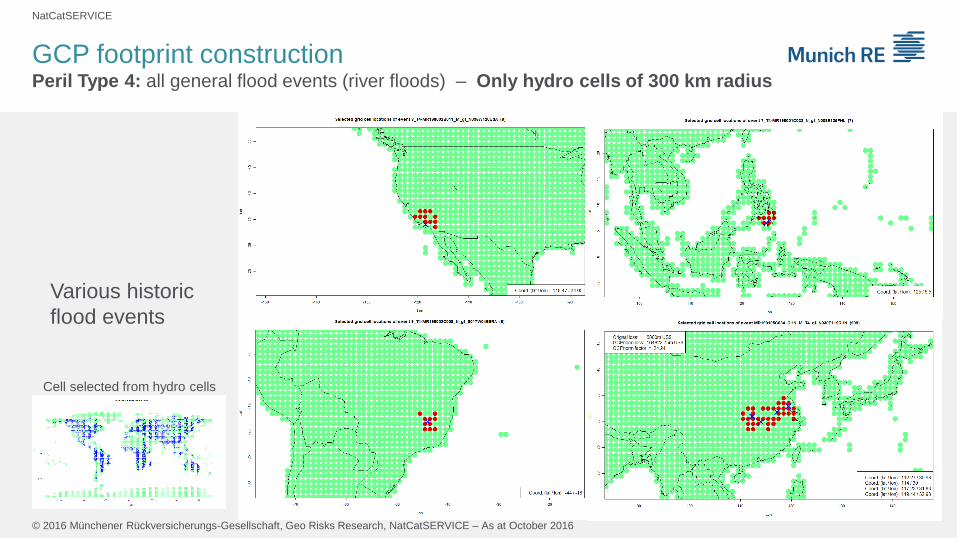
Various historic
flood events
Cell selected from hydro cells
GCP footprint construction Peril Type 4: all general flood events (river floods) – Only hydro cells of 300 km radius
NatCatSERVICE
© 2016 Münchener Rückversicherungs-Gesellschaft, Geo Risks Research, NatCatSERVICE – As at October 2016
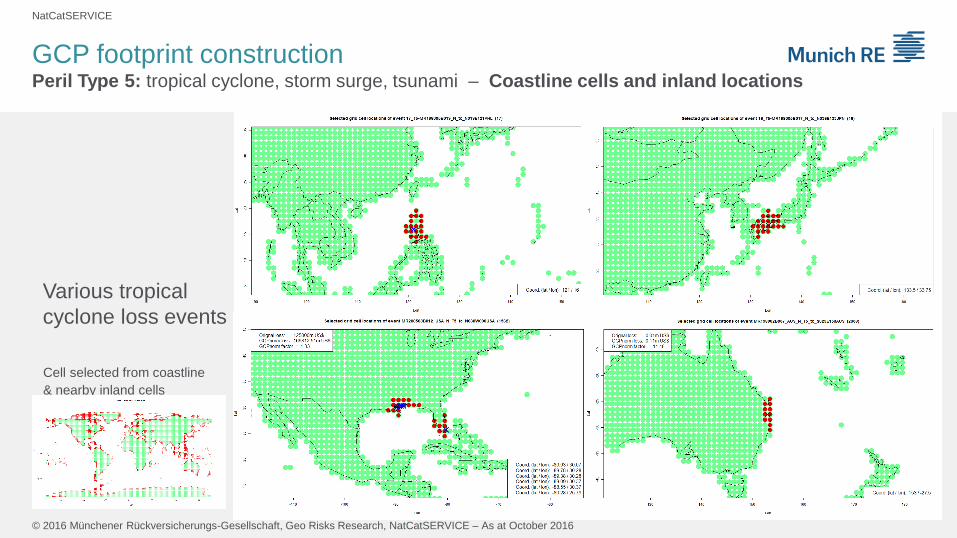
GCP footprint construction Peril Type 5: tropical cyclone, storm surge, tsunami – Coastline cells and inland locations
Various tropical
cyclone loss events
Cell selected from coastline
& nearby inland cells
NatCatSERVICE
© 2016 Münchener Rückversicherungs-Gesellschaft, Geo Risks Research, NatCatSERVICE – As at October 2016
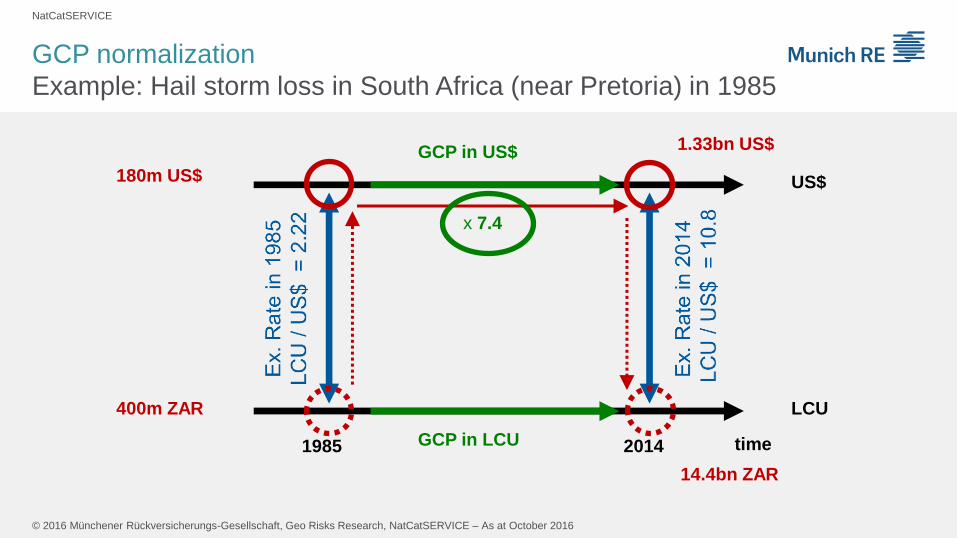
GCP normalization
Example: Hail storm loss in South Africa (near Pretoria) in 1985
time
US$
LCU
1985 2014
GCP in US$
GCP in LCU
400m ZAR
180m US$
1.33bn US$
x 7.4
14.4bn ZAR
NatCatSERVICE
© 2016 Münchener Rückversicherungs-Gesellschaft, Geo Risks Research, NatCatSERVICE – As at October 2016
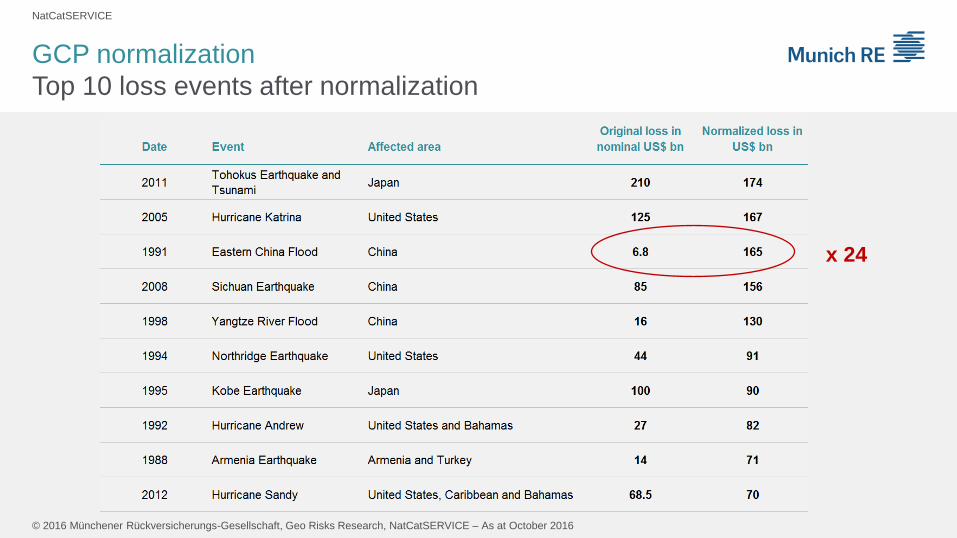
GCP normalization
Top 10 loss events after normalization
x 24
![170321 Eichner AAPV-SAPV WS-1.ppt [Kompatibilitätsmodus] · (E. Eichner 2010, phil. Dissertation, noch unveröffentlicht ) Verordnung von SAPV Dr. Eckhard Eichner Augsburger Hospiz-und](https://static.fdokument.com/doc/165x107/60609454bd5cd41a4c0b187b/170321-eichner-aapv-sapv-ws-1ppt-kompatibilittsmodus-e-eichner-2010-phil.jpg)


![Stadtwerke Gütersloh GmbH - Startseite – Gütersloh · Jan. 06 Jan. 07 Jan. 08 Jan. 09 Jan. 10 Jan. 11 Jan. 12 Jan. 13 Jan. 14 Jan. 15 Jan. 16 mg/l el.LF in [mS/m] Entwicklung](https://static.fdokument.com/doc/165x107/6028370154309631231c90b8/stadtwerke-gtersloh-gmbh-startseite-a-gtersloh-jan-06-jan-07-jan-08-jan.jpg)