
Near-field optical spectroscopy of GaAsÕAlyGa1−yAs quantum dot ...
7
Near-field optical spectroscopy of GaAs Õ Al y Ga 1-y As quantum dot pairs grown by high-temperature droplet epitaxy Robert Pomraenke, 1,2, * Christoph Lienau, 1,2 Yuriy I. Mazur, 3 Zhiming M. Wang, 3 Baolai Liang, 3 Georgiy G. Tarasov, 3,† and Gregory J. Salamo 3 1 Institut für Physik, Carl von Ossietzky Universität Oldenburg, D-26111 Oldenburg, Germany 2 Max-Born-Institut für Nichtlineare Optik und Kurzzeitspektroskopie, D-12489 Berlin, Germany 3 Department of Physics, University of Arkansas, Fayetteville, Arkansas 72701, USA Received 28 January 2007; revised manuscript received 18 October 2007; published 14 February 2008 We report a near-field photoluminescence study of pairs of GaAs quantum dots grown by droplet epitaxy, a growth mode for fabricating quantum dot arrays with controlled geometries. Our study reveals the optical properties of the individual quantum dots within each pair and, by means of a statistical analysis, the correla- tion between geometrical and optical properties of such arrays. Due to their high optical quality and unique geometry, ordered droplet epitaxy quantum dot arrays may become interesting candidates for coherent exciton and/or spin manipulation. DOI: 10.1103/PhysRevB.77.075314 PACS numbers: 42.70.Qs, 07.79.Fc, 42.25.p, 73.20.Mf I. INTRODUCTION The fabrication of semiconductor quantum dot QD ar- rays with controlled geometries is a challenging and fasci- nating current activity in solid-state research. During the past few years, the coherent manipulation of charge and spin excitations of QDs has seen encouraging progress toward applications to quantum logic. For example, Rabi oscillations, 1,2 a conditional two-qubit gate based on exciton- biexciton transitions, 3 strong coupling to photons, 4–6 and di- polar coupling in a pair of quantum dots 7 have been demon- strated. In addition, manipulation of optically induced spins in quantum dots is currently pursued in various laboratories 8,9 and, most recently, single spin Rabi oscilla- tions have been demonstrated using radio-frequency excitation. 10 These first steps toward quantum information processing are relevant because QD systems offer, at least conceptually, the potential of implementing scalable arrays of quantum bits. The fabrication of QD arrays, however, is challenging due to the inherent size and composition fluctua- tions in QD ensembles and the difficulty of achieving con- trolled spatial ordering. Different strategies have been explored for generating vertical or lateral ordering of QDs, such as using vertical strain, 6,11–13 templates, 14 or lithography. 15 Most recently, droplet epitaxy using lattice-matched semiconductors has emerged as a novel, promising technique for fabricating geo- metrically controlled QD pairs, rings or even more complex QD arrays, all of high optical quality. 16–20 While some recent studies have reported on single QD photoluminescence using this growth approach, 21 very little is known about the optical properties of more complex nanostructures. In particular, correlation studies between the complex structural and opti- cal properties are still lacking. In this paper, we present a near-field spectroscopic study of pairs of QDs grown by droplet epitaxy. By spectrally re- solving and spatially imaging excitonic and biexcitonic emis- sion lines, we are able to resolve the optical properties of the individual dots within such a pair. A near-field autocorrela- tion analysis shows that the unique geometrical property of the QD pair is preserved during overgrowth and is directly reflected in the near-field optical spectra. This result points to the potential use of droplet epitaxy of ordered QD arrays for studies in quantum logic. II. EXPERIMENT For this investigation, GaAs quantum dot pairs QDPs were grown by molecular beam epitaxy on a semi-insulating GaAs 100 substrate. The samples were fabricated by de- positing a 500 nm GaAs buffer layer and a 50 nm thick Al 0.3 Ga 0.7 As layer, followed by deposition of Ga and the formation of Ga droplets at a substrate temperature of 550 ° C with the arsenic source being fully closed. The total amount of Ga deposited was equal to an amount that would normally result in 10.0 ML of GaAs growth. Subsequently, the Ga droplets were “arsenized” into GaAs QDP oriented along the 0-11 direction by fine control of the arsenic flux and the corresponding annealing period. 17,18 The current un- derstanding is that the QDP forms due to the anisotropic surface diffusion of Ga adatoms during crystallization. 16–21 After growth, the surface morphology of the QDP samples was characterized using an atomic force microscope AFM under ambient conditions. Meanwhile, for optical character- ization, the QDPs were buried by deposition of 50 nm of an Al 0.3 Ga 0.7 As barrier layer and a 20 nm GaAs cap layer. Photoluminescence PL spectra from an ensemble of QDP were recorded in a variable temperature 8 – 300 K closed-cycle cryostat using a Nd:YAG where YAG denotes yttrium aluminum garnet laser at 532 nm as the excitation source. For these measurements, the laser light was focused to a diameter 30 m and the excitation power was varied between 0.3 W and 10 mW. The PL signal from the sample was dispersed using a monochromator and detected by a nitrogen-cooled InGaAs photodiode array. For high spatial resolution imaging of individual QDP luminescence, how- ever, we used a low-temperature near-field scanning optical microscope operating at a temperature of 15 K inside a high vacuum chamber. 22 In this case, optical excitation was pro- vided by a helium-neon laser at 632 nm at power levels of PHYSICAL REVIEW B 77, 075314 2008 1098-0121/2008/777/0753147 ©2008 The American Physical Society 075314-1
Transcript of Near-field optical spectroscopy of GaAsÕAlyGa1−yAs quantum dot ...
Near-field optical spectroscopy of GaAs ÕAlyGa1−yAs quantum dot pairs grownby high-temperature droplet epitaxy
Robert Pomraenke,1,2,* Christoph Lienau,1,2 Yuriy I. Mazur,3 Zhiming M. Wang,3 Baolai Liang,3
Georgiy G. Tarasov,3,† and Gregory J. Salamo3
1Institut für Physik, Carl von Ossietzky Universität Oldenburg, D-26111 Oldenburg, Germany2Max-Born-Institut für Nichtlineare Optik und Kurzzeitspektroskopie, D-12489 Berlin, Germany
3Department of Physics, University of Arkansas, Fayetteville, Arkansas 72701, USA�Received 28 January 2007; revised manuscript received 18 October 2007; published 14 February 2008�
We report a near-field photoluminescence study of pairs of GaAs quantum dots grown by droplet epitaxy, agrowth mode for fabricating quantum dot arrays with controlled geometries. Our study reveals the opticalproperties of the individual quantum dots within each pair and, by means of a statistical analysis, the correla-tion between geometrical and optical properties of such arrays. Due to their high optical quality and uniquegeometry, ordered droplet epitaxy quantum dot arrays may become interesting candidates for coherent excitonand/or spin manipulation.
DOI: 10.1103/PhysRevB.77.075314 PACS number�s�: 42.70.Qs, 07.79.Fc, 42.25.�p, 73.20.Mf
I. INTRODUCTION
The fabrication of semiconductor quantum dot �QD� ar-rays with controlled geometries is a challenging and fasci-nating current activity in solid-state research. During the pastfew years, the coherent manipulation of charge and spinexcitations of QDs has seen encouraging progress towardapplications to quantum logic. For example, Rabioscillations,1,2 a conditional two-qubit gate based on exciton-biexciton transitions,3 strong coupling to photons,4–6 and di-polar coupling in a pair of quantum dots7 have been demon-strated. In addition, manipulation of optically induced spinsin quantum dots is currently pursued in variouslaboratories8,9 and, most recently, single spin Rabi oscilla-tions have been demonstrated using radio-frequencyexcitation.10 These first steps toward quantum informationprocessing are relevant because QD systems offer, at leastconceptually, the potential of implementing scalable arraysof quantum bits. The fabrication of QD arrays, however, ischallenging due to the inherent size and composition fluctua-tions in QD ensembles and the difficulty of achieving con-trolled spatial ordering.
Different strategies have been explored for generatingvertical or lateral ordering of QDs, such as using verticalstrain,6,11–13 templates,14 or lithography.15 Most recently,droplet epitaxy using lattice-matched semiconductors hasemerged as a novel, promising technique for fabricating geo-metrically controlled QD pairs, rings or even more complexQD arrays, all of high optical quality.16–20 While some recentstudies have reported on single QD photoluminescence usingthis growth approach,21 very little is known about the opticalproperties of more complex nanostructures. In particular,correlation studies between the complex structural and opti-cal properties are still lacking.
In this paper, we present a near-field spectroscopic studyof pairs of QDs grown by droplet epitaxy. By spectrally re-solving and spatially imaging excitonic and biexcitonic emis-sion lines, we are able to resolve the optical properties of theindividual dots within such a pair. A near-field autocorrela-tion analysis shows that the unique geometrical property of
the QD pair is preserved during overgrowth and is directlyreflected in the near-field optical spectra. This result points tothe potential use of droplet epitaxy of ordered QD arrays forstudies in quantum logic.
II. EXPERIMENT
For this investigation, GaAs quantum dot pairs �QDPs�were grown by molecular beam epitaxy on a semi-insulatingGaAs �100� substrate. The samples were fabricated by de-positing a 500 nm GaAs buffer layer and a 50 nm thickAl0.3Ga0.7As layer, followed by deposition of Ga and theformation of Ga droplets at a substrate temperature of550 °C with the arsenic source being fully closed. The totalamount of Ga deposited was equal to an amount that wouldnormally result in 10.0 ML of GaAs growth. Subsequently,the Ga droplets were “arsenized” into GaAs QDP orientedalong the �0−11� direction by fine control of the arsenic fluxand the corresponding annealing period.17,18 The current un-derstanding is that the QDP forms due to the anisotropicsurface diffusion of Ga adatoms during crystallization.16–21
After growth, the surface morphology of the QDP sampleswas characterized using an atomic force microscope �AFM�under ambient conditions. Meanwhile, for optical character-ization, the QDPs were buried by deposition of 50 nm of anAl0.3Ga0.7As barrier layer and a 20 nm GaAs cap layer.
Photoluminescence �PL� spectra from an ensemble ofQDP were recorded in a variable temperature 8–300 Kclosed-cycle cryostat using a Nd:YAG �where YAG denotesyttrium aluminum garnet� laser at 532 nm as the excitationsource. For these measurements, the laser light was focusedto a diameter �30 �m and the excitation power was variedbetween 0.3 �W and 10 mW. The PL signal from the samplewas dispersed using a monochromator and detected by anitrogen-cooled InGaAs photodiode array. For high spatialresolution imaging of individual QDP luminescence, how-ever, we used a low-temperature near-field scanning opticalmicroscope operating at a temperature of 15 K inside a highvacuum chamber.22 In this case, optical excitation was pro-vided by a helium-neon laser at 632 nm at power levels of
PHYSICAL REVIEW B 77, 075314 �2008�
1098-0121/2008/77�7�/075314�7� ©2008 The American Physical Society075314-1
0.5 nW–0.5 �W, which was coupled into a chemicallyetched, uncoated single mode fiber.23 The local PL signalwas collected through the same fiber tip, dispersed using aspectrometer �with f =50 cm and resolution �100 �eV�, andrecorded with a nitrogen-cooled charge-coupled device cam-era. For spatial PL imaging, the fiber probe was rasterscanned across the sample surface in a 4.8�4.8 �m2 areawith a pixel of 80 nm. At every pixel, a full PL spectrum wasrecorded within an integration time of 0.5 s. A constant tip-to-sample distance of 15 nm was maintained during scanningby means of a shear-force distance control.24 This near-fieldoptical technique simultaneously demonstrated excellent PLdetection efficiency and a spatial resolution down to160 nm.25 For the studies reported here, the spatial resolutionwas held at 300 nm.
III. RESULTS
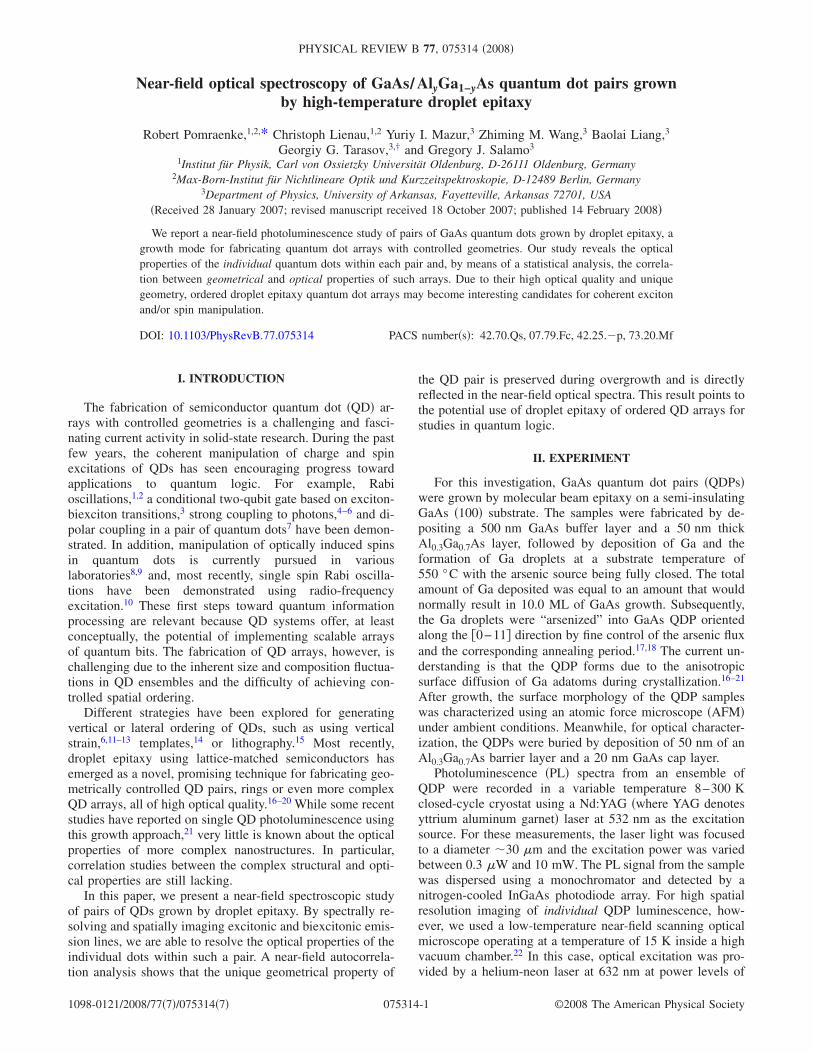
A typical AFM image of the QDP sample is shown in Fig.1�a�. The image reveals the almost perfect alignment of thequantum dot pairs along the �0−11� direction and a ratherlow QDP density of about 2.3 QDPs per �m2. A zoom intothese images �Fig. 1�c�� gives an average interdot distancewithin each pair of 130 nm. The height of individual QDs isabout 5 nm, and each pair resides on a flat and rather ex-tended 4 nm high GaAs base with a diameter of about500 nm. This picture is confirmed by additional x-ray diffusescattering measurements of the uncapped sample, showingcompletely strain-free QDPs aligned along the �0−11� direc-tion with a 135 nm inner distance.26 For all QDs, from Fig.1�a� the height was estimated, and the height distributions forthe small and large QDs within each QDP are shown in Fig.1�b�. Figure 1�b� indicates an average height of 3.5 nm andof 5.0 nm for the small and large QDs, respectively. Clearly,the height of the two QDs within each pair is not the same,but differs by about 30%.
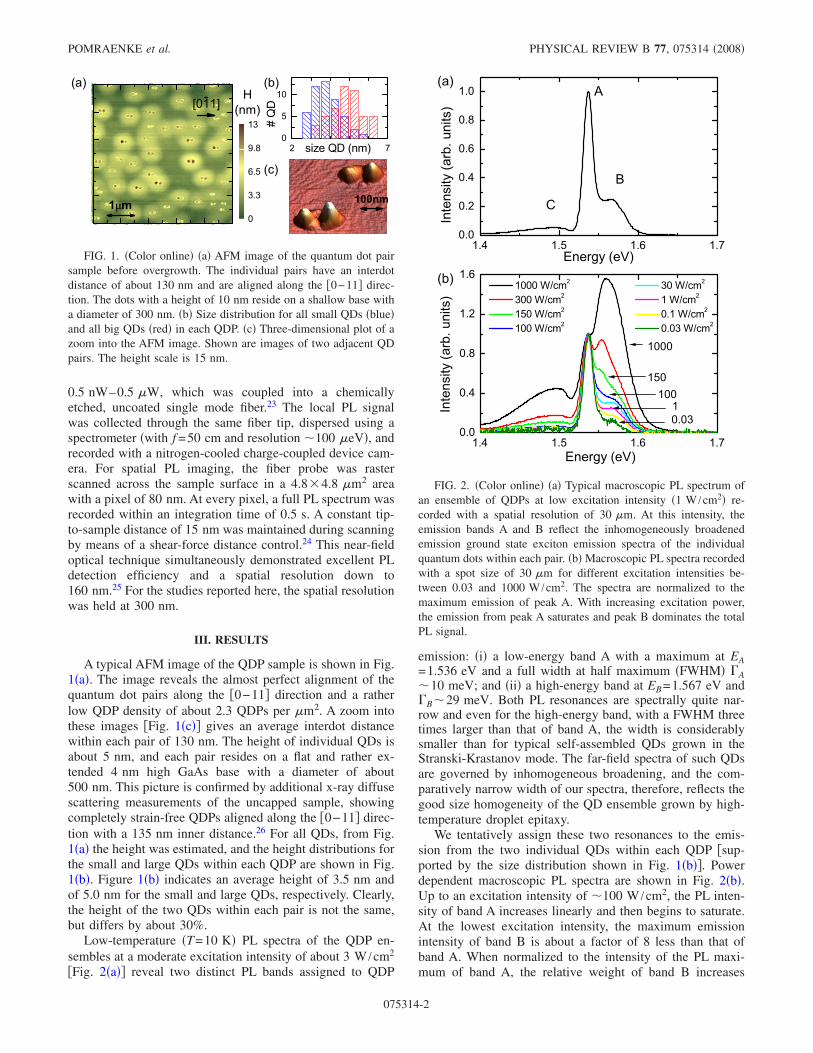
Low-temperature �T=10 K� PL spectra of the QDP en-sembles at a moderate excitation intensity of about 3 W /cm2
�Fig. 2�a�� reveal two distinct PL bands assigned to QDP
emission: �i� a low-energy band A with a maximum at EA=1.536 eV and a full width at half maximum �FWHM� �A�10 meV; and �ii� a high-energy band at EB=1.567 eV and�B�29 meV. Both PL resonances are spectrally quite nar-row and even for the high-energy band, with a FWHM threetimes larger than that of band A, the width is considerablysmaller than for typical self-assembled QDs grown in theStranski-Krastanov mode. The far-field spectra of such QDsare governed by inhomogeneous broadening, and the com-paratively narrow width of our spectra, therefore, reflects thegood size homogeneity of the QD ensemble grown by high-temperature droplet epitaxy.
We tentatively assign these two resonances to the emis-sion from the two individual QDs within each QDP �sup-ported by the size distribution shown in Fig. 1�b��. Powerdependent macroscopic PL spectra are shown in Fig. 2�b�.Up to an excitation intensity of �100 W /cm2, the PL inten-sity of band A increases linearly and then begins to saturate.At the lowest excitation intensity, the maximum emissionintensity of band B is about a factor of 8 less than that ofband A. When normalized to the intensity of the PL maxi-mum of band A, the relative weight of band B increases
FIG. 1. �Color online� �a� AFM image of the quantum dot pairsample before overgrowth. The individual pairs have an interdotdistance of about 130 nm and are aligned along the �0−11� direc-tion. The dots with a height of 10 nm reside on a shallow base witha diameter of 300 nm. �b� Size distribution for all small QDs �blue�and all big QDs �red� in each QDP. �c� Three-dimensional plot of azoom into the AFM image. Shown are images of two adjacent QDpairs. The height scale is 15 nm.
FIG. 2. �Color online� �a� Typical macroscopic PL spectrum ofan ensemble of QDPs at low excitation intensity �1 W /cm2� re-corded with a spatial resolution of 30 �m. At this intensity, theemission bands A and B reflect the inhomogeneously broadenedemission ground state exciton emission spectra of the individualquantum dots within each pair. �b� Macroscopic PL spectra recordedwith a spot size of 30 �m for different excitation intensities be-tween 0.03 and 1000 W /cm2. The spectra are normalized to themaximum emission of peak A. With increasing excitation power,the emission from peak A saturates and peak B dominates the totalPL signal.
POMRAENKE et al. PHYSICAL REVIEW B 77, 075314 �2008�
075314-2

monotonously with increasing excitation intensity and thisband begins to dominate the emission at intensities above300 W /cm2. This intensity dependence is most likely ex-plained by the saturation of the ground state exciton emissiondue to state filling of the—geometrically slightly larger—low-energy QDs and the—geometrically slightly smaller—high-energy QDs. The nonlinear increase in emission inten-sity of band B then arises from an increasing excited stateemission from both QDs at high excitation intensities. Thisinterpretation is supported by the near-field spectroscopic ex-periments discussed below.
Apart from these QD-related emission bands, the spectraat high intensities also show a broad background emissionaround 1.5 eV. In high-quality GaAs materials, emission inthis spectral region is generally due to recombination pro-cesses involving shallow acceptors, i.e., free electron–boundacceptors and donor-to-acceptor pair transitions.27 Here, it islikely that such acceptors are mostly located within the 4 nmhigh GaAs base surrounding the QDs. We note that, apartfrom these acceptor transitions, we observe no clear signa-ture of the GaAs base in photoluminescence. This indicatesthat transfer of carriers within the GaAs base and subsequenttrapping into the quantum dots22 are fast compared to the QDPL decay time and highly efficient.
Based on the macroscopic far-field photoluminescencespectra alone, it is difficult to unambiguously verify this as-signment because various alternative interpretations are pos-sible. For example, multiexcitonic transitions28 or even ex-cited states within a pair of electronically coupled QDs arepossible. Also, interdot exciton relaxation processes canlargely affect those spectra. Therefore, it is particularly inter-esting to analyze the optical properties of the QDPs by prob-ing them individually. This is challenging because of thesmall geometric separation of only about 100 nm betweenthe individual QDs of each QDP. We, therefore, decided touse low-temperature near-field scanning optical microscopyin order to obtain spatially highly resolved spectroscopiccharacterization. In order to have sufficient flexibility invarying the excitation conditions, we used an uncoated,chemically etched near fiber probe29 using the illumination-collection geometry. In this geometry, the sample was locallyexcited by transmitting the He-Ne laser light through thenear-field probe and collecting the emitted PL via the samefiber. As already mentioned, this geometry provides spatialand spectral resolutions of less than 200 nm and 100 �eV,respectively.25 A spectrally integrated near-field photolumi-nescence image of the QDP sample within a scan range of4.8�4.8 �m2 is shown in Fig. 3�a�. The image is taken at atemperature of 15 K by raster scanning the near-field probeat constant probe-to-sample distance across the sample witha step size of 80 nm. The sample is excited at the photonenergy of 1.959 eV with an intensity of 75 W /cm2. Everypixel of the imaged PL spectrum IPL�x ,y ,�� is recorded inthe detection range between 1.532 and 1.602 eV. The inte-
grated intensity of this spectrum I�x ,y�=�i�I�x ,y ,�i�� isthen plotted as a function of the position of the near-fieldprobe. In this image, the emission from the individual QDPsis clearly resolved. The spatial density of the luminescentQDPs is the same as that of the QDPs in the AFM image
�Fig. 2�a��, demonstrating that essentially all of the QDPs areoptically active. We also note that the integrated PL intensityshows very little variation from one QD to the next, which isanother signature of the high optical quality of the QDs inevery QDP.
Due to the finite spatial resolution of our measurementtechnique, it is not yet possible to resolve signatures of theindividual QDs of each QDP in these spectrally integratedimages. However, this information can be obtained by inves-tigating the local photoluminescence spectra. We focus onthe single QD pair marked by a black square in Fig. 3�a�. Arepresentative local near-field PL spectrum in this region isshown in Fig. 3�b�. We observe a series of spectrally sharpemission lines in the regions around 1.54 and 1.56 eV, re-flecting the emission from different exciton states localized
FIG. 3. �Color online� �a� Two-dimensional near-field image oftotal PL intensity of the QDP sample. The QDP sample is illumi-nated by a He-Ne laser at an intensity of about 75 W /cm2, and afull near-field PL spectrum is recorded in the energy range between1.532 and 1.602 eV at every pixel of the image. The integratedintensity of this spectrum is then plotted as a function of the posi-tion of the near-field probe, as it is scanned with a step size of80 nm within a 4.8�4.8 �m2 area. The spatial position of the in-dividual QDs within each QD pair, as extracted from the near-fieldspectra �b� and �c�, is indicated by a white �black� dot for the low-energy dot A and high-energy dot B, respectively. �b� Representa-tive near-field spectrum of a single QD pair in the region indicatedby the black square in �a�. �c� Spatial images of the PL intensity atdetection energies of 1.543 eV �QD-A� and 1.559 eV �QD-B�. Theimage is recorded by scanning the near-field probe with a step sizeof 60 nm. For this particular QD pair, the images show the align-ment along the �0−11� �x� direction and indicate an interdot dis-tance of 200�20 nm.
NEAR-FIELD OPTICAL SPECTROSCOPY OF GaAs /Al… PHYSICAL REVIEW B 77, 075314 �2008�
075314-3
within this QDP. Despite the comparatively high excitationintensities, the spectral width of most resonances is quitenarrow, and falls in the range of 0.2–0.5 meV, slightly aboveour monochromator resolution. These comparatively sharpresonances are different from the rather broad emission lineswith a width of several meV recently observed from singleQDs grown by low-temperature droplet epitaxy21 and high-light again the high optical quality of the QDP sample. Usingthe more precise information on the spatial intensity distri-bution of the individual emission lines from our near-fieldexperiments, it becomes possible to deduce the spatial originof the different emission lines. Such an analysis is shown inFig. 3�c� for the two emission lines at 1.543 and 1.559 eV inFig. 3�b�. It is evident that the spatial center of the two emis-sion peaks is shifted by 200�20 nm along the x direction,i.e., along the �0−11� direction. We find, however, no mea-surable shift along the y direction, i.e., along the �011� direc-tion. This demonstrates clearly that the near-field spectra al-low us to separately probe the optical spectra of the twoindividual quantum dots �A and B� within each pair. Basedon this spatial selectivity, we can assign most of the lines inthe low-energy region around 1.54 eV to originate fromQD-A, whereas the high-energy lines around 1.56 eV aremostly related to emission from quantum-confined excitonstates of QD-B. As we will demonstrate below, it is likelythat the sharp lines at 1.5428 and 1.5408 eV arise from ex-citon �X� and biexciton �XX� emission of QD-A, whereasthose at 1.5591 and 1.5566 eV can be assigned to the X andXX emission from QD-B.
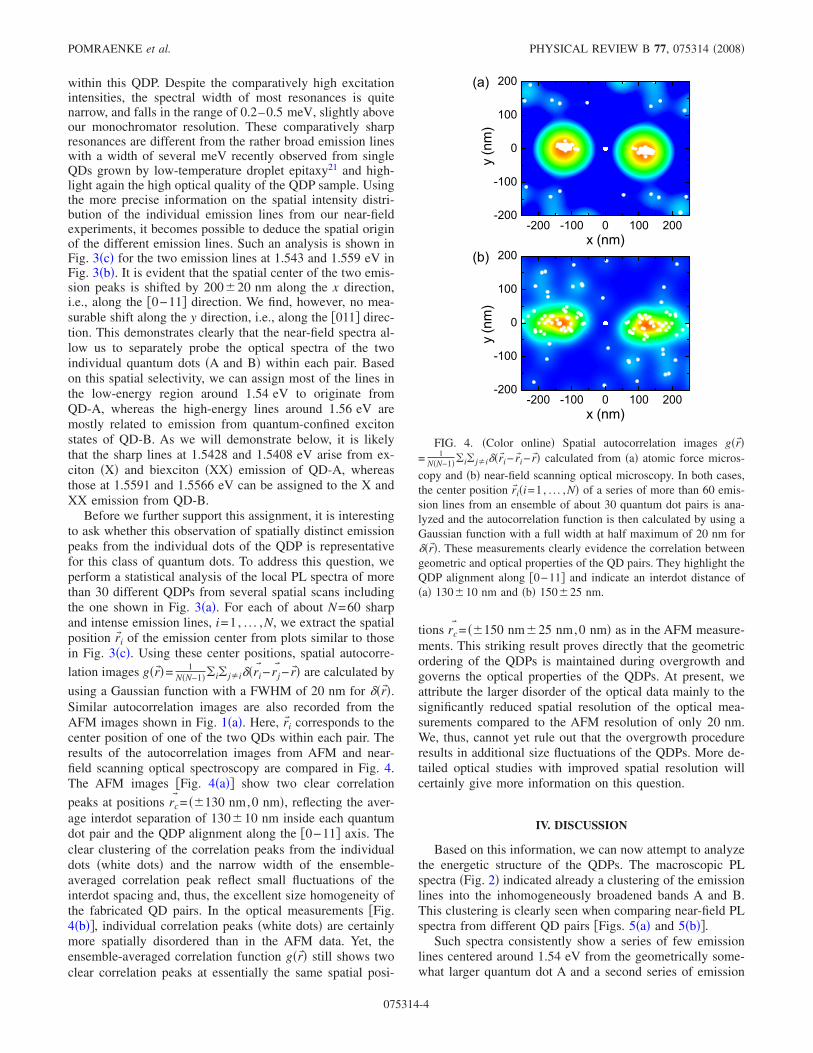
Before we further support this assignment, it is interestingto ask whether this observation of spatially distinct emissionpeaks from the individual dots of the QDP is representativefor this class of quantum dots. To address this question, weperform a statistical analysis of the local PL spectra of morethan 30 different QDPs from several spatial scans includingthe one shown in Fig. 3�a�. For each of about N=60 sharpand intense emission lines, i=1, . . . ,N, we extract the spatialposition r�i of the emission center from plots similar to thosein Fig. 3�c�. Using these center positions, spatial autocorre-
lation images g�r��= 1N�N−1��i� j�i��ri
� −rj� −r�� are calculated by
using a Gaussian function with a FWHM of 20 nm for ��r��.Similar autocorrelation images are also recorded from theAFM images shown in Fig. 1�a�. Here, r�i corresponds to thecenter position of one of the two QDs within each pair. Theresults of the autocorrelation images from AFM and near-field scanning optical spectroscopy are compared in Fig. 4.The AFM images �Fig. 4�a�� show two clear correlation
peaks at positions rc� = ��130 nm,0 nm�, reflecting the aver-
age interdot separation of 130�10 nm inside each quantumdot pair and the QDP alignment along the �0−11� axis. Theclear clustering of the correlation peaks from the individualdots �white dots� and the narrow width of the ensemble-averaged correlation peak reflect small fluctuations of theinterdot spacing and, thus, the excellent size homogeneity ofthe fabricated QD pairs. In the optical measurements �Fig.4�b��, individual correlation peaks �white dots� are certainlymore spatially disordered than in the AFM data. Yet, theensemble-averaged correlation function g�r�� still shows twoclear correlation peaks at essentially the same spatial posi-
tions rc� = ��150 nm�25 nm,0 nm� as in the AFM measure-
ments. This striking result proves directly that the geometricordering of the QDPs is maintained during overgrowth andgoverns the optical properties of the QDPs. At present, weattribute the larger disorder of the optical data mainly to thesignificantly reduced spatial resolution of the optical mea-surements compared to the AFM resolution of only 20 nm.We, thus, cannot yet rule out that the overgrowth procedureresults in additional size fluctuations of the QDPs. More de-tailed optical studies with improved spatial resolution willcertainly give more information on this question.
IV. DISCUSSION
Based on this information, we can now attempt to analyzethe energetic structure of the QDPs. The macroscopic PLspectra �Fig. 2� indicated already a clustering of the emissionlines into the inhomogeneously broadened bands A and B.This clustering is clearly seen when comparing near-field PLspectra from different QD pairs �Figs. 5�a� and 5�b��.
Such spectra consistently show a series of few emissionlines centered around 1.54 eV from the geometrically some-what larger quantum dot A and a second series of emission
FIG. 4. �Color online� Spatial autocorrelation images g�r��= 1
N�N−1��i� j�i��r�i−r�i−r�� calculated from �a� atomic force micros-
copy and �b� near-field scanning optical microscopy. In both cases,the center position r�i�i=1, . . . ,N� of a series of more than 60 emis-sion lines from an ensemble of about 30 quantum dot pairs is ana-lyzed and the autocorrelation function is then calculated by using aGaussian function with a full width at half maximum of 20 nm for��r��. These measurements clearly evidence the correlation betweengeometric and optical properties of the QD pairs. They highlight theQDP alignment along �0−11� and indicate an interdot distance of�a� 130�10 nm and �b� 150�25 nm.
POMRAENKE et al. PHYSICAL REVIEW B 77, 075314 �2008�
075314-4
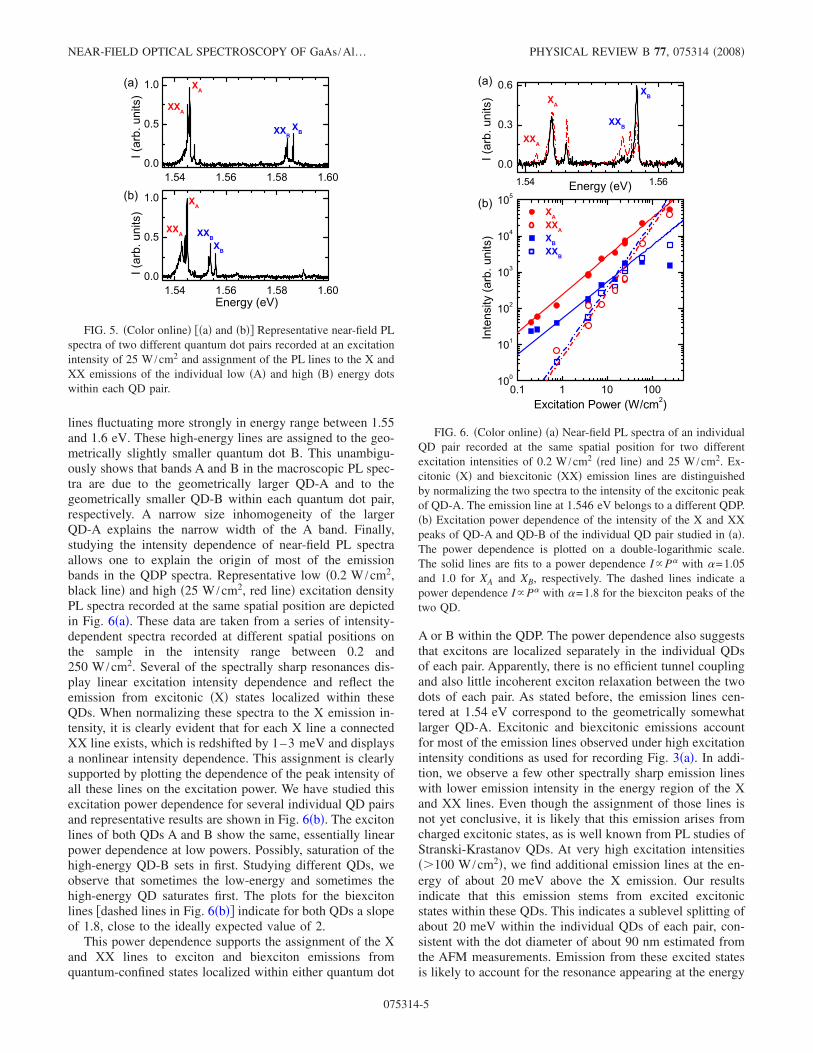
lines fluctuating more strongly in energy range between 1.55and 1.6 eV. These high-energy lines are assigned to the geo-metrically slightly smaller quantum dot B. This unambigu-ously shows that bands A and B in the macroscopic PL spec-tra are due to the geometrically larger QD-A and to thegeometrically smaller QD-B within each quantum dot pair,respectively. A narrow size inhomogeneity of the largerQD-A explains the narrow width of the A band. Finally,studying the intensity dependence of near-field PL spectraallows one to explain the origin of most of the emissionbands in the QDP spectra. Representative low �0.2 W /cm2,black line� and high �25 W /cm2, red line� excitation densityPL spectra recorded at the same spatial position are depictedin Fig. 6�a�. These data are taken from a series of intensity-dependent spectra recorded at different spatial positions onthe sample in the intensity range between 0.2 and250 W /cm2. Several of the spectrally sharp resonances dis-play linear excitation intensity dependence and reflect theemission from excitonic �X� states localized within theseQDs. When normalizing these spectra to the X emission in-tensity, it is clearly evident that for each X line a connectedXX line exists, which is redshifted by 1–3 meV and displaysa nonlinear intensity dependence. This assignment is clearlysupported by plotting the dependence of the peak intensity ofall these lines on the excitation power. We have studied thisexcitation power dependence for several individual QD pairsand representative results are shown in Fig. 6�b�. The excitonlines of both QDs A and B show the same, essentially linearpower dependence at low powers. Possibly, saturation of thehigh-energy QD-B sets in first. Studying different QDs, weobserve that sometimes the low-energy and sometimes thehigh-energy QD saturates first. The plots for the biexcitonlines �dashed lines in Fig. 6�b�� indicate for both QDs a slopeof 1.8, close to the ideally expected value of 2.
This power dependence supports the assignment of the Xand XX lines to exciton and biexciton emissions fromquantum-confined states localized within either quantum dot
A or B within the QDP. The power dependence also suggeststhat excitons are localized separately in the individual QDsof each pair. Apparently, there is no efficient tunnel couplingand also little incoherent exciton relaxation between the twodots of each pair. As stated before, the emission lines cen-tered at 1.54 eV correspond to the geometrically somewhatlarger QD-A. Excitonic and biexcitonic emissions accountfor most of the emission lines observed under high excitationintensity conditions as used for recording Fig. 3�a�. In addi-tion, we observe a few other spectrally sharp emission lineswith lower emission intensity in the energy region of the Xand XX lines. Even though the assignment of those lines isnot yet conclusive, it is likely that this emission arises fromcharged excitonic states, as is well known from PL studies ofStranski-Krastanov QDs. At very high excitation intensities��100 W /cm2�, we find additional emission lines at the en-ergy of about 20 meV above the X emission. Our resultsindicate that this emission stems from excited excitonicstates within these QDs. This indicates a sublevel splitting ofabout 20 meV within the individual QDs of each pair, con-sistent with the dot diameter of about 90 nm estimated fromthe AFM measurements. Emission from these excited statesis likely to account for the resonance appearing at the energy
FIG. 5. �Color online� ��a� and �b�� Representative near-field PLspectra of two different quantum dot pairs recorded at an excitationintensity of 25 W /cm2 and assignment of the PL lines to the X andXX emissions of the individual low �A� and high �B� energy dotswithin each QD pair.
FIG. 6. �Color online� �a� Near-field PL spectra of an individualQD pair recorded at the same spatial position for two differentexcitation intensities of 0.2 W /cm2 �red line� and 25 W /cm2. Ex-citonic �X� and biexcitonic �XX� emission lines are distinguishedby normalizing the two spectra to the intensity of the excitonic peakof QD-A. The emission line at 1.546 eV belongs to a different QDP.�b� Excitation power dependence of the intensity of the X and XXpeaks of QD-A and QD-B of the individual QD pair studied in �a�.The power dependence is plotted on a double-logarithmic scale.The solid lines are fits to a power dependence I P with =1.05and 1.0 for XA and XB, respectively. The dashed lines indicate apower dependence I P with =1.8 for the biexciton peaks of thetwo QD.
NEAR-FIELD OPTICAL SPECTROSCOPY OF GaAs /Al… PHYSICAL REVIEW B 77, 075314 �2008�
075314-5
of 18 meV above the A band in the density-dependent mac-roscopic PL spectra �Fig. 2�b��.
As a result, the following schematic picture for the ener-getic structure of the investigated QDPs emerges. For thepresent sample, the two QDs within each pair are spatiallyseparated by about 130 nm, and excitons are localized withineither the left or right dot of each pair. The geometries ofthese two dots are slightly different so that the energies of thelowest excitonic states vary slightly: around 1.54 eV for thegeometrically larger dot and 1.55–1.6 eV for the geometri-cally smaller dot. Preliminary evidence exists for a sublevelsplitting of about 20 meV within each QD.
The near-field results also help in clarifying the assign-ment of the far-field spectra in Fig. 2. The near-field resultsshow conclusively that, also at very low optical powers,emission from both the low- and high-energy dots is ob-served. The emission from the low-energy dot falls into theenergy range around 1.54 eV, whereas that of the high-energy dot scatters more strongly and falls into the rangefrom 1.56 to 1.58 eV. This makes it likely to assign theemission bands A and B in the far-field spectra at low powersto the inhomogeneously broadened emission spectra of theindividual, high- and low-energy dots of each pair. The near-field data show essentially the same power dependence forthe excitonic and biexcitonic emission peaks of both dots.Therefore, one can clearly not explain the power dependenceof the far-field spectra by considering the ground state exci-tonic emission of both dots only. Obviously, saturation of theground state emission and increasing emission from excitedstates at lower optical powers must be taken into account inorder to explain the power dependence.
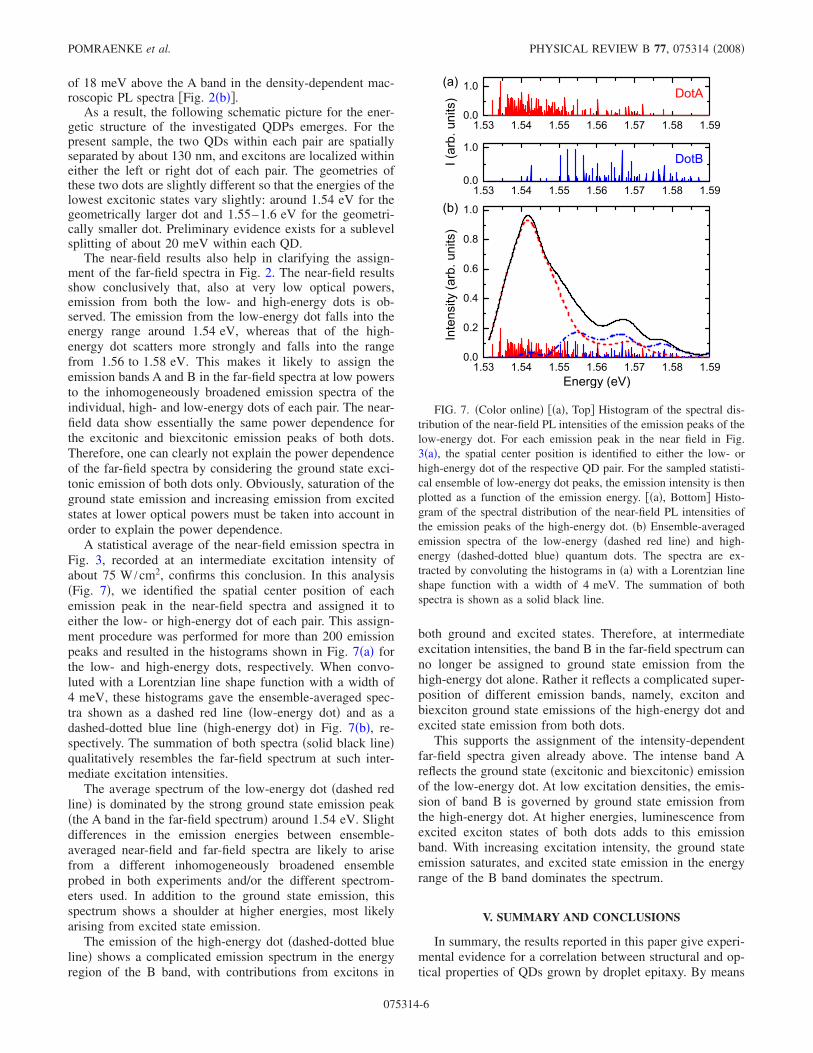
A statistical average of the near-field emission spectra inFig. 3, recorded at an intermediate excitation intensity ofabout 75 W /cm2, confirms this conclusion. In this analysis�Fig. 7�, we identified the spatial center position of eachemission peak in the near-field spectra and assigned it toeither the low- or high-energy dot of each pair. This assign-ment procedure was performed for more than 200 emissionpeaks and resulted in the histograms shown in Fig. 7�a� forthe low- and high-energy dots, respectively. When convo-luted with a Lorentzian line shape function with a width of4 meV, these histograms gave the ensemble-averaged spec-tra shown as a dashed red line �low-energy dot� and as adashed-dotted blue line �high-energy dot� in Fig. 7�b�, re-spectively. The summation of both spectra �solid black line�qualitatively resembles the far-field spectrum at such inter-mediate excitation intensities.
The average spectrum of the low-energy dot �dashed redline� is dominated by the strong ground state emission peak�the A band in the far-field spectrum� around 1.54 eV. Slightdifferences in the emission energies between ensemble-averaged near-field and far-field spectra are likely to arisefrom a different inhomogeneously broadened ensembleprobed in both experiments and/or the different spectrom-eters used. In addition to the ground state emission, thisspectrum shows a shoulder at higher energies, most likelyarising from excited state emission.
The emission of the high-energy dot �dashed-dotted blueline� shows a complicated emission spectrum in the energyregion of the B band, with contributions from excitons in
both ground and excited states. Therefore, at intermediateexcitation intensities, the band B in the far-field spectrum canno longer be assigned to ground state emission from thehigh-energy dot alone. Rather it reflects a complicated super-position of different emission bands, namely, exciton andbiexciton ground state emissions of the high-energy dot andexcited state emission from both dots.
This supports the assignment of the intensity-dependentfar-field spectra given already above. The intense band Areflects the ground state �excitonic and biexcitonic� emissionof the low-energy dot. At low excitation densities, the emis-sion of band B is governed by ground state emission fromthe high-energy dot. At higher energies, luminescence fromexcited exciton states of both dots adds to this emissionband. With increasing excitation intensity, the ground stateemission saturates, and excited state emission in the energyrange of the B band dominates the spectrum.
V. SUMMARY AND CONCLUSIONS
In summary, the results reported in this paper give experi-mental evidence for a correlation between structural and op-tical properties of QDs grown by droplet epitaxy. By means
FIG. 7. �Color online� ��a�, Top� Histogram of the spectral dis-tribution of the near-field PL intensities of the emission peaks of thelow-energy dot. For each emission peak in the near field in Fig.3�a�, the spatial center position is identified to either the low- orhigh-energy dot of the respective QD pair. For the sampled statisti-cal ensemble of low-energy dot peaks, the emission intensity is thenplotted as a function of the emission energy. ��a�, Bottom� Histo-gram of the spectral distribution of the near-field PL intensities ofthe emission peaks of the high-energy dot. �b� Ensemble-averagedemission spectra of the low-energy �dashed red line� and high-energy �dashed-dotted blue� quantum dots. The spectra are ex-tracted by convoluting the histograms in �a� with a Lorentzian lineshape function with a width of 4 meV. The summation of bothspectra is shown as a solid black line.
POMRAENKE et al. PHYSICAL REVIEW B 77, 075314 �2008�
075314-6
of a statistical analysis of low-temperature near-field PLspectra, we have demonstrated that the geometric alignmentand interdot spacing of 130 nm found in AFM images ofuncapped quantum dot pairs also govern the optical proper-ties of these nanostructures. Quantitative information on theenergetics of confined excitonic states within such pairs isobtained. For conceptual simplicity, these PL studies havebeen performed on QDPs with a rather large interdot separa-tion, where the formation of coherently coupled molecularquantum dot states is suppressed and in which excitonic in-teractions between neighboring dots within each pair areweak. During the past months, several research groups havedemonstrated that droplet epitaxy permits the growth of pairsand more complex arrays of QDs with much smaller dimen-sions and interdot distances in the range of a few tens ofnanometers. The excellent optical properties of droplet epi-taxy QDs demonstrated in our work make such pairs and
arrays highly interesting for probing the intricate opticalproperties of molecular excitonic states and in particular thecomplex dynamics of dipolar interactions in quantum dotarrays with controlled geometries. Such studies are highlyrelevant for exploring the potential of these nanostructuresfor implementing scalable arrays of exciton and/or spin-based quantum bits and are now under study.
ACKNOWLEDGMENTS
The authors acknowledge the financial support of theDeutsche Forschungsgemeinschaft via the Sonderfors-chungsbereich 296 and National Science Foundation of USthrough Grant No. DMR-0520550. One of the authors �R.P.�also greatly acknowledges the financial support from Hum-boldt Graduate School.
*[email protected]†On leave from Institute of Semiconductor Physics, National Acad-
emy of Sciences of Ukraine, prospect Nauki 41, 03028 Kiev,Ukraine.
1 T. H. Stievater, X. Q. Li, D. G. Steel, D. Gammon, D. S. Katzer,D. Park, C. Piermarocchi, and L. J. Sham, Phys. Rev. Lett. 87,133603 �2001�.
2 A. Zrenner, E. Beham, S. Stufler, F. Findeis, M. Bichler, and G.Abstreiter, Nature �London� 418, 612 �2002�.
3 X. Q. Li, Y. W. Wu, D. Steel, D. Gammon, T. H. Stievater, D. S.Katzer, D. Park, C. Piermarocchi, and L. J. Sham, Science 301,809 �2003�.
4 J. P. Reithmaier, G. Sek, A. Loffler, C. Hofmann, S. Kuhn, S.Reitzenstein, L. V. Keldysh, V. D. Kulakovskii, T. L. Reinecke,and A. Forchel, Nature �London� 432, 197 �2004�.
5 T. Yoshie, A. Scherer, J. Hendrickson, G. Khitrova, H. M. Gibbs,G. Rupper, C. Ell, O. B. Shchekin, and D. G. Deppe, Nature�London� 432, 200 �2004�.
6 A. Badolato, K. Hennessy, M. Atature, J. Dreiser, E. Hu, P. M.Petroff, and A. Imamoglu, Science 308, 1158 �2005�.
7 T. Unold, K. Mueller, C. Lienau, T. Elsaesser, and A. D. Wieck,Phys. Rev. Lett. 94, 137404 �2005�.
8 M. Kroutvar, Y. Ducommun, D. Heiss, M. Bichle, D. Schuh, G.Abstreiter, and J. J. Finley, Nature �London� 432, 81 �2005�.
9 A. Greilich, D. R. Yakovlev, A. Shabaev, A. L. Efros, I. A. Yu-gova, R. Oulton, V. Stavarache, D. Reuter, A. Wieck, and M.Bayer, Science 313, 341 �2006�.
10 F. H. L. Koppens, C. Buizert, K. J. Tielrooij, I. T. Vink, C. K.Nowack, T. Meunier, L. P. Kouwenhoven, and L. M. K. Vander-sypen, Nature �London� 442, 766 �2006�.
11 Q. Xie, A. Madhukar, P. Chen, and N. P. Kobayashi, Phys. Rev.Lett. 75, 2542 �1995�.
12 M. Schmidbauer, S. Seydmohamadi, D. Grigoriev, Z. M. Wang,Y. I. Mazur, P. Schafer, M. Hanke, R. Kohler, and G. J. Salamo,Phys. Rev. Lett. 96, 066108 �2006�.
13 T. Mano, R. Notzel, G. J. Hamhuis, T. J. Eijkemans, and J. H.
Wolter, Appl. Phys. Lett. 81, 1705 �2002�.14 B. Krause, T. H. Metzger, A. Rastelli, R. Songmuang, S. Kirav-
ittaya, and O. G. Schmidt, Phys. Rev. B 72, 085339 �2005�.15 S. C. Lee, L. R. Dawson, K. J. Malloy, and S. R. Brueck, Appl.
Phys. Lett. 79, 2630 �2001�.16 T. Mano, T. Kuroda, S. Sanguinetti, T. Ochiai, T. Tateno, J. Kim,
T. Noda, M. Kawabe, K. Sakoda, G. Kido, and N. Koguchi,Nano Lett. 5, 425 �2005�.
17 Zh. M. Wang, K. Holmes, J. L. Shultz, and G. J. Salamo, Phys.Status Solidi A 202, R85 �2005�.
18 B. L. Liang, Zh. M. Wang, J. H. Lee, K. Sablon, Yu. I. Mazur, andG. J. Salamo, Appl. Phys. Lett. 89, 043113 �2006�.
19 Zh. M. Wang, K. Holmes, Yu. I. Mazur, K. A. Ramsey, and G. J.Salamo, Nanoscale Res. Lett. 1, 57 �2006�.
20 J. H. Lee, Zh. M. Wang, N. W. Strom, Yu. I. Mazur, and G. J.Salamo, Appl. Phys. Lett. 89, 202101 �2006�.
21 M. Yamagiwa, T. Mano, T. Kuroda, T. Tateno, K. Sakoda, G.Kido, N. Koguchi, and F. Minami, Appl. Phys. Lett. 89, 113115�2006�.
22 A. Richter, G. Behme, M. Süptitz, C. Lienau, T. Elsaesser, M.Ramsteiner, R. Nötzel, and K. H. Ploog, Phys. Rev. Lett. 79,2145 �1997�.
23 C. Lienau, Philos. Trans. R. Soc. London, Ser. A 362, 861 �2004�.24 K. Karrai and R. D. Grober, Appl. Phys. Lett. 66, 1842 �1995�.25 F. Intonti, V. Emiliani, C. Lienau, T. Elsaesser, R. Nötzel, and K.
H. Ploog, Phys. Rev. B 63, 075313 �2001�.26 M. Hanke, M. Schmidbauer, D. Grigoriev, P. Schäfer, R. Köhler,
T. H. Metzger, Z. Wang, Y. Mazur, and G. J. Salamo, Appl.Phys. Lett. 89, 053116 �2006�.
27 Properties of Gallium Arsenide, EMIS Data Reviews Series No. 2�The Institute of Electrical Engineers, London, 1990�.
28 M. Bayer, T. Gutbrod, A. Forchel, V. D. Kulakovskii, A. Gor-bunov, M. Michel, R. Steffen, and K. H. Wang, Phys. Rev. B58, 4740 �1998�.
29 P. Lambelet, A. Sayah, M. Pfeffer, C. Philipona, and F. Marquis-Weible, Appl. Opt. 37, 7289 �1998�.
NEAR-FIELD OPTICAL SPECTROSCOPY OF GaAs /Al… PHYSICAL REVIEW B 77, 075314 �2008�
075314-7