Die Expression des Calcitonin receptor-like receptors in ...
Neurotransmitter receptors
in mouse models of Alzheimer’s disease
Dissertation
zur
Erlangung des Doktorgrades (Dr.rer.nat.)
der
Mathematisch-Naturwissenschaftlichen Fakultät
der
Rheinischen Friedrich-Wilhelms-Universität Bonn
vorgelegt von
Elena von Staden
aus Münster
Bonn, Januar 2014


Angefertigt mit Genehmigung der Mathematisch-Naturwissenschaftlichen Fakultät der
Rheinischen Friedrich-Wilhelms-Universität Bonn
1. Gutachter: Prof. Dr. Karl Zilles
2. Gutachter: Prof. Dr. Gerhard von der Emde
Tag der Promotion: 15. 05. 2014
Erscheinungsjahr: 2014


Für meine Mutter und Großmutter

Table of content I. Introduction ................................................................................................................................... 13
1 Alzheimer’s disease ................................................................................................................... 13
2 Pathological condition ............................................................................................................... 13
3 APP and the generation of plaques ........................................................................................... 14
3.1 Plaques .................................................................................................................................. 14
3.2 Amyloid Precursor Protein (APP)........................................................................................... 15
3.2.1 Non-amyloidogenic pathway............................................................................................. 15
3.2.2 Amyloidogenic pathway .................................................................................................... 16
3.2.3 Endocytic transport of APP ................................................................................................ 17
3.2.4 Neurotoxicity of Aβ ........................................................................................................... 18
4 Genetics of AD ........................................................................................................................... 20
5 Mouse models ........................................................................................................................... 21
5.1 TgArcAβ ................................................................................................................................. 21
5.2 Tg5xFAD ................................................................................................................................. 22
5.3 LRP1 knockout mice .............................................................................................................. 23
6 Aims of the study ....................................................................................................................... 24
II. Material and Methods ................................................................................................................... 25
1 Animals ...................................................................................................................................... 25
2 Preparations of slices ................................................................................................................ 25
2.1 Receptor autoradiography and histological staining ............................................................ 25
2.2 Immunohistochemistry ......................................................................................................... 26
3 Receptor autoradiography ........................................................................................................ 26
3.1 Binding experiments .............................................................................................................. 26
3.2 Film exposure ........................................................................................................................ 30
3.3 Digitization and analysis of the autoradiographic images .................................................... 31
3.4 Calibration, analysis and color coding ................................................................................... 31
4 Statistical analysis ...................................................................................................................... 32
5 Histological staining ................................................................................................................... 33
6 Immunohistochemical staining ................................................................................................. 34
III. Results ........................................................................................................................................... 36
1 Neurotransmitter receptor densities in brains of tg5xFAD, LRP1 and tg5xFAD/LRP1 mice ..... 36
1.1 Glutamate receptors ............................................................................................................. 36
1.1.1 Kainate receptor ................................................................................................................ 38
1.1.2 NMDA receptor ................................................................................................................. 39
1.1.3 mGlu2/3 receptor .............................................................................................................. 40
1.2 Cholinergic receptors ............................................................................................................ 41
1.2.1 Muscarinic acetylcholine receptor M1............................................................................... 44
1.2.2 Muscarinic acetylcholine receptor M2............................................................................... 44
1.2.3 Muscarinic acetylcholine receptor M3............................................................................... 46
1.3 Serotonin receptors ............................................................................................................... 47
1.3.1 5-HT2A receptor .................................................................................................................. 48
1.4 GABA receptors ..................................................................................................................... 49
1.4.1 GABAA receptor ................................................................................................................. 52
1.4.2 GABAA associated benzodiazepine binding sites (BZ) ....................................................... 53
1.4.3 GABAB receptors ................................................................................................................ 54
1.5 Adrenergic receptors ............................................................................................................. 55
1.5.1 α1 receptor ......................................................................................................................... 56
1.5.2 α2 receptor ......................................................................................................................... 57
1.6 Dopamine receptors .............................................................................................................. 58
1.6.1 D1 receptor ......................................................................................................................... 60
1.6.2 D2 receptor ......................................................................................................................... 61
1.6.3 D2/3 receptor ...................................................................................................................... 61
1.7 Adenosine receptor A2 .......................................................................................................... 62
1.7.1 A2 receptor......................................................................................................................... 63
1.8 Summary of all significant differences between LRP1, tg5xFAD and tg5xFAD/LRP1 mice
compared to controls ........................................................................................................................ 64
2 Neurotransmitter receptor densities in brains of tgArcAβ mice .............................................. 66
2.1 Glutamate receptors ............................................................................................................. 66
2.1.1 AMPA receptor .................................................................................................................. 68
2.1.2 Kainate receptor ................................................................................................................ 69
2.1.3 NMDA receptor ................................................................................................................. 70
2.1.4 mGlu2/3 receptor .............................................................................................................. 71
2.2 Cholinergic receptors ............................................................................................................ 72
2.2.1 Muscarinic acetylcholine receptor M1............................................................................... 74
2.2.2 Muscarinic acetylcholine receptor M2............................................................................... 74
2.3 Serotonin receptors ............................................................................................................... 75
2.3.1 5-HT1A receptor .................................................................................................................. 77
2.3.2 5-HT2A receptor .................................................................................................................. 77
2.4 GABA receptors ..................................................................................................................... 78
2.4.1 GABAA receptor ................................................................................................................. 80
2.4.2 GABAA associated benzodiazepine binding sites (BZ) ....................................................... 81
2.4.3 GABAB receptor ................................................................................................................. 82
2.5 Adrenergic receptors ............................................................................................................. 83
2.5.1 α1 receptor ......................................................................................................................... 84
2.5.2 α2 receptor ......................................................................................................................... 85
2.6 Dopamine receptors .............................................................................................................. 86
2.6.1 D1 receptor ......................................................................................................................... 88
2.6.2 D2 receptor ......................................................................................................................... 88
2.6.3 D2/3 receptor ...................................................................................................................... 89
2.7 Adenosine A2 receptor .......................................................................................................... 90
2.7.1 A2 receptors ....................................................................................................................... 90
2.8 Summary of all significant differences in tgArcAβ mice compared to controls .................... 92
3 Immunohistochemical staining ................................................................................................. 94
3.1 LRP1, tg5xFAD and tg5xFAD/LRP1 mice ................................................................................ 94
3.2 tgArcAβ mice ......................................................................................................................... 99
IV. Discussion .................................................................................................................................... 101
1 Glutamate receptors ............................................................................................................... 101
2 Acetylcholine receptors ........................................................................................................... 106
3 Serotonin receptors ................................................................................................................. 109
4 GABA receptors ....................................................................................................................... 111
5 Noradrenaline receptors ......................................................................................................... 112
6 Dopamine receptors ................................................................................................................ 114
7 Correlations between behavior, transmitter and receptor alterations .................................. 116
8 Olfactory function ................................................................................................................... 117
9 Conclusion ............................................................................................................................... 119
V. Summary...................................................................................................................................... 121
VI. Bibliography ................................................................................................................................. 122
VII. Appendix ...................................................................................................................................... 136
1 Chemicals, solutions and technical equipment ....................................................................... 136
2 Raw data .................................................................................................................................. 141
Abbreviations
Aβ β-amyloid
AD Alzheimer’s disease
AICD APP-intracellular domain
α2M α2-macroglobulin
AMPA α-amino-3-hydroxy-5-methyl-4-isoxazolepropionic acid
ANOVA analysis of variance
APP amyloid precursor protein
apoE apolipoprotein E
tgArcAβ mice mice that overexpress APP containing the Swedish, Florida and
London mutation and PS1 containing M146L and L286V
mutations
BZ benzodiazepine
CaMKII Ca(2+)/calmodulin-dependent protein kinase II
cAMP cyclic adenosine monophosphate
CCD charge-coupled device
ChAT acetyltransferase
CNS central nervous system
CPu caudatus-putamen (striatum)
αCTF C-terminal fragment of APP
ER endoplasmic reticulum
FAD familiar AD
tg5xFAD mice mice that overexpress APP containing the Swedish, Florida and
London mutation and PS1 containing two FAD mutations
tg5xFAD/LRP1 mice mice that overexpress APP containing the Swedish, Florida and
London mutation and PS1 containing M146L and L286V
mutations
GABA γ-amino butyric acid
hil hilus fasciae dentatae
LC locus coeruleus
LRP1 low density lipoprotein receptor-related protein 1
LRP1 mice LRP1 knockout mice
LTP long-term potentiation
M1 motor cortex
MBN basalis magnocellularis
mf mossy fiber
mRNA messenger ribonucleic acid
NMDA N-methyl-D-aspartate
NMDAR N-methyl-D-aspartate receptor
OB olfactory bulb
P3 cleavage product of APP
PET positron emission tomography
Pir piriform cortex
PS presenilin
ROI region of interest
RT room temperature
S1 somatosensory cortex
SA specific activity
SD standard deviation
MGr stratum moleculare/granulosum
WT wild type
5-HT serotonin

Introduction
13
I. Introduction
1 Alzheimer’s disease
Alzheimer’s disease (AD) is most common form of dementia (Selkoe, 2001a). It was first
described by the psychiatrist and neuropathologist Alois Alzheimer (1864-1915), who
observed the symptoms of memory disorder in Auguste Deter in 1901. After her death in
1906, he examined her brain and found amyloid plaques and loss of neurons
The disease occurs in a common sporadic and a familiar form (FAD). Both forms show a very
similar clinical and pathological picture. Most patients developing sporadic AD are 65 years
or older and have no family record of AD. For this reason, it is also called late-onset AD.
Patients suffering from FAD are commonly much younger (early-onset AD) and show
mutations on the APP-, PS1- and PS2-gene. Neither the cause nor the pathogenesis have
been understood completely till today, although several risk factors have been described,
such as age, trisomy 21, stress and genetic predisposition. Such a possible genetic risk factor
for sporadic AD is the apolipoprotein E4 (apoE-ε4) (Corder et al., 1993), a component of
lipoproteins which plays an important role in the lipoprotein metabolism (Andersen and
Willnow, 2006). Since the pathological and clinical picture is very similar in both forms, there
are good chances that the analysis of genetic components may help to understand the
sporadic form as well.
Being mostly a disease of older age and having a continuing exponential increase in the aged
population worldwide (Hynd et al., 2004), the number of persons affected by this disease is
rising. Nursing and medical care cause immense costs, and AD is among the most expensive
diseases. Therefore, without effective therapy, AD will present significant social, ethical and
socio-economic demands in the years to come.
2 Pathological condition
AD is characterized by cortical atrophy, neuron and synapse loss, neuritic plaques (chapter
4.1), and neurofibrillary tangles (Terry et al., 1991; Twamley et al., 2006) which consist
mainly of the protein tau. Especially the cholinergic neurons in the cortex and hippocampus
Introduction
14
are affected (Price et al., 1998). The neuropathological changes of AD start well before the
disease becomes clinically apparent (Braak and Braak, 1991). The brain may initially
compensate for such changes until cognitive decline becomes obvious.
AD frequently takes a typical clinical course which reflects the underlying expanding
neuropathology (Förstl and Kurz, 1999). The disease course is divided into four phases, the
pre-dementia, the mild dementia, the moderate dementia and the severe dementia stage.
From the diagnosis till death it takes five to eight years generally (Bracco et al., 1994).
In the beginning, patients show non-specific symptoms as learning disability, headache and
reduced short term memory. Later on the long term memory gets affected as well. As the
disease progresses, speech and cognitive performance as well as spatial and temporal
orientation are impaired. During this process, changes in mood can occur, often
accompanied by depression and anxiety. Motor symptoms are rigidity, taking very small
steps and stereotypical movements.
3 APP and the generation of plaques
3.1 Plaques
Plaques mainly consist of a peptide with the size of 4 kDa, the so called β-amyloid (Aβ)
(Glenner and Wong, 1984), which is generated by proteolytic cleavage of the amyloid
precursor protein (APP). Additional plaque components are for example laminin,
glycosaminoglycans and apolipoproteins. The generation of plaques occurs in the
extracellular space.
One can discriminate between two forms of plaques, namely diffuse and senile plaques.
Senile plaques are largely observed in the gray matter of the brain and have a core of β-
amyloid. They are surrounded by dystrophic neurites. Reactive astrocytes and microglia can
be observed. In contrast to senile plaques, diffuse plaques also consist of Aβ but do not
possess a core. Furthermore, there are no or only few neuritic alterations visible. Diffuse
plaques represent the earliest visible structural change and can be observed in older people
without dementia as well (Price and Morris, 1999).
Introduction
15
3.2 Amyloid Precursor Protein (APP)
APP is an ubiquitously expressed integral membrane protein (Wolfe and Guenette, 2007),
which exists in multiple isoforms due to alternative splicing (Sandbrink et al., 1994; Selkoe,
1994). The most common transcripts are APP695, APP751 and APP770, with APP695 being
the predominant form in neuronal tissue (Ling et al., 2003). APP is coded by a gene of 19
exons, which in humans is located on chromosome 21 and has a length of 400kb (Goldgaber
et al., 1987; Kang et al., 1987; Lamb et al., 1993). The protein itself is made of a large
extramembranous N-terminal region, a single transmembrane domain and a small
cytoplasmic C-terminal tail (Kang et al., 1987). During its processing, it is trafficking through
the endocytic pathway (4.2.3), thereby taking two possible pathways, the non-
amyloidogenic and the amyloidogenic way.
3.2.1 Non-amyloidogenic pathway
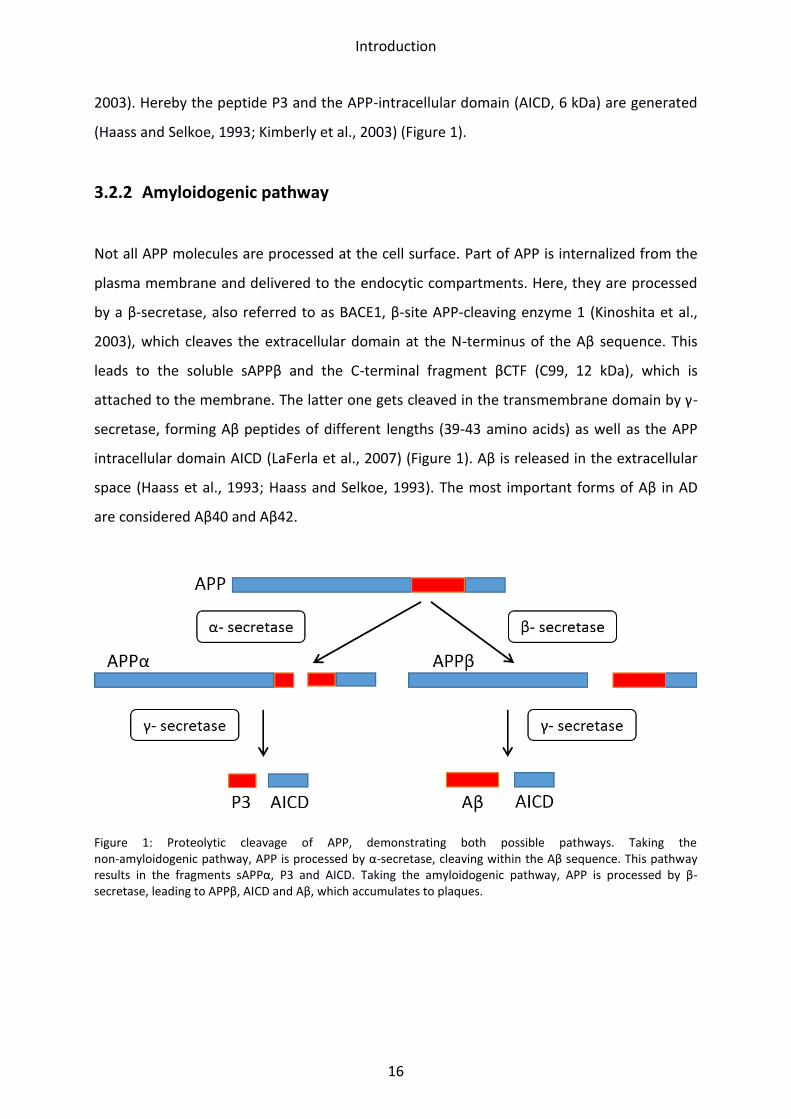
A large number of newly synthesized APP molecules are processed at the cell surface by α-
secretase (Lee et al., 2008), a member of the ADAM (A disintegrin and metalloprotease)
family. Because α-secretase cleaves within the Aβ sequence between the amino acid 16 and
17 (Anderson et al., 1991; Sisodia, 1992), it prevents generation of Aβ (Figure 1). This step
results in the soluble N-terminal APP fragment sAPPα (100-120 kDa) and the C-terminal
fragment αCTF (10 kDa), the latter one still remaining anchored in the membrane
(Weidemann et al., 1989). sAPPα is released in the extracellular space (Racchi and Govoni,
2003). There is growing evidence that sAPP is involved in many physiological processes, such
as neuroprotection, neurite outgrowth, the modulation of ion channels and synaptic
plasticity and neurogenesis (Mattson et al., 1993; Furukawa et al., 1996; Mattson and
Furukawa, 1998; Caille et al., 2004; Ring et al., 2007; Gakhar-Koppole et al., 2008; Taylor et
al., 2008). In early endosomes and the plasma membrane the αCTF fragment is cleaved
within the transmembrane domain by γ-secretase (Kaether et al., 2006). The γ-secretase is a
protease complex consisting of the transmembrane proteins presenilin 1 (PS1) or presenilin
2 (PS2), as well as nicastrin, Aph-1 (anterior pharynx-defective 1) and Pen-2 (presenilin
enhancer 2) as accessory proteins. PS1 or PS2 are the catalytic subunits (Kimberly et al.,
Introduction
16
2003). Hereby the peptide P3 and the APP-intracellular domain (AICD, 6 kDa) are generated
(Haass and Selkoe, 1993; Kimberly et al., 2003) (Figure 1).
3.2.2 Amyloidogenic pathway
Not all APP molecules are processed at the cell surface. Part of APP is internalized from the
plasma membrane and delivered to the endocytic compartments. Here, they are processed
by a β-secretase, also referred to as BACE1, β-site APP-cleaving enzyme 1 (Kinoshita et al.,
2003), which cleaves the extracellular domain at the N-terminus of the Aβ sequence. This
leads to the soluble sAPPβ and the C-terminal fragment βCTF (C99, 12 kDa), which is
attached to the membrane. The latter one gets cleaved in the transmembrane domain by γ-
secretase, forming Aβ peptides of different lengths (39-43 amino acids) as well as the APP
intracellular domain AICD (LaFerla et al., 2007) (Figure 1). Aβ is released in the extracellular
space (Haass et al., 1993; Haass and Selkoe, 1993). The most important forms of Aβ in AD
are considered Aβ40 and Aβ42.
Figure 1: Proteolytic cleavage of APP, demonstrating both possible pathways. Taking the non-amyloidogenic pathway, APP is processed by α-secretase, cleaving within the Aβ sequence. This pathway results in the fragments sAPPα, P3 and AICD. Taking the amyloidogenic pathway, APP is processed by β-secretase, leading to APPβ, AICD and Aβ, which accumulates to plaques.
Introduction
17
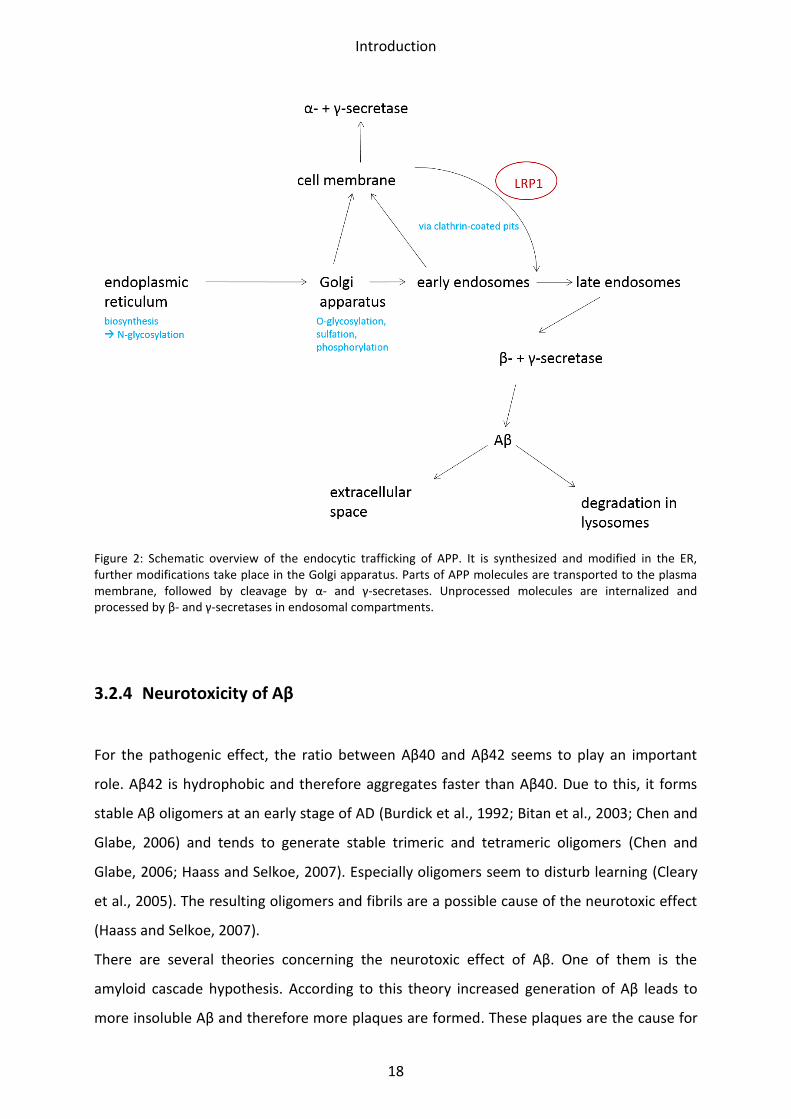
3.2.3 Endocytic transport of APP
APP is synthesized in the rough endoplasmic reticulum (ER) and delivered to the cell
membrane using the secretory pathway (Haass and Selkoe, 1993). Alternatively it may also
be transported to an endosomal compartment (Haass et al., 2012). During its transit through
the Golgi apparatus, major posttranslational modifications such as glycosylation,
phosphorylation and sulfation take place (Rajendran and Annaert, 2012). At the cell
membrane, APP can be processed directly by α- and γ-secretase, as outlined above. The part
of APP which is not processed by α-secretase is reinternalized into endosomal
compartments (Haass et al., 2012). Thereby, the low density lipoprotein receptor-related
protein 1 (LRP1) plays an important role. LRP1 belongs to the LDL receptor gene family (Herz
and Strickland, 2001) and is expressed in all neurons in the brain (Herz and Strickland, 2001;
Ling et al., 2003). It interacts with APP at the cell membrane and in the Golgi apparatus and
therefore enhances the endocytosis and modifies its metabolism. LRP1 seems to interact
with all secretases, too, thus manipulating the access of APP to proteolytic cleavage.
Furthermore, it mediates the clearance of Aβ, either alone or in complexes of Aβ with apoE
(Andersen and Willnow, 2006; Cam and Bu, 2006) as well as the transport of Aβ across the
blood-brain barrier (Shibata et al., 2000; Deane et al., 2004). Cleavage by β-secretases occurs
in the early and late endosomes. γ-secretases activity is present in endosomes and at the cell
surface (O'Brien and Wong, 2011) (Figure 2).
Introduction
18
Figure 2: Schematic overview of the endocytic trafficking of APP. It is synthesized and modified in the ER, further modifications take place in the Golgi apparatus. Parts of APP molecules are transported to the plasma membrane, followed by cleavage by α- and γ-secretases. Unprocessed molecules are internalized and processed by β- and γ-secretases in endosomal compartments.
3.2.4 Neurotoxicity of Aβ
For the pathogenic effect, the ratio between Aβ40 and Aβ42 seems to play an important
role. Aβ42 is hydrophobic and therefore aggregates faster than Aβ40. Due to this, it forms
stable Aβ oligomers at an early stage of AD (Burdick et al., 1992; Bitan et al., 2003; Chen and
Glabe, 2006) and tends to generate stable trimeric and tetrameric oligomers (Chen and
Glabe, 2006; Haass and Selkoe, 2007). Especially oligomers seem to disturb learning (Cleary
et al., 2005). The resulting oligomers and fibrils are a possible cause of the neurotoxic effect
(Haass and Selkoe, 2007).
There are several theories concerning the neurotoxic effect of Aβ. One of them is the
amyloid cascade hypothesis. According to this theory increased generation of Aβ leads to
more insoluble Aβ and therefore more plaques are formed. These plaques are the cause for
Introduction
19
neurodegeneration in the brain and symptoms like neurofibrillary tangles and degeneration
of neurons are the consequence of plaque generation (Hardy and Selkoe, 2002). Reasons for
an increased level of plaques may be changes in the processing of APP or a shift in
Aβ40/Aβ42 ratio. During transition from the soluble to insoluble form Aβ undergoes a
conformational change from α-helix to β- sheet (Zagorski and Barrow, 1992). This
transformation starts from the carboxyterminal end, therefore Aβ with an extended C-
terminal end accumulates faster than those with a truncated C-terminal end (Jarrett et al.,
1993b, a). Furthermore, Aβ42 is more resistant to degeneration (Selkoe, 1999; Glabe, 2001).
As Aβ42 is found in diffuse plaques, it is assumed that Aβ40 and fibril Aβ42 are enclaved in
diffuse plaques, which causes senile plaques (Selkoe, 2001b). The amyloid cascade theory is
supported by the fact that mutations in the tau gene alone cause no condition comparable
to AD (Hardy et al., 1998). However, there are some arguments against the amyloid cascade
hypothesis. The most important point is the weak correlation of plaques and early cognitive
decline (Terry et al., 1991; McLean et al., 1999). Furthermore, in brains of some elderly
people without AD, diffuse plaques can be observed (Price and Morris, 1999). These plaques
have no associated neuritic alterations and do not seem to be toxic (Selkoe, 1996). Taken
together, these facts indicate that plaques play an important role in the generation of AD,
but are not the exclusive cause.
Alternatively soluble Aβ42 oligomers are discussed as the primary cause of AD (Lambert et
al., 1998; Selkoe, 2002). Recent studies have shown impairment of the cognitive function
provoked by Aβ oligomers (Walsh et al., 2002; Cleary et al., 2005; Shankar et al., 2008).
Furthermore, they are able to bind at the surface of synapses and dendrites which can lead
to synaptic dysfunction (Lacor et al., 2004). Since they can be generated with only few
monomers, formation of oligomers is an early event in the course of the disease.
There is also increasing evidence that Aβ, besides the formation of plaque deposition,
accumulates intracellularly which is initially involved in AD (Wirths et al., 2004). Recent
studies have shown that Aβ exists not only as insoluble extracellular plaques, but also
intracellularly as soluble oligomers. One theory is that Aβ monomers and oligomers first
accumulate intracellularly and are secreted afterwards in the extracellular space. There,
oligomers can further aggregate into plaques (LaFerla et al., 2007). Due to this theory,
accumulation of intracellular Aβ could be a cause of AD. It occurs earlier than the generation
of extracellular plaques and correlates well with the appearance of cognitive decline in
Introduction
20
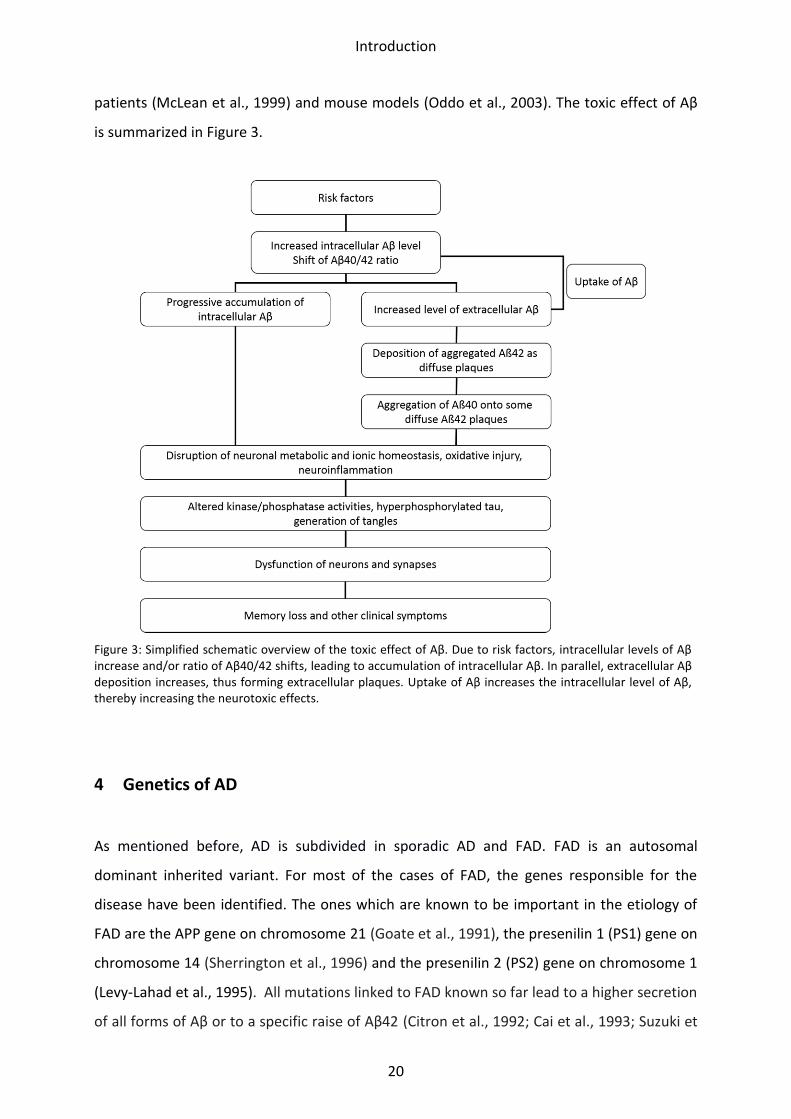
patients (McLean et al., 1999) and mouse models (Oddo et al., 2003). The toxic effect of Aβ
is summarized in Figure 3.
Figure 3: Simplified schematic overview of the toxic effect of Aβ. Due to risk factors, intracellular levels of Aβ increase and/or ratio of Aβ40/42 shifts, leading to accumulation of intracellular Aβ. In parallel, extracellular Aβ deposition increases, thus forming extracellular plaques. Uptake of Aβ increases the intracellular level of Aβ, thereby increasing the neurotoxic effects.
4 Genetics of AD
As mentioned before, AD is subdivided in sporadic AD and FAD. FAD is an autosomal
dominant inherited variant. For most of the cases of FAD, the genes responsible for the
disease have been identified. The ones which are known to be important in the etiology of
FAD are the APP gene on chromosome 21 (Goate et al., 1991), the presenilin 1 (PS1) gene on
chromosome 14 (Sherrington et al., 1996) and the presenilin 2 (PS2) gene on chromosome 1
(Levy-Lahad et al., 1995). All mutations linked to FAD known so far lead to a higher secretion
of all forms of Aβ or to a specific raise of Aβ42 (Citron et al., 1992; Cai et al., 1993; Suzuki et
Introduction
21
al., 1994; Tamaoka et al., 1994; Borchelt et al., 1996; Duff et al., 1996; Scheuner et al., 1996;
Citron et al., 1997; Haass and Steiner, 2002). In PS1, more than 100 mutations, spread
throughout the molecule, are known. All of these mutations lead to an increased ratio of
Aβ42 to Aβ40, increased plaque deposition and early age of onset (Berezovska et al., 2005).
The generation of Aβ also occurs in persons without cognitive impairment. Here, Aβ can be
found in the cerebrospinal fluid (Seubert et al., 1992). It is also found in the supernatant of
mixed-brain cell culture and human kidney 293 cells transfected with APP (Haass et al., 1992;
Seubert et al., 1992). All processing products seem to play a physiological role. Under normal
conditions, intracellular Aβ is efficiently secreted. But certain mutations, like the Artic and
Swedish mutation of APP, cause an enhancement of the intracellular retention (Rajendran et
al., 2007). All these alterations cause impaired Aβ processing, leading to increased plaque
deposition. The consequence is an early onset of the disease, usually between 50 and 65
years of age, though it can occur much earlier.
5 Mouse models
For this study, well established mouse models of AD were used. The mouse models
displayed some neuropathological and behavioral features of AD, such as enhanced levels of
Aβ or plaque deposition and cognitive impairment. However, no model did reflect the
disease completely, since they generate no tau tangles and in tgArcAβ mice no
neurodegeneration occurs. However, animal models mirror some aspects of the pathology,
therefore, they prove to be a useful tool to investigate the pathogenesis of AD.
5.1 TgArcAβ
The transgenic (tg) ArcAβ mouse model overexpresses human APP with the Swedish and the
Arctic mutation combined in a single construct (Knobloch et al., 2007). The Swedish
mutation is a double mutation, which is located right before the N-terminus of the Aβ
domain of APP. Lysine is substituted to asparagine at codon 670 and methionine to leucine
at codon 671 (K670N, M671L) (Mullan et al., 1992). This causes a three to six times increase
in the production of total Aβ (Citron et al., 1992; Cai et al., 1993; Oakley et al., 2006).
Introduction
22
Furthermore, P3 is decreased by several times in the supernatant of cultured cells (Citron et
al., 1992). The Arctic mutation is located at codon 693 within the Aβ region of APP, where
glutamic acid is replaced by glycine (E693G) (Nilsberth et al., 2001). This mutation causes
reduced extracellular Aβ levels (Nilsberth et al., 2001). Aβarc40 has been shown to
aggregate faster than wild type Aβ40 (Murakami et al., 2002) and to form soluble protofibrils
more rapidly (Nilsberth et al., 2001). The same holds true for Aβarc42 (Johansson et al.,
2006).
The tgArcAβ model shows age-dependent increases in Aβ levels in neuronal tissues and
develops strong intraneuronal Aβ aggregation at three months of age, prior to extracellular
plaque formation (Lord et al., 2006). The maximum of intracellular deposits attains between
7 and 15 months (Knobloch et al., 2007). Plaque deposition starts around 7 months of age,
with a dramatic increase between 9 and 15 months. Memory is impaired from the age of 6
months on (Knobloch et al., 2007).
5.2 Tg5xFAD
Tg5xFAD is a transgenic mouse line that co-overexpresses human APP695 harboring the
Swedish, Florida and London mutation in the same APP molecule and human PS1 containing
two FAD mutations (M146L and L286V). The Swedish mutation was described above
(chapter 5.1).
In the Florida mutation isoleucine is changed to valine at codon 716. This mutation causes
about a 2-fold increase in the ratio of Aβ42 to Aβ40 (Eckman et al., 1997). The London
mutation causes an amino-acid substitution as well. At codon 717, valine is changed to
isoleucine. This takes place within the transmembrane domain, two residues apart from the
carboxy terminus of the β-amyloid peptide (Goate et al., 1991).
Previous studies have suggested that mutations which elevate the Aβ42 level, act in an
additive manner to increase Aβ42 generation when integrated within the same molecule
(Oakley et al., 2006). In the tg5xFAD mouse model, the combination of the London and the
Florida mutation within APP doubled Aβ42 production when compared to each mutation
alone (Oakley et al., 2006). The same is true for the two PS1 mutations when introduced
together into the PS1 gene (Citron et al., 1998). Moreover, the combination of mutations in
APP and PS1 also add to each other to increase the Aβ42 generation (Citron et al., 1998).
Introduction
23
Due to this effect, tg5xFAD mice show a very high level of Aβ42 and develop cerebral
amyloid plaques and gliosis at the age of two months. Furthermore, synaptic markers are
reduced and neuron loss as well as memory impairment in the Y-maze can be observed
(Oakley et al., 2006).
5.3 LRP1 knockout mice
The low density lipoprotein receptor related protein (LRP1) is highly expressed in neurons of
the central nervous system (CNS) (Bu et al., 1994; Andersen and Willnow, 2006).
An essential component of neuronal membrane is cholesterol, therefore having a great
importance for synaptic integrity and neuronal function (Liu et al., 2010). Efficacy of
synapses requires interaction of cholesterol with apolipoprotein (apoE) and its receptors
(Mauch et al., 2001), thus, depletion of cholesterol/sphingolipid causes gradual loss of
synapses and dendritic spines (Hering et al., 2003; Liu et al., 2010). Cholesterol and other
lipids are transported to neurons via apoE receptors. The presence of the ε4 allele apoE gene
has been identified as a strong risk factor for sporadic AD (Corder et al., 1993). It is likely,
that apoE4 promotes Aβ fibrillogenesis and amyloid plaque formation (Liu et al., 2007).
Another risk factor found for sporadic AD is α2-macroglobulin (α2M), a plasma protein which
is part of the innate immune system (Blacker et al., 1998). Besides the ability to bind APP, Aβ
and secretases, as described in chapter 3.2.3, LRP1 interacts with both apoE and α2M.
Moreover, LRP1 mediates the clearance of Aβ, which for example involves cellular uptake
and degradation and clearance through the blood brain barrier (Bu, 2009; Kanekiyo et al.,
2011). Furthermore, γ-secretases-dependent APP processing seems to be involved in the
regulation of brain cholesterol via transcriptional repression of LRP1 (Liu et al., 2007; Bu,
2009). Increasing evidence point towards a role of abnormal cholesterol metabolism in AD,
such as reduced level of cholesterol and LRP1 in the brain of AD patients (Kang et al., 2000;
Vance et al., 2006).
Since LRP1 full knockout mice (LRP1 mice) are embryonic lethal, neuronal conditional LRP1
knockout mice were used. Initially, they have the same size and weight compared to wt
mice, but fall behind in their growth rate eventually. LRP1 mice show increased voluntary
movement and a constant muscle tremor. At the age of 18 months, LRP1 mice traveled
longer distances compared to control animal, indicating hyperactivity in LRP1 mice.
Introduction
24
Furthermore, behavioral test showed memory impairment at 24 months of age as well as
LTP deficiency measured in slices (Liu et al., 2010).
6 Aims of the study
In this work, the density and distribution of neurotransmitter receptor binding sites was
analyzed in four mouse models of AD using quantitative receptor autoradiography in unfixed
frozen brain tissue (Zilles et al., 2002b; Zilles et al., 2004). Since receptors interact with each
other, alterations of a single receptor often affect other receptors as well. For that reason,
17 to 19 different receptors, relevant for seven different neurotransmitter systems, were
investigated in eight brain regions.
The aim of the present study is the characterization of the neurotransmitter receptor
expression in the brain of four mouse models of AD. Two models (tgArcA, tg5xFAD) reflect
mutations associated with FAD. These models express enhanced levels of Aβ, a crucial
hallmark of AD. LRP1 knockout mice are analyzed, which show a reduced clearance of Aβ
and an impaired cholesterol metabolism as a possible risk factors of AD. Finally, the density
and distribution of receptors are investigated in a mouse model (tg5xFAD/LRP1), which
combines both factors, enhanced Aβ levels and LRP1 knockout. The correlation between
alterations of receptor and neuropathological changes (i.e., presence of Aβ and plaque
deposition) in AD will be discussed.
Material and Methods
25
II. Material and Methods
1 Animals
All animals were kept under standard conditions with free access to food and water. The
experiments were carried out according to the German animal welfare guidelines and
approved by the responsible government agency (Landesamt für Natur, Umwelt und
Verbraucherschutz). All mice used were adult males.
Transgene ArcAβ (tgArcAβ) and the corresponding control mice (C57Bl/6) were kindly
provided by Dr. Jan Deussing, Molecular Neurogenetics, Max Planck Institute of Psychiatry,
Munich. Their age was 8 months.
Transgene 5xFAD (tg5xFAD), LRP1 knock out (LRP1 mice) and tg5xFAD/ LRP1 as well as
corresponding control mice (129xBl/6) were kindly provided by the group of Prof. Dr.
Thomas Willnow, Molecular Physiology, Max Delbrück Center for Molecular Medicine
(MDC). LRP1, tg5xFAD and tg5xFAD/LRP1 mice were between 4 and 6 months old.
Mice were anesthetized with CO2 and sacrificed by decapitation. Brains were removed from
the skull and frozen in isopentane at -50°C for 2 minutes. For storage, brains were packed in
plastic bags and kept at -80°C.
2 Preparations of slices
2.1 Receptor autoradiography and histological staining
Brains were kept for 30 minutes at -15°C in the cryostat microtome (Leica Instruments
GmbH, Germany), and fixed for sectioning using a tissue freezing medium (Tissue Tec, Jung).
Coronal serial sections were prepared at -15°C. In case of the tgArcAβ mice, 20μm slices
were thaw-mounted on pre-cooled gelatin-coated glass slides. The sections of LRP1, tg5xFAD
and tg5xFAD/LRP1 mice were 10μm thick and thaw-mounted on pre-cooled silanized glass
slides. Sections were dried on a heating plate at 37°C for 20 minutes, packed in freezer bags,
vacuum sealed and stored at -80°C.
Material and Methods
26
2.2 Immunohistochemistry
Preparation of sections for immunohistochemistry was done according to the same protocol
as described in chapter 2.1. Sections were shortly thawed and stored in plastic boxes at
-15°C during preparation, immersion-fixed in 4% (w/v) paraformaldehyde for 10 minutes,
dried at room temperature for 10 minutes, vacuum sealed and stored at -80°C.
3 Receptor autoradiography
3.1 Binding experiments
One hour before binding experiments started, sections were defrosted on a heating plate at
37°C.
Receptor labeling using autoradiography was carried out according to previously described
standardized protocols (Zilles et al., 2002; Palomero-Gallagher et al., 2003). Each protocol
consists of three steps, pre-washing, main incubation and rinsing. During the first step, the
sections are incubated in the respective buffer, to rehydrate the slices, to wash out
endogenous ligands and to adapt pH value.
In a second step (main incubation), sections were incubated either in a buffer solution
containing a [3H]-labeled ligand in nM concentrations (total binding), or a [3H]-ligand
together with M concentrations of a respective non-radioactive displacer (non-specific
binding). Concentrations of the respective radioactive ligand in buffer solution were
measured by three-fold liquid scintillation. The specific binding is the difference between
total binding and non-specific binding, identified in alternating sections. In general, the non-
specific binding was lower than 10%. Therefore, the total binding is a good measure of the
specific binding.
The third step (rinsing in water) terminated the incubation, and eliminated the non-bound
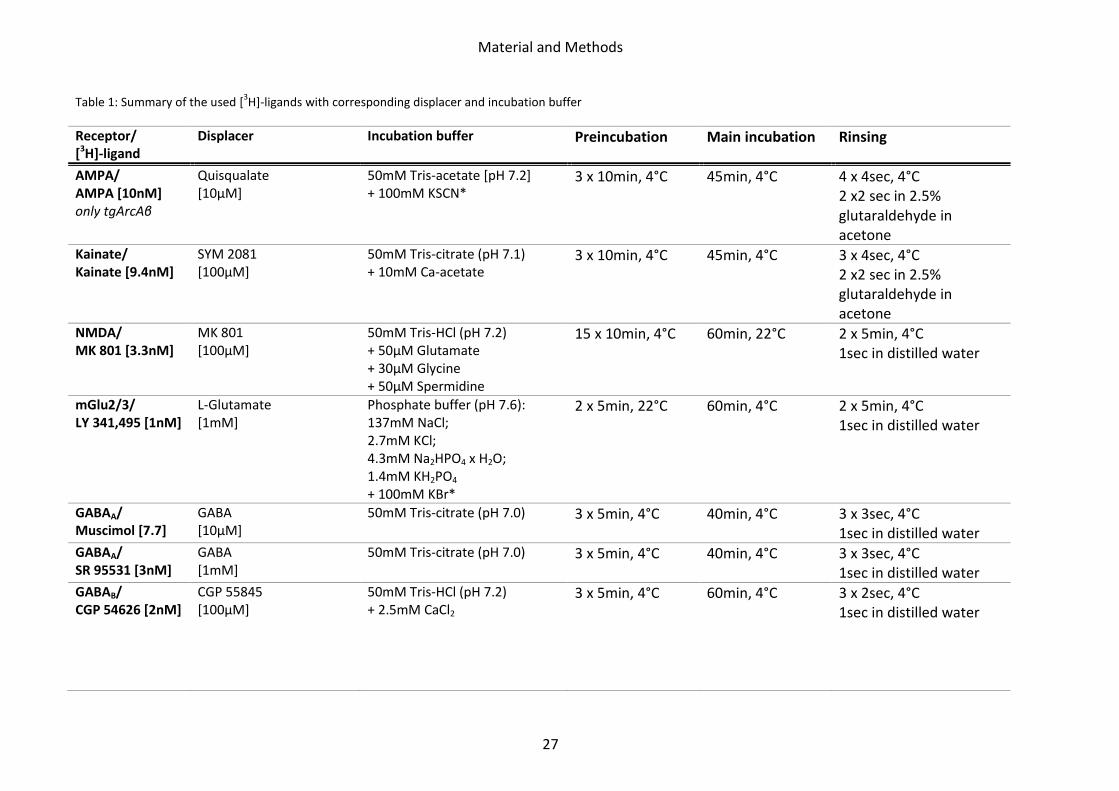
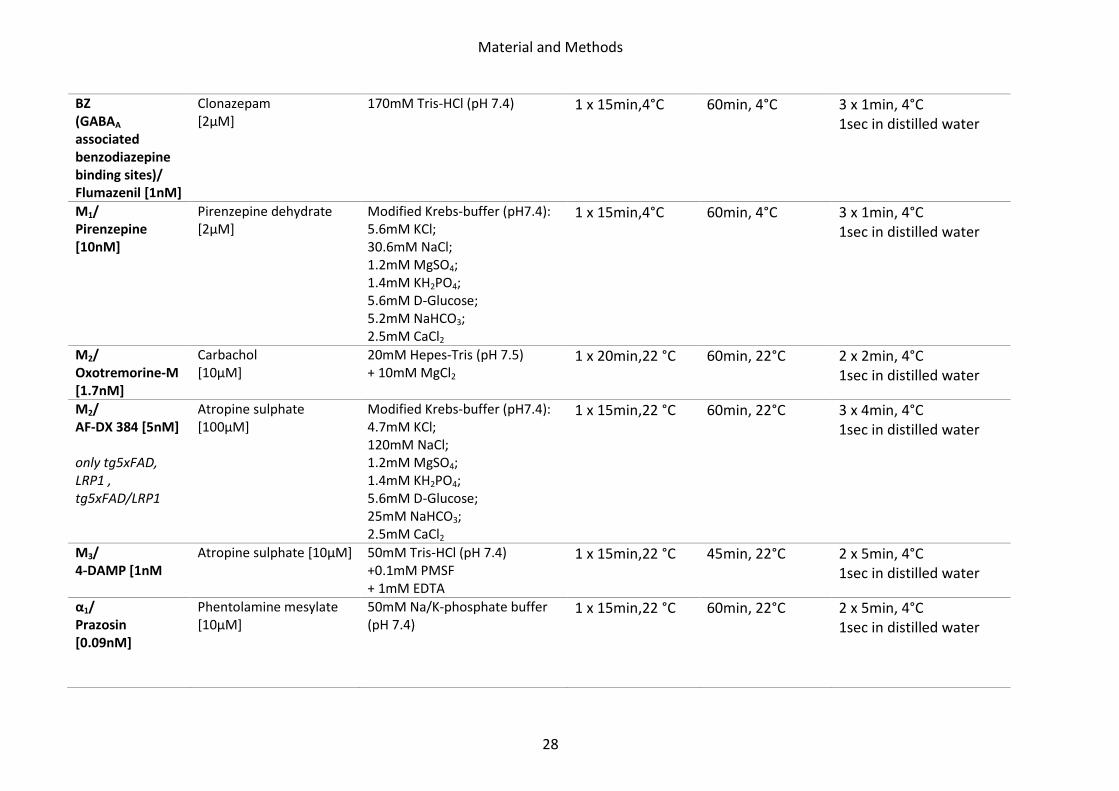
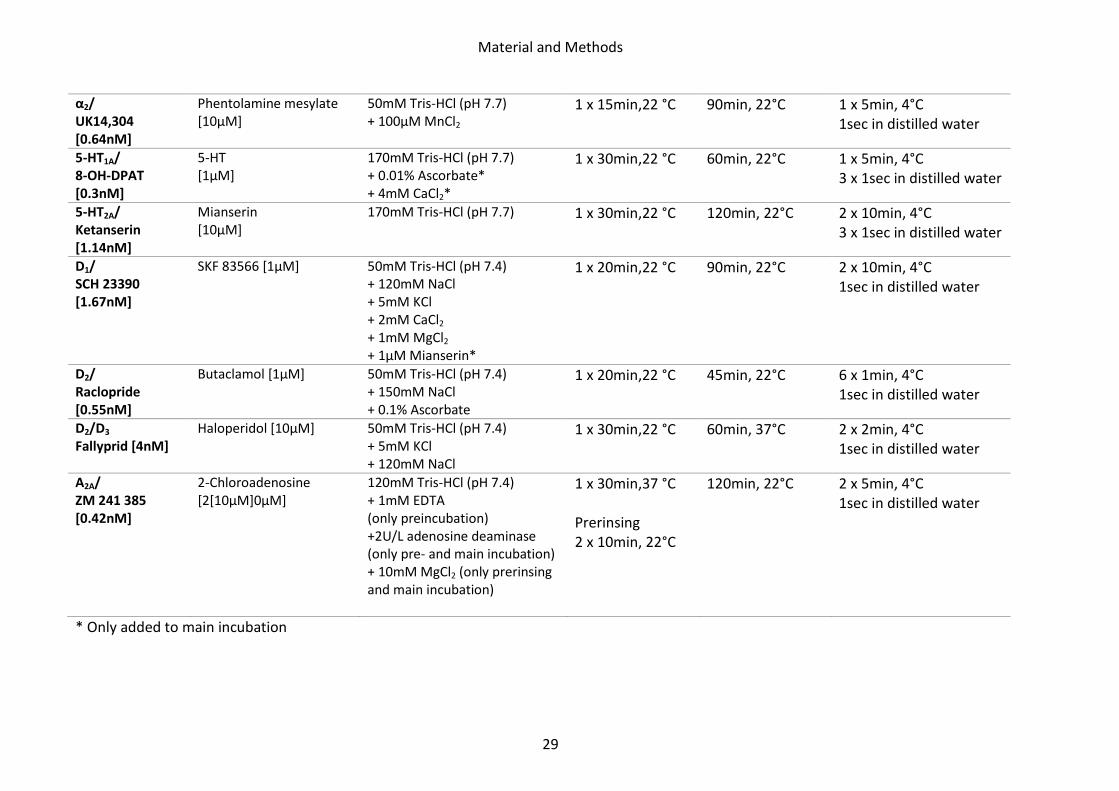
ligands and buffer salts. The specific protocols of each binding experiment are listed in
Table 1.
The sections were air-dried under a cold-air fan and stored on wooden tables at room
temperature.
Material and Methods
27
Table 1: Summary of the used [3H]-ligands with corresponding displacer and incubation buffer
Receptor/ [3H]-ligand
Displacer Incubation buffer Preincubation Main incubation Rinsing
AMPA/ AMPA [10nM] only tgArcAβ
Quisqualate [10µM]
50mM Tris-acetate [pH 7.2] + 100mM KSCN*
3 x 10min, 4°C 45min, 4°C 4 x 4sec, 4°C 2 x2 sec in 2.5% glutaraldehyde in acetone
Kainate/ Kainate [9.4nM]
SYM 2081 [100µM]
50mM Tris-citrate (pH 7.1) + 10mM Ca-acetate
3 x 10min, 4°C 45min, 4°C 3 x 4sec, 4°C 2 x2 sec in 2.5% glutaraldehyde in acetone
NMDA/ MK 801 [3.3nM]
MK 801 [100µM]
50mM Tris-HCl (pH 7.2) + 50µM Glutamate + 30µM Glycine + 50µM Spermidine
15 x 10min, 4°C 60min, 22°C 2 x 5min, 4°C 1sec in distilled water
mGlu2/3/ LY 341,495 [1nM]
L-Glutamate [1mM]
Phosphate buffer (pH 7.6): 137mM NaCl; 2.7mM KCl; 4.3mM Na2HPO4 x H2O; 1.4mM KH2PO4 + 100mM KBr*
2 x 5min, 22°C 60min, 4°C 2 x 5min, 4°C 1sec in distilled water
GABAA/ Muscimol [7.7]
GABA [10µM]
50mM Tris-citrate (pH 7.0) 3 x 5min, 4°C 40min, 4°C 3 x 3sec, 4°C 1sec in distilled water
GABAA/ SR 95531 [3nM]
GABA [1mM]
50mM Tris-citrate (pH 7.0) 3 x 5min, 4°C 40min, 4°C 3 x 3sec, 4°C 1sec in distilled water
GABAB/ CGP 54626 [2nM]
CGP 55845 [100µM]
50mM Tris-HCl (pH 7.2) + 2.5mM CaCl2
3 x 5min, 4°C 60min, 4°C 3 x 2sec, 4°C 1sec in distilled water
Material and Methods
28
BZ (GABAA associated benzodiazepine binding sites)/ Flumazenil [1nM]
Clonazepam [2µM]
170mM Tris-HCl (pH 7.4) 1 x 15min,4°C 60min, 4°C 3 x 1min, 4°C 1sec in distilled water
M1/ Pirenzepine [10nM]
Pirenzepine dehydrate [2µM]
Modified Krebs-buffer (pH7.4): 5.6mM KCl; 30.6mM NaCl; 1.2mM MgSO4; 1.4mM KH2PO4; 5.6mM D-Glucose; 5.2mM NaHCO3; 2.5mM CaCl2
1 x 15min,4°C 60min, 4°C 3 x 1min, 4°C 1sec in distilled water
M2/ Oxotremorine-M [1.7nM]
Carbachol [10µM]
20mM Hepes-Tris (pH 7.5) + 10mM MgCl2
1 x 20min,22 °C 60min, 22°C 2 x 2min, 4°C 1sec in distilled water
M2/ AF-DX 384 [5nM]
only tg5xFAD, LRP1 , tg5xFAD/LRP1
Atropine sulphate [100µM]
Modified Krebs-buffer (pH7.4): 4.7mM KCl; 120mM NaCl; 1.2mM MgSO4; 1.4mM KH2PO4; 5.6mM D-Glucose; 25mM NaHCO3; 2.5mM CaCl2
1 x 15min,22 °C
60min, 22°C 3 x 4min, 4°C 1sec in distilled water
M3/ 4-DAMP [1nM
Atropine sulphate [10µM] 50mM Tris-HCl (pH 7.4) +0.1mM PMSF + 1mM EDTA
1 x 15min,22 °C
45min, 22°C 2 x 5min, 4°C 1sec in distilled water
α1/ Prazosin [0.09nM]
Phentolamine mesylate [10µM]
50mM Na/K-phosphate buffer (pH 7.4)
1 x 15min,22 °C
60min, 22°C 2 x 5min, 4°C 1sec in distilled water
Material and Methods
29
α2/ UK14,304 [0.64nM]
Phentolamine mesylate [10µM]
50mM Tris-HCl (pH 7.7) + 100µM MnCl2
1 x 15min,22 °C
90min, 22°C 1 x 5min, 4°C 1sec in distilled water
5-HT1A/ 8-OH-DPAT [0.3nM]
5-HT [1µM]
170mM Tris-HCl (pH 7.7) + 0.01% Ascorbate* + 4mM CaCl2*
1 x 30min,22 °C
60min, 22°C 1 x 5min, 4°C 3 x 1sec in distilled water
5-HT2A/ Ketanserin [1.14nM]
Mianserin [10µM]
170mM Tris-HCl (pH 7.7) 1 x 30min,22 °C
120min, 22°C 2 x 10min, 4°C 3 x 1sec in distilled water
D1/ SCH 23390 [1.67nM]
SKF 83566 [1µM] 50mM Tris-HCl (pH 7.4) + 120mM NaCl + 5mM KCl + 2mM CaCl2
+ 1mM MgCl2 + 1µM Mianserin*
1 x 20min,22 °C
90min, 22°C 2 x 10min, 4°C 1sec in distilled water
D2/ Raclopride [0.55nM]
Butaclamol [1µM] 50mM Tris-HCl (pH 7.4) + 150mM NaCl + 0.1% Ascorbate
1 x 20min,22 °C
45min, 22°C 6 x 1min, 4°C 1sec in distilled water
D2/D3
Fallyprid [4nM] Haloperidol [10µM] 50mM Tris-HCl (pH 7.4)
+ 5mM KCl + 120mM NaCl
1 x 30min,22 °C
60min, 37°C 2 x 2min, 4°C 1sec in distilled water
A2A/
ZM 241 385 [0.42nM]
2-Chloroadenosine [2[10µM]0µM]
120mM Tris-HCl (pH 7.4) + 1mM EDTA (only preincubation) +2U/L adenosine deaminase (only pre- and main incubation) + 10mM MgCl2 (only prerinsing and main incubation)
1 x 30min,37 °C Prerinsing 2 x 10min, 22°C
120min, 22°C 2 x 5min, 4°C 1sec in distilled water
* Only added to main incubation
Material and Methods
30
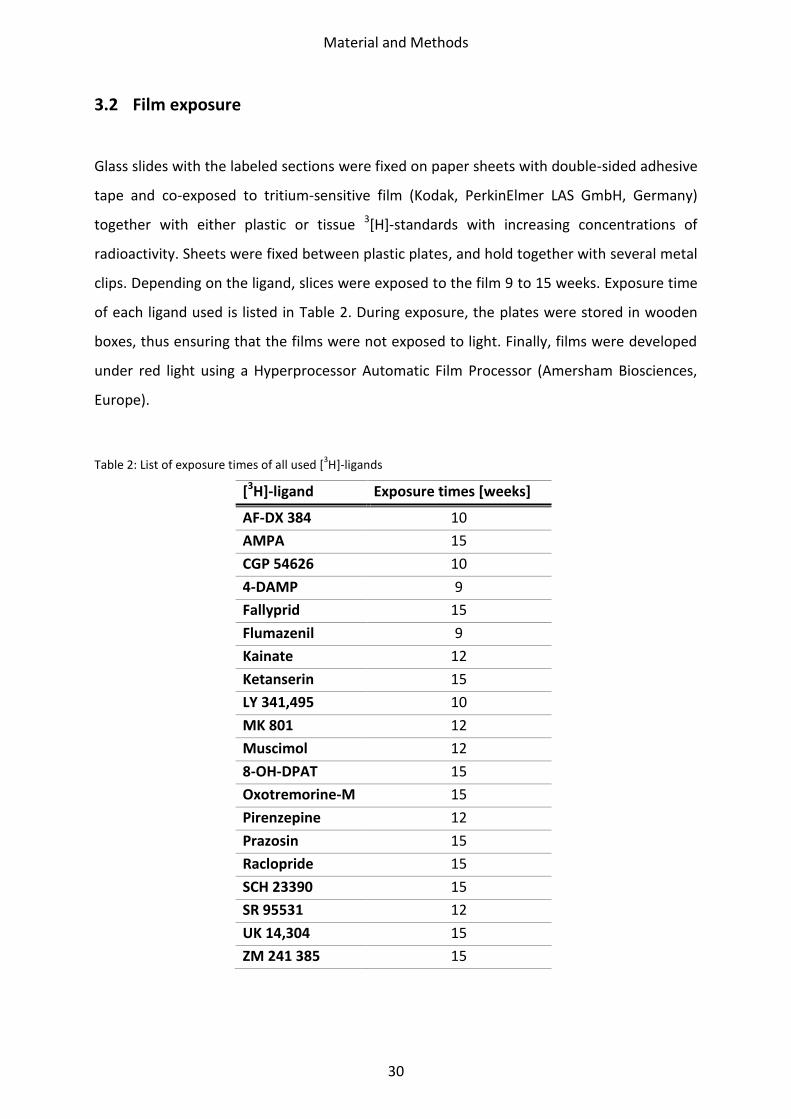
3.2 Film exposure
Glass slides with the labeled sections were fixed on paper sheets with double-sided adhesive
tape and co-exposed to tritium-sensitive film (Kodak, PerkinElmer LAS GmbH, Germany)
together with either plastic or tissue 3[H]-standards with increasing concentrations of
radioactivity. Sheets were fixed between plastic plates, and hold together with several metal
clips. Depending on the ligand, slices were exposed to the film 9 to 15 weeks. Exposure time
of each ligand used is listed in Table 2. During exposure, the plates were stored in wooden
boxes, thus ensuring that the films were not exposed to light. Finally, films were developed
under red light using a Hyperprocessor Automatic Film Processor (Amersham Biosciences,
Europe).
Table 2: List of exposure times of all used [3H]-ligands
[3H]-ligand Exposure times [weeks]
AF-DX 384 10
AMPA 15
CGP 54626 10
4-DAMP 9
Fallyprid 15
Flumazenil 9
Kainate 12
Ketanserin 15
LY 341,495 10
MK 801 12
Muscimol 12
8-OH-DPAT 15
Oxotremorine-M 15
Pirenzepine 12
Prazosin 15
Raclopride 15
SCH 23390 15
SR 95531 12
UK 14,304 15
ZM 241 385 15
Material and Methods
31
3.3 Digitization and analysis of the autoradiographic images
The autoradiographic images were digitized and analyzed using a video based technique
(Zilles and Schleicher, 1991). Images were placed on a homogenously illuminated table, and
digital images were taken using a fixed CCD-camera (Zeiss, Carl Zeiss Mikro Imaging GmbH,
Germany), and the AxioVision-Software system, Version 4.8 (Zeiss, Carl Zeiss Mikro Imaging
GmbH, Germany). Images were saved 8-bit coded in 256 gray values, at which 0 means black
and 256 white, having a resolution of 4164x3120 pixels. To avoid diffuse and uneven
illumination, shading correction was done each day. Furthermore, at the beginning of
digitization of each series of images, the intensity of the light source and the aperture of the
macro lens were adjusted measuring a blank area of the exposed film. Additional steps were
reduction of stray light and sufficient warm-up of the light source and the camera to avoid
shifts in the system (Zilles et al., 2002).
3.4 Calibration, analysis and color coding
The standards with known concentrations were used to calculate a non-linear
transformation curve, respectively, to define the correlation between the measured gray
values of the autoradiograph and the receptor concentration (Zilles et al., 2004).
Based on the transformation curve, the autoradiograph itself was converted into images
with pixel values representing concentrations of radioactivity, given in fmol/mg protein
(Zilles and Schleicher, 1995; Zilles et al., 2002a). The consequence is an image in which the
gray values are a linear function of the concentration of radioactivity.
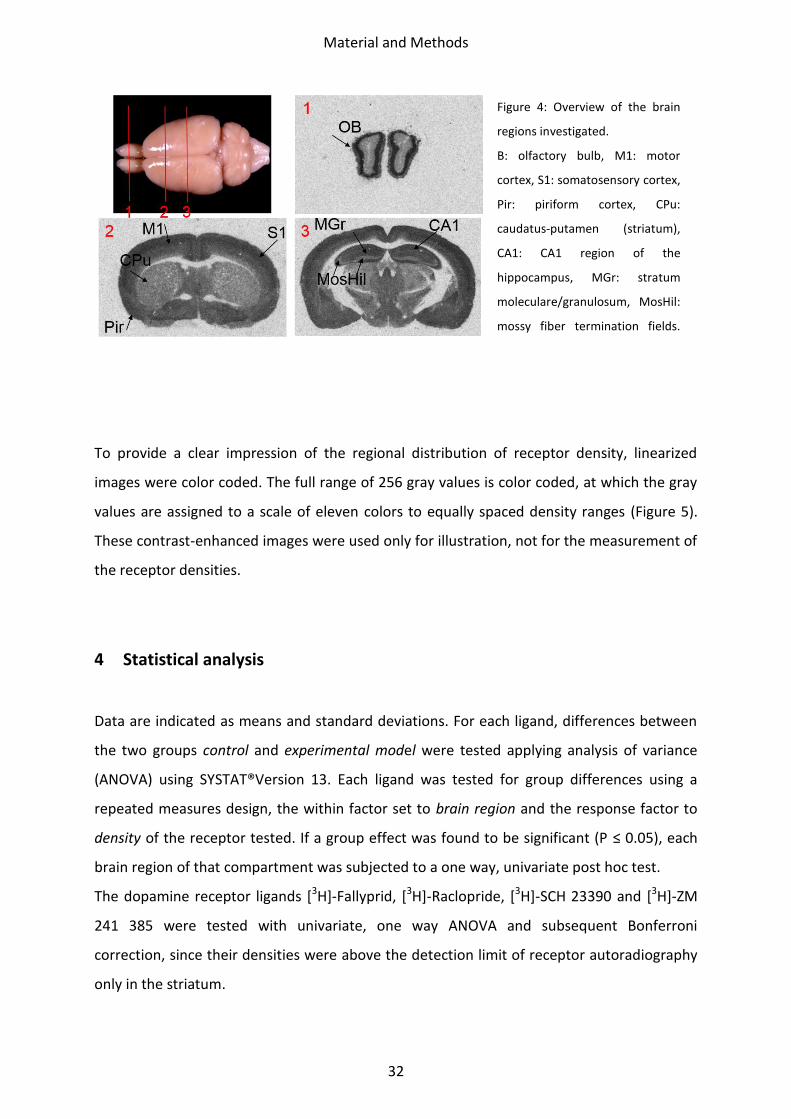
Eight brain regions, the regions of interest (ROI), were defined. ROIs were the olfactory bulb,
the motor, somatosensory and piriform cortex, striatum (caudatus-putamen), as well as CA1
region, mossy fiber termination fields/hilus and stratum moleculare/granulosum in the
hippocampus (Figure 4). The receptor density was analyzed in each of these ROIs using the
AxioVision software. Per ROI and animal, three sections were measured.
Material and Methods
32
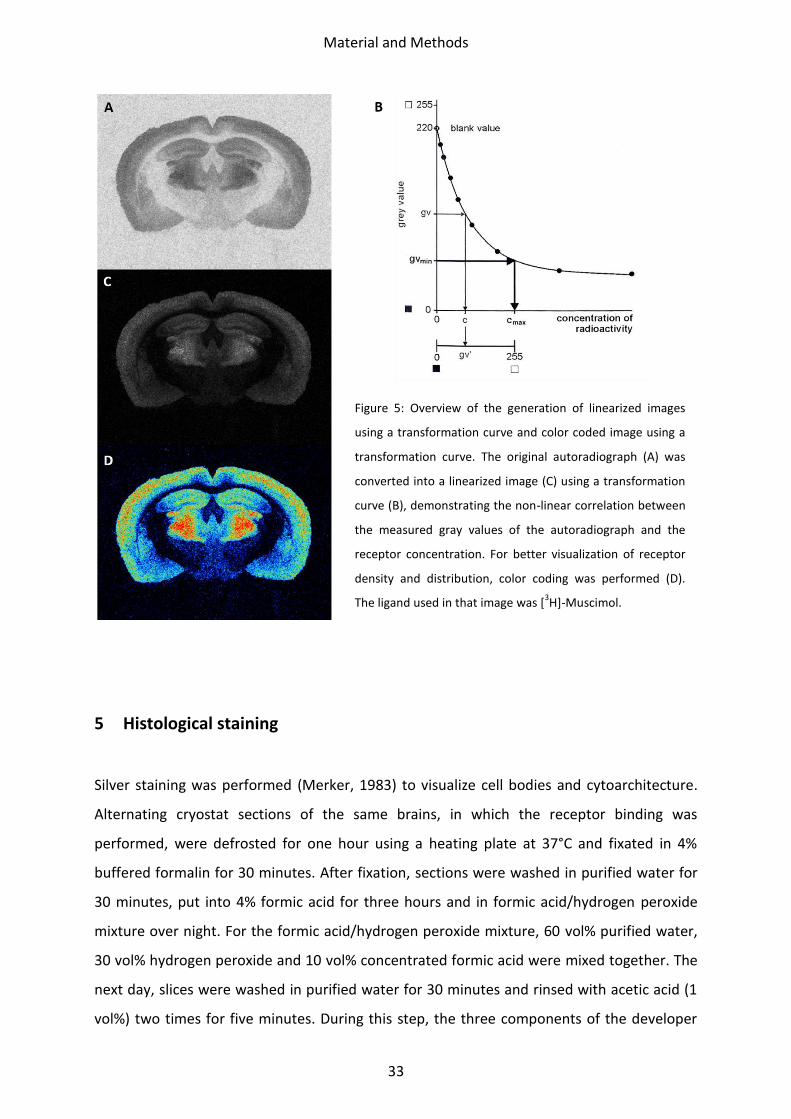
To provide a clear impression of the regional distribution of receptor density, linearized
images were color coded. The full range of 256 gray values is color coded, at which the gray
values are assigned to a scale of eleven colors to equally spaced density ranges (Figure 5).
These contrast-enhanced images were used only for illustration, not for the measurement of
the receptor densities.
4 Statistical analysis
Data are indicated as means and standard deviations. For each ligand, differences between
the two groups control and experimental model were tested applying analysis of variance
(ANOVA) using SYSTAT®Version 13. Each ligand was tested for group differences using a
repeated measures design, the within factor set to brain region and the response factor to
density of the receptor tested. If a group effect was found to be significant (P ≤ 0.05), each
brain region of that compartment was subjected to a one way, univariate post hoc test.
The dopamine receptor ligands [3H]-Fallyprid, [3H]-Raclopride, [3H]-SCH 23390 and [3H]-ZM
241 385 were tested with univariate, one way ANOVA and subsequent Bonferroni
correction, since their densities were above the detection limit of receptor autoradiography
only in the striatum.
Figure 4: Overview of the brain
regions investigated.
B: olfactory bulb, M1: motor
cortex, S1: somatosensory cortex,
Pir: piriform cortex, CPu:
caudatus-putamen (striatum),
CA1: CA1 region of the
hippocampus, MGr: stratum
moleculare/granulosum, MosHil:
mossy fiber termination fields.
Material and Methods
33
5 Histological staining
Silver staining was performed (Merker, 1983) to visualize cell bodies and cytoarchitecture.
Alternating cryostat sections of the same brains, in which the receptor binding was
performed, were defrosted for one hour using a heating plate at 37°C and fixated in 4%
buffered formalin for 30 minutes. After fixation, sections were washed in purified water for
30 minutes, put into 4% formic acid for three hours and in formic acid/hydrogen peroxide
mixture over night. For the formic acid/hydrogen peroxide mixture, 60 vol% purified water,
30 vol% hydrogen peroxide and 10 vol% concentrated formic acid were mixed together. The
next day, slices were washed in purified water for 30 minutes and rinsed with acetic acid (1
vol%) two times for five minutes. During this step, the three components of the developer
Figure 5: Overview of the generation of linearized images
using a transformation curve and color coded image using a
transformation curve. The original autoradiograph (A) was
converted into a linearized image (C) using a transformation
curve (B), demonstrating the non-linear correlation between
the measured gray values of the autoradiograph and the
receptor concentration. For better visualization of receptor
density and distribution, color coding was performed (D).
The ligand used in that image was [3H]-Muscimol.
Material and Methods
34
solution were mixed together, and sections were incubated directly after mixing. The
substances used for the developer solution are listed in Table 3. The cell body staining was
checked using a microscope and stopped with 1 vol% acetic acid. Afterwards, slices were
rinsed with purified water for five minutes, fixated with T-MAX for 2 minutes and rinsed with
purified water again. Using increasing isopropanol concentrations (70%, 80%, 97% and
100%), followed by incubation in xylol, slices were dehydrated. Finally, slices were
coverslipped with DPX.
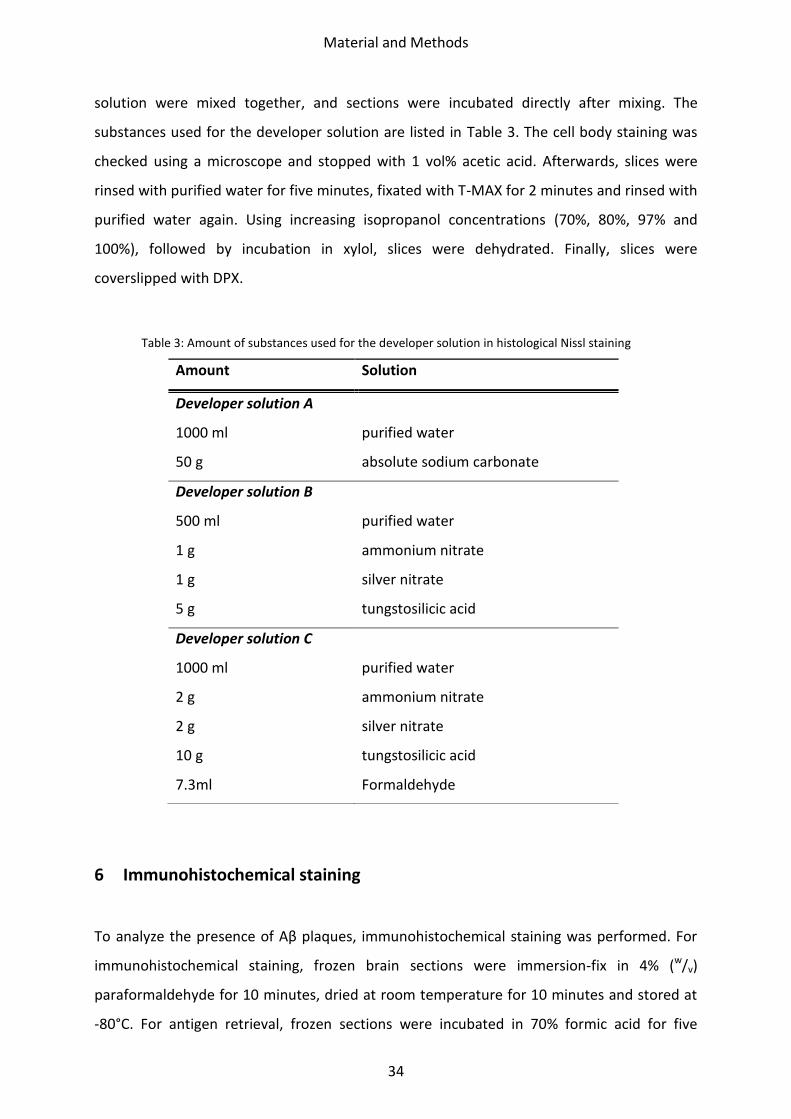
Table 3: Amount of substances used for the developer solution in histological Nissl staining
Amount Solution
Developer solution A
1000 ml purified water
50 g absolute sodium carbonate
Developer solution B
500 ml purified water
1 g ammonium nitrate
1 g silver nitrate
5 g tungstosilicic acid
Developer solution C
1000 ml purified water
2 g ammonium nitrate
2 g silver nitrate
10 g tungstosilicic acid
7.3ml Formaldehyde
6 Immunohistochemical staining
To analyze the presence of Aβ plaques, immunohistochemical staining was performed. For
immunohistochemical staining, frozen brain sections were immersion-fix in 4% (w/v)
paraformaldehyde for 10 minutes, dried at room temperature for 10 minutes and stored at
-80°C. For antigen retrieval, frozen sections were incubated in 70% formic acid for five
Material and Methods
35
minutes. Afterwards, sections were equilibrated in three changes of ice cold (1 vol%) TBS-
Triton for one minutes each and permeabilized in TBS-Triton solution (1 vol%) at room
temperature for 10 minutes. Subsequently, sections were washed in TBS-Triton three times
for one minute each. The sections were surrounded with PAP pen and the glass slides were
stored in plastic boxes. Blocking of the staining took place using M.O.M. (Mouse on Mouse;
Vector Labs, Burlingame, USA; one drop in 1.25µl TBS-Triton) for 30 minutes. Sections were
probed with a primary antibody which is diluted in 1 vol% BSA/TBS-Triton one hour at room
temperature, then over night at 8°C. Sections were double stained with G2-10 (Millipore,
Schwalbach, Germany; 1:100) for Aβ40 and 1-11-3 (Covance, Munich, Germany; 1:200) for
Aβ42.
The next morning, sections were washed in TBS-Triton three times for four minutes and
incubated with the secondary antibodies G-M A488 (Life Technologies GmbH, Darmstadt,
Germany; 1:500) and G-R A568 (Life Technologies GmbH, Darmstadt, Germany; 1:150) in 1
vol% BSA/TBS-Triton for four hours at room temperature. Next, washing took place in TBS-
Triton two times for 4 minutes. Nuclei were stained by adding 0.5µg/ml DAPI (Sigma-Aldrich
Chemie GmbH, Steinheim, Germany) for three minutes, and sections were washed with TBS-
Triton for four minutes. The tissue was coverslip-mounted with Aqua Poly/Mont (DAKO,
Agilant Technologies, Hamburg, Germany).
Results
36
III. Results
1 Neurotransmitter receptor densities in brains of tg5xFAD, LRP1 and
tg5xFAD/LRP1 mice
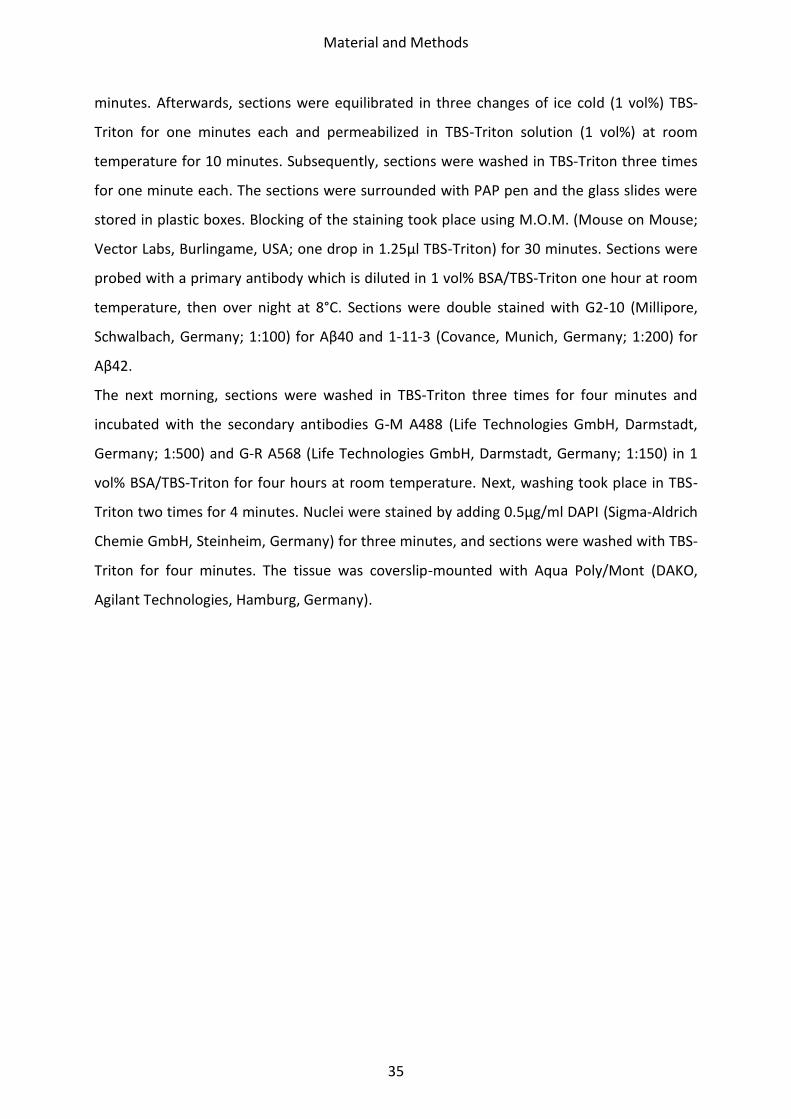
The principal regional receptor distribution patterns were similar between control mice and
all three models of AD. However, the absolute receptor densities differed between controls
and transgenic mice in various, but not all brain regions.
1.1 Glutamate receptors
Ionotropic and metabotropic glutamate receptors were present throughout all areas
investigated. Kainate receptors showed the lowest mean density in the CA1 region of the
hippocampus and highest in the mossy fiber termination fields, with intermediate densities
in the olfactory bulb, motor cortex, somatosensory and piriform cortex, hilus and stratum
moleculare/granulosum. NMDA receptors had a very similar distribution within the brain,
with the notable exception of the hippocampus area, especially the CA1 region. Here the
mean density was higher. The density of the metabotropic Glu2/3 (mGlu2/3) receptors was
higher in the neocortical areas, striatum and the stratum moleculare/granulosum than in the
olfactoric bulb and the remaining areas of the hippocampus. In the following chapters,
changes of the receptor density between AD mouse models and control mice, respectively,
are described in detail (compare Figure 6 - Figure 9).
Results
37
Figure 6: Color coded image of kainate receptor densities (fmol/mg protein) in the brains of tg5xFAD, LRP1 and tg5xFAD/LRP1 mice compared to control mice. The images show a similar regional distribution of this receptor in all strains but differences in absolute receptor densities (see text).
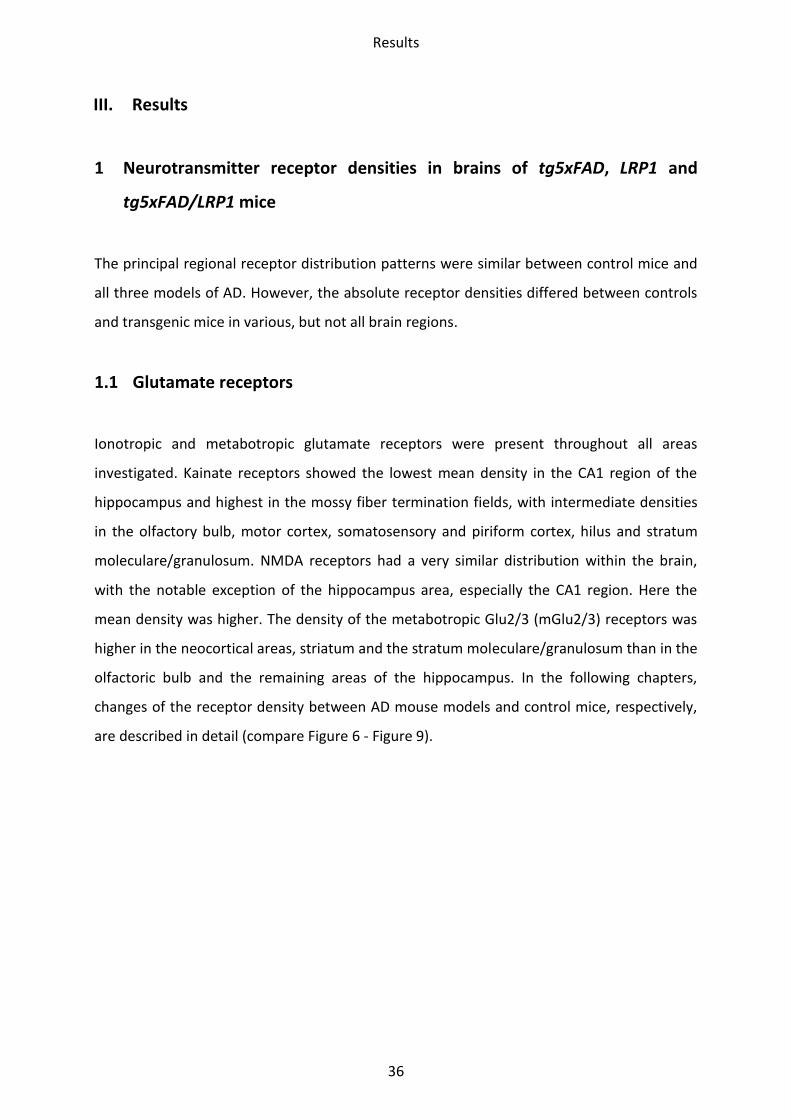
Figure 7: Color coded image of kainate receptor density (fmol/mg protein) in the hippocampus of tg5xFAD/LRP1 mice in detail. Mossy fibers can clearly be distinguished and are increased in tg5xFAD/LRP1 mice compared to control.
Results
38
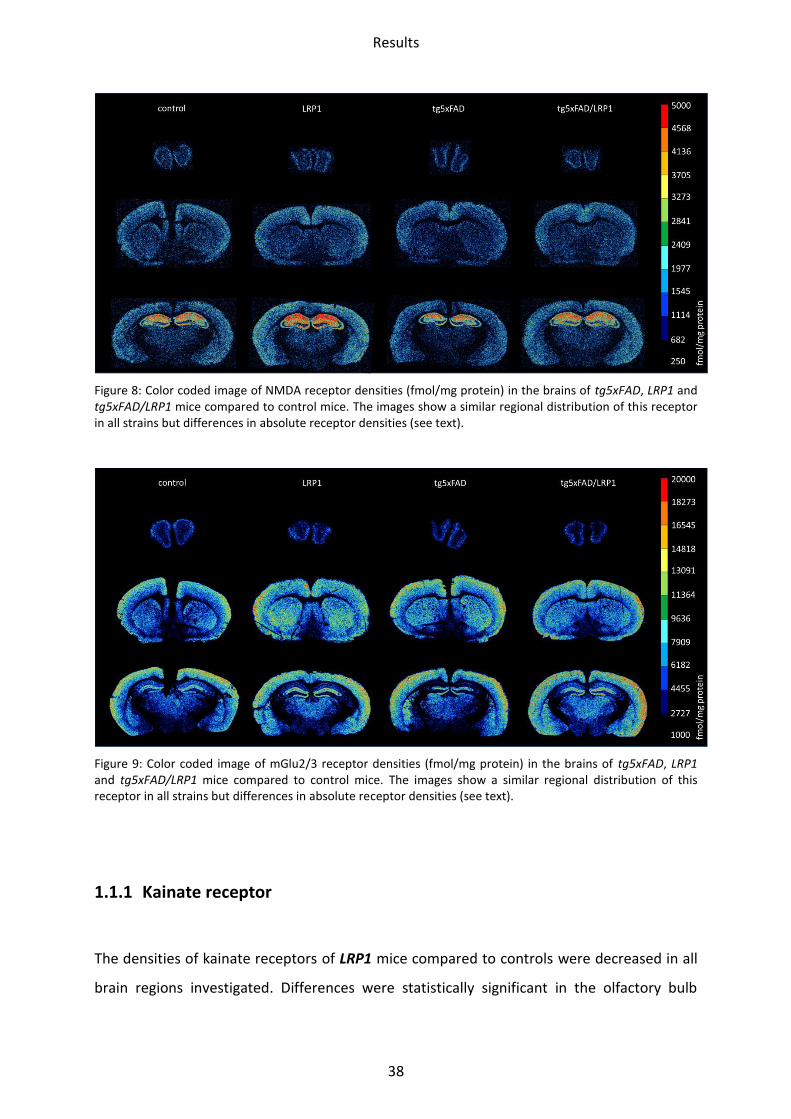
Figure 8: Color coded image of NMDA receptor densities (fmol/mg protein) in the brains of tg5xFAD, LRP1 and tg5xFAD/LRP1 mice compared to control mice. The images show a similar regional distribution of this receptor in all strains but differences in absolute receptor densities (see text).
Figure 9: Color coded image of mGlu2/3 receptor densities (fmol/mg protein) in the brains of tg5xFAD, LRP1 and tg5xFAD/LRP1 mice compared to control mice. The images show a similar regional distribution of this receptor in all strains but differences in absolute receptor densities (see text).
1.1.1 Kainate receptor
The densities of kainate receptors of LRP1 mice compared to controls were decreased in all
brain regions investigated. Differences were statistically significant in the olfactory bulb
Results
39
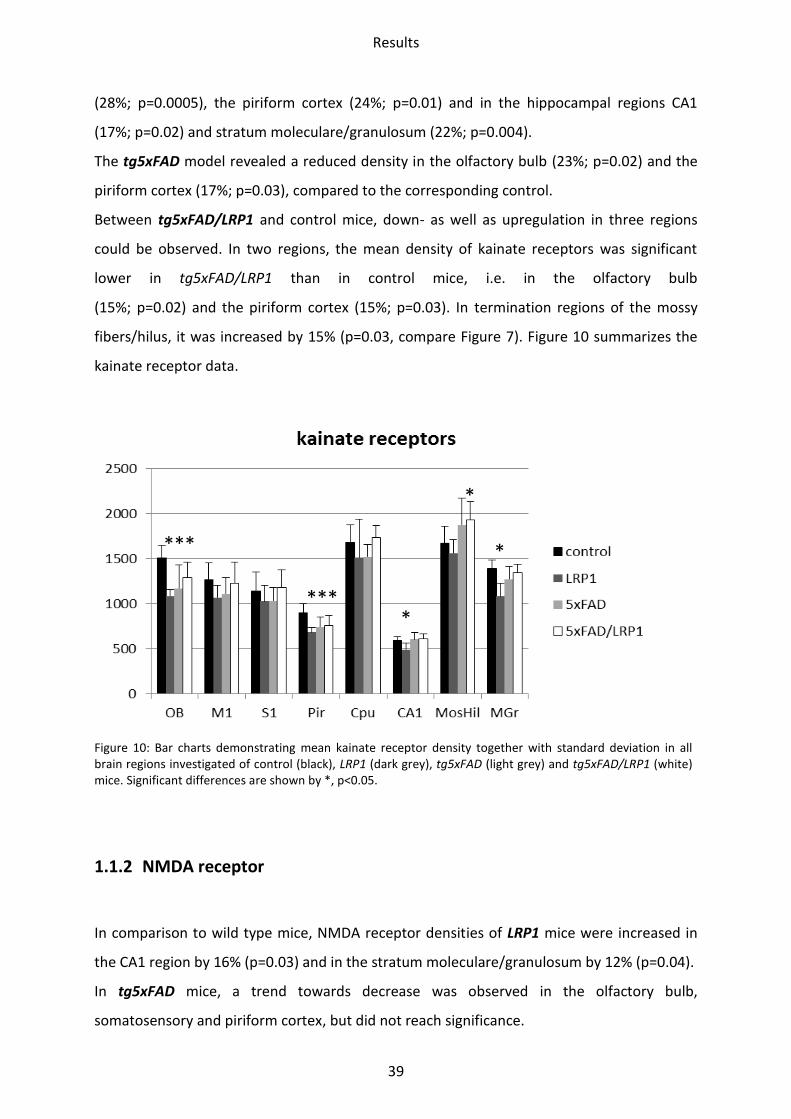
(28%; p=0.0005), the piriform cortex (24%; p=0.01) and in the hippocampal regions CA1
(17%; p=0.02) and stratum moleculare/granulosum (22%; p=0.004).
The tg5xFAD model revealed a reduced density in the olfactory bulb (23%; p=0.02) and the
piriform cortex (17%; p=0.03), compared to the corresponding control.
Between tg5xFAD/LRP1 and control mice, down- as well as upregulation in three regions
could be observed. In two regions, the mean density of kainate receptors was significant
lower in tg5xFAD/LRP1 than in control mice, i.e. in the olfactory bulb
(15%; p=0.02) and the piriform cortex (15%; p=0.03). In termination regions of the mossy
fibers/hilus, it was increased by 15% (p=0.03, compare Figure 7). Figure 10 summarizes the
kainate receptor data.
Figure 10: Bar charts demonstrating mean kainate receptor density together with standard deviation in all brain regions investigated of control (black), LRP1 (dark grey), tg5xFAD (light grey) and tg5xFAD/LRP1 (white) mice. Significant differences are shown by *, p<0.05.
1.1.2 NMDA receptor
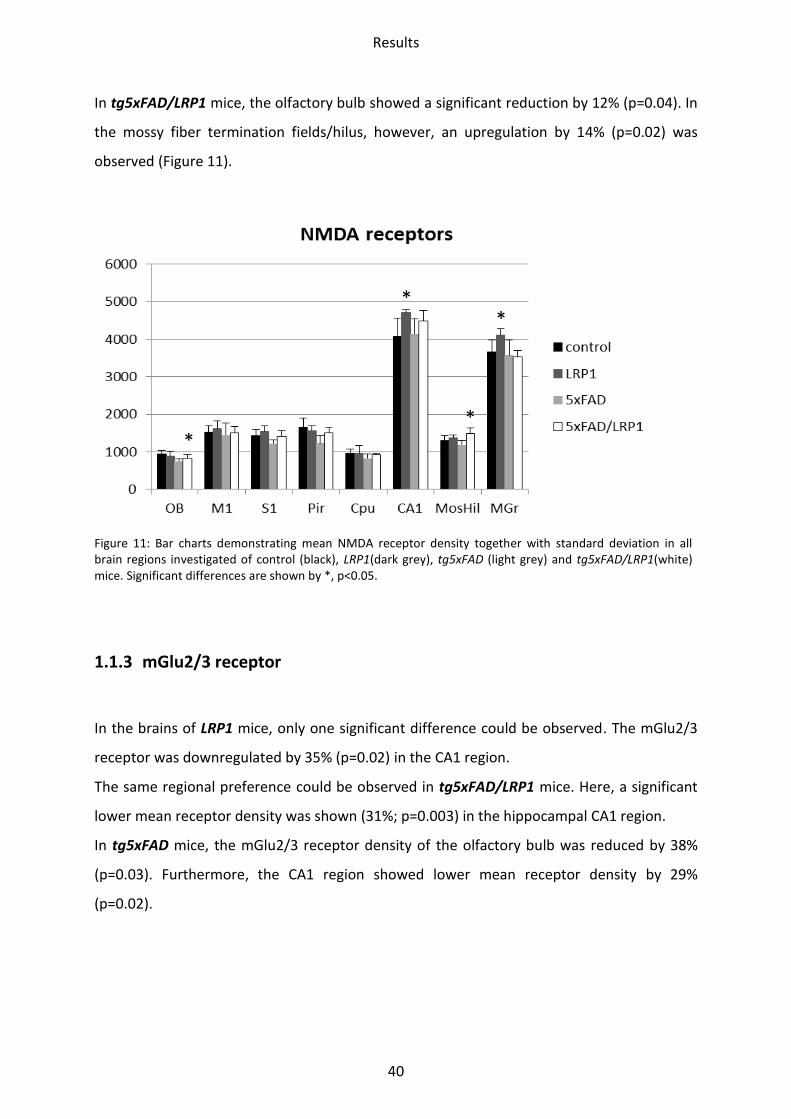
In comparison to wild type mice, NMDA receptor densities of LRP1 mice were increased in
the CA1 region by 16% (p=0.03) and in the stratum moleculare/granulosum by 12% (p=0.04).
In tg5xFAD mice, a trend towards decrease was observed in the olfactory bulb,
somatosensory and piriform cortex, but did not reach significance.
***
*
*
***
*
Results
40
In tg5xFAD/LRP1 mice, the olfactory bulb showed a significant reduction by 12% (p=0.04). In
the mossy fiber termination fields/hilus, however, an upregulation by 14% (p=0.02) was
observed (Figure 11).
Figure 11: Bar charts demonstrating mean NMDA receptor density together with standard deviation in all brain regions investigated of control (black), LRP1(dark grey), tg5xFAD (light grey) and tg5xFAD/LRP1(white) mice. Significant differences are shown by *, p<0.05.
1.1.3 mGlu2/3 receptor
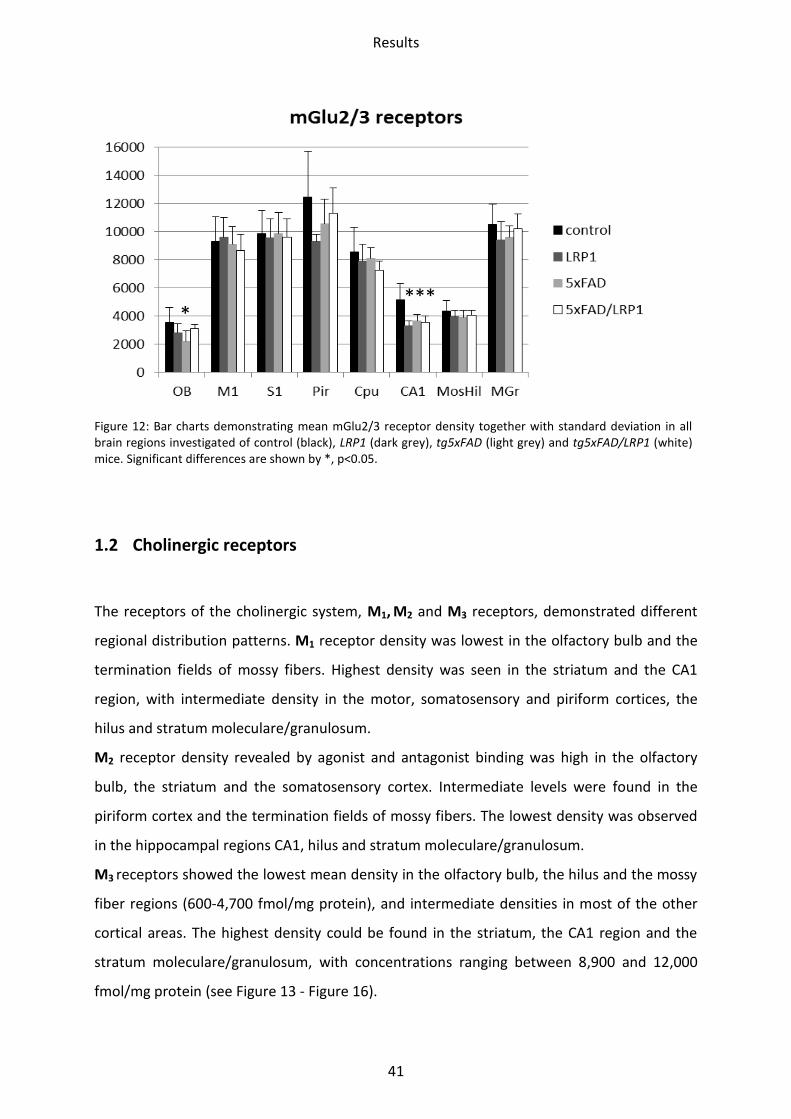
In the brains of LRP1 mice, only one significant difference could be observed. The mGlu2/3
receptor was downregulated by 35% (p=0.02) in the CA1 region.
The same regional preference could be observed in tg5xFAD/LRP1 mice. Here, a significant
lower mean receptor density was shown (31%; p=0.003) in the hippocampal CA1 region.
In tg5xFAD mice, the mGlu2/3 receptor density of the olfactory bulb was reduced by 38%
(p=0.03). Furthermore, the CA1 region showed lower mean receptor density by 29%
(p=0.02).
* *
* *
Results
41
Figure 12: Bar charts demonstrating mean mGlu2/3 receptor density together with standard deviation in all brain regions investigated of control (black), LRP1 (dark grey), tg5xFAD (light grey) and tg5xFAD/LRP1 (white) mice. Significant differences are shown by *, p<0.05.
1.2 Cholinergic receptors
The receptors of the cholinergic system, M1, M2 and M3 receptors, demonstrated different
regional distribution patterns. M1 receptor density was lowest in the olfactory bulb and the
termination fields of mossy fibers. Highest density was seen in the striatum and the CA1
region, with intermediate density in the motor, somatosensory and piriform cortices, the
hilus and stratum moleculare/granulosum.
M2 receptor density revealed by agonist and antagonist binding was high in the olfactory
bulb, the striatum and the somatosensory cortex. Intermediate levels were found in the
piriform cortex and the termination fields of mossy fibers. The lowest density was observed
in the hippocampal regions CA1, hilus and stratum moleculare/granulosum.
M3 receptors showed the lowest mean density in the olfactory bulb, the hilus and the mossy
fiber regions (600-4,700 fmol/mg protein), and intermediate densities in most of the other
cortical areas. The highest density could be found in the striatum, the CA1 region and the
stratum moleculare/granulosum, with concentrations ranging between 8,900 and 12,000
fmol/mg protein (see Figure 13 - Figure 16).
*** *
Results
42
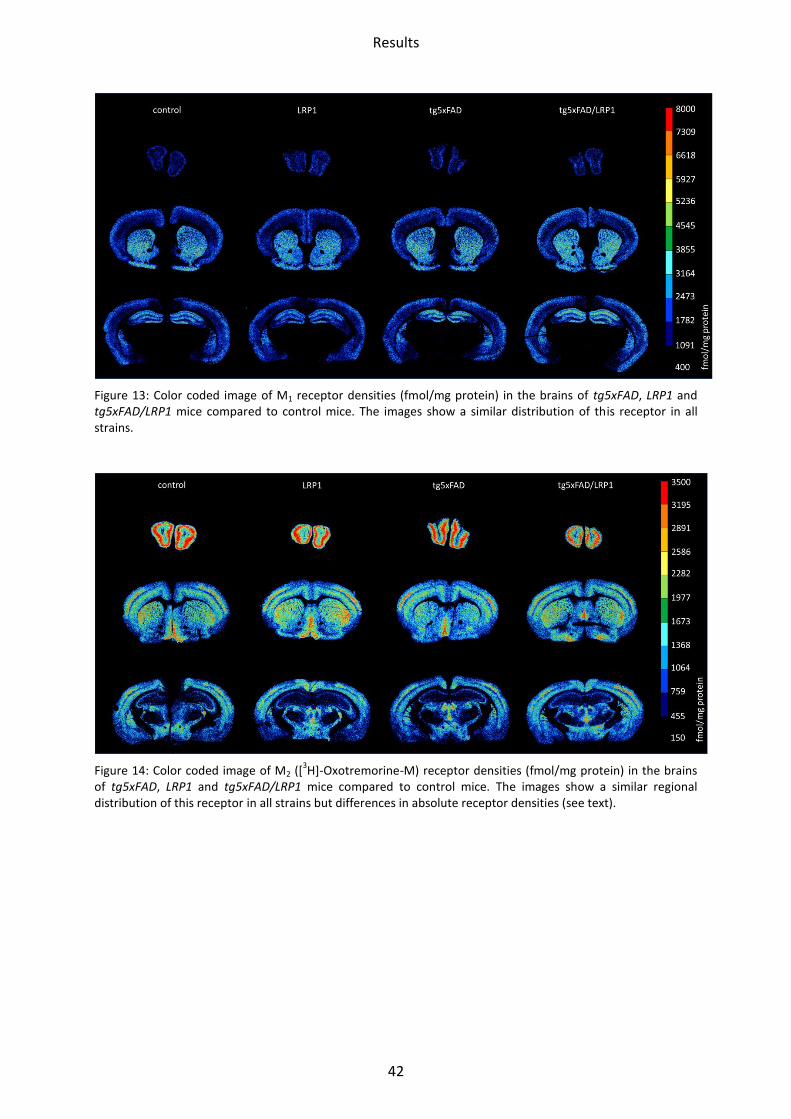
Figure 13: Color coded image of M1 receptor densities (fmol/mg protein) in the brains of tg5xFAD, LRP1 and tg5xFAD/LRP1 mice compared to control mice. The images show a similar distribution of this receptor in all strains.
Figure 14: Color coded image of M2 ([
3H]-Oxotremorine-M) receptor densities (fmol/mg protein) in the brains
of tg5xFAD, LRP1 and tg5xFAD/LRP1 mice compared to control mice. The images show a similar regional distribution of this receptor in all strains but differences in absolute receptor densities (see text).
Results
43
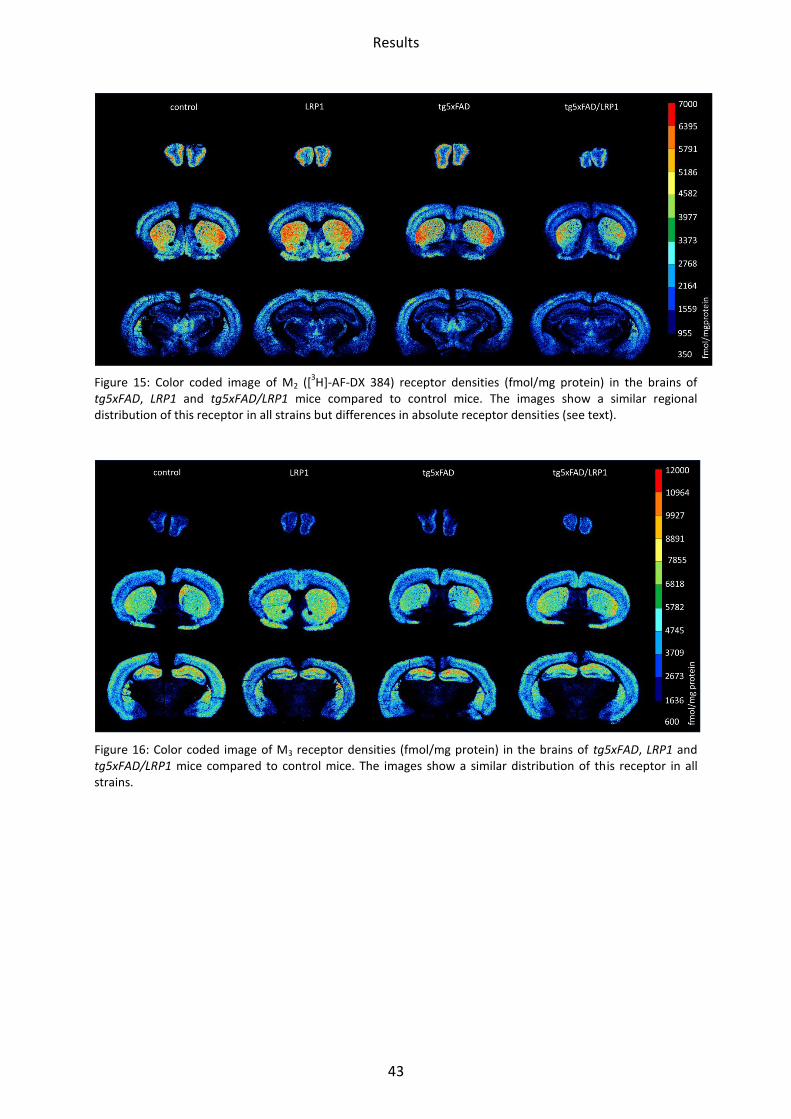
Figure 15: Color coded image of M2 ([
3H]-AF-DX 384) receptor densities (fmol/mg protein) in the brains of
tg5xFAD, LRP1 and tg5xFAD/LRP1 mice compared to control mice. The images show a similar regional distribution of this receptor in all strains but differences in absolute receptor densities (see text).
Figure 16: Color coded image of M3 receptor densities (fmol/mg protein) in the brains of tg5xFAD, LRP1 and tg5xFAD/LRP1 mice compared to control mice. The images show a similar distribution of this receptor in all strains.
Results
44
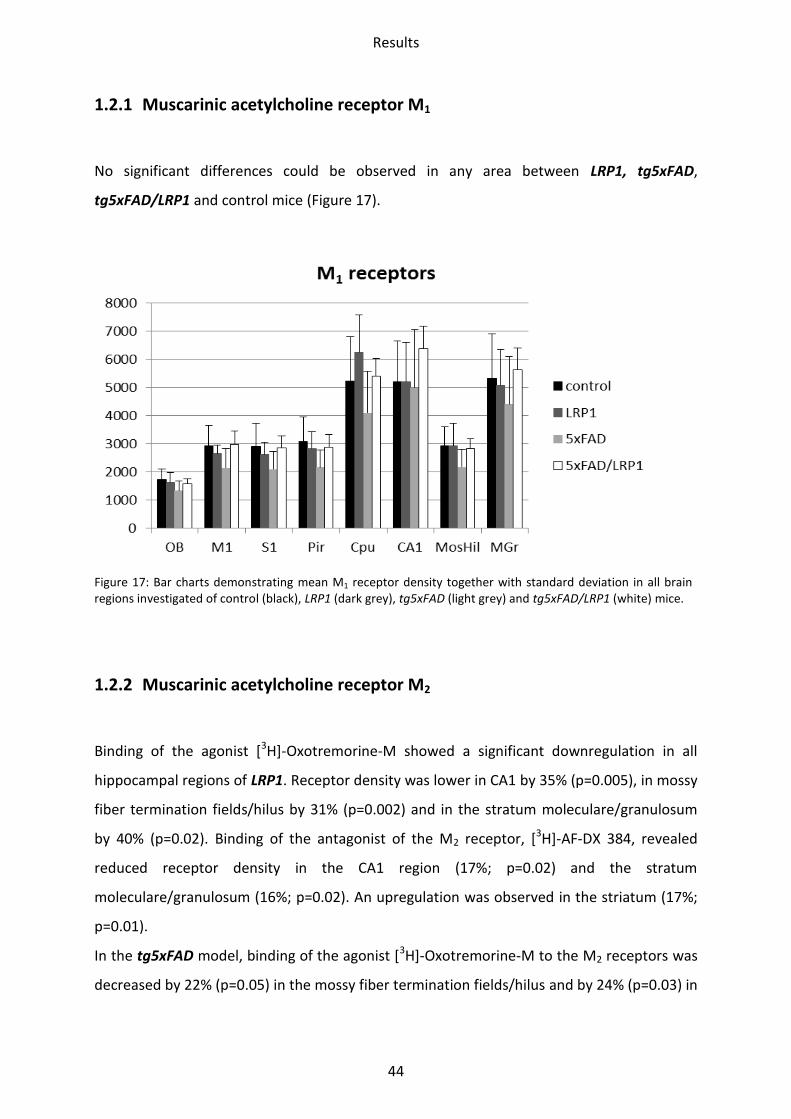
1.2.1 Muscarinic acetylcholine receptor M1
No significant differences could be observed in any area between LRP1, tg5xFAD,
tg5xFAD/LRP1 and control mice (Figure 17).
Figure 17: Bar charts demonstrating mean M1 receptor density together with standard deviation in all brain regions investigated of control (black), LRP1 (dark grey), tg5xFAD (light grey) and tg5xFAD/LRP1 (white) mice.
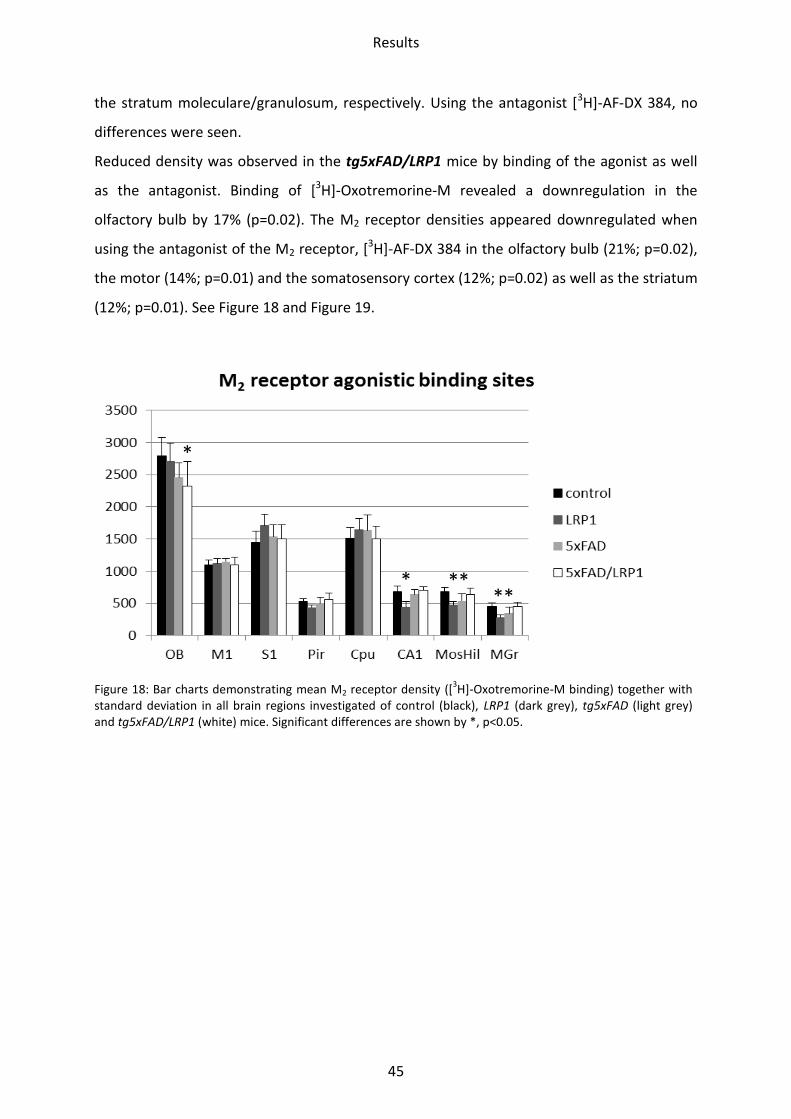
1.2.2 Muscarinic acetylcholine receptor M2
Binding of the agonist [3H]-Oxotremorine-M showed a significant downregulation in all
hippocampal regions of LRP1. Receptor density was lower in CA1 by 35% (p=0.005), in mossy
fiber termination fields/hilus by 31% (p=0.002) and in the stratum moleculare/granulosum
by 40% (p=0.02). Binding of the antagonist of the M2 receptor, [3H]-AF-DX 384, revealed
reduced receptor density in the CA1 region (17%; p=0.02) and the stratum
moleculare/granulosum (16%; p=0.02). An upregulation was observed in the striatum (17%;
p=0.01).
In the tg5xFAD model, binding of the agonist [3H]-Oxotremorine-M to the M2 receptors was
decreased by 22% (p=0.05) in the mossy fiber termination fields/hilus and by 24% (p=0.03) in
Results
45
the stratum moleculare/granulosum, respectively. Using the antagonist [3H]-AF-DX 384, no
differences were seen.
Reduced density was observed in the tg5xFAD/LRP1 mice by binding of the agonist as well
as the antagonist. Binding of [3H]-Oxotremorine-M revealed a downregulation in the
olfactory bulb by 17% (p=0.02). The M2 receptor densities appeared downregulated when
using the antagonist of the M2 receptor, [3H]-AF-DX 384 in the olfactory bulb (21%; p=0.02),
the motor (14%; p=0.01) and the somatosensory cortex (12%; p=0.02) as well as the striatum
(12%; p=0.01). See Figure 18 and Figure 19.
Figure 18: Bar charts demonstrating mean M2 receptor density ([3H]-Oxotremorine-M binding) together with
standard deviation in all brain regions investigated of control (black), LRP1 (dark grey), tg5xFAD (light grey) and tg5xFAD/LRP1 (white) mice. Significant differences are shown by *, p<0.05.
* ** **
*
Results
46
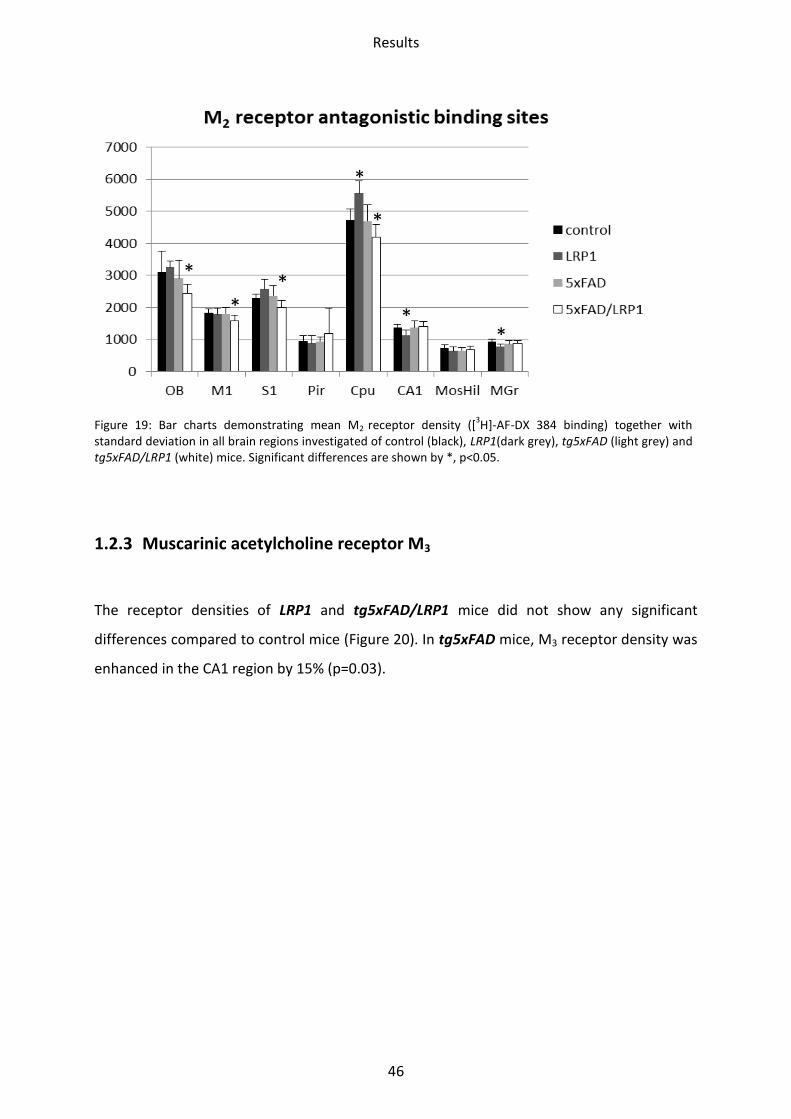
Figure 19: Bar charts demonstrating mean M2 receptor density ([3H]-AF-DX 384 binding) together with
standard deviation in all brain regions investigated of control (black), LRP1(dark grey), tg5xFAD (light grey) and tg5xFAD/LRP1 (white) mice. Significant differences are shown by *, p<0.05.
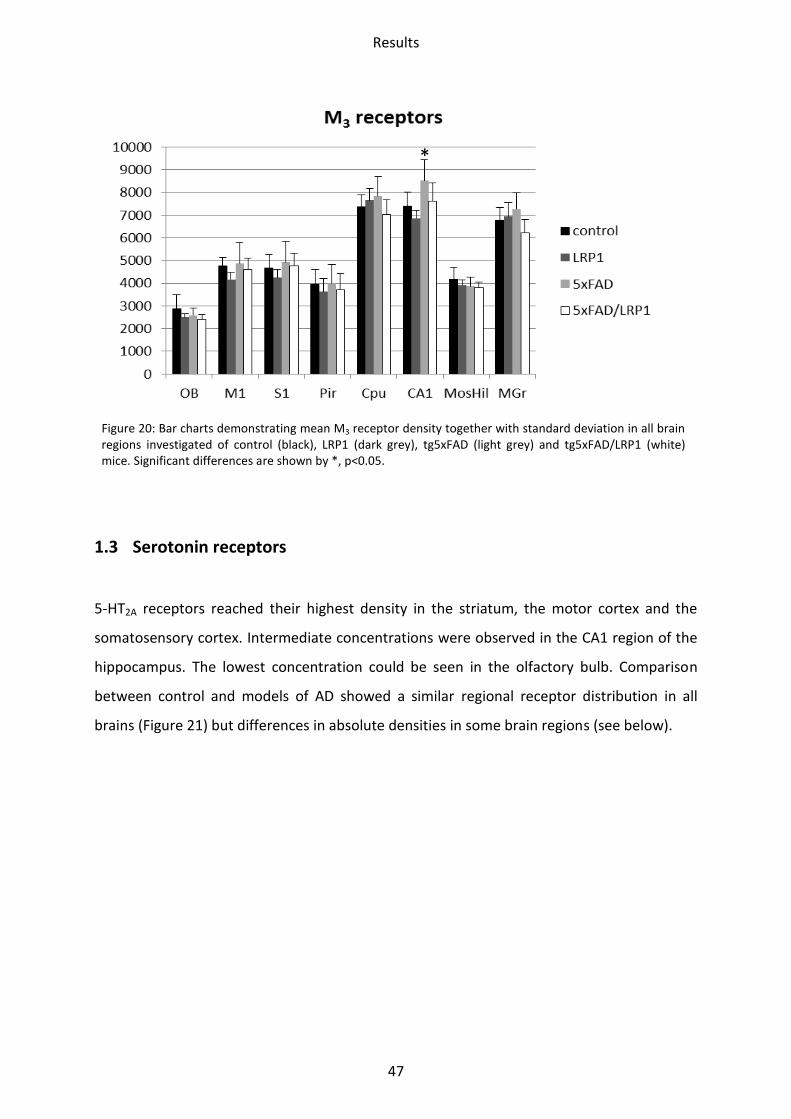
1.2.3 Muscarinic acetylcholine receptor M3
The receptor densities of LRP1 and tg5xFAD/LRP1 mice did not show any significant
differences compared to control mice (Figure 20). In tg5xFAD mice, M3 receptor density was
enhanced in the CA1 region by 15% (p=0.03).
* *
*
*
*
* *
Results
47
Figure 20: Bar charts demonstrating mean M3 receptor density together with standard deviation in all brain regions investigated of control (black), LRP1 (dark grey), tg5xFAD (light grey) and tg5xFAD/LRP1 (white) mice. Significant differences are shown by *, p<0.05.
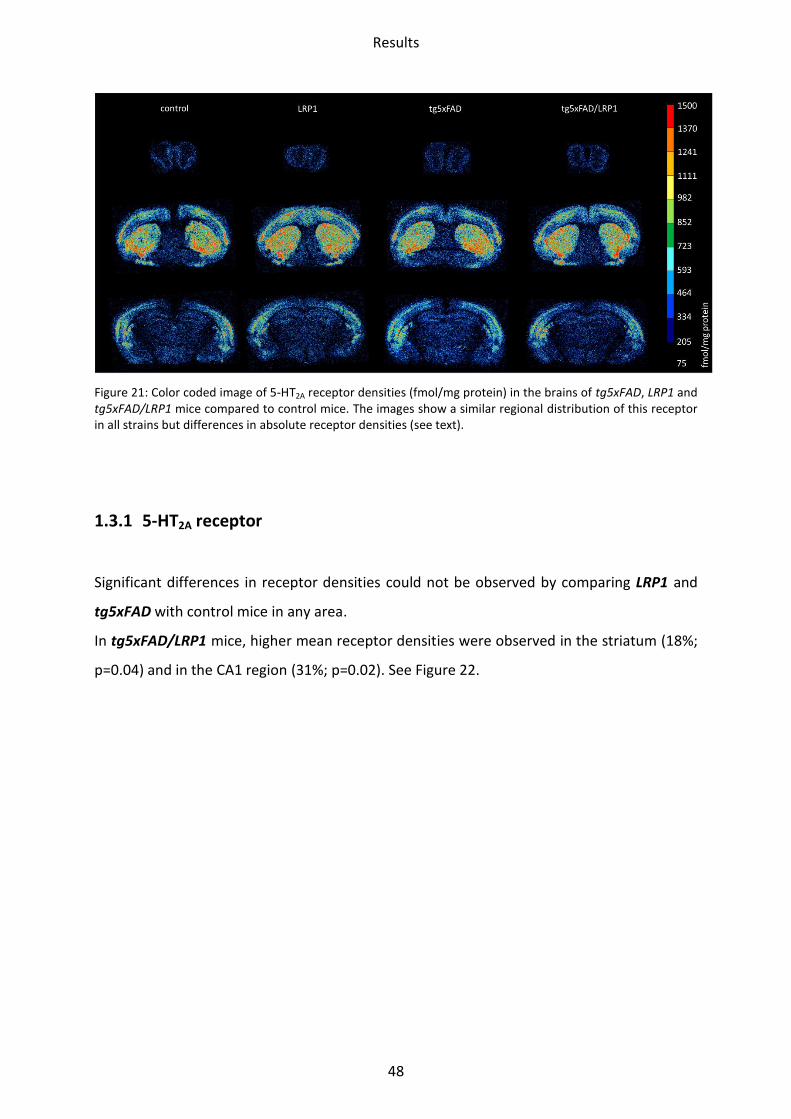
1.3 Serotonin receptors
5-HT2A receptors reached their highest density in the striatum, the motor cortex and the
somatosensory cortex. Intermediate concentrations were observed in the CA1 region of the
hippocampus. The lowest concentration could be seen in the olfactory bulb. Comparison
between control and models of AD showed a similar regional receptor distribution in all
brains (Figure 21) but differences in absolute densities in some brain regions (see below).
*
Results
48
Figure 21: Color coded image of 5-HT2A receptor densities (fmol/mg protein) in the brains of tg5xFAD, LRP1 and tg5xFAD/LRP1 mice compared to control mice. The images show a similar regional distribution of this receptor in all strains but differences in absolute receptor densities (see text).
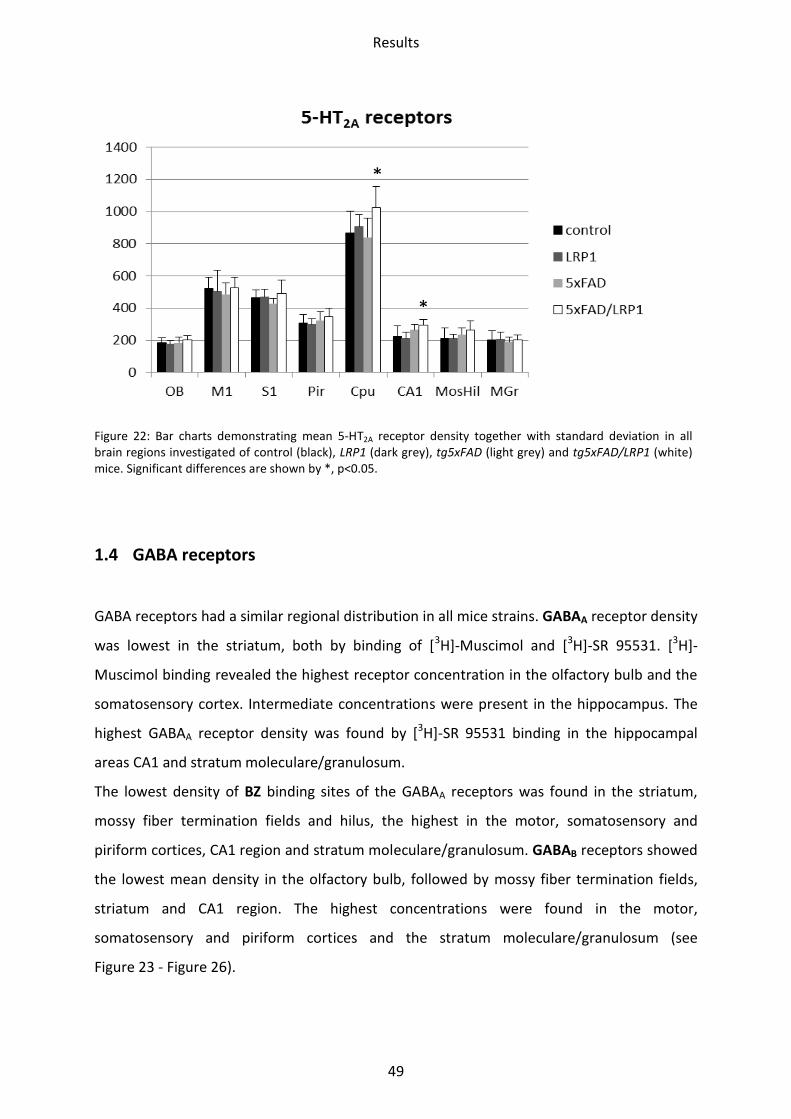
1.3.1 5-HT2A receptor
Significant differences in receptor densities could not be observed by comparing LRP1 and
tg5xFAD with control mice in any area.
In tg5xFAD/LRP1 mice, higher mean receptor densities were observed in the striatum (18%;
p=0.04) and in the CA1 region (31%; p=0.02). See Figure 22.
Results
49
Figure 22: Bar charts demonstrating mean 5-HT2A receptor density together with standard deviation in all brain regions investigated of control (black), LRP1 (dark grey), tg5xFAD (light grey) and tg5xFAD/LRP1 (white) mice. Significant differences are shown by *, p<0.05.
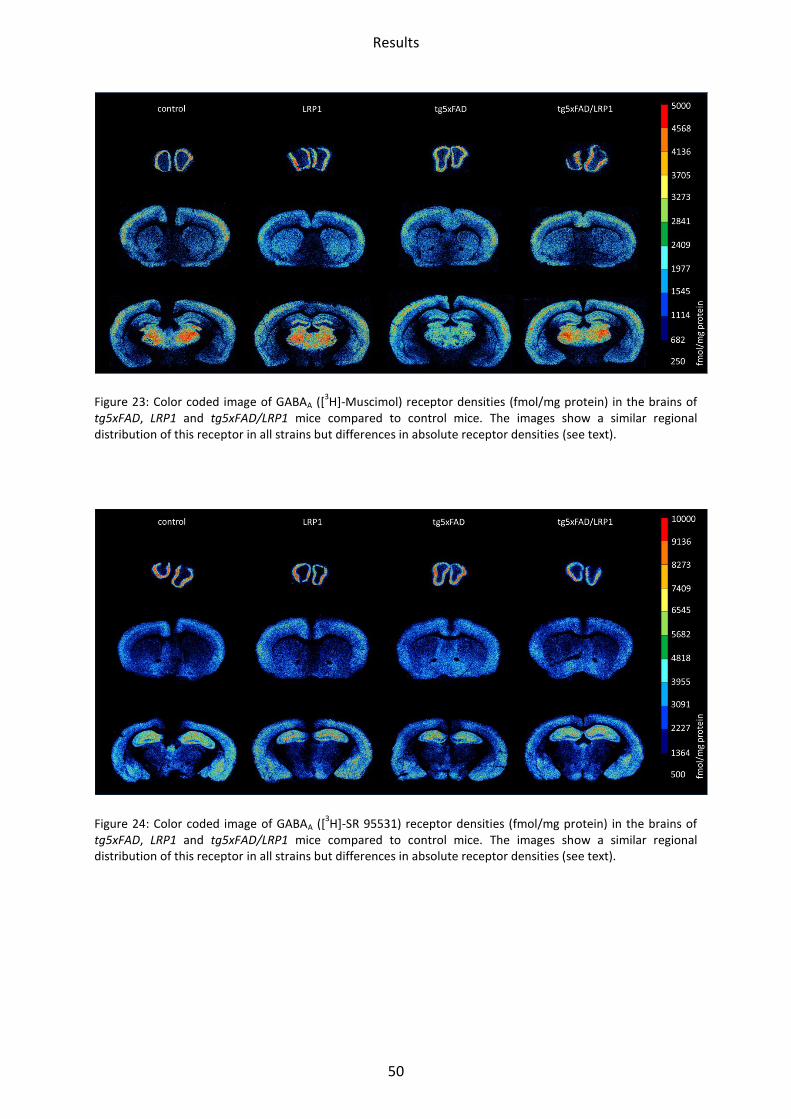
1.4 GABA receptors
GABA receptors had a similar regional distribution in all mice strains. GABAA receptor density
was lowest in the striatum, both by binding of [3H]-Muscimol and [3H]-SR 95531. [3H]-
Muscimol binding revealed the highest receptor concentration in the olfactory bulb and the
somatosensory cortex. Intermediate concentrations were present in the hippocampus. The
highest GABAA receptor density was found by [3H]-SR 95531 binding in the hippocampal
areas CA1 and stratum moleculare/granulosum.
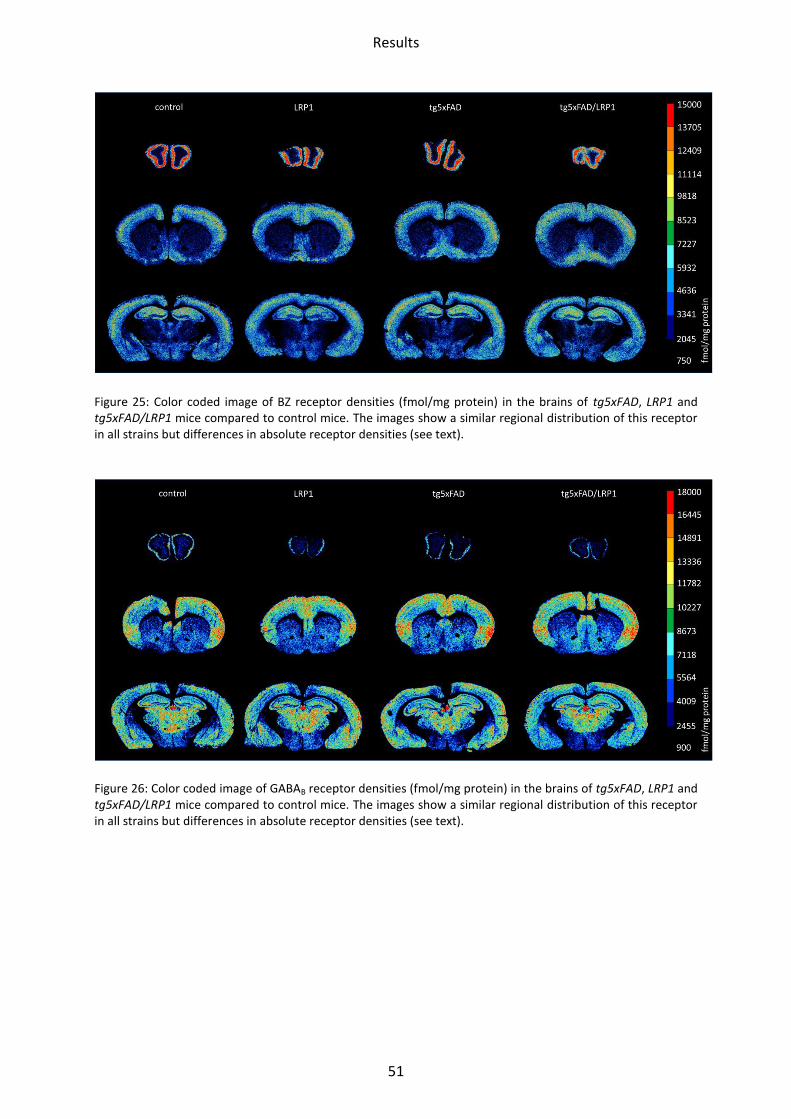
The lowest density of BZ binding sites of the GABAA receptors was found in the striatum,
mossy fiber termination fields and hilus, the highest in the motor, somatosensory and
piriform cortices, CA1 region and stratum moleculare/granulosum. GABAB receptors showed
the lowest mean density in the olfactory bulb, followed by mossy fiber termination fields,
striatum and CA1 region. The highest concentrations were found in the motor,
somatosensory and piriform cortices and the stratum moleculare/granulosum (see
Figure 23 - Figure 26).
*
*
Results
50
Figure 23: Color coded image of GABAA ([3H]-Muscimol) receptor densities (fmol/mg protein) in the brains of
tg5xFAD, LRP1 and tg5xFAD/LRP1 mice compared to control mice. The images show a similar regional distribution of this receptor in all strains but differences in absolute receptor densities (see text).
Figure 24: Color coded image of GABAA ([3H]-SR 95531) receptor densities (fmol/mg protein) in the brains of
tg5xFAD, LRP1 and tg5xFAD/LRP1 mice compared to control mice. The images show a similar regional distribution of this receptor in all strains but differences in absolute receptor densities (see text).
Results
51
Figure 25: Color coded image of BZ receptor densities (fmol/mg protein) in the brains of tg5xFAD, LRP1 and tg5xFAD/LRP1 mice compared to control mice. The images show a similar regional distribution of this receptor in all strains but differences in absolute receptor densities (see text).
Figure 26: Color coded image of GABAB receptor densities (fmol/mg protein) in the brains of tg5xFAD, LRP1 and tg5xFAD/LRP1 mice compared to control mice. The images show a similar regional distribution of this receptor in all strains but differences in absolute receptor densities (see text).
Results
52
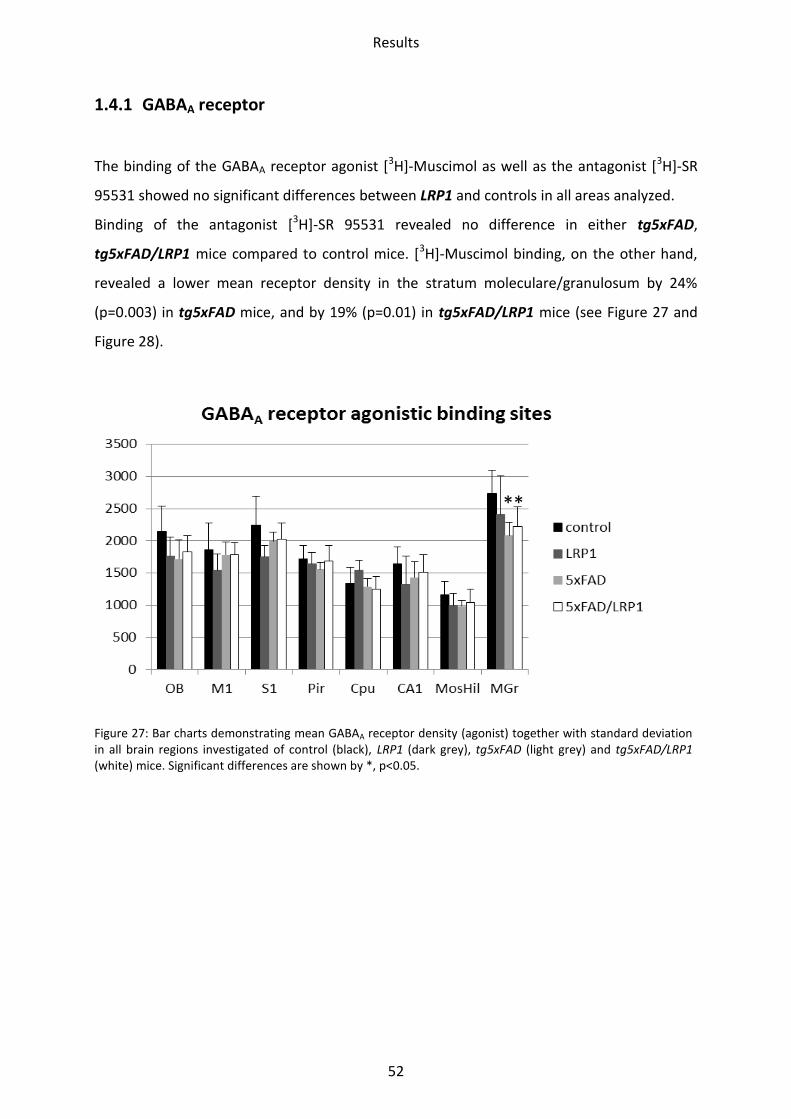
1.4.1 GABAA receptor
The binding of the GABAA receptor agonist [3H]-Muscimol as well as the antagonist [3H]-SR
95531 showed no significant differences between LRP1 and controls in all areas analyzed.
Binding of the antagonist [3H]-SR 95531 revealed no difference in either tg5xFAD,
tg5xFAD/LRP1 mice compared to control mice. [3H]-Muscimol binding, on the other hand,
revealed a lower mean receptor density in the stratum moleculare/granulosum by 24%
(p=0.003) in tg5xFAD mice, and by 19% (p=0.01) in tg5xFAD/LRP1 mice (see Figure 27 and
Figure 28).
Figure 27: Bar charts demonstrating mean GABAA receptor density (agonist) together with standard deviation in all brain regions investigated of control (black), LRP1 (dark grey), tg5xFAD (light grey) and tg5xFAD/LRP1 (white) mice. Significant differences are shown by *, p<0.05.
**
Results
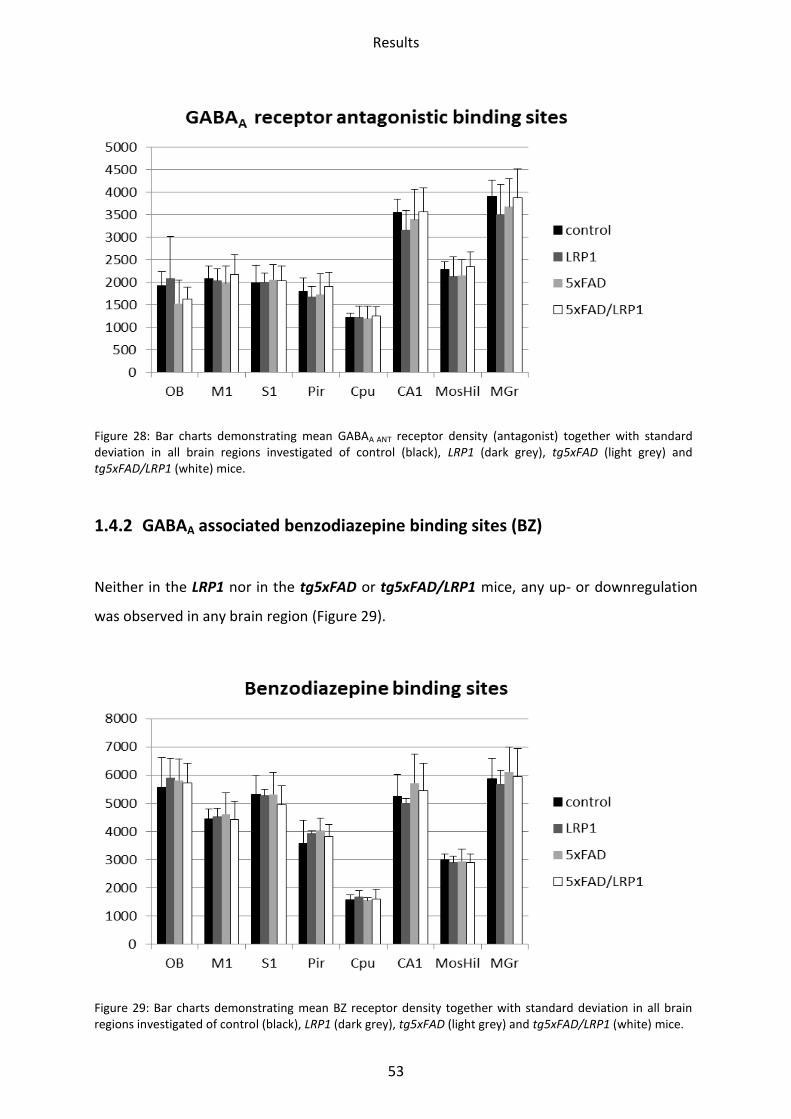
53
Figure 28: Bar charts demonstrating mean GABAA ANT receptor density (antagonist) together with standard deviation in all brain regions investigated of control (black), LRP1 (dark grey), tg5xFAD (light grey) and tg5xFAD/LRP1 (white) mice.
1.4.2 GABAA associated benzodiazepine binding sites (BZ)
Neither in the LRP1 nor in the tg5xFAD or tg5xFAD/LRP1 mice, any up- or downregulation
was observed in any brain region (Figure 29).
Figure 29: Bar charts demonstrating mean BZ receptor density together with standard deviation in all brain regions investigated of control (black), LRP1 (dark grey), tg5xFAD (light grey) and tg5xFAD/LRP1 (white) mice.
Results
54
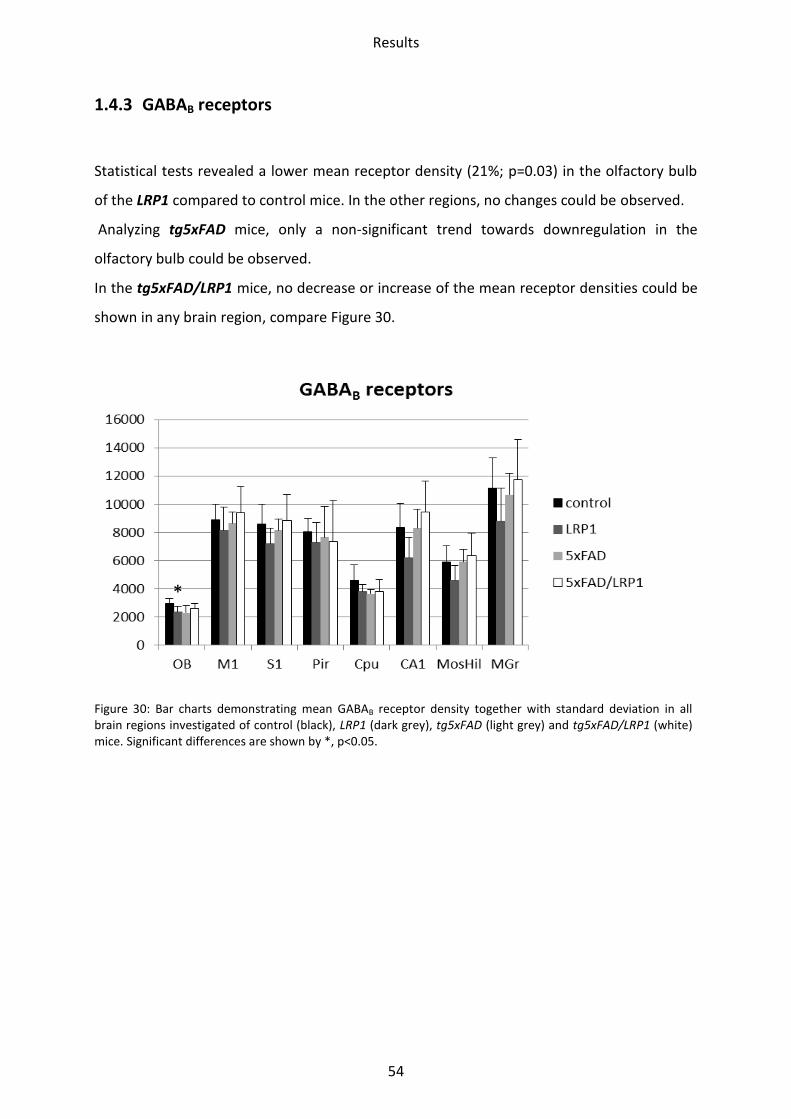
1.4.3 GABAB receptors
Statistical tests revealed a lower mean receptor density (21%; p=0.03) in the olfactory bulb
of the LRP1 compared to control mice. In the other regions, no changes could be observed.
Analyzing tg5xFAD mice, only a non-significant trend towards downregulation in the
olfactory bulb could be observed.
In the tg5xFAD/LRP1 mice, no decrease or increase of the mean receptor densities could be
shown in any brain region, compare Figure 30.
Figure 30: Bar charts demonstrating mean GABAB receptor density together with standard deviation in all brain regions investigated of control (black), LRP1 (dark grey), tg5xFAD (light grey) and tg5xFAD/LRP1 (white) mice. Significant differences are shown by *, p<0.05.
*
Results
55
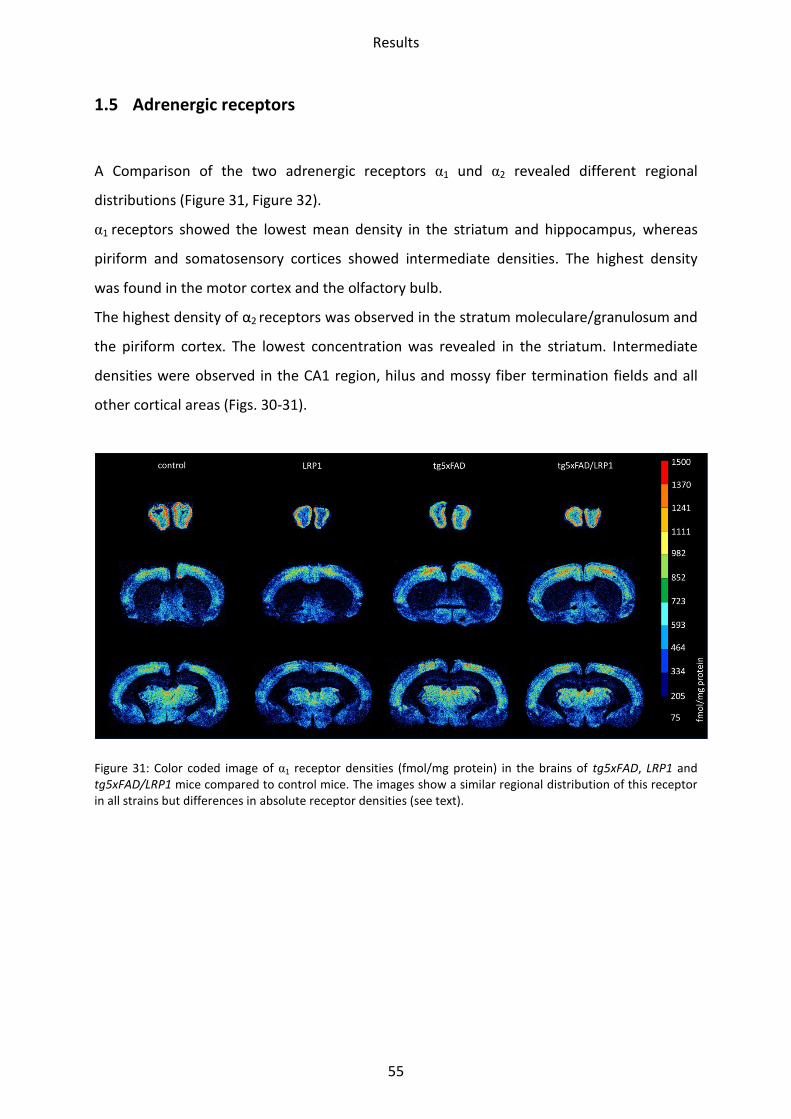
1.5 Adrenergic receptors
A Comparison of the two adrenergic receptors α1 und α2 revealed different regional
distributions (Figure 31, Figure 32).
α1 receptors showed the lowest mean density in the striatum and hippocampus, whereas
piriform and somatosensory cortices showed intermediate densities. The highest density
was found in the motor cortex and the olfactory bulb.
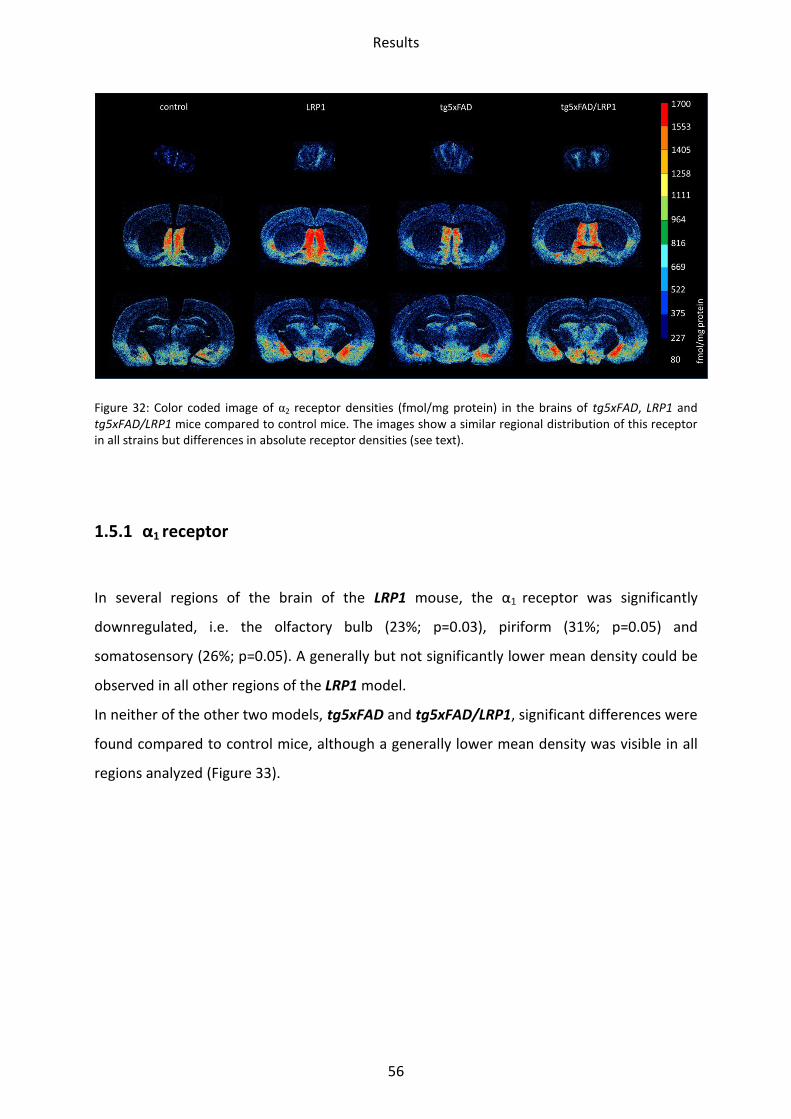
The highest density of α2 receptors was observed in the stratum moleculare/granulosum and
the piriform cortex. The lowest concentration was revealed in the striatum. Intermediate
densities were observed in the CA1 region, hilus and mossy fiber termination fields and all
other cortical areas (Figs. 30-31).
Figure 31: Color coded image of α1 receptor densities (fmol/mg protein) in the brains of tg5xFAD, LRP1 and tg5xFAD/LRP1 mice compared to control mice. The images show a similar regional distribution of this receptor in all strains but differences in absolute receptor densities (see text).
Results
56
Figure 32: Color coded image of α2 receptor densities (fmol/mg protein) in the brains of tg5xFAD, LRP1 and tg5xFAD/LRP1 mice compared to control mice. The images show a similar regional distribution of this receptor in all strains but differences in absolute receptor densities (see text).
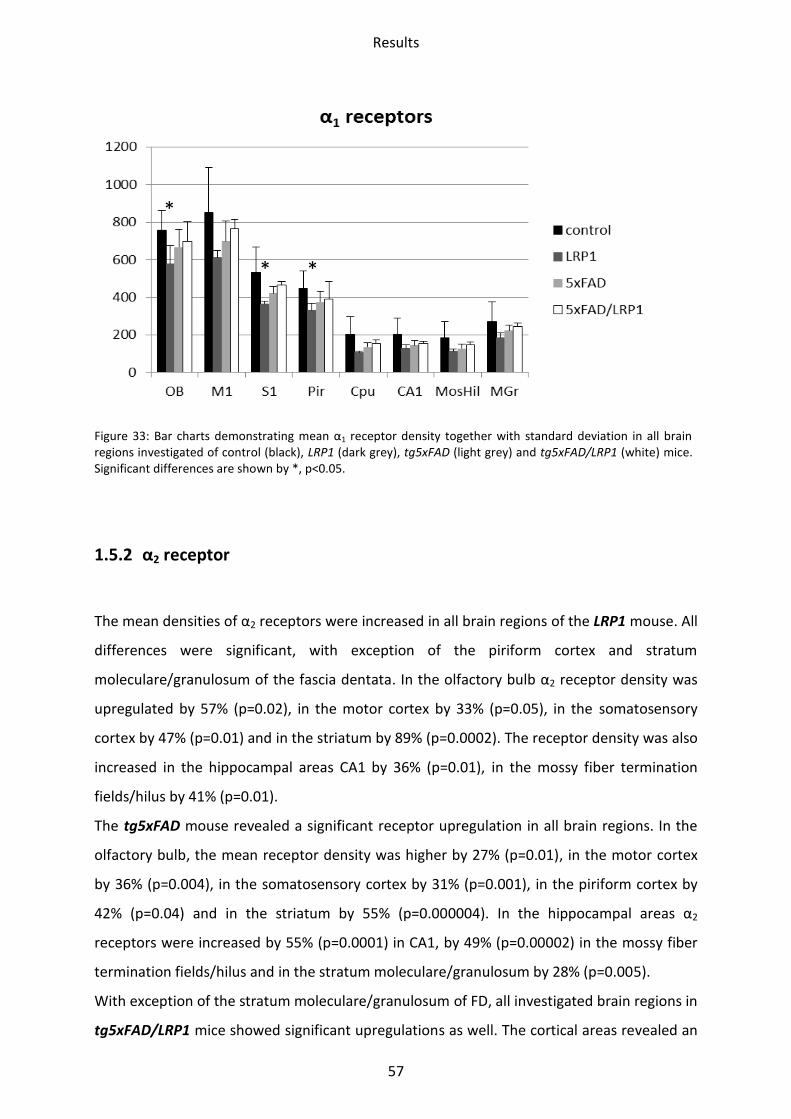
1.5.1 α1 receptor
In several regions of the brain of the LRP1 mouse, the α1 receptor was significantly
downregulated, i.e. the olfactory bulb (23%; p=0.03), piriform (31%; p=0.05) and
somatosensory (26%; p=0.05). A generally but not significantly lower mean density could be
observed in all other regions of the LRP1 model.
In neither of the other two models, tg5xFAD and tg5xFAD/LRP1, significant differences were
found compared to control mice, although a generally lower mean density was visible in all
regions analyzed (Figure 33).
Results
57
Figure 33: Bar charts demonstrating mean α1 receptor density together with standard deviation in all brain regions investigated of control (black), LRP1 (dark grey), tg5xFAD (light grey) and tg5xFAD/LRP1 (white) mice. Significant differences are shown by *, p<0.05.
1.5.2 α2 receptor
The mean densities of α2 receptors were increased in all brain regions of the LRP1 mouse. All
differences were significant, with exception of the piriform cortex and stratum
moleculare/granulosum of the fascia dentata. In the olfactory bulb α2 receptor density was
upregulated by 57% (p=0.02), in the motor cortex by 33% (p=0.05), in the somatosensory
cortex by 47% (p=0.01) and in the striatum by 89% (p=0.0002). The receptor density was also
increased in the hippocampal areas CA1 by 36% (p=0.01), in the mossy fiber termination
fields/hilus by 41% (p=0.01).
The tg5xFAD mouse revealed a significant receptor upregulation in all brain regions. In the
olfactory bulb, the mean receptor density was higher by 27% (p=0.01), in the motor cortex
by 36% (p=0.004), in the somatosensory cortex by 31% (p=0.001), in the piriform cortex by
42% (p=0.04) and in the striatum by 55% (p=0.000004). In the hippocampal areas α2
receptors were increased by 55% (p=0.0001) in CA1, by 49% (p=0.00002) in the mossy fiber
termination fields/hilus and in the stratum moleculare/granulosum by 28% (p=0.005).
With exception of the stratum moleculare/granulosum of FD, all investigated brain regions in
tg5xFAD/LRP1 mice showed significant upregulations as well. The cortical areas revealed an
*
* *
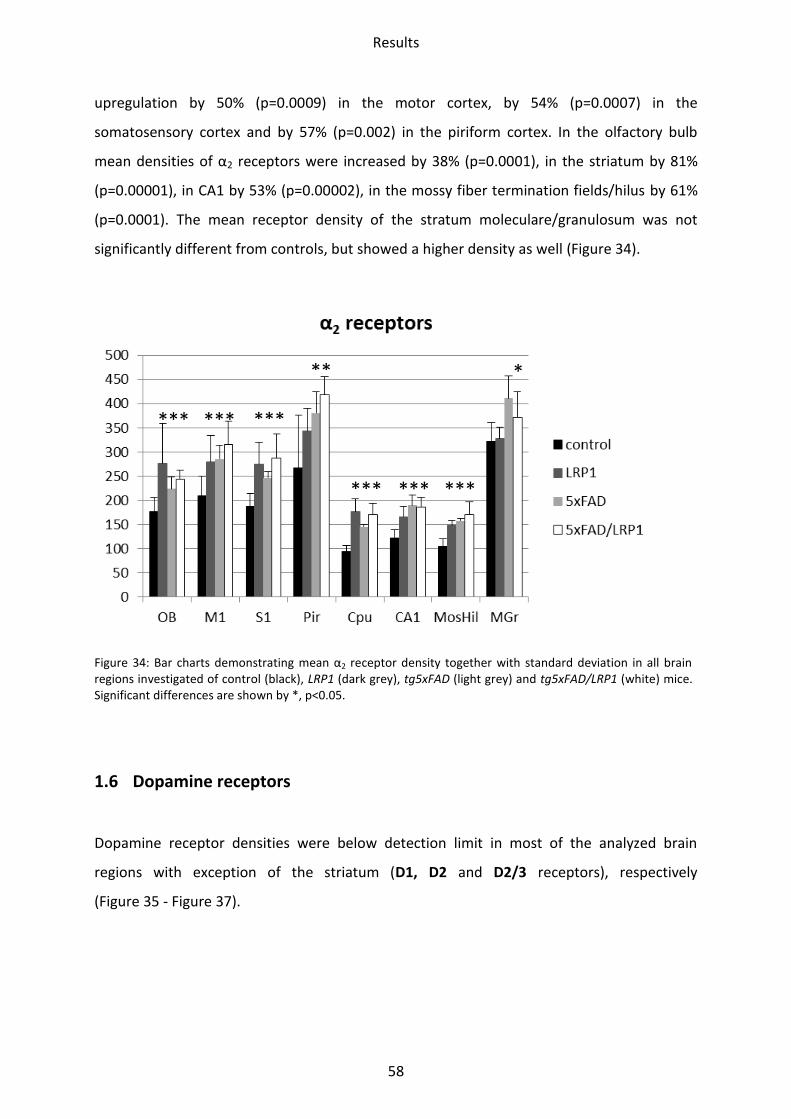
Results
58
upregulation by 50% (p=0.0009) in the motor cortex, by 54% (p=0.0007) in the
somatosensory cortex and by 57% (p=0.002) in the piriform cortex. In the olfactory bulb
mean densities of α2 receptors were increased by 38% (p=0.0001), in the striatum by 81%
(p=0.00001), in CA1 by 53% (p=0.00002), in the mossy fiber termination fields/hilus by 61%
(p=0.0001). The mean receptor density of the stratum moleculare/granulosum was not
significantly different from controls, but showed a higher density as well (Figure 34).
Figure 34: Bar charts demonstrating mean α2 receptor density together with standard deviation in all brain regions investigated of control (black), LRP1 (dark grey), tg5xFAD (light grey) and tg5xFAD/LRP1 (white) mice. Significant differences are shown by *, p<0.05.
1.6 Dopamine receptors
Dopamine receptor densities were below detection limit in most of the analyzed brain
regions with exception of the striatum (D1, D2 and D2/3 receptors), respectively
(Figure 35 - Figure 37).
*** *** ***
**
*** *** ***
*
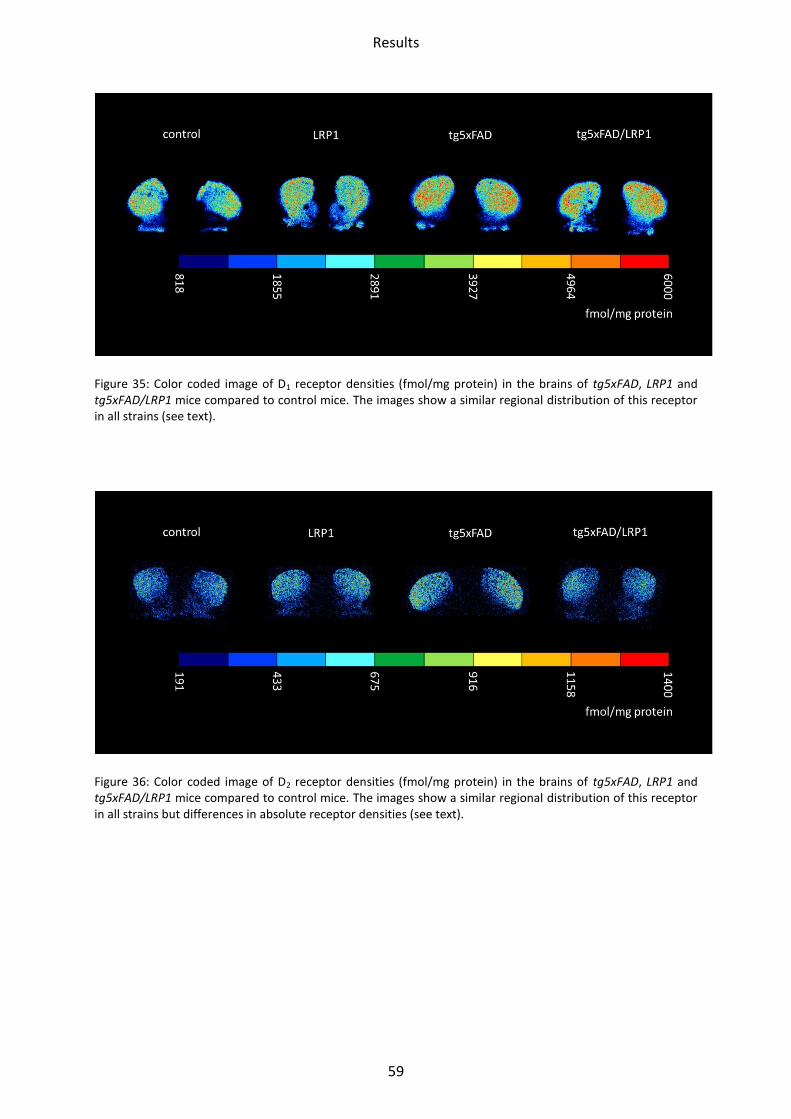
Results
59
Figure 35: Color coded image of D1 receptor densities (fmol/mg protein) in the brains of tg5xFAD, LRP1 and tg5xFAD/LRP1 mice compared to control mice. The images show a similar regional distribution of this receptor in all strains (see text).
Figure 36: Color coded image of D2 receptor densities (fmol/mg protein) in the brains of tg5xFAD, LRP1 and tg5xFAD/LRP1 mice compared to control mice. The images show a similar regional distribution of this receptor in all strains but differences in absolute receptor densities (see text).
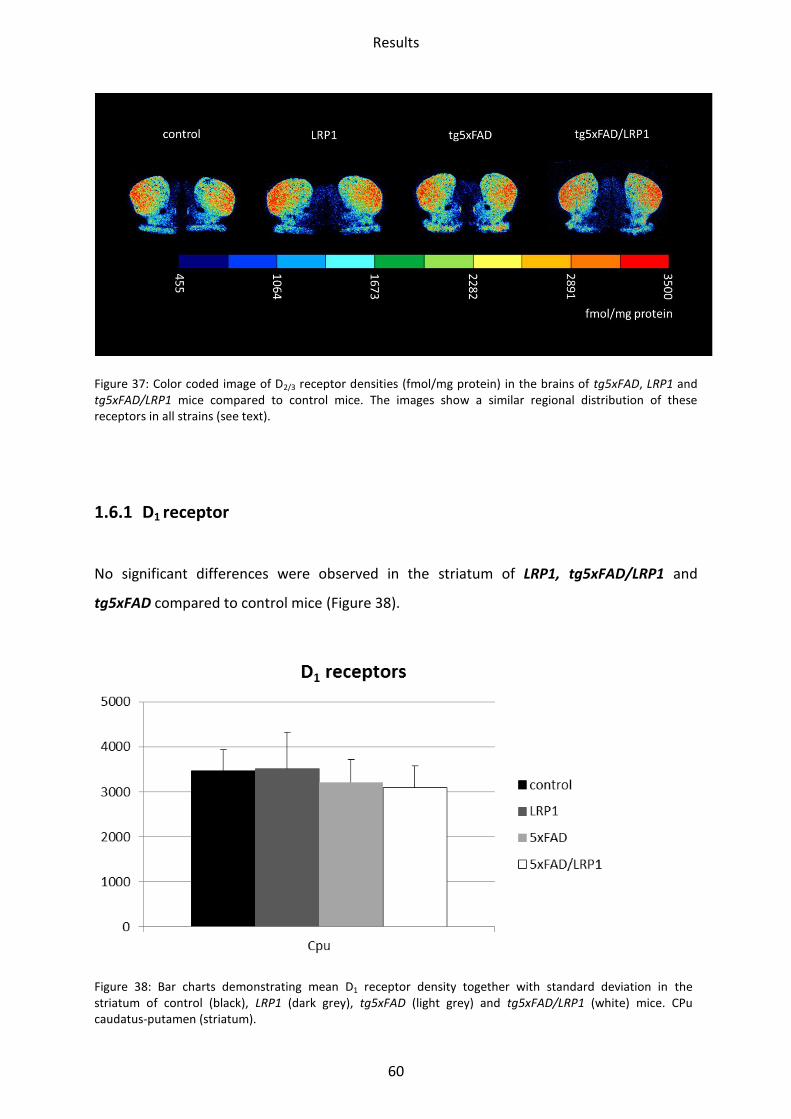
Results
60
Figure 37: Color coded image of D2/3 receptor densities (fmol/mg protein) in the brains of tg5xFAD, LRP1 and tg5xFAD/LRP1 mice compared to control mice. The images show a similar regional distribution of these receptors in all strains (see text).
1.6.1 D1 receptor
No significant differences were observed in the striatum of LRP1, tg5xFAD/LRP1 and
tg5xFAD compared to control mice (Figure 38).
Figure 38: Bar charts demonstrating mean D1 receptor density together with standard deviation in the striatum of control (black), LRP1 (dark grey), tg5xFAD (light grey) and tg5xFAD/LRP1 (white) mice. CPu caudatus-putamen (striatum).
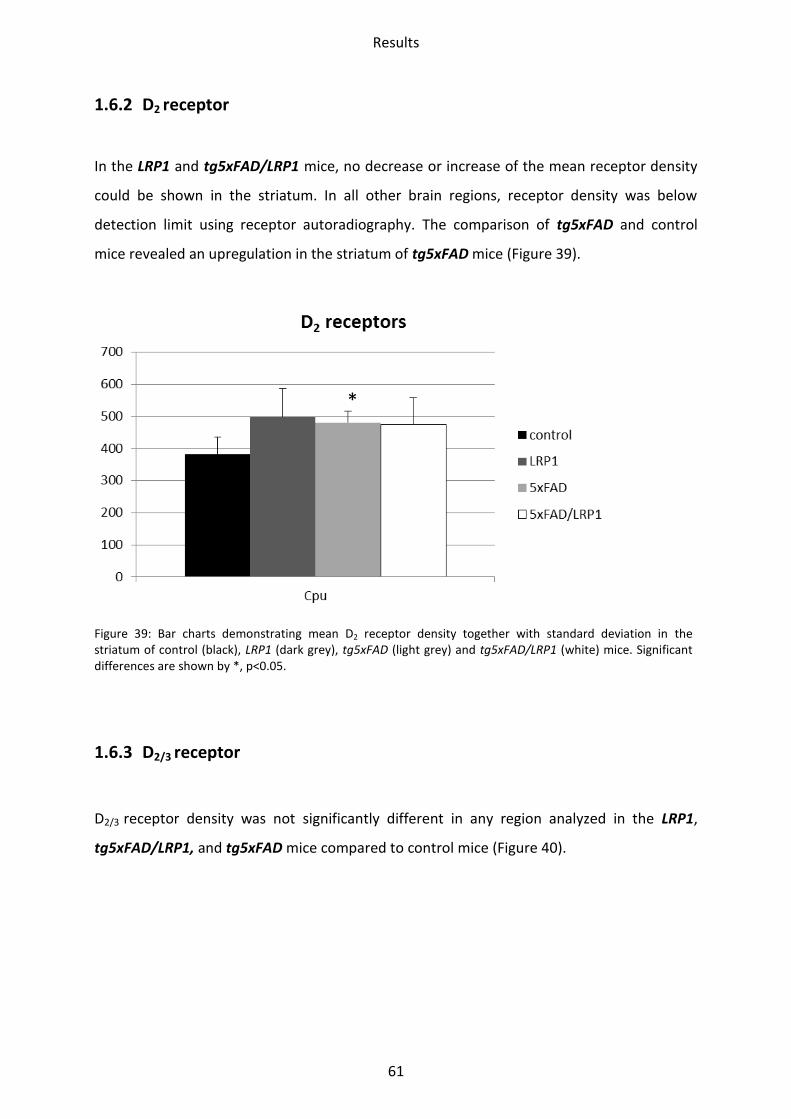
Results
61
1.6.2 D2 receptor
In the LRP1 and tg5xFAD/LRP1 mice, no decrease or increase of the mean receptor density
could be shown in the striatum. In all other brain regions, receptor density was below
detection limit using receptor autoradiography. The comparison of tg5xFAD and control
mice revealed an upregulation in the striatum of tg5xFAD mice (Figure 39).
Figure 39: Bar charts demonstrating mean D2 receptor density together with standard deviation in the striatum of control (black), LRP1 (dark grey), tg5xFAD (light grey) and tg5xFAD/LRP1 (white) mice. Significant differences are shown by *, p<0.05.
1.6.3 D2/3 receptor
D2/3 receptor density was not significantly different in any region analyzed in the LRP1,
tg5xFAD/LRP1, and tg5xFAD mice compared to control mice (Figure 40).
*
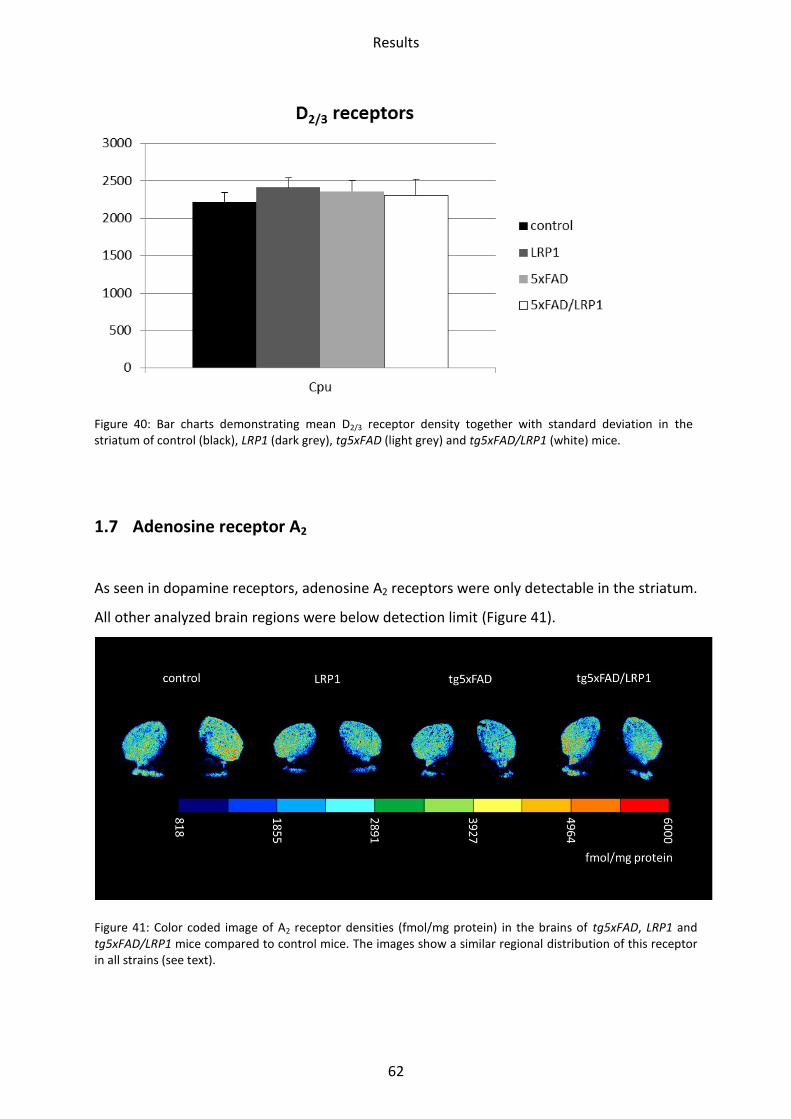
Results
62
Figure 40: Bar charts demonstrating mean D2/3 receptor density together with standard deviation in the striatum of control (black), LRP1 (dark grey), tg5xFAD (light grey) and tg5xFAD/LRP1 (white) mice.
1.7 Adenosine receptor A2
As seen in dopamine receptors, adenosine A2 receptors were only detectable in the striatum.
All other analyzed brain regions were below detection limit (Figure 41).
Figure 41: Color coded image of A2 receptor densities (fmol/mg protein) in the brains of tg5xFAD, LRP1 and tg5xFAD/LRP1 mice compared to control mice. The images show a similar regional distribution of this receptor in all strains (see text).
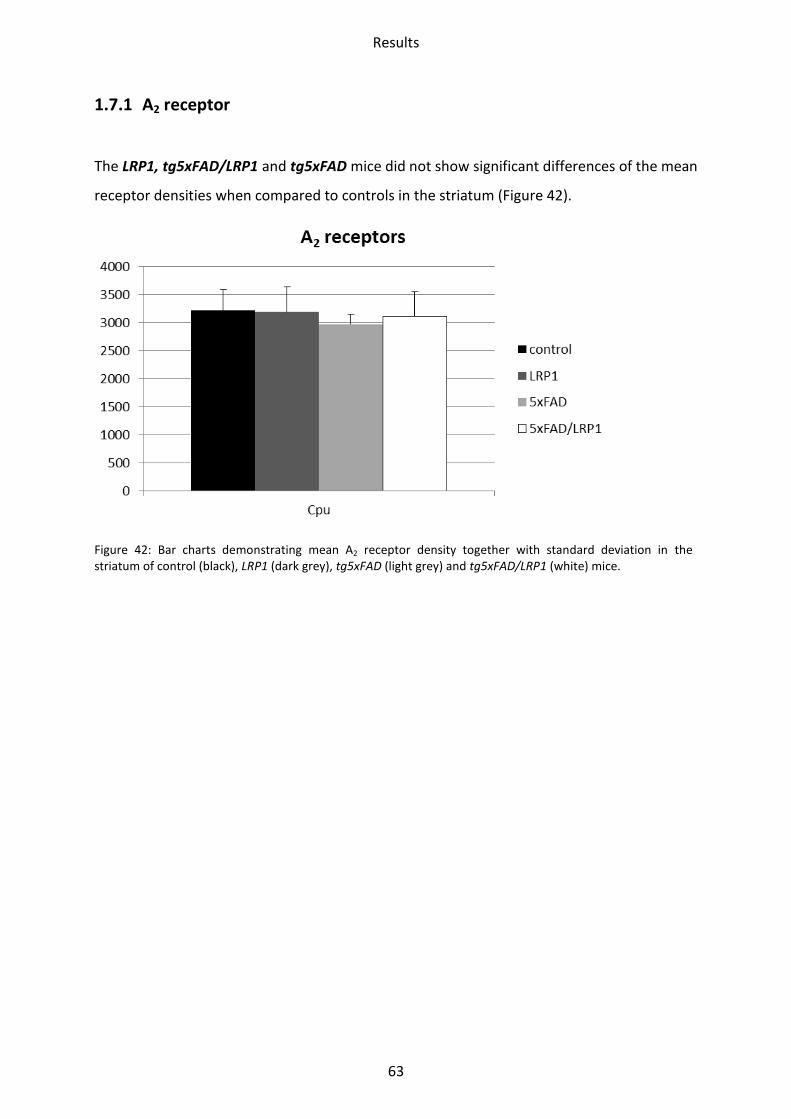
Results
63
1.7.1 A2 receptor
The LRP1, tg5xFAD/LRP1 and tg5xFAD mice did not show significant differences of the mean
receptor densities when compared to controls in the striatum (Figure 42).
Figure 42: Bar charts demonstrating mean A2 receptor density together with standard deviation in the striatum of control (black), LRP1 (dark grey), tg5xFAD (light grey) and tg5xFAD/LRP1 (white) mice.
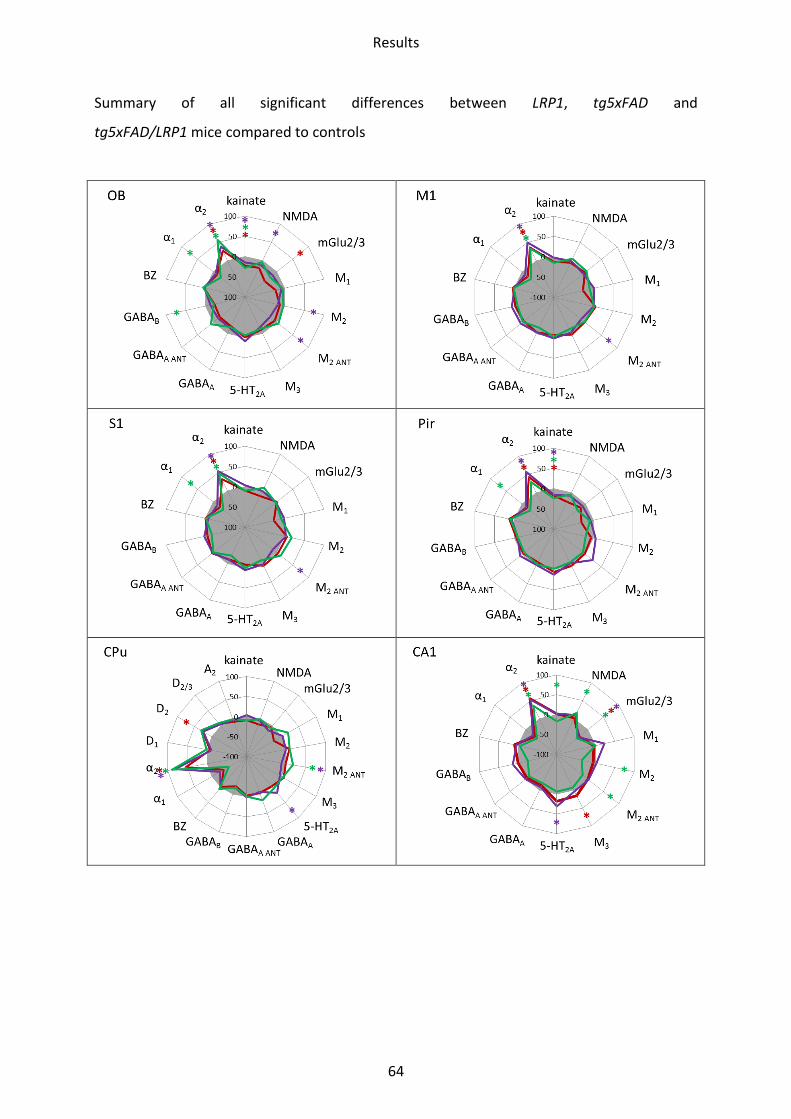
Results
64
Summary of all significant differences between LRP1, tg5xFAD and
tg5xFAD/LRP1 mice compared to controls
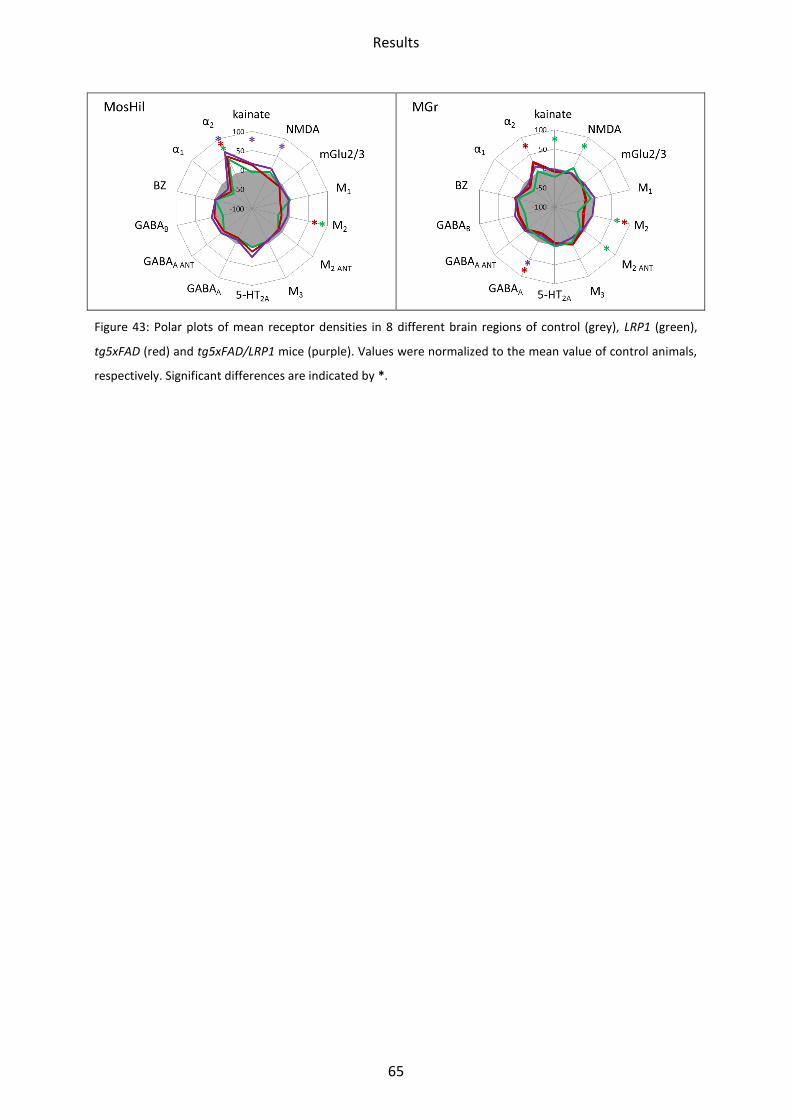
Results
65
Figure 43: Polar plots of mean receptor densities in 8 different brain regions of control (grey), LRP1 (green),
tg5xFAD (red) and tg5xFAD/LRP1 mice (purple). Values were normalized to the mean value of control animals,
respectively. Significant differences are indicated by *.
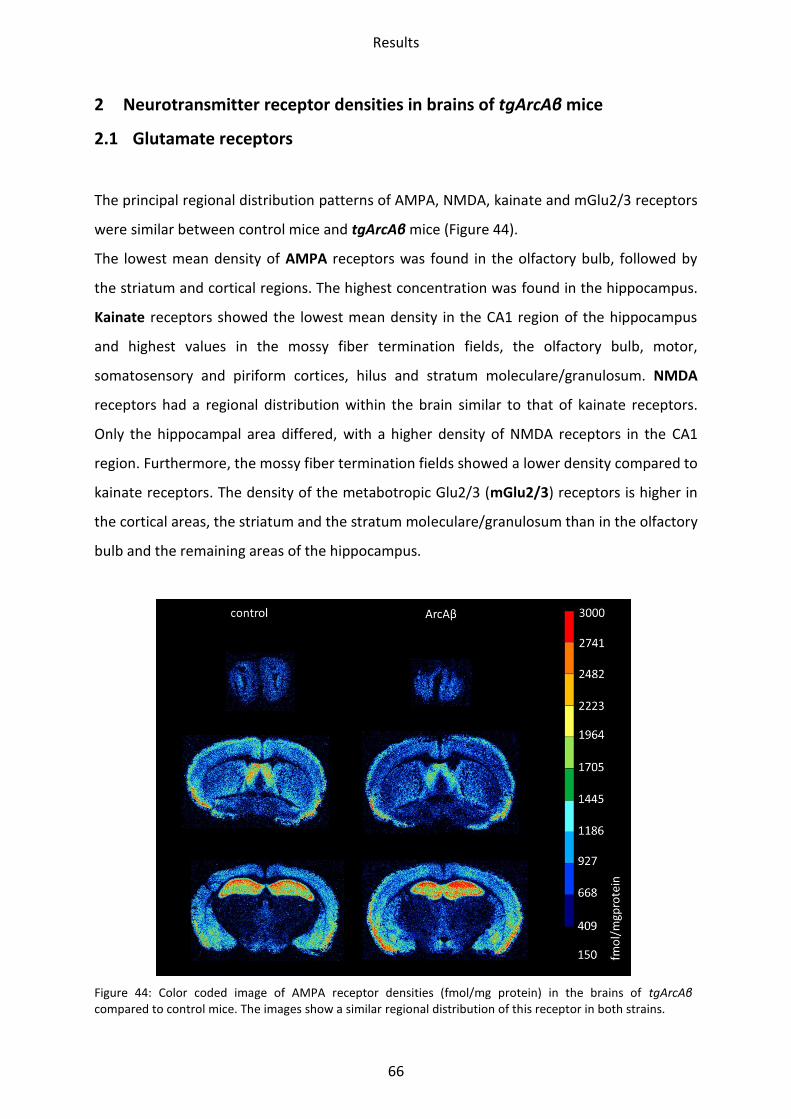
Results
66
2 Neurotransmitter receptor densities in brains of tgArcAβ mice
2.1 Glutamate receptors
The principal regional distribution patterns of AMPA, NMDA, kainate and mGlu2/3 receptors
were similar between control mice and tgArcAβ mice (Figure 44).
The lowest mean density of AMPA receptors was found in the olfactory bulb, followed by
the striatum and cortical regions. The highest concentration was found in the hippocampus.
Kainate receptors showed the lowest mean density in the CA1 region of the hippocampus
and highest values in the mossy fiber termination fields, the olfactory bulb, motor,
somatosensory and piriform cortices, hilus and stratum moleculare/granulosum. NMDA
receptors had a regional distribution within the brain similar to that of kainate receptors.
Only the hippocampal area differed, with a higher density of NMDA receptors in the CA1
region. Furthermore, the mossy fiber termination fields showed a lower density compared to
kainate receptors. The density of the metabotropic Glu2/3 (mGlu2/3) receptors is higher in
the cortical areas, the striatum and the stratum moleculare/granulosum than in the olfactory
bulb and the remaining areas of the hippocampus.
Figure 44: Color coded image of AMPA receptor densities (fmol/mg protein) in the brains of tgArcAβ compared to control mice. The images show a similar regional distribution of this receptor in both strains.
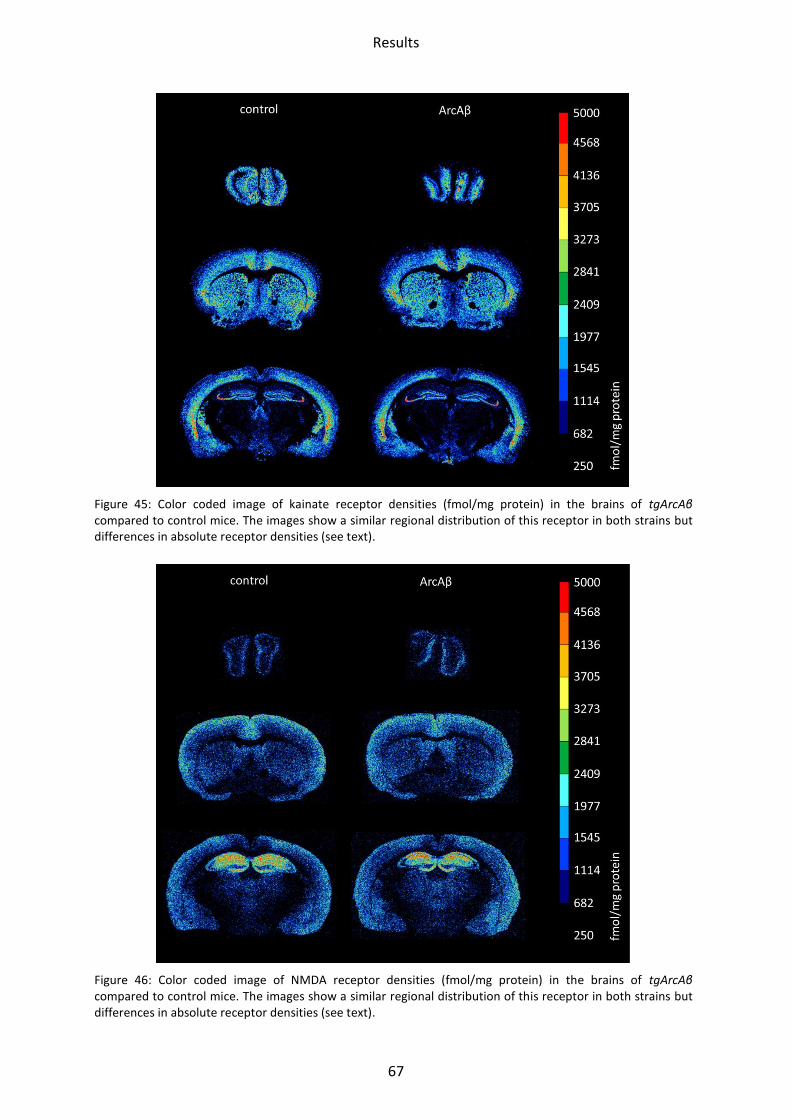
Results
67
Figure 45: Color coded image of kainate receptor densities (fmol/mg protein) in the brains of tgArcAβ compared to control mice. The images show a similar regional distribution of this receptor in both strains but differences in absolute receptor densities (see text).
Figure 46: Color coded image of NMDA receptor densities (fmol/mg protein) in the brains of tgArcAβ compared to control mice. The images show a similar regional distribution of this receptor in both strains but differences in absolute receptor densities (see text).
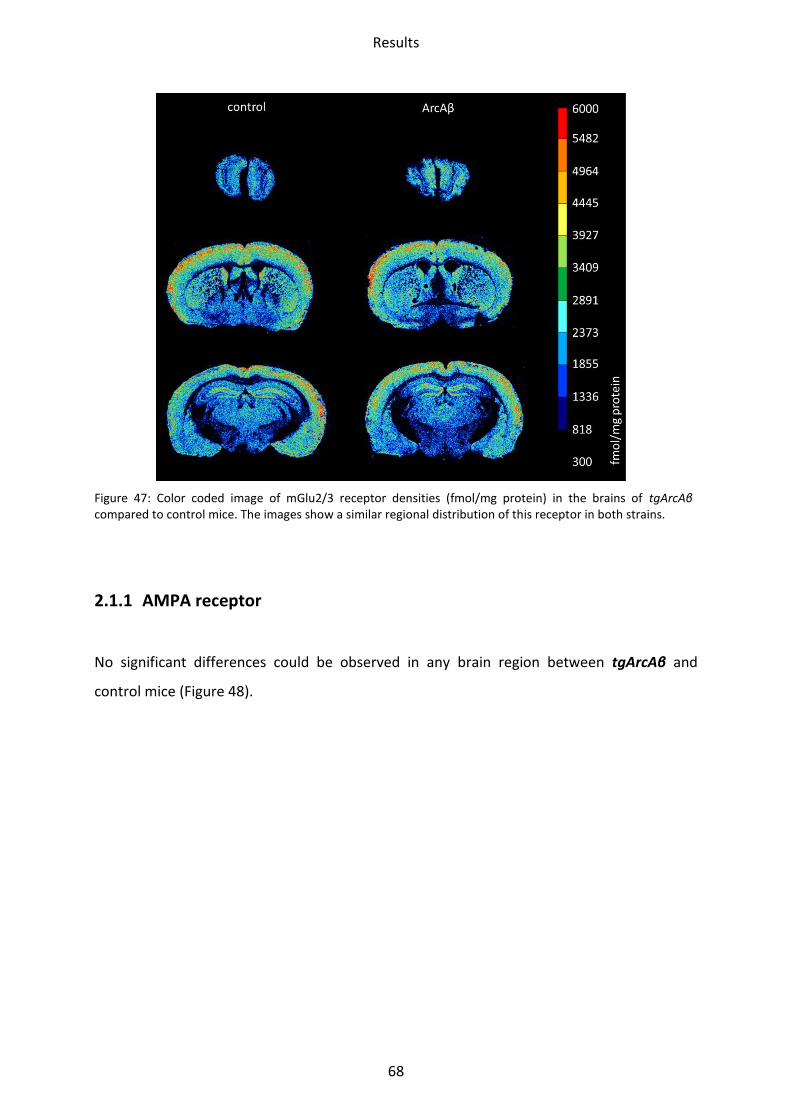
Results
68
Figure 47: Color coded image of mGlu2/3 receptor densities (fmol/mg protein) in the brains of tgArcAβ compared to control mice. The images show a similar regional distribution of this receptor in both strains.
2.1.1 AMPA receptor
No significant differences could be observed in any brain region between tgArcAβ and
control mice (Figure 48).
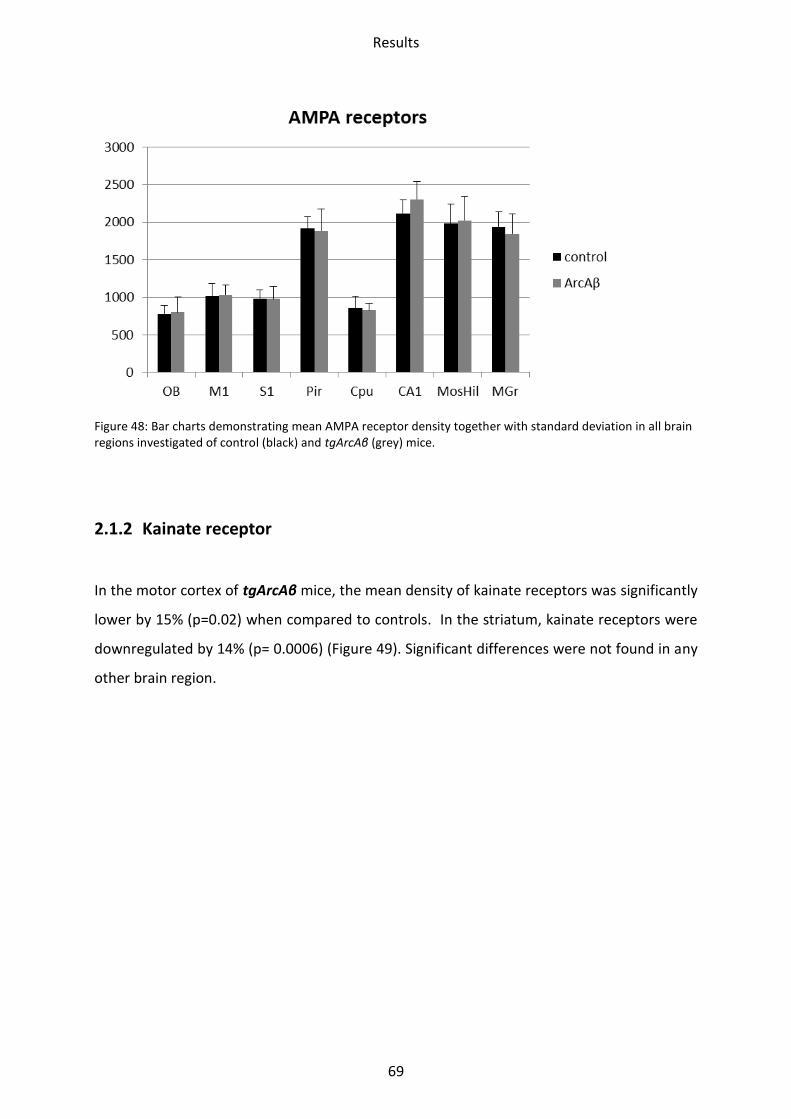
Results
69
Figure 48: Bar charts demonstrating mean AMPA receptor density together with standard deviation in all brain regions investigated of control (black) and tgArcAβ (grey) mice.
2.1.2 Kainate receptor
In the motor cortex of tgArcAβ mice, the mean density of kainate receptors was significantly
lower by 15% (p=0.02) when compared to controls. In the striatum, kainate receptors were
downregulated by 14% (p= 0.0006) (Figure 49). Significant differences were not found in any
other brain region.
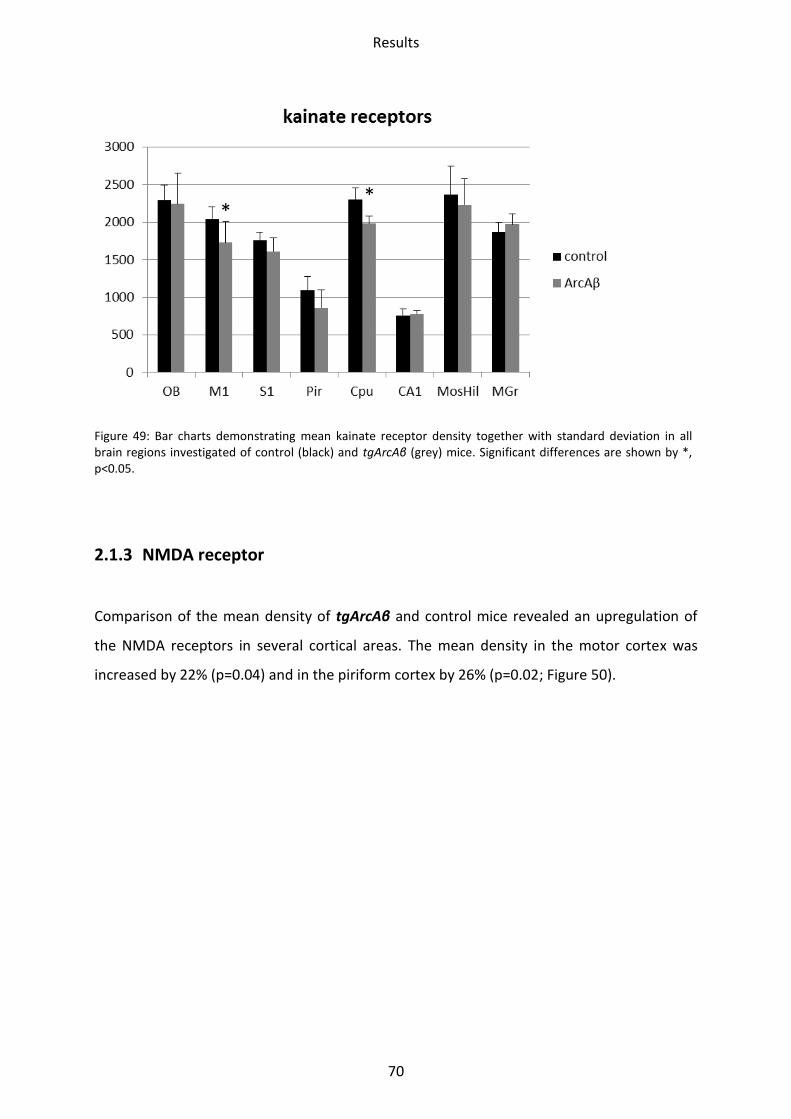
Results
70
Figure 49: Bar charts demonstrating mean kainate receptor density together with standard deviation in all brain regions investigated of control (black) and tgArcAβ (grey) mice. Significant differences are shown by *, p<0.05.
2.1.3 NMDA receptor
Comparison of the mean density of tgArcAβ and control mice revealed an upregulation of
the NMDA receptors in several cortical areas. The mean density in the motor cortex was
increased by 22% (p=0.04) and in the piriform cortex by 26% (p=0.02; Figure 50).
* *
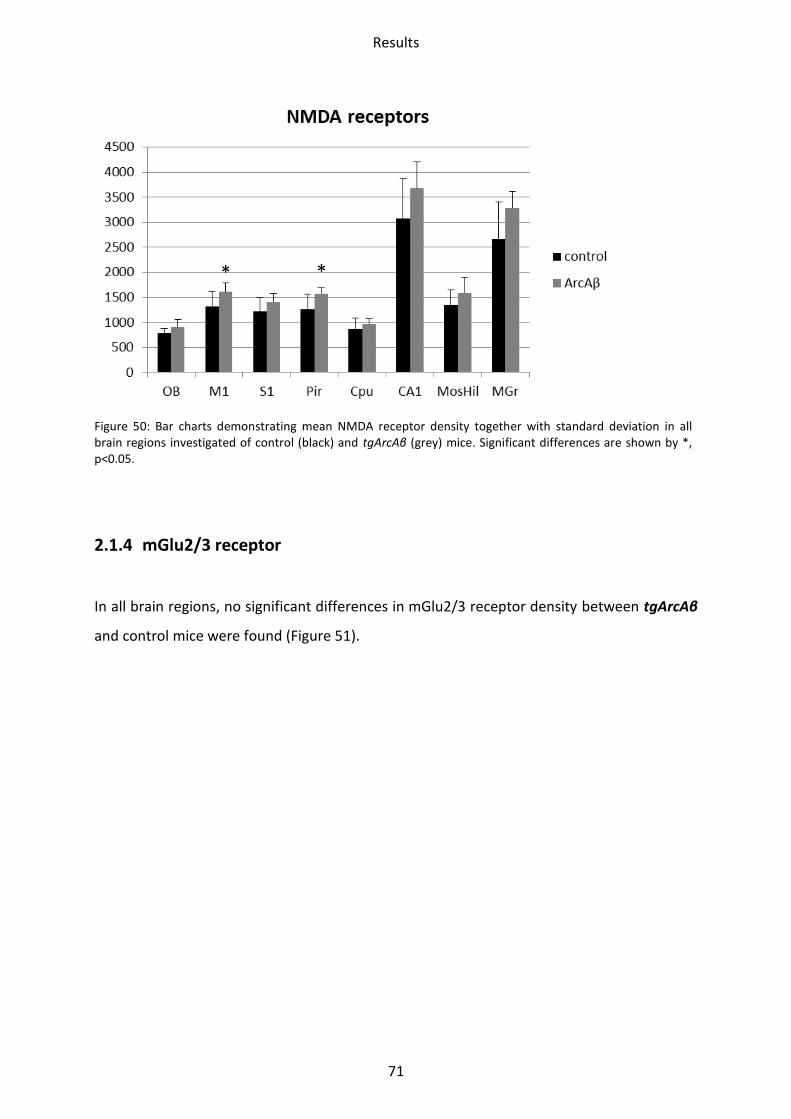
Results
71
Figure 50: Bar charts demonstrating mean NMDA receptor density together with standard deviation in all brain regions investigated of control (black) and tgArcAβ (grey) mice. Significant differences are shown by *, p<0.05.
2.1.4 mGlu2/3 receptor
In all brain regions, no significant differences in mGlu2/3 receptor density between tgArcAβ
and control mice were found (Figure 51).
* *
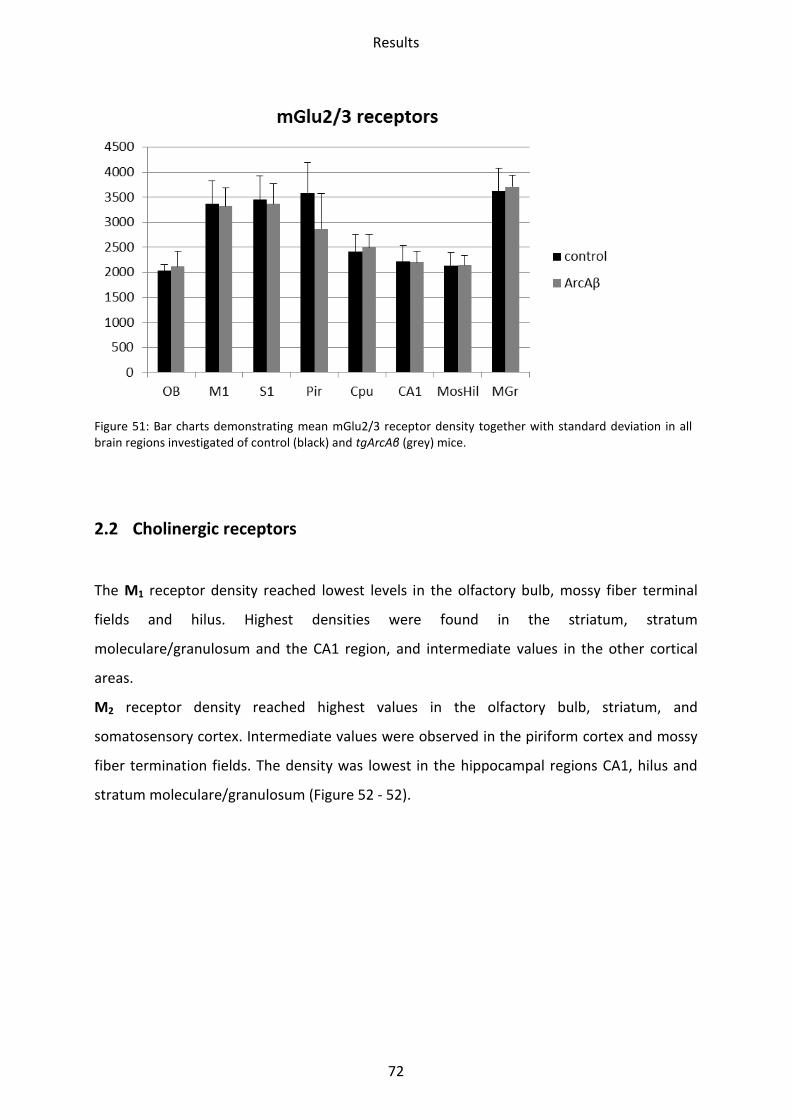
Results
72
Figure 51: Bar charts demonstrating mean mGlu2/3 receptor density together with standard deviation in all brain regions investigated of control (black) and tgArcAβ (grey) mice.
2.2 Cholinergic receptors
The M1 receptor density reached lowest levels in the olfactory bulb, mossy fiber terminal
fields and hilus. Highest densities were found in the striatum, stratum
moleculare/granulosum and the CA1 region, and intermediate values in the other cortical
areas.
M2 receptor density reached highest values in the olfactory bulb, striatum, and
somatosensory cortex. Intermediate values were observed in the piriform cortex and mossy
fiber termination fields. The density was lowest in the hippocampal regions CA1, hilus and
stratum moleculare/granulosum (Figure 52 - 52).
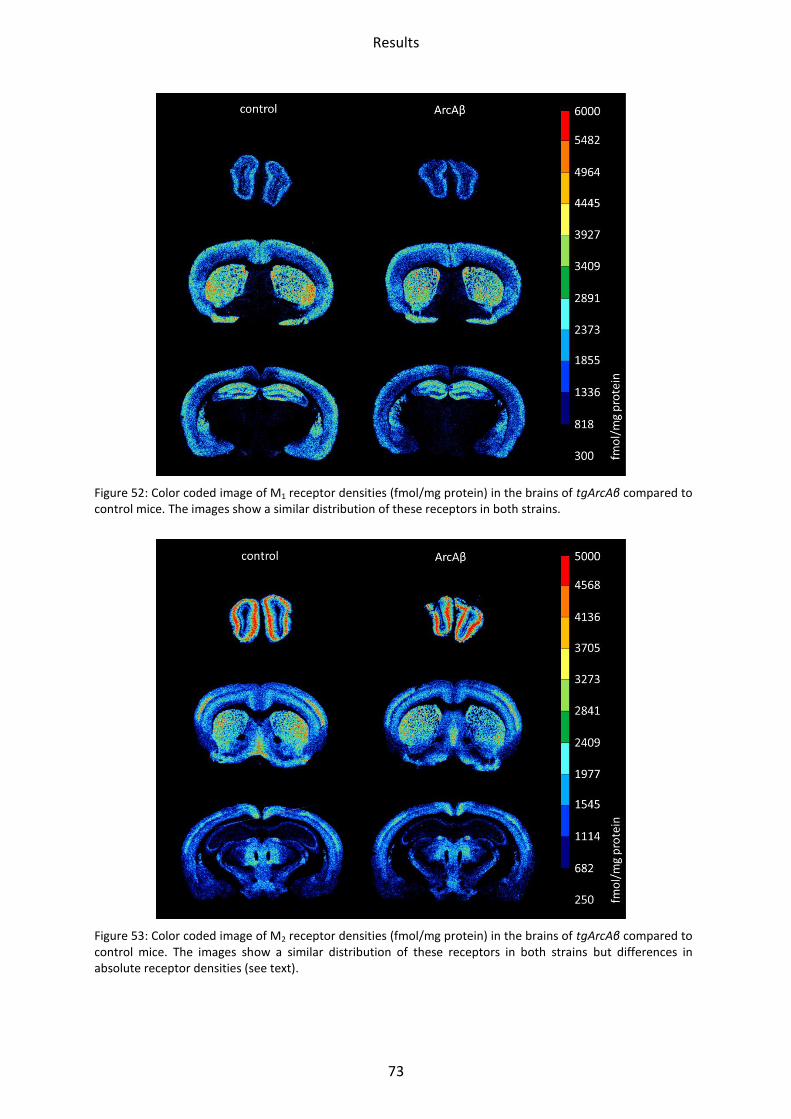
Results
73
Figure 52: Color coded image of M1 receptor densities (fmol/mg protein) in the brains of tgArcAβ compared to control mice. The images show a similar distribution of these receptors in both strains.
Figure 53: Color coded image of M2 receptor densities (fmol/mg protein) in the brains of tgArcAβ compared to control mice. The images show a similar distribution of these receptors in both strains but differences in absolute receptor densities (see text).
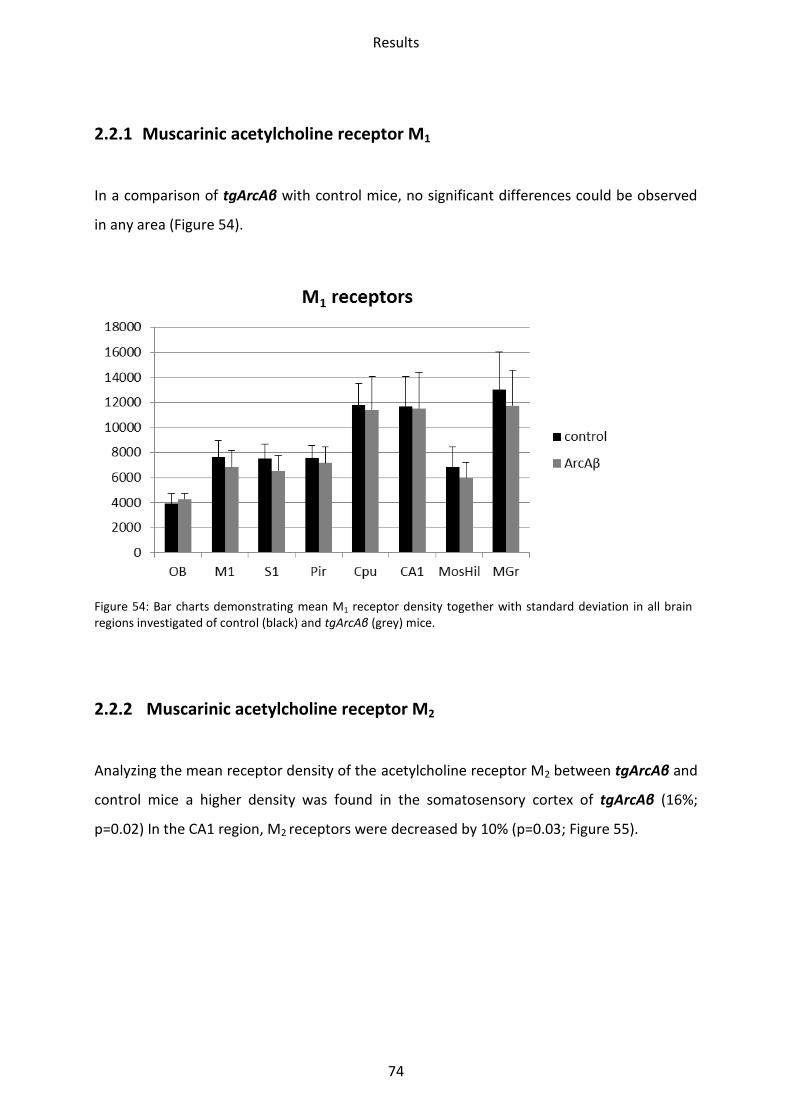
Results
74
2.2.1 Muscarinic acetylcholine receptor M1
In a comparison of tgArcAβ with control mice, no significant differences could be observed
in any area (Figure 54).
Figure 54: Bar charts demonstrating mean M1 receptor density together with standard deviation in all brain regions investigated of control (black) and tgArcAβ (grey) mice.
2.2.2 Muscarinic acetylcholine receptor M2
Analyzing the mean receptor density of the acetylcholine receptor M2 between tgArcAβ and
control mice a higher density was found in the somatosensory cortex of tgArcAβ (16%;
p=0.02) In the CA1 region, M2 receptors were decreased by 10% (p=0.03; Figure 55).
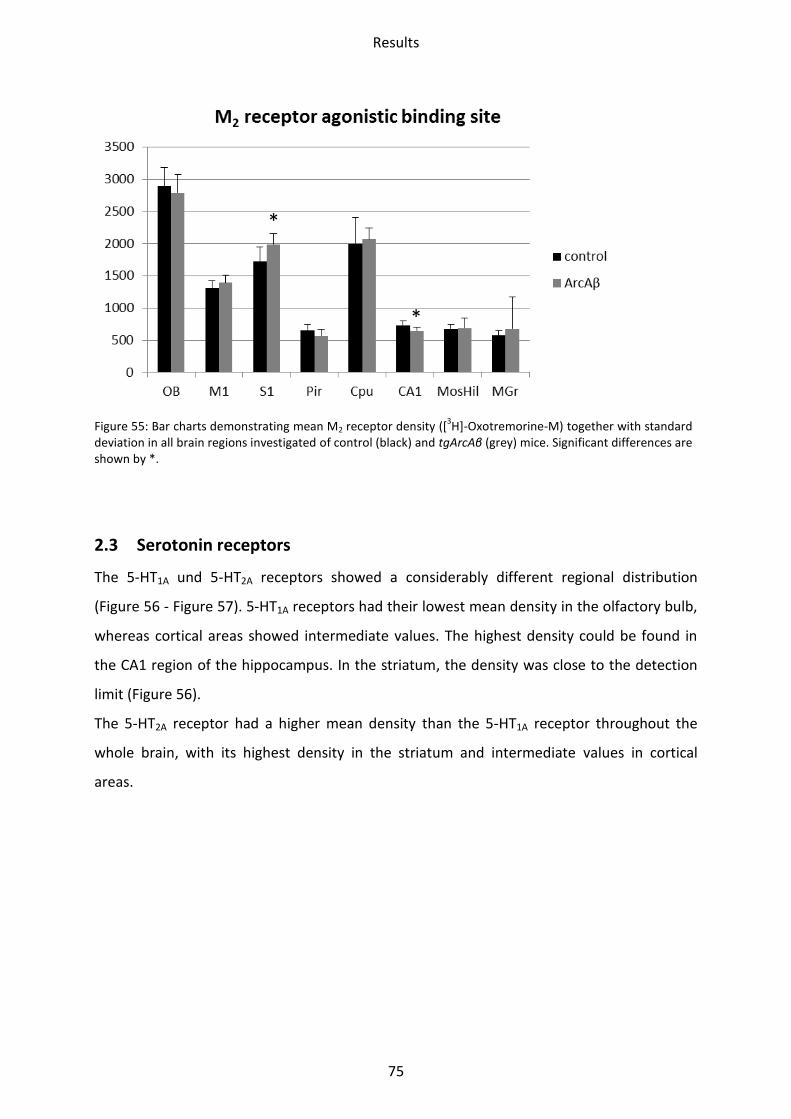
Results
75
Figure 55: Bar charts demonstrating mean M2 receptor density ([3H]-Oxotremorine-M) together with standard
deviation in all brain regions investigated of control (black) and tgArcAβ (grey) mice. Significant differences are shown by *.
2.3 Serotonin receptors
The 5-HT1A und 5-HT2A receptors showed a considerably different regional distribution
(Figure 56 - Figure 57). 5-HT1A receptors had their lowest mean density in the olfactory bulb,
whereas cortical areas showed intermediate values. The highest density could be found in
the CA1 region of the hippocampus. In the striatum, the density was close to the detection
limit (Figure 56).
The 5-HT2A receptor had a higher mean density than the 5-HT1A receptor throughout the
whole brain, with its highest density in the striatum and intermediate values in cortical
areas.
*
*
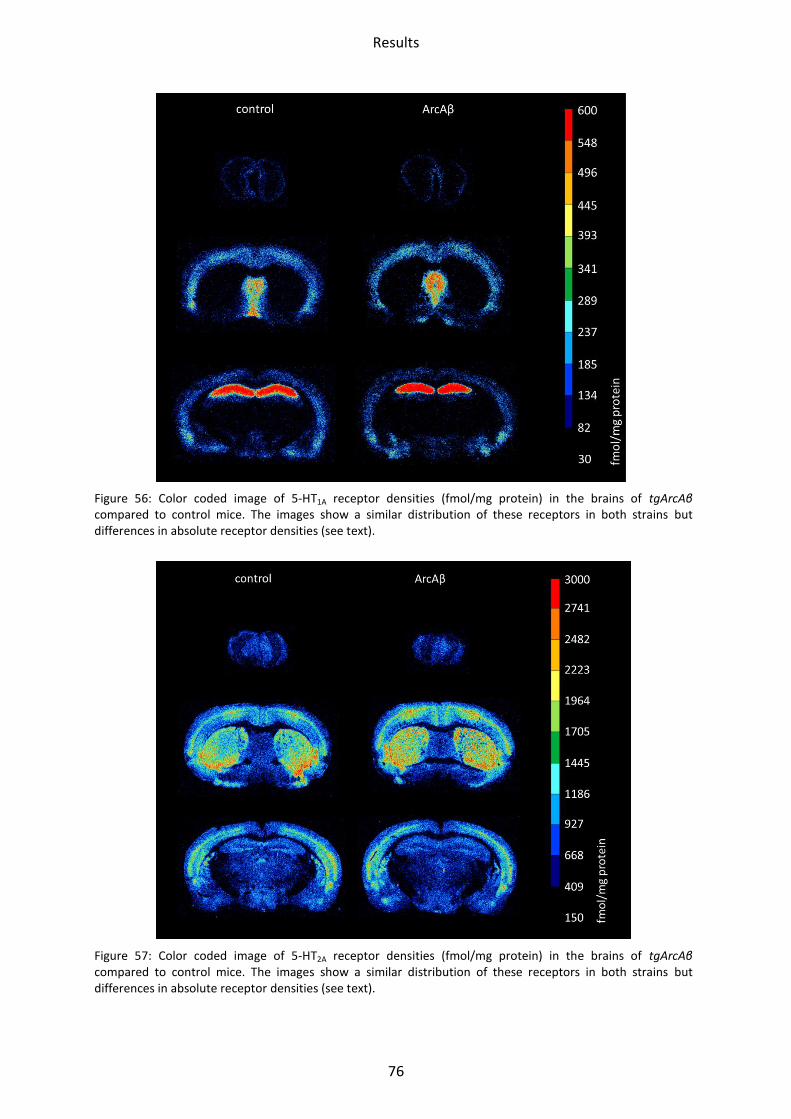
Results
76
Figure 56: Color coded image of 5-HT1A receptor densities (fmol/mg protein) in the brains of tgArcAβ compared to control mice. The images show a similar distribution of these receptors in both strains but differences in absolute receptor densities (see text).
Figure 57: Color coded image of 5-HT2A receptor densities (fmol/mg protein) in the brains of tgArcAβ compared to control mice. The images show a similar distribution of these receptors in both strains but differences in absolute receptor densities (see text).
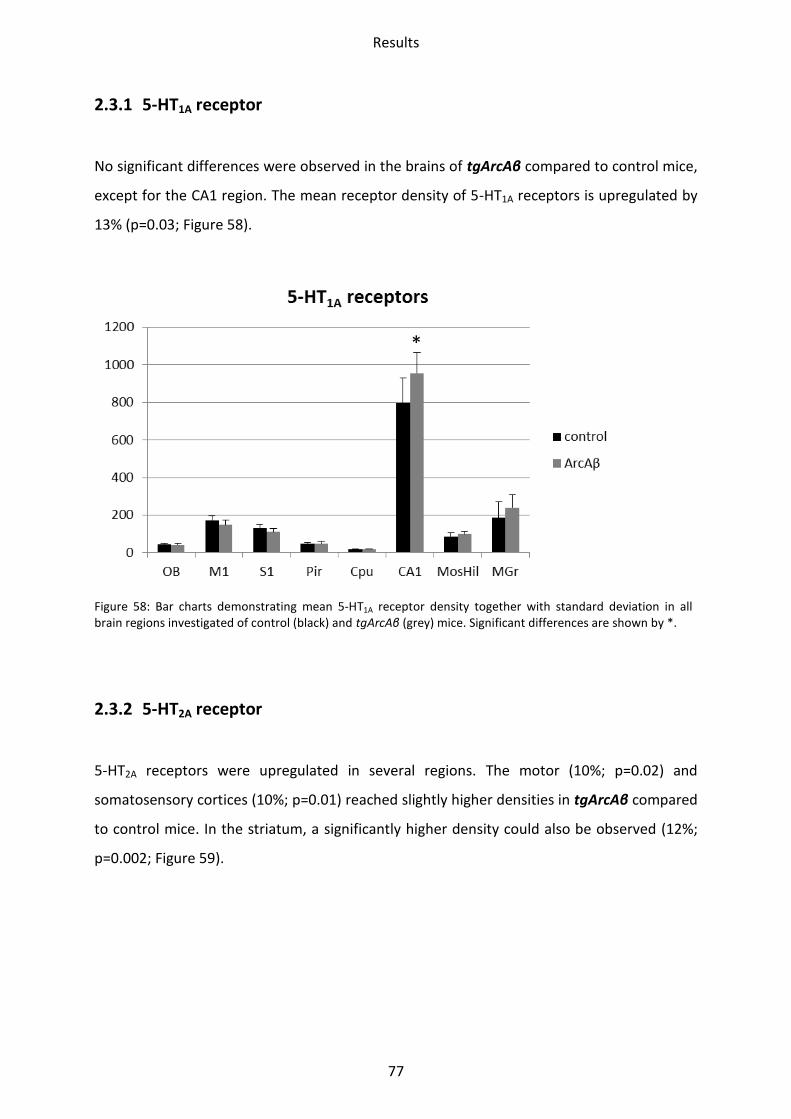
Results
77
2.3.1 5-HT1A receptor
No significant differences were observed in the brains of tgArcAβ compared to control mice,
except for the CA1 region. The mean receptor density of 5-HT1A receptors is upregulated by
13% (p=0.03; Figure 58).
Figure 58: Bar charts demonstrating mean 5-HT1A receptor density together with standard deviation in all brain regions investigated of control (black) and tgArcAβ (grey) mice. Significant differences are shown by *.
2.3.2 5-HT2A receptor
5-HT2A receptors were upregulated in several regions. The motor (10%; p=0.02) and
somatosensory cortices (10%; p=0.01) reached slightly higher densities in tgArcAβ compared
to control mice. In the striatum, a significantly higher density could also be observed (12%;
p=0.002; Figure 59).
*
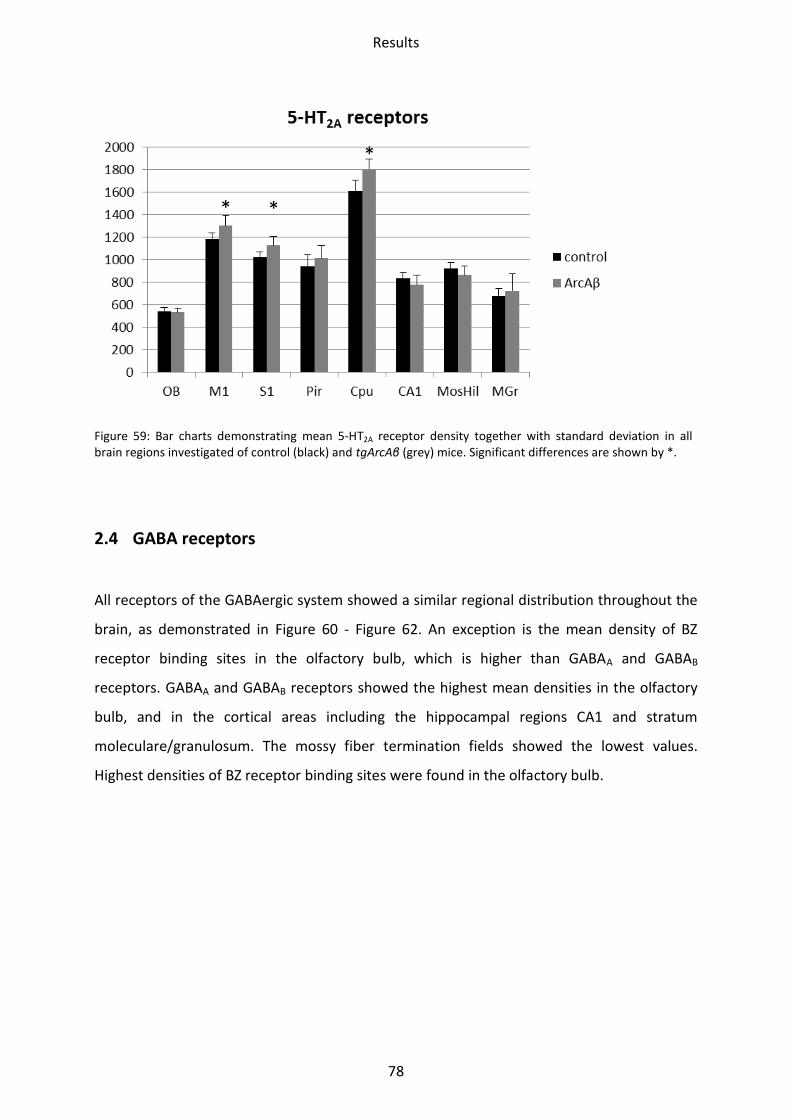
Results
78
Figure 59: Bar charts demonstrating mean 5-HT2A receptor density together with standard deviation in all brain regions investigated of control (black) and tgArcAβ (grey) mice. Significant differences are shown by *.
2.4 GABA receptors
All receptors of the GABAergic system showed a similar regional distribution throughout the
brain, as demonstrated in Figure 60 - Figure 62. An exception is the mean density of BZ
receptor binding sites in the olfactory bulb, which is higher than GABAA and GABAB
receptors. GABAA and GABAB receptors showed the highest mean densities in the olfactory
bulb, and in the cortical areas including the hippocampal regions CA1 and stratum
moleculare/granulosum. The mossy fiber termination fields showed the lowest values.
Highest densities of BZ receptor binding sites were found in the olfactory bulb.
* *
*
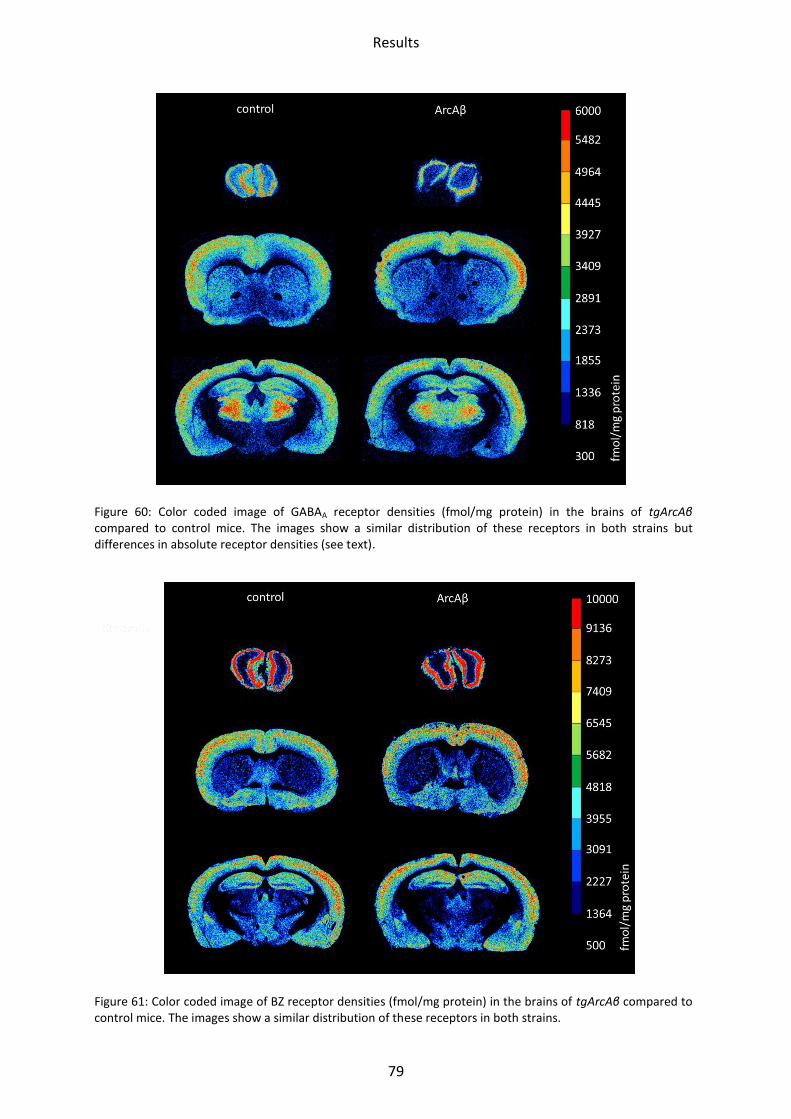
Results
79
Figure 60: Color coded image of GABAA receptor densities (fmol/mg protein) in the brains of tgArcAβ compared to control mice. The images show a similar distribution of these receptors in both strains but differences in absolute receptor densities (see text).
Figure 61: Color coded image of BZ receptor densities (fmol/mg protein) in the brains of tgArcAβ compared to control mice. The images show a similar distribution of these receptors in both strains.
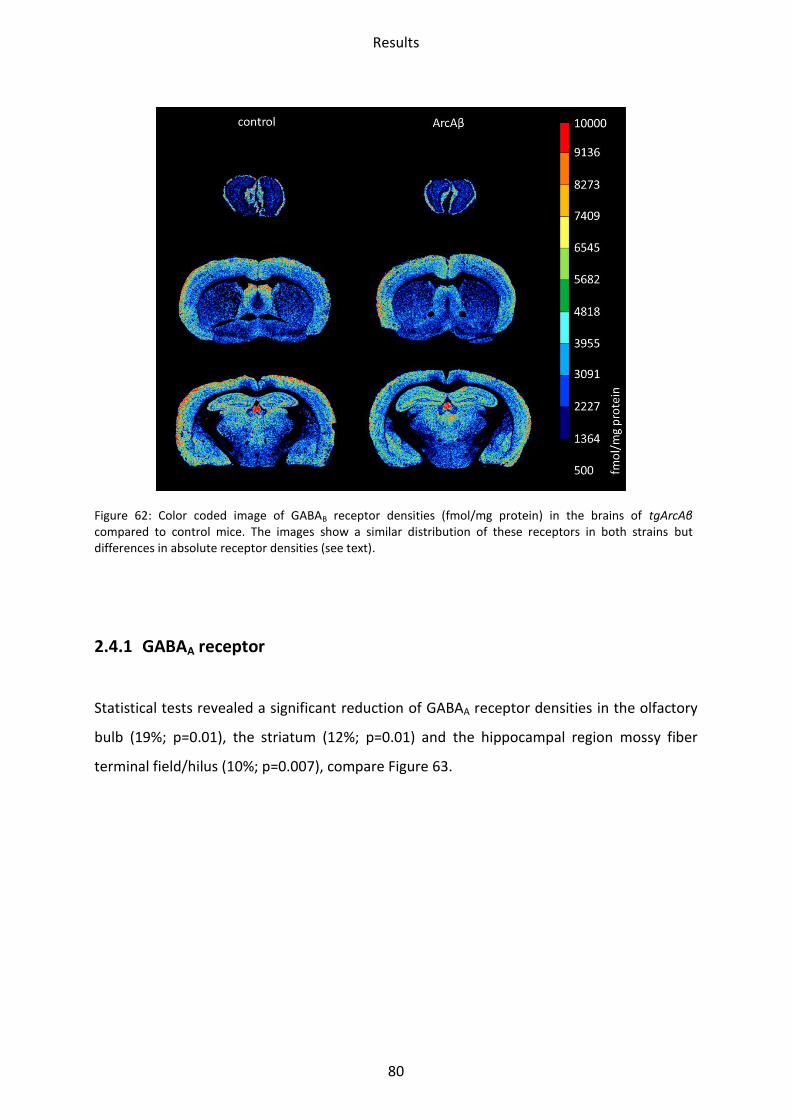
Results
80
Figure 62: Color coded image of GABAB receptor densities (fmol/mg protein) in the brains of tgArcAβ compared to control mice. The images show a similar distribution of these receptors in both strains but differences in absolute receptor densities (see text).
2.4.1 GABAA receptor
Statistical tests revealed a significant reduction of GABAA receptor densities in the olfactory
bulb (19%; p=0.01), the striatum (12%; p=0.01) and the hippocampal region mossy fiber
terminal field/hilus (10%; p=0.007), compare Figure 63.
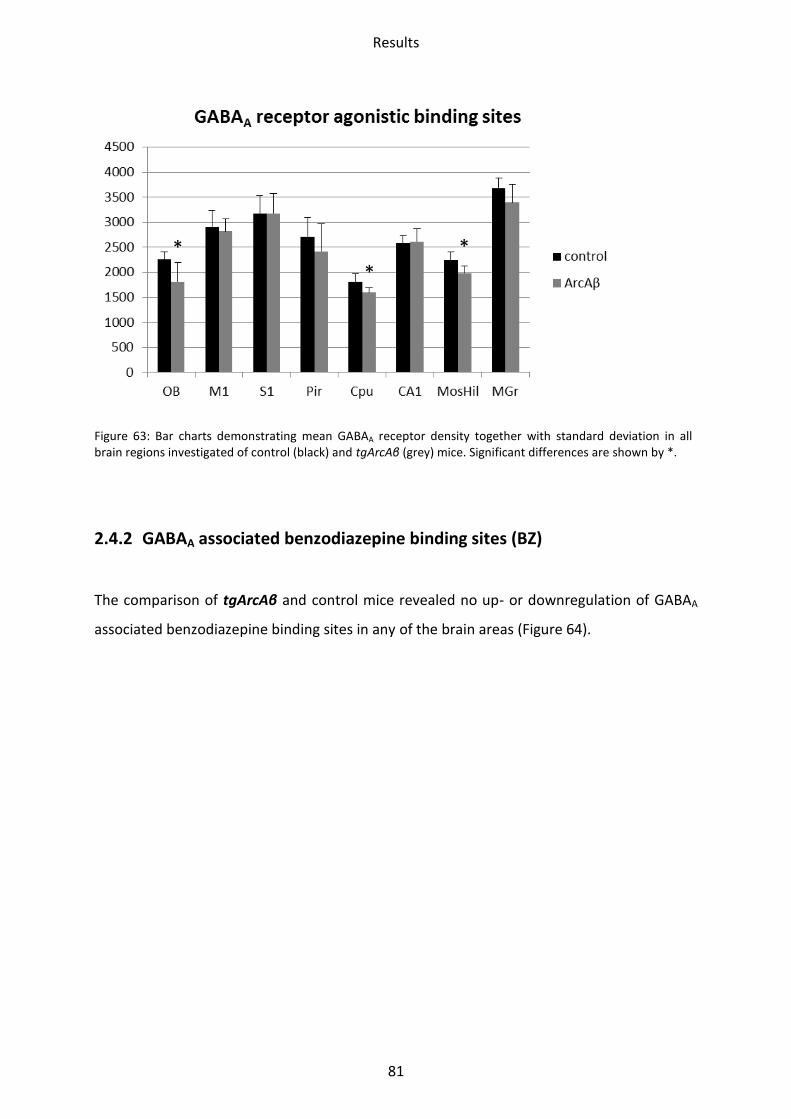
Results
81
Figure 63: Bar charts demonstrating mean GABAA receptor density together with standard deviation in all brain regions investigated of control (black) and tgArcAβ (grey) mice. Significant differences are shown by *.
2.4.2 GABAA associated benzodiazepine binding sites (BZ)
The comparison of tgArcAβ and control mice revealed no up- or downregulation of GABAA
associated benzodiazepine binding sites in any of the brain areas (Figure 64).
* *
*
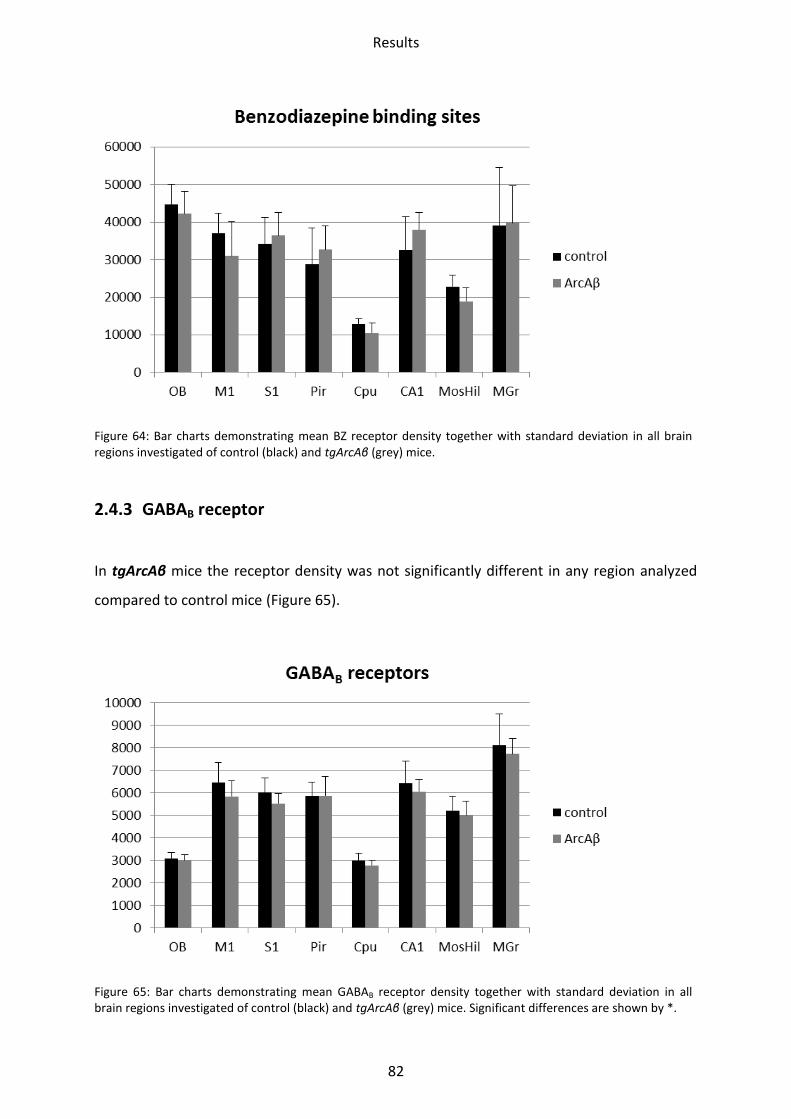
Results
82
Figure 64: Bar charts demonstrating mean BZ receptor density together with standard deviation in all brain regions investigated of control (black) and tgArcAβ (grey) mice.
2.4.3 GABAB receptor
In tgArcAβ mice the receptor density was not significantly different in any region analyzed
compared to control mice (Figure 65).
Figure 65: Bar charts demonstrating mean GABAB receptor density together with standard deviation in all brain regions investigated of control (black) and tgArcAβ (grey) mice. Significant differences are shown by *.
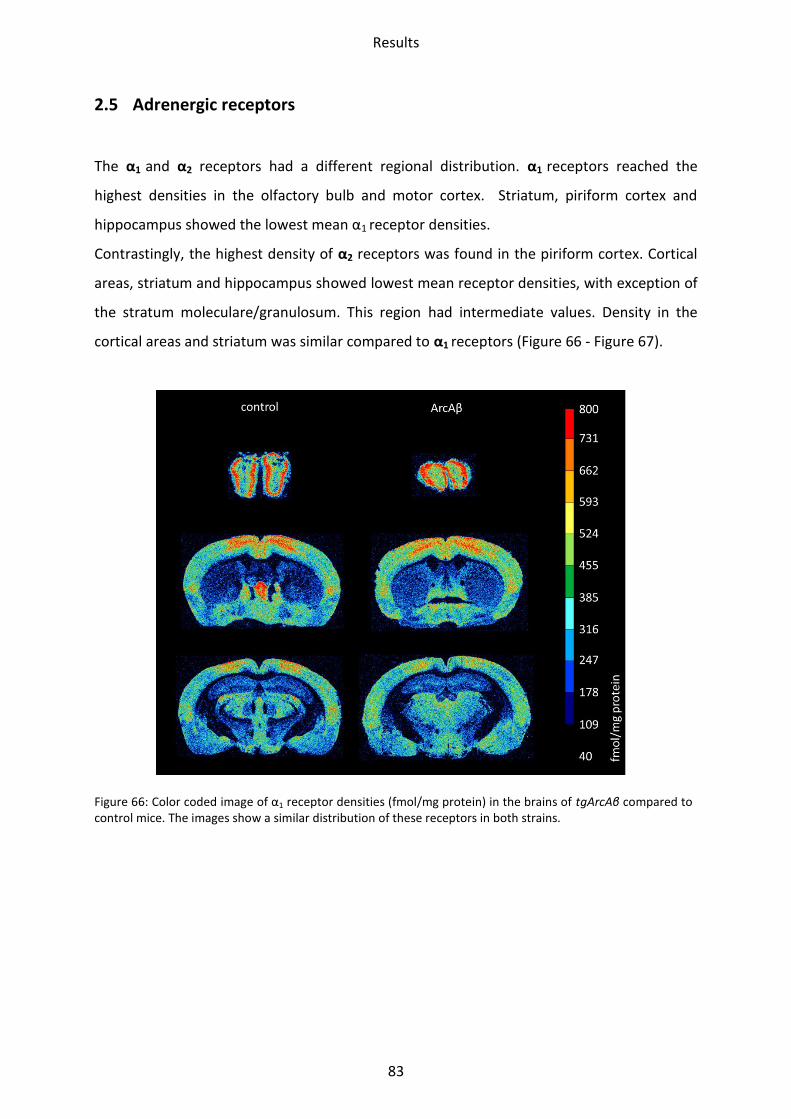
Results
83
2.5 Adrenergic receptors
The α1 and α2 receptors had a different regional distribution. α1 receptors reached the
highest densities in the olfactory bulb and motor cortex. Striatum, piriform cortex and
hippocampus showed the lowest mean α1 receptor densities.
Contrastingly, the highest density of α2 receptors was found in the piriform cortex. Cortical
areas, striatum and hippocampus showed lowest mean receptor densities, with exception of
the stratum moleculare/granulosum. This region had intermediate values. Density in the
cortical areas and striatum was similar compared to α1 receptors (Figure 66 - Figure 67).
Figure 66: Color coded image of α1 receptor densities (fmol/mg protein) in the brains of tgArcAβ compared to control mice. The images show a similar distribution of these receptors in both strains.
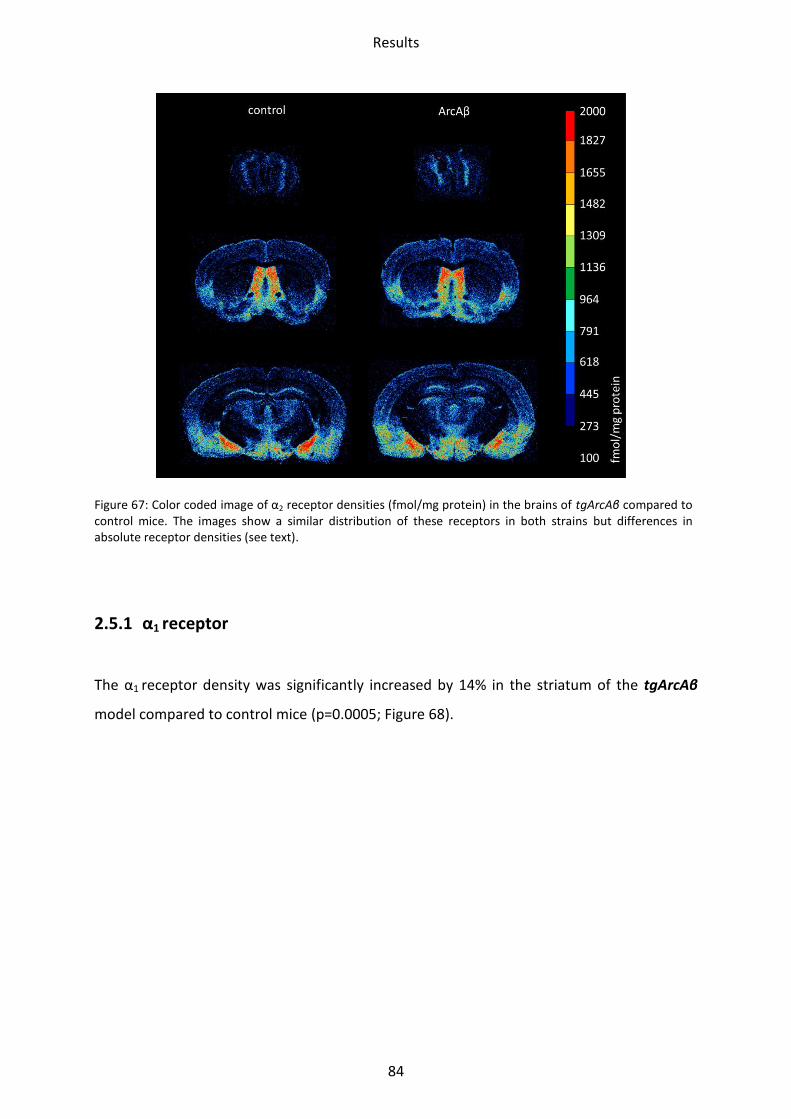
Results
84
Figure 67: Color coded image of α2 receptor densities (fmol/mg protein) in the brains of tgArcAβ compared to control mice. The images show a similar distribution of these receptors in both strains but differences in absolute receptor densities (see text).
2.5.1 α1 receptor
The α1 receptor density was significantly increased by 14% in the striatum of the tgArcAβ
model compared to control mice (p=0.0005; Figure 68).
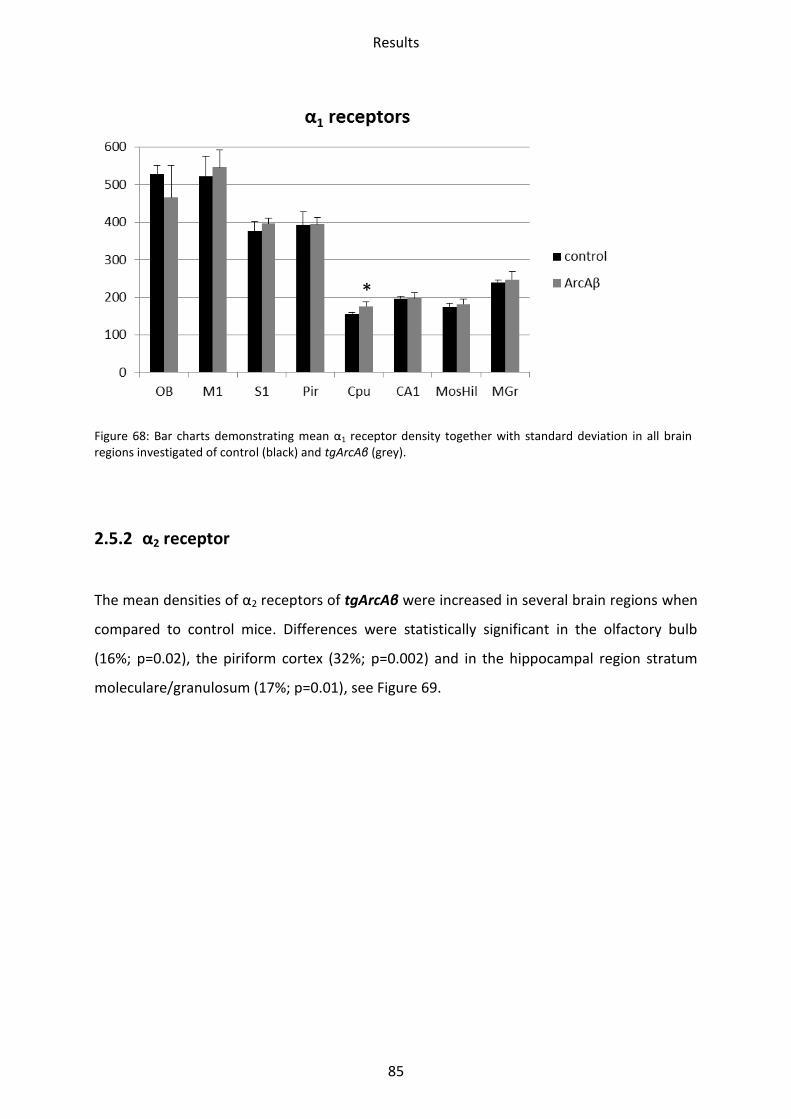
Results
85
Figure 68: Bar charts demonstrating mean α1 receptor density together with standard deviation in all brain regions investigated of control (black) and tgArcAβ (grey).
2.5.2 α2 receptor
The mean densities of α2 receptors of tgArcAβ were increased in several brain regions when
compared to control mice. Differences were statistically significant in the olfactory bulb
(16%; p=0.02), the piriform cortex (32%; p=0.002) and in the hippocampal region stratum
moleculare/granulosum (17%; p=0.01), see Figure 69.
*
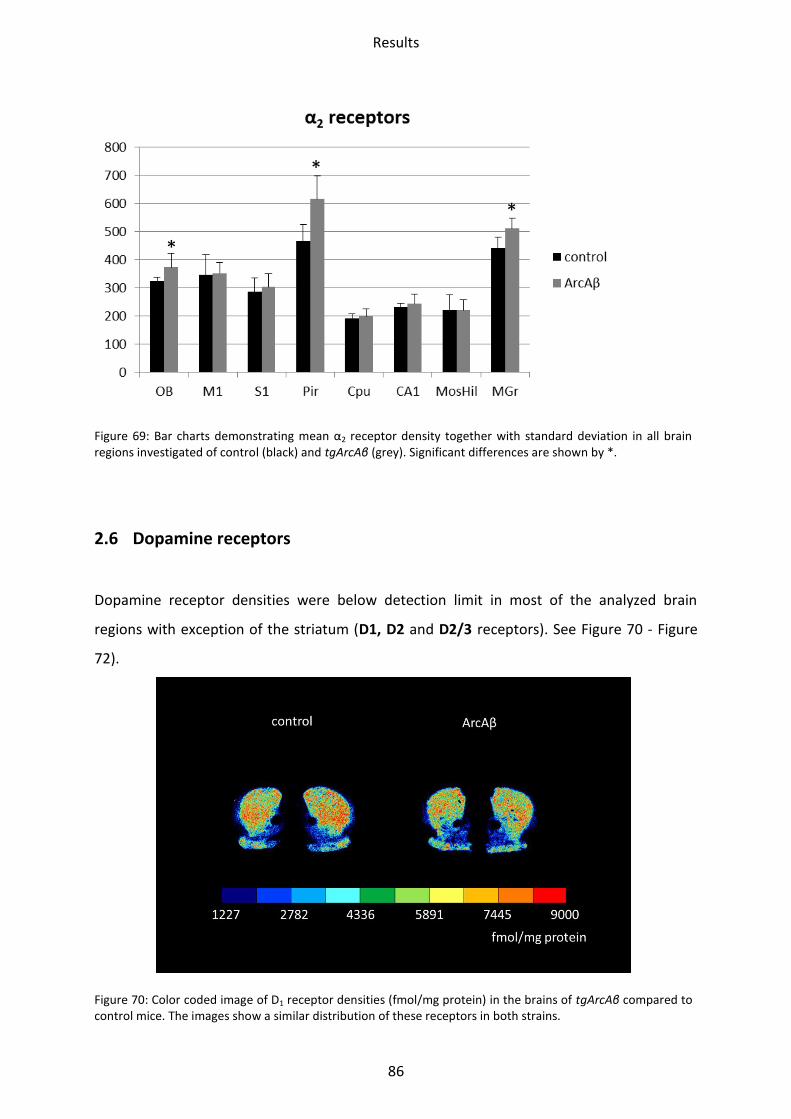
Results
86
Figure 69: Bar charts demonstrating mean α2 receptor density together with standard deviation in all brain regions investigated of control (black) and tgArcAβ (grey). Significant differences are shown by *.
2.6 Dopamine receptors
Dopamine receptor densities were below detection limit in most of the analyzed brain
regions with exception of the striatum (D1, D2 and D2/3 receptors). See Figure 70 - Figure
72).
Figure 70: Color coded image of D1 receptor densities (fmol/mg protein) in the brains of tgArcAβ compared to control mice. The images show a similar distribution of these receptors in both strains.
*
*
*
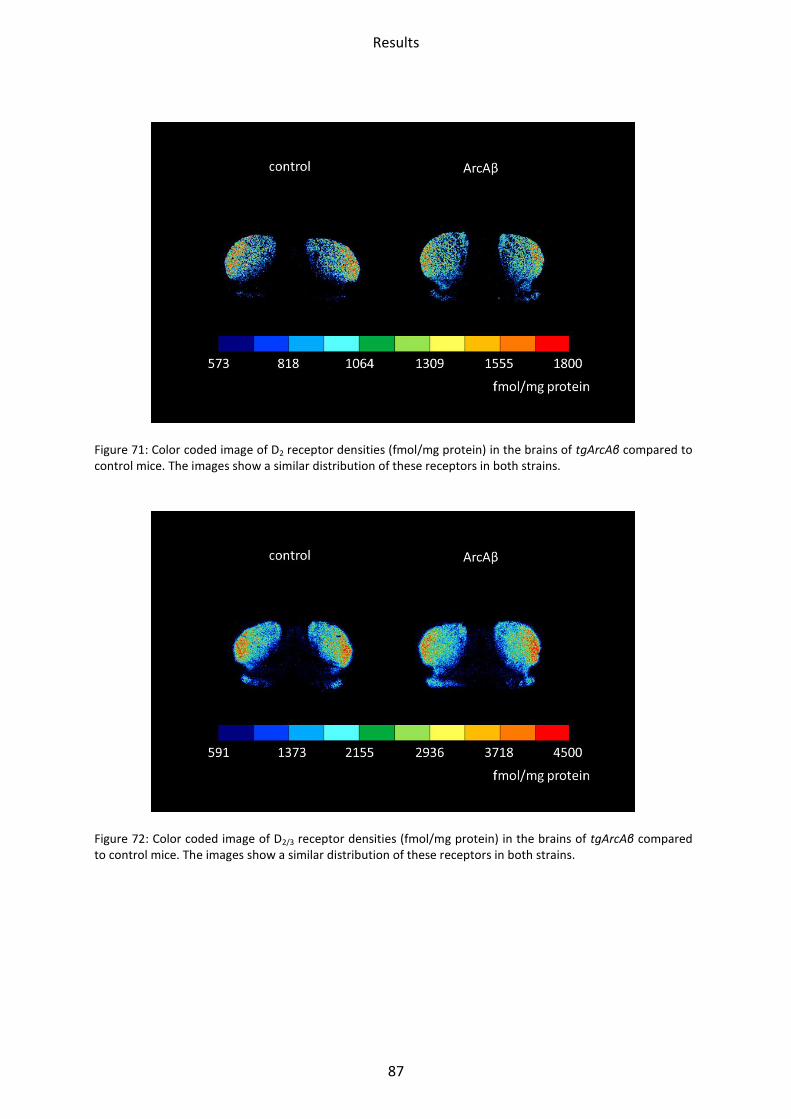
Results
87
Figure 71: Color coded image of D2 receptor densities (fmol/mg protein) in the brains of tgArcAβ compared to control mice. The images show a similar distribution of these receptors in both strains.
Figure 72: Color coded image of D2/3 receptor densities (fmol/mg protein) in the brains of tgArcAβ compared to control mice. The images show a similar distribution of these receptors in both strains.
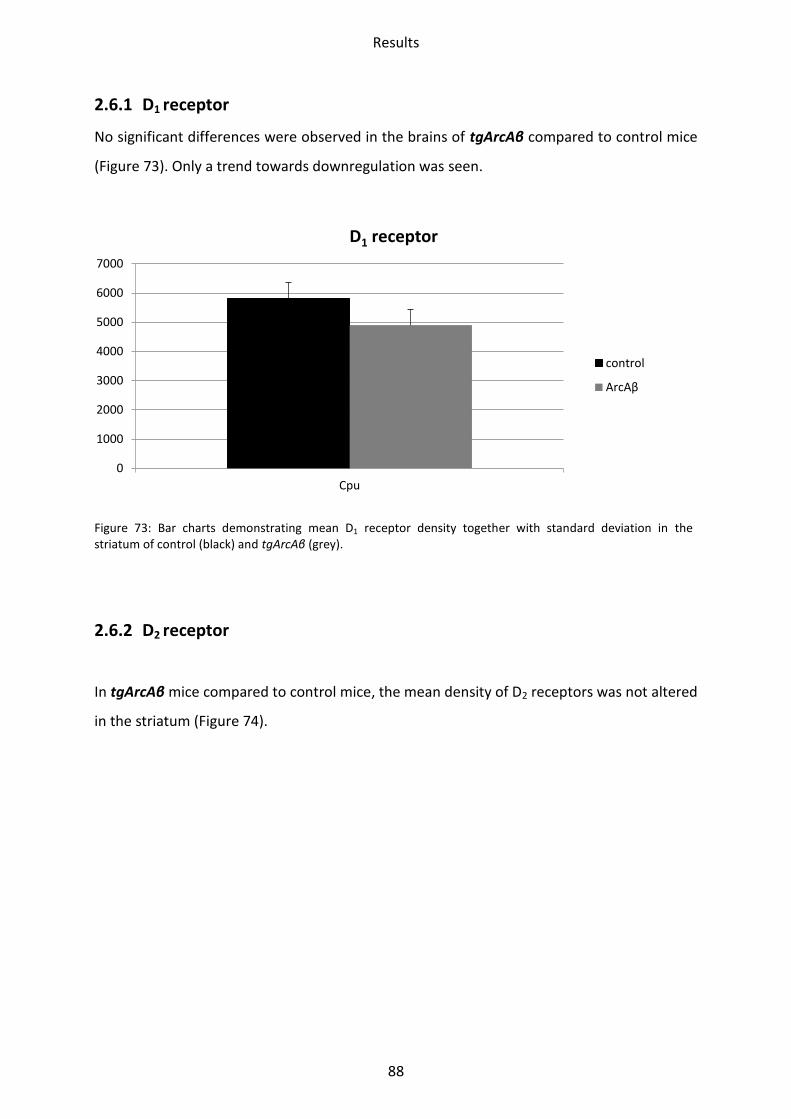
Results
88
2.6.1 D1 receptor
No significant differences were observed in the brains of tgArcAβ compared to control mice
(Figure 73). Only a trend towards downregulation was seen.
Figure 73: Bar charts demonstrating mean D1 receptor density together with standard deviation in the striatum of control (black) and tgArcAβ (grey).
2.6.2 D2 receptor
In tgArcAβ mice compared to control mice, the mean density of D2 receptors was not altered
in the striatum (Figure 74).
0
1000
2000
3000
4000
5000
6000
7000
Cpu
D1 receptor
control
ArcAβ
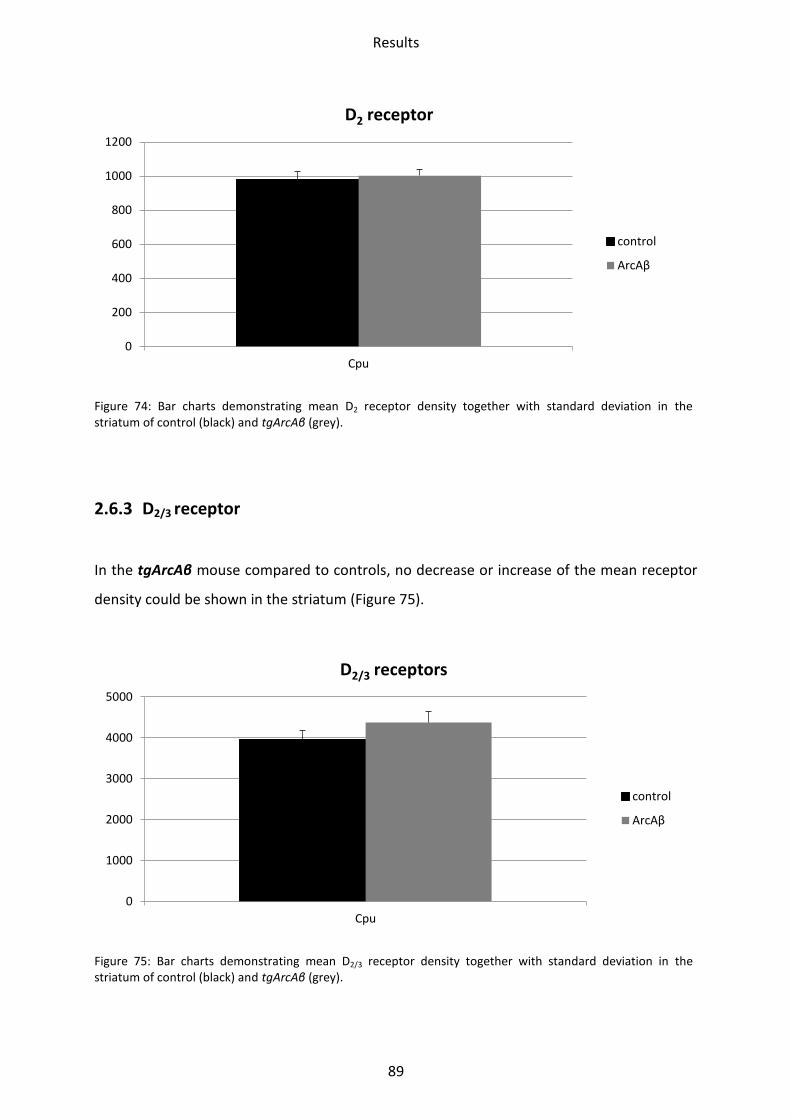
Results
89
Figure 74: Bar charts demonstrating mean D2 receptor density together with standard deviation in the striatum of control (black) and tgArcAβ (grey).
2.6.3 D2/3 receptor
In the tgArcAβ mouse compared to controls, no decrease or increase of the mean receptor
density could be shown in the striatum (Figure 75).
Figure 75: Bar charts demonstrating mean D2/3 receptor density together with standard deviation in the striatum of control (black) and tgArcAβ (grey).
0
200
400
600
800
1000
1200
Cpu
D2 receptor
control
ArcAβ
0
1000
2000
3000
4000
5000
Cpu
D2/3 receptors
control
ArcAβ
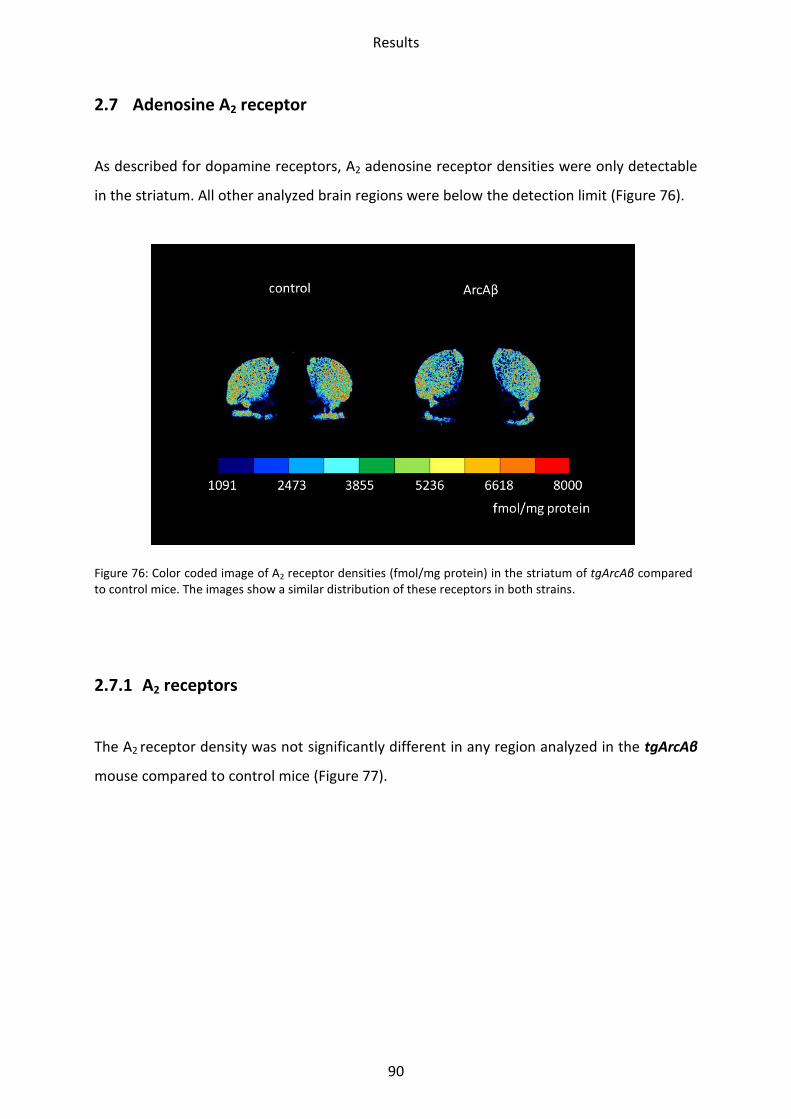
Results
90
2.7 Adenosine A2 receptor
As described for dopamine receptors, A2 adenosine receptor densities were only detectable
in the striatum. All other analyzed brain regions were below the detection limit (Figure 76).
Figure 76: Color coded image of A2 receptor densities (fmol/mg protein) in the striatum of tgArcAβ compared to control mice. The images show a similar distribution of these receptors in both strains.
2.7.1 A2 receptors
The A2 receptor density was not significantly different in any region analyzed in the tgArcAβ
mouse compared to control mice (Figure 77).
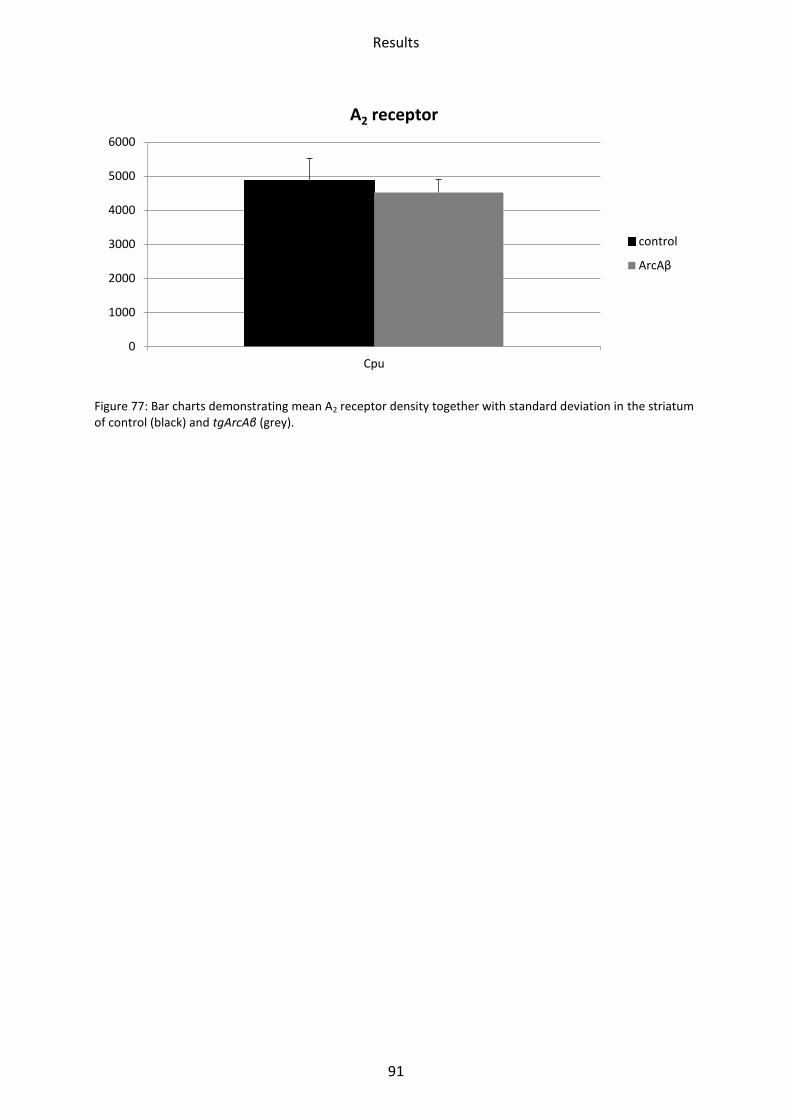
Results
91
Figure 77: Bar charts demonstrating mean A2 receptor density together with standard deviation in the striatum of control (black) and tgArcAβ (grey).
0
1000
2000
3000
4000
5000
6000
Cpu
A2 receptor
control
ArcAβ
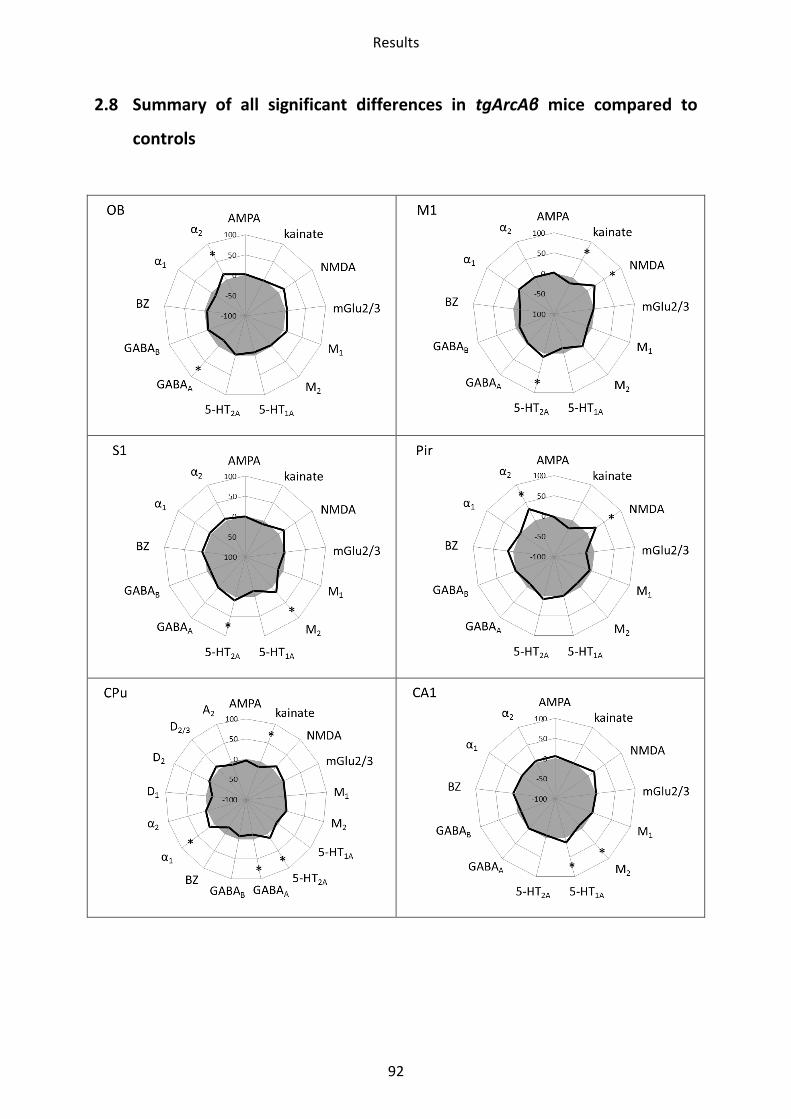
Results
92
2.8 Summary of all significant differences in tgArcAβ mice compared to
controls
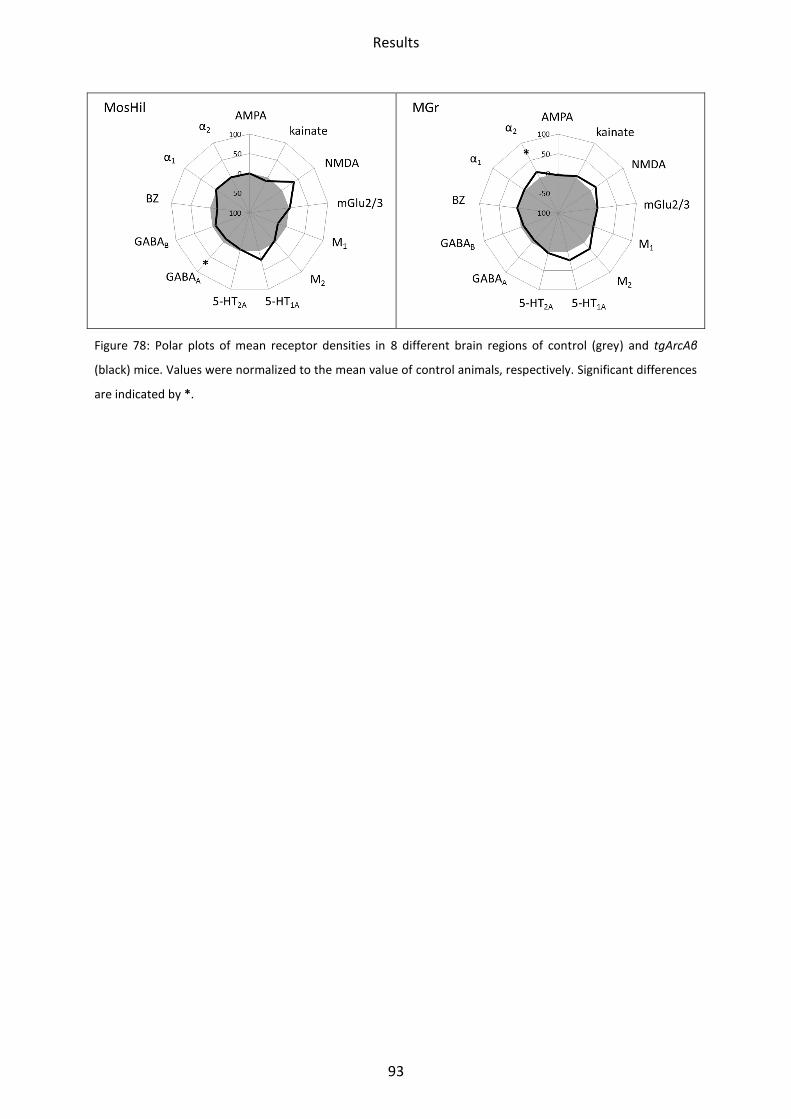
Results
93
Figure 78: Polar plots of mean receptor densities in 8 different brain regions of control (grey) and tgArcAβ
(black) mice. Values were normalized to the mean value of control animals, respectively. Significant differences
are indicated by *.
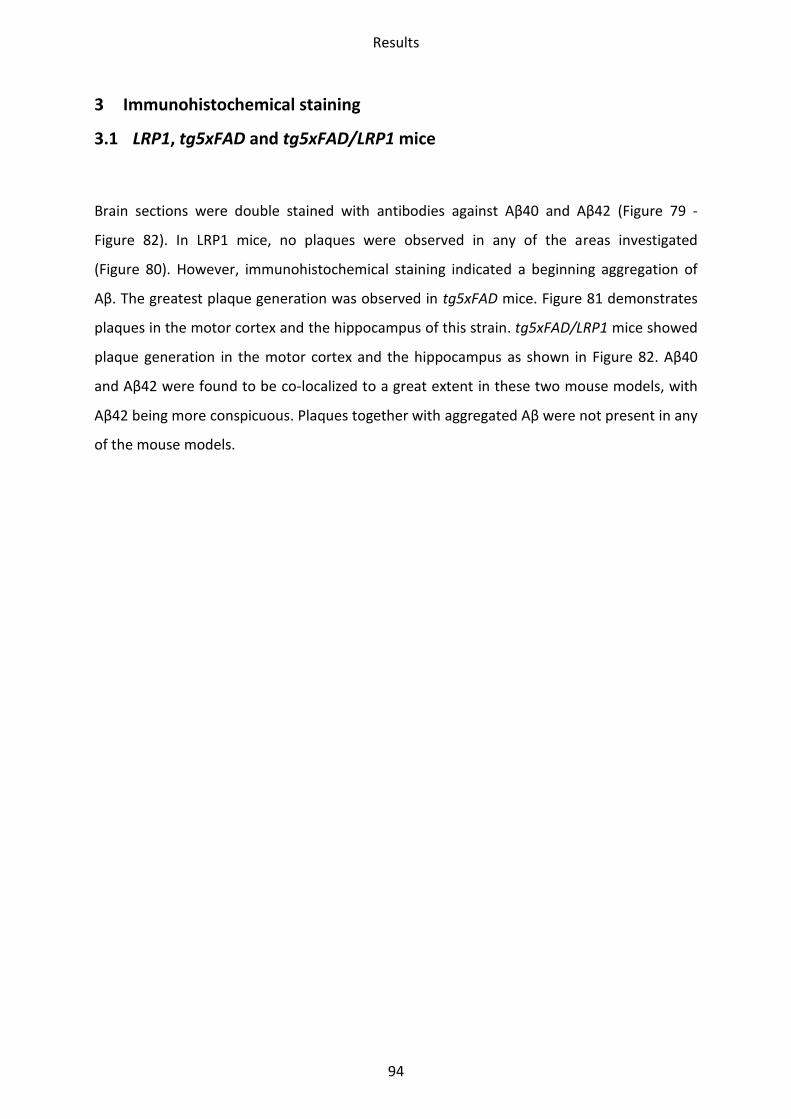
Results
94
3 Immunohistochemical staining
3.1 LRP1, tg5xFAD and tg5xFAD/LRP1 mice
Brain sections were double stained with antibodies against Aβ40 and Aβ42 (Figure 79 -
Figure 82). In LRP1 mice, no plaques were observed in any of the areas investigated
(Figure 80). However, immunohistochemical staining indicated a beginning aggregation of
Aβ. The greatest plaque generation was observed in tg5xFAD mice. Figure 81 demonstrates
plaques in the motor cortex and the hippocampus of this strain. tg5xFAD/LRP1 mice showed
plaque generation in the motor cortex and the hippocampus as shown in Figure 82. Aβ40
and Aβ42 were found to be co-localized to a great extent in these two mouse models, with
Aβ42 being more conspicuous. Plaques together with aggregated Aβ were not present in any
of the mouse models.
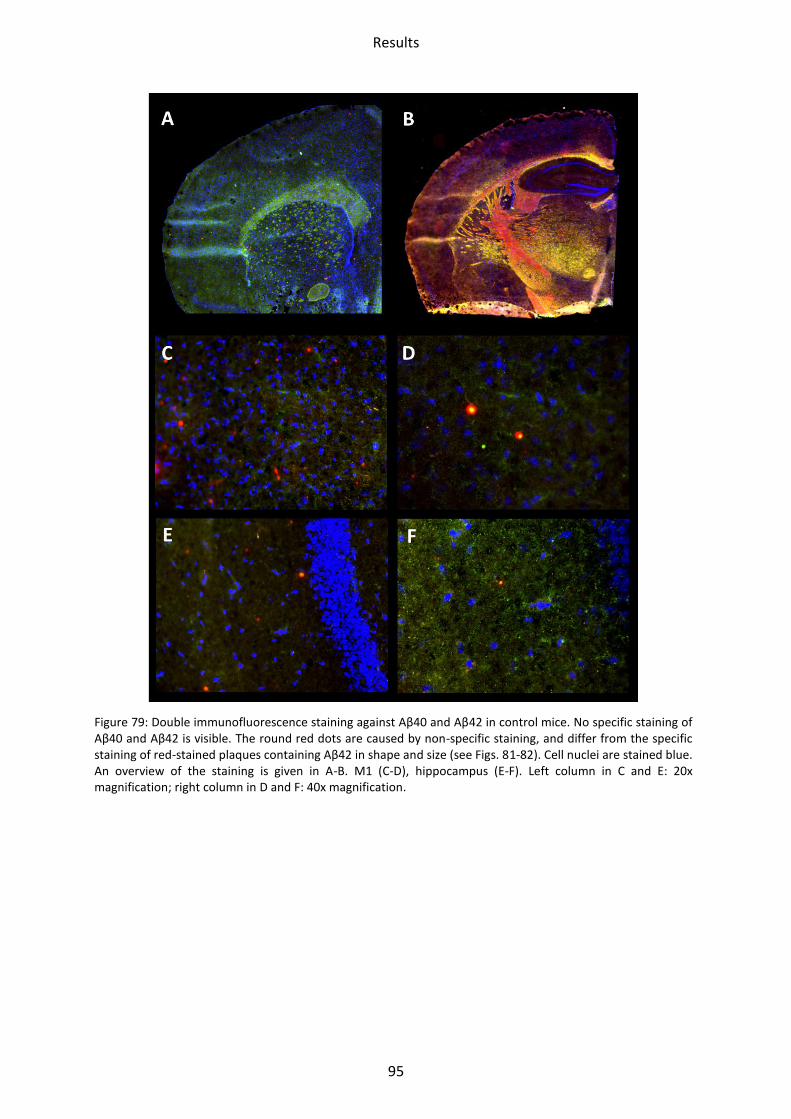
Results
95
Figure 79: Double immunofluorescence staining against Aβ40 and Aβ42 in control mice. No specific staining of Aβ40 and Aβ42 is visible. The round red dots are caused by non-specific staining, and differ from the specific staining of red-stained plaques containing Aβ42 in shape and size (see Figs. 81-82). Cell nuclei are stained blue. An overview of the staining is given in A-B. M1 (C-D), hippocampus (E-F). Left column in C and E: 20x magnification; right column in D and F: 40x magnification.
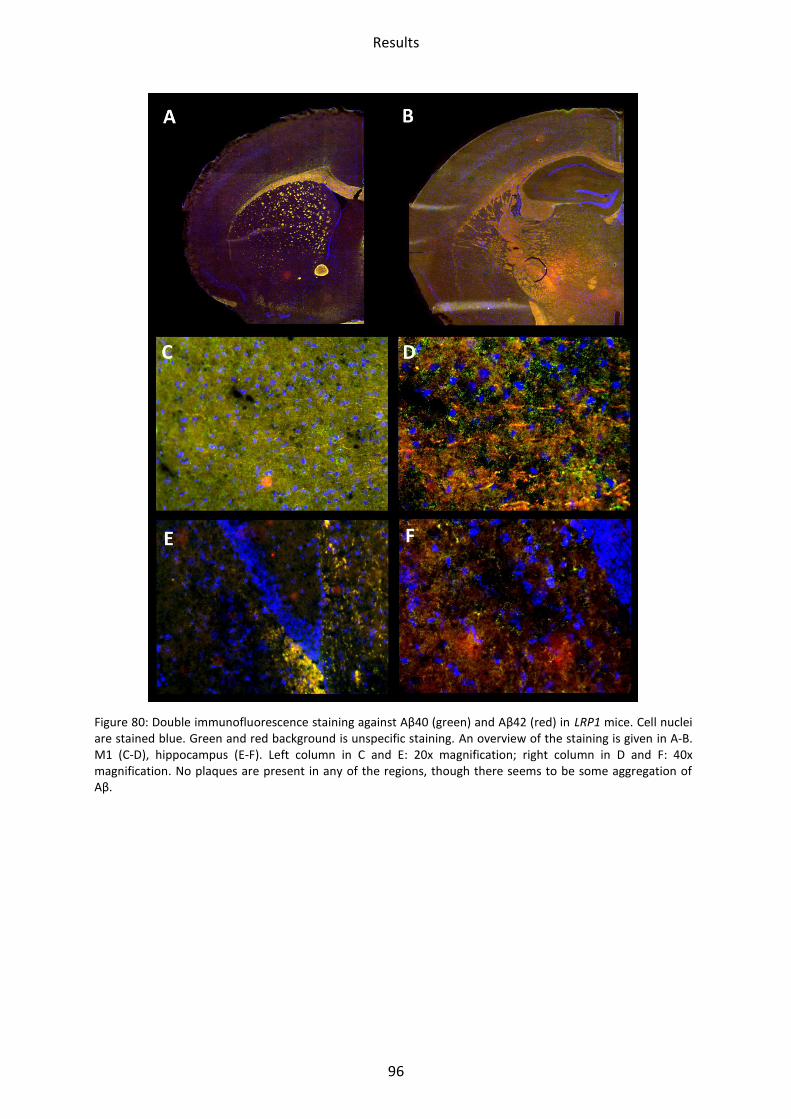
Results
96
Figure 80: Double immunofluorescence staining against Aβ40 (green) and Aβ42 (red) in LRP1 mice. Cell nuclei are stained blue. Green and red background is unspecific staining. An overview of the staining is given in A-B. M1 (C-D), hippocampus (E-F). Left column in C and E: 20x magnification; right column in D and F: 40x magnification. No plaques are present in any of the regions, though there seems to be some aggregation of Aβ.
Results
97
Figure 81: Double immunofluorescence staining against Aβ40 (green) and Aβ42 (red) in tg5xFAD mice. Cell nuclei are stained blue. An overview of the staining is given in A-B. M1 (C-D), hippocampus (E-F). Left column in C and E: 20x magnification; right column in D and F: 40x magnification. Plaques are shown in the motor cortex and the hippocampus. A co-localization of Aβ40 and Aβ42 can be observed (yellow), with Aβ42 being more conspicuous.
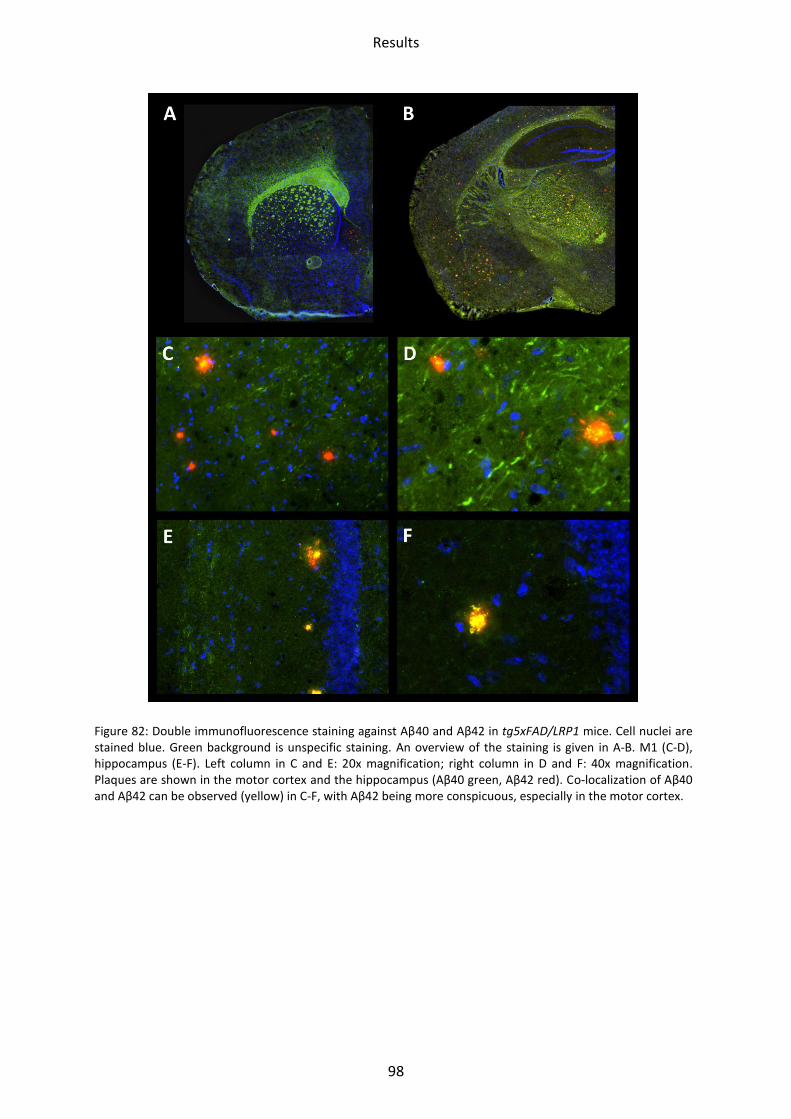
Results
98
Figure 82: Double immunofluorescence staining against Aβ40 and Aβ42 in tg5xFAD/LRP1 mice. Cell nuclei are stained blue. Green background is unspecific staining. An overview of the staining is given in A-B. M1 (C-D), hippocampus (E-F). Left column in C and E: 20x magnification; right column in D and F: 40x magnification. Plaques are shown in the motor cortex and the hippocampus (Aβ40 green, Aβ42 red). Co-localization of Aβ40 and Aβ42 can be observed (yellow) in C-F, with Aβ42 being more conspicuous, especially in the motor cortex.
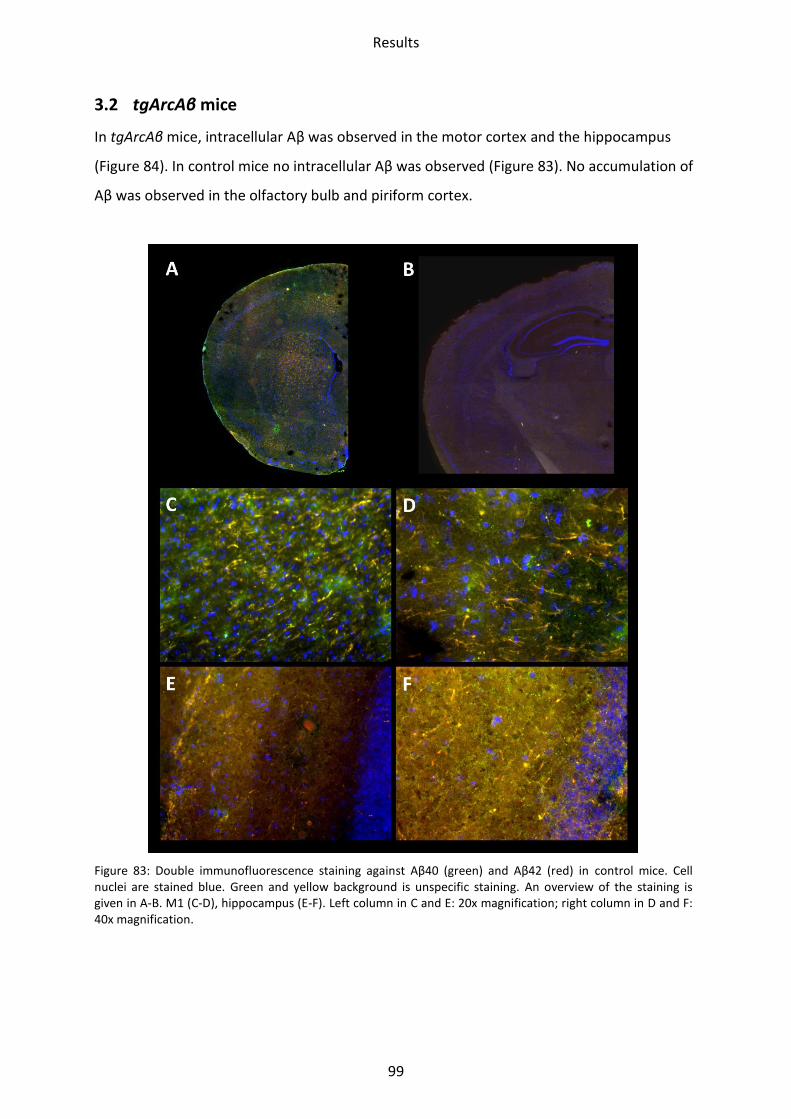
Results
99
3.2 tgArcAβ mice
In tgArcAβ mice, intracellular Aβ was observed in the motor cortex and the hippocampus
(Figure 84). In control mice no intracellular Aβ was observed (Figure 83). No accumulation of
Aβ was observed in the olfactory bulb and piriform cortex.
Figure 83: Double immunofluorescence staining against Aβ40 (green) and Aβ42 (red) in control mice. Cell nuclei are stained blue. Green and yellow background is unspecific staining. An overview of the staining is given in A-B. M1 (C-D), hippocampus (E-F). Left column in C and E: 20x magnification; right column in D and F: 40x magnification.
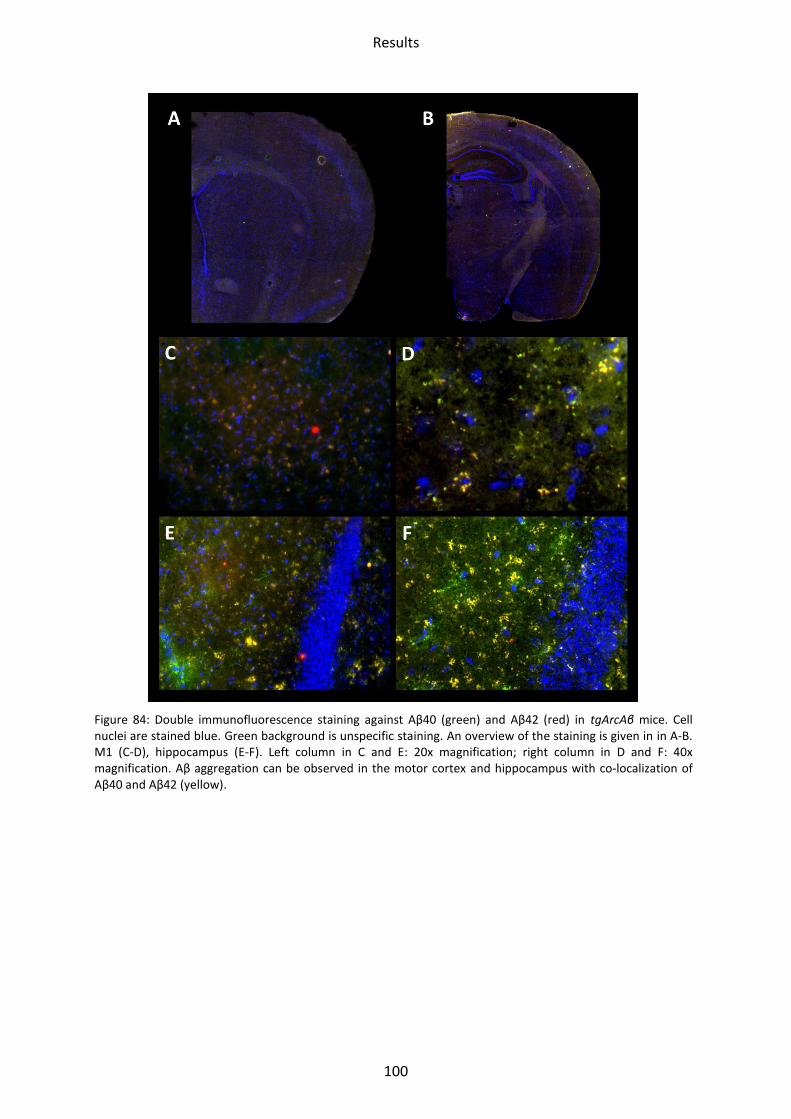
Results
100
Figure 84: Double immunofluorescence staining against Aβ40 (green) and Aβ42 (red) in tgArcAβ mice. Cell nuclei are stained blue. Green background is unspecific staining. An overview of the staining is given in in A-B. M1 (C-D), hippocampus (E-F). Left column in C and E: 20x magnification; right column in D and F: 40x magnification. Aβ aggregation can be observed in the motor cortex and hippocampus with co-localization of Aβ40 and Aβ42 (yellow).
Discussion
101
IV. Discussion
Alterations in several neurotransmitter systems were demonstrated in all mouse models.
Raw data and corresponding mean values ± standard deviation are demonstrated in the
Appendix.
1 Glutamate receptors
The excitatory neurotransmitter glutamate is found in more than 80% of all neurons in the
brain (Gao and Bao, 2011). Glutamate passes through the blood brain barrier via amino acid
transporters, and is synthetized in neurons and glial cells. Glutamate plays an essential role
in synaptic plasticity, learning and memory. Furthermore, glutamate concentrations in
temporal areas showed a significant reduction in AD patients (Ellison et al., 1986). Glutamate
induced signaling is mediated through ionotropic and metabotropic glutamate receptors
(Frisardi et al., 2011). The ionotropic AMPA, kainate and NMDA receptors contain ligand
gated ion channels, whereas mGlu2/3 receptors are metabotropic receptors, which are
coupled to second messenger systems. Eight different types of mGlu receptor exist, which
are divided into three main groups, group I (mGlu1 and mGlu5), group II (mGlu2 and mGlu3)
and group III (mGlu4 and mGlu7-8).
NMDA receptor:
LRP1 mice: The NMDA receptor density was increased in the CA1 region and the stratum
moleculare/granulosum of LRP1 mice. The present results of an increased NMDA receptor
density correspond well with a previous report by Qiu et al. (2002). One of the numerous
ligands for LRP1 is the macroglobulin α2M*, which is associated with neurodegeneration and
glutamate signaling. α2M* is able to bind a variety of small molecules, such as endogenous,
soluble Aβ peptides, and is a ligand for binding and clearance by LRP1. Moreover, calcium
signaling, which was induced by NMDA stimulation, can be reduced by treatment with
α2M*. It seems that α2M* alters calcium signaling via the LRP1-mediated mechanism (Qiu et
al., 2002). Thus, knockout of LRP1 can impair glutamate induced neurotransmission.
Contrastingly, Liu et al. (2010) found a decrease of the receptor subunit NMDAR1 in the
forebrain of a LRP1 KO mouse. Since NMDA is a heteromeric complex consisting of the
obligatory subunit NMDAR1 and several, cell type specific NNMDAR2 subunits, the reduction
Discussion
102
of NMDAR1 may not affect the binding of the antagonist MK801. Moreover, mice tested in
the study of Liu et al. (2010) were 18 months old, while in the present study, mice were
significantly younger (between four and six months of age).
Furthermore, recent studies have shown that an increase in the intracellular calcium level,
either induced by mutations or depolarization, leads to an elevation of intracellular Aβ42
(Pierrot et al., 2004). Moreover, Aβ oligomers co-immunoprecipitate NMDA receptors, i.e.
they interact with each other. Blocking of the subunit NMDAR1 reduces oligomer binding
(De Felice et al., 2007). Furthermore, Aβ is known to accumulate extracellular glutamate.
Glutamate gives rise to increased receptor activation, which leads to even more Aβ (Paula-
Lima et al., 2005). Due to the enhanced number of NMDA receptors, an increasing toxic
effect may lead to neurodegeneration.
tgArcAβ mice: In tgArcAβ mice, increased NMDA receptor density was found in the primary
motor and piriform cortex. These findings are in agreement with LRP1 mice and were
discussed above.
tg5xFAD mice: In tg5xFAD mice, NMDA receptors only show a trend towards decrease in the
olfactory bulb, the somatosensory and piriform cortices. The results will be discussed
together with the findings for tg5xFAD/LRP1 mice.
tg5xFAD/LRP1 mice: In tg5xFAD/LRP1 mice, a significant decrease of NMDA receptor
density was found in the olfactory bulb. In the mossy fiber termination fields/hilus, NMDA
receptor density was increased. Mutations in PS1 linked to FAD were shown to increase
Aβ42 production, and reduce calcium influx across the plasma membrane (Yoo et al., 2000).
Since both the tg5xFAD and tg5xFAD/LRP1 mice contain two PS1 mutations, the decrease is
in agreement with the study described above.
A study of AMPA receptors found that Aβ induces loss of the AMPA subunit GluR1 in
cultured primary neurons of APP transgenic mice (Almeida et al., 2005). There is evidence
that the loss of the subunit is caused by the reduction of Ca(2+)/calmodulin-dependent
protein kinase II (CaMKII), a signaling molecule critical for AMPA receptor trafficking and
function. The experiment was performed on cortical neurons from APP transgenic mice (Gu
et al, 2009). However, in the current study, a decrease in the NMDA receptor density was
found. It seems plausible, that NMDA receptors are affected in a similar way. CaMKII is
activated by calcium entry and translocates to the synapse. Here it binds to NMDA
receptors. Therefore a reduction of CaMKII caused by Aβ might cause a reduction of NMDA
Discussion
103
receptors as well. The Aβ induced loss of receptors might explain both the increase and
decrease of NMDA receptors in the current study. The increase of NMDA receptors leads to
enhanced calcium influx, causing increased Aβ42. This in turn causes a reduction of CaMKII,
leading to reduced NMDA receptors. In tg5xFAD and tg5xFAD/LRP1 mice, plaques were
observed (see Figure 81, 82). Therefore, more Aβ42 was present. In LRP1 and tgArcAβ mice,
no plaques were observed (see Figure 80, 84). It might be that as the disease progresses,
NMDA receptor density decreases.
In the pathogenesis of AD, pathological changes occur in the hippocampus as well as in
entorhinal, frontal and temporal cortices. Glutamate is the main excitatory neurotransmitter
in these brain regions, which are involved in higher cognitive functions (Bernareggi et al.,
2007). Therefore, a reduction of NMDA receptors may cause memory impairment, which
was described in tg5xFAD and LRP1 mice (Oakley et al., 2006; Liu et al., 2010).
In the hilus of tg5xFAD/LRP1 mice, NMDA receptor density was increased. This is
interesting, since it provides two prominent features of LRP1 and tg5xFAD mice; these are
reduced density of NMDA receptors in the olfactory bulb and increased density in the
hippocampus. It is possible, that some regions are more prone to the Aβ induced effect on
glutamate receptors than others.
Kainate receptor: In the past, kainate receptors have only rarely been studied in AD models,
although there is evidence, that kainate receptors are affected in AD. Electrophysiological
observations on glutamate receptors transplanted from human AD and non-AD-brains to
frog oocytes reported essentially the same functional properties in both cases with the
notable finding that the amplitudes of the currents elicited by glutamate were consistently
larger in case of glutamate receptors from non-AD samples compared to those of AD
samples (Bernareggi et al., 2007). Quantification of mRNA coding for the kainate subunit
GluR5 revealed a smaller amount in the AD brain. Thus, a diminished number of
corresponding receptors seemed likely (Bernareggi et al., 2007).
LRP1 mice: The most conspicuous changes were revealed in LRP1 mice, where the olfactory
bulb, piriform cortex and most hippocampal regions were affected. Behavioral test showed
memory impairment at 24 months of age as well as LTP deficiency measured in slices (Liu et
al., 2010). Since the trisynaptic pathway of the hippocampus (Henze et al., 2000) with an
exceptionally high density of kainate receptors at the mossy fiber termination fields is known
Discussion
104
to play a major role in learning and memory (Squire, 1992), the reduction of kainate
receptors might contribute to the memory impairment. Although LTP is mainly dependent
on NMDA receptors, there is evidence that altered kainate receptor availability also
contributes to LTP impairment (Boer et al., 2010). It is interesting that LRP1 mice show the
most conspicuous changes, since plaque generation was not observed at this age (compare
Figure 80). Impaired synaptic plasticity might contribute to this effect. LRP1 mediates the
uptake of cholesterol into neurons by apoE (Spuch et al., 2012). Cholesterol, however, is
important for synaptic plasticity (Frank et al., 2008). Moreover, a former study found
kainate receptors to be involved in synaptic transmission and to interact with cholesterol
(Frank et al., 2008). In LRP1 mice, uptake of cholesterol is impaired due to the knockout of
LRP1.
tgArcAβ mice: In tgArcAβ mice, kainate receptor density was reduced in the motor cortex
and the striatum, while in mossy fibers only a trend towards downregulation was revealed.
These results are in agreement with behavioral findings by Knobloch et al. (2007). From the
age of six months on, tgArcAβ mice are cognitively impaired in the Morris Water Maze, the
Y-maze and active avoidance behavior (Knobloch et al., 2007). The described reductions in
kainate receptors might underlie these behavioral alterations.
Szegedi et al. (2005) investigated the effect of Aβ on neuronal firing evoked by agonist for
AMPA, NMDA and kainate in CA1 neurons of Wistar rats. While NMDA elicited firing was
increased, the response mediated by AMPA and kainate was reduced. In both the LRP1 and
tgArcAβ mice, the density of NMDA receptors was increased. Kainate receptor density was
decreased, which fits well with the findings of Szegedi et al. (2005). AMPA was not affected
in tgArcAβ mice. This might be due to their relatively young age (8 months). In LRP1 mice,
AMPA was not investigated.
tg5xFAD and tg5xFAD/LRP1 mice: Kainate receptors are significantly reduced in the
olfactory bulb and the piriform cortex of tg5xFAD and tg5xFAD/LRP1 mice (see chapter 10).
However, in contrast to LRP1 mice, the mossy fiber termination fields of tg5xFAD/LRP1 mice
had a significant higher density of kainate receptors compared to controls. No significant
receptor changes were found in the tg5xFAD mouse, but a trend towards increase was
shown in the mossy fiber termination fields. In studies of rats, where the perforant path was
lesioned by destroying the angular bundle, a redistribution and spreading of kainate
receptors was found in the stratum moleculare (Geddes et al., 1985). This is in agreement
Discussion
105
with the findings in tg5xFAD and tg5xFAD/LRP1 mice. Furthermore, plaques were found in
the hippocampus of tg5xFAD and tg5xFAD/LRP1 mice (see Figure 81,Figure 82). In mice
without extracellular plaques in the hippocampus (tgArcAβ and LRP1 mice; see Figure
80Figure 84), the kainate receptor density in the mossy fiber termination fields was not
enhanced. This may indicate a disturbance of the synaptic transmission caused by plaques.
Plaques were also found in neocortical areas of tg5xFAD and tg5xFAD/LRP1 mice (see Figure
81, Figure 82). It is possible, that the increase was only observed in the mossy fiber terminal
fields/hilus, because here the density of kainate receptors is exceptionally high. Since in
tg5xFAD mice only a trend can be observed, it might be that the additional knockout of LRP1
aggravates the effect.
However, as described above, the density of kainate receptors was significantly lower in
numerous other brain regions of all AD models compared to controls. Apparently, the lower
kainate receptor density of the transgenic mice is the result of a more complex adaptation,
which cannot be mirrored by a surgical removal of the perforant path inducing plastic
changes in the hippocampus.
mGlu2/3:
The metabotropic glutamate receptors mGlu2/3 were downregulated in the CA1 region of
LRP1 and tg5xFAD/LRP1 mice. In tg5xFAD mice, mGlu2/3 receptors were decreased in the
CA1 region and the olfactory bulb. tgArcAβ mice were not affected in any region. mGlu2/3
metabotropic glutamate receptor was found to be neuroprotective in cortical neurons
against neuronal toxicity induced by a brief NMDA pulse or by a prolonged exposure to
kainic acid (Bruno et al., 1995). A possible mechanism of neuroprotection is reduced
glutamate release. mGlu2/3 receptors belong to group II. mGlu receptors of group II/III
reduce the vesicular release of glutamate by inhibition of presynaptic calcium influx, thereby
optimizing synaptic transmission (Coutinho and Knopfel, 2002; Parameshwaran et al., 2008).
However, receptors of group III are more important for glutamate release than mGlu2/3
receptors (Bruno et al., 2001). Therefore, another mechanism has to contribute to the
neuroprotective effect.
It was shown that agonists of mGlu2/3 receptors enhance the production of TGF-β1 in the
mouse brain (D'Onofrio et al., 2001). Former studies have demonstrated a role for TGF-β1 in
Discussion
106
neuroprotection (Brionne et al., 2003; Vivien and Ali, 2006). TGF-β1 is a member of the TGF-
β family, whose members have an important role as modulators of cell survival,
inflammation and apoptosis, as well as in immune suppression and post-lesional repair
(Taipale et al., 1998; Li et al., 2006). TGF-β1 is only expressed in specific brain regions, such
as the hippocampus and the cortex (Vivien and Ali, 2006). In mouse models of AD,
disturbance of TGF-β signaling promoted Aβ deposition and lead to neuritic dystrophy and
increased levels of secreted Aβ and β-secretase-cleaved soluble amyloid precursor protein
(Tesseur et al., 2006). Taken together, TGF-β1 seems to reduce Aβ accumulation in the brain.
Furthermore, the TGF-β1 signaling pathway has been demonstrated to be impaired
particularly in the early phase of the disease (Caraci et al., 2012; Krieglstein et al., 2012).
Since D’Onofrio showed that activation of mGlu2/3 receptors enhance the production of
TGF-β1 in the mouse brain (D'Onofrio et al., 2001), the results of the present study fit well to
this finding. Less activation of mGlu2/3 receptors due to their reduced expression might
cause reduced production of TGF-β1.
Furthermore, Lee et al. (1995) found that the activation of mGlu receptors accelerate non-
amyloidogenic processing of APP in hippocampal neurons of fetal rats by stimulation of PKC.
Hence, the downregulation of mGlu2/3 receptors found in LRP1, tg5xFAD and tg5xFAD/LRP1
mice might favor Aβ production.
2 Acetylcholine receptors
Acetylcholine receptors are integral membrane proteins, which can be divided into either
muscarinic (mACh) or nicotinic (nACh) receptors, according to their affinities and sensitivities
(Xu et al., 2012). Cholinergic neurons, which project to all layers of cortical regions, including
the olfactory bulb, hippocampal areas and the amygdala, are found in the basal forebrain
(Struble et al., 1982; Whitehouse et al., 1982; Nyakas et al., 2011). The nucleus basalis
Meynert (MBN) is part of the basal forebrain. Under physiological conditions, the cholinergic
system is critically involved - beside other functions - in the control of cognition (Everitt and
Robbins, 1997) and memory. In the pathogenesis of AD, dysfunction and severe loss of MBN
cholinergic neurons and cortical projections are one of the earliest hallmarks observed
(Nyakas et al., 2011). Likewise, drugs which potentiate central cholinergic functions have so
far proven to be one of the most effective therapeutic treatments (Auld et al., 2002).
Discussion
107
LRP1 mice: In the present study, only the M2 receptor expression was found to differ
significantly from that of controls in various brain regions in LRP1 mice. Agonist binding of
the M2 receptor revealed reduced density in all hippocampal regions. Binding of M2
antagonist showed decreased density in the CA1 and stratum moleculare/granulosum and
an increase the striatum. M1 receptors were not affected.
The signaling mechanism of the M2 receptor differs from M1 and M3 receptors. The M2
receptor is bound to a G protein, which activates potassium channels. Due to the increased
conductance for potassium, hyperpolarization is induced. Reduced density of M2 receptors
causes less hyperpolarization; hence, depolarization may occur more easily. As has been
discussed (see glutamate receptors), that increased influx of calcium through NMDA
receptors leads to increased Aβ formation. In LRP1 mice, NMDA receptor density was
increased in two hippocampal areas, i.e. the CA1 region and stratum
moleculare/granulosum. Likewise, M2 density revealed by agonist binding was found to be
reduced in the CA1 region and stratum moleculare/granulosum. Thus, the decreased density
of M2 receptors could further increase the calcium influx via the depolarization together
with the increased density of NMDA receptors and their effect on calcium influx.
Furthermore, it is striking that cholinergic reduction in LRP1 mice occurs in the hippocampus.
Cognitive function and short-term memory are disrupted when mACh receptors are blocked
(Coyle et al., 1983), while drugs increasing cholinergic function improve short-term memory
(Sitaram et al., 1978). Thus, cholinergic receptor reduction, which was found in LRP1 mice,
might contribute to the LTP and memory impairment found (Liu et al., 2010)
Binding studies using an antagonist revealed increased M2 receptor density only in the
striatum. This increase might be a compensatory mechanism, a trial to compensate reduced
acetylcholine level in the brain, as was described in Hoshi et al. (1997). Alternatively, the
regionally specific de- or increase of M2 receptors (decrease with agonist binding and
increase with antagonist binding) may be caused by different receptor affinities of the used
ligands with the antagonist preferring low affinity and the agonist high affinity binding sites,
and also by different relations between high- and low affinity binding sites of this receptor in
the different brain regions.
tg5xFAD/LRP1 mice: In tg5xFAD/LRP1 mice, M2 receptor density revealed by antagonist
binding was reduced in the olfactory bulb, the motor and somatosensory cortex as well as
Discussion
108
the striatum. Agonist binding of the M2 receptor showed downregulation in the olfactory
bulb. In tg5xFAD/LRP1 mice, plaques were observed in the neocortex and hippocampus (see
Figure 81). Former studies found evidence that the cholinergic system is affected by the
presence of Aβ. Due to the formation of plaques, it can be assumed, that the Aβ level is high
in tg5xFAD/LRP1 mice. Therefore, it is plausible that Aβ influences cholinergic receptors.
However, plaques do not seem to be the exclusive cause, since LRP1 mice show reductions
in the cholinergic system as well, but did not display any plaques (see Figure 80). Therefore,
the impairment of synaptic transmission (discussed for kainate receptors) might contribute
to alterations in the cholinergic system. Furthermore, acetylcholine synthesis is suppressed
in the presence of Aβ in primary cultures of MBN neurons (Hoshi et al., 1997), and its release
is reduced in the neocortex of humans (Nilsson et al., 1986) as well as in the hippocampus of
rats (Kar et al., 1996). Therefore, the reduced density of M2 receptors may be a response to
lower levels of acetylcholine. In transgenic mice carrying combined mutations in APP and
PS1, which is also the case for tg5xFAD/LRP1 mice, a decline in size and density of cholinergic
synapses was reported in the frontal cortex (Wong et al., 1999).
Cholinergic markers are altered as well, e.g. acetyltransferase (ChAT). Araujo et al. (1988)
found a significant decrease in the ChAT level in several brain regions, i.e. various neocortical
areas, hippocampus and the MBN. Furthermore, the density of M2 receptors in patients was
lowered in all cortical areas and in the hippocampus (Araujo et al., 1988). This is in
agreement with the finding of the current study. In tg5xFAD/LRP1 mice, the M2 receptors
are reduced in the motor and somatosensory cortex. In LRP1 mice, the CA1 region and
stratum moleculare/granulosum revealed decreased M2 density (see discussion above).
Differences between the affected areas described by Araujo et al. (1988) may be caused by
the less specific ligands and the human brain tissue used by these authors.
tg5xFAD mice: In tg5xFAD mice, the M2 receptor density was decreased in the mossy fiber
terminal fields/hilus and the stratum moleculare/granulosum. A reduction of M2 receptors
was already discussed in the discussion of LRP1 mice. Moreover, M3 receptors were
increased in the striatum. In addition to the impact of Aβ peptides on the cholinergic system
described above, the cholinergic system also seems to affect Aβ signaling. Activation of
muscarinic receptors causes modification of APP processing, thus inhibiting amyloidogenic
Aβ production and promoting the non-amyloidogenic pathway (Nitsch et al., 1992; Hung et
al., 1993). Additionally, in healthy as well as cholinergic denervated rats, treatment with a
Discussion
109
muscarinic agonist lowers APP levels (Lin et al., 1999). Taken all this together, an interaction
of Aβ and muscarinic receptors can be assumed. Thus, the enhanced M3 receptor density
might be a compensatory mechanism to reduce the Aβ level. This effect is only observed in
tg5xFAD mice. A possible cause is that they generated the most numerous plaques of all AD
models (see Figure 81).
tgArcAβ mice: Only the M2 receptor density analyzed by agonist binding was significantly
decreased in the CA1 region of tgArcAβ mice, as well as increased in the somatosensory
cortex. The reduction of this receptor was already discussed in the discussion of LRP1 mice.
The increase, however, may be a regionally specific compensatory mechanism caused by the
reduced acetylcholine level (Hoshi et al., 1997).
In summary, LRP1 and tg5xFAD/LRP1 mice revealed the strongest alterations in the
cholinergic system of all mouse models investigated. Since LRP1 is missing in both mouse
lines, LRP1 seems to play a major role in the cholinergic system. Given the fact that no
plaques were observed in the LRP1 mouse model (see Figure 80), degeneration of the
cholinergic systems may start well before plaque generation (see discussion above). This
supports the hypothesis that the alteration of the cholinergic system is an early event in the
generation of AD with regard to sporadic AD.
3 Serotonin receptors
Sixteen different types of serotonin receptors are known. Based on their primary
physiological mechanism, they can be divided into 7 sub-families (Hoyer and Martin, 1997;
Xu et al., 2012), 5-HT1 to 5-HT7. The receptor groups investigated in this study, 5-HT1A and 5-
HT2A are G protein coupled receptors (Gerhardt and van Heerikhuizen, 1997).
Serotonergic neurons of the dorsal and median raphe nuclei innervate regions of the
neocortex and the limbic system (Siever et al., 1991; Lanctot et al., 2001). They influence
aggression, anxiety, mood, feeding, sleep, temperature and motor behavior (Siever et al.,
1991; Lanctot et al., 2001).
No alterations of serotonin receptors were observed in the LRP1 and tg5xFAD mice.
tg5xFAD/LRP1 mice revealed increased 5-HT2A receptor density in the striatum and the CA1
Discussion
110
region of the hippocampus. This indicates that the mutations associated with FAD together
with knockout of LRP1 might further aggravate the effects on the serotonergic system.
In tgArcAβ mice, an enhanced level of 5-HT2A receptors was seen in the motor and
somatosensory cortex, and in the striatum. In addition, increased 5-HT1A receptor density
was found in the CA1 region.
The results of tg5xFAD/LRP1 and tgArcAβ mice support the finding of former studies.
Enhanced serotonin fiber sprouting was observed in the striatum and the hippocampus after
accumulation of Aβ (Harkany et al., 2000; Harkany et al., 2001; Noristani et al., 2011).
Moreover, the serotonin transporter (SERT) as well as the density of SERT axons and
terminals was increased in the hippocampus of a mouse model of AD (Noristani et al., 2011).
Serotonergic neurons are associated with neurotrophic factors, such as brain-derived
neurotrophic factor, somatostatin and neuropeptide Y (Lanctot et al., 2001). In addition,
serotonin has been shown to be a co-transmitter of noradrenaline. Noradrenergic α2
receptors were increased in tg5xFAD/LRP1 and tgArcAβ mice (see chapter 5), implying lower
adrenaline level. Thus, the increased density of 5-HT2A receptors might reflect a
compensatory mechanism.
However, a reduction of 5-HT2A receptors was found in former studies, both in rodents and
in humans. PET studies showed reduced 5-HT2A binding in patients with AD (Blin et al., 1993;
Meltzer et al., 1998). In a rodent model of FAD, intrahippocampal injection of aggregated Aβ
caused reduced 5-HT2A receptor level and, moreover, impairment in memory (Holm et al.,
2010). An explanation for the controversial results found by Holm et al. (2010) and in the
current study might be the age of the mice. Mice used in this study were between four to six
months or eight months old, while Holm investigated groups of mice being four, eight and
eleven months old. A reduction was only found in the mice being eleven months old.
Another study found increase of the 5-HT1A receptor in patients with mild cognitive
impairment. In patients with AD, the receptor was reduced (Truchot et al., 2007). This might
indicate that the serotonergic system decreases as the disease progresses. The same might
be true for 5-HT2A receptors. Another explanation might be different radioactive ligand used
by Holm et al. (2010). The affinity for their 5-HT2A receptor differs from the one used in the
current study (Lopez-Gimenez et al., 1998). Furthermore, the PS1 gene was partly deleted.
The mice in the current study carried mutated PS1 (tg5xFAD/LRP1 mice) or wt PS1 (tgArcAβ
mice).
Discussion
111
Additionally, serotonergic neurons interact with dopaminergic neurons. For example,
neurons emerging from the raphe nuclei control dopamine release in the midbrain, striatum
and nucleus accumbens (Meltzer, 1992; Lanctot et al., 2001). Moreover, serotonergic
neurons are able to enhance the release of dopamine (Lanctot et al., 2001). In tg5xFAD/LRP1
mice, a trend towards increase was observed in dopaminergic D2 receptors (compare
chapter 6). The increased dopamine release may be caused by the increase in the
serotonergic system.
4 GABA receptors
GABA is the major inhibitory transmitter in the mammalian brain. GABAergic transmission
plays an important role in inhibitory modulation of pyramidal cell and interneuron firing in
both the mnemonic and sensorimotor phases of the working memory process and in the
construction of spatial tuning (Rao et al., 2000; Constantinidis et al., 2002; Parameshwaran
et al., 2008). Detrimental effects of Aβ fragments on GABAergic interneurons have been
described (Pakaski et al., 1998). Significant reductions in cortical GABA concentrations were
also observed in AD brains (Ellison et al., 1986). However, other authors described the
GABAergic system as relatively spared in AD compared to the glutamatergic and cholinergic
systems (Rissman et al., 2007) and even be resistant to Aβ toxicity (Pike and Cotman, 1993).
This is in agreement with the lack of impairment of the antagonist binding sites of GABAA
receptors and benzodiazepine binding sites in LRP1, tg5xFAD and tg5xFAD/LRP1 mice in the
current study. GABAB receptors were significant reduced only in the olfactory bulb of LRP1
mice. Tg5xAFD and tg5xFAD/LRP1 mice showed a significant downregulation of the
agonistic binding sites of GABAA receptors only in the stratum moleculare/granulosum (for
discussion of this finding, see discussion of the tgArcAβ mice below).
In contrast, the tgArcAβ mouse was affected. The agonistic binding sites of GABAA receptors
were downregulated in the olfactory bulb, the striatum and the mossy fiber terminal
fields/hilus. GABAB receptors and benzodiazepine binding sites were not affected.
As described in chapter 1, Aβ can lead to accumulation of glutamate and thus to neuronal
depolarization. GABA stimulates GABAA receptors, leading to influx of Cl- and
hyperpolarization. GABAB receptors, which are coupled to G protein and activate K+
Discussion
112
conductance, cause hyperpolarization of the membrane. Thus, activation of GABA receptors
counteracts the depolarization caused by the activation of glutamate receptors. Taurine, a
naturally occurring β-amino acid in the mammalian brain, is involved in several physiological
processes, e.g. calcium ion regulation amongst others (Huxtable, 1992). Interestingly, taurine
activates GABAA receptors, and therefore enhances the Cl- conductance of the membrane
(Okamoto et al., 1983; del Olmo et al., 2000). Furthermore, taurine, GABA and Muscimol, a
GABA agonist, are able to block the neurotoxicity of Aβ to cortical and hippocampal neurons
(Paula-Lima et al., 2005). Similar findings were also made by Lee and colleagues (Lee et al.,
2005).
Treatment of cortical neurons with Muscimol protected neurons against apoptosis, inhibited
both the increase of calcium influx and the elevation of glutamate release as well as the
generation of reactive oxygen species, all processes induced by Aβ. Further evidence of
GABA receptors and taurine as factors in the generation of AD rises from the findings that
GABA (Grachev and Apkarian, 2001) and taurine (Benedetti et al., 1991) levels are decreased
in the brain of aged humans and rats as well as in the brain of AD patients (Paula-Lima et al.,
2005). Decrease of GABA and taurine in the brain of the mouse models could occur during
ageing and accumulation of glutamate would aggravate this effect. Downregulation of GABA
receptors might indicate loss of this protective effect in the tgArcAβ mice. Since our tgArcAβ
mice were 2 -4 months older than the other mouse models, this downregulation of GABA
receptors was not found in the latter mice strains with the exception of a downregulation of
the agonistic binding sites of GABAA receptors in the stratum moleculare/granulosum of
tg5xAFD and tg5xFAD/LRP1 mice and a downregulation of GABAB in the olfactory bub of
LRP1 mice.
5 Noradrenaline receptors
Adrenergic receptors belong to the group of G protein coupled receptors. They are divided
into two main groups, α and β, which can be subdivided further into α1 and α2 and β1, β2 and
β3. The corresponding neurotransmitter and hormones are adrenaline and noradrenaline,
which are produced in the adrenal medulla and the locus coeruleus (LC), respectively. The
adrenergic system is supposed to have a role in learning and memory, sleep-wake cycle
Discussion
113
regulation, affective psychosis and regulation of aggression (Russo-Neustadt and Cotman,
1997).
In the current study, the adrenergic system was affected in all mouse models, the strongest
effect was found in LRP1, tg5xFAD and tg5xFAD/LRP1 mice.
LRP1 mice: The density of α2 receptors was significantly enhanced in all regions, with
exception of the stratum granulosum/moleculare and the piriform cortex. In the piriform
cortex, LRP1 mice showed a trend towards upregulation. Significantly reduced levels of α1
receptors were found in the olfactory bulb, the somatosensory and the piriform cortex.
Furthermore, LRP1 showed reduced, though not significant, levels of α1 receptors in all other
regions analyzed, particularly in the olfactory bulb.
tg5xFAD and tg5xFAD/LRP1 mice: In all regions, the α2 receptor density was significantly
increased, with exception of the stratum granulosum/moleculare of tg5xFAD/LRP1 mice.
Still, tg5xFAD/LRP1 mice revealed a trend toward upregulation in stratum
granulosum/moleculare. In tg5xFAD and tg5xFAD/LRP1 mice, a trend towards
downregulation of α1 receptors in all brain regions was observed as well. This implicates that
lower levels of α1 receptors are linked especially to the knockout of LRP1 and PS1 mutations.
A possible explanation for the fact that most reductions were not significant could be the
age of the mice. Since AD is a disease of age, the observed modulations where only visible as
trend and may aggravate over time.
Reduction of α1 receptors indicates that noradrenaline may be reduced in the brain of the
used mouse models. Moreover, α2 receptors proved to be strongly upregulated in nearly all
brain regions. Activation of α2 receptors by noradrenaline and adrenaline leads to decreased
release of neurotransmitters, caused by negative feedback. Therefore, it seems that those
adrenergic neurotransmitters are reduced in the investigated mouse models. This is
interesting since the cholinergic system is affected as well. Release of adrenaline and
noradrenaline from the adrenal medulla is exclusively regulated by cholinergic synapses.
Cholinergic receptors are reduced in LRP1, tg5xFAD and tg5xFAD/LRP1 mice, with the
exception of the M2 antagonist binding site in the striatum of LRP1 and of the M3 receptor in
the CA1 region of tg5xFAD mice. This could at least partly account to a low level of
adrenergic transmitters.
Discussion
114
Furthermore, noradrenaline seems to exert anti-inflammatory and anti-oxidative
mechanisms within the CNS (Feinstein et al., 2002; Heneka et al., 2002; Jardanhazi-Kurutz et
al., 2011), both being associated with AD. Reduction of noradrenaline by the neurotoxin
N-(2-chloroethyl)-N-ethyl-2 bromobenzylamine (DSP4) caused increased cortical
inflammatory reaction in response to injection of aggregated Aβ (Heneka et al., 2002).
Antagonists of α2 receptors exert a positive effect regarding neuroprotection. They increase
growth factor expression and on the contrary reduce apoptosis (Bauer et al., 2003; Debeir et
al., 2004). Noradrenaline release is increased as well. Kalinin et al. (2006) proved that
injection of Aβ caused expression of the nitric oxide synthase NOS2 in cortical neurons if the
noradrenaline level was reduced first (Kalinin et al., 2006). Likewise, disruption of LC
increases Aβ burden, neuronal damage and behavioral deficits in tgAPP mice (Heneka et al.,
2006).
tgArcAβ mice: In the tgArcAβ mouse model increased density of α2 receptors was observed
in fewer regions compared to the other AD models, but was affected in the olfactory bulb,
the piriform cortex and the hippocampus. Additionally, α1 receptor density was increased in
the striatum. Increased density of α2 receptors was already explained above (see LRP1,
tg5xFAD and tg5xFAD/LRP1 mice). The increase of the α1 receptor in this strain needs
further examination.
Due to its neuroprotective actions, the adrenergic system might be considered as a novel
therapeutic target. Since the α2 receptor reduces the release of noradrenaline, and
increased receptors may further aggravate this effect, a reduction of this α2 receptor may
improve cognitive abilities. This has been shown using a chronic treatment with the α2
receptors antagonist fluparoxan. This procedure prevented memory deficits in APP/PS1 mice
in cognitive tests where noradrenaline plays an integral role in (Scullion et al., 2011).
6 Dopamine receptors
Dopamine is synthesized in midbrain neurons, i.e. in the ventral tegmental area and the
substantia nigra, and contributes importantly to synaptic plasticity, thereby innervating the
hippocampus, neocortex and basal ganglia (Martorana et al., 2013). The five dopamine
receptors are differentiated in two main subclasses, the D1-like (comprising the D1 and D5
Discussion
115
receptors) and D2-like (comprising the D2, D3 and D4 receptors). All are coupled to a G-
protein and influence cyclic adenosine monophosphate (cAMP),
D1-like by activating adenylate cyclase and D2-like by inhibiting cAMP. Dopaminergic control
of cortical activity is performed particularly by D2 and D3 receptors. Binding of dopamine to
D2 receptors causes reduced excitability (Gulledge and Jaffe, 1998; Tseng and O'Donnell,
2007), while D3 receptors innervate cortical acetylcholine release (Millan et al., 2007).
However, the role of dopamine in AD is still not quite well understood.
In the present study, the density of D2 receptors was increased significantly only in tg5xFAD
mice. Analysis of D2/3 receptor density revealed a trend towards upregulation. A trend
towards increase was also observed in the LRP1 and tg5xFAD/LRP1 mouse model in the D2
receptor and D2/3 receptor density. In the tgArcAβ mouse model a trend towards
upregulation of the D2/3 receptor density was shown.
The enhanced level of D2 receptors may play an important role in the reduction of the
cholinergic system, due to its close interaction with each other. Increased D2 receptors
density may also contribute to modification of motor behavior, although the mouse models
do not show any motor symptoms. An exception is the LRP1 mouse model, which shows
muscle tremor and dystonia (May et al., 2004). However, it is well known that rodents are
able to compensate even large alterations in their brain.
In the current study, D2 receptors were only investigated in the striatum. In recent studies,
abnormalities in the ventral striatum, i.e. rostral medial caudate head and the ventral lateral
putamen, have been found in AD patients. Moreover, cognitive impairment was associated
with the degree of surface alterations in the ventral areas of the caudate and putamen as
well as the accumbens area (de Jong et al., 2011). It seems that the volume reduction of the
putamen and the nucleus accumbens are closely related to cognitive decline (de Jong et al.,
2012). Former studies indicate a functional interaction between the prefrontal cortex and
the nucleus accumbens, thus having great importance in cognitive and motor behavior
(Ongur and Price, 2000; Tzschentke, 2001). Likewise, the stimulation of prefrontal D2
receptors decreased the extracellular level of dopamine and acetylcholine in the nucleus
accumbens. Moreover, stimulation of D2 receptors in nucleus accumbens caused reduction
in the release of acetylcholine (Brooks et al., 2007; Del Arco et al., 2007).
Discussion
116
Furthermore, in tg5xFAD mice, the glutamatergic receptors are reduced together with
enhanced D2 receptor density. Whether the reduction in the glutamatergic system is linked
to the reduced excitability caused by D2 receptors as mentioned above cannot be answered
in this study.
7 Correlations between behavior, transmitter and receptor alterations
Beside the cognitive impairment, the most frequent symptoms of AD are apathy (45%),
depression (44%) and aggression (40%) (Lyketsos et al., 2002). There is evidence that
alteration in neurotransmitter systems, especially in the cholinergic system, contribute to
these changes (Cummings and Kaufer, 1996; Lanari et al., 2006). Deficits in the cholinergic
system of the basal forebrain correlate positively with behavioral disturbance. For instance,
ChAT activity was reduced in brains of AD patients, which showed hyperactivity, compared
to controls (Minger et al., 2000). Liu et al. reported that 18 months old LRP1 mice traveled
significantly longer distance than control mice, indicating that LRP1 deletion causes
hyperactivity in mice (Liu et al., 2010). Since M2 receptor density was decreased in
hippocampal areas, it may at least partly explain the hyperactivity found in LRP1 mice.
Hyperactivity was also observed in tgArcAβ mice in the first three months. However, only a
slight increase of M2 receptors was found in the present study. This correlates with the
results of Knobloch et al. (2006), who observed hyperactivity in tgArcAβ mice during the first
three months. With age, hyperactivity disappeared and changed to hypoactivity between 6
and 9 months of age. In the present study, tgArcAβ mice were 8 months old, thus starting to
change to hypoactivity.
Besides the cholinergic system, the adrenergic system seems to be involved in mood
alteration. Several studies have found LC neuron loss in AD patients with depression
(Zubenko and Moossy, 1988; Zweig et al., 1988; Förstl et al., 1992). As already mentioned in
chapter 5, noradrenaline is produced in the LC. Therefore, less noradrenaline might be
present due to LC neuron loss. Among the most common symptoms of AD are aggression,
irritability and agitation, causing great problems in the care of the patients (Russo-Neustadt
and Cotman, 1997). Enhanced density of α2 receptors in the cerebellum has been found to
correlate with aggressive behavior in AD patients (Russo-Neustadt and Cotman, 1997). In the
Discussion
117
present study, the cerebellum was not investigated. However, in all mouse models used and
all regions analyzed in this study, α2 receptors were increased. As a result, an involvement of
the adrenergic system in behavioral changes seems plausible.
Antidepressant drugs directly or indirectly reduce NMDA receptor function (Zarate et al.,
2003) and seem to raise GABA levels (Krystal et al., 2002). This is in agreement with the
findings according to the tgArcAβ mouse model, in which NMDA receptors are upregulated
while in the GABAergic system a downregulation could be observed.
Dysfunction of the dopaminergic system is also often associated with behavioral alteration.
Common therapy for schizophrenic symptoms in AD are D2 receptor antagonists (Lanari et
al., 2006). Enhanced levels of striatal D2 receptors were reported in AD patients showing
delusional symptoms (Reeves et al., 2009). Likely, attention performance was poor when
density of dopaminergic D2 receptors was increased (Reeves et al., 2010). Notably, an
increased D2 receptor density was found in the 5xFAD model of the present study.
8 Olfactory function
One of the greatest problems in the treatment of AD is an early clinical diagnosis. At the time
when AD is first diagnosed, neurodegeneration has already started. Therefore, therapies
should start as early as possible, prior clinical manifestation, and an early marker is required
to identify AD as early as possible.
Deficits in olfactory functioning, with respect to odor detection, discrimination, recognition
identification and naming are a well-known hallmarks of AD (Cassano et al., 2011), and occur
early in the pathogenesis of dementia (Hawkes, 2003). About 90% of all patients suffering
from FAD exhibit severe olfactory dysfunction (Hawkes, 2003). Olfactory processing involves
several steps, from sensory neuron input to the olfactory bulb, decoding and plasticity in the
piriform cortex and downstream neurons in the hippocampus (Brennan and Keverne, 1997;
Cassano et al., 2011).
The patterns of neurotransmitter receptor changes in the olfactory bulb and piriform cortex
were most similar between tg5xFAD and tg5xFAD/LRP1 mice. Both mouse models revealed
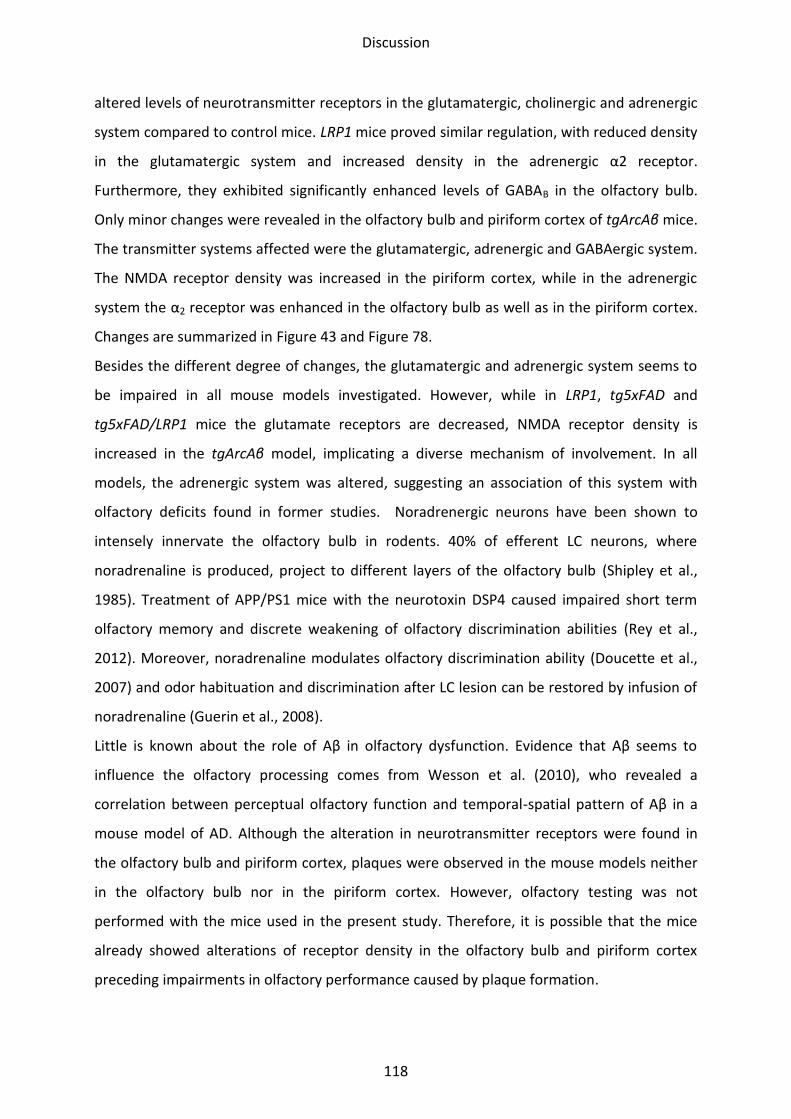
Discussion
118
altered levels of neurotransmitter receptors in the glutamatergic, cholinergic and adrenergic
system compared to control mice. LRP1 mice proved similar regulation, with reduced density
in the glutamatergic system and increased density in the adrenergic α2 receptor.
Furthermore, they exhibited significantly enhanced levels of GABAB in the olfactory bulb.
Only minor changes were revealed in the olfactory bulb and piriform cortex of tgArcAβ mice.
The transmitter systems affected were the glutamatergic, adrenergic and GABAergic system.
The NMDA receptor density was increased in the piriform cortex, while in the adrenergic
system the α2 receptor was enhanced in the olfactory bulb as well as in the piriform cortex.
Changes are summarized in Figure 43 and Figure 78.
Besides the different degree of changes, the glutamatergic and adrenergic system seems to
be impaired in all mouse models investigated. However, while in LRP1, tg5xFAD and
tg5xFAD/LRP1 mice the glutamate receptors are decreased, NMDA receptor density is
increased in the tgArcAβ model, implicating a diverse mechanism of involvement. In all
models, the adrenergic system was altered, suggesting an association of this system with
olfactory deficits found in former studies. Noradrenergic neurons have been shown to
intensely innervate the olfactory bulb in rodents. 40% of efferent LC neurons, where
noradrenaline is produced, project to different layers of the olfactory bulb (Shipley et al.,
1985). Treatment of APP/PS1 mice with the neurotoxin DSP4 caused impaired short term
olfactory memory and discrete weakening of olfactory discrimination abilities (Rey et al.,
2012). Moreover, noradrenaline modulates olfactory discrimination ability (Doucette et al.,
2007) and odor habituation and discrimination after LC lesion can be restored by infusion of
noradrenaline (Guerin et al., 2008).
Little is known about the role of Aβ in olfactory dysfunction. Evidence that Aβ seems to
influence the olfactory processing comes from Wesson et al. (2010), who revealed a
correlation between perceptual olfactory function and temporal-spatial pattern of Aβ in a
mouse model of AD. Although the alteration in neurotransmitter receptors were found in
the olfactory bulb and piriform cortex, plaques were observed in the mouse models neither
in the olfactory bulb nor in the piriform cortex. However, olfactory testing was not
performed with the mice used in the present study. Therefore, it is possible that the mice
already showed alterations of receptor density in the olfactory bulb and piriform cortex
preceding impairments in olfactory performance caused by plaque formation.
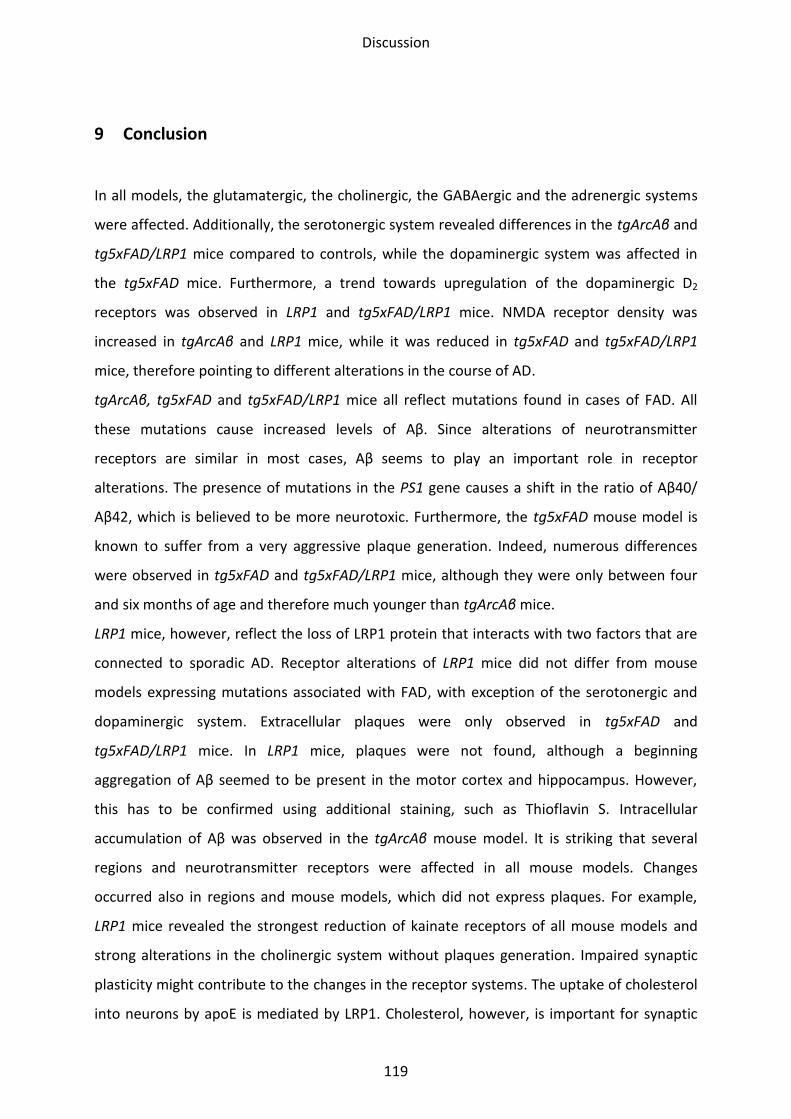
Discussion
119
9 Conclusion
In all models, the glutamatergic, the cholinergic, the GABAergic and the adrenergic systems
were affected. Additionally, the serotonergic system revealed differences in the tgArcAβ and
tg5xFAD/LRP1 mice compared to controls, while the dopaminergic system was affected in
the tg5xFAD mice. Furthermore, a trend towards upregulation of the dopaminergic D2
receptors was observed in LRP1 and tg5xFAD/LRP1 mice. NMDA receptor density was
increased in tgArcAβ and LRP1 mice, while it was reduced in tg5xFAD and tg5xFAD/LRP1
mice, therefore pointing to different alterations in the course of AD.
tgArcAβ, tg5xFAD and tg5xFAD/LRP1 mice all reflect mutations found in cases of FAD. All
these mutations cause increased levels of Aβ. Since alterations of neurotransmitter
receptors are similar in most cases, Aβ seems to play an important role in receptor
alterations. The presence of mutations in the PS1 gene causes a shift in the ratio of Aβ40/
Aβ42, which is believed to be more neurotoxic. Furthermore, the tg5xFAD mouse model is
known to suffer from a very aggressive plaque generation. Indeed, numerous differences
were observed in tg5xFAD and tg5xFAD/LRP1 mice, although they were only between four
and six months of age and therefore much younger than tgArcAβ mice.
LRP1 mice, however, reflect the loss of LRP1 protein that interacts with two factors that are
connected to sporadic AD. Receptor alterations of LRP1 mice did not differ from mouse
models expressing mutations associated with FAD, with exception of the serotonergic and
dopaminergic system. Extracellular plaques were only observed in tg5xFAD and
tg5xFAD/LRP1 mice. In LRP1 mice, plaques were not found, although a beginning
aggregation of Aβ seemed to be present in the motor cortex and hippocampus. However,
this has to be confirmed using additional staining, such as Thioflavin S. Intracellular
accumulation of Aβ was observed in the tgArcAβ mouse model. It is striking that several
regions and neurotransmitter receptors were affected in all mouse models. Changes
occurred also in regions and mouse models, which did not express plaques. For example,
LRP1 mice revealed the strongest reduction of kainate receptors of all mouse models and
strong alterations in the cholinergic system without plaques generation. Impaired synaptic
plasticity might contribute to the changes in the receptor systems. The uptake of cholesterol
into neurons by apoE is mediated by LRP1. Cholesterol, however, is important for synaptic
Discussion
120
plasticity. Mutations causing enhanced levels of Aβ also lead to altered receptor density. It
seems that Aβ as well as impairment of cholesterol metabolism has an effect on receptor
systems. Furthermore, γ-secretase-dependent APP processing seems to be involved in the
regulation of brain cholesterol by transcriptional repression of LRP1. Increased APP
processing by γ-secretase, as it was found in mice harboring FAD mutations, might lead to
reduced levels of LRP1. In summary, these results indicate similar receptor changes,
although the mechanism behind the plaque generation is different in FAD and sporadic AD.
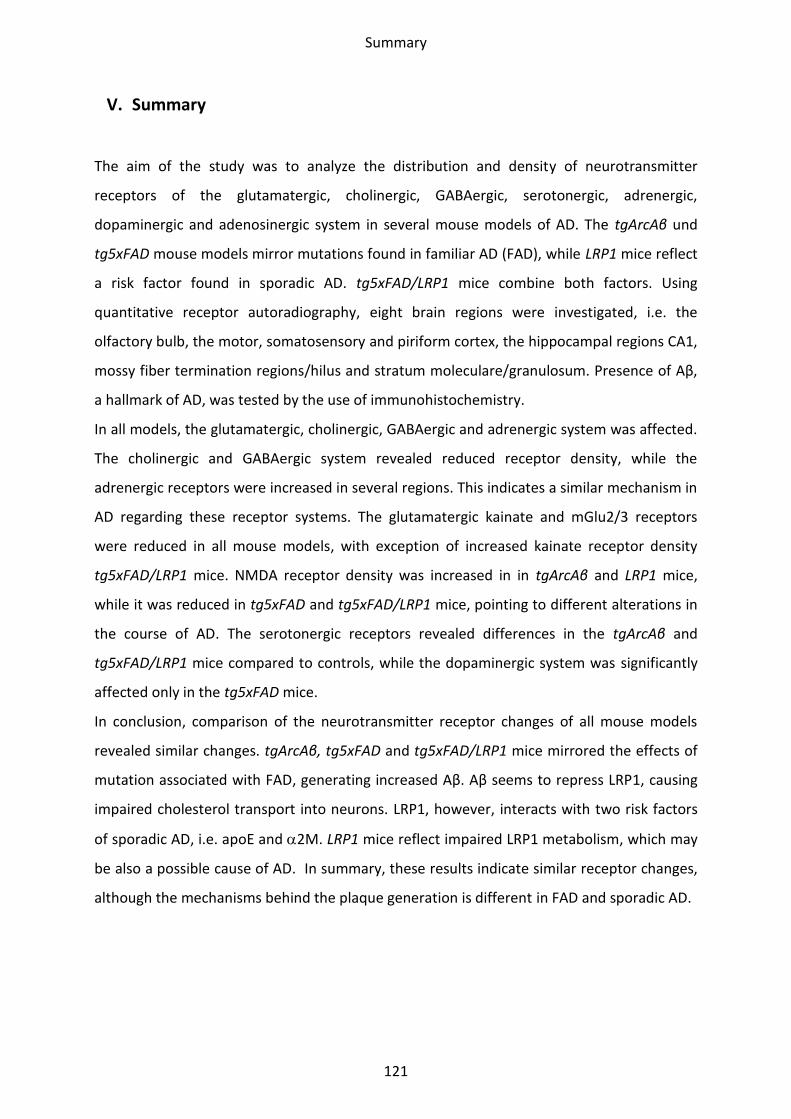
Summary
121
V. Summary
The aim of the study was to analyze the distribution and density of neurotransmitter
receptors of the glutamatergic, cholinergic, GABAergic, serotonergic, adrenergic,
dopaminergic and adenosinergic system in several mouse models of AD. The tgArcAβ und
tg5xFAD mouse models mirror mutations found in familiar AD (FAD), while LRP1 mice reflect
a risk factor found in sporadic AD. tg5xFAD/LRP1 mice combine both factors. Using
quantitative receptor autoradiography, eight brain regions were investigated, i.e. the
olfactory bulb, the motor, somatosensory and piriform cortex, the hippocampal regions CA1,
mossy fiber termination regions/hilus and stratum moleculare/granulosum. Presence of Aβ,
a hallmark of AD, was tested by the use of immunohistochemistry.
In all models, the glutamatergic, cholinergic, GABAergic and adrenergic system was affected.
The cholinergic and GABAergic system revealed reduced receptor density, while the
adrenergic receptors were increased in several regions. This indicates a similar mechanism in
AD regarding these receptor systems. The glutamatergic kainate and mGlu2/3 receptors
were reduced in all mouse models, with exception of increased kainate receptor density
tg5xFAD/LRP1 mice. NMDA receptor density was increased in in tgArcAβ and LRP1 mice,
while it was reduced in tg5xFAD and tg5xFAD/LRP1 mice, pointing to different alterations in
the course of AD. The serotonergic receptors revealed differences in the tgArcAβ and
tg5xFAD/LRP1 mice compared to controls, while the dopaminergic system was significantly
affected only in the tg5xFAD mice.
In conclusion, comparison of the neurotransmitter receptor changes of all mouse models
revealed similar changes. tgArcAβ, tg5xFAD and tg5xFAD/LRP1 mice mirrored the effects of
mutation associated with FAD, generating increased Aβ. Aβ seems to repress LRP1, causing
impaired cholesterol transport into neurons. LRP1, however, interacts with two risk factors
of sporadic AD, i.e. apoE and 2M. LRP1 mice reflect impaired LRP1 metabolism, which may
be also a possible cause of AD. In summary, these results indicate similar receptor changes,
although the mechanisms behind the plaque generation is different in FAD and sporadic AD.
Bibliography
122
VI. Bibliography
Andersen OM, Willnow TE (2006) Lipoprotein receptors in Alzheimer's disease. Trends in Neurosciences 29:687-694.
Anderson JP, Esch FS, Keim PS, Sambamurti K, Lieberburg I, Robakis NK (1991) Exact cleavage site of Alzheimer amyloid precursor in neuronal PC-12 cells. Neuroscience Letters 128:126-128.
Araujo DM, Lapchak PA, Robitaille Y, Gauthier S, Quirion R (1988) Differential alteration of various cholinergic markers in cortical and subcortical regions of human brain in Alzheimer's disease. Journal of Neurochemistry 50:1914-1923.
Auld DS, Kornecook TJ, Bastianetto S, Quirion R (2002) Alzheimer's disease and the basal forebrain cholinergic system: relations to beta-amyloid peptides, cognition, and treatment strategies. Progress in Neurobiology 68:209-245.
Bauer S, Moyse E, Jourdan F, Colpaert F, Martel JC, Marien M (2003) Effects of the alpha 2-adrenoreceptor antagonist dexefaroxan on neurogenesis in the olfactory bulb of the adult rat in vivo: selective protection against neuronal death. Neuroscience 117:281-291.
Benedetti MS, Russo A, Marrari P, Dostert P (1991) Effects of ageing on the content in sulfur-containing amino acids in rat brain. Journal of Neural Transmission General Section 86:191-203.
Berezovska O, Lleo A, Herl LD, Frosch MP, Stern EA, Bacskai BJ, Hyman BT (2005) Familial Alzheimer's disease presenilin 1 mutations cause alterations in the conformation of presenilin and interactions with amyloid precursor protein. The Journal of Neuroscience : the Official Journal of the Society for Neuroscience 25:3009-3017.
Bernareggi A, Duenas Z, Reyes-Ruiz JM, Ruzzier F, Miledi R (2007) Properties of glutamate receptors of Alzheimer's disease brain transplanted to frog oocytes. Proceedings of the National Academy of Sciences of the United States of America 104:2956-2960.
Bitan G, Kirkitadze MD, Lomakin A, Vollers SS, Benedek GB, Teplow DB (2003) Amyloid beta -protein (Abeta) assembly: Abeta 40 and Abeta 42 oligomerize through distinct pathways. Proceedings of the National Academy of Sciences of the United States of America 100:330-335.
Blacker D, Wilcox MA, Laird NM, Rodes L, Horvath SM, Go RC, Perry R, Watson B, Jr., Bassett SS, McInnis MG, Albert MS, Hyman BT, Tanzi RE (1998) Alpha-2 macroglobulin is genetically associated with Alzheimer disease. Nature Genetics 19:357-360.
Blin J, Baron JC, Dubois B, Crouzel C, Fiorelli M, Attar-Levy D, Pillon B, Fournier D, Vidailhet M, Agid Y (1993) Loss of brain 5-HT2 receptors in Alzheimer's disease. In vivo assessment with positron emission tomography and [18F]setoperone. Brain : a Journal of Neurology 116 ( Pt 3):497-510.
Boer S, Sanchez D, Reinieren I, van den Boom T, Udawela M, Scarr E, Ganfornina MD, Dean B (2010) Decreased kainate receptors in the hippocampus of apolipoprotein D knockout mice. Progress inNneuropsychopharmacology & Biological Psychiatry 34:271-278.
Borchelt DR, Thinakaran G, Eckman CB, Lee MK, Davenport F, Ratovitsky T, Prada CM, Kim G, Seekins S, Yager D, Slunt HH, Wang R, Seeger M, Levey AI, Gandy SE, Copeland NG, Jenkins NA, Price DL, Younkin SG, Sisodia SS (1996) Familial Alzheimer's disease-linked presenilin 1 variants elevate Abeta1-42/1-40 ratio in vitro and in vivo. Neuron 17:1005-1013.
Bibliography
123
Braak H, Braak E (1991) Neuropathological stageing of Alzheimer-related changes. Acta neuropathologica 82:239-259.
Bracco L, Gallato R, Grigoletto F, Lippi A, Lepore V, Bino G, Lazzaro MP, Carella F, Piccolo T, Pozzilli C, et al. (1994) Factors affecting course and survival in Alzheimer's disease. A 9-year longitudinal study. Archives of Neurology 51:1213-1219.
Brennan PA, Keverne EB (1997) Neural mechanisms of mammalian olfactory learning. Progress in Neurobiology 51:457-481.
Brionne TC, Tesseur I, Masliah E, Wyss-Coray T (2003) Loss of TGF-beta 1 leads to increased neuronal cell death and microgliosis in mouse brain. Neuron 40:1133-1145.
Brooks JM, Sarter M, Bruno JP (2007) D2-like receptors in nucleus accumbens negatively modulate acetylcholine release in prefrontal cortex. Neuropharmacology 53:455-463.
Bruno V, Battaglia G, Copani A, Giffard RG, Raciti G, Raffaele R, Shinozaki H, Nicoletti F (1995) Activation of class II or III metabotropic glutamate receptors protects cultured cortical neurons against excitotoxic degeneration. The European Journal of Neuroscience 7:1906-1913.
Bruno V, Battaglia G, Copani A, D'Onofrio M, Di Iorio P, De Blasi A, Melchiorri D, Flor PJ, Nicoletti F (2001) Metabotropic glutamate receptor subtypes as targets for neuroprotective drugs. Journal of Cerebral Blood Flow and Metabolism : official journal of the International Society of Cerebral Blood Flow and Metabolism 21:1013-1033.
Bu G (2009) Apolipoprotein E and its receptors in Alzheimer's disease: pathways, pathogenesis and therapy. Nature Reviews Neuroscience 10:333-344.
Bu G, Maksymovitch EA, Nerbonne JM, Schwartz AL (1994) Expression and function of the low density lipoprotein receptor-related protein (LRP) in mammalian central neurons. The Journal of Biological Chemistry 269:18521-18528.
Burdick D, Soreghan B, Kwon M, Kosmoski J, Knauer M, Henschen A, Yates J, Cotman C, Glabe C (1992) Assembly and aggregation properties of synthetic Alzheimer's A4/beta amyloid peptide analogs. The Journal of Biological Chemistry 267:546-554.
Cai XD, Golde TE, Younkin SG (1993) Release of excess amyloid beta protein from a mutant amyloid beta protein precursor. Science 259:514-516.
Caille I, Allinquant B, Dupont E, Bouillot C, Langer A, Muller U, Prochiantz A (2004) Soluble form of amyloid precursor protein regulates proliferation of progenitors in the adult subventricular zone. Development 131:2173-2181.
Cam JA, Bu G (2006) Modulation of beta-amyloid precursor protein trafficking and processing by the low density lipoprotein receptor family. Molecular Neurodegeneration 1:8.
Caraci F, Spampinato S, Sortino MA, Bosco P, Battaglia G, Bruno V, Drago F, Nicoletti F, Copani A (2012) Dysfunction of TGF-beta1 signaling in Alzheimer's disease: perspectives for neuroprotection. Cell and Tissue research 347:291-301.
Cassano T, Romano A, Macheda T, Colangeli R, Cimmino CS, Petrella A, LaFerla FM, Cuomo V, Gaetani S (2011) Olfactory memory is impaired in a triple transgenic model of Alzheimer disease. Behavioural Brain Research 224:408-412.
Chen YR, Glabe CG (2006) Distinct early folding and aggregation properties of Alzheimer amyloid-beta peptides Abeta40 and Abeta42: stable trimer or tetramer formation by Abeta42. The Journal of Biological Chemistry 281:24414-24422.
Citron M, Oltersdorf T, Haass C, McConlogue L, Hung AY, Seubert P, Vigo-Pelfrey C, Lieberburg I, Selkoe DJ (1992) Mutation of the beta-amyloid precursor protein in familial Alzheimer's disease increases beta-protein production. Nature 360:672-674.
Bibliography
124
Citron M, Eckman CB, Diehl TS, Corcoran C, Ostaszewski BL, Xia W, Levesque G, St George Hyslop P, Younkin SG, Selkoe DJ (1998) Additive effects of PS1 and APP mutations on secretion of the 42-residue amyloid beta-protein. Neurobiology of Disease 5:107-116.
Citron M et al. (1997) Mutant presenilins of Alzheimer's disease increase production of 42-residue amyloid beta-protein in both transfected cells and transgenic mice. Nature Medicine 3:67-72.
Cleary JP, Walsh DM, Hofmeister JJ, Shankar GM, Kuskowski MA, Selkoe DJ, Ashe KH (2005) Natural oligomers of the amyloid-beta protein specifically disrupt cognitive function. Nature Neuroscience 8:79-84.
Constantinidis C, Williams GV, Goldman-Rakic PS (2002) A role for inhibition in shaping the temporal flow of information in prefrontal cortex. Nature Neuroscience 5:175-180.
Corder EH, Saunders AM, Strittmatter WJ, Schmechel DE, Gaskell PC, Small GW, Roses AD, Haines JL, Pericak-Vance MA (1993) Gene dose of apolipoprotein E type 4 allele and the risk of Alzheimer's disease in late onset families. Science 261:921-923.
Coutinho V, Knopfel T (2002) Metabotropic glutamate receptors: electrical and chemical signaling properties. The Neuroscientist 8:551-561.
Coyle JT, Price DL, DeLong MR (1983) Alzheimer's disease: a disorder of cortical cholinergic innervation. Science 219:1184-1190.
Cummings JL, Kaufer D (1996) Neuropsychiatric aspects of Alzheimer's disease: the cholinergic hypothesis revisited. Neurology 47:876-883.
D'Onofrio M, Cuomo L, Battaglia G, Ngomba RT, Storto M, Kingston AE, Orzi F, De Blasi A, Di Iorio P, Nicoletti F, Bruno V (2001) Neuroprotection mediated by glial group-II metabotropic glutamate receptors requires the activation of the MAP kinase and the phosphatidylinositol-3-kinase pathways. Journal of Neurochemistry 78:435-445.
De Felice FG, Velasco PT, Lambert MP, Viola K, Fernandez SJ, Ferreira ST, Klein WL (2007) Abeta oligomers induce neuronal oxidative stress through an N-methyl-D-aspartate receptor-dependent mechanism that is blocked by the Alzheimer drug memantine. The Journal of Biological Chemistry 282:11590-11601.
de Jong LW, Wang Y, White LR, Yu B, van Buchem MA, Launer LJ (2012) Ventral striatal volume is associated with cognitive decline in older people: a population based MR-study. Neurobiology of Aging 33:424 e421-410.
de Jong LW, Ferrarini L, van der Grond J, Milles JR, Reiber JH, Westendorp RG, Bollen EL, Middelkoop HA, van Buchem MA (2011) Shape abnormalities of the striatum in Alzheimer's disease. Journal of Alzheimer's Disease : JAD 23:49-59.
Deane R, Wu Z, Sagare A, Davis J, Du Yan S, Hamm K, Xu F, Parisi M, LaRue B, Hu HW, Spijkers P, Guo H, Song X, Lenting PJ, Van Nostrand WE, Zlokovic BV (2004) LRP/amyloid beta-peptide interaction mediates differential brain efflux of Abeta isoforms. Neuron 43:333-344.
Debeir T, Marien M, Ferrario J, Rizk P, Prigent A, Colpaert F, Raisman-Vozari R (2004) In vivo upregulation of endogenous NGF in the rat brain by the alpha2-adrenoreceptor antagonist dexefaroxan: potential role in the protection of the basalocortical cholinergic system during neurodegeneration. Experimental Neurology 190:384-395.
Del Arco A, Mora F, Mohammed AH, Fuxe K (2007) Stimulation of D2 receptors in the prefrontal cortex reduces PCP-induced hyperactivity, acetylcholine release and dopamine metabolism in the nucleus accumbens. Journal of Neural Transmission 114:185-193.
del Olmo N, Bustamante J, del Rio RM, Solis JM (2000) Taurine activates GABA(A) but not GABA(B) receptors in rat hippocampal CA1 area. Brain Research 864:298-307.
Bibliography
125
Doucette W, Milder J, Restrepo D (2007) Adrenergic modulation of olfactory bulb circuitry affects odor discrimination. Learning & Memory 14:539-547.
Duff K, Eckman C, Zehr C, Yu X, Prada CM, Perez-tur J, Hutton M, Buee L, Harigaya Y, Yager D, Morgan D, Gordon MN, Holcomb L, Refolo L, Zenk B, Hardy J, Younkin S (1996) Increased amyloid-beta42(43) in brains of mice expressing mutant presenilin 1. Nature 383:710-713.
Eckman CB, Mehta ND, Crook R, Perez-tur J, Prihar G, Pfeiffer E, Graff-Radford N, Hinder P, Yager D, Zenk B, Refolo LM, Prada CM, Younkin SG, Hutton M, Hardy J (1997) A new pathogenic mutation in the APP gene (I716V) increases the relative proportion of A beta 42(43). Human Molecular Genetics 6:2087-2089.
Everitt BJ, Robbins TW (1997) Central cholinergic systems and cognition. Annual Review of Psychology 48:649-684.
Feinstein DL, Heneka MT, Gavrilyuk V, Dello Russo C, Weinberg G, Galea E (2002) Noradrenergic regulation of inflammatory gene expression in brain. Neurochemistry International 41:357-365.
Förstl H, Kurz A (1999) Clinical features of Alzheimer's disease. European Archives of Psychiatry and Clinical Neuroscience 249:288-290.
Förstl H, Burns A, Luthert P, Cairns N, Lantos P, Levy R (1992) Clinical and europathological correlates of depression in Alzheimer's disease. Psychological Medicine 22:877-884.
Frank C, Rufini S, Tancredi V, Forcina R, Grossi D, D'Arcangelo G (2008) Cholesterol depletion inhibits synaptic transmission and synaptic plasticity in rat hippocampus. Experimental Neurology 212:407-414.
Frisardi V, Panza F, Farooqui AA (2011) Late-life depression and Alzheimer's disease: the glutamatergic system inside of this mirror relationship. Brain Research Reviews 67:344-355.
Furukawa K, Barger SW, Blalock EM, Mattson MP (1996) Activation of K+ channels and suppression of neuronal activity by secreted beta-amyloid-precursor protein. Nature 379:74-78.
Gakhar-Koppole N, Hundeshagen P, Mandl C, Weyer SW, Allinquant B, Muller U, Ciccolini F (2008) Activity requires soluble amyloid precursor protein alpha to promote neurite outgrowth in neural stem cell-derived neurons via activation of the MAPK pathway. The European Journal of Neuroscience 28:871-882.
Gao SF, Bao AM (2011) Corticotropin-releasing hormone, glutamate, and gamma-aminobutyric acid in depression. The Neuroscientist 17:124-144.
Geddes JW, Monaghan DT, Cotman CW, Lott IT, Kim RC, Chui HC (1985) Plasticity of hippocampal circuitry in Alzheimer's disease. Science 230:1179-1181.
Gerhardt CC, van Heerikhuizen H (1997) Functional characteristics of heterologously expressed 5-HT receptors. European Journal of Pharmacology 334:1-23.
Glabe C (2001) Intracellular mechanisms of amyloid accumulation and pathogenesis in Alzheimer's disease. Journal of Molecular Neuroscience : MN 17:137-145.
Glenner GG, Wong CW (1984) Alzheimer's disease: initial report of the purification and characterization of a novel cerebrovascular amyloid protein. Biochemical and Biophysical Research Communications 120:885-890.
Goate A, Chartier-Harlin MC, Mullan M, Brown J, Crawford F, Fidani L, Giuffra L, Haynes A, Irving N, James L, et al. (1991) Segregation of a missense mutation in the amyloid precursor protein gene with familial Alzheimer's disease. Nature 349:704-706.
Bibliography
126
Goldgaber D, Lerman MI, McBride OW, Saffiotti U, Gajdusek DC (1987) Characterization and chromosomal localization of a cDNA encoding brain amyloid of Alzheimer's disease. Science 235:877-880.
Grachev ID, Apkarian AV (2001) Aging alters regional multichemical profile of the human brain: an in vivo 1H-MRS study of young versus middle-aged subjects. Journal of Neurochemistry 76:582-593.
Guerin D, Peace ST, Didier A, Linster C, Cleland TA (2008) Noradrenergic neuromodulation in the olfactory bulb modulates odor habituation and spontaneous discrimination. Behavioral Neuroscience 122:816-826.
Gulledge AT, Jaffe DB (1998) Dopamine decreases the excitability of layer V pyramidal cells in the rat prefrontal cortex. The Journal of Neuroscience : the Official Journal of the Society for Neuroscience 18:9139-9151.
Haass C, Selkoe DJ (1993) Cellular processing of beta-amyloid precursor protein and the genesis of amyloid beta-peptide. Cell 75:1039-1042.
Haass C, Steiner H (2002) Alzheimer disease gamma-secretase: a complex story of GxGD-type presenilin proteases. Trends in Cell Biology 12:556-562.
Haass C, Selkoe DJ (2007) Soluble protein oligomers in neurodegeneration: lessons from the Alzheimer's amyloid beta-peptide. Nature Reviews Molecular Cell Biology 8:101-112.
Haass C, Kaether C, Thinakaran G, Sisodia S (2012) Trafficking and proteolytic processing of APP. Cold Spring Harbor Perspectives in Medicine 2:a006270.
Haass C, Hung AY, Schlossmacher MG, Oltersdorf T, Teplow DB, Selkoe DJ (1993) Normal cellular processing of the beta-amyloid precursor protein results in the secretion of the amyloid beta peptide and related molecules. Annals of the New York Academy of Sciences 695:109-116.
Haass C, Schlossmacher MG, Hung AY, Vigo-Pelfrey C, Mellon A, Ostaszewski BL, Lieberburg I, Koo EH, Schenk D, Teplow DB, et al. (1992) Amyloid beta-peptide is produced by cultured cells during normal metabolism. Nature 359:322-325.
Hardy J, Selkoe DJ (2002) The amyloid hypothesis of Alzheimer's disease: progress and problems on the road to therapeutics. Science 297:353-356.
Hardy J, Duff K, Hardy KG, Perez-Tur J, Hutton M (1998) Genetic dissection of Alzheimer's disease and related dementias: amyloid and its relationship to tau. Nature Neuroscience 1:355-358.
Harkany T, Dijkstra IM, Oosterink BJ, Horvath KM, Abraham I, Keijser J, Van der Zee EA, Luiten PG (2000) Increased amyloid precursor protein expression and serotonergic sprouting following excitotoxic lesion of the rat magnocellular nucleus basalis: neuroprotection by Ca(2+) antagonist nimodipine. Neuroscience 101:101-114.
Harkany T, O'Mahony S, Keijser J, Kelly JP, Konya C, Borostyankoi ZA, Gorcs TJ, Zarandi M, Penke B, Leonard BE, Luiten PG (2001) Beta-amyloid(1-42)-induced cholinergic lesions in rat nucleus basalis bidirectionally modulate serotonergic innervation of the basal forebrain and cerebral cortex. Neurobiology of Disease 8:667-678.
Hawkes C (2003) Olfaction in neurodegenerative disorder. Movement Disorders : Official Journal of the Movement Disorder Society 18:364-372.
Heneka MT, Galea E, Gavriluyk V, Dumitrescu-Ozimek L, Daeschner J, O'Banion MK, Weinberg G, Klockgether T, Feinstein DL (2002) Noradrenergic depletion potentiates beta -amyloid-induced cortical inflammation: implications for Alzheimer's disease. The Journal of Neuroscience : the Official Journal of the Society for Neuroscience 22:2434-2442.
Bibliography
127
Heneka MT, Ramanathan M, Jacobs AH, Dumitrescu-Ozimek L, Bilkei-Gorzo A, Debeir T, Sastre M, Galldiks N, Zimmer A, Hoehn M, Heiss WD, Klockgether T, Staufenbiel M (2006) Locus ceruleus degeneration promotes Alzheimer pathogenesis in amyloid precursor protein 23 transgenic mice. The Journal of Neuroscience : the Official Journal of the Society for Neuroscience 26:1343-1354.
Henze DA, Urban NN, Barrionuevo G (2000) The multifarious hippocampal mossy fiber pathway: a review. Neuroscience 98:407-427.
Hering H, Lin CC, Sheng M (2003) Lipid rafts in the maintenance of synapses, dendritic spines, and surface AMPA receptor stability. The Journal of Neuroscience : the official journal of the Society for Neuroscience 23:3262-3271.
Herz J, Strickland DK (2001) LRP: a multifunctional scavenger and signaling receptor. The Journal of Clinical Investigation 108:779-784.
Holm P, Ettrup A, Klein AB, Santini MA, El-Sayed M, Elvang AB, Stensbol TB, Mikkelsen JD, Knudsen GM, Aznar S (2010) Plaque deposition dependent decrease in 5-HT2A serotonin receptor in AbetaPPswe/PS1dE9 amyloid overexpressing mice. Journal of Alzheimer's Disease : JAD 20:1201-1213.
Hoshi M, Takashima A, Murayama M, Yasutake K, Yoshida N, Ishiguro K, Hoshino T, Imahori K (1997) Nontoxic amyloid beta peptide 1-42 suppresses acetylcholine synthesis. Possible role in cholinergic dysfunction in Alzheimer's disease. The Journal of Biological Chemistry 272:2038-2041.
Hoyer D, Martin G (1997) 5-HT receptor classification and nomenclature: towards a harmonization with the human genome. Neuropharmacology 36:419-428.
Hung AY, Haass C, Nitsch RM, Qiu WQ, Citron M, Wurtman RJ, Growdon JH, Selkoe DJ (1993) Activation of protein kinase C inhibits cellular production of the amyloid beta-protein. The Journal of Biological Chemistry 268:22959-22962.
Huxtable RJ (1992) Physiological actions of taurine. Physiological Reviews 72:101-163. Hynd MR, Scott HL, Dodd PR (2004) Glutamate-mediated excitotoxicity and
neurodegeneration in Alzheimer's disease. Neurochemistry International 45:583-595. Jardanhazi-Kurutz D, Kummer MP, Terwel D, Vogel K, Thiele A, Heneka MT (2011) Distinct
adrenergic system changes and neuroinflammation in response to induced locus ceruleus degeneration in APP/PS1 transgenic mice. Neuroscience 176:396-407.
Jarrett JT, Berger EP, Lansbury PT, Jr. (1993a) The C-terminus of the beta protein is critical in amyloidogenesis. Annals of the New York Academy of Sciences 695:144-148.
Jarrett JT, Berger EP, Lansbury PT, Jr. (1993b) The carboxy terminus of the beta amyloid protein is critical for the seeding of amyloid formation: implications for the pathogenesis of Alzheimer's disease. Biochemistry 32:4693-4697.
Johansson AS, Berglind-Dehlin F, Karlsson G, Edwards K, Gellerfors P, Lannfelt L (2006) Physiochemical characterization of the Alzheimer's disease-related peptides A beta 1-42Arctic and A beta 1-42wt. The FEBS Journal 273:2618-2630.
Kaether C, Schmitt S, Willem M, Haass C (2006) Amyloid precursor protein and Notch intracellular domains are generated after transport of their precursors to the cell surface. Traffic 7:408-415.
Kalinin, S., Polak, P. E., Madrigal, J. L., Gavrilyuk, V., Sharp, A., Chauhan, N., Marien, M., Colpaert, F. & Feinstein, D. L. (2006). Beta-amyloid-dependent expression of NOS2 in neurons: prevention by an alpha2-adrenergic antagonist. Antioxid Redox Signal 8, 873-83.
Kanekiyo T, Zhang J, Liu Q, Liu CC, Zhang L, Bu G (2011) Heparan sulphate proteoglycan and the low-density lipoprotein receptor-related protein 1 constitute major pathways for
Bibliography
128
neuronal amyloid-beta uptake. The Journal of Neuroscience : the Official Journal of the Society for Neuroscience 31:1644-1651.
Kang DE, Pietrzik CU, Baum L, Chevallier N, Merriam DE, Kounnas MZ, Wagner SL, Troncoso JC, Kawas CH, Katzman R, Koo EH (2000) Modulation of amyloid beta-protein clearance and Alzheimer's disease susceptibility by the LDL receptor-related protein pathway. The Journal of Clinical Investigation 106:1159-1166.
Kang J, Lemaire HG, Unterbeck A, Salbaum JM, Masters CL, Grzeschik KH, Multhaup G, Beyreuther K, Muller-Hill B (1987) The precursor of Alzheimer's disease amyloid A4 protein resembles a cell-surface receptor. Nature 325:733-736.
Kar S, Seto D, Gaudreau P, Quirion R (1996) Beta-amyloid-related peptides inhibit potassium-evoked acetylcholine release from rat hippocampal slices. The Journal of Neuroscience : the Official Journal of the Society for Neuroscience 16:1034-1040.
Kimberly WT, Esler WP, Ye W, Ostaszewski BL, Gao J, Diehl T, Selkoe DJ, Wolfe MS (2003) Notch and the amyloid precursor protein are cleaved by similar gamma-secretase(s). Biochemistry 42:137-144.
Kinoshita A, Fukumoto H, Shah T, Whelan CM, Irizarry MC, Hyman BT (2003) Demonstration by FRET of BACE interaction with the amyloid precursor protein at the cell surface and in early endosomes. Journal of Cell Science 116:3339-3346.
Knobloch M, Konietzko U, Krebs DC, Nitsch RM (2007) Intracellular Abeta and cognitive deficits precede beta-amyloid deposition in transgenic arcAbeta mice. Neurobiology of Aging 28:1297-1306.
Krieglstein K, Miyazono K, ten Dijke P, Unsicker K (2012) TGF-beta in aging and disease. Cell and Tissue Research 347:5-9.
Krystal JH, Sanacora G, Blumberg H, Anand A, Charney DS, Marek G, Epperson CN, Goddard A, Mason GF (2002) Glutamate and GABA systems as targets for novel antidepressant and mood-stabilizing treatments. Molecular Psychiatry 7 Suppl 1:S71-80.
Lacor PN, Buniel MC, Chang L, Fernandez SJ, Gong Y, Viola KL, Lambert MP, Velasco PT, Bigio EH, Finch CE, Krafft GA, Klein WL (2004) Synaptic targeting by Alzheimer's-related amyloid beta oligomers. The Journal of Neuroscience : the Official Journal of the Society for Neuroscience 24:10191-10200.
LaFerla FM, Green KN, Oddo S (2007) Intracellular amyloid-beta in Alzheimer's disease. Nature Reviews Neuroscience 8:499-509.
Lamb BT, Sisodia SS, Lawler AM, Slunt HH, Kitt CA, Kearns WG, Pearson PL, Price DL, Gearhart JD (1993) Introduction and expression of the 400 kilobase amyloid precursor protein gene in transgenic mice [corrected]. Nature Genetics 5:22-30.
Lambert MP, Barlow AK, Chromy BA, Edwards C, Freed R, Liosatos M, Morgan TE, Rozovsky I, Trommer B, Viola KL, Wals P, Zhang C, Finch CE, Krafft GA, Klein WL (1998) Diffusible, nonfibrillar ligands derived from Abeta1-42 are potent central nervous system neurotoxins. Proceedings of the National Academy of Sciences of the United States of America 95:6448-6453.
Lanari A, Amenta F, Silvestrelli G, Tomassoni D, Parnetti L (2006) Neurotransmitter deficits in behavioural and psychological symptoms of Alzheimer's disease. Mechanisms of Ageing and Development 127:158-165.
Lanctot KL, Herrmann N, Mazzotta P (2001) Role of serotonin in the behavioral and psychological symptoms of dementia. The Journal of Neuropsychiatry and Clinical Neurosciences 13:5-21.
Bibliography
129
Lee HG, Castellani RJ, Zhu X, Perry G, Smith MA (2005) Amyloid-beta in Alzheimer's disease: the horse or the cart? Pathogenic or protective? International Journal of Experimental Pathology 86:133-138.
Lee J, Retamal C, Cuitino L, Caruano-Yzermans A, Shin JE, van Kerkhof P, Marzolo MP, Bu G (2008) Adaptor protein sorting nexin 17 regulates amyloid precursor protein trafficking and processing in the early endosomes. The Journal of Biological Chemistry 283:11501-11508.
Levy-Lahad E, Wasco W, Poorkaj P, Romano DM, Oshima J, Pettingell WH, Yu CE, Jondro PD, Schmidt SD, Wang K, et al. (1995) Candidate gene for the chromosome 1 familial Alzheimer's disease locus. Science 269:973-977.
Li MO, Wan YY, Sanjabi S, Robertson AK, Flavell RA (2006) Transforming growth factor-beta regulation of immune responses. Annual Review of Immunology 24:99-146.
Lin L, Georgievska B, Mattsson A, Isacson O (1999) Cognitive changes and modified processing of amyloid precursor protein in the cortical and hippocampal system after cholinergic synapse loss and muscarinic receptor activation. Proceedings of the National Academy of Sciences of the United States of America 96:12108-12113.
Ling Y, Morgan K, Kalsheker N (2003) Amyloid precursor protein (APP) and the biology of proteolytic processing: relevance to Alzheimer's disease. The International Journal of Biochemistry & Cell Biology 35:1505-1535.
Liu Q, Zerbinatti CV, Zhang J, Hoe HS, Wang B, Cole SL, Herz J, Muglia L, Bu G (2007) Amyloid precursor protein regulates brain apolipoprotein E and cholesterol metabolism through lipoprotein receptor LRP1. Neuron 56:66-78.
Liu Q, Trotter J, Zhang J, Peters MM, Cheng H, Bao J, Han X, Weeber EJ, Bu G (2010) Neuronal LRP1 knockout in adult mice leads to impaired brain lipid metabolism and progressive, age-dependent synapse loss and neurodegeneration. The Journal of Neuroscience : the Official Journal of the Society for Neuroscience 30:17068-17078.
Lopez-Gimenez JF, Vilaro MT, Palacios JM, Mengod G (1998) [3H]MDL 100,907 labels 5-HT2A serotonin receptors selectively in primate brain. Neuropharmacology 37:1147-1158.
Lord A, Kalimo H, Eckman C, Zhang XQ, Lannfelt L, Nilsson LN (2006) The Arctic Alzheimer mutation facilitates early intraneuronal Abeta aggregation and senile plaque formation in transgenic mice. Neurobiology of Aging 27:67-77.
Lyketsos CG, Lopez O, Jones B, Fitzpatrick AL, Breitner J, DeKosky S (2002) Prevalence of neuropsychiatric symptoms in dementia and mild cognitive impairment: results from the cardiovascular health study. JAMA : the Journal of the American Medical Association 288:1475-1483.
Martorana A, Di Lorenzo F, Esposito Z, Lo Giudice T, Bernardi G, Caltagirone C, Koch G (2013) Dopamine D(2)-agonist rotigotine effects on cortical excitability and central cholinergic transmission in Alzheimer's disease patients. Neuropharmacology 64:108-113.
Mattson MP, Furukawa K (1998) Signaling events regulating the neurodevelopmental triad. Glutamate and secreted forms of beta-amyloid precursor protein as examples. Perspectives on Developmental Neurobiology 5:337-352.
Mattson MP, Cheng B, Culwell AR, Esch FS, Lieberburg I, Rydel RE (1993) Evidence for excitoprotective and intraneuronal calcium-regulating roles for secreted forms of the beta-amyloid precursor protein. Neuron 10:243-254.
Mauch DH, Nagler K, Schumacher S, Goritz C, Muller EC, Otto A, Pfrieger FW (2001) CNS synaptogenesis promoted by glia-derived cholesterol. Science 294:1354-1357.
Bibliography
130
May P, Rohlmann A, Bock HH, Zurhove K, Marth JD, Schomburg ED, Noebels JL, Beffert U, Sweatt JD, Weeber EJ, Herz J (2004) Neuronal LRP1 functionally associates with postsynaptic proteins and is required for normal motor function in mice. Molecular and Cellular Biology 24:8872-8883.
McLean CA, Cherny RA, Fraser FW, Fuller SJ, Smith MJ, Beyreuther K, Bush AI, Masters CL (1999) Soluble pool of Abeta amyloid as a determinant of severity of neurodegeneration in Alzheimer's disease. Annals of Neurology 46:860-866.
Meltzer CC, Smith G, DeKosky ST, Pollock BG, Mathis CA, Moore RY, Kupfer DJ, Reynolds CF, 3rd (1998) Serotonin in aging, late-life depression, and Alzheimer's disease: the emerging role of functional imaging. Neuropsychopharmacology : Official Publication of the American College of Neuropsychopharmacology 18:407-430.
Meltzer HY (1992) The importance of serotonin-dopamine interactions in the action of clozapine. The British Journal of Psychiatry Supplement:22-29.
Merker B (1983) Silver staining of cell bodies by means of physical development. Journal of Neuroscience Methods 9:235-241.
Millan MJ, Di Cara B, Dekeyne A, Panayi F, De Groote L, Sicard D, Cistarelli L, Billiras R, Gobert A (2007) Selective blockade of dopamine D(3) versus D(2) receptors enhances frontocortical cholinergic transmission and social memory in rats: a parallel neurochemical and behavioural analysis. Journal of Neurochemistry 100:1047-1061.
Minger SL, Esiri MM, McDonald B, Keene J, Carter J, Hope T, Francis PT (2000) Cholinergic deficits contribute to behavioral disturbance in patients with dementia. Neurology 55:1460-1467.
Mullan M, Crawford F, Axelman K, Houlden H, Lilius L, Winblad B, Lannfelt L (1992) A pathogenic mutation for probable Alzheimer's disease in the APP gene at the N-terminus of beta-amyloid. Nature Genetics 1:345-347.
Murakami K, Irie K, Morimoto A, Ohigashi H, Shindo M, Nagao M, Shimizu T, Shirasawa T (2002) Synthesis, aggregation, neurotoxicity, and secondary structure of various A beta 1-42 mutants of familial Alzheimer's disease at positions 21-23. Biochemical and Biophysical Research Communications 294:5-10.
Nilsberth C, Westlind-Danielsson A, Eckman CB, Condron MM, Axelman K, Forsell C, Stenh C, Luthman J, Teplow DB, Younkin SG, Naslund J, Lannfelt L (2001) The 'Arctic' APP mutation (E693G) causes Alzheimer's disease by enhanced Abeta protofibril formation. Nature Neuroscience 4:887-893.
Nilsson L, Nordberg A, Hardy J, Wester P, Winblad B (1986) Physostigmine restores 3H-acetylcholine efflux from Alzheimer brain slices to normal level. Journal of Neural Transmission 67:275-285.
Nitsch RM, Slack BE, Wurtman RJ, Growdon JH (1992) Release of Alzheimer amyloid precursor derivatives stimulated by activation of muscarinic acetylcholine receptors. Science 258:304-307.
Noristani HN, Meadows RS, Olabarria M, Verkhratsky A, Rodriguez JJ (2011) Increased hippocampal CA1 density of serotonergic terminals in a triple transgenic mouse model of Alzheimer's disease: an ultrastructural study. Cell Death & Disease 2:e210.
Nyakas C, Granic I, Halmy LG, Banerjee P, Luiten PG (2011) The basal forebrain cholinergic system in aging and dementia. Rescuing cholinergic neurons from neurotoxic amyloid-beta42 with memantine. Behavioural Brain Research 221:594-603.
O'Brien RJ, Wong PC (2011) Amyloid precursor protein processing and Alzheimer's disease. Annual Review of Neuroscience 34:185-204.
Bibliography
131
Oakley H, Cole SL, Logan S, Maus E, Shao P, Craft J, Guillozet-Bongaarts A, Ohno M, Disterhoft J, Van Eldik L, Berry R, Vassar R (2006) Intraneuronal beta-amyloid aggregates, neurodegeneration, and neuron loss in transgenic mice with five familial Alzheimer's disease mutations: potential factors in amyloid plaque formation. The Journal of Neuroscience : the Official Journal of the Society for Neuroscience 26:10129-10140.
Oddo S, Caccamo A, Shepherd JD, Murphy MP, Golde TE, Kayed R, Metherate R, Mattson MP, Akbari Y, LaFerla FM (2003) Triple-transgenic model of Alzheimer's disease with plaques and tangles: intracellular Abeta and synaptic dysfunction. Neuron 39:409-421.
Okamoto K, Kimura H, Sakai Y (1983) Taurine-induced increase of the Cl-conductance of cerebellar Purkinje cell dendrites in vitro. Brain Research 259:319-323.
Ongur D, Price JL (2000) The organization of networks within the orbital and medial prefrontal cortex of rats, monkeys and humans. Cerebral Cortex 10:206-219.
Pakaski M, Farkas Z, Kasa P, Jr., Forgon M, Papp H, Zarandi M, Penke B, Kasa P, Sr. (1998) Vulnerability of small GABAergic neurons to human beta-amyloid pentapeptide. Brain Research 796:239-246.
Palomero-Gallagher N, Bidmon HJ, Zilles K (2003) AMPA, kainate, and NMDA receptor densities in the hippocampus of untreated male rats and females in estrus and diestrus. The Journal of Comparative Neurology 459:468-474.
Parameshwaran K, Dhanasekaran M, Suppiramaniam V (2008) Amyloid beta peptides and glutamatergic synaptic dysregulation. Experimental Neurology 210:7-13.
Paula-Lima AC, De Felice FG, Brito-Moreira J, Ferreira ST (2005) Activation of GABA(A) receptors by taurine and muscimol blocks the neurotoxicity of beta-amyloid in rat hippocampal and cortical neurons. Neuropharmacology 49:1140-1148.
Pierrot N, Ghisdal P, Caumont AS, Octave JN (2004) Intraneuronal amyloid-beta1-42 production triggered by sustained increase of cytosolic calcium concentration induces neuronal death. Journal of Neurochemistry 88:1140-1150.
Pike CJ, Cotman CW (1993) Cultured GABA-immunoreactive neurons are resistant to toxicity induced by beta-amyloid. Neuroscience 56:269-274.
Price DL, Tanzi RE, Borchelt DR, Sisodia SS (1998) Alzheimer's disease: genetic studies and transgenic models. Annual Review of Genetics 32:461-493.
Price JL, Morris JC (1999) Tangles and plaques in nondemented aging and "preclinical" Alzheimer's disease. Annals of Neurology 45:358-368.
Qiu Z, Strickland DK, Hyman BT, Rebeck GW (2002) alpha 2-Macroglobulin exposure reduces calcium responses to N-methyl-D-aspartate via low density lipoprotein receptor-related protein in cultured hippocampal neurons. The Journal of Biological Chemistry 277:14458-14466.
Racchi M, Govoni S (2003) The pharmacology of amyloid precursor protein processing. Experimental Gerontology 38:145-157.
Rajendran L, Annaert W (2012) Membrane trafficking pathways in Alzheimer's disease. Traffic 13:759-770.
Rajendran L, Knobloch M, Geiger KD, Dienel S, Nitsch R, Simons K, Konietzko U (2007) Increased Abeta production leads to intracellular accumulation of Abeta in flotillin-1-positive endosomes. Neurodegenerative diseases 4:164-170.
Rao SG, Williams GV, Goldman-Rakic PS (2000) Destruction and creation of spatial tuning by disinhibition: GABA(A) blockade of prefrontal cortical neurons engaged by working
Bibliography
132
memory. The Journal of Neuroscience : the Official Journal of the Society for Neuroscience 20:485-494.
Reeves S, Brown R, Howard R, Grasby P (2009) Increased striatal dopamine (D2/D3) receptor availability and delusions in Alzheimer disease. Neurology 72:528-534.
Reeves S, Mehta M, Howard R, Grasby P, Brown R (2010) The dopaminergic basis of cognitive and motor performance in Alzheimer's disease. Neurobiology of Disease 37:477-482.
Rey NL, Jardanhazi-Kurutz D, Terwel D, Kummer MP, Jourdan F, Didier A, Heneka MT (2012) Locus coeruleus degeneration exacerbates olfactory deficits in APP/PS1 transgenic mice. Neurobiology of Aging 33:426 e421-411.
Ring S, Weyer SW, Kilian SB, Waldron E, Pietrzik CU, Filippov MA, Herms J, Buchholz C, Eckman CB, Korte M, Wolfer DP, Muller UC (2007) The secreted beta-amyloid precursor protein ectodomain APPs alpha is sufficient to rescue the anatomical, behavioral, and electrophysiological abnormalities of APP-deficient mice. The Journal of Neuroscience : the Official Journal of the Society for Neuroscience 27:7817-7826.
Rissman RA, De Blas AL, Armstrong DM (2007) GABA(A) receptors in aging and Alzheimer's disease. Journal of Neurochemistry 103:1285-1292.
Russo-Neustadt A, Cotman CW (1997) Adrenergic receptors in Alzheimer's disease brain: selective increases in the cerebella of aggressive patients. The Journal of Neuroscience : the Official Journal of the Society for Neuroscience 17:5573-5580.
Sandbrink R, Masters CL, Beyreuther K (1994) Similar alternative splicing of a non-homologous domain in beta A4-amyloid protein precursor-like proteins. The Journal of Biological Chemistry 269:14227-14234.
Scheuner D et al. (1996) Secreted amyloid beta-protein similar to that in the senile plaques of Alzheimer's disease is increased in vivo by the presenilin 1 and 2 and APP mutations linked to familial Alzheimer's disease. Nature Medicine 2:864-870.
Scullion GA, Kendall DA, Marsden CA, Sunter D, Pardon MC (2011) Chronic treatment with the alpha2-adrenoceptor antagonist fluparoxan prevents age-related deficits in spatial working memory in APPxPS1 transgenic mice without altering beta-amyloid plaque load or astrocytosis. Neuropharmacology 60:223-234.
Selkoe DJ (1994) Cell biology of the amyloid beta-protein precursor and the mechanism of Alzheimer's disease. Annual Review of Cell Biology 10:373-403.
Selkoe DJ (1996) Amyloid beta-protein and the genetics of Alzheimer's disease. The Journal of Biological Chemistry 271:18295-18298.
Selkoe DJ (1999) Translating cell biology into therapeutic advances in Alzheimer's disease. Nature 399:A23-31.
Selkoe DJ (2001a) Alzheimer's disease: genes, proteins, and therapy. Physiological Reviews 81:741-766.
Selkoe DJ (2001b) Alzheimer's disease results from the cerebral accumulation and cytotoxicity of amyloid beta-protein. Journal of Alzheimer's Disease : JAD 3:75-80.
Selkoe DJ (2002) Alzheimer's disease is a synaptic failure. Science 298:789-791. Seubert P, Vigo-Pelfrey C, Esch F, Lee M, Dovey H, Davis D, Sinha S, Schlossmacher M,
Whaley J, Swindlehurst C, et al. (1992) Isolation and quantification of soluble Alzheimer's beta-peptide from biological fluids. Nature 359:325-327.
Shankar GM, Li S, Mehta TH, Garcia-Munoz A, Shepardson NE, Smith I, Brett FM, Farrell MA, Rowan MJ, Lemere CA, Regan CM, Walsh DM, Sabatini BL, Selkoe DJ (2008) Amyloid-beta protein dimers isolated directly from Alzheimer's brains impair synaptic plasticity and memory. Nature Medicine 14:837-842.
Bibliography
133
Sherrington R et al. (1996) Alzheimer's disease associated with mutations in presenilin 2 is rare and variably penetrant. Human Molecular Genetics 5:985-988.
Shibata M, Yamada S, Kumar SR, Calero M, Bading J, Frangione B, Holtzman DM, Miller CA, Strickland DK, Ghiso J, Zlokovic BV (2000) Clearance of Alzheimer's amyloid-ss(1-40) peptide from brain by LDL receptor-related protein-1 at the blood-brain barrier. The Journal of Clinical Investigation 106:1489-1499.
Shipley MT, Halloran FJ, de la Torre J (1985) Surprisingly rich projection from locus coeruleus to the olfactory bulb in the rat. Brain Research 329:294-299.
Siever LJ, Kahn RS, Lawlor BA, Trestman RL, Lawrence TL, Coccaro EF (1991) Critical issues in defining the role of serotonin in psychiatric disorders. Pharmacological Reviews 43:509-525.
Sisodia SS (1992) Beta-amyloid precursor protein cleavage by a membrane-bound protease. Proceedings of the National Academy of Sciences of the United States of America 89:6075-6079.
Sitaram N, Weingartner H, Gillin JC (1978) Human serial learning: enhancement with arecholine and choline impairment with scopolamine. Science 201:274-276.
Spuch C, Ortolano S, Navarro C (2012) LRP-1 and LRP-2 receptors function in the membrane neuron. Trafficking mechanisms and proteolytic processing in Alzheimer's disease. Frontiers in Physiology 3:269.
Squire LR (1992) Memory and the hippocampus: a synthesis from findings with rats, monkeys, and humans. Psychological Review 99:195-231.
Struble RG, Cork LC, Whitehouse PJ, Price DL (1982) Cholinergic innervation in neuritic plaques. Science 216:413-415.
Suzuki N, Cheung TT, Cai XD, Odaka A, Otvos L, Jr., Eckman C, Golde TE, Younkin SG (1994) An increased percentage of long amyloid beta protein secreted by familial amyloid beta protein precursor (beta APP717) mutants. Science 264:1336-1340.
Taipale J, Saharinen J, Keski-Oja J (1998) Extracellular matrix-associated transforming growth factor-beta: role in cancer cell growth and invasion. Advances in Cancer Research 75:87-134.
Tamaoka A, Odaka A, Ishibashi Y, Usami M, Sahara N, Suzuki N, Nukina N, Mizusawa H, Shoji S, Kanazawa I, et al. (1994) APP717 missense mutation affects the ratio of amyloid beta protein species (A beta 1-42/43 and a beta 1-40) in familial Alzheimer's disease brain. The Journal of Biological Chemistry 269:32721-32724.
Taylor CJ, Ireland DR, Ballagh I, Bourne K, Marechal NM, Turner PR, Bilkey DK, Tate WP, Abraham WC (2008) Endogenous secreted amyloid precursor protein-alpha regulates hippocampal NMDA receptor function, long-term potentiation and spatial memory. Neurobiology of Disease 31:250-260.
Terry RD, Masliah E, Salmon DP, Butters N, DeTeresa R, Hill R, Hansen LA, Katzman R (1991) Physical basis of cognitive alterations in Alzheimer's disease: synapse loss is the major correlate of cognitive impairment. Annals of Neurology 30:572-580.
Tesseur I, Zou K, Esposito L, Bard F, Berber E, Can JV, Lin AH, Crews L, Tremblay P, Mathews P, Mucke L, Masliah E, Wyss-Coray T (2006) Deficiency in neuronal TGF-beta signaling promotes neurodegeneration and Alzheimer's pathology. The Journal of Clinical Investigation 116:3060-3069.
Truchot L, Costes SN, Zimmer L, Laurent B, Le Bars D, Thomas-Anterion C, Croisile B, Mercier B, Hermier M, Vighetto A, Krolak-Salmon P (2007) Up-regulation of hippocampal serotonin metabolism in mild cognitive impairment. Neurology 69:1012-1017.
Bibliography
134
Tseng KY, O'Donnell P (2007) D2 dopamine receptors recruit a GABA component for their attenuation of excitatory synaptic transmission in the adult rat prefrontal cortex. Synapse 61:843-850.
Twamley EW, Ropacki SA, Bondi MW (2006) Neuropsychological and neuroimaging changes in preclinical Alzheimer's disease. Journal of the International Neuropsychological Society : JINS 12:707-735.
Tzschentke TM (2001) Pharmacology and behavioral pharmacology of the mesocortical dopamine system. Progress in Neurobiology 63:241-320.
Vance JE, Karten B, Hayashi H (2006) Lipid dynamics in neurons. Biochemical Society Transactions 34:399-403.
Vivien D, Ali C (2006) Transforming growth factor-beta signalling in brain disorders. Cytokine & Growth Factor Reviews 17:121-128.
Walsh DM, Klyubin I, Fadeeva JV, Cullen WK, Anwyl R, Wolfe MS, Rowan MJ, Selkoe DJ (2002) Naturally secreted oligomers of amyloid beta protein potently inhibit hippocampal long-term potentiation in vivo. Nature 416:535-539.
Weidemann A, Konig G, Bunke D, Fischer P, Salbaum JM, Masters CL, Beyreuther K (1989) Identification, biogenesis, and localization of precursors of Alzheimer's disease A4 amyloid protein. Cell 57:115-126.
Wesson DW, Levy E, Nixon RA, Wilson DA (2010) Olfactory dysfunction correlates with amyloid-beta burden in an Alzheimer's disease mouse model. The Journal of Neuroscience : the Official Journal of the Society for Neuroscience 30:505-514.
Whitehouse PJ, Price DL, Struble RG, Clark AW, Coyle JT, Delon MR (1982) Alzheimer's disease and senile dementia: loss of neurons in the basal forebrain. Science 215:1237-1239.
Wirths O, Multhaup G, Bayer TA (2004) A modified beta-amyloid hypothesis: intraneuronal accumulation of the beta-amyloid peptide--the first step of a fatal cascade. Journal of Neurochemistry 91:513-520.
Wolfe MS, Guenette SY (2007) APP at a glance. Journal of Cell Science 120:3157-3161. Wong TP, Debeir T, Duff K, Cuello AC (1999) Reorganization of cholinergic terminals in the
cerebral cortex and hippocampus in transgenic mice carrying mutated presenilin-1 and amyloid precursor protein transgenes. The Journal of Neuroscience : the Official Journal of the Society for Neuroscience 19:2706-2716.
Xu Y, Yan J, Zhou P, Li J, Gao H, Xia Y, Wang Q (2012) Neurotransmitter receptors and cognitive dysfunction in Alzheimer's disease and Parkinson's disease. Progress in Neurobiology 97:1-13.
Yoo AS, Cheng I, Chung S, Grenfell TZ, Lee H, Pack-Chung E, Handler M, Shen J, Xia W, Tesco G, Saunders AJ, Ding K, Frosch MP, Tanzi RE, Kim TW (2000) Presenilin-mediated modulation of capacitative calcium entry. Neuron 27:561-572.
Zagorski MG, Barrow CJ (1992) NMR studies of amyloid beta-peptides: proton assignments, secondary structure, and mechanism of an alpha-helix----beta-sheet conversion for a homologous, 28-residue, N-terminal fragment. Biochemistry 31:5621-5631.
Zarate CA, Jr., Du J, Quiroz J, Gray NA, Denicoff KD, Singh J, Charney DS, Manji HK (2003) Regulation of cellular plasticity cascades in the pathophysiology and treatment of mood disorders: role of the glutamatergic system. Annals of the New York Academy of Sciences 1003:273-291.
Zilles K, Schleicher A (1991) Quantitative receptor autoradiography and image analysis. Bulletin de l'Association des Anatomistes 75:117-121.
Bibliography
135
Zilles K, Schleicher A (1995) Correlative imaging of transmitter receptor distributions in human cortex. In: Autoradiography and Correlative Imaging (Stumpf WE. SH, ed), pp 277-307: Academic Press Inc.
Zilles K, Palomero-Gallagher N, Schleicher A (2004) Transmitter receptors and functional anatomy of the cerebral cortex. Journal of Anatomy 205:417-432.
Zilles K, Schleicher A, Palomero-Gallagher N, Amunts K (2002a) Quantitative Analysis of Cyto- and Receptor Architecture of the Human Brain. In: Brain Mapping: The Methods (Toga AW, Mazziotta JC, eds), pp 573-602: Elsevier Inc.
Zilles K, Palomero-Gallagher N, Grefkes C, Scheperjans F, Boy C, Amunts K, Schleicher A (2002b) Architectonics of the human cerebral cortex and transmitter receptor fingerprints: reconciling functional neuroanatomy and neurochemistry. European Neuropsychopharmacology 12:587-599.
Zubenko GS, Moossy J (1988) Major depression in primary dementia. Clinical and neuropathologic correlates. Archives of Neurology 45:1182-1186.
Zweig RM, Ross CA, Hedreen JC, Steele C, Cardillo JE, Whitehouse PJ, Folstein MF, Price DL (1988) The neuropathology of aminergic nuclei in Alzheimer's disease. Annals of Neurology 24:233-242.
Appendix
136
VII. Appendix
1 Chemicals, solutions and technical equipment
Preparation of slices
Cryostat Leica CM3050 (Leica Instruments GmbH, Wetzlar, Germany)
Paraformaldehyde (Sigma-Aldrich Chemie GmbH, Steinheim, Germany)
Phosphate buffered saline (PBS) (Invitrogen, Life Technologies GmbH, Darmstadt,
Germany)
Silan-coated slides (Paul Marienfeld GmbH & Co. KG, Lauda-Königshofen, Germany)
[3H]-receptor autoradiography
Liquid Scintillation Analyzer Tri-Carb 2100 TR (Packard BioScience, PerkinElmer,
Rodgau, Germany)
Liquid Scintillation Cocktail Ultima Gold XR (PerkinElmer, Rodgau, Germany)
[3H]-ligands:
o AF-DX 384 (Perkin Elmer, Rodgau, Germany)
o AMPA (Perkin Elmer, Rodgau, Germany)
o CGP 54626 (Biotrend Chemikalien GmbH, Köln, Germany)
o 4-DAMP (Perkin Elmer, Rodgau, Germany)
o Fallyprid (Institute for Nuclear Chemistry, Johannes Gutenberg Universität Mainz,
Mainz, Germany)
o Flumazenil (Perkin Elmer, Rodgau, Germany)
o Kainate (Perkin Elmer, Rodgau, Germany)
o Ketanserin (Perkin Elmer, Rodgau, Germany)
o LY 341,495 (Biotrend Chemikalien GmbH, Köln, Germany)
o MK 801 (Perkin Elmer, Rodgau, Germany)
o Muscimol (Perkin Elmer, Rodgau, Germany)
o 8-OH-DPAT (Perkin Elmer, Rodgau, Germany)
o Oxotremorine-M (Perkin Elmer, Rodgau, Germany)
o Pirenzepine (Perkin Elmer, Rodgau, Germany)
o Prazosin (Perkin Elmer, Rodgau, Germany)
Appendix
137
o Raclopride (Perkin Elmer, Rodgau, Germany)
o SCH 23390 (Perkin Elmer, Rodgau, Germany)
o SR 95531 (Perkin Elmer, Rodgau, Germany)
o UK14,304 (Perkin Elmer, Rodgau, Germany)
o ZM 241 385 (Biotrend Chemikalien GmbH, Köln, Germany)
Displacer:
o Atropine sulphate (Sigma-Aldrich Chemie GmbH, Steinheim, Germany)
o Butaclamol hydrochloride (Sigma-Aldrich Chemie GmbH, Steinheim, Germany)
o Carbachol (Sigma-Aldrich Chemie GmbH, Steinheim, Germany)
o CGP 55845 (Biotrend Chemikalien GmbH, Köln, Germany)
o 2-Chloroadenosine (Sigma-Aldrich Chemie GmbH, Steinheim, Germany)
o Clonazepam (Sigma-Aldrich Chemie GmbH, Steinheim, Germany)
o GABA (Biotrend Chemikalien GmbH, Köln, Germany)
o Haloperidol (Sigma-Aldrich Chemie GmbH, Steinheim, Germany)
o L-Glutamate (Sigma-Aldrich Chemie GmbH, Steinheim, Germany)
o Mianserin (Sigma-Aldrich Chemie GmbH, Steinheim, Germany)
o MK 801 (Biotrend Chemikalien GmbH, Köln, Germany)
o Nicotine-di-d-tartrate (Sigma-Aldrich Chemie GmbH, Steinheim, Germany
o Phentolamine mesylate (Biotrend Chemikalien GmbH, Köln, Germany)
o Pirenzepine dehydrate (Sigma-Aldrich Chemie GmbH, Steinheim, Germany)
o Serotonin (Sigma-Aldrich Chemie GmbH, Steinheim, Germany)
o SKF 83566 (Sigma-Aldrich Chemie GmbH, Steinheim, Germany)
o SYM 2081 (Sigma-Aldrich Chemie GmbH, Steinheim, Germany)
o Quisqualate (Biotrend Chemikalien GmbH, Köln, Germany)
Buffers and solutions:
o Adenosine deaminase (Sigma-Aldrich Chemie GmbH, Steinheim, Germany)
o Ascorbate (Sigma-Aldrich Chemie GmbH, Steinheim, Germany)
o Acetone (VWR International, Langenfeld, Germany)
o Calcium acetate (Sigma-Aldrich Chemie GmbH, Steinheim, Germany)
o Calcium chloride (CaCl2) (Merck KGaA, Darmstadt, Germany)
o D-Glucose (Merck KGaA, Darmstadt, Germany)
Appendix
138
o Ethylenediaminetetraacetic acid (EDTA) dihydrat (Sigma-Aldrich Chemie GmbH,
Steinheim, Germany)
o Glutamate (Sigma-Aldrich Chemie GmbH, Steinheim, Germany)
o Glutaraldehyde (Sigma-Aldrich Chemie GmbH, Steinheim, Germany)
o Glycine (Sigma-Aldrich Chemie GmbH, Steinheim, Germany)
o HEPES (Sigma-Aldrich Chemie GmbH, Steinheim, Germany)
o Magnesium chloride (MgCl2) (Merck KGaA, Darmstadt, Germany)
o Magnesium sulfate (MgSO4) (Sigma-Aldrich Chemie GmbH, Steinheim, Germany)
o Manganese(II) chloride (MnCl2) (Sigma-Aldrich Chemie GmbH, Steinheim,
Germany)
o Mianserin (Sigma-Aldrich Chemie GmbH, Steinheim, Germany)
o Phenylmethanesulfonyl fluoride (PMSF) (Sigma-Aldrich Chemie GmbH, Steinheim,
Germany)
o Potassium bromide (KBr) (Sigma-Aldrich Chemie GmbH, Steinheim, Germany)
o Potassium chloride (KCl) (Sigma-Aldrich Chemie GmbH, Steinheim, Germany)
o Potassium phosphate monobasic (KH2PO4) (Merck KGaA, Darmstadt, Germany)
o Potassium thiocyanate (KSCN) (Sigma-Aldrich Chemie GmbH, Steinheim,
Germany)
o Sodium bicarbonate (NaHCO3) (Merck KGaA, Darmstadt, Germany)
o Sodium chloride (NaCl) (Merck KGaA, Darmstadt, Germany)
o Sodium phosphate dibasic dihydrate (Na2HPO4 x 2H2O) (Merck KGaA, Darmstadt,
Germany)
o Spermidine (Sigma-Aldrich Chemie GmbH, Steinheim, Germany)
o Tris-acetate (Sigma-Aldrich Chemie GmbH, Steinheim, Germany)
o Tris-citrate (Sigma-Aldrich Chemie GmbH, Steinheim, Germany)
o Tris-HCl (Sigma-Aldrich Chemie GmbH, Steinheim, Germany)
Film exposition and development
BioMax MR β--sensitive films (Kodak, Sigma-Aldrich Chemie GmbH, Steinheim,
Germany)
GBX-Developer (Kodak, Sigma-Aldrich Chemie GmbH, Steinheim, Germany)
GBX-Fixer (Kodak, Sigma-Aldrich Chemie GmbH, Steinheim, Germany)
Appendix
139
Hyperprocessor SRX-101A (Amersham Biosciences, GE Healthcare Europe GmbH,
Europe)
Radioactive standards (GE Healthcare GmbH, München, Germany)
Digital processing of autoradiographic films
AxioVision image analyzing software Rel. 4.8.2 (Zeiss, Carl Zeiss MikroImaging GmbH,
Göttingen, Germany)
Digital camera AxioCam HRm (Zeiss, Carl Zeiss MikroImaging GmbH, Göttingen,
Germany)
Histological staining
Acetic acid (Merck KGaA, Darmstadt, Germany)
Ammonium nitrate (Merck KGaA, Darmstadt, Germany)
DPX mountant for histology (Fluka, Sigma-Aldrich Chemie GmbH, Steinheim,
Germany)
Formaldehyde solution (Merck KGaA, Darmstadt, Germany)
Formic acid (Milipore, Schwalbach, Germany)
Hydrogen peroxide (Milipore, Schwalbach, Germany)
2-Propanol (Merck KGaA, Darmstadt, Germany)
Silver nitrate (Merck KGaA, Darmstadt, Germany)
Sodium carbonate (Millipore, Schwalbach, Germany)
Tungstosilicic acid (Sigma-Aldrich Chemie GmbH, Steinheim, Germany)
XEM 200 (DiaTec, Diagostische System-Technik, Bamberg, Germany)
9.7. Immunohistochemistry
Aqua Poly/Mont (DAKO, Agilant Technologies, Hamburg, Germany)
DAPI (Sigma-Aldrich Chemie GmbH, Steinheim, Germany)
Formic acid (Millipore, Schwalbach, Germany)
G2-10 (Millipore, Schwalbach, Germany)
G-M A488 (Life Technologies GmbH, Darmstadt, Germany)
G-R A568 (Life Technologies GmbH, Darmstadt, Germany)
M.O.M. (Vector Labs, Burlingame, USA)

Appendix
140
NaCl (VWR International, Langenfeld, Germany)
Paraformaldehyde (Sigma-Aldrich Chemie GmbH, Steinheim, Germany)
Tris (AppliChem, Darmstadt, Germany)
Triton X (AppliChem, Darmstadt, Germany)
1-11-3 (Covance, Munich, Germany)
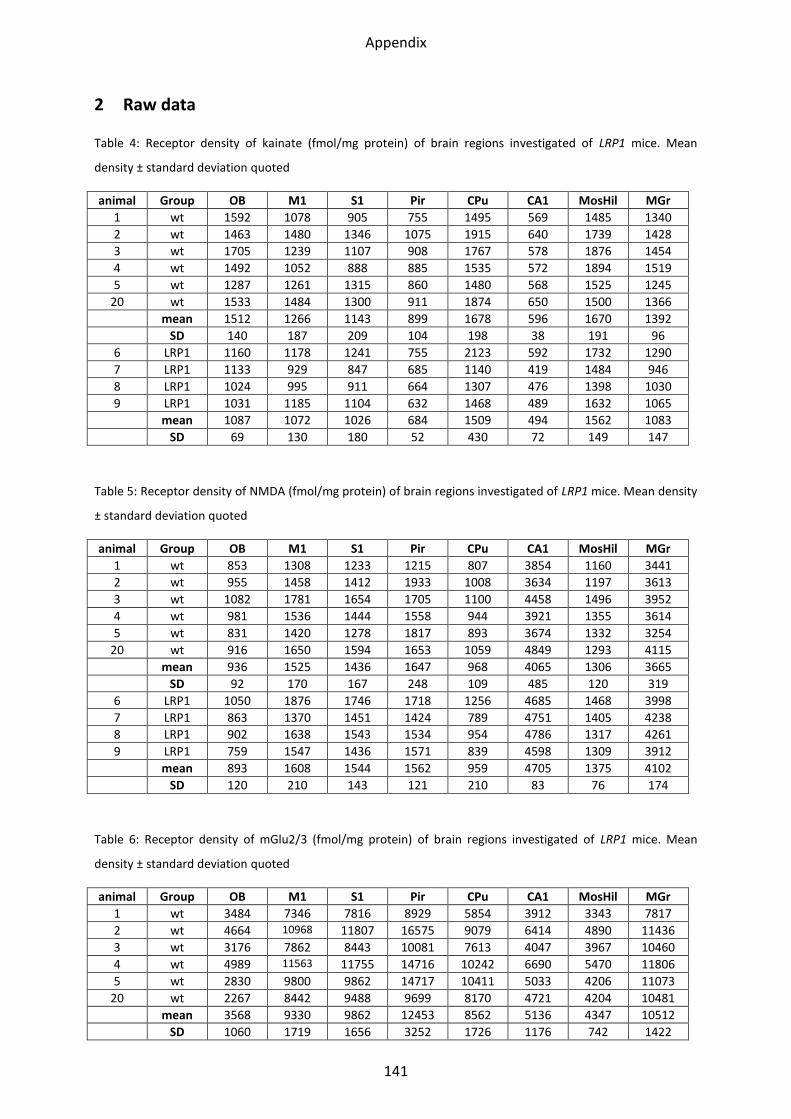
Appendix
141
2 Raw data
Table 4: Receptor density of kainate (fmol/mg protein) of brain regions investigated of LRP1 mice. Mean
density ± standard deviation quoted
animal Group OB M1 S1 Pir CPu CA1 MosHil MGr
1 wt 1592 1078 905 755 1495 569 1485 1340
2 wt 1463 1480 1346 1075 1915 640 1739 1428
3 wt 1705 1239 1107 908 1767 578 1876 1454
4 wt 1492 1052 888 885 1535 572 1894 1519
5 wt 1287 1261 1315 860 1480 568 1525 1245
20 wt 1533 1484 1300 911 1874 650 1500 1366
mean 1512 1266 1143 899 1678 596 1670 1392
SD 140 187 209 104 198 38 191 96
6 LRP1 1160 1178 1241 755 2123 592 1732 1290
7 LRP1 1133 929 847 685 1140 419 1484 946
8 LRP1 1024 995 911 664 1307 476 1398 1030
9 LRP1 1031 1185 1104 632 1468 489 1632 1065
mean 1087 1072 1026 684 1509 494 1562 1083
SD 69 130 180 52 430 72 149 147
Table 5: Receptor density of NMDA (fmol/mg protein) of brain regions investigated of LRP1 mice. Mean density
± standard deviation quoted
animal Group OB M1 S1 Pir CPu CA1 MosHil MGr
1 wt 853 1308 1233 1215 807 3854 1160 3441
2 wt 955 1458 1412 1933 1008 3634 1197 3613
3 wt 1082 1781 1654 1705 1100 4458 1496 3952
4 wt 981 1536 1444 1558 944 3921 1355 3614
5 wt 831 1420 1278 1817 893 3674 1332 3254
20 wt 916 1650 1594 1653 1059 4849 1293 4115
mean 936 1525 1436 1647 968 4065 1306 3665
SD 92 170 167 248 109 485 120 319
6 LRP1 1050 1876 1746 1718 1256 4685 1468 3998
7 LRP1 863 1370 1451 1424 789 4751 1405 4238
8 LRP1 902 1638 1543 1534 954 4786 1317 4261
9 LRP1 759 1547 1436 1571 839 4598 1309 3912
mean 893 1608 1544 1562 959 4705 1375 4102
SD 120 210 143 121 210 83 76 174
Table 6: Receptor density of mGlu2/3 (fmol/mg protein) of brain regions investigated of LRP1 mice. Mean
density ± standard deviation quoted
animal Group OB M1 S1 Pir CPu CA1 MosHil MGr
1 wt 3484 7346 7816 8929 5854 3912 3343 7817
2 wt 4664 10968 11807 16575 9079 6414 4890 11436
3 wt 3176 7862 8443 10081 7613 4047 3967 10460
4 wt 4989 11563 11755 14716 10242 6690 5470 11806
5 wt 2830 9800 9862 14717 10411 5033 4206 11073
20 wt 2267 8442 9488 9699 8170 4721 4204 10481
mean 3568 9330 9862 12453 8562 5136 4347 10512
SD 1060 1719 1656 3252 1726 1176 742 1422
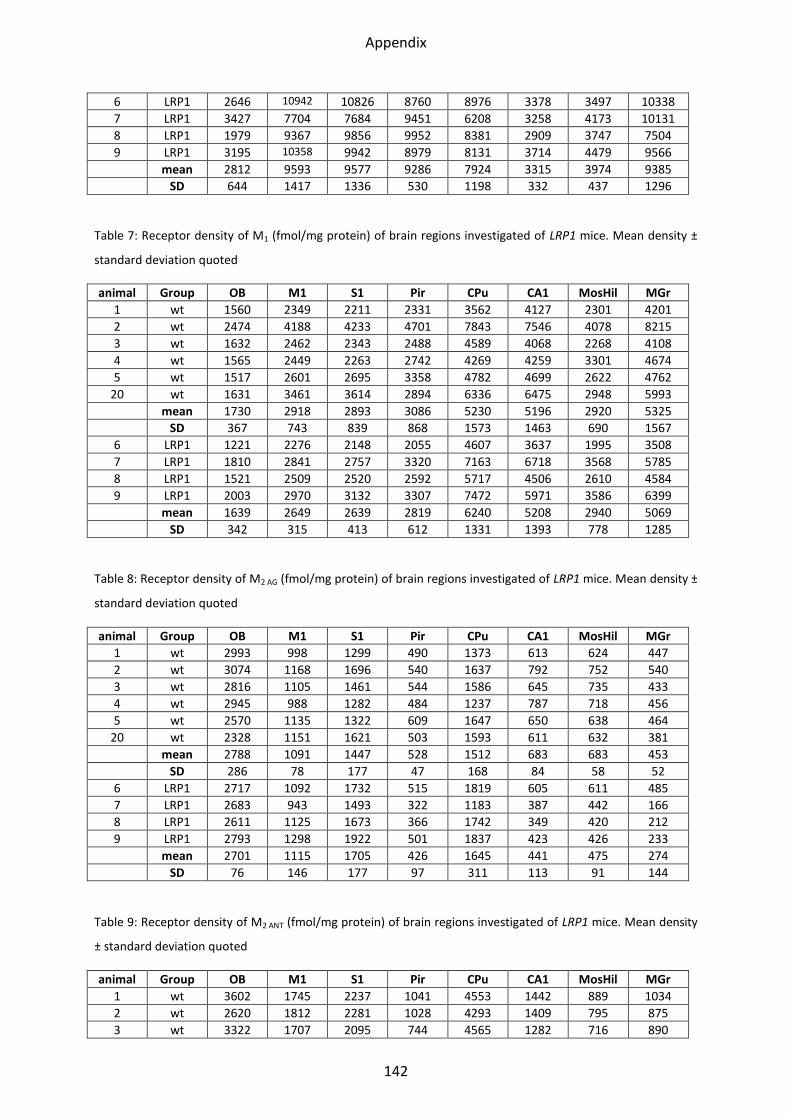
Appendix
142
6 LRP1 2646 10942 10826 8760 8976 3378 3497 10338
7 LRP1 3427 7704 7684 9451 6208 3258 4173 10131
8 LRP1 1979 9367 9856 9952 8381 2909 3747 7504
9 LRP1 3195 10358 9942 8979 8131 3714 4479 9566
mean 2812 9593 9577 9286 7924 3315 3974 9385
SD 644 1417 1336 530 1198 332 437 1296
Table 7: Receptor density of M1 (fmol/mg protein) of brain regions investigated of LRP1 mice. Mean density ±
standard deviation quoted
animal Group OB M1 S1 Pir CPu CA1 MosHil MGr
1 wt 1560 2349 2211 2331 3562 4127 2301 4201
2 wt 2474 4188 4233 4701 7843 7546 4078 8215
3 wt 1632 2462 2343 2488 4589 4068 2268 4108
4 wt 1565 2449 2263 2742 4269 4259 3301 4674
5 wt 1517 2601 2695 3358 4782 4699 2622 4762
20 wt 1631 3461 3614 2894 6336 6475 2948 5993
mean 1730 2918 2893 3086 5230 5196 2920 5325
SD 367 743 839 868 1573 1463 690 1567
6 LRP1 1221 2276 2148 2055 4607 3637 1995 3508
7 LRP1 1810 2841 2757 3320 7163 6718 3568 5785
8 LRP1 1521 2509 2520 2592 5717 4506 2610 4584
9 LRP1 2003 2970 3132 3307 7472 5971 3586 6399
mean 1639 2649 2639 2819 6240 5208 2940 5069
SD 342 315 413 612 1331 1393 778 1285
Table 8: Receptor density of M2 AG (fmol/mg protein) of brain regions investigated of LRP1 mice. Mean density ±
standard deviation quoted
animal Group OB M1 S1 Pir CPu CA1 MosHil MGr
1 wt 2993 998 1299 490 1373 613 624 447
2 wt 3074 1168 1696 540 1637 792 752 540
3 wt 2816 1105 1461 544 1586 645 735 433
4 wt 2945 988 1282 484 1237 787 718 456
5 wt 2570 1135 1322 609 1647 650 638 464
20 wt 2328 1151 1621 503 1593 611 632 381
mean 2788 1091 1447 528 1512 683 683 453
SD 286 78 177 47 168 84 58 52
6 LRP1 2717 1092 1732 515 1819 605 611 485
7 LRP1 2683 943 1493 322 1183 387 442 166
8 LRP1 2611 1125 1673 366 1742 349 420 212
9 LRP1 2793 1298 1922 501 1837 423 426 233
mean 2701 1115 1705 426 1645 441 475 274
SD 76 146 177 97 311 113 91 144
Table 9: Receptor density of M2 ANT (fmol/mg protein) of brain regions investigated of LRP1 mice. Mean density
± standard deviation quoted
animal Group OB M1 S1 Pir CPu CA1 MosHil MGr
1 wt 3602 1745 2237 1041 4553 1442 889 1034
2 wt 2620 1812 2281 1028 4293 1409 795 875
3 wt 3322 1707 2095 744 4565 1282 716 890
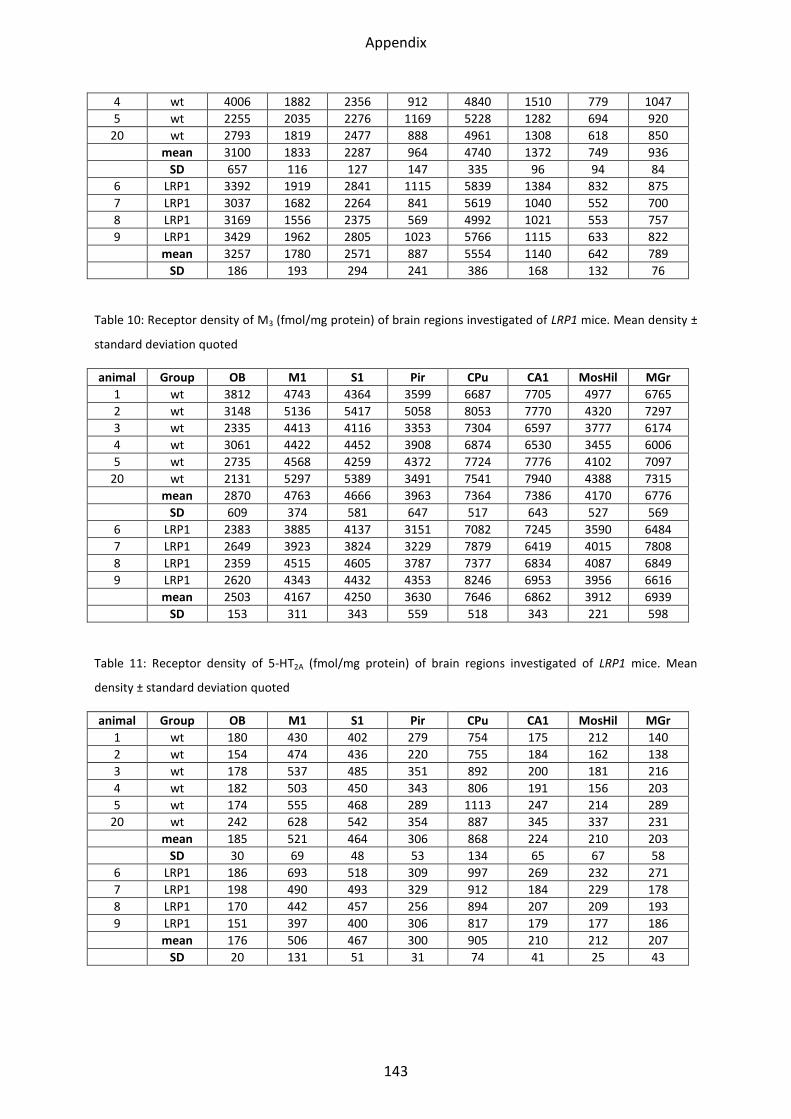
Appendix
143
4 wt 4006 1882 2356 912 4840 1510 779 1047
5 wt 2255 2035 2276 1169 5228 1282 694 920
20 wt 2793 1819 2477 888 4961 1308 618 850
mean 3100 1833 2287 964 4740 1372 749 936
SD 657 116 127 147 335 96 94 84
6 LRP1 3392 1919 2841 1115 5839 1384 832 875
7 LRP1 3037 1682 2264 841 5619 1040 552 700
8 LRP1 3169 1556 2375 569 4992 1021 553 757
9 LRP1 3429 1962 2805 1023 5766 1115 633 822
mean 3257 1780 2571 887 5554 1140 642 789
SD 186 193 294 241 386 168 132 76
Table 10: Receptor density of M3 (fmol/mg protein) of brain regions investigated of LRP1 mice. Mean density ±
standard deviation quoted
animal Group OB M1 S1 Pir CPu CA1 MosHil MGr
1 wt 3812 4743 4364 3599 6687 7705 4977 6765
2 wt 3148 5136 5417 5058 8053 7770 4320 7297
3 wt 2335 4413 4116 3353 7304 6597 3777 6174
4 wt 3061 4422 4452 3908 6874 6530 3455 6006
5 wt 2735 4568 4259 4372 7724 7776 4102 7097
20 wt 2131 5297 5389 3491 7541 7940 4388 7315
mean 2870 4763 4666 3963 7364 7386 4170 6776
SD 609 374 581 647 517 643 527 569
6 LRP1 2383 3885 4137 3151 7082 7245 3590 6484
7 LRP1 2649 3923 3824 3229 7879 6419 4015 7808
8 LRP1 2359 4515 4605 3787 7377 6834 4087 6849
9 LRP1 2620 4343 4432 4353 8246 6953 3956 6616
mean 2503 4167 4250 3630 7646 6862 3912 6939
SD 153 311 343 559 518 343 221 598
Table 11: Receptor density of 5-HT2A (fmol/mg protein) of brain regions investigated of LRP1 mice. Mean
density ± standard deviation quoted
animal Group OB M1 S1 Pir CPu CA1 MosHil MGr
1 wt 180 430 402 279 754 175 212 140
2 wt 154 474 436 220 755 184 162 138
3 wt 178 537 485 351 892 200 181 216
4 wt 182 503 450 343 806 191 156 203
5 wt 174 555 468 289 1113 247 214 289
20 wt 242 628 542 354 887 345 337 231
mean 185 521 464 306 868 224 210 203
SD 30 69 48 53 134 65 67 58
6 LRP1 186 693 518 309 997 269 232 271
7 LRP1 198 490 493 329 912 184 229 178
8 LRP1 170 442 457 256 894 207 209 193
9 LRP1 151 397 400 306 817 179 177 186
mean 176 506 467 300 905 210 212 207
SD 20 131 51 31 74 41 25 43
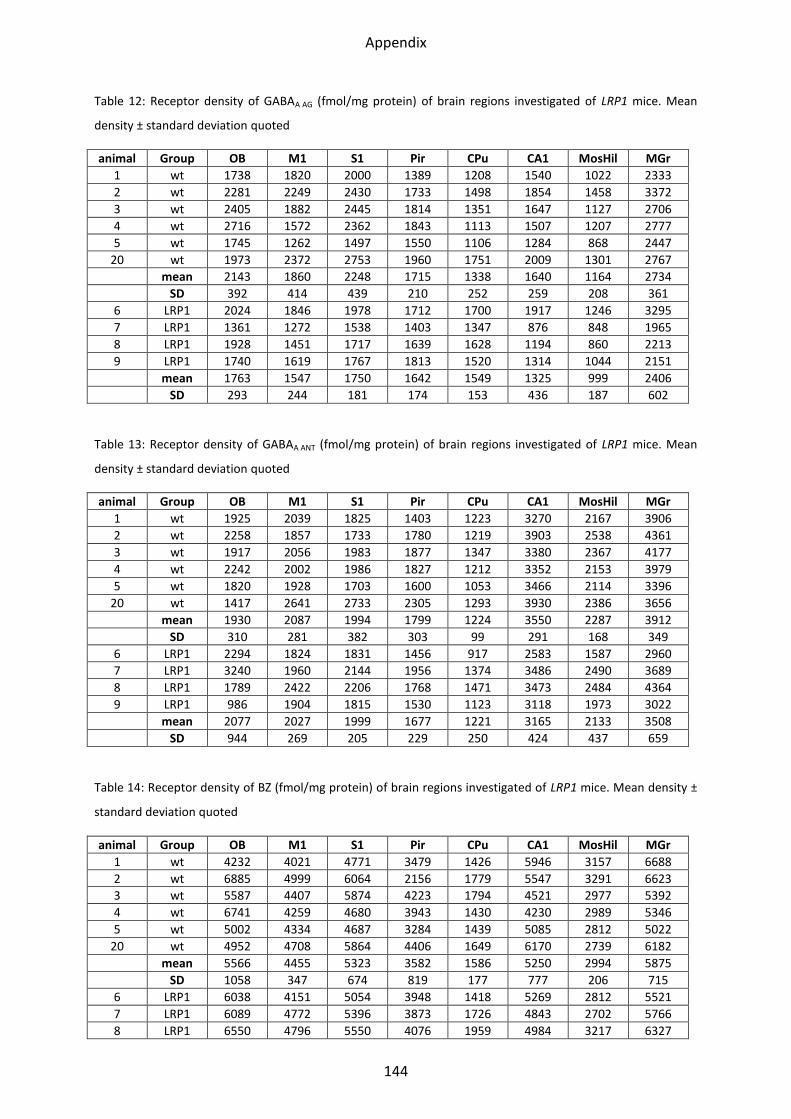
Appendix
144
Table 12: Receptor density of GABAA AG (fmol/mg protein) of brain regions investigated of LRP1 mice. Mean
density ± standard deviation quoted
animal Group OB M1 S1 Pir CPu CA1 MosHil MGr
1 wt 1738 1820 2000 1389 1208 1540 1022 2333
2 wt 2281 2249 2430 1733 1498 1854 1458 3372
3 wt 2405 1882 2445 1814 1351 1647 1127 2706
4 wt 2716 1572 2362 1843 1113 1507 1207 2777
5 wt 1745 1262 1497 1550 1106 1284 868 2447
20 wt 1973 2372 2753 1960 1751 2009 1301 2767
mean 2143 1860 2248 1715 1338 1640 1164 2734
SD 392 414 439 210 252 259 208 361
6 LRP1 2024 1846 1978 1712 1700 1917 1246 3295
7 LRP1 1361 1272 1538 1403 1347 876 848 1965
8 LRP1 1928 1451 1717 1639 1628 1194 860 2213
9 LRP1 1740 1619 1767 1813 1520 1314 1044 2151
mean 1763 1547 1750 1642 1549 1325 999 2406
SD 293 244 181 174 153 436 187 602
Table 13: Receptor density of GABAA ANT (fmol/mg protein) of brain regions investigated of LRP1 mice. Mean
density ± standard deviation quoted
animal Group OB M1 S1 Pir CPu CA1 MosHil MGr
1 wt 1925 2039 1825 1403 1223 3270 2167 3906
2 wt 2258 1857 1733 1780 1219 3903 2538 4361
3 wt 1917 2056 1983 1877 1347 3380 2367 4177
4 wt 2242 2002 1986 1827 1212 3352 2153 3979
5 wt 1820 1928 1703 1600 1053 3466 2114 3396
20 wt 1417 2641 2733 2305 1293 3930 2386 3656
mean 1930 2087 1994 1799 1224 3550 2287 3912
SD 310 281 382 303 99 291 168 349
6 LRP1 2294 1824 1831 1456 917 2583 1587 2960
7 LRP1 3240 1960 2144 1956 1374 3486 2490 3689
8 LRP1 1789 2422 2206 1768 1471 3473 2484 4364
9 LRP1 986 1904 1815 1530 1123 3118 1973 3022
mean 2077 2027 1999 1677 1221 3165 2133 3508
SD 944 269 205 229 250 424 437 659
Table 14: Receptor density of BZ (fmol/mg protein) of brain regions investigated of LRP1 mice. Mean density ±
standard deviation quoted
animal Group OB M1 S1 Pir CPu CA1 MosHil MGr
1 wt 4232 4021 4771 3479 1426 5946 3157 6688
2 wt 6885 4999 6064 2156 1779 5547 3291 6623
3 wt 5587 4407 5874 4223 1794 4521 2977 5392
4 wt 6741 4259 4680 3943 1430 4230 2989 5346
5 wt 5002 4334 4687 3284 1439 5085 2812 5022
20 wt 4952 4708 5864 4406 1649 6170 2739 6182
mean 5566 4455 5323 3582 1586 5250 2994 5875
SD 1058 347 674 819 177 777 206 715
6 LRP1 6038 4151 5054 3948 1418 5269 2812 5521
7 LRP1 6089 4772 5396 3873 1726 4843 2702 5766
8 LRP1 6550 4796 5550 4076 1959 4984 3217 6327
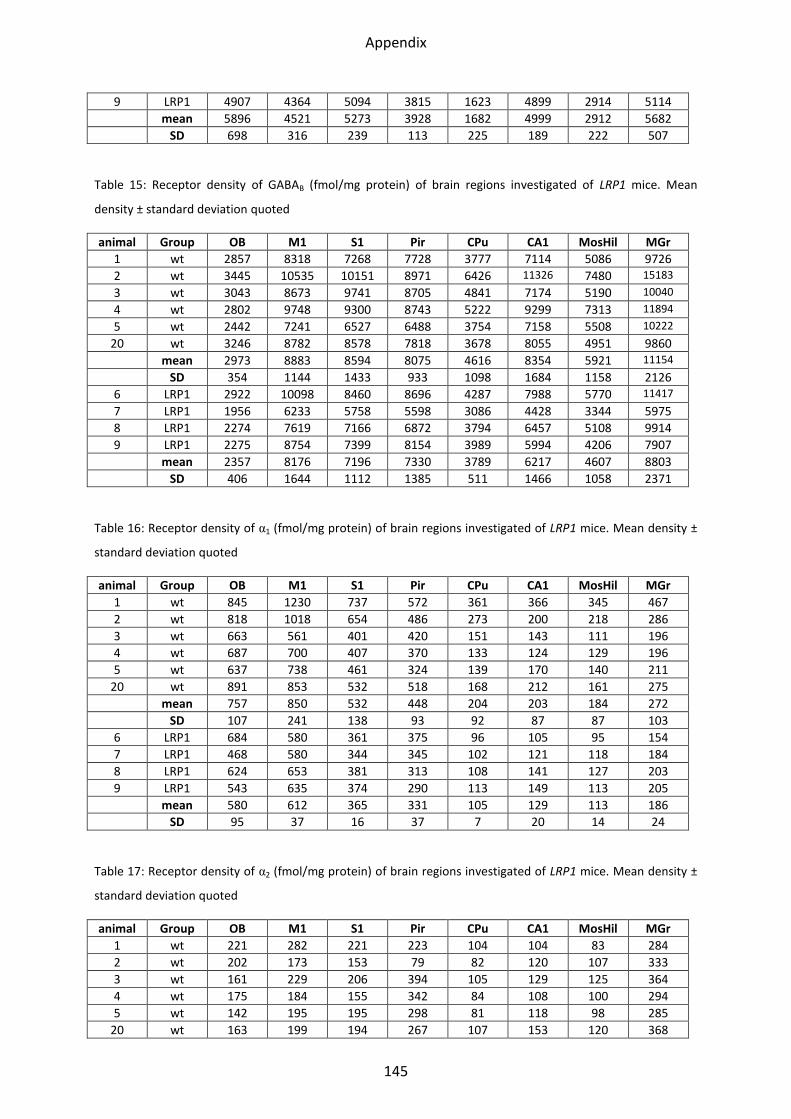
Appendix
145
9 LRP1 4907 4364 5094 3815 1623 4899 2914 5114
mean 5896 4521 5273 3928 1682 4999 2912 5682
SD 698 316 239 113 225 189 222 507
Table 15: Receptor density of GABAB (fmol/mg protein) of brain regions investigated of LRP1 mice. Mean
density ± standard deviation quoted
animal Group OB M1 S1 Pir CPu CA1 MosHil MGr
1 wt 2857 8318 7268 7728 3777 7114 5086 9726
2 wt 3445 10535 10151 8971 6426 11326 7480 15183
3 wt 3043 8673 9741 8705 4841 7174 5190 10040
4 wt 2802 9748 9300 8743 5222 9299 7313 11894
5 wt 2442 7241 6527 6488 3754 7158 5508 10222
20 wt 3246 8782 8578 7818 3678 8055 4951 9860
mean 2973 8883 8594 8075 4616 8354 5921 11154
SD 354 1144 1433 933 1098 1684 1158 2126
6 LRP1 2922 10098 8460 8696 4287 7988 5770 11417
7 LRP1 1956 6233 5758 5598 3086 4428 3344 5975
8 LRP1 2274 7619 7166 6872 3794 6457 5108 9914
9 LRP1 2275 8754 7399 8154 3989 5994 4206 7907
mean 2357 8176 7196 7330 3789 6217 4607 8803
SD 406 1644 1112 1385 511 1466 1058 2371
Table 16: Receptor density of α1 (fmol/mg protein) of brain regions investigated of LRP1 mice. Mean density ±
standard deviation quoted
animal Group OB M1 S1 Pir CPu CA1 MosHil MGr
1 wt 845 1230 737 572 361 366 345 467
2 wt 818 1018 654 486 273 200 218 286
3 wt 663 561 401 420 151 143 111 196
4 wt 687 700 407 370 133 124 129 196
5 wt 637 738 461 324 139 170 140 211
20 wt 891 853 532 518 168 212 161 275
mean 757 850 532 448 204 203 184 272
SD 107 241 138 93 92 87 87 103
6 LRP1 684 580 361 375 96 105 95 154
7 LRP1 468 580 344 345 102 121 118 184
8 LRP1 624 653 381 313 108 141 127 203
9 LRP1 543 635 374 290 113 149 113 205
mean 580 612 365 331 105 129 113 186
SD 95 37 16 37 7 20 14 24
Table 17: Receptor density of α2 (fmol/mg protein) of brain regions investigated of LRP1 mice. Mean density ±
standard deviation quoted
animal Group OB M1 S1 Pir CPu CA1 MosHil MGr
1 wt 221 282 221 223 104 104 83 284
2 wt 202 173 153 79 82 120 107 333
3 wt 161 229 206 394 105 129 125 364
4 wt 175 184 155 342 84 108 100 294
5 wt 142 195 195 298 81 118 98 285
20 wt 163 199 194 267 107 153 120 368
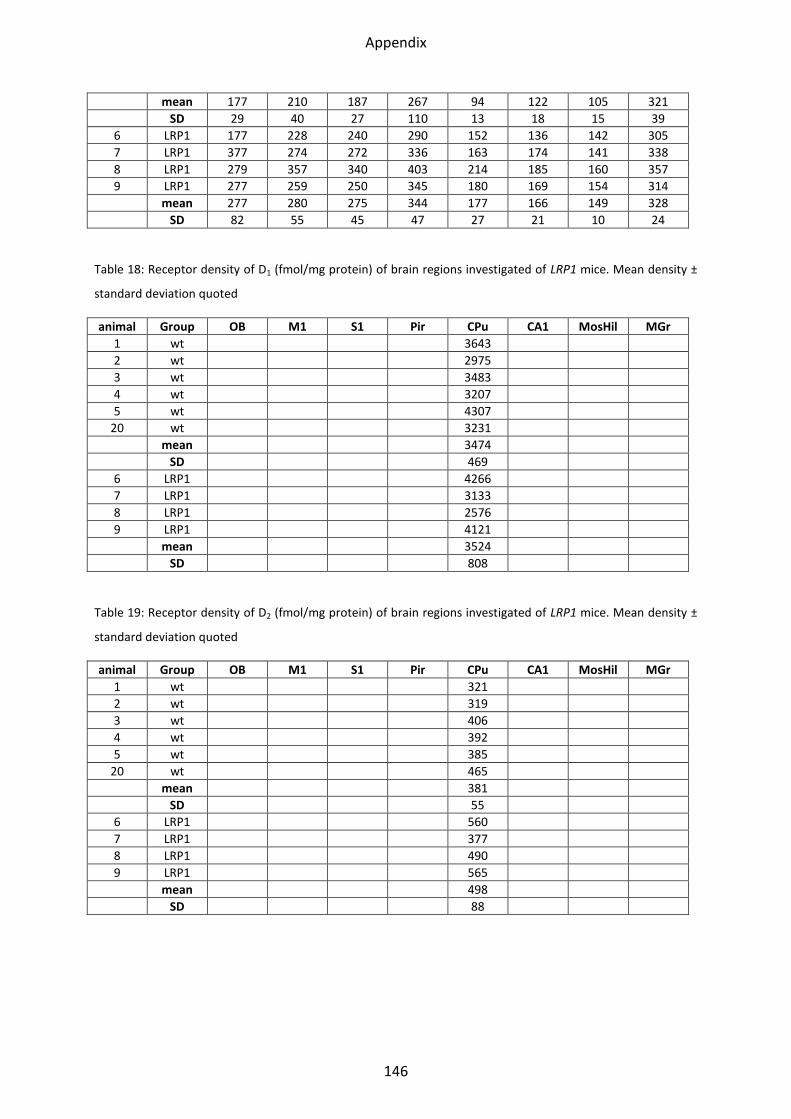
Appendix
146
mean 177 210 187 267 94 122 105 321
SD 29 40 27 110 13 18 15 39
6 LRP1 177 228 240 290 152 136 142 305
7 LRP1 377 274 272 336 163 174 141 338
8 LRP1 279 357 340 403 214 185 160 357
9 LRP1 277 259 250 345 180 169 154 314
mean 277 280 275 344 177 166 149 328
SD 82 55 45 47 27 21 10 24
Table 18: Receptor density of D1 (fmol/mg protein) of brain regions investigated of LRP1 mice. Mean density ±
standard deviation quoted
animal Group OB M1 S1 Pir CPu CA1 MosHil MGr
1 wt 3643
2 wt 2975
3 wt 3483
4 wt 3207
5 wt 4307
20 wt 3231
mean 3474
SD 469
6 LRP1 4266
7 LRP1 3133
8 LRP1 2576
9 LRP1 4121
mean 3524
SD 808
Table 19: Receptor density of D2 (fmol/mg protein) of brain regions investigated of LRP1 mice. Mean density ±
standard deviation quoted
animal Group OB M1 S1 Pir CPu CA1 MosHil MGr
1 wt 321
2 wt 319
3 wt 406
4 wt 392
5 wt 385
20 wt 465
mean 381
SD 55
6 LRP1 560
7 LRP1 377
8 LRP1 490
9 LRP1 565
mean 498
SD 88
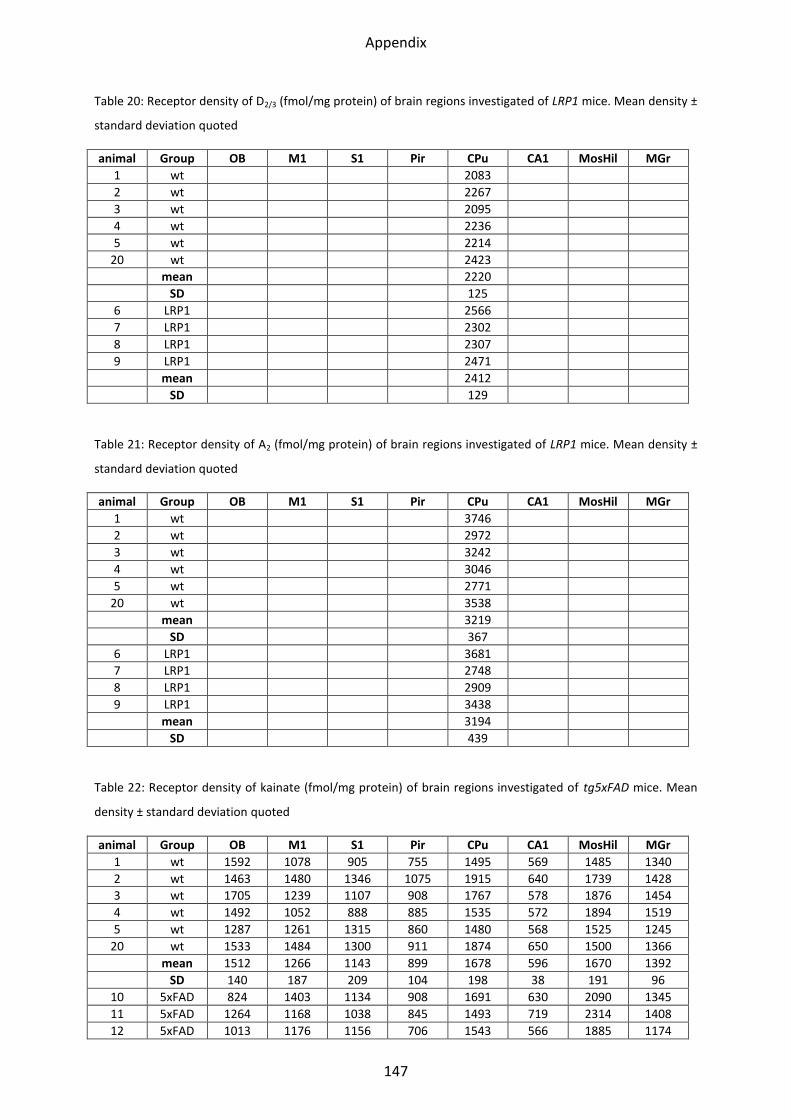
Appendix
147
Table 20: Receptor density of D2/3 (fmol/mg protein) of brain regions investigated of LRP1 mice. Mean density ±
standard deviation quoted
animal Group OB M1 S1 Pir CPu CA1 MosHil MGr
1 wt 2083
2 wt 2267
3 wt 2095
4 wt 2236
5 wt 2214
20 wt 2423
mean 2220
SD 125
6 LRP1 2566
7 LRP1 2302
8 LRP1 2307
9 LRP1 2471
mean 2412
SD 129
Table 21: Receptor density of A2 (fmol/mg protein) of brain regions investigated of LRP1 mice. Mean density ±
standard deviation quoted
animal Group OB M1 S1 Pir CPu CA1 MosHil MGr
1 wt 3746
2 wt 2972
3 wt 3242
4 wt 3046
5 wt 2771
20 wt 3538
mean 3219
SD 367
6 LRP1 3681
7 LRP1 2748
8 LRP1 2909
9 LRP1 3438
mean 3194
SD 439
Table 22: Receptor density of kainate (fmol/mg protein) of brain regions investigated of tg5xFAD mice. Mean
density ± standard deviation quoted
animal Group OB M1 S1 Pir CPu CA1 MosHil MGr
1 wt 1592 1078 905 755 1495 569 1485 1340
2 wt 1463 1480 1346 1075 1915 640 1739 1428
3 wt 1705 1239 1107 908 1767 578 1876 1454
4 wt 1492 1052 888 885 1535 572 1894 1519
5 wt 1287 1261 1315 860 1480 568 1525 1245
20 wt 1533 1484 1300 911 1874 650 1500 1366
mean 1512 1266 1143 899 1678 596 1670 1392
SD 140 187 209 104 198 38 191 96
10 5xFAD 824 1403 1134 908 1691 630 2090 1345
11 5xFAD 1264 1168 1038 845 1493 719 2314 1408
12 5xFAD 1013 1176 1156 706 1543 566 1885 1174
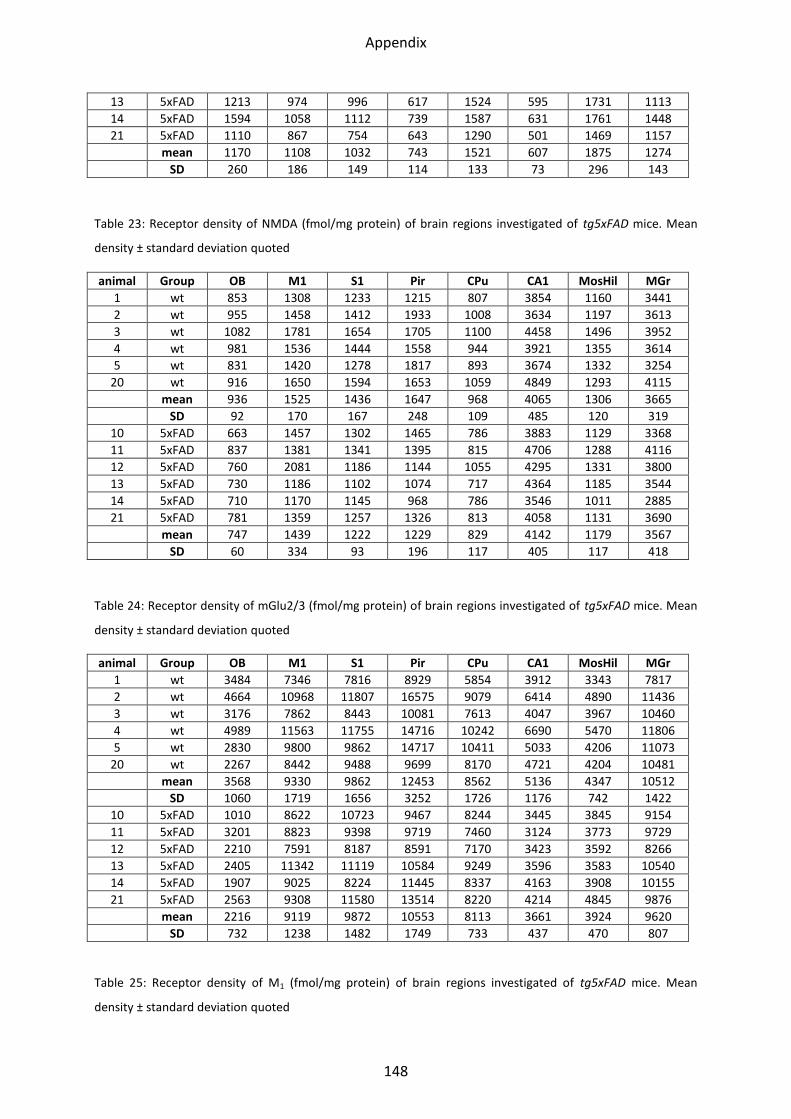
Appendix
148
13 5xFAD 1213 974 996 617 1524 595 1731 1113
14 5xFAD 1594 1058 1112 739 1587 631 1761 1448
21 5xFAD 1110 867 754 643 1290 501 1469 1157
mean 1170 1108 1032 743 1521 607 1875 1274
SD 260 186 149 114 133 73 296 143
Table 23: Receptor density of NMDA (fmol/mg protein) of brain regions investigated of tg5xFAD mice. Mean
density ± standard deviation quoted
animal Group OB M1 S1 Pir CPu CA1 MosHil MGr
1 wt 853 1308 1233 1215 807 3854 1160 3441
2 wt 955 1458 1412 1933 1008 3634 1197 3613
3 wt 1082 1781 1654 1705 1100 4458 1496 3952
4 wt 981 1536 1444 1558 944 3921 1355 3614
5 wt 831 1420 1278 1817 893 3674 1332 3254
20 wt 916 1650 1594 1653 1059 4849 1293 4115
mean 936 1525 1436 1647 968 4065 1306 3665
SD 92 170 167 248 109 485 120 319
10 5xFAD 663 1457 1302 1465 786 3883 1129 3368
11 5xFAD 837 1381 1341 1395 815 4706 1288 4116
12 5xFAD 760 2081 1186 1144 1055 4295 1331 3800
13 5xFAD 730 1186 1102 1074 717 4364 1185 3544
14 5xFAD 710 1170 1145 968 786 3546 1011 2885
21 5xFAD 781 1359 1257 1326 813 4058 1131 3690
mean 747 1439 1222 1229 829 4142 1179 3567
SD 60 334 93 196 117 405 117 418
Table 24: Receptor density of mGlu2/3 (fmol/mg protein) of brain regions investigated of tg5xFAD mice. Mean
density ± standard deviation quoted
animal Group OB M1 S1 Pir CPu CA1 MosHil MGr
1 wt 3484 7346 7816 8929 5854 3912 3343 7817
2 wt 4664 10968 11807 16575 9079 6414 4890 11436
3 wt 3176 7862 8443 10081 7613 4047 3967 10460
4 wt 4989 11563 11755 14716 10242 6690 5470 11806
5 wt 2830 9800 9862 14717 10411 5033 4206 11073
20 wt 2267 8442 9488 9699 8170 4721 4204 10481
mean 3568 9330 9862 12453 8562 5136 4347 10512
SD 1060 1719 1656 3252 1726 1176 742 1422
10 5xFAD 1010 8622 10723 9467 8244 3445 3845 9154
11 5xFAD 3201 8823 9398 9719 7460 3124 3773 9729
12 5xFAD 2210 7591 8187 8591 7170 3423 3592 8266
13 5xFAD 2405 11342 11119 10584 9249 3596 3583 10540
14 5xFAD 1907 9025 8224 11445 8337 4163 3908 10155
21 5xFAD 2563 9308 11580 13514 8220 4214 4845 9876
mean 2216 9119 9872 10553 8113 3661 3924 9620
SD 732 1238 1482 1749 733 437 470 807
Table 25: Receptor density of M1 (fmol/mg protein) of brain regions investigated of tg5xFAD mice. Mean
density ± standard deviation quoted
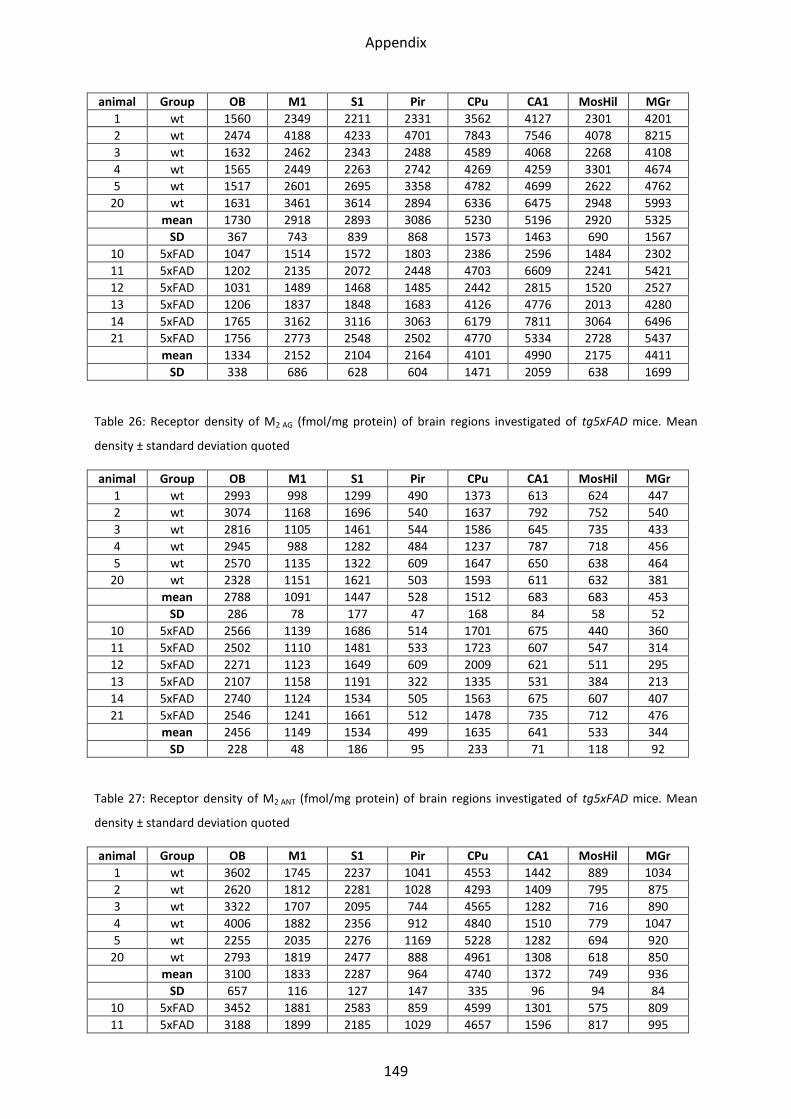
Appendix
149
animal Group OB M1 S1 Pir CPu CA1 MosHil MGr
1 wt 1560 2349 2211 2331 3562 4127 2301 4201
2 wt 2474 4188 4233 4701 7843 7546 4078 8215
3 wt 1632 2462 2343 2488 4589 4068 2268 4108
4 wt 1565 2449 2263 2742 4269 4259 3301 4674
5 wt 1517 2601 2695 3358 4782 4699 2622 4762
20 wt 1631 3461 3614 2894 6336 6475 2948 5993
mean 1730 2918 2893 3086 5230 5196 2920 5325
SD 367 743 839 868 1573 1463 690 1567
10 5xFAD 1047 1514 1572 1803 2386 2596 1484 2302
11 5xFAD 1202 2135 2072 2448 4703 6609 2241 5421
12 5xFAD 1031 1489 1468 1485 2442 2815 1520 2527
13 5xFAD 1206 1837 1848 1683 4126 4776 2013 4280
14 5xFAD 1765 3162 3116 3063 6179 7811 3064 6496
21 5xFAD 1756 2773 2548 2502 4770 5334 2728 5437
mean 1334 2152 2104 2164 4101 4990 2175 4411
SD 338 686 628 604 1471 2059 638 1699
Table 26: Receptor density of M2 AG (fmol/mg protein) of brain regions investigated of tg5xFAD mice. Mean
density ± standard deviation quoted
animal Group OB M1 S1 Pir CPu CA1 MosHil MGr
1 wt 2993 998 1299 490 1373 613 624 447
2 wt 3074 1168 1696 540 1637 792 752 540
3 wt 2816 1105 1461 544 1586 645 735 433
4 wt 2945 988 1282 484 1237 787 718 456
5 wt 2570 1135 1322 609 1647 650 638 464
20 wt 2328 1151 1621 503 1593 611 632 381
mean 2788 1091 1447 528 1512 683 683 453
SD 286 78 177 47 168 84 58 52
10 5xFAD 2566 1139 1686 514 1701 675 440 360
11 5xFAD 2502 1110 1481 533 1723 607 547 314
12 5xFAD 2271 1123 1649 609 2009 621 511 295
13 5xFAD 2107 1158 1191 322 1335 531 384 213
14 5xFAD 2740 1124 1534 505 1563 675 607 407
21 5xFAD 2546 1241 1661 512 1478 735 712 476
mean 2456 1149 1534 499 1635 641 533 344
SD 228 48 186 95 233 71 118 92
Table 27: Receptor density of M2 ANT (fmol/mg protein) of brain regions investigated of tg5xFAD mice. Mean
density ± standard deviation quoted
animal Group OB M1 S1 Pir CPu CA1 MosHil MGr
1 wt 3602 1745 2237 1041 4553 1442 889 1034
2 wt 2620 1812 2281 1028 4293 1409 795 875
3 wt 3322 1707 2095 744 4565 1282 716 890
4 wt 4006 1882 2356 912 4840 1510 779 1047
5 wt 2255 2035 2276 1169 5228 1282 694 920
20 wt 2793 1819 2477 888 4961 1308 618 850
mean 3100 1833 2287 964 4740 1372 749 936
SD 657 116 127 147 335 96 94 84
10 5xFAD 3452 1881 2583 859 4599 1301 575 809
11 5xFAD 3188 1899 2185 1029 4657 1596 817 995
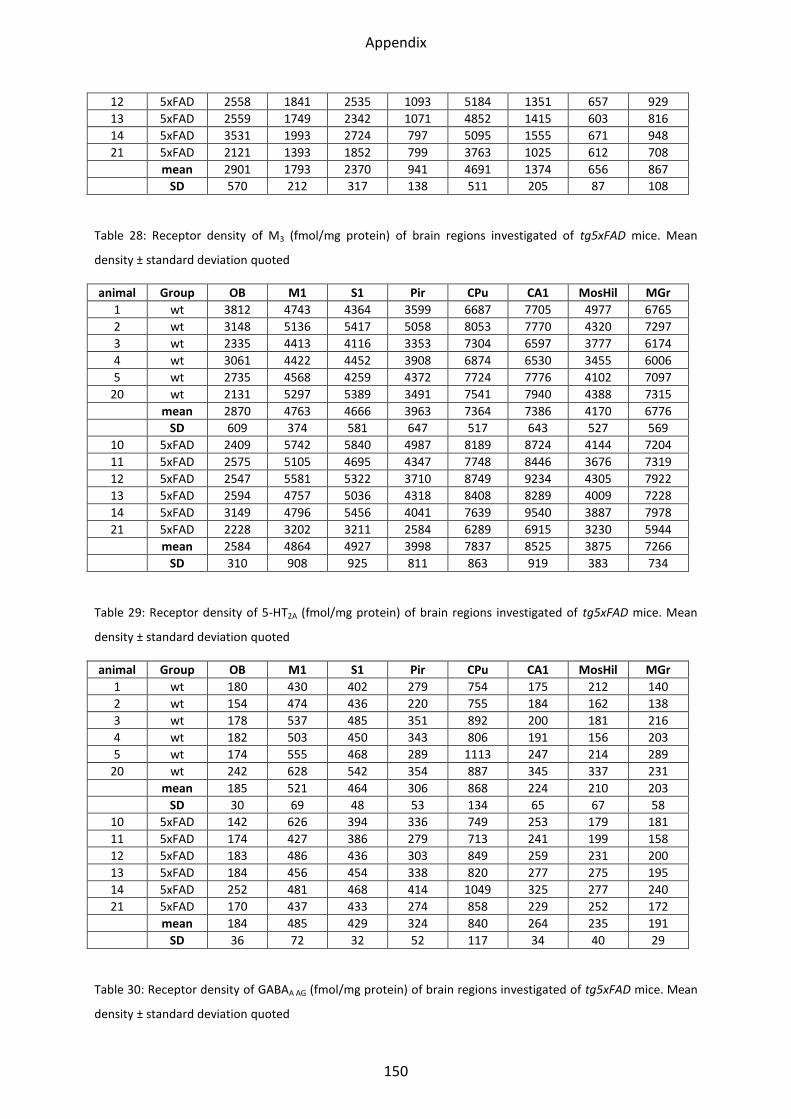
Appendix
150
12 5xFAD 2558 1841 2535 1093 5184 1351 657 929
13 5xFAD 2559 1749 2342 1071 4852 1415 603 816
14 5xFAD 3531 1993 2724 797 5095 1555 671 948
21 5xFAD 2121 1393 1852 799 3763 1025 612 708
mean 2901 1793 2370 941 4691 1374 656 867
SD 570 212 317 138 511 205 87 108
Table 28: Receptor density of M3 (fmol/mg protein) of brain regions investigated of tg5xFAD mice. Mean
density ± standard deviation quoted
animal Group OB M1 S1 Pir CPu CA1 MosHil MGr
1 wt 3812 4743 4364 3599 6687 7705 4977 6765
2 wt 3148 5136 5417 5058 8053 7770 4320 7297
3 wt 2335 4413 4116 3353 7304 6597 3777 6174
4 wt 3061 4422 4452 3908 6874 6530 3455 6006
5 wt 2735 4568 4259 4372 7724 7776 4102 7097
20 wt 2131 5297 5389 3491 7541 7940 4388 7315
mean 2870 4763 4666 3963 7364 7386 4170 6776
SD 609 374 581 647 517 643 527 569
10 5xFAD 2409 5742 5840 4987 8189 8724 4144 7204
11 5xFAD 2575 5105 4695 4347 7748 8446 3676 7319
12 5xFAD 2547 5581 5322 3710 8749 9234 4305 7922
13 5xFAD 2594 4757 5036 4318 8408 8289 4009 7228
14 5xFAD 3149 4796 5456 4041 7639 9540 3887 7978
21 5xFAD 2228 3202 3211 2584 6289 6915 3230 5944
mean 2584 4864 4927 3998 7837 8525 3875 7266
SD 310 908 925 811 863 919 383 734
Table 29: Receptor density of 5-HT2A (fmol/mg protein) of brain regions investigated of tg5xFAD mice. Mean
density ± standard deviation quoted
animal Group OB M1 S1 Pir CPu CA1 MosHil MGr
1 wt 180 430 402 279 754 175 212 140
2 wt 154 474 436 220 755 184 162 138
3 wt 178 537 485 351 892 200 181 216
4 wt 182 503 450 343 806 191 156 203
5 wt 174 555 468 289 1113 247 214 289
20 wt 242 628 542 354 887 345 337 231
mean 185 521 464 306 868 224 210 203
SD 30 69 48 53 134 65 67 58
10 5xFAD 142 626 394 336 749 253 179 181
11 5xFAD 174 427 386 279 713 241 199 158
12 5xFAD 183 486 436 303 849 259 231 200
13 5xFAD 184 456 454 338 820 277 275 195
14 5xFAD 252 481 468 414 1049 325 277 240
21 5xFAD 170 437 433 274 858 229 252 172
mean 184 485 429 324 840 264 235 191
SD 36 72 32 52 117 34 40 29
Table 30: Receptor density of GABAA AG (fmol/mg protein) of brain regions investigated of tg5xFAD mice. Mean
density ± standard deviation quoted
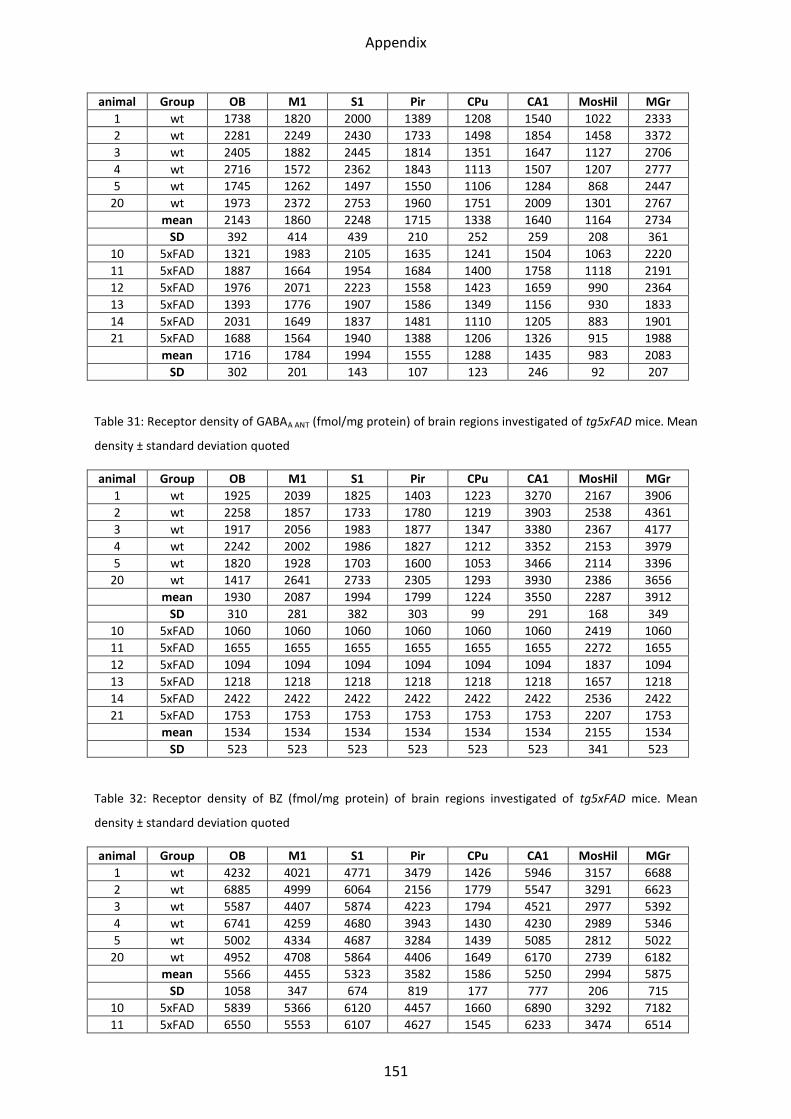
Appendix
151
animal Group OB M1 S1 Pir CPu CA1 MosHil MGr
1 wt 1738 1820 2000 1389 1208 1540 1022 2333
2 wt 2281 2249 2430 1733 1498 1854 1458 3372
3 wt 2405 1882 2445 1814 1351 1647 1127 2706
4 wt 2716 1572 2362 1843 1113 1507 1207 2777
5 wt 1745 1262 1497 1550 1106 1284 868 2447
20 wt 1973 2372 2753 1960 1751 2009 1301 2767
mean 2143 1860 2248 1715 1338 1640 1164 2734
SD 392 414 439 210 252 259 208 361
10 5xFAD 1321 1983 2105 1635 1241 1504 1063 2220
11 5xFAD 1887 1664 1954 1684 1400 1758 1118 2191
12 5xFAD 1976 2071 2223 1558 1423 1659 990 2364
13 5xFAD 1393 1776 1907 1586 1349 1156 930 1833
14 5xFAD 2031 1649 1837 1481 1110 1205 883 1901
21 5xFAD 1688 1564 1940 1388 1206 1326 915 1988
mean 1716 1784 1994 1555 1288 1435 983 2083
SD 302 201 143 107 123 246 92 207
Table 31: Receptor density of GABAA ANT (fmol/mg protein) of brain regions investigated of tg5xFAD mice. Mean
density ± standard deviation quoted
animal Group OB M1 S1 Pir CPu CA1 MosHil MGr
1 wt 1925 2039 1825 1403 1223 3270 2167 3906
2 wt 2258 1857 1733 1780 1219 3903 2538 4361
3 wt 1917 2056 1983 1877 1347 3380 2367 4177
4 wt 2242 2002 1986 1827 1212 3352 2153 3979
5 wt 1820 1928 1703 1600 1053 3466 2114 3396
20 wt 1417 2641 2733 2305 1293 3930 2386 3656
mean 1930 2087 1994 1799 1224 3550 2287 3912
SD 310 281 382 303 99 291 168 349
10 5xFAD 1060 1060 1060 1060 1060 1060 2419 1060
11 5xFAD 1655 1655 1655 1655 1655 1655 2272 1655
12 5xFAD 1094 1094 1094 1094 1094 1094 1837 1094
13 5xFAD 1218 1218 1218 1218 1218 1218 1657 1218
14 5xFAD 2422 2422 2422 2422 2422 2422 2536 2422
21 5xFAD 1753 1753 1753 1753 1753 1753 2207 1753
mean 1534 1534 1534 1534 1534 1534 2155 1534
SD 523 523 523 523 523 523 341 523
Table 32: Receptor density of BZ (fmol/mg protein) of brain regions investigated of tg5xFAD mice. Mean
density ± standard deviation quoted
animal Group OB M1 S1 Pir CPu CA1 MosHil MGr
1 wt 4232 4021 4771 3479 1426 5946 3157 6688
2 wt 6885 4999 6064 2156 1779 5547 3291 6623
3 wt 5587 4407 5874 4223 1794 4521 2977 5392
4 wt 6741 4259 4680 3943 1430 4230 2989 5346
5 wt 5002 4334 4687 3284 1439 5085 2812 5022
20 wt 4952 4708 5864 4406 1649 6170 2739 6182
mean 5566 4455 5323 3582 1586 5250 2994 5875
SD 1058 347 674 819 177 777 206 715
10 5xFAD 5839 5366 6120 4457 1660 6890 3292 7182
11 5xFAD 6550 5553 6107 4627 1545 6233 3474 6514
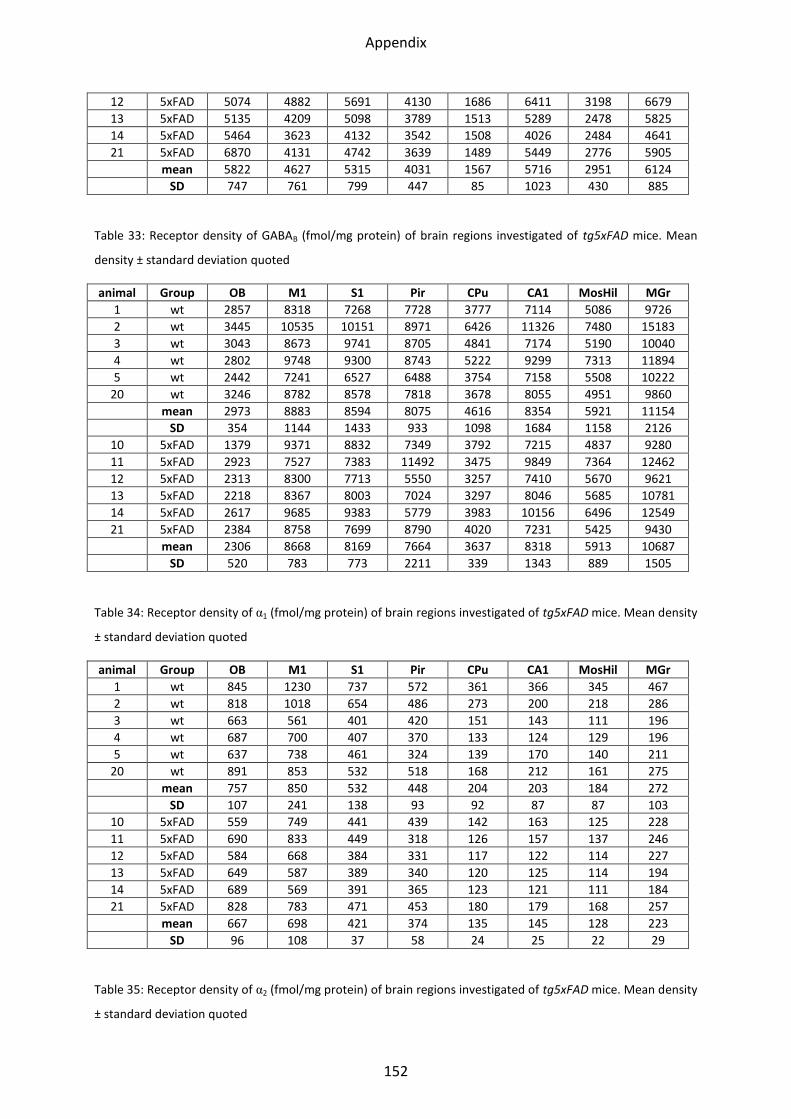
Appendix
152
12 5xFAD 5074 4882 5691 4130 1686 6411 3198 6679
13 5xFAD 5135 4209 5098 3789 1513 5289 2478 5825
14 5xFAD 5464 3623 4132 3542 1508 4026 2484 4641
21 5xFAD 6870 4131 4742 3639 1489 5449 2776 5905
mean 5822 4627 5315 4031 1567 5716 2951 6124
SD 747 761 799 447 85 1023 430 885
Table 33: Receptor density of GABAB (fmol/mg protein) of brain regions investigated of tg5xFAD mice. Mean
density ± standard deviation quoted
animal Group OB M1 S1 Pir CPu CA1 MosHil MGr
1 wt 2857 8318 7268 7728 3777 7114 5086 9726
2 wt 3445 10535 10151 8971 6426 11326 7480 15183
3 wt 3043 8673 9741 8705 4841 7174 5190 10040
4 wt 2802 9748 9300 8743 5222 9299 7313 11894
5 wt 2442 7241 6527 6488 3754 7158 5508 10222
20 wt 3246 8782 8578 7818 3678 8055 4951 9860
mean 2973 8883 8594 8075 4616 8354 5921 11154
SD 354 1144 1433 933 1098 1684 1158 2126
10 5xFAD 1379 9371 8832 7349 3792 7215 4837 9280
11 5xFAD 2923 7527 7383 11492 3475 9849 7364 12462
12 5xFAD 2313 8300 7713 5550 3257 7410 5670 9621
13 5xFAD 2218 8367 8003 7024 3297 8046 5685 10781
14 5xFAD 2617 9685 9383 5779 3983 10156 6496 12549
21 5xFAD 2384 8758 7699 8790 4020 7231 5425 9430
mean 2306 8668 8169 7664 3637 8318 5913 10687
SD 520 783 773 2211 339 1343 889 1505
Table 34: Receptor density of α1 (fmol/mg protein) of brain regions investigated of tg5xFAD mice. Mean density
± standard deviation quoted
animal Group OB M1 S1 Pir CPu CA1 MosHil MGr
1 wt 845 1230 737 572 361 366 345 467
2 wt 818 1018 654 486 273 200 218 286
3 wt 663 561 401 420 151 143 111 196
4 wt 687 700 407 370 133 124 129 196
5 wt 637 738 461 324 139 170 140 211
20 wt 891 853 532 518 168 212 161 275
mean 757 850 532 448 204 203 184 272
SD 107 241 138 93 92 87 87 103
10 5xFAD 559 749 441 439 142 163 125 228
11 5xFAD 690 833 449 318 126 157 137 246
12 5xFAD 584 668 384 331 117 122 114 227
13 5xFAD 649 587 389 340 120 125 114 194
14 5xFAD 689 569 391 365 123 121 111 184
21 5xFAD 828 783 471 453 180 179 168 257
mean 667 698 421 374 135 145 128 223
SD 96 108 37 58 24 25 22 29
Table 35: Receptor density of α2 (fmol/mg protein) of brain regions investigated of tg5xFAD mice. Mean density
± standard deviation quoted
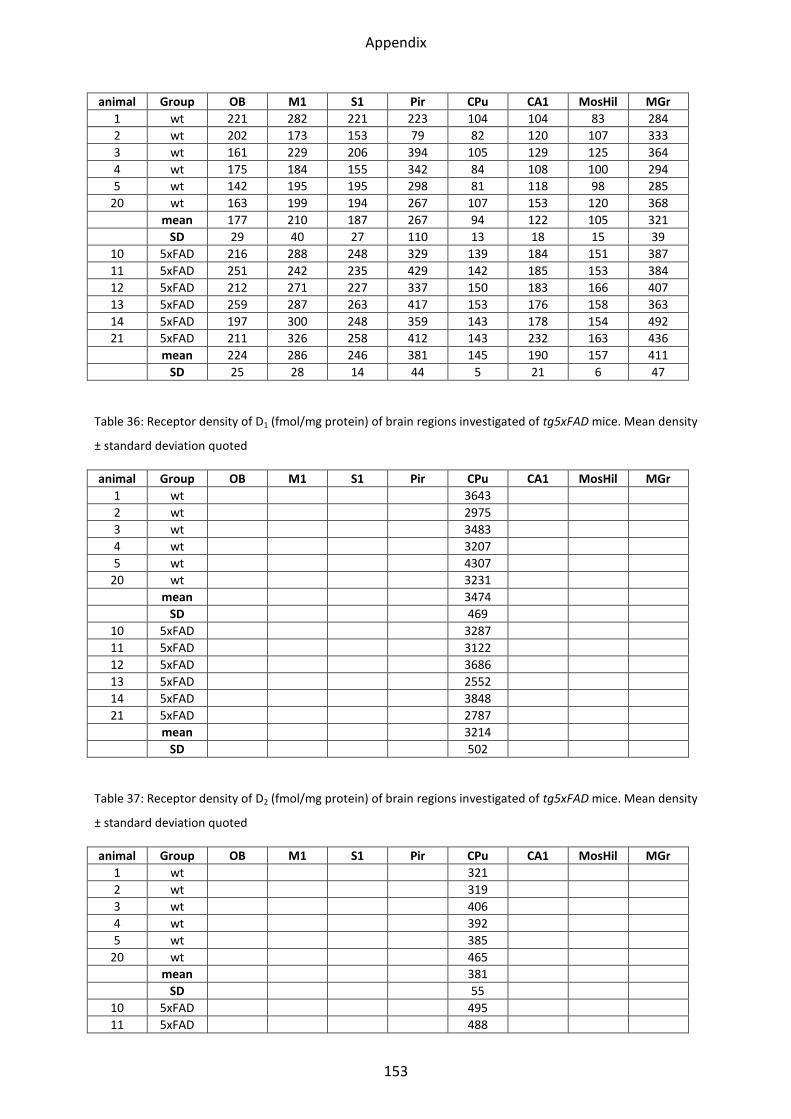
Appendix
153
animal Group OB M1 S1 Pir CPu CA1 MosHil MGr
1 wt 221 282 221 223 104 104 83 284
2 wt 202 173 153 79 82 120 107 333
3 wt 161 229 206 394 105 129 125 364
4 wt 175 184 155 342 84 108 100 294
5 wt 142 195 195 298 81 118 98 285
20 wt 163 199 194 267 107 153 120 368
mean 177 210 187 267 94 122 105 321
SD 29 40 27 110 13 18 15 39
10 5xFAD 216 288 248 329 139 184 151 387
11 5xFAD 251 242 235 429 142 185 153 384
12 5xFAD 212 271 227 337 150 183 166 407
13 5xFAD 259 287 263 417 153 176 158 363
14 5xFAD 197 300 248 359 143 178 154 492
21 5xFAD 211 326 258 412 143 232 163 436
mean 224 286 246 381 145 190 157 411
SD 25 28 14 44 5 21 6 47
Table 36: Receptor density of D1 (fmol/mg protein) of brain regions investigated of tg5xFAD mice. Mean density
± standard deviation quoted
animal Group OB M1 S1 Pir CPu CA1 MosHil MGr
1 wt 3643
2 wt 2975
3 wt 3483
4 wt 3207
5 wt 4307
20 wt 3231
mean 3474
SD 469
10 5xFAD 3287
11 5xFAD 3122
12 5xFAD 3686
13 5xFAD 2552
14 5xFAD 3848
21 5xFAD 2787
mean 3214
SD 502
Table 37: Receptor density of D2 (fmol/mg protein) of brain regions investigated of tg5xFAD mice. Mean density
± standard deviation quoted
animal Group OB M1 S1 Pir CPu CA1 MosHil MGr
1 wt 321
2 wt 319
3 wt 406
4 wt 392
5 wt 385
20 wt 465
mean 381
SD 55
10 5xFAD 495
11 5xFAD 488
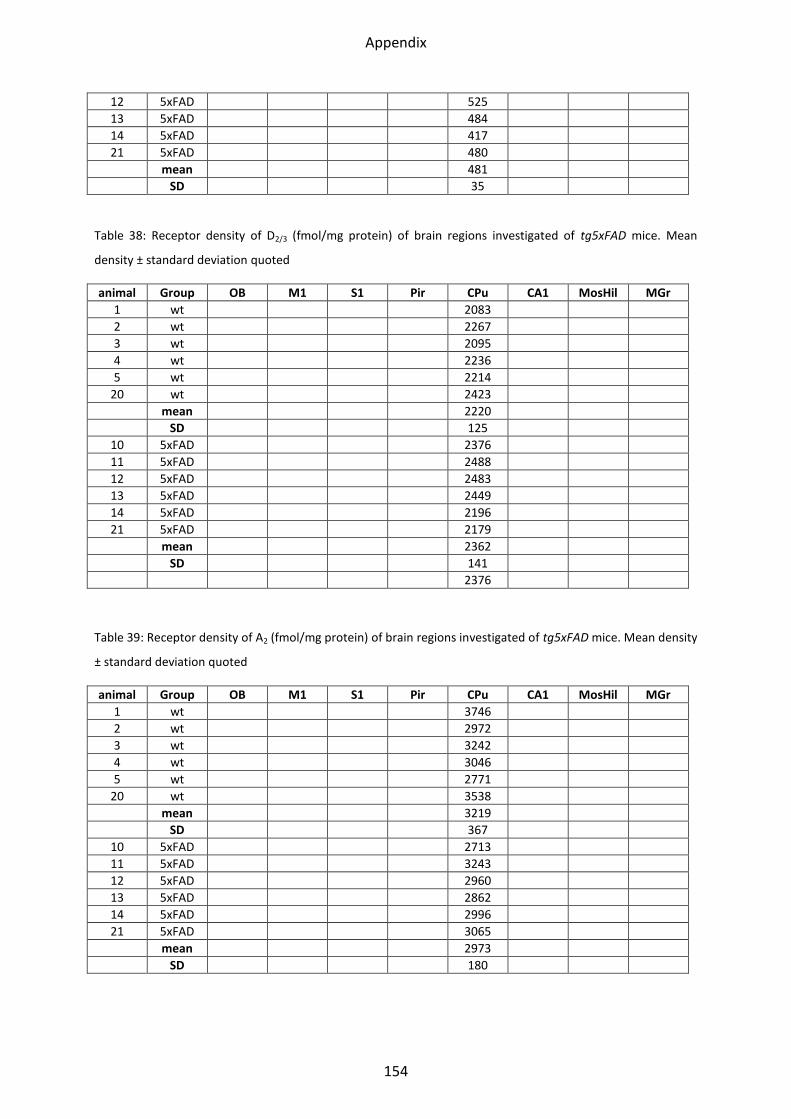
Appendix
154
12 5xFAD 525
13 5xFAD 484
14 5xFAD 417
21 5xFAD 480
mean 481
SD 35
Table 38: Receptor density of D2/3 (fmol/mg protein) of brain regions investigated of tg5xFAD mice. Mean
density ± standard deviation quoted
animal Group OB M1 S1 Pir CPu CA1 MosHil MGr
1 wt 2083
2 wt 2267
3 wt 2095
4 wt 2236
5 wt 2214
20 wt 2423
mean 2220
SD 125
10 5xFAD 2376
11 5xFAD 2488
12 5xFAD 2483
13 5xFAD 2449
14 5xFAD 2196
21 5xFAD 2179
mean 2362
SD 141
2376
Table 39: Receptor density of A2 (fmol/mg protein) of brain regions investigated of tg5xFAD mice. Mean density
± standard deviation quoted
animal Group OB M1 S1 Pir CPu CA1 MosHil MGr
1 wt 3746
2 wt 2972
3 wt 3242
4 wt 3046
5 wt 2771
20 wt 3538
mean 3219
SD 367
10 5xFAD 2713
11 5xFAD 3243
12 5xFAD 2960
13 5xFAD 2862
14 5xFAD 2996
21 5xFAD 3065
mean 2973
SD 180
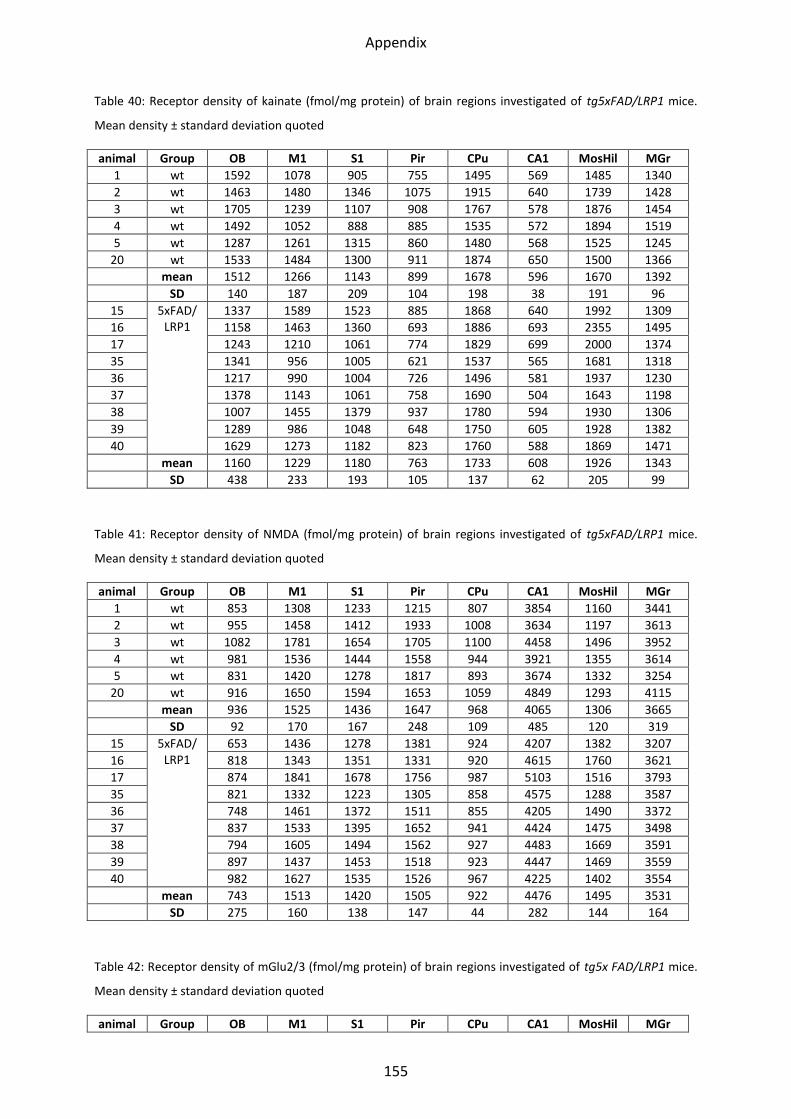
Appendix
155
Table 40: Receptor density of kainate (fmol/mg protein) of brain regions investigated of tg5xFAD/LRP1 mice.
Mean density ± standard deviation quoted
animal Group OB M1 S1 Pir CPu CA1 MosHil MGr
1 wt 1592 1078 905 755 1495 569 1485 1340
2 wt 1463 1480 1346 1075 1915 640 1739 1428
3 wt 1705 1239 1107 908 1767 578 1876 1454
4 wt 1492 1052 888 885 1535 572 1894 1519
5 wt 1287 1261 1315 860 1480 568 1525 1245
20 wt 1533 1484 1300 911 1874 650 1500 1366
mean 1512 1266 1143 899 1678 596 1670 1392
SD 140 187 209 104 198 38 191 96
15 5xFAD/ LRP1
1337 1589 1523 885 1868 640 1992 1309
16 1158 1463 1360 693 1886 693 2355 1495
17 1243 1210 1061 774 1829 699 2000 1374
35 1341 956 1005 621 1537 565 1681 1318
36 1217 990 1004 726 1496 581 1937 1230
37 1378 1143 1061 758 1690 504 1643 1198
38 1007 1455 1379 937 1780 594 1930 1306
39 1289 986 1048 648 1750 605 1928 1382
40 1629 1273 1182 823 1760 588 1869 1471
mean 1160 1229 1180 763 1733 608 1926 1343
SD 438 233 193 105 137 62 205 99
Table 41: Receptor density of NMDA (fmol/mg protein) of brain regions investigated of tg5xFAD/LRP1 mice.
Mean density ± standard deviation quoted
animal Group OB M1 S1 Pir CPu CA1 MosHil MGr
1 wt 853 1308 1233 1215 807 3854 1160 3441
2 wt 955 1458 1412 1933 1008 3634 1197 3613
3 wt 1082 1781 1654 1705 1100 4458 1496 3952
4 wt 981 1536 1444 1558 944 3921 1355 3614
5 wt 831 1420 1278 1817 893 3674 1332 3254
20 wt 916 1650 1594 1653 1059 4849 1293 4115
mean 936 1525 1436 1647 968 4065 1306 3665
SD 92 170 167 248 109 485 120 319
15 5xFAD/ LRP1
653 1436 1278 1381 924 4207 1382 3207
16 818 1343 1351 1331 920 4615 1760 3621
17 874 1841 1678 1756 987 5103 1516 3793
35 821 1332 1223 1305 858 4575 1288 3587
36 748 1461 1372 1511 855 4205 1490 3372
37 837 1533 1395 1652 941 4424 1475 3498
38 794 1605 1494 1562 927 4483 1669 3591
39 897 1437 1453 1518 923 4447 1469 3559
40 982 1627 1535 1526 967 4225 1402 3554
mean 743 1513 1420 1505 922 4476 1495 3531
SD 275 160 138 147 44 282 144 164
Table 42: Receptor density of mGlu2/3 (fmol/mg protein) of brain regions investigated of tg5x FAD/LRP1 mice.
Mean density ± standard deviation quoted
animal Group OB M1 S1 Pir CPu CA1 MosHil MGr
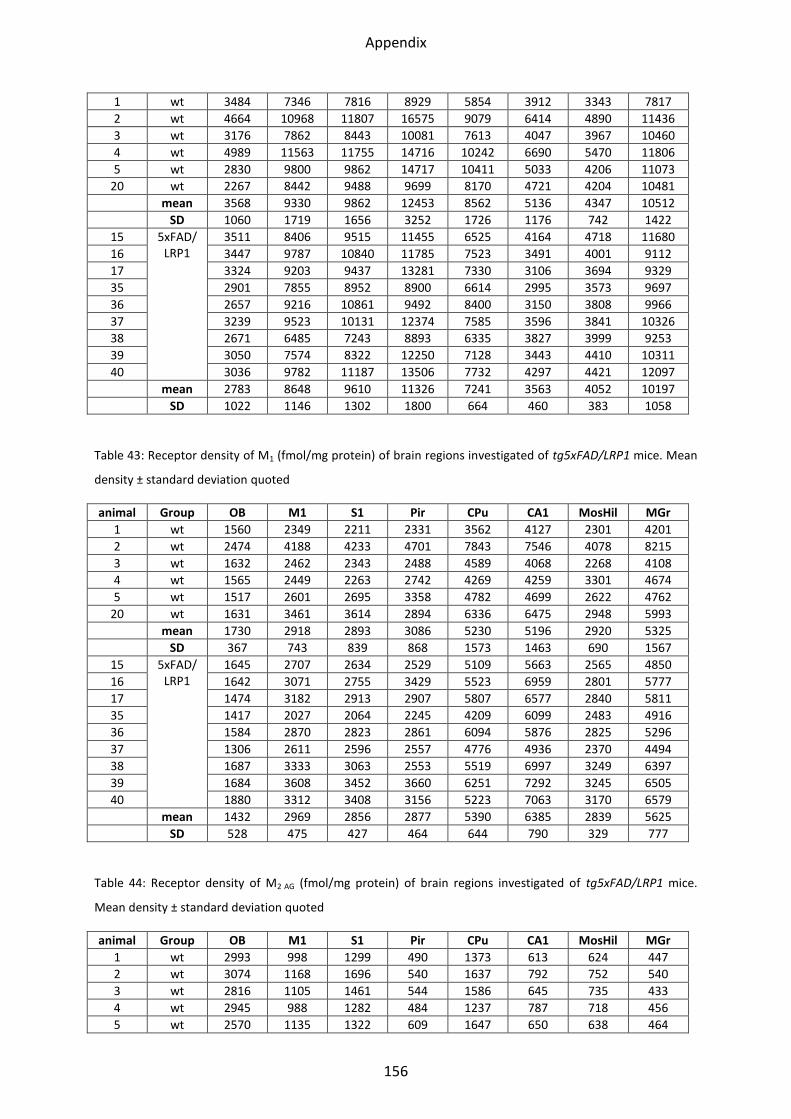
Appendix
156
1 wt 3484 7346 7816 8929 5854 3912 3343 7817
2 wt 4664 10968 11807 16575 9079 6414 4890 11436
3 wt 3176 7862 8443 10081 7613 4047 3967 10460
4 wt 4989 11563 11755 14716 10242 6690 5470 11806
5 wt 2830 9800 9862 14717 10411 5033 4206 11073
20 wt 2267 8442 9488 9699 8170 4721 4204 10481
mean 3568 9330 9862 12453 8562 5136 4347 10512
SD 1060 1719 1656 3252 1726 1176 742 1422
15 5xFAD/ LRP1
3511 8406 9515 11455 6525 4164 4718 11680
16 3447 9787 10840 11785 7523 3491 4001 9112
17 3324 9203 9437 13281 7330 3106 3694 9329
35 2901 7855 8952 8900 6614 2995 3573 9697
36 2657 9216 10861 9492 8400 3150 3808 9966
37 3239 9523 10131 12374 7585 3596 3841 10326
38 2671 6485 7243 8893 6335 3827 3999 9253
39 3050 7574 8322 12250 7128 3443 4410 10311
40 3036 9782 11187 13506 7732 4297 4421 12097
mean 2783 8648 9610 11326 7241 3563 4052 10197
SD 1022 1146 1302 1800 664 460 383 1058
Table 43: Receptor density of M1 (fmol/mg protein) of brain regions investigated of tg5xFAD/LRP1 mice. Mean
density ± standard deviation quoted
animal Group OB M1 S1 Pir CPu CA1 MosHil MGr
1 wt 1560 2349 2211 2331 3562 4127 2301 4201
2 wt 2474 4188 4233 4701 7843 7546 4078 8215
3 wt 1632 2462 2343 2488 4589 4068 2268 4108
4 wt 1565 2449 2263 2742 4269 4259 3301 4674
5 wt 1517 2601 2695 3358 4782 4699 2622 4762
20 wt 1631 3461 3614 2894 6336 6475 2948 5993
mean 1730 2918 2893 3086 5230 5196 2920 5325
SD 367 743 839 868 1573 1463 690 1567
15 5xFAD/ LRP1
1645 2707 2634 2529 5109 5663 2565 4850
16 1642 3071 2755 3429 5523 6959 2801 5777
17 1474 3182 2913 2907 5807 6577 2840 5811
35 1417 2027 2064 2245 4209 6099 2483 4916
36 1584 2870 2823 2861 6094 5876 2825 5296
37 1306 2611 2596 2557 4776 4936 2370 4494
38 1687 3333 3063 2553 5519 6997 3249 6397
39 1684 3608 3452 3660 6251 7292 3245 6505
40 1880 3312 3408 3156 5223 7063 3170 6579
mean 1432 2969 2856 2877 5390 6385 2839 5625
SD 528 475 427 464 644 790 329 777
Table 44: Receptor density of M2 AG (fmol/mg protein) of brain regions investigated of tg5xFAD/LRP1 mice.
Mean density ± standard deviation quoted
animal Group OB M1 S1 Pir CPu CA1 MosHil MGr
1 wt 2993 998 1299 490 1373 613 624 447
2 wt 3074 1168 1696 540 1637 792 752 540
3 wt 2816 1105 1461 544 1586 645 735 433
4 wt 2945 988 1282 484 1237 787 718 456
5 wt 2570 1135 1322 609 1647 650 638 464
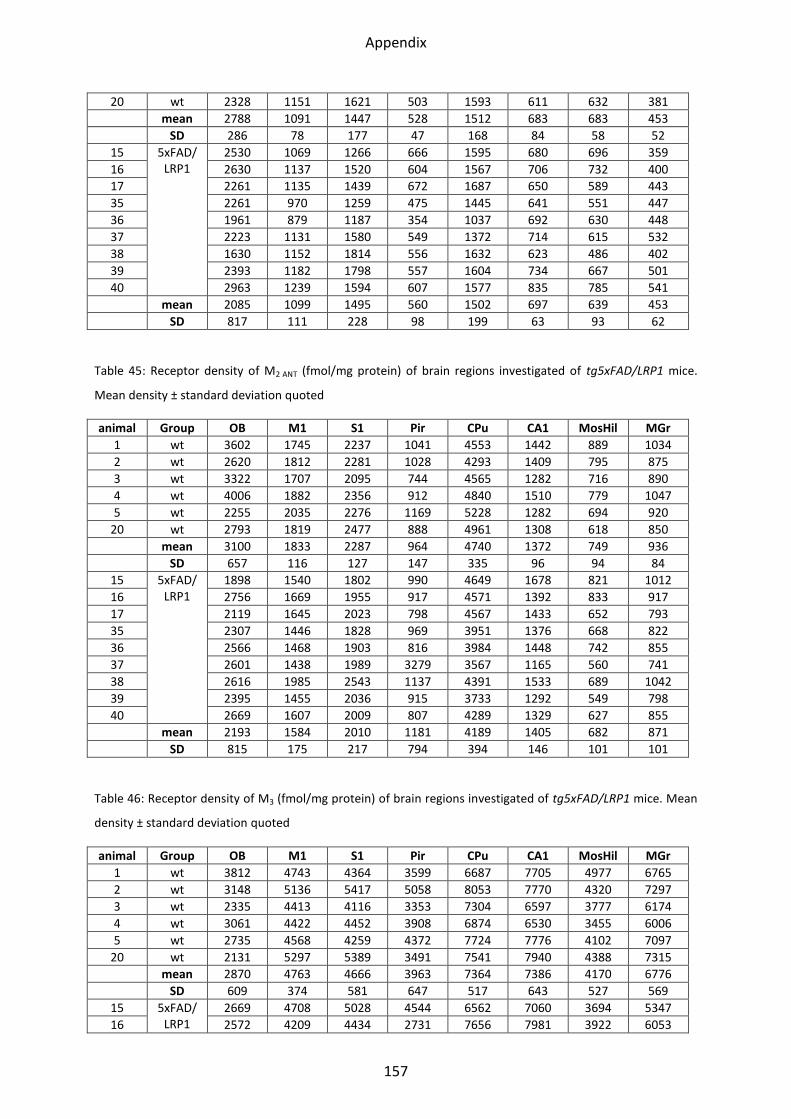
Appendix
157
20 wt 2328 1151 1621 503 1593 611 632 381
mean 2788 1091 1447 528 1512 683 683 453
SD 286 78 177 47 168 84 58 52
15 5xFAD/ LRP1
2530 1069 1266 666 1595 680 696 359
16 2630 1137 1520 604 1567 706 732 400
17 2261 1135 1439 672 1687 650 589 443
35 2261 970 1259 475 1445 641 551 447
36 1961 879 1187 354 1037 692 630 448
37 2223 1131 1580 549 1372 714 615 532
38 1630 1152 1814 556 1632 623 486 402
39 2393 1182 1798 557 1604 734 667 501
40 2963 1239 1594 607 1577 835 785 541
mean 2085 1099 1495 560 1502 697 639 453
SD 817 111 228 98 199 63 93 62
Table 45: Receptor density of M2 ANT (fmol/mg protein) of brain regions investigated of tg5xFAD/LRP1 mice.
Mean density ± standard deviation quoted
animal Group OB M1 S1 Pir CPu CA1 MosHil MGr
1 wt 3602 1745 2237 1041 4553 1442 889 1034
2 wt 2620 1812 2281 1028 4293 1409 795 875
3 wt 3322 1707 2095 744 4565 1282 716 890
4 wt 4006 1882 2356 912 4840 1510 779 1047
5 wt 2255 2035 2276 1169 5228 1282 694 920
20 wt 2793 1819 2477 888 4961 1308 618 850
mean 3100 1833 2287 964 4740 1372 749 936
SD 657 116 127 147 335 96 94 84
15 5xFAD/ LRP1
1898 1540 1802 990 4649 1678 821 1012
16 2756 1669 1955 917 4571 1392 833 917
17 2119 1645 2023 798 4567 1433 652 793
35 2307 1446 1828 969 3951 1376 668 822
36 2566 1468 1903 816 3984 1448 742 855
37 2601 1438 1989 3279 3567 1165 560 741
38 2616 1985 2543 1137 4391 1533 689 1042
39 2395 1455 2036 915 3733 1292 549 798
40 2669 1607 2009 807 4289 1329 627 855
mean 2193 1584 2010 1181 4189 1405 682 871
SD 815 175 217 794 394 146 101 101
Table 46: Receptor density of M3 (fmol/mg protein) of brain regions investigated of tg5xFAD/LRP1 mice. Mean
density ± standard deviation quoted
animal Group OB M1 S1 Pir CPu CA1 MosHil MGr
1 wt 3812 4743 4364 3599 6687 7705 4977 6765
2 wt 3148 5136 5417 5058 8053 7770 4320 7297
3 wt 2335 4413 4116 3353 7304 6597 3777 6174
4 wt 3061 4422 4452 3908 6874 6530 3455 6006
5 wt 2735 4568 4259 4372 7724 7776 4102 7097
20 wt 2131 5297 5389 3491 7541 7940 4388 7315
mean 2870 4763 4666 3963 7364 7386 4170 6776
SD 609 374 581 647 517 643 527 569
15 5xFAD/ LRP1
2669 4708 5028 4544 6562 7060 3694 5347
16 2572 4209 4434 2731 7656 7981 3922 6053

Appendix
158
17 2133 4332 4504 3620 6328 7087 3483 5983
35 2542 4283 4226 3747 7551 8312 4272 7216
36 2189 4293 4356 2932 6528 7183 3774 6025
37 2079 4452 4486 3053 7360 7059 3462 5985
38 2295 4409 4574 4590 6321 6671 3750 5896
39 2579 4861 5250 3794 6981 7907 3908 6361
40 2520 5832 5934 4368 8020 9261 3915 7078
mean 2158 4598 4755 3709 7034 7613 3798 6216
SD 787 509 550 700 635 820 248 591
Table 47: Receptor density of 5-HT2A (fmol/mg protein) of brain regions investigated of tg5xFAD/LRP1 mice.
Mean density ± standard deviation quoted
animal Group OB M1 S1 Pir CPu CA1 MosHil MGr
1 wt 180 430 402 279 754 175 212 140
2 wt 154 474 436 220 755 184 162 138
3 wt 178 537 485 351 892 200 181 216
4 wt 182 503 450 343 806 191 156 203
5 wt 174 555 468 289 1113 247 214 289
20 wt 242 628 542 354 887 345 337 231
mean 185 521 464 306 868 224 210 203
SD 30 69 48 53 134 65 67 58
15 5xFAD/ LRP1
236 607 617 446 1108 331 275 213
16 237 593 619 284 1141 347 370 234
17 223 555 517 362 996 344 316 237
35 197 438 398 290 952 266 214 168
36 199 605 453 344 1102 270 267 216
37 200 507 483 371 1189 280 234 181
38 170 507 376 305 752 252 175 169
39 172 465 473 310 964 285 263 238
40 184 465 487 389 1012 263 268 172
mean 182 527 492 345 1024 293 265 203
SD 68 65 84 53 131 37 56 31
Table 48: Receptor density of GABAA AG (fmol/mg protein) of brain regions investigated of tg5xFAD/LRP1 mice.
Mean density ± standard deviation quoted
animal Group OB M1 S1 Pir CPu CA1 MosHil MGr
1 wt 1738 1820 2000 1389 1208 1540 1022 2333
2 wt 2281 2249 2430 1733 1498 1854 1458 3372
3 wt 2405 1882 2445 1814 1351 1647 1127 2706
4 wt 2716 1572 2362 1843 1113 1507 1207 2777
5 wt 1745 1262 1497 1550 1106 1284 868 2447
20 wt 1973 2372 2753 1960 1751 2009 1301 2767
mean 2143 1860 2248 1715 1338 1640 1164 2734
SD 392 414 439 210 252 259 208 361
15 5xFAD/ LRP1
1523 1854 1823 1938 1457 1746 1201 2375
16 1792 1718 1935 1757 1341 1281 872 1853
17 1990 1951 2121 1888 1461 1478 1341 2533
35 1971 1550 1753 1596 1174 1286 899 1985
36 1945 1655 1918 1370 1154 1271 956 2196
37 1370 1598 1749 1402 997 1440 894 2072
38 2209 1766 2292 1975 1275 1457 874 1899
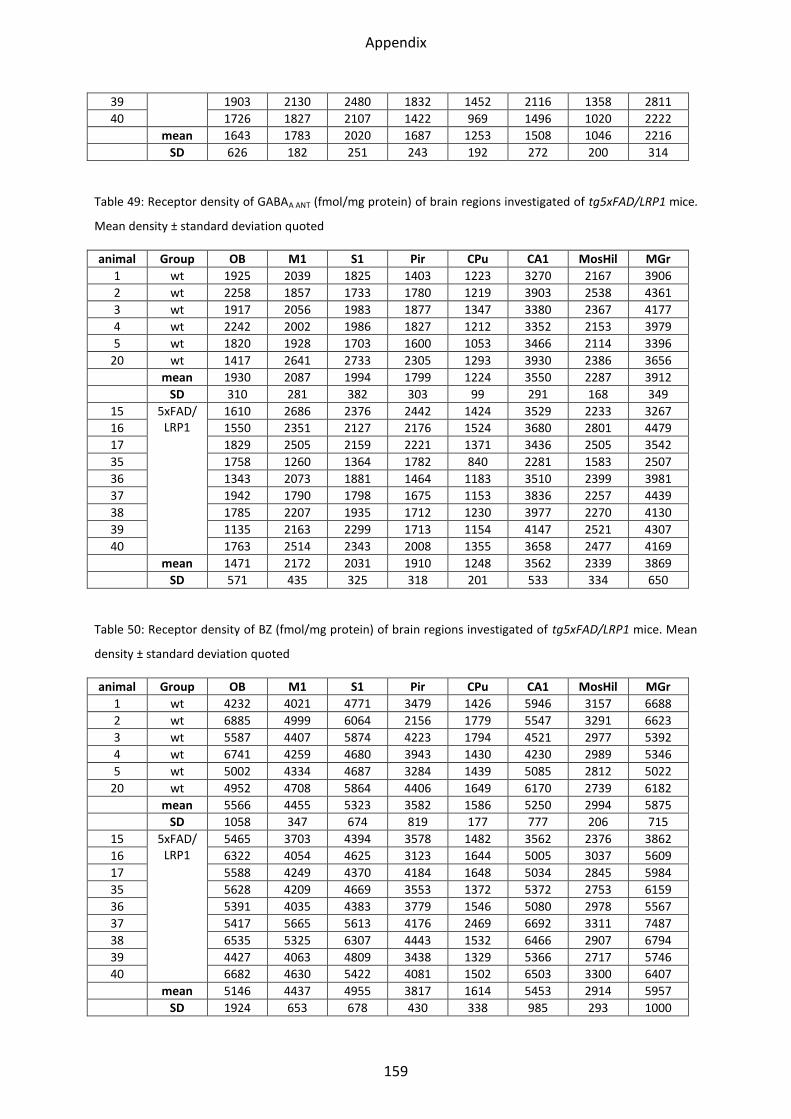
Appendix
159
39 1903 2130 2480 1832 1452 2116 1358 2811
40 1726 1827 2107 1422 969 1496 1020 2222
mean 1643 1783 2020 1687 1253 1508 1046 2216
SD 626 182 251 243 192 272 200 314
Table 49: Receptor density of GABAA ANT (fmol/mg protein) of brain regions investigated of tg5xFAD/LRP1 mice.
Mean density ± standard deviation quoted
animal Group OB M1 S1 Pir CPu CA1 MosHil MGr
1 wt 1925 2039 1825 1403 1223 3270 2167 3906
2 wt 2258 1857 1733 1780 1219 3903 2538 4361
3 wt 1917 2056 1983 1877 1347 3380 2367 4177
4 wt 2242 2002 1986 1827 1212 3352 2153 3979
5 wt 1820 1928 1703 1600 1053 3466 2114 3396
20 wt 1417 2641 2733 2305 1293 3930 2386 3656
mean 1930 2087 1994 1799 1224 3550 2287 3912
SD 310 281 382 303 99 291 168 349
15 5xFAD/ LRP1
1610 2686 2376 2442 1424 3529 2233 3267
16 1550 2351 2127 2176 1524 3680 2801 4479
17 1829 2505 2159 2221 1371 3436 2505 3542
35 1758 1260 1364 1782 840 2281 1583 2507
36 1343 2073 1881 1464 1183 3510 2399 3981
37 1942 1790 1798 1675 1153 3836 2257 4439
38 1785 2207 1935 1712 1230 3977 2270 4130
39 1135 2163 2299 1713 1154 4147 2521 4307
40 1763 2514 2343 2008 1355 3658 2477 4169
mean 1471 2172 2031 1910 1248 3562 2339 3869
SD 571 435 325 318 201 533 334 650
Table 50: Receptor density of BZ (fmol/mg protein) of brain regions investigated of tg5xFAD/LRP1 mice. Mean
density ± standard deviation quoted
animal Group OB M1 S1 Pir CPu CA1 MosHil MGr
1 wt 4232 4021 4771 3479 1426 5946 3157 6688
2 wt 6885 4999 6064 2156 1779 5547 3291 6623
3 wt 5587 4407 5874 4223 1794 4521 2977 5392
4 wt 6741 4259 4680 3943 1430 4230 2989 5346
5 wt 5002 4334 4687 3284 1439 5085 2812 5022
20 wt 4952 4708 5864 4406 1649 6170 2739 6182
mean 5566 4455 5323 3582 1586 5250 2994 5875
SD 1058 347 674 819 177 777 206 715
15 5xFAD/ LRP1
5465 3703 4394 3578 1482 3562 2376 3862
16 6322 4054 4625 3123 1644 5005 3037 5609
17 5588 4249 4370 4184 1648 5034 2845 5984
35 5628 4209 4669 3553 1372 5372 2753 6159
36 5391 4035 4383 3779 1546 5080 2978 5567
37 5417 5665 5613 4176 2469 6692 3311 7487
38 6535 5325 6307 4443 1532 6466 2907 6794
39 4427 4063 4809 3438 1329 5366 2717 5746
40 6682 4630 5422 4081 1502 6503 3300 6407
mean 5146 4437 4955 3817 1614 5453 2914 5957
SD 1924 653 678 430 338 985 293 1000
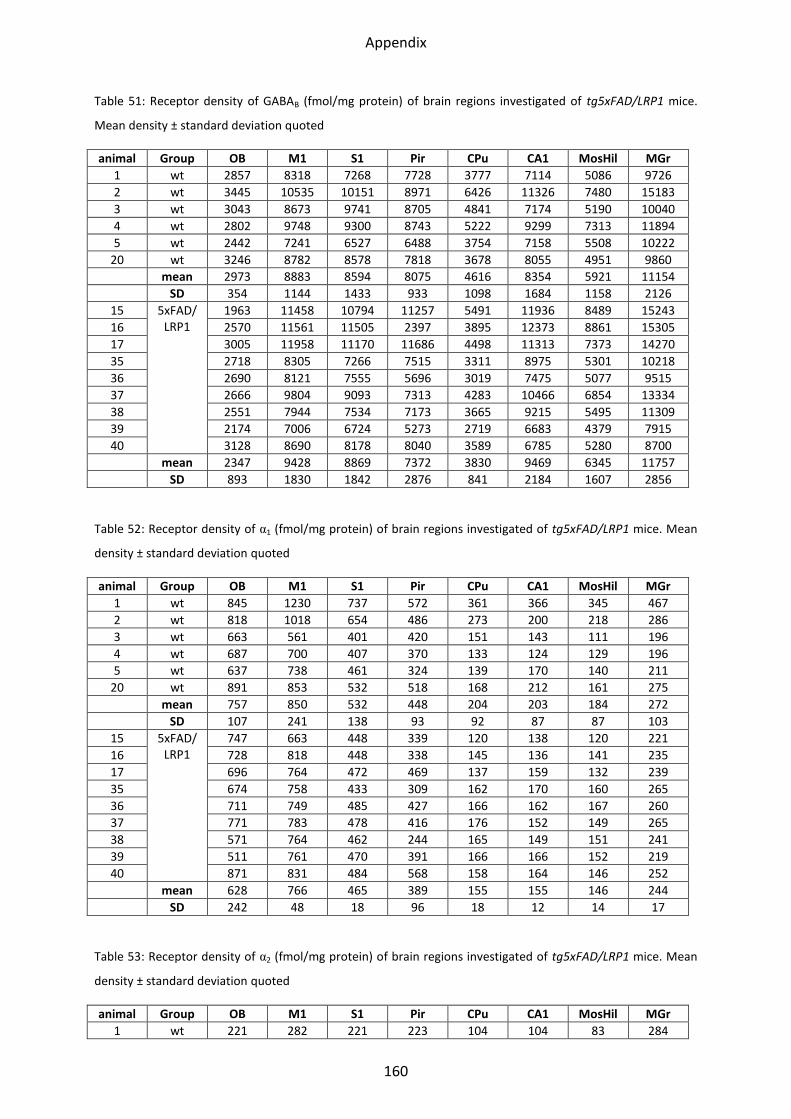
Appendix
160
Table 51: Receptor density of GABAB (fmol/mg protein) of brain regions investigated of tg5xFAD/LRP1 mice.
Mean density ± standard deviation quoted
animal Group OB M1 S1 Pir CPu CA1 MosHil MGr
1 wt 2857 8318 7268 7728 3777 7114 5086 9726
2 wt 3445 10535 10151 8971 6426 11326 7480 15183
3 wt 3043 8673 9741 8705 4841 7174 5190 10040
4 wt 2802 9748 9300 8743 5222 9299 7313 11894
5 wt 2442 7241 6527 6488 3754 7158 5508 10222
20 wt 3246 8782 8578 7818 3678 8055 4951 9860
mean 2973 8883 8594 8075 4616 8354 5921 11154
SD 354 1144 1433 933 1098 1684 1158 2126
15 5xFAD/ LRP1
1963 11458 10794 11257 5491 11936 8489 15243
16 2570 11561 11505 2397 3895 12373 8861 15305
17 3005 11958 11170 11686 4498 11313 7373 14270
35 2718 8305 7266 7515 3311 8975 5301 10218
36 2690 8121 7555 5696 3019 7475 5077 9515
37 2666 9804 9093 7313 4283 10466 6854 13334
38 2551 7944 7534 7173 3665 9215 5495 11309
39 2174 7006 6724 5273 2719 6683 4379 7915
40 3128 8690 8178 8040 3589 6785 5280 8700
mean 2347 9428 8869 7372 3830 9469 6345 11757
SD 893 1830 1842 2876 841 2184 1607 2856
Table 52: Receptor density of α1 (fmol/mg protein) of brain regions investigated of tg5xFAD/LRP1 mice. Mean
density ± standard deviation quoted
animal Group OB M1 S1 Pir CPu CA1 MosHil MGr
1 wt 845 1230 737 572 361 366 345 467
2 wt 818 1018 654 486 273 200 218 286
3 wt 663 561 401 420 151 143 111 196
4 wt 687 700 407 370 133 124 129 196
5 wt 637 738 461 324 139 170 140 211
20 wt 891 853 532 518 168 212 161 275
mean 757 850 532 448 204 203 184 272
SD 107 241 138 93 92 87 87 103
15 5xFAD/ LRP1
747 663 448 339 120 138 120 221
16 728 818 448 338 145 136 141 235
17 696 764 472 469 137 159 132 239
35 674 758 433 309 162 170 160 265
36 711 749 485 427 166 162 167 260
37 771 783 478 416 176 152 149 265
38 571 764 462 244 165 149 151 241
39 511 761 470 391 166 166 152 219
40 871 831 484 568 158 164 146 252
mean 628 766 465 389 155 155 146 244
SD 242 48 18 96 18 12 14 17
Table 53: Receptor density of α2 (fmol/mg protein) of brain regions investigated of tg5xFAD/LRP1 mice. Mean
density ± standard deviation quoted
animal Group OB M1 S1 Pir CPu CA1 MosHil MGr
1 wt 221 282 221 223 104 104 83 284
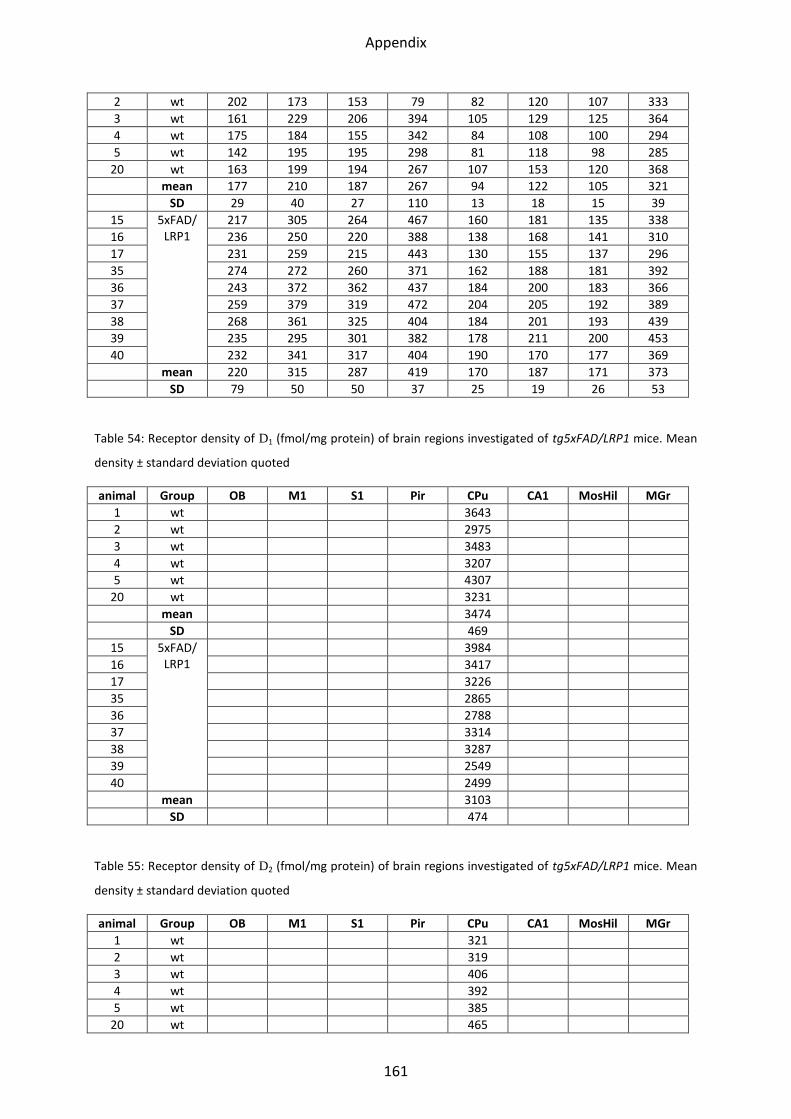
Appendix
161
2 wt 202 173 153 79 82 120 107 333
3 wt 161 229 206 394 105 129 125 364
4 wt 175 184 155 342 84 108 100 294
5 wt 142 195 195 298 81 118 98 285
20 wt 163 199 194 267 107 153 120 368
mean 177 210 187 267 94 122 105 321
SD 29 40 27 110 13 18 15 39
15 5xFAD/ LRP1
217 305 264 467 160 181 135 338
16 236 250 220 388 138 168 141 310
17 231 259 215 443 130 155 137 296
35 274 272 260 371 162 188 181 392
36 243 372 362 437 184 200 183 366
37 259 379 319 472 204 205 192 389
38 268 361 325 404 184 201 193 439
39 235 295 301 382 178 211 200 453
40 232 341 317 404 190 170 177 369
mean 220 315 287 419 170 187 171 373
SD 79 50 50 37 25 19 26 53
Table 54: Receptor density of D1 (fmol/mg protein) of brain regions investigated of tg5xFAD/LRP1 mice. Mean
density ± standard deviation quoted
animal Group OB M1 S1 Pir CPu CA1 MosHil MGr
1 wt 3643
2 wt 2975
3 wt 3483
4 wt 3207
5 wt 4307
20 wt 3231
mean 3474
SD 469
15 5xFAD/ LRP1
3984
16 3417
17 3226
35 2865
36 2788
37 3314
38 3287
39 2549
40 2499
mean 3103
SD 474
Table 55: Receptor density of D2 (fmol/mg protein) of brain regions investigated of tg5xFAD/LRP1 mice. Mean
density ± standard deviation quoted
animal Group OB M1 S1 Pir CPu CA1 MosHil MGr
1 wt 321
2 wt 319
3 wt 406
4 wt 392
5 wt 385
20 wt 465
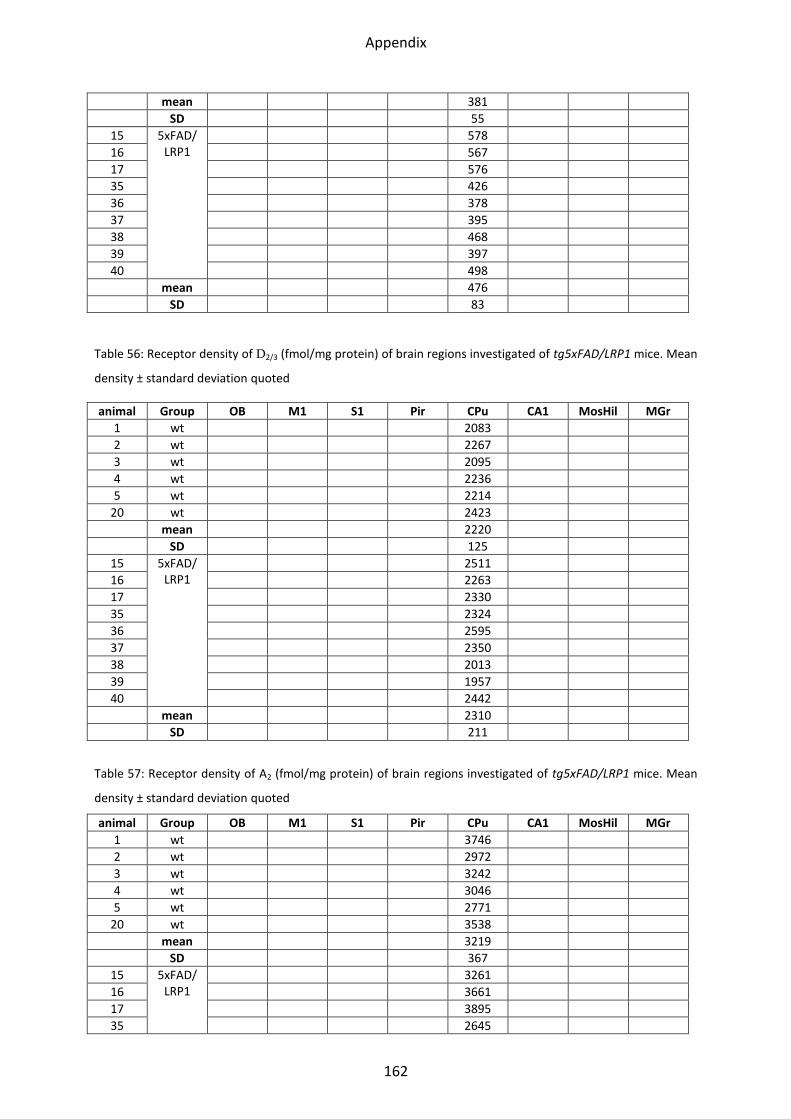
Appendix
162
mean 381
SD 55
15 5xFAD/ LRP1
578
16 567
17 576
35 426
36 378
37 395
38 468
39 397
40 498
mean 476
SD 83
Table 56: Receptor density of D2/3 (fmol/mg protein) of brain regions investigated of tg5xFAD/LRP1 mice. Mean
density ± standard deviation quoted
animal Group OB M1 S1 Pir CPu CA1 MosHil MGr
1 wt 2083
2 wt 2267
3 wt 2095
4 wt 2236
5 wt 2214
20 wt 2423
mean 2220
SD 125
15 5xFAD/ LRP1
2511
16 2263
17 2330
35 2324
36 2595
37 2350
38 2013
39 1957
40 2442
mean 2310
SD 211
Table 57: Receptor density of A2 (fmol/mg protein) of brain regions investigated of tg5xFAD/LRP1 mice. Mean
density ± standard deviation quoted
animal Group OB M1 S1 Pir CPu CA1 MosHil MGr
1 wt 3746
2 wt 2972
3 wt 3242
4 wt 3046
5 wt 2771
20 wt 3538
mean 3219
SD 367
15 5xFAD/ LRP1
3261
16 3661
17 3895
35 2645
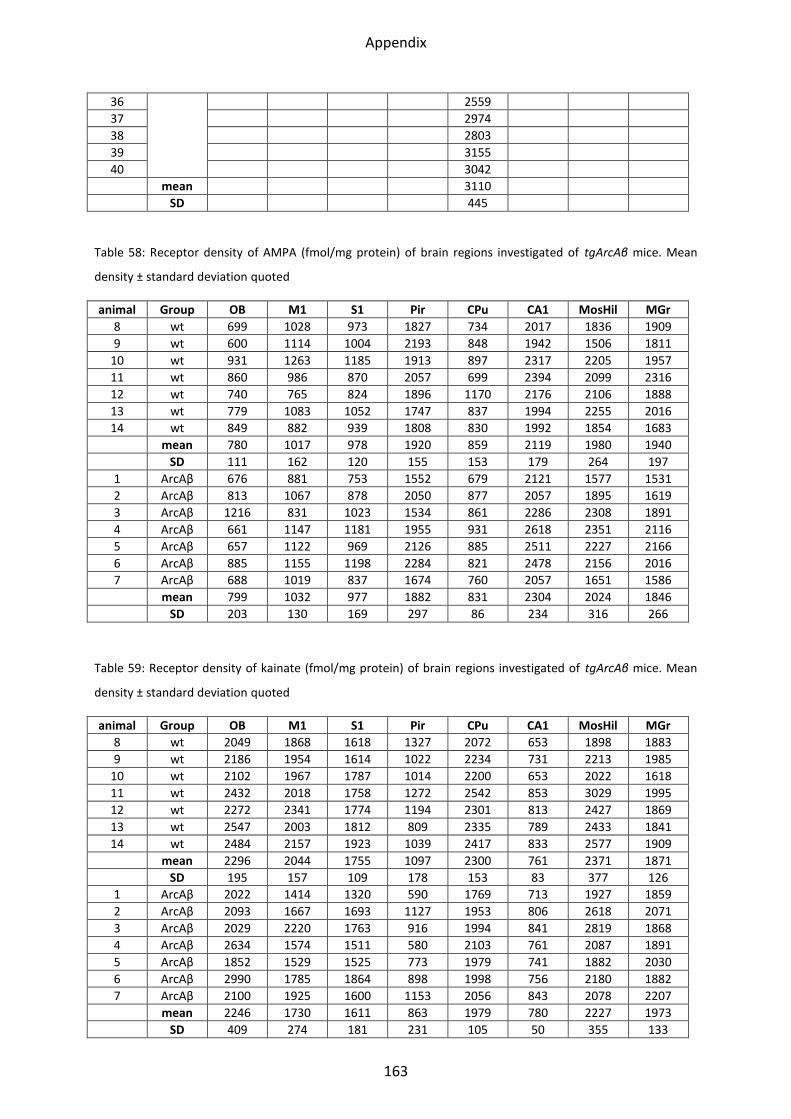
Appendix
163
36 2559
37 2974
38 2803
39 3155
40 3042
mean 3110
SD 445
Table 58: Receptor density of AMPA (fmol/mg protein) of brain regions investigated of tgArcAβ mice. Mean
density ± standard deviation quoted
animal Group OB M1 S1 Pir CPu CA1 MosHil MGr
8 wt 699 1028 973 1827 734 2017 1836 1909
9 wt 600 1114 1004 2193 848 1942 1506 1811
10 wt 931 1263 1185 1913 897 2317 2205 1957
11 wt 860 986 870 2057 699 2394 2099 2316
12 wt 740 765 824 1896 1170 2176 2106 1888
13 wt 779 1083 1052 1747 837 1994 2255 2016
14 wt 849 882 939 1808 830 1992 1854 1683
mean 780 1017 978 1920 859 2119 1980 1940
SD 111 162 120 155 153 179 264 197
1 ArcAβ 676 881 753 1552 679 2121 1577 1531
2 ArcAβ 813 1067 878 2050 877 2057 1895 1619
3 ArcAβ 1216 831 1023 1534 861 2286 2308 1891
4 ArcAβ 661 1147 1181 1955 931 2618 2351 2116
5 ArcAβ 657 1122 969 2126 885 2511 2227 2166
6 ArcAβ 885 1155 1198 2284 821 2478 2156 2016
7 ArcAβ 688 1019 837 1674 760 2057 1651 1586
mean 799 1032 977 1882 831 2304 2024 1846
SD 203 130 169 297 86 234 316 266
Table 59: Receptor density of kainate (fmol/mg protein) of brain regions investigated of tgArcAβ mice. Mean
density ± standard deviation quoted
animal Group OB M1 S1 Pir CPu CA1 MosHil MGr
8 wt 2049 1868 1618 1327 2072 653 1898 1883
9 wt 2186 1954 1614 1022 2234 731 2213 1985
10 wt 2102 1967 1787 1014 2200 653 2022 1618
11 wt 2432 2018 1758 1272 2542 853 3029 1995
12 wt 2272 2341 1774 1194 2301 813 2427 1869
13 wt 2547 2003 1812 809 2335 789 2433 1841
14 wt 2484 2157 1923 1039 2417 833 2577 1909
mean 2296 2044 1755 1097 2300 761 2371 1871
SD 195 157 109 178 153 83 377 126
1 ArcAβ 2022 1414 1320 590 1769 713 1927 1859
2 ArcAβ 2093 1667 1693 1127 1953 806 2618 2071
3 ArcAβ 2029 2220 1763 916 1994 841 2819 1868
4 ArcAβ 2634 1574 1511 580 2103 761 2087 1891
5 ArcAβ 1852 1529 1525 773 1979 741 1882 2030
6 ArcAβ 2990 1785 1864 898 1998 756 2180 1882
7 ArcAβ 2100 1925 1600 1153 2056 843 2078 2207
mean 2246 1730 1611 863 1979 780 2227 1973
SD 409 274 181 231 105 50 355 133
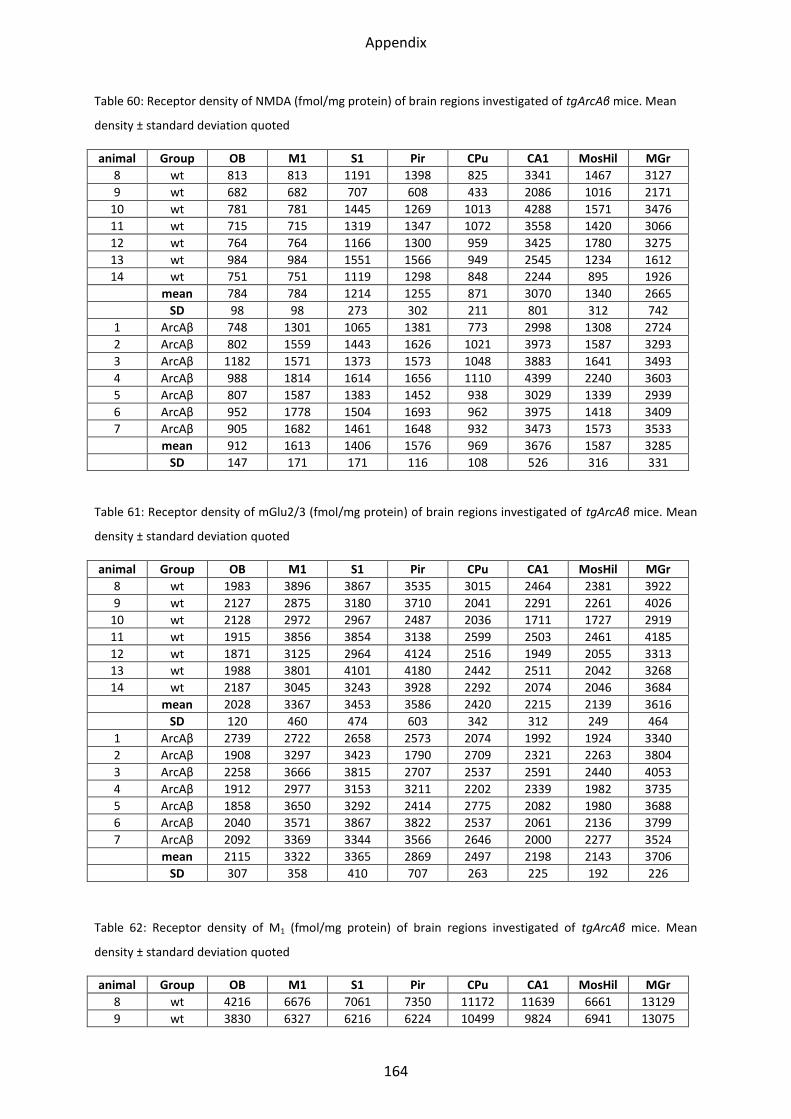
Appendix
164
Table 60: Receptor density of NMDA (fmol/mg protein) of brain regions investigated of tgArcAβ mice. Mean
density ± standard deviation quoted
animal Group OB M1 S1 Pir CPu CA1 MosHil MGr
8 wt 813 813 1191 1398 825 3341 1467 3127
9 wt 682 682 707 608 433 2086 1016 2171
10 wt 781 781 1445 1269 1013 4288 1571 3476
11 wt 715 715 1319 1347 1072 3558 1420 3066
12 wt 764 764 1166 1300 959 3425 1780 3275
13 wt 984 984 1551 1566 949 2545 1234 1612
14 wt 751 751 1119 1298 848 2244 895 1926
mean 784 784 1214 1255 871 3070 1340 2665
SD 98 98 273 302 211 801 312 742
1 ArcAβ 748 1301 1065 1381 773 2998 1308 2724
2 ArcAβ 802 1559 1443 1626 1021 3973 1587 3293
3 ArcAβ 1182 1571 1373 1573 1048 3883 1641 3493
4 ArcAβ 988 1814 1614 1656 1110 4399 2240 3603
5 ArcAβ 807 1587 1383 1452 938 3029 1339 2939
6 ArcAβ 952 1778 1504 1693 962 3975 1418 3409
7 ArcAβ 905 1682 1461 1648 932 3473 1573 3533
mean 912 1613 1406 1576 969 3676 1587 3285
SD 147 171 171 116 108 526 316 331
Table 61: Receptor density of mGlu2/3 (fmol/mg protein) of brain regions investigated of tgArcAβ mice. Mean
density ± standard deviation quoted
animal Group OB M1 S1 Pir CPu CA1 MosHil MGr
8 wt 1983 3896 3867 3535 3015 2464 2381 3922
9 wt 2127 2875 3180 3710 2041 2291 2261 4026
10 wt 2128 2972 2967 2487 2036 1711 1727 2919
11 wt 1915 3856 3854 3138 2599 2503 2461 4185
12 wt 1871 3125 2964 4124 2516 1949 2055 3313
13 wt 1988 3801 4101 4180 2442 2511 2042 3268
14 wt 2187 3045 3243 3928 2292 2074 2046 3684
mean 2028 3367 3453 3586 2420 2215 2139 3616
SD 120 460 474 603 342 312 249 464
1 ArcAβ 2739 2722 2658 2573 2074 1992 1924 3340
2 ArcAβ 1908 3297 3423 1790 2709 2321 2263 3804
3 ArcAβ 2258 3666 3815 2707 2537 2591 2440 4053
4 ArcAβ 1912 2977 3153 3211 2202 2339 1982 3735
5 ArcAβ 1858 3650 3292 2414 2775 2082 1980 3688
6 ArcAβ 2040 3571 3867 3822 2537 2061 2136 3799
7 ArcAβ 2092 3369 3344 3566 2646 2000 2277 3524
mean 2115 3322 3365 2869 2497 2198 2143 3706
SD 307 358 410 707 263 225 192 226
Table 62: Receptor density of M1 (fmol/mg protein) of brain regions investigated of tgArcAβ mice. Mean
density ± standard deviation quoted
animal Group OB M1 S1 Pir CPu CA1 MosHil MGr
8 wt 4216 6676 7061 7350 11172 11639 6661 13129
9 wt 3830 6327 6216 6224 10499 9824 6941 13075
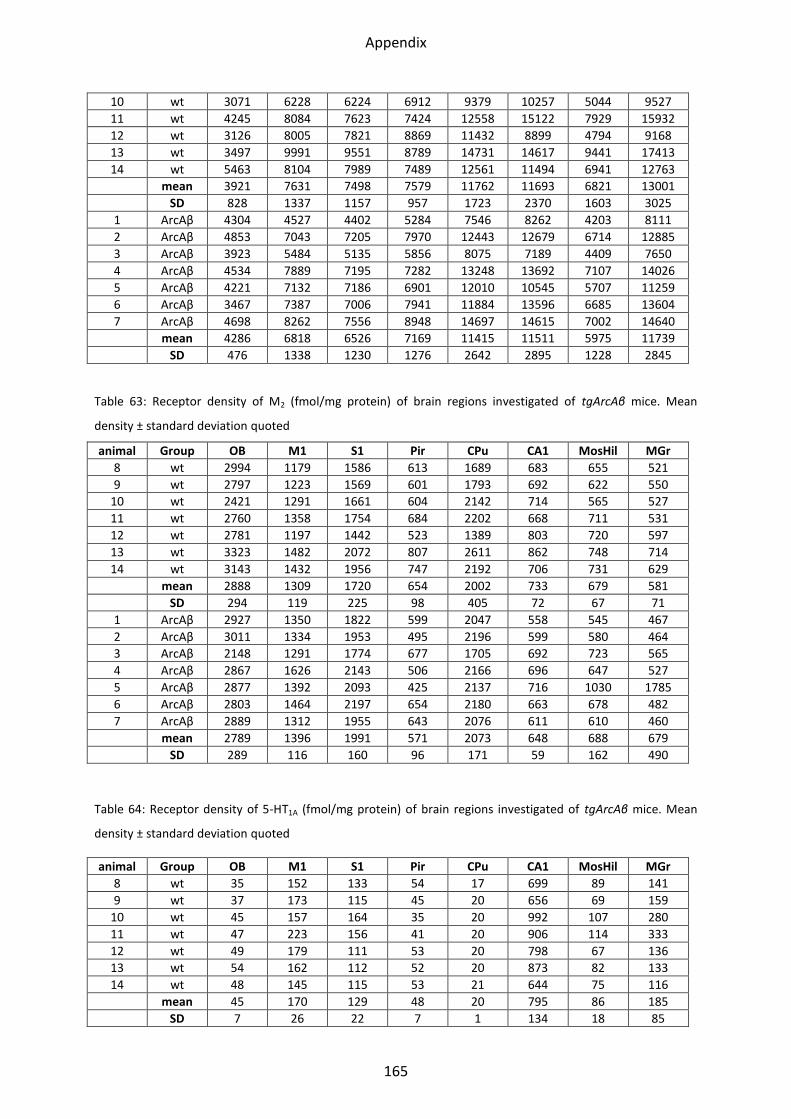
Appendix
165
10 wt 3071 6228 6224 6912 9379 10257 5044 9527
11 wt 4245 8084 7623 7424 12558 15122 7929 15932
12 wt 3126 8005 7821 8869 11432 8899 4794 9168
13 wt 3497 9991 9551 8789 14731 14617 9441 17413
14 wt 5463 8104 7989 7489 12561 11494 6941 12763
mean 3921 7631 7498 7579 11762 11693 6821 13001
SD 828 1337 1157 957 1723 2370 1603 3025
1 ArcAβ 4304 4527 4402 5284 7546 8262 4203 8111
2 ArcAβ 4853 7043 7205 7970 12443 12679 6714 12885
3 ArcAβ 3923 5484 5135 5856 8075 7189 4409 7650
4 ArcAβ 4534 7889 7195 7282 13248 13692 7107 14026
5 ArcAβ 4221 7132 7186 6901 12010 10545 5707 11259
6 ArcAβ 3467 7387 7006 7941 11884 13596 6685 13604
7 ArcAβ 4698 8262 7556 8948 14697 14615 7002 14640
mean 4286 6818 6526 7169 11415 11511 5975 11739
SD 476 1338 1230 1276 2642 2895 1228 2845
Table 63: Receptor density of M2 (fmol/mg protein) of brain regions investigated of tgArcAβ mice. Mean
density ± standard deviation quoted
animal Group OB M1 S1 Pir CPu CA1 MosHil MGr
8 wt 2994 1179 1586 613 1689 683 655 521
9 wt 2797 1223 1569 601 1793 692 622 550
10 wt 2421 1291 1661 604 2142 714 565 527
11 wt 2760 1358 1754 684 2202 668 711 531
12 wt 2781 1197 1442 523 1389 803 720 597
13 wt 3323 1482 2072 807 2611 862 748 714
14 wt 3143 1432 1956 747 2192 706 731 629
mean 2888 1309 1720 654 2002 733 679 581
SD 294 119 225 98 405 72 67 71
1 ArcAβ 2927 1350 1822 599 2047 558 545 467
2 ArcAβ 3011 1334 1953 495 2196 599 580 464
3 ArcAβ 2148 1291 1774 677 1705 692 723 565
4 ArcAβ 2867 1626 2143 506 2166 696 647 527
5 ArcAβ 2877 1392 2093 425 2137 716 1030 1785
6 ArcAβ 2803 1464 2197 654 2180 663 678 482
7 ArcAβ 2889 1312 1955 643 2076 611 610 460
mean 2789 1396 1991 571 2073 648 688 679
SD 289 116 160 96 171 59 162 490
Table 64: Receptor density of 5-HT1A (fmol/mg protein) of brain regions investigated of tgArcAβ mice. Mean
density ± standard deviation quoted
animal Group OB M1 S1 Pir CPu CA1 MosHil MGr
8 wt 35 152 133 54 17 699 89 141
9 wt 37 173 115 45 20 656 69 159
10 wt 45 157 164 35 20 992 107 280
11 wt 47 223 156 41 20 906 114 333
12 wt 49 179 111 53 20 798 67 136
13 wt 54 162 112 52 20 873 82 133
14 wt 48 145 115 53 21 644 75 116
mean 45 170 129 48 20 795 86 185
SD 7 26 22 7 1 134 18 85
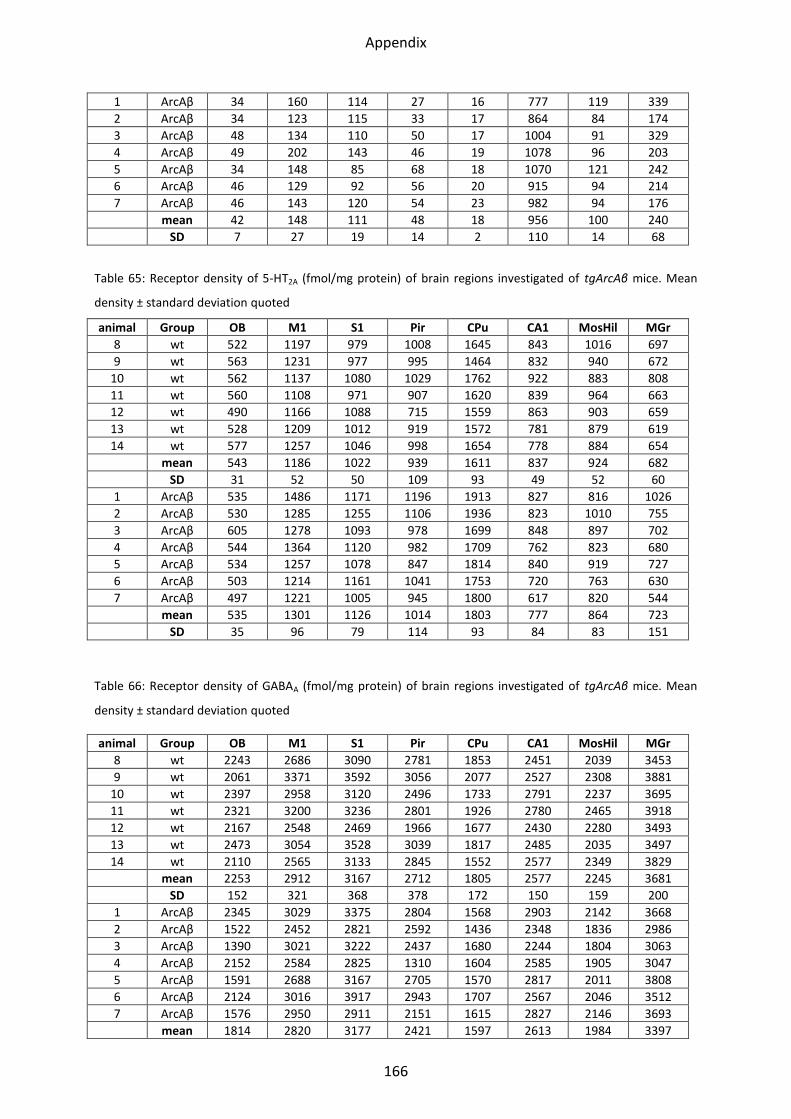
Appendix
166
1 ArcAβ 34 160 114 27 16 777 119 339
2 ArcAβ 34 123 115 33 17 864 84 174
3 ArcAβ 48 134 110 50 17 1004 91 329
4 ArcAβ 49 202 143 46 19 1078 96 203
5 ArcAβ 34 148 85 68 18 1070 121 242
6 ArcAβ 46 129 92 56 20 915 94 214
7 ArcAβ 46 143 120 54 23 982 94 176
mean 42 148 111 48 18 956 100 240
SD 7 27 19 14 2 110 14 68
Table 65: Receptor density of 5-HT2A (fmol/mg protein) of brain regions investigated of tgArcAβ mice. Mean
density ± standard deviation quoted
animal Group OB M1 S1 Pir CPu CA1 MosHil MGr
8 wt 522 1197 979 1008 1645 843 1016 697
9 wt 563 1231 977 995 1464 832 940 672
10 wt 562 1137 1080 1029 1762 922 883 808
11 wt 560 1108 971 907 1620 839 964 663
12 wt 490 1166 1088 715 1559 863 903 659
13 wt 528 1209 1012 919 1572 781 879 619
14 wt 577 1257 1046 998 1654 778 884 654
mean 543 1186 1022 939 1611 837 924 682
SD 31 52 50 109 93 49 52 60
1 ArcAβ 535 1486 1171 1196 1913 827 816 1026
2 ArcAβ 530 1285 1255 1106 1936 823 1010 755
3 ArcAβ 605 1278 1093 978 1699 848 897 702
4 ArcAβ 544 1364 1120 982 1709 762 823 680
5 ArcAβ 534 1257 1078 847 1814 840 919 727
6 ArcAβ 503 1214 1161 1041 1753 720 763 630
7 ArcAβ 497 1221 1005 945 1800 617 820 544
mean 535 1301 1126 1014 1803 777 864 723
SD 35 96 79 114 93 84 83 151
Table 66: Receptor density of GABAA (fmol/mg protein) of brain regions investigated of tgArcAβ mice. Mean
density ± standard deviation quoted
animal Group OB M1 S1 Pir CPu CA1 MosHil MGr
8 wt 2243 2686 3090 2781 1853 2451 2039 3453
9 wt 2061 3371 3592 3056 2077 2527 2308 3881
10 wt 2397 2958 3120 2496 1733 2791 2237 3695
11 wt 2321 3200 3236 2801 1926 2780 2465 3918
12 wt 2167 2548 2469 1966 1677 2430 2280 3493
13 wt 2473 3054 3528 3039 1817 2485 2035 3497
14 wt 2110 2565 3133 2845 1552 2577 2349 3829
mean 2253 2912 3167 2712 1805 2577 2245 3681
SD 152 321 368 378 172 150 159 200
1 ArcAβ 2345 3029 3375 2804 1568 2903 2142 3668
2 ArcAβ 1522 2452 2821 2592 1436 2348 1836 2986
3 ArcAβ 1390 3021 3222 2437 1680 2244 1804 3063
4 ArcAβ 2152 2584 2825 1310 1604 2585 1905 3047
5 ArcAβ 1591 2688 3167 2705 1570 2817 2011 3808
6 ArcAβ 2124 3016 3917 2943 1707 2567 2046 3512
7 ArcAβ 1576 2950 2911 2151 1615 2827 2146 3693
mean 1814 2820 3177 2421 1597 2613 1984 3397
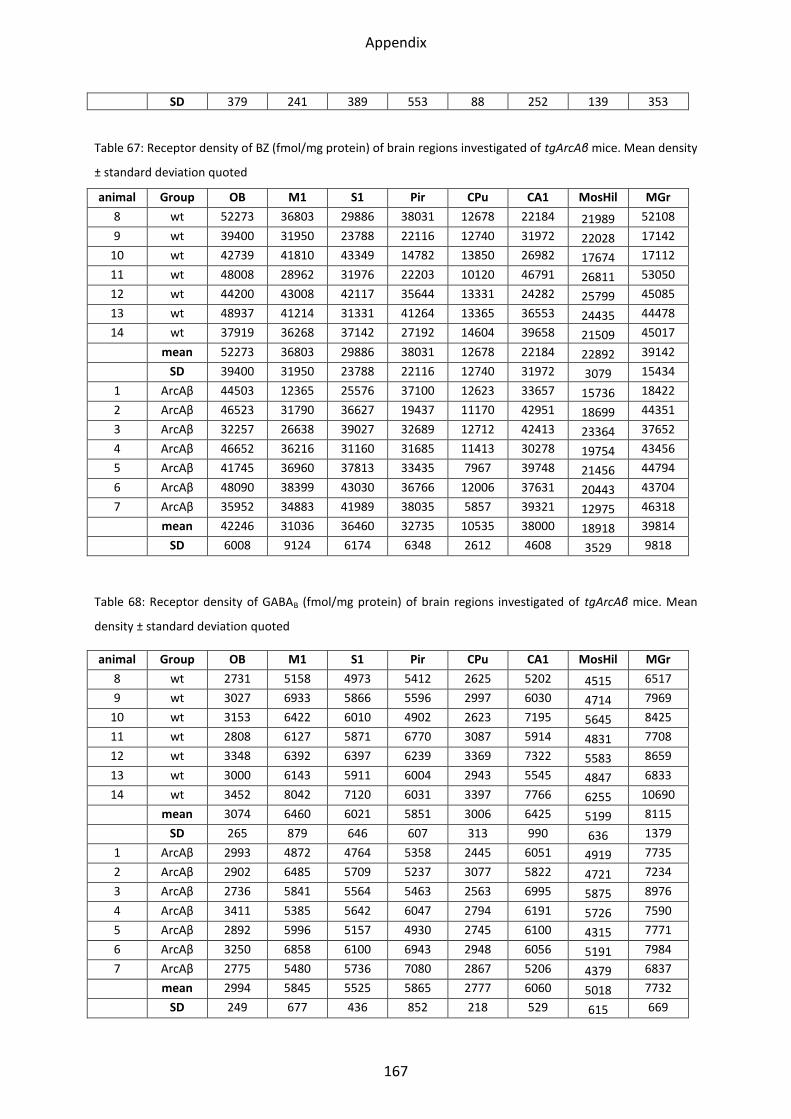
Appendix
167
SD 379 241 389 553 88 252 139 353
Table 67: Receptor density of BZ (fmol/mg protein) of brain regions investigated of tgArcAβ mice. Mean density
± standard deviation quoted
animal Group OB M1 S1 Pir CPu CA1 MosHil MGr
8 wt 52273 36803 29886 38031 12678 22184 21989 52108
9 wt 39400 31950 23788 22116 12740 31972 22028 17142
10 wt 42739 41810 43349 14782 13850 26982 17674 17112
11 wt 48008 28962 31976 22203 10120 46791 26811 53050
12 wt 44200 43008 42117 35644 13331 24282 25799 45085
13 wt 48937 41214 31331 41264 13365 36553 24435 44478
14 wt 37919 36268 37142 27192 14604 39658 21509 45017
mean 52273 36803 29886 38031 12678 22184 22892 39142
SD 39400 31950 23788 22116 12740 31972 3079 15434
1 ArcAβ 44503 12365 25576 37100 12623 33657 15736 18422
2 ArcAβ 46523 31790 36627 19437 11170 42951 18699 44351
3 ArcAβ 32257 26638 39027 32689 12712 42413 23364 37652
4 ArcAβ 46652 36216 31160 31685 11413 30278 19754 43456
5 ArcAβ 41745 36960 37813 33435 7967 39748 21456 44794
6 ArcAβ 48090 38399 43030 36766 12006 37631 20443 43704
7 ArcAβ 35952 34883 41989 38035 5857 39321 12975 46318
mean 42246 31036 36460 32735 10535 38000 18918 39814
SD 6008 9124 6174 6348 2612 4608 3529 9818
Table 68: Receptor density of GABAB (fmol/mg protein) of brain regions investigated of tgArcAβ mice. Mean
density ± standard deviation quoted
animal Group OB M1 S1 Pir CPu CA1 MosHil MGr
8 wt 2731 5158 4973 5412 2625 5202 4515 6517
9 wt 3027 6933 5866 5596 2997 6030 4714 7969
10 wt 3153 6422 6010 4902 2623 7195 5645 8425
11 wt 2808 6127 5871 6770 3087 5914 4831 7708
12 wt 3348 6392 6397 6239 3369 7322 5583 8659
13 wt 3000 6143 5911 6004 2943 5545 4847 6833
14 wt 3452 8042 7120 6031 3397 7766 6255 10690
mean 3074 6460 6021 5851 3006 6425 5199 8115
SD 265 879 646 607 313 990 636 1379
1 ArcAβ 2993 4872 4764 5358 2445 6051 4919 7735
2 ArcAβ 2902 6485 5709 5237 3077 5822 4721 7234
3 ArcAβ 2736 5841 5564 5463 2563 6995 5875 8976
4 ArcAβ 3411 5385 5642 6047 2794 6191 5726 7590
5 ArcAβ 2892 5996 5157 4930 2745 6100 4315 7771
6 ArcAβ 3250 6858 6100 6943 2948 6056 5191 7984
7 ArcAβ 2775 5480 5736 7080 2867 5206 4379 6837
mean 2994 5845 5525 5865 2777 6060 5018 7732
SD 249 677 436 852 218 529 615 669
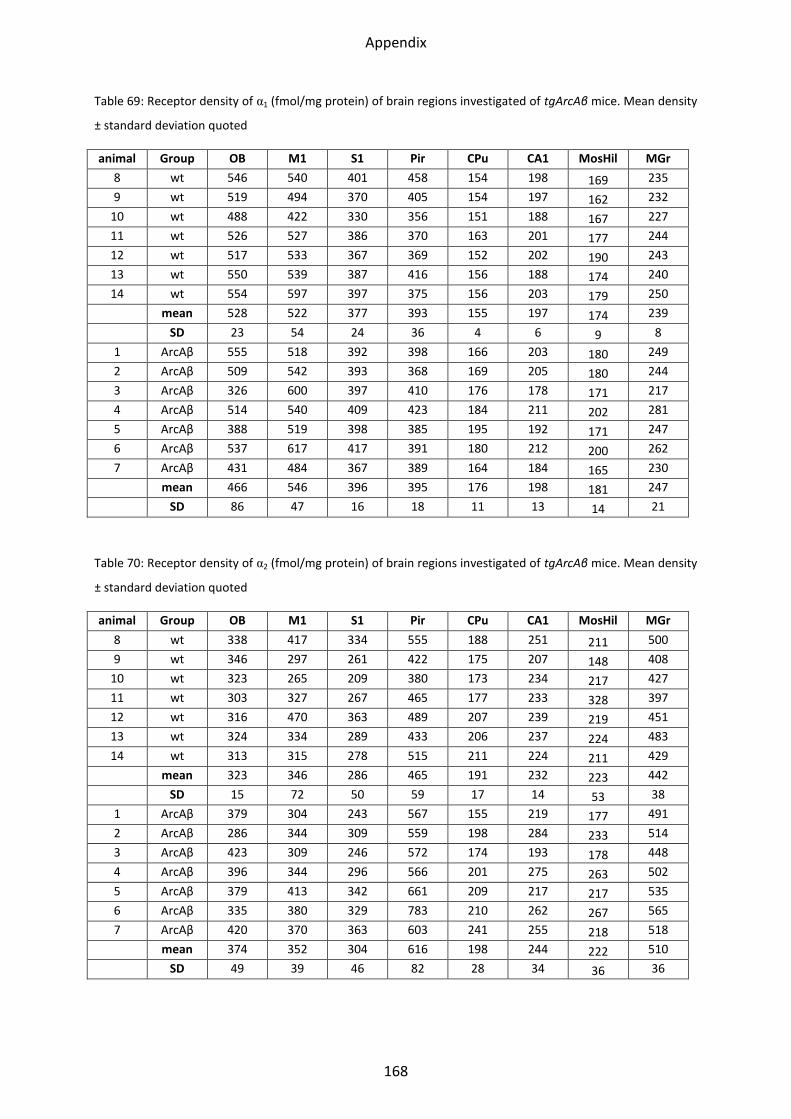
Appendix
168
Table 69: Receptor density of α1 (fmol/mg protein) of brain regions investigated of tgArcAβ mice. Mean density
± standard deviation quoted
animal Group OB M1 S1 Pir CPu CA1 MosHil MGr
8 wt 546 540 401 458 154 198 169 235
9 wt 519 494 370 405 154 197 162 232
10 wt 488 422 330 356 151 188 167 227
11 wt 526 527 386 370 163 201 177 244
12 wt 517 533 367 369 152 202 190 243
13 wt 550 539 387 416 156 188 174 240
14 wt 554 597 397 375 156 203 179 250
mean 528 522 377 393 155 197 174 239
SD 23 54 24 36 4 6 9 8
1 ArcAβ 555 518 392 398 166 203 180 249
2 ArcAβ 509 542 393 368 169 205 180 244
3 ArcAβ 326 600 397 410 176 178 171 217
4 ArcAβ 514 540 409 423 184 211 202 281
5 ArcAβ 388 519 398 385 195 192 171 247
6 ArcAβ 537 617 417 391 180 212 200 262
7 ArcAβ 431 484 367 389 164 184 165 230
mean 466 546 396 395 176 198 181 247
SD 86 47 16 18 11 13 14 21
Table 70: Receptor density of α2 (fmol/mg protein) of brain regions investigated of tgArcAβ mice. Mean density
± standard deviation quoted
animal Group OB M1 S1 Pir CPu CA1 MosHil MGr
8 wt 338 417 334 555 188 251 211 500
9 wt 346 297 261 422 175 207 148 408
10 wt 323 265 209 380 173 234 217 427
11 wt 303 327 267 465 177 233 328 397
12 wt 316 470 363 489 207 239 219 451
13 wt 324 334 289 433 206 237 224 483
14 wt 313 315 278 515 211 224 211 429
mean 323 346 286 465 191 232 223 442
SD 15 72 50 59 17 14 53 38
1 ArcAβ 379 304 243 567 155 219 177 491
2 ArcAβ 286 344 309 559 198 284 233 514
3 ArcAβ 423 309 246 572 174 193 178 448
4 ArcAβ 396 344 296 566 201 275 263 502
5 ArcAβ 379 413 342 661 209 217 217 535
6 ArcAβ 335 380 329 783 210 262 267 565
7 ArcAβ 420 370 363 603 241 255 218 518
mean 374 352 304 616 198 244 222 510
SD 49 39 46 82 28 34 36 36
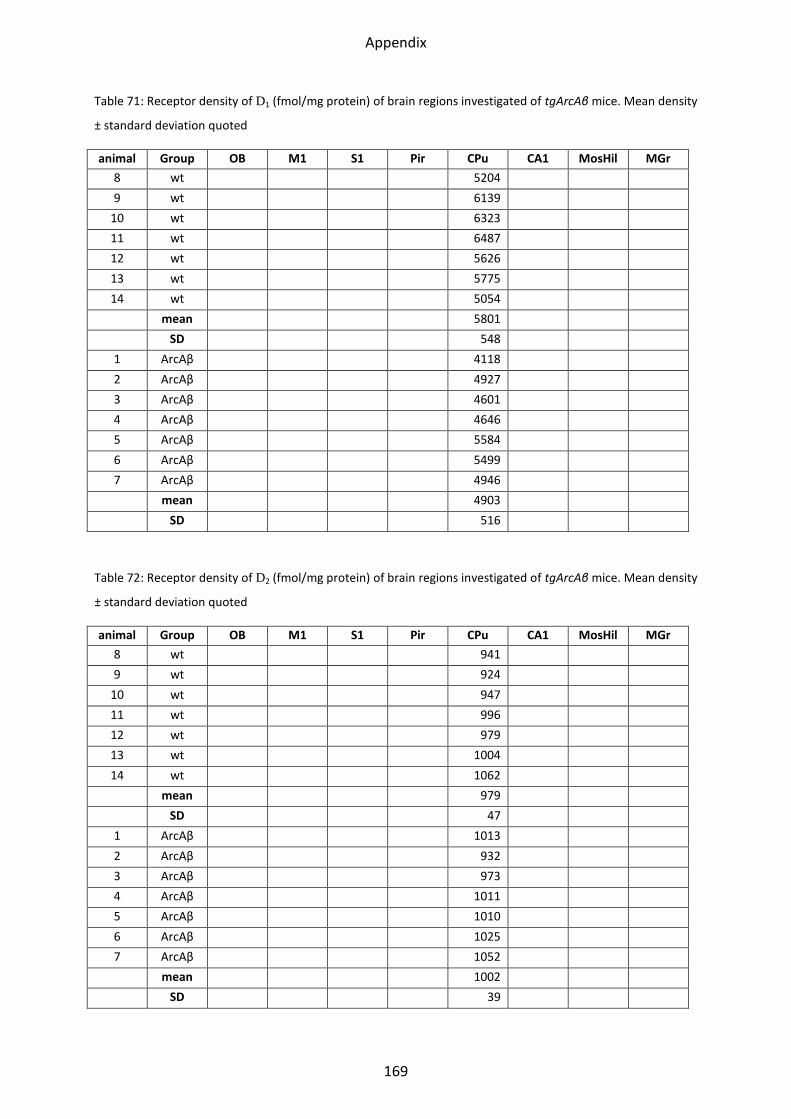
Appendix
169
Table 71: Receptor density of D1 (fmol/mg protein) of brain regions investigated of tgArcAβ mice. Mean density
± standard deviation quoted
animal Group OB M1 S1 Pir CPu CA1 MosHil MGr
8 wt 5204 9 wt 6139
10 wt 6323 11 wt 6487 12 wt 5626 13 wt 5775 14 wt 5054
mean 5801 SD 548
1 ArcAβ 4118 2 ArcAβ 4927 3 ArcAβ 4601 4 ArcAβ 4646 5 ArcAβ 5584 6 ArcAβ 5499 7 ArcAβ 4946 mean 4903 SD 516
Table 72: Receptor density of D2 (fmol/mg protein) of brain regions investigated of tgArcAβ mice. Mean density
± standard deviation quoted
animal Group OB M1 S1 Pir CPu CA1 MosHil MGr
8 wt 941 9 wt 924
10 wt 947 11 wt 996 12 wt 979 13 wt 1004 14 wt 1062
mean 979 SD 47
1 ArcAβ 1013 2 ArcAβ 932 3 ArcAβ 973 4 ArcAβ 1011 5 ArcAβ 1010 6 ArcAβ 1025 7 ArcAβ 1052 mean 1002 SD 39
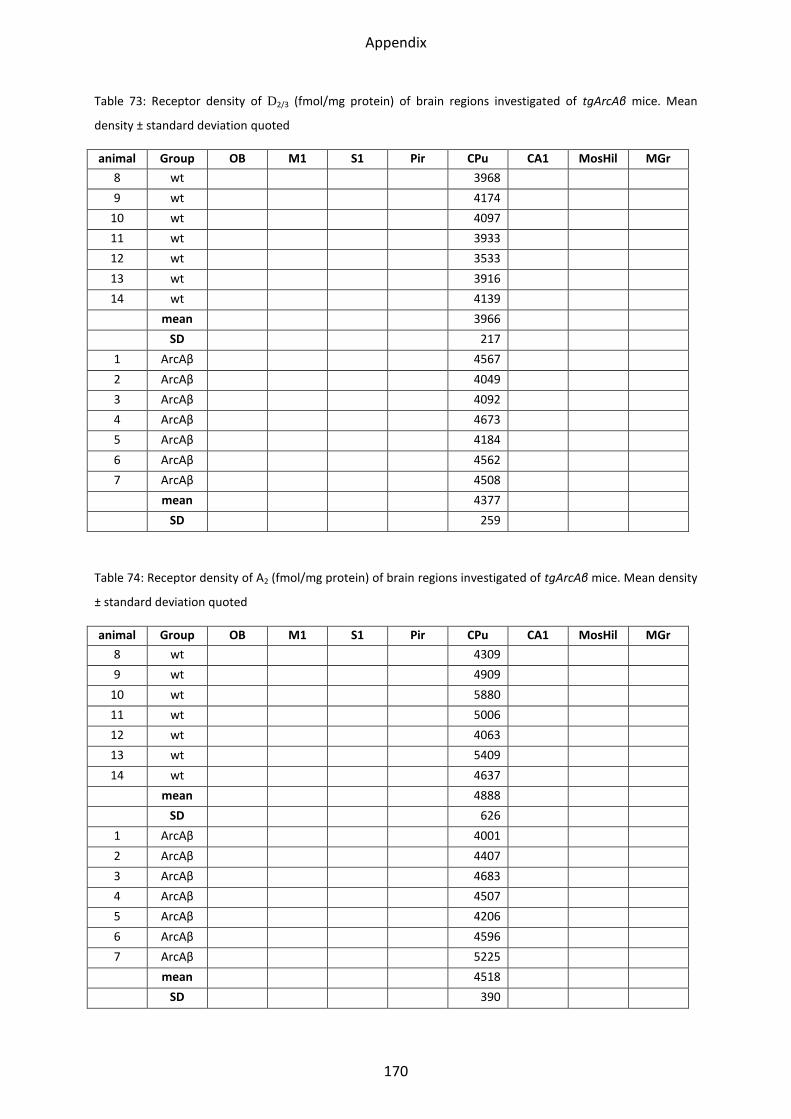
Appendix
170
Table 73: Receptor density of D2/3 (fmol/mg protein) of brain regions investigated of tgArcAβ mice. Mean
density ± standard deviation quoted
animal Group OB M1 S1 Pir CPu CA1 MosHil MGr
8 wt 3968 9 wt 4174
10 wt 4097 11 wt 3933 12 wt 3533 13 wt 3916 14 wt 4139
mean 3966 SD 217
1 ArcAβ 4567 2 ArcAβ 4049 3 ArcAβ 4092 4 ArcAβ 4673 5 ArcAβ 4184 6 ArcAβ 4562 7 ArcAβ 4508 mean 4377 SD 259
Table 74: Receptor density of A2 (fmol/mg protein) of brain regions investigated of tgArcAβ mice. Mean density
± standard deviation quoted
animal Group OB M1 S1 Pir CPu CA1 MosHil MGr
8 wt 4309 9 wt 4909
10 wt 5880 11 wt 5006 12 wt 4063 13 wt 5409 14 wt 4637
mean 4888 SD 626
1 ArcAβ 4001 2 ArcAβ 4407 3 ArcAβ 4683 4 ArcAβ 4507 5 ArcAβ 4206 6 ArcAβ 4596 7 ArcAβ 5225 mean 4518 SD 390

Appendix
171

Appendix
172
Appendix
173
Danksagung
Ich danke Prof. Dr. Zilles für die Möglichkeit, meine Arbeit an seinem Institut anzufertigen
und die Bereitschaft, mich bei dieser Arbeit als Doktorvater zu unterstützen; des Weiteren für
die hervorragende wissenschaftliche Betreuung und den vielfältigen konstruktiven
Austausch. Auch möchte ich mich für die Freiheiten bedanken, die ich bei der Umsetzung der
Arbeit hatte. Ebenfalls bedanken möchte ich mich bei Frau Prof. Dr. Amunts für die
Möglichkeit, die Arbeit an Ihrem Institut fortzuführen und für vielfältige fachliche
Anregungen.
Prof. Dr. von der Emde danke ich für Betreuung von Seiten der Universität Bonn, für die
Übernahme des Zweitgutachtens, für Anregungen und für das Interesse, dass er meiner
Arbeit entgegengebracht hat.
Herrn Dr. Schleicher und Frau Dr. Palomero-Gallagher danke ich für die Hilfe bei der
statistischen Auswertung.
In so vielen kleinen und großen Dingen liegt der Erfolg einer Arbeit. Für eine tolle
Arbeitsatmosphäre, großartige Hilfsbereitschaft, für die vielen Tipps, die den Umgang mit
manchmal störrischen Geräten erleichtert haben und für viel Kuchen möchte ich mich
besonders bei Markus Cremer, Jennifer Cremer, Sabrina Buller, Jessica Teske-Bausch,
Christian Schramm, Sabine Wilms und Andrea Radermacher bedanken.
Frau Dr. Hack und Frau Dr. Willuweit danke ich für die Korrekturen und die Unterstützung
bei den immunhistochemischen Versuchen. Zudem danke ich Frau Dr. Hack für die kreativen
Versuche, für die „Speerspitze der deutschen Neuroforschung“, und Max Anstötz für den
immerwährenden Kampf gegen das Mikroskop.
Ich danke meiner Familie und meinen Freunden, insbesondere meiner Schwester und
meinem Schwager, für die nie nachlassende Unterstützung.
Bei Thomas Schmitges bedanke ich mich für die unerschütterliche Zuversicht, für die Geduld,
für die Vergangenheit und die Zukunft.