
New Phthalimide-based Sensors for Chiral and Achiral ... · New Phthalimide-based Sensors for...
240
New Phthalimide-based Sensors for Chiral and Achiral Anions and Peroxides Inaugural-Dissertation Zur Erlangung des Doktorgrades der Mathematisch-Naturwissenschaftlichen Fakultät der Universität zu Köln vorgelegt von Yrene Hortencia Díaz Pérez aus Caracas (Venezuela) Köln 2009
Transcript of New Phthalimide-based Sensors for Chiral and Achiral ... · New Phthalimide-based Sensors for...

New Phthalimide-based Sensors for
Chiral and Achiral Anions and Peroxides
Inaugural-Dissertation
Zur Erlangung des Doktorgrades
der Mathematisch-Naturwissenschaftlichen Fakultät
der Universität zu Köln
vorgelegt von
Yrene Hortencia Díaz Pérez
aus Caracas
(Venezuela)
Köln 2009

Berichterstatter: Prof. Dr. A. G. Griesbeck
Prof. Dr. B. Goldfuß
Tag der mündlichen Prüfung: 3.02.2010

Gedruckt mit Unterstützung des Deutschen
Akademischen Austauschdienstes


For my Parents and Claus Miara


Acknowledgements
First of all, I would like to thank the Deutscher Akademischer Austausch Dienst (DAAD) for
giving me the possibility to conduct my Ph.D in Germany in the research group of Prof. Dr.
Axel Griesbeck and especially my referee Veronica Metje.
Next, I would like to express my gratitude to Prof. Dr. Axel Griesbeck for giving me the
opportunity to perform this work in his group and for his qualified and valuable help and the
excellent working conditions in his group.
I owe special thanks to Prof. Dr. Bernd Goldfuß for the fruitful cooperation and for accepting
to act as referee of my thesis as well as Prof. Dr. Klaus Meerholz and Dr. Dirk Blunk for being
part of the evaluation committee of my thesis.
Another important person that I would like to thank is Dr. Franklin Vargas in Venezuela for
his support and for his right orientation to my professional career.
It is also important to me to thank my colleagues Dr. Angela Raabe, Elmar Zimmerman,
Johannes Uhlig, Dr. Miyeon Cho, Dr. Raúl Pérez, Dr. Alberto Soldevilla, Dr. Oliver Höinck,
Marco Franke, Olga Hinze, Alan de Kiff, Viktor Schlundt, Sarah Strohmeier and Nestor
Nazarov for the very nice time together in the laboratory and the good atmosphere. Special
thanks go to Dr. Angela Raabe, Elmar Zimmerman, Dr. Raúl Pérez, Dr. Alberto Soldevilla and
Sebastian Hanft for the help and friendly cooperation on my work.
I would like to give my thanks to the NMR department consisting of Dr. Nils Schlörer,
Kathrin König and Gunter Arnold-Hässlich for the help by the NMR experiments, as well as
Christoph Schmitz for his help with the elemental analysis and Andreas Adler for the
micropipette. Dr. Jörg Neudörfl for the X-Ray measurements and Maria Schumacher for the
theoretical calculations.
In the Physical Chemistry department, I would like to thank Dr. Dirk Hertel for his help and
dedication to the measurements of lifetimes and Georgios Liaptsis for conduction of the mass
spectrometry. In the Biochemistry department, I would like to thank Dr. Kay Marin for his help
and his availability in the chemoluminescence measurements.
The luminol project was a joint work, which is why I would like to thank Robert Fichtler for
the nice time that we worked together, for his help and collaboration. I would like to thank Dr.
Axel Jacobi von Wangelin, who was a part of the Luminol project, for his help and friendship.
I would like to thank Tobias Robert, Stefanie Ritter, Jutta Schütte, Dorina Köbele-Milas and
Tobias Hermann for helping me correct my work and for the very, very nice time we have
shared together.

For their great support, I would like to say my Venezuelan friends thousand thanks.
I would like to thank Inger Miara on becoming a great guide for me, now that my parents
have become so far.
For the support, understanding, help, dedication and thousand reasons more since I came to
Germany and especially in the last months I would like to thank my husband Claus Miara.
A last thank goes to my parents (Nery de Díaz and Aquiles Díaz) as well as my brother Pablo
Díaz and all my familiy members for the absolute support and help during my study in
Venezuela and during my Ph.D., I am very grateful for all that.
Explanation
This work was performed from October 2006 to December 2009 under the supervision of
Prof. Dr. Axel G. Griesbeck at the Department of Chemistry, Institute of Organic Chemistry,
University of Cologne.
In the experimental part names in the format pydr[number] refer to the enumeration in the
lab-journal.
Abbreviations
1H NMR Proton Nuclear Magnetic Resonance Spectroscopy 13C NMR Carbon Nuclear Magnetic Resonance Spectroscopy
Abs. Absorption
Ar. Aromatic
ACN/CH3CN Acetonitrile
b.p. Boiling point (°C)
cat. Catalyst
Cbz Carbonylbenzyloxy
CL Chemoluminescence
CT Charge transfer
n-Bu n-Butyl
t-Bu t-Butyl
d Doublet
dd Doublet of Doublet
DA Diels-Alder
DABCO 1,4-Diazabicyclo[2,2,2]octane
DBU 1,8-Diazabicyclo[5.4.0]undec-7-ene
DCC Dicyclohexylcarbodiimide
DCM Dichlormethan
DMAP N,N-Dimethylaminopyridine
DMBA N,N-Dimethyl(phenyl)methanamine
1,2-DMB 1,2-Dimethoxybenzene
1,3-DMB 1,3-Dimethoxybenzene
1,4-DMB 1,4-Dimethoxybenzene
DMBA N,N-dimethyl(phenyl)methanamine
DMPAA 2-(3,4-dimethoxyphenyl)acetic acid
DMSO Dimethylsulfoxide
Em. Emission

equiv. Equivalent
eq. Equation
Es Singlet energy
EtOAc Ethylacetate
EtOH Ethanol
Et3N Trimethylamine
Exc. Excitation
F Fluorescence intensity
FRET Fluorescence Resonance Energy Transfer
GC/MS Coupled gas chromatography-mass spectrometry
GP General procedure
h Hour
HMQC Heteronuclear Multiple-Quantum Coherence Experiment
HOMO Highest Occupied Molecular Orbital
HRMs High Resolution Mass Spectrometry
IC Internal conversion
ICT Internal Charge Transfer
IR Infrared spectrum
ISC Intersystem Crossing
J Coupling constant (Hz)
KD Stern-Volmer constant
kq Bimolecular quenching constant
KCT Constant of CT complex
kF Fluorescence rate constant
LUMO Lowest Unoccupied Molecular Orbital
MeOH Methanol
M Molar concentration
m Multiplet
min. Minute
mmol Milli mole
M.p. Melting Point
MPAA 2-(4-methoxyphenyl)acetic acid
MS Mass Spectrometry
NMP N-methyl-2-pyrrolidinone
NMR Nuclear Magnetic Resonance
ns Nano second (10-9 s)
PET Photoinduced Electron Transfer

Q Quencher
q Quartet
RET Resonance Electron Trensfer
Rf Rate of flow (retention factor)
r.t. Room Temperature
s Second or singlet (in NMR)
S0 Singlet ground state
S1 First excited singlet state
T Temperature
T1 First excited triplet state
TBA Tetrabutylammonium
t Triplet
THF Tetrahydrofuran
TLC Thin-layer Chromatography
TSA p-Toluenesulfonic acid
UV Ultraviolet
UV-vis Ultraviolet visible
λ Wavelength
ε Molar extinction coefficient
µ Micro (10-6)
τ Lifetime
* Excited state
Φf Fluorescence Quantum Yield


Abstract
The first part of this work describes the synthesis of fluorescent and non-fluorescent
phthalimide derivatives via straightforward synthetic routes, including multicomponent
reactions (MCRs) (scheme 1-a), and aromatic substitutions and reductions (scheme 1-b).
a.-
R1 NH2
O+
H
OR2
CO2Me
CO2Me
+ O
O
O
O
NH
O
R1
R2
R2
TSA, Ac2O,NMP
120 °C, 24 h
O
O
O
O
NH
O
R1
R2
R2
MnO2120 °C, toluene+
NH
O
R1
R2
R2
N
O
O
R3
H2N-R3
b.-
O
O
O
NH2 N
O
O
NO2NO2
+ + H2Pd/C N
O
O
NH2
NEt3
toluene EtOH
RR R
OH
O
NHO
O
NH
N R
O
O
OHN
O
O
Ac2O N R
O
O
NH
O
Scheme 1
In the second part the synthesis of new photocages based on aminophthalimide-serine was
carried out and the fluorescence quenching behaviour of these photocages was investigated
(scheme 2)
N
OCOO-
OAcO
R1
R2
N
O
O
R1
R2
hν+ CO2 + AcO-
Scheme 2
In order to obtain new chiral sensors for achiral and chiral anion recognition the fluorescent
sensors 107, 109-112 were synthesized in the third part of this work. The syntheses are based on
urea-activated phthalimides with stereogenic centers that were synthesized using an efficient
procedure involving a Curtius rearrangement (scheme 3).

ii
NHO2C
O
O
N
HN
O
O
HN
OR
2. , 25 °C
1. PhOCOCl, NaN3t-BuONa/DME, 75°C
R-NH2
Scheme 3
The non-fluorescent sensor 123 based on a thiourea-activated phthalimide with a stereogenic
center was synthesized following a synthetic route involving five steps each of which could be
performed with good yields (scheme 4).
NH
O
O
H2SO4 / HNO3NH
O
O
O2NN
O
O
O2N
Br
K2CO3, KIN
O
O
H2NH2,Pd/C
N
O
O
SCN
Cl Cl
S
N
O
O
HN
HN
S
NH2
Dioxan, Ar
Scheme 4
This work demonstrates the capability of a new series of fluorescent and non-fluorescent
chiral sensors obtained through the previously described synthetic routes to recognize achiral
and chiral anions and peroxides.
Photophysical properties of the sensors such as absorption (abs), excitation (exc),
emission (em) wavelengths (λ), Stokes shifts, singlet energies (Es), fluorescence lifetimes (τF),
quantum fluorescence yields (ΦF) and fluorescence rate constants (kF) were determined in
several solvents in order to compare the solvent effects on the different photophysical properties
of the sensor.
The recognition of the achiral and chiral anions was performed through absorption,
fluorescence and 1H NMR experiments. To consolidate the experimental results, theoretical
calculations based on DFT methods at B31YP/6-31G* level were carried out.
Recognition of peroxides was conducted by fluorescence experiments before and after
irradiation of the sensor−peroxide solutions at 350 nm.

iii
NHNH
NH2 O
O
NHNH
NH2 O
O
NHNH
i-PrNH2
i-Pr
O
O
NHNH
BnNH2
Bn
O
O
NHNH
NH2 O
O
NHNH
NH2 O
O
S
NH2
NHNH
O
O
Scheme 5
In the last part of this thesis the photophysical properties of luminol derivatives were
compared with the parent luminol. Furthermore, comparative studies of the chemoluminescence
efficiency of these luminol derivatives were carried out (scheme 5).

Kurzzusammenfassung
Im ersten Teil dieser Arbeit wurden verschiedene fluoreszierende und nicht-fluoreszierende
Phthalimidderivate über vergleichsweise einfache synthetische Routen hergestellt. Eine der
verwendeten Routen verlief über eine Multikomponeten-Reaktion (MCR, Abbildung 1-a).
Davon abgesehen, wurden überwiegend aromatische Substitution und Reduktionen eingesetzt
(Abbildung 1-b).
a.-
R1 NH2
O+
H
OR2
CO2Me
CO2Me
+ O
O
O
O
NH
O
R1
R2
R2
TSA, Ac2O,NMP
120 °C, 24 h
O
O
O
O
NH
O
R1
R2
R2
MnO2120 °C, toluene+
NH
O
R1
R2
R2
N
O
O
R3
H2N-R3
b.-
O
O
O
NH2 N
O
O
NO2NO2
+ + H2Pd/C N
O
O
NH2
NEt3
toluene EtOH
RR R
OH
O
NHO
O
NH
N R
O
O
OHN
O
O
Ac2O N R
O
O
NH
O
Abbildung 1
Im zweiten Teil der Arbeit wurde eine Synthese für neue Aminophthalimid-Serin Systeme,
die als sogenannte photocages eingesetzt werden konnten, entwickelt und durchgeführt. Für
diese photocages wurden eine Reihe von Fluoreszenzlöschungs-Experimenten durchgeführt
(Abbildung 2).
N
OCOO-
OAcO
R1
R2
N
O
O
R1
R2
hν+ CO2 + AcO-
Abbildung 2
Neue chirale Sensoren 107, 109-112 für die Erkennung von achiralen und chiralen Anionen
wurden im dritten Teil dieser Arbeit synthetisiert und untersucht. Die verwendete Synthese

v
zielte auf Harnstoff-aktivierte Phthalimide mit einem stereogenenen Zentrum, die unter
Anwendung einer effizienten Methode (Curtius-Umlagerung) hergestellt wurden (Abbildung 3).
NHO2C
O
O
N
HN
O
O
HN
OR
2. , 25 °C
1. PhOCOCl, NaN3t-BuONa/DME, 75°C
R-NH2
Abbildung 3
Der nicht fluoreszierende Sensor 123 basiert auf einem über Thioharnstoff aktivierten
Phtalimid mit einem stereogenen Zentrum und wurde durch Fünfstufensynthese in guten
Ausbeuten hergestellt (Abbildung 4).
NH
O
O
H2SO4 / HNO3NH
O
O
O2NN
O
O
O2N
Br
K2CO3, KIN
O
O
H2NH2,Pd/C
N
O
O
SCN
Cl Cl
S
N
O
O
HN
HN
S
NH2
Dioxan, Ar
Abbildung 4
In der vorliegenden Arbeit wurde das Potential dieser neuen fluoreszierenden und nicht
fluoreszierenden chiralen Sensoren für chirale und achirale Anionen und Peroxide untersucht.
Die photophysikalischen Eigenschaften der Sensoren wie Absorption (abs), Anregung (exc),
Wellenlänge (λ), Stokes-Verschiebung, Singulett Energie (Es), Fluoreszenz-Lebensdauer (τF),
Fluoreszenz-Quantenausbeute (ΦF) and Fluoreszenz-Geschwindigkeits-konstante (kF) wurden in
verschiedenen Lösungsmitteln gemessen, um Lösungsmitteleffekte auf die verschiedenen
photophysikalischen Eigenschaften der Sensoren zu vergleichen.
Die Erkennung von achiralen und chiralen Anionen wurde über Absorption, Fluoreszenz und 1H-NMR Experimente bestimmt. Um die experimentellen Ergebnisse zu stützen, wurden DFT-
theoretische Berechnungen auf B31YP/6-31G* Niveau durchgeführt.
Die Erkennung der Peroxide wurde durch Fluoreszenzexperimente vor und nach der
Belichtung von Sensor-Peroxid Proben bei 350 nm durchgeführt.
vi
NHNH
NH2 O
O
NHNH
NH2 O
O
NHNH
i-PrNH2
i-Pr
O
O
NHNH
BnNH2
Bn
O
O
NHNH
NH2 O
O
NHNH
NH2 O
O
S
NH2
NHNH
O
O
Abbildung 5
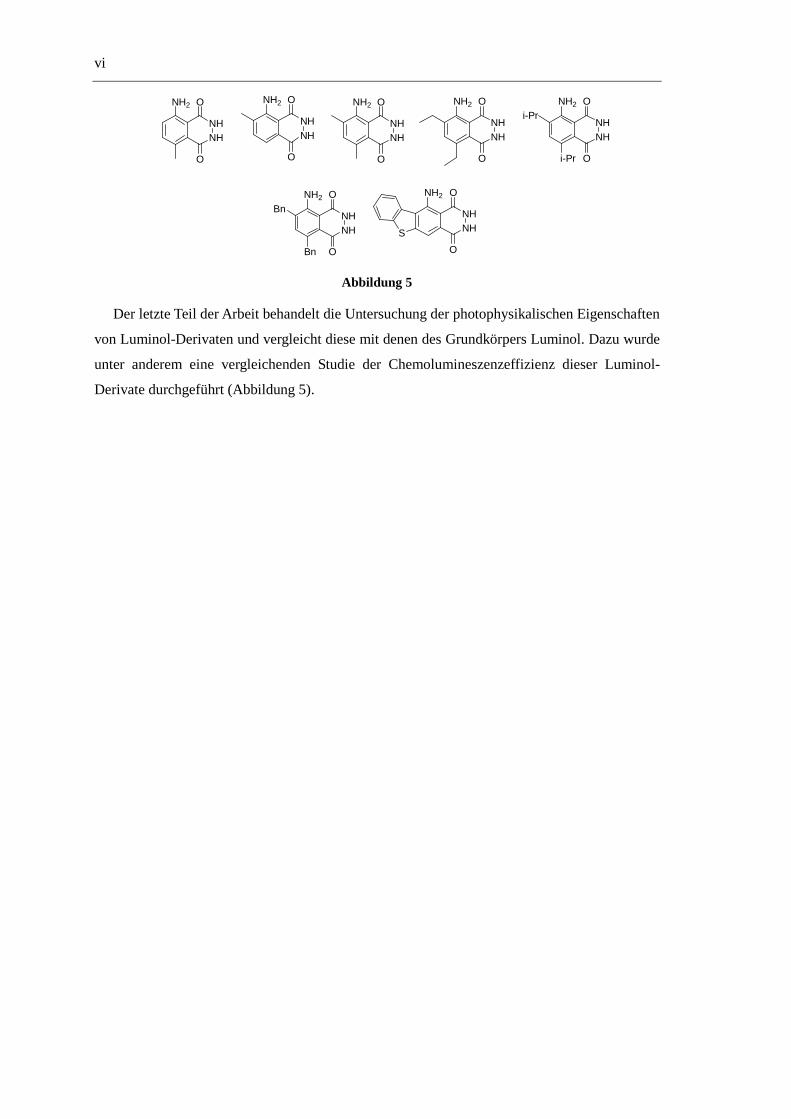
Der letzte Teil der Arbeit behandelt die Untersuchung der photophysikalischen Eigenschaften
von Luminol-Derivaten und vergleicht diese mit denen des Grundkörpers Luminol. Dazu wurde
unter anderem eine vergleichenden Studie der Chemolumineszenzeffizienz dieser Luminol-
Derivate durchgeführt (Abbildung 5).
CONTENT
1 INTRODUCTION 1
1.1 Electronic States 1
1.2 Energy level diagrams for photoluminescent molecules (Jablonski Diagram) 2
1.3 The Franck-Condon principle, absorption and emission spectra 3
1.4 Fluorescence 4
1.4.1 Characteristic of fluorescence emission 6
1.4.2 Fluorescence quenching 8
1.4.3 Resonance energy transfer (RET) 11
1.4.4 Mechanisms of quenching 12
1.5 Fluorescence lifetimes and quantum yields 14
1.6 Fluorescence sensing 15
1.6.1 Mechanisms of sensing 15
1.6.2 Cations sensing 16
1.6.3 Anions sensing 23
1.6.4 Chiral recognition 36
1.6.5 Hydrogen peroxide recognition 46
1.7 Phthalimides as chromophore 49
1.8 Multicomponent reactions 50
1.8.1 One-pot reactions with dienophilic acetylendicarboxylates 51
1.8.2 One-pot reactions with dienophilic maleimide and methyl maleimide 52
1.9 Chemoluminescence 53
2 AIM OF THE WORK 57
3 RESULTS AND DISCUSSION 59
3.1 Synthesis of nitro- and amino-substituted phthalimide derivatives from benzylamine 59
3.2 Synthesis of phathalimide derivativess from 4-amino-2-benzylisoindoline-1,3-dione 59

II
3.3 Synthesis of nitro-, amino-substituted phthalimide deriva-tives from 2,2-
Diphenylhydrazine 61
3.4 Quenching study of amino- and acetamido-substituted phthalimide derivatives 61
3.4.1 Quenching study of 4-amino-2-benzylisoindoline-1,3-dione 62
3.4.2 Quenching study of N-(2-Benzyl-1,3-dioxoisoindolin-4-yl)acetamide 64
3.4.3 Preliminary study: fluorescence activation of 2-(diphenyl-amino)-4-aminoisoindoline-1,3-
dione through cation coordination 67
3.5 From 1-(2-Aminonaphthalen-1-yl) naphthalene-2-amine to chiral phthalimides 71
3.6 Multicomponent Reaction 73
3.6.1 One-pot reaction with dienophilic dimethyl acetylenedi-carboxylate 73
3.7 Synthesis of Phthalimide-Serine Couples 78
3.7.1 Irradiation of caged acetates 3-acetoxy-2-(5,6-dimethoxy-1,3-dioxoisoindolin-2-
yl)propionic acid and 3-acetoxy-2-(5-methoxycarbonylamino-1,3-dioxoisoindolin-2-yl)
propanoic acid 80
3.8 Synthesis of Chiral Phthalimide-Urea-Conjugates 85
3.9 Photophysical properties, anion sensing and chiral recognition by chiral phthalimide-
urea-conjugate 87
3.9.1 Photophysical properties 87
3.9.2 Anion Sensing 89
3.9.3 Chiral recognition 108
3.10 Fluorescence study of the sensors 107 and 109-112 with different peroxides 116
3.11 Synthesis of Chiral Phthalimide-Thiourea-Conjugate 123
3.12 Photophysical Properties, Anion Sensing and Chiral Recognition by Chiral Phthalimide-
Thiourea-Conjugates 123
3.13 Synthesis and Photophysical Properties of Luminol Derivates 132
3.13.1 Photophysical data and spectroscopic properties 134
3.13.2 pH-Dependence on absorption and steady-state fluorescence of 129-135 136
3.13.3 Chemoluminescence (CL) 138
4 CONCLUSION 145
III
5 EXPERIMENTAL PART 153
5.1 General Remarks 153
5.2 General Procedures 155
5.3 Synthesis of nitro; amino- and acetamide-substituted phthalimide derivatives 158
5.4 Preliminary quenching study of 4-amino-2-benzylisoindo-line-1,3-dione, N-(2-benzyl-
1,3-dioxoisoindolin-4-yl)acetamide. 164
5.5 Preliminary study for fluorescence activation of 2-(diphenylamino)-4-
aminoisoindoline-1,3-dione through cation coordination 164
5.6 Reactions with 1-(2-Aminonaphthalen-1-yl) naphthalene-2-amine to get chiral
phthalimides 165
5.7 Multicomponent coupling with dienophilic dimethyl acetylenedicarboxylate 168
5.8 Anilines via MnO2-mediated oxidation 170
5.9 Synthesis of Phthalimides from aniline derivatives 172
5.10 Reactions of Dimethyl 3-acetamido-4,6-diethylbenzene-1,2-dioate with acid and basic 174
5.11 Synthesis of Phthalimide-Serine Couples 175
5.12 Synthesis of chiral phthalimide-Urea-Conjugates 184
5.13 Photophysical properties, anion sensing and chiral recognition by chiral phthalimide-
urea-conjugate 191
5.14 Fluorescence study of chiral phthalimide-urea-conjugate with different peroxides 192
5.15 Fluorescence study of 107 and 109-112 with hydrogen peroxides 193
5.16 Synthesis of Chiral Phthalimide-Thiourea-Conjugate 193
5.17 Photophysical Properties, anion sensing and chiral recognition by Chiral Phthalimide-
Thiourea-Conjugates 197
5.18 Synthesis and Photophysical Properties of Luminol Derivates 197
6 APPENDIX 203

IV
7 LITERATUR 207
1 Introduction
1.1 Electronic States
A full understanding of photochemical reactions requires an appreciation of the nature and
properties of electronically excited states. Quantum mechanical concepts are invaluable in the
analysis of the behavior of electronically excited molecules and can be used to rationalize
experimental observations despite the approximations involved.
Each electron in a molecule carries a spin angular momentum with a spin quantum number
s = 1/2. A point charge moving in a Coulomb field gives rise to a magnetic moment which, in
the presence of a magnetic field, may take up one of two orientations. The magnetic moment
may be aligned in the direction of the lines of force of the applied magnetic field or opposed to
it, giving rise to two different energy states of the electron. A transition between the two energy
levels corresponding to these states involves a change of alignment of the electron magnetic
moment and is the basis of electron spin resonance.
The term electron spin refers to the alignment of the electron magnetic moment with respect
to an imaginary magnetic field. If no field is present, there can be no splitting in the electron
spin energy levels but the individual moments will still be present and will still dictate how the
electrons interact with each other and with the nucleus.
The total spin angular momentum possessed by a many-electron atom or molecule is
represented by the total spin quantum number S, which may be calculated as the vector sum of
all the individual contributions from each electron. Two electrons, each possessing s = 1/2, may
be present with their spins parallel or opposed. If the spins are opposed the total quantum
number S is zero. If the electron spins are parallel the total quantum number S is 1/2 + 1/2 = 1.
The spin multiplicity gives the number of states expected in the presence of an applied magnetic
field and is given by 2S+1. Thus, a molecule with all electrons spin-paired (which will be the
case for the ground electronic state of most organic molecules) possesses S = 0 and a spin
multiplicity of 1. Such an electronic state is referred to as a singlet state. The combination of
ground state and singlet state is abbreviated by the symbol S0. [1]
The Pauli Exclusion Principle states that two electrons in an atom can not have the same set
of four quantum numbers. This restriction requires that no more than two electrons can fit in one
orbital; furthermore, the two must have opposed spin states. [2]
2
S2
S1
S0
T2
T1
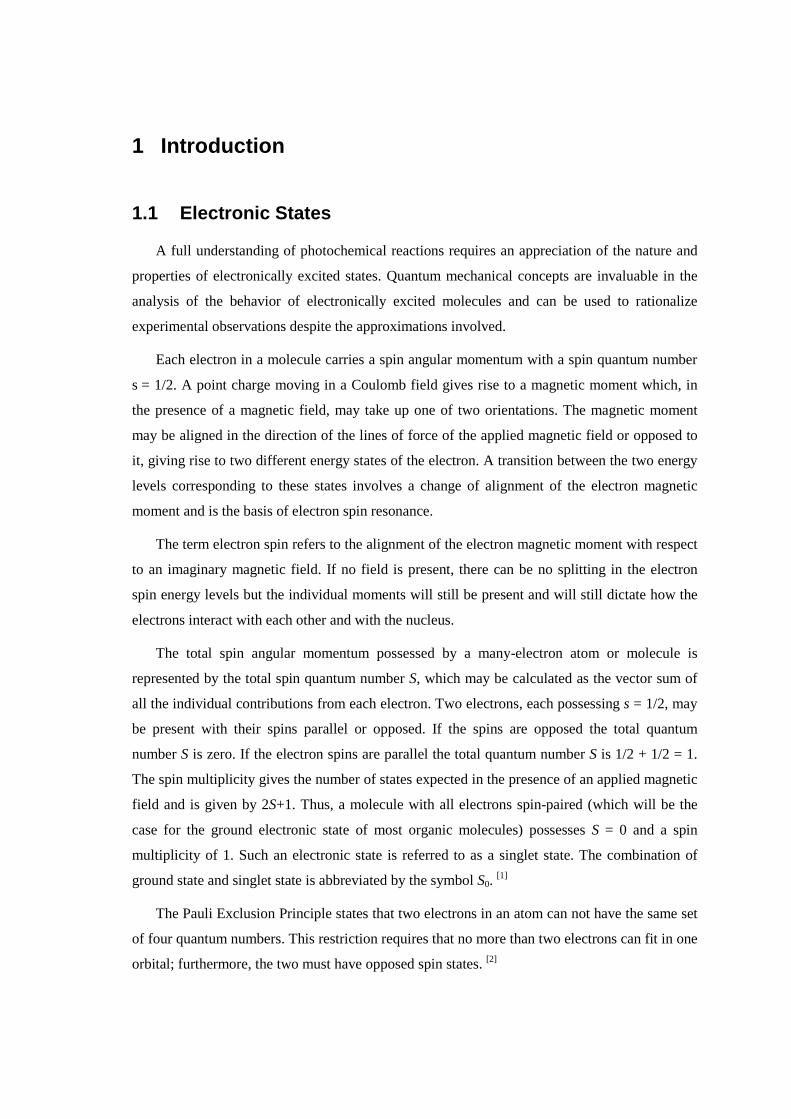
It is common to present these different spin states by a simplified molecular energy level
diagram to which the appropriate labels are attached. An example of such a state diagram is
illustrated in figure 1 for a generalized unsaturated hydrocarbon.
Figure 1: General state diagram of the (relative) energy of the lowest vibrational level
The excited T1 state is indicated to have an energy lower than that of the excited S1 state.
This lowering of the T1 state energy is due to spin correlation. It is a consequence of the
operation of the Pauli principle, and is summarized by Hund´s rule [1] of maximum multiplicity.
Even in the present situation where the two unpaired electrons occupy different orbitals, there is
a minimum energy of electron-electron repulsion when their spins are parallel. This repulsion
energy will determine the energy difference between the excited and singlet state and will
depend on the extent of space between the orbitals involved.
1.2 Energy level diagrams for photoluminescent molecules
(Jablonski Diagram)
Excitation of molecules are initiated by absorption of two modes of radiation, one centered
around the wavelength λ1 (S0→S1), and the second around a shorter wavelength λ2 (S0→S2).
What happens to an electronically excited molecule that does not undergo some kind of
chemical reaction? The molecule cannot persist in an excited state indefinitely, since it
represents a situation unstable with respect to the ground state. Electron de-excitation must
occur somehow, the excess energy being released as thermal or radiative energy. Transitions
involving the de-excitation of electronically excited states that do not involve the emission of
radiation are called nonradiative transitions.
The emitted radiation is called fluorescence if it originates in the de-excitation of an excited
state that has the same spin multiplicity as the ground state, and the emission is called
3
phosphorescence if it originates from the de-excitation of an excited state of spin multiplicity
different from that of the ground state (for example, T1….S0).
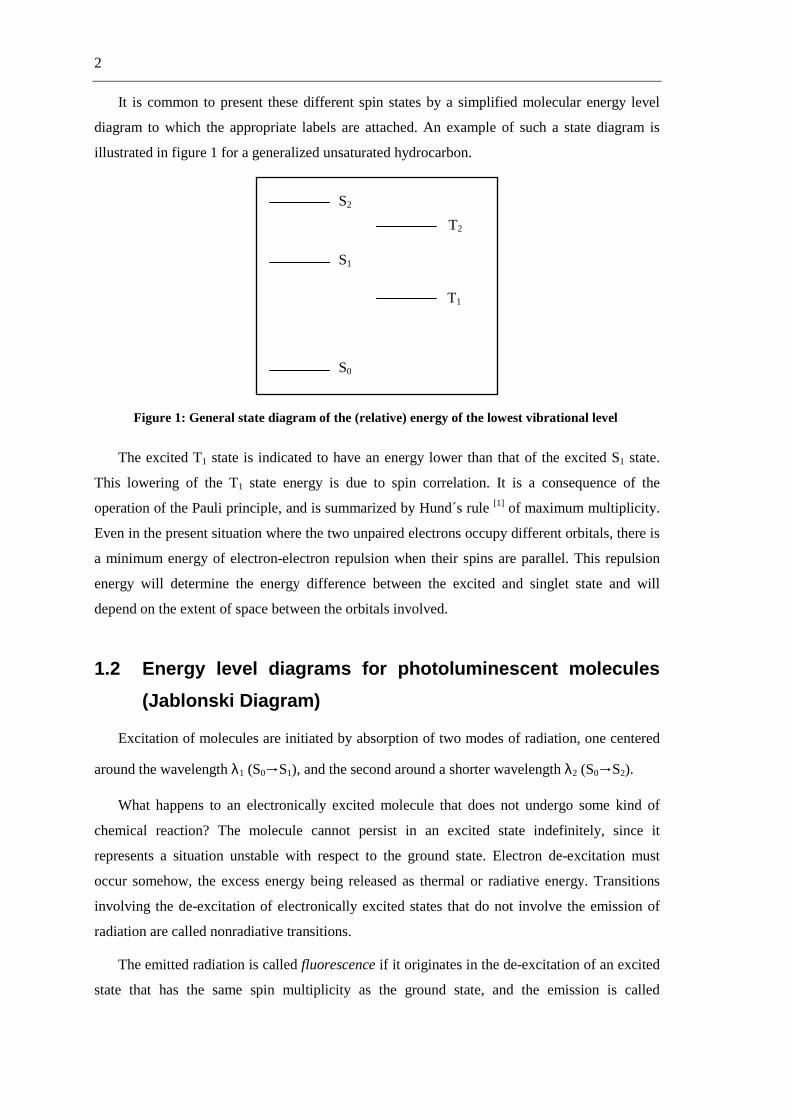
We can use the state diagram in figure 1 and indicate all the possible transitions that may
occur between different energy levels. The result (figure 2) is called a Jablonski diagram.
Figure 2: Jablonski Diagram [3]
Radiative transitions are “vertical” transitions and involve a change in the total energy of
the molecule due to the absorption and emission of a photon. Nonradiative transitions are
“horizontal” transitions and involve conversion from one state to another at a constant energy. A
conversion between states of the same spin multiplicity is called internal conversion (IC) and
for states of different spin multiplicity the term intersystem crossing (ISC) is used. In the
solution phase the excess vibrational energy is rapidly removed by collisions with solvent
molecules, a process sometimes referred to as vibrational relaxation (VR).
1.3 The Franck-Condon principle, absorption and emission
spectra
The Franck-Condon principle states for the classical electronic transition of a vibrating
molecule:
“Since electronic motions are much faster than nuclear motion, electronic transitions occur
most favorably when the nuclear structure of the initial and final state are most similar”.
The conversion of electronic energy into vibrational energy may be the rate determining
step in an electronic transition between states of different nuclear geometries. A description of
the Franck-Condon principle would be that (a) for radiative transitions, nuclei geometries do not
change during the time it takes for a photon to “hit”, “be absorbed” and cause an electron to
jump; and (b) for nonradiative transitions, nuclear motions do not change during the time it

4
takes an electron to jump from one orbital to another. Figure 3 shows the potential energy
curves of the possible Franck-Condon transition.
Absorption and emission spectra are not sharp lines with respect to the frequency ν of the
absorbed or emitted light of the equation ∆E = hν from the postulate that only one electron is
excited or de-excited in an individual absorption or emission event.
In a set of molecules, an electronic transition is not as “pure” as it is in a single atom or
molecule. This is due to the fact that, in order to describe the electronic states of a molecule, the
motions of nuclei relative to one another (e.g. vibrations, rotations, collisions) must be
considered. The sharp line or band which characterizes atomic transitions is replaced by a set of
closely spaced lines in molecular absorption which may be only partially resolved or even
completely unresolved. For organic molecules in solution - i.e. our case - this latter situation is
common.
In analogy to absorption, the most probable emissions will be those which occur vertically.
In contrast to absorption, the equilibrium separation of the ground state potential-energy curve
minimum is smaller than that of the excited state curve, so that the most probable vertical
transitions produce an elongated ground state, while absorption produces a compressed excited
state immediately after transition. [4]
Figure 3: Franck-Condon diagram [5]
1.4 Fluorescence
The electron in the excited orbital is paired (by opposite spin) to the second electron in the
ground state orbital. Consequently, return to the ground state is spin allowed and occurs rapidly

5
by emission of a photon. The emission rates of fluorescence are typically 108 s-1, so that a
typical fluorescence lifetime is close to 10 ns. [6]
Some typical fluorescent substance (fluorophores) are quinine, fluorescein, rhodamine B,
pyridine 1 etc, as shown in figure 4. The first observation of fluorescence from a quinine
solution in sunlight was reported by Sir John Frederick William Herschel in 1845. [6],[7] The
experiment consisted of a observation of a glass of tonic water that was exposed to sunlight; a
faint blue glow is frequently visible at the surface. The quinine in tonic water is excited by the
ultraviolet light from the sun. Upon return to the ground state the quinine emits blue light with a
wavelength near 450 nm. Due to this discovery, quinine was responsible for stimulating the
development of the first spectrofluorometers that appeared in the 1950s.
N
HO N
HMeO
OHO O
CO2H
O(C2H5)2N N(C2H5)2
CO2HNC2H5
(CH CH)2 N(CH3)2
ClO4-
Quinine Fluorescein Rhodamine B Pyridine 1
Figure 4: Typical fluorescent compounds
Other fluorophores are encountered in daily life like fluorescein and rhodamine.
Polynuclear aromatic hydrocarbons, such as anthracene and perylene, are also fluorescent, and
the emission from such species is used for environmental monitoring of oil pollution. Pyridine 1
and rhodamine are frequently used in dye lasers.
The most intense and useful fluorescence is found in compounds containing aromatic
functional groups with low energy π→π* transition levels. Compounds containing aliphatic and
alicyclic carbonyl structures or highly conjugated double bond structures may also exhibit
fluorescence, but the number of these is small compared to the number of existing aromatic
system. Another group which can fluorescence in solution are the unsubstituted aromatic
hydrocarbon, the quantum efficiency usually increasing with the number of the rings and their
degree of condensation.
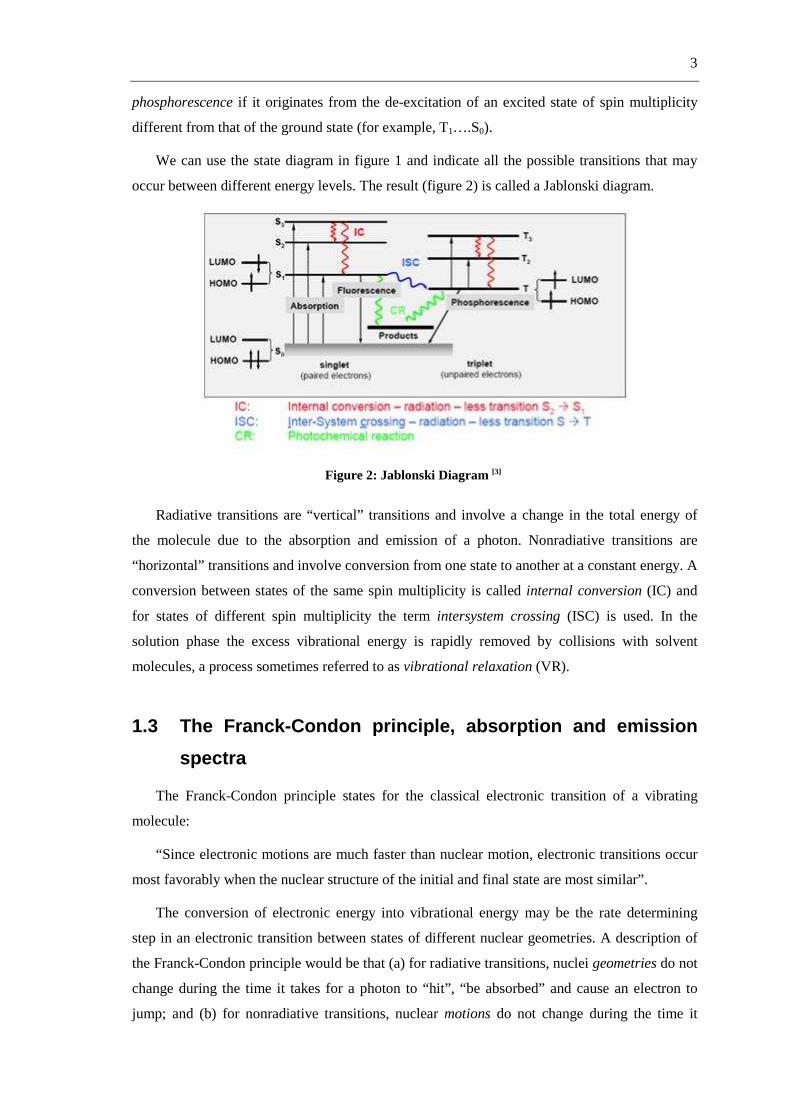
The simple heterocycles, such as pyridine, furane, thiophene and pyrrole (figure 5) do not
exhibit fluorescence, on the other hand, fused ring structures ordinarily do. Fluorescence is
observed for compounds like quinoline, isoquinoline, and indole.
6
N
NN
HN
pyridine furan thiophene pyrrole
quinoline isoquinoline indole
non-fluorescent
fluorescent
O SHN
Figure 5: Fluorescent and non-fluorescent molecules
The influence of halogen substitution is striking: the decrease in fluorescence with
increasing atomic number of the halogen is thought to be in part due to the heavy atom effect,
which increases the probability for intersystem crossing to the triplet state because of large spin-
orbit coupling contribution. [2]
Substitution of a carboxylic acid or carbonyl group on an aromatic ring generally inhibits
fluorescence. In these compounds, the energy of the n, π∗ transition is less than that of the π, π*
transitions.[2]
1.4.1 Characteristic of fluorescence emission
A fluorescence emission spectrum is a plot of the fluorescence intensity vs. wavelength
(nm) or wavenumber (cm-1). Emission spectra are dependent on the chemical structure of the
fluorophore and the solvent in which it is dissolved. Another important feature of fluorescence
is its highly sensitive detection. Fluorescence has some more general characteristics that will be
describe in the following sections.
The Stokes Shift
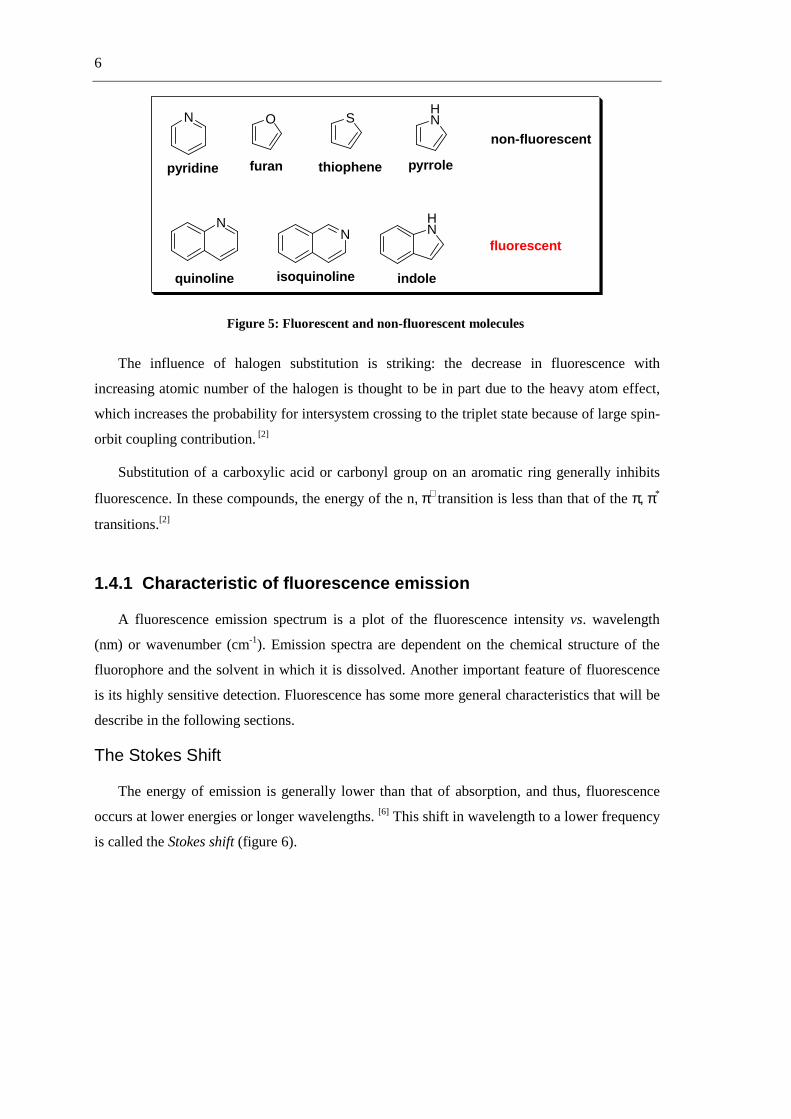
The energy of emission is generally lower than that of absorption, and thus, fluorescence
occurs at lower energies or longer wavelengths. [6] This shift in wavelength to a lower frequency
is called the Stokes shift (figure 6).

7
Figure 6: Absorption and emission spectra, Stokes shift [8]
Emission spectra are typically independent of the excitation wavelength
The same fluorescence emission spectrum is generally observed irrespectivly of the
excitation wavelength (Kasha´s rule).[9],[6] Upon excitation into higher electronic and vibrational
levels, the excess energy is quickly dissipated, leaving the fluorophore in the lowest vibrational
level of S1. Because of this rapid relaxation (about 10-12 s), emission spectra are usually
independent of the excitation wavelength.
There are exceptions, such as fluorophores that exist in two ionization states, each of which
display distinct absorption and emission spectra. Also, some molecules are known to emit from
the S2 level, but such emissions are rare and generally not observed in biological molecules. [6]
Effect of pH on Fluorescence
The wavelength and the emission intensity are likely to be different for the ionized and
nonionized forms of the compounds, if they have acidic or basic substituents which are pH-
dependent. For example, aniline has several resonance forms while the anilinium ion has only
one. This resonance form leads to a more stable first excited state; fluorescence in the ultraviolet
region is the consequence.
Experiments with pH-sensors have been used for the detection of end points in acid/base
titrations. Changes in acid or base dissociation constants with excitation are common and
occasionally as large as four to five orders of magnitude. [2]
Effect of solvent polarity
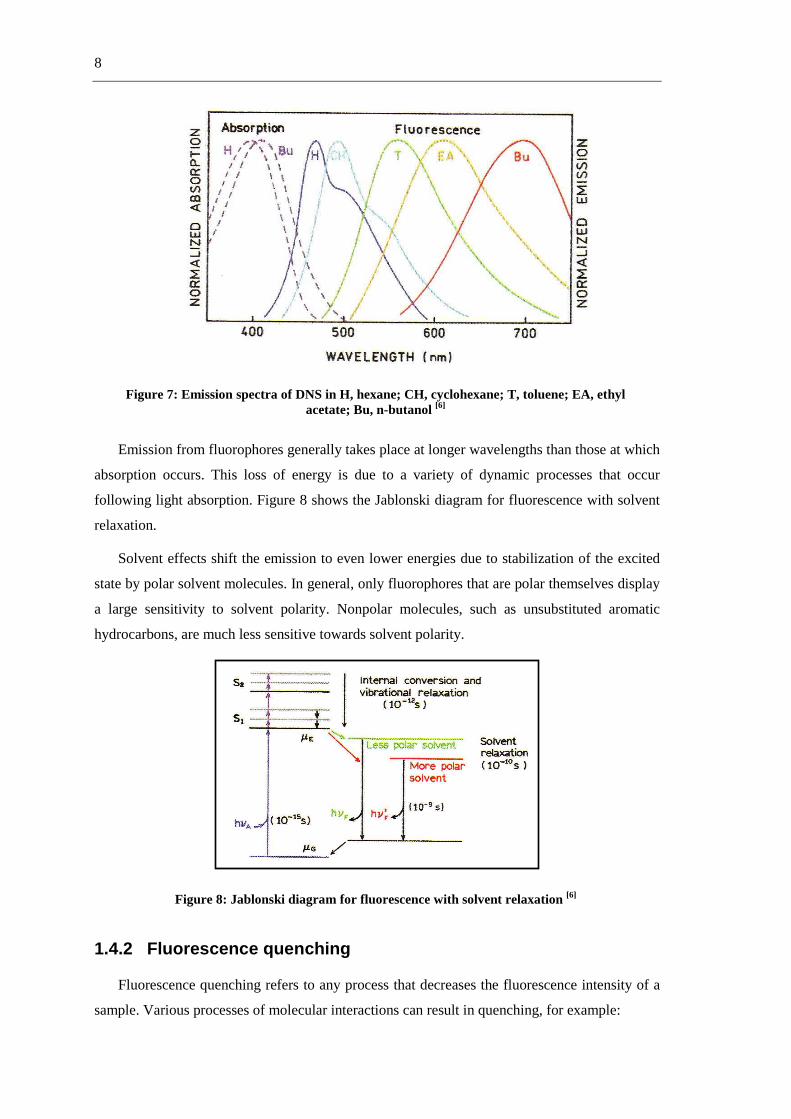
The effects of solvent polarity are one origin of the Stokes shift. Figure 7 shows a plot of
emission spectra of 4-dimethylamino-4´-nitrostilbene (DNS) in solvents of increasing polarity.
8
Figure 7: Emission spectra of DNS in H, hexane; CH, cyclohexane; T, toluene; EA, ethyl acetate; Bu, n-butanol [6]
Emission from fluorophores generally takes place at longer wavelengths than those at which
absorption occurs. This loss of energy is due to a variety of dynamic processes that occur
following light absorption. Figure 8 shows the Jablonski diagram for fluorescence with solvent
relaxation.
Solvent effects shift the emission to even lower energies due to stabilization of the excited
state by polar solvent molecules. In general, only fluorophores that are polar themselves display
a large sensitivity to solvent polarity. Nonpolar molecules, such as unsubstituted aromatic
hydrocarbons, are much less sensitive towards solvent polarity.
Figure 8: Jablonski diagram for fluorescence with solvent relaxation [6]
1.4.2 Fluorescence quenching
Fluorescence quenching refers to any process that decreases the fluorescence intensity of a
sample. Various processes of molecular interactions can result in quenching, for example:

9
• Excited state reactions (chemical quenching)
• Molecular rearrangements (chemical quenching)
• Energy transfer (physical quenching)
• Ground state complex formation (static quenching)
• Collisional quenching (dynamic quenching)
In this opportunity two of the molecular interactions will be discussed, collisional or
dynamic quenching and the ground state complex formation or static quenching.
Collisional quenching
Collisional quenching occurs when the excited state fluorophore is deactivated upon contact
with some other molecule in solution, which is called quencher. The Jablonski diagram figure 9
illustrates this process and fluorescence resonance energy transfer (FRET).
Figure 9: Jablonski diagram with solvent relaxation and energy transfer (FRET) [6]
For collisional quenching the fluorophore is returned to the ground state during a diffusive
encounter with the quencher. The molecule is not chemically altered in the process.
The decrease of intensity in this process is described by the Stern-Volmer equation (1):
F0 / F = 1 + K [Q] = 1 + kqττττ0 [Q] (1)
In this equation F0 is the emission intensity of the fluorophor without quencher, F is the
emission intensity with quencher, K is the Stern-Volmer quenching constant, kq is the
bimolecular quenching constant, τ0 is the unquenched lifetime, and [Q] is the quenching
concentration.
The Stern-Volmer quenching constant K indicates the sensitivity of the fluorophore to a
quencher. A linear Stern-Volmer plot is generally indicative of a single class of fluorophores, all

10
equally accessible to the quencher. It is important to recognize that observation of a linear
Stern-Volmer plot does not prove that collisional quenching of fluorescence has occurred.
Static quenching
Static quenching can occur as a result of the formation of a nonfluorescent ground state
complex between the fluorophore and the quencher. When this complex absorbs light it
immediately returns to the ground state without emission of a photon.
Static quenching is described by equation 2:
F0 / F = 1 +Ks [Q] (2)
Note that the dependency of F0 / F on [Q] is linear, which is identical to the observed for
dynamic quenching (eq. 1), except that the quenching constant is now the association constant.
The measurement of fluorescence lifetimes is the most definitive method to distinguish
static and dynamic quenching. For static quenching τ0 / τ = 1, in contrast to dynamic quenching
F0 / F = τ0 / τ well as shown in figure 10.
Figure 10: Comparision of dynamic and static quenching [6]
Both quenching processes can also be distinguished by their differing dependence on
temperature and viscosity. Higher temperatures result in faster diffusion and hence large
amounts of collisional quenching. Higher temperatures will typically result in the dissociation of
weakly bound complexes, and hence smaller amounts of static quenching.
The absorption spectrum of the fluorophor is, on careful examination, one additional
method to distinguish between static and dynamic quenching. Collisional quenching only
affects the excited states of the fluorophore, and thus no changes in the absorption spectra are
expected. In contrast, ground state complex formation will frequently result in perturbation of
the absorption spectrum of the fluorophore.

11
Combined dynamic and static quenching
It is possible that the fluorophore can be quenched both by collisions and by complex
formation with the same quencher.
The Stern-Volmer plot is an upward curvature, concave towards the y-axis. The Stern-
Volmer equation is modified to second order in [Q] (eq. 3), which accounts for the upward
curvature observed when both static and dynamic quenching occur for the same fluorophore.
F0 / F = 1 + (KD +KS) [Q] + KD KS [Q]2 (3)
The dynamic component can generally be selected to compare the magnitude of the
expected diffusion- controlled value of the solution, by the temperature or viscosity dependence
of the values or from other available informations about the sample.
1.4.3 Resonance energy transfer (RET)
There is a process that causes a decrease in the fluorescence intensity of the donor and
transfers the energy to an acceptor. This process is called resonance energy transfer (RET) and
it can be considered a quenching process. The acceptor can be fluorescent or nonfluorescent, but
in both cases the fluorescence intensity of the initially excited molecule is decreased.
Figure 11 shows that the fluorophore initially has two electrons in the highest-occupied
(HO) molecular orbital. Absorption of light results in elevation of one electron to the lowest-
unoccupied (LU) orbital.
Figure 11: Molecular orbital schematic for resonance energy transfer. The top row the size of fluorophores relative to the Föster distance R0
[6]
When RET occurs, the electron in the excited donor (DR*) returns to the ground state.
Simultaneously an electron in the acceptor (AR) goes into a higher excited-state orbital. If the
acceptor is fluorescent it may then emit. If the acceptor is nonfluorescent the energy is
dissipated as heat.
12
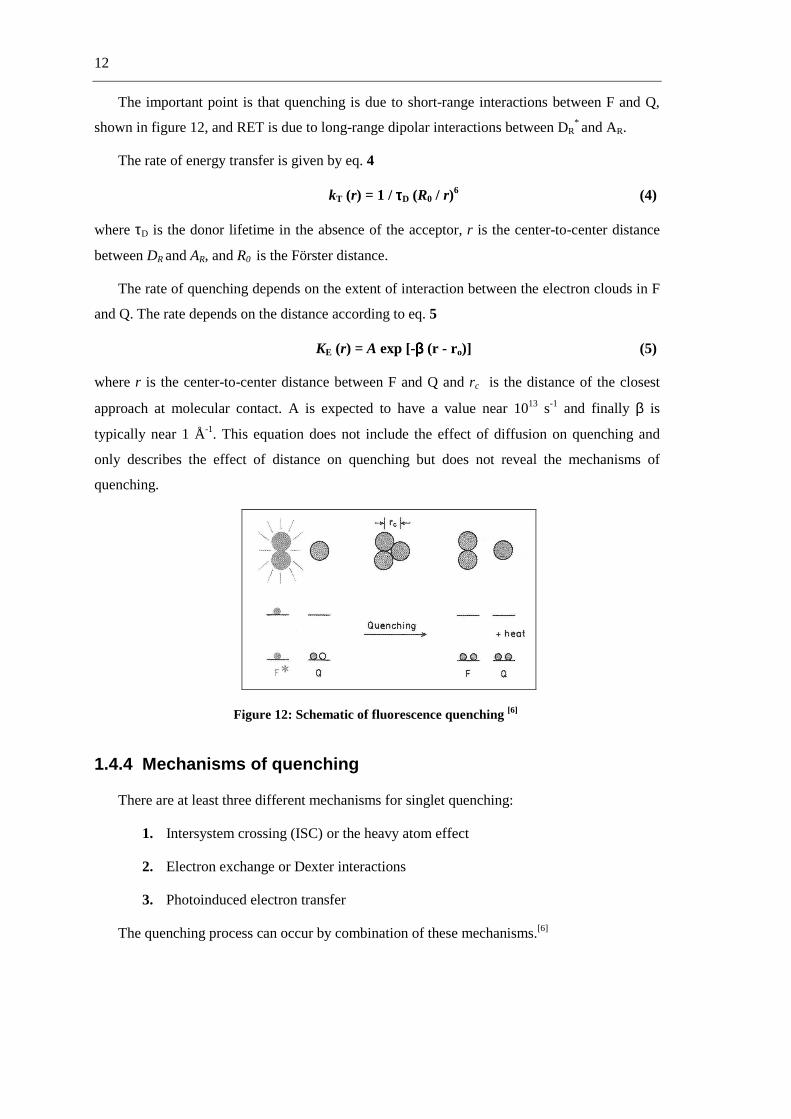
The important point is that quenching is due to short-range interactions between F and Q,
shown in figure 12, and RET is due to long-range dipolar interactions between DR* and AR.
The rate of energy transfer is given by eq. 4
kT (r) = 1 / ττττD (R0 / r)6 (4)
where τD is the donor lifetime in the absence of the acceptor, r is the center-to-center distance
between DR and AR, and R0 is the Förster distance.
The rate of quenching depends on the extent of interaction between the electron clouds in F
and Q. The rate depends on the distance according to eq. 5
KE (r) = A exp [-ββββ (r - r o)] (5)
where r is the center-to-center distance between F and Q and rc is the distance of the closest
approach at molecular contact. A is expected to have a value near 1013 s-1 and finally β is
typically near 1 Å-1. This equation does not include the effect of diffusion on quenching and
only describes the effect of distance on quenching but does not reveal the mechanisms of
quenching.
Figure 12: Schematic of fluorescence quenching [6]
1.4.4 Mechanisms of quenching
There are at least three different mechanisms for singlet quenching:
1. Intersystem crossing (ISC) or the heavy atom effect
2. Electron exchange or Dexter interactions
3. Photoinduced electron transfer
The quenching process can occur by combination of these mechanisms.[6]

13
Intersystem crossing
ISC is a process in which the spin of an excited electron is reversed wich results in a change
of the multiplicity of the molecules results. This process is most common in molecules that
contain heavy atoms (the heavy atom effect). Apparently spin-orbital interactions become large
in the presence of such atoms and a change in spin is thus more favorable. The presence of
paramagnetic species such as molecular oxygen in solution also enhances intersystem crossing
and consequently decreases fluorescence, [2] as shown in figure 13.
Figure 13: Quenching by intersystem crossing [6]
Electron exchange
This interaction occurs between a donor DE and an acceptor AE, where E indicates electron
exchange. The excited donor has an electron in the LU orbital. This electron is transferred to the
HO orbital of the acceptor, so the acceptor is left in an excited state.
Figure 14: Schematic for stepwise (top) or concerted (bottom) electron exchange [6]

14
At the same time or in a subsequent step an electron from the acceptor HO undergoes
electron back transfer to the donor HO. Electron exchange is similar to RET because the energy
is transferred to an acceptor. Figure 14 shows a schematic view for the electron exchange
quenching.
Photoinduced electron transfer
In photoinduced electron transfer (PET) a complex is formed between the electron donor DP
and the electron acceptor Ap, yielding Dp+Ap
-. This charge transfer complex can return to the
ground state without emission of a photon, but in some cases exciplex emission is observed.
Finally, the extra electron of the acceptor is returned to the electron donor. Figure 15 shows the
molecular orbital diagram for photoinduced electron transfer.
Figure 15: Molecular orbital schematic for photoinduced electron transfer [6]
PET quenching can also occur by electron transfer from the excited fluorophore to the
quencher. In PET the terms donor and acceptor do not classify which species is initially in the
excited state. This is the difference from RET, where the fluorophore is always the donor.
1.5 Fluorescence lifetimes and quantum yields
The singlet lifetime determinates the time available for the fluorophore to interact with a
substrate or diffuse in its environment, and hence the information available from its emission.
The lifetime of the excited state is defined by the average time wich the molecule spends in the
excited state. Generally, fluorescenece lifetimes are between 100 ps and 10 ns. [6]
Quantum yield of fluorescence is the number of emitted photons relative to the number of
absorbed photons. [6] For a highly fluorescent molecule such as fluorescein, the quantum yield
under several conditions approaches unity. Species that do not fluoresce have quantum yield
that approach zero. [2]

15
1.6 Fluorescence sensing
The design of fluorescent sensors has attracted considerable interest due to its importance to
analytical chemistry, clinical biochemistry, medicine, industrial and environmental chemistry
etc. Numerous chemical and biochemical analytes can be detected by fluorescence methods:
cations, anions, neutral molecules and gases. [10]
Fluorescence sensors are more sensitive than absorption sensors (colorimetric sensors)
because the light absorbance is measured as the difference in intensity between light passing
through the reference and the sample. In fluorescence the intensity is measured directly, without
comparison with a reference beam. [6]
Fluorescence sensing requires a change in a spectral property in response to the analyte.
Changes can occur in the fluorescence intensity, excitation spectrum, emission spectrum,
anisotropy, or lifetime of the sensing probe. [6]
In a fluorescence sensing approach, the fluorophore is the signaling species, i.e. it acts as a
signal transducer that converts the information in the presence of an analyte (guest) into an
optical signal expressed as the changes in the photophysical characteristics of the
fluorophore. [10] The receptor recognizes the guest and a behaviour change in the fluorescence
signal is produced (figure 16).
Figure 16: Principle of fluorescence sensing
1.6.1 Mechanisms of sensing
There is a variety of signaling mechanisms the simplest mechanism is collisional quenching,
where the fluorophor is quenched by the analyte. Static quenching can also be used for sensing
but the lifetime does not change. [6] Other mechanisms have been described such as ground state
16
charge transfer, [11a,b] photoinduced electron transfer (PET), [11c,g] excimer / exciplex
formation, [12] intramolecular charge transfer [11g],[13] and excited-state proton transfer.[14]
Resonance energy transfer (RET) is perhaps the most general and valuable phenomenon for
fluorescence sensors.[6]
Due to the mechanisms of sensing fluorescent sensors can be classified in three classes: [10]
• Class 1: fluorophores that undergo quenching upon collision with an analyte (e.g.
O2, Cl-).
• Class 2: fluorophores that can reversibly bind an analyte. If the analyte is a proton,
the term fluorescent pH indicator is often used. If the analyte is an ion, the term
fluorescent chelating agent is appropriate. Fluorescence can either be quenched
upon binding (CEQ type: Chelation Enhancement of Quenching), or enhanced
(CEF type: Chelation Enhancement of Fluorescence). In other cases, the compound
is said to be fluorgenic (e.g. 8-hydroxyquinoline (oxime)).
• Class 3: fluorophore linked, via a spacer or not, to a receptor. The design of such
sensors, which are based on molecule or ion recognition by the receptor, requires
special care in order to fulfill the criteria of affinity and selectivity. These aspects
are revelant to the field of supramolecular chemistry. The changes in photophysical
properties of the fluorophore upon interaction with the bound analyte are due to the
perturbation by the latter of photoinduced processes such as electron transfer,
charge transfer, energy transfer, excimer / exciplex formation or disappearance etc.
In this work it was tried to approach achiral and chiral anions, cations and peroxides-
sensors.
1.6.2 Cations sensing
Detecting cations is of great interest for different areas such as chemistry, biology or
medicine. Sodium, potassium, magnesium and calcium are involved in biological processes
such as the transmission of nerve impulses, muscle contraction, regulation of cell activity, etc.
Zinc is an essential component of many enzymes; it plays a major role in enzyme regulation,
gene expression, neurotransmission, etc.
On the other hand, there are some metal ions toxic to organisms (mercury, cadmium, etc.),
and early detection in the environment is desirable. Aluminum is also potentially toxic: it is
probably at the origin of some diseases such as osteomalacia, anemia, neurodegenerytive or
bone diseases. Control of aluminum content of is thus necessary in the production of
agricultural goods as well as in the pharmaceutical industry.[10]

17
Colorimetric determination of cations based on changes in color on complexation by dye
reagents started to be popular a long time ago, especially in the case of alkaline earth metals
ions, which are efficiently chelated by agents of the EDTA type. Sine fluorimetric techniques
are more sensitive than photometric ones, numerous fluorogenic chelating reagents were studied
and applied to practical cases.
Fluorescent molecular sensors of the EDTA type exhibit high selectivity for calcium with
respect to other ions present in cells. In the late 1960s Crown ethers and cryptands were
discovered [10] and opened up new possibilities for cation recognition with improvement of
selectivity, especially for alkali metal ions.
Fluorescent sensors emerged some years later with the design of a fluoroionophore. The
ionophore moiety has been recognized by the fluorophore, this experienced changes in its
fluorescence properties due to binding between ionophore and fluorophore.
The stability of a complex between ionophore and fluorophore depends on many factors:
nature of cation, nature of solvent, temperature, ionic strength and in some cases also pH.
The connection between the ionophore and the fluorophore is very important in aspects of
sensing design, bearing in mind the search for the strongest perturbation of the photophysical
properties of the fluorophore by the cation. The ionophore may be linked to the fluorophore via
a spacer, but in many cases some atoms or groups participating in the complexation belong to
the fluorophore. Therefore, the selectivity of binding often results from the whole structure
involving both signaling and recognition moieties.
Fluorescence sensors of cations will be presented in the following part. The recognition of
the cation can be explained by different mechanisms.
Stanculescu and coworkers [15] used tetrandrine (6,6´,7,12-tetramethoxy-2,2´-dimethyl-
berbaman; TET; figure 17) as fluorescent sensor. They characterized the binding properties of
TET as host towards alkaline and alkaline earth metals, engaged in a molecular recognition
process. The recognition has been studied by UV-vis and fluorescence spectroscopy.
After titration of TET with Na+, K+, Mg2+ and Ca+, changes in the absorbance of TET were
observed in the region of 300-325 nm, where TET starts to absorb with the derived spectra
slightly shifted. These aspects lead to the conclusion that TET selectively complexes Ca2+ and
Mg 2+ ions which can be classificated as hard acids.

18
N
O
O
O
O
N
O
O
1
Figure 17: 6,6´,7,12-Tetramethoxy-2,2´-dimethyl-berbaman; TET (1)
The fluorescence emission showed a hypsochromic shift (~6 nm) upon addition of Ca2+,
accompanied by a 1.5- fold fluorescence enhancement. The blue shift and the increase in
fluoresecence intensity are attributed to Ca2+ binding to TET which results in a more rigid
structure of the ligand after complexation. The fluorescence enhancement may happen due to
the suppression of the intramolecular phothoinduced electron transfer (PET) from the oxygen
ion pairs. Another explanations is that the metal binding alters the rate of one or more relaxation
processes from the excited state: radiative decay, internal conversion (IC) or intersystem
crossing (ISC).
Zinc is one of the most important transition metal ions found in nature, where it has multiple
roles in both extra- and intra-cellular functions. Gunnlaugsson and coworkers [16] were active in
the development of supramolecular luminescent chemosensors for zinc and other ions and
molecules. In this case they chose to use 4-amino-1,8-naphthalimide (figure 18) as a photostable
fluorophore reporter in designing 2 , as it absorbs in the visible region and emits in the green,
with Stokes shift of ca.100 nm. Importantly, 2 does not respond to Ca2+ and Mg2+, or many
other transition metal ions.
N OO
HN
N
CO2- Na+
CO2- Na+
2
Figure 18: 4-amino-1,8-naphthalimide (2)
The ability of 2 to detect Zn2+ and other physiologically and non-physiogically relevant
cations was carried out at pH 7.4 by monitoring the changes in the absorption and emission
spectra. The absorption spectra of 2 showed a broad band in the visible region between 370 and

19
510 nm with λmax at ca. 442 nm (logε = 4.28) which was assigned to an internal charge transfer
excited state (ICT). No significant changes were seen in the absorption spectra upon a
spectroscopic pH titration from pH 2-12.
The enhancement in the fluorescence emission at pH 7.4 upon addition of ZnCl2 is due to
the binding of the Zn+2 to the carboxylates of the imidodiacetate and the aromatic nitrogen
moiety. In particular, the latter interactions increase the oxidation potential of the receptor with
comitant reduction in the receptor´s ability to quench the fluorescence of the naphthalimide
moiety via PET, in the same way as for H+ above. Other experiments with different divalent and
monovalent cations confirmed the selectivity of 2 towards Zn2+.
Detection of Cu2+ ions is important for environmental and biological systems. However, the
selectivity for Cu2+ over other ions, such as Pb2+, and Fe3+, is not very satisfactory in some
cases [17]. So, development of new Cu2+ selective turn-on fluorescence sensors is still important
and necessary. Li and coworkers [17] synthesized a new fluorescent sensors based on
calix[4]arene 3 and 4 (figure 19) bearing four iminoquinoline subunits on the upper rim, which
showed a remarkable enhanced fluorescent intensity in the presence of Cu2+ ions and a high
selectivity towards Cu2+ ions over a wide range of tested metal ions in acetronitrile.
OO OO
N N N N
N N N N
O OO O
OO OO
N N
NN
O OO O
3 4
Figure 19: Calix[4]arene derivates 3 and 4
The fluorescence titration of 3 with Cu2+ showed an increase of the emission intensity of
about 1200-fold when the concentration of Cu2+ was increased up to 11 x 10-5 M. The
association constant (Kass) was determined to be 3.67 x 10⁷ M-1, which indicates a high affinity
of 3 to Cu2+.
Similar to 3, the fluorescence enhancement of 4 in the presence on Cu2+ could also be
observed, but it is obviously less than that of 3 induced by Cu2+ in the same conditions. The

20
association constant (Kass) of the 1:1 complex 4-Cu2+ was calculated to be 3.7 x 10⁵ M-1, which
is only about one-hundredth of that of the 1:1 complex [3-Cu2+]. These results indicated that
tetraiminoquinoline derived calix[4]arene 3 might have a preorganized and multi-coordinated
complexing site for Cu2+ ions.
For rationalizing the observed fluorescenece enhancement, two factors may be considered.
First, the low fluorescence intensity of 3 in CH3CN in the absence of Cu2+ ions may be
attributed to a radiationless channel from the nπ* state of the emission of the quinoline group by
the lone-pair electron of the imine nitrogen atom (PET). When a Cu2+ ion coordinates with the
ion pair of the imino and quinoline nitrogens, the energy of the nπ* state is raised so that the ππ*
state of the emission of the quinoline group becomes the lowest excited state, leading to a
substantial increase in fluorescence intensity (PET). Secondary, Cu2+ binding to 3 induces its
conformation restriction, which could also result in the increased fluorescence intensity.
Lanthanide ions are known to show long-lived spectrally distinct fluorescence or
phosphorescence. Lifetimes are generally in the order of several hundreds of microseconds to
milliseconds for visible-light-emitting Eu(III) and Tb(III). These long lifetimes, caused by
parity-forbidden transition resulting from 4f orbitals and characteristic linelike emmission
spectra have triggered the application of lanthanides for the development of luminescent
materials, chemosensors and luminescent labels. Oueslati and coworkers [18] were interested in
calix[4]azacrowns with aminopolyamide bridges. These compounds contain amide and amine
functionalities, both known for their capability to bind lanthanide ions via interaction with C=O
oxygen atoms and amine nitrogen atoms.
O OHO O
NH
N
OHN
O
HN O
HO OHO O
NHO HN O
OOO O
NH
NH
O
NHO
HN
HN
NH
OO
5 6 7
Figure 20: Calix[4]azacrown derivates 5, 6 and 7
They used 5 and 6 for the complexation of lanthanide ions such as Eu3+, Tb3+, Nd3+, Er3+,
La3+, which was investigated by UV-vis, fluorescence spectroscopy and 1H NMR.

21
The UV absorption spectra of 5 and 6 upon addition of lanthanide triflates showed
significant changes, albeit dependent on the ligand structure. The observed changes indicated
the formation of at least two different complexes. The complex stability constant in the form log
βij values were calculated by analysis of the absorption spectra and are summarized in table 1.
Table 1: Stability Constants (log ββββij ) of Lanthanide Complexes with 5 in acetonitrile.
Metal Ra Log ββββij b
Eu (III) 1:1 1:2
4.69 ± 0.32 9.52 ± 0.01
Tb (III) 1:1 1:2
5.67 ± 0.30 10.66 ± 0.70
Nd (III) 1:1 1:2
5.71 ± 0.02 10.66 ± 0.70
Er (III) 1:1 1:2
4.94 ± 0.30 10.54 ± 0.02
La (III) 1:1 1:2
6.01 ± 0.20 9.80 ± 0.20
a Metal-to ligand ratio. b Determined by absorption spectroscopy : T = 298 K, [5] = 6.89 10 -5 M.
This data has to be interpreted with caution, since the small changes in the UV spectra did
not allow a sufficiently accurate determination of complex stability constants.
The fluorescence of 5 was enhanced upon lanthanide complexation and other experiments
were carried out to prove that the mechanism involves the amine nitrogen in the fluorescence
enhancement of 5. PET from the electron-donating tertiary amine to the aromatic moieties of the
calixarene, which is switched off upon involvement of nitrogen lone pair in metal complexation
and can be assumed to be the transduction mechanism. This conclusion is supported by strong
fluorescence quenching (90%) of 5 to that of 7 as verified by the quantum yield and lifetime
measurements. [18]
Compound 6 showed strong fluorescence quenching as a result of lanthanide ion
complexation. With the control experiment of trifluoroacetic acid no significant changes of the
fluorescence was observed, similar situation for 7. This is surprising since 6 also contains
electron-donating secondary amine groups on the bridges, albeit weaker than the tertiary amine
group in 5. The blocking of PET upon lanthanide complexation, which would result in an
enhancement of the fluorescence, seems to be of minor importance compared to other effects
which lead to fluorescence quenching, for instance the participation of accelerated intersystem
crossing (ISC) due to lanthanides as heavy atoms.
In summary, for ligand 5 complexation outside the ionophoric cavity is assumed, the more
flexible ligand 6 should be able to accommodate the lanthanide ion inside the cavity.
Fluorescein and related derivates have been widely employed as signaling basis for
molecular imaging and chemosensing applications, including the detection of metal ions like

22
K+, Mg2+, Zn2+, Cd2+, Pb2+ and Hg2+. Choi and coworkers [19] reported the selective
chemodosimetric (chemodosimeters detect an analyte trough a highly selective and usually
irreversible chemical reaction) between the dosimeter molecule and the target analyte leadind to
an observable signal, in which an accumulative effect is directly related to the analyte
concentration [20] Hg2+ signaling behavior of simply structured fluorescein derivates (scheme 1).
Dichlorofluorescein and its methyl ester derivate showed pronounced Hg2+ selective
chromogenic and fluorogenic signaling behaviors in aqueous environment via selective
mercuration of the 4´,5´-position of the xanthene moiety.
O
OCl
HO OH
Cl
O
O
OCl
HO OH
Cl
O
HgOAc HgOAc
Hg(II)
Acetate buffer (pH 5.0)
8
Scheme 1: Dichlorofluorescein derivate (8) with Hg2+
The absorption bands at 475 and 505 nm of 8 upon treatment with Hg2+ ions were gradually
decreased and red-shifted to 483 and 533 nm. The color of the solution changed from yellowish
green to orange. Other metal ions induced some variation in absorbance without significantly
changing the absorption maximum. The ratio of A533/A483 was 1.02 for Hg2+ ions and varied in a
limited range from 0.058 (Ni2+) to 0.085 (Ag+) for the other metal ions.
The characteristic fluorescence spectrum of 8 was effectively quenched upon treatment with
Hg2+ ions. The quenching efficiency can be expressed by the ratio of I0/I at 528 nm (I0 and I
represent the fluorescence intensity of 8 in the absence and in the presence of metals ions,
respectively); I0/I was greater than 1900 for Hg2+ ions. Other metal ions did not induce
noticeable changes in the fluorescence emission of 8.
O
Cl
HO OH
ClCO2CH3
O
OCl
O O
Cl
O
tBu
O
But
O
9 10
Figure 21: Derivates of dichlorofluorescein

23
Methyl ester 9 (figure 21) exihibited similar chromogenic and fluorogenic behaviors to 8,
the absorption band was red-shifted (∆λ = 35 nm), and fluorescence was exclusively and
efficiently quenched by Hg2+ ions (I0/I at 534 nm = 501). However, compound 9 showed
somewhat less sensitive Hg2+ signaling than 8. In contrast, the response of the pivaloyl derivate
10, which could not be mercurated on the xanthene moiety, were insignificant, highlighting the
importance of the phenolic moieties of the xanthene in the signaling process.
1.6.3 Anions sensing
Anions play an important role in chemical and biological processes. Many anions act as
nucleophiles, bases, redox agents or transfer catalysts. [10] Most enzymes bind anions as either
substrates or cofactors. The chloride ion is of special interest because it is crucial in several
phases of human biology and in disease regulation. Moreover, it is of great interest to detect
anionic molecule pollutants such as nitrate and phosphates in ground water. [10]
Anions such as organic phosphates and even fluoride are harmful to the environment and
consequently to humans. The ability to selectively detect these anions in environmental samples
has become a dramatic necessity as organophosphates are components of nerve agents [21] and
fluoride is associated with nerve gases and the refinement of uranium used to nuclear weapons
manufacture. [22]
The design of selective anion molecular sensors with optical or electrochemical detection is
thus of major interest, however it has received much less attention than molecular sensors for
cations.
A typical fluorescent sensor for anions is generally built through a modular approach, by
either covalently or noncovalently attaching an appropriate photoactive fluorophore to the
receptor with an affinity for the desired substrate. Following the receptor-anion interaction, an
appropriate signaling process must take place.
The fluorescent mechanisms used in the signaling process for anion sensing are generally
photoinduced electron transfer (PET), excited-state proton transfer, excimer/exciplex formation,
metal-to-ligand charge transfer, and modulation of efficiency of interchromophore energy
transfer. [23]
There are many fluorescence sensors for halide ions (except F-) that are based on dynamic
quenching of a dye (fluorophor). In particular, the determination of chloride anions in living
cells is done according to this principle. Some halide ion sensors are given in figure 22.
24
N N N
N
NN
H3CO
(CH2)2SO3- (CH2)2SO3
-
CH3
CH3
O OCH3
CH3
O OCH3
CH3
SPQ SPA
Lucigenin
MACA MAMC
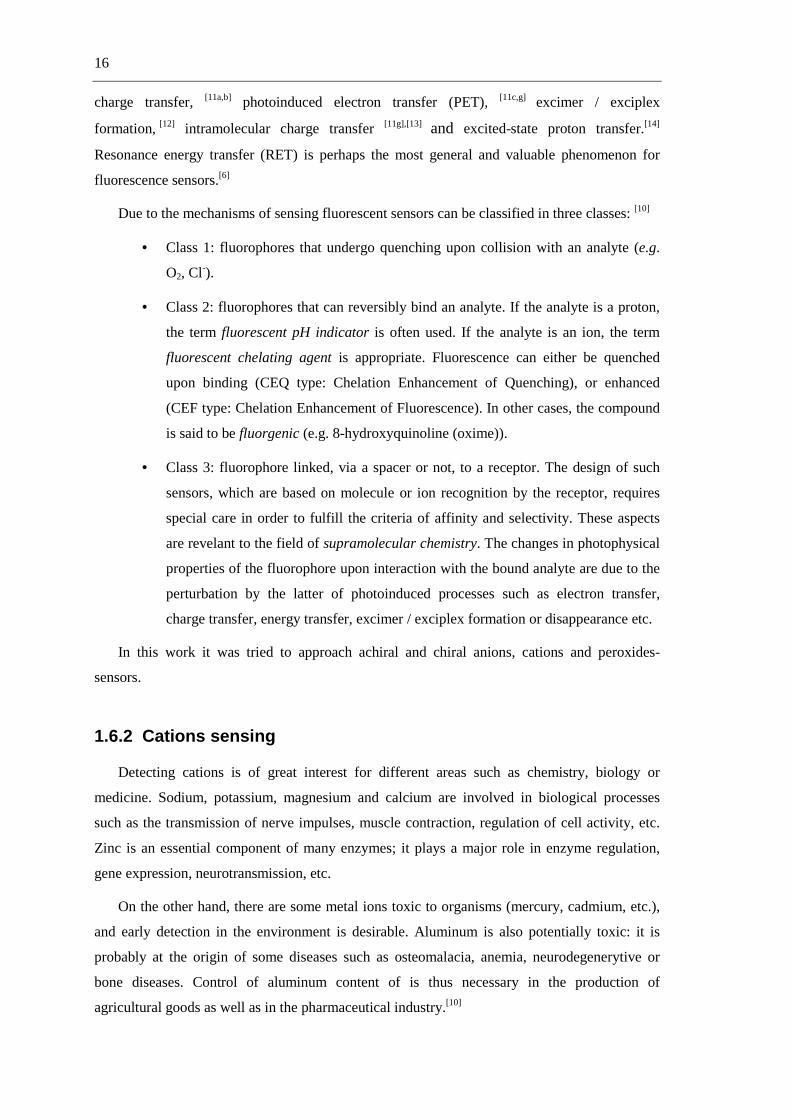
Figure 22: Various halide ion sensors
Their lack of selectivity is shown by the Stern-Volmer constants in table 2. For instance 6-
methoxy- N-(3-sulfopropyl)quinolinium (SPQ) is mainly used as Cl- sensitive fluorescent
indicator, but its fluorescence is also quenched by several other anions (I-, Br- and SCN-, but not
by NO3-). [24]
Table 2: Stern-Vollmer constants (M-1) of halide molecular sensors in aqueous solutions.
Compound Cl- Br - I - SCN-
SPQ 118 175 276 211
SPA 5 224 307 255
Lucigenin 390 585 750 590
MACA 225 480 550 480
MAMC 160 250 267 283
Abbreviations: SPQ: 6-methoxy-N-(sulfopropyl)quinolinium; SPA: N-(sulfopropyl)acridinium; lucigenin: bis-N-methylacridinium nitrate; MACA: 10-methylacridinium-9-carboxamide; MAMC: N-methylacridinium-9-methyl carboxylate.
For F- recognition the diprotonated form of hexadecyltetramethylsapphyrin is used that
contains a pentaaza macrocyclic core as shown in figure 23. The selectivity for fluoride ions
was found to be high in methanol (stability constants of the complex ~ 105) with respect to
chloride and bromide (stability constants ≤ 102).

25
HN
NH
NH
NH
HN
2+
+ F-
HN
NH
NH
NH
HNF-
+
11
Figure 23: Selective sensor (11) for fluoride ions
This selectivity can be explained by the fact that F- (ionic radius ~ 1.19 Å) can be
accommodated within the sapphyrin cavity to form a 1:1 complex with the anion in the plane of
the sapphyrin, whereas Cl- and Br- are too large (ionic radii 1.67 and 1.82 Å respectively) and
form an out-of-plane ion paired complex. [25]
Phosphate anions have attracted much attention because of their biological relevance.
Anthrylpolyamine conjugate probes can recognize phosphate groups due to photoinduced
electron transfer from the unprotonated amino group to anthracene, but it is dependent of the pH
on the fluorescence sensor. At pH 6, a fraction of 70% of 12 exists as a triprotonated form, the
nitrogen atom close to the anthracene moiety being unprotonated. This fraction has a very low
fluorescence emission.
NH
NHH3N
NH3
O
PO O
OH+
low fluorescence non-fluorescent
NH
NH
H3N
NH3
O
PO O
O
H
high fluorescence
12
Figure 24: Selective sensor (12) for phosphate anions
The monohydrogenophosphate whose three oxygen atoms interact with the three positive
charges (tri-cation of the amine groups); the remaining phosphate OH group is in a favorable

26
position to undergo intracomplex proton transfer to the unprotonated amino group, which
eliminates intramolecular quenching. The result of this binding is a drastic enhancement of
fluorescence emission of the complex. This fluorescence sensor can also bind ATP, citrate and
sulfate but the stability of the complex is low. [26] The mechanism is shown in figure 24.
The development of neutral charge chemosensors involves the criteria of PET sensing using
the fluorophore-spacer-receptor model. In function of this criterion Gunnlaugsson and
coworkers [27] synthesized a neutral charge chemosensor through the combination of anthracene
as chromophore and thiourae as electroneutral anion receptor. The different chemosensors are
shown in figure 25.
HN
S
NH
CF3
HN
S
NH
HN
S
NH
CH3
13a
13b
13c
Figure 25: Anthracene derivates used as fluorescence sensors (13 a-c)
Anthracene fluorescence emission is selectively quenched upon titration with AcO-, H2PO4-
and F- but not by Cl- or Br- in DMSO. Of the three chemosensors, 13a was expected to show the
strongest binding due to this effect and 13c the least.
The fluorescence emission spectra of 1-((anthracen-10-yl)methyl)-3-(4-(trifluoromethyl)
phenyl)thiourea (13a) when titrated with AcO- in DMSO displayed typical PET behaviour.
Upon adittion of the AcO-, the maximum emission intensity decreased with no other spectral
changes being observed. Similar emission and absorption effects were observed for 1-
((anthracen-10-yl)methyl)-3-phenylthiourea (13b) and 1-((anthracen-10-yl)methyl)-3-methyl-
thiourea (13c).
When the fluorescence titrations of 13a-c were carried out in other solvents such as CH3CN,
CH3CO2Et or THF, the emission was also quenched upon adittion of AcO- but the degree of
quenching was somewhat smaller. In EtOH, wich is a higly competitive hydrogen bonding
solvent, no binding was observed between the 13a and AcO-. Furthemore, no exciplex emission
could be observed in any of these solvents.

27
The simple fluorescent PET anion chemosensors 13a-c show ideal PET sensing behaviour
upon ion recognition, only fluorescence emission is switched off.
In order to investigate the selectivity and sensitivity of the sensor towards biologically
important anions, Gunnlaugsson and coworkers [27] carried out a series of titrations using TBA
salts of F-, Cl-, Br- and H2PO4- in DMSO. In the case of H2PO4
- and F- the fluorescence emission
was quenched by ca. 50 (ΦF = 0.0156) and 90% (ΦF = 0.0011) respectively (at 443 nm), but for
Cl- and Br- a minor quenching process was observed (< 7%), ruling out a quenching by the
heavy atom effect.
Gunnlaugsson and coworkers [27] proposed that the rate of electron transfer from the HOMO
of the thiourea-anion complex to the anthracene excited state, upon anion recognition i.e, the
reduction potential of the thiourea is increased causing PET to become competitively more
viable, which causes the fluorescence emission to be quenched. The fluorescence emission
spectra of 13a when titrated with AcO- in DMSO displayed typical PET behavior, the intensity
of the bands at 443, 419 and 397 nm decreased gradually with no other changes being observed.
Another reason why the detection of F- is important is the over-accumulation of fluorides in
the bones can be toxic, which is. Lee and coworkers [23] synthesized a fluorescent anion sensor
(figure 26), based on a biaryl-thiourea system, which shows a fluorescent emission
enhancement by conformational restriction upon hydrogen bond-mediated complexation of F-.
HN
HNS
Bun
HN
HNS
nBu
14
Figure 26: Fluorescence anion sensor 14
The anion (as TBA salts) recognition was investigated in CH3Cl. In the absence of anions,
the maximum of the emission spectrum of 14 is characterized at 379 nm. The presence of F-
resulted in a fluorescence enhancement at 356 nm. The dependence of the intensity at 356 nm
on the concentration of F- strongly suggests that two kinds of complexes are formed.
As the complex A is formed, 14 shows fluorescence enhancement via conformational
restriction. Then, as complex B is formed, a decrease in the fluorescence intensity takes place
by the loss of conformational restriction induced by complex A, this mechanism is shown in

28
scheme 2. For complex A the association constant is calculated to be 1.08 x 10⁴ M-2 and for
complex B to be 2.28 x 10⁷ M-2.
HN
HNS
Bun
HN
HNS
nBu
N
NS
Bun
N
NS
nBu
H
HF
H
HF
NH
NH
S
Bun
NH
NH SnBu
F
F- F-
14 A B
Scheme 2: Proposed mechanism for the complexation of 14 with fluoride ions
The fluorescence titration of 14 with H2PO4-, CH3CO2
-, HSO4-, Cl- and Br- only shows broad
emission enhancement around 470 nm. This result indicates that even though these anions
interact with thiourea groups, they do not necessarily form a complex with 14 like complex A.
Thus, fluorescence enhancement at 356 nm via conformation restriction was not detected.
The fluoride anion- exhibits a stronger basicity than other anions, and should exhibit a more
effective hydrogen bonding interaction with the thiourea groups comprising the binding site.
The fluorescent sensor shows fluorescence emission enhancement by conformational restriction
upon hydrogen-bond mediated complexation of fluoride ions.
Zhang and coworkers [28] observed a red-shifted fluorescence emission in 3-hydroxyl-2-
naphthanilide (15) in acetonitrile and drastically enhanced of the fluorescence intensity upon
addition of anions such as F-, AcO- and H2PO4-, with the enhancement depending on anion
basicity (figure 27).
HN
O
OHHN
O
O HAcO- AcO-
low fluorescent, λem = 392 nm high fluorescent, λem = 515 nm
15
Figure 27: Proposed mechanism of fluorescence sensor 15 for the recognition of AcO-
29
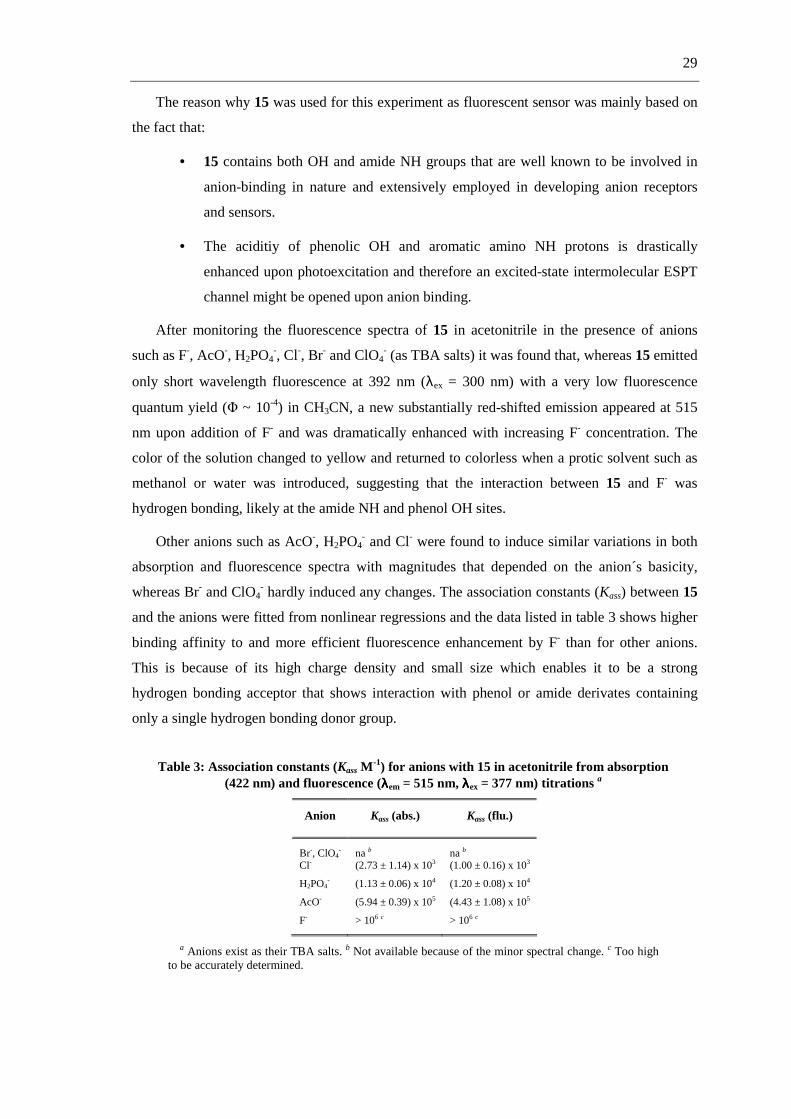
The reason why 15 was used for this experiment as fluorescent sensor was mainly based on
the fact that:
• 15 contains both OH and amide NH groups that are well known to be involved in
anion-binding in nature and extensively employed in developing anion receptors
and sensors.
• The aciditiy of phenolic OH and aromatic amino NH protons is drastically
enhanced upon photoexcitation and therefore an excited-state intermolecular ESPT
channel might be opened upon anion binding.
After monitoring the fluorescence spectra of 15 in acetonitrile in the presence of anions
such as F-, AcO-, H2PO4-, Cl-, Br- and ClO4
- (as TBA salts) it was found that, whereas 15 emitted
only short wavelength fluorescence at 392 nm (λex = 300 nm) with a very low fluorescence
quantum yield (Φ ~ 10-4) in CH3CN, a new substantially red-shifted emission appeared at 515
nm upon addition of F- and was dramatically enhanced with increasing F- concentration. The
color of the solution changed to yellow and returned to colorless when a protic solvent such as
methanol or water was introduced, suggesting that the interaction between 15 and F- was
hydrogen bonding, likely at the amide NH and phenol OH sites.
Other anions such as AcO-, H2PO4- and Cl- were found to induce similar variations in both
absorption and fluorescence spectra with magnitudes that depended on the anion´s basicity,
whereas Br- and ClO4- hardly induced any changes. The association constants (Kass) between 15
and the anions were fitted from nonlinear regressions and the data listed in table 3 shows higher
binding affinity to and more efficient fluorescence enhancement by F- than for other anions.
This is because of its high charge density and small size which enables it to be a strong
hydrogen bonding acceptor that shows interaction with phenol or amide derivates containing
only a single hydrogen bonding donor group.
Table 3: Association constants (Kass M-1) for anions with 15 in acetonitrile from absorption
(422 nm) and fluorescence (λλλλem = 515 nm, λλλλex = 377 nm) titrations a
Anion Kass (abs.) Kass (flu.)
Br-, ClO4- na b na b
Cl- (2.73 ± 1.14) x 103 (1.00 ± 0.16) x 103
H2PO4- (1.13 ± 0.06) x 104 (1.20 ± 0.08) x 104
AcO- (5.94 ± 0.39) x 105 (4.43 ± 1.08) x 105
F- > 106 c > 106 c
a Anions exist as their TBA salts. b Not available because of the minor spectral change. c Too high to be accurately determined.
30
Zhang and coworkers [28] demostrated a simple fluorescent sensor for anions following the
excited-state intermolecular proton transfer (ESPT) signaling mechanism.
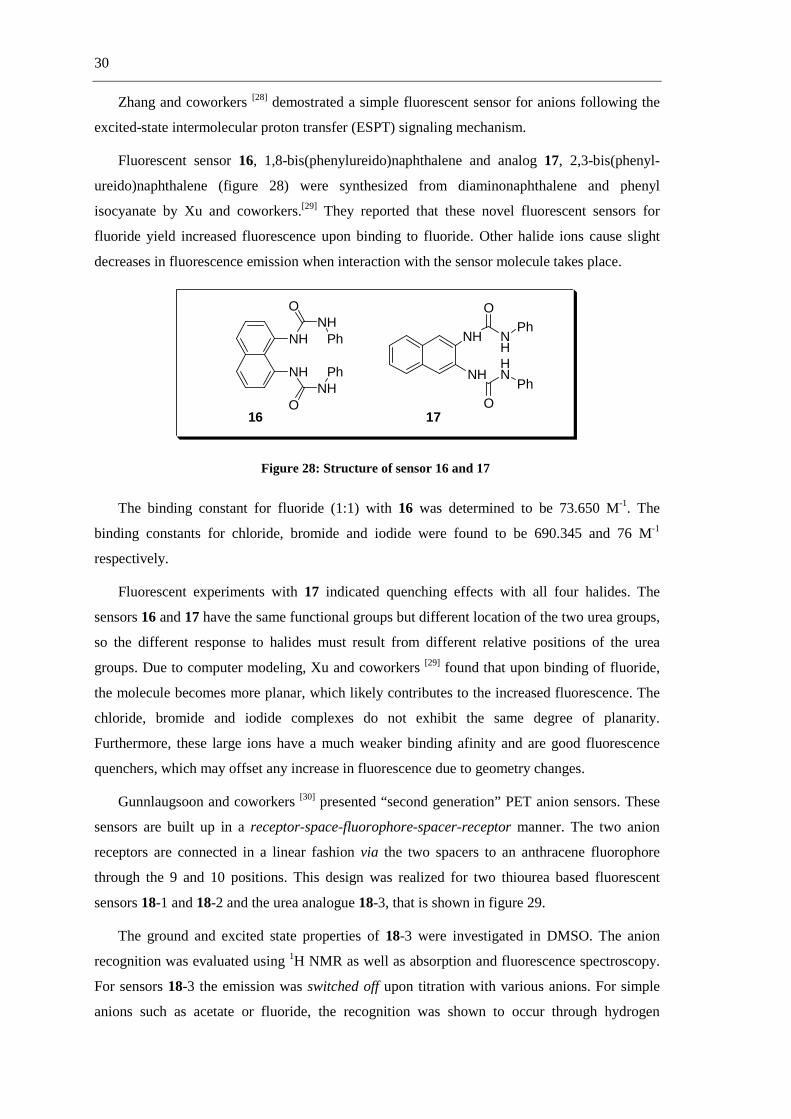
Fluorescent sensor 16, 1,8-bis(phenylureido)naphthalene and analog 17, 2,3-bis(phenyl-
ureido)naphthalene (figure 28) were synthesized from diaminonaphthalene and phenyl
isocyanate by Xu and coworkers.[29] They reported that these novel fluorescent sensors for
fluoride yield increased fluorescence upon binding to fluoride. Other halide ions cause slight
decreases in fluorescence emission when interaction with the sensor molecule takes place.
NH
NHNH
O
NHO
Ph
Ph
NH
O
NH
Ph
NHHN
OPh
16 17
Figure 28: Structure of sensor 16 and 17
The binding constant for fluoride (1:1) with 16 was determined to be 73.650 M-1. The
binding constants for chloride, bromide and iodide were found to be 690.345 and 76 M-1
respectively.
Fluorescent experiments with 17 indicated quenching effects with all four halides. The
sensors 16 and 17 have the same functional groups but different location of the two urea groups,
so the different response to halides must result from different relative positions of the urea
groups. Due to computer modeling, Xu and coworkers [29] found that upon binding of fluoride,
the molecule becomes more planar, which likely contributes to the increased fluorescence. The
chloride, bromide and iodide complexes do not exhibit the same degree of planarity.
Furthermore, these large ions have a much weaker binding afinity and are good fluorescence
quenchers, which may offset any increase in fluorescence due to geometry changes.
Gunnlaugsoon and coworkers [30] presented “second generation” PET anion sensors. These
sensors are built up in a receptor-space-fluorophore-spacer-receptor manner. The two anion
receptors are connected in a linear fashion via the two spacers to an anthracene fluorophore
through the 9 and 10 positions. This design was realized for two thiourea based fluorescent
sensors 18-1 and 18-2 and the urea analogue 18-3, that is shown in figure 29.
The ground and excited state properties of 18-3 were investigated in DMSO. The anion
recognition was evaluated using 1H NMR as well as absorption and fluorescence spectroscopy.
For sensors 18-3 the emission was switched off upon titration with various anions. For simple
anions such as acetate or fluoride, the recognition was shown to occur through hydrogen

31
bonding of the corresponding anion to the receptors. This gave rise to only minor changes in the
absorption spectra, but caused significant changes in the fluorescence emission spectrum, which
was substantially (70-95%) quenched. These results corroborated the PET quenching of the
anthracene excited state upon anion recognition, due to hydrogen bonding between the thiourea
or urea protons and the anions. Fluorescence emission changes upon recognition of simple
anions such as AcO- and H2PO4- were monitored in function of anion concentration.
Gunnlaugsson and coworkers demonstrated that the recognition was due to the formation of a
1:2 binding between the sensors and the anions. For halides such as Cl- and Br- no significant
fluorescence changes occurred. However, for F- the emission was almost fully quenched after
addition of only one equivalent of the anion.
Figure 29: The receptor-spacer-fluorophore-spacer-receptor model used and the corresponding sensor 18 (1-3)
For all of the anions, the quenching contributed to enhanced efficiency of PET from the
receptor to the excited state of the fluorophor.
The recognition of bis-anions such as pyrophosphate, malonate and glutarate was also
demonstrated. For the first two of these anions, the sensing was shown to have a 1:1
stoichiometry, whereas for glutarate the binding was most likely 1:2 for 18-1 and 18-2.
However, for the urea based sensor 18-3, the binding was found to be 1:1 for all the bis-anions.
The binding (1:1 and 1:2) was observed to depend on the length of the spacer separating the two
carboxylate moieties and the nature of the receptor. The binding constants are summarized in
table 4.
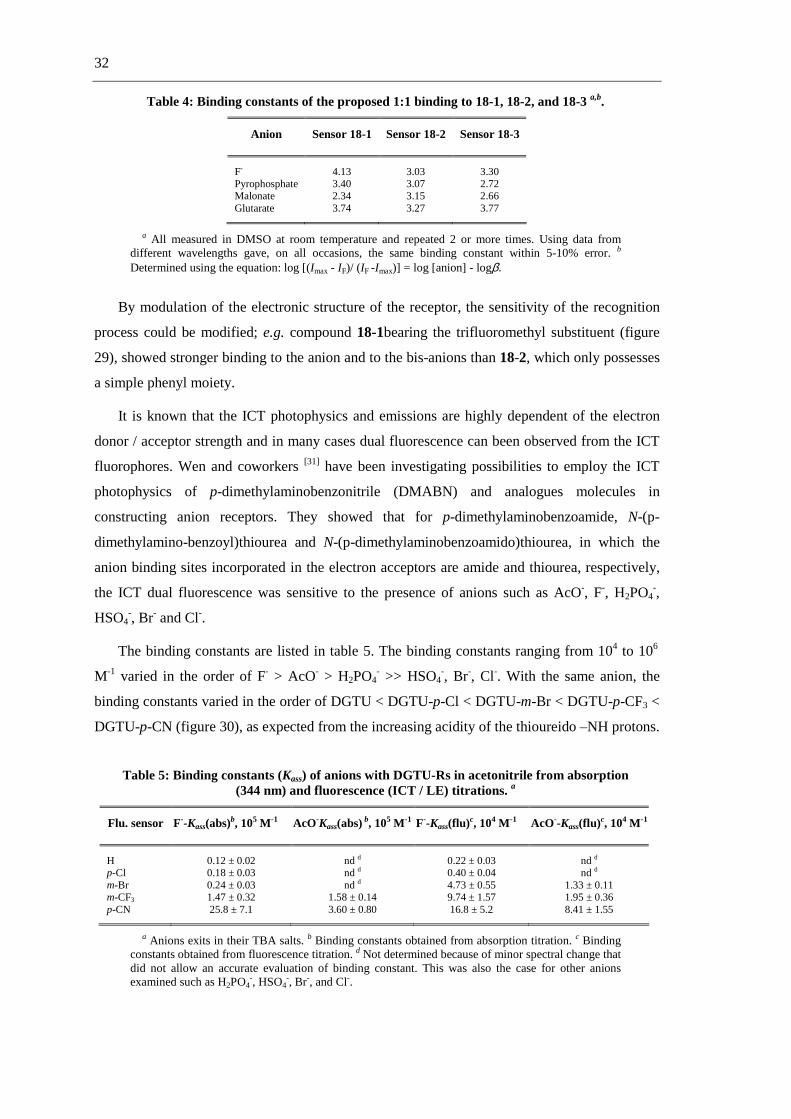
32
Table 4: Binding constants of the proposed 1:1 binding to 18-1, 18-2, and 18-3 a,b.
Anion Sensor 18-1 Sensor 18-2 Sensor 18-3
F- 4.13 3.03 3.30 Pyrophosphate 3.40 3.07 2.72 Malonate 2.34 3.15 2.66 Glutarate 3.74 3.27 3.77
a All measured in DMSO at room temperature and repeated 2 or more times. Using data from different wavelengths gave, on all occasions, the same binding constant within 5-10% error. b Determined using the equation: log [(Imax - IF)/ (IF -Imax)] = log [anion] - logβ.
By modulation of the electronic structure of the receptor, the sensitivity of the recognition
process could be modified; e.g. compound 18-1bearing the trifluoromethyl substituent (figure
29), showed stronger binding to the anion and to the bis-anions than 18-2, which only possesses
a simple phenyl moiety.
It is known that the ICT photophysics and emissions are highly dependent of the electron
donor / acceptor strength and in many cases dual fluorescence can been observed from the ICT
fluorophores. Wen and coworkers [31] have been investigating possibilities to employ the ICT
photophysics of p-dimethylaminobenzonitrile (DMABN) and analogues molecules in
constructing anion receptors. They showed that for p-dimethylaminobenzoamide, N-(p-
dimethylamino-benzoyl)thiourea and N-(p-dimethylaminobenzoamido)thiourea, in which the
anion binding sites incorporated in the electron acceptors are amide and thiourea, respectively,
the ICT dual fluorescence was sensitive to the presence of anions such as AcO-, F-, H2PO4-,
HSO4-, Br- and Cl-.
The binding constants are listed in table 5. The binding constants ranging from 104 to 106
M-1 varied in the order of F- > AcO- > H2PO4- >> HSO4
-, Br-, Cl-. With the same anion, the
binding constants varied in the order of DGTU < DGTU-p-Cl < DGTU-m-Br < DGTU-p-CF3 <
DGTU-p-CN (figure 30), as expected from the increasing acidity of the thioureido –NH protons.
Table 5: Binding constants (Kass) of anions with DGTU-Rs in acetonitrile from absorption (344 nm) and fluorescence (ICT / LE) titrations. a
Flu. sensor F--Kass(abs)b, 105 M -1 AcO-Kass(abs) b, 105 M -1 F--Kass(flu) c, 104 M -1 AcO--Kass(flu) c, 104 M -1
H 0.12 ± 0.02 nd d 0.22 ± 0.03 nd d p-Cl 0.18 ± 0.03 nd d 0.40 ± 0.04 nd d m-Br 0.24 ± 0.03 nd d 4.73 ± 0.55 1.33 ± 0.11 m-CF3 1.47 ± 0.32 1.58 ± 0.14 9.74 ± 1.57 1.95 ± 0.36 p-CN 25.8 ± 7.1 3.60 ± 0.80 16.8 ± 5.2 8.41 ± 1.55
a Anions exits in their TBA salts. b Binding constants obtained from absorption titration. c Binding constants obtained from fluorescence titration. d Not determined because of minor spectral change that did not allow an accurate evaluation of binding constant. This was also the case for other anions examined such as H2PO4
-, HSO4-, Br-, and Cl-.

33
NO
NNH
NHS
NH
H3C
H3C
H
R
DGTU-R
R = H p-Cl m-Br m-CF3 p-CN
Figure 30: Molecular structures of DGTU-Rs 19
By substitution at the phenylthiourea moiety it was observed that the substituent electronic
effect could be efficiently transmitted to the CT fluorophore and hence influenced its CT dual
fluorescence.
The recognition of the anions involved a blue-shift in the CT emission and a decrease in the
CT to LE (locally excited state) intensity ratio.
Fabbrizzi and coworkers [32] compared the H-bond donor tendencies of urea and thiourea
and verified the occurrence of deprotonation processes in the presence of certain basic anions
such as halides and carboxylates in DMSO solution. They used a phthalimide substituent as
fluorophor. The phthalimide substituent has been appended at the urea or thiourea subunit in
order to provide an optical signal for the occurrence of the receptor-anion interaction. The
fluorescent sensor is shown in figure 31.
NH
NH
X
NO
O
20: X = S
21: X = O
Figure 31: Fluorescence sensors based on thiourea 20 and urea 21 receptors
This study was performed via UV-vis and 1H NMR tritration experiments in DMSO
solution. It was found that two consecutive equilibria take place in solution, involving the
neutral receptor LH and the anion X-:
LH + X- ⇌ [LH⋯X]- (6)
[LH⋯⋯⋯⋯X] - + X- ⇌ ⇌ ⇌ ⇌ L - + [HX2]- (7)

34
The first equilibrium (eq. 6) resulted in a more or less stable H-bond complex for all
investigated anions. The second equilibrium (eq.7) is related to both the intrinsic acidity of HL
and the stability of [HX2]-. The table shows that the receptor 21, containing the less acidic urea
subunit, undergoes the protonation and HX release only in the presence of F-, to form the very
stable [HF2]- self-complex. On the other hand, the more acidic thiourea containing receptor 20
undergoes deprotonation in the presence of a greater number of anions, the value of the binding
constants decreasing with stability of the self complex [HX2] : F- > AcO- > H2PO4
-.
Table 6: LogK values for the interaction of receptors 20 and 21 with the anions in DMSO solution at 25 °C.
Receptor Equilibrium F - AcO- C6H5CO2- H2PO4
- Cl-
20 LH + X- ⇌⇌⇌⇌ [LH⋯⋯⋯⋯X]- 5.7 6.02 5.77 5.44 4.88
[LH⋯X] - + X- ⇌ L- + [HX2] - 5.5 3.23 3.36 0.55 __
21 LH + X- ⇌⇌⇌⇌ [LH⋯⋯⋯⋯X]- 4.86 4.63 4.18 4.47 4.38
[LH⋯X] - + X- ⇌ L- + [HX2] - 1.83 __ __ __ __
In summary the more acidic receptor 21 forms, with a given anion, a more stable complex
than the less acidic receptor 22. This behavior is consistent with the view of hydrogen bonding
as an incipient proton transfer from the receptor to the anion; where the more acidic the
receptor, the stronger the H-bond with anion.
Chen and coworkers [33] designed and synthesized a series of fluorescent sensors integrating
both an amide and a pyrrole functionality for anion-recognition and sensing. The recognition
and sensing have been investigated through changes in the UV-vis and fluorescence spectra in
the presence of anions. The mechanism for the reaction between the fluorescent sensors and the
anions has been further explored by 1H NMR titration experiments.
The fluorescent sensors are shown in figure 32. The authors were prepared by condensation
of pyrrol-2-carbonyl chloride with the corresponding aryldiamine in CH2Cl2.
The anion sensing was carried out with 11 different anions (CN-, F-, Cl-, Br-, I-, NO3-, OH-,
AcO-, H2PO4-, HSO4
- and ClO4-) with all fluorescent sensors.
Fluorescent sensor 22 displays colorimetric and fluorescent responses only to OH-, F- and
CN-. 23 exhibited a strong response to CN- and somewhat weakes responses to OH-, AcO- and
H2PO4- in CH3CN solution.
Addition of CN-, OH-, F-, AcO- and H2PO4- to 24 produced a color change from colorless to
orange-red. Except for F-, which apparently displays multiple equilibria in solution, a new band
developed at around 480 nm on addition of CN-, OH-, AcO- or H2PO4-.

35
The spectrometric titrations of 25 and 26 with anions were carried out in DMSO solution
because of the solubility issue. 25 and 26 responded only to CN-, OH-, F-, and AcO- to produce a
color change from red to purple for 25 and colorless to pale yellow for 26.
S
NH HNO O
NH HN
S SNN
Ph Ph
NH HNOO
NH HN
NO2O2N
NH HNOO
NH HN
NH HN OO
NH HN
O
O
ClCl
NH HNOO
NH HN
22
2324
25 26
Figure 32: Fluorescent sensors 22-26
The formation of hydrogen-bonded complexes apparently exerts very little perturbation of
the electron density distribution and thus, the absorption and fluorescence spectra show almost
no or very little changes compared with the 1H NMR spectra. The observations of a red shift in
both absorption and fluorescence spectra generally imply that neat proton transfer occurs from
the acidic amide NH group to the anion.
Cyanide is a nucleophilic anion, its addition on the 22, 25 and 26 produced the
deprotonation of the acidic NH group on this fluorescent sensors, addition of cyanide resulted in
nucleophilic addition on the electron-deficient amide carbonyl group in the fluorescent sensors
23 and 24.
The strong electron-withdrawing nature of the NO2 or quinoxaline functionality renders the
amide groups highly electron-deficient and susceptible to the nucleophilic addition by cyanide
to the carbonyl groups along with a higher acidity of the amine groups. Nucleophilic attac of the
cyanide in the vicinity of the amide carbonyl groups induces the potential hydrogen-bonding.
The next figure shows the reaction of cyanide with 24.

36
NO2O2N
NH HNOO
NH HN
CN-
NO2O2N
N NOO
N NCN NC
HH
H H
H+
NO2O2N
NH HNOH
HN
CN
HO
NH
NC
colorless yellow colorless
Scheme 3: Proposed cyanohydrin formation fronm reaction of probe 24 and cyanide
1.6.4 Chiral recognition
It is well known that chemical properties and biological activity of chiral compounds are
strongly dependent on the absolute configuration; each enantiomer may have different
pharmacological properties in terms of activity, potency, toxicity, transport mechanisms and
metabolitic route. [34]
The development of artificial chiral receptors, which show properties of chiral recognition
and chiral catalysis, has attracted considerable attention, because recognition and catalysis are
fundamental characteristics of biochemical systems, and could contribute to the development of
pharmaceuticals, enantioselective sensors, catalysts, enzyme models and other molecular
devices.[35]
O
HNO
CH*L-R
NHO
NHO
BocHN
HN
tButBu ButtBu
n
HO OH O
NHO
CH*L-RO
HN
HNO
NH
NHBoc
n
27a: R = CH3, n = 227b: R = PhCH2, n = 227c: R = CH3, n = 327d: R = PhCH2, n = 3
Figure 33: Fluorescent sensors 27a-d
Qing and coworkers [36] reported four two-armed chiral calix[4]arenes derivates (figure 33)
bearing L-tryptophan units, which exhibit highly sensitive fluorescence response to
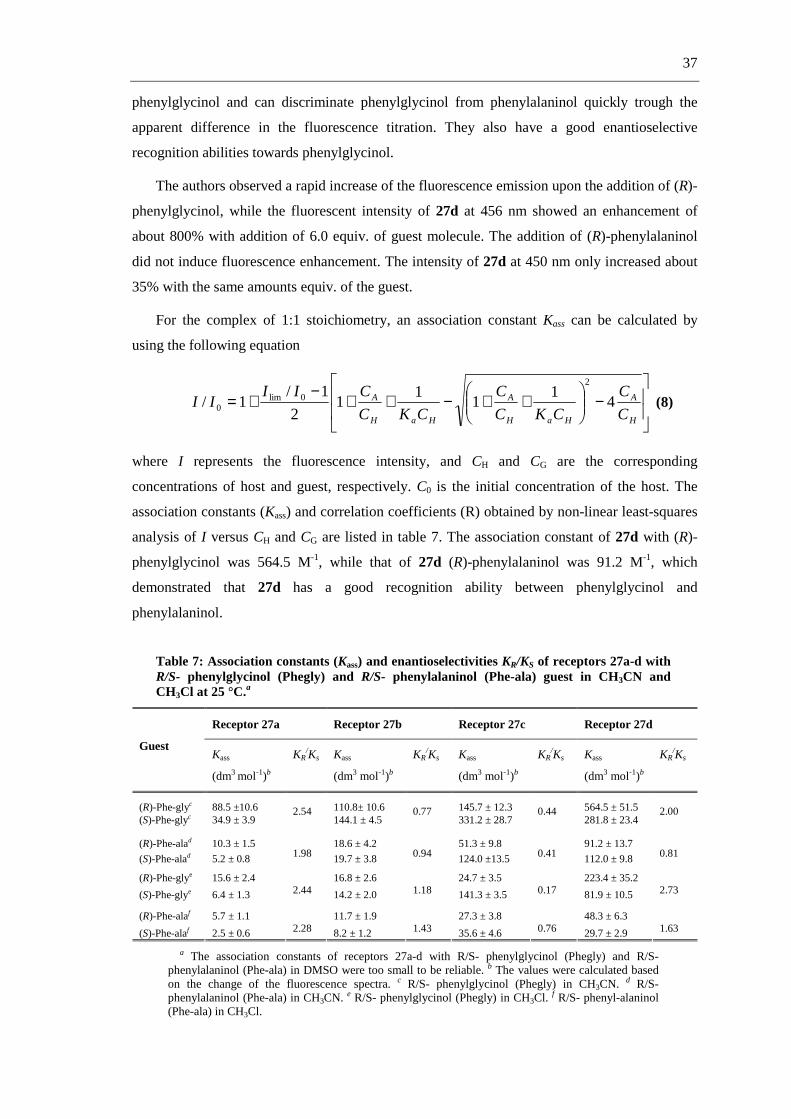
37
phenylglycinol and can discriminate phenylglycinol from phenylalaninol quickly trough the
apparent difference in the fluorescence titration. They also have a good enantioselective
recognition abilities towards phenylglycinol.
The authors observed a rapid increase of the fluorescence emission upon the addition of (R)-
phenylglycinol, while the fluorescent intensity of 27d at 456 nm showed an enhancement of
about 800% with addition of 6.0 equiv. of guest molecule. The addition of (R)-phenylalaninol
did not induce fluorescence enhancement. The intensity of 27d at 450 nm only increased about
35% with the same amounts equiv. of the guest.
For the complex of 1:1 stoichiometry, an association constant Kass can be calculated by
using the following equation
−
++−++
−+=
H
A
HaH
A
HaH
A
C
C
CKC
C
CKC
CIIII 4
11
11
2
1/1/
2
0lim0 (8)
where I represents the fluorescence intensity, and CH and CG are the corresponding
concentrations of host and guest, respectively. C0 is the initial concentration of the host. The
association constants (Kass) and correlation coefficients (R) obtained by non-linear least-squares
analysis of I versus CH and CG are listed in table 7. The association constant of 27d with (R)-
phenylglycinol was 564.5 M-1, while that of 27d (R)-phenylalaninol was 91.2 M-1, which
demonstrated that 27d has a good recognition ability between phenylglycinol and
phenylalaninol.
Table 7: Association constants (Kass) and enantioselectivities KR/KS of receptors 27a-d with R/S- phenylglycinol (Phegly) and R/S- phenylalaninol (Phe-ala) guest in CH3CN and CH3Cl at 25 °C.a
Receptor 27a Receptor 27b Receptor 27c Receptor 27d
Guest Kass
(dm3 mol-1)b
KR/Ks Kass
(dm3 mol-1)b
KR/Ks Kass
(dm3 mol-1)b
KR/Ks Kass
(dm3 mol-1)b
KR/Ks
(R)-Phe-glyc 88.5 ±10.6 110.8± 10.6 145.7 ± 12.3 564.5 ± 51.5 (S)-Phe-glyc 34.9 ± 3.9
2.54
144.1 ± 4.5
0.77
331.2 ± 28.7
0.44
281.8 ± 23.4
2.00
(R)-Phe-alad 10.3 ± 1.5 18.6 ± 4.2 51.3 ± 9.8 91.2 ± 13.7
(S)-Phe-alad 5.2 ± 0.8
1.98 19.7 ± 3.8
0.94 124.0 ±13.5
0.41
112.0 ± 9.8
0.81
(R)-Phe-glye 15.6 ± 2.4 16.8 ± 2.6 24.7 ± 3.5 223.4 ± 35.2
(S)-Phe-glye 6.4 ± 1.3
2.44 14.2 ± 2.0
1.18 141.3 ± 3.5
0.17 81.9 ± 10.5
2.73
(R)-Phe-alaf 5.7 ± 1.1 11.7 ± 1.9 27.3 ± 3.8 48.3 ± 6.3
(S)-Phe-alaf 2.5 ± 0.6
2.28 8.2 ± 1.2
1.43 35.6 ± 4.6
0.76 29.7 ± 2.9
1.63
a The association constants of receptors 27a-d with R/S- phenylglycinol (Phegly) and R/S- phenylalaninol (Phe-ala) in DMSO were too small to be reliable. b The values were calculated based on the change of the fluorescence spectra. c R/S- phenylglycinol (Phegly) in CH3CN. d R/S- phenylalaninol (Phe-ala) in CH3CN. e R/S- phenylglycinol (Phegly) in CH3Cl. f R/S- phenyl-alaninol (Phe-ala) in CH3Cl.

38
The reason of this selective recognition may be that the two indole rings of 27d are in close
proximity and an intramolecular excimer is formed through the interaction of one indole in the
excited state with the other indole in the ground state. When the phenylglycinol is added, the
π−π stacking between the aromatic ring of phenylglycinol and the indole rings of receptor
promoted energy transfer from the excited fluorophore to the other one in the ground state and
an enhancement of fluorescence is observed.
Phenylalaninol could not induce such fluorescence enhancement probably because the
aromatic ring of phenylalaninol is incapable of forming effective π−π stacking with the indole
rings of the receptors molecule to promote the energy transfer between the two fluorophores.
Such differences in the fluorescent response also prove that the π−π stacking is the most
important factor in the fluorescence response upon complexation between the host and amino
alcohol.
The receptors 27c and 27d exhibited better fluorescent response than the receptors 27a and
27b, which may be because the receptors 27c and 27d have a much more flexible structure
compared with 27a and 27b. The flexible structures could enable the two indole rings to
approach to closer proximity promote the energy transfer process more easily.
Solvent comparison experiments demonstrated that CH3CN was the most effective solvent
to detect the concentration of amino alcohol and to carry out the chemical recognition process.
Amino acids and their derivates are important components of chemical and biological
systems and their recognition, in particular chiral recognition attracts considerable interest.
Many examples in literature show that thiourea as receptors is able to form stable complexes
with anions, some of them also exhibit good enantioselective recognition abilities towards
various amino acid derivates. [37]
Qing and coworkers [37] synthesized three linear thioureas as anion receptors (28-30) from
amino acids. Their bonding properties with various chiral N-protected amino acid anions have
been examined by using UV-vis and fluorescence titration experiments in DMSO (figure 34).
Receptor 28 exhibited upon addition of the N-Boc-L-Ala anion a gradual decrease of the
absorption maximum (at 360 nm) with red shift (about 10 nm) and a new absorption peak at 482
nm. The new absorption suggested the formation of a complex between 28 and N-Boc-L-Ala.
Similar phenomena were observed when N-Boc-D-Ala was added to the solution of receptor 28.
There are differences in the absorbance spectra and the color of the solution indicates that
28 has a good enantioselective recognition ability towards the N-Boc-D/L-Ala anions. In
addition the association constants (Kass) are different, which corresponds to moderate
enantioselectivity (Kass(L)/Kass(D)) of 2.7.

39
NH
NHBoc
O
NH
NH
S
NH
R
NHBoc
O
NH
NH
S
NH
NO2
O
NH
NH
S
NH
NO2
NBoc
28a- R = NO228b- R = CH3
29 30
Figure 34: Fluorescent sensors 28a-b, 29 and 30
The fluorescence emission (λex = 295 nm; λem = 347 nm) of the receptor 28a in the presence
of the N-Boc-D-Ala or N-Boc-L-Ala anion in DMSO increases gradually. The result is a
nonlinear curve that confirms the interaction between receptor 28a and N-Boc-D-Ala to form a
1:1 complex. The data of these chiral recognitions systems is summarized in table 8.
Comparative UV-vis and fluorescence experiments were performed to explore whether
receptors 29 and 30 have the similar recognition abilities.
Table 8: Association constants (Kass) and enantioselectivities KD/KL of receptor 28a with D/L-monocarboxylate in DMSO at 25 °C.
Guesta Kass (dm3 mol-1)b.c KD/KL
N-Boc-L-Ala 192.7 ± 6.1
2.70
N-Boc-D-Ala 519.7 ± 13.4
N-Ac-L-Ala 79.9 ± 8.6
7.24
N-Ac-D-Ala 578.3 ± 31.5
N-Bz-L-Ala d
N-Bz-D-Ala d
N-Boc-L-Phe 347.2 ± 24.1
N-Boc-D-Phe 83.3 ± 8.8
0.24
L-mandelate 303.7 ± 8.9
D-mandelate 619.5 ± 13.8
2.04
L-phenylglicine (1.52 ± 0.07) x 103
D-phenylglycine (4.62 ± 0.24) x 103
3.04
a The anions were used as their tetrabutylammonium salts. The amino groups of the amino acid were protected by tert-butylcarbonate, acetyl or benzoyl respectively.b The data were calculated from UV-vis titration in DMSO. C All error values were obtained by results of nonlinear curve fitting, the correlation coefficient (R) of nonlinear curve; fitting is over 0.99. d Reliable association constants could not be obtained due to the too small change in the UV-vis spectra.
Receptor 28a was developed to give strong hydrogen bonding to anions, which could rise to
colorimetric changes upon anion recognition; the 4-nitro-phenyl moiety is part of amidothiourea

40
anion receptor moiety, giving rise to an internal charge transfer (ICT) absorption band in the
absorption spectra.
In the absence of anions, the photoinduced electron transfer (PET) process between the
indole group and weak electron withdrawing amide substituents results in a decreasing
fluorescence intensity. When the anions were added to the solution, the interaction of the anion
with receptor unit could erase this specific PET progress and induce fluorescence recovery.
Therefore, anion induced fluorescence enhancement was observed.
Huang and coworkers [34] reported two chiral fluorescent receptors 31a and 31b (figure 35)
bearing anthracene, amino acid and thiourea units, which were conveniently synthesized in a
few steps and in good yields. Their enantioselective recognition of malete, aspartate and
glutamate were studied by fluorescence emission, UV-vis absorption in DMSO solution, and 1H
NMR spectra.
NH
HN
O HN
HN
S
ONH
NH
SR
R 31a: R = NO231b: R = CH3
Figure 35: Fluorescent sensor 31a-b
The recognition of L-malate in DMSO with the fluorescent sensor 31a showed a decrease of
the fluorescence emission intensity at 429 nm, while it was enhanced at 538 nm, when gradually
increasing the concentration of the anions. The dual fluorescence peaks may be due to the
locally excited (LE) state and charge transfer (CT) state in equilibrium.
When the receptor binds anions, hydrogen bonds are formed leading to the corresponding
complexes. Therefore, formed electron density in the supramolecular system is increased to
enhance the charge-transfer interactions between the electron-rich donor nitrogen of the thiourea
units and the electron-deficient p-nitophenyl moieties.
The changes in fluorescence emission and UV-vis spectra with different concentrations of
D-malate were similar. Addition of L-malate to a solution of 31a led the same effect but weaker
compound to D-malate. The quenching efficiencies (∆IL / ∆ID = 1.67) indicated that the receptor
31a has a good enantioselective recognition ability for D/L-malate. In addition, the association
contants (Kass) are different; the association constant of 31a with L-malate is 3.62 x 10⁴ M-1,

41
while that of 31a with D-malate is 3.75 x 10³ M-1, thus the enantioselectivity (Kass(L) / Kass(D))
is 9.65 for malate. These obvious changes in fluorescence and UV-vis spectra show that 31a has
an excellent chiral recognition ability towards the enantiomers of malate. The corresponding
association constants (Kass) of interaction between host and guest are listed in table 9.
Table 9: Association constants (Kass) of 31a and 31b with the chiral dicarboxylate anions in DMSO.
Receptor 31a Receptor 31b
Guest Kass (M) -1b KL/KD Kass (M) -1b KL/KD
L-malate (3.62 ± 0.25c) x 104 (5.18 ± 0.26 c) x 103 D-malate (3.75 ± 0.33 c) x 103
9.65 (2.38 ± 0.32 c) x 103
2.18 L-aspartate (2.90 ± 0.17 c) x 104 (9.91 ± 0.17 c) x 103 D-aspartate (5.11 ± 0..24 c) x 103
5.68 (2.45 ± 0.23 c) x 103
4.04
L-glutamate (1.78 ± 0.48 c) x 104 2.16
(6.13 ± 0.15 c) x 103 2.45
D-glutamate (8.24 ± 0.33 c) x 103 (2.50 ± 0.34 c) x 103
a The anions were used as their tetrabutylamonium salts. b The data were calculated from results of fluorescence titrations in DMSO. c All error values were obtained by results of nonlinear curve fitting.
When D/L-malate interacts with the receptor of 31b, a PET process is involved.
Fluorescence quenching and the changes in the absorption spectra of the anthracene moiety
confirms that the PET process occurs with anion binding.
The value of the association constant of 31b with L-malate is 5.18 x 10³ M-1, while that of
31b with D-malate is 2.38 x 10³ M-1, which corresponds to a L/D-selectivity (Kass(L) / Kass(D))
of 2.18.
The variations of fluorescence emission and absorption spectra of 31b in the presence of
D/L-aspartate and glutamate were similar to that observed for 31b with D/L-malate, which
implies that the PET process occurred with anion binding. All results are summarized in table 9.
The steric effect of the receptors, structural complementarity with guests, and multiple
hydrogen bonding may be responsible for the enantioselective recognition. Sensitive fluorescent
response and good enantioselctive recognition ability reveals that 31a can be used as fluorescent
chemosensor for malate.
In addition Huang and coworkers [38] reported four chiral fluorescent sensors 32a-d
containing thiourea and amine groups. Their enantioselective recognition towards α-
phenylglycine and phenylglycinol in DMSO was studied by fluorescence emission and UV-vis
absorption spectra.

42
NH
OHN NH
SHN
R
*NH
ONH
S HN
* R
32a, c: R = NO232b, d: R = CH3
Figure 36: Fluorescent sensor 32a-d
At higher concentrations of D/L-phenylglycine, the fluorescence emission intensity
gradually increased which indicates a complexation between 32a and the anions. In the absence
of anions, the photoinduced electron transfer PET process between the anthracene group and the
weak electron-withdrawing amide substituents might result in decreased fluorescence intensity.
Upon addition of anions, the interaction between the anion with the NH-group of thiourea and
indole could diminish the PET progress to induce fluorescence retrieval. Therefore, anion-
induced fluorescence enhancement was observed.
The different increasing efficiencies (∆IL / ∆ID = 1.8) indicate that receptor 32a has a good
enantioselectivitve recognition ability between L/D-α-phenylglycine. The UV-vis spectra show
a gradual decrease of the absorption intensity at 370 nm and a new absorption band at 475 nm
upon decreasing the concentration of L/D-α-phenylglycine. This can be explained by expansion
of the conjugative system as a result of an intermolecular charge transfer (ICT) process. An
isosbestic point at 393 nm was observed, indicating the formation of a host-guest complex.
Similar but smaller variations in the fluorescence and absorption spectra were observed when
32a interacted with L/D-phenylglycinol. The data for all anions with the fluorescent sensor are
summarized in table 10.
The association contants of 32a and 32c are always much higher compared to 32b and 32d
with the corresponding anions. The results demonstrated that the introduction of an electron-
withdrawing substituent (NO2) enhances the acidity of NH group of thiourea, which provides an
effective intramolecular charge transfer and enhances the hydrogen bond ability.
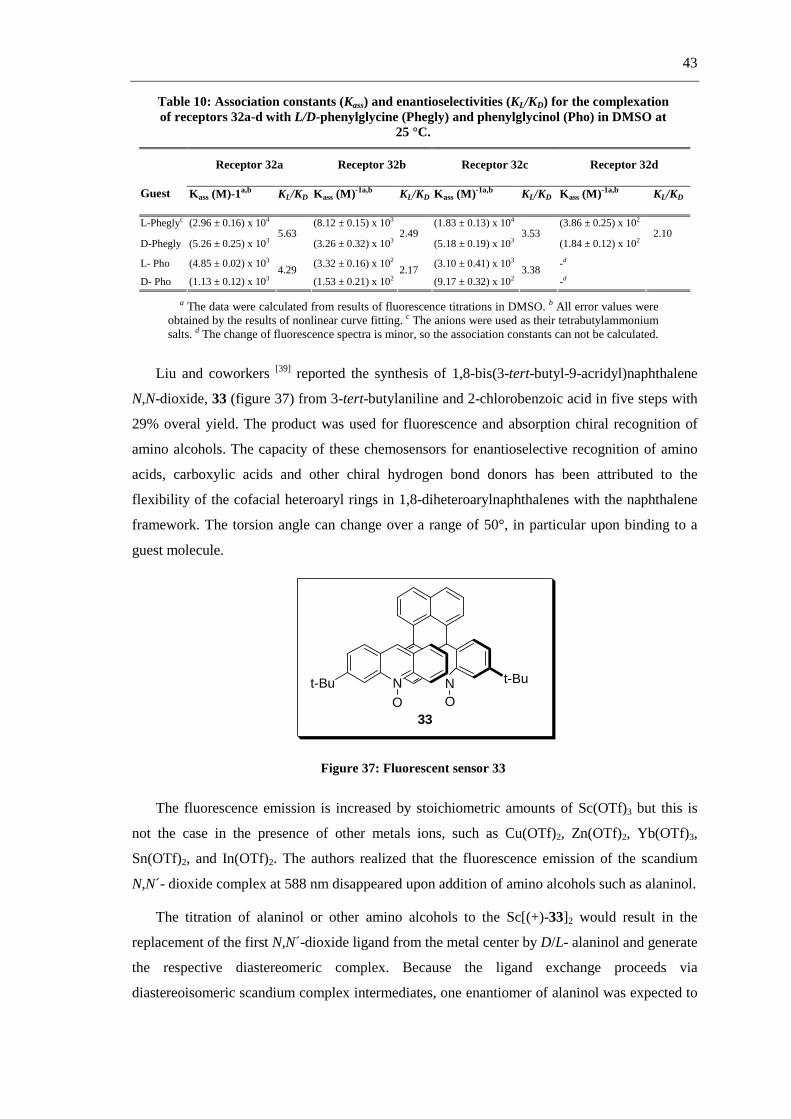
43
Table 10: Association constants (Kass) and enantioselectivities (KL/KD) for the complexation of receptors 32a-d with L/D-phenylglycine (Phegly) and phenylglycinol (Pho) in DMSO at
25 °C.
Receptor 32a Receptor 32b Receptor 32c Receptor 32d
Guest K ass (M)-1a,b KL/KD K ass (M) -1a,b KL/KD K ass (M) -1a,b KL/KD K ass (M) -1a,b KL/KD
L-Pheglyc (2.96 ± 0.16) x 104 (8.12 ± 0.15) x 103 (1.83 ± 0.13) x 104 (3.86 ± 0.25) x 102
D-Phegly (5.26 ± 0.25) x 103 5.63
(3.26 ± 0.32) x 103 2.49
(5.18 ± 0.19) x 103 3.53
(1.84 ± 0.12) x 102 2.10
L- Pho (4.85 ± 0.02) x 103 (3.32 ± 0.16) x 102 (3.10 ± 0.41) x 103 -d
D- Pho (1.13 ± 0.12) x 103 4.29
(1.53 ± 0.21) x 102 2.17
(9.17 ± 0.32) x 102 3.38
-d
a The data were calculated from results of fluorescence titrations in DMSO. b All error values were obtained by the results of nonlinear curve fitting. c The anions were used as their tetrabutylammonium salts. d The change of fluorescence spectra is minor, so the association constants can not be calculated.
Liu and coworkers [39] reported the synthesis of 1,8-bis(3-tert-butyl-9-acridyl)naphthalene
N,N-dioxide, 33 (figure 37) from 3-tert-butylaniline and 2-chlorobenzoic acid in five steps with
29% overal yield. The product was used for fluorescence and absorption chiral recognition of
amino alcohols. The capacity of these chemosensors for enantioselective recognition of amino
acids, carboxylic acids and other chiral hydrogen bond donors has been attributed to the
flexibility of the cofacial heteroaryl rings in 1,8-diheteroarylnaphthalenes with the naphthalene
framework. The torsion angle can change over a range of 50°, in particular upon binding to a
guest molecule.
N t-But-BuO O
N
33
Figure 37: Fluorescent sensor 33
The fluorescence emission is increased by stoichiometric amounts of Sc(OTf)3 but this is
not the case in the presence of other metals ions, such as Cu(OTf)2, Zn(OTf)2, Yb(OTf)3,
Sn(OTf)2, and In(OTf)2. The authors realized that the fluorescence emission of the scandium
N,N - dioxide complex at 588 nm disappeared upon addition of amino alcohols such as alaninol.
The titration of alaninol or other amino alcohols to the Sc[(+)-33]2 would result in the
replacement of the first N,N -dioxide ligand from the metal center by D/L- alaninol and generate
the respective diastereomeric complex. Because the ligand exchange proceeds via
diastereoisomeric scandium complex intermediates, one enantiomer of alaninol was expected to

44
be more effective in displacing D-alaninol than L-alaninol. As a result, the fluorescence signal
of the N,N -dioxide-derivate scandium complex could be exploited for sensing purposes.
Chiral recognition requires multiple-point interaction. [40] Chi and coworkers [41] developed a
mono boronic acid by using an additional interaction, i.e. hydrogen bonding. This compound
showed enantioselectivity towards mono α-hydroxyl acids. Using this concept the authors
reported two photoinduced electron transfer (PET) chiral sensors 34 and 35 (figure 38).
N
B(OH)2
OH
N
B(OH)2
34-R 34-S 35-R 35-S
Figure 38: Chiral fluorescent sensors 34 and 35
Enantioselective fluorescence enhancement was observed for 34-S. An association constant
(Kass) of 5.04 x 10³ M-1 was observed for D-mandelic acid, versus Kass of 2.77 x 10³ M-1 for L-
mandelic acid, which corresponds to D/L-selectivity (Kass(D) / Kass(L)) of 1.8 for mandelic acid.
A mirror effect was observed for the 34-R with the pair D/L- mandelic acid and the selectivity
was Kass(L) / Kass(D) = 2.7. Chemosensor 35 is not enantioselective for mandelic acid.
The authors inferred that the hydroxyl group in 34 is essential for the enantioselectivity,
because this additional intramolecular hydrogen bond increases the enantioselectivity.
For lactic acids, the enantioselective recognition is more challenging because the methyl
group is less bulky than the phenyl group in mandelic acid, and the minor steric hindrance may
attenuate the enantioselectivity. However, the titration of D/L-lactatic acid into 34 shows
selectivity in a factor of 2.8 of D-lactic acid over L-lactic acid. With 35, no enantioselectivity
was found.
The recognition of 34 and 35 toward chiral acids is summarized in table 11.

45
Table 11: Association constants (Kass) and enantioselectivities KD/KL of sensors D/L- 34 and 35 with αααα-hydroxy acids.
Receptor D-34 Receptor L-34 Receptor D-35 Receptor L-35
Guest Kass(M) -1a KD/Kl Kass (M) -1a KD/Kl Kass (M) -1a KD/Kl Kass (M) -1a, KD/Kl
D-mandelic acid (2.11 ± 0.15)x 103 (5.04 ± 0.77) x 103 (4.20 ± 0.02) x 104 (4.29 ± 0.03) x 104 L-mandelic acid (6.62 ± 0.64) x 103
2.66 (2.77 ± 0.57) x 103
0.54 (4.34 ± 0.02) x 104
1.03 (4.49 ± 0.03) x 104
1.04
D- lactic acid (4.46 ± 0.57) x 102 (1.26 ± 0.21) x 103 (1.63 ± 0.07) x 104 (1.74 ± 0.08) x 104 L- lactic acid (1.05 ± 0.14) x 103
2.35 (4.72 ± 0.82) x 102
0.37 (1.36 ± 0.07) x 104
0.83 (1.40 ± 0.07) x 104
0.80
D-tartaric acid (8.51 ± 0.13) x 103 (8.88 ± 0.40) x 103 (3.25 ± 0.14) x 104 (3.35 ± 0.12) x 104
L-tartaric acid (7.90 ± 0.37) x 103 0.92
(8.42 ± 0.31) x 103 0.94
(3.24 ± 0.12) x 104 0.99
(3.22 ± 0.14) x 104 0.96
a Constant determined by fitting a 1:1 binding model I/I0.
The enantioselectivity of 34 towards chiral mono α-hydroxy acids may be result of the
additional hydrogen binding of the hydroxyl group to the boron center. Recognition of 34 in
aqueous solution was carried out, but no enantioselectivity was found.
46
1.6.5 Hydrogen peroxide recognition
Hydrogen peroxide (H2O2) is an essential oxygen metabolite in living systems and
increasing evidence supports its role as a messenger in cellular signal transduction. However,
overproduction of H2O2 and other reactive oxygen species (ROS) from the mitochondrial
electron transport chain leads to oxidative stress and the subsequent functional decline of organ
system. Accumulation of oxidative damage over time is connected to debilitating human
diseases where age is a risk factor, including Alzheimer´s and related neurodegenerative
diseases, as well as cardiovascular disorders and cancer.[42]
In industry hydrogen peroxide it also an important product, the current global production of
hydrogen peroxide is ca. 2.1 x 10⁶ ton per year. It is used in many areas including the bleaching
of wood pulp and paper, the treatment of industrial wastewaters and effluent, in food and
pharmaceuticals industry as a bleach and disinfectant.
The limit for inhalation of H2O2 vapor is set to 1 ppm and the concentration levels over
7 ppm are known to cause lung irritation. The high concentration of H2O2 in aqueous solutions
that are commonly used in industry (greater than 10% w/v) is very oxidizing and corrosive upon
contact, causing severe burns to mucus membranes, gastrointestinal mucosa, skin and eyes. [43]
Above roughly 70% concentration, hydrogen peroxide can give off vapor that can detonate
above 70 °C (158 °F) at normal atmospheric pressure. [44]
Detection and analysis of explosive materials and formulations has become an integral part
of national and global security. The lack of robust low-power portable detection devices for the
rapid on-site screening of both common and suspicious chemicals, materials, cargo and persons,
has driven the need for improved sensor devices, such as photoluminescence sensors. However,
improvised peroxide explosives are not detectable by these technologies. [45]
The following part will present some new approaches for the detection of H2O2.
Chang and coworkers [46] designed a cellpermeable optical probe for H2O2 using 3´,6´-
bis(pinacolatoboron)fluoran 36 (scheme 4). This specific dye contains arylborante groups,
which were converted into phenols upon interaction with the peroxide. This compound is
nonfluorescent under physiological conditions (pH = 7) and does not absorb in the visible
spectral range due to its lactone form. Exposure to H2O2 causes the hydrolytic deprotection of
the boronate functions and generates the open colored fluorescein. This gradually leads to an
increase in fluorescence intensity at around 510 nm when excited at 450 nm. They evaluated the
probe in living cells and confirmed that the compound responds to H2O2 in the micromolar
range.

47
O
O
B BO
O O
O
O
OHO O
CO2H
H2O2
36
Scheme 4: Raction between 36 and hydrogen peroxide
Xu and coworkers [46] synthesized naphthofluorescein disulfonate with the aim to shift the
absorbance and fluorescence into the near infrared spectral range and to enhance sensitivity. The
initial dye is a colourless lactone, and a hydrolytic deprotection of the naphthofluorescein
disulfonate 37 (scheme 5) by H2O2 causes the formation of a coloured and fluorescent
naphthofluorescein with a fluorescence maximum at 662 nm (excitation at 602 nm). It exhibited
good selectivity also in the presence of interfering species such as ascorbic acid, glutathione,
hypochloride or hydroxyl radical and could be applied for monitoring nanomolar concentrations
of H2O2 in living cells.
O
O
O
O OS
O
O SO
O
O
HO O
CO2H
H2O2
37
Scheme 5: Reaction between 37 and hydrogen peroxide
Maeda and coworkers [46] reported the synthesis of comparable fluorescein derivates with
chloro- and fluoro substituents e.g.compound 38 (scheme 6) and observed similar selectivity (5
pmol to 90 nmol hydrogen peroxide), albeit the fluorescence increases at around 514 nm when
excited at 492 nm.

48
O
O
O
OS
O
O
OO
F F
FF
F
FF
H2O2
O
F F
CO2H
OHO
38
Scheme 6: Reaction between 38 and hydrogen peroxide
RPF1 presents a single absorption band at 420 nm, with blue-colored fluorescence from a
corresponding emission band at 464 nm. The spectral date is consistent with minimal FRET
from the coumarin donor to the closed form of the colorless fluoran acceptor. Upon treatment
with H2O2, excitation at 420 nm produces a bright green-colored fluorescence. The resulting
emission spectrum possesses one major band centered at 517 nm with a minor band at 461 nm,
consistent with increased FRET from the coumarin donor to the open form of the colored
fluorescein acceptor. The fluorescence response is accompanied by concomitant growth of a
visible wavelength absorption band characteristic for fluorescein, and high-resolution mass
spectrometry confirms that pedant fluorescein is generated from the reaction between RPF1 and
H2O2.
O OHN
ONH
O
O
O
B
B
O
Et2N
O
O
O
O
exc em
O OHN
O
NH
O
O
Et2N
CO2H
HO
O
excFRET
em
H2O2
39
Scheme 7: Activation of Ratio-Peroxyfluor-1, RPF-1 or 39

49
This FRET-based reagent features good selectivity for H2O2 over competing ROS (reactive
oxygen species) as well as visible wavelength excitation and emission profiles to minimize
damage and autofluorescence from biological samples.
Mills and coworkers [43] prepared a dye ion-pair complex of tris(2,2´-bipyridyl)-
ruthenium(II)ditetraphenylborate, [Ru(bpy)32+(Ph4B
-)2] to improve the detection of H2O2. This
recognition was carried out by recording the UV-vis and fluorescence spectra.
H2O2 + 2Ru(bpy)32+ →→→→ 2Ru(bpy)3
3+ + 2 OH-
The main feature of this system is the one-pot formulation of a coating ink that, when dried,
forms an active, single-layer, fluorescence-based H2O2 sensor capable of detecting H2O2 over
the range 0.01-1 M.
1.7 Phthalimides as chromophore
The photopysical properties of phthalimides have been intensively studied over the last
decades. Phthalimides show a relatively unstructured UV absorption spectra with absorption
maxima around 220 nm (π, π*) and 295 nm (n, π*), respectively. The fluorescence properties are
sensitive to solvent polarity and in protic solvents, also to hydrogen bonding. In general,
phthalimides show a broad structureless phosphorescence centered around 450 nm with a triplet
lifetime between τp = 0.7-1.06 s at -196 °C and between 2 and 10 µs at room temperature in the
absence of oxygen. Quantum yields of phosphorescence were measured in the range of
Φp = 0.3 - 0.7. The order of the excited states of phthalimides has been controversially
discussed. The level of the (n, π) triplet state is either slightly below or above the lowest singlet
state which accounts for the high intersystem crossing rates. [47]
4-Amino-N-methylphthalimide (4-AMP) (figure 39:) fluorophore has been described as
convenient solvatochromic fluorescent dye because of its high fluorescence quantum yield,
sensitivity of the fluorescence parameters to the added reagents and surounding environment
and electron-deficient nature. [48]
H2NN
O
O40
Figure 39: 4-Amino-N-methylphthalimide (40)

50
Recently, Fabbrizzi and coworkers [32] have used urea / thiourea-phthalimide derivates as
chemosensors, where binding tendencies of the sensor towards anions were investigated by UV-
vis and 1H NMR titration. More recently, Samanta and coworkers [48] have studied the behavior
of an amido-phthalimide derivate in the absence / presence of halide ions, suggesting that F-
induces deprotonation of the urea moiety of the sensor system as a signaling mechanism.
NH
NH
X
NO
O
20: X = S
21: X = O
Figure 40: Fluorescence sensors base on thioure 20 and urea 21 receptors
1.8 Multicomponent reactions
The usual procedure for the synthesis of organic compounds is the stepwise formation of the
individual bonds in the target molecule. Multicomponent reactions (MCRs) would be a much
more efficient route to the target compounds as they offer significant advantages over stepwise
procedures, especially with respect to environmental sustainability, practicability and atom
efficiency. Compared to stepwise procedures, the most evident benefit of multicomponent
reactions lies in the inherent formation of several bonds in one operation without isolation of the
intermediates, changing the reaction conditions or addition of any further reagents. [49]
Figure 41: Chemistry jigsaws: Multi-step (top) or multicomponent (bottom) assembly of the same compound
Prominent examples of MCRs are the Strecker reaction, the Hantzsch pyrrole synthesis, the
Biginelli synthesis of dihydropyrimidines, the Mannich reaction, and the Ugi MCR. [49]
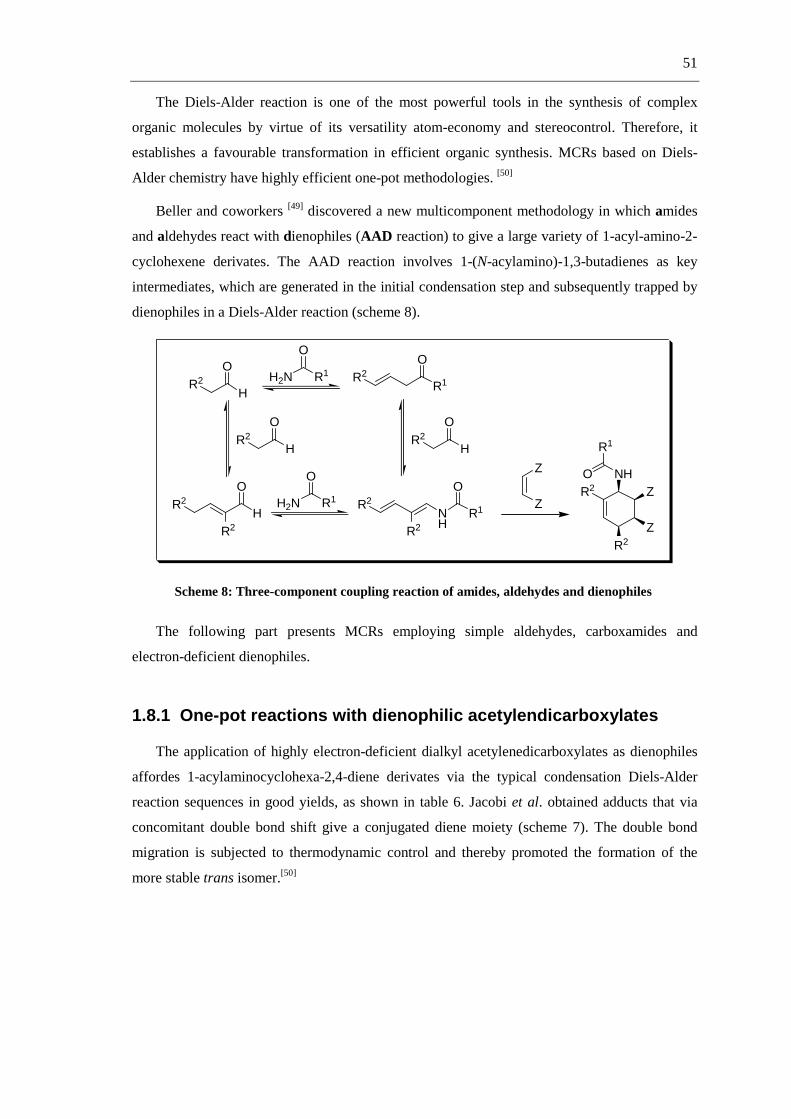
51
The Diels-Alder reaction is one of the most powerful tools in the synthesis of complex
organic molecules by virtue of its versatility atom-economy and stereocontrol. Therefore, it
establishes a favourable transformation in efficient organic synthesis. MCRs based on Diels-
Alder chemistry have highly efficient one-pot methodologies. [50]
Beller and coworkers [49] discovered a new multicomponent methodology in which amides
and aldehydes react with dienophiles (AAD reaction) to give a large variety of 1-acyl-amino-2-
cyclohexene derivates. The AAD reaction involves 1-(N-acylamino)-1,3-butadienes as key
intermediates, which are generated in the initial condensation step and subsequently trapped by
dienophiles in a Diels-Alder reaction (scheme 8).
R2
H
OH2N R1
O
R1
OR2
R2
H
OR2
H
O
H
O
R2
R2 H2N R1
O
NH
R1
O
R2
R2
Z
ZR2
NH
R2
Z
Z
R1
O
Scheme 8: Three-component coupling reaction of amides, aldehydes and dienophiles
The following part presents MCRs employing simple aldehydes, carboxamides and
electron-deficient dienophiles.
1.8.1 One-pot reactions with dienophilic acetylendicarboxylates
The application of highly electron-deficient dialkyl acetylenedicarboxylates as dienophiles
affordes 1-acylaminocyclohexa-2,4-diene derivates via the typical condensation Diels-Alder
reaction sequences in good yields, as shown in table 6. Jacobi et al. obtained adducts that via
concomitant double bond shift give a conjugated diene moiety (scheme 7). The double bond
migration is subjected to thermodynamic control and thereby promoted the formation of the
more stable trans isomer.[50]

52
NH2
O+
H
OR2
CO2Et
CO2Et
+ O
O
O
O
NH
O
R1
R2
R2
TSA, Ac2O,NMP
120 °C, 24 h
41
Scheme 9: One-pot reaction of aldehydes, carboxamides and diethyl acetylendicarboxylate
Table 12: Substituent of the one-pot reaction of aldhydes, carboxamides and diethyl acetylenedicarboxylate and the yield of each reaction
R1 R2 Yield (%)
Me Me 69
Me Et 84
Me i-Pr 74
1.8.2 One-pot reactions with dienophilic maleimide and methyl
maleimide
In general, the synthesis of 4-(N-acetylamino)-5,7-dimethyl-1,3-dioxo-cis-2,3,3a,4,7,7a-
hexahydro-1H-isoindole (42) can be realized via two different routes that are shown in scheme
10. The target compound 42 is accessible via a one-pot protocol which obviates the need for
intermediate workup and purification procedures.
H2N R1
O
R2
H
O+ +
TSA, Ac2O, NMP
120 °C, 24 h
R2NH
R2
R1
OHNO
O NH
O
O
42
Scheme 10: One-pot synthesis of Diels-Alder aducct
The multicomponent route indeed afforded (42) in excellent yields. With more than the
twice yield, this one-pot approach outperforms the two-step route in efficiency as well as in
simplicity and involves nearly quantitative formation of intermediate aminodiene.

53
The combination of the MCRs of O-benzyl carbamate, aldehydes and maleimide as
dienophilic produces the precursor of luminol derivates (scheme 11)
BnO NH2
O+
R1
O
R1O
R1
or
2
+ N
O
O
[H+]N
O
O
NH
OBn
O
R1
R1
Pd/C
N
NH2
R1
R1
O
O
NHNH
R1
NH2
R1
O
O
NH2NH2
43
Scheme 11: Three-step synthesis of substituted luminol derivates
A palladium catalyzed aromatization of the three-component coupling products (product of
the MCRs), which is based on a new intramolecular transfer hydrogenation reaction produces
deprotection-aromatization of the MCRs products and allows the synthesis of polysubstituted
anilines with diverse substitution patterns. [51] With the 3-aminophthalimide and its derivates
(product of the deprotection-aromatization) different luminol derivates were synthesized by the
reaction with hydrazine. [51]
1.9 Chemoluminescence
The number of chemical reactions that produce chemoluminescence is small, thus limiting
this procedure to a relatively small number of species. Nevertheless, some of the compounds
that do react to give chemoluminescence are important components in nature.
Chemoluminescence is produced when a chemical reaction yields an electronically excited
species which emits light as it returns to its ground state. Chemoluminescence reactions are
encountered in a number of biological systems, where the process is often termed
bioluminescence.

54
Over a century ago, it was discovered that several relatively simple organic compounds also
are capable of exhibiting chemoluminescence. The simplest type of reaction of such compounds
to produce chemoluminescence can be formulated as
A + B → C* + D
C* → C +hνννν
Were C* represents the excited state of the species C. Most chemoluminescence reactions
are considerably more complicated than it is suggested by the foregoing equations.[2]
Since the discovery of luminol (5-amino-2,3-dihydro-1,4-phthalazinedione) by Albrecht in
1928, much effort has been expended in an attempt to understand the mechanisms of phthal-
hydrazide chemoluminescence and to uncover the factors governing the efficiency of light
production.[52]
Luminol has been observed to produce chemoluminescence at a wavelength of 425 nm
under many conditions. The chemoluminescence of luminol is now being used widely as
analytical tool for many laboratory and environmental applications, including immunoassay,
monitoring of metabolic pathways, detection of free radicals, analysis of a variety of trace
metals, and detection of other inorganic substances. [53]
The detection of Fe2+ by chemoluminescence was first described as an analytical tool by
Seitz and Hercules. The development of methods for practical and sensitive measurements of
Fe2+ was carried out by O´Suvillan and coworkers and King and coworkers. Unlike methods
developed for other trace metals, many of which rely upon the use of H2O2 as an oxidizing
agent, Fe2+ can produce strong chemoluminescence with luminol in the presence of O2 only. [53]
The chemoluminescence method has the following advantages:
• high sensitivity
• the measurements can be made extremely rapidly
• no chemical treatment of the sample is required prior to analysis
• it is relatively insensitive to interference from other trace metals
• it can distinguish between Fe2+ and Fe3+ oxidation states.
The mechanism via which the oxidation of luminol leads to chemoluminescence is not easy
to understand. However, well-controlled experimentation by Merényi et al has isolated many of
the mechanism through which luminol chemoluminescence can proceed. Similarly, the
mechanism via which Fe2+ induces chemoluminescence in luminol is not adequately reported,

55
despite multiple studies examining the influence of different factors such as pH, buffer and
organic ligands in the presence and absence of H2O2. [53]
Other authors suppose that the chemoluminescence intensity of the system is directly related
to the Fe2+ concentration, without giving detailed consideration to the mechanism involved. This
is problematic because the concentration of free radicals in solution for a given Fe2+
concentration may differ depending on the initial Fe2+ concentration. Thus, the calibrated value
of chemoluminescence intensity for a particular Fe2+ may depend on the starting concentration
of Fe2+ used during calibration, even if the medium used in calibration is identical to the sample.
The interference with the chemoluminescence based detection of Fe2+ by organic material
has been attributed to three potential sources:
• scavenging of radical intermediates in the luminol oxidation process
• complexation of free Fe2+
• re-absorption of the chemoluminescence light.
Rose and coworkers [53] clarified the mechanism of luminol chemoluminescence in the Fe2+-
O2 system and identified existing agent(s) of luminol oxidation. In summary, the possible
mechanism for this chemoluminescence system is shown in scheme 12. [53]
Fe (II) + H2O2 Fe (III) + HO + HO-
NHNH
NH2 O
O
Luminol
HO-
NHN-
NH2 O
O
N-N
NH2 O
OH+
Luminol radical (LH·,L·-)
Fe (II) + O2 Fe (III) + O22- (L·- only)
NN
NH2 O
O- OOH+H
α-hydroxy-hydroperoxide
(LH·,L·-) NN
NH2 O
ODiazaquinone
HO2-
decomposition
hν
OO
NH2 O
O
+N2
HO
Scheme 12: Possible chemoluminescence mechanism of luminol with Fe2+ and hydrogen peroxide
Luminol chemoluminescence is initiated by the one electron oxidation of luminol to luminol
radical anions by strong oxidants including horseradish peroxidase, metals such as cobalt,
copper and iron and organic complexes of these metals. Despite a huge number of studies, the
mechanism of the process leading to enhancement or inhibition of luminol chemoluminescence

56
is still not fully understood. However, Uzu and coworkers [54] studied in dicopper complexes
because it has been reported that H2O2 is formed concurrently with quinone formation catalyzed
by dicopper complex. The dicopper complex catalyzes both the reduction of dissolved O2 and
the following oxidation of luminol with H2O2 to yield efficient chemoluminescence (scheme
13).
NHNH
O
O
NH2 dissolved O2,ascorbic acid in H2O
NCu II
O
O
O
OH
O IICu
O
O
OH
O
O
NH2
OO
+ hνννν
Scheme 13: Mechanism of luminol oxidation through dicopper complex
Numerous methods like Cu2+, Fe2+, Co2+ have also been used as redox-active compounds in
the luminol chemoluminescence. [55]

2 Aim of the work
Detecting cations, achiral and chiral anions and hydrogen peroxide is of great interest for
many fields of science, such as chemistry, biology and medical science. In the last decades
much effort has been put into the research on the synthesis of a new generation of sensors that
are able to recognize these analytes.
One approach to detect these analytes is the use of fluorescent sensors. Typically these
sensors are more sensitive than absorption sensors (colorimetric sensors) as the signal can be
detected directly and does not have to be compared to a reference beam. Different studies show
that interaction between analyte and sensor through hydrogen bonding is a powerful tool due to
the strong binding of the formed complexes. Furthermore, the resulting change in the electronic
structure can possibly change the fluorescence properties of the fluorophor.
In the last years significant reactions and characteristics of phthalimide derivatives have been
intensively studied and reported by our research group. The high fluorescence quantum yield
makes phthalimides attractive fluorophores.
Taking in account these factors, the aim of this work was to synthesize new fluorescent
sensors based on phthalimide derivatives to recognized cations, achiral and chiral anions and
hydrogen peroxide. The recognition was to be based on hydrogen bonding interaction or metal
coordination.
In the last part of this work the interest was focused on the study of photophysical properties
and the chemoluminescence efficiency of a series of new luminol derivatives. Luminol as parent
motif has been known for decades for its robust chemoluminescent behavior in the presence of
oxidants. Therefore, structural analogs can lead to practical applications as analytical probe for
metal ions, oxidants or anions.


3 Results and Discussion
3.1 Synthesis of nitro- and amino-substituted phthalimide
derivatives from benzylamine
In order to develop new fluorescence sensors based on phthalimide derivativess, a synthetic
route via the reaction between 3-nitrophthalic anhydride and benzylamine was developed.
Heating under azeotropic conditions with a catalytic amount of triethylamine led to the
formation of the expected product 2-benzyl-4-nitroisoindoline-1,3-dione (46) (N-benzyl-3-nitro-
phthalimide) in 85 % isolated yield.[56]
In the next step 2-benzyl-4-nitroisoindoline-1,3-dione was reduced with catalytic amounts of
Pd/C under H2-atmosphere in EtOH, giving the product 4-amino-2-benzylisoindoline-1,3-dione
(47) which was the precursor for other syntheses (scheme 14).[57]
O
O
O
NH2 N
O
O
NO2NO2
+ + H2Pd/C
N
O
O
NH2
NEt3
toluene EtOH
44 45 46 47
Scheme 14
Product 47 was isolated in 82 % yield and characterized by NMR and IR-spectroscopy. The
N-H stretch bands was observed at 3472 (m) and 3351 (m) cm-1.
3.2 Synthesis of phathalimide derivativess from 4-amino-2-
benzylisoindoline-1,3-dione
Compound 47 was acetylated to give N-(2-benzyl-1,3-dioxoisoindolin-4-yl)acetamide (48).
IR-spectroscopy showed the change of the NH2 signal (two bands at 3472 and 3351 cm-1) to a
NHAc-group (one band at 3346 cm-1 with minor intensity, due to hydrogen bonding).
Compound 48 was then used for preliminary fluorescence experiments as well as a starting
material 47 (scheme 15).
Other syntheses were carried out in order to produce chiral carbamates and chiral ureas
based on phthalimide derivate 47. Unfortunately, the majority of attempts were not successful.
One possible reason may be that the amine group in position 3 of the aromatic ring is less
reactive towards an electrophilic attack than the one in position 4. This low reactivity may be
due to hydrogen bonding between the carbonyl group of the indole moiety and the amine to
form a stable 6-membered ring.

60
N
O
O
NH2
+ Ac2O N
O
O
NH
O
47 48
Scheme 15
The coupling reaction was carried out with DCC in dry CH2Cl2 and the progress of this
reaction was monitored by TLC. After two days a new product was observed and isolated. The
product benzyl (S)-1-(2-benzyl-1,3-dioxoisoindolin-4-ylcarbamoyl)ethylcarbamate (50) was
characterized by 1H NMR only. Due to the low yield of this synthesis (35 %), not enough
substance was present for other characterizations methods. For time reasons it was not possible
to repeat this reaction or purify the target molecule (scheme 16).
NH2
N
O
O
HO
O
HN O
O
+
NH
N
O
O
OHN
O
O
48 49
50
Scheme 16
This synthetic route that uses the coupling between the amine group and an amino acid
establishes an easy access to new interesting chiral fluorescence sensors. The method has to be
optimized for a higher yield.
10.0 9.0 8.0 7.0 6.0 5.0 4.0 3.0 2.0 1.0
1
23
4
56NH 7
8
N910
11
O12
O13
1415
16
1718
1920
O21
22HN
23
24
O25
O26
2728
2930
31
3233
34
34
24
11
277 1 23
23
14-1928-33
10.0 9.0 8.0 7.0 6.0 5.0 4.0 3.0 2.0 1.0
1
23
4
56NH 7
8
N910
11
O12
O13
1415
16
1718
1920
O21
22HN
23
24
O25
O26
2728
2930
31
3233
34
10.0 9.0 8.0 7.0 6.0 5.0 4.0 3.0 2.0 1.0
1
23
4
56NH 7
8
N910
11
O12
O13
1415
16
1718
1920
O21
22HN
23
24
O25
O26
2728
2930
31
3233
34
34
24
11
277 1 23
23
14-1928-33
Figure 42: 1H NMR spectrum of the isolated product 50

61
We used the synthetic route shown in part 3.1 to obtain other phthalimide derivatives such as
the compounds presented in the following chapter.
3.3 Synthesis of nitro-, amino-substituted phthalimide deriva-
tives from 2,2-Diphenylhydrazine
The reaction between 3-nitrophthalic anhydride and 2,2-diphenylhydrazine was carried out
by heating the two starting materials in the presence of catalytic amounts of triethylamine
(azeotropic conditions). The expected product 2-(diphenylamino)-4-nitroisoindoline-1,3-dione
(52) was obtained in 70 % yield.[56]
In the next step, compound 52 was reduced with catalytic amounts of Pd/C under H2
atmosphere in EtOH and the product 2-(diphenylamino)-4-aminoisoindoline-1,3-dione (53) was
isolated in 67 % yield.
This synthetic route for the synthesis of nitro-, amino-substituted phthalimide-derivatives is a
simple method that, in general, gives good yields. The purification of the products was carried
out by crystallization and by column chromatography.
O
NO2 O
O
H2N N+ N
NO2 O
O
NNEt3
Toluene+ H2 N
NH2 O
O
NPd/C
EtOH
44 51 52 53
Scheme 17
Products 47, 48 and 53 were characterized directly and used for different fluorescence
experiments such as the deactivation and activation of the fluorescence emission through
addition of molecular quenchers or metal ions. In the following part, the results of this
fluorescence experiments are presented.
3.4 Quenching study of amino- and acetamido-substituted
phthalimide derivatives
Fluorescence quenching studies of products 47 and 48 were conducted with different
molecular quenchers which are shown in figure 43. The concentration of the quencher was
adjusted at 0.3 M and of the fluorophor at 1mM. The excitation and emission slits were set to
2.5 nm. Equivalents of quencher were added into the quartz cells that contained the fluorophor.
The fluorescence spectrum was measured directly after each addition step.
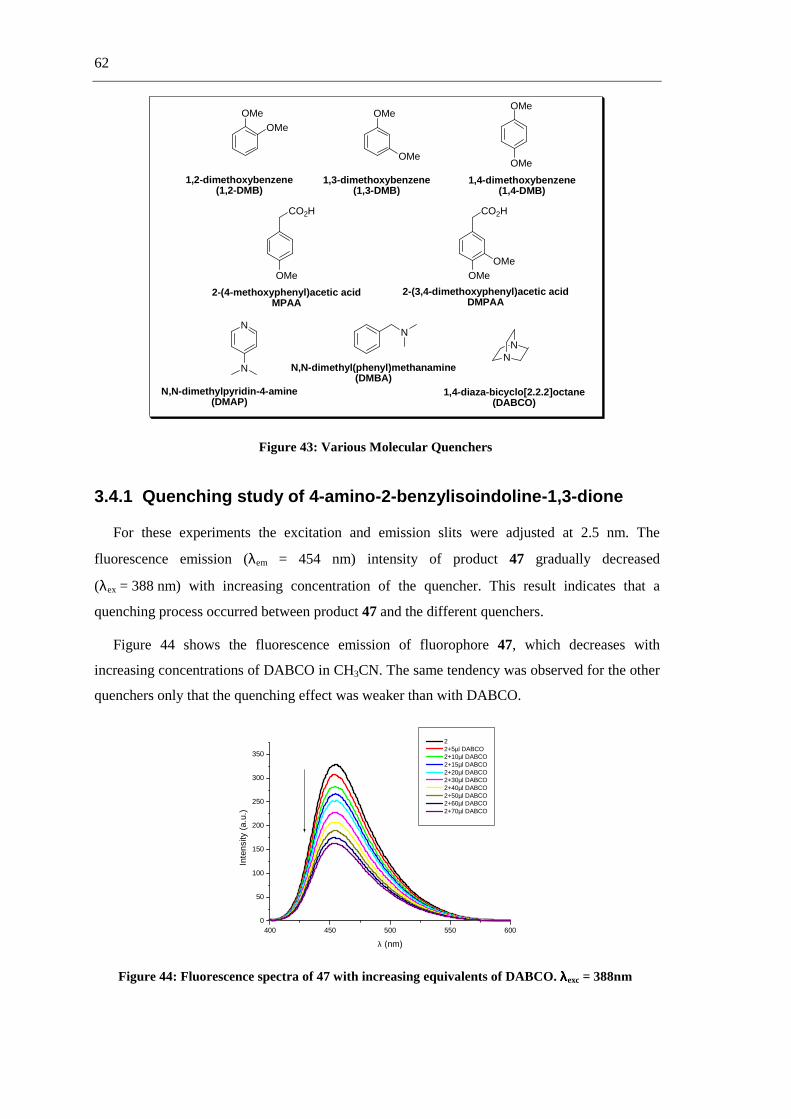
62
OMeOMe
OMe
OMe
OMe
OMe
N
CO2H
OMe
CO2H
OMeOMe
N
N
NN
1,2-dimethoxybenzene(1,2-DMB)
1,3-dimethoxybenzene(1,3-DMB)
1,4-dimethoxybenzene(1,4-DMB)
2-(4-methoxyphenyl)acetic acidMPAA
2-(3,4-dimethoxyphenyl)acetic acidDMPAA
N,N-dimethylpyridin-4-amine(DMAP)
N,N-dimethyl(phenyl)methanamine(DMBA)
1,4-diaza-bicyclo[2.2.2]octane(DABCO)
Figure 43: Various Molecular Quenchers
3.4.1 Quenching study of 4-amino-2-benzylisoindoline-1,3-dione
For these experiments the excitation and emission slits were adjusted at 2.5 nm. The
fluorescence emission (λem = 454 nm) intensity of product 47 gradually decreased
(λex = 388 nm) with increasing concentration of the quencher. This result indicates that a
quenching process occurred between product 47 and the different quenchers.
Figure 44 shows the fluorescence emission of fluorophore 47, which decreases with
increasing concentrations of DABCO in CH3CN. The same tendency was observed for the other
quenchers only that the quenching effect was weaker than with DABCO.
400 450 500 550 6000
50
100
150
200
250
300
350
Inte
nsity
(a.
u.)
λ (nm)
2 2+5µl DABCO 2+10µl DABCO 2+15µl DABCO 2+20µl DABCO 2+30µl DABCO 2+40µl DABCO 2+50µl DABCO 2+60µl DABCO 2+70µl DABCO
Figure 44: Fluorescence spectra of 47 with increasing equivalents of DABCO. λλλλexc = 388nm

63
The Stern-Volmer constants for the different quenchers with product 47 were calculated via
a Stern-Volmer plot. [6]
The Stern-Volmer equation can also be obtained by considering the fraction of excited
fluorophores, relative to the total, which decay by emission. This factor (F/F0) gives the ratio of
the decay rate in the absence of a quencher (γ) to the total decay rate in the presence of quencher
(γ + kq[Q]):
F / F0 = γγγγ / γγγγ + kq[Q] = 1 / 1 + kq[Q] (9)
This is again one from of the Stern-Volmer equation. Since collisional quenching is a rate
process that depopulates the excited state, the lifetimes in the absence (τ0) and presence (τ) of a
quencher are given by:
ττττ0 = γγγγ -1 (10)
ττττ = (γγγγ + kq[Q]) -1 (11)
and therefore,
ττττ0000 / ττττ = 1 + kq ττττ0000 [Q] (12)
This equation illustrates an important characteristic of collisional (dynamic) quenching,
which is an equivalent decrease in fluorescence intensity and lifetime. For dynamic quenching
the following equation applies:
F0 / F = ττττ0 / ττττ (13)
The decrease in lifetime occurs because quenching is an additional rate process that
depopulating the excited sate.
The Stern-Volmer plots for our system resulted in a linear correlation, that is shown in figure
45. The slope represents the Stern-Volmer quenching constant that is given by
KD = kq ττττ0 (14)
The linear correlation showes a possible dynamic process. It is clear that with only one
experiment it can not be proved that the involved mechanism is dynamic. Experiments such as
lifetime measurement and variation of the temperature can distinguish between dynamic and
static quenching mechanism and will be carried out in future work.

64
0,00 0,01 0,02 0,03 0,04 0,05 0,06 0,07 0,08 0,091,0
1,1
1,2
1,3
1,4
1,5
1,6
1,7
1,8
1,9
F0 /
F
[Q] mol/L
DMBA DAMP DABCO 1,4-DMB MPAA DMPAA 1,2-DMB 1,3-DMB
Figure 45: Stern-Volmer plots of the product 47 with the different molecular quenchers
The next table shows the Stern-Volmer constants that were obtained from the Stern-Volmer
plots as well as the bimolecular quenching constants (kq) that were calculated with equation 6.
For the bimolecular quenching constants the lifetime of the 3-amino phthalimide (3-AP) were
used (12.5 ns). [58]
Table 13: Stern-Volmer constant (KD) and bimolecular quenching constant (kq) of fluorophore 47.
Quenchera,b KD (M) -1 c kq (M s)-1 x 10⁹
DABCO 143.75 ± 1.17 11.50
DMAP 139.61 ± 4.76 11.17
1,4-DMB 89.10 ± 0.80 7.13
DMBA 61.12 ± 0.46 4.89
1,2-DMB 38.48 ± 1.37 3.08
1,3-DMB 37.56 ± 1.43 3.00
DMPAA 5.65 ± 0.17 0.45
MPAA 5.26 ± 0.08 0.42
a The concentration of product 47 was 1 mM. b The concentration of the quencher stock solutions was 0.3 M, all solutions were prepared in CH3CN. cThe plot was carried out with Origin 6.0 and all correlation coefficient were obtained between 0.995 and 0.999.
3.4.2 Quenching study of N-(2-Benzyl-1,3-dioxoisoindolin-4-yl)acet-
amide
The excitation and emission slits were adjusted at 2.5 nm for the quenching experiments.
Fluorophore emission 48 was excited at 342 nm. The fluorescence emission intensity with a
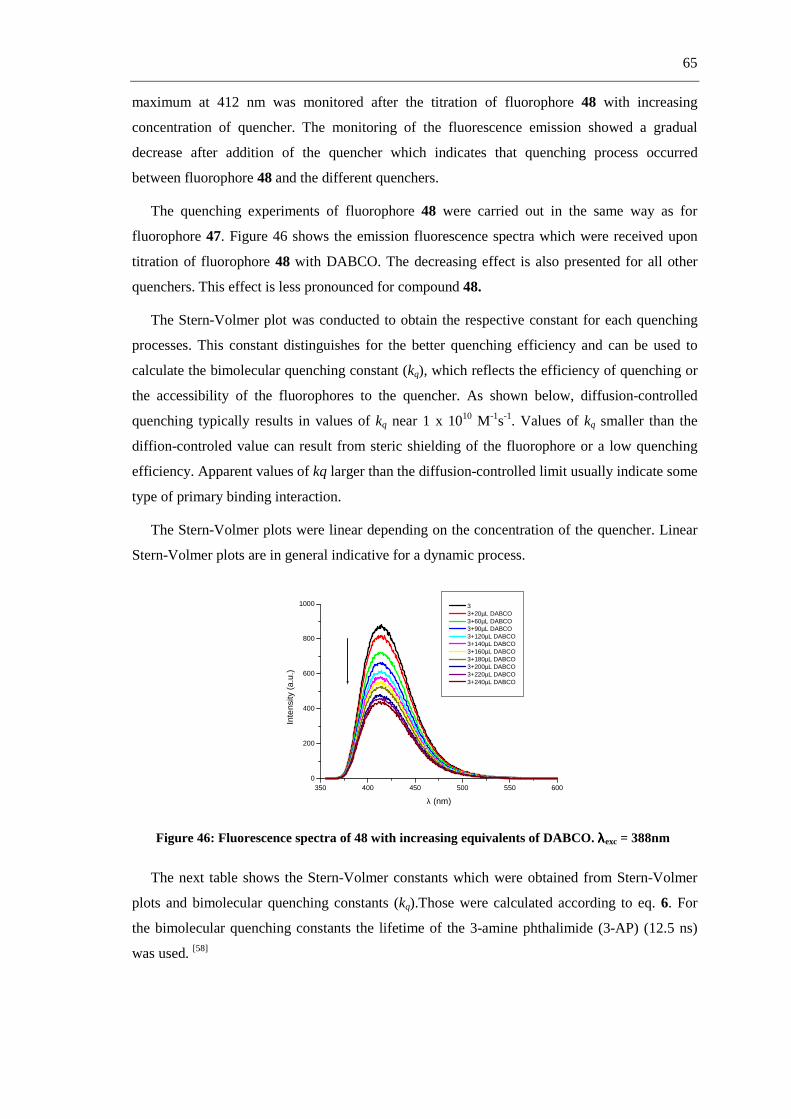
65
maximum at 412 nm was monitored after the titration of fluorophore 48 with increasing
concentration of quencher. The monitoring of the fluorescence emission showed a gradual
decrease after addition of the quencher which indicates that quenching process occurred
between fluorophore 48 and the different quenchers.
The quenching experiments of fluorophore 48 were carried out in the same way as for
fluorophore 47. Figure 46 shows the emission fluorescence spectra which were received upon
titration of fluorophore 48 with DABCO. The decreasing effect is also presented for all other
quenchers. This effect is less pronounced for compound 48.
The Stern-Volmer plot was conducted to obtain the respective constant for each quenching
processes. This constant distinguishes for the better quenching efficiency and can be used to
calculate the bimolecular quenching constant (kq), which reflects the efficiency of quenching or
the accessibility of the fluorophores to the quencher. As shown below, diffusion-controlled
quenching typically results in values of kq near 1 x 10¹⁰ M-1s-1. Values of kq smaller than the
diffion-controled value can result from steric shielding of the fluorophore or a low quenching
efficiency. Apparent values of kq larger than the diffusion-controlled limit usually indicate some
type of primary binding interaction.
The Stern-Volmer plots were linear depending on the concentration of the quencher. Linear
Stern-Volmer plots are in general indicative for a dynamic process.
350 400 450 500 550 6000
200
400
600
800
1000
Inte
nsity
(a.
u.)
λ (nm)
3 3+20µL DABCO 3+60µL DABCO 3+90µL DABCO 3+120µL DABCO 3+140µL DABCO 3+160µL DABCO 3+180µL DABCO 3+200µL DABCO 3+220µL DABCO 3+240µL DABCO
Figure 46: Fluorescence spectra of 48 with increasing equivalents of DABCO. λλλλexc = 388nm
The next table shows the Stern-Volmer constants which were obtained from Stern-Volmer
plots and bimolecular quenching constants (kq).Those were calculated according to eq. 6. For
the bimolecular quenching constants the lifetime of the 3-amine phthalimide (3-AP) (12.5 ns)
was used. [58]

66
Table 14: Stern-Volmer constant (KD) and bimolecular quenching constant (kq) of fluorophore 48.
Quenchera,b KD (M) -1 c kq (M s)-1x 10⁹
DABCO 40.75 ± 1.49 3..26
DAMP 40.14 ± 0.33 3.21
DMPAA 27.76 ± 0.59 2.22
DMBA 27.32 ± 0.24 2.18
1,2-DMB 26.02 ± 1.11 2.10
1,4-DMB 25.16 ± 0.30 2.01
1,3-DMB 21.36 ± 0.21 1.71
MPAA 14.57 ± 0.11 1.16
a The concentration of 48 was 1 mM. b The concentration of the quencher stock solutions was 0.3 M. All solutions were prepared in CH3CN. c The plot was prepared with Origin 6.0 and all correlation coefficients were obtained between 0.998 and 0.999.
As illustrated in table 13 and table 14, DABCO shows the best quenching effect for both
fluorophores. This indicates the high electron-transfer efficiency of DABCO as a quencher.
Quenchers with methoxy groups as substituents on the aromatic ring such as 1,4-
dimethoxybenzene and 1,2-dimethoxybenzene only show a moderate quenching effect.
The interaction between quenchers and fluorophore was stronger with fluorophor 47 for all
quenchers than for fluorophore 48. The only structural difference between these fluorophores is
the protection of the amine group with an acetamide functionality. This substitution change
from amine to acetamide can affect several properties involved in the quenching process; one of
them is the ground state reduction potential.
The dynamic fluorescence quenching can occur though PET (photoinduced electron transfer)
from the ground state quencher to the excited state fluorophore. It is also possible that the
radical cation of the quencher and the radical anion of the fluorophore are combined as last step
of the dynamic quenching process. If the PET is involved as possible mechanism, a change in
the reduction potential favors the quenching process. Another factor is the stability of the
generated radical cation of the quencher. Functional groups that stabilize the radical cation
assist the efficiency of the quenching process.
After PET of the quencher to the fluorophore, a combination of fluorophore and quencher
can occur. This combination produces a new adduct, which is not a ground state complex. For
that reason a static fluorescence quenching process does not occur during the combination.
Quenchers such as 2-(4-methoxyphenyl)acetic acid (MPAA) and 2-(3,4-dimethoxyphenyl)
acetic acid (DMPAA) showed a poor quenching effect in presence of the fluorophor 47. One
possible reason could be that the quenchers in the solvent exist as carboxylate anions and induce

67
acid-basic reaction between the amine group of the fluorophore and the carboxylate anion of the
quenchers. Thus, the dynamic quenching process is thus not observed.
The same quenchers interact with fluorophore 48 according to another mechanism. The
Stern-Volmer constant of 2-(3,4-dimethoxyphenyl) acetic acid (DMPAA) shows a higher value
than for amino and dimethoxy quenchers, which indicates that a dynamic quenching process is
involved between fluorophore 3 and the quencher. But for 2-(4-methoxyphenyl)acetic acid
(MPAA) another process of interaction can be involved between the fluorophore 48 and the
quencher such as radical stabilization or decarboxylation which makes the process slower.
The proposed general mechanism is presented in scheme 18.
N
O
O
R2
R1
hνN
O
R2
R1
1P*
OET
quencher+ quencher N
O
R2
R1
OH
Quencher
Scheme 18
3.4.3 Preliminary study: fluorescence activation of 2-(diphenyl-
amino)-4-aminoisoindoline-1,3-dione through cation
coordination
This experiment was based on the addition of more equivalents of the cation into a quartz
cells containing fluorophor 53. After each addition of the cation the emission fluorescence
spectrum was measured. The concentration of 53 was adjusted to 1 mM and for the cations
(Ba2+, Cu2+, Ni2+, Mg2+, Ag+, Zn+, Fe3+ as nitrate and Eu3+ as triflate salt) it was varied between
0.01-0.1 M. For excitation and emission experiments, slit widths were adjusted to 5.0 nm.
The activation of emission fluorescence of product 53 was measured after excitation at
388 nm with increasing concentration of the cations.
Considerable changes of the fluorescence emission were not observed. The fluorescence
emission maximum was detected at 420 nm with an intensity between 0 and 13.85 a.u. for
product 53 with the cations. The histogram shows that zinc ions contributed the most to an
increase of the emission intensity with a factor of nearly 14. However, this is still a weak effect
for the detection of a cation. Other fluorescence sensors reported in literature exhibit an increase
of about 1200-fold [17] for the detection of copper and other metal ions.

68
0
2
4
6
8
10
12
14
6 Zn Ag Ba Mg Ni Fe Cu
Figure 47: Histogram of the fluorescence quenching efficiency between 53 and metal ions
It is possible that the coordination site of product 53 is not suitable for these cations and thus
PET between fluorophore and cations was not possible. Another reason can be a competition
between the primary and the tertiary amine groups in the fluorophore. It would be possible to
confirm this speculation by protecting the amine group with acetamide or another protecting
group and to repeat the quenching experiment (figure 48).
In conclusion, the idea of synthesizing a simple fluorescence sensor for the detection of
cations (product 53) due to PET did not lead to the expected results.
N
NH2 O
O
N
M+
Figure 48: Possible complex between 53 and the metal ions
Many examples for cations fluorescence sensors exist, the great majority containing
complexing groups such as chelators or calixarenes.[10] Possible phthalimide derivatives
containing one of these complexing groups can be proposed as new cation sensors and are
shown in figure 49. Increasing the capability to bind cations could possibly increase the
efficiency of the cation detection by fluorescence emission.
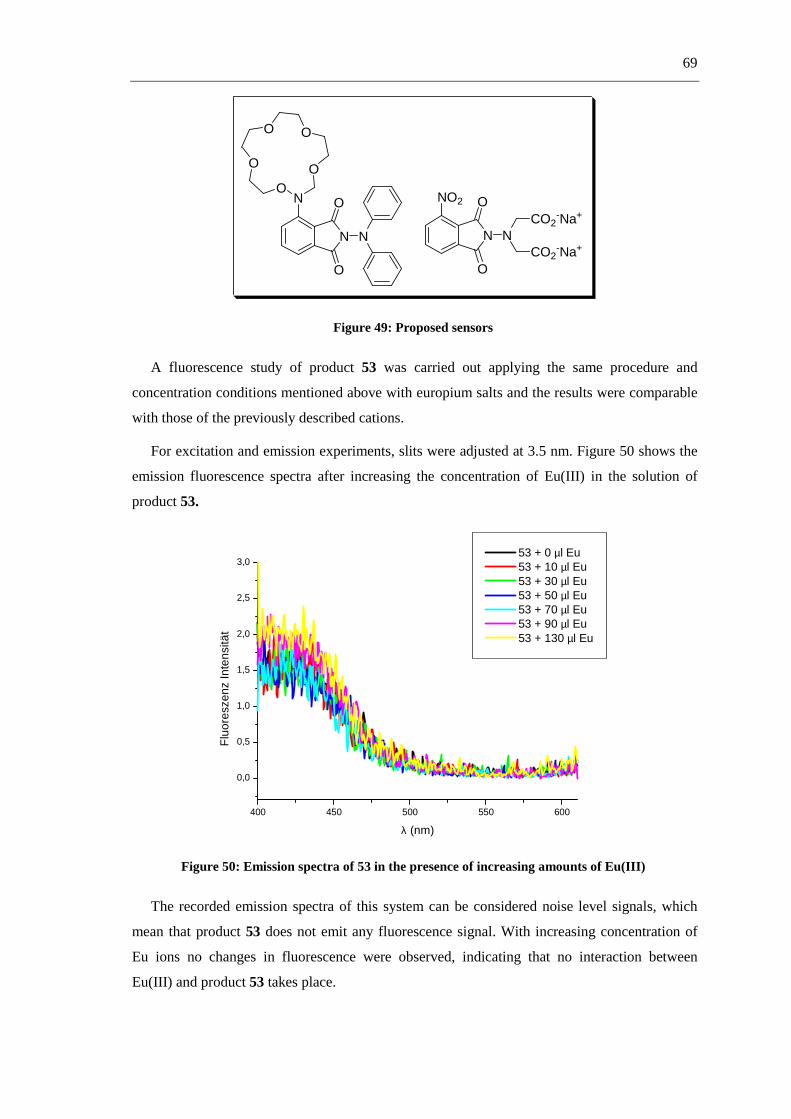
69
N
O
O
N
O
OO
O
ON
N
NO2 O
O
NCO2
-Na+
CO2-Na+
Figure 49: Proposed sensors
A fluorescence study of product 53 was carried out applying the same procedure and
concentration conditions mentioned above with europium salts and the results were comparable
with those of the previously described cations.
For excitation and emission experiments, slits were adjusted at 3.5 nm. Figure 50 shows the
emission fluorescence spectra after increasing the concentration of Eu(III) in the solution of
product 53.
400 450 500 550 600
0,0
0,5
1,0
1,5
2,0
2,5
3,0
Flu
ores
zenz
Inte
nsitä
t
λ (nm)
53 + 0 µl Eu 53 + 10 µl Eu 53 + 30 µl Eu 53 + 50 µl Eu 53 + 70 µl Eu 53 + 90 µl Eu 53 + 130 µl Eu
Figure 50: Emission spectra of 53 in the presence of increasing amounts of Eu(III)
The recorded emission spectra of this system can be considered noise level signals, which
mean that product 53 does not emit any fluorescence signal. With increasing concentration of
Eu ions no changes in fluorescence were observed, indicating that no interaction between
Eu(III) and product 53 takes place.

70
To induce the detection of Eu (III) with product 53 the last probe of the titration process
containing 100µl of Eu (III) solution was irradiated for about 180 min. The irradiation was
performed in the photoreactor Luzchem LZC-4V (14 lamps, λ = 350 ± 20 nm), and every 30
minutes a fluorescence spectrum was measured.
Two new bands appeared in the emission spectra with their maxima centered at 452 and
531 nm (figure 51). In the course of the irradiation, the intensity of these maxima increased
reaching a maximum after 60 min and declined when the experiment was continued.
400 450 500 550 600
0
20
40
60
80
100
Inte
nsity
(a.
u.)
λ (nm)
53 + 100 µl Eu t=0 min 53 + 100 µl Eu t= 30 min (λ
exc = 350 nm)
53 + 100 µl Eu t= 60 min (λexc
= 350 nm) 53 + 100 µl Eu t= 90 min (λ
exc = 350 nm)
53 + 100 µl Eu t= 180 min (λexc
= 350 nm)
Figure 51: Emission spectra after irradiation of the solution 53 + 100µL Eu(III)
This increase can be interpreted as an interaction signal between compound 53 and Eu(III),
because the blank sample (only fluorophore solution, same irradiation conditions) did not show
changes in fluorescence emission after irradiation. However, this increase of the fluorescence
emission intensity was not very remarkable considering that the slits were opened to at 3.5 nm.
The deployed fluorospectrometer is able to measure a fluorescence intensity up to 1000 a.u. thus
an increase of 100 a.u. does not represent a significant change.
N
NH2 O
O
N
*
[Eu3+]
PET
53, non-fluorescent 53a, fluorescent
N
NH2 O
O
N
*
Eu
PET
Scheme 19: Possible quenching mechanism between 53 and Eu(III)
However, a rationale for this fluorescence increase can be Eu(III) complexation promoted by
irradiation which hinders the amine nitrogen lone pair to take part in the PET. This
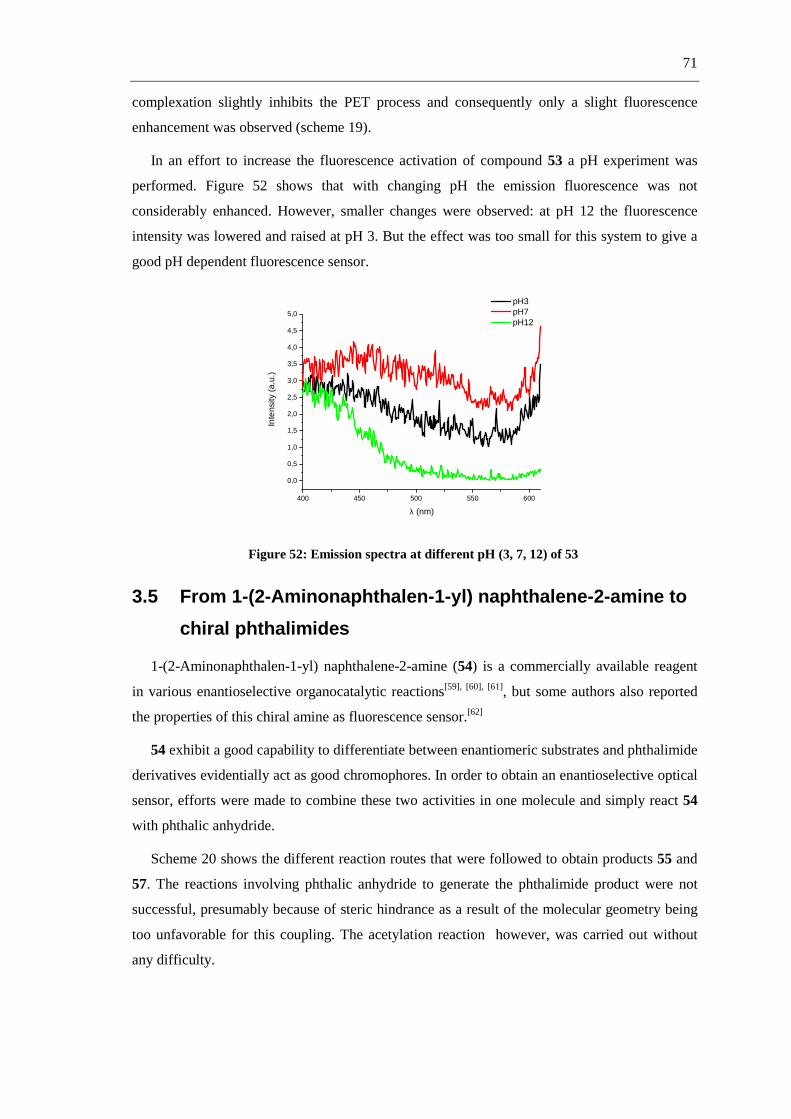
71
complexation slightly inhibits the PET process and consequently only a slight fluorescence
enhancement was observed (scheme 19).
In an effort to increase the fluorescence activation of compound 53 a pH experiment was
performed. Figure 52 shows that with changing pH the emission fluorescence was not
considerably enhanced. However, smaller changes were observed: at pH 12 the fluorescence
intensity was lowered and raised at pH 3. But the effect was too small for this system to give a
good pH dependent fluorescence sensor.
400 450 500 550 600
0,0
0,5
1,0
1,5
2,0
2,5
3,0
3,5
4,0
4,5
5,0
pH3 pH7 pH12
Inte
nsity
(a.
u.)
λ (nm)
Figure 52: Emission spectra at different pH (3, 7, 12) of 53
3.5 From 1-(2-Aminonaphthalen-1-yl) naphthalene-2-amine to
chiral phthalimides
1-(2-Aminonaphthalen-1-yl) naphthalene-2-amine (54) is a commercially available reagent
in various enantioselective organocatalytic reactions[59], [60], [61], but some authors also reported
the properties of this chiral amine as fluorescence sensor.[62]
54 exhibit a good capability to differentiate between enantiomeric substrates and phthalimide
derivatives evidentially act as good chromophores. In order to obtain an enantioselective optical
sensor, efforts were made to combine these two activities in one molecule and simply react 54
with phthalic anhydride.
Scheme 20 shows the different reaction routes that were followed to obtain products 55 and
57. The reactions involving phthalic anhydride to generate the phthalimide product were not
successful, presumably because of steric hindrance as a result of the molecular geometry being
too unfavorable for this coupling. The acetylation reaction however, was carried out without
any difficulty.

72
O
O
O
NH2
NH2
NH2
Pht NHAcNH2 Pht
NHAc
O
O
ClPO
OMeOMe
O
O
O
AcOH + Ac2O54
55 56 57
Scheme 20
These first trials were performed with racemic 54. We then wanted to apply an optimized
synthetic route in the synthesis of an enantiomerically pure compound.
Wang and coworkers [63] reported the reaction depicted in scheme 21. In the last step a
reaction between the primary amine group of 1-(2-aminonaphthalen-1-yl) naphthalene-2-amine
and 3,5-bis(trifluoromethyl)phenyl thioisocyante was carried out to produce the corresponding
thiourea.
NH2
NH2AcOH
Ac2O
NH2
NHAc CH2O
NaBH3CNN(CH3)2
NHAc
4 M HCl
N(CH3)2
NH2
CF3
CF3
SCN
N(CH3)2
NH
S
NH
CF3
CF3
58 59 60
6162
Scheme 21

73
Consequently, with this route it should be possible to synthesize an enantioselective
fluorescence sensor containing the two key elements by reaction of 54 and a thioisocianate or
isocyanate substituted phthalimide derivative.
Taking into account the synthetic problems that appeared in the attempt to directly couple
the amine group and the phthalic anhydride, it was proposed to modify the route to get a similar
phthalimide derivative. This modification consists of the application of a thioisocyanate or
isocyanate phthalimide derivatives which in a second step will be coupled with 54. The
proposed synthetic route is depicted in scheme 22.
N(CH3)2
NH
R3
NH
NO
O
R1
R3 = O or S
N
O
O
R1
R2
R2 = OCN or SCN
N(CH3)2
NH2+
63 64 65
Scheme 22
3.6 Multicomponent Reaction
Looking for new higher substituted phthalimide derivatives, a new synthesis route was
developed by applying multicomponent reactions based on Diels-Alder chemistry in the first
step. The principle of this multicomponent reaction consists of the reaction between amines and
aldehydes with dienophiles to give a large variety of 1-acylamino-2-cyclohexene derivatives
(scheme 23).
In the second step a dehydrogenative oxidation of the conjugated cyclohexadiene product
was carried out using MnO2. At last different ways were examined to conduct a direct reaction
between the ester group of the cyclohexadiene and amine derivatives to achieve a phthalimide.
3.6.1 One-pot reaction with dienophilic dimethyl acetylenedi-
carboxylate
3.6.1.1 Synthesis of dimethyl 3-acetamido-4,6-dimethylbenzene-1,2-dioate
As dimethyl acetylenedicarboxylate (68) represents a molecule with high electron-deficiency
it was used as dienophile in the Diels-Alder reaction to obtain dimethyl 6-acetamido-3,5-
dimethylcyclohexa-1,3-diene-1,2-dicarboxylate (69) in 66 % yield.

74
The oxidation of 69 was carried out with 89 % yield, demonstrating that MnO2 acts as a
good oxidation agent to achieve polysubstituted anilide derivativess via dehydrogenative
oxidations. Polysubstituted anilides are important substructures in pharmaceuticals and
herbicides. [64]
NH2
O+
H
OCO2Me
CO2Me
+ O
O
O
O
NH
O
TSA, Ac2O,NMP
120 °C, 24 hO
O
O
O
NH
O
MnO2120 °C, Toluene
+
66 67 68 69 70
Scheme 23
Different reaction conditions were examined to synthesize the phthalimide derivatives (see
experimental part). When aromatic amines were used, it was not possible to obtain the expected
product and only reactants were found after workup.
O
O
O
O
NH
O
H2N
N
O
O
NH
O
H2N N
N
NH O
O
N
O
NH2(CH2)2N
NH
N
O
O
O
N
70
71
72
73
Scheme 24
The situation was different for the reaction with aliphatic amines. Here, the conditions
described by Joseph and coworkers [65] were employed as the last step of this route. A solution
of compound 70 in N,N -dimethylethylenediamine was stirred at 100°C for 72 h. After
evaporation of the solvent the residue was purified by column chromatography (see conditions
in the experimental part) to give a mixture of the dehydroaminated phthalimide derivatives in
60% yield and the amino phthalimide derivatives in 30 % yield as shown in figure 53. The
product structures were confirmed by X-ray structure analysis and 1H NMR. A 2:1 ratio was
observed in the crude mixture, three aromatic signals and the amine signal (scheme 25).
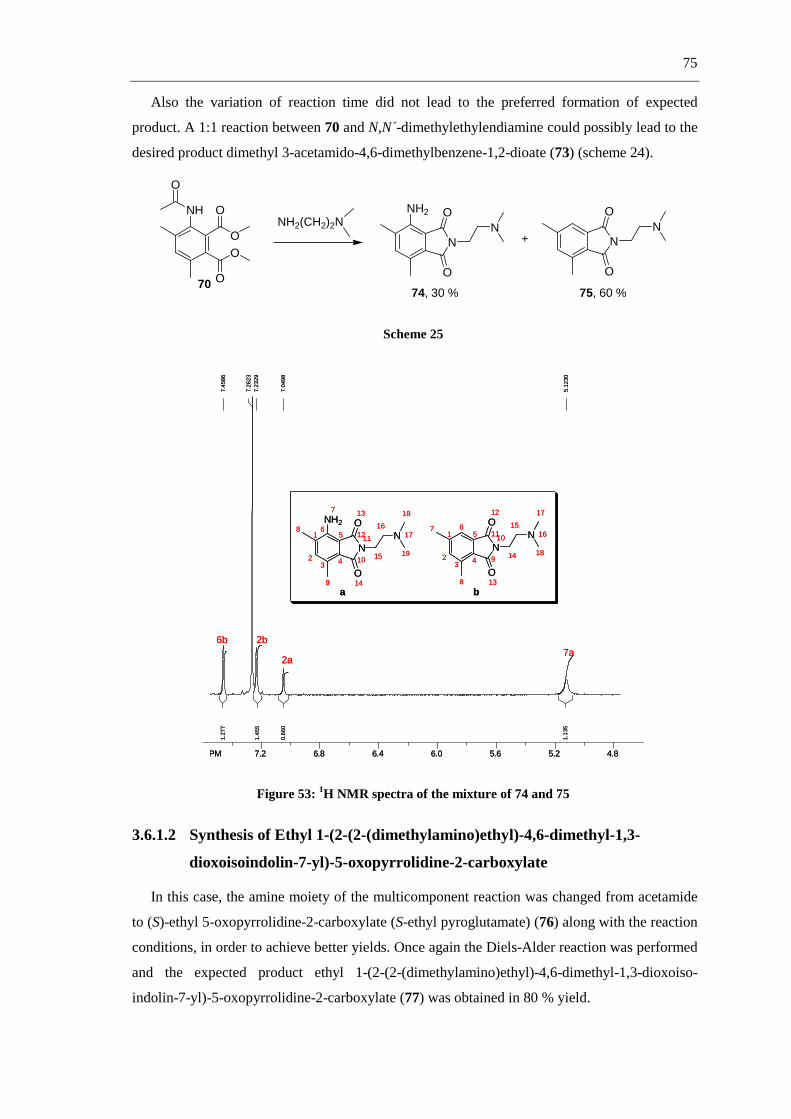
75
Also the variation of reaction time did not lead to the preferred formation of expected
product. A 1:1 reaction between 70 and N,N -dimethylethylendiamine could possibly lead to the
desired product dimethyl 3-acetamido-4,6-dimethylbenzene-1,2-dioate (73) (scheme 24).
O
O
O
O
NH
O
NH2(CH2)2NNH2
N
O
O
NN
O
O
N+
74, 30 % 75, 60 %70
Scheme 25
PPM 7.2 6.8 6.4 6.0 5.6 5.2 4.8
1.
135
1.
277
1.
455
0.
660
7.
4586
7.
2623
7.
2329
7.
0498
5.
1230
1
23 4
56NH2
7
8
9
10
N1112
O13
O14
15
16N 17
18
19
1
23 4
567
8
9
N1011
O12
O13
14
15N 16
17
18
a b
7a2a
2b6b
PPM 7.2 6.8 6.4 6.0 5.6 5.2 4.8
1.
135
1.
277
1.
455
0.
660
7.
4586
7.
2623
7.
2329
7.
0498
5.
1230
1
23 4
56NH2
7
8
9
10
N1112
O13
O14
15
16N 17
18
19
1
23 4
567
8
9
N1011
O12
O13
14
15N 16
17
18
a b
7a2a
2b6b
Figure 53: 1H NMR spectra of the mixture of 74 and 75
3.6.1.2 Synthesis of Ethyl 1-(2-(2-(dimethylamino)ethyl)-4,6-dimethyl-1,3-
dioxoisoindolin-7-yl)-5-oxopyrrolidine-2-carboxylate
In this case, the amine moiety of the multicomponent reaction was changed from acetamide
to (S)-ethyl 5-oxopyrrolidine-2-carboxylate (S-ethyl pyroglutamate) (76) along with the reaction
conditions, in order to achieve better yields. Once again the Diels-Alder reaction was performed
and the expected product ethyl 1-(2-(2-(dimethylamino)ethyl)-4,6-dimethyl-1,3-dioxoiso-
indolin-7-yl)-5-oxopyrrolidine-2-carboxylate (77) was obtained in 80 % yield.
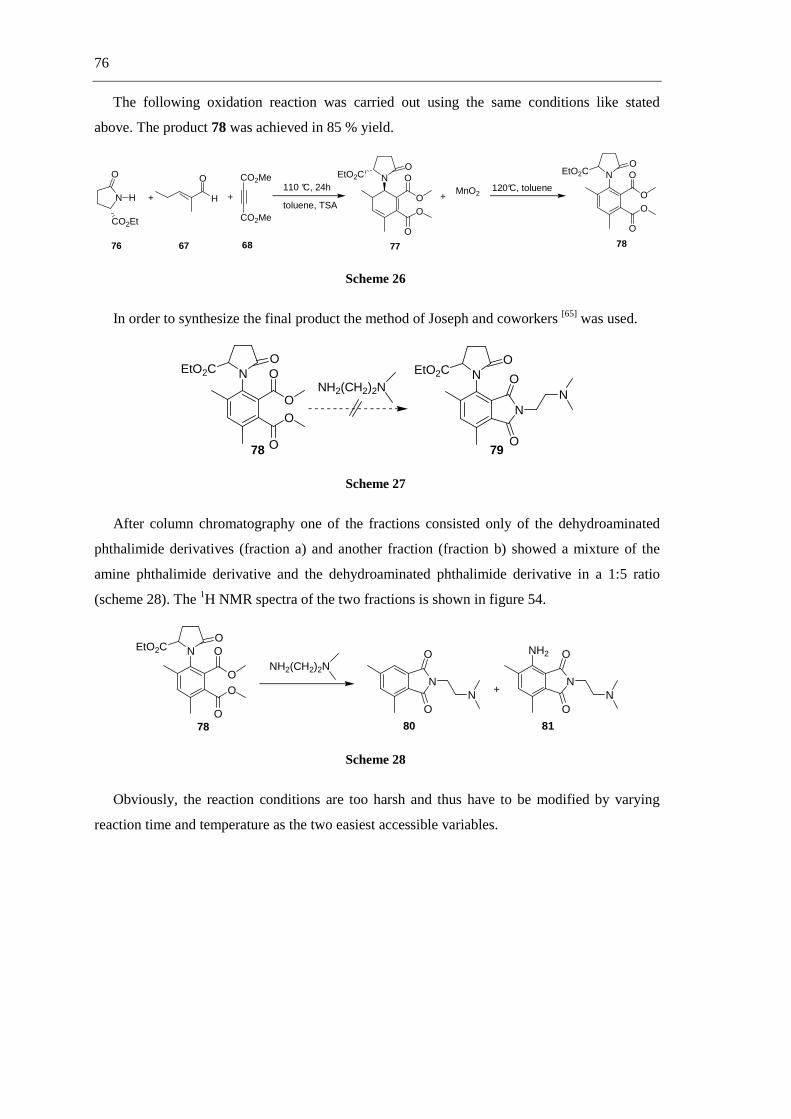
76
The following oxidation reaction was carried out using the same conditions like stated
above. The product 78 was achieved in 85 % yield.
N
O
CO2Et
H + H
O
+
CO2Me
CO2Me
N O
O
O
O
OEtO2C
110 °C, 24h
toluene, TSA+
MnO2
N O
O
O
O
OEtO2C
120°C, toluene
76 67 68 77 78
Scheme 26
In order to synthesize the final product the method of Joseph and coworkers [65] was used.
N O
O
O
O
O
NH2(CH2)2NN
O
N
O
O
EtO2C EtO2C
N
78 79
Scheme 27
After column chromatography one of the fractions consisted only of the dehydroaminated
phthalimide derivatives (fraction a) and another fraction (fraction b) showed a mixture of the
amine phthalimide derivative and the dehydroaminated phthalimide derivative in a 1:5 ratio
(scheme 28). The 1H NMR spectra of the two fractions is shown in figure 54.
N O
O
O
O
O
NH2(CH2)2N
EtO2C
N
O
ON
NH2
N
O
ON+
78 80 81
Scheme 28
Obviously, the reaction conditions are too harsh and thus have to be modified by varying
reaction time and temperature as the two easiest accessible variables.

77
7.0 6.0 5.0
1
23 4
56NH2
7
8
9
10
N1112
O13
O14
15
16N 17
18
19
1
23 4
567
8
9
N1011
O12
O13
14
15N 16
17
18
a b
7a2a
2b
2b
6b
6b
Fraction a
Fraction b
7.0 6.0 5.0
1
23 4
56NH2
7
8
9
10
N1112
O13
O14
15
16N 17
18
19
1
23 4
567
8
9
N1011
O12
O13
14
15N 16
17
18
a b
7a2a
2b
2b
6b
6b
Fraction a
Fraction b
Figure 54: 1H NMR spectra of fractions a and b i.e. the mixture of 80 and 81
3.6.1.3 Synthesis of Dimethyl 3-acetamido-4,6-diethylbenzene-1,2-dioate
The aim was to synthesize 3-amino-4,6-diethylbenzene-1,2-dioate (84) because of the
studies of luminol derivatives which were carried out in this work. Again the multicomponent
reaction and the following oxidation with MnO2 were used to synthesize dimethyl 3-acetamido-
4,6-diethylbenzene-1,2-dioate (83).
Acetamide (66), butyraldehyde (82) and dimethyl acetylenedicarboxylate (68) were used for
the Diels-Alder reaction in the first step of this route. The product was isolated in 70 % yield
and could be used without further purification in the next step. After dehydrogenative oxidation
with MnO2 dimethyl 3-acetamido-4,6-diethylbenzene-1,2-dioate (83) was obtained in 65 %
yield. Scheme 29 shows the synthetic route.
NH2
O+ H
O CO2Me
CO2Me
+O
O
O
O
NH
O
TSA, Toluene
120 °C, 24h+
O
O
O
O
NH
O
MnO2120°C, Toluene
66 82 68 83 84
Scheme 29

78
Better yields in the last oxidation step were achieved for the described reaction routes by
using toluene as a solvent instead of NMP and acetic anhydride.
To obtain the desired product 86, two different methods were followed. The first method was
the application of a mineralic acid (HCl), thus it was possible to obtain the dimethyl 3-amino-
4,6-diethylbenzene-1,2-dioate (85). The product 85 was then subjected to a base (NaOH) but the
expected molecule could not be isolated by normal workup conditions.
For the basic method, the same problem occurred extracting the product. Different methods
of workup such as solvent extraction or continuous extraction were attempted. Finally it was
tried to crystallize the product through solvent diffusion.
O
O
O
O
NH
O
HCl
O
O
O
O
NH2
NaOH
NH2
O-
O
O-
O
84
85 86
NaOH
Scheme 30
3.7 Synthesis of Phthalimide-Serine Couples
Recently, the use of chiral phthalimide-serine/theonine couples for the photorelease of
acetate was described to take place with high diastereoselectivity in the liberation process. [66]
These so called photocages, however, absorb light in the UV-C region, which is not
advantageous for the potential application environments, and furthermore no fluorescence
process is involved, neither from the substrate nor from the separated chromophore.
Another study reports that the 4,5-dimethoxyphthalimide (88) is a chromophore that exhibits
a strong fluorescence and acts as an excellent electron acceptor in the excited state based on
PET. [67] A combination of both systems could lead to new photocages.
The synthetic route consists of four steps and starts with methanolysis that induces a
phthalate ring opening to give 89. Consecutive DCC-coupling in the presence of N-
hydroxysuccinimide (NHS) led to the activated phthalates 90. These were subsequently reacted
with serine in the third step to produce 3-hydroxy-2-(5,6-dimethoxy-1,3-dioxoisoindo-lin-2-
yl)propanoic acid (91) which was finally acyleted to give the photocage 92 (scheme 31).
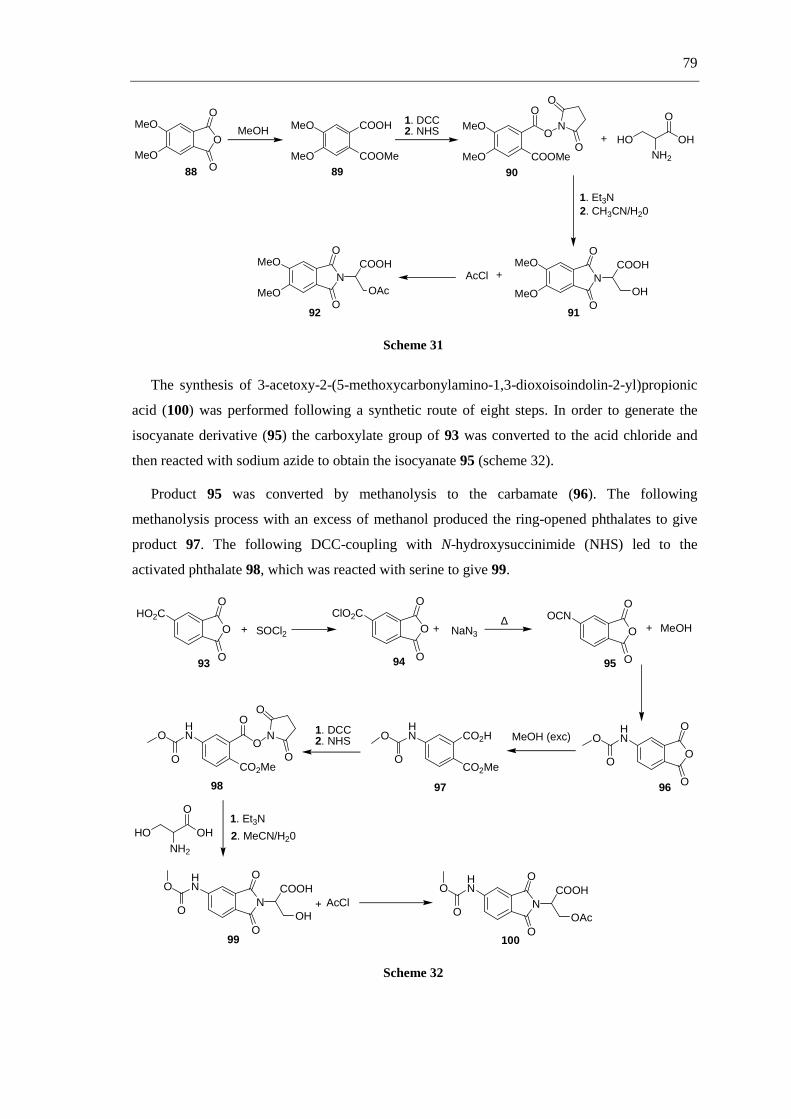
79
MeO
MeOO
O
O
MeO
MeO COOMe
COOHMeOH MeO
MeO
O
O
COOMe
N
O
O
1. DCC2. NHS
+ HO OH
O
NH2
N
O
O
COOH
OH
MeO
MeO
1. Et3N
+AcClN
O
O
COOH
OAc
MeO
MeO
2. CH3CN/H20
88 89 90
9192
Scheme 31
The synthesis of 3-acetoxy-2-(5-methoxycarbonylamino-1,3-dioxoisoindolin-2-yl)propionic
acid (100) was performed following a synthetic route of eight steps. In order to generate the
isocyanate derivative (95) the carboxylate group of 93 was converted to the acid chloride and
then reacted with sodium azide to obtain the isocyanate 95 (scheme 32).
Product 95 was converted by methanolysis to the carbamate (96). The following
methanolysis process with an excess of methanol produced the ring-opened phthalates to give
product 97. The following DCC-coupling with N-hydroxysuccinimide (NHS) led to the
activated phthalate 98, which was reacted with serine to give 99.
O
O
O
HNO
O
MeOH
HNO
O
MeOH (exc)
+
CO2H
CO2Me
HNO
OO
ON 1. DCC
2. NHS
CO2MeO
O
NCOOH
OH
O
O
HNO
O
HO OH
O
NH2
1. Et3N
2. MeCN/H20
NCOOH
OAc
O
O
HNO
O+ AcCl
O
O
O
HO2CO
O
O
SOCl2 O
O
O
OCNNaN3
∆+ +
ClO2C
93 94 95
969798
99 100
Scheme 32
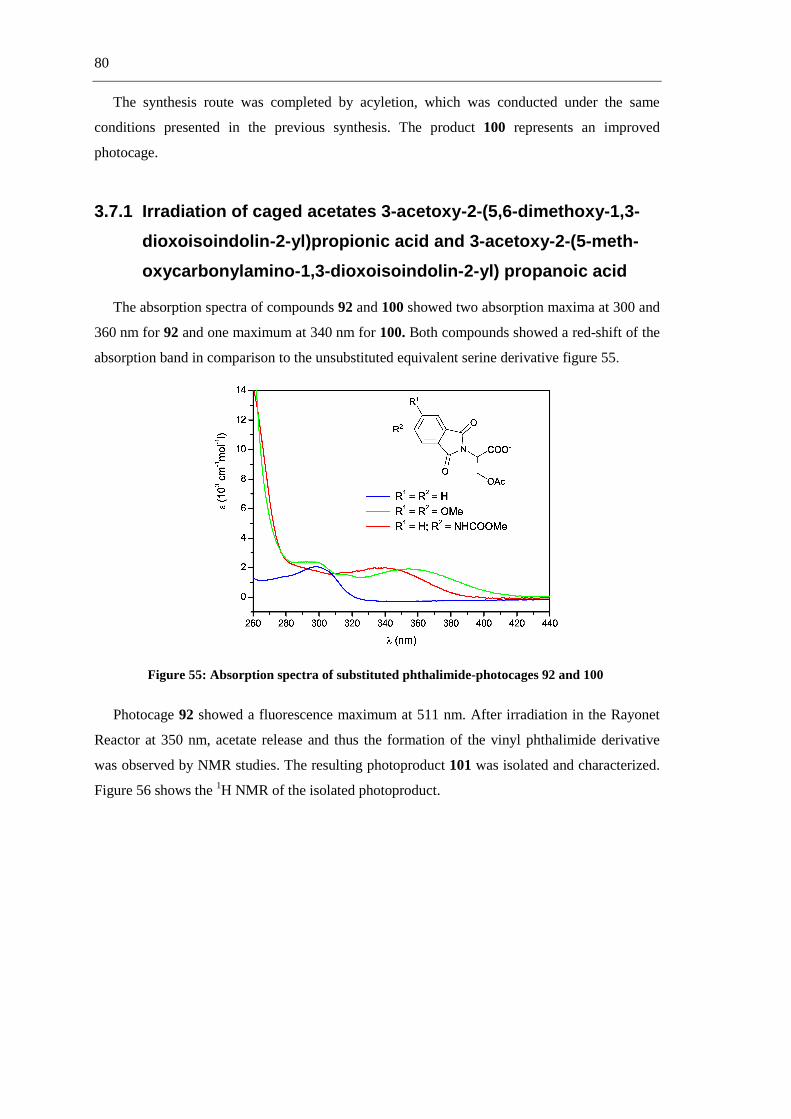
80
The synthesis route was completed by acyletion, which was conducted under the same
conditions presented in the previous synthesis. The product 100 represents an improved
photocage.
3.7.1 Irradiation of caged acetates 3-acetoxy-2-(5,6-dimethoxy-1,3-
dioxoisoindolin-2-yl)propionic acid and 3-acetoxy-2-(5-meth-
oxycarbonylamino-1,3-dioxoisoindolin-2-yl) propanoic acid
The absorption spectra of compounds 92 and 100 showed two absorption maxima at 300 and
360 nm for 92 and one maximum at 340 nm for 100. Both compounds showed a red-shift of the
absorption band in comparison to the unsubstituted equivalent serine derivative figure 55.
Figure 55: Absorption spectra of substituted phthalimide-photocages 92 and 100
Photocage 92 showed a fluorescence maximum at 511 nm. After irradiation in the Rayonet
Reactor at 350 nm, acetate release and thus the formation of the vinyl phthalimide derivative
was observed by NMR studies. The resulting photoproduct 101 was isolated and characterized.
Figure 56 shows the 1H NMR of the isolated photoproduct.

81
1
23
4
56
7
N89
O10
11
12
O13
O14
O15
1617
16,17
1212
11
3,6
1
23
4
56
7
N89
O10
11
12
O13
O14
O15
1617
16,17
1212
11
3,6
Figure 56: 1H NMR spectrum of photoproduct 101
Carbamate photocage 100 displays a combination process of decarboxylation and release.
The formation of product 102 was accompanied by an increase of the fluorescence emission.
This was observed by taking a sample of the irradiated solution every minute over a period of
8 minutes and examining it by fluorescence measurement. In order to detect the weak
fluorescence signal of compound 100 at the beginning of the experiment the excitation and
emission slit had to be adjusted to 3.5 nm. The fluorescence maximum was located at 458 nm
with a comparably small intensity.
Photoproduct 102 was isolated and characterized. Figure 57 shows the 1H NMR of the
isolated photoproduct.
1
23
4
56
7
N89
O10
11
12
O13
HN
14
15O16
O17
1818
121211
3,6
2
14
1
23
4
56
7
N89
O10
11
12
O13
HN
14
15O16
O17
1818
121211
3,6
2
14
Figure 57: 1H NMR spectrum of photoproduct 102

82
Figure 58 shows the emission spectra of 92 and 100 after different irradiation times where it
can be seen that the increasing fluorescence effect of the photocages 92 is lower than the
decreasing fluorescence effect of photocages 100.
400 450 500 550 600 6500
20
40
60
80
100
120
140
160
180
200
100 t=0 min 100 t=1 min 100 t=2 min 100 t=3 min 100 t=8 min
Flu
ores
cenc
e (a
.u.)
λ (nm)
400 450 500 550 600 6500
100
200
300
400
500
600
700
Flu
ores
cenc
e (a
.u.)
λ (nm)
92 t=0 min 92 t=1 min 92 t=2 min 92 t=3 min 92 t=8 min
400 450 500 550 600 6500
20
40
60
80
100
120
140
160
180
200
100 t=0 min 100 t=1 min 100 t=2 min 100 t=3 min 100 t=8 min
Flu
ores
cenc
e (a
.u.)
λ (nm)
400 450 500 550 600 6500
100
200
300
400
500
600
700
Flu
ores
cenc
e (a
.u.)
λ (nm)
92 t=0 min 92 t=1 min 92 t=2 min 92 t=3 min 92 t=8 min
Figure 58: Emission spectra at different irradiations times, showing a fluorescence increase for 100 (left spectrum) and a fluorescence decrease for 92 (right spectrum)
In order to compare the process that is involved in the decarboxylation, the fluorescence
intensities were normalized. Thus, the carbamate photocage 100 shows a fluorescence increase
with a red shift of the maximum of about 10 nm and the dimethoxy photocage 92 presents a
decrease of fluorescence emission after 8 min irradiation without any changes of the maximum
position. A similar fluorescence increase has been observed in xanthone acetic acids, also
involving a decarboxylation process but without liberation of caged molecular fragments.[68]
0,0
0,2
0,4
0,6
0,8
1,0N
O
O
O
COOHO
HNO
O
hν λmax = 350 nm
PBS, pH = 7air
Rel
ativ
e F
luor
esce
nce
(a.u
.)
t= 0min t= 1min t= 2min t= 3min t= 8min
0,0
0,2
0,4
0,6
0,8
1,0
Rel
ativ
e F
luor
esce
nce
(a.u
.)
N
O
O
O
COOHOMeO hν λmax = 350 nm
PBS, pH = 7airMeO
t = 0min t = 1min t = 2min t = 3min t = 8min
0,0
0,2
0,4
0,6
0,8
1,0N
O
O
O
COOHO
HNO
O
hν λmax = 350 nm
PBS, pH = 7air
Rel
ativ
e F
luor
esce
nce
(a.u
.)
t= 0min t= 1min t= 2min t= 3min t= 8min
0,0
0,2
0,4
0,6
0,8
1,0
Rel
ativ
e F
luor
esce
nce
(a.u
.)
N
O
O
O
COOHOMeO hν λmax = 350 nm
PBS, pH = 7airMeO
t = 0min t = 1min t = 2min t = 3min t = 8min
Figure 59: Relative emission spectra at different irradiations times, showing a fluorescence increase for 100 (left spectrum) and a fluorescence decrease for 92 (right spectrum)
In figure 60, the maxima of the normalized fluorescence intensities are plotted against time
for both processes. It can be seen that both photocages underwent the photodecarboxylation
process but in one case fluorescence intensity increases and in the other case the opposite
happens.

83
0 2 4 6 8
0.2
0.4
0.6
0.8
1.0
Nor
mal
ised
Flu
ores
cenc
e In
tens
ity (
a.u.
)time (min)
Black: CarbamateRed: Dimethoxy
Figure 60: Normalized fluorescence intensities for the fluorescence increase and decrease process of 92 and 100
The fluorescence decrease indicates a stronger electron transfer donor capability of the
enamide group in 101 in comparison with the carboxylate in the starting material 92. The
additional conjugation of the vinyl group in enamide 101 is represented by the bathochromic
shift in absorption and emission. It is striking that the fluorescence of 92 is more than 50 times
stronger than that of the glycine derivative under the same pH conditions. This indicates that the
intramolecular fluorescence quenching is strongly inhibited by the presence of the acetate group
in 92.
The photodecarboxylation mechanism of 100 supposably involves a competition between the
singlet state decay and the intersystem crossing because most likely, the photodecarboxylation
process occurs from the corresponding triplet state (scheme 33).
92 192*
PETquenching
F
-CO2
-OAc101 hν 1101*
F
100 1100*
F
-CO2
-OAc102 hν 1102*
FISC 3100*
PETquenching
Scheme 33
In summary, an efficient and fast photoremovable protecting group has been described in
two substituent-modified chromophores, which also includes a simple but effective fluorescent
reporting function associated with a photorelease process. Depending on the substitution pattern
at the aromatic ring, fluorescence up/down reporter function was observed. If the photocages
would include a stereogenic element in proximity of a receptor group, these could be used for
recognition of other chiral species and for enantiodifferentiation in combination with photo-
decarboxylation. One possible approach is described in the following chapter.

84
N
OCOO-
OAcO
R1
R2
N
O
O
R1
R2
hν+ CO2 + AcO-
R1 = R2 = OMe 92
R1 = NHCOOMe R2 = H 100R1 = R2 = OMe 101
R1 = NHCOOMe R2 = H 102
Scheme 34

85
3.8 Synthesis of Chiral Phthalimide-Urea-Conjugates
In a first attempt the synthesis of chiral phthalimide-urea conjugates was performed by a
reaction of 3-aminophthalimide derivates with 1-((S)-1-isocyanatoethyl)benzene (104).
Unfortunately, the expected product was not obtained by the applied methods (see experimental
part), as the amino group in position 3 of the phthalimide derivate shows little reactivity towards
electrophiles; in this case an isocyanate derivate. Scheme 35 shows the syntheses that were
carried out for the two amino phthalimide derivates with phenylmethylisocyanate.
N
O
O
NH2
+NCO
N
O
O
NHNH
O
RR
R = 47 =
R =103 =
104 105
R =105a =
R =105b =
Scheme 35
Bearing in mind the results obtained in the previous reactions with 3-aminophthalimide
derivates, a new synthetic route was proposed allowing the amino group to appear in another
position of the aromatic ring. Thus, the synthesis of the urea-phthalimide derivates was achieved
following a recently reported procedure of Lebel and coworkers [69] involving a very efficient
employment of the Curtius rearrangment that allows the direct conversion of aromatic
carboxylic acids into ureas.
A mixture of phenyl chloroformate (1.1 equiv.) and a less nucleophilic alcohol, N-benzyl-
1,3-dioxoisoindoline-5-carboxylic acid (106, 1 equiv., received from the commercially available
1,2,4-benzenetricarboxylic anhydride) and sodium azide (1.7 equiv.) was prepared and heated to
75°C, leading to the formation of the acyl azide. The reaction mixture was then cooled to 25 °C
and an amine derivate (1.5 equiv.) was added, which is able to trap the developing isocyanate
intermediate and thus forms the corresponding urea.
NHO2C
O
O
N
HN
O
O
HN
OR
2. , 25 °C
1. PhOCOCl, NaN3t-BuONa/DME, 75°C
R-NH2
106
Scheme 36

86
The general synthesis is shown in scheme 36 and in table 15 the different urea phthalimide
derivates synthesized by this route are given.
Table 15: Synthesis of urea phthalimide derivates from aromatic carboxylic acids via Curtius rearrangement.a
Entry Urea Yield (%) b
107
N
HN
O
O
HN
O
63
108
N
HN
O
O
HN
ONH2
0 c
109
N
HN
O
O
HN
O
OH
65
110
N
HN
HN
OHO
O
O
60
111
N
HN
HN
OHO
O
O
68
112
N
O
O
HN
HN
OHO
62
a Conditions: PhOCOCl (1.1 equiv.), NaN3 (1.5 equiv.), t-BuONa (15 mol %), RNH2 (1.5 equiv.). b
Isolated yield.c Isolation of 108 was not possible.
Using several aromatic and aliphatic amines and amino alcoholes as nucleophiles, this
method opened access to many urea phthalimide derivates, employing phenyl chloroformate
and sodium azide as reagents.
Good yields were obtained for the formation of aromatic urea phthalimide derivates. The
only exception (1S,2R)-cyclohexane-1,2-diamine did not led to the expected product 107. No

87
characteristic signals of the coupling to generate the corresponding urea could be observed in
the experiments.
In order to characterize sensor 111 it was necessary to carry out NMR experiments with
variable temperature to clearly identify the OH signal, as this signal overlapped with the CH2
signal of the benzyl group. The spectrum shows the low field shift of the OH signal upon
temperature variation of 1 K (figure 61).
9 . 0 8 . 0 7 . 0 6 . 0 5 . 0 4 . 0 3 . 0 2 . 0 1 . 0
0
.92
0
0
.96
7
0
.94
7
5
.06
7
0
.95
6
1
.07
0
1
.87
2
2
.00
8
1
.14
0
0
.95
9
0
.96
0
5
.99
9
4.80 4.70 4.60
1
.070
1
.872
1
23
4
56
7
N89
HN
10
11HN
12
O13
14
15
16HO17
O18
O19
20
21
22
2324
25
2627
28
20,21
15
16
14
22
17
22
17
12
23-28
106
23
9 . 0 8 . 0 7 . 0 6 . 0 5 . 0 4 . 0 3 . 0 2 . 0 1 . 0
0
.92
0
0
.96
7
0
.94
7
5
.06
7
0
.95
6
1
.07
0
1
.87
2
2
.00
8
1
.14
0
0
.95
9
0
.96
0
5
.99
9
4.80 4.70 4.60
1
.070
1
.872
9 . 0 8 . 0 7 . 0 6 . 0 5 . 0 4 . 0 3 . 0 2 . 0 1 . 0
0
.92
0
0
.96
7
0
.94
7
5
.06
7
0
.95
6
1
.07
0
1
.87
2
2
.00
8
1
.14
0
0
.95
9
0
.96
0
5
.99
9
4.80 4.70 4.60
1
.070
1
.872
1
23
4
56
7
N89
HN
10
11HN
12
O13
14
15
16HO17
O18
O19
20
21
22
2324
25
2627
28
20,21
15
16
14
22
17
22
17
12
23-28
106
23
Figure 61: 1H NMR spectrum of the sensor 111 in DMSO at 297 K
3.9 Photophysical properties, anion sensing and chiral
recognition by chiral phthalimide-urea-conjugate
3.9.1 Photophysical properties
The photophysical properties of the sensors were determined in different solvents and are
summarized in the tables corresponding to each sensor.
With increasing solvent polarity, no significant changes were observed for sensor 107.
However, the substantial red-shift in emission in the protic solvent methanol and the strongly
increased Stokes shift account for the formation of an internal charge transfer state after
excitation to the first excited singlet state. Singlet state deactivation by non-radiative pathways
is also increased in the protic solvent methanol; in comparison with acetonitrile, the
fluorescence quantum yield drops to one-third and the fluorescence lifetime increases to 17 ns.

88
Table 16: Photophysical data of sensor 107.
λλλλ abs a λλλλ em
a Stokes b Es c ττττf
d ΦΦΦΦf e kf x 107 f
DMSO 353 443 5755 72 11.8 0.31 2.6
MeCN 339 430 6242 75 13.0 0.37 2.8
MeOH 337 465 8168 72 16.9 0.11 0.6
DCM 337 428 6309 75 14.8 0.22 1.4
a In nm. b In cm-1. c Singlet energy in Kcal / mol. d In ns. e From comparation with quinine sulfate reference. f Fluorescence rate constant (kf = (Φf / τf)) in s-1.
Sensor 109 did not show significant changes in the photophysical properties in dependence
of the solvent polarity. In the presence of protic solvents such as methanol, however, a strongly
increased Stokes shift accounts for the formation of an internal charge transfer state after
excitation to the first excited singlet state. In contrast to 107, the quantum yield of sensor 109
decreased in the presence of methanol to one-ninth of the value in acetonitrile, and a diminished
fluorescence lifetime of 8.0 ns was detected, approximately half of the corresponding time of
sensor 107.
This difference in the fluorescence lifetimes is due to the hydroxy group that accounts for a
fast deactivation from the first excited singlet state to the ground state. The non-radiative
pathway that deactivates the singlet state is increased in methanol.
Table 17: Photophysical data of sensor 109.
λλλλ abs a λλλλ em
a Stokes b Es c ττττf
d ΦΦΦΦf e kf x 107 f
DMSO 354 443 5675 72 7.8 0.16 2.0
MeCN 340 430 6155 74 14.8 0.36 2.4
MeOH 338 464 8034 71 8.3 0.04 0.5
DCM 337 425 6144 75 17.6 0.23 1.3
a In nm. b In cm-1. c Singlet energy in Kcal / mol. d In ns. e From comparison with quinine sulfate reference. f Fluorescence rate constant (kf = (Φf / τf)) in s-1.
For sensor 110, 111 and 112 the photopysical properties are similar to those of sensor 107. A
substantial red-shift of the emission in the presence of MeOH was observed, in consequence the
Stokes shift increases and the formation of an internal charge transfer state after excitation to the
first excited singlet state is available.
The hydroxyl group of these three sensors does not contribute to a particular change of the
fluorescence lifetime compared to sensor 107. Sensor 109 is the only one where hydrogen
bonding between the hydroxy group and the NH of the urea can take place so this structural
reason results in a significantly different change of the lifetime.
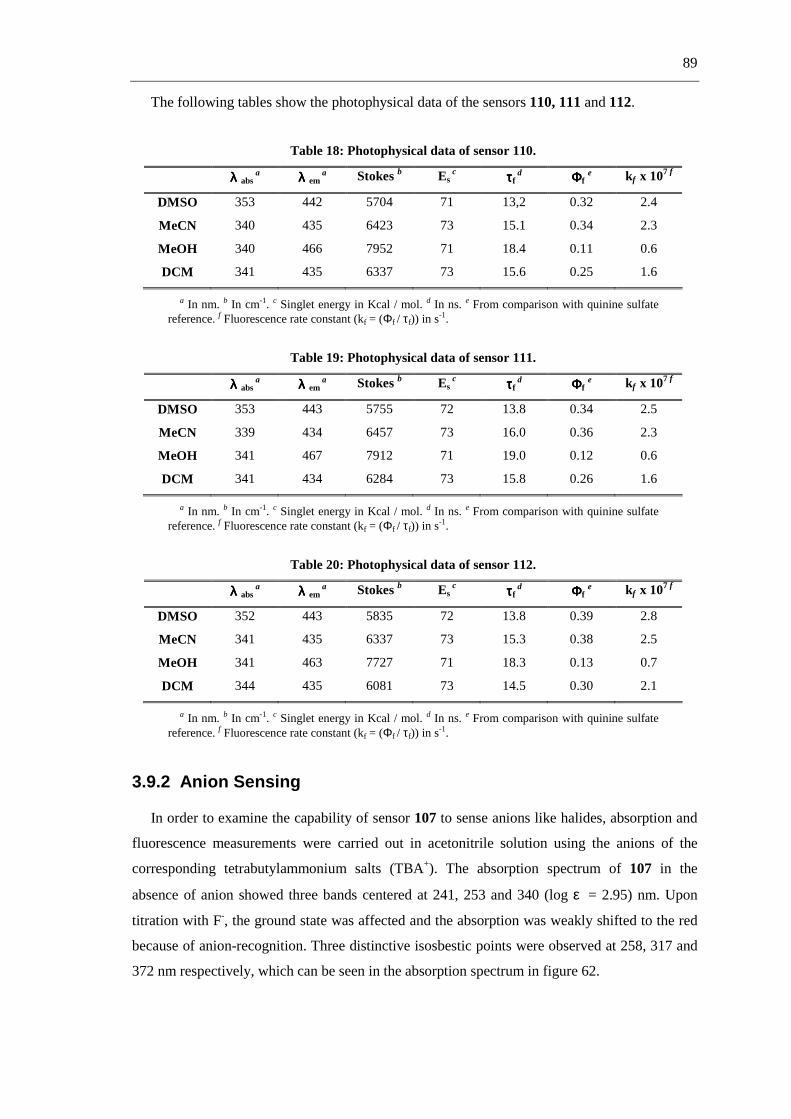
89
The following tables show the photophysical data of the sensors 110, 111 and 112.
Table 18: Photophysical data of sensor 110.
λλλλ abs a λλλλ em
a Stokes b Es c ττττf
d ΦΦΦΦf e kf x 107 f
DMSO 353 442 5704 71 13,2 0.32 2.4
MeCN 340 435 6423 73 15.1 0.34 2.3
MeOH 340 466 7952 71 18.4 0.11 0.6
DCM 341 435 6337 73 15.6 0.25 1.6
a In nm. b In cm-1. c Singlet energy in Kcal / mol. d In ns. e From comparison with quinine sulfate reference. f Fluorescence rate constant (kf = (Φf / τf)) in s-1.
Table 19: Photophysical data of sensor 111.
λλλλ abs a λλλλ em
a Stokes b Es c ττττf
d ΦΦΦΦf e kf x 107 f
DMSO 353 443 5755 72 13.8 0.34 2.5
MeCN 339 434 6457 73 16.0 0.36 2.3
MeOH 341 467 7912 71 19.0 0.12 0.6
DCM 341 434 6284 73 15.8 0.26 1.6
a In nm. b In cm-1. c Singlet energy in Kcal / mol. d In ns. e From comparison with quinine sulfate reference. f Fluorescence rate constant (kf = (Φf / τf)) in s-1.
Table 20: Photophysical data of sensor 112.
λλλλ abs a λλλλ em
a Stokes b Es c ττττf
d ΦΦΦΦf e kf x 107 f
DMSO 352 443 5835 72 13.8 0.39 2.8
MeCN 341 435 6337 73 15.3 0.38 2.5
MeOH 341 463 7727 71 18.3 0.13 0.7
DCM 344 435 6081 73 14.5 0.30 2.1
a In nm. b In cm-1. c Singlet energy in Kcal / mol. d In ns. e From comparison with quinine sulfate reference. f Fluorescence rate constant (kf = (Φf / τf)) in s-1.
3.9.2 Anion Sensing
In order to examine the capability of sensor 107 to sense anions like halides, absorption and
fluorescence measurements were carried out in acetonitrile solution using the anions of the
corresponding tetrabutylammonium salts (TBA+). The absorption spectrum of 107 in the
absence of anion showed three bands centered at 241, 253 and 340 (log ε = 2.95) nm. Upon
titration with F-, the ground state was affected and the absorption was weakly shifted to the red
because of anion-recognition. Three distinctive isosbestic points were observed at 258, 317 and
372 nm respectively, which can be seen in the absorption spectrum in figure 62.

90
240 320 4000,0
0,2
0,4
0,6
350 375 400 4250.00
0.06
A
bso
rba
nce
(a
.u.)
λ (nm)
Abs
orba
nce
(a.u
.)
λ (nm)
Figure 62: Absorption spectra of 107 (10-4 M) in the presence of increasing amounts of F- (0, 0.033 →0.3 mM) in acetonitrile. Inset: difference UV-spectra of [107 + F-] – 107 in the long wavelength region
In order to examine the formation of a charge transfer (CT) complex, difference spectra
([1 + F-] – 1) were recorded (figure 62, insert). A new band was clearly observed at ca. 380 nm
which was attributed to the CT complex absorption maximum. The formation constant of the
CT complex (KCT) was estimated spectrophotometrically by the Benesi-Hildebrand [70]
procedure (eq. 15). A concentration plot is shown in figure 63.
[1] / AbsCT = [1 / KCT εεεεCT [F-])] + (1 / εεεεCT) (15)
10000 20000 30000
0,002
0,003
0,004
0,005
0,006
102 x
([1
] / A
bsC
T)
1 / [F - ] (M - 1 )
Figure 63: Benesi-Hildebrand plot to obtain the formation constant from the absorbance of the CT complex (λλλλmax = 380 nm) at different concentrations of F-
AbsCT describes the absorbance due to the CT band at 380 nm at different concentrations of
F- and εCT represents the molar absorption coefficient. The εCT value in acetonitrile was
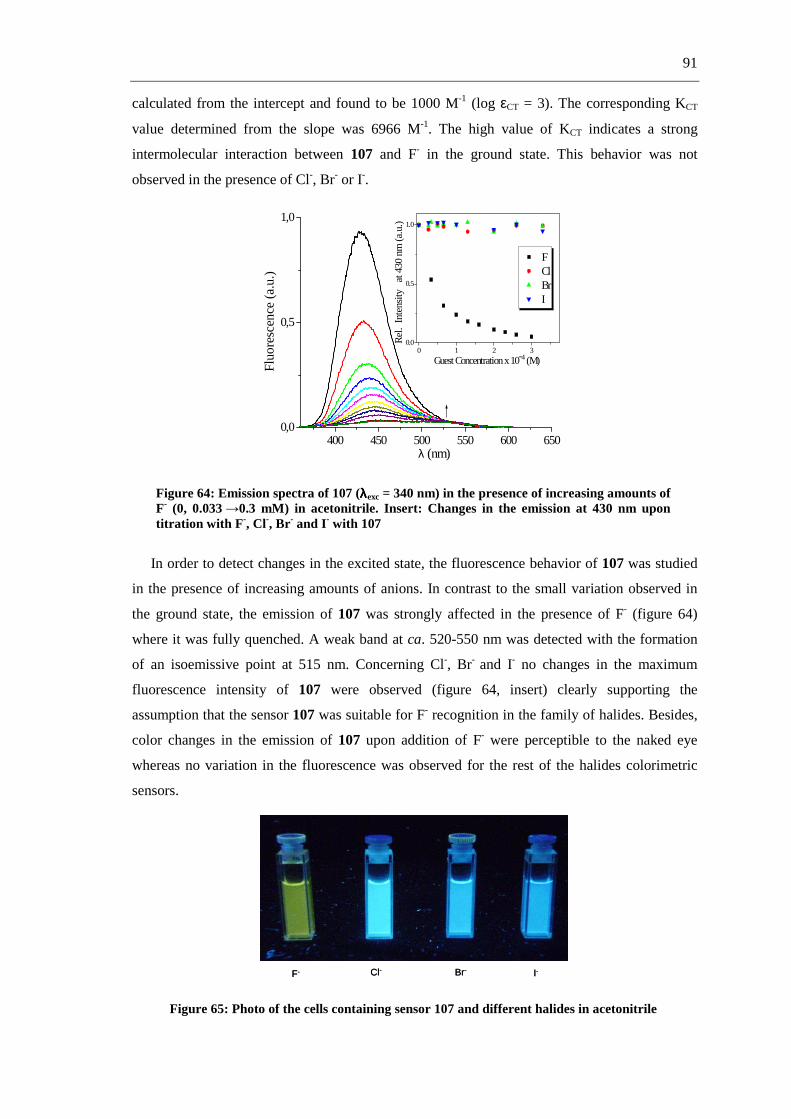
91
calculated from the intercept and found to be 1000 M-1 (log εCT = 3). The corresponding KCT
value determined from the slope was 6966 M-1. The high value of KCT indicates a strong
intermolecular interaction between 107 and F- in the ground state. This behavior was not
observed in the presence of Cl-, Br- or I-.
400 450 500 550 600 6500,0
0,5
1,0
0 1 2 30.0
0.5
1.0
F Cl Br I
Rel
. In
tens
ity
at 4
30 n
m (
a.u.
)
Guest Concentration x 10-4 (M)
Flu
ore
scen
ce (
a.u.
)
λ (nm)
Figure 64: Emission spectra of 107 (λλλλexc = 340 nm) in the presence of increasing amounts of F- (0, 0.033 →0.3 mM) in acetonitrile. Insert: Changes in the emission at 430 nm upon titration with F -, Cl-, Br- and I- with 107
In order to detect changes in the excited state, the fluorescence behavior of 107 was studied
in the presence of increasing amounts of anions. In contrast to the small variation observed in
the ground state, the emission of 107 was strongly affected in the presence of F- (figure 64)
where it was fully quenched. A weak band at ca. 520-550 nm was detected with the formation
of an isoemissive point at 515 nm. Concerning Cl-, Br- and I- no changes in the maximum
fluorescence intensity of 107 were observed (figure 64, insert) clearly supporting the
assumption that the sensor 107 was suitable for F- recognition in the family of halides. Besides,
color changes in the emission of 107 upon addition of F- were perceptible to the naked eye
whereas no variation in the fluorescence was observed for the rest of the halides colorimetric
sensors.
F- Cl- Br- I-F- Cl- Br- I-
Figure 65: Photo of the cells containing sensor 107 and different halides in acetonitrile
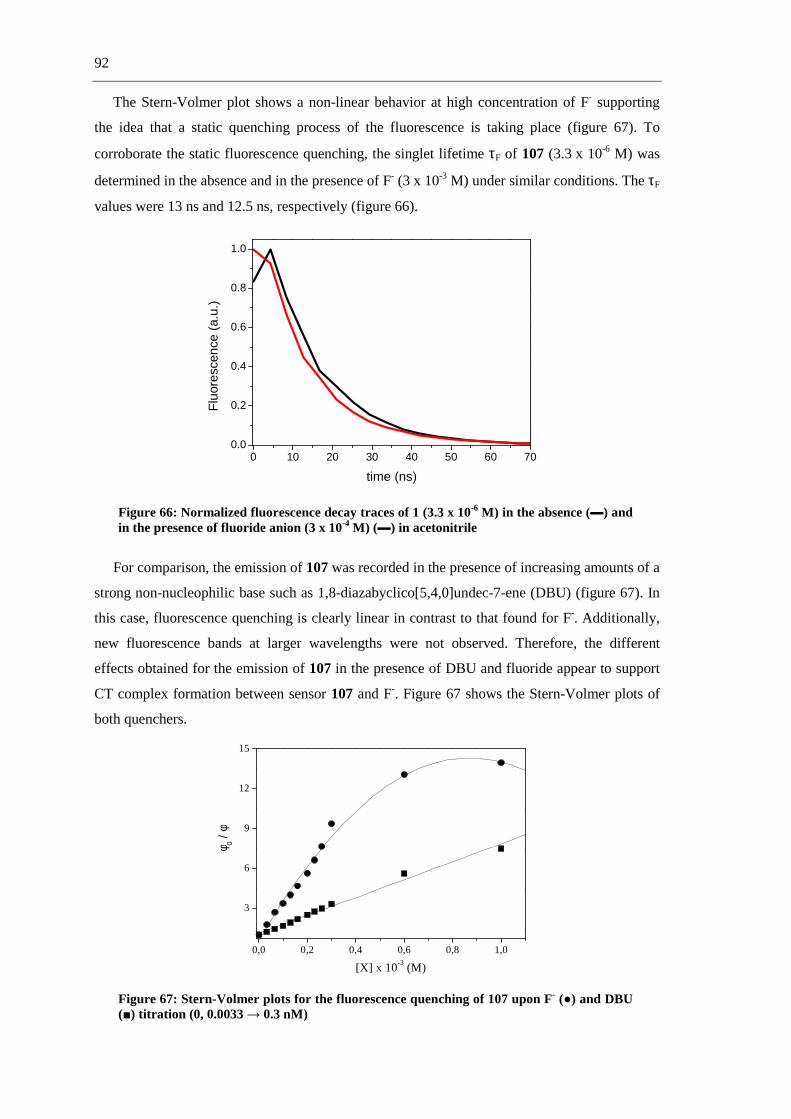
92
The Stern-Volmer plot shows a non-linear behavior at high concentration of F- supporting
the idea that a static quenching process of the fluorescence is taking place (figure 67). To
corroborate the static fluorescence quenching, the singlet lifetime τF of 107 (3.3 x 10⁻⁶ M) was
determined in the absence and in the presence of F- (3 x 10⁻³ M) under similar conditions. The τF
values were 13 ns and 12.5 ns, respectively (figure 66).
0 10 20 30 40 50 60 700.0
0.2
0.4
0.6
0.8
1.0
Flu
ores
cenc
e (a
.u.)
time (ns)
Figure 66: Normalized fluorescence decay traces of 1 (3.3 x 10⁻⁶ M) in the absence (▬) and in the presence of fluoride anion (3 x 10⁻⁴ M) (▬) in acetonitrile
For comparison, the emission of 107 was recorded in the presence of increasing amounts of a
strong non-nucleophilic base such as 1,8-diazabyclico[5,4,0]undec-7-ene (DBU) (figure 67). In
this case, fluorescence quenching is clearly linear in contrast to that found for F-. Additionally,
new fluorescence bands at larger wavelengths were not observed. Therefore, the different
effects obtained for the emission of 107 in the presence of DBU and fluoride appear to support
CT complex formation between sensor 107 and F-. Figure 67 shows the Stern-Volmer plots of
both quenchers.
0,0 0,2 0,4 0,6 0,8 1,0
3
6
9
12
15
φ 0 / φ
[X] x 10-3 (M)
Figure 67: Stern-Volmer plots for the fluorescence quenching of 107 upon F- (●) and DBU (■) titration (0, 0.0033 → 0.3 nM)

93
Taking the formation of a [107-F-] complex as a basis, a steady state fluorescence
measurement was carried out with a solution of 107 (10-4) and F- (3.4 x 10⁻³ M) in acetonitrile.
A fluorescence maximum at 520 nm was observed under selective CT complex excitation at
380 nm. The excitation maximum appears at 380 nm in good agreement with the UV-absorption
measurement. Figure 68 shows the normalized absorption spectra.
300 400 500 6000,0
0,5
1,0
Nor
mal
ized
Inte
nsity
(a.
u.)
λ (nm)
Figure 68: Normalized absorption bands of 107 (▲), excitation (●, λλλλem = 520 nm) and emission (■, λλλλexc = 380 nm) spectra of the complex [107-F-] in acetonitrile. All measurements were made under aerated conditions
To further confirm the formation of the [107-F-] complex though H-bonding interaction
between F- and the urea moiety, we also performed 1H NMR titration experiments in CD3CN.
As stated above, the urea protons appeared at 5.89 ppm (H1) and 7.81 ppm (H2) (figure 69, top
spectrum). In the presence of increasing equivalents of F-, the urea resonances were gradually
shifted downfield by 2 ppm and 4.5-5 ppm, respectively, reflecting an H-bond between the
receptor and the anion. The NMR titration experiment is shown in figure 69.
More information about the nature of [107-F-] complex could be achieved from the aryl-
protons Ha and Hb. It is worth to consider that H-bonding interaction between urea subunit and
anion could induce also effects on the aryl group. As an example a polarization induced shift of
the C-H bonds via a through-space effect, producing downfield shifts due to a deshielding effect
by a partial positive charge formed on the proton. [71] In fact, this electrostatic effect was
observed for the aromatic protons Ha and Hb as indicated by the weak downfield shift upon
addition of F- equivalents (figure 69), being in agreement with previous studies. [32] Besides,
proton Hc was too far away from the N-H protons to undergo any electrostatic effect. On the
other hand, the H1 proton signal did not vanish even at a high concentration of anion concluding
that complete deprotonation was not taking place, although the bond-length of N-H amide
may increase considerably.
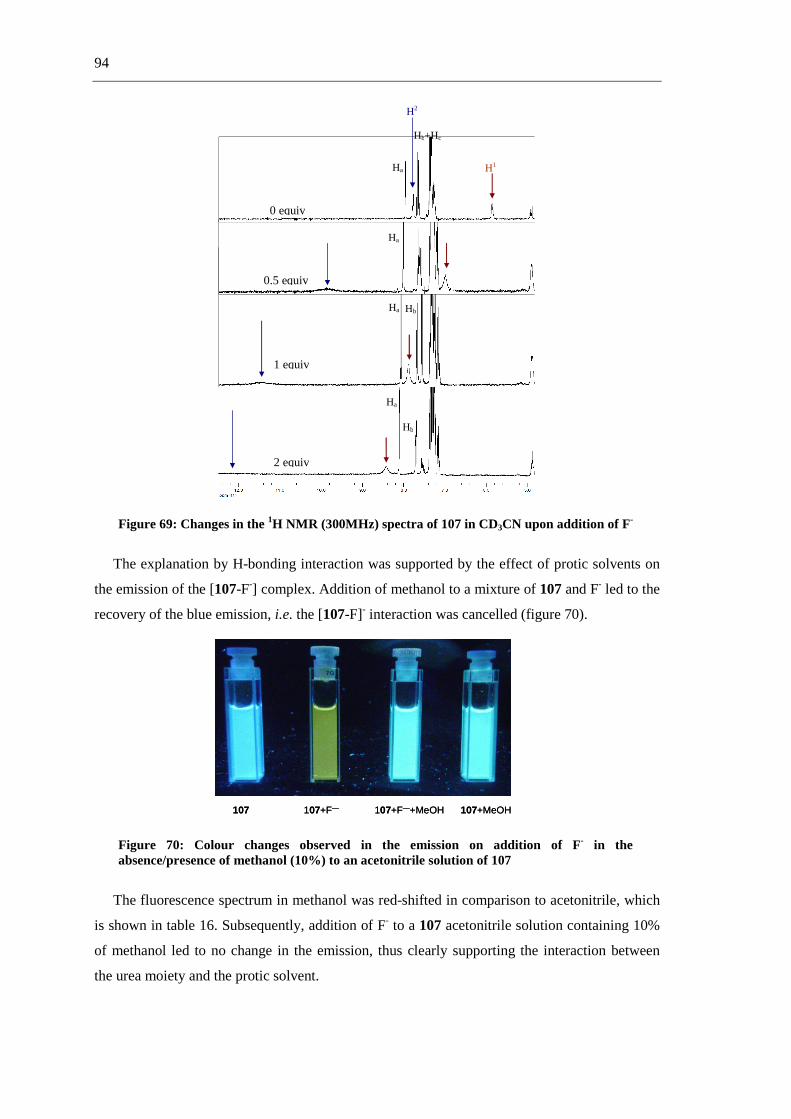
94
Figure 69: Changes in the 1H NMR (300MHz) spectra of 107 in CD3CN upon addition of F-
The explanation by H-bonding interaction was supported by the effect of protic solvents on
the emission of the [107-F-] complex. Addition of methanol to a mixture of 107 and F- led to the
recovery of the blue emission, i.e. the [107-F]- interaction was cancelled (figure 70).
107 107+F— 107+F—+MeOH 107+MeOH107 107+F— 107+F—+MeOH 107+MeOH
Figure 70: Colour changes observed in the emission on addition of F- in the absence/presence of methanol (10%) to an acetonitrile solution of 107
The fluorescence spectrum in methanol was red-shifted in comparison to acetonitrile, which
is shown in table 16. Subsequently, addition of F- to a 107 acetonitrile solution containing 10%
of methanol led to no change in the emission, thus clearly supporting the interaction between
the urea moiety and the protic solvent.
2 equiv
H1
H2
1 equiv
0.5 equiv
0 equiv
Hb+Hc
Ha
Ha
Ha
Ha
Hb
Hb

95
Sensor 107 was found to selectively detect F- since the absorption as well as the fluorescence
changes were only observed in the presence of this halide anion. In this context, a fluorescence
static quenching was proposed for the signalling mechanism, like depicted in scheme 37.
- hν430 nm13 ns
CT
F
Ph N N
O
H1 H2
Pht.
hν340 nm
Ph N N
O
H1 H2
Pht.
F
- hν520 nm
hν
380 nm
- hν
465 nm16.9 ns
Ph N N
O
H1 H2
Pht.
hν340 nm
H O Me
F-
H O Me
H O Me
Scheme 37: The proposed mechanism for the interaction between 107 and F-
To ensure whether the recognition process involves a CT complex formation through H-
bonding interaction between 107 and F-, computational calculations based on B3LYP/6-
31G* [72] level of theory using the CPCM method (acetonitrile as solvent) [73] were carried out.
Model system geometries were optimized in the absence and presence of the fluoride ion (figure
71) and corresponding N-H bond distances were calculated. [74] Hence, N-H1 and N-H2 bond
lengths in the absence of anion were found to be 1.022 Å and 1.024 Å, respectively, whereas
values of these bond distances after fluoride binding complex optimization were 1.035 Å for N-
H1 bond and 1.051 Å for N-H2 bond. Although bond-elongation was observed in both cases
(+0.013 Å for N---H1 and +0.025 Å for N---H2), it appeared no sufficient for hydrogen
abstraction by F-, in contrast of previous observations.[75] The H---F distances were also
estimated and found to be 1.710 Å (H1---F) and 1.602 Å (H2---F) which were close to that
experimentally found in the literature for complexation of isophthalimide-like compounds with
fluoride ions.[76]
Figure 71: Geometries of the free (left) and fluoride bonded (right) model system
Moreover, both N-H1 and N-H2 GIAO-NMR shifts (δ) were also theoretically calculated in
the absence/presence of fluoride ion. These data were in line with that obtained experimentally
where δN-H values for H1 and H2 in the absence of F- were 4.0 ppm and 5.7 ppm, respectively
whereas they shifted to downfield at 7.7 ppm (∆ δN-H = 3.7 ppm) and 10.7 ppm

96
(∆ δN-H = 5 ppm), respectively, after complexation with F-. Overall, these computational
results are in agreement with experimental observations where formation of a complex between
sensor 107 and F- in the ground state prevails over a possible deprotonation of the urea moiety.
Upon recognition of the anion, absorption studies revealed the typical band of a CT complex
at longer wavelengths with a large formation constant. Moreover, in the presence of F- neither
changes in the singlet lifetime of 107, nor a non-linear dependence of the Stern-Volmer plot was
observed, ruling out the possibility of a dynamic fluorescence quenching. The formation of the
[107-F]- complex through H-bonding interaction was proved by 1H NMR studies.
Furthermore, the capability of the other sensors (109-112) to detect anions such as halides,
acetate and dihydrogen phosphate was tested in acetonitrile solution using the corresponding
tetrabutylammonium salts (TBA+) of the anions. The absorption spectra of the sensors 109-112
in absence of anions presented bands centered between 239-241, 250-253 and 339-345 nm.
With the addition of F-, AcO- and H2PO4- anions to the solution containing sensors 109-112,
the characteristic absorption peak of the host at ca. 340 nm increased gradually with a red-shift
(about 15 nm) and the formation of three isosbestic points around 258, 320 and 420 nm was
observed.
Gradually increasing the concentration of F- induced a color change of the sensor solution
from colorless to yellow, which could be observed by the naked eye. The most drastic color
change appeared with sensor 111 in presence of F-. The absorption spectrum for this recognition
shows a new band at 430 nm that is an evidence for the formation of a complex.
Figure 72 and figure 73 clearly show the difference in intensity of the new band of the
complex. With sensor 109 (figure 72) it is possible to detect this new band at ca. 430 nm by the
difference spectra ([109- F] - 109) (a-inset) with low intensity. With sensor 111 (figure 73) the
new band at ca. 430 nm can be detected directly in the titration spectra.
These results show, that after addition of F-, the ground state is affected and the absorption is
weakly shifted to the red through recognition of the anion, which can be assigned to an
intramolecular charge transfer (CT).
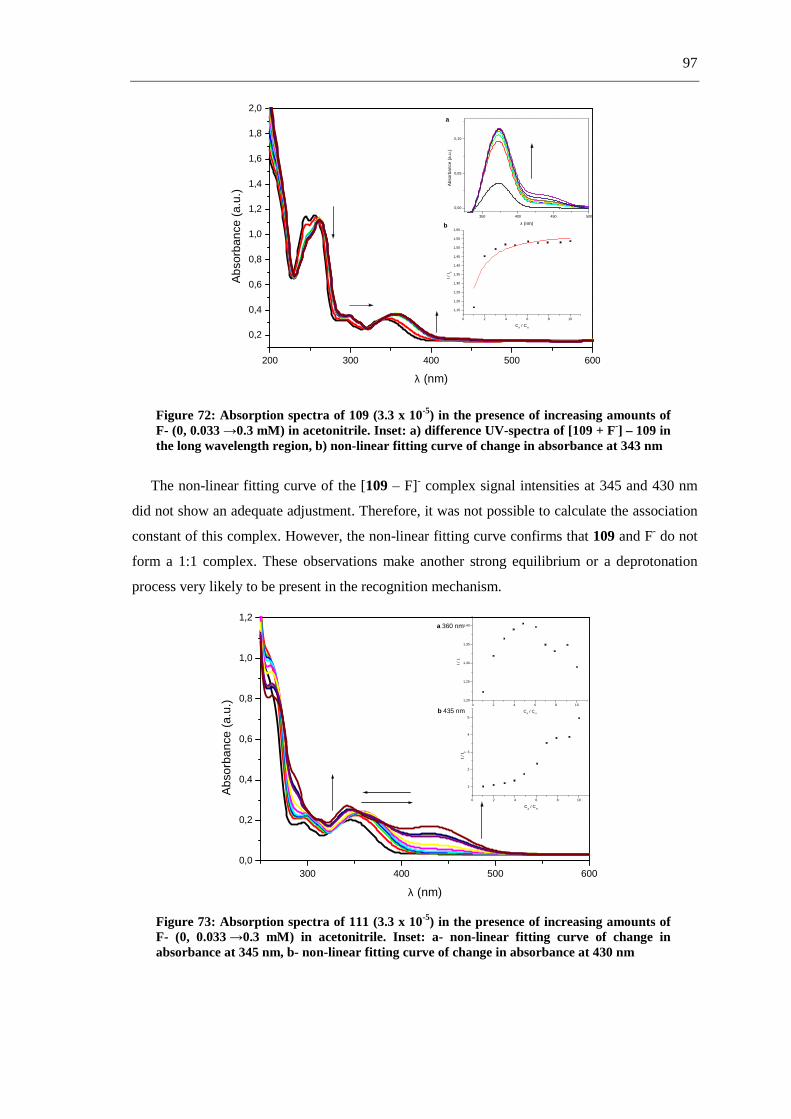
97
200 300 400 500 600
0,2
0,4
0,6
0,8
1,0
1,2
1,4
1,6
1,8
2,0a
b
0 2 4 6 8 10
1,15
1,20
1,25
1,30
1,35
1,40
1,45
1,50
1,55
1,60
I / I 0
CA / C
H
350 400 450 500
0,00
0,05
0,10
Abs
orba
nce
(a.u
.)
λ (nm)
Abs
orba
nce
(a.u
.)
λ (nm)
Figure 72: Absorption spectra of 109 (3.3 x 10⁻⁵) in the presence of increasing amounts of F- (0, 0.033 →0.3 mM) in acetonitrile. Inset: a) difference UV-spectra of [109 + F-] – 109 in the long wavelength region, b) non-linear fitting curve of change in absorbance at 343 nm
The non-linear fitting curve of the [109 – F]- complex signal intensities at 345 and 430 nm
did not show an adequate adjustment. Therefore, it was not possible to calculate the association
constant of this complex. However, the non-linear fitting curve confirms that 109 and F- do not
form a 1:1 complex. These observations make another strong equilibrium or a deprotonation
process very likely to be present in the recognition mechanism.
300 400 500 6000,0
0,2
0,4
0,6
0,8
1,0
1,2
b 435 nm
a 360 nm
0 2 4 6 8 101,20
1,25
1,30
1,35
1,40
I / I 0
CA / C
H
0 2 4 6 8 10
1
2
3
4
5
I / I 0
CA / C
H
Abs
orba
nce
(a.u
.)
λ (nm)
Figure 73: Absorption spectra of 111 (3.3 x 10⁻⁵) in the presence of increasing amounts of F- (0, 0.033 →0.3 mM) in acetonitrile. Inset: a- non-linear fitting curve of change in absorbance at 345 nm, b- non-linear fitting curve of change in absorbance at 430 nm

98
As shown in figure 74 and figure 75, a phenomenon similar to the [109 + F-] complex was
observed when AcO- and H2PO4- were added into the solution of receptor 109 in acetonitrile.
The new band at 430 nm was not observed with both anions but AcO- and H2PO4- also induced
an increase of the band at ca. 360 nm. The prepared non-linear fitting curve confirms that 109
and the anions form a 1:1 complex.
200 300 400 500 600
0,0
0,2
0,4
0,6
0,8
1,0
1,2
1,4
1,6
1,8
2,0
2,2
b
a
0 2 4 6 8 109,5
10,0
10,5
11,0
11,5
12,0
12,5
13,0
13,5
I / I 0
CA / C
H
350 400 4500,00
0,05
0,10
0,15
Abs
orba
nce
(a.u
.)
λ (nm)
Abs
orba
nce
(a.u
.)
λ (nm)
Figure 74: Absorption spectra of 109 (3.3 x 10⁻⁵) in the presence of increasing amounts of AcO- (0, 0.033 →0.3 mM) in acetonitrile. Inset: a) difference UV-spectra of [109 + AcO-] – 109 in the long wavelength region, b) non-linear fitting curve of change in absorbance at 343 nm
200 300 400 500 600
0,0
0,2
0,4
0,6
0,8
1,0
1,2
1,4
1,6
0 2 4 6 8 10
2,5
3,0
3,5
4,0
4,5
5,0
I / I 0
CA / C
H
b
a
350 400 450 5000,00
0,05
0,10
0,15
Abs
orba
nce
(a.u
.)
λ (nm)
Abs
orba
nce
(a.u
.)
λ (nm)
Figure 75: Absorption spectra of 109 (3.3 x 10⁻⁵ M) in the presence of increasing amounts of H2PO4
- (0, 0.033 →0.3 mM) in acetonitrile. Inset: a) difference UV-spectra of [109 + H2PO4
-] – 109 in the long wavelength region, b) non-linear fitting curve of change in absorbance at 343 nm
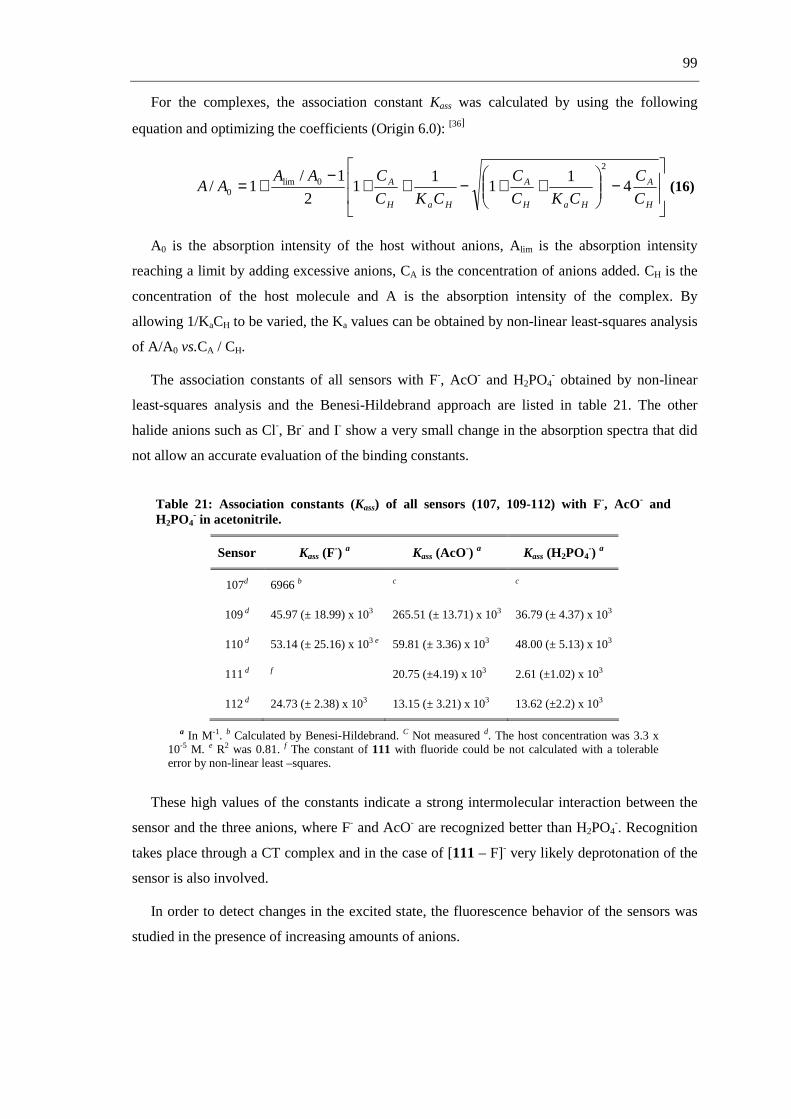
99
For the complexes, the association constant Kass was calculated by using the following
equation and optimizing the coefficients (Origin 6.0): [36]
−
++−++
−+=
H
A
HaH
A
HaH
A
C
C
CKC
C
CKC
CAAAA 4
11
11
2
1/1/
2
0lim0 (16)
A0 is the absorption intensity of the host without anions, Alim is the absorption intensity
reaching a limit by adding excessive anions, CA is the concentration of anions added. CH is the
concentration of the host molecule and A is the absorption intensity of the complex. By
allowing 1/KaCH to be varied, the Ka values can be obtained by non-linear least-squares analysis
of A/A0 vs.CA / CH.
The association constants of all sensors with F-, AcO- and H2PO4- obtained by non-linear
least-squares analysis and the Benesi-Hildebrand approach are listed in table 21. The other
halide anions such as Cl-, Br- and I- show a very small change in the absorption spectra that did
not allow an accurate evaluation of the binding constants.
Table 21: Association constants (Kass) of all sensors (107, 109-112) with F-, AcO- and H2PO4
- in acetonitrile.
Sensor Kass (F-) a Kass (AcO-) a Kass (H2PO4
-) a
107d 6966 b c c
109 d 45.97 (± 18.99) x 103 265.51 (± 13.71) x 103 36.79 (± 4.37) x 103
110 d 53.14 (± 25.16) x 103 e 59.81 (± 3.36) x 103 48.00 (± 5.13) x 103
111 d f 20.75 (±4.19) x 103 2.61 (±1.02) x 103
112 d 24.73 (± 2.38) x 103 13.15 (± 3.21) x 103 13.62 (±2.2) x 103
a In M-1. b Calculated by Benesi-Hildebrand. C Not measured d. The host concentration was 3.3 x 10⁻⁵ M. e R2 was 0.81. f The constant of 111 with fluoride could be not calculated with a tolerable error by non-linear least –squares.
These high values of the constants indicate a strong intermolecular interaction between the
sensor and the three anions, where F- and AcO- are recognized better than H2PO4-. Recognition
takes place through a CT complex and in the case of [111 – F]- very likely deprotonation of the
sensor is also involved.
In order to detect changes in the excited state, the fluorescence behavior of the sensors was
studied in the presence of increasing amounts of anions.
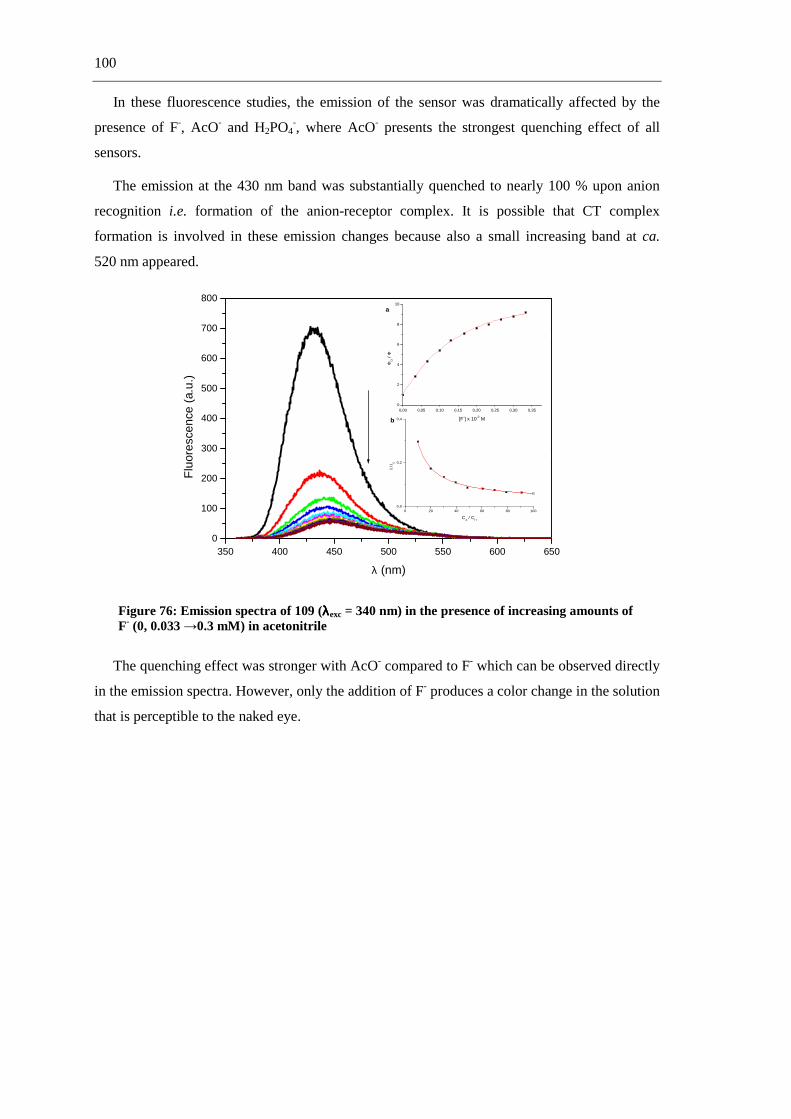
100
In these fluorescence studies, the emission of the sensor was dramatically affected by the
presence of F-, AcO- and H2PO4-, where AcO- presents the strongest quenching effect of all
sensors.
The emission at the 430 nm band was substantially quenched to nearly 100 % upon anion
recognition i.e. formation of the anion-receptor complex. It is possible that CT complex
formation is involved in these emission changes because also a small increasing band at ca.
520 nm appeared.
350 400 450 500 550 600 6500
100
200
300
400
500
600
700
800
b
a
0 20 40 60 80 1000,0
0,2
0,4
I / I 0
CA / C
H
0,00 0,05 0,10 0,15 0,20 0,25 0,30 0,350
2
4
6
8
10
ΦO /
Φ
[F-] x 10-3 M
Flu
ores
cenc
e (a
.u.)
λ (nm)
Figure 76: Emission spectra of 109 (λλλλexc = 340 nm) in the presence of increasing amounts of F- (0, 0.033 →0.3 mM) in acetonitrile
The quenching effect was stronger with AcO- compared to F- which can be observed directly
in the emission spectra. However, only the addition of F- produces a color change in the solution
that is perceptible to the naked eye.

101
350 400 450 500 550 600 6500
200
400
600
800
b
a
0,00 0,05 0,10 0,15 0,20 0,25 0,30 0,350
2
4
6
8
10
12
14
16
Φ0
/ Φ
[AcO-] M
0 20 40 60 80 1000,0
0,2
I / I 0
CA / C
H
Flu
ores
cenc
e (a
.u.)
λ (nm)
Figure 77: Emission spectra of 109 (λλλλexc = 340 nm) in the presence of increasing amounts of AcO- (0, 0.033 →0.3 mM) in acetonitrile
350 400 450 500 550 600 6500
100
200
300
400
500
600
700
0,00 0,05 0,10 0,15 0,20 0,25 0,30 0,350
1
2
3
4
5
6
7
8
Φ0 /
Φ
[H2PO
4
-] M
b
a
0 20 40 60 80 1000,0
0,2
0,4
I / I
0
CA / C
H
Flu
ores
cenc
e (a
.u.)
λ (nm)
Figure 78: Emission spectra of 107 (λλλλexc = 340 nm) in the presence of increasing amounts of H2PO4- (0, 0.033 →0.3 mM) in acetonitrile
The anion recognition process due to CT is reversible and can be suppressed by addition of a
protic solvent like methanol by competitive hydrogen bonding. The fluorescence emission was
restored with 210 µL of methanol by a 380-fold. This indicates that the anion-receptor
complexes are broken and the methanolic solvated sensor presents a red-shift of about 10 nm
(445 nm).

102
350 400 450 500 550 600 6500
100
200
300
400
500
600
700
800
Flu
ores
cenc
e (a
.u)
λ (nm)
in CH3CN
2.5µl TBA-F-
2.5µl TBA-F-+10µl MeOH 2.5µl TBA-F-+110µl MeOH 2.5µl TBA-F-+210µl MeOH
Figure 79: Emission spectra of 109 (λλλλexc = 340 nm) in the presence of F- (0.83 mM) and increasing amounts of methanol
The Stern-Volmer plots showed a non-linear behavior at high concentration levels of anions
supporting the theory that a static quenching process of the fluorescence was taking place. For
comparison, the emission of the sensors 109-112 was recorded in the presence of increasing
amounts of a strong non-nucleophilic base (1,8-diazabyclico[5,4,0]undec-7-ene, DBU) which is
depicted in figure 80. In this case, fluorescence quenching followed a clearly fitted-linearity in
contrast to that found for F-, AcO- and H2PO4-. Figure 80 shows the Stern-Volmer plots of the
sensor 109 with different anions in presence of DBU.
0,00 0,05 0,10 0,15 0,20 0,25 0,30 0,35
0
2
4
6
8
10
12
14
16
Φ0/Φ
[X] x 10-3 (M)
F-
PO4
3-
AcO-
DBU
Figure 80: Stern-Volmer plots for the fluorescence quenching of 109 upon AcO- (▲), F- (■), H2PO4
- (●) and DBU (▼) titration (0, 0.033 → 0.3 mM)

103
Conducting the experiment with Cl-, Br- and I-, no changes in the maximum fluorescence
intensity of the sensors were observed. A plot of the relative intensity vs. guest concentration
shows that no interaction of these halides with the sensor occurs, clearly supporting the notion
that the sensors 109-112 were suitable for F-, AcO-, and H2PO4-. A possible reason can be a
heavy atom effect for the halides Cl-, Br- and I- with the sensors. The recognition effect is
depicted in figure 81.
0,00 0,05 0,10 0,15 0,20 0,25 0,30 0,350,0
0,2
0,4
0,6
0,8
1,0
Rel
.Inte
nsity
at 4
30 n
m (
a.u.
)
Guest concentration 10-3 (M)
F-
AcO-
H2PO
4
-
Cl-
Br-
I-
Figure 81: Changes in the emission at 430 nm upon titration with F -, Cl-, Br-, I-, AcO- and H2PO4
- with 109
The photophysical properties did not show significant changes upon changing the solvent
polarity. However, the hydrogen bonding competition is always present in the process. With
increasing amounts of methanol the fluorescence signal returns (figure 79). Figure 82 illustrates
the Stern-Volmer plot indicating that the quenching process in DMSO is significantly slower
than in CH3CN.
Sensors 109-112 (containing hydroxy groups) can interact with the solvent through hydrogen
bonds thus inhibiting the formation of the complex between anion and sensor; DMSO is a
solvent that can act as a hydrogen bond acceptor. Therefore, the quenching process can not take
place rapidly.

104
0,00 0,05 0,10 0,15 0,20 0,25 0,30 0,35
0
2
4
6
8
10
12
14
16
18
[F-] x 10-3 (M)
Φ0/
Φ
39+F- in DMSO 39+F- in CH
3CN
Figure 82: Changes in the emission at 430 nm upon titration with F - in DMSO and CH3CN with 111
For the complexes, the association constant Kass was calculated by using the following
equation and optimizing the coefficients (Origin 6.0): [36]
−
++−++
−+=
H
A
HaH
A
HaH
A
C
C
CKC
C
CKC
CIIII 4
11
11
2
1/1/
2
0lim0 (8)
I0 is the fluorescence intensity of the host without anions, I lim is fluorescence intensity
reaching a limit by addition of an excess of anions, CA is the concentration of anions added, CH
is the concentration of host molecule and I is the fluorescence intensity of the complex.
Table 22: Association constants (Kass) of all sensors (109-112) with F-, AcO- and H2PO4- in
acetonitrile
Sensor Kass (F-) a Kass (AcO-) a Kass (H2PO4
-) a
109 b 86.32 (± 3.14) x 103 169.70 (± 5.64) x 103 70.15 (± 2.04) x 103
110 b 26.74 (± 1.92) x 103 195.31 (± 7.71) x 103 57.24 (± 3.93) x 103
111 b 46.89 (± 2.02) x 103 90.42 (± 3.25) x 103 41.84 (± 1.40) x 103
112 b 25.37 (± 1.35) x 103 169.71 (± 7.80) x 103 49.61 (±2.01) x 103
a In M-1. b. The host concentration was 3.3 x 10⁻⁶ M. e R2 was between 0.990-0997. f The constant of all sensors with the anions could be calculated with a tolerable error by non-linear least–squares method.
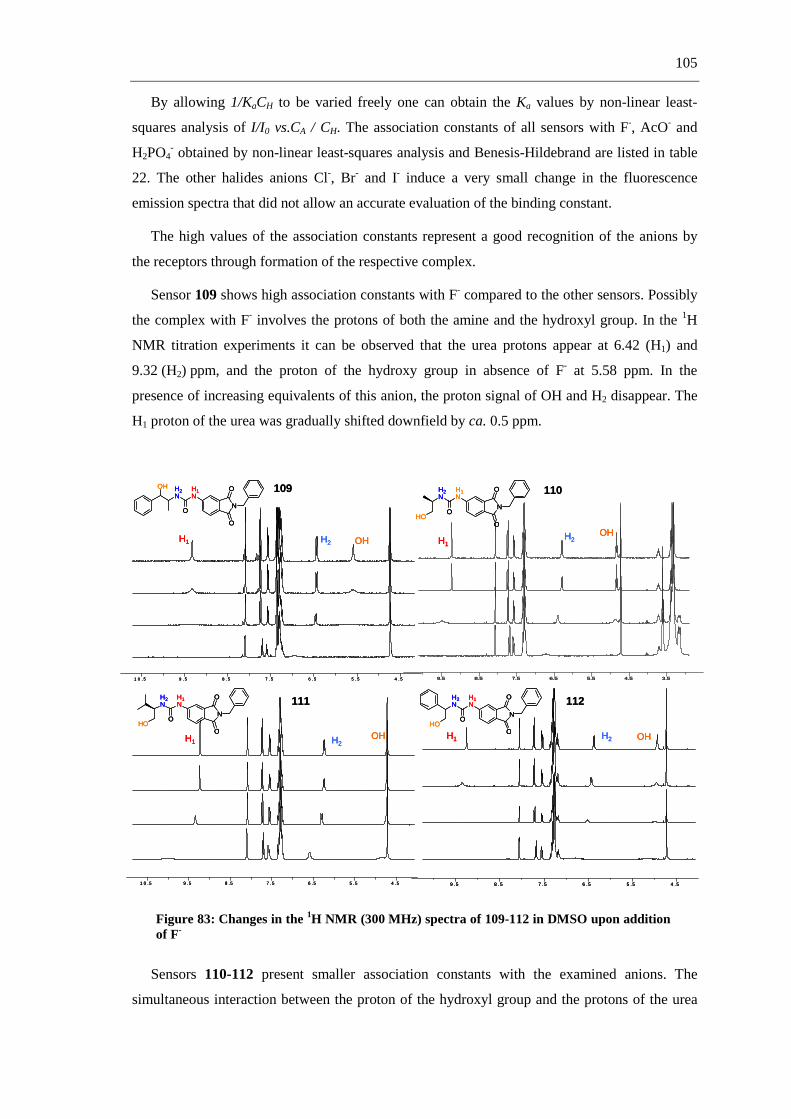
105
By allowing 1/KaCH to be varied freely one can obtain the Ka values by non-linear least-
squares analysis of I/I 0 vs.CA / CH. The association constants of all sensors with F-, AcO- and
H2PO4- obtained by non-linear least-squares analysis and Benesis-Hildebrand are listed in table
22. The other halides anions Cl-, Br- and I- induce a very small change in the fluorescence
emission spectra that did not allow an accurate evaluation of the binding constant.
The high values of the association constants represent a good recognition of the anions by
the receptors through formation of the respective complex.
Sensor 109 shows high association constants with F- compared to the other sensors. Possibly
the complex with F- involves the protons of both the amine and the hydroxyl group. In the 1H
NMR titration experiments it can be observed that the urea protons appear at 6.42 (H1) and
9.32 (H2) ppm, and the proton of the hydroxy group in absence of F- at 5.58 ppm. In the
presence of increasing equivalents of this anion, the proton signal of OH and H2 disappear. The
H1 proton of the urea was gradually shifted downfield by ca. 0.5 ppm.
1 0 . 5 9 . 5 8 . 5 7 . 5 6 . 5 5 . 5 4 . 5
OHH2H1
9.5 8.5 7.5 6.5 5.5 4.5 3.5
N
H1N
O
O
H2N
OHO
OHH2H1
1 0 .5 9 .5 8 .5 7 . 5 6 .5 5 .5 4 . 5
N
H1N
O
O
H2N
OHO
OHH2H1
9 .5 8 .5 7 .5 6 .5 5 .5 4 .5
H1 H2 OH
N
H1N
O
O
H2N
OHO
N
H1N
O
O
H2N
O
OH 109 110
111 112
1 0 . 5 9 . 5 8 . 5 7 . 5 6 . 5 5 . 5 4 . 5
OHH2H1
9.5 8.5 7.5 6.5 5.5 4.5 3.5
N
H1N
O
O
H2N
OHO
OHH2H1
1 0 .5 9 .5 8 .5 7 . 5 6 .5 5 .5 4 . 5
N
H1N
O
O
H2N
OHO
OHH2H1
9 .5 8 .5 7 .5 6 .5 5 .5 4 .5
H1 H2 OH
N
H1N
O
O
H2N
OHO
N
H1N
O
O
H2N
O
OH
1 0 . 5 9 . 5 8 . 5 7 . 5 6 . 5 5 . 5 4 . 5
OHH2H1
9.5 8.5 7.5 6.5 5.5 4.5 3.5
N
H1N
O
O
H2N
OHO
OHH2H1
1 0 .5 9 .5 8 .5 7 . 5 6 .5 5 .5 4 . 5
N
H1N
O
O
H2N
OHO
OHH2H1
9 .5 8 .5 7 .5 6 .5 5 .5 4 .5
H1 H2 OH
N
H1N
O
O
H2N
OHO
N
H1N
O
O
H2N
O
OH 109 110
111 112
Figure 83: Changes in the 1H NMR (300 MHz) spectra of 109-112 in DMSO upon addition of F-
Sensors 110-112 present smaller association constants with the examined anions. The
simultaneous interaction between the proton of the hydroxyl group and the protons of the urea

106
with the anions is not possible here because the hydroxyl group may generate hydrogen bonding
with the carbonyl group of the urea. Therefore, the association constants have smaller values
than for sensor 109. 1H NMR titration experiments show a similar behavior like sensor 109 but
the proton signal of the hydroxy group disappears slower. This is due to the fact that the
hydrogen bonding between the carbonyl group of the urea and the hydroxyl group has to be
broken before interaction with the anions can take place which delays the process.
To ensure whether the recognition process involves a CT complex formation through H-
bonding interactions between 109-112 and F-, computational calculations based on B3LYP/6-
31G(d) [72] (gas phase) were carried out. Model system geometries were optimized in the
absence and presence of the fluoride ion (figure 84). To compare the stable geometry of the
complexes the conformation of the sensor owing the lowest energy was set to zero (kcal/mol).
Figure 84: Geometries of the free (left) and fluoride bonded (right) model system for 109
For sensor 109, the optimum geometry is given by a conformation where the fluoride is
centered between the OH and the two NH of the urea. This conformation makes multiple
hydrogen bonding possible.
Sensors 110-112 showed a similar geometry for complex formation. Again the fluoride is
centered between OH and the two NH of the urea moiety, which makes hydrogen bonging
possible (figure 85).
110 111 112110 111 112
Figure 85: Calculated geometries of fluoride bound to sensors 110-112
Alternative complex conformations were also observed for all sensors with hydrogen
bonding between the hydroxy group and the carbonyl group of the urea moiety. As a
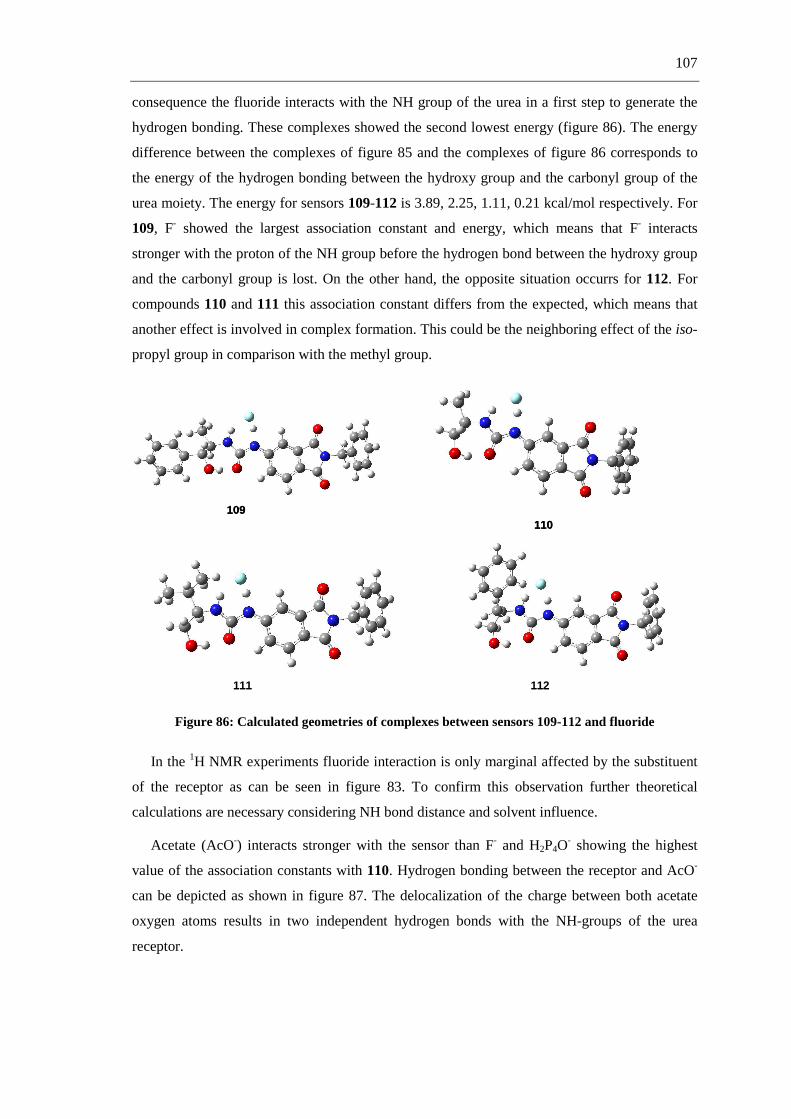
107
consequence the fluoride interacts with the NH group of the urea in a first step to generate the
hydrogen bonding. These complexes showed the second lowest energy (figure 86). The energy
difference between the complexes of figure 85 and the complexes of figure 86 corresponds to
the energy of the hydrogen bonding between the hydroxy group and the carbonyl group of the
urea moiety. The energy for sensors 109-112 is 3.89, 2.25, 1.11, 0.21 kcal/mol respectively. For
109, F- showed the largest association constant and energy, which means that F- interacts
stronger with the proton of the NH group before the hydrogen bond between the hydroxy group
and the carbonyl group is lost. On the other hand, the opposite situation occurrs for 112. For
compounds 110 and 111 this association constant differs from the expected, which means that
another effect is involved in complex formation. This could be the neighboring effect of the iso-
propyl group in comparison with the methyl group.
109110
111 112
109110
111 112
Figure 86: Calculated geometries of complexes between sensors 109-112 and fluoride
In the 1H NMR experiments fluoride interaction is only marginal affected by the substituent
of the receptor as can be seen in figure 83. To confirm this observation further theoretical
calculations are necessary considering NH bond distance and solvent influence.
Acetate (AcO-) interacts stronger with the sensor than F- and H2P4O- showing the highest
value of the association constants with 110. Hydrogen bonding between the receptor and AcO-
can be depicted as shown in figure 87. The delocalization of the charge between both acetate
oxygen atoms results in two independent hydrogen bonds with the NH-groups of the urea
receptor.

108
N
N
OO
NO
RH
H CH3CO2-
N
N
OO
NO
RH
HCH3
O
O
Figure 87: Hydrogen bonding of the urea receptor with acetate
The hydroxyl group of the R-substituent at the urea moiety can be responsible for an increase
or decrease of the association constant depending on possible groups that can interact through a
competing hydrogen bonding.
In summary the new sensors also showed a good binding selectivity towards the anions
AcO−, F-, H2PO4- that in most cases followed the order Kass AcO- > Kass F
- > Kass H2PO4- or Kass
AcO- > Kass H2PO4- > Kass F
-. Evidence for the hydrogen bonding nature of the urea-anion and
hydroxyl group-anion was further obtained by 1H NMR titration of the sensors with the anion in
DMSO-d6. The fluoride complexes established through hydrogen bonding were proved by
theoretical calculations. For the other anions this still has to be calculated in future
investigations.
3.9.3 Chiral recognition
Molecular recognition, especially chiral recognition, is one of the most fundamental and
crucial properties of various natural systems. [77]
Erwing and coworkers [78] found that meningococci (bacterium that causes cerebrospinal
meningitis) are able to grow on either enantiomer of lactate. The enzymes for the lactate-
oxidizing activity in the bacteria are specific for one of the two isomers which is D-lactate.
Chan and coworkers [79] explored the neurological toxicity of the isomeric form of lactate in
experimental animals to determine the serum levels of D- and L-lactate achieved in stable
patients during routine peritoneal dialysis (a treatment for patients with severe chronic kidney
failure). In patients undergoing peritoneal dialysis who develop abnormal neurological changes
they observed serum levels of D-lactate. L-lactate is produced in the anaerobic metabolism of
glucose and its determination is of interest in clinical analysis, sports medicine and food
analysis.[80] The important role of the lactate in a wide variety of biological processes motivates
the development of other methods for detection and chiral discrimination of the lactate isomers.
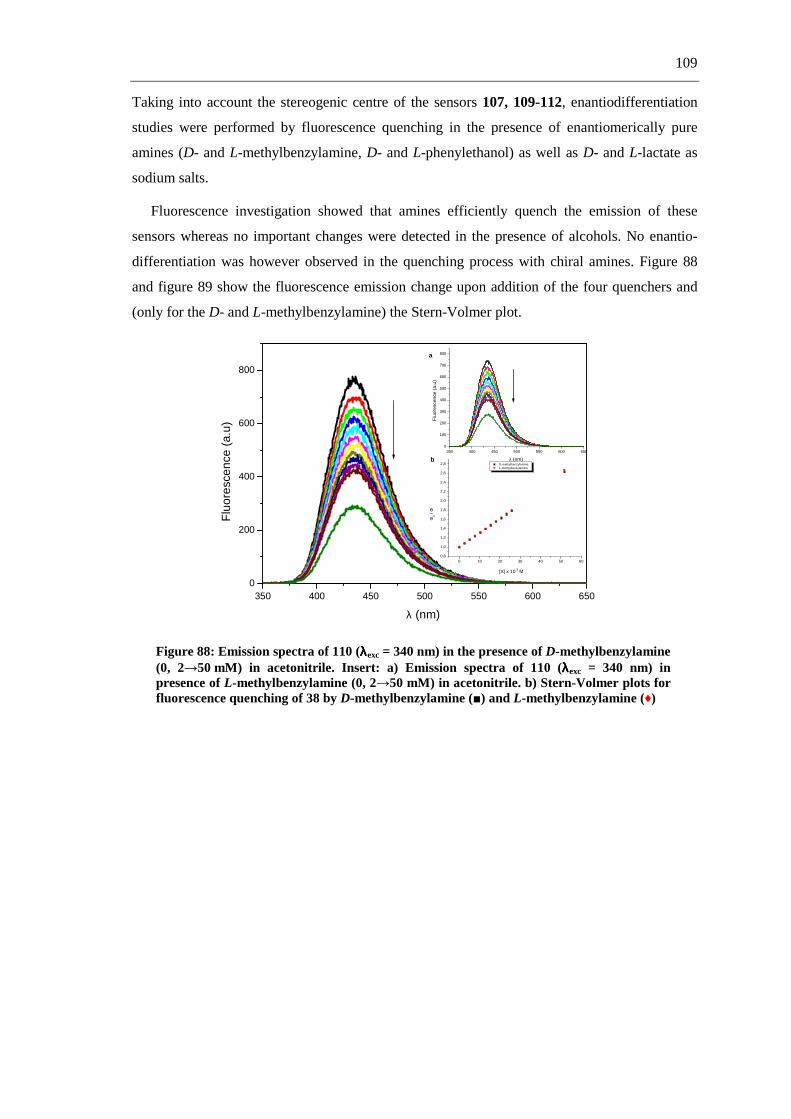
109
Taking into account the stereogenic centre of the sensors 107, 109-112, enantiodifferentiation
studies were performed by fluorescence quenching in the presence of enantiomerically pure
amines (D- and L-methylbenzylamine, D- and L-phenylethanol) as well as D- and L-lactate as
sodium salts.
Fluorescence investigation showed that amines efficiently quench the emission of these
sensors whereas no important changes were detected in the presence of alcohols. No enantio-
differentiation was however observed in the quenching process with chiral amines. Figure 88
and figure 89 show the fluorescence emission change upon addition of the four quenchers and
(only for the D- and L-methylbenzylamine) the Stern-Volmer plot.
350 400 450 500 550 600 6500
200
400
600
800
b
a
0 10 20 30 40 50 600,8
1,0
1,2
1,4
1,6
1,8
2,0
2,2
2,4
2,6
2,8
[X] x 10-3 M
Φ0
/ Φ
D-methylbenzylamine L-methylbenzylamine
350 400 450 500 550 600 6500
100
200
300
400
500
600
700
800
Flu
ores
cen
ce (
a.u
)
λ (nm)
Flu
ores
cenc
e (a
.u)
λ (nm)
Figure 88: Emission spectra of 110 (λλλλexc = 340 nm) in the presence of D-methylbenzylamine (0, 2→50 mM) in acetonitrile. Insert: a) Emission spectra of 110 (λλλλexc = 340 nm) in presence of L-methylbenzylamine (0, 2→50 mM) in acetonitrile. b) Stern-Volmer plots for fluorescence quenching of 38 by D-methylbenzylamine (■) and L-methylbenzylamine (♦)

110
350 400 450 500 550 600 6500
100
200
300
400
500
600
700
800
350 400 450 500 550 600 6500
100
200
300
400
500
600
700
800
Flu
ores
cenc
e In
tens
ity (
a.u.
)
λ (nm)
Flu
ores
cenc
e (a
.u.)
λ (nm)
Figure 89: Emission spectra of 110 (λλλλexc = 340 nm) in the presence of D-phenylethanol (0, 2→220 mM) in acetonitrile. Insert: Emission spectra of 38 (λλλλexc = 340 nm) in the presence of L-phenylethanol (0, 2→220 mM) in acetonitrile
Chiral recognition of D- and L-lactate was carried out through UV-vis absorption and
fluorescence quenching.
Upon addition of D- and L-lactate no drastic changes were observed in the absorption spectra
of the sensors, but a new band at 340 nm with weak intensity was detected together with an
isosbestic point at 317 nm. To examine the formation of a new complex between the sensors
and the D- and L-lactate, the difference spectra [Sensor + D- or L-lactate]-Sensor were
calculated and are shown for sensor 107 in figure 90 and figure 91.
300 400 500 6000,0
0,2
0,4
0,6
0,8
1,0
1,2
350 400 450
0,00
0,01
0,02
0,03
0,04
0,05
0,06
Abs
orb
ance
(a.
u.)
λ (nm)
Abs
orba
nce
(a.u
.)
λ (nm)
Figure 90: Absorption spectra of 107 (3.3 x 10⁻⁵ M) in the presence of increasing amounts of D-lactate (0, 0.033 →0.3 mM) in acetonitrile. Inset: a) difference UV-spectra of [107 + D-lacate] – 107 in the long wavelength region

111
300 400 500 6000,0
0,2
0,4
0,6
0,8
1,0
1,2
350 400 450
0,000
0,005
0,010
0,015
0,020
0,025
0,030
0,035
0,040
0,045
0,050
0,055
0,060
Abs
orba
nce
(a.u
.)
λ (nm)
Abs
orba
nce
(a.u
.)
λ (nm)
Figure 91: Absorption spectra of 107 (3.3 x 10⁻⁵ M) in the presence of increasing amounts of L-lactate (0, 0.033 →0.3 mM) in acetonitrile. Inset: a) difference UV-spectra of [107 + L-lacate] – 107 in the long wavelength region
The results of the difference spectra confirm the formation of new species. The association
constant could not be calculated from these absorption spectra because the changes were not
strong enough. However, this effect was found for all interactions between sensors and the
lactate isomers.
Chiral recognition requires multiple-point interaction. [40] In this work the interaction was
based on hydrogen bonding between the receptor and D- and L-lactate. Enantioselective
detection of D- and L-lactate due to fluorescence quenching promises a higher sensitivity than
detection by absorption, so fluorescence experiments were conducted. The fluorescence
emission of the sensors was decreased upon addition of D- and L-lactate (0.033 → 0.3 mM) and
was observed for all sensors with stronger or weaker effect. The next figures show the emission
spectra (λem = 430 nm) of sensor 107 and its changes upon addition of D- and L-lactate (figure
92 and figure 93).
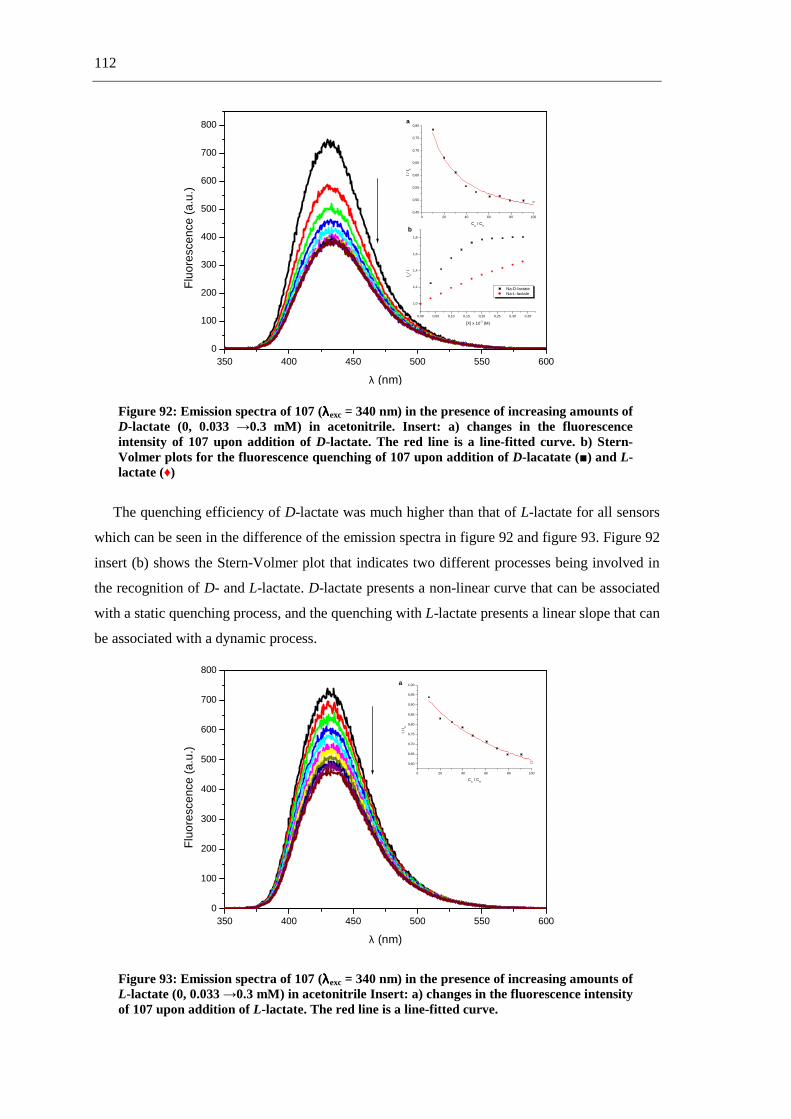
112
350 400 450 500 550 6000
100
200
300
400
500
600
700
800
b
a
0,00 0,05 0,10 0,15 0,20 0,25 0,30 0,35
1,0
1,2
1,4
1,6
1,8
I 0 / I
[X] x 10-3 (M)
Na-D-lactate Na-L-lactate
0 20 40 60 80 1000,45
0,50
0,55
0,60
0,65
0,70
0,75
0,80
I / I 0
CA / C
H
Flu
ores
cenc
e (a
.u.)
λ (nm)
Figure 92: Emission spectra of 107 (λλλλexc = 340 nm) in the presence of increasing amounts of D-lactate (0, 0.033 →0.3 mM) in acetonitrile. Insert: a) changes in the fluorescence intensity of 107 upon addition of D-lactate. The red line is a line-fitted curve. b) Stern-Volmer plots for the fluorescence quenching of 107 upon addition of D-lacatate (■) and L-lactate (♦)
The quenching efficiency of D-lactate was much higher than that of L-lactate for all sensors
which can be seen in the difference of the emission spectra in figure 92 and figure 93. Figure 92
insert (b) shows the Stern-Volmer plot that indicates two different processes being involved in
the recognition of D- and L-lactate. D-lactate presents a non-linear curve that can be associated
with a static quenching process, and the quenching with L-lactate presents a linear slope that can
be associated with a dynamic process.
350 400 450 500 550 6000
100
200
300
400
500
600
700
800a
0 20 40 60 80 100
0,60
0,65
0,70
0,75
0,80
0,85
0,90
0,95
1,00
I / I 0
CA / C
H
Flu
ores
cenc
e (a
.u.)
λ (nm)
Figure 93: Emission spectra of 107 (λλλλexc = 340 nm) in the presence of increasing amounts of L-lactate (0, 0.033 →0.3 mM) in acetonitrile Insert: a) changes in the fluorescence intensity of 107 upon addition of L-lactate. The red line is a line-fitted curve.

113
Measurements of the fluorescence lifetimes is the most definite method to distinguish
between static and dynamic quenching: for static quenching τ0 / τ = 1, in contrast to dynamic
quenching where F0 / F = τ0 / τ. [6]
To confirm the nature of the quenching process lifetime measurements of sensor 109 were
performed upon addition of D- and L-lactate. For D-lactate it could be confirmed that the
interaction between the sensor and anion occurs by a static process. The lifetimes of the
complex [D-lactate-109] remain almost constant and satisfy the equation τ0 / τ = 1.
Lifetime measurement of complex [L-lactate-109] presents results that can not confirm a
pure static quenching because equation F0 / F = τ0 / τ is not satisfied. The Stern-Volmer
plots for both lactates are shown in figure 94.
0,00 0,05 0,10 0,15 0,20 0,25 0,30
1,0
1,2
1,4
1,6
1,8
2,0
φ 0 / φ
and
τ0 /
τ
[D-lactate] x 10-3 M
τ0 / τ
φ0 / φ
0,00 0,05 0,10 0,15 0,20 0,25 0,30
1,0
1,1
1,2
1,3
1,4
1,5
φ 0 / φ
and
τ0
/ τ
[L-lactate] x 10-3 M
τ0 / τ
φ0 / φ
Figure 94: Stern-Volmer plot for the fluorescence quenching of 109 in function of the
intensity (φφφφ, , , , ◆◆◆◆) and lifetimes (ττττ, , , , ■) upon addition of D-lacatate (right) and L-lactate (left)
In most instances the fluorophore can be quenched both collisional and by complex
formation with the same quencher. [6] This combination of quenching processes can be
represented by the following mechanism:
F + Q
F* (F-Q*)Kq [Q]
non-fluorescent
F-Q
hν
Ks
Figure 95: Mechanism of combined dynamic and static quenching
Satisfactory non-linear curve fitting (the correlation coefficient is over 0.99) confirmed that
D-lactate forms a complex with all sensors whereas L-lactate shows the formation of a weaker
complex compared to D-lactate.

114
Sensor 109 shows a high value for the association constant, indicating that the interaction of
lactate with the sensor may occur in a similar way like it happens with acetate (due to charge
delocalization between two oxygen atoms).
With the results of these absorption and fluorescence quenching studies the formation of a
complex between D- and L-lactate with the urea receptors is obvious, which can be observed at
longer wavelengths.
The enantioselectivity was satisfactory because recognition of the enatiomers takes place by
different mechanisms. The D-lactate recognition occurs under static quenching and L-lactate is
very likely recognized by a combination of static and dynamic quenching. For these complexes,
the association constant Kass was calculated by using the following equation and optimizing the
coefficients (Origin 6.0): [36]
−
++−++
−+=
H
A
HaH
A
HaH
A
C
C
CKC
C
CKC
CIIII 4
11
11
2
1/1/
2
0lim0
(8)
where I0 is the fluorescence intensity of the host without anions, Ilim is the fluorescence
intensity reaching a limit by addition of an excess anions, CA is the concentration of anions
added, CH is the concentration of host molecule and I is the fluorescence intensity of the
complex.
By allowing 1/KaCH to be varied free, the Ka values can be obtained by non-linear least-
squares analysis of I/I0 vs.CA / CH.
Table 23: Association constants (Kass) for all sensors (107, 109-112) with D- and L-lactate in acetonitrile
Sensor Kass (Na-D-Lactate)- a Kass (Na-L-Lactate )- a KassD/KassL
107b 19.16 (± 1.80) x 103 3.84 (± 0.74) x 103 4.99
109 b 25.89 (± 2.08) x 103 5.54 (± 0.47) x 103 4.67
110 b 17.75 (± 2.08) x 103 4.15 (± 0.40) x 103 4.27
111 b 15.80 (± 3.62) x 103 3.37 (±0.57) x 103 4.70
112 b 20.40 (± 1.49) x 103 2.93 (±0.40) x 103 6.96
a In M-1. b The host concentration was 3.3 x 10⁻⁶ M. e R2 was between 0.987-0998.c The constant of all sensors with D- and L-lactate could be calculated with a tolerable error by non-linear least –squares method.
To ensure whether the chiral recognition process involves a CT complex formation via H-
bonding interaction between 107, 109-112 and D- and L-lactate, computational calculations
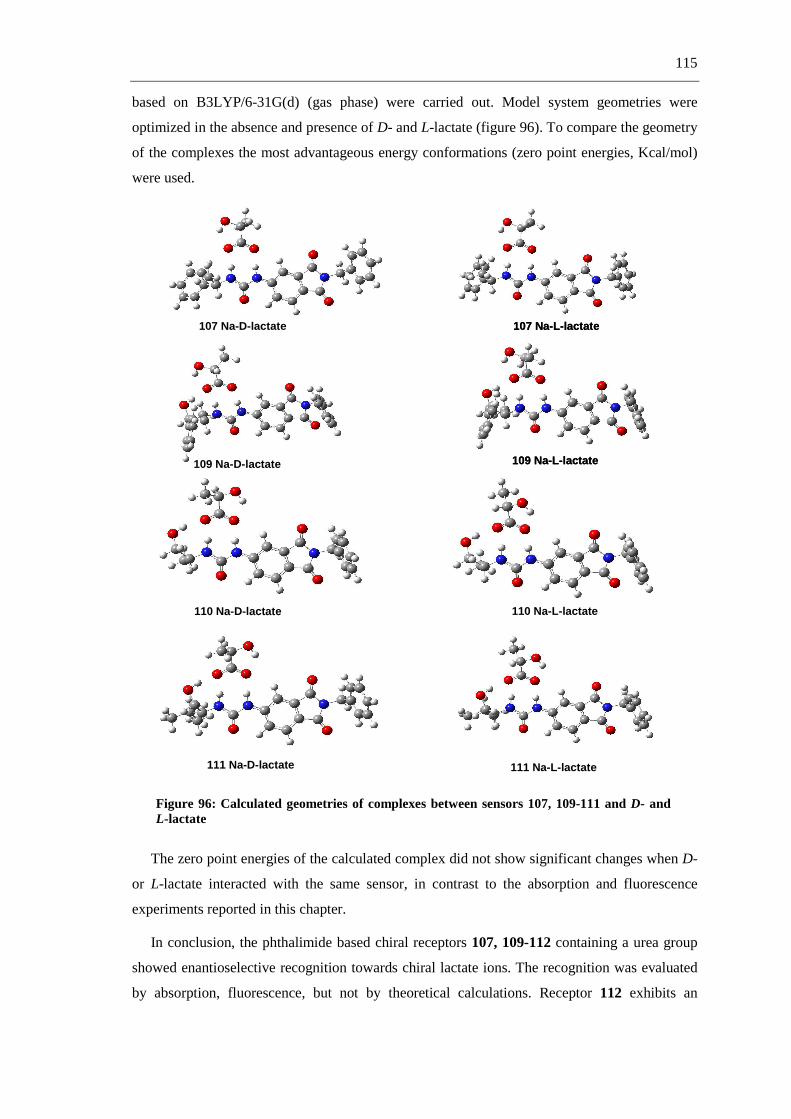
115
based on B3LYP/6-31G(d) (gas phase) were carried out. Model system geometries were
optimized in the absence and presence of D- and L-lactate (figure 96). To compare the geometry
of the complexes the most advantageous energy conformations (zero point energies, Kcal/mol)
were used.
107 Na-D-lactate 107 Na-L-lactate
109 Na-D-lactate 109 Na-L-lactate
110 Na-D-lactate 110 Na-L-lactate
111 Na-L-lactate111 Na-D-lactate
107 Na-D-lactate 107 Na-L-lactate
109 Na-D-lactate 109 Na-L-lactate
110 Na-D-lactate 110 Na-L-lactate
111 Na-L-lactate111 Na-D-lactate
Figure 96: Calculated geometries of complexes between sensors 107, 109-111 and D- and L-lactate
The zero point energies of the calculated complex did not show significant changes when D-
or L-lactate interacted with the same sensor, in contrast to the absorption and fluorescence
experiments reported in this chapter.
In conclusion, the phthalimide based chiral receptors 107, 109-112 containing a urea group
showed enantioselective recognition towards chiral lactate ions. The recognition was evaluated
by absorption, fluorescence, but not by theoretical calculations. Receptor 112 exhibits an

116
excellent chiral recognition ability towards the enantiomers of lactate, the other sensors can
distinguish between both enantiomers with less efficiency. Fluorescence recognition of the
anions involves two different processes for all sensors, D-lactate due to a static quenching
process and L-lactate by a combination of a static and dynamic process. Theoretical calculations
are ongoing to rationalize the enantioselectivity of the sensors towards D- and L-lactate.
3.10 Fluorescence study of the sensors 107 and 109-112 with
different peroxides
Previous fluorescence experiments showed that sensors 107 as well as 109-112 interact
directly with protic solvents such as methanol and thus exhibit changes in the fluorescence
emission. The following experiments were executed in order to examine if this effect can be
used for the recognition of hydrogen peroxide and other peroxides.
As it is well known, hydrogen peroxide is one of the most important analytes because of its
involvement in explosives. Figure 97 shows that no fluorescence changes can be observed in the
fluorescence emission of sensor 107 in dry acetonitrile solution as well as in the presence of
water after two hours of irradiation. However, when hydrogen peroxide was present, the
fluorescence of the probe in the UV-reactor (355 nm) which was perceptible to the naked eye
completely disappeared. In a first assumption, sensor 107 seemed to be a suitable sensor for
hydrogen peroxide recognition.
Subsequently time dependent fluorescence quenching studies were performed for this
system. The samples were placed into quartz cells of 1 cm path length. Compound
concentration was adjusted to 3.3 µM (10 µL of a 1 mM solution in 3 ml MeCN) for the
phthalimide, hydrogen peroxide (H2O2) was used as a 25 % aqueous solution. Excitation and
emission slit widths were adjusted to 2.5 nm and the experiment was carried out in two steps:
a. In the first step the fluorophor was treated with the corresponding peroxide (1µL up to
20 µL).
b. Then the mixture (3.3 µM fluorophor + 20 µM of peroxide) was irradiated in the
photoreactor Luzchem LZC-4V (14 lamps, λ = 350 ± 20 nm) for about 180 min, while
every 30 min a fluorescence spectrum was measured.
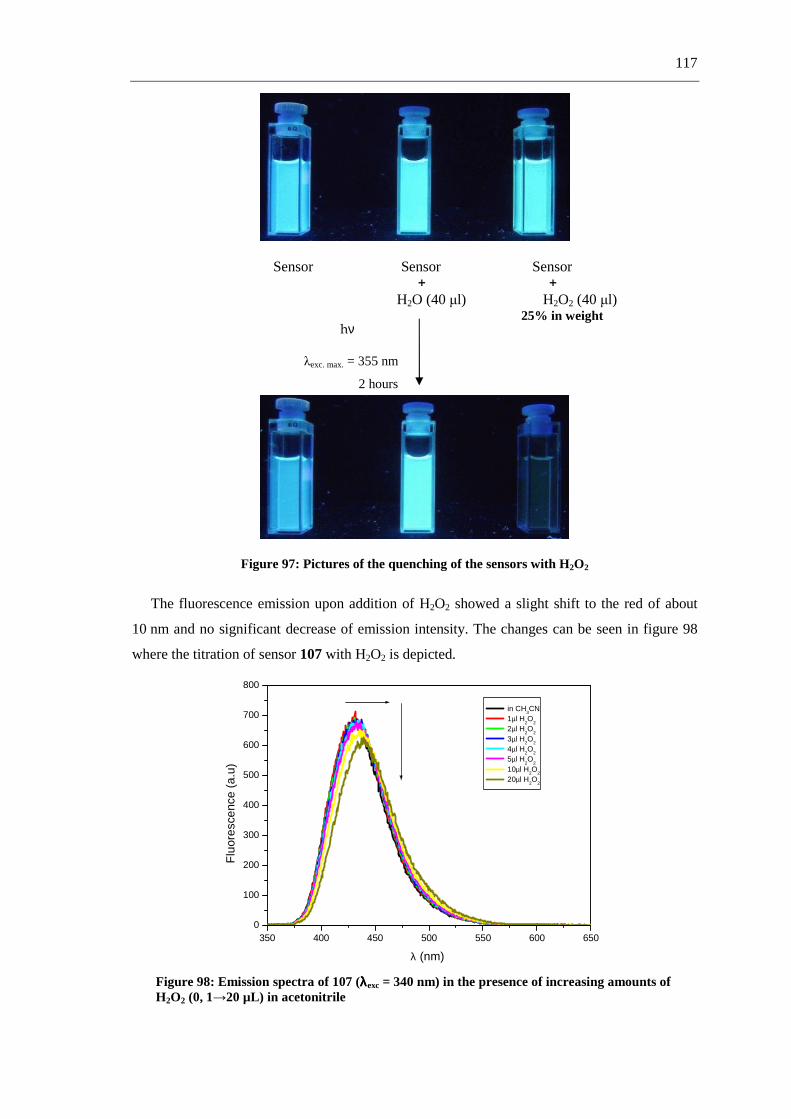
117
Sensor Sensor Sensor + +
H2O (40 µl) H2O2 (40 µl) 25% in weight
Figure 97: Pictures of the quenching of the sensors with H 2O2
The fluorescence emission upon addition of H2O2 showed a slight shift to the red of about
10 nm and no significant decrease of emission intensity. The changes can be seen in figure 98
where the titration of sensor 107 with H2O2 is depicted.
350 400 450 500 550 600 6500
100
200
300
400
500
600
700
800
Flu
ores
cenc
e (a
.u)
λ (nm)
in CH3CN
1µl H2O
2
2µl H2O
2
3µl H2O
2
4µl H2O
2
5µl H2O
2
10µl H2O
2
20µl H2O
2
Figure 98: Emission spectra of 107 (λλλλexc = 340 nm) in the presence of increasing amounts of H2O2 (0, 1→20 µL) in acetonitrile
hν
λexc. max. = 355 nm
2 hours
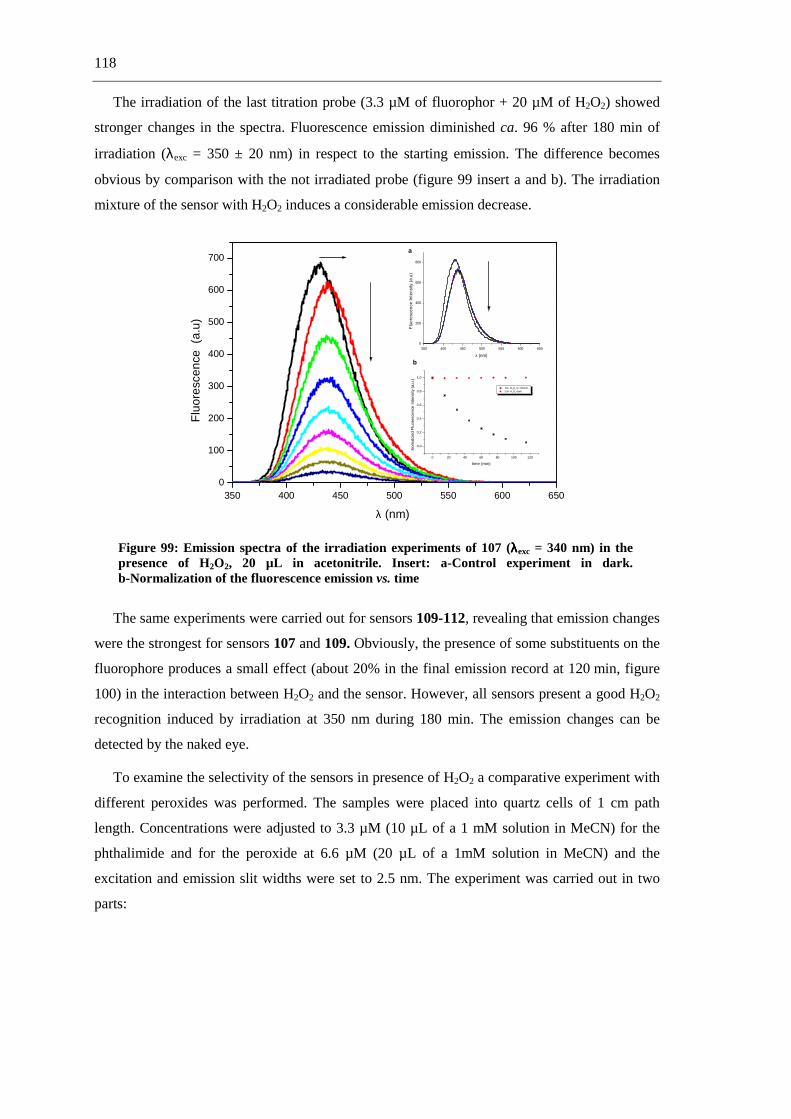
118
The irradiation of the last titration probe (3.3 µM of fluorophor + 20 µM of H2O2) showed
stronger changes in the spectra. Fluorescence emission diminished ca. 96 % after 180 min of
irradiation (λexc = 350 ± 20 nm) in respect to the starting emission. The difference becomes
obvious by comparison with the not irradiated probe (figure 99 insert a and b). The irradiation
mixture of the sensor with H2O2 induces a considerable emission decrease.
350 400 450 500 550 600 6500
100
200
300
400
500
600
700
b
a
0 20 40 60 80 100 120
0,0
0,2
0,4
0,6
0,8
1,0
Nom
aliz
ed F
luor
esce
nce
Inte
nsity
(a.
u.)
time (min)
S3+ H2O
2 hν 350nm
S3+ H2O
2 dark
350 400 450 500 550 600 6500
200
400
600
800
Flu
ores
cenc
e In
tens
ity (
a.u)
λ (nm)
Flu
ores
cenc
e (
a.u)
λ (nm)
Figure 99: Emission spectra of the irradiation experiments of 107 (λλλλexc = 340 nm) in the presence of H2O2, 20 µL in acetonitrile. Insert: a-Control experiment in dark. b-Normalization of the fluorescence emission vs. time
The same experiments were carried out for sensors 109-112, revealing that emission changes
were the strongest for sensors 107 and 109. Obviously, the presence of some substituents on the
fluorophore produces a small effect (about 20% in the final emission record at 120 min, figure
100) in the interaction between H2O2 and the sensor. However, all sensors present a good H2O2
recognition induced by irradiation at 350 nm during 180 min. The emission changes can be
detected by the naked eye.
To examine the selectivity of the sensors in presence of H2O2 a comparative experiment with
different peroxides was performed. The samples were placed into quartz cells of 1 cm path
length. Concentrations were adjusted to 3.3 µM (10 µL of a 1 mM solution in MeCN) for the
phthalimide and for the peroxide at 6.6 µM (20 µL of a 1mM solution in MeCN) and the
excitation and emission slit widths were set to 2.5 nm. The experiment was carried out in two
parts:
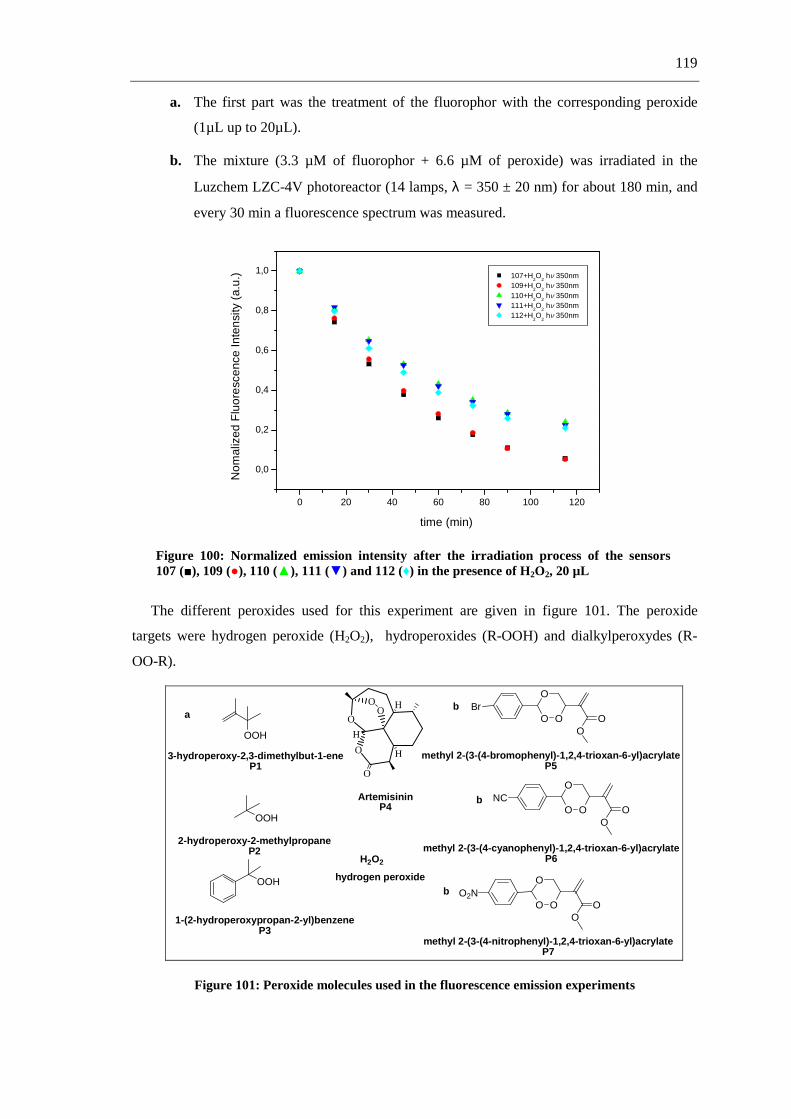
119
a. The first part was the treatment of the fluorophor with the corresponding peroxide
(1µL up to 20µL).
b. The mixture (3.3 µM of fluorophor + 6.6 µM of peroxide) was irradiated in the
Luzchem LZC-4V photoreactor (14 lamps, λ = 350 ± 20 nm) for about 180 min, and
every 30 min a fluorescence spectrum was measured.
0 20 40 60 80 100 120
0,0
0,2
0,4
0,6
0,8
1,0
Nom
aliz
ed F
luor
esce
nce
Inte
nsity
(a.
u.)
time (min)
107+H2O
2 hν 350nm
109+H2O
2 hν 350nm
110+H2O
2 hν 350nm
111+H2O
2 hν 350nm
112+H2O
2 hν 350nm
Figure 100: Normalized emission intensity after the irradiation process of the sensors 107 (■), 109 (●), 110 (▲), 111 (▼) and 112 (♦) in the presence of H2O2, 20 µL
The different peroxides used for this experiment are given in figure 101. The peroxide
targets were hydrogen peroxide (H2O2), hydroperoxides (R-OOH) and dialkylperoxydes (R-
OO-R).
O
O
OO
O
H
H
H
OOH
OOH
OOH
H2O2
3-hydroperoxy-2,3-dimethylbut-1-eneP1
2-hydroperoxy-2-methylpropaneP2
1-(2-hydroperoxypropan-2-yl)benzeneP3
methyl 2-(3-(4-nitrophenyl)-1,2,4-trioxan-6-yl)acrylateP7
methyl 2-(3-(4-bromophenyl)-1,2,4-trioxan-6-yl)acrylateP5
methyl 2-(3-(4-cyanophenyl)-1,2,4-trioxan-6-yl)acrylateP6
NCO O
O
OO
O2NO O
O
OO
BrO O
O
OO
hydrogen peroxide
ArtemisininP4
ab
b
b
Figure 101: Peroxide molecules used in the fluorescence emission experiments

120
These quenching experiments showed results similar to those conducted with H2O2: a slight
red shift of the emission intensity and a weak decrease of the intensity. The most striking
difference is shown in Figure 102, where the efficiency of sensor 107 to recognize H2O2
compared to other peroxides can be observed. However, comparing the selectivity to peroxides
other than H2O2 the sensor shows better recognition for peroxides (R-OO-R) than to
hydroperoxides (R-OOH).
Irradiation of sensor 107 under nitrogen atmosphere resulted in small changes in the
fluorescence emission compared to the experiments carried out under normal atmosphere /
aerobic conditions, which indicates that air oxygen is interacting weakly with the sensor.
In presence of water, changes in the fluorescence emission appear but in a minor proportion
than with the peroxides. This change can not be observed with the naked eye as can be seen in
figure 97.
0 20 40 60 80 100 120 140 160 180 200-0,1
0,0
0,1
0,2
0,3
0,4
0,5
0,6
0,7
0,8
0,9
1,0
(a)
No
rmal
ize
Flu
ores
cenc
e In
tens
ity (
a.u.
)
Time (min)
107+H2O
107+H2O
2
107+P1 107+P2 107+P3 107+P4 107+P5 107+P6 107+P7 107+air 107+N
2
0 20 40 60 80 100 120 140 160 180 200
0,0
0,2
0,4
0,6
0,8
1,0
(b)
Nor
mal
ized
Flu
ores
cen
ce In
tens
ity (
a.u.
)
Time (min)
107+H2O
107+H2O
2
107+P1 107+P2 107+P3 107+P4 107+P5 107+P6 107+P7 107+air 107+N
2
Figure 102: Normalized emission intensity after the irradiation process of sensor 107 with the different peroxides.
The new fluorescence sensors 107 and 109 exhibit a excellent recognition of H2O2: nearly
100 % of the fluorescence emission disappears in the presence of H2O2. Other hydroperoxides
can also be detected but only with moderate efficiency.
After 180 min the detection of H2O2 is perceptible to the naked eye which can be very
advantageous for possible applications.
Until now the mechanism involved in the recognition of H2O2 and other hydroperoxides is
unclear. One possibility is a nucleophilic attack of H2O2 to the phthalimide. H2O2 thus induces
ring-opening of the imide group. Route a in scheme 38 shows the product 113 that could be
obtained by a nucleophilic attack of the NH group to the hydroperoxide. Another possibility
would be route b, where the hydroperoxide attacks the carbonyl group to form a cycle and the
benzylamine leaves the molecule by a rearrangement. Finally as possible products phthalate 115
or a benzodioxinedione 114 could be obtained.

121
N
O
O
RH2O2
hν
R
NH
O
O
OO
H
R
NHO
O
O
R
OO
O
-O NH
RO
O-
O
O-
a b
RO
O
O
Oor
113
114 115
Scheme 38
In order to clarify which reaction is taking place between the sensor and H2O2, 2-benzyliso-
indoline-1,3-dione (117) was synthesized according to GP1. The product was isolated with
83 % yield (scheme 39).
N
O
O
ONH2
O
O
+NEt3
Toluene
45116 117
Scheme 39
1H NMR experiments were performed to elucidate which mechanism is involved in the
interaction between 117 and H2O2. A 1:1 solution of 117 and H2O2 in DMSO-d6 was prepared.
The solution was irradiated at 300 nm in the Luzchem LZC-4V photoreactor (14 lamps,
λ = 300 ± 20 nm) for 180 min and every 30 min a 1H NMR spectrum was recorded. The
resulting 1H NMR spectra after 30, 60 and 180 min of irradiation are shown in figure 103.

122
5 10.5 9.5 8.5 7.5 6.5 5.5 4.5 3.5
1
23
4
56
7
N89
O10
O11
12
1314
15
1617
18
1213-18
1-3,6
H2O2
H2O2
H2O2
0 min
30 min
60 min
180 min
5 10.5 9.5 8.5 7.5 6.5 5.5 4.5 3.5
1
23
4
56
7
N89
O10
O11
12
1314
15
1617
18
1213-18
1-3,6
H2O2
H2O2
H2O2
0 min
30 min
60 min
180 min
Figure 103: 1H NMR spectra of the solution (107 + H2O2) after different intervals of irradiation time
The experiment shows no changes of the proton signals after irradiation of the solution. With
both mechanisms, the CH2 signal as well as the phenyl signals of the benzylamine would
disappear when the reaction is complete. The spectra show only the position changes of the
H2O2 signal but no changes on the aromatic signals.
Considering the previous results another experiment was carried out, this time in a
preparative scale experiment. A 1:1.1 equiv. solution of sensor 107 and H2O2 in acetronitrile
was irradiated in a Rayonet chamber photoreactor PRR-100 (16 x 3500 Å lamps, ca. 400 W;
λ = 350 ± 20 nm) for 90 min, the reaction mixture being cooled with tap water (15 °C). After
evaporating the organic solvent in vacuo the reaction mixture was dissolved in CH2Cl2 and
washed with water. The organic layer was dried over MgSO4 and concentrated in vacuo. After
extraction of the crude product, the recorded NMR spectra showed only the starting material
107. Unfortunately, a possible photoproduct could not be isolated in this case. Therefore, no
information is yet available about the mechanism in the reaction between sensors 107, 109-112
and H2O2.
The fluorescence experiments indicate that the interaction is only possible when the solution
containing a sensor and H2O2 is irradiated. This leads to the assumption that the reaction takes
place from the excited state. Taking into account that phthalimides are versatile electron
acceptors in PET reactions [81] and H2O2 is a strong oxidant (electron donor) the possibility that
a PET process occurs in the excited state is high. However, further experiments are necessary to
understand this process and to propose a valid mechanism.

123
3.11 Synthesis of Chiral Phthalimide-Thiourea-Conjugate
The synthesis of thiourea-phthalimide couples was achieved following the synthetic route
shown in scheme 40. The synthetic route involves five steps. The first is an electrophilic
aromatic substitution on C-4 of the phthalimide ring system through nitration with H2SO4 and
HNO3, which yielded 58 % isolated product. [82]
2-Benzyl-5-nitroisoindoline-1,3-dione (120) was obtained in the second step of this route by
nucleophilic substitution in 47 % yield. [83] In the following reaction, 120 was reduced with
catalytic amounts of Pd/C under H2-atmosphere in EtOH, giving the product 5-amino-2-benzyl-
isoindoline-1,3-dione (121) in 78% yield. [57]
2-Benzyl-5-isothiocyanatoisoindoline-1,3-dione 122 was obtained through a reaction of the
aminophthalimide derivate (121) and thiosphosgene. [84] The thioisocyanate derivate 122 was
isolated in 57% yield. In the last step, a coupling between ((S)-1-phenylethanamine) and 122
and 1-(2-benzyl-1,3-dioxoisoindolin-5-yl)-3-((R)-1-phenylethyl)thiourea (123) in 81% yield is
performed.[32]
NH
O
O
H2SO4 / HNO3NH
O
O
O2NN
O
O
O2N
Br
K2CO3, KIN
O
O
H2NH2,Pd/C
N
O
O
SCN
Cl Cl
S
N
O
O
HN
HN
S
NH2
dioxane, Ar
118 119 120 121
122123
Scheme 40
3.12 Photophysical Properties, Anion Sensing and Chiral
Recognition by Chiral Phthalimide-Thiourea-Conjugates
Absorption spectra were recorded using a Perkin-Elmer Lambda 35 UV/vis spectrometer.
The samples were placed into quartz cells of 1 cm path length and compound concentrations
were adjusted to 3.3 x 10⁻⁵ M in DMSO while the quencher concentrations were adjusted
between 0 and 333.33 x 10⁻⁶ M.
First, the absorption spectrum of sensor 123 was measured in absence of anions in
acetonitrile and shows bands centered at 272 and 350 nm.

124
Then absorption spectra of sensor 123 were determined in different solvents which are
shown in figure 104. The observed bands refer to two electronic transitions, the π, π* transition
at higher energy and the n, π* transition at lower energy.
300 350 4000
5
10
15
20
25
30
35
ε, 1
03 l·m
ol-1
·cm
-1
λ (nm)
DCM
MeCN
DMSO
MeOH
π, π*
n, π*
Figure 104: Absorption spectra of 123 (3.3 x 10⁻⁵ M) in different solvents
Table 24 shows the absorption bands of sensor 123 in different solvents, the π, π* transition
band appears between 270 and 276 nm and the n, π* transition band between 347 and 356 nm.
The calculated absorption coefficient (log ε) corresponds to the n, π* transition. No significant
changes were observed with increasing solvent polarity and a protic solvent like methanol did
not produce changes in the absorption of the sensor.
Table 24: Absorption bands of sensor 123 and log εεεε for the transition n, ππππ* in different solvents
Solvent π, ππ, ππ, ππ, π* (nm) n, ππππ* (nm) Log εεεε of n, ππππ* (nm)a
DCM 274 351 3.87
MeCN 271 347 3.73
DMSO 276 356 3.82
MeOH 270 348 3.88
a A = ε x c x l where A = absorption, ε = absorption coefficient (M-1 cm-1), c = concentration of the sensor (3.3 x 10 -5 M) and l = length of the cell 1cm.
In the next step, anion recognition was studied by absorption spectra. The sensor solution
was titrated with different anions such as F-, Cl-, Br-, I-, AcO- and H2PO4-, each applied as the
corresponding tetrabutylammonium salt (TBA+) in acetronitrile.
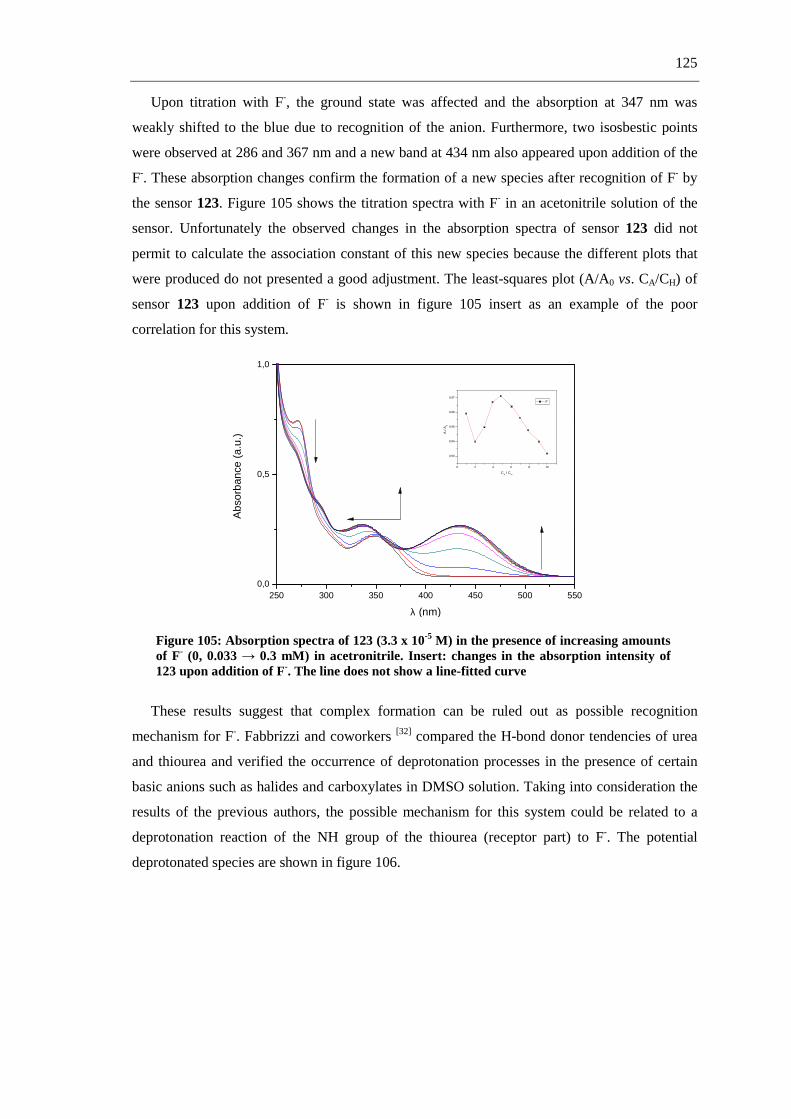
125
Upon titration with F-, the ground state was affected and the absorption at 347 nm was
weakly shifted to the blue due to recognition of the anion. Furthermore, two isosbestic points
were observed at 286 and 367 nm and a new band at 434 nm also appeared upon addition of the
F-. These absorption changes confirm the formation of a new species after recognition of F- by
the sensor 123. Figure 105 shows the titration spectra with F- in an acetonitrile solution of the
sensor. Unfortunately the observed changes in the absorption spectra of sensor 123 did not
permit to calculate the association constant of this new species because the different plots that
were produced do not presented a good adjustment. The least-squares plot (A/A0 vs. CA/CH) of
sensor 123 upon addition of F- is shown in figure 105 insert as an example of the poor
correlation for this system.
250 300 350 400 450 500 5500,0
0,5
1,0
0 2 4 6 8 10
0,93
0,94
0,95
0,96
0,97
A /
A0
CA / C
H
F-
Abs
orba
nce
(a.u
.)
λ (nm)
Figure 105: Absorption spectra of 123 (3.3 x 10⁻⁵ M) in the presence of increasing amounts of F- (0, 0.033 → 0.3 mM) in acetronitrile. Insert: changes in the absorption intensity of 123 upon addition of F-. The line does not show a line-fitted curve
These results suggest that complex formation can be ruled out as possible recognition
mechanism for F-. Fabbrizzi and coworkers [32] compared the H-bond donor tendencies of urea
and thiourea and verified the occurrence of deprotonation processes in the presence of certain
basic anions such as halides and carboxylates in DMSO solution. Taking into consideration the
results of the previous authors, the possible mechanism for this system could be related to a
deprotonation reaction of the NH group of the thiourea (receptor part) to F-. The potential
deprotonated species are shown in figure 106.

126
N
O
O
NN
S
H
N
O
O
NN
S
H
N
O
O
NN
S
H H
F-
123
124a 124b
Figure 106
To confirm the deprotonation process of 123 1H NMR titration experiments were performed
in DMSO-d6 as described above. The thiourea protons appeared at 8.36 (H2) and 9.35(H1) ppm
(figure 107). In presence of increasing equivalents of F-, the H1 signal disappeared and the H2
signal was gradually shifted highfield and progressively disappeared.
The deprotonation of H1 produced changes on the three proton signals Ha, Hb and Hc. The
formation of a negative charge generated an electrostatic effect, which led to a highfield shift of
the three aromatic proton signals. After addition of 3 equiv. of F- a strong deprotonation
tendency of H1was produced, although deprotonation of the H2 could not be observed. A
rationale could be bond-lengthening of the N-H2-bond that is responsible for this upfield shift.
.5 9.5 8.5 7.5 6.5 5.5 4.5
H1
N
O
O
HN
HN
S
Ha
Hb
Hc
2 1Hd
0 eq.
1 eq.
2 eq.
3 eq.
Ha
Hb
Hc
H2 Hd
.5 9.5 8.5 7.5 6.5 5.5 4.5
H1
N
O
O
HN
HN
S
Ha
Hb
Hc
2 1Hd
0 eq.
1 eq.
2 eq.
3 eq.
Ha
Hb
Hc
H2 Hd
Figure 107: Changes in 1H NMR (300MHz) spectra of 123 in DMSO-d6 upon addition of F-

127
Other anions such as AcO- and H2PO4- were also recognized. The absorption spectra of
sensor 123 show an isosbestic point at 353 nm on increasing concentration of AcO- and the band
at 347 nm is weakly shifted to the red for about 19 nm. Figure 108 shows the absorption spectra
of this titration.
The absorption shift indicates that the ground state of sensor 123 is affected i.e. these
changes in the absorption spectra can be the consequence of a complex formation or
deprotonation process of the thiourea protons.
In this case it was possible to calculate the association constant by a non-linear least-squares
method (eq. 8), the insert in figure 108 shows the corresponding plot.
300 400 5000,0
0,2
0,4
0,6
0,8
0 2 4 6 8 100,93
0,94
0,95
0,96
0,97
0,98
A /
A0
CA / C
H
Abs
orba
ncce
(a.
u.)
λ (nm)
Figure 108: Absorption spectra of 123 (3.3 x 10⁻⁵ M) in the presence of increasing amounts of AcO-- (0, 0.033 → 0.3 mM) in acetronitrile. Insert: changes in the absorption intensity of 123 upon addition of AcO-. The line shows a fitted curve
250 300 350 400 450 500 5500,0
0,5
1,0
0 2 4 6 8 100,945
0,950
0,955
0,960
0,965
0,970
0,975
0,980
0,985
0,990
A/A
0
CA / C
H
Abs
orba
nce
(a.u
.)
λ (nm)
Figure 109: Absorption spectra of 123 (3.3 x 10⁻⁵ M) in the presence of increasing amounts of H2PO4
- (0, 0.033 → 0.3 mM) in acetronitrile. Insert: changes in the absorption intensity of 123 upon addition of H2PO4
-. The line show a line-fitted curve
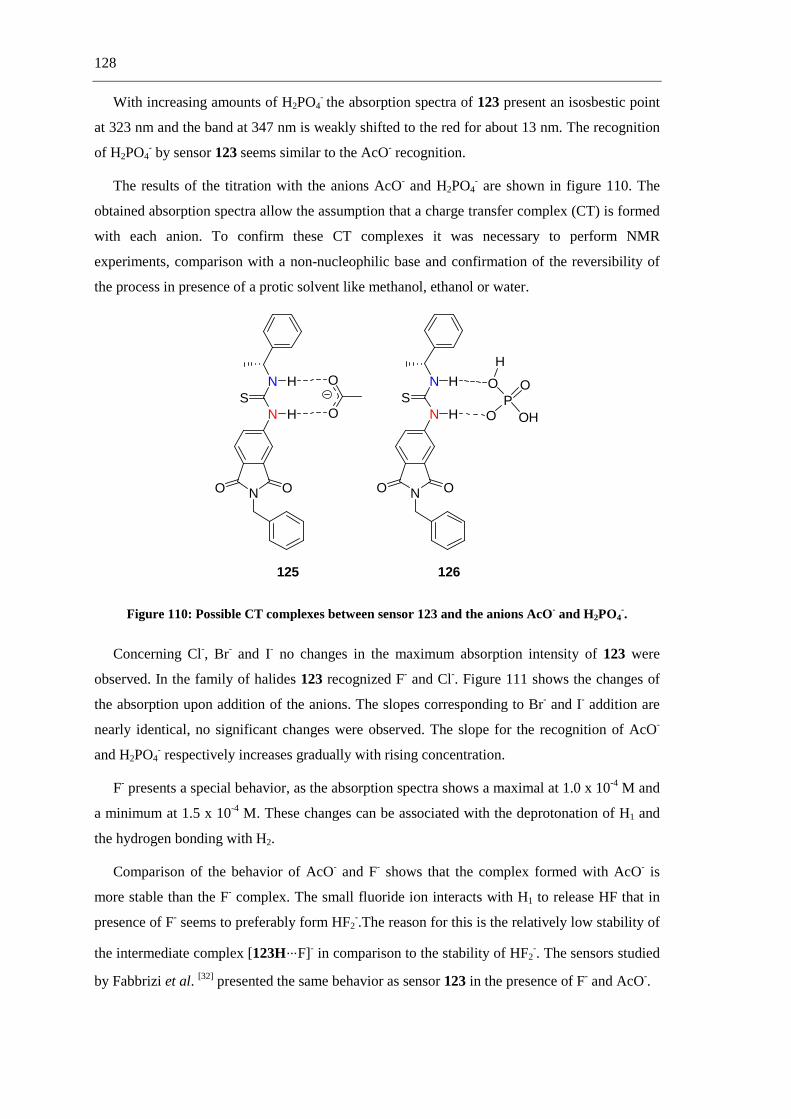
128
With increasing amounts of H2PO4- the absorption spectra of 123 present an isosbestic point
at 323 nm and the band at 347 nm is weakly shifted to the red for about 13 nm. The recognition
of H2PO4- by sensor 123 seems similar to the AcO- recognition.
The results of the titration with the anions AcO- and H2PO4- are shown in figure 110. The
obtained absorption spectra allow the assumption that a charge transfer complex (CT) is formed
with each anion. To confirm these CT complexes it was necessary to perform NMR
experiments, comparison with a non-nucleophilic base and confirmation of the reversibility of
the process in presence of a protic solvent like methanol, ethanol or water.
N OO
N
NS
H
H
O
O
N OO
N
NS
H
HP
O
O OH
O
H
125 126
Figure 110: Possible CT complexes between sensor 123 and the anions AcO- and H2PO4-.
Concerning Cl-, Br- and I- no changes in the maximum absorption intensity of 123 were
observed. In the family of halides 123 recognized F- and Cl-. Figure 111 shows the changes of
the absorption upon addition of the anions. The slopes corresponding to Br- and I- addition are
nearly identical, no significant changes were observed. The slope for the recognition of AcO-
and H2PO4- respectively increases gradually with rising concentration.
F- presents a special behavior, as the absorption spectra shows a maximal at 1.0 x 10⁻⁴ M and
a minimum at 1.5 x 10⁻⁴ M. These changes can be associated with the deprotonation of H1 and
the hydrogen bonding with H2.
Comparison of the behavior of AcO- and F- shows that the complex formed with AcO- is
more stable than the F- complex. The small fluoride ion interacts with H1 to release HF that in
presence of F- seems to preferably form HF2-.The reason for this is the relatively low stability of
the intermediate complex [123H⋯F]- in comparison to the stability of HF2-. The sensors studied
by Fabbrizi et al. [32] presented the same behavior as sensor 123 in the presence of F- and AcO-.

129
-5,0x10⁻⁵ 0,0 5,0x10⁻⁵ 1,0x10⁻⁴ 1,5x10⁻⁴ 2,0x10⁻⁴ 2,5x10⁻⁴ 3,0x10⁻⁴ 3,5x10⁻⁴
0,93
0,94
0,95
0,96
0,97
0,98
0,99
1,00
1,01
Rel
. abs
orba
nce
at 3
50 n
m
Guest Concentration (M)
AcO-
F-
H2PO
4
-
Cl-
Br-
I-
Figure 111: Changes in the absorption of 123 at 350 nm upon titration of F -, Cl-, Br-, I-, AcO- and H2PO4
-
Motivated by the formerly described successful experiments with sensor 107-112 chiral
recognition experiments were also carried out. The absorption spectra of sensor 123 in the
presence of D- and L-lactate did not show significant changes. Figure 112 shows the absorption
spectra of 123 in the presence of L-lactate. Only a weak increase of the absorption band at
373 nm was observed. This can be interpreted again as complex formation in the ground state.
A similar behavior was observed for D-lactate.
250 300 350 400 450 500 5500,0
0,5
1,0
Abs
orba
nce
(a.u
.)
λ (nm)
Figure 112: Absorption spectra of 123 (3.3 x 10⁻⁵ M) in the presence of increasing amounts of L-lactate (0, 0.033 → 0.3 mM) in acetonitrile
Figure 113 shows the plot of the absorption changes of 123 in the presence of D- and L-
lactate. The difference between both anions can be observed in the plot towards lower
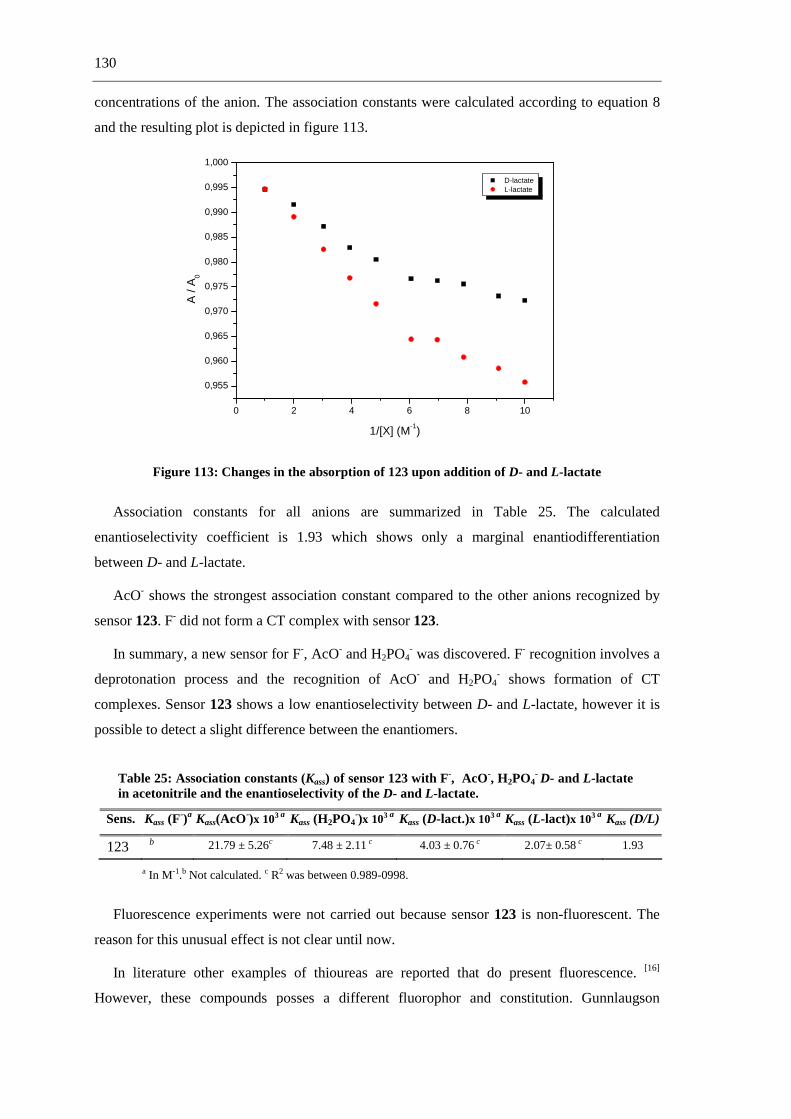
130
concentrations of the anion. The association constants were calculated according to equation 8
and the resulting plot is depicted in figure 113.
0 2 4 6 8 10
0,955
0,960
0,965
0,970
0,975
0,980
0,985
0,990
0,995
1,000
A /
A0
1/[X] (M-1)
D-lactate L-lactate
Figure 113: Changes in the absorption of 123 upon addition of D- and L-lactate
Association constants for all anions are summarized in Table 25. The calculated
enantioselectivity coefficient is 1.93 which shows only a marginal enantiodifferentiation
between D- and L-lactate.
AcO- shows the strongest association constant compared to the other anions recognized by
sensor 123. F- did not form a CT complex with sensor 123.
In summary, a new sensor for F-, AcO- and H2PO4- was discovered. F- recognition involves a
deprotonation process and the recognition of AcO- and H2PO4- shows formation of CT
complexes. Sensor 123 shows a low enantioselectivity between D- and L-lactate, however it is
possible to detect a slight difference between the enantiomers.
Table 25: Association constants (Kass) of sensor 123 with F-, AcO-, H2PO4- D- and L-lactate
in acetonitrile and the enantioselectivity of the D- and L-lactate.
Sens. Kass (F-)a Kass(AcO-)x 103 a Kass (H2PO4
-)x 103 a Kass (D-lact.)x 103 a Kass (L-lact)x 103 a Kass (D/L)
123 b 21.79 ± 5.26c 7.48 ± 2.11 c 4.03 ± 0.76 c 2.07± 0.58 c 1.93
a In M-1.b Not calculated. c R2 was between 0.989-0998.
Fluorescence experiments were not carried out because sensor 123 is non-fluorescent. The
reason for this unusual effect is not clear until now.
In literature other examples of thioureas are reported that do present fluorescence. [16]
However, these compounds posses a different fluorophor and constitution. Gunnlaugson

131
presents sensors that are constructed with a fluorophore-spacer-receptor structure, whereas
sensor 123 is constructed in the form fluorophore-receptor. Due to the acidity of the NH
protons very likely a non-fluorescent anion is generated (figure 114). To confirm this
assumption pH experiments were performed but no increase in fluorescence was observed.
N
O
O
NN
S
H
N
O
O
NN
S
H
127a 127b
Figure 114: Possible non-fluorescent structure of sensor 123
The NH protons play an important role in the operating mode of the sensor, but as pH
experiments elucidated anion formation is not the only reason why the sensor does not show
fluorescence. Thus another internal process has to be involved in the deactivation of the
fluorescence which has to remain under investigation.
In summary, the thiourea showed a different behavior than the urea concerning recognition
of the examined anions. The acidity of the NH protons gives rise to of the different interactions
between sensor and anions. The recognition of these anions through hydrogen bonding and
deprotonation was observed by absorption spectra and 1H NMR. The sensor showed efficient
recognition of AcO- though hydrogen bonding and for F- the recognition occurs due to
deprotonation of the receptor. In comparison with the urea receptor of the previous sensors the
enantioselectivity of this thiourea receptor was moderate. The enantioselectivity of the urea
receptors is ca. 50% higher compared with the thiourea moiety.
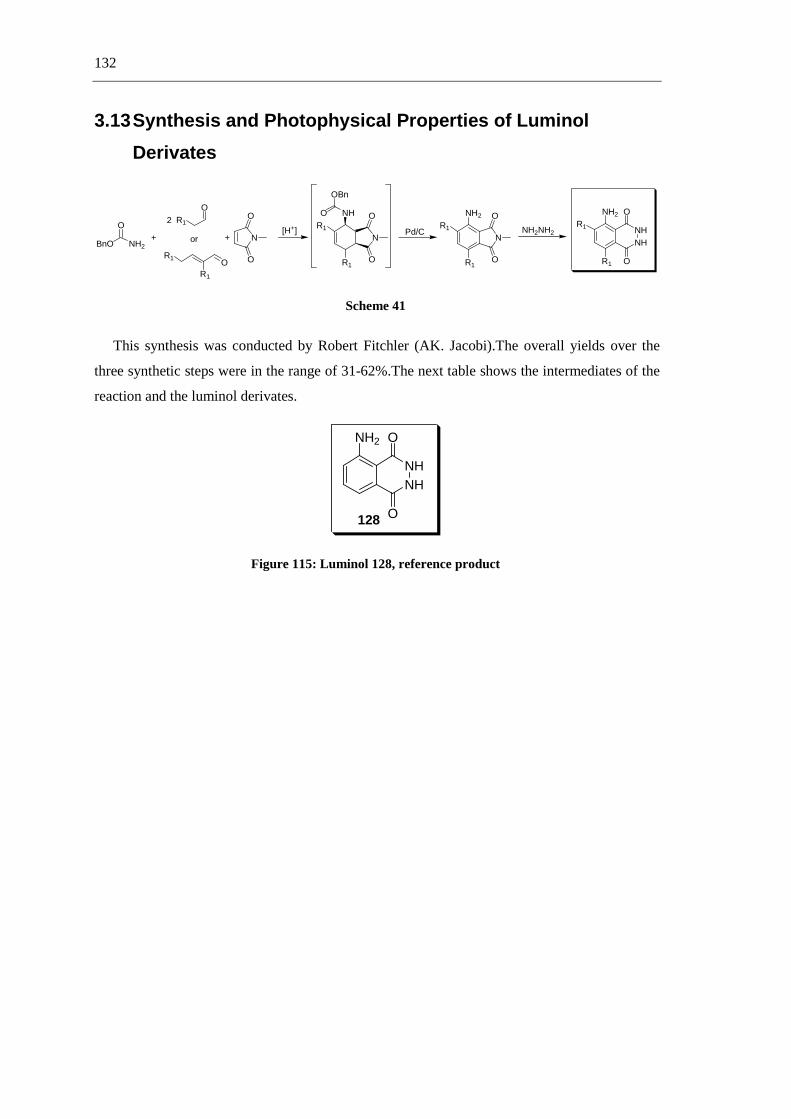
132
3.13 Synthesis and Photophysical Properties of Luminol
Derivates
BnO NH2
O+
R1
O
R1O
R1
or
2
+ N
O
O
[H+]N
O
O
NH
OBn
O
R1
R1 Pd/CN
NH2
R1
R1
O
O
NHNH
R1
NH2
R1
O
O
NH2NH2
Scheme 41
This synthesis was conducted by Robert Fitchler (AK. Jacobi).The overall yields over the
three synthetic steps were in the range of 31-62%.The next table shows the intermediates of the
reaction and the luminol derivates.
NHNH
NH2 O
O128
Figure 115: Luminol 128, reference product

133
Table 26 : Aldehydes were used by the MCRs, MCR-Adducts, oxidation products (Anilines) and the luminol derivates.
Entry Aldehyde MCR-Adducts
Gruppe a
Anilines
Gruppe b
Luminol
Gruppe c
129 O
N
O
O
NH
OBn
O
N
NH2 O
O
NHNH
NH2 O
O
130 O
N
O
O
NH
OBn
O
N
NH2 O
O
NHNH
NH2 O
O
131 O
i-Pr N
O
O
NH
OBn
O
i-Pr
i-Pr
N
NH2
i-Pr
i-Pr
O
O
NHNH
i-PrNH2
i-Pr
O
O
132 O
Bn N
O
O
NH
OBn
O
Bn
Bn
N
NH2
Bn
Bn
O
O
NHNH
BnNH2
Bn
O
O
133
S
O
N OO
S
HN
OBnO
N OO
S
H2N
S
H2N
NHHNOO
134 O
N
O
O
NH
OBn
O
N
NH2 O
O
NHNH
NH2 O
O
135 O
N
O
O
NH
OBn
O
N
NH2 O
O
NHNH
NH2 O
O

134
3.13.1 Photophysical data and spectroscopic properties
Photophysical data of luminol were determined in DMSO in literature studies. [85],[86] The
parent luminol was used as reference system for all studies of photophysical properties of
luminol derivates. The photophysical measurements of luminol derivates were performed in
DMSO to compare the spectroscopic data with luminol. The absorption spectra of derivates
129-132, 134 and 135 in DMSO exhibited two distinct bands which were comparable to the
reference compound 128, whereas three red-shifted maximum were found for compound 133.
The excitation and absorption spectra of the luminol derivates showed the same position of
the maximum. The band in the 355-380 nm region was in all cases stronger than the 295-
320 nm band. The presence of these two bands in the absorption as well as excitation spectra
indicate the presence of two distinct electronically excited states S1 and S2. The excited luminol
derivates relax from the S2 (π, π*)-state to the S1 (π, π*)-state. The NH2 group in luminol and the
derivates may be a possible site of interaction with an electron donating polar aprotic solvent
such as DMSO.[85] This interaction between the NH2 group and DMSO could be generate a
complex through hydrogen bonding in the excited state S1 (π, π*) and its emission is associated
with the minor energy absorption band.
300 350 400 4500,0
0,1
0,2
0,3
Abs
orba
nce
(a.u
.)
λ (nm)
128 129 130 131 132 133 134 135
Figure 116: Absorption spectra of 128-135 in DMSO (c = 2.5 x 10⁻⁶ M)
133 compound showed three absorption and excitation bands, all slightly red-shifted in
comparision to 128. Benzothiophene is an excellent additional electron-donating group and
might stabilize an internal charge transfer state additionally to the two local excited singlet
states. Table 27 summarizes the relevant spectral data that were collected for the luminol
derivates 129-135.

135
Table 27: Spectroscopic properties and photophysical properties of luminol derivates (125-131).
Luminol λλλλmaxAbs a ε ε ε ε b λλλλmax
Em a Stokes c Es d ΦΦΦΦF
e ττττS f 108 Ks
g 128 297
358 7768 7508
405
3241 75 0.15 1.8 0.8
129 302 367
8972 9676
425
3718 72 0.23 2.0 1.1
130 305 368
5872 7752
429
3863 72 0.21 2.0 1.0
131 304 370
6232 8196
430
3771 72 0.31 2.0 1.5
132 305 372
9320 10016
430
3625 72 0.48 2.2 2.1
133 333 380 398
9048 9852 10152
418 435
2392 70 0.21 0.9 2.3
134 297 358
8176 8304
401
2995 75 0.40 2.8 1.4
135 297 357
6156 7916
408
3501 75 0.34 1.8 1.8
a In nm, concentration of 2.5 x 10⁻⁵ M. b Concentration of 2.5 x 10⁻⁵ M. c In nm, concentration of 2.5 x 10⁻⁶ M. d in cm-1. e Fluorescence quantum yield (ref to luminol ΦF = 0.15). f In ns. g Fluorescence rate constant (KF = ΦF / τS)
h All measurement was performed in DMSO.
The emission spectra of the luminol derivates 128-132, 134-135 showed broad bands in the
region between 405-430 nm (table 27). For compound 133 two fluorescent separated bands at
418 and 435 nm were observed.
Addition of one methyl group in the donor-acceptor system of the parent luminol 128 did not
significantly alter the fluorescence properties (134-135). Although the para orientation of
methyl substituents and one carbonyl moiety is likely to exert electronic communication across
the arene, steric effects appear to be more dominant. The introduction of 6,8-disubstitution in
129, 130, 131 and 132 as well as anellation with benzothiophene (133) prompoted moderated
red-shift of the emission band (∆λem = 20-25 nm) in comparison with 128. This red-shift can be
a direct consequence of the electron-donor abilities of the substituents and may be include the
formation of an ICT state after local excitation to S1.
Steric effect placing two substituents in relative ortho positions to the amino and carbonyl
groups of the parent luminol derivates could produced directly a effect the stability of the
excited state geometries and thus influence the energy and lifetime of the corresponding excited
state. Moderate Stokes shifts (≥ 3000 cm-1) were determined for all compounds except the 133
(table 27).
The excited singlet state energies were calculated from the intersection of excitation and
emissions bands and exhibited no significant dependence on the substitution pattern (table 27).
In contrast to the excited state energies, the fluorescence quantum yields showed significant
changes in comparison to luminol 128. The derivate 132 showed a threefold increased

136
fluorescence quantum yield (0.48 vs. 0.15 for 128). The singlet lifetimes of compounds 128-135
are summarized in table 27, in all cases their decay traces predominantly exhibit exponential
behavior (R2 = 0.9997, figure 117). As expected from the significantly lower Stokes shifts of
compound 133, also the singlet state lifetime was decreased. This is in accord with the largest
fluorescence rate constant for 133 in the investigated series.
0 3 6 9 12 150,0
0,2
0,4
0,6
0,8
1,0
129 130 131 132 133 134 135
Nor
mal
ised
Inte
nsity
(a.
u.)
τ (ns)
Figure 117: Normalized fluorescence decays (λλλλexc = 355 nm) of luminol derivates 129-135 in DMSO under aerobic conditions. All concentrations 1.3 x 10⁻³ M
3.13.2 pH-Dependence on absorption and steady-state
fluorescence of 129-135
A recent spectrophotometric study of luminol 128 under different solvent conditions such as
DMSO, DMSO-water showed pH dependence of its absorption and fluorescence properties. [86]
In order to investigate the photophysical properties of the new luminol derivates under these
conditions, their behavior was investigated at different pH buffer-solution conditions.
The absorption as well as the steady-state fluorescence measurements of compounds 128-
135 were performed in water at different pH (commercial buffer solutions at pH 3, 7 and 12),
the data are summarized in table 28.
Two absorption maxima were found in all cases except for derivate 132 at pH 3 and 7 and
for 133 at pH 3 due to partial insolubility. As depicted in figure 118 for the diethyl-substituted
compound 130, the low energy transition is slightly bathochromic when going from low to high
pH-values with a moderate increase in extinction coefficients. More pronounced effects
appeared for high energy transition that is subsequently shifted hypso-and hyperchromic.

137
Table 28: Spestroscopic data in aqueous buffer solutions at different pH.
pH = 3 pH = 7 pH = 12
aλmax
Abs bλmax
Em c∆ a
λmaxAbs b
λmaxEm c
∆ aλmax
Abs
128 294, 351 430 5234 301, 351 - - 301, 351
129 301, 360 443 5240 309, 356 443 5516 312, 354
130 303, 360 446 5356 311, 357 446 5589 316, 357
131 304, 362 450 5402 313, 359 450 5632 317, 357
132 - - - - - - 317, 362
133 - - - 322, 337, 381 437, 492 3294 5852 322, 337, 381
134 296, 350 428 5206 303, 347 427 5399 303, 347
135 294, 351 431 5288 304, 349 429 5343 305, 349
a. In nm, concentration 1.5 x 10⁻⁴. b In nm, concentration 2.5 x 10⁻⁶ M, λexc = 350 nm, for 133 λexc = 380 nm. c Stokes shift in cm-1.
300 350 400 4500,0
0,2
0,4
0,6
0,8
1,0
Abs
orb
ance
(a
.u.)
λ (nm)
Figure 118: Normalized absorption spectra of 130 in H2O/DMSO 9:1 at pH 3 (−−−−), pH 7(−−−−))))
and pH 12 (−−−−);););); c = 1.3 x 10⁻³ M
Taking into account the high acidity of the phthalhydrazine group (pKa 12.7 in DMSO [87],
compared with the pKa of acetic acid in DMSO 12), it can be safely assumed that at high pH the
phthalhydrazine group is doubly deprotonated and fully protonated at pH 3, which is not the
case for the aniline-type group at C5. The more pronounced changes in absorption behavior at
shorter wavelength can thus be correlated with the phthalhydrazide part of the molecule and its
S2 electronic excitation. These effects were also detected (with different magnitudes but

138
identical tendencies) for the luminol derivates 128, 129, 131 and 132 as well as for the
monoalkylated compounds 134 and 135, respectively. As expected, strong fluorescence was
observed at pH 3 for all derivatives whereas their intensities decreased to 50% at pH 7 under the
same conditions. In line with the literature results, [86] no emission was detected for any luminol
derivative at pH 12 and this observation is in agreement with the formation of the
phthalhydrazide dianion species which could delocalize the negative charges and consequently
quench the fluorescence by ICT (scheme 42). Finally, the increase in Stokes shift at higher pH
can be interpreted as an increased charge shift stabilization of the excited state relative to the
ground state.
NHNH
NH3 O
O
R H
pH
NH2 O
O
R
- H
pH
NNH
fluorescent fluorescent non-fluorescent
NN
NH2 O
O
R
Scheme 42: pH-dependent fluorescence of luminol derivates
3.13.3 Chemoluminescence (CL)
The CL resulting from the reaction of 128 with an oxidant (H2O2 in particular) in strong
alkaline medium has been extensively studied and applied to determination of several inorganic
and organic species. Luminol 128 CL promotion has been used as a superior tool of metal ion
determination where at least 20 metal ions increase the rate of CL for this reaction. In this
context, many previous studies of 128 CL have usually employed different conditions
concerning the oxidant and the catalyst. [88]
The CL effect dependence on the ring substitution of the luminol derivatives 129-135 was
investigated under the same conditions (i.e., same catalyst/oxidant system such as
Fe+3/H2O2) [89]. Aside from that, luminescence intensities were recorded with a fluorescence
plate reader which allowed to obtain fast information in situ about: i) the suitable amount of
catalyst/oxidant system equivalents which might be added; ii) rapid comparison study of the CL
process between compounds belonging to the same family under the same conditions, iii) to
estimate relative CL quantum yields.
Hence, solutions of luminol derivatives 128-135 (7.5 µM) in alkaline medium (pH 12) were
placed in a plate reader in combination with increasing amounts of Fe+3/H2O2 (5%). Figure 119
shows an illustration of the plate reader where 2 mL solution of combined luminol derivatives

139
and catalyst/oxidant was used. After a fast luminescence measurement, detailed values were
obtained which represented the emitted photons due to the CL process. According to these data,
luminescence enhancement reached a maximum when 40 equivalents of catalyst/oxidant system
were added in all cases.
Fe+3 / H2O2 (5%) (eq)
0 10 20 30 40 50
Fe+3 / H2O2 (5%) (eq)
0 10 20 30 40 50
128
129
130
131
132
133
134
135
128
129
130
131
132
133
134
135
Figure 119: Picture of the fluorescence plate reader combining the luminol derivatives together with increasing equivalents of Fe+3 (25 mg/ml)/H2O2 (5%). Numbers represent the emitted luminescence photons by corresponding solutions (2 ml per well)
Once the methodology including suitable conditions concerning the addition of
catalyst/oxidant equivalents was available, the next step was to make comparison studies of the
CL process with the parent 128. Thus, data treatment by plotting the luminescence enhancement
vs. the corresponding derivative was carried out (figure 120). Interestingly, derivatives 129-135
presented an immense increase in the emission of the CL whereas 133-135 showed even less
intensity in the process than 128.

140
Figure 120: Luminescence enhancement of luminol derivatives (7.5 µM) in addition of 40 equivalents of Fe+3(25 mg/ml)/H2O2 (5%)
0 50 100 150
0,2
0,4
0,6
0,8
1,0
Rel
ativ
e Lu
min
esce
nce
Inte
nsity
(R
LU)
time (sec)
128 129 130 131 132 133 134 135
Figure 121: Variation of the relative luminescence intensities with time of derivatives 128-135
It is well-assumed that oxidation of 128-135 led to the formation of the corresponding
carboxylates excited singlet state that was the responsible of the light emission.[90]
The absolute CL efficiency depends on three important factors: i) fraction of molecules that
follow the correct chemical path to give the critical intermediates; ii) fraction of molecules that
cross over to the excited state of the product and iii) fluorescence quantum yield of the emitters.
With this method the absolute CL efficiencies could not be obtained because of technical
restrictions as well as missing relative data. Relative CL quantum yields (ФCLRel) could be
estimated by eq 9 since 128-135 luminescence intensities were found to be dependent on the
time (figure 121).
ФCLRel = (d0/dsample) (I sample/ I 0) ФCL
0 (17)
0,00E+00
1,00E+06
2,00E+06
3,00E+06
4,00E+06
5,00E+06
6,00E+06
1 2 3 4 5 6 7 8
Luminol DerivativeE
mit
ted
Lu
min
esce
nce
Ph
oto
ns
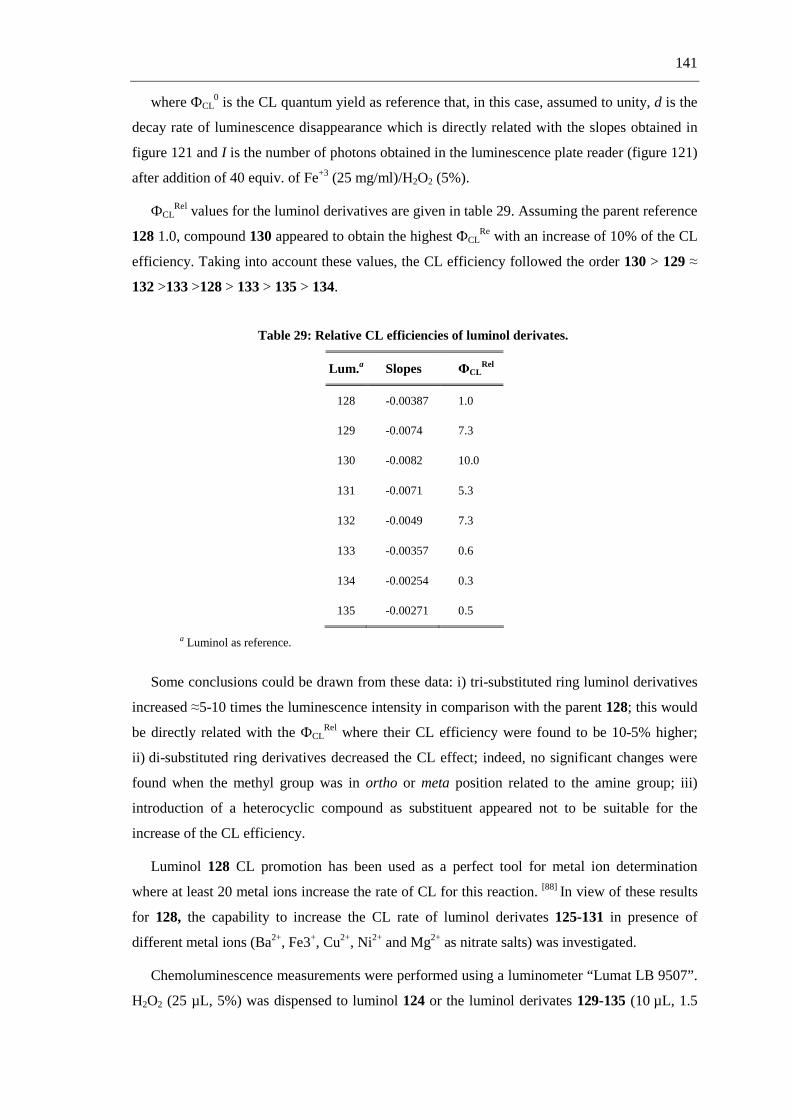
141
where ФCL0 is the CL quantum yield as reference that, in this case, assumed to unity, d is the
decay rate of luminescence disappearance which is directly related with the slopes obtained in
figure 121 and I is the number of photons obtained in the luminescence plate reader (figure 121)
after addition of 40 equiv. of Fe+3 (25 mg/ml)/H2O2 (5%).
ФCLRel values for the luminol derivatives are given in table 29. Assuming the parent reference
128 1.0, compound 130 appeared to obtain the highest ФCLRe with an increase of 10% of the CL
efficiency. Taking into account these values, the CL efficiency followed the order 130 > 129 ≈
132 >133 >128 > 133 > 135 > 134.
Table 29: Relative CL efficiencies of luminol derivates.
Lum.a Slopes ФCLRel
128 -0.00387 1.0
129 -0.0074 7.3
130 -0.0082 10.0
131 -0.0071 5.3
132 -0.0049 7.3
133 -0.00357 0.6
134 -0.00254 0.3
135 -0.00271 0.5
a Luminol as reference.
Some conclusions could be drawn from these data: i) tri-substituted ring luminol derivatives
increased ≈5-10 times the luminescence intensity in comparison with the parent 128; this would
be directly related with the ФCLRel where their CL efficiency were found to be 10-5% higher;
ii) di-substituted ring derivatives decreased the CL effect; indeed, no significant changes were
found when the methyl group was in ortho or meta position related to the amine group; iii)
introduction of a heterocyclic compound as substituent appeared not to be suitable for the
increase of the CL efficiency.
Luminol 128 CL promotion has been used as a perfect tool for metal ion determination
where at least 20 metal ions increase the rate of CL for this reaction. [88] In view of these results
for 128, the capability to increase the CL rate of luminol derivates 125-131 in presence of
different metal ions (Ba2+, Fe3+, Cu2+, Ni2+ and Mg2+ as nitrate salts) was investigated.
Chemoluminescence measurements were performed using a luminometer “Lumat LB 9507”.
H2O2 (25 µL, 5%) was dispensed to luminol 124 or the luminol derivates 129-135 (10 µL, 1.5
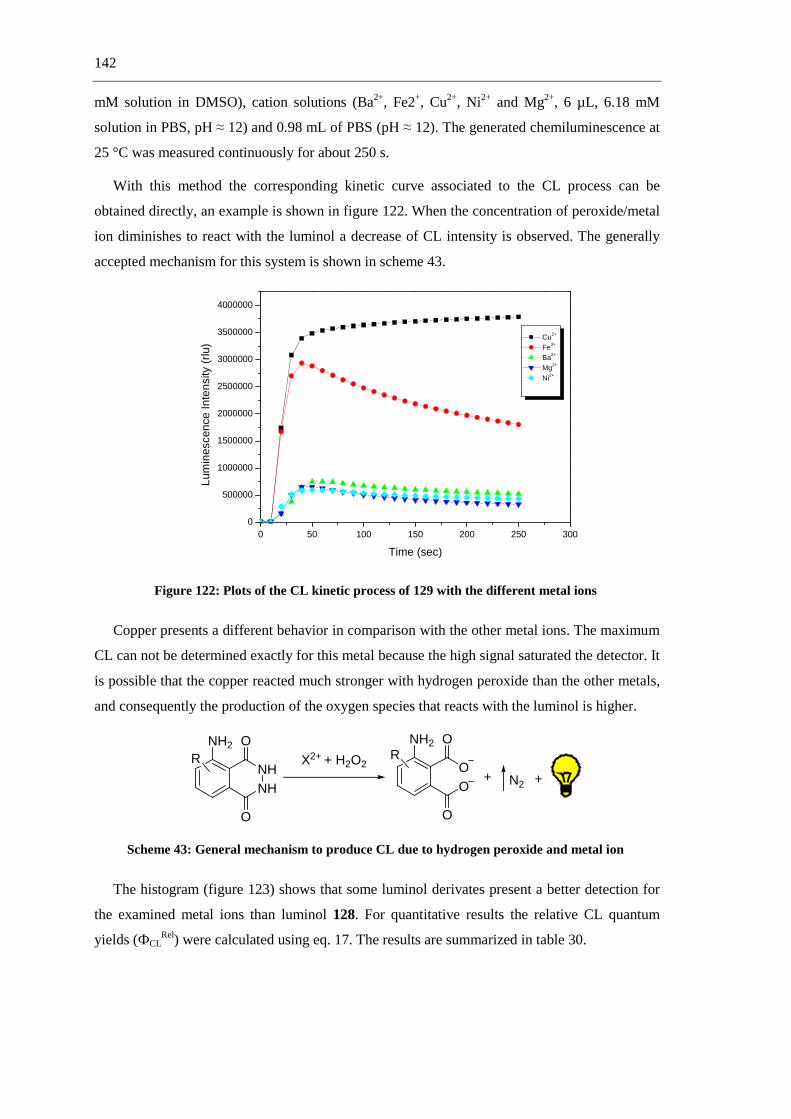
142
mM solution in DMSO), cation solutions (Ba2+, Fe2+, Cu2+, Ni2+ and Mg2+, 6 µL, 6.18 mM
solution in PBS, pH ≈ 12) and 0.98 mL of PBS (pH ≈ 12). The generated chemiluminescence at
25 °C was measured continuously for about 250 s.
With this method the corresponding kinetic curve associated to the CL process can be
obtained directly, an example is shown in figure 122. When the concentration of peroxide/metal
ion diminishes to react with the luminol a decrease of CL intensity is observed. The generally
accepted mechanism for this system is shown in scheme 43.
0 50 100 150 200 250 3000
500000
1000000
1500000
2000000
2500000
3000000
3500000
4000000
Lum
ines
cenc
e In
tens
ity (
rlu)
Time (sec)
Cu2+
Fe3+
Ba2+
Mg2+
Ni2+
Figure 122: Plots of the CL kinetic process of 129 with the different metal ions
Copper presents a different behavior in comparison with the other metal ions. The maximum
CL can not be determined exactly for this metal because the high signal saturated the detector. It
is possible that the copper reacted much stronger with hydrogen peroxide than the other metals,
and consequently the production of the oxygen species that reacts with the luminol is higher.
+ N2NHNH
NH2 O
O
OO
NH2 O
O
+X2+ + H2O2R R
Scheme 43: General mechanism to produce CL due to hydrogen peroxide and metal ion
The histogram (figure 123) shows that some luminol derivates present a better detection for
the examined metal ions than luminol 128. For quantitative results the relative CL quantum
yields (ФCLRel) were calculated using eq. 17. The results are summarized in table 30.

143
Copper
Iron
Barium
Magnesium
Nickel
Lum
128
Lum
129
Lum
130
Lum
131
Lum
132
Lum
133
Lum
134
Lum
135
000,0E+0
500,0E+3
1,0E+6
1,5E+6
2,0E+6
2,5E+6
3,0E+6
3,5E+6
4,0E+6
4,5E+6
em. P
ho
ton
s
Metal ions
Luminolderivates
Figure 123: Luminescence enhancement of luminol derivatives 128-135 upon addition of 2.5 equivalents of X2+/H2O2 (5%). Copper exceeds the range
Defining the parent reference 128 as unity, compound 132 appeared to obtain the highest
ФCLRe in presence of all metal ions within an increment between 7 and 43% of the CL
efficiency.Luminol 133 showed the lowest CL efficiency in the reaction with iron, and for the
other metal ions the reaction with luminol 134 was the least efficient. The experiment covering
Ni2+ showed a threefold better efficiency of CL in comparison with Fe+2. CL efficiency of Ba2+
was similar to that of Fe2+ and Mg2+ showed the lowest CL efficiency of this metal ions group
because Mg2+ did not undergo the redox reaction with H2O2.
The type of metal ion plays an important role on the examined CL reaction. The CL intensity
generally increases with increasing H2O2 concentration and the decomposition rate of H2O2. The
catalytic decomposition of H2O2 is directly affected in presence of metal ions as can be seen in
table 30.

144
Table 30: Relative CL efficiencies of luminol derivates with different metal ions.
Lum. a Cu(NO3)2 a Fe(NO3)
2 Ba(NO3)2 Mg(NO3)
2 Ni(NO3)2
128 - 1.00 1.00 1.00 1.00
129 - 10.33 5.70 4.07 6.58
130 - 7.74 8.06 3.16 8.18
131 - 12.56 14.58 3.50 24.15
132 - 19.45 31.79 7.09 43.18
133 - 0.96 1.14 0.94 2.52
134 - 1.34 1.06 0.67 1.21
135 - 2.10 1.95 0.69 3.11
a Luminol as reference. b Not calculated.
In summary the photophysical properties of a series of luminol derivates were investigated
and compared with the parent luminol. Spectroscopic properties of the compounds 128-135
were determined with focus on absorption as well as fluorescence behaviour. Additionally,
singlet lifetimes and quantum yields of the fluorescent excited singlet states were determined in
DMSO. Significant differences were found depending on the substituents attached to the
luminol core in particular for the heterocyclic ring annulation. Additionally, the photophysical
behavior of derivates 128-135 was studied under difference pH conditions in buffer solutions.
The absorption spectra revealed several species which were present at different pH conditions
with a major presence of the dianion luminol derivates at pH 12. Chemiluminescence studies of
128-135 were performed using a luminescence plate reader and a luminometer injector system.
The luminescence plate reader allowed obtaining fast and detailed information about the
intensity as well as efficiency of the process depending on the substituents under the same
conditions. It was experimentally observed that tri-substituted luminol derivatives enhanced the
luminescence in comparison with that of 128 together with a better CL efficiency a factor of 10.
Employing the luminometer was possible to obtain the kinetics of the process with a high
efficiency of light collection. The substituents of the luminol derivates showed a significant
influence on the CL efficiency of the processes under the same experimental conditions,
concurrently the type metal ions in the process is important to the CL efficiency process where
iron and nickel presented the better efficiency values. The new luminol derivates can be applied
for detection of trace metals with a good CL efficiency and can thus be applied as analytical tool
for practical applications.

4 Conclusion
The fluorescent and non-fluorescent sensors (47, 48 and 53) presented in the first part of this
work were synthesized by a straightforward synthetic route that consisted of straight-forward
reactions such as aromatic substitution and reduction reactions and in one case acetylation with
good reaction yields.
O
O
O
NH2 N
O
O
NO2NO2
+ + H2Pd/C
N
O
O
NH2
NEt3
toluene EtOH
RR R
Ac2ON R
O
O
NH
O
Scheme 44
Fluorescence quenching studies of compounds 47 and 48 were conducted with different
molecular quenchers. By menas of Stern-Volmer plots the quenching constants (KD) and the
bimolecular quenching constants (kq) were calculated. From all quenchers DABCO showed the
best quenching effect for both fluorophores in comparison with the other molecular quenchers
as can be seen from the high quenching constant.
Linear Stern-Volmer plots were obtained for all quenching processes which is indicative for
dynamic processes taking place. This dynamic fluorescence quenching can occur through PET
from the ground-state quencher to the excited fluorophore. It is also possible that the radical
cation of the quencher and the radical anion of the fluorophore combine as last step of the
dynamic quenching process (scheme 45).
N
O
O
R2
R1
hνN
O
R2
R1
1P*
OET
quencher+ quencher N
O
R2
R1
OH
Quencher
Scheme 45
The activation of fluorescence emission via metal ion recognition of product 53 was
investigated. Considerable changes in the fluorescence emission were not observed. It is
possible that the coordination site of product 53 is not suitable for the cations used and thus PET
between the fluorophore and cations is not possible (figure 124). Another reason can be a
competition in the complex formation between the primary and the tertiary amine groups in the
fluorophore. It would be possible to confirm this speculation by protecting one amine group
with acetamide or another protecting group and to repeat the quenching experiment.

146
N
NH2 O
O
N
M+
Figure 124: Possible complex between 53 and the metal ions
The results of the fluorescence experiments with 53 and Eu(III) were comparable with the
other metal ions. Emission fluorescence changes were not observed. The mechanism shown in
scheme 46 could thus not be realized.
N
NH2 O
O
N
*
[Eu3+]
PET
53, non-fluorescent 53a, fluorescent
N
NH2 O
O
N
*
Eu
PET
Scheme 46
Unfortunately, attempts to synthesize 1-(2-aminonaphthalen-1-yl) naphthalene-2-amine (54)
were not successful (scheme 47) and taking into account the synthetic problems, it is proposed
to modify target structure and synthesis route.
O
O
O
NH2
NH2
NH2
Pht NHAcNH2 Pht
NHAc
O
O
ClPO
OMeOMe
O
O
O
AcOH + Ac2O54
55 56 57
Scheme 47

147
The modification would consist in changing the coupling position of binaphthyldiamine
(with one amine group methylated as described in literature [3]) and couple it with the a
thioisocyanate or isocyanate group of the corresponding phthalimide derivate. The
consequential route is depicted in scheme 48 and should be followed in future examinations.
N(CH3)2
NH
R3
NH
NO
O
R1
R3 = O or S
N
O
O
R1
R2
R2 = OCN or SCN
N(CH3)2
NH2+
63 64 65
Scheme 48
Looking for new higher substituted phthalimide derivatives a new synthesis route was
developed by applying multicomponent reactions based on Diels-Alder chemistry in the first
step. In the second step a dehydrogenative oxidation of the conjugated cyclohexadiene product
was carried out using MnO2. At last, different ways were examined to conduct a direct reaction
between the ester group of the cyclohexadiene and amine derivatives to achieve a phthalimide.
The last step of the synthetic route could not be conducted because the aromatic amine
compounds showed no tendency the react with the phthalic diester to give the phthalimide.
However with aliphatic amines the formation of the phthalimide was possible but nevertheless a
mixture of the dehydraminated phthalimide and amino phthalimide derivates as final products
was obtained and not the desired product (scheme 49).
O
O
O
O
NH
O
H2N
N
O
O
NH
O
H2N N
N
NH O
O
N
O
NH2(CH2)2N
NH
N
O
O
O
N
70
71
72
73
Scheme 49

148
The synthesis of new photocages based on an aminophthalimide-serine system was carried
out and the fluorescence quenching behavior of these photocages was investigated (scheme 50).
N
OCOO-
OAcO
R1
R2
N
O
O
R1
R2
hν+ CO2 + AcO-
Scheme 50
Both photocages 92 and 100 exhibit fluorescence changes associated with acetate
photorelease. The photodecarboxylation mechanism of 92 involves a competition between
decarboxylation releases in the singlet excited state and the PET quenching to come back to the
ground state. The photodecarboxylation mechanism of 100 involves a competition between the
singlet state decay and the intersystem crossing because most likely, the photodecarboxylation
process occurs from the corresponding triplet state (scheme 51).
92 192*
PETquenching
F
-CO2
-OAc101 hν 1101*
F
100 1100*
F
-CO2
-OAc102 hν 1102*
FISC 3100*
PETquenching
Scheme 51
Syntheses of chiral phthalimide-urea conjugates were carried out employing a Curtius
rearrangement that allows the direct conversion of aromatic carboxylic acids into ureas (scheme
52).
NHO2C
O
O
N
HN
O
O
HN
OR
2. , 25 °C
1. PhOCOCl, NaN3t-BuONa/DME, 75°C
R-NH2
106
Scheme 52
For the sensors 107, 109-112 photophysical properties were determined in different solvents.
Sensors 107, 110-112 did not show changes in the photophysical properties depending on
solvent polarity. In the presence of protic solvents such as methanol however, a strongly
increased Stokes shift accounts for the formation of an internal charge transfer state after
excitation to the first excited singlet state. Unlike the others, in the presence of methanol sensor

149
109 showed a decrease of the quantum yield in the ratio of one-ninth compared to acetonitrile,
and a diminished fluorescence lifetime of 8.0 ns was detected, approximately half of the
corresponding time of sensor 107.
This difference in the fluorescence lifetimes is probably due to the hydroxy group that
accounts for a fast deactivation from the first excited singlet state to the ground state. The non-
radiative pathway that deactivates the singlet state is not favored in methanol.
Sensor 107 was found to selectively detect F- since the absorption as well as fluorescence
changes were only observed in presence of this halide anion. In this context, a fluorescence
static quenching was proposed for the signalling mechanism, like depicted in scheme 53.
- hν430 nm13 ns
CT
F
Ph N N
O
H1 H2
Pht.
hν340 nm
Ph N N
O
H1 H2
Pht.
F
- hν520 nm
hν
380 nm
- hν
465 nm16.9 ns
Ph N N
O
H1 H2
Pht.
hν340 nm
H O Me
F-
H O Me
H O Me
Scheme 53: Proposed mechanism for the interaction between 107 and F-
Hydrogen bonding interactions between sensors and fluoride are evidenced by 1H-NMR
studies, and the reversibility of these interactions is observed upon addition of a protic solvent
like methanol.
The new sensors 109-112 also showed a good binding selectivity towards the anions AcO−,
F-, H2PO4- that in most cases followed the order Kass AcO- > Kass F
- > Kass H2PO4- or Kass AcO- >
Kass H2PO4- > Kass F
-. Evidence for the hydrogen bonding nature of the urea-anion and hydroxy
group-anion interaction was further obtained by 1H NMR titration of the sensors with the
anions.
The high values for the association constants represent a good recognition ability of the
anions F-, AcO- and H2PO4- by the receptors of the sensors 107, 109-112 through formation of
the respective complexes.
Taking into account the stereogenic center of the sensors 107, 109-112,
enantiodifferentiation studies were performed by fluorescence quenching in the presence of
enantiomerically pure amines (D- and L-methylbenzylamine, D- and L-phenylethanol) as well
as D- and L-lactate as sodium salts.

150
This recognition was investigated by absorption and fluorescence spectroscopy and by
theoretical calculations. Receptor 112 exhibits an excellent chiral recognition ability towards the
enantiomers of lactate, the other sensors can also distinguish between both enantiomers but with
less efficiency. Fluorescence recognition of the anions involves two different processes for all
sensors, for D-lactate due to a static quenching process and for L-lactate by a combination of a
static and a dynamic process. Theoretical calculations are on the way to evaluate the
enantioselectivity of the sensors towards D- and L-lactate.
Experiments to recognize peroxides through the receptors of the sensors 107, 109-112 were
also carried out. The fluorescence experiments indicate that interaction is only possible when
the solution, containing a sensor and H2O2 is irradiated. This leads to the assumption that the
reaction takes place from the excited state. Taking into account that phthalimides are versatile
electron acceptors in PET reactions [81] and H2O2 is a strong oxidant (electron donor) the
possibility that a PET process occurs in the excited state is high. The interaction with
hydroperoxides was not stronger than with hydrogen peroxide. However, further experiments
are necessary to understand this process and to propose a valid mechanism.
The non-fluorescent sensor 123 based on a thiourea-activated phthalimide with a stereogenic
center was synthesized following a five-step synthetic route. The thiourea showed a different
behavior than the urea concerning recognition of the examined anions. The acidity of the NH
protons gives reason to different interactions between sensor and anions. Recognition of these
anions through hydrogen bonding and deprotonation were observed by absorption spectra and 1H NMR. The sensor showed efficient recognition of AcO- through hydrogen bonding, and for
F- the recognition occurs due to deprotonation of the receptor. In comparison with the urea
receptor of the previous sensors 107, 109-112 the enantioselectivity of the thiourea receptor was
moderate. In comparison with the thiourea the enantioselectivity of the urea receptors is ca.
50% higher.
The last chapter of this thesis elucidated photophysical data, spectroscopic properties and
chemioluminescence of luminol derivatives. Differences in the photophysical properties and
spectroscopic properties were found depending on the substituents at the luminol core in
particular in the case of heterocyclic ring annulation. The photophysical behavior of the
derivatives 128-135 was studied under different pH conditions in buffer solutions. The
absorption spectra revealed several species, which were present at different pH with a major
presence of the dianion at pH 12.
Chemoluminescence studies of 128-135 were performed using a luminescence plate reader
and a luminometer injector system. It was experimentally observed that trisubstituted luminol
derivatives enhanced the luminescence in comparison with that of 128 combined with a better

151
CL efficiency a factor of 10. Employing the luminometer it was possible to obtain the kinetics
of the process with a high efficiency of light collection. The substituents of the luminol
derivates showed a significant influence on the CL efficiency under identical experimental
conditions. The type of metal ions in the process is important to the CL efficiency where iron
and nickel presented the better efficiency values. The new luminol derivates can be applied for
detection of metal traces with a good CL efficiency and can thus be applied as a convenient
analytical tool for practical applications.

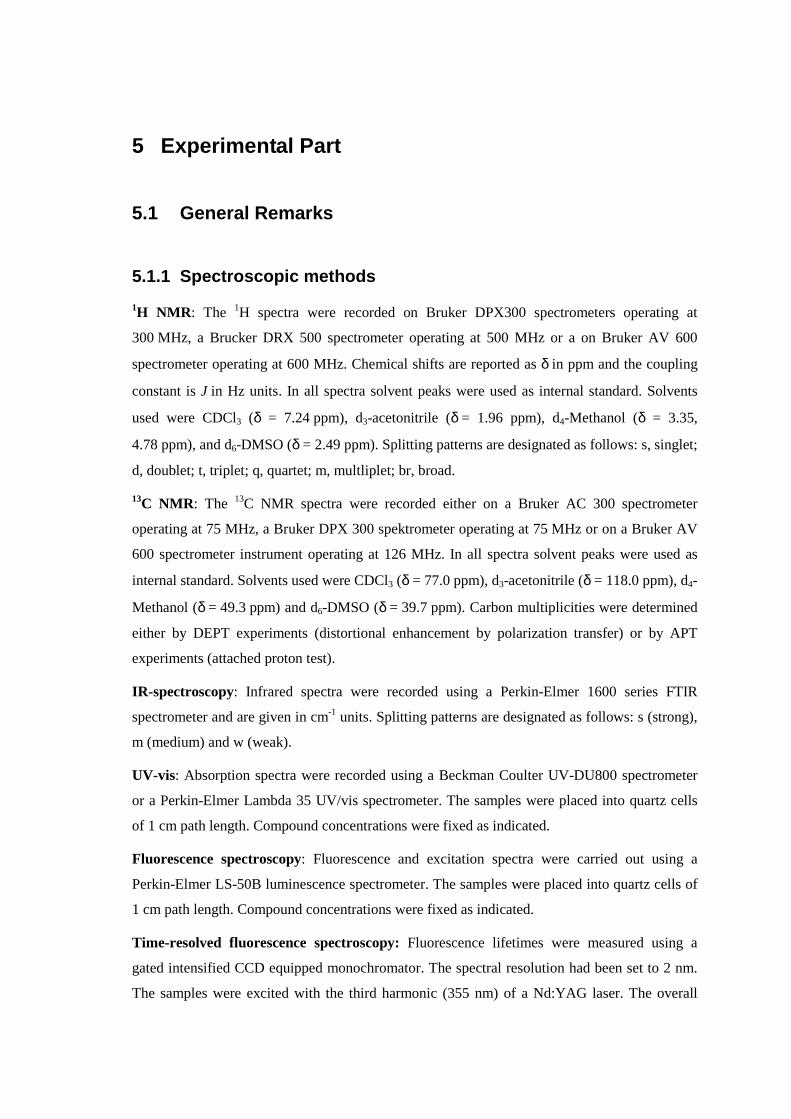
5 Experimental Part
5.1 General Remarks
5.1.1 Spectroscopic methods
1H NMR : The 1H spectra were recorded on Bruker DPX300 spectrometers operating at
300 MHz, a Brucker DRX 500 spectrometer operating at 500 MHz or a on Bruker AV 600
spectrometer operating at 600 MHz. Chemical shifts are reported as δ in ppm and the coupling
constant is J in Hz units. In all spectra solvent peaks were used as internal standard. Solvents
used were CDCl3 (δ = 7.24 ppm), d3-acetonitrile (δ = 1.96 ppm), d4-Methanol (δ = 3.35,
4.78 ppm), and d6-DMSO (δ = 2.49 ppm). Splitting patterns are designated as follows: s, singlet;
d, doublet; t, triplet; q, quartet; m, multliplet; br, broad.
13C NMR: The 13C NMR spectra were recorded either on a Bruker AC 300 spectrometer
operating at 75 MHz, a Bruker DPX 300 spektrometer operating at 75 MHz or on a Bruker AV
600 spectrometer instrument operating at 126 MHz. In all spectra solvent peaks were used as
internal standard. Solvents used were CDCl3 (δ = 77.0 ppm), d3-acetonitrile (δ = 118.0 ppm), d4-
Methanol (δ = 49.3 ppm) and d6-DMSO (δ = 39.7 ppm). Carbon multiplicities were determined
either by DEPT experiments (distortional enhancement by polarization transfer) or by APT
experiments (attached proton test).
IR-spectroscopy: Infrared spectra were recorded using a Perkin-Elmer 1600 series FTIR
spectrometer and are given in cm-1 units. Splitting patterns are designated as follows: s (strong),
m (medium) and w (weak).
UV-vis: Absorption spectra were recorded using a Beckman Coulter UV-DU800 spectrometer
or a Perkin-Elmer Lambda 35 UV/vis spectrometer. The samples were placed into quartz cells
of 1 cm path length. Compound concentrations were fixed as indicated.
Fluorescence spectroscopy: Fluorescence and excitation spectra were carried out using a
Perkin-Elmer LS-50B luminescence spectrometer. The samples were placed into quartz cells of
1 cm path length. Compound concentrations were fixed as indicated.
Time-resolved fluorescence spectroscopy: Fluorescence lifetimes were measured using a
gated intensified CCD equipped monochromator. The spectral resolution had been set to 2 nm.
The samples were excited with the third harmonic (355 nm) of a Nd:YAG laser. The overall

154
instrument response function is 1.5 ns. The samples were placed into quartz cells of 1 cm path
length.
Singlet lifetime experiments were determined after excitation with laser pulses about 120 fs
length. The pump laser was an “Integra-C” from Quantronix providing pulse of 2 mJ with
120 fs duration at 796 nm and 500 MHz repetition rate The Optical Parametric Amplifier
“TOPAS” was from Light Conversion and an oscilloscope WavePro 960XL was from LeCroy
(2 GHz bandwhidth). Compound concentrations were fixed as indicated.
Luminescence: Luminescence measurements were performed using a computer-controlled
fluorimeter Tecan SPECTRAFluor Plus for microplate, and Lumat LB 9507 from Berthold
Technologie for measuring individual samples.
Ms: Mass spectra were recorded on a MAT Incos 50 Galaxy System Mass spectrometer and on
a Finnigan MAT H-SQ 30 Mass spectrometer and ESI experiments were measured using a
Bruker Daltonics Esquire 3000
5.1.2 Analytical methods
CHN-Elementary analysis: CHN-combustion analyses were measured using a Elementar
Vario EL Instrument.
M.p: M.ps were measurements using a Büchi melting point apparatus type B-535 and are
uncorrected.
X-ray analysis: All X-ray measurements were recorded using a Nonius KappaCCD
diffractometer (2Θmax = 54°, MoKα radiation, λ = 0.71073 Å), graphite monochromator,
φ / ω scans. The structures were solved using the direct methods SHELXS-97 and SHELXL-97.
5.1.3 Chromatographic methods:
Column Chromatography: Silica gel 60, 0.0063-0.200 nm (70-230 mesh ASTM) purchased
from Merck Company, silica gel 60, 0.040-0.063 nm (230-240 mesh ASTM) purchased from
Macherey-Nagel Company or basic aluminium oxide from ICN Biomedicals was used as
stationary phase.
TLC : Thin layer chromatography was performed on plastic sheets precoated with silica gel
60 F254 (Merck) or aluminium sheets precoated polygram SIL G/UV254 (Macherey-Nagel). Spots
were visualized under a UV lamp (254 or 366 nm) or with a KMnO4 solution.
PLC: Preparative thin layer chromatography was carried out on 20 x 20 cm glass plates coated
with silica gel (Merck silica gel G F254) and eluted with the solvent system indicated. The

155
separated compounds were located under 254 or 366 nm UV light and extracted using ethyl
acetate.
5.1.4 Photolyses
Glass apparatus: Quartz and Pyrex ® vessels were used for irradiation.
Reactors: Rayonet chamber photoreactors PRR-100 (16 x 3500 Å lamps, ca. 400 W;
λ = 350± 20 nm) were used for irradiation as well as the photoreactor Luzchem LZC-4V (14
lamps, λ = 350 ± 20 nm).
Solvents and reagents: Solvents (acetonitrile (MeCN), dimethylsulfoxide (DMSO), methanol
(MeOH) and dichloromethane (DCM)) used for irradiations and spectroscopy study were
purchased from Fisher Scientific Company. All reagents were purchased from standad chemical
suppliers and purified to match the reported physical and spectra data.
Gas: Nitrogen (Linde) was used for irradiation.
5.1.5 Computational Calculations
The structures were optimized with GAUSSIAN03, [91] using B3LYP/6-31*[72] and the CPCM-
SCRF method, solvent = acetonitrile. [73] NMR shifts were computed of the optimized structures
using the GIAO method. [74]
5.2 General Procedures
GP1: General procedure for the synthesis of 3-nitro-phthalimides
A mixture of benzylamine (10.0 mmol), 3-nitrophthalic anhydride (1.93 g, 10.0 mmol) and
triethylamine (0.5 mL) in toluene (70 mL) is refluxed with a Dean-Stark apparaturs for 3 hours.
The reaction mixture is cooled and concentrated in vacuo. The residue is dissolved in
dichloromethane, washed with 10% hydrochloric acid solution and then with hydrogen
carbonate solution. The organic layer is separated and dried over magnesium sulfate, and
concentrated in vacuo. Recrystalization of the residue from ethanol gives the product. [56]
GP2: General procedure for reduction of 3-nitro-phthalimides to 3-amine-phthalimides
A mixture of the substrate (10.0 mmol), 5% Pd/C in EtOH (100 mL) is vigorously stirred at
room temperature (appr. 22°C) under hydrogen atmosphere with the pressure of a hydrogen
balloon for 4 hours. The reaction mixture is then filtered over Celite® and concentrated in

156
vacuo. The residue is purified by column chromatography or recrystallization; see the paragraph
pertinent to the respective product. [57]
GP3: General procedure for multicomponent coupling with a simple aldehyde and
dimethyl acetylenedicarboxylates.
a. Amide (≥ 15 mmol), aldehyde (15 mmol), dienophile (15 mmol), acetic anhydride
(1.53 g, 15 mmol) and p-toluensulfonic acid monohydrate (43 mg, 1.5 mol%) are combined in a
round bottomed flask and NMP (10 mL) is added. Then the reaction is stirred at elevated
temperature (120°C). After 24 h, the solvent and other volatile compounds is removed by oil
pump vacuum. For work up procedures (silica gel chromatography) see the paragraph pertinent
to the respective product. [50]
b. The amine (1 equiv) is placed in a threaded pressure tube, then toluene
(0.25 mL/mmol), aldehyde (1.5 equiv), dienophile (1.5 equiv), and p-toluenesulfonic acid
monohydrate (2 mol%) are added. The reaction mixture is stirred at elevated temperature
(120°C) for 24 h. After cooling, all volatile compounds are removed under reduced pressure.
For work up procedures (silica gel chromatography) see the paragraph pertinent to the
respective product. [49]
GP4: General procedure for alanines via MnO2-mediated oxidation
A 100 mL flask is charged with an N-acylaminocyclohexene or diene derivate (5 mmol), then
85% activated MnO2 (1.52 g, 15 mmol) and toluene (10 mL) are added, and the reaction is
stirred at 120°C. After 5 h, the solvent is removed by oil pump vacuum. The residue is subjected
to silica gel chromatography. [50]
GP5: General procedure for the synthesis of the urea-phthalimide derivaivtes.
To a solution of sodium azide (110 mg, 1.70 mmol), potassium tert-butoxide (14.4 mg,
0.150 mmol), and 2-benzyl-1,3-dioxoisoindoline-5-carboxylic acid (281 mg, 1.00 mmol) in
DME (10.0 mL) at 75 °C, the phenylchloroformate (140 µL, 1.10 mmol) is added. The resulting
mixture is stirred at 25 °C overnight. Then, the mixture is slowly cooled down to room
temperature, the amine (1.50 mmol) was added and the reaction mixture was stirred for 16
hours. Afterwards, the mixture is diluted with hexane (40 mL) and the resulting solution poured
into ice-cold water with continuous stirring. 10 mL water are added and stirring was maintained
during 20 minutes. The white solid is filtered off; for work up procedures (silica gel
chromatography or precipitation) see the paragraph pertinent to the respective product. [69]

157
GP7: General procedure for fluorescence spectroscopy measurements
The samples are placed into quartz cells of 1 cm path length. Compound concentrations were
adjusted as indicated in the text. The excitation and emission slit widths are between 2.5 and
5.0 nm.
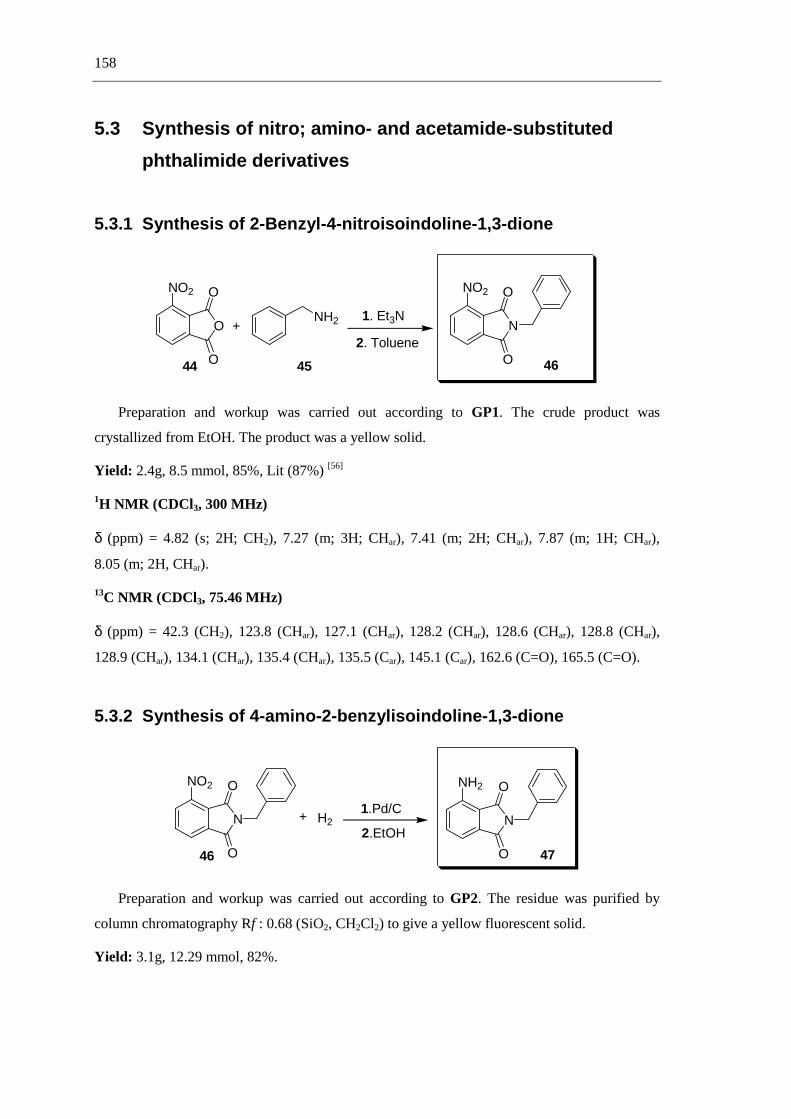
158
5.3 Synthesis of nitro; amino- and acetamide-substituted
phthalimide derivatives
5.3.1 Synthesis of 2-Benzyl-4-nitroisoindoline-1,3-dione
O
O
O
NH2 N
O
O
NO2NO2
+1. Et3N
2. Toluene
44 45 46
Preparation and workup was carried out according to GP1. The crude product was
crystallized from EtOH. The product was a yellow solid.
Yield: 2.4g, 8.5 mmol, 85%, Lit (87%) [56]
1H NMR (CDCl 3, 300 MHz)
δ (ppm) = 4.82 (s; 2H; CH2), 7.27 (m; 3H; CHar), 7.41 (m; 2H; CHar), 7.87 (m; 1H; CHar),
8.05 (m; 2H, CHar).
13C NMR (CDCl 3, 75.46 MHz)
δ (ppm) = 42.3 (CH2), 123.8 (CHar), 127.1 (CHar), 128.2 (CHar), 128.6 (CHar), 128.8 (CHar),
128.9 (CHar), 134.1 (CHar), 135.4 (CHar), 135.5 (Car), 145.1 (Car), 162.6 (C=O), 165.5 (C=O).
5.3.2 Synthesis of 4-amino-2-benzylisoindoline-1,3-dione
N
O
O
NO2
+ H21.Pd/C
N
O
O
NH2
2.EtOH
46 47
Preparation and workup was carried out according to GP2. The residue was purified by
column chromatography Rf : 0.68 (SiO2, CH2Cl2) to give a yellow fluorescent solid.
Yield: 3.1g, 12.29 mmol, 82%.

159
1H NMR (CDCl 3, 300 MHz)
δ (ppm) = 4.80 (s; 2H; CH2), 5.22 (s; 2H; NH2), 6.82 (d; 1H; J = 8.32 Hz; CHar), 6.85 (d; 1H;
J = 7.12 Hz; CHar), 7.14-7.40 (m; 3H; CHar), 7.41-7.45 (m; 3H; CHar).
13C NMR (CDCl3, 300 MHz)
δ (ppm) = 41.2 (CH2), 112.3 (Car), 112.8 (CHar), 121.0 (CHar), 127.7-128.6 (CHar x 5), 132.8
(Car), 135.2 (CHar), 136.7 (Car), 145.2 (Car), 162.3(C=O), 168.3 (C=O).
IR
ν (cm−1) = 3472 (m), 3351 (m), 1743 (s), 1682 (s), 1633 (s), 1480 (s), 1454 (m), 1431 (s), 1403
(s), 1371 (s), 1328 (s), 1180 (m).
UV-Vis (CH3CN, 33.33 x 10⁻⁶ M)
λmax (nm), Log(εmax): 226 (4.48), 237 (4.42), 255 (3.90), 380 (3.81).
GC-Ms:
[M +] = 252 (100%).
M.p.
145-146 °C.
5.3.3 Synthesis of N-(2-benzyl-1,3-dioxoisoindolin-4-yl)acetamide
N
O
O
NH2
+ Ac2O N
O
O
NH
O
138 °C
6 h
47 48
Freshly distilled acetic anhydride (10 mL) was added into a flask with 200 mg (0.8 mmol)
of 4-amino-2-benzylisoindoline-1,3-dione (47). The reaction mixture was stirred at 138°C for
6 h. After cooling, the mixture was poured into a beaker with ice, the resulting mixture was
extracted with CH2Cl2 (2 x 30 mL) and the organic phase was washed with NaHCO3
(3 x 20 mL). The organic phase was dried over MgSO4. The solvent was evaporated under
reduced pressure and the residue purified by column chromatography Rf: 0.65 (SiO2,
EtOAc / cyclohexane 1:1). The product was isolated as a colorless solid.
Yield: 211 mg, 0.71 mmol, 90%.
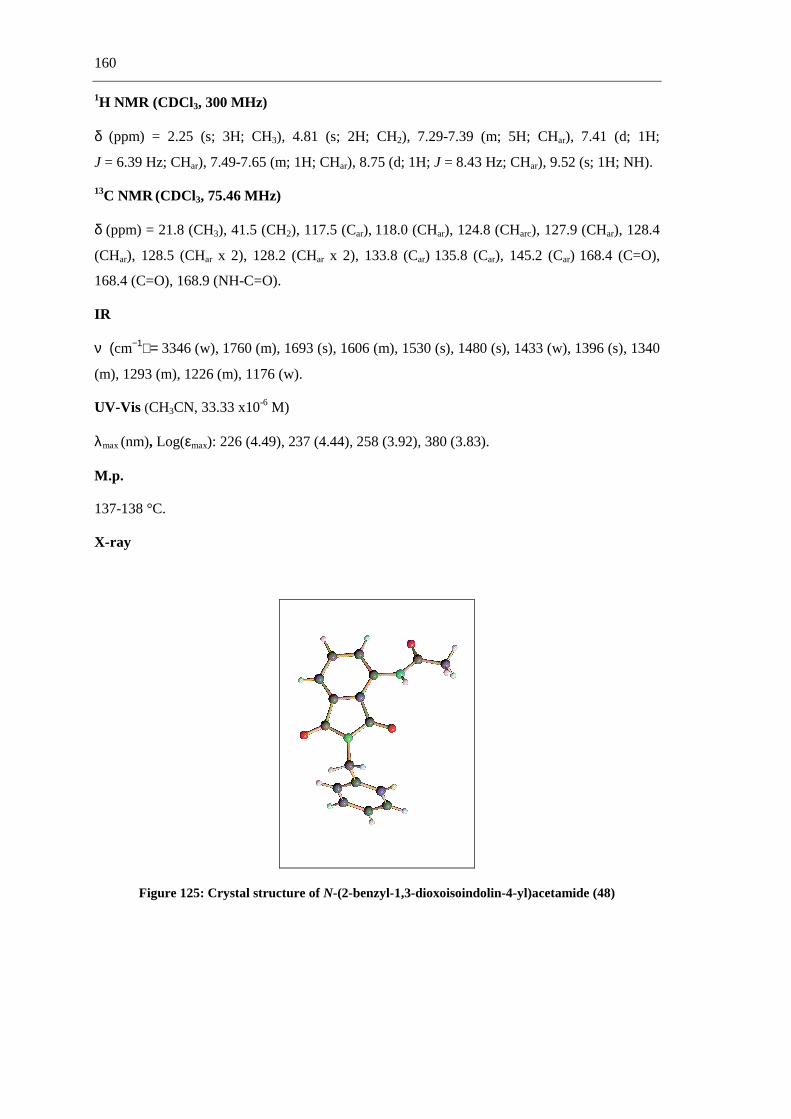
160
1H NMR (CDCl 3, 300 MHz)
δ (ppm) = 2.25 (s; 3H; CH3), 4.81 (s; 2H; CH2), 7.29-7.39 (m; 5H; CHar), 7.41 (d; 1H;
J = 6.39 Hz; CHar), 7.49-7.65 (m; 1H; CHar), 8.75 (d; 1H; J = 8.43 Hz; CHar), 9.52 (s; 1H; NH).
13C NMR (CDCl3, 75.46 MHz)
δ (ppm) = 21.8 (CH3), 41.5 (CH2), 117.5 (Car), 118.0 (CHar), 124.8 (CHarc), 127.9 (CHar), 128.4
(CHar), 128.5 (CHar x 2), 128.2 (CHar x 2), 133.8 (Car) 135.8 (Car), 145.2 (Car) 168.4 (C=O),
168.4 (C=O), 168.9 (NH-C=O).
IR
ν (cm−1) = 3346 (w), 1760 (m), 1693 (s), 1606 (m), 1530 (s), 1480 (s), 1433 (w), 1396 (s), 1340
(m), 1293 (m), 1226 (m), 1176 (w).
UV-Vis (CH3CN, 33.33 x10⁻⁶ M)
λmax (nm), Log(εmax): 226 (4.49), 237 (4.44), 258 (3.92), 380 (3.83).
M.p.
137-138 °C.
X-ray
Figure 125: Crystal structure of N-(2-benzyl-1,3-dioxoisoindolin-4-yl)acetamide (48)
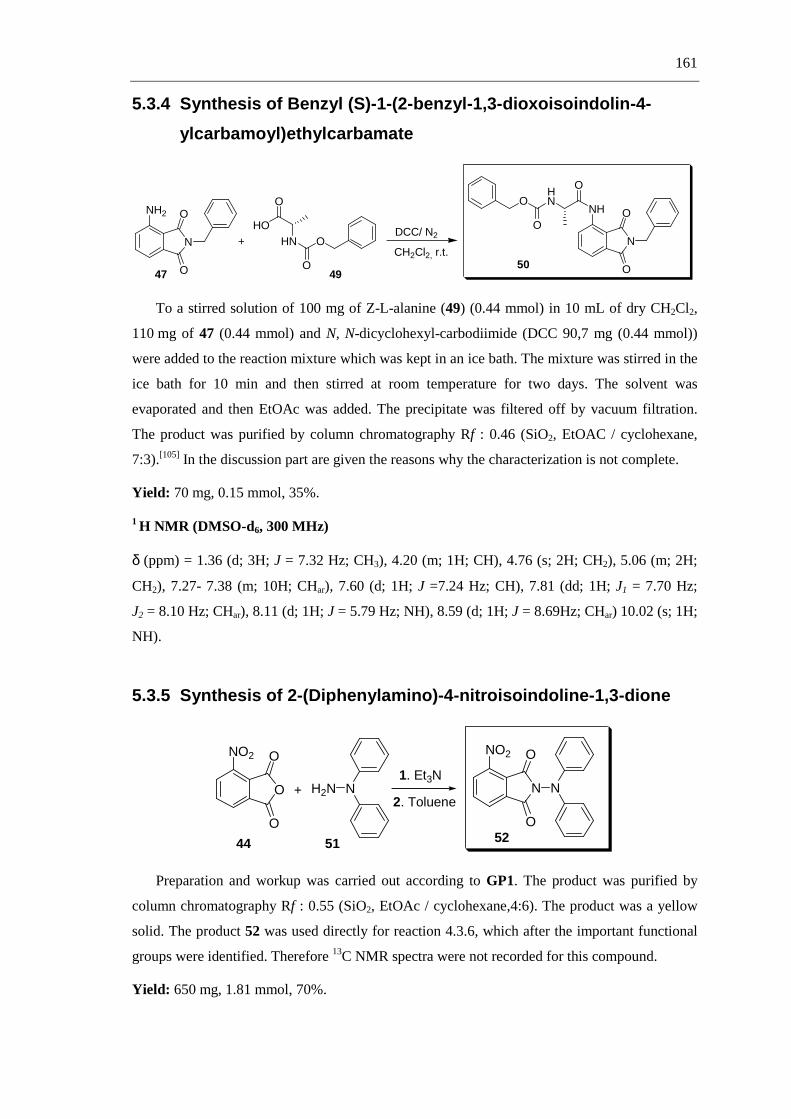
161
5.3.4 Synthesis of Benzyl (S)-1-(2-benzyl-1,3-dioxoisoindolin-4-
ylcarbamoyl)ethylcarbamate
NH2
N
O
O
HO
O
HN O
O
+
NH
N
O
O
OHN
O
O
CH2Cl2, r.t.
DCC/ N2
47 4950
To a stirred solution of 100 mg of Z-L-alanine (49) (0.44 mmol) in 10 mL of dry CH2Cl2,
110 mg of 47 (0.44 mmol) and N, N-dicyclohexyl-carbodiimide (DCC 90,7 mg (0.44 mmol))
were added to the reaction mixture which was kept in an ice bath. The mixture was stirred in the
ice bath for 10 min and then stirred at room temperature for two days. The solvent was
evaporated and then EtOAc was added. The precipitate was filtered off by vacuum filtration.
The product was purified by column chromatography Rf : 0.46 (SiO2, EtOAC / cyclohexane,
7:3).[105] In the discussion part are given the reasons why the characterization is not complete.
Yield: 70 mg, 0.15 mmol, 35%.
1 H NMR (DMSO-d 6, 300 MHz)
δ (ppm) = 1.36 (d; 3H; J = 7.32 Hz; CH3), 4.20 (m; 1H; CH), 4.76 (s; 2H; CH2), 5.06 (m; 2H;
CH2), 7.27- 7.38 (m; 10H; CHar), 7.60 (d; 1H; J =7.24 Hz; CH), 7.81 (dd; 1H; J1 = 7.70 Hz;
J2 = 8.10 Hz; CHar), 8.11 (d; 1H; J = 5.79 Hz; NH), 8.59 (d; 1H; J = 8.69Hz; CHar) 10.02 (s; 1H;
NH).
5.3.5 Synthesis of 2-(Diphenylamino)-4-nitroisoindoline-1,3-dione
O
NO2 O
O
H2N N+ N
NO2 O
O
N1. Et3N
2. Toluene
44 51 52
Preparation and workup was carried out according to GP1. The product was purified by
column chromatography Rf : 0.55 (SiO2, EtOAc / cyclohexane,4:6). The product was a yellow
solid. The product 52 was used directly for reaction 4.3.6, which after the important functional
groups were identified. Therefore 13C NMR spectra were not recorded for this compound.
Yield: 650 mg, 1.81 mmol, 70%.
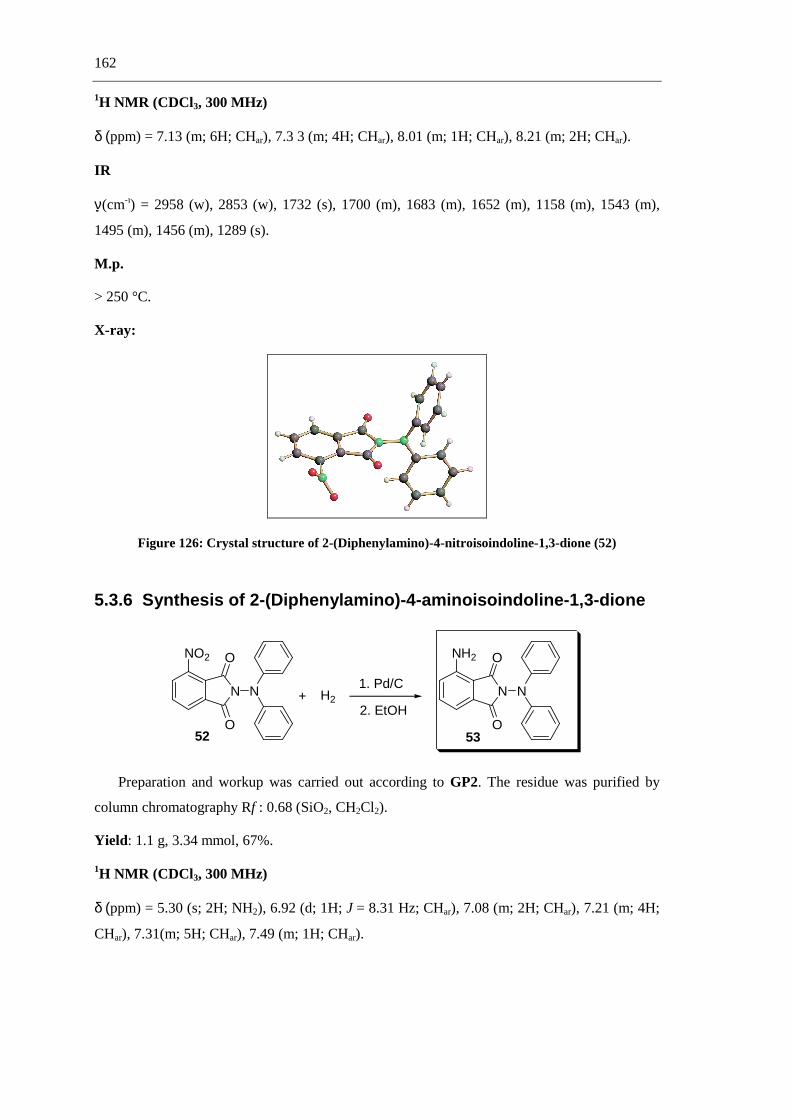
162
1H NMR (CDCl 3, 300 MHz)
δ (ppm) = 7.13 (m; 6H; CHar), 7.3 3 (m; 4H; CHar), 8.01 (m; 1H; CHar), 8.21 (m; 2H; CHar).
IR
ν (cm-) = 2958 (w), 2853 (w), 1732 (s), 1700 (m), 1683 (m), 1652 (m), 1158 (m), 1543 (m),
1495 (m), 1456 (m), 1289 (s).
M.p.
> 250 °C.
X-ray:
Figure 126: Crystal structure of 2-(Diphenylamino)-4-nitroisoindoline-1,3-dione (52)
5.3.6 Synthesis of 2-(Diphenylamino)-4-aminoisoindoline-1,3-dione
N
NO2 O
O
N + H2N
NH2 O
O
N1. Pd/C
2. EtOH
52 53
Preparation and workup was carried out according to GP2. The residue was purified by
column chromatography Rf : 0.68 (SiO2, CH2Cl2).
Yield: 1.1 g, 3.34 mmol, 67%.
1H NMR (CDCl 3, 300 MHz)
δ (ppm) = 5.30 (s; 2H; NH2), 6.92 (d; 1H; J = 8.31 Hz; CHar), 7.08 (m; 2H; CHar), 7.21 (m; 4H;
CHar), 7.31(m; 5H; CHar), 7.49 (m; 1H; CHar).

163
13C NMR (CDCl3, 75.46 MHz)
δ (ppm) = 113.3 (CHar), 120.1 (CHar x 4), 121.7 (CHar), 123.8 (CHar x 3), 129.4 (CHar x 4),
136.0 (CHar), 136.3 (CHar), 144.7 (Car x 2), 148.5 (Car), 165.3 (C=O), 165.8 (C=O).
IR
ν (cm-1) = 3368 (w), 3059 (w), 1769 (m), 1715 (s), 1632 (m), 1589 (s), 1493 (s), 1392 (m), 1219
(m), 1173 (w),1096 (m).
UV-Vis (CH3CN, 33.33 x10⁻⁶ M)
λmax (nm), Log(εmax): 223 (4.40), 260 (4.21), 388 (3.80).
GC-Ms
[M +] = 329 (100%).
M.p.
210 °C, decomposition.

164
5.4 Preliminary quenching study of 4-amino-2-benzylisoindo-
line-1,3-dione, N-(2-benzyl-1,3-dioxoisoindolin-4-yl)acet-
amide.
Fluorescence and excitation studies were carried out using a Perkin-Elmer LS-50B
luminescence spectrometer. For 47 and 48 a fluorescence quenching study was conducted with
different molecular quenchers, shown in figure 127. The concentrations of the quencher were
adjusted to0.3 M and for the fluorophor at 1mM. The excitation and emission slit widths were
set to 2.5 nm. The experiment was to add more equivalents of quencher into the quartz cells
containing the fluorophor and the fluorescence spectrum was measured for each addition step.
OMeOMe
OMe
OMe
OMe
OMe
N
CO2H
OMe
CO2H
OMeOMe
N
N
NN
1,2-dimethoxybenzene(1,2-DMB)
1,3-dimethoxybenzene(1,3-DMB)
1,4-dimethoxybenzene(1,4-DMB)
2-(4-methoxyphenyl)acetic acidMPAA
2-(3,4-dimethoxyphenyl)acetic acidDMPAA
N,N-dimethylpyridin-4-amine(DMAP)
N,N-dimethyl(phenyl)methanamine(DMBA)
1,4-diaza-bicyclo[2.2.2]octane(DABCO)
Figure 127: Various Molecular Quenchers
5.5 Preliminary study for fluorescence activation of 2-
(diphenylamino)-4-aminoisoindoline-1,3-dione through
cation coordination
Fluorescence and excitation studies were carried out using a Perkin-Elmer LS-50B
luminescence spectrometer. The samples were placed into quartz cells of 1 cm path length. The
concentration of 53 at 1 mM and for the cations (Ba2+, Cu2+, Ni2+, Mg2+, Ag+, Zn+, Fe3+and
Eu3+ as nitrate and triflate salts) between 0.01-0.1 M. For excitation and emission experiments,
slit widths were 5.0 nm. The experiment was to add more equivalents of the cation into the

165
quartz cells containing the fluorophor and the fluorescence spectrum was measured after each
addition step.
5.6 Reactions with 1-(2-Aminonaphthalen-1-yl) naphthalene-2-
amine to get chiral phthalimides
5.6.1 Synthesis of 2-(1-(2-Aminonaphthalen-1-yl)naphthalen-2-
yl)isoindoline-1,3-dione
O
O
ONH2
NH2
NH2
Pht
5455
Different conditions were used for this reaction but none was successful to obtain the
product 55. The reactions conditions are given in table 31.
Table 31: Reaction conditions for the synthesis of 2-(1-(2-Aminonaphthalen-1-yl)-naphthalen-2-yl)isoindoline-1,3-dione (55).
Equiv. Solvent Temp. °C h (hours) Work-up
a. 1:1 Toluene 120 4 According to GP1.
b. 1:1 DMF 120 6 The reaction mixture was cooled to r.t, water was added to precipitate
and the product mixture was filtered. Purification by column
chromatograpy (EtOAc / cyclohexane, 2:1).
c. 1:1 DMF 120 6 The reaction mixture was cooled to r.t, water was added to precipitate
and the product mixture filtered. The crude product was crystallized
from toluene. The desired product could not be isolated
d. 1:1 Toluene 110 7 min This reaction was conducted in a MW. The crude product was from
EtOH. The desired product could not be isolated

166
5.6.2 Synthesis of N-(1-(2-Aminonaphthalene-1-yl)naphthalen-2-
yl)acetamide
+ AcOH + Ac2ONH2
NH2
NHAcNH2
54
56
0°C, N 2
To a solution of (±)1-(2-aminonaphthalen-1-yl)naphthalen-2-amine (54) (1.14 g, 4mmol)
and AcOH (2.4 mL 40 mmol) in 40 mL of dried CH2Cl2 was added Ac2O (0.42 mL, 4 mmol) at
0 °C under N2. The resulting solution was stirred overnight at room temperature, and then 2 N
NaOH aqueous solution was added until a pH ≈ 7. The reaction mixture was extracted with
CH2Cl2 (3 x 50 mL) and the combined organic phases were washed with saturated brine and
dried over MgSO4. The solvent was removed under reduced pressure and the crude product was
purified by flash chromatography Rf : 0.52 (SiO2, EtOAc / hexane, 2:1) to afford a colorless
solid [92] The product was used directly for reactions 5.6.3.
Yield: 913 mg, 2.8 mmol, 70%.
1H NMR (CDCl3, 300 MHz)
δ (ppm) = 1.89 (s; 3H; CH3), 3.68 (s; 2H; NH2), 6.93 (d; 1H; J = 7.63 Hz; CHar), 7.15-7.30 (m;
6H; CHar), 7.40-7.46 (m; 1H; CHar), 7.82-7.94 (m; 3H; CHar), 8.02 (d; 1H; J = 8.90 Hz; CHar),
8.6 (d; 1H; J = 8.90 Hz; CHar).
13C NMR (CDCl3, 75.46 MHz)
δ (ppm) = 24.7 (CH3); 118.3 (CHar); 121.1 (CHar); 123.0 (CHar); 123.8 (CHar), 125.2 (CHar),
125.4 (CHar), 126.9 (CHar), 127.4 (CHar x 2), 128.3 (CHar x 2), 129.3 (Car x 2), 130.4 (CHar),
131.3 (Car x 2), 132.4 (Car x 2), 133.6 (Car), 135.2 (Car), 168.9 (C=O).

167
5.6.3 Synthesis of N-(1-(2-(1,3-Dioxoisoindolin-2-yl)naphthalen-1-
yl)naphthalen-2-yl)acetamide
a.
O
O
ClPO
OMeOMe
NH2
NHAcPhtNHAc
56
57
A solution of N-(1-(2-aminonaphthalen-1-yl)naphthalen-2-yl)acetamide (56) (222 mg,
0.65 mmol), and dimethyl 1-chloro-1,3-dihydro-3-oxoisobenzofuran-1-yl-1-phosphonate
(140 mg, 0.5 mmol) in 10 mL CH3CN was stirred at room temperature and 90 µL of Et3N were
added to the solution. The reaction mixture was stirred at room temperature for 15 min. The
solvent was removed under reduced pressure and the residue was extracted with CH2Cl2. The
organic phase was washed with NaHCO3 and dried over MgSO4. The product was purified by
PLC (SiO2, EtOAc / cyclohexane, 2:1 and 3:1). [93] This method was not succesessful.
b.
NH2
NHAc
O
O
O PhtNHAc
5657
For this reaction the methods a, b and d of table 31 were used. However, the product could not
be obtained under these conditions.

168
5.7 Multicomponent coupling with dienophilic dimethyl
acetylenedicarboxylate
5.7.1 Synthesis of Dimethyl 6-acetamido-3,5-dimethylcyclohexa-1,3-
diene-1,2-dicarboxylate
NH2
O
+ H
OCO2Me
CO2Me
+ O
O
O
O
NH
O
TSA, Ac2O,NMP
120 °C, 24 h
66 67 6869
Acording to GP3-a, acetamide 891 mg (66) (15 mmol), propionaldehyde (67) (870 mg,
15 mmol), and diethyl acetylenedicarboxylate 2.13 g (68) (15 mmol) were reacted. The product
69 was purified by column chromatography Rf : 0.38 (SiO2, EtOAc / cyclohexane 2:1). The
product was isolated as white solid.
Yield: 3.71 g, 13.18 mmol, 66%.
1H NMR (CDCl3, 300 MHz)
δ (ppm) = 1.02 (d; 3H; J = 7.58 Hz; CH3), 1.75 (s; 3H; CH3), 2.01 (s; 3H; CH3), 2.75 (m; 1H;
CH), 3.61 (s; 3H; CH3), 3.67 (s; 3H; CH3), 5.21 (m; 1H; CH), 5.57 (s; 1H; NH).
13C NMR (CDCl3, 75.46 MHz)
δ (ppm) = 18.4 (CH3), 19.8 (CH3), 23.0 (CH3), 30.0 (CH), 47.1 (CH), 52.4 (CH3), 52.4 (CH3),
130.5 (C x 1), 132.0 (CH), 141. 0 (C x 2), 167.2 (C=O), 167.9 (C=O), 170.0 (C=O).
5.7.2 Synthesis of (6R)-Dimethyl 6-((S)-2-(ethoxycarbonyl)-5-
oxopyrrolidin-1-yl)-3,5-dimethylcyclohexa-1,3-diene-1,2-
dicarboxylate
N
O
CO2Et
H +H
O
+
CO2Me
CO2Me
N O
O
O
O
OEtO2C
110 °C, 24h
Toluene, TSA
76 67 68 77

169
Acording to GP3-b, N-methylmaleimide 783 mg (76) (5 mmol), propionaldehyde (67)
(1.10 g, 7.5 mmol), and diethyl acetylenedicarboxylate (68) (2.13 g, 15 mmol) were reacted.
The product was purified by column chromatography Rf: 0.30 (SiO2, EtOAc / cyclohexane,
2:1). The isolated product (77) was a white solid.
Yield: 1.5 g, 4 mmol, 80%.
1H NMR (CDCl3, 300 MHz)
δ (ppm) = 1.14 (m; 6H; CH3), 1.53 (s; 3H; CH3), 2.33 (m; 4H; CH2), 3.01(m; 1H; CH), 3.65 (s;
3H; CH3), 3.70 (s; 3H; CH3), 3.79 (m; 2H; CH2), 3.82 (m; 1H; CH), 4.09 (m; 1H; CH), 5.56 (m;
H; CH).
13C NMR (CDCl3, 75.46 MHz)
δ (ppm) = 13.7 (CH3), 18.7 (CH3), 19.4 (CH3), 24.4 (CH2), 29.8 (CH2), 34.4 (CH), 48.5 (CH),
52.1 (CH3), 52.1 (CH3), 55.8 (CH), 61.6 (CH2), 123.3 (C x 1), 127.7 (C x 1), 129.1 (CH), 148.9
(CH), 164.6 (C=O), 169.3(C=O), 172.4 (C=O), 174.9 (C=O).
5.7.3 Synthesis of (5S,6R)-Dimethyl-6-acetamido-3,5-diethylcyclo-
hexa-1,3-diene-1,2-dicarboxylate
NH2
O+ H
OCO2Me
CO2Me
+ O
O
O
O
NH
O
TSA, Toluene
120 °C, 24h
66 6882 83
According to GP3-b, acetamide (66) 891 mg (15 mmol), butyraldehyde (82) (1.08 g,
15 mmol), and dimethyl acetylenedicarboxylate (68) 2.13 g (15 mmol) were reacted. The
product 83 was purified by column chromatography Rf: 0.38 (SiO2, EtOAc / cyclohexane, 2:1).
The product 83 (3.24 g, 10.5 mmol, 70%) was isolated as white solid and directly used for
reaction 5.8.3without further characterization.

170
5.8 Anilines via MnO2-mediated oxidation
5.8.1 Synthesis of Dimethyl 3-acetamido-4,6-dimethylbenzene-1,2-
dioate
O
O
O
O
NH
O
+O
O
O
O
NH
O
MnO2120 °C, toluene
69 70
According to GP4 dimethyl 6-acetamido-3,5-dimethylcyclohexa-1,3-diene-1,2-dicarboxy-
late (1.40 g, 5 mmol) was reacted. The product was purified by column chromatography
Rf : 0.52 (SiO2, EtOAc). The product was isolated as white solid and was used for reaction
5.9.1, 5.9.2 and 5.9.3.
Yield: 1.24 g, 4.85 mmol, 89%.
1H NMR (CDCl3, 300 MHz)
δ (ppm) = 2.15 (s; 3H; CH3), 2.24 (s; 3H; CH3), 2.35 (s; 3H; CH3), 3.83 (s; 3H; CH3), 3.84 (s;
3H; CH3), 7.21 (s; 1H; CHar), 8.24 (s; 1H; NH).
5.8.2 Synthesis of dimethyl 3-(2-(ethoxycarbonyl)-5-oxopyrrolidin-1-
yl)-4,6-dimethylbenzene-1,2-dioate
N O
O
O
O
OEtO2C
+ MnO2
N O
O
O
O
OEtO2C
120°C, toluene
77 78
According to GP4 (6S)-dimethyl 6-((S)-2-(ethoxycarbonyl)-5-oxopyrrolidin-1-yl)-3,5-di-
methylcyclohexa-1,3-diene-1,2-dicarboxylate (77) (1.89 g, 5 mmol) was reacted. The product
was purified by column chromatography Rf: 0.52 (SiO2, EtOAc). The product 78 was isolated
as white solid and was used for reaction 4.9.4
Yield: 1.60 g, 4.25 mmol, 85%.
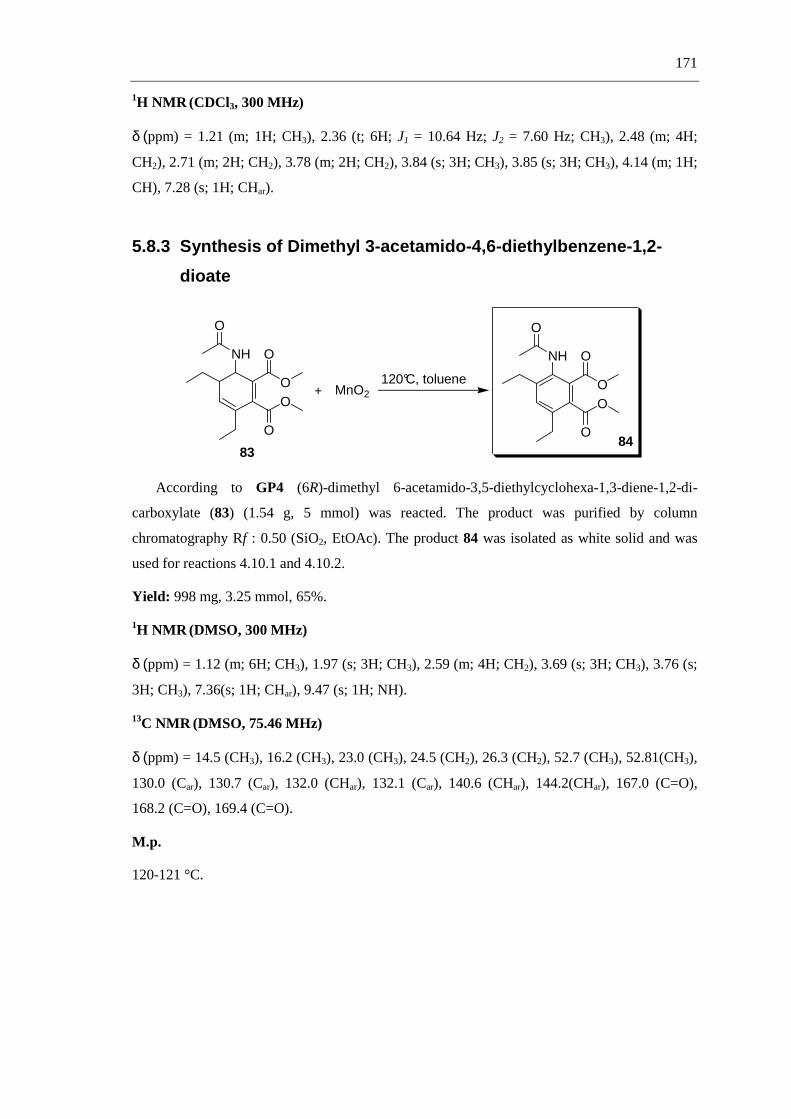
171
1H NMR (CDCl3, 300 MHz)
δ (ppm) = 1.21 (m; 1H; CH3), 2.36 (t; 6H; J1 = 10.64 Hz; J2 = 7.60 Hz; CH3), 2.48 (m; 4H;
CH2), 2.71 (m; 2H; CH2), 3.78 (m; 2H; CH2), 3.84 (s; 3H; CH3), 3.85 (s; 3H; CH3), 4.14 (m; 1H;
CH), 7.28 (s; 1H; CHar).
5.8.3 Synthesis of Dimethyl 3-acetamido-4,6-diethylbenzene-1,2-
dioate
O
O
O
O
NH
O
+ O
O
O
O
NH
O
MnO2120°C, toluene
8384
According to GP4 (6R)-dimethyl 6-acetamido-3,5-diethylcyclohexa-1,3-diene-1,2-di-
carboxylate (83) (1.54 g, 5 mmol) was reacted. The product was purified by column
chromatography Rf : 0.50 (SiO2, EtOAc). The product 84 was isolated as white solid and was
used for reactions 4.10.1 and 4.10.2.
Yield: 998 mg, 3.25 mmol, 65%.
1H NMR (DMSO, 300 MHz)
δ (ppm) = 1.12 (m; 6H; CH3), 1.97 (s; 3H; CH3), 2.59 (m; 4H; CH2), 3.69 (s; 3H; CH3), 3.76 (s;
3H; CH3), 7.36(s; 1H; CHar), 9.47 (s; 1H; NH).
13C NMR (DMSO, 75.46 MHz)
δ (ppm) = 14.5 (CH3), 16.2 (CH3), 23.0 (CH3), 24.5 (CH2), 26.3 (CH2), 52.7 (CH3), 52.81(CH3),
130.0 (Car), 130.7 (Car), 132.0 (CHar), 132.1 (Car), 140.6 (CHar), 144.2(CHar), 167.0 (C=O),
168.2 (C=O), 169.4 (C=O).
M.p.
120-121 °C.

172
X-Ray
Figure 128: Crystal structure of dimethyl 3-acetamido-4,6-diethylbenzene-1,2-diote (84)
5.9 Synthesis of Phthalimides from aniline derivatives
5.9.1 Synthesis of N-(2-Benzyl-4,6-dimethyl-1,3-dioxoisoindolin-7-
yl)acetamide
O
O
O
O
NH
O
NH2
N
O
O
NH
O
7071
This reaction was carried out using different conditions and could not be successfully
performed. The reaction conditions are given in table 32.
Table 32: Reaction conditions for the synthesis of N-(2-benzyl-4,6-dimethyl-1,3-dioxoisoindolin-7-yl)acetamide (71).
Equiv. Solvent Temp. °C Cat. h (hours) Work-up
a. 1:1 No solvent 120 No cat. 24 Extraction with CH2Cl2
b. 1 Benzylamine 120 BF3 24 Extraction with CH2Cl2
c. 1:6 Toluene 120 BF3 24 Extraction with CH2Cl2 and washed with NaHCO3
d. 1:6 Toluene 120 BF3 56 Extraction with CH2Cl2 , washed with NaHCO3. PLC (2:1, EtOAc / cyclohexane)
e. 1:1 Toluene 120 10% N-MM
56 Extraction with CH2Cl2 , washed with NaHCO3. Column Chromatography (2:1, EtOAc / cyclohexane)

173
5.9.2 Synthesis of N-(2-(Diphenylamino)-4,6-dimethyl-1,3-dioxoiso-
indolin-7-yl)acetamide
O
O
O
O
NH
O
H2N N
N
NH O
O
N
O
Toluene, 48h
70
72
The preparation and work up were carried out according to GP1. Dimethyl 3-acetamido-
4,6-dimethylbenzene-1,2-dioate (70) (152,3 mg, 0.54 mmol), 2,2-diphenylhydrazine (120.0 mg,
0.54 mmol) and Et3N 0.05 mL were used. The reaction was not successful.
5.9.3 Synthesis of Dimethyl 3-acetamido-4,6-dimethylbenzene-1,2-
dioate
O
O
O
O
NH
O
NH2(CH2)2N NH
N
O
O
O
N
7073
This reaction was carried out with different conditions and was not successful. [65] The
conditions are given in table 33.
Table 33: Reaction conditions for the synthesis of dimethyl-3-acetamido-4,6-dimethyl-benzene-1,2-dioate (73).
Equiv. Solvent Temp. °C h (hours) Work-up
a. 1:1 No solvent 100 72 Column Chromatography (EtOH / Cyclohexane, 9:1)
b. 1:1 No solvent 100 24 Column Chromatography (EtOH / Cyclohexane, 8:2)

174
5.9.4 Synthesis of Ethyl 1-(2-(2-(dimethylamino)ethyl)-4,6-dimethyl-
1,3-dioxoisoindolin-7-yl)-5-oxopyrrolidine-2-carboxylate
N O
O
O
O
O
NH2(CH2)2NN
O
N
O
O
EtO2C EtO2C
N
7879
In a 25 mL flask 1.13 g (3.00 mmol) of dimethyl 3-(2-(ethoxycarbonyl)-5-oxopyrrolidin-1-
yl)-4,6-dimethylbenzene-1,2-dioate (78) was dissolved in 10 mL of N,N-dimethylethane-1,2-
diamine. The mixture was stirred at 100 °C for 24 h. After evaporation, the crude residue was
purified by column chromatography (EtOAc / methanol 9:1).[65] The desired product (79) could
not be isolated.
The conducted reaction led to the formation of the dehydroaminated phthalimide derivate
(80) and the amine phthalimide derivate (81) in a 5:1 ratio.
N O
O
O
O
O
+ NH2(CH2)2N
EtO2C
N
O
ON
NH2
N
O
ON+
5 : 1
7880 81
5.10 Reactions of Dimethyl 3-acetamido-4,6-diethylbenzene-
1,2-dioate with acid and basic
5.10.1 Reaction with mineralic acid
O
O
O
O
NH
O
+ HClO
O
O
O
NH2
8485
EtOH
A mixture of dimethyl 3-acetamido-4,6-diethylbenzene-1,2-dioate (84) (100 mg,
0.32 mmol), 0.5 mL conc. HCl and 0.25 mL ethanol was heated to 85°C for 5 h. After cooling

175
to room temperature, 2 mL of water were added. Then a 40% KOH solution was added until the
solution became basic pH. The product 85 was extracted with EtOAc and purified by PLC
(SiO2, EtOAc / cyclohexane, 7:3).[94]
Yield: 56.8 mg, 0.21 mmol, 66%.
1H NMR (CDCl3, 300 MHz)
δ (ppm) = 1.20 (m; 3H; CH3), 1.42 (m; 3H; CH3), 2.52 (m; 4H; CH2), 3.84 (s; 3H; CH3), 3.87 (s;
3H; CH3), 5.56 (s; 2H; NH2), 7.07 (s; 1H; CHar).
5.10.2 Reaction with base
O
O
O
O
NH
O
+ NaOH
NH2
O-
O
O-
O84
86
EtOH
Dimethyl 3-acetamido-4,6-diethylbenzene-1,2-dioate (84) (100 mg, 0.32 mmol), and
sodium hydroxide (65 mg, 1.62 mmol) were dissolved in EtOH (0.8 mL) and heated for 2 h at
90°C in a closed vessel. After heating was finished, water was added to the reaction mixture and
the resulting solution was extracted. The extraction was tried with ether, EtOAc and CH2Cl2 but
was not successful. [95]
5.11 Synthesis of Phthalimide-Serine Couples
5.11.1 Synthesis of 2-(methoxycarbonyl)-4,5-dimetoxy-
benzoic acid
MeO
MeOO
O
O
MeO
MeO COOMe
COOHMeOH
88 89
A 100 mL flask was charged with (1.04 g, 85 mmol) of 4,5-dimethoxyphthalic anhydride
(88) [96] and 30 mL of dry methanol. The mixture was stirred and heated to reflux until the solid
was completely dissolved. The heating and stirring was continued for 2h. Then, the excess of

176
methanol was evaporated in vacuo. The product 89 was a semicrystalline solid that could
directly be used for the following transformation.
Yield: 1.14 g, 4.74 mmol, 95%.
1H NMR (CD 3CN, 300 MHz)
δ (ppm) = 3.92 (s; 3H; CH3), 3.96 (s; 3H; CH3), 3.97 (s; 3H; CH3), 7.19 (s; 1H; CHar), 7.47 (s;
1H; CHar).
13C NMR (+APT, CD3CN, 75.46 MHz)
δ (ppm) = 53.0 (CH3), 56.3 (CH3 x 2), 103.4 (CHar), 106.2 (CHar), 123.3 (Car), 126.3 (Car), 150.3
(Car), 151.6 (Car), 168.9 (C=O), 170.6 (C=O).
5.11.2 Synthesis of N-Hydroxysuccinimide ester of 2-(Methoxy-
carbonyl)-4,5-dimethoxybenzoic acid
MeO
MeO COOMe
COOH MeO
MeO
O
O
COOMe
N
O
O
1.NHS 2.DCC
89 90
To a mixture of 1.20 g (5 mmol) of 2-(methoxycarbonyl)-4.5-dimethoxybenzoic acid (89)
and (575 mg, 5 mmol) of N-hydroxysuccinimide 50 mL of dry CH2Cl2 was added and the
reaction flask was cooled to 0-5 °C using an ice bath. Then (1.14 g, 5.5 mmol) of DDC were
added and the mixture was vigorously stirred overnight. After completion of the reaction,
determined by TLC, the mixture was diluted with 100 mL of EtOAc and the precipitated solid
was filtered off. The remaining organic phase was evaporated. The product 90 was an
amorphous solid.
Yield: 1.38 g, 4.09 mmol, 93%.
1H NMR (CD 3CN, 300 MHz)
δ (ppm) = 2.6 (s; 4H; CH2), 3.83 (s; 3H; CH3), 3.89 (s; 3H; CH3), 3.9 (s; 3H; CH3), 7.31 (s; 1H;
CHar), 7.35 (s; 1H; CHar).
13C NMR (+APT, CD3CN, 75.46 MHz)
δ (ppm) = 25.5 (CH2 x 2), 52.5 (CH3), 55.9 (CH3), 56.0 (CH3), 104.2 (CHar), 105.6 (CHar), 118.5
(Car), 126.6 (Car), 151.0 (Car), 152.6 (Car), 162.6 (C=O), 166.8 (C=O), 170.1 (C=O), 170.3
(C=O).

177
5.11.3 Synthesis of 3-Hydroxy-2-(5,6-dimethoxy-1,3-
dioxoisoindo-lin-2-yl)propanoic acid
MeO
MeO
O
O
COOMe
N
O
O+ HO OH
O
NH22. MeCN/H20
N
O
O
COOH
OH
MeO
MeO
1. Et3N
90 91
210 mg (2 mmol) of serine were dissolved in 2 mL of distilled water at room temperature.
To this solution 0.7 mL (5 mmol) of triethylamine were added, followed by 10 mL of
acetonitrile and 674 mg (2 mmol) of N-hydroxysuccinimide ester of 2-(methoxycarbonyl)-4,5-
dimethoxybenzoic acid (90). The mixture was stirred for 6 h. After evaporating most of the
acetonitrile in vacuo, the solution was treated with 15 mL of saturated NaHCO3 solution and
washed with EtOAc (2 x 15 mL). The aqueous phase was acidified with HCl 6 N until pH ≈ 2
and extracted with dichloromethane (3 x 15 mL). The organic phase was dried over MgSO4,
filtered and evaporated. The product 91 was isolated a viscous oil.
Yield: 440 mg, 1.49 mmol, 74%.
1H NMR (CD 3CN, 300 MHz)
δ (ppm) = 3.97 (s; 6H; CH3), 4.10 (m; 2H; CH2), 4.90 (m; 1H; CH), 7.38 (s; 2H; CHar).
13C NMR (+APT, CD3CN, 75.46 MHz)
δ (ppm) = 53.8 (CH), 56.2 (OCH3 x 2), 59.2 (CH2), 105.6 (CHar), 125.0 (Car x 2), 154.4
(Car x 2), 167.9 (C=O), 168.7 (C=O).
5.11.4 Synthesis of 3-Acetoxy-2-(5,6-dimethoxy-1,3-dioxoisoin-
dolin-2-yl)propanoic acid
N
O
O
COOH
OH
MeO
MeO
+ AcCl N
O
O
COOH
OAc
MeO
MeO
r.T, 4h
91 92
In a 50 mL flask 295 mg (1 mmol) of 3-hydroxy-2-(5,6-dimethoxy-1,3-dioxoisoindolin-2-
yl)propanoic acid (91) was dissolved in 4 mL of acetyl chloride at room temperature. The
mixture was stirred for 4 h, then the excess of acetyl chloride was distilled off in vacuo. A 1:1
mixture of acetone and water (10 mL) was added and the acetone evaporated under reduced
pressure. The solution was treated with 15 mL of NaHCO3 solution and washed with ethyl
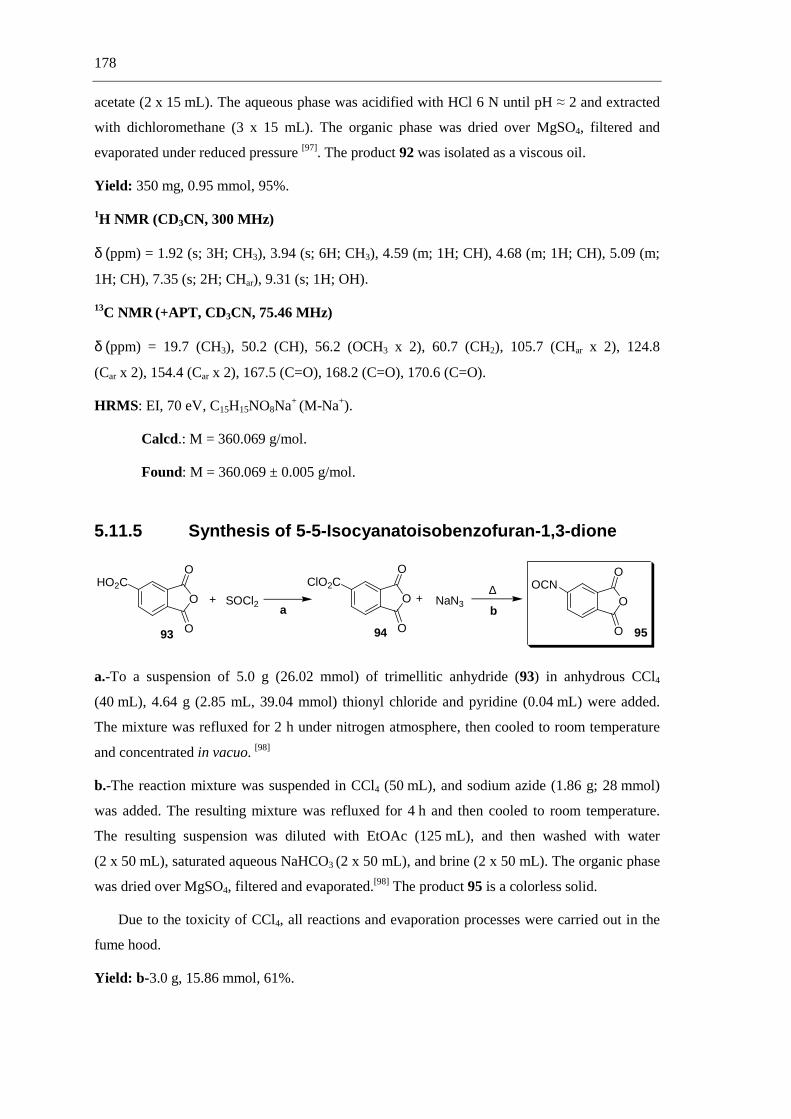
178
acetate (2 x 15 mL). The aqueous phase was acidified with HCl 6 N until pH ≈ 2 and extracted
with dichloromethane (3 x 15 mL). The organic phase was dried over MgSO4, filtered and
evaporated under reduced pressure [97]. The product 92 was isolated as a viscous oil.
Yield: 350 mg, 0.95 mmol, 95%.
1H NMR (CD 3CN, 300 MHz)
δ (ppm) = 1.92 (s; 3H; CH3), 3.94 (s; 6H; CH3), 4.59 (m; 1H; CH), 4.68 (m; 1H; CH), 5.09 (m;
1H; CH), 7.35 (s; 2H; CHar), 9.31 (s; 1H; OH).
13C NMR (+APT, CD3CN, 75.46 MHz)
δ (ppm) = 19.7 (CH3), 50.2 (CH), 56.2 (OCH3 x 2), 60.7 (CH2), 105.7 (CHar x 2), 124.8
(Car x 2), 154.4 (Car x 2), 167.5 (C=O), 168.2 (C=O), 170.6 (C=O).
HRMS: EI, 70 eV, C15H15NO8Na+ (M-Na+).
Calcd.: M = 360.069 g/mol.
Found: M = 360.069 ± 0.005 g/mol.
5.11.5 Synthesis of 5-5-Isocyanatoisobenzofuran-1,3-dione
O
O
O
HO2CO
O
O
SOCl2 O
O
O
OCNNaN3
∆+ +
ClO2C
a b
93 94 95
a.-To a suspension of 5.0 g (26.02 mmol) of trimellitic anhydride (93) in anhydrous CCl4
(40 mL), 4.64 g (2.85 mL, 39.04 mmol) thionyl chloride and pyridine (0.04 mL) were added.
The mixture was refluxed for 2 h under nitrogen atmosphere, then cooled to room temperature
and concentrated in vacuo. [98]
b.-The reaction mixture was suspended in CCl4 (50 mL), and sodium azide (1.86 g; 28 mmol)
was added. The resulting mixture was refluxed for 4 h and then cooled to room temperature.
The resulting suspension was diluted with EtOAc (125 mL), and then washed with water
(2 x 50 mL), saturated aqueous NaHCO3 (2 x 50 mL), and brine (2 x 50 mL). The organic phase
was dried over MgSO4, filtered and evaporated.[98] The product 95 is a colorless solid.
Due to the toxicity of CCl4, all reactions and evaporation processes were carried out in the
fume hood.
Yield: b-3.0 g, 15.86 mmol, 61%.

179
1H NMR (acetone-d6, 300 MHz)
δ (ppm) = 8.27 (d; 1H; J = 8.01 Hz; CHar), 8.53 (s; 1H; CHar), 8.62 (d; 1H; J = 8.26 Hz; CHar).
13C NMR (acetone-d6, 75.46 MHz)
δ (ppm) = 125.3 (CHar), 125.9 (CHar), 130.0 (C=O), 132.2 (Car), 132.4 (Car), 136.3 (CHar), 137.4
(Car), 162.5 (2-C=O).
IR
ν (cm-1) = 3083 (w), 2935 (m),2931 (m), 2203 (m), 2151 (s), 1857 (ms), 1776 (s),1731 (ms),
1681 (s), 1430 (m), 1348 (m), 1271 (s), 1238 (s), 1178 (m).
GC-Ms
[M +] = 189.00 (100%).
5.11.6 Synthesis of 2-(Methoxycarbonyl)-5-(methoxycarbonyl-
amino)benzoic acid
O
O
O
HNO
OMeOH
HNO
O
MeOH (exc)+O
O
O
OCN CO2H
CO2Mea b
reflux
95 96 97
A 100-mL flask was charged with 945 mg (5 mmol) of 5-isocyanatoisobenzofuran-1,3-
dione (95) and 30 mL of dry methanol were added. The mixture was stirred and heated to reflux
until the solid completely dissolved. The heating and stirring was continued for 2 h. Then the
excess of methanol was evaporated in vacuo. The product 97 was a semycrystalline solid that
could directly be used in the following step. A small amount of the regioisomeric hemiester
could be detected, but was used as well since both lead to the same phthalimide. The reaction
with the alcohol can be conducted stepwise, first treating with 1 equiv. of methanol in
toluene [99] then with excess methanol.
Yield: 1.16 g, 4.58 mmol, 92%.
1H NMR (DMSO-d 6, 300 MHz)
δ (ppm) = 3.70 (s; 3H; CH3), 3.79 (s; 3H; CH3), 7.60-7.80 (m; 3H; CHar), 10.10 (m; 1H; NH).
13C NMR (+APT, DMSO-d6, 75.46 MHz)
δ (ppm) = 52.3 (CH3), 52.8 (CH3), 116.9 (CHar), 119.3 (CHar), 124.4 (Car), 131.1 (CHar), 135.2
(Car), 142.8 (Car), 154.3 (OC=ONH), 167.5 (C=O), 169.0 (C=O).

180
5.11.7 Synthesis of N-Hydroxysuccinimide ester of 2-(Methoxy-
carbonyl)-5-(methoxycarbonylamino)benzoic acid
HNO
OO
ON
1. DCC2. NHS
HNO
O
CO2H
CO2Me CO2MeO
O
97 98
To a mixture of 1.27 g (5 mmol) 2-(methoxycarbonyl)-5-(methoxycarbonylamino) benzoic
acid (97) and 575 mg of N-hydroxysuccinimide, 50 mL of dry CH2Cl2 were added and the
reaction flask was cooled to 0-5 °C using an ice bath. Then, 1.14 g (5.5 mmol) of DCC were
added and the mixture was vigorously stirred overnight. After completion of the reaction
(determined by TLC) the mixture was diluted with 100 mL of EtOAc and the precipitated solid
was filtered off. The remaining organic phase was evaporated in vacuo. The product was an
amorphous solid. A small amount of the regioisomeric ester was present, but could used directly
since both lead to the same phthalimide.
Yield: 155 g, 4.42 mmol, 88%.
1H NMR (DMSO-d 6, 300 MHz)
δ (ppm) = 2.88 (s; 4H; CH2), 3.73 (s; 3H; CH3), 3.81 (s; 3H; CH3), 7.80-8.05 (m; 3H; CHar),
10.4 (m; 1H, NH).
13C NMR (+APT, DMSO-d6, 75.46 MHz)
δ (ppm) = 26.0 (CH2 x 2), 52.6 (CH3), 53.4 (CH3), 117.4 (Car), 117.9 (CHar), 119.8 (CHar), 132.0
(CHar), 135.7 (Car), 145.1 (Car), 152.4 (OC=ONH), 161.8 (C=O), 167.5 (C=O), 170.6 (C=O x 2).
5.11.8 Synthesis of 3-Hydroxy-2-(5-methoxycarbonylamino-1,3-
dioxoisoindolin-2-yl) propanoic acid
NCOOH
OH
O
O
HNO
O
HNO
OO
ON
O
OCO2Me
+ HO OH
O
NH2
1. Et3N
2. MeCN/H20
98 99
Serine 210 mg; 2 mmol was disolved in 2 mL of distillied water at room temparature. To
this solution 0.7 mL (5 mmol) of triethylamine were added, followed by 10 mL of acetonitrile
and 700 mg (2 mmol) of the N-hydroxysuccinimide ester of 2-(methoxy-carbonyl)-5-(methoxy-
carbonylamino)benzoic acid (98). The mixture was stirred for 6 h. After evaporating most of the

181
acetonitrile in vacuo, the solution was treated with 15 mL of a saturated NaHCO3 solution and
washed with ethyl acetate (2 x 15 mL). The aqueous phase was acidified with 6 N HCl until
pH ≈ 2 and extracted with dichloromethane (3 x 15 mL). The organic phase was dried over
MgSO4, filtered and evaporated. The product 99 was isolated as a viscous oil.
Yield: 155 g, 4.42 mmol, 88%.
1H NMR (CD 3CN, 300 MHz)
δ (ppm) = 3.75 (s; 3H; CH3), 4.10 (m; 2H; CH2), 4.93 (m; 1H; CH), 7.74 (m; 2H; CHar), 7.98
(m; 1H; CHar), 8.37 (m; 1H; NH).
13C NMR (+APT, CD3CN, 75.46 MHz)
δ (ppm) = 52.3 (CH), 54.1 (CH3), 59.0 (CH2), 112.2 (CHar), 122.7 (CHar), 124.5 (CHar), 125.0
(Car), 133.4 (Car), 145.1 (Car), 153.9 (OC=ONH), 167.4 (C=O), 167.6 (C=O), 168.6 (C=O).
5.11.9 Synthesis of 3-acetoxy-2-(5-methoxycarbonylamino-1,3-
dioxoisoindolin-2-yl)propanoic acid
NCOOH
OH
O
O
HNO
O+ AcCl N
COOH
OAc
O
O
HNO
O
r.t., 4h
99 100
In a 50 mL flask 308 mg (1 mmol) of 3-hydroxy-2-(5-methoxycarbonylamino-1,3-dioxoiso-
indolin-2-yl)propanoic acid (99) was dissolved in 4 mL of acetyl chloride at room temperature.
The mixture was stirred for 4 h, then the excess of acetyl chloride was distilled off in vacuo. A
1:1 mixture of acetone and water (10 mL) was added, and the acetone was evaporated. The
solution was treated with 15 mL of a NaHCO3 solution and washed with ethyl acetate
(2 x 15 mL). The aqueous phase was acidified with 6 N HCl until pH ≈ 2 and extracted with
dichloromethane (3 x 15 mL). The organic phase was dried over MgSO4, filtered and
evaporated. [97] The product 100 was isolated as a viscous oil.
Yield: 325 mg, 0.92 mmol, 93%.
1H NMR (CD 3CN, 300 MHz)
δ (ppm) = 1.93 (s; 3H; CH3), 3.77 (s; 3H; CH3), 4.60 (m; 1H; CH2), 4.70 (m; 1H; CH2), 5.14 (m;
1H; CH), 7.77 (m; 2H; CHar), 8.03 (m; 1H; CHar), 8.39 (m; 1H; NH).

182
13C NMR (+APT, CD3CN, 75.46 MHz)
δ (ppm) = 19.8 (CH3), 50.5 (CH), 52.5 (CH3), 60.6 (CH2), 112.3 (CHar), 122.8 (CHar), 124.6
(CHar), 124.8 (Car), 133.2 (Car), 145.2 (Car), 153.9 (OC=ONH), 166.9 (C=O), 167.1 (C=O),
167.7 (C=O), 170.5 (C=O).
HRMS: EI, 70 eV, C15H14N2O8Na+ (M-Na+).
Calcd.: M = 373.064 g/mol.
Found: M = 373.064 ± 0.005 g/mol.
5.11.10 Procedure for the irradiation of caged acetates, 3-
acetoxy-2-(5,6-dimethoxy-1,3-dioxoisoindolin-2-yl)propanoic
acid and 3-acetoxy-2-(5-methoxycarbonylamino-1,3-
dioxoisoindolin-2-yl) propanoic acid
N
OCOO-
OAcO
R1
R2
N
O
O
R1
R2
hν+ CO2 + AcO-
R1 = R2 = OMe 92
R1 = NHCOOMe R2 = H 100R1 = R2 = OMe 101
R1 = NHCOOMe R2 = H 102
Solutions of 0.2 mmol of 3-acetoxy-2-(5,6-dimethoxy-1,3-dioxoisoindolin-2-yl)propanoic
acid (92) and 3-acetoxy-2-(5-methoxycarbonylamino-1,3-dioxoisoindolin-2-yl)propanoic
acid(100) in 50 mL of phosphate buffer at pH = 7 were irradiated at 15-20°C for 2 h with
phosphor-coated mercury low-pressure lamps (emission maximum at 350 ± 20 nm). The
resulting alkenyl-phthalimide was extracted with CH2Cl2 (3 x 50 mL). The organic phase was
dried over MgSO4, filtered and the solvent evaporated in vacuo. The residue was dissolved in
deuterated solvent and analyzed by NMR. In the aqueous phase, the liberated acetate was
analyzed after irradiation using a modification of a published method. [100] By addition of benzyl
bromide and warming at 50 °C for 4 h, acetate was derivatized as benzyl acetate. It was then
extracted with CH2Cl2 and detected by GC, comparing with an authentic sample.

183
5.11.10.1 Irradiation of 3-Acetoxy-2-(5,6-dimethoxy-1,3-dioxo-isoindolin-
2-yl)propanoic acid. Synthesis of 5,6-Dimethoxy-2-vinylisoindoline-
1,3-dione
N
O
O
MeO
MeO101
1H NMR (CDCl 3, 300 MHz)
δ (ppm) = 4.00 (s; 6H; CH3), 4.95 (d;1H; J = 10.0Hz, CH), 5.98 (d; 1H;J = 16.0 Hz; CH),
6.81 (dd; 1H; J1 = 10.0 Hz; J2 = 16.0 Hz; CH), 7.31 (s; 2H; CHar).
13C NMR (+DEPT, CDCl3, 75.46 MHz)
δ (ppm) = 53.6 (CH3), 103.0 (CH2), 105.3 (CH), 123.8 (CHar), 125.0 (Car), 154.2 (Car),
166.5 (C=O).
5.11.10.2 Irradiation of 3-Acetoxy-2-(5-methoxycarbonylamino-1,3-
dioxoisoindolin-2-yl) propanoic acid. Synthesis of Methyl (1,3-dioxo-
2vinylisoindolin-5-yl)carbamate
N
O
O
MeO2CHN
102
1H NMR (DMSO-d 6 300 MHz)
δ (ppm) = 3.73 (s; 3H; CH3), 5.0 (d,1H; J = 10.0 Hz; CH), 5.87 (d; 1H; J = 16 Hz; CH), 6.76
(dd; 1H; J1 = 10.0 Hz; J2 = 16.0 Hz; CH), 7.77 (m; 2H; CHar), 8.01 (m; 1H; CHar), 10.40 (s; 1H;
NH).
13C NMR (+DEPT, DMSO-d6, 75.46 MHz)
δ (ppm) = 52.6 (CH3), 103.7 (CH2), 112.1 (CH), 123.1 (CHar), 124.4 (Car), 124.7 (CHar), 125.2
(CHar), 133.3 (Car), 145.9 (Car), 154.2 (OC=ONH), 166.3 (C=O), 166.5 (C=O).

184
5.12 Synthesis of chiral phthalimide-Urea-Conjugates
5.12.1 Synthesis of 1-(2-Benzyl-1,3-dioxoisoindolin-4-yl)-3-((R)-
1-phenylethyl)urea
N
O
O
NH2
+NCO
N
O
O
NHNH
O
47 104 105a
This product was not provided satisfactorily with the method presented in table 34.
Table 34: Reaction conditions for the synthesis of 1-(2-benzyl-1,3-dioxoisoindolin-4-yl)-3-((R)-1-phenylethyl)urea 105a.
Equiv. Solvent Temp. °C Cat. time (min) Work-up
a. 1:1.1 EtOAc r.t No cat. 10 After evaporation of the solvent, cyclohexane was added and the product was washed with ether.
b. 1:1 EtOAc r.t Et3N 10 After evaporation of the solvent, cyclohexane was added and the product was washed with ether
c. 1:1.1 EtOAc r.t N-MM 30 After evaporation of the solvent, the residue was crystallized from benzene.
5.12.2 Synthesis of 1-(1,3-Dioxo-2-p-tolylisoindolin-4-yl)-3-((R)-
1-phenylethyl)urea
N
O
O
NH2
+NCO
NH
O
NH
N
O
O103 104 105b
This product was not provided satisfactorily with the methods presented in table 35.
Table 35: Reaction conditions for the synthesis of 1-(1,3-dioxo-2-p-tolylisoindolin-4-yl)-3-((R)-1-phenylethyl)urea 105b.
Eq. Solvent Temp. °C h (hours) Work-up
a. 1:1 THF 50 1 The mixture was cooled to room temperature, and the solvent was removed in vacuo. [104]
b. 1:1 t-BuOH 80 4 The solvent was evaporated under reduced pressure. The residue was crystallized from benzene.
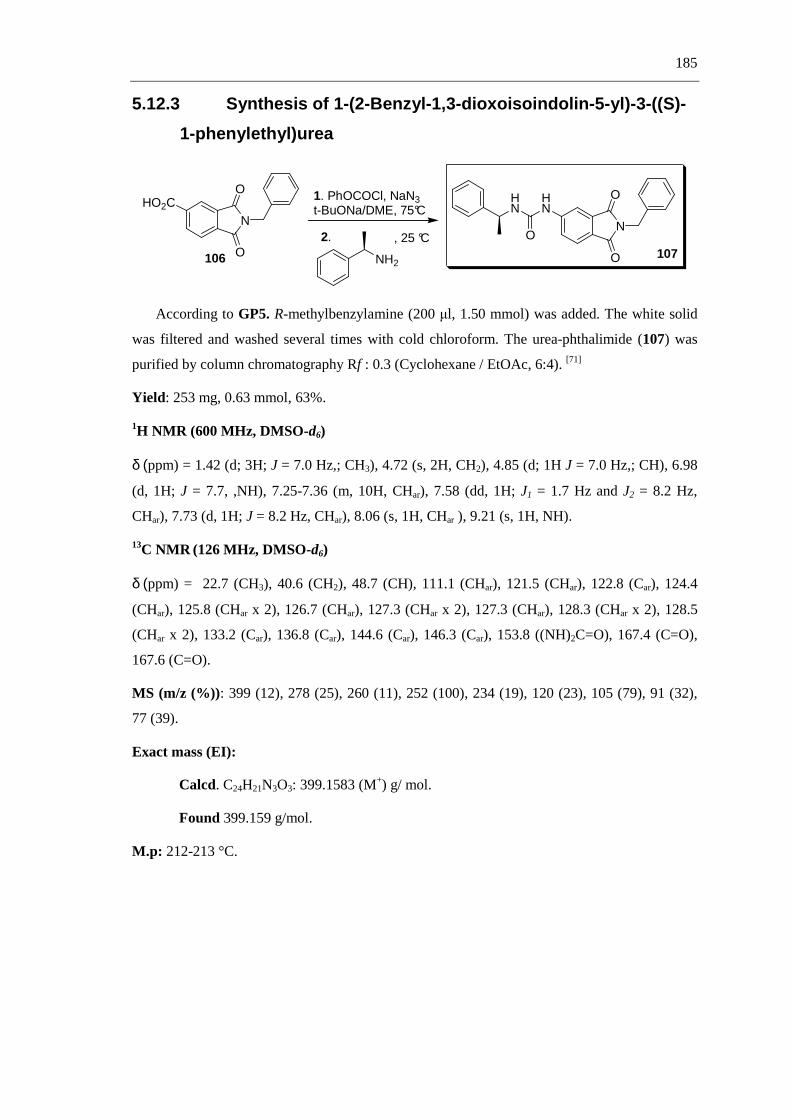
185
5.12.3 Synthesis of 1-(2-Benzyl-1,3-dioxoisoindolin-5-yl)-3-((S)-
1-phenylethyl)urea
NHO2C
O
O NH2
N
HN
O
O
HN
O2. , 25 °C
1. PhOCOCl, NaN3t-BuONa/DME, 75°C
106 107
According to GP5. R-methylbenzylamine (200 µl, 1.50 mmol) was added. The white solid
was filtered and washed several times with cold chloroform. The urea-phthalimide (107) was
purified by column chromatography Rf : 0.3 (Cyclohexane / EtOAc, 6:4). [71]
Yield: 253 mg, 0.63 mmol, 63%.
1H NMR (600 MHz, DMSO-d6)
δ (ppm) = 1.42 (d; 3H; J = 7.0 Hz,; CH3), 4.72 (s, 2H, CH2), 4.85 (d; 1H J = 7.0 Hz,; CH), 6.98
(d, 1H; J = 7.7, ,NH), 7.25-7.36 (m, 10H, CHar), 7.58 (dd, 1H; J1 = 1.7 Hz and J2 = 8.2 Hz,
CHar), 7.73 (d, 1H; J = 8.2 Hz, CHar), 8.06 (s, 1H, CHar ), 9.21 (s, 1H, NH).
13C NMR (126 MHz, DMSO-d6)
δ (ppm) = 22.7 (CH3), 40.6 (CH2), 48.7 (CH), 111.1 (CHar), 121.5 (CHar), 122.8 (Car), 124.4
(CHar), 125.8 (CHar x 2), 126.7 (CHar), 127.3 (CHar x 2), 127.3 (CHar), 128.3 (CHar x 2), 128.5
(CHar x 2), 133.2 (Car), 136.8 (Car), 144.6 (Car), 146.3 (Car), 153.8 ((NH)2C=O), 167.4 (C=O),
167.6 (C=O).
MS (m/z (%)): 399 (12), 278 (25), 260 (11), 252 (100), 234 (19), 120 (23), 105 (79), 91 (32),
77 (39).
Exact mass (EI):
Calcd. C24H21N3O3: 399.1583 (M+) g/ mol.
Found 399.159 g/mol.
M.p: 212-213 °C.

186
5.12.4 Synthesis of 1-((1R,2S)-2-Aminocyclohexyl)-3-(2-benzyl-
1,3-dioxoisoindolin-5-yl)urea
NHO2C
O
ONH2
NH2
N
HN
O
O
HN
ONH2
2. , 25 °C
1. PhOCOCl, NaN3t-BuONa/DME, 75°C
106108
This reaction was carried out according to GP5 but the method did not provide the desired
product 108.
5.12.5 Synthesis of 1-(2-Benzyl-1,3-dioxoisoindolin-5-yl)-3-
((1R,2R)-1-hydroxy-1-phenylpropan-2-yl)urea
NHO2C
O
O
NH2
OHN
HN
O
O
HN
O
OH
2. , 25 °C
1. PhOCOCl, NaN3t-BuONa/DME, 75°C
106109
Acoording to GP5 (1R,2S)-2-amino-1-phenylpropan-1-ol (226 mg, 1.5 mmol) was added.
The product 109 was purified by column chromatography Rf: 0.41 (SiO2, EtOAc / hexane, 7:3)
and crystallized from benzene / EtOH, 9:1.
Yield: 278 mg, 0.65 mmol, 65%.
1H NMR (DMSO, 300 MHz)
δ (ppm) = 0.88 (d; 3H; J =6.78 Hz; CH3), 3.89 (m; 1H; CH), 4.73 (s; 3H; CH2 and OH), 5.59 (d;
1H; J = 4.90 Hz; CH), 6.42 (d; 1H; J = 9.42 Hz; NH), 7.21-7.38 (m; 10H; CHar), 7.56 (dd; 1H;
J1 = 1.88 Hz; J2 = 8.67 Hz; CHar), 7.74 (d; 1H; J = 8.67 Hz; CHar), 8.08 (d; 1H; J =1.50 Hz;
CHar), 9.33 (s; 1H; NH).
13C NMR (75 MHz, DMSO-d6)
δ (ppm) = 14.3 (CH3), 41.2 (CH2), 51,1 (CH), 74.5 (CH), 111.55 (CHar), 121.9 (CHar),
124.9 (Car), 126.4 (CHar), 127.2 (CHar x 2), 127.8 (CHar x 3), 128.4 (CHar x 2), 129.1 (CHar x 3),
133.8 (Car), 137.34 (Car), 143.6 (Car), 147.0 (Car), 154.4 ((NH)C=O), 167.4 (C=O), 168.2 (C=O).

187
IR
ν (cm-1) = 3390-3340 (w); 2970 (w) 1700 (s); 1690 (s); 1560 (m).
Exact mass (EI):
Calcd. C25H23N3O4: 429.16 (M+) g/mol.
Found 430,2 g/mol.
Anal:
Calcd: C 69.92 H 5.40 N 9.78.
Found: C 69.72 H 5.38 N 9.80.
M.p: 210-211 °C.
5.12.6 Synthesis of 1-(2-Benzyl-1,3-dioxoisoindolin-5-yl)-3-((R)-
1-hydroxypropan-2-yl)urea
N
HN
HN
OHO
O
O
HOOCN
O
O
NH2
OH
1. PhOCOCl, NaN3t-BuONa/DME, 75°C
2. , 25 °C
106110
According to GP5 (S)-2-aminopropan-1-ol (112 mg, 117 µL, 1.5 mmol) was added. The
product 110 was crystallized from benzene / EtOH, 9:1. The product 110 was isolated as white
powder.
Yield: 212 mg, 0.60 mmol, 60%.
1H NMR (DMSO, 300 MHz)
δ (ppm) = 1.08 (d; 3H; J = 6.99 Hz; CH3), 3.39 (m; 2H; CH2), 3.72 (m; 1H; CH), 4.74 (s; 2H;
CH2), 4.84 (m; 1H; OH), 6.28 (d; 1H; J =8.10 Hz; NH), 7.31 (m; 5H; CHar), 7.56 (dd; 1H; J1 =
1.27 Hz; J2 = 8.10 Hz; CHar), 7.73 (d; 1H; J = 8.27 Hz; CHar), 8.07 (s; 1H; CHar), 9.23 (s; 1H;
NH).
13C NMR (75 MHz, DMSO-d6)
δ (ppm) = 18.1 (CH3); 41.2 (CH2); 47.3 (CH); 64.8 (CH2); 111.6 (CHar), 121.8 (CHar); 123.2
(Car); 124.9 (CHar); 127.8 (CHar x 3); 129.0 (CHar x 2); 133.8 (Car); 137.3 (Car); 147.0 (Car);
154.6 ((N-H)C=O); 163.7 (2-C=O).
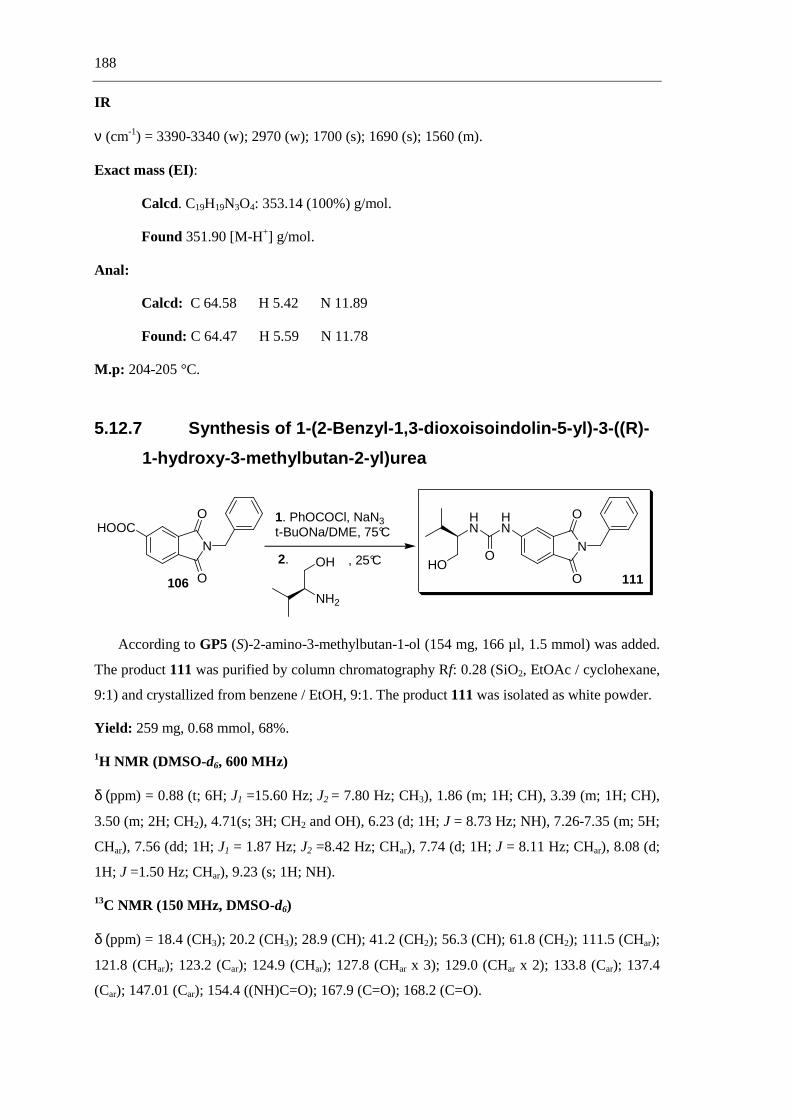
188
IR
ν (cm-1) = 3390-3340 (w); 2970 (w); 1700 (s); 1690 (s); 1560 (m).
Exact mass (EI):
Calcd. C19H19N3O4: 353.14 (100%) g/mol.
Found 351.90 [M-H+] g/mol.
Anal:
Calcd: C 64.58 H 5.42 N 11.89
Found: C 64.47 H 5.59 N 11.78
M.p: 204-205 °C.
5.12.7 Synthesis of 1-(2-Benzyl-1,3-dioxoisoindolin-5-yl)-3-((R)-
1-hydroxy-3-methylbutan-2-yl)urea
HOOCN
O
O
NH2
OHN
HN
HN
OHO
O
O
1. PhOCOCl, NaN3t-BuONa/DME, 75°C
2. , 25°C
106 111
According to GP5 (S)-2-amino-3-methylbutan-1-ol (154 mg, 166 µl, 1.5 mmol) was added.
The product 111 was purified by column chromatography Rf: 0.28 (SiO2, EtOAc / cyclohexane,
9:1) and crystallized from benzene / EtOH, 9:1. The product 111 was isolated as white powder.
Yield: 259 mg, 0.68 mmol, 68%.
1H NMR (DMSO-d6, 600 MHz)
δ (ppm) = 0.88 (t; 6H; J1 =15.60 Hz; J2 = 7.80 Hz; CH3), 1.86 (m; 1H; CH), 3.39 (m; 1H; CH),
3.50 (m; 2H; CH2), 4.71(s; 3H; CH2 and OH), 6.23 (d; 1H; J = 8.73 Hz; NH), 7.26-7.35 (m; 5H;
CHar), 7.56 (dd; 1H; J1 = 1.87 Hz; J2 =8.42 Hz; CHar), 7.74 (d; 1H; J = 8.11 Hz; CHar), 8.08 (d;
1H; J =1.50 Hz; CHar), 9.23 (s; 1H; NH).
13C NMR (150 MHz, DMSO-d6)
δ (ppm) = 18.4 (CH3); 20.2 (CH3); 28.9 (CH); 41.2 (CH2); 56.3 (CH); 61.8 (CH2); 111.5 (CHar);
121.8 (CHar); 123.2 (Car); 124.9 (CHar); 127.8 (CHar x 3); 129.0 (CHar x 2); 133.8 (Car); 137.4
(Car); 147.01 (Car); 154.4 ((NH)C=O); 167.9 (C=O); 168.2 (C=O).
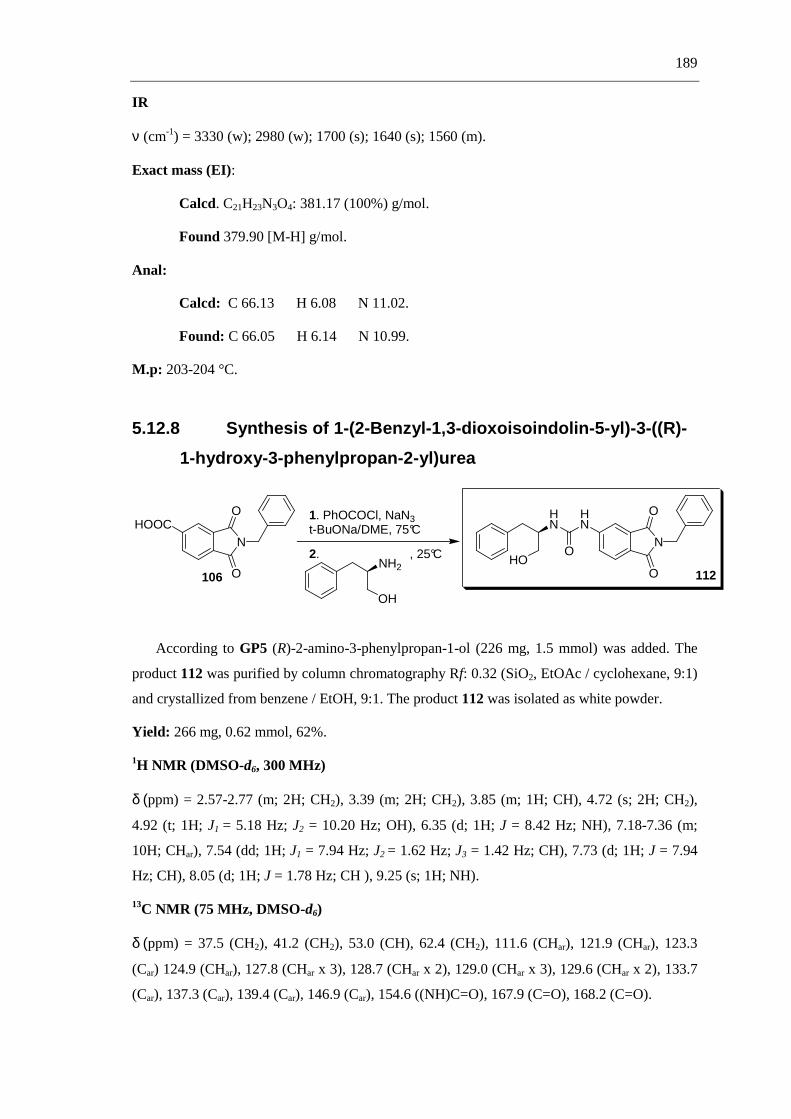
189
IR
ν (cm-1) = 3330 (w); 2980 (w); 1700 (s); 1640 (s); 1560 (m).
Exact mass (EI):
Calcd. C21H23N3O4: 381.17 (100%) g/mol.
Found 379.90 [M-H] g/mol.
Anal:
Calcd: C 66.13 H 6.08 N 11.02.
Found: C 66.05 H 6.14 N 10.99.
M.p: 203-204 °C.
5.12.8 Synthesis of 1-(2-Benzyl-1,3-dioxoisoindolin-5-yl)-3-((R)-
1-hydroxy-3-phenylpropan-2-yl)urea
N
O
O
HOOC
NH2
OH
N
O
O
HN
HN
OHO
1. PhOCOCl, NaN3t-BuONa/DME, 75°C
2. , 25°C
106 112
According to GP5 (R)-2-amino-3-phenylpropan-1-ol (226 mg, 1.5 mmol) was added. The
product 112 was purified by column chromatography Rf: 0.32 (SiO2, EtOAc / cyclohexane, 9:1)
and crystallized from benzene / EtOH, 9:1. The product 112 was isolated as white powder.
Yield: 266 mg, 0.62 mmol, 62%.
1H NMR (DMSO-d6, 300 MHz)
δ (ppm) = 2.57-2.77 (m; 2H; CH2), 3.39 (m; 2H; CH2), 3.85 (m; 1H; CH), 4.72 (s; 2H; CH2),
4.92 (t; 1H; J1 = 5.18 Hz; J2 = 10.20 Hz; OH), 6.35 (d; 1H; J = 8.42 Hz; NH), 7.18-7.36 (m;
10H; CHar), 7.54 (dd; 1H; J1 = 7.94 Hz; J2 = 1.62 Hz; J3 = 1.42 Hz; CH), 7.73 (d; 1H; J = 7.94
Hz; CH), 8.05 (d; 1H; J = 1.78 Hz; CH ), 9.25 (s; 1H; NH).
13C NMR (75 MHz, DMSO-d6)
δ (ppm) = 37.5 (CH2), 41.2 (CH2), 53.0 (CH), 62.4 (CH2), 111.6 (CHar), 121.9 (CHar), 123.3
(Car) 124.9 (CHar), 127.8 (CHar x 3), 128.7 (CHar x 2), 129.0 (CHar x 3), 129.6 (CHar x 2), 133.7
(Car), 137.3 (Car), 139.4 (Car), 146.9 (Car), 154.6 ((NH)C=O), 167.9 (C=O), 168.2 (C=O).
190
IR
ν (cm-1) = 3370-3320 (w); 3000 (w); 1700 (s); 1660 (m); 1560 (s).
Exact mass (EI):
Calcd. C25H23N3O4: 429.17 (100%) g/mol.
Found 427.90 [M-H+] g/mol.
Anal:
Calcd: C 69.92 H 5.40 N 9.78.
Found: C 69.83 H 5.44 N 9.64.
M.p: 213-214 °C.

191
5.13 Photophysical properties, anion sensing and chiral
recognition by chiral phthalimide-urea-conjugate
Absorption spectroscopy
Absorption spectra were recorded using a Beckman Coulter UV-DU800 spectrometer and a
Perkin-Elmer Lambda 35 UV/vis spectrometer. The samples were placed into quartz cells of
1 cm path length. Compound concentrations were adjusted to 10-5 M in DMSO or MeCN.
Steady-state fluorescence spectroscopy
Fluorescence and excitation spectra were carried out using a Perkin-Elmer LS-50B
luminescence spectrometer. The samples were placed into quartz cells of 1 cm path length.
Compound concentrations were adjusted as indicated. The excitation and emission slit widths
were 2.5 nm. The fluorescence quantum yields in different solvents were measured with
reference to quinine sulfate (фF = 0.546 in 0.5 M H2SO4) by comparing the area of fluorescence
and absorbance at the excitation wavelength of 340 nm, using the formula [101]
фsample = (asample/astd) (Astd/Asample) (nsample/nstd) фstd (16)
where фsample and фstd, asample and astd, nsample and nstd and Asample and Astd are the quantum yield,
area under emission spectra, refractive index and the absorbance of the sample under study
(sensor 107, 109-112) and the standard (quinine sulfate), respectively.
Time-resolved fluorescence spectroscopy
Fluorescence lifetimes were measured using a gated intensified CCD equipped mono-
chromator. The spectral resolution has been set to 2 nm. The samples were excited with the
third harmonic (355 nm) of a Nd:YAG laser. The overall instrument response function was
1.5 ns. The samples were placed into quartz cells of 1 cm path length. Compound
concentrations were adjusted as indicated.
NMR study to confirm the formation of a complex
1H NMR titration experiments were performed in CD3CN and or DMSO-d6. In the presence
of increasing equivalents of anions, the changing field shift of urea-protons was followed. The
concentrations of the solutions of the urea were between 10-15 mM and the equivalents of the
anion were between 0.025-2 equiv.
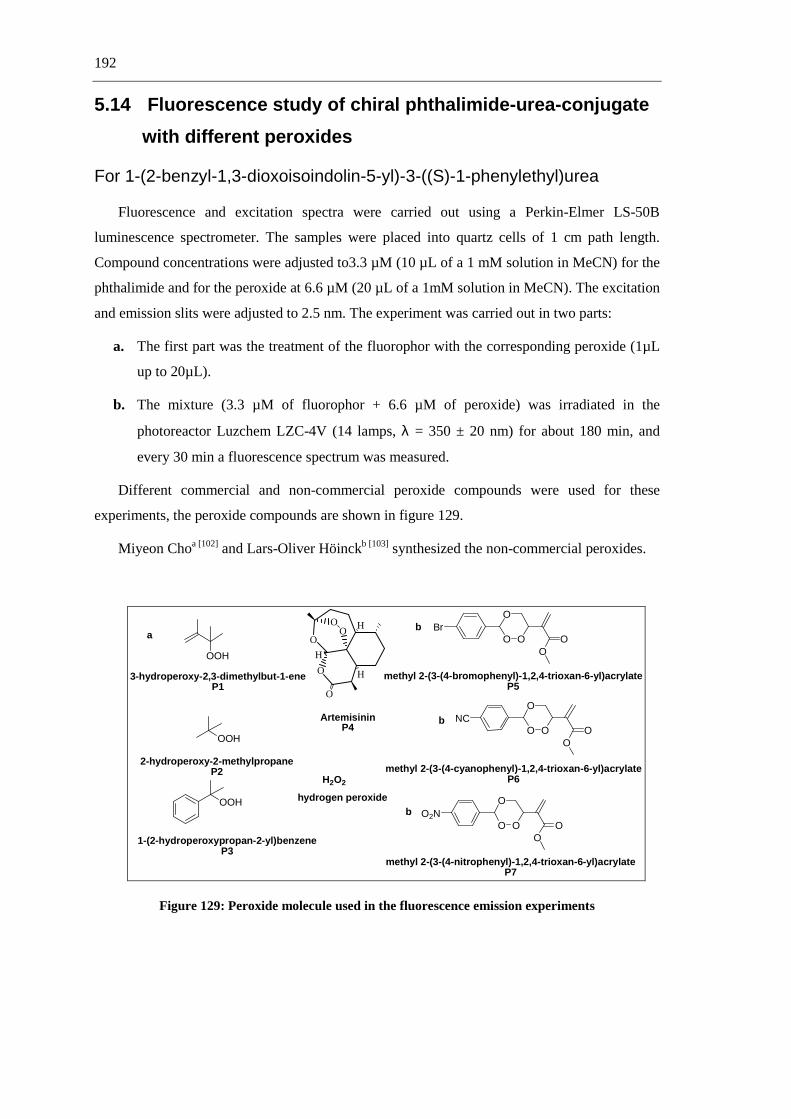
192
5.14 Fluorescence study of chiral phthalimide-urea-conjugate
with different peroxides
For 1-(2-benzyl-1,3-dioxoisoindolin-5-yl)-3-((S)-1-phenylethyl)urea
Fluorescence and excitation spectra were carried out using a Perkin-Elmer LS-50B
luminescence spectrometer. The samples were placed into quartz cells of 1 cm path length.
Compound concentrations were adjusted to3.3 µM (10 µL of a 1 mM solution in MeCN) for the
phthalimide and for the peroxide at 6.6 µM (20 µL of a 1mM solution in MeCN). The excitation
and emission slits were adjusted to 2.5 nm. The experiment was carried out in two parts:
a. The first part was the treatment of the fluorophor with the corresponding peroxide (1µL
up to 20µL).
b. The mixture (3.3 µM of fluorophor + 6.6 µM of peroxide) was irradiated in the
photoreactor Luzchem LZC-4V (14 lamps, λ = 350 ± 20 nm) for about 180 min, and
every 30 min a fluorescence spectrum was measured.
Different commercial and non-commercial peroxide compounds were used for these
experiments, the peroxide compounds are shown in figure 129.
Miyeon Choa [102] and Lars-Oliver Höinckb [103] synthesized the non-commercial peroxides.
O
O
OO
O
H
H
H
OOH
OOH
OOH
H2O2
3-hydroperoxy-2,3-dimethylbut-1-eneP1
2-hydroperoxy-2-methylpropaneP2
1-(2-hydroperoxypropan-2-yl)benzeneP3
methyl 2-(3-(4-nitrophenyl)-1,2,4-trioxan-6-yl)acrylateP7
methyl 2-(3-(4-bromophenyl)-1,2,4-trioxan-6-yl)acrylateP5
methyl 2-(3-(4-cyanophenyl)-1,2,4-trioxan-6-yl)acrylateP6
NCO O
O
OO
O2NO O
O
OO
BrO O
O
OO
hydrogen peroxide
ArtemisininP4
ab
b
b
Figure 129: Peroxide molecule used in the fluorescence emission experiments

193
5.15 Fluorescence study of 107 and 109-112 with hydrogen
peroxides
Fluorescence and excitation spectra were measured using a Perkin-Elmer LS-50B
luminescence spectrometer. The samples were placed into quartz cells of 1 cm path length.
Compound concentrations were adjusted to3.3 µM (10 µL of a 1 mM solution in MeCN) for the
phthalimide. Hydrogen peroxide was used as an 25% aqueous solution. The excitation and
emission slit widths were 2.5 nm. The experiment was carried out in two parts:
a. The first part was the treatment of the fluorophor with the hydrogen peroxides (1µL up
to 20 µL).
b. The mixture (3.3 µM of fluorophor + 20 µM of peroxide) was irradiated in the
photoreactor Luzchem LZC-4V (14 lamps, λ = 350 ± 20 nm) for about 115 min, every
15 min a fluorescence spectrum was measured.
Preparative irradiation of S3 with hydrogen peroxide
In a pyrex ® vessel 199.58 mg (0.5 mmol) of 1-(2-benzyl-1,3-dioxoisoindolin-5-yl)-3-((S)-
1-phenylethyl)urea, 5 mL hydrogen peroxide at 25%, and 30 mL MeCN were added. The
reaction mixture was irradiated in a Rayonet chamber photoreactors PRR-100 (16 x 3500 Å
lamps, ca. 400 W; λ = 350 ± 20 nm) for 90 min under nitrogen. The reaction system was cooled
with tap water (15 °C). The organic solvent was evaporated in vacuo. The reaction mixture was
dissolved in CH2Cl2 and washed with water. The organic layer was dried over MgSO4 and
concentrated in vacuo. The isolated product was the starting material.
5.16 Synthesis of Chiral Phthalimide-Thiourea-Conjugate
5.16.1 Synthesis of 5-Nitroisoindoline-1,3-dione
NH
O
O
H2SO4 / HNO3NH
O
O
O2N
118119
To 62.5 mL of a mixture of concentrated sulfuric acid and 100% nitric acid (4:1 v / v) at
15 °C was added 10 g (68.0 mmol) of phthalimide (118) in portions over a 15 min interval with
stirring the reaction mixture. The temperature was raised slowly to 35 °C and held for 45 min.
The solution turned yellow in color. The product 119 mixture was cooled to 0 °C, slowly stirred

194
into 250 g of ice at a rate such that the temperature was kept below 15 °C, collected by vacuum
filtration and washed with cold water. The product 119 was recrystallized from ethanol to give
colorless crystals. [82]
Yield: 7.59 g, 39.5 mmol, 58%
1H NMR (DMSO-d6, 300 MHz)
δ (ppm) = 8.07 (d; 1H; J = 8.2 Hz; CH ar), 8.44 (d; 1H; J = 1.9 Hz; CHar), 8.61 (dd; 1H;
J1 = 8.2 Hz; J2 = 2.0 Hz; CHar), 11.38 (s; 1H; NH).
5.16.2 Synthesis of 2-Benzyl-5-nitroisoindoline-1,3-dione
NH
O
O
O2NN
O
O
O2N
Br
K2CO3, KI
119120
In a 100 mL round flask was placed 2.00 g (10.4 mmol) of 4-nitrophatlamide (119), 0.90 g
(6.51 mmol) of anhydridus potasium carbonate and 0.20 g potassium iodide. Then 12.4 mL
benzylbromide and 20 mL of dried DMF were added. The mixture was heated at 140°C for
1.5 h. The cooled reaction mixture was poured into 150 mL of cold water. After collecting the
solid, it was washed successively with 40 mL portions of water, 2% sodium hydroxide solution,
and water again. The dried crude product 120 was recrystallized from EtOH and filtered while
hot. The solution was concentrated somewhat, and water was added dropwise until the turbidity
just disappeared. [83]
Yield: 1.38 g, 4.89 mmol, 47%
1H NMR (CDCl 3, 300 MHz)
δ (ppm) = 4.89 (s; 2H; CH2), 7.32 (m; 3H; CHar), 7.44 (m; 2H; CHar), 8.04 (d; 1H; J = 8.1 Hz;
CHar), 8.59 (dd; 1H; J1 = 8.1 Hz; J2 = 1.8 Hz; CHar), 8.66 (d; 1H; J = 1.7 Hz; CHar).

195
5.16.3 Synthesis of 5-amino-2-benzylisoindoline-1,3-dione
N
O
O
O2NN
O
O
H2NH2,Pd/C
120121
According to GP2. 2-Benzyl-5-nitroisoindoline-1,3-dione (120) (590 mg, 2.09 mmol) was
used for this reaction. [57]
Yield: 1.04 g, 4.12 mmol, 78%
1H NMR (CDCl 3, 300 MHz)
δ (ppm) = 4.33 (s; 2H; NH2), 4.81 (s; 2H; CH2), 6.82 (dd; 1H; J1 = 8.1 Hz; J2 = 2.1 Hz; CHar),
7.03 (d; 1H; J = 2.0 Hz; CHar), 7.34 (m; 5H; CHar), 7.61 (d; 1H; J = 8.1 Hz; CHar).
13C NMR (CDCl 3, 75 MHz)
δ (ppm) = 41.3 (CH2), 108.5 (CHar), 117.8 (CHar), 120.5 (Car), 125.1 (CHar), 127.6 (CH ar x 2),
128.4 (CH ar), 128.5 (CH ar x 2), 134.9 (Car), 136.7 (Car), 152.2 (Car), 168.1 (C=O), 168.3 (C=O).
5.16.4 Synthesis of 2-benzyl-5-isothiocyanatoisoindoline-1,3-
dione
N
O
O
H2NN
O
O
SCNCl Cl
S
121 122
To a stirred solution of 126 mg (0.50 mmol) 5-amino-2-benzylisoindoline-1,3-dione (121)
in 2 mL CH2Cl2, 46.0 µL of thiophosgene (69.0 mg, 0.60 mmol) was added in one portion via
syringe. After 10 min of stirring Et3N (0.15 mL) was added in one portion. The whole mixture
was stirred at room temperature for additional 4 h. Next, CH2Cl2 (2 mL) and water (5 mL) were
added to the mixture. The layers were separated, the organic layer was washed with 1 N HCl
(2 X 5 mL), dried over MgSO4 and evaporated to drynes. The crude product was purified by
column cromatography Rf: 0.90 (SiO2, CH2Cl2). [84]
Yield: 84.0 mg, 0.29 mmol, 57%.

196
1H NMR (CDCl 3, 300 MHz)
δ (ppm) = 4.83 (s; 2H; CH2), 7.34 (m; 5H; CHar), 7.47 (dd; 1H; J1 = 7.9 Hz; J2 = 1.8 Hz; CHar),
7.63 (d; 1H; J = 1.7 Hz; CHar), 7.82 (d; 1H; J = 7.9 Hz; CH ar).
13C NMR (CDCl 3, 75 MHz)
δ (ppm) = 41.9 (CH2), 120.5 (CHar), 124.7 (CHar), 127.9 (CHar x 2), 128.6(Car), 128.7
(CHar x 2), 129.6 (CH ar), 130.8 (CH ar), 133.9 (C ar), 135.9 (C ar), 137.4 (C ar), 140.2 (S=C=N),
166.5 (C=O), 166.7 (C=O).
5.16.5 Synthesis of 1-(2-benzyl-1,3-dioxoisoindolin-5-yl)-3-((R)-
1-phenylethyl)thiourea
N
O
O
HN
HN
SN
O
O
NC
S
NH2
Dioxan, Ar
122 123
(S)-1-phenylethanamine 18.3 µL (17.3 mg, 0.143 mmol) was added into an argon filled reactor
containing 42.2 mg of 2-benzyl-5-isothiocyanatoisoindoline-1,3-dione (122) (0.143 mmol) in
dry dioxane (10 mL). The mixture was heated at 100 °C under stirring for 24 h. The solvent was
evaporated. The crude product 123 was purified by column cromatography Rf: 0.42 (SiO2,
EtOAc / cyclohexane, 2:3). [32]
Yield: 48.1 mg, 0.116 mmol, 81%.
1H NMR (Aceton-d6, 300 MHz)
δ (ppm) = 1.57 (d; 3H; J = 6.9 Hz, CH3), 4.80 (s; 2H; CH2), 5.71 (m; 1H; CH), 7.34 (m; 10H;
CHar), 7.75 (d; 1H; J = 8.1 Hz; CHar), 7.89 (dd; 1H; J1 = 8.1 Hz; J2 = 1.8 Hz; CHar), 7.95 (d; 1H;
J = 7.7, NH), 8.36 (m; 1H; CHar), 9.35 (s; 1H; NH).
13C NMR (Aceton-d6, 75 MHz)
δ (ppm) = 22.9 (CH3), 42.9 (CH2), 55.0 (CH), 117.9 (CHar), 125.4 (CHar), 128.0 (CH ar), 128.2
(CHar), 128.9 (CHar), 129.3 (CHar x 2), 129.7 (CHar x 2), 130.3 (CHar x 2), 130.4 (CHar x 2),
134.8 (Car x 2), 139.0 (Car), 145.2 (Car), 147.5 (Car), 168.1 (C=O), 168.2 (C=O), 180.9 (C=S).
IR
ν (cm-1) = 3306(w), 2920 (w), 1769 (m), 1697 (s), 1614 (m), 1530 (s).

197
Exact mass (EI).
Calcd. C24H21N3O2S: 412.14 (100%) g/mol.
Found 415.00 [M-H+] g/mol.
Anal:
Calcd: C 69.37 H 5.09 N 10.11
Found: C 69.39 H 5.13 N 10.06
M.p: 175-176 °C.
5.17 Photophysical Properties, anion sensing and chiral
recognition by Chiral Phthalimide-Thiourea-Conjugates
Absorption spectroscopy
Absorption spectra were recorded using a Perkin-Elmer Lambda 35 UV/vis spectrometer.
The samples were placed into quartz cells of 1 cm path length. Compound concentrations were
adjusted to10-5 M in DMSO or MeCN.
NMR study to confirm the formation of complex
1H NMR titrations experiments were performed in CD3CN and or DMSO-d6’. The changes
of thiourea-protons were followed in the presence of increasing equivalents of anions. The
concentrations of the solutions of thiourea were between 10-15 mM and the equivalents for the
anion were between 0.025-2.
5.18 Synthesis and Photophysical Properties of Luminol
Derivates
5.18.1 Synthesis of Luminol derivates
BnO NH2
O+
R1
O
R1O
R1
or
2
+ N
O
O
[H+]N
O
O
NH
OBn
O
R1
R1 Pd/CN
NH2
R1
R1
O
O
NHNH
R1
NH2
R1
O
O
NH2NH2
This synthesis was conducted by Robert Fitchler (AK. Jacobi).

198
Procedure for the synthesis of group a compounds [51]
A mixture of O-benzyl carbamate (9.06 g, 60 mmol), p-toluenesulfonic acid monohydrate
(0.23 g, 1.2 mmol), aldehyde (60 mmol), acetic anhydride (5.53 mL, 60 mmol), N-
methylmaleimide 5.55 g (50 mmol), and 50 mL of toluene was confined to a 100 mL flask and
fitted with a 3 cm stirbar and a reflux condenser. The reaction mixture was refluxed at 120 °C
for 16 h, after which the solvent and other volatic compounds were removed by destillation on a
rotary evaporated at 60 °C / 25 mbar. The solid residue was subjected to flash column
cromatography (SiO2, EtOAc / heptane) to give the adducts that shown in table 36.
With α, β-unsaturated aldehydes, reactions were run in the presence of 30 mmol aldehyde
and no added acetic anhydride.
Procedure for the synthesis of group b compounds
A 250 mL flask was equipped with a reflux condenser and charged with the corresponding
carbamate (20 mmol), Pd/C (10% Pd, 2.13 g, 2 mmol Pd) and trietyleneglycoldimethylether
(80 mL). The reaction was stirred at 140 °C for 18 h. Then, the mixture was cooled, filtered
trough a 2 cm celite pad and evaporated by high vacumm distillation (80 °C / 5 mbar). The
residue was subjected to flash column cromatography (SiO2, EtOAc / heptane).
Procedure for the synthesis of group c compounds
Phthalimide (10 mmol) and hydrazine hydrate 5 mL (100 mmol) were transferred to a
pressure tube. The mixture was heated at 110 °C for 5 h. After cooling to ambient temperature,
the volatic compounds were removed by high vacumm distillation and the residue suspended in
MeOH (50 mL). The mixture was filtered and the solid product suspended in 1N HCl (50 mL),
filtired and washed with water (3 x 10 mL). The resultant white to yellowish solid was dried in
high vacuum at room temperature for 12 h.

199
Table 36 : Products of the one-pot reaction (group a), products of the Pd/C-catalyzed (group b) and luminol derivates (group c)
Entry Aldehyde MCR-Adducts
Group a
Anilines
Group b
Luminol
Group c
129 O
N
O
O
NH
OBn
O
N
NH2 O
O
NHNH
NH2 O
O
130 O
N
O
O
NH
OBn
O
N
NH2 O
O
NHNH
NH2 O
O
131 O
i-Pr N
O
O
NH
OBn
O
i-Pr
i-Pr
N
NH2
i-Pr
i-Pr
O
O
NHNH
i-PrNH2
i-Pr
O
O
132 O
Bn N
O
O
NH
OBn
O
Bn
Bn
N
NH2
Bn
Bn
O
O
NHNH
BnNH2
Bn
O
O
133 O
N
O
O
NH
OBn
O
N
NH2 O
O
NHNH
NH2 O
O
134 O
N
O
O
NH
OBn
O
N
NH2 O
O
NHNH
NH2 O
O
135
S
O
N OO
S
HN
OBnO
N OO
S
H2N
S
H2N
NHHNOO

200
5.18.2 Photophysical Properties of Luminol Derivates
Absorption spectroscopy
Absorption spectra were recorded using a Beckman Coulter UV-DU800. The samples were
placed into a quarts cells of 1 cm path length. Compound concentrations were adjusted to 10-4M
in DMSO.
Steady-state Fluorescence
Fluorescence and excitation spectra were carried out using a Perkin- Elmer LS-50B
luminescence spectrometer. The samples were placed into a quartz cell of 1 cm path length.
Compound concentrations were adjusted to 3.3 x10⁻⁶ M in DMSO under aerobic conditions. The
excitation and emission slit were adjusted to 2.5-2.7 nm.
Absorption spectroscopy and steady-state at different pH (3,7 and 12)
Absorption as well as steady-state fluorescence measurements of luminol derivates were
performed in water at different pH (commercial buffer solutions at pH 3,7 and 12).
Time-resolved fluorescence
These measurements were performed on the Department of Physics, University of Cologne
with the collaboration of H. Neumann, and M. Beller.
Singlet lifetime experiments were performed after excitation with laser pulses of about
120fs length. The pump laser was an “Integra-C” from Quantronix providing pulses of 2 mJ
with 120 fs duration at 796 nm and 500 Hz repetition rate was reduced to 50 Hz with the use of
a chopper. The UV pulses were focused with a 10 cm focal lense onto the solution under
investigation. The sample was placed slightly before the focous to avoid bubble formation, and
the concentration of the probe was adjusted to exhibit complete absorption of the UV pulse and
give light emission in a small region behind the quartz window. The emitted light was collected
trough a lense and the focused light sent to ensure that not reflected or scattered light from the
pump pulse impinged on the detector. The spectral traces of the ultra-fast diode were recorded
on a WavePro 960XL oscilloscope from LeCroy (2 GHz bandwidth). Each trace was the
average of 1000 single traces.
Luminescence
Luminescence measurements were performed using a computer-controlled fluorimeter
Tecan SPECTRFluor Plus for measuring samples in a microplate. A mixture dynamic range was
used for luminescence integration time with an optimal amplification value. Samples were

201
placed in a nunclon 24-well microplate with transparent flat-bottom. Sample concentrations
were adjusted to 7.5 µM for the luminol derivates and 8 µM of Fe+3 (25mg/mL)/H2O2 (5%).
Luminescence measurements were performed using a luminometer “Lumat LB 9507”. H2O2
(25 µL, 5%) was dispensed to the Luminol derivates (10 µL, 1.5 mM solution in DMSO), cation
solutions (Ba2+, Fe2+, Cu2+, Ni2+ and Mg2+, 6 µL, 6.18 mM solution in PBS, pH ≈ 12) and
0.98 mL of PBS (pH ≈ 12). The generated chemiluminescence at 25 °C was measured
continuously about 250 s.


6 Appendix
47 (Pydp092a) 47 (Pydp092b)
Crystal date Pydp092 Empirical formula C15H12N2 O2 Formula weight 252.27
Temperature (°K) 100(2) Crystal system triclinic Space group P-1
a [Å] 7.0740(5) b [Å] 8.6459(8) c [Å] 10.4195(11) α [°] 96.067(4) β [°] 100.715(5) γ [°] 107.977(5)
Volume A-3 586.45(9) Z 2
Density [mg/m3] 1.429 Crystal size [mm] 0.4 x 0.3 x 0.3
Refl. collected/unique 3916 / 2533 Refl. observed [I>2sigma(I)] 1705
R1a 0.0444 wR2a 0.1304
Largest diff. peak / hole[e/ Å-3]
0.203 / -0.205

204
48 (pyd05a) 75 (pydr160f)
Crystal date Pyd05a Pydr160f Empirical formula C17 H14 N2 O3 C14H18 N2 O2 Formula weight 294.30 246.30
Temperature (°K) 100(2) 100(2) Crystal system Monoclinic Monoclinic Space group P21/n P21/c
a [Å] 9.7004(15) 10.5840(16) b[Å] 4.6954(9) 7.3141(8) c [Å] 30.850(7) 17.059(3) α [°] 90 90 β [°] 91.211(8) 95.487(5) γ [°] 90 90
Volume A-3 1404.8(5) 1314.5(3) Z 4 4
Density [mg/m3] 1.392 1.245 Crystal size [mm] 0.3 x 0.05 x 0.01 0.3 x 0.2 x 0.02
Refl. collected/unique 2426 / 1774 5781 / 276 Refl. observed [I>2sigma(I)] 854 1766
R1a 0.0472 0.0464 wR2a 0.0918 0.1154
Largest diff. peak / hole[e/ Å-3]
0.212 / -0.199 0.588 / -0.216

205
52 (Pydr215) 84 (Pydr 191)
Crystal date Pydr215 Pydr191 Empirical formula C20H13N3O4 C16H21NO5 Formula weight 359.33 2458.70
Temperature (°K) 100(2) 100(2) Crystal system Orthorhombic Monoclinic Space group P212121 C2/c
a [Å] 9.0793(5) 24.408(2) b[Å] 11.2615(5) 0.2876(12) c [Å] 16.5493(9) 5.4839(10) α [°] 90 90 β [°] 90 126.543(5) γ [°] 90 90
Volume A-3 1692.11(15) 3123.7(5) Z 4 1
Density [mg/m3] 1.411 1.307 Crystal size [mm] 0.3 x 0.3 x 0.3 0.3 x 0.2 x 0.1
Refl. collected/unique 8253 / 3706 7369 / 3386 Refl. observed [I>2sigma(I)] 2864 1719
R1a 0.0349 0.0450 wR2a 0.0653 0.0810
Largest diff. peak / hole[e/ Å-3]
0.146 / -0.198 0.223 / -0.301

206
107 (Pydrs001a)
Crystal date Pydrs001a
Empirical formula C24H21N3O3 Formula weight 399.44
Temperature (°K) 100(2) Crystal system Triclinic Space group P1
a [Å] 4.7444(3) b[Å] 6.5898(8) c [Å] 16.224(2) α [°] 78.946(4) β [°] 88.347(7) γ [°] 87.806(6)
Volume A-3 497.34(9) Z 1
Density [mg/m3] 1.334 Crystal size [mm] 0.2 x 0.1 x 0.03
Refl. collected/unique 2930 / 2077 Refl. observed [I>2sigma(I)] 1446
R1a 0.0442 wR2a 0.0798
Largest diff. peak / hole[e/ Å-3]
0.203 / -0.233
7 Literatur
[1] A. Gilbert, and J. Baggott, Essentials of Molecular Photochemistry, 1991, 1st edition, Blackwell Scientifics Publications, Oxford.
[2] D. A. Skoog, and J. J. Leary, Principles of Instrumental Analysis, 1992, 4th edition, Florida, United States.
[3] http://www.ciba.com/index/ind-index/ind-paints_and_coatings/ind-pai_coa-tec-new/ind-paints_and_coatings_technologies_protection/ind-paints_and_coatings_technologies_protection_light-stabilizers.htm
[4] N. J. Turro, Modern Molecular Photochemistry, 1991, 1st edition, University Science Books, United States.
[5] http://www.photobiology.info/Photochem.html
[6] J.R. Lakowicz, Principles of Fluorescence Spectroscopy, 2006, 3rd edition, Springer Science, New York, United States.
[7] Sir J.F. W. Herschel, Phil. Trans Poy Soc, 1845, 135, 143-145.
[8] http://images.absoluteastronomy.com/images/encyclopediaimages/s/st/stokes_shift.png.
[9] M. Kasha, Disc. Faraday Soc., 1950, 9, 14-19.
[10] B. Valeur, Molecular Fluorescence Principle and Applications, 2002, Wiley-VCH, Weinheim, Germany.
[11] (a)R. Yang, W.-X. Liu, H. Shen, H.-H. Huang, Y.-B. Jiang, J. Phys. Chem. B 2008, 112, 5105.(b) L. Nie, Z. Li, J. Han, X. Zhang, R. Yang, W.-X. Liu, F.-Y. Wu, J.-W. Xie, Y.-F. Zhao, Y.-B. Jiang, J. Org. Chem. 2004, 69, 6449 (c) S. K. Kim, J. Yoon, Chem. Commun. 2002, 770; (d) T. Gunnlaugsson, A. P. Davis, G. M. Hussey, J. Tierney, M. Glynn, Org. Biomol. Chem., 2004, 2, 1856; (e) T. Gunnlaugsson, A. P. Davis, J. O’Brien, M. Glynn, Org. Lett., 2002, 4, 2449; (f) T. Gunnlaugsson, A. P. Davis, M. Glynn, Chem. Commun., 2001, 2556; (g) V. Thiagarajan, P. Ramamurthy, D. Thirumalai, V. T. Ramakrishnan, Org. Lett., 2005, 7, 657.
[12] (a) S. Nishizawa, H. Kaneda,, T. Uchida, N. Teramae, J. Chem. Soc., Perkin Trans. 2., 1998, 2325; (b) S. Nishizawa, Y. Kato, N. Teramae, J. Am. Chem. Soc., 1999, 121, 946.
[13] (a) A. Kovalchuk, J. L. Bricks, G. Reck, K. Rurack, B. Schulz, A. Szumna, H. Weibhoff, Chem. Commun., 2004, 1946; (b) F.-Y Wu, Y.-B. Jiang, Chem. Phys. Lett., 2002, 355, 438.
[14] (a) X. Zhang, L. Guo, F.-Y Wu, Y.-B. Jiang, Org. Lett., 2003, 5, 2667; (b) K. Choi, A. D. Hamilton, Angew. Chem., 2001, 113, 4030; Angew. Chem. Int. Ed., 2001, 40, 3912.
[15] I. Stanculescu, C. Mandravel, F. Delattre, D. Landy, P. Woisel, and G. Suspateanu, J.Photochem. Photobiol. A: Chem., 2003, 161, 79-85.
[16] T. Gunnlaugsson, A. P. Davis, G. M. Hussey, J. Tierney, and M. Glynn, Org. Biomol. Chem., 2004, 2, 1856-183.
[17] G-K. Li, Z-X. Xu, C-F. Chen, and Z-T. Huang, Chem.Commun., 2008, 1774-1776.
[18] I. Oueslati, R. A. Sá Ferreira, L. D. Carlos, C. Baleizão, M. N. Berberan-Santos, B. de Castro, J. Vicens, and U. Pischel, Inog. Chem., 2006, 45, 2652-2660.
[19] M. G. Choi, D. H. Ryu, H. L. Jeon, S. Cha, J. Cho, H. H. Joo, K.S. Hong, C. Lee, S. Ahn, and S-K. Chang, Org. Lett., 2008, 10, 17, 3717-3720.
[20] S. S. Mallajosyula, H. Usha, A. Datta, and S. K. Pati, J.Chem. Sci., 2008, 120, 627-635.

208
208
[21] R. Duke, and T. Gunnlaugsson, Tetrahedron Lett., 2007, 48, 8043-8047.
[22] T-H. Kim, and T. M. Swager, Angew. Chem. Int. Ed., 2003, 42, 4803-4806.
[23] D. H. Lee, J. H. Im, J-H. Lee, and J.-I. Hong, , 2002, 43, 9637-9640.
[24] J. Biwersi, B. Tulk, and A.S. Verkman, Anal. Biochem., 1994, 219, 139-143.
[25] M. Shionoya, H. Futura, V. Lynch, A. Harriman, and J. L. Sessler, J. Am. Chem. Soc., 1992, 114, 5714-5722.
[26] M. E. Huston, E. U. Akkaya, and A. W. Czarnik, J. Am. Chem. Soc., 1989, 111, 8735-8737.
[27] T. Gunnlaugsson, A. P. Davis, and M. Glynn, Chem.Commun., 2001, 2556-2557.
[28] X. Zhang, L. Guo, F-Y. Wu, and Y-B Jiang, Org. Lett., 2003, 5, 2667-2670.
[29] G. Xu, and M. A. Tarr, Chem. Commun., 2004, 1050-1051.
[30] T. Gunnlaugsson, A. P. Davis, J. E. O´Brien, and M. Glynn, Org. Biomol. Chem., 2005, 3, 48-56.
[31] Z.-C. Wen, and Y-B. Jiang, Tetrahedron, 2004, 60, 11109-11115.
[32] D. E. Goméz, L. Fabbrizzi, M. Licchelli, and E. Monzani. Org. Biomol Chem., 2005, 3, 1495-1500.
[33] C-L. Chen, T-P. Lin, Y-S, Chen, and S-S. Sun, Eur. J. Org. Chem., 2007, 3999-4010.
[34] X-H. Huang, Y-B. He, Z-H. Chen, C-G. Hu, and G-Y. Qing, Can. J. Chem., 2008, 86, 170-176.
[35] C. Hu, A. He, Z. Chen, and X. Huang, Tetrahedrom: Asymmetry, 2009, 20, 104-110.
[36] G-Y. Qing, F. W, Y-B. He, C-G. Hu, and X. Yang, Supramol. Chem., 2008, 20, 7, 635-641.
[37] G-Y. Qing, T. Sun, Z.Chen, X. Yang, X. Wu, and Y. He, Chirality, 2009, 21, 363-373.
[38] X-H. Huang, Y-B. He, C-G. Hu, and Z-H. Chen, J.Fluoresc., 2009, 19, 97-104.
[39] S. Liu, J. P. C. Pestano, and C. Wolf, J. Org. Chem., 2008, 73, 4267-4270.
[40] L. Salem, X. Chapuisat, G. Segal, P. C. Hiberty, C. Minot, C. Leforestier, and P. Sautet, J. Am. Chem. Soc.,1987, 109, 2887.
[41] L. Chi, J. Zhao, and T. D. James, J.Org.Chem., 2008, 73, 4684-4687.
[42] A. E. Albers, V. s. Okreglak, and C. J. Chang, J. Am.Chem. Soc., 2006, 128, 9640-9641.
[43] A. Mills, C. Tommons, R. T. Bailey. M. C. Tedford, and P. J. Crilly, Analyst, 2007, 132, 566-571.
[44] http://en.wikipedia.org/wiki/Hydrogen_peroxide
[45] J. C. Sanchez, and W. C. Trogler, J. Mater. Chem., 2008, 18, 5134-5141.
[46] G. J. Mohr, Anal. Bioanal. Chem., 2006, 386, 1201-1214.
[47] M. Oelgemöller, A. G. Griesbeck, J. Photochem. Photobiol. C., 2002, 3, 109-127.
[48] M. Sarkar, R. Yellampalli, B. Bhattacharya, R. K. Kanaparthi, and A. Samanta, J. Chem. Sci., 2007, 119, 2, 91-97.
[49] S. Hübner, D. Michalik, H. Jiao, H. Neumann, S. Klaus, D. Strübing, A. Spannenberg, and M. Beller, J Chem. Asian., 2007, 2, 734-746.
[50] A. Jacobi von Wangelin, Dissertation, Universität Rostock, 2002.

209
[51] H. Neumann, S. Klaus, M. Klawonn, D. Strübing, S. Hübner, D. Gördes, A.Jacobi von Wangelin, M. Lalk, and M. Beller, Z. Naturforsch., 2004, 59b, 431-438.
[52] R. B. Brundrett, and E. H. White, J. Am. Chem. Soc., 1974, 96:24, 7497-7502.
[53] A. Rose, and T. David Waite, Anal. Chem., 2001, 73, 5909-5920.
[54] T. Uzu, and S. Sasaki, Org. Lett., 2007, 9, 21, 4383-4386.
[55] W. R. Seitz, and D. M. Hercules, Anal. Chem., 1972, 44, 13, 2173-2149.
[56] A. Chihab-Eddine, A. Dafch, A. Jilate, and B. Decroix, J. Heterocyclic Chem. 2000, 37,1543-1548.
[57] X. Collin, J-M. Robert, G. Wielgosz, G. Le Baut, C. Bobin-Dubigeon, N. Grimaud, and J-Y. Petit, Eur. J. Med. Chem., 2001, 36, 639.
[58] B. A. Pyrror, P. M. Palmer, P. M. Andrews, M. B. Berger, T. Troxler, and M. R. Topp, Chem. Phys. Lett., 1997, 271, 19-26.
[59] G-N. Ma, Y-P. Zhang, and M. Shi, Synthesis, 2007, 2, 197-208.
[60] H. Suga, T. Kitamura, A. Kakehi and T. Baba, Chem. Commun., 2004, 1414-1415.
[61] C-J. Wang, and M. Shi, J.Org. Chem., 2003, 68, 6229-6237.
[62] Y-W. Wang, Y-T. Shi, Y. Peng, A-J. Zhang, T-H. Ma, W. Dou, and J-R. Zheng, Spectrochim. Acta, A., 2009, 72, 322-326.
[63] J. Wang, H. Li, X. Yu, L. Zu, and W. Wang, Org.Lett, 2005, 7, 19, 4293-4296.
[64] Acetanilides are structural relatives to the powerful pharmaceutical Paracetamol ® and Phenacetin ®.
[65] B. Joseph, H. Da Costa, J-Y. Mérour, and S. Léonce, Tetrahedrom, 2000, 56, 3189-3196.
[66] A. Soldevilla, A.G. Griesbeck, J. Am. Chem. Soc, 2006, 128, 16472-16473.
[67] K.-D, Warzecha, H. Görner, A. G. Griesbeck, J. Phys. Chem. A, 2006, 110, 3356-3363.
[68] J. A. Blake, E. Gagnon, M. Lukeman and J. C. Scaiano, Org. Lett., 2006, 8, 1057
[69] H. Lebel, and O. Leogane, Org. Letter, 2006, 8, 25, 5717-5720.
[70] H. G. Benesi, J. H. Hildebrand, J. Am. Chem. Soc., 1949, 71, 2703.
[71] R. Pérez-Ruiz, Y. Diaz, B. Goldfuss, D. Hertel, K. Meerholz, and A. Griesbeck, Org. Biomol. Chem., 2009, 7, 3499-3504.
[72] (a) A. D. Becke, J. Chem. Phys., 1993, 98, 5648. Implementation: (b) P. J. Stephens, F. J. Devlin, C. F. Chabalowski, M. J. Frisch: J. Phys. Chem., 1994, 98, 11623. (c) C. Lee, W. Yang, R. G. Parr, Phys. Rev. B., 1988, 37, 785. (d) B. Miehlich, A. Savin, H. Stoll, H. Preuss, Chem. Phys. Lett., 1989, 157, 200.
[73] (a) V. Barone, M. Cossi, J. Phys. Chem. A., 1998, 102, 1995. (b) M. Cossi, N. Rega, G. Scalmani, V. Barone, J. Comp. Chem., 2003, 6, 669.
[74] K. Wolinski, J. F. Hilton, and P. Pulay, J. Am. Chem. Soc., 1990, 112, 8251.
[75] M. Sarkar, R. Yellampalli, B. Bhattacharya, R. K. Kanaparthi, and A. Samanta, J. Chem. Sci., 2007, 119, 91.
[76] S. J. Brooks, L. S. Evans, P. A. Gale, M. B. Hursthouse, and M. E. Light, Chem. Commun., 2005, 734.
[77] (a) J. M.Lehn., Supramolecular Chemistry. In Concepts and Perspective; VCH, Weinheim, 1995. (b) X.X. Zhang, J. S. Bradshaw, R.M. Izatt, Chem. Rev., 1997, 97, 3313-3362. (c) M.G. Finn, Chirality, 2002, 14, 534-540.

210
210
[78] A. L. Erwin, and E. C. Gostschlich, J. Bacteriol., 1993, 175, 6382-6391.
[79] L. Chan, J. Slater, J. Hasbargen, D. H. Herndon, R. L. Veech, and S. Wolf, Integr Psych Behav., 1994, 29, 383-394.
[80] J. Ballesta-Claver, M.C. Valencia-Mirón, and L.F. Capitán-Callvey, Anal. Chim. Acta, 2008, 629, 136-144.
[81] A. G. Griesbeck, N. Hoffmann, and K-D. Warzecha, Acc. Chem. Res., 2007, 40, 128-140.
[82] J. G. Young, and W. Onyebuagu, J. Org. Chem., 1990, 55, 7, 2155-2159.
[83] J. H. Billman, and R. Vicent Cash, J. Am. Chem. Soc., 1953, 75, 10, 2499.
[84] J. Gawronski, M. Kwit, and P. Skowronek, Org. Biomol. Chem., 2009, 7, 1570.
[85] S. Mitra, R. Das, and S. Mukherjee, J. Photochem. Photobiol A: Chem., 1995, 87, 225-230.
[86] M. Voicescu, M. Vasilescu, T. Constantinescu, and A. Meghea, J. Luminesc., 2003, 13, 315-322.
[87] Y. Zhao, F. G. Bordwell, J-P. Cheng, and D. Wang, J. Am. Chem. Soc., 1997, 119, 9125–9129.
[88] T. S. Dobrolyubskaya, and L. I. Anikina, J. Appl. Spectrosc., 1971, 14, 402–404.
[89] P. B. Shevlin, and H. A. Neufeld, J. Org. Chem., 1970, 35, 2178.
[90] (a) R. B. Brundrett, and E. H. White, J. Am. Chem. Soc., 1974, 96, 7497. (b) R. B. Brundrett, D. F. Roswell, and E. H. White, J. Am. Chem. Soc., 1972, 94, 7536.
[91] Gaussian 03, Revision C.02, M. J. Frisch, G. W. Trucks, H. B. Schlegel, G. E. Scuseria, M. A. Robb, J. R. Cheeseman, J. A. Montgomery, Jr., T. Vreven, K. N. Kudin, J. C. Burant, J. M. Millam, S. S. Iyengar, J. Tomasi, V. Barone, B. Mennucci, M. Cossi, G. Scalmani, N. Rega, G. A. Petersson, H. Nakatsuji, M. Hada, M. Ehara, K. Toyota, R. Fukuda, J. Hasegawa, M. Ishida, T. Nakajima, Y. Honda, O Kitao, H. Nakai, M. Klene, X. Li, J. E. Knox, H. P. Hratchian, J. B. Cross, C. Adamo, J. Jaramillo, R. Gomperts, R. E. Stratmann, O. Yazyev, A. J. Austin, R. Cammi, C. Pomelli, J. W. Ochterski, P. Y. Ayala, K. Morokuma, G. A. Voth, P. Salvador, J. J. Dannenberg, V. G. Zakrzewski, S. Dapprich, A. D. Daniels, M. C. Strain, O. Farkas, D. K. Malick, A. D. Rabuck, K. Raghavachari, J. B. Foresman, J. V. Ortiz, Q. Cui, A. G. Baboul, S. Clifford, J. Cioslowski, B. B. Stefanov, G. Liu, A. Liashenko, P. Piskorz, I. Komaromi, R. L. Martin, D. J. Fox, T. Keith, M. A. Al-Laham, C. Y. Peng, A. Nanayakkara, M. Challacombe, P. M. W. Gill, B. Johnson, W. Chen, M. W. Wong, C. Gonzalez, and J. A. Pople, Gaussian, Inc., Wallingford CT, 2004.
[92] J. Wang, H. Li, X. Yu, L. Zu, and W. Wang, Adv. Synth. Catal., 2007, 349, 11-12, 1182-1886.
[93] J. Kehler, and E. Breuer, Synthesis., 1998, 1419-1420.
[94] A. Mayr, M. Srisailas, Q. Zhao, Y. Gao, H. Hsieh, M. Hoshmand-Kochi, and N. St. Fleur, Tetrahedrom, 2007, 63, 8206-8217.
[95] D. Shabashov, and O. Daugulis, J. Org. Chem., 2007, 72, 7720-7725.
[96] J. Gawroński, K. Gawroński, and K. Brzostowaska, Tetrahedrom Lett., 1999, 40, 1191.
[97] J. R. Casimir, G. Guichard, and J. -P. Briand, J. Org. Chem., 2002, 67, 3764.
[98] S-J. Wen, and Z-J. Yao, Org. Lett., 2004, 6, 16, 2721-2724.
[99] H. Ulrich, and R. Richter, J. Org. Chem., 1973, 38, 2557.

211
[100] G. Wittmann, H.van Langenhove, and J.Dewulf, J.Chromatogr. A; 2000, 874, 225.
[101] S. Aich, C. Raha, and S. Basu, J. Chem. Soc., Faraday trans., 1997, 93, 2991.
[102] M. Cho, Dissertation, Universität zu Köln, 2009.
[103] O. Höinck, Dissertation, Universität zu Köln, 2008.
[104] P. R. Kym, A.J. Souers, T.J. Campbell, J. K. Lynch, A. S. Judd, R. Iyengar, A. Vasudevan, J. Gao, J C. Freeman, D. Wodka, M. Mulhem, G. Zhao, S. H. Wagaw, J. J. Napier, S. Brodjian, B. D. Dayton, R. M, Reilly, J. A. Segreti, R. M. Fryer, L. C. Preusser, G. A. Reinhart, L. Hernandez, K. C. Marsh, H. L. Sham, C. A. Collins, and J. S. Polakowski, J.Med.Chem, 2006, 49, 2339-2352.
[105] J. Jones, The Chemical Synthesis of Peptides, 1994, International series of monographs on chemistry 23, Oxford-United States.


Erklärung
Ich versichere, dass ich die von mir vorgelegte Dissertation selbständig angefertigt, die
benutzten Quellen und Hilfsmittel vollständig angegeben und die Stellen der Arbeit -
einschließlich Tabellen, Karten und Abbildungen -, die anderen Werken im Wortlaut oder dem
Sinn nach entnommen sind, in jedem Einzelfall als Entlehnung kenntlich gemacht habe; dass
diese Dissertation noch keiner anderen Fakultät oder Universität zur Prüfung vorgelegen hat;
dass sie - abgesehen von unten angegebenen Teilpublikationen - noch nicht veröffentlicht
worden ist sowie, dass ich eine solche Veröffentlichung vor Abschluss des
Promotionsverfahrens nicht vornehmen werde. Die Bestimmungen dieser Promotionsordnung
sind mir bekannt.
Die von mir vorgelegte Dissertation ist von Prof. Dr. Axel. G. Griesbeck betreut worden.
…………………………………
Yrene Díaz Pérez
07. Dezember 2009.


List of Publications and Presentations
“Fluoride recognition by a chiral urea receptor linked to a phthalimide
chromophore”, Raúl Pérez-Ruiz, Yrene Díaz, Bernd Goldfuss, Dirk Hertel, Klaus Meerholz,
and Axel G. Griesbeck, Org. Biomol. Chem.2009, 7, 3499-3504.
“Synthesis of New Phthalimides as Fluorescent Sensors and Switches” , Y. Díaz, A.G.
Griesbeck and A.Soldevilla. XXIII International Conference on Photochemstry, 29 July-3
August 2007, Cologne, Germany. Poster
“Synthesis of New Phthalimides as Fluorescent Sensors and Decarboxylative Photorelease
coupled with Fluorescent Reporter Function based on the Aminophthalimide-Serine System”, Y.
Díaz, A.Soldevilla and A.G. Griesbeck. Central European Conference on Photochemistry, 10-14
February, 2008, Bad Hofgastein, Austria. Poster
“Novel urea-activated phthalimide chemosensor: selective sensing fluoride”, Yrene Díaz,
Raúl Pérez-Ruiz, and Axel G. Griesbeck. 21. Lecture Conference, 6-8 October, 2008, Bielefeld,
Germany. Poster and oral communication


Lebenslauf
Persönliche Daten
Name: Yrene Hortencia Díaz Pérez
Anschrift: Melatengürtel 101
50825 Köln
Tel.: 0177 / 2198763
E-Mail: [email protected]
geboren: 18.09.1982 in Caracas
Familienstand verheiratet
Schulbindung
1988 – 1994 Grundschule in Caracas
1994 – 1997 Gymnasium San Marco Evangelista, Caracas
1997 – 1999 Abschluss: Abitur am Gymnasium Esteban Gil Borges, Caracas
Hochschulausbildung
Okt. 1999 – Jul. 2004 Studium im Studiengang Chemie, Diplom an der Universidad Central de Venezuela
Jul. 2004 – Mai. 2005 Diplomarbeit im Bereich organische Chemie „Estudio de metabolitos secundarios de Phyllanthus tenellus Roxb.(Euphorbiaceae) y su actividad biológica“
Sep. 2005 – Mai. 2006 Magister Studium an der I.V.I.C (Instituto Venezolano de Investigaciones Cientificas).
Okt. 2006 Feb. 2010 Beginn Promotionsstudium an der Universität zu Köln Institut für Organische Chemie; im Arbeitskreis von Prof. Dr. A. G. Griesbeck , gefördert durch ein Doktoranden Stipendium des Deutscher Akademischer Austauschdiensts (DAAD)
Köln, den 07. Dezember 2009
Yrene Hortencia Díaz Pérez