Palliative Therapie des kolorektalen Karzinoms · Palliative Therapie des kolorektalen Karzinoms...
55
Palliative Therapie des kolorektalen Karzinoms Susanna Hegewisch-Becker Onkologische Schwerpunktpraxis Hamburg-Eppendorf
Transcript of Palliative Therapie des kolorektalen Karzinoms · Palliative Therapie des kolorektalen Karzinoms...

Palliative Therapie des kolorektalen Karzinoms
Susanna Hegewisch-Becker
Onkologische Schwerpunktpraxis Hamburg-Eppendorf
Advisory Role
Roche, Novartis, Pfizer, Merck-Serono
Disclosure of Potential Conflicts of Interest
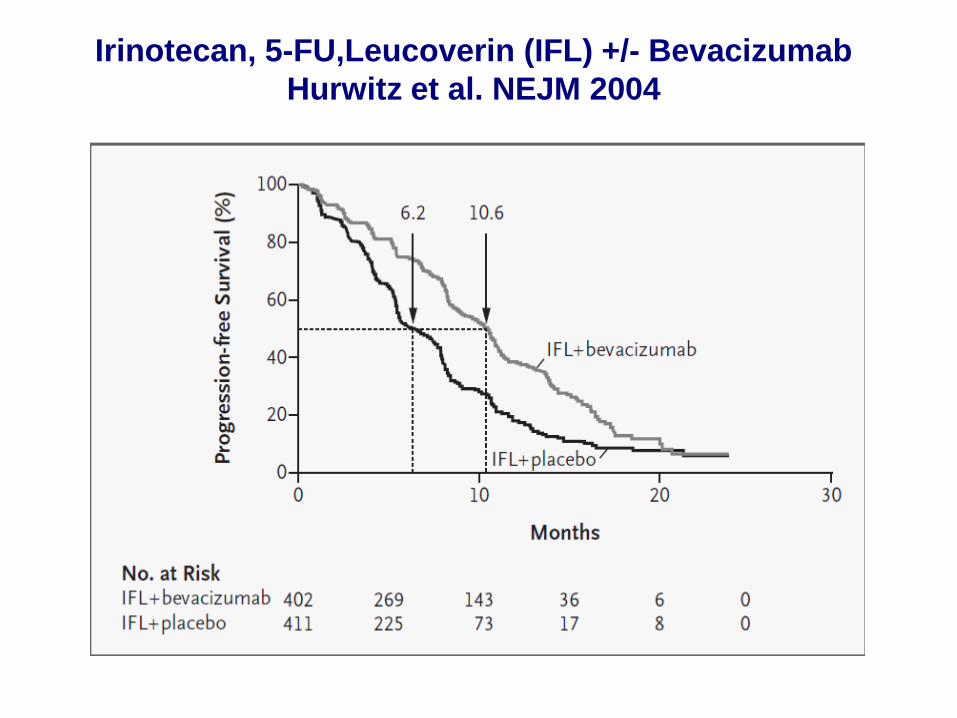
Irinotecan, 5-FU,Leucoverin (IFL) +/- BevacizumabHurwitz et al. NEJM 2004
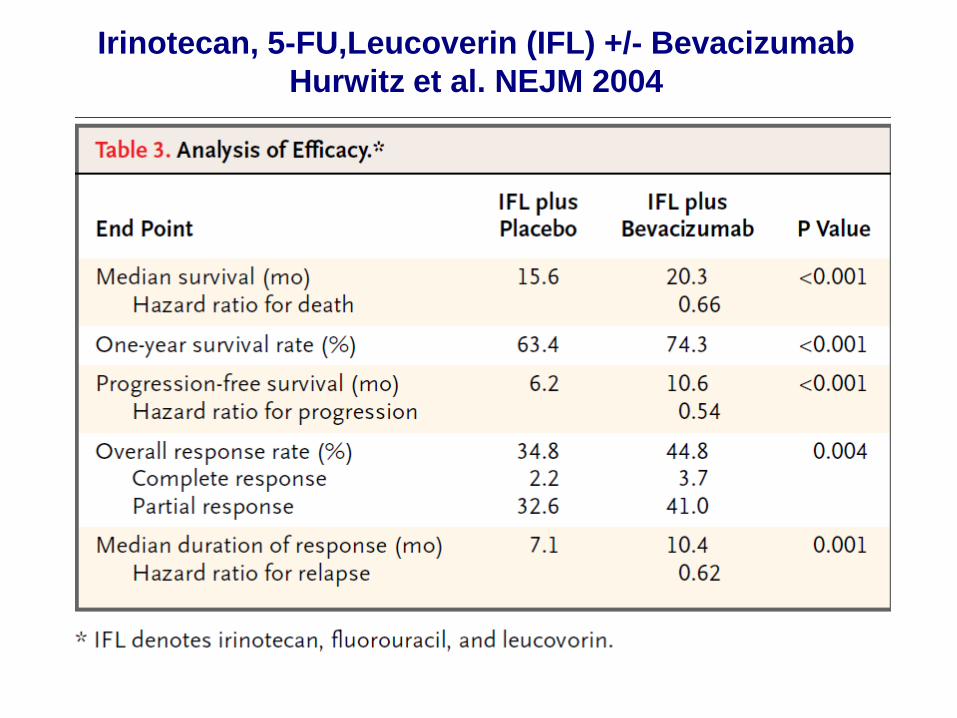
Irinotecan, 5-FU,Leucoverin (IFL) +/- BevacizumabHurwitz et al. NEJM 2004
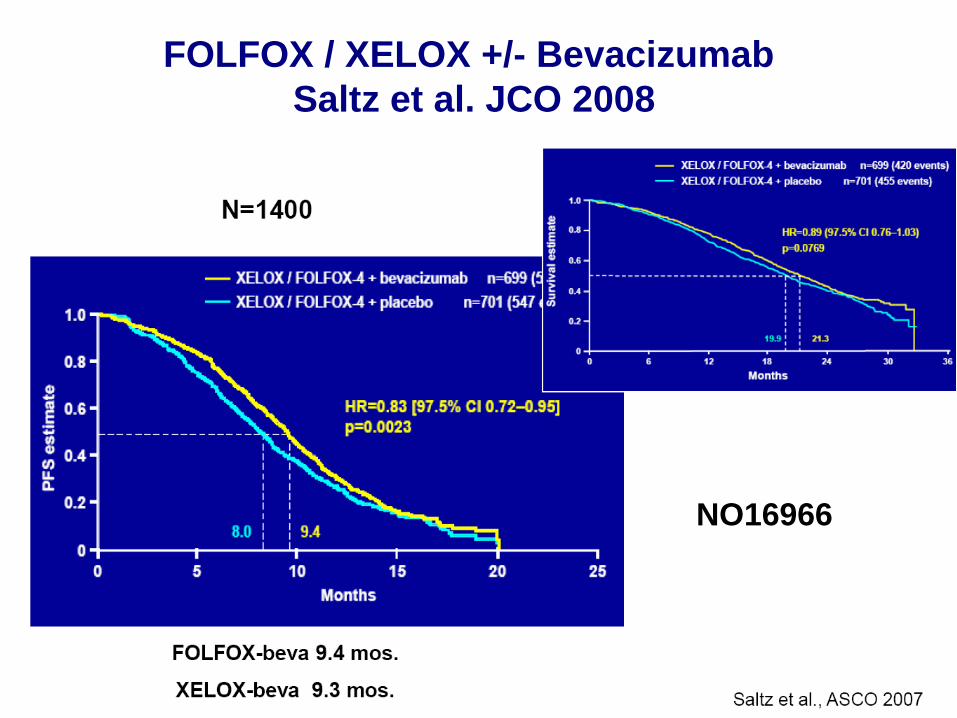
FOLFOX / XELOX +/- Bevacizumab Saltz et al. JCO 2008
NO16966
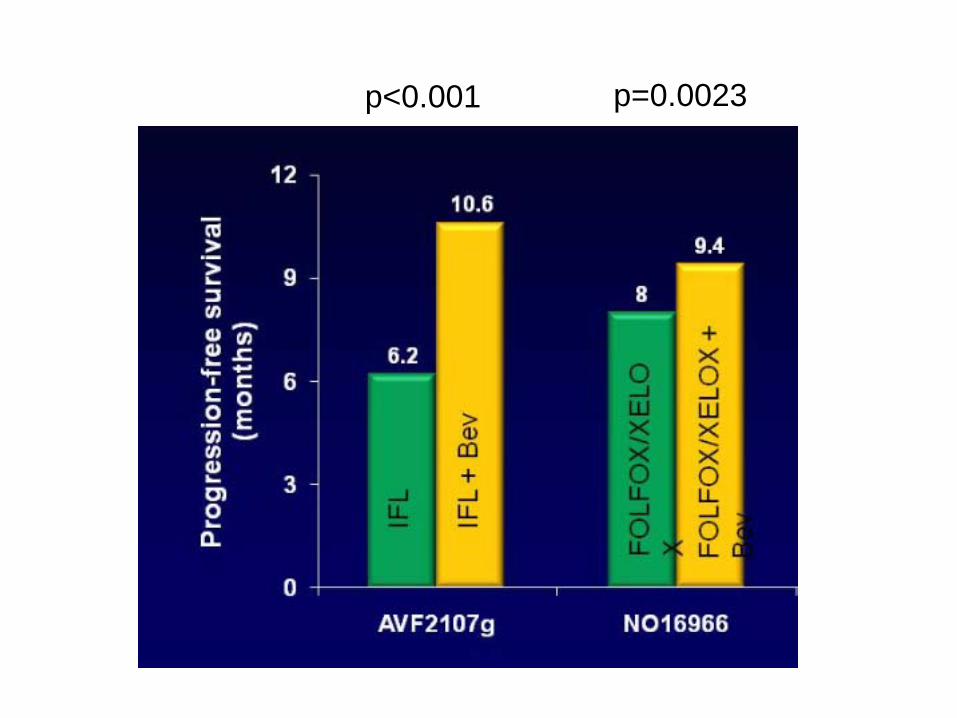
p<0.001 p=0.0023
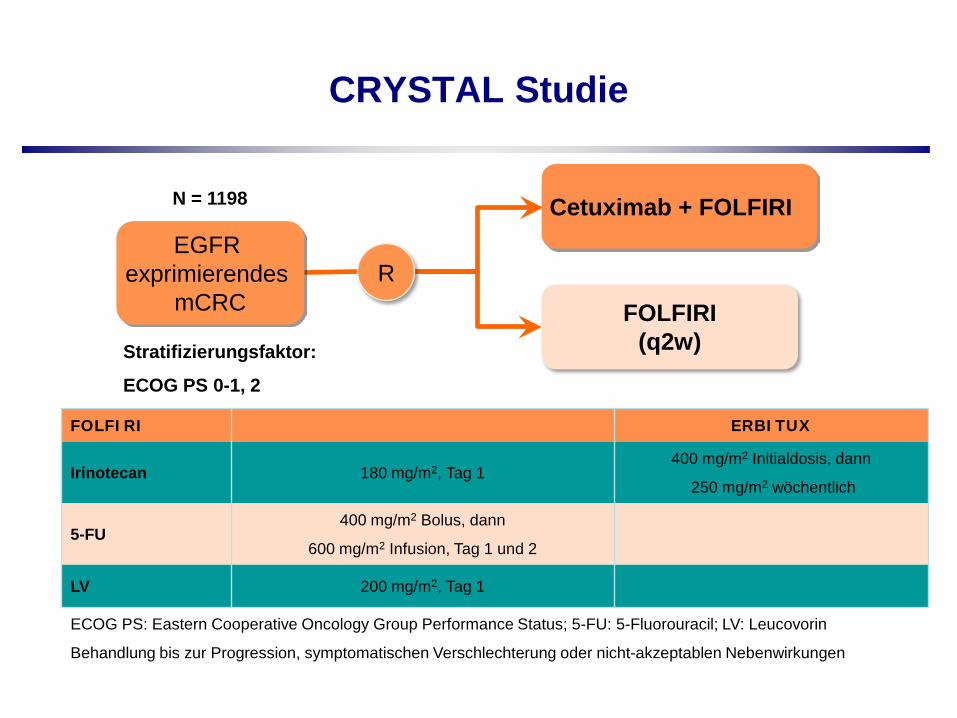
CRYSTAL Studie
FOLFIRI(q2w)
Cetuximab + FOLFIRIEGFR
exprimierendes mCRC
Stratifizierungsfaktor:
ECOG PS 0-1, 2
R
FOLFIRI ERBITUX
Irinotecan 180 mg/m2, Tag 1400 mg/m2 Initialdosis, dann
250 mg/m2 wöchentlich
5-FU400 mg/m2 Bolus, dann
600 mg/m2 Infusion, Tag 1 und 2
LV 200 mg/m2, Tag 1
ECOG PS: Eastern Cooperative Oncology Group Performance Status; 5-FU: 5-Fluorouracil; LV: Leucovorin
Behandlung bis zur Progression, symptomatischen Verschlechterung oder nicht-akzeptablen Nebenwirkungen
N = 1198
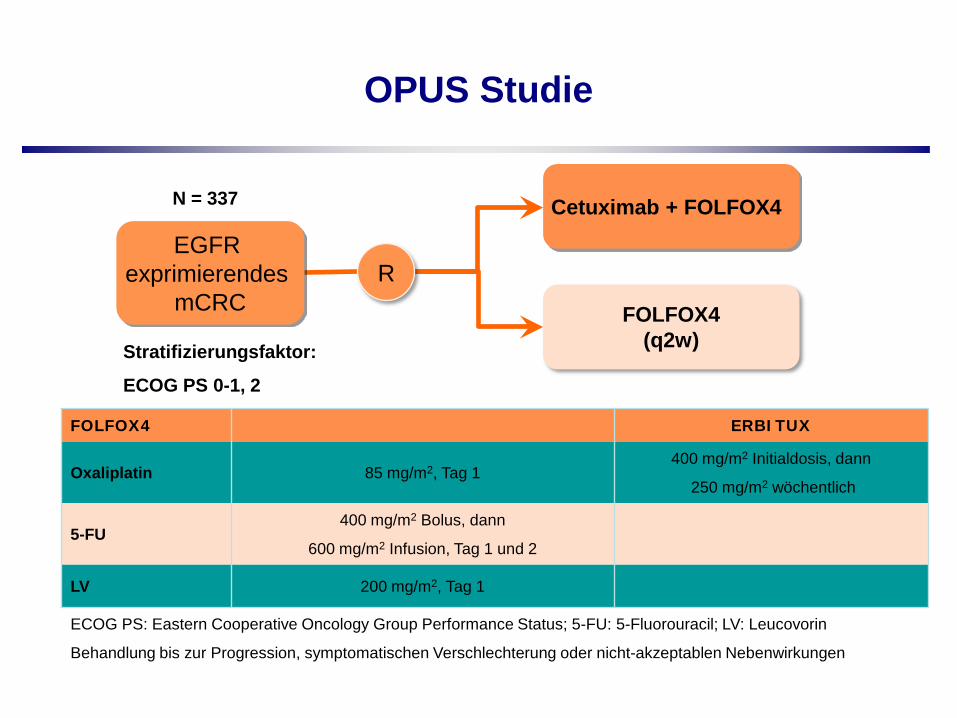
OPUS Studie
FOLFOX4(q2w)
Cetuximab + FOLFOX4
EGFR exprimierendes
mCRC
Stratifizierungsfaktor:
ECOG PS 0-1, 2
R
FOLFOX4 ERBITUX
Oxaliplatin 85 mg/m2, Tag 1400 mg/m2 Initialdosis, dann
250 mg/m2 wöchentlich
5-FU400 mg/m2 Bolus, dann
600 mg/m2 Infusion, Tag 1 und 2
LV 200 mg/m2, Tag 1
ECOG PS: Eastern Cooperative Oncology Group Performance Status; 5-FU: 5-Fluorouracil; LV: Leucovorin
Behandlung bis zur Progression, symptomatischen Verschlechterung oder nicht-akzeptablen Nebenwirkungen
N = 337
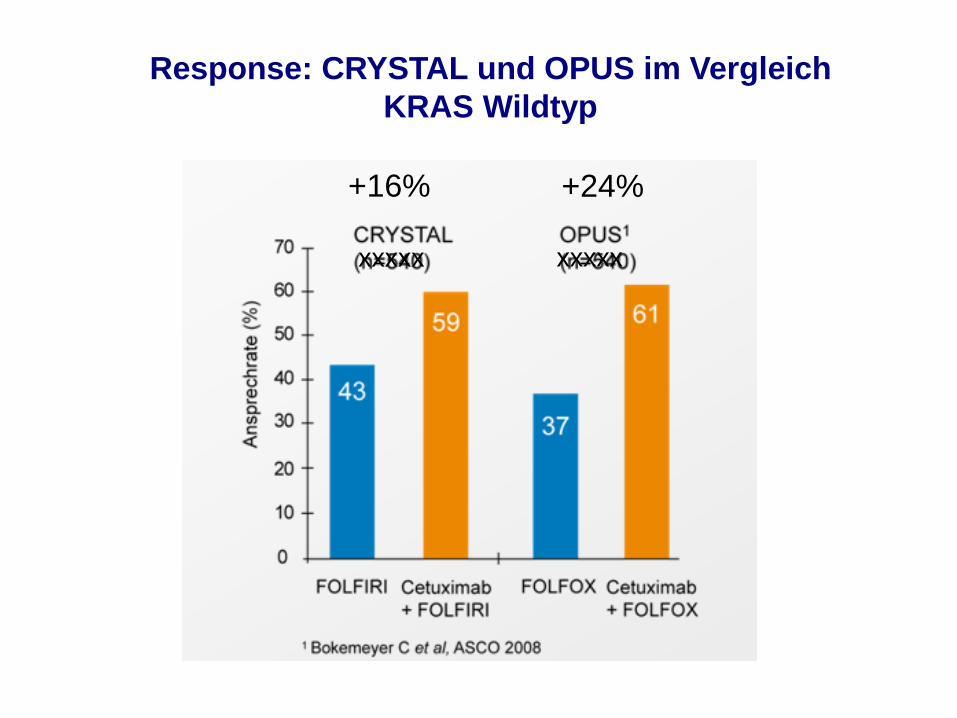
Response: CRYSTAL und OPUS im VergleichKRAS Wildtyp
xxxxx xxxxx
+16% +24%
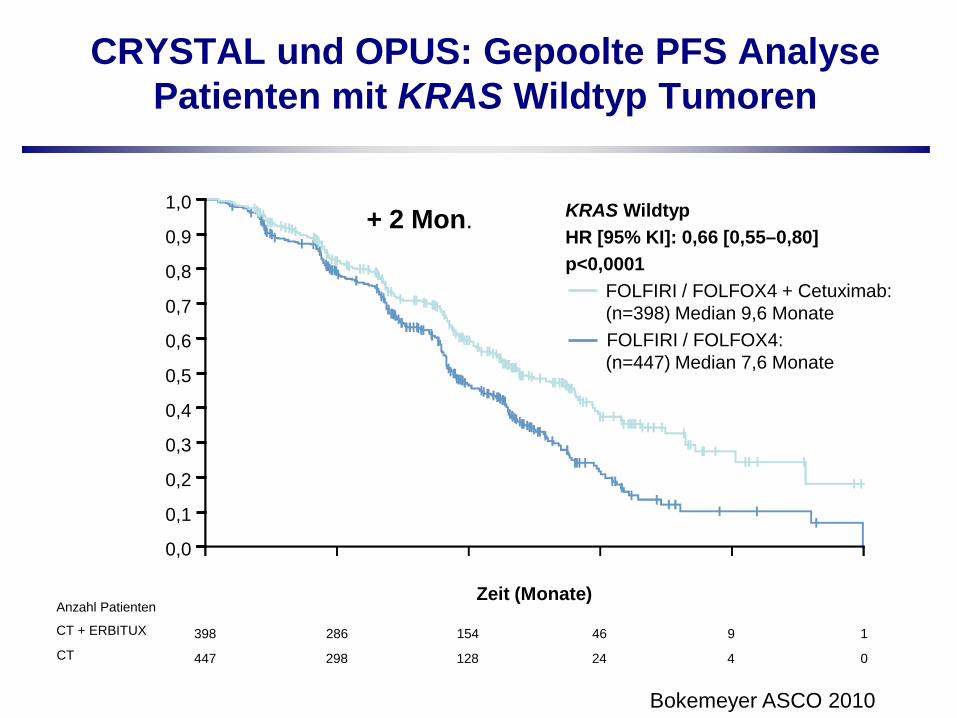
CRYSTAL und OPUS: Gepoolte PFS Analyse Patienten mit KRAS Wildtyp Tumoren
CT
Anzahl Patienten
CT + ERBITUX 398 286 9 1
447 298 4 0
154
128
46
24
PFS
120 4 8 16 20
KRAS WildtypHR [95% KI]: 0,66 [0,55–0,80]p<0,0001
FOLFIRI / FOLFOX4 + Cetuximab: (n=398) Median 9,6 MonateFOLFIRI / FOLFOX4: (n=447) Median 7,6 Monate
Zeit (Monate)
1,0
0,8
0,6
0,4
0,2
0,0
0,1
0,3
0,5
0,7
0,9
Bokemeyer ASCO 2010
+ 2 Mon.
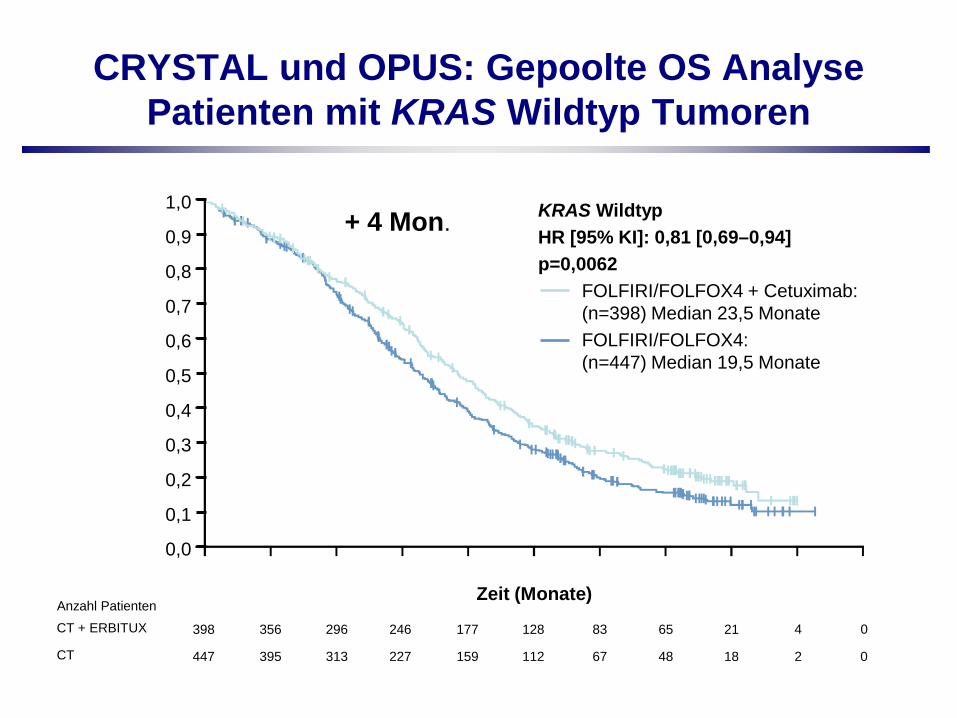
CRYSTAL und OPUS: Gepoolte OS Analyse Patienten mit KRAS Wildtyp Tumoren
CT
Anzahl PatientenCT + ERBITUX 398 356 177 128 65 0
447 395 159 112 48 0
296
313
246
227
83
67
21
18
4
2
OS
180 6 12 24 6030 36 42 48 54Zeit (Monate)
KRAS WildtypHR [95% KI]: 0,81 [0,69–0,94]p=0,0062
FOLFIRI/FOLFOX4 + Cetuximab: (n=398) Median 23,5 MonateFOLFIRI/FOLFOX4: (n=447) Median 19,5 Monate
1,0
0,8
0,6
0,4
0,2
0,0
0,1
0,3
0,5
0,7
0,9+ 4 Mon.
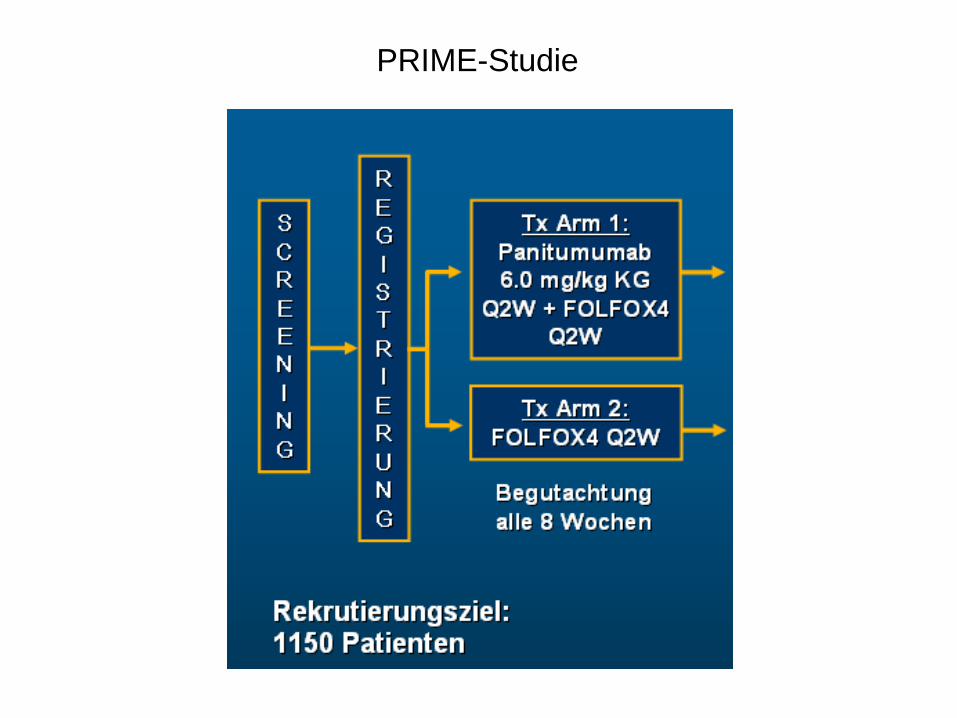
PRIME-Studie
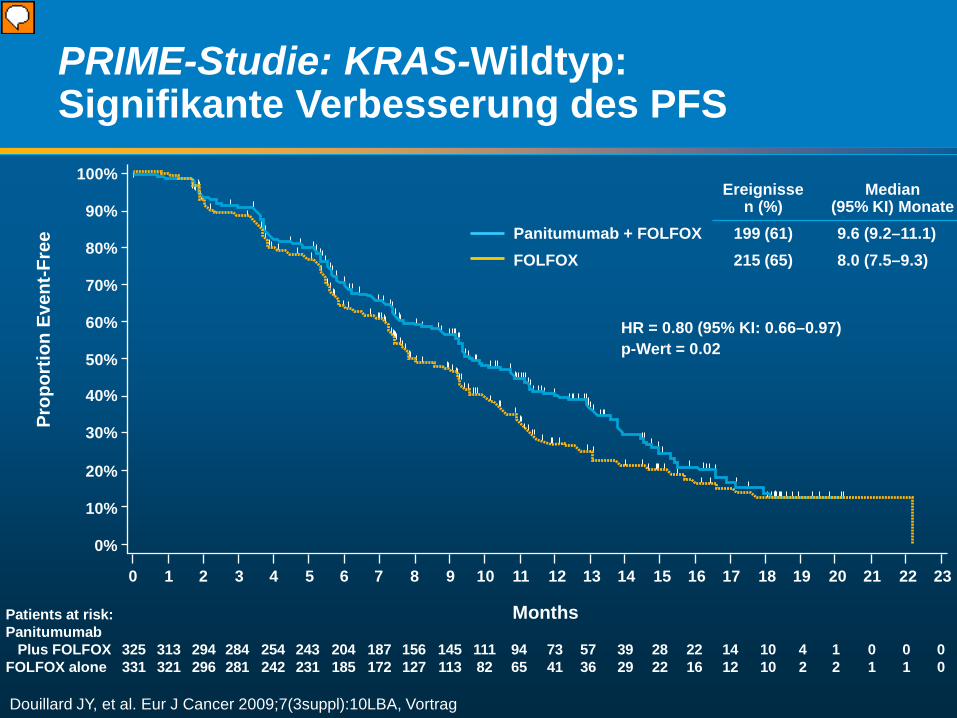
Months
Prop
ortio
n Ev
ent-F
ree
0
0%
10%
20%
30%
40%
50%
60%
70%
80%
90%
100%
1 2 3 4 5 6 7 8 9 10 11 12 13 14 15 16 17 18 19 20 21 22 23
Patients at risk:Panitumumab Plus FOLFOX 325 313 294 284 254 243 204 187 156 145 111 94 73 57 39 28 22 14 10 4 1 0 0 0FOLFOX alone 331 321 296 281 242 231 185 172 127 113 82 65 41 36 29 22 16 12 10 2 2 1 1 0
Ereignissen (%)
Median (95% KI) Monate
Panitumumab + FOLFOX 199 (61) 9.6 (9.2–11.1)FOLFOX 215 (65) 8.0 (7.5–9.3)
HR = 0.80 (95% KI: 0.66–0.97) p-Wert = 0.02
PRIME-Studie: KRAS-Wildtyp: Signifikante Verbesserung des PFS
Douillard JY, et al. Eur J Cancer 2009;7(3suppl):10LBA, Vortrag
Vorführender
Präsentationsnotizen
HR- Cox model stratified by randomization factors: ECOG status, geographic region P-value log rank test- also stratified by same randomization factors Includes patients with unevaluable tumors This was overall PFS, not on-treatment PFS
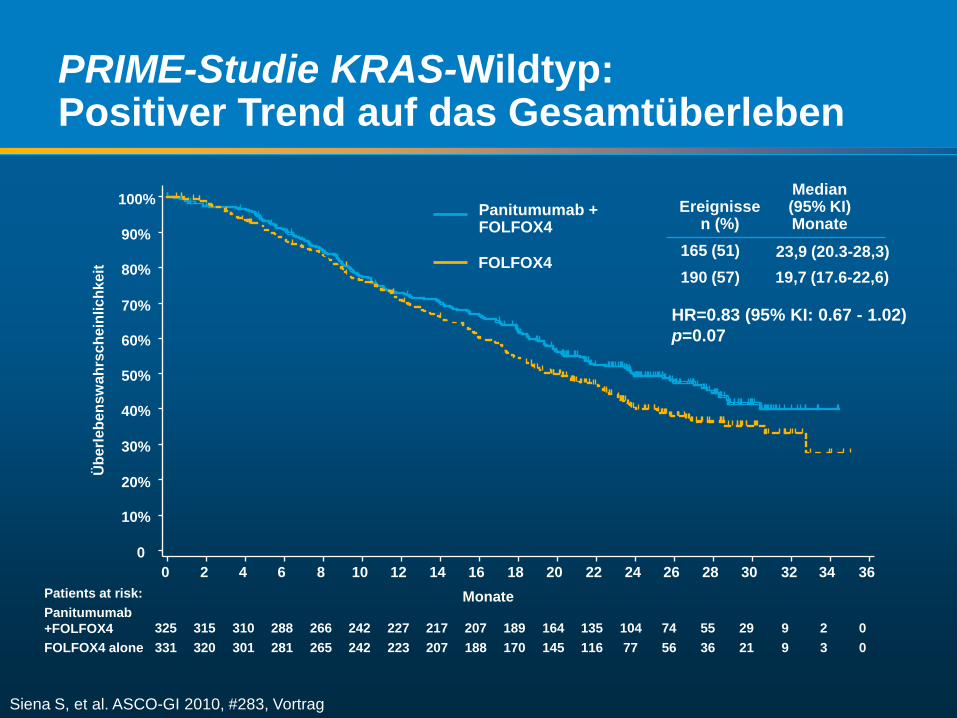
PRIME-Studie KRAS-Wildtyp:Positiver Trend auf das Gesamtüberleben
19,7 (17.6-22,6) 190 (57)23,9 (20.3-28,3) 165 (51)
Median (95% KI) Monate
Ereignissen (%)
Siena S, et al. ASCO-GI 2010, #283, Vortrag
Monate
Übe
rlebe
nsw
ahrs
chei
nlic
hkei
t
0
10%
20%
30%
40%
50%
60%
70%
80%
90%
100%
0 2 4 6 8 10 12 14 16 18 20 22 24 26 28 30 32 34 36Patients at risk:Panitumumab+FOLFOX4FOLFOX4 alone
325 315 310 288 266 242 227 217 207 189 164 135 104 74 55 29 9 2 0331 320 301 281 265 242 223 207 188 170 145 116 77 56 36 21 9 3 0
HR=0.83 (95% KI: 0.67 - 1.02) p=0.07
Panitumumab + FOLFOX4
FOLFOX4
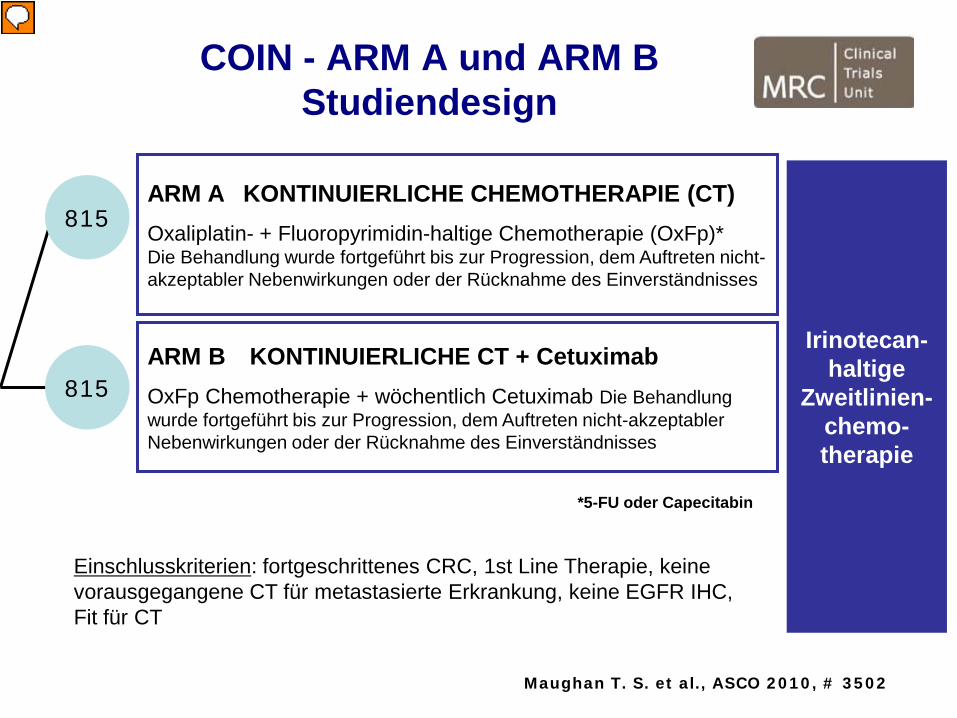
ARM A KONTINUIERLICHE CHEMOTHERAPIE (CT)Oxaliplatin- + Fluoropyrimidin-haltige Chemotherapie (OxFp)*Die Behandlung wurde fortgeführt bis zur Progression, dem Auftreten nicht-akzeptabler Nebenwirkungen oder der Rücknahme des Einverständnisses
COIN - ARM A und ARM BStudiendesign
815
815ARM B KONTINUIERLICHE CT + CetuximabOxFp Chemotherapie + wöchentlich Cetuximab Die Behandlung wurde fortgeführt bis zur Progression, dem Auftreten nicht-akzeptabler Nebenwirkungen oder der Rücknahme des Einverständnisses
Irinotecan-haltige
Zweitlinien-chemo-therapie
*5-FU oder Capecitabin
Maughan T. S. et al., ASCO 2010, # 3502
Einschlusskriterien: fortgeschrittenes CRC, 1st Line Therapie, keine vorausgegangene CT für metastasierte Erkrankung, keine EGFR IHC, Fit für CT
Vorführender
Präsentationsnotizen
CT, Chemotherapie OxFp, Oxaliplatin- + Fluoropyrimidin-haltig
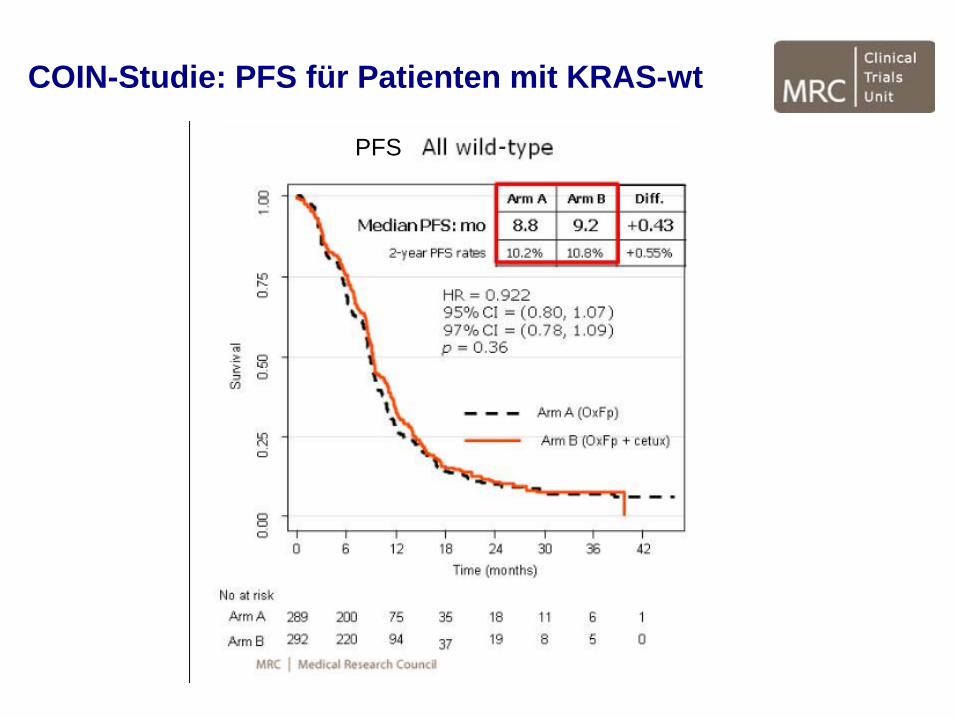
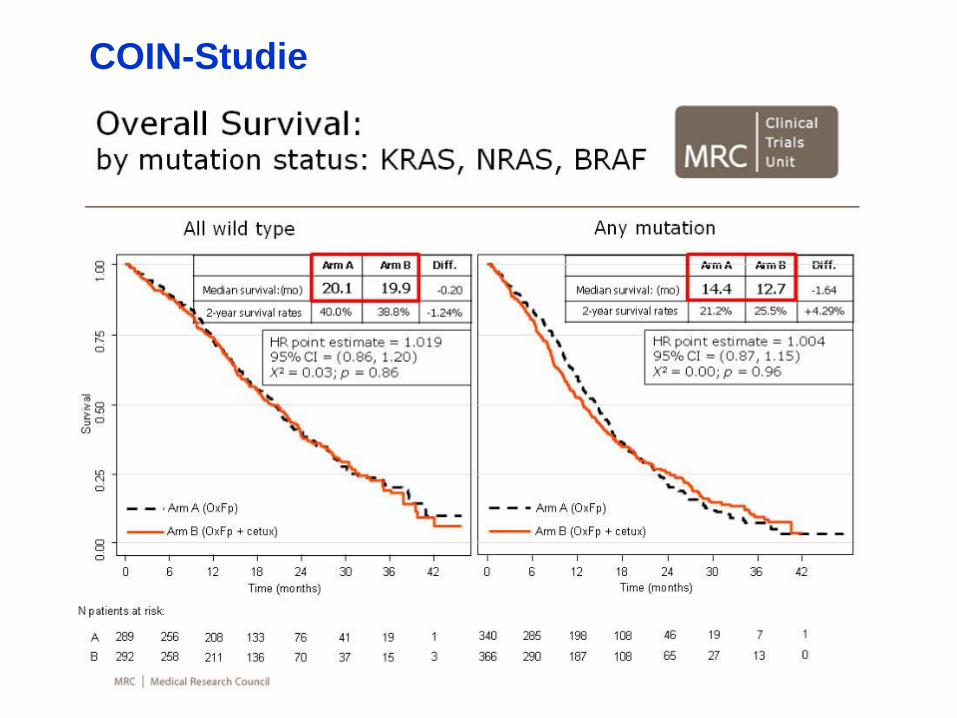
COIN-Studie: PFS für Patienten mit KRAS-wt
PFS
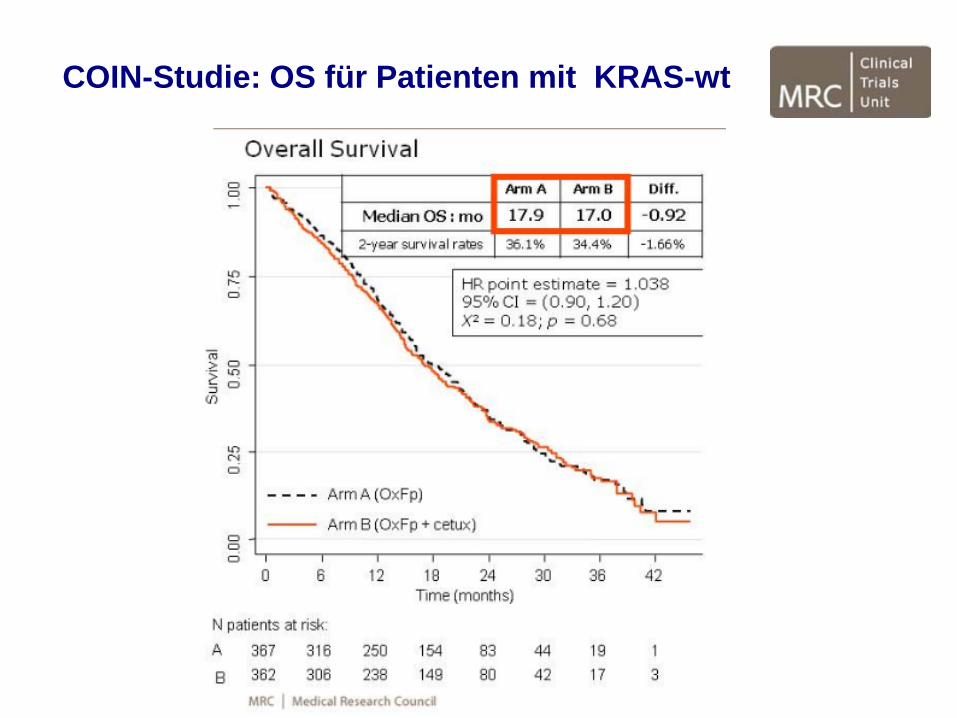
COIN-Studie: OS für Patienten mit KRAS-wt
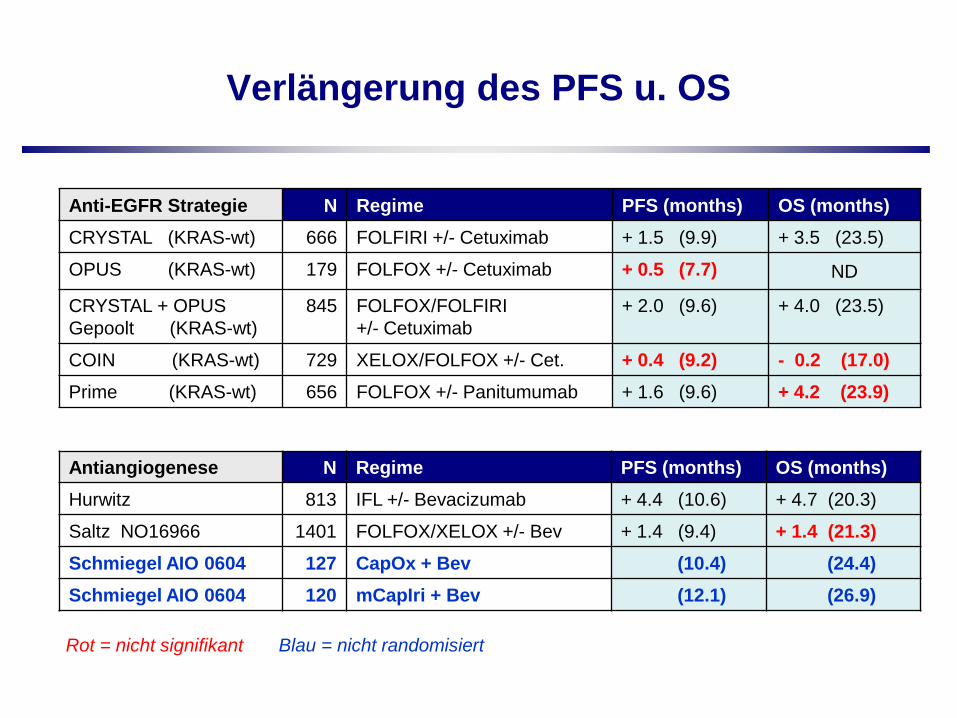
Verlängerung des PFS u. OS
Rot = nicht signifikant Blau = nicht randomisiert
Anti-EGFR Strategie N Regime PFS (months) OS (months)CRYSTAL (KRAS-wt) 666 FOLFIRI +/- Cetuximab + 1.5 (9.9) + 3.5 (23.5)
OPUS (KRAS-wt) 179 FOLFOX +/- Cetuximab + 0.5 (7.7) ND
CRYSTAL + OPUS Gepoolt (KRAS-wt)
845 FOLFOX/FOLFIRI+/- Cetuximab
+ 2.0 (9.6) + 4.0 (23.5)
COIN (KRAS-wt) 729 XELOX/FOLFOX +/- Cet. + 0.4 (9.2) - 0.2 (17.0)Prime (KRAS-wt) 656 FOLFOX +/- Panitumumab + 1.6 (9.6) + 4.2 (23.9)
Antiangiogenese N Regime PFS (months) OS (months)Hurwitz 813 IFL +/- Bevacizumab + 4.4 (10.6) + 4.7 (20.3)
Saltz NO16966 1401 FOLFOX/XELOX +/- Bev + 1.4 (9.4) + 1.4 (21.3)Schmiegel AIO 0604 127 CapOx + Bev (10.4) (24.4)Schmiegel AIO 0604 120 mCapIri + Bev (12.1) (26.9)

Warum sind die Daten der COIN-Studieso schlecht?
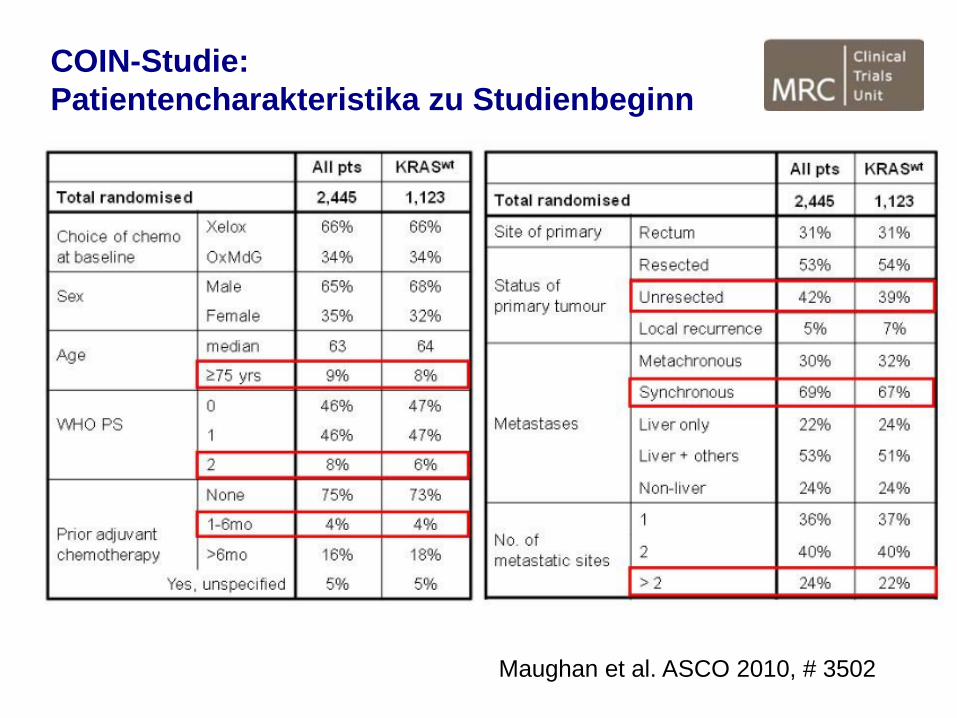
COIN-Studie:Patientencharakteristika zu Studienbeginn
Maughan et al. ASCO 2010, # 3502
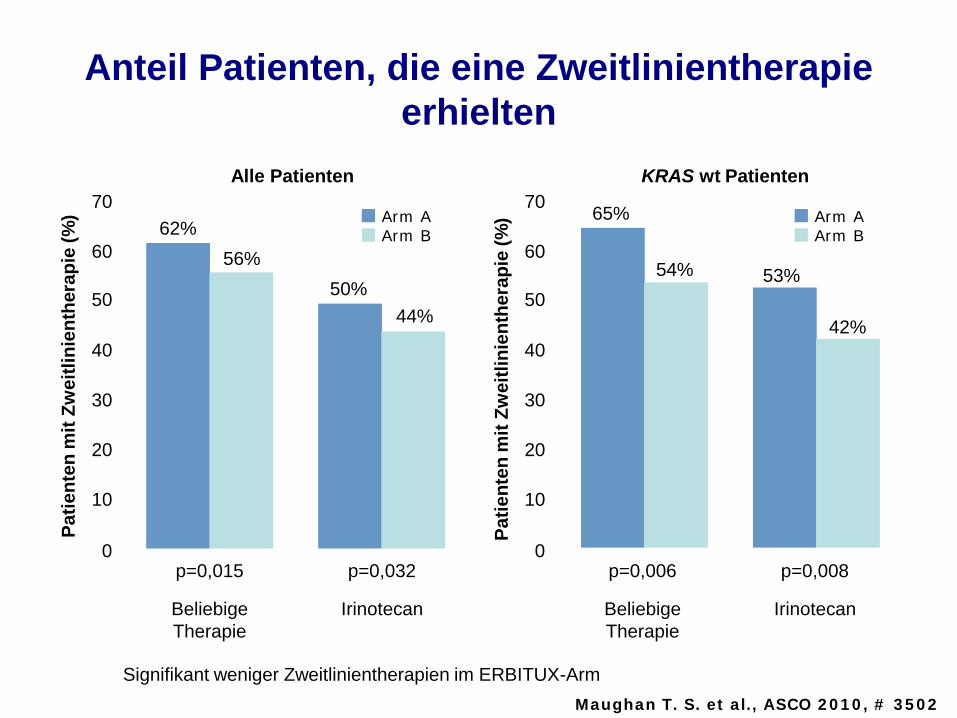
Anteil Patienten, die eine Zweitlinientherapie erhielten
70
60
50
40
30
20
10
0
62%56%
50%44%
Patie
nten
mit
Zwei
tlini
enth
erap
ie (%
)
p=0,015 p=0,032
Beliebige Therapie
Irinotecan
Alle Patienten
Arm AArm B
70
60
50
40
30
20
10
0
65%
54% 53%
42%
Patie
nten
mit
Zwei
tlini
enth
erap
ie (%
)
p=0,006 p=0,008
Beliebige Therapie
Irinotecan
KRAS wt Patienten
Arm AArm B
Signifikant weniger Zweitlinientherapien im ERBITUX-Arm Maughan T. S. et al., ASCO 2010, # 3502
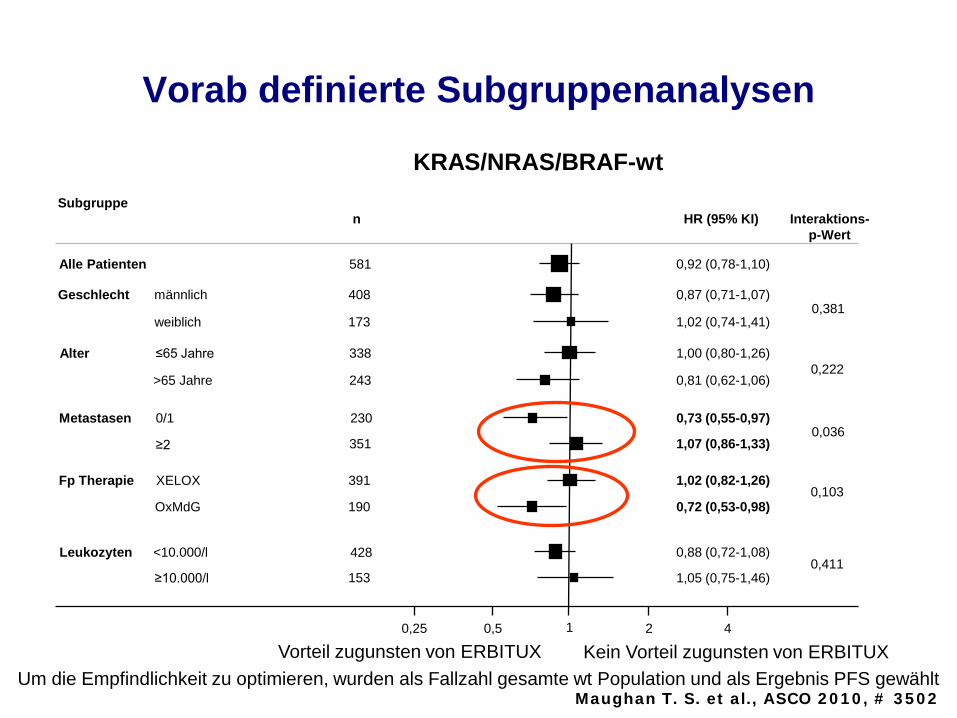
Vorab definierte Subgruppenanalysen
Alle Patienten
Geschlecht
Alter
Fp Therapie
Leukozyten
Subgruppe
männlich
weiblich
≤65 Jahre
>65 Jahre
XELOX
OxMdG
<10.000/l
≥10.000/l
581
408
173
338
243
351
391
190
428
153
n
0,92 (0,78-1,10)
0,87 (0,71-1,07)
1,02 (0,74-1,41)
1,00 (0,80-1,26)
0,81 (0,62-1,06)
1,07 (0,86-1,33)
1,02 (0,82-1,26)
0,72 (0,53-0,98)
0,88 (0,72-1,08)
1,05 (0,75-1,46)
HR (95% KI)
10,25 4
≥2
KRAS/NRAS/BRAF-wt
0,5 2
0,222
0,036
0,103
0,411
Interaktions-p-Wert
0,381
Metastasen 230 0,73 (0,55-0,97)0/1
Um die Empfindlichkeit zu optimieren, wurden als Fallzahl gesamte wt Population und als Ergebnis PFS gewählt Vorteil zugunsten von ERBITUX Kein Vorteil zugunsten von ERBITUX
Maughan T. S. et al., ASCO 2010, # 3502
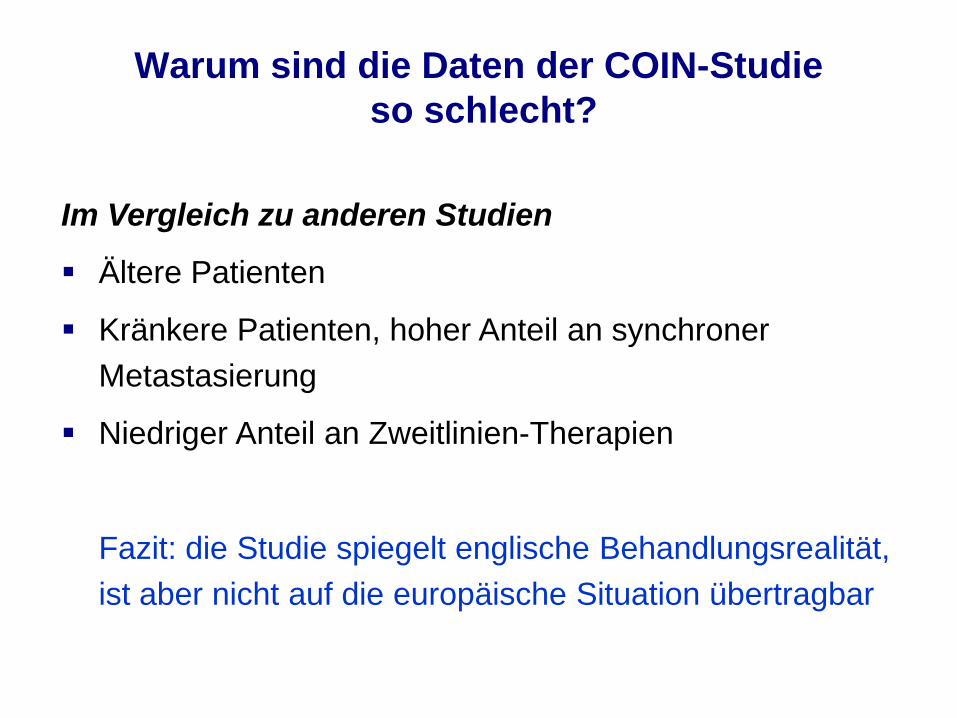
Warum sind die Daten der COIN-Studieso schlecht?
Im Vergleich zu anderen Studien
Ältere Patienten
Kränkere Patienten, hoher Anteil an synchroner Metastasierung
Niedriger Anteil an Zweitlinien-Therapien
Fazit: die Studie spiegelt englische Behandlungsrealität, ist aber nicht auf die europäische Situation übertragbar
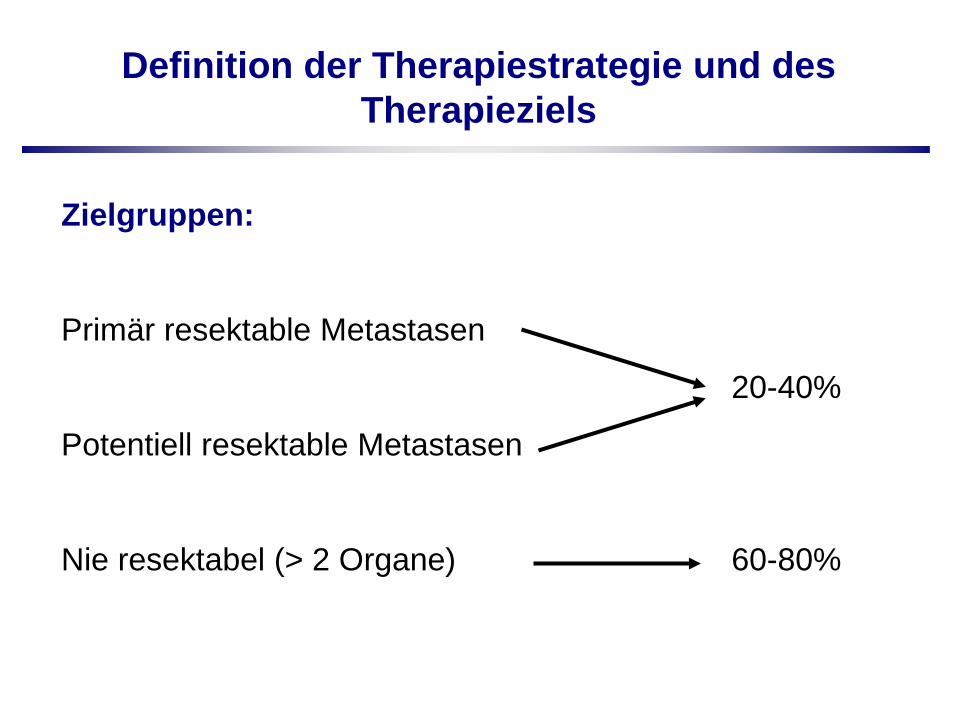
Definition der Therapiestrategie und des Therapieziels
Zielgruppen:
Primär resektable Metastasen
20-40%
Potentiell resektable Metastasen
Nie resektabel (> 2 Organe) 60-80%
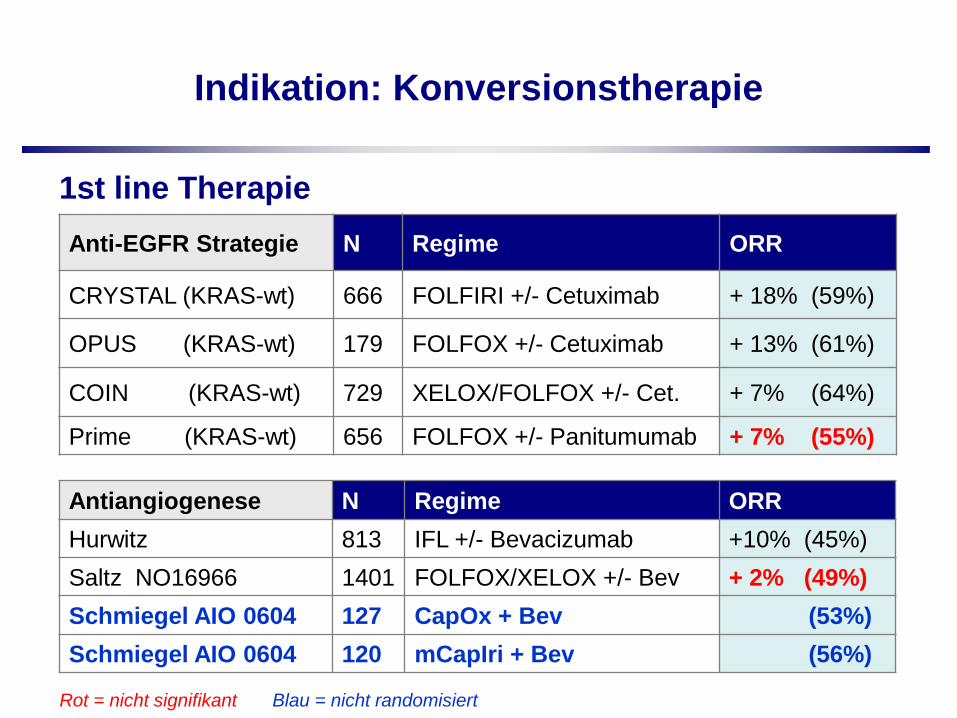
Indikation: Konversionstherapie
Rot = nicht signifikant Blau = nicht randomisiert
Anti-EGFR Strategie N Regime ORR
CRYSTAL (KRAS-wt) 666 FOLFIRI +/- Cetuximab + 18% (59%)
OPUS (KRAS-wt) 179 FOLFOX +/- Cetuximab + 13% (61%)
COIN (KRAS-wt) 729 XELOX/FOLFOX +/- Cet. + 7% (64%)
Prime (KRAS-wt) 656 FOLFOX +/- Panitumumab + 7% (55%)
Antiangiogenese N Regime ORRHurwitz 813 IFL +/- Bevacizumab +10% (45%)Saltz NO16966 1401 FOLFOX/XELOX +/- Bev + 2% (49%)Schmiegel AIO 0604 127 CapOx + Bev (53%)Schmiegel AIO 0604 120 mCapIri + Bev (56%)
1st line Therapie
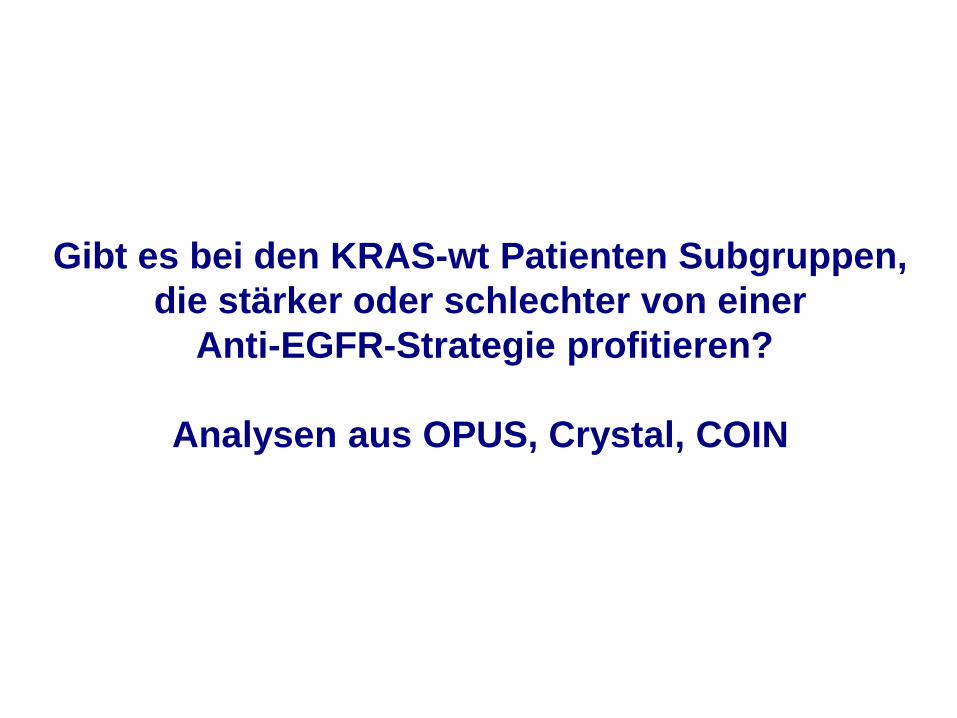
Gibt es bei den KRAS-wt Patienten Subgruppen,die stärker oder schlechter von einer
Anti-EGFR-Strategie profitieren?
Analysen aus OPUS, Crystal, COIN
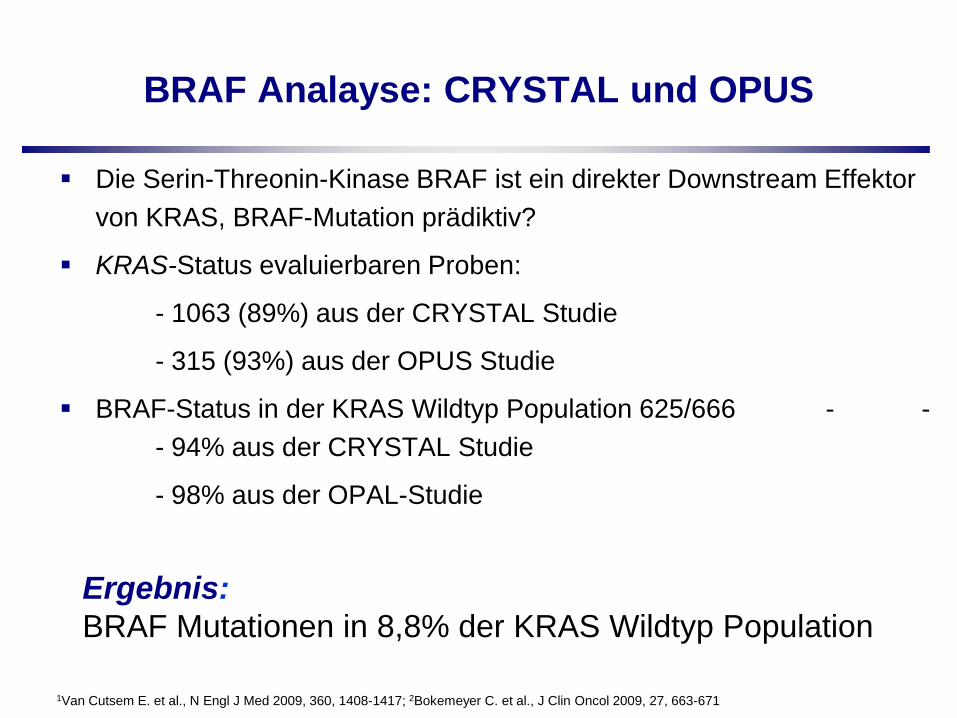
BRAF Analayse: CRYSTAL und OPUS
Die Serin-Threonin-Kinase BRAF ist ein direkter Downstream Effektor von KRAS, BRAF-Mutation prädiktiv?
KRAS-Status evaluierbaren Proben:
- 1063 (89%) aus der CRYSTAL Studie
- 315 (93%) aus der OPUS Studie
BRAF-Status in der KRAS Wildtyp Population 625/666 - -- 94% aus der CRYSTAL Studie
- 98% aus der OPAL-Studie
1Van Cutsem E. et al., N Engl J Med 2009, 360, 1408-1417; 2Bokemeyer C. et al., J Clin Oncol 2009, 27, 663-671
Ergebnis:BRAF Mutationen in 8,8% der KRAS Wildtyp Population
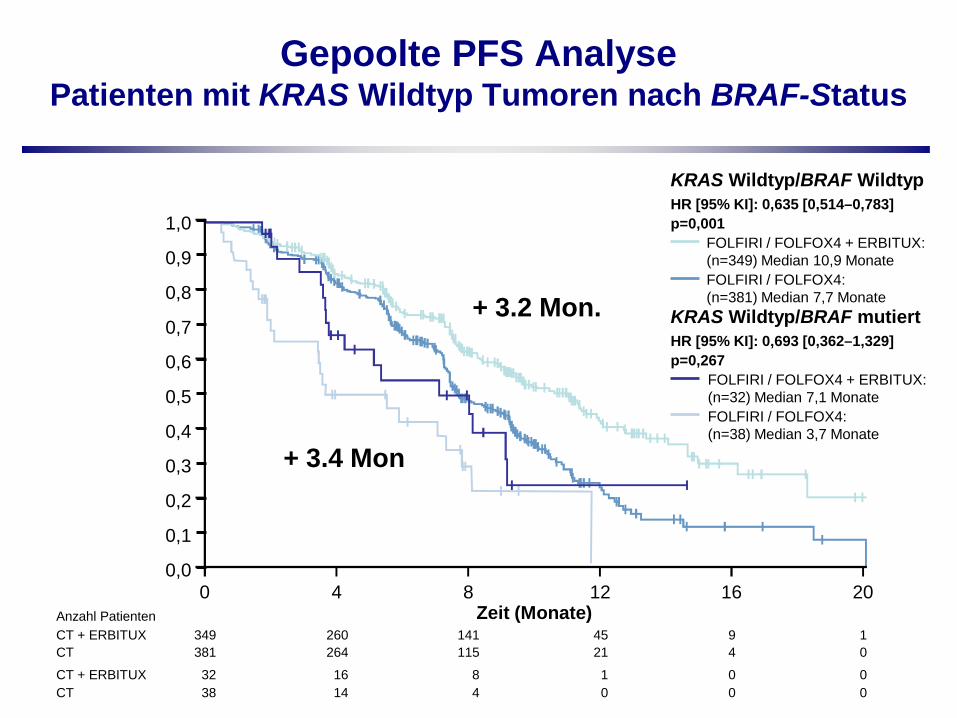
Gepoolte PFS Analyse Patienten mit KRAS Wildtyp Tumoren nach BRAF-Status
32 16 0 038 14 0 0
84
10
349 260 9 1381 264 4 0
141115
4521
KRAS Wildtyp/BRAF WildtypHR [95% KI]: 0,635 [0,514–0,783]p=0,001
FOLFIRI / FOLFOX4 + ERBITUX: (n=349) Median 10,9 MonateFOLFIRI / FOLFOX4: (n=381) Median 7,7 Monate
KRAS Wildtyp/BRAF mutiertHR [95% KI]: 0,693 [0,362–1,329]p=0,267
FOLFIRI / FOLFOX4 + ERBITUX: (n=32) Median 7,1 MonateFOLFIRI / FOLFOX4: (n=38) Median 3,7 Monate
PFS
Zeit (Monate)
CTCT + ERBITUX
CTCT + ERBITUX
0 4 8 2012 16Anzahl Patienten
1,0
0,8
0,6
0,4
0,2
0,0
0,1
0,3
0,5
0,7
0,9
+ 3.2 Mon.
+ 3.4 Mon
32 25 16 12 8 5 2 2 2 038 24 14 6 6 3 3 1 0 0
00CT
CT + ERBITUX
349 317 268 225 163 120 80 63 19 4381 350 283 212 149 107 63 46 17 2
00CT
CT + ERBITUX
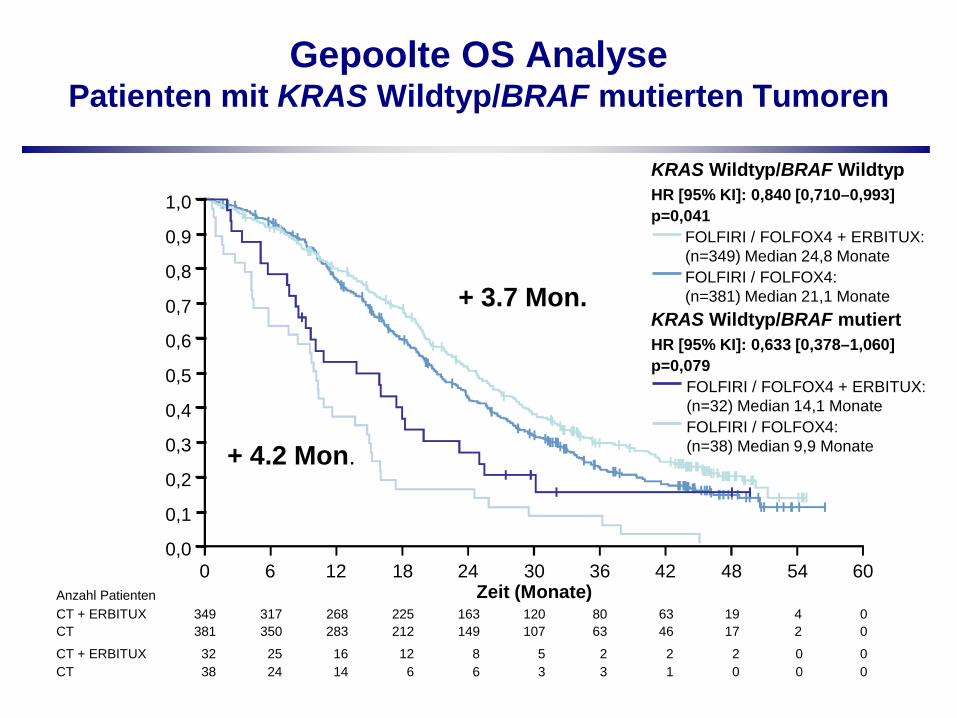
KRAS Wildtyp/BRAF WildtypHR [95% KI]: 0,840 [0,710–0,993]p=0,041
FOLFIRI / FOLFOX4 + ERBITUX: (n=349) Median 24,8 MonateFOLFIRI / FOLFOX4: (n=381) Median 21,1 Monate
KRAS Wildtyp/BRAF mutiertHR [95% KI]: 0,633 [0,378–1,060]p=0,079
FOLFIRI / FOLFOX4 + ERBITUX: (n=32) Median 14,1 MonateFOLFIRI / FOLFOX4: (n=38) Median 9,9 Monate
Gepoolte OS Analyse Patienten mit KRAS Wildtyp/BRAF mutierten Tumoren
OS
Zeit (Monate)180 6 12 24 6030 36 42 48 54
Anzahl Patienten
1,0
0,8
0,6
0,4
0,2
0,0
0,1
0,3
0,5
0,7
0,9
+ 3.7 Mon.
+ 4.2 Mon.
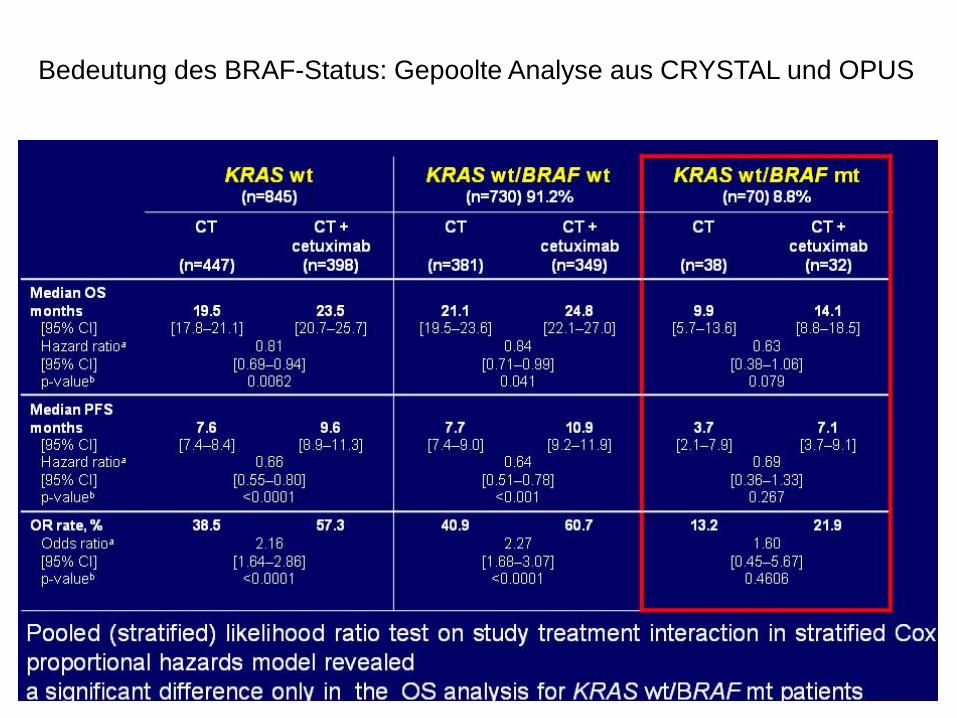
Bedeutung des BRAF-Status: Gepoolte Analyse aus CRYSTAL und OPUS
BRAF Mutation alle Patientenbeliebige MutationKRAS Mutation
KRAS Wildtypalle wt
Mutationsstatus:
06
12
Med
iane
s PF
S (M
onat
e) Arm A Arm B
06
1218
Med
iane
s O
S (M
onat
e)57
340268
815367
28945
366297
815362
2920
1020
3040
2-Ja
hres
-OS
(%)
n
Prognostischer Einfluss des Mutationsstatus
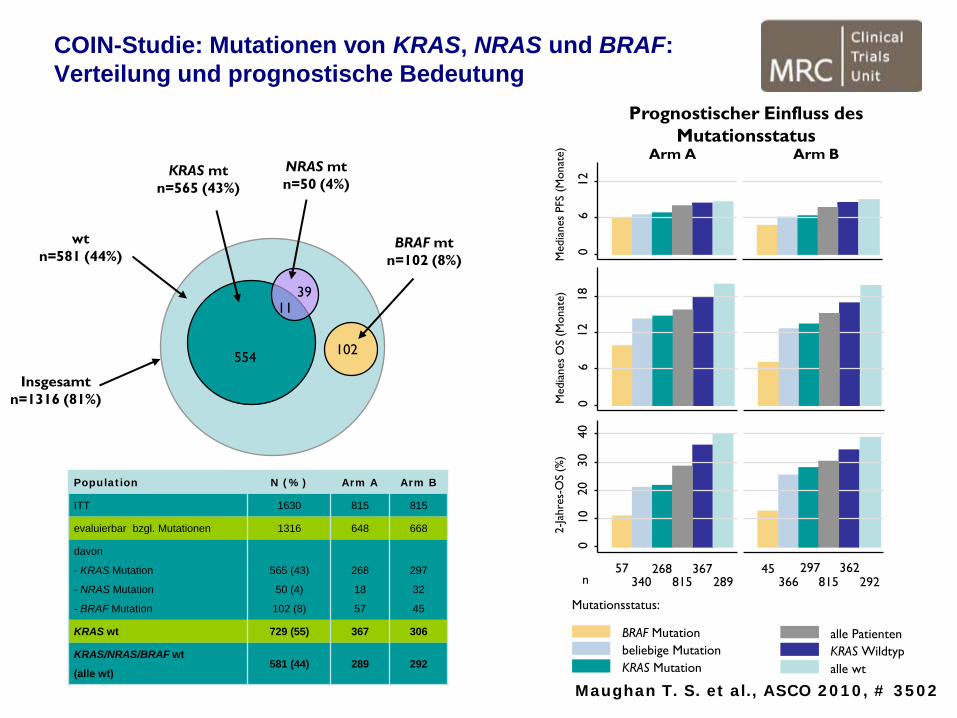
wtn=581 (44%)
KRAS mtn=565 (43%)
NRAS mtn=50 (4%)
BRAF mtn=102 (8%)
Insgesamtn=1316 (81%)
554
1139
102
Population N (%) Arm A Arm B
ITT 1630 815 815
evaluierbar bzgl. Mutationen 1316 648 668
davon
- KRAS Mutation
- NRAS Mutation
- BRAF Mutation
565 (43)
50 (4)
102 (8)
268
18
57
297
32
45
KRAS wt 729 (55) 367 306
KRAS/NRAS/BRAF wt
(alle wt)581 (44) 289 292
COIN-Studie: Mutationen von KRAS, NRAS und BRAF:Verteilung und prognostische Bedeutung
Maughan T. S. et al., ASCO 2010, # 3502
COIN-Studie
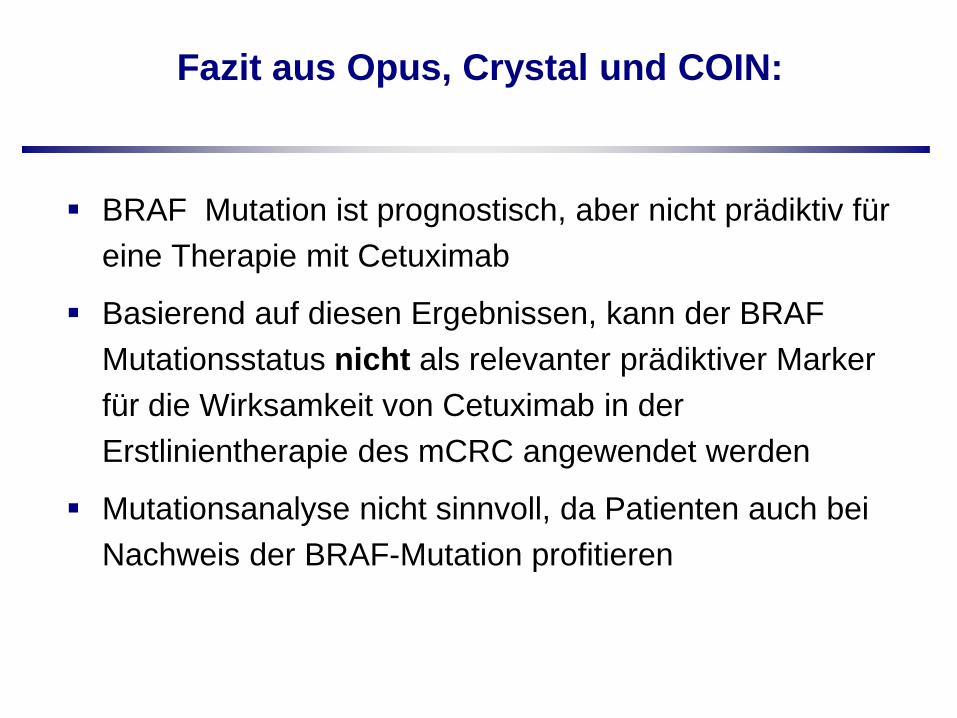
Fazit aus Opus, Crystal und COIN:
BRAF Mutation ist prognostisch, aber nicht prädiktiv für eine Therapie mit Cetuximab
Basierend auf diesen Ergebnissen, kann der BRAF Mutationsstatus nicht als relevanter prädiktiver Marker für die Wirksamkeit von Cetuximab in der Erstlinientherapie des mCRC angewendet werden
Mutationsanalyse nicht sinnvoll, da Patienten auch bei Nachweis der BRAF-Mutation profitieren
Arnold et al., ASCO GI 2008; WCGIC 2009
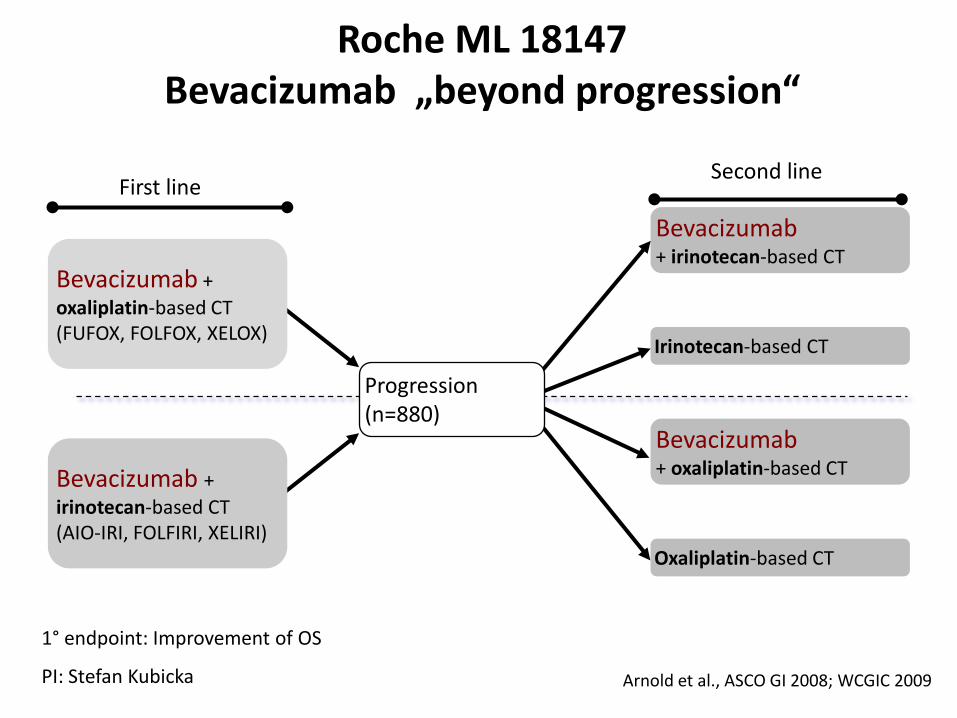
Bevacizumab + oxaliplatin-based CT(FUFOX, FOLFOX, XELOX)
Bevacizumab + irinotecan-based CT(AIO-IRI, FOLFIRI, XELIRI)
Oxaliplatin-based CT
Bevacizumab+ oxaliplatin-based CT
Irinotecan-based CT
Bevacizumab+ irinotecan-based CT
First line Second line
Progression (n=880)
Roche ML 18147Bevacizumab „beyond progression“
1° endpoint: Improvement of OS
PI: Stefan Kubicka
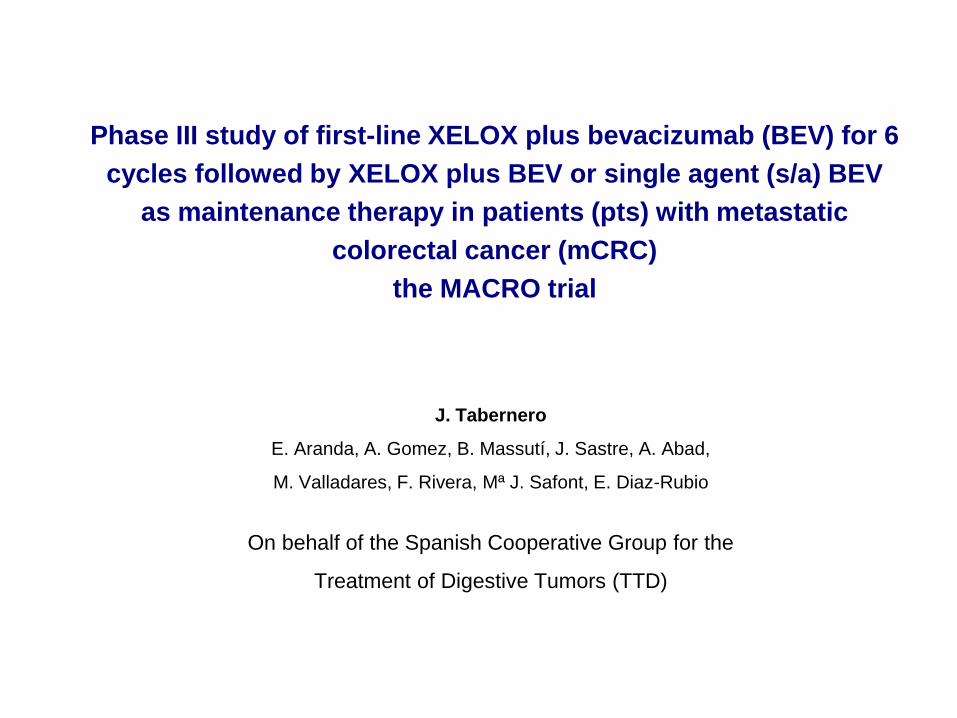
Phase III study of first-line XELOX plus bevacizumab (BEV) for 6 cycles followed by XELOX plus BEV or single agent (s/a) BEV
as maintenance therapy in patients (pts) with metastatic colorectal cancer (mCRC)
the MACRO trial
J. Tabernero
E. Aranda, A. Gomez, B. Massutí, J. Sastre, A. Abad,
M. Valladares, F. Rivera, Mª J. Safont, E. Diaz-Rubio
On behalf of the Spanish Cooperative Group for the
Treatment of Digestive Tumors (TTD)
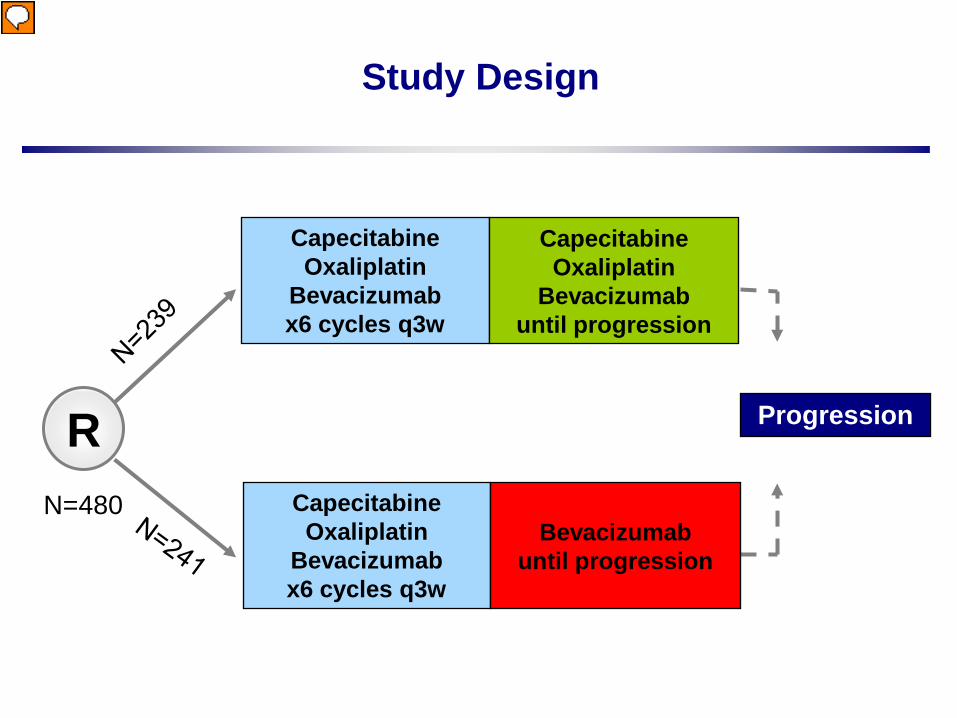
Study Design
ProgressionRCapecitabineOxaliplatin
Bevacizumabx6 cycles q3w
Bevacizumabuntil progression
N=480
CapecitabineOxaliplatin
Bevacizumabx6 cycles q3w
CapecitabineOxaliplatin
Bevacizumabuntil progression
Vorführender
Präsentationsnotizen
sample size refres to IIT population. Check demographics etc to see if all are PP
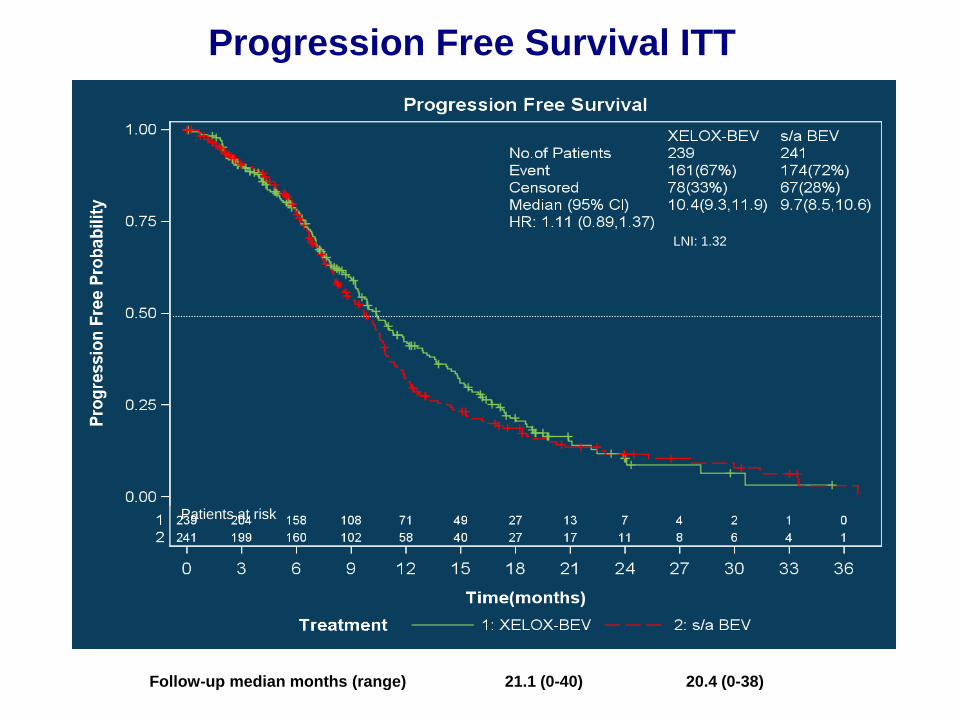
Progression Free Survival ITT
LNI: 1.32
Follow-up median months (range) 21.1 (0-40) 20.4 (0-38)
Patients at risk
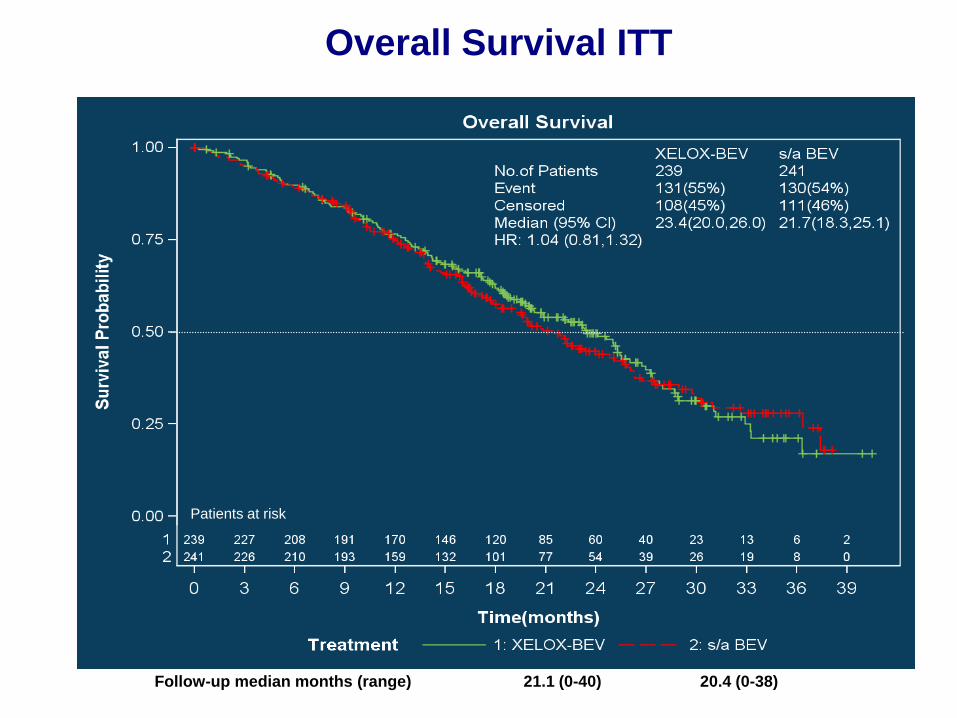
Overall Survival ITT
Patients at risk
Follow-up median months (range) 21.1 (0-40) 20.4 (0-38)
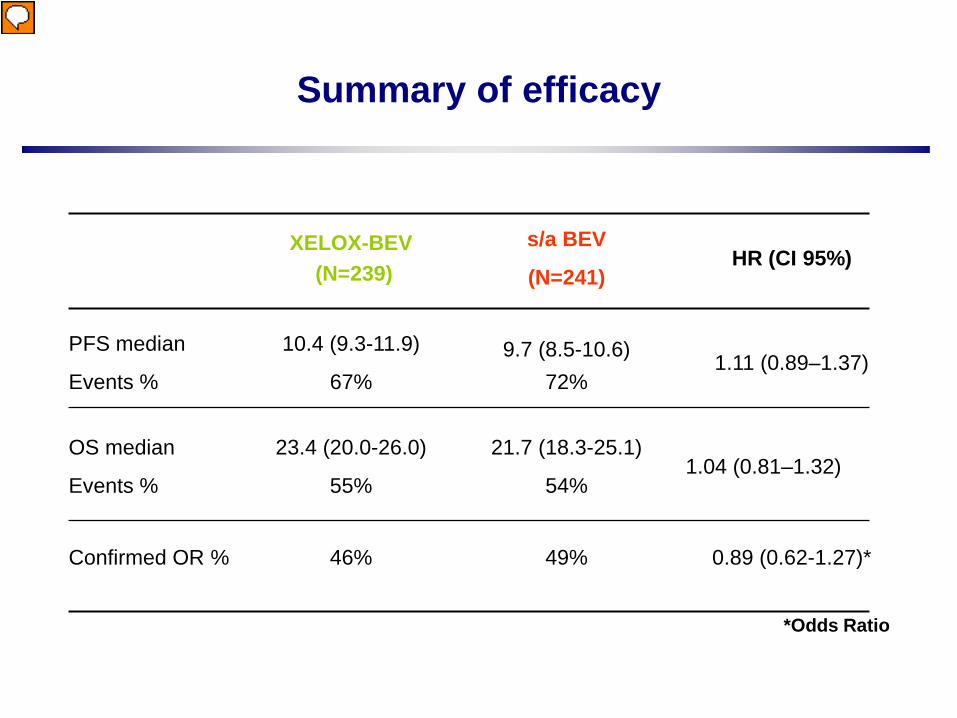
Summary of efficacy
XELOX-BEV(N=239)
s/a BEV
(N=241)HR (CI 95%)
PFS median
Events %
10.4 (9.3-11.9)
67%9.7 (8.5-10.6)
72%1.11 (0.89–1.37)
OS median
Events %
23.4 (20.0-26.0)
55%
21.7 (18.3-25.1)
54%1.04 (0.81–1.32)
Confirmed OR % 46% 49% 0.89 (0.62-1.27)*
*Odds Ratio
Vorführender
Präsentationsnotizen
Moreover this post hoc change raises some multiplicity concerns too. With 3 arms there is a multiplicity of hypothesis test leading to a alpha risk inflation. To be confirmatory, the trial must control this inflation by using a signification level adjustment (Bonferroni, etc.). In the reported analysis, no such a method was performed. So given the post hos change of hypothesis and the multiplicity concern these results are only exploratory, not confirmatory. The present conclusion is a little bit stronger given these restrictions. For the calculation of the sample size, the underlying incidence (in the control group) is missing. The sample size calculation presented here is for 2 groups, I guess that in the protocol a sample size calculation for 3 arms was performed initially Is this trial registered into a clinical trial register (if yes what are the change in the protocol compared with the description put in the register) In the abstract the trial was described as a phase II/III trial, here it’s a phase III only The methodology of this trial seems like meta analysis or others? One more point may be that the number of patients enrolled is not so large which may make people challenge the results.
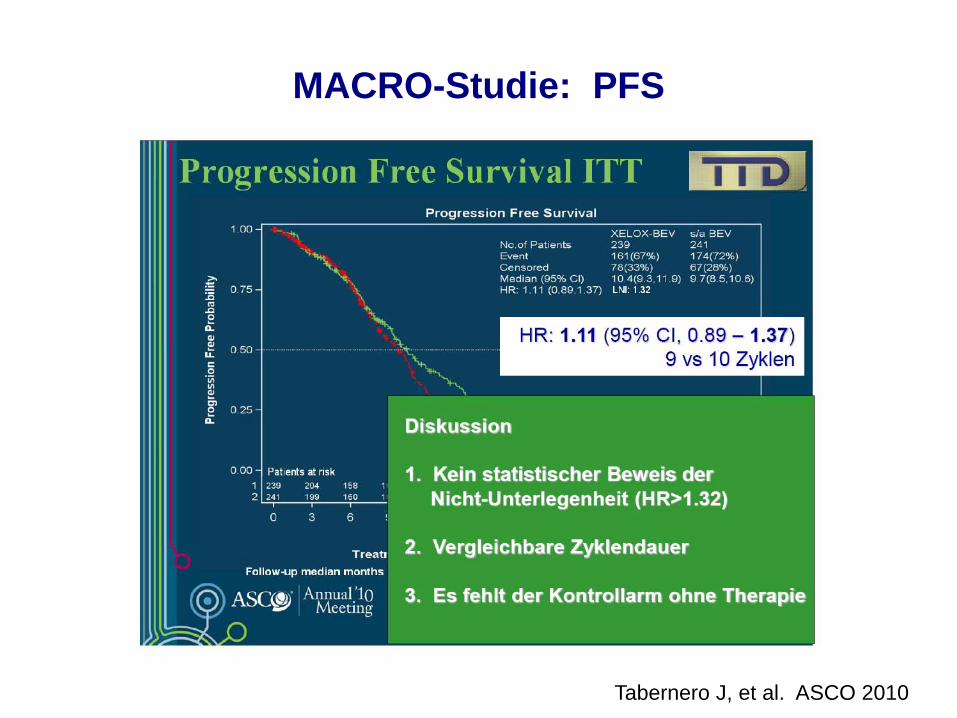
MACRO-Studie: PFS
Tabernero J, et al. ASCO 2010
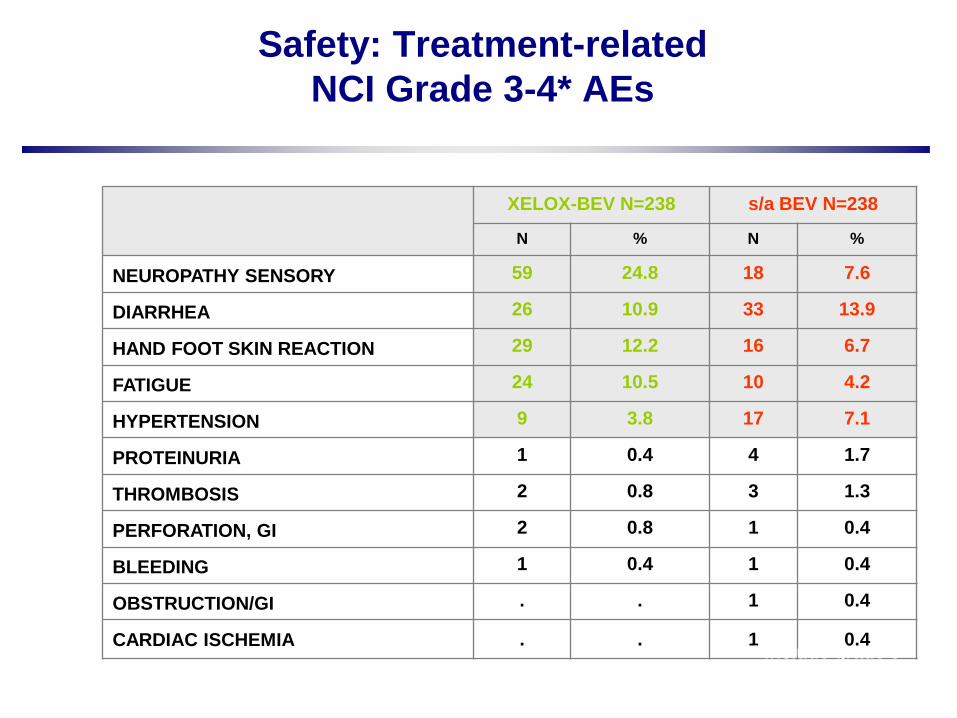
Safety: Treatment-related NCI Grade 3-4* AEs
XELOX-BEV N=238 s/a BEV N=238
N % N %
NEUROPATHY SENSORY 59 24.8 18 7.6
DIARRHEA 26 10.9 33 13.9
HAND FOOT SKIN REACTION 29 12.2 16 6.7
FATIGUE 24 10.5 10 4.2
HYPERTENSION 9 3.8 17 7.1
PROTEINURIA 1 0.4 4 1.7
THROMBOSIS 2 0.8 3 1.3
PERFORATION, GI 2 0.8 1 0.4
BLEEDING 1 0.4 1 0.4
OBSTRUCTION/GI . . 1 0.4
CARDIAC ISCHEMIA . . 1 0.4* Include grade 5
Arbeitsgemeinschaft Internistische OnkologieArbeitsgruppe “Kolon-/Rektum-/Dünndarmkarzinom”
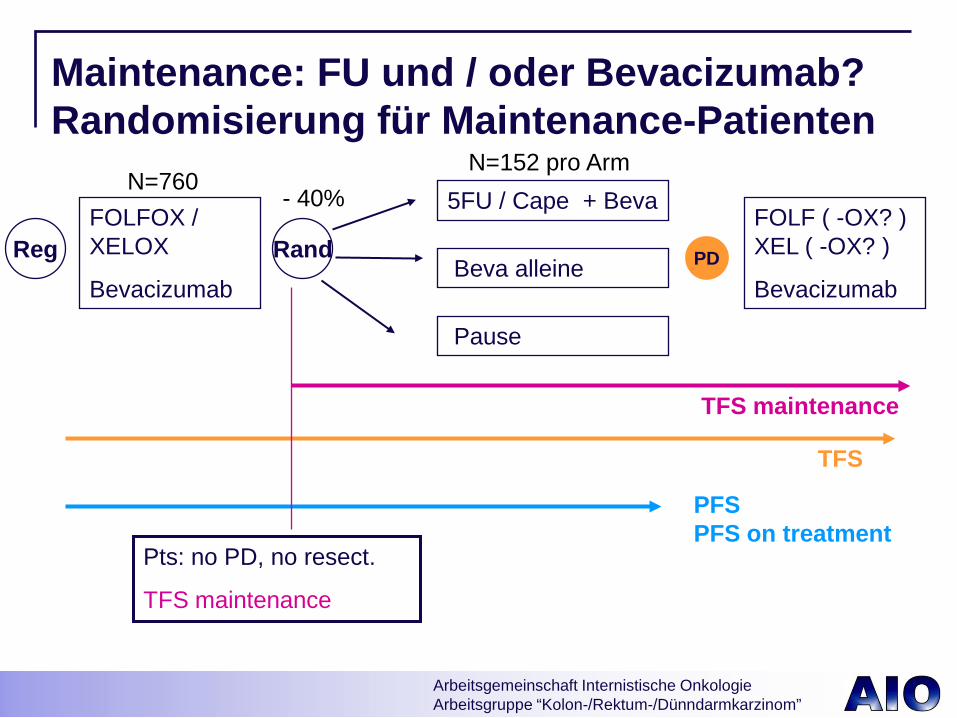
5FU / Cape + Beva
Beva alleine
FOLF ( -OX? ) XEL ( -OX? )
Bevacizumab
FOLFOX / XELOX
Bevacizumab
PFSPFS on treatment
TFS maintenance
Rand
Pts: no PD, no resect.
TFS maintenance
Maintenance: FU und / oder Bevacizumab? Randomisierung für Maintenance-Patienten
TFS
Pause
PD
N=760N=152 pro Arm
- 40%
Reg
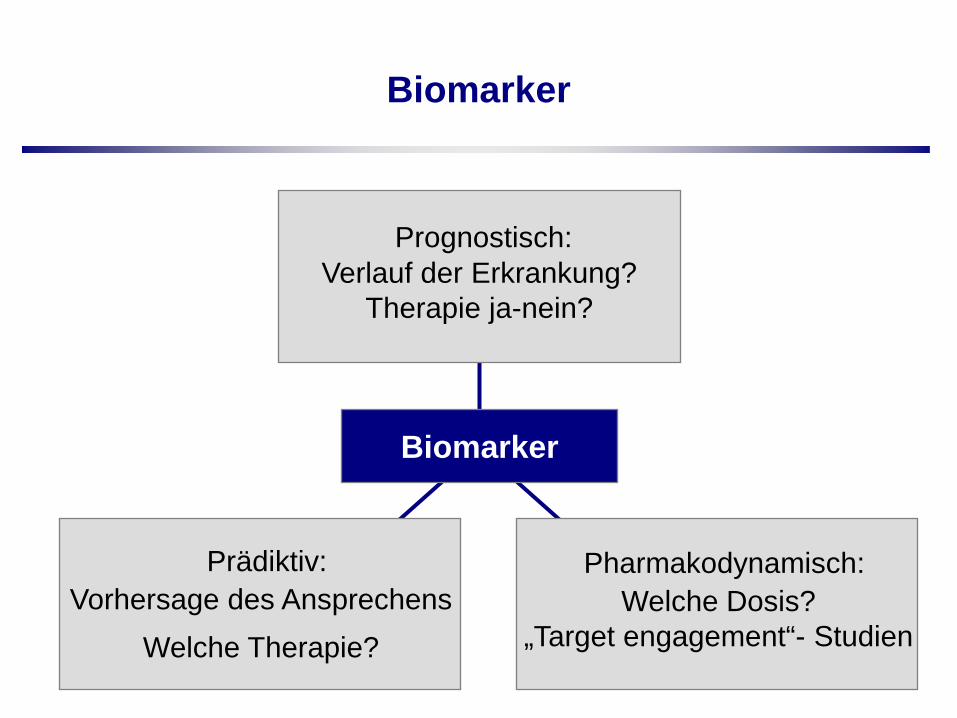
Biomarker
Biomarker
Prognostisch: Verlauf der Erkrankung?
Therapie ja-nein?
Prädiktiv: Vorhersage des Ansprechens
Welche Therapie?
Pharmakodynamisch: Welche Dosis?
„Target engagement“- Studien
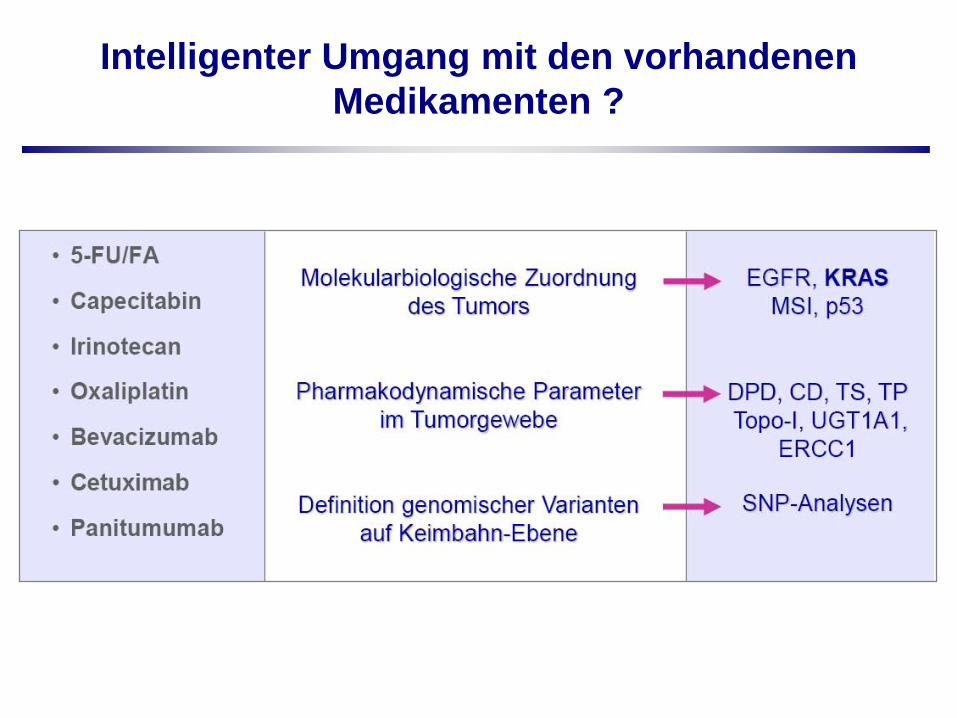
Intelligenter Umgang mit den vorhandenen Medikamenten ?
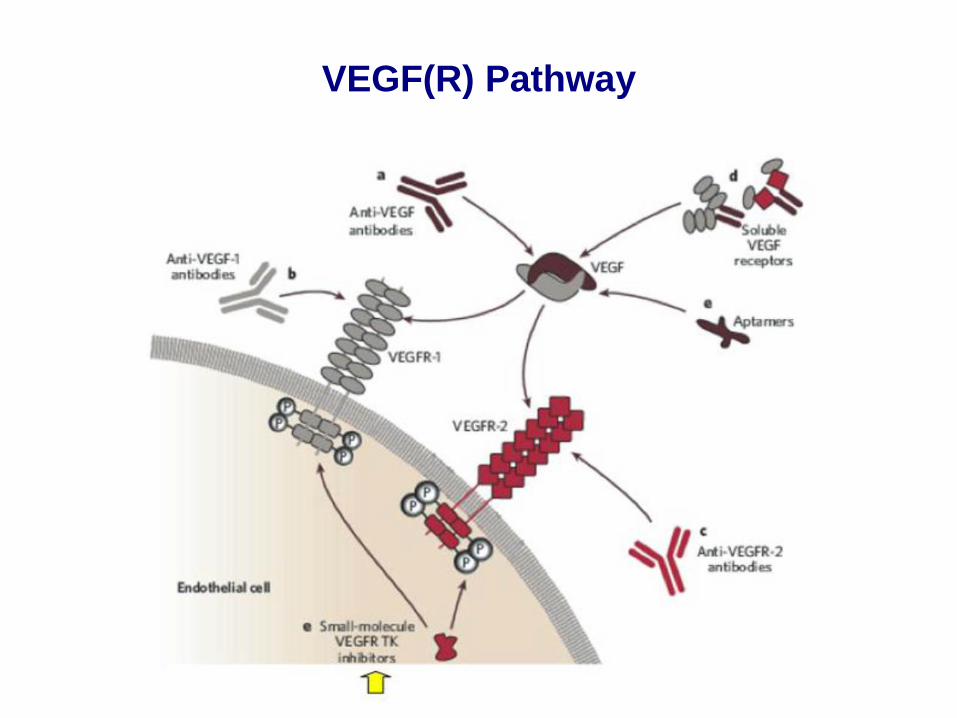
VEGF(R) Pathway
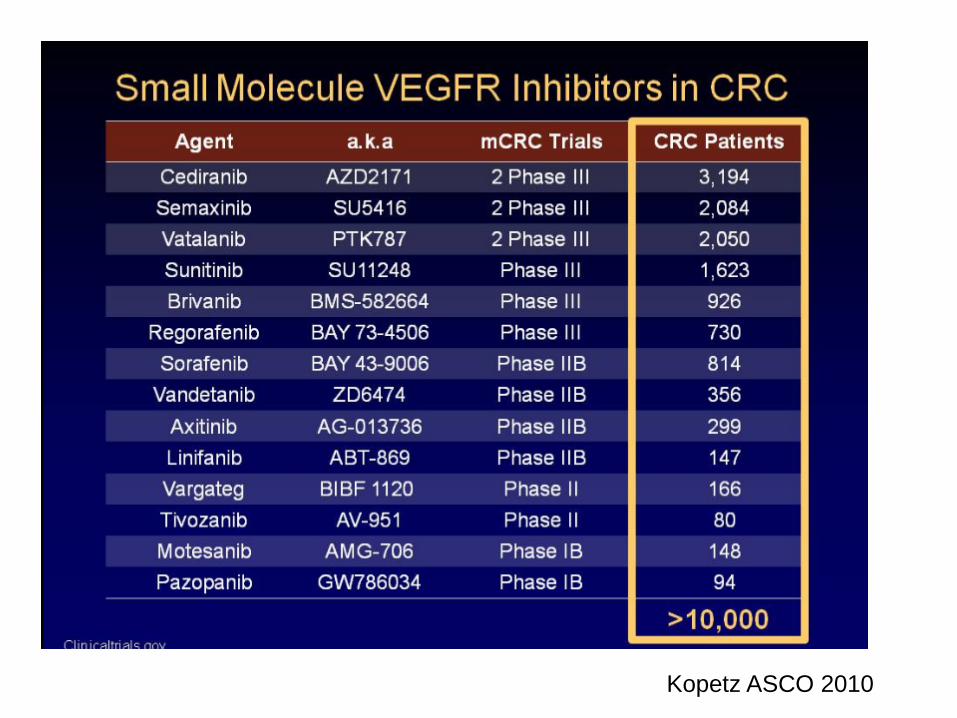
Kopetz ASCO 2010
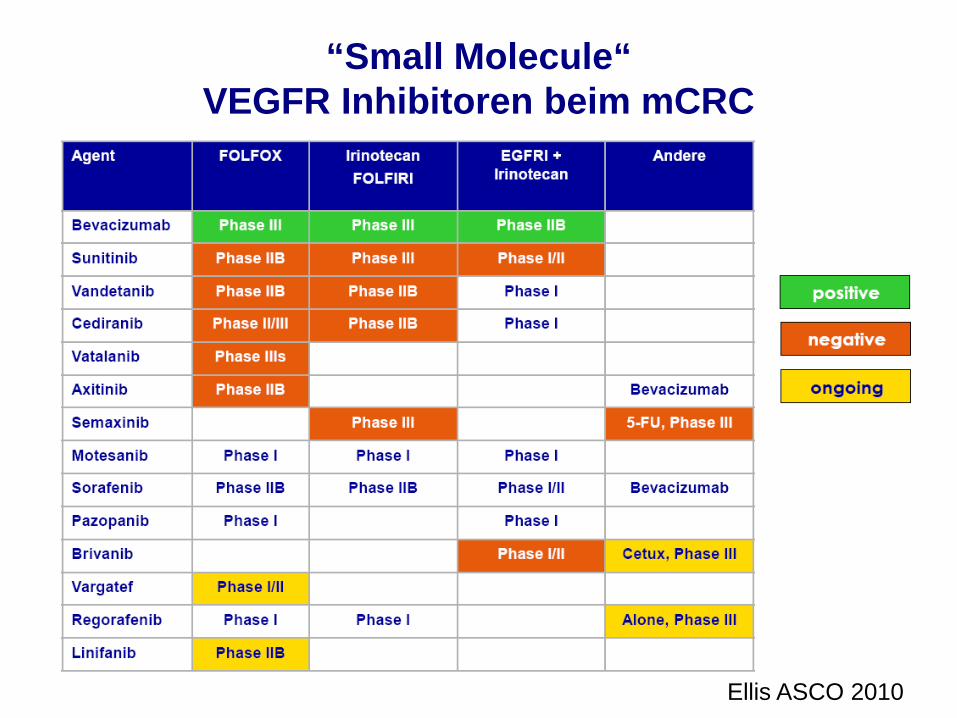
“Small Molecule“ VEGFR Inhibitoren beim mCRC
Ellis ASCO 2010
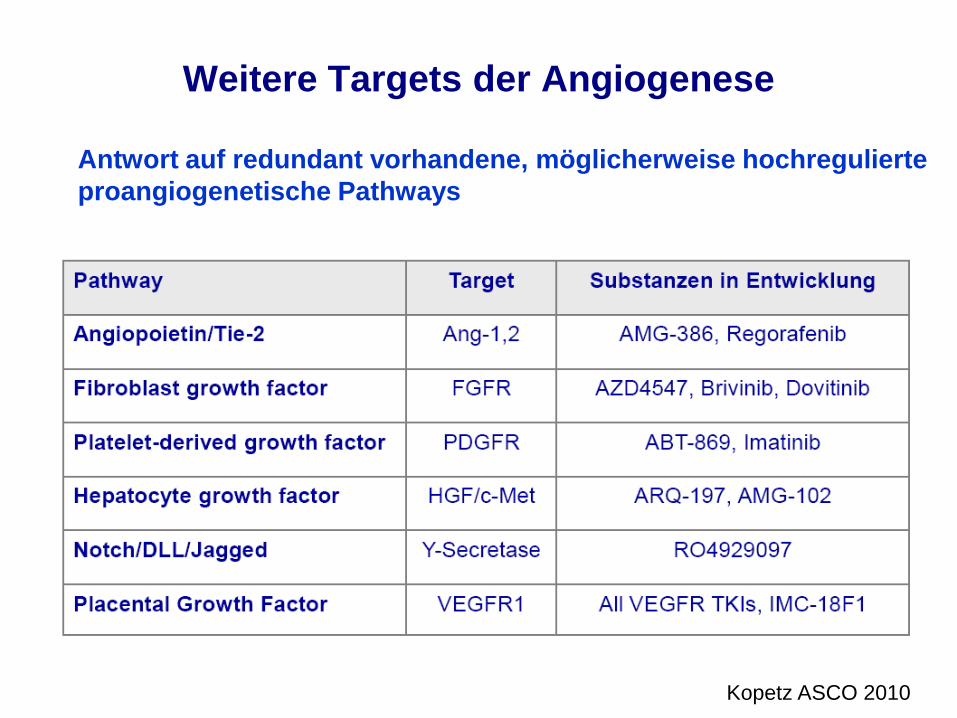
Weitere Targets der Angiogenese
Kopetz ASCO 2010
Antwort auf redundant vorhandene, möglicherweise hochregulierteproangiogenetische Pathways
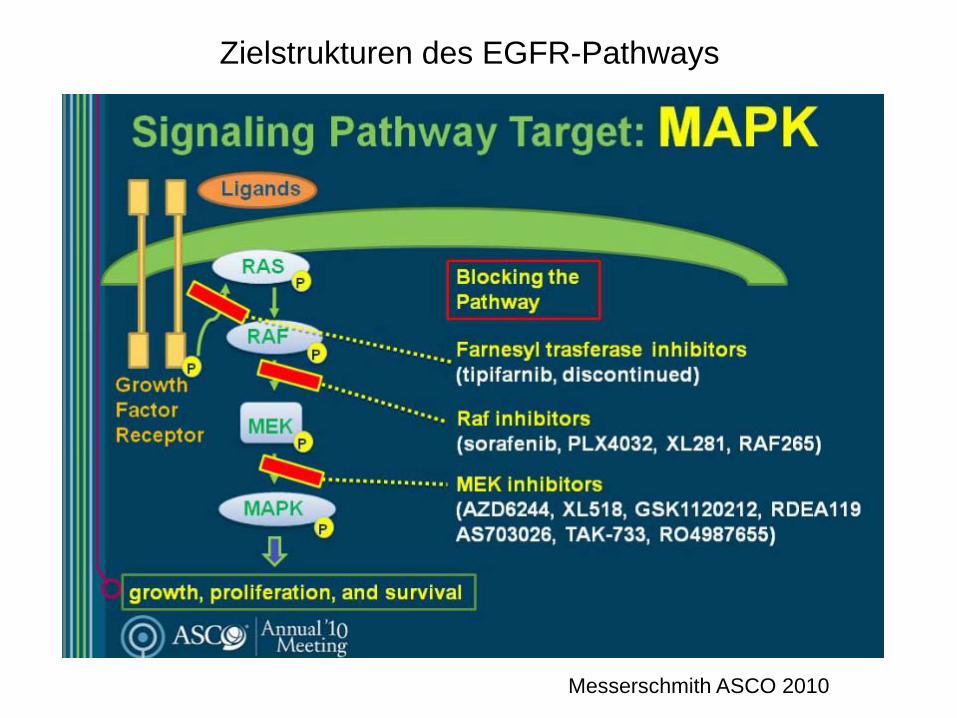
Zielstrukturen des EGFR-Pathways
Messerschmith ASCO 2010
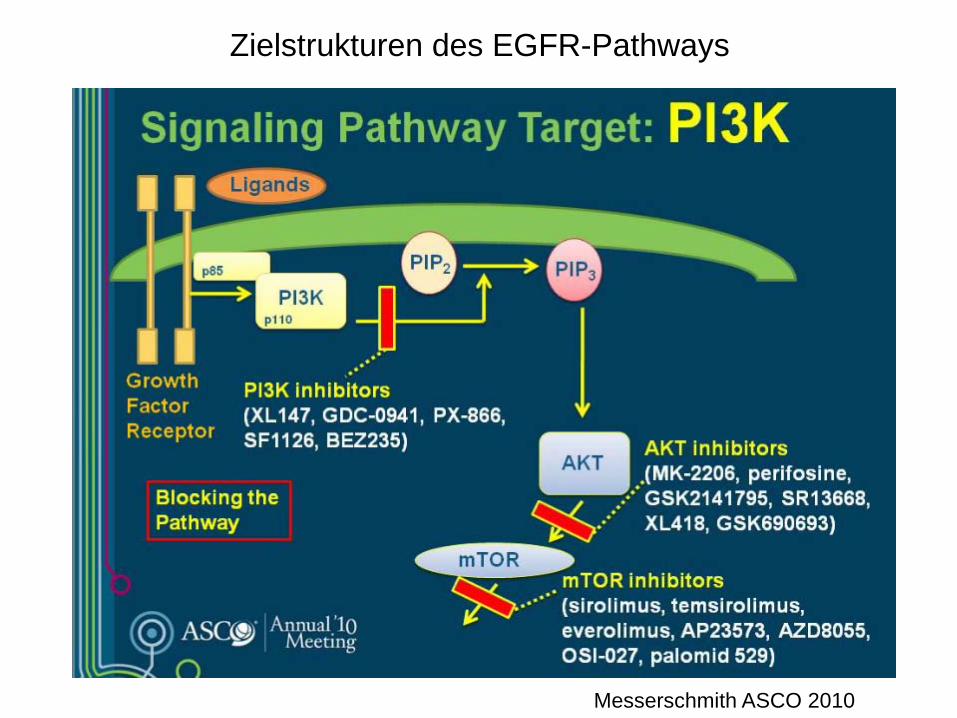
Zielstrukturen des EGFR-Pathways
Messerschmith ASCO 2010
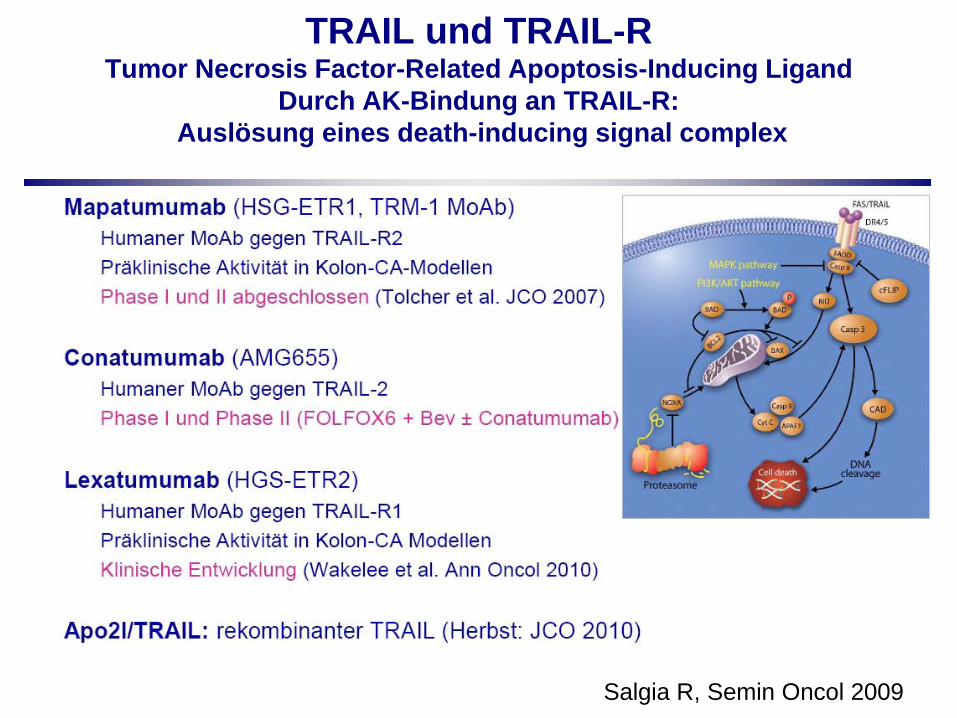
TRAIL und TRAIL-R Tumor Necrosis Factor-Related Apoptosis-Inducing Ligand
Durch AK-Bindung an TRAIL-R:Auslösung eines death-inducing signal complex
Salgia R, Semin Oncol 2009
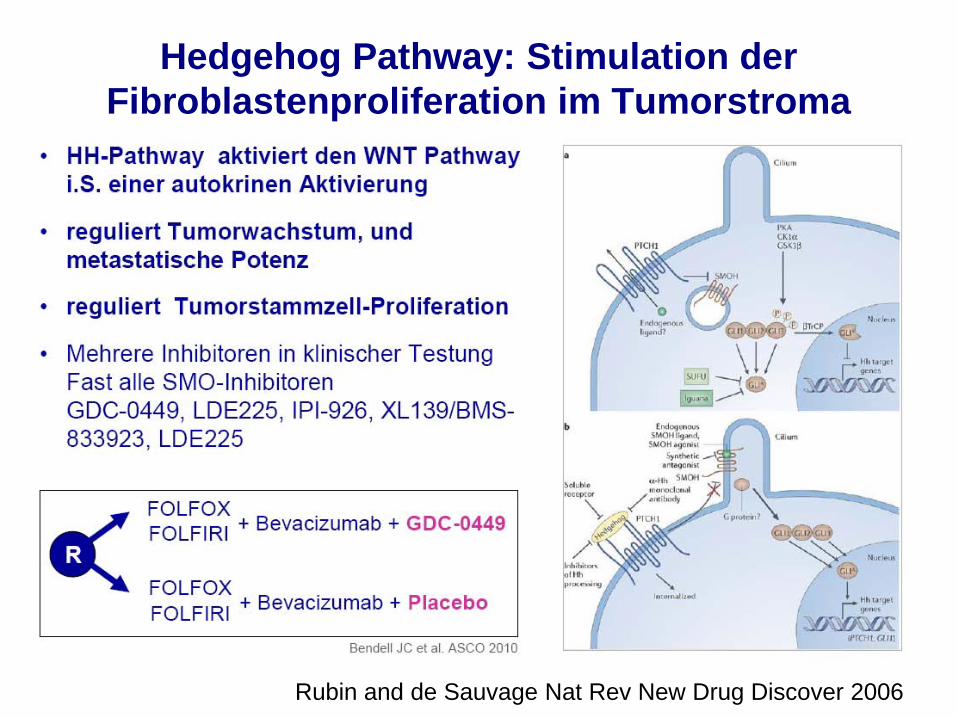
Hedgehog Pathway: Stimulation der Fibroblastenproliferation im Tumorstroma
Rubin and de Sauvage Nat Rev New Drug Discover 2006
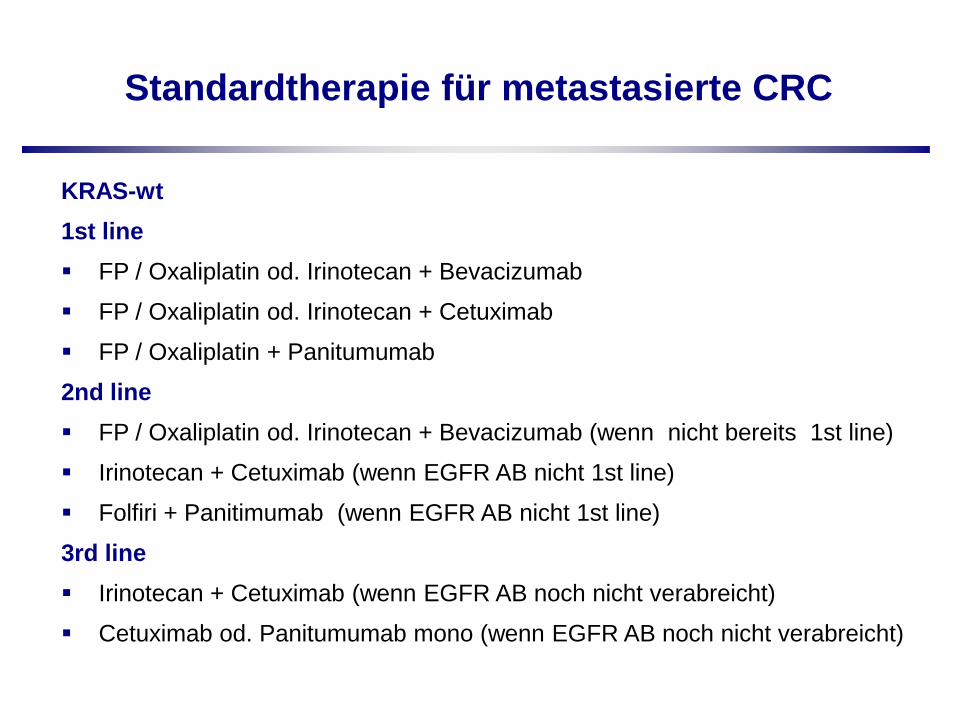
Standardtherapie für metastasierte CRC
KRAS-wt1st line FP / Oxaliplatin od. Irinotecan + Bevacizumab
FP / Oxaliplatin od. Irinotecan + Cetuximab
FP / Oxaliplatin + Panitumumab
2nd line FP / Oxaliplatin od. Irinotecan + Bevacizumab (wenn nicht bereits 1st line)
Irinotecan + Cetuximab (wenn EGFR AB nicht 1st line)
Folfiri + Panitimumab (wenn EGFR AB nicht 1st line)
3rd line Irinotecan + Cetuximab (wenn EGFR AB noch nicht verabreicht)
Cetuximab od. Panitumumab mono (wenn EGFR AB noch nicht verabreicht)

Standardtherapie für metastasierte CRC, Deutschland 2010
KRAS-mt1st line• FP / Oxaliplatin od. Irinotecan + Benacizumab
2nd line• FP / Oxaliplatin od. Irinotecan + Benacizumab (wenn nicht bereits 1st line)
3rd line Kein Standard, möglichst Studien
Weiterhin unklar Stellenwert von Bevacizumab beyond progression Dauer der Induktionstherapie Deeskalationsstrategien
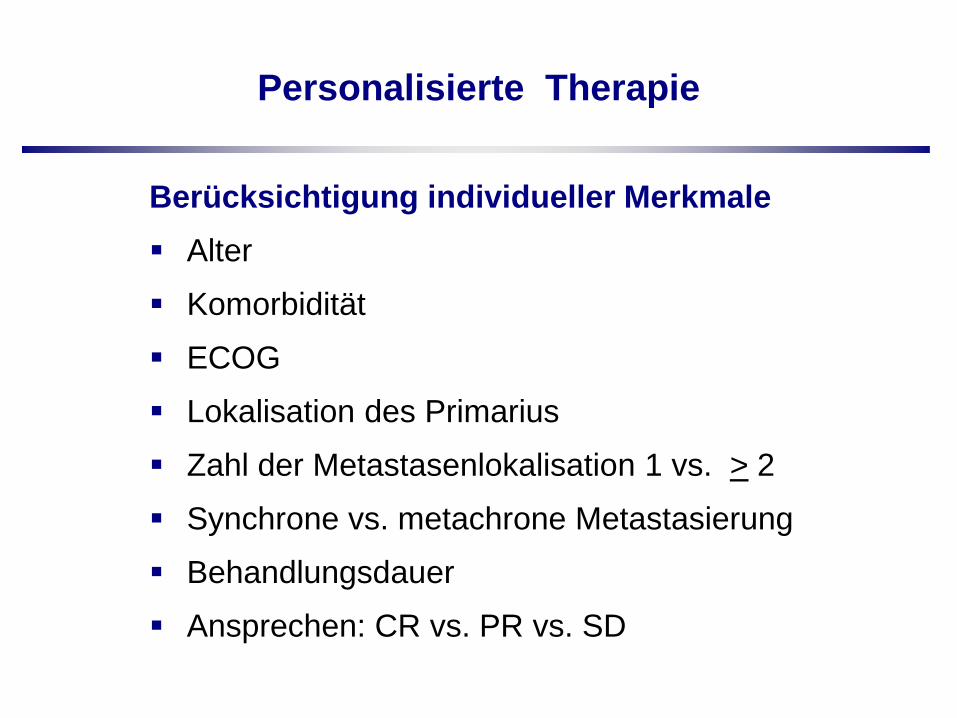
Personalisierte Therapie
Berücksichtigung individueller Merkmale Alter
Komorbidität
ECOG
Lokalisation des Primarius
Zahl der Metastasenlokalisation 1 vs. > 2
Synchrone vs. metachrone Metastasierung
Behandlungsdauer
Ansprechen: CR vs. PR vs. SD