Plastic deformation of cubic zirconia single crystals: The … · 2001-05-30 · Plastic...
109
Plastic deformation of cubic zirconia single crystals: The influence of the orientation of compression axis and yttria stabilizer content Dissertation Zur Erlangung des akademischen Grades Doctor rerum naturalium (Dr. rer. Nat.) Vorgelegt der Mathematisch-Naturwissenschaftlich-Technischen Fakultät (mathematisch-naturwissenschaftlicher Bereich) der Martin-Luther-Universität Halle-Wittenberg von Alexander Tikhonovsky geb. am 01.04.1974 in Kiew Gutachter: 1. Prof. Dr. H.-R. Höche 2. Prof. Dr. U. Messerschmidt 3. Prof. Dr. M. Rühle Die öffentliche Verteidigung der Dissertation fand am 27.04.2001 statt.
Transcript of Plastic deformation of cubic zirconia single crystals: The … · 2001-05-30 · Plastic...
Plastic deformation of cubic zirconia single crystals:
The influence of the orientation of compression axis and
yttria stabilizer content
Dissertation
Zur Erlangung des akademischen Grades
Doctor rerum naturalium (Dr. rer. Nat.)
Vorgelegt der Mathematisch-Naturwissenschaftlich-Technischen Fakultät
(mathematisch-naturwissenschaftlicher Bereich)
der Martin-Luther-Universität Halle-Wittenberg
von Alexander Tikhonovsky
geb. am 01.04.1974 in Kiew
Gutachter:
1. Prof. Dr. H.-R. Höche
2. Prof. Dr. U. Messerschmidt
3. Prof. Dr. M. Rühle
Die öffentliche Verteidigung der Dissertation fand am 27.04.2001 statt.
Table of contents
1. Introduction 1
2. Introduction to plastic deformation of crystals 3
2.1. Microscopic models of plastic deformation of crystalline solids 3
2.2. Dislocation mechanisms controlling plastic deformation of crystals 7
2.3. Macroscopic compression experiments 13
3. Cubic zirconia single crystals 17
3.1. Structure and phase relationship of cubic zirconium dioxide 17
3.2. Dislocation plasticity in cubic zirconia single crystals 20
4. Experimental 31
4.1. Macroscopic deformation experiments 31
4.2. Transmission electron microscopy experiments 34
4.3. Diffraction patterns and dislocation contrast in a TEM 34
4.4. Preparation of samples 36
5. Experimental results of the compression experiments 38
5.1. Effect of the deformation axis 38
5.2. Effect of yttria content 45
5.3. Plastic instabilities in cubic zirconia single crystals 50
6. Microstructure of deformed cubic zirconia single crystals 58
6.1. Optical microscopy of cubic zirconia 58
6.2. Transmission electron microscopy in the HVEM 61
7. Discussion of experimental results 68
7.1. Introduction 68
7.2. Flow stress contributions for ZrO2-10mol%-Y2O3
deformed in the 100 and 112 compression directions 70
7.3. Dependence of the deformation parameters of cubic zirconia
on the yttria content 80
8. Conclusions 86
9. Addendum 89
9.1. Literature 89
9.2. List of figures 96
9.3. List of abbreviations 100
9.4. Curriculum vitae 104
9.5. Sincerity statement 105
9.6. Acknowledgements 106
1. Introduction
1
1. Introduction
Cubic zirconia (c-ZrO2) is an industrially attractive material that has a wide range of
applications. It is used in automotive sensors [1] and solid electrolyte fuel cells [2, 3]
because of its high-temperature ionic conductivity. Besides, cubic zirconia is known
to be widely utilized in jewelry as a remarkable substitute of natural diamonds. Other
phases of zirconium dioxide, i.e. the tetragonal and monoclinic modifications, are of
high interest due to the transformation toughening of materials involving the
tetragonal-to-monoclinic transformation [5, 6] as well as ferroelastic behavior of the
metastable t’-ZrO2 phase [7]. Both phenomena can increase the strength and fracture
toughness of zirconia-containing ceramics. The former is used in zirconia toughened
alumina alloys (ZTA) known for their high wear resistance [8]. The tetragonal phase
may also be dispersed as precipitates in a cubic zirconia matrix leading to the so-
called partially stabilized zirconia (PSZ). Owing to precipitation hardening, these
materials have a high flow stress up to high temperatures [9]. That the plastic
properties of the different zirconia-based materials can be understood, an in-depth
background in the microprocesses of deformation of cubic zirconia single crystals is
indispensable, mostly because the material is a frequently used component of other
ceramics.
There have been several attempts of investigating plastic deformation of cubic
zirconia single crystals so far, and during different periods of time [4, 10-27]. Cubic
zirconia is a high-temperature phase of zirconia. It can be stabilized down to room
temperature by adding aliovalent oxides, particularly Y2O3 or CaO [28-30]. The
previous papers on deformation of cubic zirconia single crystals dealt primarily with
the dependence of the flow stress on the temperature and the concentration of the
stabilizer as well as the defect microstructure of deformed specimens, i.e. with studies
of the dislocation structure and of point defects [31-35]. From the studies of the
dislocation structure and macroscopic deformation parameters, several dislocation
mechanisms have been identified (for a review, see [17]). The mechanisms govern the
flow stress of the zirconia single crystals at different temperatures. These are lattice
friction at low temperatures, thermally activated overcoming of localized obstacles
1. Introduction
2
and athermal long-range dislocation interactions at intermediate temperatures, and
dislocation recovery at high temperatures.
In spite of the substantial amount of work done on the plastic deformation of cubic
zirconia, the basic deformation processes are still incompletely understood. Firstly,
most of the former studies were performed at high temperatures, particularly at
1400°C. Only the experiments of Teracher et al. [15] under a confining pressure and
of the plasticity group at the Max Planck Insitute in Halle [4, 17-22, 46, 47] span the
temperature range below about 1200°C revealing the dislocation mechanisms listed
above. However, the latter experiments are restricted mostly to a single specimen
orientation and a single concentration of the yttria stabilizer. Therefore, it is not clear
whether these mechanisms act on all possible slip systems in zirconia. Secondly, very
little is known about the ways that yttria dopant influences the flow stress. In view of
this, the objective of this thesis is to carry out a detailed study on the plastic
deformation of c-ZrO2 with two main series of experiments:
- activation of other slip systems by applying another sample orientation with the same
yttria concentration as that done so far in [4] and the related papers;
- using other (higher) stabilizer concentrations with the same sample orientation as
that done so far.
To achieve these goals, compression experiments are conducted in air at a constant
strain rate at various temperatures. The microstructure after deformation is
investigated by transmission electron microscopy. It was tried to attain experimental
temperatures as low as possible, taking due account that cubic zirconia single crystals
is very brittle at these temperatures. All the experiments are aimed at clarifying the
deformation mechanisms on different slip systems of cubic zirconia and at the part of
the yttria stabilizer in controlling the flow stress.
2.1. Microscopic models of plastic deformation of crystalline solids
3
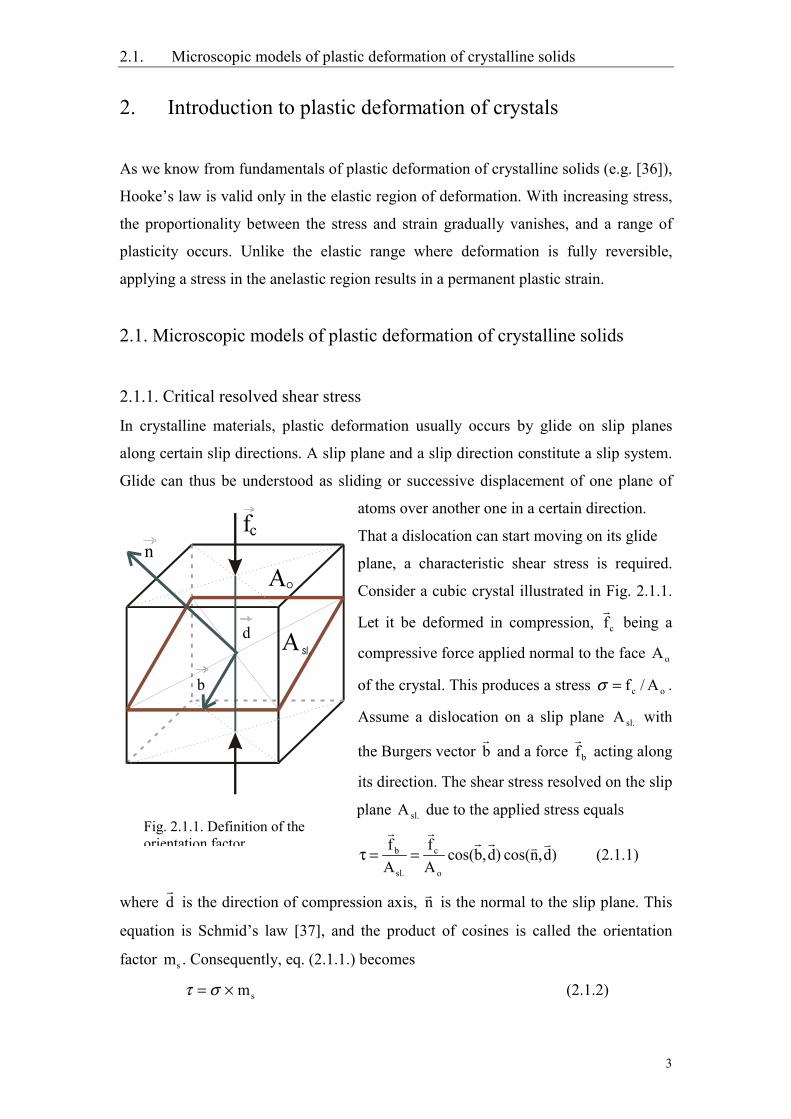
Fig. 2.1.1. Definition of theorientation factor
2. Introduction to plastic deformation of crystals
As we know from fundamentals of plastic deformation of crystalline solids (e.g. [36]),
Hooke’s law is valid only in the elastic region of deformation. With increasing stress,
the proportionality between the stress and strain gradually vanishes, and a range of
plasticity occurs. Unlike the elastic range where deformation is fully reversible,
applying a stress in the anelastic region results in a permanent plastic strain.
2.1. Microscopic models of plastic deformation of crystalline solids
2.1.1. Critical resolved shear stress
In crystalline materials, plastic deformation usually occurs by glide on slip planes
along certain slip directions. A slip plane and a slip direction constitute a slip system.
Glide can thus be understood as sliding or successive displacement of one plane of
atoms over another one in a certain direction.
That a dislocation can start moving on its glide
plane, a characteristic shear stress is required.
Consider a cubic crystal illustrated in Fig. 2.1.1.
Let it be deformed in compression,
fc being a
compressive force applied normal to the face Ao
of the crystal. This produces a stress oc A/f=σ .
Assume a dislocation on a slip plane A sl. with
the Burgers vector
b and a force
fb acting along
its direction. The shear stress resolved on the slip
plane A sl. due to the applied stress equals
)d,ncos( )d,bcos( Af
Af
o
c
sl.
b
==τ (2.1.1)
where
d is the direction of compression axis, n is the normal to the slip plane. This
equation is Schmid’s law [37], and the product of cosines is called the orientation
factor ms . Consequently, eq. (2.1.1.) becomes
τ σ= × ms (2.1.2)
b
n
d
Ao
A sl.
fc
2.1. Microscopic models of plastic deformation of crystalline solids
4
with
)d,ncos( )d,bcos(ms
= (2.1.3)
It is possible to define a critical resolved shear stress (CRSS), above which the plastic
deformation sets in as slip on a given slip plane.
Microscopically, slip is realized by the motion of line defects in the crystal structure,
that is dislocations. While moving through a crystal, dislocations bring about the
plastic strain ε pl. . If moving dislocations of a density ρ m are displaced by a distance
x each, the plastic strain will be ε ρpl. s mm bx= . The derivation of this equation with
respect to time yields the Orowan equation
bvsm mpl.ρε = (2.1.4)
where v is the velocity of the moving dislocations. The Orowan equation establishes a
direct connection between the macroscopic parameter ε pl. and the microscopic one v.
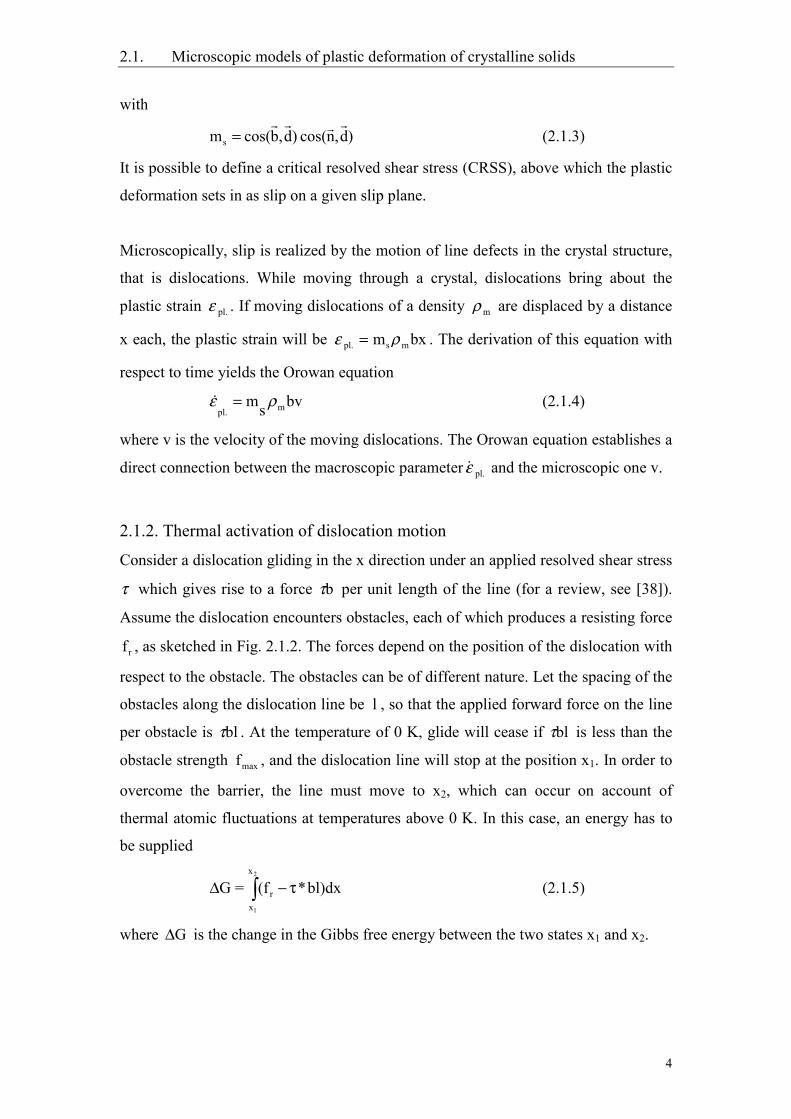
2.1.2. Thermal activation of dislocation motion
Consider a dislocation gliding in the x direction under an applied resolved shear stress
τ which gives rise to a force bτ per unit length of the line (for a review, see [38]).
Assume the dislocation encounters obstacles, each of which produces a resisting force
rf , as sketched in Fig. 2.1.2. The forces depend on the position of the dislocation with
respect to the obstacle. The obstacles can be of different nature. Let the spacing of the
obstacles along the dislocation line be l , so that the applied forward force on the line
per obstacle is blτ . At the temperature of 0 K, glide will cease if blτ is less than the
obstacle strength fmax , and the dislocation line will stop at the position x1. In order to
overcome the barrier, the line must move to x2, which can occur on account of
thermal atomic fluctuations at temperatures above 0 K. In this case, an energy has to
be supplied
τ−∆2
1
x
xr bl)dx*(f=G (2.1.5)
where G∆ is the change in the Gibbs free energy between the two states x1 and x2.
2.1. Microscopic models of plastic deformation of crystalline solids
5
On the other hand, when a dislocation oscillates with an attempt frequency χ (≤ an
atomic vibration frequency) at a given temperature, it successfully overcomes
G/kT)exp( ∆−χ barriers per second. Hence, the dislocation velocity becomes
∆=kTG-expv κν (2.1.6)
where κ is the forward distance of
the dislocation after a successful
activation. Substituting this
dislocation velocity into the
Orowan equation of the
macroscopic plastic strain (2.1.4)
yields an Arrhenius rate equation for
the plastic strain rate
exp( )ε εpl. o
GkT
= − ∆ (2.1.7)
where oε is the pre-exponential factor, which is supposed to be constant.
According to [39, 41-43] (for a review, see [40]), the Gibbs free energy of activation
(lightly shaded area in the Fig. 2.1.2.) is given by
W∆−∆−∆=∆−∆−∆∆ STU VSTU=G τ (2.1.8)
where ∆U is the change of the internal energy, ∆S , the change of the activation
entropy, ∆V, the activation volume, and ∆W is the so-called work term (dark shaded
area in Fig. 2.1.2) that reflects the work done on the system by the shear stress τ
during thermal activation
xlb=W ∆∆ τ (2.1.9)
with ∆x = x2 –x1. Besides, ∆ ∆U T S− is the Helmholtz free energy
∆ ∆ ∆F = U T S− (2.1.10)
Consequently, formula (2.1.8) becomes
xlbF=G ∆−∆∆ τ (2.1.11)
The quantity lb x∆ is the activation volume introduced above
xlb=V ∆∆ (2.1.12)
x1 x2
f
fmax
∆G
τ∆ ∆V= Wτbl
r
Fig. 2.1.2. The resisting force fr versusdistance x for the thermal barriers thatoppose dislocation motion
2.1. Microscopic models of plastic deformation of crystalline solids
6
The activation volume can be understood as the activation area swept by a dislocation
segment of length l over the activation distance ∆x multiplied by the Burgers vector
of the dislocation. This quantity is also given by the thermodynamical relation
T)G(=V∂τ
∂∆−∆ (2.1.13)
The activation volume can be determined from macroscopical deformation
experiments by logarithmic differentiation of the Arrhenius equation (2.1.7), taking
eq. (2.1.13) into account, too
T
o
lnkT=V
∆∂τ
εε∂
(2.1.14)
Assuming ε o const= , this equation can be converted, so that it contains only
experimentally measurable quantities [40]
sT m1lnkT=V
∆∆
σε (2.1.15)
where ms is the orientation factor introduced above. The term in parentheses is the
inverse strain rate sensitivity r. It will be described in chapter 2.3.
Logarithmic differentiation of eq. (2.1.7) with respect to the temperature yields the
thermodynamical activation enthalpy
H=TGTG=
T
lnkT
*
o2 ∆
∆−∆
τ
τ
∂∂
∂εε∂
(2.1.16)
where S=TG ∆−
∆
τ∂∂ is the entropy change mentioned above. Schöck has shown
that under the assumption that the main contribution to the activation entropy results
from the temperature dependence of the shear modulus µ, the Gibbs free energy of
activation can be calculated [39]
dTdT1
VmdTdT+H
=Gs
µµ
σµµ
−
∆∆ (2.1.17)
2.2. Dislocation mechanisms controlling plastic deformation of crystals
7
This formula contains only measurable quantities, as do the equations (2.1.15) and
(2.1.16)
2.2. Dislocation mechanisms controlling plastic deformation of crystals
Fundamentally, the motion of a dislocation is opposed by two different types of
barriers: short-range interactions with dislocations that can be overcome by thermal
activation described in the chapter 2.1. and long-range interactions due to, for
instance, dislocations on parallel slip planes that cannot be surmounted with the help
of thermal activation. Thus, the (shear) flow stress comprises two contributions: the
thermal component τ * and the athermal component τ i (e.g. [38]). Hence,
τ τ τ= +* i (2.2.1)
The long-range component τ i leads to a local decrease in the applied stress τ , so that
only the component τ * acts to overcome the short-range obstacles. τ * is therefore
called the effective stress. Dislocation mechanisms governing the plastic deformation
of solids will be hereafter considered with respect to their contributions to the thermal
and athermal parts of the flow stress.
2.2.1. Thermally activated contribution
Lattice friction (Peierls mechanism)
Because of the periodicity of the crystal structure, a moving dislocation in a crystal
experiences a potential energy, or more exactly a free energy, of displacement that
varies with the lattice periodicity. This potential energy is called the Peierls potential.
The stress necessary for the dislocation to surmount it is named the Peierls stress (for
reviews, see [44-48]). In the case of a screw dislocation at 0 K, this stress is given by
)b
a2exp()-(1
2.fr.
πνµτ −= (2.2.2)
where µ is the shear modulus, ν , Poisson’s ratio, and a, the interplanar distance
between neighboring glide planes. Twice the amplitude of the periodic part of the
Peierls potential is called the Peierls energy, and it is related to the Peierls stress by
πτ ab/U fr.fr. = (2.2.3)
2.2. Dislocation mechanisms controlling plastic deformation of crystals
8
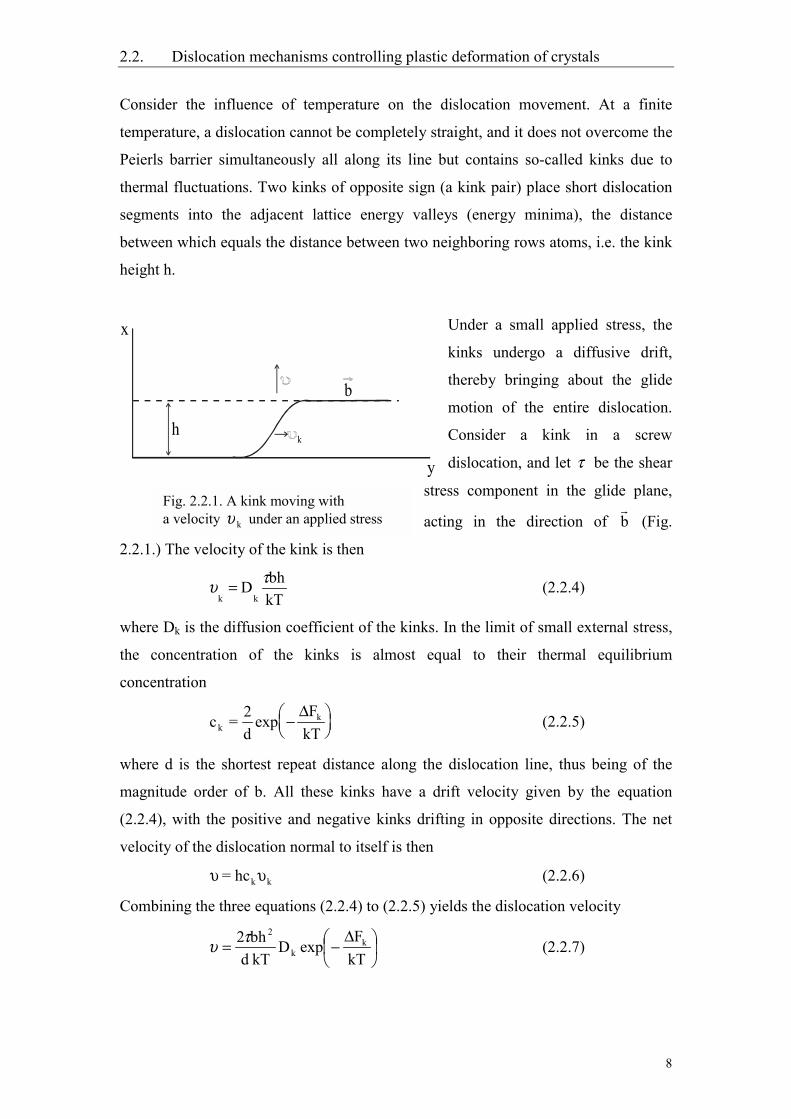
Consider the influence of temperature on the dislocation movement. At a finite
temperature, a dislocation cannot be completely straight, and it does not overcome the
Peierls barrier simultaneously all along its line but contains so-called kinks due to
thermal fluctuations. Two kinks of opposite sign (a kink pair) place short dislocation
segments into the adjacent lattice energy valleys (energy minima), the distance
between which equals the distance between two neighboring rows atoms, i.e. the kink
height h.
Under a small applied stress, the
kinks undergo a diffusive drift,
thereby bringing about the glide
motion of the entire dislocation.
Consider a kink in a screw
dislocation, and let τ be the shear
stress component in the glide plane,
acting in the direction of
b (Fig.
2.2.1.) The velocity of the kink is then
kTbhD
kk
τυ = (2.2.4)
where Dk is the diffusion coefficient of the kinks. In the limit of small external stress,
the concentration of the kinks is almost equal to their thermal equilibrium
concentration
c = 2d
FkTk
kexp −
∆(2.2.5)
where d is the shortest repeat distance along the dislocation line, thus being of the
magnitude order of b. All these kinks have a drift velocity given by the equation
(2.2.4), with the positive and negative kinks drifting in opposite directions. The net
velocity of the dislocation normal to itself is then
kkhc= υυ (2.2.6)
Combining the three equations (2.2.4) to (2.2.5) yields the dislocation velocity
∆−=
kTF
expDkT dbh2 k
k
2τυ (2.2.7)
y
x
h
b
k
Fig. 2.2.1. A kink moving witha velocity υ k under an applied stress
2.2. Dislocation mechanisms controlling plastic deformation of crystals
9
It can be shown that this relation is valid in a broad range of stresses [44]. The kink
formation energy can be expressed by the Peierls energy
)(2U)h/2(=F fr.kΓπ∆ (2.2.8)
where Γ is the line tension.
Chemical hardening: solution and precipitation hardening
Solution hardening is defined as an increase of the flow stress of a crystal containing
non-diffusing foreign atoms dissolved in its lattice owing to interactions between the
atoms, so-called solute atoms, and dislocations in the crystal. The dislocations are
hindered by these interactions. At zero temperature, their movement is possible only if
the applied shear stress is higher than a critical shear stress τ c [49, 50]. At the critical
stress, the force a dislocation exerts on the obstacles blcτ is just high enough to
overcome the interaction force of the obstacles. In addition to electrical interactions in
ionic crystals and semiconductors, the origin of the local interaction forces fint may be
due to the paraelastic interaction on account of a size misfit between the solute atoms
and the matrix as well as due to the dielastic interaction because of a modulus misfit
between them. There may also be interactions owing to a possible non-spherical
symmetry of the stress fields of the point defects.
Real crystalline solids frequently contain a certain amount of precipitates, that is
extrinsic particles. Dislocation interaction with these defects causes the so-called
precipitation hardening. Two different cases of such interactions may occur. The
particles may be either impenetrable or penetrable for dislocations [51]. In the former
case, a dislocation is forced by the applied stress to bow around the particle and by-
pass it. The by-passing dislocation leaves a loop around the particle. This mechanism
was suggested by Orowan and is therefore called the Orowan mechanism. In the latter
case, the particle is sheared by the dislocation as the latter moves through the crystal.
This can only occur if the interface between the particle and the matrix is coherent.
The coherent interface does not show any geometric discontinuity in the atomic
arrangement.
Both the Orowan and the cutting mechanisms can be discussed in terms of the
interaction of a single dislocation with a linear array of particles of diameter D and a
2.2. Dislocation mechanisms controlling plastic deformation of crystals
10
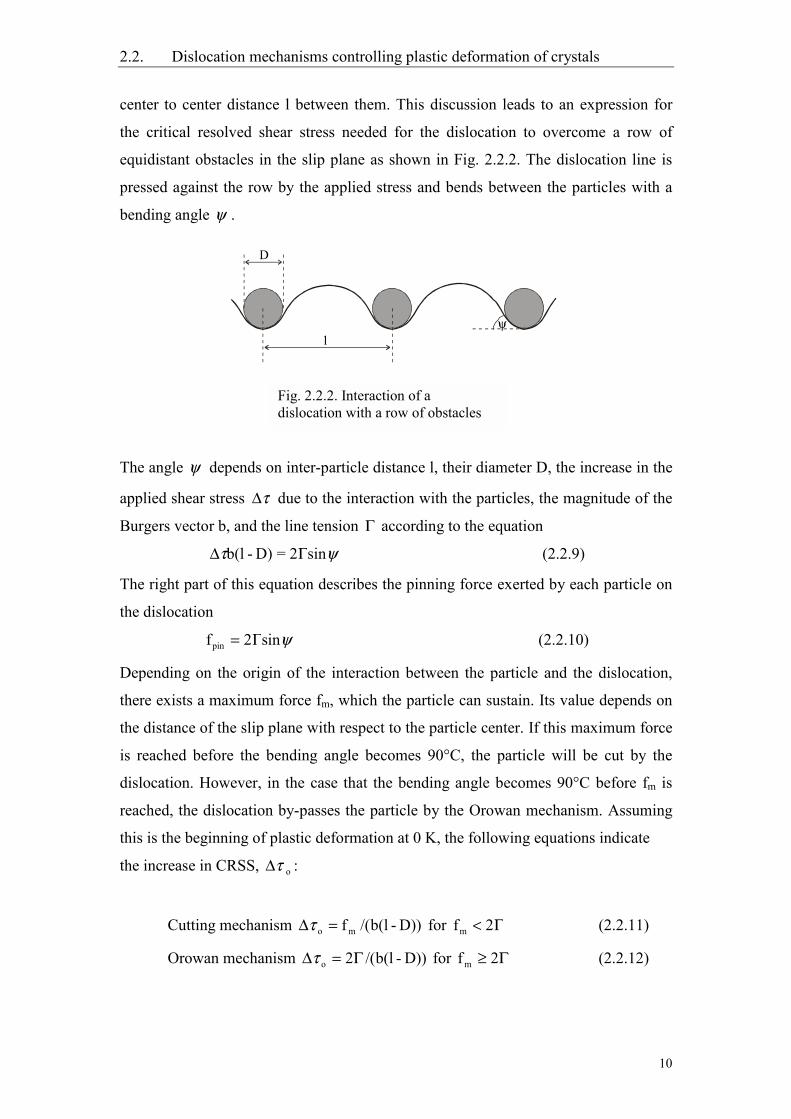
center to center distance l between them. This discussion leads to an expression for
the critical resolved shear stress needed for the dislocation to overcome a row of
equidistant obstacles in the slip plane as shown in Fig. 2.2.2. The dislocation line is
pressed against the row by the applied stress and bends between the particles with a
bending angle ψ .
The angle ψ depends on inter-particle distance l, their diameter D, the increase in the
applied shear stress ∆τ due to the interaction with the particles, the magnitude of the
Burgers vector b, and the line tension Γ according to the equation
∆ Γτ ψb(l - D) = 2 sin (2.2.9)
The right part of this equation describes the pinning force exerted by each particle on
the dislocation
f sinpin = 2Γ ψ (2.2.10)
Depending on the origin of the interaction between the particle and the dislocation,
there exists a maximum force fm, which the particle can sustain. Its value depends on
the distance of the slip plane with respect to the particle center. If this maximum force
is reached before the bending angle becomes 90°C, the particle will be cut by the
dislocation. However, in the case that the bending angle becomes 90°C before fm is
reached, the dislocation by-passes the particle by the Orowan mechanism. Assuming
this is the beginning of plastic deformation at 0 K, the following equations indicate
the increase in CRSS, ∆τ o :
Cutting mechanism D))-b(l/(fmo =∆τ for fm < 2Γ (2.2.11)
Orowan mechanism D))-b(l/(2o Γ=∆τ for Γ≥ 2fm (2.2.12)
D
lψ
Fig. 2.2.2. Interaction of adislocation with a row of obstacles
2.2. Dislocation mechanisms controlling plastic deformation of crystals
11
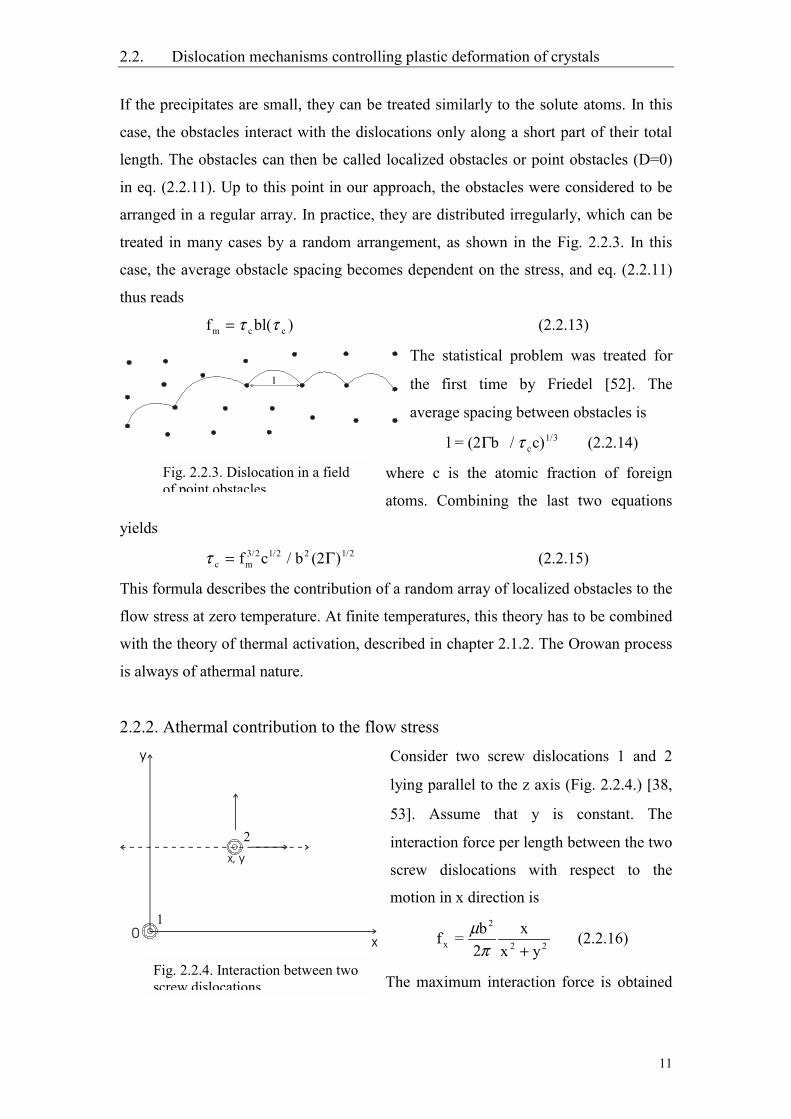
If the precipitates are small, they can be treated similarly to the solute atoms. In this
case, the obstacles interact with the dislocations only along a short part of their total
length. The obstacles can then be called localized obstacles or point obstacles (D=0)
in eq. (2.2.11). Up to this point in our approach, the obstacles were considered to be
arranged in a regular array. In practice, they are distributed irregularly, which can be
treated in many cases by a random arrangement, as shown in the Fig. 2.2.3. In this
case, the average obstacle spacing becomes dependent on the stress, and eq. (2.2.11)
thus reads
f bl(m c c= τ τ ) (2.2.13)
The statistical problem was treated for
the first time by Friedel [52]. The
average spacing between obstacles is
l = (2 b c)c1/3Γ / τ (2.2.14)
where c is the atomic fraction of foreign
atoms. Combining the last two equations
yields
τ c m3/2 1/2 2 1/2f c b (2 )= / Γ (2.2.15)
This formula describes the contribution of a random array of localized obstacles to the
flow stress at zero temperature. At finite temperatures, this theory has to be combined
with the theory of thermal activation, described in chapter 2.1.2. The Orowan process
is always of athermal nature.
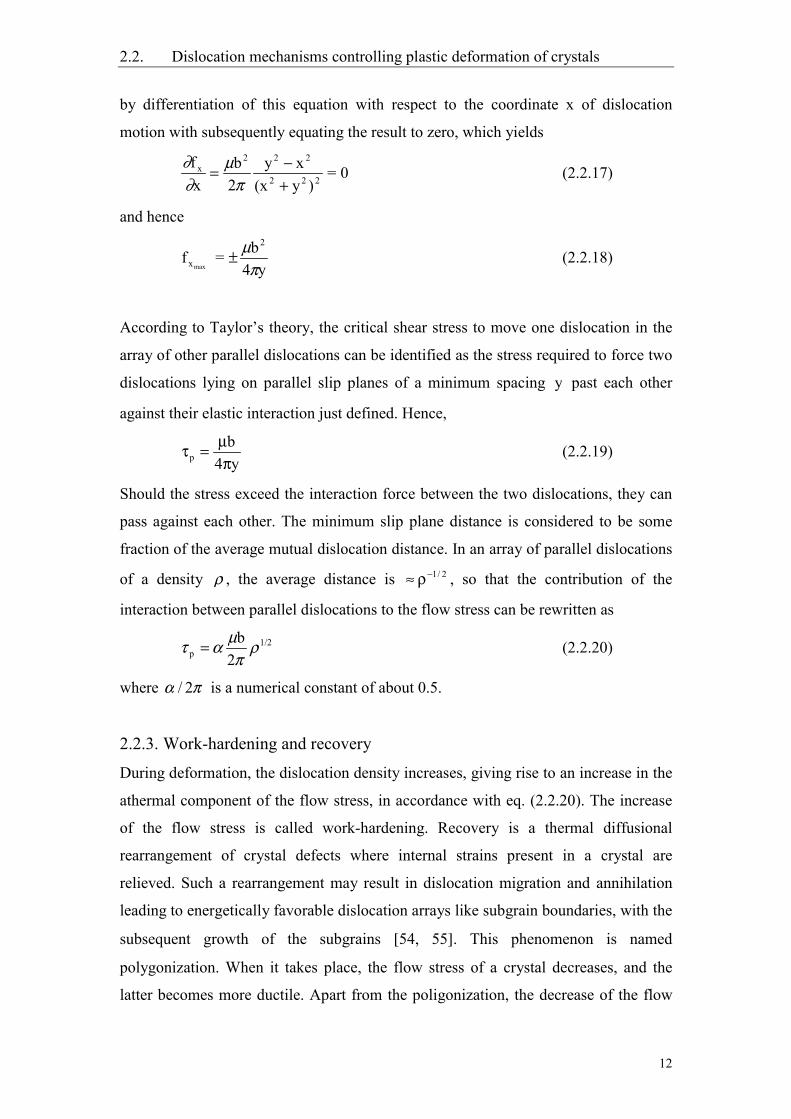
2.2.2. Athermal contribution to the flow stress
Consider two screw dislocations 1 and 2
lying parallel to the z axis (Fig. 2.2.4.) [38,
53]. Assume that y is constant. The
interaction force per length between the two
screw dislocations with respect to the
motion in x direction is
22
2
x yxx
2b=f
+πµ (2.2.16)
The maximum interaction force is obtained
l
0
y
x
1
2x, y
Fig. 2.2.3. Dislocation in a fieldof point obstacles
Fig. 2.2.4. Interaction between twoscrew dislocations
2.2. Dislocation mechanisms controlling plastic deformation of crystals
12
by differentiation of this equation with respect to the coordinate x of dislocation
motion with subsequently equating the result to zero, which yields
0=)y(x
xy2b
xf
222
222x
+−=
πµ
∂∂
(2.2.17)
and hence
y4b=f
2
xmax πµ± (2.2.18)
According to Taylor’s theory, the critical shear stress to move one dislocation in the
array of other parallel dislocations can be identified as the stress required to force two
dislocations lying on parallel slip planes of a minimum spacing y past each other
against their elastic interaction just defined. Hence,
y4b
p πµ=τ (2.2.19)
Should the stress exceed the interaction force between the two dislocations, they can
pass against each other. The minimum slip plane distance is considered to be some
fraction of the average mutual dislocation distance. In an array of parallel dislocations
of a density ρ , the average distance is 2/1−ρ≈ , so that the contribution of the
interaction between parallel dislocations to the flow stress can be rewritten as
1/2p 2
b ρπ
µατ = (2.2.20)
where πα 2/ is a numerical constant of about 0.5.
2.2.3. Work-hardening and recovery
During deformation, the dislocation density increases, giving rise to an increase in the
athermal component of the flow stress, in accordance with eq. (2.2.20). The increase
of the flow stress is called work-hardening. Recovery is a thermal diffusional
rearrangement of crystal defects where internal strains present in a crystal are
relieved. Such a rearrangement may result in dislocation migration and annihilation
leading to energetically favorable dislocation arrays like subgrain boundaries, with the
subsequent growth of the subgrains [54, 55]. This phenomenon is named
polygonization. When it takes place, the flow stress of a crystal decreases, and the
latter becomes more ductile. Apart from the poligonization, the decrease of the flow
2.2. Dislocation mechanisms controlling plastic deformation of crystals
13
stress is also associated with mutual annihilation of dislocations (e.g. [36]). There are
several recovery controlled creep models of crystals known up to date, and we will
briefly consider the most essential points of these. Firstly, we assume that the applied
stress of creep is a function of time and strain [56]
εε∂ε∂σ
∂∂σσ
ε
d+dt =ddtt
=d rect
ΘΥ−
+
(2.2.21)
where Υrec and Θ are defined as the
recovery rate and the work-hardening
rate, respectively (Fig. 2.2.5.). During
creep at constant stress, the last
formula turns into the Bailey-Orowan
equation. Consequently, the steady
state strain rate can be expressed
( /( /
ε ∂σ ∂∂σ ∂ε
εst
t
t))
= − (2.2.22)
and it is reduced to
ε strec=
ΥΘ
(2.2.23)
2.3. Macroscopic compression experiments
The previous chapters show that the flow stress measured during a deformation
experiment depends on the temperature and the strain rate applied owing to the
thermal part of the flow stress. Furthermore, the deformation behavior is a function of
the crystal orientation in accordance with Schmid’s law. Since the microstructure of
the sample is changed during the deformation as a result of dislocation production and
annihilation, the deformation behavior depends also on the degree of the sample
deformation. Therefore, the crystal microstructure should be considered a function of
the strain [57, 58].
2.3.1. The stress-strain curve
One of the macroscopic methods to study plastic deformation consists in compression
tests along a defined deformation axis. The material is deformed at a constant strain
0=
0t=recY
→∆
∆∆Θ
→∆
∆∆
σεσ
σ
σ
∆t
∆ε−∆σ
+∆σ
= t
=recY
∆∆Θ
∆∆
εσσ
Fig. 2.2.5. Schematic display forestimating recovery and work-hardeningrates
2.3. Macroscopic compression experiments
14
rate and temperature, and the stress-
strain or deformation curve, i.e. a plot
of the stress applied to the sample
versus its strain, is measured (e.g.
[59]). It can have several different
regions, two of them being the yield
point and work-hardening ranges, as
shown in Fig. 2.3.1. The former
constitutes a phenomenon where after
the stress reaches a maximum (the
“upper yield point”), a finite amount of plastic deformation occurs at decreasing
stress, so that the flow stress drops to the level of the “lower yield stress”, after which
the plastic deformation can occur without adding to the stress. This interval is called
the steady state. After that, work-hardening starts taking place, that is the flow stress
increases constantly as the strain rises. The work-hardening may be of various origins
[36]. Mainly, the increase of the flow stress is a consequence of the increasing
dislocation density. This can be due to the mutual interaction between dislocations
moving on parallel slip planes, as was described by eq. (2.2.20) of chapter 2.2.2.
Besides, dislocations moving on non-parallel slip planes intersect each other. Hence,
the produced elastic interactions give rise to the flow stress, with the latter depending
on the dislocation density in a similar way as eq. (2.2.20) says. In addition, dislocation
intersections result in the formation of jogs, the motion of which contributes to the
flow stress, too. The work-hardening coefficient is inferred from eq. (2.2.21), and
according to [60], becomes
Θ = ∂σ∂ε ε , T
(2.3.1)
The total strain during a compression experiment consists of elastic and plastic parts
pl.pl.el.E/ ε+σ=ε+ε=ε (2.3.2)
where ε el. is a function of compressive stress according to Hooke’s law. E is Young's
modulus. As a result, the total strain rate ε contains elastic and plastic parts
E/pl. σ+ε=ε (2.3.3)
up.
l.
Fig. 2.3.1. Schematic representation of theyield point effect. σ up. and σ l. are theupper and lower yield stresses, respectively
2.3. Macroscopic compression experiments
15
By means of special tests within the macroscopic deformation experiments, one can
identify the parameters of thermal activation described in chapter 2.1.2. Their
numerical values allow one to conclude on the mechanisms controlling the plastic
deformation, which were discussed in chapter 2.2.
2.3.2. The strain rate sensitivity
The dependence of the flow stress on the plastic strain rate can be expressed using the
so-called strain rate sensitivity:
pl.
.ln
=rε
σ
∂
∂ (2.3.4)
or the stress exponent
σ∂ε∂
lnln=m*
(2.3.5)
The strain rate sensitivity can be measured by a strain rate cycling experiment. It
consists in an instantaneous change of the strain rate ε of the compression
experiment, so that one can identify the resulting stress increment ∆σ and hence r
according to eq. (2.3.4)
Another way to obtain the strain rate sensitivity is to do stress relaxation tests. These
are a sudden stop of the loading process where the sample continues to deform at a
diminishing strain-rate and under the action of a decreasing stress, while the total
strain remains constant [61, 62]. Therefore, the plastic part of the strain rate becomes
proportional to the negative stress rate according to equation (2.3.3)
E/pl σε −= (2.3.6.)
If one plots the logarithm of the negative stress rate versus the decreasing stress, one
obtains the so-called relaxation curve of the test, the inverse slope of which is the
strain rate sensitivity r.
2.3.3. The temperature sensitivity
The temperature sensitivity of the flow stress T∆
∆− σ is measured by means of
temperature cycling tests. During such a test, the sample is unloaded, the specimen
temperature is increased or decreased, and the sample is reloaded. Hence, an
2.3. Macroscopic compression experiments
16
increment of the flow stress ∆σ appears. Using eq. (2.1.16) and keeping in mind that
ετ
ττ
εεεε
T*
/lnT/ln
T
oo
∂∂
∂∂
−=∂
∂ [53], the activation enthalpy can be calculated
+
∆σ∆∆
2121 rr
2T
TkT -=H (2.3.7)
where k is the Boltzman constant, T1 and T2 are temperatures before and after the
change takes place, and r1 and r2 are the strain rate sensitivities before and after the
cycle. This equation deals with the proper averages of the temperatures and strain rate
sensitivities before and after the temperature change.
3.1. Structure and phase relationship of cubic zirconium dioxide
17
3. Cubic zirconia single crystals
3.1. Structure and phase relationship of cubic zirconium dioxide
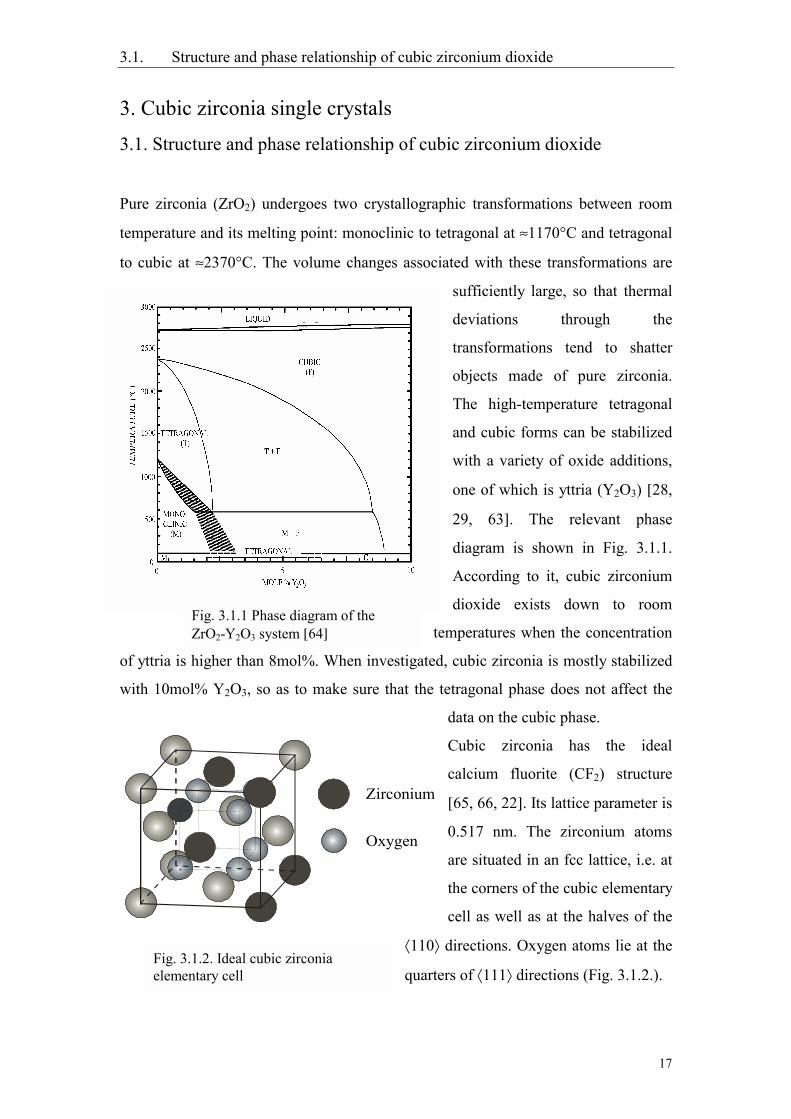
Pure zirconia (ZrO2) undergoes two crystallographic transformations between room
temperature and its melting point: monoclinic to tetragonal at ≈1170°C and tetragonal
to cubic at ≈2370°C. The volume changes associated with these transformations are
sufficiently large, so that thermal
deviations through the
transformations tend to shatter
objects made of pure zirconia.
The high-temperature tetragonal
and cubic forms can be stabilized
with a variety of oxide additions,
one of which is yttria (Y2O3) [28,
29, 63]. The relevant phase
diagram is shown in Fig. 3.1.1.
According to it, cubic zirconium
dioxide exists down to room
temperatures when the concentration
of yttria is higher than 8mol%. When investigated, cubic zirconia is mostly stabilized
with 10mol% Y2O3, so as to make sure that the tetragonal phase does not affect the
data on the cubic phase.
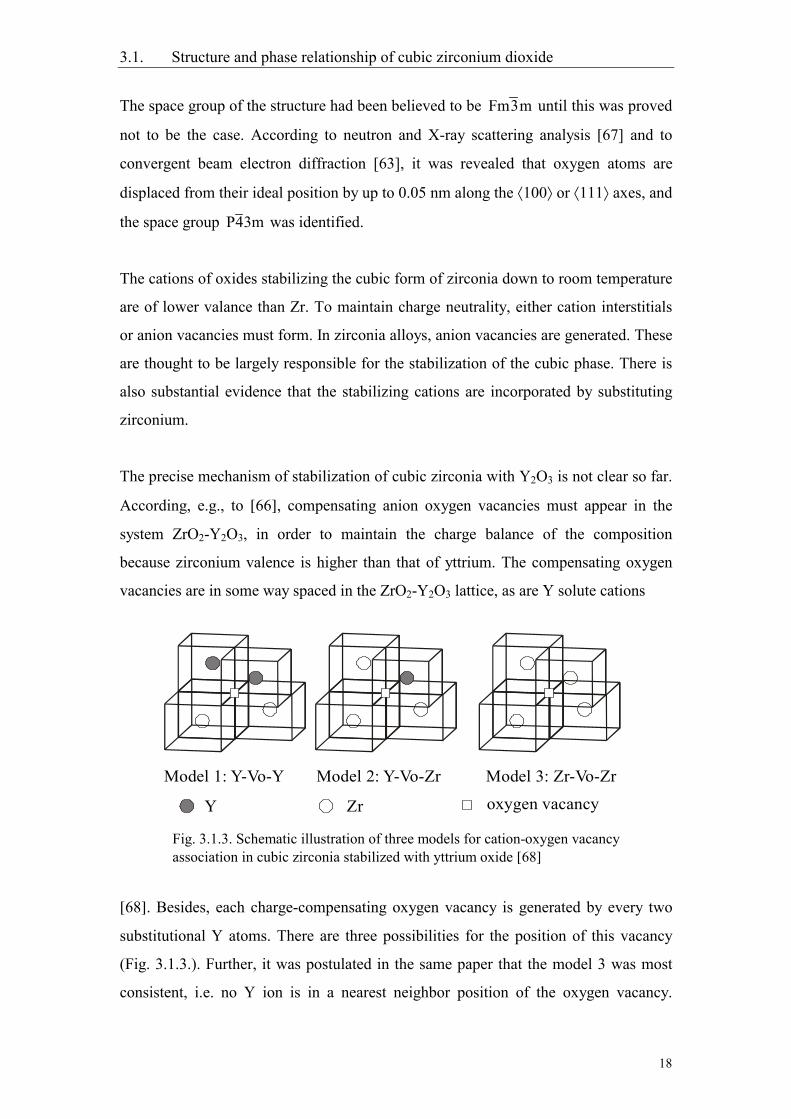
Cubic zirconia has the ideal
calcium fluorite (CF2) structure
[65, 66, 22]. Its lattice parameter is
0.517 nm. The zirconium atoms
are situated in an fcc lattice, i.e. at
the corners of the cubic elementary
cell as well as at the halves of the
110 directions. Oxygen atoms lie at the
quarters of 111 directions (Fig. 3.1.2.).
Zirconium
Oxygen
Fig. 3.1.1 Phase diagram of theZrO2-Y2O3 system [64]
Fig. 3.1.2. Ideal cubic zirconiaelementary cell
3.1. Structure and phase relationship of cubic zirconium dioxide
18
The space group of the structure had been believed to be Fm3m until this was proved
not to be the case. According to neutron and X-ray scattering analysis [67] and to
convergent beam electron diffraction [63], it was revealed that oxygen atoms are
displaced from their ideal position by up to 0.05 nm along the 100 or 111 axes, and
the space group P43m was identified.
The cations of oxides stabilizing the cubic form of zirconia down to room temperature
are of lower valance than Zr. To maintain charge neutrality, either cation interstitials
or anion vacancies must form. In zirconia alloys, anion vacancies are generated. These
are thought to be largely responsible for the stabilization of the cubic phase. There is
also substantial evidence that the stabilizing cations are incorporated by substituting
zirconium.
The precise mechanism of stabilization of cubic zirconia with Y2O3 is not clear so far.
According, e.g., to [66], compensating anion oxygen vacancies must appear in the
system ZrO2-Y2O3, in order to maintain the charge balance of the composition
because zirconium valence is higher than that of yttrium. The compensating oxygen
vacancies are in some way spaced in the ZrO2-Y2O3 lattice, as are Y solute cations
[68]. Besides, each charge-compensating oxygen vacancy is generated by every two
substitutional Y atoms. There are three possibilities for the position of this vacancy
(Fig. 3.1.3.). Further, it was postulated in the same paper that the model 3 was most
consistent, i.e. no Y ion is in a nearest neighbor position of the oxygen vacancy.
Model 1: Y-Vo-Y Model 2: Y-Vo-Zr
Y Zr
Model 3: Zr-Vo-Zr
oxygen vacancy
Fig. 3.1.3. Schematic illustration of three models for cation-oxygen vacancyassociation in cubic zirconia stabilized with yttrium oxide [68]
3.1. Structure and phase relationship of cubic zirconium dioxide
19
Hence, it is inferred that the distance between yttrium and oxygen ions must remain
constant (Y maintains eightfold coordination), and this was in turn calculated to 0.233
nm. However, the mechanism whereby the oxygen vacancies retain cubic zirconia at
room temperatures remains a point to clarify.
Elastic constants of single crystals of yttria-stabilized zirconia
That one can study dislocation mechanisms controlling the flow stress of a crystalline
material, one has to be familiar with its elastic constants. In the case of cubic
zirconium dioxide, only three elastic constants C11, C12 as well as C44 have to be
introduced. There are a number of papers on the elastic constants of cubic zirconia
with respect to the yttria concentration and temperature [28, 69-71]. Temperature
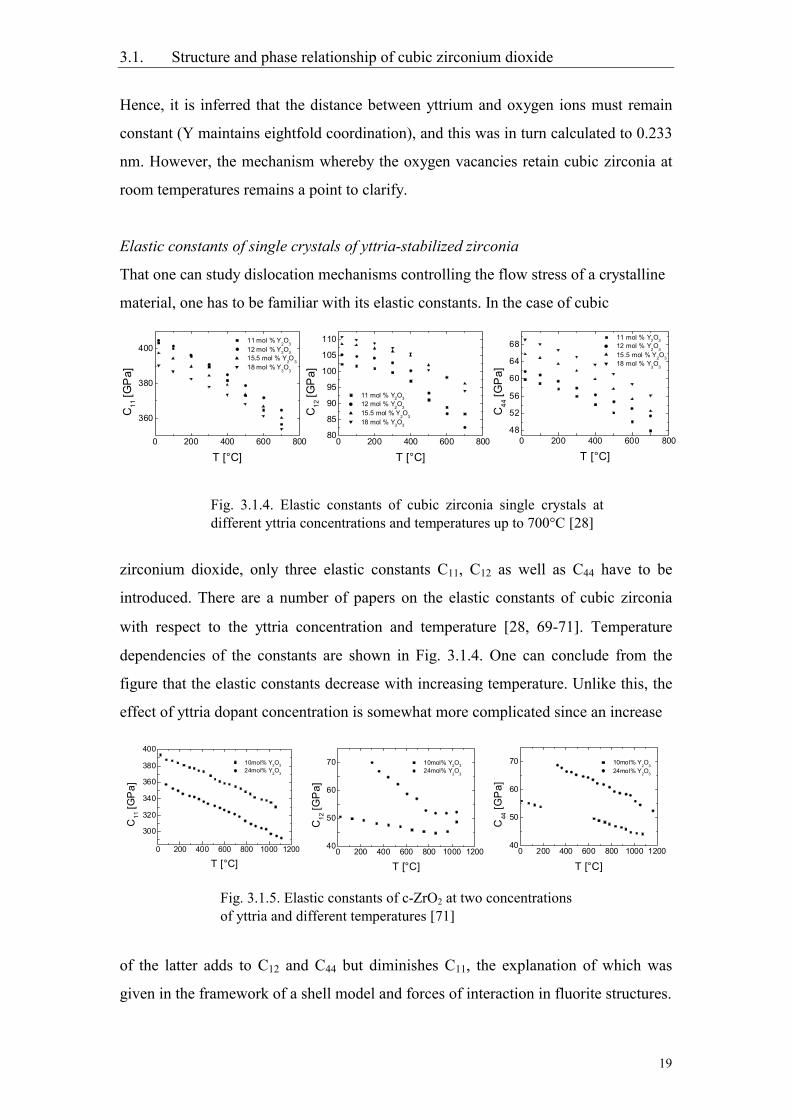
dependencies of the constants are shown in Fig. 3.1.4. One can conclude from the
figure that the elastic constants decrease with increasing temperature. Unlike this, the
effect of yttria dopant concentration is somewhat more complicated since an increase
of the latter adds to C12 and C44 but diminishes C11, the explanation of which was
given in the framework of a shell model and forces of interaction in fluorite structures.
Fig. 3.1.4. Elastic constants of cubic zirconia single crystals atdifferent yttria concentrations and temperatures up to 700°C [28]
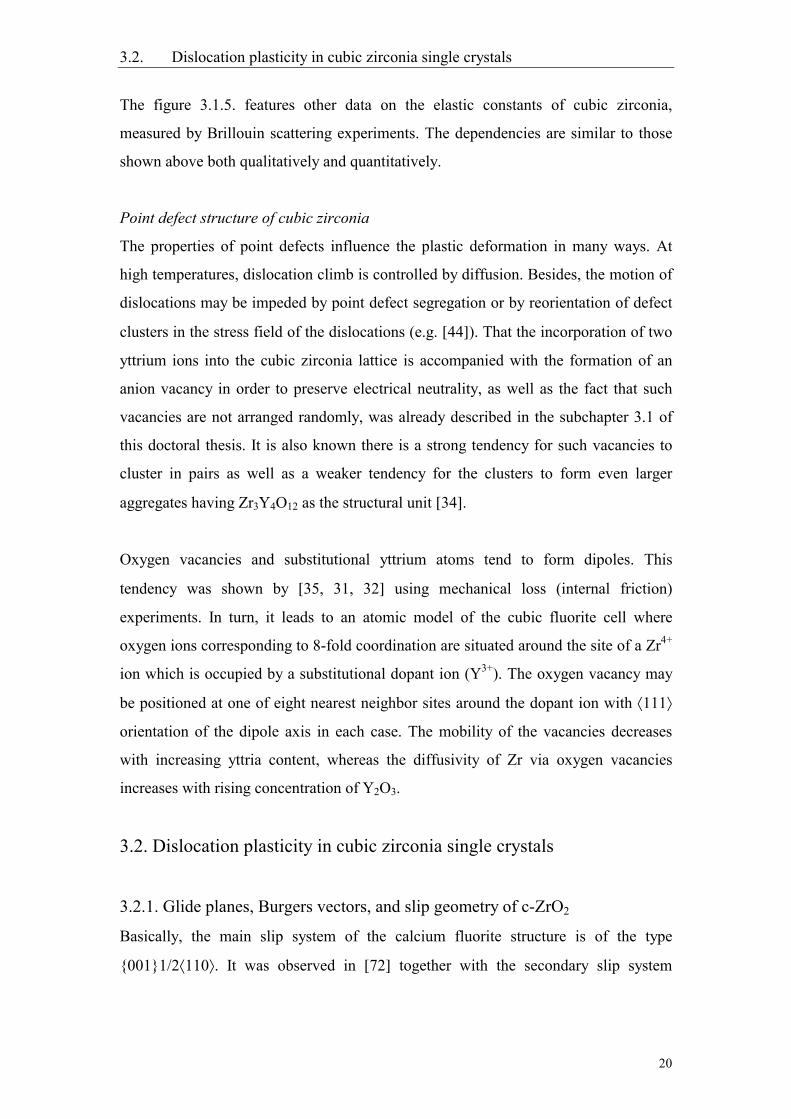
Fig. 3.1.5. Elastic constants of c-ZrO2 at two concentrationsof yttria and different temperatures [71]
0 200 400 600 800
360
380
400 11 mol % Y
2O
3 12 mol % Y2O3 15.5 mol % Y
2O
3 18 mol % Y
3O
3
C11
[GP
a]
T [°C]0 200 400 600 800
80
85
90
95
100
105
110
11 mol % Y2O3 12 mol % Y2O3 15.5 mol % Y
2O
3 18 mol % Y3O3
C12
[GP
a]
T [°C]0 200 400 600 800
48
52
56
60
64
68 11 mol % Y2O3 12 mol % Y
2O
3 15.5 mol % Y2O3 18 mol % Y
3O
3
C44
[GP
a]
T [°C]
0 200 400 600 800 1000 1200
300
320
340
360
380
400 10mol% Y2O3 24mol% Y
2O
3
C11
[GP
a]
T [°C]0 200 400 600 800 1000 1200
40
50
60
70 10mol% Y2O3 24mol% Y
2O
3
C12
[GP
a]
T [°C]0 200 400 600 800 1000 1200
40
50
60
70 10mol% Y2O
3 24mol% Y2O3
C44
[GP
a]
T [°C]
3.2. Dislocation plasticity in cubic zirconia single crystals
20
The figure 3.1.5. features other data on the elastic constants of cubic zirconia,
measured by Brillouin scattering experiments. The dependencies are similar to those
shown above both qualitatively and quantitatively.
Point defect structure of cubic zirconia
The properties of point defects influence the plastic deformation in many ways. At
high temperatures, dislocation climb is controlled by diffusion. Besides, the motion of
dislocations may be impeded by point defect segregation or by reorientation of defect
clusters in the stress field of the dislocations (e.g. [44]). That the incorporation of two
yttrium ions into the cubic zirconia lattice is accompanied with the formation of an
anion vacancy in order to preserve electrical neutrality, as well as the fact that such
vacancies are not arranged randomly, was already described in the subchapter 3.1 of
this doctoral thesis. It is also known there is a strong tendency for such vacancies to
cluster in pairs as well as a weaker tendency for the clusters to form even larger
aggregates having Zr3Y4O12 as the structural unit [34].
Oxygen vacancies and substitutional yttrium atoms tend to form dipoles. This
tendency was shown by [35, 31, 32] using mechanical loss (internal friction)
experiments. In turn, it leads to an atomic model of the cubic fluorite cell where
oxygen ions corresponding to 8-fold coordination are situated around the site of a Zr4+
ion which is occupied by a substitutional dopant ion (Y3+). The oxygen vacancy may
be positioned at one of eight nearest neighbor sites around the dopant ion with 111
orientation of the dipole axis in each case. The mobility of the vacancies decreases
with increasing yttria content, whereas the diffusivity of Zr via oxygen vacancies
increases with rising concentration of Y2O3.
3.2. Dislocation plasticity in cubic zirconia single crystals
3.2.1. Glide planes, Burgers vectors, and slip geometry of c-ZrO2
Basically, the main slip system of the calcium fluorite structure is of the type
0011/2110. It was observed in [72] together with the secondary slip system
3.2. Dislocation plasticity in cubic zirconia single crystals
21
1101/2110, although the secondary slip was reported to occur on 0011/2110,
too. That dislocations can also glide on 111 planes was postulated in [73] for
UO2 whose structure is similar to that of ZrO2. In all the cases, the Burgers vector is
1/2110 (see [74]).
More or less the same situation has been observed in cubic zirconium dioxide by
several investigators. Initially, the glide system 0011/2110 was observed in [27,
10], the so-called easy slip system. The compression axis was 112. This axis is
called a soft orientation because it activates single slip on the system with the cube
plane whose orientation factor is 0.47 (the highest possible at this deformation axis in
cubic zirconia). In [11-13] and later in [23], the 0011/2110 primary slip system
was postulated; the experiments have been mostly performed at 1400°C. Apart from
compression experiments at a constant strain rate, a few sets of indentation tests with
yttria-stabilized cubic zirconia have been carried out by [24, 25, 65] at temperatures
up to 1000°C. Repeatedly, these indicated 0011/2110 slip.
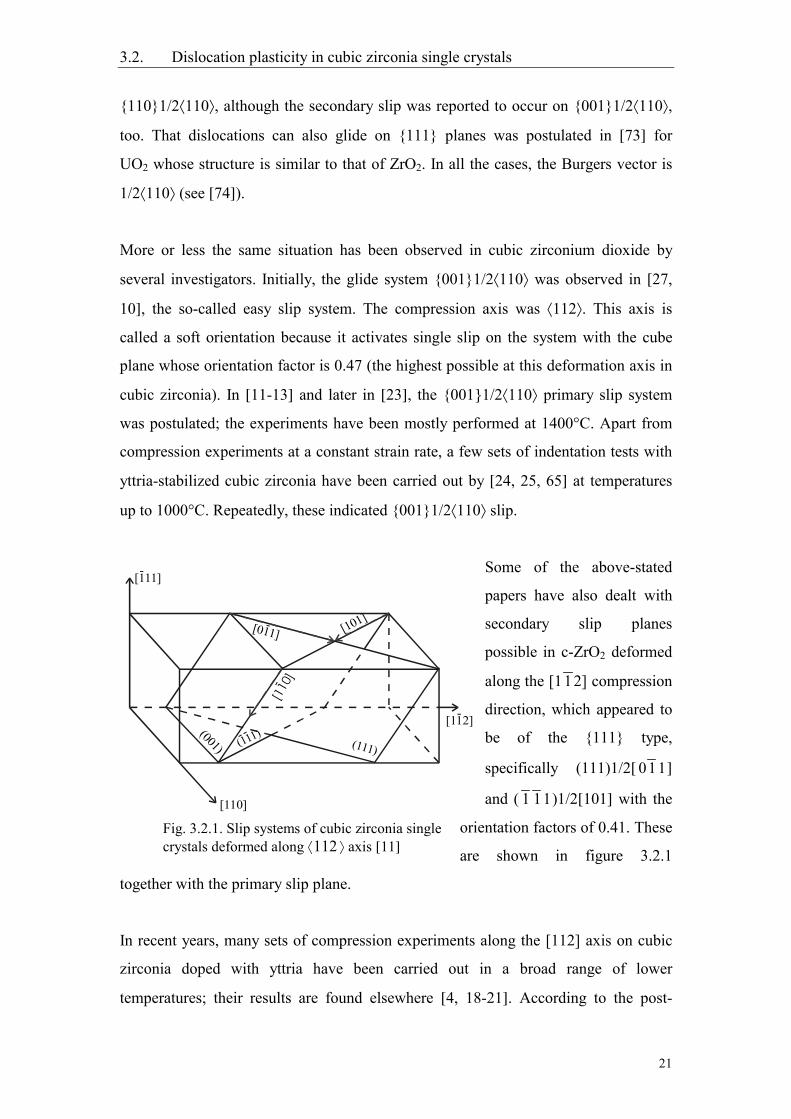
Some of the above-stated
papers have also dealt with
secondary slip planes
possible in c-ZrO2 deformed
along the [112] compression
direction, which appeared to
be of the 111 type,
specifically (111)1/2[ 011]
and ( 1 11)1/2[101] with the
orientation factors of 0.41. These
are shown in figure 3.2.1
together with the primary slip plane.
In recent years, many sets of compression experiments along the [112] axis on cubic
zirconia doped with yttria have been carried out in a broad range of lower
temperatures; their results are found elsewhere [4, 18-21]. According to the post-
(001) (111)(111)
--
[110]-
[011]- [101]
[111]
[110]
[112]
-
-
Fig. 3.2.1. Slip systems of cubic zirconia singlecrystals deformed along 112 axis [11]
3.2. Dislocation plasticity in cubic zirconia single crystals
22
mortem optical and transmission electron microscopy analyses, the 001 slip plane
has been unambiguously confirmed the primary slip plane with the Burgers vector
1/2110. As far as secondary slip systems are concerned, these have been identified
as (010) and (100), their Burgers vector directions being [101] and [ 011]. This result
is rather unusual since the orientation factor of the secondary cube planes is 0.35 at the
112 axis, whereas that of 111 planes is 0.41, and CRSS of the secondary cube
planes was concluded to be actually the same as that of 111 planes [14].
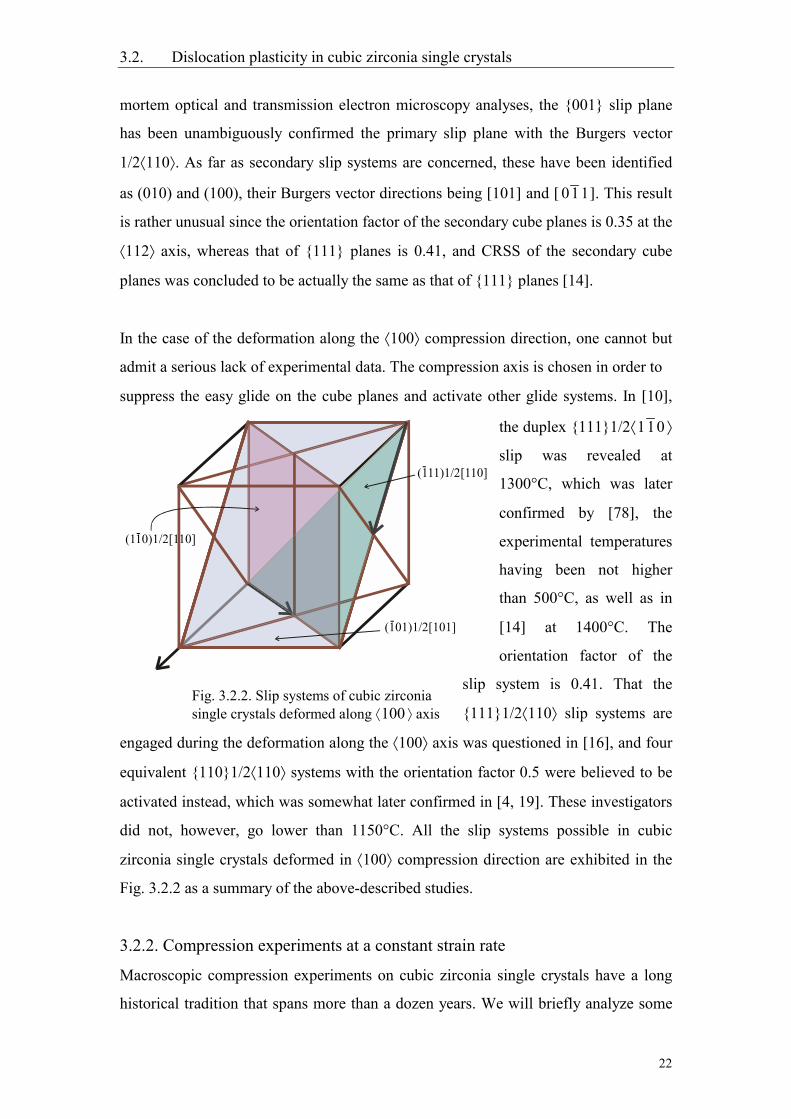
In the case of the deformation along the 100 compression direction, one cannot but
admit a serious lack of experimental data. The compression axis is chosen in order to
suppress the easy glide on the cube planes and activate other glide systems. In [10],
the duplex 1111/2110
slip was revealed at
1300°C, which was later
confirmed by [78], the
experimental temperatures
having been not higher
than 500°C, as well as in
[14] at 1400°C. The
orientation factor of the
slip system is 0.41. That the
1111/2110 slip systems are
engaged during the deformation along the 100 axis was questioned in [16], and four
equivalent 1101/2110 systems with the orientation factor 0.5 were believed to be
activated instead, which was somewhat later confirmed in [4, 19]. These investigators
did not, however, go lower than 1150°C. All the slip systems possible in cubic
zirconia single crystals deformed in 100 compression direction are exhibited in the
Fig. 3.2.2 as a summary of the above-described studies.
3.2.2. Compression experiments at a constant strain rate
Macroscopic compression experiments on cubic zirconia single crystals have a long
historical tradition that spans more than a dozen years. We will briefly analyze some
(101)1/2[101]
(111)1/2[110]
(110)1/2[110]
-
-
-
Fig. 3.2.2. Slip systems of cubic zirconiasingle crystals deformed along 100 axis
3.2. Dislocation plasticity in cubic zirconia single crystals
23
of these results, whereas a comprehensive review can be found in [17]. The first
attempt to study plastic deformation of ZrO2 fully stabilized with Y2O3 was made in
[27], where the deformation of the material was investigated along the 112
compression axis at 1400°C at a strain rate of 1.3*10-5 s-1. All the studied samples
exhibited apparent well-defined upper and lower yield points followed by a
transitional region leading to flow with zero work hardening, which proved to be
similar to the dependence observed in [30], where plastic deformation of calcia
stabilized cubic zirconia was analyzed. The flow stress increased with increasing yttria
content whose maximum value was 18.0 mol%. In [10], fully stabilized zirconia
single crystals were studied at 1400°C with the same strain rate as in [27] along three
different compression axes: 100, 111, and 112. The stress-strain curves of the
111 and 112 crystals showed the yield point effect and modest work hardening
thereafter, whereas those of the 100 samples did not exhibit any yield point effect at
all, yet a considerable work hardening region occurred, which was accounted for the
difference between single and duplex slip of the deformation in 112 or 111 and
100, respectively, according to the opinion of the investigators. In [12-14], plastic
deformation of cubic zirconia was studied in the 112 axis in the temperature range
from 1200°C up to 1500°C. The relevant stress-strain curves did not show the yield
point effect at 1200-1300°C, which was explained by an increased work hardening
rate and decreased recovery rate with decreasing temperature.
The dependence of the flow stress of cubic zirconia single crystals on the yttria
concentration was investigated in [23] by compression tests at 1400°C. When the
dopant concentration was up to 18mol%, the stress-strain curves exhibited the yield
point. Unlike it, the stress-strain curves of the crystals stabilized with a higher yttria
content did not show the yield drop, but were serrated, which was understood by the
formation of Lüders bands in these samples. The maximum of the flow stress was
observed with the sample doped with 21mol% yttria, which was subsequently proved
in [16, 26].
A study of plastic deformation of fully stabilized zirconia doped with three different
concentrations of yttria (10, 12.5, and 15mol%) has been carried out by [15]. The
3.2. Dislocation plasticity in cubic zirconia single crystals
24
investigators made three sets of compression experiments along 112 from 250°C up
to 550°C under confining hydrostatic pressure lest the samples have broken before the
plastic deformation began. The basic strain rate was chosen 2*10-4 s-1. It was found in
the framework of the research that the flow stress of cubic zirconia single crystals
increased with increasing yttria content up to a maximum at 15mol%, and it is with
that concentration that the yield point effect was observed at 450°C, being absent in
all the other cases, whereas work hardening was registered during most of the
experiments. As to the compression experiments along the 100 axis, these were
performed on ZrO2-10mol%Y2O3 single crystals from 350°C up to 500°C with the
same basic strain rate as in the case of the soft mode. The apparent stress-strain curves
showed the yield point effect at all temperatures barring 400°C, the flow stress of the
curves being higher than that obtained on ZrO2-10mol%Y2O3 during the deformation
along 112 at the respective temperatures, which might be because the 112
compression samples had mostly broken before any essential portion of plastic
deformation could be attained.
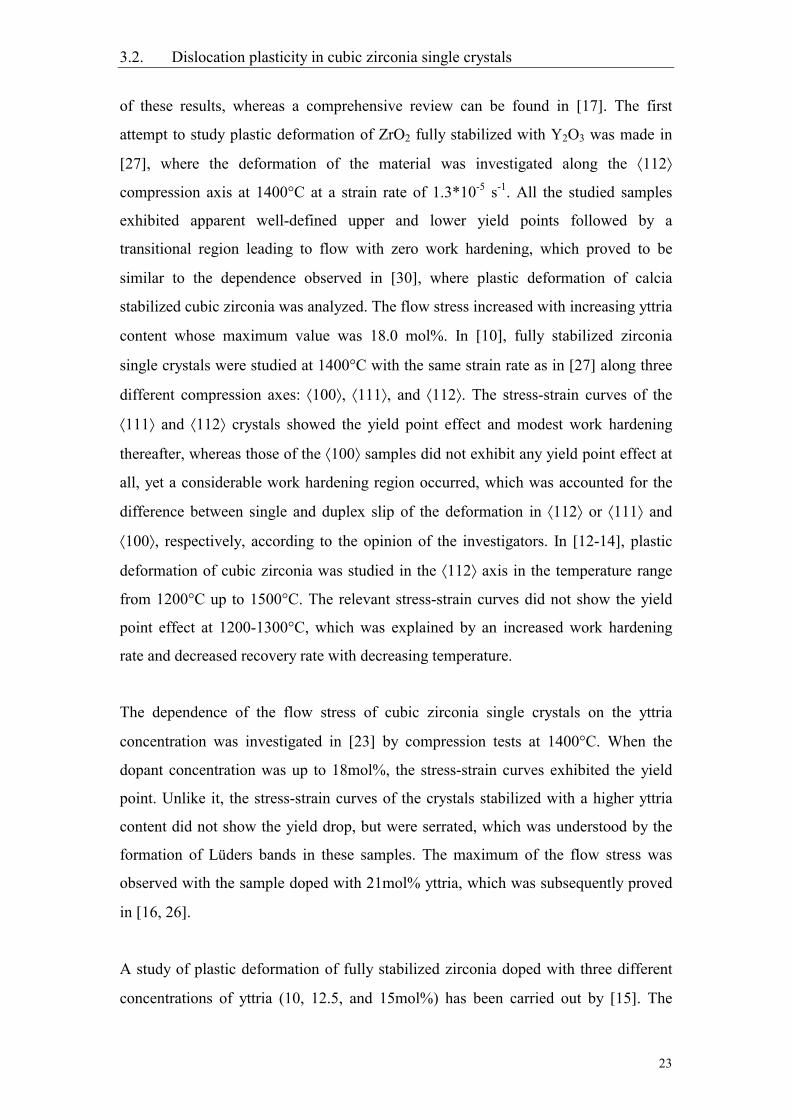
Over the recent ten years, several series of macroscopic compression experiments on
cubic zirconia have also been performed, most fundamental of these being [4, 17-22]
carried out in the plasticity group in
the MPI of Microstructure Physics in
Halle. They studied the plastic
deformation of ZrO2-10mol%Y2O3
single crystals along the 112
compression axis in the temperature
range from 500°C, for it was the
lowest possible experimental
temperature, up to 1400°C at the basic
strain rate 10-6 s-1, although several
additional tests were made at 10-4 s-1 at
1400°C. All the experiments were carried
out in air environment. According to the
results of the research, the flow stress of
Fig. 3.2.3. Stress-strain curves ofZrO2-10mol%Y2O3 in 112 [4]
3.2. Dislocation plasticity in cubic zirconia single crystals
25
the cubic zirconia decreases gradually with increasing experimental temperature, as
shown in the Fig. 3.2.3. Similarly to the previous research, the yield drop occurs at
1400°C but disappears from 1200°C down to 700°C, the relevant stress-strain curves
exhibiting work-hardening instead.
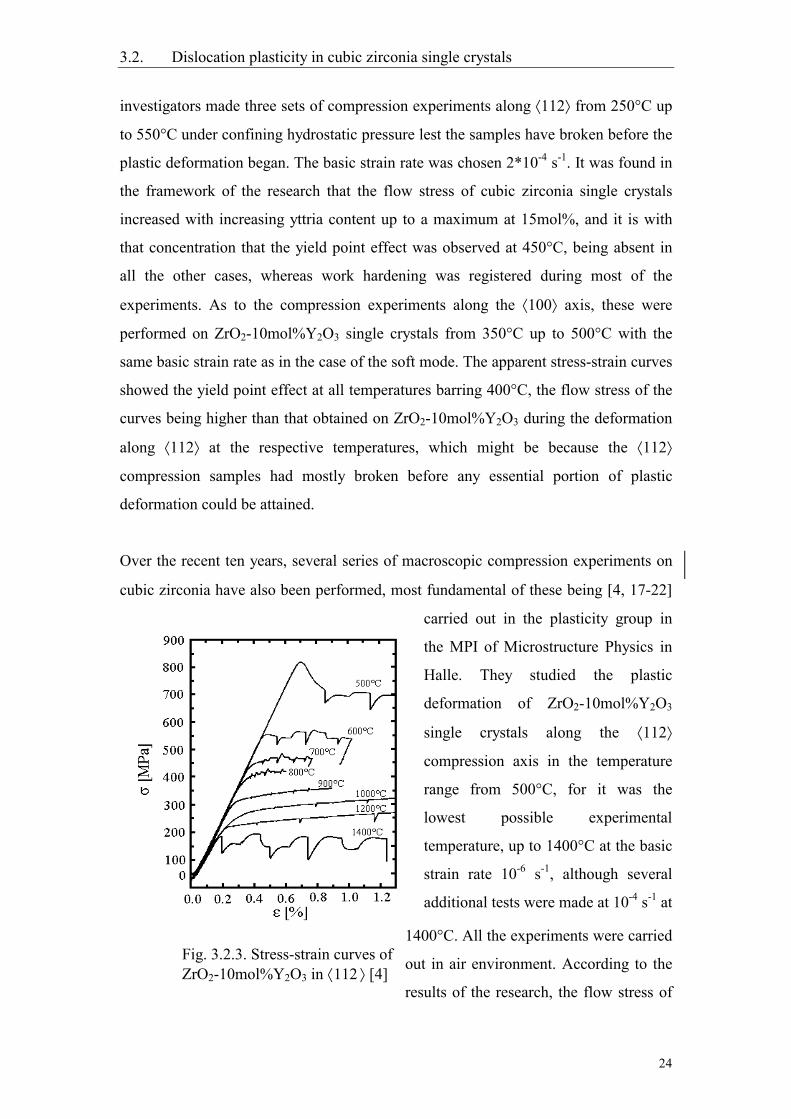
Below 600°C, the yield drop starts to take place again. Within the performed
compression experiments, SRC and SR tests were made. The results of these were
used to calculate the strain rate
sensitivity of the flow stress. The
flow stress is very sensitive to the
strain rate near 1400°C and down
from 600°C, the interval from 800°C
up to 1200°C being the least sensitive
to the experimental strain rate. The
temperature dependence of the strain
rate sensitivity below 1250°C is
presented in Fig. 3.2.4. It shows that
the strain rate sensitivity decreases constantly
with increasing temperature, being less than
10 MPa from about 800°C up to 1200°C.
The same group of researchers studied plastic deformation of cubic zirconia single
crystals in the 100 compression direction, too, but one cannot help admitting a lack
of relevant experimental data. The experiments were carried out at 1400°C with the
basic strain rates 10-4 s-1 and 10-6 s-1, and another test was made at 1150°C at 10-6 s-1.
The stress-strain curves show the yield point effect at 1400°C with both strain rates,
but it does not appear in the 1150°C compression experiment.
Apart from the compression experiments, high-temperature creep behavior of yttria
stabilized zirconia single crystals as well as the influence of the yttria concentration on
this behavior have been investigated [75-77]. The concentration of yttria was from 9.4
up to 21mol%, and the entire range of the experimental temperatures lay between
Fig. 3.2.4. Temperature dependenceof the strain rate sensitivity of ZrO2-10mol%Y2O3 in 112 [4]
3.2. Dislocation plasticity in cubic zirconia single crystals
26
1300°C and 1800°C. The creep behavior was explained in terms of a transition
between glide and climb controlled creep. As regards the yttria concentration
dependence of the creep rate in that the latter increased with decreasing yttria content,
it was accounted for by assuming a strong dependence of cation diffusion on the
concentration of yttria. The decrease of the creep rate at constant stress with
increasing yttria concentration is explained by a strong dependence of the cation
diffusion coefficient on the latter.
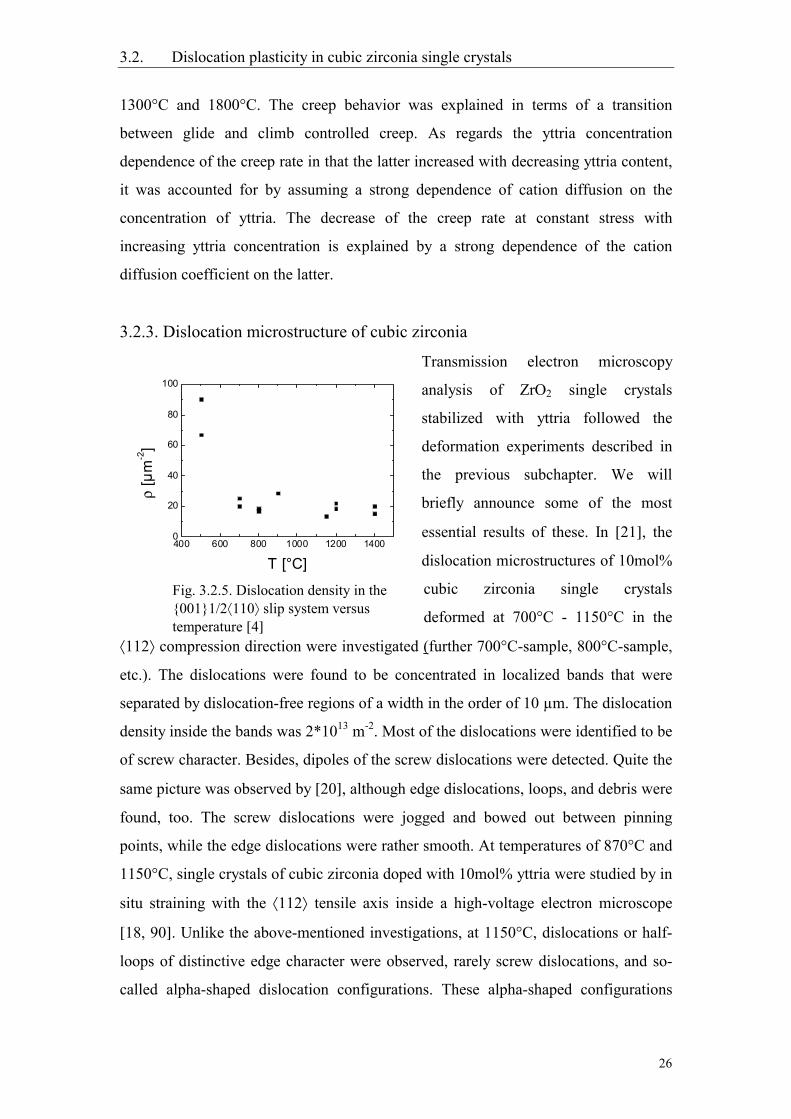
3.2.3. Dislocation microstructure of cubic zirconia
Transmission electron microscopy
analysis of ZrO2 single crystals
stabilized with yttria followed the
deformation experiments described in
the previous subchapter. We will
briefly announce some of the most
essential results of these. In [21], the
dislocation microstructures of 10mol%
cubic zirconia single crystals
deformed at 700°C - 1150°C in the
112 compression direction were investigated (further 700°C-sample, 800°C-sample,
etc.). The dislocations were found to be concentrated in localized bands that were
separated by dislocation-free regions of a width in the order of 10 µm. The dislocation
density inside the bands was 2*1013 m-2. Most of the dislocations were identified to be
of screw character. Besides, dipoles of the screw dislocations were detected. Quite the
same picture was observed by [20], although edge dislocations, loops, and debris were
found, too. The screw dislocations were jogged and bowed out between pinning
points, while the edge dislocations were rather smooth. At temperatures of 870°C and
1150°C, single crystals of cubic zirconia doped with 10mol% yttria were studied by in
situ straining with the 112 tensile axis inside a high-voltage electron microscope
[18, 90]. Unlike the above-mentioned investigations, at 1150°C, dislocations or half-
loops of distinctive edge character were observed, rarely screw dislocations, and so-
called alpha-shaped dislocation configurations. These alpha-shaped configurations
Fig. 3.2.5. Dislocation density in the0011/2110 slip system versustemperature [4]
400 600 800 1000 1200 14000
20
40
60
80
100
ρ [µ
m-2]
T [°C]
3.2. Dislocation plasticity in cubic zirconia single crystals
27
consisted of a straight screw segment and a more or less bowed edge one. These
configurations are intermediate stages of dislocation multiplication. In addition, a high
number of dislocation loops occurred. It was also reported that the dislocations were
created instantaneously in a region larger than the area under observation of about 15
µm in diameter. The dislocations moved very jerkily at jump distances usually larger
than the viewing area. One in situ experiment was started at 1150°C, after which the
temperature was reduced down to 870°C, so as to compare both microstructures. At
870°C the dislocation loops were much smaller and the screw dislocations were curly-
shaped. The glide behavior was similar to that observed at 1150°C. The dislocations
moved very jerkily, too, but their jump distances were shorter. These were measured
as 0.3 µm.
In [78], the dislocation microstructure of cubic zirconia single crystals deformed at
250°C - 550°C in compression was studied by TEM. Long screw dislocation segments
with numerous pinning points and dislocation loops were observed. At 250°C, the
loops were elongated in the screw orientation leaving behind screw dipoles. Long
dipolar loops of screw character resulted from a local recombination of these dipoles.
At 550°C, the edge components of the loops were longer than at 250°C, but the screw
segments still dominated. That dislocations of screw character were hindered by
pinning points at temperature lower than 900°C was also registered by [4, 17, 21]. At
500°C, dislocation density was so high that the individual dislocations could not be
discerned. A temperature dependence of dislocation density is presented in the Fig.
3.2.5. In the same temperature range, pairs of dislocations were detected. These lay
practically on neighbouring slip planes, and their Burgers vectors were anti-parallel.
Such dislocation pairs could appear due to mutual impeding of the two constituent
separate dislocations as they glided beside one another. Sometimes, one of the two
could overcome the mutual attraction, so that it moved over some distance. Finally, it
reached out another dislocation and became hindered again.
In [27], the dislocation microstructure of a 9.4mol% cubic zirconia single crystal
deformed at 1400°C in the 112 compression was studied, and many curved
dislocations together with small dislocation loops were observed. Also, various
3.2. Dislocation plasticity in cubic zirconia single crystals
28
dislocation reactions were believed to occur. In [10], the dislocation network of a
1200°C sample was compared with that of a 1400°C. In both cases, dislocation loops
were observed, but the dislocation density of the 1400°C sample was lower than that
of the 1200°C, which was somewhat later confirmed with the results of [13]. Similar
loops as well as dislocation dipoles were determined by [12] where 1400°C samples
were investigated at different levels of deformation. The dipoles were guessed to form
by pinning of screw dislocations by solute or impurity atoms. In turn, the loops
formed out of the dipoles by climb and/or cross-slip. Besides, a number of dislocation
nodes was observed, particularly at high deformation level. These were guessed to
originate from the intersection of primary and secondary slip planes in cubic zirconia
single crystals according to the following dislocation reaction:
12
[110 ] + 12
[ 101 ] → 12
[ 01 1 ]
The formation of nodes and dislocation loops were also detected by [77, 79] where
high-temperature creep of cubic zirconia was studied from 1300°C up to 1600°C.
Cross slip was reported to occur, too.
3.2.4. Microprocesses of plastic deformation of cubic zirconia single crystals.
Typical dislocation models (lattice friction, athermal interaction between parallel
dislocations, thermal recovery, to name but a few) controlling plastic deformation of
crystalline materials are presented in the subchapter 2.2 of this doctoral dissertation.
Let us now take an insight into the models, insofar as these have to do with zirconia
single crystals deformed at different temperatures.
As has been already pointed out, a certain number of Y ion – O vacancy dipoles exists
in cubic zirconia. These may give rise to contributions to the flow stress by
reorientation in the stress field of moving dislocations, the so-called Snoek effect. The
latter can in turn cause transient effects after changes of the strain rate. However, since
the stress increments owing to these are negligibly small [17], elastic interactions
between dislocations and isolated point defects as well as small clusters of such
defects cannot be of importance in the plastic deformation of cubic zirconia. As
discussed and presented in [4, 17, 22], from 1000°C up to 1200°C, plastic
deformation of cubic zirconia is controlled by athermal long-range interactions
3.2. Dislocation plasticity in cubic zirconia single crystals
29
between parallel dislocations (Taylor hardening). Furthermore, dislocations can be
hindered by jogs in this temperature region, thereby forming dislocation loops.
At temperatures from 1000°C down to nearly 600°C, the solution-hardening may take
place [27, 10, 26]. It is assumed in this model that a gliding dislocation takes a zig-
zag” configuration when it interacts with an array of transient pinning points, each
pinning point comprising a cluster containing solute atoms (and possibly other point
defects). Such a cluster contains Y3+ ions and charge compensating oxygen vacancies.
In order to unpin the dislocation from the cluster, one has to supply an amount of
stress.
In the same temperature range, precipitation hardening is believed to influence the
flow stress of cubic zirconia single crystals in that dislocations interact with localized
obstacles of possibly hafnium nature [21]. A similar model has been proposed for the
deformation of cubic zirconia matrix with tetragonal ZrO2 precipitates, too [27].
Unlike these, zirconium nitride (ZrN) precipitates were observed in c-ZrO2 [79]. The
origin of these is probably due to absorption of atmospheric nitrogen by liquid
zirconia when the crystals are produced in air or by the skull melting process, the
essence of which was also proved by [80, 81].
In [46, 47], the mechanisms controlling the plastic deformation were supposed to
change gradually from the pinning by localized obstacles to the lattice friction below
700°C. The authors stated that kink pairs formed on segments of dislocations bowing
out under the action of an applied stress, that is the authors did not separate both
mechanisms but considered them to act simultaneously. With the pinning by localized
obstacles predominant, the experimental activation volume appeared relatively large,
which corresponded to low values of the strain rate sensitivity, whereas the lattice
friction being of more influence, the activation volume was empirically found low,
and high values of the strain rate sensitivity were thus obtained.
At the temperatures of 1300°C - 1600°C, thermal recovery takes place and governs
plastic deformation of cubic zirconia [26, 75-77, 4, 19], i.e. a mechanism of
3.2. Dislocation plasticity in cubic zirconia single crystals
30
dislocation annihilation. The rate of the annihilation is controlled by a diffusional
processes where dislocation climb is involved.
3.2.5. Aim of the present doctoral thesis
While the plastic deformation of cubic zirconia single crystals doped with 10mol%
Y2O3 has been thoroughly investigated in the soft mode, i.e. involving macroscopic
compression experiments along the 112 axis, the plastic deformation of cubic
zirconia in the 100 compression direction is not very well studied. Moreover, the
existing papers on the 112 material are geared primarily to cubic zirconia single
crystals stabilized with 10mol% yttria, and there are only a couple of studies of cubic
zirconium dioxide doped with any other concentration of Y2O3.
With respect to the aforesaid, the objective of the present doctoral dissertation is to
investigate the plastic deformation of cubic zirconia single crystals doped with 10
mol% yttria in the 100 compression direction, expressly and extensively. In order to
achieve this, compression experiments with a constant strain rate in air environment is
to be used. Since the deformation in the 100 direction suppresses glide on the easy
100 planes, other slip systems must be activated at the deformation in this axis.
That one can analyse the slip systems after relevant compression samples have been
deformed, transmission electron microscopy observations are to be applied.
As the second part of this thesis, the plastic deformation of cubic zirconia single
crystals stabilized with 15 and 20mol% yttria will be investigated, so that the
concentration dependence of the flow stress of the material could be empirically found
out. Finally, an interwoven and elaborated dependence of the flow stress of cubic
zirconia on the concentration of yttria dopant and the deformation direction is to be
postulated. According to the magnitude of experimental variables such as the strain
rate sensitivity of the flow stress yielding the activation volume as well as the results
of transmission electron microscopy analyses, the dislocation mechanisms responsible
for the plastic deformation of cubic zirconia are to be determined.
4.1. Macroscopic deformation experiments
31
4. Experimental
4.1. Macroscopic deformation experiments
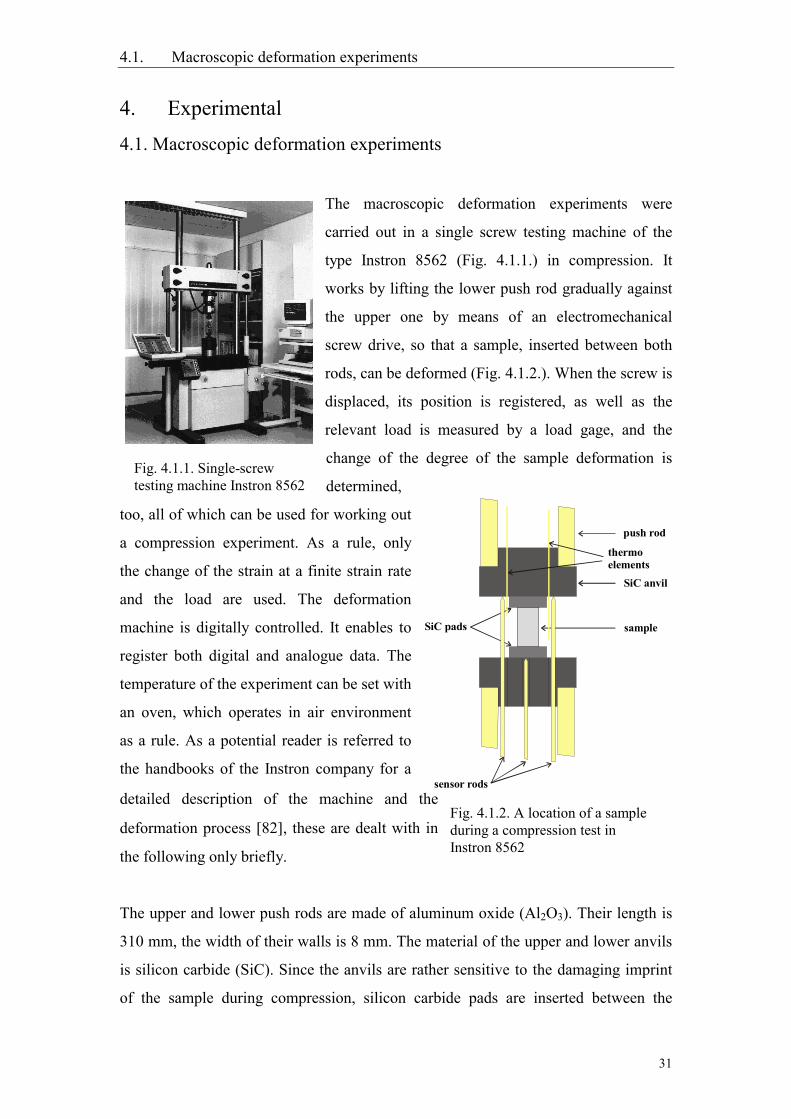
The macroscopic deformation experiments were
carried out in a single screw testing machine of the
type Instron 8562 (Fig. 4.1.1.) in compression. It
works by lifting the lower push rod gradually against
the upper one by means of an electromechanical
screw drive, so that a sample, inserted between both
rods, can be deformed (Fig. 4.1.2.). When the screw is
displaced, its position is registered, as well as the
relevant load is measured by a load gage, and the
change of the degree of the sample deformation is
determined,
too, all of which can be used for working out
a compression experiment. As a rule, only
the change of the strain at a finite strain rate
and the load are used. The deformation
machine is digitally controlled. It enables to
register both digital and analogue data. The
temperature of the experiment can be set with
an oven, which operates in air environment
as a rule. As a potential reader is referred to
the handbooks of the Instron company for a
detailed description of the machine and the
deformation process [82], these are dealt with in
the following only briefly.
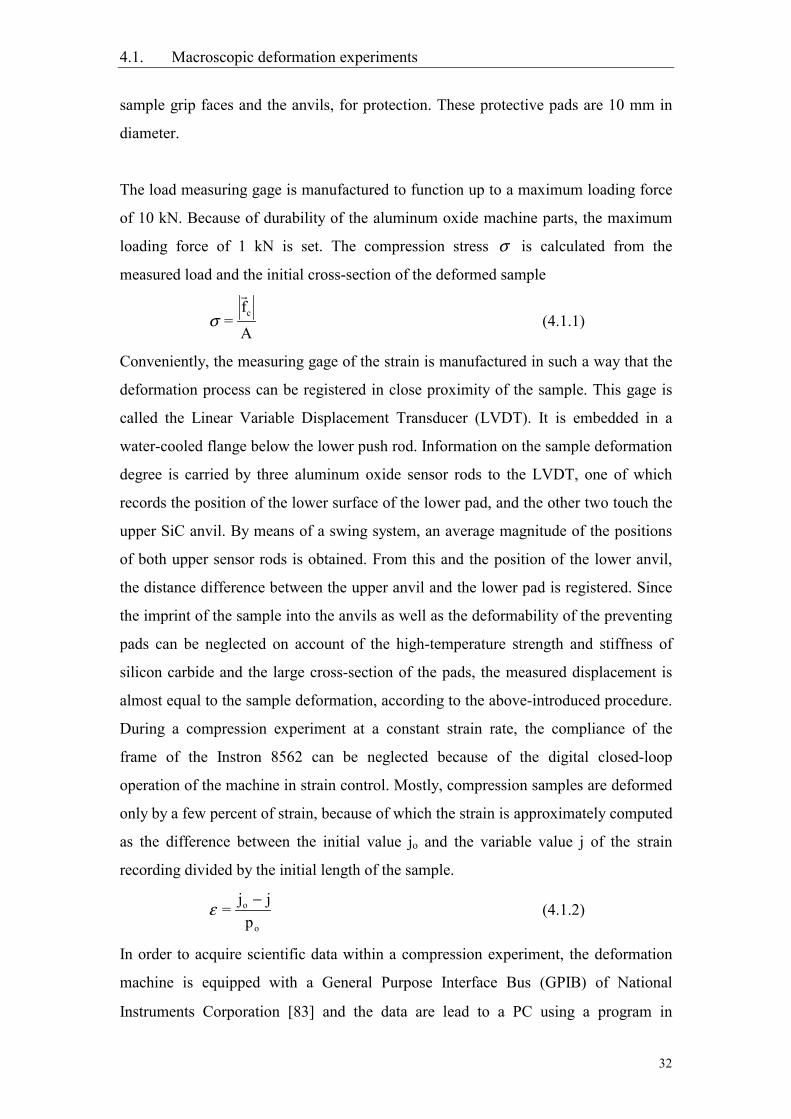
The upper and lower push rods are made of aluminum oxide (Al2O3). Their length is
310 mm, the width of their walls is 8 mm. The material of the upper and lower anvils
is silicon carbide (SiC). Since the anvils are rather sensitive to the damaging imprint
of the sample during compression, silicon carbide pads are inserted between the
Fig. 4.1.1. Single-screwtesting machine Instron 8562
Fig. 4.1.2. A location of a sampleduring a compression test inInstron 8562
SiC pads
SiC anvil
sample
thermo elements
sensor rods
push rod
4.1. Macroscopic deformation experiments
32
sample grip faces and the anvils, for protection. These protective pads are 10 mm in
diameter.
The load measuring gage is manufactured to function up to a maximum loading force
of 10 kN. Because of durability of the aluminum oxide machine parts, the maximum
loading force of 1 kN is set. The compression stress σ is calculated from the
measured load and the initial cross-section of the deformed sample
σ =f
Ac
(4.1.1)
Conveniently, the measuring gage of the strain is manufactured in such a way that the
deformation process can be registered in close proximity of the sample. This gage is
called the Linear Variable Displacement Transducer (LVDT). It is embedded in a
water-cooled flange below the lower push rod. Information on the sample deformation
degree is carried by three aluminum oxide sensor rods to the LVDT, one of which
records the position of the lower surface of the lower pad, and the other two touch the
upper SiC anvil. By means of a swing system, an average magnitude of the positions
of both upper sensor rods is obtained. From this and the position of the lower anvil,
the distance difference between the upper anvil and the lower pad is registered. Since
the imprint of the sample into the anvils as well as the deformability of the preventing
pads can be neglected on account of the high-temperature strength and stiffness of
silicon carbide and the large cross-section of the pads, the measured displacement is
almost equal to the sample deformation, according to the above-introduced procedure.
During a compression experiment at a constant strain rate, the compliance of the
frame of the Instron 8562 can be neglected because of the digital closed-loop
operation of the machine in strain control. Mostly, compression samples are deformed
only by a few percent of strain, because of which the strain is approximately computed
as the difference between the initial value jo and the variable value j of the strain
recording divided by the initial length of the sample.
o
o
pjj
=−ε (4.1.2)
In order to acquire scientific data within a compression experiment, the deformation
machine is equipped with a General Purpose Interface Bus (GPIB) of National
Instruments Corporation [83] and the data are lead to a PC using a program in
4.1. Macroscopic deformation experiments
33
Turbopascal [4]. The program can be used for data acquisition and storage, although
the control of an experiment is carried out manually. During such an experiment, data
are recorded either after a step of 2 N load or of 0.2 µm strain. Also, the program
enables to set other steps of both strain and load. The course of experiment can be
displayed on the monitor as a stress-strain diagram, and it is also shown in form of
curves written by the recorders simultaneously.
That compression experiments can be conducted at high temperatures, the
deformation machine is equipped with an oven of the firm Severn Furnaces Limited
[84]. An array of six molybdenum disilicide heating elements are mounted parallel to
the furnace axis to provide symmetrical radial heating of the working chamber. The
furnace is regulated with a Eurotherm 818 P controller. Its highest possible
temperature is 1500°C. The outer face of the oven and the bases of the rods are water-
cooled using a COLORA FK 3500 heat exchanger. In order to protect the push rods
from a thermal shock, the oven’s temperature can be changed by 12 K per minute,
both at heating and cooling. The upper push rod is provided with two additional
thermoelements, so that the temperatures near the upper and lower ends of the
compression sample can be measured.
Before a compression test at both high and low temperature is started, one has to make
sure that the grip faces of the sample fit the upper and lower pads in that the sample
faces and the surfaces of anvils should be as parallel as possible, in order to achieve
uniaxial loading. Furthermore, to avoid temperature gradients near the sample, two
convex ceramic shields are placed in the oven, so that these encircle the sample
completely. Finally, the oven is closed and clamped. A compression experiment can
be started as soon as the experimental temperature is constant, and the strain
oscillations are lower than 0.02 µm/min.
Mostly, experiments are performed at a constant strain rate, although the latter is
changed in order to carry out strain rate cycling tests (SRC) for the sake of obtaining
the strain rate sensitivity of the flow stress, or the deformation process is stopped
when making relaxation tests (SR). That the temperature sensitivity of
4.2. Transmission electron microscopy experiments
34
the flow stress can be obtained, the temperature cycling tests are conducted, too.
When the temperature is being changed, the sample should partially be unloaded, so
that the plastic strain will not change, unregistered. If a compression experiment is
finished by quickly unloading the sample at constant temperature, the elastic stiffness
of the sample can be determined.
4.2. Transmission electron microscopy experimentsThe dislocation structure of the deformed compression samples of cubic zirconia was
investigated by transmission electron microscopy techniques. As a device for the
experiments, the JOEL High-Voltage Electron Microscope JEM 1000 (HVEM) was
used, a microscope that makes for in-depth studies of the dislocation structure of
crystalline solids. Since the maximum acceleration voltage of the microscope is 1000
kV as well as its penetrating power is about 2.8 times that of a 100 kV transmission
electron microscope, investigated specimens can be fairly thick [85]. In the same
reference, a reader can also find the apparatus and principle of work of this
microscope. Although cubic zirconia single crystals doped with yttria are electrically
non-conductive, the specimens did not need coating because of the high accelerating
voltage.
4.3. Diffraction patterns and dislocation contrast in a TEM
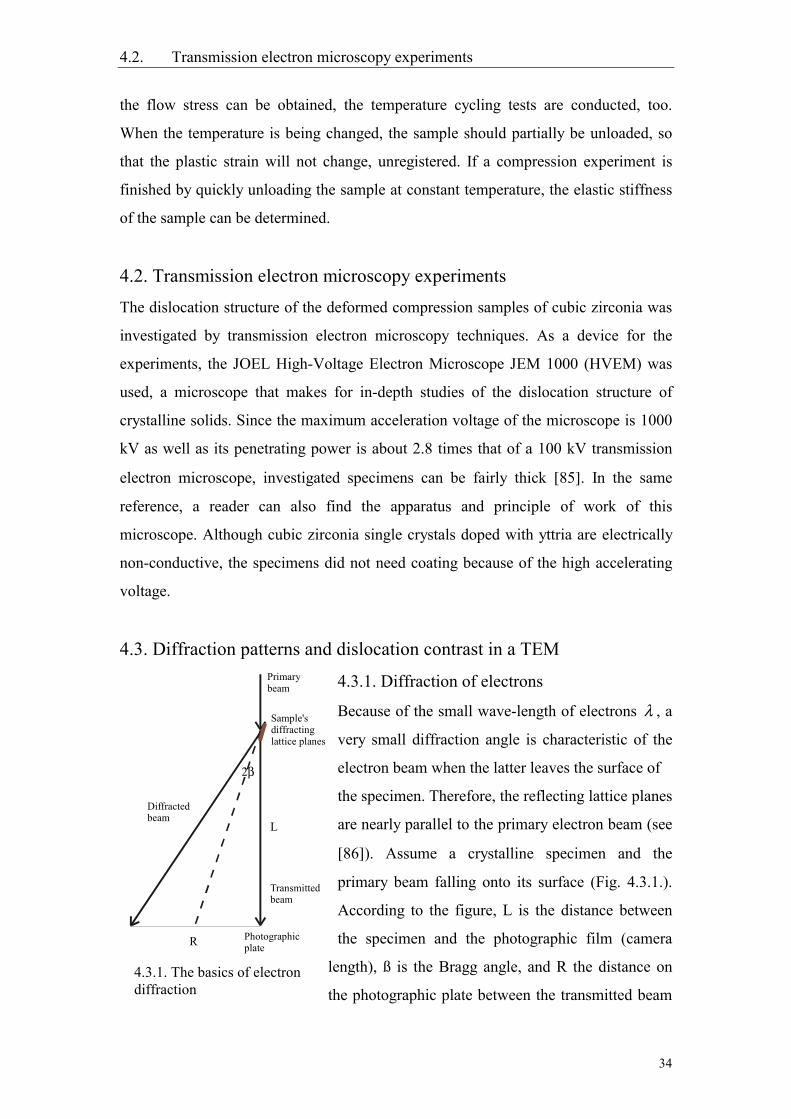
4.3.1. Diffraction of electrons
Because of the small wave-length of electrons λ , a
very small diffraction angle is characteristic of the
electron beam when the latter leaves the surface of
the specimen. Therefore, the reflecting lattice planes
are nearly parallel to the primary electron beam (see
[86]). Assume a crystalline specimen and the
primary beam falling onto its surface (Fig. 4.3.1.).
According to the figure, L is the distance between
the specimen and the photographic film (camera
length), ß is the Bragg angle, and R the distance on
the photographic plate between the transmitted beam4.3.1. The basics of electrondiffraction
Primarybeam
L
Diffractedbeam
R
Transmittedbeam
Sample'sdiffractinglattice planes
2β
Photographicplate
4.3. Diffraction patterns and dislocation contrast in a TEM
35
and a diffraction spot. Besides, ß approximately equals to R/2L since the diffraction
angle is small. Consequently, the Bragg equation can be written as
λL = Ra (4.3.1)
where a is the interplanar spacing. When electrons are of the same energy, the product
λL is constant. Therefore, a conclusion can be drawn that the distance R of each
diffraction spot from the primary beam is inversely proportional to the interplanar
spacing a, as well as the position vector of each diffraction spot
R is normal to its
relevant diffracting plane.
Diffraction patterns of crystals are
interpreted by the model of a reciprocal
lattice. While the definition of a reciprocal
lattice and its unit vectors can be found
elsewhere [86], we confine to a statement
which is, however, essential to
transmission electron microscopy
a1 =g (4.3.2)
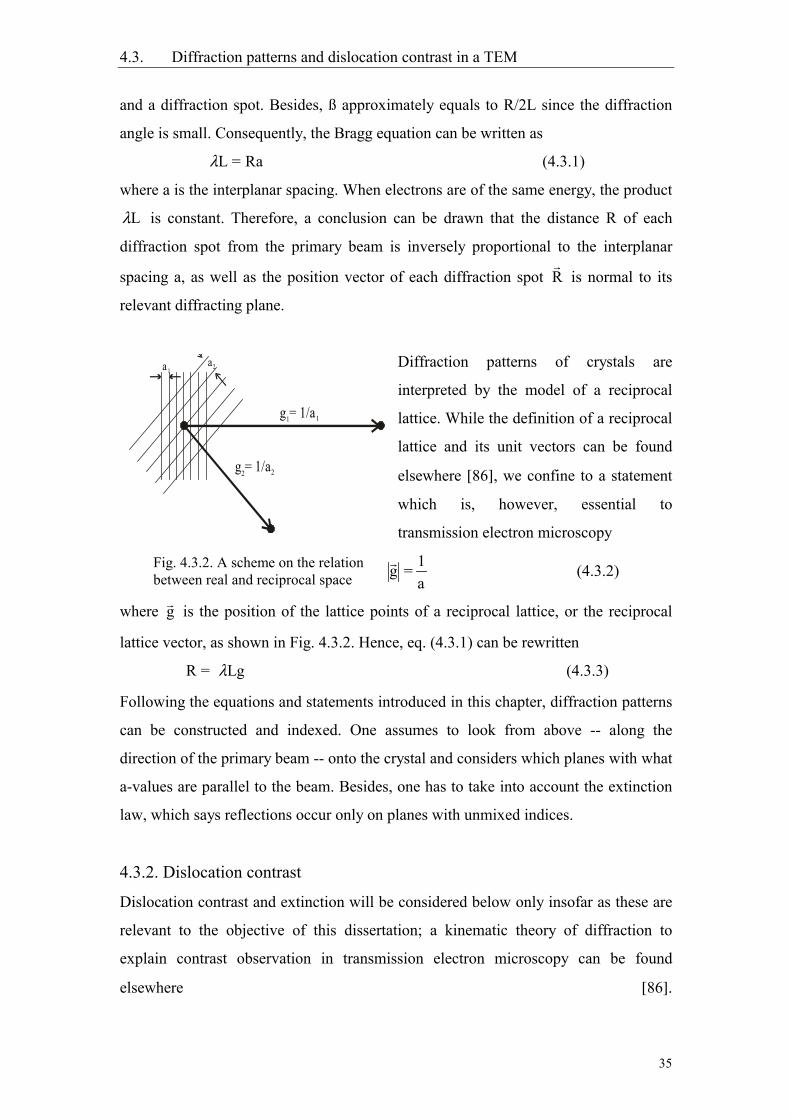
where g is the position of the lattice points of a reciprocal lattice, or the reciprocal
lattice vector, as shown in Fig. 4.3.2. Hence, eq. (4.3.1) can be rewritten
R = Lgλ (4.3.3)
Following the equations and statements introduced in this chapter, diffraction patterns
can be constructed and indexed. One assumes to look from above -- along the
direction of the primary beam -- onto the crystal and considers which planes with what
a-values are parallel to the beam. Besides, one has to take into account the extinction
law, which says reflections occur only on planes with unmixed indices.
4.3.2. Dislocation contrast
Dislocation contrast and extinction will be considered below only insofar as these are
relevant to the objective of this dissertation; a kinematic theory of diffraction to
explain contrast observation in transmission electron microscopy can be found
elsewhere [86].
Fig. 4.3.2. A scheme on the relationbetween real and reciprocal space
aa 2
g = 1/a1 1
g = 1/a2 2
1
4.4. Preparation of samples
36
When the electron beam encounters a dislocation or rather a space wherein lattice
planes are bent due to the distortion caused by the dislocation, the intensity of the
directly transmitted beam will be reduced (and that of the diffracted beam increased).
As a result, the dislocation will appear as a dark line in the bright-field image (or as a
bright line in a dark-field image). This line can also be invisible, which may be
exploited to determine the Burgers vector of the dislocation.
A dislocation is invisible when its Burgers vector is orthogonal to the imaging vector
of the reciprocal lattice (e.g. [87]), that is when
g b = 0⋅ (4.4.4)
More generally, only a screw dislocation is invisible when imaged with a reflection
for which eq. (4.4.4) is valid. If the specimen is tilted in the microscope to find two
different diffraction vectors g1 and g2 for which the dislocation line is invisible, its
Burgers vector must be perpendicular to both g1 and g2 and therefore has the
direction of g g1 2× . For an edge dislocation, all planes parallel to its line are bent,
which is why an edge dislocation does not disappear completely when imaged with
g b = 0⋅ , but a very small contrast is still present. However, its Burgers vector can
still be determined.
4.4. Preparation of samples
4.4.1. Macroscopic compression samples
In this work, three sets of cubic zirconia single crystals were used. The first of these
was ZrO2-10mol%Y2O3 single crystals oriented for the deformation in the 100 axis.
The second and the third sets were both oriented along 112 for easy glide on 100
planes, but the dopant concentration of these was different, namely 15mol% and
20mol% yttria. The crystals were oriented using the Laue back-reflection X-ray
technique.
Compression samples were made according to the following scheme: the oriented
crystals were cut into small bars by a wire saw and boron-carbide slurry, taking due
account of the compression axes of the samples. In order to make their opposite sides
parallel, these were ground with a Multipol precision polishing machine using a
4.4. Preparation of samples
37
mixture of boron-carbide powder and glycerine. Finally, the samples were
successively polished with diamond pastes whose polishing particles were 3 µm and 1
µm in diameter, respectively. For this, a Minimet polishing machine was used.
Since edges of a rectangular deformation sample often contain microcracks that can
become sources of unplanned and undesirable brittle fraction even before any
essential portion of plastic deformation can be attained [88, 89], these were polished
with abrasive paper, after which they were finally polished with 6 µm down to 1 µm
diamond pastes sprayed onto the rough side of photographic paper. On account of the
high brittleness of cubic zirconia single crystals, particularly of high concentrations of
Y2O3, many compression samples were irretrievably damaged so that they could not
be studied in compression. Otherwise, the samples were as closely as possible 2*2*8
mm3.
4.4.2. Transmission electron microscopy specimens
That the dislocation structure of cubic zirconia single crystals can be investigated,
some of the compression samples deformed along 100 were used to prepare
transmission electron microscopy foils. The specimens were cut into slices about 400
µm in thickness, ground and polished in the same way as the compression samples
discussed above. The final thickness of the specimens was from 150 µm to 200 µm.
After that, the specimens were dimpled with copper and rubber wheels, successively,
so that the final thickness in the center of the specimens was about 40 µm. Further, the
specimens were thinned down to 1 µm by ion milling with argon ions of 3-5 kV and a
beam current up to 3 mA, after they had been glued onto aluminum ringlets for further
convenient handling.
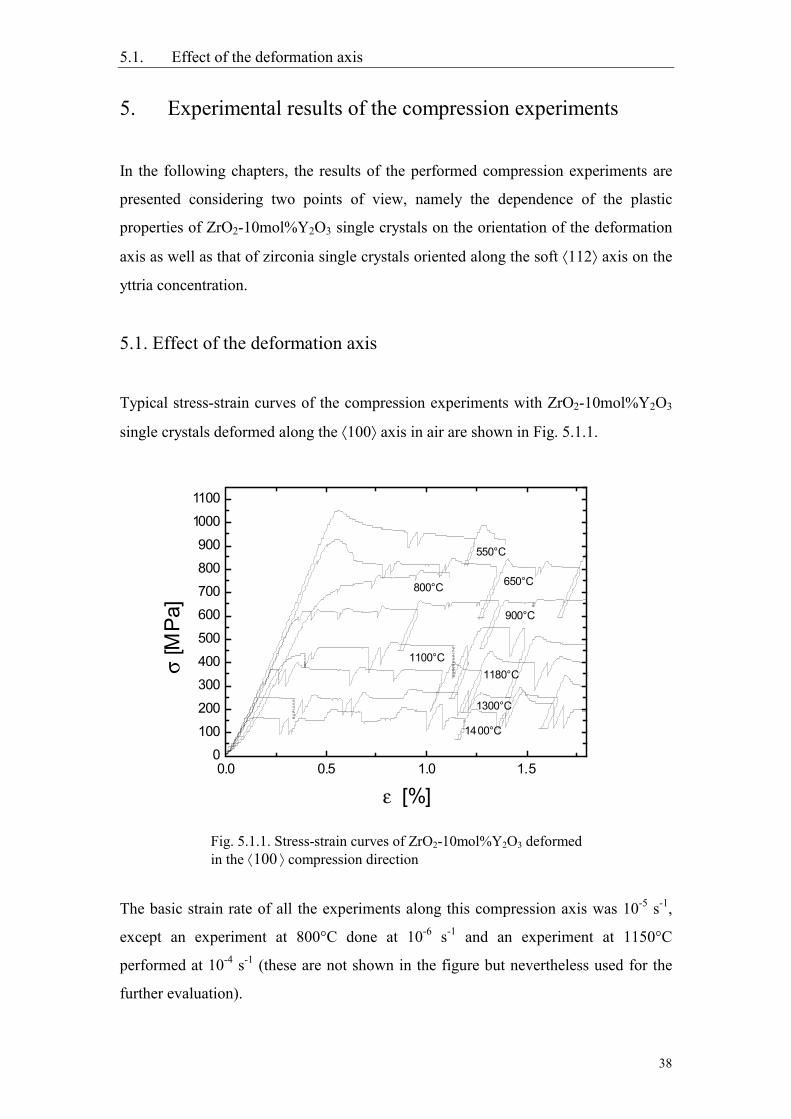
5.1. Effect of the deformation axis
38
5. Experimental results of the compression experiments
In the following chapters, the results of the performed compression experiments are
presented considering two points of view, namely the dependence of the plastic
properties of ZrO2-10mol%Y2O3 single crystals on the orientation of the deformation
axis as well as that of zirconia single crystals oriented along the soft 112 axis on the
yttria concentration.
5.1. Effect of the deformation axis
Typical stress-strain curves of the compression experiments with ZrO2-10mol%Y2O3
single crystals deformed along the 100 axis in air are shown in Fig. 5.1.1.
The basic strain rate of all the experiments along this compression axis was 10-5 s-1,
except an experiment at 800°C done at 10-6 s-1 and an experiment at 1150°C
performed at 10-4 s-1 (these are not shown in the figure but nevertheless used for the
further evaluation).
Fig. 5.1.1. Stress-strain curves of ZrO2-10mol%Y2O3 deformedin the 100 compression direction
0.0 0.5 1.0 1.50
100200300400500600700800900
10001100
1100°C
550°C
650°C800°C
900°C
1180°C
1300°C
1400°C
σ [M
Pa]
ε [%]
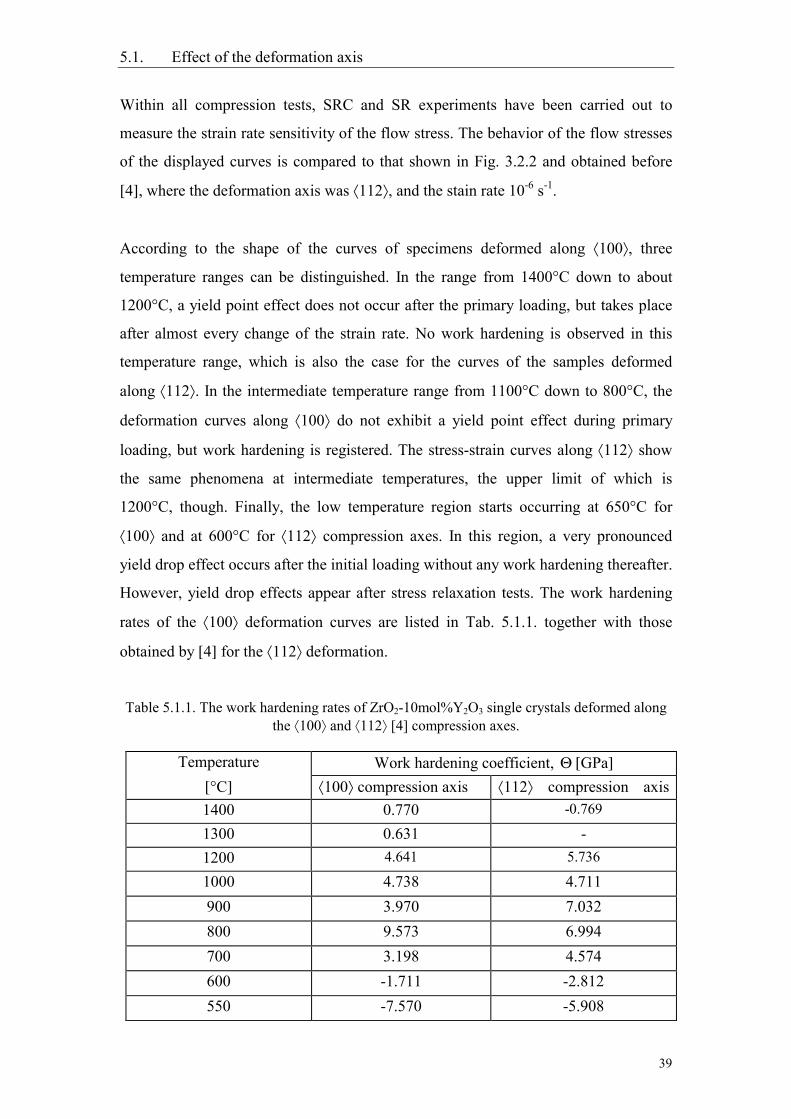
5.1. Effect of the deformation axis
39
Within all compression tests, SRC and SR experiments have been carried out to
measure the strain rate sensitivity of the flow stress. The behavior of the flow stresses
of the displayed curves is compared to that shown in Fig. 3.2.2 and obtained before
[4], where the deformation axis was 112, and the stain rate 10-6 s-1.
According to the shape of the curves of specimens deformed along 100, three
temperature ranges can be distinguished. In the range from 1400°C down to about
1200°C, a yield point effect does not occur after the primary loading, but takes place
after almost every change of the strain rate. No work hardening is observed in this
temperature range, which is also the case for the curves of the samples deformed
along 112. In the intermediate temperature range from 1100°C down to 800°C, the
deformation curves along 100 do not exhibit a yield point effect during primary
loading, but work hardening is registered. The stress-strain curves along 112 show
the same phenomena at intermediate temperatures, the upper limit of which is
1200°C, though. Finally, the low temperature region starts occurring at 650°C for
100 and at 600°C for 112 compression axes. In this region, a very pronounced
yield drop effect occurs after the initial loading without any work hardening thereafter.
However, yield drop effects appear after stress relaxation tests. The work hardening
rates of the 100 deformation curves are listed in Tab. 5.1.1. together with those
obtained by [4] for the 112 deformation.
Table 5.1.1. The work hardening rates of ZrO2-10mol%Y2O3 single crystals deformed alongthe 100 and 112 [4] compression axes.
Temperature Work hardening coefficient, Θ [GPa][°C] 100 compression axis 112 compression axis1400 0.770 -0.769
1300 0.631 -1200 4.641 5.736
1000 4.738 4.711900 3.970 7.032800 9.573 6.994700 3.198 4.574600 -1.711 -2.812550 -7.570 -5.908
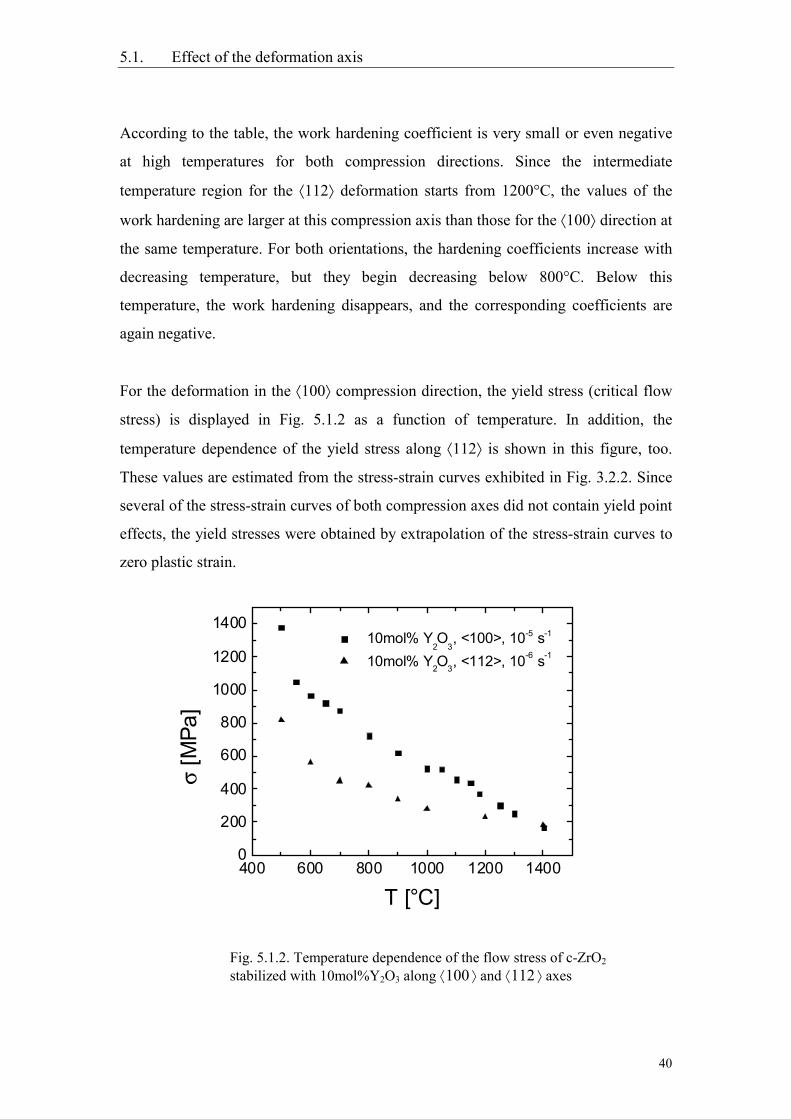
5.1. Effect of the deformation axis
40
According to the table, the work hardening coefficient is very small or even negative
at high temperatures for both compression directions. Since the intermediate
temperature region for the 112 deformation starts from 1200°C, the values of the
work hardening are larger at this compression axis than those for the 100 direction at
the same temperature. For both orientations, the hardening coefficients increase with
decreasing temperature, but they begin decreasing below 800°C. Below this
temperature, the work hardening disappears, and the corresponding coefficients are
again negative.
For the deformation in the 100 compression direction, the yield stress (critical flow
stress) is displayed in Fig. 5.1.2 as a function of temperature. In addition, the
temperature dependence of the yield stress along 112 is shown in this figure, too.
These values are estimated from the stress-strain curves exhibited in Fig. 3.2.2. Since
several of the stress-strain curves of both compression axes did not contain yield point
effects, the yield stresses were obtained by extrapolation of the stress-strain curves to
zero plastic strain.
Fig. 5.1.2. Temperature dependence of the flow stress of c-ZrO2
stabilized with 10mol%Y2O3 along 100 and 112 axes
400 600 800 1000 1200 14000
200
400
600
800
1000
1200
1400 10mol% Y
2O
3, <100>, 10-5 s-1
10mol% Y2O3, <112>, 10-6 s-1
σ [M
Pa]
T [°C]

5.1. Effect of the deformation axis
41
As shown in Fig. 5.1.2., the yield stresses of both orientations are the same only at
1400°C, being somewhat lower than 200 MPa. From 1200°C down to 800°C, the
critical flow stress values of the specimens deformed along 100 are almost twice as
high as those of the samples deformed along 112. The values of the yield stresses
along 100 increase from 400 MPa up to 800 MPa with decreasing temperature; the
values of those along 112, from 200 MPa up to 400 MPa, respectively. Below
800°C, the difference in the yield stresses between both orientations remains
approximately constant. Their maximum magnitudes constitute 1400 MPa for the
100 and 800 MPa for the 112 compression direction.
The temperature sensitivity of the 100 flow stress obtained from temperature cycling
tests is shown in Fig. 5.1.3. It was calculated using the following method: After the
temperature of a compression experiment had been changed, the corresponding stress
increment was measured. This increment was between the first steady state and the
second steady state, both of which straddled the temperature alteration.
When a work hardening region occurred after the temperature had been altered, the
hardening coefficient was also taken into consideration in order to amend the upper
flow stress, in which case the latter was obtained using the formula
Fig. 5.1.3. Temperature sensitivity of the flow stressT/∆∆σ of ZrO2-10mol%Y2O3 along the 100 and
112 axes
600 800 1000 1200 14000.0
0.2
0.4
0.6
0.8
1.0
1.2
1.4
1.6
1.8
10mol%-Y2O3, <100> 10mol%-Y2O3, <112>
∆σ/∆
Τ [M
Pa/K
]
T [°C]
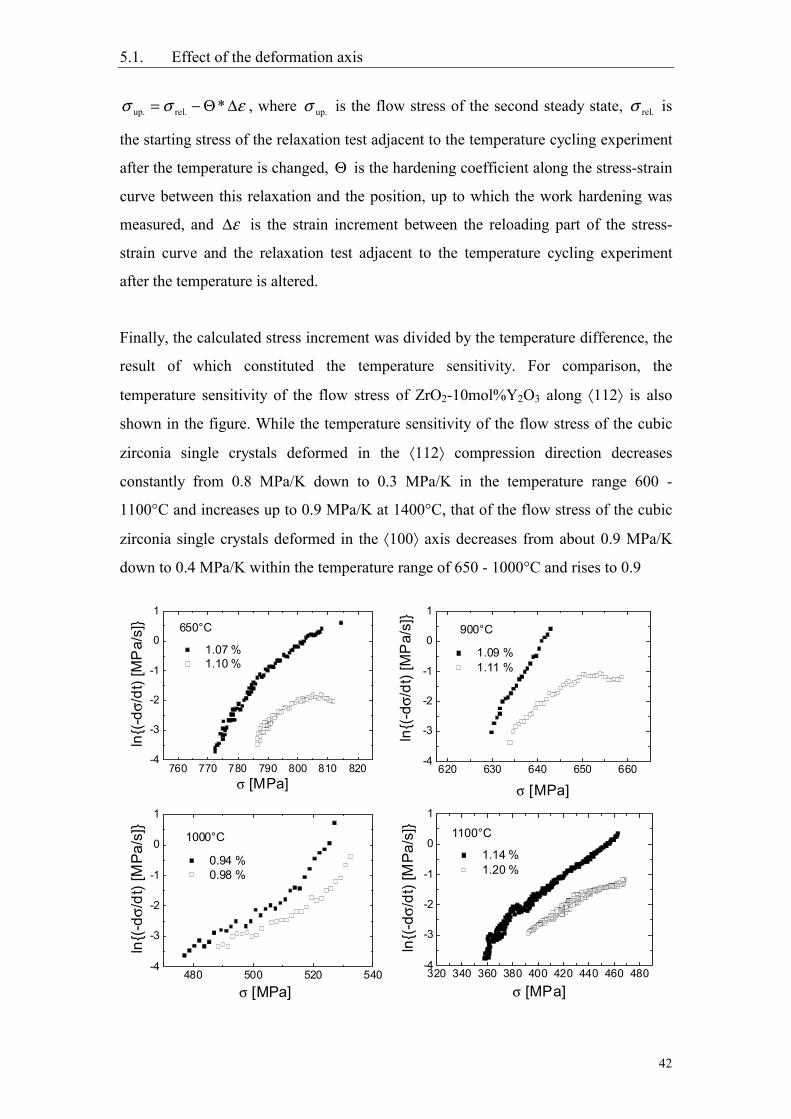
5.1. Effect of the deformation axis
42
εσσ ∆Θ−= *rel.up. , where up.σ is the flow stress of the second steady state, rel.σ is
the starting stress of the relaxation test adjacent to the temperature cycling experiment
after the temperature is changed, Θ is the hardening coefficient along the stress-strain
curve between this relaxation and the position, up to which the work hardening was
measured, and ε∆ is the strain increment between the reloading part of the stress-
strain curve and the relaxation test adjacent to the temperature cycling experiment
after the temperature is altered.
Finally, the calculated stress increment was divided by the temperature difference, the
result of which constituted the temperature sensitivity. For comparison, the
temperature sensitivity of the flow stress of ZrO2-10mol%Y2O3 along 112 is also
shown in the figure. While the temperature sensitivity of the flow stress of the cubic
zirconia single crystals deformed in the 112 compression direction decreases
constantly from 0.8 MPa/K down to 0.3 MPa/K in the temperature range 600 -
1100°C and increases up to 0.9 MPa/K at 1400°C, that of the flow stress of the cubic
zirconia single crystals deformed in the 100 axis decreases from about 0.9 MPa/K
down to 0.4 MPa/K within the temperature range of 650 - 1000°C and rises to 0.9
760 770 780 790 800 810 820-4
-3
-2
-1
0
1
1.07 % 1.10 %
650°C
ln(-
dσ/d
t) [M
Pa/
s]
σ [MPa]620 630 640 650 660
-4
-3
-2
-1
0
1
1.09 % 1.11 %
900°C
ln(-
dσ/d
t) [M
Pa/
s]
σ [MPa]
480 500 520 540-4
-3
-2
-1
0
1
0.94 % 0.98 %
1000°C
ln(-
dσ/d
t) [M
Pa/s
]
σ [MPa]320 340 360 380 400 420 440 460 480
-4
-3
-2
-1
0
1
1.14 % 1.20 %
1100°C
ln(-
dσ/d
t) [M
Pa/s
]
σ [MPa]
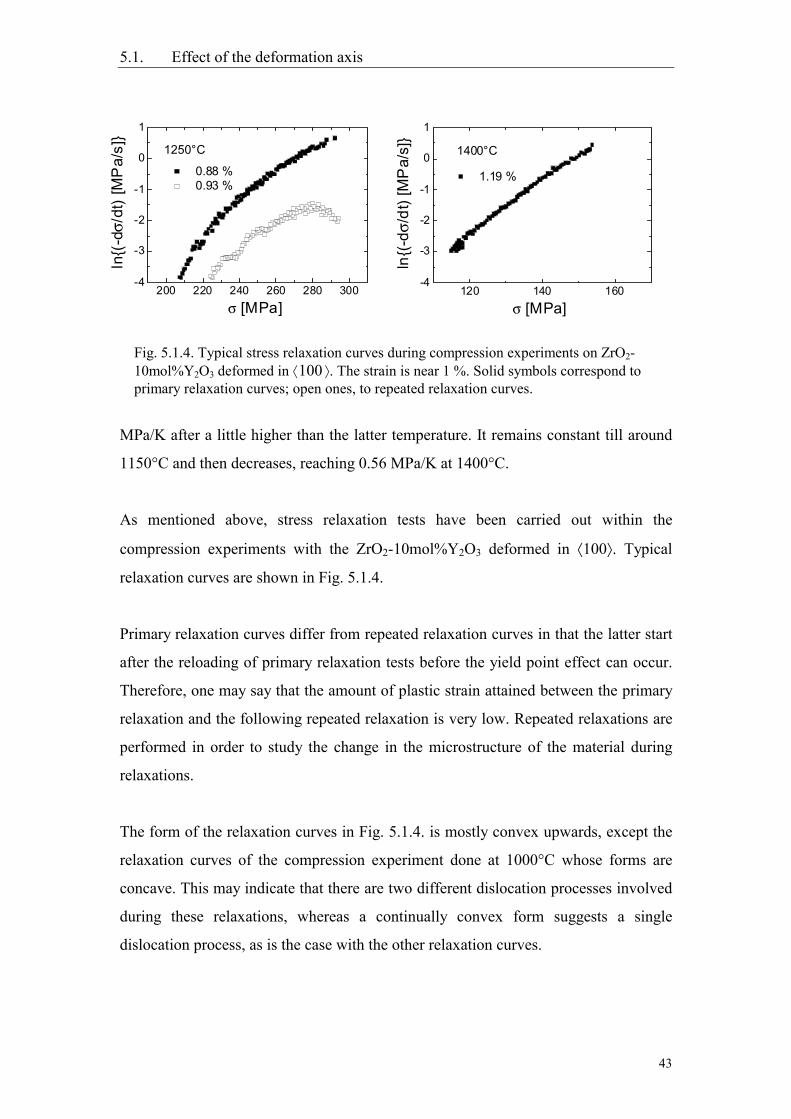
5.1. Effect of the deformation axis
43
MPa/K after a little higher than the latter temperature. It remains constant till around
1150°C and then decreases, reaching 0.56 MPa/K at 1400°C.
As mentioned above, stress relaxation tests have been carried out within the
compression experiments with the ZrO2-10mol%Y2O3 deformed in 100. Typical
relaxation curves are shown in Fig. 5.1.4.
Primary relaxation curves differ from repeated relaxation curves in that the latter start
after the reloading of primary relaxation tests before the yield point effect can occur.
Therefore, one may say that the amount of plastic strain attained between the primary
relaxation and the following repeated relaxation is very low. Repeated relaxations are
performed in order to study the change in the microstructure of the material during
relaxations.
The form of the relaxation curves in Fig. 5.1.4. is mostly convex upwards, except the
relaxation curves of the compression experiment done at 1000°C whose forms are
concave. This may indicate that there are two different dislocation processes involved
during these relaxations, whereas a continually convex form suggests a single
dislocation process, as is the case with the other relaxation curves.
Fig. 5.1.4. Typical stress relaxation curves during compression experiments on ZrO2-10mol%Y2O3 deformed in 100 . The strain is near 1 %. Solid symbols correspond toprimary relaxation curves; open ones, to repeated relaxation curves.
200 220 240 260 280 300-4
-3
-2
-1
0
1
0.88 % 0.93 %
1250°C
ln(
-dσ/
dt) [
MP
a/s]
σ [MPa]120 140 160
-4
-3
-2
-1
0
1
1.19 %
1400°C
ln(-
dσ/d
t) [M
Pa/
s]
σ [MPa]
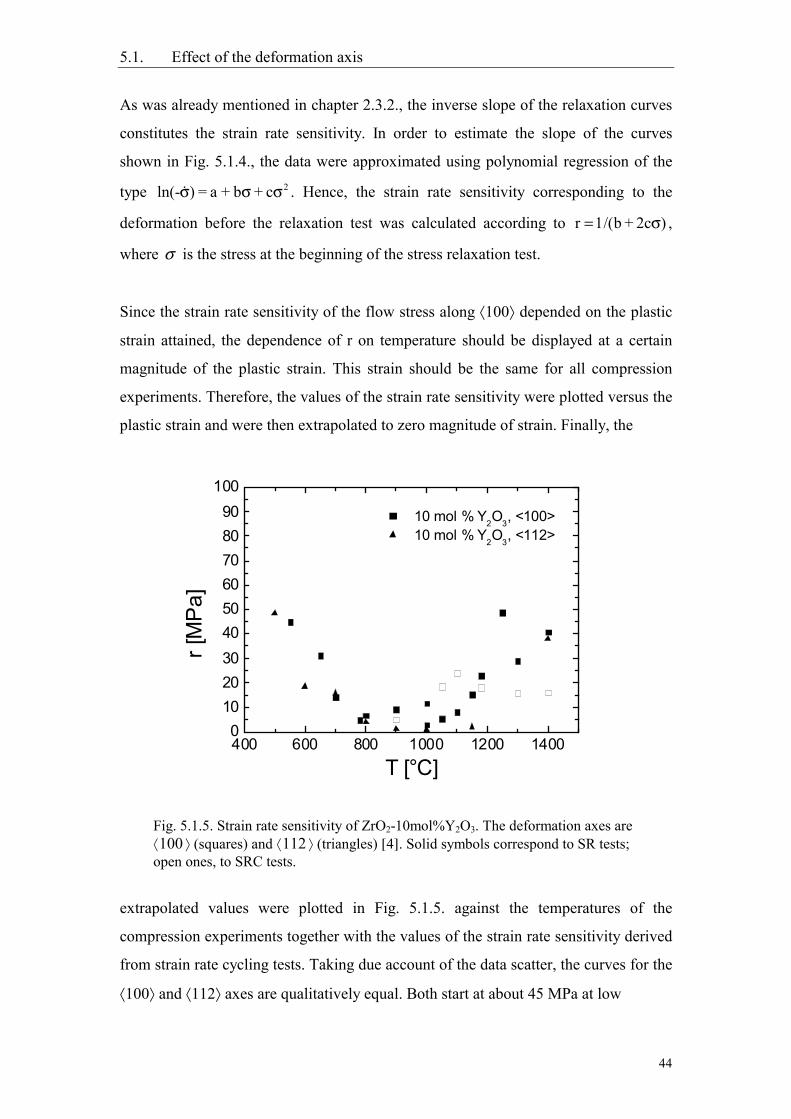
5.1. Effect of the deformation axis
44
As was already mentioned in chapter 2.3.2., the inverse slope of the relaxation curves
constitutes the strain rate sensitivity. In order to estimate the slope of the curves
shown in Fig. 5.1.4., the data were approximated using polynomial regression of the
type 2c + b + a = )ln(- σσσ . Hence, the strain rate sensitivity corresponding to the
deformation before the relaxation test was calculated according to )2c+b/(1r σ= ,
where σ is the stress at the beginning of the stress relaxation test.
Since the strain rate sensitivity of the flow stress along 100 depended on the plastic
strain attained, the dependence of r on temperature should be displayed at a certain
magnitude of the plastic strain. This strain should be the same for all compression
experiments. Therefore, the values of the strain rate sensitivity were plotted versus the
plastic strain and were then extrapolated to zero magnitude of strain. Finally, the
extrapolated values were plotted in Fig. 5.1.5. against the temperatures of the
compression experiments together with the values of the strain rate sensitivity derived
from strain rate cycling tests. Taking due account of the data scatter, the curves for the
100 and 112 axes are qualitatively equal. Both start at about 45 MPa at low
Fig. 5.1.5. Strain rate sensitivity of ZrO2-10mol%Y2O3. The deformation axes are100 (squares) and 112 (triangles) [4]. Solid symbols correspond to SR tests;open ones, to SRC tests.
400 600 800 1000 1200 14000
102030405060708090
100
10 mol % Y2O3, <100> 10 mol % Y2O3, <112>
r [M
Pa]
T [°C]
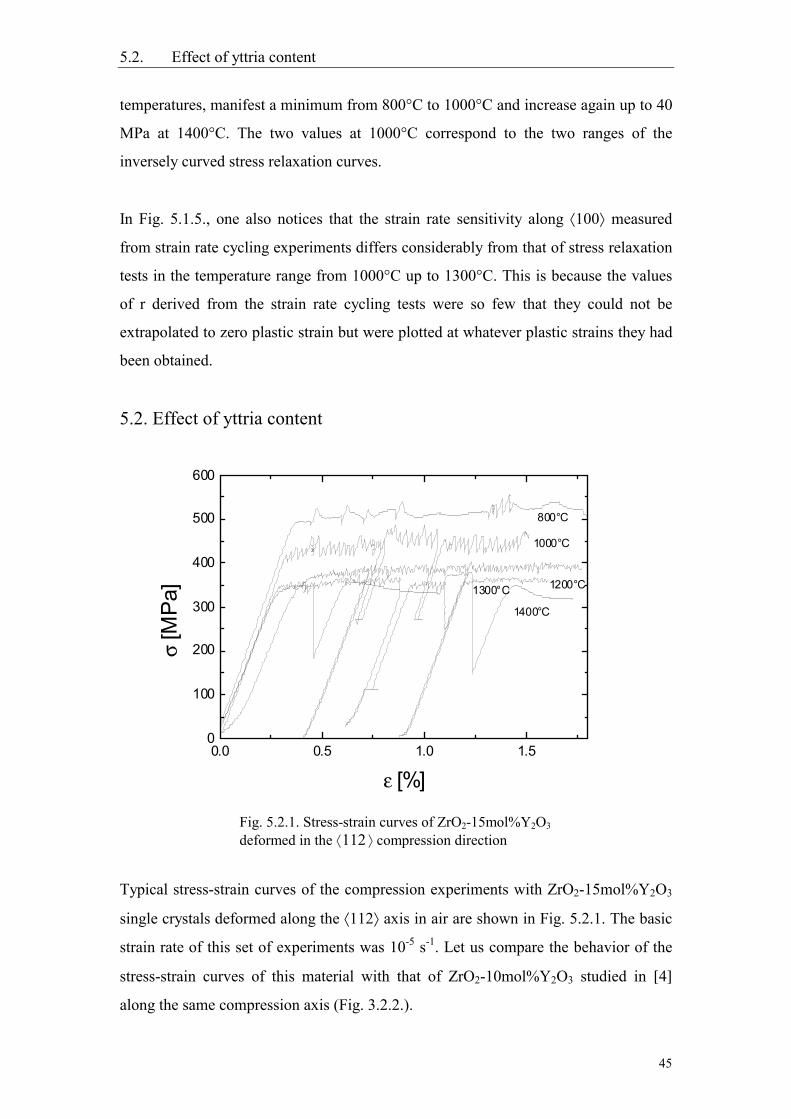
5.2. Effect of yttria content
45
temperatures, manifest a minimum from 800°C to 1000°C and increase again up to 40
MPa at 1400°C. The two values at 1000°C correspond to the two ranges of the
inversely curved stress relaxation curves.
In Fig. 5.1.5., one also notices that the strain rate sensitivity along 100 measured
from strain rate cycling experiments differs considerably from that of stress relaxation
tests in the temperature range from 1000°C up to 1300°C. This is because the values
of r derived from the strain rate cycling tests were so few that they could not be
extrapolated to zero plastic strain but were plotted at whatever plastic strains they had
been obtained.
5.2. Effect of yttria content
Typical stress-strain curves of the compression experiments with ZrO2-15mol%Y2O3
single crystals deformed along the 112 axis in air are shown in Fig. 5.2.1. The basic
strain rate of this set of experiments was 10-5 s-1. Let us compare the behavior of the
stress-strain curves of this material with that of ZrO2-10mol%Y2O3 studied in [4]
along the same compression axis (Fig. 3.2.2.).
Fig. 5.2.1. Stress-strain curves of ZrO2-15mol%Y2O3
deformed in the 112 compression direction
0.0 0.5 1.0 1.50
100
200
300
400
500
600
800°C
1000°C
1200°C1300°C
1400°C
σ [M
Pa]
ε [%]
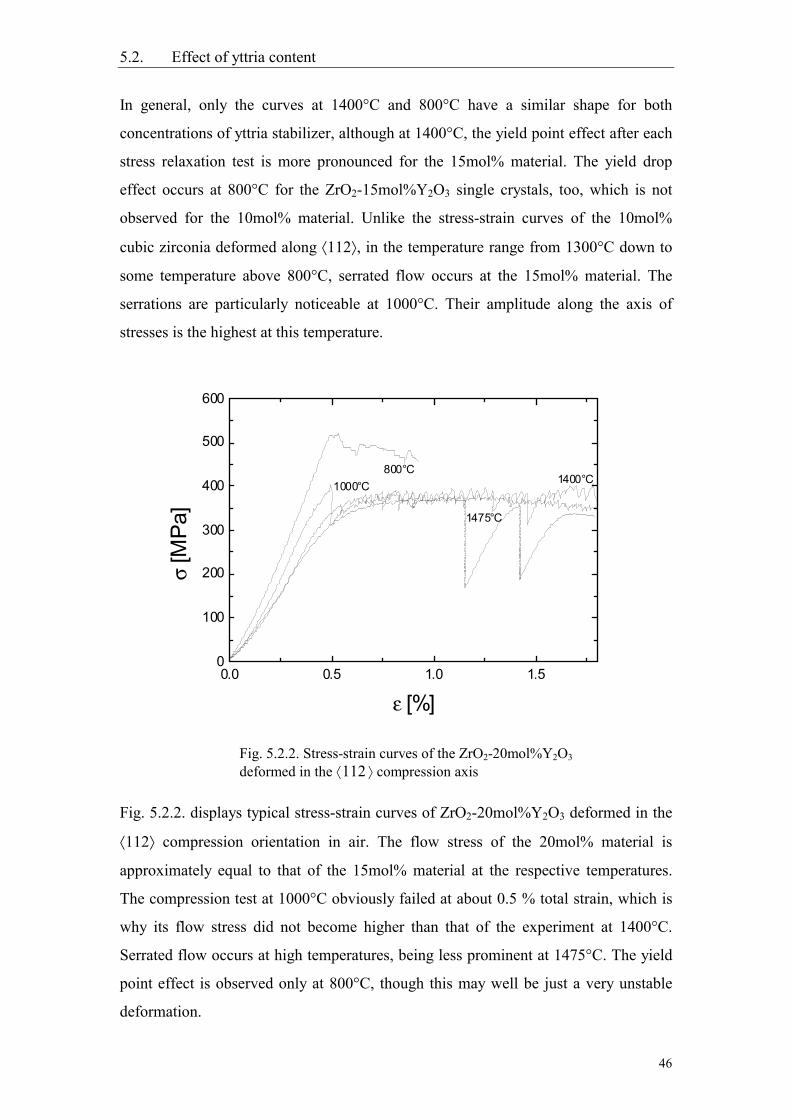
5.2. Effect of yttria content
46
In general, only the curves at 1400°C and 800°C have a similar shape for both
concentrations of yttria stabilizer, although at 1400°C, the yield point effect after each
stress relaxation test is more pronounced for the 15mol% material. The yield drop
effect occurs at 800°C for the ZrO2-15mol%Y2O3 single crystals, too, which is not
observed for the 10mol% material. Unlike the stress-strain curves of the 10mol%
cubic zirconia deformed along 112, in the temperature range from 1300°C down to
some temperature above 800°C, serrated flow occurs at the 15mol% material. The
serrations are particularly noticeable at 1000°C. Their amplitude along the axis of
stresses is the highest at this temperature.
Fig. 5.2.2. displays typical stress-strain curves of ZrO2-20mol%Y2O3 deformed in the
112 compression orientation in air. The flow stress of the 20mol% material is
approximately equal to that of the 15mol% material at the respective temperatures.
The compression test at 1000°C obviously failed at about 0.5 % total strain, which is
why its flow stress did not become higher than that of the experiment at 1400°C.
Serrated flow occurs at high temperatures, being less prominent at 1475°C. The yield
point effect is observed only at 800°C, though this may well be just a very unstable
deformation.
Fig. 5.2.2. Stress-strain curves of the ZrO2-20mol%Y2O3
deformed in the 112 compression axis
0.0 0.5 1.0 1.50
100
200
300
400
500
600
1475°C
1000°C 1400°C800°C
σ [M
Pa]
ε [%]
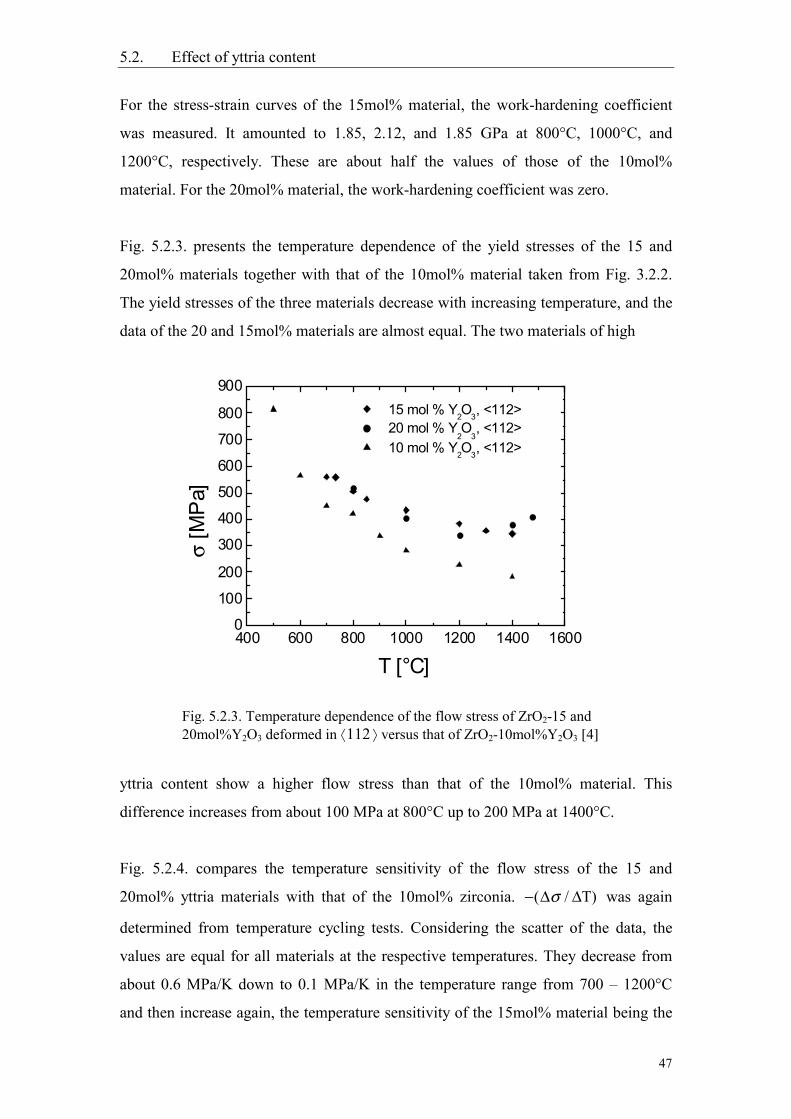
5.2. Effect of yttria content
47
For the stress-strain curves of the 15mol% material, the work-hardening coefficient
was measured. It amounted to 1.85, 2.12, and 1.85 GPa at 800°C, 1000°C, and
1200°C, respectively. These are about half the values of those of the 10mol%
material. For the 20mol% material, the work-hardening coefficient was zero.
Fig. 5.2.3. presents the temperature dependence of the yield stresses of the 15 and
20mol% materials together with that of the 10mol% material taken from Fig. 3.2.2.
The yield stresses of the three materials decrease with increasing temperature, and the
data of the 20 and 15mol% materials are almost equal. The two materials of high
yttria content show a higher flow stress than that of the 10mol% material. This
difference increases from about 100 MPa at 800°C up to 200 MPa at 1400°C.
Fig. 5.2.4. compares the temperature sensitivity of the flow stress of the 15 and
20mol% yttria materials with that of the 10mol% zirconia. −( /∆ ∆σ T) was again
determined from temperature cycling tests. Considering the scatter of the data, the
values are equal for all materials at the respective temperatures. They decrease from
about 0.6 MPa/K down to 0.1 MPa/K in the temperature range from 700 – 1200°C
and then increase again, the temperature sensitivity of the 15mol% material being the
Fig. 5.2.3. Temperature dependence of the flow stress of ZrO2-15 and20mol%Y2O3 deformed in 112 versus that of ZrO2-10mol%Y2O3 [4]
400 600 800 1000 1200 1400 16000
100
200
300
400
500
600
700
800
900 15 mol % Y2O3, <112> 20 mol % Y
2O
3, <112>
10 mol % Y2O3, <112>
σ [M
Pa]
T [°C]
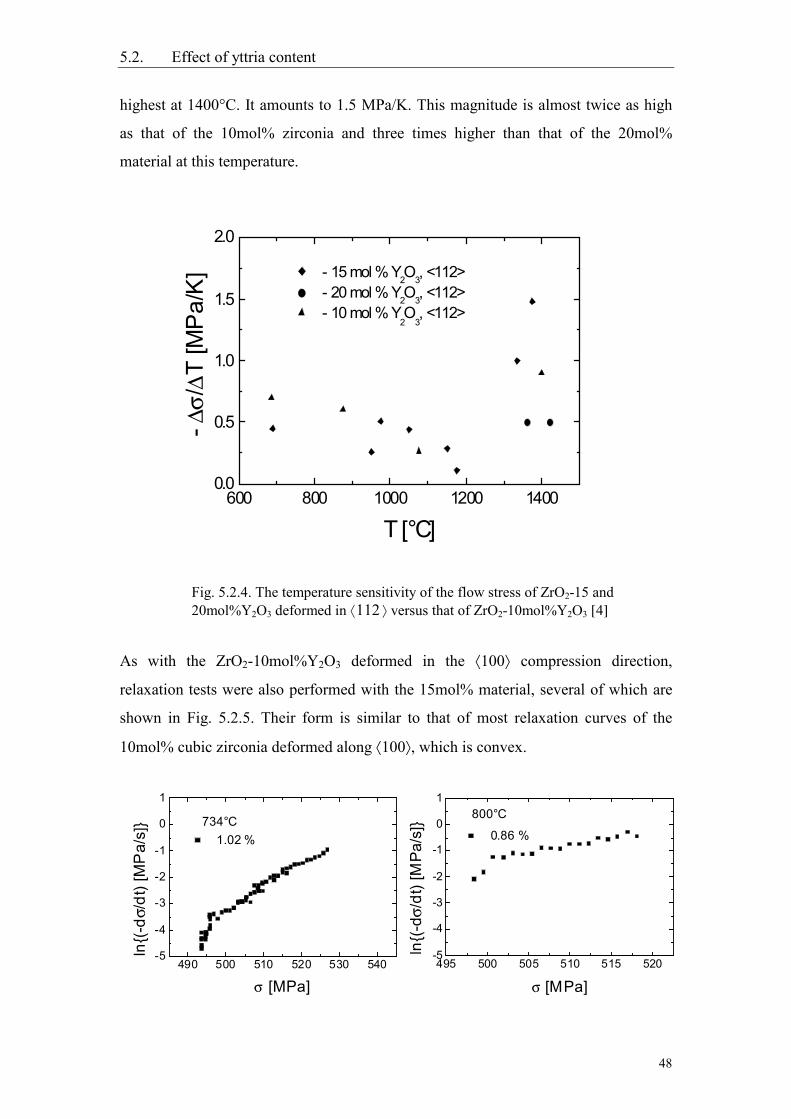
5.2. Effect of yttria content
48
highest at 1400°C. It amounts to 1.5 MPa/K. This magnitude is almost twice as high
as that of the 10mol% zirconia and three times higher than that of the 20mol%
material at this temperature.
As with the ZrO2-10mol%Y2O3 deformed in the 100 compression direction,
relaxation tests were also performed with the 15mol% material, several of which are
shown in Fig. 5.2.5. Their form is similar to that of most relaxation curves of the
10mol% cubic zirconia deformed along 100, which is convex.
Fig. 5.2.4. The temperature sensitivity of the flow stress of ZrO2-15 and20mol%Y2O3 deformed in 112 versus that of ZrO2-10mol%Y2O3 [4]
490 500 510 520 530 540-5
-4
-3
-2
-1
0
1
1.02 %734°C
ln(-
dσ/d
t) [M
Pa/
s]
σ [MPa]495 500 505 510 515 520
-5
-4
-3
-2
-1
0
1800°C
0.86 %
ln(-
dσ/d
t) [M
Pa/s
]
σ [MPa]
600 800 1000 1200 14000.0
0.5
1.0
1.5
2.0
- ∆σ/
∆T [M
Pa/
K] - 15 mol % Y2O3, <112>
- 20 mol % Y2O3, <112> - 10 mol % Y
2O
3, <112>
T [°C]
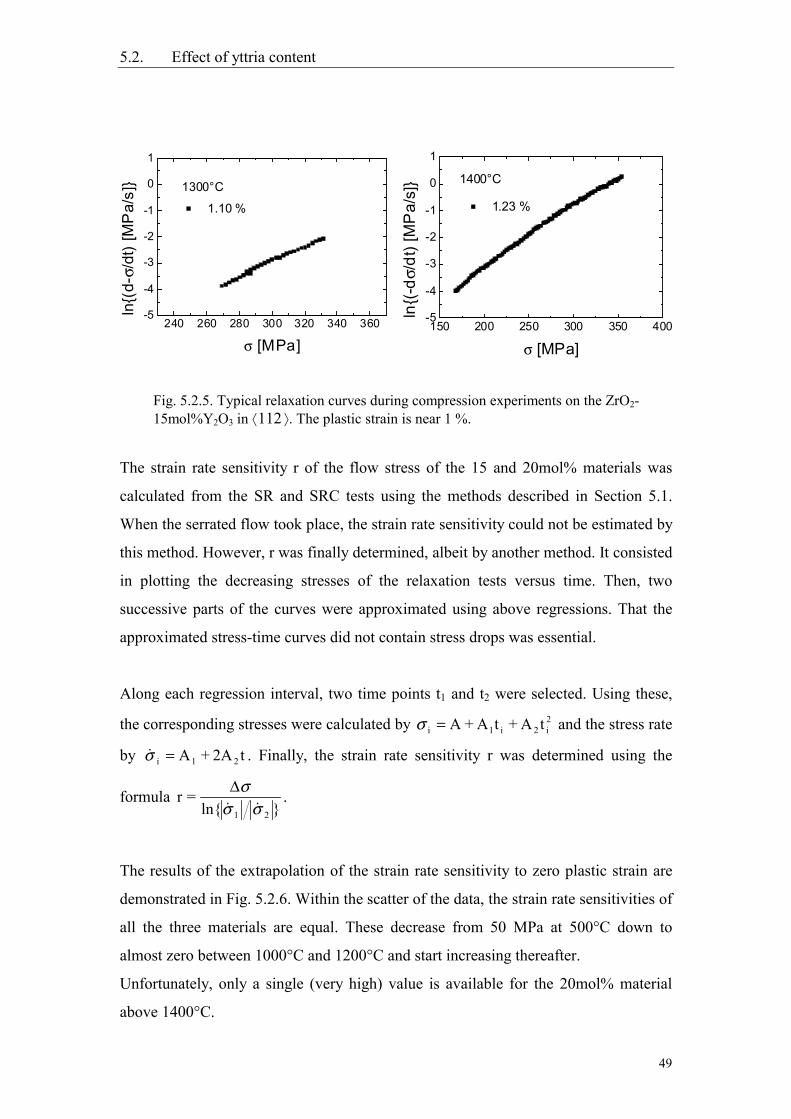
5.2. Effect of yttria content
49
The strain rate sensitivity r of the flow stress of the 15 and 20mol% materials was
calculated from the SR and SRC tests using the methods described in Section 5.1.
When the serrated flow took place, the strain rate sensitivity could not be estimated by
this method. However, r was finally determined, albeit by another method. It consisted
in plotting the decreasing stresses of the relaxation tests versus time. Then, two
successive parts of the curves were approximated using above regressions. That the
approximated stress-time curves did not contain stress drops was essential.
Along each regression interval, two time points t1 and t2 were selected. Using these,
the corresponding stresses were calculated by 2i2i1i tA+tA+A=σ and the stress rate
by σ i 1 2A + 2A t= . Finally, the strain rate sensitivity r was determined using the
formula r =ln
∆σσ σ 1 2
.
The results of the extrapolation of the strain rate sensitivity to zero plastic strain are
demonstrated in Fig. 5.2.6. Within the scatter of the data, the strain rate sensitivities of
all the three materials are equal. These decrease from 50 MPa at 500°C down to
almost zero between 1000°C and 1200°C and start increasing thereafter.
Unfortunately, only a single (very high) value is available for the 20mol% material
above 1400°C.
Fig. 5.2.5. Typical relaxation curves during compression experiments on the ZrO2-15mol%Y2O3 in 112 . The plastic strain is near 1 %.
150 200 250 300 350 400-5
-4
-3
-2
-1
0
1
1.23 %
1400°C
ln(-
dσ/d
t) [M
Pa/
s]
σ [MPa]240 260 280 300 320 340 360
-5
-4
-3
-2
-1
0
1
1.10 %
1300°C
ln(
d-σ/
dt) [
MP
a/s]
σ [MPa]
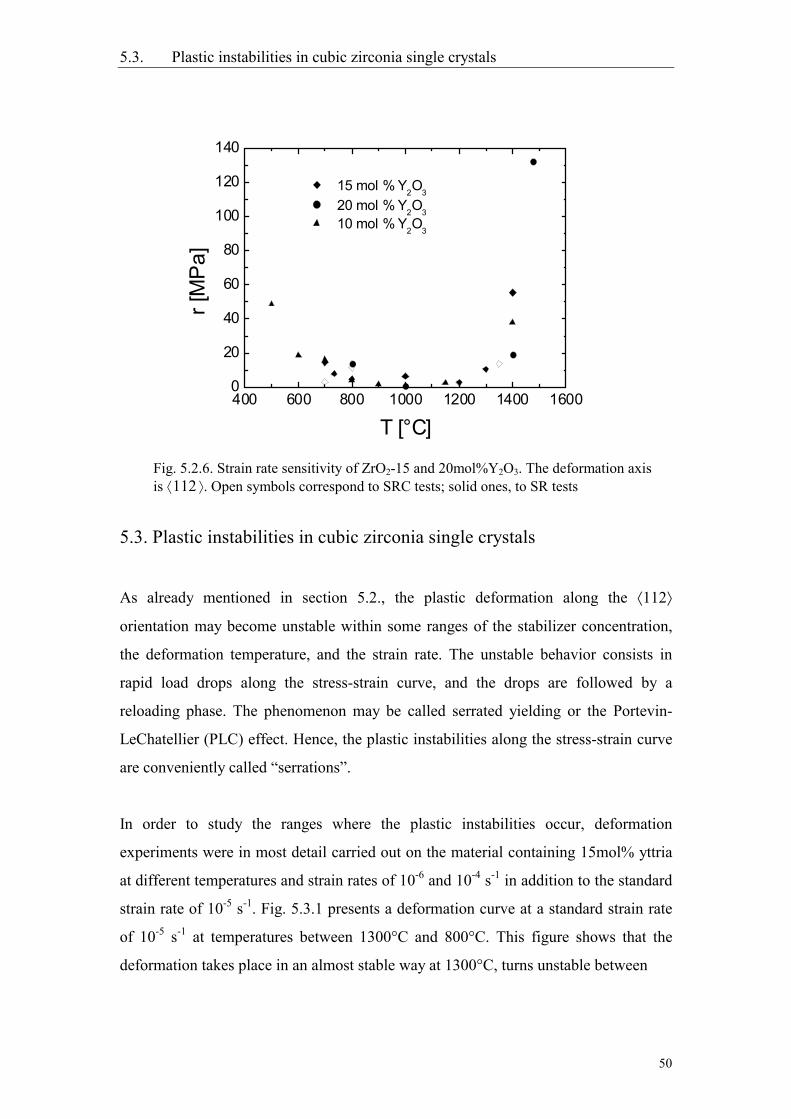
5.3. Plastic instabilities in cubic zirconia single crystals
50
5.3. Plastic instabilities in cubic zirconia single crystals
As already mentioned in section 5.2., the plastic deformation along the 112
orientation may become unstable within some ranges of the stabilizer concentration,
the deformation temperature, and the strain rate. The unstable behavior consists in
rapid load drops along the stress-strain curve, and the drops are followed by a
reloading phase. The phenomenon may be called serrated yielding or the Portevin-
LeChatellier (PLC) effect. Hence, the plastic instabilities along the stress-strain curve
are conveniently called “serrations”.
In order to study the ranges where the plastic instabilities occur, deformation
experiments were in most detail carried out on the material containing 15mol% yttria
at different temperatures and strain rates of 10-6 and 10-4 s-1 in addition to the standard
strain rate of 10-5 s-1. Fig. 5.3.1 presents a deformation curve at a standard strain rate
of 10-5 s-1 at temperatures between 1300°C and 800°C. This figure shows that the
deformation takes place in an almost stable way at 1300°C, turns unstable between
Fig. 5.2.6. Strain rate sensitivity of ZrO2-15 and 20mol%Y2O3. The deformation axisis 112 . Open symbols correspond to SRC tests; solid ones, to SR tests
400 600 800 1000 1200 1400 16000
20
40
60
80
100
120
140
15 mol % Y2O3
20 mol % Y2O3 10 mol % Y2O3
r [M
Pa]
T [°C]
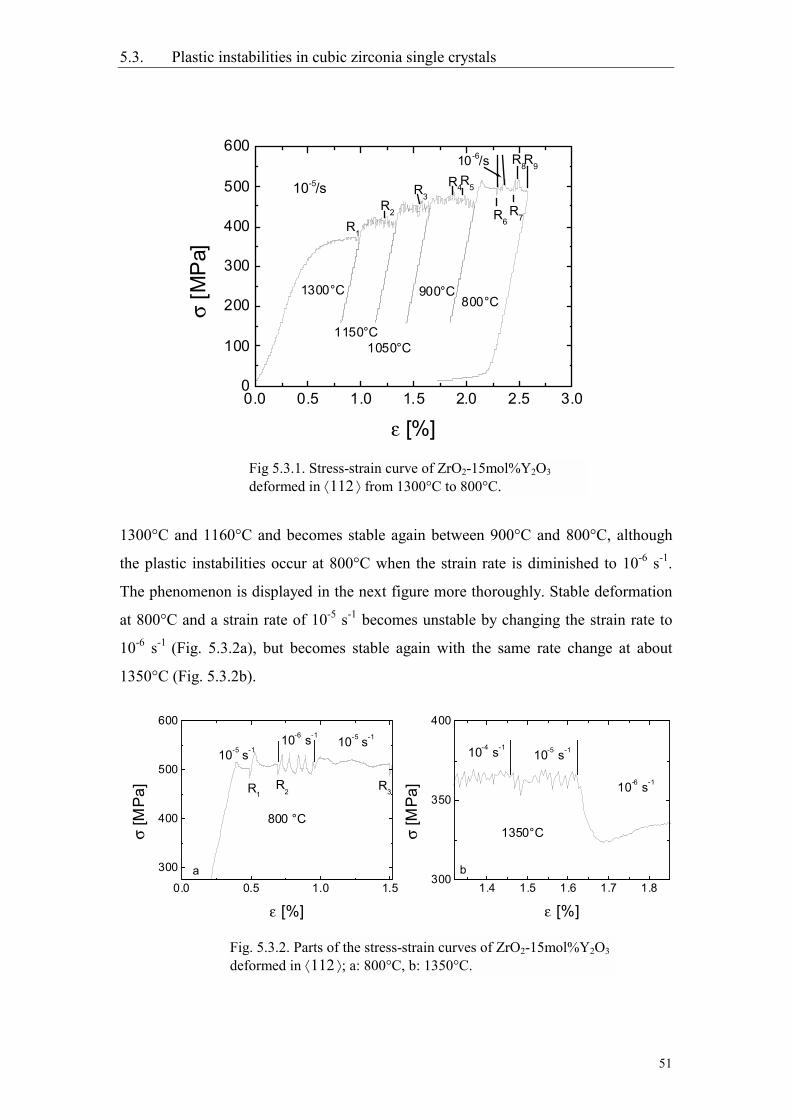
5.3. Plastic instabilities in cubic zirconia single crystals
51
1300°C and 1160°C and becomes stable again between 900°C and 800°C, although
the plastic instabilities occur at 800°C when the strain rate is diminished to 10-6 s-1.
The phenomenon is displayed in the next figure more thoroughly. Stable deformation
at 800°C and a strain rate of 10-5 s-1 becomes unstable by changing the strain rate to
10-6 s-1 (Fig. 5.3.2a), but becomes stable again with the same rate change at about
1350°C (Fig. 5.3.2b).
Fig 5.3.1. Stress-strain curve of ZrO2-15mol%Y2O3
deformed in 112 from 1300°C to 800°C.
Fig. 5.3.2. Parts of the stress-strain curves of ZrO2-15mol%Y2O3
deformed in 112 ; a: 800°C, b: 1350°C.
0.0 0.5 1.0 1.5 2.0 2.5 3.00
100
200
300
400
500
600
10-5/s
R9R8
R7R6
R5R4
800°C900°C
1050°C1150°C
1300°C
R3R2
R1
10-6/s
σ [M
Pa]
ε [%]
0.0 0.5 1.0 1.5
300
400
500
600
a
10-5 s-110-6 s-1
R3R
2R1
800 °C
10-5 s-1
σ [M
Pa]
ε [%]1.4 1.5 1.6 1.7 1.8
300
350
400
b
1350°C
10-6 s-1
10-5 s-110-4 s-1
σ [M
Pa]
ε [%]
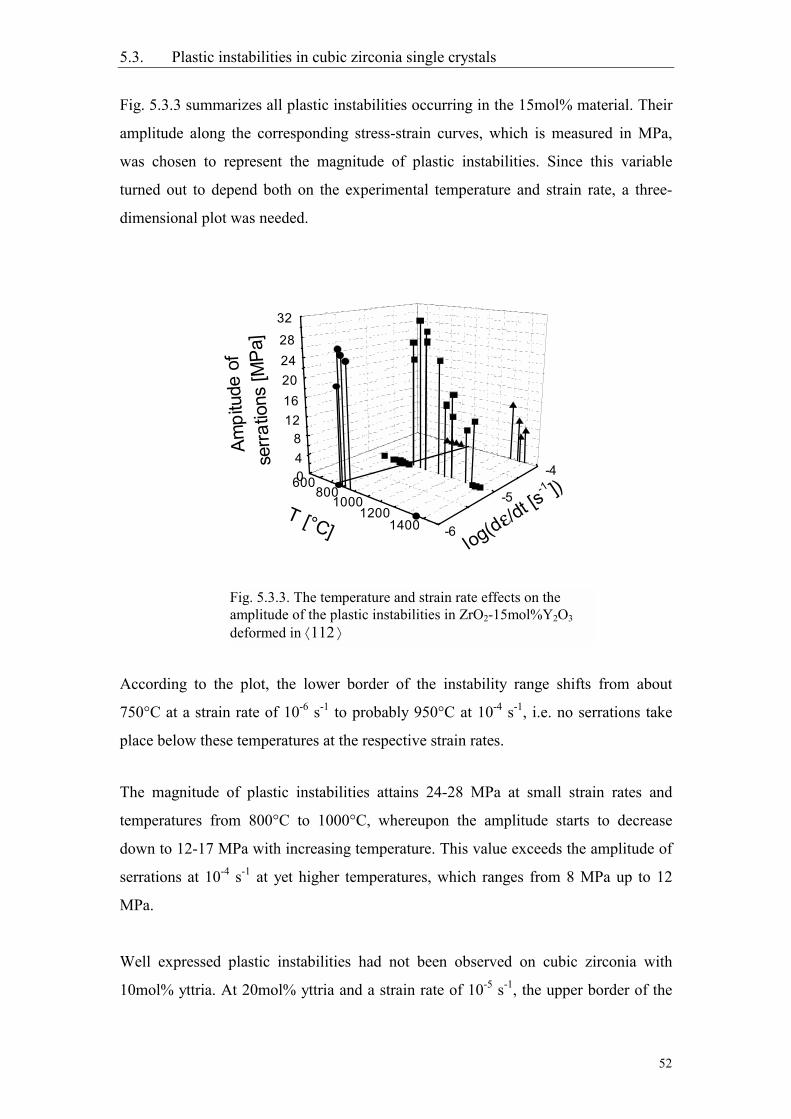
5.3. Plastic instabilities in cubic zirconia single crystals
52
Fig. 5.3.3 summarizes all plastic instabilities occurring in the 15mol% material. Their
amplitude along the corresponding stress-strain curves, which is measured in MPa,
was chosen to represent the magnitude of plastic instabilities. Since this variable
turned out to depend both on the experimental temperature and strain rate, a three-
dimensional plot was needed.
According to the plot, the lower border of the instability range shifts from about
750°C at a strain rate of 10-6 s-1 to probably 950°C at 10-4 s-1, i.e. no serrations take
place below these temperatures at the respective strain rates.
The magnitude of plastic instabilities attains 24-28 MPa at small strain rates and
temperatures from 800°C to 1000°C, whereupon the amplitude starts to decrease
down to 12-17 MPa with increasing temperature. This value exceeds the amplitude of
serrations at 10-4 s-1 at yet higher temperatures, which ranges from 8 MPa up to 12
MPa.
Well expressed plastic instabilities had not been observed on cubic zirconia with
10mol% yttria. At 20mol% yttria and a strain rate of 10-5 s-1, the upper border of the
Fig. 5.3.3. The temperature and strain rate effects on theamplitude of the plastic instabilities in ZrO2-15mol%Y2O3
deformed in 112
600800
10001200
1400
048
121620242832
-6
-5
-4
Ampi
tude
of
serra
tions
[MPa
]
log(dε/dt [s-1 ])
T [°C]
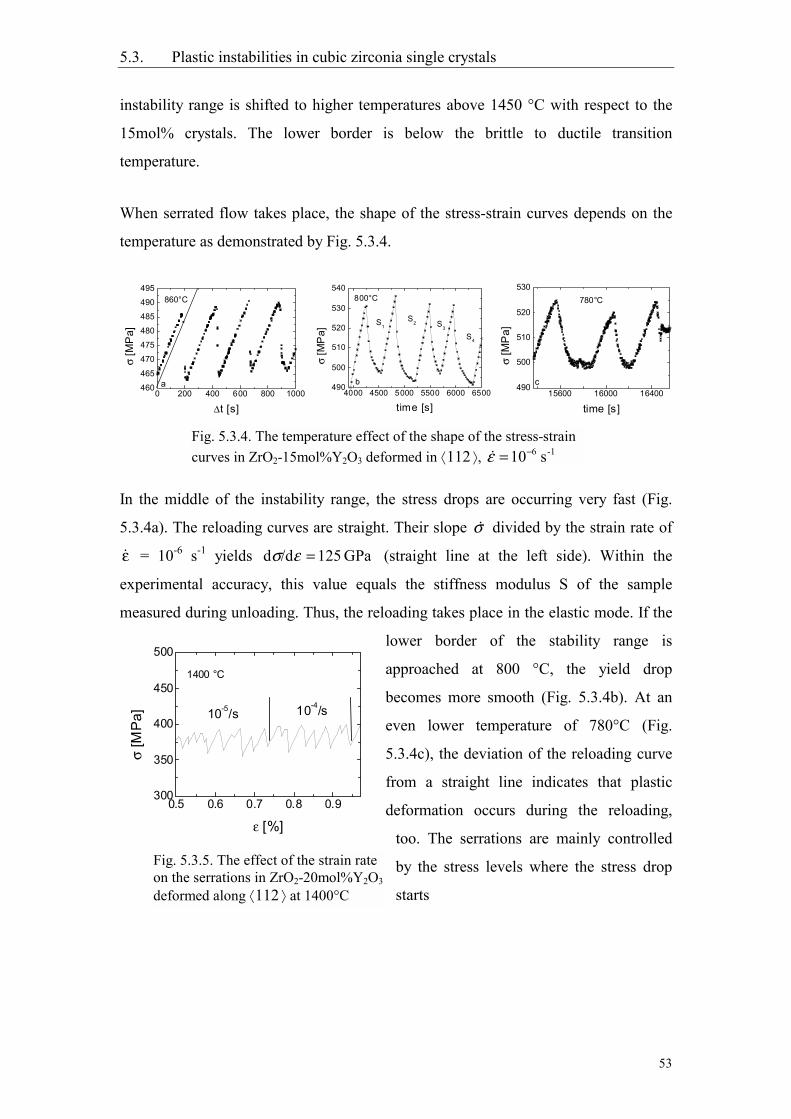
5.3. Plastic instabilities in cubic zirconia single crystals
53
instability range is shifted to higher temperatures above 1450 °C with respect to the
15mol% crystals. The lower border is below the brittle to ductile transition
temperature.
When serrated flow takes place, the shape of the stress-strain curves depends on the
temperature as demonstrated by Fig. 5.3.4.
In the middle of the instability range, the stress drops are occurring very fast (Fig.
5.3.4a). The reloading curves are straight. Their slope σ divided by the strain rate of
ε = 10-6 s-1 yields GPa 125/dd =εσ (straight line at the left side). Within the
experimental accuracy, this value equals the stiffness modulus S of the sample
measured during unloading. Thus, the reloading takes place in the elastic mode. If the
lower border of the stability range is
approached at 800 °C, the yield drop
becomes more smooth (Fig. 5.3.4b). At an
even lower temperature of 780°C (Fig.
5.3.4c), the deviation of the reloading curve
from a straight line indicates that plastic
deformation occurs during the reloading,
too. The serrations are mainly controlled
by the stress levels where the stress drop
starts
Fig. 5.3.4. The temperature effect of the shape of the stress-straincurves in ZrO2-15mol%Y2O3 deformed in 112 , -16 s 10−=ε
Fig. 5.3.5. The effect of the strain rateon the serrations in ZrO2-20mol%Y2O3
deformed along 112 at 1400°C
0 200 400 600 800 1000460
465
470
475
480
485
490
495860°C
a
σ [M
Pa]
∆t [s]15600 16000 16400
490
500
510
520
530780°C
c
σ [M
Pa]
time [s]4000 4500 5000 5500 6000 6500
490
500
510
520
530
540800°C
b
S4
S3
S2S1
σ [M
Pa]
time [s]
0.5 0.6 0.7 0.8 0.9300
350
400
450
500
10-4/s10-5/s
1400 °C
σ [M
Pa]
ε [%]
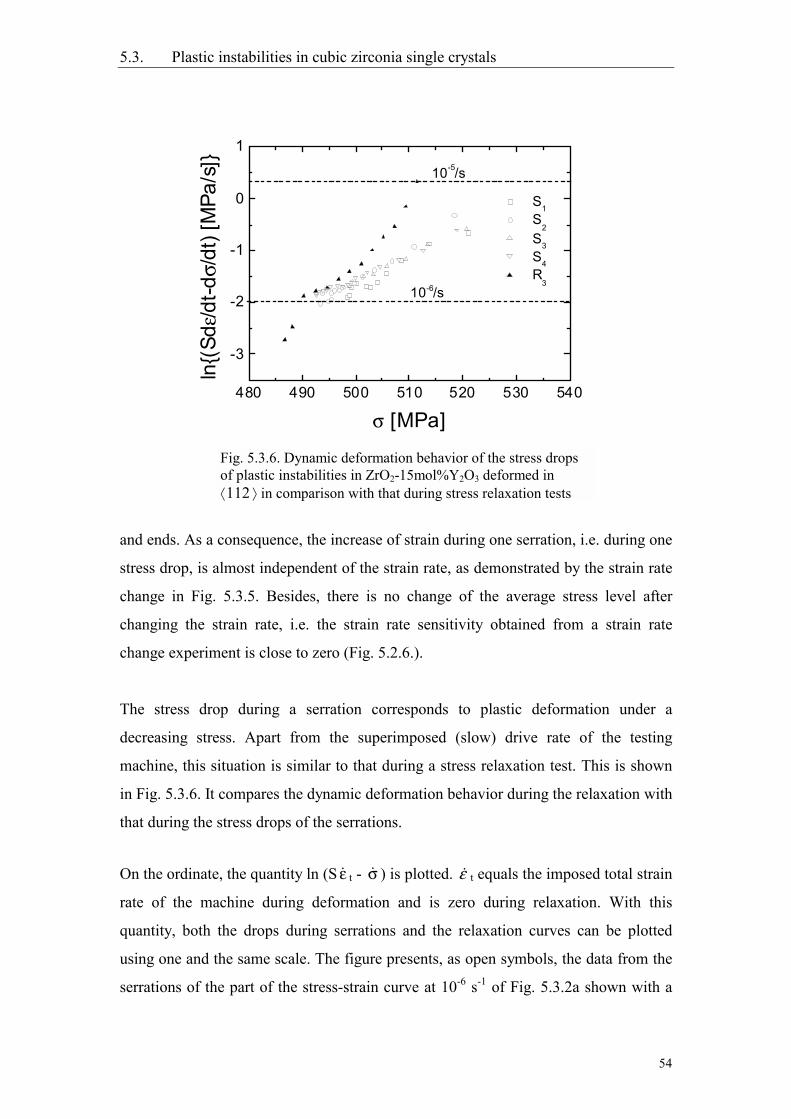
5.3. Plastic instabilities in cubic zirconia single crystals
54
and ends. As a consequence, the increase of strain during one serration, i.e. during one
stress drop, is almost independent of the strain rate, as demonstrated by the strain rate
change in Fig. 5.3.5. Besides, there is no change of the average stress level after
changing the strain rate, i.e. the strain rate sensitivity obtained from a strain rate
change experiment is close to zero (Fig. 5.2.6.).
The stress drop during a serration corresponds to plastic deformation under a
decreasing stress. Apart from the superimposed (slow) drive rate of the testing
machine, this situation is similar to that during a stress relaxation test. This is shown
in Fig. 5.3.6. It compares the dynamic deformation behavior during the relaxation with
that during the stress drops of the serrations.
On the ordinate, the quantity ln (S ε t - σ ) is plotted. ε t equals the imposed total strain
rate of the machine during deformation and is zero during relaxation. With this
quantity, both the drops during serrations and the relaxation curves can be plotted
using one and the same scale. The figure presents, as open symbols, the data from the
serrations of the part of the stress-strain curve at 10-6 s-1 of Fig. 5.3.2a shown with a
Fig. 5.3.6. Dynamic deformation behavior of the stress dropsof plastic instabilities in ZrO2-15mol%Y2O3 deformed in112 in comparison with that during stress relaxation tests
480 490 500 510 520 530 540
-3
-2
-1
0
1
10-5/s
10-6/s
S1 S
2 S3 S4 R
3
ln(
Sdε/d
t-dσ/
dt) [
MPa
/s]
σ [MPa]
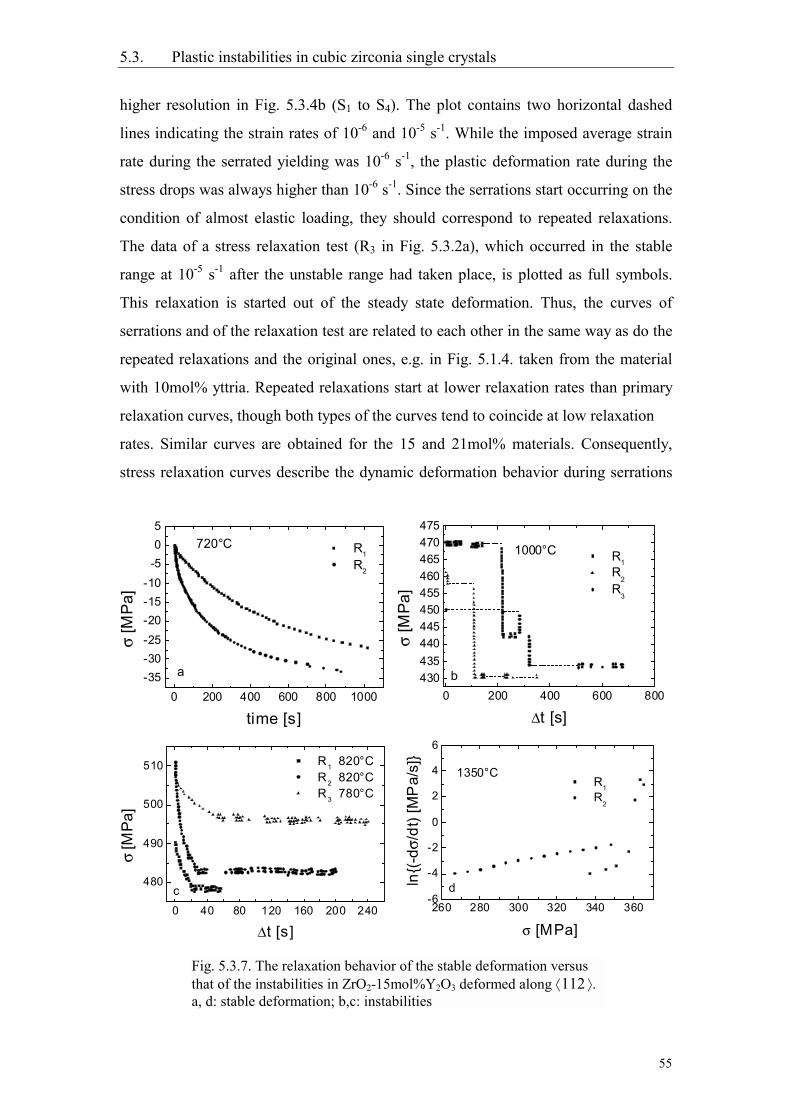
5.3. Plastic instabilities in cubic zirconia single crystals
55
higher resolution in Fig. 5.3.4b (S1 to S4). The plot contains two horizontal dashed
lines indicating the strain rates of 10-6 and 10-5 s-1. While the imposed average strain
rate during the serrated yielding was 10-6 s-1, the plastic deformation rate during the
stress drops was always higher than 10-6 s-1. Since the serrations start occurring on the
condition of almost elastic loading, they should correspond to repeated relaxations.
The data of a stress relaxation test (R3 in Fig. 5.3.2a), which occurred in the stable
range at 10-5 s-1 after the unstable range had taken place, is plotted as full symbols.
This relaxation is started out of the steady state deformation. Thus, the curves of
serrations and of the relaxation test are related to each other in the same way as do the
repeated relaxations and the original ones, e.g. in Fig. 5.1.4. taken from the material
with 10mol% yttria. Repeated relaxations start at lower relaxation rates than primary
relaxation curves, though both types of the curves tend to coincide at low relaxation
rates. Similar curves are obtained for the 15 and 21mol% materials. Consequently,
stress relaxation curves describe the dynamic deformation behavior during serrations
Fig. 5.3.7. The relaxation behavior of the stable deformation versusthat of the instabilities in ZrO2-15mol%Y2O3 deformed along 112 .a, d: stable deformation; b,c: instabilities
0 200 400 600 800 1000-35-30-25-20-15-10
-505
720°C
a
R1
R2
σ [M
Pa]
time [s]0 200 400 600 800
430435440445450455460465470475
1000°C
b
R1 R
2 R
3
σ [M
Pa]
∆t [s]
0 40 80 120 160 200 240
480
490
500
510
c
R1 820°C R2 820°C R3 780°C
σ [M
Pa]
∆t [s]260 280 300 320 340 360
-6
-4
-2
0
2
4
6
1350°C
d
R1 R
2
ln(-
dσ/d
t) [M
Pa/
s]
σ [MPa]
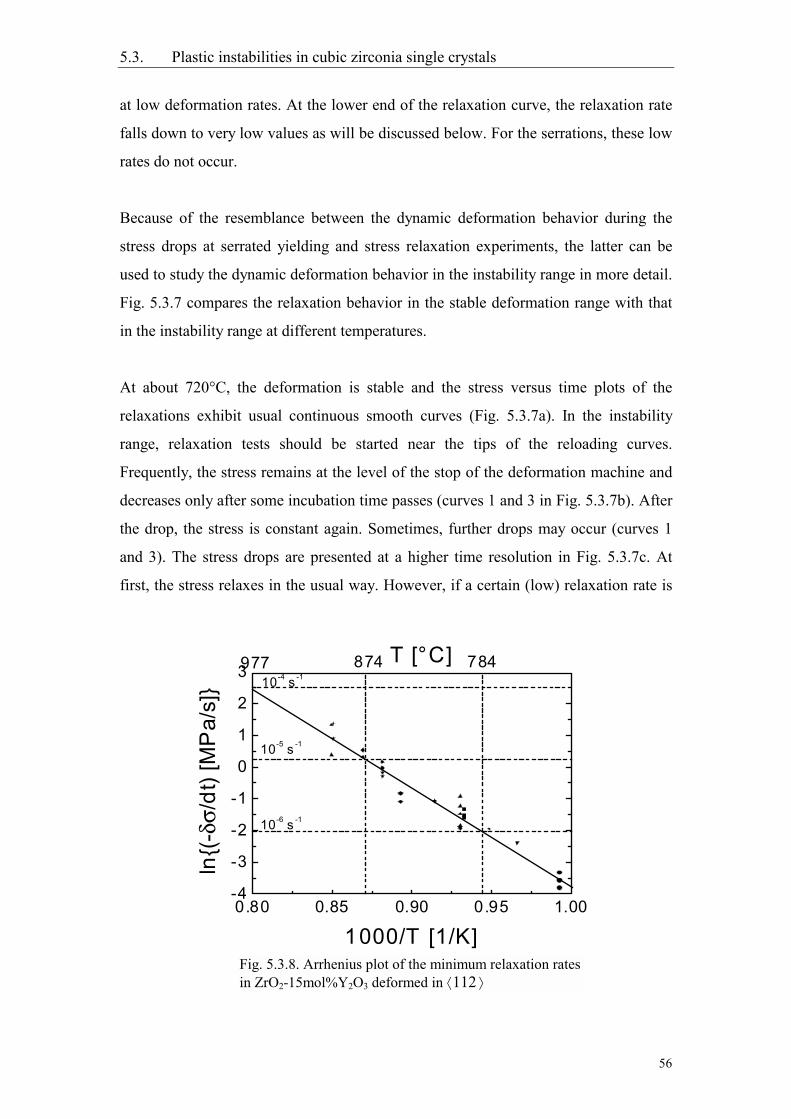
5.3. Plastic instabilities in cubic zirconia single crystals
56
at low deformation rates. At the lower end of the relaxation curve, the relaxation rate
falls down to very low values as will be discussed below. For the serrations, these low
rates do not occur.
Because of the resemblance between the dynamic deformation behavior during the
stress drops at serrated yielding and stress relaxation experiments, the latter can be
used to study the dynamic deformation behavior in the instability range in more detail.
Fig. 5.3.7 compares the relaxation behavior in the stable deformation range with that
in the instability range at different temperatures.
At about 720°C, the deformation is stable and the stress versus time plots of the
relaxations exhibit usual continuous smooth curves (Fig. 5.3.7a). In the instability
range, relaxation tests should be started near the tips of the reloading curves.
Frequently, the stress remains at the level of the stop of the deformation machine and
decreases only after some incubation time passes (curves 1 and 3 in Fig. 5.3.7b). After
the drop, the stress is constant again. Sometimes, further drops may occur (curves 1
and 3). The stress drops are presented at a higher time resolution in Fig. 5.3.7c. At
first, the stress relaxes in the usual way. However, if a certain (low) relaxation rate is
Fig. 5.3.8. Arrhenius plot of the minimum relaxation ratesin ZrO2-15mol%Y2O3 deformed in 112
0.80 0.85 0.90 0.95 1.00-4
-3
-2
-1
0
1
2
3
10-5 s -1
T [°C]977 874 784
10-6 s -1
10-4 s -1
ln(-
δσ/d
t) [M
Pa/
s]
1000/T [1/K]

5.3. Plastic instabilities in cubic zirconia single crystals
57
reached, the stress versus time curves show a sharp knee. Then, the stress remains
constant, i.e. the relaxation rate drops to zero. This stress level is only slightly below
the lower stress level of the serrations. The zero relaxation rate is even observed at
780 °C, where the deformation is stable again. The observed behaviour indicates that
the material deforms continuously only if the strain rate exceeds a defined minimum
strain rate. Below it, the deformation is statically blocked. At high temperatures
slightly below the upper border of the instability range, the relaxation rate does not
decrease to zero, as shown in the relaxation curves of Fig. 5.3.7d. At these
temperatures, the specimens relax to stress levels far below the lower level of the
serrations. Fig. 5.3.8 exhibits an Arrhenius plot of the minimum relaxation rates. A
straight line fits the data points relatively well. Its slope corresponds to an activation
energy of about 2.7 eV.
Strain rates which correspond to relaxation rates above the solid line should allow
unstable deformation. Strain rates corresponding to relaxation rates below the solid
line are impossible for serrated flow to occur. The dashed horizontal lines mark
experimental strain rates of 10-6, 10-5 and 10-4 s-1. These lines intersect the Arrhenius
curve at the points corresponding to temperatures of 784°C, 874°C and 977°C. These
temperatures agree well with the lower limits of the instability range in Fig. 5.3.3.
The processes which cause the locking of dislocations in the instability range may also
lead to transient phenomena at other deformation conditions, e.g., at stress relaxation
tests and the following reloading in the stable deformation ranges. As shown for the
relaxation test R1 in Fig. 5.3.2a and some relaxations in the 802°C section of Fig.
5.3.1, prominent yield drop effects appear during reloading after the relaxations at
deformation conditions close to the lower border of the instability range. Within this
range, the yield drop effects after changes of the deformation conditions are
suppressed by the serrated flow. In conclusion, plastic instabilities occur if the strain
rate drops below a temperature dependent minimum strain rate below which the
deformation is statically blocked. The minimum rates obey an Arrhenius-type relation
with the temperature with an activation energy of 2.7 eV.
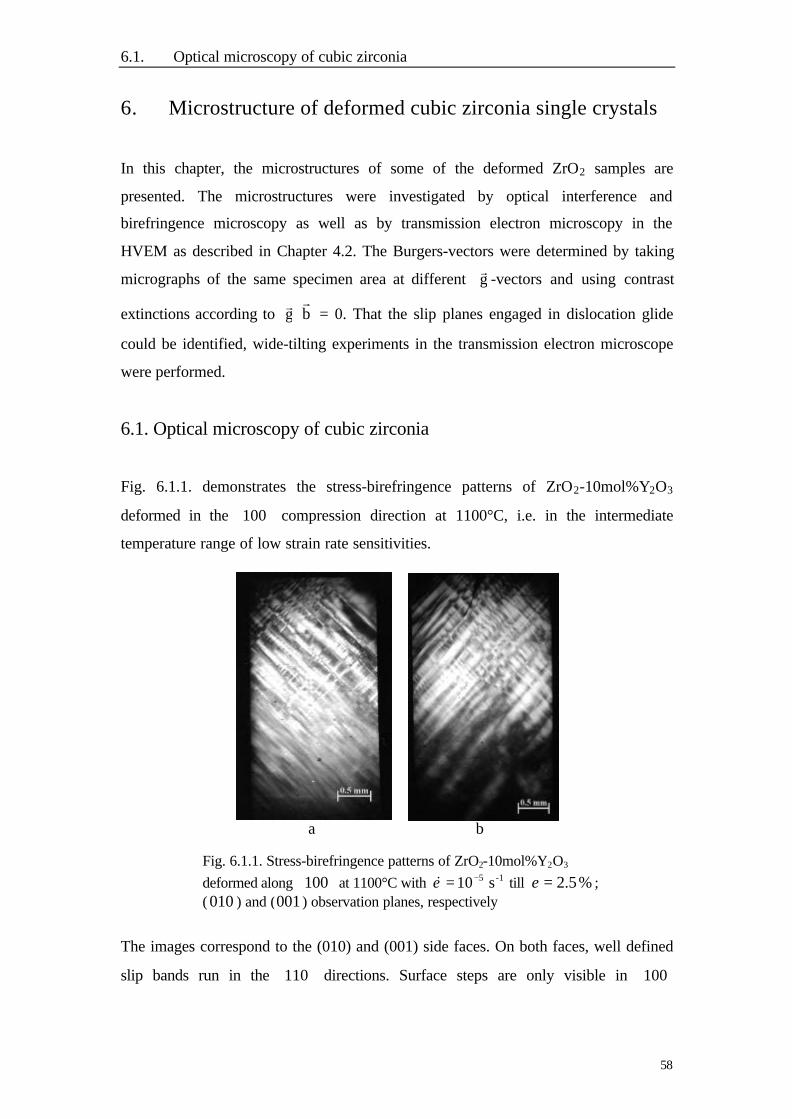
6.1. Optical microscopy of cubic zirconia
58
6. Microstructure of deformed cubic zirconia single crystals
In this chapter, the microstructures of some of the deformed ZrO2 samples are
presented. The microstructures were investigated by optical interference and
birefringence microscopy as well as by transmission electron microscopy in the
HVEM as described in Chapter 4.2. The Burgers-vectors were determined by taking
micrographs of the same specimen area at different gr
-vectors and using contrast
extinctions according to gr
⋅br
= 0. That the slip planes engaged in dislocation glide
could be identified, wide-tilting experiments in the transmission electron microscope
were performed.
6.1. Optical microscopy of cubic zirconia
Fig. 6.1.1. demonstrates the stress-birefringence patterns of ZrO2-10mol%Y2O3
deformed in the ⟨100⟩ compression direction at 1100°C, i.e. in the intermediate
temperature range of low strain rate sensitivities.
a b
The images correspond to the (010) and (001) side faces. On both faces, well defined
slip bands run in the ⟨110⟩ directions. Surface steps are only visible in ⟨100⟩
Fig. 6.1.1. Stress-birefringence patterns of ZrO2-10mol%Y2O3
deformed along ⟨ 100 ⟩ at 1100°C with -15 s 10−=ε& till % 5.2=ε ;( 010 ) and (001 ) observation planes, respectively
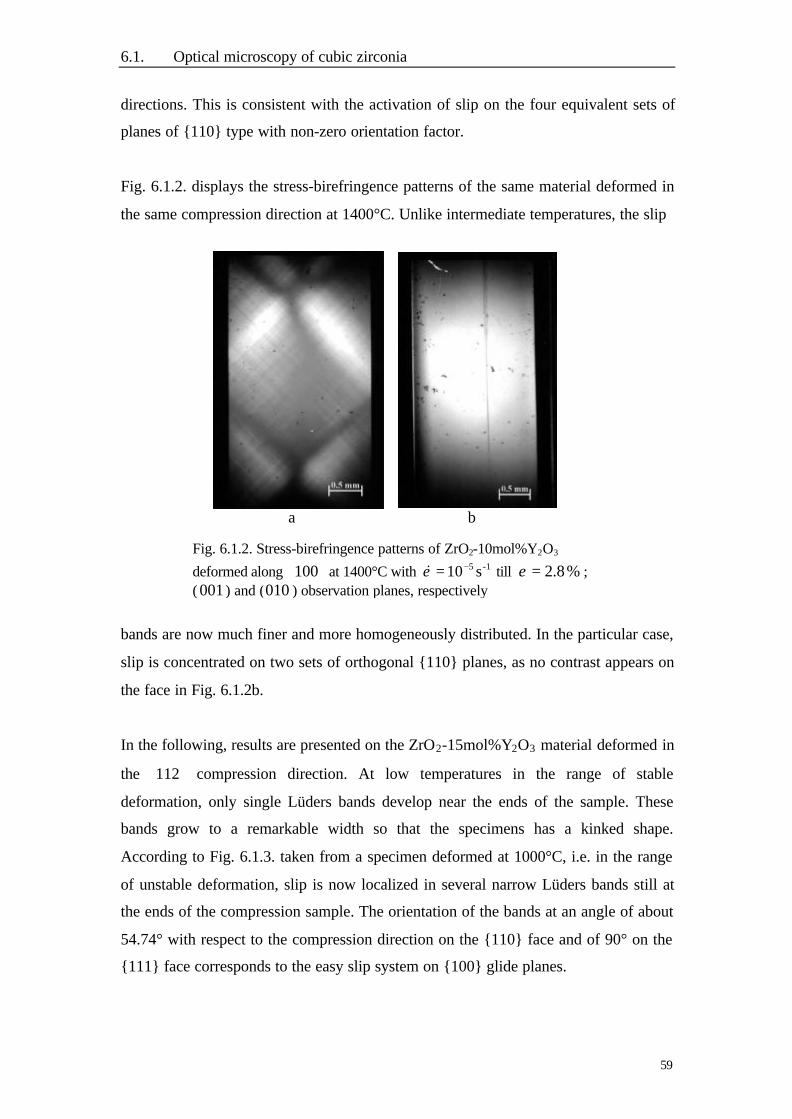
6.1. Optical microscopy of cubic zirconia
59
directions. This is consistent with the activation of slip on the four equivalent sets of
planes of 110 type with non-zero orientation factor.
Fig. 6.1.2. displays the stress-birefringence patterns of the same material deformed in
the same compression direction at 1400°C. Unlike intermediate temperatures, the slip
a b
bands are now much finer and more homogeneously distributed. In the particular case,
slip is concentrated on two sets of orthogonal 110 planes, as no contrast appears on
the face in Fig. 6.1.2b.
In the following, results are presented on the ZrO2-15mol%Y2O3 material deformed in
the ⟨112⟩ compression direction. At low temperatures in the range of stable
deformation, only single Lüders bands develop near the ends of the sample. These
bands grow to a remarkable width so that the specimens has a kinked shape.
According to Fig. 6.1.3. taken from a specimen deformed at 1000°C, i.e. in the range
of unstable deformation, slip is now localized in several narrow Lüders bands still at
the ends of the compression sample. The orientation of the bands at an angle of about
54.74° with respect to the compression direction on the 110 face and of 90° on the
111 face corresponds to the easy slip system on 100 glide planes.
Fig. 6.1.2. Stress-birefringence patterns of ZrO2-10mol%Y2O3
deformed along ⟨ 100 ⟩ at 1400°C with -15 s10−=ε& till % 8.2=ε ;( 001 ) and (010 ) observation planes, respectively
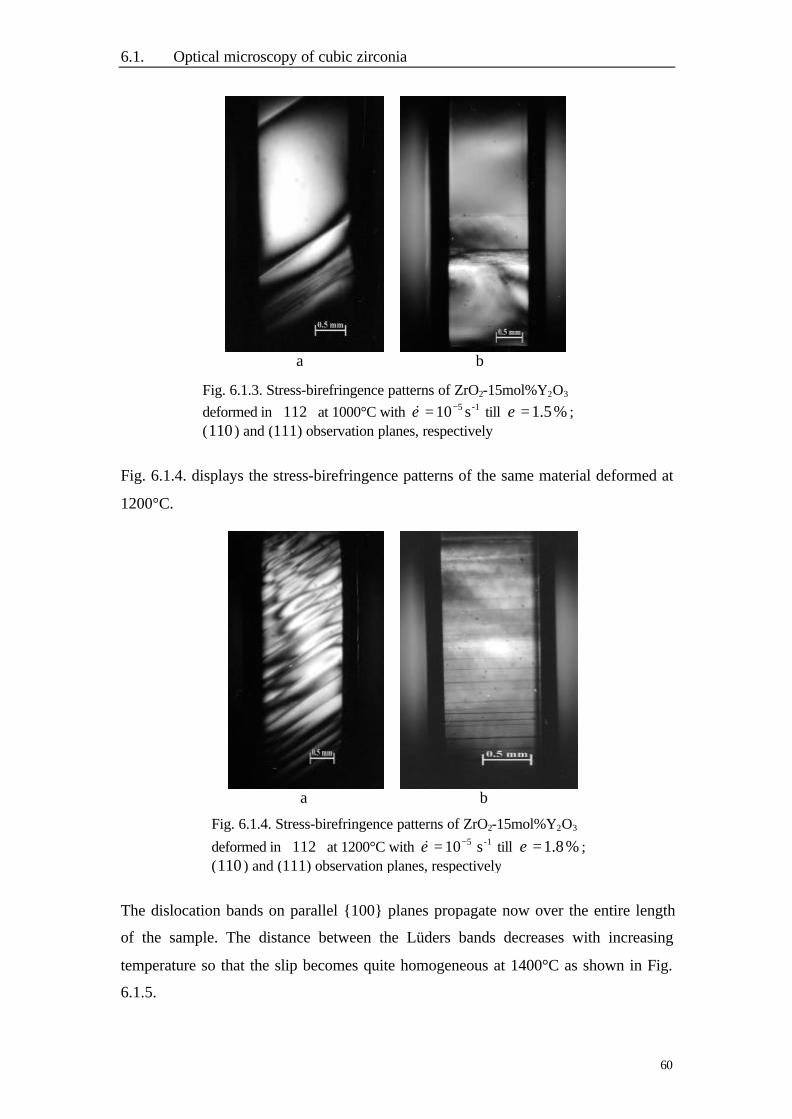
6.1. Optical microscopy of cubic zirconia
60
a b
Fig. 6.1.4. displays the stress-birefringence patterns of the same material deformed at
1200°C.
a b
The dislocation bands on parallel 100 planes propagate now over the entire length
of the sample. The distance between the Lüders bands decreases with increasing
temperature so that the slip becomes quite homogeneous at 1400°C as shown in Fig.
6.1.5.
Fig. 6.1.3. Stress-birefringence patterns of ZrO2-15mol%Y2O3
deformed in ⟨ 112 ⟩ at 1000°C with -15 s10−=ε& till % 5.1=ε ;(110 ) and (111) observation planes, respectively
Fig. 6.1.4. Stress-birefringence patterns of ZrO2-15mol%Y2O3
deformed in ⟨ 112 ⟩ at 1200°C with -15 s 10−=ε& till % 8.1=ε ;(110 ) and (111) observation planes, respectively

6.2. Transmission electron microscopy in the HVEM
61
a b
6.2. Transmission electron microscopy in the HVEM
The following series of figures presents the dislocation structure of ZrO2-
10mol%Y2O3 crystals deformed along ⟨100⟩ at different temperatures. In the
micrographs, the compression direction is indicated by the vector dr
. All micrographs
were taken near [001] poles perpendicular to the 001 side faces. It was tried to
identify the activated slip planes by the following criteria. In the projection used, two
sets of orthogonal slip planes run in ⟨110⟩ directions and are oriented edge-on.
Dislocations on these planes should therefore be imaged as straight lines. The other
two sets of orthogonal 110 planes intersect the specimen surface along the [010]
direction and are inclined with respect to the surface by 45°, so that the dislocations
may show their curved shape. 111 planes intersect the specimen surface always
along ⟨110⟩ directions and are also inclined, so that the respective dislocations may
show a curved shape, too. In addition, the directions of the Burgers vectors were used
to back up the identification of the slip planes.
At low temperatures, slip is concentrated in slip bands, as shown by optical
microscopy for the intermediate temperature range in Fig. 6.1.1. The following figures
Fig. 6.1.5. Stress-birefringence patterns of ZrO2-15mol%Y2O3
deformed in ⟨ 112 ⟩ at 1400°C with -15 s 10−=ε& till % 5.3=ε ;(110 ) and (111) observation planes, respectively
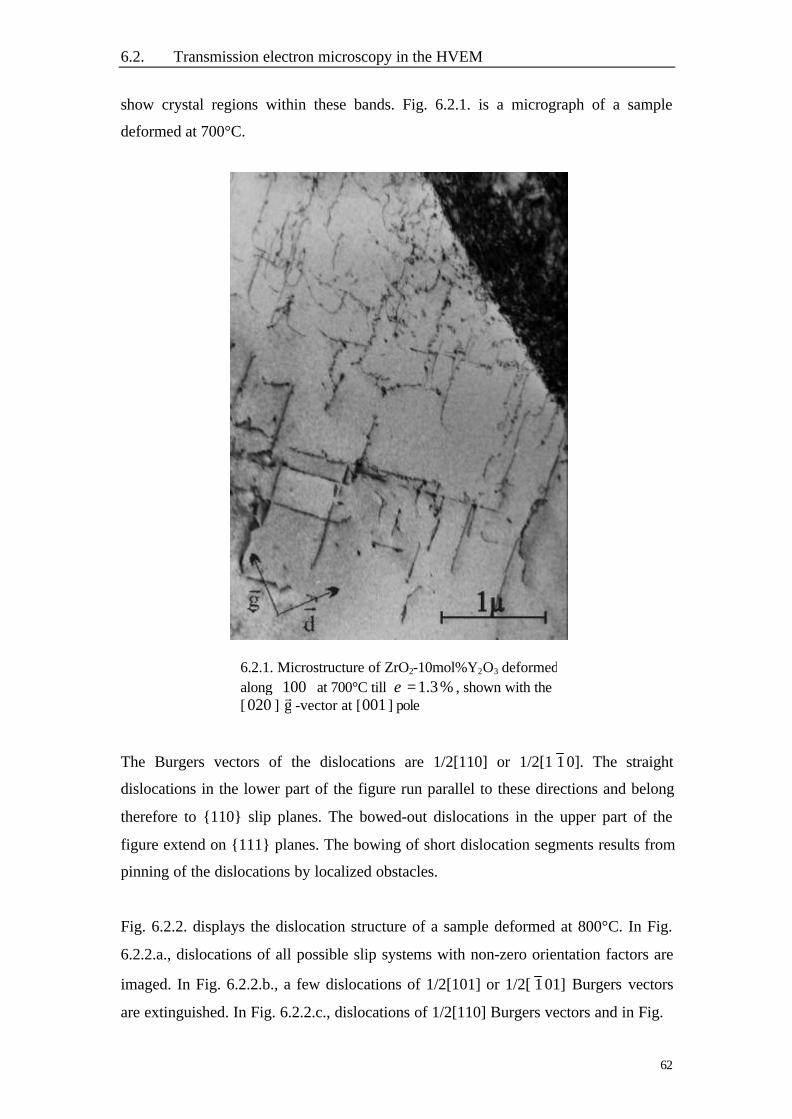
6.2. Transmission electron microscopy in the HVEM
62
show crystal regions within these bands. Fig. 6.2.1. is a micrograph of a sample
deformed at 700°C.
The Burgers vectors of the dislocations are 1/2[110] or 1/2[1 10]. The straight
dislocations in the lower part of the figure run parallel to these directions and belong
therefore to 110 slip planes. The bowed-out dislocations in the upper part of the
figure extend on 111 planes. The bowing of short dislocation segments results from
pinning of the dislocations by localized obstacles.
Fig. 6.2.2. displays the dislocation structure of a sample deformed at 800°C. In Fig.
6.2.2.a., dislocations of all possible slip systems with non-zero orientation factors are
imaged. In Fig. 6.2.2.b., a few dislocations of 1/2[101] or 1/2[ 101] Burgers vectors
are extinguished. In Fig. 6.2.2.c., dislocations of 1/2[110] Burgers vectors and in Fig.
6.2.1. Microstructure of ZrO2-10mol%Y2O3 deformedalong ⟨100 ⟩ at 700°C till % 3.1=ε , shown with the[ 020 ] g
r-vector at [001 ] pole
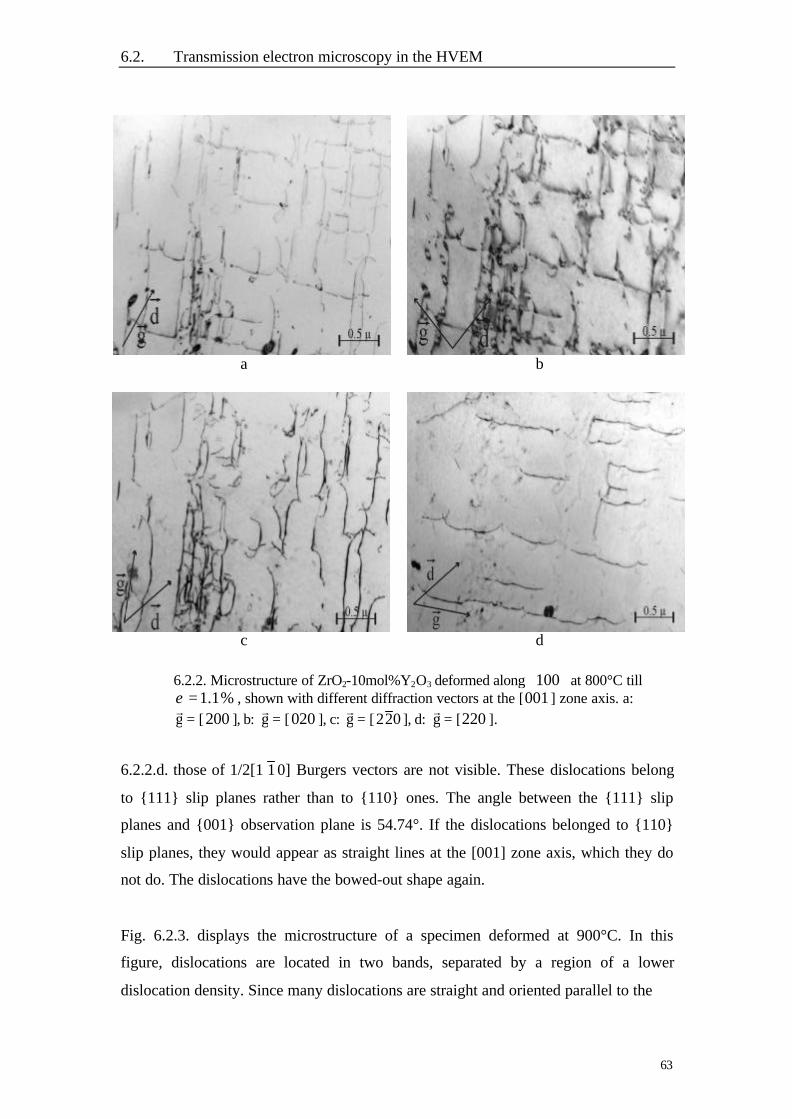
6.2. Transmission electron microscopy in the HVEM
63
a b
c d
6.2.2.d. those of 1/2[1 10] Burgers vectors are not visible. These dislocations belong
to 111 slip planes rather than to 110 ones. The angle between the 111 slip
planes and 001 observation plane is 54.74°. If the dislocations belonged to 110
slip planes, they would appear as straight lines at the [001] zone axis, which they do
not do. The dislocations have the bowed-out shape again.
Fig. 6.2.3. displays the microstructure of a specimen deformed at 900°C. In this
figure, dislocations are located in two bands, separated by a region of a lower
dislocation density. Since many dislocations are straight and oriented parallel to the
6.2.2. Microstructure of ZrO2-10mol%Y2O3 deformed along ⟨100 ⟩ at 800°C till% 1.1=ε , shown with different diffraction vectors at the [001 ] zone axis. a:
gr
= [200 ], b: gr
= [020 ], c: gr
= [ 022 ], d: gr
= [220 ].
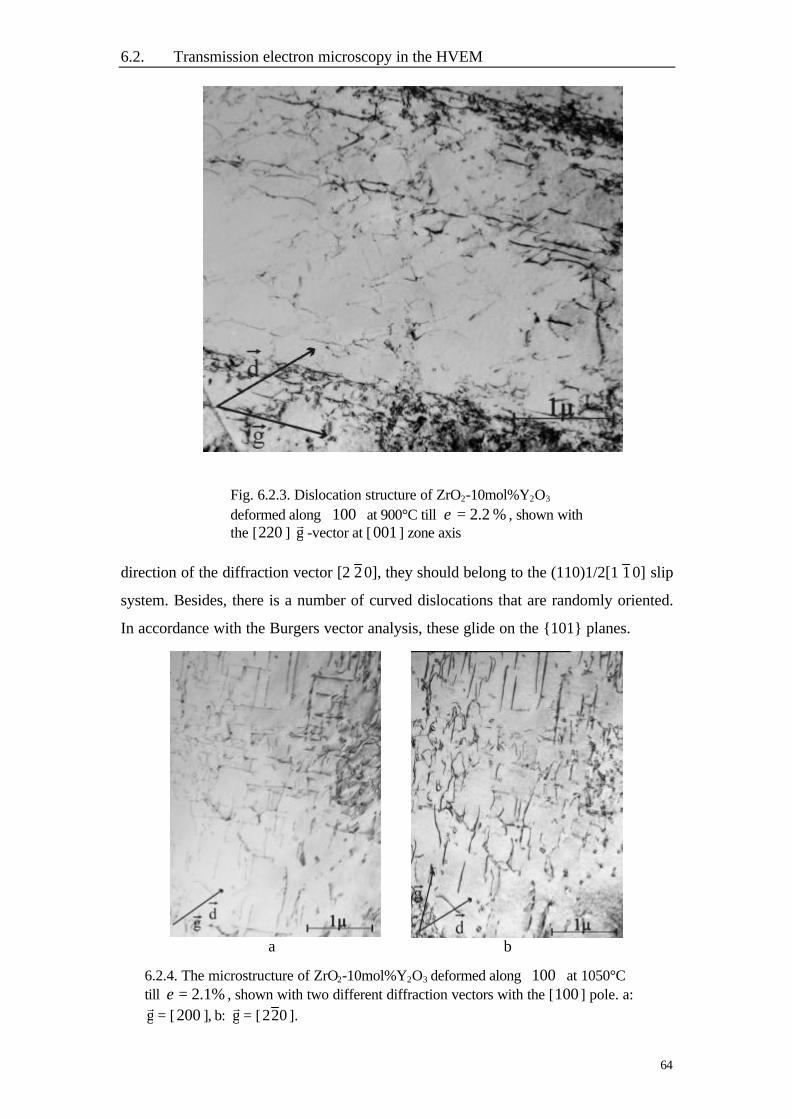
6.2. Transmission electron microscopy in the HVEM
64
direction of the diffraction vector [2 20], they should belong to the (110)1/2[1 10] slip
system. Besides, there is a number of curved dislocations that are randomly oriented.
In accordance with the Burgers vector analysis, these glide on the 101 planes.
a b
Fig. 6.2.3. Dislocation structure of ZrO2-10mol%Y2O3
deformed along ⟨ 100 ⟩ at 900°C till % 2.2=ε , shown withthe [220 ] g
r-vector at [001 ] zone axis
6.2.4. The microstructure of ZrO2-10mol%Y2O3 deformed along ⟨100 ⟩ at 1050°Ctill %1.2=ε , shown with two different diffraction vectors with the [100 ] pole. a:gr
= [200 ], b: gr
= [ 022 ].
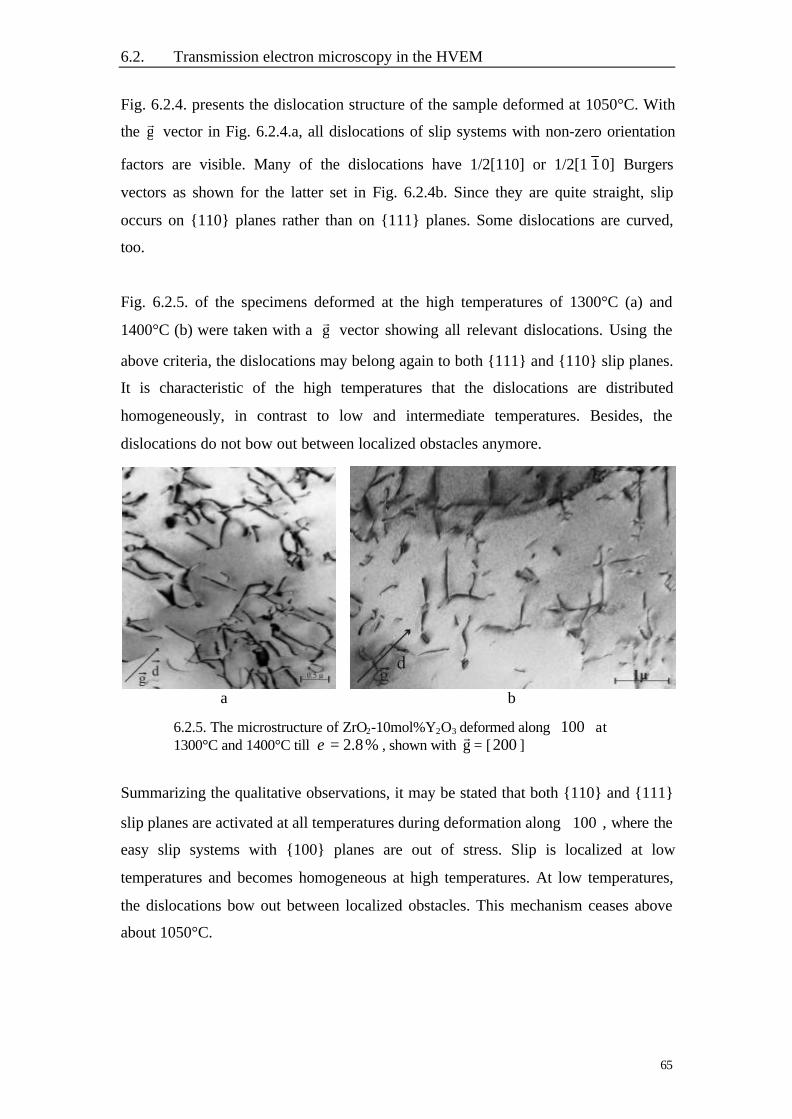
6.2. Transmission electron microscopy in the HVEM
65
Fig. 6.2.4. presents the dislocation structure of the sample deformed at 1050°C. With
the gr
vector in Fig. 6.2.4.a, all dislocations of slip systems with non-zero orientation
factors are visible. Many of the dislocations have 1/2[110] or 1/2[1 10] Burgers
vectors as shown for the latter set in Fig. 6.2.4b. Since they are quite straight, slip
occurs on 110 planes rather than on 111 planes. Some dislocations are curved,
too.
Fig. 6.2.5. of the specimens deformed at the high temperatures of 1300°C (a) and
1400°C (b) were taken with a gr
vector showing all relevant dislocations. Using the
above criteria, the dislocations may belong again to both 111 and 110 slip planes.
It is characteristic of the high temperatures that the dislocations are distributed
homogeneously, in contrast to low and intermediate temperatures. Besides, the
dislocations do not bow out between localized obstacles anymore.
a b
Summarizing the qualitative observations, it may be stated that both 110 and 111
slip planes are activated at all temperatures during deformation along ⟨100⟩, where the
easy slip systems with 100 planes are out of stress. Slip is localized at low
temperatures and becomes homogeneous at high temperatures. At low temperatures,
the dislocations bow out between localized obstacles. This mechanism ceases above
about 1050°C.
6.2.5. The microstructure of ZrO2-10mol%Y2O3 deformed along ⟨100 ⟩ at1300°C and 1400°C till % 8.2=ε , shown with g
r= [200 ]
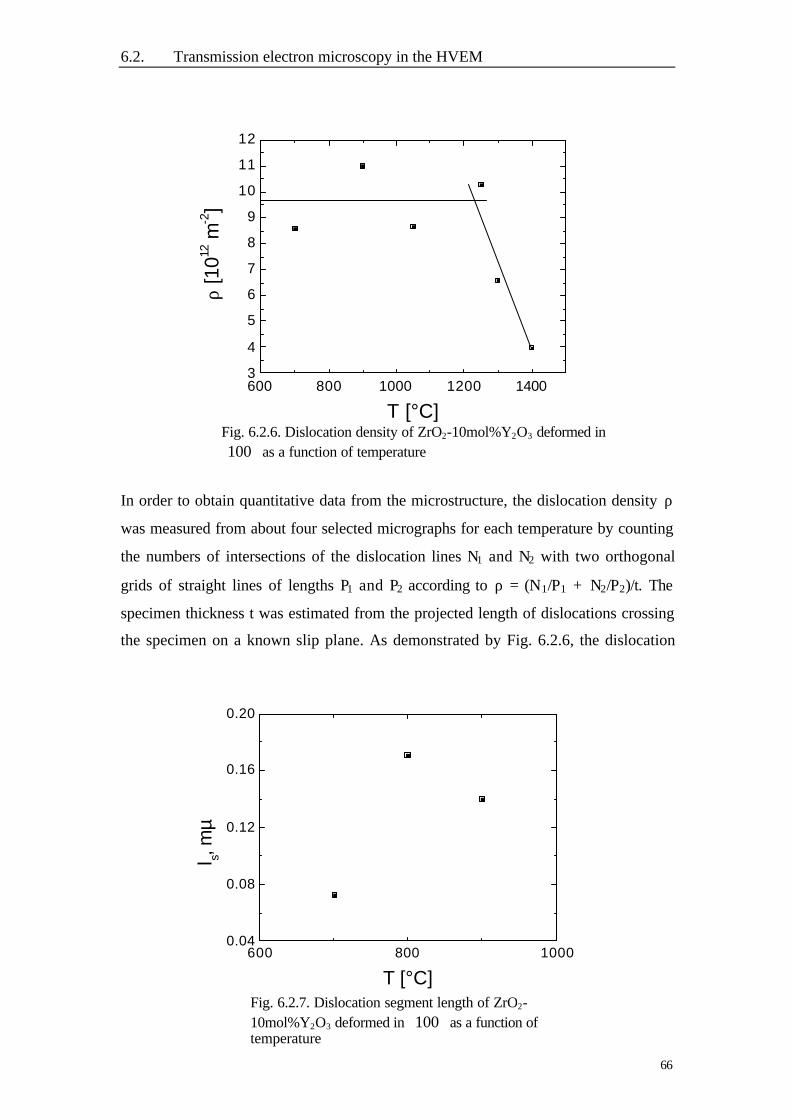
6.2. Transmission electron microscopy in the HVEM
66
In order to obtain quantitative data from the microstructure, the dislocation density ρ
was measured from about four selected micrographs for each temperature by counting
the numbers of intersections of the dislocation lines N1 and N2 with two orthogonal
grids of straight lines of lengths P1 and P2 according to ρ = (N1/P1 + N2/P2)/t. The
specimen thickness t was estimated from the projected length of dislocations crossing
the specimen on a known slip plane. As demonstrated by Fig. 6.2.6, the dislocation
Fig. 6.2.6. Dislocation density of ZrO2-10mol%Y2O3 deformed in⟨100 ⟩ as a function of temperature
Fig. 6.2.7. Dislocation segment length of ZrO2-10mol%Y2O3 deformed in ⟨100 ⟩ as a function oftemperature
600 800 1000 1200 14003
4
5
6
7
8
9
10
11
12
ρ [1
012 m
-2]
T [°C]
600 800 10000.04
0.08
0.12
0.16
0.20
l s, m
µ
T [°C]
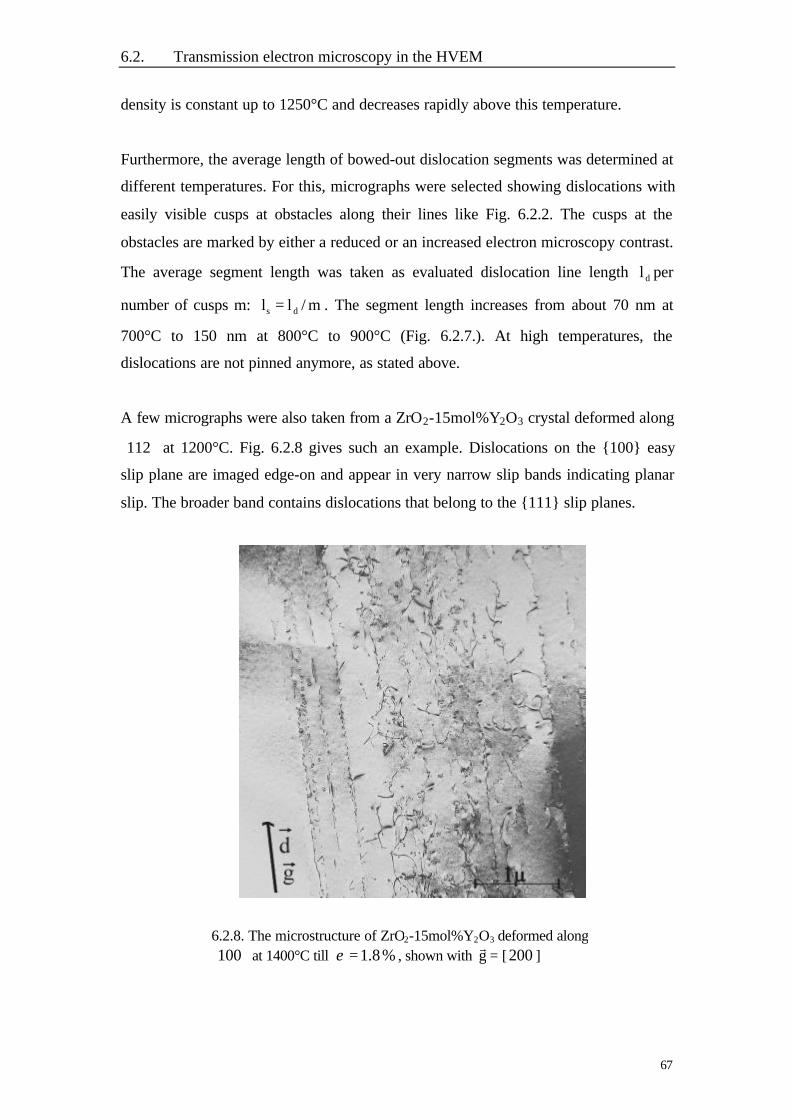
6.2. Transmission electron microscopy in the HVEM
67
density is constant up to 1250°C and decreases rapidly above this temperature.
Furthermore, the average length of bowed-out dislocation segments was determined at
different temperatures. For this, micrographs were selected showing dislocations with
easily visible cusps at obstacles along their lines like Fig. 6.2.2. The cusps at the
obstacles are marked by either a reduced or an increased electron microscopy contrast.
The average segment length was taken as evaluated dislocation line length dl per
number of cusps m: m/ll ds = . The segment length increases from about 70 nm at
700°C to 150 nm at 800°C to 900°C (Fig. 6.2.7.). At high temperatures, the
dislocations are not pinned anymore, as stated above.
A few micrographs were also taken from a ZrO2-15mol%Y2O3 crystal deformed along
⟨112⟩ at 1200°C. Fig. 6.2.8 gives such an example. Dislocations on the 100 easy
slip plane are imaged edge-on and appear in very narrow slip bands indicating planar
slip. The broader band contains dislocations that belong to the 111 slip planes.
6.2.8. The microstructure of ZrO2-15mol%Y2O3 deformed along⟨100 ⟩ at 1400°C till % 8.1=ε , shown with g
r= [200 ]
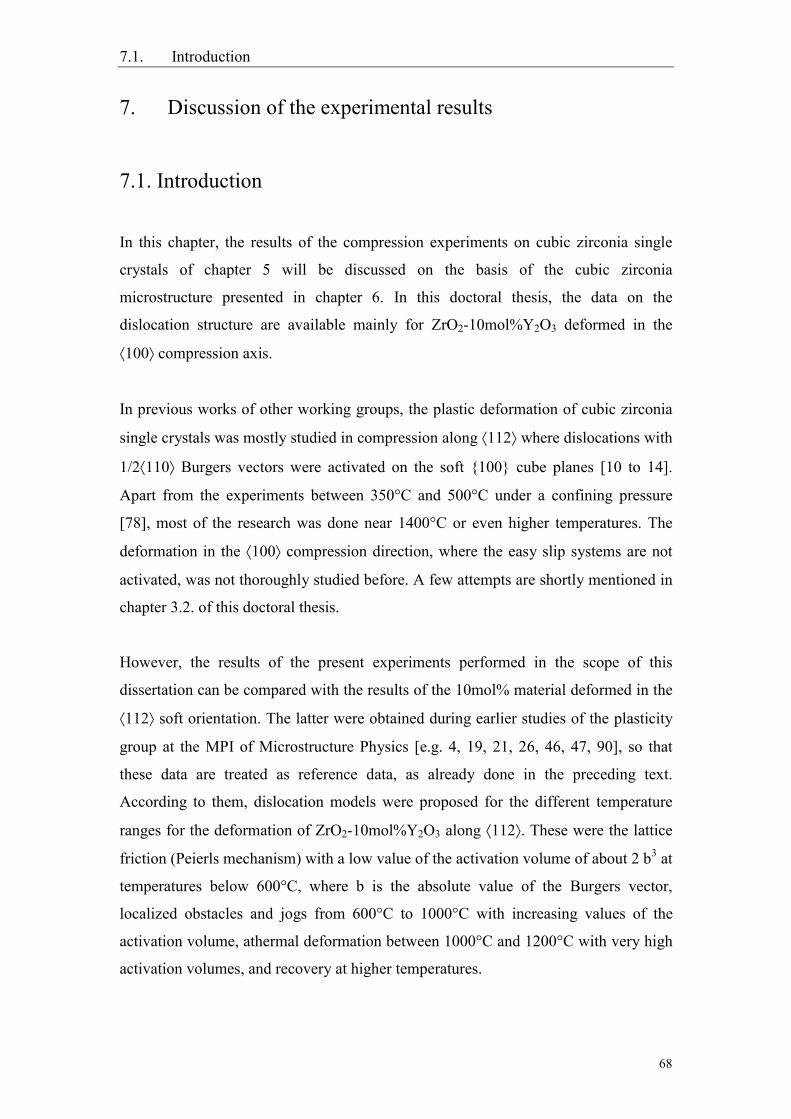
7.1. Introduction
68
7. Discussion of the experimental results
7.1. Introduction
In this chapter, the results of the compression experiments on cubic zirconia single
crystals of chapter 5 will be discussed on the basis of the cubic zirconia
microstructure presented in chapter 6. In this doctoral thesis, the data on the
dislocation structure are available mainly for ZrO2-10mol%Y2O3 deformed in the
100 compression axis.
In previous works of other working groups, the plastic deformation of cubic zirconia
single crystals was mostly studied in compression along 112 where dislocations with
1/2110 Burgers vectors were activated on the soft 100 cube planes [10 to 14].
Apart from the experiments between 350°C and 500°C under a confining pressure
[78], most of the research was done near 1400°C or even higher temperatures. The
deformation in the 100 compression direction, where the easy slip systems are not
activated, was not thoroughly studied before. A few attempts are shortly mentioned in
chapter 3.2. of this doctoral thesis.
However, the results of the present experiments performed in the scope of this
dissertation can be compared with the results of the 10mol% material deformed in the
112 soft orientation. The latter were obtained during earlier studies of the plasticity
group at the MPI of Microstructure Physics [e.g. 4, 19, 21, 26, 46, 47, 90], so that
these data are treated as reference data, as already done in the preceding text.
According to them, dislocation models were proposed for the different temperature
ranges for the deformation of ZrO2-10mol%Y2O3 along 112. These were the lattice
friction (Peierls mechanism) with a low value of the activation volume of about 2 b3 at
temperatures below 600°C, where b is the absolute value of the Burgers vector,
localized obstacles and jogs from 600°C to 1000°C with increasing values of the
activation volume, athermal deformation between 1000°C and 1200°C with very high
activation volumes, and recovery at higher temperatures.
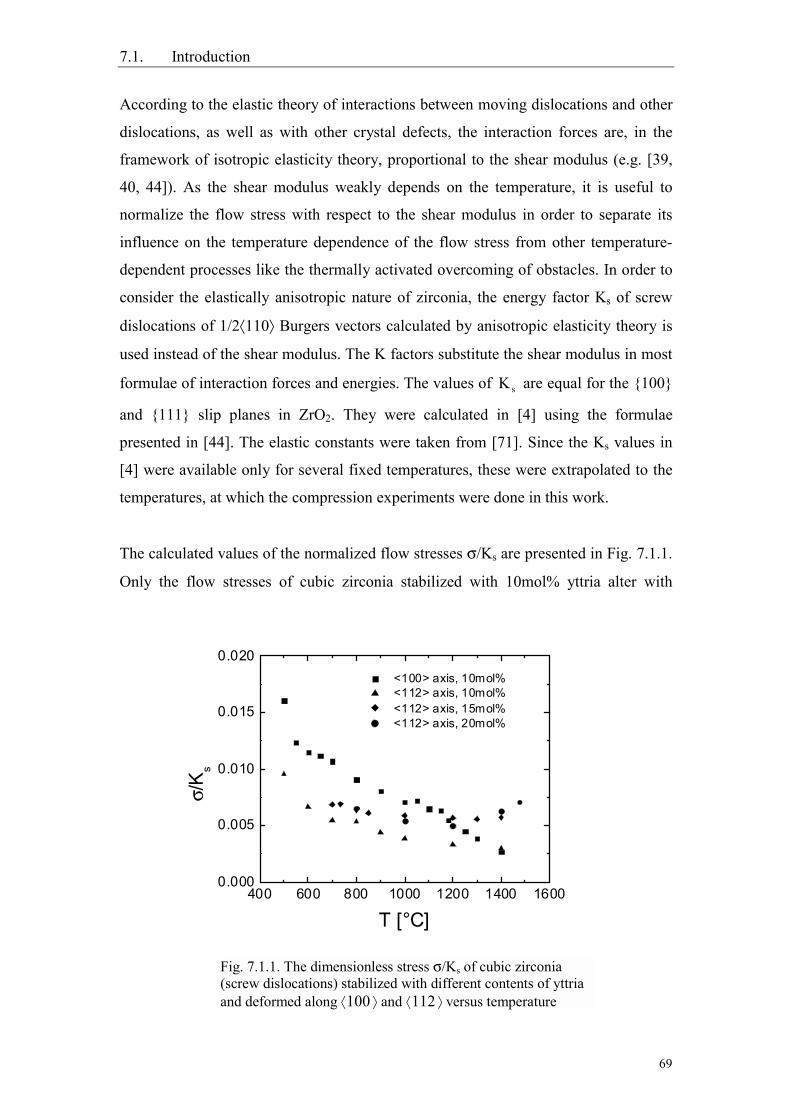
7.1. Introduction
69
According to the elastic theory of interactions between moving dislocations and other
dislocations, as well as with other crystal defects, the interaction forces are, in the
framework of isotropic elasticity theory, proportional to the shear modulus (e.g. [39,
40, 44]). As the shear modulus weakly depends on the temperature, it is useful to
normalize the flow stress with respect to the shear modulus in order to separate its
influence on the temperature dependence of the flow stress from other temperature-
dependent processes like the thermally activated overcoming of obstacles. In order to
consider the elastically anisotropic nature of zirconia, the energy factor Ks of screw
dislocations of 1/2110 Burgers vectors calculated by anisotropic elasticity theory is
used instead of the shear modulus. The K factors substitute the shear modulus in most
formulae of interaction forces and energies. The values of sK are equal for the 100
and 111 slip planes in ZrO2. They were calculated in [4] using the formulae
presented in [44]. The elastic constants were taken from [71]. Since the Ks values in
[4] were available only for several fixed temperatures, these were extrapolated to the
temperatures, at which the compression experiments were done in this work.
The calculated values of the normalized flow stresses σ/Ks are presented in Fig. 7.1.1.
Only the flow stresses of cubic zirconia stabilized with 10mol% yttria alter with
Fig. 7.1.1. The dimensionless stress σ/Ks of cubic zirconia(screw dislocations) stabilized with different contents of yttriaand deformed along 100 and 112 versus temperature
400 600 800 1000 1200 1400 16000.000
0.005
0.010
0.015
0.020 <100> axis, 10mol% <112> axis, 10mol% <112> axis, 15mol% <112> axis, 20mol%
σ/K
s
T [°C]
7.2. Comparison between deformation in 100 and 112 in ZrO2-10mol%Y2O3
70
changing temperature in both orientations of the compression axis. The curve for the
112 orientation shows a very weak dependence above about 1000°C. The flow
stresses of the 15 and 20mol% materials are almost independent of the temperature
within the experimental accuracy of the data.
As outlined above, the flow stress of cubic zirconia single crystals consists of several
components, each of which dominates within a corresponding temperature range, and
each of which contributes to the flow stress in a different way. In the following, it will
be attempted to estimate these diverse contributions for the material stabilized with
10mol% yttria deformed in the 100 compression direction, since most of the
microstructural data are available for these deformation conditions. Afterwards, the
influence of the different yttria contents will be discussed, in particular with respect to
the plastic instabilities.
7.2. Flow stress contributions for ZrO2-10mol%Y2O3: Comparison
between deformation along the 100 and 112 compression directions
As shown in chapter 5.1. and in Fig. 7.1.1., the flow stresses of ZrO2-10mol%Y2O3
deformed in the 100 and 112 compression axes exhibit different dependencies on
the temperature. The flow stress along 100 is mostly higher than that along 112.
Both flow stresses are equal only at 1400°C. The differences should be related to the
different glide planes activated. At high temperatures, recovery controls the
deformation, so that the shear stresses along both orientations become the same.
As described above several times, slip on the easy 100 planes is activated during
deformation along 112. As to the microstructure of ZrO2-10mol%Y2O3 deformed in
the 100 compression axis, the stress-birefringence observations of chapter 6.1. are
most consistent with the slip on 110 planes, while the transmission electron
microscopy studies of chapter 6.2. showed dislocations arranged on 111 and 110
planes at the same time, the former type prevailing. It may therefore be assumed that
slip on both types of the planes is simultaneously active. This is in contrast to the
result in [19], where slip was observed only on 110 planes during deformation
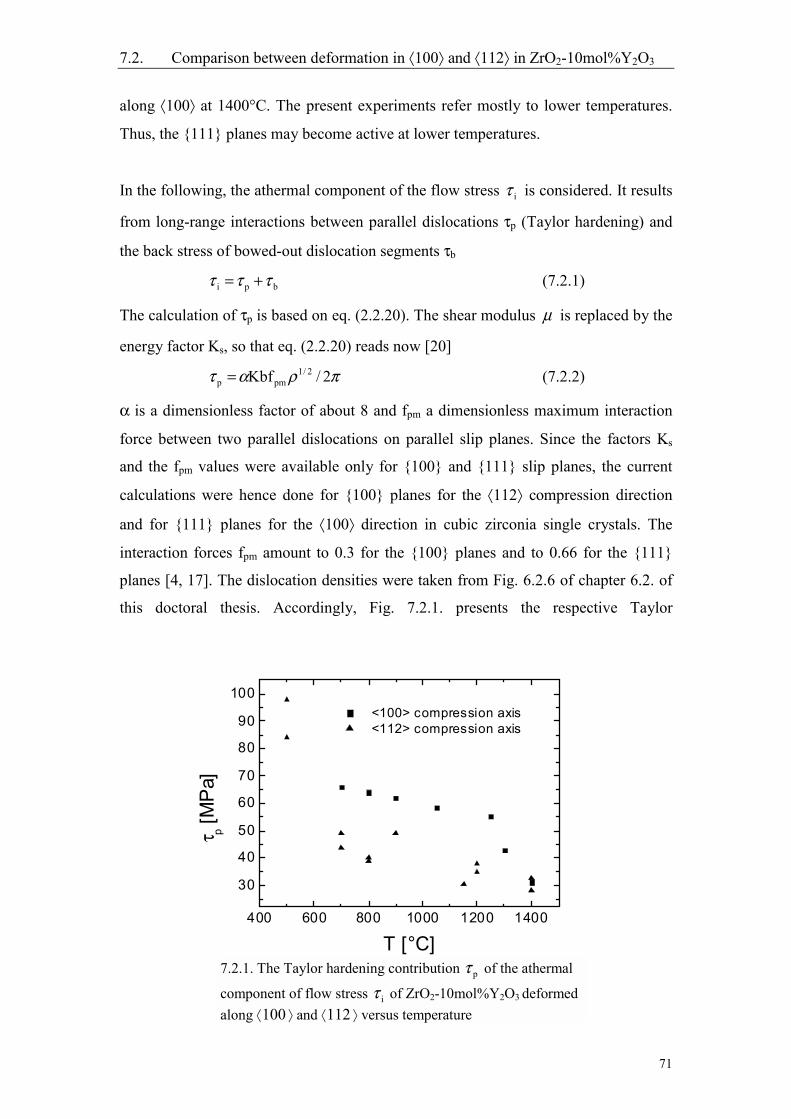
7.2. Comparison between deformation in 100 and 112 in ZrO2-10mol%Y2O3
71
along 100 at 1400°C. The present experiments refer mostly to lower temperatures.
Thus, the 111 planes may become active at lower temperatures.
In the following, the athermal component of the flow stress iτ is considered. It results
from long-range interactions between parallel dislocations τp (Taylor hardening) and
the back stress of bowed-out dislocation segments τb
bpi τττ += (7.2.1)
The calculation of τp is based on eq. (2.2.20). The shear modulus µ is replaced by the
energy factor Ks, so that eq. (2.2.20) reads now [20]
πρατ 2/Kbf 2/1pmp = (7.2.2)
α is a dimensionless factor of about 8 and fpm a dimensionless maximum interaction
force between two parallel dislocations on parallel slip planes. Since the factors Ks
and the fpm values were available only for 100 and 111 slip planes, the current
calculations were hence done for 100 planes for the 112 compression direction
and for 111 planes for the 100 direction in cubic zirconia single crystals. The
interaction forces fpm amount to 0.3 for the 100 planes and to 0.66 for the 111
planes [4, 17]. The dislocation densities were taken from Fig. 6.2.6 of chapter 6.2. of
this doctoral thesis. Accordingly, Fig. 7.2.1. presents the respective Taylor
7.2.1. The Taylor hardening contribution pτ of the athermal
component of flow stress iτ of ZrO2-10mol%Y2O3 deformedalong 100 and 112 versus temperature
400 600 800 1000 1200 1400
30
40
50
60
70
80
90
100 <100> compression axis <112> compression axis
τ p [MPa
]
T [°C]
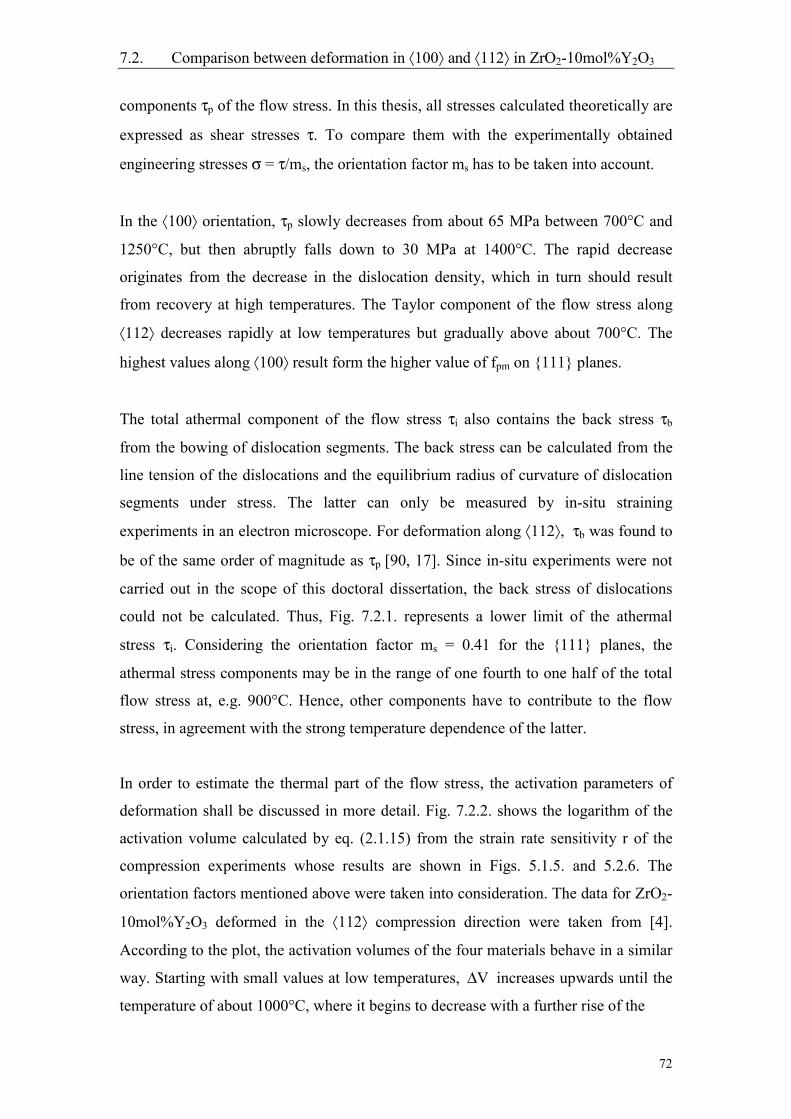
7.2. Comparison between deformation in 100 and 112 in ZrO2-10mol%Y2O3
72
components τp of the flow stress. In this thesis, all stresses calculated theoretically are
expressed as shear stresses τ. To compare them with the experimentally obtained
engineering stresses σ = τ/ms, the orientation factor ms has to be taken into account.
In the 100 orientation, τp slowly decreases from about 65 MPa between 700°C and
1250°C, but then abruptly falls down to 30 MPa at 1400°C. The rapid decrease
originates from the decrease in the dislocation density, which in turn should result
from recovery at high temperatures. The Taylor component of the flow stress along
112 decreases rapidly at low temperatures but gradually above about 700°C. The
highest values along 100 result form the higher value of fpm on 111 planes.
The total athermal component of the flow stress τi also contains the back stress τb
from the bowing of dislocation segments. The back stress can be calculated from the
line tension of the dislocations and the equilibrium radius of curvature of dislocation
segments under stress. The latter can only be measured by in-situ straining
experiments in an electron microscope. For deformation along 112, τb was found to
be of the same order of magnitude as τp [90, 17]. Since in-situ experiments were not
carried out in the scope of this doctoral dissertation, the back stress of dislocations
could not be calculated. Thus, Fig. 7.2.1. represents a lower limit of the athermal
stress τi. Considering the orientation factor ms = 0.41 for the 111 planes, the
athermal stress components may be in the range of one fourth to one half of the total
flow stress at, e.g. 900°C. Hence, other components have to contribute to the flow
stress, in agreement with the strong temperature dependence of the latter.
In order to estimate the thermal part of the flow stress, the activation parameters of
deformation shall be discussed in more detail. Fig. 7.2.2. shows the logarithm of the
activation volume calculated by eq. (2.1.15) from the strain rate sensitivity r of the
compression experiments whose results are shown in Figs. 5.1.5. and 5.2.6. The
orientation factors mentioned above were taken into consideration. The data for ZrO2-
10mol%Y2O3 deformed in the 112 compression direction were taken from [4].
According to the plot, the activation volumes of the four materials behave in a similar
way. Starting with small values at low temperatures, V∆ increases upwards until the
temperature of about 1000°C, where it begins to decrease with a further rise of the
7.2. Comparison between deformation in 100 and 112 in ZrO2-10mol%Y2O3
73
temperature. Up to about 1000°C, the activation volumes of ZrO2-10mol%Y2O3 are
equal for both orientations. They are well consistent with the model of overcoming
localized obstacles as discussed in [21, 46, 17] for the 112 orientation. This model is
propped up by the shape of dislocations, e.g., in Figs. 6.2.1. and 6.2.2., where
dislocations bow out between pinning centers. With the help of the formula 2.1.12.,
the activation distance V/2lb3x ∆=∆ can be estimated, where l is again the obstacle
distance along the dislocation line whose magnitude is taken from Fig. 6.2.7. The
factor of 3/2 is included in order to consider the Friedel statistics of the overcoming of
localized obstacles [52, 40]. The result is an activation distance of the order of
magnitude of 0.5 b. Similar relations between the activation volume and the segment
length are observed also in other materials showing bowed-out dislocation segments
(e.g. [91]).
The activation enthalpies of deformation H∆ were calculated from the temperature
sensitivities in Figs. 5.1.3. and 5.2.4. and the strain rate sensitivities in Figs. 5.1.5. and
7.2.2. The logarithm of the activation volume V∆ of cubiczirconia single crystals stabilized with different contents ofyttria and deformed in two different axes versus
400 600 800 1000 1200 1400 16000.8
1.2
1.6
2.0
2.4
2.8
3.2
3.6
4.0
T [°C]
log(
∆V [b
3 ])
<100>, 10mol% <112>, 10mol% <112>, 15mol% <112>, 20mol%
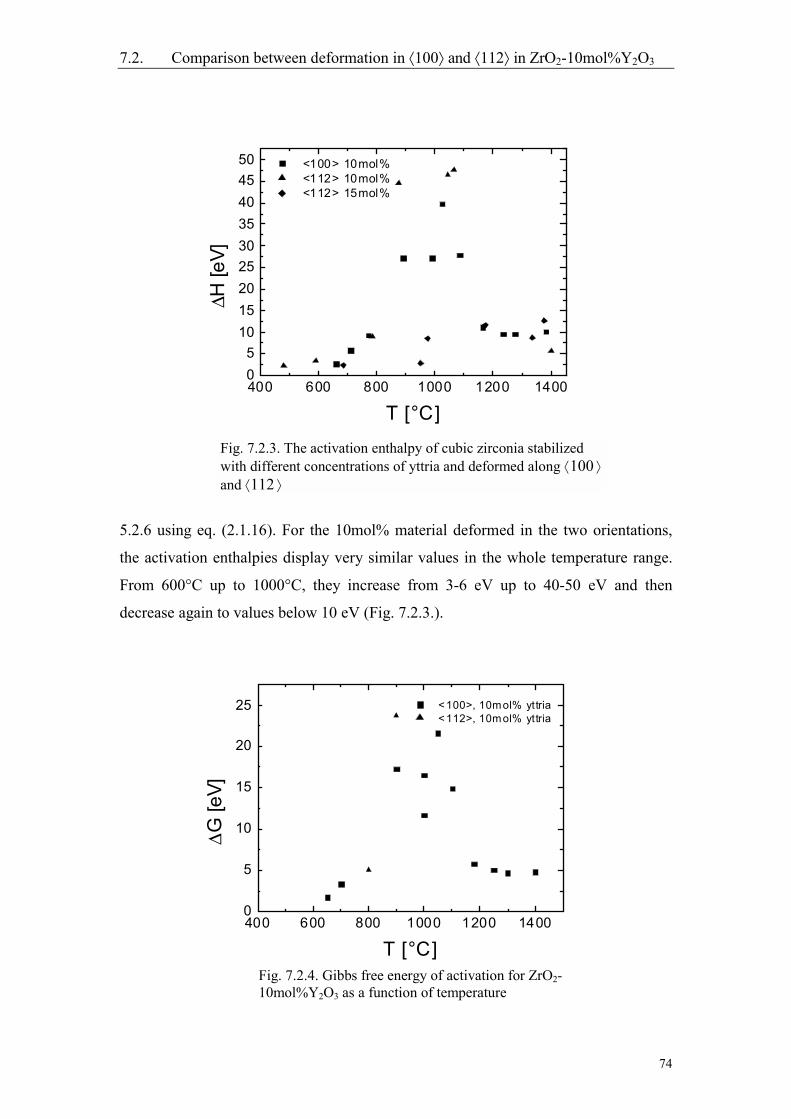
7.2. Comparison between deformation in 100 and 112 in ZrO2-10mol%Y2O3
74
5.2.6 using eq. (2.1.16). For the 10mol% material deformed in the two orientations,
the activation enthalpies display very similar values in the whole temperature range.
From 600°C up to 1000°C, they increase from 3-6 eV up to 40-50 eV and then
decrease again to values below 10 eV (Fig. 7.2.3.).
Fig. 7.2.3. The activation enthalpy of cubic zirconia stabilizedwith different concentrations of yttria and deformed along 100 and 112
Fig. 7.2.4. Gibbs free energy of activation for ZrO2-10mol%Y2O3 as a function of temperature
400 600 800 1000 1200 14000
5
10
15
20
25 <100>, 10mol% yttria <112>, 10mol% yttria
∆G [e
V]
T [°C]
400 600 800 1000 1200 140005
101520253035404550 <100> 10mol%
<112> 10mol% <112> 15mol%
∆H [e
V]
T [°C]
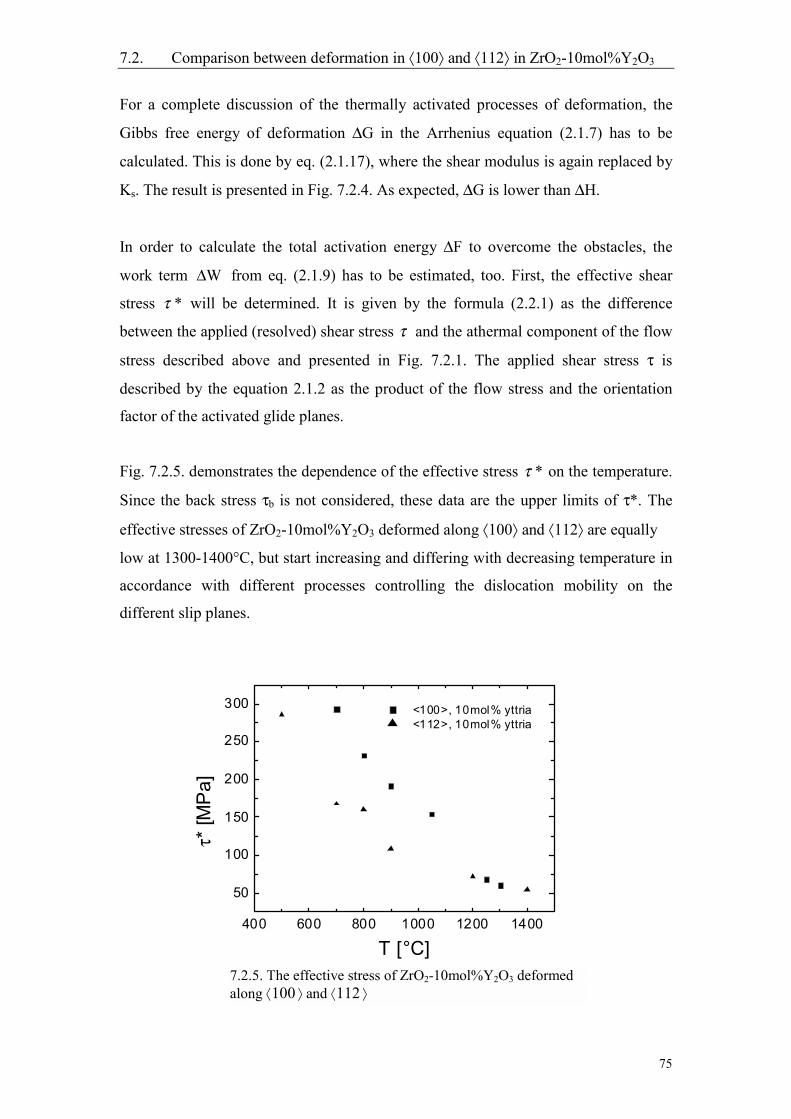
7.2. Comparison between deformation in 100 and 112 in ZrO2-10mol%Y2O3
75
For a complete discussion of the thermally activated processes of deformation, the
Gibbs free energy of deformation ∆G in the Arrhenius equation (2.1.7) has to be
calculated. This is done by eq. (2.1.17), where the shear modulus is again replaced by
Ks. The result is presented in Fig. 7.2.4. As expected, ∆G is lower than ∆H.
In order to calculate the total activation energy ∆F to overcome the obstacles, the
work term W∆ from eq. (2.1.9) has to be estimated, too. First, the effective shear
stress *τ will be determined. It is given by the formula (2.2.1) as the difference
between the applied (resolved) shear stress τ and the athermal component of the flow
stress described above and presented in Fig. 7.2.1. The applied shear stress τ is
described by the equation 2.1.2 as the product of the flow stress and the orientation
factor of the activated glide planes.
Fig. 7.2.5. demonstrates the dependence of the effective stress *τ on the temperature.
Since the back stress τb is not considered, these data are the upper limits of τ*. The
effective stresses of ZrO2-10mol%Y2O3 deformed along 100 and 112 are equally
low at 1300-1400°C, but start increasing and differing with decreasing temperature in
accordance with different processes controlling the dislocation mobility on the
different slip planes.
7.2.5. The effective stress of ZrO2-10mol%Y2O3 deformedalong 100 and 112
400 600 800 1000 1200 1400
50
100
150
200
250
300 <100>, 10mol% yttria <112>, 10mol% yttria
τ* [M
Pa]
T [°C]
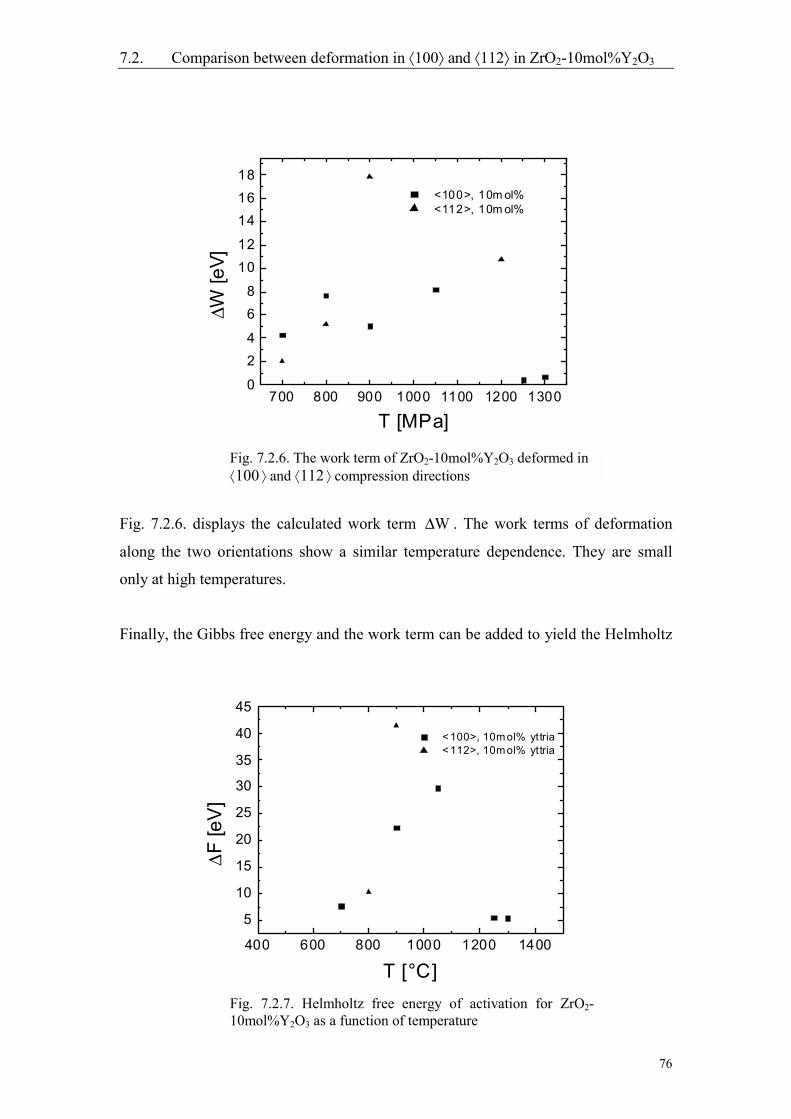
7.2. Comparison between deformation in 100 and 112 in ZrO2-10mol%Y2O3
76
Fig. 7.2.6. displays the calculated work term W∆ . The work terms of deformation
along the two orientations show a similar temperature dependence. They are small
only at high temperatures.
Finally, the Gibbs free energy and the work term can be added to yield the Helmholtz
Fig. 7.2.6. The work term of ZrO2-10mol%Y2O3 deformed in100 and 112 compression directions
Fig. 7.2.7. Helmholtz free energy of activation for ZrO2-10mol%Y2O3 as a function of temperature
700 800 900 1000 1100 1200 13000
24
68
1012
141618
<100>, 10m ol% <112>, 10m ol%
∆W [e
V]
T [MPa]
400 600 800 1000 1200 1400
5
10
15
20
25
30
35
40
45
∆F [e
V]
T [°C]
<100>, 10mol% yttria <112>, 10mol% yttria
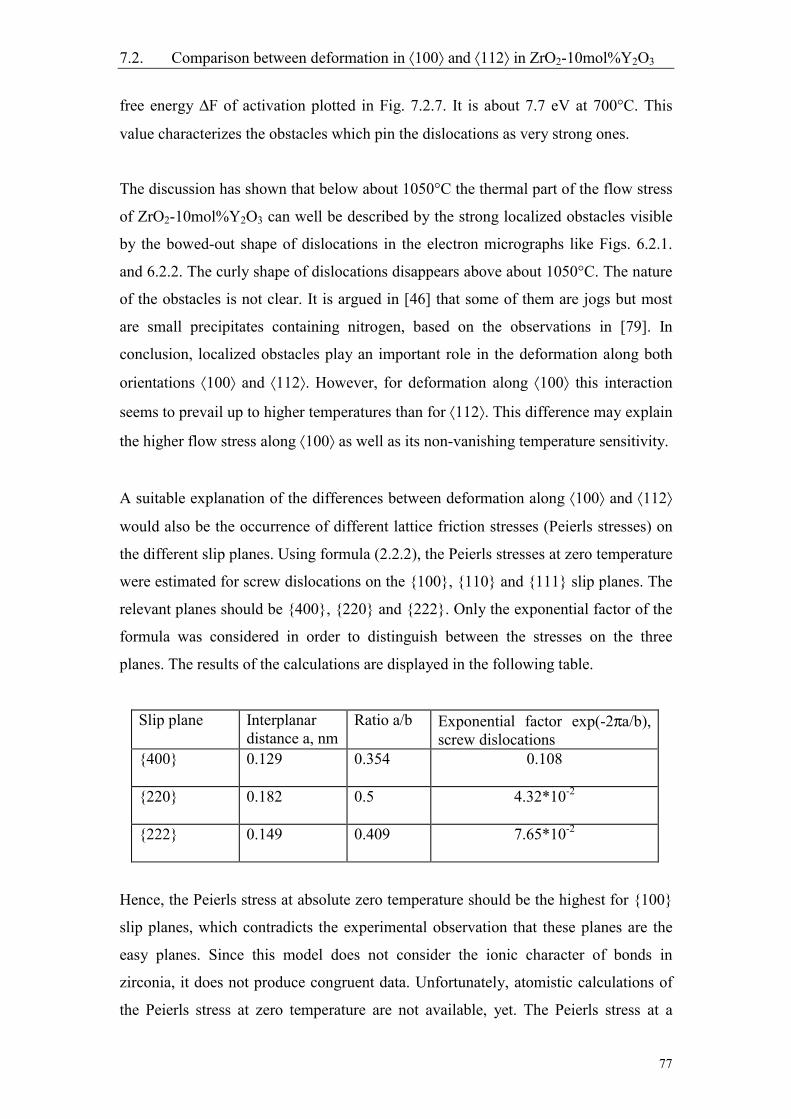
7.2. Comparison between deformation in 100 and 112 in ZrO2-10mol%Y2O3
77
free energy ∆F of activation plotted in Fig. 7.2.7. It is about 7.7 eV at 700°C. This
value characterizes the obstacles which pin the dislocations as very strong ones.
The discussion has shown that below about 1050°C the thermal part of the flow stress
of ZrO2-10mol%Y2O3 can well be described by the strong localized obstacles visible
by the bowed-out shape of dislocations in the electron micrographs like Figs. 6.2.1.
and 6.2.2. The curly shape of dislocations disappears above about 1050°C. The nature
of the obstacles is not clear. It is argued in [46] that some of them are jogs but most
are small precipitates containing nitrogen, based on the observations in [79]. In
conclusion, localized obstacles play an important role in the deformation along both
orientations 100 and 112. However, for deformation along 100 this interaction
seems to prevail up to higher temperatures than for 112. This difference may explain
the higher flow stress along 100 as well as its non-vanishing temperature sensitivity.
A suitable explanation of the differences between deformation along 100 and 112
would also be the occurrence of different lattice friction stresses (Peierls stresses) on
the different slip planes. Using formula (2.2.2), the Peierls stresses at zero temperature
were estimated for screw dislocations on the 100, 110 and 111 slip planes. The
relevant planes should be 400, 220 and 222. Only the exponential factor of the
formula was considered in order to distinguish between the stresses on the three
planes. The results of the calculations are displayed in the following table.
Slip plane Interplanardistance a, nm
Ratio a/b Exponential factor exp(-2πa/b),screw dislocations
400 0.129 0.354 0.108
220 0.182 0.5 4.32*10-2
222 0.149 0.409 7.65*10-2
Hence, the Peierls stress at absolute zero temperature should be the highest for 100
slip planes, which contradicts the experimental observation that these planes are the
easy planes. Since this model does not consider the ionic character of bonds in
zirconia, it does not produce congruent data. Unfortunately, atomistic calculations of
the Peierls stress at zero temperature are not available, yet. The Peierls stress at a
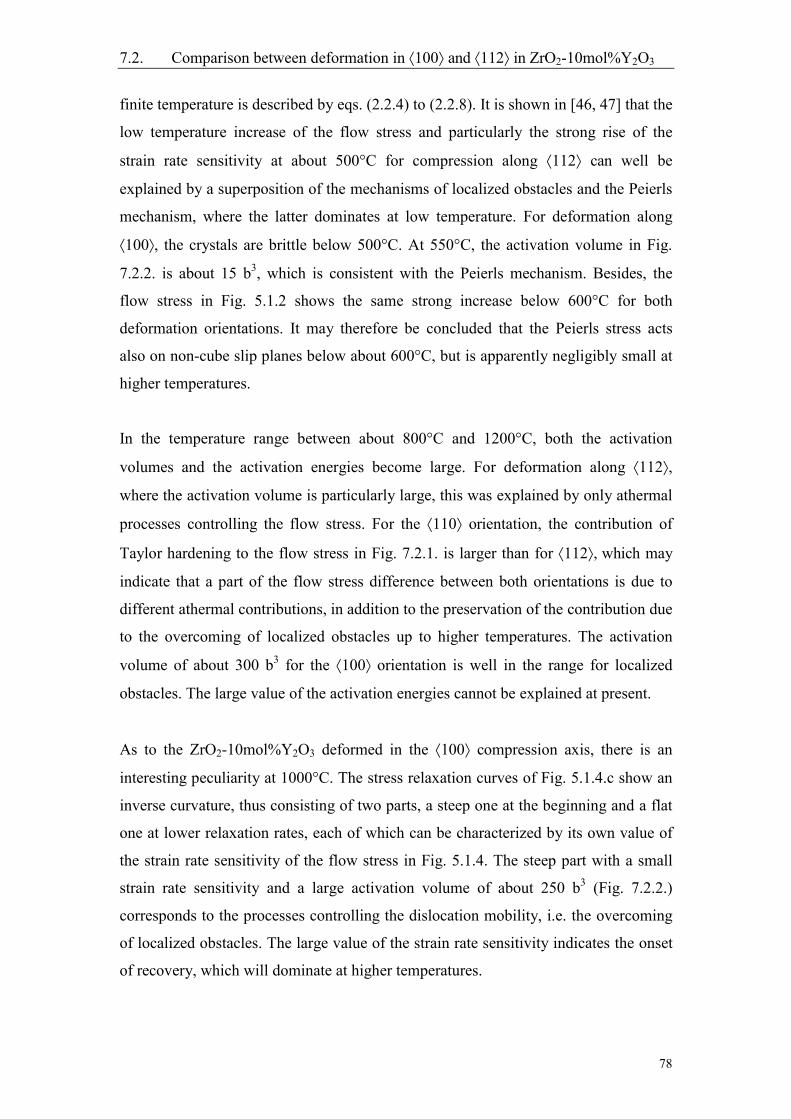
7.2. Comparison between deformation in 100 and 112 in ZrO2-10mol%Y2O3
78
finite temperature is described by eqs. (2.2.4) to (2.2.8). It is shown in [46, 47] that the
low temperature increase of the flow stress and particularly the strong rise of the
strain rate sensitivity at about 500°C for compression along 112 can well be
explained by a superposition of the mechanisms of localized obstacles and the Peierls
mechanism, where the latter dominates at low temperature. For deformation along
100, the crystals are brittle below 500°C. At 550°C, the activation volume in Fig.
7.2.2. is about 15 b3, which is consistent with the Peierls mechanism. Besides, the
flow stress in Fig. 5.1.2 shows the same strong increase below 600°C for both
deformation orientations. It may therefore be concluded that the Peierls stress acts
also on non-cube slip planes below about 600°C, but is apparently negligibly small at
higher temperatures.
In the temperature range between about 800°C and 1200°C, both the activation
volumes and the activation energies become large. For deformation along 112,
where the activation volume is particularly large, this was explained by only athermal
processes controlling the flow stress. For the 110 orientation, the contribution of
Taylor hardening to the flow stress in Fig. 7.2.1. is larger than for 112, which may
indicate that a part of the flow stress difference between both orientations is due to
different athermal contributions, in addition to the preservation of the contribution due
to the overcoming of localized obstacles up to higher temperatures. The activation
volume of about 300 b3 for the 100 orientation is well in the range for localized
obstacles. The large value of the activation energies cannot be explained at present.
As to the ZrO2-10mol%Y2O3 deformed in the 100 compression axis, there is an
interesting peculiarity at 1000°C. The stress relaxation curves of Fig. 5.1.4.c show an
inverse curvature, thus consisting of two parts, a steep one at the beginning and a flat
one at lower relaxation rates, each of which can be characterized by its own value of
the strain rate sensitivity of the flow stress in Fig. 5.1.4. The steep part with a small
strain rate sensitivity and a large activation volume of about 250 b3 (Fig. 7.2.2.)
corresponds to the processes controlling the dislocation mobility, i.e. the overcoming
of localized obstacles. The large value of the strain rate sensitivity indicates the onset
of recovery, which will dominate at higher temperatures.
7.2. Comparison between deformation in 100 and 112 in ZrO2-10mol%Y2O3
79
Above 1250°C, the dislocation density decreases rapidly and the athermal component
of the flow stress does the same, too. At 1400°C, both the total flow stresses in Fig.
5.1.2. and their Taylor components in Fig. 7.2.1. are the same for the 100 and 112
compression axes. At high temperatures, the deformation along 112 is strongly
influenced by recovery [26, 19, 17], which is also true for deformation along 100. In
this case, it is appropriate to express the strain rate sensitivity in terms of the stress
exponent m* defined by the eq. (2.3.5). It can be calculated from the strain rate
sensitivity r by
/rm* σ= (7.2.3)
The results are presented in Fig. 7.2.8. From 1200°C up to 1400°C, the stress
exponent decreases from around 15 down to 5. This agrees with recovery controlled
deformation, where m* should be around 4 (e.g. [92]). The activation energies are
about ∆G = 4.8eV and ∆F = 5.4 eV. If recovery controls the deformation, the
activation energy should be equal to the self-diffusion energy. In a binary material,
this should be the cation diffusion. The activation energy of Zr diffusion is found to
be in the range of 4.5 to 5.5 eV [32, 93, 94], thus well agreeing with the present
deformation data. The diffusion coefficient decreases with increasing yttria content
[95]. This should be one reason of the dependence of the flow stress on the yttria
Fig. 7.2.8. The stress exponent of ZrO2-10mol%Y2O3
deformed in 100 and 112 compression directions
1100 1200 1300 1400 15000
5
10
15
20
<100>, 10mol% yttria <112>, 10mol% yttria
m*
T [°C]
7.3. Dependence of the deformation parameters of c-ZrO2 on the yttria content
80
concentration at high temperatures [26]. The recovery type of deformation at high
temperatures is also expressed in the dislocation structure in Fig. 6.2.5. showing a
homogeneous distribution of dislocations.
7.3. Dependence of the deformation parameters of cubic zirconia on the
yttria content
In this chapter, the effect of the yttria content on the flow stress of cubic zirconia
single crystals will be discussed. As shown in Fig. 7.1.1., the flow stresses of the 15
and 20mol% materials in the 112 compression axis are higher than that of the
10mol% material, particularly at high temperatures. Besides, these flow stresses are
almost independent of the temperature in contrast to that of the 10mol% cubic
zirconia single crystals. On the other hand, the strain rate sensitivity of the flow stress
is virtually independent of the yttria concentration except at the highest experimental
temperature. In the early papers (e.g. [27]), the concentration dependence of the
deformation parameters is explained by solution hardening described in chapter 2.2.,
i.e. the direct interaction between dislocations and non-diffusing solutes where the
contribution to the flow stress depends on the solute concentration according to eq.
(2.2.15.). It is discussed for the first time in [26] that this direct influence of the
solutes cannot influence the flow stress at the high temperatures of the present
experiments. Part of the flow stress difference is certainly due to a different athermal
contributions owing to different dislocation densities. Unfortunately, reliable
dislocation density data are not available for the higher yttria concentrations.
An important issue in understanding the plastic deformation behavior of cubic
zirconia with higher yttria concentrations is the occurrence of plastic instabilities, i.e.
serrated flow stress region. This phenomenon was already observed in [16] for ZrO2
containing 18 and 20mol%Y2O3 deformed along 112. First, the present results given
in chapters 5.2. and 5.3. are briefly compared with those obtained in [16]. At 1400°C,
serrations take place at a strain rate of ~10-5 s-1 for the 20mol% material. This is also
the case in this work, although the corresponding flow stresses are different, being
almost 400 MPa in this work and about 300 MPa in [16]. Cubic zirconia stabilized
with 18mol% yttria did not yield a serrated region during an experiment done at
7.3. Dependence of the deformation parameters of c-ZrO2 on the yttria content
81
1400°C with 10-5 s-1 [16], and ZrO2-15mol%Y2O3 studied at the same strain rate and
temperature in this dissertation did not exhibit any serrations, either. With decreasing
temperature, the occurrence of plastic instabilities was observed both in [16] and in
this work for the 18 and 15mol% materials, respectively. According to the results of
the stress-birefringence and TEM experiments, the glide systems engaged in slip are
of the 100 type for both papers. In [16], it is stated that instabilities always occur if
the flow stress exceeds 300 MPa. This does not agree with the measurements of this
study at lower temperatures, where the deformation is stable again although the flow
stress is high (Fig. 5.3.3.). The stability limits in [16] correspond only to the high-
temperature stability border of this study.
In order to classify plastic instabilities, Estrin and Kubin [96] start by analyzing
changes of the flow stress of a specimen due to changes in the plastic strain and the
strain rate [97]
εεσ rdlndd pl. +Θ= (7.3.1)
where Θ is the work-hardening coefficient and r is the strain rate sensitivity. Linear
stability analysis leads then to the ensuing instability criterion
0r/)( <−Θ σ (7.3.2)
Thus, instabilities can either occur if the numerator becomes negative, which are
called h instabilities, or if r becomes negative, which are denominated strain rate-
softening or s instabilities. Since hardening coefficients of about 2 GPa are registered
for the 15mol% material, the numerator of eq. (7.3.2) is positive. In the middle of the
instability range at about 1000°C, the strain rate sensitivity assumes very small values
in Fig. 5.2.6., but remains positive, too, with all yttria contents. None the less, the
corresponding serrations are considered to be strain rate-softening instabilities, in
contrast to the conclusion in [16]. A recently refined theoretical analysis of the
stability conditions [97], which considers not only localization of slip in time but also
in space, shows that instabilities may occur, too, if the strain rate sensitivity is small
but still positive. In the theory, it is distinguished between the instantaneous strain rate
sensitivity ri, which originates from the strain rate sensitivity of the dislocation
mobility and is measured, e.g., at the beginning of stress relaxation tests, and a steady
state strain rate sensitivity rs, which results from changes in the dislocation structure
and appears only after some time or strain passes after such a test start. It is measured
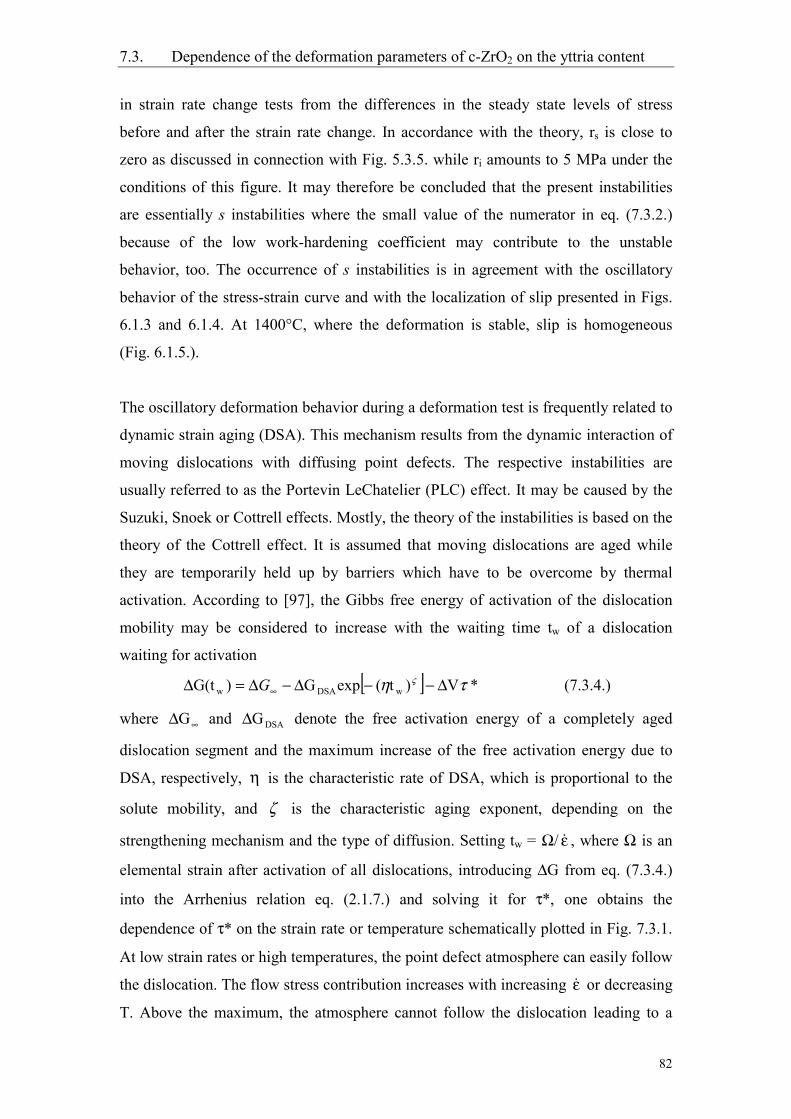
7.3. Dependence of the deformation parameters of c-ZrO2 on the yttria content
82
in strain rate change tests from the differences in the steady state levels of stress
before and after the strain rate change. In accordance with the theory, rs is close to
zero as discussed in connection with Fig. 5.3.5. while ri amounts to 5 MPa under the
conditions of this figure. It may therefore be concluded that the present instabilities
are essentially s instabilities where the small value of the numerator in eq. (7.3.2.)
because of the low work-hardening coefficient may contribute to the unstable
behavior, too. The occurrence of s instabilities is in agreement with the oscillatory
behavior of the stress-strain curve and with the localization of slip presented in Figs.
6.1.3 and 6.1.4. At 1400°C, where the deformation is stable, slip is homogeneous
(Fig. 6.1.5.).
The oscillatory deformation behavior during a deformation test is frequently related to
dynamic strain aging (DSA). This mechanism results from the dynamic interaction of
moving dislocations with diffusing point defects. The respective instabilities are
usually referred to as the Portevin LeChatelier (PLC) effect. It may be caused by the
Suzuki, Snoek or Cottrell effects. Mostly, the theory of the instabilities is based on the
theory of the Cottrell effect. It is assumed that moving dislocations are aged while
they are temporarily held up by barriers which have to be overcome by thermal
activation. According to [97], the Gibbs free energy of activation of the dislocation
mobility may be considered to increase with the waiting time tw of a dislocation
waiting for activation
[ ] *V)t(expG)G(t wDSAw τη ς ∆−−∆−∆=∆ ∞G (7.3.4.)
where ∞∆G and DSAG∆ denote the free activation energy of a completely aged
dislocation segment and the maximum increase of the free activation energy due to
DSA, respectively, η is the characteristic rate of DSA, which is proportional to the
solute mobility, and ζ is the characteristic aging exponent, depending on the
strengthening mechanism and the type of diffusion. Setting tw = Ω/ ε , where Ω is an
elemental strain after activation of all dislocations, introducing ∆G from eq. (7.3.4.)
into the Arrhenius relation eq. (2.1.7.) and solving it for τ*, one obtains the
dependence of τ* on the strain rate or temperature schematically plotted in Fig. 7.3.1.
At low strain rates or high temperatures, the point defect atmosphere can easily follow
the dislocation. The flow stress contribution increases with increasing ε or decreasing
T. Above the maximum, the atmosphere cannot follow the dislocation leading to a
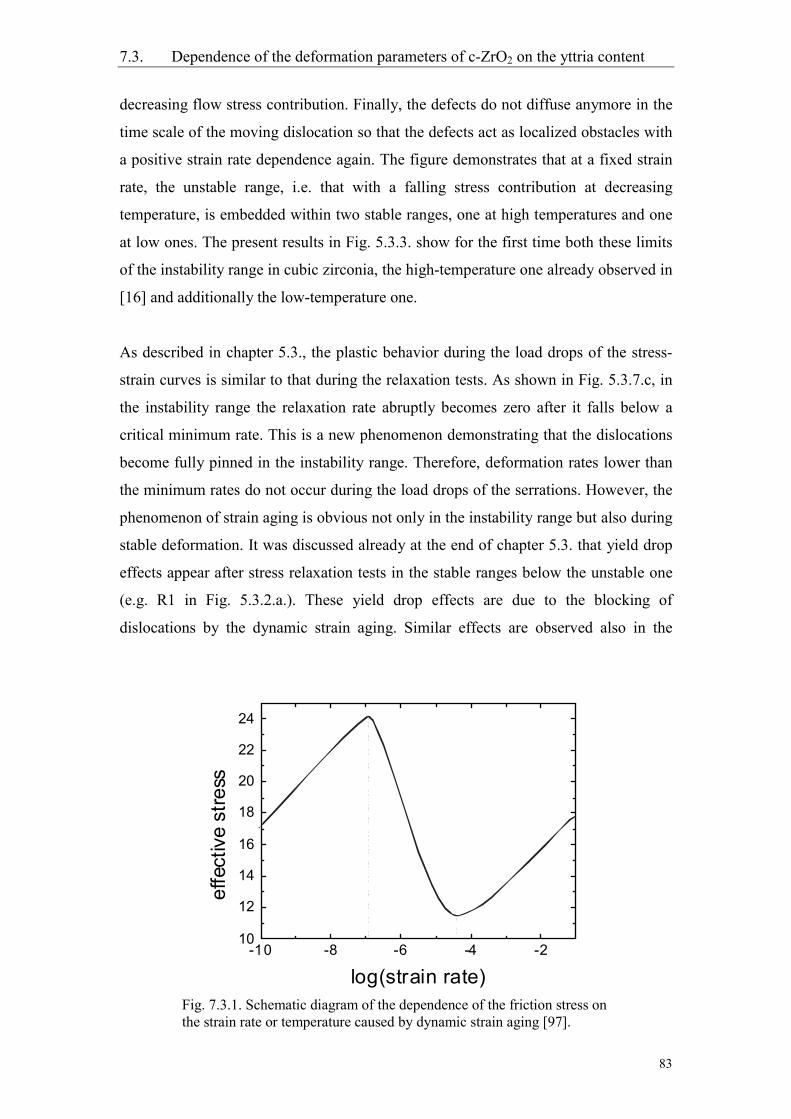
7.3. Dependence of the deformation parameters of c-ZrO2 on the yttria content
83
decreasing flow stress contribution. Finally, the defects do not diffuse anymore in the
time scale of the moving dislocation so that the defects act as localized obstacles with
a positive strain rate dependence again. The figure demonstrates that at a fixed strain
rate, the unstable range, i.e. that with a falling stress contribution at decreasing
temperature, is embedded within two stable ranges, one at high temperatures and one
at low ones. The present results in Fig. 5.3.3. show for the first time both these limits
of the instability range in cubic zirconia, the high-temperature one already observed in
[16] and additionally the low-temperature one.
As described in chapter 5.3., the plastic behavior during the load drops of the stress-
strain curves is similar to that during the relaxation tests. As shown in Fig. 5.3.7.c, in
the instability range the relaxation rate abruptly becomes zero after it falls below a
critical minimum rate. This is a new phenomenon demonstrating that the dislocations
become fully pinned in the instability range. Therefore, deformation rates lower than
the minimum rates do not occur during the load drops of the serrations. However, the
phenomenon of strain aging is obvious not only in the instability range but also during
stable deformation. It was discussed already at the end of chapter 5.3. that yield drop
effects appear after stress relaxation tests in the stable ranges below the unstable one
(e.g. R1 in Fig. 5.3.2.a.). These yield drop effects are due to the blocking of
dislocations by the dynamic strain aging. Similar effects are observed also in the
Fig. 7.3.1. Schematic diagram of the dependence of the friction stress onthe strain rate or temperature caused by dynamic strain aging [97].
-10 -8 -6 -4 -210
12
14
16
18
20
22
24
effe
ctiv
e st
ress
log(strain rate)
7.3. Dependence of the deformation parameters of c-ZrO2 on the yttria content
84
10mol% yttria material deformed in the 100 orientation in the whole range between
650°C and 1400°C, with a minimum at about 1000°C as discussed in connection with
Fig. 5.1.1. They are also observed in the 10mol% material during deformation along
112 at temperatures below 1000°C [21]. It is demonstrated there that the amplitude
of the yield drops increases with increasing aging time. The different kinds of
transient effects, which occur after changing the deformation conditions, point at the
occurrence of dynamic strain aging in all cubic zirconia materials. Strain aging is
connected with an additional contribution to the flow stress which has never been paid
attention to before. It may account for part of the difference in the flow stress between
the 10mol% material and the materials containing higher concentrations of yttria. In
intermetallic materials, similar diffusion processes in the dislocation cores may give
rise to a flow stress anomaly, i.e. an increasing flow stress at increasing temperature
(e.g. [100]). The constancy of the flow stress in the normalized diagram of Fig. 7.1.1.
of the 15 and 20mol% materials below the recovery range, i.e. the missing of the
usual decrease with increasing temperature, may be an expression of the flow stress
anomaly connected with the dynamic strain aging.
The activation energy of 2.7 eV obtained from the Arrhenius plot of the minimum
relaxation rates in Fig. 5.3.8. should correspond to the activation energy of the
diffusion of the responsible point defects. The occurrence of the instabilities is clearly
influenced by the yttria content of the materials. In this respect, one has to recall that
the incorporation of every two yttrium ions into ZrO2 necessitates the appearance of
an oxygen vacancy. The yttrium ions are substitutionally solved on zirconium sites.
At low temperatures, the oxygen vacancies tend to associate with the incorporated
yttrium ions to form elastic dipoles along 111, the stress-induced reorientation of
which gives rise to peaks of the internal friction [35, 31, 93]. However, these peaks
are below about 400°C so that this mechanism (induced Snoek effect) cannot be the
origin of the observed dynamic strain aging. Besides, direct segregation of oxygen
vacancies to dislocations can also not cause the strain aging since their mobility has
an activation energy of only about 1 eV [98]. Thus, most probably the yttrium ions
themselves are the diffusing species giving rise to the strain aging. The activation
energy of 2.7 eV from Fig. 5.3.8. is lower than the energy of yttrium diffusion of 4.4
7.3. Dependence of the deformation parameters of c-ZrO2 on the yttria content
85
eV [99]. This is probably due to the fact that the diffusion is of short-range character
restricted to a region close to the dislocation cores.
Near 1400°C, recovery also influence the deformation of the 15 and 20mol%
materials. Due to the strong dependence of the cation diffusion coefficient on the
yttria concentration [95], the recovery is reduced for the materials with a higher
concentration yielding a higher flow stress as discussed first in [26].
8. Conclusions
86
8. Conclusions
In the scope of this thesis, a thorough investigation of the plastic deformation of cubic
zirconia single crystals was done by compression experiments at a constant strain rate
including stress relaxation, strain rate cycling, and temperature cycling tests. For the
first time, the deformation behavior of ZrO2-10mol%Y2O3 along the 100
compression direction, as well as of ZrO2-15mol%Y2O3 and 20mol%Y2O3 along the
112 compression direction was studied in a wide temperature range between 1400°C
and the lowest temperatures possible above the brittle to ductile transition. The results
were compared with those obtained by other investigators who studied the
deformation behavior of ZrO2-10mol%Y2O3 along 112.
The microstructure of deformed specimens was studied by optical stress-birefringence
microscopy and by transmission electron microscopy in a high-voltage electron
microscope operating at 1 MeV. According to the stress-birefringence observations,
110 slip planes were activated in ZrO2-10mol%Y2O3 deformed along 100, where
the easy slip systems with 100 planes are out of stress. However, the transmission
electron micrographs are mostly consistent with 111 slip planes being engaged,
although some micrographs show clearly 110 slip planes, too. Since data of the
anisotropic elasticity theory were not available for deformation on 110 planes, the
interpretation of the deformation along the 100 compression axis was based on glide
on 111 planes.
The flow stress of ZrO2-10mol%Y2O3 deformed along 100 exceeds that along 112
at low and intermediate temperatures owing to the different slip planes activated in
these specimen orientations. The difference in the flow stresses decreases with
increasing temperature and vanishes at 1400°C. The processes which control the
plastic deformation of cubic zirconia deformed along 100 were identified according
to the activation parameters of deformation and the microstructural observations in the
TEM. The athermal stress component arising from Taylor hardening calculated from
the dislocation density is higher for the 111 planes with respect to the 100 planes
because of a stronger mutual interaction between parallel dislocations. Below 600°C,
the lattice friction (Peierls) mechanism acts in cubic zirconia deformed both in the
8. Conclusions
87
100 and 112 compression directions. This mechanism was concluded from the
high values of the strain rate sensitivity leading to small activation volumes in the
order of 15 b3. Above 600°C up to 1050°C, the thermally activated overcoming of
obstacles by the moving dislocations becomes dominating. Within this temperature
range, the activation volume increases up to about 300 b3 which, however, is smaller
than that for deformation along 112. In this temperature range, the dislocations bow
strongly out between the obstacles. The obstacle distances are between 200 and 500 b
yielding an activation distance of a fraction of b. The obstacles are probably small
precipitates containing nitrogen.
At 1000°C, the stress relaxation curves show an inverse curvature with two ranges of
a different strain rate sensitivity. This points to different dislocation mechanisms
responsible for the deformation behavior of cubic zirconia deformed in the 100
compression axis at different strain rates. One of the processes at high strain rates is
the thermally activated dislocation motion discussed above. Apparently, the other
mechanism is the onset of recovery where dislocations start to annihilate. The
recovery becomes the dominating thermally activated process at the highest
experimental temperature of 1400°C. In the recovery range, the stress exponent is
about 5 and the Gibbs free energy of activation equals the cation diffusion energy,
which is both consistent with recovery controlled high-temperature deformation.
The flow stresses of ZrO2-15mol%Y2O3 and 20mol%Y2O3 along 112 are higher
than that of ZrO2-10mol%Y2O3 and do almost not depend on the temperature.
Besides, a region of instabilities in the corresponding stress-strain curves occurs from
about 1000°C up to 1350°C at a strain rate of 10-5 s-1. For the first time, the lower
limit of the instability range was observed for cubic zirconia. The borders of the
instability range shift to higher temperatures with increasing strain rates. The
instabilites are explained on account of the Portevin LeChatelier effect caused by so-
called dynamic strain aging. This is a diffusional process in the dislocation cores
probably of the yttrium added in order to stabilize the cubic structure of zirconia. The
strain aging leads to complete locking of the dislocations below a temperature
depending deformation rate. The higher flow stress of the crystals with a higher yttria
content results from an additional contribution by the strain aging and, in the recovery
8. Conclusions
88
range, from suppressed recovery owing to the reduced diffusion coefficient by the
increased yttria concentration.
9.1. Literature
89
9.1. Literature
1. E.M. Logothetis, ZrO2 Oxygen Sensors in Automotive Applications, Advanced in
Ceramics, 3, 1981, p. 388.
2. Hans-Heinrich Möbius, On the History of Solid Electrolyte Fuel Cells, J Sol. St.
Electrochem., 1, 1997, pp.2-16.
3. 'Reaction-diffusion of fuel with air between planar solid oxide fuels cells stacked
with ceramic felt', 1996, R.C. Copcutt, A.C. King & K. Kendall, Proceedings of the
Royal Society A, 452, pp. 2639-2653.
4. B. Baufeld, Plastische Verformung von kubishen Zirkondioxid-Einkristallen bei
Temperaturen zwischen 400°C und 1400°C, Doctoral Thesis, Halle (Saale), 1996.
5. F.F. Lange, Transformation toughening. Part 3. Experimental observations in the
ZrO2-Y2O3, J. Mat. Sci., 17, 1982, pp. 240-246.
6. M. Rühle, Microcrack and Transformation Toughening of Zirconia-Containing
Alumina, Mat. Sci. and Eng. A 105/106, 1988, pp. 77-82.
7. A.V. Virkar, R.L.K. Matsumoto, Ferroelastic Domain Switching as a Toughening
Mechanism in Tetragonal Zirconia, J. Am. Ceram. Soc., 69, 1986, pp. 224-226.
8. B. Kerkwijk, E. Mulder, and H. Verweij, Zirconia-Alumina Ceramic Composites
with Extremely High Wear Resistance, Adv. Eng. Mater., 1, 1999, pp. 69-71.
9. A.H. Heuer, V. Lanteri, A. Dominguez-Rodriguez, High-Temperature Precipitation
Hardening Of Y2O3 Partially-Stabilized ZrO2 (Y-PSZ) Single Crystals, Acta metall.,
37, 1989, pp. 559-567.
10. A. Dominguez-Rodriguez and A.H. Heuer, Plastic Deformation of Y2O3 Stabilized
ZrO2 (YSZ) Single Crystals, Cryst. Latt. Def. and Amorph. Mat., 16, 1987, pp. 117-
123.
11. D.-S. Cheong and A.H. Heuer, High-temperature plastic deformation of Y2O3-
stabilized ZrO2 single crystals: Part I. The origin of the yield drop and associated
glide polygonization, Phil. Mag. A, 1989, 60, pp. 107-121.
12. D.-S. Cheong, A. Dominguez-Rodriguez and A.H. Heuer, High-temperature
plastic deformation of Y2O3-stabilized ZrO2 single crystals: Part II. Electron
microscopy studies of dislocation substructures, Phil Mag. A, 1989, 60,
pp. 123-138.
13. D.-S. Cheong, A. Dominguez-Rodriguez and A.H. Heuer, High-temperature plastic
deformation of Y2O3-stabilized ZrO2 single crystals: Part III. Variation in work
hardening between 1200 and 1500°C, Phil. Mag. A, Vol. 63, 3, pp. 377-388.
9.1. Literature
90
14. A. Dominguez-Rodriguez, D.-S. Cheong and A.H. Heuer, High-temperature plastic
deformation of Y2O3-stabilized ZrO2 single crystals: Part IV. The secondary slip
systems, Phil. Mag. A, 1991, 64, pp. 923-929.
15. Pascal Teracher, Proprietes Mecaniques de la Zircone Cubique Monocristalline:
Dislocations et Plasticite, Doctoral Thesis, France, 1990.
16. K. J. McClellan, A.H. Heuer and L.P. Kubin, Localized Yielding During High
Temperature Deformation of Y2O3-Fully-Stabilized Cubic ZrO2 Single Crystals,
Acta mater., 44, pp. 2651-2662.
17. U. Messerschmidt, B. Baufeld and D. Baither, Plastic Deformation of Cubic
Zirconia Single Crystals, Key Engineering Materials, Vols. 153-154, 1998,
pp. 143-182.
18. B. Baufeld, U. Messerschmidt, D. Baither, M. Bartsch, A. Foitzik, and M. Rühle,
Plastic Deformation of Zirconia Single Crystals by In Situ Straining Experiments in
an HVEM at 1150°C, Plastic Deformation of Ceramics, edited by R.C. Bradt,
C.A. Brooks, and J. Routbort, Plenum Press, New York and London 1995, p.43.
19. B. Baufeld, D. Baither, M. Bartsch, and U. Messerschmidt, Plastic Deformation of
Cubic Zirconia Single Crystals at 1400°C, phys. stat. sol. a, 166, 1998, pp. 127-153.
20. B. Baufeld, U. Messerschmidt, M. Bartsch and D. Baither, Plasticity of Cubic
Zirconia between 700°C and 1150°C observed by Macroscopic Compression and by
In Situ Tensile Straining Tests, Key Engineering Materials, 97-98, 1994, pp. 431-
436.
21. B. Baufeld, M. Bartsch, U. Messerschmidt and D. Baither, Plastic Deformation of
Cubic Zirconia at Temperatures between 1150 and 700°C, Acta metall. mater., 43,
pp. 1925-1993.
22. U. Messerschmidt, D. Baither, B. Baufeld, M. Bartsch, Plastic deformation of
zirconia single crystals: a review, Mat. Sci. Eng., A233, 1997, pp. 61-74.
23. A. Dominguez-Rodriguez, A.H. Heuer, J. Castaing, Dislocations and the mechanical
properties of stabilized ZrO2, Rad. Def. and Def. in Sol., 119-121, 1991, pp. 759-769.
24. D. Holmes, A.H. Heuer, P. Pirouz, Dislocation structures around Vickers indents in
9.4mol%Y2O3 - stabilized cubic ZrO2 single crystals, Phil. Mag. A, 67, 1993, pp.
325-342.
25. B.Ya. Farber, A.S. Chiarelli, A.H. Heuer, A dislocation mechanism of crack
nucleation in cubic zirconia single crystals, Phil. Mag. A, 70, 1994, pp. 201-217.
26. U. Messerschmidt, B. Baufeld, K.J. McClellan, A.H. Heuer, Stress relaxation and
solid solution hardening of cubic ZrO2 single crystals, Acta metall. mater., 43, 1995,
pp. 1917-1923.
9.1. Literature
91
27. A. Dominguez-Rodriguez, K.P.D. Lagerlöf, and A.H. Heuer, Plastic Deformation and
Solid-Solution Hardening of Y2O3-Stabilized ZrO2, J. Am. Ceram. Soc., 69, 1986,
pp. 281-284.
28. H.M. Kandil, J.D. Greiner, and J.F. Smith, Single-Crystal Constants of Yttria-
Stabilized Zirconia in the Range 20°C to 700°C, J. Am. Ceram. Soc., 67, 1984,
pp. 341-346.
29. H.G. Scott, Phase relationship in the yttria-rich part of the yttria-zirconia system, J.
Mat. Sci., 13, 1977, pp. 311-316.
30. M.L. Mecartney, W.T. Donlon, A.H. Heuer, Plastic deformation in CaO-stabilized
ZrO2 (CSZ), J. Mat. Sci., 15, 1980, pp. 1063-1065.
31. M. Weller, A. Lakki, Defects in Cubic Zirconia Studied by Mechanical Loss
Spectroscopy, Phys. Chem., 101, 1997, pp. 1297-1302.
32. M. Kilo, G. Borchardt, S. Weber, S. Scherrer, K. Tinschert, Zirconium and Calcium
Tracer Diffusion in Stabilized Cubic Zirconia, Ber. Bunsenges. Phys. Chem. 101,
1997, pp. 1361-1365.
33. N.H. Andersen, K. Clausen, M.A. Hackett, W. Hayes, M.T. Hutchings,
J.E. Macdonald, R. Osborn, The defect structure of yttria-stabilized zirconia, studied
by quasielastic diffuse neutron scattering, Physica 136B, 1986, pp. 315-317.
34. R. Osborn, N.H. Andersen, K. Clausen, M.A. Hackett, W. Hayes, M.T. Hutchings,
J.E. MacDonald, Neutron Scattering Investigations of the Defect Structure of Y2O3 -
stabilized ZrO2 and its dynamical behaviour at high temperatures, Mat. Sci. For., 7,
1986, pp. 55-62.
35. M. Weller, Atomic Defects in Yttria - and - Calcia - stabilized Zirconia, Z. Metallkd.
84, 1993, pp. 381-386.
36. H. G. Van Bueren, Imperfections in Crystals, North-Holland Publishing Company,
Amsterdam, 1961.
37. Schmidt, E. and W. Boas, Kristallplastizität, Springer, Berlin, 1935.
38. D. Hull and D.J. Bacon, Introduction to Dislocations, Pergamon, 1994.
39. G. Schoek, The Activation Energy of Dislocation Movement, phys. stat. sol. 8, 1965,
pp. 499-507.
40. A.G. Evans and R.D. Rawlings, The Thermally Activated Deformation of Crystalline
Materials, phys. stat. sol. 34, 1969, pp. 9-31.
41. G.B. Gibbs, The Thermodynamics of Creep Deformation, phys. stat. sol. 5, 1964,
pp. 693-695
42. G.B. Gibbs, The Thermodynamics of Thermally-Activated Dislocation Glide, phys.
stat. sol. 10, 1965, pp. 507-512.
9.1. Literature
92
43. G.B. Gibbs, The Activation Parameters for Dislocation Glide, 16, 1967, pp. 97-102.
44. J.P. Hirth, J. Lothe, Theory of Dislocations, McGraw-Hill, New York 1968,
45. T. Suzuki, S. Takeuchi, H. Yoshinaga, Dislocation Dynamics and Plasticity, Springer
Verlag, 1991.
46. B. Baufeld, B.V. Petukhov, M. Bartsch, U. Messerschmidt, Transition of Mechanism
Controlling the Dislocation Motion in Cubic ZrO2 below 700°C, Acta mater., 46,
1998, pp. 3077-3085.
47. B.V. Petukhov, M. Bartsch, U. Messerschmidt, Temperature dependence of the flow
stress and the strain rate sensitivity at the transition from the Peierls mechanism to
pinning by localized obstacles, Eur. Phys. J., AP 9, 2000, pp. 89-95.
48. A. Seeger, Dislocations, CNRS, Paris, 1984.
49. P. Haasen, Solution Hardening in f.c.c. Metals, in: Dislocations in Solids, Vol. 4, ed.
by F.R.N. Nabarro, North-Holland Publ., Amsterdam 1979, p. 155-260.
50. R. Labusch, A Statistical Theory of Solid Solution Hardening, phys. stat. sol. 41,
1970, pp. 659-669.
51. V. Gerold, Precipitation Hardening, in: Dislocations in Solids, 4, ed. by F.R.N.
Nabarro, North-Holland Publ., Amsterdam 1979, pp. 219-260.
52. J. Friedel, Dislocations, Pergamon, Oxford, 1964.
53. U. Messerschmidt, Lectures, Realstruktur und Festigkeit von Werkstoffen,
Halle/Saale, 1988.
54. L. V. Azarov, Introduction to Solids, McGraw-Hill Book Company Inc., 1960
55. M. Liu and B. Evans, Dislocation recovery kineticks in single-crystal calcite, J.
Geoph. Res., 102, 1997, pp. 24801-24809.
56. S. Takeuchi, A.S. Argon, Steady-state creep of a single-phase crystalline matter at
high temperature, J. Mat. Sci., 11, 1976, pp. 1542-1566.
57. P.P. Gillis, J.J. Gilman, Dynamical Dislocation Theory of Crystal Plasticity. I. The
Yield Stress, J. Appl. Phys., 36, pp. 3370-3380.
58. P.P. Gillis, J.J. Gilman, Dynamical Dislocation Theory of Crystal Plasticity. II. Easy
Glide and Strain Hardening, J. Appl. Phys., 36, pp. 3380-3386.
59. R.W. Cahn, P. Haasen, Physical Metallurgy, North-Holland Physics Publishing, part
II, 1983.
60. U.F. Kocks, Laws for Work-Hardening and Low Temperature Creep, J. Eng.
Mater. Technol., 98, 1976, pp. 76-85.
61. F. Guiu, P.L. Pratt, Stress Relaxation and the Plastic Deformation of Solids,
phys. stat. sol. 6, 1964, pp. 111-120.
9.1. Literature
93
62. U. Kocks, A. S. Argon, M. F. Ashby, Thermodynamics and Kinetics of Slip,
Pergamon Press, 1975.
63. K.J. McClellan, S.-Q. Xiao, K.P.D. Lagerhof and A.H. Heuer, Determination of the
Structure of the Cubic Phase in High-ZrO2 Y2O3-ZrO2 Alloys by CBED, Phil. Mag.
A, 70, 1994, 185.
64. H.G. Scott, Phase relationships in the zirconia-yttria system, J. Mat. Sci., 10, 1975,
pp. 1527-1535.
65. B. Ya. Farber, A.S. Chiarelli, and A.H. Heuer, Dislocation velocities in cubic
zirconia (ZrO2) single crystals, Phil. Mag. A, 72, 1995, pp. 59-80.
66. E.H. Kisi, C.J. Howard, Crystal Structures of Zirconia Phases and their Inter-
Relation, Zirconia Engineering Ceramics, edited Erich Kisi, Trans Tech Publications
LTD, 1998.
67. C.J. Howard, R.J. Hill, The polymorphs of zirconia: phase abundance and crystal
structure by Rietveld analysis of neutron and X-ray diffraction data,
J. Mat. Sci., 26, 1991, pp. 127-134.
68. P. Li, I-Wei Chen, J. E. Penner-Hahn, X-ray-absorption studies of zirconia
polymorphs. II. Effect of Y2O3 dopant on ZrO2 structure, Phys. Rev. B, 48, 1993,
pp. 10074-10081.
69. R.P. Ingel, D. Lewis III, Elastic Anisotropy in Zirconia Single Crystals, J. Am.
Ceram. Soc., 71, 1988, pp. 265-271
70. M. Hayakawa, H. Miyauchi, A. Ikegami, M. Nishida, Elastic Constants of Zirconia
Single Crystals Determined by X-ray Measurements for Polycrystals, Mat. Trans.,
JIM, 39, 1998, pp. 268-274.
71. P.J. Botha, J.C.H. Chiang, J.D. Comins, P.M. Mjwara, P.E. Ngoepe, Behavior of
elastic constants, refractive index, and lattice parameter of cubic zirconia at high
temperatures, J. Appl. Phys. 73, 1993, pp. 7268-7274.
72. W.M. Sherry, J.B. Vander Sande, TEM investigation of the plastic deformation
behaviour of calcium fluorite, Phil. Mag. A, 40, 1979, pp. 77-95.
73. R.J. Keller, T.E. Mitchell, A.H. Heuer, Plastic deformation in nonstoichiometric
UO2+x single crystals - I. Deformation at low temperatures, Acta metall. 36, 1988, pp.
1061-1071.
74. A.G. Evans and P.L. Pratt, Dislocations in the Fluorite Structure, Phil. Mag., 31,
1969, pp. 1213-1237.
75. D. Gomez-Garcia, J. Martinez-Fernandez, A. Dominguez-Rodriguez, P. Eveno,
J. Castaing, Deformation Mechanisms for High-Temperature Creep of High Yttria
Content Stabilized Zirconia Single Crystals, Acta mater., 44, 1996, pp. 991-999.
9.1. Literature
94
76. D. Gomez-Garcia, J. Martinez-Fernandez, A. Dominguez-Rodriguez, J. Castaing,
Mechanisms of High-Temperature Creep of Fully Stabilized Zirconia Single
Crystals as a function of the Yttria Content, J. Am. Ceram. Soc., 80, 1997, pp. 1668-
1672.
77. J. Martinez-Fernandez, M. Jimenez-Melendo, A. Dominguez-Rodriguez,
A. H. Heuer, High-Temperature Creep of Yttria Stabilized Zirconia Single Crystals,
J. Am. Cer. Soc., 73, 1990, pp. 2452-2456.
78. P. Teracher, H. Garem and J. Rabier, Dislocation mobilities and plastic deformation
of ZrO2 single crystals, Strength of Metals and Alloys, ed. by D.G. Brandon, R.
Chaim and A. Rosen, Freund Publs. London 1991, p. 217 223.
79. D. Gomez-Garcia, J. Martinez-Fernandez, A. Dominguez-Rodriguez,
K.H. Westmacott, Zirconium Nitride Precipitation in Nominally Pure Yttria-
Stabilized Zirconia, J. Am. Ceram. Soc., 79, 1996, pp. 487-490.
80. D. Gomez-Garcia, J. Martinez- Fernandez, A.Dominguez-Rodriguez,
K.H. Westmacott, On the influence of heat behaviour of yttria fully stabilized single
crystals, Phil. Mag. A, 79, 1999, pp. 1839-1852.
81. D. Gomez-Garcia, J. Martinez-Fernandez, A. Dominguez-Rodriguez,
K.H. Westmacott, On the nature of electron-beam induced loop formation on
dislocations in yttria fully-stabilized zirconia, Phil. Mag. A, 73, 1996, p. 681.
82. Instron, Instron Model 8500, Instructions for use, Issues A, B, C, 1990, 1993, 1995.
83. National Instruments, NI-488.2 Software Reference Manual for MS-DOS,
320282-01, March 1992.
84. Severn Furnaces Limited, Operating Instr., Furnace Model MDS 1003, Control
System CU 1003.
85. Electron Microscope JEM 1000, Instruction Manual, JEOL CO., LTD.
86. M. von Heimendahl, Electron Microscopy of Materials, Academic Press, 1980.
87. Direct observation of imperfections in crystals, ed. by J.B. Newkirk, J.H. Wernick,
Interscience Publishers, 1962.
88. T.J. Marrow, S.G. Roberts & A.K. Pearce-Higgings, The Brittle/Ductile Transition in
Cubic Stabilized Zirconia, J. Europ. Ceram. Soc., 14, 1994, pp. 447-453.
89. J. Lankford, Deformation and fracture of yttria-stabilized zirconia single crystals, J.
Mater. Sci., 21, 1986, pp. 1981-1989.
90. D. Baither, B. Baufeld, U. Messerschmidt, M. Bartsch, HVEM high-temperature in
situ straining experiments on cubic zirconia single crystals, Mat. Sci. Eng. A 233,
1997, pp. 75-87.
9.1. Literature
95
91. F. Appel M. Bartsch, U. Messerschmidt, E.M. Nadgornyi, S.N. Valkovskii,
Dislocation Motion and Plasticity in MgO Single Crystals, Phys. Status Solidi A 83,
1984, pp. 179-194.
92. W.R. Cannon, T.G. Langdon, Creep of ceramics, Part 1, Mechanical characteristics,
J. Mater. Sci. 18, 1983, p. 1-50.
93. A. Lakki, R. Herzog, M. Weller, H. Schubert, C. Reetz, O. Görke, M. Kilo, G.
Borchardt, Mechanical loss, creep, diffusion and ionic conductivity of ZrO2-
8mol%Y2O3 polycrystals, J. Ecers 20 (2000), pp. 285-296.
94. M. Kilo, C. Funderberger, G. Borchardt, R. Herzog, A. Lakki, M. Weller, S. Weber,
S. Scherrer, Oxygen and host cation transport in yttria stabilized zirconia, subm. To
J. Am. Ceram. Soc.
95. F.R. Chien and A.H. Heuer, Lattice diffusion kinetics in Y2O3-stabilized cubic ZrO2
single crystals: a dislocation loop annealing study, Phil. Mag. A, 73, 1996, pp. 681-
697.
96. L.P. Kubin and Y. Estrin, Evolution of Dislocation Densities and the Critical
Conditions for the Portevin-Le Chatelier Effect, Acta metall. Mater., 38, 1990, pp.
697-708
97. M. Zaiser, P. Hähner, Oscillatory Modes Of Plastic Deformation: Theoretical
Concepts, Phys. Stat. Sol. (b) 199, 1997, p. 267.
98. Y. Oishi and K. Ando, Oxygen self-diffusion in cubic ZrO2 solid solutions, Transport
in Nonstoichiometric Compounds, ed. by G. Simkovic and V.S. Stubican, Plenum
Publ., 1985, p. 189
99. Y. Oishi, K. Ando and Y. Sakka, Lattice and grain-boundary diffusion coefficients of
cations in stabilized zirconias, Advances in Ceramics (edited by M.F. Yang and A.H.
Heuer), 7, 1989, p. 208
100. U. Messerschmidt, M. Bartsch, S. Guder, D. Häussler, Dislocation Dynamics During
the Deformation of Intermetallic Alloys and the Flow Stress Anomaly, Mat. Res.
Soc. Symp. Proc. Vol. 552, 1999.
9.2. List of figures
96
9.2. The list of figures
Fig. 2.1.1.: Definition of the orientation factor 3
Fig. 2.1.2.: The resisting force fr versus distance x for thermal barriers 5
that oppose dislocation motion
Fig. 2.2.1.: A kink moving with a velocity υ k under an applied stress 8
Fig. 2.2.2.: Interaction of a dislocation with a row of obstacles 10
Fig. 2.2.3.: Dislocation in a field of point obstacles 11
Fig. 2.2.4.: Interaction between two screw dislocations 11
Fig. 2.2.5.: Schematic display for estimating recovery and work-hardening rates 13
Fig. 2.3.1.: Schematic representation of the yield point effect 14
Fig. 3.1.1.: Phase diagram of the ZrO2-Y2O3 system 17
Fig. 3.1.2.: Ideal cubic zirconia elementary cell 17
Fig. 3.1.3.: Schematic illustration of three models for cation-oxygen vacancy 18
association in cubic zirconia stabilized with yttrium oxide
Fig. 3.1.4.: Elastic constants of cubic zirconia single crystals 19
at different yttria concentrations and temperatures up to 700°C
Fig. 3.1.5.: Elastic constants of c-ZrO2 at two concentrations 19
of yttria and different temperatures
Fig. 3.2.1.: Slip systems of cubic zirconia single crystals 21
deformed along 112 axis
Fig. 3.2.2.: Slip systems of cubic zirconia single crystals 22
deformed along 100 axis
Fig. 3.2.3.: Stress-strain curves of ZrO2-10mol%Y2O3 25
Fig. 3.2.4.: Temperature dependence of the strain rate sensitivity 25
of ZrO2-10mol%Y2O3 in 112
Fig. 3.2.5.: Dislocation density in the 0011/2110 slip system 26
versus temperature
Fig. 4.1.1.: Single-screw testing machine Instron 8562 31
Fig. 4.1.2.: The location of a sample during a compression test in Instron 8562 31
Fig. 4.3.1.: The basics of electron diffraction 34
Fig. 4.3.2.: A scheme on the relation between real and reciprocal space 35
Fig. 5.1.1.: Stress-strain curves of ZrO2-10mol%Y2O3 38
deformed in the 100 compression direction
Fig. 5.1.2.: Temperature dependence of the flow stress of c-ZrO2 40
stabilized with 10mol%Y2O3 along 100 and 112 axes
9.2. List of figures
97
Fig. 5.1.3.: Temperature sensitivity of the flow stress T/∆∆σ 41
of ZrO2-10mol%Y2O3 along the 100 and 112 axes
Fig. 5.1.4.: Typical stress relaxation curves during compression experiments 43
on ZrO2-10mol%Y2O3 deformed in 100.
Fig. 5.1.5.: Strain rate sensitivity of ZrO2-10 mol%Y2O3 44
Fig. 5.2.1.: Stress-strain curves of ZrO2-15mol%Y2O3 45
deformed in the 112 compression direction
Fig. 5.2.2.: Stress-strain curves of the ZrO2-20mol%Y2O3 46
deformed in the 112 compression axis
Fig. 5.2.3.: Temperature dependence of the flow stress 47
of ZrO2-15 and 20mol%Y2O3 deformed in 112
versus that of ZrO2-10mol%Y2O3
Fig. 5.2.4.: The temperature sensitivity of the flow stress 48
of ZrO2-15 and 20mol%Y2O3 deformed in 112
versus that of ZrO2-10mol%Y2O3
Fig. 5.2.5.: Typical relaxation curves during compression experiments 49
on the ZrO2-15mol%Y2O3 in 112. The plastic strain is near 1 %.
Fig. 5.2.6.: Strain rate sensitivity of ZrO2-15 and 20mol%Y2O3 50
Fig. 5.3.1.: Stress-strain curve of ZrO2-15mol%Y2O3 51
deformed in 112 from 1300°C to 800°C
Fig. 5.3.2.: Parts of the stress-strain curves of ZrO2-15mol%Y2O3 51
deformed in 112; a: 800°C, b: 1300°C.
Fig. 5.3.3.: The temperature and strain rate effects 52
on the amplitude of the plastic instabilities
in ZrO2-15mol%Y2O3 deformed in 112
Fig. 5.3.4.: The temperature effect of the shape of the stress-strain curves 53
in ZrO2-15mol%Y2O3 deformed in 112
Fig. 5.3.5.: The effect of the strain rate on the serrations in 53
ZrO2-20mol%Y2O3 deformed in 112 at 1400°C
Fig. 5.3.6.: Dynamic deformation behavior of the stress drops 54
of plastic instabilities in ZrO215mol%Y2O3
deformed in 112 in comparison with that during stress relaxation tests
Fig. 5.3.7. The relaxational behavior of the stable deformation versus 55
that of the instabilities in ZrO2-15mol%Y2O3 deformed in 112
Fig. 5.3.8. Arrhenius plot of the maximum relaxation rates 56
in ZrO2-15mol%Y2O3 deformed in 112
9.2. List of figures
98
Fig. 6.1.1.: Stress-birefringence patterns of ZrO2-10mol%Y2O3 58
deformed along 100 at 1100°C with -15 s 10−=ε till % 5.2=ε ;
( 010 ) and ( 001 ) observation planes, respectively
Fig. 6.1.2.: Stress-birefringence patterns of ZrO2-10mol%Y2O3 59
deformed along 100 at 1400°C with -15 s10−=ε till % 8.2=ε ;
( 001 ) and ( 010 ) observation planes, respectively
Fig. 6.1.3.: Stress-birefringence patterns of ZrO2-15mol%Y2O3 60
deformed in 112 at 1000°C with -15 s10−=ε till % 5.1=ε ;
(110 ) and (111) observation planes, respectively
Fig. 6.1.4.: Stress-birefringence patterns of ZrO2-15mol%Y2O3 60
deformed in 112 at 1200°C with -15 s 10−=ε till % 8.1=ε ;
(110 ) and (111) observation planes, respectively
Fig. 6.1.5.: Stress-birefringence patterns of ZrO2-15mol%Y2O3 61
deformed in 112 at 1400°C with -15 s 10−=ε till % 5.3=ε ;
(110 ) and (111) observation planes, respectively
Fig. 6.2.1.: Microstructure of ZrO2-10mol%Y2O3 deformed along 100 62
at 700°C till % 3.1=ε , shown with the [ 020 ] g -vector at [ 001] pole
Fig. 6.2.2.: Microstructure of ZrO2-10mol%Y2O3 deformed along 100 63
at 800°C till % 1.1=ε , shown with different diffraction vectors
at the [ 001] zone axis. a: g = [ 200 ], b: g = [ 020 ],
c: g = [ 022 ], d: g = [ 220 ].
Fig. 6.2.3.: Dislocation structure of ZrO2-10mol%Y2O3 64
deformed along 100 at 900°C till % 2.2=ε ,
shown with the [ 220 ] g -vector at [ 001] zone axis
Fig. 6.2.4.: The microstructure of ZrO2-10mol%Y2O3 64
deformed along 100 at 1050°C till %1.2=ε ,
shown with two different diffraction vectors with the [100 ] pole.
a: g = [ 200 ], b: g = [ 022 ].
Fig. 6.2.5.: The microstructure of ZrO2-10mol%Y2O3 65
deformed along 100 at 1300°C and 1400°C till % 8.2=ε ,
shown with g = [ 200 ]
Fig. 6.2.6.: Dislocation density of ZrO2-10mol%Y2O3 deformed in 100 66
as a function of temperature
9.2. List of figures
99
Fig. 6.2.7.: Dislocation segment length of ZrO2-10mol%Y2O3 66
deformed in 100 as a function of temperature
Fig. 6.2.8.: The microstructure of ZrO2-15mol%Y2O3 67
deformed along 100 at 1400°C till % 8.1=ε ,
shown with g = [ 200 ]
Fig. 7.1.1.: The dimensionless stress σ/Ks of cubic zirconia 69
(screw dislocations) stabilized with different contents of yttria
and deformed along 100 and 112 versus temperature
Fig. 7.2.1.: The Taylor hardening contribution pτ 71
of the athermal component of flow stress iτ of ZrO2-10mol%Y2O3
deformed along 100 and 112 versus temperature
Fig. 7.2.2.: The logarithm of the activation volume V∆ 73
of cubic zirconia single crystals stabilized with
different contents of yttria and deformed in two different axes versus
Fig. 7.2.3.: The activation enthalpy of cubic zirconia 74
stabilized with different concentrations of yttria and deformed along 100
and 112 Fig. 7.2.4.: Gibbs free energy of activation for ZrO2-10mol%Y2O3 74
as a function of temperature
Fig. 7.2.5.: The effective stress of ZrO2-10mol%Y2O3 75
deformed along 100 and 112
Fig. 7.2.6.: The work term of ZrO2-10mol%Y2O3 76
deformed in 100 and 112 compression directions
Fig. 7.2.7.: Helmholtz free energy of activation for ZrO2-10mol%Y2O3 76
as a function of temperature
Fig. 7.2.8.: The stress exponent of ZrO2-10mol%Y2O3 79
deformed in 100 and 112 compression directions
Fig. 7.3.1.: Schematic diagram of the dependence of the friction stress 83
on the strain rate or temperature caused by dynamic strain aging

9.3. List of abbreviations
100
9.3. Abbreviationsa interplanar distance
Ao plane of applied compressive force
A sl. slip plane
A sample cross-section
b Burgers vector
b absolute value of the Burgers vector
c atomic fraction of foreign atoms
ck concentration of kinks
C44, C11, C12 elastic constants
CRSS critical resolved shear stress
d shortest repeat distance along the dislocation line
d direction of compression axis
dsl distance between two slip planes
Dk diffusion coefficient of the drift of kinks
D diameter of an obstacle
E Young modulus
∆F Helmholtz free activation energy
∆Fk kink formation energy
fc compressive force
fb force acting along the Burgers vector of a dislocation
rf resisting force that thermally activated obstacles exert on a dislocation line
fmax maximum resisting force
fint local interaction force
fpin pinning force exerted by each particle on a dislocation
fm maximum force that can be sustained by a particle
fx interaction force between two parallel dislocations
fpm dimensionless maximum interaction force between two parallel dislocationsg vector of the reciprocal lattice (diffraction vector)
∆G Gibbs free energy of activation
∞∆G the activation energy of a completely aged dislocation segment
DSAG∆ maximum increase of the free activation energy on account of DSA
∆H activation enthalpy
9.3. List of abbreviations
101
h kink height
j strain recording value of the deformation machine
κ forward distance of a dislocation after a successful activation
k Boltzman constant
sK energetical coefficient
l obstacle spacing along the dislocation line
sl dislocation segment length (equals to the obstacle spacing along the
dislocation line, i.e. to l)
dl dislocation line length
L distance between sample and photographic plate (camera length)
m the number of cusps occurring along the dislocation line
m* stress exponent
ms orientation factorn slip plane normal
N number of intersections of dislocation lines and orthogonal grid lines
po sample initial length
P grid line length (dislocation density determination)
R distance on the photographic plate between the transmitted beam and a
diffraction spotR diffraction spot position vector
r strain rate sensitivity of the flow stress
ri instantaneous strain rate sensitivity
rs steady state strain rate sensitivity
∆S activation entropy
t time
tw aging (waiting) time
T temperature
fr.U Peierls energy
∆U change of internal energy
∆V * activation volume
v velocity of moving dislocations
∆W work term
x displacement of dislocations
∆x activation distance
9.3. List of abbreviations
102
y minimum spacing between two parallel slip planes
Υrec recovery rate
α numerical constant
ß Bragg angle
Γ line tension
ε st steady strain rate
ε total macroscopic strain
ε el. macroscopic elastic strain
ε pl. macroscopic plastic strain
ε total macroscopic strain rate
ε pl. macroscopic plastic strain rate
ε el. macroscopic elastic strain rate
ε o pre-exponential factor of the Arrhenius plastic strain rate equation
ζ characteristic aging exponent
Θ work-hardening coefficient
ϑ dislocation radius of curvature
η characteristic rate of DSA
λ electron wave length
µ shear modulus
ν Poisson’s ratio
ρ m mobile dislocation density
ρ total dislocation density
σ up. flow stress of the upper yield point
σ l. flow stress of the lower yield point
σ applied stress
τ c critical resolved shear stress
τ resolved shear stress
τ * thermal component of the shear stress (effective stress)
τ i athermal component of the shear stress
pτ stress resulting from the long-range interaction between parallel dislocations
(Taylor hardening stress)
bτ back stress of bowed-out dislocation segments
9.3. List of abbreviations
103
fr.τ lattice friction stress (Peierls stress)
υk
kink velocity
υ velocity of a kinked dislocation
ψ bending angle
χ frequency of dislocation oscillation
Ω elemental strain after all dislocations are activated
9.4. Curriculum vitae
104
9.4. Curriculum vitae
April 1, 1974 born in Kiev, Ukraine
09/81 – 06/91 Shevchenko Secondary School, Kiev, Ukraine
09/91 – 06/96 National Shevchenko University, Kiev, Ukraine
06/94 internship in the Institute of Material Science, Kiew, Ukraine
09/95 – 05/96 diploma project “Fractogrphy of fracture surfaces of silicon
nitride (Si3N4)” in the Institute of Material Science, Kiev,
Ukraine
Master of Science, Physics
11/96 entering the doctoral studentship in the Institute of Material
Science
03/98 Ph.D. student in the workgroup of Prof. U. Messerschmidt in
Max Planck Institute of Microstructure Physics in the
framework of the Graduiertenkolleg 415
“Defektstrukturbestimmte physikalische Eigenschaften,”
Martin-Luther-Universität, Halle-Wittenberg
9.5. Sincerity statement
105
9.5. Sincerity statement
I hereby assure that the submitted dissertation:
Plastic deformation of cubic zirconia single crystals: the influence of
the orientation of compression axis and yttria stabilizer content
is composed by myself alone, and that all the indicated references are rightly and truly
stated. In this dissertation, no other scientific papers were quoted.
Alexander Tikhonovsky
Halle, 07 February, 2001
9.6. Acknowledgements
106
9.6. Acknowledgements
I hereby express my gratefulness to my scientific supervisor Prof. U. Messerschmidt
for his numerous suggestions and voluminous clarifications as to the content and style
of my doctoral thesis. Besides, I am thankful to Dr. M. Bartsch whose in-depth
explanations were indispensable for me to comprehend the principles of dislocation
plasticity of solids.
This doctoral dissertation was funded by Deutsche Forschunggemeinschaft through
the Graduiertenkolleg 415 “Defektstrukturbestimmte physikalische Eigenschaften,”
Martin-Luther-Universität, Halle-Wittenberg.
I appreciate the assistance of Dr. B. Baufeld, whose briefing and encouraging
facilitated my performing of this thesis.
I am grateful to Mr. C. Dietzsch and Mr. W. Greie for beautiful maintenance of the
High-Voltage Electron Microscope JEM 1000, owing to which a big part of this thesis
was successfully done.
Finally, I am thankful to friendly scientific collaborators and managers of the Max
Planck Institute of Microstructure Physics who contributed to my performance within
the scope of my work. I also highly esteem the help of the people of city Halle/Saale –
I would have never coped with my work alone.