Plate Lines Reduce Lifetime of Wake Vortices During Final ...
18
American Institute of Aeronautics and Astronautics 1 Plate Lines Reduce Lifetime of Wake Vortices During Final Approach to Vienna Airport Frank Holzäpfel * , Anton Stephan, Grigory Rotshteyn Institut für Physik der Atmosphäre, Deutsches Zentrum für Luft- und Raumfahrt, 82234 Oberpfaffenhofen, Germany To mitigate the risk of wake vortex encounters during final approach, so-called plate lines have been developed. Wake vortices generated by landing aircraft induce secondary vortices at the plates’ surfaces that approach the primary vortices and trigger prema ture wake vortex decay. Each plate line consists of several upright plates that are installed underneath the approach glide path. While the plate line extends perpendicular to the flight direction, its individual plates are oriented in parallel to the runway centerline. In order to obtain the approval of the authorities for the installation of the plate lines at runway 16 of Vienna International Airport, the plate design had to comply with airport requirements like obstacle clearance, stability, and frangibility. During a six-month campaign wake vortex behavior with and without plates was measured simultaneously by three lidars completed by a comprehensive suite of meteorological instrumentation. A preliminary analysis of 430 measured wake vortex evolutions indicates that the plate lines reduce the lifetime of long- lived vortices in a safety corridor along the final approach on average by more than 30%. More comprehensive analyses are underway and will be presented at the AVIATION Forum 2020 in Reno. I. Introduction S an unavoidable consequence of lift, every flying vehicle generates counter-rotating regions of turbulence known as wake vortices 1 . Wake vortices represent a potential threat to following air traffic. Aircraft must therefore keep to a predetermined minimum separation distance. These aircraft separations limit the capacity of congested airports in a rapidly growing aeronautical environment. The most likely economic scenario for the future European airport demand indicates that there will be around 1.5 million unaccommodated flights in 2040, constituting approximately 8% of the expected demand 2 . Such a lack of capacity could mean 160 million passengers would not be able to travel with a potential economic loss of around € 88 billion to the European economy. In the recent years wake turbulence separations have been readjusted for new aircraft types, new arrival procedures, and modified aircraft weight categories. Whereas an unprecedented test program including many different phases of flight was accomplished for the determination of appropriate separation standards of the A380, most other new developments focused mainly on wake vortex evolution in ground proximity. The B747-8 lidar measurement program conducted wake measurements at one wing span above ground, because this altitude was considered the most hazardous scenario 7 . Also the lidar measurements employed for the development of the time-based separations procedures at London Heathrow airport focused on the same flight altitude. The time-based separations concept helps to maintain landing rates in strong headwinds by adjusting aircraft separations according to the current headwind strength 8 . The rationale for this substantial constraint is that most encounters occur at flight altitudes below 300 ft (see Refs. 3, 4). In ground proximity vortex descent is restricted and the vortices tend to rebound due to the interaction with the ground surface. Weak crosswinds may compensate the self-induced lateral propagation of the upwind vortex, such that it may hover over the runway directly in the flight path of the following aircraft 5 . As a consequence aircraft experience wake vortex encounters time after time, even under adherence to separation standards 6 . During final approach, pilots usually respond to encounters by initiating go-arounds, since their options to counteract the imposed rolling moment and re-stabilize the approach are restricted at low heights above ground. The same flight height restriction applies to the aircraft wake turbulence re-categorization initiative (RECAT) of ICAO. RECAT Phase 1 classifies aircraft types into six categories considering besides the weight the approach speed, wing characteristics and in parts also the rolling moment exerted on following aircraft. RECAT-1 has been implemented in November 2012 at Memphis airport 9 , followed by numerous other US airports. The new European * Senior Scientist, [email protected], Associate Fellow AIAA A Downloaded by Frank Holzäpfel on January 5, 2020 | http://arc.aiaa.org | DOI: 10.2514/6.2020-0050 AIAA Scitech 2020 Forum 6-10 January 2020, Orlando, FL 10.2514/6.2020-0050 Copyright © 2020 by Frank Holzäpfel. Published by the American Institute of Aeronautics and Astronautics, Inc., with permission. AIAA SciTech Forum
Transcript of Plate Lines Reduce Lifetime of Wake Vortices During Final ...
American Institute of Aeronautics and Astronautics
1
Plate Lines Reduce Lifetime of Wake Vortices
During Final Approach to Vienna Airport Frank Holzäpfel
*, Anton Stephan, Grigory Rotshteyn
Institut für Physik der Atmosphäre, Deutsches Zentrum für Luft- und Raumfahrt,
82234 Oberpfaffenhofen, Germany
To mitigate the risk of wake vortex encounters during final approach, so-called plate
lines have been developed. Wake vortices generated by landing aircraft induce secondary
vortices at the plates’ surfaces that approach the primary vortices and trigger premature
wake vortex decay. Each plate line consists of several upright plates that are installed
underneath the approach glide path. While the plate line extends perpendicular to the flight
direction, its individual plates are oriented in parallel to the runway centerline. In order to
obtain the approval of the authorities for the installation of the plate lines at runway 16 of
Vienna International Airport, the plate design had to comply with airport requirements like
obstacle clearance, stability, and frangibility. During a six-month campaign wake vortex
behavior with and without plates was measured simultaneously by three lidars completed by
a comprehensive suite of meteorological instrumentation. A preliminary analysis of 430
measured wake vortex evolutions indicates that the plate lines reduce the lifetime of long-
lived vortices in a safety corridor along the final approach on average by more than 30%.
More comprehensive analyses are underway and will be presented at the AVIATION Forum
2020 in Reno.
I. Introduction
S an unavoidable consequence of lift, every flying vehicle generates counter-rotating regions of turbulence
known as wake vortices1. Wake vortices represent a potential threat to following air traffic. Aircraft must
therefore keep to a predetermined minimum separation distance. These aircraft separations limit the capacity of
congested airports in a rapidly growing aeronautical environment. The most likely economic scenario for the future
European airport demand indicates that there will be around 1.5 million unaccommodated flights in 2040,
constituting approximately 8% of the expected demand2. Such a lack of capacity could mean 160 million passengers
would not be able to travel with a potential economic loss of around € 88 billion to the European economy.
In the recent years wake turbulence separations have been readjusted for new aircraft types, new arrival
procedures, and modified aircraft weight categories. Whereas an unprecedented test program including many
different phases of flight was accomplished for the determination of appropriate separation standards of the A380,
most other new developments focused mainly on wake vortex evolution in ground proximity.
The B747-8 lidar measurement program conducted wake measurements at one wing span above ground, because
this altitude was considered the most hazardous scenario7. Also the lidar measurements employed for the
development of the time-based separations procedures at London Heathrow airport focused on the same flight
altitude. The time-based separations concept helps to maintain landing rates in strong headwinds by adjusting
aircraft separations according to the current headwind strength8.
The rationale for this substantial constraint is that most encounters occur at flight altitudes below 300 ft (see
Refs. 3, 4). In ground proximity vortex descent is restricted and the vortices tend to rebound due to the interaction
with the ground surface. Weak crosswinds may compensate the self-induced lateral propagation of the upwind
vortex, such that it may hover over the runway directly in the flight path of the following aircraft5. As a consequence
aircraft experience wake vortex encounters time after time, even under adherence to separation standards6. During
final approach, pilots usually respond to encounters by initiating go-arounds, since their options to counteract the
imposed rolling moment and re-stabilize the approach are restricted at low heights above ground.
The same flight height restriction applies to the aircraft wake turbulence re-categorization initiative (RECAT) of
ICAO. RECAT Phase 1 classifies aircraft types into six categories considering besides the weight the approach
speed, wing characteristics and in parts also the rolling moment exerted on following aircraft. RECAT-1 has been
implemented in November 2012 at Memphis airport9, followed by numerous other US airports. The new European
* Senior Scientist, [email protected], Associate Fellow AIAA
A
Dow
nloa
ded
by F
rank
Hol
zäpf
el o
n Ja
nuar
y 5,
202
0 | h
ttp://
arc.
aiaa
.org
| D
OI:
10.
2514
/6.2
020-
0050
AIAA Scitech 2020 Forum
6-10 January 2020, Orlando, FL
10.2514/6.2020-0050
Copyright © 2020 by Frank Holzäpfel. Published by the American Institute of Aeronautics and Astronautics, Inc., with permission.
AIAA SciTech Forum
American Institute of Aeronautics and Astronautics
2
separation standard for aircraft wake turbulence called RECAT-EU has been first introduced for arrivals and
departures at Charles de Gaulle airport Paris in March 2016 followed by the airports London-Heathrow,
Leipzig/Halle, and Toulouse10
. The long-term goal of the RECAT initiative is to introduce dynamic pair-wise
separations that consider the aircraft type pairing (pair-wise) and the environmental conditions (dynamic). In
SESAR2020 the envisaged developments for static pair wise separations and weather dependent reduced wake
turbulence separations for arrival and departure also focus on wake evolution in the same height range.
To mitigate the risk of wake encounters during final approach and, in a next step, to improve runway capacity,
so-called plate lines have been developed11
. Each plate line consists of several upright plates that are installed
beyond the ends of runways underneath the approach glide path perpendicular to the runway centerline. Secondary
vortices detach from the individual plates’ surfaces, actively approach the primary vortices, and interact with those
such that the wake vortex lifetime is reduced. Previous investigations of the plate line principle comprise towing
tank experiments13
, large eddy simulations12,13,14
, and flight experiments with DLR’s research aircraft HALO11
. Here
we report the first installation of plate lines at an international airport and simultaneous measurements of the wake
vortices with three lidars completed by a comprehensive suite of meteorological instrumentation.
II. Previous Investigations of Plate Line Effects
Before the current project, the plate line principle has been thoroughly investigated. First, fundamental research
was conducted employing a towing tank through which a simplified aircraft model was towed and the flow was
visualized with dye13
. Initially, a rod-shaped massive obstacle was placed at the ground to trigger premature vortex
decay. Quantitative measurements were conducted with particle image velocimetry indicating substantially
accelerated vortex decay rates above and close to the obstacle at the ground13
.
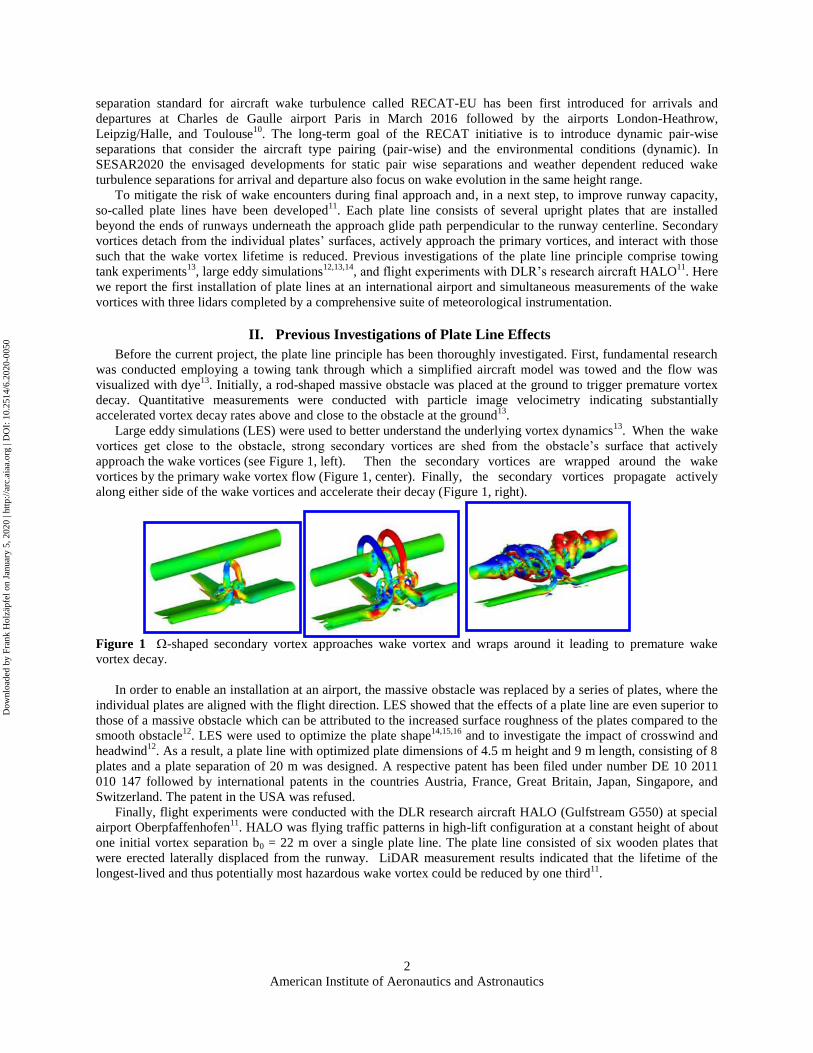
Large eddy simulations (LES) were used to better understand the underlying vortex dynamics13
. When the wake
vortices get close to the obstacle, strong secondary vortices are shed from the obstacle’s surface that actively
approach the wake vortices (see Figure 1, left). Then the secondary vortices are wrapped around the wake
vortices by the primary wake vortex flow (Figure 1, center). Finally, the secondary vortices propagate actively
along either side of the wake vortices and accelerate their decay (Figure 1, right).
Figure 1 -shaped secondary vortex approaches wake vortex and wraps around it leading to premature wake
vortex decay.
In order to enable an installation at an airport, the massive obstacle was replaced by a series of plates, where the
individual plates are aligned with the flight direction. LES showed that the effects of a plate line are even superior to
those of a massive obstacle which can be attributed to the increased surface roughness of the plates compared to the
smooth obstacle12
. LES were used to optimize the plate shape14,15,16
and to investigate the impact of crosswind and
headwind12
. As a result, a plate line with optimized plate dimensions of 4.5 m height and 9 m length, consisting of 8
plates and a plate separation of 20 m was designed. A respective patent has been filed under number DE 10 2011
010 147 followed by international patents in the countries Austria, France, Great Britain, Japan, Singapore, and
Switzerland. The patent in the USA was refused.
Finally, flight experiments were conducted with the DLR research aircraft HALO (Gulfstream G550) at special
airport Oberpfaffenhofen11
. HALO was flying traffic patterns in high-lift configuration at a constant height of about
one initial vortex separation b0 = 22 m over a single plate line. The plate line consisted of six wooden plates that
were erected laterally displaced from the runway. LiDAR measurement results indicated that the lifetime of the
longest-lived and thus potentially most hazardous wake vortex could be reduced by one third11
.
Dow
nloa
ded
by F
rank
Hol
zäpf
el o
n Ja
nuar
y 5,
202
0 | h
ttp://
arc.
aiaa
.org
| D
OI:
10.
2514
/6.2
020-
0050

American Institute of Aeronautics and Astronautics
3
III. Plate Design and Approval of Authorities
Several potential plate designs have been developed prior to the installation at Vienna airport. For example, a
permanent design consisting of aluminum lattice masts certified for airports covered by truck tarpaulin and fixed to
the ground by concrete foundations. Another low-cost, robust, and safe alternative were thuja hedges where the wind
force would be distributed on many flexible stems. However, Vienna airport opted for the development of a
temporal plate line design that can be removed easily after the live trial. A permanent design should only be
considered after the benefits of the plate lines have been demonstrated.
The developed plate line design for temporary installation consists of four wooden frames covered by truck
tarpaulin with a height of 4.5 m and a length of 2.25 m, respectively (see Figure 2). A complete plate consisting of
four elements has the dimensions of 4.5 m height and 9 m length. The plates are manufactured with hinges such that
they can be folded up and down and secured at the ground when they are not used. The plates and the synthetic
ropes are fixed to the ground with ground anchors.
Figure 2 Plate line design for temporary installation.
The plates were designed for a maximum wind speed of 20 m/s with a safety factor of S = 3. A stability test with
a plate prototype during cyclone Friederike showed that the plate may resist winds of 15 m/s (54 km/h, Bft 7)
measured at 2 m above ground. An independent expert assessment confirmed the stability analysis regarding wind
forces, the stability analysis of the ground anchors, and conducted a geotechnical assessment of the soil at runway
16 of Vienna airport. Finally, an assessment of the secured plates for winds of 200 km/h was conducted in a wind
tunnel to make sure that the secured plates would also resist heavy storms.
The University of Braunschweig proved the electromagnetic compatibility with the ILS localizer conducting
measurements at scale 1:144. They found that even disturbances by steel plates are well within ICAO CAT III
tolerances17
. Nevertheless, it was decided to install the first plate line behind the localizer in order to avoid any
impairment of the ILS signal which appeared to be already close to the tolerances due to other disturbances.
Dow
nloa
ded
by F
rank
Hol
zäpf
el o
n Ja
nuar
y 5,
202
0 | h
ttp://
arc.
aiaa
.org
| D
OI:
10.
2514
/6.2
020-
0050
American Institute of Aeronautics and Astronautics
4
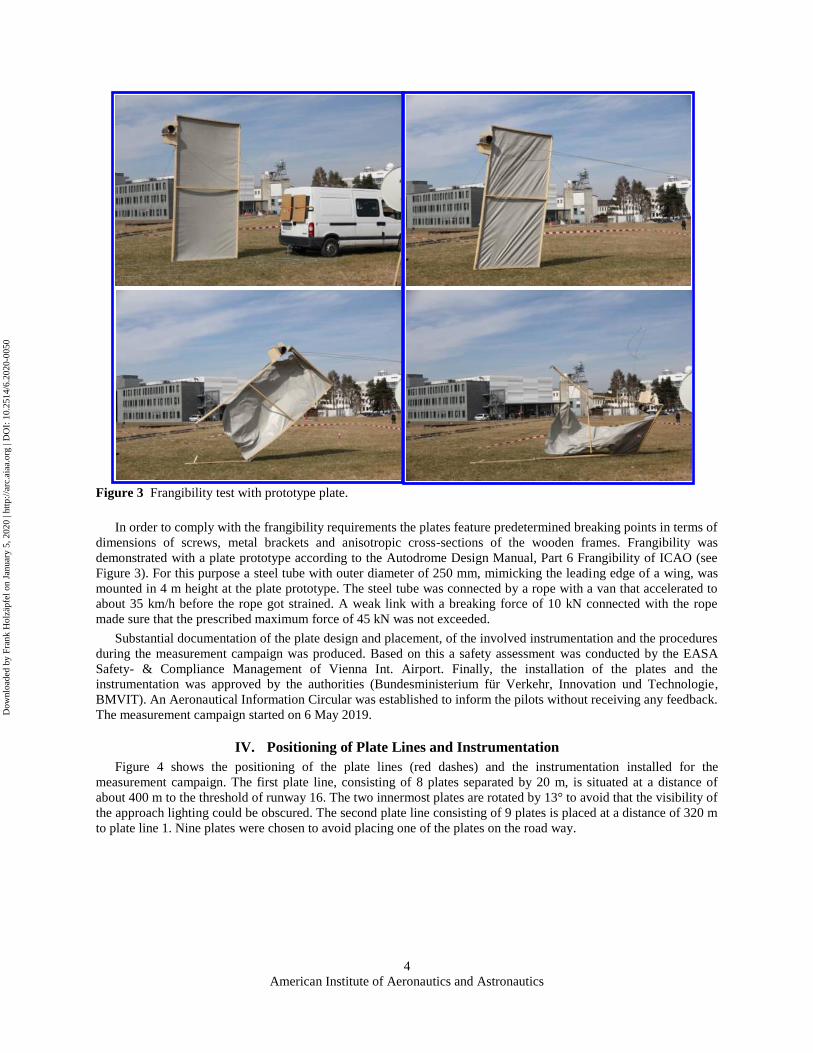
Figure 3 Frangibility test with prototype plate.
In order to comply with the frangibility requirements the plates feature predetermined breaking points in terms of
dimensions of screws, metal brackets and anisotropic cross-sections of the wooden frames. Frangibility was
demonstrated with a plate prototype according to the Autodrome Design Manual, Part 6 Frangibility of ICAO (see
Figure 3). For this purpose a steel tube with outer diameter of 250 mm, mimicking the leading edge of a wing, was
mounted in 4 m height at the plate prototype. The steel tube was connected by a rope with a van that accelerated to
about 35 km/h before the rope got strained. A weak link with a breaking force of 10 kN connected with the rope
made sure that the prescribed maximum force of 45 kN was not exceeded.
Substantial documentation of the plate design and placement, of the involved instrumentation and the procedures
during the measurement campaign was produced. Based on this a safety assessment was conducted by the EASA
Safety- & Compliance Management of Vienna Int. Airport. Finally, the installation of the plates and the
instrumentation was approved by the authorities (Bundesministerium für Verkehr, Innovation und Technologie,
BMVIT). An Aeronautical Information Circular was established to inform the pilots without receiving any feedback.
The measurement campaign started on 6 May 2019.
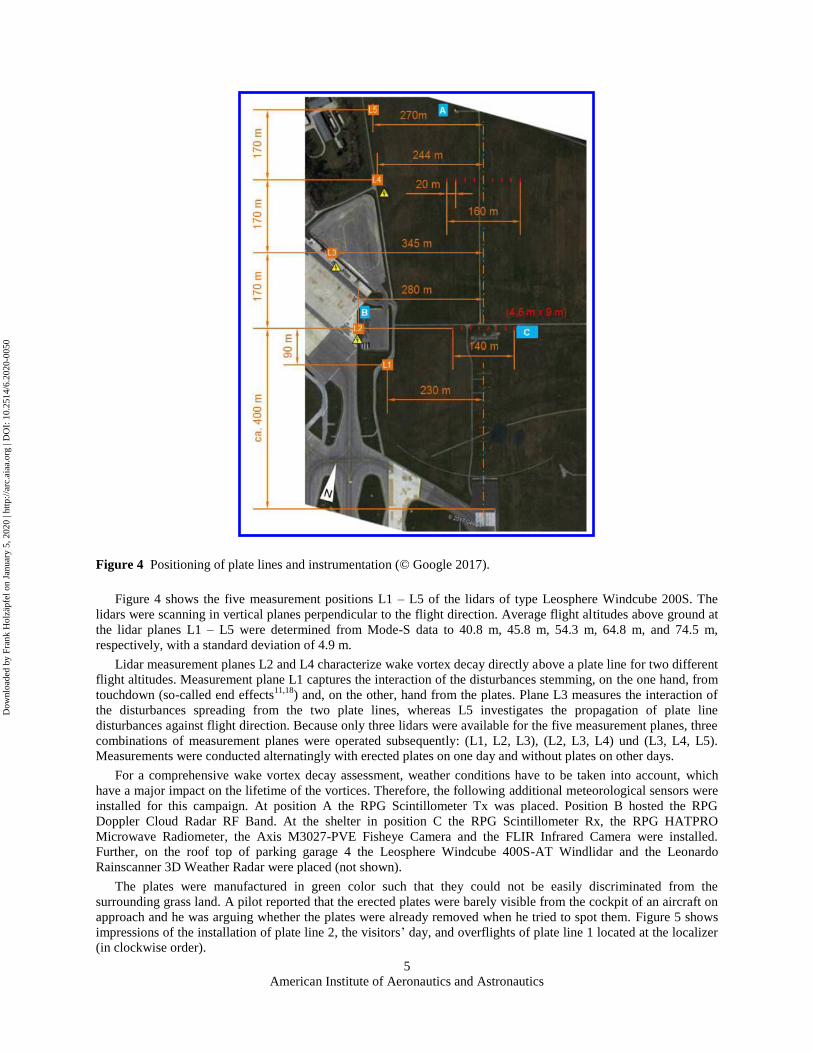
IV. Positioning of Plate Lines and Instrumentation
Figure 4 shows the positioning of the plate lines (red dashes) and the instrumentation installed for the
measurement campaign. The first plate line, consisting of 8 plates separated by 20 m, is situated at a distance of
about 400 m to the threshold of runway 16. The two innermost plates are rotated by 13° to avoid that the visibility of
the approach lighting could be obscured. The second plate line consisting of 9 plates is placed at a distance of 320 m
to plate line 1. Nine plates were chosen to avoid placing one of the plates on the road way.
Dow
nloa
ded
by F
rank
Hol
zäpf
el o
n Ja
nuar
y 5,
202
0 | h
ttp://
arc.
aiaa
.org
| D
OI:
10.
2514
/6.2
020-
0050
American Institute of Aeronautics and Astronautics
5
Figure 4 Positioning of plate lines and instrumentation (© Google 2017).
Figure 4 shows the five measurement positions L1 – L5 of the lidars of type Leosphere Windcube 200S. The
lidars were scanning in vertical planes perpendicular to the flight direction. Average flight altitudes above ground at
the lidar planes L1 – L5 were determined from Mode-S data to 40.8 m, 45.8 m, 54.3 m, 64.8 m, and 74.5 m,
respectively, with a standard deviation of 4.9 m.
Lidar measurement planes L2 and L4 characterize wake vortex decay directly above a plate line for two different
flight altitudes. Measurement plane L1 captures the interaction of the disturbances stemming, on the one hand, from
touchdown (so-called end effects11,18
) and, on the other, hand from the plates. Plane L3 measures the interaction of
the disturbances spreading from the two plate lines, whereas L5 investigates the propagation of plate line
disturbances against flight direction. Because only three lidars were available for the five measurement planes, three
combinations of measurement planes were operated subsequently: (L1, L2, L3), (L2, L3, L4) und (L3, L4, L5).
Measurements were conducted alternatingly with erected plates on one day and without plates on other days.
For a comprehensive wake vortex decay assessment, weather conditions have to be taken into account, which
have a major impact on the lifetime of the vortices. Therefore, the following additional meteorological sensors were
installed for this campaign. At position A the RPG Scintillometer Tx was placed. Position B hosted the RPG
Doppler Cloud Radar RF Band. At the shelter in position C the RPG Scintillometer Rx, the RPG HATPRO
Microwave Radiometer, the Axis M3027-PVE Fisheye Camera and the FLIR Infrared Camera were installed.
Further, on the roof top of parking garage 4 the Leosphere Windcube 400S-AT Windlidar and the Leonardo
Rainscanner 3D Weather Radar were placed (not shown).
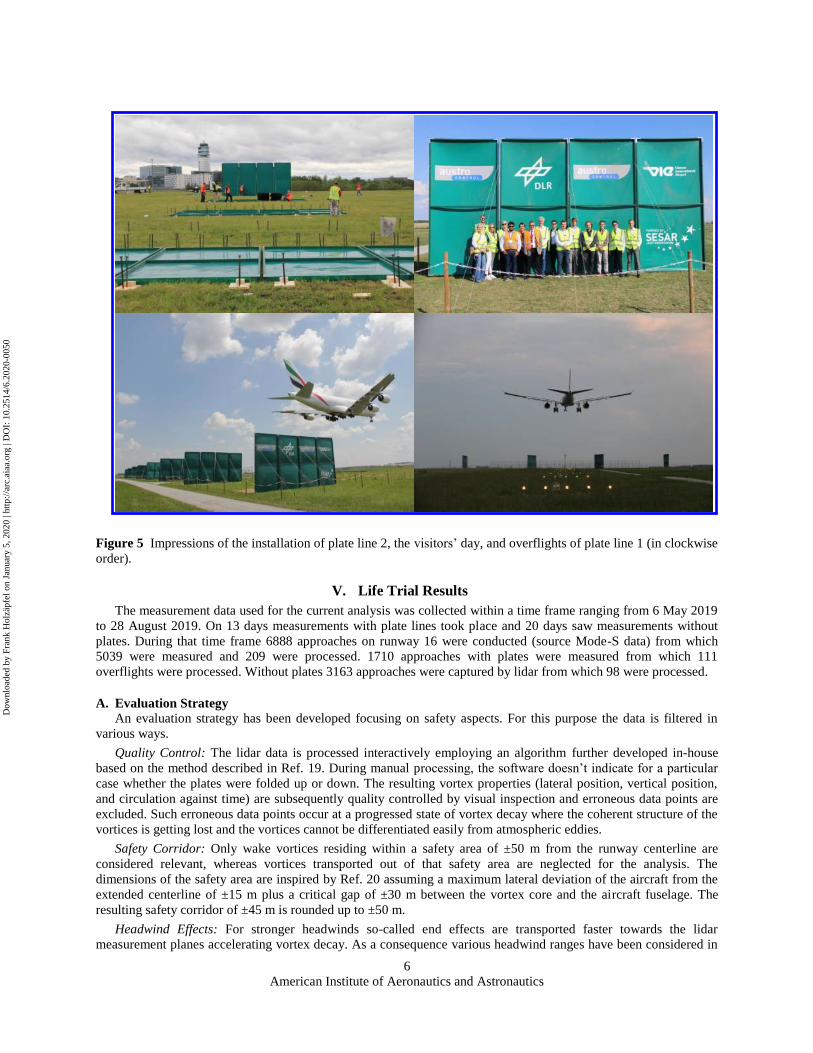
The plates were manufactured in green color such that they could not be easily discriminated from the
surrounding grass land. A pilot reported that the erected plates were barely visible from the cockpit of an aircraft on
approach and he was arguing whether the plates were already removed when he tried to spot them. Figure 5 shows
impressions of the installation of plate line 2, the visitors’ day, and overflights of plate line 1 located at the localizer
(in clockwise order).
Dow
nloa
ded
by F
rank
Hol
zäpf
el o
n Ja
nuar
y 5,
202
0 | h
ttp://
arc.
aiaa
.org
| D
OI:
10.
2514
/6.2
020-
0050
American Institute of Aeronautics and Astronautics
6
Figure 5 Impressions of the installation of plate line 2, the visitors’ day, and overflights of plate line 1 (in clockwise
order).
V. Life Trial Results
The measurement data used for the current analysis was collected within a time frame ranging from 6 May 2019
to 28 August 2019. On 13 days measurements with plate lines took place and 20 days saw measurements without
plates. During that time frame 6888 approaches on runway 16 were conducted (source Mode-S data) from which
5039 were measured and 209 were processed. 1710 approaches with plates were measured from which 111
overflights were processed. Without plates 3163 approaches were captured by lidar from which 98 were processed.
A. Evaluation Strategy
An evaluation strategy has been developed focusing on safety aspects. For this purpose the data is filtered in
various ways.
Quality Control: The lidar data is processed interactively employing an algorithm further developed in-house
based on the method described in Ref. 19. During manual processing, the software doesn’t indicate for a particular
case whether the plates were folded up or down. The resulting vortex properties (lateral position, vertical position,
and circulation against time) are subsequently quality controlled by visual inspection and erroneous data points are
excluded. Such erroneous data points occur at a progressed state of vortex decay where the coherent structure of the
vortices is getting lost and the vortices cannot be differentiated easily from atmospheric eddies.
Safety Corridor: Only wake vortices residing within a safety area of ±50 m from the runway centerline are
considered relevant, whereas vortices transported out of that safety area are neglected for the analysis. The
dimensions of the safety area are inspired by Ref. 20 assuming a maximum lateral deviation of the aircraft from the
extended centerline of ±15 m plus a critical gap of ±30 m between the vortex core and the aircraft fuselage. The
resulting safety corridor of ±45 m is rounded up to ±50 m.
Headwind Effects: For stronger headwinds so-called end effects are transported faster towards the lidar
measurement planes accelerating vortex decay. As a consequence various headwind ranges have been considered in
Dow
nloa
ded
by F
rank
Hol
zäpf
el o
n Ja
nuar
y 5,
202
0 | h
ttp://
arc.
aiaa
.org
| D
OI:
10.
2514
/6.2
020-
0050
American Institute of Aeronautics and Astronautics
7
the data analysis (plots not shown). The main analysis focuses on headwinds lower than 2 m/s. This includes also
cases with tailwinds where an accumulation of encounters was observed at Vienna airport6. The wind data consists
of 2 min averages taken from the anemometer of runway 16 (WMA16) situated about 760 m from plate line 1.
Aircraft Type Effects: To enable the comparison of wake vortices generated by different aircraft types, the data
characterizing vortex decay is partly normalized (made dimensionless). Normalized quantities are denoted by an
asterisk (*). The vortex circulation (strength) data is normalized by its initial value 0 = 0.85 MLW g / b0 TAS.
The required values of true airspeed (TAS) in the lidar measurement planes are taken from the Mode-S protocol. Air
density is retrieved from pressure and temperature also from the Mode-S protocol. The landing weight is assumed
to correspond to 85% of the maximum landing weight (MLW). The initial vortex separation is computed according
to b0 = /4 B assuming elliptical circulation distribution. Here B is the wing span. The characteristic vortex time
scale t0 is used to normalize vortex age. t0 corresponds to the time the wake vortices initially need to descend one
vortex separation b0 and is calculated according to t0 = 2 b02 / 0.
Decay Percentiles: In order to quantify the degree of circulation decay with and without the plate lines 0th
(minimum), 5th
, 25th
, 50th
(median), 75th
, 95th
, and 100th
(maximum) percentiles are employed. On the one hand,
vortex-age-binned percentiles are computed with dimensional bin widths of 20 s. For example, this provides
circulation values for the seven selected percentiles in a vortex age frame of 50 s ±10 s (see Figure 7). The
normalized bin widths are adjusted to one vortex time scale t0 (±0.5 t0) On the other hand, circulation-binned
percentiles are used to extract different vortex lifetimes for given circulation strengths (see Figure 8). The circulation
bin widths are adjusted to 100 m²/s (±50 m²/s) for dimensional circulation values and to 0.1 0 (±0.05 0) for
normalized circulation values.
B. Analysis of Wake Vortex Behavior
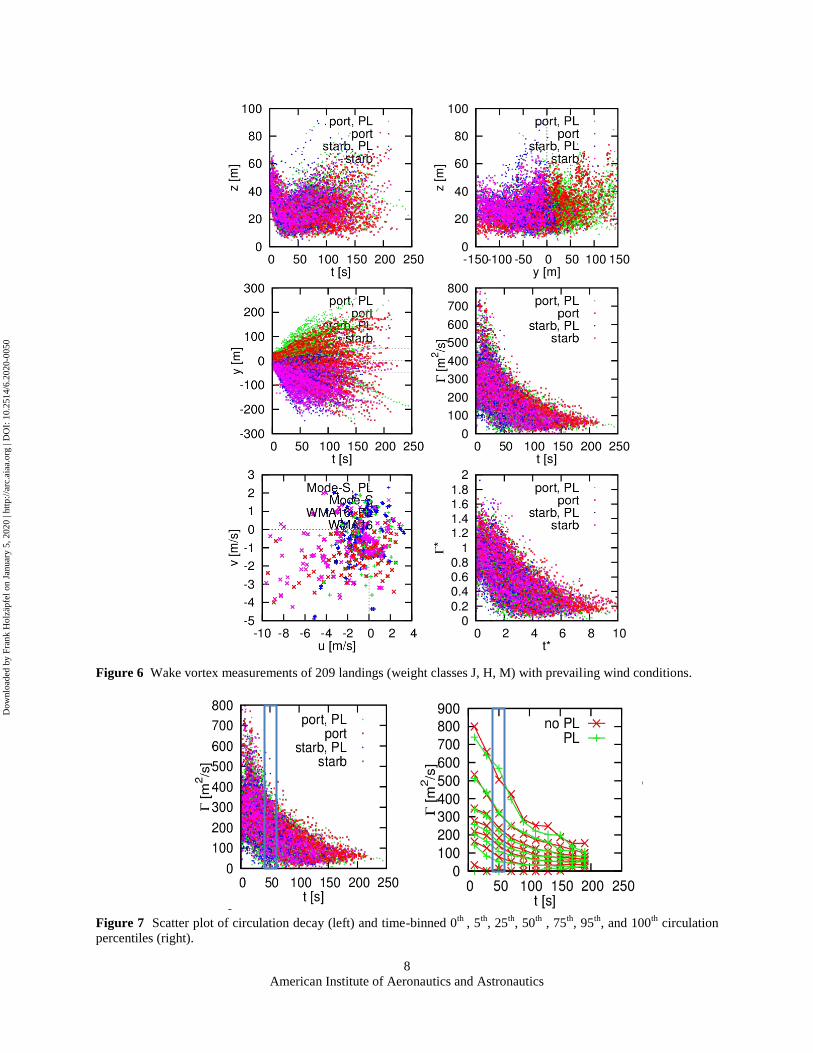
Figure 6 depicts the wake vortex behavior of all evaluated 209 landings comprising aircraft of the weight
categories Super, Heavy, and Medium. Measurements with plate lines (PL) are denoted by dots in cold colors: green
dots for the port vortex and blue dots for the starboard vortex. Warm colors are used for the reference cases without
plates: red dots for the port vortex and magenta dots for the starboard vortex. The individual panels show vortex
height z against vortex age t (top left), vortex height z over vortex lateral position y (top right, y = 0 corresponds to
the extended runway centerline), vortex lateral position y against vortex age t (center-left), vortex circulation over
vortex age t (center-right), lateral wind speed v (positive away from lidar) over longitudinal wind speed u (positive
in flight direction) measured by anemometer WMA16 and derived from Mode-S data in the five lidar measurement
planes (bottom left), normalized vortex circulation * over normalized vortex age t
* (bottom right).
Dow
nloa
ded
by F
rank
Hol
zäpf
el o
n Ja
nuar
y 5,
202
0 | h
ttp://
arc.
aiaa
.org
| D
OI:
10.
2514
/6.2
020-
0050
American Institute of Aeronautics and Astronautics
8
Figure 6 Wake vortex measurements of 209 landings (weight classes J, H, M) with prevailing wind conditions.
Figure 7 Scatter plot of circulation decay (left) and time-binned 0th
, 5th
, 25th
, 50th
, 75th
, 95th
, and 100th
circulation
percentiles (right).
Dow
nloa
ded
by F
rank
Hol
zäpf
el o
n Ja
nuar
y 5,
202
0 | h
ttp://
arc.
aiaa
.org
| D
OI:
10.
2514
/6.2
020-
0050
American Institute of Aeronautics and Astronautics
9
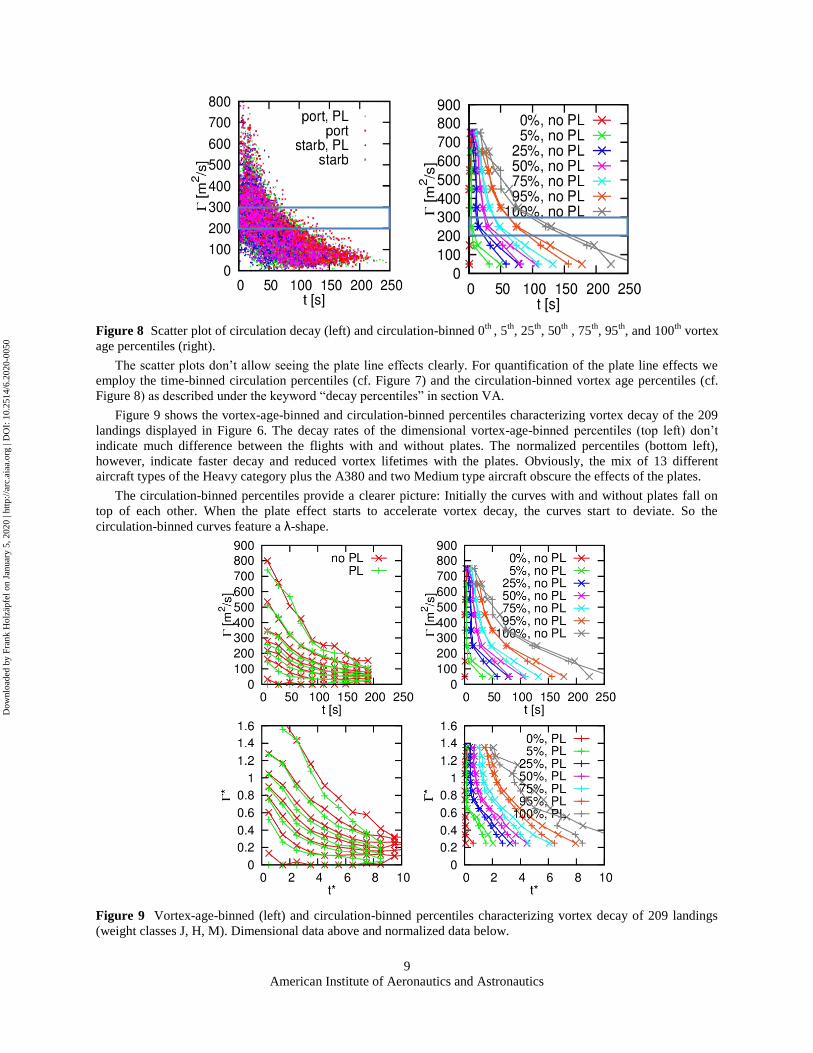
Figure 8 Scatter plot of circulation decay (left) and circulation-binned 0th
, 5th
, 25th
, 50th
, 75th
, 95th
, and 100th
vortex
age percentiles (right).
The scatter plots don’t allow seeing the plate line effects clearly. For quantification of the plate line effects we
employ the time-binned circulation percentiles (cf. Figure 7) and the circulation-binned vortex age percentiles (cf.
Figure 8) as described under the keyword “decay percentiles” in section VA.
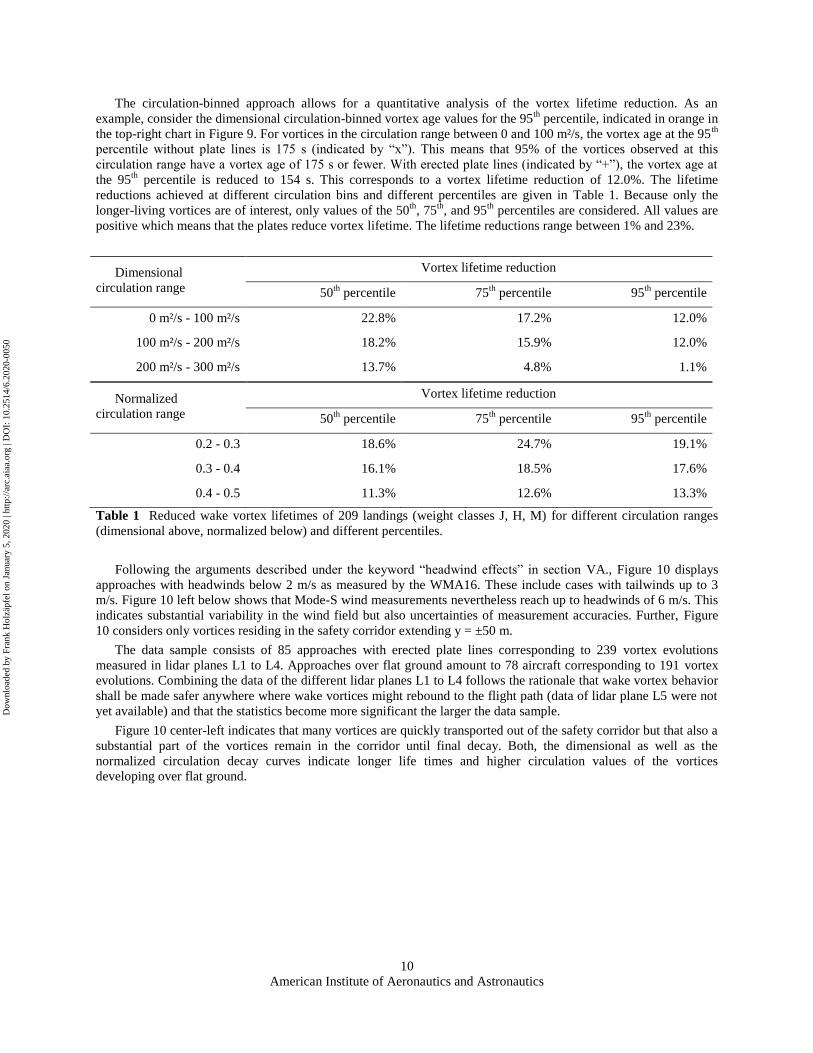
Figure 9 shows the vortex-age-binned and circulation-binned percentiles characterizing vortex decay of the 209
landings displayed in Figure 6. The decay rates of the dimensional vortex-age-binned percentiles (top left) don’t
indicate much difference between the flights with and without plates. The normalized percentiles (bottom left),
however, indicate faster decay and reduced vortex lifetimes with the plates. Obviously, the mix of 13 different
aircraft types of the Heavy category plus the A380 and two Medium type aircraft obscure the effects of the plates.
The circulation-binned percentiles provide a clearer picture: Initially the curves with and without plates fall on
top of each other. When the plate effect starts to accelerate vortex decay, the curves start to deviate. So the
circulation-binned curves feature a λ-shape.
Figure 9 Vortex-age-binned (left) and circulation-binned percentiles characterizing vortex decay of 209 landings
(weight classes J, H, M). Dimensional data above and normalized data below.
Dow
nloa
ded
by F
rank
Hol
zäpf
el o
n Ja
nuar
y 5,
202
0 | h
ttp://
arc.
aiaa
.org
| D
OI:
10.
2514
/6.2
020-
0050
American Institute of Aeronautics and Astronautics
10
The circulation-binned approach allows for a quantitative analysis of the vortex lifetime reduction. As an
example, consider the dimensional circulation-binned vortex age values for the 95th
percentile, indicated in orange in
the top-right chart in Figure 9. For vortices in the circulation range between 0 and 100 m²/s, the vortex age at the 95th
percentile without plate lines is 175 s (indicated by “x”). This means that 95% of the vortices observed at this
circulation range have a vortex age of 175 s or fewer. With erected plate lines (indicated by “+”), the vortex age at
the 95th
percentile is reduced to 154 s. This corresponds to a vortex lifetime reduction of 12.0%. The lifetime
reductions achieved at different circulation bins and different percentiles are given in Table 1. Because only the
longer-living vortices are of interest, only values of the 50th
, 75th
, and 95th
percentiles are considered. All values are
positive which means that the plates reduce vortex lifetime. The lifetime reductions range between 1% and 23%.
Dimensional
circulation range
Vortex lifetime reduction
50th
percentile 75th
percentile 95th
percentile
0 m²/s - 100 m²/s 22.8% 17.2% 12.0%
100 m²/s - 200 m²/s 18.2% 15.9% 12.0%
200 m²/s - 300 m²/s 13.7% 4.8% 1.1%
Normalized
circulation range
Vortex lifetime reduction
50th
percentile 75th
percentile 95th
percentile
0.2 - 0.3 18.6% 24.7% 19.1%
0.3 - 0.4 16.1% 18.5% 17.6%
0.4 - 0.5 11.3% 12.6% 13.3%
Table 1 Reduced wake vortex lifetimes of 209 landings (weight classes J, H, M) for different circulation ranges
(dimensional above, normalized below) and different percentiles.
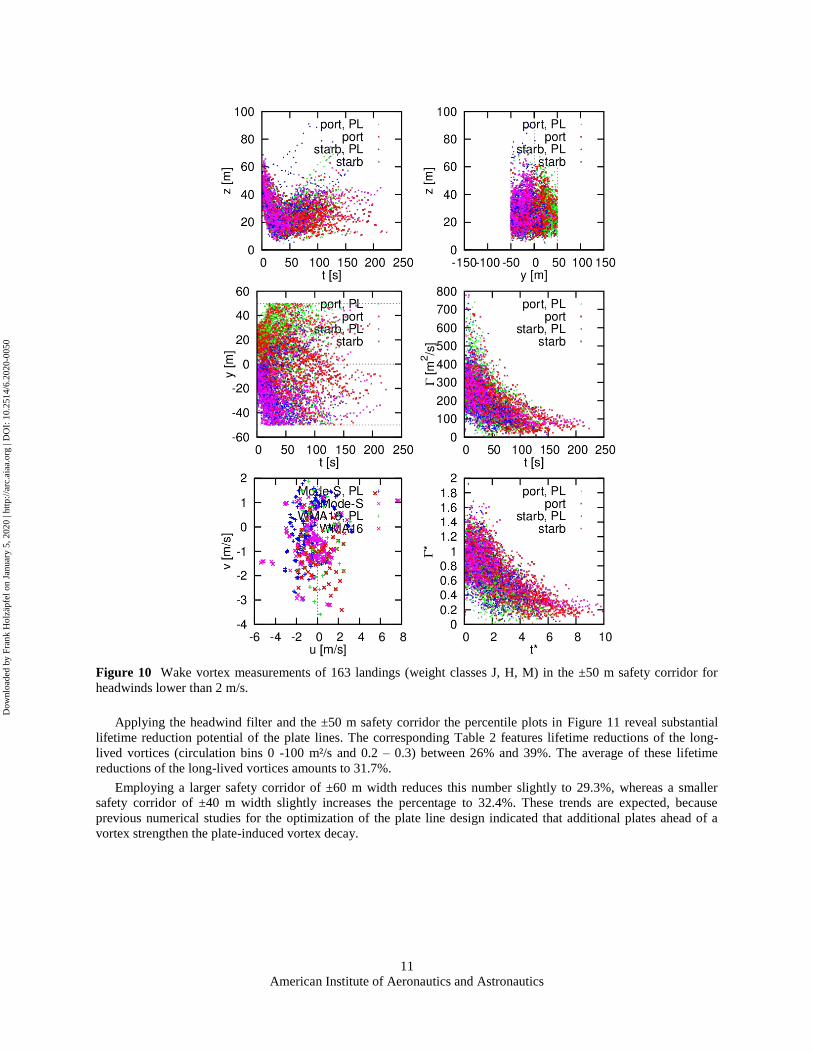
Following the arguments described under the keyword “headwind effects” in section VA., Figure 10 displays
approaches with headwinds below 2 m/s as measured by the WMA16. These include cases with tailwinds up to 3
m/s. Figure 10 left below shows that Mode-S wind measurements nevertheless reach up to headwinds of 6 m/s. This
indicates substantial variability in the wind field but also uncertainties of measurement accuracies. Further, Figure
10 considers only vortices residing in the safety corridor extending y = ±50 m.
The data sample consists of 85 approaches with erected plate lines corresponding to 239 vortex evolutions
measured in lidar planes L1 to L4. Approaches over flat ground amount to 78 aircraft corresponding to 191 vortex
evolutions. Combining the data of the different lidar planes L1 to L4 follows the rationale that wake vortex behavior
shall be made safer anywhere where wake vortices might rebound to the flight path (data of lidar plane L5 were not
yet available) and that the statistics become more significant the larger the data sample.
Figure 10 center-left indicates that many vortices are quickly transported out of the safety corridor but that also a
substantial part of the vortices remain in the corridor until final decay. Both, the dimensional as well as the
normalized circulation decay curves indicate longer life times and higher circulation values of the vortices
developing over flat ground.
Dow
nloa
ded
by F
rank
Hol
zäpf
el o
n Ja
nuar
y 5,
202
0 | h
ttp://
arc.
aiaa
.org
| D
OI:
10.
2514
/6.2
020-
0050
American Institute of Aeronautics and Astronautics
11
Figure 10 Wake vortex measurements of 163 landings (weight classes J, H, M) in the ±50 m safety corridor for
headwinds lower than 2 m/s.
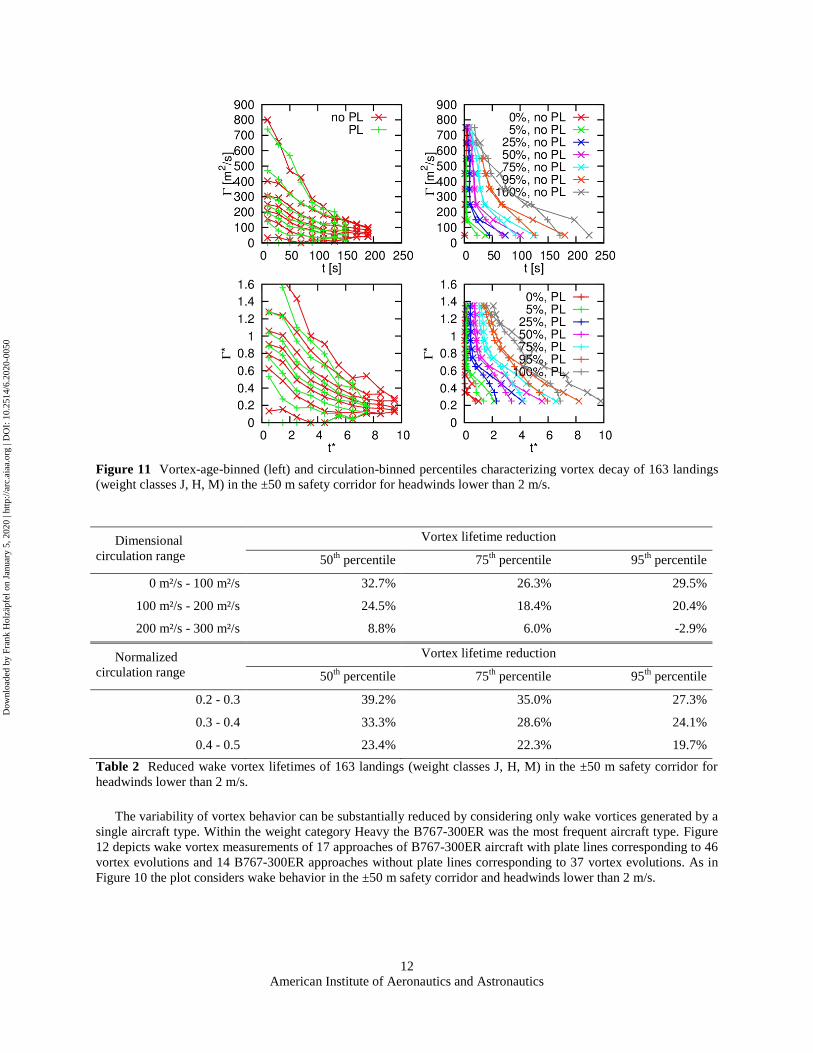
Applying the headwind filter and the ±50 m safety corridor the percentile plots in Figure 11 reveal substantial
lifetime reduction potential of the plate lines. The corresponding Table 2 features lifetime reductions of the long-
lived vortices (circulation bins 0 -100 m²/s and 0.2 – 0.3) between 26% and 39%. The average of these lifetime
reductions of the long-lived vortices amounts to 31.7%.
Employing a larger safety corridor of ±60 m width reduces this number slightly to 29.3%, whereas a smaller
safety corridor of ±40 m width slightly increases the percentage to 32.4%. These trends are expected, because
previous numerical studies for the optimization of the plate line design indicated that additional plates ahead of a
vortex strengthen the plate-induced vortex decay.
Dow
nloa
ded
by F
rank
Hol
zäpf
el o
n Ja
nuar
y 5,
202
0 | h
ttp://
arc.
aiaa
.org
| D
OI:
10.
2514
/6.2
020-
0050
American Institute of Aeronautics and Astronautics
12
Figure 11 Vortex-age-binned (left) and circulation-binned percentiles characterizing vortex decay of 163 landings
(weight classes J, H, M) in the ±50 m safety corridor for headwinds lower than 2 m/s.
Dimensional
circulation range
Vortex lifetime reduction
50th
percentile 75th
percentile 95th
percentile
0 m²/s - 100 m²/s 32.7% 26.3% 29.5%
100 m²/s - 200 m²/s 24.5% 18.4% 20.4%
200 m²/s - 300 m²/s 8.8% 6.0% -2.9%
Normalized
circulation range
Vortex lifetime reduction
50th
percentile 75th
percentile 95th
percentile
0.2 - 0.3 39.2% 35.0% 27.3%
0.3 - 0.4 33.3% 28.6% 24.1%
0.4 - 0.5 23.4% 22.3% 19.7%
Table 2 Reduced wake vortex lifetimes of 163 landings (weight classes J, H, M) in the ±50 m safety corridor for
headwinds lower than 2 m/s.
The variability of vortex behavior can be substantially reduced by considering only wake vortices generated by a
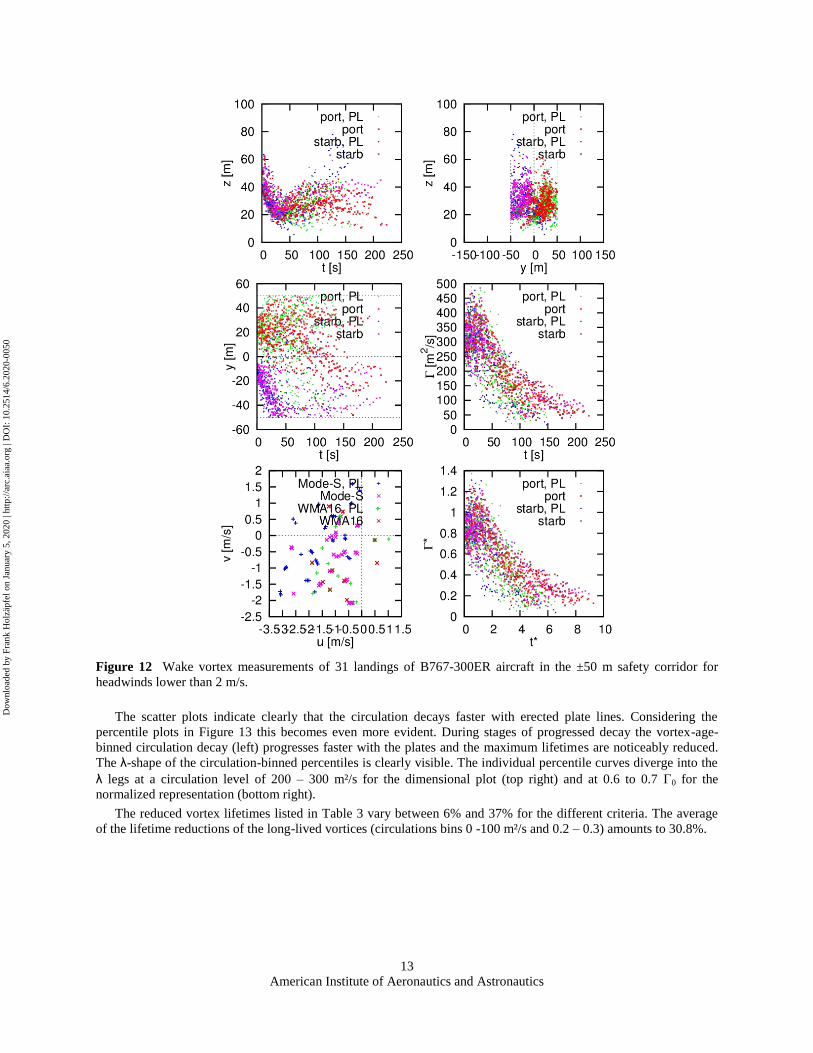
single aircraft type. Within the weight category Heavy the B767-300ER was the most frequent aircraft type. Figure
12 depicts wake vortex measurements of 17 approaches of B767-300ER aircraft with plate lines corresponding to 46
vortex evolutions and 14 B767-300ER approaches without plate lines corresponding to 37 vortex evolutions. As in
Figure 10 the plot considers wake behavior in the ±50 m safety corridor and headwinds lower than 2 m/s.
Dow
nloa
ded
by F
rank
Hol
zäpf
el o
n Ja
nuar
y 5,
202
0 | h
ttp://
arc.
aiaa
.org
| D
OI:
10.
2514
/6.2
020-
0050
American Institute of Aeronautics and Astronautics
13
Figure 12 Wake vortex measurements of 31 landings of B767-300ER aircraft in the ±50 m safety corridor for
headwinds lower than 2 m/s.
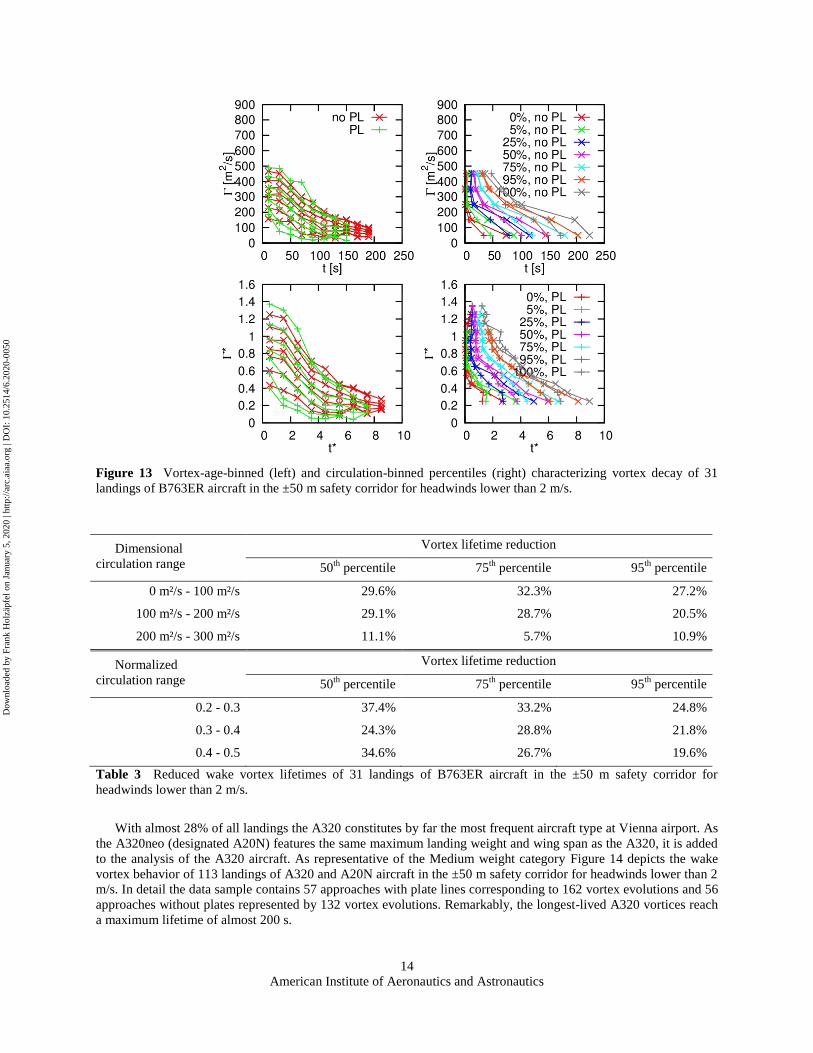
The scatter plots indicate clearly that the circulation decays faster with erected plate lines. Considering the
percentile plots in Figure 13 this becomes even more evident. During stages of progressed decay the vortex-age-
binned circulation decay (left) progresses faster with the plates and the maximum lifetimes are noticeably reduced.
The λ-shape of the circulation-binned percentiles is clearly visible. The individual percentile curves diverge into the
λ legs at a circulation level of 200 – 300 m²/s for the dimensional plot (top right) and at 0.6 to 0.7 0 for the
normalized representation (bottom right).
The reduced vortex lifetimes listed in Table 3 vary between 6% and 37% for the different criteria. The average
of the lifetime reductions of the long-lived vortices (circulations bins 0 -100 m²/s and 0.2 – 0.3) amounts to 30.8%.
Dow
nloa
ded
by F
rank
Hol
zäpf
el o
n Ja
nuar
y 5,
202
0 | h
ttp://
arc.
aiaa
.org
| D
OI:
10.
2514
/6.2
020-
0050
American Institute of Aeronautics and Astronautics
14
Figure 13 Vortex-age-binned (left) and circulation-binned percentiles (right) characterizing vortex decay of 31
landings of B763ER aircraft in the ±50 m safety corridor for headwinds lower than 2 m/s.
Dimensional
circulation range
Vortex lifetime reduction
50th
percentile 75th
percentile 95th
percentile
0 m²/s - 100 m²/s 29.6% 32.3% 27.2%
100 m²/s - 200 m²/s 29.1% 28.7% 20.5%
200 m²/s - 300 m²/s 11.1% 5.7% 10.9%
Normalized
circulation range
Vortex lifetime reduction
50th
percentile 75th
percentile 95th
percentile
0.2 - 0.3 37.4% 33.2% 24.8%
0.3 - 0.4 24.3% 28.8% 21.8%
0.4 - 0.5 34.6% 26.7% 19.6%
Table 3 Reduced wake vortex lifetimes of 31 landings of B763ER aircraft in the ±50 m safety corridor for
headwinds lower than 2 m/s.
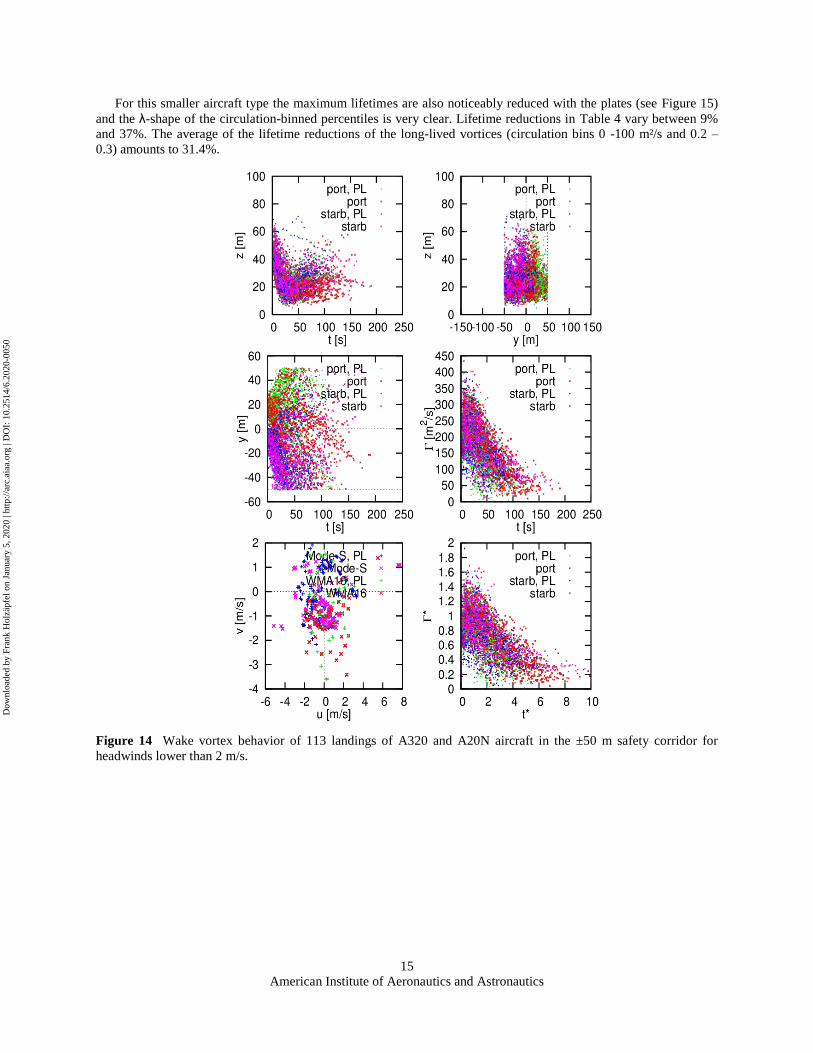
With almost 28% of all landings the A320 constitutes by far the most frequent aircraft type at Vienna airport. As
the A320neo (designated A20N) features the same maximum landing weight and wing span as the A320, it is added
to the analysis of the A320 aircraft. As representative of the Medium weight category Figure 14 depicts the wake
vortex behavior of 113 landings of A320 and A20N aircraft in the ±50 m safety corridor for headwinds lower than 2
m/s. In detail the data sample contains 57 approaches with plate lines corresponding to 162 vortex evolutions and 56
approaches without plates represented by 132 vortex evolutions. Remarkably, the longest-lived A320 vortices reach
a maximum lifetime of almost 200 s.
Dow
nloa
ded
by F
rank
Hol
zäpf
el o
n Ja
nuar
y 5,
202
0 | h
ttp://
arc.
aiaa
.org
| D
OI:
10.
2514
/6.2
020-
0050
American Institute of Aeronautics and Astronautics
15
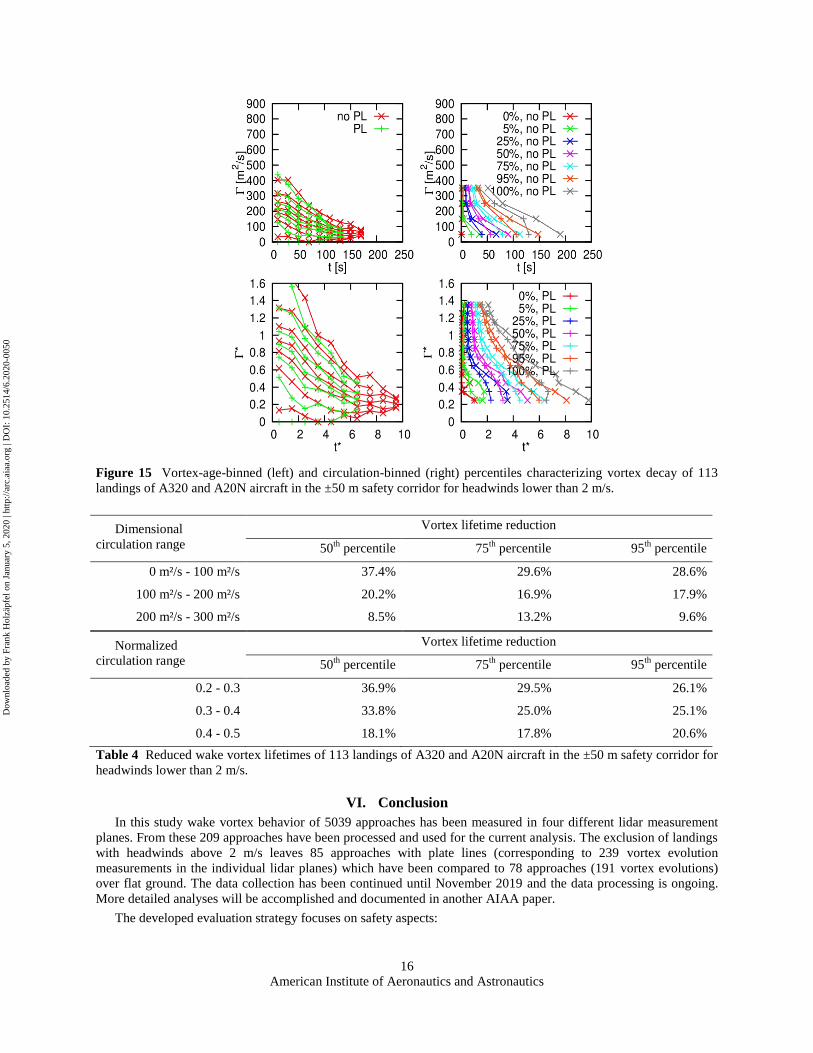
For this smaller aircraft type the maximum lifetimes are also noticeably reduced with the plates (see Figure 15)
and the λ-shape of the circulation-binned percentiles is very clear. Lifetime reductions in Table 4 vary between 9%
and 37%. The average of the lifetime reductions of the long-lived vortices (circulation bins 0 -100 m²/s and 0.2 –
0.3) amounts to 31.4%.
Figure 14 Wake vortex behavior of 113 landings of A320 and A20N aircraft in the ±50 m safety corridor for
headwinds lower than 2 m/s.
Dow
nloa
ded
by F
rank
Hol
zäpf
el o
n Ja
nuar
y 5,
202
0 | h
ttp://
arc.
aiaa
.org
| D
OI:
10.
2514
/6.2
020-
0050
American Institute of Aeronautics and Astronautics
16
Figure 15 Vortex-age-binned (left) and circulation-binned (right) percentiles characterizing vortex decay of 113
landings of A320 and A20N aircraft in the ±50 m safety corridor for headwinds lower than 2 m/s.
Dimensional
circulation range
Vortex lifetime reduction
50th
percentile 75th
percentile 95th
percentile
0 m²/s - 100 m²/s 37.4% 29.6% 28.6%
100 m²/s - 200 m²/s 20.2% 16.9% 17.9%
200 m²/s - 300 m²/s 8.5% 13.2% 9.6%
Normalized
circulation range
Vortex lifetime reduction
50th
percentile 75th
percentile 95th
percentile
0.2 - 0.3 36.9% 29.5% 26.1%
0.3 - 0.4 33.8% 25.0% 25.1%
0.4 - 0.5 18.1% 17.8% 20.6%
Table 4 Reduced wake vortex lifetimes of 113 landings of A320 and A20N aircraft in the ±50 m safety corridor for
headwinds lower than 2 m/s.
VI. Conclusion
In this study wake vortex behavior of 5039 approaches has been measured in four different lidar measurement
planes. From these 209 approaches have been processed and used for the current analysis. The exclusion of landings
with headwinds above 2 m/s leaves 85 approaches with plate lines (corresponding to 239 vortex evolution
measurements in the individual lidar planes) which have been compared to 78 approaches (191 vortex evolutions)
over flat ground. The data collection has been continued until November 2019 and the data processing is ongoing.
More detailed analyses will be accomplished and documented in another AIAA paper.
The developed evaluation strategy focuses on safety aspects:
Dow
nloa
ded
by F
rank
Hol
zäpf
el o
n Ja
nuar
y 5,
202
0 | h
ttp://
arc.
aiaa
.org
| D
OI:
10.
2514
/6.2
020-
0050
American Institute of Aeronautics and Astronautics
17
The conducted analysis employs an aircraft safety corridor extending ±50 m from the runway centreline.
Vortices transported out of that safety area are neglected for the analysis. The sensitivity to the width of the
safety corridor turned out to be weak. A smaller safety corridor slightly increases the plate line efficiency,
because additional plates ahead of a vortex strengthen the plate-induced vortex decay.
Cases with headwinds stronger than 2 m/s have been excluded, because strong headwinds support the
transport of end effects (occurring during touchdown and accelerating vortex decay) into the measurement
planes. Encounter frequencies and go-around rates are highest at weak headwinds or even tailwinds.
The analysis combines data of all the available lidar measurement planes, because the accelerated vortex
decay should be effective all along the stretch where rebounding vortices may reach up to the flight
corridor.
Further the analysis focuses on long-lived wake vortices. Therefore, the accelerated circulation decay is
evaluated in dimensional circulation bins ranging from 0 to 100 m²/s and normalized circulation bins
ranging from 20% to 30% of the initial circulation (lower values cannot be evaluated reasonably well,
because the vortices lose their coherent structure and cannot be differentiated uniquely from environmental
turbulence). Within these circulation bins we consider the median, the 75th
percentile, and the 95th
percentile of the vortex lifetime. In order to further condense the accelerated circulation decay into a single
number, the six values resulting from the two circulation bins and the three percentiles are averaged.
Following all the above listed criteria, the lifetime of the long-lived vortices in the safety corridor is reduced by
32% for all (163) landings comprising medium, heavy, and super weight class aircraft. For this 239 vortex evolution
measurements with plates and 191 vortex evolutions without plates have been considered.
As a representative for heavy aircraft landings of 29 B763 aircraft (46 vortex evolutions with plates and 37
vortex evolutions without plates) have been assessed separately leading to a 31% vortex lifetime reduction. For 113
medium weight category A320 and A20N aircraft (162 vortex evolutions with plates and 132 vortex evolutions
without plates) the vortex lifetime could be reduced by 31%.
In summary it can be concluded that the plate lines reduce the lifetime of long-lived vortices in a safety corridor
along the final approach on average by more than 30%.
More detailed analysis of the measurement data, shedding more light on the effects of individual aircraft types,
flight altitudes, and environmental conditions, will be conducted in SESAR 2020 Wave2 VLD3 and documented in
another AIAA paper to be presented at the AVIATION Forum 2020 in Reno21
.
Acknowledgments
This project has received funding within the framework of the SESAR Joint Undertaking “Increased Runway
and Airport Throughput” project (PJ.02 EARTH) within the European Union's Horizon 2020 research and
innovation programme under grant agreement No 731781 and the German Aerospace Research Center (DLR)
project “Wetteroptimierter Luftverkehr”. The priceless contributions from numerous colleagues of Austro Control
GmbH, MeteoServe Wetterdienst GmbH, Vienna International Airport, Leonardo Germany GmbH, and RPG
Radiometer Physics GmbH, who will co-author the AVIATION Forum 2020 paper, only made this endeavor
possible and are highly appreciated.
References 1 Hallock, J.N., Holzäpfel, F., “A Review of Recent Wake Vortex Research for Increasing Airport Capacity”, Progress in Aerospace Sciences,
Vol. 98, 2018, pp. 27-36, https://doi.org/10.1016/j.paerosci.2018.03.003. 2 Eurocontrol, “European Aviation in 2040 - Challenges of growth 2018”, 2 Oct. 2018, https://www.eurocontrol.int/publication/challenges-
growth-2018. 3 Critchley, J., Foot, P., “UK CAA Wake Vortex Database: Analysis of Incidents Reported Between 1982 and 1990”, Civil Aviation
Authority, CAA Paper 91, 1991. 4 WakeNet3-Europe, “Aircraft Wake Vortex State-of-the-Art & Research Needs”, compiled by F. Holzäpfel et al., issued by A. Reinke, C.
Schwarz, 2015, 201 pages, doi.org/10.17874/BFAEB7154B0. 5 Holzäpfel, F., Steen, M., “Aircraft Wake-Vortex Evolution in Ground Proximity: Analysis and Parameterization,” AIAA Journal, Vol. 45,
2007, pp. 218-227. 6 Holzäpfel, F., “Analysis of potential wake vortex encounters at a major European airport,” Aircraft Engineering and Aerospace Technology,
Vol. 89, 2017, pp. 634-643, http://dx.doi.org/10.1108/AEAT-01-2017-0043. 7 Crouch, J.D., Czech, M.J., “Comparative wake wake-turbulence assessments and findings for the B747-8”, 4th WakeNet3-Europe workshop,
Langen, Germany, 2012, http://www.wakent.eu/index.php?id=185.
Dow
nloa
ded
by F
rank
Hol
zäpf
el o
n Ja
nuar
y 5,
202
0 | h
ttp://
arc.
aiaa
.org
| D
OI:
10.
2514
/6.2
020-
0050
American Institute of Aeronautics and Astronautics
18
8 Duffy, K., Deluca, A., “One year of time-based separation at London’s Heathrow airport”, WakeNet-USA, Port Authority of NY & NJ, New York City, 2016.
9 SAFO 14007, “Safety Alert for Operators, Federal Aviation Administration,” 2014, http://www.faa.gov/other_visit/aviation_industry/airline_operators/airline_safety/safo.
10 EUROCONTROL, 2016, http://www.eurocontrol.int/news/recat-eu-now-use-paris-charles-de-gaulle. 11 Holzäpfel, F., Stephan, A., Heel, T., Körner, S., “Enhanced Wake Vortex Decay in Ground Proximity Triggered by Plate Lines,” Aircraft
Engineering and Aerospace Technology, Vol. 88, 2015, doi: 10.1108/AEAT-02-2015-0045. 12 Stephan, A., Holzäpfel, F., Misaka, T., “Aircraft Wake-Vortex Decay in Ground Proximity - Physical Mechanisms and Artificial
Enhancement,” Journal of Aircraft, Vol. 50, 2013, DOI:10.2514/1.C032179, pp. 1250 - 1260. 13 Stephan, A., Holzäpfel, F., Misaka, T., Geisler, R., Konrath, R., “Enhancement of aircraft wake vortex decay in ground proximity,” CEAS
Aeronautical Journal, Vol. 5, 2014, pp. 109-125, DOI 10.1007/s13272-013-0094-8. 14 Stephan, A., Schrall, J., Holzäpfel, F., “Numerical Optimization of Plate-Line Design for Enhanced Wake-Vortex Decay,” Journal of
Aircraft, Vol. 54, 2017, pp. 995-1010, http://dx.doi.org/10.2514/1.C033973. 15 Wang, C.H.J., Zhao, D., Schlüter, J., Holzäpfel, F., Stephan, A., “LES study on the shape effect of ground obstacles on wake vortex
dissipation”, Aerospace Science and Technology, Vol. 63, 2017, pp. 245–258, http://dx.doi.org/10.1016/j.ast.2016.12.032. 16 Wang, C.H.J., Zhao, D., Schlüter, J., Stephan, A., Holzäpfel, F., “Computational Investigation of Varying Plate-Line Geometry and
Placement on Wake Vortex Dissipation”, Journal of Aircraft, Vol. 55, 2018, pp. 133-144, https://doi.org/10.2514/1.C034346. 17 Geise, R., Neubauer, B., Zimmer, G., “Scaled Measurements of Multipath Propagation and Navigations Systems - a Practical Example for
ILS,” 2019 Joint International Symposium on Electromagnetic Compatibility, Sapporo and Asia-Pacific International Symposium on Electromagnetic Compatibility (EMC Sapporo/APEMC), 2019, http://dx.doi.org/10.23919/EMCTokyo.2019.8893769.
18 Stephan, A., Holzäpfel, F., Misaka, T., “Hybrid simulation of wake-vortex evolution during landing on flat terrain and with plate line”, International Journal of Heat and Fluid Flow, Vol. 49, 2014, pp. 18-27, http://dx.doi.org/10.1016/j.ijheatfluidflow.2014.05.004.
19 Smalikho, I.N. , Banakh, V.A., Holzäpfel, F., Rahm, S., “Method of radial velocities for the estimation of aircraft wake vortex parameters from data measured by coherent Doppler lidar,” Optics Express, Vol. 23, pp. A1194-A1207, 2015, http://dx.doi.org/10.1364/OE.23.0A1194.
20 Gurke, T., Lafferton, H., “The Development of the Wake Vortices Warning System for Frankfurt Airport: Theory and Implementation,” Air Traffic Control Quarterly, Vol. 5, 1997.
21 Holzäpfel, F., Borek, G., Czekala, H., Floh, A., Gerz, T., Kauczok, S., Kern, C., Kerschbaum, M., Körner, S., Maschwitz, G., Nossal, R., Oswald, L., Rotshteyn, G., Schiefer, C., Schwarzenbacher, J., Stephan, A., Stieber, M., Strauss, L., Strobel, M., Weiß, C., Wildmann, N., “Reduction of Wake Vortex Lifetime During Final Approach Via Plate Lines,” AIAA Aviation Forum 2020, Reno.
Dow
nloa
ded
by F
rank
Hol
zäpf
el o
n Ja
nuar
y 5,
202
0 | h
ttp://
arc.
aiaa
.org
| D
OI:
10.
2514
/6.2
020-
0050