Tunnel eld-effect transistors for sensitive terahertz detection
UNDERGRADUATE THESIS
POWER ENHANCEMENT IN THE
TERAHERTZ BAND
Author: Virginia Izquierdo Bermúdez
Advisor: Luis Enrique García Muñoz
Director: Gottfried Döhler
Leganés, July 2012
Department of Signal Theory and Communications

ii

Power Enhancement in the THz Band
iii
Title: POWER ENHANCEMENT IN THE THZ BAND
Author: Virginia Izquierdo Bermúdez
Advisor: Luis Enrique García Muñoz
Director: Gottfried Döhler
EL TRIBUNAL
Presidente: Pablo Acedo Gallardo
Vocal: Alberto García Martínez
Secretario: Alejandro Rivera Lavado
Realizado el acto de defensa y lectura del Proyecto Fin de Carrera el día 18 de julio de 2012 en Leganés, en
la Escuela Politécnica Superior de la Universidad Carlos III de Madrid, acuerda otorgarle la CALIFICACIÓN de
VOCAL
SECRETARIO PRESIDENTE

iv
Power Enhancement in the THz Band
v
A mis padres y a mi hermana

vi
Power Enhancement in the THz Band
vii
Agradecimientos Quiero comenzar con un grandísimo agradecimiento a mi tutor de proyecto, Enrique García, por haber
confiado en mí este último año, por haberme brindado la oportunidad de trabajar junto a él y por ayudarme
siempre que lo he necesitado para finalizar exitosamente este proyecto. A Gottfried Döhler, director de mi
proyecto, por todo lo que me ha enseñado y ayudado durante su estancia en la universidad así como su
apoyo durante mi estancia en Erlangen. A ambos y a Daniel Segovia me gustaría agradecerles el haberme
abierto las puertas para poder realizar parte de este proyecto en el Max Plank Institute for the Science of
Light en Erlangen, donde he tenido el honor de aprender acerca de su labor de investigación. Gracias a
Sascha Preu, Stefan Malzer, Sebastian Bauerschmidt y Christian Müller por su inestimable ayuda para el
desarrollo de las medidas necesarias mostradas en el último capítulo de este proyecto. Por último, me
gustaría agradecer a Belén García y a Alejandro Rivera, sin quienes la realización de este proyecto hubiera
sido mucho más costosa.
A mis padres tengo que agradecerlos todo lo que soy. Su apoyo incondicional y su cariño han sido
fundamentales a lo largo de toda mi vida, tanto en los buenos como en los malos momentos. Sin ellos, no
hubiera llegado hasta aquí.
A mi hermana, un ejemplo a seguir desde mis primeros años. Su motivación y admiración han servido para
superarme día a día. Su apoyo, su compañía, sus consejos y su forma de ver las cosas han sido vitales a lo
largo de estos años.
A mis amigos de siempre, por todos los momentos que hemos compartido juntos durante tantos años de
amistad. En especial, quiero agradecer a Rocío, a Sonia y a Fer su confianza en mí y su apoyo. Siempre serán
una parte fundamental de mi vida.
A mis compañeros de universidad, a Yuchen, a Felipe, a Juan y a David, por estos cinco años que hemos
pasado juntos. Por su constante confianza, han sido una gran motivación y ayuda a lo largo de la carrera. En
especial a Yuchen, por tantas horas que hemos pasado en la universidad y por todo su apoyo.
Por último, no puedo olvidarme del resto de mi familia y amigos. Todos han aportado algo en mi vida y han
ayudado a formarme como la persona que soy.

viii
Power Enhancement in the THz Band
ix
Abstract In the last years, the Terahertz band has achieved great importance due to its multiple applications in
different fields. These applications may go from medicine, to defense and security. Additionally, its short
wavelength allows to transmit large amount of data in a short period of time. Developing the Terahertz
technology could lead to an improvement in the existing applications and to overcome different problems
that actual technology presents. For example, harmful X-Ray scanners could be replaced by Terahertz
technology avoiding that it affects negatively to the human health. Spectroscopies with higher resolution can
also be performed thanks to the Terahertz waves.
However, this band, sometimes called as frequency gap, presents some limitations related to the radiated
power. Although big efforts have been made within the last decade to close the gap, obtaining high power
in the THz band is still challenging. There exist two different alternatives so as to generate THz power. By
using electronics, where higher power can be achieved or through optoelectronics using photomixing
technics. This project is focused in the later alternative, where getting higher powers is more challenging.
This work is part of a broader interdisciplinary project that involves experts from different fields, combining
the expertise on antenna design at the Signal and Communications Theory Department at Universidad Carlos
III de Madrid with the experience at the Max Planck Institute for the Science of light (Erlangen, Germany) on
optoelectronic THz emitters. The specific aim of the thesis is to study different ways of enhancing the
radiated THz power through simulation and through experimental results.
Three different approaches are done in order to achieve the desired results. Firstly, a 2D-array of TSA
antennas is intended. When constructing a 2D-array with end-fire antennas, the power will be increased due
to the contribution of all antennas that compose the array. However, before constructing it, it is required to
perfectly understand how these antennas behave under the circumstances that are required for designing
an array. As second alternative, simple antenna emitters are used. These antennas are dipoles or spirals
antennas connected to a photomixer device able to generate Terahertz power. The main task is to optimize
all the designed structure so as to obtain a symmetric radiation pattern, and calculate its corresponding
equivalent circuit. Lastly, some experimental measurements are done. These results are attained with
dielectric horn antennas measured in the laboratory of the Max Plank Institute for the Science of Light in
Erlangen. The efficiency of different antennas should be studied so as to know how the improvement
introduced by the dielectric horn etched is. In these different ways, enhancement in the Terahertz power is
achieved broadening the possible applications of this technology.
Keywords: Terahertz, Power, Radiation, Photomixer, Device, TSA, Dipole, Spiral, Horn, Efficiency.

x
Power Enhancement in the THz Band
xi
Resumen En los últimos años, la banda de Terahercios ha obtenido una gran importancia debido a su múltiple número
de aplicaciones en distintos campos. Estas aplicaciones van desde la medicina hasta defensa y seguridad.
Además, su corta longitud de onda permite transmitir grandes cantidades de información en un pequeño
periodo de tiempo. Desarrollar la tecnología de Terahercios puede dar lugar a una mejora en las aplicaciones
existentes y superar diferentes problemas que la tecnología actual presenta. Por ejemplo, los dañinos
escáneres de rayos X pueden ser remplazados por la tecnología de Terahercios evitando que estos afecten
negativamente a la salud. Espectroscopias con mayor resolución pueden realizarse también gracias a las
ondas de Terahercios.
Sin embargo, esa banda, a veces conocida como gap, presenta algunas limitaciones en relación a la potencia
radiada. Aunque se han realizado grandes esfuerzos durante la última década para cerrar este gap, obtener
altas potencias en la banda de Terahercios es aún desafiante.
Este trabajo es parte de un amplio proyecto interdisciplinar que involucra expertos de diferentes campos,
combinando la habilidad en el diseño de antenas en el Departamento de Teoría de la Señal y las
Comunicaciones en la Universidad Carlos III de Madrid con la experiencia del Max Plank Institute for the
Science of Light (Erlangen, Alemania) en emisores de Terahercios optoelectrónicos. El objetivo específico de
esta tesis es el estudio de diferentes formas de aumentar la potencia radiada en Terahercios mediante la
simulación y mediante resultados experimentales.
Se han hecho tres enfoques diferentes con el fin de conseguir los resultados deseados. En primer lugar, un
array 2D formado por antenas TSA ha sido diseñado. Para construir un array 2D con antenas end-fire, la
potencia incrementará debido a la contribución de todas las antenas que forman el array. Sin embargo,
antes de su construcción, es necesario entender perfectamente como estas antenas se comportan bajos las
circunstancias que se requieren para diseñar el array. Como segunda alternativa, se usan antenas emisoras.
Estas antenas son dipolos y espirales conectadas a un fotomezclador capaz de generar potencia en
Terahercios. La tarea principal es optimizar todas las estructuras diseñadas para obtener un diagrama de
radiación simétrico y calcular los correspondientes circuitos equivalentes. Finalmente, algunas medidas
experimentales son realizadas. Estas medidas son conseguidas por medio de bocinas dieléctricas medidas
en el laboratorio del Max Plank Institute for the Science of Light en Erlangen. La eficiencia de las diferentes
antenas ha de ser estudiada para saber las mejoras introducidas por la bocina dieléctrica. Con estas tres
alternativas, se consiguen mejoras en la potencia en Terahercios, aumentando el número de aplicaciones
que esta tecnología presenta.
Palabras clave: Terahercios, Potencia, Radiación, Fotomezclador, Dispositivo, TSA, Dipolo,
Espiral, Bocina, Eficiencia.

Power Enhancement in the THz Band
xiii
Contents CHAPTER 1 ................................................................................................................................................. 1
1 INTRODUCTION AND AIMS ........................................................................................................................... 1
1.1 Introduction .......................................................................................................................................... 1
1.2 Motivation ............................................................................................................................................ 2
1.3 Objectives ............................................................................................................................................. 3
1.4 Approach ............................................................................................................................................... 3
1.5 Contents ................................................................................................................................................ 4
CHAPTER 2 ................................................................................................................................................. 5
2 TAPERED SLOT ANTENNAS ........................................................................................................................... 5
2.1 Fundamentals ....................................................................................................................................... 6
2.2 Modal analysis .................................................................................................................................... 11
2.3 Field attenuation ................................................................................................................................. 14
2.4 Shape dependence ............................................................................................................................. 17
2.5 Conclusions ......................................................................................................................................... 20
CHAPTER 3 ............................................................................................................................................... 21
3 ANTENNA EMITTERS ................................................................................................................................. 21
3.1 Photomixer device .............................................................................................................................. 21
3.2 Dipole configuration ........................................................................................................................... 22
3.2.1 Device displacement ................................................................................................................... 23
3.2.2 Dimension optimization .............................................................................................................. 28
3.2.3 Equivalent circuit ......................................................................................................................... 30
3.3 Spiral configuration ............................................................................................................................. 32
3.3.1 Logarithmic spiral ........................................................................................................................ 32
3.3.2 Adiabatic spiral ............................................................................................................................ 34
3.3.3 Equivalent circuit ......................................................................................................................... 35

Contents
xiv
3.4 Conclusions ......................................................................................................................................... 36
CHAPTER 4 ............................................................................................................................................... 37
4 DIELECTRIC HORNS ................................................................................................................................... 37
4.1 Laboratory setup ................................................................................................................................. 38
4.1.1 Laser generation .......................................................................................................................... 39
4.1.2 DC bias ......................................................................................................................................... 39
4.1.3 Golay cell ..................................................................................................................................... 40
4.1.3 Lock-in amplifier .......................................................................................................................... 40
4.1.4 Laser alignment ........................................................................................................................... 41
4.2 Experimental results ........................................................................................................................... 42
4.2.1 Measurement procedure ............................................................................................................ 42
4.2.2 Initial measurements ................................................................................................................... 43
4.2.3 Reference measurements ........................................................................................................... 45
4.2.4 Horns measurement .................................................................................................................... 47
4.2.4.1 Horn etching ......................................................................................................................... 47
4.2.4.2 Measurements ..................................................................................................................... 48
4.2.5 Results comparison ..................................................................................................................... 51
4.2.6 Power analysis ............................................................................................................................. 54
4.3 Conclusions ......................................................................................................................................... 55
CHAPTER 5 ............................................................................................................................................... 57
5 CONCLUSIONS AND FUTURE WORK ............................................................................................................... 57
5.1 Conclusions ......................................................................................................................................... 57
5.2 Future work......................................................................................................................................... 59
5.3 Budget ................................................................................................................................................. 60
REFERENCES .............................................................................................................................................. 63
1
Chapter 1
1 Introduction and aims
The Terahertz (THz) band has taken great importance during the last decade due to its multiple applications
in different fields such as medicine, defense and security. However, the generation of THz radiation,
especially high power signals, has been an issue in this frequency band, sometimes known as frequency gap
due to the limitations imposed on it. This chapter is an introduction to the topic, describing its main features
and the importance of its different application. This work is part of a broader interdisciplinary project that
involves experts from different fields, combining the expertise on antenna design at the Signal and
Communications Theory Department at Universidad Carlos III de Madrid with the experience at the Max
Planck Institute for the Science of light (Erlangen, Germany) on optoelectronic THz emitters.
1.1 Introduction
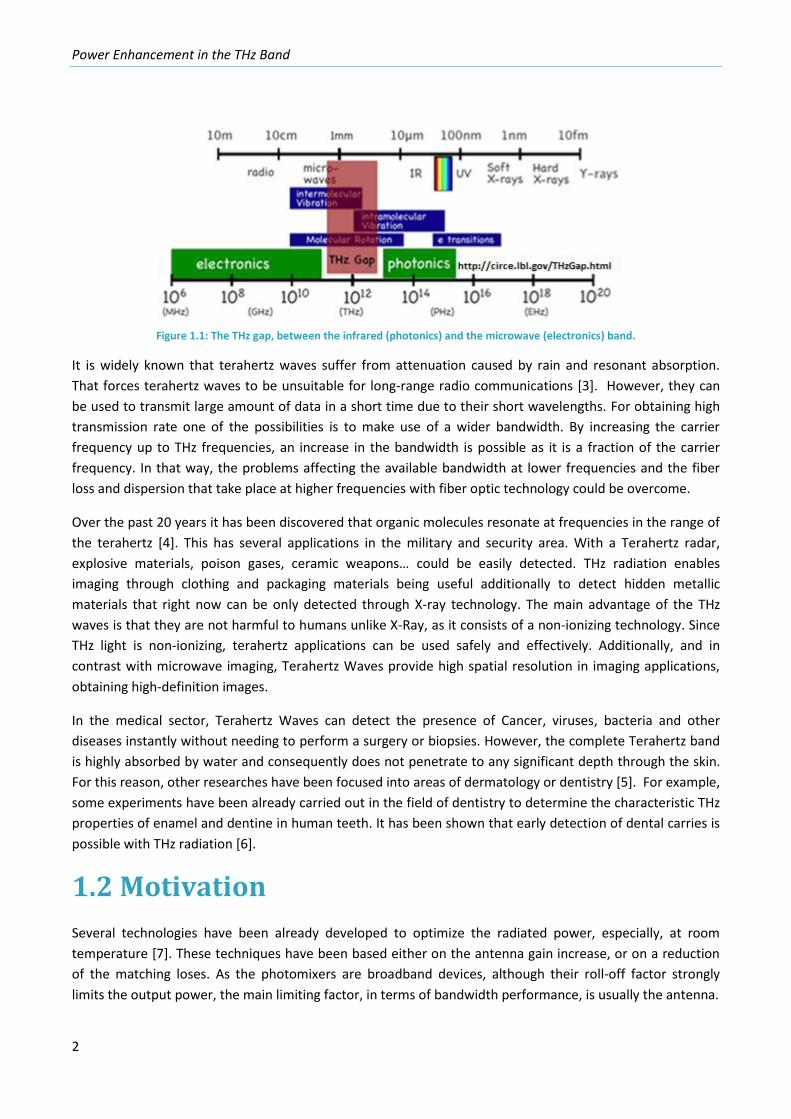
In the last years there has been big efforts focusing in building suitable sources and detectors for the THz gap
[1], [2] which covers the frequency range between 100 GHz and 10 THz. The main interest in this band is due
to the broad number of applications in which Terahertz and Millimetric waves can be present. It is the most
scientifically rich band of frequencies in the entire spectrum.
Power Enhancement in the THz Band
2
Figure 1.1: The THz gap, between the infrared (photonics) and the microwave (electronics) band.
It is widely known that terahertz waves suffer from attenuation caused by rain and resonant absorption.
That forces terahertz waves to be unsuitable for long-range radio communications [3]. However, they can
be used to transmit large amount of data in a short time due to their short wavelengths. For obtaining high
transmission rate one of the possibilities is to make use of a wider bandwidth. By increasing the carrier
frequency up to THz frequencies, an increase in the bandwidth is possible as it is a fraction of the carrier
frequency. In that way, the problems affecting the available bandwidth at lower frequencies and the fiber
loss and dispersion that take place at higher frequencies with fiber optic technology could be overcome.
Over the past 20 years it has been discovered that organic molecules resonate at frequencies in the range of
the terahertz [4]. This has several applications in the military and security area. With a Terahertz radar,
explosive materials, poison gases, ceramic weapons… could be easily detected. THz radiation enables
imaging through clothing and packaging materials being useful additionally to detect hidden metallic
materials that right now can be only detected through X-ray technology. The main advantage of the THz
waves is that they are not harmful to humans unlike X-Ray, as it consists of a non-ionizing technology. Since
THz light is non-ionizing, terahertz applications can be used safely and effectively. Additionally, and in
contrast with microwave imaging, Terahertz Waves provide high spatial resolution in imaging applications,
obtaining high-definition images.
In the medical sector, Terahertz Waves can detect the presence of Cancer, viruses, bacteria and other
diseases instantly without needing to perform a surgery or biopsies. However, the complete Terahertz band
is highly absorbed by water and consequently does not penetrate to any significant depth through the skin.
For this reason, other researches have been focused into areas of dermatology or dentistry [5]. For example,
some experiments have been already carried out in the field of dentistry to determine the characteristic THz
properties of enamel and dentine in human teeth. It has been shown that early detection of dental carries is
possible with THz radiation [6].
1.2 Motivation
Several technologies have been already developed to optimize the radiated power, especially, at room
temperature [7]. These techniques have been based either on the antenna gain increase, or on a reduction
of the matching loses. As the photomixers are broadband devices, although their roll-off factor strongly
limits the output power, the main limiting factor, in terms of bandwidth performance, is usually the antenna.
Chapter 1: Introduction and aims
3
Although big efforts have been made within the last decade to close the gap, obtaining high power in the
THz band is still challenging. From electronics a maximum power of around 1 THz has been achieve
through microwave technology [8]. With optoelectronics devices a maximum power in the range of is
possible by photomixing of two laser beams in a semiconductor [9], [10]. In this work, only optoelectronics
devices will be studied focusing on maximizing the radiated THz power by the antenna.
1.3 Objectives
The main objective of this work is to analyze different structures for the generation of THz power. Photomixer devices are used in combination with different antenna topologies with the aim of improving the radiated power and its radiation diagram. The specific tasks that were performed in the present thesis were:
- To study the radiation properties of tapered slot antennas (TSA) with the aim of constructing 2D-arrays.
- To study how the generated power by a photomixer device radiates through a dipole configuration.
- To study how the generated power by a photomixer device radiates through a spiral configuration.
- To study the improvement in the radiated power by using dielectric horn antennas.
In order to achieve this final aim, additional tasks should be performed:
- To learn how to use all the equipment available at the Max Plank laboratory for the measurement of THz power.
- To etch the dielectric horns in the already fabricated antennas.
- To compare the radiated power of the horn antennas with those measured before the etching procedure.
1.4 Approach
With the aim of achieving successful results, specialized software for antenna design should be used. Two
different softwares have been in charge of the simulations: HFSS and CST. HFSS has been mainly used for the
study of the LTSA antennas while CST has performed the remaining simulations present in this work. For
obtaining the equivalent circuit of some of the structures, AWR software has been used as simulation tool.
The experimental results were done in the laboratory of the Max Planck Institute for the Science of light, in
Erlangen, Germany. Apart from the equipment available, the used of LabVIEW were compulsory for
performing the required measurements.
All the necessary data processing has been done with MATLAB.
Power Enhancement in the THz Band
4
1.5 Contents
This work is divided in five chapters, going from the general concept of THz radiation to the different approaches for this purpose.
The first chapter presents a general description and motivation of the project. A brief introduction shows the importance of the problem to deal with and its practical applications. The particular objectives to be reached within the project are defined. Last but not least, the particular software and material used are detailed.
Chapter 2 presents a way of enhancing the radiated power in the THz band using 2D-arrays. The antennas used are TSA and its radiation properties are studied. As the thickness of the substrate antenna increases, the end-fire radiation is lost in detriment of the performance of the 2D-array. In this chapter, the reasons why the antenna stops working as well as possible solutions are presented.
Chapter 3 studies in detail the radiated THz power by dipole and spiral antennas. For it, a photomixer device has been previously designed. This photomixer connected to an antenna will be capable of radiating THz power. Different parameters that could affect to the radiation pattern are studied, mainly related to the dimensions of the photomixer and its relative position in the configuration. Additionally, the equivalent circuit for the photomixer device is calculated.
Chapter 4 shows experimental results attained in the laboratory. These experimental results are related with the performance of an antenna printed over a dielectric horn in comparison with the performance of a single antenna regarding its efficiency. All the laboratory equipment along with the measurement procedure is detailed. The obtained measurements and some pictures of the resulting etched horns are also presented in this chapter.
In the last chapter, Chapter 5, the obtained conclusions are summarized and future researching lines are proposed together with the budget needed for them.
5
Chapter 2
2 Tapered Slot Antennas
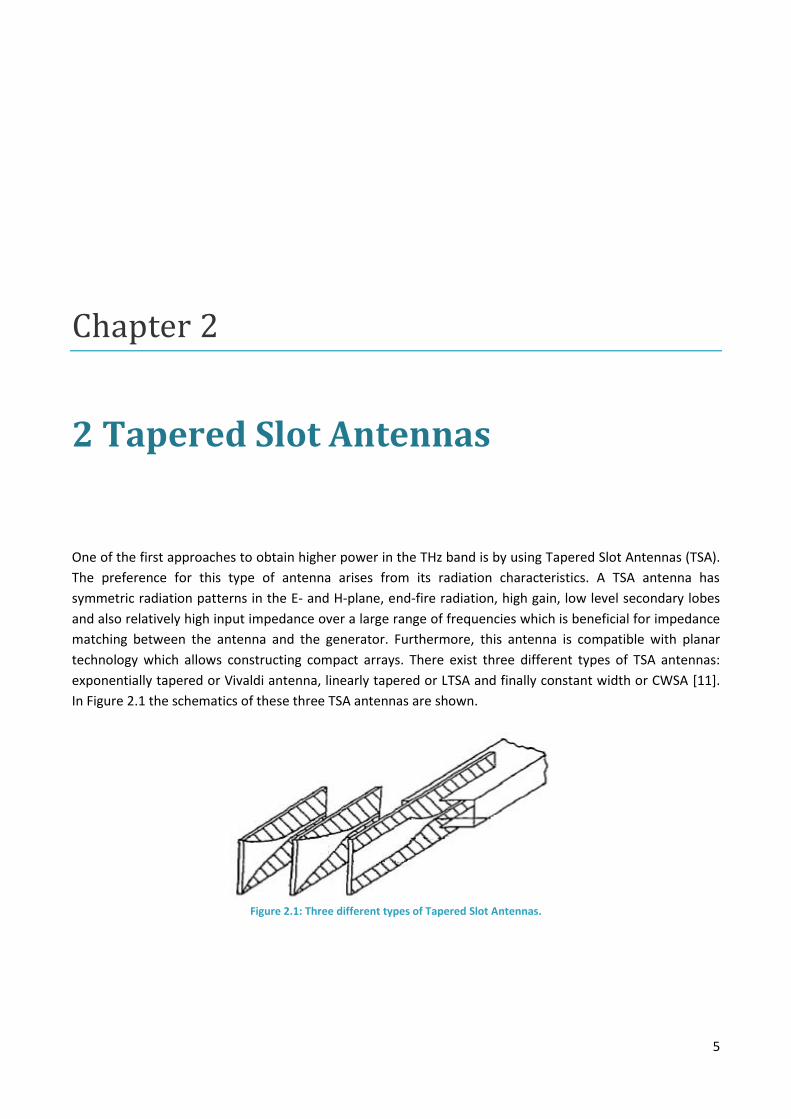
One of the first approaches to obtain higher power in the THz band is by using Tapered Slot Antennas (TSA).
The preference for this type of antenna arises from its radiation characteristics. A TSA antenna has
symmetric radiation patterns in the E- and H-plane, end-fire radiation, high gain, low level secondary lobes
and also relatively high input impedance over a large range of frequencies which is beneficial for impedance
matching between the antenna and the generator. Furthermore, this antenna is compatible with planar
technology which allows constructing compact arrays. There exist three different types of TSA antennas:
exponentially tapered or Vivaldi antenna, linearly tapered or LTSA and finally constant width or CWSA [11].
In Figure 2.1 the schematics of these three TSA antennas are shown.
Figure 2.1: Three different types of Tapered Slot Antennas.
Power Enhancement in the THz Band
6
2.1 Fundamentals
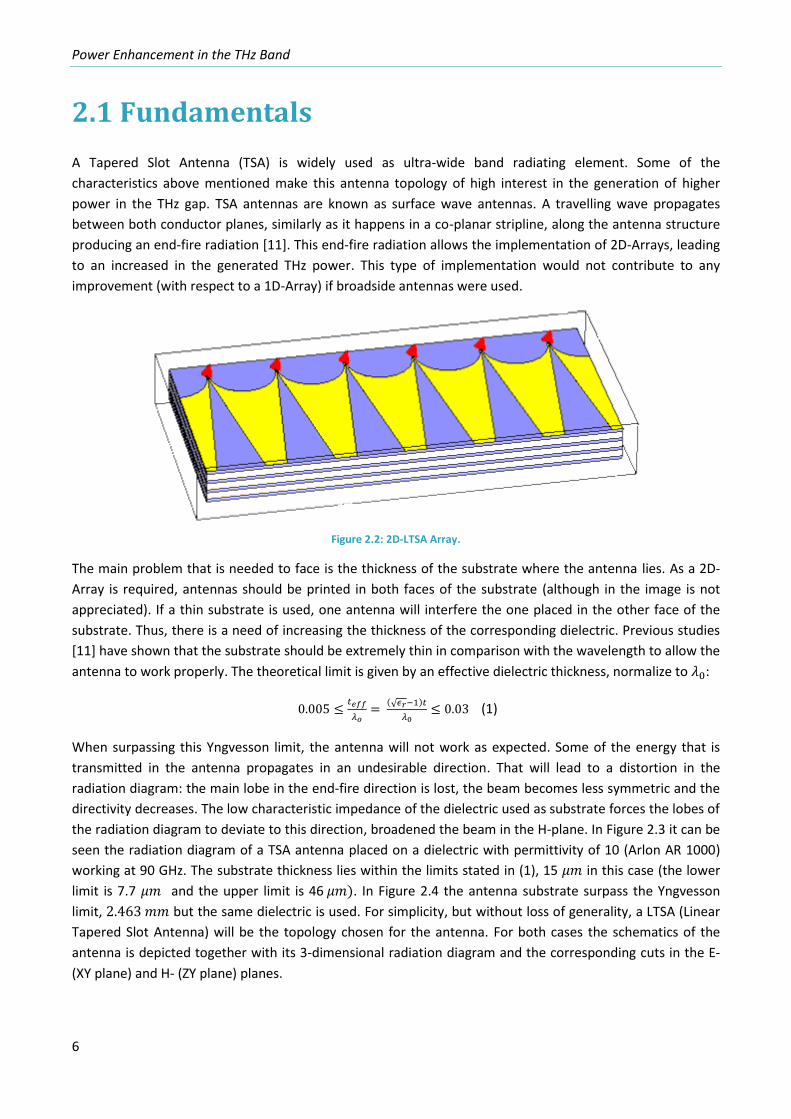
A Tapered Slot Antenna (TSA) is widely used as ultra-wide band radiating element. Some of the
characteristics above mentioned make this antenna topology of high interest in the generation of higher
power in the THz gap. TSA antennas are known as surface wave antennas. A travelling wave propagates
between both conductor planes, similarly as it happens in a co-planar stripline, along the antenna structure
producing an end-fire radiation [11]. This end-fire radiation allows the implementation of 2D-Arrays, leading
to an increased in the generated THz power. This type of implementation would not contribute to any
improvement (with respect to a 1D-Array) if broadside antennas were used.
Figure 2.2: 2D-LTSA Array.
The main problem that is needed to face is the thickness of the substrate where the antenna lies. As a 2D-
Array is required, antennas should be printed in both faces of the substrate (although in the image is not
appreciated). If a thin substrate is used, one antenna will interfere the one placed in the other face of the
substrate. Thus, there is a need of increasing the thickness of the corresponding dielectric. Previous studies
[11] have shown that the substrate should be extremely thin in comparison with the wavelength to allow the
antenna to work properly. The theoretical limit is given by an effective dielectric thickness, normalize to :
(√ )
(1)
When surpassing this Yngvesson limit, the antenna will not work as expected. Some of the energy that is
transmitted in the antenna propagates in an undesirable direction. That will lead to a distortion in the
radiation diagram: the main lobe in the end-fire direction is lost, the beam becomes less symmetric and the
directivity decreases. The low characteristic impedance of the dielectric used as substrate forces the lobes of
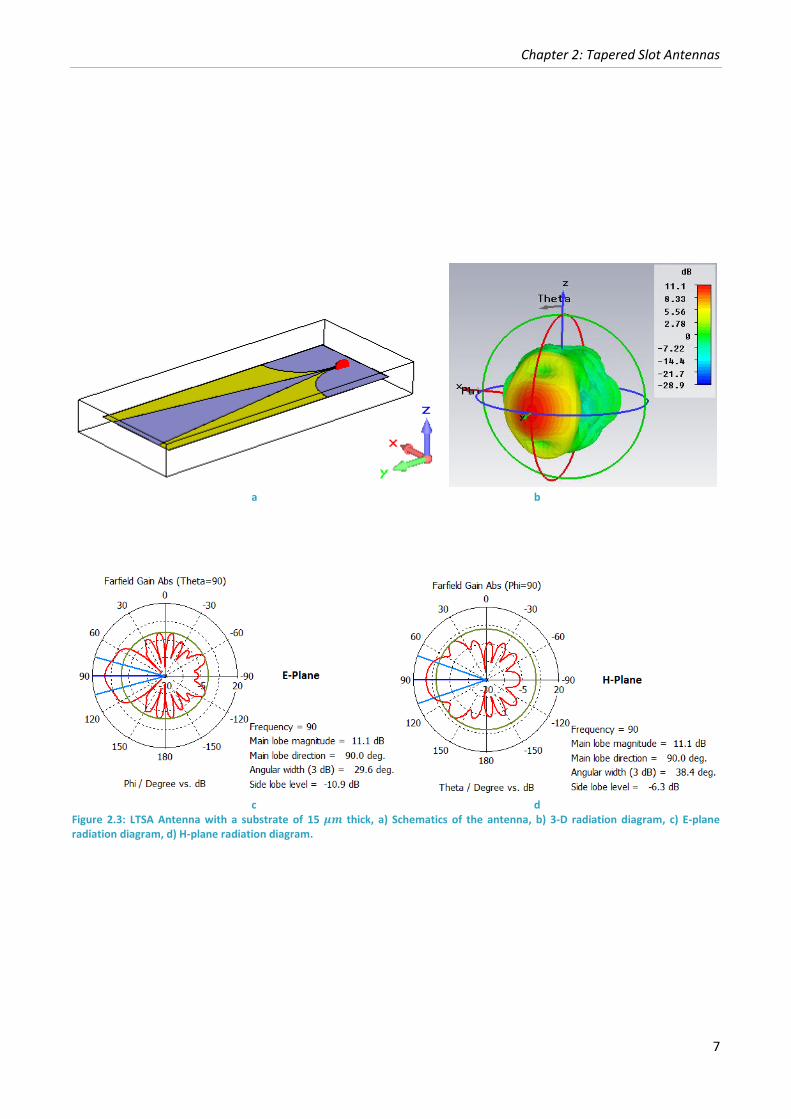
the radiation diagram to deviate to this direction, broadened the beam in the H-plane. In Figure 2.3 it can be
seen the radiation diagram of a TSA antenna placed on a dielectric with permittivity of 10 (Arlon AR 1000)
working at 90 GHz. The substrate thickness lies within the limits stated in (1), 15 in this case (the lower
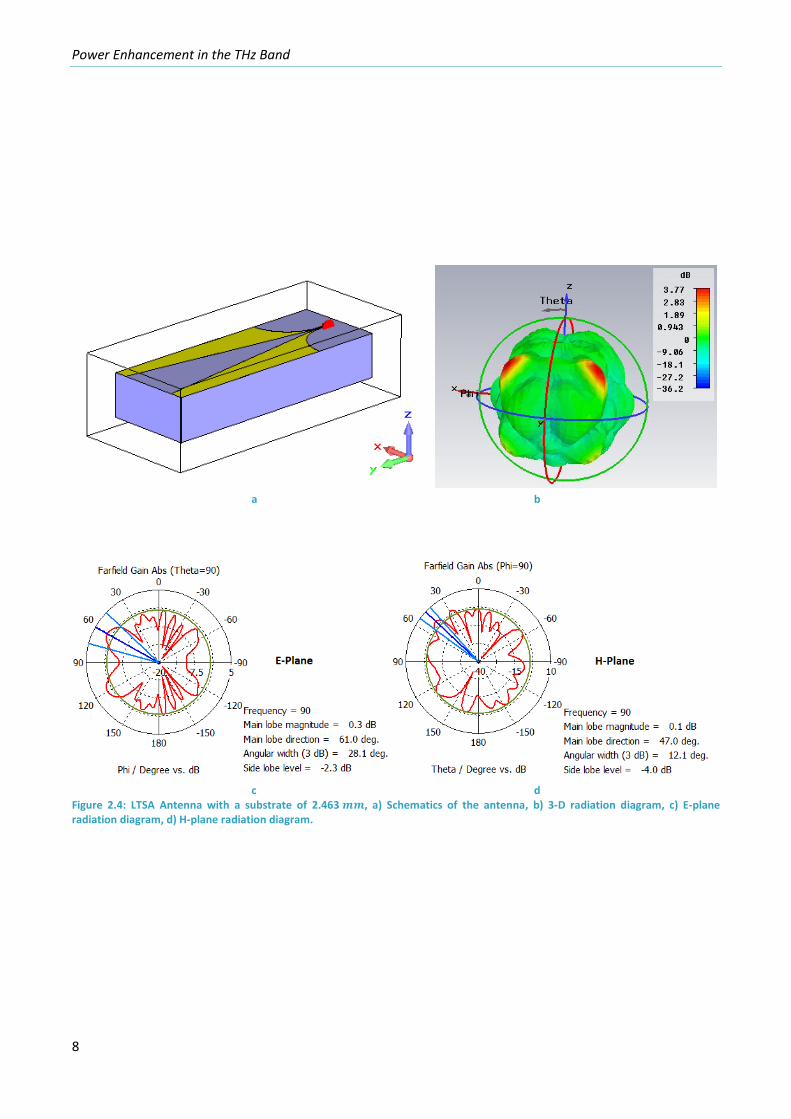
limit is 7.7 and the upper limit is 46 ). In Figure 2.4 the antenna substrate surpass the Yngvesson
limit, but the same dielectric is used. For simplicity, but without loss of generality, a LTSA (Linear
Tapered Slot Antenna) will be the topology chosen for the antenna. For both cases the schematics of the
antenna is depicted together with its 3-dimensional radiation diagram and the corresponding cuts in the E-
(XY plane) and H- (ZY plane) planes.
Chapter 2: Tapered Slot Antennas
7
a b
c d
Figure 2.3: LTSA Antenna with a substrate of 15 thick, a) Schematics of the antenna, b) 3-D radiation diagram, c) E-plane radiation diagram, d) H-plane radiation diagram.
Power Enhancement in the THz Band
8
a b
c d
Figure 2.4: LTSA Antenna with a substrate of 2.463 , a) Schematics of the antenna, b) 3-D radiation diagram, c) E-plane radiation diagram, d) H-plane radiation diagram.
Chapter 2: Tapered Slot Antennas
9
It can be seen how an antenna that was working correctly degrades completely just by increasing the
thickness of the substrate where the antenna lies. In this particular case, as the thickness is much bigger than
the Yngvesson limit, no main lobe can be observed anymore. The radiation diagram is completely different
as the one expected from a well-designed LTSA.
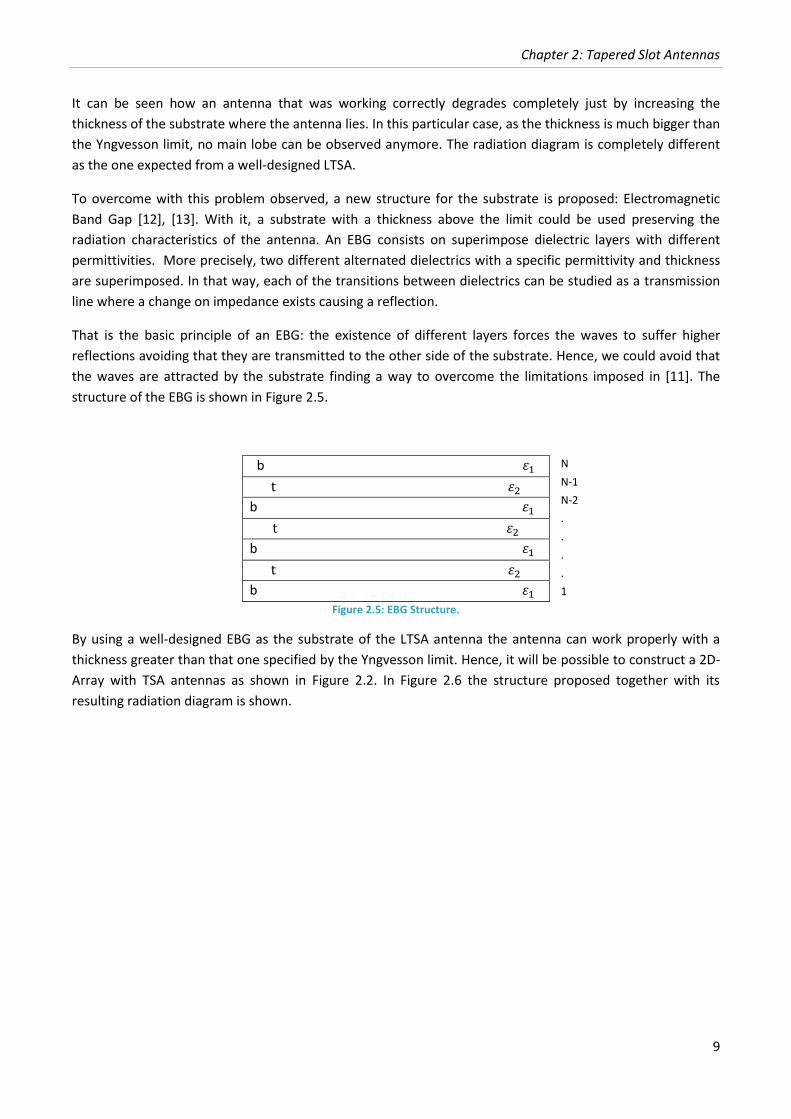
To overcome with this problem observed, a new structure for the substrate is proposed: Electromagnetic
Band Gap [12], [13]. With it, a substrate with a thickness above the limit could be used preserving the
radiation characteristics of the antenna. An EBG consists on superimpose dielectric layers with different
permittivities. More precisely, two different alternated dielectrics with a specific permittivity and thickness
are superimposed. In that way, each of the transitions between dielectrics can be studied as a transmission
line where a change on impedance exists causing a reflection.
That is the basic principle of an EBG: the existence of different layers forces the waves to suffer higher
reflections avoiding that they are transmitted to the other side of the substrate. Hence, we could avoid that
the waves are attracted by the substrate finding a way to overcome the limitations imposed in [11]. The
structure of the EBG is shown in Figure 2.5.
b
b
b
b
Figure 2.5: EBG Structure.
By using a well-designed EBG as the substrate of the LTSA antenna the antenna can work properly with a
thickness greater than that one specified by the Yngvesson limit. Hence, it will be possible to construct a 2D-
Array with TSA antennas as shown in Figure 2.2. In Figure 2.6 the structure proposed together with its
resulting radiation diagram is shown.
N
N-1
N-2
.
.
.
.
1
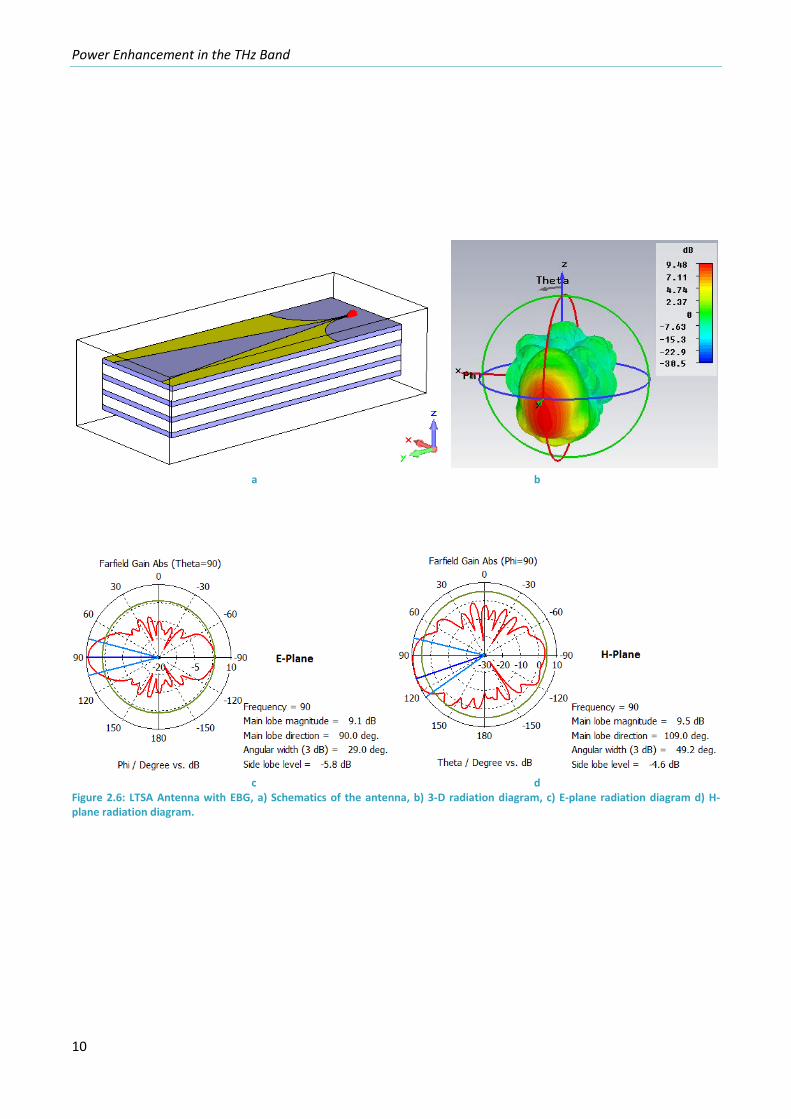
Power Enhancement in the THz Band
10
a b
c d
Figure 2.6: LTSA Antenna with EBG, a) Schematics of the antenna, b) 3-D radiation diagram, c) E-plane radiation diagram d) H-plane radiation diagram.
Chapter 2: Tapered Slot Antennas
11
The EBG consist of two different dielectrics following the structure in Figure 2.5: The first dielectric, Arlon AR
1000, with permittivity, , 10 and a thickness b of 0.237mm; the second one, Rogers RT5880, with
permittivity, 2.2 and a thickness t of 0.505 mm. The Yngvesson limit for this structure will depend on the
mean permittivity given by the former dielectrics. It should be taken into account that 4 layers of Arlon AR
1000 and 3 layers of Rogers RT5880 compose the structure (with its corresponding thickness). The mean
permittivity is 5.2 and thus the limiting upper thickness at 90 GHz is . The limit is surpassed with
the proposed structure as the total thickness is , the same as shown in Figure 2.4.
Even the same thickness is used in Figure 2.4 and in Figure 2.6, for this last case the antenna is working
properly even when the limit in (1) is not accomplished as an EBG is used. The main lobe in the H-plane is
still a little bit deviated. As it has been already clarified, the low characteristic impedance of the substrate
makes that this main lobe deviates slightly but in this case, an end-fire radiation is still achieved with
relatively high directivity.
In the following sections, different studies will be done for trying to explain the reasons why this antenna
stops working when a thicker substrate is used. Three different theories will be highlighted, firstly taking into
account the modes that are propagating through the antenna under study, secondly studying the field
attenuation by the EBG structure and finally the shape dependence of this type of antennas.
2.2 Modal analysis
The first approach to the radiation mechanism of a TSA is through the study of the modes that are
propagating in the antenna. A previous study [14] has shown that when a thin substrate is used, the
electromagnetic field in the LTSA has the same structure as the electromagnetic field in a dielectric slab
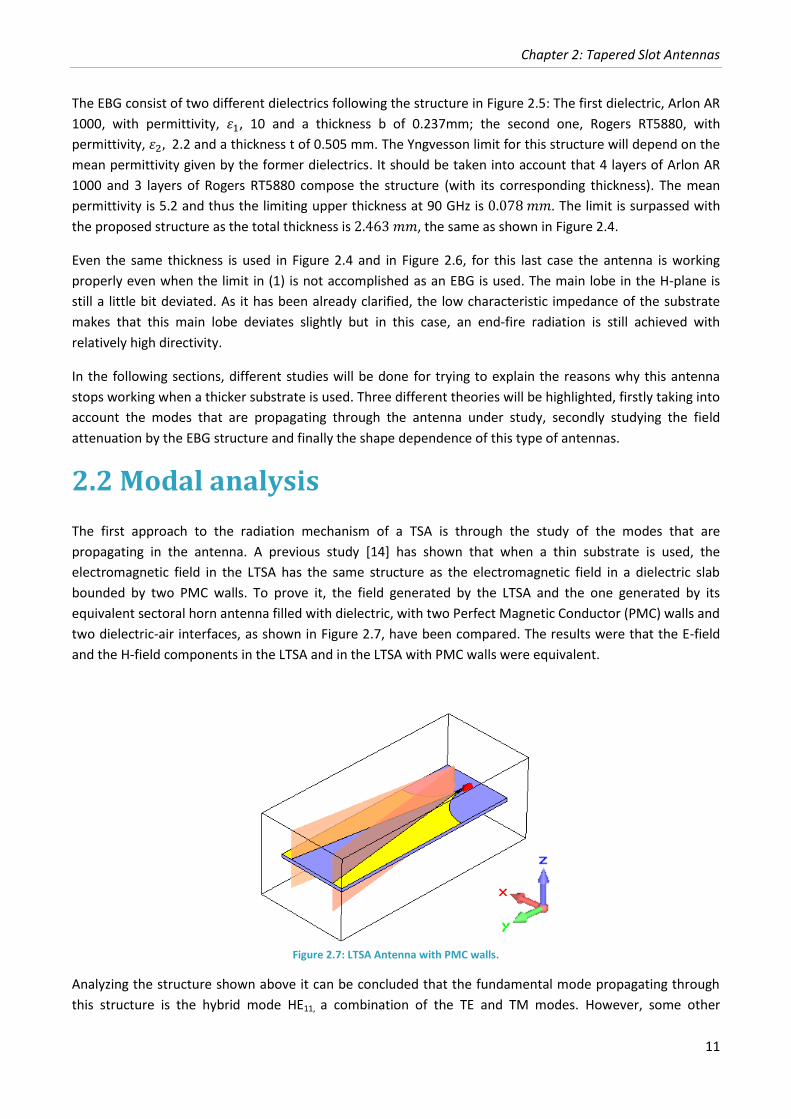
bounded by two PMC walls. To prove it, the field generated by the LTSA and the one generated by its
equivalent sectoral horn antenna filled with dielectric, with two Perfect Magnetic Conductor (PMC) walls and
two dielectric-air interfaces, as shown in Figure 2.7, have been compared. The results were that the E-field
and the H-field components in the LTSA and in the LTSA with PMC walls were equivalent.
Figure 2.7: LTSA Antenna with PMC walls.
Analyzing the structure shown above it can be concluded that the fundamental mode propagating through
this structure is the hybrid mode HE11, a combination of the TE and TM modes. However, some other
Power Enhancement in the THz Band
12
secondary modes such as TM01, HE10 or HE12 can propagate in the structure when the antenna is not well
designed. It can be said that when only the fundamental mode HE11 propagates, the antenna will work
properly, or equivalently, when the antenna substrate is thin. In that situation, most of the power is
associated to this fundamental mode. In the study is stated that as the effective thickness of the substrate
increases, more energy is coupled to higher order modes radiating thus the antenna not only in its end-fire
configuration.
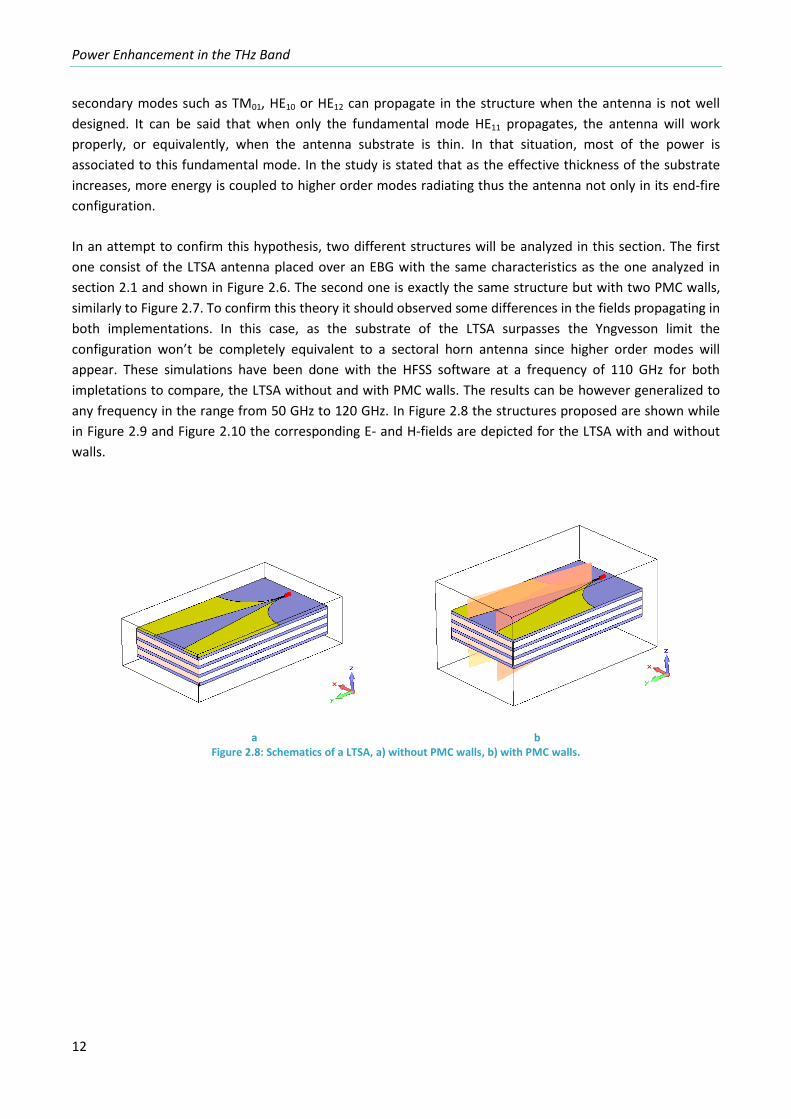
In an attempt to confirm this hypothesis, two different structures will be analyzed in this section. The first
one consist of the LTSA antenna placed over an EBG with the same characteristics as the one analyzed in
section 2.1 and shown in Figure 2.6. The second one is exactly the same structure but with two PMC walls,
similarly to Figure 2.7. To confirm this theory it should observed some differences in the fields propagating in
both implementations. In this case, as the substrate of the LTSA surpasses the Yngvesson limit the
configuration won’t be completely equivalent to a sectoral horn antenna since higher order modes will
appear. These simulations have been done with the HFSS software at a frequency of 110 GHz for both
impletations to compare, the LTSA without and with PMC walls. The results can be however generalized to
any frequency in the range from 50 GHz to 120 GHz. In Figure 2.8 the structures proposed are shown while
in Figure 2.9 and Figure 2.10 the corresponding E- and H-fields are depicted for the LTSA with and without
walls.
a b Figure 2.8: Schematics of a LTSA, a) without PMC walls, b) with PMC walls.
Chapter 2: Tapered Slot Antennas
13
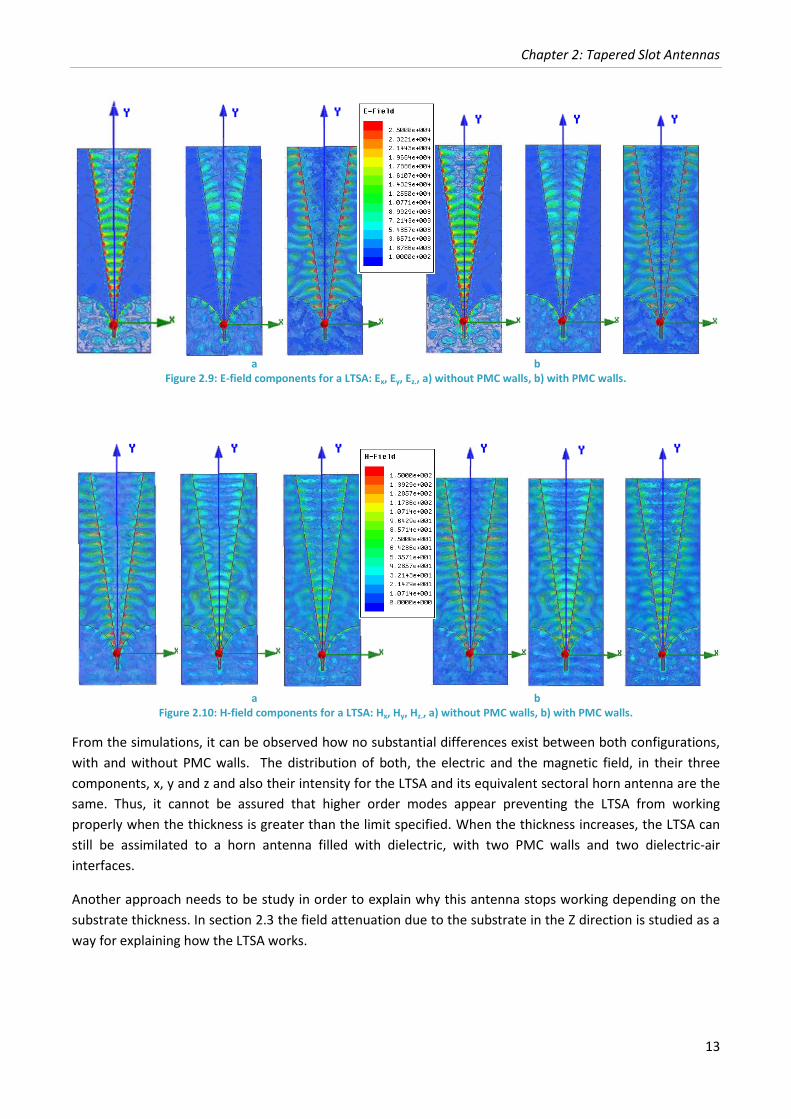
a b
Figure 2.9: E-field components for a LTSA: Ex, Ey, Ez., a) without PMC walls, b) with PMC walls.
a b
Figure 2.10: H-field components for a LTSA: Hx, Hy, Hz., a) without PMC walls, b) with PMC walls.
From the simulations, it can be observed how no substantial differences exist between both configurations,
with and without PMC walls. The distribution of both, the electric and the magnetic field, in their three
components, x, y and z and also their intensity for the LTSA and its equivalent sectoral horn antenna are the
same. Thus, it cannot be assured that higher order modes appear preventing the LTSA from working
properly when the thickness is greater than the limit specified. When the thickness increases, the LTSA can
still be assimilated to a horn antenna filled with dielectric, with two PMC walls and two dielectric-air
interfaces.
Another approach needs to be study in order to explain why this antenna stops working depending on the
substrate thickness. In section 2.3 the field attenuation due to the substrate in the Z direction is studied as a
way for explaining how the LTSA works.
Power Enhancement in the THz Band
14
2.3 Field attenuation
The degradation of the antenna when the effective thickness of the substrate is higher can also be explained
through the attenuation that suffers the fields in a LTSA antenna in the vertical Z direction, normal to the
dielectric-air interface [14]. As the thickness increases, the attenuation factor ( ) associated to the
field drops dramatically with Z. When the substrate is thinner, the variation of this attenuation constant is
not strong within the limits. However, as the thickness increases and the antenna degrades its performance
this variation within the substrate becomes higher, implying that the radiation pattern becomes much
broader in the H plane resulting in an asymmetric radiation beam.
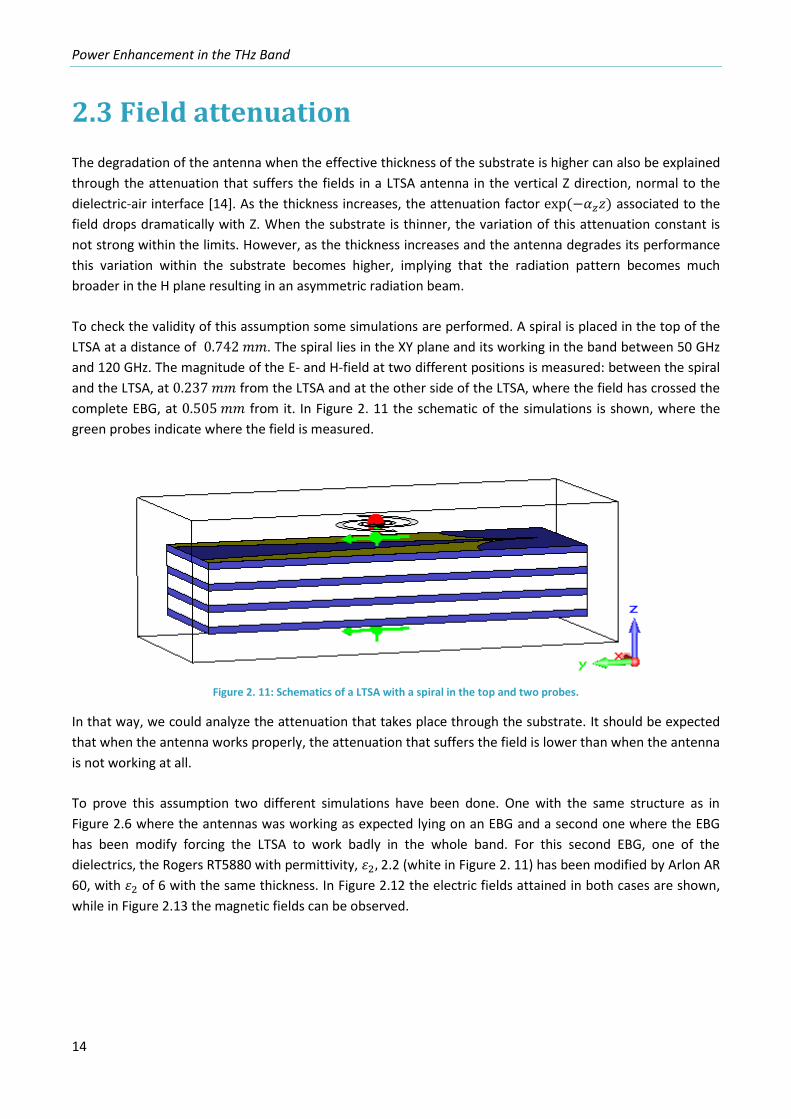
To check the validity of this assumption some simulations are performed. A spiral is placed in the top of the
LTSA at a distance of . The spiral lies in the XY plane and its working in the band between 50 GHz
and 120 GHz. The magnitude of the E- and H-field at two different positions is measured: between the spiral
and the LTSA, at from the LTSA and at the other side of the LTSA, where the field has crossed the
complete EBG, at from it. In Figure 2. 11 the schematic of the simulations is shown, where the
green probes indicate where the field is measured.
Figure 2. 11: Schematics of a LTSA with a spiral in the top and two probes.
In that way, we could analyze the attenuation that takes place through the substrate. It should be expected
that when the antenna works properly, the attenuation that suffers the field is lower than when the antenna
is not working at all.
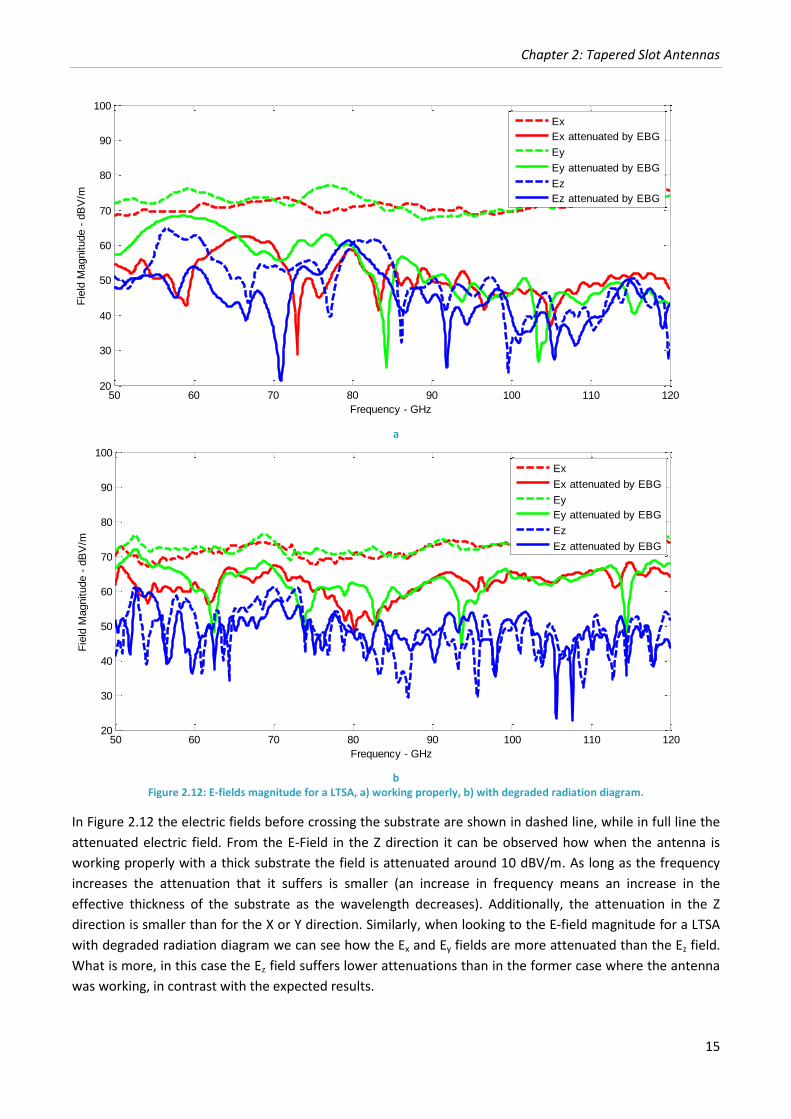
To prove this assumption two different simulations have been done. One with the same structure as in
Figure 2.6 where the antennas was working as expected lying on an EBG and a second one where the EBG
has been modify forcing the LTSA to work badly in the whole band. For this second EBG, one of the
dielectrics, the Rogers RT5880 with permittivity, 2.2 (white in Figure 2. 11) has been modified by Arlon AR
60, with of 6 with the same thickness. In Figure 2.12 the electric fields attained in both cases are shown,
while in Figure 2.13 the magnetic fields can be observed.
Chapter 2: Tapered Slot Antennas
15
a
b
Figure 2.12: E-fields magnitude for a LTSA, a) working properly, b) with degraded radiation diagram.
In Figure 2.12 the electric fields before crossing the substrate are shown in dashed line, while in full line the
attenuated electric field. From the E-Field in the Z direction it can be observed how when the antenna is
working properly with a thick substrate the field is attenuated around 10 dBV/m. As long as the frequency
increases the attenuation that it suffers is smaller (an increase in frequency means an increase in the
effective thickness of the substrate as the wavelength decreases). Additionally, the attenuation in the Z
direction is smaller than for the X or Y direction. Similarly, when looking to the E-field magnitude for a LTSA
with degraded radiation diagram we can see how the Ex and Ey fields are more attenuated than the Ez field.
What is more, in this case the Ez field suffers lower attenuations than in the former case where the antenna
was working, in contrast with the expected results.
50 60 70 80 90 100 110 12020
30
40
50
60
70
80
90
100
Frequency - GHz
Fie
ld M
agnitude -
dB
V/m
Ex
Ex attenuated by EBG
Ey
Ey attenuated by EBG
Ez
Ez attenuated by EBG
50 60 70 80 90 100 110 12020
30
40
50
60
70
80
90
100
Frequency - GHz
Fie
ld M
agnitude -
dB
V/m
Ex
Ex attenuated by EBG
Ey
Ey attenuated by EBG
Ez
Ez attenuated by EBG
Power Enhancement in the THz Band
16
a
b
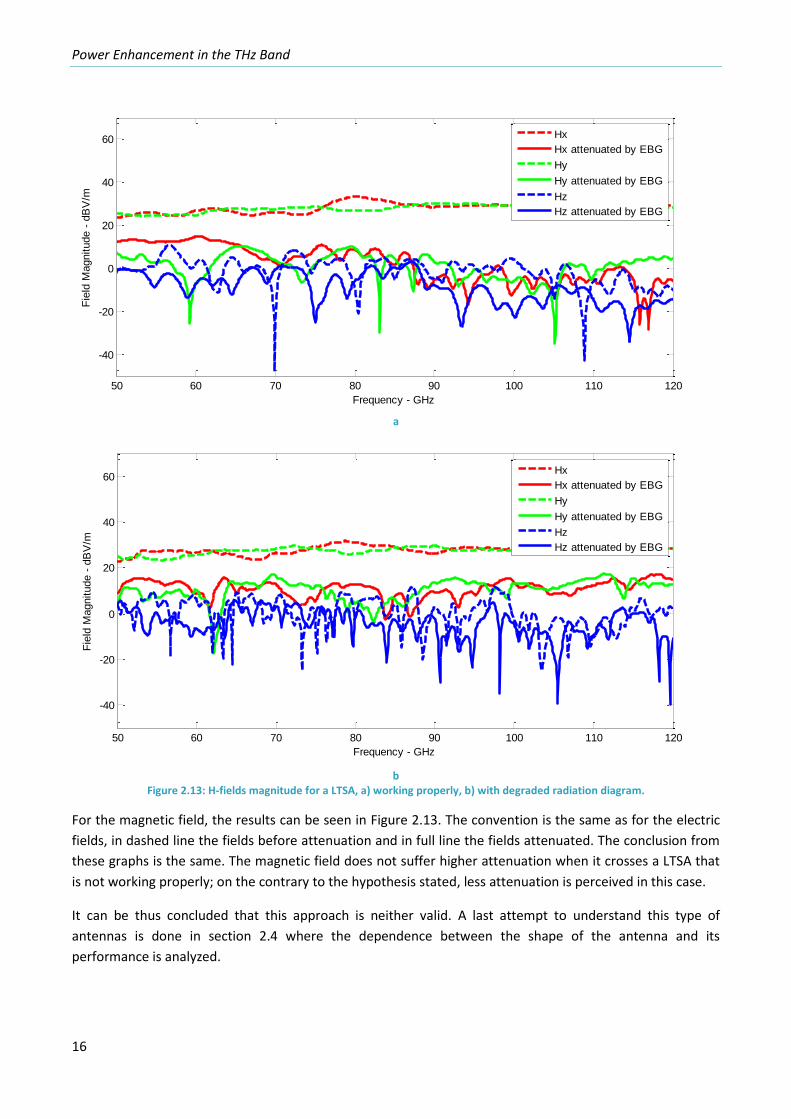
Figure 2.13: H-fields magnitude for a LTSA, a) working properly, b) with degraded radiation diagram.
For the magnetic field, the results can be seen in Figure 2.13. The convention is the same as for the electric
fields, in dashed line the fields before attenuation and in full line the fields attenuated. The conclusion from
these graphs is the same. The magnetic field does not suffer higher attenuation when it crosses a LTSA that
is not working properly; on the contrary to the hypothesis stated, less attenuation is perceived in this case.
It can be thus concluded that this approach is neither valid. A last attempt to understand this type of
antennas is done in section 2.4 where the dependence between the shape of the antenna and its
performance is analyzed.
50 60 70 80 90 100 110 120
-40
-20
0
20
40
60
Frequency - GHz
Fie
ld M
agnitude -
dB
V/m
Hx
Hx attenuated by EBG
Hy
Hy attenuated by EBG
Hz
Hz attenuated by EBG
50 60 70 80 90 100 110 120
-40
-20
0
20
40
60
Frequency - GHz
Fie
ld M
agnitude -
dB
V/m
Hx
Hx attenuated by EBG
Hy
Hy attenuated by EBG
Hz
Hz attenuated by EBG
Chapter 2: Tapered Slot Antennas
17
2.4 Shape dependence
In this section different versions of the LTSA antenna lying on an EBG will be analyzed. The main purpose is
to find out how the shape of the antenna and the design of the EBG affect the performance of the LTSA. In
order to design this type of antennas, it is important to know how the shape of the gold layer affects as well
as the EBG selected. Thus, different simulations will be performed by changing these two basic
characteristics of the antenna under study. All the radiation diagrams are compared with the one in Figure
2.6 , working at the same frequency of 90 GHz, in terms of gain and shape.
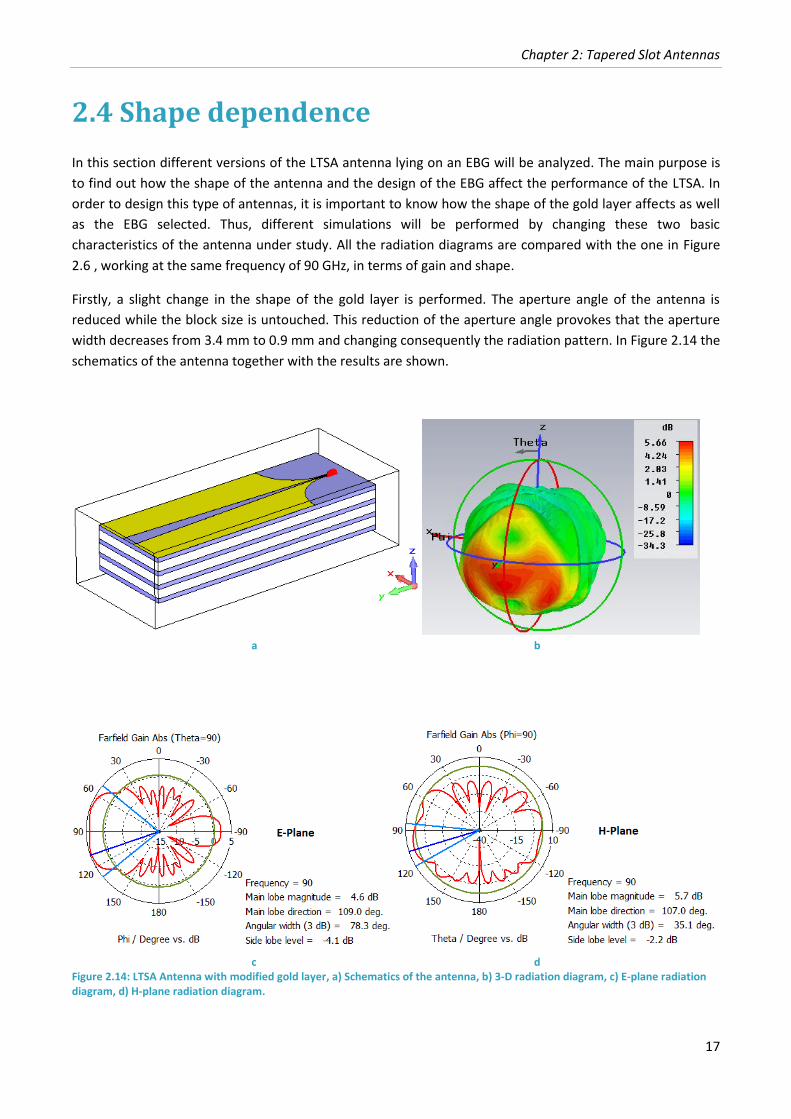
Firstly, a slight change in the shape of the gold layer is performed. The aperture angle of the antenna is
reduced while the block size is untouched. This reduction of the aperture angle provokes that the aperture
width decreases from 3.4 mm to 0.9 mm and changing consequently the radiation pattern. In Figure 2.14 the
schematics of the antenna together with the results are shown.
a b
c d
Figure 2.14: LTSA Antenna with modified gold layer, a) Schematics of the antenna, b) 3-D radiation diagram, c) E-plane radiation diagram, d) H-plane radiation diagram.
Power Enhancement in the THz Band
18
It can be seen how the gold layer affects drastically to the performance of the antenna. A main lobe in the
end-fire radiation is not any more present and the directivity has decreased considerably. From the E-plane
it can be seen how the radiation diagram degrades broadening the main lobe, being the maximum in a
direction different from the end-fire radiation. The H-plane is completely worsened, it does not exist a main
lobe anymore and the pattern is deviated toward the substrate. The side lobe level has been also reduced in
both planes concluding that the antenna is not working any more due to the change produced in the gold
layer.
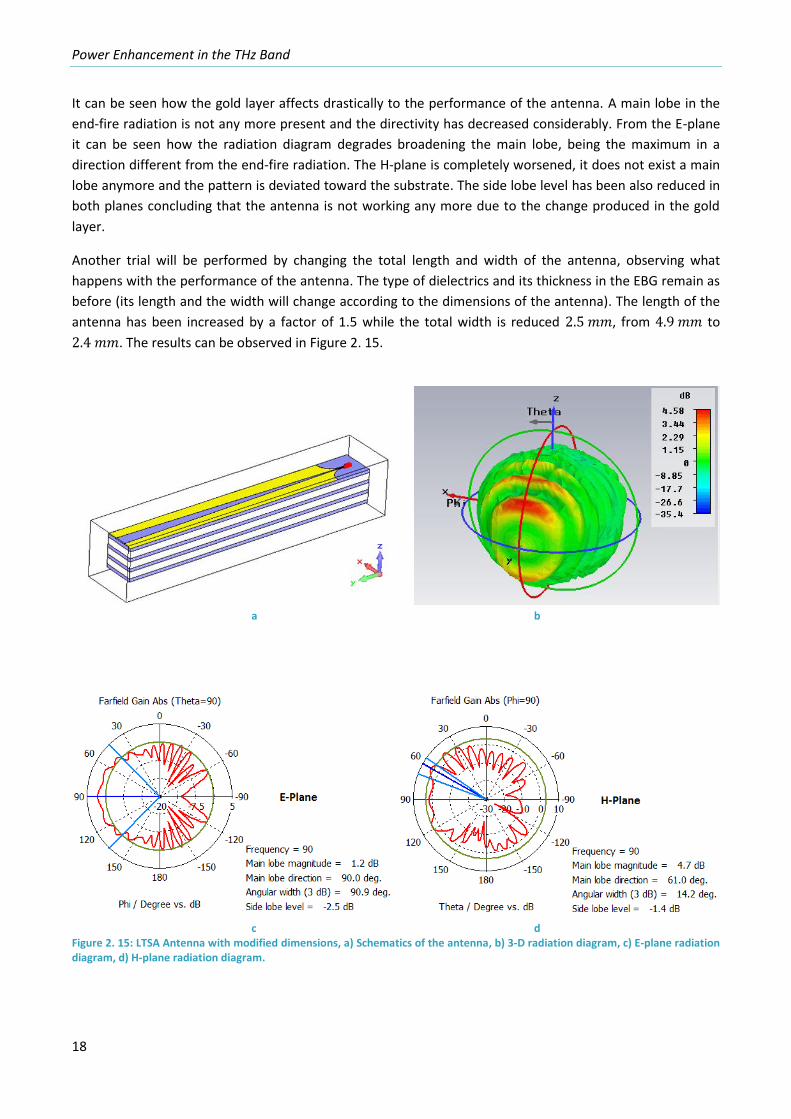
Another trial will be performed by changing the total length and width of the antenna, observing what
happens with the performance of the antenna. The type of dielectrics and its thickness in the EBG remain as
before (its length and the width will change according to the dimensions of the antenna). The length of the
antenna has been increased by a factor of 1.5 while the total width is reduced , from to
. The results can be observed in Figure 2. 15.
a b
c d
Figure 2. 15: LTSA Antenna with modified dimensions, a) Schematics of the antenna, b) 3-D radiation diagram, c) E-plane radiation diagram, d) H-plane radiation diagram.
Chapter 2: Tapered Slot Antennas
19
Just by changing the width and the length of the antenna it becomes completely useless, as appreciated in
the radiation diagram. A main lobe is not recognized anymore and evidently the end-fire radiation is lost
although we are using an EBG that was working with prior designs. Details about any further characteristic
are omitted as there is no sense on talking about main lobe and secondary lobes in any of the planes, E- and
H-plane.
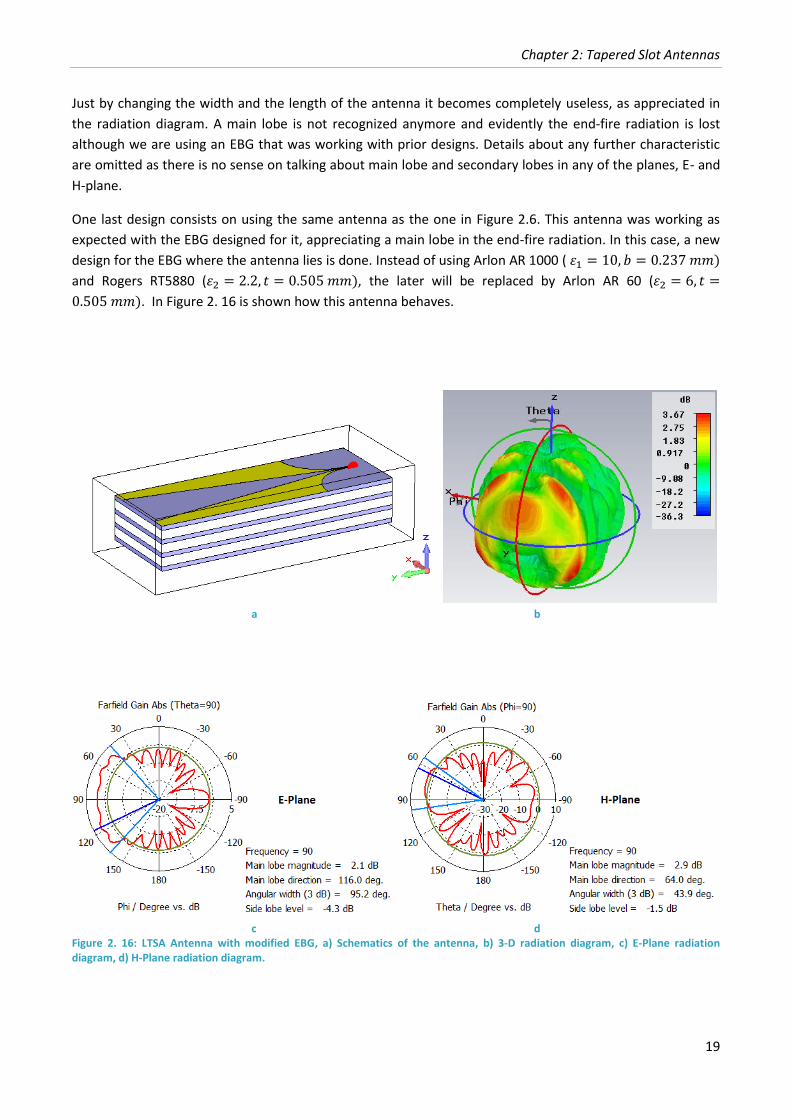
One last design consists on using the same antenna as the one in Figure 2.6. This antenna was working as
expected with the EBG designed for it, appreciating a main lobe in the end-fire radiation. In this case, a new
design for the EBG where the antenna lies is done. Instead of using Arlon AR 1000 ( )
and Rogers RT5880 ( ), the later will be replaced by Arlon AR 60 (
). In Figure 2. 16 is shown how this antenna behaves.
a b
c d
Figure 2. 16: LTSA Antenna with modified EBG, a) Schematics of the antenna, b) 3-D radiation diagram, c) E-Plane radiation diagram, d) H-Plane radiation diagram.
Power Enhancement in the THz Band
20
Although the antenna was working with the former EBG, just by changing one of the dielectrics that
composes it the antenna stops working. Secondary lobes appear and the main lobe is not any more defined
in the end-fire radiation. The antenna remains useless just due to the fact that a wrong EBG has been used
for the TSA.
From these three simulations we can conclude that the shape and the EBG of the antenna are highly
dependent for the proper operation of the antenna and do not exist any strict rules leading to a correct
design of a TSA antenna over an EBG. The antenna must be designed from scratch knowing that a specific
antenna does not work with any EBG and that a standard EBG is not valid for all TSA antennas. One EBG
should be design for each antenna designed in order to reach successful results with this type of antennas.
2.5 Conclusions
It has been checked how the distribution of the field in the TSA antenna is completely equivalent to a
sectoral horn antenna filled with dielectric, with two Perfect Magnetic Conductor (PMC) walls and two
dielectric-air interfaces when the substrate increases. With these results, it cannot be demonstrated that
upper modes are propagating through the structure impeding the antenna from working properly.
Additionally, the field attenuation suffered in the structure has been studied. Once more, no successful
results have been achieved so as to explain why this antenna stops working under certain circumstances. For
this reason, individual antennas have been analyzed with a specific EBG. Two facts have been arisen from
this study. Firstly, when using the same antenna with two different EBG, it does not necessarily work with
both of them. Secondly, when in the same EBG different antennas with different dimensions are placed, not
all of them will work properly. In that way, it can be concluded that antenna and EBG should be designed
together in this antenna topology, as one EBG may work with one antenna but not with a different one. It
does not exist a standard EBG valid for all antennas or an antenna that is working using any EBG.
21
Chapter 3
3 Antenna Emitters
The version most commonly used for THz photomixers is the used of Antenna Emitters [1]. Continuous Wave
generation by photomixing is based on the THz-periodic generation of electrons and holes in semiconductors
by absorption of two laser beams with two different frequencies: . The interference of
both beams results in the THz-periodic carrier generation. The emission of THz radiation using antenna-
based emitter is originated from the collective current of the carriers generated within a small area and
being fed into an antenna. In order to have successful results after the photomixing procedure, both beams
should have the same polarization and electric field amplitude. If the same amplitude is not achieved for
both laser beams, the power of the resulting THz wave will be reduced in detriment of the performance of
the system.
To achieve an acceptable THz power level it is required to limit the photomixer dimensions, much smaller
than the THz wavelength, reducing consequently the available area where the laser beam should be focused.
The strongly focused laser beam leads to high carrier and current densities in detrimental to the efficiency of
the device, limiting its maximum power available. For this reason, it is very important to design a
photomixer whose dimensions are optimized.
3.1 Photomixer device
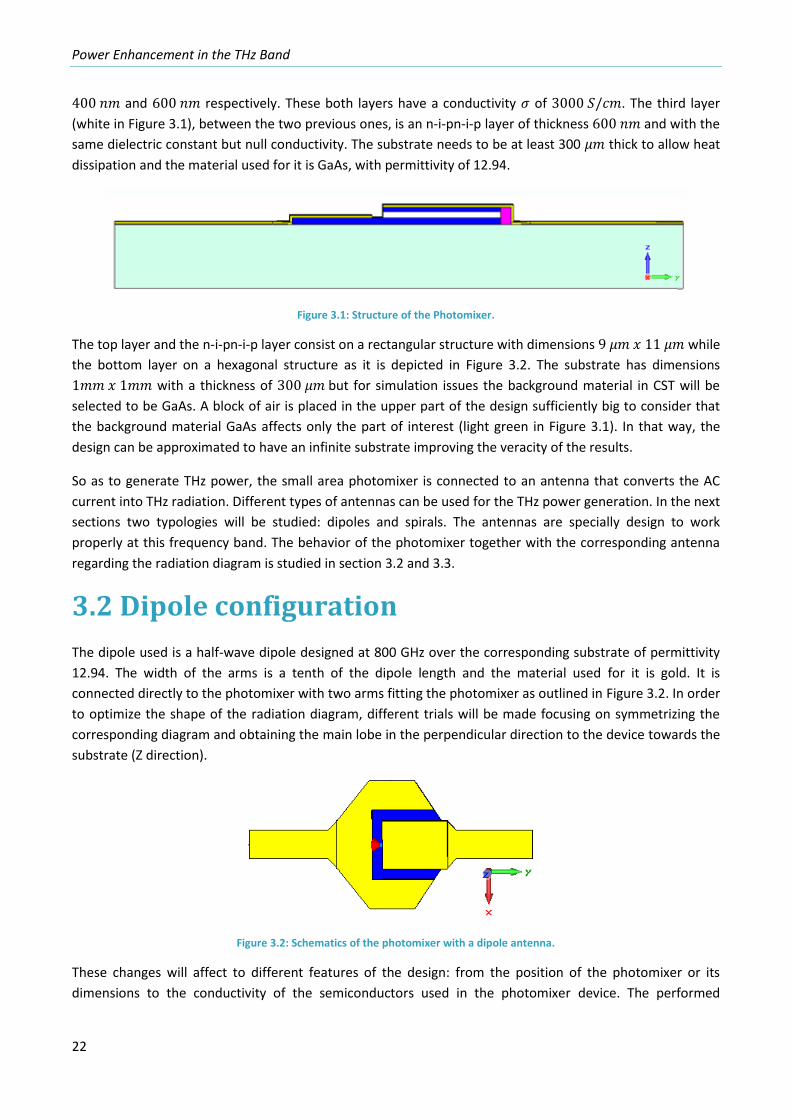
The photomixer used for the THz generation is depicted in Figure 3.1. It is composed by three dielectric
layers lying on a substrate required for heat dissipation. The top and bottom layers (dark blue in Figure 3.1)
or n-layers, consist on a semiconductor material In(GaAl)As with a permittivity of 12.25 and a thickness of
Power Enhancement in the THz Band
22
and respectively. These both layers have a conductivity of . The third layer
(white in Figure 3.1), between the two previous ones, is an n-i-pn-i-p layer of thickness and with the
same dielectric constant but null conductivity. The substrate needs to be at least 300 thick to allow heat
dissipation and the material used for it is GaAs, with permittivity of 12.94.
Figure 3.1: Structure of the Photomixer.
The top layer and the n-i-pn-i-p layer consist on a rectangular structure with dimensions while
the bottom layer on a hexagonal structure as it is depicted in Figure 3.2. The substrate has dimensions
with a thickness of but for simulation issues the background material in CST will be
selected to be GaAs. A block of air is placed in the upper part of the design sufficiently big to consider that
the background material GaAs affects only the part of interest (light green in Figure 3.1). In that way, the
design can be approximated to have an infinite substrate improving the veracity of the results.
So as to generate THz power, the small area photomixer is connected to an antenna that converts the AC
current into THz radiation. Different types of antennas can be used for the THz power generation. In the next
sections two typologies will be studied: dipoles and spirals. The antennas are specially design to work
properly at this frequency band. The behavior of the photomixer together with the corresponding antenna
regarding the radiation diagram is studied in section 3.2 and 3.3.
3.2 Dipole configuration
The dipole used is a half-wave dipole designed at 800 GHz over the corresponding substrate of permittivity
12.94. The width of the arms is a tenth of the dipole length and the material used for it is gold. It is
connected directly to the photomixer with two arms fitting the photomixer as outlined in Figure 3.2. In order
to optimize the shape of the radiation diagram, different trials will be made focusing on symmetrizing the
corresponding diagram and obtaining the main lobe in the perpendicular direction to the device towards the
substrate (Z direction).
Figure 3.2: Schematics of the photomixer with a dipole antenna.
These changes will affect to different features of the design: from the position of the photomixer or its
dimensions to the conductivity of the semiconductors used in the photomixer device. The performed
Chapter 3: Antenna Emitters
23
changes will be useful to approach to the optimal design of the structure for the generation of THz as
outlined in the following sections.
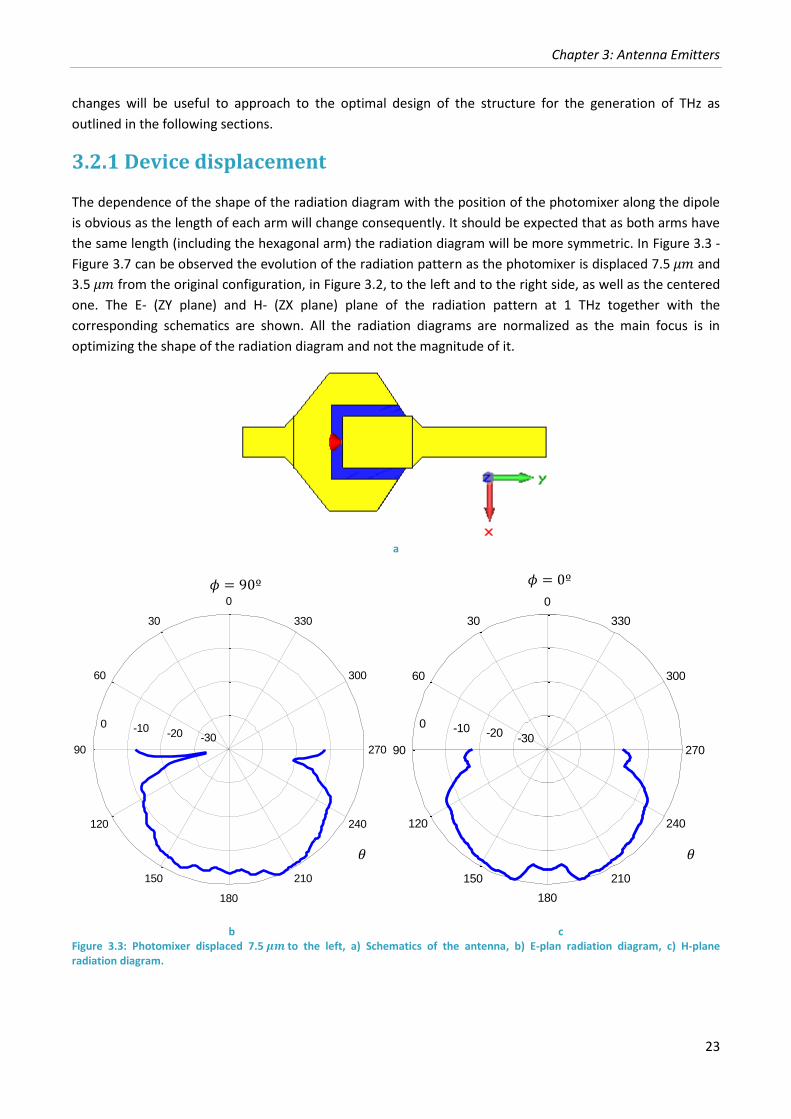
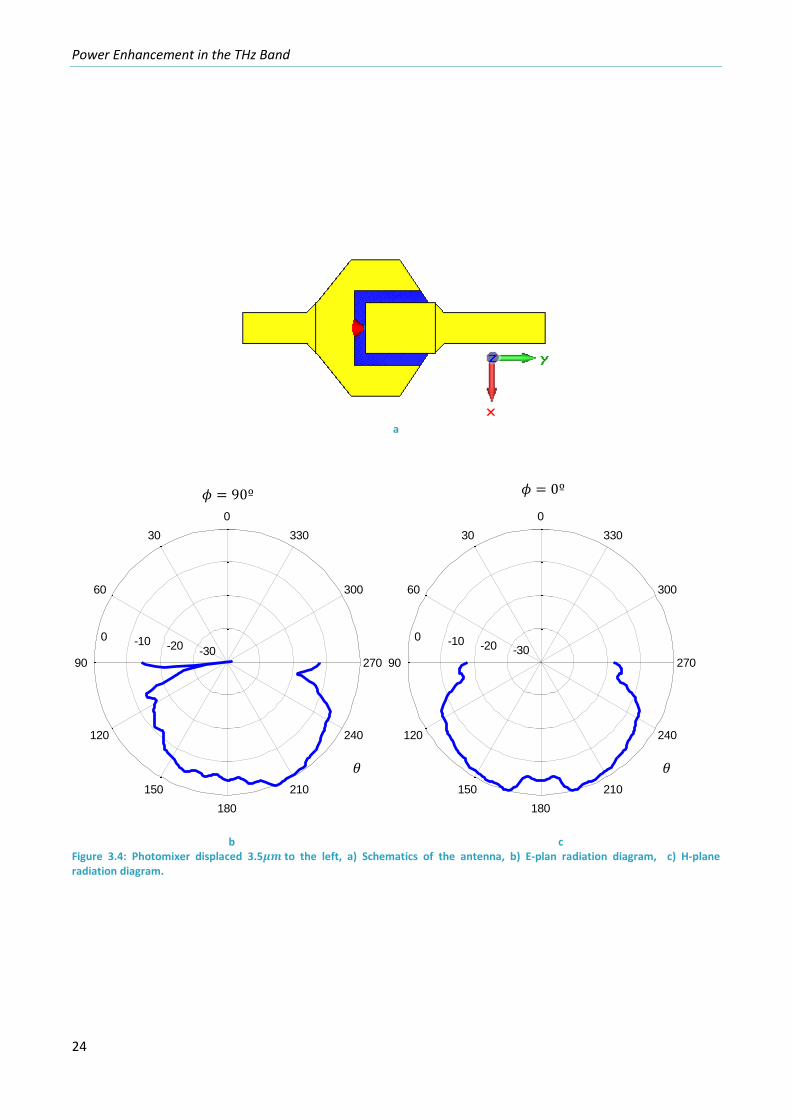
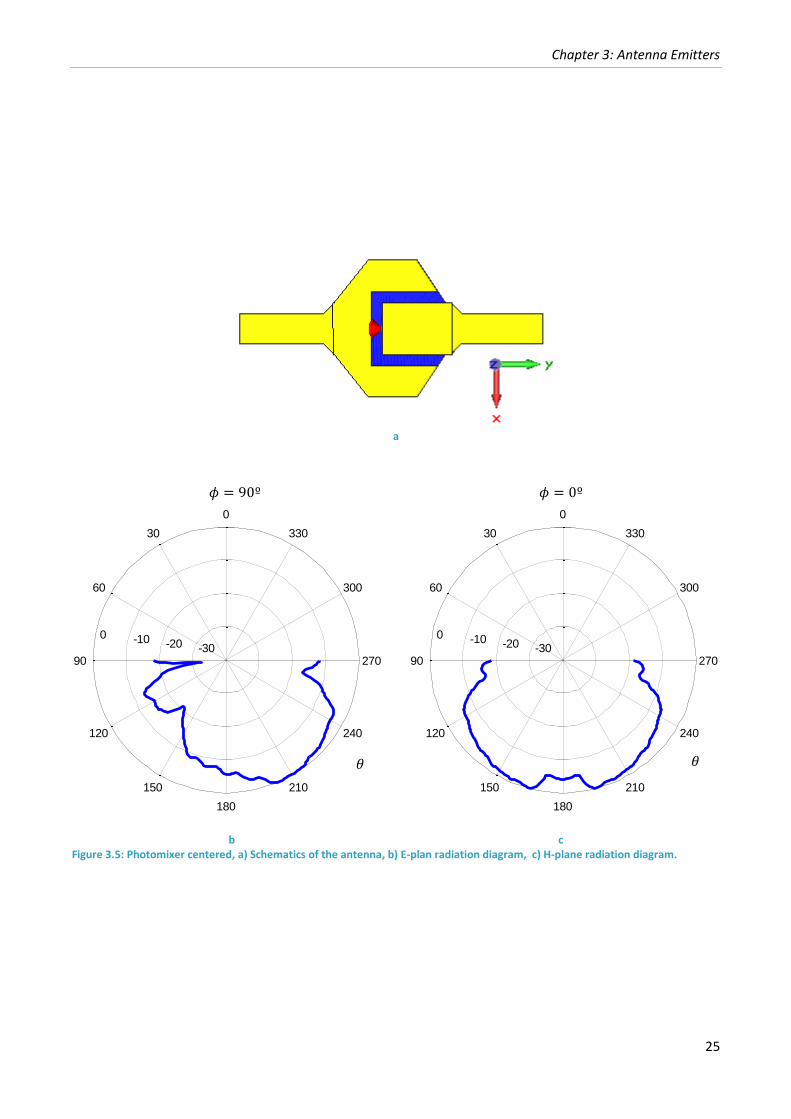
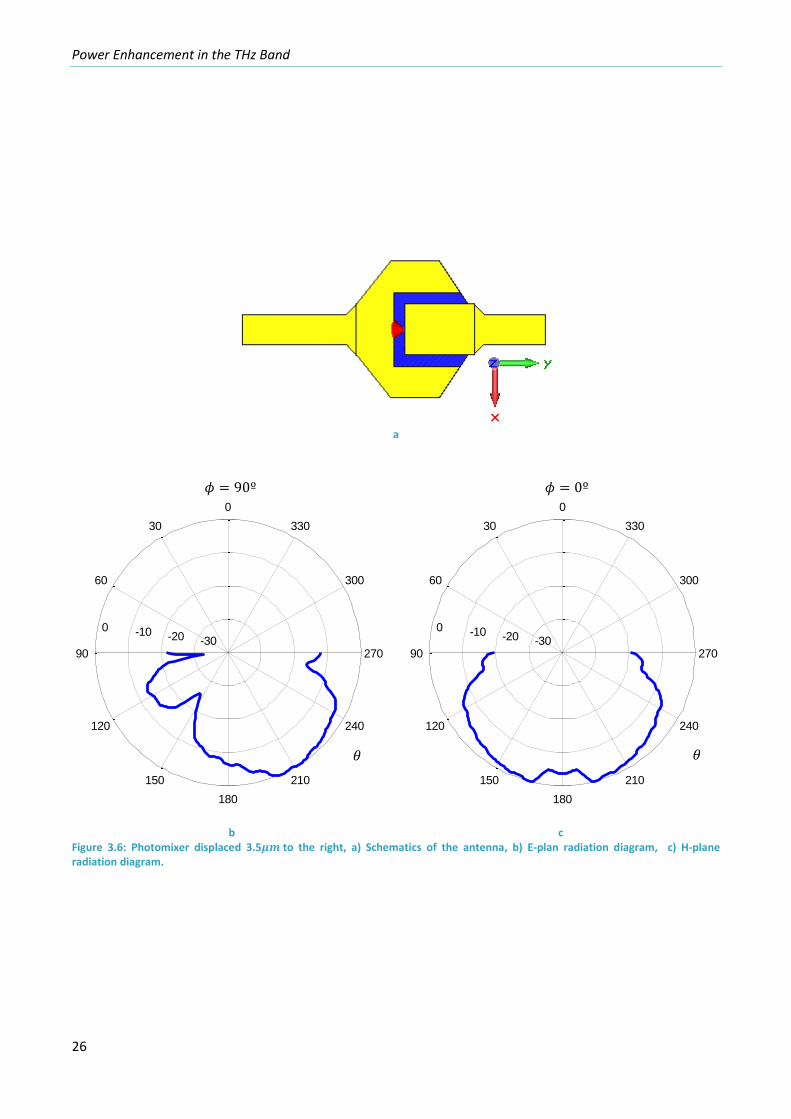
3.2.1 Device displacement
The dependence of the shape of the radiation diagram with the position of the photomixer along the dipole
is obvious as the length of each arm will change consequently. It should be expected that as both arms have
the same length (including the hexagonal arm) the radiation diagram will be more symmetric. In Figure 3.3 -
Figure 3.7 can be observed the evolution of the radiation pattern as the photomixer is displaced 7.5 and
3.5 from the original configuration, in Figure 3.2, to the left and to the right side, as well as the centered
one. The E- (ZY plane) and H- (ZX plane) plane of the radiation pattern at 1 THz together with the
corresponding schematics are shown. All the radiation diagrams are normalized as the main focus is in
optimizing the shape of the radiation diagram and not the magnitude of it.
a
b c
Figure 3.3: Photomixer displaced 7.5 to the left, a) Schematics of the antenna, b) E-plan radiation diagram, c) H-plane radiation diagram.
-30 -20 -10 0
30
210
60
240
90 270
120
300
150
330
180
0
-30 -20 -10 0
30
210
60
240
90 270
120
300
150
330
180
0
𝜙 º 𝜙 º
𝜃 𝜃
Power Enhancement in the THz Band
24
a
b c
Figure 3.4: Photomixer displaced 3.5 to the left, a) Schematics of the antenna, b) E-plan radiation diagram, c) H-plane radiation diagram.
-30 -20 -10 0
30
210
60
240
90 270
120
300
150
330
180
0
-30 -20 -10 0
30
210
60
240
90 270
120
300
150
330
180
0
𝜙 º 𝜙 º
𝜃 𝜃
Chapter 3: Antenna Emitters
25
a
b c
Figure 3.5: Photomixer centered, a) Schematics of the antenna, b) E-plan radiation diagram, c) H-plane radiation diagram.
-30 -20 -10 0
30
210
60
240
90 270
120
300
150
330
180
0
-30 -20 -10 0
30
210
60
240
90 270
120
300
150
330
180
0
𝜙 º 𝜙 º
𝜃 𝜃
Power Enhancement in the THz Band
26
a
b c
Figure 3.6: Photomixer displaced 3.5 to the right, a) Schematics of the antenna, b) E-plan radiation diagram, c) H-plane radiation diagram.
-30 -20 -10 0
30
210
60
240
90 270
120
300
150
330
180
0
-30 -20 -10 0
30
210
60
240
90 270
120
300
150
330
180
0
𝜙 º 𝜙 º
𝜃 𝜃
Chapter 3: Antenna Emitters
27
a
b c
Figure 3.7: Photomixer displaced 7.5 to the right, a) Schematics of the antenna, b) E-plan radiation diagram, c) H-plane radiation diagram.
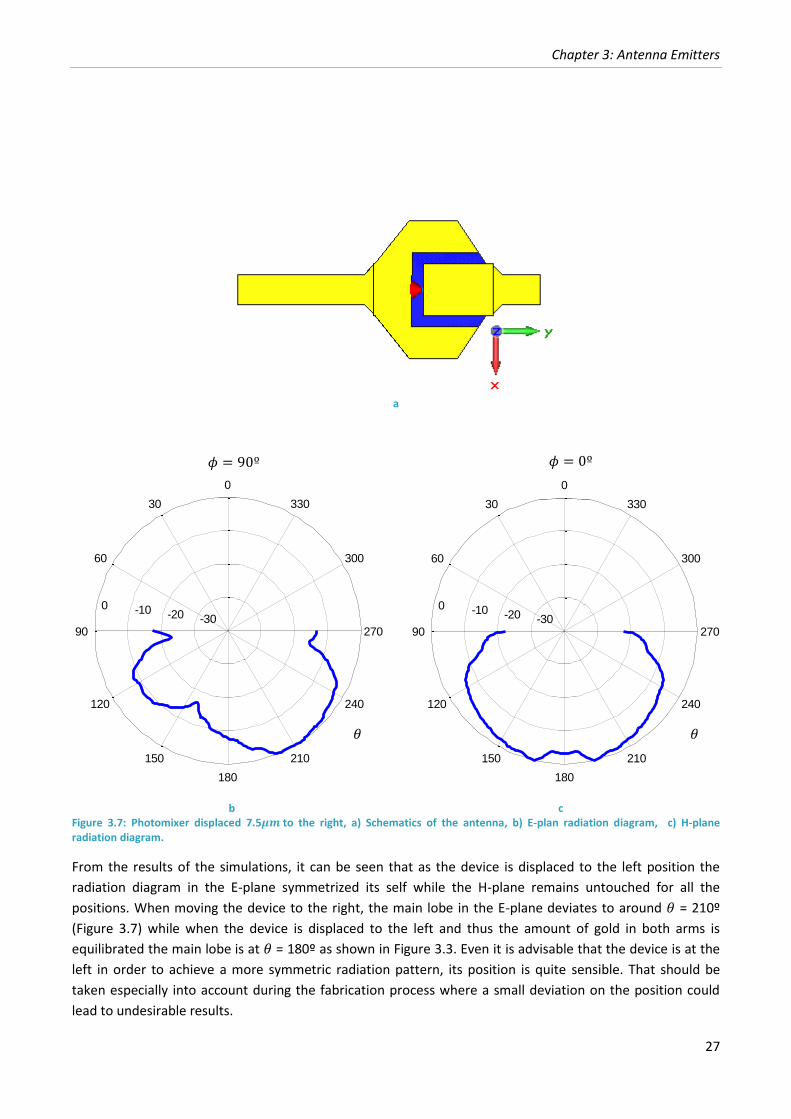
From the results of the simulations, it can be seen that as the device is displaced to the left position the
radiation diagram in the E-plane symmetrized its self while the H-plane remains untouched for all the
positions. When moving the device to the right, the main lobe in the E-plane deviates to around = 210º
(Figure 3.7) while when the device is displaced to the left and thus the amount of gold in both arms is
equilibrated the main lobe is at = 180º as shown in Figure 3.3. Even it is advisable that the device is at the
left in order to achieve a more symmetric radiation pattern, its position is quite sensible. That should be
taken especially into account during the fabrication process where a small deviation on the position could
lead to undesirable results.
-30 -20 -10 0
30
210
60
240
90 270
120
300
150
330
180
0
-30 -20 -10 0
30
210
60
240
90 270
120
300
150
330
180
0
𝜙 º 𝜙 º
𝜃 𝜃
Power Enhancement in the THz Band
28
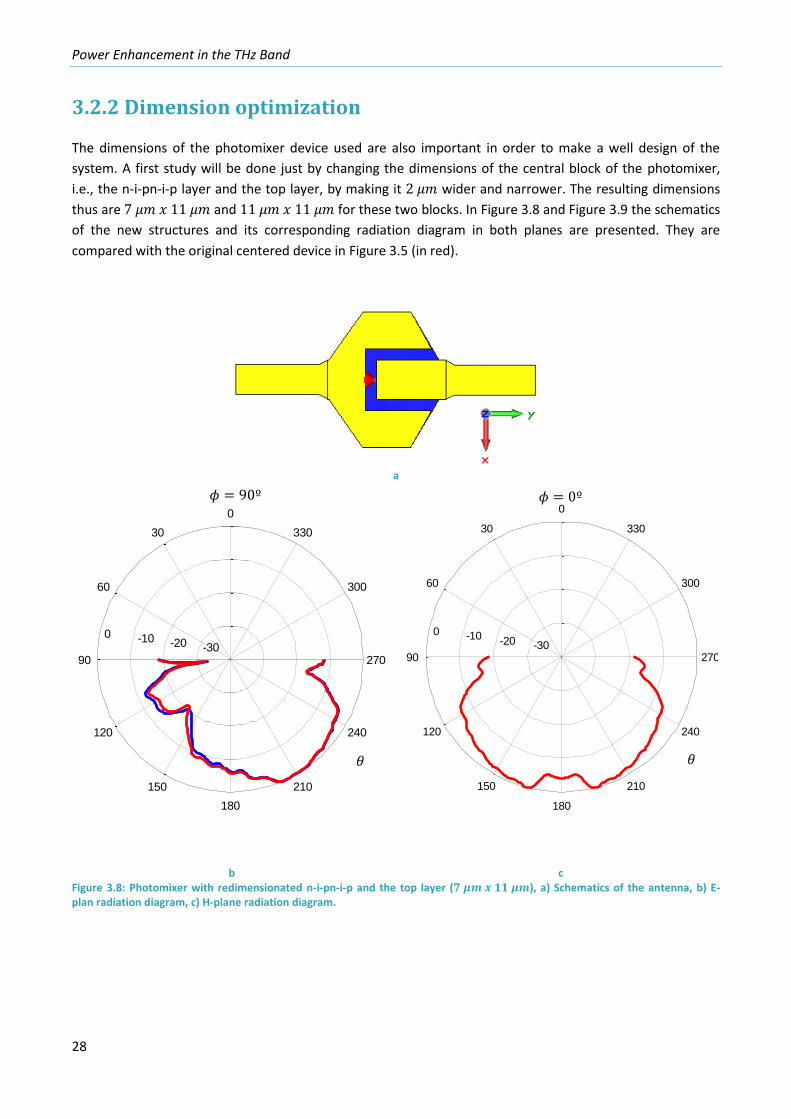
3.2.2 Dimension optimization
The dimensions of the photomixer device used are also important in order to make a well design of the
system. A first study will be done just by changing the dimensions of the central block of the photomixer,
i.e., the n-i-pn-i-p layer and the top layer, by making it wider and narrower. The resulting dimensions
thus are and for these two blocks. In Figure 3.8 and Figure 3.9 the schematics
of the new structures and its corresponding radiation diagram in both planes are presented. They are
compared with the original centered device in Figure 3.5 (in red).
a
b c Figure 3.8: Photomixer with redimensionated n-i-pn-i-p and the top layer ( ), a) Schematics of the antenna, b) E-plan radiation diagram, c) H-plane radiation diagram.
-30 -20 -10 0
30
210
60
240
90 270
120
300
150
330
180
0
-30 -20 -10 0
30
210
60
240
90 270
120
300
150
330
180
0𝜙 º 𝜙 º
𝜃 𝜃
Chapter 3: Antenna Emitters
29
a
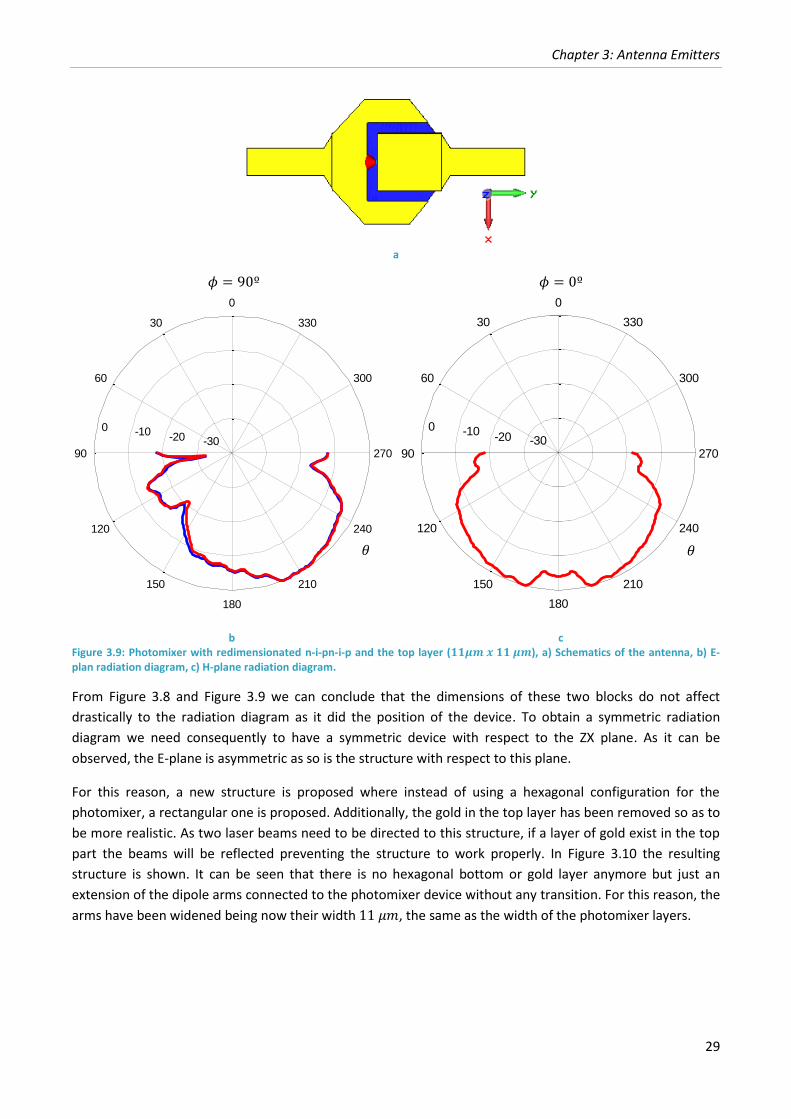
b c
Figure 3.9: Photomixer with redimensionated n-i-pn-i-p and the top layer ( ), a) Schematics of the antenna, b) E-plan radiation diagram, c) H-plane radiation diagram.
From Figure 3.8 and Figure 3.9 we can conclude that the dimensions of these two blocks do not affect
drastically to the radiation diagram as it did the position of the device. To obtain a symmetric radiation
diagram we need consequently to have a symmetric device with respect to the ZX plane. As it can be
observed, the E-plane is asymmetric as so is the structure with respect to this plane.
For this reason, a new structure is proposed where instead of using a hexagonal configuration for the
photomixer, a rectangular one is proposed. Additionally, the gold in the top layer has been removed so as to
be more realistic. As two laser beams need to be directed to this structure, if a layer of gold exist in the top
part the beams will be reflected preventing the structure to work properly. In Figure 3.10 the resulting
structure is shown. It can be seen that there is no hexagonal bottom or gold layer anymore but just an
extension of the dipole arms connected to the photomixer device without any transition. For this reason, the
arms have been widened being now their width , the same as the width of the photomixer layers.
-30 -20 -10 0
30
210
60
240
90 270
120
300
150
330
180
0
-30 -20 -10 0
30
210
60
240
90 270
120
300
150
330
180
0
𝜙 º 𝜙 º
𝜃 𝜃
Power Enhancement in the THz Band
30
a
b c
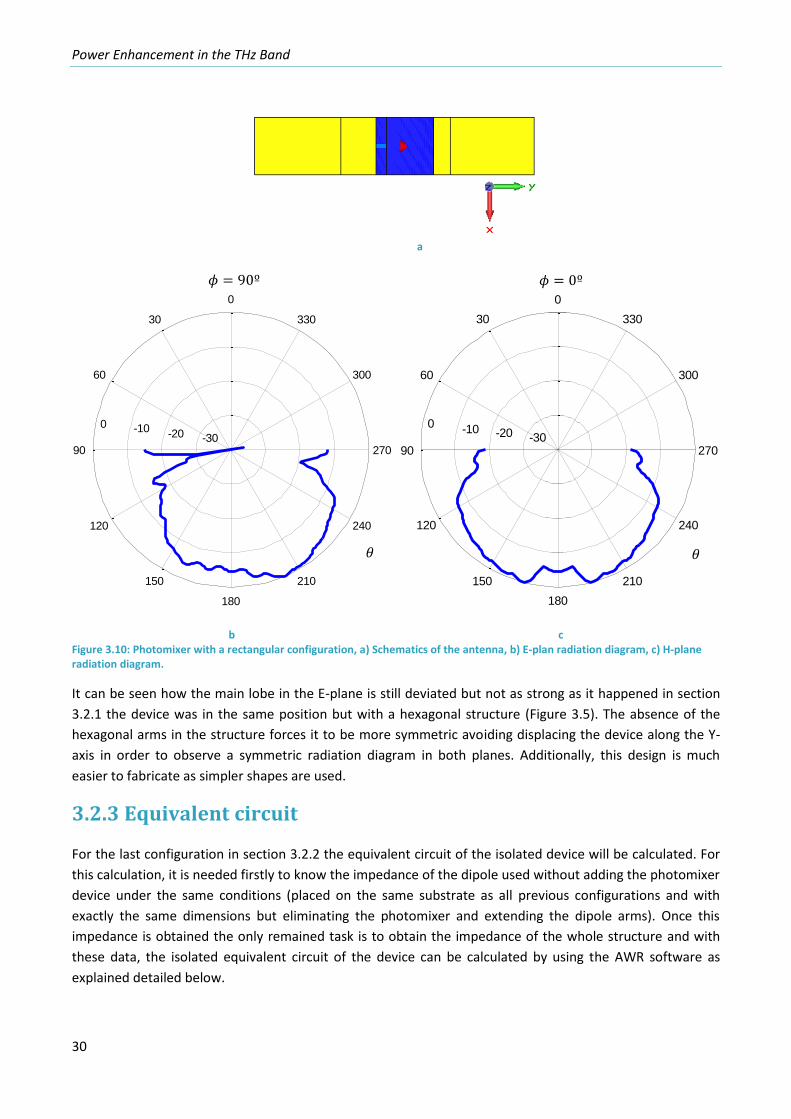
Figure 3.10: Photomixer with a rectangular configuration, a) Schematics of the antenna, b) E-plan radiation diagram, c) H-plane radiation diagram.
It can be seen how the main lobe in the E-plane is still deviated but not as strong as it happened in section
3.2.1 the device was in the same position but with a hexagonal structure (Figure 3.5). The absence of the
hexagonal arms in the structure forces it to be more symmetric avoiding displacing the device along the Y-
axis in order to observe a symmetric radiation diagram in both planes. Additionally, this design is much
easier to fabricate as simpler shapes are used.
3.2.3 Equivalent circuit
For the last configuration in section 3.2.2 the equivalent circuit of the isolated device will be calculated. For
this calculation, it is needed firstly to know the impedance of the dipole used without adding the photomixer
device under the same conditions (placed on the same substrate as all previous configurations and with
exactly the same dimensions but eliminating the photomixer and extending the dipole arms). Once this
impedance is obtained the only remained task is to obtain the impedance of the whole structure and with
these data, the isolated equivalent circuit of the device can be calculated by using the AWR software as
explained detailed below.
-30 -20 -10 0
30
210
60
240
90 270
120
300
150
330
180
0
-30 -20 -10 0
30
210
60
240
90 270
120
300
150
330
180
0
𝜙 º 𝜙 º
𝜃 𝜃
Chapter 3: Antenna Emitters
31
The equivalent circuit of the dipole will be just simulated as a frequency dependent resistor which will
follows exactly the impedance obtain by simulating the single dipole in CST. Once the equivalent circuit of
the single dipole is obtained the equivalent circuit of the whole configuration should be calculated. To obtain
it, it is just needed to place in parallel to the resulting circuit of the dipole the new elements that will
compose the equivalent circuit of the isolated device. It is required to find the correct combination of values
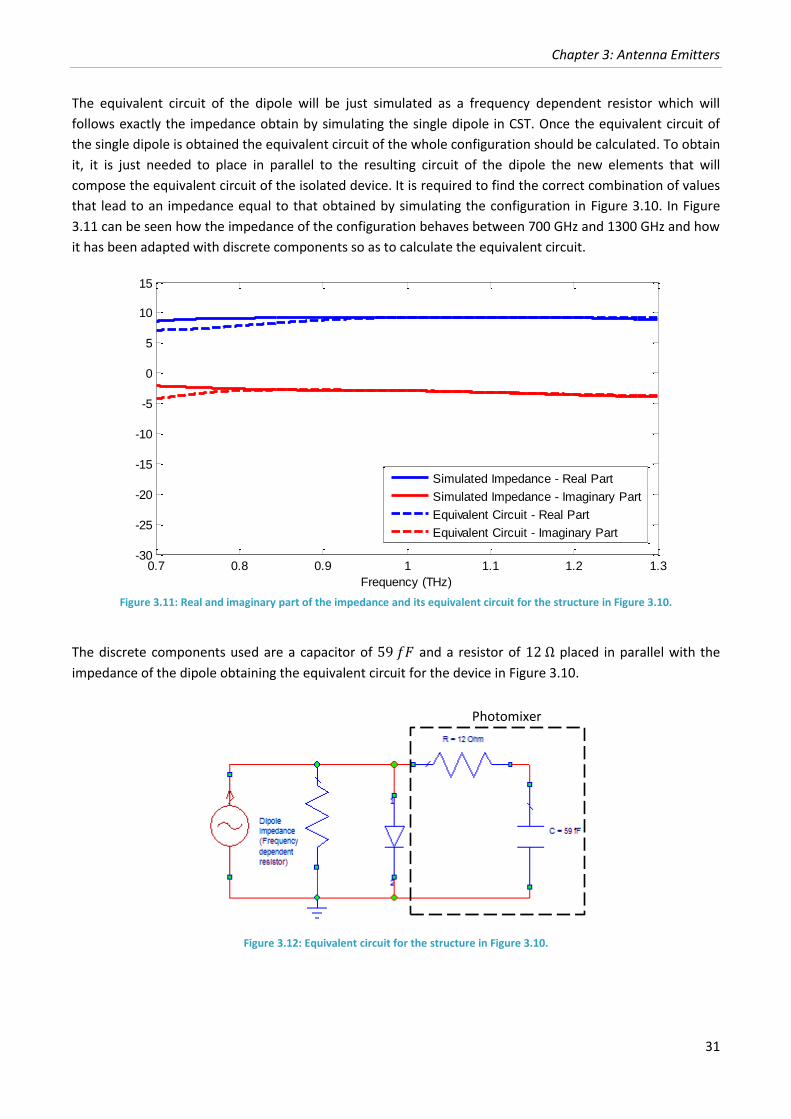
that lead to an impedance equal to that obtained by simulating the configuration in Figure 3.10. In Figure
3.11 can be seen how the impedance of the configuration behaves between 700 GHz and 1300 GHz and how
it has been adapted with discrete components so as to calculate the equivalent circuit.
Figure 3.11: Real and imaginary part of the impedance and its equivalent circuit for the structure in Figure 3.10.
The discrete components used are a capacitor of and a resistor of placed in parallel with the
impedance of the dipole obtaining the equivalent circuit for the device in Figure 3.10.
Figure 3.12: Equivalent circuit for the structure in Figure 3.10.
0.7 0.8 0.9 1 1.1 1.2 1.3-30
-25
-20
-15
-10
-5
0
5
10
15
Frequency (THz)
Simulated Impedance - Real Part
Simulated Impedance - Imaginary Part
Equivalent Circuit - Real Part
Equivalent Circuit - Imaginary Part
Photomixer
Power Enhancement in the THz Band
32
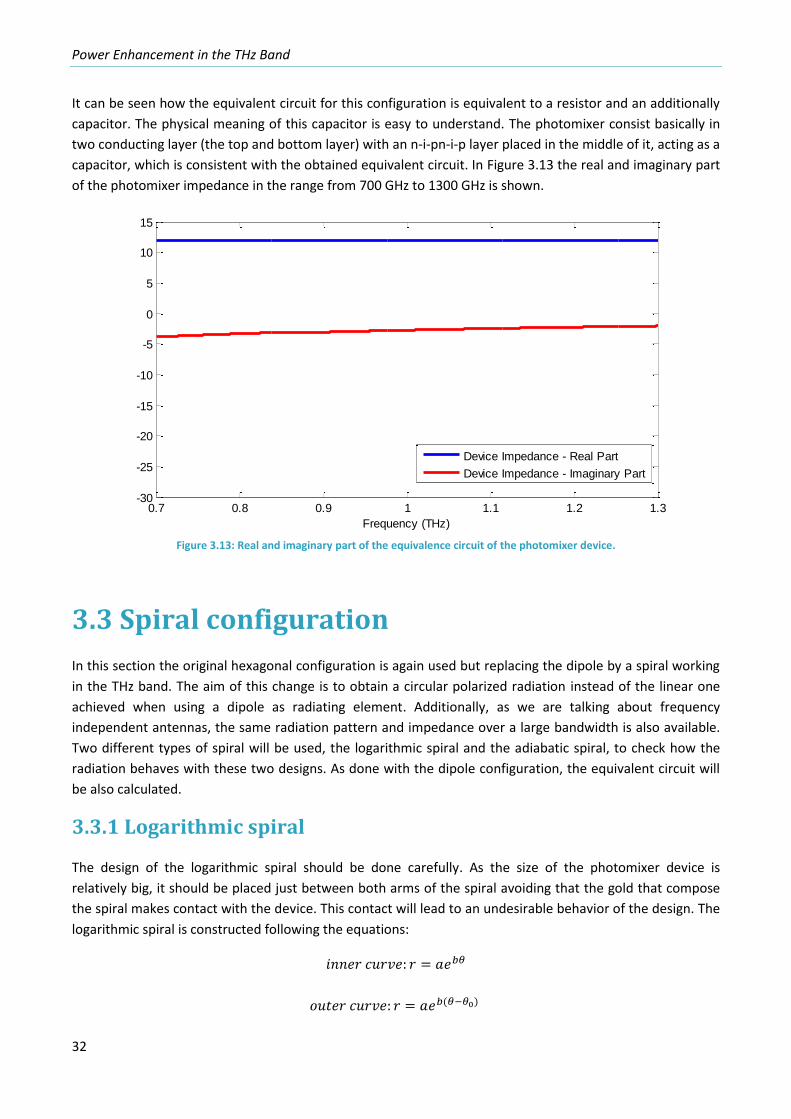
It can be seen how the equivalent circuit for this configuration is equivalent to a resistor and an additionally
capacitor. The physical meaning of this capacitor is easy to understand. The photomixer consist basically in
two conducting layer (the top and bottom layer) with an n-i-pn-i-p layer placed in the middle of it, acting as a
capacitor, which is consistent with the obtained equivalent circuit. In Figure 3.13 the real and imaginary part
of the photomixer impedance in the range from 700 GHz to 1300 GHz is shown.
Figure 3.13: Real and imaginary part of the equivalence circuit of the photomixer device.
3.3 Spiral configuration
In this section the original hexagonal configuration is again used but replacing the dipole by a spiral working
in the THz band. The aim of this change is to obtain a circular polarized radiation instead of the linear one
achieved when using a dipole as radiating element. Additionally, as we are talking about frequency
independent antennas, the same radiation pattern and impedance over a large bandwidth is also available.
Two different types of spiral will be used, the logarithmic spiral and the adiabatic spiral, to check how the
radiation behaves with these two designs. As done with the dipole configuration, the equivalent circuit will
be also calculated.
3.3.1 Logarithmic spiral
The design of the logarithmic spiral should be done carefully. As the size of the photomixer device is
relatively big, it should be placed just between both arms of the spiral avoiding that the gold that compose
the spiral makes contact with the device. This contact will lead to an undesirable behavior of the design. The
logarithmic spiral is constructed following the equations:
( )
0.7 0.8 0.9 1 1.1 1.2 1.3-30
-25
-20
-15
-10
-5
0
5
10
15
Frequency (THz)
Device Impedance - Real Part
Device Impedance - Imaginary Part
Chapter 3: Antenna Emitters
33
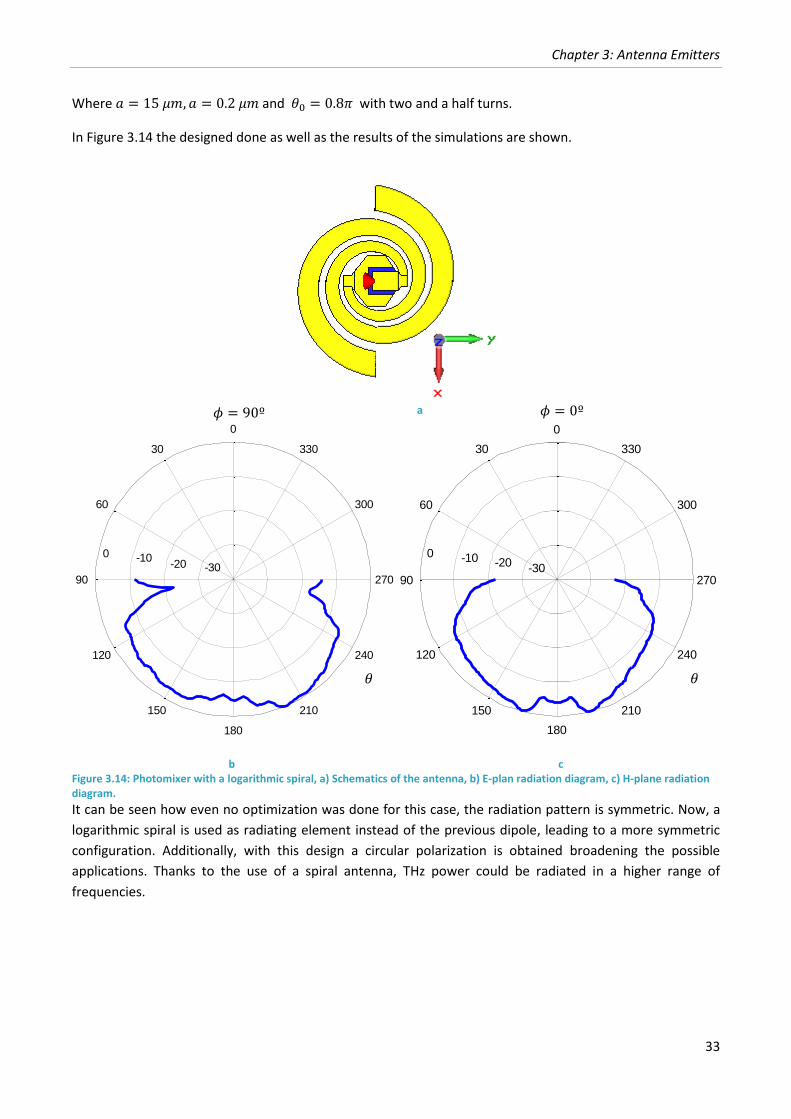
Where and with two and a half turns.
In Figure 3.14 the designed done as well as the results of the simulations are shown.
a
b c
Figure 3.14: Photomixer with a logarithmic spiral, a) Schematics of the antenna, b) E-plan radiation diagram, c) H-plane radiation diagram.
It can be seen how even no optimization was done for this case, the radiation pattern is symmetric. Now, a
logarithmic spiral is used as radiating element instead of the previous dipole, leading to a more symmetric
configuration. Additionally, with this design a circular polarization is obtained broadening the possible
applications. Thanks to the use of a spiral antenna, THz power could be radiated in a higher range of
frequencies.
-30 -20 -10 0
30
210
60
240
90 270
120
300
150
330
180
0
-30 -20 -10 0
30
210
60
240
90 270
120
300
150
330
180
0
𝜙 º 𝜙 º
𝜃 𝜃
Power Enhancement in the THz Band
34
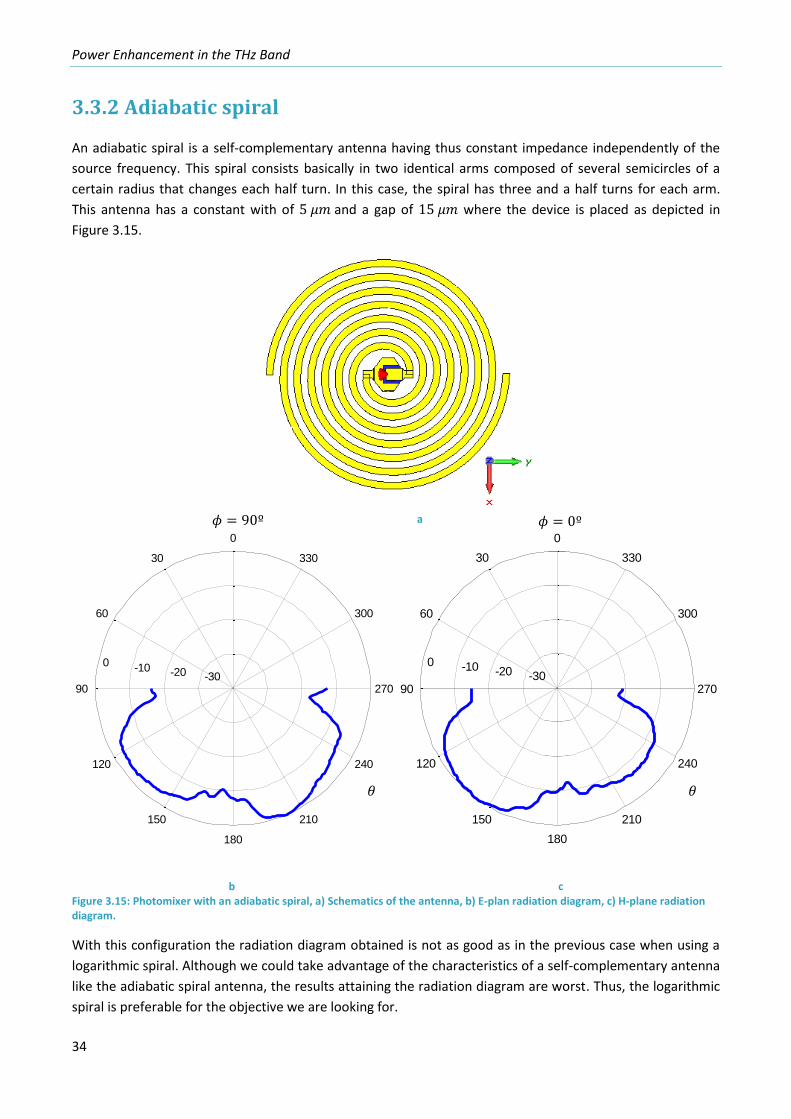
3.3.2 Adiabatic spiral
An adiabatic spiral is a self-complementary antenna having thus constant impedance independently of the
source frequency. This spiral consists basically in two identical arms composed of several semicircles of a
certain radius that changes each half turn. In this case, the spiral has three and a half turns for each arm.
This antenna has a constant with of and a gap of where the device is placed as depicted in
Figure 3.15.
a
b c Figure 3.15: Photomixer with an adiabatic spiral, a) Schematics of the antenna, b) E-plan radiation diagram, c) H-plane radiation diagram.
With this configuration the radiation diagram obtained is not as good as in the previous case when using a
logarithmic spiral. Although we could take advantage of the characteristics of a self-complementary antenna
like the adiabatic spiral antenna, the results attaining the radiation diagram are worst. Thus, the logarithmic
spiral is preferable for the objective we are looking for.
-30 -20 -10 0
30
210
60
240
90 270
120
300
150
330
180
0
-30 -20 -10 0
30
210
60
240
90 270
120
300
150
330
180
0
𝜙 º 𝜙 º
𝜃 𝜃
Chapter 3: Antenna Emitters
35
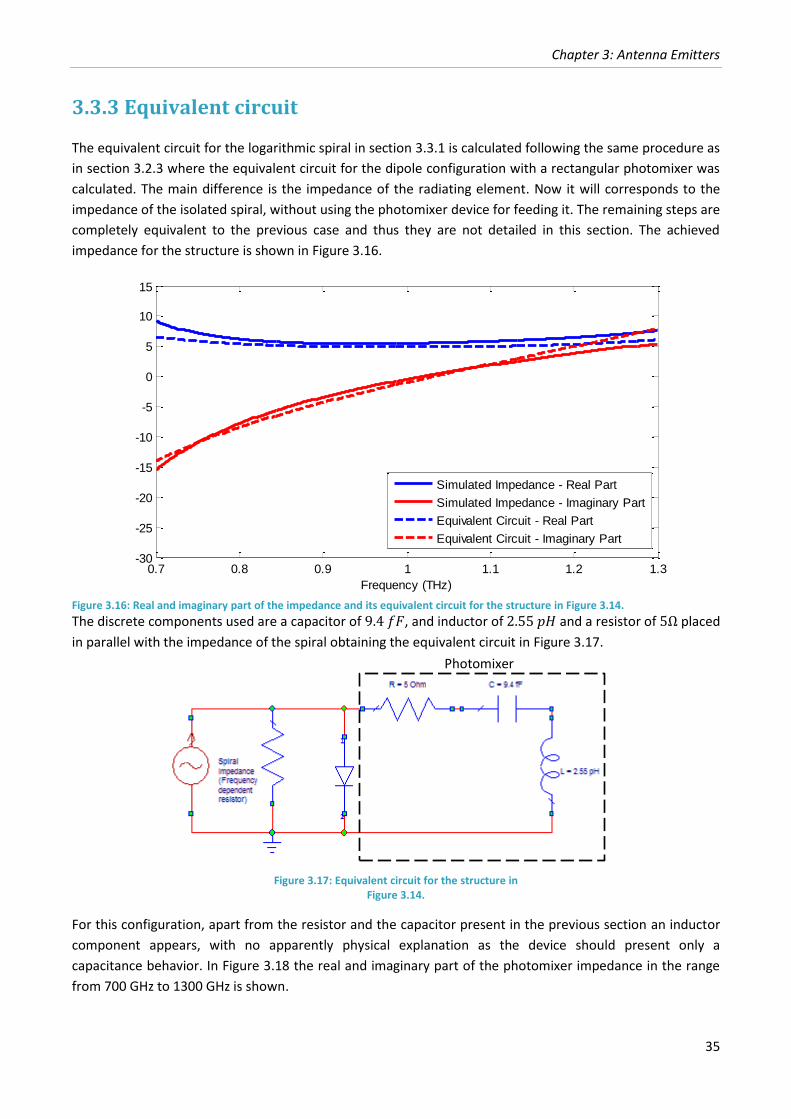
3.3.3 Equivalent circuit
The equivalent circuit for the logarithmic spiral in section 3.3.1 is calculated following the same procedure as
in section 3.2.3 where the equivalent circuit for the dipole configuration with a rectangular photomixer was
calculated. The main difference is the impedance of the radiating element. Now it will corresponds to the
impedance of the isolated spiral, without using the photomixer device for feeding it. The remaining steps are
completely equivalent to the previous case and thus they are not detailed in this section. The achieved
impedance for the structure is shown in Figure 3.16.
Figure 3.16: Real and imaginary part of the impedance and its equivalent circuit for the structure in Figure 3.14.
The discrete components used are a capacitor of , and inductor of and a resistor of placed
in parallel with the impedance of the spiral obtaining the equivalent circuit in Figure 3.17.
Figure 3.17: Equivalent circuit for the structure in
Figure 3.14.
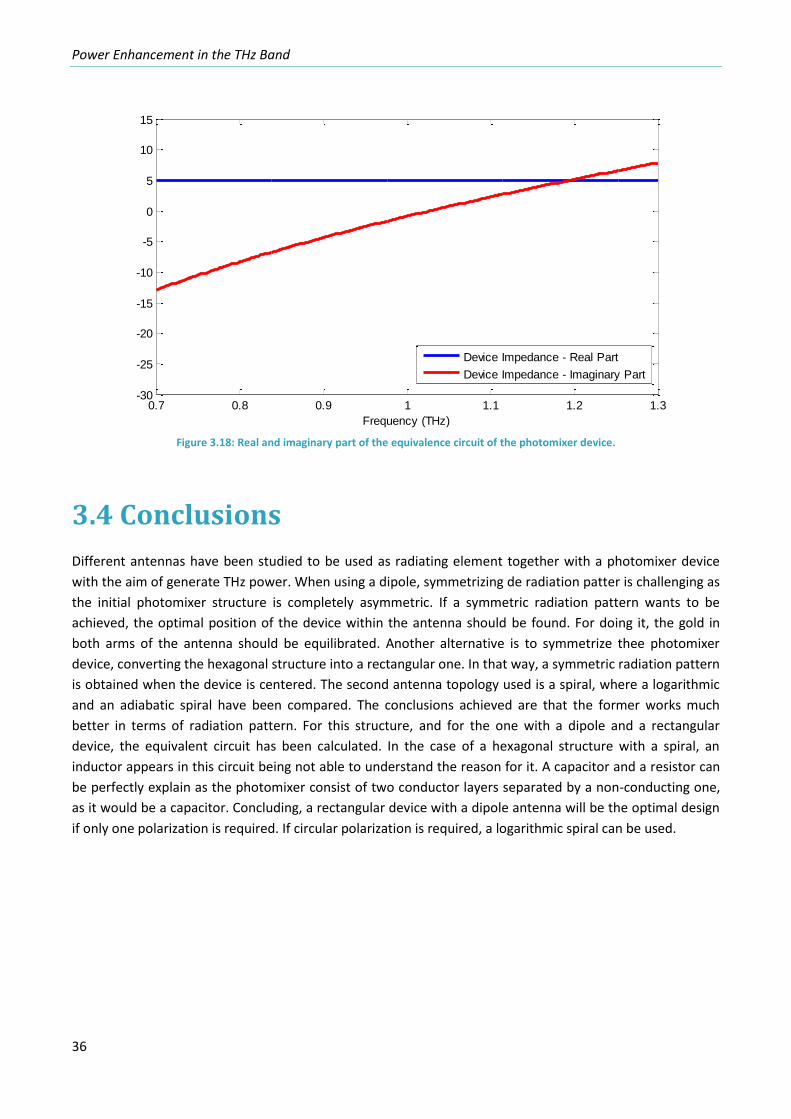
For this configuration, apart from the resistor and the capacitor present in the previous section an inductor
component appears, with no apparently physical explanation as the device should present only a
capacitance behavior. In Figure 3.18 the real and imaginary part of the photomixer impedance in the range
from 700 GHz to 1300 GHz is shown.
0.7 0.8 0.9 1 1.1 1.2 1.3-30
-25
-20
-15
-10
-5
0
5
10
15
Frequency (THz)
Simulated Impedance - Real Part
Simulated Impedance - Imaginary Part
Equivalent Circuit - Real Part
Equivalent Circuit - Imaginary Part
Photomixer
Power Enhancement in the THz Band
36
Figure 3.18: Real and imaginary part of the equivalence circuit of the photomixer device.
3.4 Conclusions
Different antennas have been studied to be used as radiating element together with a photomixer device
with the aim of generate THz power. When using a dipole, symmetrizing de radiation patter is challenging as
the initial photomixer structure is completely asymmetric. If a symmetric radiation pattern wants to be
achieved, the optimal position of the device within the antenna should be found. For doing it, the gold in
both arms of the antenna should be equilibrated. Another alternative is to symmetrize thee photomixer
device, converting the hexagonal structure into a rectangular one. In that way, a symmetric radiation pattern
is obtained when the device is centered. The second antenna topology used is a spiral, where a logarithmic
and an adiabatic spiral have been compared. The conclusions achieved are that the former works much
better in terms of radiation pattern. For this structure, and for the one with a dipole and a rectangular
device, the equivalent circuit has been calculated. In the case of a hexagonal structure with a spiral, an
inductor appears in this circuit being not able to understand the reason for it. A capacitor and a resistor can
be perfectly explain as the photomixer consist of two conductor layers separated by a non-conducting one,
as it would be a capacitor. Concluding, a rectangular device with a dipole antenna will be the optimal design
if only one polarization is required. If circular polarization is required, a logarithmic spiral can be used.
0.7 0.8 0.9 1 1.1 1.2 1.3-30
-25
-20
-15
-10
-5
0
5
10
15
Frequency (THz)
Device Impedance - Real Part
Device Impedance - Imaginary Part
37
Chapter 4
4 Dielectric horns
Another approach for achieving gain enhancement in the terahertz band is through the use of a photomixing
device printed on a dielectric horn. The aim of the dielectric horn is to focus all the radiation into the
broadside direction, in contrast to the energy diffusion through the substrate that occurs when using a
conventional system. The fundamental mode propagating in the horn is the result of the combination of a
and a mode, the hybrid [2]. Upper TE and TM modes of the same order have both the same
cut-off frequency. Thus, hybrid modes will be always propagating in the structure. Due to the high dielectric
constant, the single mode operation bandwidth is reduced being the design of the horn critical. It is
important to avoid that more power is coupled into higher order modes preventing the radiation being
highly directive, especially when the flare angle is large. The proposed antenna is a logarithmic spiral
antenna as in section 3.3, printed at the mouth of the dielectric horn. The dielectric horns have the same
angle in both E and H plane allowing the dimensions of it just propagating the first two modes that
composed the fundamental mode, The substrate used consist on an InP substrate ( ). The
dimensions of the antenna should be as small as possible. In that way, a higher working frequency can be
achieve as the dielectric waveguide input aperture size is reduced. It is important to notice that the upper
frequency in the dielectric horn substrate is limited by the higher order modes propagating in the substrate.
In this chapter some experimental results attending this technology are presented.
Power Enhancement in the THz Band
38
4.1 Laboratory setup
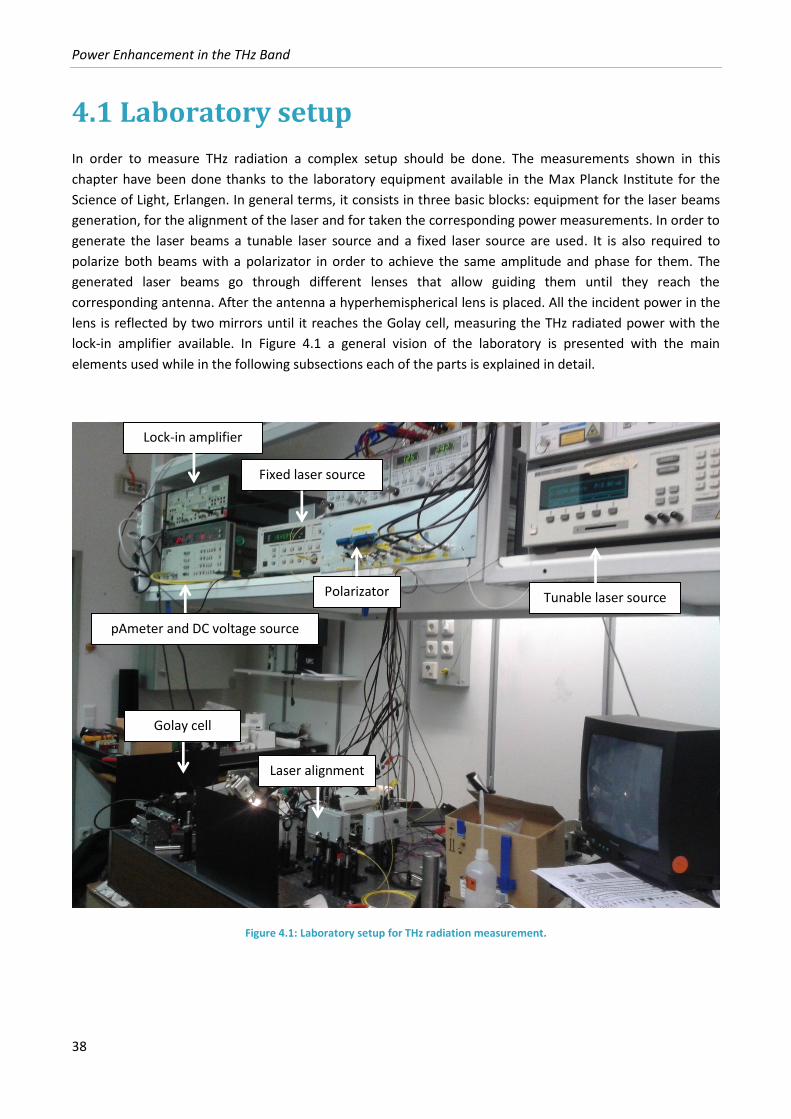
In order to measure THz radiation a complex setup should be done. The measurements shown in this
chapter have been done thanks to the laboratory equipment available in the Max Planck Institute for the
Science of Light, Erlangen. In general terms, it consists in three basic blocks: equipment for the laser beams
generation, for the alignment of the laser and for taken the corresponding power measurements. In order to
generate the laser beams a tunable laser source and a fixed laser source are used. It is also required to
polarize both beams with a polarizator in order to achieve the same amplitude and phase for them. The
generated laser beams go through different lenses that allow guiding them until they reach the
corresponding antenna. After the antenna a hyperhemispherical lens is placed. All the incident power in the
lens is reflected by two mirrors until it reaches the Golay cell, measuring the THz radiated power with the
lock-in amplifier available. In Figure 4.1 a general vision of the laboratory is presented with the main
elements used while in the following subsections each of the parts is explained in detail.
Figure 4.1: Laboratory setup for THz radiation measurement.
pAmeter and DC voltage source
Lock-in amplifier
Tunable laser source
Fixed laser source
Polarizator
Laser alignment
Golay cell
Chapter 4: Dielectric Horns
39
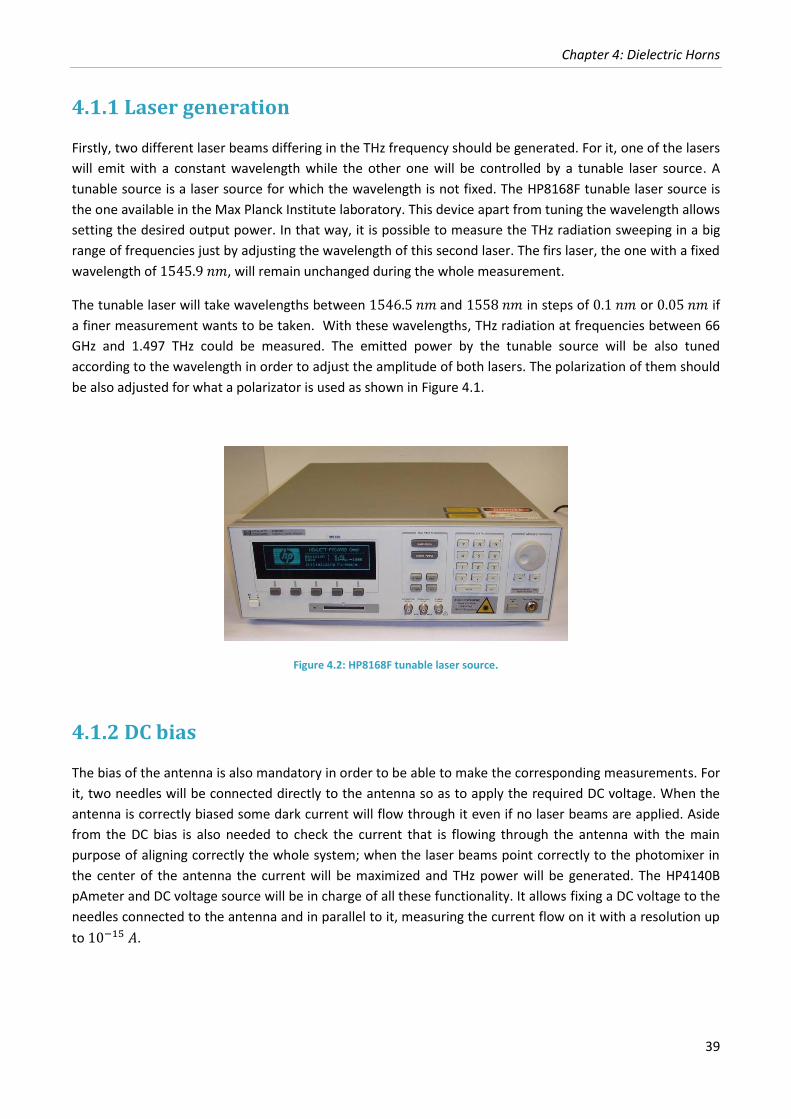
4.1.1 Laser generation
Firstly, two different laser beams differing in the THz frequency should be generated. For it, one of the lasers
will emit with a constant wavelength while the other one will be controlled by a tunable laser source. A
tunable source is a laser source for which the wavelength is not fixed. The HP8168F tunable laser source is
the one available in the Max Planck Institute laboratory. This device apart from tuning the wavelength allows
setting the desired output power. In that way, it is possible to measure the THz radiation sweeping in a big
range of frequencies just by adjusting the wavelength of this second laser. The firs laser, the one with a fixed
wavelength of , will remain unchanged during the whole measurement.
The tunable laser will take wavelengths between and in steps of or if
a finer measurement wants to be taken. With these wavelengths, THz radiation at frequencies between 66
GHz and 1.497 THz could be measured. The emitted power by the tunable source will be also tuned
according to the wavelength in order to adjust the amplitude of both lasers. The polarization of them should
be also adjusted for what a polarizator is used as shown in Figure 4.1.
Figure 4.2: HP8168F tunable laser source.
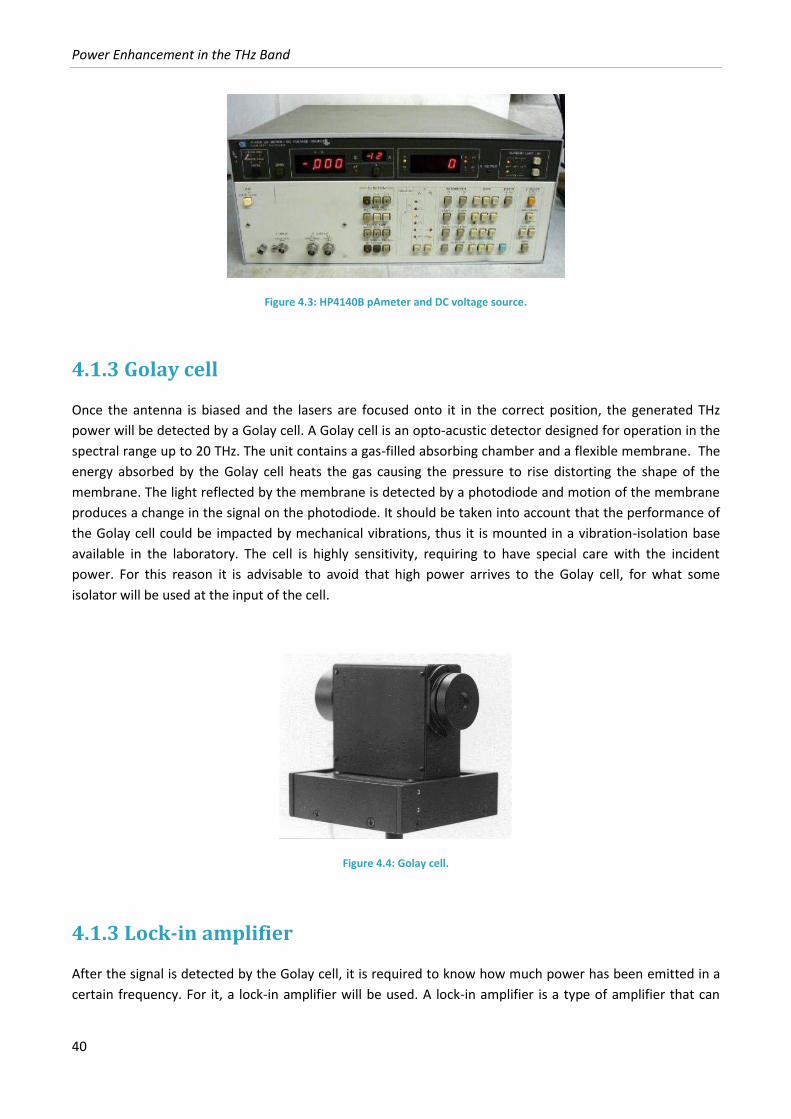
4.1.2 DC bias
The bias of the antenna is also mandatory in order to be able to make the corresponding measurements. For
it, two needles will be connected directly to the antenna so as to apply the required DC voltage. When the
antenna is correctly biased some dark current will flow through it even if no laser beams are applied. Aside
from the DC bias is also needed to check the current that is flowing through the antenna with the main
purpose of aligning correctly the whole system; when the laser beams point correctly to the photomixer in
the center of the antenna the current will be maximized and THz power will be generated. The HP4140B
pAmeter and DC voltage source will be in charge of all these functionality. It allows fixing a DC voltage to the
needles connected to the antenna and in parallel to it, measuring the current flow on it with a resolution up
to .
Power Enhancement in the THz Band
40
Figure 4.3: HP4140B pAmeter and DC voltage source.
4.1.3 Golay cell
Once the antenna is biased and the lasers are focused onto it in the correct position, the generated THz
power will be detected by a Golay cell. A Golay cell is an opto-acustic detector designed for operation in the
spectral range up to 20 THz. The unit contains a gas-filled absorbing chamber and a flexible membrane. The
energy absorbed by the Golay cell heats the gas causing the pressure to rise distorting the shape of the
membrane. The light reflected by the membrane is detected by a photodiode and motion of the membrane
produces a change in the signal on the photodiode. It should be taken into account that the performance of
the Golay cell could be impacted by mechanical vibrations, thus it is mounted in a vibration-isolation base
available in the laboratory. The cell is highly sensitivity, requiring to have special care with the incident
power. For this reason it is advisable to avoid that high power arrives to the Golay cell, for what some
isolator will be used at the input of the cell.
Figure 4.4: Golay cell.
4.1.3 Lock-in amplifier
After the signal is detected by the Golay cell, it is required to know how much power has been emitted in a
certain frequency. For it, a lock-in amplifier will be used. A lock-in amplifier is a type of amplifier that can
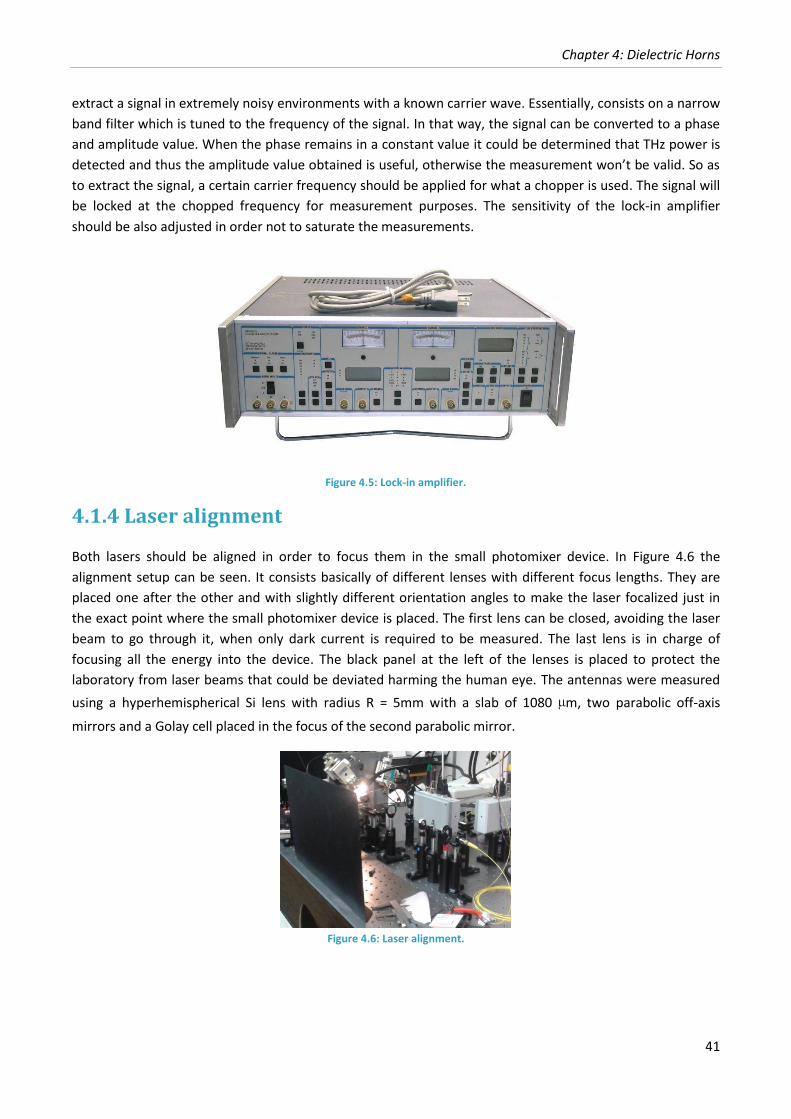
Chapter 4: Dielectric Horns
41
extract a signal in extremely noisy environments with a known carrier wave. Essentially, consists on a narrow
band filter which is tuned to the frequency of the signal. In that way, the signal can be converted to a phase
and amplitude value. When the phase remains in a constant value it could be determined that THz power is
detected and thus the amplitude value obtained is useful, otherwise the measurement won’t be valid. So as
to extract the signal, a certain carrier frequency should be applied for what a chopper is used. The signal will
be locked at the chopped frequency for measurement purposes. The sensitivity of the lock-in amplifier
should be also adjusted in order not to saturate the measurements.
Figure 4.5: Lock-in amplifier.
4.1.4 Laser alignment
Both lasers should be aligned in order to focus them in the small photomixer device. In Figure 4.6 the
alignment setup can be seen. It consists basically of different lenses with different focus lengths. They are
placed one after the other and with slightly different orientation angles to make the laser focalized just in
the exact point where the small photomixer device is placed. The first lens can be closed, avoiding the laser
beam to go through it, when only dark current is required to be measured. The last lens is in charge of
focusing all the energy into the device. The black panel at the left of the lenses is placed to protect the
laboratory from laser beams that could be deviated harming the human eye. The antennas were measured
using a hyperhemispherical Si lens with radius R = 5mm with a slab of 1080 µm, two parabolic off-axis
mirrors and a Golay cell placed in the focus of the second parabolic mirror.
Figure 4.6: Laser alignment.
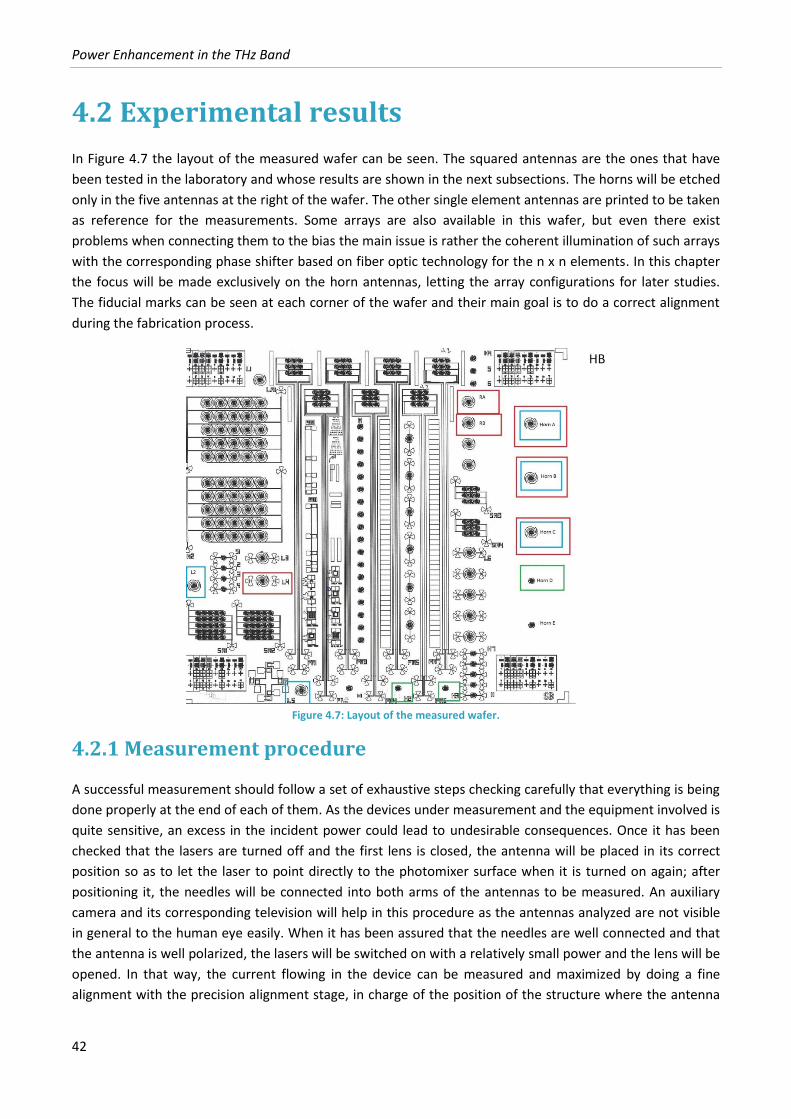
Power Enhancement in the THz Band
42
4.2 Experimental results
In Figure 4.7 the layout of the measured wafer can be seen. The squared antennas are the ones that have
been tested in the laboratory and whose results are shown in the next subsections. The horns will be etched
only in the five antennas at the right of the wafer. The other single element antennas are printed to be taken
as reference for the measurements. Some arrays are also available in this wafer, but even there exist
problems when connecting them to the bias the main issue is rather the coherent illumination of such arrays
with the corresponding phase shifter based on fiber optic technology for the n x n elements. In this chapter
the focus will be made exclusively on the horn antennas, letting the array configurations for later studies.
The fiducial marks can be seen at each corner of the wafer and their main goal is to do a correct alignment
during the fabrication process.
Figure 4.7: Layout of the measured wafer.
4.2.1 Measurement procedure
A successful measurement should follow a set of exhaustive steps checking carefully that everything is being
done properly at the end of each of them. As the devices under measurement and the equipment involved is
quite sensitive, an excess in the incident power could lead to undesirable consequences. Once it has been
checked that the lasers are turned off and the first lens is closed, the antenna will be placed in its correct
position so as to let the laser to point directly to the photomixer surface when it is turned on again; after
positioning it, the needles will be connected into both arms of the antennas to be measured. An auxiliary
camera and its corresponding television will help in this procedure as the antennas analyzed are not visible
in general to the human eye easily. When it has been assured that the needles are well connected and that
the antenna is well polarized, the lasers will be switched on with a relatively small power and the lens will be
opened. In that way, the current flowing in the device can be measured and maximized by doing a fine
alignment with the precision alignment stage, in charge of the position of the structure where the antenna
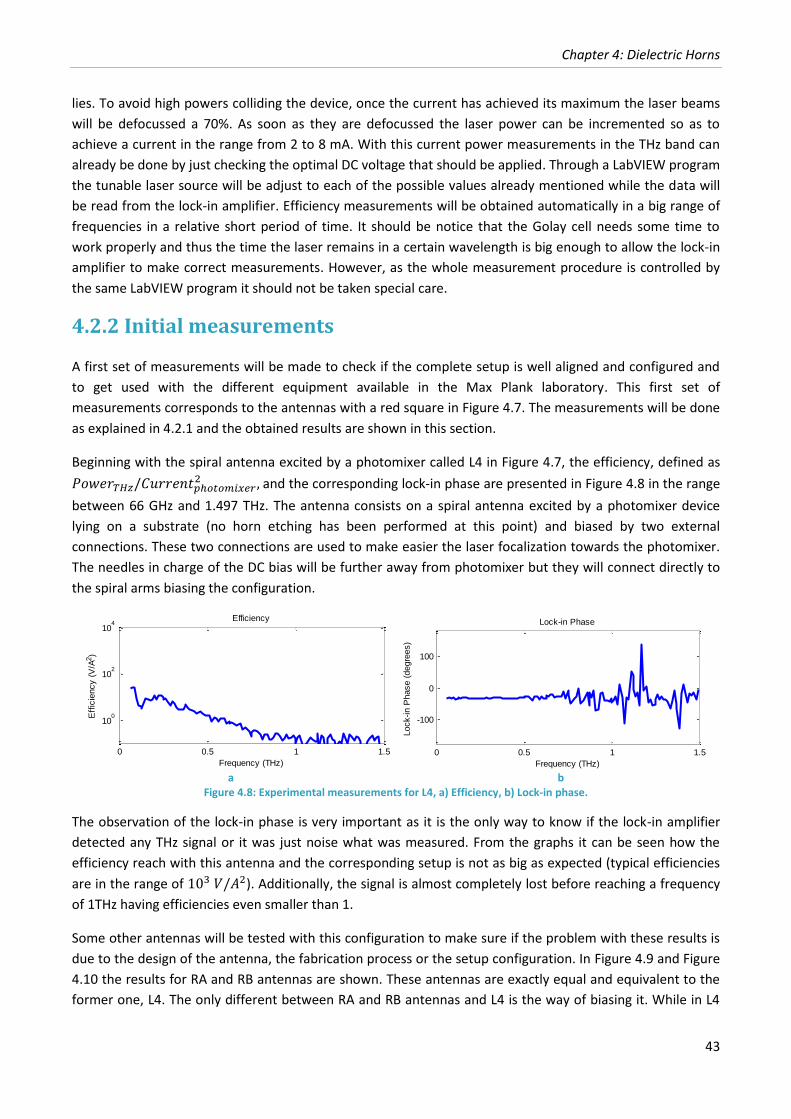
Chapter 4: Dielectric Horns
43
lies. To avoid high powers colliding the device, once the current has achieved its maximum the laser beams
will be defocussed a 70%. As soon as they are defocussed the laser power can be incremented so as to
achieve a current in the range from 2 to 8 mA. With this current power measurements in the THz band can
already be done by just checking the optimal DC voltage that should be applied. Through a LabVIEW program
the tunable laser source will be adjust to each of the possible values already mentioned while the data will
be read from the lock-in amplifier. Efficiency measurements will be obtained automatically in a big range of
frequencies in a relative short period of time. It should be notice that the Golay cell needs some time to
work properly and thus the time the laser remains in a certain wavelength is big enough to allow the lock-in
amplifier to make correct measurements. However, as the whole measurement procedure is controlled by
the same LabVIEW program it should not be taken special care.
4.2.2 Initial measurements
A first set of measurements will be made to check if the complete setup is well aligned and configured and
to get used with the different equipment available in the Max Plank laboratory. This first set of
measurements corresponds to the antennas with a red square in Figure 4.7. The measurements will be done
as explained in 4.2.1 and the obtained results are shown in this section.
Beginning with the spiral antenna excited by a photomixer called L4 in Figure 4.7, the efficiency, defined as
and the corresponding lock-in phase are presented in Figure 4.8 in the range
between 66 GHz and 1.497 THz. The antenna consists on a spiral antenna excited by a photomixer device
lying on a substrate (no horn etching has been performed at this point) and biased by two external
connections. These two connections are used to make easier the laser focalization towards the photomixer.
The needles in charge of the DC bias will be further away from photomixer but they will connect directly to
the spiral arms biasing the configuration.
a b
Figure 4.8: Experimental measurements for L4, a) Efficiency, b) Lock-in phase.
The observation of the lock-in phase is very important as it is the only way to know if the lock-in amplifier
detected any THz signal or it was just noise what was measured. From the graphs it can be seen how the
efficiency reach with this antenna and the corresponding setup is not as big as expected (typical efficiencies
are in the range of ). Additionally, the signal is almost completely lost before reaching a frequency
of 1THz having efficiencies even smaller than 1.
Some other antennas will be tested with this configuration to make sure if the problem with these results is
due to the design of the antenna, the fabrication process or the setup configuration. In Figure 4.9 and Figure
4.10 the results for RA and RB antennas are shown. These antennas are exactly equal and equivalent to the
former one, L4. The only different between RA and RB antennas and L4 is the way of biasing it. While in L4
0 0.5 1 1.5
100
102
104
Efficiency
Frequency (THz)
Eff
icie
ncy (
V/A
2)
0 0.5 1 1.5
-100
0
100
Lock-in Phase
Frequency (THz)
Lock-in P
hase (
degre
es)
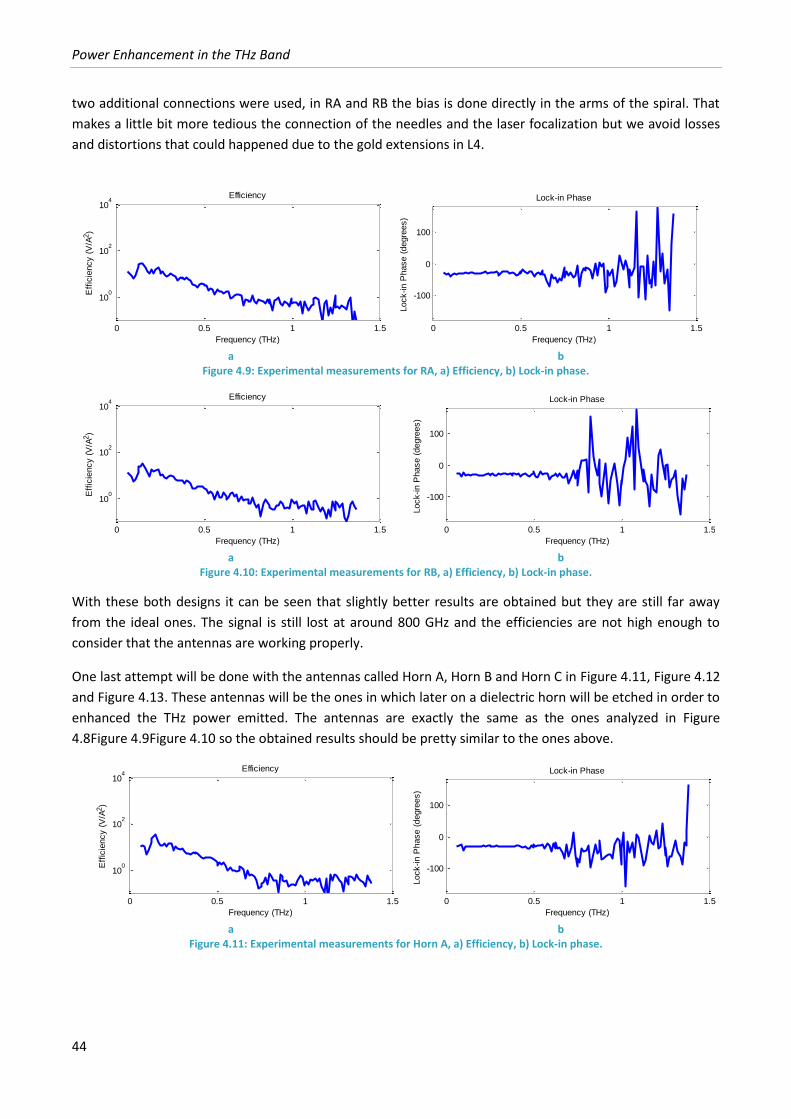
Power Enhancement in the THz Band
44
two additional connections were used, in RA and RB the bias is done directly in the arms of the spiral. That
makes a little bit more tedious the connection of the needles and the laser focalization but we avoid losses
and distortions that could happened due to the gold extensions in L4.
a b
Figure 4.9: Experimental measurements for RA, a) Efficiency, b) Lock-in phase.
a b
Figure 4.10: Experimental measurements for RB, a) Efficiency, b) Lock-in phase.
With these both designs it can be seen that slightly better results are obtained but they are still far away
from the ideal ones. The signal is still lost at around 800 GHz and the efficiencies are not high enough to
consider that the antennas are working properly.
One last attempt will be done with the antennas called Horn A, Horn B and Horn C in Figure 4.11, Figure 4.12
and Figure 4.13. These antennas will be the ones in which later on a dielectric horn will be etched in order to
enhanced the THz power emitted. The antennas are exactly the same as the ones analyzed in Figure
4.8Figure 4.9Figure 4.10 so the obtained results should be pretty similar to the ones above.
a b
Figure 4.11: Experimental measurements for Horn A, a) Efficiency, b) Lock-in phase.
0 0.5 1 1.5
100
102
104
Efficiency
Frequency (THz)
Eff
icie
ncy (
V/A
2)
0 0.5 1 1.5
-100
0
100
Lock-in Phase
Frequency (THz)
Lock-in P
hase (
degre
es)
0 0.5 1 1.5
100
102
104
Efficiency
Frequency (THz)
Eff
icie
ncy (
V/A
2)
0 0.5 1 1.5
-100
0
100
Lock-in Phase
Frequency (THz)
Lock-in P
hase (
degre
es)
0 0.5 1 1.5
100
102
104
Efficiency
Frequency (THz)
Eff
icie
ncy (
V/A
2)
0 0.5 1 1.5
-100
0
100
Lock-in Phase
Frequency (THz)
Lock-in P
hase (
degre
es)
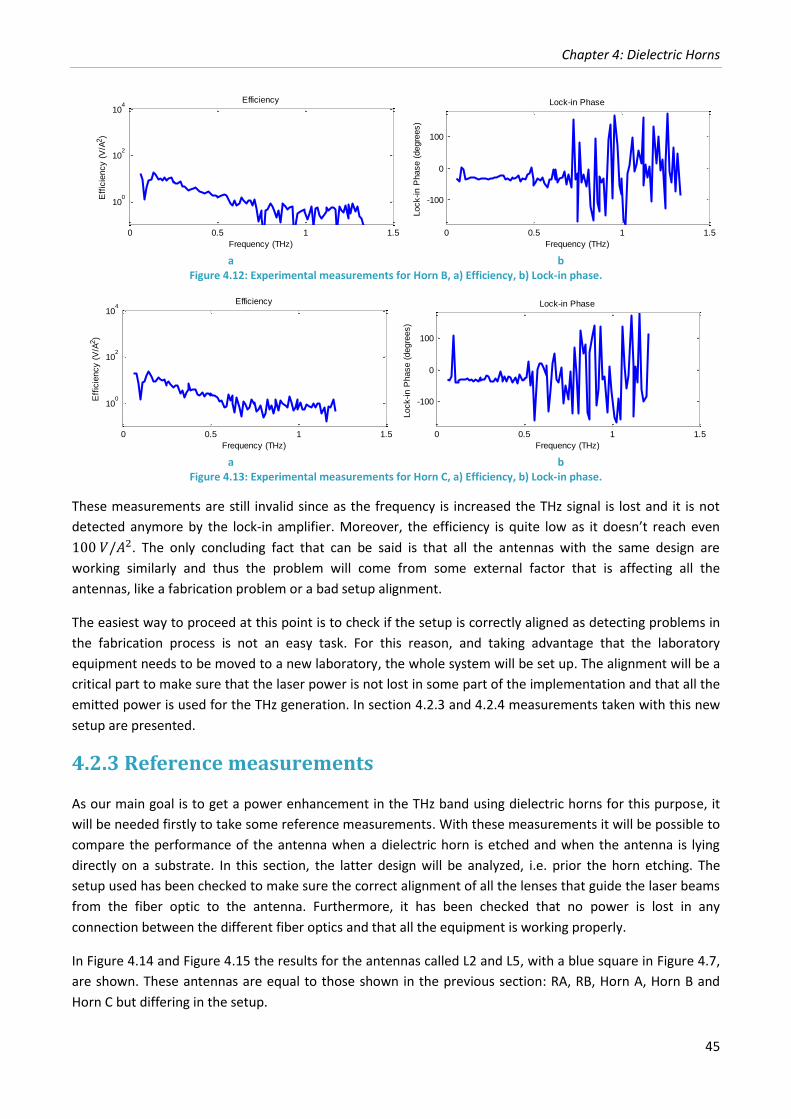
Chapter 4: Dielectric Horns
45
a b
Figure 4.12: Experimental measurements for Horn B, a) Efficiency, b) Lock-in phase.
a b
Figure 4.13: Experimental measurements for Horn C, a) Efficiency, b) Lock-in phase.
These measurements are still invalid since as the frequency is increased the THz signal is lost and it is not
detected anymore by the lock-in amplifier. Moreover, the efficiency is quite low as it doesn’t reach even
. The only concluding fact that can be said is that all the antennas with the same design are
working similarly and thus the problem will come from some external factor that is affecting all the
antennas, like a fabrication problem or a bad setup alignment.
The easiest way to proceed at this point is to check if the setup is correctly aligned as detecting problems in
the fabrication process is not an easy task. For this reason, and taking advantage that the laboratory
equipment needs to be moved to a new laboratory, the whole system will be set up. The alignment will be a
critical part to make sure that the laser power is not lost in some part of the implementation and that all the
emitted power is used for the THz generation. In section 4.2.3 and 4.2.4 measurements taken with this new
setup are presented.
4.2.3 Reference measurements
As our main goal is to get a power enhancement in the THz band using dielectric horns for this purpose, it
will be needed firstly to take some reference measurements. With these measurements it will be possible to
compare the performance of the antenna when a dielectric horn is etched and when the antenna is lying
directly on a substrate. In this section, the latter design will be analyzed, i.e. prior the horn etching. The
setup used has been checked to make sure the correct alignment of all the lenses that guide the laser beams
from the fiber optic to the antenna. Furthermore, it has been checked that no power is lost in any
connection between the different fiber optics and that all the equipment is working properly.
In Figure 4.14 and Figure 4.15 the results for the antennas called L2 and L5, with a blue square in Figure 4.7,
are shown. These antennas are equal to those shown in the previous section: RA, RB, Horn A, Horn B and
Horn C but differing in the setup.
0 0.5 1 1.5
100
102
104
Efficiency
Frequency (THz)
Eff
icie
ncy (
V/A
2)
0 0.5 1 1.5
-100
0
100
Lock-in Phase
Frequency (THz)
Lock-in P
hase (
degre
es)
0 0.5 1 1.5
100
102
104
Efficiency
Frequency (THz)
Eff
icie
ncy (
V/A
2)
0 0.5 1 1.5
-100
0
100
Lock-in Phase
Frequency (THz)
Lock-in P
hase (
degre
es)
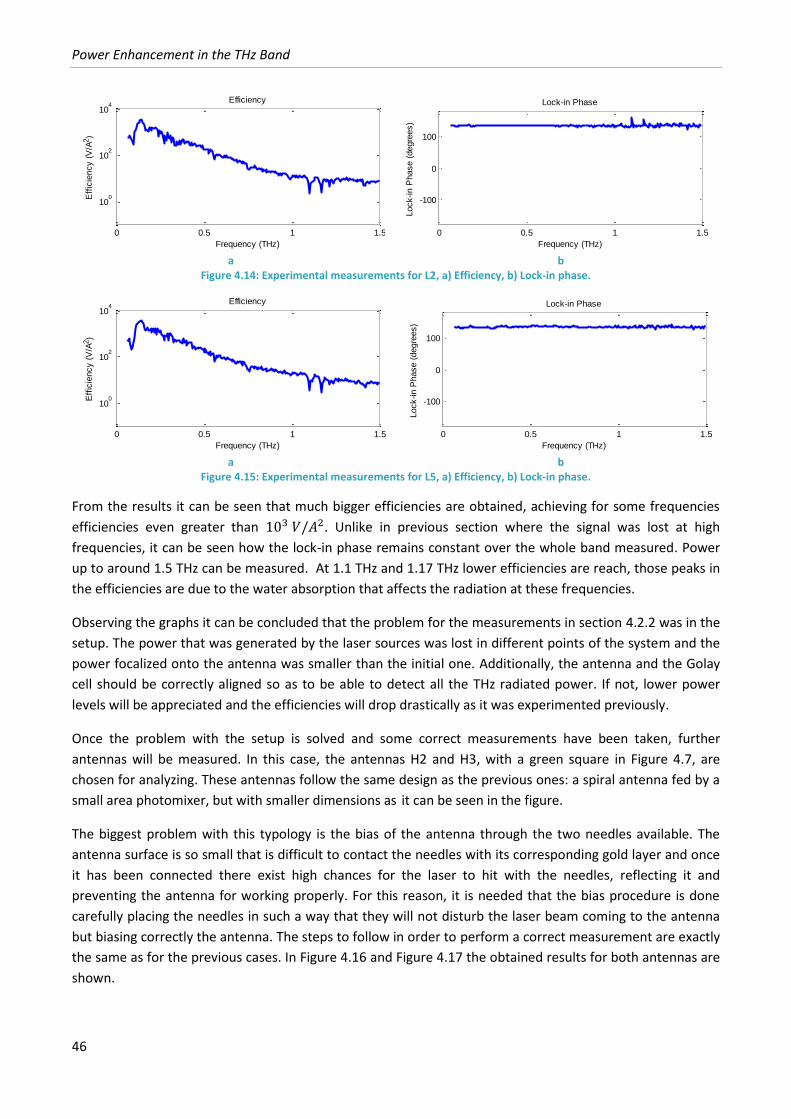
Power Enhancement in the THz Band
46
a b
Figure 4.14: Experimental measurements for L2, a) Efficiency, b) Lock-in phase.
a b
Figure 4.15: Experimental measurements for L5, a) Efficiency, b) Lock-in phase.
From the results it can be seen that much bigger efficiencies are obtained, achieving for some frequencies
efficiencies even greater than . Unlike in previous section where the signal was lost at high
frequencies, it can be seen how the lock-in phase remains constant over the whole band measured. Power
up to around 1.5 THz can be measured. At 1.1 THz and 1.17 THz lower efficiencies are reach, those peaks in
the efficiencies are due to the water absorption that affects the radiation at these frequencies.
Observing the graphs it can be concluded that the problem for the measurements in section 4.2.2 was in the
setup. The power that was generated by the laser sources was lost in different points of the system and the
power focalized onto the antenna was smaller than the initial one. Additionally, the antenna and the Golay
cell should be correctly aligned so as to be able to detect all the THz radiated power. If not, lower power
levels will be appreciated and the efficiencies will drop drastically as it was experimented previously.
Once the problem with the setup is solved and some correct measurements have been taken, further
antennas will be measured. In this case, the antennas H2 and H3, with a green square in Figure 4.7, are
chosen for analyzing. These antennas follow the same design as the previous ones: a spiral antenna fed by a
small area photomixer, but with smaller dimensions as it can be seen in the figure.
The biggest problem with this typology is the bias of the antenna through the two needles available. The
antenna surface is so small that is difficult to contact the needles with its corresponding gold layer and once
it has been connected there exist high chances for the laser to hit with the needles, reflecting it and
preventing the antenna for working properly. For this reason, it is needed that the bias procedure is done
carefully placing the needles in such a way that they will not disturb the laser beam coming to the antenna
but biasing correctly the antenna. The steps to follow in order to perform a correct measurement are exactly
the same as for the previous cases. In Figure 4.16 and Figure 4.17 the obtained results for both antennas are
shown.
0 0.5 1 1.5
100
102
104
Efficiency
Frequency (THz)
Eff
icie
ncy (
V/A
2)
0 0.5 1 1.5
-100
0
100
Lock-in Phase
Frequency (THz)
Lock-in P
hase (
degre
es)
0 0.5 1 1.5
100
102
104
Efficiency
Frequency (THz)
Eff
icie
ncy (
V/A
2)
0 0.5 1 1.5
-100
0
100
Lock-in Phase
Frequency (THz)
Lock-in P
hase (
degre
es)
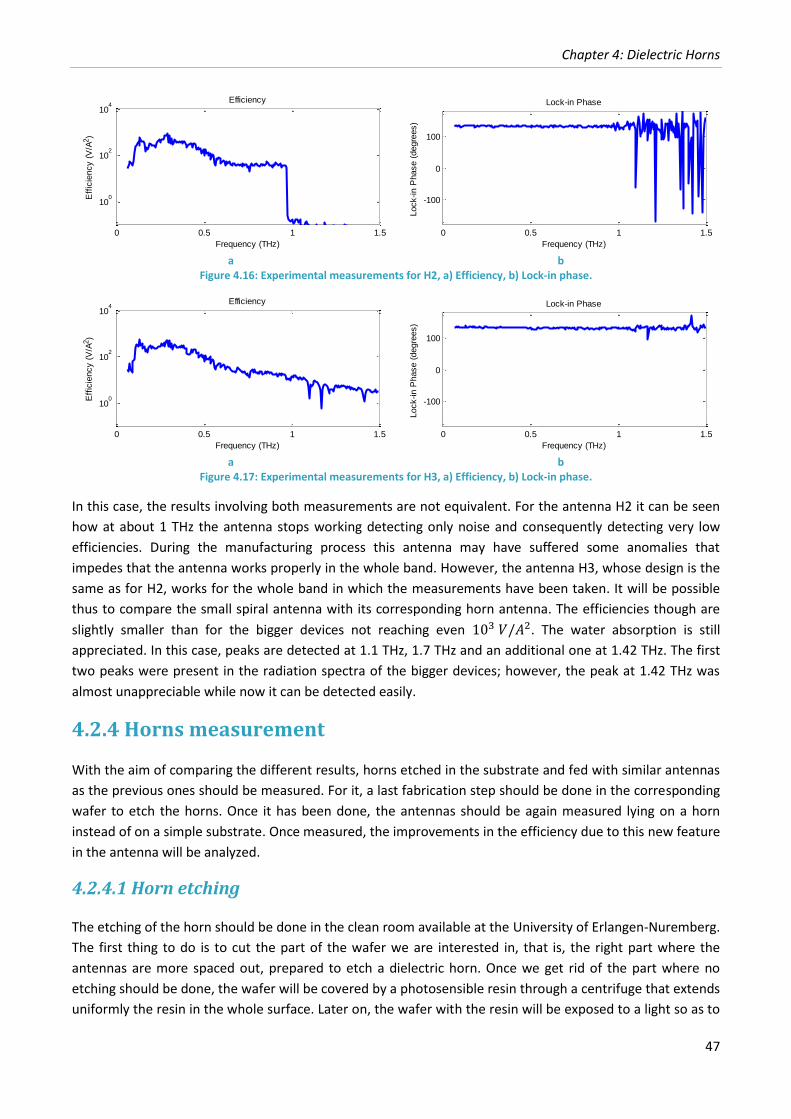
Chapter 4: Dielectric Horns
47
a b
Figure 4.16: Experimental measurements for H2, a) Efficiency, b) Lock-in phase.
a b
Figure 4.17: Experimental measurements for H3, a) Efficiency, b) Lock-in phase.
In this case, the results involving both measurements are not equivalent. For the antenna H2 it can be seen
how at about 1 THz the antenna stops working detecting only noise and consequently detecting very low
efficiencies. During the manufacturing process this antenna may have suffered some anomalies that
impedes that the antenna works properly in the whole band. However, the antenna H3, whose design is the
same as for H2, works for the whole band in which the measurements have been taken. It will be possible
thus to compare the small spiral antenna with its corresponding horn antenna. The efficiencies though are
slightly smaller than for the bigger devices not reaching even . The water absorption is still
appreciated. In this case, peaks are detected at 1.1 THz, 1.7 THz and an additional one at 1.42 THz. The first
two peaks were present in the radiation spectra of the bigger devices; however, the peak at 1.42 THz was
almost unappreciable while now it can be detected easily.
4.2.4 Horns measurement
With the aim of comparing the different results, horns etched in the substrate and fed with similar antennas
as the previous ones should be measured. For it, a last fabrication step should be done in the corresponding
wafer to etch the horns. Once it has been done, the antennas should be again measured lying on a horn
instead of on a simple substrate. Once measured, the improvements in the efficiency due to this new feature
in the antenna will be analyzed.
4.2.4.1 Horn etching
The etching of the horn should be done in the clean room available at the University of Erlangen-Nuremberg.
The first thing to do is to cut the part of the wafer we are interested in, that is, the right part where the
antennas are more spaced out, prepared to etch a dielectric horn. Once we get rid of the part where no
etching should be done, the wafer will be covered by a photosensible resin through a centrifuge that extends
uniformly the resin in the whole surface. Later on, the wafer with the resin will be exposed to a light so as to
0 0.5 1 1.5
100
102
104
Efficiency
Frequency (THz)
Eff
icie
ncy (
V/A
2)
0 0.5 1 1.5
-100
0
100
Lock-in Phase
Frequency (THz)
Lock-in P
hase (
degre
es)
0 0.5 1 1.5
100
102
104
Efficiency
Frequency (THz)
Eff
icie
ncy (
V/A
2)
0 0.5 1 1.5
-100
0
100
Lock-in Phase
Frequency (THz)
Lock-in P
hase (
degre
es)
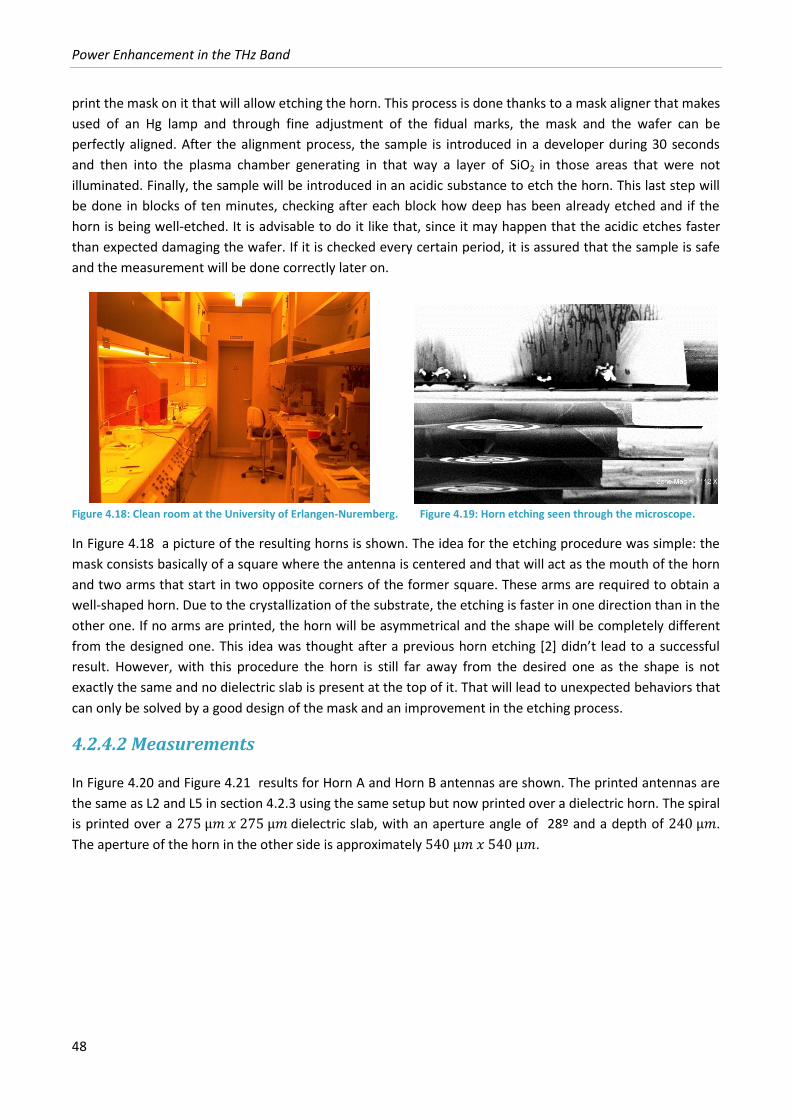
Power Enhancement in the THz Band
48
print the mask on it that will allow etching the horn. This process is done thanks to a mask aligner that makes
used of an Hg lamp and through fine adjustment of the fidual marks, the mask and the wafer can be
perfectly aligned. After the alignment process, the sample is introduced in a developer during 30 seconds
and then into the plasma chamber generating in that way a layer of SiO2 in those areas that were not
illuminated. Finally, the sample will be introduced in an acidic substance to etch the horn. This last step will
be done in blocks of ten minutes, checking after each block how deep has been already etched and if the
horn is being well-etched. It is advisable to do it like that, since it may happen that the acidic etches faster
than expected damaging the wafer. If it is checked every certain period, it is assured that the sample is safe
and the measurement will be done correctly later on.
Figure 4.18: Clean room at the University of Erlangen-Nuremberg. Figure 4.19: Horn etching seen through the microscope.
In Figure 4.18 a picture of the resulting horns is shown. The idea for the etching procedure was simple: the
mask consists basically of a square where the antenna is centered and that will act as the mouth of the horn
and two arms that start in two opposite corners of the former square. These arms are required to obtain a
well-shaped horn. Due to the crystallization of the substrate, the etching is faster in one direction than in the
other one. If no arms are printed, the horn will be asymmetrical and the shape will be completely different
from the designed one. This idea was thought after a previous horn etching [2] didn’t lead to a successful
result. However, with this procedure the horn is still far away from the desired one as the shape is not
exactly the same and no dielectric slab is present at the top of it. That will lead to unexpected behaviors that
can only be solved by a good design of the mask and an improvement in the etching process.
4.2.4.2 Measurements
In Figure 4.20 and Figure 4.21 results for Horn A and Horn B antennas are shown. The printed antennas are
the same as L2 and L5 in section 4.2.3 using the same setup but now printed over a dielectric horn. The spiral
is printed over a dielectric slab, with an aperture angle of 28º and a depth of .
The aperture of the horn in the other side is approximately .
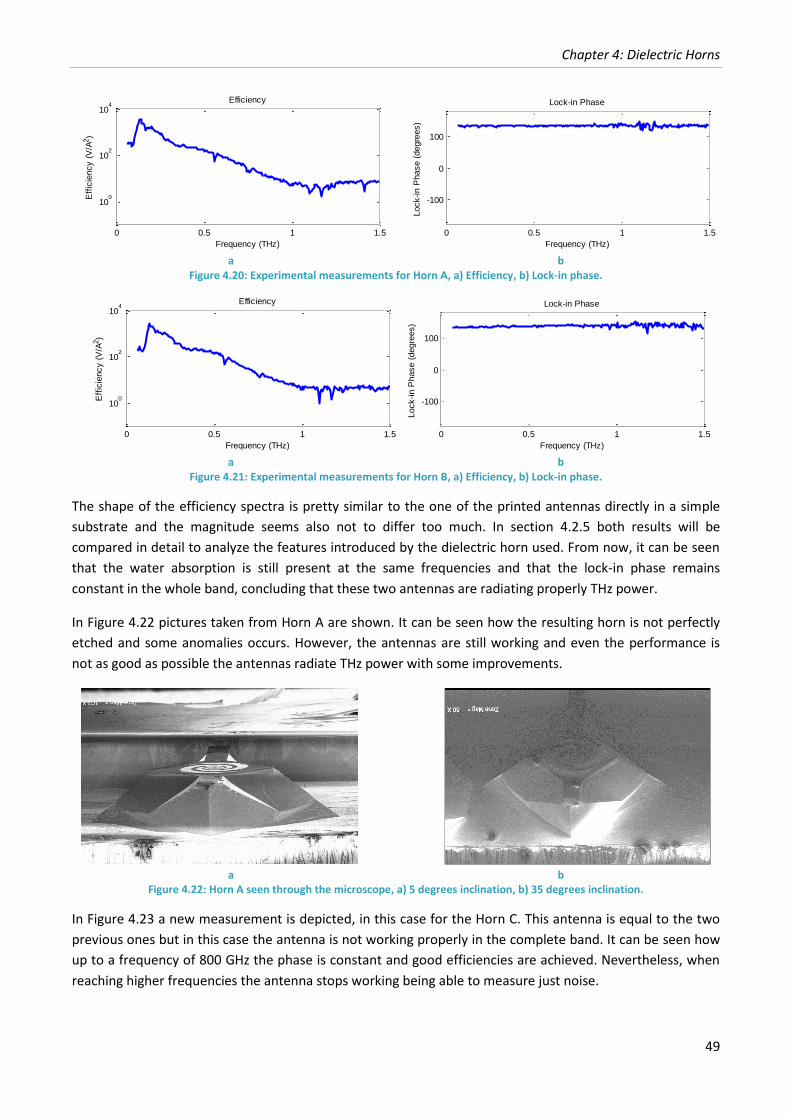
Chapter 4: Dielectric Horns
49
a b
Figure 4.20: Experimental measurements for Horn A, a) Efficiency, b) Lock-in phase.
a b
Figure 4.21: Experimental measurements for Horn B, a) Efficiency, b) Lock-in phase.
The shape of the efficiency spectra is pretty similar to the one of the printed antennas directly in a simple
substrate and the magnitude seems also not to differ too much. In section 4.2.5 both results will be
compared in detail to analyze the features introduced by the dielectric horn used. From now, it can be seen
that the water absorption is still present at the same frequencies and that the lock-in phase remains
constant in the whole band, concluding that these two antennas are radiating properly THz power.
In Figure 4.22 pictures taken from Horn A are shown. It can be seen how the resulting horn is not perfectly
etched and some anomalies occurs. However, the antennas are still working and even the performance is
not as good as possible the antennas radiate THz power with some improvements.
a b
Figure 4.22: Horn A seen through the microscope, a) 5 degrees inclination, b) 35 degrees inclination.
In Figure 4.23 a new measurement is depicted, in this case for the Horn C. This antenna is equal to the two
previous ones but in this case the antenna is not working properly in the complete band. It can be seen how
up to a frequency of 800 GHz the phase is constant and good efficiencies are achieved. Nevertheless, when
reaching higher frequencies the antenna stops working being able to measure just noise.
0 0.5 1 1.5
100
102
104
Efficiency
Frequency (THz)
Eff
icie
ncy (
V/A
2)
0 0.5 1 1.5
-100
0
100
Lock-in Phase
Frequency (THz)
Lock-in P
hase (
degre
es)
0 0.5 1 1.5
100
102
104
Efficiency
Frequency (THz)
Eff
icie
ncy (
V/A
2)
0 0.5 1 1.5
-100
0
100
Lock-in Phase
Frequency (THz)
Lock-in P
hase (
degre
es)
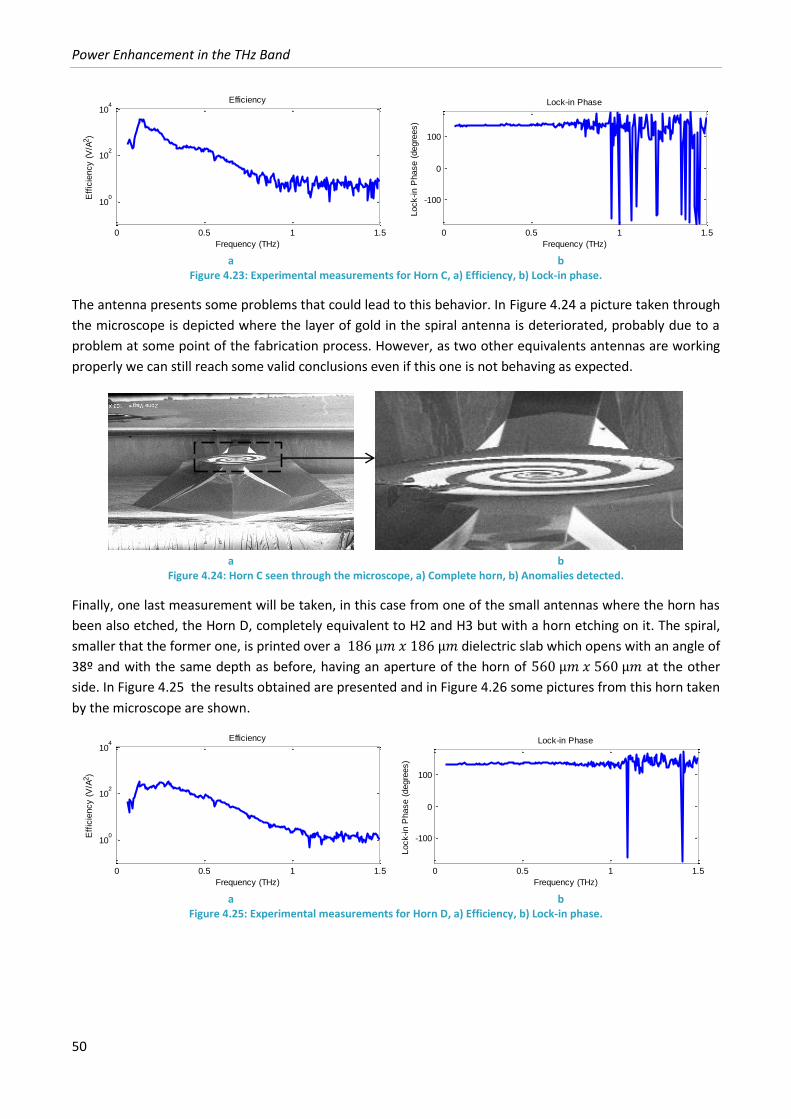
Power Enhancement in the THz Band
50
a b
Figure 4.23: Experimental measurements for Horn C, a) Efficiency, b) Lock-in phase.
The antenna presents some problems that could lead to this behavior. In Figure 4.24 a picture taken through
the microscope is depicted where the layer of gold in the spiral antenna is deteriorated, probably due to a
problem at some point of the fabrication process. However, as two other equivalents antennas are working
properly we can still reach some valid conclusions even if this one is not behaving as expected.
a b
Figure 4.24: Horn C seen through the microscope, a) Complete horn, b) Anomalies detected.
Finally, one last measurement will be taken, in this case from one of the small antennas where the horn has
been also etched, the Horn D, completely equivalent to H2 and H3 but with a horn etching on it. The spiral,
smaller that the former one, is printed over a dielectric slab which opens with an angle of
38º and with the same depth as before, having an aperture of the horn of at the other
side. In Figure 4.25 the results obtained are presented and in Figure 4.26 some pictures from this horn taken
by the microscope are shown.
a b
Figure 4.25: Experimental measurements for Horn D, a) Efficiency, b) Lock-in phase.
0 0.5 1 1.5
100
102
104
Efficiency
Frequency (THz)
Eff
icie
ncy (
V/A
2)
0 0.5 1 1.5
-100
0
100
Lock-in Phase
Frequency (THz)
Lock-in P
hase (
degre
es)
0 0.5 1 1.5
100
102
104
Efficiency
Frequency (THz)
Eff
icie
ncy (
V/A
2)
0 0.5 1 1.5
-100
0
100
Lock-in Phase
Frequency (THz)
Lock-in P
hase (
degre
es)
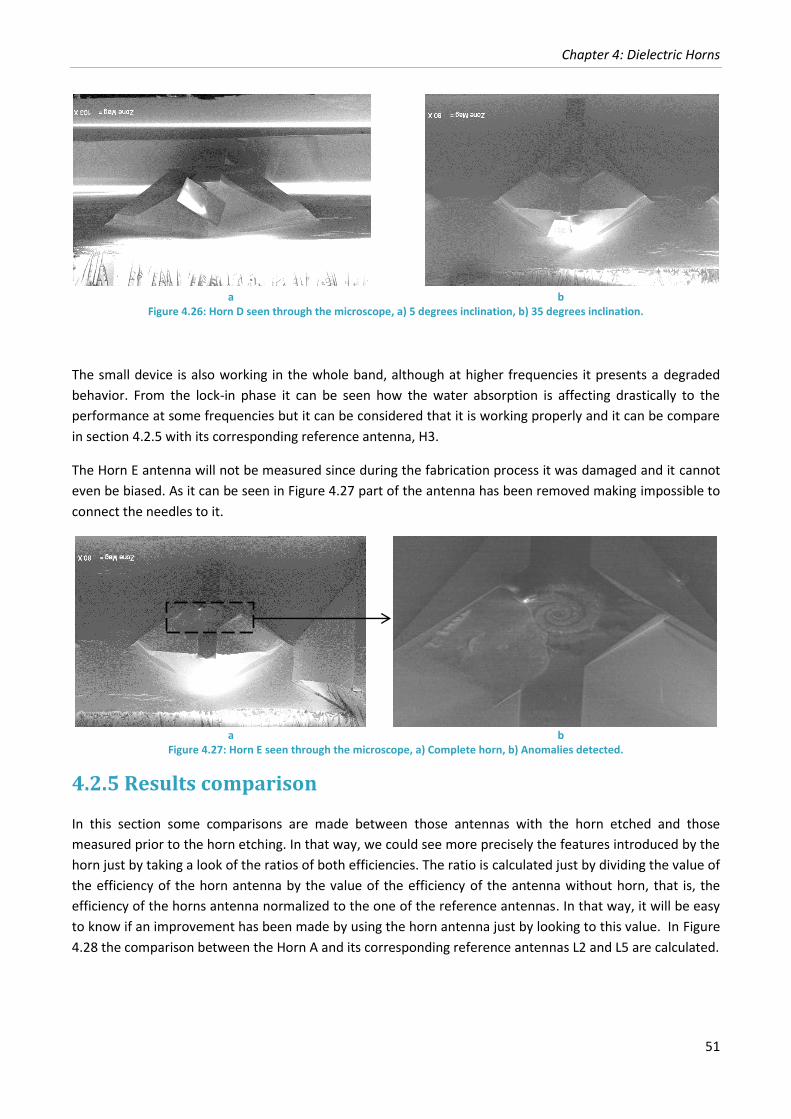
Chapter 4: Dielectric Horns
51
a b
Figure 4.26: Horn D seen through the microscope, a) 5 degrees inclination, b) 35 degrees inclination.
The small device is also working in the whole band, although at higher frequencies it presents a degraded
behavior. From the lock-in phase it can be seen how the water absorption is affecting drastically to the
performance at some frequencies but it can be considered that it is working properly and it can be compare
in section 4.2.5 with its corresponding reference antenna, H3.
The Horn E antenna will not be measured since during the fabrication process it was damaged and it cannot
even be biased. As it can be seen in Figure 4.27 part of the antenna has been removed making impossible to
connect the needles to it.
a b
Figure 4.27: Horn E seen through the microscope, a) Complete horn, b) Anomalies detected.
4.2.5 Results comparison
In this section some comparisons are made between those antennas with the horn etched and those
measured prior to the horn etching. In that way, we could see more precisely the features introduced by the
horn just by taking a look of the ratios of both efficiencies. The ratio is calculated just by dividing the value of
the efficiency of the horn antenna by the value of the efficiency of the antenna without horn, that is, the
efficiency of the horns antenna normalized to the one of the reference antennas. In that way, it will be easy
to know if an improvement has been made by using the horn antenna just by looking to this value. In Figure
4.28 the comparison between the Horn A and its corresponding reference antennas L2 and L5 are calculated.
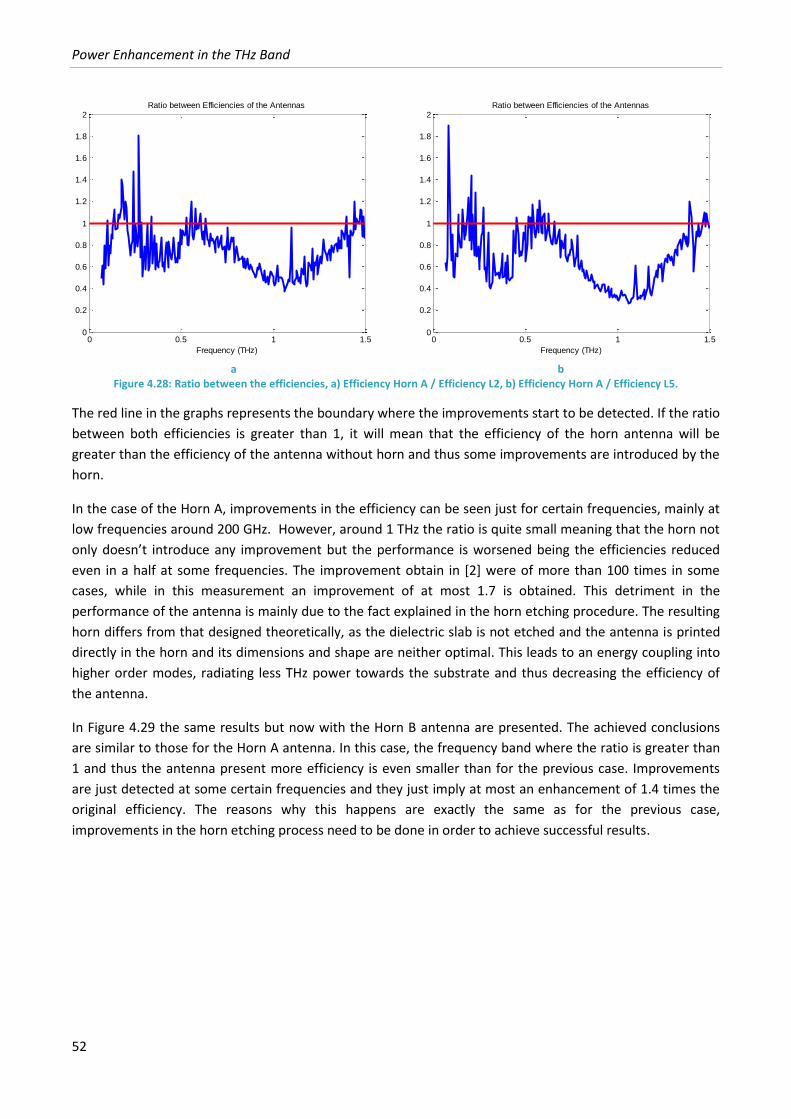
Power Enhancement in the THz Band
52
a b
Figure 4.28: Ratio between the efficiencies, a) Efficiency Horn A / Efficiency L2, b) Efficiency Horn A / Efficiency L5.
The red line in the graphs represents the boundary where the improvements start to be detected. If the ratio
between both efficiencies is greater than 1, it will mean that the efficiency of the horn antenna will be
greater than the efficiency of the antenna without horn and thus some improvements are introduced by the
horn.
In the case of the Horn A, improvements in the efficiency can be seen just for certain frequencies, mainly at
low frequencies around 200 GHz. However, around 1 THz the ratio is quite small meaning that the horn not
only doesn’t introduce any improvement but the performance is worsened being the efficiencies reduced
even in a half at some frequencies. The improvement obtain in [2] were of more than 100 times in some
cases, while in this measurement an improvement of at most 1.7 is obtained. This detriment in the
performance of the antenna is mainly due to the fact explained in the horn etching procedure. The resulting
horn differs from that designed theoretically, as the dielectric slab is not etched and the antenna is printed
directly in the horn and its dimensions and shape are neither optimal. This leads to an energy coupling into
higher order modes, radiating less THz power towards the substrate and thus decreasing the efficiency of
the antenna.
In Figure 4.29 the same results but now with the Horn B antenna are presented. The achieved conclusions
are similar to those for the Horn A antenna. In this case, the frequency band where the ratio is greater than
1 and thus the antenna present more efficiency is even smaller than for the previous case. Improvements
are just detected at some certain frequencies and they just imply at most an enhancement of 1.4 times the
original efficiency. The reasons why this happens are exactly the same as for the previous case,
improvements in the horn etching process need to be done in order to achieve successful results.
0 0.5 1 1.50
0.2
0.4
0.6
0.8
1
1.2
1.4
1.6
1.8
2Ratio between Efficiencies of the Antennas
Frequency (THz)
0 0.5 1 1.50
0.2
0.4
0.6
0.8
1
1.2
1.4
1.6
1.8
2Ratio between Efficiencies of the Antennas
Frequency (THz)
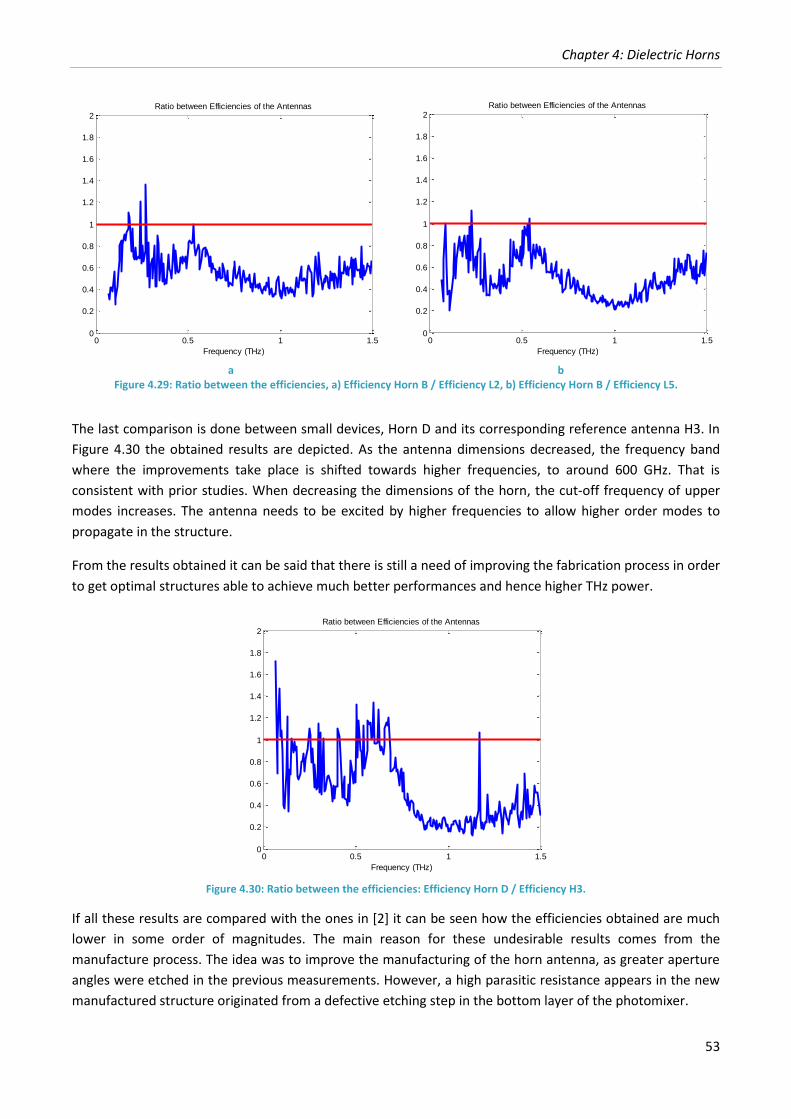
Chapter 4: Dielectric Horns
53
a b
Figure 4.29: Ratio between the efficiencies, a) Efficiency Horn B / Efficiency L2, b) Efficiency Horn B / Efficiency L5.
The last comparison is done between small devices, Horn D and its corresponding reference antenna H3. In
Figure 4.30 the obtained results are depicted. As the antenna dimensions decreased, the frequency band
where the improvements take place is shifted towards higher frequencies, to around 600 GHz. That is
consistent with prior studies. When decreasing the dimensions of the horn, the cut-off frequency of upper
modes increases. The antenna needs to be excited by higher frequencies to allow higher order modes to
propagate in the structure.
From the results obtained it can be said that there is still a need of improving the fabrication process in order
to get optimal structures able to achieve much better performances and hence higher THz power.
Figure 4.30: Ratio between the efficiencies: Efficiency Horn D / Efficiency H3.
If all these results are compared with the ones in [2] it can be seen how the efficiencies obtained are much
lower in some order of magnitudes. The main reason for these undesirable results comes from the
manufacture process. The idea was to improve the manufacturing of the horn antenna, as greater aperture
angles were etched in the previous measurements. However, a high parasitic resistance appears in the new
manufactured structure originated from a defective etching step in the bottom layer of the photomixer.
0 0.5 1 1.50
0.2
0.4
0.6
0.8
1
1.2
1.4
1.6
1.8
2Ratio between Efficiencies of the Antennas
Frequency (THz)
0 0.5 1 1.50
0.2
0.4
0.6
0.8
1
1.2
1.4
1.6
1.8
2Ratio between Efficiencies of the Antennas
Frequency (THz)
0 0.5 1 1.50
0.2
0.4
0.6
0.8
1
1.2
1.4
1.6
1.8
2Ratio between Efficiencies of the Antennas
Frequency (THz)
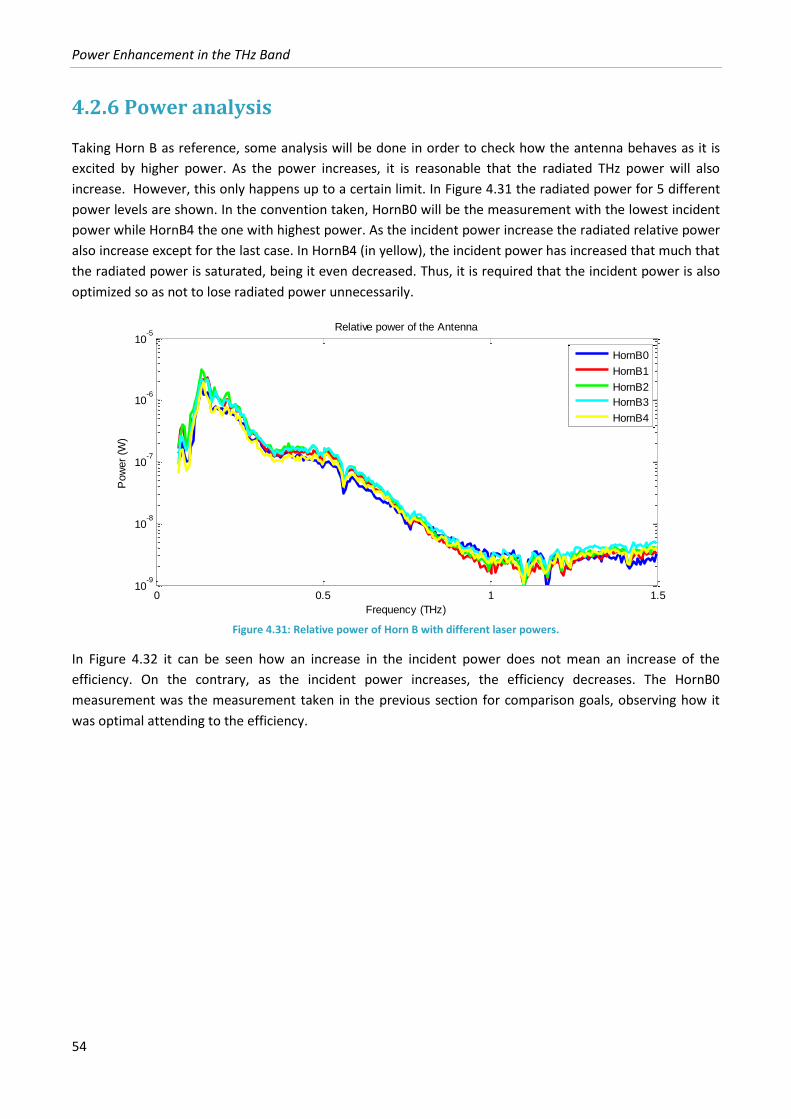
Power Enhancement in the THz Band
54
4.2.6 Power analysis
Taking Horn B as reference, some analysis will be done in order to check how the antenna behaves as it is
excited by higher power. As the power increases, it is reasonable that the radiated THz power will also
increase. However, this only happens up to a certain limit. In Figure 4.31 the radiated power for 5 different
power levels are shown. In the convention taken, HornB0 will be the measurement with the lowest incident
power while HornB4 the one with highest power. As the incident power increase the radiated relative power
also increase except for the last case. In HornB4 (in yellow), the incident power has increased that much that
the radiated power is saturated, being it even decreased. Thus, it is required that the incident power is also
optimized so as not to lose radiated power unnecessarily.
Figure 4.31: Relative power of Horn B with different laser powers.
In Figure 4.32 it can be seen how an increase in the incident power does not mean an increase of the
efficiency. On the contrary, as the incident power increases, the efficiency decreases. The HornB0
measurement was the measurement taken in the previous section for comparison goals, observing how it
was optimal attending to the efficiency.
0 0.5 1 1.510
-9
10-8
10-7
10-6
10-5
Relative power of the Antenna
Frequency (THz)
Pow
er
(W)
HornB0
HornB1
HornB2
HornB3
HornB4
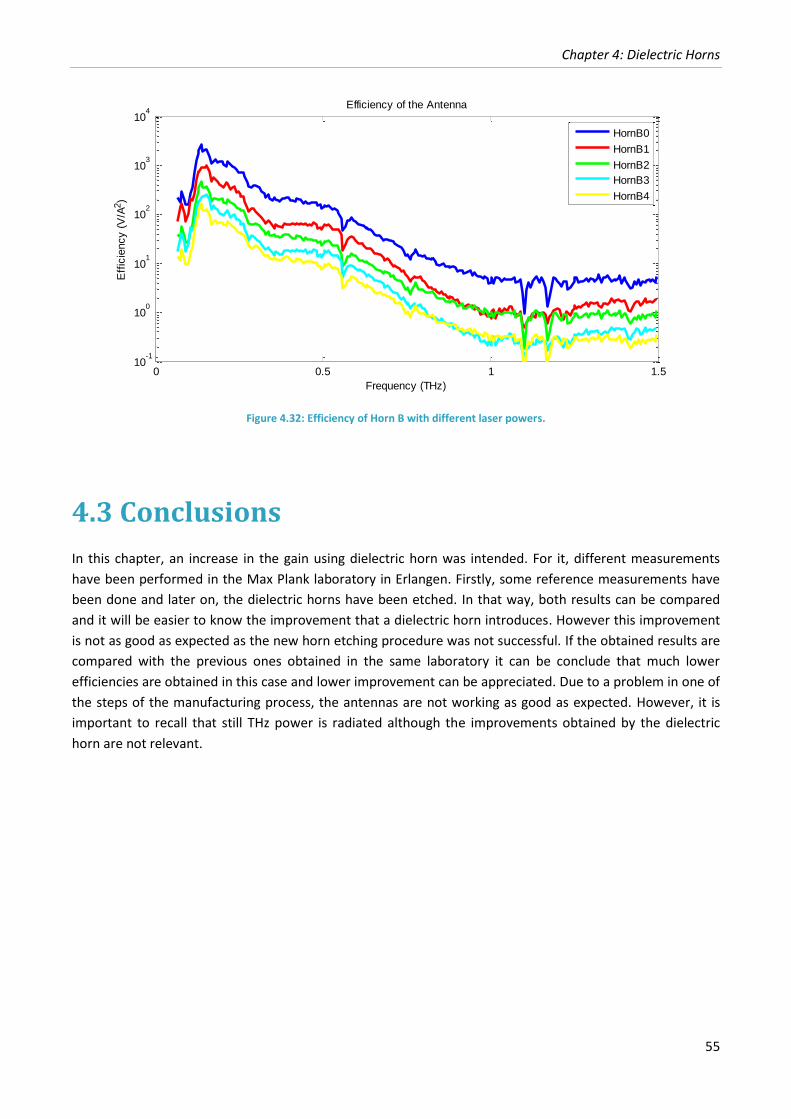
Chapter 4: Dielectric Horns
55
Figure 4.32: Efficiency of Horn B with different laser powers.
4.3 Conclusions
In this chapter, an increase in the gain using dielectric horn was intended. For it, different measurements
have been performed in the Max Plank laboratory in Erlangen. Firstly, some reference measurements have
been done and later on, the dielectric horns have been etched. In that way, both results can be compared
and it will be easier to know the improvement that a dielectric horn introduces. However this improvement
is not as good as expected as the new horn etching procedure was not successful. If the obtained results are
compared with the previous ones obtained in the same laboratory it can be conclude that much lower
efficiencies are obtained in this case and lower improvement can be appreciated. Due to a problem in one of
the steps of the manufacturing process, the antennas are not working as good as expected. However, it is
important to recall that still THz power is radiated although the improvements obtained by the dielectric
horn are not relevant.
0 0.5 1 1.510
-1
100
101
102
103
104
Efficiency of the Antenna
Frequency (THz)
Eff
icie
ncy (
V/A
2)
HornB0
HornB1
HornB2
HornB3
HornB4

Power Enhancement in the THz Band
56
Chapter 5
5 Conclusions and future work
This chapter remarks the conclusion reached along the work and the future lines to address the issues arisen
together with the required budget.
5.1 Conclusions
In the present work different ways of enhancing the radiated power in the THz band have been study. Currently, there exists a need of improving the radiated THz power so as to broaden the possible number of applications of the Terahertz waves. The main conclusions that can be extracted from this work are sorted in three groups. The first one corresponds to the Tapered Slot Antennas, the second one to the antenna emitters and the third one to the dielectric horns antennas.
1. Tapered Slot Antennas a. In order to design 2D-Arrays composed by Tapered Slot Antennas the thickness of the substrate
should surpass the limits established. This limit is established by Yngvesson and should be always taken into account when designing a TSA antenna. If the antenna is designed without taking into account this limit, it will not behave as expected.
b. Surpassing the limits of the substrate thickness prevents the antenna from working properly. When the thickness of the substrate increase beyond the limit explained in a., it is thought that upper modes appear, which prevent the antenna from working properly. It is required to design a structure that allows a TSA antenna to work with greater substrate thickness.
Power Enhancement in the THz Band
58
c. A new structure should be designed as substrate, allowing the TSA to radiate properly: Electromagnetic Band Gap (EBG). This EBG consist on superimposed dielectric layers of two different permittivities. The EBG forces the waves to suffer higher reflection avoiding to be transmitted to the other side of the substrate, overcoming the limitations imposed by the substrate thickness.
d. The modes propagating in the structure or the attenuation that the field suffers through the structure are not sufficiently for explaining the problem. When increasing the substrate thickness, the modes propagating in the structure are still equivalent to a sectoral horn antenna, so it cannot be said that higher modes appear. When studying the field attenuation, comparison results between an antenna that is working or another one that not are neither consistent, being it neither the reason for preventing the antenna from working properly.
e. It does not exist a certain EBG valid for each TSA antenna designed. An EBG should be designed from scratch for each TSA. It has been seen how an antenna that is working under a certain EBG stops working when a new EBG is used. Similarly, if an antenna is working with a certain EBG, it does not necessarily work when the dimensions are changed even the same EBG is used.
2. Antenna emitters a. Photomixers can be used for the generation of THz waves. Two laser beams with different
frequencies are focused onto it, allowing the generation of THz by mixing both beams. The beams should be equal in amplitude and polarization in order to achieve acceptable THz power. The size of the photomixer should be much smaller than the THz wavelength.
b. The AC current generated by the photomixer can be converted to THz radiation connecting the photomixer to an antenna. This antenna should be designed in order to properly allow it to radiate in the THz band. Thus, a careful design has been done for all antennas used: Dipoles and Spirals. They have been design considering the frequencies at which they should work and the dielectric where they lies.
c. The dipole configuration is more sensible to the position of the photomixer than the spiral configuration. When displacing the device to the left, the radiation pattern symmetrized as the amount of gold in both arms is approximately equivalent. When moving to the right, the radiation pattern is completely asymmetric, since there exists more gold in the left arm than in the right one.
d. When using a dipole as radiating element, it is advisable to use a rectangular photomixer instead of a hexagonal one. In that way, the radiation pattern will be symmetric without needing to care about the exact position of the photomixer. For the manufacturing process, it is much less sensible than the hexagonal one.
e. Logarithmic and adiabatic spirals have been used, being the former more suitable for symmetrizing the radiation pattern. When using an adiabatic spiral the radiation pattern is worsened. Even we could take advantage of the self-complementary characteristics, the maxima of the pattern is deviated.
f. The equivalent circuits for two of the designs have been calculated. Theoretically, a resistor and a capacitor should be enough to model the photomixer. When using a dipole with a rectangular
Chapter 5: Conclusions and future work
59
photomixer this is accomplish. However, if the spiral configuration is used, an inductor behavior appears, which apparently do not present any physical explanation.
3. Dielectric horns a. Dielectric horns are an alternative for increasing the radiated THz power. The aim of the
dielectric horn is to focus all the radiation into the broadside direction, in contrast to the energy diffusion through the substrate that occurs when using a conventional system.
b. Experimental results from this topic are depicted in this chapter. The proposed antenna is a
logarithmic spiral antenna as in chapter 3. Two different dimensions are proposed, changing the frequencies at which they work.
c. The setup available in the Max Plank Institute for the Science of Light has been detailed. In
general terms, it consists in three basic blocks: equipment for the laser beams generation, for the alignment of the laser and for taken the corresponding power measurements. In order to generate the laser beams a tunable laser source and a fixed laser source are used. It is also required to polarize both beams with a polarizator in order to achieve the same amplitude and phase for them.
d. The procedure for measuring the different antennas is explained. The critical steps consist on aligning the laser beam, the antenna and the Golay cell in order to achieve at most power as possible. However, it should be taken into account that so much power could saturate the performance. Thus, the beams will be defocused once the maximum power has been achieved.
e. Measurements of reference antennas and antennas with a horn etched have been performed.
The efficiencies of all the antennas have been measured and are shown together with its lock-in-phase so as to check if signal is detected in the lock-in amplifier.
f. The results have been compared and analyzed, checking the improvements introduced by the
horn antennas. These improvements are not as good as expected. Previous measurements in the same laboratory have shown better performance. The problem arisen from a manufacturing problem in one of the etching steps.
g. A study on the how the incident power affect the radiated power has been done, concluding
that an increased in the incident power do not mean necessarily an increased in the radiated power.
From the conclusions arisen, it can be said that the best option for the moment in order to improve the THz radiated power is through etching dielectric horns in the corresponding antennas. However, deeply study of the manufacturing process should be done in order to achieve better results. A good alternative not studied in this work is the use of arrays of the antenna emitters studied in Chapter 3, which is let for future work.
5.2 Future work
In order to achieve higher enhancement and confirm the obtained result future studies should address the
following tasks:
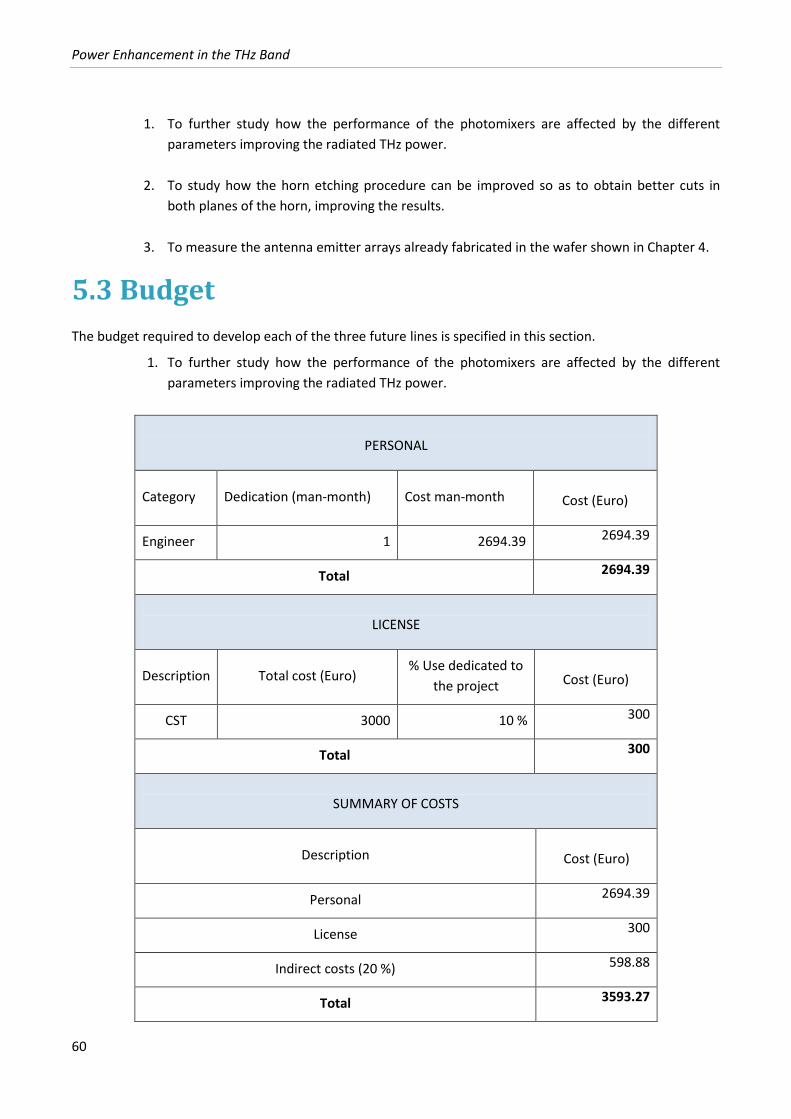
Power Enhancement in the THz Band
60
1. To further study how the performance of the photomixers are affected by the different
parameters improving the radiated THz power.
2. To study how the horn etching procedure can be improved so as to obtain better cuts in
both planes of the horn, improving the results.
3. To measure the antenna emitter arrays already fabricated in the wafer shown in Chapter 4.
5.3 Budget
The budget required to develop each of the three future lines is specified in this section.
1. To further study how the performance of the photomixers are affected by the different
parameters improving the radiated THz power.
PERSONAL
Category Dedication (man-month) Cost man-month
Cost (Euro)
Engineer 1 2694.39 2694.39
Total 2694.39
LICENSE
Description Total cost (Euro) % Use dedicated to
the project
Cost (Euro)
CST 3000 10 % 300
Total 300
SUMMARY OF COSTS
Description
Cost (Euro)
Personal 2694.39
License 300
Indirect costs (20 %) 598.88
Total 3593.27
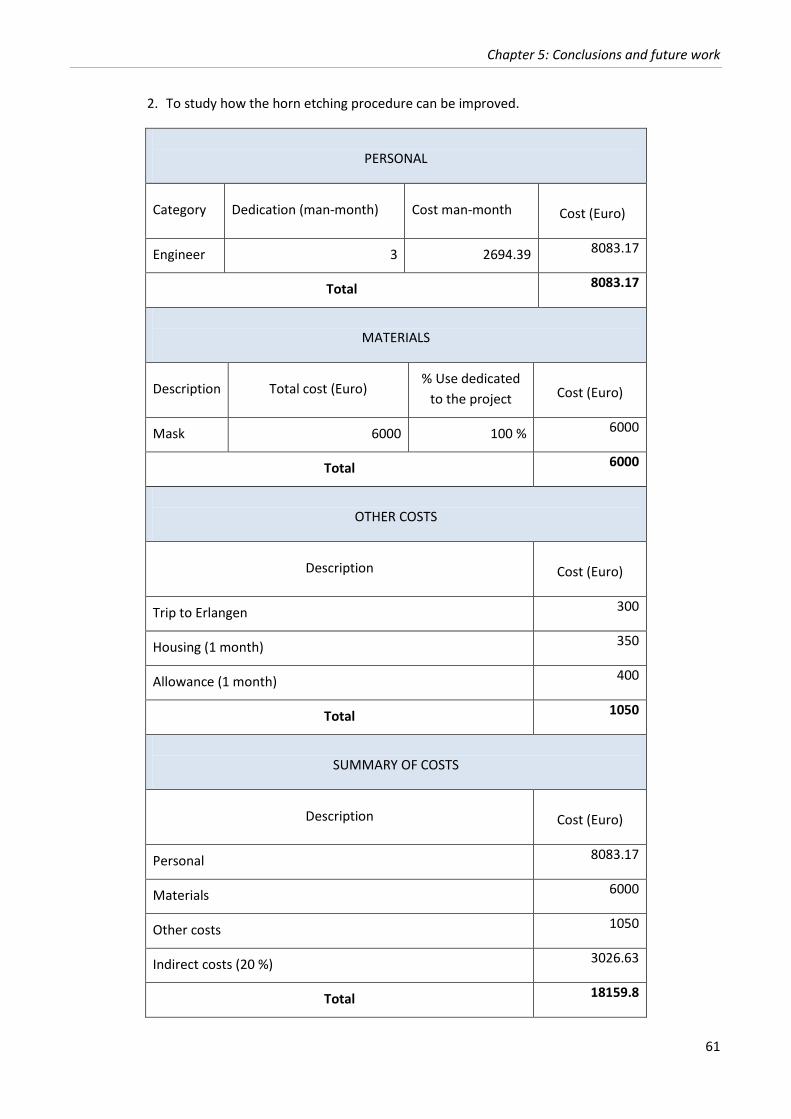
Chapter 5: Conclusions and future work
61
2. To study how the horn etching procedure can be improved.
PERSONAL
Category Dedication (man-month) Cost man-month
Cost (Euro)
Engineer 3 2694.39 8083.17
Total 8083.17
MATERIALS
Description Total cost (Euro) % Use dedicated
to the project
Cost (Euro)
Mask 6000 100 % 6000
Total 6000
OTHER COSTS
Description
Cost (Euro)
Trip to Erlangen 300
Housing (1 month) 350
Allowance (1 month) 400
Total 1050
SUMMARY OF COSTS
Description
Cost (Euro)
Personal 8083.17
Materials 6000
Other costs 1050
Indirect costs (20 %) 3026.63
Total 18159.8
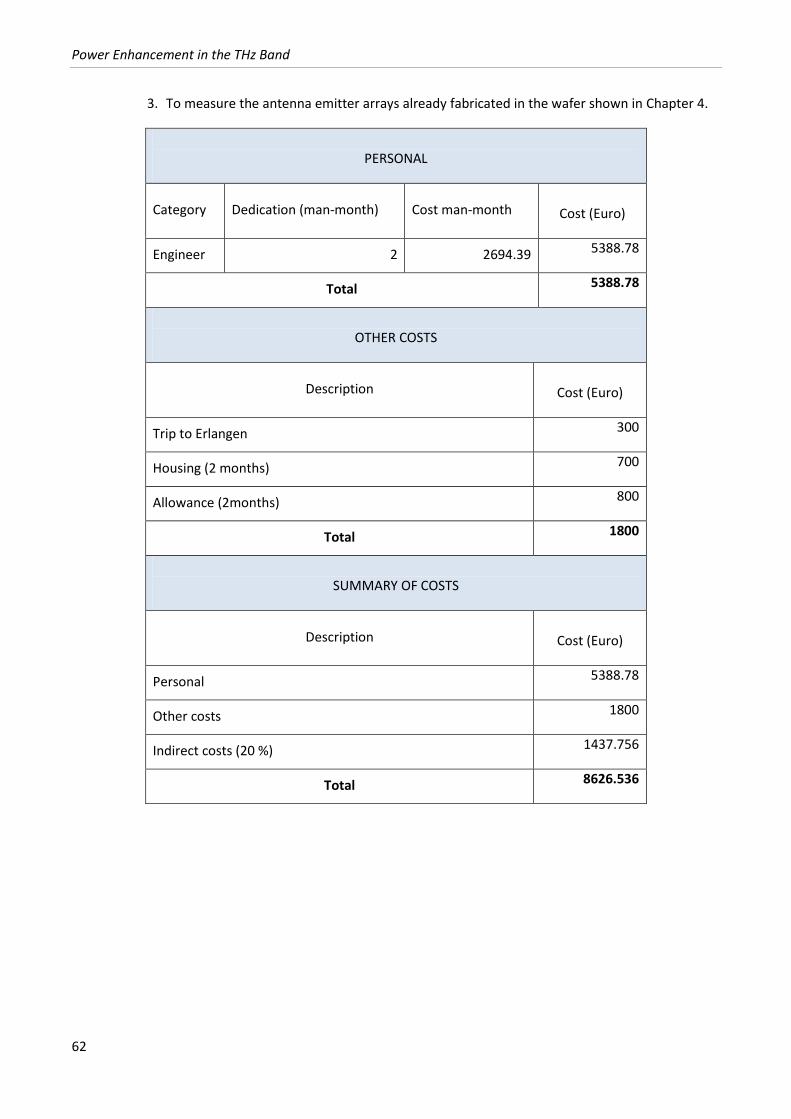
Power Enhancement in the THz Band
62
3. To measure the antenna emitter arrays already fabricated in the wafer shown in Chapter 4.
PERSONAL
Category Dedication (man-month) Cost man-month
Cost (Euro)
Engineer 2 2694.39 5388.78
Total 5388.78
OTHER COSTS
Description
Cost (Euro)
Trip to Erlangen 300
Housing (2 months) 700
Allowance (2months) 800
Total 1800
SUMMARY OF COSTS
Description
Cost (Euro)
Personal 5388.78
Other costs 1800
Indirect costs (20 %) 1437.756
Total 8626.536

63
Power Enhancement in the THz Band
64
References [1] S. Preu, G. Göhler, S. Malzer, L. Wang and A. Gossard, "Tunable, continuous-wave Terahertz
photomixer sources and applications," Journal of Applied Physics, vol. 109, no. 061301, 2011.
[2] B. Andres García, L. E. García Muñoz, S. Bauerschmidt, S. Preu, S. Malzer, G. H. Döhler, L. Wang and
D. Segovia Vargas, "Gain Enhancement by Dielectric Horns in the Terahertz Band," IEEE Transactions
on Antennas and Propagation, vol. 59, no. 9, pp. 3164-3170, 2011.
[3] N. Kukutsu and Y. Kado, "Overview of Millimeter and Terahertz Wave Application Research,"
Technology for Millimeter and Terahertz Electromagnetic Waves.
[4] "Teraphysics," [Online]. Available: http://www.teraphysics.com/understanding-thz. [Accessed 20 06
2012]
[5] K. Ajito, Y. Ueno, T. Haga and N. Kukutsu, "Terahertz Spectroscopy Technology for Molecular,"
Applied Technology for Millimeter and Terahertz Electromagnetic Waves.
[6] C. M. Ciesla, D. Arnone, A. Corchia, D. Crawley, C. Longbottom and E. H. Linfield, "Biomedical
Applications of Teraherzt Pulse Imaging," Proc. SPIE, vol. 3934, pp. 73-81, 2000.
[7] P. H. siegel, "Terahertz Technology," IEEE Transactions on microwave theory and techniques, vol. 50,
no. 3, pp. 910-928, 2002.
[8] B. Thomas, A. Maestrini, J. Gill, C. Lee, R. Lin, I. Mehdi and P. de Maagt, "A broadband 835-900 GHz
fundamental balanced mixer based on monolithic GaAs membrane Schottky diodes” IEEE
Transaction on Microwave Theory Technology, vol. 58, no. 7, pp. 1917-1924, 2010.
[9] I. C. Mayorga, P. Muñoz Pradas, E. Michael, M. Mikulics, A. Schmitz, P. van der Wal, C. Kaseman, R.
Güsten, K. Jacobs, M. Marso, H. Luth and P. Kordos, "Terahertz photonic mixers as local oscillators
for hot electron bolometer and superconductor-insulator-superconductor astronomical receivers,"
Journal of Applied Physics, vol. 100, no. 4, pp. 043116-043116-4, 2006.
References
65
[10] A. Stohr, A. Malcoci, A. Sauerwald, I. Mayorga, R. Güsten and D. S. Jäger, "Ultra-wide-band travellig
wave photodetectors for photonic local oscillators," J. Lightw. Technol., vol. 21, no. 12, pp. 3062-
3070, 2003.
[11] K. S. Yngvesson, D. H. Schaubert, T. L. Korzeniowski, E. L. Kollberg, T. Thungren and J. F. Johansson,
"Endfire Tapered Slot Antennas on Dielectric Substrates," IEEE Transactions on Antennas and
Propagation, vol. 33, no. 12, pp. 1392-1400, December 1985.
[12] T. Zhao, D. R. Jackson, J. . T. Williams and A. A. Oliner, "Simple CAD Model for a
Dielectric," Antennas and Wireless Propagation Letters, vol. 3, pp. 243-245, 2004.
[13] D. R. Jackson, A. A. Oliner and A. Ip, "Leaky-Wave Propagation and Radiation for a Narrow-Beam
Multiple-Layer Dielectric Structure," IEEE Transactions on Antennas and Propagation, vol. 41, no. 3,
pp. 344-348, 1993.
[14] B. Andres Muñoz, E. García Muñoz, A. Murphy, J. Montero de Paz, M. Midrio, V. Gonzalez Posadas
and D. Segovia Vargas, "New Approach to the Radiation Mechanism of Tapered Slot Antennas".