Property – the holy grail of investments?€¦ · Property – the holy grail of investments? 3...
12
Property – the holy grail of investments? June 2018
Transcript of Property – the holy grail of investments?€¦ · Property – the holy grail of investments? 3...

StockholmJakobsgatan 6SE-111 52 StockholmSweden+46 8 535 245 00
HelsinkiPohjoisesplanadi 33FI-00100 Helsinki, Finland(temporary address)+358 10 505 7000
Copenhagen Frederiksborggade 15DK-1360 CopenhagenDenmark+45 30 10 24 08
Malmö Glasvasen, Carlsgatan 3SE-211 20 MalmöSweden+46 76 871 00 06
www.nordanopartners.com
Property – the holy grail of investments?June 2018

2 Property – the holy grail of investments?
Appetite for property investments, and commercial property in particular, is at an all-time high. A majority of institutional investors want to increase their exposure to property as it offers attractive risk-adjusted returns and contributes to an efficient portfolio allocation (i.e. moves the efficient frontier outwards). Institutional investors are increasing their exposure to property both by direct investments, and indirectly, via property funds and other vehicles, for instance separate accounts and JVs.
In this article we will focus on the commercial property market in order to analyse if the returns on property investments compensate for the associated risks, in comparison with other asset classes. We will also compare prime properties and secondary properties from a risk-return perspective. The examples in this article are based on the Swedish market, but the trends and conclusions are applicable across western and northern Europe, although an international comparison is beyond the scope of this article.
First of all, there are three types of risk associated with an investment in property:
• Market risk: this refers to the non-diversifiable market risk, i.e. the risk that is not isolated to a single property. This is measured by the beta of property investments.
• Liquidity risk: property is a less liquid asset class than equities or bonds. Buying and selling properties takes time and is associated with transaction costs.
• Specific risk: the risk related to a particular asset, for instance vacancy in a single-tenant building. This risk is diversifiable, and investors should not require an additional risk premium to hold a particular asset(1).
Property – the holy grail of investments?
1. This assumes investors make unbiased expectations, i.e. that cash
flows represent the statistically expected value of the income.
Does property offer an unbeatable combination of risk and return? Or are record low yields an indicator of a bubble? Furthermore, do secondary, high-yielding, properties have a more attractive risk-return profile than prime properties?
3Property – the holy grail of investments?
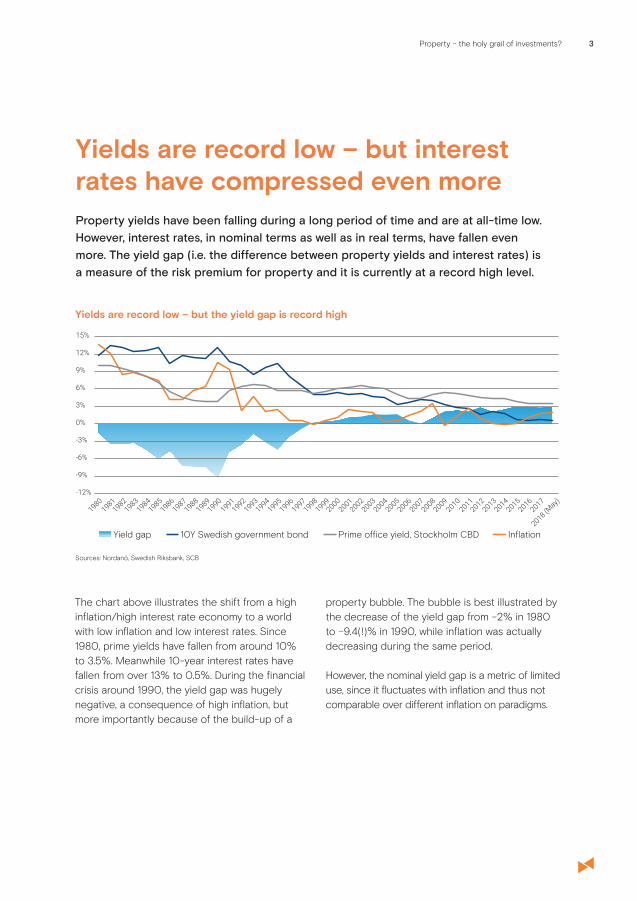
Property yields have been falling during a long period of time and are at all-time low. However, interest rates, in nominal terms as well as in real terms, have fallen even more. The yield gap (i.e. the difference between property yields and interest rates) is a measure of the risk premium for property and it is currently at a record high level.
Yields are record low – but interest rates have compressed even more
The chart above illustrates the shift from a high inflation/high interest rate economy to a world with low inflation and low interest rates. Since 1980, prime yields have fallen from around 10% to 3.5%. Meanwhile 10-year interest rates have fallen from over 13% to 0.5%. During the financial crisis around 1990, the yield gap was hugely negative, a consequence of high inflation, but more importantly because of the build-up of a
property bubble. The bubble is best illustrated by the decrease of the yield gap from –2% in 1980 to –9.4(!)% in 1990, while inflation was actually decreasing during the same period.
However, the nominal yield gap is a metric of limited use, since it fluctuates with inflation and thus not comparable over different inflation on paradigms.
Yields are record low – but the yield gap is record high
Sources: Nordanö, Swedish Riksbank, SCB
-12%
Yield gap 10Y Swedish government bond Prime office yield, Stockholm CBD Inflation
19801981
19821983
19841985
19861987
19881989
19901991
19921993
19941995
19961997
19981999
20002001
20022003
20042005
20062007
20082009
20102011
20122013
20142015
20162017
2018 (May)
-9%
-6%
-3%
0%
3%
6%
9%
12%
15%

4 Property – the holy grail of investments?
If we look at real interest rates we get a better picture of the risk premium on property. Inflation-linked bonds offer a measure of the real interest rate and can be used to calculate the real yield gap. Looking at the chart below you can see that real interest rates have fallen much more than property yields and thus, the real yield gap has gradually widened.
From the chart below, even at the current record low yield levels, returns for property look attractive compared to fixed income. In other words, in spite of record low yields, property is a high yielding asset in relative terms. Investors are paid a handsome risk premium for holding property rather than risk-free government bonds.
The property yield gap is record high, not only in nominal terms but in real terms as well
-2%
-1%
0%
1%
2%
3%
4%
5%
6%
7%
19992000
20012002
20042005
20062007
20082009
20102011
20122013
20142015
20162017
2018 (May)
2003
Real yield gap Inflation-linked bonds Prime office yield, Stockholm CBD
Sources: Nordanö, Riksgälden
5Property – the holy grail of investments?
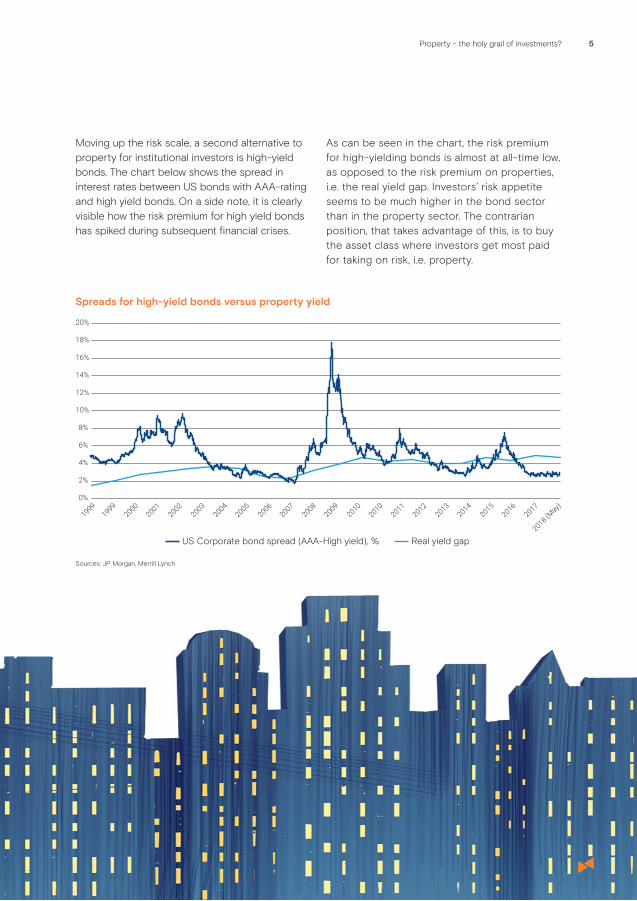
Spreads for high-yield bonds versus property yield
Sources: JP Morgan, Merrill Lynch
Moving up the risk scale, a second alternative to property for institutional investors is high-yield bonds. The chart below shows the spread in interest rates between US bonds with AAA-rating and high yield bonds. On a side note, it is clearly visible how the risk premium for high yield bonds has spiked during subsequent financial crises.
As can be seen in the chart, the risk premium for high-yielding bonds is almost at all-time low, as opposed to the risk premium on properties, i.e. the real yield gap. Investors’ risk appetite seems to be much higher in the bond sector than in the property sector. The contrarian position, that takes advantage of this, is to buy the asset class where investors get most paid for taking on risk, i.e. property.
0%
2%
4%
6%
8%
10%
12%
14%
16%
18%
20%
19991999
20002001
20022004
20052006
20072008
20092010
20102011
20122013
20142015
20162017
2018 (May)
2003
Real yield gapUS Corporate bond spread (AAA-High yield), %
6 Property – the holy grail of investments?
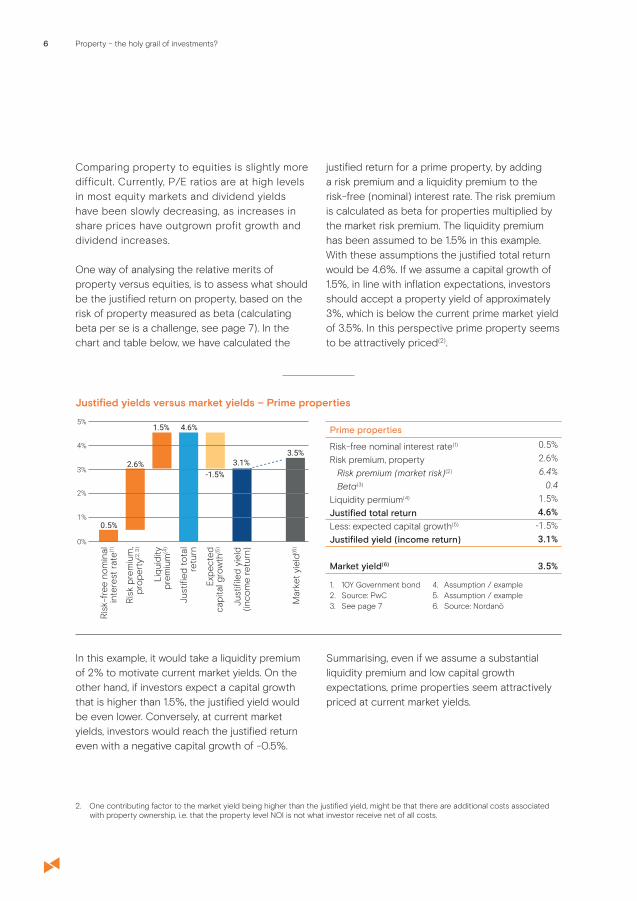
Justified yields versus market yields – Prime properties
10Y Government bondSource: PwCSee page 7
1.2.3.
Assumption / exampleAssumption / exampleSource: Nordanö
4.5.6.
0%
1%
2%
3%
4%
5%
0.5%
2.6%
1.5% 4.6%
-1.5%3.1%
3.5%
Ris
k pr
emiu
m,
prop
erty
(2, 3
)
Liqu
idity
prem
ium
(4)
Just
ified
tot
alre
turn
Expe
cted
capi
tal g
row
th(5
)
Just
ifile
d yi
eld
(inco
me
retu
rn)
Mar
ket
yiel
d(6)
Ris
k-fr
ee n
omin
alin
tere
st r
ate(1
)
Prime properties
Risk-free nominal interest rate(1)
Risk premium, propertyRisk premium (market risk)(2)
Beta(3)
Liquidity permium(4)
Justified total returnLess: expected capital growth(5)
Justifiled yield (income return)
Market yield(6)
0.5%2.6%6.4%
0.41.5%4.6%-1.5%3.1%
3.5%
Comparing property to equities is slightly more difficult. Currently, P/E ratios are at high levels in most equity markets and dividend yields have been slowly decreasing, as increases in share prices have outgrown profit growth and dividend increases.
One way of analysing the relative merits of property versus equities, is to assess what should be the justified return on property, based on the risk of property measured as beta (calculating beta per se is a challenge, see page 7). In the chart and table below, we have calculated the
justified return for a prime property, by adding a risk premium and a liquidity premium to the risk-free (nominal) interest rate. The risk premium is calculated as beta for properties multiplied by the market risk premium. The liquidity premium has been assumed to be 1.5% in this example. With these assumptions the justified total return would be 4.6%. If we assume a capital growth of 1.5%, in line with inflation expectations, investors should accept a property yield of approximately 3%, which is below the current prime market yield of 3.5%. In this perspective prime property seems to be attractively priced(2).
In this example, it would take a liquidity premium of 2% to motivate current market yields. On the other hand, if investors expect a capital growth that is higher than 1.5%, the justified yield would be even lower. Conversely, at current market yields, investors would reach the justified return even with a negative capital growth of -0.5%.
Summarising, even if we assume a substantial liquidity premium and low capital growth expectations, prime properties seem attractively priced at current market yields.
2. One contributing factor to the market yield being higher than the justified yield, might be that there are additional costs associated with property ownership, i.e. that the property level NOI is not what investor receive net of all costs.

7Property – the holy grail of investments?
Calculating beta for property investments – not as “smooth” as it seems
Assessing beta for directly owned property is tricky. Returns for direct property, based on property appraisals suffer from a phenomenon known as “smoothing”, i.e. that appraisers tend to not fully reflect the fluctuations of the market. “Smoothing” is due to many factors, for instance the lack of comparable transactions and the fact that every asset is unique, as opposed to a share or a bond, thus making the appraisal using comparables difficult. “Smoothing” is also a consequence of the hands-on nature of appraisals; behavioural economics factors, such as
anchoring, are probably at play. “Smoothing” has been studied extensively and is well-documented, although beyond the scope of this article.
One way to calculate beta for direct property is to use REITs or listed property companies as a proxy and adjust for leverage. Using this method, the property beta in general is assessed to be around 0.3 - 0.4. Another way is to use de-smoothing techniques on appraised property returns(3). Using either method, we find that a reasonable estimation for the purpose of this article is 0.4.
3. For instance, a factor of 3.5x, according to Risk estimation and appraisal- smoothing in UK property returns, Graeme Newell MacFarlane & John MacFarlane.
8 Property – the holy grail of investments?
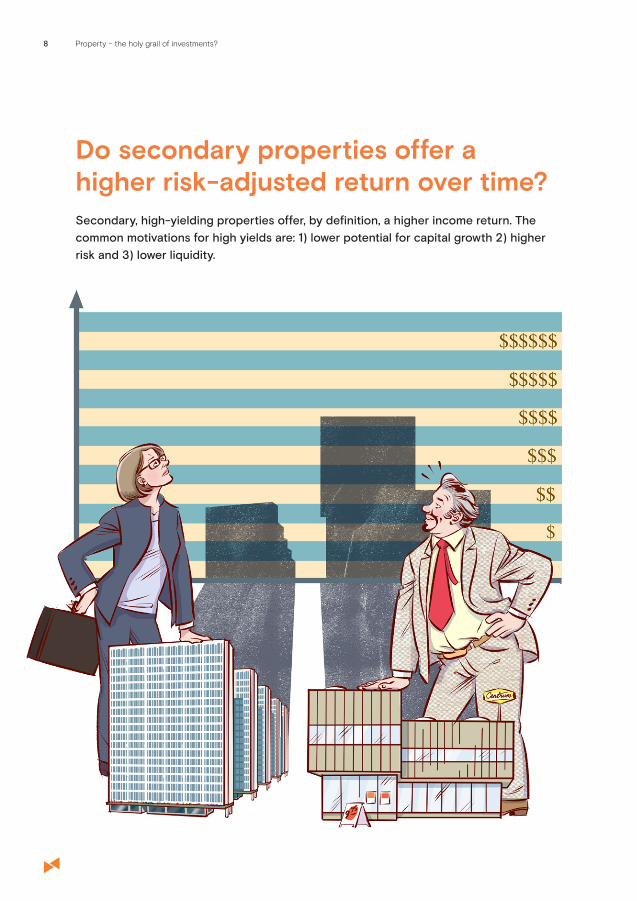
Secondary, high-yielding properties offer, by definition, a higher income return. The common motivations for high yields are: 1) lower potential for capital growth 2) higher risk and 3) lower liquidity.
Do secondary properties offer a higher risk-adjusted return over time?
9Property – the holy grail of investments?
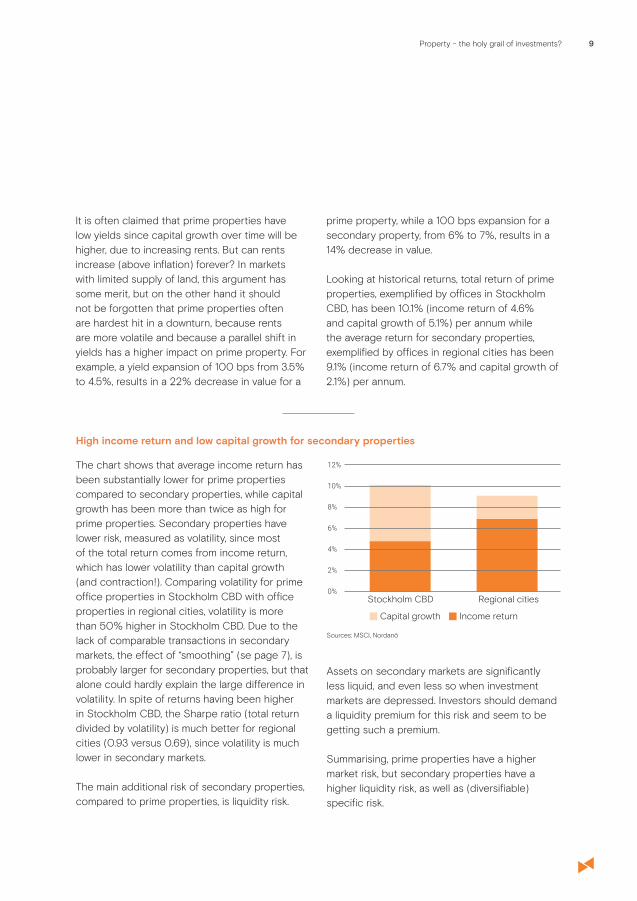
The chart shows that average income return has been substantially lower for prime properties compared to secondary properties, while capital growth has been more than twice as high for prime properties. Secondary properties have lower risk, measured as volatility, since most of the total return comes from income return, which has lower volatility than capital growth (and contraction!). Comparing volatility for prime office properties in Stockholm CBD with office properties in regional cities, volatility is more than 50% higher in Stockholm CBD. Due to the lack of comparable transactions in secondary markets, the effect of “smoothing” (se page 7), is probably larger for secondary properties, but that alone could hardly explain the large difference in volatility. In spite of returns having been higher in Stockholm CBD, the Sharpe ratio (total return divided by volatility) is much better for regional cities (0.93 versus 0.69), since volatility is much lower in secondary markets.
The main additional risk of secondary properties, compared to prime properties, is liquidity risk.
Assets on secondary markets are significantly less liquid, and even less so when investment markets are depressed. Investors should demand a liquidity premium for this risk and seem to be getting such a premium.
Summarising, prime properties have a higher market risk, but secondary properties have a higher liquidity risk, as well as (diversifiable) specific risk.
High income return and low capital growth for secondary properties
Sources: MSCI, Nordanö
0%
2%
4%
6%
8%
10%
12%
Stockholm CBD Regional cities
Capital growth Income return
It is often claimed that prime properties have low yields since capital growth over time will be higher, due to increasing rents. But can rents increase (above inflation) forever? In markets with limited supply of land, this argument has some merit, but on the other hand it should not be forgotten that prime properties often are hardest hit in a downturn, because rents are more volatile and because a parallel shift in yields has a higher impact on prime property. For example, a yield expansion of 100 bps from 3.5% to 4.5%, results in a 22% decrease in value for a
prime property, while a 100 bps expansion for a secondary property, from 6% to 7%, results in a 14% decrease in value.
Looking at historical returns, total return of prime properties, exemplified by offices in Stockholm CBD, has been 10.1% (income return of 4.6% and capital growth of 5.1%) per annum while the average return for secondary properties, exemplified by offices in regional cities has been 9.1% (income return of 6.7% and capital growth of 2.1%) per annum.
10 Property – the holy grail of investments?
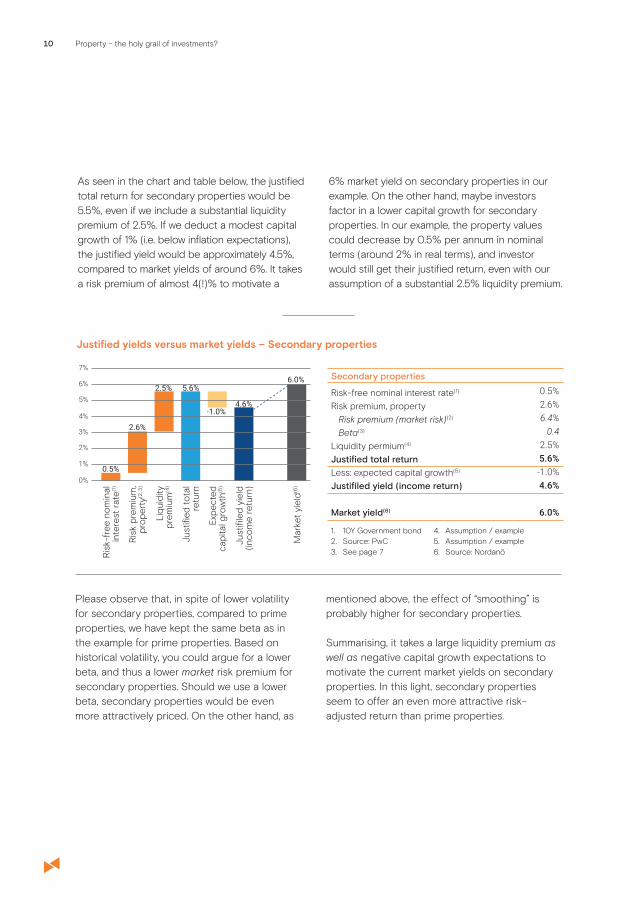
Justified yields versus market yields – Secondary properties
Please observe that, in spite of lower volatility for secondary properties, compared to prime properties, we have kept the same beta as in the example for prime properties. Based on historical volatility, you could argue for a lower beta, and thus a lower market risk premium for secondary properties. Should we use a lower beta, secondary properties would be even more attractively priced. On the other hand, as
mentioned above, the effect of “smoothing” is probably higher for secondary properties.
Summarising, it takes a large liquidity premium as well as negative capital growth expectations to motivate the current market yields on secondary properties. In this light, secondary properties seem to offer an even more attractive risk-adjusted return than prime properties.
0%
1%
2%
3%
4%
5%
6%
7%
Ris
k pr
emiu
m,
prop
erty
(2, 3
)
Liqu
idity
prem
ium
(4)
Just
ified
tot
alre
turn
Expe
cted
capi
tal g
row
th(5
)
Just
ifile
d yi
eld
(inco
me
retu
rn)
Mar
ket
yiel
d(6)
Ris
k-fr
ee n
omin
alin
tere
st r
ate(1
)
0.5%
2.6%
2.5% 5.6%
-1.0%4.6%
6.0% Secondary properties
Risk-free nominal interest rate(1)
Risk premium, propertyRisk premium (market risk)(2)
Beta(3)
Liquidity permium(4)
Justified total returnLess: expected capital growth(5)
Justifiled yield (income return)
Market yield(6)
0.5%2.6%6.4%
0.42.5%5.6%-1.0%4.6%
6.0%
As seen in the chart and table below, the justified total return for secondary properties would be 5.5%, even if we include a substantial liquidity premium of 2.5%. If we deduct a modest capital growth of 1% (i.e. below inflation expectations), the justified yield would be approximately 4.5%, compared to market yields of around 6%. It takes a risk premium of almost 4(!)% to motivate a
6% market yield on secondary properties in our example. On the other hand, maybe investors factor in a lower capital growth for secondary properties. In our example, the property values could decrease by 0.5% per annum in nominal terms (around 2% in real terms), and investor would still get their justified return, even with our assumption of a substantial 2.5% liquidity premium.
10Y Government bondSource: PwCSee page 7
1.2.3.
Assumption / exampleAssumption / exampleSource: Nordanö
4.5.6.

11Property – the holy grail of investments?
Historical returns on prime properties have been high, driven by capital growth. Given the limited supply of prime properties this trend might continue. But even if capital growth is lower going forward, prime properties offer good relative returns compare to bonds due to the fact that the yield gap is substantial in absolute terms and at a historically high level.
A cautionary note though, even if property yields seem justified or even high in the current market, there is always a risk that yields expand if investor sentiment deteriorates and/or the underlying rental market weakens.
Regarding secondary properties it can be argued that for a conservative investor, holding secondary high-yielding properties is, in some ways, a safer strategy since more of the total return comes from less volatile income return, rather than volatile capital growth. The flip side of this is that high-yielding properties have lower liquidity, but for an institutional investor, with a long investment horizon, the additional return generated by the liquidity premium may well be worth it. Although both prime and secondary properties provide good risk-adjusted returns compared to other asset classes, it seems that secondary properties have the edge.
ConclusionsProperty seems to be attractively priced compared to fixed income and other asset classes. Given the relative pricing of property and bonds, it seems reasonable for an institutional investor to sell bonds and buy property, which is exactly what many institutional investors are doing and/or planning to do (see our Leimdörfer research report from 2014: The proper(ty) allocation – The role of property in portfolio management).

StockholmJakobsgatan 6SE-111 52 StockholmSweden+46 8 535 245 00
HelsinkiPohjoisesplanadi 33FI-00100 Helsinki, Finland(temporary address)+358 10 505 7000
Copenhagen Frederiksborggade 15DK-1360 CopenhagenDenmark+45 30 10 24 08
Malmö Glasvasen, Carlsgatan 3SE-211 20 MalmöSweden+46 76 871 00 06
www.nordanopartners.com
Property – the holy grail of investments?June 2018