Pyhsics
3
Quantum Dot Fluorescence Characterizes the Nanoscale Organization of T Cell Receptors for Antigen Sara h Boyle , † Davi d L. Kolin , ‡ Joan Glick Biel er, § Jon atha n P. Schn eck, § Paul W. Wiseman, ‡ and Mich ael Edidi n † * † Biology Department, The Johns Hopkins University, Baltimore, Maryland; ‡ Department of Physics, McGill University, Montreal, Canada; and § Pathology Department, Johns Hopkins Medical Institutions, Baltimore, Maryland ABSTRACT Change s in the clustering of surfac e receptors mod ulate cell respo nses to ligands. Hence, global mea sures of receptor clustering can be useful for characterizing cell states. Using T cell receptor for antigen as an example, we show that k-space image correlation spectroscopy of quantum dots blinking detects T cell receptor clusters on a scale of tens of nano- meters and reports changes in clustering after T cell activation. Our results offer a general approach to the global analysis of lateral organization and receptor clustering in single cells, and can thus be applied when the cell type of interest is rare. Received for publication 2 August 2011 and in final form 13 October 2011. *Correspondence: [email protected] Quan tum dots (QDs) are stab le, brig ht fluor escen t label s and, despite the fact that they exhibit intermittent fluores- cenc e, i.e. , blin king , they have been used in micr osco py for imaging of surface receptors and for tracking their diffu- sion over the surface ( 1,2). We have found that QD blinking itself is a useful parameter for characterizing the nanometer- scale organization of the T-cell receptor (TCR) for antigen. The blinking statistics differentiate small clusters of QDs from a single QD or large clusters, and thus function as reporters of nanometer-scale changes in QD-labeled TCR organization after T cell activation by antigen. Studies of QDs, on a surface using AFM to resolve QD and fluo res cence to ima ge the ir bli nki ng, sho w tha t the blink ing of a sing le QD sho ws pers isten t auto corr elatio n over time due to power law emission statistics; there are variable on- and off-periods of fluorescence emission that spa n ma ny ord ers of time. The blink ing of clu sters of many QDs also exhibits persistent autocorrelation in time. On the other hand, blinking of small groups of QDs sepa- rated by a few tens of nanometers is poorly correlated. There are frequent transitions between fluorescent and nonfluores- cen t states, apparently due to Fo ¨ rste r reso nanc e ener gy transfer interactions between individual dots ( 3–5). It has been reported that TCRs of naı ¨ ve, unstimulated T cells are present as a mixture of monomers and small oligomers (6,7), which form larger clusters when cells are activated by a specific antigen ( 8,9). If this is correct, then we expec t tha t bli nki ng of QD lab eli ng TCRs wil l shift from relatively uncorrelated (the signature of small numbers of QD in nanometer proximity on labeled TCR oligomers) to highly time-correlated (the signature of larger QD clus- ters labeling clustered TCR). QD bli nking wa s characte riz ed usi ng k-s pac e ima ge corre latio n spec trosc opy (kICS ) ( 10) (developed by D.K. and P .W.W.). kICS char acte rizes the phot ophy sics and distribution of fluorescence for large regions or entire cells, by calculating changes in k-space time correlation functions calcu lat ed fro m ima ge ser ies . The kICS ana lys is yie lds a temp oral autocorr elatio n func tion for prob e blin king , hQ(t ) Q(t þt )i, where Q ¼ 1 if a QD is fluorescent and Q ¼ 0 if it is not ( Fig. 1 A), averaged over the image series in both spa ce and time. The kICS cor rel ati on functi on amplitude is directly proportional to the mean number of fluorescent entities per image area as well as the amplitude of correlated photophysical fluctuations ( 10). The decay of the blinking autocorrelation is characterized in terms of a Q-ratio, the ratio of the correlation amplitude for the longest and shortest lag times ( t ) observed. We first used kICS to see if clustering QDs in buffer alters thei r bl inki ng in the sa meway as de sc ri be d for QDs in pl as ti c (3). QDs in buffer, immobile and adhered on glass, were imag ed ove r a rang e of conc entra tion s. Blink ing of indi vidu al fluorescent spots was easily seen, especially at the lowest concentration of QDs. Quantifying this blinking by kICS, we expected to see high Q-ratios for high concentrations of QDs, because at high concentrations, each fluorescent spot con tain s man y QDs, whereas at the lowest concentration use d, sin glespot s arelike ly to rep res ent a sin gleQD andagai n will yield high Q-ratios. Intermediate concentratio ns of QDs will yield some spots that contain two or three QDs within Fo ¨ rste r reso nance ener gy trans fer prox imit y and so yiel d low Q-ratios. This proved to be the case ( Fig. 1 B). About 5 percent of the spots gave Q-ratios <0.5. We also found the same ef fec t whe n T cells we re lab ele d wit h sat ura tin g amounts of biotin MHC/peptide and then with dilutions of QDs (Fig. 1, C and D). Whatever the distribution of TCR, we expect that as QDs are diluted, fewer and fewer clusters of TCR will be labeled with multiple QDs until at a limiting dilution there is only one (or no) QD per TCR cluster. Editor: Susan Pierce. 2011 by the Biophysical Society doi: 10.1016/j.bpj.2011.10.0 28 Biophysical Jour nal Volume 101 December 2011 L57– L59 L57
-
Upload
aditya-budi-fauzi -
Category
Documents
-
view
216 -
download
0
Transcript of Pyhsics
8/10/2019 Pyhsics
http://slidepdf.com/reader/full/pyhsics 1/3
Quantum Dot Fluorescence Characterizes the Nanoscale Organizationof T Cell Receptors for Antigen
Sarah Boyle,† David L. Kolin,‡ Joan Glick Bieler,§ Jonathan P. Schneck,§ Paul W. Wiseman,‡ and Michael Edidin†*†Biology Department, The Johns Hopkins University, Baltimore, Maryland; ‡Department of Physics, McGill University, Montreal, Canada;and §Pathology Department, Johns Hopkins Medical Institutions, Baltimore, Maryland
ABSTRACT Changes in the clustering of surface receptors modulate cell responses to ligands. Hence, global measures of
receptor clustering can be useful for characterizing cell states. Using T cell receptor for antigen as an example, we show that
k-space image correlation spectroscopy of quantum dots blinking detects T cell receptor clusters on a scale of tens of nano-
meters and reports changes in clustering after T cell activation. Our results offer a general approach to the global analysis of
lateral organization and receptor clustering in single cells, and can thus be applied when the cell type of interest is rare.
Received for publication 2 August 2011 and in final form 13 October 2011.
*Correspondence: [email protected]
Quantum dots (QDs) are stable, bright fluorescent labels
and, despite the fact that they exhibit intermittent fluores-
cence, i.e., blinking, they have been used in microscopyfor imaging of surface receptors and for tracking their diffu-
sion over the surface (1,2). We have found that QD blinking
itself is a useful parameter for characterizing the nanometer-
scale organization of the T-cell receptor (TCR) for antigen.
The blinking statistics differentiate small clusters of QDs
from a single QD or large clusters, and thus function as
reporters of nanometer-scale changes in QD-labeled TCR
organization after T cell activation by antigen.
Studies of QDs, on a surface using AFM to resolve QD
and fluorescence to image their blinking, show that the
blinking of a single QD shows persistent autocorrelation
over time due to power law emission statistics; there are
variable on- and off-periods of fluorescence emission that
span many orders of time. The blinking of clusters of
many QDs also exhibits persistent autocorrelation in time.
On the other hand, blinking of small groups of QDs sepa-
rated by a few tens of nanometers is poorly correlated. There
are frequent transitions between fluorescent and nonfluores-
cent states, apparently due to Forster resonance energy
transfer interactions between individual dots (3–5).
It has been reported that TCRs of naıve, unstimulated
T cells are present as a mixture of monomers and small
oligomers (6,7), which form larger clusters when cells are
activated by a specific antigen (8,9). If this is correct, then
we expect that blinking of QD labeling TCRs will shiftfrom relatively uncorrelated (the signature of small numbers
of QD in nanometer proximity on labeled TCR oligomers)
to highly time-correlated (the signature of larger QD clus-
ters labeling clustered TCR).
QD blinking was characterized using k-space image
correlation spectroscopy (kICS) (10) (developed by D.K.
and P.W.W.). kICS characterizes the photophysics and
distribution of fluorescence for large regions or entire cells,
by calculating changes in k-space time correlation functions
calculated from image series. The kICS analysis yields
a temporal autocorrelation function for probe blinking,
hQ(t ) Q(t þt )i, where Q ¼ 1 if a QD is fluorescent andQ ¼ 0 if it is not (Fig. 1 A), averaged over the image series
in both space and time. The kICS correlation function
amplitude is directly proportional to the mean number of
fluorescent entities per image area as well as the amplitude
of correlated photophysical fluctuations (10). The decay of
the blinking autocorrelation is characterized in terms of a
Q-ratio, the ratio of the correlation amplitude for the longest
and shortest lag times (t ) observed.
We first used kICS to see if clustering QDs in buffer alters
their blinking in the sameway as described for QDs in plastic
(3). QDs in buffer, immobile and adhered on glass, were
imaged over a range of concentrations. Blinking of individual
fluorescent spots was easily seen, especially at the lowest
concentration of QDs. Quantifying this blinking by kICS,
we expected to see high Q-ratios for high concentrations of
QDs, because at high concentrations, each fluorescent spot
contains many QDs, whereas at the lowest concentration
used, singlespots arelikely to represent a singleQD andagain
will yield high Q-ratios. Intermediate concentrations of QDs
will yield some spots that contain two or three QDs within
Forster resonance energy transfer proximity and so yield
low Q-ratios. This proved to be the case (Fig. 1 B). About 5
percent of the spots gave Q-ratios <0.5. We also found the
same effect when T cells were labeled with saturating
amounts of biotin MHC/peptide and then with dilutions of QDs (Fig. 1, C and D). Whatever the distribution of TCR,
we expect that as QDs are diluted, fewer and fewer clusters
of TCR will be labeled with multiple QDs until at a limiting
dilution there is only one (or no) QD per TCR cluster.
Editor: Susan Pierce.
2011 by the Biophysical Society
doi: 10.1016/j.bpj.2011.10.028
Biophysical Journal Volume 101 December 2011 L57–L59 L57
8/10/2019 Pyhsics
http://slidepdf.com/reader/full/pyhsics 2/3
We next used TCR transgenic T cells to test the model
prediction that a single QD will show highly correlated
blinking and high Q-ratios (3). The TCRs of CD8þ 2C
T cells were specifically labeled to saturation with mono-
meric biotin-MHC/peptide H2K b /SIY, followed by dilu-
tions of streptavidin-conjugated QD655 (see Methods,
below). Labeled cells were imaged at ~0.5 s intervals for~3 min. If the model holds for labeled T cells, then we
expect a progressive decrease in Q-ratio, followed by an
increase when we reach the limit of one QD per TCR
cluster. This proved to be the case both for 2C TCR
CD8þ T cells and for 5CC.7 CD4þ T cells (labeled with
anti-CD3-biotin þQD). This reinforces our interpretation
that the rapid decay of hQ(t ) Q(t þ t )i autocorrelation
reports small clusters of TCR on naıve T cells and the
slow decay of hQ(t ) Q(t þ t )i is consistent with aggrega-
tion of receptor microclusters, or with their dispersion to
single receptors.
Naıve CD8þ 2C T cells stimulated by antigen in vitro acti-
vate, proliferate, and acquire lytic effector function over a
4–6 day time-course. We followed the changes in Q-ratio
as a measure of TCR organization in a population of 2C
T cells after in vitro stimulation. The meanQ-ratio increased
significantly within a day of stimulation, remained high fordays 2–5, and dropped at day 6 (Fig. 2). The Q-ratio rose
again after the cultures were stimulated with T cell growth
factors on day 6 (data not shown). Thelower values of Q-ratio
for naıve cells as compared to activated cells are consistent
with antigen-independent clustering of small numbers of
TCR on a scale of tens of nanometers, an organization sug-
gested by electron microscopy (7), though not observable
using standard light microscopy techniques. kICS also
measures intensity and larger-scale clustering of label
(number of fluorescent spots per unitcell surfacearea), degree
of aggregation, and its diffusion. These changed as implied by
the higher Q-ratios. Degree of aggregation increased ~20
from day 0 to day 3, whereas diffusion decreased ~5-foldfrom 2.5 10
3mm
2s
1to 0.5 10
3mm
2s
1. All these
values are also consistent with published reports of increased
TCR microclustering associated with T cell activation (8,9).
kICS and specific QD labels allow characterization of
nanoscale TCR clustering and inferences about functional
activity by sampling thousands of spots of fluorescence on
as few as 20–50 cells. As noted above, the system also yields
data about larger-scale clustering. Although the range of
measured Q-ratios (0–1) is limited and a given Q-ratio
may reflect clustering or a monomeric state, if all parameters
are used, the technique can be as a tool for distinguishing
T cell subsets differing in receptor sensitivity, organization,
and response to ligand. More generally, our approach offers
the possibility of monitoring many types of receptors and
a wide range of cell biological responses to stimuli.
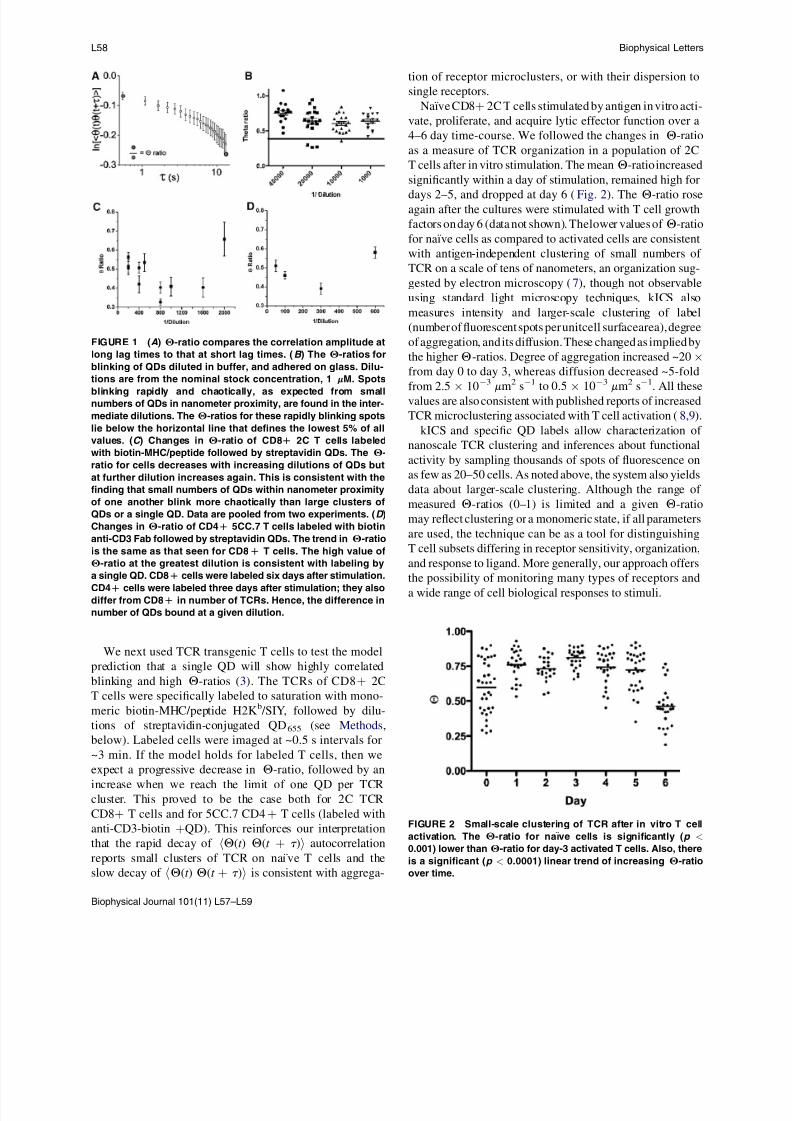
FIGURE 1 (A) Q-ratio compares the correlation amplitude at
long lag times to that at short lag times. (B ) The Q-ratios for
blinking of QDs diluted in buffer, and adhered on glass. Dilu-tions are from the nominal stock concentration, 1 mM. Spots
blinking rapidly and chaotically, as expected from small
numbers of QDs in nanometer proximity, are found in the inter-
mediate dilutions. The Q-ratios for these rapidly blinking spots
lie below the horizontal line that defines the lowest 5% of all
values. (C ) Changes in Q-ratio of CD8D 2C T cells labeled
with biotin-MHC/peptide followed by streptavidin QDs. The Q-
ratio for cells decreases with increasing dilutions of QDs but
at further dilution increases again. This is consistent with the
finding that small numbers of QDs within nanometer proximity
of one another blink more chaotically than large clusters of
QDs or a single QD. Data are pooled from two experiments. (D )
Changes in Q-ratio of CD4D 5CC.7 T cells labeled with biotin
anti-CD3 Fab followed by streptavidin QDs. The trend in Q-ratio
is the same as that seen for CD8D T cells. The high value of
Q-ratio at the greatest dilution is consistent with labeling by
a single QD. CD8D cells were labeled six days after stimulation.
CD4D cells were labeled three days after stimulation; they also
differ from CD8D in number of TCRs. Hence, the difference in
number of QDs bound at a given dilution.
FIGURE 2 Small-scale clustering of TCR after in vitro T cell
activation. The Q-ratio for naıve cells is significantly (p <
0.001) lower than Q-ratio for day-3 activated T cells. Also, there
is a significant (p < 0.0001) linear trend of increasing Q-ratio
over time.
Biophysical Journal 101(11) L57–L59
L58 Biophysical Letters
8/10/2019 Pyhsics
http://slidepdf.com/reader/full/pyhsics 3/3
METHODS
In vitro activation
Naıve 2C T cells were purified from spleens of 2C trans-
genic mice using a Murine T Cell CD8 Subset Column
Kit (R&D Systems, Minneapolis, MN). T cells were acti-
vated on irradiated alloreactive splenic stimulator cells
from BALB/c mice, then cultured in RPMI media (Sigma-Aldrich, St. Louis, MO), supplemented with 10% fetal
calf serum and conditioned medium containing IL-2 and
growth factors. Fresh medium was at days 0, 3, and 6.
CD4þ T cells were purified from spleens of 5C.C7 mice
(Taconic Farms, Germantown, NY) The studies have been
reviewed and approved by the Institutional Animal Care
and Use Committee at Johns Hopkins University.
Labeling CD8D
T cells were labeled using H2-SIY
K b
monomer (National
Institutes of Health Tetramer Facility, Atlanta, GA), which
has been shown to bind stably to 2C cells (11), at a concen-
tration of 2 mg/2–5 106
T cells in 100 ml phosphate-buff-
ered saline (PBS) for 30 min on ice and then washed once
with 2 ml PBS, followed by 10 nM streptavidin-coated
QD655
(Invitrogen, Carlsbad, CA) in 100 ml PBS incubated
for 30 min at 0C. Labeled cells were then washed 2 with
2 ml PBS before imaging. Labeling was specific; H2K b
monomer loaded with three different noncognate peptides
(TSINFVK, SSIEFARL, and SSYRRPVG) did not label
2C cells as detected by either microscopy or flow cytometry.
Although streptavidin QD655
is nominally polyvalent, a
comparison of QD bound to T cells with antibody labeling
of TCR (Stone and Stern (11) and our data, not shown) indi-
cated that most QD bound monovalently. CD4þ T cellswere labeled with biotin-anti-CD3 mAb and streptavidin
QD655
.
Imaging
Cells were imaged using a 3-I Marianas Live Cell Imaging
Workstation (Intelligent Imaging Innovations, Denver, CO)
equipped with dual Cascade II 512 electron-multiplying
charge-coupled device cameras (Photometrics, Tucson,
AZ). Each image in a series of 300–500, taken 550 ms apart,
is fast Fourier-transformed in two dimensions to convert to
k-space followed by temporal correlation of the series.
Image processing
Each image series was preprocessed before kICS analysis.
Initially, the image series was corrected for background
intensity values using a top-hat transformation (12). Cells
were then segmented using the watershed transform (12).
Mean-intensity padding outside the cells was used to
maximize the analysis area (13). For the photophysical
measurements, the image series was filtered for immobile
components (as described in Hebert et al. (14)). For all of
the image series, 25 time lags were calculated in the time
correlation function, which is <10% of the length of the
image series. Changes in the Q-ratio were insensitive to
the time point used for the calculation, as long as the corre-
lation functions had not decayed to zero. The k-space corre-
lation functions were fit up until jk j2 ¼ 20 mm2.
ACKNOWLEDGMENTS
We thank S. V. Desiderio, J. Hwang, J. Peters, J. Powell, R. Siliciano, and T.
Schroer for help, comments, and discussion.
This work was supported by National Institutes of Health grants AI14584
(to M.E.) and P01 AI072677, AI29575, AI44129, and CA108835 (to
J.P.S.); it was also supported by grants from the Natural Sciences and Engi-
neering Research Council (Canada), the Canadian Institutes of Health
Research (to P.W.W.), and a Natural Sciences and Engineering Research
Council (Canada) Postgraduate Scholarships fellowship (to D.K.).
REFERENCES and FOOTNOTES
1. Michalet, X., F. F. Pinaud,.
, S. Weiss. 2005. Quantum dots for livecells, in vivo imaging, and diagnostics. Science. 307:538–544.
2. Dahan, M., S. Levi, ., A. Triller. 2003. Diffusion dynamics of glycinereceptors revealed by single-quantum dot tracking. Science. 302:442–445.
3. Yu, M., and A. Van Orden. 2006. Enhanced fluorescence intermittencyof CdSe-ZnS quantum-dot clusters. Phys. Rev. Lett. 97:237402.
4. Lee, J. D., and S. Maenosomo. 2009. Intensified blinking, continuousmemory loss, and fluorescence enhancement of interacting light-emission quantum dots. Phys. Rev. B. 80. 205327–1–5.
5. Shepherd, D. P., K. J. Whitcomb,., A. Van Orden.2010. Fluorescenceintermittency and energy transfer in small clusters of semiconductorquantum dots. J. Phys. Chem. C. 114:14831–14837.
6. Schamel, W. W., I. Arechaga, ., B. Alarcon. 2005. Coexistence of multivalent and monovalent TCRs explains high sensitivity and wide
range of response. J. Exp. Med. 202:493–503.
7. Lillemeier, B. F., J. R. Pfeiffer, ., M. M. Davis. 2006. Plasmamembrane-associated proteins are clustered into islands attached tothe cytoskeleton. Proc. Natl. Acad. Sci. USA. 103:18992–18997.
8. Fahmy, T. M., J. G. Bieler, ., J. P. Schneck. 2001. Increased TCRavidity after T cell activation: a mechanism for sensing low-densityantigen. Immunity. 14:135–143.
9. Chen, Y., L. Shao, ., Z. W. Chen. 2008. NSOM/QD-based nanoscaleimmunofluorescence imaging of antigen-specific T-cell receptorresponses during an in vivo clonal VG2VD2 T-cell expansion. Blood.
111:4220–4232.
10. Kolin, D. L., D. Ronis, and P. W. Wiseman. 2006. k-Space image corre-lation spectroscopy: a method for accurate transport measurementsindependent of fluorophore photophysics. Biophys. J. 91:3061–3075.
11. Stone, J. D., and L. J. Stern. 2006. CD8 T cells, like CD4 T cells, are
triggered by multivalent engagement of TCRs by MHC-peptide ligandsbut not by monovalent engagement. J. Immunol. 176:1498–1505.
12. Soille, P. 2003. Morphological Image Analysis, 2nd Ed. Springer-Verlag, New York.
13. Comeau, J. W., D. L. Kolin, and P. W. Wiseman. 2008. Accuratemeasurements of protein interactions in cells via improved spatialimage cross-correlation spectroscopy. Mol. Biosyst. 4:672–685.
14. Hebert, B., S. Costantino, and P. W. Wiseman. 2005. Spatiotemporalimage correlation spectroscopy (STICS) theory, verification, andapplication to protein velocity mapping in living CHO cells. Biophys.
J. 88:3601–3614.
Biophysical Journal 101(11) L57–L59
Biophysical Letters L59