Microbial Degradation of Woven Fabrics and Protection Against Biodegradation
Upload
phamnguyetCategory
view
243download
0
Resonance Raman spectroscopy on
microbial rhodopsins
vorgelegt von
M.Sc.
Sara Bruun
aus Blomskog
von der Fakultät II – Mathematik und Naturwissenschaften
der Technischen Universität Berlin
zur Erlangung des Akademischen Grades
Doktor der Naturwissenschaften
Dr. rer. nat.
genehmigte Dissertation
Promotionsausschuss:
Vorsitzender: Prof. Dr. Reinhard Schomäcker
Berichter: Prof. Dr. Peter Hildebrandt
Berichter: Prof. Dr. Peter Hegemann
Tag der wissenschaftlichen Aussprache: 11.04.2013
Berlin 2013
D83

“He woke up, the room was bare
He didn’t see her anywhere
He told himself he didn’t care, pushed the window open wide
Felt an emptiness inside to which he just could not relate
Brought on by a simple twist of fate”
Bob Dylan “Simple twist of fate” 1974

Resonance Raman spectroscopy on microbial rhodopsins 1
Abstract
Resonance Raman spectroscopy has been employed to determine the chromophore structure
in the dark and intermediate states of various microbial rhodopsins, i.e., channelrhodopsin-2
(ChR2), histidine kinase rhodopsin-1 (HRK1), and xanthorhodopsin (XR). Assignment of the
structure was mainly accomplished by the comparison with bacteriorhodopsin (BR) spectra of
states with known conformation of the retinal. ChR2 was studied both at ambient and
cryogenic temperatures, using different excitation conditions to preferentially probe the dark
state and the intermediates P500 and P390. Global analysis of the spectra in the C=C
stretching region, using Lorentzian functions, revealed that the dark state (D470) consists of
two different isomers, presumably all-trans, 15-anti and 13-cis, 15-syn, both including a
protonated Schiff base, as in the case of dark-adapted BR and Rh-Bl in HKR1. The
photocycle is predominantly initiated by 13-trans/cis isomerisation to afford 13-cis, 15-anti
retinal in the photocycle intermediates as found for the P390 state in the slow-cycling mutant
ChR2-C128S-D156A. Photoisomerisation of the 13-cis isomer of the dark state appears to be
less efficient if it takes place at all. Analysis of the C=NH+ stretching modes of both dark state
isomers indicate a closer proximity of a water molecule to the Schiff base bond in the case of
the dark state all-trans isomer as compared to the 13-cis isomer. The photocycle of ChR2-
C128T includes a side-reaction involving the reversible hydrolysis of the retinal Schiff base
bond (P353). Regardless of the similarities in the fine-structured absorption pattern, the retinal
configuration in P353 is not identical to a reduced and UV-treated chromophore state in BR as
shown by resonance Raman spectroscopy. The retinal configuration in the dark state (Rh-UV)
of the histidine kinase rhodopsin-1 (HKR1) was found to be 13-cis, 15-anti with a
deprotonated RSB, similar to the M-intermediate of BR but thermally stable. Photoconversion
of Rh-UV to a stable meta state (Rh-Bl) is associated with a 13-cis/trans or 15-anti/syn
isomerisation resulting in two retinal isomers (all-trans, 15-anti and 13-cis, 15-syn) as
identified in the resonance Raman spectra. XR contains a photoinactive carotenoid,
salinixanthin, in addition to the retinal chromophore, with an absorption spectrum that largely
obscures that of the retinal chromophore. Using an excitation line at the long-wavelength side
of the absorption envelop identifies most of the resonance Raman bands of the retinal to an
all-trans, 15-anti configuration with a protonated retinal Schiff base in accordance with most
microbial rhodopsins.
2 Resonance Raman spectroscopy on microbial rhodopsins
Zusammenfassung
In dieser Arbeit wurde Resonanz-Raman-Spektroskopie (RR-Spektroskopie) eingesetzt, um
Strukturen von Chromophoren aus mikrobiellen Rhodopsinen, insbesondere
Channelrhodopsin-2 (ChR2), Histidin-Kinase-Rhodopsin-1 (HRK1) und Xanthorhodopsin
(XR) in ihren Dunkel- sowie in den Zwischenzuständen des Photozyklus zu untersuchen. Die
Zuordnung der Strukturen erfolgte durch Vergleich mit RR-Spektren von Bacteriorhodopsin
(BR), dessen verschiedene Konformationen bekannt sind. ChR2 wurde dafür bei
Raumtemperatur und unter kryogenen Bedingungen untersucht. Dabei wurden jeweils
verschiedene Anregungsbedingungen verwendet um selektiv den Dunkel- bzw. die
Zwischenstände P500 und P390 untersuchen zu können. Eine vorgenommene
Bandenanpassung für die erhaltenen Spektren insbesondere im C=C
Streckschwingungsbereich unter Zuhilfenahme von Banden mit Lorentzprofilen zeigte, dass
der Dunkelzustand (D470) sich aus zwei verschiedenen Isomeren zusammensetzt. Vermutlich
handelt es sich dabei um die Isomere mit den Konformationen all-trans, 15-anti bzw. 13-cis,
15-syn, wobei beide eine protonierte Schiff’sche Base des Retinals (RSB) aufweisen, wie im
Falle des dunkel-adaptierten BR und Rh-B1 in HKR1. Der Photozyklus wird überwiegend
durch eine 13-trans/cis Isomerisierung eingeleitet, die zu einem Zwischenzustand mit einer
13-cis, 15-anti Konformation des Retinals führt, wie sie für den P390 Zustand in der Mutante
ChR2-C128S-D156A mit einem langsamen Photozyklus gefunden wurde. Die photoinduzierte
Isomerisierung des 13-cis Isomers des Dunkelzustandes scheint hingegen weniger effizient zu
sein, falls sie überhaupt auftritt. Eine genauere Analyse der C=NH+ Streckschwingungen der
beiden Isomere des Dunkelzustandes deutet daraufhin, dass im Falle des all-trans Isomers im
Vergleich zum 13-cis Isomer das Wassermolekül sich näher an der RSB befindet. Der
Photozyklus von ChR2-C128T beinhaltet als Seitenreaktion eine reversible Hydrolyse der
Schiff’schen Base des Retinals (P353). Trotz der Ähnlichkeiten in den Feinstrukturen in den
Absorptionsspektren unterscheidet sich die Konfiguration des Retinals in P353 von der eines
reduzierten und UV-bestrahlten Chromophors in BR wie mittels RR-Spektroskopie gezeigt
wurde. Für das Retinal im Dunkelzustand (Rh-UV) von HKR1 wurde eine 13-cis, 15-anti
Konfiguration mit einer deprotonierten RSB gefunden, ähnlich zum M-Zwischenzustand von
BR aber dafür thermisch stabil. Es konnte gezeigt werden, dass die photoinduzierte
Umwandlung von Rh-UV in einen stabilen Zwischenzustand (Rh-B1) mit einer 13-cis/trans
oder 15-anti/syn Isomerisierung verbunden ist, die folglich zur Akkumulation beider

Resonance Raman spectroscopy on microbial rhodopsins 3
Retinalisomere (all-trans, 15-anti und 13-cis, 15-syn) führt. Zusätzlich zu Retinalen enthält
XR ein photoinaktives Carotenoid, welches ein Absorptionsspektrum aufweist, das das des
Retinals überlagert. Mittels Verwendung einer Anregungswellenlänge die im langwelligen
Bereich der Absorption liegt, konnten RR-Signale der Retinale erhalten werden. Deren
Struktur konnte mit einer, für mikorbielle Rhodopsine typische all-trans, 15-anti
Konfiguration bestimmt werden.
4 Resonance Raman spectroscopy on microbial rhodopsins
Publications
Parts of this work have been published in:
Luck, M., Mathes, T., Bruun, S., Fudim, R., Hagedorn, R., Nguyen, T. M. T., Kateriya, S.,
Kennis, J. T. M. Hildebrandt, P. and Hegemann, P. A photochromic histidine kinase rhodopsin
(HKR1) that is bimodally switched by UV and blue light. JBC 287 (2012) 40083-90
Bruun, S., Naumann, H., Kuhlmann, U., Schulz, C., Stehfest, K., Hegemann, P. and
Hildebrandt, P. The chromophore structure of the long-lived intermediate of the C128T
channelrhodopsin-2 variant. FEBS Letters 585 (2011) 3998-4001
Bruun, S., Naumann, H., Kuhlmann, U., Schulz, C., Hegemann, P. and Hildebrandt, P.
Investigation of Channelrhodopsin-2 mutants using resonance Raman spectroscopy. Meeting
abstract in European Biophysics Journal with Biophysics Letters 40 supplement 1 (2011) 166-
167
Resonance Raman spectroscopy on microbial rhodopsins 5
Index
Abstract .............................................................................................................. 1
Zusammenfassung ............................................................................................. 2
Publications ........................................................................................................ 4
Introduction and motivation .............................................................................. 9
1. Theoretical background ................................................................................ 13
1.1 Microbial rhodopsins ......................................................................................................... 14
1.1.1 Bacteriorhodopsin ..................................................................................................... 18
1.1.2 Xanthorhodopsin ....................................................................................................... 20
1.1.3 Rhodopsins in Chlamydomonas reinhardtii ................................................................ 21
1.1.3.1 Channelrhodopin-2 ............................................................................................ 22
1.1.3.2 Histidine kinase rhodopsin-1 .............................................................................. 26
1.2 Raman spectroscopy ......................................................................................................... 28
1.2.1 Vibrational spectroscopy ........................................................................................... 28
1.2.2 Resonance Raman scattering ..................................................................................... 30
1.2.3 Resonance Raman spectroscopy on microbial rhodopsins ......................................... 33
1.2.3 Vibrational modes in retinal proteins ......................................................................... 35
2. Materials and Methods ................................................................................ 37
2.1 Heterologous expression of channelrhodopsin-2 ............................................................... 38
2.1.1 Transformation in Pichia pastoris .............................................................................. 38
2.1.1.1 Construction of plasmid ..................................................................................... 38
2.1.1.2 Transformation .................................................................................................. 39
2.1.1.3 Phenotype and multicopy test ........................................................................... 39
2.1.2 Cell cultivation ........................................................................................................... 39
2.1.3 Purification of channelrhodopsin-2 ............................................................................ 40
2.1.3.1 Exchange of the buffer for the spectroscopic measurements ............................. 41
2.1.3.2 Deglycosylation protocol .................................................................................... 41
2.2 Reduction of the retinal in bacteriorhodopsin ................................................................... 43
2.3 Optical and vibrational spectroscopy ................................................................................. 44
2.3.1 UV-vis absorption spectroscopy ................................................................................. 44
2.3.2.1 Conventional setup ............................................................................................ 44
2.3.1.2 Flash photolysis ................................................................................................. 44
2.3.2 The Raman setup ....................................................................................................... 45
6 Resonance Raman spectroscopy on microbial rhodopsins
2.3.2.1 Lasers and spectrometers .................................................................................. 45
2.3.2.2 Sample containers ............................................................................................. 45
2.3.2.3 Data evaluation ................................................................................................. 47
2.3.2.4 Time-resolved probe-only resonance Raman spectroscopy ................................ 49
2.3.2.5 Time-resolved pump-probe resonance Raman spectroscopy .............................. 50
3. Results and discussion .................................................................................. 53
3.1 Channelrhodopsin-2 .......................................................................................................... 54
3.1.1 ChR2-H134R .............................................................................................................. 55
3.1.1.1 Optimisation of the biochemical procedures ...................................................... 55
3.1.1.2 N-glycosylation of channelrhodopsin-2 .............................................................. 57
3.1.1.3 Kinetics of the P500, P390 and P520 intermediates ............................................ 59
3.1.1.4 pH-dependent kinetics of the P480a/b intermediates .......................................... 61
3.1.1.5 Trapping of early intermediates at cryogenic temperatures ................................ 63
3.1.1.6 Resonance Raman spectroscopy at cryogenic temperatures .............................. 65
3.1.1.7 Resonance Raman spectroscopy at room temperature....................................... 70
3.1.1.8 Summary ........................................................................................................... 80
3.1.2 ChR2-C128T ............................................................................................................... 82
3.1.2.1 The UV-absorbing intermediates ........................................................................ 83
3.1.2.2 The chromophores of P380 and P353 ................................................................ 85
3.1.3 ChR2-C128S-D156A ................................................................................................... 90
3.1.3.1 The dark and UV-absorbing states ...................................................................... 90
3.1.3.2 Cryo-trapping of P500 ........................................................................................ 92
3.1.3.3 Resonance Raman spectroscopy at room temperature....................................... 93
3.1.3.4 Resonance Raman spectroscopy at cryogenic temperature ................................ 97
3.1.4 Discussion ................................................................................................................. 98
3.3.4.1 Isomeric configuration of the retinal chromophore in D470 ............................... 98
3.3.4.2 Water and RSB interactions in D470 all-trans and 13-cis. .................................. 101
3.3.4.3 Introducing mutations close to the retinal........................................................ 103
3.2 Histidine kinase rhodopsin-1 ........................................................................................... 108
3.2.1 Retinal chromophores in Rh-UV and Rh-Bl ............................................................... 108
3.2.2 Light-induced structural changes of the protein backbone ....................................... 111
3.2.3 Discussion ............................................................................................................... 112
3.3 Xanthorhodopsin............................................................................................................. 114
3.3.1 The salinixanthin and retinal chromophores ............................................................ 114
3.3.2 Accumulation of the L-intermediate in the laser spot .............................................. 116
3.3.3 Summary ................................................................................................................. 117

Resonance Raman spectroscopy on microbial rhodopsins 7
3.4 Bacteriorhodopsin ........................................................................................................... 118
3.4.1 Reduced and UV-treated bacteriorhodopsin ............................................................ 118
3.4.2 The M410 state ......................................................................................................... 122
3.4.3 Summary ................................................................................................................. 123
Summary and outlook .................................................................................... 124
Acknowledgements ........................................................................................ 126
Bibliography ................................................................................................... 130
Appendix ........................................................................................................ 146

8 Resonance Raman spectroscopy on microbial rhodopsins
Resonance Raman spectroscopy on microbial rhodopsins 9
Introduction and motivation
Photoreceptors can be divided into three main classes of proteins, namely rhodopsins,
phytochromes and blue-light receptors including cryptochromes, LOV and BLUF proteins.
With the onset of light stimuli, they initiate a wide range of functions such as vision in
animals, the growth in the direction of the light in plants (phototropism), the locomotory
movement of an organism (phototaxis) or are involved in the circadian clock which is the
oscillations of biological processes in dependence of day and night [1]. Rhodopsins are
membrane proteins consisting of seven α-helices and a retinal co-factor and they appear in the
entire phylogenic tree of life. The first rhodopsins were found in the retina of animals. All so
far known animal rhodopsins function as G-protein coupled receptors where the absorption of
light is the initial step in a signal transduction leading to vision. Over 40 years ago, Walther
Stoeckenius and Dieter Oesterhelt discovered that the archeon Halobacterium halobium
contains a rhodopsin arranged in a hexagonal pattern in the membranes [2,3]. It was named
bacteriorhodopsin (BR) and it functions as a proton pump creating a proton gradient that
drives the synthesis of ATP, thus it facilitates the conversion of light into chemical energy.
Since the discovery of BR several other rhodopsins have been found in archea but also in
bacteria, fungi and algae. Many of these microbial rhodopsins, like BR, function as proton
pumps but some are classified as sensory proteins which can bind to transducer proteins. In
the beginning of this century Georg Nagel, Ernst Bamberg and Peter Hegemann proved that
two rhodopsins, named channelrhodosin-1 and -2, from the microalga Chlamydomonas
reinhardtii function as light-gated cation channels with the ability to depolarise the plasma
membrane in the eyespot which triggers a photophobic response [4,5]. A few years later Karl
Deisseroth and co-workers managed, after lentiviral transfection, to express
channelrhodopsin-2 (ChR2) in hippocampal neurons of rats and observed neuronal spiking
with the onset of light pulses [6]. Shortly after, ChR2 was expressed in embryonic chick
spinal cords [7] and in the mechanosensory neurons of the nematode (worm) Caenorhabditis
elegans which caused a withdrawal behaviour upon light stimuli [8]. This pioneering work
has now grown into a new broad research field called optogenetics and it offers advantages
compared to the traditionally used techniques in neuroscience which rely on electrical
stimulation or drugs [9]. The lentivirus including the ChR2 gene can be designed to induce
expression in specific neurons whereas electrodes cannot discriminate between cells. When
compared to the slow effect of drugs, ChR2 can trigger neuronal firering with the temporal
10 Resonance Raman spectroscopy on microbial rhodopsins
precision defined by the light pulse. ChR2 as well as other microbial rhodopsins (BR and
halorhodopsin) are now used to activate or deactivate neurons in tissues or living animals
such as mice or rats [10,11], Drosophilia (fly) larvae [12], and zebrafish [13]. Expression and
activation of ChR2 in neurons of mice have helped researchers to understand different
functions and diseases of the brain, in medium spiny projection neurons in mice suffering
from Parkinson’s it reduced the symptoms of the disease [14], in a part of the brain normally
assigned to the reproduction it triggered an attack behaviour [15], in the medial prefrontal
cortex of the brain it had an anti-depressive like effect [16] and in inner retinal neurons it
restored perception of light in blind mice [17]. ChR2 has also been used to stimulate heart
muscle [18]. The list of examples is long and the discovery of ChR2 and the implementation
in neuroscience is likely to contribute to the development of therapy for neuronal diseases.
ChR2 undergoes a photocycle after the absorption of blue light of the retinal chromophore.
The light-induced all-trans to 13-cis isomerisation of the retinal leads to structural
rearrangements of the entire protein where at one point in the photocycle a cation conducting
pore is formed. The cations are passively transported to the intracellular side of the plasma
membrane under physiological conditions. The channel spontaneously closes and the retinal
re-isomerises correlated with the re-formation of the dark state. [19–21] In the native alga, it
was found that the configuration of the functional chromophore is all-trans retinal [22].
Extraction of the retinal in heterologously expressed and purified ChR2 and following HPLC
analysis showed additional contributions of an 13-cis isomer in dark state which cannot be
assigned to an unbound retinal due to the fine-structure in the absorption spectrum [23,24].
However, it might be related to the BR dark-state, which consists of two different isomers,
beside all-trans, 15-anti also additional 13-cis, 15-syn that differs from the 13-cis, 15-anti
present in the photocycle intermediates [25–27]. Light-adaptation of BR removes 13-cis, 15-
syn and only the all-trans form is observed in this so-called light-adapted dark state, as
demonstrated by extraction experiments and UV-vis absorption spectra as a shift of the
absorption maximum [25,26]. Dark-adaptation of BR re-establishes the mixed isomeric state
due to a thermal equilibrium between the two isomers. ChR2, on the other hand, shows almost
no difference in the extraction or resonance Raman experiments after light-adaptation [23,24]
as well as in the UV-vis absorption and FTIR spectra after long periods of dark-adaptation
[19–21]. It implies that the 13-cis form is either inactive or both isomers are immediately
formed after completing the photocycle. Beside the extraction experiments, the configuration
of the retinal can be determined by using NMR spectroscopy or X-ray diffraction on crystals.
Resonance Raman spectroscopy on microbial rhodopsins 11
However, this depends on the availability of crystals which are often hard to obtain. Recently,
the first crystal structure of C1C2, a chimera of channelrhodopsin-1 and 2, was published
which showed an all-trans, 15-anti retinal [28]. Thus, the involvement of the second isomer in
the dark state is still not clear.
Raman spectroscopy selectively probes chromophores and might be applied as an additional
technique for assigning the structure of the retinal. It is based on the excitation of molecular
vibrations by using monochromatic (laser) light. This leads to a shift in the wavelength of the
incident photons correlated with a vibrational transition which in turn depends on the
configuration of the retinal. The intensity of the vibrational bands can be enhanced by
choosing a wavelength matching the transition into the first electronically excited state, i.e.
close to the absorption maximum of the retinal. This is called resonance Raman spectroscopy,
for a review on the application of vibrational spectroscopy on biological samples see [29].
Several disadvantages concerning Raman spectroscopy have to be taken into consideration.
Unless isotopically labelled retinals are available the assignment of the structure often
requires that the spectra show similarities to other well-characterised rhodopsins.
Furthermore, large amounts of protein is needed since the laser will trigger the photocycle,
thus the sample has to be exchanged in a flow system. However, the main advantage of
Raman spectroscopy is that only the chomophore is being detected and the intermediate states
can be followed by using a time-resolved pump-probe setup. In this work, resonance Raman
spectroscopy was employed to study the chormophores in the dark and intermediate states of
ChR2 mutants widely used in the optogenetic research, with the main objective to identify the
retinal configuration in these states. The work was also extended to other microbial
rhodopsins, the carotenoid-containing xanthorhodopsin from the eubacterium Salinibacter
ruber, a reduced chromophore in BR and the histidine kinase rhodopsin-1 from
Chlamydomonas reinhardtii.

12 Resonance Raman spectroscopy on microbial rhodopsins

Resonance Raman spectroscopy on microbial rhodopsins 13
1. Theoretical background
14 Resonance Raman spectroscopy on microbial rhodopsins
1.1 Microbial rhodopsins
Retinylidene proteins, also called rhodopsins, belong to a family of photoreceptors consisting
of seven α-helices stretching throughout the cell membrane. The helices are connected by
intra- and extracellular loops. Rhodopsins absorb visible light corresponding to an electronic
excitation of a retinal (vitamin A aldehyde) chromophore. The retinal is covalently linked to a
lysine (Lys, K) in helix VII via a Retinal Schiff Base (RSB) and embedded within the helices
in a cavity referred to as the chromophore pocket. Free retinal absorbs in the UV whereas for
retinal bound to rhodopsin the absorption is shifted towards the red, denoted as the opsin-
shift. The isomerisation of the retinal induces changes in the arrangement of the helices which
in turn allows the protein to transform light into chemical energy or sensory and regulatory
signalling of the organism. The wavelength for the maximum absorption of the rhodopsin
depends mainly on the electrostatic interactions between the positively charged protonated
RSB and a counter ion which consists of a negatively charged and deprotonated aspartic or
glutamic amino acid residue. However, also the polarity of the amino acids surrounding the
entire chromophore is important since it defines the planarity and the level of electron
delocalization in the retinal chain. Based on the amino acid sequence and the arrangement of
the helices, the rhodopsins are divided into two different sub-groups. [30]
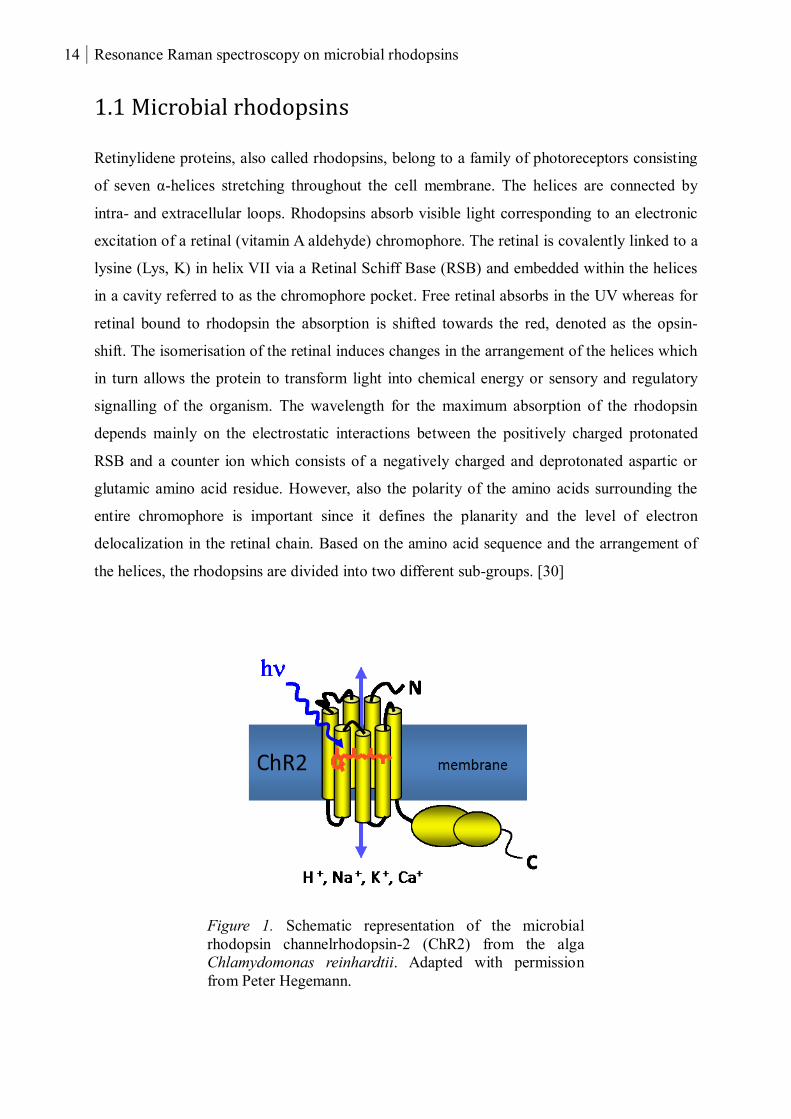
Figure 1. Schematic representation of the microbial
rhodopsin channelrhodopsin-2 (ChR2) from the alga
Chlamydomonas reinhardtii. Adapted with permission
from Peter Hegemann.
Resonance Raman spectroscopy on microbial rhodopsins 15
Animal or type II rhodopsins are found in the eyes, brain or other tissues and they are
involved in vision of vertebrates and invertebrates. Type II rhodopsins belong to the family of
so-called G-protein coupled receptors (GPCR). The best studied example is rhodopsin from
the bovine outer rod segment membranes in the eye retina. Light (absorption maximum is
around 500 nm) induces an 11-cis to all-trans isomerisation of the retinal (linked to K296)
(Figure 2) and the photoinduced process includes several intermediate states before the RSB
is hydrolysed and all-trans retinal is released from the protein. Enzymes are required for the
re-assembly of opsin and 11-cis retinal to recover the functional photoreceptor. One of the
intermediates in the photocycle, Meta II, has an all-trans deprotonated RSB. In this state
rhodopsin binds to a G-protein and cGMP is hydrolysed. The reduction of the cGMP level in
the cell leads to the closing of a cGMP-gated Na+/Ca
2+ channel and the photoreceptor cell is
hyperpolarized. This signal is then transferred to the brain via the ganglion cells. Other
rhodopsins with different absorption maxima enable the discrimination of different colours.
[31–33]
Microbial or type I rhodopsins are found in archaea and bacteria but also in eukaryote such as
fungi and algae. The first discovered microbial rhodopsin was the light-driven proton-pump
bacteriorhodopsin (BR) from the archeon Halobacterium salinarum. BR pumps one proton
out of the cell per photocycle and the resultant electrochemical gradient drives the synthesis
of ATP by ATP synthase. Other rhodopsins were later found in Halobacterium salinarum, i.e.
halorhodopsin (HR) and sensory rhodopsin (SR). The structures and functions of these
rhodopsins have been thoroughly characterised. Halorhodopsin is an inward-directed chloride
pump with the ability to hyperpolarize the cell membrane. The sensory rhodopsins I or II are
involved in the phototaxis, the ability of the organism to sense changes in the intensity of the
light and respond to different wavelengths and thus move towards or away from the light-
source. The signal transferred to the flagella motor is induced during the photocycle by the
formation of a complex between the sensory rhodopsins and transducer proteins. Unlike
visual rhodopins, the retinal in microbial rhodopsins isomerises from all-trans to 13-cis
(Figure 2). No hydrolysation of the RSB is involved and the chromophore remains inside the
protein throughout the entire photocycle. [1,30,34,35]
Analogues to BR with the ability to translocate protons using light have been found in various
organisms. Examples are proteorhodopsin (PR) from the γ-Proteobacteria (SAR86) [36],
Archaerhodopsin-1 and -2 (aR-1 and -2) from the archeon Halorubrum sp. aus -1 and -2 [37],
16 Resonance Raman spectroscopy on microbial rhodopsins
Gleobacter rhodopsin (GR) from the cyanobacterium Gleobacter violaceus [38],
Leptosphaeria rhodopsin (LR) from the fungus Leptosphaeria maculans [39,40] and
Acetabularia rhodopsin (AR) from the alga Acetabularia acetabulum [41]. The following
chapter includes an introduction to four microbial rhodopsins with quite different functions.
The already mention BR as well as another proton-pump xanthorhodopsin from the archaeon
Salinibacter ruber. The latter shows an extended absorption range due to a second carotenoid
chromophore. Furthermore, two rhodopsins from the alga Chlamydomonas reinhartdii will be
described; the newly discovered histidine kinase rhodopsin-1 and the cation conducting
channelrhodopsin-2.
Resonance Raman spectroscopy on microbial rhodopsins 17
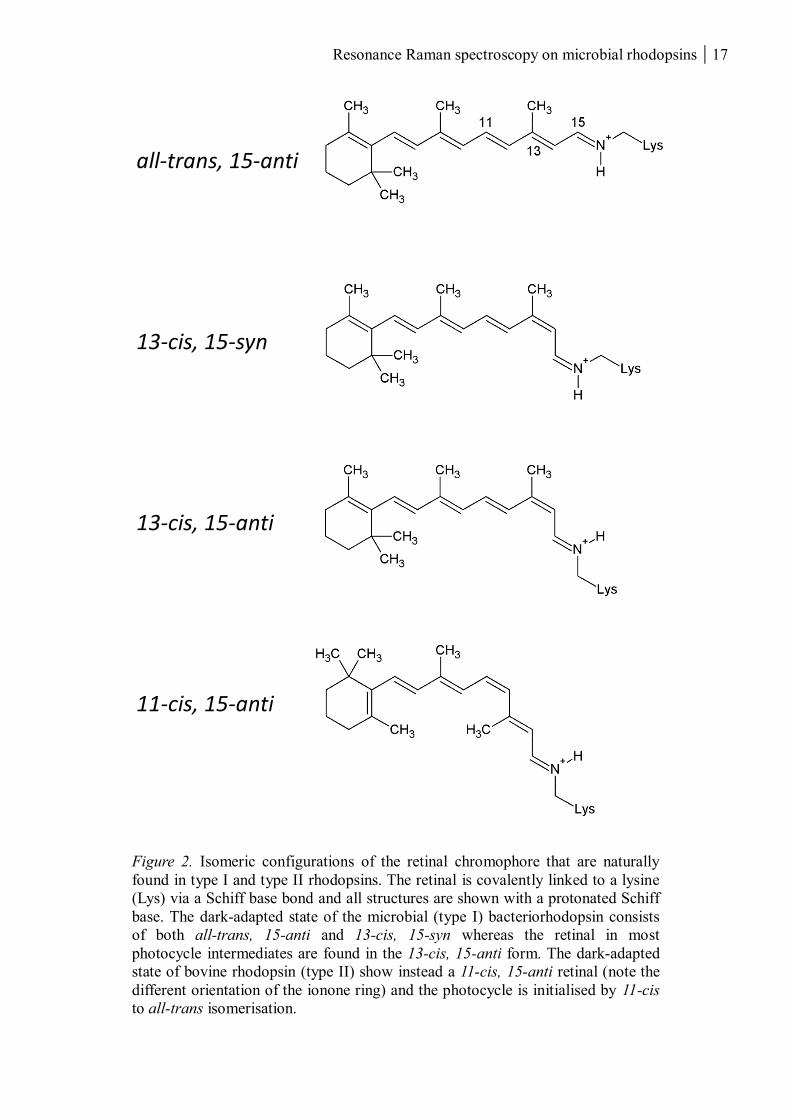
Figure 2. Isomeric configurations of the retinal chromophore that are naturally
found in type I and type II rhodopsins. The retinal is covalently linked to a lysine
(Lys) via a Schiff base bond and all structures are shown with a protonated Schiff
base. The dark-adapted state of the microbial (type I) bacteriorhodopsin consists
of both all-trans, 15-anti and 13-cis, 15-syn whereas the retinal in most
photocycle intermediates are found in the 13-cis, 15-anti form. The dark-adapted
state of bovine rhodopsin (type II) show instead a 11-cis, 15-anti retinal (note the
different orientation of the ionone ring) and the photocycle is initialised by 11-cis
to all-trans isomerisation.
all-trans, 15-anti
13-cis, 15-syn
11-cis, 15-anti
13-cis, 15-anti
18 Resonance Raman spectroscopy on microbial rhodopsins
1.1.1 Bacteriorhodopsin
The proton-pumping (26.8 kDa) membrane protein bacteriorhodopsin (BR), which is the most
widely studied microbial rhodopsin, was discovered and first studied by Allen E. Blaurock,
Dieter Oesterhelt and Walther Stoeckenius in the 70’s [2,42]. The light-driven proton
translocation and resultant proton gradient is used to drive the synthesis of ATP
(phosphorylation of ADP) which acts as an energy source in the cell metabolism [3]. BR is
organised in a hexagonal arrangement mixed with lipids in membrane patches of the archeon
Halobacterium salinarum and these so-called purple membranes can be readily isolated. Due
to the extensive research conducted on this protein it is often used as a reference when the
function, structure and photocycle are being investigated of newly discovered microbial
rhodopsins.
The BR photocycle is initialised by absorption of (green) light leading to an electronic
excitation of the retinal. The next steps include isomerisation and thermal relaxation of the
chromophore (J625, K590 and L550) as well as deprotonation of the Schiff base (M410) that
covalently links the retinal to Lys216 (Figure 3). The proton from the RSB is transferred to
the aspartic acid 85 (Asp85, located at the extracellular side compared to the retinal) via a
water molecule. This is the start of a translocation of protons facilitated by a complex network
of charged residues and water. Eventually the Schiff base is again re-protonated (N560) by
Asp96 which requires a so-called switch of the RSB towards the intracellular side in the later
M-state [43,44]. The net transfer per photocycle (and absorbed photon) is one proton being
released on the extracellular and one taken up on the intracellular side of the membrane.
Deprotonation at one residue leads to a coupled protonation at another and this transfer of
charge also induce structural alterations of the protein backbone and changes in the pKa
values. [45–48]
Extraction of the retinal and NMR spectroscopy showed that dark-adapted BR560 have two
different isomeric configurations of the retinal, namely all-trans, 15-anti and 13-cis, 15-syn,
both with a protonated RSB [25–27]. However, light-adaptation leads to the presence of only
one isomer in the dark state. In this so-called light-adapted dark-state (BR570) the
configuration of the retinal is exclusively in the all-trans form. The light-induced
isomerisation of all-trans, 15-anti into 13-cis, 15-anti (different from 13-cis, 15-syn in the
dark-adapted state) initialises the photocycle. At the end of the cycle this process is reversed
Resonance Raman spectroscopy on microbial rhodopsins 19
(in O640), by thermal 13-cis to trans isomerisation. Long periods of dark-adaptation are
necessary to thermally recover the mixed isomeric dark state of BR seen as a shift in the
absorption maximum [25]. The structure of the chromophores in the dark-state of BR can be
easily characterised since these isomers are thermally stable. The description of the retinal
configuration throughout the photocycle is more complicated. The full 13-trans/cis
isomerisation is strictly speaking only achieved in the later M-state when the Schiff base is
facing towards the intracellular side whereas the preceding intermediates are in a distorted 13-
cis configuration. The crystal structures of the intermediates do not always provide a clear
answer to the exact structure of the retinal, for instance in the case of the L intermediate where
different experiments generated different configurations [49–52]. However, many crystal
structures are now available for the dark-adapted [53,54] and intermediate states [55] of BR
which, together with other techniques, has contributed to the elucidation of the proton
translocation during the photocycle.
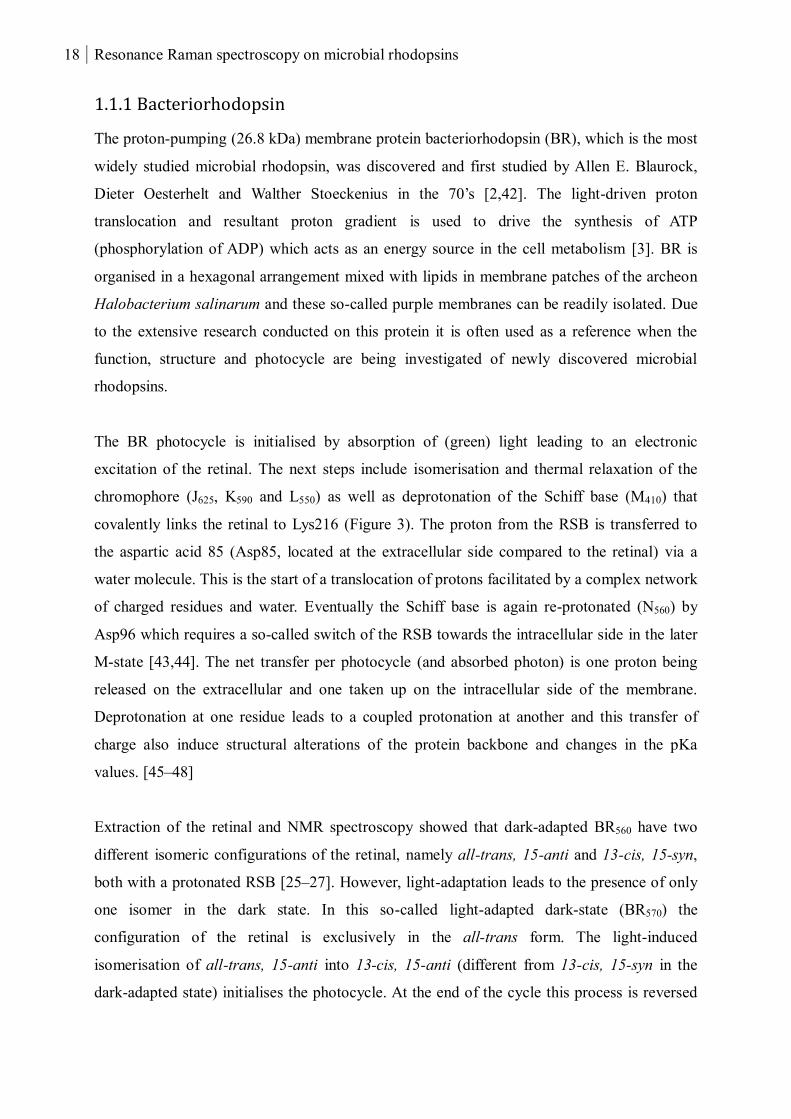
Figure 3. Photocycle of BR showing the sequential order of the
intermediates after the light-induced isomerisation of the retinal and
the proton release and uptake from the extracellular and intracellular
side, respectively. The isomeric state of the retinal in the dark-states is
13-cis, 15-syn in bR555 and all-trans, 15-anti in bR568, both with
protonated RSB. Adapted with permission from [56]. Copyright
(2008) National Academy of Sciences, USA.
hν hν
20 Resonance Raman spectroscopy on microbial rhodopsins
1.1.2 Xanthorhodopsin
Xanthorhodopsin (XR) shares homology with and has a similar photocycle as BR. It functions
as a proton pump in the eubacterium Salinibacter ruber and it can be purified directly from
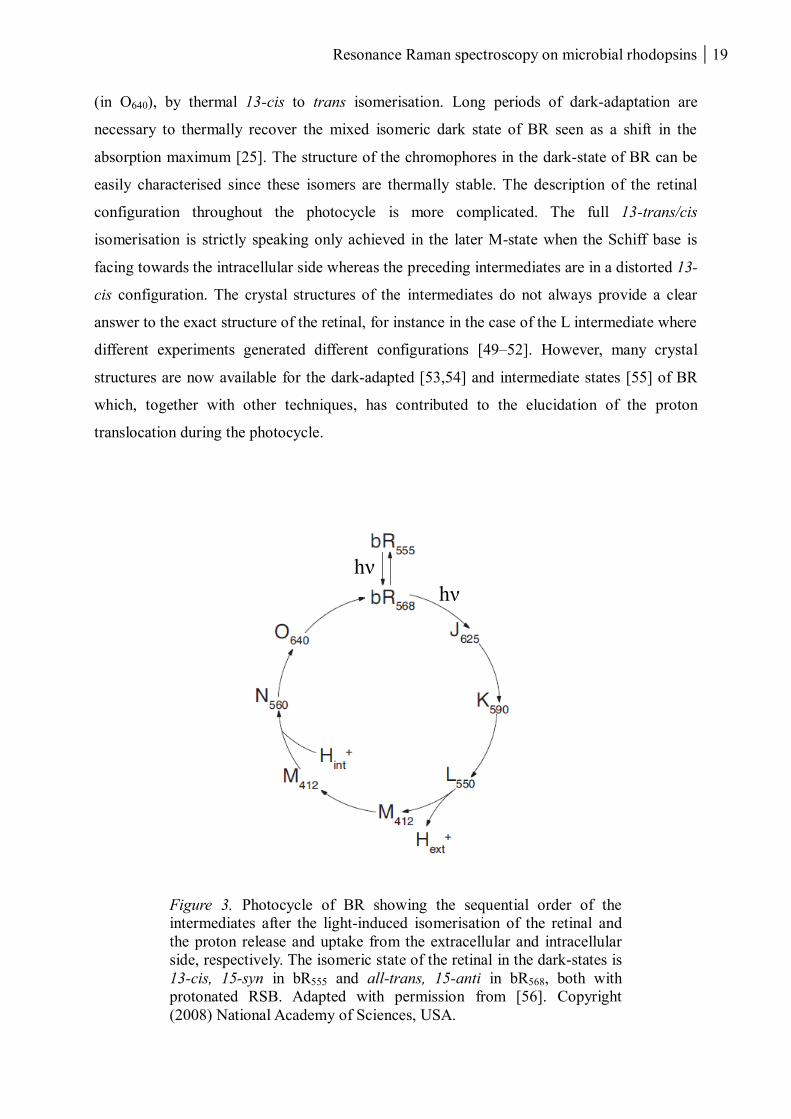
the native membranes [57]. However quite distinctive for XR is the presence of a second
chromophore, a C40 carotenoid called salinixanthin containing a ß-D-glycoside and an acyl
tail, that is not covalently linked to the protein (Figure 4A) [58]. The Schiff base bound retinal
and the salinixanthin are found in the protein with a 1:1 stoichiometry. The crystal structure
revealed that the keto ring of the salinixanthin is located within van der Waals distance to the
ionone ring of the retinal [59]. This facilitates the so-called light-harvesting function – the
energy absorbed by the salinixanthin is transferred with around 40% quantum efficiency from
the S2 state in salinixanthin to the S1 state in retinal which eventually leads to isomerisation
of the latter and the photocycle is initialised [57,60]. Thus, salinixanthin broadens the spectral
absorption of the protein beyond that of the retinal alone. The retinal absorbs in the green
(~560 nm) and is seen as a shoulder of the salinixanthin fine-structured absorption with peaks
at 458, 486 and 521 nm (Figure 4B). For review see [61].
Figure 4. (A) The molecular structure of salinixanthin includes a caroteinoid with
a 4-keto group, a ß-D-glycoside and an acyl tail. Reprinted with permission from
[58]. Copyright (2002) American Chemical Society. (B) Absorption spectrum of
xanthorhodopsin in the native membranes of Salinibacter ruber. The solid and
dotted lines represent the absorption spectra before and after hydroxylamine
treatment, respectively. The retinal chomophore is removed by hydroxylamine due
to the transformation into a retinal oxime correlated with a shift of the absorption
from ~567 to 367 nm. The fine-structured pattern with peaks at 458, 486 and 521
nm corresponds to the salinixanthin and it is partly lost upon removal of the
retinal. Adapted with permission from [60]. Copyright (2008) Elsevier.
Resonance Raman spectroscopy on microbial rhodopsins 21
1.1.3 Rhodopsins in Chlamydomonas reinhardtii
Eight rhodopsin genes (chlamyopsins or COP) are found in the genome of the single cellular
alga Chlamydomonas reinhardii. Whereas COP1 and 2 (both transcribed from the COP1
gene) show homology to vertebra rhodopsins, COP3 and 4 are more microbial-like and
functions as light-gated cation channels (channelrhodopsin-1 and 2). COP5-8 are enzymatic
rhodopsins and they include a histidine kinase, response regulator and sometimes a cyclase at
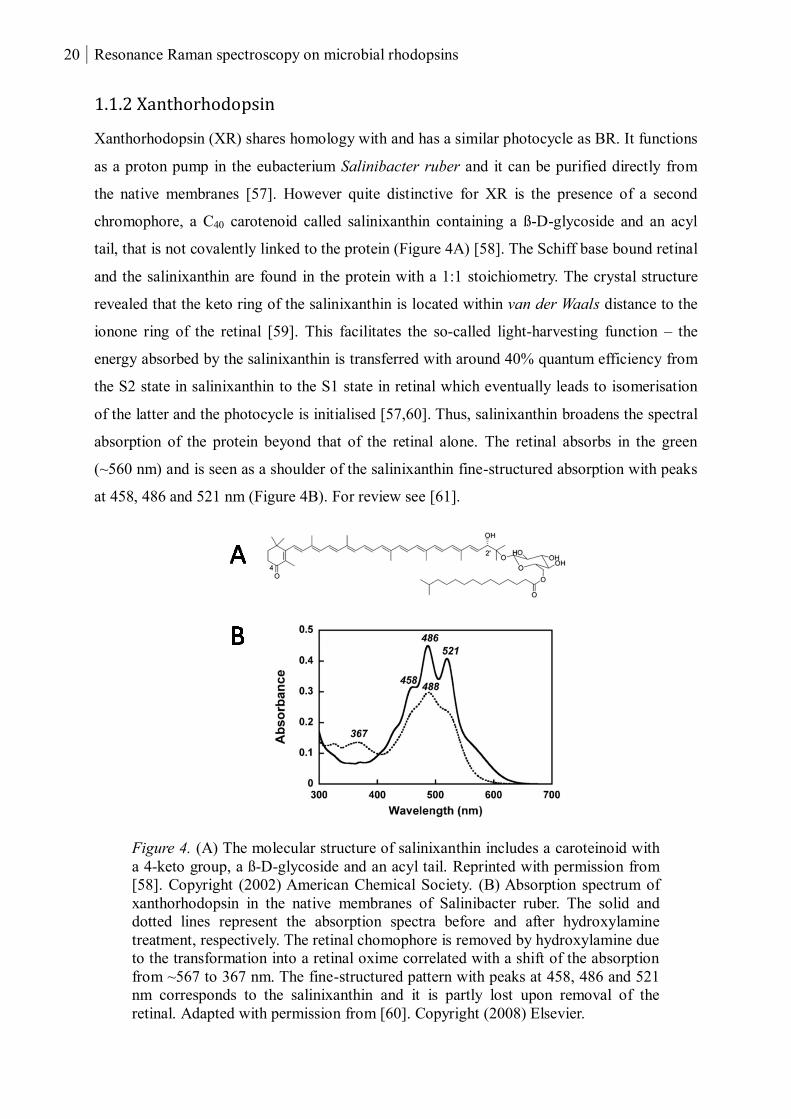
the c-terminal end. At least COP1-5 are located in the plasma membrane of the C. reinhardtii
eyespot (Figure 5). [62,63] Channelrhodopsin-1 and 2 (ChR1 and ChR2) and the histidine
kinase rhodopsin-1 (HKR1, COP5) have been heterologously expressed in for instance
Xenopus laevis oocytes, human embryonic kidney (HEK) cells, COS (monkey kidney) cells
or the yeast Pichia pastoris which enabled researchers to characterise these proteins using
electrophysiology, spectroscopy, microscopy and recently X-ray diffraction.
Figure 5. The microalgae Chlamydomonas reinhardtii. The
chlamyopsins are localized in the orange eyespot (white arrow).
Under physiological conditions Ca2+
ions are transported into
the cell facilitated by light-gated cation channels and it activates
voltage sensitive channels in the flagella (black arrow)
membrane. The subsequent influx of Ca2+
into the flagella leads
to a switch of the movement (phototaxis). [63] Scale bar 10 µm.
Reprinted with permission from [64]. Copyright (2009)
Springer.
22 Resonance Raman spectroscopy on microbial rhodopsins
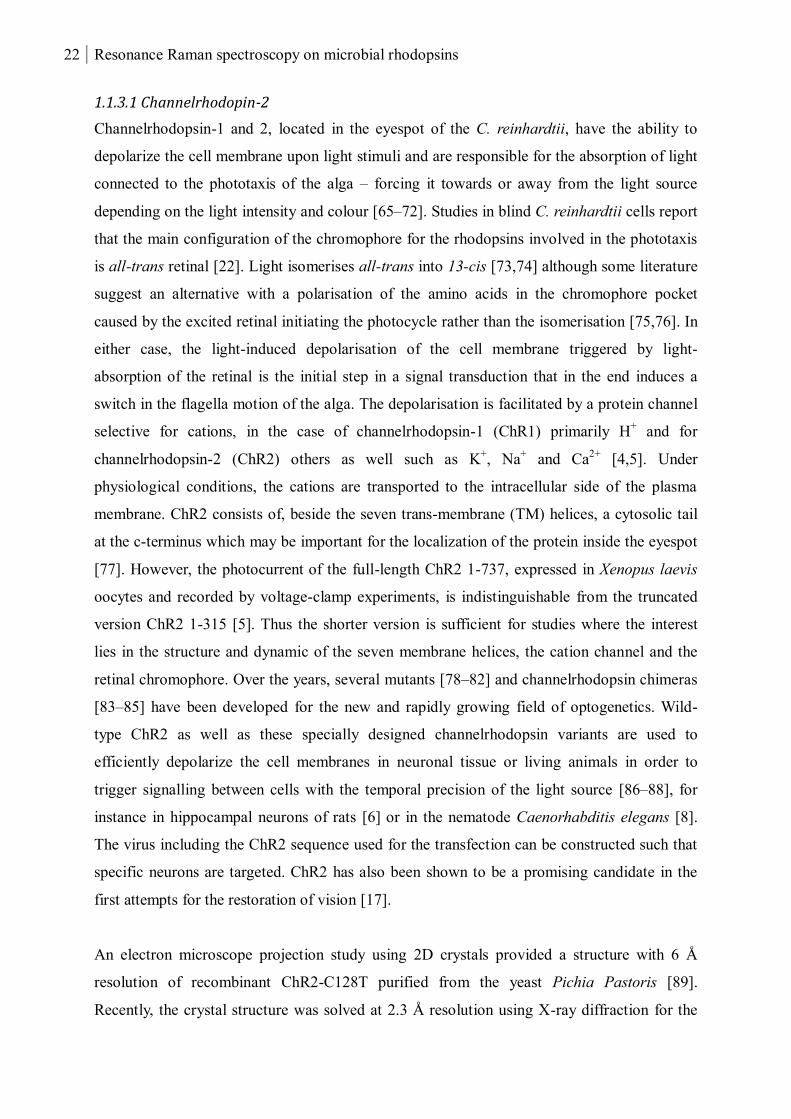
1.1.3.1 Channelrhodopin-2
Channelrhodopsin-1 and 2, located in the eyespot of the C. reinhardtii, have the ability to
depolarize the cell membrane upon light stimuli and are responsible for the absorption of light
connected to the phototaxis of the alga – forcing it towards or away from the light source
depending on the light intensity and colour [65–72]. Studies in blind C. reinhardtii cells report
that the main configuration of the chromophore for the rhodopsins involved in the phototaxis
is all-trans retinal [22]. Light isomerises all-trans into 13-cis [73,74] although some literature
suggest an alternative with a polarisation of the amino acids in the chromophore pocket
caused by the excited retinal initiating the photocycle rather than the isomerisation [75,76]. In
either case, the light-induced depolarisation of the cell membrane triggered by light-
absorption of the retinal is the initial step in a signal transduction that in the end induces a
switch in the flagella motion of the alga. The depolarisation is facilitated by a protein channel
selective for cations, in the case of channelrhodopsin-1 (ChR1) primarily H+ and for
channelrhodopsin-2 (ChR2) others as well such as K+, Na
+ and Ca
2+ [4,5]. Under
physiological conditions, the cations are transported to the intracellular side of the plasma
membrane. ChR2 consists of, beside the seven trans-membrane (TM) helices, a cytosolic tail
at the c-terminus which may be important for the localization of the protein inside the eyespot
[77]. However, the photocurrent of the full-length ChR2 1-737, expressed in Xenopus laevis
oocytes and recorded by voltage-clamp experiments, is indistinguishable from the truncated
version ChR2 1-315 [5]. Thus the shorter version is sufficient for studies where the interest
lies in the structure and dynamic of the seven membrane helices, the cation channel and the
retinal chromophore. Over the years, several mutants [78–82] and channelrhodopsin chimeras
[83–85] have been developed for the new and rapidly growing field of optogenetics. Wild-
type ChR2 as well as these specially designed channelrhodopsin variants are used to
efficiently depolarize the cell membranes in neuronal tissue or living animals in order to
trigger signalling between cells with the temporal precision of the light source [86–88], for
instance in hippocampal neurons of rats [6] or in the nematode Caenorhabditis elegans [8].
The virus including the ChR2 sequence used for the transfection can be constructed such that
specific neurons are targeted. ChR2 has also been shown to be a promising candidate in the
first attempts for the restoration of vision [17].
An electron microscope projection study using 2D crystals provided a structure with 6 Å
resolution of recombinant ChR2-C128T purified from the yeast Pichia Pastoris [89].
Recently, the crystal structure was solved at 2.3 Å resolution using X-ray diffraction for the
Resonance Raman spectroscopy on microbial rhodopsins 23
chimera C1C2 expressed in insect cells [28]. C1C2 consists of the first five TM helices from
ChR1 and the last two from ChR2. However, the high homology between ChR1 and ChR2
implies that the positions of the amino acids are likely to be the same. Both studies found
channelrhodopsin as a dimer with connections at the TM3 and TM4. Calculations of the
electrostatic surface potential indicate that the cation channel is constituted of an
electronegative pore located between TM1, TM2, TM3 and TM7 [28]. E90 and E87 (in
ChR2) are important residues for the ion flux [90–93] and ChR2 lacks several serines
responsible for intrahelical interactions in BR which may be the reason for the large pore-
diameter necessary for the channeling function [94]. Furthermore, the position of TM1 and
TM2 are quite different with respect to BR and many of the negatively charged residues from
the pore are found in TM2 [28,95].
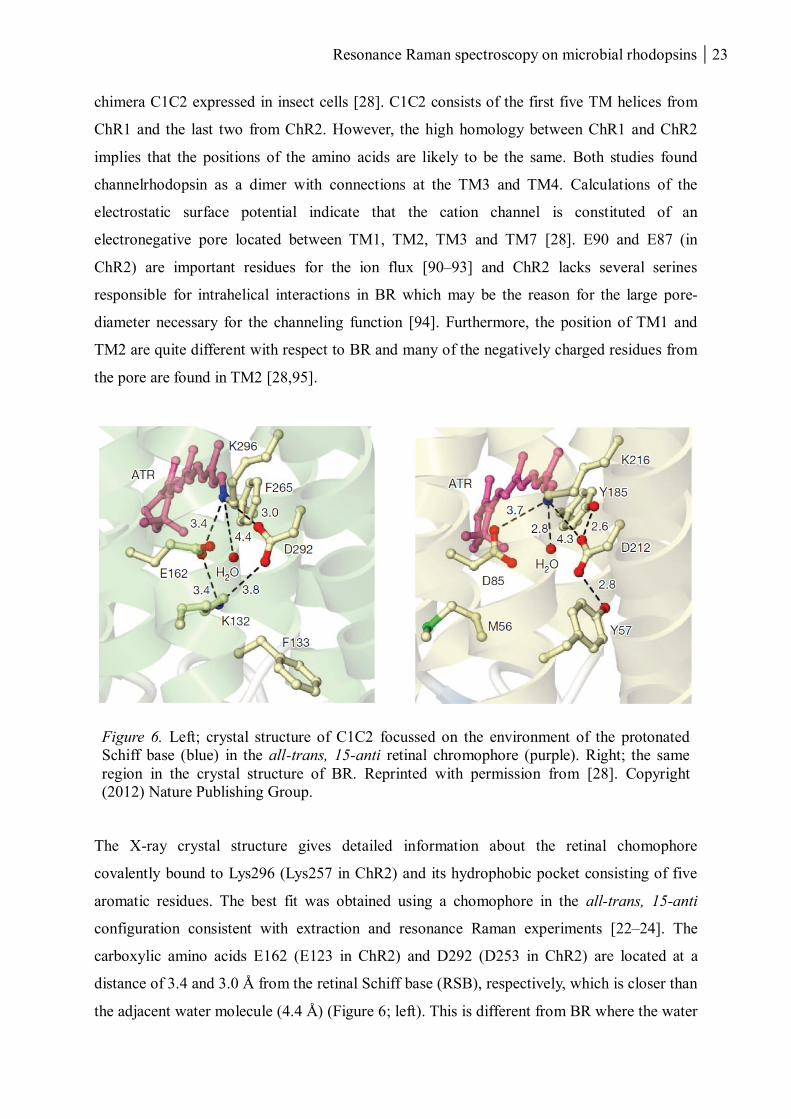
Figure 6. Left; crystal structure of C1C2 focussed on the environment of the protonated
Schiff base (blue) in the all-trans, 15-anti retinal chromophore (purple). Right; the same
region in the crystal structure of BR. Reprinted with permission from [28]. Copyright
(2012) Nature Publishing Group.
The X-ray crystal structure gives detailed information about the retinal chomophore
covalently bound to Lys296 (Lys257 in ChR2) and its hydrophobic pocket consisting of five
aromatic residues. The best fit was obtained using a chomophore in the all-trans, 15-anti
configuration consistent with extraction and resonance Raman experiments [22–24]. The
carboxylic amino acids E162 (E123 in ChR2) and D292 (D253 in ChR2) are located at a
distance of 3.4 and 3.0 Å from the retinal Schiff base (RSB), respectively, which is closer than
the adjacent water molecule (4.4 Å) (Figure 6; left). This is different from BR where the water
24 Resonance Raman spectroscopy on microbial rhodopsins
is closer to the RSB and it indicates that in ChR2 there is a direct proton transfer from the
RSB to one of the carboxylic acids without involvement of the water. Calculations showed
that E162 but not D292 might be protonated. Thus only D292 is negatively charged and can
act as the counter-ion for the protonated RSB [28]. In contradiction, ultra-fast spectroscopy
showed that E123 (E162 in ChR1) is negatively charged [96]. Regardless of the protonation
state of E162, electrophysiological studies of C1C2 with mutations at these positions point out
D292 to be the proton acceptor rather than E162 [28]. D292 in C1C2 is located 1.3 Å closer to
the RSB than its counterpart in BR (D212) which may be one of the reasons for the blue-
shifted absorption (hypsochromic shift) of ChR1 and ChR2 compared to BR (Figure 6)
[28,97]. The cysteine-167 (C128 in ChR2) in TM3 and aspartic acid-195 (D156 in ChR2) in
TM4 are located in the chromophore pocket. Mutations at these positions drastically reduce
the kinetics of the photocycle [21,24,78,98] which was suggested to be related to an
interhelical hydrogen bond between the sulfhydryl in C128 and carbonyl in (the protonated)
D156 which is disrupted in the mutants [98,99]. However, this hydrogen bond could not be
confirmed either by QM-MM calculations [95] or the crystal structure [28] and it is
inconsistent with electrophysiological data [83].
The photocycle of ChR2 has been extensively studied using absorption and vibrational
spectroscopy [19–21,100]. The photocycle is initiated by light absorption correlated with
electronic excitation and polarisation of the retinal chromophore (Figure 7; top). The
chromophore relaxes by isomerising, most likely from all-trans to 13-cis resulting in the first
intermediate P500 which is slightly red-shifted compared to the dark state D470 (the numbers
denotes the absorption maximum) [23]. On the time-scale of microseconds the RSB is
deprotonated upon formation of the UV-absorbing P390 intermediate (counterpart of M410 in
the BR photocycle) which is also connected to structural changes of the protein backbone.
P390 is in an equilibrium with the conducting P520 state where the RSB is again re-
protonated. Beside the passive transport of cations, which is under physiological conditions
directed towards the intracellular side, ChR2 has been proposed to act as a weak proton
translocator where the proton on the RSB leaves on the extracellular side and upon formation
of P520 taken up on the intracellular side [101,102]. The closing of the channel (in
milliseconds) involves the two intermediates P480a and P480b with absorptions similar to
D470 and the structural rearrangements of the protein helixes (enabling the conduction of
cations) are reversed. The photocycle is complete after roughly a minute which is
considerably slower than the proton-pumping rhodopsins. A two-cycle model has been

Resonance Raman spectroscopy on microbial rhodopsins 25
proposed on the basis of the channelrhodopsin photocurrents and it involves two open states
of the channel with different ion selectivies [103–107] (Figure 7; bottom). So far spectroscopy
provided no evidence for multiple cycles, thus the sequential order and the absorption and
vibrational properties of the intermediates may be almost identical in the two cycles [20].
Figure 7. Top; photocycle of ChR2 showing the sequential order of
the photocycle intermediates (P500, P390, P520 and P480a/b) after the
retinal absorption of light in the dark-state (D470). Adapted with
permission from [20]. Copyright (2008) American Society for
Biochemistry and Molecular Biology. Bottom; the two-cycle model
involving two dark-states (D470 and desensitised Des480) as well as
two open states (O1 and O2). Reprinted with permission from [106].
Copyright (2010) John Wiley and Sons.
26 Resonance Raman spectroscopy on microbial rhodopsins
1.1.3.2 Histidine kinase rhodopsin-1
Histidine kinase rhodopsin-1 (HKR1) consists of the rhodopsin, histidine kinase, response
regulator and cyclase domains [108]. The histidine kinase is phosphorylated by ATP and the
phosphate group transferred via the response regulator to produce cyclic AMP or GMP.
Whether HKR1 function as a guanylyl or adenylyl cyclase is not known yet since so far it has
not been possible to reconstitute the functional full-length protein in either Pichia Pastoris or
Xenopus laevis oocytes. However the rhodopsin part of HKR1 has successfully been
expressed in P. Pastoris, purified, solubilised in detergent and characterised using absorption
spectroscopy, stationary as well as time-resolved in the range from femtoseconds up to
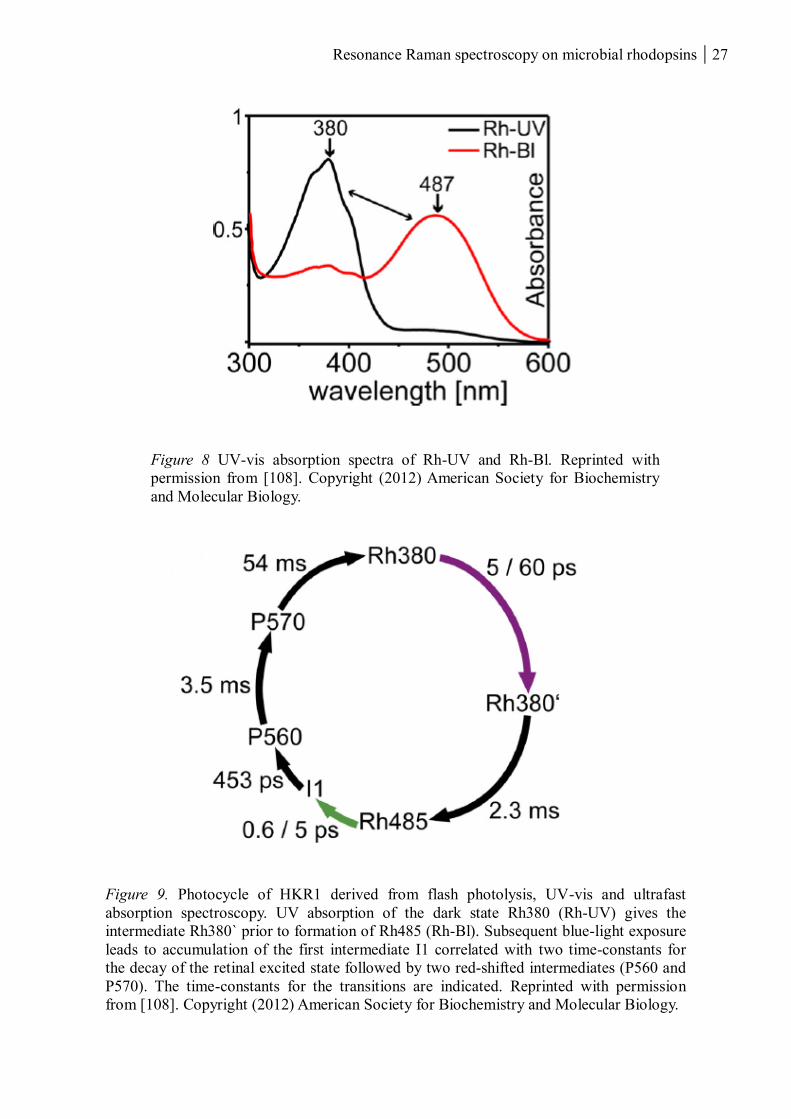
minutes [108]. The rhodopsin part of HKR1 shows an interesting bimodal behaviour
switching from the dark state absorbing in the UV (Rh-UV; λmax = 380nm) to a stable meta
state absorbing in the blue (Rh-Bl; λmax = 490nm) (Figure 8). Rh-UV is transferred to Rh-Bl
within milliseconds after UV exposure via an intermediate with similar absorption (Rh380`).
The back-reaction triggered by illumination in the blue follows, compared to other microbial
rhodopsins, a more classical photocycle pathway, including two red-shifted intermediates
(P560 and P570) (Figure 9). The large photochromic shift between these two stable states and
the fact that the dark state is absorbing in the UV has previously not been reported for
microbial rhodopsins. The light-induced conversion of Rh-UV and Rh-Bl may represent an
on/off switching of the enzymatic activity. Photochromism has previously been observed in
retinochromes [109]. UV-absorbing retinol acts as an additional pigment in fly rhodopsin
where the absorbed energy is transferred to the bound retinal [110]. Anabena sensory
rhodopsin shows a small photochromic shift between the dark- and light-adapted states
consisting predominantly of an all-trans (λmax = 549 nm) and 13-cis (λmax = 537 nm) retinal,
respectively. The 13-trans/cis isomerisation is initiated by orange light and the 13-cis/trans by
blue light. However after light-adaptation, this microbial rhodopsin thermally decays into the
dark state in the time-scale of hours [111]. Bimodal photoconversion of the dark (λmax = 590
nm) and UV-absorbing intermediate (λmax = 370 nm) is reported for the slow-cycling sensory
rhodopsin-I in archaea. However, the UV-absorbing state is also not thermally stable and
decays into the dark-state within a second [112].
Resonance Raman spectroscopy on microbial rhodopsins 27
Figure 8 UV-vis absorption spectra of Rh-UV and Rh-Bl. Reprinted with
permission from [108]. Copyright (2012) American Society for Biochemistry
and Molecular Biology.
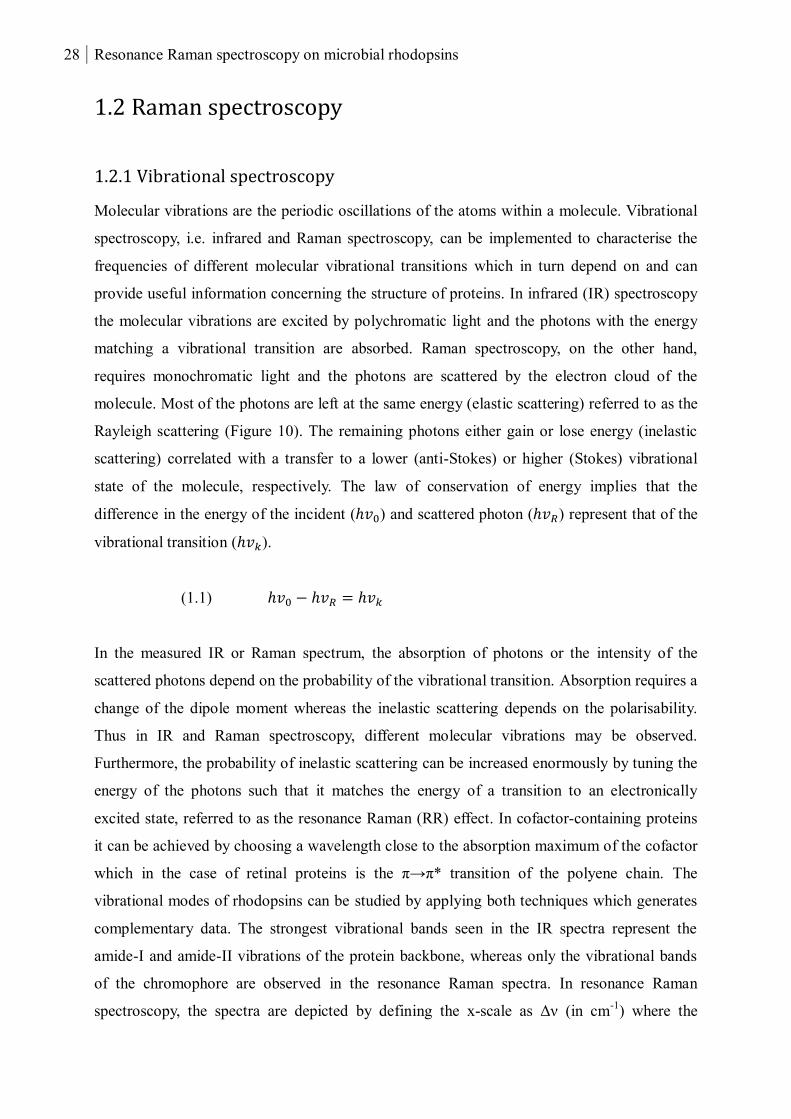
Figure 9. Photocycle of HKR1 derived from flash photolysis, UV-vis and ultrafast
absorption spectroscopy. UV absorption of the dark state Rh380 (Rh-UV) gives the
intermediate Rh380` prior to formation of Rh485 (Rh-Bl). Subsequent blue-light exposure
leads to accumulation of the first intermediate I1 correlated with two time-constants for
the decay of the retinal excited state followed by two red-shifted intermediates (P560 and
P570). The time-constants for the transitions are indicated. Reprinted with permission
from [108]. Copyright (2012) American Society for Biochemistry and Molecular Biology.
28 Resonance Raman spectroscopy on microbial rhodopsins
1.2 Raman spectroscopy
1.2.1 Vibrational spectroscopy
Molecular vibrations are the periodic oscillations of the atoms within a molecule. Vibrational
spectroscopy, i.e. infrared and Raman spectroscopy, can be implemented to characterise the
frequencies of different molecular vibrational transitions which in turn depend on and can
provide useful information concerning the structure of proteins. In infrared (IR) spectroscopy
the molecular vibrations are excited by polychromatic light and the photons with the energy
matching a vibrational transition are absorbed. Raman spectroscopy, on the other hand,
requires monochromatic light and the photons are scattered by the electron cloud of the
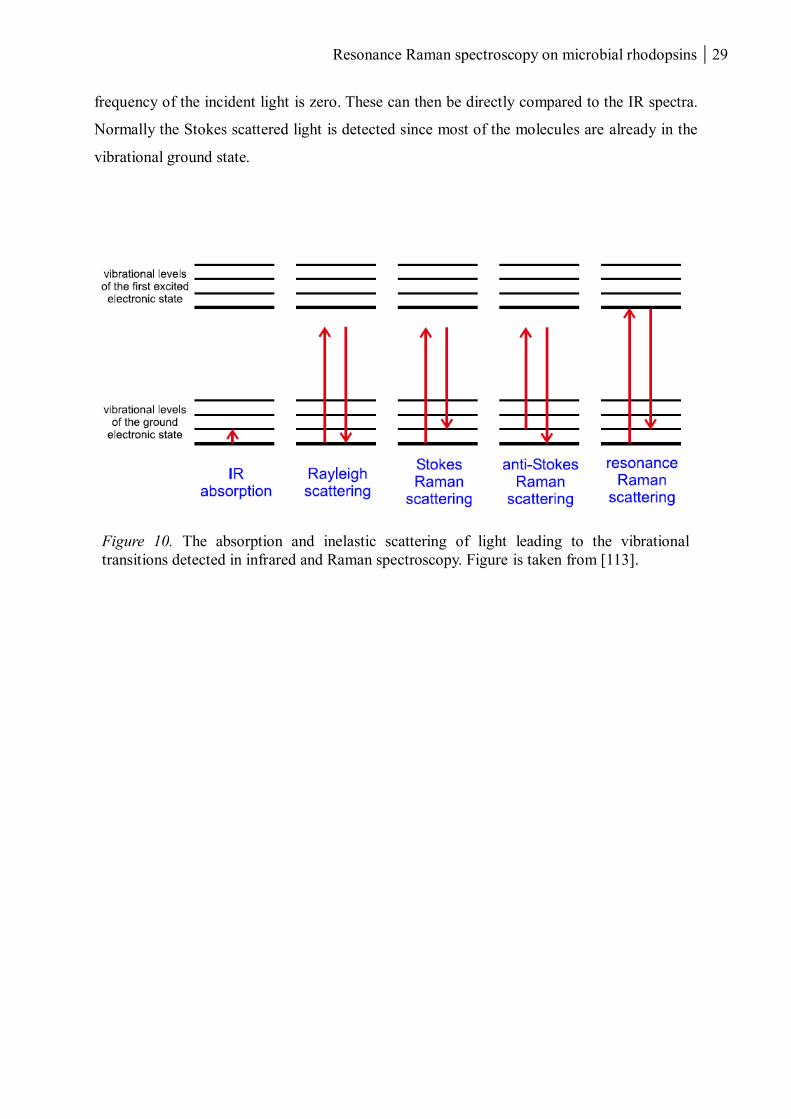
molecule. Most of the photons are left at the same energy (elastic scattering) referred to as the
Rayleigh scattering (Figure 10). The remaining photons either gain or lose energy (inelastic
scattering) correlated with a transfer to a lower (anti-Stokes) or higher (Stokes) vibrational
state of the molecule, respectively. The law of conservation of energy implies that the
difference in the energy of the incident (ℎ𝑣0) and scattered photon (ℎ𝑣𝑅) represent that of the
vibrational transition (ℎ𝑣𝑘).
(1.1) ℎ𝑣0 − ℎ𝑣𝑅 = ℎ𝑣𝑘
In the measured IR or Raman spectrum, the absorption of photons or the intensity of the
scattered photons depend on the probability of the vibrational transition. Absorption requires a
change of the dipole moment whereas the inelastic scattering depends on the polarisability.
Thus in IR and Raman spectroscopy, different molecular vibrations may be observed.
Furthermore, the probability of inelastic scattering can be increased enormously by tuning the
energy of the photons such that it matches the energy of a transition to an electronically
excited state, referred to as the resonance Raman (RR) effect. In cofactor-containing proteins
it can be achieved by choosing a wavelength close to the absorption maximum of the cofactor
which in the case of retinal proteins is the π→π* transition of the polyene chain. The
vibrational modes of rhodopsins can be studied by applying both techniques which generates
complementary data. The strongest vibrational bands seen in the IR spectra represent the
amide-I and amide-II vibrations of the protein backbone, whereas only the vibrational bands
of the chromophore are observed in the resonance Raman spectra. In resonance Raman
spectroscopy, the spectra are depicted by defining the x-scale as Δν (in cm-1
) where the
Resonance Raman spectroscopy on microbial rhodopsins 29
frequency of the incident light is zero. These can then be directly compared to the IR spectra.
Normally the Stokes scattered light is detected since most of the molecules are already in the
vibrational ground state.
Figure 10. The absorption and inelastic scattering of light leading to the vibrational
transitions detected in infrared and Raman spectroscopy. Figure is taken from [113].

30 Resonance Raman spectroscopy on microbial rhodopsins
1.2.2 Resonance Raman scattering
The Raman effect was discovered in an experimental study performed by the Indian scientist
Sir Chandrasekhara Venkata Raman in 1928 [114]. The Raman effect can be theoretically
described using second order perturbation theory. The following derivations are adopted from
[29,115,116].
A dipole moment (�⃑�) is induced in a molecule by the magnetic field (�⃑⃑�) of an electromagnetic
wave with the frequency 𝜐0.
(1.2) �⃑� = 𝛼(𝜐) ∙ �⃑⃑�(𝜐0)
It depends on the polarisability (𝛼) tensor of the molecule which varies with the movements
of the electron cloud brought about by the oscillation of the nuclei. The polarisability tensor
can be described by a Taylor series of normal coordinates 𝑄𝑘 , in this case for a non-linear
molecule with 3N-6 normal modes
(1.3) 𝛼 = 𝛼0 + ∑ (𝛿𝛼
𝛿𝑄𝑘)
0
3𝑁−6𝑘=1 𝑄𝑘 + ⋯
where the main Rayleigh scattering is described by 𝛼0. The intensity of the (frequency-
shifted) Raman scattered light (𝐼𝑅𝑎𝑚𝑎𝑛) is strong when the molecular polarisability changes
along its normal coordinate.
(1.4) 𝐼𝑅𝑎𝑚𝑎𝑛 ∝ ((𝛿𝛼
𝛿𝑄𝑘)
0𝑄𝑘)
2
The Raman cross section for the vibrational transition 𝑖 → 𝑗 is defined by the intensity of the
incident (𝐼0) and scattered light (𝐼).
(1.5) 𝜎𝑖𝑗 =𝐼
𝐼0
For the description of the Raman intensities and specifically for the resonance Raman effect, a
quantum mechanical treatment of the polarisability or scattering tensor in Eq. (1.2) is
Resonance Raman spectroscopy on microbial rhodopsins 31
required. According to the Kramers-Heisenberg-Dirac’s dispersion theory, the matrix elements
of the scattering tensor are defined as
(1.6) [𝛼𝜌𝜎]𝑖𝑓
=1
ℎ∑ (
⟨𝐺𝑖|𝑀𝜌|𝑅𝑟⟩⟨𝑅𝑟|𝑀𝜎|𝐺𝑓⟩
𝜐𝑅𝑟−𝜐𝑘−𝜐0+𝑖Γ𝑅+
⟨𝐺𝑖|𝑀𝜎|𝑅𝑟⟩⟨𝑅𝑟|𝑀𝜌|𝐺𝑓⟩
𝜐𝑅𝑟−𝜐𝑘+𝜐0+𝑖Γ𝑅)𝑟,𝑅
where ℎ is the Planck’s constant, 𝑅 denote the electronic and 𝑟 the vibrational states subject to
the summation, and 𝐺𝑖 the initial and 𝐺𝑓 the final vibrational state of the electronic ground
state. 𝑀𝜌 is the dipole moment of the electronic transition in the 𝜌-direction (𝜌 = 𝑥, 𝑦, 𝑧) and
Γ𝑅 is a damping constant which is connected to the lifetime of the vibronic state 𝑅𝑟. The sum
describing the scattering tensor includes the transitions 𝐺𝑖 → 𝑅𝑟 and 𝑅𝑟 → 𝐺𝑓. Consequently,
the Raman intensity depends on the transition probability of all vibronic states 𝑅𝑟.
In resonance Raman spectroscopy, the excitation frequency 𝜐0 is close to the frequency of an
electronic transition and the summation is reduced to the vibrational states 𝑟 of the resonant
electronically excited state and Eq. 1.6 is simplified to
(1.7) [𝛼𝜌𝜎]𝑖𝑓
≅1
ℎ∑ (
⟨𝐺𝑖|𝑀𝜌|𝑅𝑟⟩⟨𝑅𝑟|𝑀𝜎|𝐺𝑓⟩
𝜐𝑅𝑟−𝜐𝑘−𝜐0+𝑖Γ𝑅)𝑟
where the second non-resonant term is neglected. The Born-Oppenheimer approximation
separates the electronic and nuclear coordinates as given by
(1.8) ⟨𝐺𝑖|𝑀𝜌|𝑅𝑟⟩ = ⟨𝑖𝑟⟩⟨𝐺|𝑀𝜌|𝑅⟩ = ⟨𝑖𝑟⟩𝑀𝐺𝑅,𝜌
where the transition dipole moments can be expanded in a Taylor series with respect to the
normal coordinates 𝑄𝑘 .
(1.9) 𝑀𝐺𝑅,𝜌(𝑄𝑘) = 𝑀𝐺𝑅,𝜌0 + ∑ (
𝜕𝑀𝐺𝑅,𝜌
𝜕𝑄𝑘)
0𝑄𝑘 + ⋯𝑘
Higher order terms are neglected within the harmonic approximation. Combination of Eq. 1.7-
9 gives the scattering tensor as the sum of the two so-called Albrecht A- and B-terms.
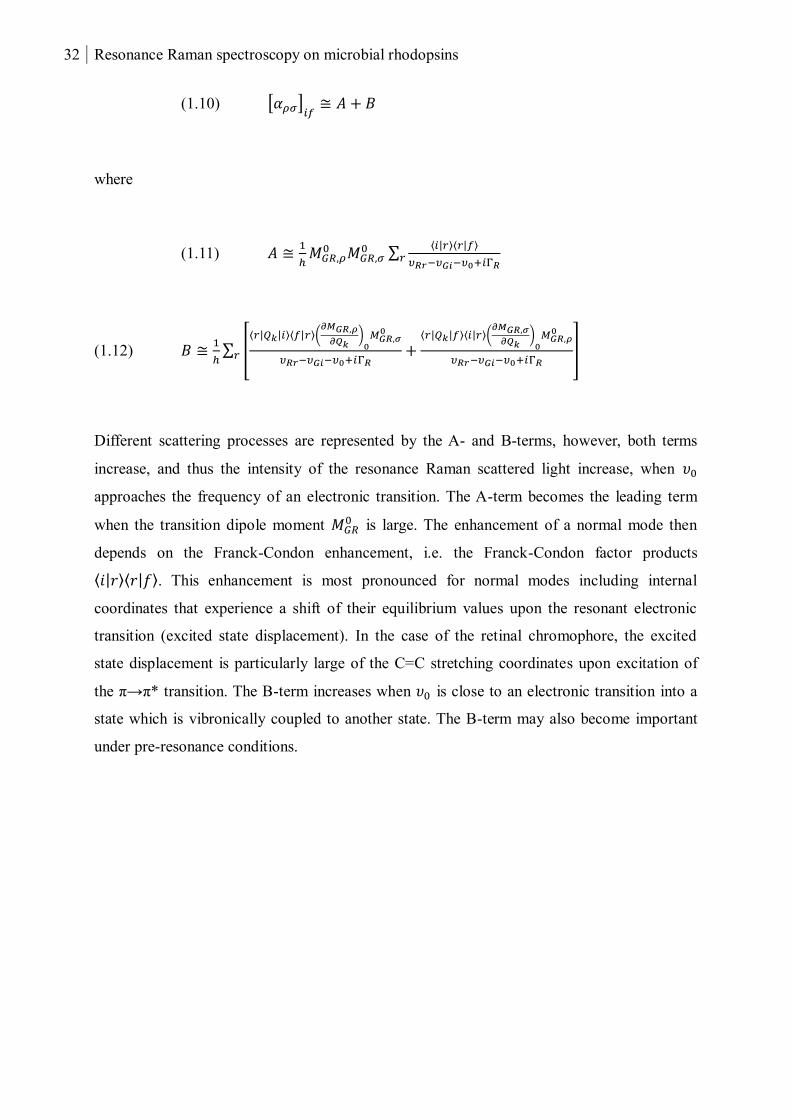
32 Resonance Raman spectroscopy on microbial rhodopsins
(1.10) [𝛼𝜌𝜎]𝑖𝑓
≅ 𝐴 + 𝐵
where
(1.11) 𝐴 ≅1
ℎ𝑀𝐺𝑅,𝜌
0 𝑀𝐺𝑅,𝜎0 ∑
⟨𝑖|𝑟⟩⟨𝑟|𝑓⟩
𝜐𝑅𝑟−𝜐𝐺𝑖−𝜐0+𝑖Γ𝑅𝑟
(1.12) 𝐵 ≅1
ℎ∑ [
⟨𝑟|𝑄𝑘|𝑖⟩⟨𝑓|𝑟⟩(𝜕𝑀𝐺𝑅,𝜌
𝜕𝑄𝑘)
0𝑀𝐺𝑅,𝜎
0
𝜐𝑅𝑟−𝜐𝐺𝑖−𝜐0+𝑖Γ𝑅+
⟨𝑟|𝑄𝑘|𝑓⟩⟨𝑖|𝑟⟩(𝜕𝑀𝐺𝑅,𝜎
𝜕𝑄𝑘)
0𝑀𝐺𝑅,𝜌
0
𝜐𝑅𝑟−𝜐𝐺𝑖−𝜐0+𝑖Γ𝑅]𝑟
Different scattering processes are represented by the A- and B-terms, however, both terms
increase, and thus the intensity of the resonance Raman scattered light increase, when 𝜐0
approaches the frequency of an electronic transition. The A-term becomes the leading term
when the transition dipole moment 𝑀𝐺𝑅0 is large. The enhancement of a normal mode then
depends on the Franck-Condon enhancement, i.e. the Franck-Condon factor products
⟨𝑖|𝑟⟩⟨𝑟|𝑓⟩. This enhancement is most pronounced for normal modes including internal
coordinates that experience a shift of their equilibrium values upon the resonant electronic
transition (excited state displacement). In the case of the retinal chromophore, the excited
state displacement is particularly large of the C=C stretching coordinates upon excitation of
the π→π* transition. The B-term increases when 𝜐0 is close to an electronic transition into a
state which is vibronically coupled to another state. The B-term may also become important
under pre-resonance conditions.
Resonance Raman spectroscopy on microbial rhodopsins 33
1.2.3 Resonance Raman spectroscopy on microbial rhodopsins
Resonance Raman spectroscopy has been employed to study both animal and microbial
rhodopsins as well as free retinals (for reviews see [117–119]). In animal rhodospins (visual
pigments), the photoinduced reaction sequence is terminated by the hydrolysis of the retinal
Schiff base and the subsequent release of the chromophore from the protein. The irreversible
character of the photoconversion imposes severe restrictions of the resonance Raman
spectroscopic measurements of these rhodopsins. In this respect, microbial rhodopsins are
more convenient research targets since the chromophore remains attached to the protein and
the photoinduced reaction sequence eventually leads to the recovery of dark state
(photocycle).
There are various strategies that can be adopted for the identification of the vibrational bands
in the experimental resonance Raman spectrum of microbial rhodopsins and thus the structure
of a retinal in an unknown configuration. In the simplest case, there is a match of the overall
band-pattern compared to the resonance Raman spectrum of a retinal protein for which the
isomeric state of the chromophore is known. In fact, in the literature this is the most common
approach [38,120–125]. The spectrum can also be compared to those of model systems, such
as free retinal in organic solvent. However, the chromophore pocket surrounding the retinal
and especially the counter ion of the protonated Schiff base has a considerable effect on the
vibrational modes [126]. Calculations of the normal mode frequencies can be used to assign
the experimental bands to certain vibrational modes and have been extensively employed for
BR and model compounds although it relies on the availability of isotopically labelled retinals
[119,126–129]. If the spectra are retrieved from QM-MM simulations, the accuracy of the
crystal structure or structural model is important [130]. In the end, it is also constructive to
consider complementary data concerning the retinal configuration, obtained for example from
retinal extraction combined with HPLC analysis or NMR and X-ray crystallography. This was
actually the case for BR where it was already known that the dark-adapted state consisted of
two isomers, all-trans, 15-anti and 13-cis, 15-syn, when Mathies and co-workers successfully
assigned the vibrational bands in the resonance Raman spectra to different normal modes
using a combination of isotopic labelling and calculations [127,128]. Thus, before analysing a
Raman spectrum of a new rhodopsin one should at least perform a retinal extraction to
determine the isomeric states involved, even though the extraction procedure is associated
with considerable uncertainties. During the extraction the retinal Schiff base is hydrolysed
34 Resonance Raman spectroscopy on microbial rhodopsins
which may promote thermal isomerisation reactions. Furthermore, it is not possible to retrieve
any information concerning the 15-syn/anti conformation.
Time-resolved resonance Raman spectra are available for the bacteriorhodopsin intermediates,
L550 [131,132], M410 [129], N560 [133] and O640 [134], but also of retinal analogues
incorporated into BR such as 13-desmethyl [135,136]. The dark and intermediate states of
other microbial rhodopsins have been characterised using Raman spectroscopy and they can
be divided into two groups. Dark states obtained after light-adaptation, in accordance with
bacteriorhodopsin, that contain an all-trans, 15-anti (protonated RSB) which partially and
thermally relax into 13-cis, 15-syn (protonated RSB) after dark-adaptation. Examples are
halorhodopsin [120], Neurospora rhodopsin [124], Leptosphaeria rhodopsin [123] and sensory
rhodopsin II from Halobacterium salinarum [122]. The other group shows in the dark state
only the all-trans, 15-anti (protonated RSB) and no additional isomer is thermally formed
after long periods in the dark. Examples of these are Gleobacter rhodopsin [38], green and
blue absorbing proteorhodopsin [125] and sensory rhodopsin I from Halobacterium halobium
[121]. Both groups have in common that the light-induced isomerisation to 13-cis, 15-anti
triggers the photocycle. The above mentioned rhodopsins come from different organisms such
as archaea, cyanobacteria and fungi and in both groups pumps as well as sensors are
represented. Thus, it is tempting to assume that all newly discovered microbial rhodopsins
exhibit the same isomeric states, either with or without thermal isomerisation in the dark.
Resonance Raman spectroscopy on microbial rhodopsins 35
1.2.3 Vibrational modes in retinal proteins
The most important vibrational bands of retinals, in crystalline form or dissolved in organic
solvent as well as bound to proteins, are found in the region between 800 and 1700 cm-1
. In
resonance and pre-resonance Raman spectroscopy this region includes the molecular
vibrations located within the conjugated system since only the vibrational transitions related
to the π→π* electronic transition of the polyene chain are enhanced. Thus, the vibrations of
the ionone ring are normally not detectable. The molecular vibrations of the retinal can be
described by the internal coordinates which are the C=N (in Schiff base bound retinal), C=O
(in free retinal), C=C and C-C stretching’s as well as CH3 deformation, C-H and CH3 rocking
and C-H out of plane (HOOP) wagging (Figure 11). [119]
The ethylenic stretch (C=C) stretch vibration is the most intense band in the rhodopsin spectra
and is found around 1520-1570 cm-1
(1570-1580 in free retinal). This band normally
constitutes of more than one normal mode where each is dominated by the C=C stretching
coordinates of the polyene chain. The most intense mode is attributed to the in-phase
combination of individual stretching coordinates. There is a linear dependence of the C=C
stretching frequency and the absorption maximum of rhodopsins, i.e a blue-shift in the
absorption leads to a shift of the C=C stretching frequency towards higher frequencies [137].
The C=N stretching is found above 1600 cm-1
and the frequency of this vibration strongly
depends on the protonation state of the Schiff base, showing a higher frequency for a
protonated compared to a deprotonated Schiff base. The mode of the protonated Schiff base
has been shown to be involved in intramolecular energy transfer to adjacent water molecules
(if available), leading to a broadening of the bandwidth [138]. Furthermore, H/D exchange at
the retinal Schiff base causes a shift of the C=N stretching frequency towards lower
frequencies. This shift is used to confirm that the RSB is protonated. The frequency of the
C=N vibration also depends on the strength of the N-H bond, strong hydrogen bond
interactions afford a higher C=N frequency [121].
The fingerprint region, 1100-1400 cm-1
, is reflected by a distinct pattern depending on the
isomeric state of the retinal and can be used to identify the configuration. The underlying
modes include the C-C stretching and the C-H rocking but also the N-H rocking coordinate as
reflected by shifts upon H/D exchange. Between 1400-1500 cm-1
one finds the methyl (CH3)
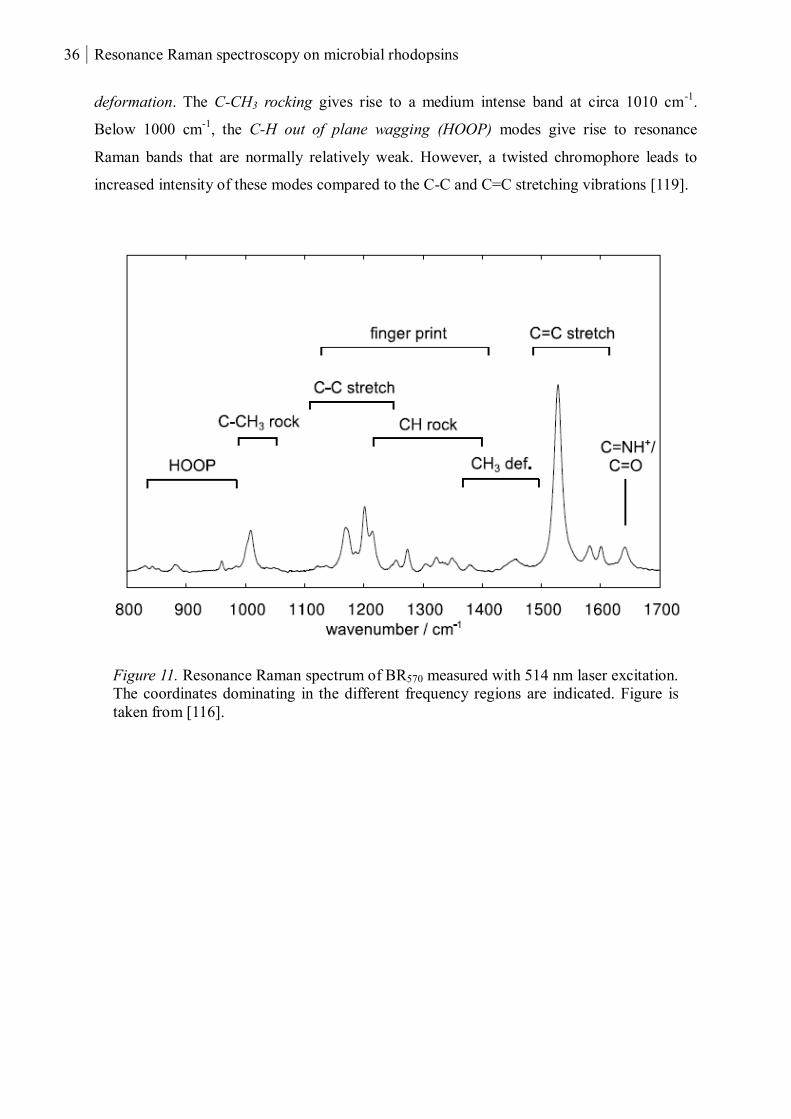
36 Resonance Raman spectroscopy on microbial rhodopsins
deformation. The C-CH3 rocking gives rise to a medium intense band at circa 1010 cm-1
.
Below 1000 cm-1
, the C-H out of plane wagging (HOOP) modes give rise to resonance
Raman bands that are normally relatively weak. However, a twisted chromophore leads to
increased intensity of these modes compared to the C-C and C=C stretching vibrations [119].
Figure 11. Resonance Raman spectrum of BR570 measured with 514 nm laser excitation.
The coordinates dominating in the different frequency regions are indicated. Figure is
taken from [116].

Resonance Raman spectroscopy on microbial rhodopsins 37
2. Materials and Methods
38 Resonance Raman spectroscopy on microbial rhodopsins
2.1 Heterologous expression of channelrhodopsin-2
In contrast to BR and XR, not all microbial rhodopsins can be extracted from the membranes
of the native organisms in the amounts required for spectroscopic studies. When the
heterologous expression of microbial rhodopsins in the bacterium Escherichia coli fails, the
methylotrophic yeast Pichia pastoris has been shown to be a satisfactory alternative, for
example in the case of NOP-1 from Neurospora crassa [139] and Leptosphaeria rhodopsin
[39]. For a review on heterologous expression of proteins in P. pastoris see [140].
Channelrhodopsins have previously been expressed in COS-1 cells (fibroblast cells from the
kidney of monkey) [20,141] as well as in P. pastoris [19,142] in amounts sufficient for
purification. COS cells are cultured at the surface of flasks, which may be a limitation when
large-scale production of protein is requested. Yeast cells, on the other hand, grow in solution
and can be cultivated in large batch cultures on a medium simpler than the one used for the
COS cells. Thus in this work P. pastoris was chosen for the preparation of ChR2 samples.
2.1.1 Transformation in Pichia pastoris
2.1.1.1 Construction of plasmid
cDNA encoding ChR2 1-309 (H134R mutant, accession number AF461397), including c-myc
and 12 His tags at the c-terminal end, with the codon optimised for yeast, was ordered from
Mr. Gene GmbH and inserted into the plasmid pPICZ-C (Invitrogen) by using the restriction
sites EcoRI and AgeI. A yeast consensus sequence (encoding an extra methionine and serine)
was introduced at the N-terminus in order to achieve proper initiation of translation. The
plasmid consist of, inter alia, the AOX1 promotor and the Zeocin™ resistance gene [143].
Mutations were introduced by using the QuickChange® Site-Directed Mutagenesis kit
(Stratagene). Following PCR and digestion with DPN1, transformation of supercompetent
XL1-Blue was performed and the cells were grown in LB medium (see Appendix, BD
Biosciences/Invitrogen) containing 25 µg/mL Zeocin. The plasmid was purified using the
NucleoSpin® Plasmid kit (Macherey-Nagel GmbH) and digested with the restriction enzymes
EcoRI and NotI. Gel chromatography facilitated the separation of the cDNA strands and the
insert containing the mutated ChR2 sequence was purified using the NucleoSpin®
ExtractII
kit (Macherey-Nagel GmbH). The insert was introduced into a fresh pPIC-Z vector and the
plasmid sent for sequencing in order to confirm that the mutation was successfully introduced.
Resonance Raman spectroscopy on microbial rhodopsins 39
2.1.1.2 Transformation
Competent cells were prepared by cultivating Pichia pastoris strain SMD1163 in 500 mL
YPD medium (see Appendix, BD Biosciences/Invitrogen) until OD600 = 1.3-1.5. The cells
were repeatedly washed with ice-cold sterile water and finally re-suspended in ice-cold 1M
sorbitol solution. The plasmid was linearized using the restriction enzyme PmeI (MssI) and
transferred into the competent cells by electroporation (1500 V, 200Ω and 25µF). Ice-cold
sorbitol (1 M) was immediately added and the cells stored for 1 hour on ice followed by 1
hour at 30 ºC. The transformed cells were then plated on YPD medium (1 M sorbitol)
containing 500, 1000 or 2000 µg/mL Zeocin and left at 30ºC for around 1 week. Clones were
picked, re-plated and finally transferred to 25 mL YPD medium in 250 mL flasks and left to
grow over-night at 250 rpm and 28-30ºC. The cells were finally transferred to fresh YPD
medium with 30% glycerol, shock-frozen in liquid N2 and stored at -80ºC. [143]
2.1.1.3 Phenotype and multicopy test
SMD1163 belongs to the strains with wild-type methanol metabolism which is called the
Mut+ phenotype. If the promoter AOX1 is disrupted the cells can still metabolise methanol,
however, at a much slower rate and by using the AOX2 promoter. This phenotype is called
MutS (methanol utilization slow). [143] Transformed P. pastoris cells were checked for
phenotype by plating them on the MMH medium (Minimal Methanol with Histidine, see
Appendix, BD Biosciences/Invitrogen) and comparing the growth to that of GS115 MutS
albumin and GS115/pPICZ/lacZ Mut+. However, none of the clones showed Mut
S growth and
were all assigned to the Mut+ phenotype.
Upon electroporation several plasmids can enter the cell and integrate into the genome.
Generally, more copies of the plasmid lead to a higher protein expression. Transformed cells
were plated on YPD medium (1 M sorbitol) containing 2000 µg/mL Zeocin whereby clones
showing the best growth, and thereby potentially containing most inserted plasmids and
Zeocin resistance, were chosen for further cultivation and expression. [143]
2.1.2 Cell cultivation
Transformed cells were transferred to 25 mL BMGY medium (see Appendix, BD
Biosciences/Invitrogen) in 250 mL flasks and the pre-culture was left to grow over-night at
40 Resonance Raman spectroscopy on microbial rhodopsins
250 rpm and 28-30ºC. Parts of the pre-culture was inoculated into 500 mL BMGY medium in
5 L baffled flasks and grown until the optical density at 600 nm (OD600) reached 4-6. The
initial optical density (OD600(ini)) and thus the amount of the pre-culture required for the
inoculation was calculated according to
(2.1) 𝑂𝐷600(𝑡) = 𝑂𝐷600(𝑖𝑛𝑖) ∙ 2𝑡
𝑑⁄
where 𝑡 is the time of the cell growth and 𝑑 is the cell doubling time experimentally found to
be roughly 2.5 hours in the logarithmic growth phase. After the cell growth the old media was
removed by centrifugation. The cell pellet was resuspended in BMMY medium (see
Appendix, BD Biosciences/Invitrogen) containing 2.5% methanol and 10 µM all-trans retinal
such that OD600 = 1. The medium was removed after 12 hours of induction and the cells
washed in breaking buffer pH 7.4 (see Appendix, containing 1 mM PMSF) by repetitive
centrifugation steps. The induced cells were stored in breaking buffer and at - 80°C after
rapid-freeze with liquid N2.
2.1.3 Purification of channelrhodopsin-2
The disruption of the induced cells was achieved using a French Press (G. Heinemann
Ultraschall und Labortechnik) and the cell suspension (0.2-0.3 g cells / mL breaking buffer)
was pressed twice under 20000 Psi. This was followed by two centrifugation steps, first to
remove intact cells (10 min, 4000×g, 4°C) and the acquired supernatant further separated into
the membrane and cytosol fractions by the means of ultracentrifugation (1 hour, 180000×g,
4°C). The final pellet comprising of the membranes was pottered in solubilisation buffer
consisting of 20 mM HEPES, 100 mM NaCl, 10 vol% glycerol, 10 mM imidazole and 0.1
mM PMSF at pH 7.4 (see Appendix). The total amount of proteins was determined using the
DC Protein Assay (BioRad). The volume was adjusted and the detergent dodecyl maltoside
(DDM) added such the final concentration corresponded to 1 w/w% DDM, 250 mM arginine,
3 µM all-trans retinal and 10 mg proteins / mL solubilisation buffer. The proteins in the
membranes were solubilised overnight at 4°C while the solution was being stirred and un-
solubilised protein was then removed by ultracentrifugation (1 hour, 180000×g, 4°C). The
supernatant was added onto a 1 mL Ni-NTA column (HisTrapTM
FF crude, GE Healthcare)
connected to an ÄKTATM
purifier 10 system (Amersham Pharmacia Biotech). If larger
amounts of protein were purified (i.e. more than 1 L cell culture), two columns were
Resonance Raman spectroscopy on microbial rhodopsins 41
connected linearly. The column was washed using 15 column volumes of solubilisation buffer
containing 25 mM imidazole and 0.03 w/w% DDM. The flow-rate of the system was typically
set to 1 mL/min. A linear gradient of imidazole ranging from 25 to 500 mM, with a slope of
around 30 mM/min, eluted the proteins attached to the column. The release was monitored by
absorption changes at 280 and 470 nm. The purified protein was dialysed in solubilisation
buffer (0.03 w/w% DDM, pH 7.4) without the imidazole and concentrated in an Amicon ultra
(100000 MWCO, Millipore). Finally the protein purity and functionality was checked by UV-
vis absorption spectroscopy before and after illumination in the blue. The yield was calculated
on the basis of the absorption at 450 nm using Lambert-Beer law
(2.2) 𝐴 = 𝜀 ∙ 𝑐 ∙ 𝑑
where 𝐴 is the absorption, 𝑐 the concentration, 𝑑 the optical path length and 𝜀 the extinction
coefficient which was adopted from the Volvox carteri channelrhodopsin (VChR) with an
experimentally determined value of ɛ450 = 45500 M-1
cm-1
[141]. The molar mass of ChR2 is
roughly 39000 g/mol not taking into consideration any attached carbohydrates.
2.1.3.1 Exchange of the buffer for the spectroscopic measurements
Protein in D2O buffer was a requirement in the resonance Raman experiments since the
proton-to-deuterium (H/D) exchange of the retinal Schiff base leads to isotopic shifts most
clearly seen for the C=N stretching mode. The sample was first measured in the normal
solubilisation buffer at pH 7.4. The same sample was diluted 1:10 in the equivalent buffer,
except containing D2O at pD 7.4, and then concentrated. The dilution and concentration step
was repeated once in order to achieve a 1:100 dilution of the H2O. Note that when measuring
pD using a standard pH-meter one must take into account that pD equals the measured pH +
0.4. The change of the pH was performed by using the solubilisation buffer where the HEPES
was replaced with 20 mM phosphate or 20 mM tris with pH adjusted to 6.0 and 9.0,
respectively.
2.1.3.2 Deglycosylation protocol
Roughly 10 µg ChR2-H134R in a solution containing 1 w/w% SDS was denatured at 95ºC for
10 min. The solution (14 µL) was diluted in 20 mM sodium phosphate buffer (pH 7.2, 1
w/w% DDM) such that the concentration of SDS was reduced by a factor of 7.
42 Resonance Raman spectroscopy on microbial rhodopsins
Deglycosylation was performed by addition of 2 µL N-Glycosidase F and the sample was
stored for 20 h at 37ºC. The enzyme was then denatured at 90ºC for 10 min. The
deglycosylated sample was analysed using SDS-PAGE and Western blot and compared to
glycosylated (untreated) ChR2-H134R.
Resonance Raman spectroscopy on microbial rhodopsins 43
2.2 Reduction of the retinal in bacteriorhodopsin
Reduced and UV-irradiated BR displays a fine-structured pattern in the absorption spectra and
is proposed to contain a retro-retinyl chromophore corresponding to a one-bond shift of the
conjugated system towards or away from the ionone ring [144]. Reduced and UV-irradiated
BR was prepared in a protocol similar to [144,145]. Purple membrane expressed in
Halobacterium halobium strain S9 was purified according to [3].
Purple membrane (OD570 = 1.5, 0.1 M NH4CO3H, pH ~10) was reduced by adding 20 mg
NaBH4 per 1 mL solution followed by exposure to yellow light (Xe-lamp 220W, Schott filter
OG 435) for 10-45 minutes until the sample fully and irreversibly bleached. The reaction was
performed while the sample was being stirred and cooled in an ice-bath. The initial step is
proposed to reduce the retinal Schiff base upon formation of a C-N single bond [144].
Following exposure for 3-10 minutes to the UV-fraction of white light (simply by removing
the Schott filter) leads to the fine-structure in the absorption spectrum presumably due to a
shift of the entire conjugated system [144]. The reaction was performed using both NaBH4
and NaBD4 (Sigma-Aldrich®), as well as in H2O and D2O buffers. Prior to the resonance
Raman experiments, the buffer was exchanged by diluting the samples in 5 mL sodium
phosphate buffer (150 mM, pH 7.0), followed by centrifugation at 8000 g for 2 hours and re-
suspending the pellet in sodium phosphate buffer.
44 Resonance Raman spectroscopy on microbial rhodopsins
2.3 Optical and vibrational spectroscopy
2.3.1 UV-vis absorption spectroscopy
2.3.2.1 Conventional setup
A Cary 50 Bio spectrophotometer (Varian Inc.) or Cary 4000 UV-vis spectrophotometer
(Agilent Technologies) was used for measuring stationary or time-resolved (in seconds to
minutes) absorption spectra. The absorption spectroscopy at cryogenic temperatures were
performed according to [146]. Illumination of the samples was facilitated by a blue (λmax ~
455 nm, LEDC2, Thorlabs) or a green (λmax ~ 525 nm, LIU002, Thorlabs) LED.
2.3.1.2 Flash photolysis
The experiments and data evaluations were done in collaboration with Rolf Hagedorn. The
setup for the transient spectroscopy was based on the LKS.60 flash photolysis system
(Applied Photophysics Ltd., Leatherhead, UK) as described in [20,108,147]. The photocycle
was initiated using a Rainbow OPO/Nd:YAG laser (10 ns pulse, 470 nm, 16 mJ/shot) and the
absorption differences, comparing before and after the laser flash, was detected by a 150 W
Xe-lamp and an Andor iStar ICCD Camera with a Shamrock-spectrograph of 2 nm (Andor
technology, Belfast, Northern Ireland). The measurements were performed at 19ºC and a set
of difference spectra was recorded covering a time-range from 1 µs to 1 s after the laser flash.
Singular value decomposition (using Matlab, The MathWorks, Natick, MA) identified the
significant components of the time-resolved difference spectra. The kinetic constants,
component spectra and reconstructed data set were obtained by target analysis with a
sequential kinetic model. As a simple example, a model involving three states (A, B and C)
with the kinetic constants k1 and k2 can be written according to:
𝐴 𝑘1→ 𝐵
𝑘2→ 𝐶
In this case the mean life time (τ) of one state represent the reciprocal value of the kinetic
constant.
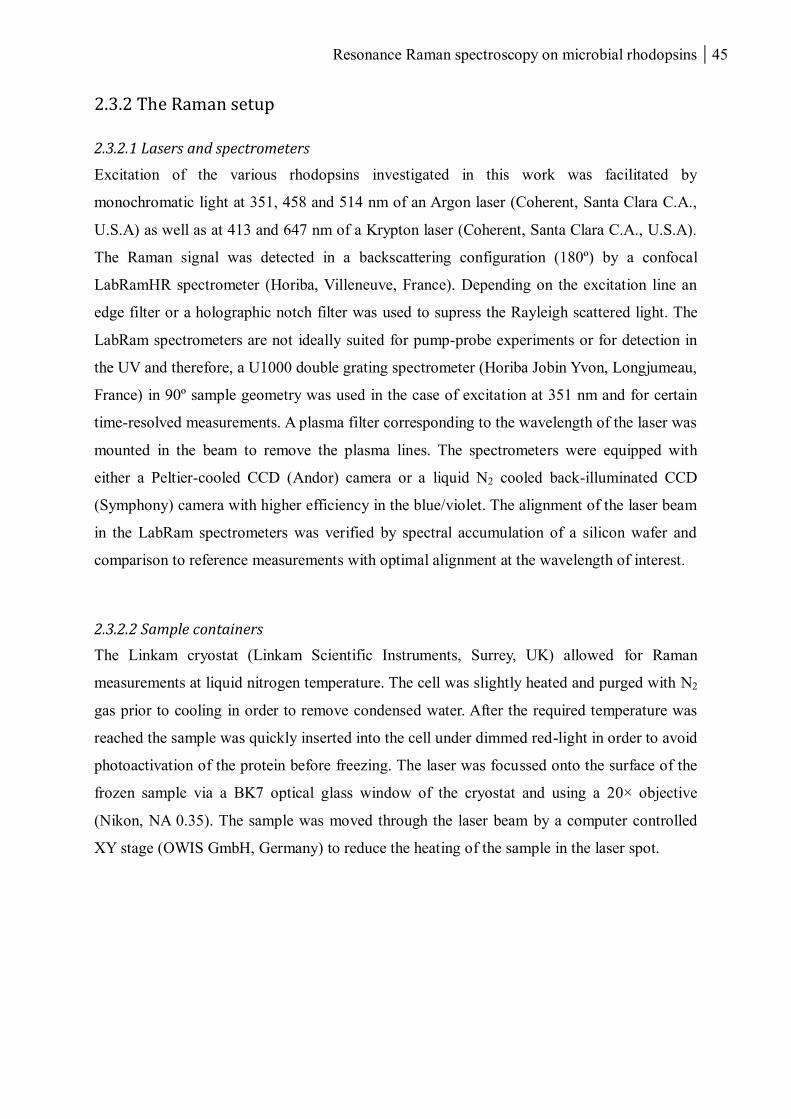
Resonance Raman spectroscopy on microbial rhodopsins 45
2.3.2 The Raman setup
2.3.2.1 Lasers and spectrometers
Excitation of the various rhodopsins investigated in this work was facilitated by
monochromatic light at 351, 458 and 514 nm of an Argon laser (Coherent, Santa Clara C.A.,
U.S.A) as well as at 413 and 647 nm of a Krypton laser (Coherent, Santa Clara C.A., U.S.A).
The Raman signal was detected in a backscattering configuration (180º) by a confocal
LabRamHR spectrometer (Horiba, Villeneuve, France). Depending on the excitation line an
edge filter or a holographic notch filter was used to supress the Rayleigh scattered light. The
LabRam spectrometers are not ideally suited for pump-probe experiments or for detection in
the UV and therefore, a U1000 double grating spectrometer (Horiba Jobin Yvon, Longjumeau,
France) in 90º sample geometry was used in the case of excitation at 351 nm and for certain
time-resolved measurements. A plasma filter corresponding to the wavelength of the laser was
mounted in the beam to remove the plasma lines. The spectrometers were equipped with
either a Peltier-cooled CCD (Andor) camera or a liquid N2 cooled back-illuminated CCD
(Symphony) camera with higher efficiency in the blue/violet. The alignment of the laser beam
in the LabRam spectrometers was verified by spectral accumulation of a silicon wafer and
comparison to reference measurements with optimal alignment at the wavelength of interest.
2.3.2.2 Sample containers
The Linkam cryostat (Linkam Scientific Instruments, Surrey, UK) allowed for Raman
measurements at liquid nitrogen temperature. The cell was slightly heated and purged with N2
gas prior to cooling in order to remove condensed water. After the required temperature was
reached the sample was quickly inserted into the cell under dimmed red-light in order to avoid
photoactivation of the protein before freezing. The laser was focussed onto the surface of the
frozen sample via a BK7 optical glass window of the cryostat and using a 20× objective
(Nikon, NA 0.35). The sample was moved through the laser beam by a computer controlled
XY stage (OWIS GmbH, Germany) to reduce the heating of the sample in the laser spot.
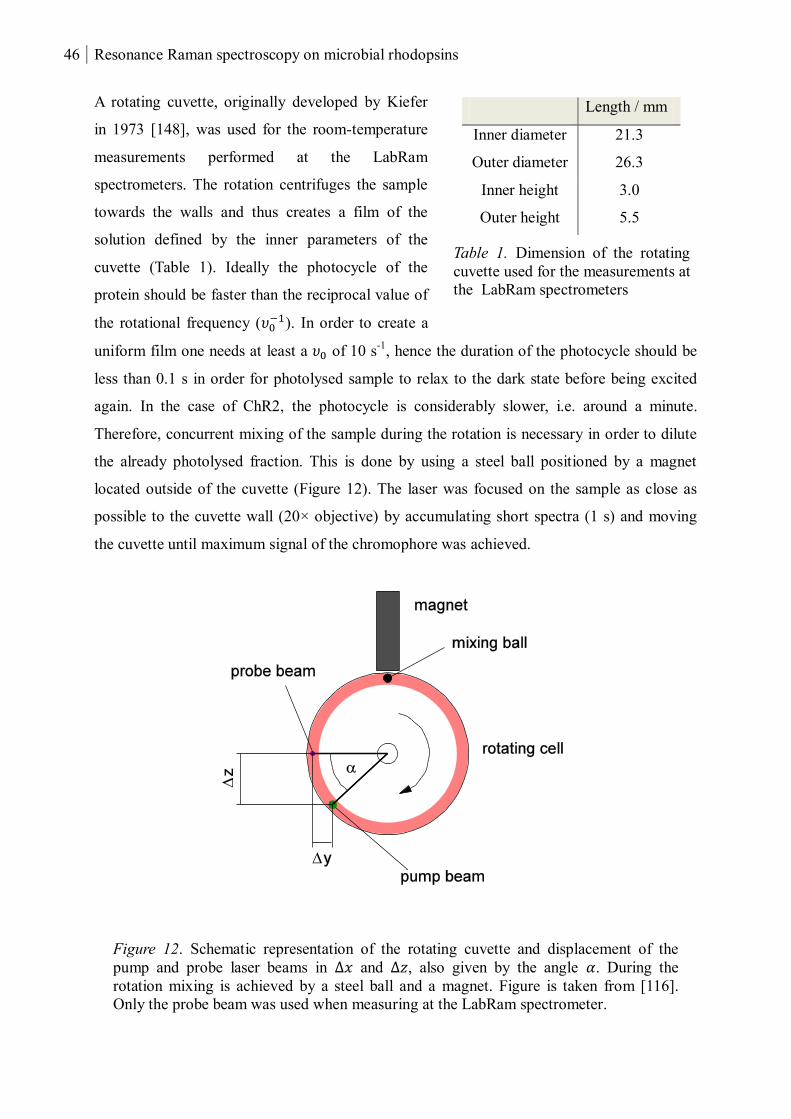
46 Resonance Raman spectroscopy on microbial rhodopsins
A rotating cuvette, originally developed by Kiefer
in 1973 [148], was used for the room-temperature
measurements performed at the LabRam
spectrometers. The rotation centrifuges the sample
towards the walls and thus creates a film of the
solution defined by the inner parameters of the
cuvette (Table 1). Ideally the photocycle of the
protein should be faster than the reciprocal value of
the rotational frequency (𝜐0−1). In order to create a
uniform film one needs at least a 𝜐0 of 10 s-1
, hence the duration of the photocycle should be
less than 0.1 s in order for photolysed sample to relax to the dark state before being excited
again. In the case of ChR2, the photocycle is considerably slower, i.e. around a minute.
Therefore, concurrent mixing of the sample during the rotation is necessary in order to dilute
the already photolysed fraction. This is done by using a steel ball positioned by a magnet
located outside of the cuvette (Figure 12). The laser was focused on the sample as close as
possible to the cuvette wall (20× objective) by accumulating short spectra (1 s) and moving
the cuvette until maximum signal of the chromophore was achieved.
Figure 12. Schematic representation of the rotating cuvette and displacement of the
pump and probe laser beams in ∆𝑥 and ∆𝑧, also given by the angle 𝛼. During the
rotation mixing is achieved by a steel ball and a magnet. Figure is taken from [116].
Only the probe beam was used when measuring at the LabRam spectrometer.
Length / mm
Inner diameter 21.3
Outer diameter 26.3
Inner height 3.0
Outer height 5.5
Table 1. Dimension of the rotating
cuvette used for the measurements at
the LabRam spectrometers

Resonance Raman spectroscopy on microbial rhodopsins 47
2.3.2.3 Data evaluation
The spectra were evaluated using the free numeric software Octave (GNU General Public
Licence, version 2.1.73) and by running modified scripts originally developed by Hendrik
Naumann for the analysis of the Raman data on sensory rhodopsin-II from Natronomanas
pharaonis (NpSRII) [116]. In some cases it was possible to remove some of the background
and bands not originating from the chromophore by a simple subtraction procedure. An
example is shown in Figure 13, where LED UV-illumination is needed to accumulate Rh-Bl
of HKR1 (blue). The absence of the UV-light leads to laser-induced photo-excitation of Rh-Bl
and subsequent formation of Rh-UV (red) with very small Raman cross-section at 514 nm.
Thus the subtraction, UV-background minus without, generates a spectrum free of buffer
bands (black). Next, the spectra were calibrated according to the toluene standard and,
depending on the spectral window, either to the 1003.6, 1211.4 or 1605.1 cm-1
toluene bands
(see example of a fit in Figure 14). A rough calibration of the spectrometer was done before
the measurements but toluene spectra were also recorded throughout the entire experiment to
verify the stability of the spectrometer. Normally the spectra were shifted, if at all, in the
range of one wavenumber or less. Finally a baseline was subtracted using a polynomial
function (Figure 15).
Figure 13. Resonance Raman spectra of HKR1 measured using the 514 nm laser
line (1 mW) with (blue) and without (red) UV-LED irradiation. Subtracted
spectrum ‘with minus without LED’ (black) represents Rh-Bl where the
contributions of the buffer are removed.
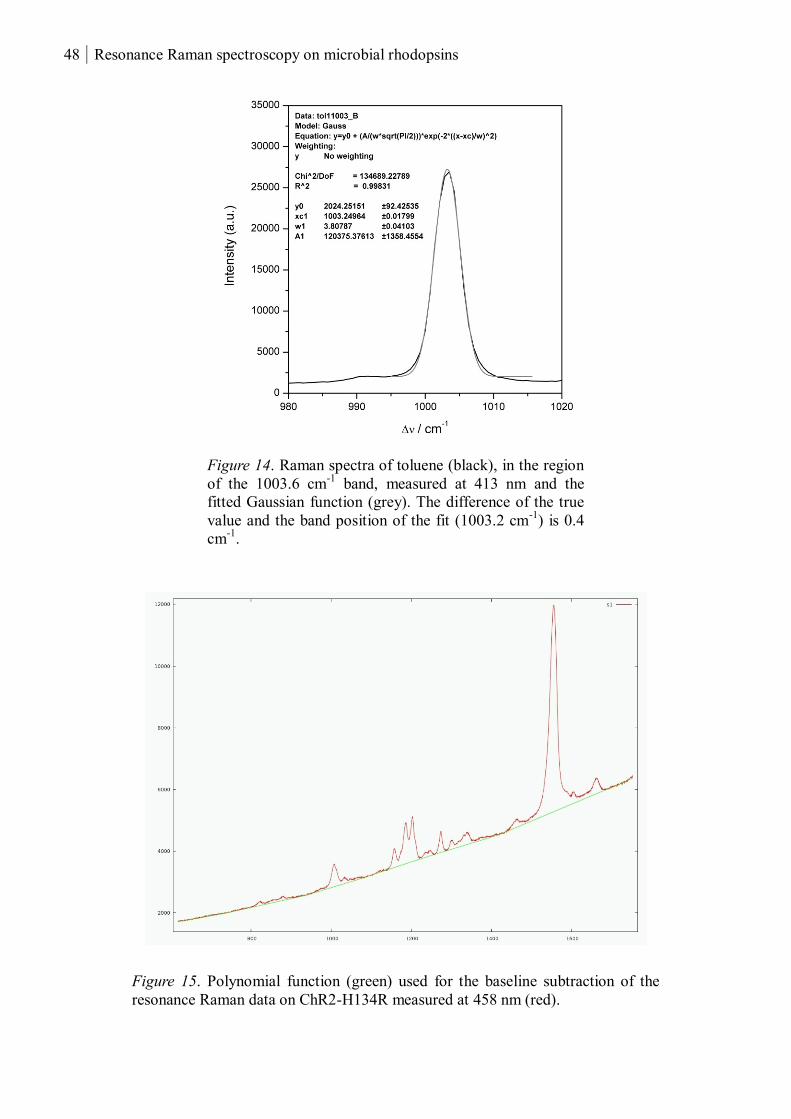
48 Resonance Raman spectroscopy on microbial rhodopsins
Figure 14. Raman spectra of toluene (black), in the region
of the 1003.6 cm-1
band, measured at 413 nm and the
fitted Gaussian function (grey). The difference of the true
value and the band position of the fit (1003.2 cm-1
) is 0.4
cm-1
.
Figure 15. Polynomial function (green) used for the baseline subtraction of the
resonance Raman data on ChR2-H134R measured at 458 nm (red).
Resonance Raman spectroscopy on microbial rhodopsins 49
2.3.2.4 Time-resolved probe-only resonance Raman spectroscopy
The LabRam spectrometer with a 20× objective gives a beam radius 𝑟𝑙𝑎𝑠 of the Gaussian laser
profile on the sample of roughly 20 µm. 500 µL sample in a rotating cuvette with a cell radius
𝑟𝑐𝑒𝑙𝑙 of 13.15 mm was continuously mixed via the magnetic ball technique. The rotational
frequency of the cuvette 𝜈0 in these experiments was ~15 s-1
.
The photochemical rate constant can be calculated using
(2.3) 𝑙0 = 4.81 ∙ 10−10 ∙𝛾∙ 𝜆𝑙𝑎𝑠
∙𝑃𝑙𝑎𝑠∙𝜆𝑙𝑎𝑠
𝑟𝑙𝑎𝑠2 [𝑠−1]
where 𝛾 is the quantum yield, 𝑃𝑙𝑎𝑠 the power of the laser and 𝜀𝜆𝑙𝑎𝑠 the extinction coefficient
for the chromophore at the laser wavelength 𝜆𝑙𝑎𝑠. For ChR2, 𝜀458 ≈ 45500 M-1
cm-1
at the 458
nm laser line. The residence time of the sample in the laser beam is given by
(2.4) Δ𝑡𝑙𝑎𝑠 =𝑟𝑙𝑎𝑠
𝑟𝑐𝑒𝑙𝑙∙𝜋∙𝜈0≈ 30 𝜇𝑠
Combining equation 2.3 and 2.4 – after inserting the experimental values and if we assume
that 𝛾 = 0.1 – the photoconversion parameter (Δ𝑡𝑙𝑎𝑠 ∙ 𝑙0) now only depends on the power of
the laser.
(2.5) Δ𝑡𝑙𝑎𝑠 ∙ 𝑙0 = 4.81 ∙ 10−10 𝛾∙ 𝜆𝑙𝑎𝑠
∙𝑃𝑙𝑎𝑠∙𝜆𝑙𝑎𝑠
𝑟𝑙𝑎𝑠∙𝑟𝑐𝑒𝑙𝑙∙𝜋∙𝜈0= 809 ∙ 𝑃𝑙𝑎𝑠
0.1 mW laser power gives a photocoversion of less than 10 %. If we assume that due to the
mixing ball we have an efficient exchange of the sample, the theoretical limit for the total
time 𝑡𝑚𝑒𝑎𝑠 the sample can be measured until a photolysed sample is photolysed a second time
is given by the ratio of the cell volume 𝑉𝑐𝑒𝑙𝑙 and the irradiated volume 𝑉𝑙𝑎𝑠 according to
(2.6) 𝑉𝑙𝑎𝑠 = 𝑟𝑙𝑎𝑠2 ∙ 𝜋 ∙ 𝑑𝑝𝑒𝑛
where 𝑑𝑝𝑒𝑛 is the penetration depth of the laser in the sample which may be approximated by
𝑟𝑙𝑎𝑠 . For 𝑉𝑐𝑒𝑙𝑙 = 0.5·10-3
L one obtains under the assumption of a complete mixing of the
50 Resonance Raman spectroscopy on microbial rhodopsins
sample
(2.7) 𝑡𝑚𝑒𝑎𝑠 =𝑉𝑐𝑒𝑙𝑙
𝑉𝑙𝑎𝑠∙
1
𝜈0=
𝑉𝑐𝑒𝑙𝑙
𝑟𝑙𝑎𝑠3 ∙𝜋∙𝜈0
≈ 370 ℎ𝑜𝑢𝑟𝑠
as a theoretical limit. Thus preferential enhancement of the dark state should be possible by
using 0.1 mW laser power, a rotational frequency of 15 s-1
, 500 µL sample mixed in the
rotating cuvette by a magnetic ball and upon an hour of spectral accumulation at 458 nm
excitation. Dark-adaptation corresponding to the recovering of the protein dark-state (~1 min)
is then necessary before further laser exposure. Increasing the laser power, i.e. to 10 mW
increases the photocoversion by a factor of 10 which should allow detectable amounts of
intermediates in the laser spot. The residence time of the laser spot on a fraction of the sample
and thus the window for the intermediate life time is 30 µs as defined by equation 2.4.
2.3.2.5 Time-resolved pump-probe resonance Raman spectroscopy
Resonance Raman spectra of photoreceptor intermediates can also be obtained by using a
pump and probe two laser system. The photocycle is initiated in the pump laser spot, the
photolysed sample is then transported according to the rotational frequency of the cuvette and
probed with a spatially displaced laser beam (Figure 12). The difference in time between the
pump and probe, defined by the rotational frequency of the cuvette and the displacement of
the laser beams, determines what intermediate is being probed. Furthermore, the pump laser
should be tuned to the absorption maximum of the dark state in order to achieve high photo-
conversion whereas the probe wavelength should correspond to the absorption maximum of
the intermediate.
Since the BR-M410 spectrum is used to be compared with deprotonated states of other
microbial rhodopsin, a (514 nm) pump (413 nm) probe experiment was performed. The
experimental conditions, with modifications, were adapted from [129]. The measurement was
performed on the U1000 spectrometer using a cuvette with a rotational frequency 𝜐0 of 20 s-1
and a cell radius 𝑟0 of 21 mm. The delay ∆𝑡 between the pump and probe laser beams should
be 1 ms which is in order of the BR-M410 life time, and the angle 𝛼 correlated to this delay is
calculated according to
Resonance Raman spectroscopy on microbial rhodopsins 51
(2.8) 𝛼 = 2𝜋 ∙ ∆𝑡 ∙ 𝜐0
Thus the displacement of the lasers in Δ𝑥 and ∆𝑧 (Figure 12) is
(2.9) Δ𝑥 = 𝑟0 ∙ (1 − 𝑐𝑜𝑠(2𝜋 ∙ ∆𝑡 ∙ 𝜐0)) = 0.17 𝑚𝑚
(2.10) ∆𝑧 = 𝑟0 ∙ 𝑠𝑖𝑛(2𝜋 ∙ ∆𝑡 ∙ 𝜐0) = 2.63 𝑚𝑚
The lasers were initially aligned such that they both passed through a 5 µm pinhole. The
pinhole was then moved by Δ𝑥 and ∆𝑧 and the probe beam adjusted to the new position.

52 Resonance Raman spectroscopy on microbial rhodopsins

Resonance Raman spectroscopy on microbial rhodopsins 53
3. Results and discussion
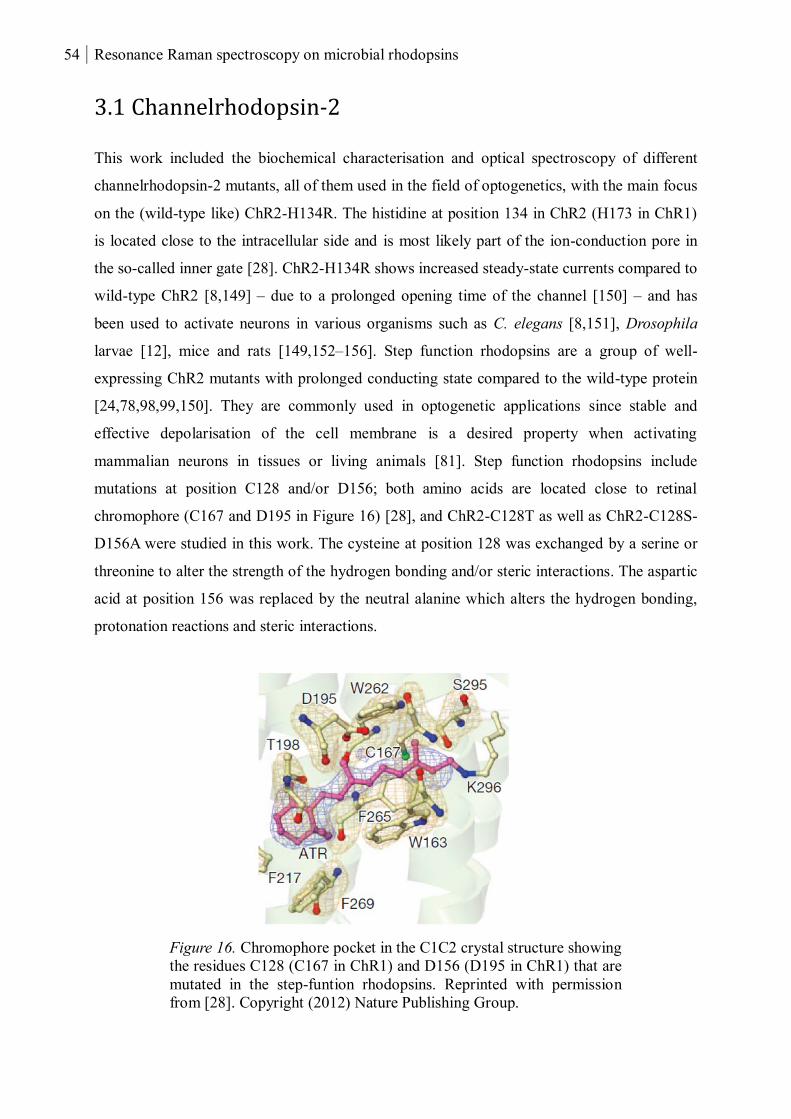
54 Resonance Raman spectroscopy on microbial rhodopsins
3.1 Channelrhodopsin-2
This work included the biochemical characterisation and optical spectroscopy of different
channelrhodopsin-2 mutants, all of them used in the field of optogenetics, with the main focus
on the (wild-type like) ChR2-H134R. The histidine at position 134 in ChR2 (H173 in ChR1)
is located close to the intracellular side and is most likely part of the ion-conduction pore in
the so-called inner gate [28]. ChR2-H134R shows increased steady-state currents compared to
wild-type ChR2 [8,149] – due to a prolonged opening time of the channel [150] – and has
been used to activate neurons in various organisms such as C. elegans [8,151], Drosophila
larvae [12], mice and rats [149,152–156]. Step function rhodopsins are a group of well-
expressing ChR2 mutants with prolonged conducting state compared to the wild-type protein
[24,78,98,99,150]. They are commonly used in optogenetic applications since stable and
effective depolarisation of the cell membrane is a desired property when activating
mammalian neurons in tissues or living animals [81]. Step function rhodopsins include
mutations at position C128 and/or D156; both amino acids are located close to retinal
chromophore (C167 and D195 in Figure 16) [28], and ChR2-C128T as well as ChR2-C128S-
D156A were studied in this work. The cysteine at position 128 was exchanged by a serine or
threonine to alter the strength of the hydrogen bonding and/or steric interactions. The aspartic
acid at position 156 was replaced by the neutral alanine which alters the hydrogen bonding,
protonation reactions and steric interactions.
Figure 16. Chromophore pocket in the C1C2 crystal structure showing
the residues C128 (C167 in ChR1) and D156 (D195 in ChR1) that are
mutated in the step-funtion rhodopsins. Reprinted with permission
from [28]. Copyright (2012) Nature Publishing Group.
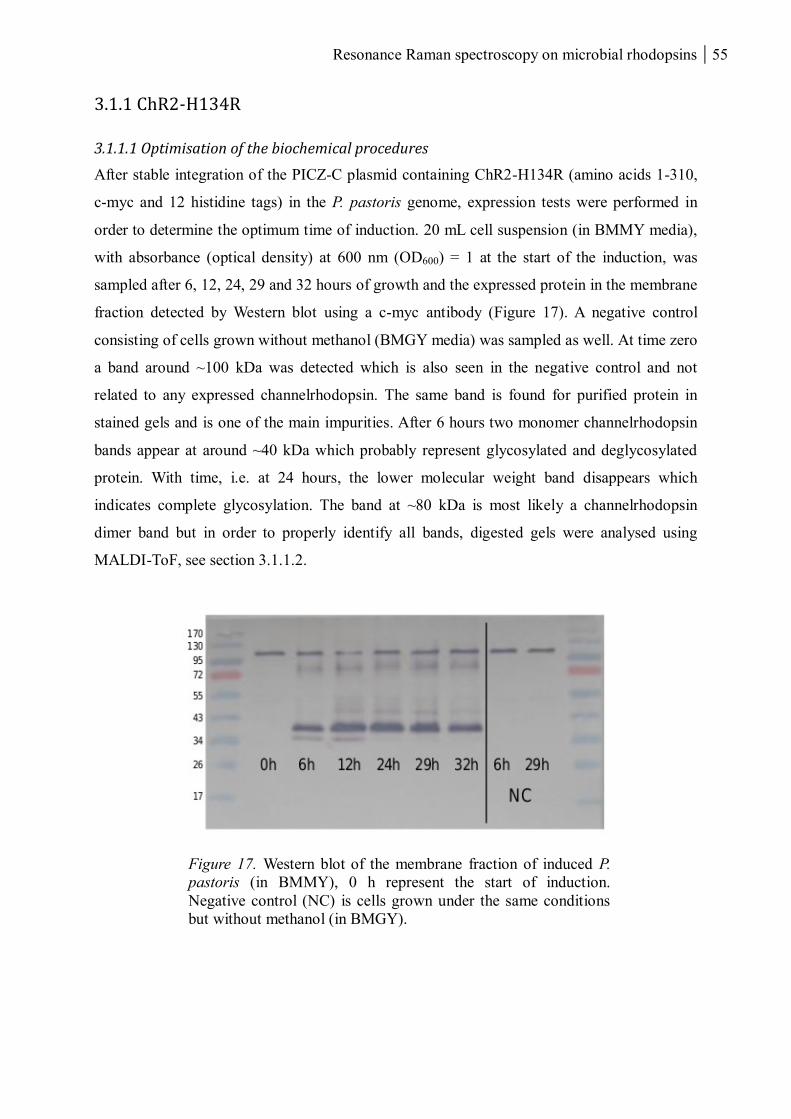
Resonance Raman spectroscopy on microbial rhodopsins 55
3.1.1 ChR2-H134R
3.1.1.1 Optimisation of the biochemical procedures
After stable integration of the PICZ-C plasmid containing ChR2-H134R (amino acids 1-310,
c-myc and 12 histidine tags) in the P. pastoris genome, expression tests were performed in
order to determine the optimum time of induction. 20 mL cell suspension (in BMMY media),
with absorbance (optical density) at 600 nm (OD600) = 1 at the start of the induction, was
sampled after 6, 12, 24, 29 and 32 hours of growth and the expressed protein in the membrane
fraction detected by Western blot using a c-myc antibody (Figure 17). A negative control
consisting of cells grown without methanol (BMGY media) was sampled as well. At time zero
a band around ~100 kDa was detected which is also seen in the negative control and not
related to any expressed channelrhodopsin. The same band is found for purified protein in
stained gels and is one of the main impurities. After 6 hours two monomer channelrhodopsin
bands appear at around ~40 kDa which probably represent glycosylated and deglycosylated
protein. With time, i.e. at 24 hours, the lower molecular weight band disappears which
indicates complete glycosylation. The band at ~80 kDa is most likely a channelrhodopsin
dimer band but in order to properly identify all bands, digested gels were analysed using
MALDI-ToF, see section 3.1.1.2.
Figure 17. Western blot of the membrane fraction of induced P.
pastoris (in BMMY), 0 h represent the start of induction.
Negative control (NC) is cells grown under the same conditions
but without methanol (in BMGY).

56 Resonance Raman spectroscopy on microbial rhodopsins
Next the cell growth was studied by measuring the optical density during the induction. The
growth curves of 500 mL cell culture in BMMY (5 L bottles, 28º) with initial OD600 = 1
showed that best growth is achieved at 250 rpm and using a sterile cloth to cover the bottle
(Figure 18). The supply of oxygen is important since both lowering the speed of shaking (to
150 rpm) as well as using a plug reduced the cell growth. Although the OD is constantly
increasing, the amount of dead cells is as well seen as a sand-like precipitation. This is
qualitatively observed in the Western blot as the intensity of the channelrhodopsin monomer
band is largely unchanged at 12, 24 and 29 hours but slightly decreased at 32 hours (Figure
17). The time of induction was therefore fixed to 24 hours when the glycosylation is complete
and the cell culture still in a healthy state.
Figure 18. Growth curve represented by
the absorbance at 600 nm of induced P.
pastoris (500 mL BMMY, 5 L bottle,
28ºC) using sterile cloth or plug to cover
the bottle and 150 or 250 rpm shaking.
Figure 19. UV-vis absorption spectra of
solubilised and purified ChR2-H134R.
The ratio of the absorbance at 280 and 450
nm is 2.7.
The amount of purified protein was typically 1-2 mg per litre cell culture. The purity of the
samples can be evaluated by comparing the absorbance of the aromatic amino acids at 280 nm
and the maximal absorbance of the retinal chromophore around 470 nm. Depending on the
preparation, the ratio of absorbance at 280 and 470 nm varied around 2-3. Although the
samples contain impurities – seen in the SDS-PAGE after Coomassie staining – no other
proteins with chromophores were detected in the UV-vis absorption spectra (Figure 19). Thus
for optical spectroscopy the amount and purity of the samples were sufficient.
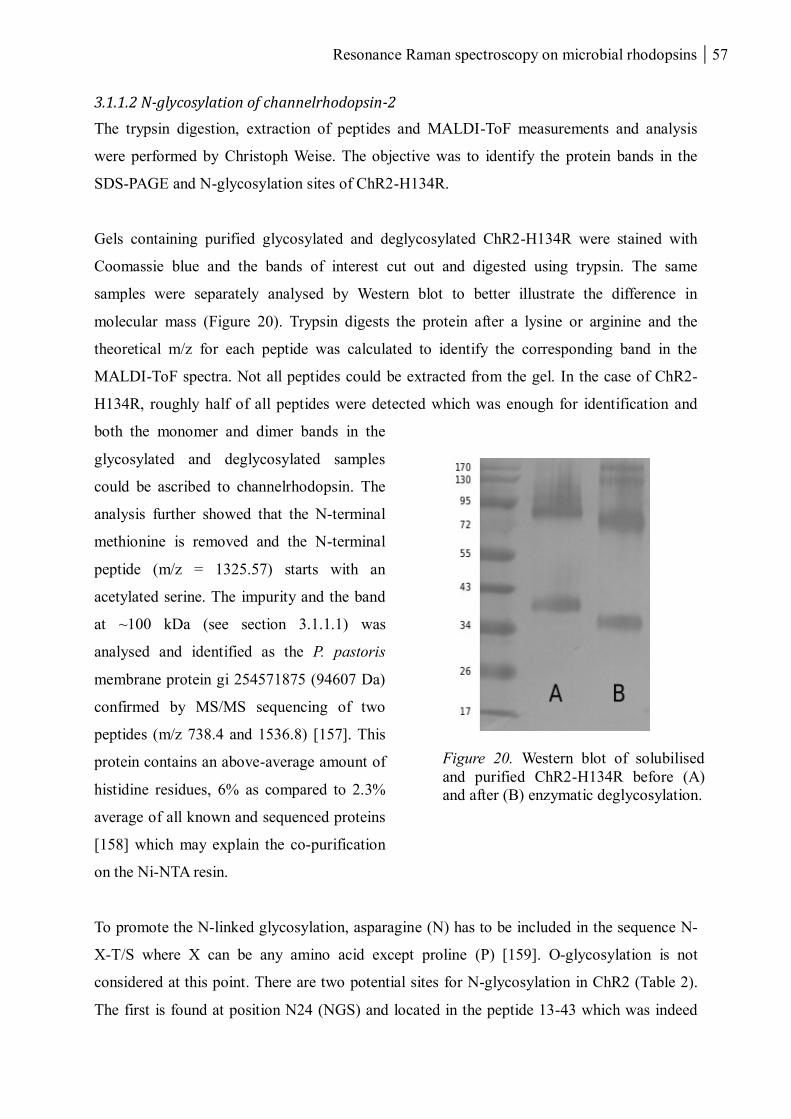
Resonance Raman spectroscopy on microbial rhodopsins 57
3.1.1.2 N-glycosylation of channelrhodopsin-2
The trypsin digestion, extraction of peptides and MALDI-ToF measurements and analysis
were performed by Christoph Weise. The objective was to identify the protein bands in the
SDS-PAGE and N-glycosylation sites of ChR2-H134R.
Gels containing purified glycosylated and deglycosylated ChR2-H134R were stained with
Coomassie blue and the bands of interest cut out and digested using trypsin. The same
samples were separately analysed by Western blot to better illustrate the difference in
molecular mass (Figure 20). Trypsin digests the protein after a lysine or arginine and the
theoretical m/z for each peptide was calculated to identify the corresponding band in the
MALDI-ToF spectra. Not all peptides could be extracted from the gel. In the case of ChR2-
H134R, roughly half of all peptides were detected which was enough for identification and
both the monomer and dimer bands in the
glycosylated and deglycosylated samples
could be ascribed to channelrhodopsin. The
analysis further showed that the N-terminal
methionine is removed and the N-terminal
peptide (m/z = 1325.57) starts with an
acetylated serine. The impurity and the band
at ~100 kDa (see section 3.1.1.1) was
analysed and identified as the P. pastoris
membrane protein gi 254571875 (94607 Da)
confirmed by MS/MS sequencing of two
peptides (m/z 738.4 and 1536.8) [157]. This
protein contains an above-average amount of
histidine residues, 6% as compared to 2.3%
average of all known and sequenced proteins
[158] which may explain the co-purification
on the Ni-NTA resin.
To promote the N-linked glycosylation, asparagine (N) has to be included in the sequence N-
X-T/S where X can be any amino acid except proline (P) [159]. O-glycosylation is not
considered at this point. There are two potential sites for N-glycosylation in ChR2 (Table 2).
The first is found at position N24 (NGS) and located in the peptide 13-43 which was indeed
Figure 20. Western blot of solubilised
and purified ChR2-H134R before (A)
and after (B) enzymatic deglycosylation.
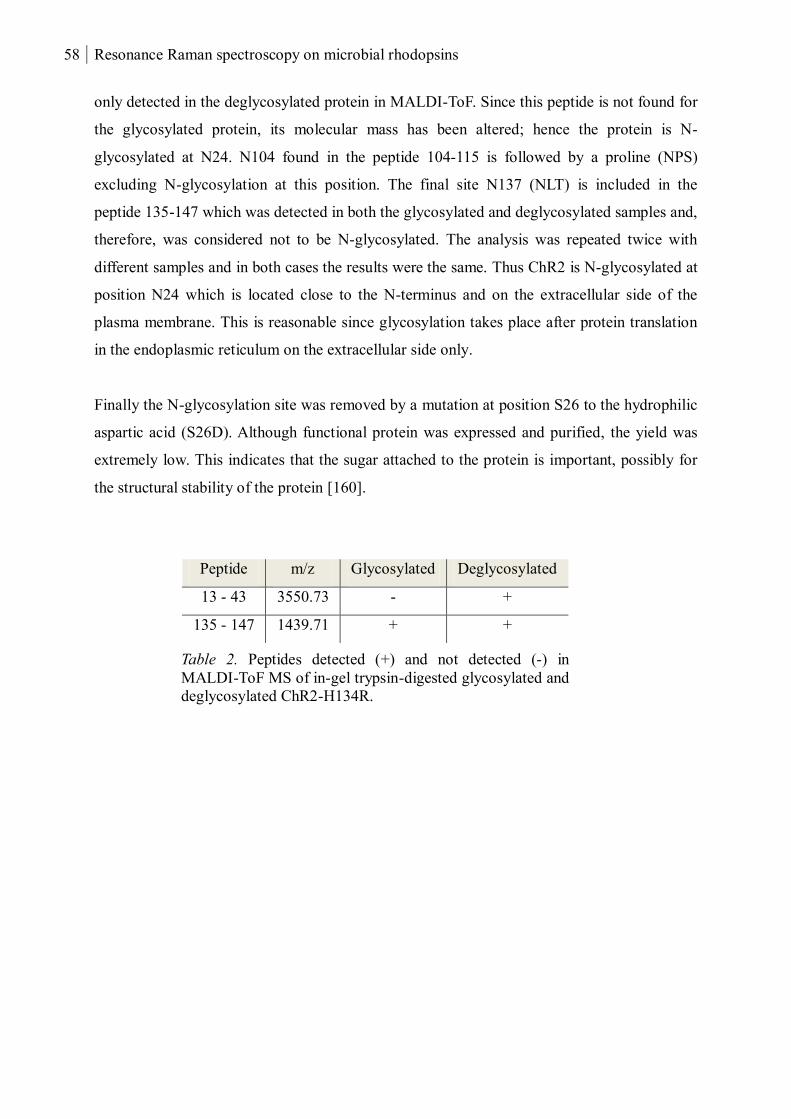
58 Resonance Raman spectroscopy on microbial rhodopsins
only detected in the deglycosylated protein in MALDI-ToF. Since this peptide is not found for
the glycosylated protein, its molecular mass has been altered; hence the protein is N-
glycosylated at N24. N104 found in the peptide 104-115 is followed by a proline (NPS)
excluding N-glycosylation at this position. The final site N137 (NLT) is included in the
peptide 135-147 which was detected in both the glycosylated and deglycosylated samples and,
therefore, was considered not to be N-glycosylated. The analysis was repeated twice with
different samples and in both cases the results were the same. Thus ChR2 is N-glycosylated at
position N24 which is located close to the N-terminus and on the extracellular side of the
plasma membrane. This is reasonable since glycosylation takes place after protein translation
in the endoplasmic reticulum on the extracellular side only.
Finally the N-glycosylation site was removed by a mutation at position S26 to the hydrophilic
aspartic acid (S26D). Although functional protein was expressed and purified, the yield was
extremely low. This indicates that the sugar attached to the protein is important, possibly for
the structural stability of the protein [160].
Table 2. Peptides detected (+) and not detected (-) in
MALDI-ToF MS of in-gel trypsin-digested glycosylated and
deglycosylated ChR2-H134R.
Peptide m/z Glycosylated Deglycosylated
13 - 43 3550.73 - +
135 - 147 1439.71 + +
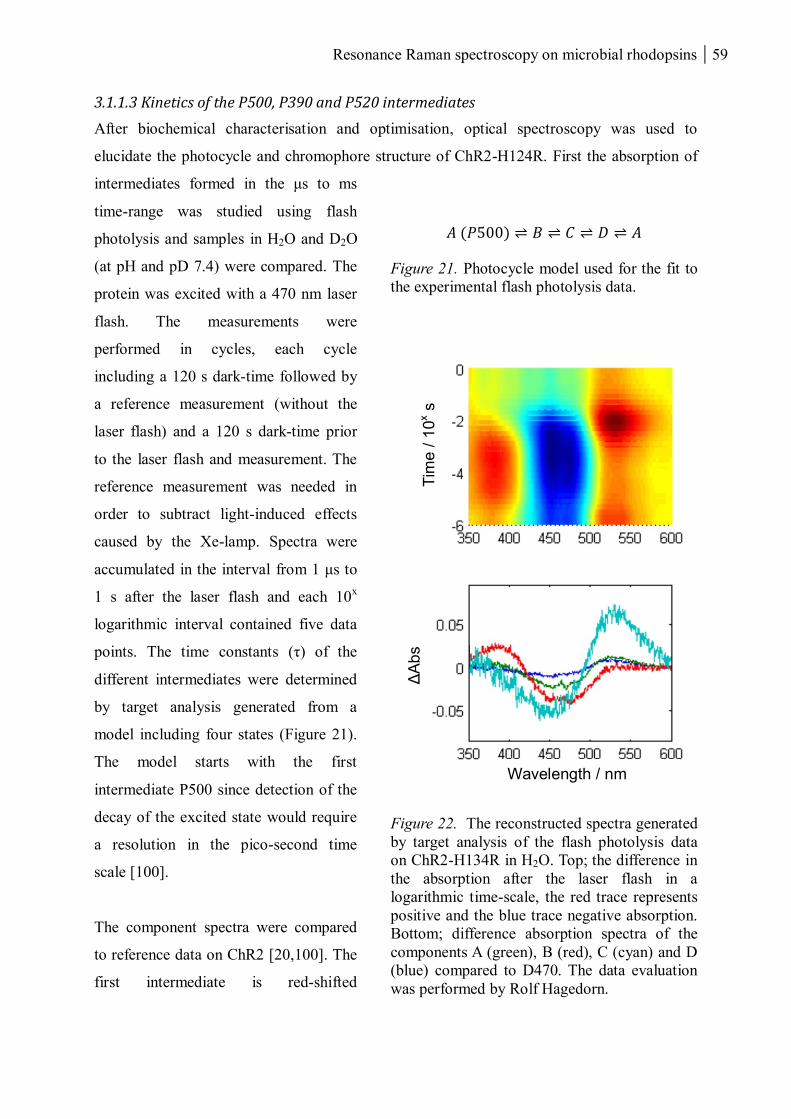
Resonance Raman spectroscopy on microbial rhodopsins 59
3.1.1.3 Kinetics of the P500, P390 and P520 intermediates
After biochemical characterisation and optimisation, optical spectroscopy was used to
elucidate the photocycle and chromophore structure of ChR2-H124R. First the absorption of
intermediates formed in the μs to ms
time-range was studied using flash
photolysis and samples in H2O and D2O
(at pH and pD 7.4) were compared. The
protein was excited with a 470 nm laser
flash. The measurements were
performed in cycles, each cycle
including a 120 s dark-time followed by
a reference measurement (without the
laser flash) and a 120 s dark-time prior
to the laser flash and measurement. The
reference measurement was needed in
order to subtract light-induced effects
caused by the Xe-lamp. Spectra were
accumulated in the interval from 1 μs to
1 s after the laser flash and each 10x
logarithmic interval contained five data
points. The time constants (τ) of the
different intermediates were determined
by target analysis generated from a
model including four states (Figure 21).
The model starts with the first
intermediate P500 since detection of the
decay of the excited state would require
a resolution in the pico-second time
scale [100].
The component spectra were compared
to reference data on ChR2 [20,100]. The
first intermediate is red-shifted
𝐴 (𝑃500) ⇌ 𝐵 ⇌ 𝐶 ⇌ 𝐷 ⇌ 𝐴
Figure 21. Photocycle model used for the fit to
the experimental flash photolysis data.
Figure 22. The reconstructed spectra generated
by target analysis of the flash photolysis data
on ChR2-H134R in H2O. Top; the difference in
the absorption after the laser flash in a
logarithmic time-scale, the red trace represents
positive and the blue trace negative absorption.
Bottom; difference absorption spectra of the
components A (green), B (red), C (cyan) and D
(blue) compared to D470. The data evaluation
was performed by Rolf Hagedorn.
Tim
e /
10
x s
Δ
Ab
s
Wavelength / nm
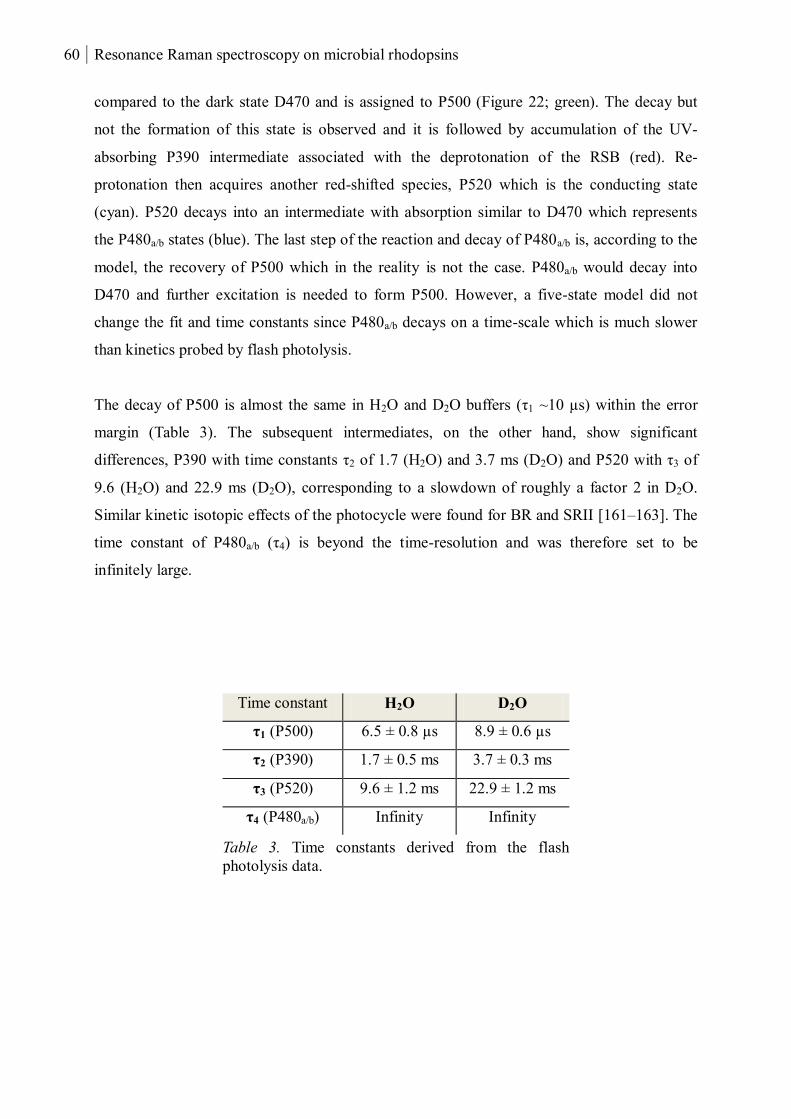
60 Resonance Raman spectroscopy on microbial rhodopsins
compared to the dark state D470 and is assigned to P500 (Figure 22; green). The decay but
not the formation of this state is observed and it is followed by accumulation of the UV-
absorbing P390 intermediate associated with the deprotonation of the RSB (red). Re-
protonation then acquires another red-shifted species, P520 which is the conducting state
(cyan). P520 decays into an intermediate with absorption similar to D470 which represents
the P480a/b states (blue). The last step of the reaction and decay of P480a/b is, according to the
model, the recovery of P500 which in the reality is not the case. P480a/b would decay into
D470 and further excitation is needed to form P500. However, a five-state model did not
change the fit and time constants since P480a/b decays on a time-scale which is much slower
than kinetics probed by flash photolysis.
The decay of P500 is almost the same in H2O and D2O buffers (τ1 ~10 µs) within the error
margin (Table 3). The subsequent intermediates, on the other hand, show significant
differences, P390 with time constants τ2 of 1.7 (H2O) and 3.7 ms (D2O) and P520 with τ3 of
9.6 (H2O) and 22.9 ms (D2O), corresponding to a slowdown of roughly a factor 2 in D2O.
Similar kinetic isotopic effects of the photocycle were found for BR and SRII [161–163]. The
time constant of P480a/b (τ4) is beyond the time-resolution and was therefore set to be
infinitely large.
Table 3. Time constants derived from the flash
photolysis data.
Time constant H2O D2O
τ1 (P500) 6.5 ± 0.8 µs 8.9 ± 0.6 µs
τ2 (P390) 1.7 ± 0.5 ms 3.7 ± 0.3 ms
τ3 (P520) 9.6 ± 1.2 ms 22.9 ± 1.2 ms
τ4 (P480a/b) Infinity Infinity
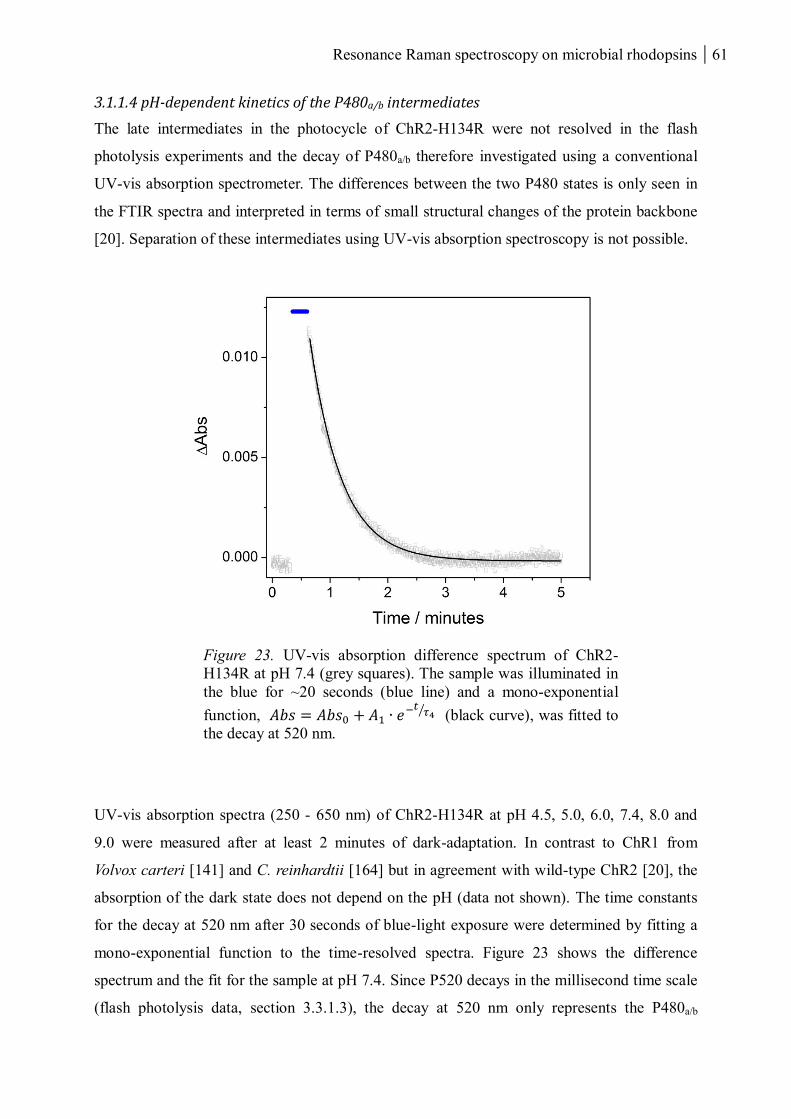
Resonance Raman spectroscopy on microbial rhodopsins 61
3.1.1.4 pH-dependent kinetics of the P480a/b intermediates
The late intermediates in the photocycle of ChR2-H134R were not resolved in the flash
photolysis experiments and the decay of P480a/b therefore investigated using a conventional
UV-vis absorption spectrometer. The differences between the two P480 states is only seen in
the FTIR spectra and interpreted in terms of small structural changes of the protein backbone
[20]. Separation of these intermediates using UV-vis absorption spectroscopy is not possible.
Figure 23. UV-vis absorption difference spectrum of ChR2-
H134R at pH 7.4 (grey squares). The sample was illuminated in
the blue for ~20 seconds (blue line) and a mono-exponential
function, 𝐴𝑏𝑠 = 𝐴𝑏𝑠0 + 𝐴1 ∙ 𝑒−𝑡𝜏4⁄ (black curve), was fitted to
the decay at 520 nm.
UV-vis absorption spectra (250 - 650 nm) of ChR2-H134R at pH 4.5, 5.0, 6.0, 7.4, 8.0 and
9.0 were measured after at least 2 minutes of dark-adaptation. In contrast to ChR1 from
Volvox carteri [141] and C. reinhardtii [164] but in agreement with wild-type ChR2 [20], the
absorption of the dark state does not depend on the pH (data not shown). The time constants
for the decay at 520 nm after 30 seconds of blue-light exposure were determined by fitting a
mono-exponential function to the time-resolved spectra. Figure 23 shows the difference
spectrum and the fit for the sample at pH 7.4. Since P520 decays in the millisecond time scale
(flash photolysis data, section 3.3.1.3), the decay at 520 nm only represents the P480a/b
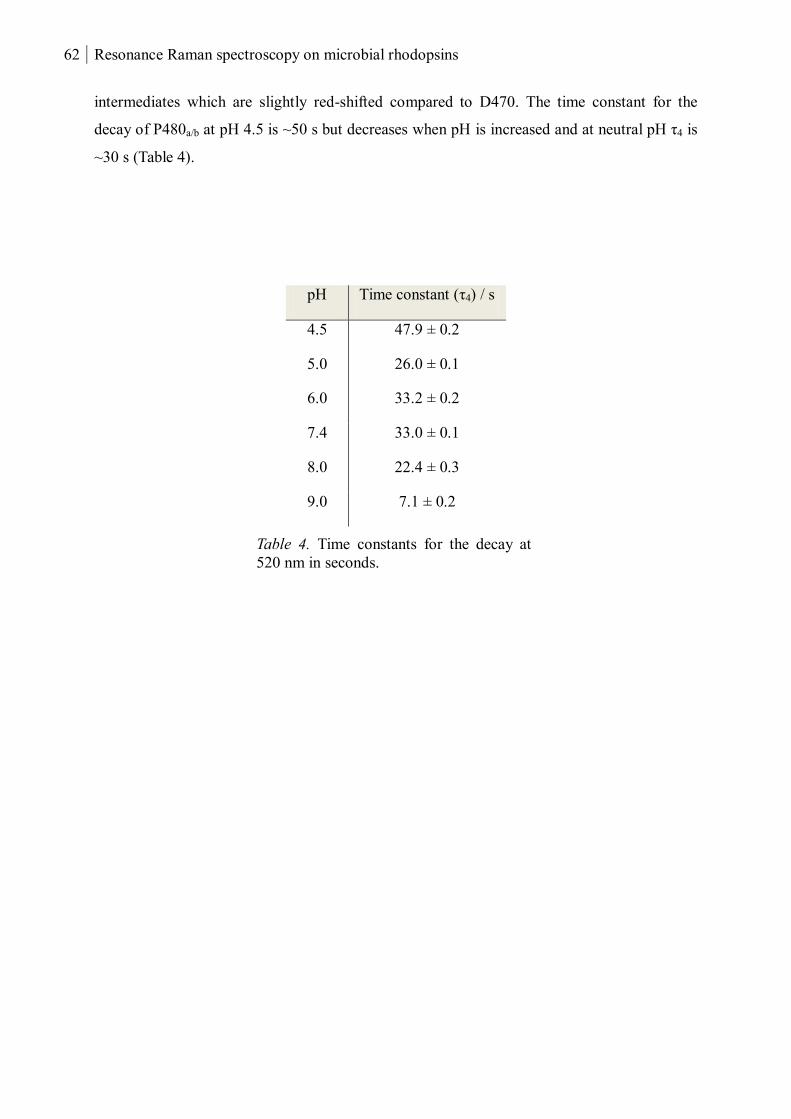
62 Resonance Raman spectroscopy on microbial rhodopsins
intermediates which are slightly red-shifted compared to D470. The time constant for the
decay of P480a/b at pH 4.5 is ~50 s but decreases when pH is increased and at neutral pH τ4 is
~30 s (Table 4).
pH Time constant (τ4) / s
4.5 47.9 ± 0.2
5.0 26.0 ± 0.1
6.0 33.2 ± 0.2
7.4 33.0 ± 0.1
8.0 22.4 ± 0.3
9.0 7.1 ± 0.2
Table 4. Time constants for the decay at
520 nm in seconds.
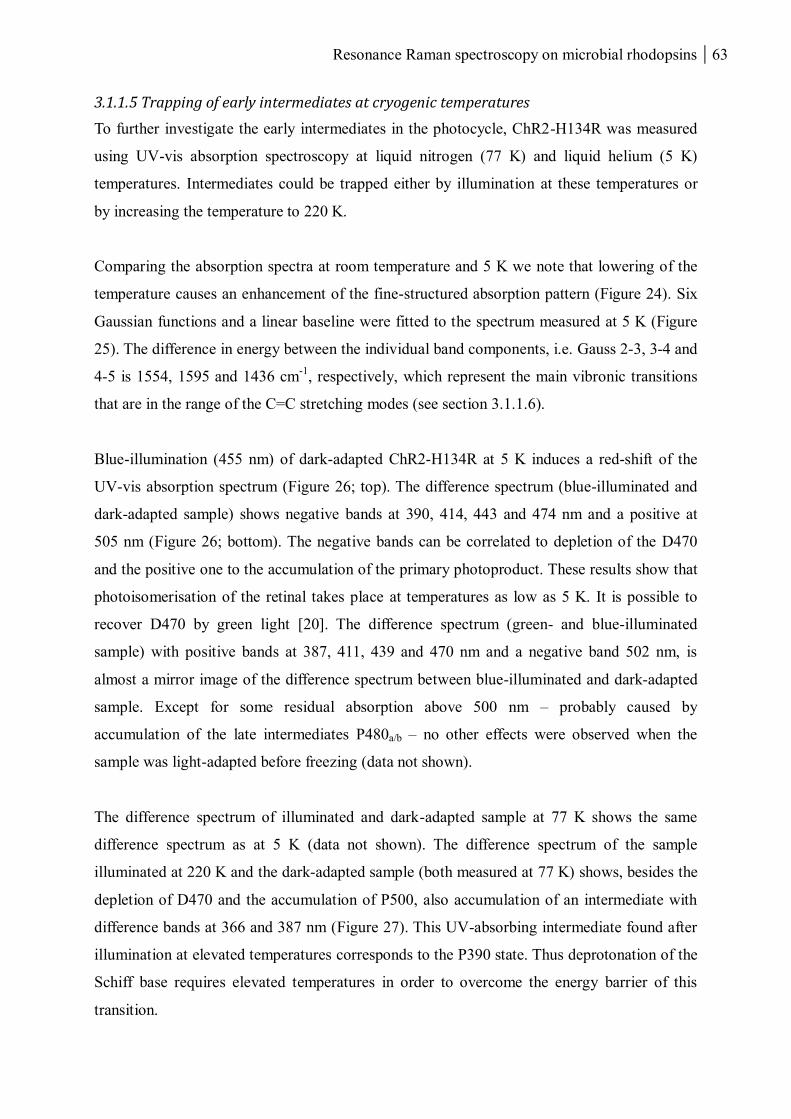
Resonance Raman spectroscopy on microbial rhodopsins 63
3.1.1.5 Trapping of early intermediates at cryogenic temperatures
To further investigate the early intermediates in the photocycle, ChR2-H134R was measured
using UV-vis absorption spectroscopy at liquid nitrogen (77 K) and liquid helium (5 K)
temperatures. Intermediates could be trapped either by illumination at these temperatures or
by increasing the temperature to 220 K.
Comparing the absorption spectra at room temperature and 5 K we note that lowering of the
temperature causes an enhancement of the fine-structured absorption pattern (Figure 24). Six
Gaussian functions and a linear baseline were fitted to the spectrum measured at 5 K (Figure
25). The difference in energy between the individual band components, i.e. Gauss 2-3, 3-4 and
4-5 is 1554, 1595 and 1436 cm-1
, respectively, which represent the main vibronic transitions
that are in the range of the C=C stretching modes (see section 3.1.1.6).
Blue-illumination (455 nm) of dark-adapted ChR2-H134R at 5 K induces a red-shift of the
UV-vis absorption spectrum (Figure 26; top). The difference spectrum (blue-illuminated and
dark-adapted sample) shows negative bands at 390, 414, 443 and 474 nm and a positive at
505 nm (Figure 26; bottom). The negative bands can be correlated to depletion of the D470
and the positive one to the accumulation of the primary photoproduct. These results show that
photoisomerisation of the retinal takes place at temperatures as low as 5 K. It is possible to
recover D470 by green light [20]. The difference spectrum (green- and blue-illuminated
sample) with positive bands at 387, 411, 439 and 470 nm and a negative band 502 nm, is
almost a mirror image of the difference spectrum between blue-illuminated and dark-adapted
sample. Except for some residual absorption above 500 nm – probably caused by
accumulation of the late intermediates P480a/b – no other effects were observed when the
sample was light-adapted before freezing (data not shown).
The difference spectrum of illuminated and dark-adapted sample at 77 K shows the same
difference spectrum as at 5 K (data not shown). The difference spectrum of the sample
illuminated at 220 K and the dark-adapted sample (both measured at 77 K) shows, besides the
depletion of D470 and the accumulation of P500, also accumulation of an intermediate with
difference bands at 366 and 387 nm (Figure 27). This UV-absorbing intermediate found after
illumination at elevated temperatures corresponds to the P390 state. Thus deprotonation of the
Schiff base requires elevated temperatures in order to overcome the energy barrier of this
transition.
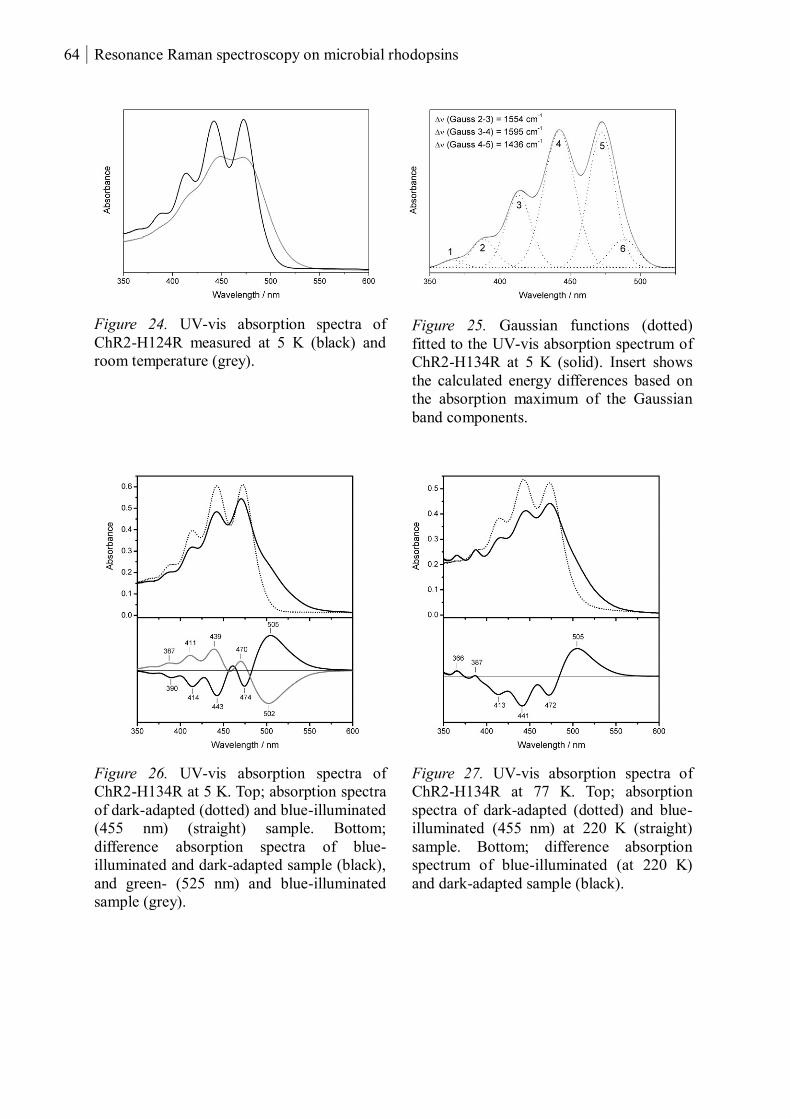
64 Resonance Raman spectroscopy on microbial rhodopsins
Figure 24. UV-vis absorption spectra of
ChR2-H124R measured at 5 K (black) and
room temperature (grey).
Figure 25. Gaussian functions (dotted)
fitted to the UV-vis absorption spectrum of
ChR2-H134R at 5 K (solid). Insert shows
the calculated energy differences based on
the absorption maximum of the Gaussian
band components.
Figure 26. UV-vis absorption spectra of
ChR2-H134R at 5 K. Top; absorption spectra
of dark-adapted (dotted) and blue-illuminated
(455 nm) (straight) sample. Bottom;
difference absorption spectra of blue-
illuminated and dark-adapted sample (black),
and green- (525 nm) and blue-illuminated
sample (grey).
Figure 27. UV-vis absorption spectra of
ChR2-H134R at 77 K. Top; absorption
spectra of dark-adapted (dotted) and blue-
illuminated (455 nm) at 220 K (straight)
sample. Bottom; difference absorption
spectrum of blue-illuminated (at 220 K)
and dark-adapted sample (black).
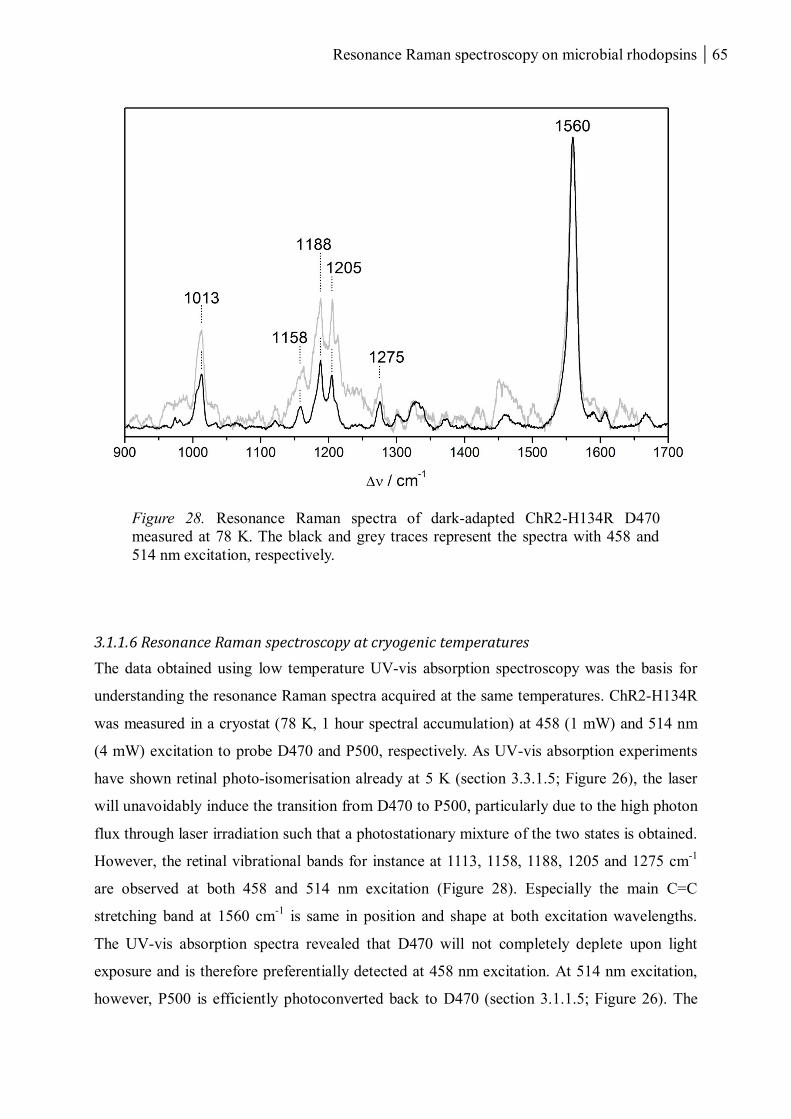
Resonance Raman spectroscopy on microbial rhodopsins 65
Figure 28. Resonance Raman spectra of dark-adapted ChR2-H134R D470
measured at 78 K. The black and grey traces represent the spectra with 458 and
514 nm excitation, respectively.
3.1.1.6 Resonance Raman spectroscopy at cryogenic temperatures
The data obtained using low temperature UV-vis absorption spectroscopy was the basis for
understanding the resonance Raman spectra acquired at the same temperatures. ChR2-H134R
was measured in a cryostat (78 K, 1 hour spectral accumulation) at 458 (1 mW) and 514 nm
(4 mW) excitation to probe D470 and P500, respectively. As UV-vis absorption experiments
have shown retinal photo-isomerisation already at 5 K (section 3.3.1.5; Figure 26), the laser
will unavoidably induce the transition from D470 to P500, particularly due to the high photon
flux through laser irradiation such that a photostationary mixture of the two states is obtained.
However, the retinal vibrational bands for instance at 1113, 1158, 1188, 1205 and 1275 cm-1
are observed at both 458 and 514 nm excitation (Figure 28). Especially the main C=C
stretching band at 1560 cm-1
is same in position and shape at both excitation wavelengths.
The UV-vis absorption spectra revealed that D470 will not completely deplete upon light
exposure and is therefore preferentially detected at 458 nm excitation. At 514 nm excitation,
however, P500 is efficiently photoconverted back to D470 (section 3.1.1.5; Figure 26). The
66 Resonance Raman spectroscopy on microbial rhodopsins
signal-to-noise ratio at 514 nm is poor compared to that at 458 nm due to low absorption of
D470 at this wavelength. The spectral features that are not seen at 458 nm but at 514 nm can
be ascribed to fluorescence and the buffer. Probing at 413 nm (4 mW) gave a comparable
spectrum to those at 458 and 514 nm (data not shown). Thus, the resonance Raman spectra
accumulated at 413, 458 and 514 nm at 78 K represent largely a pure D470 state.
In a previous study, the pre-resonance Raman spectra of ChR2, obtained with 647 nm
excitation, were measured at 77 K and analysed by a band fitting procedure to disentangle the
spectral contributions of an all-trans as well as a 13-cis retinal, according to the results of
extraction experiments of the dark state D470 [23]. Here a similar procedure was applied to
the resonance Raman measured with the three excitation wavelengths at 77 K. Four
Lorentzian functions were fitted to the C=C stretching envelope, centred at ca. 1560 cm-1
,
taking into account that all-trans and 13-cis isomers each exhibit two C=C stretching modes
contributing to the most prominent peak in the spectrum [127,128]. The 13-cis retinal with a
protonated Schiff base in the dark-adapted and intermediate states of BR has clearly separated
C=C stretching modes [128,132,133]. Thus, as a first assumption, the Lorentzian functions
with the highest and lowest frequency was assigned to the 13-cis and the two remaining to the
all-trans retinal. The fit was initially preformed for the D470 spectrum obtained at 458 nm
excitation. The positions and the half-widths of the four Lorentzians were then fixed (Table
5). Due to the fact that the vibrational modes are differently enhanced when the excitation
wavelength is changed, the intensities of the Lorenzian functions were allowed to vary for the
analysis of the spectra measured with 413 and 514 nm (Figure 29; left panel). The fits at all
excitation wavelengths showed that the major isomeric contribution in the resonance Raman
spectra of D470 is all-trans (red curves) with a smaller fraction of 13-cis (blue curves),
consistent with the isomeric composition (70% all-trans and 30% 13-cis) derived from
extraction experiments of the dark-adapted state [23]. However, one has to take into account
the inherent uncertainties of the fitting procedure despite the restrictions imposed on the
variations of frequencies and half-widths.
The sample was then heated to 223 K, illuminated in the blue, cooled to 78 K, and measured
at 413, 458 and 514 nm. Elevated temperature and illumination induces changes in the
resonance Raman spectra at all excitation wavelengths. The peaks exhibit asymmetric band-
shapes and especially at 413 nm a distinct shoulder, indicating the involvement of more than
one state. The spectra after heating and illumination represent the additional contributions
Resonance Raman spectroscopy on microbial rhodopsins 67
besides those from D470 which according to cryogenic UV-vis absorption spectroscopy are
the P500 and P390 intermediates. The Lorenzian functions representing the D470 all-trans
and 13-cis were fitted to the spectra and the intensity ratio of the two conjugate bands of each
isomer, as well as the respective frequencies and half-widths, were kept constant as for the fits
to the D470 spectrum at the same excitation wavelength. However, the ratio of all-trans and
13-cis was allowed to vary and additional Lorentzian functions were added representing the
accumulated intermediate states (Figure 29; right panel). Taking into account the partial
photoconversion due to the exciting laser beam, the preferential enhancement of the state with
absorption maximum close to the excitation wavelength, and the inverse relationship between
the C=C stretching frequency and the absorption maximum, one may thus conclude that the
spectra obtained with 458 and 514 nm excitation represent a mixture of D470 and P500
whereas the 413 nm excited spectra may reflect a mixture of D470 and P390. In the case of
the P500 intermediate, the band positions and widths of the Lorentzian functions were
determined during the fitting procedure of the spectrum at 514 nm and then fixed for the fit of
the spectrum at 458 nm. The P390 intermediate is only represented by one mode consistent
with the highly symmetric C=C stretching band of BR-M410 with a 13-cis deprotonated RSB
[129]. Besides accumulation of intermediates, a significant reduction of the D470 all-trans
compared to 13-cis was observed at all excitation wavelengths. The subtraction procedures
did not generate pure intermediate spectra (data not shown) due to the fact that the ratio of all-
trans and 13-cis is different in D470 before and after the heating and illumination.
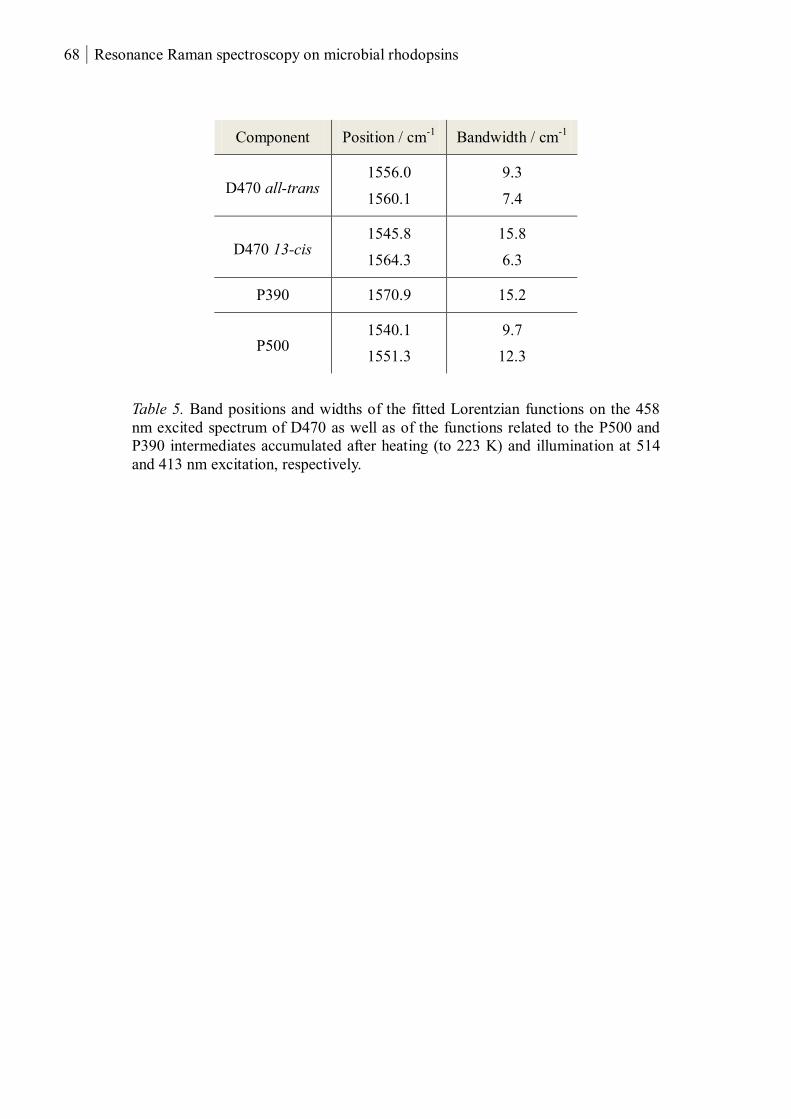
68 Resonance Raman spectroscopy on microbial rhodopsins
Component Position / cm-1
Bandwidth / cm-1
D470 all-trans 1556.0
1560.1
9.3
7.4
D470 13-cis 1545.8
1564.3
15.8
6.3
P390 1570.9 15.2
P500 1540.1
1551.3
9.7
12.3
Table 5. Band positions and widths of the fitted Lorentzian functions on the 458
nm excited spectrum of D470 as well as of the functions related to the P500 and
P390 intermediates accumulated after heating (to 223 K) and illumination at 514
and 413 nm excitation, respectively.
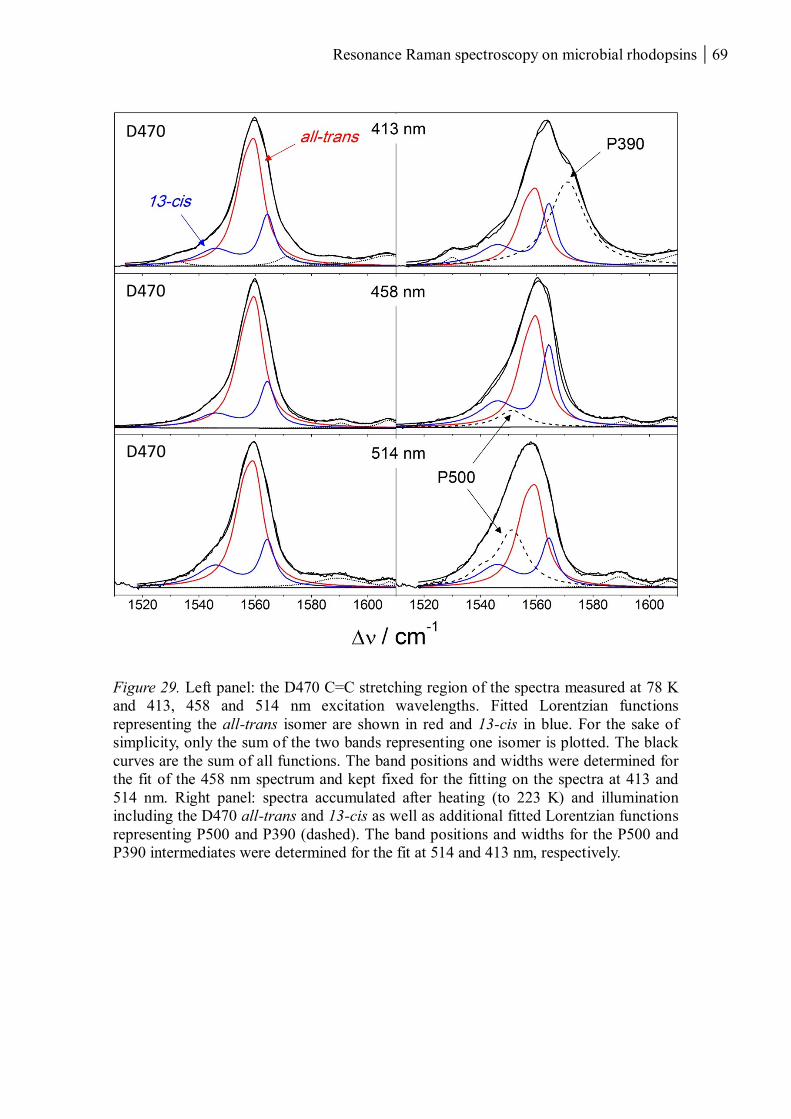
Resonance Raman spectroscopy on microbial rhodopsins 69
Figure 29. Left panel: the D470 C=C stretching region of the spectra measured at 78 K
and 413, 458 and 514 nm excitation wavelengths. Fitted Lorentzian functions
representing the all-trans isomer are shown in red and 13-cis in blue. For the sake of
simplicity, only the sum of the two bands representing one isomer is plotted. The black
curves are the sum of all functions. The band positions and widths were determined for
the fit of the 458 nm spectrum and kept fixed for the fitting on the spectra at 413 and
514 nm. Right panel: spectra accumulated after heating (to 223 K) and illumination
including the D470 all-trans and 13-cis as well as additional fitted Lorentzian functions
representing P500 and P390 (dashed). The band positions and widths for the P500 and
P390 intermediates were determined for the fit at 514 and 413 nm, respectively.
D470
D470
D470
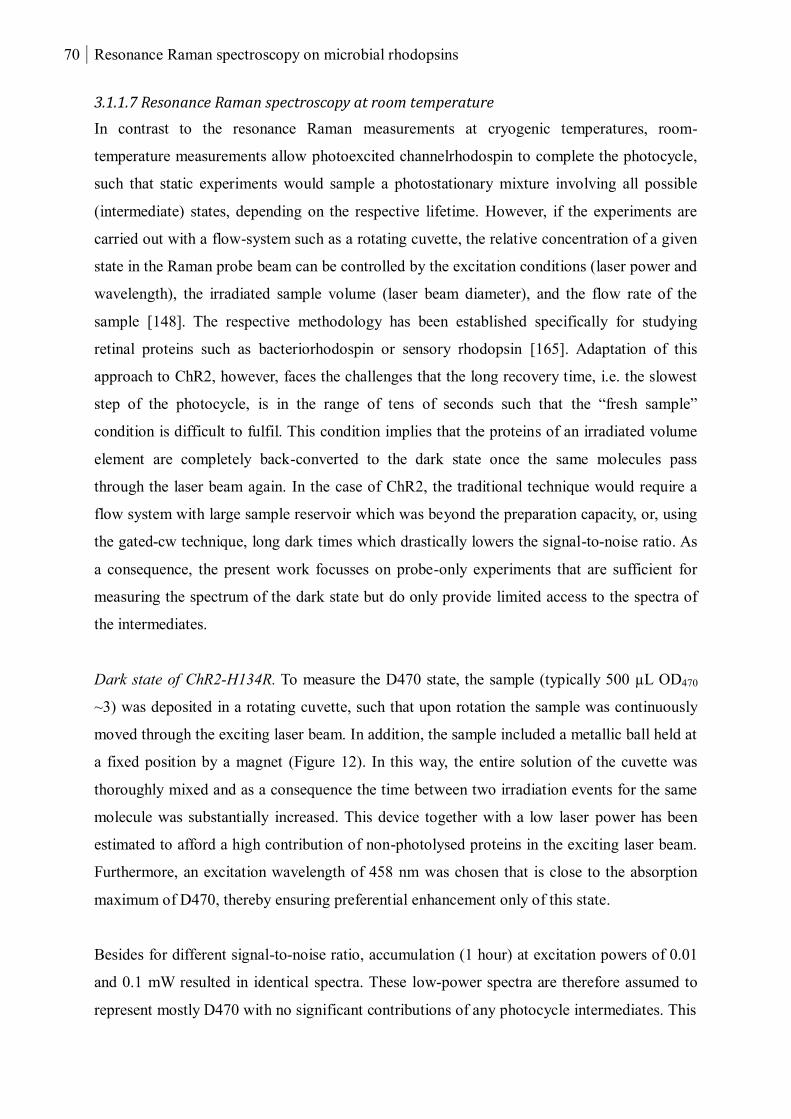
70 Resonance Raman spectroscopy on microbial rhodopsins
3.1.1.7 Resonance Raman spectroscopy at room temperature
In contrast to the resonance Raman measurements at cryogenic temperatures, room-
temperature measurements allow photoexcited channelrhodospin to complete the photocycle,
such that static experiments would sample a photostationary mixture involving all possible
(intermediate) states, depending on the respective lifetime. However, if the experiments are
carried out with a flow-system such as a rotating cuvette, the relative concentration of a given
state in the Raman probe beam can be controlled by the excitation conditions (laser power and
wavelength), the irradiated sample volume (laser beam diameter), and the flow rate of the
sample [148]. The respective methodology has been established specifically for studying
retinal proteins such as bacteriorhodospin or sensory rhodopsin [165]. Adaptation of this
approach to ChR2, however, faces the challenges that the long recovery time, i.e. the slowest
step of the photocycle, is in the range of tens of seconds such that the “fresh sample”
condition is difficult to fulfil. This condition implies that the proteins of an irradiated volume
element are completely back-converted to the dark state once the same molecules pass
through the laser beam again. In the case of ChR2, the traditional technique would require a
flow system with large sample reservoir which was beyond the preparation capacity, or, using
the gated-cw technique, long dark times which drastically lowers the signal-to-noise ratio. As
a consequence, the present work focusses on probe-only experiments that are sufficient for
measuring the spectrum of the dark state but do only provide limited access to the spectra of
the intermediates.
Dark state of ChR2-H134R. To measure the D470 state, the sample (typically 500 µL OD470
~3) was deposited in a rotating cuvette, such that upon rotation the sample was continuously
moved through the exciting laser beam. In addition, the sample included a metallic ball held at
a fixed position by a magnet (Figure 12). In this way, the entire solution of the cuvette was
thoroughly mixed and as a consequence the time between two irradiation events for the same
molecule was substantially increased. This device together with a low laser power has been
estimated to afford a high contribution of non-photolysed proteins in the exciting laser beam.
Furthermore, an excitation wavelength of 458 nm was chosen that is close to the absorption
maximum of D470, thereby ensuring preferential enhancement only of this state.
Besides for different signal-to-noise ratio, accumulation (1 hour) at excitation powers of 0.01
and 0.1 mW resulted in identical spectra. These low-power spectra are therefore assumed to
represent mostly D470 with no significant contributions of any photocycle intermediates. This
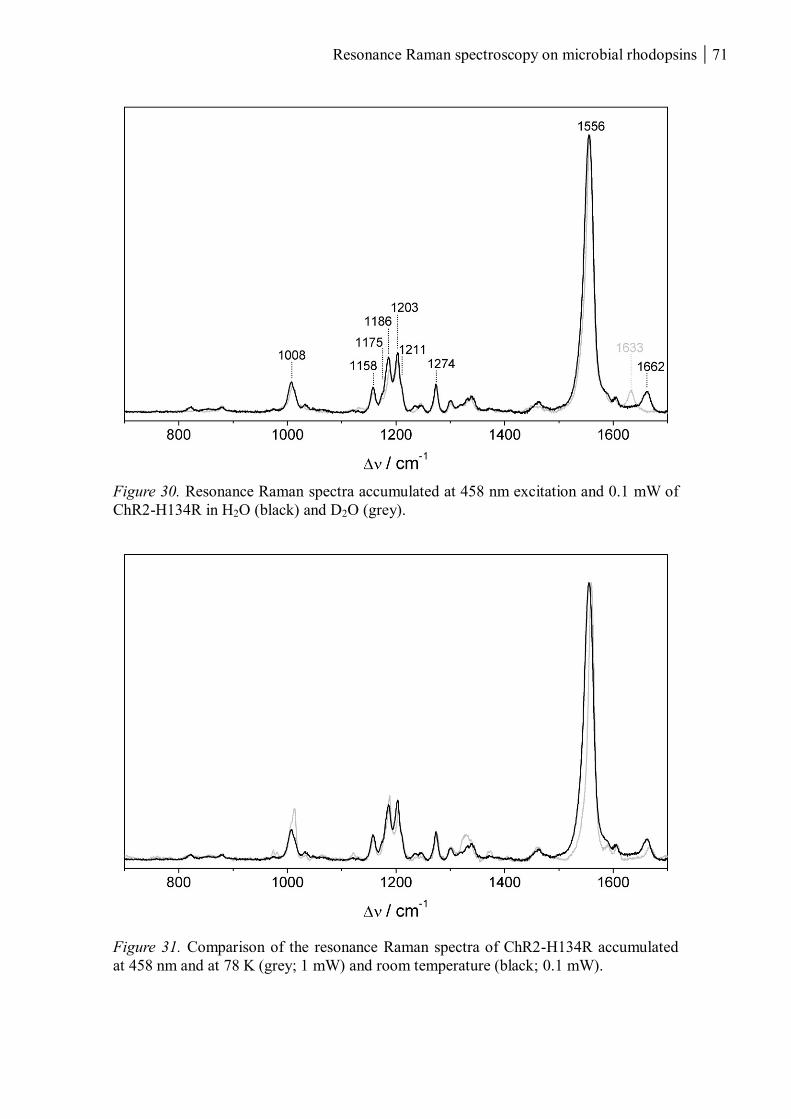
Resonance Raman spectroscopy on microbial rhodopsins 71
Figure 30. Resonance Raman spectra accumulated at 458 nm excitation and 0.1 mW of
ChR2-H134R in H2O (black) and D2O (grey).
Figure 31. Comparison of the resonance Raman spectra of ChR2-H134R accumulated
at 458 nm and at 78 K (grey; 1 mW) and room temperature (black; 0.1 mW).
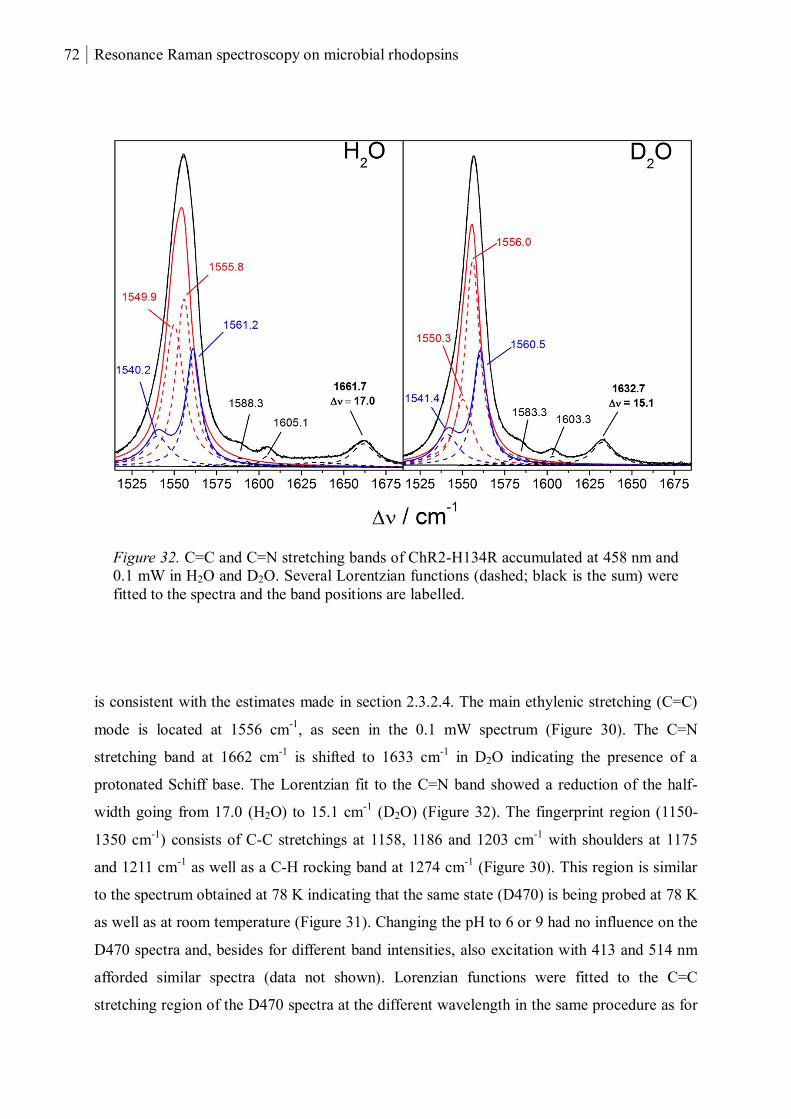
72 Resonance Raman spectroscopy on microbial rhodopsins
is consistent with the estimates made in section 2.3.2.4. The main ethylenic stretching (C=C)
mode is located at 1556 cm-1
, as seen in the 0.1 mW spectrum (Figure 30). The C=N
stretching band at 1662 cm-1
is shifted to 1633 cm-1
in D2O indicating the presence of a
protonated Schiff base. The Lorentzian fit to the C=N band showed a reduction of the half-
width going from 17.0 (H2O) to 15.1 cm-1
(D2O) (Figure 32). The fingerprint region (1150-
1350 cm-1
) consists of C-C stretchings at 1158, 1186 and 1203 cm-1
with shoulders at 1175
and 1211 cm-1
as well as a C-H rocking band at 1274 cm-1
(Figure 30). This region is similar
to the spectrum obtained at 78 K indicating that the same state (D470) is being probed at 78 K
as well as at room temperature (Figure 31). Changing the pH to 6 or 9 had no influence on the
D470 spectra and, besides for different band intensities, also excitation with 413 and 514 nm
afforded similar spectra (data not shown). Lorenzian functions were fitted to the C=C
stretching region of the D470 spectra at the different wavelength in the same procedure as for
Figure 32. C=C and C=N stretching bands of ChR2-H134R accumulated at 458 nm and
0.1 mW in H2O and D2O. Several Lorentzian functions (dashed; black is the sum) were
fitted to the spectra and the band positions are labelled.

Resonance Raman spectroscopy on microbial rhodopsins 73
the data obtained at 77 K (section 3.1.1.6) and including the all-trans and 13-cis components.
The fitting was first carried out for the 458 nm accumulated spectrum, the band positions and
widths were then fixed for the fits to the spectra accumulated at 413 and 514 nm excitation
(Figure 33; left panel). Compared to the fits for the 77 K data, the D470 all-trans and 13-cis
functions were shifted to lower frequencies and the half-widths increased (Table 6) The shape
of the sum of the two functions of one component is similar to its equivalent at 77 K, i.e.
D470 all-trans consists of two closely positioned functions (1549.9 and 1555.8 cm-1
) with
comparable intensities whereas 13-cis has two separated Lorenzians (1540.2 and 1561.2 cm-1
)
and, except for the fit for the 514 nm spectrum, with a higher intensity for the function at
1561.2 cm-1
. The ratio of the different isomers shows, in good agreement with the fits for the
77 K spectra, that the major contribution comes from the all-trans configuration. Also, the
ratio of all-trans/13-cis is comparable at 413 and 458 nm excitations whereas the all-trans
form is dominating at 514 nm indicating a red-shift of the absorption of the all-trans species
compared the 13-cis form consistent with the isomers present in the dark-adapted state of BR.
Component Position / cm-1
Bandwidth / cm-1
D470 all-trans 1549.9 (-6.1)
1555.8 (-4.3)
13.9 (+4.6)
11.5 (+4.1)
D470 13-cis 1540.2 (-5.6)
1561.2 (-3.1)
17.1 (+1.3)
10.1 (+3.8)
P390 1566.0 (-4.9) 19.0 (+3.8)
Table 6. Band positions and widths of the fitted Lorenzian
functions for the D470 spectrum accumulated at 458 nm, 0.1
mW and room temperature, the values in brackets represent the
difference to the fits for the 77 K data. The fit of the P390
intermediate was performed for the spectrum accumulated at 10
mW and 413 nm and the band position was fixed to 1569.0
which is the position of the C=C stretching frequency in BR-
M410.
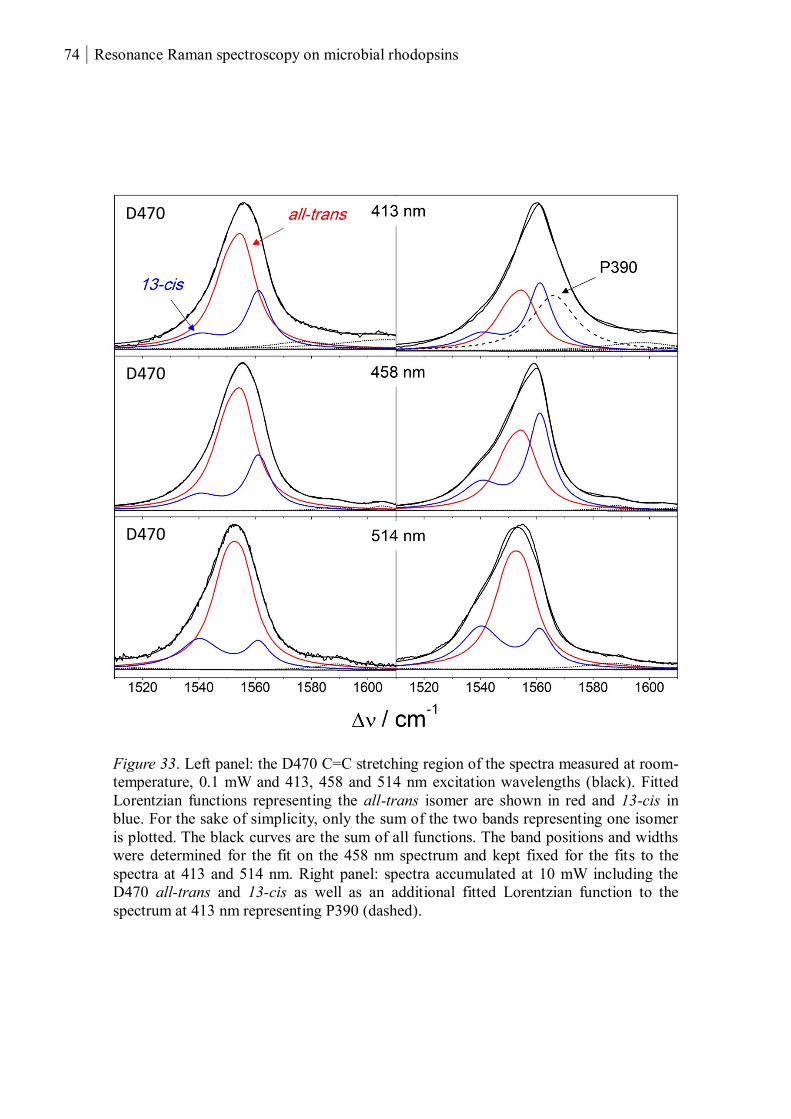
74 Resonance Raman spectroscopy on microbial rhodopsins
Figure 33. Left panel: the D470 C=C stretching region of the spectra measured at room-
temperature, 0.1 mW and 413, 458 and 514 nm excitation wavelengths (black). Fitted
Lorentzian functions representing the all-trans isomer are shown in red and 13-cis in
blue. For the sake of simplicity, only the sum of the two bands representing one isomer
is plotted. The black curves are the sum of all functions. The band positions and widths
were determined for the fit on the 458 nm spectrum and kept fixed for the fits to the
spectra at 413 and 514 nm. Right panel: spectra accumulated at 10 mW including the
D470 all-trans and 13-cis as well as an additional fitted Lorentzian function to the
spectrum at 413 nm representing P390 (dashed).
D470
D470
D470
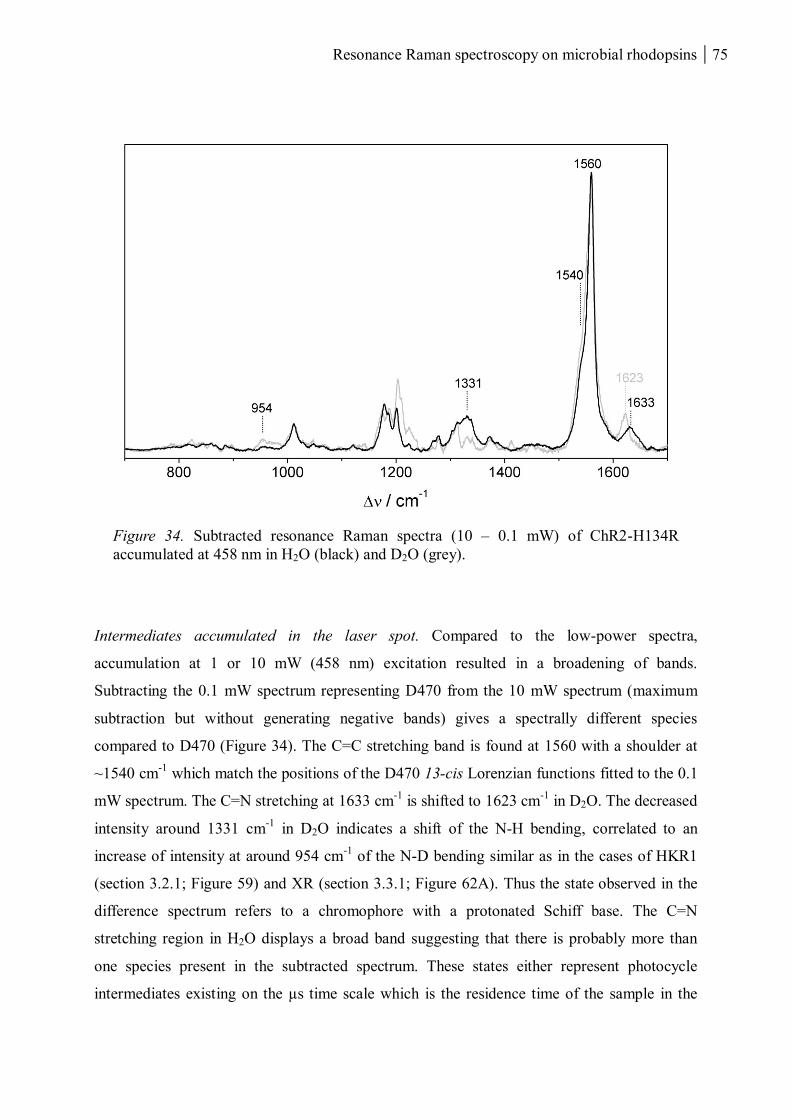
Resonance Raman spectroscopy on microbial rhodopsins 75
Figure 34. Subtracted resonance Raman spectra (10 – 0.1 mW) of ChR2-H134R
accumulated at 458 nm in H2O (black) and D2O (grey).
Intermediates accumulated in the laser spot. Compared to the low-power spectra,
accumulation at 1 or 10 mW (458 nm) excitation resulted in a broadening of bands.
Subtracting the 0.1 mW spectrum representing D470 from the 10 mW spectrum (maximum
subtraction but without generating negative bands) gives a spectrally different species
compared to D470 (Figure 34). The C=C stretching band is found at 1560 with a shoulder at
~1540 cm-1
which match the positions of the D470 13-cis Lorenzian functions fitted to the 0.1
mW spectrum. The C=N stretching at 1633 cm-1
is shifted to 1623 cm-1
in D2O. The decreased
intensity around 1331 cm-1
in D2O indicates a shift of the N-H bending, correlated to an
increase of intensity at around 954 cm-1
of the N-D bending similar as in the cases of HKR1
(section 3.2.1; Figure 59) and XR (section 3.3.1; Figure 62A). Thus the state observed in the
difference spectrum refers to a chromophore with a protonated Schiff base. The C=N
stretching region in H2O displays a broad band suggesting that there is probably more than
one species present in the subtracted spectrum. These states either represent photocycle
intermediates existing on the µs time scale which is the residence time of the sample in the
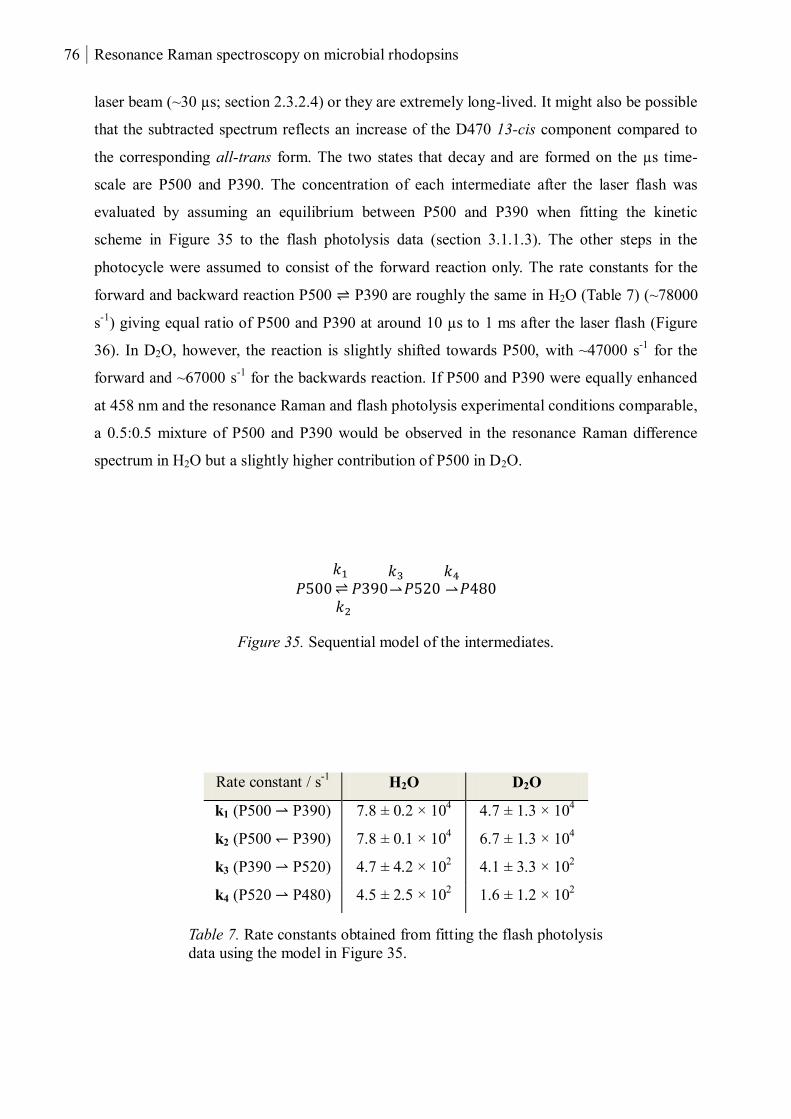
76 Resonance Raman spectroscopy on microbial rhodopsins
laser beam (~30 µs; section 2.3.2.4) or they are extremely long-lived. It might also be possible
that the subtracted spectrum reflects an increase of the D470 13-cis component compared to
the corresponding all-trans form. The two states that decay and are formed on the µs time-
scale are P500 and P390. The concentration of each intermediate after the laser flash was
evaluated by assuming an equilibrium between P500 and P390 when fitting the kinetic
scheme in Figure 35 to the flash photolysis data (section 3.1.1.3). The other steps in the
photocycle were assumed to consist of the forward reaction only. The rate constants for the
forward and backward reaction P500 ⇌ P390 are roughly the same in H2O (Table 7) (~78000
s-1
) giving equal ratio of P500 and P390 at around 10 µs to 1 ms after the laser flash (Figure
36). In D2O, however, the reaction is slightly shifted towards P500, with ~47000 s-1
for the
forward and ~67000 s-1
for the backwards reaction. If P500 and P390 were equally enhanced
at 458 nm and the resonance Raman and flash photolysis experimental conditions comparable,
a 0.5:0.5 mixture of P500 and P390 would be observed in the resonance Raman difference
spectrum in H2O but a slightly higher contribution of P500 in D2O.
𝑃500𝑘1
⇌ 𝑘2
𝑃390𝑘3
⇀𝑃520 𝑘4
⇀𝑃480
Figure 35. Sequential model of the intermediates.
Table 7. Rate constants obtained from fitting the flash photolysis
data using the model in Figure 35.
Rate constant / s-1
H2O D2O
k1 (P500 ⇀ P390) 7.8 ± 0.2 × 10⁴
4.7 ± 1.3 × 10⁴
k2 (P500 ↽ P390) 7.8 ± 0.1 × 10⁴ 6.7 ± 1.3 × 10
4
k3 (P390 ⇀ P520) 4.7 ± 4.2 × 10² 4.1 ± 3.3 × 10
2
k4 (P520 ⇀ P480) 4.5 ± 2.5 × 10² 1.6 ± 1.2 × 10
2
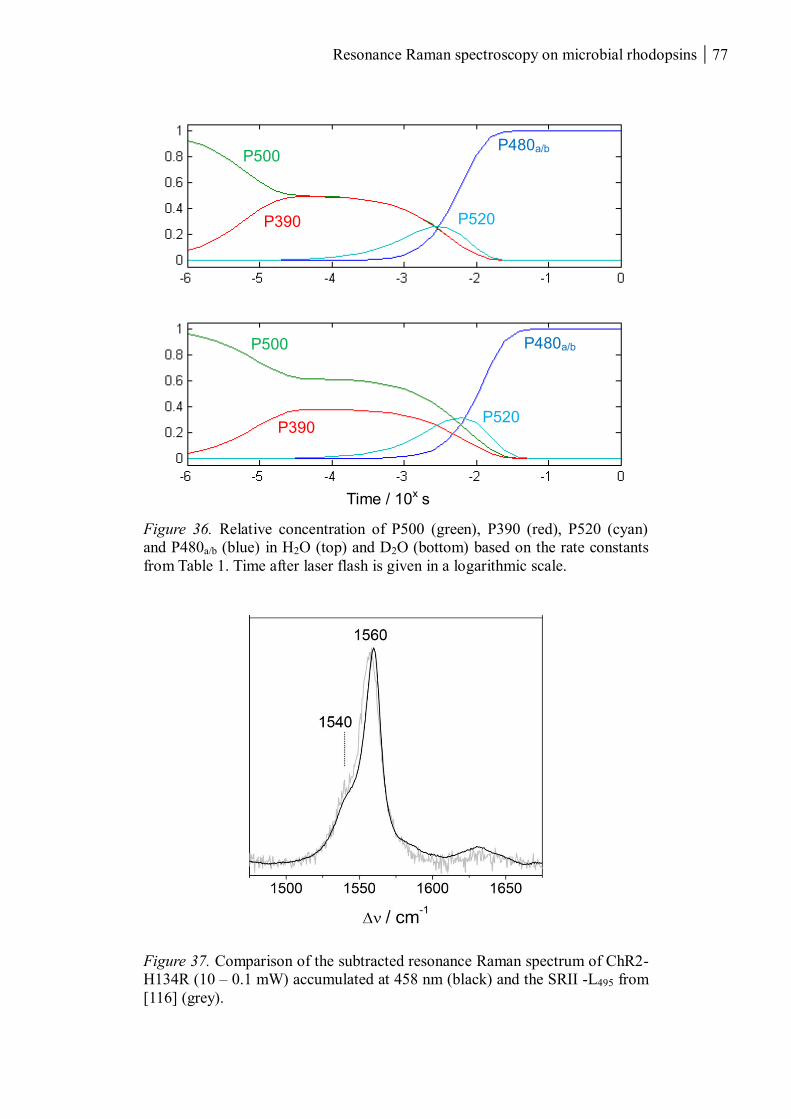
Resonance Raman spectroscopy on microbial rhodopsins 77
Figure 36. Relative concentration of P500 (green), P390 (red), P520 (cyan)
and P480a/b (blue) in H2O (top) and D2O (bottom) based on the rate constants
from Table 1. Time after laser flash is given in a logarithmic scale.
Figure 37. Comparison of the subtracted resonance Raman spectrum of ChR2-
H134R (10 – 0.1 mW) accumulated at 458 nm (black) and the SRII -L495 from
[116] (grey).
Time / 10x s
P500
P390 P520
P480a/b
P390
P500 P480a/b
P520
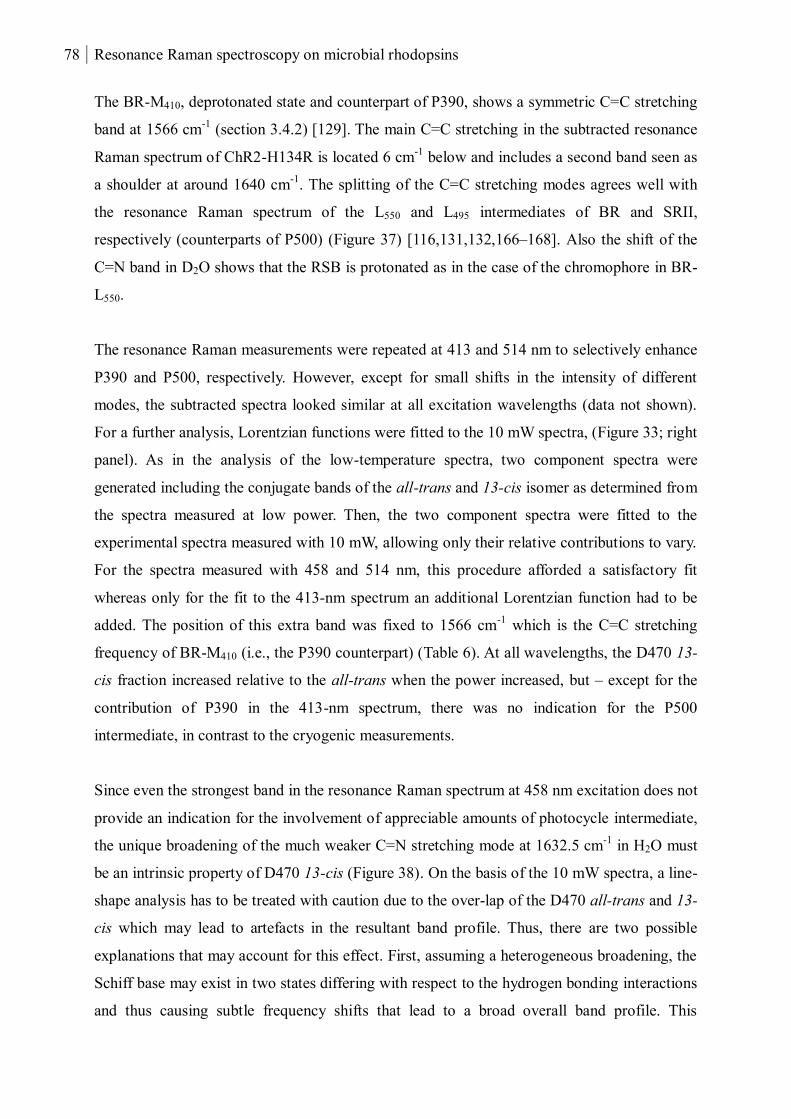
78 Resonance Raman spectroscopy on microbial rhodopsins
The BR-M410, deprotonated state and counterpart of P390, shows a symmetric C=C stretching
band at 1566 cm-1
(section 3.4.2) [129]. The main C=C stretching in the subtracted resonance
Raman spectrum of ChR2-H134R is located 6 cm-1
below and includes a second band seen as
a shoulder at around 1640 cm-1
. The splitting of the C=C stretching modes agrees well with
the resonance Raman spectrum of the L550 and L495 intermediates of BR and SRII,
respectively (counterparts of P500) (Figure 37) [116,131,132,166–168]. Also the shift of the
C=N band in D2O shows that the RSB is protonated as in the case of the chromophore in BR-
L550.
The resonance Raman measurements were repeated at 413 and 514 nm to selectively enhance
P390 and P500, respectively. However, except for small shifts in the intensity of different
modes, the subtracted spectra looked similar at all excitation wavelengths (data not shown).
For a further analysis, Lorentzian functions were fitted to the 10 mW spectra, (Figure 33; right
panel). As in the analysis of the low-temperature spectra, two component spectra were
generated including the conjugate bands of the all-trans and 13-cis isomer as determined from
the spectra measured at low power. Then, the two component spectra were fitted to the
experimental spectra measured with 10 mW, allowing only their relative contributions to vary.
For the spectra measured with 458 and 514 nm, this procedure afforded a satisfactory fit
whereas only for the fit to the 413-nm spectrum an additional Lorentzian function had to be
added. The position of this extra band was fixed to 1566 cm-1
which is the C=C stretching
frequency of BR-M410 (i.e., the P390 counterpart) (Table 6). At all wavelengths, the D470 13-
cis fraction increased relative to the all-trans when the power increased, but – except for the
contribution of P390 in the 413-nm spectrum, there was no indication for the P500
intermediate, in contrast to the cryogenic measurements.
Since even the strongest band in the resonance Raman spectrum at 458 nm excitation does not
provide an indication for the involvement of appreciable amounts of photocycle intermediate,
the unique broadening of the much weaker C=N stretching mode at 1632.5 cm-1
in H2O must
be an intrinsic property of D470 13-cis (Figure 38). On the basis of the 10 mW spectra, a line-
shape analysis has to be treated with caution due to the over-lap of the D470 all-trans and 13-
cis which may lead to artefacts in the resultant band profile. Thus, there are two possible
explanations that may account for this effect. First, assuming a heterogeneous broadening, the
Schiff base may exist in two states differing with respect to the hydrogen bonding interactions
and thus causing subtle frequency shifts that lead to a broad overall band profile. This
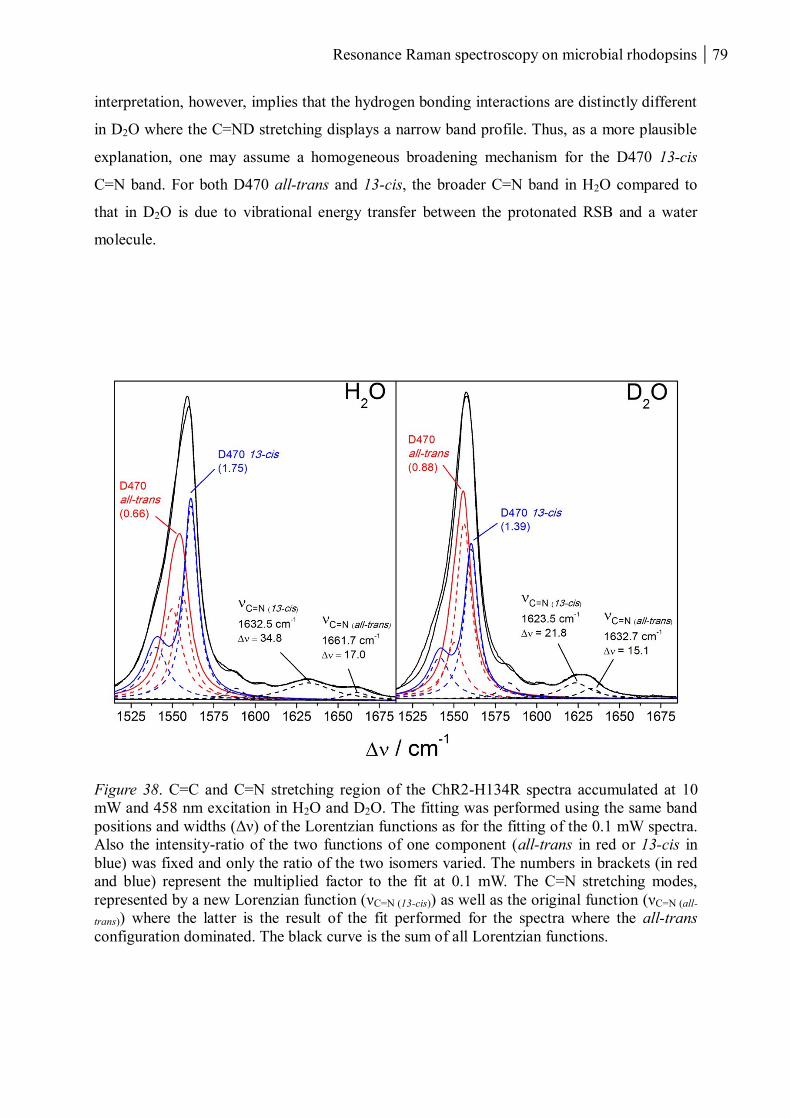
Resonance Raman spectroscopy on microbial rhodopsins 79
interpretation, however, implies that the hydrogen bonding interactions are distinctly different
in D2O where the C=ND stretching displays a narrow band profile. Thus, as a more plausible
explanation, one may assume a homogeneous broadening mechanism for the D470 13-cis
C=N band. For both D470 all-trans and 13-cis, the broader C=N band in H2O compared to
that in D2O is due to vibrational energy transfer between the protonated RSB and a water
molecule.
Figure 38. C=C and C=N stretching region of the ChR2-H134R spectra accumulated at 10
mW and 458 nm excitation in H2O and D2O. The fitting was performed using the same band
positions and widths (Δν) of the Lorentzian functions as for the fitting of the 0.1 mW spectra.
Also the intensity-ratio of the two functions of one component (all-trans in red or 13-cis in
blue) was fixed and only the ratio of the two isomers varied. The numbers in brackets (in red
and blue) represent the multiplied factor to the fit at 0.1 mW. The C=N stretching modes,
represented by a new Lorenzian function (νC=N (13-cis)) as well as the original function (νC=N (all-
trans)) where the latter is the result of the fit performed for the spectra where the all-trans
configuration dominated. The black curve is the sum of all Lorentzian functions.
80 Resonance Raman spectroscopy on microbial rhodopsins
3.1.1.8 Summary
ChR2-H134R could successfully be expressed in P. pastoris to a yield of 1-2 mg purified
protein per litre cell culture based on a protocol similar to [19,142]. Induction tests showed
that the glycosylation is complete after 24 hours and that sufficient supply of oxygen is
important for the cell growth. MALDI-ToF experiments identified a N-glycosylation site at
N24 which is crucial for the folding and/or transport of the protein to the membrane since the
removal (by the mutation NGS to NGD) drastically decreased the yield of purified ChR2. One
of the main impurities in the purified samples is a P. pastoris membrane protein with a high
amount of histidine residues which is likely to be the reason for the co-accumulation during
Ni-NTA chromatography. However most importantly for optical spectroscopy, no other co-
purified chromophore-containing proteins were detected in the UV-vis absorption spectra.
The kinetics of the ChR2-H134R photocycle at pH 7.4, derived from UV-vis absorption and
flash photolysis experiments, resulted in time constants for the decay of P500, P390, P520 and
P480a/b of 7 µs, 2 ms, 10 ms and 30 s, respectively which is comparable to the data of the
wild-type ChR2 [19,20,98,100,102]. Since the obtained kinetic data did not show a significant
increase of any of the time constants, the increased conductivity of ChR2-H134R seen in the
electrophysiological measurements [150] might instead be related to a higher expression level
of this mutant. Note that the kinetics may depend on the protein lipid or detergent
environment. Samples in D2O showed a significant decrease of the P390 and P520 time
constants related to the slower diffusion and transport of the heavier deuterium. A shift
towards alkaline pH showed decreased time constants of P480a/b possibly related to a
generally accelerated photocycle.
The primary photochemical process of D480, i.e. the isomerisation of the retinal
chromophore, is induced by illumination in the blue already at 5 K. The fine-structure in the
absorption spectrum at low temperatures, caused by restrictions in the movement of the
chomophore, is related to the vibronic transitions. This is demonstrated by the calculated
energy differences of the Gaussian band positions which correlates with the energy of the
main vibrational C=C stretching modes. Heating of the sample and exposure to blue light
leads to accumulation of the deprotonated and UV-absorbing P390 state.
Resonance Raman experiments of dark-adapted ChR2-H134R at cryogenic temperatures (78
K) mainly probed D470 since the spectral appearances were independent on the excitation
Resonance Raman spectroscopy on microbial rhodopsins 81
wavelength. Spectra accumulated after heating and illumination gave a mixture of the D470,
P500 and P390 states, perceived as shifts of the main C=C stretching vibration when
comparing spectra at 413, 458 and 514 nm. Room-temperature resonance Raman experiments
generated a largely pure D470 spectrum at 458 nm excitation and 0.1 mW. The fitting
procedure using Lorenzian functions indicated that D470 consists of two isomers, most likely
the all-trans and 13-cis configurations. Increasing the laser power afforded accumulation of
the D470 13-cis isomer in the laser spot.
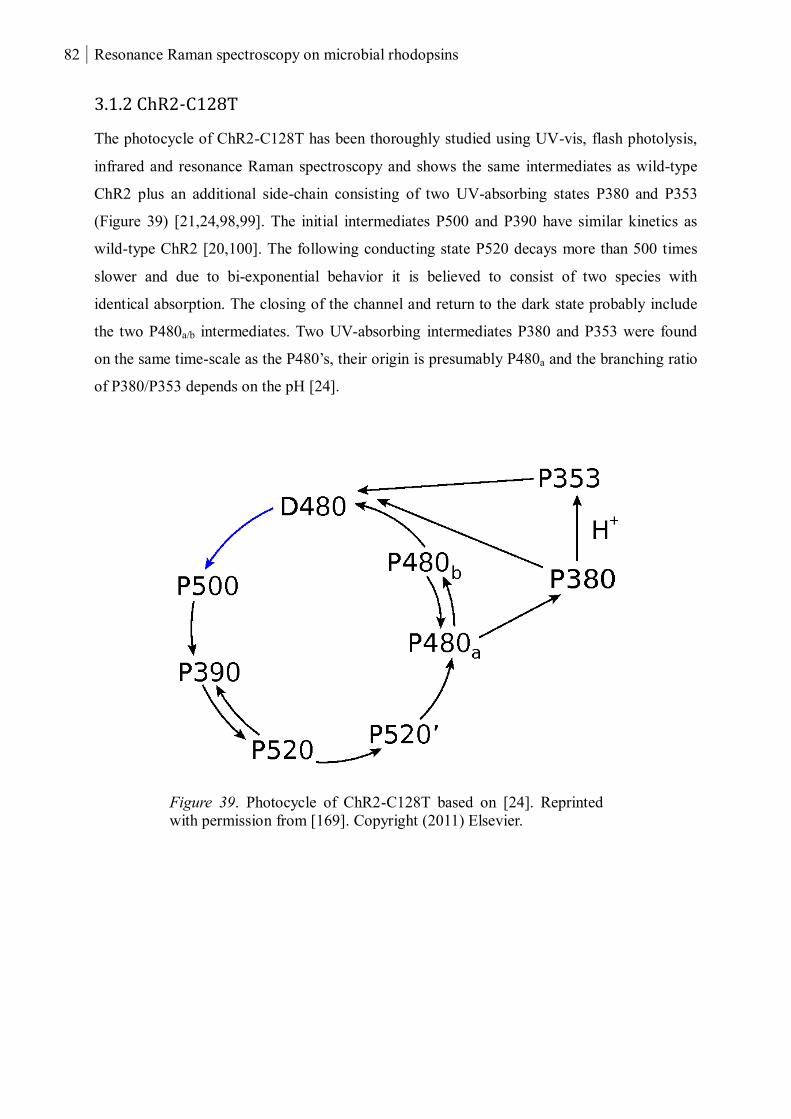
82 Resonance Raman spectroscopy on microbial rhodopsins
3.1.2 ChR2-C128T
The photocycle of ChR2-C128T has been thoroughly studied using UV-vis, flash photolysis,
infrared and resonance Raman spectroscopy and shows the same intermediates as wild-type
ChR2 plus an additional side-chain consisting of two UV-absorbing states P380 and P353
(Figure 39) [21,24,98,99]. The initial intermediates P500 and P390 have similar kinetics as
wild-type ChR2 [20,100]. The following conducting state P520 decays more than 500 times
slower and due to bi-exponential behavior it is believed to consist of two species with
identical absorption. The closing of the channel and return to the dark state probably include
the two P480a/b intermediates. Two UV-absorbing intermediates P380 and P353 were found
on the same time-scale as the P480’s, their origin is presumably P480a and the branching ratio
of P380/P353 depends on the pH [24].
Figure 39. Photocycle of ChR2-C128T based on [24]. Reprinted
with permission from [169]. Copyright (2011) Elsevier.
Resonance Raman spectroscopy on microbial rhodopsins 83
3.1.2.1 The UV-absorbing intermediates
At pH 6.0, in accordance with previous experiments [21,24,98], a fine-structured pattern with
maxima at 338, 356 and 377 nm is found in the UV-vis absorption spectra after illumination
in the blue of dark-adapted ChR2-C128T (Figure 40; black). This absorption spectrum is
attributed to the P353 intermediate. At pH 7.4 the spectrum is similar (blue) but increasing pH
to 9.0 (red) leads to an absorption band without fine-structure in this region corresponding to
a relative increase of P380 but also to protein degradation as seen by an increased background
absorption. The fine-structure corresponds to resolved vibronic transitions of the
chromophore. Fitting Gaussian functions to the UV-bands in the spectrum of ChR2-C128T at
pH 6 afforded band positions at 356.4 and 377.1 nm (Figure 41) corresponding to an energy
difference of ~1540 cm-1
similar to the frequency of the C=C stretching mode in the
resonance Raman spectrum (section 3.1.2.2).
Fine-structured absorption spectra have also been found for other retinal proteins such as the
reduced and UV-treated BR. It was proposed to contain a retro-retinyl chromophore (retro-
BR, section 3.4.1). In this retinal derivative the conjugated double bonds are shifted towards
or away from the ionone ring by one unit (Figure 42) [144,145]. The question arose whether
or not the same chromophore structure could be assigned to the long-lived intermediate P353
[24]. The difference absorption spectrum of retro- and dark-adapted BR shows the depletion
of BR560 and an increase in the UV with maxima at 344, 362 and 383 nm representing retro-
BR (Figure 43; blue). The difference spectrum of illuminated and dark-adapted ChR2-C128T
(black) shows a similar increase in the UV with maxima at 340, 356 and 376 nm representing
P353, as well as accumulation of P520 and P480a/b and the depletion of D480. Despite the
comparable UV-absorption features, it is important to note that retro-BR is irreversibly
created after reduction and UV-irradiation whereas P353 is part of the ChR2-C128T
photocycle and eventually relaxes into D480. To further study the chromophores of retro-BR
and P353 and to possibly confirm the retro-retinyl structure of retro-BR, resonance Raman
experiments were carried out.

84 Resonance Raman spectroscopy on microbial rhodopsins
Figure 40. UV-vis absorption spectra of
dark-adapted (pH 6.0, grey) and illuminated
ChR2-C128T at pH 6.0 (black), 7.4 (blue)
and 9.0 (light blue).
Figure 41. Absorption spectrum in the UV
of illuminated ChR2-C128T at pH 6.0
(black). Fitted Gaussian functions are
represented by the dashed and blue lines.
Figure 42. Top; structure of all-trans
protonated RSB. Bottom; all-trans retro-
retinyl lysine.
Figure 43. Difference UV-vis absorption
spectra of illuminated and dark-adapted
ChR2-C128T at pH 6.0 (black), and retro-
and dark-adapted BR (blue). BR spectra
were normalised before subtraction.
Resonance Raman spectroscopy on microbial rhodopsins 85
3.1.2.2 The chromophores of P380 and P353
The UV-absorbing intermediates were investigated using resonance Raman spectroscopy with
laser excitation at 351 nm (10 mW, 2 hours accumulation, 500 µL, OD480 ~1-2, rotating
cuvette) to preferentially enhance the chromophore bands of P390, P380 and P353. However,
the decay of P390 (in ms) is too fast compared to P380 and P353 (in min) to expect
contributions in the spectra [24]. The ratio of P380 and P353 was shifted by variation of the
pH (6.0, 7.4 and 9.0). Continuous irradiation with blue LED light (455 nm) was applied
during acquisition of spectra in order to ensure sufficient amounts of these intermediates in
the laser beam.
The resonance Raman spectrum of the buffer at pH 6.0 was the same as at pH 7.4 and 9.0, and
used to identify and separate buffer and retinal bands (Figure 44; grey). In fact, the bands
assigned to the retinal chromophore in ChR2-C128T are the same at all pH, indicating that the
chromophores of P380 and P353 are structurally very similar. At pH 9.0 the contributions of
the retinal compared to the buffer bands was lower than at pH 6.0 and 7.4, which is related to
the instability of the protein at alkaline pH as seen in the UV-vis absorption spectra (section
3.1.2.1; Figure 40). Thus the loss of fine-structure at high pH in the UV-vis absorption spectra
is not correlated to any changes in the resonance Raman spectra.
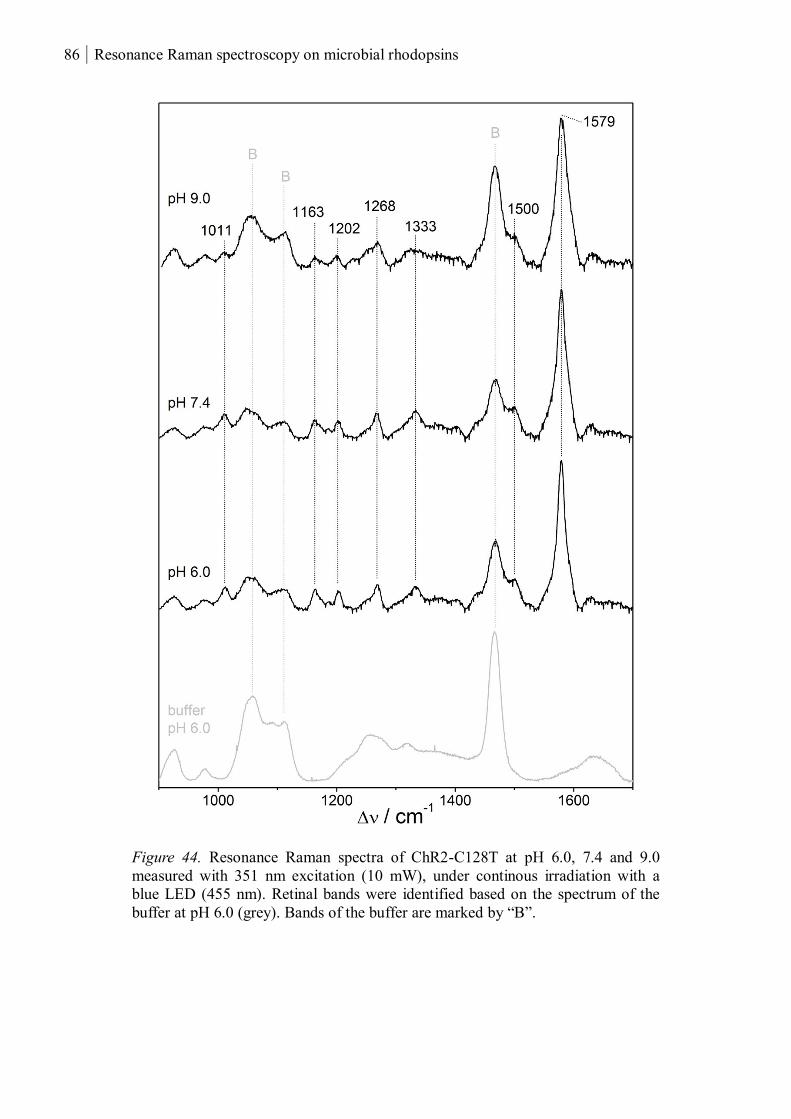
86 Resonance Raman spectroscopy on microbial rhodopsins
Figure 44. Resonance Raman spectra of ChR2-C128T at pH 6.0, 7.4 and 9.0
measured with 351 nm excitation (10 mW), under continous irradiation with a
blue LED (455 nm). Retinal bands were identified based on the spectrum of the
buffer at pH 6.0 (grey). Bands of the buffer are marked by “B”.
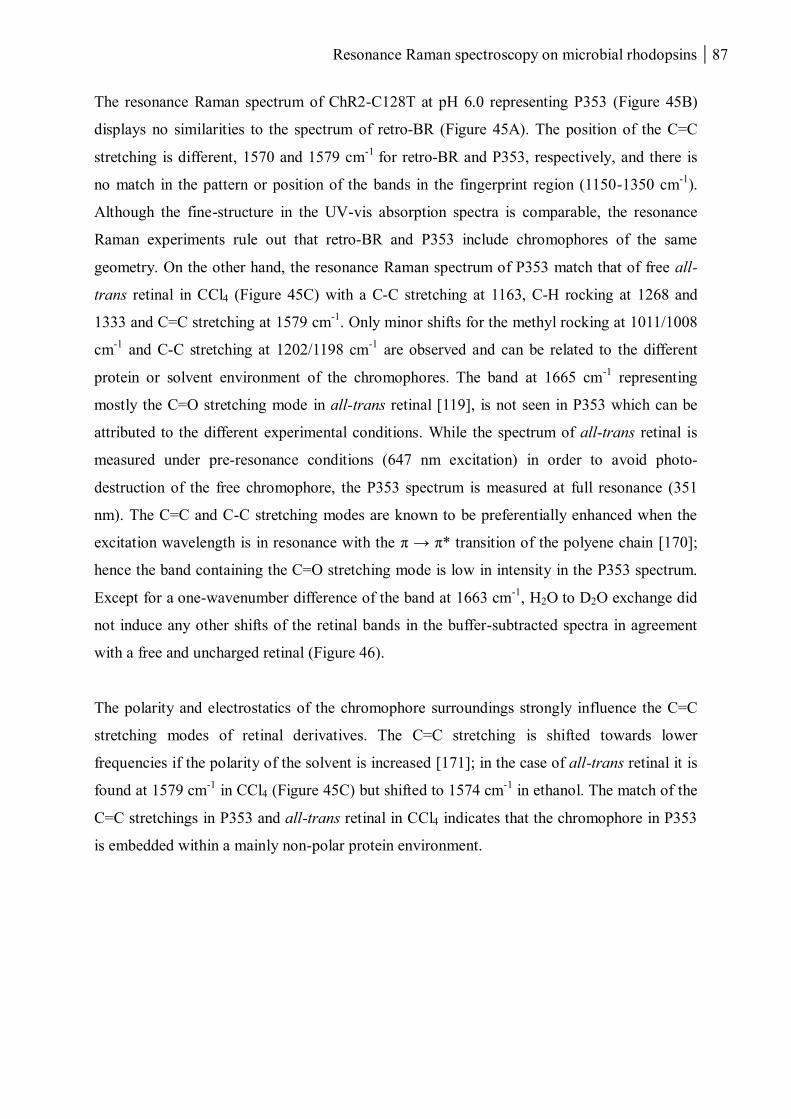
Resonance Raman spectroscopy on microbial rhodopsins 87
The resonance Raman spectrum of ChR2-C128T at pH 6.0 representing P353 (Figure 45B)
displays no similarities to the spectrum of retro-BR (Figure 45A). The position of the C=C
stretching is different, 1570 and 1579 cm-1
for retro-BR and P353, respectively, and there is
no match in the pattern or position of the bands in the fingerprint region (1150-1350 cm-1
).
Although the fine-structure in the UV-vis absorption spectra is comparable, the resonance
Raman experiments rule out that retro-BR and P353 include chromophores of the same
geometry. On the other hand, the resonance Raman spectrum of P353 match that of free all-
trans retinal in CCl4 (Figure 45C) with a C-C stretching at 1163, C-H rocking at 1268 and
1333 and C=C stretching at 1579 cm-1
. Only minor shifts for the methyl rocking at 1011/1008
cm-1
and C-C stretching at 1202/1198 cm-1
are observed and can be related to the different
protein or solvent environment of the chromophores. The band at 1665 cm-1
representing
mostly the C=O stretching mode in all-trans retinal [119], is not seen in P353 which can be
attributed to the different experimental conditions. While the spectrum of all-trans retinal is
measured under pre-resonance conditions (647 nm excitation) in order to avoid photo-
destruction of the free chromophore, the P353 spectrum is measured at full resonance (351
nm). The C=C and C-C stretching modes are known to be preferentially enhanced when the
excitation wavelength is in resonance with the π → π* transition of the polyene chain [170];
hence the band containing the C=O stretching mode is low in intensity in the P353 spectrum.
Except for a one-wavenumber difference of the band at 1663 cm-1
, H2O to D2O exchange did
not induce any other shifts of the retinal bands in the buffer-subtracted spectra in agreement
with a free and uncharged retinal (Figure 46).
The polarity and electrostatics of the chromophore surroundings strongly influence the C=C
stretching modes of retinal derivatives. The C=C stretching is shifted towards lower
frequencies if the polarity of the solvent is increased [171]; in the case of all-trans retinal it is
found at 1579 cm-1
in CCl4 (Figure 45C) but shifted to 1574 cm-1
in ethanol. The match of the
C=C stretchings in P353 and all-trans retinal in CCl4 indicates that the chromophore in P353
is embedded within a mainly non-polar protein environment.
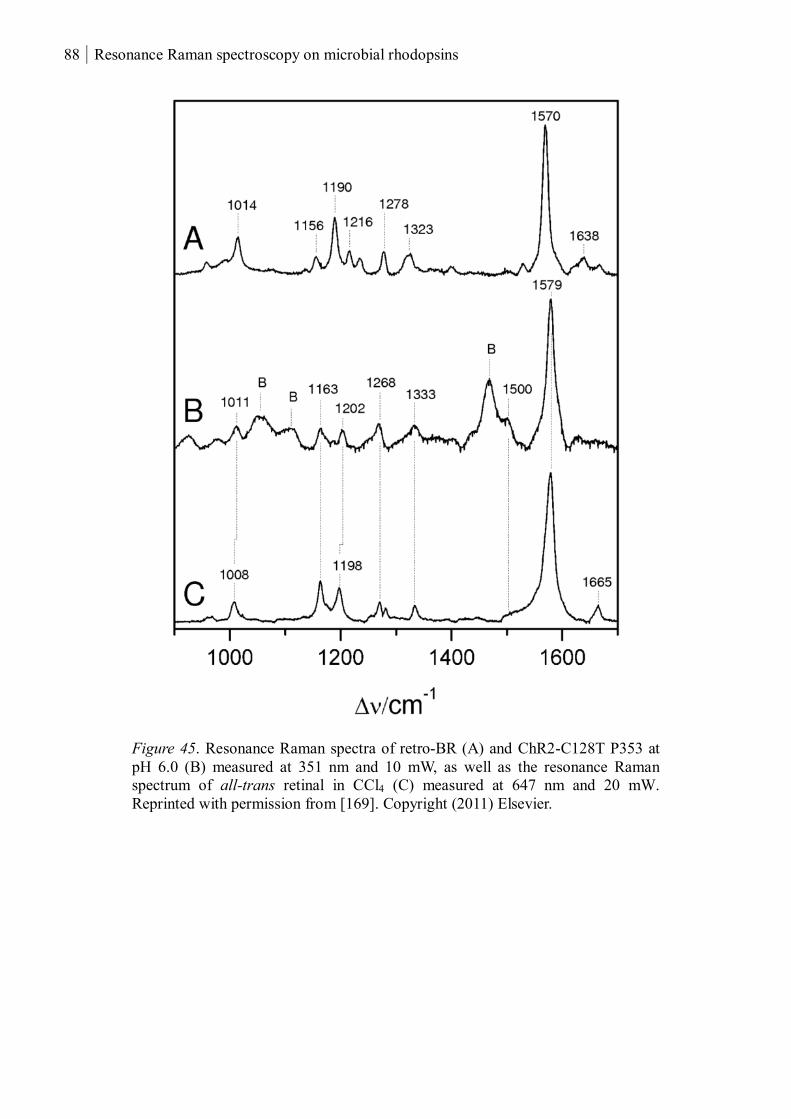
88 Resonance Raman spectroscopy on microbial rhodopsins
Figure 45. Resonance Raman spectra of retro-BR (A) and ChR2-C128T P353 at
pH 6.0 (B) measured at 351 nm and 10 mW, as well as the resonance Raman
spectrum of all-trans retinal in CCl4 (C) measured at 647 nm and 20 mW.
Reprinted with permission from [169]. Copyright (2011) Elsevier.
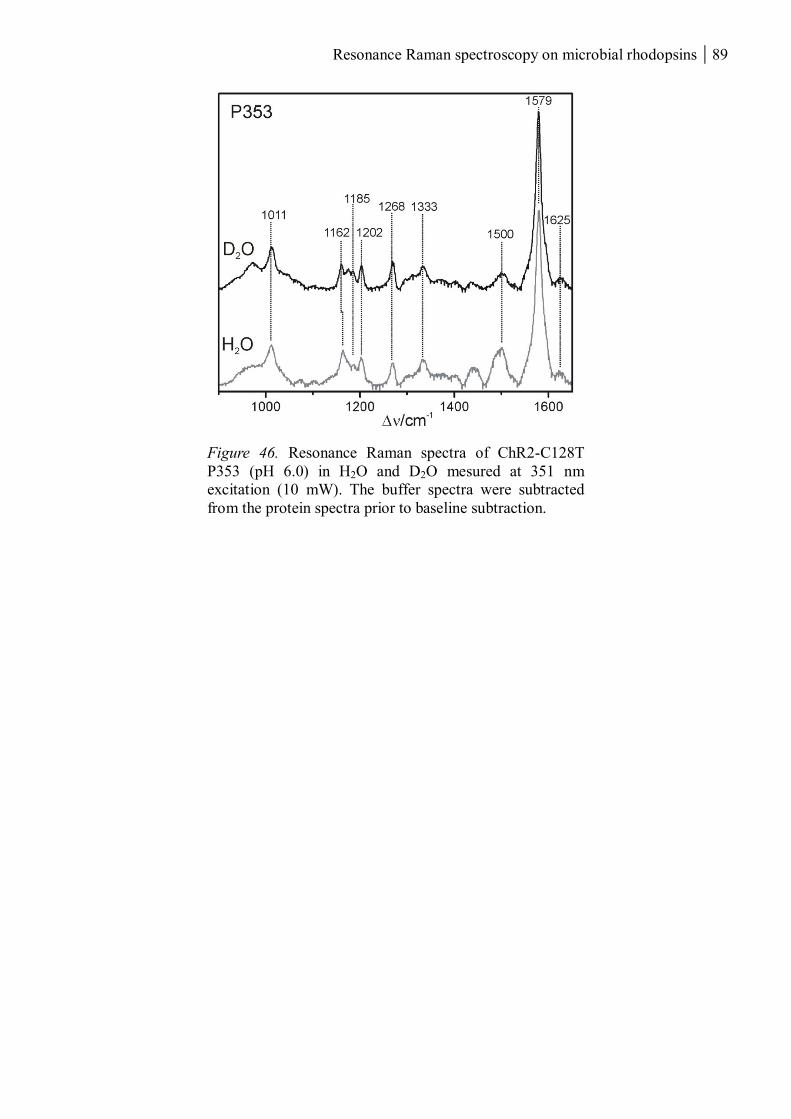
Resonance Raman spectroscopy on microbial rhodopsins 89
Figure 46. Resonance Raman spectra of ChR2-C128T
P353 (pH 6.0) in H2O and D2O mesured at 351 nm
excitation (10 mW). The buffer spectra were subtracted
from the protein spectra prior to baseline subtraction.

90 Resonance Raman spectroscopy on microbial rhodopsins
3.1.3 ChR2-C128S-D156A
The ChR2-C128S-D156A photocycle was characterised by UV-vis absorption prior to
resonance Raman spectroscopy to study slow intermediate/s as well as mutation-induced
effects on the structure of the chromophore in the dark state. The transition from the
conducting state P520 to P480a/b has been shown to be blocked in this mutant [81].
3.1.3.1 The dark and UV-absorbing states
The absorption spectrum of dark-adapted ChR2-C128S-D156A with maximum at 480 nm is
slightly red-shifted compared to wild-type ChR2 [20] and therefore named D480 (Figure 48;
top; grey). Illumination in the blue (480 nm) (top; blue) depletes D480, seen as a negative
absorption at 479 nm in the difference spectrum (bottom; blue). The absorbance is increased
in the UV at 387 nm indicating the accumulation of a deprotonated state corresponding to
P390. This state is stable for hours as seen in the kinetic measurements (Figure 47; left). The
mono-exponential fitting resulted in a time constant of around 80 min for the decrease of
absorption at 390 nm after illumination as well as the increase at 480 nm (Figure 47; right).
The decay of P390 can be influenced by illumination in the UV (375 nm) (Figure 48; top;
black), and the difference spectrum, UV- minus blue-illuminated sample, mirrors the
difference spectrum blue-illuminated minus dark-adapted (bottom; black). Thus blue light
induces the transition D480 → P390 and UV accelerates the back-reaction P390 → D480.
Figure 47. Absorbance changes of ChR2-C128S-D156A (grey) after illumination in the blue
(blue arrow) measured at 390 nm (left) and 480 nm (right). A mono-exponential function
(black curves) was fitted to the time-resolved data. The time constants derived from both fits
was 88.3 ± 0.5 for the decay at 390 nm and 75.8 ± 0.3 for the rise at 480 nm.
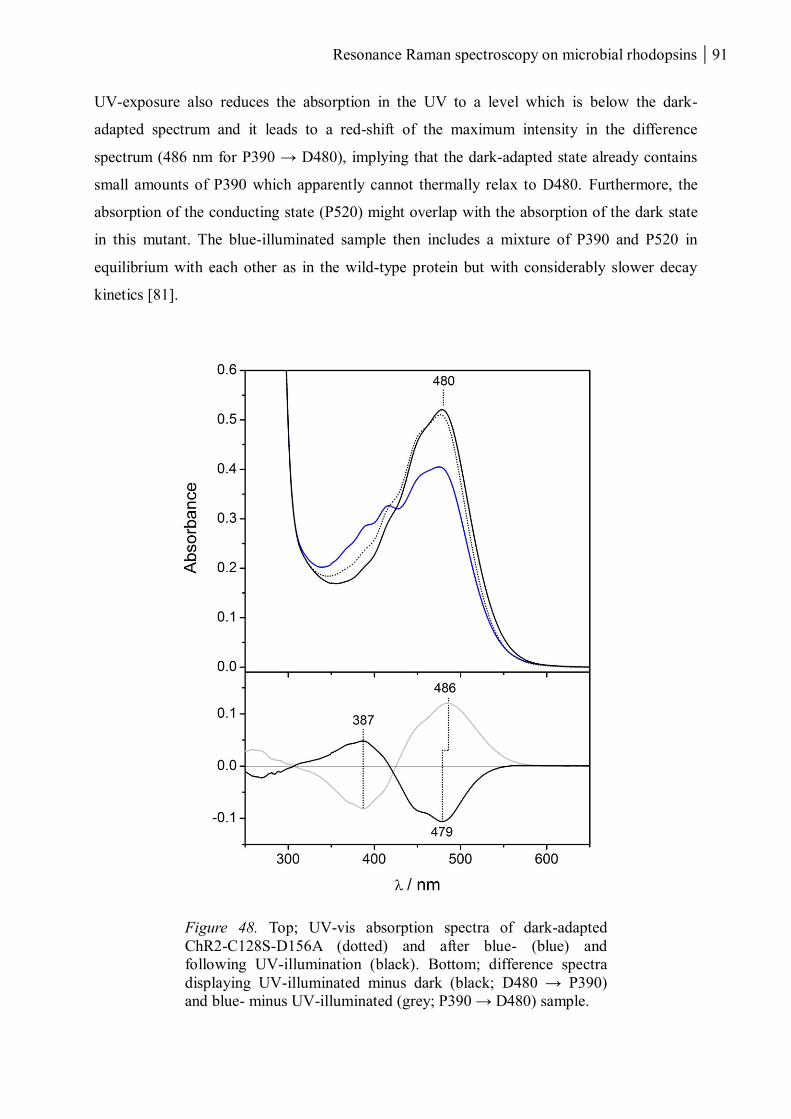
Resonance Raman spectroscopy on microbial rhodopsins 91
UV-exposure also reduces the absorption in the UV to a level which is below the dark-
adapted spectrum and it leads to a red-shift of the maximum intensity in the difference
spectrum (486 nm for P390 → D480), implying that the dark-adapted state already contains
small amounts of P390 which apparently cannot thermally relax to D480. Furthermore, the
absorption of the conducting state (P520) might overlap with the absorption of the dark state
in this mutant. The blue-illuminated sample then includes a mixture of P390 and P520 in
equilibrium with each other as in the wild-type protein but with considerably slower decay
kinetics [81].
Figure 48. Top; UV-vis absorption spectra of dark-adapted
ChR2-C128S-D156A (dotted) and after blue- (blue) and
following UV-illumination (black). Bottom; difference spectra
displaying UV-illuminated minus dark (black; D480 → P390)
and blue- minus UV-illuminated (grey; P390 → D480) sample.
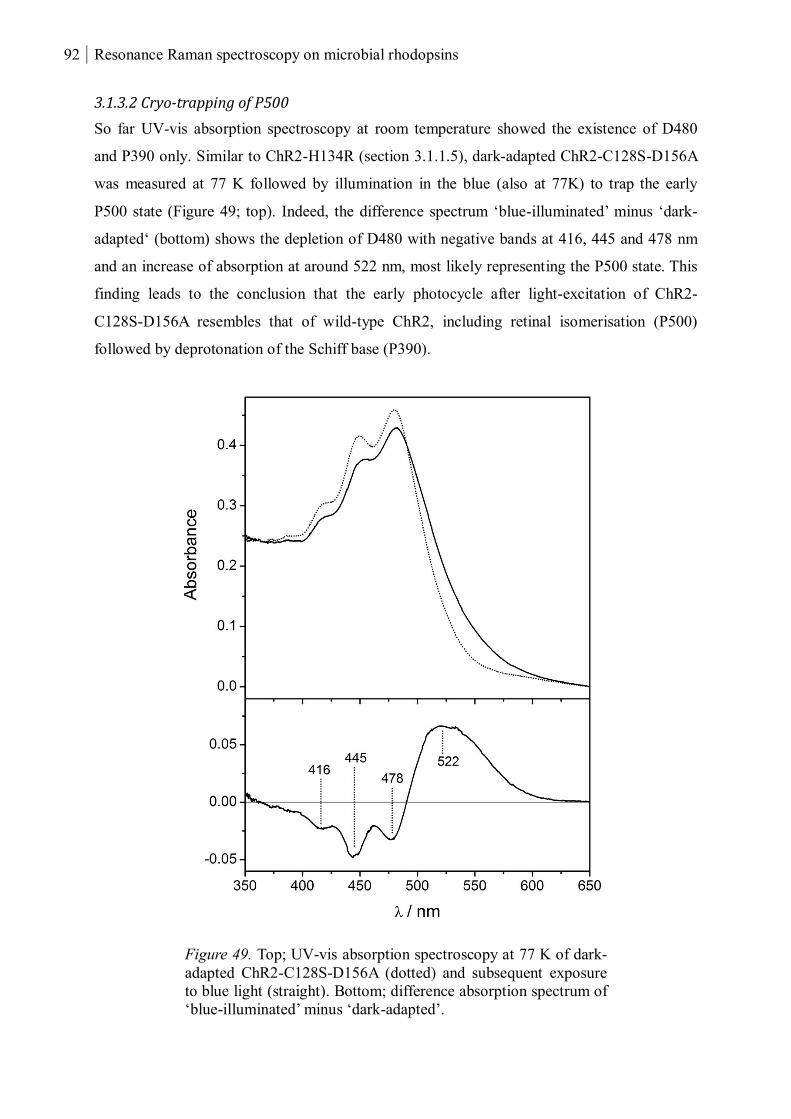
92 Resonance Raman spectroscopy on microbial rhodopsins
3.1.3.2 Cryo-trapping of P500
So far UV-vis absorption spectroscopy at room temperature showed the existence of D480
and P390 only. Similar to ChR2-H134R (section 3.1.1.5), dark-adapted ChR2-C128S-D156A
was measured at 77 K followed by illumination in the blue (also at 77K) to trap the early
P500 state (Figure 49; top). Indeed, the difference spectrum ‘blue-illuminated’ minus ‘dark-
adapted‘ (bottom) shows the depletion of D480 with negative bands at 416, 445 and 478 nm
and an increase of absorption at around 522 nm, most likely representing the P500 state. This
finding leads to the conclusion that the early photocycle after light-excitation of ChR2-
C128S-D156A resembles that of wild-type ChR2, including retinal isomerisation (P500)
followed by deprotonation of the Schiff base (P390).
Figure 49. Top; UV-vis absorption spectroscopy at 77 K of dark-
adapted ChR2-C128S-D156A (dotted) and subsequent exposure
to blue light (straight). Bottom; difference absorption spectrum of
‘blue-illuminated’ minus ‘dark-adapted’.
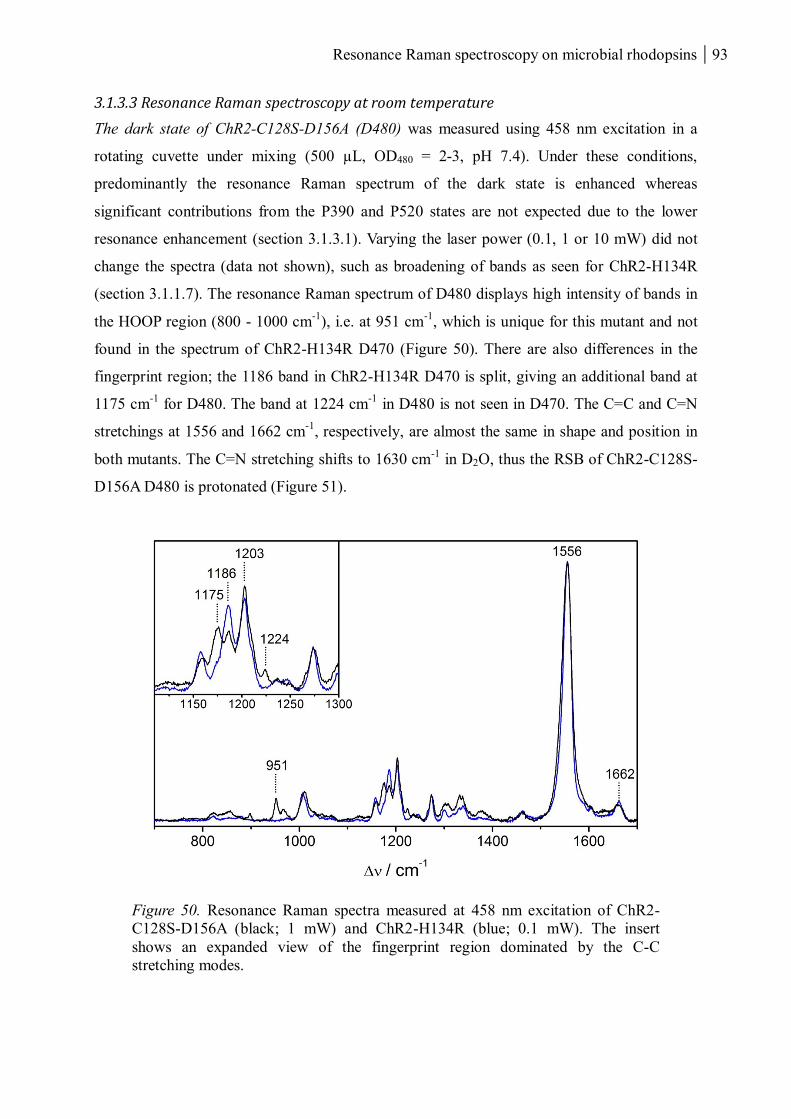
Resonance Raman spectroscopy on microbial rhodopsins 93
3.1.3.3 Resonance Raman spectroscopy at room temperature
The dark state of ChR2-C128S-D156A (D480) was measured using 458 nm excitation in a
rotating cuvette under mixing (500 µL, OD480 = 2-3, pH 7.4). Under these conditions,
predominantly the resonance Raman spectrum of the dark state is enhanced whereas
significant contributions from the P390 and P520 states are not expected due to the lower
resonance enhancement (section 3.1.3.1). Varying the laser power (0.1, 1 or 10 mW) did not
change the spectra (data not shown), such as broadening of bands as seen for ChR2-H134R
(section 3.1.1.7). The resonance Raman spectrum of D480 displays high intensity of bands in
the HOOP region (800 - 1000 cm-1
), i.e. at 951 cm-1
, which is unique for this mutant and not
found in the spectrum of ChR2-H134R D470 (Figure 50). There are also differences in the
fingerprint region; the 1186 band in ChR2-H134R D470 is split, giving an additional band at
1175 cm-1
for D480. The band at 1224 cm-1
in D480 is not seen in D470. The C=C and C=N
stretchings at 1556 and 1662 cm-1
, respectively, are almost the same in shape and position in
both mutants. The C=N stretching shifts to 1630 cm-1
in D2O, thus the RSB of ChR2-C128S-
D156A D480 is protonated (Figure 51).
Figure 50. Resonance Raman spectra measured at 458 nm excitation of ChR2-
C128S-D156A (black; 1 mW) and ChR2-H134R (blue; 0.1 mW). The insert
shows an expanded view of the fingerprint region dominated by the C-C
stretching modes.
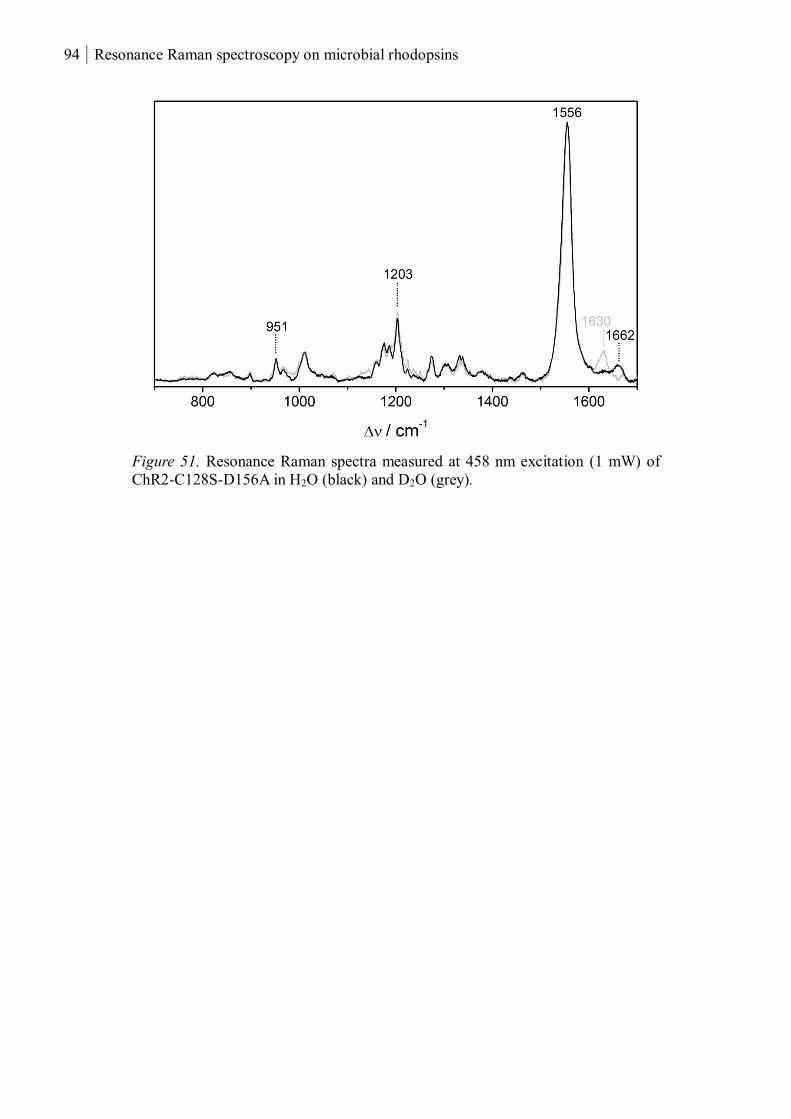
94 Resonance Raman spectroscopy on microbial rhodopsins
Figure 51. Resonance Raman spectra measured at 458 nm excitation (1 mW) of
ChR2-C128S-D156A in H2O (black) and D2O (grey).
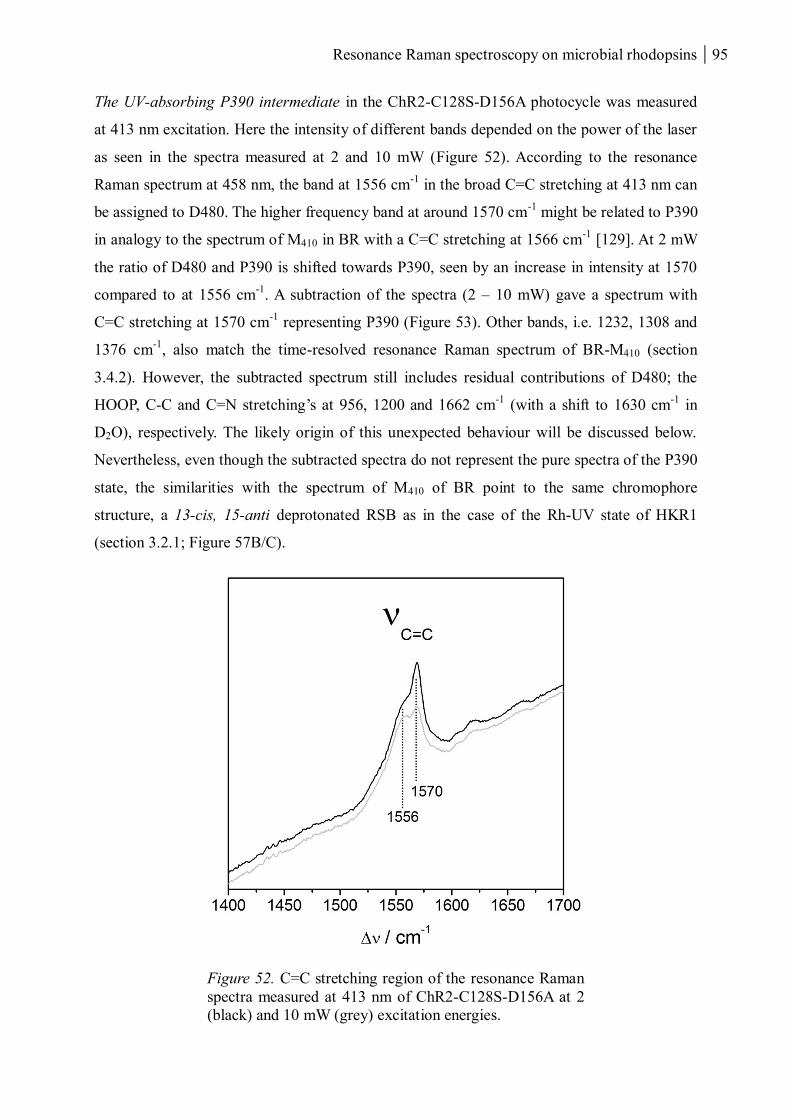
Resonance Raman spectroscopy on microbial rhodopsins 95
The UV-absorbing P390 intermediate in the ChR2-C128S-D156A photocycle was measured
at 413 nm excitation. Here the intensity of different bands depended on the power of the laser
as seen in the spectra measured at 2 and 10 mW (Figure 52). According to the resonance
Raman spectrum at 458 nm, the band at 1556 cm-1
in the broad C=C stretching at 413 nm can
be assigned to D480. The higher frequency band at around 1570 cm-1
might be related to P390
in analogy to the spectrum of M410 in BR with a C=C stretching at 1566 cm-1
[129]. At 2 mW
the ratio of D480 and P390 is shifted towards P390, seen by an increase in intensity at 1570
compared to at 1556 cm-1
. A subtraction of the spectra (2 – 10 mW) gave a spectrum with
C=C stretching at 1570 cm-1
representing P390 (Figure 53). Other bands, i.e. 1232, 1308 and
1376 cm-1
, also match the time-resolved resonance Raman spectrum of BR-M410 (section
3.4.2). However, the subtracted spectrum still includes residual contributions of D480; the
HOOP, C-C and C=N stretching’s at 956, 1200 and 1662 cm-1
(with a shift to 1630 cm-1
in
D2O), respectively. The likely origin of this unexpected behaviour will be discussed below.
Nevertheless, even though the subtracted spectra do not represent the pure spectra of the P390
state, the similarities with the spectrum of M410 of BR point to the same chromophore
structure, a 13-cis, 15-anti deprotonated RSB as in the case of the Rh-UV state of HKR1
(section 3.2.1; Figure 57B/C).
Figure 52. C=C stretching region of the resonance Raman
spectra measured at 413 nm of ChR2-C128S-D156A at 2
(black) and 10 mW (grey) excitation energies.
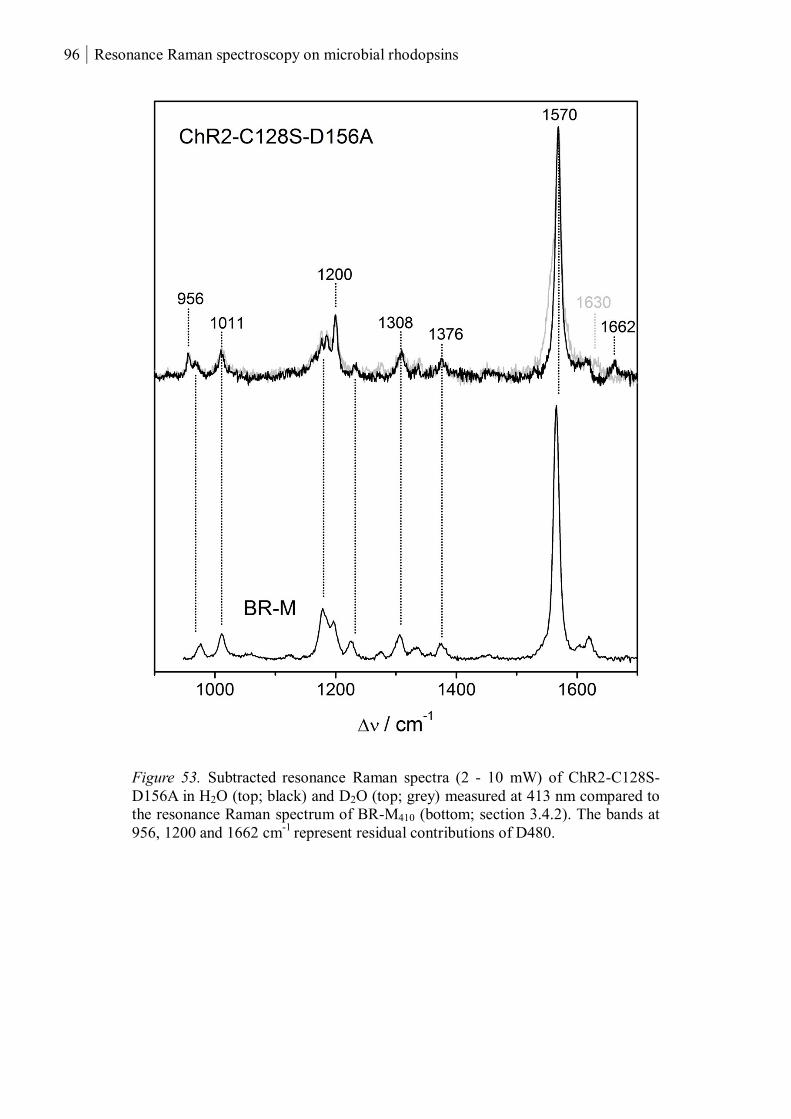
96 Resonance Raman spectroscopy on microbial rhodopsins
Figure 53. Subtracted resonance Raman spectra (2 - 10 mW) of ChR2-C128S-
D156A in H2O (top; black) and D2O (top; grey) measured at 413 nm compared to
the resonance Raman spectrum of BR-M410 (bottom; section 3.4.2). The bands at
956, 1200 and 1662 cm-1
represent residual contributions of D480.
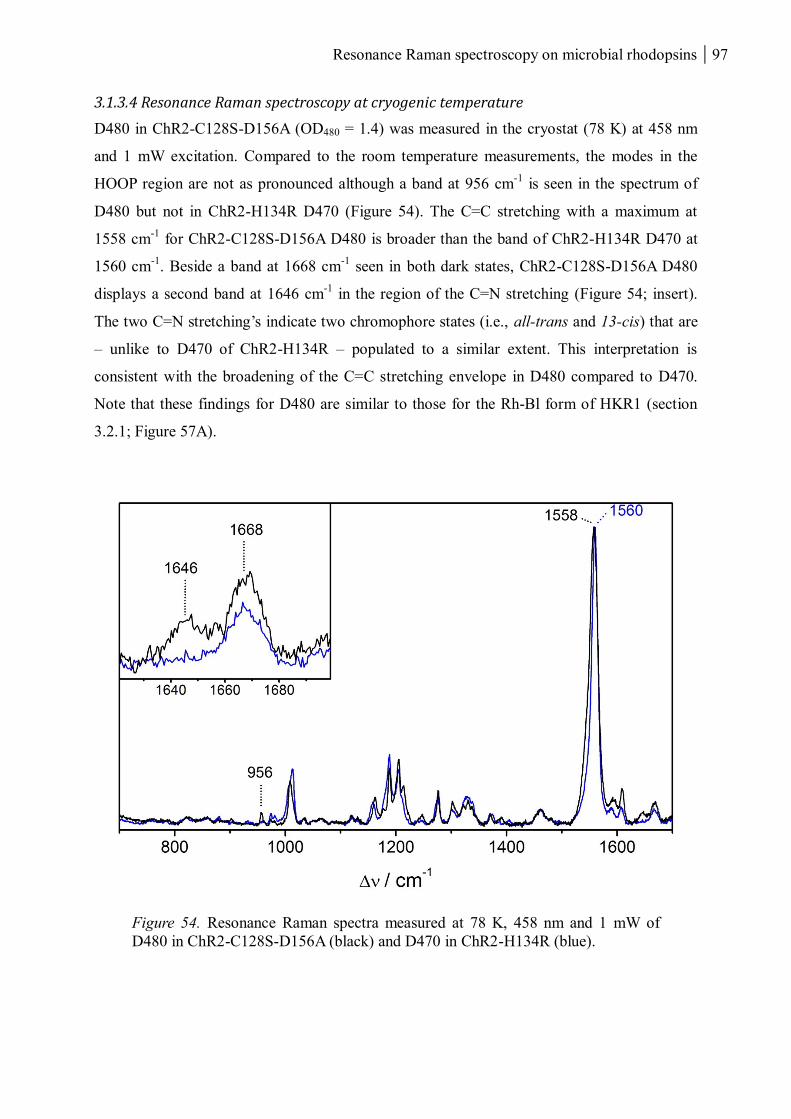
Resonance Raman spectroscopy on microbial rhodopsins 97
3.1.3.4 Resonance Raman spectroscopy at cryogenic temperature
D480 in ChR2-C128S-D156A (OD480 = 1.4) was measured in the cryostat (78 K) at 458 nm
and 1 mW excitation. Compared to the room temperature measurements, the modes in the
HOOP region are not as pronounced although a band at 956 cm-1
is seen in the spectrum of
D480 but not in ChR2-H134R D470 (Figure 54). The C=C stretching with a maximum at
1558 cm-1
for ChR2-C128S-D156A D480 is broader than the band of ChR2-H134R D470 at
1560 cm-1
. Beside a band at 1668 cm-1
seen in both dark states, ChR2-C128S-D156A D480
displays a second band at 1646 cm-1
in the region of the C=N stretching (Figure 54; insert).
The two C=N stretching’s indicate two chromophore states (i.e., all-trans and 13-cis) that are
– unlike to D470 of ChR2-H134R – populated to a similar extent. This interpretation is
consistent with the broadening of the C=C stretching envelope in D480 compared to D470.
Note that these findings for D480 are similar to those for the Rh-Bl form of HKR1 (section
3.2.1; Figure 57A).
Figure 54. Resonance Raman spectra measured at 78 K, 458 nm and 1 mW of
D480 in ChR2-C128S-D156A (black) and D470 in ChR2-H134R (blue).
98 Resonance Raman spectroscopy on microbial rhodopsins
3.1.4 Discussion
3.3.4.1 Isomeric configuration of the retinal chromophore in D470
Unlike dark-adapted BR560 and Rh-Bl in HKR1 (section 4.2) with mixed all-trans, 15-anti
and 13-cis, 15-syn isomeric compositions, the D470 room temperature spectrum of ChR2-
H134R reveal no obvious asymmetries of the peak profiles of the C=C and C=N stretching
bands (section 3.1.1.7; Figure 30). However, a global fit of all D470 spectra measured with
413, 458 and 514 nm excitation at 77 K and at room temperature with very low power,
showed that two different isomeric states are involved.
On the other hand, UV-vis absorption spectroscopy has demonstrated that a photochemical
reaction of the dark state is possible even at 5 K, implying a transition essentially without any
thermal activation barrier. Furthermore, this reaction is fully reversible such that it is assigned
to the primary photochemical process. The product displays the same absorption
characteristics as the P500 intermediate which has been shown to be formed within 3 ps [100]
and it decays within 6.5 µs as determined in this work (section 3.1.1.3; Table 3). Thus the life
time is much longer than those of the photoproducts of BR or HR [172], suggesting that P500
represents not only the primary photoproduct, denoted as P500a, but also subsequent thermal
relaxation products (P500i) which all exhibit very similar UV-vis absorption spectra.
According to this hypothesis, we can rationalize both the UV-vis absorption and the
resonance Raman spectroscopic results obtained at cryogenic temperatures. At 4 K (UV-vis)
and 77 K (UV-vis and resonance Raman) only the primary photoreaction can take place
whereas subsequent thermal reactions are blocked. Whereas in the UV-vis absorption
experiment, this photoreaction must be initiated by extra blue-light irradiation, in the
resonance Raman experiment the photoreaction is inevitably induced already by the Raman
probe beam. Since this photoreaction is reversible (section 3.1.1.5; Figure 26), the resonance
Raman spectrum of D470 measured at 77 K represents in fact the photostationary equilibrium
between the true dark state and P500a.
Upon blue-light irradiation of ChR2-H134R at 220 K, thermal relaxation processes can take
place such that P500a can thermally decay to P500i and even further to P390 as demonstrated
by the UV-vis absorption (section 3.1.1.5; Figure 27) but also the resonance Raman spectra
measured at different excitation wavelengths (section 3.1.1.6; Figure 29). P500i exhibits a
protonated Schiff base with the retinal chromophore most likely in the 13-cis, 15-anti
Resonance Raman spectroscopy on microbial rhodopsins 99
configuration as this is the chromophore configuration of the subsequent decay product P390.
This conclusion is derived from the comparison of the resonance Raman spectra of M410 state
of BR with that of the long-lived P390 state of ChR2-C128S-D156A (section 3.1.3.3). The
starting point of this photoinduced reaction sequence is hence attributed to a chromophore in
an all-trans, 15-anti configuration.
The proposed interpretation is also consistent with the analysis of the resonance Raman
spectra obtained at room temperature with high laser power. Under these conditions, the
photocycle is efficiently initiated and, in view of the residence time of the sample in the laser
beam (30 µs), the fraction of the photolysed protein is expected to be in the P390 state. This
state was in fact detected in the resonance Raman spectrum obtained with 413 nm excitation
but, due to the lack of sufficient resonance enhancement, not with 458 and 514 nm excitation.
In all spectra, however, we noted a distinct increase of the relative contribution of the 13-cis
species at the expense of the all-trans isomer compared to the spectra obtained at low laser
power (section 3.1.1.7; Figure 33). A similar redistribution between the all-trans and 13-cis
species are observed by comparing the low-temperature spectra obtained with and without
blue-light irradiation at 220 K (section 3.1.1.6; Figure 29).
The Raman spectra of the dark state of other microbial rhodopsins such as green and blue
absorbing proteorhodopsin [125], gleobactar rhodopsin [38] and sensory rhodopsin I and II
from Halobacterium [121,122] are comparable to BR570 where the chromophore configuration
has been identified as all-trans, 15-anti [127]. The fingerprint region of ChR2-H134R D470
with peaks at 1158, 1186, 1203 cm-1
and shoulders at 1175 and 1210 cm-1
is very similar to
the blue-absorbing proteorhodopsin with peaks at 1162, 1185 and 1200 and a shoulder at 1172
cm-1
[125].
These findings indicate that the D470 state includes a mixture of a photochemically active all-
trans, 15-anti isomer and a 13-cis species that is not or only to a much lower extent capable to
undergo a photochemical conversion. If this 13-cis species has some photochemical activity at
all, it is likely to lead to the same photoproduct as the photoconversion of the all-trans, 15-
anti species, i.e. to a 13-cis, 15-anti configuration. This would imply that the
photoisomerisation refers to the Schiff base double bond. In fact, such a scenario is not
unlikely in view of a similar reaction pathway identified for HKR1 (section 3.2.3).
100 Resonance Raman spectroscopy on microbial rhodopsins
ChR2 shows no indication for a dark-adaptation like BR or HR [25,27,120,127,128], because
this should be reflected by time-dependent changes in the UV-vis absorption and FTIR
spectra [19–21]. However, 13-cis is detected in the extraction and pre-resonance Raman
experiments for the so-called “dark-adapted” ChR2 [23] and ChR2-C128T [24], to a ratio of
around 7:3 all-trans to 13-cis. The ratio remains fairly similar after “light-adaptation”.
Contrary to this, extraction experiments from [142] showed 100% all-trans for “dark-
adapted” ChR2 and 5:1 all-trans to 13-cis after “light-adaptation”. It appears to be that this
scattering of the extraction data reflects the intrinsic inaccuracy of the method. Nevertheless,
in BR only all-trans is found in the extraction experiments after light-adaptation [25] showing
that the 13-cis isomer in the dark state of ChR2 behaves differently from that in BR.
Dark-adapted BR includes two chromophore isomers, i.e. an all-trans, 15-anti and a 13-cis,
15-syn configuration. In both cases, the protonated RSB is assumed to face the counterion
Asp85 and a water molecule [54]. A similar arrangement was suggested for the Rh-Bl state of
HKR1 after homology modelling [108]. Such a scenario may also hold for the two isomers in
D470 of ChR2. In fact, the reduction of bandwidth for both (D470 all-trans and 13-cis) upon
deuteration showed that a water molecule is located in the near vicinity in agreement with
previous Raman measurements on wild-type ChR2 [23] and the C1C2 crystal structure [28]
(see section 3.3.4.2.).
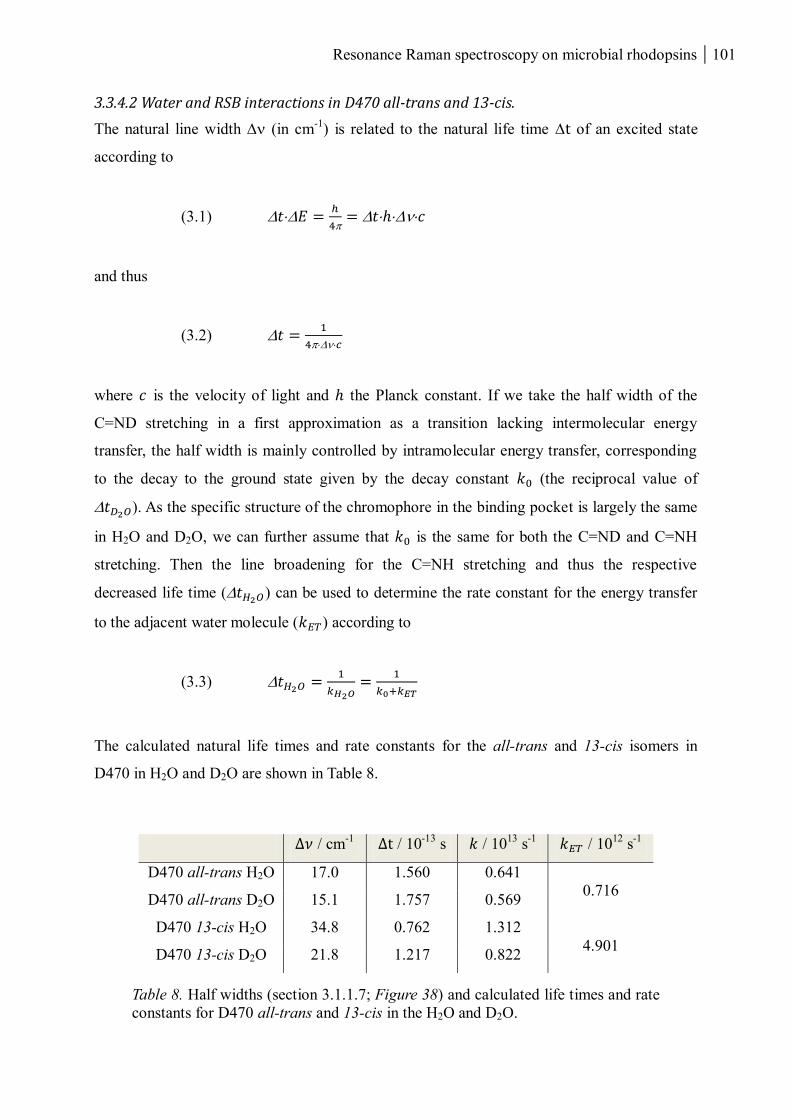
Resonance Raman spectroscopy on microbial rhodopsins 101
3.3.4.2 Water and RSB interactions in D470 all-trans and 13-cis.
The natural line width (in cm-1
) is related to the natural life time t of an excited state
according to
(3.1) 𝑡𝐸 =ℎ
4= 𝑡ℎ𝑐
and thus
(3.2) 𝑡 =1
4𝑐
where 𝑐 is the velocity of light and ℎ the Planck constant. If we take the half width of the
C=ND stretching in a first approximation as a transition lacking intermolecular energy
transfer, the half width is mainly controlled by intramolecular energy transfer, corresponding
to the decay to the ground state given by the decay constant 𝑘0 (the reciprocal value of
𝑡𝐷2𝑂). As the specific structure of the chromophore in the binding pocket is largely the same
in H2O and D2O, we can further assume that 𝑘0 is the same for both the C=ND and C=NH
stretching. Then the line broadening for the C=NH stretching and thus the respective
decreased life time (𝑡𝐻2𝑂) can be used to determine the rate constant for the energy transfer
to the adjacent water molecule (𝑘𝐸𝑇) according to
(3.3) 𝑡𝐻2𝑂 =1
𝑘𝐻2𝑂=
1
𝑘0+𝑘𝐸𝑇
The calculated natural life times and rate constants for the all-trans and 13-cis isomers in
D470 in H2O and D2O are shown in Table 8.
Table 8. Half widths (section 3.1.1.7; Figure 38) and calculated life times and rate
constants for D470 all-trans and 13-cis in the H2O and D2O.
∆𝜈 / cm-1
Δt / 10-13
s 𝑘 / 1013
s-1
𝑘𝐸𝑇 / 1012
s-1
D470 all-trans H2O 17.0 1.560 0.641
0.716 D470 all-trans D2O 15.1 1.757 0.569
D470 13-cis H2O 34.8 0.762 1.312
4.901 D470 13-cis D2O 21.8 1.217 0.822
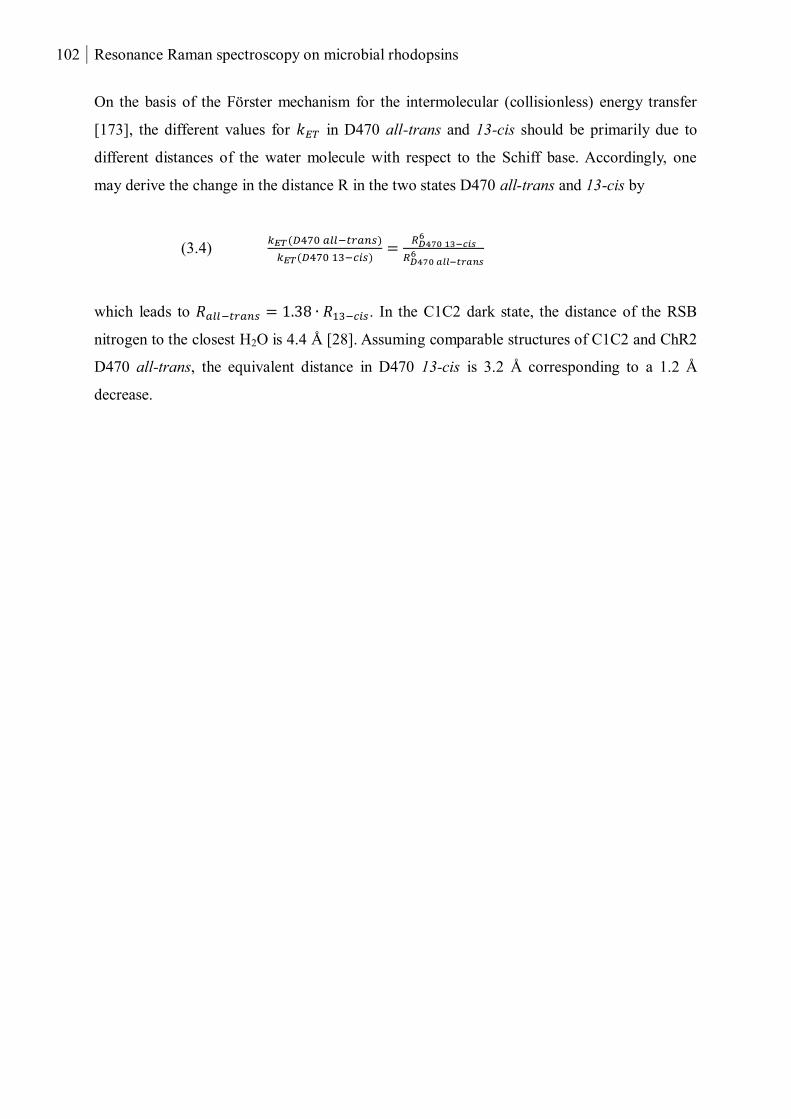
102 Resonance Raman spectroscopy on microbial rhodopsins
On the basis of the Förster mechanism for the intermolecular (collisionless) energy transfer
[173], the different values for 𝑘𝐸𝑇 in D470 all-trans and 13-cis should be primarily due to
different distances of the water molecule with respect to the Schiff base. Accordingly, one
may derive the change in the distance R in the two states D470 all-trans and 13-cis by
(3.4) 𝑘𝐸𝑇(𝐷470 𝑎𝑙𝑙−𝑡𝑟𝑎𝑛𝑠)
𝑘𝐸𝑇(𝐷470 13−𝑐𝑖𝑠)=
𝑅𝐷470 13−𝑐𝑖𝑠6
𝑅𝐷470 𝑎𝑙𝑙−𝑡𝑟𝑎𝑛𝑠6
which leads to 𝑅𝑎𝑙𝑙−𝑡𝑟𝑎𝑛𝑠 = 1.38 ∙ 𝑅13−𝑐𝑖𝑠. In the C1C2 dark state, the distance of the RSB
nitrogen to the closest H2O is 4.4 Å [28]. Assuming comparable structures of C1C2 and ChR2
D470 all-trans, the equivalent distance in D470 13-cis is 3.2 Å corresponding to a 1.2 Å
decrease.
Resonance Raman spectroscopy on microbial rhodopsins 103
3.3.4.3 Introducing mutations close to the retinal
The slow photocycle of ChR2-C128S-D156A. The dark state of ChR2-C128S-D156A (D480)
has a slightly red-shifted absorption spectra compared to wild-type ChR2 (D470). UV-vis
absorption spectroscopy at 77 K and room temperature showed that the first part of the
photocycle of ChR2-C128S-D156A includes the same intermediates as ChR2. D480 is
photoconverted to P500 upon retinal isomerisation followed by the deprotonation of the RSB
giving P390. UV-vis absorption spectroscopy at room temperature showed no indications for
the presence of the late intermediates P520 and P480a/b unless their absorption is obscured by
the absorption of the dark state. Electrophysiology data showed that the channel in ChR2-
C128S-D156A is open long after illumination, thus the conducting state P520 is likely to be in
equilibrium with P390, and the involvement of P520 in the photocycle is further substantiated
by the fact the channel off-kinetics can be accelerated by exposure to red light [81,150]. The
decay of P390 matches the recovery of D480 with time constants of around 80 min implying
that the thermal decay of P390 is much slower than the decay of the subsequent intermediates
P480a/b (section 3.1.3.1; Figure 47). The recovery of D480 can be accelerated by illumination
in the UV evidently due to a photoconversion of P390 similar to, for example, the M to the
dark state ppR phototransformation in pharaonis phoborhodopsin [174].
In terms of the kinetics, the early events up to the formation of P390 are quite similar in
ChR2-C128S-D156A as in the wild-typ like protein ChR2-H134R. This is most likely also
true for the isomeric composition of the dark state D480 in terms of an all-trans, 15-anti and a
13-cis, 15-syn species. However, details of the chromophore structures are likely to be
different and the relative contribution of the 13-cis species is presumably higher than in the
D470 state of ChR2-H134R. This conclusion is derived, inter alia, from the clearly detectable
second C=N stretching mode, the broadening of the C=C stretching band profile, and the
changes in the fingerprint region as well as in the HOOP region. Specifically, the relatively
high resonance Raman activity in the HOOP region which has no counterpart in the spectrum
of the dark state of ChR2-H134R suggests that the mutation in the chromophore pocket of
ChR2-C128S-D156A causes a distortion of the retinal polyene chain with substantial
deviations from planarity [119].
If we assume the same photochemical behaviour of the two isomers of the dark state as in
ChR2-H134R, photolysis within the exciting laser beam of the high-power resonance Raman
spectrum should lead to the accumulation of the P390 state whereas the all-trans species of
104 Resonance Raman spectroscopy on microbial rhodopsins
the dark state is preferentially depleted. In fact, formation of P390 is observed upon 413-nm
excitation and its spectrum exhibits basically the same vibrational pattern of the M410 state of
BR, confirming the assignment of the chromophore to a 13-cis, 15-anti retinal with a non-
protonated Schiff base (section 3.1.3.3; Figure 53). Also in analogy to BR, the P390 can be
photochemically converted back to the dark state as indicated by the decrease of its relative
contribution in the spectrum obtained with high laser power. This effect corresponds to the
observation that recovery of the dark state is promoted under UV irradiation (vide supra).
Since the difference spectrum “high power-minus-low power” does not correspond to the pure
P390 spectrum, one must conclude that either an additional intermediate is involved or the
isomeric composition of the “residual dark state” is different in the high power spectrum
compared to the low-power spectrum. As the only intermediate on the pathway from D480 to
P390 is the short-lived P500 with a life time shorter than the residence time of the sample in
the laser beam (section 3.3.4.1), the former interpretation can be discarded. Instead, the
present observations nicely support the view that photoconversion preferentially occurs with
the all-trans form of D480 as discussed in detail for the ChR2-H134R variant. However, it
cannot be excluded that also a P520-like state contributes to the spectra if this state is blue-
shifted compared to the wild-type P520 and thus enhanced at 413 nm.
In this context it is interesting to compare the difference UV-vis absorption spectrum of
ChR2-H134R “illuminated at 220 K minus dark state” (section 3.1.1.5; Figure 27) with the
difference spectrum “ChR2-C128S-D156A D480 minus ChR2-H134R D470” (Figure 55)
which are very similar. Whereas the former spectrum reflects the formation of the
intermediate states P500 and P390 at the expense of the dark state D470, the latter spectrum
demonstrates the different isomeric composition in the dark state. Residual P390 intermediate
was observed in the dark state of ChR2-C128S-D156A since the absorption in the UV after
UV-irradiation was depleted to below the level of the dark-adapted spectrum (section 3.1.3.1;
Figure 48). The red-shifted absorption of this mutant can be rationalised if we assume that the
altered isomeric composition in the dark state of ChR2-C128S-D156A corresponds to an
increased 13-cis contribution since the UV-vis absorption spectrum of this isomer (rather than
the all-trans species) should be more closely related to the absorption spectrum of P500,
carrying a 13-cis chromophore as well, albeit with a presumably different Schiff base
configuration (i.e. syn vs. anti). The similarity of these spectra reflecting the dark state with a
13-cis retinal and the P500 intermediate, respectively, indicates that UV-vis absorption
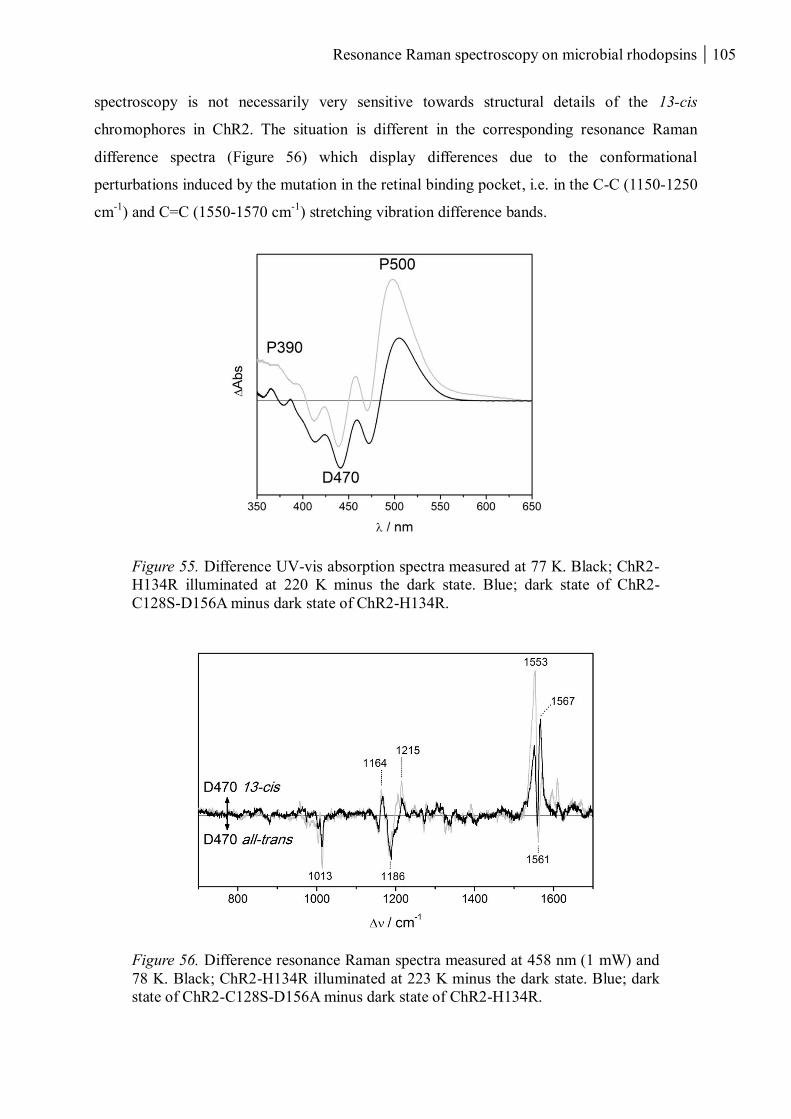
Resonance Raman spectroscopy on microbial rhodopsins 105
spectroscopy is not necessarily very sensitive towards structural details of the 13-cis
chromophores in ChR2. The situation is different in the corresponding resonance Raman
difference spectra (Figure 56) which display differences due to the conformational
perturbations induced by the mutation in the retinal binding pocket, i.e. in the C-C (1150-1250
cm-1
) and C=C (1550-1570 cm-1
) stretching vibration difference bands.
Figure 55. Difference UV-vis absorption spectra measured at 77 K. Black; ChR2-
H134R illuminated at 220 K minus the dark state. Blue; dark state of ChR2-
C128S-D156A minus dark state of ChR2-H134R.
Figure 56. Difference resonance Raman spectra measured at 458 nm (1 mW) and
78 K. Black; ChR2-H134R illuminated at 223 K minus the dark state. Blue; dark
state of ChR2-C128S-D156A minus dark state of ChR2-H134R.
106 Resonance Raman spectroscopy on microbial rhodopsins
The side-reaction of the photocycle of ChR2-C128T involves hydrolysis of the retinal Schiff
base. ChR2-C128T shows a full photocycle and an additional side-reaction including the two
UV-absorbing intermediates P380 and P353 [24]. Different to P380, P353 displays a fine-
structured UV-vis absorption spectrum [21,24,98]. Resonance Raman spectroscopy at
different pH revealed that there are no structural differences between the chomophores in
P380 and P353. The differences in the absorption pattern of these states is therefore rather
related to the environment of the chromophores. The retinal vibrational bands of P380 and
P353 matched those of free all-trans retinal in the hydrophobic solvent CCl4. Thus the
formation of P380 and P353 involves the hydrolysis of the Schiff base and the created free
all-trans retinal is embedded within a hydrophobic protein pocket.
The resonance Raman spectra of retro-BR and P353 excluded any similarities of the
chromophores, not unexpectedly since P353 is part of the ChR2-C128T photocycle whereas
retro-BR is irreversibly created after reduction and UV-treatment (section 3.4.1). Beside retro-
BR, vibronic fine-structure in the UV has been found in the absorption spectra of BR and
blowfly rhodopsin containing an unbound retinol located in the chromophore pocket
[110,145,175]. The fine-structure is proposed to origin from environmentally-induced
geometric constraints such as hydrogen bonding leading to a coplanar ring-chain organisation
of the chromophore. For the retinol bound in BR, the fine-structure is lost at acidic pH
presumably due to protonation of an amino acid in the chromophore pocket leading to loss of
a hydrogen bond to the retinol hydroxyl group [176]. The opposite pH-dependence is
observed in the case of P380 and P353 and may analogously be explained by deprotonation of
an amino acid at alkaline conditions and loss of hydrogen bonding to the aldehyde in retinal.
According to the C1C2 crystal structure [28], a water is located 4.4 Å from the RSB which is
also seen in the resonance Raman spectra of ChR2 [23] and ChR2-H134R (section 3.1.1.7). It
is conceivable that this water is responsible for the hydrolysis if the structural changes during
the photocycle bring the water closer to the RSB. This argument may hold for both ChR2-
H134R and ChR2-C128T but the latter variant exhibits much longer life times of the
intermediates formed after re-protonation of the Schiff base corresponding to a much longer
reaction time. For instance, the decay time of P520 is ca. 500 times slower than in ChR2-
H134R [24]. On the first sight, this interpretation may be questioned by the fact that the
recovery time of the photocycle of ChR2-C128S-D156A is even much longer than that of
ChR2-C128T but does not provide any indication for the transient hydrolysis of the Schiff
Resonance Raman spectroscopy on microbial rhodopsins 107
base. However, this unusually long recovery time in ChR2-C128S-D156A is caused by the
slow decay of P390 and P520, whereas the lifetime of the subsequent intermediate P480a at
which branching to the P380/P353 intermediates in C128T occurs must be significantly
shorter although it cannot be determined.
P380 and P353 decays into D470 upon reformation of the RSB; hence the free all-trans
retinal in these intermediates must remain inside the protein in contrary to human rhodopsins
where the all-trans retinal – formed after RSB hydrolysis in metarhodopsin II – escapes from
the protein via a “retinal channel” [177]. Enzymes are needed for the reformation of
functional phororeceptor by isomerising the released chromophore and reconstituting opsin
with 11-cis retinal (see [31] for a review). The free retinal in ChR2-C128T is apparently
stronger bound in the chromophore pocket than in the case of visual rhodopsins consistent
with the vibronic fine-structure and thus steric confinement as well as the hydrophobic
environment of the free all-trans retinal in P353.
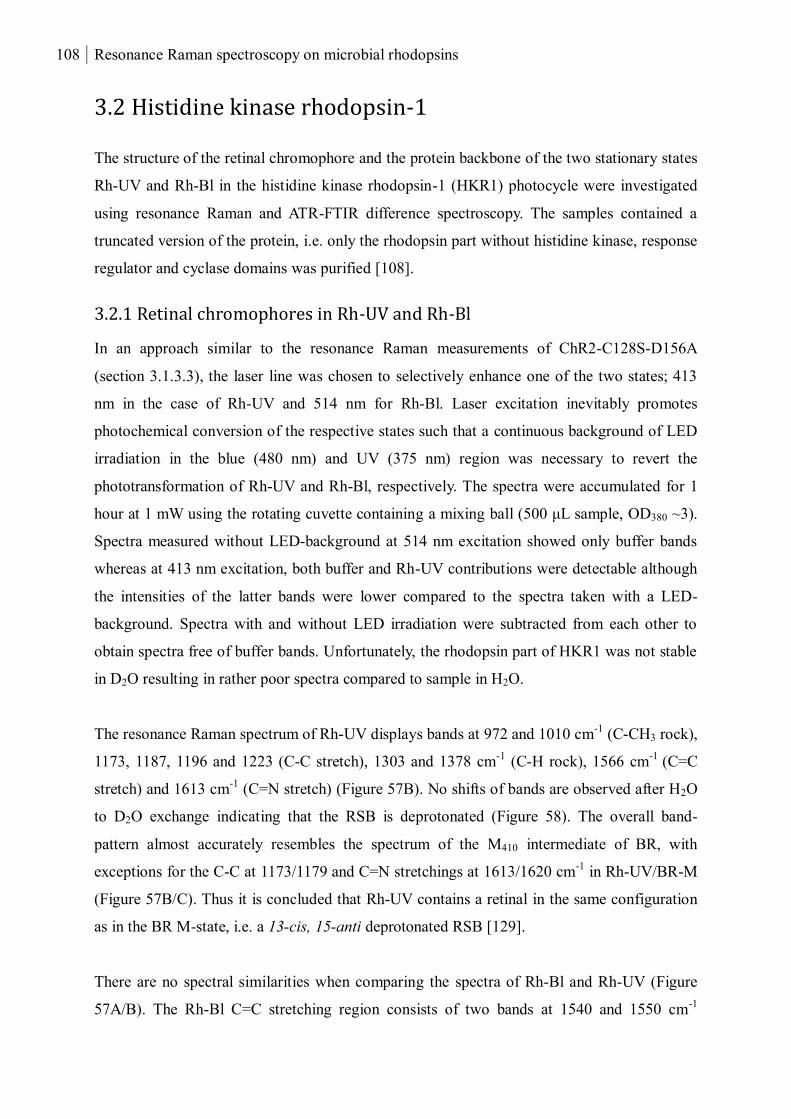
108 Resonance Raman spectroscopy on microbial rhodopsins
3.2 Histidine kinase rhodopsin-1
The structure of the retinal chromophore and the protein backbone of the two stationary states
Rh-UV and Rh-Bl in the histidine kinase rhodopsin-1 (HKR1) photocycle were investigated
using resonance Raman and ATR-FTIR difference spectroscopy. The samples contained a
truncated version of the protein, i.e. only the rhodopsin part without histidine kinase, response
regulator and cyclase domains was purified [108].
3.2.1 Retinal chromophores in Rh-UV and Rh-Bl
In an approach similar to the resonance Raman measurements of ChR2-C128S-D156A
(section 3.1.3.3), the laser line was chosen to selectively enhance one of the two states; 413
nm in the case of Rh-UV and 514 nm for Rh-Bl. Laser excitation inevitably promotes
photochemical conversion of the respective states such that a continuous background of LED
irradiation in the blue (480 nm) and UV (375 nm) region was necessary to revert the
phototransformation of Rh-UV and Rh-Bl, respectively. The spectra were accumulated for 1
hour at 1 mW using the rotating cuvette containing a mixing ball (500 μL sample, OD380 ~3).
Spectra measured without LED-background at 514 nm excitation showed only buffer bands
whereas at 413 nm excitation, both buffer and Rh-UV contributions were detectable although
the intensities of the latter bands were lower compared to the spectra taken with a LED-
background. Spectra with and without LED irradiation were subtracted from each other to
obtain spectra free of buffer bands. Unfortunately, the rhodopsin part of HKR1 was not stable
in D2O resulting in rather poor spectra compared to sample in H2O.
The resonance Raman spectrum of Rh-UV displays bands at 972 and 1010 cm-1
(C-CH3 rock),
1173, 1187, 1196 and 1223 (C-C stretch), 1303 and 1378 cm-1
(C-H rock), 1566 cm-1
(C=C
stretch) and 1613 cm-1
(C=N stretch) (Figure 57B). No shifts of bands are observed after H2O
to D2O exchange indicating that the RSB is deprotonated (Figure 58). The overall band-
pattern almost accurately resembles the spectrum of the M410 intermediate of BR, with
exceptions for the C-C at 1173/1179 and C=N stretchings at 1613/1620 cm-1
in Rh-UV/BR-M
(Figure 57B/C). Thus it is concluded that Rh-UV contains a retinal in the same configuration
as in the BR M-state, i.e. a 13-cis, 15-anti deprotonated RSB [129].
There are no spectral similarities when comparing the spectra of Rh-Bl and Rh-UV (Figure
57A/B). The Rh-Bl C=C stretching region consists of two bands at 1540 and 1550 cm-1
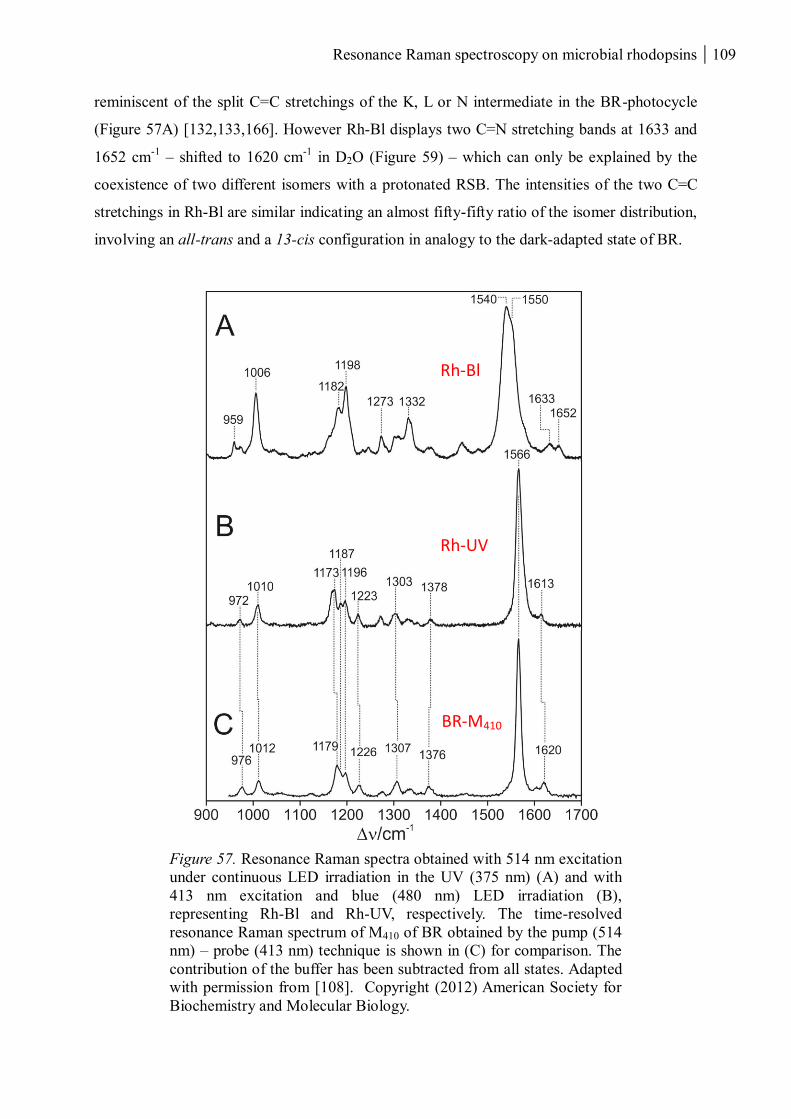
Resonance Raman spectroscopy on microbial rhodopsins 109
reminiscent of the split C=C stretchings of the K, L or N intermediate in the BR-photocycle
(Figure 57A) [132,133,166]. However Rh-Bl displays two C=N stretching bands at 1633 and
1652 cm-1
– shifted to 1620 cm-1
in D2O (Figure 59) – which can only be explained by the
coexistence of two different isomers with a protonated RSB. The intensities of the two C=C
stretchings in Rh-Bl are similar indicating an almost fifty-fifty ratio of the isomer distribution,
involving an all-trans and a 13-cis configuration in analogy to the dark-adapted state of BR.
Figure 57. Resonance Raman spectra obtained with 514 nm excitation
under continuous LED irradiation in the UV (375 nm) (A) and with
413 nm excitation and blue (480 nm) LED irradiation (B),
representing Rh-Bl and Rh-UV, respectively. The time-resolved
resonance Raman spectrum of M410 of BR obtained by the pump (514
nm) – probe (413 nm) technique is shown in (C) for comparison. The
contribution of the buffer has been subtracted from all states. Adapted
with permission from [108]. Copyright (2012) American Society for
Biochemistry and Molecular Biology.
Rh-Bl
Rh-UV
BR-M410
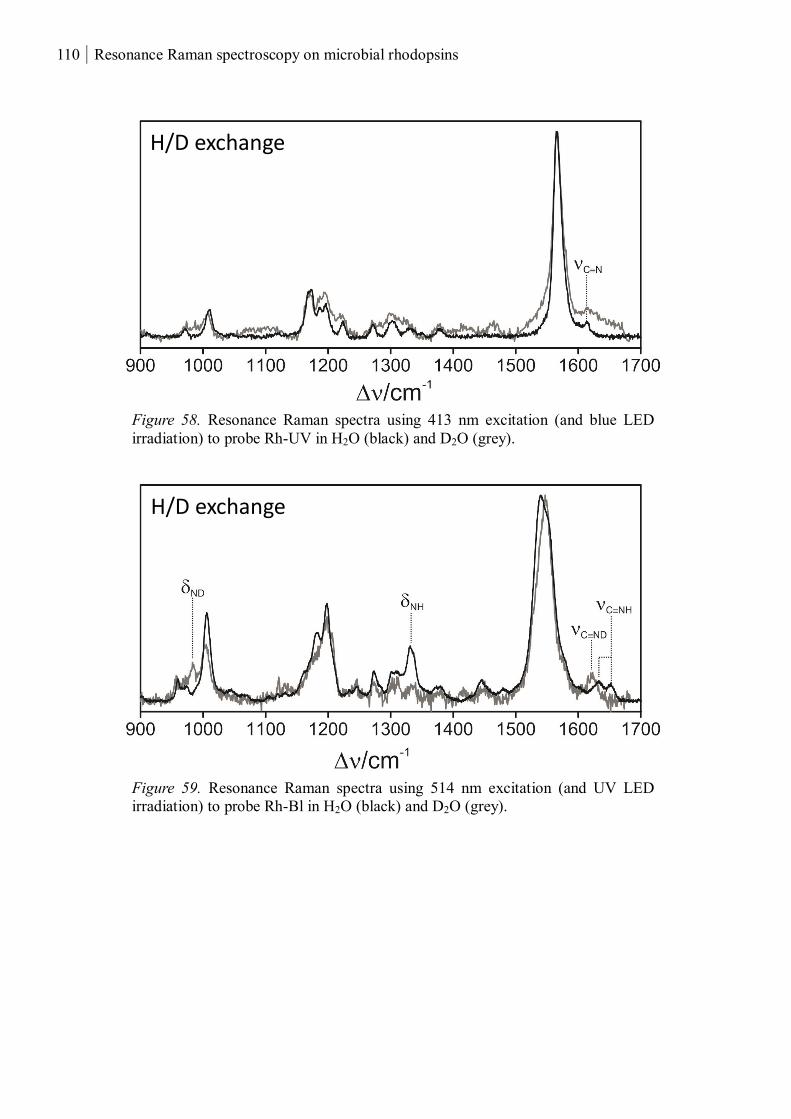
110 Resonance Raman spectroscopy on microbial rhodopsins
Figure 58. Resonance Raman spectra using 413 nm excitation (and blue LED
irradiation) to probe Rh-UV in H2O (black) and D2O (grey).
Figure 59. Resonance Raman spectra using 514 nm excitation (and UV LED
irradiation) to probe Rh-Bl in H2O (black) and D2O (grey).
H/D exchange
H/D exchange
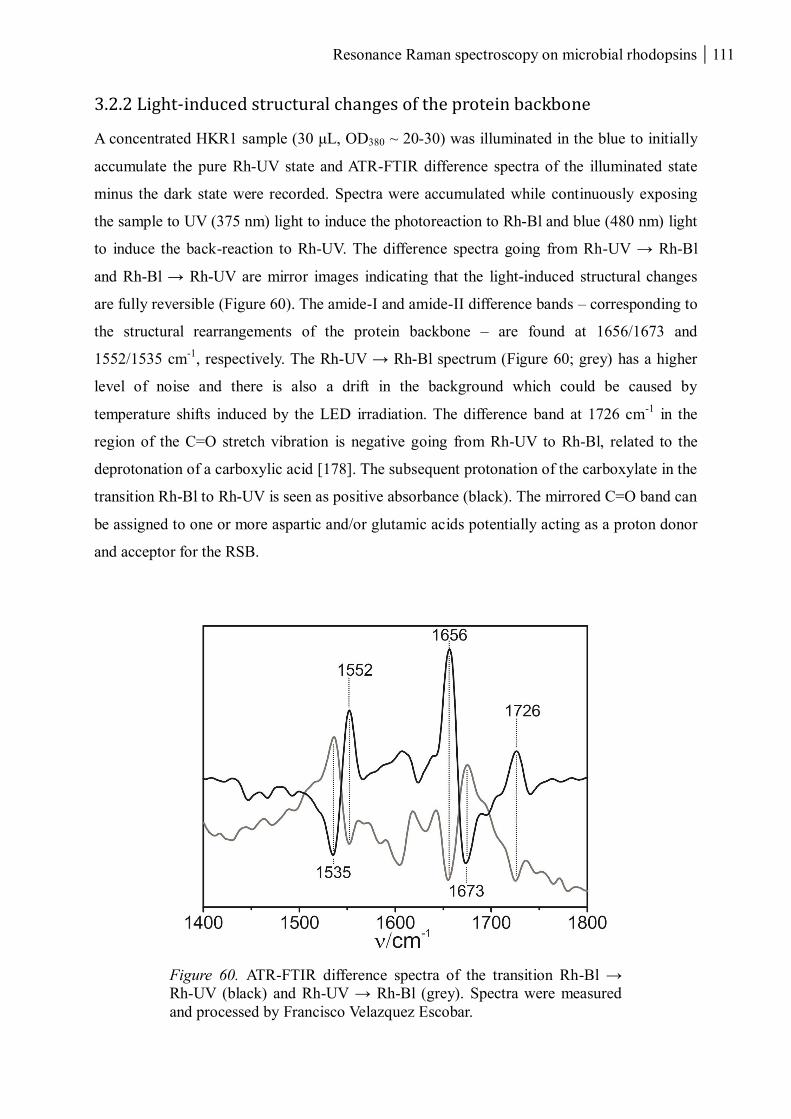
Resonance Raman spectroscopy on microbial rhodopsins 111
3.2.2 Light-induced structural changes of the protein backbone
A concentrated HKR1 sample (30 μL, OD380 ~ 20-30) was illuminated in the blue to initially
accumulate the pure Rh-UV state and ATR-FTIR difference spectra of the illuminated state
minus the dark state were recorded. Spectra were accumulated while continuously exposing
the sample to UV (375 nm) light to induce the photoreaction to Rh-Bl and blue (480 nm) light
to induce the back-reaction to Rh-UV. The difference spectra going from Rh-UV → Rh-Bl
and Rh-Bl → Rh-UV are mirror images indicating that the light-induced structural changes
are fully reversible (Figure 60). The amide-I and amide-II difference bands – corresponding to
the structural rearrangements of the protein backbone – are found at 1656/1673 and
1552/1535 cm-1
, respectively. The Rh-UV → Rh-Bl spectrum (Figure 60; grey) has a higher
level of noise and there is also a drift in the background which could be caused by
temperature shifts induced by the LED irradiation. The difference band at 1726 cm-1
in the
region of the C=O stretch vibration is negative going from Rh-UV to Rh-Bl, related to the
deprotonation of a carboxylic acid [178]. The subsequent protonation of the carboxylate in the
transition Rh-Bl to Rh-UV is seen as positive absorbance (black). The mirrored C=O band can
be assigned to one or more aspartic and/or glutamic acids potentially acting as a proton donor
and acceptor for the RSB.
Figure 60. ATR-FTIR difference spectra of the transition Rh-Bl →
Rh-UV (black) and Rh-UV → Rh-Bl (grey). Spectra were measured
and processed by Francisco Velazquez Escobar.
112 Resonance Raman spectroscopy on microbial rhodopsins
3.2.3 Discussion
The excellent spectral agreement between Rh-UV of BR-M410 indicates that the most stable
dark state of the rhodopsin part in HKR1 includes a chromophore in the 13-cis, 15-anti
configuration with a deprotonated RSB. Although the function and photocycle of BR and
HKR1 are different, the amino acid sequence in the retinal pocket is highly homologous
(supplementary info in [108]) supporting the conclusion of similar structures of the
chromophores. Homology modelling using structures of other microbial rhodopsins such as
BR, SRII [179], HR [180] and C1C2 [28] implied that the free electron pair of the RSB
nitrogen is facing away from the bona fide counterion Asp-239 [108]. Thus, it may explain
why the protein is stable in this state since protonation facilitated by the Asp-239 is sterically
unfavourable (Figure 61A). In order to stabilise Rh-Bl, the RSB proton should instead face
towards the negatively charged Asp-239 which could be achieved by a retinal in the all-trans,
15-anti or 13-cis, 15-syn configuration (Figure 61B/C). Furthermore, introducing the mutation
D239E caused a hypsochromic (blue) shift in absorption of Rh-Bl implying that this residue
interacts with the protonated Schiff base [108]. The proton transfer of D239 might be assigned
to the C=O difference bands at 1726 cm-1
in the FTIR spectra which reflects the deprotonation
of the carboxylic acid (Rh-UV to Rh-Bl) or protonation of the carboxylate (Rh-Bl to Rh-UV)
although mutational removal of this residue is necessary to unambiguously confirm this
interpretation. Unfortunately, no functional protein could be purified without a carboxylic acid
at position 239 (Roman Fudim, personal communication). The mirrored amide-I and amide-II
in the difference FTIR spectra further indicates that the structural rearrangements of the
protein helixes are reversible between the two states.
Rh-Bl includes two different isomeric states seen as a pair of C=C and C=N stretching bands
in the resonance Raman spectra. H/D exchange confirmed that the RSB is protonated in both
species. Retinal extraction experiments and HPLC analysis (supplementary info in [108])
detected a mixture of all-trans and 13-cis in both Rh-Bl and Rh-UV. The all-trans found in
Rh-UV (which was less than in Rh-Bl) may be attributed to thermal relaxation of the
chromophore during or after the extraction procedure since the resonance Raman spectra
showed no indications for the presence of a second isomer. Assuming all-trans and 13-cis are
the two isomers in Rh-Bl, the transition to this state can then only be achieved by 13-cis/trans
or 15-anti/syn isomerisation prior to the protonation of the RSB. This would generate a
mixture of all-trans, 15-anti and 13-cis, 15-syn, which are the two isomeric configurations

Resonance Raman spectroscopy on microbial rhodopsins 113
found in the dark-adapted BR570. The electronically excited state of Rh-UV is unusually long
(~60 ps) which might reflect the dual option of isomerisation [108]. Anti/syn isomerisation is
also involved in the photochemical transition from the Meta-II to the Meta-III state of bovine
rhodopsin [181]. Ultrafast spectroscopy revealed that the excited state after light-activation of
Rh-Bl decays with two different time constants which might be assigned to the two Rh-Bl
isomers [108].
Figure 61. The retinal configuration in Rh-UV (A) as well as the proposed
isomers involved in Rh-Bl (B & C). Light-induced 13-cis/trans isomerisation is
indicated in blue and 15-anti/syn in green. A thermal equilibrium (T) presumably
exists between the Rh-Bl isomers. Reprinted with permission from [108].
Copyright (2012) American Society for Biochemistry and Molecular Biology.
114 Resonance Raman spectroscopy on microbial rhodopsins
3.3 Xanthorhodopsin
3.3.1 The salinixanthin and retinal chromophores
Xanthorhodopsin (XR) displays a broad UV-vis spectrum covering the absorption of
salinixanthin and retinal [57]. The structure of the chromophores was investigated using
resonance Raman spectroscopy with excitation lines at 458, 514 and 568 nm (1 mW). Probing
at 458 and 514 nm should preferentially enhance the spectrum of the salinixanthin and at 568
nm that of the retinal chromophore. 500 µL (OD486 ~3) XR in the native membrane of the
bacterium Salinibacter ruber (1 mM tris, 15 mM KCl, pH 7.0) was measured in a rotating
cuvette using the mixing ball. The exchange of sample in the laser spot combined with the
short photocycle (~1 s; [57]) assure detection of only the dark state. The accumulation time
was 10 min at 458/514 nm and 30 min at 568 nm. In order to increase the frequency-window
at 568 nm, spectra were accumulated in two different segments – covering an interval of 800
– 1800 cm-1
with an overlap of around 200 cm-1
– and finally combined.
The bands assigned to the retinal chromophore in the 568 nm spectrum (Figure 62A; black)
are located at 825 and 879 (HOOP), 957 and 1006 (C-CH3 rock), 1171, 1186, 1200 and 1206
(C-C stretch), 1254 and 1275 (C-H rock), 1530 and 1578 (C=C stretch) and 1644 cm-1
(C=N
stretch) and show the almost identical counterparts of resonance Raman spectrum of BR570
[127]. In D2O (Figure 62A; grey) the C=N stretching at 1644 shifts to 1628 cm-1
and the N-H
bending at around 1350 to 976 cm-1
, showing that the RSB is protonated (Figure 4A/B in
[127]). The bands at 1156 and 1516 cm-1
are assigned to the C-C and C=C stretchings of
salinixanthin as seen in the 458 and 514 nm spectra (Figure 62B/C) as well as in the FT-
Raman spectrum of salinixanthin in deuterated methanol (Figure 62D), consistent with the
characteristic vibrational pattern of carotenoids [170]. The salinixanthin spectrum taken at
514 nm does not change in D2O (data not shown) and the excitation wavelength 458 or 514
nm only affected the intensities of the various modes.
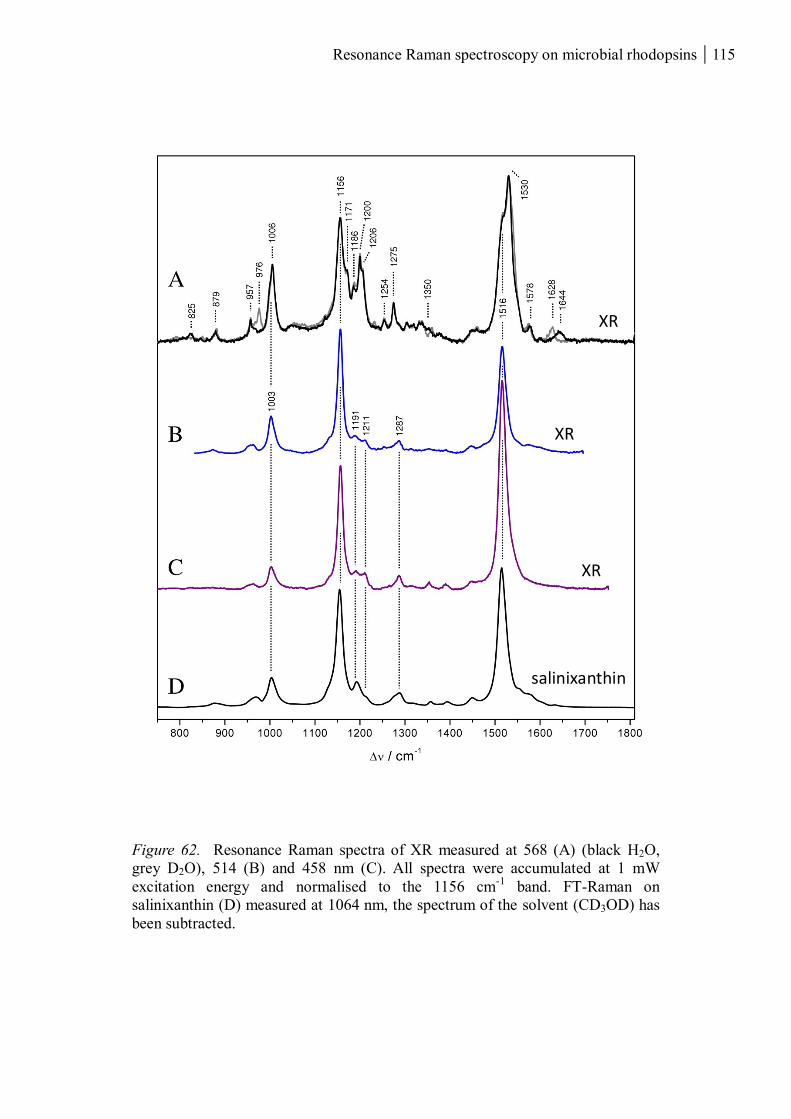
Resonance Raman spectroscopy on microbial rhodopsins 115
Figure 62. Resonance Raman spectra of XR measured at 568 (A) (black H2O,
grey D2O), 514 (B) and 458 nm (C). All spectra were accumulated at 1 mW
excitation energy and normalised to the 1156 cm-1
band. FT-Raman on
salinixanthin (D) measured at 1064 nm, the spectrum of the solvent (CD3OD) has
been subtracted.
XR
XR
XR
salinixanthin
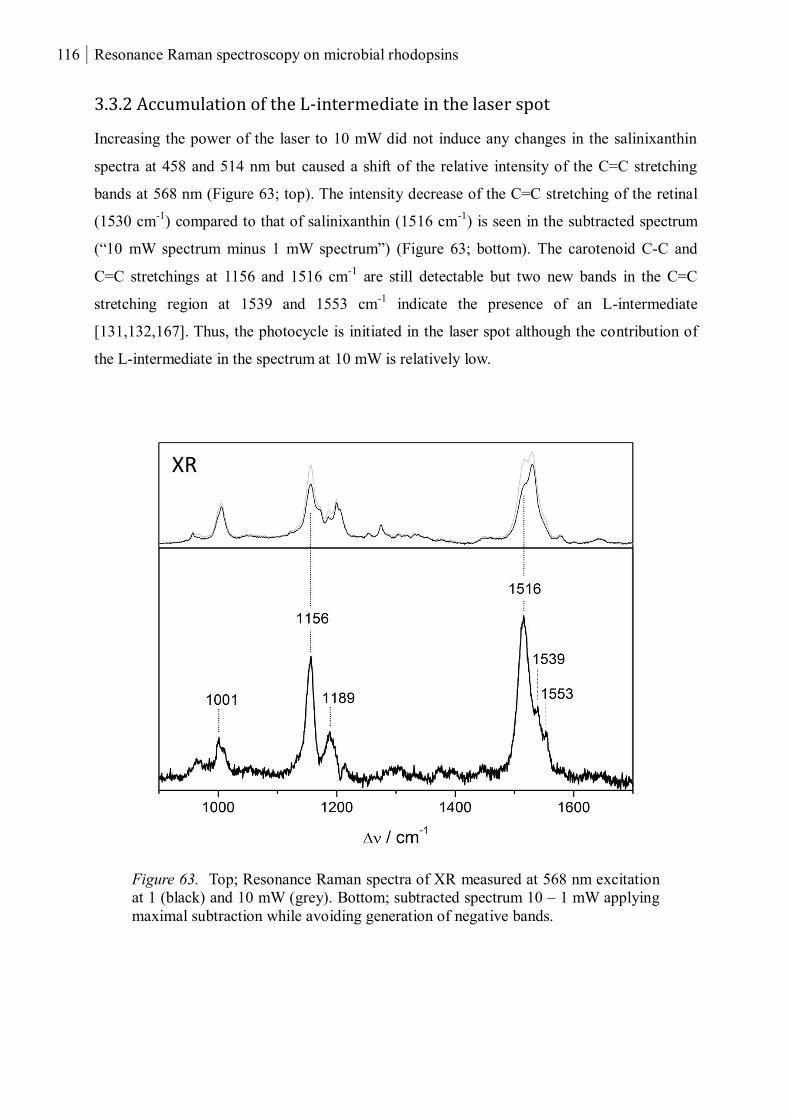
116 Resonance Raman spectroscopy on microbial rhodopsins
3.3.2 Accumulation of the L-intermediate in the laser spot
Increasing the power of the laser to 10 mW did not induce any changes in the salinixanthin
spectra at 458 and 514 nm but caused a shift of the relative intensity of the C=C stretching
bands at 568 nm (Figure 63; top). The intensity decrease of the C=C stretching of the retinal
(1530 cm-1
) compared to that of salinixanthin (1516 cm-1
) is seen in the subtracted spectrum
(“10 mW spectrum minus 1 mW spectrum”) (Figure 63; bottom). The carotenoid C-C and
C=C stretchings at 1156 and 1516 cm-1
are still detectable but two new bands in the C=C
stretching region at 1539 and 1553 cm-1
indicate the presence of an L-intermediate
[131,132,167]. Thus, the photocycle is initiated in the laser spot although the contribution of
the L-intermediate in the spectrum at 10 mW is relatively low.
Figure 63. Top; Resonance Raman spectra of XR measured at 568 nm excitation
at 1 (black) and 10 mW (grey). Bottom; subtracted spectrum 10 – 1 mW applying
maximal subtraction while avoiding generation of negative bands.
XR
Resonance Raman spectroscopy on microbial rhodopsins 117
3.3.3 Summary
The selective enhancement by tuning the laser wavelength to the absorption maximum of a
certain state or chromophore is nicely demonstrated in the case of XR. The salinixanthin
chromophore can be detected at 458, 514 and 568 nm whereas sufficient enhancement for the
retinal is only obtained at 568 nm excitation. This allows for separation and identification of
salinixanthin and retinal bands. The salinixanthin spectra at 458 and 514 nm did not display a
dependence on the laser power showing the photochemical stability of the chromophore. The
resonance Raman spectrum with 514 nm excitation displayed no isotopic shifts in D2O since
there are no exchangeable protons on salinixanthin.
The retinal bands at 568 nm as well as the shifts of the C=N stretching and N-H bending in
D2O, revealed almost identical features compared to the light-adapted BR570. Thus the retinal
chromophore in the dark state of XR is in the all-trans, 15-anti geometry with a protonated
RSB [127]. The marker bands at 800 (HOOP) and 1183 cm-1
(C-C stretching) of the second
isomer (13-cis, 15-syn protonated RSB) in dark-adapted BR560 [128] was not found in the XR
resonance Raman spectrum. However if present original, it might not be detected due to laser-
induced isomerisation of the chromophore with the onset of the resonance Raman
measurement. Unlike to the salinixanthin spectra at 458 and 514 nm, higher laser powers
induced spectral changes at 568 nm seen by a shift of the intensity ratio of the salinixanthin
and retinal C=C stretching bands. At high power, a species similar to the BR L-intermediate is
accumulated in the laser spot, albeit with low concentrations.
118 Resonance Raman spectroscopy on microbial rhodopsins
3.4 Bacteriorhodopsin
3.4.1 Reduced and UV-treated bacteriorhodopsin
The retinal chromophore in BR, after reduction and UV-treatment according to [144,145]
(see material and methods, section 2.2), was investigated using UV-vis and resonance Raman
spectroscopy. The spectra were compared to those of the UV-absorbing intermediates in the
ChR2-C128T photocycle (section 3.1.2.2) as well as to calculated spectra.
The reduction of the retinal chromophore in BR using NaBH4 had to be carried out under
yellow illumination to induce the transition into the M-state. It is therefore assumed that the
chromophore being reduced is in the configuration of 13-cis, 15-anti deprotonated RSB. The
proposed mechanism for the reduction reaction includes hydride transfer to carbon 15 and a
shift of one electron pair to the nitrogen (Figure 64). The now negatively charged nitrogen
receives a proton from the environment, probably from Asp96, the amino acid responsible for
the re-protonation of the RSB in the BR photocycle [46,47,178]. The reduced chromophore
has an absorption maximum at around 370 nm and, after irradiation in the UV, it is transferred
into a state displaying a fine-structured UV-vis absorption spectrum (Figure 65). The
reduction and UV reaction is irreversible and the chromophore un-extractable [144,145]. The
fine-structure obtained after UV-irradiation or by acidic pH is proposed to be related to a shift
of the conjugated bonds either towards or away from the ionone ring to afford a so-called
retro configuration (Figure 64) [144,145]. In retro-retinyl the angle of the ionone ring is fixed
with respect to the polyene chain via the double bond between carbons 6 and 7 which leads to
steric constraints in the conformational flexibility and thus to a fine-structured absorption
pattern. The reduced and UV-treated BR will, for the sake of simplicity, be called retro-BR.
Under the assumption of a reduction mechanism as proposed in Figure 64, performing the
reaction in NaBD4 should give a deuterium at carbon 15 and in D2O at the nitrogen. The
reduction and UV-treatment was carried out in a) H2O/NaBH4, b) H2O/NaBD4, c)
D2O/NaBH4 and d) D2O/NaBD4 followed by exchange to 150 mM sodium phosphate buffer,
pH 7.0 (in H2O). The four reaction mixtures gave the same UV-vis absorption spectra with
maxima at 344, 363 and 383 nm (Figure 65B). Unfortunately, also the resonance Raman
spectra measured at 351 nm were identical in all of these cases. The spectrum of retro-BR
showed bands at 1014 (C-CH3 rock), 1156, 1190 and 1216 (C-C stretch), 1278 and 1323 (C-H

Resonance Raman spectroscopy on microbial rhodopsins 119
rock) and 1570 cm-1
(C=C stretching) (Figure 66). The band at 1638 cm-1
cannot be assigned
to a C=N stretching since the C=N bond was reduced. However, the frequency is in line with
that of a stretching mode of a poorly conjugated C=C bond. It is conceivable that carbon 15
and the nitrogen are no longer part of the conjugated system, such that these vibrations are
therefore not enhanced and deuterated-induced shifts not detected which argues in favour of a
shift of the conjugated system towards the ionone ring. To evaluate this, the Raman spectrum
of retro-retinyl ethyl amine was calculated using density functional theory [116] (Figure 66).
The bands at 1156, 1190, 1216, 1278 and 1323 cm-1
in the fingerprint region of retro-BR
show a comparable pattern in the calculated spectrum. However the main C=C stretching
frequency is too high in the calculated spectrum (1594 cm-1
) compared to in the experimental
spectrum (1570 cm-1
) to safely confirm the structure. The calculation includes a hexane
solvent model and the work has to be continued with advanced hybrid techniques in order to
consider the protein environment of the chromophore.
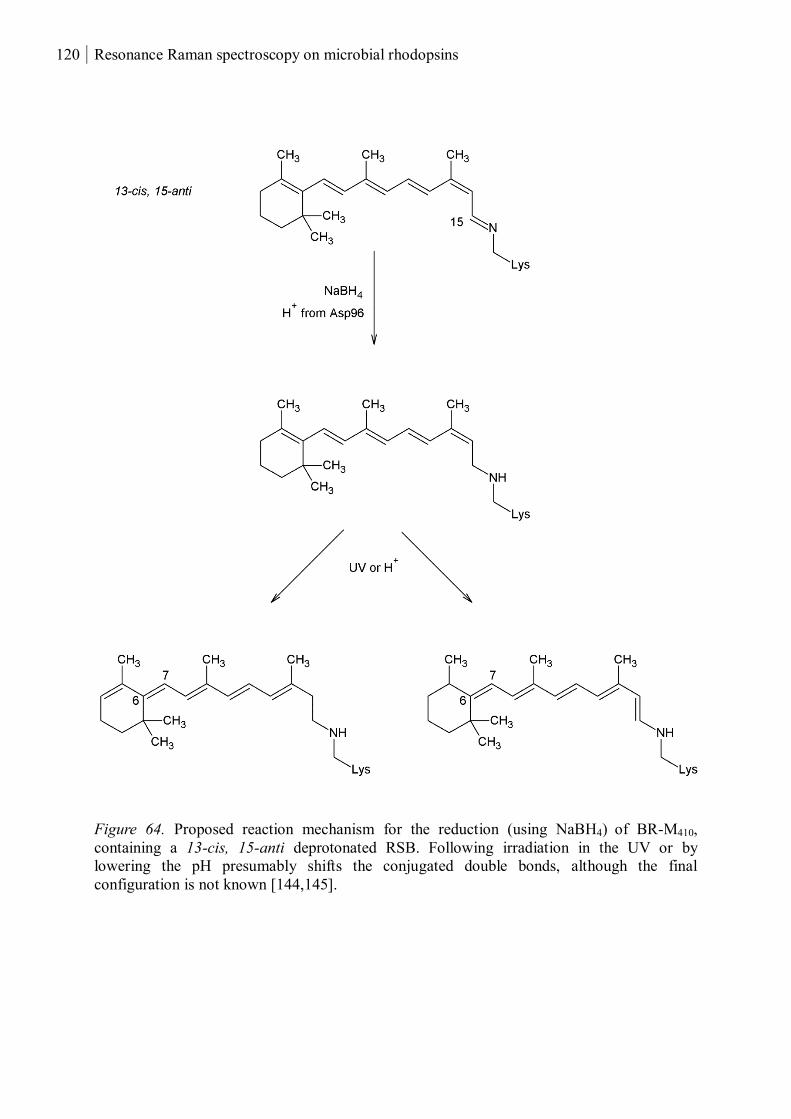
120 Resonance Raman spectroscopy on microbial rhodopsins
Figure 64. Proposed reaction mechanism for the reduction (using NaBH4) of BR-M410,
containing a 13-cis, 15-anti deprotonated RSB. Following irradiation in the UV or by
lowering the pH presumably shifts the conjugated double bonds, although the final
configuration is not known [144,145].
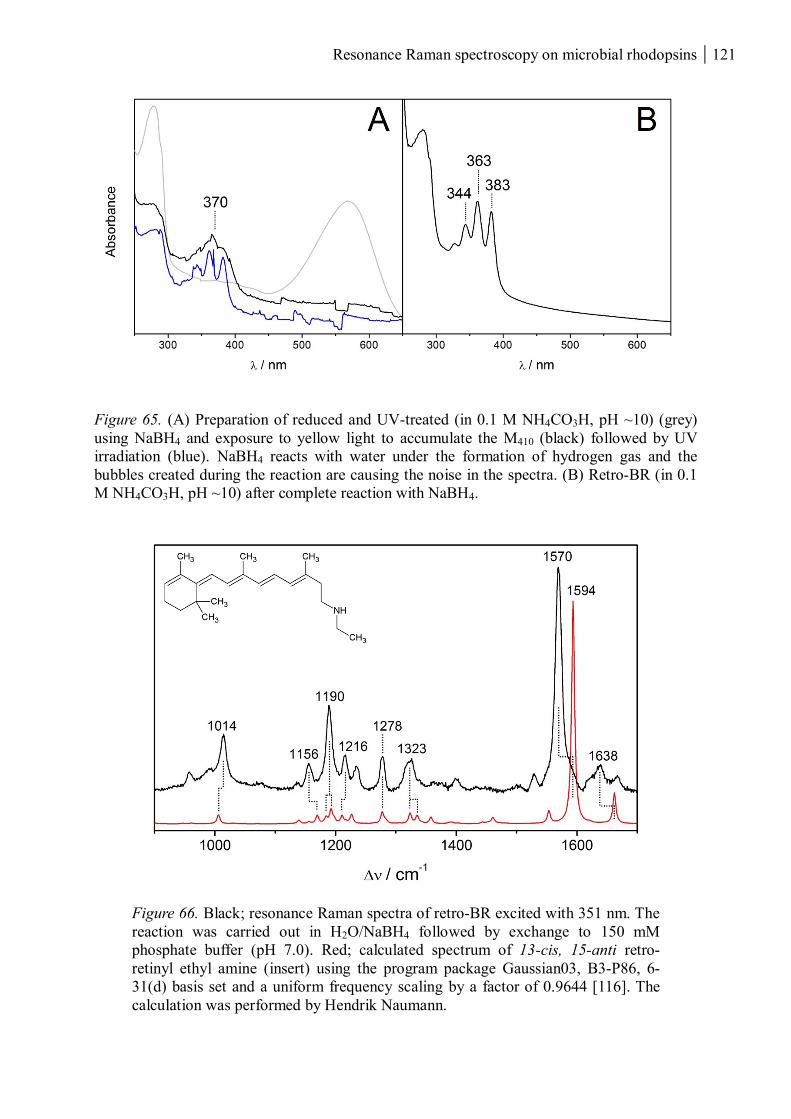
Resonance Raman spectroscopy on microbial rhodopsins 121
Figure 65. (A) Preparation of reduced and UV-treated (in 0.1 M NH4CO3H, pH ~10) (grey)
using NaBH4 and exposure to yellow light to accumulate the M410 (black) followed by UV
irradiation (blue). NaBH4 reacts with water under the formation of hydrogen gas and the
bubbles created during the reaction are causing the noise in the spectra. (B) Retro-BR (in 0.1
M NH4CO3H, pH ~10) after complete reaction with NaBH4.
Figure 66. Black; resonance Raman spectra of retro-BR excited with 351 nm. The
reaction was carried out in H2O/NaBH4 followed by exchange to 150 mM
phosphate buffer (pH 7.0). Red; calculated spectrum of 13-cis, 15-anti retro-
retinyl ethyl amine (insert) using the program package Gaussian03, B3-P86, 6-
31(d) basis set and a uniform frequency scaling by a factor of 0.9644 [116]. The
calculation was performed by Hendrik Naumann.

122 Resonance Raman spectroscopy on microbial rhodopsins
3.4.2 The M410 state
BR-M410 is used in comparison with deprotonated states of other microbial rhodopsin and a
pump probe experiment was performed in order to acquire a fresh data-set. 2 mL purple
membrane from Halobacterium halobium strain S9 (OD570 ~2, 10 mM Tris-buffer, pH 8.0) in
a rotating cuvette was measured using a 25 mW 413 nm probe beam. The photocycle was
initiated using a 250 mW 514 nm pump beam which was spatially displaced with respect to
the probe beam so that the delay of probe after pump was circa 1 ms. The accumulation time
was 4 hours and the buffer contribution was removed prior to polynomial baseline
subtraction. The measured spectrum agrees very well with those previously published (Figure
67) [129]. Bands are found at 976 and 1012 (C-CH3 rock), 1179, 1187, 1197 and 1226 (C-C
stretch), 1274, 1307, 1334 and 1376 (C-H rock), 1566 (C=C stretch) and 1620 cm-1
(C=N
stretch). The chromophore was assigned to a 13-cis, 15-anti configuration with a deprotonated
RSB [129].
Figure 67. Pump (514 nm) and probe (413 nm) resonance Raman experiment of
purple membrane representing BR-M410.
BR-M410

Resonance Raman spectroscopy on microbial rhodopsins 123
3.4.3 Summary
The preparation of reduced and UV-exposed BR (retro-BR) according to [144,145] was
successfully reproduced. Retro-BR absorbs in the UV and shows a distinct fine-structured
pattern believed to originate from a shift of the conjugated double bonds. This involves
fixation of the ionone ring with respect to the polyene chain leading to restrictions in
movement of the chromophore out of the co-planar structure. Resonance Raman experiments
of retro-BR afforded a unique spectrum which remained unchanged when the reaction was
performed in NaBD4 and/or D2O. The shift of the conjugated system during UV-irradiation is
therefore most likely moving in the direction of the ionone ring since the deuterated parts of
the chromophore are then separated from the conjugated region. The DFT calculated spectrum
of this structure was comparable to the experimental spectrum in the C-C stretching and C-H
bending region. However a 24 cm-1
difference was observed for the main C=C stretching
which might be explained by polarity and/or electrostatic effects related to the surroundings
that are not adequately considered by the present approach.
124 Resonance Raman spectroscopy on microbial rhodopsins
Summary and outlook
In this work, resonance Raman spectroscopy has been used to specifically target and elucidate
the structure of the chromophore of several microbial rhodopsins, among them XR, various
ChR2 mutants and HRK1, which have not yet been characterised by resonance Raman
spectroscopy in depth so far. Special emphasis has been laid on the analysis of the
chromophore structure in the dark states which in most cases display heterogeneous isomer
composition. This is certainly one of the reasons for the quite complex phototransformation
pathways which are by far not fully understood. Although the present work already provides
some information about the photoisomerisation steps via determining the retinal configuration
in photoconversion products, future studies have to be focussed on the vibrational
spectroscopic characterisation of the intermediate states.
a) HKR1 Rh-UV and Rh-Bl could be studied by the means of two different laser lines. The
chromophore of Rh-UV was assigned to a 13-cis, 15-anti deprotonated RSB whereas Rh-
Bl consists of two different isomers (with shifted frequencies of the C=C and C=N
stretching’s), most likely corresponding to an all-trans, 15-anti and 13-cis, 15-syn retinal,
both with protonated Schiff bases. The phototransformation pathways, however, do not
resemble that of BR and related bacterial rhodopsins, specifically due to the lack of
detectable intermediate states with characteristic UV-vis absorption maxima and life times
on the micro- and millisecond time scale. On the other hand, it is reasonable to assume
that protein structural changes occur on this time scale which hence should be explored by
IR difference spectroscopy.
b) The analysis of the resonance Raman spectra at 78 K and at room temperature showed that
the ChR2 dark state (D470) consists of two different isomeric states with predominant
contributions of the all-trans form. The contributions of the D470 13-cis isomer was
found to increase upon increased laser intensity at room temperature and thus increasing
the extent of photoconversion, or by heating and illuminating the sample in the cryogenic
experiments and thus allowing the thermal transition into later intermediates. The shift of
the isomeric distribution might be related to inactivity or lower photo-reactivity of the
D470 13-cis isomer based on the observation that the photocycle intermediates were not
enhanced and therefore not detected at 458 nm excitation in contrary to at 413 nm (P390;
78 K and room temperatures) and 514 nm (P500; 78 K). Future experiments would
include pump-probe resonance Raman spectroscopy to obtain high quality spectra of the
Resonance Raman spectroscopy on microbial rhodopsins 125
intermediates P500, P390 and the conducting state P520 to explicitly determine the
isomeric configuration of the retinal in these states but also to study, for instance, the
interaction of the retinal Schiff base with the protein/solvent environment.
c) Furthermore, the recent C1C2 crystal structure now enables QM-MM calculations which
can provide calculated spectra for the ChR2 dark state. This theoretical technique has to
be implemented to the reduced chromophore in BR as well.
d) The P353/P380 intermediates in the side-chain of the ChR2-C128T photocycle could be
assigned to an unbound free all-trans retinal. Thus, the side-reaction corresponds to the
hydrolysis of the RSB under the formation of free retinal and subsequent reformation of
the covalent linkage to the protein.
e) ChR2-C128S-D156A was found to include small amounts of the P390 intermediate in the
dark-adapted sample. P390 can be further accumulated by exposing this mutant to blue
light and P390 decays, correlated with the formation of the dark state, on the time-scale of
hours. However, the transition into the dark state can be accelerated by irradiation with
UV light. The retinal structure of P390 was studied by subtracting the low and high power
resonance Raman spectra. Although the subtracted spectrum included residual
contributions of the dark state, probably due to a shift of the all-trans and 13-cis isomer
distribution in the dark state, the remaining bands could be assigned to a 13-cis, 15-anti
deprotonated retinal Schiff base, in view of the similarities with the resonance Raman
spectrum of BR-M410. However, time-resolved resonance Raman spectroscopy, where the
transition into the P390 state can be effectively induced by a pump beam, would be
required to improve the P390 spectrum.
126 Resonance Raman spectroscopy on microbial rhodopsins
Acknowledgements
I have had the privilege to work in two groups, being co-supervised by Prof. Dr. Peter
Hildebrandt at the TU Berlin (Raman spectroscopy) and Prof. Dr. Peter Hegemann at the HU
Berlin (protein expression and characterisation) which has been a rewarding experience. I
would like to express my deepest gratitude to both supervisors for offering the opportunity to
work on this topic as well as for the expertise and inspiring feedback. To Peter Hildebrandt for
bringing clarity into a sometimes diffuse topic and to Peter Hegemann for always supporting
and critically evaluating the project and thereby accelerating the progress.
Additional supervision was provided by Dr. Katja Stehfest at the HU Berlin and Dr. Hendrik
Naumann at the TU Berlin, who excellently taught and guided me in the practical aspects of
protein expression/purification and resonance Raman spectroscopy on photoreceptors.
ChR2 expression and purification at the TU Berlin was performed by Claudia Schulz, who
provided high quality samples for the resonance Raman experiments. The general handling of
the Raman setup was done under supervision of Dr. Uwe Kuhlmann. Without both of them,
progress would have been much too slow.
I would also like to thank Meike Luck at HU Berlin for the nice collaboration concerning
HKR1 and Miriam Colindres and Prof. Dr. Rolf Diller at the TU Kaiserslautern for providing
the XR samples.
Valuable data was generated in collaborations with Dr. Christoph Weise at the FU Berlin
(MALDI-ToF), Dr. Rolf Hagedorn and Christina Mrosek at the HU Berlin (flash photolysis)
and P.D. Dr. Eberhard Schlodder and Marianne Çetin at the TU Berlin (absorption
spectroscopy at cryogenic temperature).
The undergraduate students Alexander Wolkow, Stefan Wahlefeld and Stefanie Kathe all
contributed greatly to the studies on the slow mutant ChR2-C128S-D156A.
Special thanks to Dr. Khoa Hoang Ly at the TU Berlin for reading and correcting the thesis as
well as helping with the data fitting procedure, to Margrit Michalsky, Heide Evers and Gabi
Resonance Raman spectroscopy on microbial rhodopsins 127
Reinke at the HU Berlin for always helping out with a friendly smile and to the group of P.D.
Dr. Ullrich Keller for offering the possibility to use the French Press.
IR spectra and interpretations, although all were not shown here, were provided by Francisco
Velazquez Escobar, Prof. Dr. Friedrich Siebert and Dr. Ingo Zebger. Financial support and
exciting seminars were offered within the framework of the Cluster of Excellence UniCat and
BIG-NSE by Claudia Nasrallah, Dr. Jean-Philippe Lonjaret and Prof. Dr. Reinhard
Schomäcker.
Many thanks to
my colleagues at the TU Berlin: Anke Keidel, Dr. Diego Millo, Elisabeth Siebert, Dr.
Friedhelm Lendzian, Dr. Gal Schkolnik, Dr. Grazia Daminelli-Widany, Dr. Jacek Kozuch, Ina
Seuffert, Dr. Inez Weidinger, Johannes Salewski, Jürgen Krauss, Lars Paasche, Prof. Dr.
Maria Andrea Mroginski, Marina Böttcher, Marius Horch, Dr. Murat Sezer, Norbert Michael,
Tillmann Utesch, Wiebke Meister and Yvonne Rippers
my colleagues at the HU Berlin: Altina Klein, Dr. André Berndt, Andre Greiner, Angela
Piater, Franziska Schneider, Kyoko Tsunoda, Maila Reh, Manuela Stierl, Dr. Matthias Prigge,
Roman Fudim, Dr. Satoshi Tsunoda, Dr. Tilo Mathes and Tra My Tran Nguyen
my former teachers John Granberg at Solbergagymnasiet in Arvika, Prof. Dr. Rolf Berger and
Prof. Dr. Mats Boman at Uppsala Universitet for the inspiration and encouragement to
continue in the field of chemistry
Johanna Von Münchhofen and Dr. Thomas Hauß for helping me out in a new country and a
new city
Jesper Gunnarsson, Dan Engelbrektson, Jonas Hallberg, Jonas Gerborn, Ole Martin Larsen,
Anita Hamre, Sven Ödman, Trude Warner, Johan Lindberg, Petter Nyberg, Anna Henriksson,
Emma Zaars and all the others at “Arvika nation” at Dragarbrunnsgatan in Uppsala
my ”Mitbewohnerinnen” Tina Eichendorf and Gema Montaner Rios
128 Resonance Raman spectroscopy on microbial rhodopsins
my “Ersatzeltern“ Elke Ganschow and Manfred Töpfer
hele familien S. B. Hansen and my aunts and uncles with families
Lasse & Malou Johanson, Anne-Marie Lindberg, Stina Andersson, Karin & Per Tidlund
Annci Danielsson & Anne-Sofie Bäck på ”affärn”, saknar dig Conny
Agata Pomorska, Felix Daume and Dr. Susanne Perlt from the HMI summer school and my
friends at the BIG-NSE, especially Dr. Subhamoy Bhattacharya and Dr. Kirstin Hobiger for
pushing me in the right direction when times were tough
my girls for all the fun we had: Dr. Anabel Molero, Anna Dahlgren, Amandine Guiet, Catrin
Andersson, Helena Saarela, Julia Hellmich, Kathinka Leine, Klara Flink, Nina Heidary and
Xiao Xie
my grandparents and Arnevi, I wish that you were still around
my parents, my brothers with families and Søren B. Hansen for the all the love and support
throughout the years.

Resonance Raman spectroscopy on microbial rhodopsins 129
130 Resonance Raman spectroscopy on microbial rhodopsins
Bibliography
[1] W.J. Gehring, The evolution of vision, WIREs Dev Biol, DOI: 10.1002/wdev.96,
(2012).
[2] D. Oesterhelt, W. Stoeckenius, Rhodopsin-like protein from the purple membrane of
Halobacterium halobium, Nature New Biology, 233 (1971) 149–152.
[3] D. Oesterhelt, W. Stoeckenius, Functions of a new photoreceptor membrane, Proc. Nat.
Acad. Sci. USA, 70 (1973) 2853–2857.
[4] G. Nagel, D. Ollig, M. Fuhrmann, S. Kateriya, A.M. Musti, E. Bamberg, P. Hegemann,
Channelrhodopsin-1: a light-gated proton channel in green algae, Science, 296 (2002)
2395–2398.
[5] G. Nagel, T. Szellas, W. Huhn, S. Kateriya, N. Adeishvili, P. Berthold, D. Ollig, P.
Hegemann, E. Bamberg, Channelrhodopsin-2, a directly light-gated cation-selective
membrane channel, Proc. Nat. Acad. Sci. USA, 100 (2003) 13940–13945.
[6] E.S. Boyden, F. Zhang, E. Bamberg, G. Nagel, K. Deisseroth, Millisecond-timescale,
genetically targeted optical control of neural activity, Nature Neuroscience, 8 (2005)
1263–1268.
[7] X. Li, D. V Gutierrez, M.G. Hanson, J. Han, M.D. Mark, H. Chiel, P. Hegemann, L.T.
Landmesser, S. Herlitze, Fast noninvasive activation and inhibition of neural and
network activity by vertebrate rhodopsin and green algae channelrhodopsin, Proc. Nat.
Acad. Sci. USA, 102 (2005) 17816–17821.
[8] G. Nagel, M. Brauner, J.F. Liewald, N. Adeishvili, E. Bamberg, A. Gottschalk, Light
activation of channelrhodopsin-2 in excitable cells of Caenorhabditis elegans triggers
rapid behavioral responses, Current Biology, 15 (2005) 2279–2284.
[9] K. Deisseroth, Optogenetics, Nature Methods, DOI: 10.1038/NMETH.F.324, (2010).
[10] A.R. Adamantidis, F. Zhang, A.M. Aravanis, K. Deisseroth, L. de Lecea, Neural
substrates of awakening probed with optogenetic control of hypocretin neurons,
Nature, 450 (2007) 420–424.
[11] A.M. Aravanis, L.-P. Wang, F. Zhang, L.A. Meltzer, M.Z. Mogri, M.B. Schneider, K.
Deisseroth, An optical neural interface: in vivo control of rodent motor cortex with
integrated fiberoptic and optogenetic technology, Journal of Neural Engineering, 4
(2007) S143–S156.
[12] S.R. Pulver, S.L. Pashkovski, N.J. Hornstein, P.A. Garrity, L.C. Griffith, Temporal
dynamics of neuronal activation by channelrhodopsin-2 and TRPA1 determine
behavioral output in Drosophila larvae, Journal of Neurophysiology, 101 (2009) 3075–
3088.
Resonance Raman spectroscopy on microbial rhodopsins 131
[13] A.D. Douglass, S. Kraves, K. Deisseroth, A.F. Schier, F. Engert, Escape behavior
elicited by single, channelrhodopsin-2-evoked spikes in zebrafish somatosensory
neurons, Current Biology, 18 (2008) 1133–1137.
[14] A. V Kravitz, B.S. Freeze, P.R.L. Parker, K. Kay, M.T. Thwin, K. Deisseroth, A.C.
Kreitzer, Regulation of parkinsonian motor behaviours by optogenetic control of basal
ganglia circuitry, Nature, 466 (2010) 622–626.
[15] D.J. Anderson, Optogenetics, sex and violence in the brain: implications for psychiatry,
Biol. Psychiatry, 71 (2012) 1081–1089.
[16] H.E. Covington III, M.K. Lobo, I. Maze, V. Vialou, J.M. Hyman, S. Zaman, Q.
Laplant, E. Mouzon, S. Ghose, A. Tamminga, Carol, R.L. Neve, K. Deisseroth, E.J.
Nestler, Antidepressant effect of optogenetic stimulation of the medial prefrontal
cortex, Journal of Neuroscience, 30 (2010) 16082–16090.
[17] A. Bi, J. Cui, Y.-P. Ma, E. Olshevskaya, M. Pu, A.M. Dizhoor, Z.-H. Pan, Ectopic
expression of a microbial-type rhodopsin restores visual responses in mice with
photoreceptor degeneration, Neuron, 50 (2006) 23–33.
[18] T. Bruegmann, D. Malan, M. Hesse, T. Beiert, C.J. Fuegemann, B.K. Fleischmann, P.
Sasse, Optogenetic control of heart muscle in vitro and in vivo, Nature Methods, 7
(2010) 897–900.
[19] C. Bamann, T. Kirsch, G. Nagel, E. Bamberg, Spectral characteristics of the photocycle
of channelrhodopsin-2 and its implication for channel function, Journal of Molecular
Biology, 375 (2008) 686–694.
[20] E. Ritter, K. Stehfest, A. Berndt, P. Hegemann, F.J. Bartl, Monitoring light-induced
structural changes of channelrhodopsin-2 by UV-visible and Fourier transform infrared
spectroscopy, The Journal of Biological Chemistry, 283 (2008) 35033–35041.
[21] I. Radu, C. Bamann, M. Nack, G. Nagel, E. Bamberg, J. Heberle, Conformational
changes of channelrhodopsin-2, Journal of the American Chemical Society, 131 (2009)
7313–7319.
[22] P. Hegemann, W. Gärtner, R. Uhl, All-trans retinal constitutes the functional
chromophore in Chlamydomonas rhodopsin, Biophysical Journal, 60 (1991) 1477–
1489.
[23] M. Nack, I. Radu, C. Bamann, E. Bamberg, J. Heberle, The retinal structure of
channelrhodopsin-2 assessed by resonance Raman spectroscopy, FEBS Letters, 583
(2009) 3676–3680.
[24] K. Stehfest, E. Ritter, A. Berndt, F. Bartl, P. Hegemann, The branched photocycle of
the slow-cycling channelrhodopsin-2 mutant C128T, Journal of Molecular Biology,
398 (2010) 690–702.
132 Resonance Raman spectroscopy on microbial rhodopsins
[25] D. Oesterhelt, M. Meentzen, L. Schuhmann, Reversible dissociation of the purple
complex in bacteriorhodopsin and identification of 13-cis and all-trans-retinal as its
chromophores, European Journal of Biochemistry, 40 (1973) 453–463.
[26] M.J. Pettei, A.P. Yudd, K. Nakanishi, R. Henselman, W. Stoeckenius, Identification of
retinal isomers isolated from bacteriorhodopsin, Biochemistry, 16 (1977) 1955–1959.
[27] G.S. Harbison, S.O. Smith, J.A. Pardoen, C. Winkel, J. Lugtenburg, J. Herzfeld, R.
Mathies, R.G. Griffin, Dark-adapted bacteriorhodopsin contains 13-cis,15-syn and all-
trans,15-anti retinal Schiff bases, Proc. Nat. Acad. Sci. USA, 81 (1984) 1706–1709.
[28] H.E. Kato, F. Zhang, O. Yizhar, C. Ramakrishnan, T. Nishizawa, K. Hirata, J. Ito, Y.
Aita, T. Tsukazaki, S. Hayashi, P. Hegemann, A.D. Maturana, R. Ishitani, K.
Deisseroth, O. Nureki, Crystal structure of the channelrhodopsin light-gated cation
channel, Nature, 482 (2012) 369–374.
[29] F. Siebert, P. Hildebrandt, Vibrational Spectroscopy in Life Science, WILEY-VCH
Verlag GmbH & Co. KGaA, Weinheim, 2008.
[30] J.L. Spudich, C.-S. Yang, K.-H. Jung, E.N. Spudich, Retinylidene proteins: structures
and functions from archaea to humans, Annual Review of Cell and Developmental
Biology, 16 (2000) 365–392.
[31] T.G. Kusakabe, N. Takimoto, M. Jin, M. Tsuda, Evolution and the origin of the visual
retinoid cycle in vertebrates, Phil. Trans. R. Soc. B, 364 (2009) 2897–2910.
[32] C.-H. Sung, J.-Z. Chuang, The cell biology of vision, The Journal of Cell Biology, 190
(2010) 953–963.
[33] K. Palczewski, G protein-coupled receptor rhodopsin, Annual Review of Biochemistry,
75 (2006) 743–767.
[34] M.X. Ruiz-González, I. Marín, New insights into the evolutionary history of type 1
rhodopsins, Journal of Molecular Evolution, 58 (2004) 348–358.
[35] D. Oesterhelt, The structure and mechanism of the family of retinal proteins from
halophilic archaea, Current Opinion in Structural Biology, 8 (1998) 489–500.
[36] O. Béjà, L. Aravind, E. V Koonin, M.T. Suzuki, A. Hadd, L.P. Nguyen, S.B.
Jovanovich, C.M. Gates, R.A. Feldman, J.L. Spudich, E.N. Spudich, E.F. DeLong,
Bacterial rhodopsin: evidence for a new type of phototrophy in the sea, Science, 289
(2000) 1902–1906.
[37] N. Enami, K. Yoshimura, M. Murakami, H. Okumura, K. Ihara, T. Kouyama, Crystal
structures of archaerhodopsin-1 and -2: common structural motif in archaeal light-
driven proton pumps, Journal of Molecular Biology, 358 (2006) 675–685.
[38] M.R.M. Miranda, A.R. Choi, L. Shi, A.G. Bezerra Jr., K.-H. Jung, L.S. Brown, The
photocycle and proton translocation pathway in a cyanobacterial ion-pumping
rhodopsin, Biophysical Journal, 96 (2009) 1471–1481.
Resonance Raman spectroscopy on microbial rhodopsins 133
[39] M. Sumii, Y. Furutani, S.A. Waschuk, L.S. Brown, H. Kandori, Strongly hydrogen-
bonded water molecule present near the retinal chromophore of Leptosphaeria
rhodopsin, the bacteriorhodopsin-like proton pump from a eukaryote, Biochemistry, 44
(2005) 15159–15166.
[40] A. Idnurm, B.J. Howlett, Characterization of an opsin gene from the ascomycete
Leptosphaeria maculans, Genome, 44 (2001) 167–171.
[41] S.P. Tsunoda, D. Ewers, S. Gazzarrini, A. Moroni, D. Gradmann, P. Hegemann, H+-
pumping rhodopsin from the marine alga Acetabularia, Biophysical Journal, 91 (2006)
1471–1479.
[42] A.E. Blaurock, W. Stoeckenius, Structure of the purple membrane, Nature New
Biology, 233 (1971) 152–155.
[43] J.K. Lanyi, B. Schobert, Crystallographic structure of the retinal and the protein after
deprotonation of the Schiff base: the switch in the bacteriorhodopsin photocycle,
Journal of Molecular Biology, 321 (2002) 727–737.
[44] U. Haupts, J. Tittor, E. Bamberg, D. Oesterhelt, General concept for ion translocation
by halobacterial retinal proteins: the isomerization/switch/transfer (IST) model,
Biochemistry, 36 (1997) 2–7.
[45] J.K. Lanyi, Proton transfers in the bacteriorhodopsin photocycle, Biochimica Et
Biophysica Acta, 1757 (2006) 1012–1018.
[46] H.J. Butt, K. Fendler, E. Bamberg, J. Tittor, D. Oesterhelt, Aspartic acids 96 and 85
play a central role in the function of bacteriorhodopsin as a proton pump, The EMBO
Journal, 8 (1989) 1657–1663.
[47] H. Otto, T. Marti, M. Holz, T. Mogi, M. Lindau, H.G. Khorana, M.P. Heyn, Aspartic
acid-96 is the internal proton donor in the reprotonation of the Schiff base of
bacteriorhodopsin, Proc. Nat. Acad. Sci. USA, 86 (1989) 9228–9232.
[48] F. Garczarek, K. Gerwert, Functional waters in intraprotein proton transfer monitored
by FTIR difference spectroscopy, Nature, 439 (2006) 109–112.
[49] K. Edman, P. Nollert, A. Royant, H. Belrhali, E. Pebay-Peyroula, J. Hajdu, R. Neutze,
E.M. Landau, High-resolution X-ray structure of an early intermediate in the
bacteriorhodopsin photocycle, Nature, 401 (1999) 822–826.
[50] J.K. Lanyi, B. Schobert, Mechanism of proton transport in bacteriorhodopsin from
crystallographic structures of the K, L, M1, M2, and M2′ intermediates of the
photocycle, Journal of Molecular Biology, 328 (2003) 439–450.
[51] T. Kouyama, T. Nishikawa, T. Tokuhisa, H. Okumura, Crystal structure of the L
intermediate of bacteriorhodopsin: evidence for vertical translocation of a water
molecule during the proton pumping cycle, Journal of Molecular Biology, 335 (2004)
531–546.
134 Resonance Raman spectroscopy on microbial rhodopsins
[52] J.K. Lanyi, B. Schobert, Structural changes in the L photointermediate of
bacteriorhodopsin, Journal of Molecular Biology, 365 (2007) 1379–1392.
[53] H. Luecke, B. Schobert, H.-T. Richter, J.-P. Cartailler, J.K. Lanyi, Structure of
bacteriorhodopsin at 155 Å resolution, Journal of Molecular Biology, 291 (1999) 899–
911.
[54] T. Nishikawa, M. Murakami, T. Kouyama, Crystal structure of the 13-cis isomer of
bacteriorhodopsin in the dark-adapted state, Journal of Molecular Biology, 352 (2005)
319–328.
[55] J.K. Lanyi, X-ray diffraction of bacteriorhodopsin photocycle intermediates, Molecular
Membrane Biology, 21 (2004) 143–150.
[56] M.L. Mak-Jurkauskas, V.S. Bajaj, M.K. Hornstein, M. Belenky, R.G. Griffin, J.
Herzfeld, Energy transformations early in the bacteriorhodopsin photocycle revealed
by DNP-enhanced solid-state NMR, Proc. Nat. Acad. Sci. USA, 105 (2008) 883–888.
[57] S.P. Balashov, E.S. Imasheva, V.A. Boichenko, J. Antón, J.M. Wang, J.K. Lanyi,
Xanthorhodopsin: a proton pump with a light-harvesting carotenoid antenna, Science,
309 (2005) 2061–2064.
[58] B.F. Lutnaes, A. Oren, S. Liaaen-Jensen, New C40-carotenoid acyl glycoside as
principal carotenoid in Salinibacter ruber, an extremely halophilic eubacterium, Journal
of Natural Products, 65 (2002) 1340–1343.
[59] H. Luecke, B. Schobert, J. Stagno, E.S. Imasheva, J.M. Wang, S.P. Balashov, J.K.
Lanyi, Crystallographic structure of xanthorhodopsin, the light-driven proton pump
with a dual chromophore, Proc. Nat. Acad. Sci. USA, 105 (2008) 16561–16565.
[60] S.P. Balashov, E.S. Imasheva, J.M. Wang, J.K. Lanyi, Excitation energy-transfer and
the relative orientation of retinal and carotenoid in xanthorhodopsin, Biophysical
Journal, 95 (2008) 2402–2414.
[61] J.K. Lanyi, S.P. Balashov, Xanthorhodopsin: a bacteriorhodopsin-like proton pump
with a carotenoid antenna, Biochimica Et Biophysica Acta, 1777 (2008) 684–688.
[62] P. Hegemann, Algal sensory photoreceptors, Annual Review of Plant Biology, 59
(2008) 167–189.
[63] S. Kateriya, G. Nagel, E. Bamberg, P. Hegemann, “Vision” in single-celled algae,
News in Physiological Sciences, 19 (2004) 133–137.
[64] G. Kreimer, The green algal eyespot apparatus: a primordial visual system and more?,
Current Genetics, 55 (2009) 19–43.
[65] K.W. Foster, J. Saranak, N. Patel, G. Zarilli, M. Okabe, T. Kline, K. Nakanishi, A
rhodopsin is the functional photoreceptor for phototaxis in the unicellular eukaryote
Chlamydomonas, Nature, 311 (1984) 756–759.
Resonance Raman spectroscopy on microbial rhodopsins 135
[66] H. Harz, P. Hegemann, Rhodopsin-regulated calcium currents in Chlamydomonas,
Nature, 351 (1991) 489–491.
[67] E.-M. Holland, F.-J. Braun, C. Nonnengässer, H. Harz, P. Hegemann, The nature of
rhodopsin-triggered photocurrents in Chlamydomonas I Kinetics and influence of
divalent ions, Biophysical Journal, 70 (1996) 924–931.
[68] C. Nonnengässer, E.-M. Holland, H. Harz, P. Hegemann, The nature of rhodopsin-
triggered photocurrents in Chlamydomonas II Influence of monovalent ions,
Biophysical Journal, 70 (1996) 932–938.
[69] S. Ehlenbeck, D. Gradmann, F.-J. Braun, P. Hegemann, Evidence for a light-induced
H+ conductance in the eye of the green alga Chlamydomonas reinhardtii, Biophysical
Journal, 82 (2002) 740–751.
[70] O.A. Sineshchekov, K.-H. Jung, J.L. Spudich, Two rhodopsins mediate phototaxis to
low- and high-intensity light in Chlamydomonas reinhardtii, Proc. Nat. Acad. Sci.
USA, 99 (2002) 8689–8694.
[71] E.G. Govorunova, K.-H. Jung, O.A. Sineshchekov, J.L. Spudich, Chlamydomonas
sensory rhodopsins A and B: cellular content and role in photophobic responses,
Biophysical Journal, 86 (2004) 2342–2349.
[72] O.A. Sineshchekov, E.G. Govorunova, J.L. Spudich, Photosensory functions of
channelrhodopsins in native algal cells, Photochemistry and Photobiology, 85 (2009)
556–563.
[73] T. Takahashi, K. Yoshihara, M. Watanabe, M. Kubota, R. Johnson, F. Derguini, K.
Nakanishi, Photoisomerization of retinal at 13-ene is important for phototaxis of
Chlamydomonas reinhardtii: simultaneous measurements of phototactic and
photophobic responses, Biochemical and Biophysical Research Communications, 178
(1991) 1273–1279.
[74] D.N. Zacks, F. Derguini, K. Nakanishi, J.L. Spudich, Comparative study of phototactic
and photophobic receptor chromophore properties in Chlamydomonas reinhardtii,
Biophysical Journal, 65 (1993) 508–518.
[75] K.W. Foster, J. Saranak, F. Derguini, G.R. Zarrilli, R. Johnson, M. Okabe, K.
Nakanishi, Activation of Chlamydomonas rhodopsin in vivo does not require
isomerization of retinal, Biochemistry, 28 (1989) 819–824.
[76] K.W. Foster, J. Saranak, S. Krane, R.L. Johnson, K. Nakanish, Evidence from
Chlamydomonas on the photoactivation of rhodopsins without isomerization of their
chromophore, Chemistry & Biology, 18 (2011) 733–742.
[77] T.M. Mittelmeier, J.S. Boyd, M.R. Lamb, C.L. Dieckmann, Asymmetric properties of
the Chlamydomonas reinhardtii cytoskeleton direct rhodopsin photoreceptor
localization, The Journal of Cell Biology, 193 (2011) 741–753.
136 Resonance Raman spectroscopy on microbial rhodopsins
[78] A. Berndt, O. Yizhar, L.A. Gunaydin, P. Hegemann, K. Deisseroth, Bi-stable neural
state switches, Nature Neuroscience, 12 (2009) 229–234.
[79] A. Berndt, P. Schoenenberger, J. Mattis, K.M. Tye, K. Deisseroth, P. Hegemann, T.G.
Oertner, High-efficiency channelrhodopsins for fast neuronal stimulation at low light
levels, Proc. Nat. Acad. Sci. USA, 108 (2011) 7595–7600.
[80] S. Kleinlogel, K. Feldbauer, R.E. Dempski, H. Fotis, P.G. Wood, C. Bamann, E.
Bamberg, Ultra light-sensitive and fast neuronal activation with the Ca2+-permeable
channelrhodopsin CatCh, Nature Neuroscience, 14 (2011) 513–518.
[81] O. Yizhar, L.E. Fenno, M. Prigge, F. Schneider, T.J. Davidson, D.J. O’Shea, V.S.
Sohal, I. Goshen, J. Finkelstein, J.T. Paz, K. Stehfest, R. Fudim, C. Ramakrishnan, J.R.
Huguenard, P. Hegemann, K. Deisseroth, Neocortical excitation/inhibition balance in
information processing and social dysfunction, Nature, 477 (2011) 171–178.
[82] L.A. Gunaydin, O. Yizhar, A. Berndt, V.S. Sohal, K. Deisseroth, P. Hegemann,
Ultrafast optogenetic control, Nature Neuroscience, 13 (2010) 387–392.
[83] M. Prigge, F. Schneider, S.P. Tsunoda, C. Shilyansky, J. Wietek, K. Deisseroth, P.
Hegemann, Color-tuned channelrhodopsins for multiwavelength optogenetics, The
Journal of Biological Chemistry, 287 (2012) 31804–31812.
[84] J.Y. Lin, M.Z. Lin, P. Steinbach, R.Y. Tsien, Characterization of engineered
channelrhodopsin variants with improved properties and kinetics, Biophysical Journal,
96 (2009) 1803–1814.
[85] L. Wen, H. Wang, S. Tanimoto, R. Egawa, Y. Matsuzaka, H. Mushiake, T. Ishizuka, H.
Yawo, Opto-current-clamp actuation of cortical neurons using a strategically designed
channelrhodopsin, PloS One, 5 (2010) e12893.
[86] J.Y. Lin, Optogenetic excitation of neurons with channelrhodopsins: light
instrumentation, expression systems, and channelrhodopsin variants, Progress in Brain
Research, 196 (2012) 29–47.
[87] P. Hegemann, A. Möglich, Channelrhodopsin engineering and exploration of new
optogenetic tools, Nature Methods, 8 (2011) 39–42.
[88] C. Bamann, G. Nagel, E. Bamberg, Microbial rhodopsins in the spotlight, Current
Opinion in Neurobiology, 20 (2010) 610–616.
[89] M. Müller, C. Bamann, E. Bamberg, W. Kühlbrandt, Projection structure of
channelrhodopsin-2 at 6 Å resolution by electron crystallography, Journal of Molecular
Biology, 414 (2011) 86–95.
[90] Y. Sugiyama, H. Wang, T. Hikima, M. Sato, J. Kuroda, T. Takahashi, T. Ishizuka, H.
Yawo, Photocurrent attenuation by a single polar-to-nonpolar point mutation of
channelrhodopsin-2, Photochemical & Photobiological Sciences, 8 (2009) 328–336.

Resonance Raman spectroscopy on microbial rhodopsins 137
[91] S. Tanimoto, Y. Sugiyama, T. Takahashi, T. Ishizuka, H. Yawo, Involvement of
glutamate 97 in ion influx through photo-activated channelrhodopsin-2, Neuroscience
Research, In press (2012).
[92] K. Ruffert, B. Himmel, D. Lall, C. Bamann, E. Bamberg, H. Betz, V. Eulenburg,
Glutamate residue 90 in the predicted transmembrane domain 2 is crucial for cation
flux through channelrhodopsin 2, Biochemical and Biophysical Research
Communications, 410 (2011) 737–743.
[93] K. Eisenhauer, J. Kuhne, E. Ritter, A. Berndt, S. Wolf, E. Freier, F. Bartl, P.
Hegemann, K. Gerwert, In channelrhodopsin-2 Glu-90 is crucial for ion selectivity and
is deprotonated during the photocycle, The Journal of Biological Chemistry, 287
(2012) 6904–6911.
[94] R. Richards, R.E. Dempski, Re-introduction of transmembrane serine residues reduce
the minimum pore diameter of channelrhodopsin-2, PloS One, 7 (2012) e50018.
[95] H.C. Watanabe, K. Welke, F. Schneider, S. Tsunoda, F. Zhang, K. Deisseroth, P.
Hegemann, M. Elstner, Structural model of channelrhodopsin, The Journal of
Biological Chemistry, 287 (2012) 7456–7466.
[96] F. Scholz, E. Bamberg, C. Bamann, J. Wachtveitl, Tuning the primary reaction of
channelrhodopsin-2 by imidazole, pH, and site-specific mutations, Biophysical Journal,
102 (2012) 2649–2657.
[97] K. Welke, J.S. Frähmcke, H.C. Watanabe, P. Hegemann, M. Elstner, Color tuning in
binding pocket models of the chlamydomonas-type channelrhodopsins, The Journal of
Physical Chemistry B, 115 (2011) 15119–15128.
[98] C. Bamann, R. Gueta, S. Kleinlogel, G. Nagel, E. Bamberg, Structural guidance of the
photocycle of channelrhodopsin-2 by an interhelical hydrogen bond, Biochemistry, 49
(2010) 267–278.
[99] M. Nack, I. Radu, M. Gossing, C. Bamann, E. Bamberg, G.F. von Mollard, J. Heberle,
The DC gate in channelrhodopsin-2: crucial hydrogen bonding interaction between
C128 and D156, Photochemical & Photobiological Sciences, 9 (2010) 194–198.
[100] M.-K. Verhoefen, C. Bamann, R. Blöcher, U. Förster, E. Bamberg, J. Wachtveitl, The
photocycle of channelrhodopsin-2: ultrafast reaction dynamics and subsequent reaction
steps, ChemPhysChem, 11 (2010) 3113–3122.
[101] K. Feldbauer, D. Zimmermann, V. Pintschovius, J. Spitz, C. Bamann, E. Bamberg,
Channelrhodopsin-2 is a leaky proton pump, Proc. Nat. Acad. Sci. USA, 106 (2009)
12317–12322.
[102] M. Nack, I. Radu, B.-J. Schultz, T. Resler, R. Schlesinger, A.-N. Bondar, C. del Val, S.
Abbruzzetti, C. Viappiani, C. Bamann, E. Bamberg, J. Heberle, Kinetics of proton
release and uptake by channelrhodopsin-2, FEBS Letters, 586 (2012) 1344–1348.
138 Resonance Raman spectroscopy on microbial rhodopsins
[103] P. Hegemann, S. Ehlenbeck, D. Gradmann, Multiple photocycles of channelrhodopsin,
Biophysical Journal, 89 (2005) 3911–3918.
[104] K. Nikolic, N. Grossman, M.S. Grubb, J. Burrone, C. Toumazou, P. Degenaar,
Photocycles of channelrhodopsin-2, Photochemistry and Photobiology, 85 (2009) 400–
411.
[105] A. Berndt, M. Prigge, D. Gradmann, P. Hegemann, Two open states with progressive
proton selectivities in the branched channelrhodopsin-2 photocycle, Biophysical
Journal, 98 (2010) 753–761.
[106] K. Stehfest, P. Hegemann, Evolution of the channelrhodopsin photocycle model,
ChemPhysChem, 11 (2010) 1120–1126.
[107] D. Gradmann, A. Berndt, F. Schneider, P. Hegemann, Rectification of the
channelrhodopsin early conductance, Biophysical Journal, 101 (2011) 1057–1068.
[108] M. Luck, T. Mathes, S. Bruun, R. Fudim, R. Hagedorn, T.M.T. Nguyen, S. Kateriya,
J.T.M. Kennis, P. Hildebrandt, P. Hegemann, A photochromic histidine kinase
rhodopsin (HKR1) that is bimodally switched by UV and blue light, The Journal of
Biological Chemistry, 287 (2012) 40083–40090.
[109] Y. Furutani, A. Terakita, Y. Shichida, H. Kandori, FTIR studies of the photoactivation
processes in squid retinochrome, Biochemistry, 44 (2005) 7988–7997.
[110] K. Vogt, K. Kirschfeld, Chemical identity of the chromophores of fly visual pigment,
Naturwissenschaften, 71 (1984) 211–213.
[111] L. Vogeley, O.A. Sineshchekov, V.D. Trivedi, J. Sasaki, J.L. Spudich, H. Luecke,
Anabaena sensory rhodopsin: a photochromic color sensor at 20 Å, Science, 306
(2004) 1390–1393.
[112] J.L. Spudich, R.A. Bogomolni, Mechanism of colour discrimination by a bacterial
sensory rhodopsin, Nature, 312 (1984) 509–513.
[113] J. Grochol, Raman spectroelectrochemical investigations of immobilized redox
proteins, PhD thesis, Technische Universität Berlin, 2007.
[114] C. V Raman, K.S. Krishnan, A new type of secondary radiation, Nature, 121 (1928)
501–502.
[115] D. von Stetten, Investigation of the chromophore structure in plant and bacterial
phytochromes by comparison of experimental and calculated Raman spectra, PhD
thesis, Technische Universität Berlin, 2008.
[116] H. Naumann, The NpSRII photocycle and its dependence on the electric field - a
combined quantum chemical and Raman spectroscopic study, PhD thesis, Technische
Universität Berlin, 2009.
Resonance Raman spectroscopy on microbial rhodopsins 139
[117] A. Warschel, Interpretation of resonance Raman spectra of biological molecules, Ann.
Rev. Biophys. Bioeng., 6 (1977) 273–300.
[118] R. Callender, B. Honig, Resonance Raman studies of visual pigments, Ann. Rev.
Biophys. Bioeng., 6 (1977) 33–55.
[119] B. Curry, I. Palings, A.D. Broek, J.A. Pardoen, J. Lugtenburg, R. Mathies, Chapter 3
Vibrational analysis of the retinal isomers, in: Advances in Infrared and Raman
Spectroscopy Volume 12, 1985: pp. 115–178.
[120] A. Maeda, T. Ogurusu, T. Yoshizawa, T. Kitagawa, Resonance Raman study on
binding of chloride to the chromophore of halorhodopsin, Biochemistry, 24 (1985)
2517–2521.
[121] S.P.A. Fodor, R. Gebhard, J. Lugtenburg, R.A. Bogomolni, R.A. Mathies, Structure of
the retinal chromophore in sensory rhodopsin I from resonance Raman spectroscopy,
The Journal of Biological Chemistry, 264 (1989) 18280–18283.
[122] O.S. Mironova, R.G. Efremov, B. Person, J. Heberle, I.L. Budyak, G. Büldt, R.
Schlesinger, Functional characterization of sensory rhodopsin II from Halobacterium
salinarum expressed in Escherichia coli, FEBS Letters, 579 (2005) 3147–3151.
[123] S.A. Waschuk, A.G. Bezerra Jr., L. Shi, L.S. Brown, Leptosphaeria rhodopsin:
bacteriorhodopsin-like proton pump from a eukaryote, Proc. Nat. Acad. Sci. USA, 102
(2005) 6879–6883.
[124] Y. Furutani, A.G. Bezerra Jr., S. Waschuk, M. Sumii, L.S. Brown, H. Kandori, FTIR
spectroscopy of the K photointermediate of Neurospora rhodopsin: structural changes
of the retinal, protein, and water molecules after photoisomerization, Biochemistry, 43
(2004) 9636–9646.
[125] J.M. Kralj, E.N. Spudich, J.L. Spudich, K.J. Rothschild, Raman spectroscopy reveals
direct chromophore interactions in the Leu/Gln105 spectral tuning switch of
proteorhodopsins, The Journal of Physical Chemistry B, 112 (2008) 11770–11776.
[126] S.O. Smith, A.B. Myers, R.A. Mathies, J.A. Pardoen, C. Winkel, E.M.M. van den
Berg, J. Lugtenburg, Vibrational analysis of the all-trans retinal protonated Schiff base,
Biophysical Journal, 47 (1985) 653–664.
[127] S.O. Smith, M.S. Braiman, A.B. Myers, J.A. Pardoen, J.M.L. Courtin, C. Winkel, J.
Lugtenburg, R.A. Mathies, Vibrational analysis of the all-trans-retinal chromophore in
light-adapted bacteriorhodopsin, Journal of the American Chemical Society, 109
(1987) 3108–3125.
[128] S.O. Smith, J.A. Pardoen, J. Lugtenburg, R.A. Mathies, Vibrational analysis of the 13-
cis-retinal chromophore in dark-adapted bacteriorhodopsin, The Journal of Physical
Chemistry, 91 (1987) 804–819.
140 Resonance Raman spectroscopy on microbial rhodopsins
[129] J.B. Ames, S.P.A. Fodor, R. Gebhard, J. Raap, E.M.M. van den Berg, J. Lugtenburg,
R.A. Mathies, Bacteriorhodopsin’s M412 intermediate contains a 13-cis,14-s-trans,15-
anti-retinal Schiff base chromophore, Biochemistry, 28 (1989) 3681–3687.
[130] M.A. Mroginski, QM/MM calculations of vibrational spectra, Encyclopedia of
Biophysics, (2013) 2149–2154.
[131] J. Terner, C.-L. Hsieh, M.A. El-Sayed, Time-resolved resonance Raman
characterization of the bL550 intermediate and the two dark-adapted bRDA560 forms
of bacteriorhodopsin, Biophysical Journal, 26 (1979) 527–541.
[132] R. Diller, M. Stockburger, Kinetic resonance Raman studies reveal different
conformational states of bacteriorhodopsin, Biochemistry, 27 (1988) 7641–7651.
[133] S.P.A. Fodor, J.B. Ames, R. Gebhard, E.M.M. van den Berg, W. Stoeckenius, J.
Lugtenburg, R.A. Mathies, Chromophore structure in bacteriorhodopsin’s N
intermediate: implications for the proton-pumping mechanism, Biochemistry, 27
(1988) 7097–7101.
[134] S.O. Smith, J.A. Pardoen, P.P.J. Mulder, B. Curry, J. Lugtenburg, R. Mathies,
Chromophore structure in bacteriorhodopsin’s O640 photointermediate, Biochemistry,
22 (1983) 6141–6148.
[135] N.B. Gillespie, L. Ren, L. Ramos, H. Daniell, D. Dews, K.A. Utzat, J.A. Stuart, C.H.
Buck, R.R. Birge, Characterization and photochemistry of 13-desmethyl
bacteriorhodopsin, The Journal of Physical Chemistry B, 109 (2005) 16142–16152.
[136] R.E. Cookingham, A. Lewis, A.T. Lemley, A vibrational analysis of rhodopsin and
bacteriorhodopsin chromophore analogues: resonance Raman and infrared
spectroscopy of chemically modified retinals and Schiff bases, Biochemistry, 17 (1978)
4699–4711.
[137] B. Aton, A.G. Doukas, R.H. Callender, B. Becher, T.G. Ebrey, Resonance Raman
studies of the purple membrane, Biochemistry, 16 (1977) 2995–2999.
[138] P. Hildebrandt, M. Stockburger, Role of water in bacteriorhodopsin’s chromophore:
resonance Raman study, Biochemistry, 23 (1984) 5539–5548.
[139] J.A. Bieszke, E.N. Spudich, K.L. Scott, K.A. Borkovich, J.L. Spudich, A eukaryotic
protein, NOP-1, binds retinal to form an archaeal rhodopsin-like photochemically
reactive pigment, Biochemistry, 38 (1999) 14138–14145.
[140] S. Macauley-Patrick, M.L. Fazenda, B. McNeil, L.M. Harvey, Heterologous protein
production using the Pichia pastoris expression system, Yeast, 22 (2005) 249–270.
[141] O.P. Ernst, P.A. Sánchez Murcia, P. Daldrop, S.P. Tsunoda, S. Kateriya, P. Hegemann,
Photoactivation of channelrhodopsin, The Journal of Biological Chemistry, 283 (2008)
1637–1643.
Resonance Raman spectroscopy on microbial rhodopsins 141
[142] T. Kirsch, Funktionelle Expression von Channelrhodopsin 2 (ChR2) in der
methylotrophen Hefe Pichia pastoris und biophysikalische Charakterisierung, PhD
thesis, Johann Wolfgang Goethe-Universität, 2007.
[143] InvitrogenTM, EasySelectTM Pichia Expression Kit, user manual, 2009.
[144] J. Peters, R. Peters, W. Stoeckenius, A photosensitive product of sodium borohydride
reduction of bacteriorhodopsin, FEBS Letters, 61 (1976) 128–134.
[145] T. Schreckenbach, B. Walckhoff, D. Oesterhelt, Studies on the retinal-protein
interaction in bacteriorhodopsin, European Journal of Biochemistry / FEBS, 76 (1977)
499–511.
[146] E. Schlodder, M. Cetin, M. Byrdin, I. V Terekhova, N. V Karapetyan, P700+- and
3P700-induced quenching of the fluorescence at 760 nm in trimeric Photosystem I
complexes from the cyanobacterium Arthrospira platensis, Biochimica Et Biophysica
Acta, 1706 (2005) 53–67.
[147] M. Stierl, P. Stumpf, D. Udwari, R. Gueta, R. Hagedorn, A. Losi, W. Gärtner, L.
Petereit, M. Efetova, M. Schwarzel, T.G. Oertner, G. Nagel, P. Hegemann, Light
modulation of cellular cAMP by a small bacterial photoactivated adenylyl cyclase,
bPAC, of the soil bacterium Beggiatoa, The Journal of Biological Chemistry, 286
(2011) 1181–1188.
[148] W. Kiefer, Raman difference spectroscopy with rotating cell, Applied Spectroscopy, 27
(1973) 253–257.
[149] V. Gradinaru, K.R. Thompson, F. Zhang, M. Mogri, K. Kay, M.B. Schneider, K.
Deisseroth, Targeting and readout strategies for fast optical neural control in vitro and
in vivo, The Journal of Neuroscience, 27 (2007) 14231–14238.
[150] A. Berndt, Mechanismus und anwendungsbezogene Optimierung von
Channelrhodopsin-2, PhD thesis, Humboldt-Universität zu Berlin, 2011.
[151] C. Schultheis, J.F. Liewald, E. Bamberg, G. Nagel, A. Gottschalk, Optogenetic long-
term manipulation of behavior and animal development, PloS One, 6 (2011) e18766.
[152] S.B.G. Abbott, R.L. Stornetta, M.G. Fortuna, S.D. Depuy, G.H. West, T.E. Harris, P.G.
Guyenet, Photostimulation of retrotrapezoid nucleus phox2b-expressing neurons in
vivo produces long-lasting activation of breathing in rats, The Journal of Neuroscience,
29 (2009) 5806–5819.
[153] M.S. Grubb, J. Burrone, Channelrhodopsin-2 localised to the axon initial segment,
PloS One, 5 (2010) e13761.
[154] E. Papagiakoumou, F. Anselmi, A. Bègue, V. de Sars, J. Glückstad, E.Y. Isacoff, V.
Emiliani, Scanless two-photon excitation of channelrhodopsin-2, Nature Methods, 7
(2010) 848–854.
142 Resonance Raman spectroscopy on microbial rhodopsins
[155] D. Kätzel, B. V Zemelman, C. Buetfering, M. Wölfel, G. Miesenböck, The columnar
and laminar organization of inhibitory connections to neocortical excitatory cells,
Nature Neuroscience, 14 (2011) 100–107.
[156] K.M. Tye, R. Prakash, S.-Y. Kim, L.E. Fenno, L. Grosenick, H. Zarabi, K.R.
Thompson, V. Gradinaru, C. Ramakrishnan, K. Deisseroth, Amygdala circuitry
mediating reversible and bidirectional control of anxiety, Nature, 471 (2011) 358–362.
[157] C. Weise, MASCOT,
http://www.matrixscience.com/cgi/master_results.pl?file=../data/20091222/FtmmfbSe
R.dat, (2009).
[158] Swiss Institute of Bioinformatics - UniProtKB/Swiss-Prot,
Http://web.expasy.org/docs/relnotes/relstat.html, (2012).
[159] F. Schwarz, M. Aebi, Mechanisms and principles of N-linked protein glycosylation,
Current Opinion in Structural Biology, 21 (2011) 576–582.
[160] B.M. Tam, O.L. Moritz, The role of rhodopsin glycosylation in protein folding,
trafficking, and light-sensitive retinal degeneration, The Journal of Neuroscience, 29
(2009) 15145–15154.
[161] I. Chizhov, G. Schmies, R. Seidel, J.R. Sydor, B. Lüttenberg, M. Engelhard, The
photophobic receptor from Natronobacterium pharaonis: temperature and pH
dependencies of the photocycle of sensory rhodopsin II, Biophysical Journal, 75 (1998)
999–1009.
[162] S. Dickopf, M.P. Heyn, Evidence for the first phase of the reprotonation switch of
bacteriorhodopsin from time-resolved photovoltage and flash photolysis experiments
on the photoreversal of the M-intermediate, Biophysical Journal, 73 (1997) 3171–3181.
[163] J. le Coutre, K. Gerwert, Kinetic isotope effects reveal an ice-like and a liquid-phase-
type intramolecular proton transfer in bacteriorhodopsin, FEBS Letters, 398 (1996)
333–336.
[164] P. Berthold, S.P. Tsunoda, O.P. Ernst, W. Mages, D. Gradmann, P. Hegemann,
Channelrhodopsin-1 initiates phototaxis and photophobic responses in chlamydomonas
by immediate light-induced depolarization, The Plant Cell, 20 (2008) 1665–1677.
[165] T. Althaus, W. Eisfeld, L. Lohrmann, M. Stockburger, Application of Raman
spectroscopy to retinal proteins, Israel Journal of Chemistry, 35 (1995) 227–251.
[166] R. Lohrmann, I. Grieger, M. Stockburger, Resonance Raman studies on the
intermedlate K-590 in the photocycle of bacterlorhodopsin, The Journal of Physical
Chemistry, 95 (1991) 1993–2001.
[167] R. Lohrmann, M. Stockburger, Time-resolved resonance Raman studies of
bacteriorhodopsin and its intermediates K590 and L550: biological implications,
Journal of Raman Spectroscopy, 23 (1992) 575–583.

Resonance Raman spectroscopy on microbial rhodopsins 143
[168] J. Terner, C.-L. Hsieh, A.R. Burns, M.A. El-Sayed, Time-resolved resonance Raman
spectroscopy of intermediates of bacteriorhodopsin: The bK590 intermediate, Proc.
Nat. Acad. Sci. USA, 76 (1979) 3046–3050.
[169] S. Bruun, H. Naumann, U. Kuhlmann, C. Schulz, K. Stehfest, P. Hegemann, P.
Hildebrandt, The chromophore structure of the long-lived intermediate of the C128T
channelrhodopsin-2 variant, FEBS Letters, 585 (2011) 3998–4001.
[170] N. Tschirner, M. Schenderlein, K. Brose, E. Schlodder, M.A. Mroginski, C. Thomsen,
P. Hildebrandt, Resonance Raman spectra of beta-carotene in solution and in
photosystems revisited: an experimental and theoretical study, Physical Chemistry
Chemical Physics, 11 (2009) 11471–11478.
[171] M.E. Heyde, D. Gill, R.G. Kilponen, L. Rimai, Raman spectra of Schiff bases of retinal
(models of visual photoreceptors), Journal of the American Chemical Society, 93
(1971) 6776–6780.
[172] A.C. Terentis, L. Ujj, H. Abramczyk, G.H. Atkinson, Primary events in the
bacteriorhodopsin photocycle: torsional vibrational dephasing in the first excited
electronic state, Chemical Physics, 313 (2005) 51–62.
[173] S. Woutersen, H.J. Bakker, Resonant intermolecular transfer of vibrational energy in
liquid water, Nature, 402 (1999) 507–509.
[174] S.P. Balashov, M. Sumi, N. Kamo, The M intermediate of Pharaonis phoborhodopsin
is photoactive, Biophysical Journal, 78 (2000) 3150–3159.
[175] D.G. Stavenga, On visual pigment templates and the spectral shape of invertebrate
rhodopsins and metarhodopsins, Journal of Comparative Physiology A, 196 (2010)
869–878.
[176] T. Schreckenbach, B. Walckhoff, D. Oesterhelt, Specificity of the retinal binding site
of bacteriorhodopsin: chemical and stereochemical requirements for the binding of
retinol and retinal, Biochemistry, 17 (1978) 5353–5359.
[177] P.W. Hildebrand, P. Scheerer, J.H. Park, H.-W. Choe, R. Piechnick, O.P. Ernst, K.P.
Hofmann, M. Heck, A ligand channel through the G protein coupled receptor opsin,
PloS One, 4 (2009) e4382.
[178] K. Gerwert, B. Hess, J. Soppa, D. Oesterhelt, Role of aspartate-96 in proton
translocation by bacteriorhodopsin, Proc. Nat. Acad. Sci. USA, 86 (1989) 4943–4947.
[179] H. Luecke, B. Schobert, J.K. Lanyi, E.N. Spudich, J.L. Spudich, Crystal structure of
sensory rhodopsin II at 24 angstroms: insights into color tuning and transducer
interaction, Science, 293 (2001) 1499–1503.
[180] M. Kolbe, H. Besir, L.-O. Essen, D. Oesterhelt, Structure of the light-driven chloride
pump halorhodopsin at 18 Å resolution, Science, 288 (2000) 1390–1396.
144 Resonance Raman spectroscopy on microbial rhodopsins
[181] E. Ritter, K. Zimmermann, M. Heck, K.P. Hofmann, F.J. Bartl, Transition of rhodopsin
into the active metarhodopsin II state opens a new light-induced pathway linked to
Schiff base isomerization, The Journal of Biological Chemistry, 279 (2004) 48102–
48111.

Resonance Raman spectroscopy on microbial rhodopsins 145

146 Resonance Raman spectroscopy on microbial rhodopsins
Appendix
Media recipes
The Media were prepared according to reference [143]. 20 g agar/L was added in the Media
used for plates. All solutions were autoclaved or filter sterilized. Percentages represent weight
per weight.
Low salt LB (Luria-Bertani)
1 % tryptone
0.5 % yeast extract
0.5 % NaCl
pH 7.5 (adjusted with 1 M NaOH)
YPD – Yeast Extract Peptone Dextrose
1 % yeast extract
2 % peptone (tryptone)
2 % dextrose (D-glucose)
MMH – Minimal Methanol with Histidine
1.34 % YNB (Yeast Nitrogen Base with ammonium sulfate without amino acids)
4×10⁻⁵
% biotin
0.5 % methanol
4×10⁻³
% histidine
BMGY/BMMY – Buffered Glycerol/Methanol-complex
1 % yeast extract
2 % peptone
100 mM potassium phosphate buffer, pH 6.0
1.34% YNB
4×10⁻⁵
% biotin
1 % glycerol or 2.5 % methanol
Resonance Raman spectroscopy on microbial rhodopsins 147
Buffers recipes
Breaking buffer
11.3 mM NaH2PO4
100 mM NaCl
1 mM EDTA
5 vol% glycerol
pH 7.4 (adjusted with NaOH)
Solubilisation buffer
100 mM NaCl
20 mM HEPES
10 vol% glycerol
1 w/w% or 0.03 w/w% DDM
pH 7.4