Regional Analysis of Household Consumption of Sorghum in ...oar.icrisat.org/6422/1/J258_2011 WPS...
24
Working Paper Series no. 28 Regional Analysis of Household Consumption of Sorghum in Major Sorghum-Producing and Consuming States in India G Basavaraj and P Parthasarathy Rao IMOD Innovate • Grow • Prosper •
Transcript of Regional Analysis of Household Consumption of Sorghum in ...oar.icrisat.org/6422/1/J258_2011 WPS...

Working Paper Series no. 28
Regional Analysis of Household Consumption of Sorghum in Major
Sorghum-Producing and Consuming States in India
G Basavaraj and P Parthasarathy Rao
258-2011
ICRISAT-Patancheru(Headquarters)Patancheru 502 324Andhra Pradesh, IndiaTel +91 40 30713071Fax +91 40 [email protected]
ICRISAT-Liaison OfficeCG Centers BlockNASC ComplexDev Prakash Shastri MargNew Delhi 110 012, IndiaTel +91 11 32472306 to 08 Fax +91 11 25841294
ICRISAT-Nairobi(Regional hub ESA)PO Box 39063, Nairobi, KenyaTel +254 20 7224550Fax +254 20 [email protected]
ICRISAT-Bamako(Regional hub WCA)BP 320Bamako, MaliTel +223 20 223375Fax +223 20 [email protected]
ICRISAT-NiameyBP 12404, Niamey, Niger (Via Paris)Tel +227 20722529, 20722725Fax +227 [email protected]
ICRISAT-BulawayoMatopos Research StationPO Box 776,Bulawayo, ZimbabweTel +263 383 311 to 15Fax +263 383 [email protected]
ICRISAT-LilongweChitedze Agricultural Research StationPO Box 1096Lilongwe, MalawiTel +265 1 707297, 071, 067, 057Fax +265 1 [email protected]
ICRISAT-Maputoc/o IIAM, Av. das FPLM No 2698Caixa Postal 1906Maputo, MozambiqueTel +258 21 461657Fax +258 21 [email protected]
Contact Information
About ICRISAT
www.icrisat.org
The International Crops Research Institute for the Semi-Arid-Tropics (ICRISAT) is a non-profit, non-political organization that conducts agricultural research for development in Asia and sub-Saharan Africa with a wide array of partners throughout the world. Covering 6.5 million square kilometers of land in 55 countries, the semi-arid tropics have over 2 billion people, and 644 million of these are the poorest of the poor. ICRISAT and its partners help empower these poor people to overcome poverty, hunger and a degraded environment through better agriculture.
ICRISAT is headquartered in Hyderabad, Andhra Pradesh, India, with two regional hubs and four country offices in sub-Saharan Africa. It belongs to the Consortium of Centers supported by the Consultative Group on International Agricultural Research (CGIAR).
IMOD Innovate • Grow • Prosper •

Citation: Basavaraj G and Parthasarathy Rao P. 2011. Regional Analysis of Household Consumption of Sorghum in Major Sorghum-Producing and Consuming States in India. Working Paper Series no. 28. Patancheru 502 324, Andhra Pradesh, India: International Crops Research Institute for the Semi-Arid Tropics. 20 pp.
AbstractIn the past, studies that have analyzed household consumption data of the National Sample Survey Organization (NSSO) show a long term declining trend in per capita consumption of nutritious cereals such as sorghum and pearl millet both at National and State levels. However, a true picture can be drawn by looking at the household consumption data at a disaggregated regional level. Regional disaggregation of sorghum consumption shows that sorghum is still important in the consumption basket particularly in rural regions of central, eastern and western Maharashtra, and northern Karnataka. The NSSO data used for this analysis does not separate consumption by kharif (rainy season) and rabi (postrainy season) sorghum. The bulk of rabi sorghum is used for food consumption due to its superior grain quality, while only 40-50% of kharif sorghum is used for direct food use. The finding thus suggests that an increase in rabi sorghum production through productivity increase would help to bring down the prices of rabi sorghum and make its consumption affordable for low income consumers.
© International Crops Research Institute for the Semi-Arid Tropics (ICRISAT), 2011. All rights reserved.
ICRISAT holds the copyright to its publications, but these can be shared and duplicated for non-commercial purposes. Permission to make digital or hard copies of part(s) or all of any publication for non-commercial use is hereby granted as long as ICRISAT is properly cited. For any clarification, please contact the Director of Communication at [email protected]. ICRISAT’s name and logo are registered trademarks and may not be used without permission. You may not alter or remove any trademark, copyright or other notice.

Working Paper Series no. 28RP – Markets, Institutions and Policies
August 2011
Regional Analysis of Household Consumption of Sorghum in Major
Sorghum-Producing and Consuming States in India
G Basavaraj and P Parthasarathy Rao

ii
AcknowledgmentThis research work was carried out under the "HOPE" project. The funding support from the Bill & Melinda Gates Foundation is gratefully acknowledged. We thank Alastair Orr, P Kumar and Belum VS Reddy for their comments on the earlier version of the draft.

iii
Contents
1. Introduction ........................................................................................................................... 1
2. Data source and methodology ............................................................................................ 1
2.1 Sample design of NSSO ................................................................................................... 1
3. Results and discussion ....................................................................................................... 3
3.1 Annual consumption trends of sorghum in rural and urban India .............................................33.1.1 All-India .................................................................................................................... 33.1.2 Regional level .......................................................................................................... 3
3.2 Consumption pattern across income groups .................................................................... 53.2.1 State level ................................................................................................................ 53.2.2 Regional level .......................................................................................................... 7
3.3 Production pattern of sorghum ......................................................................................... 83.3.1 State level ................................................................................................................ 83.3.2 Regional level .......................................................................................................... 8
3.4 Supply and demand of sorghum ....................................................................................... 93.4.1 State level ................................................................................................................ 93.4.2 Regional level .........................................................................................................11
4. Conclusion .......................................................................................................................... 12
References .............................................................................................................................. 14
Appendix ................................................................................................................................. 15


1
1. IntroductionCereals form the major staples of the food consumption basket of households in India. Among the major cereals of rice, wheat, sorghum, pearl millet and finger millet that are consumed in significant proportions in India, the consumption of nutritious cereals such as sorghum, pearl millet and finger millet are confined to the regions specific to where they are cultivated. Sorghum forms the staple food commodity of central and western regions of Maharashtra and the northern regions of Karnataka and Andhra Pradesh, while pearl millet is consumed mainly in the western states of India chiefly Gujarat and Rajasthan. Similarly, although wheat is consumed all over India, it forms the main staple in the consumption basket of the people in the northern parts of India such as Punjab, Delhi, Haryana, Madhya Pradesh and Uttar Pradesh. Over the past decade, research studies that have analyzed household consumption data collected by the National Sample Survey Organisation (NSSO) have reported a long term historical declining trend in per capita consumption of all cereals and particularly nutritious cereals (Meenakshi 1996, Kumar P 1998, Hamumantha Rao 2000, Radha Krishna 2005, Mittal 2006). This is partially attributed to a shift in dietary patterns of consumption from cereals to a more balanced diet that includes livestock products, fruits and vegetables (Chand 2007) – a change driven by income growth and urbanization.
Among cereals, consumption of nutritious cereals has declined the most as indicated in the trends in all-India and state level consumption. However, a true picture of consumption of coarse cereals can be drawn only by looking at the household consumption data disaggregated at the regional level, which helps gain better insights into inter-regional differences in consumption in the states where they are cultivated. Very few studies have attempted to analyze the household consumption data at a disaggregated regional level. To fill this lacuna and provide valuable insights on consumption of nutritious cereals, an attempt is made in this study to analyze the regional pattern of consumption and production of sorghum in the major growing states of Maharashtra, Karnataka and Andhra Pradesh. This type of region-specific analysis will provide insights into:
1. The importance of sorghum in the consumption basket in the main sorghum production regions in Maharashtra, Karnataka and Andhra Pradesh,
2. Differences in consumption of sorghum by various income groups in the regions,3. Better insights into the gap between demand-supply of sorghum in these regions, and4. Inter-state and intra-regional trade in sorghum.
2. Data source and methodologyThe main data source for this study is the National Sample Survey Organisation (NSSO), which publishes data on household consumer expenditure on food and non-food items for rural and urban consumers in India every five years. The household consumption data pertaining to the 61st round (2004-2005) was used to disaggregate the data for different regions of the states of Maharashtra, Karnataka and Andhra Pradesh.
2.1 Sample design of NSSOThe National Sample Survey Organisation (NSSO) adopted a multi-stage stratified sampling design in their surveys. The first stage units are villages for the rural sector and Urban Frame
2
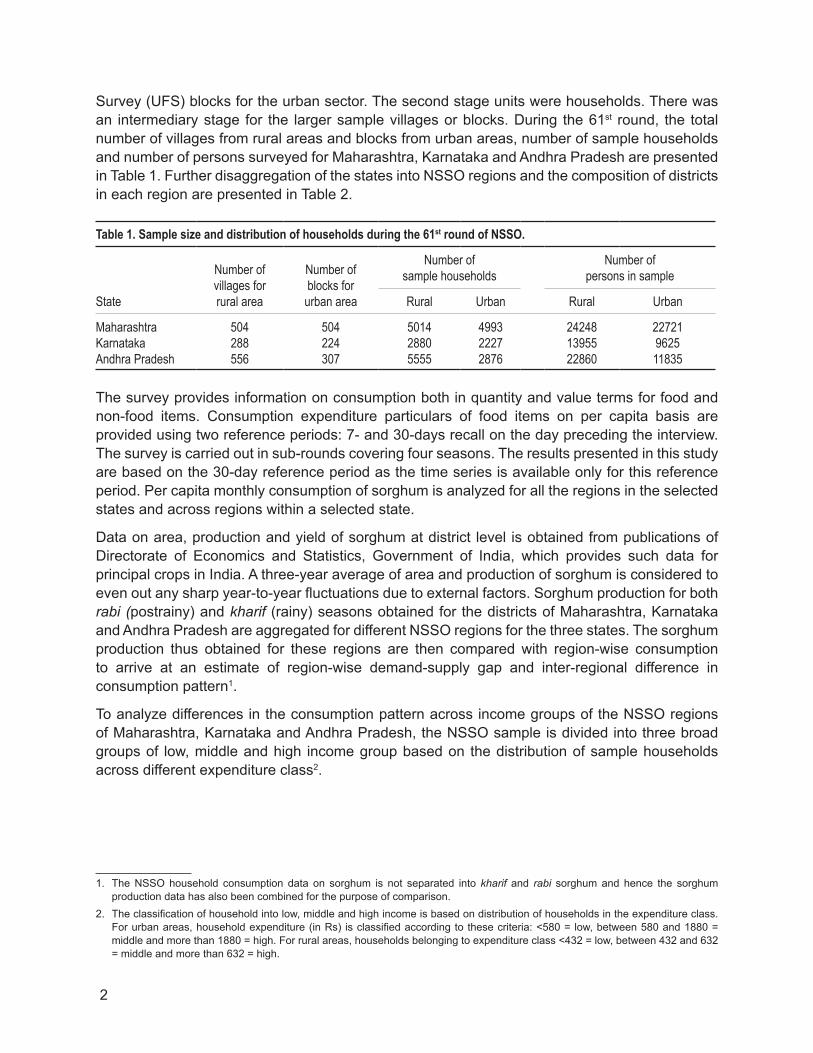
Survey (UFS) blocks for the urban sector. The second stage units were households. There was an intermediary stage for the larger sample villages or blocks. During the 61st round, the total number of villages from rural areas and blocks from urban areas, number of sample households and number of persons surveyed for Maharashtra, Karnataka and Andhra Pradesh are presented in Table 1. Further disaggregation of the states into NSSO regions and the composition of districts in each region are presented in Table 2.
Table 1. Sample size and distribution of households during the 61st round of NSSO.
State
Number of villages for rural area
Number of blocks for urban area
Number of sample households
Number of persons in sample
Rural Urban Rural Urban
Maharashtra 504 504 5014 4993 24248 22721Karnataka 288 224 2880 2227 13955 9625Andhra Pradesh 556 307 5555 2876 22860 11835
The survey provides information on consumption both in quantity and value terms for food and non-food items. Consumption expenditure particulars of food items on per capita basis are provided using two reference periods: 7- and 30-days recall on the day preceding the interview. The survey is carried out in sub-rounds covering four seasons. The results presented in this study are based on the 30-day reference period as the time series is available only for this reference period. Per capita monthly consumption of sorghum is analyzed for all the regions in the selected states and across regions within a selected state.
Data on area, production and yield of sorghum at district level is obtained from publications of Directorate of Economics and Statistics, Government of India, which provides such data for principal crops in India. A three-year average of area and production of sorghum is considered to even out any sharp year-to-year fluctuations due to external factors. Sorghum production for both rabi (postrainy) and kharif (rainy) seasons obtained for the districts of Maharashtra, Karnataka and Andhra Pradesh are aggregated for different NSSO regions for the three states. The sorghum production thus obtained for these regions are then compared with region-wise consumption to arrive at an estimate of region-wise demand-supply gap and inter-regional difference in consumption pattern1.
To analyze differences in the consumption pattern across income groups of the NSSO regions of Maharashtra, Karnataka and Andhra Pradesh, the NSSO sample is divided into three broad groups of low, middle and high income group based on the distribution of sample households across different expenditure class2.
1. The NSSO household consumption data on sorghum is not separated into kharif and rabi sorghum and hence the sorghum production data has also been combined for the purpose of comparison.
2. The classification of household into low, middle and high income is based on distribution of households in the expenditure class. For urban areas, household expenditure (in Rs) is classified according to these criteria: <580 = low, between 580 and 1880 = middle and more than 1880 = high. For rural areas, households belonging to expenditure class <432 = low, between 432 and 632 = middle and more than 632 = high.

3
3. Results and discussion
3.1 Annual consumption trends of sorghum in rural and urban India
3.1.1 All-India
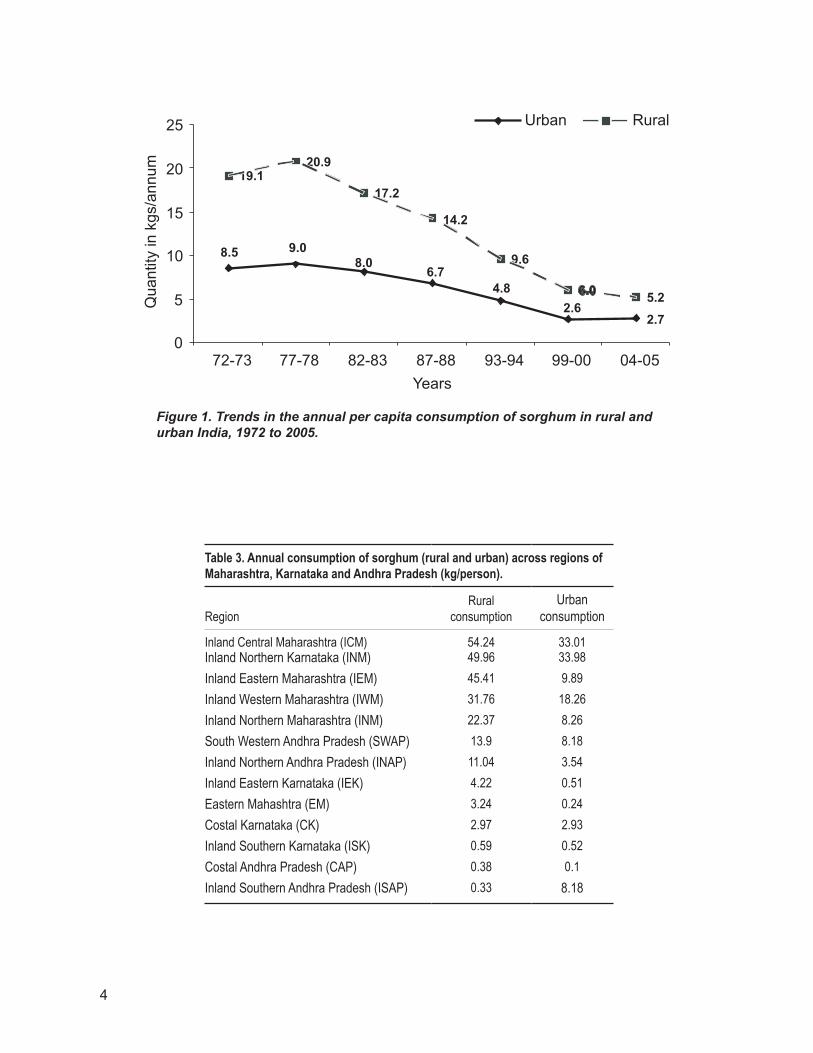
Between 1972-73 and 2004-05, the annual per capita consumption of sorghum at the all-India level has declined sharply by 68% (8.5 to 2.7kg) in urban areas and by 70% (19.1 to 5.2kg) in rural areas of India (Figure 1).
A closer examination of the data reveals that a steep decline in consumption started in 1987-88 and reached a low in 1999-2000. Since then the decline has plateaued until 2004-05 which is the latest year for which data is available. A number of factors have contributed to this trend and are discussed in the paper on the availability and utilization of sorghum grain in India by Parthasarathy Rao et al. (2010).
3.1.2 Regional level
Annual consumption of sorghum across different regions of the states of Maharashtra, Karnataka and Andhra Pradesh in rural and urban areas is presented in Table 3. Inland Central Maharashtra (ICM), Inland Northern Karnataka, (INK), Inland Eastern Maharashtra (IEM), Inland Western Maharashtra (IWM), South Western Andhra Pradesh (SWAP) and Inland Northern Andhra
Table 2. NSSO regions and their composition of districts in Maharashtra, Karnataka and Andhra Pradesh.
Region Districts composing the region
Coastal Maharashtra (CM) Thane, Mumbai Suburban, Mumbai, Raigarh, Ratnagiri, Sindhudurg
Inland Western Maharashtra (IWM ) Pune, Ahmadnagar, Solapur, Satara, Kolhapur, Sangli
Inland Northern Maharashtra (INM ) Nandurbar, Dhule, Jalgaon, Nasik
Inland Central Maharashtra (ICM) Nanded, Hingoli, Parbhani, Jalna, Aurangabad, Beed, Latur, Osmanabad
Inland Eastern Maharashtra (IEM ) Buldana, Akola, Washim, Amravati, Wardha, Nagpur, Yavatmal
Eastern Maharashtra (EM ) Bhandara, Gondiya, Gadchiroli, Chandrapur
Coastal & Ghats Karnataka (CK ) Uttara Kannada,Udupi, Dakshina Kannada
Inland Eastern Karnataka (IEK ) Shimoga, Chikmagalur, Hassan, Kodagu
Inland Southern Karnataka (ISK ) Tumkur, Kolar, Bangalore, Bangalore (Rural), Mandya, Mysore, Chamarajanagar
Inland Northern Karnataka ( INK ) Belgaum, Bagalkot, Bijapur, Gulbarga, Bidar, Raichur, Koppal, Gadag, Dharwad, Haveri, Bellary, Chitradurga, Davanagere
Coastal Andhra Pradesh (CAP ) Srikakulam, Vizianagaram, Visakhapatnam, East Godavari, West Godavari, Krishna, Guntur, Prakasam, Nellore.
Inland Northern Andhra Pradesh (INAP ) Adilabad, Nizamabad, Karimnagar, Medak, Hyderabad, Rangareddi, Mahbubnagar, Nalgonda, Warangal, Khammam
South Western Andhra Pradesh (SWAP ) Kurnool, Anantapur
Inland Southern Andhra Pradesh ( ISAP) Cuddapah, Chittoor
4
Table 3. Annual consumption of sorghum (rural and urban) across regions of Maharashtra, Karnataka and Andhra Pradesh (kg/person).
Region Rural
consumptionUrban
consumption
Inland Central Maharashtra (ICM) 54.24 33.01Inland Northern Karnataka (INM) 49.96 33.98
Inland Eastern Maharashtra (IEM) 45.41 9.89
Inland Western Maharashtra (IWM) 31.76 18.26
Inland Northern Maharashtra (INM) 22.37 8.26
South Western Andhra Pradesh (SWAP) 13.9 8.18
Inland Northern Andhra Pradesh (INAP) 11.04 3.54
Inland Eastern Karnataka (IEK) 4.22 0.51
Eastern Mahashtra (EM) 3.24 0.24
Costal Karnataka (CK) 2.97 2.93
Inland Southern Karnataka (ISK) 0.59 0.52
Costal Andhra Pradesh (CAP) 0.38 0.1
Inland Southern Andhra Pradesh (ISAP) 0.33 8.18
Figure 1. Trends in the annual per capita consumption of sorghum in rural and urban India, 1972 to 2005.
5
Pradesh (INAP) are the major sorghum consuming regions. These seven regions from the states of Maharashtra, Karnataka and Andhra Pradesh account for nearly 60% of consumption of the total production of these states. Geographically, these regions are located in close proximity to each other and hence the consumption habits exhibit a similar pattern.
As indicated, trends at the all-India level mask the trends at a more disaggregate regional level. Inland Central Maharashtra (ICM), which comprises districts of Nanded, Hingoli, Parbhani, Jalna, Aurangabad, Beed, Latur and Osmanabad, and which is the traditional sorghum consuming belt of Maharashtra has the highest per capita annual consumption of 54kg in rural areas and 34kg in urban areas. Similarly, Inland Northern Karnataka (INK) which comprises the districts of Belgaum, Bagalkot, Bijapur, Gulbarga, Bidar, Raichur, Koppal, Gadag, Dharwad, Haveri, Bellary, Chitradurga and Davanagere has per capita per annum sorghum consumption of 50kg in rural areas and 33kg in urban areas.
Apart from cultural practices and the eating habits of these regions, other plausible reasons for such high consumption of sorghum include prevailing climatic conditions. These regions are prone to erratic rainfall and the soils are infertile and fragile. Hence, sorghum which is tolerant to drought and other adverse climatic conditions is cultivated and forms one of the main staples for food and feed security. The other reason is high summer temperatures in these regions: sorghum is consumed in large quantities as it keeps the body cool during the hot months (anecdotal evidence).
At the other end, coastal regions of these states consume minuscule proportions of sorghum. Rice is largely preferred here, and other typical coastal habits such as fondness for fish, which is easily available, are characteristic of these regions.
3.2 Consumption pattern across income groups
3.2.1 State level
Consumption patterns of food commodities vary with household income and this is more so for nutritious cereals. To analyze the changes in consumption patterns of sorghum in the regions according to income, NSSO classification of expenditure classes are grouped into three income/expenditure groups: high, medium and low.
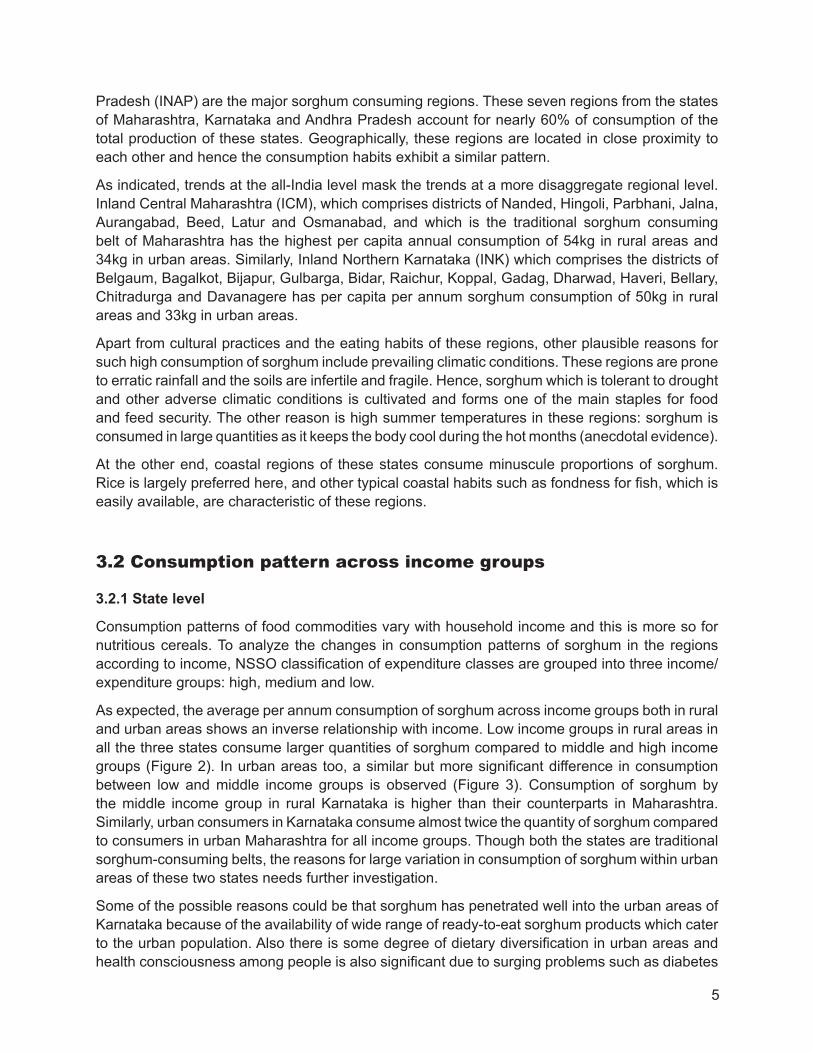
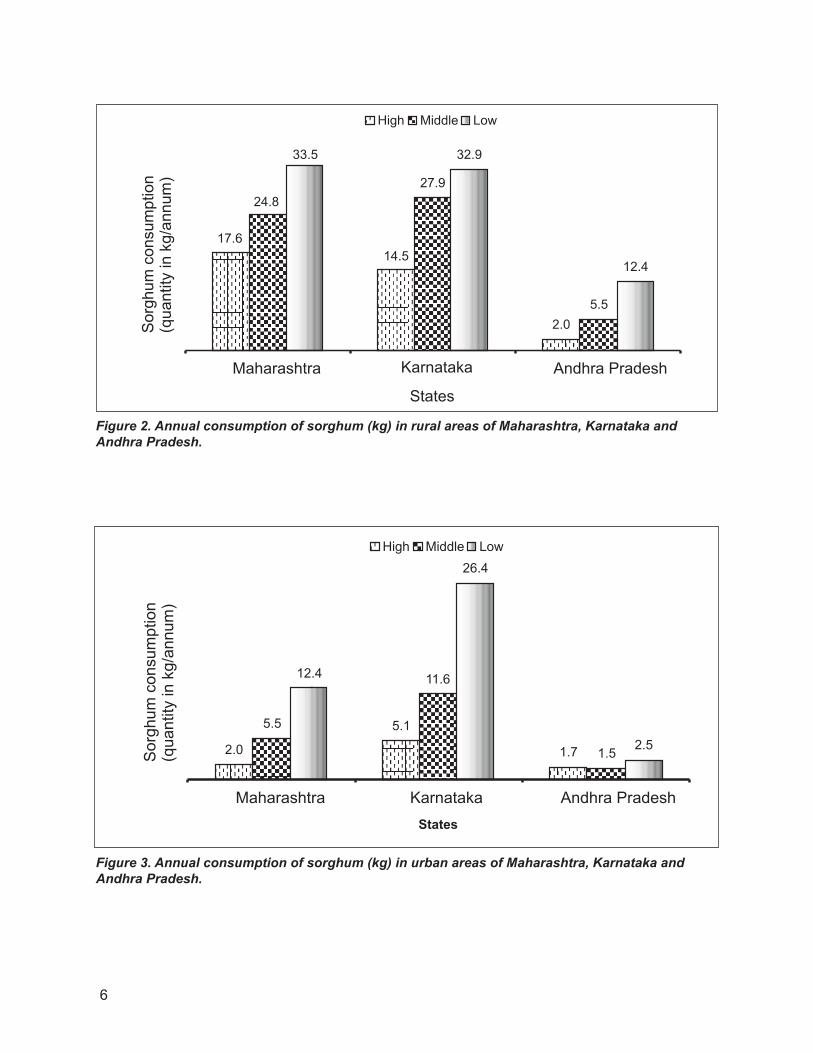
As expected, the average per annum consumption of sorghum across income groups both in rural and urban areas shows an inverse relationship with income. Low income groups in rural areas in all the three states consume larger quantities of sorghum compared to middle and high income groups (Figure 2). In urban areas too, a similar but more significant difference in consumption between low and middle income groups is observed (Figure 3). Consumption of sorghum by the middle income group in rural Karnataka is higher than their counterparts in Maharashtra. Similarly, urban consumers in Karnataka consume almost twice the quantity of sorghum compared to consumers in urban Maharashtra for all income groups. Though both the states are traditional sorghum-consuming belts, the reasons for large variation in consumption of sorghum within urban areas of these two states needs further investigation.
Some of the possible reasons could be that sorghum has penetrated well into the urban areas of Karnataka because of the availability of wide range of ready-to-eat sorghum products which cater to the urban population. Also there is some degree of dietary diversification in urban areas and health consciousness among people is also significant due to surging problems such as diabetes
6
Figure 2. Annual consumption of sorghum (kg) in rural areas of Maharashtra, Karnataka and Andhra Pradesh.
Figure 3. Annual consumption of sorghum (kg) in urban areas of Maharashtra, Karnataka and Andhra Pradesh.

7
and coronary diseases. However, field investigation studies would provide better explanations for the variation in consumption levels across these states, particularly in urban areas.
3.2.2 Regional level
Across the regions of Maharashtra, Karnataka and Andhra Pradesh in rural areas, Inland Central Maharashtra (ICM) has the highest average annual per capita consumption of sorghum by lower income group at 55kg. For urban areas however, Inland Northern Karnataka (INK) has higher levels of sorghum consumption across all regions and income groups (Table 4).
Table 4. Region-wise annual consumption of sorghum across income groups (2004-05) in rural and urban areas of Maharashtra, Karnataka and Andhra Pradesh (kg/person).
Region
Rural Urban
High(>632)
Middle(432-632)
Low(<432)
High(1880)
Middle(580-1880)
Low(580)
ICM 34 52 55 12 26 34IEM 33 29 48 3 8 11IWM 23 31 32 4 11 21INM 20 18 23 4 6 9EM 0 0.1 4 0.0 1 0.2INK 49 51 44 25 33 37IEK 1 6 3 0.0 1 0.7ISK 0 1 1 0.1 1 0.1INA 12 9 11 4 2 4SWA 12 12 14 0.0 6 9ISA 3 0.4 0.2 0.0 0.3 0.3
Interestingly, higher and middle income groups in rural areas of INK region consume more sorghum compared to lower income groups. Thus, sorghum in INK is consumed irrespective of income groups, ie, the inverse relationship between consumption and income for sorghum does not hold good here as this is the staple and an essential food commodity of the region. Thus this evidence suggests that even with increase in income in rural areas, sorghum as food is not going to be an inferior commodity in this region in the medium term. Similarly in ICM, IEM and IWM regions, sorghum forms the staple food commodity in rural areas as reflected in higher levels of per capita consumption across all income groups.
In all the regions in urban areas, lower income groups consume more sorghum compared to higher income groups. Across all the regions of these three states, INK has the highest consumption across all the income groups as was also observed at the state level. Some of the possible reasons for higher consumption in urban areas have been alluded to earlier and the matter needs further investigation.

8
3.3 Production pattern of sorghum
3.3.1 State level
Among the major sorghum producing states in India, Maharashtra with 47% of all India production has highest production followed by Karnataka (20%) and Andhra Pradesh (9%) (Table 5). Maharashtra has almost equal proportion of both kharif (rainy) and rabi (postrainy) production to all-India sorghum production while the states of Karnataka and Andhra Pradesh produce more rabi sorghum than kharif.
Table 5. Sorghum production (kharif and rabi) in major sorghum-producing states during 2004-05 (’000 tons).
State
Production State’s share to all-India
production (%)
State’s share to all-India rabi production (%)Rabi Kharif Total
Maharashtra 1519 1889 3408 47 53Karnataka 912 506 1418 20 33Andhra Pradesh 331 285 615 9 12All India 2865 4320 7185
3.3.2 Regional level
Within Maharashtra, Inland Western Maharashtra (IWM) has the highest area under rabi sorghum while Inland Central Maharashtra (ICM) has highest area under kharif sorghum (Table 6). Within IWM region, rabi sorghum production accounts for 79% of total sorghum production, while it is 48% in ICM region (Table 7). The two regions (IWM & ICM) together account for 92% of rabi and 47% of kharif sorghum production in the state.
Table 6. Region-wise area of sorghum in major producing states of India, 2004-05 (’000 hectares).
Region Kharif areaShare of kharif to total
regional area Rabi areaShare of rabi to total
regional area Total area
IWM 164 8 1864 92 2028ICM 636 36 1111 64 1747IEM 520 95 28 5 549CM 0 0 0 0 0EM 11 26 31 73 43INM 200 71 80 29 281CK 0 97 0 3 0IEK 8 46 9 54 17ISK 47 97 1 3 48INK 295 19 1230 81 1526CAP 9 35 16 64 25INAP 181 49 188 51 370SWAP 24 19 103 81 127ISAP 6 54 4 40 10

9
Table 7. Region-wise production of sorghum in major producing states of India, 2004-05 (’000 tons).
RegionKharif
productionRabi
production
Kharif share to total regional production
Rabi share to total regional production
Total production
IWM 204 764 21 79 968ICM 696 638 52 48 1334IEM 631 15 98 2 646CM 0 0 0 0 0EM 12 11 51 49 24INM 346 91 79 21 437CK 0 0 0 0 0IEK 8 6 57 43 15ISK 53 1 98 2 54INK 444 905 33 67 1350CAP 17 32 34 66 50INAP 178 141 56 44 320SWAP 85 155 36 64 240ISAP 5 3 63 37 8
Price and non-price factors like resource endowments, climate and consumption pattern of the regions besides relative profitability explains the variation in cropping pattern across regions within a state. Accordingly, a wide variation in area under cultivation of sorghum is seen across regions of the same state. Inland Central Maharshtra (ICM), which consists of the districts of Nanded, Hingoli, Parbhani, Jalna, Aurangabad, Beed, Latur and Osmanabad are predominantly rainfed parts of the state and hence both rabi and kharif sorghum is cultivated which has demand from industrial users for poultry, livestock feed and alcohol. Coming to Inland Western Maharashtra (IWM): the region consists of the districts of Pune, Ahmadnagar, Solapur, Satara, Kolhapur and Sangli which are endowed with better resources, and this is predominately a sorghum-consuming region and consequently has larger proportion of cultivation under rabi. Similarly, Inland Northern region of Karnataka (INK) and Inland Northern region of Andhra Pradesh (INAP) have large proportions of area under rabi sorghum. Because of the geographical proximity of the regions of IWM, ICM, INK and INAP, similar cropping and consumption patterns are exhibited.
3.4 Supply and demand of sorghum
3.4.1 State level
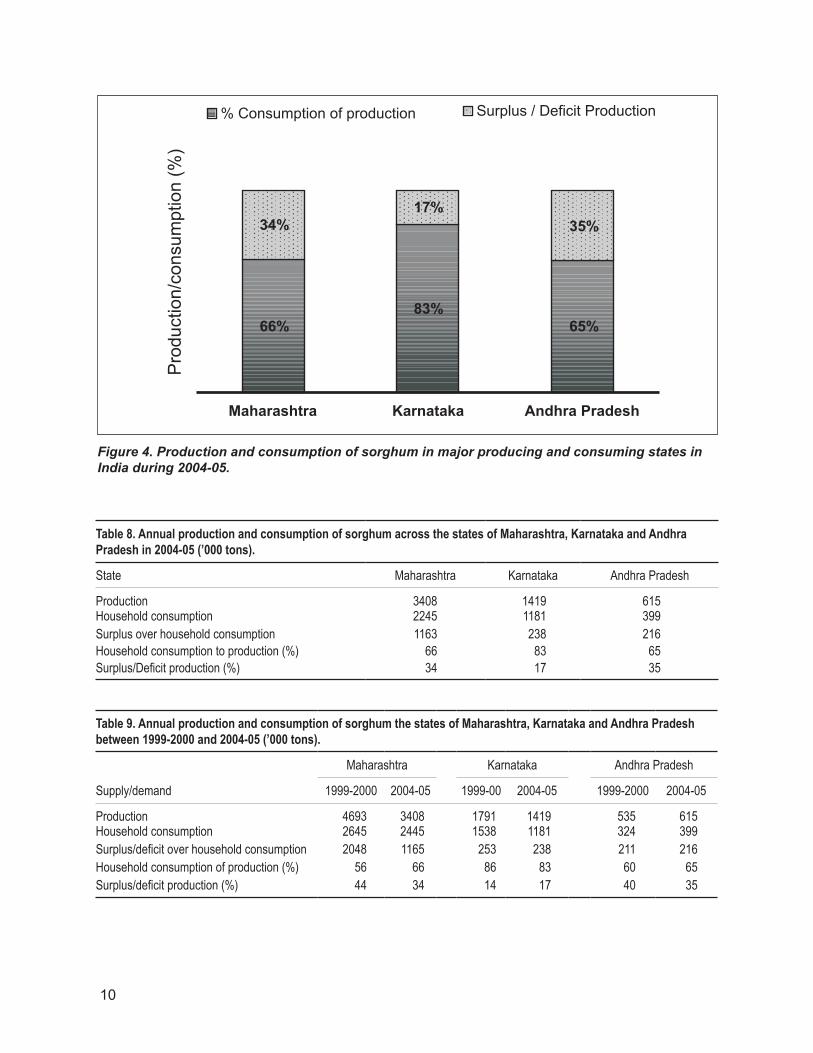
In all the three major sorghum-producing and -consuming states, there is surplus production over household consumption of sorghum. During 2004-05, Karnataka had the highest consumption to production ratio of 83% followed by Maharashtra and Andhra Pradesh (Table 8 and Figure 4). Between 1999-2000 and 2004-05 the consumption to production ratio has increased by 10% in Maharashtra, while in Karnataka and Andhra Pradesh, there is a marginal increase by 3% and 5% respectively in the ratio during the same period (Table 9). However, there is a marginal decline in absolute consumption of sorghum from 1999-2000 to 2004-05. Thus, the overall increase in consumption to production ratio from 1999-2000 to 2004-2005 is due to fall in production in the states of Maharashtra and Karnataka by 27% and 20% respectively (Table 9).
10
Table 8. Annual production and consumption of sorghum across the states of Maharashtra, Karnataka and Andhra Pradesh in 2004-05 (’000 tons).
State Maharashtra Karnataka Andhra Pradesh
Production 3408 1419 615Household consumption 2245 1181 399Surplus over household consumption 1163 238 216Household consumption to production (%) 66 83 65Surplus/Deficit production (%) 34 17 35
Table 9. Annual production and consumption of sorghum the states of Maharashtra, Karnataka and Andhra Pradesh between 1999-2000 and 2004-05 (’000 tons).
Supply/demand
Maharashtra Karnataka Andhra Pradesh
1999-2000 2004-05 1999-00 2004-05 1999-2000 2004-05
Production 4693 3408 1791 1419 535 615Household consumption 2645 2445 1538 1181 324 399Surplus/deficit over household consumption 2048 1165 253 238 211 216Household consumption of production (%) 56 66 86 83 60 65Surplus/deficit production (%) 44 34 14 17 40 35
Figure 4. Production and consumption of sorghum in major producing and consuming states in India during 2004-05.
11
As indicated earlier, separate data for consumption of rabi and kharif sorghum are not available. However, based on field observations and literature we find that kharif production of sorghum is generally from hybrids and is therefore susceptible to grain mold. Consequently the produce is of poor quality and less preferred for human consumption (Parthasarathy Rao et al. 2004). The best quality kharif grain is mainly consumed by low income consumers because it is priced lower than rabi sorghum, wheat etc. On the other hand, production from rabi sorghum is mainly used for human consumption to the extent of 90% and a small proportion goes to the processed food sector (field observations; Dayakar et al. 2010). Hence, the surplus production in all the three states available after meeting the consumption demand is mainly kharif produce, since lesser quantities of it are used for food. Kharif sorghum tends to be used more as feed ingredient in the poultry and livestock industries and as raw material for the alcohol industry (Kleih et al. 2000). Thus kharif sorghum is traded across regions and states in India to meet these demands (Marshland and Parthasarathy Rao 1999).
Surpluses of rabi sorghum are also seen: they are reflected in inter-state and inter-regional trade from surplus to deficit regions mainly to meet food demand for household consumption and sorghum rotis in restaurants. Rabi sorghum is also traded for seed purpose which is mainly used to grow sorghum as a fodder crop in neighboring states like Gujarat.
A majority of the restaurants in Marathwada region and southern parts of Maharashtra and northern Karnataka include sorghum rotis on their menus. The concept of sorghum rotis have penetrated a few other big cities in these states, and are promoted as a novel delicacy. Hence rabi sorghum requirement by hotels and restaurants has been increasing over time; however, this demand has not been captured by NSSO data and it needs to be made clear that a portion of the surplus production, particularly rabi sorghum, would be accounted for by this sector. The fact that food consumed outside the home is not included or made allowance for has been a major shortcoming of household consumption data collected by NSSO.
3.4.2 Regional level
As with the state level picture in most of the sorghum-growing regions, there is surplus production over consumption. However, if household consumption needs are accounted only from rabi sorghum production then most of the regions would fall short of meeting the consumption demand (Table 10). This shortfall is presently met from kharif sorghum of good quality. This finding suggests that increase in rabi sorghum production through productivity/area increase would help to bring down the prices of rabi sorghum and make it affordable for low income consumers also.
12
4. ConclusionRegional level disaggregation of sorghum consumption in important producing/ consuming states has shown that sorghum is still important in the consumption basket particularly in rural regions of central, eastern and western Maharashtra and northern Karnataka regions. This is further corroborated by household consumption data analyzed at the state level that indicates sorghum is still able to compete with rice and wheat in Maharashtra and with wheat in Karnataka in the consumption basket of cereals (Parthasarathy Rao et al. 2010).
A further disaggregation of the data by income groups has shown that in sorghum-growing and -consuming regions, sorghum is consumed by all income groups but more so by lower income consumers. In the urban areas of Inland Northern Karnataka (INK) region, consumption of sorghum by high income group is unexpectedly more than that of their peers in the low income bracket. Most of this consumption can be attributed to rabi sorghum. Hence, the evidence suggests that in sorghum growing regions where sorghum forms a staple food, purchasing power determines the consumption habits as rabi sorghum prices are 1.5 to 2 times higher than kharif sorghum prices (Parthasarathy Rao et al. 2010). The evidence also suggests that even with increase in income, in the medium term, sorghum as a food commodity is not going to be seen as an inferior dietary component in these regions.
The higher consumption of sorghum in urban regions by higher income groups in INK region of Karnataka shows better penetration of sorghum value-added products in the form of dry rotis, dosa, vermicelli, upma etc at a household level. Availability of such diversified products acts as one of the factors to drive consumption in homes. Field level findings suggests that there is scope to arrest the declining demand for sorghum in urban centers by promoting value-added and ready-to-eat products as they are in much demand in hotels and restaurants. Though consumers are aware of the health benefits of sorghum in their dietary requirement, unavailability of processed products (for example, like those available with wheat) has contributed to a decline in consumption of sorghum. Hence, keeping in view of the potential benefits of sorghum, research efforts should
Table 10. Region-wise production and consumption of sorghum in major sorghum-growing states (’000 tons).
Region Production ConsumptionSurplus/Deficit (%)
(total sorghum)Surplus/Deficit (%) (rabi sorghum only)
ICM 1334 807 527 -27IWM 968 692 276 91IEM 646 509 137 -3390INM 437 218 219 -140EM 24 15 9 -36CM 0 4 -4 0INK 1349 1140 209 -26ISK 54 11 43 -1000IEK 16 17 -2 -183CK 0.37 13 -13 0INAP 320 280 40 -99SWAP 240 94 146 39CAP 49 10 39 69ISAP 8 14 -6 -367

13
be focused on release of varieties to cater to the demand from processing sector, so that it may result in better value-added products and meet the demand of the growing urban population.
The results show that there is surplus production of sorghum available from most of the regions of the producing states. Most of the surplus production is of kharif production which is utilized for industrial uses and only about 40-45 % is used as food. Rabi sorghum is also traded for food use to the non-producing regions in these states.
Since sorghum is still a staple, and an important commodity for food consumption in Maharashtra, Karnataka and Andhra Pradesh, efforts should be made at the policymaking level to include sorghum in the Public Distribution System (PDS) in these states3. This would, in the long run, help both the producers and consumers. It would provide incentives to producers to grow sorghum and to consumers by making it available at cheaper price for consumption as is done for rice and wheat.
Research efforts, particularly for rabi sorghum, should be in the direction of increasing production through productivity, which will help bring down the real prices in the long-run and make it affordable for the poorer sections also.
3. Alternatively food stamps could be issued enabling consumers to buy the grain of their choice.

14
ReferencesChand R. 2007. Demand for food grains. Economic and Political Weekly, 42(52).
Government of India. 2001. Census of India. Registrar General and Census Commission of India, New Delhi.
Government of India. 2007. Agriculture statistics at a glance. Directorate of Economics and Statistics, Ministry of Agriculture, New Delhi.
Hanumanth Rao CH. 2000. Declining demand for foodgrains in rural India: Causes and implications. Pages 201-206 in Economic and Political Weekly January 22. Kleih U, Bala Ravi S and Dayakar Rao B. 2000. Industrial utilization of sorghum in India. Working paper series no. 4, Socioeconomics and Policy Program, Patancheru 502 324, Andhra Pradesh, India: International Crops Research Institute for the Semi-Arid Tropics.
Kumar Praduman. 1998. Food demand and supply projections for India. Agricultural Economics policy paper 98-01. New Delhi: IARI.
Marsland N and Parthasarathy Rao. 1999. Marketing of rainy and postrainy-season sorghum in Andhra Pradesh, Karnataka and Maharashtra. Working paper series no. 1, Socioeconomics and Policy Program, Patancheru 502 324, Andhra Pradesh, India: International Crops Research Institute for the Semi-Arid Tropics. 40 pp.
Meenakshi JV. 1996. How important are changes in taste? A state-level analysis of food demand. Pages 3265-3269 in Economic and Political Weekly, 34(52).
Mittal S. 2006. Structural shift in demand for food: Projections for 2020. Working paper No. 184, ICRIER, New Delhi.
National Sample Survey Organisation. Various years. Level and pattern of consumer expenditure. Ministry of Planning and Programme Implementation, Government of India, New Delhi.
Parthasarathy Rao P, Birthal PS and Joshi PK. 2006. Diversification towards high-value agriculture: Role of urbanisation and infrastructure. Pages 2747-2753 in Economic and Political Weekly, 41(26).
Parthasarathy Rao P, Basavaraj G, Wasim Ahmad and Bhagavatula S. 2010. An analysis of availability and utilization of sorghum grain in India. Journal of SAT Agricultural Research, Vol. 8.
Radhakrishan R. 2005. Food and nutrition security of the poor. Pages 1817-1821 in Economic and Political Weekly, 40(18).
Rao Dayakar B, Seetharama A, Suresh A, Sreekanth M, Reddy Nirmal K and Rao SV. 2010. Dynamics of value and trade channels of sorghum in India. Rajendranagar, Hyderabad: Directorate of Sorghum Research.
15
Appendix
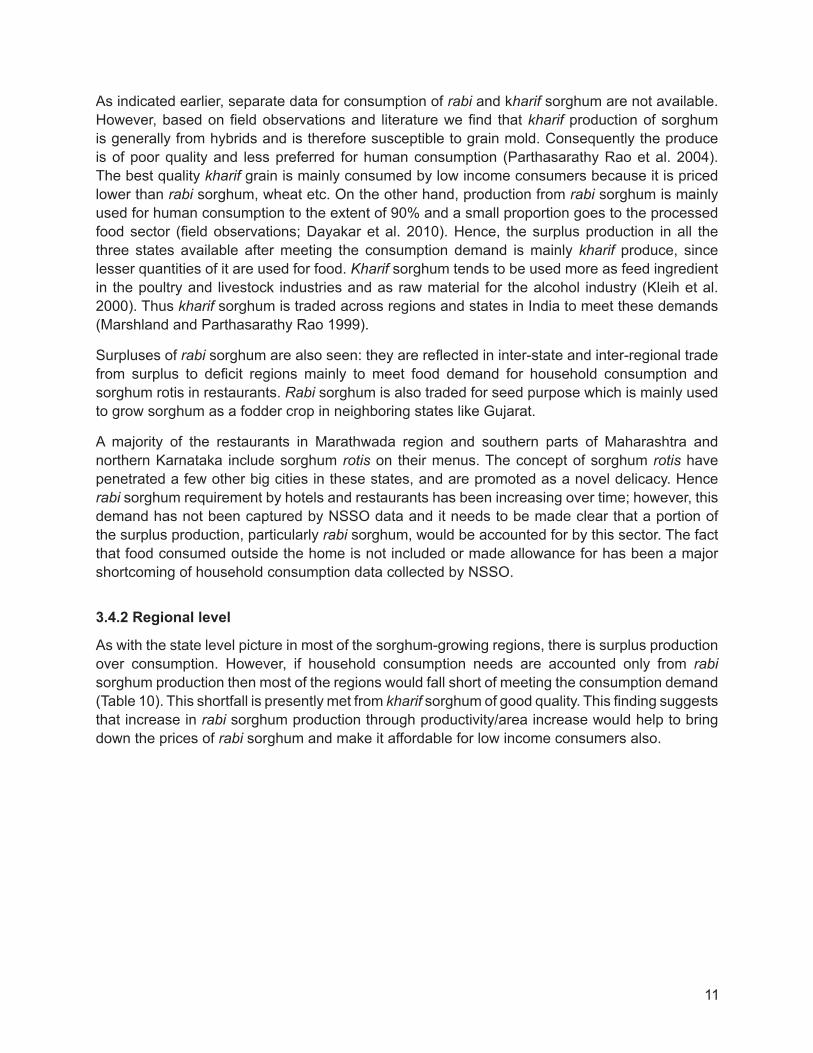
Map 1. Sorghum consumption across NSSO regions of Maharashtra, Karnataka and Andhra Pradesh.
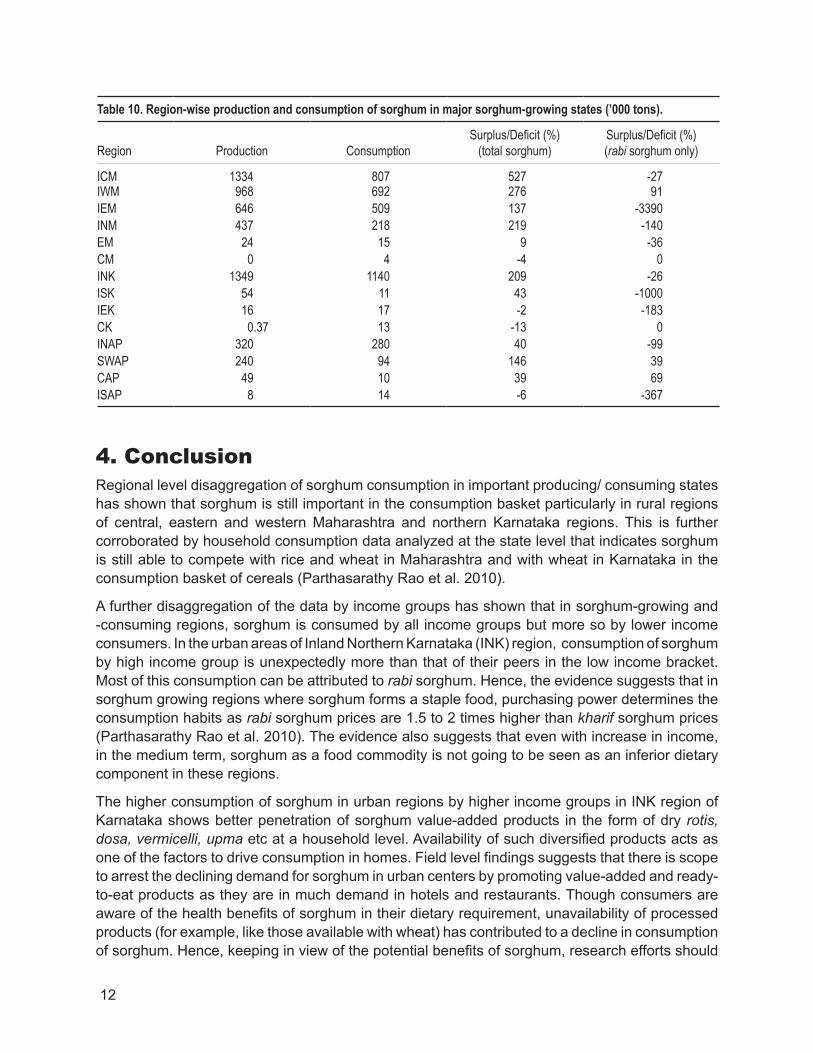
Map 2. Rainfall distribution across NSSO regions of Maharashtra, Karnataka and Andhra Pradesh.


Working Paper Series no. 28
Regional Analysis of Household Consumption of Sorghum in Major
Sorghum-Producing and Consuming States in India
G Basavaraj and P Parthasarathy Rao
258-2011
ICRISAT-Patancheru(Headquarters)Patancheru 502 324Andhra Pradesh, IndiaTel +91 40 30713071Fax +91 40 [email protected]
ICRISAT-Liaison OfficeCG Centers BlockNASC ComplexDev Prakash Shastri MargNew Delhi 110 012, IndiaTel +91 11 32472306 to 08 Fax +91 11 25841294
ICRISAT-Nairobi(Regional hub ESA)PO Box 39063, Nairobi, KenyaTel +254 20 7224550Fax +254 20 [email protected]
ICRISAT-Bamako(Regional hub WCA)BP 320Bamako, MaliTel +223 20 223375Fax +223 20 [email protected]
ICRISAT-NiameyBP 12404, Niamey, Niger (Via Paris)Tel +227 20722529, 20722725Fax +227 [email protected]
ICRISAT-BulawayoMatopos Research StationPO Box 776,Bulawayo, ZimbabweTel +263 383 311 to 15Fax +263 383 [email protected]
ICRISAT-LilongweChitedze Agricultural Research StationPO Box 1096Lilongwe, MalawiTel +265 1 707297, 071, 067, 057Fax +265 1 [email protected]
ICRISAT-Maputoc/o IIAM, Av. das FPLM No 2698Caixa Postal 1906Maputo, MozambiqueTel +258 21 461657Fax +258 21 [email protected]
Contact Information
About ICRISAT
www.icrisat.org
The International Crops Research Institute for the Semi-Arid-Tropics (ICRISAT) is a non-profit, non-political organization that conducts agricultural research for development in Asia and sub-Saharan Africa with a wide array of partners throughout the world. Covering 6.5 million square kilometers of land in 55 countries, the semi-arid tropics have over 2 billion people, and 644 million of these are the poorest of the poor. ICRISAT and its partners help empower these poor people to overcome poverty, hunger and a degraded environment through better agriculture.
ICRISAT is headquartered in Hyderabad, Andhra Pradesh, India, with two regional hubs and four country offices in sub-Saharan Africa. It belongs to the Consortium of Centers supported by the Consultative Group on International Agricultural Research (CGIAR).
IMOD Innovate • Grow • Prosper •