REPORTS Extensive Variation in Chromatin States Across...
3
Extensive Variation in Chromatin States Across Humans Maya Kasowski, 1,2 * Sofia Kyriazopoulou-Panagiotopoulou, 3 * Fabian Grubert, 1 * Judith B. Zaugg, 1 * Anshul Kundaje, 1,3,4,5 * Yuling Liu, 8 Alan P. Boyle, 1 Qiangfeng Cliff Zhang, 1 Fouad Zakharia, 1 Damek V. Spacek, 1 Jingjing Li, 1 Dan Xie, 1 Anthony Olarerin-George, 6 Lars M. Steinmetz, 1,7 John B. Hogenesch, 6 Manolis Kellis, 4,5 Serafim Batzoglou, 3 Michael Snyder 1 † The majority of disease-associated variants lie outside protein-coding regions, suggesting a link between variation in regulatory regions and disease predisposition. We studied differences in chromatin states using five histone modifications, cohesin, and CTCF in lymphoblastoid lines from 19 individuals of diverse ancestry. We found extensive signal variation in regulatory regions, which often switch between active and repressed states across individuals. Enhancer activity is particularly diverse among individuals, whereas gene expression remains relatively stable. Chromatin variability shows genetic inheritance in trios, correlates with genetic variation and population divergence, and is associated with disruptions of transcription factor binding motifs. Overall, our results provide insights into chromatin variation among humans. A ssociation and gene expression studies have linked disease predisposition to spe- cific alleles (1–3) and identified inter- mediate molecular phenotypes that may be responsible for organismal differences (4–7). However, the underlying mechanisms by which genetic variation drives either disease or expression differences remain poorly understood. Interindi- vidual variability has been reported for transcription factor (TF) binding ( 8–10) and deoxyribonuclease I (DNase I) accessibility ( 11, 12). However, TF studies assay a very small fraction of regulatory elements, whereas DNase I hypersensitivity does not distin- guish between different types of regulatory elements (e.g., enhancers versus promoters), is biased toward active elements, and provides little information on domain-level features (e.g., Polycomb-repressed domains). To further characterize human variation in di- verse types of regulatory elements, we studied the chromatin state of lymphoblastoid cell lines (LCLs) derived from 19 individuals: five European (CEU), seven Yoruban (YRI), and two Asian individuals from the 1000 Genomes Project (including two mother-father-daughter trios) (13), an additional Caucasian individual (14), and four deeply se- quenced individuals from the San population ( 15) (table S1). We used RNA sequencing (RNA-seq) to measure expression and chromatin immunoprecip- itation followed by high-throughput sequencing (ChIP-seq) to map five histone modifications (H3K27ac, H3K4me1, H3K4me3, H3K36me3, and H3K27me3) and two general factors (CTCF and SA1, a subunit of cohesin) (figs. S1 and S2 and tables S1 to S4). ChIP-seq reads were mapped to each line ’ s phased genome to reduce mapping biases. To systematically identify variable regions across individuals, we used analysis of variance (ANOVA) as well as DESeq (figs. S3 and S4) ( 16). Active chromatin marks H3K27ac, H3K4me1, and H3K4me3, and the repressive mark H3K27me3 show the highest fraction of variable regions, in contrast to gene-body marks and RNA expres- sion levels (Fig. 1A and fig. S4). We additionally used ChromHMM (17) to segment the genome of each individual into 15 chromatin states based on the combinatorial pat- terns of the chromatin marks and CTCF (Fig. 1, B and C, figs. S5 to S8, and table S5). We found that enhancer states exhibit the most variability (fig. S9), with bivalent (poised) enhancers having the highest fraction of individual-specific regions, followed by weak enhancers, followed by strong active enhancers. Similarly, bivalent promoters are more variable than active promoters and strongly transcribed states. The variability of chromatin marks is often de- pendent on functional context defined by combi- natorial chromatin patterns. H3K27ac and H3K4me3 show significantly higher variability at enhancers 1 Department of Genetics, Stanford University School of Med- icine, Stanford, CA 94305, USA. 2 Department of Molecular, Cellular, and Developmental Biology, Yale University, New Haven, CT 06520, USA. 3 Department of Computer Science, Stanford University, Stanford, CA 94305, USA. 4 Department of Computer Science, Massachusetts Institute of Technology (MIT), Cambridge, MA 02139, USA. 5 Broad Institute of MIT and Harvard, Cambridge, MA 02142, USA. 6 Department of Pharmacology, Uni- versity of Pennsylvania, Philadelphia, PA 19104, USA. 7 Genome Biology, The European Molecular Biology Laboratory Heidelberg, 69117 Heidelberg, Germany. 8 Department of Chemistry, Stanford University, Stanford, CA 94305, USA. *These authors contributed equally to this study. †Corresponding author. E-mail: [email protected] Tx TssA Chromatin states TssF EnhA Enh EnhW TssP EnhP ReprPC Ctcf Low H3K4me3 H3K27ac H3K4me1 H3K36me3 H3K27me3 CTCF TxW TxEnhA TxEnh TxEnhW 0 1 A B C -3 0 3 -0.05 0.06 0.97 0.17 0.29 0.29 0.15 0.22 0.1 -0.03 0.12 0.76 0.02 0.29 0.13 -0.45-0.07 0.78 0.64 0.15 -0.45-0.19 0.49 0.39 -0.06-0.13 0.21 0.09 0.24 0.26 0.1 0.01 0.91 0.2 TssA TssF Ctcf Tx TxW EnhA TxEnhA TxEnh Enh TxEnhW EnhW ReprPC Low EnhP TssP Promoter Ctcf Transcribed Enhancer Repressed Low Bivalent D 0.1 0.2 0.3 7234 10605 48220 52894 23964 3281 1422 48586 CTCF SA1 H3K27ac H3K4me1 H3K4me3 RNA H3K36me3 H3K27me3 Fraction of variable regions chr1:156,372,591-156,515,244 SAN ASIAN YRI CEU 19 Individuals Variable region Non-variable region Fig. 1. Variation in chromatin, factors, and expression across indi- viduals. (A) Number and fraction of enriched regions (for chromatin marks and factors) and expressed genes (for RNA) that are variable across indi- viduals. (B) Composition (emission probability) of five chromatin marks and CTCF in 15 chromatin states: TssA (active promoters), TssF (flanking active promoters), Tx (strong transcription), TxW (weak transcription), EnhA (active enhancers with H3K4me3), TxEnhA (active enhancers in transcribed regions), Enh (active enhancers without H3K4me3), TxEnh (active enhancers without H3K4me3 in transcribed regions), EnhW (weak enhancers), TxEnhW (weak enhancers in transcribed regions), TssP (poised promoters), EnhP (poised en- hancers), ReprPC (Polycomb repressed), Ctcf (CTCF enriched regions), and Low (low signal). (C) Examples of a nonvariable and a variable region. Coordinates are in build hg19 of the human reference sequence. State colors are as in (B). (D) log 10 ratio of the observed probability that a region switches from one state (row) to another (column) in any pair of individuals relative to background switching across pairs of replicates. 8 NOVEMBER 2013 VOL 342 SCIENCE www.sciencemag.org 750 REPORTS
Transcript of REPORTS Extensive Variation in Chromatin States Across...

Extensive Variation in ChromatinStates Across HumansMaya Kasowski,1,2* Sofia Kyriazopoulou-Panagiotopoulou,3* Fabian Grubert,1* Judith B. Zaugg,1*Anshul Kundaje,1,3,4,5* Yuling Liu,8 Alan P. Boyle,1 Qiangfeng Cliff Zhang,1 Fouad Zakharia,1
Damek V. Spacek,1 Jingjing Li,1 Dan Xie,1 Anthony Olarerin-George,6 Lars M. Steinmetz,1,7
John B. Hogenesch,6 Manolis Kellis,4,5 Serafim Batzoglou,3 Michael Snyder1†
The majority of disease-associated variants lie outside protein-coding regions, suggesting a linkbetween variation in regulatory regions and disease predisposition. We studied differences inchromatin states using five histone modifications, cohesin, and CTCF in lymphoblastoid linesfrom 19 individuals of diverse ancestry. We found extensive signal variation in regulatory regions,which often switch between active and repressed states across individuals. Enhancer activity isparticularly diverse among individuals, whereas gene expression remains relatively stable.Chromatin variability shows genetic inheritance in trios, correlates with genetic variation andpopulation divergence, and is associated with disruptions of transcription factor binding motifs.Overall, our results provide insights into chromatin variation among humans.
Association and gene expression studieshave linked disease predisposition to spe-cific alleles (1–3) and identified inter-
mediate molecular phenotypes that may be
responsible for organismal differences (4–7).However, the underlying mechanisms by whichgenetic variation drives either disease or expressiondifferences remain poorly understood. Interindi-vidual variability has been reported for transcriptionfactor (TF) binding (8–10) and deoxyribonuclease I(DNase I) accessibility (11,12).However, TF studiesassay a very small fraction of regulatory elements,whereas DNase I hypersensitivity does not distin-guish between different types of regulatory elements(e.g., enhancers versus promoters), is biased towardactive elements, and provides little informationon domain-level features (e.g., Polycomb-represseddomains).
To further characterize human variation in di-verse types of regulatory elements, we studied thechromatin state of lymphoblastoid cell lines (LCLs)
derived from 19 individuals: five European (CEU),seven Yoruban (YRI), and two Asian individualsfrom the 1000 Genomes Project (including twomother-father-daughter trios) (13), an additionalCaucasian individual (14), and four deeply se-quenced individuals from the San population (15)(table S1).WeusedRNAsequencing (RNA-seq) tomeasure expression and chromatin immunoprecip-itation followed by high-throughput sequencing(ChIP-seq) to map five histone modifications(H3K27ac, H3K4me1, H3K4me3, H3K36me3,and H3K27me3) and two general factors (CTCFand SA1, a subunit of cohesin) (figs. S1 and S2 andtables S1 to S4). ChIP-seq reads were mapped toeach line’s phasedgenome to reducemappingbiases.
To systematically identify variable regionsacross individuals, we used analysis of variance(ANOVA) as well as DESeq (figs. S3 and S4)(16). Active chromatinmarks H3K27ac, H3K4me1,andH3K4me3, and the repressivemarkH3K27me3show the highest fraction of variable regions, incontrast to gene-body marks and RNA expres-sion levels (Fig. 1A and fig. S4).
We additionally used ChromHMM (17) tosegment the genome of each individual into 15chromatin states based on the combinatorial pat-terns of the chromatin marks and CTCF (Fig. 1,B and C, figs. S5 to S8, and table S5). We foundthat enhancer states exhibit the most variability(fig. S9), with bivalent (poised) enhancers havingthe highest fraction of individual-specific regions,followed by weak enhancers, followed by strongactive enhancers. Similarly, bivalent promoters aremore variable than active promoters and stronglytranscribed states.
The variability of chromatin marks is often de-pendent on functional context defined by combi-natorial chromatin patterns.H3K27ac andH3K4me3show significantly higher variability at enhancers
1Department of Genetics, Stanford University School of Med-icine, Stanford, CA 94305, USA. 2Department of Molecular,Cellular, and Developmental Biology, Yale University, NewHaven, CT 06520, USA. 3Department of Computer Science,Stanford University, Stanford, CA 94305, USA. 4Department ofComputer Science, Massachusetts Institute of Technology (MIT),Cambridge, MA 02139, USA. 5Broad Institute of MIT and Harvard,Cambridge, MA 02142, USA. 6Department of Pharmacology, Uni-versity of Pennsylvania, Philadelphia, PA 19104, USA. 7GenomeBiology, The EuropeanMolecular Biology Laboratory Heidelberg,69117Heidelberg, Germany. 8Department of Chemistry, StanfordUniversity, Stanford, CA 94305, USA.
*These authors contributed equally to this study.†Corresponding author. E-mail: [email protected]
Tx
TssA
Chr
omat
in s
tate
s
TssF
EnhA
Enh
EnhW
TssPEnhP
ReprPCCtcfLow
H3K
4me3
H3K
27ac
H3K
4me1
H3K
36m
e3H
3K27
me3
CT
CF
TxW
TxEnhA
TxEnh
TxEnhW
0
1
A B C-3 0 3
-0.05 0.06 0.62 0.97 0.32 0.17 0.22-0.2-
-0.2 0.29 0.24-0.08 0.29 0.23 0.15-
-0.07 0.22-
-0.04-
-0.02 0.1 0.18-
-0.03 0.12 1.08 0.76 0.93-
-0.02 0.02 1.12 0.29 0.61 0.13-
-0.45-0.07 0.78 0.64 0.64 0.2 0.15-0.25-
-0.45-0.19 0.49 0.67 0.39 0.15 0.6 0.04-
-0.06-0.13 0.21 0.18 0.09 0.69 0.24 0.19 0.26-0.24-
-0 0.1 0.18 0.01 0.78 0.91 0.78 0.2 0.08-
-
-
-0.4-
-
Tss
A
Tss
F
Ctc
fT
x
TxW
Enh
AT
xEnh
A
TxE
nhE
nhT
xEnh
WE
nhW
Rep
rPC
Low
Enh
P
Tss
PPro
mot
er
Ctcf
Trans
cribe
d
Enhan
cer
Repre
ssed
Low
Bivalen
t
D
0.1
0.2
0.3
723410605
48220
5289423964
3281
1422
48586
CTCFSA1
H3K27
ac
H3K4m
e1
H3K4m
e3RNA
H3K36
me3
H3K27
me3
Fra
ctio
n of
var
iabl
e re
gion
s
chr1:156,372,591-156,515,244
SA
NA
SIA
NY
RI
CE
U
19 In
divi
dual
s
Variable region Non-variable region
Fig. 1. Variation in chromatin, factors, and expression across indi-viduals. (A) Number and fraction of enriched regions (for chromatin marksand factors) and expressed genes (for RNA) that are variable across indi-viduals. (B) Composition (emission probability) of five chromatin marks andCTCF in 15 chromatin states: TssA (active promoters), TssF (flanking activepromoters), Tx (strong transcription), TxW (weak transcription), EnhA (activeenhancers with H3K4me3), TxEnhA (active enhancers in transcribed regions),Enh (active enhancers without H3K4me3), TxEnh (active enhancers without
H3K4me3 in transcribed regions), EnhW (weak enhancers), TxEnhW (weakenhancers in transcribed regions), TssP (poised promoters), EnhP (poised en-hancers), ReprPC (Polycomb repressed), Ctcf (CTCF enriched regions), and Low(low signal). (C) Examples of a nonvariable and a variable region. Coordinatesare in build hg19 of the human reference sequence. State colors are as in(B). (D) log10 ratio of the observed probability that a region switches fromone state (row) to another (column) in any pair of individuals relative tobackground switching across pairs of replicates.
8 NOVEMBER 2013 VOL 342 SCIENCE www.sciencemag.org750
REPORTS
compared with promoters (fig. S10). This couldexplain the apparent discrepancy between the highvariability of H3K4me3 and the low variabilityof expression and gene body marks (Fig. 1A).Furthermore, the repressive mark H3K27me3 issignificantly more variable when co-enriched withother marks in bivalent states—such as poised en-hancers and poised promoters—than in stablePolycomb-repressed domains (Fig. 1B and fig. S10).
Investigating the dynamics of chromatin stateconversions among individuals, we found thatmost significant state switches are between activestates, such as enhancers, promoters, or transcribedregions, and repressed or weakly active states(Fig. 1D and fig. S11). Although changes in ac-
tivity are common, switching between enhancersand core promoter states is rare, highlighting thatthese are distinct types of regulatory elements.
We examined the effects of enhancer varia-bility on gene expression and found no signifi-cant difference in expression variability betweengenes with one variable enhancer and those lack-ing variable enhancers. However, there is a signif-icant increase in expression variability whenmorethan 60% of the gene’s enhancers vary (fig. S12A;Wilcoxon’s rank sum test, P < 0.05), indicatingthat changes in multiple enhancers are often re-quired to alter gene expression. We also foundthat 74% of nonvariable genes and 99% of var-iable genes are associated with at least one var-
iable enhancer (24-fold enrichment, Fisher’s exacttest, P < 2.2 × 10⁻¹⁶) (15, 18) and that enhancer-gene expression correlations are stronger for geneswith a single enhancer than for genes linked tomultiple enhancers (fig. S12B;Wilcoxon,P= 7 ×10⁻⁵). Thus, a substantial fraction of the enhancersthat are variable across individuals do not resultin detectable differences in gene expression, sug-gesting that compensatory regulatory effects, enhanc-er redundancy, subtle gene expression variation,or nonconsequential enhancer variation exist un-der the experimental conditions examined.
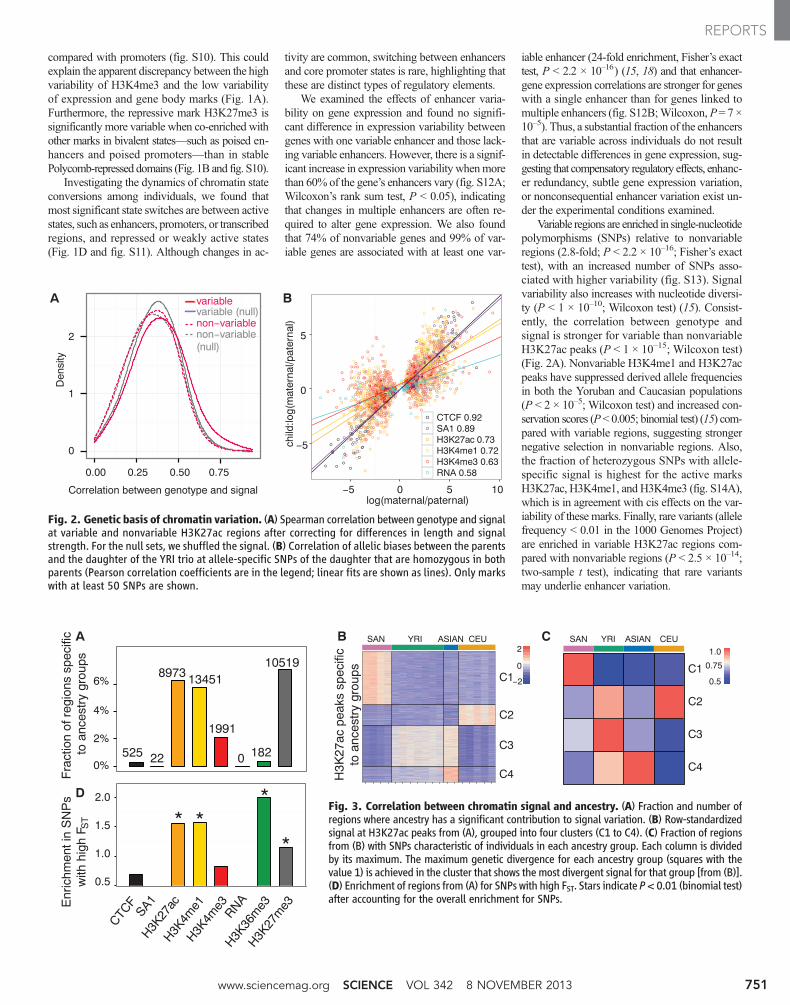
Variable regions are enriched in single-nucleotidepolymorphisms (SNPs) relative to nonvariableregions (2.8-fold; P < 2.2 × 10⁻¹⁶; Fisher’s exacttest), with an increased number of SNPs asso-ciated with higher variability (fig. S13). Signalvariability also increases with nucleotide diversi-ty (P < 1 × 10⁻¹⁰; Wilcoxon test) (15). Consist-ently, the correlation between genotype andsignal is stronger for variable than nonvariableH3K27ac peaks (P < 1 × 10–15; Wilcoxon test)(Fig. 2A). Nonvariable H3K4me1 and H3K27acpeaks have suppressed derived allele frequenciesin both the Yoruban and Caucasian populations(P < 2 × 10⁻⁵; Wilcoxon test) and increased con-servation scores (P< 0.005; binomial test) (15) com-pared with variable regions, suggesting strongernegative selection in nonvariable regions. Also,the fraction of heterozygous SNPs with allele-specific signal is highest for the active marksH3K27ac, H3K4me1, and H3K4me3 (fig. S14A),which is in agreement with cis effects on the var-iability of these marks. Finally, rare variants (allelefrequency < 0.01 in the 1000 Genomes Project)are enriched in variable H3K27ac regions com-pared with nonvariable regions (P < 2.5 × 10⁻¹⁴;two-sample t test), indicating that rare variantsmay underlie enhancer variation.
A
0
1
2
0.00 0.25 0.50 0.75
Correlation between genotype and signal
Den
sity
variablevariable (null)non−variablenon−variable (null)
−5
0
5
−5 0 5 10log(maternal/paternal)
child
:log(
mat
erna
l/pat
erna
l)
CTCF 0.92SA1 0.89H3K27ac 0.73H3K4me1 0.72H3K4me3 0.63RNA 0.58
B
Fig. 2. Genetic basis of chromatin variation. (A) Spearman correlation between genotype and signalat variable and nonvariable H3K27ac regions after correcting for differences in length and signalstrength. For the null sets, we shuffled the signal. (B) Correlation of allelic biases between the parentsand the daughter of the YRI trio at allele-specific SNPs of the daughter that are homozygous in bothparents (Pearson correlation coefficients are in the legend; linear fits are shown as lines). Only markswith at least 50 SNPs are shown.
* **
*
0.5
1.0
1.5
2.0
CTCF
SA1H3K
27ac
H3K4m
e1H3K
4me3
RNAH3K
36m
e3H3K
27m
e3Enr
ichm
ent i
n S
NP
s
w
ith h
igh
F ST
525
8973 13451
1991
22
10519
0 1820%
2%
4%
6%
Fra
ctio
n of
reg
ions
spe
cific
to
anc
estr
y gr
oups
A B
C4
C3
C2
C10.5
0.75
1.0
D
−2
0
2SAN SANYRI YRIASIAN ASIANCEU CEU
H3K
27ac
pea
ks s
peci
ficto
anc
estr
y gr
oups
C4
C3
C2
C1
C
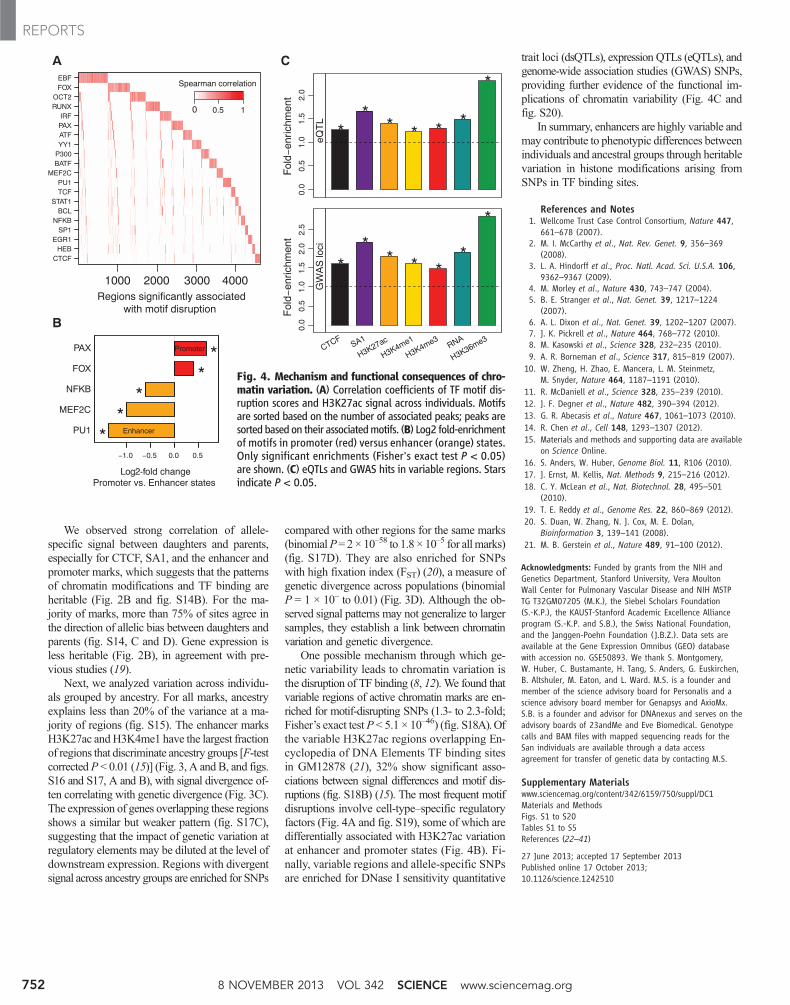
Fig. 3. Correlation between chromatin signal and ancestry. (A) Fraction and number ofregions where ancestry has a significant contribution to signal variation. (B) Row-standardizedsignal at H3K27ac peaks from (A), grouped into four clusters (C1 to C4). (C) Fraction of regionsfrom (B) with SNPs characteristic of individuals in each ancestry group. Each column is dividedby its maximum. The maximum genetic divergence for each ancestry group (squares with thevalue 1) is achieved in the cluster that shows the most divergent signal for that group [from (B)].(D) Enrichment of regions from (A) for SNPs with high FST. Stars indicate P< 0.01 (binomial test)after accounting for the overall enrichment for SNPs.
www.sciencemag.org SCIENCE VOL 342 8 NOVEMBER 2013 751
REPORTS
We observed strong correlation of allele-specific signal between daughters and parents,especially for CTCF, SA1, and the enhancer andpromoter marks, which suggests that the patternsof chromatin modifications and TF binding areheritable (Fig. 2B and fig. S14B). For the ma-jority of marks, more than 75% of sites agree inthe direction of allelic bias between daughters andparents (fig. S14, C and D). Gene expression isless heritable (Fig. 2B), in agreement with pre-vious studies (19).
Next, we analyzed variation across individu-als grouped by ancestry. For all marks, ancestryexplains less than 20% of the variance at a ma-jority of regions (fig. S15). The enhancer marksH3K27ac andH3K4me1 have the largest fractionof regions that discriminate ancestry groups [F-testcorrectedP < 0.01 (15)] (Fig. 3, A and B, and figs.S16 and S17, A and B), with signal divergence of-ten correlating with genetic divergence (Fig. 3C).The expression of genes overlapping these regionsshows a similar but weaker pattern (fig. S17C),suggesting that the impact of genetic variation atregulatory elements may be diluted at the level ofdownstream expression. Regions with divergentsignal across ancestry groups are enriched for SNPs
compared with other regions for the same marks(binomialP= 2 × 10–58 to 1.8 × 10⁻⁵ for allmarks)(fig. S17D). They are also enriched for SNPswith high fixation index (FST) (20), a measure ofgenetic divergence across populations (binomialP = 1 × 10– to 0.01) (Fig. 3D). Although the ob-served signal patterns may not generalize to largersamples, they establish a link between chromatinvariation and genetic divergence.
One possible mechanism through which ge-netic variability leads to chromatin variation isthe disruption of TF binding (8, 12). We found thatvariable regions of active chromatin marks are en-riched for motif-disrupting SNPs (1.3- to 2.3-fold;Fisher’s exact testP < 5.1 × 10–46) (fig. S18A).Ofthe variable H3K27ac regions overlapping En-cyclopedia of DNA Elements TF binding sitesin GM12878 (21), 32% show significant asso-ciations between signal differences and motif dis-ruptions (fig. S18B) (15). The most frequent motifdisruptions involve cell-type–specific regulatoryfactors (Fig. 4A and fig. S19), some of which aredifferentially associated with H3K27ac variationat enhancer and promoter states (Fig. 4B). Fi-nally, variable regions and allele-specific SNPsare enriched for DNase I sensitivity quantitative
trait loci (dsQTLs), expression QTLs (eQTLs), andgenome-wide association studies (GWAS) SNPs,providing further evidence of the functional im-plications of chromatin variability (Fig. 4C andfig. S20).
In summary, enhancers are highly variable andmay contribute to phenotypic differences betweenindividuals and ancestral groups through heritablevariation in histone modifications arising fromSNPs in TF binding sites.
References and Notes1. Wellcome Trust Case Control Consortium, Nature 447,
661–678 (2007).2. M. I. McCarthy et al., Nat. Rev. Genet. 9, 356–369
(2008).3. L. A. Hindorff et al., Proc. Natl. Acad. Sci. U.S.A. 106,
9362–9367 (2009).4. M. Morley et al., Nature 430, 743–747 (2004).5. B. E. Stranger et al., Nat. Genet. 39, 1217–1224
(2007).6. A. L. Dixon et al., Nat. Genet. 39, 1202–1207 (2007).7. J. K. Pickrell et al., Nature 464, 768–772 (2010).8. M. Kasowski et al., Science 328, 232–235 (2010).9. A. R. Borneman et al., Science 317, 815–819 (2007).
10. W. Zheng, H. Zhao, E. Mancera, L. M. Steinmetz,M. Snyder, Nature 464, 1187–1191 (2010).
11. R. McDaniell et al., Science 328, 235–239 (2010).12. J. F. Degner et al., Nature 482, 390–394 (2012).13. G. R. Abecasis et al., Nature 467, 1061–1073 (2010).14. R. Chen et al., Cell 148, 1293–1307 (2012).15. Materials and methods and supporting data are available
on Science Online.16. S. Anders, W. Huber, Genome Biol. 11, R106 (2010).17. J. Ernst, M. Kellis, Nat. Methods 9, 215–216 (2012).18. C. Y. McLean et al., Nat. Biotechnol. 28, 495–501
(2010).19. T. E. Reddy et al., Genome Res. 22, 860–869 (2012).20. S. Duan, W. Zhang, N. J. Cox, M. E. Dolan,
Bioinformation 3, 139–141 (2008).21. M. B. Gerstein et al., Nature 489, 91–100 (2012).
Acknowledgments: Funded by grants from the NIH andGenetics Department, Stanford University, Vera MoultonWall Center for Pulmonary Vascular Disease and NIH MSTPTG T32GM07205 (M.K.), the Siebel Scholars Foundation(S.-K.P.), the KAUST-Stanford Academic Excellence Allianceprogram (S.-K.P. and S.B.), the Swiss National Foundation,and the Janggen-Poehn Foundation ( J.B.Z.). Data sets areavailable at the Gene Expression Omnibus (GEO) databasewith accession no. GSE50893. We thank S. Montgomery,W. Huber, C. Bustamante, H. Tang, S. Anders, G. Euskirchen,B. Altshuler, M. Eaton, and L. Ward. M.S. is a founder andmember of the science advisory board for Personalis and ascience advisory board member for Genapsys and AxioMx.S.B. is a founder and advisor for DNAnexus and serves on theadvisory boards of 23andMe and Eve Biomedical. Genotypecalls and BAM files with mapped sequencing reads for theSan individuals are available through a data accessagreement for transfer of genetic data by contacting M.S.
Supplementary Materialswww.sciencemag.org/content/342/6159/750/suppl/DC1Materials and MethodsFigs. S1 to S20Tables S1 to S5References (22–41)
27 June 2013; accepted 17 September 2013Published online 17 October 2013;10.1126/science.1242510
A
Log2-fold changePromoter vs. Enhancer states
PU1
MEF2C
NFKB
FOX
PAX
−1.0 −0.5 0.0 0.5
**
**
*
Enhancer
Promoter
B
Regions significantly associated with motif disruption
CTCFHEB
EGR1SP1
NFKBBCL
STAT1TCFPU1
MEF2CBATFP300YY1ATFPAXIRF
RUNXOCT2
FOXEBF
1000 2000 3000 4000
0 0.5 1
Spearman correlation
C
Fol
d−en
richm
ent
Fol
d−en
richm
ent
0.0
0.5
1.0
1.5
2.0
2.5
CTCFSA1
H3K27ac
H3K4me1
H3K4me3RNA
H3K36me3
*
** * *
*
*
GW
AS
loci
0.0
0.5
1.0
1.5
2.0
**
** *
*
*
eQT
L
Fig. 4. Mechanism and functional consequences of chro-matin variation. (A) Correlation coefficients of TF motif dis-ruption scores and H3K27ac signal across individuals. Motifsare sorted based on the number of associated peaks; peaks aresorted based on their associatedmotifs. (B) Log2 fold-enrichmentof motifs in promoter (red) versus enhancer (orange) states.Only significant enrichments (Fisher's exact test P < 0.05)are shown. (C) eQTLs and GWAS hits in variable regions. Starsindicate P < 0.05.
8 NOVEMBER 2013 VOL 342 SCIENCE www.sciencemag.org752
REPORTS


![Viral integration transforms chromatin to drive oncogenesis...2020/02/12 · [36] JüriReimand,TambetArak,PriitAdler,LiisKolberg,SulevReisberg,HediPeterson,andJaakVilo.g:Profiler—awebserverforfunctionalinterpretation](https://static.fdokument.com/doc/165x107/603c19f7499e610de0739366/viral-integration-transforms-chromatin-to-drive-oncogenesis-20200212-36.jpg)