save@work Evaluation Report
109
Grant Agreement no. 649660 Activity acronym: save@work Activity full name: The Energy Saving Competition for Public Authorities save@work Evaluation Report: Lessons learnt for future sustainable energy projects aiming to change everyday behaviour D6.5 September 30, 2017 Authors: Edina Vadovics and Szandra Szomor with contributions from Diana Uitdenbogerd*, Sylvia Breukers*, Kristóf Vadovics and Andrea Király GreenDependent Institute * DuneWorks Reviewed by: Anke Merziger (BSU), Gianluca Avella (AESS), Emma Denorme (AM), Lena Eckerberg (Energikontor), Teresa Kallsperger (GEA), Karen Robinson (SWEA), Lisa Sentimenti (AESS) and Liga Zogla (Ekodoma)
Transcript of save@work Evaluation Report
Grant Agreement no. 649660
Activity acronym: save@work
Activity full name:
The Energy Saving Competition for Public Authorities
save@work Evaluation Report:
Lessons learnt for future sustainable energy projects aiming to change
everyday behaviour
D6.5
September 30, 2017
Authors:
Edina Vadovics and Szandra Szomor
with contributions from Diana Uitdenbogerd*, Sylvia Breukers*, Kristóf Vadovics
and Andrea Király
GreenDependent Institute
* DuneWorks
Reviewed by: Anke Merziger (BSU), Gianluca Avella (AESS), Emma Denorme (AM),
Lena Eckerberg (Energikontor), Teresa Kallsperger (GEA), Karen Robinson (SWEA),
Lisa Sentimenti (AESS) and Liga Zogla (Ekodoma)
s@w Evaluation Report ___________________________________________________________________________________________________________________________________________________________________________________
2
Published in September 2017
This save@work publication is published under a Creative Commons Attribution-Non-Commercial-No
Derivative Works 2.0 UK: England & Wales License (http://creativecommons.org/licenses/by-nc-nd/3.0/legalcode).
Authors: Edina Vadovics and Szandra Szomor with contributions from Diana Uitdenbogerd*, Sylvia Breukers*, Kristóf Vadovics and Andrea Király GreenDependent Institute, Hungary // *DuneWorks, the Netherlands
The report was presented and discussed at the save@work Partner Meeting in Brussels (June 2017) and then reviewed by Anke Merziger (BSU, Germany), Gianluca Avella (AESS, Italy), Emma Denorme (AM, Belgium), Lena Eckerberg (Energikontor, Sweden), Teresa Kallsperger (GEA, Austria), Karen Robinson (SWEA, the UK), Lisa Sentimenti (AESS, Italy) and Liga Zogla (Ekodoma, Latvia)
save@work – The Energy Saving Competition
www.saveatwork.eu
save@work was a year-long energy saving competition for public authorities and their employees between March 2016 and February 2017 in nine European countries.
For further information on this report contact Edina Vadovics at [email protected]. For information on the save@work project contact Anke Merziger at [email protected] or visit www.saveatwork.eu.
This Report was written for the save@work project financed by the Horizon2020 Programme of the European Union, grant agreement No. 649660.
The sole responsibility for the content of the report lies with the authors. It does not necessarily reflect the opinion of the European Union. Neither the EASME nor the European Commission is responsible for any use that may be made of the information contained therein.
s@w Evaluation Report ___________________________________________________________________________________________________________________________________________________________________________________
3
TABLE OF CONTENTS
EXECUTIVE SUMMARY 6
save@work: the evaluation process and its main outcomes 6
save@work: successful in changing behaviour and supporting the change 7
save@work: some challenges 8
save@work: reflections on the methodology applied 8
save@work: summary recommendations for future projects 9
INTRODUCTION 11
CHAPTER 1: ABOUT THE SAVE@WORK PROJECT AND ITS METHODOLOGY 13
1.1. Aims and objectives of the save@work project 13
1.2. The basic elements of the save@work methodology 15
Shared and distributed responsibility 15
Sequence and description of project activities 18
Tools and materials 21
1.3. Summary of save@work results and outcomes 27
1.4. The methodology used for preparing this report 28
Information and feedback from project partners 29
Information and feedback from participants 30
Information and feedback from Energy Teams 34
CHAPTER 2: THE IMPACT OF THE PROJECT: LEARNING FROM THE OUTCOMES OF
THE PRE- AND POST-CAMPAIGN SURVEYS 35
Methodological considerations 35
2.1. The reception of the save@work campaign 36
2.2. The impact of the save@work campaign 38
Performance of energy saving actions 38
Knowledge and skills related to energy saving 41
New actions introduced during the save@work campaign 42
Attitudes to and support for saving energy 45
Spill-over effect: save@work reaching beyond public offices 47
Conclusions 48
2.3. Plans for the future: the longer-term impact of the save@work campaign 49
2.4. Intention to participate in a similar campaign in the future 51
2.5. Summary and Conclusions 52
CHAPTER 3: THE IMPLEMENTATION OF THE SAVE@WORK PROJECT IN
9 COUNTRIES: SIMILARITIES AND DIFFERENCES 54
3.1. Recruitment, implementation and communication structures 54
Single vs. multiple contacts 54
s@w Evaluation Report ___________________________________________________________________________________________________________________________________________________________________________________
4
Types of public organizations involved 55
Project implementation and communication structures 56
Summary and Conclusions 60
3.2. Materials, tools and events 60
Materials and tools 61
Events 64
Summary and Conclusions 65
3.3. Competition and the European aspect of the campaign 66
3.4. Conclusions: dealing with and building on diversity in a European project 67
CHAPTER 4: SAVE@WORK SUCCESS STORIES AND CHALLENGES 69
4.1 What worked best in the save@work campaign 69
Tools and events 69
Enjoyment 74
Success factors and success stories 75
4.2. Challenges encountered in the save@work campaign 78
Recruiting buildings to participate 78
Lack of motivation and time 79
Managing communication at multiple levels 80
Collecting energy consumption data 80
Filling in the pre- and post-campaign surveys 81
4.3 Elements potentially missing from the save@work campaign 82
Post campaign survey: participants' perspective 82
Self-evaluation survey: project partners' perspective 84
Best campaign questionnaires: Energy Team members' perspective 85
Summary and Conclusions 86
CHAPTER 5: CONCLUSIONS AND RECOMMENDATIONS FOR FUTURE PROJECTS 87
5.1. Rethinking the save@work methodology: suggestions for an improved plan 87
Project implementation structure(s): recognizing and learning from diversity 87
Facilitate a better integration of the project into existing municipal structures 87
The timing of activities 89
Use existing tools in new ways to help create a more tailored approach 89
Teamwork, group building, Energy Teams 89
Materials and tools reconsidered 90
5.2. Practical tips for (behaviour change) project implementers 91
Recruitment 91
Timing 92
Communication 92
Events 93
Creating and training local teams (Energy Teams) 93
Group and community building 94
Tools and materials 95
Evaluation and data collection 95
5.3. Summary and Conclusions 96
s@w Evaluation Report ___________________________________________________________________________________________________________________________________________________________________________________
5
REFERENCES 97
ANNEXES 98
ANNEX I: STRATEGIC HANDBOOK: TABLE OF CONTENTS 98
ANNEX II: DESCRIPTION OF THE STARTER KITS FOR EACH S@W PARTICIPATING
COUNTRY 99
ANNEX III: LIST OF TOPICS FOR ENERGY SAVING TIPS IN S@W 100
ANNEX IV: PROJECT IMPLEMENTATION AND COMMUNICATION FIGURES FOR THE
9 COUNTRIES PARTICIPATING IN S@W 101
s@w Evaluation Report ___________________________________________________________________________________________________________________________________________________________________________________
6
EXECUTIVE SUMMARY
save@work was a European project conceived to help realize the energy saving potential in public
buildings and support public employees to change their everyday energy consuming behaviour and
practices. Across nine countries, save@work engaged with more than 17,000 public employees in
176 buildings in a 1-year behaviour change programme. With support from the expert partners in
each country, local energy teams were formed from the employees in each public building. These
teams were then responsible for the planning, implementation and, partly, the evaluation of the
energy saving campaign in their building with continued support from the local expert save@work
partners.
The save@work Evaluation Report was prepared for three main reasons. First, to present the
methodology applied and the achievements reached in nine European countries. Secondly, to
describe the evaluation process developed and used in the project, and to share its outcomes.
Finally, to propose an improved project methodology including tips and recommendations for
implementers of similar projects in the future. Thus, the contents of this report are intended for a
rather wide audience: implementers of projects intending to initiate and/or maintain behaviour
change initiatives in public offices (as well as other offices, or indeed, households), policy makers and
project funders as well as researchers working in the field.
The save@work project was built on a research-based methodology that considered the theory
of interpersonal behaviour, and combined top-down with bottom-up approaches. As for the latter,
on the one hand, public authorities were invited to be active partners, and the top management or
leadership of each public building was asked to commit to participation in the programme thereby
ensuring that employees at all levels were supported to engage in save@work activities. On the
other hand, Energy Teams, composed of the energy/building manager and interested employees
were formed in each building, mostly on a voluntary basis. The project thus intentionally built on
small groups as facilitators and enablers of behaviour change, and used a variety of means and
motivators, in other words tools and materials, simultaneously to cater for the needs of different
personality types.
The majority (73%) of the participating buildings did save energy during the project: on average
8% energy was saved. A total of 6.5 GWh of primary energy was saved in the 9 participating
countries and 1,783 tons of CO2 emissions were avoided. However, in addition to the results in
energy saving and CO2 emissions avoided, it is important to expose the role and significance of the
project in raising the awareness of employees and establishing new energy efficient behaviour and
practices that can serve as the basis for future sustainable energy activities. save@work
contributed to developing more knowledgeable and skilful, as well as more cohesive, employee
communities that are ready to focus on making even more energy savings - an outcome that is as
important as the savings achieved.
save@work: the evaluation process and its main outcomes
The save@work evaluation process was conceived to (1) support internal learning and evaluation;
(2) learn more about the impact of the project; and (3) help identify success factors and barriers in
different local settings. It included the following elements:
s@w Evaluation Report ___________________________________________________________________________________________________________________________________________________________________________________
7
pre- and post-campaign participant surveys filled in by 2965 (17%) and 2059 (12%)
employees respectively;
partner self-evaluation surveys (mid-term and final);
partner interviews and discussions organized partly by a party external to the project
consortium; and
best campaign surveys conducted with local implementation teams (i.e. Energy Teams).
The Evaluation Report provides a summary of information and outcomes gained through all these
methods, and based on them puts forward recommendations for future projects. Below we outline
the main findings.
save@work: successful in changing behaviour and supporting the change
Based on the pre-campaign survey results, the main reasons for employees to join the project
were an interest in saving energy and other environmental issues and simply wanting to learn more
about energy saving. In addition, a lot of respondents selected wanting to be involved in something
positive as a reason. In line with this finding and according to the post-campaign survey, the thing
employees liked most about save@work was that they became more aware (i.e. learnt new things).
They also highlighted the bi-weekly saving tips and teamwork as sources of enjoyment.
Overall, the project was very successful, it…
was appreciated by employees (66% 'liked it a lot' or 'liked it' while only 6% said they 'did
not like it');
reached its objectives in that it managed to involve considerably more employees (17,280
compared to 9,000) and only slightly fewer buildings (176 compared to 180) than planned;
managed to initiate, support and create behaviour change so that
all the eight energy saving actions surveyed were performed by a higher
regularity by the end of the campaign with the greatest increase observed for
turning off computers and laptops when not in use.
a greater than twofold increase was found for those who performed all the eight
surveyed actions regularly (from 6.5% to 14.2% in the whole sample or to as high
as 18.9% for those more engaged); and
increased support for energy saving activities from the management, IT services and in
general from colleagues.
On average, 54% of survey respondents took up new energy saving actions in their
individual routines, the most often cited actions being turning off equipment when not in
use, taking up more efficient lighting practices and creating more rational heating/
ventilation practices.
40% said that the management in their building introduced energy efficiency related
changes that had not been planned or done beforehand.
It is important to note that save@work had important spill-over effects as well: 82% of the
respondents were inspired by save@work to engage in activities that were not strictly part of the
project, for example, start energy saving activities or invest in energy efficiency in their homes or talk
about energy saving to their family or friends.
s@w Evaluation Report ___________________________________________________________________________________________________________________________________________________________________________________
8
Finally, and very importantly, on average 86% of survey participants believe that they would be
able to continue with energy saving activities in their office, with the highest percentage for the UK
and Hungary (91% and 89% respectively), and only 2% responding with a definite 'no' and 12% being
uncertain. About half of the respondents also provided reasons for continuing with energy saving
activities, the most often cited being the actions making sense, being beneficial and already become
routines.
save@work: some challenges
A successful project does not mean that the consortium did not have to deal with some
challenges.
The first important challenge was a general low level of interest and motivation from public
buildings to engage in and stay active in the campaign. This was due to a number of reasons, but
those often cited were employee workload and the fact that energy saving had not yet become an
integral part of everyday routines and practices. Both were barriers to engagement in all nine
save@work countries.
The availability and access to energy consumption data both historical and current also posed a
considerable challenge. The save@work project helped participating authorities recognize the
inadequacy of data availability as well as the need for setting up data management systems and
assigning responsibilities for managing them. The save@work consortium can only hope that this
process will continue in the future.
The save@work consortium would have wished to see more improvement in terms of energy
saving during the lifetime of the project. However, through participant surveys we observed an
increase in the performance of all the energy saving actions, accompanied by an increase in the ratio
of participants performing all energy saving actions simultaneously and with high regularity. Whilst it
is recognized that there is still room for improvement, the save@work consortium was glad to see
that 86% of survey respondents believe they would be able to continue with energy efficiency
actions in the office after the campaign.
save@work: reflections on the methodology applied
The save@work methodology, with an impressive tools, materials and events repository, was
generally found satisfactory by participant groups, and the conclusion of the evaluation activities was
that there were no essential or basic tools missing from it. The tools and materials used most as well
as found the most useful by most project participant groups (i.e. partners, Energy Teams and
employees) were the energy saving tips, promotional materials, the information pages on the
project website and the measuring devices (e.g. energy meter, thermometer) provided as part of the
Starter Kits. Importantly, energy saving tips were also identified as the second most important
source of enjoyment by participants.
Nevertheless, drawing on the outcomes of the varied evaluation processes used in the project, we
have identified ways in which the methodology could be enhanced and the repository improved. In
the detailed report we propose an improved plan that could be used in future campaigns and would
hopefully result in avoiding challenges or responding to them more swiftly.
s@w Evaluation Report ___________________________________________________________________________________________________________________________________________________________________________________
9
One of the improvements suggested concerns better integration of campaign activities and tasks
into existing municipal structures and processes through greater engagement of the building
management. This would mean allowing for a longer preparation phase (e.g. at least 6 months).
Another proposal concerned improving the effectiveness of the existing tools and materials, for
example, the strategic handbook for Energy Teams delivered in modules, thematic tips prepared
based on its contents (i.e. tips on team building, management and communication), and more
training workshops for employees to assist developing an approach tailored to local needs even
easier. Finally, tools that could be added to the save@work repository for an improved methodology
include those that encourage the sharing of experience and ideas at all levels and between all project
participant groups. Communication tools to facilitate the involvement of management would also be
beneficial.
save@work: summary recommendations for future projects
Finally, based on the experience of the save@work project as well as the analysis presented in
this report, the 5 most important lessons learnt and recommendations for future behaviour change
projects include:
INTEGRATE AND MAKE IT THE NORM: behaviour (or practice) change related activities work
best if they are integrated as much as possible into everyday processes, tasks, job descriptions
and strategies. Employees need to see them as part of their job and not have to worry about
spending time and effort on it in their free time or taking away time from their 'regular tasks'.
This way sustainable energy use behaviour can become the new norm that everyone strives to
achieve as part of their work.
Integration, however, should not mean that no special and/or additional activities, training,
events, etc. are needed to achieve sustainable energy use.
BUILD COHESIVE GROUPS AND EMPLOYEE COMMUNITIES: both research and practice,
including our experience in save@work, point toward the importance of small groups and
communities in changing, supporting and maintaining more sustainable (energy use) behaviour
and practices as well as being a source of enjoyment, fun and learning. We know, groups do not
become cohesive by themselves, therefore, as part of any campaign it is of vital importance to
spend time and effort on building cohesive groups and employee communities through
specifically focused activities and training as well as through creating opportunities where
groups can develop naturally.
KNOW WHAT YOU WANT TO CHANGE: in order to be able to know whether efforts to change
energy use behaviour and to reduce consumption are successful, we need access to historical
and current energy consumption data. If no data management system exists yet, campaigns like
save@work can help with setting up simple processes and establish responsibilities for
managing them, which seems to be a general need identified by the project.
Furthermore, data and information are also needed on behaviour, practices, skills, knowledge
and infrastructure specific to local contexts and supporting or hindering sustainable energy use.
Uncovering them should constitute an important part of the baseline assessment.
CHANGE AND LEARNING NEW THINGS CAN BE ENJOYABLE: changing routine and habitual
behaviour and practices poses challenges. Thus, connecting the necessity for change and
s@w Evaluation Report ___________________________________________________________________________________________________________________________________________________________________________________
10
learning new things with enjoyment, increasing comfort and well-being is important.
Participants in the save@work project acknowledged the existence of this connection: learning
new things and becoming more aware were important motivations for joining the campaign as
well as important sources for enjoyment.
RECOGNIZE AND BUILD ON DIVERSITY: in a European campaign it is important to follow a
shared timeline, structure and content. However, it is just as important to allow for flexibility
thus provide methods and tools tailored to local contexts and circumstances. This should be
seen as an opportunity for learning and sharing, and campaigns should include opportunities to
reflect and build on the resulting diversity that can help enrich the learning experience of all
participants. Self-evaluation methods proved helpful in save@work for recognizing and
appreciating diversity.
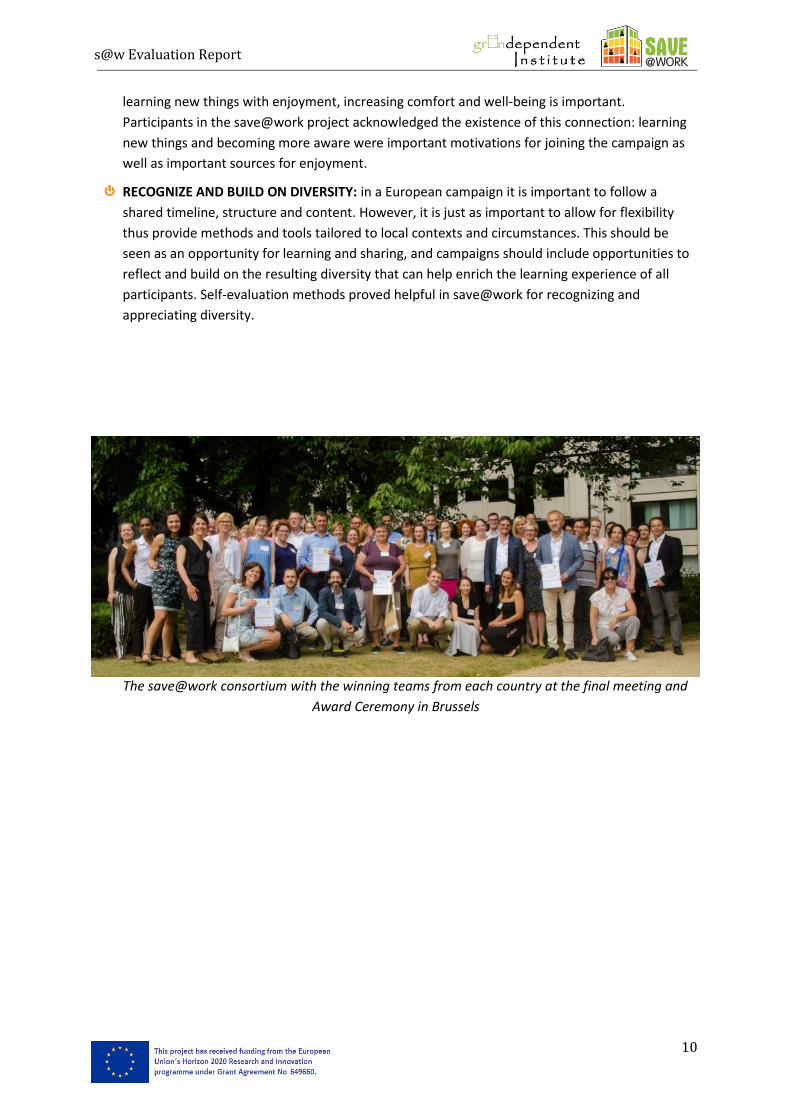
The save@work consortium with the winning teams from each country at the final meeting and
Award Ceremony in Brussels
s@w Evaluation Report ___________________________________________________________________________________________________________________________________________________________________________________
11
INTRODUCTION
save@work was a European project conceived to help realize the energy saving potential in public
buildings and support public employees to change their everyday energy use behaviour and
practices. The save@work Evaluation Report was prepared for three main reasons. First, to present
the methodology applied and the achievements reached in nine European countries. Secondly, to
describe the evaluation process developed and used in the project, and to share its outcomes.
Finally, to propose an improved project methodology including tips and recommendations for
implementers of similar projects in the future. Thus, the contents of this report are intended for a
rather wide audience: implementers of projects intending to initiate and/or maintain behaviour
change initiatives in public offices (as well as other offices, or indeed, households), policy makers and
project funders as well as researchers working in the field.
The report first describes the save@work project and its methodology, including details of its
main results in terms of participant numbers, energy saved and CO2 emission avoided (Chapter 1).
The first chapter also provides details about the evaluation process and methodology used in the
project, and the different types of information collected from the different participant groups,
including project partners, local implementation teams at participating buildings (i.e. Energy Teams)
as well as participating employees. In Chapter 2 we discuss the main impacts of the project in terms
of, for example, changed behaviour, attitude and support for energy saving, long-term change, and
spill-over effects based mainly on the outcomes of the pre- and post-campaign participant surveys.
We follow this with a discussion of similarities and differences of implementation in the nine
participating countries in Chapter 3. After this we describe challenges and success stories in
Chapter 4, where we also reflect on the methodology used in the project. In Chapter 5 we present an
improved methodology for similar future projects as well as practical tips for project planners and
implementers. Finally, we close with the 5 most important lessons learnt and recommendations for
future behaviour change projects.
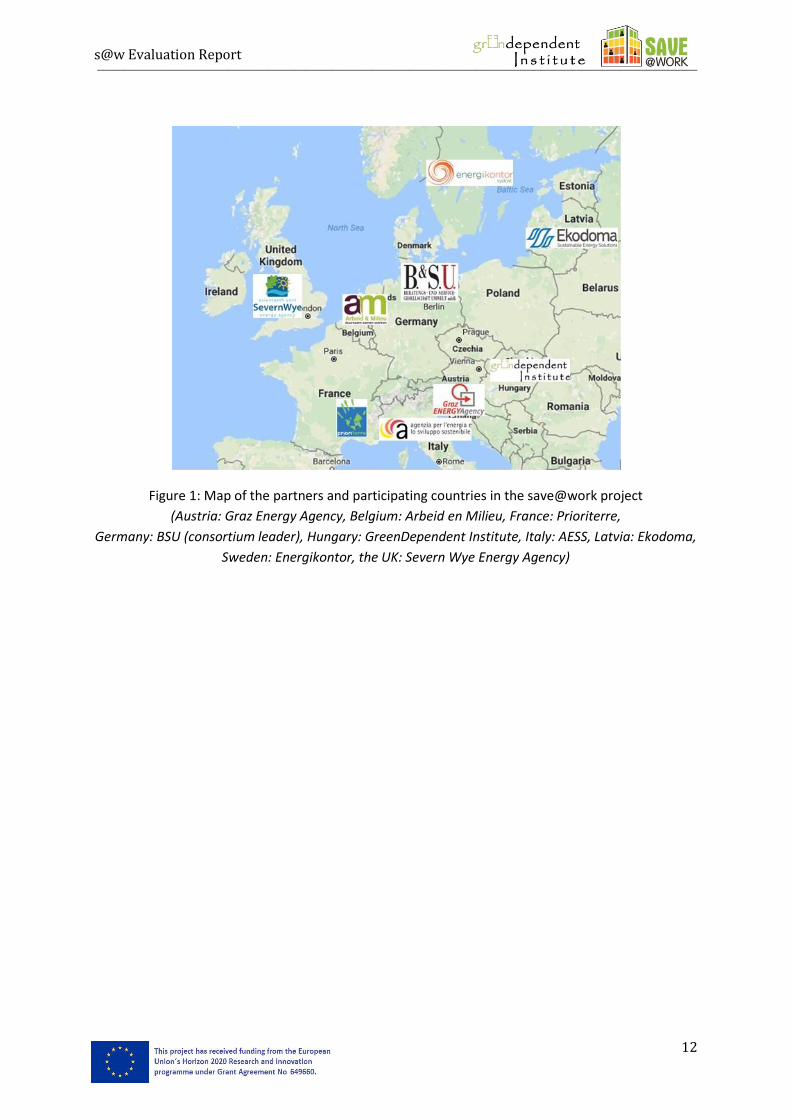
save@work was implemented in nine countries by nine local partners as shown on the map
below. In addition, as in the project evaluation, including self-evaluation, played an important role,
so the project consortium selected an external organization to assist with as well as take part as an
observer in this process. DuneWorks was selected for this role, a research and consulting
organization focusing on social issues concerning sustainability and sustainable innovations.
Finally, it needs to be noted that in the save@work project the consortium was very ambitious
and, as it is shown in the report, used a variety of methods and tools to evaluate the impact and
success of the project (see details in section 1.4.). The contents and conclusions of the present report
are based on the analysis of these materials. However, as there is a wealth of information available,
we were not able to present everything within the scope of this report. Should you have any
questions or want to find out more, please feel free to contact the authors of this report or the
members of the save@work team.
s@w Evaluation Report ___________________________________________________________________________________________________________________________________________________________________________________
12
Figure 1: Map of the partners and participating countries in the save@work project
(Austria: Graz Energy Agency, Belgium: Arbeid en Milieu, France: Prioriterre,
Germany: BSU (consortium leader), Hungary: GreenDependent Institute, Italy: AESS, Latvia: Ekodoma,
Sweden: Energikontor, the UK: Severn Wye Energy Agency)
s@w Evaluation Report ___________________________________________________________________________________________________________________________________________________________________________________
13
CHAPTER 1: About the save@work project and its methodology
Buildings are responsible for 40% of energy consumption and 36% of CO2 emissions in the
European Union1, and 10-12% of the buildings are public. Since public buildings are important not
only in view of how much energy they use but also as role models for the population, it is very
important that their energy saving potential is realized. Furthermore, since up to 15% of energy
saving can be achieved through various behaviour change measures (EEA, 2013), thus without
considerable funds and investment, it is important that public employees learn about their potential
to reduce their contribution to climate change and resource use as well as are empowered to enact
the change and become role models.
save@work was a European project conceived to help realize the energy saving potential in public
buildings and support public employees to change their everyday energy consuming behaviour and
practices. Across nine countries, save@work engaged with more than 17,000 public employees in
176 buildings in a 1-year behaviour change programme. With support from the expert partners in
each country, local energy teams were formed from the employees in each public building. These
teams were then responsible for the planning, implementation and, partly, the evaluation of the
energy saving campaign in their building with continued support from the local expert save@work
partners.
1.1. Aims and objectives of the save@work project
The s@w project identified several aims and objectives in its original Description of Work, which
were as follows:
Improving energy literacy of public sector employees and motivating energy
efficient behaviour for improving the energy performance in public office buildings
One of the primary objectives of save@work was to provide public authorities and employees
with the necessary knowledge, tools and means to control and reduce energy consumption in their
buildings. The measurement and web based display of the energy, CO2 and cost savings is an
important motivating factor for employees but it also helps promote the project outside the
organisation, by being able to present verified results in an easy understandable way. Individual
energy audits and training held in all participating public buildings were intended to provide the
necessary knowledge for translating the results of energy monitoring systems into action and for
reducing energy consumption in each building, covering low cost and behavioural measures, green
procurement as well as supporting measures for investments in building renovation and
modernisation. Each building had its own Energy Team the members of which were responsible for
running a year-long motivation and information campaign to engage their colleagues, helping them
to see where and how they use energy and, more importantly, how they can reduce this
consumption, also in the longer term. Evaluation surveys conducted among all employees at the
start and the end of the one-year competition (pre- and post-campaign surveys) provided
information on the learning impacts generated by the campaign among the employees.
Empowering public authorities to fulfil their function as a role model regarding
energy efficiency and inspire other organisations to follow the lead
1 Source: https://ec.europa.eu/energy/en/topics/energy-efficiency/buildings (last accessed Sept 2017)
s@w Evaluation Report ___________________________________________________________________________________________________________________________________________________________________________________
14
The public sector has been assigned an exemplary role in the field of energy efficiency by the
European Commission (EC, 2011 and EP, 2010 . Buildings occupied by public authorities and visited
by the public should set an example and show that energy and environmental considerations are of
importance. save@work enables each participating public authority to fulfil this role, through
meeting expectations and leading by example. Furthermore, purchasing decisions made by the public
sector in the field of energy efficient products and services have a large influence on the position of
“green products” in the market. The importance of this role model function is seen in respect to the
society and its encouragement of energy efficient behaviour among citizens, the private sector as
well as other public authorities. The communication strategies of save@work ensured that the public
recognised the positive role of the public authorities by addressing a broad audience including
citizens and key decision makers. In addition, with the information and lessons learnt provided in the
current report, the project can be replicated with an improved methodology in other public as well as
private office buildings.
Providing measurable energy, CO2 and cost savings
The consortium set out to involve 180 public office buildings (20 per country) in the competition
all aiming to achieve the highest energy savings possible. An Energy Saving Online Tool was
employed for the first time in the public office buildings ensuring that all energy, and CO2 savings
achieved during the project could be measured, traced and documented in a transparent way. The
project goal - which was based on studies and experiences made with similar interventions in the
public sector2 - of reaching at least an average 15% energy reduction was calculated to lead to
13 GWh primary energy saved, 3,100 t CO2 emissions avoided for the public sector within the project
lifetime, contributing to reduction goals as set out in local/regional climate plans and consequently of
each participating country and those of the European Union.
Providing valuable input to improve the effectiveness of initiatives focussing on
changing the behaviour at the work place
An evaluation component was included in save@work to capture success and challenge factors
relating to energy use behaviour change in different public buildings in different countries. As part of
this pre- and post-campaign surveys were filled in by participants as well as self-evaluation surveys
by project partners to gain insights into what helped and what obstructed behaviour change. To
support and increase the success of other similar projects, the results of the evaluation activities are
to be published (see, for example, this report) and widely communicated inside and outside the
project.
Stimulation of energy efficient behaviour at the private level
The secondary objective of the save@work project was to capture the energy saving motivation
experienced at work by the employees involved in the initiative and help apply it to their home life as
well as how they travel to and from work – thus the aim of the consortium was to improve their
overall energy literacy. Motivation, increased awareness and understanding of how energy saving
practices can be applied at home (by providing special tips and tools) will lead to a changed
behaviour at the private level as part of the spill-over impact of the project.
2 Studies and previous projects in office buildings promoting energy efficient behaviour show that average
energy savings between 5-20% can be realised, see: Results of „Energie Cup Hessen“, http://www.hessen-nachhaltig.de/web/co2-neutrale-landesverwaltung/energie-cup-hessen, as of 26
th of May 2014 and EEA, 2013
s@w Evaluation Report ___________________________________________________________________________________________________________________________________________________________________________________
15
1.2. The basic elements of the save@work methodology
The save@work programme had a research-based methodology, based partly on the analysis of
behaviour change programmes in Europe and in Australia (Molonev et al, 2010; Mourik et al, 2009,
2010), and success factors identified in the relevant literature (Molonev et al, 2010; Mourik et al,
2009, 2010; Nolan et al, 2008). The most important elements of the methodology were as follows:
(1) It considered the theory of interpersonal behaviour through recognizing the importance of
social factors and emotions as well as of past behaviour in shaping currently existing
practices (Jackson, 2005).
(2) It was built on a combination of top-down and bottom-up approaches. On the one hand,
public authorities were invited to be active partners, and the top management or leadership
of each public building committed to participation in the programme thereby ensuring that
employees at all levels were supported to engage in save@work activities.
On the other, Energy Teams, composed of the energy/building manager and interested
employees were formed in each building, mostly on a voluntary basis. Each energy team was
responsible for running the year-long competition in their building and had to motivate their
colleagues to change their behaviour and daily practices.
(3) As facilitators and enablers of behaviour change, small groups, or energy teams, were of
great importance in the programme. Groups help question and change social norms, help
tackle social dilemmas, empower individuals and were also found important in exerting
pressure on individuals to follow sustainable norms. (Heiskanen et al, 2010)
Furthermore, as groups do not automatically work well by themselves, a special effort was
made to encourage and support the group development process of energy teams. They were
made aware of and provided training in group dynamics methodology.
(4) Using a variety of means, enablers and motivators, in other words tools, simultaneously was
also important in order to cater for the needs of different personality types.
(5) Finally, as having good management skills were also found to be vital for the success of
behaviour change programmes (Mourik et al, 2009), energy teams were given some training
and guidance in the management of their local energy-saving campaigns.
In the current chapter we provide details of the common methodology, which was then adapted
by the local expert partners (i.e. s@w consortium members) to fit the differing local needs and
circumstances in the participating countries (see details in Chapters 3 and 4).
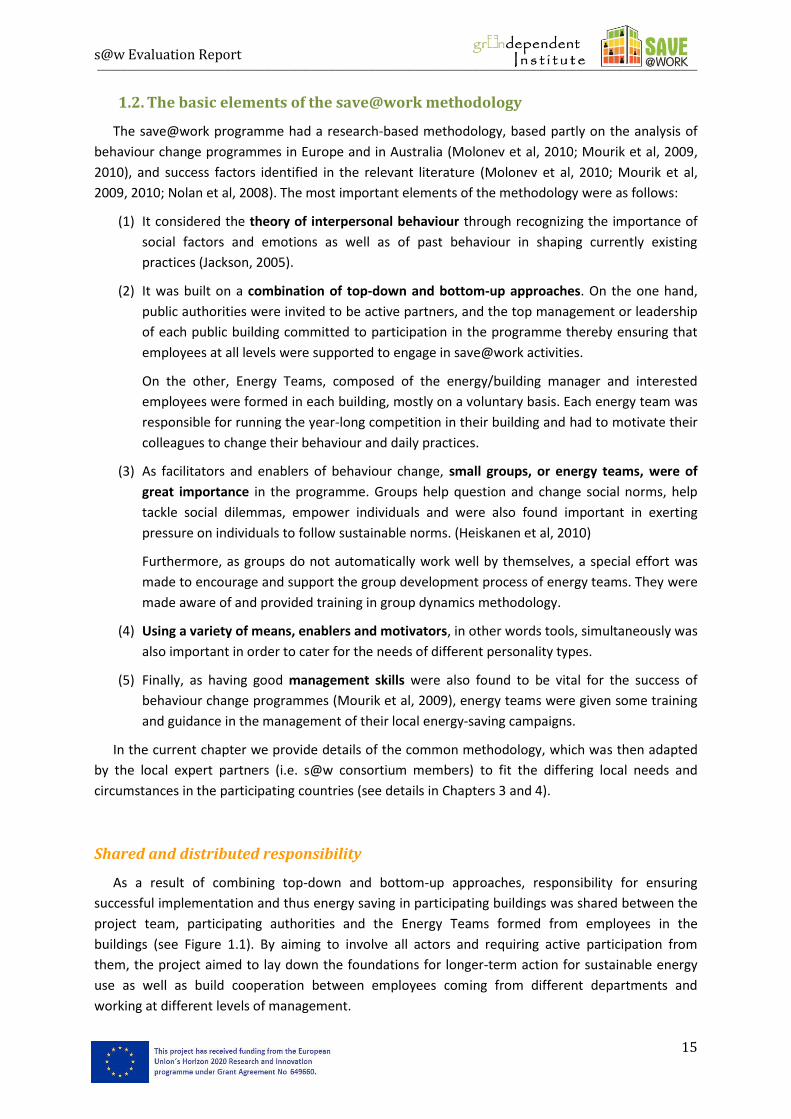
Shared and distributed responsibility
As a result of combining top-down and bottom-up approaches, responsibility for ensuring
successful implementation and thus energy saving in participating buildings was shared between the
project team, participating authorities and the Energy Teams formed from employees in the
buildings (see Figure 1.1). By aiming to involve all actors and requiring active participation from
them, the project aimed to lay down the foundations for longer-term action for sustainable energy
use as well as build cooperation between employees coming from different departments and
working at different levels of management.
s@w Evaluation Report ___________________________________________________________________________________________________________________________________________________________________________________
16
Figure 1.1: Shared and distributed responsibility in the save@work project
As it can be seen from Figures 1.1 and 1.2, all parties had many responsibilities and tasks during
the project, and, in fact, most of the tasks could only be completed successfully if project partners,
authorities and Energy Teams cooperated. This was sometimes challenging as can be seen in later
chapters (see Chapters 2. and 4.), however, it was key for ensuring longer term change in the
buildings as well as for establishing the structures for this change.
s@w Evaluation Report __________________________________________________________________________________________________________________________________________________________________________________________________________________________________________________________________________________
17
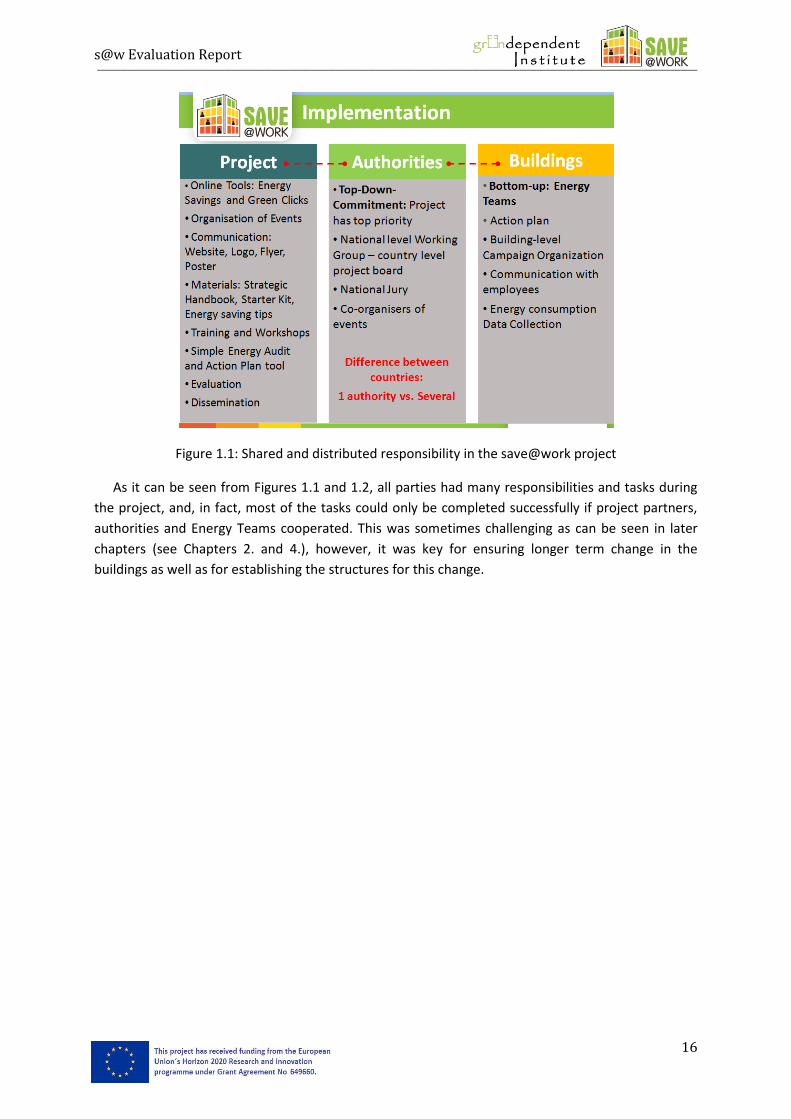
Figure 1.2: The tasks of different save@work project stakeholders
s@w Evaluation Report ___________________________________________________________________________________________________________________________________________________________________________________
18
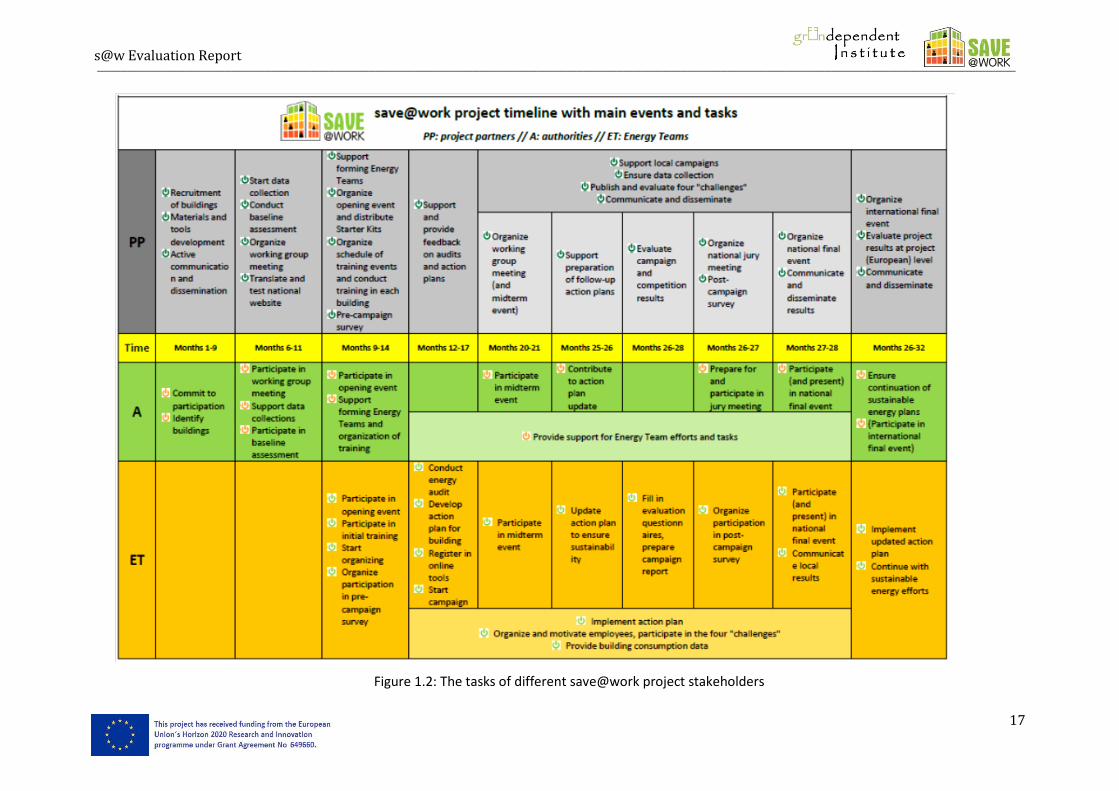
Sequence and description of project activities
Above, in Figure 1.2, the timeline of the project as seen and experienced through tasks by
different key participant groups was shown. In this section we present a simpler timeline: Figure 1.3
depicts the overall sequence of activities in the save@work project and campaign without details and
sub-steps for the different main steps. This is the general figure for the project, and as we will show
in Chapter 2, there were some differences in timing, implementation, etc. between the 9 countries
involved in the project. Furthermore, as shown in Figure 1.2 earlier, the sequence of activities was
not always as linear and clear as suggested by Figure 1.3 here as there were often overlaps between
different stages of the work, mainly due to the fact that several authorities were involved in all
countries and they each progressed with tasks at their own pace.
Figure 1.3: Sequence of activities in the save@work project
Preparation
As shown in the Figure, the project started with a preparatory stage during which the recruitment
of participating authorities, i.e. public buildings, was concluded as well as the materials and tools for
the campaign prepared. As for recruitment, it should be noted that a number of authorities had
already signed up for participation in the project during the proposal writing stage in each country.
Nonetheless, the consortium found that in most countries there was need for a more substantial
recruitment process than originally planned (see more details in Chapter 2 and 4). As for developing
the tools and materials, save@work proved to be a good example of sharing responsibility between
partners based on expertise and previous experience:
s@w Evaluation Report ___________________________________________________________________________________________________________________________________________________________________________________
19
the online tools and website were developed by the French and Austrian partners;
the contents of the starter kit, the strategic handbook and saving tips by the Hungarian
partner;
the audit tool and action plan template by the Austrian partner;
the promotional materials by the partner from the UK; and
the materials and content for the competition by the Latvian partner.
Of course, all of the tools and materials prepared received helpful comments and contributions
from the other partners not leading these tasks. Thus, the great amount of work needed could be
shared between several members of the consortium.
Implementation in buildings
Step 1: Forming Energy Teams: establishing the Energy Teams was key to the success of the
project (see section 1.2 above) as they were meant to be the ambassadors of the
competition, and the heart and soul of energy saving efforts in each participating building.
Even though in some buildings the top management selected one or several members of the
Energy Team, they were formed mainly on a voluntary basis: they were a group of office
employees feeling enthusiastic, responsible and ready to drive change towards more
sustainable energy use in their building. At the same time, they did not need to do everything
themselves - but they were the ones who had to make sure that things got done, information
was spread, and people working in the office started using energy in a more sustainable way.
In parallel to forming Energy Teams, national level working groups were also formed and
meetings assembled to consult with and involve high level representatives from participating
authorities in the implementation of the campaign.
Step 2: National Opening Events: in each country there was an opening event held to mark
and celebrate the start of the competition, to provide information to all participants and
distribute the starter kits to Energy Teams as well as to allow for networking between
participants. This event was also used as an opportunity to notify the press and other
important stakeholders about the project.
Step 3: Local campaign preparation: during this step, Energy Teams were given a significant
amount of expert support for preparing the campaign for their building. This meant that
consortium partners held initial training workshops for the Energy Teams in each building to
provide input on energy saving, on the use of s@w tools as well as on managing groups and
motivating people, provided assistance in carrying out simple energy audits and in drawing
up action plans. Action plans - that provide framework to the energy saving activities within
the competing building for the duration of the campaign - were then evaluated and given
feedback on by consortium partners. In addition, Energy Teams were also asked to mobilize
employees in their buildings to fill in a pre-campaign survey as part of the evaluation
activities.
Step 4: Energy saving campaign in buildings: this was when Energy Teams really started
mobilizing and involving their colleagues in energy saving activities between March 2016 and
February 2017; i.e. they implemented their action plans, regularly entered energy
consumption data into the online Energy Saving Tool, etc. They continued to receive expert
support from the consortium in the form of regular and themed saving tips, challenges as
s@w Evaluation Report ___________________________________________________________________________________________________________________________________________________________________________________
20
part of an effort to further motivate and encourage group work (and gamification), feedback
on the pre-campaign survey, prompts to use the Green Clicks tool, regular blog articles from
all countries, etc.
During this step, the national working groups (see Step 1) were also convened and consulted
to discuss the progress of the campaign and see whether any adjustments, etc. were
necessary.
Step 5: Action plan update: towards the end of the campaign Energy Teams were asked to
conduct a simple evaluation of their activities in the form of updating their action plans. This
was also intended to ensure the sustainability of the campaign and the continuation of
activities in the buildings.
Step 6: National level evaluation: with the involvement of the national jury - i.e.
representatives from all participating authorities - the campaign was evaluated from
different aspects, namely the three s@w competition categories:
(1) highest energy saving achieved, measured in kWh, based on data and calculations by
the online calculation tool;
(2) best campaign implementation (most involving, most creative, etc.), based on
questionnaires (called 'Best campaign questionnaire') filled in and reports prepared
by the Energy Teams;
(3) most sustainable campaign (Best Action Plan), based on the original and updated
action plans.
As part of the national level evaluation, national strategy papers were also prepared in each
country on taking the campaigns further and disseminating the results as well as the general
s@w methodology.
Step 7: National Closing Events: in each of the s@w countries a closing event was organized
to celebrate the successful completion of the project as well as the saving and changes
achieved together. At these events, the best performing buildings in the 3 evaluation
categories were awarded by various prizes and, importantly, they were also given an
opportunity to present their results and specific approach used to achieve the results.
Similarly to opening events, closing events were used as an opportunity to notify the press
and other important stakeholders about the outcomes of the project.
European level evaluation: once national level results were available, the European jury,
comprised of the representatives of project partners, convened to discuss who the winners
at the European level are. At this level, the three best buildings in terms of saving were
found.
European closing and prize event: the event, to which the representatives of the best
performing building from each country were invited, was organized in Brussels so that
stakeholders at the European level could also be invited. At the event, the overall results of
s@w were presented in addition to presentations by the winning Energy Teams and
European level stakeholders. Furthermore, the teams from the participating countries were
also invited to take part in some professional activities: visit to energy efficient buildings,
workshop on municipal level action, networking, etc.
s@w Evaluation Report ___________________________________________________________________________________________________________________________________________________________________________________
21
Project evaluation, conclusion and dissemination: the impact achieved by the project was
evaluated from various points of views, e.g. as measured by the pre- and post-campaign
focusing on change in office practices related to energy saving, attitudes, etc., see details of
the evaluation methodology in section 1.3. and of the outcomes of the two surveys in
Chapter 2.
Apart from the evaluation activities, the s@w consortium placed a great emphasis on
dissemination both at the national and European levels, e.g. in the form of brochures,
presentations, press releases and scientific reports.
Tools and materials
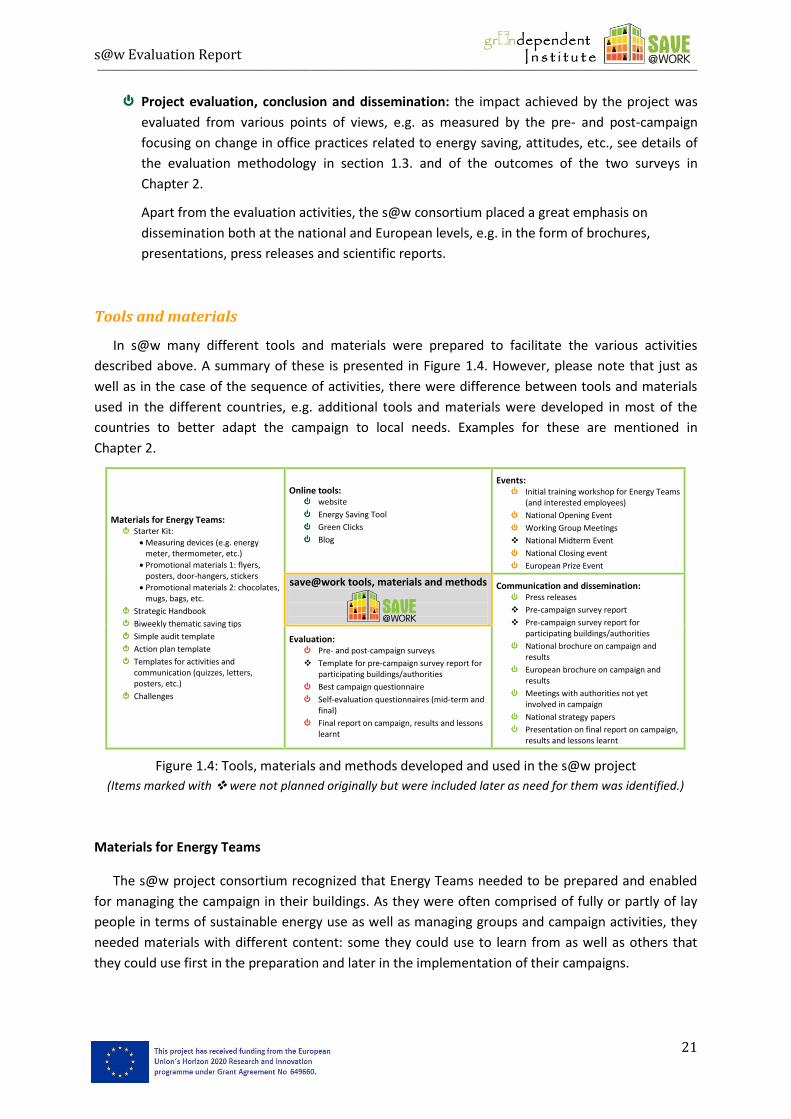
In s@w many different tools and materials were prepared to facilitate the various activities
described above. A summary of these is presented in Figure 1.4. However, please note that just as
well as in the case of the sequence of activities, there were difference between tools and materials
used in the different countries, e.g. additional tools and materials were developed in most of the
countries to better adapt the campaign to local needs. Examples for these are mentioned in
Chapter 2.
Figure 1.4: Tools, materials and methods developed and used in the s@w project
(Items marked with were not planned originally but were included later as need for them was identified.)
Materials for Energy Teams
The s@w project consortium recognized that Energy Teams needed to be prepared and enabled
for managing the campaign in their buildings. As they were often comprised of fully or partly of lay
people in terms of sustainable energy use as well as managing groups and campaign activities, they
needed materials with different content: some they could use to learn from as well as others that
they could use first in the preparation and later in the implementation of their campaigns.
Materials for Energy Teams: Starter Kit:
Measuring devices (e.g. energy meter, thermometer, etc.)
Promotional materials 1: flyers, posters, door-hangers, stickers
Promotional materials 2: chocolates, mugs, bags, etc.
Strategic Handbook
Biweekly thematic saving tips
Simple audit template
Action plan template
Templates for activities and communication (quizzes, letters, posters, etc.)
Challenges
Online tools: website
Energy Saving Tool
Green Clicks
Blog
Events: Initial training workshop for Energy Teams
(and interested employees)
National Opening Event
Working Group Meetings
National Midterm Event
National Closing event
European Prize Event
save@work tools, materials and methods
Communication and dissemination: Press releases
Pre-campaign survey report
Pre-campaign survey report for participating buildings/authorities
National brochure on campaign and results
European brochure on campaign and results
Meetings with authorities not yet involved in campaign
National strategy papers
Presentation on final report on campaign, results and lessons learnt
Evaluation: Pre- and post-campaign surveys
Template for pre-campaign survey report for participating buildings/authorities
Best campaign questionnaire
Self-evaluation questionnaires (mid-term and final)
Final report on campaign, results and lessons learnt
s@w Evaluation Report ___________________________________________________________________________________________________________________________________________________________________________________
22
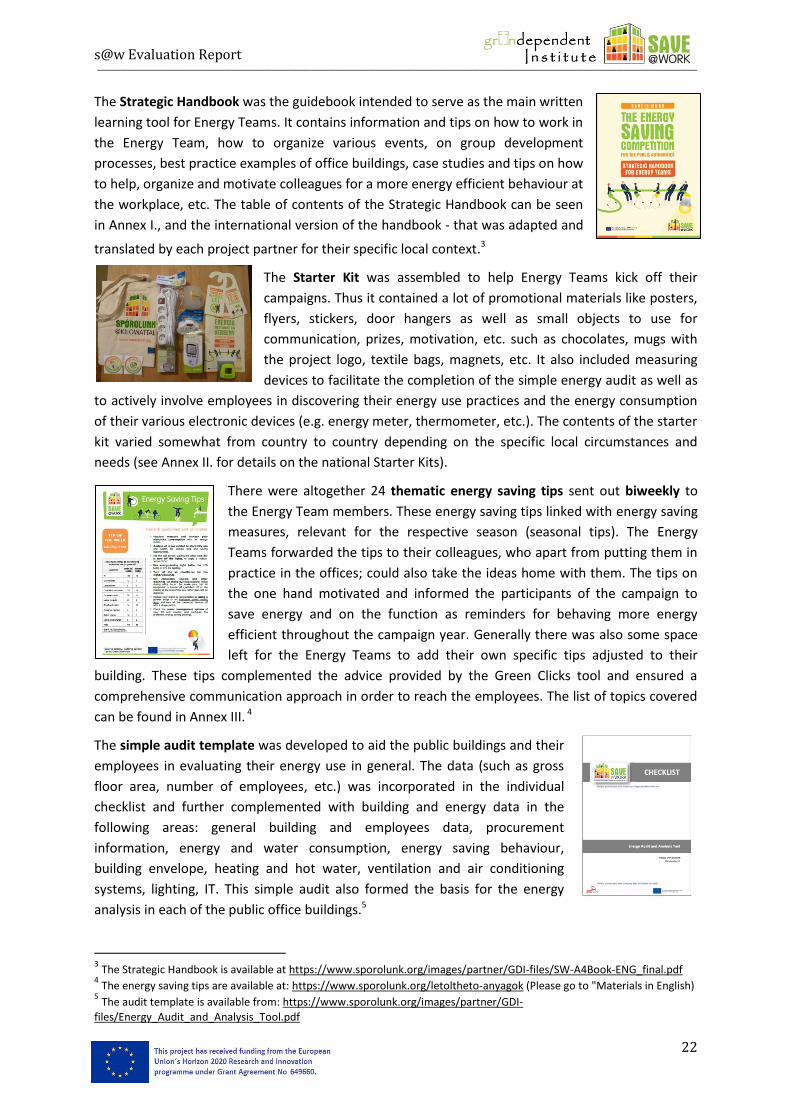
The Strategic Handbook was the guidebook intended to serve as the main written
learning tool for Energy Teams. It contains information and tips on how to work in
the Energy Team, how to organize various events, on group development
processes, best practice examples of office buildings, case studies and tips on how
to help, organize and motivate colleagues for a more energy efficient behaviour at
the workplace, etc. The table of contents of the Strategic Handbook can be seen
in Annex I., and the international version of the handbook - that was adapted and
translated by each project partner for their specific local context.3
The Starter Kit was assembled to help Energy Teams kick off their
campaigns. Thus it contained a lot of promotional materials like posters,
flyers, stickers, door hangers as well as small objects to use for
communication, prizes, motivation, etc. such as chocolates, mugs with
the project logo, textile bags, magnets, etc. It also included measuring
devices to facilitate the completion of the simple energy audit as well as
to actively involve employees in discovering their energy use practices and the energy consumption
of their various electronic devices (e.g. energy meter, thermometer, etc.). The contents of the starter
kit varied somewhat from country to country depending on the specific local circumstances and
needs (see Annex II. for details on the national Starter Kits).
There were altogether 24 thematic energy saving tips sent out biweekly to
the Energy Team members. These energy saving tips linked with energy saving
measures, relevant for the respective season (seasonal tips). The Energy
Teams forwarded the tips to their colleagues, who apart from putting them in
practice in the offices; could also take the ideas home with them. The tips on
the one hand motivated and informed the participants of the campaign to
save energy and on the function as reminders for behaving more energy
efficient throughout the campaign year. Generally there was also some space
left for the Energy Teams to add their own specific tips adjusted to their
building. These tips complemented the advice provided by the Green Clicks tool and ensured a
comprehensive communication approach in order to reach the employees. The list of topics covered
can be found in Annex III. 4
The simple audit template was developed to aid the public buildings and their
employees in evaluating their energy use in general. The data (such as gross
floor area, number of employees, etc.) was incorporated in the individual
checklist and further complemented with building and energy data in the
following areas: general building and employees data, procurement
information, energy and water consumption, energy saving behaviour,
building envelope, heating and hot water, ventilation and air conditioning
systems, lighting, IT. This simple audit also formed the basis for the energy
analysis in each of the public office buildings.5
3 The Strategic Handbook is available at https://www.sporolunk.org/images/partner/GDI-files/SW-A4Book-ENG_final.pdf
4 The energy saving tips are available at: https://www.sporolunk.org/letoltheto-anyagok (Please go to "Materials in English)
5 The audit template is available from: https://www.sporolunk.org/images/partner/GDI-
files/Energy_Audit_and_Analysis_Tool.pdf
s@w Evaluation Report ___________________________________________________________________________________________________________________________________________________________________________________
23
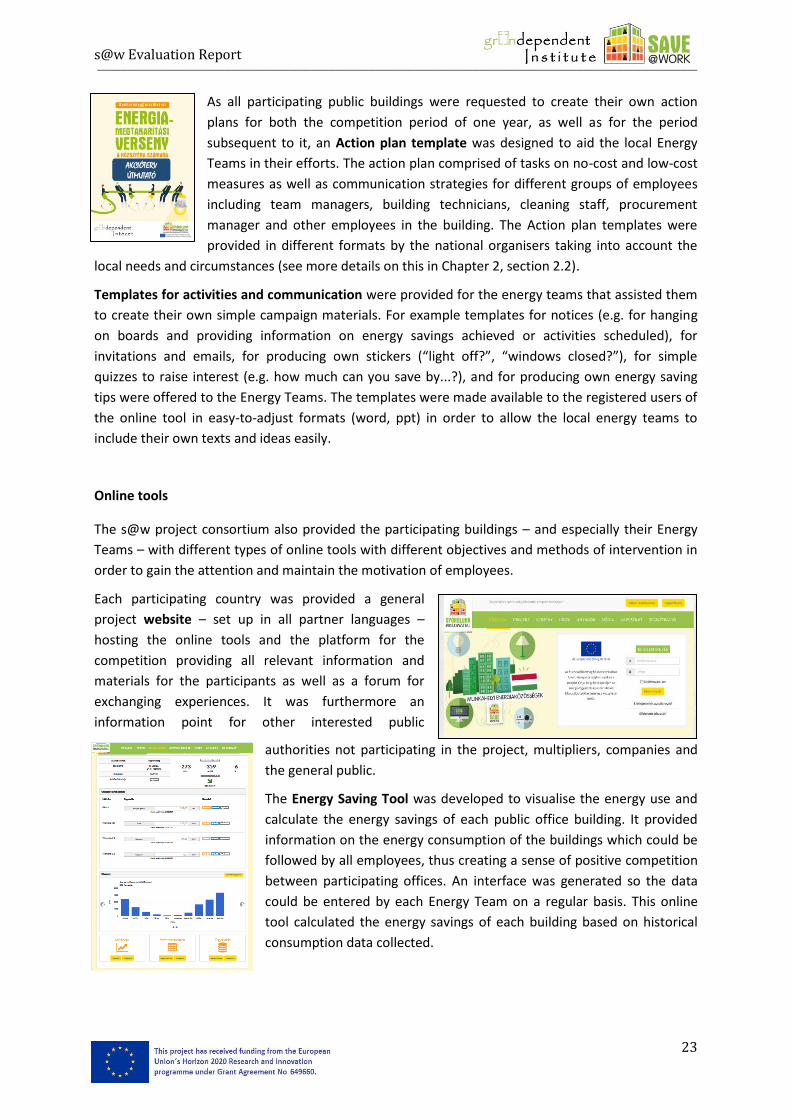
As all participating public buildings were requested to create their own action
plans for both the competition period of one year, as well as for the period
subsequent to it, an Action plan template was designed to aid the local Energy
Teams in their efforts. The action plan comprised of tasks on no-cost and low-cost
measures as well as communication strategies for different groups of employees
including team managers, building technicians, cleaning staff, procurement
manager and other employees in the building. The Action plan templates were
provided in different formats by the national organisers taking into account the
local needs and circumstances (see more details on this in Chapter 2, section 2.2).
Templates for activities and communication were provided for the energy teams that assisted them
to create their own simple campaign materials. For example templates for notices (e.g. for hanging
on boards and providing information on energy savings achieved or activities scheduled), for
invitations and emails, for producing own stickers (“light off?”, “windows closed?”), for simple
quizzes to raise interest (e.g. how much can you save by...?), and for producing own energy saving
tips were offered to the Energy Teams. The templates were made available to the registered users of
the online tool in easy-to-adjust formats (word, ppt) in order to allow the local energy teams to
include their own texts and ideas easily.
Online tools
The s@w project consortium also provided the participating buildings – and especially their Energy
Teams – with different types of online tools with different objectives and methods of intervention in
order to gain the attention and maintain the motivation of employees.
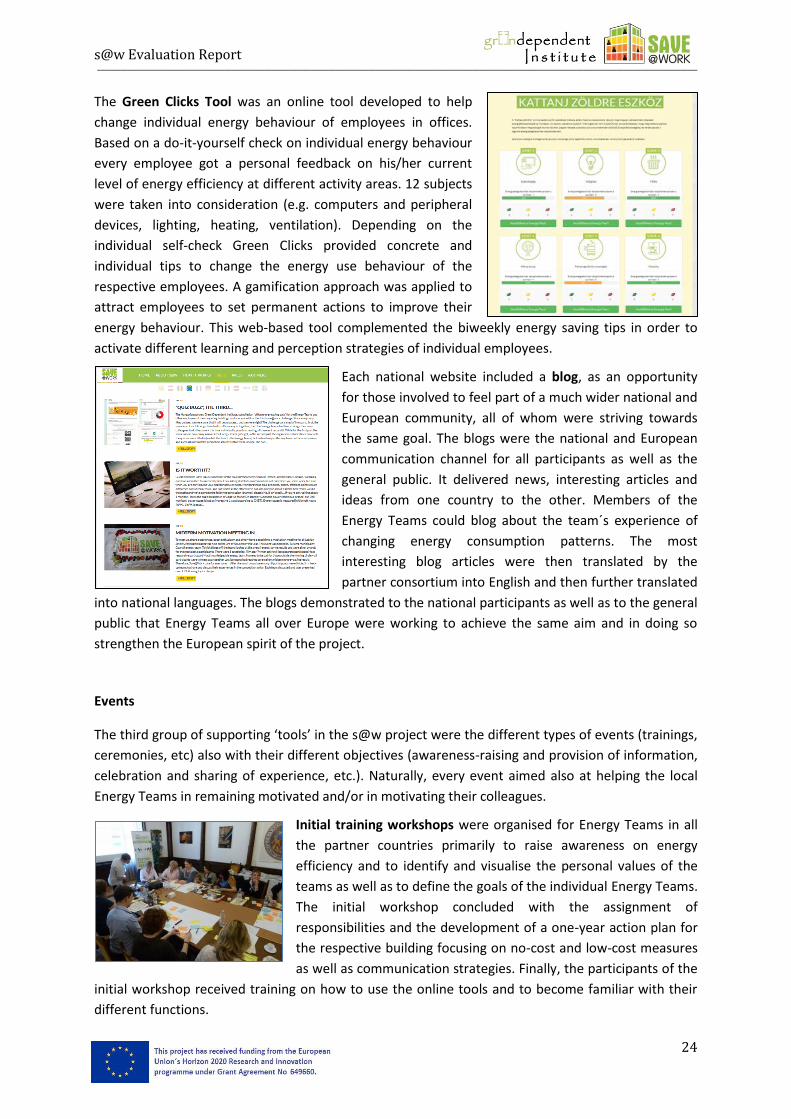
Each participating country was provided a general
project website – set up in all partner languages –
hosting the online tools and the platform for the
competition providing all relevant information and
materials for the participants as well as a forum for
exchanging experiences. It was furthermore an
information point for other interested public
authorities not participating in the project, multipliers, companies and
the general public.
The Energy Saving Tool was developed to visualise the energy use and
calculate the energy savings of each public office building. It provided
information on the energy consumption of the buildings which could be
followed by all employees, thus creating a sense of positive competition
between participating offices. An interface was generated so the data
could be entered by each Energy Team on a regular basis. This online
tool calculated the energy savings of each building based on historical
consumption data collected.
s@w Evaluation Report ___________________________________________________________________________________________________________________________________________________________________________________
24
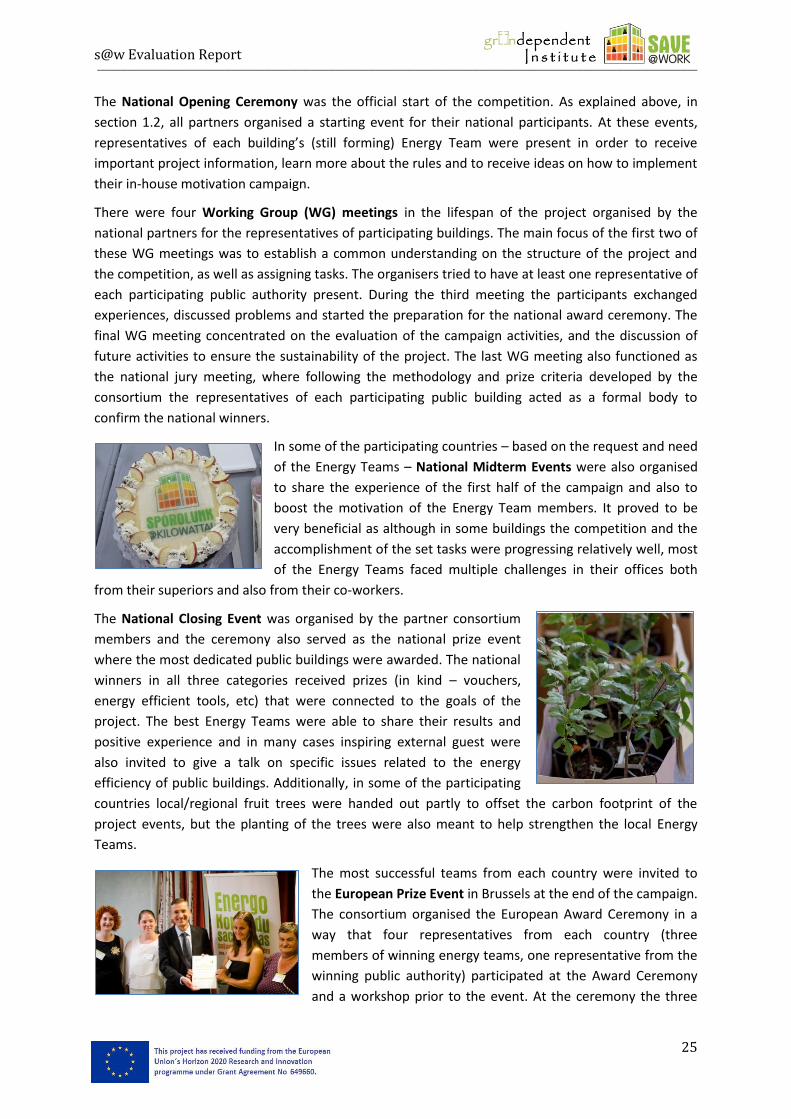
The Green Clicks Tool was an online tool developed to help
change individual energy behaviour of employees in offices.
Based on a do-it-yourself check on individual energy behaviour
every employee got a personal feedback on his/her current
level of energy efficiency at different activity areas. 12 subjects
were taken into consideration (e.g. computers and peripheral
devices, lighting, heating, ventilation). Depending on the
individual self-check Green Clicks provided concrete and
individual tips to change the energy use behaviour of the
respective employees. A gamification approach was applied to
attract employees to set permanent actions to improve their
energy behaviour. This web-based tool complemented the biweekly energy saving tips in order to
activate different learning and perception strategies of individual employees.
Each national website included a blog, as an opportunity
for those involved to feel part of a much wider national and
European community, all of whom were striving towards
the same goal. The blogs were the national and European
communication channel for all participants as well as the
general public. It delivered news, interesting articles and
ideas from one country to the other. Members of the
Energy Teams could blog about the team´s experience of
changing energy consumption patterns. The most
interesting blog articles were then translated by the
partner consortium into English and then further translated
into national languages. The blogs demonstrated to the national participants as well as to the general
public that Energy Teams all over Europe were working to achieve the same aim and in doing so
strengthen the European spirit of the project.
Events
The third group of supporting ‘tools’ in the s@w project were the different types of events (trainings,
ceremonies, etc) also with their different objectives (awareness-raising and provision of information,
celebration and sharing of experience, etc.). Naturally, every event aimed also at helping the local
Energy Teams in remaining motivated and/or in motivating their colleagues.
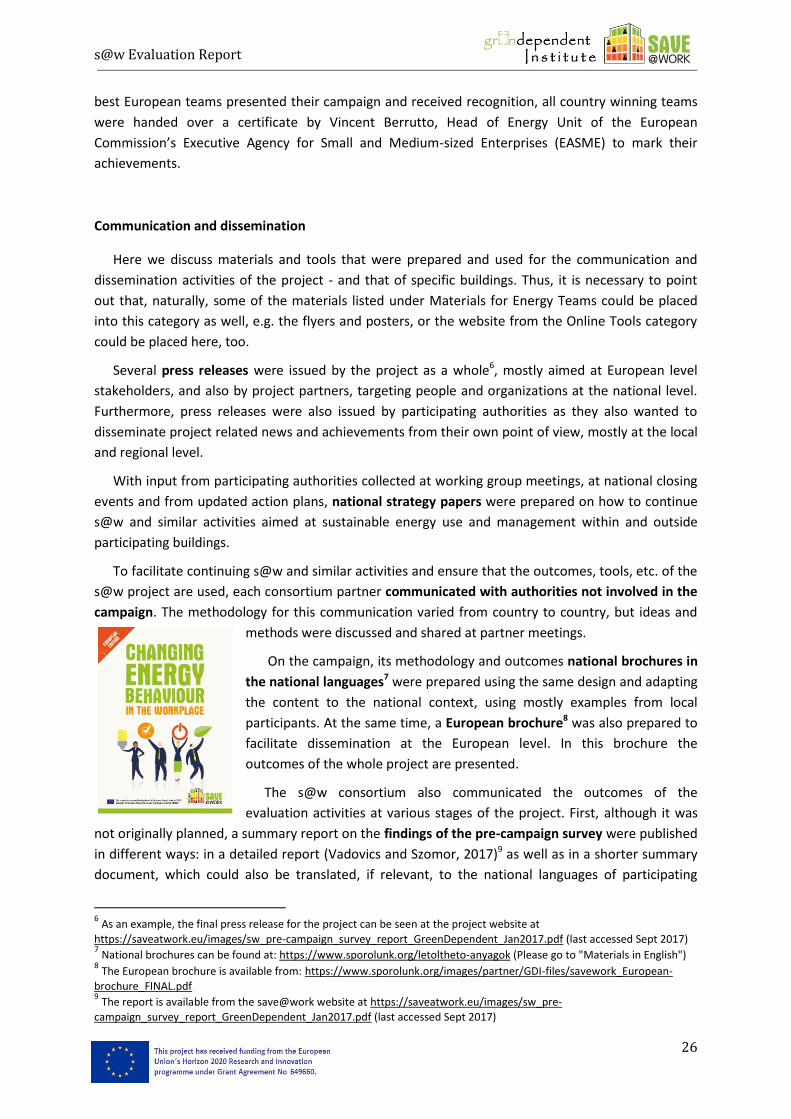
Initial training workshops were organised for Energy Teams in all
the partner countries primarily to raise awareness on energy
efficiency and to identify and visualise the personal values of the
teams as well as to define the goals of the individual Energy Teams.
The initial workshop concluded with the assignment of
responsibilities and the development of a one-year action plan for
the respective building focusing on no-cost and low-cost measures
as well as communication strategies. Finally, the participants of the
initial workshop received training on how to use the online tools and to become familiar with their
different functions.
s@w Evaluation Report ___________________________________________________________________________________________________________________________________________________________________________________
25
The National Opening Ceremony was the official start of the competition. As explained above, in
section 1.2, all partners organised a starting event for their national participants. At these events,
representatives of each building’s (still forming) Energy Team were present in order to receive
important project information, learn more about the rules and to receive ideas on how to implement
their in-house motivation campaign.
There were four Working Group (WG) meetings in the lifespan of the project organised by the
national partners for the representatives of participating buildings. The main focus of the first two of
these WG meetings was to establish a common understanding on the structure of the project and
the competition, as well as assigning tasks. The organisers tried to have at least one representative of
each participating public authority present. During the third meeting the participants exchanged
experiences, discussed problems and started the preparation for the national award ceremony. The
final WG meeting concentrated on the evaluation of the campaign activities, and the discussion of
future activities to ensure the sustainability of the project. The last WG meeting also functioned as
the national jury meeting, where following the methodology and prize criteria developed by the
consortium the representatives of each participating public building acted as a formal body to
confirm the national winners.
In some of the participating countries – based on the request and need
of the Energy Teams – National Midterm Events were also organised
to share the experience of the first half of the campaign and also to
boost the motivation of the Energy Team members. It proved to be
very beneficial as although in some buildings the competition and the
accomplishment of the set tasks were progressing relatively well, most
of the Energy Teams faced multiple challenges in their offices both
from their superiors and also from their co-workers.
The National Closing Event was organised by the partner consortium
members and the ceremony also served as the national prize event
where the most dedicated public buildings were awarded. The national
winners in all three categories received prizes (in kind – vouchers,
energy efficient tools, etc) that were connected to the goals of the
project. The best Energy Teams were able to share their results and
positive experience and in many cases inspiring external guest were
also invited to give a talk on specific issues related to the energy
efficiency of public buildings. Additionally, in some of the participating
countries local/regional fruit trees were handed out partly to offset the carbon footprint of the
project events, but the planting of the trees were also meant to help strengthen the local Energy
Teams.
The most successful teams from each country were invited to
the European Prize Event in Brussels at the end of the campaign.
The consortium organised the European Award Ceremony in a
way that four representatives from each country (three
members of winning energy teams, one representative from the
winning public authority) participated at the Award Ceremony
and a workshop prior to the event. At the ceremony the three
s@w Evaluation Report ___________________________________________________________________________________________________________________________________________________________________________________
26
best European teams presented their campaign and received recognition, all country winning teams
were handed over a certificate by Vincent Berrutto, Head of Energy Unit of the European
Commission’s Executive Agency for Small and Medium-sized Enterprises (EASME) to mark their
achievements.
Communication and dissemination
Here we discuss materials and tools that were prepared and used for the communication and
dissemination activities of the project - and that of specific buildings. Thus, it is necessary to point
out that, naturally, some of the materials listed under Materials for Energy Teams could be placed
into this category as well, e.g. the flyers and posters, or the website from the Online Tools category
could be placed here, too.
Several press releases were issued by the project as a whole6, mostly aimed at European level
stakeholders, and also by project partners, targeting people and organizations at the national level.
Furthermore, press releases were also issued by participating authorities as they also wanted to
disseminate project related news and achievements from their own point of view, mostly at the local
and regional level.
With input from participating authorities collected at working group meetings, at national closing
events and from updated action plans, national strategy papers were prepared on how to continue
s@w and similar activities aimed at sustainable energy use and management within and outside
participating buildings.
To facilitate continuing s@w and similar activities and ensure that the outcomes, tools, etc. of the
s@w project are used, each consortium partner communicated with authorities not involved in the
campaign. The methodology for this communication varied from country to country, but ideas and
methods were discussed and shared at partner meetings.
On the campaign, its methodology and outcomes national brochures in
the national languages7 were prepared using the same design and adapting
the content to the national context, using mostly examples from local
participants. At the same time, a European brochure8 was also prepared to
facilitate dissemination at the European level. In this brochure the
outcomes of the whole project are presented.
The s@w consortium also communicated the outcomes of the
evaluation activities at various stages of the project. First, although it was
not originally planned, a summary report on the findings of the pre-campaign survey were published
in different ways: in a detailed report (Vadovics and Szomor, 2017)9 as well as in a shorter summary
document, which could also be translated, if relevant, to the national languages of participating
6 As an example, the final press release for the project can be seen at the project website at
https://saveatwork.eu/images/sw_pre-campaign_survey_report_GreenDependent_Jan2017.pdf (last accessed Sept 2017) 7 National brochures can be found at: https://www.sporolunk.org/letoltheto-anyagok (Please go to "Materials in English")
8 The European brochure is available from: https://www.sporolunk.org/images/partner/GDI-files/savework_European-
brochure_FINAL.pdf 9 The report is available from the save@work website at https://saveatwork.eu/images/sw_pre-
campaign_survey_report_GreenDependent_Jan2017.pdf (last accessed Sept 2017)
s@w Evaluation Report ___________________________________________________________________________________________________________________________________________________________________________________
27
countries. In addition, partners received guidance and templates for preparing building-specific
reports on pre-campaign survey results for authorities to help make their campaigns as relevant to
the needs of the employees working in that building as possible.
Finally, a report on evaluation activities, the outcomes and lessons learnt of the s@w project was
published in the form of the present report, a short version of this report for decision makers and
project implementers as well as a presentation for project partners.
Evaluation
The tools and methods used for evaluation are discussed in section 1.4. below (The methodology
used for preparing this report).
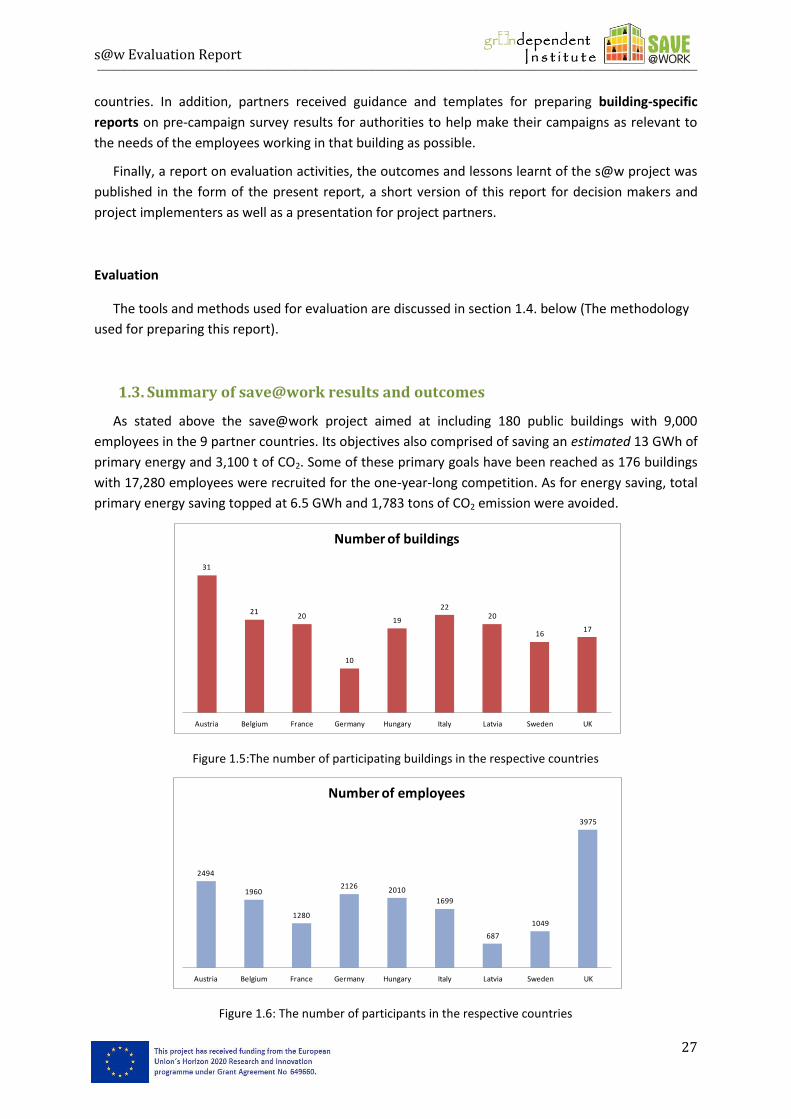
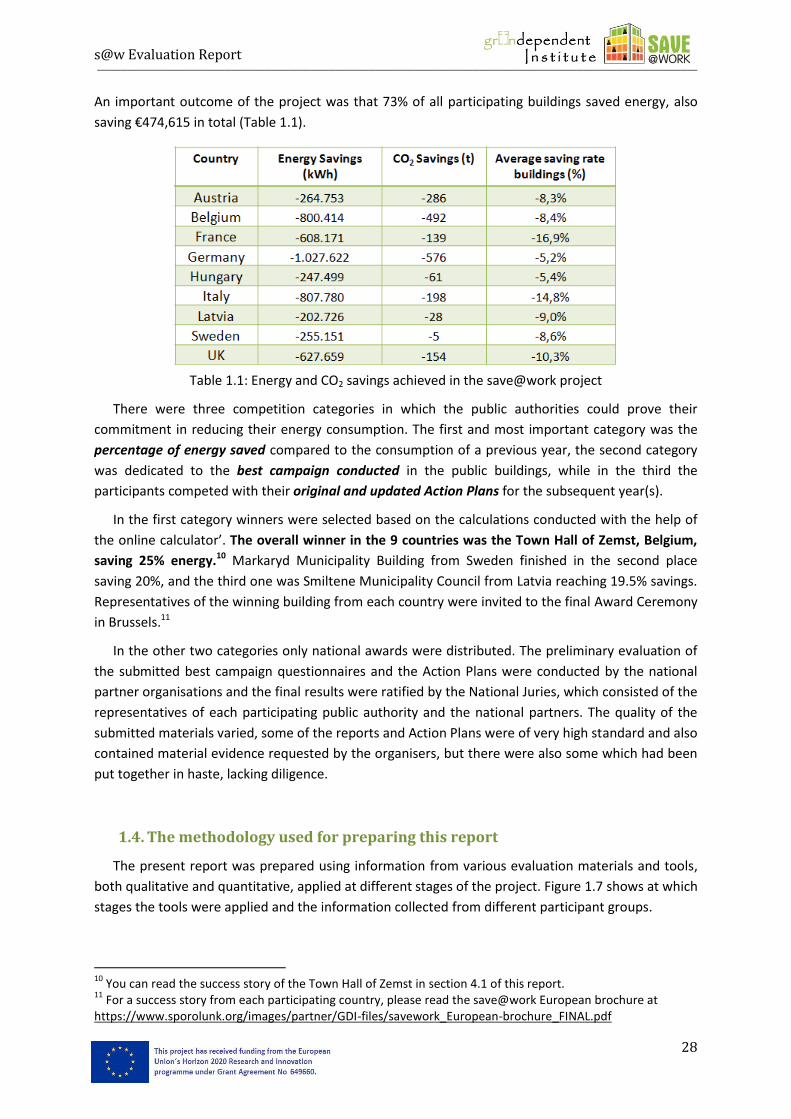
1.3. Summary of save@work results and outcomes
As stated above the save@work project aimed at including 180 public buildings with 9,000
employees in the 9 partner countries. Its objectives also comprised of saving an estimated 13 GWh of
primary energy and 3,100 t of CO2. Some of these primary goals have been reached as 176 buildings
with 17,280 employees were recruited for the one-year-long competition. As for energy saving, total
primary energy saving topped at 6.5 GWh and 1,783 tons of CO2 emission were avoided.
Figure 1.5:The number of participating buildings in the respective countries
Figure 1.6: The number of participants in the respective countries
31
2120
10
19
2220
1617
Austria Belgium France Germany Hungary Italy Latvia Sweden UK
Number of buildings
2494
1960
1280
2126 2010
1699
687
1049
3975
Austria Belgium France Germany Hungary Italy Latvia Sweden UK
Number of employees
s@w Evaluation Report ___________________________________________________________________________________________________________________________________________________________________________________
28
An important outcome of the project was that 73% of all participating buildings saved energy, also
saving €474,615 in total (Table 1.1).
Table 1.1: Energy and CO2 savings achieved in the save@work project
There were three competition categories in which the public authorities could prove their
commitment in reducing their energy consumption. The first and most important category was the
percentage of energy saved compared to the consumption of a previous year, the second category
was dedicated to the best campaign conducted in the public buildings, while in the third the
participants competed with their original and updated Action Plans for the subsequent year(s).
In the first category winners were selected based on the calculations conducted with the help of
the online calculator’. The overall winner in the 9 countries was the Town Hall of Zemst, Belgium,
saving 25% energy.10 Markaryd Municipality Building from Sweden finished in the second place
saving 20%, and the third one was Smiltene Municipality Council from Latvia reaching 19.5% savings.
Representatives of the winning building from each country were invited to the final Award Ceremony
in Brussels.11
In the other two categories only national awards were distributed. The preliminary evaluation of
the submitted best campaign questionnaires and the Action Plans were conducted by the national
partner organisations and the final results were ratified by the National Juries, which consisted of the
representatives of each participating public authority and the national partners. The quality of the
submitted materials varied, some of the reports and Action Plans were of very high standard and also
contained material evidence requested by the organisers, but there were also some which had been
put together in haste, lacking diligence.
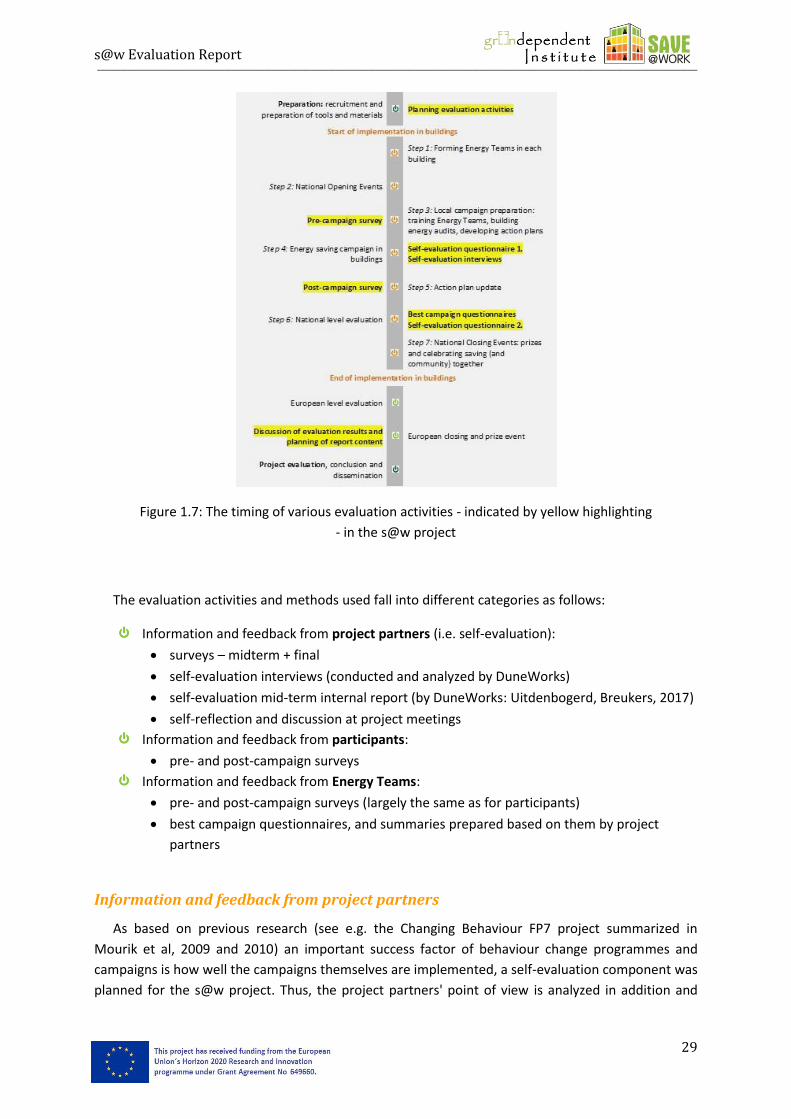
1.4. The methodology used for preparing this report
The present report was prepared using information from various evaluation materials and tools,
both qualitative and quantitative, applied at different stages of the project. Figure 1.7 shows at which
stages the tools were applied and the information collected from different participant groups.
10
You can read the success story of the Town Hall of Zemst in section 4.1 of this report. 11
For a success story from each participating country, please read the save@work European brochure at https://www.sporolunk.org/images/partner/GDI-files/savework_European-brochure_FINAL.pdf
s@w Evaluation Report ___________________________________________________________________________________________________________________________________________________________________________________
29
Figure 1.7: The timing of various evaluation activities - indicated by yellow highlighting
- in the s@w project
The evaluation activities and methods used fall into different categories as follows:
Information and feedback from project partners (i.e. self-evaluation):
surveys – midterm + final
self-evaluation interviews (conducted and analyzed by DuneWorks)
self-evaluation mid-term internal report (by DuneWorks: Uitdenbogerd, Breukers, 2017)
self-reflection and discussion at project meetings
Information and feedback from participants:
pre- and post-campaign surveys
Information and feedback from Energy Teams:
pre- and post-campaign surveys (largely the same as for participants)
best campaign questionnaires, and summaries prepared based on them by project
partners
Information and feedback from project partners
As based on previous research (see e.g. the Changing Behaviour FP7 project summarized in
Mourik et al, 2009 and 2010) an important success factor of behaviour change programmes and
campaigns is how well the campaigns themselves are implemented, a self-evaluation component was
planned for the s@w project. Thus, the project partners' point of view is analyzed in addition and
s@w Evaluation Report ___________________________________________________________________________________________________________________________________________________________________________________
30
comparison to participant surveys in order to gain a fuller picture of success - and how different
implementation and contextual factors had an effect on it.
Project partners filled in two self-evaluation questionnaires: a mid-term and a post-campaign
questionnaire12. These investigated the partners' view of the project, the usefulness and actual use of
materials, challenges as well as success factors and stories. They also asked for information on what
partners would do differently in a similar future project to ensure an even greater level of success.
Both questionnaires were filled in by representatives of all consortium partners.
In addition to the self-evaluation questionnaires, and partly based on the outcomes of the first
questionnaire as well as the pre-campaign survey, experts from DuneWorks also conducted
interviews with the representatives of all partners. The results of these interviews were first
discussed at the 5th partner meeting at a session lead by DuneWorks, and then summarized in an
internal working report by DuneWorks for the consortium (Uitdenbogerd, Breukers, 2017).
Finally, lead by relevant WP-lead GreenDependent, consortium members also organized
discussions among themselves on the outcomes of the first self-evaluation questionnaire along with
the pre-campaign survey at the 4th partner meeting. This was followed by a similar discussion at the
final partner meeting on all the evaluation activities conducted.
Information and feedback from participants
Employees working in the 176 buildings participating in the s@w campaign were asked on two
occasions - at the beginning and end of the campaign - to fill in surveys in order for the consortium to
be able to assess the change in behaviour, attitudes, practices, etc. achieved during the project. As
described in the pre-campaign survey report (Vadovics and Szomor, 2017), the consortium grappled
with competing objectives when deciding on the survey content. On the one hand, the consortium
wanted to be able to collect useful information, but on the other, wanted to ensure that a sufficient
number of people would fill the survey in. Thus, limiting its contents became necessary based on
finding a balance between what was needed for the evaluation and what was possible to achieve in
reality, with the involvement of the employees.
The consortium thus decided to have the following main parts in the surveys:13
12
In case you would like to find out more about the detailed contents of the self-evaluation surveys, contact the authors at the email address provided on the internal cover page of this report. 13
The pre-campaign survey can be found in Vadovics and Szomor, 2017. Information about the detailed contents of both surveys is available from the authors at the email address provided on the internal cover page of this report.
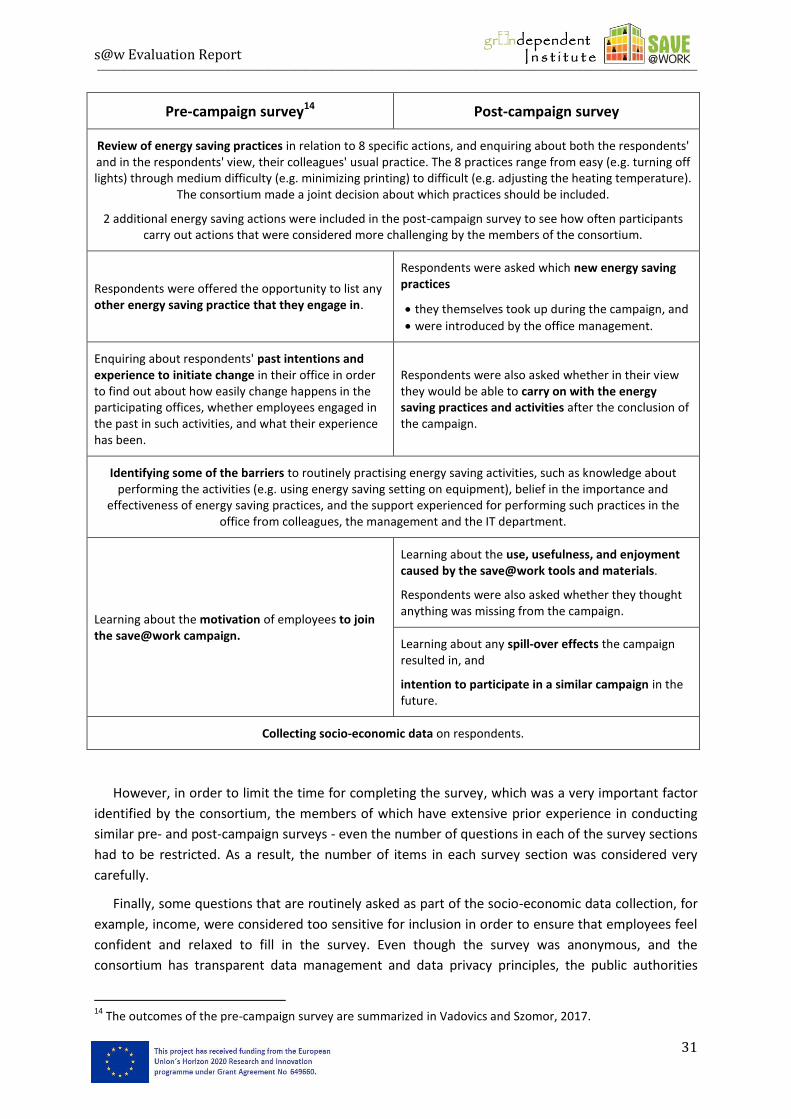
s@w Evaluation Report ___________________________________________________________________________________________________________________________________________________________________________________
31
Pre-campaign survey14 Post-campaign survey
Review of energy saving practices in relation to 8 specific actions, and enquiring about both the respondents' and in the respondents' view, their colleagues' usual practice. The 8 practices range from easy (e.g. turning off lights) through medium difficulty (e.g. minimizing printing) to difficult (e.g. adjusting the heating temperature).
The consortium made a joint decision about which practices should be included.
2 additional energy saving actions were included in the post-campaign survey to see how often participants carry out actions that were considered more challenging by the members of the consortium.
Respondents were offered the opportunity to list any other energy saving practice that they engage in.
Respondents were asked which new energy saving practices
they themselves took up during the campaign, and
were introduced by the office management.
Enquiring about respondents' past intentions and experience to initiate change in their office in order to find out about how easily change happens in the participating offices, whether employees engaged in the past in such activities, and what their experience has been.
Respondents were also asked whether in their view they would be able to carry on with the energy saving practices and activities after the conclusion of the campaign.
Identifying some of the barriers to routinely practising energy saving activities, such as knowledge about performing the activities (e.g. using energy saving setting on equipment), belief in the importance and
effectiveness of energy saving practices, and the support experienced for performing such practices in the office from colleagues, the management and the IT department.
Learning about the motivation of employees to join the save@work campaign.
Learning about the use, usefulness, and enjoyment caused by the save@work tools and materials.
Respondents were also asked whether they thought anything was missing from the campaign.
Learning about any spill-over effects the campaign resulted in, and
intention to participate in a similar campaign in the future.
Collecting socio-economic data on respondents.
However, in order to limit the time for completing the survey, which was a very important factor
identified by the consortium, the members of which have extensive prior experience in conducting
similar pre- and post-campaign surveys - even the number of questions in each of the survey sections
had to be restricted. As a result, the number of items in each survey section was considered very
carefully.
Finally, some questions that are routinely asked as part of the socio-economic data collection, for
example, income, were considered too sensitive for inclusion in order to ensure that employees feel
confident and relaxed to fill in the survey. Even though the survey was anonymous, and the
consortium has transparent data management and data privacy principles, the public authorities
14
The outcomes of the pre-campaign survey are summarized in Vadovics and Szomor, 2017.
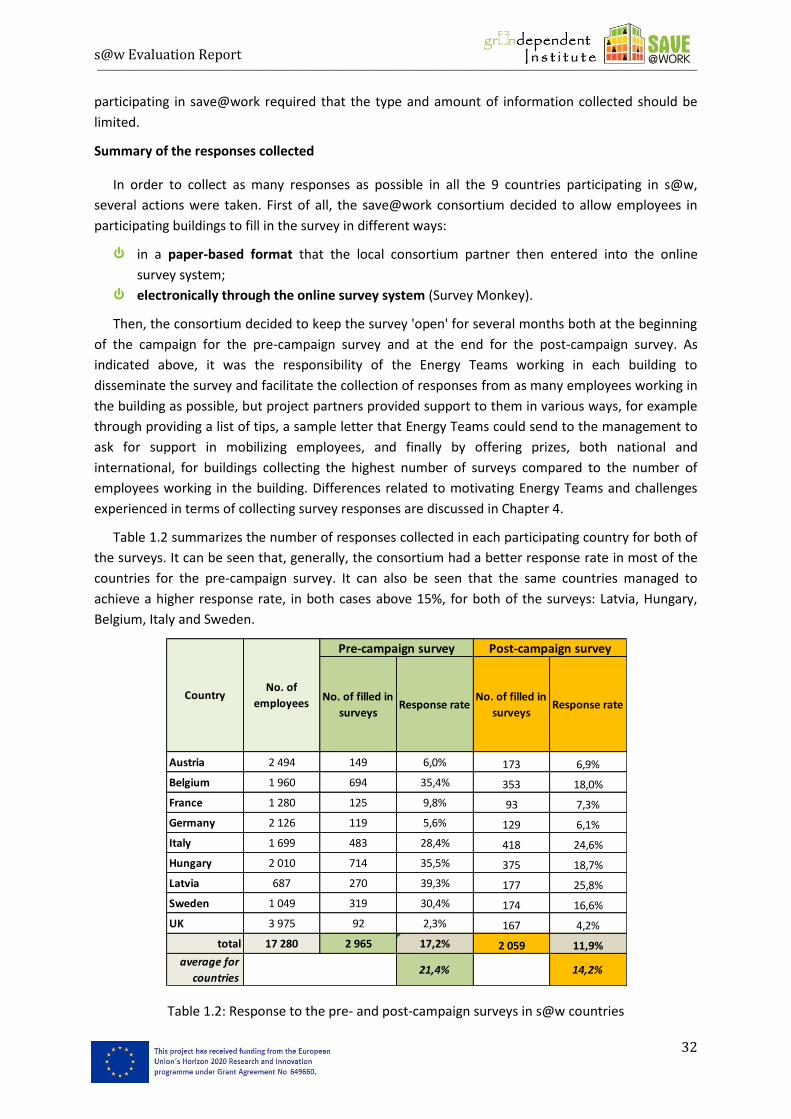
s@w Evaluation Report ___________________________________________________________________________________________________________________________________________________________________________________
32
participating in save@work required that the type and amount of information collected should be
limited.
Summary of the responses collected
In order to collect as many responses as possible in all the 9 countries participating in s@w,
several actions were taken. First of all, the save@work consortium decided to allow employees in
participating buildings to fill in the survey in different ways:
in a paper-based format that the local consortium partner then entered into the online
survey system;
electronically through the online survey system (Survey Monkey).
Then, the consortium decided to keep the survey 'open' for several months both at the beginning
of the campaign for the pre-campaign survey and at the end for the post-campaign survey. As
indicated above, it was the responsibility of the Energy Teams working in each building to
disseminate the survey and facilitate the collection of responses from as many employees working in
the building as possible, but project partners provided support to them in various ways, for example
through providing a list of tips, a sample letter that Energy Teams could send to the management to
ask for support in mobilizing employees, and finally by offering prizes, both national and
international, for buildings collecting the highest number of surveys compared to the number of
employees working in the building. Differences related to motivating Energy Teams and challenges
experienced in terms of collecting survey responses are discussed in Chapter 4.
Table 1.2 summarizes the number of responses collected in each participating country for both of
the surveys. It can be seen that, generally, the consortium had a better response rate in most of the
countries for the pre-campaign survey. It can also be seen that the same countries managed to
achieve a higher response rate, in both cases above 15%, for both of the surveys: Latvia, Hungary,
Belgium, Italy and Sweden.
Table 1.2: Response to the pre- and post-campaign surveys in s@w countries
No. of filled in
surveysResponse rate
No. of filled in
surveysResponse rate
Austria 2 494 149 6,0% 173 6,9%
Belgium 1 960 694 35,4% 353 18,0%
France 1 280 125 9,8% 93 7,3%
Germany 2 126 119 5,6% 129 6,1%
Italy 1 699 483 28,4% 418 24,6%
Hungary 2 010 714 35,5% 375 18,7%
Latvia 687 270 39,3% 177 25,8%
Sweden 1 049 319 30,4% 174 16,6%
UK 3 975 92 2,3% 167 4,2%
total 17 280 2 965 17,2% 2 059 11,9%
average for
countries21,4% 14,2%
Pre-campaign survey Post-campaign survey
CountryNo. of
employees
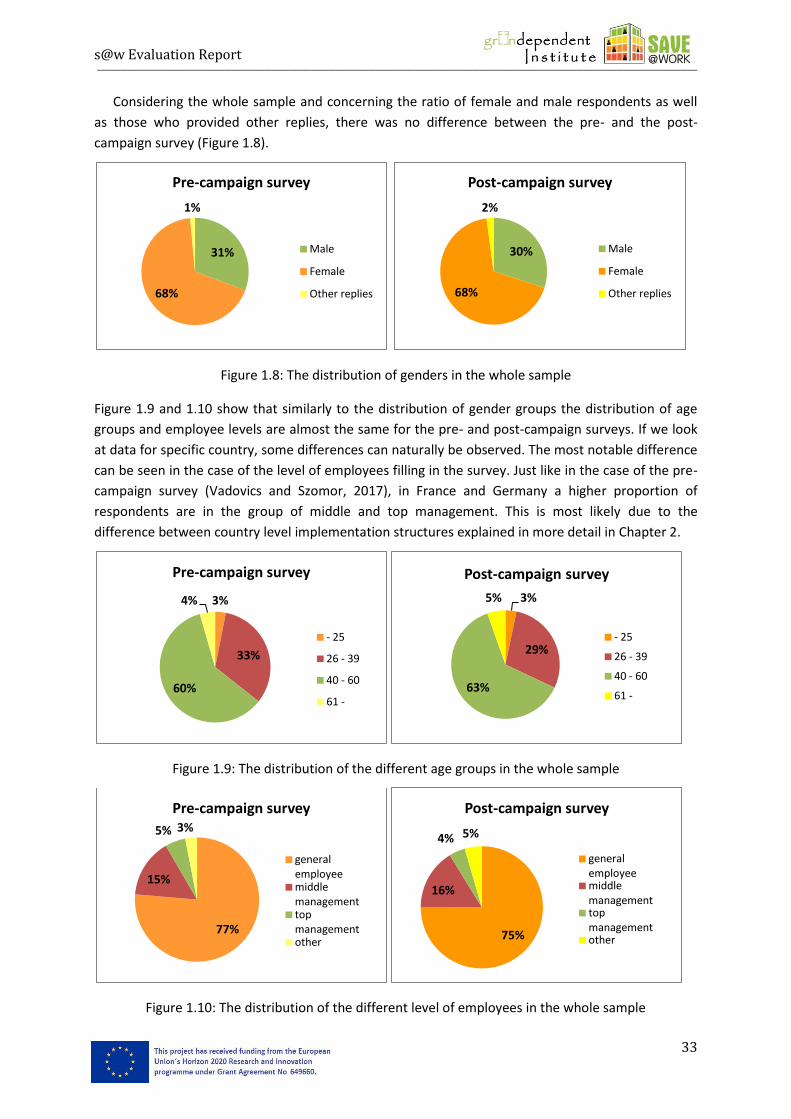
s@w Evaluation Report ___________________________________________________________________________________________________________________________________________________________________________________
33
Considering the whole sample and concerning the ratio of female and male respondents as well
as those who provided other replies, there was no difference between the pre- and the post-
campaign survey (Figure 1.8).
Figure 1.8: The distribution of genders in the whole sample
Figure 1.9 and 1.10 show that similarly to the distribution of gender groups the distribution of age
groups and employee levels are almost the same for the pre- and post-campaign surveys. If we look
at data for specific country, some differences can naturally be observed. The most notable difference
can be seen in the case of the level of employees filling in the survey. Just like in the case of the pre-
campaign survey (Vadovics and Szomor, 2017), in France and Germany a higher proportion of
respondents are in the group of middle and top management. This is most likely due to the
difference between country level implementation structures explained in more detail in Chapter 2.
Figure 1.9: The distribution of the different age groups in the whole sample
Figure 1.10: The distribution of the different level of employees in the whole sample
31%
68%
1%
Pre-campaign survey
Male
Female
Other replies
30%
68%
2%
Post-campaign survey
Male
Female
Other replies
3%
33%
60%
4%
Pre-campaign survey
- 25
26 - 39
40 - 60
61 -
3%
29%
63%
5%
Post-campaign survey
- 25
26 - 39
40 - 60
61 -
77%
15%
5% 3%
Pre-campaign survey
general employee middle management top management other
75%
16%
4% 5%
Post-campaign survey
general employee middle management top management other
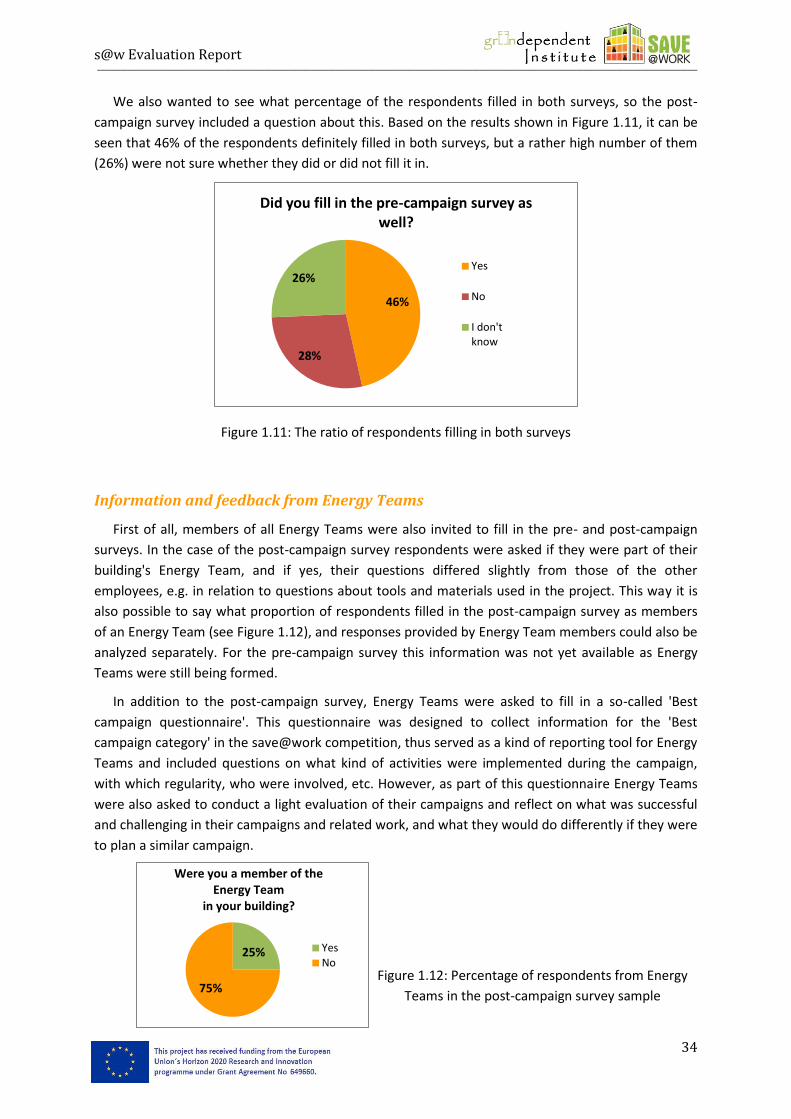
s@w Evaluation Report ___________________________________________________________________________________________________________________________________________________________________________________
34
We also wanted to see what percentage of the respondents filled in both surveys, so the post-
campaign survey included a question about this. Based on the results shown in Figure 1.11, it can be
seen that 46% of the respondents definitely filled in both surveys, but a rather high number of them
(26%) were not sure whether they did or did not fill it in.
Figure 1.11: The ratio of respondents filling in both surveys
Information and feedback from Energy Teams
First of all, members of all Energy Teams were also invited to fill in the pre- and post-campaign
surveys. In the case of the post-campaign survey respondents were asked if they were part of their
building's Energy Team, and if yes, their questions differed slightly from those of the other
employees, e.g. in relation to questions about tools and materials used in the project. This way it is
also possible to say what proportion of respondents filled in the post-campaign survey as members
of an Energy Team (see Figure 1.12), and responses provided by Energy Team members could also be
analyzed separately. For the pre-campaign survey this information was not yet available as Energy
Teams were still being formed.
In addition to the post-campaign survey, Energy Teams were asked to fill in a so-called 'Best
campaign questionnaire'. This questionnaire was designed to collect information for the 'Best
campaign category' in the save@work competition, thus served as a kind of reporting tool for Energy
Teams and included questions on what kind of activities were implemented during the campaign,
with which regularity, who were involved, etc. However, as part of this questionnaire Energy Teams
were also asked to conduct a light evaluation of their campaigns and reflect on what was successful
and challenging in their campaigns and related work, and what they would do differently if they were
to plan a similar campaign.
Figure 1.12: Percentage of respondents from Energy
Teams in the post-campaign survey sample
46%
28%
26%
Did you fill in the pre-campaign survey as well?
Yes
No
I don't know
25%
75%
Were you a member of the Energy Team
in your building?
Yes
No
s@w Evaluation Report ___________________________________________________________________________________________________________________________________________________________________________________
35
CHAPTER 2: The impact of the project: learning from the outcomes of
the pre- and post-campaign surveys
To assess the impact of the save@work project we first looked at how much participants liked the
campaign overall and how satisfied project partners were with the national campaign conducted
(section 2.1). Then, we analyzed whether there were any changes in the frequency of employees
carrying out energy saving practices, in their related level of knowledge and skills, and in their
attitude and support for energy saving, by comparing the results of the post-campaign surveys to the
pre-campaign surveys15 (section 2.2). In this section we also discuss whether respondents or the
management initiated any new activities related to energy saving during the course of the one-year
campaign, and whether participation in the project stimulated them to save more energy outside of
the office. Finally, in section 2.3 and 2.4 we consider the long-lasting impact of the behaviour
changes initiated as part of the save@work campaign and whether participants intend to and are
able to carry on with the energy saving activities as well as whether they would join a similar
campaign in the future.
Methodological considerations
There are some important considerations to take into account when reading the descriptions and
discussions presented in the Report:
The French pre- or post-campaign survey answers are not taken into account in
Chapters 2 and 416.
Since there were some respondents who did not fill in the whole survey questionnaire,
the number of respondents varies from question to question. Besides, some questions
were not compulsory to be filled in. Where it was deemed necessary, we indicated the
number of respondents / answers received.
Many of the figures presented in Chapter 2 show 'rating average' values, calculated
between 1 and 5. It was calculated by converting all possible answers to one of these
numbers: 'never' and 'strongly disagree' correspond to 1, 'rarely' and 'disagree'
correspond to 2, 'sometimes, sometimes not (50-50%)' and 'undecided/ not sure' to 3,
'often' and 'agree' to 4, and finally 'all the time' and 'strongly agree' correspond to 5.
Therefore, an average could be calculated and thus countries, for example, could be
directly compared. 'Not relevant / not possible in the office' answers were not included in
this value.
In the last section of the post-campaign survey we enquired whether respondents filled in the
pre-campaign survey at the beginning of the save@work campaign. Out of all respondents who
answered this question, 47% selected 'yes', 25% chose 'I do not know' and 25% answered 'no' − not
taking into consideration responses from France17. Therefore we can say that at least about half of
15
For further information on the pre- and post-campaign surveys, please see Chapter 1, section 1.4. 16
The French project partner (Prioriterre) had to leave the project before it was finalized, so the French results are excluded from the discussion in Chapters 2 and 4. 17
The same result is presented in Figure 1.11 in Chapter 1. The difference between the numbers presented there and here occur due to the fact that unlike here, in Chapter 1 we included the results for all 9 countries, including France.
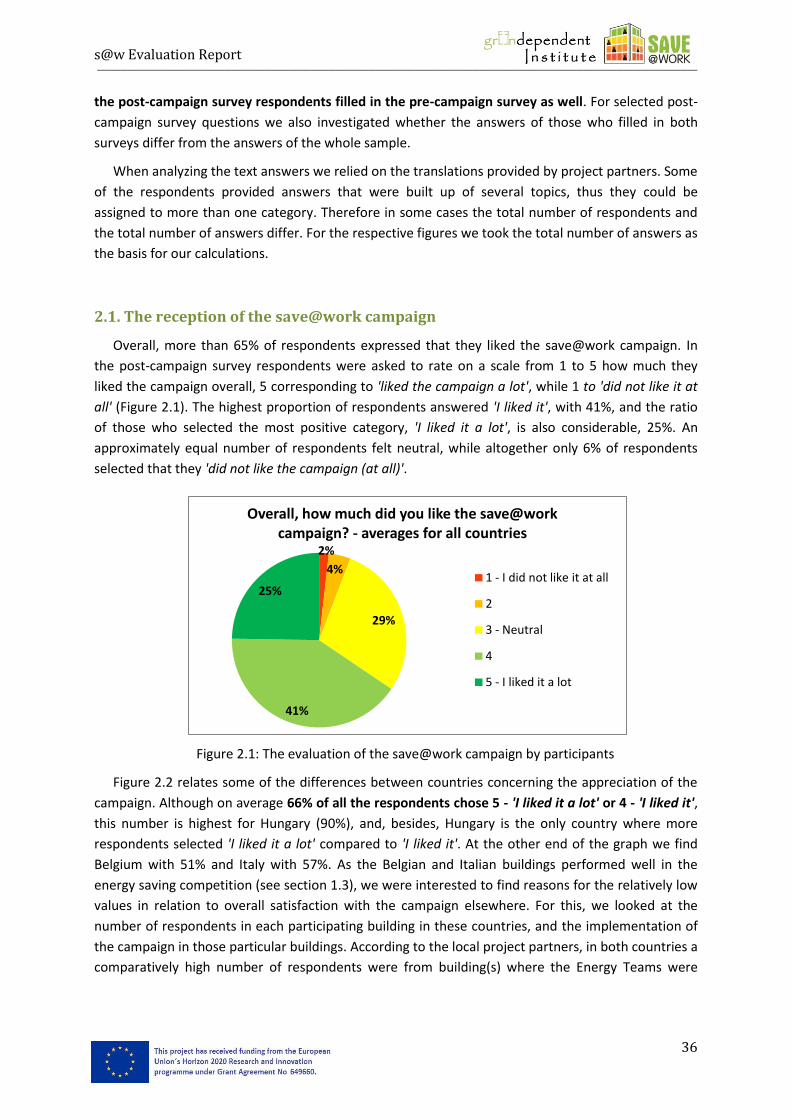
s@w Evaluation Report ___________________________________________________________________________________________________________________________________________________________________________________
36
the post-campaign survey respondents filled in the pre-campaign survey as well. For selected post-
campaign survey questions we also investigated whether the answers of those who filled in both
surveys differ from the answers of the whole sample.
When analyzing the text answers we relied on the translations provided by project partners. Some
of the respondents provided answers that were built up of several topics, thus they could be
assigned to more than one category. Therefore in some cases the total number of respondents and
the total number of answers differ. For the respective figures we took the total number of answers as
the basis for our calculations.
2.1. The reception of the save@work campaign
Overall, more than 65% of respondents expressed that they liked the save@work campaign. In
the post-campaign survey respondents were asked to rate on a scale from 1 to 5 how much they
liked the campaign overall, 5 corresponding to 'liked the campaign a lot', while 1 to 'did not like it at
all' (Figure 2.1). The highest proportion of respondents answered 'I liked it', with 41%, and the ratio
of those who selected the most positive category, 'I liked it a lot', is also considerable, 25%. An
approximately equal number of respondents felt neutral, while altogether only 6% of respondents
selected that they 'did not like the campaign (at all)'.
Figure 2.1: The evaluation of the save@work campaign by participants
Figure 2.2 relates some of the differences between countries concerning the appreciation of the
campaign. Although on average 66% of all the respondents chose 5 - 'I liked it a lot' or 4 - 'I liked it',
this number is highest for Hungary (90%), and, besides, Hungary is the only country where more
respondents selected 'I liked it a lot' compared to 'I liked it'. At the other end of the graph we find
Belgium with 51% and Italy with 57%. As the Belgian and Italian buildings performed well in the
energy saving competition (see section 1.3), we were interested to find reasons for the relatively low
values in relation to overall satisfaction with the campaign elsewhere. For this, we looked at the
number of respondents in each participating building in these countries, and the implementation of
the campaign in those particular buildings. According to the local project partners, in both countries a
comparatively high number of respondents were from building(s) where the Energy Teams were
2%
4%
29%
41%
25%
Overall, how much did you like the save@work campaign? - averages for all countries
1 - I did not like it at all
2
3 - Neutral
4
5 - I liked it a lot
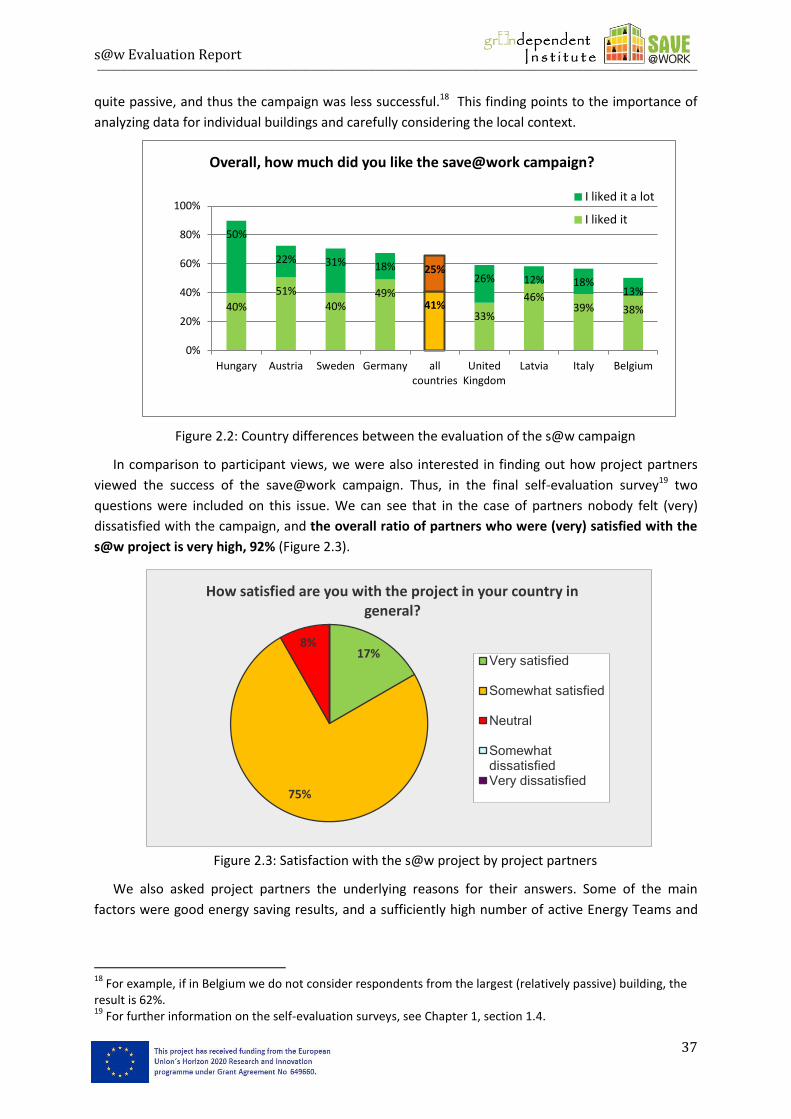
s@w Evaluation Report ___________________________________________________________________________________________________________________________________________________________________________________
37
quite passive, and thus the campaign was less successful.18 This finding points to the importance of
analyzing data for individual buildings and carefully considering the local context.
Figure 2.2: Country differences between the evaluation of the s@w campaign
In comparison to participant views, we were also interested in finding out how project partners
viewed the success of the save@work campaign. Thus, in the final self-evaluation survey19 two
questions were included on this issue. We can see that in the case of partners nobody felt (very)
dissatisfied with the campaign, and the overall ratio of partners who were (very) satisfied with the
s@w project is very high, 92% (Figure 2.3).
Figure 2.3: Satisfaction with the s@w project by project partners
We also asked project partners the underlying reasons for their answers. Some of the main
factors were good energy saving results, and a sufficiently high number of active Energy Teams and
18
For example, if in Belgium we do not consider respondents from the largest (relatively passive) building, the result is 62%. 19
For further information on the self-evaluation surveys, see Chapter 1, section 1.4.
17%
75%
8%
How satisfied are you with the project in your country in general?
Very satisfied
Somewhat satisfied
Neutral
Somewhat dissatisfied Very dissatisfied
40%
51%
40% 49%
41% 33%
46% 39% 38%
50%
22% 31% 18% 25% 26% 12% 18%
13%
0%
20%
40%
60%
80%
100%
Hungary Austria Sweden Germany all countries
United Kingdom
Latvia Italy Belgium
Overall, how much did you like the save@work campaign?
I liked it a lot
I liked it
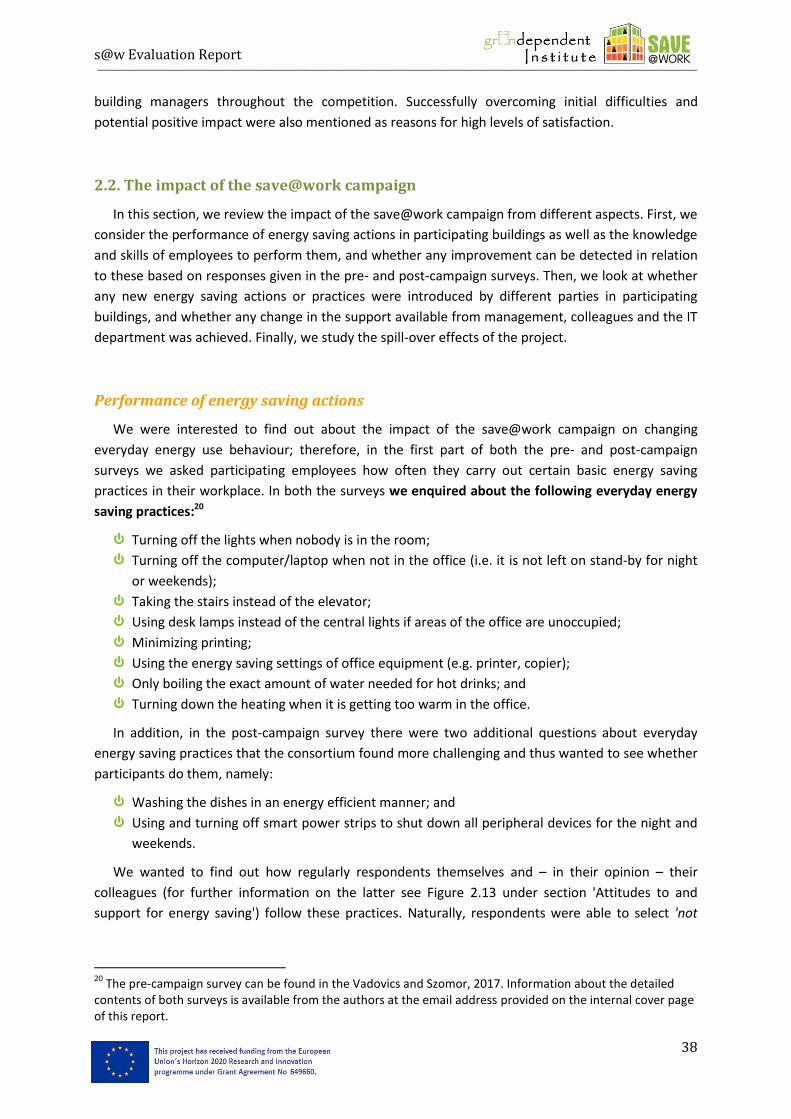
s@w Evaluation Report ___________________________________________________________________________________________________________________________________________________________________________________
38
building managers throughout the competition. Successfully overcoming initial difficulties and
potential positive impact were also mentioned as reasons for high levels of satisfaction.
2.2. The impact of the save@work campaign
In this section, we review the impact of the save@work campaign from different aspects. First, we
consider the performance of energy saving actions in participating buildings as well as the knowledge
and skills of employees to perform them, and whether any improvement can be detected in relation
to these based on responses given in the pre- and post-campaign surveys. Then, we look at whether
any new energy saving actions or practices were introduced by different parties in participating
buildings, and whether any change in the support available from management, colleagues and the IT
department was achieved. Finally, we study the spill-over effects of the project.
Performance of energy saving actions
We were interested to find out about the impact of the save@work campaign on changing
everyday energy use behaviour; therefore, in the first part of both the pre- and post-campaign
surveys we asked participating employees how often they carry out certain basic energy saving
practices in their workplace. In both the surveys we enquired about the following everyday energy
saving practices:20
Turning off the lights when nobody is in the room;
Turning off the computer/laptop when not in the office (i.e. it is not left on stand-by for night
or weekends);
Taking the stairs instead of the elevator;
Using desk lamps instead of the central lights if areas of the office are unoccupied;
Minimizing printing;
Using the energy saving settings of office equipment (e.g. printer, copier);
Only boiling the exact amount of water needed for hot drinks; and
Turning down the heating when it is getting too warm in the office.
In addition, in the post-campaign survey there were two additional questions about everyday
energy saving practices that the consortium found more challenging and thus wanted to see whether
participants do them, namely:
Washing the dishes in an energy efficient manner; and
Using and turning off smart power strips to shut down all peripheral devices for the night and
weekends.
We wanted to find out how regularly respondents themselves and – in their opinion – their
colleagues (for further information on the latter see Figure 2.13 under section 'Attitudes to and
support for energy saving') follow these practices. Naturally, respondents were able to select 'not
20
The pre-campaign survey can be found in the Vadovics and Szomor, 2017. Information about the detailed contents of both surveys is available from the authors at the email address provided on the internal cover page of this report.
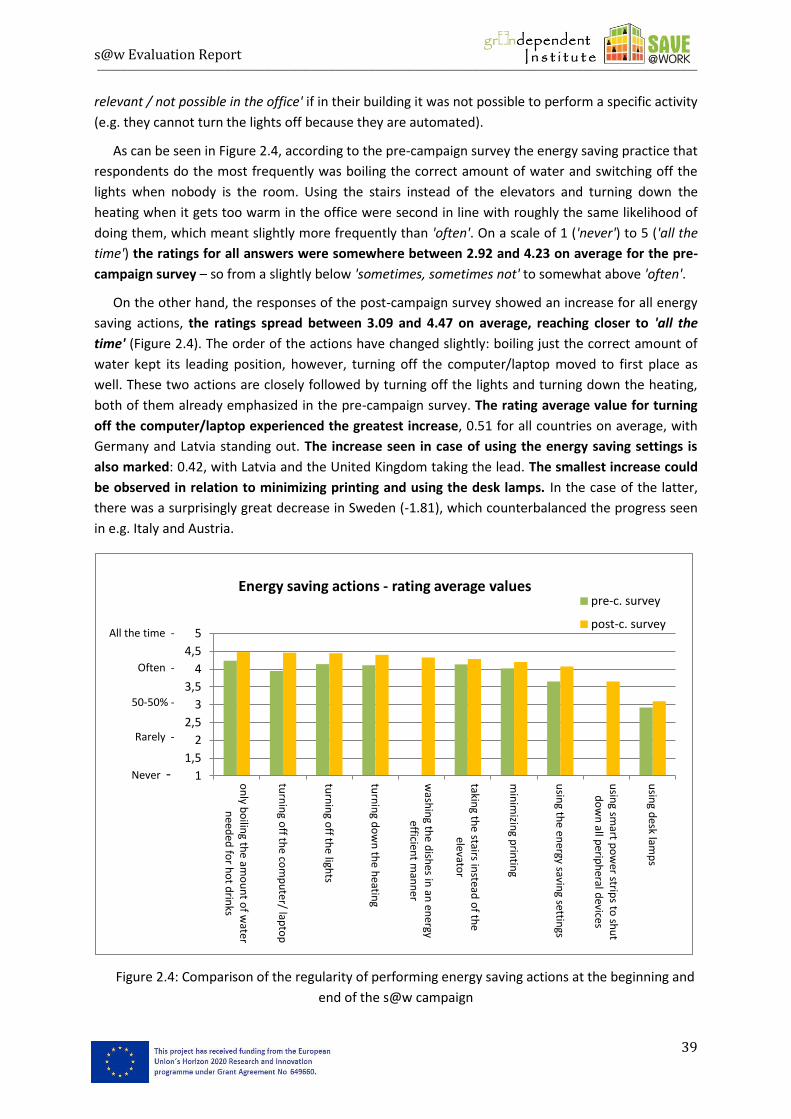
s@w Evaluation Report ___________________________________________________________________________________________________________________________________________________________________________________
39
relevant / not possible in the office' if in their building it was not possible to perform a specific activity
(e.g. they cannot turn the lights off because they are automated).
As can be seen in Figure 2.4, according to the pre-campaign survey the energy saving practice that
respondents do the most frequently was boiling the correct amount of water and switching off the
lights when nobody is the room. Using the stairs instead of the elevators and turning down the
heating when it gets too warm in the office were second in line with roughly the same likelihood of
doing them, which meant slightly more frequently than 'often'. On a scale of 1 ('never') to 5 ('all the
time') the ratings for all answers were somewhere between 2.92 and 4.23 on average for the pre-
campaign survey – so from a slightly below 'sometimes, sometimes not' to somewhat above 'often'.
On the other hand, the responses of the post-campaign survey showed an increase for all energy
saving actions, the ratings spread between 3.09 and 4.47 on average, reaching closer to 'all the
time' (Figure 2.4). The order of the actions have changed slightly: boiling just the correct amount of
water kept its leading position, however, turning off the computer/laptop moved to first place as
well. These two actions are closely followed by turning off the lights and turning down the heating,
both of them already emphasized in the pre-campaign survey. The rating average value for turning
off the computer/laptop experienced the greatest increase, 0.51 for all countries on average, with
Germany and Latvia standing out. The increase seen in case of using the energy saving settings is
also marked: 0.42, with Latvia and the United Kingdom taking the lead. The smallest increase could
be observed in relation to minimizing printing and using the desk lamps. In the case of the latter,
there was a surprisingly great decrease in Sweden (-1.81), which counterbalanced the progress seen
in e.g. Italy and Austria.
Figure 2.4: Comparison of the regularity of performing energy saving actions at the beginning and
end of the s@w campaign
1
1,5
2
2,5
3
3,5
4
4,5
5
on
ly bo
iling th
e amo
un
t of w
ater n
eeded
for h
ot d
rinks
turn
ing o
ff the co
mp
uter/ lap
top
turn
ing o
ff the ligh
ts
turn
ing d
ow
n th
e heatin
g
wash
ing th
e dish
es in an
energy
efficient m
ann
er
taking th
e stairs instead
of th
e elevato
r
min
imizin
g prin
ting
usin
g the en
ergy saving settin
gs
usin
g smart p
ow
er strips to
shu
t d
ow
n all p
eriph
eral devices
usin
g desk lam
ps
Energy saving actions - rating average values pre-c. survey
post-c. survey All the time -
Often -
50-50% -
Rarely -
Never -
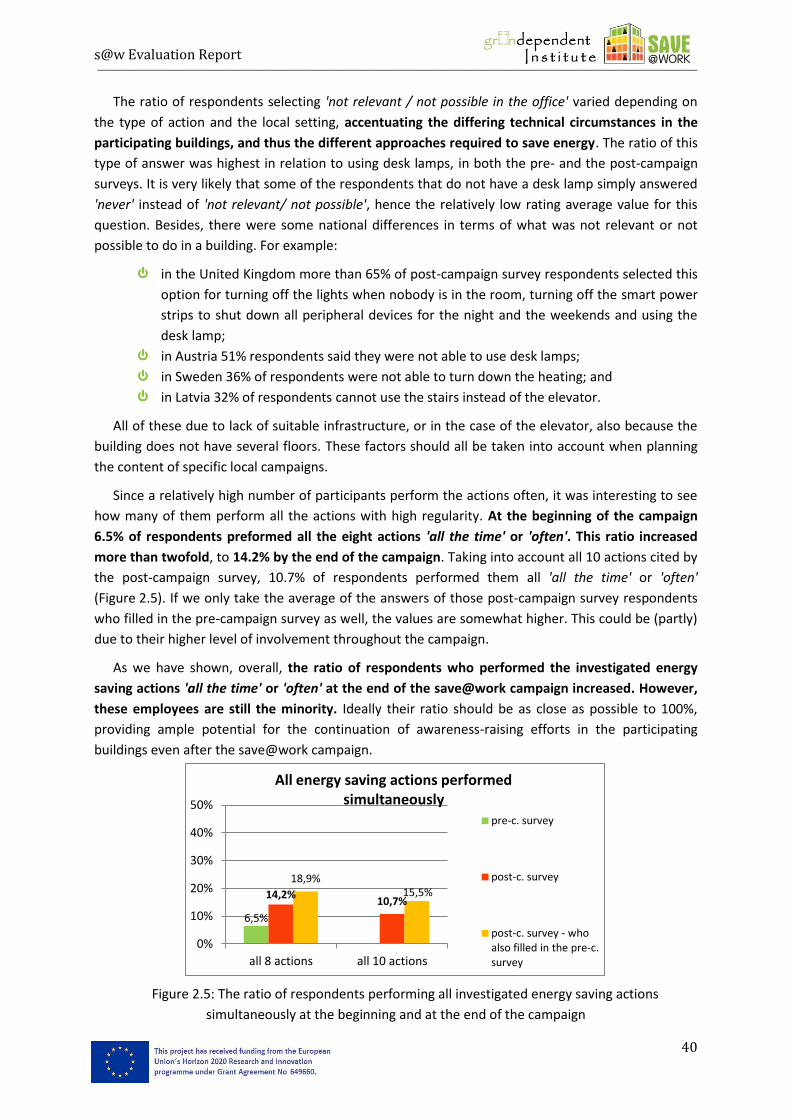
s@w Evaluation Report ___________________________________________________________________________________________________________________________________________________________________________________
40
The ratio of respondents selecting 'not relevant / not possible in the office' varied depending on
the type of action and the local setting, accentuating the differing technical circumstances in the
participating buildings, and thus the different approaches required to save energy. The ratio of this
type of answer was highest in relation to using desk lamps, in both the pre- and the post-campaign
surveys. It is very likely that some of the respondents that do not have a desk lamp simply answered
'never' instead of 'not relevant/ not possible', hence the relatively low rating average value for this
question. Besides, there were some national differences in terms of what was not relevant or not
possible to do in a building. For example:
in the United Kingdom more than 65% of post-campaign survey respondents selected this
option for turning off the lights when nobody is in the room, turning off the smart power
strips to shut down all peripheral devices for the night and the weekends and using the
desk lamp;
in Austria 51% respondents said they were not able to use desk lamps;
in Sweden 36% of respondents were not able to turn down the heating; and
in Latvia 32% of respondents cannot use the stairs instead of the elevator.
All of these due to lack of suitable infrastructure, or in the case of the elevator, also because the
building does not have several floors. These factors should all be taken into account when planning
the content of specific local campaigns.
Since a relatively high number of participants perform the actions often, it was interesting to see
how many of them perform all the actions with high regularity. At the beginning of the campaign
6.5% of respondents preformed all the eight actions 'all the time' or 'often'. This ratio increased
more than twofold, to 14.2% by the end of the campaign. Taking into account all 10 actions cited by
the post-campaign survey, 10.7% of respondents performed them all 'all the time' or 'often'
(Figure 2.5). If we only take the average of the answers of those post-campaign survey respondents
who filled in the pre-campaign survey as well, the values are somewhat higher. This could be (partly)
due to their higher level of involvement throughout the campaign.
As we have shown, overall, the ratio of respondents who performed the investigated energy
saving actions 'all the time' or 'often' at the end of the save@work campaign increased. However,
these employees are still the minority. Ideally their ratio should be as close as possible to 100%,
providing ample potential for the continuation of awareness-raising efforts in the participating
buildings even after the save@work campaign.
Figure 2.5: The ratio of respondents performing all investigated energy saving actions
simultaneously at the beginning and at the end of the campaign
6,5%
14,2% 10,7%
18,9% 15,5%
0%
10%
20%
30%
40%
50%
all 8 actions all 10 actions
All energy saving actions performed simultaneously
pre-c. survey
post-c. survey
post-c. survey - who also filled in the pre-c. survey
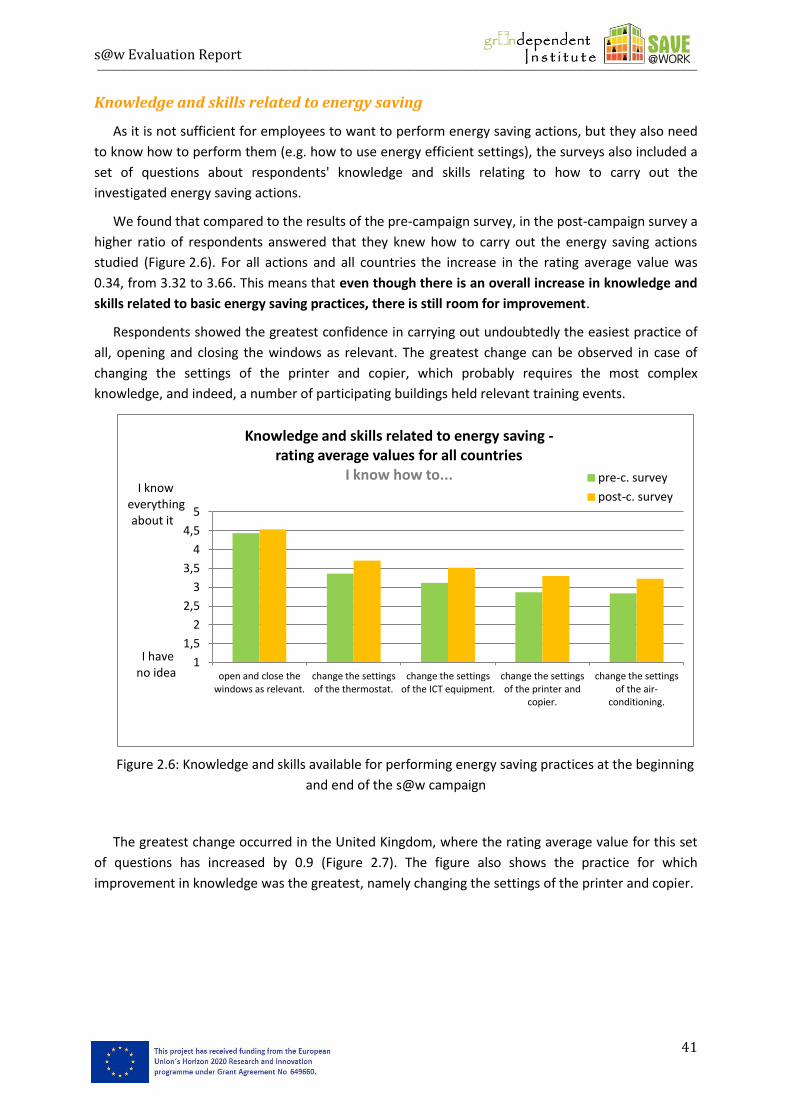
s@w Evaluation Report ___________________________________________________________________________________________________________________________________________________________________________________
41
Knowledge and skills related to energy saving
As it is not sufficient for employees to want to perform energy saving actions, but they also need
to know how to perform them (e.g. how to use energy efficient settings), the surveys also included a
set of questions about respondents' knowledge and skills relating to how to carry out the
investigated energy saving actions.
We found that compared to the results of the pre-campaign survey, in the post-campaign survey a
higher ratio of respondents answered that they knew how to carry out the energy saving actions
studied (Figure 2.6). For all actions and all countries the increase in the rating average value was
0.34, from 3.32 to 3.66. This means that even though there is an overall increase in knowledge and
skills related to basic energy saving practices, there is still room for improvement.
Respondents showed the greatest confidence in carrying out undoubtedly the easiest practice of
all, opening and closing the windows as relevant. The greatest change can be observed in case of
changing the settings of the printer and copier, which probably requires the most complex
knowledge, and indeed, a number of participating buildings held relevant training events.
Figure 2.6: Knowledge and skills available for performing energy saving practices at the beginning
and end of the s@w campaign
The greatest change occurred in the United Kingdom, where the rating average value for this set
of questions has increased by 0.9 (Figure 2.7). The figure also shows the practice for which
improvement in knowledge was the greatest, namely changing the settings of the printer and copier.
1
1,5
2
2,5
3
3,5
4
4,5
5
open and close the windows as relevant.
change the settings of the thermostat.
change the settings of the ICT equipment.
change the settings of the printer and
copier.
change the settings of the air-
conditioning.
Knowledge and skills related to energy saving - rating average values for all countries
I know how to... pre-c. survey
post-c. survey I know
everything about it
I have no idea
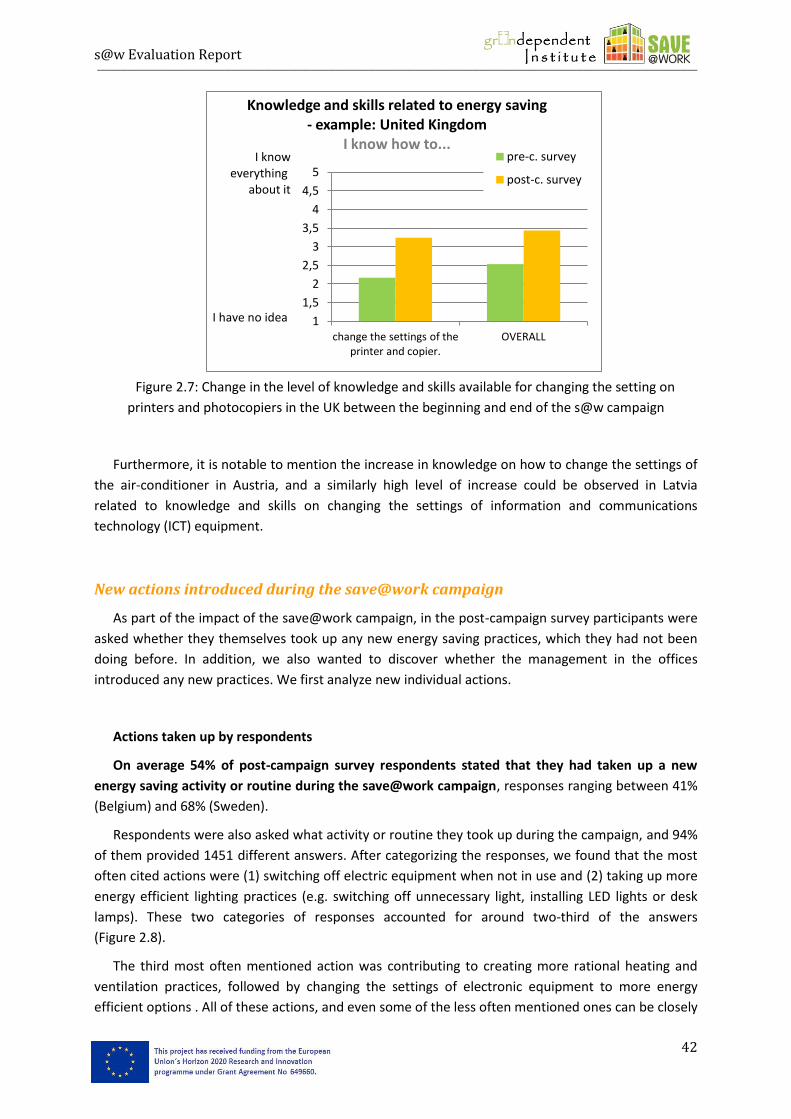
s@w Evaluation Report ___________________________________________________________________________________________________________________________________________________________________________________
42
Figure 2.7: Change in the level of knowledge and skills available for changing the setting on
printers and photocopiers in the UK between the beginning and end of the s@w campaign
Furthermore, it is notable to mention the increase in knowledge on how to change the settings of
the air-conditioner in Austria, and a similarly high level of increase could be observed in Latvia
related to knowledge and skills on changing the settings of information and communications
technology (ICT) equipment.
New actions introduced during the save@work campaign
As part of the impact of the save@work campaign, in the post-campaign survey participants were
asked whether they themselves took up any new energy saving practices, which they had not been
doing before. In addition, we also wanted to discover whether the management in the offices
introduced any new practices. We first analyze new individual actions.
Actions taken up by respondents
On average 54% of post-campaign survey respondents stated that they had taken up a new
energy saving activity or routine during the save@work campaign, responses ranging between 41%
(Belgium) and 68% (Sweden).
Respondents were also asked what activity or routine they took up during the campaign, and 94%
of them provided 1451 different answers. After categorizing the responses, we found that the most
often cited actions were (1) switching off electric equipment when not in use and (2) taking up more
energy efficient lighting practices (e.g. switching off unnecessary light, installing LED lights or desk
lamps). These two categories of responses accounted for around two-third of the answers
(Figure 2.8).
The third most often mentioned action was contributing to creating more rational heating and
ventilation practices, followed by changing the settings of electronic equipment to more energy
efficient options . All of these actions, and even some of the less often mentioned ones can be closely
1
1,5
2
2,5
3
3,5
4
4,5
5
change the settings of the printer and copier.
OVERALL
Knowledge and skills related to energy saving - example: United Kingdom
I know how to... pre-c. survey
post-c. survey
I know everything
about it
I have no idea
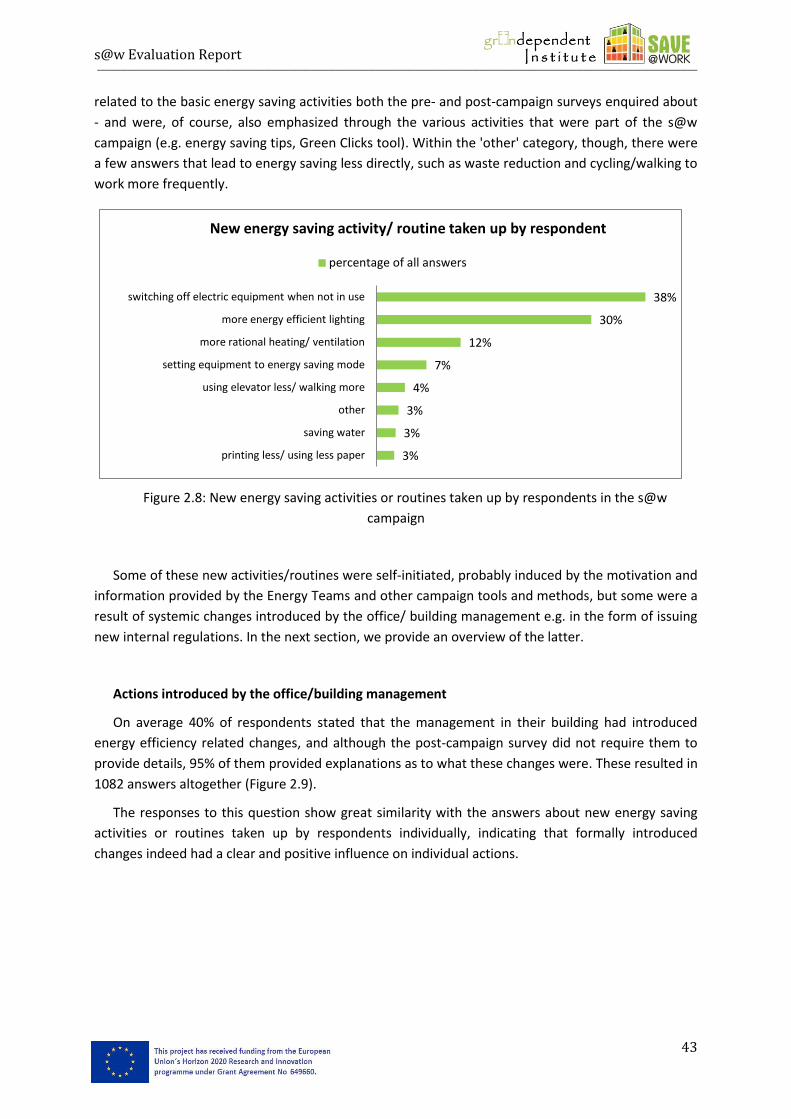
s@w Evaluation Report ___________________________________________________________________________________________________________________________________________________________________________________
43
related to the basic energy saving activities both the pre- and post-campaign surveys enquired about
- and were, of course, also emphasized through the various activities that were part of the s@w
campaign (e.g. energy saving tips, Green Clicks tool). Within the 'other' category, though, there were
a few answers that lead to energy saving less directly, such as waste reduction and cycling/walking to
work more frequently.
Figure 2.8: New energy saving activities or routines taken up by respondents in the s@w
campaign
Some of these new activities/routines were self-initiated, probably induced by the motivation and
information provided by the Energy Teams and other campaign tools and methods, but some were a
result of systemic changes introduced by the office/ building management e.g. in the form of issuing
new internal regulations. In the next section, we provide an overview of the latter.
Actions introduced by the office/building management
On average 40% of respondents stated that the management in their building had introduced
energy efficiency related changes, and although the post-campaign survey did not require them to
provide details, 95% of them provided explanations as to what these changes were. These resulted in
1082 answers altogether (Figure 2.9).
The responses to this question show great similarity with the answers about new energy saving
activities or routines taken up by respondents individually, indicating that formally introduced
changes indeed had a clear and positive influence on individual actions.
3%
3%
3%
4%
7%
12%
30%
38%
printing less/ using less paper
saving water
other
using elevator less/ walking more
setting equipment to energy saving mode
more rational heating/ ventilation
more energy efficient lighting
switching off electric equipment when not in use
New energy saving activity/ routine taken up by respondent
percentage of all answers
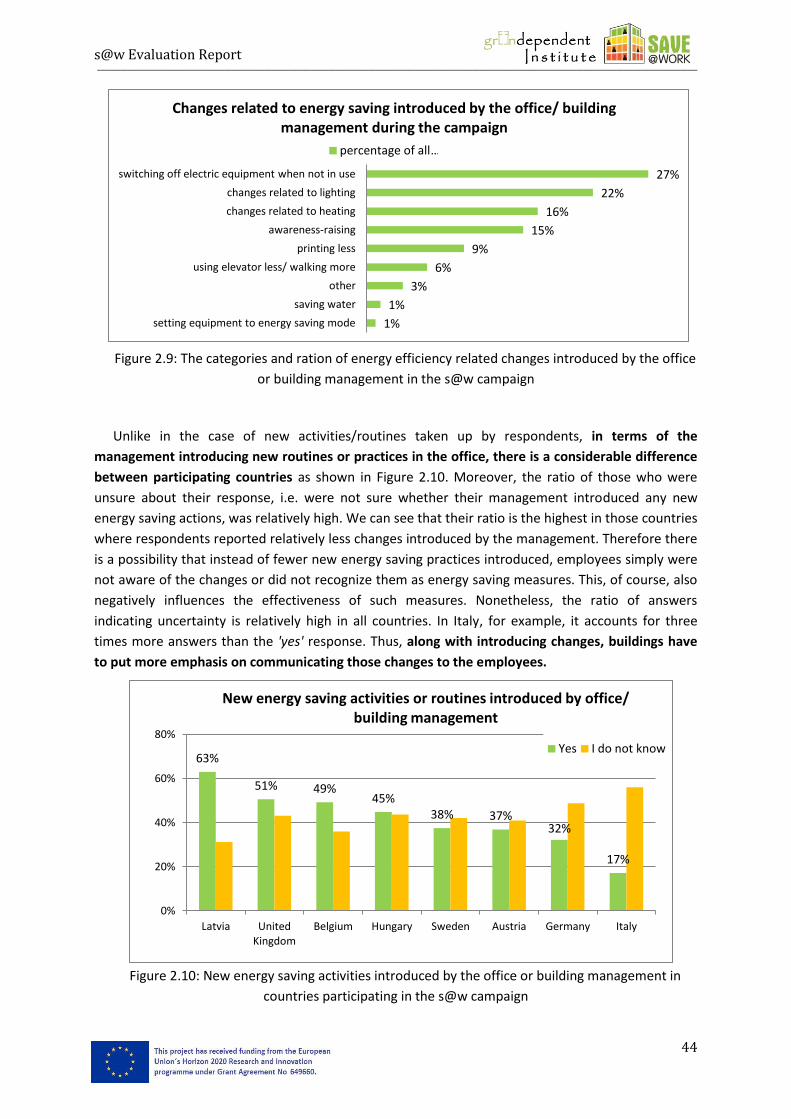
s@w Evaluation Report ___________________________________________________________________________________________________________________________________________________________________________________
44
Figure 2.9: The categories and ration of energy efficiency related changes introduced by the office
or building management in the s@w campaign
Unlike in the case of new activities/routines taken up by respondents, in terms of the
management introducing new routines or practices in the office, there is a considerable difference
between participating countries as shown in Figure 2.10. Moreover, the ratio of those who were
unsure about their response, i.e. were not sure whether their management introduced any new
energy saving actions, was relatively high. We can see that their ratio is the highest in those countries
where respondents reported relatively less changes introduced by the management. Therefore there
is a possibility that instead of fewer new energy saving practices introduced, employees simply were
not aware of the changes or did not recognize them as energy saving measures. This, of course, also
negatively influences the effectiveness of such measures. Nonetheless, the ratio of answers
indicating uncertainty is relatively high in all countries. In Italy, for example, it accounts for three
times more answers than the 'yes' response. Thus, along with introducing changes, buildings have
to put more emphasis on communicating those changes to the employees.
Figure 2.10: New energy saving activities introduced by the office or building management in
countries participating in the s@w campaign
63%
51% 49% 45%
38% 37% 32%
17%
0%
20%
40%
60%
80%
Latvia United Kingdom
Belgium Hungary Sweden Austria Germany Italy
New energy saving activities or routines introduced by office/ building management
Yes I do not know
1%
1%
3%
6%
9%
15%
16%
22%
27%
setting equipment to energy saving mode
saving water
other
using elevator less/ walking more
printing less
awareness-raising
changes related to heating
changes related to lighting
switching off electric equipment when not in use
Changes related to energy saving introduced by the office/ building management during the campaign
percentage of all …
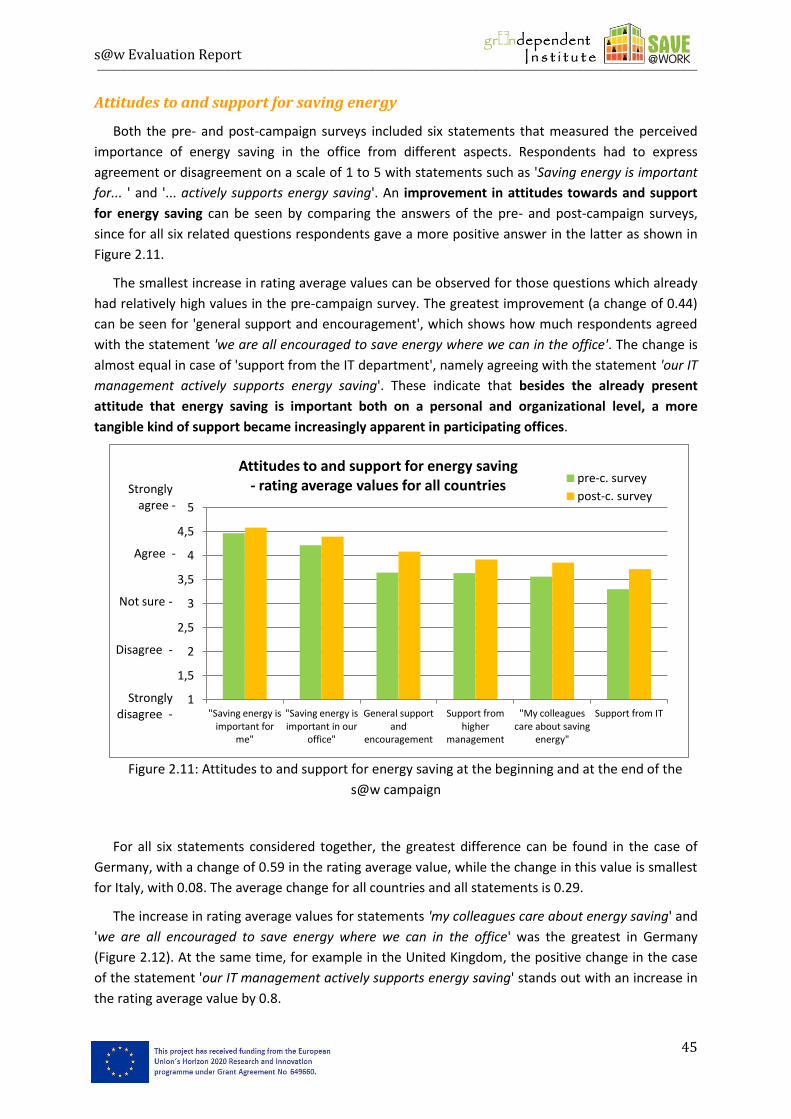
s@w Evaluation Report ___________________________________________________________________________________________________________________________________________________________________________________
45
Attitudes to and support for saving energy
Both the pre- and post-campaign surveys included six statements that measured the perceived
importance of energy saving in the office from different aspects. Respondents had to express
agreement or disagreement on a scale of 1 to 5 with statements such as 'Saving energy is important
for... ' and '... actively supports energy saving'. An improvement in attitudes towards and support
for energy saving can be seen by comparing the answers of the pre- and post-campaign surveys,
since for all six related questions respondents gave a more positive answer in the latter as shown in
Figure 2.11.
The smallest increase in rating average values can be observed for those questions which already
had relatively high values in the pre-campaign survey. The greatest improvement (a change of 0.44)
can be seen for 'general support and encouragement', which shows how much respondents agreed
with the statement 'we are all encouraged to save energy where we can in the office'. The change is
almost equal in case of 'support from the IT department', namely agreeing with the statement 'our IT
management actively supports energy saving'. These indicate that besides the already present
attitude that energy saving is important both on a personal and organizational level, a more
tangible kind of support became increasingly apparent in participating offices.
Figure 2.11: Attitudes to and support for energy saving at the beginning and at the end of the
s@w campaign
For all six statements considered together, the greatest difference can be found in the case of
Germany, with a change of 0.59 in the rating average value, while the change in this value is smallest
for Italy, with 0.08. The average change for all countries and all statements is 0.29.
The increase in rating average values for statements 'my colleagues care about energy saving' and
'we are all encouraged to save energy where we can in the office' was the greatest in Germany
(Figure 2.12). At the same time, for example in the United Kingdom, the positive change in the case
of the statement 'our IT management actively supports energy saving' stands out with an increase in
the rating average value by 0.8.
1
1,5
2
2,5
3
3,5
4
4,5
5
"Saving energy is important for
me"
"Saving energy is important in our
office"
General support and
encouragement
Support from higher
management
"My colleagues care about saving
energy"
Support from IT
Attitudes to and support for energy saving - rating average values for all countries
pre-c. survey
post-c. survey Strongly
agree -
Agree -
Not sure -
Disagree -
Strongly disagree -
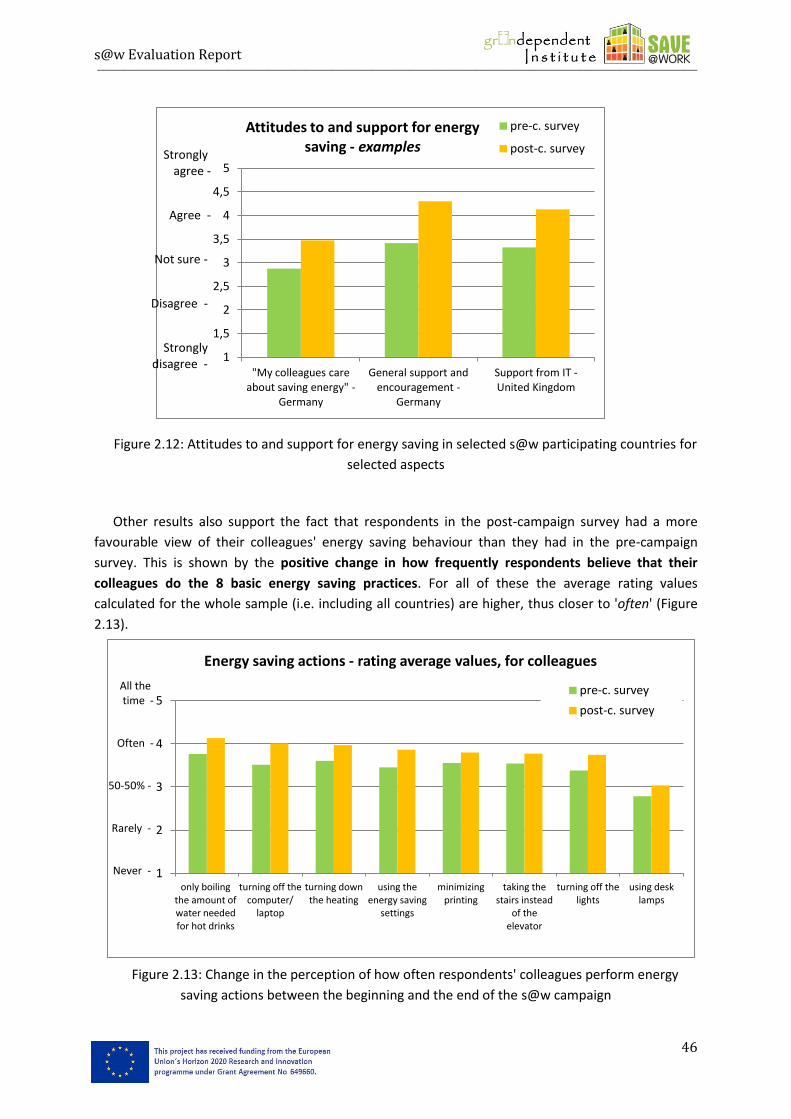
s@w Evaluation Report ___________________________________________________________________________________________________________________________________________________________________________________
46
Figure 2.12: Attitudes to and support for energy saving in selected s@w participating countries for
selected aspects
Other results also support the fact that respondents in the post-campaign survey had a more
favourable view of their colleagues' energy saving behaviour than they had in the pre-campaign
survey. This is shown by the positive change in how frequently respondents believe that their
colleagues do the 8 basic energy saving practices. For all of these the average rating values
calculated for the whole sample (i.e. including all countries) are higher, thus closer to 'often' (Figure
2.13).
Figure 2.13: Change in the perception of how often respondents' colleagues perform energy
saving actions between the beginning and the end of the s@w campaign
1
1,5
2
2,5
3
3,5
4
4,5
5
"My colleagues care about saving energy" -
Germany
General support and encouragement -
Germany
Support from IT - United Kingdom
Attitudes to and support for energy saving - examples
pre-c. survey
post-c. survey Strongly agree -
Agree -
Not sure -
Disagree -
Strongly disagree -
1
2
3
4
5
only boiling the amount of water needed for hot drinks
turning off the computer/
laptop
turning down the heating
using the energy saving
settings
minimizing printing
taking the stairs instead
of the elevator
turning off the lights
using desk lamps
Energy saving actions - rating average values, for colleagues
pre-c. survey
post-c. survey
All the time -
Often -
50-50% -
Rarely -
Never -
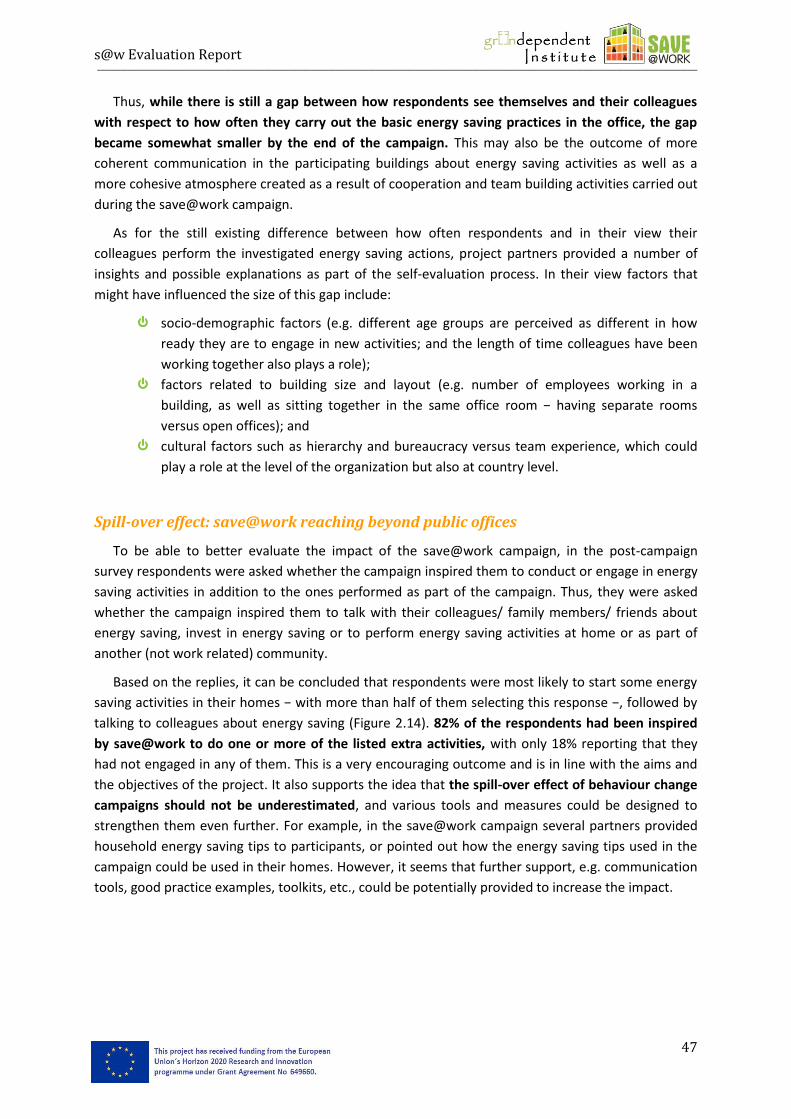
s@w Evaluation Report ___________________________________________________________________________________________________________________________________________________________________________________
47
Thus, while there is still a gap between how respondents see themselves and their colleagues
with respect to how often they carry out the basic energy saving practices in the office, the gap
became somewhat smaller by the end of the campaign. This may also be the outcome of more
coherent communication in the participating buildings about energy saving activities as well as a
more cohesive atmosphere created as a result of cooperation and team building activities carried out
during the save@work campaign.
As for the still existing difference between how often respondents and in their view their
colleagues perform the investigated energy saving actions, project partners provided a number of
insights and possible explanations as part of the self-evaluation process. In their view factors that
might have influenced the size of this gap include:
socio-demographic factors (e.g. different age groups are perceived as different in how
ready they are to engage in new activities; and the length of time colleagues have been
working together also plays a role);
factors related to building size and layout (e.g. number of employees working in a
building, as well as sitting together in the same office room − having separate rooms
versus open offices); and
cultural factors such as hierarchy and bureaucracy versus team experience, which could
play a role at the level of the organization but also at country level.
Spill-over effect: save@work reaching beyond public offices
To be able to better evaluate the impact of the save@work campaign, in the post-campaign
survey respondents were asked whether the campaign inspired them to conduct or engage in energy
saving activities in addition to the ones performed as part of the campaign. Thus, they were asked
whether the campaign inspired them to talk with their colleagues/ family members/ friends about
energy saving, invest in energy saving or to perform energy saving activities at home or as part of
another (not work related) community.
Based on the replies, it can be concluded that respondents were most likely to start some energy
saving activities in their homes − with more than half of them selecting this response −, followed by
talking to colleagues about energy saving (Figure 2.14). 82% of the respondents had been inspired
by save@work to do one or more of the listed extra activities, with only 18% reporting that they
had not engaged in any of them. This is a very encouraging outcome and is in line with the aims and
the objectives of the project. It also supports the idea that the spill-over effect of behaviour change
campaigns should not be underestimated, and various tools and measures could be designed to
strengthen them even further. For example, in the save@work campaign several partners provided
household energy saving tips to participants, or pointed out how the energy saving tips used in the
campaign could be used in their homes. However, it seems that further support, e.g. communication
tools, good practice examples, toolkits, etc., could be potentially provided to increase the impact.
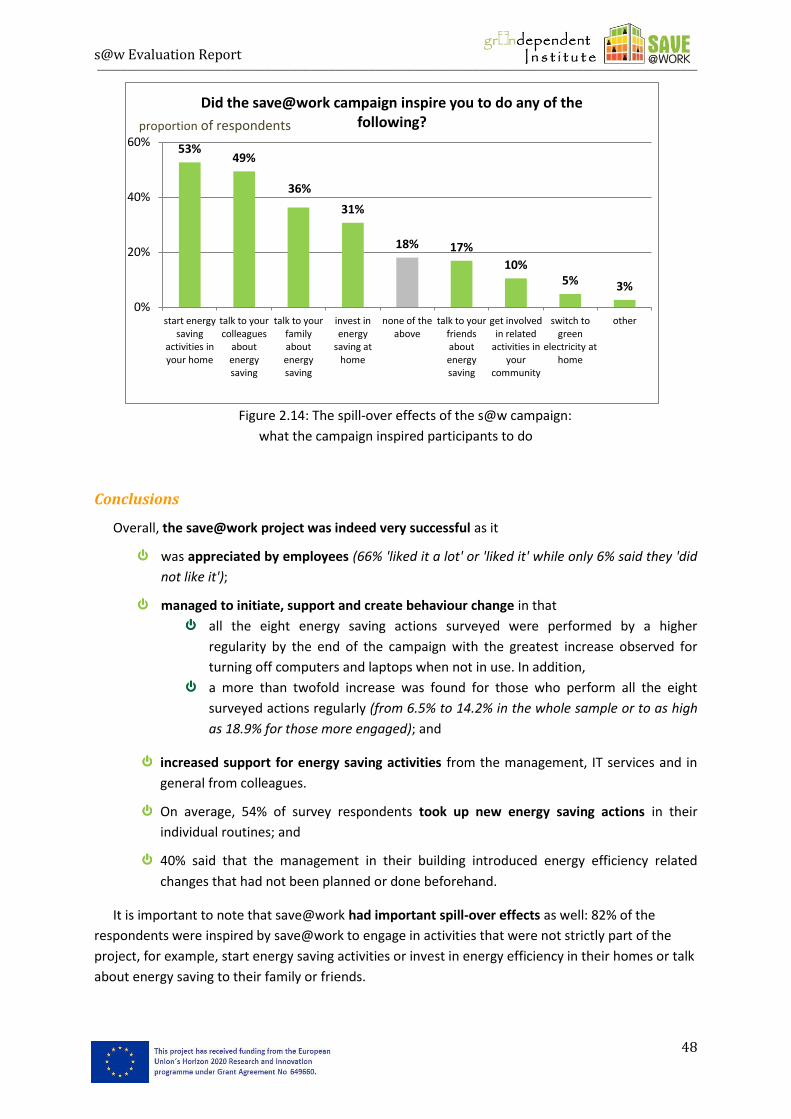
s@w Evaluation Report ___________________________________________________________________________________________________________________________________________________________________________________
48
Figure 2.14: The spill-over effects of the s@w campaign:
what the campaign inspired participants to do
Conclusions
Overall, the save@work project was indeed very successful as it
was appreciated by employees (66% 'liked it a lot' or 'liked it' while only 6% said they 'did
not like it');
managed to initiate, support and create behaviour change in that
all the eight energy saving actions surveyed were performed by a higher
regularity by the end of the campaign with the greatest increase observed for
turning off computers and laptops when not in use. In addition,
a more than twofold increase was found for those who perform all the eight
surveyed actions regularly (from 6.5% to 14.2% in the whole sample or to as high
as 18.9% for those more engaged); and
increased support for energy saving activities from the management, IT services and in
general from colleagues.
On average, 54% of survey respondents took up new energy saving actions in their
individual routines; and
40% said that the management in their building introduced energy efficiency related
changes that had not been planned or done beforehand.
It is important to note that save@work had important spill-over effects as well: 82% of the
respondents were inspired by save@work to engage in activities that were not strictly part of the
project, for example, start energy saving activities or invest in energy efficiency in their homes or talk
about energy saving to their family or friends.
53% 49%
36%
31%
18% 17%
10% 5% 3%
0%
20%
40%
60%
start energy saving
activities in your home
talk to your colleagues
about energy saving
talk to your family about energy saving
invest in energy
saving at home
none of the above
talk to your friends about energy saving
get involved in related
activities in your
community
switch to green
electricity at home
other
Did the save@work campaign inspire you to do any of the following? proportion of respondents
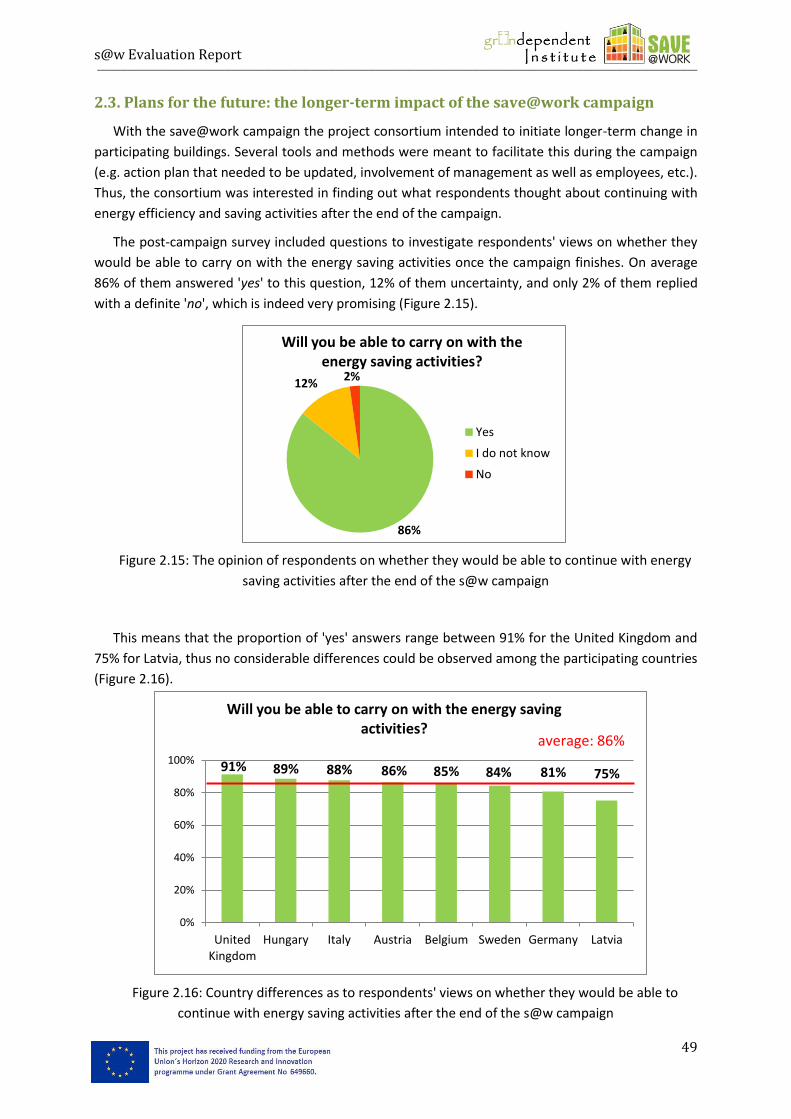
s@w Evaluation Report ___________________________________________________________________________________________________________________________________________________________________________________
49
2.3. Plans for the future: the longer-term impact of the save@work campaign
With the save@work campaign the project consortium intended to initiate longer-term change in
participating buildings. Several tools and methods were meant to facilitate this during the campaign
(e.g. action plan that needed to be updated, involvement of management as well as employees, etc.).
Thus, the consortium was interested in finding out what respondents thought about continuing with
energy efficiency and saving activities after the end of the campaign.
The post-campaign survey included questions to investigate respondents' views on whether they
would be able to carry on with the energy saving activities once the campaign finishes. On average
86% of them answered 'yes' to this question, 12% of them uncertainty, and only 2% of them replied
with a definite 'no', which is indeed very promising (Figure 2.15).
Figure 2.15: The opinion of respondents on whether they would be able to continue with energy
saving activities after the end of the s@w campaign
This means that the proportion of 'yes' answers range between 91% for the United Kingdom and
75% for Latvia, thus no considerable differences could be observed among the participating countries
(Figure 2.16).
Figure 2.16: Country differences as to respondents' views on whether they would be able to
continue with energy saving activities after the end of the s@w campaign
91% 89% 88% 86% 85% 84% 81% 75%
0%
20%
40%
60%
80%
100%
United Kingdom
Hungary Italy Austria Belgium Sweden Germany Latvia
Will you be able to carry on with the energy saving activities?
average: 86%
86%
12% 2%
Will you be able to carry on with the energy saving activities?
Yes
I do not know
No
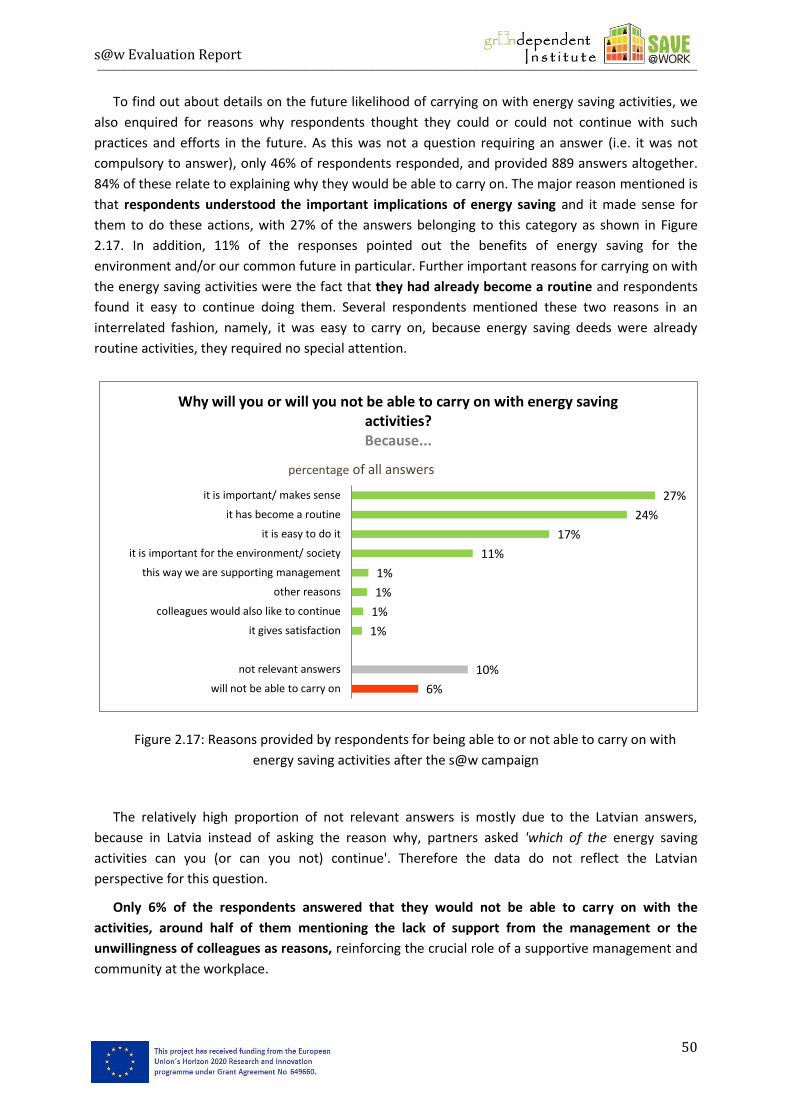
s@w Evaluation Report ___________________________________________________________________________________________________________________________________________________________________________________
50
To find out about details on the future likelihood of carrying on with energy saving activities, we
also enquired for reasons why respondents thought they could or could not continue with such
practices and efforts in the future. As this was not a question requiring an answer (i.e. it was not
compulsory to answer), only 46% of respondents responded, and provided 889 answers altogether.
84% of these relate to explaining why they would be able to carry on. The major reason mentioned is
that respondents understood the important implications of energy saving and it made sense for
them to do these actions, with 27% of the answers belonging to this category as shown in Figure
2.17. In addition, 11% of the responses pointed out the benefits of energy saving for the
environment and/or our common future in particular. Further important reasons for carrying on with
the energy saving activities were the fact that they had already become a routine and respondents
found it easy to continue doing them. Several respondents mentioned these two reasons in an
interrelated fashion, namely, it was easy to carry on, because energy saving deeds were already
routine activities, they required no special attention.
Figure 2.17: Reasons provided by respondents for being able to or not able to carry on with
energy saving activities after the s@w campaign
The relatively high proportion of not relevant answers is mostly due to the Latvian answers,
because in Latvia instead of asking the reason why, partners asked 'which of the energy saving
activities can you (or can you not) continue'. Therefore the data do not reflect the Latvian
perspective for this question.
Only 6% of the respondents answered that they would not be able to carry on with the
activities, around half of them mentioning the lack of support from the management or the
unwillingness of colleagues as reasons, reinforcing the crucial role of a supportive management and
community at the workplace.
6%
10%
1%
1%
1%
1%
11%
17%
24%
27%
will not be able to carry on
not relevant answers
it gives satisfaction
colleagues would also like to continue
other reasons
this way we are supporting management
it is important for the environment/ society
it is easy to do it
it has become a routine
it is important/ makes sense
Why will you or will you not be able to carry on with energy saving activities? Because...
percentage of all answers
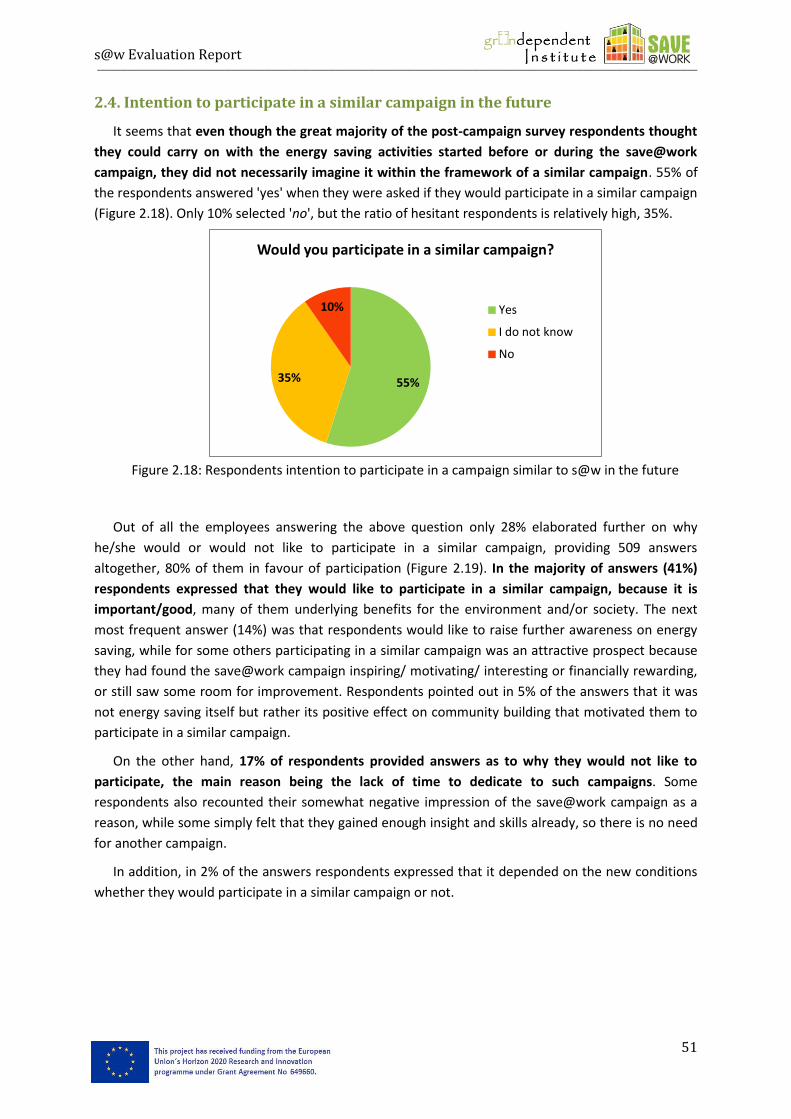
s@w Evaluation Report ___________________________________________________________________________________________________________________________________________________________________________________
51
2.4. Intention to participate in a similar campaign in the future
It seems that even though the great majority of the post-campaign survey respondents thought
they could carry on with the energy saving activities started before or during the save@work
campaign, they did not necessarily imagine it within the framework of a similar campaign. 55% of
the respondents answered 'yes' when they were asked if they would participate in a similar campaign
(Figure 2.18). Only 10% selected 'no', but the ratio of hesitant respondents is relatively high, 35%.
Figure 2.18: Respondents intention to participate in a campaign similar to s@w in the future
Out of all the employees answering the above question only 28% elaborated further on why
he/she would or would not like to participate in a similar campaign, providing 509 answers
altogether, 80% of them in favour of participation (Figure 2.19). In the majority of answers (41%)
respondents expressed that they would like to participate in a similar campaign, because it is
important/good, many of them underlying benefits for the environment and/or society. The next
most frequent answer (14%) was that respondents would like to raise further awareness on energy
saving, while for some others participating in a similar campaign was an attractive prospect because
they had found the save@work campaign inspiring/ motivating/ interesting or financially rewarding,
or still saw some room for improvement. Respondents pointed out in 5% of the answers that it was
not energy saving itself but rather its positive effect on community building that motivated them to
participate in a similar campaign.
On the other hand, 17% of respondents provided answers as to why they would not like to
participate, the main reason being the lack of time to dedicate to such campaigns. Some
respondents also recounted their somewhat negative impression of the save@work campaign as a
reason, while some simply felt that they gained enough insight and skills already, so there is no need
for another campaign.
In addition, in 2% of the answers respondents expressed that it depended on the new conditions
whether they would participate in a similar campaign or not.
55% 35%
10%
Would you participate in a similar campaign?
Yes
I do not know
No
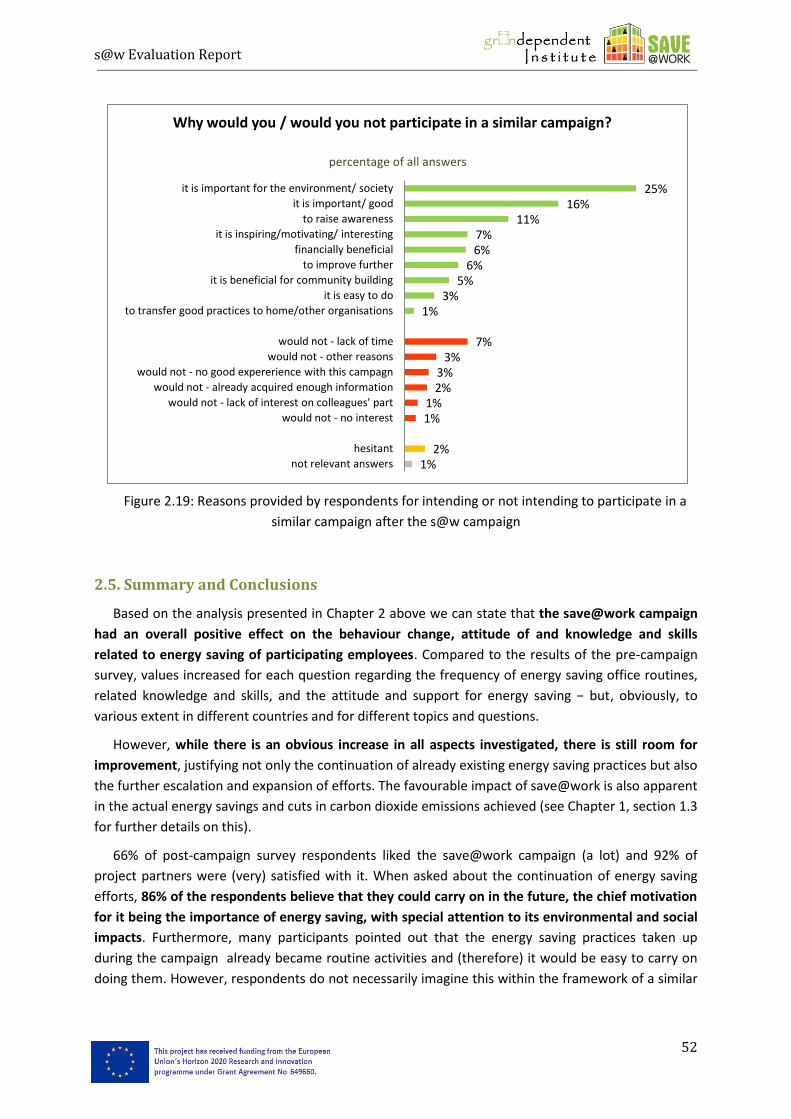
s@w Evaluation Report ___________________________________________________________________________________________________________________________________________________________________________________
52
Figure 2.19: Reasons provided by respondents for intending or not intending to participate in a
similar campaign after the s@w campaign
2.5. Summary and Conclusions
Based on the analysis presented in Chapter 2 above we can state that the save@work campaign
had an overall positive effect on the behaviour change, attitude of and knowledge and skills
related to energy saving of participating employees. Compared to the results of the pre-campaign
survey, values increased for each question regarding the frequency of energy saving office routines,
related knowledge and skills, and the attitude and support for energy saving − but, obviously, to
various extent in different countries and for different topics and questions.
However, while there is an obvious increase in all aspects investigated, there is still room for
improvement, justifying not only the continuation of already existing energy saving practices but also
the further escalation and expansion of efforts. The favourable impact of save@work is also apparent
in the actual energy savings and cuts in carbon dioxide emissions achieved (see Chapter 1, section 1.3
for further details on this).
66% of post-campaign survey respondents liked the save@work campaign (a lot) and 92% of
project partners were (very) satisfied with it. When asked about the continuation of energy saving
efforts, 86% of the respondents believe that they could carry on in the future, the chief motivation
for it being the importance of energy saving, with special attention to its environmental and social
impacts. Furthermore, many participants pointed out that the energy saving practices taken up
during the campaign already became routine activities and (therefore) it would be easy to carry on
doing them. However, respondents do not necessarily imagine this within the framework of a similar
1% 2%
1% 1%
2% 3%
3% 7%
1% 3%
5% 6%
6% 7%
11% 16%
25%
not relevant answers
hesitant
would not - no interest
would not - lack of interest on colleagues' part
would not - already acquired enough information
would not - no good expererience with this campagn
would not - other reasons
would not - lack of time
to transfer good practices to home/other organisations
it is easy to do
it is beneficial for community building
to improve further
financially beneficial
it is inspiring/motivating/ interesting
to raise awareness
it is important/ good
it is important for the environment/ society
Why would you / would you not participate in a similar campaign?
percentage of all answers
s@w Evaluation Report ___________________________________________________________________________________________________________________________________________________________________________________
53
campaign, since comparatively less, 55% of the participants stated that they would participate in a
similar campaign.
The spill-over effects of the save@work campaign were also important and substantial. Already
during the one-year campaign 82% of the respondents were inspired by save@work to talk with
their colleagues/ family members/ friends about energy saving, to invest in energy saving and/or to
do energy saving activities at home or as part of another (not work related) community. These
figures indicate that the scope of the save@work campaign already reaches beyond the
participating office buildings and its impact will likely be long-lasting.
s@w Evaluation Report ___________________________________________________________________________________________________________________________________________________________________________________
54
CHAPTER 3: The implementation of the save@work project in
9 countries: similarities and differences
The save@work campaign was implemented in nine European countries with different local
opportunities, challenges and circumstances impacting the campaign. In this chapter we provide an
overview of some of these differences and reflect on how they can be considered, or even taken
advantage of in a European context. We first discuss recruitment, implementation and
communication structures (section 3.1.), then materials, tools and events (section 3.2.), and finally
the European aspect of the campaign and how it was communicated and taken advantage of in the
nine countries (section 3.3.).
3.1. Recruitment, implementation and communication structures
The recruitment of buildings started very early in the project, and it became clear early on that
there are considerable differences between the recruitment approach used by project partners. This
was later confirmed by the first self-assessment survey as well as the follow-up discussion organized
by DuneWorks in the framework of the 5th partner meeting.
Single vs. multiple contacts
The recruitment approach taken by each partner was influenced by a number of factors: (1)
existing contacts and networks, (2) letters of intent collected from authorities during the proposal
preparation stage, (3) national decision making structure for authorities, and the (4) local
organization of authorities. Taking all these factors into consideration, the recruitment of authorities
and buildings often started with existing contacts of the project partners. For some partners it meant
addressing multiple contacts (Hungary, Italy, Latvia, Sweden), while other partners found a single
communication channel or one contact which lead to the involvement of several buildings (Austria,
France, the UK, Belgium, Germany). Those partners that relied on multiple contacts needed to
communicate with all contacts separately, widening the contact circle if necessary in order to find
the target number of buildings. In the end, these project partners had several authorities
participating, some, but not all of them with several buildings (see Table 3.1). At the same time,
partners who relied on one contact to begin with, often found all their participating buildings
through that contact. This, however, did not mean that the latter group of partners found it easier to
recruit a sufficient number of buildings as even communicating through one contact meant having to
meet and convince different departments and levels of management to get the final agreement for
participation and thus recruit a sufficient number of buildings.
As can be seen from the colouring of countries in Table 3.1, Belgium and Germany were in a
mixed position. Recruitment in these countries happened through a single contact, by publishing a
call through a province or involving one authority. However, the project partners then had the
freedom to communicate with the authorities/buildings directly.
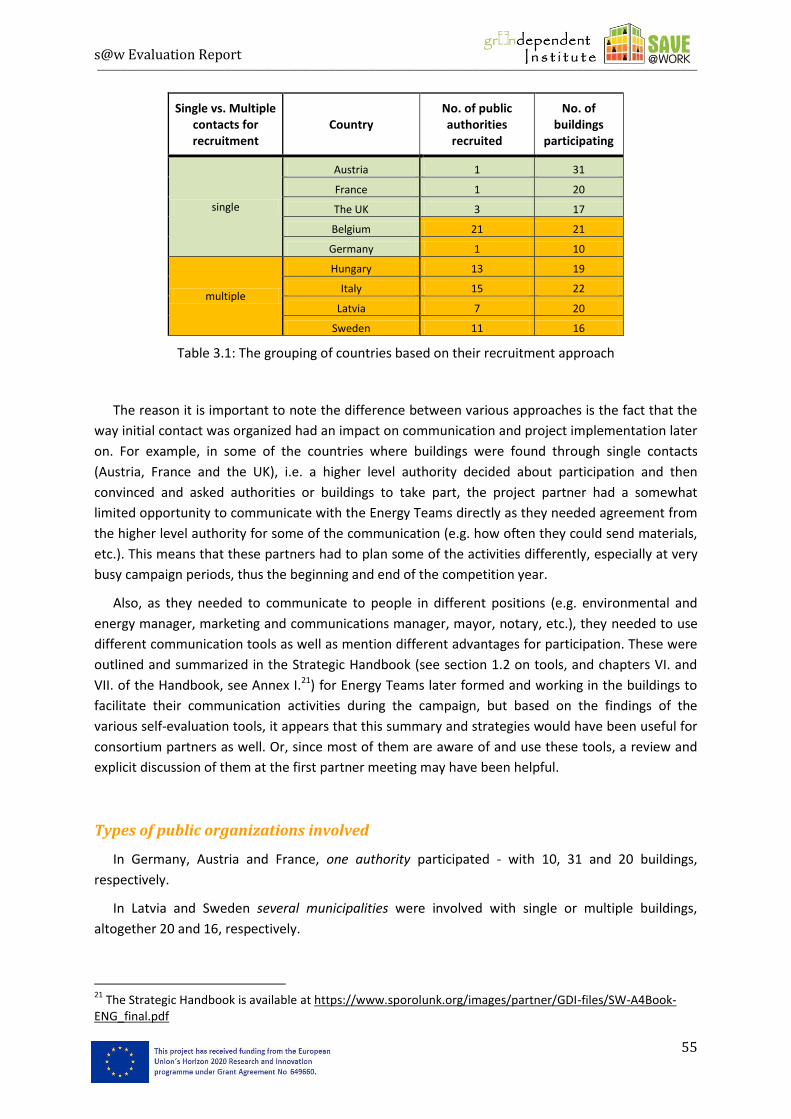
s@w Evaluation Report ___________________________________________________________________________________________________________________________________________________________________________________
55
Single vs. Multiple contacts for recruitment
Country No. of public authorities recruited
No. of buildings
participating
single
Austria 1 31
France 1 20
The UK 3 17
Belgium 21 21
Germany 1 10
multiple
Hungary 13 19
Italy 15 22
Latvia 7 20
Sweden 11 16
Table 3.1: The grouping of countries based on their recruitment approach
The reason it is important to note the difference between various approaches is the fact that the
way initial contact was organized had an impact on communication and project implementation later
on. For example, in some of the countries where buildings were found through single contacts
(Austria, France and the UK), i.e. a higher level authority decided about participation and then
convinced and asked authorities or buildings to take part, the project partner had a somewhat
limited opportunity to communicate with the Energy Teams directly as they needed agreement from
the higher level authority for some of the communication (e.g. how often they could send materials,
etc.). This means that these partners had to plan some of the activities differently, especially at very
busy campaign periods, thus the beginning and end of the competition year.
Also, as they needed to communicate to people in different positions (e.g. environmental and
energy manager, marketing and communications manager, mayor, notary, etc.), they needed to use
different communication tools as well as mention different advantages for participation. These were
outlined and summarized in the Strategic Handbook (see section 1.2 on tools, and chapters VI. and
VII. of the Handbook, see Annex I.21) for Energy Teams later formed and working in the buildings to
facilitate their communication activities during the campaign, but based on the findings of the
various self-evaluation tools, it appears that this summary and strategies would have been useful for
consortium partners as well. Or, since most of them are aware of and use these tools, a review and
explicit discussion of them at the first partner meeting may have been helpful.
Types of public organizations involved
In Germany, Austria and France, one authority participated - with 10, 31 and 20 buildings,
respectively.
In Latvia and Sweden several municipalities were involved with single or multiple buildings,
altogether 20 and 16, respectively.
21
The Strategic Handbook is available at https://www.sporolunk.org/images/partner/GDI-files/SW-A4Book-ENG_final.pdf
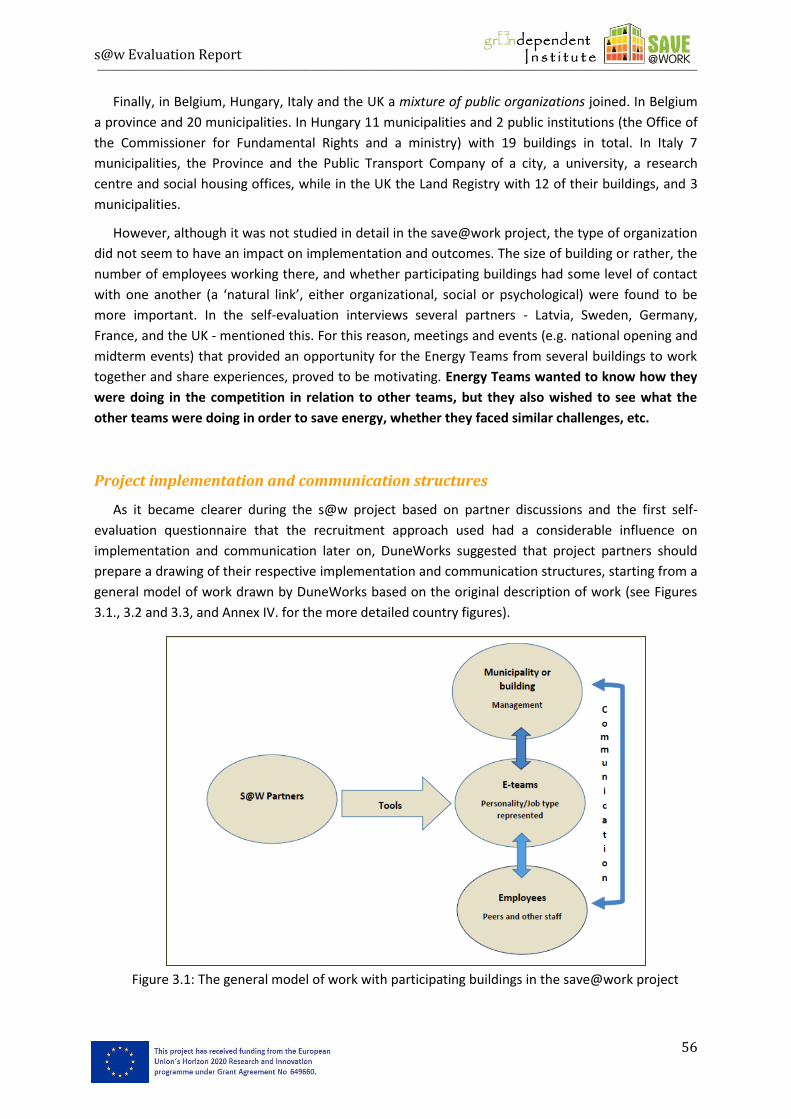
s@w Evaluation Report ___________________________________________________________________________________________________________________________________________________________________________________
56
Finally, in Belgium, Hungary, Italy and the UK a mixture of public organizations joined. In Belgium
a province and 20 municipalities. In Hungary 11 municipalities and 2 public institutions (the Office of
the Commissioner for Fundamental Rights and a ministry) with 19 buildings in total. In Italy 7
municipalities, the Province and the Public Transport Company of a city, a university, a research
centre and social housing offices, while in the UK the Land Registry with 12 of their buildings, and 3
municipalities.
However, although it was not studied in detail in the save@work project, the type of organization
did not seem to have an impact on implementation and outcomes. The size of building or rather, the
number of employees working there, and whether participating buildings had some level of contact
with one another (a ‘natural link’, either organizational, social or psychological) were found to be
more important. In the self-evaluation interviews several partners - Latvia, Sweden, Germany,
France, and the UK - mentioned this. For this reason, meetings and events (e.g. national opening and
midterm events) that provided an opportunity for the Energy Teams from several buildings to work
together and share experiences, proved to be motivating. Energy Teams wanted to know how they
were doing in the competition in relation to other teams, but they also wished to see what the
other teams were doing in order to save energy, whether they faced similar challenges, etc.
Project implementation and communication structures
As it became clearer during the s@w project based on partner discussions and the first self-
evaluation questionnaire that the recruitment approach used had a considerable influence on
implementation and communication later on, DuneWorks suggested that project partners should
prepare a drawing of their respective implementation and communication structures, starting from a
general model of work drawn by DuneWorks based on the original description of work (see Figures
3.1., 3.2 and 3.3, and Annex IV. for the more detailed country figures).
Figure 3.1: The general model of work with participating buildings in the save@work project
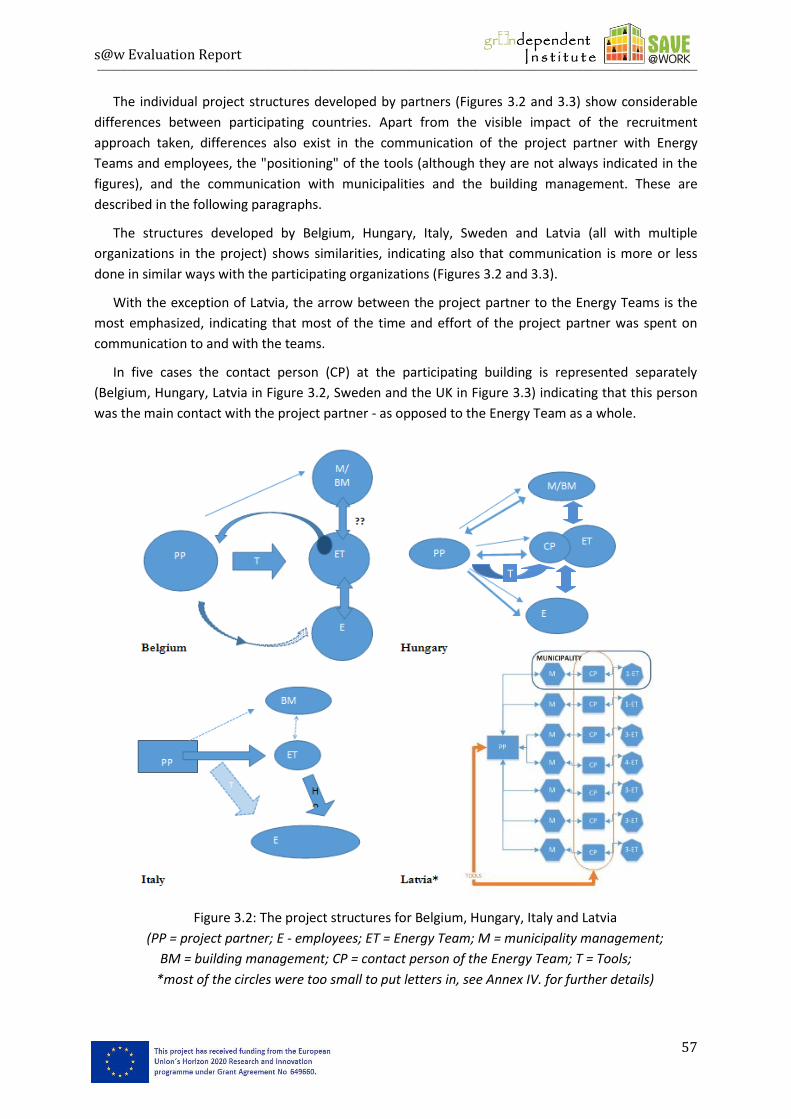
s@w Evaluation Report ___________________________________________________________________________________________________________________________________________________________________________________
57
The individual project structures developed by partners (Figures 3.2 and 3.3) show considerable
differences between participating countries. Apart from the visible impact of the recruitment
approach taken, differences also exist in the communication of the project partner with Energy
Teams and employees, the "positioning" of the tools (although they are not always indicated in the
figures), and the communication with municipalities and the building management. These are
described in the following paragraphs.
The structures developed by Belgium, Hungary, Italy, Sweden and Latvia (all with multiple
organizations in the project) shows similarities, indicating also that communication is more or less
done in similar ways with the participating organizations (Figures 3.2 and 3.3).
With the exception of Latvia, the arrow between the project partner to the Energy Teams is the
most emphasized, indicating that most of the time and effort of the project partner was spent on
communication to and with the teams.
In five cases the contact person (CP) at the participating building is represented separately
(Belgium, Hungary, Latvia in Figure 3.2, Sweden and the UK in Figure 3.3) indicating that this person
was the main contact with the project partner - as opposed to the Energy Team as a whole.
Figure 3.2: The project structures for Belgium, Hungary, Italy and Latvia
(PP = project partner; E - employees; ET = Energy Team; M = municipality management;
BM = building management; CP = contact person of the Energy Team; T = Tools;
*most of the circles were too small to put letters in, see Annex IV. for further details)
T
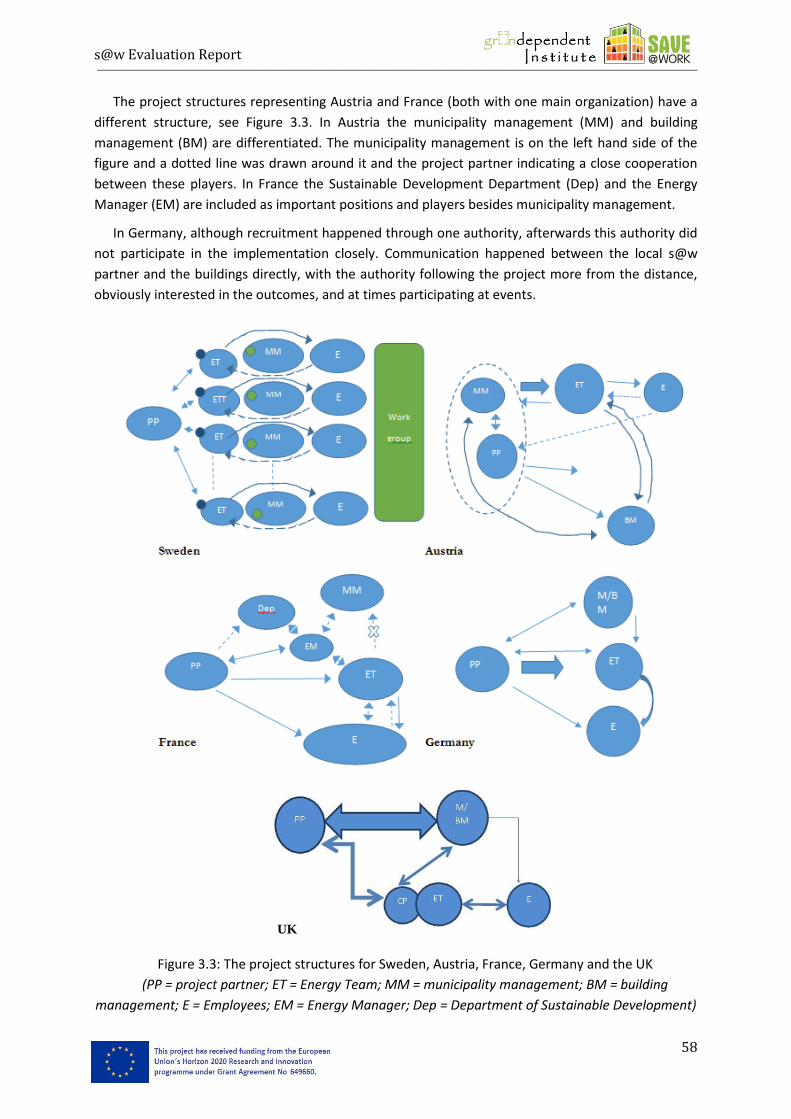
s@w Evaluation Report ___________________________________________________________________________________________________________________________________________________________________________________
58
The project structures representing Austria and France (both with one main organization) have a
different structure, see Figure 3.3. In Austria the municipality management (MM) and building
management (BM) are differentiated. The municipality management is on the left hand side of the
figure and a dotted line was drawn around it and the project partner indicating a close cooperation
between these players. In France the Sustainable Development Department (Dep) and the Energy
Manager (EM) are included as important positions and players besides municipality management.
In Germany, although recruitment happened through one authority, afterwards this authority did
not participate in the implementation closely. Communication happened between the local s@w
partner and the buildings directly, with the authority following the project more from the distance,
obviously interested in the outcomes, and at times participating at events.
Figure 3.3: The project structures for Sweden, Austria, France, Germany and the UK
(PP = project partner; ET = Energy Team; MM = municipality management; BM = building
management; E = Employees; EM = Energy Manager; Dep = Department of Sustainable Development)
UK
s@w Evaluation Report ___________________________________________________________________________________________________________________________________________________________________________________
59
The lines for communication between the s@w project partner and the Energy Teams and
employees are different in the countries:
The Energy Teams or contact persons communicated back to the project partner, but
compared to one another these arrows are different in nature: ‘dotted’ (i.e. relatively
weak in Sweden), thinner (Austria, Germany), the word ‘passive’ was added (Belgium),
the communication was not indicated at all (Italy) or it was indicated to go through the
contact person (Latvia, UK) or the Energy Manager (France).
The project structures as drawn by partners also indicate differences regarding the
extent of direct communication between the project partners and the employees: some
project partners did this actively (Latvia, Hungary, France, Germany with workshops,
trainings events and presentations); others to a lesser extent (Belgium and Italy with
tools and blogs) and others do not appear to have engaged in this at all trusting the
Energy Teams, or in the case of the UK, the building management, to communicate with
the employees (Austria, Sweden).
The positioning and placement of the tools also varies between countries:
In Belgium, Germany and Latvia the tools were emphasized, whereas in Hungary and
France (arrows to Energy Teams and employees), and Italy (arrow mainly to employees)
the tools appear to have taken a less prominent, though still important position, and in
the figures for Sweden and the UK the tools were not shown at all.
Furthermore, the ‘tool’ arrows differ in where they were directed at: Energy Teams,
employees, or both.
As for the communication between project partners and municipalities / building management:
It is interesting to note the variation in where municipalities were placed in the figures:
on the right or in the centre (Latvia, Sweden and the UK), or on the left of the figure,
indicating a relatively close cooperation with the project partner (Austria).
In Austria and Germany thin two-way communication lines represent the communication
between the project partner and the municipality, whereas in Italy and Belgium the one-
way-lines are ‘thin and dotted’ with a note that this communication channel was mainly
used at the beginning of the campaign. In Hungary there was a two-way communication
between the project partner and the municipality/building management as well as
between the project partner and the Energy Teams, first of all through the contact
persons within the Energy Teams. In addition, there was a one-way communication from
the project partner towards the employees. Most of the communication happened
between the project partner and the contact person. In the UK communication between
the project partner and the municipality seems to be the most important for the project,
whereas no communication lines between project partner and the municipalities or
building management were drawn in the figures for France, Sweden and Latvia,
indicating that this communication either does not exist or is not relevant for the project.
The communication between the management of municipalities and Energy Teams
and/or employees was either not drawn at all or was over-arching (Sweden, the UK),
crossed out (France), questioned (Belgium), dotted (Germany, Italy), or mainly one-way
(Austria, Germany, Latvia) or represented by a thick arrow, suggesting its importance
s@w Evaluation Report ___________________________________________________________________________________________________________________________________________________________________________________
60
(Austria). In Hungary all arrows related to communication within the municipality in the
general model of work drawn by DuneWorks existed.
Summary and Conclusions
The recruitment of municipalities and buildings to participate in the save@work competition
mostly started with the existing contacts of partners, building on the Letters of Intent acquired in
each country for the project when still in the proposal stage. For some partners this meant
addressing multiple contacts (Hungary, Italy, Latvia, and Sweden), while others had a single
communication channel or one contact which lead to the involvement of several buildings (Austria,
France, the UK, Belgium, and Germany). The recruitment method through existing or new, single or
multiple contacts affected to some extent how close relationship the project partner had eventually
with the building management, the Energy Teams and the employees. The degree of closeness
influenced the effectiveness of the communication and how much the project partner knew what the
Energy Teams were actually doing. This said, some of the project partners invested a great amount
effort into building a well-working relationship with the management and/or the Energy Teams
depending on the importance of each in implementation. In larger organizations the top-down
communication and support for the campaign from the building management was important for the
success of Energy Teams. For smaller organizations top-down support also had to be present,
however, the informal contacts between Energy Team members and other employees were more
important for the success of the work of the Team.
The project structures developed for Belgium, Hungary, Italy, Latvia and Sweden (all with multiple
organizations in the project) were set up more or less along similar lines, indicating that the
communication channels employed and used were also similar. The figures for Austria, France,
Germany and the UK (all with one or very few main organizations) have a different structure, mainly
relating to the different position and/or contact with the municipality/building management.
Finally, the project figures differ most when we zoom in on the communication lines (in general),
and the position and contact with the municipality/building management. The variation in the
representation of the communication lines (thick, dotted, absent, one- or two-way, ‘at the
start/end’) suggest variation in the intensity of communication as well as in the particular selection of
communication channels and tools used. Based on the project figures, we can conclude that the
greatest effort in communication was invested into building and maintaining the contact with the
contact person(s) and /or energy teams, depending on which was more important for the success of
the project.
3.2. Materials, tools and events
As described in chapter 1.2, a great variety of materials and tools were developed in the
save@work project, which were adapted and translated by partners for use in their particular local
context. Partners were asked about their experience with the materials and tools in both of the self-
evaluation surveys, and their responses to the first of these surveys were also discussed during the
interviews DuneWorks conducted. Energy Teams and employees from participating buildings were
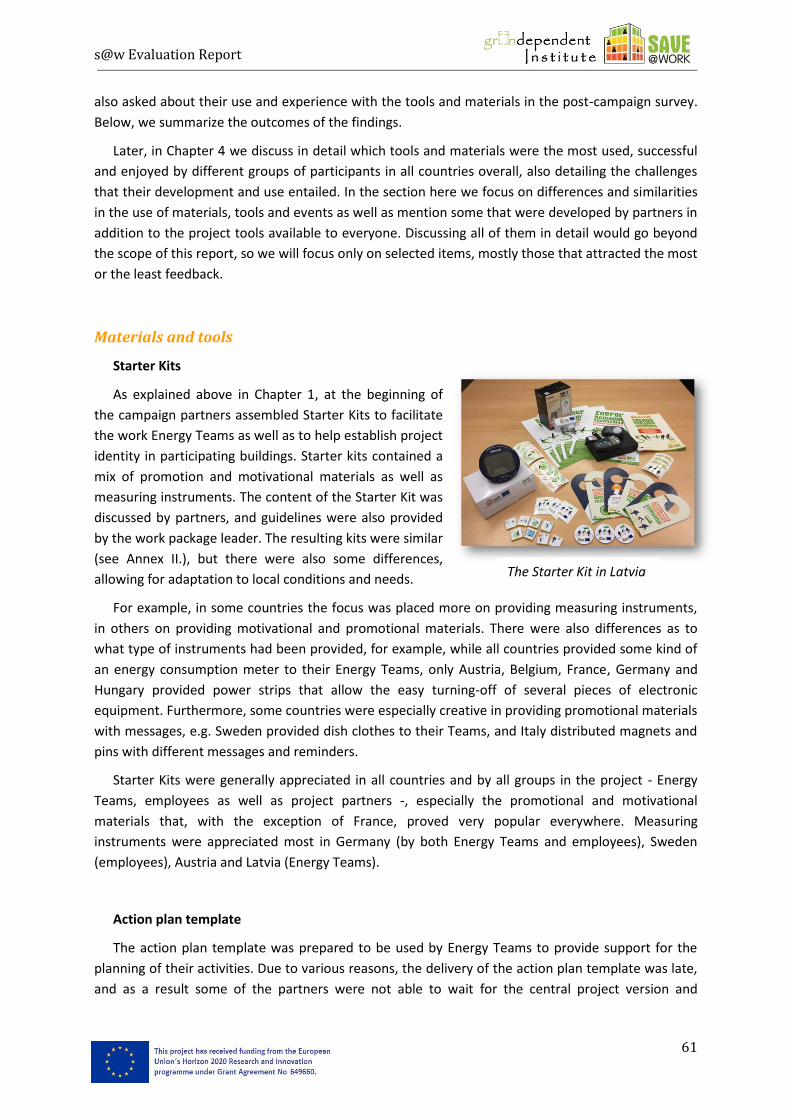
s@w Evaluation Report ___________________________________________________________________________________________________________________________________________________________________________________
61
also asked about their use and experience with the tools and materials in the post-campaign survey.
Below, we summarize the outcomes of the findings.
Later, in Chapter 4 we discuss in detail which tools and materials were the most used, successful
and enjoyed by different groups of participants in all countries overall, also detailing the challenges
that their development and use entailed. In the section here we focus on differences and similarities
in the use of materials, tools and events as well as mention some that were developed by partners in
addition to the project tools available to everyone. Discussing all of them in detail would go beyond
the scope of this report, so we will focus only on selected items, mostly those that attracted the most
or the least feedback.
Materials and tools
Starter Kits
As explained above in Chapter 1, at the beginning of
the campaign partners assembled Starter Kits to facilitate
the work Energy Teams as well as to help establish project
identity in participating buildings. Starter kits contained a
mix of promotion and motivational materials as well as
measuring instruments. The content of the Starter Kit was
discussed by partners, and guidelines were also provided
by the work package leader. The resulting kits were similar
(see Annex II.), but there were also some differences,
allowing for adaptation to local conditions and needs.
For example, in some countries the focus was placed more on providing measuring instruments,
in others on providing motivational and promotional materials. There were also differences as to
what type of instruments had been provided, for example, while all countries provided some kind of
an energy consumption meter to their Energy Teams, only Austria, Belgium, France, Germany and
Hungary provided power strips that allow the easy turning-off of several pieces of electronic
equipment. Furthermore, some countries were especially creative in providing promotional materials
with messages, e.g. Sweden provided dish clothes to their Teams, and Italy distributed magnets and
pins with different messages and reminders.
Starter Kits were generally appreciated in all countries and by all groups in the project - Energy
Teams, employees as well as project partners -, especially the promotional and motivational
materials that, with the exception of France, proved very popular everywhere. Measuring
instruments were appreciated most in Germany (by both Energy Teams and employees), Sweden
(employees), Austria and Latvia (Energy Teams).
Action plan template
The action plan template was prepared to be used by Energy Teams to provide support for the
planning of their activities. Due to various reasons, the delivery of the action plan template was late,
and as a result some of the partners were not able to wait for the central project version and
The Starter Kit in Latvia
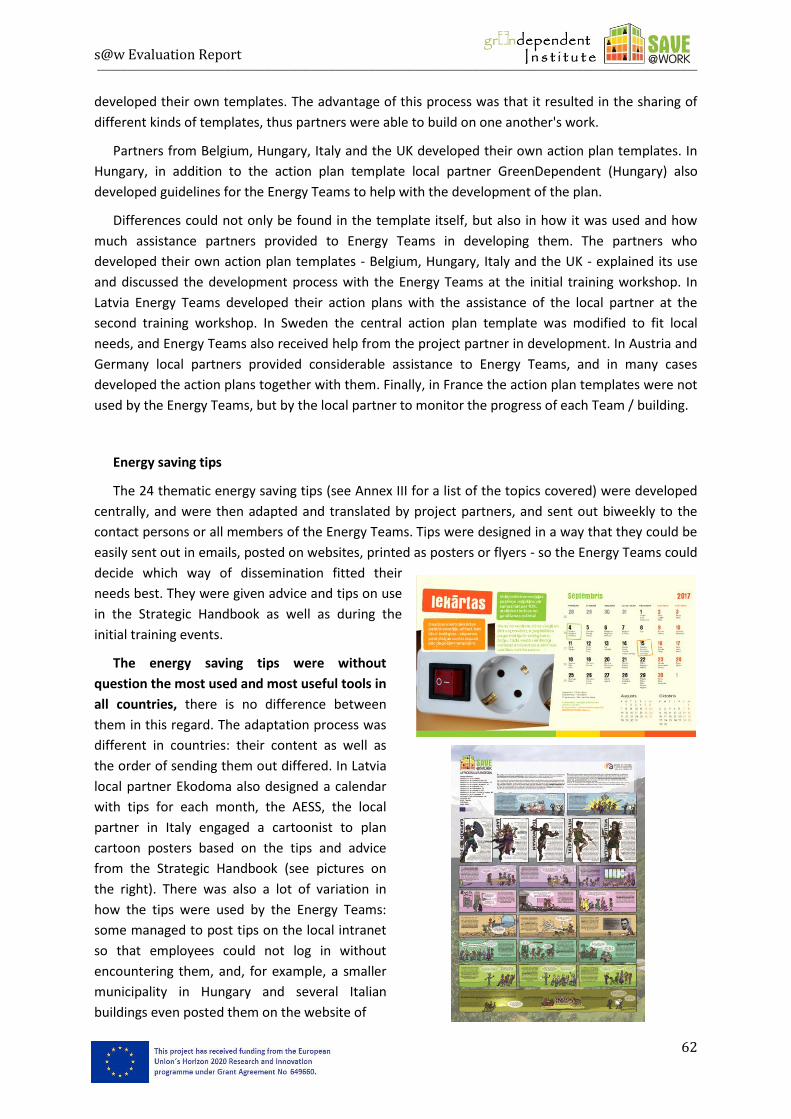
s@w Evaluation Report ___________________________________________________________________________________________________________________________________________________________________________________
62
developed their own templates. The advantage of this process was that it resulted in the sharing of
different kinds of templates, thus partners were able to build on one another's work.
Partners from Belgium, Hungary, Italy and the UK developed their own action plan templates. In
Hungary, in addition to the action plan template local partner GreenDependent (Hungary) also
developed guidelines for the Energy Teams to help with the development of the plan.
Differences could not only be found in the template itself, but also in how it was used and how
much assistance partners provided to Energy Teams in developing them. The partners who
developed their own action plan templates - Belgium, Hungary, Italy and the UK - explained its use
and discussed the development process with the Energy Teams at the initial training workshop. In
Latvia Energy Teams developed their action plans with the assistance of the local partner at the
second training workshop. In Sweden the central action plan template was modified to fit local
needs, and Energy Teams also received help from the project partner in development. In Austria and
Germany local partners provided considerable assistance to Energy Teams, and in many cases
developed the action plans together with them. Finally, in France the action plan templates were not
used by the Energy Teams, but by the local partner to monitor the progress of each Team / building.
Energy saving tips
The 24 thematic energy saving tips (see Annex III for a list of the topics covered) were developed
centrally, and were then adapted and translated by project partners, and sent out biweekly to the
contact persons or all members of the Energy Teams. Tips were designed in a way that they could be
easily sent out in emails, posted on websites, printed as posters or flyers - so the Energy Teams could
decide which way of dissemination fitted their
needs best. They were given advice and tips on use
in the Strategic Handbook as well as during the
initial training events.
The energy saving tips were without
question the most used and most useful tools in
all countries, there is no difference between
them in this regard. The adaptation process was
different in countries: their content as well as
the order of sending them out differed. In Latvia
local partner Ekodoma also designed a calendar
with tips for each month, the AESS, the local
partner in Italy engaged a cartoonist to plan
cartoon posters based on the tips and advice
from the Strategic Handbook (see pictures on
the right). There was also a lot of variation in
how the tips were used by the Energy Teams:
some managed to post tips on the local intranet
so that employees could not log in without
encountering them, and, for example, a smaller
municipality in Hungary and several Italian
buildings even posted them on the website of
s@w Evaluation Report ___________________________________________________________________________________________________________________________________________________________________________________
63
the municipality as well as printed and distributed the ones relevant to households in the settlement.
Website, Energy Saving Tool and blog
Save@work had a central website and local websites for all participating countries. The local sites
all had the same design, and included the Energy Saving Tool that required registration, the Green
Clicks tool (see below), and the international blog. However, partners were free to add menus,
decide about what exactly to post under the blog or news items, etc. They were also free to add
more materials to the internal website that were accessible only to Energy Team members and
employees from participating buildings.
On the one hand, the website itself - without the Energy Saving Tool, was considered a success by
all partners, similarly to the adaptable design. It was also found useful by Energy Teams as well as
employees, the most so in Hungary, Italy and Sweden.
On the other hand, it needs to be noted that the development, testing and use of the Energy
Saving Tool proved rather challenging in the project. It was conceptualized to be a rather
sophisticated tool: the building management could use it to monitor progress, project partners could
use it to have an overview of the progress of the project in the country and in each participating
building, to calculate energy savings and compare the buildings, and Energy Teams had to fill in
consumption data for their building and could follow the results of their efforts. Different user groups
had access to different datasets to avoid the misuse of data. Furthermore, the tool was important in
determining which building achieved the most energy saving in each country as well as at the
European level of the campaign. Developing and testing such a complex tool is very time-consuming,
and as a result it was not quite ready for the start of the campaign. Moreover,, its use proved to be
difficult for some Energy Teams who otherwise were not used to handling consumption data. Thus,
since the tool is central for the project even more focus would need to be put on its development
phase, as well as in training employees in using it.
The blog, the objective of which was to emphasize the European nature of the project, was also
part of the website and included stories on local implementation and experiences from all countries.
Local partners took turns to write the stories in which they often involved the Energy Teams. The
stories were available in both English and the local languages. Even though they were well-liked,
interesting and enjoyable, the blog was not among the most useful tools in the opinion of Energy
Teams and employees in most countries, except for Sweden where based on the responses provided
by employees it was among the three most useful tools and materials available to them.
Green Clicks tool
The Green Clicks tool was also part of the website, and required registration by the employees of
participating buildings. It was intended to involve employees on an individual level and provide
opportunities for them to learn and develop in the field of energy saving and efficiency, but in many
countries it was not used very often. Project partners mentioned many potential reasons for this, for
example difficult access, too uniform content, situation misfit and that it was difficult for employees
to spend time using it at work. Even contests organized to encourage its use in Latvia (by Energy
Teams), Austria and Hungary (by the project partners) did not help.
s@w Evaluation Report ___________________________________________________________________________________________________________________________________________________________________________________
64
In the UK the tool was rewritten to fit the local situation, and this seemed to improve its use
greatly as the tool was used most and was found to be one of the most useful by both employees
(the only country in the project) and Energy Team members. Apart from the UK, Energy Teams in
Austria and Italy also found the Green Clicks to be useful.
Newsletter: a new tool in selected countries
It has to be noted that the majority of partners reported that they developed materials to
supplement the centrally prepared ones such as the calendar in Latvia, the cartoon in Italy or the
guides for using the energy calculation tool and the action plan template in Hungary. Another such
tool was a newsletter some of the project partners (in Austria, Belgium, Latvia, and Sweden)
compiled regularly in order to inform and keep the management of the buildings engaged. In
Sweden, this newsletter was not only sent to the management and the Energy Teams but also to
municipalities that were not participating in the s@w project to make them interested and motivated
to participate at a later point.
Events
Due partly to differences in the recruitment process and the challenges encountered during the
process (see details in section 4.2), and partly to an effort to adapt the general events timeline and
organization to local needs, there were variations in how the Opening Event and the initial
workshops were organized in participating countries.
The opening event was meant to kick-off the competition at the national level. These were most
often held for all the participating buildings in a country, often with the mayors, top managers and
representatives of employees (or the Energy Teams if they were already formed) present. This was
the case, for example, in Belgium, Germany, Hungary, Italy, Latvia and Sweden. In Belgium and
Hungary, for example, starter kits were also distributed at the kick-off events, and in Latvia
participants were also invited to participate in team building activities. However, as in some
countries, for example, in the UK, participating buildings were situated rather far from one another,
holding such an event proved impossible, and the several smaller kick-off events were held.
Based on the original project plan, partners intended to hold two training workshops at each
municipality or participating building. The first workshop was planned to be prior to the opening
event and to be more technical to collect baseline data for the local campaigns. The second
workshop was intended for the Energy Teams in each building after the opening event. This original
plan was abandoned by all project partners due to how the recruitment process and the forming of
the Energy Teams happened: it had to be accepted that mainly as a result of lack of time (and
sometimes motivation) on the part of participating authorities and municipalities, it was not possible
and practical to organize two workshop for two different target groups. Thus, the contents of the
two workshop was combined everywhere, except for Latvia. However, even here the target group of
the workshops were the members of the Energy Teams, but the more technically and data oriented
members of the Teams attended the first workshop, and those interested in motivation, the use of
tools and preparing the action plans the second.
s@w Evaluation Report ___________________________________________________________________________________________________________________________________________________________________________________
65
With the exception of the Latvian partner, all project partners held one training workshop for the
Energy Teams. However, there were differences in how the training workshop was organized. In
some countries there was a separate training workshop held for each Energy Team (e.g. in the UK
and Germany), in others, e.g. Hungary, workshops were held jointly for selected Energy Teams (e.g.
from the same municipality but working in different buildings or Energy Teams from buildings
situated in the same region). In Italy, however, the local partner AESS held one big training event for
all the Energy Teams as they wanted to provide extra motivation to the Energy Teams as well as an
opportunity to network. Latvian and Swedish Energy Teams found the training workshops most
useful for their work.
Concerning events one more finding needs to be mentioned, namely, that since the campaign and
competition period was relatively long (12 months), extra effort had to be invested in maintaining
the motivation and engagement of Energy Teams as well as employees. To this end, several partners
(e.g. in Belgium, Germany, Hungary, Latvia and the UK) decided to organize national Midterm Events
to where Energy Teams from all participating buildings were invited. The main purpose of these
events was to re-motivate Team members through the sharing of experience, success stories and
challenges as well as providing additional input on the use of tools and materials. In several countries
information was provided on the European aspect of the project as well through sharing experience
from other countries.
Finally, apart from the events organized by the project partners, Energy Teams also organized
events for employees in their buildings. These events took different forms: discussion groups,
quizzes, talks by experts, plant and seed swaps, baking competitions, Christmas parties, etc. These
events were found to be one of the most useful tools in Belgium, France and Hungary by employees,
and in Belgium, France, Germany and Sweden by Energy Team members.
Summary and Conclusions
Based on the analysis of the responses in the different evaluation tools used in s@w, the tools,
materials and events can basically be placed into three categories:
useful, used and appreciated by the majority of project participant groups (partners,
Energy Teams and employees);
useful, but their use could be improved but otherwise needed for the project;
useful and added to the project by selected partners during implementation.
In addition, we also identified some tools and methods that could be added to the inventory of a
similar project in the future; these are discussed in section 4.3.
Tools, materials and events belonging in the first category (used and appreciated) include the
energy saving tips, the website, the starter kits including the promotional materials and measuring
devices as well as the various events, particularly the training workshops, though local events
organized in the various buildings were found to be most useful.
Tools, materials and events in the second category can be improved in various ways, and the
different participant groups in the project already provided some ideas as to how this could be done.
For example, the local partner SWEA in the UK provided a good example on how the Green Clicks
tool could be adapted to fit local user needs better, and the Hungarian partner on how the energy
s@w Evaluation Report ___________________________________________________________________________________________________________________________________________________________________________________
66
calculation tool could be made more accessible through providing a guide for use. As for the Strategic
Handbook for Energy Teams that was not top-rated and was indeed among the top three tools only
in Germany, but was found useful by most project partners at the beginning of the campaign as
revealed by the first self-evaluation survey, we conclude that more effort should be made for the
sharing and using of its content during the second part of the campaign.
Furthermore, Energy Teams need different amounts of guidance and support in the use of the
tools depending on the composition of the team, i.e. what kind of expertise the members of the
team bring with them. In order to provide such tailor-made support, local implementation partners
would need to invest in more effort to map the expertise and skills of Energy Team members, or,
alternatively, include such activities in the training workshop. The relevant content of the Strategic
Handbook could also be made use of to this end: for example, since energy saving tips proved to be
so popular and useful everywhere, it may be worthwhile to develop management and group
development tips specifically for the Energy Teams. Further ideas for development are discussed in
Chapter 5.
The third category of tools, materials and events includes those that were found to be needed as
implementation progressed in the s@w project: newsletter for the management, midterm events, or
additional promotional and motivational tools.
Finally, as it was also observed in the Strategic Handbook, people are very different: they prefer
different ways of communication. Thus, it is very important to use a variety of tools and
communication channels in projects like save@work, and not just in a general sense, but in the
communication of possibly each message. This also helps to remind people in different ways and
strengthen and extend the message, for example, first through an email in the form of saving tips,
then a sticker on the wall, a post on the website, and perhaps finally at an event. This way
sustainable energy use behaviour and practices can become the general, accepted norm instead of
the 'strange' green practice of the committed.
3.3. Competition and the European aspect of the campaign
In this section we focus on the European aspect of the campaign, the competition at the European
level, and whether these were emphasized by the project partners and/or whether it played a role in
the national campaigns or in the motivation of the Energy Teams in participating buildings.
In Germany the local partner BSU talked about the European setup of the s@w project but it
attracted only a limited level of interest from both the management and the Energy Teams. Thus, it
was not a motivational factor for authorities for joining the campaign.
The project partners in Austria, Belgium, Hungary, Italy and Latvia talked about the European
aspect and competition at various occasions (meetings during recruitment, all campaign events, etc.)
and in their experience it was only the management that was interested in this fact apart from
selected Energy Teams who were, for example in Hungary and Latvia, very motivated by the promise
of the trip to Brussels for the winning team. In Austria the front page of all the printed materials
showed the European aspect of the project, and as a result it was often discussed by participants.
The local partner, GEA believes that it helped attract employees to participate in the campaign.
s@w Evaluation Report ___________________________________________________________________________________________________________________________________________________________________________________
67
In Belgium the link between s@w and the Covenant of Mayors initiative was emphasized, and in
the opinion of AM, the local partner, it helped them, as a small organization, convince ‘others’ to
believe in the project. In Hungary municipalities showed some interest in developing twin city
relationships through meeting municipalities from various countries in the project. In Italy the s@w
project was implemented in a region where the Covenant of Mayors initiative is very well-known,
and seven municipalities that joined s@w are signatories of the Covenant as well. The s@w project
can contribute to the implementation of action plans developed by municipalities to fulfil their
obligations of being members of the Covenant of Mayors, specifically related to actions planned on
achieving behaviour change.
In some of the countries (Sweden, the UK, and France) the interest of employees in the European
competition element of s@w was rather high. In Sweden taking part in a European level competition
is generally perceived as interesting and fun. At the same time, Energy Teams in the UK and France
were interested in learning about how teams in other countries were doing. To support this, the local
partner SWEA (in the UK) mentioned that they received numerous worried calls about the project
during the Brexit campaign and voting that, according to SWEA, was a sign of how keen the teams
were about the project.
3.4. Conclusions: dealing with and building on diversity in a European project
Diversity in a European project like save@work with this particular set-up and target group
encounters with diversity on numerous levels:
the experience and expertise project partners bring to the project;
the (sometimes unconscious belief) about how change happens and should happen;
the way the project is implemented locally (see the project structures);
the way communication happens with participants: through the management vs. the
Energy Teams directly, through a designated contact person or groups of people, relying
mostly on emails or the phone, etc.;
the way events are organized: for all participants or for groups of participants due to large
distances;
the ways in which tools are used and adapted;
and the list could go on...
Diversity can be a great resource and can enrich the experience of the project for everyone as
well as expand the tools and methods available for the completion of project tasks. However, in
order for this to happen, it needs to be recognized and explicitly discussed. At save@work partner
meetings members of the consortium regularly discussed diversity, e.g. in terms of approaches to
local implementation, which was very useful. However, there could perhaps been even more effort
made to build on it even more. For example:
it would have been useful to discuss recruitment and implementation plans in detail
sooner in the project, and use different tools to facilitate this process - e.g. drawing and
comparing project structure figures - earlier to be able to build on it more.
This, in a similar project, is especially important to do as decisions made about
recruitment or limits posed by the recruitment have quite a big impact on the project
later: e.g. if we work with one large municipality and its 20 buildings, our communication
s@w Evaluation Report ___________________________________________________________________________________________________________________________________________________________________________________
68
with participants will be quite different as compared to if we work with several
municipalities and their buildings;
once the differences and similarities are clear, it is useful to have discussions - perhaps
even in smaller groups based on identified similarities - about tools and strategies most
appropriate for a given situation. For example, a discussion in the consortium on how to
communicate with Energy Teams successfully through the management vs. a contact
person vs. to the whole team.
Finally, the diversity in a European project can be a motivating factor contributing to both
learning and enjoyment not only for project partners but also for participants, so it is important to
include it in communication activities with them. The save@work project had an international blog
and at the end a European brochure to emphasize this element, but in a future project it may be
useful to include more tools to facilitate even more exchange between participants in different
countries, for example, through organizing a European Midterm Even for Energy Teams, or an online
discussion group for Energy Teams as part of the project website or set up as a closed group on a
social media site.
s@w Evaluation Report ___________________________________________________________________________________________________________________________________________________________________________________
69
CHAPTER 4: save@work success stories and challenges
In this chapter we discuss how useful the tools provided and events organised within the
framework of the save@work project were, what participants enjoyed the most, and according to
the experience of participating employees and project partners which activities, organisational
structures, communication methods, etc. proved to be a success (section 4.1) and where the
challenges lied (section 4.2). Finally, we also analyzed what participants and partners found to be
missing or what they would do differently in hindsight, with the experience of the campaign (section
4.3). In other words, this chapter is about the lessons learnt, providing important information for
similar future projects.22
4.1 What worked best in the save@work campaign
Tools and events
First, we looked at the use and usefulness of the tools, materials and events developed as part of
the save@work methodology (see Chapter 1, section 1.2). The post-campaign survey enquired about
which tools and events respondents used or participated in and among them which ones they found
most useful. Energy Team (ET) members and other employees were asked separately, Energy Team
members were given a slightly longer list to choose from reflecting the fact that they had more tools
at their disposal. These included, for example, the Strategic Handbook (a manual given to Energy
Teams, including information about the campaign and tips on how to select team members, organize
meetings, motivate colleagues, etc., for further details see Chapter 1), the initial training workshop (a
one-time training workshop delivered by the national partner for Energy Teams) and other events
organized by the national partner.23
To allow for local differences to be shown, respondents could also add items of their own to the
lists. When enquiring about the usefulness of tools and materials, respondents were asked to list
maximum three items that they had found the most useful. In case of the question investigating the
use of tools and materials, there was, obviously, no such limitation.
The most widely used campaign tools were the energy saving tips, the promotional materials
and the save@work general website among Energy Team members and other employees alike as
shown in Figure 4.1. It is also apparent from the figure that Energy Team members used the different
save@work tools and participated in the related events in much higher proportions.
22
As the French project partner (Prioriterre) had to leave the project before it was finalized, the French results are excluded from the discussion in Chapters 2 and 4. 23
Please note that in Austria there was an accidental mix-up of items between the lists presented to general employees and Energy Team members, therefore the values for some questions are based upon responses from 7 instead of 8 participating countries.
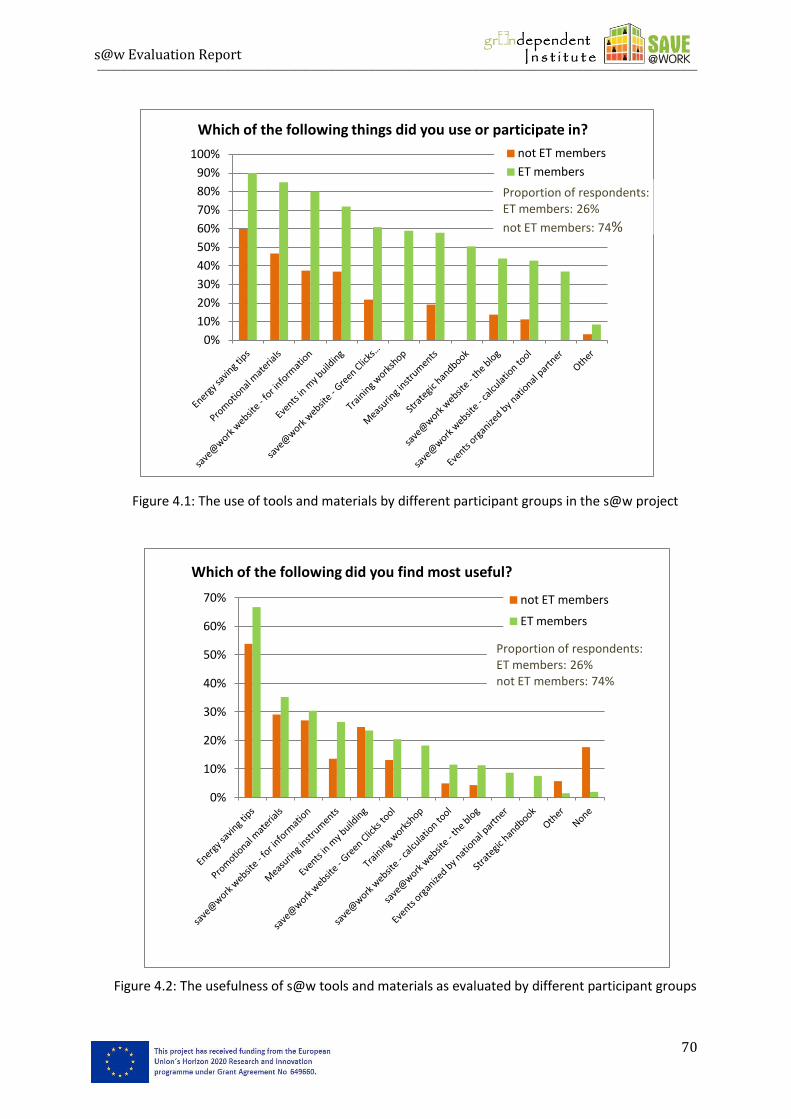
s@w Evaluation Report ___________________________________________________________________________________________________________________________________________________________________________________
70
Figure 4.1: The use of tools and materials by different participant groups in the s@w project
Figure 4.2: The usefulness of s@w tools and materials as evaluated by different participant groups
0%
10%
20%
30%
40%
50%
60%
70%
80%
90%
100%
Which of the following things did you use or participate in?
not ET members
ET members
Proportion of respondents: ET members: 26%
not ET members: 74%
0%
10%
20%
30%
40%
50%
60%
70%
Which of the following did you find most useful?
not ET members
ET members
Proportion of respondents: ET members: 26% not ET members: 74%
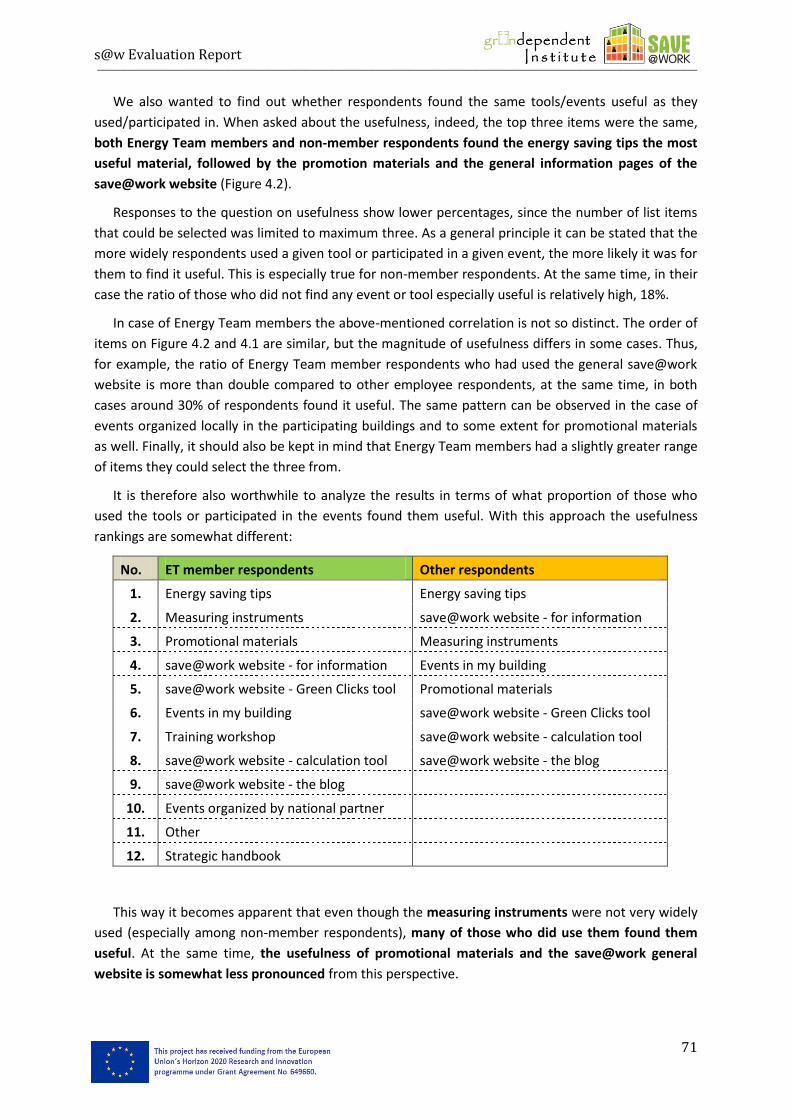
s@w Evaluation Report ___________________________________________________________________________________________________________________________________________________________________________________
71
We also wanted to find out whether respondents found the same tools/events useful as they
used/participated in. When asked about the usefulness, indeed, the top three items were the same,
both Energy Team members and non-member respondents found the energy saving tips the most
useful material, followed by the promotion materials and the general information pages of the
save@work website (Figure 4.2).
Responses to the question on usefulness show lower percentages, since the number of list items
that could be selected was limited to maximum three. As a general principle it can be stated that the
more widely respondents used a given tool or participated in a given event, the more likely it was for
them to find it useful. This is especially true for non-member respondents. At the same time, in their
case the ratio of those who did not find any event or tool especially useful is relatively high, 18%.
In case of Energy Team members the above-mentioned correlation is not so distinct. The order of
items on Figure 4.2 and 4.1 are similar, but the magnitude of usefulness differs in some cases. Thus,
for example, the ratio of Energy Team member respondents who had used the general save@work
website is more than double compared to other employee respondents, at the same time, in both
cases around 30% of respondents found it useful. The same pattern can be observed in the case of
events organized locally in the participating buildings and to some extent for promotional materials
as well. Finally, it should also be kept in mind that Energy Team members had a slightly greater range
of items they could select the three from.
It is therefore also worthwhile to analyze the results in terms of what proportion of those who
used the tools or participated in the events found them useful. With this approach the usefulness
rankings are somewhat different:
No. ET member respondents Other respondents
1. Energy saving tips Energy saving tips
2. Measuring instruments save@work website - for information
3. Promotional materials Measuring instruments
4. save@work website - for information Events in my building
5. save@work website - Green Clicks tool Promotional materials
6. Events in my building save@work website - Green Clicks tool
7. Training workshop save@work website - calculation tool
8. save@work website - calculation tool save@work website - the blog
9. save@work website - the blog
10. Events organized by national partner
11. Other
12. Strategic handbook
This way it becomes apparent that even though the measuring instruments were not very widely
used (especially among non-member respondents), many of those who did use them found them
useful. At the same time, the usefulness of promotional materials and the save@work general
website is somewhat less pronounced from this perspective.
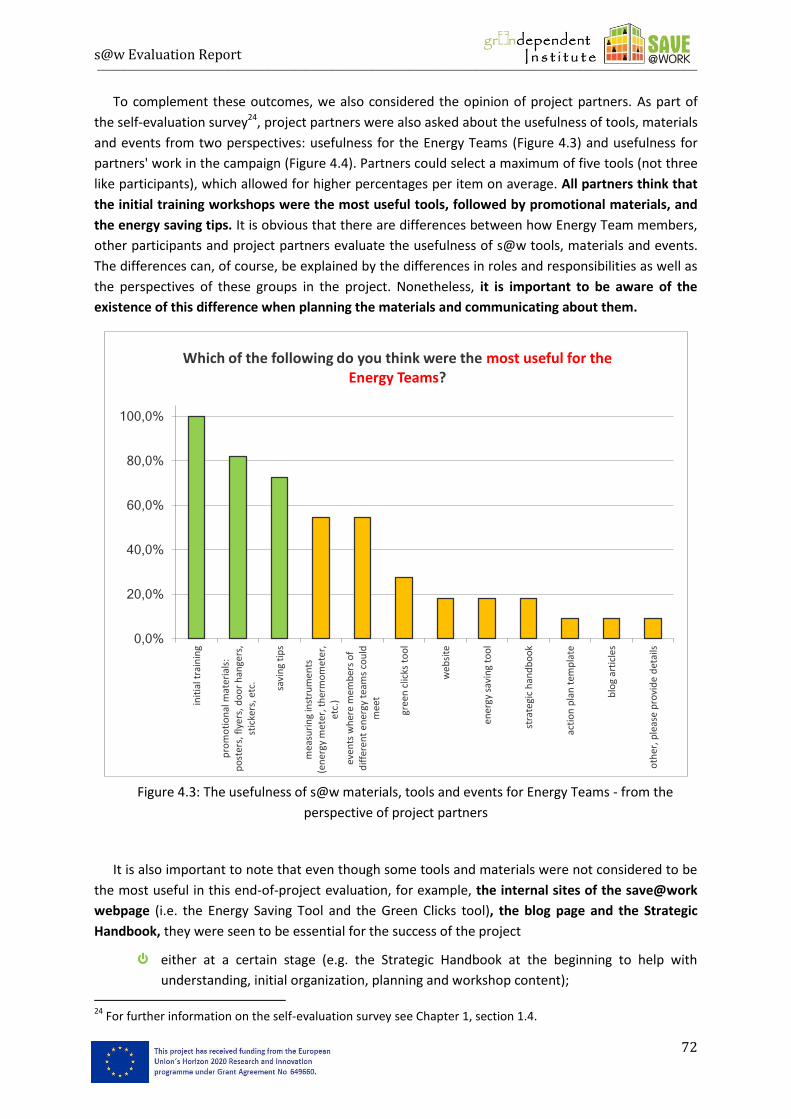
s@w Evaluation Report ___________________________________________________________________________________________________________________________________________________________________________________
72
To complement these outcomes, we also considered the opinion of project partners. As part of
the self-evaluation survey24, project partners were also asked about the usefulness of tools, materials
and events from two perspectives: usefulness for the Energy Teams (Figure 4.3) and usefulness for
partners' work in the campaign (Figure 4.4). Partners could select a maximum of five tools (not three
like participants), which allowed for higher percentages per item on average. All partners think that
the initial training workshops were the most useful tools, followed by promotional materials, and
the energy saving tips. It is obvious that there are differences between how Energy Team members,
other participants and project partners evaluate the usefulness of s@w tools, materials and events.
The differences can, of course, be explained by the differences in roles and responsibilities as well as
the perspectives of these groups in the project. Nonetheless, it is important to be aware of the
existence of this difference when planning the materials and communicating about them.
Figure 4.3: The usefulness of s@w materials, tools and events for Energy Teams - from the
perspective of project partners
It is also important to note that even though some tools and materials were not considered to be
the most useful in this end-of-project evaluation, for example, the internal sites of the save@work
webpage (i.e. the Energy Saving Tool and the Green Clicks tool), the blog page and the Strategic
Handbook, they were seen to be essential for the success of the project
either at a certain stage (e.g. the Strategic Handbook at the beginning to help with
understanding, initial organization, planning and workshop content);
24
For further information on the self-evaluation survey see Chapter 1, section 1.4.
0,0%
20,0%
40,0%
60,0%
80,0%
100,0%
init
ial t
rain
ing
pro
mo
tio
nal
mat
eria
ls:
po
ster
s, f
lyer
s, d
oo
r h
ange
rs,
stic
kers
, etc
.
savi
ng
tip
s
mea
suri
ng
inst
rum
ents
(e
ner
gy m
eter
, th
erm
om
eter
, et
c.)
even
ts w
her
e m
emb
ers
of
dif
fere
nt
ener
gy t
eam
s co
uld
m
eet
gree
n c
licks
to
ol
web
site
ener
gy s
avin
g to
ol
stra
tegi
c h
and
bo
ok
acti
on
pla
n t
emp
late
blo
g ar
ticl
es
oth
er, p
leas
e p
rovi
de
det
ails
Which of the following do you think were the most useful for the Energy Teams?
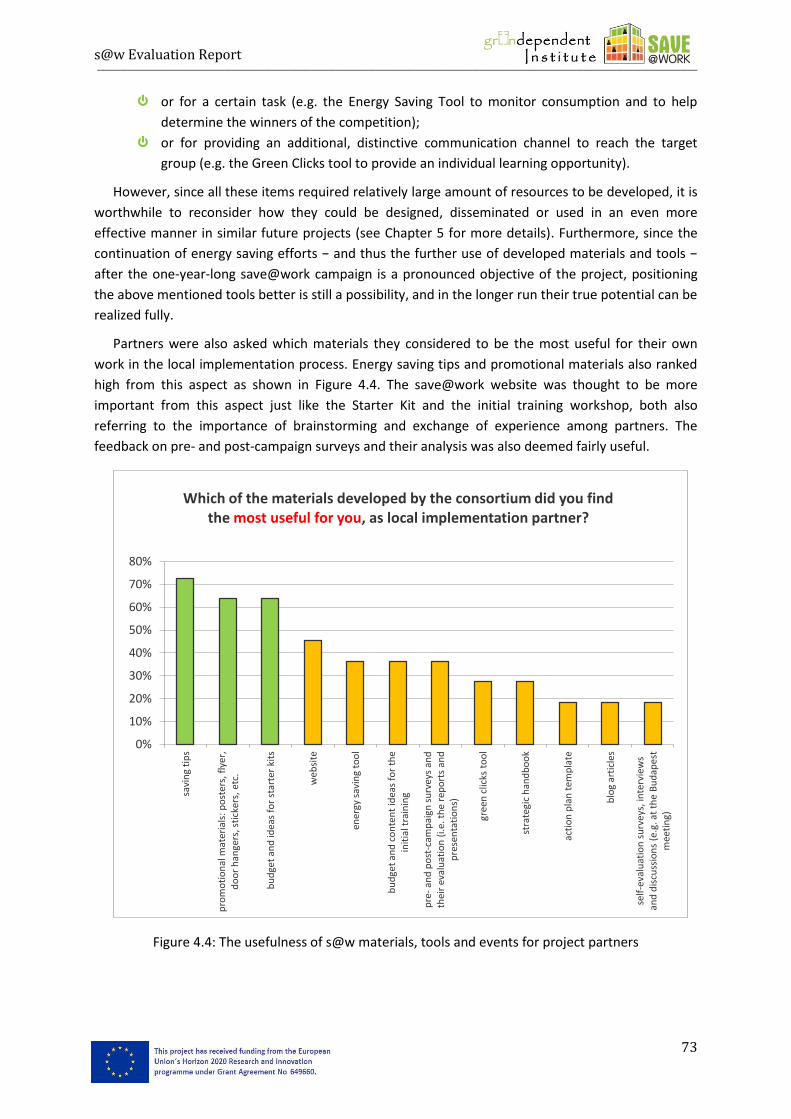
s@w Evaluation Report ___________________________________________________________________________________________________________________________________________________________________________________
73
or for a certain task (e.g. the Energy Saving Tool to monitor consumption and to help
determine the winners of the competition);
or for providing an additional, distinctive communication channel to reach the target
group (e.g. the Green Clicks tool to provide an individual learning opportunity).
However, since all these items required relatively large amount of resources to be developed, it is
worthwhile to reconsider how they could be designed, disseminated or used in an even more
effective manner in similar future projects (see Chapter 5 for more details). Furthermore, since the
continuation of energy saving efforts − and thus the further use of developed materials and tools −
after the one-year-long save@work campaign is a pronounced objective of the project, positioning
the above mentioned tools better is still a possibility, and in the longer run their true potential can be
realized fully.
Partners were also asked which materials they considered to be the most useful for their own
work in the local implementation process. Energy saving tips and promotional materials also ranked
high from this aspect as shown in Figure 4.4. The save@work website was thought to be more
important from this aspect just like the Starter Kit and the initial training workshop, both also
referring to the importance of brainstorming and exchange of experience among partners. The
feedback on pre- and post-campaign surveys and their analysis was also deemed fairly useful.
Figure 4.4: The usefulness of s@w materials, tools and events for project partners
0%
10%
20%
30%
40%
50%
60%
70%
80%
savi
ng
tip
s
pro
mo
tio
nal
mat
eria
ls: p
ost
ers,
fly
er,
do
or
han
gers
, sti
cker
s, e
tc.
bu
dge
t an
d id
eas
for
star
ter
kits
web
site
ener
gy s
avin
g to
ol
bu
dge
t an
d c
on
ten
t id
eas
for
the
init
ial t
rain
ing
pre
- an
d p
ost
-cam
pai
gn s
urv
eys
and
th
eir
eval
uat
ion
(i.e
. th
e re
po
rts
and
p
rese
nta
tio
ns)
gree
n c
licks
to
ol
stra
tegi
c h
and
bo
ok
acti
on
pla
n t
emp
late
blo
g ar
ticl
es
self
-eva
luat
ion
su
rvey
s, in
terv
iew
s an
d d
iscu
ssio
ns
(e.g
. at
the
Bu
dap
est
mee
tin
g)
Which of the materials developed by the consortium did you find the most useful for you, as local implementation partner?
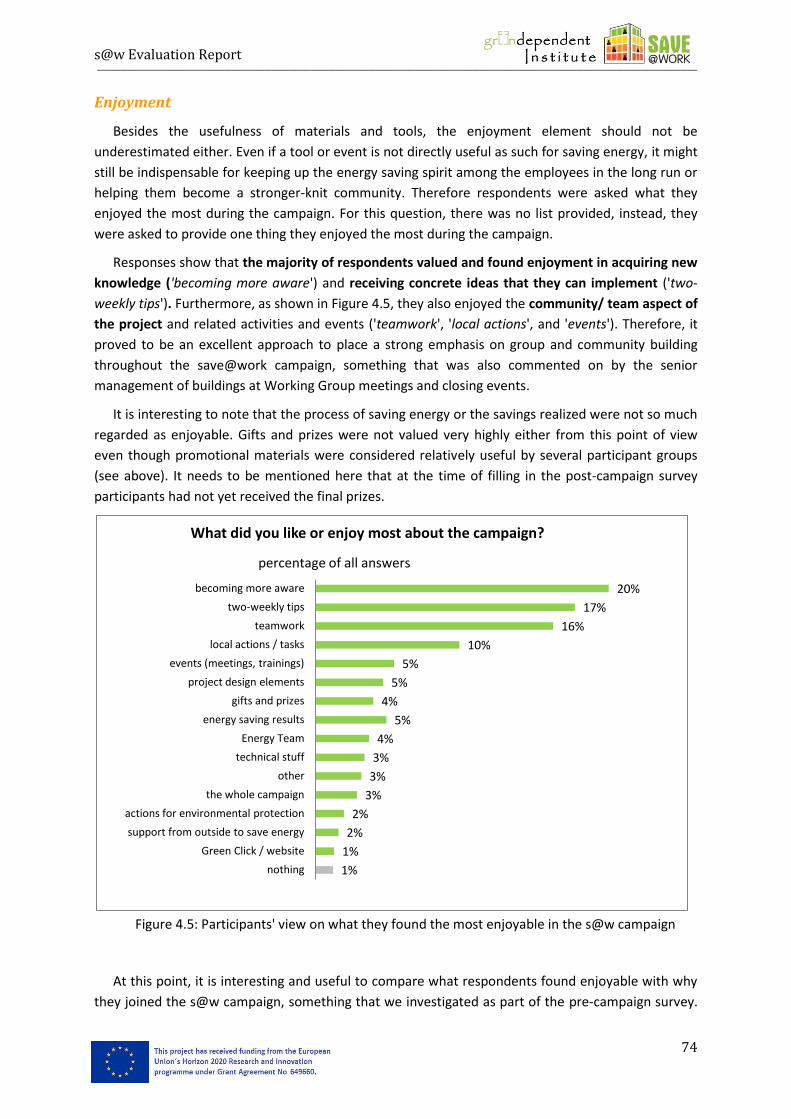
s@w Evaluation Report ___________________________________________________________________________________________________________________________________________________________________________________
74
Enjoyment
Besides the usefulness of materials and tools, the enjoyment element should not be
underestimated either. Even if a tool or event is not directly useful as such for saving energy, it might
still be indispensable for keeping up the energy saving spirit among the employees in the long run or
helping them become a stronger-knit community. Therefore respondents were asked what they
enjoyed the most during the campaign. For this question, there was no list provided, instead, they
were asked to provide one thing they enjoyed the most during the campaign.
Responses show that the majority of respondents valued and found enjoyment in acquiring new
knowledge ('becoming more aware') and receiving concrete ideas that they can implement ('two-
weekly tips'). Furthermore, as shown in Figure 4.5, they also enjoyed the community/ team aspect of
the project and related activities and events ('teamwork', 'local actions', and 'events'). Therefore, it
proved to be an excellent approach to place a strong emphasis on group and community building
throughout the save@work campaign, something that was also commented on by the senior
management of buildings at Working Group meetings and closing events.
It is interesting to note that the process of saving energy or the savings realized were not so much
regarded as enjoyable. Gifts and prizes were not valued very highly either from this point of view
even though promotional materials were considered relatively useful by several participant groups
(see above). It needs to be mentioned here that at the time of filling in the post-campaign survey
participants had not yet received the final prizes.
Figure 4.5: Participants' view on what they found the most enjoyable in the s@w campaign
At this point, it is interesting and useful to compare what respondents found enjoyable with why
they joined the s@w campaign, something that we investigated as part of the pre-campaign survey.
1%
1%
2%
2%
3%
3%
3%
4%
5%
4%
5%
5%
10%
16%
17%
20%
nothing
Green Click / website
support from outside to save energy
actions for environmental protection
the whole campaign
other
technical stuff
Energy Team
energy saving results
gifts and prizes
project design elements
events (meetings, trainings)
local actions / tasks
teamwork
two-weekly tips
becoming more aware
What did you like or enjoy most about the campaign?
percentage of all answers
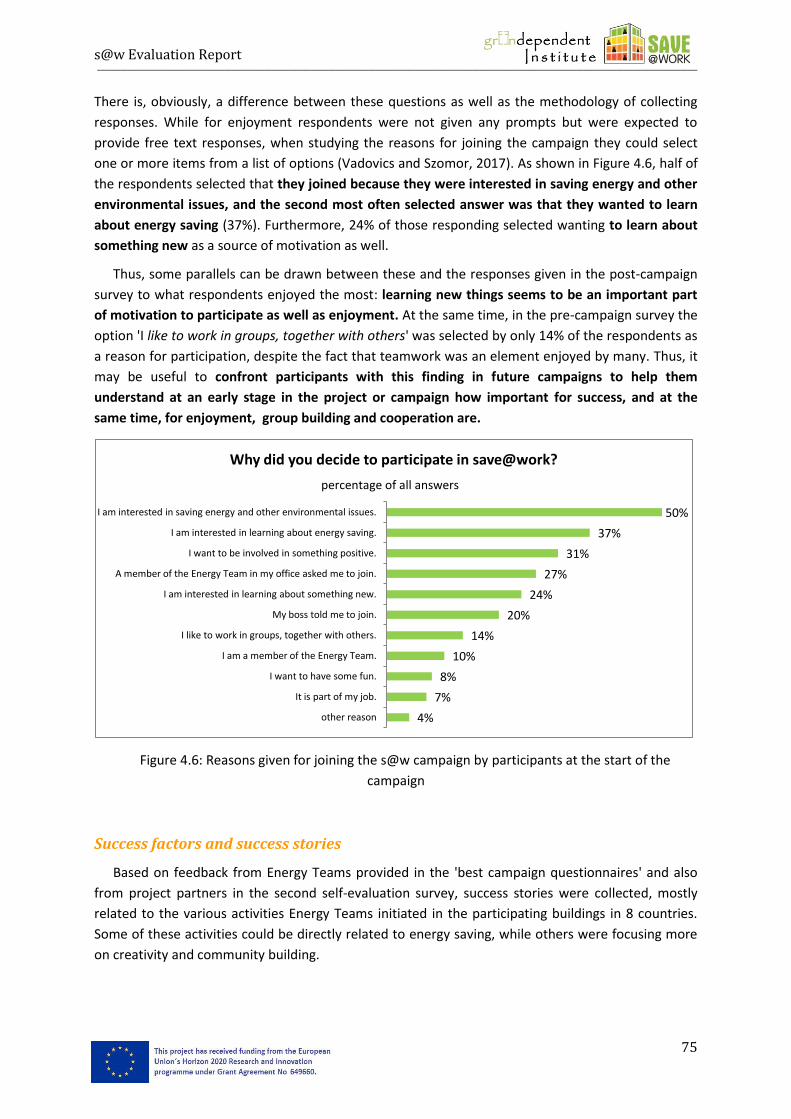
s@w Evaluation Report ___________________________________________________________________________________________________________________________________________________________________________________
75
There is, obviously, a difference between these questions as well as the methodology of collecting
responses. While for enjoyment respondents were not given any prompts but were expected to
provide free text responses, when studying the reasons for joining the campaign they could select
one or more items from a list of options (Vadovics and Szomor, 2017). As shown in Figure 4.6, half of
the respondents selected that they joined because they were interested in saving energy and other
environmental issues, and the second most often selected answer was that they wanted to learn
about energy saving (37%). Furthermore, 24% of those responding selected wanting to learn about
something new as a source of motivation as well.
Thus, some parallels can be drawn between these and the responses given in the post-campaign
survey to what respondents enjoyed the most: learning new things seems to be an important part
of motivation to participate as well as enjoyment. At the same time, in the pre-campaign survey the
option 'I like to work in groups, together with others' was selected by only 14% of the respondents as
a reason for participation, despite the fact that teamwork was an element enjoyed by many. Thus, it
may be useful to confront participants with this finding in future campaigns to help them
understand at an early stage in the project or campaign how important for success, and at the
same time, for enjoyment, group building and cooperation are.
Figure 4.6: Reasons given for joining the s@w campaign by participants at the start of the
campaign
Success factors and success stories
Based on feedback from Energy Teams provided in the 'best campaign questionnaires' and also
from project partners in the second self-evaluation survey, success stories were collected, mostly
related to the various activities Energy Teams initiated in the participating buildings in 8 countries.
Some of these activities could be directly related to energy saving, while others were focusing more
on creativity and community building.
4%
7%
8%
10%
14%
20%
24%
27%
31%
37%
50%
other reason
It is part of my job.
I want to have some fun.
I am a member of the Energy Team.
I like to work in groups, together with others.
My boss told me to join.
I am interested in learning about something new.
A member of the Energy Team in my office asked me to join.
I want to be involved in something positive.
I am interested in learning about energy saving.
I am interested in saving energy and other environmental issues.
Why did you decide to participate in save@work?
percentage of all answers
s@w Evaluation Report ___________________________________________________________________________________________________________________________________________________________________________________
76
Having, establishing and cultivating personal contacts
In the self-evaluation survey project partners were asked to describe what was the most
successful in their country as well as relate success stories from different areas of the project (e.g.
working with the management and Energy Teams, tools and methods developed, etc.). Several
partners pointed out the importance of personal contacts, both between the national partner and
Energy Teams, and between the local Energy Team and colleagues. Furthermore, two partners
mentioned that the midterm events they had organized were well-received and considered as very
useful in facilitating exchange between the Energy Teams of different buildings while the
competition was still ongoing.
Being creative and fostering an inquisitive atmosphere
Internal competitions, quizzes, video clips, communicating own calculations related to energy
saving were the most widely mentioned good examples that local Energy Teams organized or used
with great success. Bringing arts in as an aid for energy saving efforts were also mentioned by a few
partners: e.g. complementing the tips with a quotation by a famous author, organizing a creative
writing competition, or hosting an arts exhibition related to energy saving/ climate change within the
participating building.
Careful selection of buildings and Energy Team members, involving the management
At the end of the second self-evaluation survey partners were asked to share some tips for
success. The majority of them mentioned involving the top management more closely, as well as
selecting the buildings as well as members of the Energy Teams more carefully, possibly designating
the responsibility of a contact person/leader to someone within the team of dedicated members
coming from diverse backgrounds. The Energy Team should ideally include somebody from the
technical staff (e.g. building manager or energy manager), from maintenance (e.g. cleaning) and the
management as well.
Sharing responsibility within the Energy Team and meeting regularly
The best campaign questionnaires filled in by Energy Teams and then summarized by project
partners also highlight the importance of the above aspects for achieving success. Besides, partners
also concluded that sharing responsibilities clearly and more or less evenly among Energy Team
members, and meeting even more frequently than once a month in an informal setting are also
important success factors.
Success story from the UK - The most successful activity was the one centred around computer and screen
switch off. Each member of staff at the Land Registry have two screens, many of which were left on at the
end of the day. A member of the Energy Team worked out how much energy this wasted over the space of
an hour, multiplied it by the number of people in the office and across the 12 participating Land Registry
offices, showing a significant impact against a 14 hour night period. The Energy Team member who came up
with the calculations then wrote a blog about it on the Land Registry blog page. This became a big hit and a
campaign was rolled out across the organisation.
s@w Evaluation Report ___________________________________________________________________________________________________________________________________________________________________________________
77
Providing feedback and motivation on a regular basis
Providing regular feedback on energy savings to employees and/or the top management also
proved to be important, in several buildings it was done as part of the regular staff meetings.
Colleagues also welcomed the energy saving Christmas party and other informal office events which
included energy saving elements. They were also open to playful initiatives, such as 'energy
detectives/ commando', 'Mr Watt' or the 'Energy Saving Santa Claus', and were motivated by quizzes
and other internal competitions − as already mentioned earlier. Chocolate was a common treat for
employees who paid attention to basic energy saving practices, with great success in several
countries.
Balance between technical and creative aspects
Once again it was pointed out that a good balance between technical aspects and creative
campaign elements ensures the successful implementation of planned energy saving measures.
Reaching out to employees through the office intranet and providing an 'idea box' with the help of
which anybody could give an input to the save@work campaign also proved to be working very well.
Providing a supporting environment for energy saving and considering comfort
Modifying automatic settings and introducing new office regulations in a way that they support
energy saving within the building − or alternatively, integrating the save@work action plan into the
office strategy or other important strategies/ plans − also proved to be beneficial. Moreover,
combining energy saving measures with increasing the comfort of employees, e.g. purchasing desk
lamps, optimizing office temperature in a way that temperature actually increased in some places
(but decreased in the majority of rooms), installing decorations that increase the feeling of warmth in
winter (e.g. through colours), attracted an especially positive response.
Success story from Italy - Collective meeting of employees such as 'shared lunches' (where employees
brought from home selected lunch items to be shared with the other colleagues) or Christmas parties/
dinners where energy saving issues were also discussed were big successes. The human dimension of
such events − rediscovering the pleasure of human relationships within the organisation − was really
appreciated and most of the municipalities experiencing those events, are planning to continue
organising them in the future.
Success story from Hungary - Two of the Hungarian buildings chose to carry out their energy saving activities
in the framework of 'topic months', meaning that in each month of the competition period they focused on a
different special activity to enhance energy saving. This way besides the routine practices of turning down
the heating, switching off the lights and office equipment at the end of the day, etc. employees could use
their creativity and work towards more savings either directly or indirectly. For example, in April they
decorated their workstations with more greenery, in September one office held a 'bike to work' event, while
the other building rearranged the furniture in their office rooms using professional help to make it more
energy efficient, e.g. by using natural light better, by placing lighting better, etc.
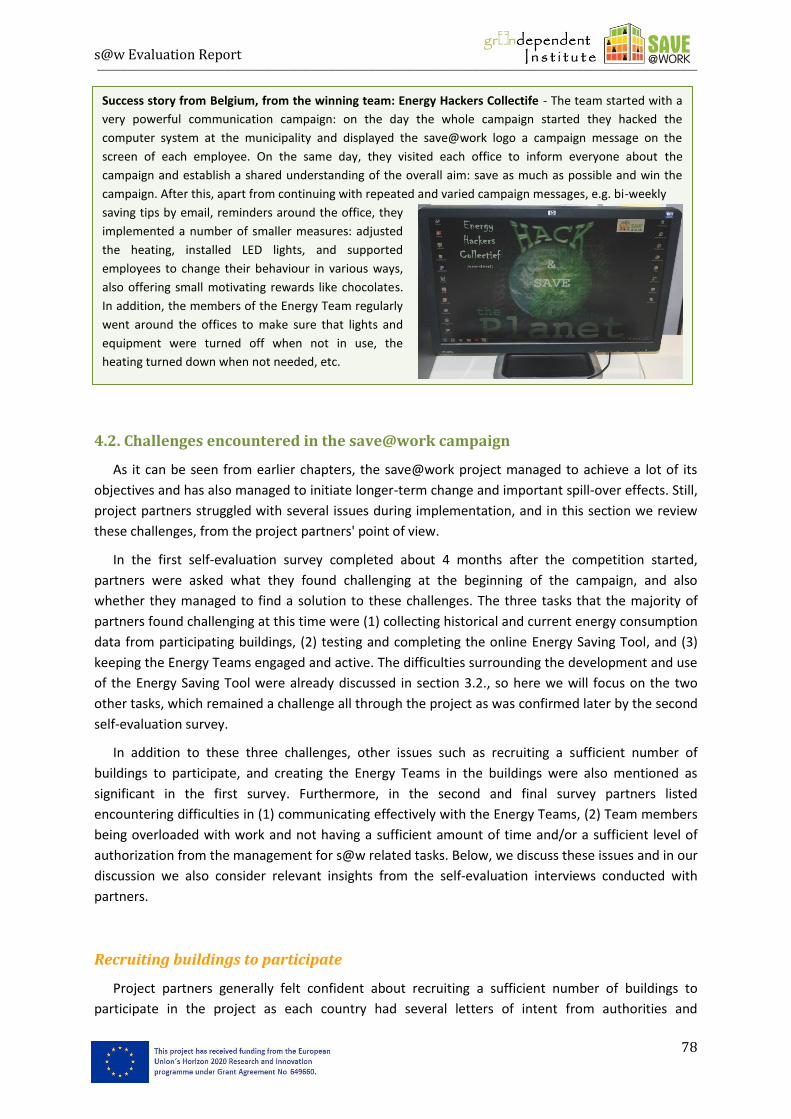
s@w Evaluation Report ___________________________________________________________________________________________________________________________________________________________________________________
78
4.2. Challenges encountered in the save@work campaign
As it can be seen from earlier chapters, the save@work project managed to achieve a lot of its
objectives and has also managed to initiate longer-term change and important spill-over effects. Still,
project partners struggled with several issues during implementation, and in this section we review
these challenges, from the project partners' point of view.
In the first self-evaluation survey completed about 4 months after the competition started,
partners were asked what they found challenging at the beginning of the campaign, and also
whether they managed to find a solution to these challenges. The three tasks that the majority of
partners found challenging at this time were (1) collecting historical and current energy consumption
data from participating buildings, (2) testing and completing the online Energy Saving Tool, and (3)
keeping the Energy Teams engaged and active. The difficulties surrounding the development and use
of the Energy Saving Tool were already discussed in section 3.2., so here we will focus on the two
other tasks, which remained a challenge all through the project as was confirmed later by the second
self-evaluation survey.
In addition to these three challenges, other issues such as recruiting a sufficient number of
buildings to participate, and creating the Energy Teams in the buildings were also mentioned as
significant in the first survey. Furthermore, in the second and final survey partners listed
encountering difficulties in (1) communicating effectively with the Energy Teams, (2) Team members
being overloaded with work and not having a sufficient amount of time and/or a sufficient level of
authorization from the management for s@w related tasks. Below, we discuss these issues and in our
discussion we also consider relevant insights from the self-evaluation interviews conducted with
partners.
Recruiting buildings to participate
Project partners generally felt confident about recruiting a sufficient number of buildings to
participate in the project as each country had several letters of intent from authorities and
Success story from Belgium, from the winning team: Energy Hackers Collectife - The team started with a
very powerful communication campaign: on the day the whole campaign started they hacked the
computer system at the municipality and displayed the save@work logo a campaign message on the
screen of each employee. On the same day, they visited each office to inform everyone about the
campaign and establish a shared understanding of the overall aim: save as much as possible and win the
campaign. After this, apart from continuing with repeated and varied campaign messages, e.g. bi-weekly
saving tips by email, reminders around the office, they
implemented a number of smaller measures: adjusted
the heating, installed LED lights, and supported
employees to change their behaviour in various ways,
also offering small motivating rewards like chocolates.
In addition, the members of the Energy Team regularly
went around the offices to make sure that lights and
equipment were turned off when not in use, the
heating turned down when not needed, etc.
s@w Evaluation Report ___________________________________________________________________________________________________________________________________________________________________________________
79
municipalities already during the proposal stage. However, in almost all the participating countries
these letters of intent did not prove sufficient: some otherwise interested authorities reconsidered
or were forced to reconsider their participation for various reasons. Thus, new participants needed
to be found. This naturally delayed the recruitment process, especially if the local partner was not
prepared for a larger number of potential participants to withdraw from the project. Although some
partners had been ready for this and already had a well-thought out recruitment strategy in place,
the consortium as a whole was not fully prepared for the challenge posed by finding a sufficient
number of participating buildings. This resulted in the delay of delivering some of the tasks later on
(e.g. forming the Energy Teams, organizing the initial training workshops or completing the pre-
campaign survey).
In the end, the challenge of recruitment was overcome in most of the countries (see section 1.3.
on results and participant numbers), but in a future project, we would suggest some changes in
recruitment efforts and tools used, please see Chapter 5 for details of these suggestions.
Lack of motivation and time
Although there were, obviously, some very motivated Energy Teams participating in save@work
in each partner country, in general partners had to find creative ways to deal with an overall lack of
motivation to engage and be proactive on the part of public authorities. This could often be
connected to two reasons. First of all, public employees in all countries seem to be overloaded with
work already, partly due to a lack of resources available to the public sector, often as a result of
various austerity measures. This, combined with the fact that employees often did not receive a
sufficient level of authorization from the management for carrying out save@work project related
tasks and activities resulted in a lack of motivation to participate in or initiate campaign activities.
Partners applied a variety of tools and methods to overcome this issue, for example:
by signing agreements with the management of municipalities for participation in the
project including granting sufficient time to employees for completing project tasks;
through discussing this issue with representatives of the management at working group
meetings; and
through keeping the management informed about project activities and progress.
Providing intermediate smaller prizes for completing certain project tasks and related
dissemination activities also helped, for example, in Hungary.
Still, in a future project we would suggest further integration of project activities into the general
activities and tasks of participating buildings and employees, as discussed in Chapter 5 in more detail.
The third reason for lack of motivation is different in nature from the other two in that it is
connected to the difficulty of keeping up motivation during a relatively long campaign period
(12 months in the case of s@w). From the point of view of changing behaviour and helping the
changed behaviour and practices become the norm, the length of the campaign was definitely
advantageous, however, from the point of view of motivating participants, it posed challenges. Thus,
in addition to trying to involve the management more, project partners also applied and developed
several tools and methods to maintain the motivation of Energy Teams. First of all, by using a
gamification approach and providing challenges that were constructed to engage and mobilize the
s@w Evaluation Report ___________________________________________________________________________________________________________________________________________________________________________________
80
Teams as well as the employees. The focus and topic of these challenges varied from country to
country as the local context required. Small prizes provided for challenges that were completed best
motivated some Teams even more. Another tool was the organization of midterm events and thus
providing an opportunity for Energy Teams from different buildings to meet and exchange
experience. Finally, partners often motivated Teams by providing tailor-made support to them, and
contacted them on a regular basis either through phone or email.
Managing communication at multiple levels
As shown in the project structure figures introduced and described in section 3.1. (and see
Annex IV. as well), project partners needed to communicate with very different target groups in the
s@w project: with the management (including mayors, building and energy/environmental
managers, communication managers, etc.), the Energy Teams and often also with employees. This
required a rather complex communication strategy and using a variety of tools.
The greatest challenge for the project partners was to manage the communication with the
management, especially given that their commitment and support had a great impact on the success
of the campaign in the buildings managed by them, especially if the building had a large number of
employees. Although s@w consortium members regularly discussed this issue at partner meetings
and exchanged experience and ideas for managing communication with this influential target group,
it would probably have been useful to have a strategy for communication including some specific
tools to help engage the management.
Communicating with the Energy Teams proved to be challenging for a different reasons, especially
if communication happened through a designated contact person like in Hungary, Latvia or Sweden.
Part of the difficulty arose from the fact that project partners often were not notified if the contact
person changed and a new person took over. Furthermore, for project partners it was rather difficult
to motivate the new person if he or she did not receive an introduction from the municipality and
was just assigned the task among numerous others. Finally, having just one person as contact
appeared to provide for a very narrow communication channel, especially if the person was not very
active, or did not have any communication experience and found it a challenge to pass information
on, etc. Thus, the importance of a careful build-up of Energy Teams is reinforced from this aspect as
well.
Finally, it is important to note that communication and using appropriate communication
strategies and tools can provide solutions to a variety of challenges encountered in projects like
save@work. In the first self-evaluation survey partners were also asked about the solutions they
came up with for the issues they faced, and increasing the amount of communication activities was
naturally one of the most often cited response. This, for example, meant forming closer links with the
building management and the Energy Teams, communicating with not just one but several members
of the Energy Teams as well as communicating more with their own colleagues and s@w partners.
Collecting energy consumption data
The collection of both historical and current energy consumption data, although very important
for energy saving campaigns, proved to be one of the most challenging tasks in a number of buildings
s@w Evaluation Report ___________________________________________________________________________________________________________________________________________________________________________________
81
in all participating countries. There are different reasons for this. First of all, Energy Teams,
responsible for providing this data to project partners through entering it into the Energy Saving
Tool, often did not have a member who was authorized to handle and/or had access to such data. As
a result, Energy Teams had to find the source of data in their building, which was often a challenge as
energy consumption data is not readily available everywhere, and then establish contact and acquire
the necessary permission to receive and use the data. Then, in quite a number of buildings the
collection of the appropriate historical energy consumption data was in itself a relatively challenging
research task as this data was not stored and handled in a systematic way. Participating authorities
and municipalities were often not sure where their meters were, and if their shared energy systems
with other organizations, they were not sure which were their own meters and which their
neighbours', and, in general, there was quite a considerable lack of energy data management
systems including a lack of employees or teams of employees responsible for managing them in
buildings in all participating countries. There were, of course, exceptions to this rather general
challenge, but only a few. Thus, the save@work project contributed to the realization of this fact as
well as a resolve from management to overcome this, sometimes already during the project.
Filling in the pre- and post-campaign surveys
Save@work consortium partners prepared carefully for the administration of both the pre- and
post-campaign participant surveys as based on their prior experience the expectation had been that
it would prove to be challenging to collect the required number of responses.
Based on the Description of Work for the save@work project, 40% of employees in participating
buildings were required to fill in the survey. This is a rather high number, but the save@work
consortium wanted to gain a sufficient amount of information on campaign participants and
buildings.
As partners did not expect the survey response collection process to be easy, the consortium
spent time and effort on brainstorming and collecting ways in which employees in participating
buildings could be motivated to fill in the survey. The ideas brainstormed were summarized in a file
and circulated within the consortium, with updates and an additional tool (letter to the management
to support the survey) for the post-campaign survey.25 From among these methods partners in
different countries selected different ones, and, indeed, different methods worked well in different
settings. For example, giving a small prize for buildings that managed to complete the largest number
of surveys as compared to their total employee count proved to be very successful in Hungary, but
did not motivated employees in Germany.
Similarly, different countries experienced different challenges, but challenges, especially for filling
in the pre-campaign survey, were most apparent in Austria, Germany and the UK, where employees
in participating buildings were extremely reluctant to participate - in spite of the different
methodological solutions partners used (see details in Vadovics and Szomor, 2017). Methods that
were very successful in other countries (e.g. setting a prize in Hungary) did not work in these. As a
result, in these countries the response rate was lower than would be desirable (see Table 4.1). The
response rate was lower than planned in all participating countries as it did not reach the planned
40%, but still a sufficient number of responses were provided for analysis.
25
The tips collected for the pre-campaing survey can be found in Vadovics and Szomor, 2017.
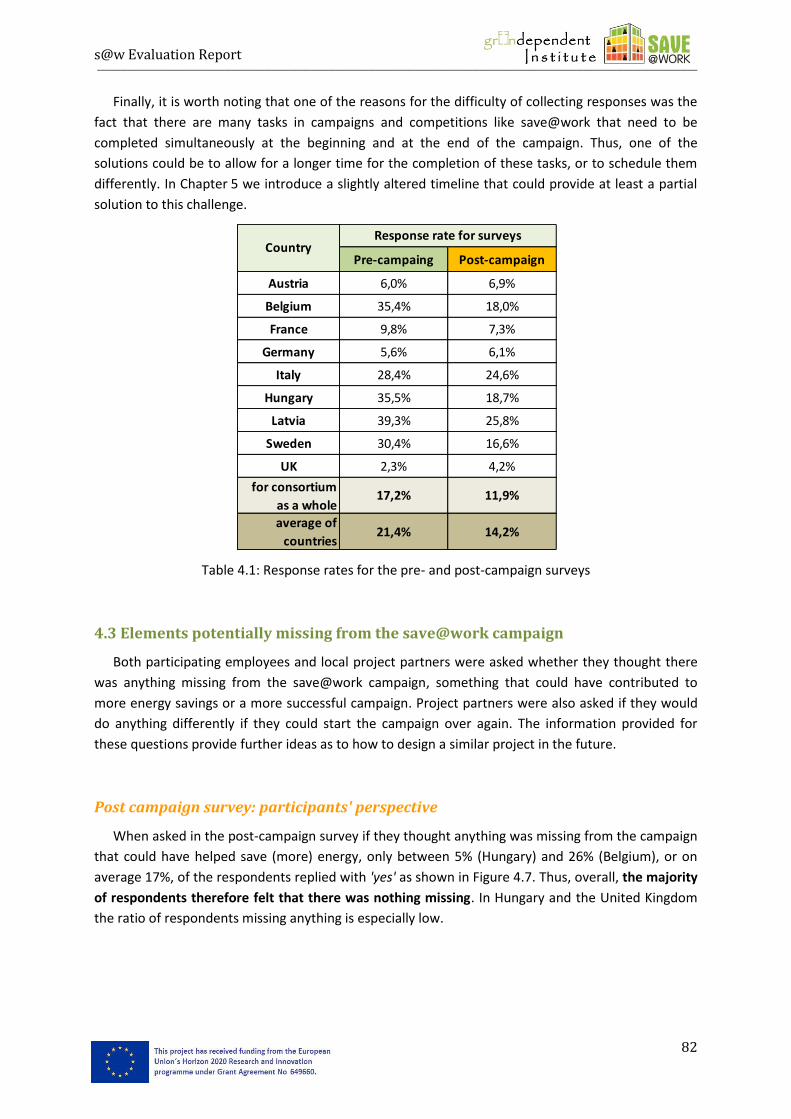
s@w Evaluation Report ___________________________________________________________________________________________________________________________________________________________________________________
82
Finally, it is worth noting that one of the reasons for the difficulty of collecting responses was the
fact that there are many tasks in campaigns and competitions like save@work that need to be
completed simultaneously at the beginning and at the end of the campaign. Thus, one of the
solutions could be to allow for a longer time for the completion of these tasks, or to schedule them
differently. In Chapter 5 we introduce a slightly altered timeline that could provide at least a partial
solution to this challenge.
Table 4.1: Response rates for the pre- and post-campaign surveys
4.3 Elements potentially missing from the save@work campaign
Both participating employees and local project partners were asked whether they thought there
was anything missing from the save@work campaign, something that could have contributed to
more energy savings or a more successful campaign. Project partners were also asked if they would
do anything differently if they could start the campaign over again. The information provided for
these questions provide further ideas as to how to design a similar project in the future.
Post campaign survey: participants' perspective
When asked in the post-campaign survey if they thought anything was missing from the campaign
that could have helped save (more) energy, only between 5% (Hungary) and 26% (Belgium), or on
average 17%, of the respondents replied with 'yes' as shown in Figure 4.7. Thus, overall, the majority
of respondents therefore felt that there was nothing missing. In Hungary and the United Kingdom
the ratio of respondents missing anything is especially low.
Pre-campaing Post-campaign
Austria 6,0% 6,9%
Belgium 35,4% 18,0%
France 9,8% 7,3%
Germany 5,6% 6,1%
Italy 28,4% 24,6%
Hungary 35,5% 18,7%
Latvia 39,3% 25,8%
Sweden 30,4% 16,6%
UK 2,3% 4,2%
for consortium
as a whole17,2% 11,9%
average of
countries21,4% 14,2%
CountryResponse rate for surveys
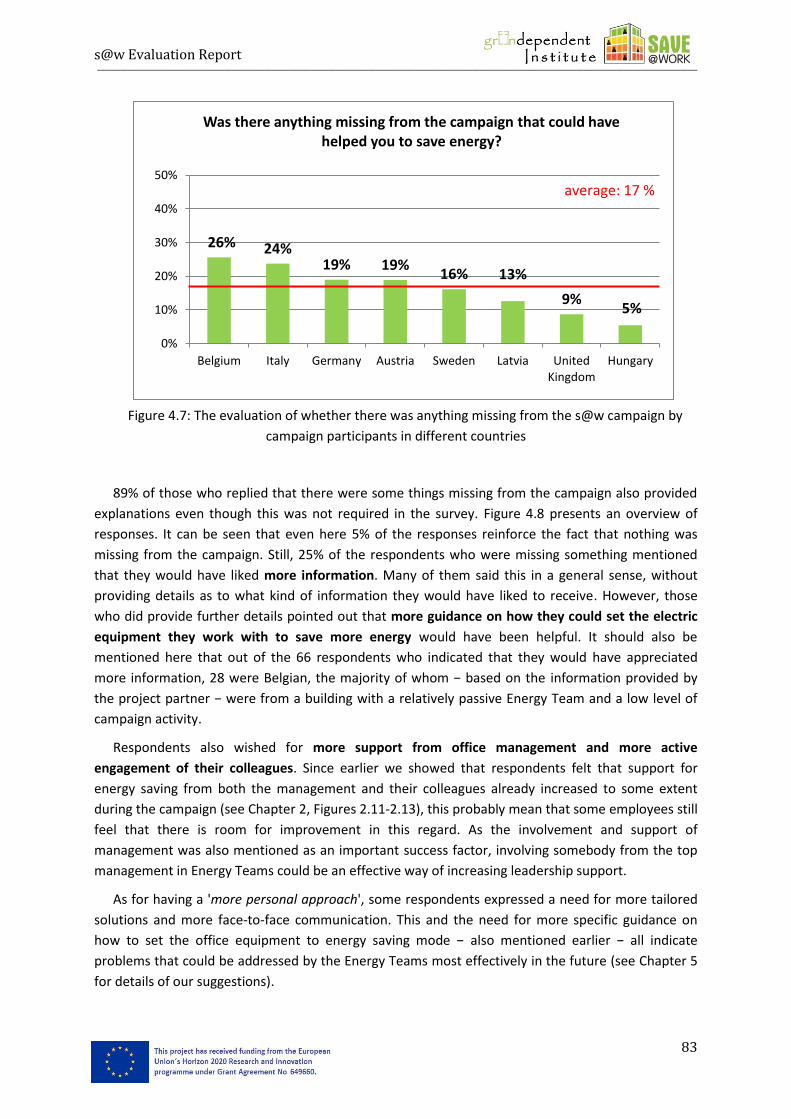
s@w Evaluation Report ___________________________________________________________________________________________________________________________________________________________________________________
83
Figure 4.7: The evaluation of whether there was anything missing from the s@w campaign by
campaign participants in different countries
89% of those who replied that there were some things missing from the campaign also provided
explanations even though this was not required in the survey. Figure 4.8 presents an overview of
responses. It can be seen that even here 5% of the responses reinforce the fact that nothing was
missing from the campaign. Still, 25% of the respondents who were missing something mentioned
that they would have liked more information. Many of them said this in a general sense, without
providing details as to what kind of information they would have liked to receive. However, those
who did provide further details pointed out that more guidance on how they could set the electric
equipment they work with to save more energy would have been helpful. It should also be
mentioned here that out of the 66 respondents who indicated that they would have appreciated
more information, 28 were Belgian, the majority of whom − based on the information provided by
the project partner − were from a building with a relatively passive Energy Team and a low level of
campaign activity.
Respondents also wished for more support from office management and more active
engagement of their colleagues. Since earlier we showed that respondents felt that support for
energy saving from both the management and their colleagues already increased to some extent
during the campaign (see Chapter 2, Figures 2.11-2.13), this probably mean that some employees still
feel that there is room for improvement in this regard. As the involvement and support of
management was also mentioned as an important success factor, involving somebody from the top
management in Energy Teams could be an effective way of increasing leadership support.
As for having a 'more personal approach', some respondents expressed a need for more tailored
solutions and more face-to-face communication. This and the need for more specific guidance on
how to set the office equipment to energy saving mode − also mentioned earlier − all indicate
problems that could be addressed by the Energy Teams most effectively in the future (see Chapter 5
for details of our suggestions).
26% 24% 19% 19%
16% 13%
9% 5%
0%
10%
20%
30%
40%
50%
Belgium Italy Germany Austria Sweden Latvia United Kingdom
Hungary
Was there anything missing from the campaign that could have helped you to save energy?
average: 17 %
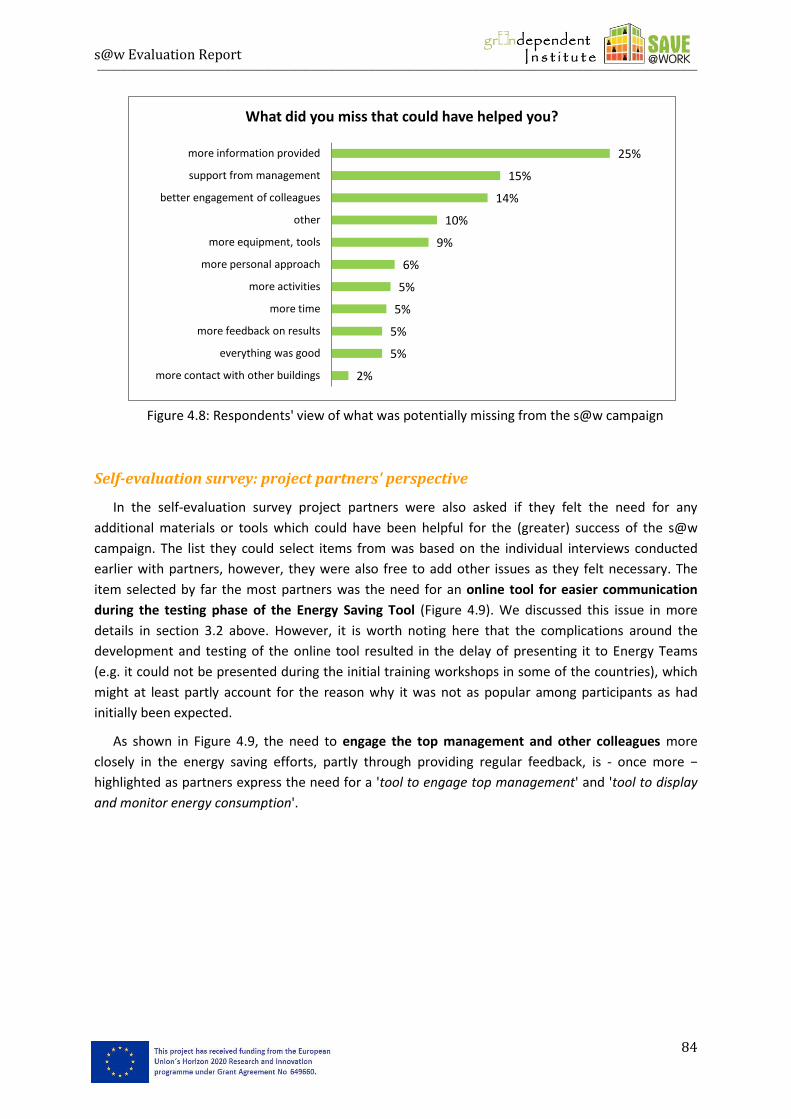
s@w Evaluation Report ___________________________________________________________________________________________________________________________________________________________________________________
84
Figure 4.8: Respondents' view of what was potentially missing from the s@w campaign
Self-evaluation survey: project partners' perspective
In the self-evaluation survey project partners were also asked if they felt the need for any
additional materials or tools which could have been helpful for the (greater) success of the s@w
campaign. The list they could select items from was based on the individual interviews conducted
earlier with partners, however, they were also free to add other issues as they felt necessary. The
item selected by far the most partners was the need for an online tool for easier communication
during the testing phase of the Energy Saving Tool (Figure 4.9). We discussed this issue in more
details in section 3.2 above. However, it is worth noting here that the complications around the
development and testing of the online tool resulted in the delay of presenting it to Energy Teams
(e.g. it could not be presented during the initial training workshops in some of the countries), which
might at least partly account for the reason why it was not as popular among participants as had
initially been expected.
As shown in Figure 4.9, the need to engage the top management and other colleagues more
closely in the energy saving efforts, partly through providing regular feedback, is - once more −
highlighted as partners express the need for a 'tool to engage top management' and 'tool to display
and monitor energy consumption'.
2%
5%
5%
5%
5%
6%
9%
10%
14%
15%
25%
more contact with other buildings
everything was good
more feedback on results
more time
more activities
more personal approach
more equipment, tools
other
better engagement of colleagues
support from management
more information provided
What did you miss that could have helped you?
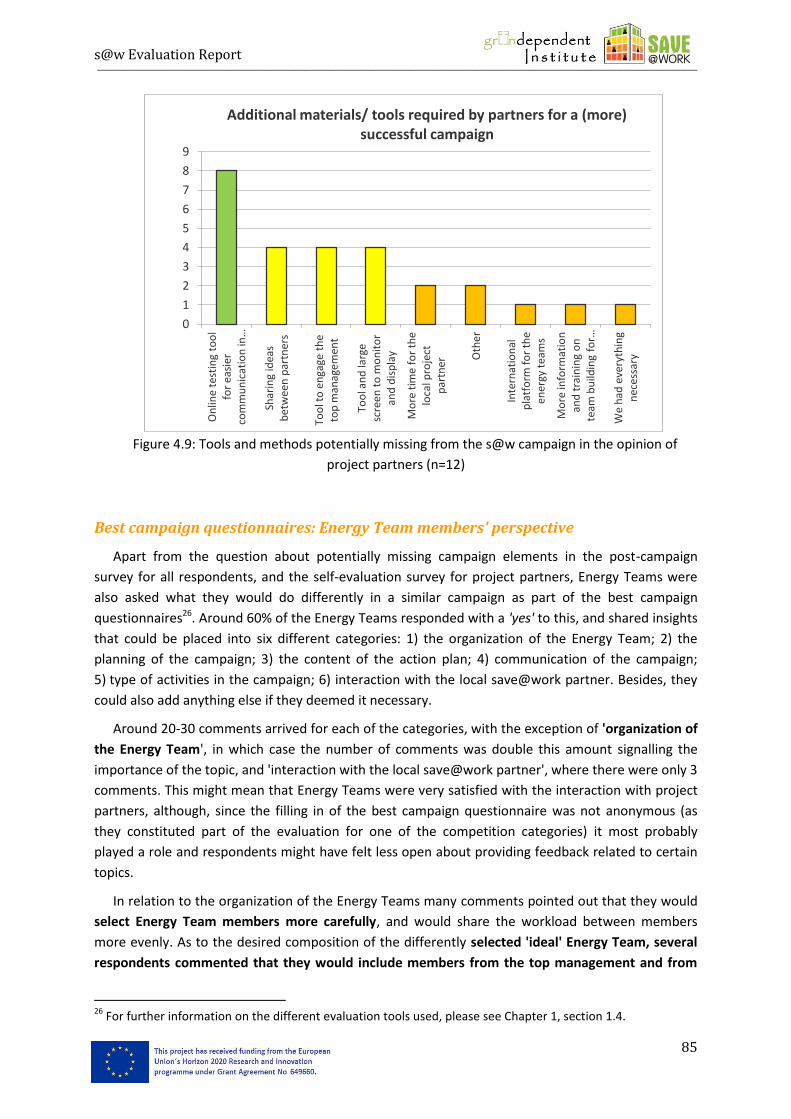
s@w Evaluation Report ___________________________________________________________________________________________________________________________________________________________________________________
85
Figure 4.9: Tools and methods potentially missing from the s@w campaign in the opinion of
project partners (n=12)
Best campaign questionnaires: Energy Team members' perspective
Apart from the question about potentially missing campaign elements in the post-campaign
survey for all respondents, and the self-evaluation survey for project partners, Energy Teams were
also asked what they would do differently in a similar campaign as part of the best campaign
questionnaires26. Around 60% of the Energy Teams responded with a 'yes' to this, and shared insights
that could be placed into six different categories: 1) the organization of the Energy Team; 2) the
planning of the campaign; 3) the content of the action plan; 4) communication of the campaign;
5) type of activities in the campaign; 6) interaction with the local save@work partner. Besides, they
could also add anything else if they deemed it necessary.
Around 20-30 comments arrived for each of the categories, with the exception of 'organization of
the Energy Team', in which case the number of comments was double this amount signalling the
importance of the topic, and 'interaction with the local save@work partner', where there were only 3
comments. This might mean that Energy Teams were very satisfied with the interaction with project
partners, although, since the filling in of the best campaign questionnaire was not anonymous (as
they constituted part of the evaluation for one of the competition categories) it most probably
played a role and respondents might have felt less open about providing feedback related to certain
topics.
In relation to the organization of the Energy Teams many comments pointed out that they would
select Energy Team members more carefully, and would share the workload between members
more evenly. As to the desired composition of the differently selected 'ideal' Energy Team, several
respondents commented that they would include members from the top management and from
26
For further information on the different evaluation tools used, please see Chapter 1, section 1.4.
0
1
2
3
4
5
6
7
8
9
On
line
test
ing
too
l fo
r ea
sier
co
mm
un
icat
ion
in …
Shar
ing
idea
s b
etw
een
par
tner
s
Too
l to
en
gage
th
e to
p m
anag
emen
t
Too
l an
d la
rge
scre
en t
o m
on
ito
r an
d d
isp
lay
Mo
re t
ime
for
the
loca
l pro
ject
p
artn
er Oth
er
Inte
rnat
ion
al
pla
tfo
rm f
or
the
ener
gy t
eam
s
Mo
re in
form
atio
n
and
tra
inin
g o
n
team
bu
ildin
g fo
r …
We
had
eve
ryth
ing
nec
essa
ry
Additional materials/ tools required by partners for a (more) successful campaign
s@w Evaluation Report ___________________________________________________________________________________________________________________________________________________________________________________
86
the department responsible for maintenance, or that they would invite at least one member per
department. All these aspects have already been emphasized above. It is an interesting contrast,
that while seemingly many teams struggled with the ideal member composition, the Strategic
Handbook, which contained a number of tips − including advice practically identical to the
conclusions just drawn − on this topic, had not been as widely circulated as initially desired.
Moreover, it is possible that since the Handbook was distributed at the beginning of the campaign
where there were a number of tasks to complete, members of the Energy Teams might have felt
overwhelmed to spend time on studying it. Thus, for similar projects in the future it may be useful to
either provide the Strategic Handbook in a modular manner (i.e. chapter by chapter as relevant
during the campaign) or regularly remind participants about the content, e.g. through specific
organization and management tips for the Energy Teams.
Concerning the communication of the s@w campaign several Energy Teams mentioned that they
would want to communicate about the save@work campaign more: some externally, some making
more use of the internally available channels (e.g. intranet), while others mentioned using more
kinds of channels or involving the leadership more - again echoing the advice and tips given in the
Strategic Handbook. Furthermore, there were Energy Teams from three different countries who
emphasized the importance of more face-to-face communication in the future.
Two teams suggested that a national blog for Energy Teams would be useful to exchange
experience. Since there was such a blog site available, maybe the problem was that they could not
write on it directly or did not know about the opportunity. However, those who knew about it did
not rate the blog to be very useful (see section 4.1). Therefore, it would be worthwhile to reconsider
the management and communication of such blog sites in similar future projects and perhaps
provide more opportunity for participants to publish their stories on it more directly.
Summary and Conclusions
In summary it can be concluded that all important participant groups - Energy Teams,
participating employees and project partners - appear to agree that there are no essential or basic
tools and materials missing from the save@work campaign 'toolkit'. However, there are some tools
that could be added to further improve the effectiveness of the campaign. One such tool would be a
communication tool to help involve the top management more as well as make their involvement
and support more apparent to employees to increase their level of activity and motivation. Another
opportunity for improving the campaign from the point of view of tools and materials is the changing
of the use or some other features of some of the existing tools. One of these is the Energy Saving
Tool that could be made more user-friendly. Another example is the Strategic Handbook that should
be used in a more step-by-step fashion with regular reminders for Energy Teams about the content
as it seems to be very relevant, though not readily accessible as yet. Finally, the blog could be made
more readily accessible to Energy Teams for use in more national level communication and
information exchange between them.
It is also worth noting that these conclusions are very much in line with those drawn after
considering similarities and differences between national level implementations in the nine
countries. Consequently, they are important to consider when rethinking the save@work
methodology.
s@w Evaluation Report ___________________________________________________________________________________________________________________________________________________________________________________
87
CHAPTER 5: Conclusions and recommendations for future projects
In Chapter 5 we come back to the save@work methodology and review it based on the findings of
our analysis presented in this report (section 5.1). Following this, we provide practical tips for
implementers of (similar) behaviour change focused projects (section 5.2). Finally, we summarize the
lessons learnt in the save@work project in five main recommendations (section 5.3).
5.1. Rethinking the save@work methodology: suggestions for an improved plan
Based on the findings presented in this report so far, in this section our objective is to reconsider
the save@work methodology and make suggestions for an improved plan that could be used in
future campaigns. We do these by discussing the suggested changes one by one as well as including a
reconsidered project implementation as well as a materials and tools figure (Figure 5.1 and 5.2,
respectively).
Project implementation structure(s): recognizing and learning from diversity
As it became apparent in the save@work project, although all national partners were able to
follow the general project implementation plan, there were considerable differences in
implementation between partners concerning recruitment, communication, the use of materials and
tools, etc. Thus, in a future project we would suggest a more explicit discussion of the local
implementation and communication plans and the use of tools - such as the drawing of project
implementation figures like the ones presented in Annex IV. here - to facilitate this process.
Furthermore, it is also useful to start this process as soon as possible, preferably already at the kick-
off meeting, and have regular discussions about differences and similarities about implementation
throughout the project at project partner meetings. Save@work partners followed this practice,
however, through forming specific smaller 'implementation teams' along similarities or differences
may help enhance this process further and increase the learning impact. For example, in the
save@work project small teams could have been formed based on working with one main authority
representing all the participating buildings in the competition (Austria, France, Germany and the UK)
or working with several authorities each representing a few buildings (Belgium, Italy, Hungary, Latvia,
and Sweden), with the groups first sharing their experience and tools first 'internally' to be able to
develop more tailor-made solutions, but then eventually sharing their conclusions with the whole
team.
Facilitate a better integration of the project into existing municipal structures
There are several outcomes in the save@work project – in several cases the lack of engagement
from top management, lack of time and authorization for employees to work on the project,
difficulty of collecting energy consumption data, etc. - that suggest that better integration of project
activities into existing municipal structures and processes may help overcome a variety of issues and
contribute to success significantly. Furthermore, as it is the overall objective of the save@work
project consortium - and we imagine similar project consortiums in the future - to lay the
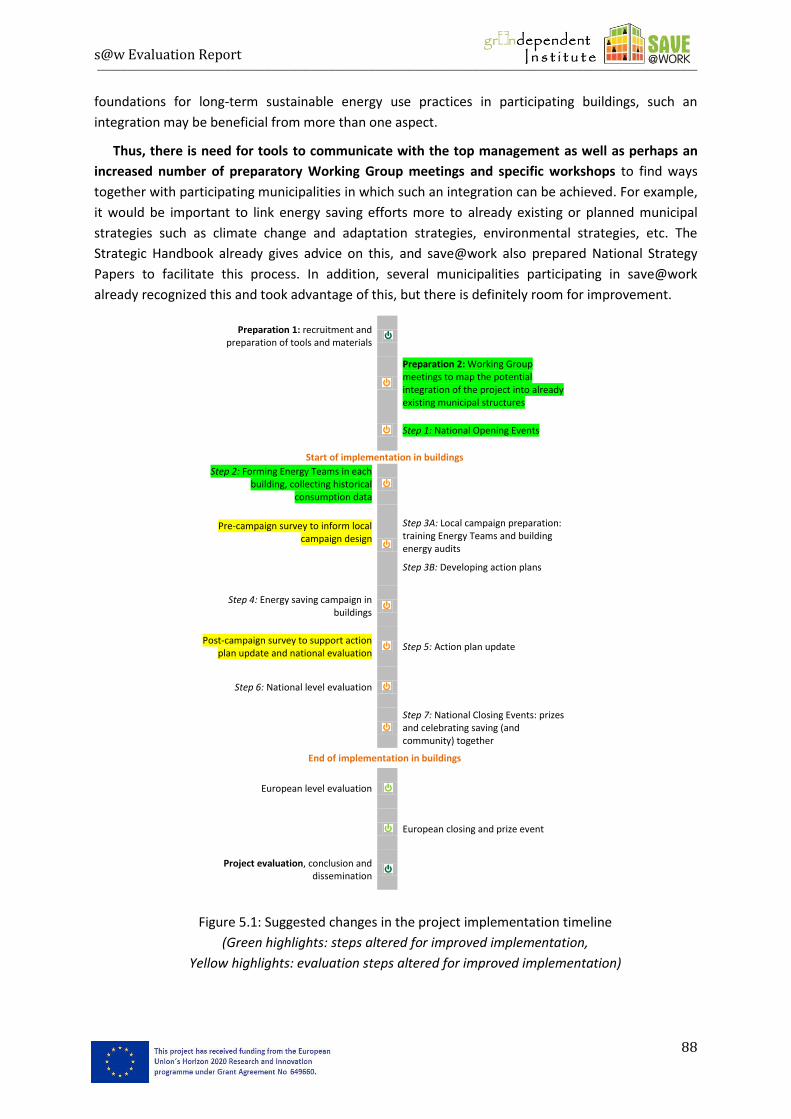
s@w Evaluation Report ___________________________________________________________________________________________________________________________________________________________________________________
88
foundations for long-term sustainable energy use practices in participating buildings, such an
integration may be beneficial from more than one aspect.
Thus, there is need for tools to communicate with the top management as well as perhaps an
increased number of preparatory Working Group meetings and specific workshops to find ways
together with participating municipalities in which such an integration can be achieved. For example,
it would be important to link energy saving efforts more to already existing or planned municipal
strategies such as climate change and adaptation strategies, environmental strategies, etc. The
Strategic Handbook already gives advice on this, and save@work also prepared National Strategy
Papers to facilitate this process. In addition, several municipalities participating in save@work
already recognized this and took advantage of this, but there is definitely room for improvement.
Figure 5.1: Suggested changes in the project implementation timeline
(Green highlights: steps altered for improved implementation,
Yellow highlights: evaluation steps altered for improved implementation)
Preparation 1: recruitment and preparation of tools and materials
Preparation 2: Working Group meetings to map the potential integration of the project into already existing municipal structures
Step 1: National Opening Events
Start of implementation in buildings
Step 2: Forming Energy Teams in each building, collecting historical
consumption data
Pre-campaign survey to inform local campaign design
Step 3A: Local campaign preparation: training Energy Teams and building energy audits
Step 3B: Developing action plans
Step 4: Energy saving campaign in buildings
Post-campaign survey to support action plan update and national evaluation
Step 5: Action plan update
Step 6: National level evaluation
Step 7: National Closing Events: prizes and celebrating saving (and community) together
End of implementation in buildings
European level evaluation
European closing and prize event
Project evaluation, conclusion and dissemination
s@w Evaluation Report ___________________________________________________________________________________________________________________________________________________________________________________
89
The timing of activities
In the save@work project, especially in the year-long campaign phase, there were too many tasks
and activities for participating buildings to complete at the beginning of the campaign: forming
Energy Teams, completing baseline assessments (i.e. simple audits), collecting historical energy
consumption data, drawing up action plans, involving employees in the pre-campaign survey, holding
initial workshops, etc. Thus, we suggest allowing for a sufficiently long preparation phase in order to
prepare the competition, and thus, the energy saving phase better. Changing the order of steps may
be a good idea to allow for this to happen: as indicated in Figure 5.1 (cf. Figure 1.3), we propose
holding the National Opening Events prior to forming the Energy Teams (soma participating
countries, e.g. Germany and Hungary already followed this practice). This way, the Opening Events
could also serve as the finalization of the otherwise often challenging recruitment process: still
wavering authorities could be invited as guests and could potentially be convinced at these events.
Furthermore, having a face to face event would allow for giving advice and guidance to participants
about some of the initial steps, such as forming the Energy Teams, local communication, data
collection, etc.
Use existing tools in new ways to help create a more tailored approach
Buildings that participate in campaigns like save@work are often very different: they work to
different timelines, they make decisions following different structures, they are organized into
different departments, they are very diverse in terms of already existing sustainable energy
strategies and processes, their available infrastructure supporting energy efficiency and saving are
different, the attitude and knowledge of their employees to energy saving varies, etc. Therefore, it is
very important to assist them in developing tailored local action plans - using the general guidelines,
tools and materials provided 'centrally'. In save@work we found that the pre-campaign survey can
be an important source of information for helping to create campaigns tailored to local needs. The
contents of the pre-campaign survey need to be planned well in order to provide useful information
on existing attitudes and norms to, knowledge and practices of, and barriers to energy saving,
motivations for employees to engage in change, etc. This information supplemented with the
findings of the baseline assessment (simple audit) and historical consumption data can help draw up
locally relevant action plans. The post-campaign survey could contribute to drawing up the revised
action plans for the continuation of activities following the campaign period in a similar fashion.
In save@work the original project plan had not yet realized the role of the pre-campaign survey in
this, however, adjustments were made during the campaign and extra tools developed to help make
up for this. Still, in a future campaign developing a tool to make survey analysis easier and quicker
would be very useful. Furthermore, we suggest timing the pre- and post-surveys a little bit differently
from their timing in the current campaign - as indicated in Figure 5.1 (cf. Figure 1.7).
Teamwork, group building, Energy Teams
As it was explained in section 1.2, the save@work methodology already recognized the
importance of groups in motivating, supporting and maintaining change, creating new norms and
practices as well as empowering individuals to become change agents. Thus, communities, especially
s@w Evaluation Report ___________________________________________________________________________________________________________________________________________________________________________________
90
the Energy Teams formed in each participating building were already in the forefront. As a result, the
Strategic Handbook included chapters on forming and developing groups (see Annex I.), the focus of
the first set of energy saving tips was in fact on forming Energy Teams (see Annex III.), group building
activities were included in the programme of some of the National Opening Events (e.g. in Latvia) or
the initial training workshops (e.g. in Hungary). Still, based on feedback from participants as well as
the top management who all recognized that group building is an important part of energy saving
activities, group building and development could have an even more prominent position in similar
campaigns in the future: it could become the part of a follow-up training workshop for Energy Teams
or be incorporated into the programme of midterm events, and a separate set of tips could be
developed specifically to help build, develop and maintain groups, partly using already available
materials and information in the Strategic Handbook. Potentially, group building and development
could become part of the Green Clicks tool as well. This is all the more important since teamwork and
working groups were found to play an important role in creating not just useful, but also enjoyable
energy saving campaigns (see more details in section 4.1).
Materials and tools reconsidered
As it was discussed above, there were no essential or basic tools missing from the save@work
project methodology. Our most important finding was that the use of several tools could be made
more effective in different ways, most of them discussed already in Chapter 2 and 4. Here, we would
like to emphasize once more the challenges surrounding the development and use of the online
Energy Saving Tool and the conclusion of the save@work consortium that in a similar project it may
be useful to consider using (and potentially improving) an already existing calculation tool. Moreover,
in order for such a tool to be used by project participant groups, it is important to make it user-
friendly, and thus test it (i.e. pilot it) with user groups (in the case of s@w, municipal employees) not
only with project partners.
Furthermore, there are some tools that could be developed in addition to the ones already
existing, or based on the ones already existing. We mentioned such a development for
facilitating the discussion of national (or local) project implementation structure;
the pre- and post-campaign surveys;
group development tips and training workshops; and
regular national newsletter to keep important project stakeholders, e.g. the management
of buildings, updated about the progress of project (we described above in section 2.2
that such a tool was already used by some partners in Austria, Latvia and Sweden).
These tools are all marked in capital orange letters in the reconsidered project materials and tools
figure (Figure 5.2 cf. Figure 1.4).
Finally, additional tools could be used to encourage and facilitate the sharing of experience and
ideas at the international level between project partners as well as Energy Teams and potentially
even between interested employees and/or members of management. An international blog was
already part of the save@work methodology, however, through the tools used in the evaluation
process a suggestion came up for an online discussion group either as part of the internal project
website or a separately established closed group in a social media platform. Such groups can be very
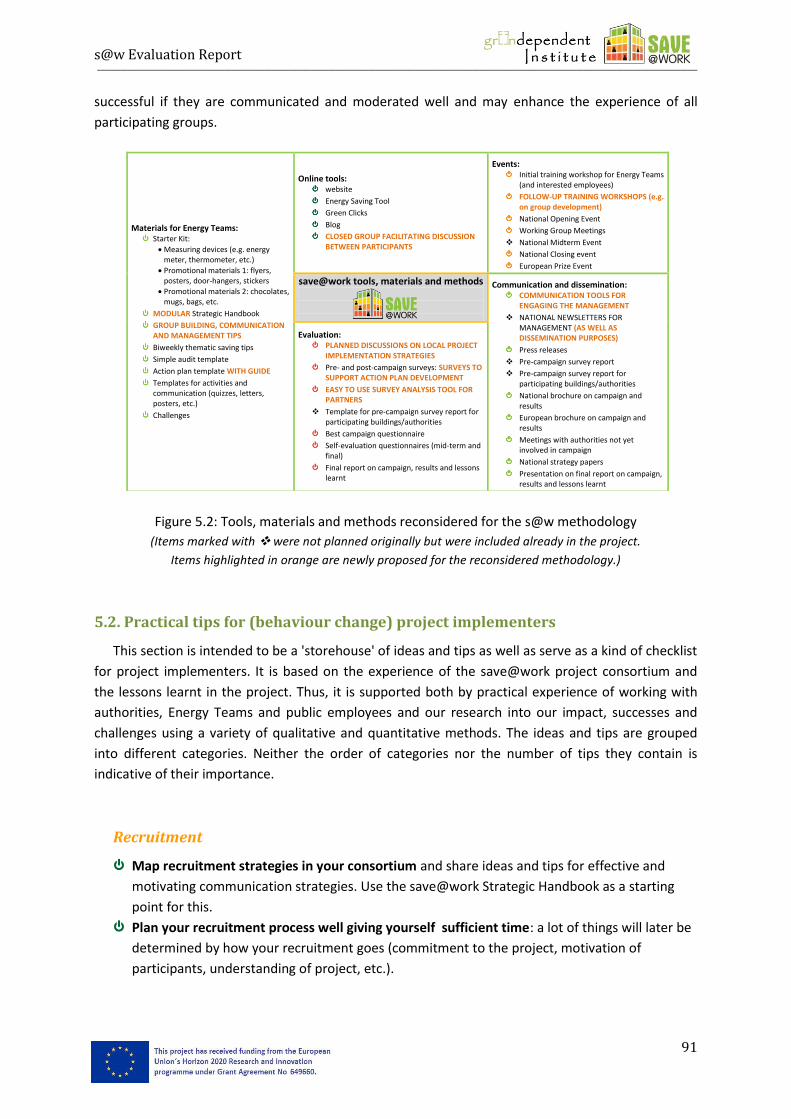
s@w Evaluation Report ___________________________________________________________________________________________________________________________________________________________________________________
91
successful if they are communicated and moderated well and may enhance the experience of all
participating groups.
Figure 5.2: Tools, materials and methods reconsidered for the s@w methodology
(Items marked with were not planned originally but were included already in the project.
Items highlighted in orange are newly proposed for the reconsidered methodology.)
5.2. Practical tips for (behaviour change) project implementers
This section is intended to be a 'storehouse' of ideas and tips as well as serve as a kind of checklist
for project implementers. It is based on the experience of the save@work project consortium and
the lessons learnt in the project. Thus, it is supported both by practical experience of working with
authorities, Energy Teams and public employees and our research into our impact, successes and
challenges using a variety of qualitative and quantitative methods. The ideas and tips are grouped
into different categories. Neither the order of categories nor the number of tips they contain is
indicative of their importance.
Recruitment
Map recruitment strategies in your consortium and share ideas and tips for effective and
motivating communication strategies. Use the save@work Strategic Handbook as a starting
point for this.
Plan your recruitment process well giving yourself sufficient time: a lot of things will later be
determined by how your recruitment goes (commitment to the project, motivation of
participants, understanding of project, etc.).
Materials for Energy Teams: Starter Kit:
Measuring devices (e.g. energy meter, thermometer, etc.)
Promotional materials 1: flyers, posters, door-hangers, stickers
Promotional materials 2: chocolates, mugs, bags, etc.
MODULAR Strategic Handbook
GROUP BUILDING, COMMUNICATION AND MANAGEMENT TIPS
Biweekly thematic saving tips
Simple audit template
Action plan template WITH GUIDE
Templates for activities and communication (quizzes, letters, posters, etc.)
Challenges
Online tools: website
Energy Saving Tool
Green Clicks
Blog
CLOSED GROUP FACILITATING DISCUSSION BETWEEN PARTICIPANTS
Events: Initial training workshop for Energy Teams
(and interested employees)
FOLLOW-UP TRAINING WORKSHOPS (e.g. on group development)
National Opening Event
Working Group Meetings
National Midterm Event
National Closing event
European Prize Event
save@work tools, materials and methods
Communication and dissemination: COMMUNICATION TOOLS FOR
ENGAGING THE MANAGEMENT
NATIONAL NEWSLETTERS FOR MANAGEMENT (AS WELL AS DISSEMINATION PURPOSES)
Press releases
Pre-campaign survey report
Pre-campaign survey report for participating buildings/authorities
National brochure on campaign and results
European brochure on campaign and results
Meetings with authorities not yet involved in campaign
National strategy papers
Presentation on final report on campaign, results and lessons learnt
Evaluation: PLANNED DISCUSSIONS ON LOCAL PROJECT
IMPLEMENTATION STRATEGIES
Pre- and post-campaign surveys: SURVEYS TO SUPPORT ACTION PLAN DEVELOPMENT
EASY TO USE SURVEY ANALYSIS TOOL FOR PARTNERS
Template for pre-campaign survey report for participating buildings/authorities
Best campaign questionnaire
Self-evaluation questionnaires (mid-term and final)
Final report on campaign, results and lessons learnt
s@w Evaluation Report ___________________________________________________________________________________________________________________________________________________________________________________
92
Letters of Intent, signed by the leadership of the public buildings for proposal submission, are
important but they are not sufficient for ensuring participation. They need to be confirmed as
soon as possible once the project proposal is accepted.
In addition to Letters of Intent it is important to have a recruitment plan in place with
sufficient time allowed for press releases, face to face meetings, etc.
In order to gain positive commitment from the management include a tool and more
strategies to engage them. This is important as later on you will need positive communication
from the management to the employees.
Think ahead about your target group: what kind of municipalities, departments and buildings
do you wish to engage with? Adapt the recruitment method to match the needs of the target
group, and fine-tune the method during the recruitment phase.
Once the management is ready to participate, sign participation and co-operation agreements
with them detailing what both parties need to do to ensure success. Make sure time and
resource requirements are clear to the management, and ask them to grant sufficient time for
their employees to work on the project.
Discuss how the project fits into the already existing strategies, plans, processes, etc. of the
municipality and find common goals, processes, etc.
Timing
Your participants, e.g. buildings will progress with project activities and through project steps
at their own pace. It is always a challenge to keep to a common timeline between countries
but it can be surprisingly difficult to keep to a common timeline between participating
buildings within one country. The solution is to allow for flexibility in your plans while you have
concrete and well-communicated deadlines for tasks.
Prepare a project timeline for the recruitment stage so that your participants know what they
are signing up to. Regularly update this timeline and communicate all updates very clearly to
all participant groups.
Communication
Map the different types of communication activities you will need to do (with management,
with Energy Teams, with employees, with the media, etc.) and the different tools necessary for
their success.
Do not underestimate the importance of face-to-face communication at all levels and for all
purposes: with management, with Energy Teams and with employees. It is important, effective
and enjoyable to meet in person whether that be in meetings, training workshops or larger
events.
Facilitate the exchange of experience, both good practice and challenges at all levels: local,
national and European.
Establish different channels for the exchange of experience: online in the form of a blog or
closed group, and offline at community events including group discussions.
Use several communication channels for communicating the same message: people prefer
and respond to different channels, and you do need to repeat even the simplest message. Be
creative!
s@w Evaluation Report ___________________________________________________________________________________________________________________________________________________________________________________
93
Maintain regular communication with and provide feedback to the important participant
groups in the project: to the management (newsletter, Working Group meetings), to Energy
Teams (emails, phone calls, events, etc.) as well as employees.
Facilitate the communication of your local participants (i.e. Energy Teams) by providing them
with communication tools and ideas: remember, they are not experts! The save@work
Strategic Handbook can help with ideas.
Spend enough time and resources on dissemination: it is motivating for participants to read
and hear about 'their' project in the media.
Events
Events are important and can contribute to the success of your project, so make sure to have
them and prepare for them carefully. They are great for: information exchange, providing
motivation, networking, dissemination, and if organized well, for team building.
Plan with and organize different types of events: local, regional (if relevant), national and in a
European project: international as well. Although participants are sometimes challenging to
recruit, in the end they always find them motivating.
If your project includes a longer campaign period (9-12 months), plan with Opening, Midterm
and Closing events. Use the Midterm event to strengthen motivation, share experience and
provide feedback as well as additional input.
Encourage the local teams to organize various local events: lunches for employees, talks,
quizzes, plant swaps, baking and writing contests, bike to work events, Christmas parties, etc.
They all help build a supportive community, motivate employees as well as create a sense of
enjoyment and positive atmosphere around sustainable energy use - on top of raising the level
of awareness.
Entrust participants with presenting their own stories, challenges and achievements even if
they seem reluctant at first.
Organize your events in a way that fits the focus of your project. i.e. make sure to organize
'green' events in a sustainable energy project.
Creating and training local teams (Energy Teams)
It is much better to have a local team to implement a behaviour change campaign than just a
single responsible person: in groups responsibility can be shared, more skills are available, they
can empower people and individuals do not feel alone with the task.
Allow a sufficient amount of time for the forming of the local team and facilitate the process
with training, tips and advice. The save@work Strategic Handbook includes some useful
materials for this.
Help select the members of the Energy Team carefully: make sure that different departments
are represented, different skills are available, responsibility can be shared, etc. If possible,
invite a member of the management and a more technically oriented person (ideally the
building or energy manager) to join.
Make sure that the tasks and responsibilities of the local team are clear and the workload is
shared as evenly as possible. Ask for a designated point of contact, preferably more than one
person in order not to lose contact if someone leaves or is on holiday.
s@w Evaluation Report ___________________________________________________________________________________________________________________________________________________________________________________
94
Train the local teams well: one training event will probably not be enough. It is important to
train them not only in expert matters (i.e. how to save energy, how to collect energy data, how
to use the project tools, etc.) but also in management and team building ideas (e.g. how to
plan a campaign, how to develop their group and deal with disagreements, etc.).
Besides energy saving tips, also provide management and team building tips developed
specifically for facilitating the work of the local teams.
Communicate with your local teams regularly, but also visit them. It is best to do the baseline
assessment and the basics of the action plan for the campaign together with them.
Provide tools and materials to help the work of teams: measuring devices (e.g. energy meter,
thermometer), promotional materials (e.g. flyers, stickers, chocolates, textile bags, mugs, etc.),
example quizzes are very useful and appreciated. Check the save@work Starter Kits for
inspiration.
Allow for and create opportunities as well as tools for local teams to share their experience:
through online tools as well as face to face events.
Provide regular feedback to your local teams on their progress: they need constructive
feedback on all aspects of their work (energy saving, challenges completed, action plan
content, etc.) to be able to stay motivated and focused.
Be prepared that some of your local teams may lose their motivation and focus during the
campaign. Share ideas in your project team for getting over them. Here are some from
save@work: regular contact, challenges, feedback, events, and sharing between teams.
Reward your local teams: it is useful and can be motivating to have smaller prizes for the best
completion of some tasks (e.g. pre-campaign survey, challenges).
Group and community building
Group-based activities as well as group and community building are very important in
behaviour change programmes for several reasons (e.g. people see that they are not alone,
they receive encouragement and motivation, they develop solutions together, etc.), so make
sure to include them in your campaign. Building a cohesive employee group is almost a
prerequisite for behaviour and practice change based energy saving efforts: cooperation is
needed to change automatic unsustainable practices.
In changing behaviour, creativity, enjoyment and comfort play a big part: people are more
likely to take up a new practice if it not only saves energy but also contributes to their well-
being.
Help participants realize that they are not only part of a local, but also a national and
European community, the members of which of want to contribute to more sustainable
energy use. This provides motivation as well as the realization that each small step counts if it
is carried out by lots of people - their efforts add up.
Having a competition element in campaigns can help provide additional momentum and
motivation to change, especially if the competition is organized between groups who
otherwise cooperate. Local teams from different buildings will (hopefully) be motivated to do
at least as much as teams in other buildings, so make sure to provide feedback to them.
Be careful, though, to keep a healthy balance between the collaborative and the competitive
aspects of the campaign.
s@w Evaluation Report ___________________________________________________________________________________________________________________________________________________________________________________
95
Tools and materials
It is very useful to have centrally developed tools and materials in the context of a European
project. However, make sure to adapt the materials to the local context both in content and
time of delivery (e.g. energy saving tips developed for heating may be needed at different
times in Italy and in Sweden). You can find a lot more information and examples of this if you
review save@work materials and tools in Chapter 1.2.
Some of your materials may need to be adapted more than others, depending on the local
context, and the infrastructure, knowledge and skills available there. For example, if you have
automated lighting in a building, your lighting tips will need to be very different to those
buildings with no automation. Make sure to introduce and explain the use of tools and
materials, giving examples on why and how they are to be used. Remember, the members of
the local teams are not experts, thus the reason for having some of the tools or the value of
these tools may not be obvious to them.
Prepare guidebooks to ease the use of your more complicated materials (e.g. online energy
saving tool) or those requiring expert knowledge (e.g. action plan template).
Enable and encourage local teams to prepare their own materials, e.g. by providing templates
and examples (you may want to get inspiration from the save@work templates provided to
Energy Teams). Encourage the sharing of ideas for new materials between the local teams.
If possible, test and pilot the most important tools with members of the target group to
ensure that they are as user-friendly as possible (e.g. you may want to do this with online tools
such as the energy saving tool or the Green Clicks tool in save@work).
Provide regular feedback from energy consumption tools: this way you provide reports on
progress and also provide an example on how the tool can be used (i.e. your local teams can
use it in a similar way when they report to the management and the employees).
Evaluation and data collection
In energy consumption reduction campaigns you will need to have access to reliable data,
preferably on historical as well as current consumption. However, never assume that data is
readily available!
As soon as you start the project, start investigating the availability of data, and make it a
condition for participation if you can.
If possible, involve the persons with access to energy consumption data as part of the local
teams; this will save you a great deal of time and effort.
Include an evaluation component in your campaign: if possible both the evaluation of the
impact of your campaign (e.g. pre- and post-campaign surveys) and that of your own efforts
(i.e. self-evaluation).
Pre- and post-campaign surveys - if planned and used well - can also contribute to the
preparation of local action plans for the campaign and its future in the target group. Well-
planned surveys can help make your campaign be even more responsive to the local context.
Communicate the outcomes of your evaluation amongst your stakeholders, it is an important
part of the feedback that you share with them.
s@w Evaluation Report ___________________________________________________________________________________________________________________________________________________________________________________
96
5.3. Summary and Conclusions
Based on the experience of the save@work project as well as the analysis presented in this report
including the numerous successes as well as the challenges that needed to be overcome, we have
drawn the following 5 most important lessons learnt and recommendations for future behaviour
change projects focusing on energy use - or, indeed, on any other area of practice.
INTEGRATE AND MAKE IT THE NORM: behaviour (or practice) change related activities work
best if they are integrated as much as possible into everyday processes, tasks, job descriptions
and strategies. Employees need to see them as part of their job and not have to worry about
spending time and effort on it in their free time or taking away time from their 'regular tasks'.
This way sustainable energy use behaviour can become the new norm that everyone strives to
achieve as part of their work.
Integration, however, should not mean that no special and/or additional activities, training,
events, etc. are needed to achieve sustainable energy use.
BUILD COHESIVE GROUPS AND EMPLOYEE COMMUNITIES: both research and practice,
including our experience in save@work, point toward the importance of small groups and
communities in changing, supporting and maintaining more sustainable (energy use) behaviour
and practices as well as being a source of enjoyment, fun and learning. We know, groups do not
become cohesive by themselves, therefore, as part of any campaign it is of vital importance to
spend time and effort on building cohesive groups and employee communities through
specifically focused activities and training as well as through creating opportunities where
groups can develop naturally.
KNOW WHAT YOU WANT TO CHANGE: in order to be able to know whether efforts to change
energy use behaviour and to reduce consumption are successful, we need access to historical
and current energy consumption data. If no data management system exists yet, campaigns like
save@work can help with setting up simple processes and establish responsibilities for
managing them, which seems to be a general need identified by the project.
Furthermore, data and information are also needed on behaviour, practices, skills, knowledge
and infrastructure specific to local contexts, and supporting or hindering sustainable energy use.
Uncovering them should constitute an important part of the baseline assessment.
CHANGE AND LEARNING NEW THINGS CAN BE ENJOYABLE: changing routine and habitual
behaviour and practices poses challenges. Thus, connecting the necessity for change and
learning new things with enjoyment, increasing comfort and well-being is important.
Participants in the save@work project acknowledged the existence of this connection: learning
new things and becoming more aware were important motivations for joining the campaign as
well as important sources for enjoyment.
RECOGNIZE AND BUILD ON DIVERSITY: in a European campaign it is important to follow a
shared timeline, structure and content. However, it is just as important to allow for flexibility
thus provide methods and tools tailored to local contexts and circumstances. This should be
seen as an opportunity for learning and sharing, and campaigns should include opportunities to
reflect and build on the resulting diversity that can help enrich the learning experience of all
participants. Self-evaluation methods proved helpful in save@work for recognizing and
appreciating diversity.
s@w Evaluation Report ___________________________________________________________________________________________________________________________________________________________________________________
97
REFERENCES
European Commission (EC) (2011) Energy 2020 - A strategy for competitive, sustainable and secure energy, p. 7; p. 9; p. 11, http://ec.europa.eu/energy/publications/doc/2011_energy2020_en.pdf (last accessed Sept 2017)
European Environment Agency (EEA) (2013) Achieving energy efficiency through behaviour change: what does it take? Copenhagen, Denmark. 52 p. Available from: http://www.eea.europa.eu/publications/achieving-energy-efficiency-through-behaviour (last accessed Sept 2017)
European Parliament and Council (EP) (2010) Directive 2010/31/EU of the European Parliament and of the Council of 19 May 2010 on the energy performance of buildings. Official Journal of the European Union, L153/16, http://eur-lex.europa.eu/legal-content/en/TXT/?uri=celex%3A32010L0031 (last accessed Sept 2017)
Heiskanen, E., Johnson, M., Robinson, S., Vadovics, E. and Saastamoinen, M. (2010) Low-carbon communities as a context for individual behavioural change. Energy Policy, 38(12): 7586-7595.
Jackson, T. (2005) Motivating sustainable consumption- A review of models of consumer behaviour and behavioural change. A Report to the Sustainable Development Research Network. London, UK. Available from: http://www.sustainablelifestyles.ac.uk/sites/default/files/motivating_sc_final.pdf (last accessed Sept 2017)
Moloney, S. Horne, R E. and Fien J. (2010) Transitioning to Low Carbon Communities – From Behaviour Change to Systemic Change: Lessons from Australia, Energy Policy 38: 7614-7623. Available from: https://researchbank.rmit.edu.au/view/rmit:5869/n2006016057.pdf
Mourik, R.M., Heiskanen, E., Anttonen, M., Backhaus, J., Barabanova, Y., Bauknecht, D., Bern, R.M., Breukers, S., Brohmann, B., Bürger, V., Feenstra, C.F.J., Hodson, M., Jalas, M., Johnson, M., Kallaste, T., Kamenders, A., Liang, V., Malamatenios, C., Maier, P., Marvin, S., Meinel, H., Papandreou, V., Pariag, J., Rask, M., Rinne, S., Robinson, S., Saastamoinen, M., Salminnen, J., Valuntiené, I., Vadovics, E. (2009) Past 10 year of best and bad practices in demand management: a meta analysis of 27 case studies focusing on conditions explaining success and failure of demand-side management programmes. Deliverable 4 of the Changing Behaviour project. Available from http://www.energychange.info
Mourik, R.M., Breukers, S., Heiskanen, E., Bauknecht, D. Hodson, M., Barabanova, Y., Brohmann, B., Bürger, V., Feenstra, C.F.J., Jalas, M.,, Johnson, M., Maier, P., Meinel, H., Pariag, J., Rask, M., Rinne, S., Robinson, S., Saastamoinen, M., Salminen, J., Valuntiené, I., Vadovics, E. (2010) Conceptual framework and model: Synthesis report tailored for policy makers as target group. A practical and conceptual framework of intermediary demand-side practice. Deliverable 6 of the Changing Behaviour project. Available from http://www.energychange.info
Nolan, J.M., Wesley Schultz, P., Cialdini, R. B., Goldstein, N. J. and Griskevicius, V. (2008) Normative social influence is underdetected. Personality and Social Psychology Bulletin 34: 913-923. Available from: http://www.greenudge.no/uploads/Personality_and_Social_Psychology_Bulletin.pdf
Uitdenbogerd, D., Breukers, S. (2017) Report on Self-Evaluation activities: Interviews and Discussion with S@W Consortium Partners. Internal Report, The Energy Saving Competition for Public Authorities: Save@Work, Duneworks. pp.60
Vadovics, E. and Szomor, Sz. (2017) Pre-Campaign Survey Report I. First findings based on the analysis of pre-campaign survey responses. The Energy Saving Competition for Public Authorities: Save@Work, GreenDependent Institute. pp. 60 Available from: http://intezet.greendependent.org/en/node/305 (last accessed Sept 2017)
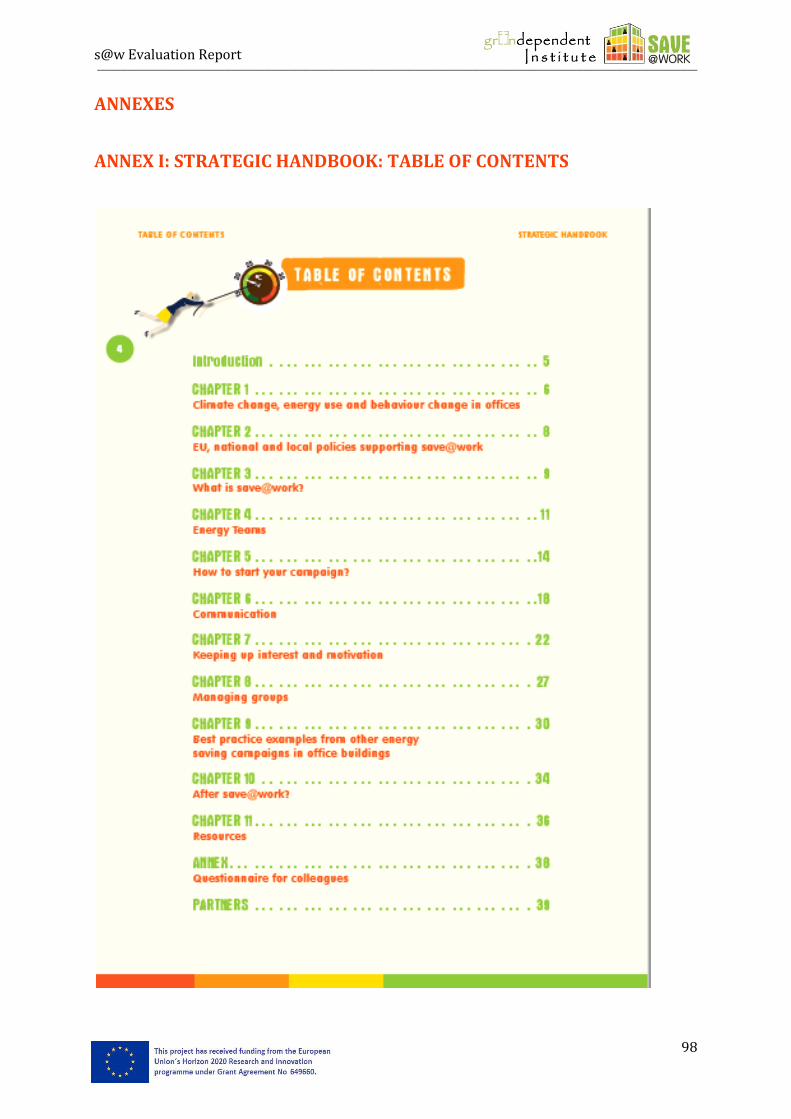
s@w Evaluation Report ___________________________________________________________________________________________________________________________________________________________________________________
98
ANNEXES
ANNEX I: STRATEGIC HANDBOOK: TABLE OF CONTENTS
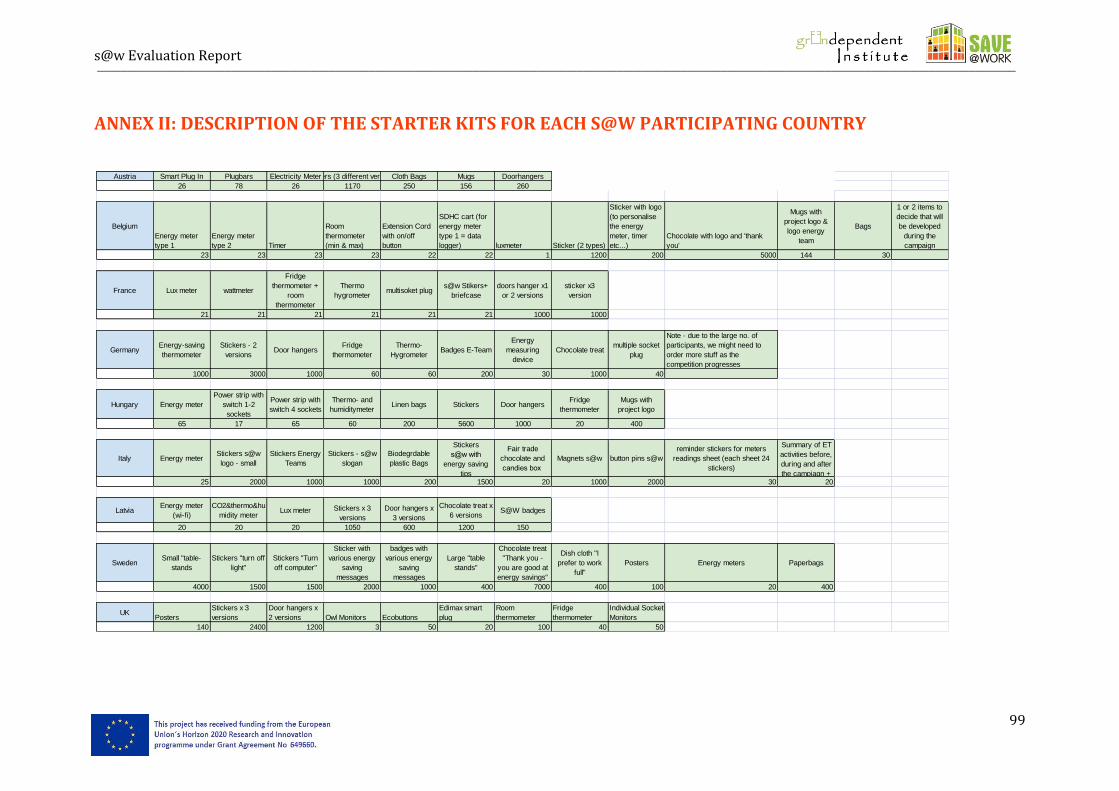
s@w Evaluation Report __________________________________________________________________________________________________________________________________________________________________________________________________________________________________________________________________________________
99
ANNEX II: DESCRIPTION OF THE STARTER KITS FOR EACH S@W PARTICIPATING COUNTRY
Austria Smart Plug In Plugbars Electricity MeterStickers (3 different versions)Cloth Bags Mugs Doorhangers
26 78 26 1170 250 156 260
Belgium
Energy meter
type 1
Energy meter
type 2 Timer
Room
thermometer
(min & max)
Extension Cord
with on/off
button
SDHC cart (for
energy meter
type 1 = data
logger) luxmeter Sticker (2 types)
Sticker with logo
(to personalise
the energy
meter, timer
etc...)
Chocolate with logo and 'thank
you'
Mugs with
project logo &
logo energy
team
Bags
1 or 2 items to
decide that will
be developed
during the
campaign
23 23 23 23 22 22 1 1200 200 5000 144 30
France Lux meter wattmeter
Fridge
thermometer +
room
thermometer
Thermo
hygrometermultisoket plug
s@w Stikers+
briefcase
doors hanger x1
or 2 versions
sticker x3
version
21 21 21 21 21 21 1000 1000
GermanyEnergy-saving
thermometer
Stickers - 2
versionsDoor hangers
Fridge
thermometer
Thermo-
HygrometerBadges E-Team
Energy
measuring
device
Chocolate treatmultiple socket
plug
Note - due to the large no. of
participants, we might need to
order more stuff as the
competition progresses
1000 3000 1000 60 60 200 30 1000 40
Hungary Energy meter
Power strip with
switch 1-2
sockets
Power strip with
switch 4 sockets
Thermo- and
humiditymeterLinen bags Stickers Door hangers
Fridge
thermometer
Mugs with
project logo
65 17 65 60 200 5600 1000 20 400
Italy Energy meterStickers s@w
logo - small
Stickers Energy
Teams
Stickers - s@w
slogan
Biodegrdable
plastic Bags
Stickers
s@w with
energy saving
tips
Fair trade
chocolate and
candies box
Magnets s@w button pins s@w
reminder stickers for meters
readings sheet (each sheet 24
stickers)
Summary of ET
activities before,
during and after
the campiagn + 25 2000 1000 1000 200 1500 20 1000 2000 30 20
LatviaEnergy meter
(wi-fi)
CO2&thermo&hu
midity meterLux meter Stickers x 3
versions
Door hangers x
3 versions
Chocolate treat x
6 versionsS@W badges
20 20 20 1050 600 1200 150
SwedenSmall "table-
stands
Stickers "turn off
light"
Stickers "Turn
off computer"
Sticker with
various energy
saving
messages
badges with
various energy
saving
messages
Large "table
stands"
Chocolate treat
"Thank you -
you are good at
energy savings"
Dish cloth "I
prefer to work
full"
Posters Energy meters Paperbags
4000 1500 1500 2000 1000 400 7000 400 100 20 400
UKPosters
Stickers x 3
versions
Door hangers x
2 versions Owl Monitors Ecobuttons
Edimax smart
plug
Room
thermometer
Fridge
thermometer
Individual Socket
Monitors
140 2400 1200 3 50 20 100 40 50
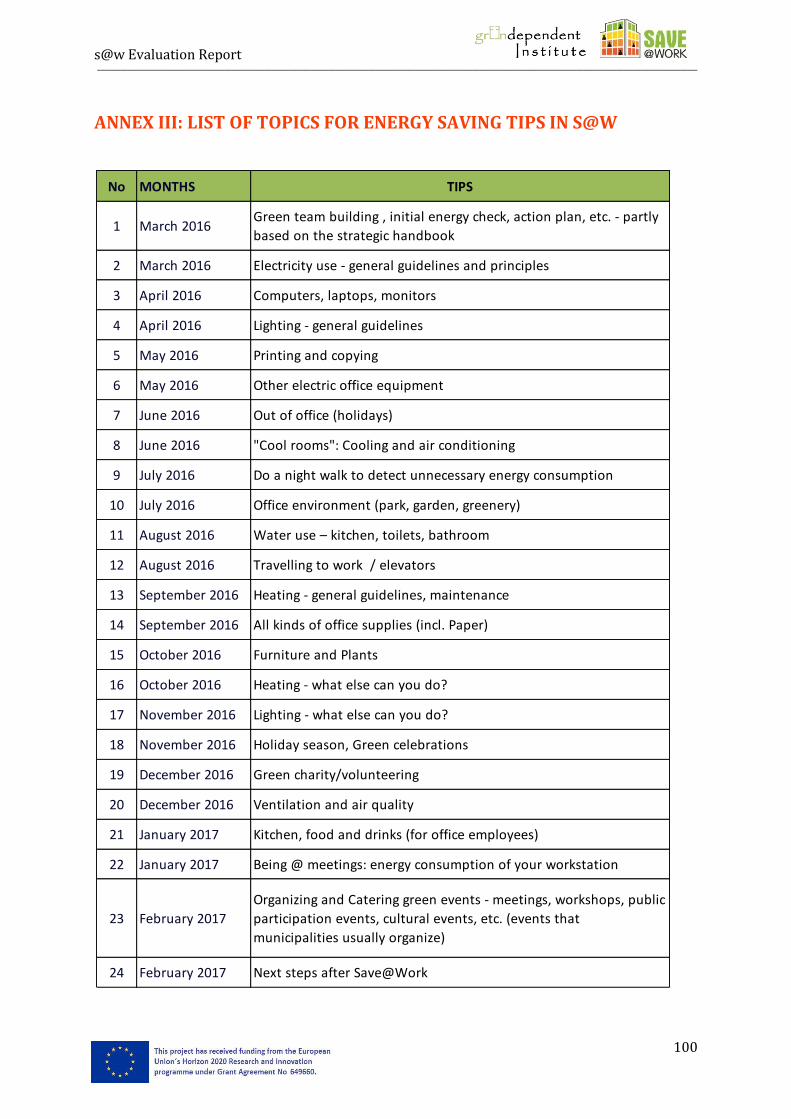
s@w Evaluation Report ___________________________________________________________________________________________________________________________________________________________________________________
100
ANNEX III: LIST OF TOPICS FOR ENERGY SAVING TIPS IN S@W
No MONTHS TIPS
1 March 2016Green team building , initial energy check, action plan, etc. - partly
based on the strategic handbook
2 March 2016 Electricity use - general guidelines and principles
3 April 2016 Computers, laptops, monitors
4 April 2016 Lighting - general guidelines
5 May 2016 Printing and copying
6 May 2016 Other electric office equipment
7 June 2016 Out of office (holidays)
8 June 2016 "Cool rooms": Cooling and air conditioning
9 July 2016 Do a night walk to detect unnecessary energy consumption
10 July 2016 Office environment (park, garden, greenery)
11 August 2016 Water use – kitchen, toilets, bathroom
12 August 2016 Travelling to work / elevators
13 September 2016 Heating - general guidelines, maintenance
14 September 2016 All kinds of office supplies (incl. Paper)
15 October 2016 Furniture and Plants
16 October 2016 Heating - what else can you do?
17 November 2016 Lighting - what else can you do?
18 November 2016 Holiday season, Green celebrations
19 December 2016 Green charity/volunteering
20 December 2016 Ventilation and air quality
21 January 2017 Kitchen, food and drinks (for office employees)
22 January 2017 Being @ meetings: energy consumption of your workstation
23 February 2017
Organizing and Catering green events - meetings, workshops, public
participation events, cultural events, etc. (events that
municipalities usually organize)
24 February 2017 Next steps after Save@Work
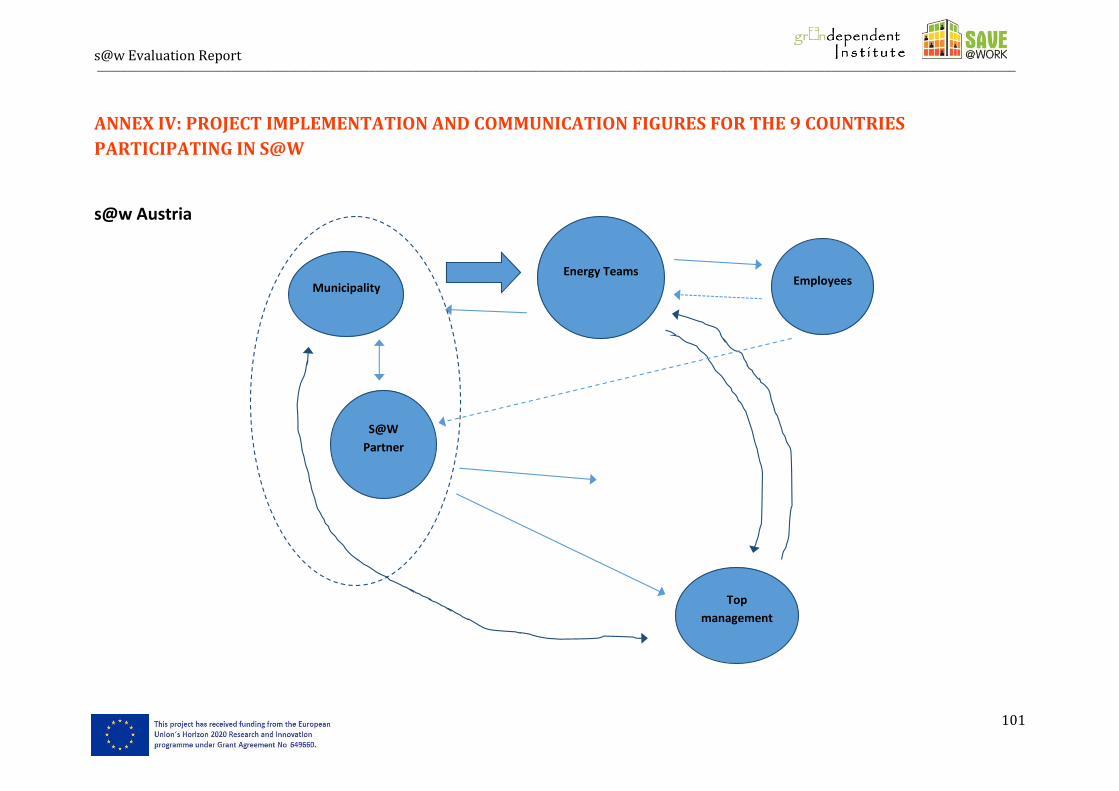
s@w Evaluation Report __________________________________________________________________________________________________________________________________________________________________________________________________________________________________________________________________________________
101
ANNEX IV: PROJECT IMPLEMENTATION AND COMMUNICATION FIGURES FOR THE 9 COUNTRIES
PARTICIPATING IN S@W
s@w Austria
Municipality
S@W
Partner
Energy Teams Employees
Top
management
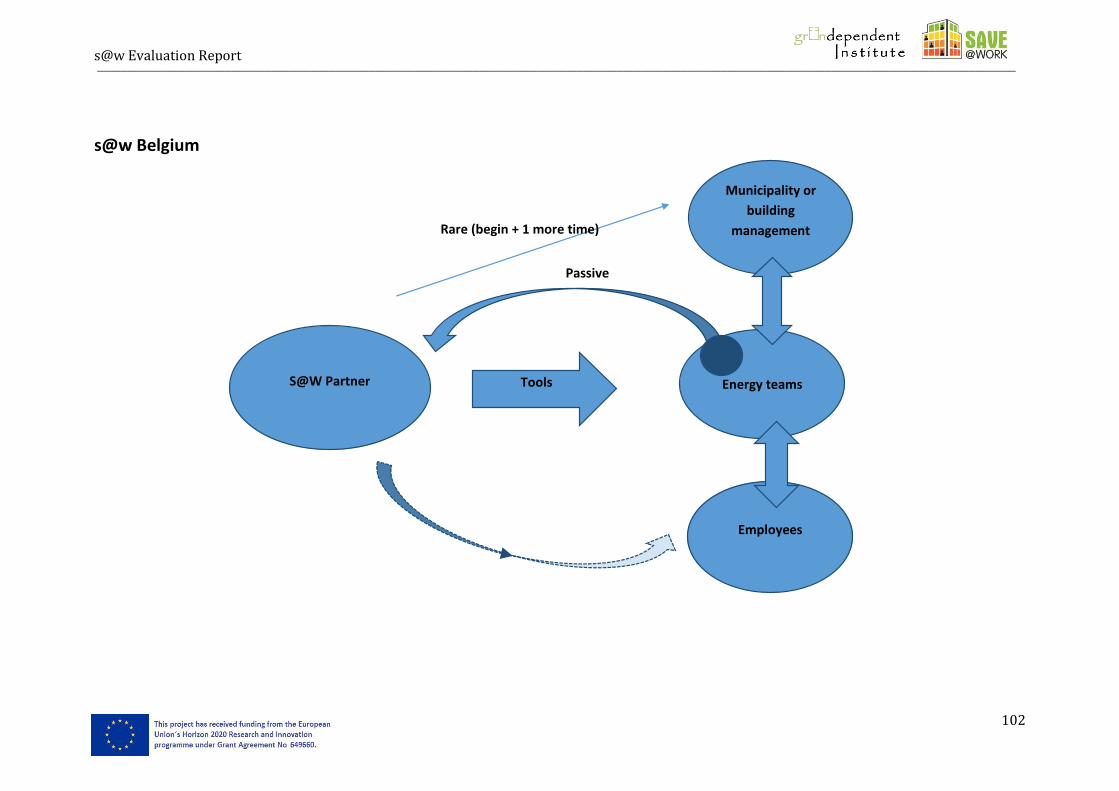
s@w Evaluation Report __________________________________________________________________________________________________________________________________________________________________________________________________________________________________________________________________________________
102
s@w Belgium
Passive
S@W Partner Tools
Municipality or
building
management
Energy teams
Employees
Rare (begin + 1 more time)
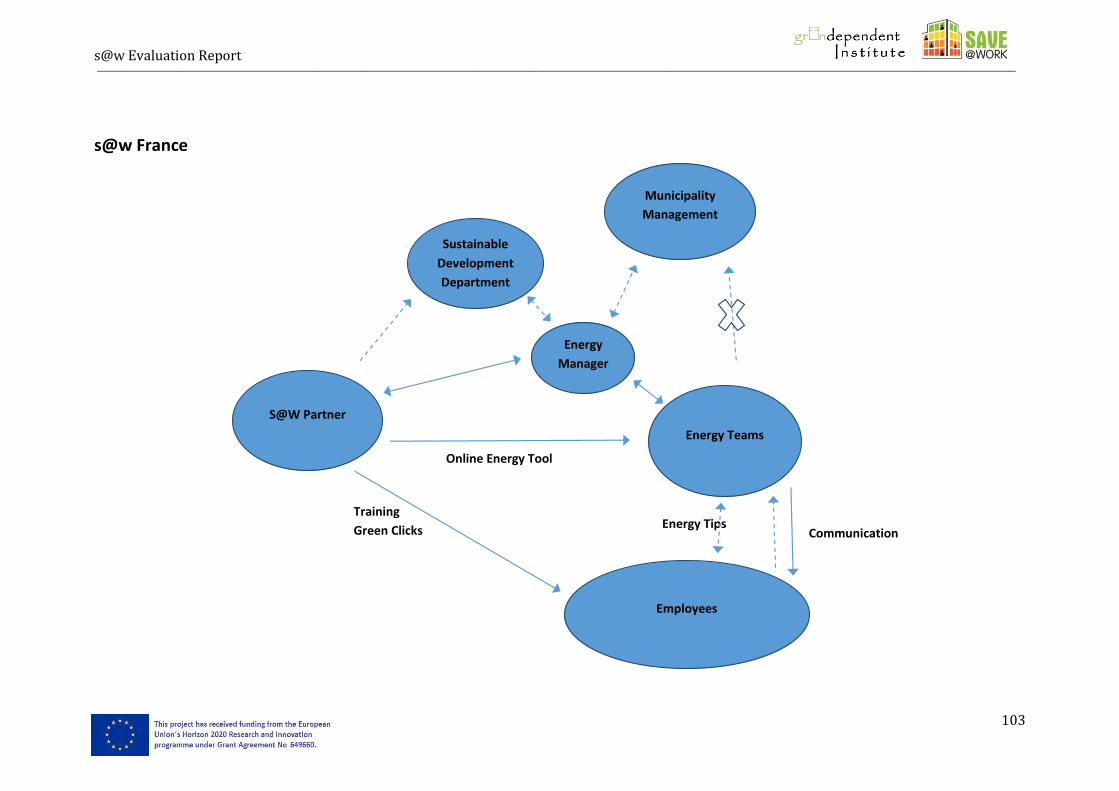
s@w Evaluation Report __________________________________________________________________________________________________________________________________________________________________________________________________________________________________________________________________________________
103
s@w France
Energy Tips
Online Energy Tool
Communication
Training
Green Clicks
S@W Partner
Sustainable
Development
Department
Communicatio
n
Energy
Manager
Municipality
Management
Energy Teams
Employees
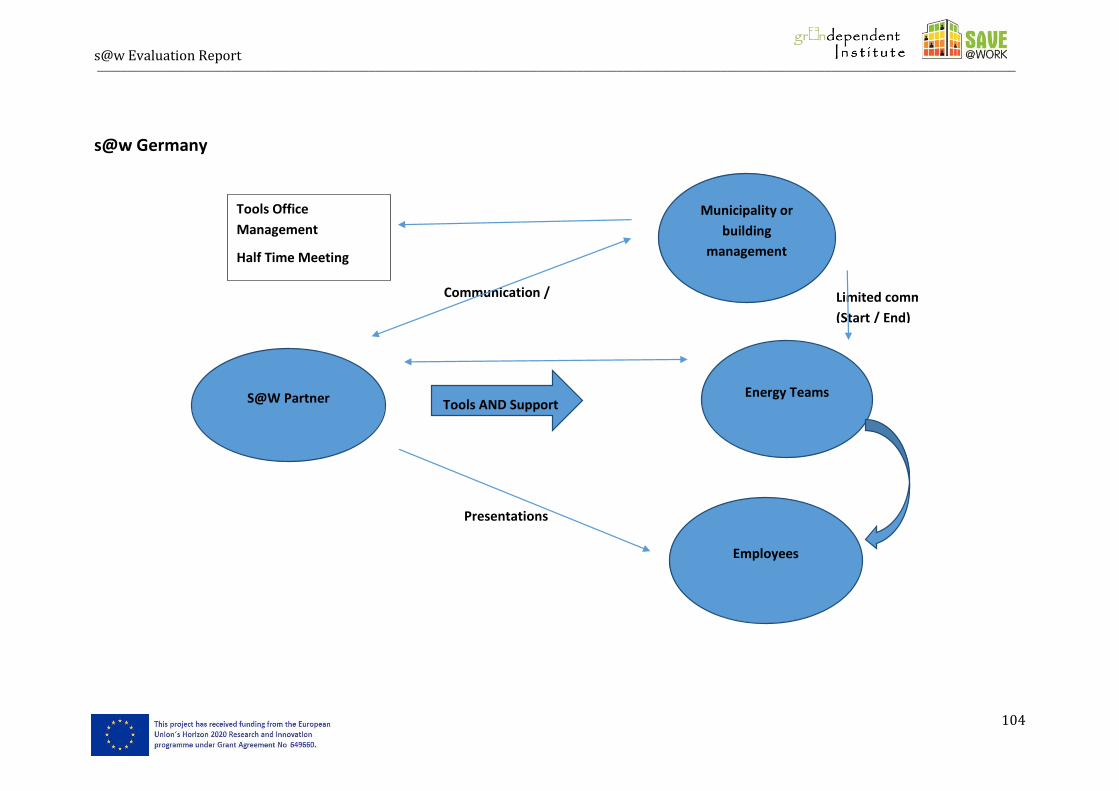
s@w Evaluation Report __________________________________________________________________________________________________________________________________________________________________________________________________________________________________________________________________________________
104
s@w Germany
Limited communication
(Start / End)
Communication /
organization
Presentations
S@W Partner Tools AND Support
Municipality or
building
management
Energy Teams
Employees
Tools Office
Management
Half Time Meeting
Updates to the office
management
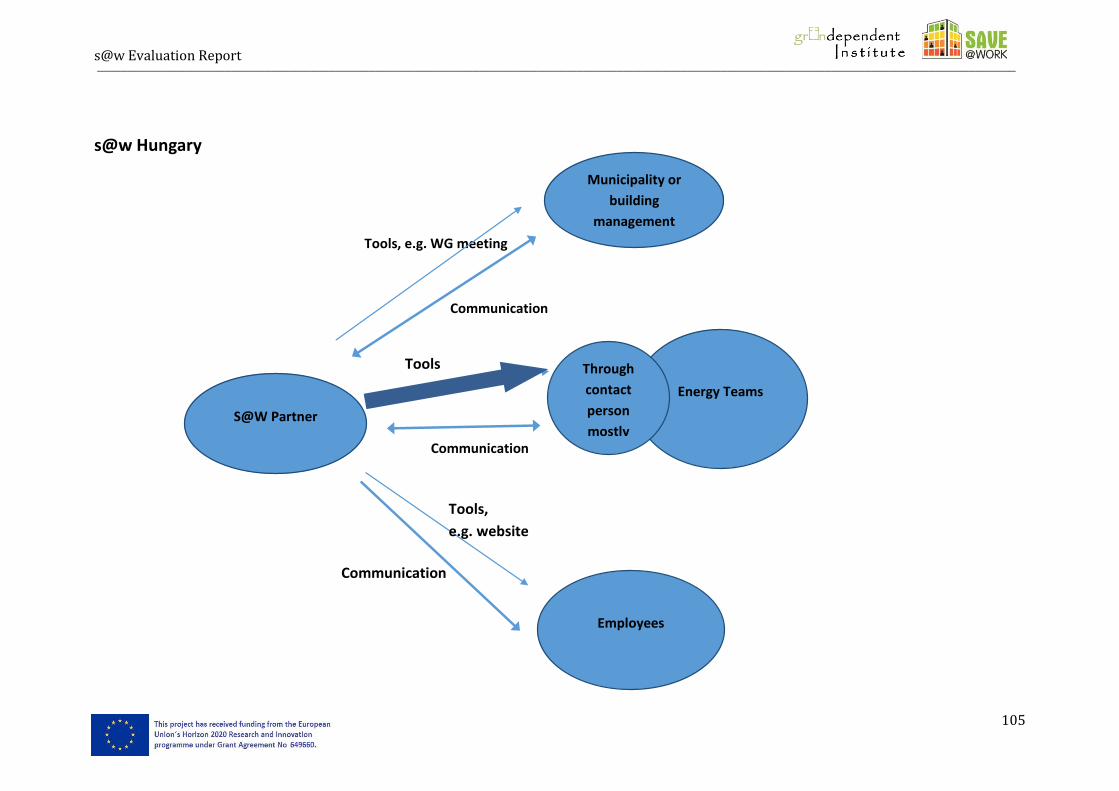
s@w Evaluation Report __________________________________________________________________________________________________________________________________________________________________________________________________________________________________________________________________________________
105
s@w Hungary
Communication
Tools, e.g. WG meeting
Communication
S@W Partner
Municipality or
building
management
Energy Teams
Employees
Through
contact
person
mostly
Tools
Tools,
e.g. website
Communication
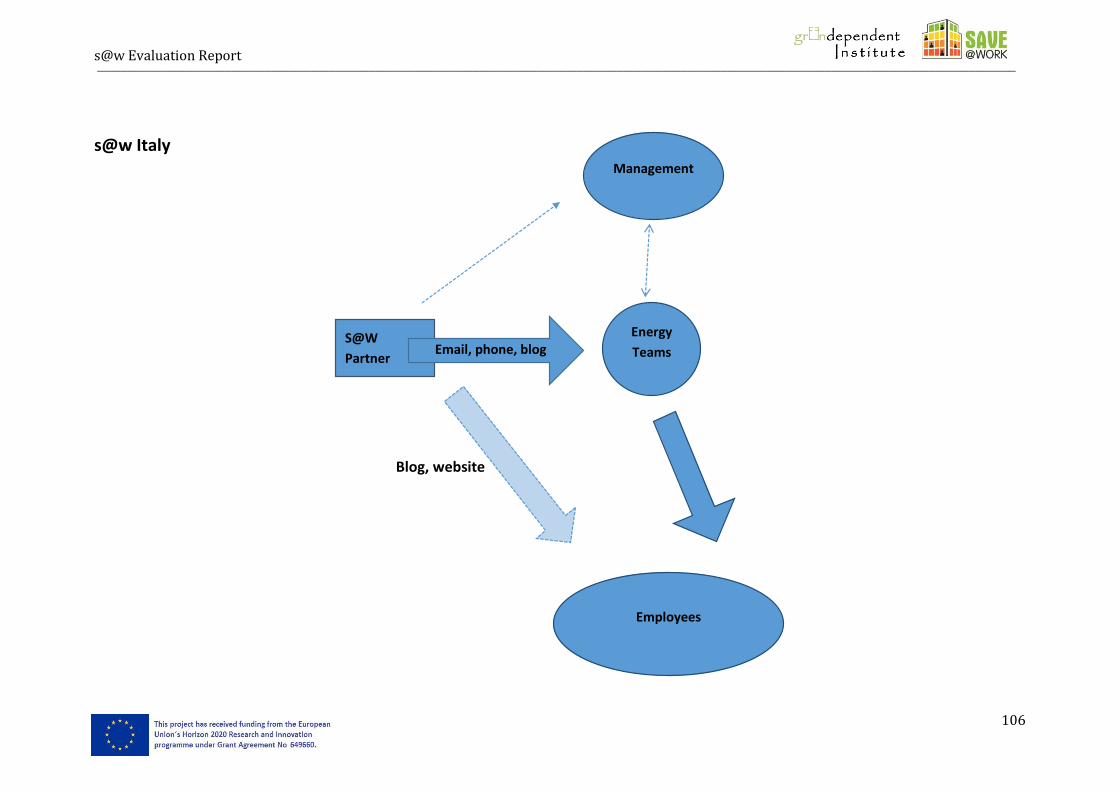
s@w Evaluation Report __________________________________________________________________________________________________________________________________________________________________________________________________________________________________________________________________________________
106
s@w Italy
S@W
Partner
Management
Energy
Teams
Employees
Email, phone, blog
Blog, website
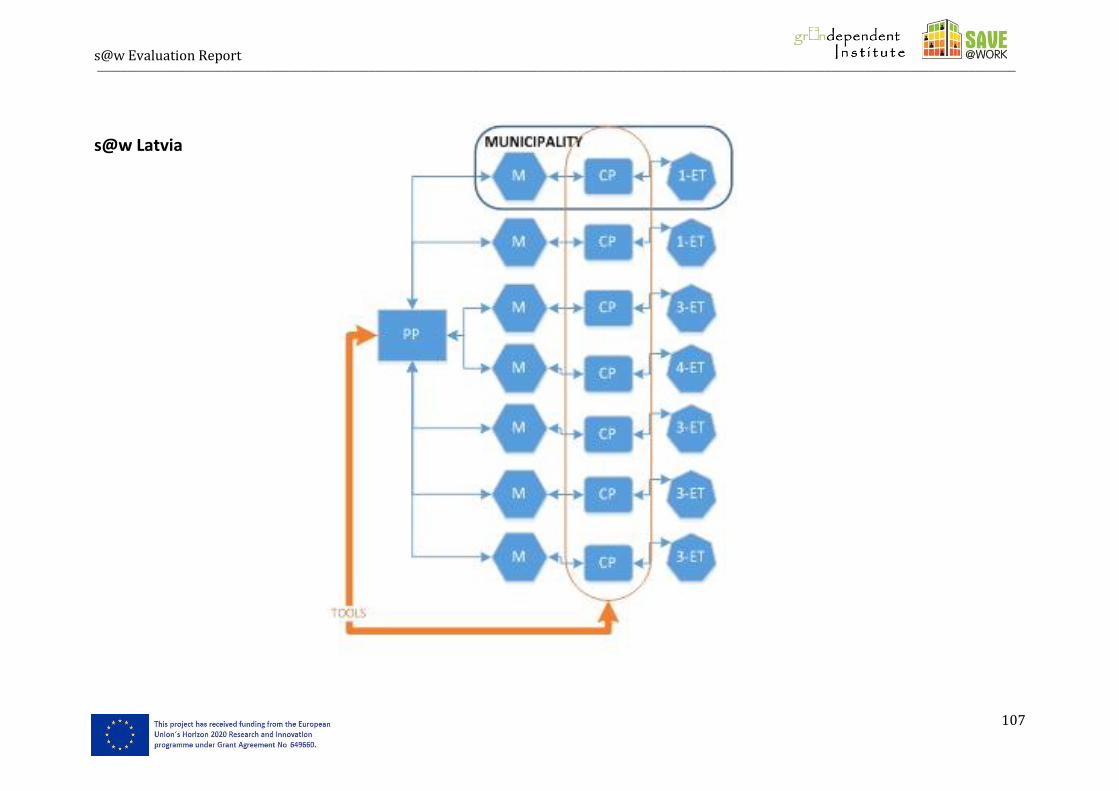
s@w Evaluation Report __________________________________________________________________________________________________________________________________________________________________________________________________________________________________________________________________________________
107
s@w Latvia
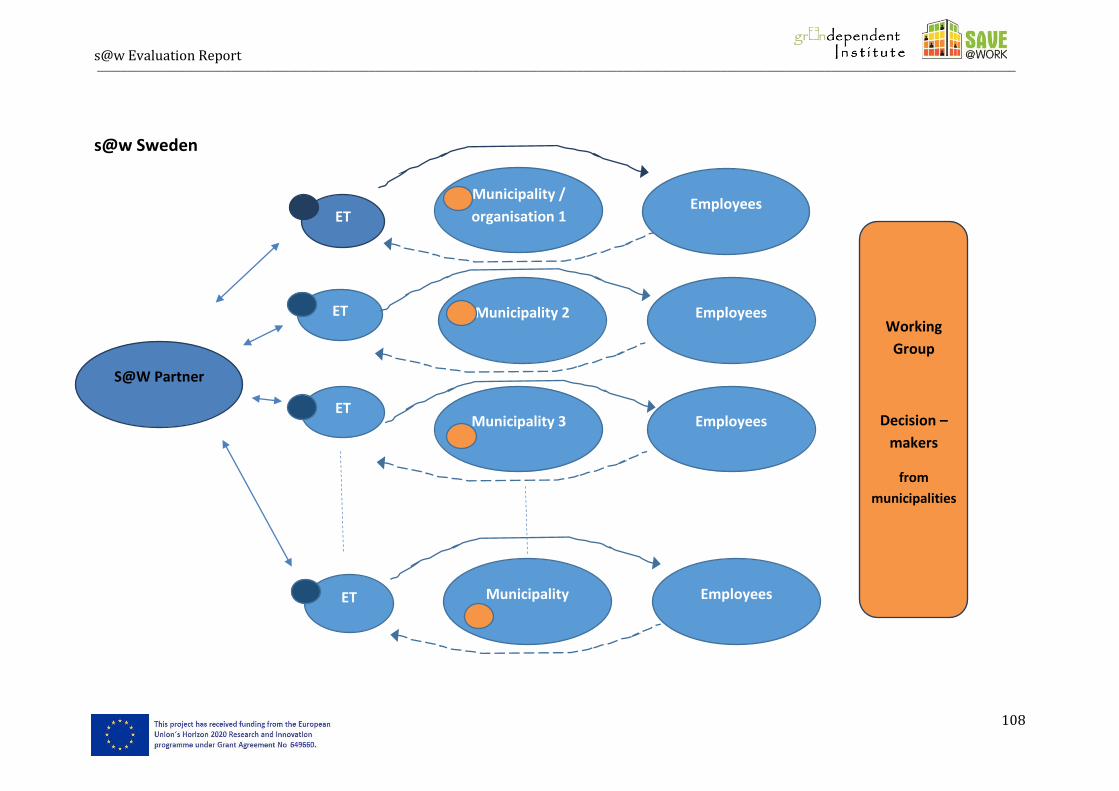
s@w Evaluation Report __________________________________________________________________________________________________________________________________________________________________________________________________________________________________________________________________________________
108
s@w Sweden
Municipality
Municipality 3
Municipality 2
Municipality /
organisation 1
Employees
Employees
Employees
Employees
Working
Group
Decision –
makers
from
municipalities
S@W Partner
ET
ET
ET
ET
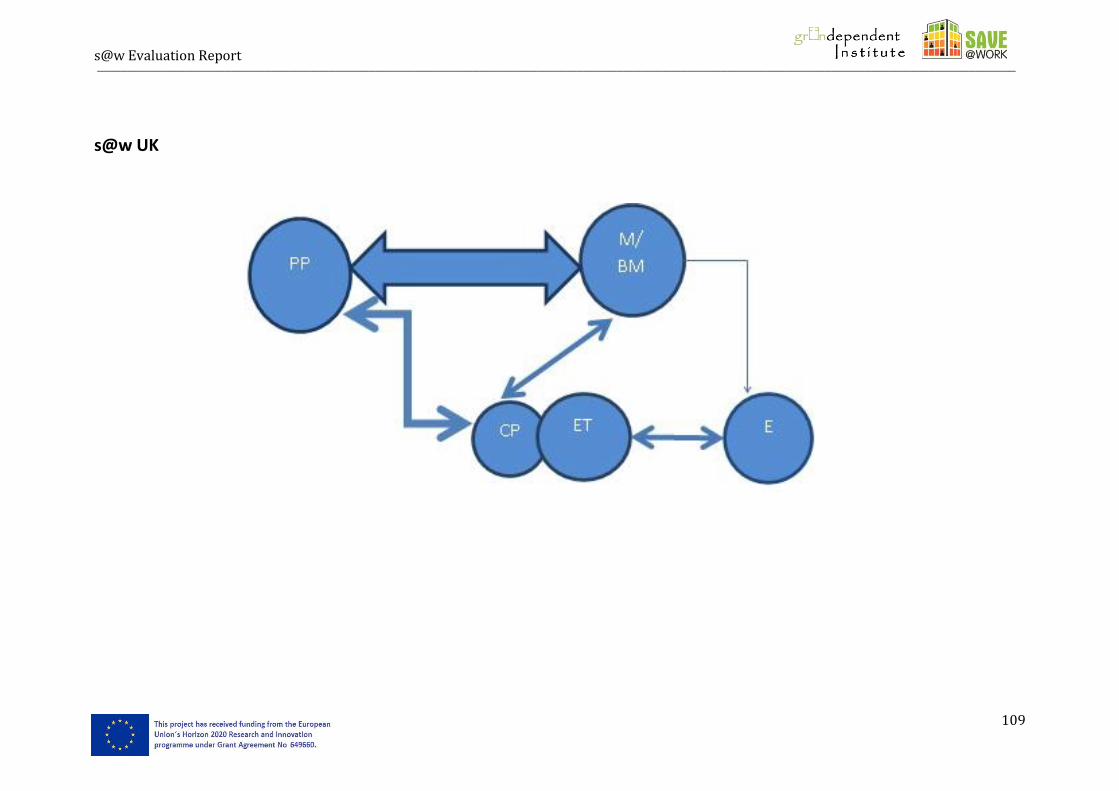
s@w Evaluation Report __________________________________________________________________________________________________________________________________________________________________________________________________________________________________________________________________________________
109
s@w UK