Selected properties of core-buildup materials for...
99
Inaugural- Dissertation zur Erlangung des Grades eines Doktors der Zahnheilkunde des Fachbereichs Humanmedizin der Justus-Liebig-Universität Giessen vorgelegt von (Badawy, Rania) aus (Ägypten) Gießen (2011) Selected Properties of Core-Buildup Materials for Prosthetic Restorations
-
Upload
dinhkhuong -
Category
Documents
-
view
218 -
download
0
Transcript of Selected properties of core-buildup materials for...
Inaugural- Dissertation
zur Erlangung des Grades eines Doktors der Zahnheilkunde
des Fachbereichs Humanmedizin
der Justus-Liebig-Universität Giessen
vorgelegt von (Badawy, Rania)
aus (Ägypten)
Gießen (2011)
Selected Properties of Core-Buildup Materials for
Prosthetic Restorations
Aus dem Medizinischen Zentrum für Zahn-, Mund- und Kieferheilkunde
Poliklinik für Zahnärztliche Prothetik
Direktor: Prof. Dr. Wöstmann
Gutachter: Prof. Dr. Wöstmann
Gutachter: Prof. Dr. Frankenberger
Tag der Disputation: 27.06.2011
Index
I
Index 1. Introduction ..............................................................................................................1 2. General on tooth-colored core-buildup materials .......................................................2
2.1. Core-buildup materials .......................................................................................2
2.1.1.Definition ..................................................................................................2
2.1.2.Requirements of core- buildup materials....................................................2
2.1.3.Materials available for core-buildups .........................................................2
2.2. Composite resins (CR) .......................................................................................3
2.2.1.Composition and setting reaction...............................................................3
2.2.2.Presentation and properties ........................................................................4
2.3. Glass-ionomer cements (GIC) ............................................................................5
2.3.1.Composition and setting reaction...............................................................5
2.3.2.Presentation and properties ........................................................................5
2.4. Metal-modified glass ionomers (MMGI) ............................................................6
2.4.1.Composition and setting reaction...............................................................6
2.4.2.Presentation and properties ........................................................................6
2.5. Resin-modified glass-ionomers (RMGI):............................................................7
2.5.1.Composition and setting reaction...............................................................7
2.5.2.Presentation and properties ........................................................................7
2.6. Polyacid-modified composite resins (Compomers).............................................8
2.6.1.Composition and setting reaction...............................................................8
2.6.2.Presentation and properties ........................................................................8
2.7. Testing the mechanical properties of tooth-colored restorative materials ............9
2.8. Degree of conversion (DC) and its measurement ................................................9
Index
II
3. Review of the Literature..........................................................................................11
3.1. Flexure Strength (FS).......................................................................................11
3.1.1.Effect of storage environment and storage time on Flexure Strength........11
3.1.2.Effect of composition on Flexure Strength...............................................14
3.2. Flexural Modulus (FM) ....................................................................................17
3.2.1.Effect of storage environment and storage time on Flexural Modulus ......17
3.2.2.Effect of composition on Flexural Modulus .............................................18
3.3. Material and Degree of Conversion (DC) .........................................................19
3.3.1.Effect of storage environment and storage time on Degree of Conversion19
3.3.2.Effect of composition and curing mode on Degree of Conversion............20
4. Aim of the Study.....................................................................................................24 5. Materials and Methods............................................................................................25
5.1. Test conditions.................................................................................................25
5.2. Materials ..........................................................................................................25
5.2.1.Flexure Strength and Flexural Modulus ...................................................25
5.2.2.Degree of Conversion..............................................................................26
5.3. Methods ...........................................................................................................27
5.3.1.Flexure Strength and Flexural Modulus ...................................................27
5.3.1.1 Storage of specimens ......................................................................29
5.3.1.2 3-Point bending test ........................................................................30
5.3.2. Degree of Conversion.............................................................................31
5.3.2.1 Storage of specimens ......................................................................32
5.3.2.2 Degree of Conversion test ...............................................................33
5.4. Statistical Methods...........................................................................................35
5.4.1.Flexure Strength and Flexural Modulus ...................................................35
Index
III
5.4.2.Degree of Conversion..............................................................................35
6. Results ....................................................................................................................36
6.1. Flexure Strength...............................................................................................36
6.2. Flexural Modulus.............................................................................................39
6.3. Omission of the light-curing step......................................................................42
6.3.1. Flexure Strength .....................................................................................42
6.3.2. Flexural Modulus ...................................................................................44
6.4. Degree of Conversion ......................................................................................46
6.4.1. Correlation between Flexure Strength and Degree of Conversion ...........46
6.4.2. Correlation between Flexural Modulus and Degree of Conversion..........49
6.4.3. Correlation between Storage condition and Degree of Conversion..........52
7. Discussion ..............................................................................................................61
7.1. Flexural Strength .............................................................................................61
7.1.1. Conventional Glass-ionomers .................................................................61
7.1.2. Resin-modified Glass-ionomers..............................................................62
7.1.3. Polyacid-modified composite resins........................................................64
7.1.4. Composite resins ....................................................................................65
7.2. Flexural Modulus.............................................................................................67
7.2.1. Conventional Glass-ionomers .................................................................67
7.2.2. Resin-modified Glass-ionomers..............................................................68
7.2.3. Polyacid-modified composite resins........................................................68
7.2.4. Composite resins ....................................................................................69
7.3. Omission of light-curing step ...........................................................................70
7.3.1. Flexure Strength .....................................................................................71
7.3.2. Flexural Modulus ...................................................................................72
Index
IV
7.4. Degree of Conversion ......................................................................................72
7.4.1. Correlation between flexural properties and Degree of Conversion.........72
7.4.2. Correlation between storage condition and Degree of Conversion...........77
8. Summary ................................................................................................................79 9. Zusammenfassung ..................................................................................................81
10.Conclusions ............................................................................................................83 11.References ..............................................................................................................84
12.Declaration .............................................................................................................92 13.Acknowledgment....................................................................................................93
Introduction
1
1. Introduction A lot of teeth often show considerable coronal hard tissue defects, frequently requiring
a core-buildup as a preprosthetic treatment [103, 111] before fabrication of the
subsequent extra-coronal prosthesis [35, 93] providing retention and support [111, 127]
to restore lost functions and esthetics. This problem is even greater when the restoration
has to be placed on an endodontically treated tooth.[111]
A lot of skill in selecting the most appropriate material and technique is required, [129]
as the strength demanded of such a foundation varies according to the amount of tooth
structure lost, as well as its location. [127]
As a core-buildup has to support and preserve the residual tooth structure, as well as to
offer sufficient resistance to displacement and retention of the final restoration, [93, 127]
it should also possess adequate mechanical and physical properties, surely influencing
its longevity in service.
Flexure strength (FS), flexural modulus (FM) as well as degree of conversion (DC) were
among the most famous parameters used to determine the mechanical properties [44, 47,
51, 52, 64, 65, 74, 112] for restorative materials to be successful in service, with
differences in these properties occurring according to type and composition of each
material, as well as the type of bonds participating in its structure.
With increasing esthetic demands in restorative dentistry over the past few years, [3, 33,
79] tooth-colored restorative materials specifically formulated to restore esthetic dental
defects, [3, 79] are nowadays preferred, even over traditionally famous non-esthetic
restorative materials, for restoring badly damaged teeth, serving as cores. These
materials possess mechanical and physical properties, making them suitable for both
situations. [127]
Nowadays, four chemically different groups of alloplastic materials are used for this
purpose, replacing traditional core-buildup materials, comprising glass ionomer cements
(GIC), resin modified glass ionomer cements (RMGIC), compomers (Compo), and
composite resins (CR). [36, 72, 127, 128] Therefore, it is of clinical interest to establish
which of these materials are most suitable to form a base for the subsequent long term
stable tooth-colored restoration.
General on tooth-colored core-buildup Materials
2
2. General on tooth-colored core-buildup materials
2.1. Core-buildup materials Due to increased esthetic demands in restorative dentistry during the past few years, [3,
6, 36, 127] the use of tooth-colored restorative materials has even been extended to the
construction of cores, as a means of building-up badly broken-down teeth, [127]
restoring lost resistance and retention, required for proper seating the future prosthesis.
[111] These include composite resins, glass- ionomers, resin–modified glass ionomer
formulations and polyacid modified composite resins.[8, 34]
2.1.1. Definition Core- buildup materials are used for restoring badly broken down vital or non-vital teeth
[35, 93, 111, 128] that are to be used as abutments [103, 127] under subsequent
restorations [35, 93] trying to stabilize its weakened part, providing a foundation for
the tooth, that allows the clinician to create a favorable retention and resistance form
for the overlying prosthesis. [111]
2.1.2. Requirements of core- buildup materials A material used for a core-buildup should possess satisfactory mechanical and physical
properties, including compressive and flexural strength (FS), to resist intraoral forces
which could result in core fracture or displacement during service. The materials used
should also be biocompatible, easy to apply, with an ability to bond to tooth structure,
and to pins or posts, if applied.[127] Core materials should be independently retentive,
having a stable connection with the remaining tooth structure and properties similar to
those of the tooth structure to be replaced.
These systems usually have a contrasting color to the tooth structure [6, 127], most
commonly being blue-white, or opaque. [36]
2.1.3. Materials available for core-buildups A core material could either be metallic, resinous or ceramic, being directly or indirectly
constructed. Gold alloys and ceramics, which were placed as indirect core materials,
and the directly placed amalgam, were the most common core materials used until
relatively recently. Within the past few years, directly placed tooth-colored restorative
materials, were introduced for use as core-buildups, as opposed to the most famous
General on tooth-colored core-buildup Materials
3
metallic dental amalgam. These include resin composites, reinforced glass-ionomer
cements, resin-modified glass-ionomers and compomers (polyacid-modified
composites), providing the possibility of core-buildup and tooth preparation to be done
in the same appointment. [36, 72, 127, 128]
Cores could be retained in place through several methods, including cavity
modifications, as well as application of resin or cement bonding agents. Pins could also
be used, either single or in combination. [128] In case of endodontically treated teeth,
cores are either in cast forms as one unit with the post, or are built-up on ready-made
posts seated in the root-canal.[111]
2.2. Composite resins (CR) 2.2.1. Composition and setting reaction Resin composites are widely used in restorative dentistry, since their introduction in
1960, with several improvements undertaken since. [75] These materials are mainly
composed of 3 components, the organic polymer matrix, the inorganic fillers, and the
coupling agent (organosilane) that bonds the filler to the matrix. [6, 123]
The polymer matrices most commonly used are the highly viscous diacrylate resin
matrices Bis-glycidyl dimethacrylate (Bis-GMA) or Urethane dimethacrylate (UDMA),
[57, 76, 122] requiring the addition of a low molecular weight ‘co-monomer’ to dilute
their viscosity, [57] with Methyl-methacrylate (MMA), Ethylene-dimethacrylate
(EDMA), Triethylenegycol- dimethacrylate (TEGDMA) being the most commonly used
diluents.
Improvements carried out since their introduction were mainly based on the
development of new monomers, [11, 29] while for fillers, the developments
concentrated on filler loading, particle size, silanization and on developing new filler
particles. [59, 104] According to the type, size, shape, and distribution of its fillers,
dental composites were classified into traditional macrofilled composites with larger
glass filler particles, [36] microfilled resins introduced in the late 1970s containing
colloidal silica particles ranging between 0.01-0.05 µm., followed by microfine particles
(0.04-0.2 µm), fine particles (0.4-3 µm), and finally microhybrid blends of fine particles
and some microfine particles. [36]
General on tooth-colored core-buildup Materials
4
In regard to the setting reaction, it is via a free-radical addition polymerization process,
[102, 122] chemically linking monomer units together, rendering high-molecular-weight
molecules. [36]
2.2.2. Presentation and properties Early composites were introduced as two chemically–setting pastes, to be hand-mixed,
with an activator, such as a tertiary amine in one paste, and an initiator, usually a
benzoyl-peroxide (BPO) in the other. [57, 123] With the introduction of light-activated
composites as a single paste in the early 1970s, the problems of chemically-cured
systems, of increased air incorporation during mixing, and the inability to control
working time of the mix were overcome, [6] allowing a controlled working time as well
as less air incorporation into the mix, with less resultant discoloration and increased
strength of the material. [6] At the beginning, these were ultra-violet (UV) - activated, to
be replaced by visible light-cured (VLC) types, in 1976 [43, 102, 123], with
camphorquione (CQ) being the most commonly used photo-initiator, having an
absorption maximum of around 470 nm. [57] Dual-cured resins, formed of two light-
curable pastes were then introduced, with a combination of both chemically and visible
light-curing components to overcome the problems of limited curing depths, as these
composite resins set by light as well as a chemical reaction. [6] To ensure complete
polymerization of composites, and to reduce the inherently occurring polymerization-
shrinkage, [1, 6, 108] they are to be incrementally placed, [36, 93] except for specifically
light-activated core composites, offering depths of cure up to 8 mm, [127] or indirectly
constructed inlays. [6]
Composite core materials are often two-paste chemically-cured systems, designed for
bulk placement, [36, 93] as well as light - cured and dual - cured products, [36] usually
having a contrasting color to the tooth structure. [6, 127]
For tooth-colored restorative materials being placed directly into the cavity, [6, 36] they
also show chemical bonding to the tooth structure by the use of bonding agents under
provided moisture control. Additionally the rapid command set of the material allows
immediate tooth preparation for the fitting of a crown, therefore saving time.[34, 93,
127] Due to their high mechanical properties, including tensile and flexure strengths,
[35, 70] their acceptance as a core-buildup restorative material has increased
tremendously.[93]
General on tooth-colored core-buildup Materials
5
Unfortunately, these materials are not easy to handle, displaying technique sensitivity
and therefore being more time consuming, due to their incremental placement technique,
[6, 76] as well as inadequate degree of conversion (DC) and inherent polymerization-
shrinkage, [116] with a resulting breakdown at the interface and consequent gap
formation with microleakage. [93] The huge potential for water-uptake and the high
coefficient of thermal expansion are other shortcomings of these materials. [127]
2.3. Glass-ionomer cements (GIC) Glass-ionomer cements (GIC), also known as glass-polyalkenoate cements, were
introduced by Wilson and Kent in 1971. [123]
2.3.1. Composition and setting reaction Glass-ionomer cements are formed mainly of an inorganic fluoroaluminosilicate (FAS)
glass powder, the polyacid, water and tartaric acid, [57, 123] with an acid-base reaction
taking place upon mixing to form the set cement. [122] Its slowly developed final
structure [36] consists of unreacted glass particles, each of which is surrounded by
silica gel, embedded in a matrix of cross-linked polyacrylic acid, [53, 123] showing
increasing properties with the progress of the setting reaction.[99]
2.3.2. Presentation and properties Glass-ionomer cements are available in 3 formulations, namely the traditional
powder/liquid systems with the polyacid in an aqueous solution, the anhydrous systems
formed of a freeze-dried acid incorporated in the powder, and finally the encapsulated
versions. [123]
All commercial glass-ionomers have been categorized as either conventional glass-
ionomer cements or resin-modified glass-ionomers (RMGIs), [131] to be used mainly
for the restoration of abrasion/erosion lesions and as luting agents for crown and bridge
restorations. [123]
Glass-ionomer cements possess several unique properties, including their ability to
bond to tooth structure, their anticariogenic property due to Fluoride-release, thermal
compatibility due to their coefficient of thermal conductivity being similar to tooth
structure, their biocompatibility, [133] as well as their translucency. [6] Due to the
lower shrinkage with acid-base–mediated cross-linking reactions in case of glass-
ionomer cements, better bond strength and retention in low-stress areas [6, 36] is
General on tooth-colored core-buildup Materials
6
achieved, as compared to composite resins, which show higher polymerization-
stresses.[123]
On the other hand, traditional glass-ionomers show mechanical properties, being much
more unfavorable than those of other restorative materials, such as their brittle nature
with minimal deformation when subjected to force fracturing, [57, 84, 93, 129]
restricting their use to low-stress sites. [57, 133] Also, the short available working time
and long setting time of glass-ionomers, as well as their relative brittleness, cracking
easily on desiccation, and their poor resistance to acid attack, add to their major
disadvantages. [123, 129]
2.4. Metal-modified glass ionomers (MMGI)
2.4.1. Composition and setting reaction As an attempt to reinforce glass-ionomer cements, and to render them sufficiently
radiopaque as well, [123] silver-tin metal alloys were either physically incorporated
with glass powder, resulting in a silver alloy admix, or were sintered with glass,
producing a glass cermet material. [6, 93] The idea of the silver cermet was to increase
the toughness of the material, by acting as a stress-absorber, to improve its wear
characteristics, and to render the restoration sufficiently opaque.[123] Regarding their
setting reaction, it is by the conventional acid-base reaction known for glass-
ionomers.[6, 36, 123]
2.4.2. Presentation and properties An incorporation of metallic fillers, as admixed types or cermets, in the form of
capsules, have provided no advantages over conventional glass-ionomers, [6, 87, 123,
127] limiting their use as core-buildups to situations where the cement constitutes less
than 40% of the total remaining tooth structure.[6, 7]
These products have also shown poor adhesion to tooth structure, [127] initially
releasing appreciable amounts of fluoride (F), with a decrease over time. A lower F
amount is released from the cermet cement, because a portion of the glass particle is
metal-coated.[6]
General on tooth-colored core-buildup Materials
7
2.5. Resin-modified glass-ionomers (RMGI):
2.5.1. Composition and setting reaction A modification of glass-ionomer cement by the incorporation of polymerizable
functional groups, in the product known as resin-modified glass-ionomer, was
undertaken recently. These products are hybrids between conventional glass-ionomers
and chemically- or light-cured resin restorations, [79, 93] typically consisting of a
powder similar to that of glass-ionomers, [36] a chemically- or light-curable monomer
in the liquid, such as hydroxyethylmethacrylate (HEMA), an ion-leachable glass, and
water. [67, 89] As some of the water in resin-modified glass-ionomer system has been
replaced by HEMA, the initial setting of these materials is due to the free radical
addition polymerization of HEMA. [131] Subsequently, the acid-base reaction typical
of conventional glass-ionomer takes place, [89] serving to harden and strengthen the
already created polymer matrix, [131] allowing a considerable working time, with ease
of manipulation and maintained fluoride-release [123]. Chemical bonding to tooth
structure without a bonding agent is maintained as well. [36] Finally, a metal
polyacrylate salt matrix as well as a polymer matrix is formed. [131]
2.5.2. Presentation and properties Resin-modified glass-ionomers are presented in powder/liquid (P/L) form for hand
mixing, or in the form of capsules to be mixed mechanically. [36] Depending on the
formulation of the material, and P/L ratios, resin-modified glass-ionomers may be used
as liners, fissure sealants, bases, core-buildups, restoratives as well as for several other
purposes. [6]
These hybrid ionomers set rapidly, after chemical- or light initiation, allowing for an
immediate finishing of the restoration [36] with better mechanical properties. [6, 36, 84,
131] Also, improved resistance to desiccation and acid attack is obvious, [78, 92]
compared to conventional glass-ionomer cements. Its coefficient of thermal expansion
and contraction is close to ideal, minimizing the microleakage typical of conventional
glass-ionomers. [123]
However, their greater degree of shrinkage upon polymerization compared to
conventional glass-ionomers, [6] their lower rigidity compared to that of composites,
[20] and a strength being lower than that of the tooth structure, hybrid ionomers should
General on tooth-colored core-buildup Materials
8
only be used as fillers.[28, 127] Resin-modified glass-ionomers also lacked
translucency. [131]
Additionally, due to the presence of the hydrophilic HEMA in the formulation, resin-
modified glass-ionomers absorb water easily, [24] with accompanying degradation.
[67] Also, a retardation of the acid-base reaction [89] and a reduced ability to wet the
tooth structure with increased microleakage and less ionic activity were noticed, [6] due
to the reduced carboxylic acid and water quantity in the liquid. [6, 36, 123]
2.6. Polyacid-modified composite resins (Compomers) These were introduced in 1995, [36] also referred to as compomers (Compo).
2.6.1. Composition and setting reaction Compomers are composed of fluoroaluminosilicate (FAS) glass particles and a polyacid-
modified monomer without any water [6, 123] Compomers have a volume filler %
ranging from 42-67% [36] with their glass particles partially silanized, and its matrix
being formed mainly during the light activation, through a free-radical polymerization
reaction of its monomers, [82] being the driving force for the setting process of these
materials. The acid-base reaction that also takes place provides further cross-linking to
the matrix, ionic diffusion, [25, 82] and a slow but continuous fluoride-release. [123]
2.6.2. Presentation and properties Compomers are usually packaged as single paste formulations in compules and
syringes for restorative applications, protecting them from humidity, and facilitating
their application. [6, 36] They show the fluoride-releasing capability of conventional
glass-ionomers, the structure, physical properties, durability and improved handling, as
well as esthetic properties of composites. [3, 6, 57] These properties have made them
suitable for applications in class V cavities in permanent teeth and as filling materials in
primary dentition [115] resembling popular alternatives to glass-ionomers and resin-
modified glass-ionomers. [123]
In contrast to the slow rate of water-uptake shown by composites, compomers show a
more rapid rate of water sorption, provided by its hydrophilic resin matrix. [6, 36, 123]
The rapid water sorption helps a rapid compensation for polymerization-shrinkage of
the resin matrix, with a reduction of marginal gapping. [123]
General on tooth-colored core-buildup Materials
9
Compomers show mechanical properties being somewhat inferior to those of composite
resins, but better than those of glass-ionomer and resin-modified glass-ionomer
cements, which show a higher Fluoride-release. An excessive hygroscopic expansion
was also recorded for compomers. [123] Because of the absence of water in the
formulation of compomers, the cement is not self-adhesive, requiring an adhesive to
bond to the tooth structure. [6, 123]
2.7. Testing the mechanical properties of tooth-colored restorative materials
The fracture-related material properties under stress have usually been evaluated by
choosing the material parameters flexure strength (FS), flexural modulus (FM) and
fracture toughness (FT), [36] where for brittle materials, flexural tests are preferred to
other mechanical tests. This is because these properties more closely simulate the stress
distribution in the restoration during service.[6]
Flexural strength of a material represents the maximum stress it withstands before
failure when subjected to bending loads [113], whereas the elastic modulus of a
material describes its stiffness. This is measured by the slope of the elastic portion of
the stress-strain curve, [6] as the interatomic and intermolecular forces of the material
are responsible for its elastic properties. [36] Early achievement of high physical-
mechanical performance of a restoration minimizes the possibility of early damage,
[99] since the greatest increase in strength or in shrinkage occurs at the time of
polymerization. [137]
2.8. Degree of conversion (DC) and its measurement Degree of conversion (DC) is a measure of the percentage of methacrylate double
bonds converted to single bonds during formation of a polymeric resin. [6, 36] It was
proven to play an important role in determining the ultimate success of the restorative,
as it affects several properties of the resin system [44, 47, 51, 52, 64, 65, 74, 112], such
as flexural properties, solubility, dimensional and color stability as well as their
biocompatibility. [114] Due to the positive correlation found to exist between the
increased conversion and the improved mechanical properties of dental resins, their
degree of cure was indirectly evaluated by means of measuring the mechanical
properties of resin materials.[44] However, no correlation between DC and the
General on tooth-colored core-buildup Materials
10
diametral tensile strength, compressive strength, hardness, or fracture toughness of
composite resin materials was detected. [30, 31, 48]
Several authors proved a correlation between DC and mechanical properties to be
dependent on the material, and further being significantly influenced by variables of
depth from the surface, light source and energy level. [15, 31, 44, 136]
Moreover, Ferracane [44] has stated that the mechanical properties of resins proved to
be much dependent upon network formation, which is not equivalent to the DC of these
materials. [31, 44, 52]
Besides the beneficial effects of higher DC, it also results in larger amounts of
polymerization-shrinkage in materials based on resin/filler systems.[43]
Several techniques have been used to determine the DC of resins, with the Fourier
Transformation Infra Red Spectroscopy (FTIR) being widely used as a reliable method,
detecting the carbon double-bond stretching vibrations directly before and after curing
of the material. [41, 75, 105] The FTIR spectroscopy is based on the fact that molecules
absorb electromagnetic radiation in the IR region (750 nm to 0.5 nm), triggering
vibrations and rotations in the system.[32, 130] The attenuated total reflection (ATR)
FTIR type of spectroscopy, utilizes the physical phenomena of light reflection at an
interface of two media of different refractive indices. [130] The % DC of each material
is determined from the ratio of the absorbance intensities of C=C aliphatic peak (at
1638 cm-1) / C..C aromatic ring peak (at 1608 cm-1) before and after curing [30, 38,
105, 118] , as shown in the following equation:
DC% = 100 x [1-R polymerized / R unpolymerized]
Where R represents the rates between peak heights, representing recorded aliphatic:
aromatic ratio of the individual samples. [6, 36, 42]
Review of Literature
11
3. Review of the Literature Effects of different storage conditions and various factors related to type of material and
composition on flexural properties as well as DC of tooth-colored core-buildup
materials:
3.1. Flexure Strength (FS)
3.1.1. Effect of storage environment and storage time on Flexure Strength The storage environment significantly influences FS of tooth-colored restorative
materials. The composite resins, glass-ionomers, resin-modified glass-ionomers,
compomers tested, have shown a higher dry strength compared to their wet ones, with
most of conventional glass-ionomers, metal-modified glass-ionomers and resin-
modified glass-ionomers tested, showing little decrease in their FS and softer surfaces
after aging in distilled water . [13, 18, 23-26, 46, 62, 63, 82-84, 86, 96]
Flexural strength of various glass-ionomer cements (luting, esthetic, reinforced cements
and liners or bases) are lower compared to those of amalgams or composite resins.
Compared to conventional glass-ionomers and cermets tested after 24 h or 1w storage
in distilled water, resin-modified glass-ionomers show higher dry and wet FS, and more
water sensitivity, absorbing higher amounts of water during the first 24 h. [24, 26, 84,
121, 133]
Light-cured microfilled composite resins show a reduction in FS with time of wet
storage, and Dyract, the compomer tested, shows a decline from its peak in FS with time
of storage in artificial saliva. On the other hand, all resin-modified glass-ionomer
cements and conventional glass-ionomer cements tested show an increase in FS with
maturation in distilled water, with the values for resin-modified glass-ionomers being
higher than for conventional glass-ionomers. [18, 62, 67, 86]
Flexural strength of conventional glass-ionomers and resin-modified glass-ionomer
specimens (Vitremer) either stored in an acidic medium (Coca-Cola) or in neutral
media, were not significantly different. In contrast to this, storage of specimens in acidic
beverages (orange and apple juices), has resulted in the loss of strength, with the
conventional glass-ionomers undergoing severe erosion. Also, FS of glass-ionomers and
Review of Literature
12
the compomer tested were lower when stored in artificial saliva than when stored in
saturated water vapor. [81, 86]
Compared to resin-modified glass-ionomers and microfilled composite resins,
compomers (inclusive Dyract and Compoglass) show higher flexural properties when
tested dry, immediately after light activation, as well as after 1w water storage. [63]
Flexural strength of composite resins tested, shows a great sensitivity to increased
testing conditions (temperature and cross-head speed) with significant softening and a
small decline in FS under wet immersion at different temperatures (12, 24 and 37°C),
with the visible light-cured composite resin showing limited variation. On the other
hand, FS of composite resins was unaffected by preparation temperatures, or
thermocycling, with differences occurring as a function of material. The hybrid,
packable and flowable composite resins tested, perform well before as well as after
thermocycling, with the packable composite resin showing highest FS values. [66, 76,
85, 124, 126]
A positive effect of water storage on FS and mechanical properties of glass-ionomer,
resin-modified glass-ionomer and composite resin tested is also noticed, with glass-
ionomers showing a slow rise in FS with maturation within the first 24 h, maintaining a
constant value afterwards, with no effect of storage time on the properties. Resin-
modified glass-ionomers have shown higher FS values compared to conventional glass-
ionomers with maturation in distilled water. The flowable and hybrid composite resin
show a significant increase in FS after 24 h water storage, but a decrease in strength was
obvious for the microfilled composites, revealing the lowest FS besides other
mechanical properties, when tested after (7d) storage in water at 37°C. [2, 18, 62, 67,
98]
Other authors are of the opinion, that storage environment has no effect on FS of glass-
ionomers, resin-modified glass-ionomers, and composite resins, showing similar values
when either stored in dry air with 22% relative humidity (RH), water vapor with 100 %
relative humidity (RH), and artificial saliva or in distilled water, while storage time had
an effect on their FS. [2, 53, 67, 81, 86]
Regarding setting and storage times, some authors were of the opinion, that these
properties influence the mechanical performance of composite resins, compomers and
glass-ionomers tested, with the FS of glass-ionomers being lower than those of self-
Review of Literature
13
cured composite resins and compomers [2, 53, 67, 81, 103], or having little or no
influence on the mechanical properties of materials tested. [24, 25, 27, 35, 46, 82-84,
99, 121]
Little influence of long term aging on composite resins is proven, only showing limited
degradation and increased water sorption, with visible light-cured composite resins
being significantly stronger than chemically-cured types, and Ketac Silver, the metal-
modified glass-ionomer, being the weakest. [120] Light-cured glass-ionomers and
polyacid-modified composites (Compo) tested, have shown similar FS values
throughout their storage in water for different time periods (1d, 1w, 2w, 1 mth, 2 mths),
with their values being inferior to those of composite resins tested. [120]
The compomers (Dyract AP and Compoglass F), a conventional glass-ionomer cement
(Ketac Molar) and a self-cured composite resin tested show an increase in their FS at
the times between 15 minutes and 24 h, of storage in distilled water for different time
periods. [103] Compomers have shown significantly higher FS values compared to
light-cured glass-ionomers after 1 d and 6 mths, but not after 1 year of water storage,
with the conventional glass-ionomers showing lowest values. [121] It was also stated
that the FS of the compomer tested (Dyract) sharply declines from its 1 mth peak after
storage in artificial saliva (AS) for different time periods. [86, 103, 121]
Flexural strength of metal-modified glass-ionomer materials tested have shown a
significant increase after water storage for 1 w, staying unchanged after 1 mth. The FS
values of metal-modified glass-ionomers were not significantly affected by a changing
storage environment, (distilled water or artificial saliva) for different time periods,
maintaining their early strength over extended storage periods. [6] Also, prolonged
aging in water of commercial glass-ionomers of types I, II, and III tested, resulted
neither in a continuous increase nor a decrease in FS. However, most of them have kept
rather constant mechanical strengths, with records of 24 h and 12 mths usually being
similar. [6, 27]
As composite resins have shown higher FS compared to resin-modified glass-ionomers,
compomers and conventional glass-ionomers, which have all shown similar values, [12,
72, 103, 120] composite resins turned out to be more suitable as a core material for the
restoration of mutilated posterior as well as for anterior teeth. [18, 26, 132]
Review of Literature
14
All types of current glass-ionomers (conventional-, resin-modified-, metal-modified-
glass-ionomers, and Cermets) are proven unsuitable as core-buildups for anterior or
posterior teeth, and should only be used as fillers for defect elimination, being limited to
areas subject to low stresses [82, 132], whereas the mechanical properties of light-cured
glass-ionomers could be suitable for core foundations. [72, 82, 132]
3.1.2. Effect of composition on Flexure Strength The existence of an important relationship between the composition, microstructure and
mechanical properties of glass-ionomers (filling cermets, resin-modified glass-
ionomers, base cements and filling cements) and composite resins has been proven. [10,
18, 47, 59, 62, 125, 133, 138]
Metal or resin addition to glass-ionomer cements tested, had little or no effect on their
strength, as metal-modified glass-ionomers were only significantly stronger than resin-
modified glass-ionomer cements at 7d of wet storage, with no significant differences
between the conventional glass-ionomer, metal-modified glass-ionomer, or resin-
modified glass-ionomer materials at any other time. [13, 87, 95, 119]
An increased FS of experimental composite resins was achieved by replacing bisphenol-
A-glycidyl methacrylate (Bis-GMA) or TEGDMA by urethane dimethacrylate
(UDMA), whilst replacing Bis-GMA with TEGDMA has resulted in a reduction of the
FS of experimental composite resins stored in water for 1 w. [10]
Increased inhibitor, initiator and activator concentrations have negatively affected FS of
composite resins tested after storage in water for 24h, obtaining its highest FS with a 2.5
wt% initiator and 1 wt % activator concentration. [47, 125]
The FS of composite resin has been proven to generally increase with the degree of
cure, to a lesser extent with increased filler volume, and the percentage of silane-treated
fillers. [46, 59, 69, 138] Also, filler silanization, shape and loading are proven to be
determining factors for materials’ strength, with higher filler volume amount and filler
silanization being associated with increased strength of the experimental composite
resin tested. Also, composite resin containing stronger and more porous fillers has
shown better FS values. [46, 138]
Glass-ionomer materials based on polyacrylic acid alone have shown a more rapid rise
and higher FS values as compared to materials based on polymaleic/polyacrylic acid
copolymers (Ketac Fil and Ketac Silver), which have a slower increase in FS over 24h
Review of Literature
15
after mixing, keeping a relatively constant value for up to 3 mths of water storage. [6,
98]
The results of the storage environment, time and composition on FS of tooth-colored
restorative materials are summarized in the following table. (Table 3.1)
Review of Literature
16
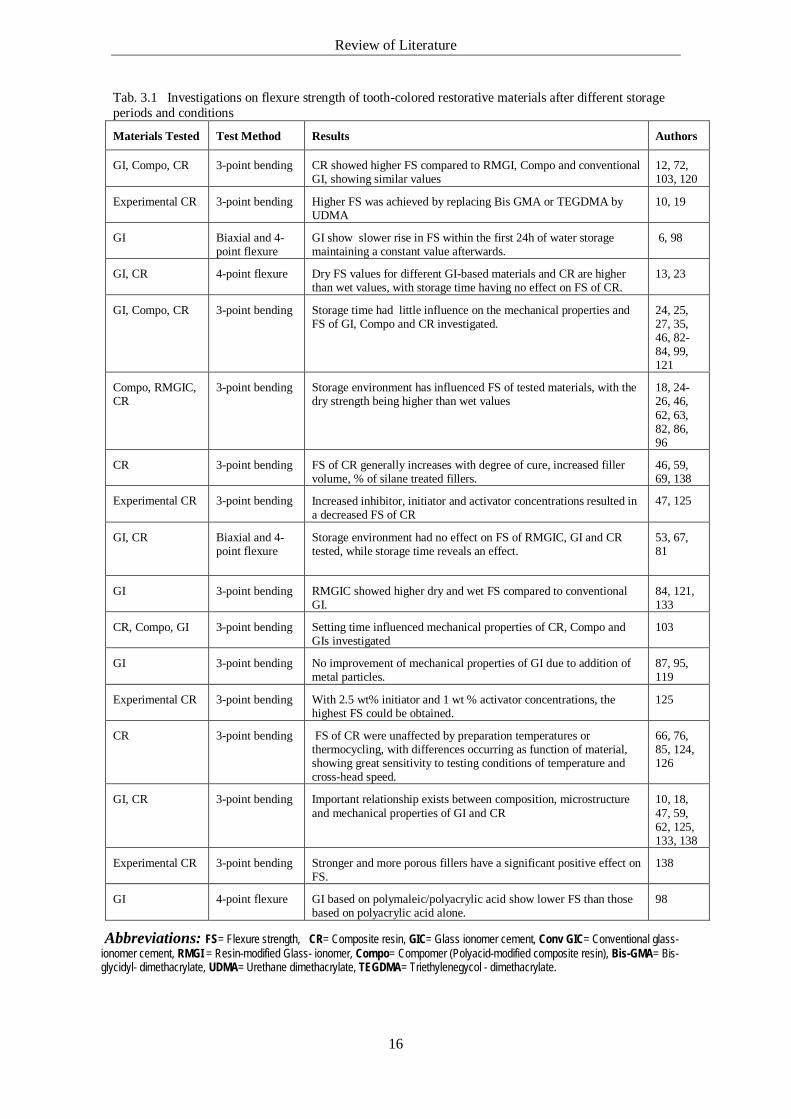
Tab. 3.1 Investigations on flexure strength of tooth-colored restorative materials after different storage periods and conditions
Materials Tested Test Method Results Authors
GI, Compo, CR 3-point bending CR showed higher FS compared to RMGI, Compo and conventional GI, showing similar values
12, 72, 103, 120
Experimental CR 3-point bending Higher FS was achieved by replacing Bis GMA or TEGDMA by UDMA
10, 19
GI Biaxial and 4-point flexure
GI show slower rise in FS within the first 24h of water storage maintaining a constant value afterwards.
6, 98
GI, CR 4-point flexure Dry FS values for different GI-based materials and CR are higher than wet values, with storage time having no effect on FS of CR.
13, 23
GI, Compo, CR 3-point bending Storage time had little influence on the mechanical properties and FS of GI, Compo and CR investigated.
24, 25, 27, 35, 46, 82-84, 99, 121
Compo, RMGIC, CR
3-point bending Storage environment has influenced FS of tested materials, with the dry strength being higher than wet values
18, 24-26, 46, 62, 63, 82, 86, 96
CR 3-point bending FS of CR generally increases with degree of cure, increased filler volume, % of silane treated fillers.
46, 59, 69, 138
Experimental CR 3-point bending Increased inhibitor, initiator and activator concentrations resulted in a decreased FS of CR
47, 125
GI, CR Biaxial and 4-point flexure
Storage environment had no effect on FS of RMGIC, GI and CR tested, while storage time reveals an effect.
53, 67, 81
GI 3-point bending RMGIC showed higher dry and wet FS compared to conventional GI.
84, 121, 133
CR, Compo, GI 3-point bending Setting time influenced mechanical properties of CR, Compo and GIs investigated
103
GI 3-point bending No improvement of mechanical properties of GI due to addition of metal particles.
87, 95, 119
Experimental CR 3-point bending With 2.5 wt% initiator and 1 wt % activator concentrations, the highest FS could be obtained.
125
CR 3-point bending FS of CR were unaffected by preparation temperatures or thermocycling, with differences occurring as function of material, showing great sensitivity to testing conditions of temperature and cross-head speed.
66, 76, 85, 124, 126
GI, CR 3-point bending Important relationship exists between composition, microstructure and mechanical properties of GI and CR
10, 18, 47, 59, 62, 125, 133, 138
Experimental CR 3-point bending Stronger and more porous fillers have a significant positive effect on FS.
138
GI
4-point flexure GI based on polymaleic/polyacrylic acid show lower FS than those based on polyacrylic acid alone.
98
Abbreviations: FS= Flexure strength, CR= Composite resin, GIC= Glass ionomer cement, Conv GIC= Conventional glass- ionomer cement, RMGI = Resin-modified Glass- ionomer, Compo= Compomer (Polyacid-modified composite resin), Bis-GMA= Bis- glycidyl- dimethacrylate, UDMA= Urethane dimethacrylate, TEGDMA= Triethylenegycol - dimethacrylate.
Review of Literature
17
3.2. Flexural Modulus (FM)
3.2.1. Effect of storage environment and storage time on Flexural Modulus The storage environment influences FM of tooth-colored restorative materials tested.
Conventional glass-ionomers, resin-modified glass-ionomers, composite resins,
compomers under investigation have shown higher dry strength values compared to
samples stored in water, or those dried after storage in water. The FM of conventional
glass-ionomer cement and resin-modified glass-ionomer proved to be more affected in
comparison with CR, which has shown significant softening. [18, 24, 25, 46, 82, 86, 96,
124]
Composite resin materials showed higher FM values compared to those of resin-modified
glass-ionomer cements, compomers and conventional glass-ionomers, showing similar
values. The resin-modified glass-ionomer cement tested showed higher dry, (30 min after
mixing) as well as wet FM values, compared to conventional glass-ionomers tested after
storage in distilled water for different time periods (24h and 3 mths). [12, 84]
It is proven, that the type of composite resin is a determining factor in the materials
performance in a wet environment, as flowable and hybrid composite resins have shown
a significant increase in FM after 24h water storage , whilst microfilled composite
resins have shown the lowest values after 7d aging in water. [18, 62]
It was also stated that FM of composite resins proved to be unaffected by preparation
temperatures, nor to be significantly changed by thermocycling. [66, 126] However,
they proved to be highly influenced by testing conditions of temperature and cross-head
speed. [85] Similar FM values were shown when prepared under temperatures either
simulating intraoral or ambient laboratory conditions, with differences having only
occurred as function of the material tested. [85] Visible light-cured (VLC) composite
resin tested has shown a marked decline in FM when the temperature and cross-head
speed were increased, whilst by solely increasing the cross-head speed, a steady
increase in FM at all temperatures was noticed, except at 0°C, as the specimens were
stored for 7d in artificial saliva at temperatures of 12, 24, and 37°C. [ 66, 76, 85, 126]
The compomer tested has shown a slight decline in its FM when stored in dry air with
22% relative humidity, saturated water vapor with 100% relative humidity, or in
artificial saliva for different storage periods, whilst that of composite resin and glass-
Review of Literature
18
ionomer were relatively stable, showing higher dry, as well as wet FM values, compared
to resin-modified glass-ionomers and microfilled composite resins. [46, 63, 86]
The storage time has influenced FM of the glass-ionomer, composite resin and
compomer tested, increasing with time of storage, either being dry or wet (in distilled
water) for longer periods. The FM of visible light-cured, a chemically-cured composite
resin and a metal-modified glass-ionomer have shown less difference throughout all
storage periods, whilst compomers and resins-modified glass-ionomers tested have
shown significantly higher FM values when aged in (distilled) water for longer periods
compared to those aged for shorter periods. [25, 35]
Other authors were of the opinion that wet storage (in artificial saliva) for longer periods
has negatively affected FM of Dyract, the compomer tested, resulting in a slight decline
from its 1 mth peak, whilst that of composite resin and glass-ionomer were relatively
stable. [46, 86]
3.2.2. Effect of composition on Flexural Modulus With increasing initiator and activator concentrations, a decrease in FM was noticed,
whilst with 1 wt% initiator and activator concentrations, the highest value of FM was
reached. [47, 125]
Also, filler shape, loading and silanization have influenced the mechanical properties of
composite resins tested, after being stored in distilled water for 24h, showing higher FM
with silanized fillers incorporated, compared to composites with unsilanized fillers and
with a higher filler volume percentage. [59, 69]
On the other hand, replacing Bis GMA or TEGDMA by UDMA has increased the FM
of experimental composite resins tested after storage in water for 1w. [10]
Regarding the types of composite resin, nanofilled types have shown a higher FM
compared to hybrid and microfilled types, except for one which was tested after 7d of
water storage. [18]
The results of storage environment, time and composition on flexure modulus of tooth-
colored restorative materials are summarized in the following table.( Table 3.2)
Review of Literature
19
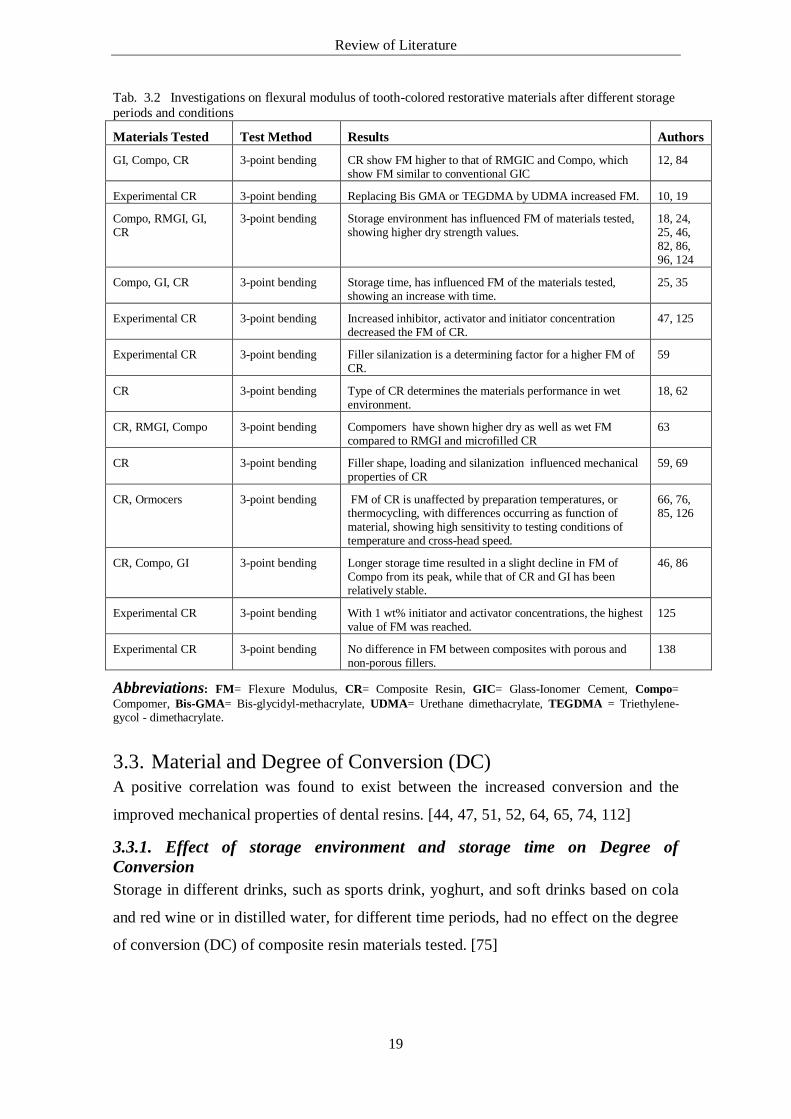
Tab. 3.2 Investigations on flexural modulus of tooth-colored restorative materials after different storage periods and conditions
Materials Tested Test Method Results Authors
GI, Compo, CR 3-point bending CR show FM higher to that of RMGIC and Compo, which show FM similar to conventional GIC
12, 84
Experimental CR 3-point bending Replacing Bis GMA or TEGDMA by UDMA increased FM. 10, 19
Compo, RMGI, GI, CR
3-point bending Storage environment has influenced FM of materials tested, showing higher dry strength values.
18, 24, 25, 46, 82, 86, 96, 124
Compo, GI, CR 3-point bending Storage time, has influenced FM of the materials tested, showing an increase with time.
25, 35
Experimental CR 3-point bending Increased inhibitor, activator and initiator concentration decreased the FM of CR.
47, 125
Experimental CR 3-point bending Filler silanization is a determining factor for a higher FM of CR.
59
CR 3-point bending Type of CR determines the materials performance in wet environment.
18, 62
CR, RMGI, Compo 3-point bending Compomers have shown higher dry as well as wet FM compared to RMGI and microfilled CR
63
CR 3-point bending Filler shape, loading and silanization influenced mechanical properties of CR
59, 69
CR, Ormocers 3-point bending FM of CR is unaffected by preparation temperatures, or thermocycling, with differences occurring as function of material, showing high sensitivity to testing conditions of temperature and cross-head speed.
66, 76, 85, 126
CR, Compo, GI 3-point bending Longer storage time resulted in a slight decline in FM of Compo from its peak, while that of CR and GI has been relatively stable.
46, 86
Experimental CR 3-point bending With 1 wt% initiator and activator concentrations, the highest value of FM was reached.
125
Experimental CR 3-point bending No difference in FM between composites with porous and non-porous fillers.
138
Abbreviations: FM= Flexure Modulus, CR= Composite Resin, GIC= Glass-Ionomer Cement, Compo= Compomer, Bis-GMA= Bis-glycidyl-methacrylate, UDMA= Urethane dimethacrylate, TEGDMA = Triethylene-gycol - dimethacrylate.
3.3. Material and Degree of Conversion (DC) A positive correlation was found to exist between the increased conversion and the
improved mechanical properties of dental resins. [44, 47, 51, 52, 64, 65, 74, 112]
3.3.1. Effect of storage environment and storage time on Degree of Conversion Storage in different drinks, such as sports drink, yoghurt, and soft drinks based on cola
and red wine or in distilled water, for different time periods, had no effect on the degree
of conversion (DC) of composite resin materials tested. [75]
Review of Literature
20
3.3.2. Effect of composition and curing mode on Degree of Conversion Several factors, such as resin composition, light transmission through the material,
concentration of sensitizer, initiator and inhibitor affected the monomer to polymer
conversion. Additionally, curing time, power of the curing unit as well as changing the
baseline technique played a significant role in the degree of monomer conversion of
composite resins. [6, 46, 47, 61, 94, 97, 105, 112, 117, 123, 125, 136] Also, the type of
composite polymerization, time of testing and the curing style applied significantly
influenced the DC of composite resin materials. Whereas different curing modes did not
result in conversion differences, as long as the same monomer formulations and
adequate light-curing was employed, [6, 51] depending for optimal conversion on the
monomer composition.[106] It was stated that dual-cured composite resins have shown
higher values of monomer conversion when tested after 24h, than when tested
immediately, while that of light-cured composite resins was not significantly affected by
the testing time, [97] where the DC at 24h could be referred to as the maximum DC,
showing an approximately linear increase with time through 24h, with no further
increase at 48h. [44]
A higher DC was noticed with higher diluents (e.g. TEGDMA), initiator and activator
concentrations in dental resins, as well as lower inhibitor and filler concentrations, less
filler silanization, lighter shades and longer irradiation. [46, 47, 55, 61, 93, 117, 125,
136, 138] It was also proven, that the use of multifunctional monomers having more
than two reactive double bonds per molecule allows higher reaction rates with more
cross-links, but reduced DC. [5]
Increased TEGDMA amounts in Bis-GMA/ TEGDMA mixtures have shown higher
polymerization rates due to the higher accelerating and plasticizing effect of TEGDMA
on Bis-GMA compared to UDMA and Bis-EMA, [112] whereas UEDMA-based resins
were declared to be even more reactive than Bis-GMA-based resins. [42]
Moreover, longer irradiation resulted in higher DC due to improved mobility of reactive
groups during curing, allowing for enhanced diffusion of reactive groups. [51, 61]
However, as the polymerization of composite resins further continues at slower rates
after exposure, a termination point at approximately one day is reached, with no further
significant increase of the final degree of conversion with extended exposure time. [71,
138] That is because the diffusion rates of the propagating free radicals, the unreacted
dimethacrylate molecules and the pendant methacrylate groups are reduced as the
Review of Literature
21
polymerization reaction proceeds. [50] Most probably a decay of the radicals is the main
cause for the great loss in the post-curing efficiency of the remaining unpolymerized
bonds observed 24h after irradiation. [41]
Actually, TEGDMA is considered to be the main contributor to post-irradiation of
polymerization of Bis-GMA based composites, with higher amounts of TEGDMA
resulting in increased DC, however being accompanied by a decrease in post-irradiation
polymerization. [118] Contribution of TEGDMA is most probably related to its
chemical nature, specifically its ether linkages and the lack of hydroxyl groups, as well
as its lower molecular weight being about half that of Bis-GMA, rendering the molecule
more flexible, of lower viscosity and thus significantly higher DC. [31, 118]
It was also declared that different amounts of residual methacrylate groups in
polymerized materials were related to different resin formulations, and that an increased
TEGDMA content in the mixture resulted in decreased amounts of TEGDMA
molecules remaining unreacted during post-irradiation. [107, 118]
Regarding the filler content, it is assumed that the filler concentration and the nature of
bonding between filler particles and resinous matrix play an important role in
determining the properties of dental composites. [30, 31] Halvorson et al [55] have
stated that the conversion progressively decreased with increased filler loading,
independent of the filler being silane-treated or not, with the suggestion, that most of the
methacrylate functionality within the silane layer is in a non-reactive environment.
Several authors have proven flowable composite resins to demonstrate higher DC than
universal types, followed by packable composites, at a 1 mm distance from the surface.
[46, 61, 117, 136, 138]
The higher the filler fraction and the smaller the particle size, the lower the stability of
the radicals, denoting a catalytic effect of the filler surface on the decomposition of
radicals, the effect being reduced by silane-treatment of the fillers. [22]
Ferracane et al [49] had proven that DC showed a tendency to increase when the
volume of silane treated fillers was reduced, being in accordance with the opinion that
composite resins showed higher DC with lower filler volume amount, less silanization,
and lighter shades. [46, 61, 117, 136, 138]
Depth of cure and hardness of composite resins tested, extended with increased
inorganic loading, [41] As long as the selected light-curable dental composite resin of a
Review of Literature
22
certain thickness receives a fixed light energy amount, the same degree of cure is
produced independent of light-irradiance. [43, 108, 136] Additionally, it was affirmed,
that the chemistry of photo-initiator and co-initiators incorporated, markedly influenced
the light transmission and DC of experimental composite resins. [94, 117]
On the other hand, Luiz et al [75]denied any change in DC at different specimen depths,
and significant differences being only observed either when materials compared or
when top and bottom surfaces of single specimens were studied. [43]
Investigations undertaken on the DC of tooth-colored restorative materials are
summarized in the following table (Table 3.3).
Review of Literature
23
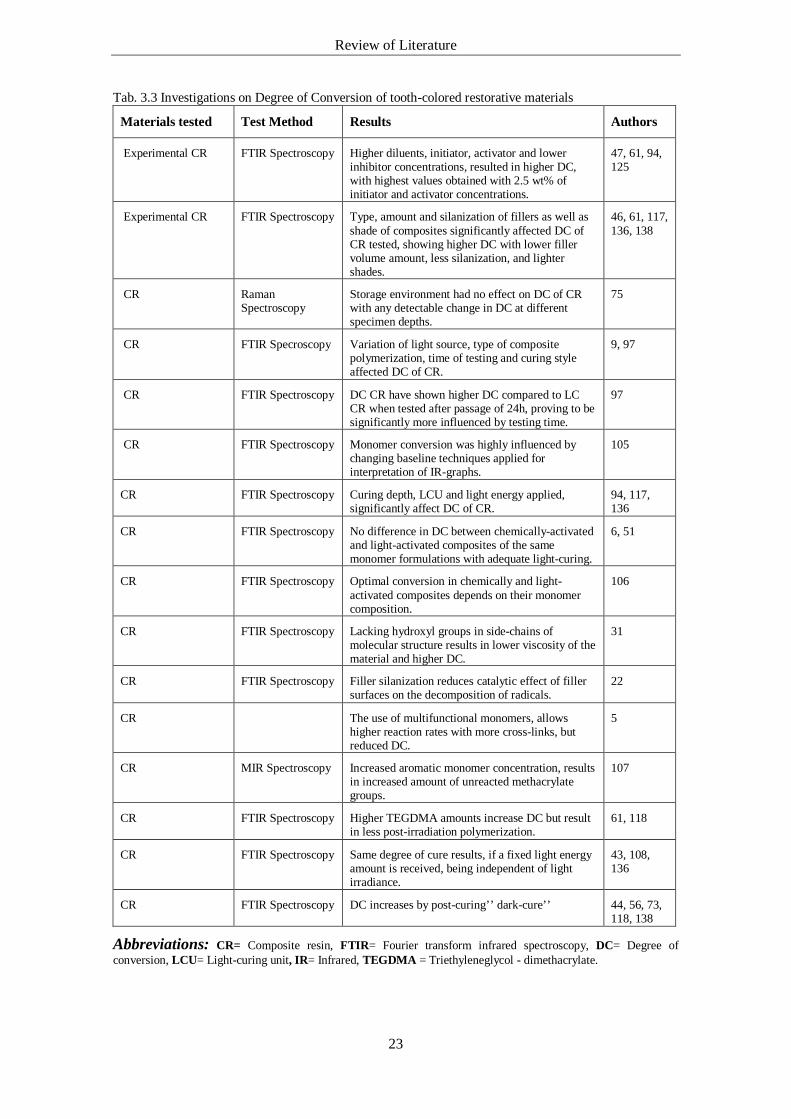
Tab. 3.3 Investigations on Degree of Conversion of tooth-colored restorative materials
Materials tested Test Method Results Authors
Experimental CR FTIR Spectroscopy Higher diluents, initiator, activator and lower inhibitor concentrations, resulted in higher DC, with highest values obtained with 2.5 wt% of initiator and activator concentrations.
47, 61, 94, 125
Experimental CR FTIR Spectroscopy Type, amount and silanization of fillers as well as shade of composites significantly affected DC of CR tested, showing higher DC with lower filler volume amount, less silanization, and lighter shades.
46, 61, 117, 136, 138
CR Raman Spectroscopy
Storage environment had no effect on DC of CR with any detectable change in DC at different specimen depths.
75
CR FTIR Specroscopy Variation of light source, type of composite polymerization, time of testing and curing style affected DC of CR.
9, 97
CR FTIR Spectroscopy DC CR have shown higher DC compared to LC CR when tested after passage of 24h, proving to be significantly more influenced by testing time.
97
CR FTIR Spectroscopy Monomer conversion was highly influenced by changing baseline techniques applied for interpretation of IR-graphs.
105
CR FTIR Spectroscopy Curing depth, LCU and light energy applied, significantly affect DC of CR.
94, 117, 136
CR FTIR Spectroscopy No difference in DC between chemically-activated and light-activated composites of the same monomer formulations with adequate light-curing.
6, 51
CR FTIR Spectroscopy Optimal conversion in chemically and light-activated composites depends on their monomer composition.
106
CR FTIR Spectroscopy Lacking hydroxyl groups in side-chains of molecular structure results in lower viscosity of the material and higher DC.
31
CR FTIR Spectroscopy Filler silanization reduces catalytic effect of filler surfaces on the decomposition of radicals.
22
CR The use of multifunctional monomers, allows higher reaction rates with more cross-links, but reduced DC.
5
CR MIR Spectroscopy Increased aromatic monomer concentration, results in increased amount of unreacted methacrylate groups.
107
CR FTIR Spectroscopy Higher TEGDMA amounts increase DC but result in less post-irradiation polymerization.
61, 118
CR FTIR Spectroscopy Same degree of cure results, if a fixed light energy amount is received, being independent of light irradiance.
43, 108, 136
CR FTIR Spectroscopy DC increases by post-curing’’ dark-cure’’ 44, 56, 73, 118, 138
Abbreviations: CR= Composite resin, FTIR= Fourier transform infrared spectroscopy, DC= Degree of conversion, LCU= Light-curing unit, IR= Infrared, TEGDMA = Triethyleneglycol - dimethacrylate.
Aim of the Study
24
4. Aim of the Study
The following study aimed to test 4 hypotheses:
The first hypothesis was that material types as well as storage condition have no
influence on the flexural properties of 4 different groups of tooth-colored filling
materials, tested in a 3-point bending test following storage for different time periods
under different storage conditions.
The second hypothesis tested was that for 4 dual-cured materials, no difference in
flexural properties exists within the same material when either dual-cured or when
tested after omission of the light-curing step.
The third hypothesis tested was the absence of any correlation between the degree of
conversion and the flexural properties of 7 composite resins investigated.
And finally, the hypothesis that storage conditions have no influence on the degree of
conversion of the composite resins investigated was tested.
Materials and Methods
25
5. Materials and Methods 5.1. Test conditions All tests were conducted under ambient laboratory conditions at 50 % relative
humidity and a room temperature of 23 ± 1°C. All materials were used according to
their manufacturers’ instructions.
5.2. Materials
5.2.1. Flexure Strength and Flexural Modulus Fourteen different materials comprising the following material groups were
investigated in this study:
1) Glass-Ionomers (GI) a- conventional glass –ionomers (GI)
b- metal-modified glass-ionomers (mmGI)
2) Resin-modified glass-ionomers (RMGI)
3) Composite resins a- self-cured (SC)
b- light-cured (LC)
c- dual-cured (DC)
4) Polyacid-modified composite resins (Compomers)
Table 5.1 represents the materials under investigation.

Materials and Methods
26
Tab. 5.1 Materials under investigation
Abbreviations: SC= Self-cured, LC = Light-cured, DC = Dual-cured, mm = Metal-modified, GI = Glass- ionomer, RMGI = Resin-modified glass-ionomer
5.2.2. Degree of Conversion Seven composite resins were separately investigated for their degree of conversion in
this study. Table 5.2 represents the composite resins under investigation.
Tab. 5.2 Composite resins under investigation
No Material Type of Material Shade Manufacturer
1. Luxa Core Automix SC composite A3 DMG
2. Clearfil Core New Bond SC composite Neutral Kuraray
3. Rebilda SC SC composite Dentin Voco
4. Clearfi Photo Core LC composite Translucent Kuraray
5. Charisma LC composite A3 Heraeus Kulzer
6. Rebilda DC DC composite Dentin Voco
7. Luxa Core Automix Dual DC composite A3 DMG
Abbreviations: SC = Self-cured, LC = Light-cured, DC = Dual-cured
No Material Type of Material Shade Manufacturer
1. Luxa Core Automix SC composite A3 DMG
2. Clearfil Core New Bond SC composite Neutral Kuraray
3. Rebilda SC SC composite Dentin Voco
4. Clearfi Photo Core LC composite Translucent Kuraray
5. Charisma LC composite A3 Heraeus Kulzer
6. Rebilda DC DC composite Dentin Voco
7. Luxa Core Automix Dual DC composite A3 DMG
8. Ketac Molar Applicap GI A3 3M ESPE
9. Fuji IX GP GI A3 GC
10. Ketac Silver mm GI 3M ESPE
11. Vitremer RMGI A3 3M ESPE
12. Fuji II LC RMGI A3 GC
13. Dyract Extra Compomer A3 Dentsply
14. F2000 Compomer A3 3M ESPE
Materials and Methods
27
5.3. Methods
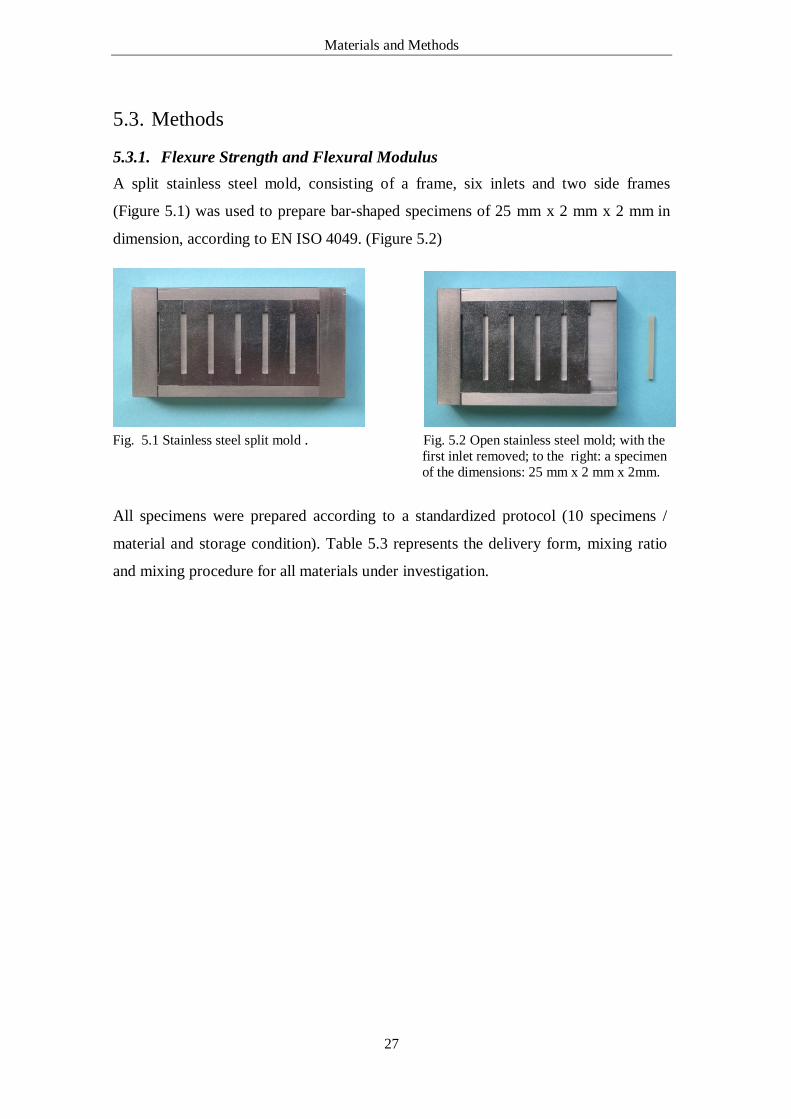
5.3.1. Flexure Strength and Flexural Modulus A split stainless steel mold, consisting of a frame, six inlets and two side frames
(Figure 5.1) was used to prepare bar-shaped specimens of 25 mm x 2 mm x 2 mm in
dimension, according to EN ISO 4049. (Figure 5.2)
Fig. 5.1 Stainless steel split mold . Fig. 5.2 Open stainless steel mold; with the first inlet removed; to the right: a specimen of the dimensions: 25 mm x 2 mm x 2mm.
All specimens were prepared according to a standardized protocol (10 specimens /
material and storage condition). Table 5.3 represents the delivery form, mixing ratio
and mixing procedure for all materials under investigation.
Materials and Methods
28
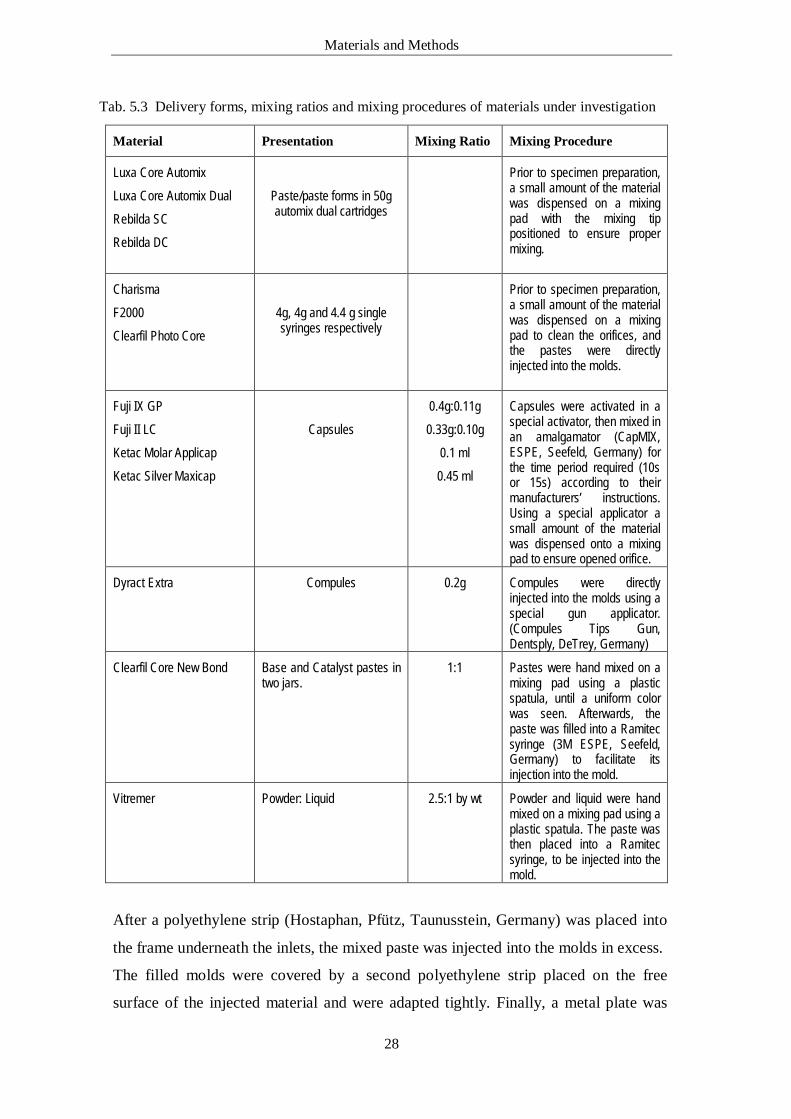
Tab. 5.3 Delivery forms, mixing ratios and mixing procedures of materials under investigation
After a polyethylene strip (Hostaphan, Pfütz, Taunusstein, Germany) was placed into
the frame underneath the inlets, the mixed paste was injected into the molds in excess.
The filled molds were covered by a second polyethylene strip placed on the free
surface of the injected material and were adapted tightly. Finally, a metal plate was
Material Presentation Mixing Ratio Mixing Procedure
Luxa Core Automix Luxa Core Automix Dual Rebilda SC Rebilda DC
Paste/paste forms in 50g automix dual cartridges
Prior to specimen preparation, a small amount of the material was dispensed on a mixing pad with the mixing tip positioned to ensure proper mixing.
Charisma F2000 Clearfil Photo Core
4g, 4g and 4.4 g single syringes respectively
Prior to specimen preparation, a small amount of the material was dispensed on a mixing pad to clean the orifices, and the pastes were directly injected into the molds.
Fuji IX GP Fuji II LC Ketac Molar Applicap Ketac Silver Maxicap
Capsules
0.4g:0.11g 0.33g:0.10g
0.1 ml 0.45 ml
Capsules were activated in a special activator, then mixed in an amalgamator (CapMIX, ESPE, Seefeld, Germany) for the time period required (10s or 15s) according to their manufacturers’ instructions. Using a special applicator a small amount of the material was dispensed onto a mixing pad to ensure opened orifice.
Dyract Extra Compules 0.2g Compules were directly injected into the molds using a special gun applicator. (Compules Tips Gun, Dentsply, DeTrey, Germany)
Clearfil Core New Bond Base and Catalyst pastes in two jars.
1:1 Pastes were hand mixed on a mixing pad using a plastic spatula, until a uniform color was seen. Afterwards, the paste was filled into a Ramitec syringe (3M ESPE, Seefeld, Germany) to facilitate its injection into the mold.
Vitremer Powder: Liquid 2.5:1 by wt Powder and liquid were hand mixed on a mixing pad using a plastic spatula. The paste was then placed into a Ramitec syringe, to be injected into the mold.
Materials and Methods
29
placed on top, and the assembly was placed under a hydraulic press for five seconds,
to extrude excess material. For LC and DC materials, the metal plate was removed and
the assembly was inserted into the incubator with the polyethylene strip tightly
adapted, to allow for light-curing.
After removal from underneath the hydraulic press, self-curing materials were
immediately placed with the assembly into an incubator (Ehret, Emmendingen,
Germany) for 10 min at 37°C, whereas LC and DC materials were first light-cured
inside their molds from one side in a Uni XS laboratory light-curing unit (Heraeus
Kulzer, Hanau Germany) for 90 s, then on the other side after removal from their
molds for the same time period. The Uni XS unit is equipped with two Xenon bulbs,
having a power input of 270 W, a flash frequency of 20 Hz, and a wavelength of 320-
520 nm. Afterwards, the materials were placed into the incubator for 10 min. Prior to
light-curing; the light-output of the light-curing unit was checked using a Translux
Tester (Heraeus Kulzer, Hanau, Germany). The metal plate on top of the self-cured
materials was removed, the screws opened, and the polyethylene strip removed in
order to remove the specimens from the molds.
Additionally, 4 dual-cured materials, namely 2 resin-modified glass-ionomers (Fuji II
LC and Vitremer) and 2 composite resins (Luxa Core Automix Dual and Rebilda DC)
were tested after omitting the light-curing step, depending only on their chemically-
initiated polymerization.
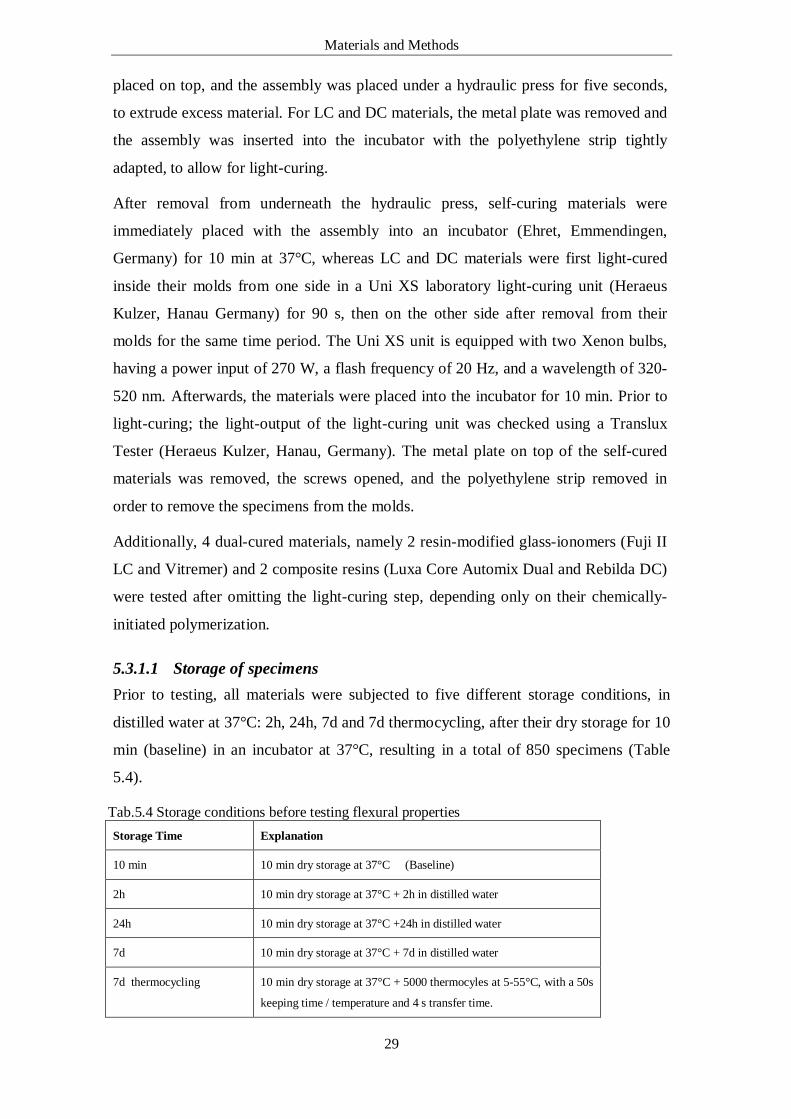
5.3.1.1 Storage of specimens Prior to testing, all materials were subjected to five different storage conditions, in
distilled water at 37°C: 2h, 24h, 7d and 7d thermocycling, after their dry storage for 10
min (baseline) in an incubator at 37°C, resulting in a total of 850 specimens (Table
5.4).
Tab.5.4 Storage conditions before testing flexural properties Storage Time Explanation
10 min 10 min dry storage at 37°C (Baseline)
2h 10 min dry storage at 37°C + 2h in distilled water
24h 10 min dry storage at 37°C +24h in distilled water
7d 10 min dry storage at 37°C + 7d in distilled water
7d thermocycling 10 min dry storage at 37°C + 5000 thermocyles at 5-55°C, with a 50s
keeping time / temperature and 4 s transfer time.
Materials and Methods
30
5.3.1.2 3-Point bending test Excess material was removed by wet grinding on SiC paper (grit 2400) immediately
before testing, the specimens were then dried and their height and width was measured
using a digimatic screw micrometer (Mitutoyo, Kawasaki, Japan) at an accuracy of ±
0.001 mm. Specimens were also inspected for cracks or bubbles. If any defect was
found, the specimen was discarded.
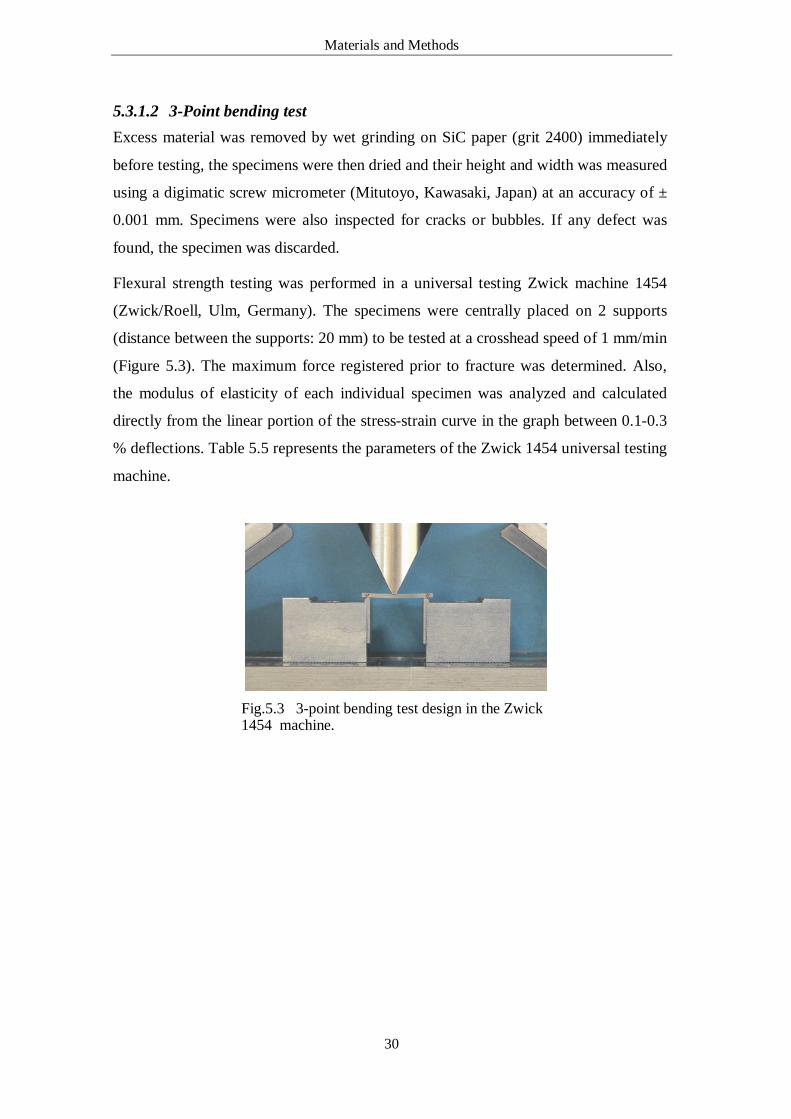
Flexural strength testing was performed in a universal testing Zwick machine 1454
(Zwick/Roell, Ulm, Germany). The specimens were centrally placed on 2 supports
(distance between the supports: 20 mm) to be tested at a crosshead speed of 1 mm/min
(Figure 5.3). The maximum force registered prior to fracture was determined. Also,
the modulus of elasticity of each individual specimen was analyzed and calculated
directly from the linear portion of the stress-strain curve in the graph between 0.1-0.3
% deflections. Table 5.5 represents the parameters of the Zwick 1454 universal testing
machine.
Fig.5.3 3-point bending test design in the Zwick 1454 machine.
Materials and Methods
31
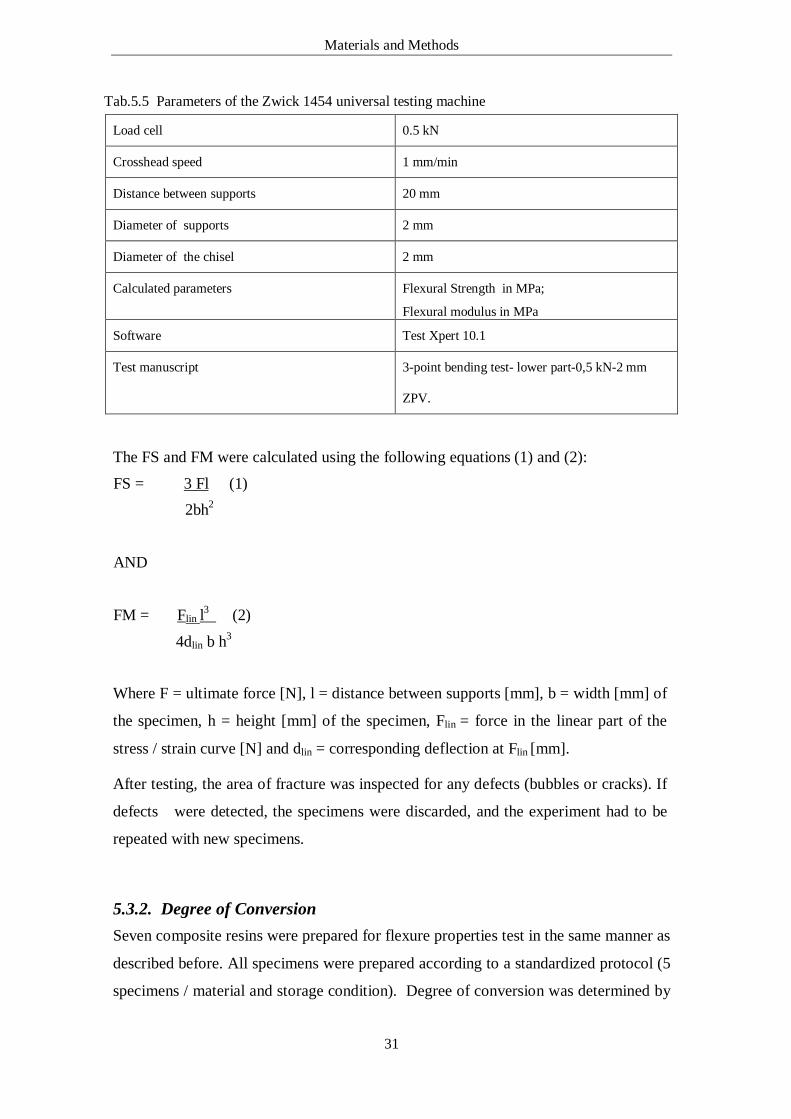
Tab.5.5 Parameters of the Zwick 1454 universal testing machine
The FS and FM were calculated using the following equations (1) and (2):
FS = 3 Fl (1) 2bh2
AND
FM = Flin l3 (2)
4dlin b h3
Where F = ultimate force [N], l = distance between supports [mm], b = width [mm] of
the specimen, h = height [mm] of the specimen, Flin = force in the linear part of the
stress / strain curve [N] and dlin = corresponding deflection at Flin [mm].
After testing, the area of fracture was inspected for any defects (bubbles or cracks). If
defects were detected, the specimens were discarded, and the experiment had to be
repeated with new specimens.
5.3.2. Degree of Conversion Seven composite resins were prepared for flexure properties test in the same manner as
described before. All specimens were prepared according to a standardized protocol (5
specimens / material and storage condition). Degree of conversion was determined by
Load cell 0.5 kN
Crosshead speed 1 mm/min
Distance between supports 20 mm
Diameter of supports 2 mm
Diameter of the chisel 2 mm
Calculated parameters Flexural Strength in MPa;
Flexural modulus in MPa
Software Test Xpert 10.1
Test manuscript 3-point bending test- lower part-0,5 kN-2 mm
ZPV.
Materials and Methods
32
calculating the percentage of reacted C=C double bonds using FTIR analysis
(baseline method) [14, 21, 32, 101] on the fractured bar-shaped specimens after
recording the flexural properties. Table 5.6 represents the delivery form, presentation,
mixing ratio and mixing procedure of the composite resins investigated.
Tab.5.6 Delivery form, presentation, mixing ratio and mixing procedure of composite resins investigated for degree of conversion testing
5.3.2.1 Storage of specimens Prior to testing, the 7 composite resin materials were subjected to 8 different storage
conditions: 5 min and 10 min dry storage in an incubator at 37°C, in distilled water at
37°C: 1h, 4h, 24h, 2d, 7d and 7d thermocycling after their dry storage for 10 min
(baseline) in an incubator at 37°C, resulting in a total of 280 specimens. Table 5.7
represents the storage conditions of composite resins before testing their flexural
properties in a 3-point bending test, to be followed by testing their degree of
conversion.
Material Presentation Mixing Ratio Mixing Procedure
Luxa Core Automix Luxa Core Automix Dual Rebilda SC Rebilda DC
In paste/ paste forms in 50g automix dual cartridge
Prior to specimen preparation, a small amount of the material was dispensed on a mixing pad with the mixing tip positioned to ensure proper mixing.
Charisma Clearfil Photo Core
4g and 4.4 g single syringes respectively
Prior to specimen preparation, a small amount of the material was dispensed on a mixing pad to clean the orifices, and the pastes were directly injected into the molds.
Clearfil Core New Bond Base and Catalyst pastes in two jars.
1:1 Pastes were hand mixed on a mixing pad using a plastic spatula, until a uniform color was seen. Afterwards, the paste was filled into a Ramitec syringe (3M ESPE, Seefeld, Germany) to facilitate its injection into the mold.
Materials and Methods
33
Tab.5.7 Storage conditions of composite resins before testing their degree of conversion after fracture in a 3-point bending test
5.3.2.2 Degree of Conversion test All composite resins were tested in a 3-point bending test following the same
procedures mentioned before, to determine their flexural properties. Afterwards,
fractured specimens were immediately placed on an ATR diamond crystal of a
SpectrumTM 100 FTIR device (Perkin Elmer, Shelton, USA) to determine their degree
of conversion. The machine was equipped with a universal diamond ATR unit
(spectral range: 4000-650 cm-1; operating at a spectral resolution of 4 cm-1) [30, 65].
Moreover, the amount of unreacted double bonds inside the material prior to
polymerization was determined, by directly dispensing a small amount of freshly
mixed material (0.2 ml) on the ATR crystal (n = 5 per material), to record a spectrum
immediately (16 scans / spot). [30, 65] Figure 5.4 illustrates the uncured paste
dispensed on the ATR crystal of the Spectrum 100TM FTIR testing device. As a
reference, the mean spectrum of the uncured samples was calculated.
For calculation of the degree of conversion, spectra of the cured bar-shaped specimens
(n = 5 / material and storage condition) were recorded after fracture, by placing the
specimens onto the ATR crystal, fixing them with the ATR unit’s movable arm to
achieve the closest contact possible at a maximum force of 150 units for optimal
documentation (Figure 5.5). On each specimen, spectra were recorded at 3 different
points, requiring 64s scan-time per spot. Mean spectrum of all 15 measurements was
Storage time Explanation
5 min 5 min dry storage at 37°C
10 min 10 min dry storage at 37°C (baseline)
1h 10 min dry storage at 37°C + 1h in distilled water
4h 10 min dry storage at 37°C + 4h in distilled water
24h 10 min dry storage at 37°C +24h in distilled water
2d 10 min dry storage at 37°C + 2d in distilled water
7d 10 min dry storage at 37°C + 7d in distilled water
7d thermocycling 10 min dry storage at 37°C + 5000 thermocycles at 5-55°C, with a 50s
keeping time / temperature and 4s transfer time.
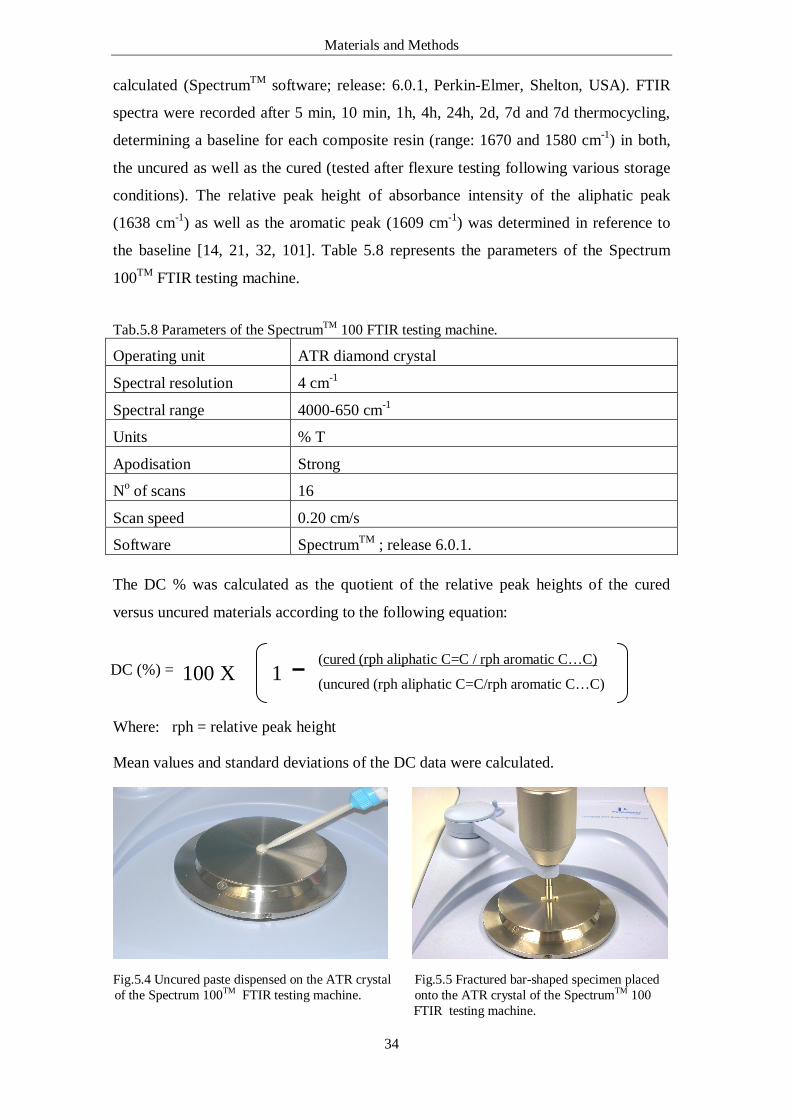
Materials and Methods
34
1 100 X
calculated (SpectrumTM software; release: 6.0.1, Perkin-Elmer, Shelton, USA). FTIR
spectra were recorded after 5 min, 10 min, 1h, 4h, 24h, 2d, 7d and 7d thermocycling,
determining a baseline for each composite resin (range: 1670 and 1580 cm-1) in both,
the uncured as well as the cured (tested after flexure testing following various storage
conditions). The relative peak height of absorbance intensity of the aliphatic peak
(1638 cm-1) as well as the aromatic peak (1609 cm-1) was determined in reference to
the baseline [14, 21, 32, 101]. Table 5.8 represents the parameters of the Spectrum
100TM FTIR testing machine.
Tab.5.8 Parameters of the SpectrumTM 100 FTIR testing machine.
Operating unit ATR diamond crystal
Spectral resolution 4 cm-1
Spectral range 4000-650 cm-1
Units % T
Apodisation Strong
No of scans 16
Scan speed 0.20 cm/s
Software SpectrumTM ; release 6.0.1. The DC % was calculated as the quotient of the relative peak heights of the cured
versus uncured materials according to the following equation: (cured (rph aliphatic C=C / rph aromatic C…C)
(uncured (rph aliphatic C=C/rph aromatic C…C) Where: rph = relative peak height
Mean values and standard deviations of the DC data were calculated.
Fig.5.4 Uncured paste dispensed on the ATR crystal Fig.5.5 Fractured bar-shaped specimen placed
of the Spectrum 100TM FTIR testing machine. onto the ATR crystal of the SpectrumTM 100 FTIR testing machine.
DC (%) =
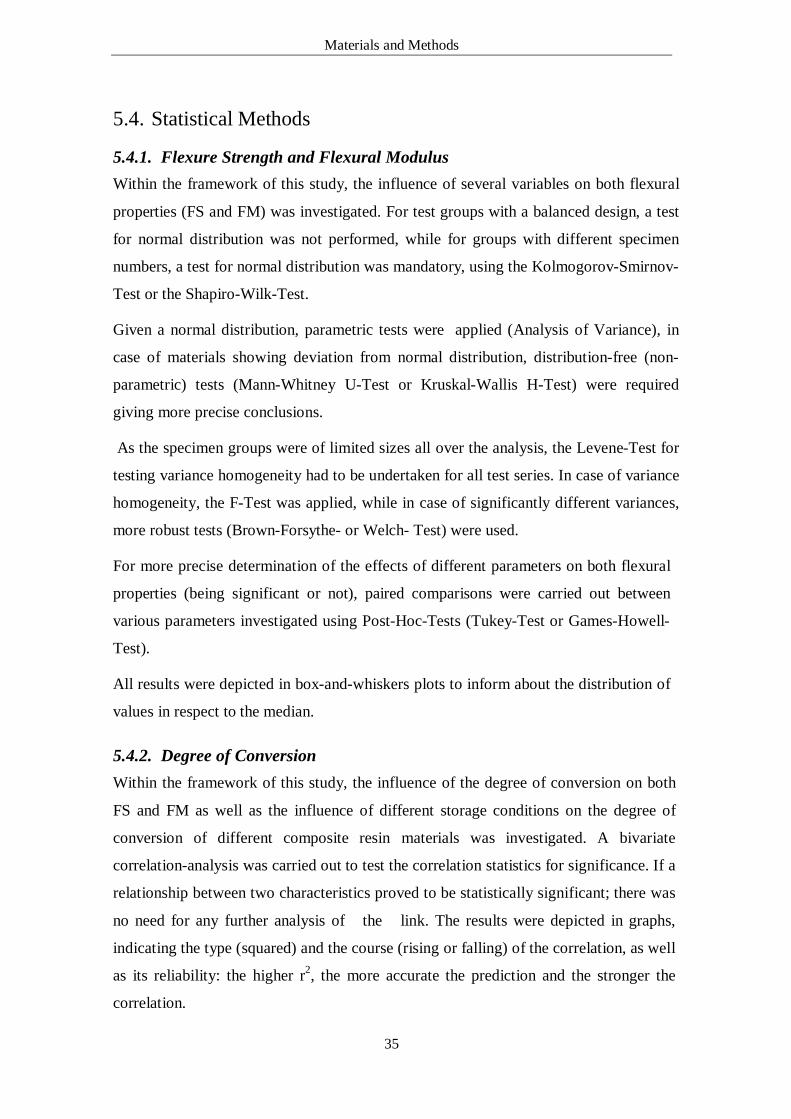
Materials and Methods
35
5.4. Statistical Methods
5.4.1. Flexure Strength and Flexural Modulus Within the framework of this study, the influence of several variables on both flexural
properties (FS and FM) was investigated. For test groups with a balanced design, a test
for normal distribution was not performed, while for groups with different specimen
numbers, a test for normal distribution was mandatory, using the Kolmogorov-Smirnov-
Test or the Shapiro-Wilk-Test.
Given a normal distribution, parametric tests were applied (Analysis of Variance), in
case of materials showing deviation from normal distribution, distribution-free (non-
parametric) tests (Mann-Whitney U-Test or Kruskal-Wallis H-Test) were required
giving more precise conclusions.
As the specimen groups were of limited sizes all over the analysis, the Levene-Test for
testing variance homogeneity had to be undertaken for all test series. In case of variance
homogeneity, the F-Test was applied, while in case of significantly different variances,
more robust tests (Brown-Forsythe- or Welch- Test) were used.
For more precise determination of the effects of different parameters on both flexural
properties (being significant or not), paired comparisons were carried out between
various parameters investigated using Post-Hoc-Tests (Tukey-Test or Games-Howell-
Test).
All results were depicted in box-and-whiskers plots to inform about the distribution of
values in respect to the median.
5.4.2. Degree of Conversion Within the framework of this study, the influence of the degree of conversion on both
FS and FM as well as the influence of different storage conditions on the degree of
conversion of different composite resin materials was investigated. A bivariate
correlation-analysis was carried out to test the correlation statistics for significance. If a
relationship between two characteristics proved to be statistically significant; there was
no need for any further analysis of the link. The results were depicted in graphs,
indicating the type (squared) and the course (rising or falling) of the correlation, as well
as its reliability: the higher r2, the more accurate the prediction and the stronger the
correlation.
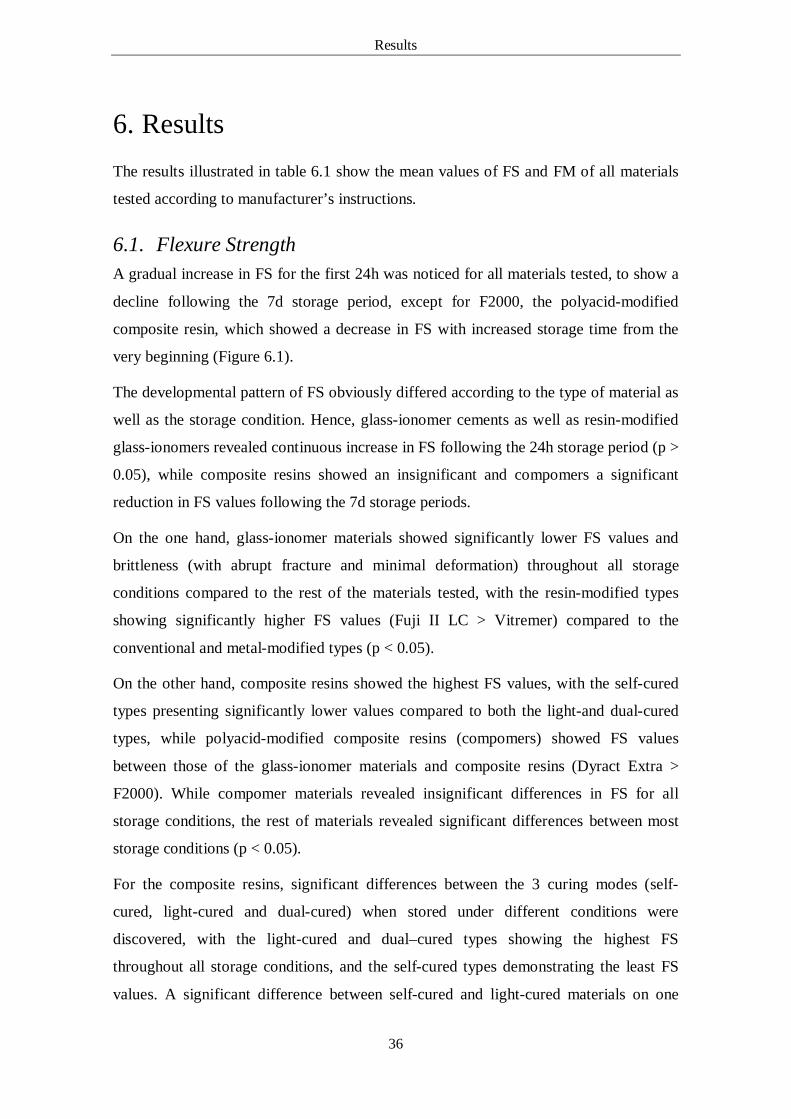
Results
36
6. Results The results illustrated in table 6.1 show the mean values of FS and FM of all materials
tested according to manufacturer’s instructions.
6.1. Flexure Strength A gradual increase in FS for the first 24h was noticed for all materials tested, to show a
decline following the 7d storage period, except for F2000, the polyacid-modified
composite resin, which showed a decrease in FS with increased storage time from the
very beginning (Figure 6.1).
The developmental pattern of FS obviously differed according to the type of material as
well as the storage condition. Hence, glass-ionomer cements as well as resin-modified
glass-ionomers revealed continuous increase in FS following the 24h storage period (p >
0.05), while composite resins showed an insignificant and compomers a significant
reduction in FS values following the 7d storage periods.
On the one hand, glass-ionomer materials showed significantly lower FS values and
brittleness (with abrupt fracture and minimal deformation) throughout all storage
conditions compared to the rest of the materials tested, with the resin-modified types
showing significantly higher FS values (Fuji II LC > Vitremer) compared to the
conventional and metal-modified types (p < 0.05).
On the other hand, composite resins showed the highest FS values, with the self-cured
types presenting significantly lower values compared to both the light-and dual-cured
types, while polyacid-modified composite resins (compomers) showed FS values
between those of the glass-ionomer materials and composite resins (Dyract Extra >
F2000). While compomer materials revealed insignificant differences in FS for all
storage conditions, the rest of materials revealed significant differences between most
storage conditions (p < 0.05).
For the composite resins, significant differences between the 3 curing modes (self-
cured, light-cured and dual-cured) when stored under different conditions were
discovered, with the light-cured and dual–cured types showing the highest FS
throughout all storage conditions, and the self-cured types demonstrating the least FS
values. A significant difference between self-cured and light-cured materials on one
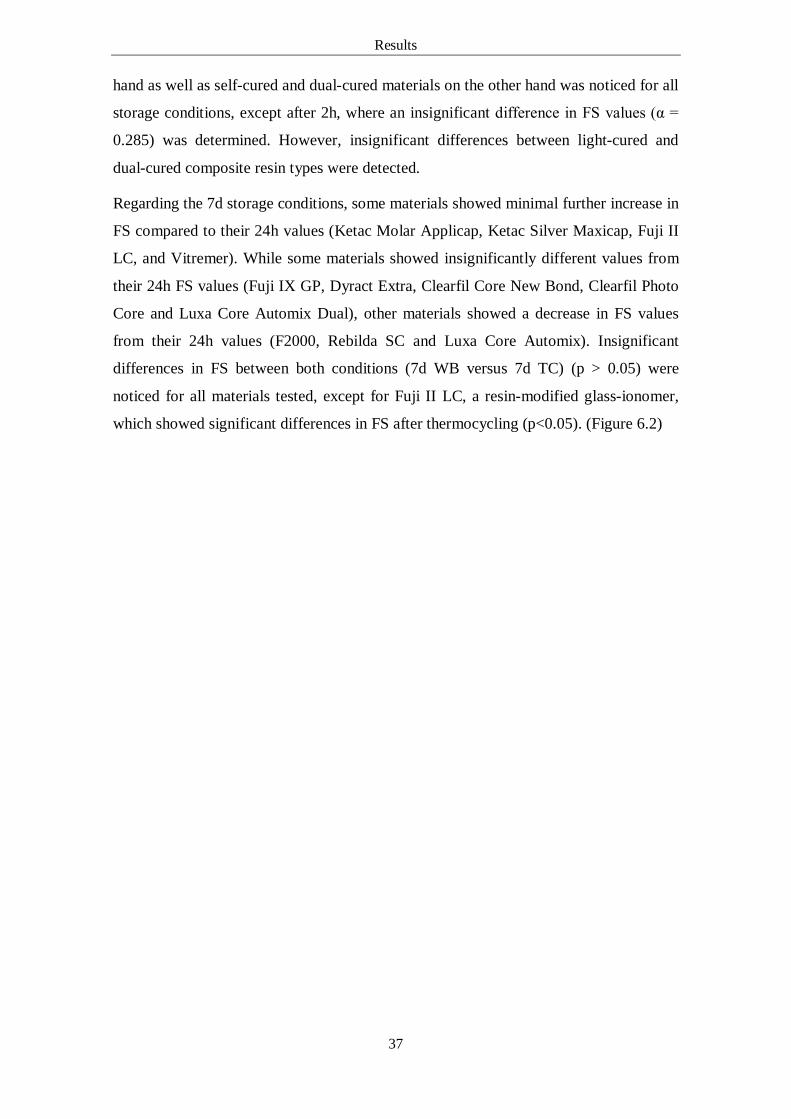
Results
37
hand as well as self-cured and dual-cured materials on the other hand was noticed for all
storage conditions, except after 2h, where an insignificant difference in FS values (α =
0.285) was determined. However, insignificant differences between light-cured and
dual-cured composite resin types were detected.
Regarding the 7d storage conditions, some materials showed minimal further increase in
FS compared to their 24h values (Ketac Molar Applicap, Ketac Silver Maxicap, Fuji II
LC, and Vitremer). While some materials showed insignificantly different values from
their 24h FS values (Fuji IX GP, Dyract Extra, Clearfil Core New Bond, Clearfil Photo
Core and Luxa Core Automix Dual), other materials showed a decrease in FS values
from their 24h values (F2000, Rebilda SC and Luxa Core Automix). Insignificant
differences in FS between both conditions (7d WB versus 7d TC) (p > 0.05) were
noticed for all materials tested, except for Fuji II LC, a resin-modified glass-ionomer,
which showed significant differences in FS after thermocycling (p<0.05). (Figure 6.2)
Results
38
10 min incub+ 7d WB10 min incub+ 7d TC
Storage
Fuji IX
GP
Keta
c M
olar
App
licap
Keta
c Si
lver M
axica
p
Fuji II
LC
Vitre
mer
Dyr
act E
xtra
F200
0
Reb
ilda
SC
Lux
a Co
re A
utom
ix
Cle
arfil
Core
New
Bon
d
Cha
rism
a
Cle
arfil P
hoto
Cor
e
Reb
ilda
DC
Luxa
Cor
e Au
tom
ix D
ual
Material
0.00
50.00
100.00
150.00
FS in
MPa
10 min i ncub10 min i ncub+ 2h WB10 min i ncub+ 24h WB
Storage
Fuji
IX G
P
Ket
ac M
olar
App
licap
Keta
c Silv
er M
axica
p
Fuji
II LC
Vitre
mer
Dyr
act E
xtra
F200
0
Reb
ilda
SC
Lux
a Co
re A
utom
ix
Cle
arfil
Core
New
Bon
d
Cha
rism
a
Cle
arfil
Phot
o Cor
e
Reb
ilda
DC
Luxa
Cor
e Au
tom
ix D
ual
Material
0.00
50.00
100.00
150.00
FS in
MPa
Fig.6.1 FS of materials tested after storage under different storage conditions for storage times up to 24h.
Fig.6.2 FS of materials tested after storage for 7d (WBvs.TC).
Results
39
6.2. Flexural Modulus A gradual increase in FM for all materials until 24h was noticed (p<0.05), to show
insignificant differences afterwards, being almost similar (p>0.05). Moreover,
insignificant differences between the 4 material groups for most storage periods were
recorded, with their least values confirmed after the 10 min storage period. For all
storage times and conditions a significant difference in FM between materials existed,
whereas for the first 24h, glass-ionomer cements and resin-modified glass-ionomers on
one hand as well as composite resins and compomers on the other hand revealed almost
similar FM values. (Figure 6.3)
Concerning the glass-ionomer materials, their FM increased significantly until 24h, with
insignificant differences in FM between 24h and 7d storage periods (p > 0.05). Fuji IX
GP, the highly viscous conventional glass-ionomer material, revealed significantly
higher values after 24h and 7d thermocycling period, compared to the rest of glass-
ionomers, while Ketac Molar Applicap revealed the highest value for the 7d WB period,
compared to the rest of glass-ionomer materials tested.
Throughout all storage conditions, Fuji II LC, the resin-modified glass-ionomer
material, showed significantly higher FM values compared to Vitremer, the other resin-
modified glass-ionomer material.
For the compomer materials, they showed some insignificant increase in FM with
increased storage time, having their FM values existing inbetween those of glass-
ionomers and composite resins; with F2000 showing higher FM values compared to
Dyract Extra, being insignificantly different from those of Clearfil Core New Bond, the
self-cured composite resin, throughout all storage conditions.
Concerning the composite resins tested, FM values raised significantly from the
beginning until 2h, to stagnate afterwards. In regards to the different curing modes of
composite resins, FM was significantly different between self-cured and light-cured
specimens throughout all storage conditions. Moreover, significantly different FM
values were recorded between self-cured and dual-cured specimens for all storage
conditions, except after 24h (p > 0.05). Likewise, FM was insignificantly different
between light-cured and dual-cured specimens (for 10 min, 2h and 7d TC), but
significantly different for the 24h and 7d WB storage conditions.
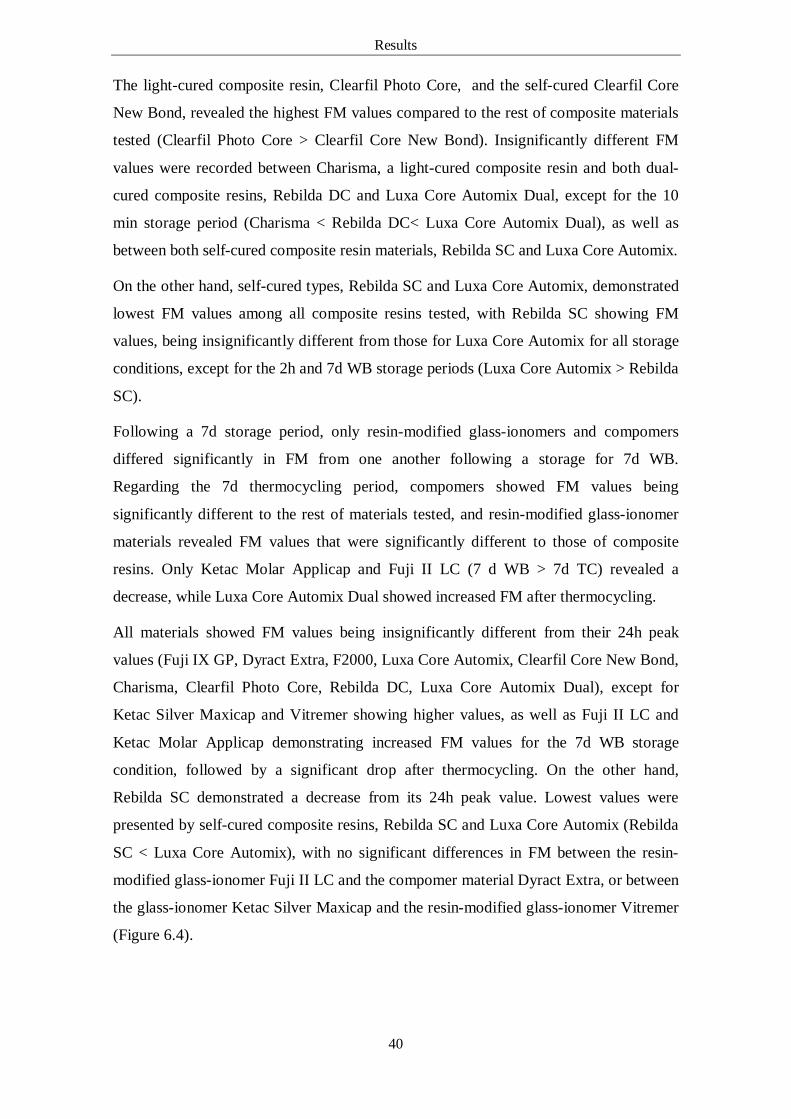
Results
40
The light-cured composite resin, Clearfil Photo Core, and the self-cured Clearfil Core
New Bond, revealed the highest FM values compared to the rest of composite materials
tested (Clearfil Photo Core > Clearfil Core New Bond). Insignificantly different FM
values were recorded between Charisma, a light-cured composite resin and both dual-
cured composite resins, Rebilda DC and Luxa Core Automix Dual, except for the 10
min storage period (Charisma < Rebilda DC< Luxa Core Automix Dual), as well as
between both self-cured composite resin materials, Rebilda SC and Luxa Core Automix.
On the other hand, self-cured types, Rebilda SC and Luxa Core Automix, demonstrated
lowest FM values among all composite resins tested, with Rebilda SC showing FM
values, being insignificantly different from those for Luxa Core Automix for all storage
conditions, except for the 2h and 7d WB storage periods (Luxa Core Automix > Rebilda
SC).
Following a 7d storage period, only resin-modified glass-ionomers and compomers
differed significantly in FM from one another following a storage for 7d WB.
Regarding the 7d thermocycling period, compomers showed FM values being
significantly different to the rest of materials tested, and resin-modified glass-ionomer
materials revealed FM values that were significantly different to those of composite
resins. Only Ketac Molar Applicap and Fuji II LC (7 d WB > 7d TC) revealed a
decrease, while Luxa Core Automix Dual showed increased FM after thermocycling.
All materials showed FM values being insignificantly different from their 24h peak
values (Fuji IX GP, Dyract Extra, F2000, Luxa Core Automix, Clearfil Core New Bond,
Charisma, Clearfil Photo Core, Rebilda DC, Luxa Core Automix Dual), except for
Ketac Silver Maxicap and Vitremer showing higher values, as well as Fuji II LC and
Ketac Molar Applicap demonstrating increased FM values for the 7d WB storage
condition, followed by a significant drop after thermocycling. On the other hand,
Rebilda SC demonstrated a decrease from its 24h peak value. Lowest values were
presented by self-cured composite resins, Rebilda SC and Luxa Core Automix (Rebilda
SC < Luxa Core Automix), with no significant differences in FM between the resin-
modified glass-ionomer Fuji II LC and the compomer material Dyract Extra, or between
the glass-ionomer Ketac Silver Maxicap and the resin-modified glass-ionomer Vitremer
(Figure 6.4).
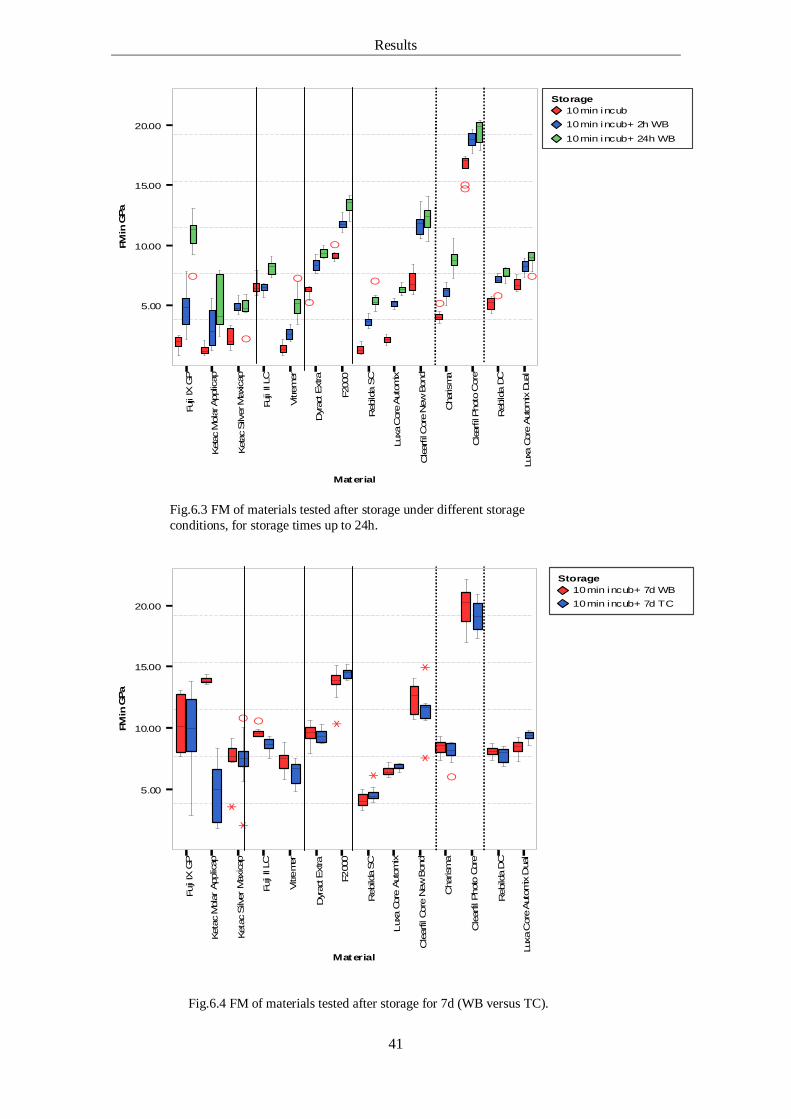
Results
41
Fig.6.3 FM of materials tested after storage under different storage conditions, for storage times up to 24h.
Fig.6.4 FM of materials tested after storage for 7d (WB versus TC).
10 min incub+ 7d WB10 min incub+ 7d TC
Storage
Fuji I
X G
P
Keta
c M
olar
App
licap
Keta
c Silv
er M
axica
p
Fuji II
LC
Vitre
mer
Dyr
act E
xtra
F200
0
Reb
ilda
SC
Lux
a Co
re A
utom
ix
Cle
arfil C
ore
New
Bon
d
Cha
rism
a
Cle
arfil
Phot
o Co
re
Reb
ilda
DC
Luxa
Cor
e Aut
omix
Dua
l
Material
5.00
10.00
15.00
20.00
FM in
GPa
10 min incub10 min incub+ 2h WB10 min incub+ 24h WB
Storage
Fuji
IX G
P
Ket
ac M
olar
App
licap
Ket
ac S
ilver
Max
icap
Fuji
II LC
Vitre
mer
Dyr
act E
xtra
F200
0
Reb
ilda
SC
Lux
a C
ore
Auto
mix
Clear
fil C
ore
New
Bon
d
Cha
rism
a
Clea
rfil Ph
oto
Cor
e
Reb
ilda
DC
Luxa
Cor
e Au
tom
ix D
ual
Material
5.00
10.00
15.00
20.00FM
in G
Pa
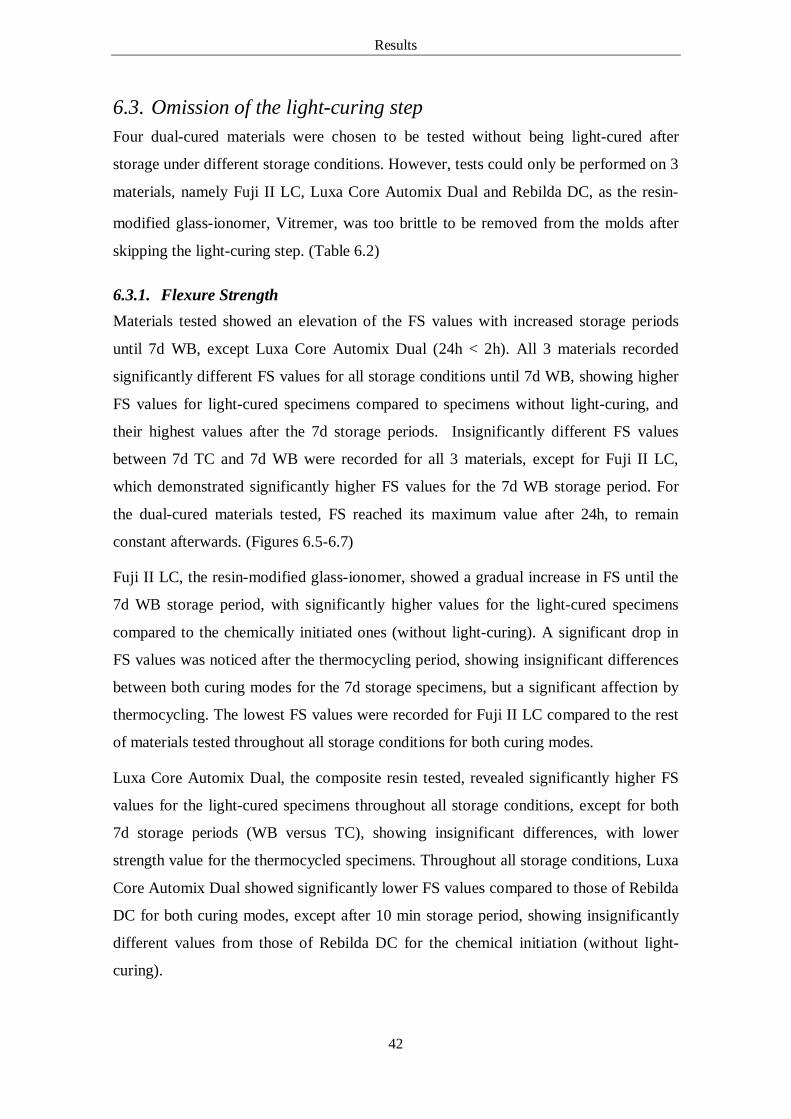
Results
42
6.3. Omission of the light-curing step Four dual-cured materials were chosen to be tested without being light-cured after
storage under different storage conditions. However, tests could only be performed on 3
materials, namely Fuji II LC, Luxa Core Automix Dual and Rebilda DC, as the resin-
modified glass-ionomer, Vitremer, was too brittle to be removed from the molds after
skipping the light-curing step. (Table 6.2)
6.3.1. Flexure Strength Materials tested showed an elevation of the FS values with increased storage periods
until 7d WB, except Luxa Core Automix Dual (24h < 2h). All 3 materials recorded
significantly different FS values for all storage conditions until 7d WB, showing higher
FS values for light-cured specimens compared to specimens without light-curing, and
their highest values after the 7d storage periods. Insignificantly different FS values
between 7d TC and 7d WB were recorded for all 3 materials, except for Fuji II LC,
which demonstrated significantly higher FS values for the 7d WB storage period. For
the dual-cured materials tested, FS reached its maximum value after 24h, to remain
constant afterwards. (Figures 6.5-6.7)
Fuji II LC, the resin-modified glass-ionomer, showed a gradual increase in FS until the
7d WB storage period, with significantly higher values for the light-cured specimens
compared to the chemically initiated ones (without light-curing). A significant drop in
FS values was noticed after the thermocycling period, showing insignificant differences
between both curing modes for the 7d storage specimens, but a significant affection by
thermocycling. The lowest FS values were recorded for Fuji II LC compared to the rest
of materials tested throughout all storage conditions for both curing modes.
Luxa Core Automix Dual, the composite resin tested, revealed significantly higher FS
values for the light-cured specimens throughout all storage conditions, except for both
7d storage periods (WB versus TC), showing insignificant differences, with lower
strength value for the thermocycled specimens. Throughout all storage conditions, Luxa
Core Automix Dual showed significantly lower FS values compared to those of Rebilda
DC for both curing modes, except after 10 min storage period, showing insignificantly
different values from those of Rebilda DC for the chemical initiation (without light-
curing).
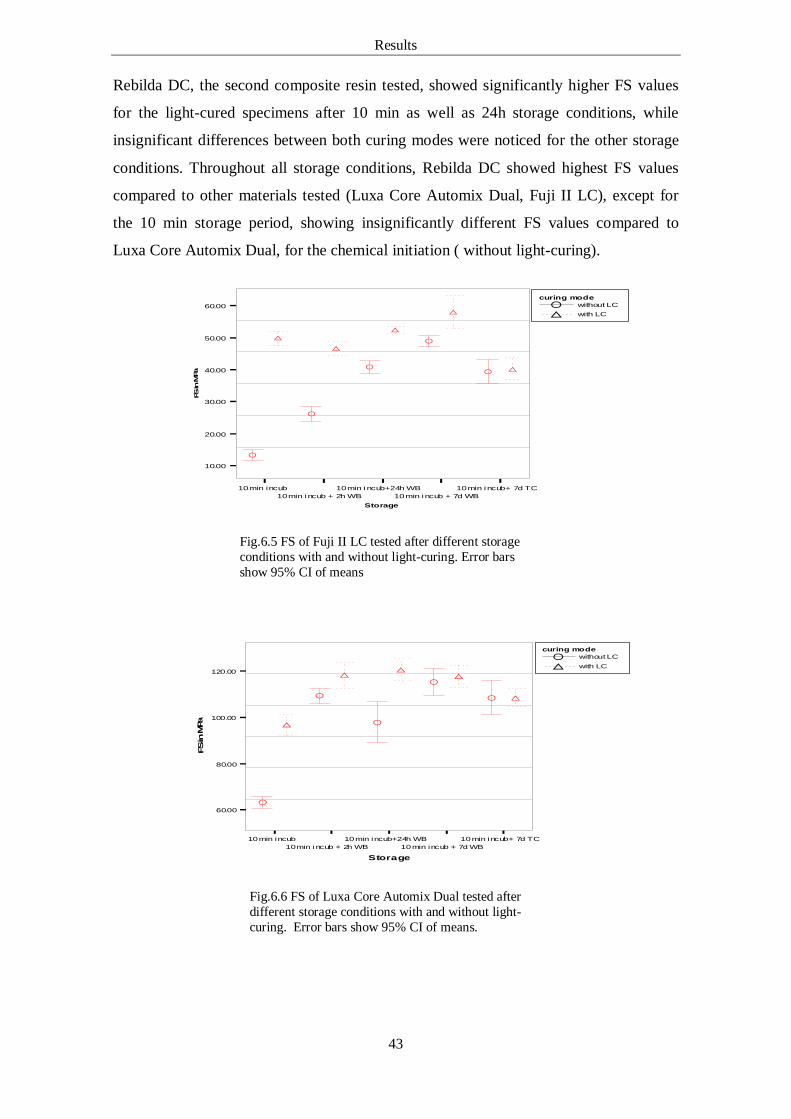
Results
43
without LC with LC
curing mode
10 min incub10 min i ncub + 2h WB
10 min incub+24h WB10 min incub + 7d WB
10 min i ncub+ 7d TC
Storage
60.00
80.00
100.00
120.00
FS in
MPa
without LC with LC
curing mode
10 min incub10 min incub + 2h WB
10 min incub+24h WB10 min incub + 7d WB
10 min incub+ 7d TC
Storage
10.00
20.00
30.00
40.00
50.00
60.00
FS in
MPa
Rebilda DC, the second composite resin tested, showed significantly higher FS values
for the light-cured specimens after 10 min as well as 24h storage conditions, while
insignificant differences between both curing modes were noticed for the other storage
conditions. Throughout all storage conditions, Rebilda DC showed highest FS values
compared to other materials tested (Luxa Core Automix Dual, Fuji II LC), except for
the 10 min storage period, showing insignificantly different FS values compared to
Luxa Core Automix Dual, for the chemical initiation ( without light-curing).
Fig.6.5 FS of Fuji II LC tested after different storage conditions with and without light-curing. Error bars show 95% CI of means
Fig.6.6 FS of Luxa Core Automix Dual tested after different storage conditions with and without light- curing. Error bars show 95% CI of means.
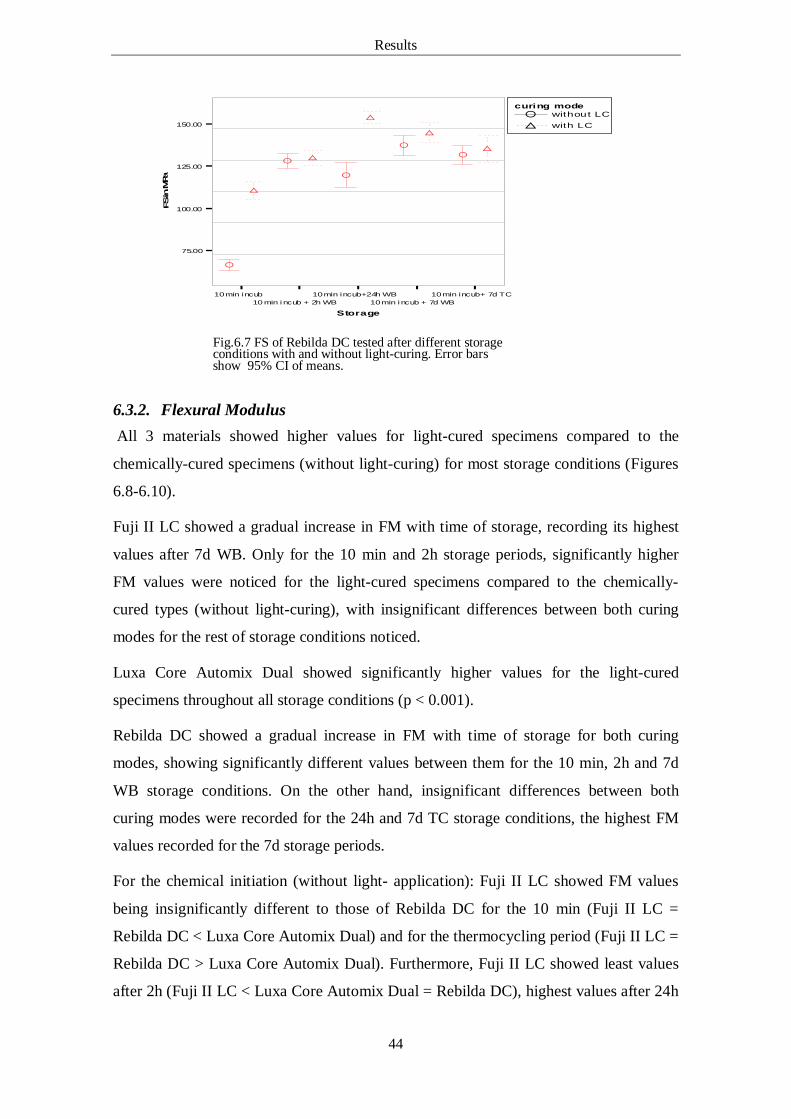
Results
44
without LC with LC
curing mode
10 min incub10 min incub + 2h WB
10 min incub+24h WB10 min incub + 7d WB
10 min incub+ 7d TC
Storage
75.00
100.00
125.00
150.00
FS in
MPa
Fig.6.7 FS of Rebilda DC tested after different storage conditions with and without light-curing. Error bars show 95% CI of means.
6.3.2. Flexural Modulus All 3 materials showed higher values for light-cured specimens compared to the
chemically-cured specimens (without light-curing) for most storage conditions (Figures
6.8-6.10).
Fuji II LC showed a gradual increase in FM with time of storage, recording its highest
values after 7d WB. Only for the 10 min and 2h storage periods, significantly higher
FM values were noticed for the light-cured specimens compared to the chemically-
cured types (without light-curing), with insignificant differences between both curing
modes for the rest of storage conditions noticed.
Luxa Core Automix Dual showed significantly higher values for the light-cured
specimens throughout all storage conditions (p < 0.001).
Rebilda DC showed a gradual increase in FM with time of storage for both curing
modes, showing significantly different values between them for the 10 min, 2h and 7d
WB storage conditions. On the other hand, insignificant differences between both
curing modes were recorded for the 24h and 7d TC storage conditions, the highest FM
values recorded for the 7d storage periods.
For the chemical initiation (without light- application): Fuji II LC showed FM values
being insignificantly different to those of Rebilda DC for the 10 min (Fuji II LC =
Rebilda DC < Luxa Core Automix Dual) and for the thermocycling period (Fuji II LC =
Rebilda DC > Luxa Core Automix Dual). Furthermore, Fuji II LC showed least values
after 2h (Fuji II LC < Luxa Core Automix Dual = Rebilda DC), highest values after 24h
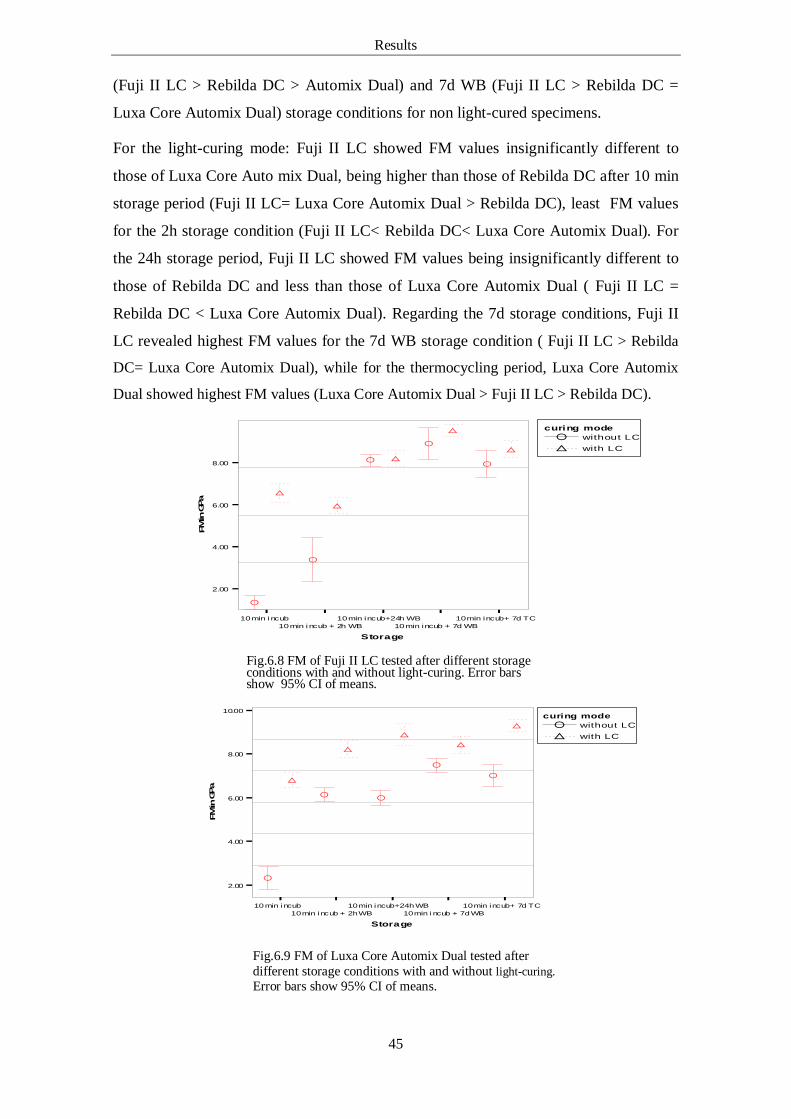
Results
45
(Fuji II LC > Rebilda DC > Automix Dual) and 7d WB (Fuji II LC > Rebilda DC =
Luxa Core Automix Dual) storage conditions for non light-cured specimens.
For the light-curing mode: Fuji II LC showed FM values insignificantly different to
those of Luxa Core Auto mix Dual, being higher than those of Rebilda DC after 10 min
storage period (Fuji II LC= Luxa Core Automix Dual > Rebilda DC), least FM values
for the 2h storage condition (Fuji II LC< Rebilda DC< Luxa Core Automix Dual). For
the 24h storage period, Fuji II LC showed FM values being insignificantly different to
those of Rebilda DC and less than those of Luxa Core Automix Dual ( Fuji II LC =
Rebilda DC < Luxa Core Automix Dual). Regarding the 7d storage conditions, Fuji II
LC revealed highest FM values for the 7d WB storage condition ( Fuji II LC > Rebilda
DC= Luxa Core Automix Dual), while for the thermocycling period, Luxa Core Automix
Dual showed highest FM values (Luxa Core Automix Dual > Fuji II LC > Rebilda DC).
Fig.6.8 FM of Fuji II LC tested after different storage conditions with and without light-curing. Error bars show 95% CI of means.
Fig.6.9 FM of Luxa Core Automix Dual tested after different storage conditions with and without light-curing. Error bars show 95% CI of means.
without LC with LC
curing mode
10 min i ncub10 min i ncub + 2h WB
10 min incub+24h WB10 min incub + 7d WB
10 min incub+ 7d TC
Storage
2.00
4.00
6.00
8.00
FM in
GPa
without LC with LC
curing mode
10 min incub10 min incub + 2h WB
10 min incub+24h WB10 min i ncub + 7d WB
10 min incub+ 7d TC
Storage
2.00
4.00
6.00
8.00
10.00
FM in
GPa
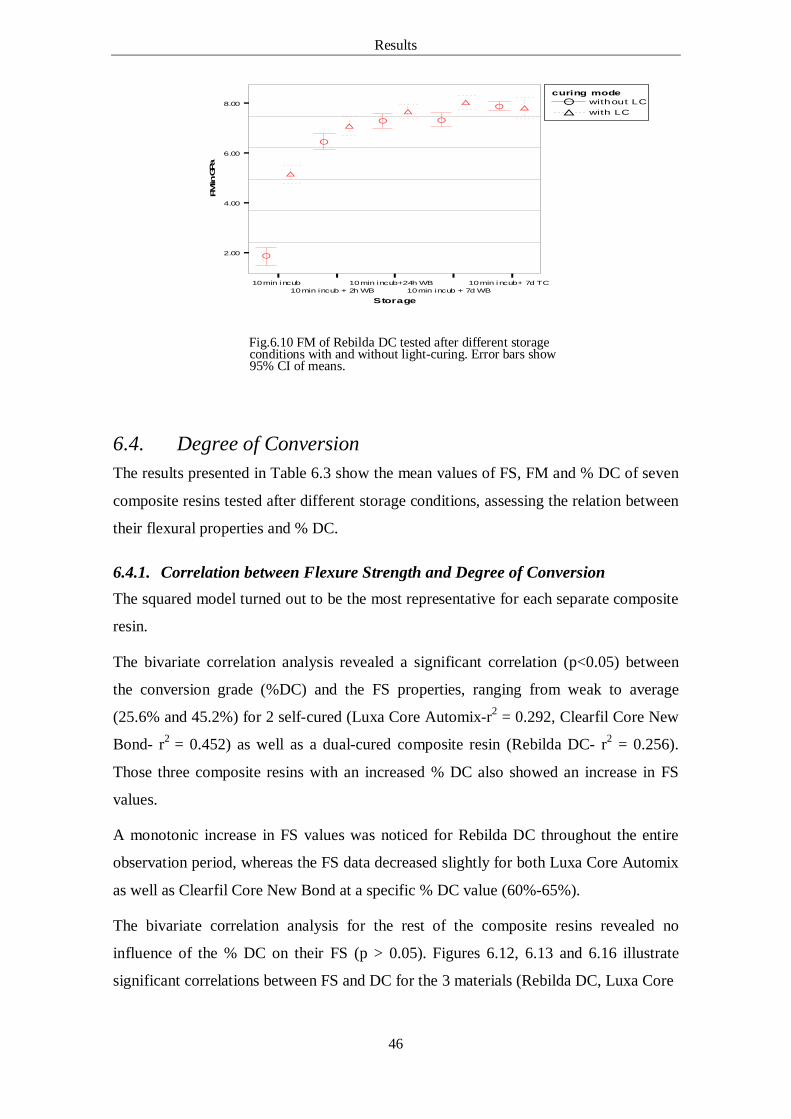
Results
46
without LC with LC
curing mode
10 min incub10 min incub + 2h WB
10 min incub+24h WB10 min incub + 7d WB
10 min incub+ 7d TC
Storage
2.00
4.00
6.00
8.00
FM in
GPa
Fig.6.10 FM of Rebilda DC tested after different storage conditions with and without light-curing. Error bars show 95% CI of means.
6.4. Degree of Conversion The results presented in Table 6.3 show the mean values of FS, FM and % DC of seven
composite resins tested after different storage conditions, assessing the relation between
their flexural properties and % DC.
6.4.1. Correlation between Flexure Strength and Degree of Conversion The squared model turned out to be the most representative for each separate composite
resin.
The bivariate correlation analysis revealed a significant correlation (p<0.05) between
the conversion grade (%DC) and the FS properties, ranging from weak to average
(25.6% and 45.2%) for 2 self-cured (Luxa Core Automix-r2 = 0.292, Clearfil Core New
Bond- r2 = 0.452) as well as a dual-cured composite resin (Rebilda DC- r2 = 0.256).
Those three composite resins with an increased % DC also showed an increase in FS
values.
A monotonic increase in FS values was noticed for Rebilda DC throughout the entire
observation period, whereas the FS data decreased slightly for both Luxa Core Automix
as well as Clearfil Core New Bond at a specific % DC value (60%-65%).
The bivariate correlation analysis for the rest of the composite resins revealed no
influence of the % DC on their FS (p > 0.05). Figures 6.12, 6.13 and 6.16 illustrate
significant correlations between FS and DC for the 3 materials (Rebilda DC, Luxa Core
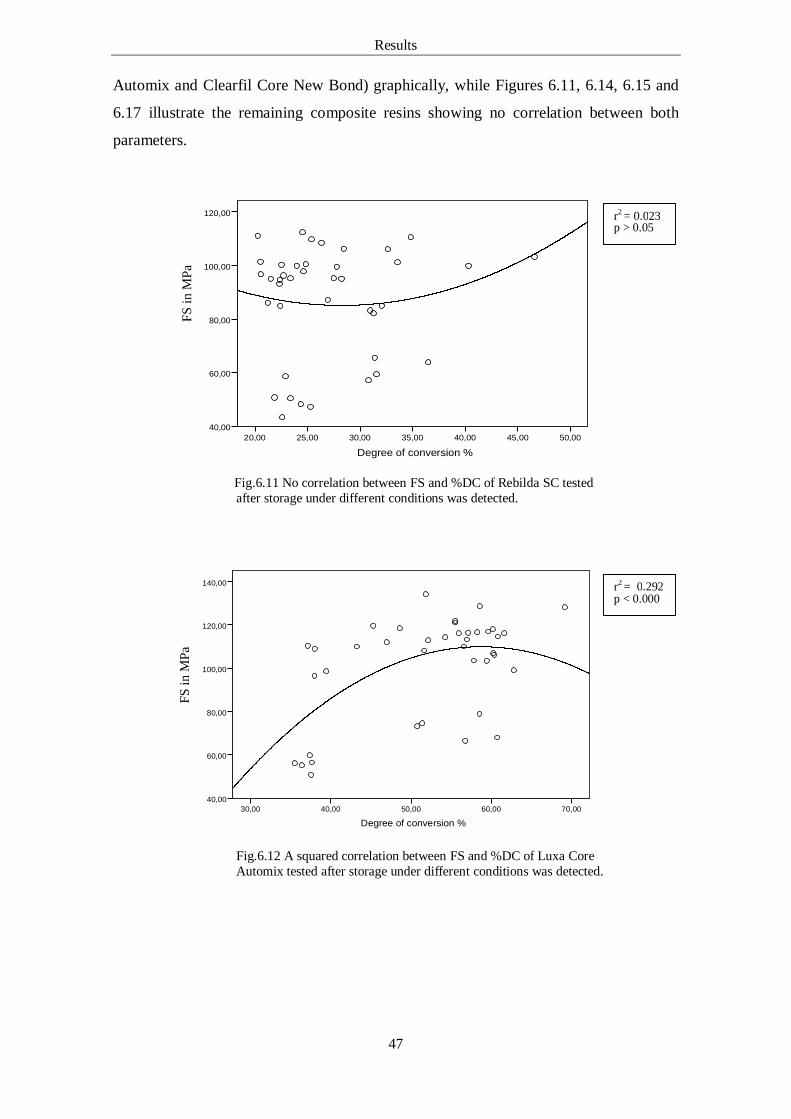
Results
47
Automix and Clearfil Core New Bond) graphically, while Figures 6.11, 6.14, 6.15 and
6.17 illustrate the remaining composite resins showing no correlation between both
parameters.
Degree of conversion %50,0045,0040,0035,0030,0025,0020,00
120,00
100,00
80,00
60,00
40,00
Fig.6.11 No correlation between FS and %DC of Rebilda SC tested after storage under different conditions was detected.
Degree of conversion %70,0060,0050,0040,0030,00
140,00
120,00
100,00
80,00
60,00
40,00
Fig.6.12 A squared correlation between FS and %DC of Luxa Core Automix tested after storage under different conditions was detected.
FS
in M
Pa
F
S in
MPa
r2 = 0.023 p > 0.05
r2 = 0.292 p < 0.000
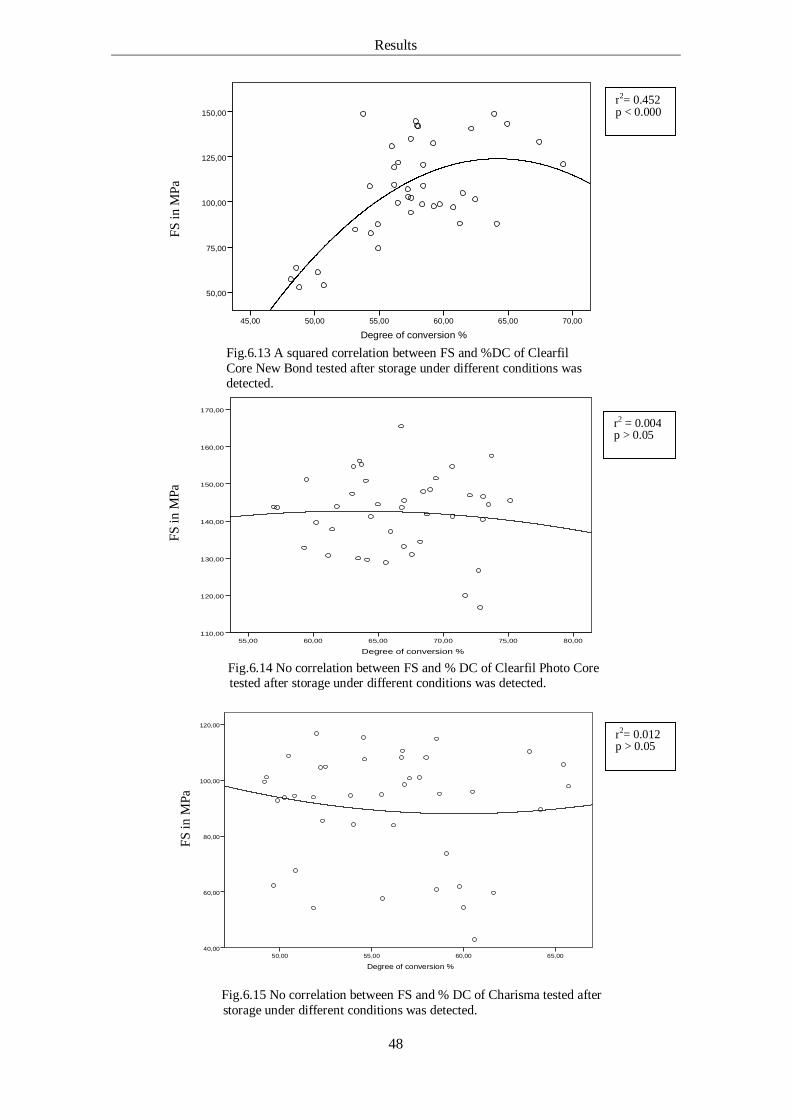
Results
48
Degree of conversion %70,0065,0060,0055,0050,0045,00
150,00
125,00
100,00
75,00
50,00
Fig.6.13 A squared correlation between FS and %DC of Clearfil Core New Bond tested after storage under different conditions was detected.
Degree of conversion %80,0075,0070,0065,0060,0055,00
170,00
160,00
150,00
140,00
130,00
120,00
110,00
Fig.6.14 No correlation between FS and % DC of Clearfil Photo Core tested after storage under different conditions was detected.
Degree of conversion %65,0060,0055,0050,00
120,00
100,00
80,00
60,00
40,00
Fig.6.15 No correlation between FS and % DC of Charisma tested after storage under different conditions was detected.
F
S in
MPa
FS in
MPa
FS
in M
Pa
r2 = 0.004 p > 0.05
r2= 0.012 p > 0.05
r2= 0.452 p < 0.000
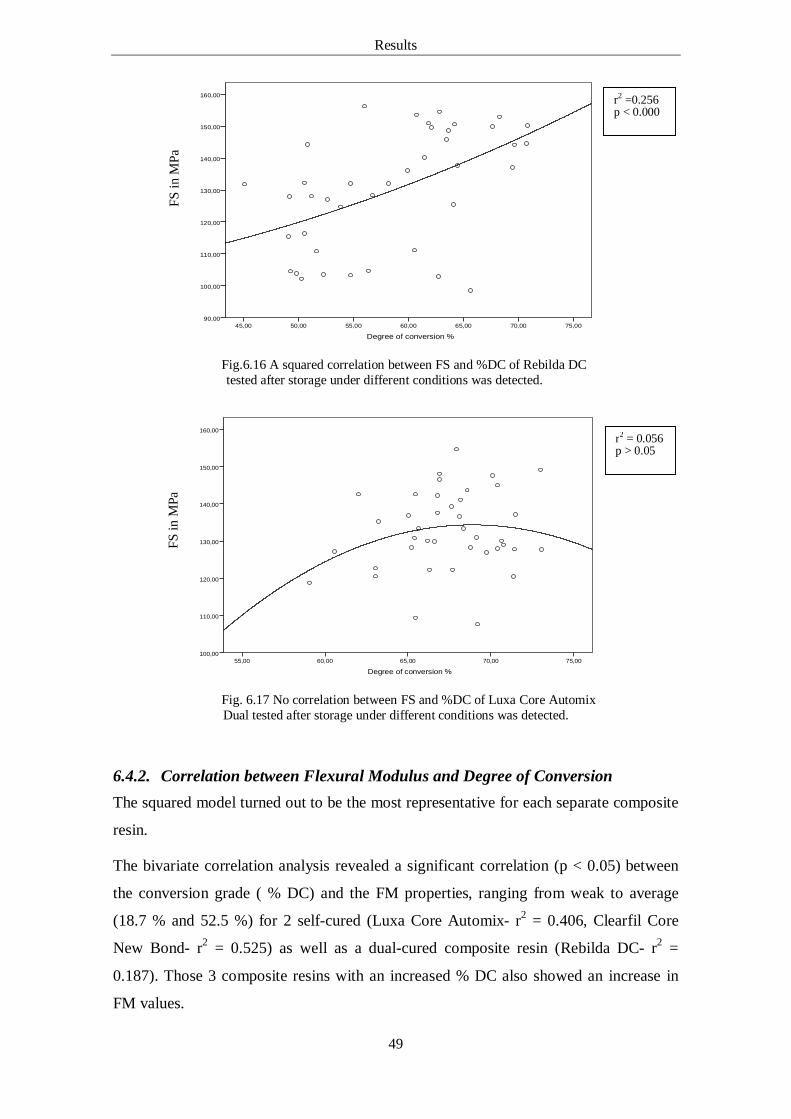
Results
49
Degree of conversion %75,0070,0065,0060,0055,0050,0045,00
160,00
150,00
140,00
130,00
120,00
110,00
100,00
90,00
Fig.6.16 A squared correlation between FS and %DC of Rebilda DC tested after storage under different conditions was detected.
Degree of conversion %75,0070,0065,0060,0055,00
160,00
150,00
140,00
130,00
120,00
110,00
100,00
Fig. 6.17 No correlation between FS and %DC of Luxa Core Automix Dual tested after storage under different conditions was detected.
6.4.2. Correlation between Flexural Modulus and Degree of Conversion The squared model turned out to be the most representative for each separate composite
resin.
The bivariate correlation analysis revealed a significant correlation (p < 0.05) between
the conversion grade ( % DC) and the FM properties, ranging from weak to average
(18.7 % and 52.5 %) for 2 self-cured (Luxa Core Automix- r2 = 0.406, Clearfil Core
New Bond- r2 = 0.525) as well as a dual-cured composite resin (Rebilda DC- r2 =
0.187). Those 3 composite resins with an increased % DC also showed an increase in
FM values.
FS in
MPa
F
S in
MPa
r2 =0.256 p < 0.000
r2 = 0.056 p > 0.05
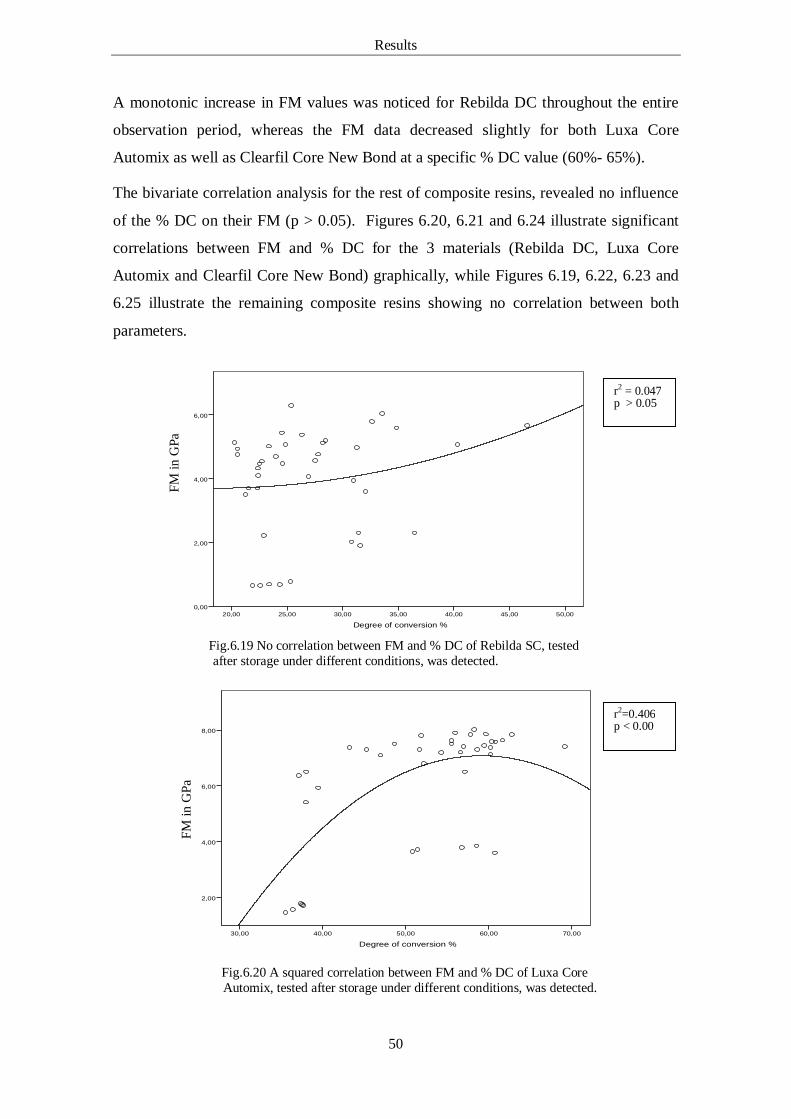
Results
50
A monotonic increase in FM values was noticed for Rebilda DC throughout the entire
observation period, whereas the FM data decreased slightly for both Luxa Core
Automix as well as Clearfil Core New Bond at a specific % DC value (60%- 65%).
The bivariate correlation analysis for the rest of composite resins, revealed no influence
of the % DC on their FM (p > 0.05). Figures 6.20, 6.21 and 6.24 illustrate significant
correlations between FM and % DC for the 3 materials (Rebilda DC, Luxa Core
Automix and Clearfil Core New Bond) graphically, while Figures 6.19, 6.22, 6.23 and
6.25 illustrate the remaining composite resins showing no correlation between both
parameters.
Degree of conversion %50,0045,0040,0035,0030,0025,0020,00
6,00
4,00
2,00
0,00
Fig.6.19 No correlation between FM and % DC of Rebilda SC, tested after storage under different conditions, was detected.
Degree of conversion %70,0060,0050,0040,0030,00
8,00
6,00
4,00
2,00
Fig.6.20 A squared correlation between FM and % DC of Luxa Core Automix, tested after storage under different conditions, was detected.
FM
in G
Pa
FM
in G
Pa
r2 = 0.047 p > 0.05
r2=0.406 p < 0.00
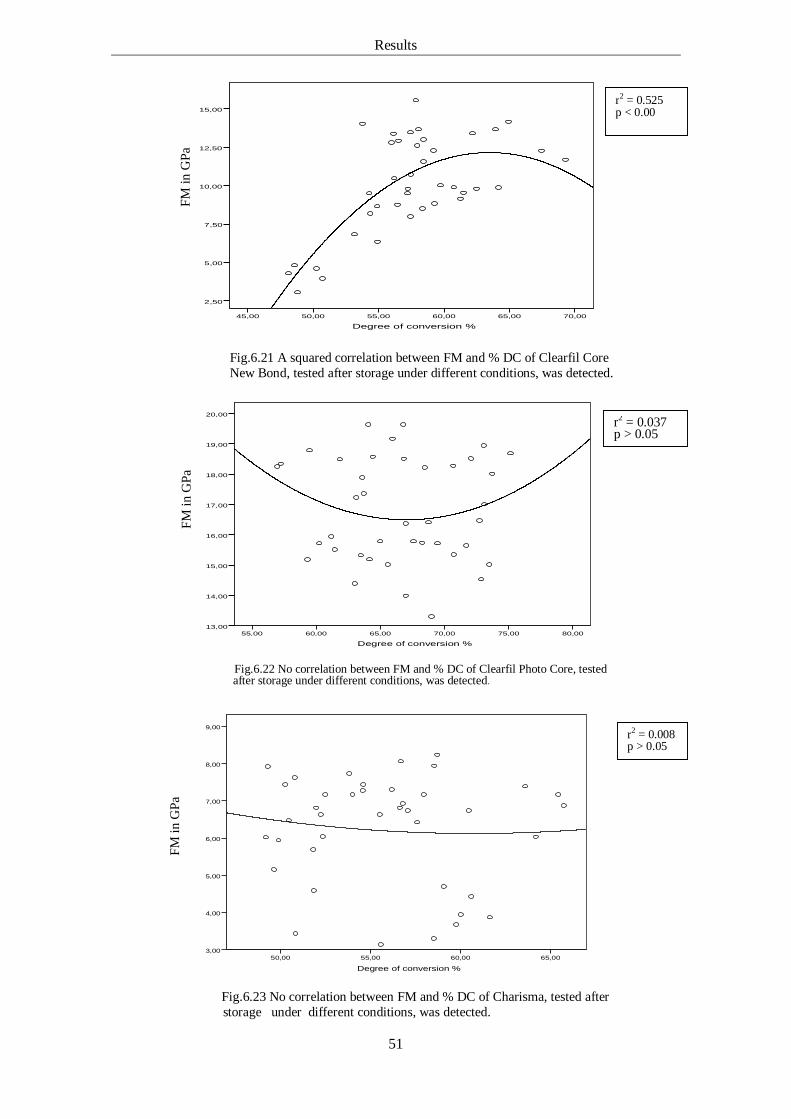
Results
51
Degree of conversion %70,0065,0060,0055,0050,0045,00
15,00
12,50
10,00
7,50
5,00
2,50
Fig.6.21 A squared correlation between FM and % DC of Clearfil Core New Bond, tested after storage under different conditions, was detected.
Degree of conversion %80,0075,0070,0065,0060,0055,00
20,00
19,00
18,00
17,00
16,00
15,00
14,00
13,00
Fig.6.22 No correlation between FM and % DC of Clearfil Photo Core, tested after storage under different conditions, was detected.
Degree of conversion %65,0060,0055,0050,00
9,00
8,00
7,00
6,00
5,00
4,00
3,00
Fig.6.23 No correlation between FM and % DC of Charisma, tested after storage under different conditions, was detected.
FM
in G
Pa
FM in
GPa
r2 = 0.525 p < 0.00
r2 = 0.037 p > 0.05
r2 = 0.008 p > 0.05
FM
in G
Pa
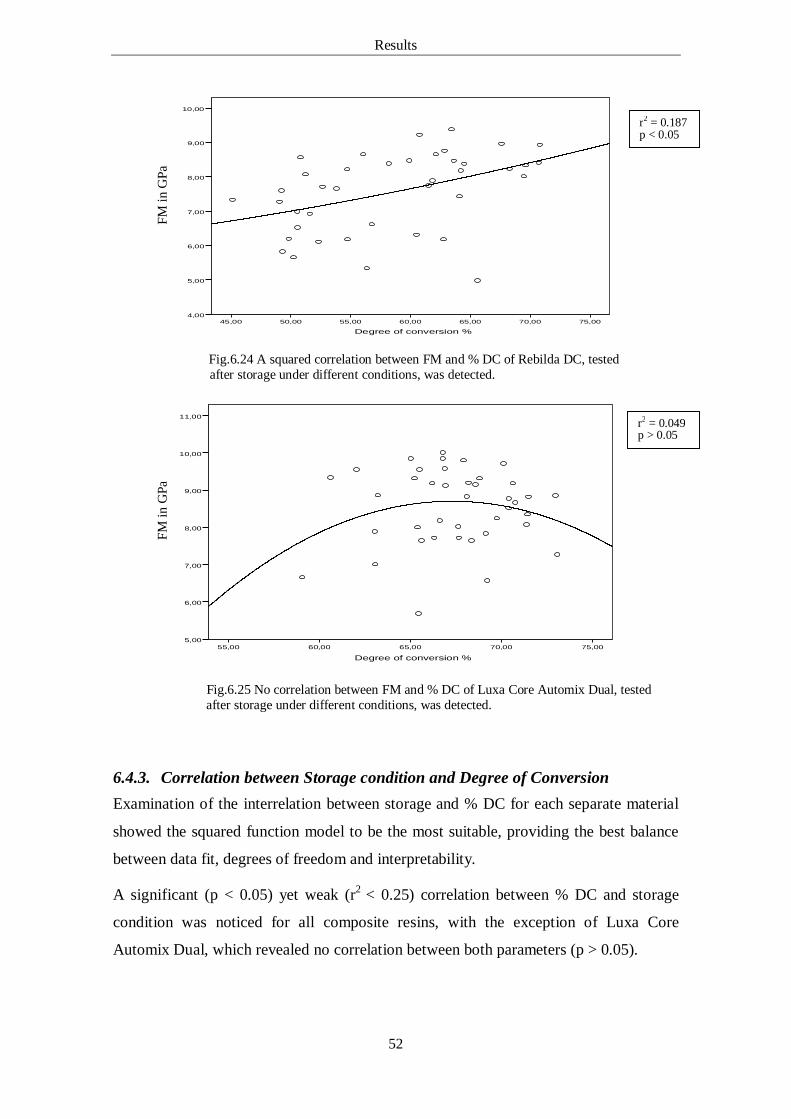
Results
52
Degree of conversion %75,0070,0065,0060,0055,0050,0045,00
10,00
9,00
8,00
7,00
6,00
5,00
4,00
Fig.6.24 A squared correlation between FM and % DC of Rebilda DC, tested after storage under different conditions, was detected.
Degree of conversion %75,0070,0065,0060,0055,00
11,00
10,00
9,00
8,00
7,00
6,00
5,00
Fig.6.25 No correlation between FM and % DC of Luxa Core Automix Dual, tested after storage under different conditions, was detected.
6.4.3. Correlation between Storage condition and Degree of Conversion Examination of the interrelation between storage and % DC for each separate material
showed the squared function model to be the most suitable, providing the best balance
between data fit, degrees of freedom and interpretability.
A significant (p < 0.05) yet weak (r2 < 0.25) correlation between % DC and storage
condition was noticed for all composite resins, with the exception of Luxa Core
Automix Dual, which revealed no correlation between both parameters (p > 0.05).
F
M in
GPa
FM
in G
Pa
r2 = 0.187 p < 0.05
r2 = 0.049 p > 0.05
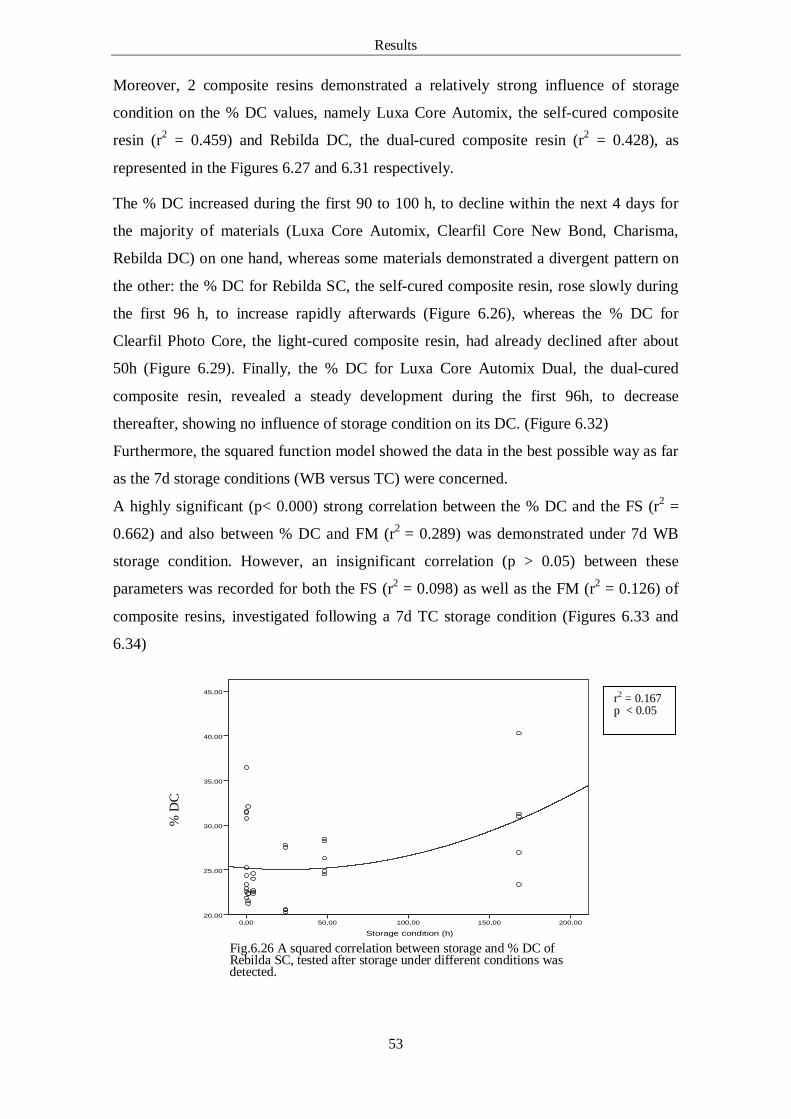
Results
53
% D
C
Moreover, 2 composite resins demonstrated a relatively strong influence of storage
condition on the % DC values, namely Luxa Core Automix, the self-cured composite
resin (r2 = 0.459) and Rebilda DC, the dual-cured composite resin (r2 = 0.428), as
represented in the Figures 6.27 and 6.31 respectively.
The % DC increased during the first 90 to 100 h, to decline within the next 4 days for
the majority of materials (Luxa Core Automix, Clearfil Core New Bond, Charisma,
Rebilda DC) on one hand, whereas some materials demonstrated a divergent pattern on
the other: the % DC for Rebilda SC, the self-cured composite resin, rose slowly during
the first 96 h, to increase rapidly afterwards (Figure 6.26), whereas the % DC for
Clearfil Photo Core, the light-cured composite resin, had already declined after about
50h (Figure 6.29). Finally, the % DC for Luxa Core Automix Dual, the dual-cured
composite resin, revealed a steady development during the first 96h, to decrease
thereafter, showing no influence of storage condition on its DC. (Figure 6.32)
Furthermore, the squared function model showed the data in the best possible way as far
as the 7d storage conditions (WB versus TC) were concerned.
A highly significant (p< 0.000) strong correlation between the % DC and the FS (r2 =
0.662) and also between % DC and FM (r2 = 0.289) was demonstrated under 7d WB
storage condition. However, an insignificant correlation (p > 0.05) between these
parameters was recorded for both the FS (r2 = 0.098) as well as the FM (r2 = 0.126) of
composite resins, investigated following a 7d TC storage condition (Figures 6.33 and
6.34)
Storage condition (h)200,00150,00100,0050,000,00
45,00
40,00
35,00
30,00
25,00
20,00
Fig.6.26 A squared correlation between storage and % DC of Rebilda SC, tested after storage under different conditions was detected.
r2 = 0.167 p < 0.05
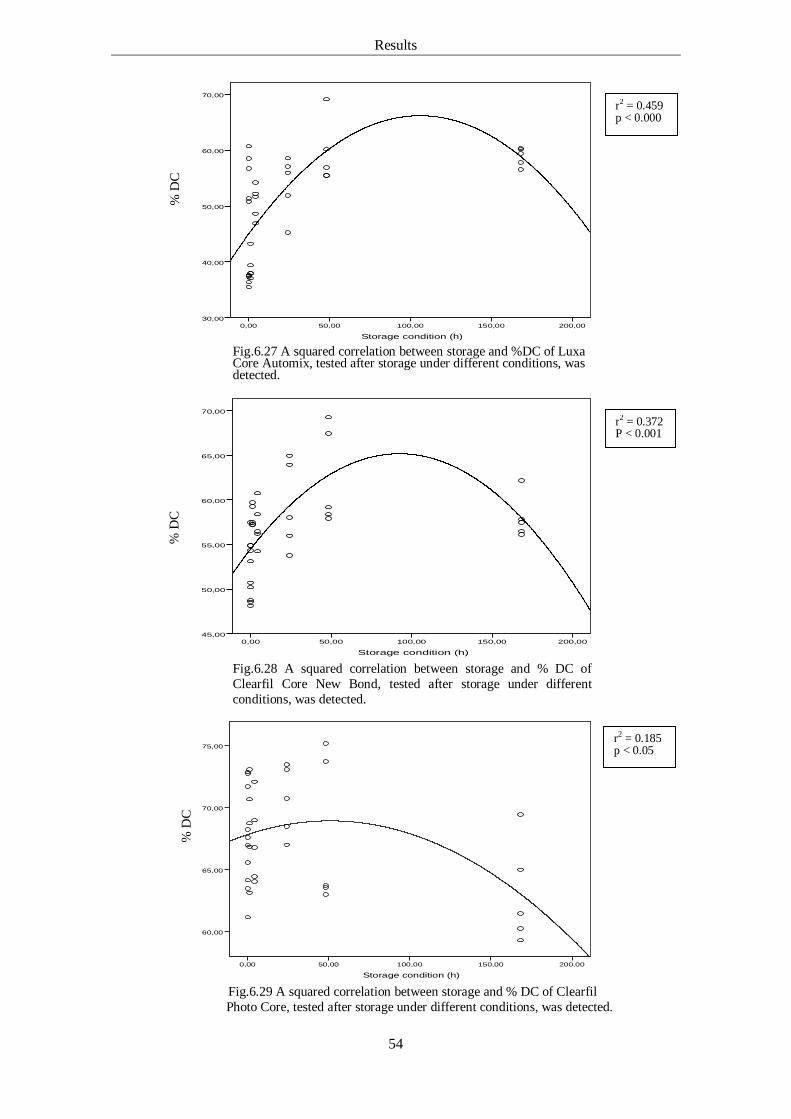
Results
54
Storage condition (h)200,00150,00100,0050,000,00
70,00
60,00
50,00
40,00
30,00
Fig.6.27 A squared correlation between storage and %DC of Luxa Core Automix, tested after storage under different conditions, was detected.
Storage condition (h)200,00150,00100,0050,000,00
70,00
65,00
60,00
55,00
50,00
45,00
Fig.6.28 A squared correlation between storage and % DC of Clearfil Core New Bond, tested after storage under different conditions, was detected.
Storage condition (h)200,00150,00100,0050,000,00
75,00
70,00
65,00
60,00
Fig.6.29 A squared correlation between storage and % DC of Clearfil Photo Core, tested after storage under different conditions, was detected.
%
DC
%
DC
% D
C
r2 = 0.459 p < 0.000
r2 = 0.372 P < 0.001
r2 = 0.185 p < 0.05
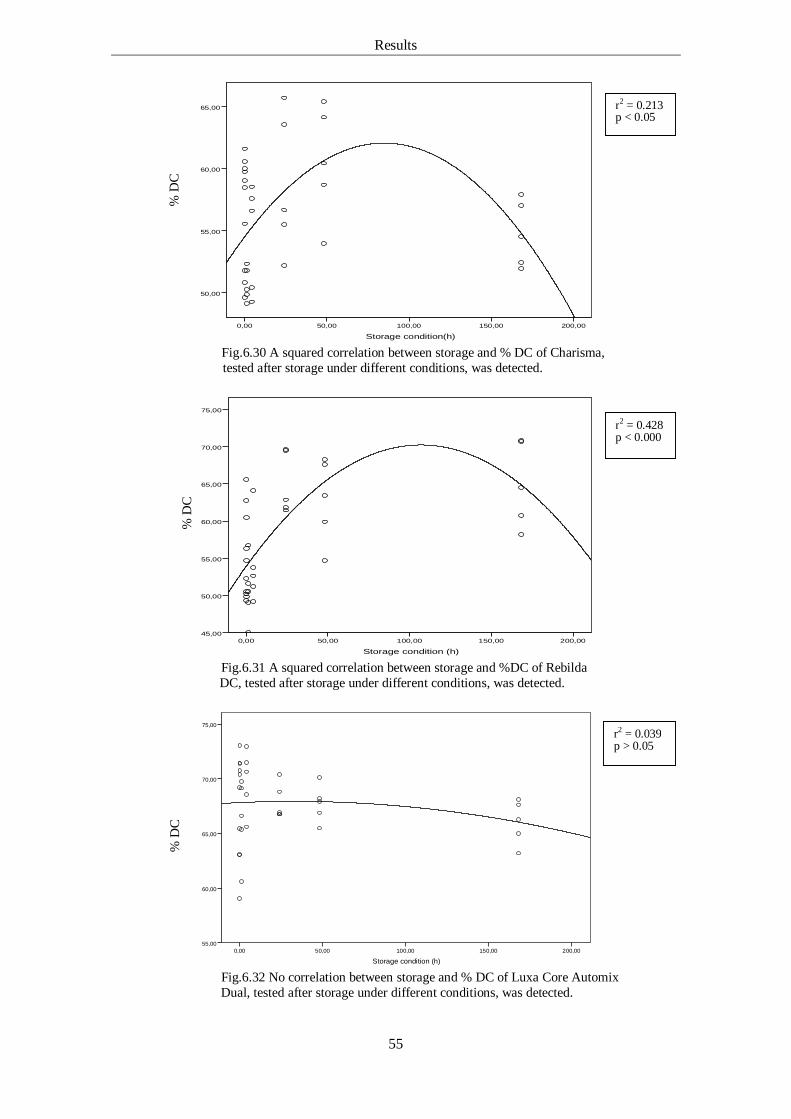
Results
55
Storage condition(h)200,00150,00100,0050,000,00
65,00
60,00
55,00
50,00
Fig.6.30 A squared correlation between storage and % DC of Charisma, tested after storage under different conditions, was detected.
Storage condition (h)200,00150,00100,0050,000,00
75,00
70,00
65,00
60,00
55,00
50,00
45,00
Fig.6.31 A squared correlation between storage and %DC of Rebilda DC, tested after storage under different conditions, was detected.
Storage condition (h)200,00150,00100,0050,000,00
75,00
70,00
65,00
60,00
55,00
Fig.6.32 No correlation between storage and % DC of Luxa Core Automix
Dual, tested after storage under different conditions, was detected.
% D
C
%
DC
% D
C
r2 = 0.213 p < 0.05
r2 = 0.428 p < 0.000
r2 = 0.039 p > 0.05
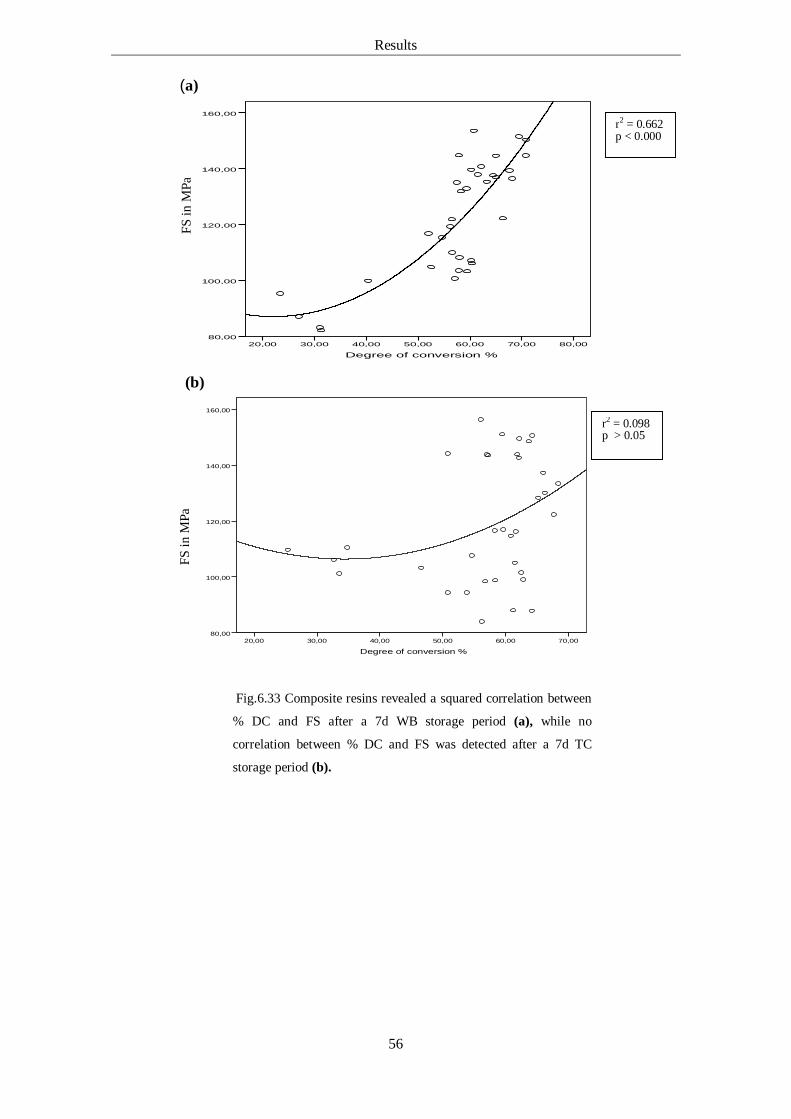
Results
56
(a)
Degree of conversion %80,0070,0060,0050,0040,0030,0020,00
160,00
140,00
120,00
100,00
80,00
(b)
Degree of conversion %70,0060,0050,0040,0030,0020,00
160,00
140,00
120,00
100,00
80,00
Fig.6.33 Composite resins revealed a squared correlation between
% DC and FS after a 7d WB storage period (a), while no
correlation between % DC and FS was detected after a 7d TC
storage period (b).
r2 = 0.662 p < 0.000
r2 = 0.098 p > 0.05
F
S in
MPa
FS
in M
Pa
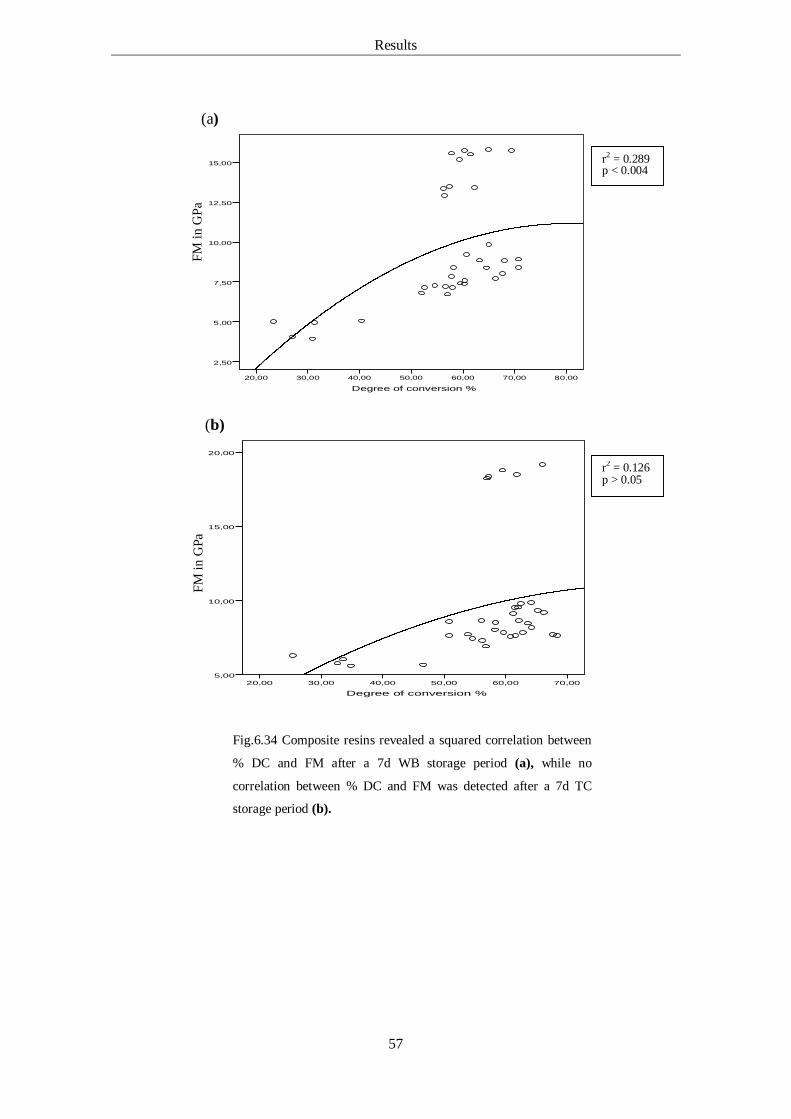
Results
57
(a)
Degree of conversion %80,0070,0060,0050,0040,0030,0020,00
15,00
12,50
10,00
7,50
5,00
2,50
(b)
Degree of conversion %70,0060,0050,0040,0030,0020,00
20,00
15,00
10,00
5,00
Fig.6.34 Composite resins revealed a squared correlation between
% DC and FM after a 7d WB storage period (a), while no
correlation between % DC and FM was detected after a 7d TC
storage period (b).
r2 = 0.289 p < 0.004
r2 = 0.126 p > 0.05
FM in
GPa
FM
in G
Pa
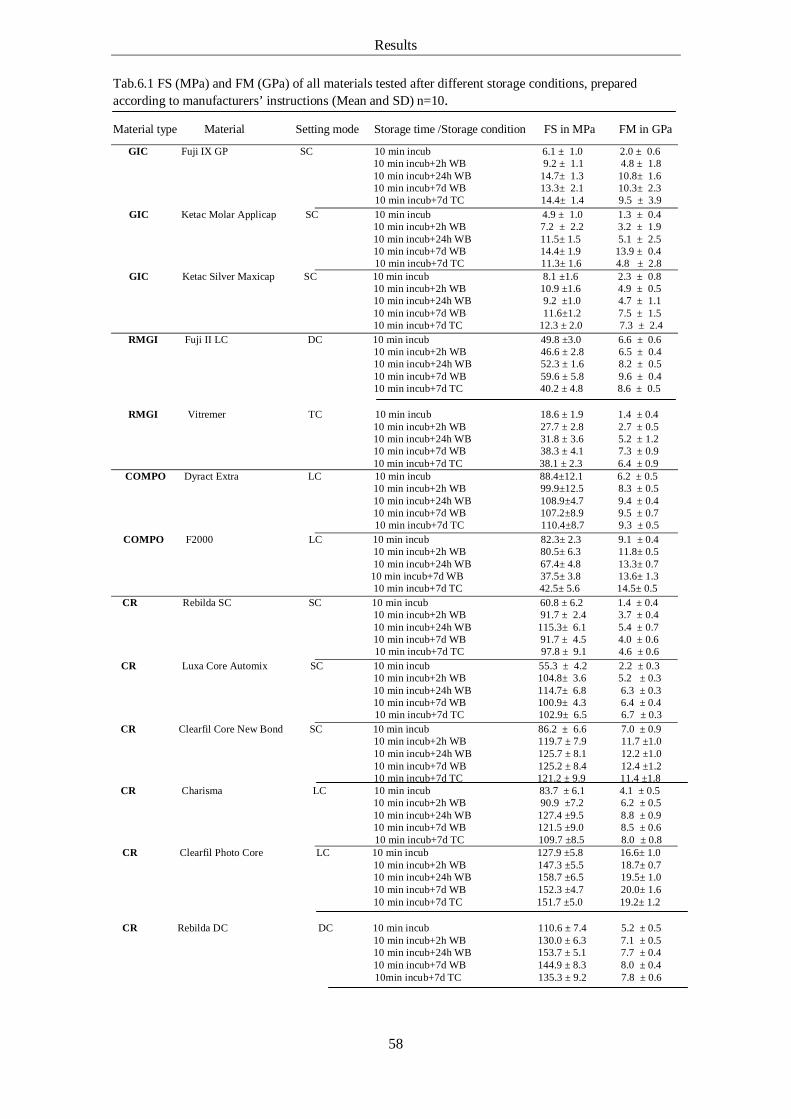
Results
58
Tab.6.1 FS (MPa) and FM (GPa) of all materials tested after different storage conditions, prepared according to manufacturers’ instructions (Mean and SD) n=10. Material type Material Setting mode Storage time /Storage condition FS in MPa FM in GPa
GIC Fuji IX GP SC 10 min incub 6.1 ± 1.0 2.0 ± 0.6 10 min incub+2h WB 9.2 ± 1.1 4.8 ± 1.8 10 min incub+24h WB 14.7± 1.3 10.8± 1.6 10 min incub+7d WB 13.3± 2.1 10.3± 2.3
10 min incub+7d TC 14.4± 1.4 9.5 ± 3.9 GIC Ketac Molar Applicap SC 10 min incub 4.9 ± 1.0 1.3 ± 0.4
10 min incub+2h WB 7.2 ± 2.2 3.2 ± 1.9 10 min incub+24h WB 11.5± 1.5 5.1 ± 2.5 10 min incub+7d WB 14.4± 1.9 13.9 ± 0.4
10 min incub+7d TC 11.3± 1.6 4.8 ± 2.8 GIC Ketac Silver Maxicap SC 10 min incub 8.1 ±1.6 2.3 ± 0.8
10 min incub+2h WB 10.9 ±1.6 4.9 ± 0.5 10 min incub+24h WB 9.2 ±1.0 4.7 ± 1.1 10 min incub+7d WB 11.6±1.2 7.5 ± 1.5
10 min incub+7d TC 12.3 ± 2.0 7.3 ± 2.4 RMGI Fuji II LC DC 10 min incub 49.8 ±3.0 6.6 ± 0.6
10 min incub+2h WB 46.6 ± 2.8 6.5 ± 0.4 10 min incub+24h WB 52.3 ± 1.6 8.2 ± 0.5 10 min incub+7d WB 59.6 ± 5.8 9.6 ± 0.4 10 min incub+7d TC 40.2 ± 4.8 8.6 ± 0.5
RMGI Vitremer TC 10 min incub 18.6 ± 1.9 1.4 ± 0.4
10 min incub+2h WB 27.7 ± 2.8 2.7 ± 0.5 10 min incub+24h WB 31.8 ± 3.6 5.2 ± 1.2 10 min incub+7d WB 38.3 ± 4.1 7.3 ± 0.9
10 min incub+7d TC 38.1 ± 2.3 6.4 ± 0.9 COMPO Dyract Extra LC 10 min incub 88.4±12.1 6.2 ± 0.5
10 min incub+2h WB 99.9±12.5 8.3 ± 0.5 10 min incub+24h WB 108.9±4.7 9.4 ± 0.4 10 min incub+7d WB 107.2±8.9 9.5 ± 0.7
10 min incub+7d TC 110.4±8.7 9.3 ± 0.5 COMPO F2000 LC 10 min incub 82.3± 2.3 9.1 ± 0.4
10 min incub+2h WB 80.5± 6.3 11.8± 0.5 10 min incub+24h WB 67.4± 4.8 13.3± 0.7 10 min incub+7d WB 37.5± 3.8 13.6± 1.3
10 min incub+7d TC 42.5± 5.6 14.5± 0.5 CR Rebilda SC SC 10 min incub 60.8 ± 6.2 1.4 ± 0.4
10 min incub+2h WB 91.7 ± 2.4 3.7 ± 0.4 10 min incub+24h WB 115.3± 6.1 5.4 ± 0.7 10 min incub+7d WB 91.7 ± 4.5 4.0 ± 0.6
10 min incub+7d TC 97.8 ± 9.1 4.6 ± 0.6 CR Luxa Core Automix SC 10 min incub 55.3 ± 4.2 2.2 ± 0.3
10 min incub+2h WB 104.8± 3.6 5.2 ± 0.3 10 min incub+24h WB 114.7± 6.8 6.3 ± 0.3 10 min incub+7d WB 100.9± 4.3 6.4 ± 0.4
10 min incub+7d TC 102.9± 6.5 6.7 ± 0.3 CR Clearfil Core New Bond SC 10 min incub 86.2 ± 6.6 7.0 ± 0.9
10 min incub+2h WB 119.7 ± 7.9 11.7 ±1.0 10 min incub+24h WB 125.7 ± 8.1 12.2 ±1.0 10 min incub+7d WB 125.2 ± 8.4 12.4 ±1.2 10 min incub+7d TC 121.2 ± 9.9 11.4 ±1.8
CR Charisma LC 10 min incub 83.7 ± 6.1 4.1 ± 0.5 10 min incub+2h WB 90.9 ±7.2 6.2 ± 0.5 10 min incub+24h WB 127.4 ±9.5 8.8 ± 0.9 10 min incub+7d WB 121.5 ±9.0 8.5 ± 0.6
10 min incub+7d TC 109.7 ±8.5 8.0 ± 0.8 CR Clearfil Photo Core LC 10 min incub 127.9 ±5.8 16.6± 1.0
10 min incub+2h WB 147.3 ±5.5 18.7± 0.7 10 min incub+24h WB 158.7 ±6.5 19.5± 1.0 10 min incub+7d WB 152.3 ±4.7 20.0± 1.6 10 min incub+7d TC 151.7 ±5.0 19.2± 1.2
CR Rebilda DC DC 10 min incub 110.6 ± 7.4 5.2 ± 0.5
10 min incub+2h WB 130.0 ± 6.3 7.1 ± 0.5 10 min incub+24h WB 153.7 ± 5.1 7.7 ± 0.4 10 min incub+7d WB 144.9 ± 8.3 8.0 ± 0.4
10min incub+7d TC 135.3 ± 9.2 7.8 ± 0.6
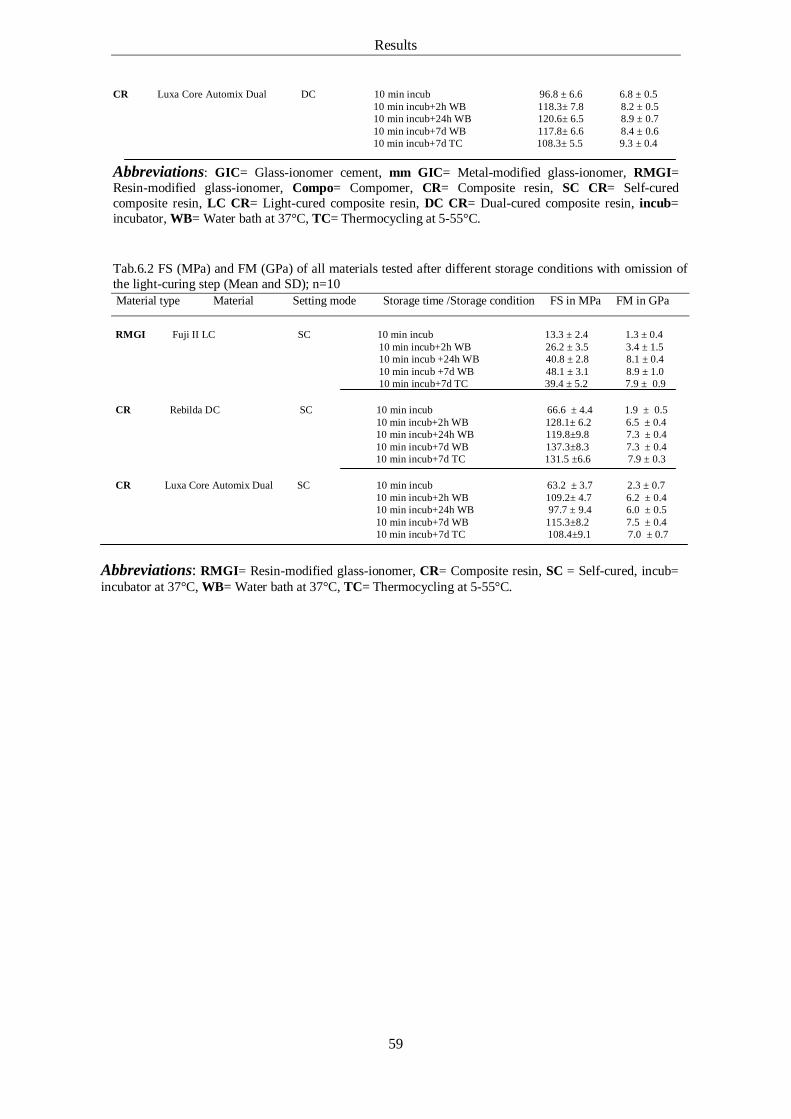
Results
59
CR Luxa Core Automix Dual DC 10 min incub 96.8 ± 6.6 6.8 ± 0.5
10 min incub+2h WB 118.3± 7.8 8.2 ± 0.5 10 min incub+24h WB 120.6± 6.5 8.9 ± 0.7 10 min incub+7d WB 117.8± 6.6 8.4 ± 0.6
10 min incub+7d TC 108.3± 5.5 9.3 ± 0.4
Abbreviations: GIC= Glass-ionomer cement, mm GIC= Metal-modified glass-ionomer, RMGI= Resin-modified glass-ionomer, Compo= Compomer, CR= Composite resin, SC CR= Self-cured composite resin, LC CR= Light-cured composite resin, DC CR= Dual-cured composite resin, incub= incubator, WB= Water bath at 37°C, TC= Thermocycling at 5-55°C.
Tab.6.2 FS (MPa) and FM (GPa) of all materials tested after different storage conditions with omission of the light-curing step (Mean and SD); n=10 Material type Material Setting mode Storage time /Storage condition FS in MPa FM in GPa
RMGI Fuji II LC SC 10 min incub 13.3 ± 2.4 1.3 ± 0.4
10 min incub+2h WB 26.2 ± 3.5 3.4 ± 1.5 10 min incub +24h WB 40.8 ± 2.8 8.1 ± 0.4 10 min incub +7d WB 48.1 ± 3.1 8.9 ± 1.0 10 min incub+7d TC 39.4 ± 5.2 7.9 ± 0.9
CR Rebilda DC SC 10 min incub 66.6 ± 4.4 1.9 ± 0.5
10 min incub+2h WB 128.1± 6.2 6.5 ± 0.4 10 min incub+24h WB 119.8±9.8 7.3 ± 0.4 10 min incub+7d WB 137.3±8.3 7.3 ± 0.4 10 min incub+7d TC 131.5 ±6.6 7.9 ± 0.3
CR Luxa Core Automix Dual SC 10 min incub 63.2 ± 3.7 2.3 ± 0.7
10 min incub+2h WB 109.2± 4.7 6.2 ± 0.4 10 min incub+24h WB 97.7 ± 9.4 6.0 ± 0.5 10 min incub+7d WB 115.3±8.2 7.5 ± 0.4
10 min incub+7d TC 108.4±9.1 7.0 ± 0.7
Abbreviations: RMGI= Resin-modified glass-ionomer, CR= Composite resin, SC = Self-cured, incub= incubator at 37°C, WB= Water bath at 37°C, TC= Thermocycling at 5-55°C.
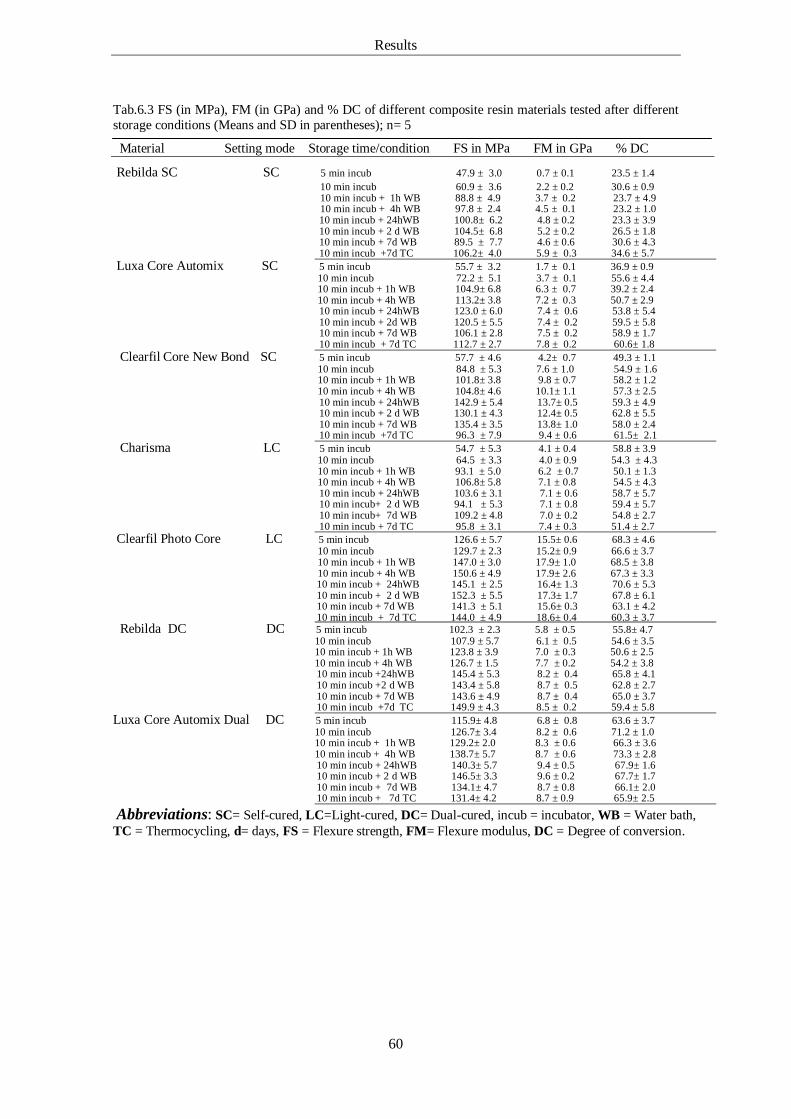
Results
60
Tab.6.3 FS (in MPa), FM (in GPa) and % DC of different composite resin materials tested after different storage conditions (Means and SD in parentheses); n= 5
Material Setting mode Storage time/condition FS in MPa FM in GPa % DC
Rebilda SC SC 5 min incub 47.9 ± 3.0 0.7 ± 0.1 23.5 ± 1.4 10 min incub 60.9 ± 3.6 2.2 ± 0.2 30.6 ± 0.9 10 min incub + 1h WB 88.8 ± 4.9 3.7 ± 0.2 23.7 ± 4.9 10 min incub + 4h WB 97.8 ± 2.4 4.5 ± 0.1 23.2 ± 1.0
10 min incub + 24hWB 100.8± 6.2 4.8 ± 0.2 23.3 ± 3.9 10 min incub + 2 d WB 104.5± 6.8 5.2 ± 0.2 26.5 ± 1.8 10 min incub + 7d WB 89.5 ± 7.7 4.6 ± 0.6 30.6 ± 4.3 10 min incub +7d TC 106.2± 4.0 5.9 ± 0.3 34.6 ± 5.7
Luxa Core Automix SC 5 min incub 55.7 ± 3.2 1.7 ± 0.1 36.9 ± 0.9 10 min incub 72.2 ± 5.1 3.7 ± 0.1 55.6 ± 4.4 10 min incub + 1h WB 104.9± 6.8 6.3 ± 0.7 39.2 ± 2.4 10 min incub + 4h WB 113.2± 3.8 7.2 ± 0.3 50.7 ± 2.9
10 min incub + 24hWB 123.0 ± 6.0 7.4 ± 0.6 53.8 ± 5.4 10 min incub + 2d WB 120.5 ± 5.5 7.4 ± 0.2 59.5 ± 5.8 10 min incub + 7d WB 106.1 ± 2.8 7.5 ± 0.2 58.9 ± 1.7 10 min incub + 7d TC 112.7 ± 2.7 7.8 ± 0.2 60.6± 1.8
Clearfil Core New Bond SC 5 min incub 57.7 ± 4.6 4.2± 0.7 49.3 ± 1.1 10 min incub 84.8 ± 5.3 7.6 ± 1.0 54.9 ± 1.6 10 min incub + 1h WB 101.8± 3.8 9.8 ± 0.7 58.2 ± 1.2 10 min incub + 4h WB 104.8± 4.6 10.1± 1.1 57.3 ± 2.5
10 min incub + 24hWB 142.9 ± 5.4 13.7± 0.5 59.3 ± 4.9 10 min incub + 2 d WB 130.1 ± 4.3 12.4± 0.5 62.8 ± 5.5 10 min incub + 7d WB 135.4 ± 3.5 13.8± 1.0 58.0 ± 2.4 10 min incub +7d TC 96.3 ± 7.9 9.4 ± 0.6 61.5± 2.1
Charisma LC 5 min incub 54.7 ± 5.3 4.1 ± 0.4 58.8 ± 3.9 10 min incub 64.5 ± 3.3 4.0 ± 0.9 54.3 ± 4.3 10 min incub + 1h WB 93.1 ± 5.0 6.2 ± 0.7 50.1 ± 1.3 10 min incub + 4h WB 106.8± 5.8 7.1 ± 0.8 54.5 ± 4.3
10 min incub + 24hWB 103.6 ± 3.1 7.1 ± 0.6 58.7 ± 5.7 10 min incub+ 2 d WB 94.1 ± 5.3 7.1 ± 0.8 59.4 ± 5.7 10 min incub+ 7d WB 109.2 ± 4.8 7.0 ± 0.2 54.8 ± 2.7 10 min incub + 7d TC 95.8 ± 3.1 7.4 ± 0.3 51.4 ± 2.7
Clearfil Photo Core LC 5 min incub 126.6 ± 5.7 15.5± 0.6 68.3 ± 4.6 10 min incub 129.7 ± 2.3 15.2± 0.9 66.6 ± 3.7 10 min incub + 1h WB 147.0 ± 3.0 17.9± 1.0 68.5 ± 3.8 10 min incub + 4h WB 150.6 ± 4.9 17.9± 2.6 67.3 ± 3.3
10 min incub + 24hWB 145.1 ± 2.5 16.4± 1.3 70.6 ± 5.3 10 min incub + 2 d WB 152.3 ± 5.5 17.3± 1.7 67.8 ± 6.1 10 min incub + 7d WB 141.3 ± 5.1 15.6± 0.3 63.1 ± 4.2 10 min incub + 7d TC 144.0 ± 4.9 18.6± 0.4 60.3 ± 3.7
Rebilda DC DC 5 min incub 102.3 ± 2.3 5.8 ± 0.5 55.8± 4.7 10 min incub 107.9 ± 5.7 6.1 ± 0.5 54.6 ± 3.5 10 min incub + 1h WB 123.8 ± 3.9 7.0 ± 0.3 50.6 ± 2.5 10 min incub + 4h WB 126.7 ± 1.5 7.7 ± 0.2 54.2 ± 3.8
10 min incub +24hWB 145.4 ± 5.3 8.2 ± 0.4 65.8 ± 4.1 10 min incub +2 d WB 143.4 ± 5.8 8.7 ± 0.5 62.8 ± 2.7 10 min incub + 7d WB 143.6 ± 4.9 8.7 ± 0.4 65.0 ± 3.7 10 min incub +7d TC 149.9 ± 4.3 8.5 ± 0.2 59.4 ± 5.8
Luxa Core Automix Dual DC 5 min incub 115.9± 4.8 6.8 ± 0.8 63.6 ± 3.7 10 min incub 126.7± 3.4 8.2 ± 0.6 71.2 ± 1.0 10 min incub + 1h WB 129.2± 2.0 8.3 ± 0.6 66.3 ± 3.6 10 min incub + 4h WB 138.7± 5.7 8.7 ± 0.6 73.3 ± 2.8
10 min incub + 24hWB 140.3± 5.7 9.4 ± 0.5 67.9± 1.6 10 min incub + 2 d WB 146.5± 3.3 9.6 ± 0.2 67.7± 1.7 10 min incub + 7d WB 134.1± 4.7 8.7 ± 0.8 66.1± 2.0 10 min incub + 7d TC 131.4± 4.2 8.7 ± 0.9 65.9± 2.5
Abbreviations: SC= Self-cured, LC=Light-cured, DC= Dual-cured, incub = incubator, WB = Water bath, TC = Thermocycling, d= days, FS = Flexure strength, FM= Flexure modulus, DC = Degree of conversion.
Discussion
61
7. Discussion As the aim of this study was to find out which of the restorative materials, belonging to
4 different groups, are most suitable to form a base for a long term stable tooth-colored
consecutive restoration, both the FS and FM of these materials, as well as the degree of
conversion of the group of composite resins were investigated. These parameters were
chosen for testing, as for brittle materials, flexural tests are preferred to other
mechanical tests, due to the fact that these properties more closely simulate the stress-
dispersal in the restoration during service, [6] and the % DC was proven to play an
important role in determining the mechanical properties and longevity of these
materials. [47, 51, 52, 64, 65, 74, 112].
7.1. Flexural Strength From the previously illustrated results, the noticed increase in FS for the first 24h for all
materials (except for F2000) might be a result of an ongoing setting reaction of the
materials after initial polymerization, accompanied by continuous cross-linking of the
polymer chains with time of storage . [2, 18, 62, 67, 98]
Since FS shows more sensitivity to surface imperfections, high FS values might reflect
better resistance to surface erosion caused by contact with water, with less tendency for
the cement to craze.[26, 110 ]
Also, an important relationship exists between composition, and mechanical properties
of materials tested, as previously confirmed. [10, 18, 47, 59, 62, 125, 133, 138 ]
7.1.1. Conventional Glass-ionomers Glass-ionomers showed a slow rise in FS within the first 24h of water storage, [2, 98 ]
with the conventional glass-ionomers demonstrating mechanical properties being much
worse compared to those of other restorative materials tested [57, 133], showing a brittle
nature with an abrupt fracture and minimal deformation when subjected to force.[57, 84,
93, 129] This increase in strength is thought to result from continued formation of
polysalt complexes relating several ionic types, slow additional cross-linking and the
buildup of a silica-gel phase accompanying the ongoing acid-base reaction due to
hydration of the cross-linked matrix. [27, 53] However, these findings are in contrast to
the opinions of some authors who denied any difference between conventional and
resin-modified glass-ionomer materials, also demonstrating adverse affection of
Discussion
62
conventional, metal-modified and resin-modified glass-ionomer materials by storage in
aqueous media.[13] The metal-modified glass-ionomer material, Ketac Silver Maxicap,
demonstrated lower FS values after 24h storage period, compared to both viscous
conventional glass-ionomer materials, Fuji IX GP and Ketac Molar Applicap, [103]
probably as a result of a different acid base incorporation: the glass-ionomer material
based on polymaleic / polyacrylic acid (Ketac Silver Maxicap) showed lower FS values
than those based on polyacrylic acid alone (Fuji IX GP and Ketac Molar Applicap),
with the latter showing greater stabilities.[98] A lower FS observed for polymaleic-
based materials can be attributed to the copolymer and to the different type of glass
used, whereas the increase in FS of conventional glass-ionomers with time of storage,
can be attributed to the presence of water, allowing slow-setting glass-ionomers to
complete the acid-base reaction or possibly to minimize the surface cracks. [16, 98]
Most of the glass-ionomer cements did not reach their maximum strength after 24h, [26]
due to the slow rate of the preceding acid-base reaction, the strength increasing further
with longer times of storage. FS values of the conventional glass-ionomer materials
investigated were very close to each other showing insignificant differences throughout
all storage conditions.
On the other hand slight weakening that occurred for the glass-ionomer material, Ketac
Silver Maxicap, following 24 h water storage, may result from the plasticizing effect of
water diffusion through the specimen, resulting in a reduction of their FS. The
contacting water partly dissolves material components with a consequently altered
network of the glass-ionomer cement.[24] Authors have attributed the decreased
strength of conventional glass-ionomers to increased solubility of glass-ionomer
materials, and the hydrogel phase increasing water sorption of the set materials, with
the higher degree of hydration resulting in lower mechanical properties. [16, 89, 123]
In accordance with the relevant literature, metal-modified glass-ionomers showed
properties not different to those of the other conventional glass-ionomers tested, with no
improvement in flexural properties, as stated by several authors.[87, 95, 103, 119, 129]
7.1.2. Resin-modified Glass-ionomers Resin-modified glass-ionomers showed significantly higher FS values compared to the
conventional glass-ionomers throughout all storage conditions. A positive influence of
resin incorporation [78, 83, 84, 133] was noted, allowing an initial setting reaction due
Discussion
63
to hydroxyethyl methacrylate (HEMA) polymerization, subsequently followed by the
slowly proceeding acid-base reaction typical of conventional glass-ionomers. The
latter reaction served only to harden and strengthen the already created matrix.[89, 131]
In resin-modified glass-ionomer materials, several polymerizations take place:[131]
1-HEMA polymerization to poly HEMA
2-Modified polyacrylic acid (PAA), that contains unsaturated groups, will copolymerize
with HEMA, so that HEMA will be chemically-linked to the polyacrylate matrix,
preventing an occurrence of phase separation.
3-Modified PAA will further polymerize to form a cross-linked PAA, increasing
strength of the cement.
Fuji II LC and Vitremer, the resin-modified glass-ionomers, have shown significantly
higher FS values (Fuji II LC > Vitremer) throughout all storage conditions compared to
the rest of glass-ionomers tested. The higher FS might be a result of a different
composition, as an additional photocurable monomer in the liquid, such as HEMA, was
incorporated to the glass-ionomer cement [36], enabling an additional light-cured
polymerization to occur, with a resultant structure reinforcement, having a polymeric
network containing both ionic and covalent cross-links. [24, 25, 63, 67, 89, 131]
Fuji II LC and Vitremer reached their maximum FS within 7d. [67] This might be a
result of the acid-base reaction being much slower in water/HEMA mixtures than in
water alone, the case with conventional glass-ionomers [131]. As some of the water in
conventional glass-ionomers was replaced by HEMA, the initial set of these materials is
due to the polymerization of HEMA , the chemically- or photocurable monomer[131]
with the acid-base reaction further continuing for some days thereafter. Fuji II LC
demonstrated significantly lower FS values following the 7d thermocycling period.
The reason for Fuji II LC showing higher FS values compared to Vitremer might be due
to a different composition, as Fuji II LC contains urethane dimethacrylate (UDMA)
monomers as compared to Vitremer which does not contain that component, proving
increased FS values with replacement of Bis-GMA or TEGDMA by UDMA, as has
been declared by some authors.[10, 19] Moreover, a more integrated microstructure (i.e.
better glass particle-polymer matrix bonding) [133] with UDMA and dimethacrylate
(DMA) oligomers added to the liquid, might be a result for higher FS values compared
to Vitremer material, imparting more cross-linking with increased stiffness.
Discussion
64
Another reason for the lower FS values for Vitremer compared to those of Fuji II LC,
could be a result of the mixing mode, being hand-mixed for Vitremer, and in the form of
automixed capsules for Fuji II LC. As Vitremer is hand-mixed, the increased possibility
of air-bubble incorporation may cause a negative effect on the material’s properties,
hindering a more integrated microstructure.[27, 133]
Remarkable weakening in Fuji II LC following the thermocycling period may appear
due to the plasticizing effect of water diffusion through the specimens, resulting in
reduced FS. The contacting water partly dissolves material components with a
consequently altered network of the glass-ionomer cement.[18] For Fuji II, the resin-
modified glass-ionomer, showed hydrophilicity, readily absorbing water, due to its
content of poly/HEMA, as well as its behavior like a hydrogel in presence of water. [19]
With regards to the 7d storage condition, some materials tested showed minimal further
increase in FS with time of storage, (Ketac Molar Applicap, Ketac Silver Maxicap, Fuji
II LC) indicating an ongoing acid-base reaction with further cross-linking and silica–gel
phase buildup. It was stated that further setting during storage was dependent on the
capacity of the cement setting reaction to continue after initial polymerization.[84]
The resin component in resin-modified glass ionomers slows down the ionic cure (acid-
base) reaction and increases water sorption reversibly, most probably interfering with
the ion-transport required for the acid-base reaction, hindering the formation of the ionic
matrix.[13, 88] On the contrary, other authors were of the opinion that resin addition to
materials increases their mechanical properties and flexure strength compared to those
with limited or no resin content, demonstrating less water solubility and decreased
moisture sensitivity. [53, 78, 84, 121, 133]
7.1.3. Polyacid-modified composite resins Compomer materials showed FS values between those of glass-ionomers and composite
resin restorative materials, [40, 82, 103, 121] depending on the resin content of the
matrix phase of the set material[53], with properties determined by its composite
character, [25] having less filler amount compared to hybrid composite resins.[60]
Initial setting of compomers is by light-activation to be followed by acid-base
reaction.[91] Moreover, compomer materials, which are partially silanized,[82, 90, 91]
actually set only by polymerization, due to the insufficient amount of carboxylic acid
functional groups to confer water-solubility on the molecule, without starting a
neutralization reaction.[90]
Discussion
65
Furthermore, silanization of reactive ionomer glass reduces rate of undergoing acid-base
reaction for compomers and the water/HEMA mixtures in the resin-modified glass-
ionomers, with a consequent reduction in FS.[4]
Both the brand of material and storage time significantly affected FS of compomers
tested,[58] with Dyract Extra showing a gradual increase in FS with significantly higher
values compared to those of F2000 throughout all storage conditions.
F2000 showed a reduction in FS despite of its high filler content (84 wt %) with
increased time of water storage (least values after 7d storage (7d WB< 7d TC)]. This
might be due to its hydrophilic polymer content of CDMA (a methacrylated
polycarboxylic acid), [134] increasing water sorption of the material, or due to the use
of fluoroaluminosilicate (FAS) glass fillers with a resultant decrease in strength due to
the plasticizing effect of water partially dissolving material components [27] or
degrading the filler matrix interface.[113]
Dyract Extra, the other compomer material, which has lower filler content (75 wt %)
does not contain that hydrophilic component, but rather a mixture of methacrylate
resins. No deteriorating effect of water storage was noticed. [58] Also the incorporated
TCB- resin, the carboxylic-acid modified dimethacrylate, did serve to provide high
cohesion to the resin mixture, imparting increased strength.
Another cause for lower FS of Dyract Extra, the compomer material, compared to
composite resins, might be due to the incorporation of an ethoxylated dimethacrylate
(Bis-EMA) that imparts less hydrophilicity into the compomer (due to the absence of
hydroxyl groups) with reduced viscosity [68] and increased conversion [52], but with an
absence of strong secondary molecular interactions, with a consequently decreased
strength.[101]
Storage time in water proved to have an effect on FS of conventional glass-ionomers,
resin-modified glass-ionomers and compomers, [2, 52, 66, 81, 103] contradicting the
finding of some authors who proved little or no influence of storage time on the FS of
these materials, being only influenced by the difference in material type.[ 24, 25, 27,
35, 46, 82-84, 99, 121]
7.1.4. Composite resins Compared to composite resins which show a slower rate of water-uptake, lower FS
values of compomers may be partially attributed to the more rapid uptake of water,
Discussion
66
which is necessary for the activation of the acid-base reaction with the polymer
matrix.[135]
Composite resin materials showed the highest FS values compared to the rest of the
materials tested, throughout all storage conditions.[25, 28, 33, 59, 60] Clearfil Photo
Core, the microhybrid light-cured composite resin, demonstrated the highest FS values
throughout all storage conditions. [24] This might be due to its highest filler content (83
wt %), resulting an increased strength.[46, 59, 69, 138] The self-cured composite resin,
filled with fine particles, Luxa Core Automix (72 wt%) and the flowable Rebilda SC (
68.5 wt%), showed lower FS values compared to Clearfil Core New Bond, the
microhybrid self-cured composite resin of higher filler amount (78 wt%) in its
formulation., proving a trend for the FS to increase with increased filler content up to a
specific level. [28, 33, 46, 59]
Charisma, the microglass-filled (78 wt%), light-cured composite resin showed FS
values that were similar to Clearfil Core New Bond, a self-cured composite resin, but
higher than those of the other self-cured types, for all storage conditions. FS values of
Charisma were also higher than for the dual-cured composite resin Luxa Core Automix
Dual (72 wt % microhybrid filler) for the 24h storage period, but not as high as those of
the light-cured material Clearfil Photo Core, and the dual cured material, Rebilda DC
(flowable, having 70 wt% fine dispersion fillers). Having lower FS values compared to
the other light-cured and dual-cured materials might be due to its additional microsized
silica content of increased surface area, favoring water sorption with accompanied
degradation and a reduction of its FS.[18, 62, 67, 86] This finding contradicts the
statement of some authors, who propose that a higher filler volume percentage of
composite resins leads to higher flexural properties. [69, 109]
Also, the dual-cured material Rebilda DC, has its monomer system additionally based
on di-UDMA monomers, providing more cross-linking and significantly higher
strengths. [19, 35, 52] This is because the kinked bisphenol A core (in Bis-GMA),
present in other composite resins, imparts stiffness and strength to the dimethacrylate,
hindering polymerization, finally resulting in a higher amount of residual double bonds
and a higher potentially leachable monomer, compared to the aliphatic UDMA.[73]
Lowered mechanical properties of composite resins when stored in water, could be
attributed to a softened resin matrix and / or bond failures in the outer layer of fillers,
Discussion
67
either placed in the silane coating or at the silane/matrix interface as a negative water
effect.[113]
The brittleness of dimethacrylate-based networks (Bis-GMA, UDMA and TEGDMA)
may be due to a specific structure-buildup by the formation and agglomeration of
microgels.[17]
Regarding the 7d storage conditions (7d WB versus 7d TC), all materials tested showed
insignificant differences between both storage periods. Storage environment has
influenced the FS of some materials; Ketac Molar Applicap (a conventional glass-
ionomer), Fuji II LC (a resin-modified glass-ionomer) and Luxa Core Automix Dual (a
dual-curing composite resin), which showed decreased strength after thermocycling,
supporting the opinion that composite resins are less influenced by storage environment,
whilst glass-ionomers materials are influenced by temperature change.[25, 82] This may
be due to the higher resin content in composite resins (compared to compomers and
resin-modified composite resins) and the total absence of fillers in conventional glass-
ionomer materials.[6, 36, 88, 95]
7.2. Flexural Modulus Elastic modulus is a material’s constant, completely dependent on its composition, not
being influenced by the amount of elastic- or plastic-stress to which the material is
subjected, but rather the interatomic forces of the materials, which are responsible for
their elastic properties. [6, 36]
A gradual increase in FM of all materials was noticed for all storage conditions, with
fewer differences between materials as previously declared by some authors,[25, 35, 66,
110] contradicting the opinions of other authors, announcing a negative effect of wet
storage on resin-based and acid-based materials.[20, 77]
Water sorption has been associated with a change in the nature of the material from
brittle to plastic, as absorbed water acts as plasticizer. [67, 96]
Increasing strength supposes a continuing setting reaction with increased cross-linking,
where highly cross-linked polymers are expected to reveal high elastic modulus, but
increased brittleness.[101]
7.2.1. Conventional Glass-ionomers Conventional glass-ionomers showed FM values that were either insignificantly
different or significantly higher than Vitremer, the resin-modified glass-ionomer,
Discussion
68
Rebilda SC as well as Luxa Core Automix, the self-cured composite resins. This is most
probably due to the more flexible nature of the glass-ionomer matrix, being in
accordance with the literature. [84, 133]
All glass-ionomer materials showed highest FM values after 7d storage periods, being
insignificantly different from their 24h storage time, which might result from the slow
acid-base reaction, rendering the FM values constant thereafter. [6, 27, 98]
Fuji IX GP, the highly viscous, fast-setting glass-ionomer cement,[36, 103] revealed its
highest FM values after the 24h and 7d thermocycling periods, most probably due to its
composition, which is different, as it is based on polyacrylic acid alone.[80, 98]
Additionally Fuji IX GP contains fine glass particles, anhydrous polyacrylic acid of
high molecular weight and a high powder–to-liquid mixing ratio.[36] On the other hand,
Ketac Molar Applicap showed the highest FM values only for the 7d WB storage
period, [103] most probably resulting from its slower acid-base reaction, with a slower
setting and cross-linking, due to its type of acid base (polymaleic/polyacrylic acid) and
its lower powder-to-liquid mixing ratio. Ketac Silver Maxicap showed significantly
higher FM values for both 7d storage conditions compared to the rest of storage
conditions, which may be related to its slower acid-base reaction with a resulting matrix
formation.
7.2.2. Resin-modified Glass-ionomers Throughout all storage conditions, Fuji II LC showed higher FM values compared to
Vitremer. This might be due to different backbones of both materials. The
incorporation of UDMA into the liquid of Fuji II LC, having its hydroxyl groups
enabling formation of strong hydrogen bonds, resulted in increased FM of the
material[10, 16, 17], while only HEMA monomer as well as pendant methacrylate
groups were present in the Vitremer.[133] For the direct correlation between water-
uptake and decreased FM that was recognized, the absorbed water partially dissolves
material components with a subsequently altered network.[24] An increased bond
strength within the material (in Fuji II LC), may also result in an increased resistance to
the plasticizing effect of water.[10, 16, 17]
7.2.3. Polyacid-modified composite resins F2000, the compomer material, showed higher FM values compared to Dyract Extra
throughout all storage conditions, which may be due to its higher filler content (84 wt%)
Discussion
69
compared to 75 wt% for Dyract Extra, with a resultant increased stiffness of the
material, as well as due to the smaller filler size in Dyract Extra (0.35 µm, 1.5 µm),
having increased surface area,[60] favoring plasticizing effect of water, weakening bond
strength in the materials network. [36, 123]
F2000 materials have shown FM values being higher compared to resin-modified glass-
ionomers and self-cured composite resins tested [63], most probably due to its higher
resin amount, compared to resin-modified glass-ionomers, as properties of compomers
are determined by their composite character [25], as well as their filler silanization, an
important property for optimal physical properties. [4] Also, a greater strength of
dimethacrylate-based networks (as for Dyract Extra, Rebilda SC and Rebilda DC) due
to stronger hydrogen bonds, results in the formation of larger heterogeneities, being
accompanied by increased brittleness of poly-dimethacrylates. [17] This brittleness
results most probably from the formation and agglomeration of microgels.[17]
7.2.4. Composite resins The light-cured Clearfil Photo Core and the self-cured Clearfil Core New Bond revealed
highest FM values compared to the rest of composite resins tested (Clearfil Photo Core
> Clearfil Core New Bond), both hybrid composite resins with higher filler amount (83
wt% and 78 wt% respectively) This might result from the higher filler volume fraction
of the material, [59] while the lowest FM values were presented by the flowable self-
cured Rebilda SC, in accordance with the literature, for the flowable type to show lower
FM values.[66]
The microglass-filled universal composite resin, Charisma, showed lower FM values
compared to the highly-packed hybrid composite resins, Clearfil Core New Bond and
Clearfil Photo Core, and similar values to the dual-cured types (Rebilda DC and Luxa
Core Automix Dual) for the 24h storage period, supporting the statement that hybrid
composite resins possess better mechanical properties as compared to microfilled
types.[18]
Rebilda SC and Rebilda DC, the flowable composite resins with lower filler content
(68.5 wt% and 70 wt% respectively), although UDMA monomers added, still showed
lower FM values. This may be due to its setting mechanism, which is only chemically-
initiated (for Rebilda SC), lower filler content and size (fine dispersion fillers), the
incorporation of HEDMA, favoring water sorption with increased plasticizing effect of
water, which consequently results in bond deterioration.[13, 17] Also, the incorporation
Discussion
70
of Bis-GMA in the material, containing pendant hydroxyl groups, renders the materials
more hydrophilic with increased water sorption.[68]
Both dual-cured composite resins (Rebilda DC and Luxa Core Automix Dual) proved to
be changed insignificantly by thermocycling, with the differences occurring as a
function of material,[66, 76, 85, 126] as the type of composite resin material determines
the materials’ performance in wet environment.[18, 62]
Amongst self-cured composite resins, Clearfil Core New Bond revealed the highest FM
values throughout all storage conditions, compared to the other 2 materials, Rebilda SC
and Luxa Core Automix, both showing insignificant differences except at 2h and 7d
WB storage conditions. This might be a result of the TEGDMA content of Clearfil Core
New Bond, with the molecule behaving as a cross-linking agent with antiplasticiant
effect.[101] Additionally, Clearfil Core New Bond is a microhybrid composite resin,
with a higher filler content (78 wt %) and filler distribution, compared to the other self-
cured composite resins, with Rebilda SC being of the flowable type (68 wt %) and Luxa
Core Automix a fine particle size composite resin (72 wt%). These results support the
statement that FM increases with increased filler volume fraction. [59]
Lower FM properties for self-cured composite resins could also result from the intense
effect of the composite’s component degradation following water storage.[8]
Some composite resins showed FM higher to that of resin-modified glass-ionomers and
Compomers, which showed FM values similar to conventional glass-ionomers, possibly
due to increased resin content in composite resins and their fillers being silanized. [12,
37]
Both self-cured composite resins, Rebilda SC and Luxa Core Automix showed FM
values lower than that of compomers tested, contradicting the statement that composite
resins show higher FM values.[33]
7.3. Omission of light-curing step All 3 materials tested (Fuji II LC, Rebilda DC and Luxa Core Automix Dual), showed
higher flexural properties for the light-cured specimens compared to the non light-cured
specimens. A positive effect of water storage was recorded, with a gradual increase with
time of storage, proving the continuing setting reaction with increased strength as a
result of increased cross-linking with time. [2, 18, 62, 67, 98]
Discussion
71
7.3.1. Flexure Strength The lowest FS values were recorded for Fuji II LC, the highest for Rebilda DC,
compared to both the other materials tested throughout all storage conditions for both
curing modes. This could most probably be due to the fact, that the resin-modified
glass-ionomer have limited resin content [53, 79], as well as an absence of filler
silanization, [4, 37] as the case with composite resins tested.
The presence of HEMA in Fuji II LC may be a factor in its’ increased water sorption,
with an accompanying plasticizing effect on the matrix.[24, 27, 77]
Fuji II LC showed higher FS values for the light-cured specimen, and was significantly
affected by the omission of the light-curing step, decreasing the integrity of the material
with lower mechanical properties, contradicting the statement of de Gee et al, 1998 who
stated that Fuji II LC is not affected by omission of the light-curing step, with a proved
decrease in the integrity of Vitremer, the resin-modified glass-ionomer with delayed
light-activation and further decline with light omission.[39] As the structural integrity of
resin-modified glass-ionomers benefits from a chemical integration of the polyalkenoate
/poly HEMA networks, which is most probably enabled with light-curing, these types of
materials are greatly affected by skipping the light-curing step for polymerization of the
HEMA component.[39]So, this material would only be dependent on the slow acid-base
reaction, showing its complete strength after 7d storage in distilled water, followed by a
significant drop after thermocycling, most probably due to erosion and plasticizing
effect of water on the matrix.[27]
For the composite resin materials tested, filler silanization enhances damage tolerance,
improving their clinical performance, as stated by Curtis et al 2009 [37] and several
other authors [46, 59, 69, 138]
Rebilda DC, the flowable hybrid composite resin showed higher FS values compared to
Luxa Core Automix Dual for both the light-cured as well as the chemically-cured
specimens (without light-curing) throughout all storage conditions. The difference in FS
was most probably due to incorporation of UDMA in Rebilda DC material [19] which
enabled more cross-linking , flexibility and weaker intermolecular bonds [52], as well as
less hydrophilicity, [25] compared to Bis-GMA oligomer available in Luxa Core
Automix Dual. The Bis-GMA oligomer was proven to be more rigid, showing higher
water sorption as well as less cross-linking and lower strength. [52]
Discussion
72
7.3.2. Flexural Modulus Amongst the non light-cured materials, Fuji II LC showed the lowest FM values after
10 min and for both modes after 2h storage conditions. This could be attributed to it
depending for its setting only on the slowly progressing acid-base reaction, with a
resultant slow additional cross-linking and buildup of a silica gel phase.[27]
On the other hand, Luxa Core Automix Dual recorded the lowest FM values after 24h
and 7d thermocycling, for non light-cured specimens, showing insignificantly different
values from those of Rebilda DC for the rest of storage conditions.
Higher cross-linking, with accompanying embrittlement and weaker intermolecular
bonds in Rebilda DC material due to the incorporated UDMA,[52, 101] could be a
result of a decreased FM, as increased strength of hydrogen bonds in dimethacrylates
results in occurrence of larger heterogeneities increasing the materials’
embrittlement.[17]
Rebilda DC, containing lower amount of fine dispersion fillers(70 wt%) compared to
the microfine particles in Luxa Core Automix Dual (72 wt%), both depending in their
setting only on the self-cured mechanism, most probably taking longer time, may be due
to increased amount of residual monomers, that act as plasticizers with resulting
structure alteration and weakness. [6, 123]
7.4. Degree of Conversion
7.4.1. Correlation between flexural properties and Degree of Conversion The previously illustrated results showed a significant correlation between flexural
properties (FS and FM) and % DC for 2 self-cured composite resins (Luxa Core
Automix and Clearfil Core New Bond) and a dual-cured composite resin (Rebilda DC).
Those three composite resins demonstrated with increased conversion, an apparent
increase in FS as well as FM values, both rising gradually with increased storage time
and % DC, being in accordance with several authors affirming the presence of a
significant correlation between % DC and flexural properties. [44, 47, 51, 52, 64, 65,
74, 112]
However, there was no remarkable influence of DC on the development of flexural
properties of the rest of composite resins investigated (Rebilda SC, Charisma, Clearfil
Photo Core and Luxa Core Automix Dual), revealing a more rapid rise in %DC
compared to their mechanical properties. The faster rise in DC noticed for these
Discussion
73
materials compared to their flexural properties, can be explained by the continuous
growth of polymer chains after mixing, resulting in higher molecular oligomers, most
probably consuming higher amounts of double bonds during the very early stages of the
reaction.[5] As the cross-linking density between the created oligomers required for a
mechanical stability of a material has not yet been established at these early stages of
polymerization, it seems the mechanical stability of a material to be inequivalent to its
DC.[44] Though, with additional cross-linking over time, more molecular oligomers get
linked together into a rigid polymer, with a considerable increase in mechanical
properties.[5]
It has been reported, that the use of multifunctional monomers, of more than 2 reactive
double bonds per molecule, apparently lead to higher reaction rates with more cross
links, but a simultaneous reduction in DC.[5] That is because on polymerization of
multifunctional monomers, pendant double bonds can react intramolecularly with the
radical on its propagating chain to form a loop in a 1ry cyclization, resulting merely in
microgel formation and heterogeneity of the matrix.[74]
This disparity between DC on one hand and the flexural properties (FS and FM) on the
other, depends most probably on the material itself, with the mechanical properties
being much dependent upon network formation, [31, 44] with more cross-linking, which
is considered to be of greater importance for good network formation and better
physical properties.[52] Differences in % DC values could accordingly be ascribed to
dissimilarity in monomer systems used amongst materials, or the different chemical
structure of the spacer group connecting the methacrylate groups.[42, 106, 112]
It has also been stated that dimethacrylate monomers polymerize to highly cross-linked,
three-dimensional networks, within which polymerization has been found to occur at
different rates, being higher in so-called ‘’microgel’’ regions because of a local gel
effect.[107] As polymerization proceeds, diffusion rates of propagating free radicals and
unreacted dimethacrylate molecules are considerably reduced, hindering complete
conversion of methacrylate double bonds. Therefore, about 25 to 55% of the
methacrylate groups remain unreacted. [9, 106, 107]
Other parameters, such as inhibitor- and diluent concentrations influenced the DC,
achieving higher DC with higher diluent- and lower inhibitor concentrations. [32, 47]
Composite resins with higher DC are thought to develop more rigid networks than
materials with lower conversion.[118]
Discussion
74
Most composite resins in this investigation showed % DC varying between 55-73%,
most probably due to limitations in conversion caused by vitrification of the polymer
network during polymerization. [45, 51, 106]
The lowest flexural properties, accompanied by the lowest % DC were recorded for
Rebilda SC, the flowable self-cured material, remaining at lower levels when compared
to the rest of composite resins investigated. The poor performance of Rebilda SC, can
be explained by its self-curing setting mechanism, since setting of dimethacrylates at
room temperature may be the reason for creating glassy resins with an incomplete
double bond conversion.[74, 112] Since the matrix of Rebilda SC is based on Bis-GMA
monomer, relatively strong intermolecular interactions with higher viscosities are
created, as a result of the available OH groups, finally causing slow diffusion of radicals
within the network and a lower % DC. [31, 61, 101, 118] Increased viscosity of Bis-
GMA monomers always results in incomplete and considerable concentration of
unreacted C=C double bonds, which may be a reason for loss of mobility,[31, 74] and
decreased reactivity of polymer radicals in highly viscous networks. Such mobility
restrictions are thought to result in lower DC in polymer systems, [9, 31, 47, 52, 100,
106] with the diffusion-controlled kinetics and unreacted radical population limiting the
final conversion.[74] Moreover, as nearly 25 to 55 % of methacrylate groups remain
unreacted, [9, 106, 107] the plasticizing effect of residual unreacted monomers or
unreacted C=C bonds on the polymer matrix renders them more susceptible to
degradative reactions.
As the resin matrix of Clearfil Photo Core, Charisma and Clearfil Core New Bond is
based on a Bis-GMA/TEGDMA mixture; an autoacceleration takes place with a rapid
highly cross-linked network formation over comparatively shorter curing times due to a
buildup of radicals. [74, 112] This is due to increased diluent monomer concentration
(such as TEGDMA) reportedly improving the mobility of monomer molecules with
enhanced reactivity of the components and increased diffusion of reactive groups. [51,
52, 61, 101, 112, 118] Triethyleneglycol- dimethacrylate (TEGDMA) also acts as a
cross-linking agent with an antiplasticiant effect,[101] and is considered to be the main
contributor towards post-irradiation of Bis-GMA-based composite resins, due to their
ether linkages which render the molecule highly flexible.[73, 107, 118] Still, the
TEGDMA-rich resin mixtures could develop lower strength as a result of cyclizaton,
rendering the materials heterogeneous with higher conversion but lower strength.
Discussion
75
Embitterment of TEGDMA-containing materials is the result of the formation of a
glassy network.[52, 101]
The highest % DC was observed for dual-cured composite resins (Luxa Core Automix
Dual and Rebilda DC) as well as a light-cured composite resin (Clearfil Photo Core), all
showing higher flexural properties and higher % DC. [47, 51, 52, 64, 65, 74, 112].
These 3 materials were of different polymer matrix composition:
Luxa Core Automix Dual has its polymer matrix based only on Bis-GMA, that of
Rebilda DC is based on both Bis-GMA and UDMA dimethacrylates, and finally that of
Clearfil Photo Core is based on a Bis-GMA/TGDMA mixture.
The literature states that UDMA mixtures show a significantly higher conversion
compared to Bis-GMA which shows more cross-linking. The increased reactivity of
UDMA is most probably due to greater flexibility, weaker intermolecular bonding and
chain transfer reactions caused by NH-groups present in UDMA, allowing for increased
mobility of the radical sites in the network.[52, 112]
The network formation decreases the mobility of the monomer and the diffusion rates
of proliferating free radicals and the pendant methacrylate groups as polymerization
progresses, trapping unreacted monomers because of a rapid rise in viscosity, rendering
these materials less resistant to degradation.[22, 32, 38, 52, 107, 112, 118]
The continuously increasing DC with time of storage, is most probably due to post-
curing, resulting in increased DC, FS and FM; a phenomenon known as‘’ dark post-
cure.’’ [44, 56, 73, 118, 138]
For post-polymerization, sufficient mobility of remaining free radicals is required to
increase DC, especially occurring at higher temperatures.[118] That is because new
radicals are formed by stimulating residual catalysts or by splitting residual C=C
groups, resulting in increased DC.[50, 65]
It was also established that higher amounts of stress are created inside the polymeric
network during polymerization, due to further development of the elastic modulus,
rendering the material susceptible to fracture.[116] A relief of such stresses could be
achieved during storage at elevated temperatures (37°C, TC), due to relaxation
processes occurring within the material, through reconfiguration and rearrangement of
polymer chains with increased fracture resistance. [6]
Discussion
76
From the obtained results, it could be seen, that materials differ in many aspects besides
their differences in monomer base, with respect to type, amount and silanization of filler
particles incorporated, as well as the differences in initiators and inhibitors added. [9,
30-32, 116, 138]
The type of filler, its concentration, as well as the nature of its bonding to the resinous
matrix clearly affected the DC of composite resin materials investigated,[30, 31, 138] as
far as the incorporated fillers are concerned, where microhybrid composite resins show
a more reliable % DC. [38, 64] Several authors have proven that flowable composite
resins demonstrate a higher DC than universal types, followed by packable composites
of higher filler content. [46, 61, 117, 136, 138]
The difference in % DC between materials may be related to the fillers incorporated:
Whilst Rebilda DC, the flowable composite resin with the least filler amount (70 wt %
fine silica particles, average diameter: 2µm), followed by Luxa Core Automix (72 wt%
microfine Ba-glass / pyrogenic silica, average diameter: 0.02- 4 µm ), revealed the
weakest correlation between % DC and FS (Rebilda DC: r2 = 0.256, Luxa Core
Automix: r2: 0.292), as well as between % DC and FM ( Rebilda DC: r2 = 0.187, Luxa
Core Automix: r2 = 0.406), the hybrid self-cured Clearfil Core New Bond (78 wt%
colloidal silica, average diameter: 4 µm) showed the highest correlation ( FS: r2 = 0.452,
FM: r2 = 0.525).
Clearfil Core New Bond revealed the highest correlation between flexural properties
and % DC, most probably as a result of its higher silanized microhybrid filler
concentration. This can be explained by the fact, that filler silanization reduces the
catalytic effect of the filler surface on the decomposition of free radicals. [22] However,
Clearfil Photo Core, the light-cured composite resin, of a much higher content of hybrid
silane treated fillers (83 wt %) did in fact show no correlation between gradually
increasing flexural properties and more rapidly increasing % DC, contradicting the
opinion of authors stating a reduction in % DC with increased amount of silanized
fillers. [46, 61, 117, 136, 138]
The influence of increased % DC on FS and FM was obvious for Rebilda DC
throughout the entire observation period, whereas both self-cured composite resins
(Luxa Core Automix and Clearfil Core New Bond) showed a slight reduction in their
flexural properties starting at a 60-65% DC.
Discussion
77
The weak correlation between flexural properties and % DC recorded for Luxa Core
Automix and Rebilda DC may be explained by the smaller filler size and less filler
amount of these materials. According to relevant literature, as a result of the light-
scattering phenomena with reduced light transmission through the material, microfilled
composite resins do present smaller depth of cure and higher amount of remaining C=C
[41] as well as lower % DC. [64]
In conclusion, DC does not allow conclusions to be equally made across the mechanical
properties for all composite resins.[14]
7.4.2. Correlation between storage condition and Degree of Conversion All composite resin materials investigated, revealed a significant (p < 0.05) yet weak
(r2< 0.25) correlation between % DC and storage condition, except for Luxa Core
Automix Dual, which revealed no correlation between both parameters (p > 0.05).
The relatively strong influence of storage on % DC, demonstrated for Luxa Core
Automix (r2 = 0.459) and Rebilda DC (r2 = 0.428), may be due to the diluting water
effect on the mixtures, resulting in lower viscosity, thus enhancing diffusion and C=C
double bond conversion.[54] As an improved mobility of reactive molecular groups is
inevitable for an enhanced diffusion of reactive groups.[51]
The observed increase in % DC for the first 90 to 100 h, declining over the next 4 days
for most composite resins investigated, largely depends on the monomer system
incorporated, [31, 44] since the increased availability of unreacted molecular groups
containing free radicals at the beginning of the polymerization process allows for
substantial increase in DC.[50, 116, 118] Whereas the decline in % DC over 4 days is
most probably the result of a decay of free radicals.[41, 50]
However, some materials demonstrated a divergent pattern of correlation on the other
hand: Rebilda SC, the self-cured composite resin, showed a slow rise in its % DC
during the first 96 h, which might possibly be explained by its lower filler content (68.5
wt%) of fine dispersion silica and its monomer system being based on both Bis-GMA
and UDMA, rendering it more hydrophilic. Moreover, the hydroxyethyl-dimethacrylate
(HEDMA) content of the material makes it more susceptible to water sorption,
rendering the unreacted free radicals sufficiently mobile to contact other reactive
molecular groups, with a resultant increased DC. [118,50, 65]
Discussion
78
For Clearfil Photo Core, the light-cured composite resin, on the other hand, its % DC
already declined after about 50h, which could possibly be explained by the
autoacceleration process (gel effect) taking place, to demonstrate a highly cross-linked
network formation over a comparatively short time, attributable to a buildup of free
radicals in the system.[74, 112] However, a restriction of mobility of polymeric radicals
(diffusion-controlled termination rate coefficient) with decreased % DC occurs with
polymerization proceeding over time to develop a more rigid network.
Finally, the % DC for Luxa Core Automix Dual, the dual-cured composite resin, revealed
an almost constant development during the first 96h, to decrease afterwards. This
behavior may be explained by the free radical termination being a diffusion-controlled
process, with the rate coefficient termination in the reaction being controlled by the time
constant for diffusion to form radical-radical meeting pairs, rather than on the chemical
reaction itself. [5] The decrease in % DC after 96h could be related to the depletion of
free radicals in the monomer structure. [46, 61, 117, 136, 138]
Regarding the 7d storage conditions (WB versus TC), only the WB storage condition
seemed to have a highly significant influence (p < 0.000) on the % DC. A strong
correlation was demonstrated between % DC and flexural properties (FS: r2 = 0.662,
FM: r2 = 0.289). This strong influence could be developed by the prolonged storage
period (7d at a 37°C), thus increasing the availability of free radicals remaining in the
composite resin after 7d to result in a significant increase in DC.[50]
On the contrary, following a 7d TC storage condition, no correlation (p > 0.05) between
DC and flexural properties was recorded (FS: r2 = 0.098, FM: r2 = 0.126) for composite
resins investigated. The reason for this behavior could be explained by the existence of
a logarithmic relationship between the half-life of the radicals and the storage temp,[22]
since it was proven, that an increased post-cure temperature of a composite resin
severely reduced the half-life of radicals. Moreover, the type, size and filler coating
affect the half-life of the radicals as well. [22]
Hydrohilicity and hydrophobicity of photo-initiators significantly affected both the DC
as well as polymerization rate in presence of water. Since the addition of photo-initiator
types improving radical efficiency, positively affects both the final DC and conversion
rate. [54]
Summary
79
8. Summary The aim of this study was to test four hypotheses, divided into two parts:
In the 1st Part of the study, the flexural properties (flexure- strength (FS) and flexural-
modulus (FM)) of 4 different groups of tooth-colored core-buildup materials (glass-
ionomers: conventional-and metal-modified, resin-modified glass-ionomers, polyacid-
modified composite resins (compomers) and composite resins: self-, light- and dual-
cured, were investigated, testing the effect of different variables (material type, storage
time and condition, and the curing mode) on flexural properties. Moreover, the effect of
the light-curing step on 3 dual-cured materials (a resin-modified glass-ionomer and 2
composite resins) was investigated, comparing their flexural properties with and without
light-curing.
A total of 850 bar-shaped specimens (25 mm x 2mm x 2mm) were tested in a 3-point-
bending test device, after storage under 5 different conditions (10 min dry in an incubator
(baseline) to be additionally stored for either 2h,24h and 7d in deionized water (37°C/7d
thermocycling with 5000 cycles at 5-55°C).
From the results it can be concluded that several variables influence the flexural
properties of the 4 groups of tooth-colored core-buildup materials. The type of material
(glass-ionomer or resin-based), storage condition, as well as light-curing, significantly
influences flexural properties of the 4 groups of tooth-colored restorative materials,
showing higher flexural properties (FS and FM) for resin-based materials and light-
cured-types compared to chemically-cured types.
In the 2nd Part of the study the relationship between the flexural properties (FS and FM)
and the degree of conversion as well as the influence of storage condition on the degree
of conversion of 7 different composite resin materials were assessed.
A total of 280 bar-shaped specimens were tested. The degree of conversion was
determined by calculating the percentage of reacted C=C bonds using an FTIR analysis
(baseline method) on the fractured bar-shaped specimens immediately after recording the
flexural properties. Prior to testing, the specimens were subjected to 8 different storage
conditions (5 min and 10 min dry storage in an incubator at 37°C, in distilled water at
Summary
80
37°C for 1h, 4h, 24h, 2d, 7d and 7d thermocycling after being stored for 10 min as
baseline in an incubator at 37°C).
The bivariate correlation analysis revealed a significant relationship (p<0.05) between
% DC and flexural properties (FS and FM) for 3 materials: 2 self-cured composite
resins (Luxa Core Automix and Clearfil Core New Bond) as well as Rebilda DC, the
dual-cured composite resin, while the rest of composite resins revealed no correlation
between both parameters.
For the influence of storage condition on the degree of conversion, a significant (p <
0.05) yet weak (r2 < 0.25) correlation between both parameters was recorded for all
composite resins, except for Luxa Core Automix Dual, the dual-cured composite resin,
which revealed no correlation between both parameters (p > 0.05).
From the results it can be concluded that degree of conversion does not reflect the
mechanical properties for all composite resins equally, and that in contrast to the 7 day
storage period in distilled water, which obviously influenced both flexural properties,
the thermocycling period revealed no influence on the DC values for all composite
resins tested.
Zusammenfassung
81
9. Zusammenfassung Das Ziel dieser Studie war es, vier Hypothesen, unterteilt in zwei Teile, zu untersuchen:
Im 1.Teil der Studie, wurden die Biegeeigenschaften (Biegefestigkeit (FS) und
Biegemodul (FM) von 4 verschiedener Gruppen zahnfarbener Kernaufbau-Materialien
(Glas-Ionomere: konventionell-und Metall-modifiziert, Harz-Glas-Ionomere, Polysäure-
modifizierte Komposite (Kompomere) und Komposit-Harze: selbst-, Licht- und
dualhärtend) untersucht. Der Effekt verschiedener Variablen (Materialart, Lagerzeit und
Zustand, und das Härtungsverfahren) auf die Biegeigenschaften wurde getestet. Darüber
hinaus, wurde die Wirkung des Lichthärtungsverfahrens auf 3 dual-gehärtete Materialien
untersucht (ein hazmodifiziertes Glasionomerzement und 2 Komposit-Harze), wobei
deren Biegeeigenschaften (FS und FM) mit- und ohne Lichthärtung verglichen wurden.
Insgesamt wurden 850 stabförmige Proben (25 mm x 2mm x 2mm) in einem 3-Punkt-
Biegeversuch getestet, nachdem diese einer Lagerung unter 5 verschiedenen
Bedingungen (10 min trocken in einem Brutschrank (Basislinie), und dann eine
zusätzliche Lagerung entweder für 2h, 24h und 7d in deionisiertem Wasser (37 ° C/7d
Thermocycling mit 5000 Zyklen bei 5-55 ° C) ausgesetzt waren.
Aus den Ergebnissen lässt sich schließen, dass mehrere Variablen die Biegeeigenschaften
der 4 Gruppen von zahnfarbenen Kern-Aufbau Materialien beeinflussen. Die Art des
Materials (Glasionomer oder Harz-basiert), Lagerungsbedingungen sowie das
Härtungsverfahren, beeinflusst die Biegeeigenschaften der 4 Gruppen maßgeblich, wobei
Harz-basierte Werkstoffe sowie Lichthärtende - Materialien höhere Biegeeigenschaften
(FS und FM) im Vergleich zu den chemischhärtenden Materialien zeigten.
Im 2. Teil der Studie wurden die Beziehung zwischen der Biegeeigenschaften (FS und
FM) und dem Umsetzungsgrad (%DC), sowie der Einfluss der Lagerungsbedingungen
auf den Umsatzungsgrad (%DC) 7 verschiedener Komposit Materialien bewertet.
Insgesamt wurden 280 stabförmige Proben getestet. Der Grad der Umsetzung wurde als
Anteil (Prozent) der umgesetzten C=C- Bindungen mit Hilfe einer FTIR - Analyse
(Baseline-Methode) der gebrochenen stabförmigen Proben sofort nach der Aufnahme der
Biegeeigenschaften bestimmt. Vor der Prüfung wurden die Proben 8 verschiedenen
Lagerbedingungen (5 min und 10 min trockene Lagerung in einem Brutschrank bei 37 °
Zusammenfassung
82
C, in destilliertem Wasser bei 37 ° C für 1h, 4h, 24h, 2d, 7d und 7d Thermocycling
nach einer Lagerung in einem Brutschrank bei 37 ° C als Basislinie) ausgesetzt.
Die bivariate Korrelationsanalyse ergab eine signifikante Beziehung (p<0,05) zwischen
% DC und Biegeeigenschaften (FS und FM) für 3 Materialien: 2 selbsthärtende
Komposit-Harzen (Luxa Core Automix und Clearfil Core New Bond) sowie das
dualhärtende Rebilda DC, während die anderen Komposit Materialien keine Korrelation
zwischen beiden Parametern zeigte.
Bezüglich des Einflusses der Lagerungsbedingungen auf den Umsetzungsgrad, war eine
signifikante (p < 0,05) doch schwache (r2 < 0,25) Korrelation zwischen beiden
Parametern für alle Komposit - Harze festzustellen. (Ausnahme: Luxa Core Automix
Dual)
Aus den Ergebnissen lässt sich schließen, dass der Umsetzungsgrad nicht die
mechanischen Eigenschaften für alle Komposit Materialien gleichermaßen widerspiegelt,
und dass im Gegensatz zu einer 7 Tagen Lagerungszeit in destilliertem Wasser, welche
die % DC-Werte aller untersuchten Komposit-Harzen beeinflusste, zeigte Thermocycling
keinen Einfluss auf die % DC-Werte der Komposit Materialien.
Conclusions
83
10. Conclusions Within the limitations of this study, the following conclusions were drawn:
1-Non of the investigated tooth-colored core-buildup material fulfills all requirements of
sufficient flexural properties and degree of conversion under different storage
conditions.
2- The mechanical properties proved to be more network-dependent, while the influence
of % DC on the mechanical properties proved to be material-dependent.
3- Degree of conversion does not permit drawing conclusions about the mechanical
properties equally for all composite resins.
4- Monomer composition, filler amount, size and distribution as well as particle content
interaction, influence the flexural properties as well as % DC of materials tested.
5- Light-curing is mandatory for resin-based materials to achieve adequate flexural
properties, as a result of the additional cross-linking reactions of the resin components
occurring.
6- Storage time, material type and curing mode significantly influenced flexural
properties of tooth-colored restorative materials.
7- Thermocycling negatively affects flexural properties of almost all restorative
materials significantly, while having no influence on the degree of conversion of
composite resins investigated.
8- Dentists should be informed about the early strength of resin-based and glass-
ionomer core-buildup materials, trying to restrict their use to low-stress bearing areas.
References
84
11. References 1. Abbas G., Flemming G.J.P., Harringto E. Cuspal movement and microleakage in premolar teeth restored with a packable composite cured in bulk or in increments. J Dent; 2003; 31:437-444. 2. Abour M.A.B., Labella R., Pearson G.J. Evaluation of long-term strength of an alloy-reinforced GIC. J Dent Res; 1996; 75 [5]:1177. 3. Abu-Bakr N., Han L., Okamoto A., Iwaku M. Changes in the mechanical properties and surface texture of compomer immersed in various media. J Prosthet Dent; 2000; 84:444-445.
4. Adusei G.O., Deb S., Nicholson J.W. The role of the ionomer glass component in polyacid-modified composite resin dental restorative materials. J Dent Mater Sci: Materials in Medicine; 2004; 15:751-754. 5. Andrzejewska E. Photopolymerization kinetics of multifunctional monomers. Prog Polym Sci; 2001; 26:605-655. 6. Anusavice K.J. Phillips' Science of Dental Materials*Phillips' Science of Dental Materials Saunders; 11th ed*2003. 7. Arcoria C.J., De Wald J.P., Moody C.R., Ferracane J.L. Effects of thermocycling on amalgam and alloy-glass ionomer cores luted to cast Au crowns. Dent Mater; 1988; 4:155-157.
8. Arksornnukit M., Takahashi H. Thermo-hydrolytic stability of core foundation and restorative composites. J Prosthet Dent; 2004; 92:348-353.
9. Asmussen E. Factors affecting the quantity of remaining double bonds in restorative resin polymers. Scand J Dent Res; 1982; 90:490-496.
10. Asmussen E., Peutzfeldt A. Influence of UEDMA, Bis GMA and TEGDMA on selected mechanical properties of experimental resin composites. Dent Mater; 1998; 14:51-56.
11. Atai M., Nekoomanesh M., Hashemi S.A., Amani S. Physical and mechanical properties of an experimental dental composite based on new monomer. Dent Mater; 2004; 20:663-668. 12. Attin T., Vataschki M., Hellwig E. Properties of resin-modified restorative materials and two polyacid-modified resin composite materials. Quint Int; 1996; 27 [3]:203-221. 13. Azillah M.A., Anstice H.M., Pearson G.J. Long-term flexural strength of three direct aesthetic restorative materials. JDent; 1998; 26:177-182. 14. Balkenhol M., Ferger P., Mautner M.C., Wöstmann B. Provisional crown and fixed partial denture materials: Mechanical properties and degree of conversion. Dent Mater; 2007; 23:1574-1583.
15. Balkenhol M., Köhler H., Orbach K, Wöstmann B. Fracture toughness of cross-linked and non-cross-linked temporary crown and fixed partial denture materials. Dent Mater; 2009; 25: 917-928. 16. Bapna M.S., Gadia C.M., Drummond J.L. Effects of aging and cyclic loading on mechanical properties of glass-ionomer cements. Eur J Oral Sci; 2002; 110:330-334.
References
85
17. Barszczewska-Rybarek I.M. Structure -property relationships in dimethacrylate networks based on Bis-GMA, UDMA and TEGDMA. Dent Mater; 2009; 25:1082-1089.
18. Beun S., Glorieux T., Devaux J., Leloup G. Characterization of nanofilled compared to universal and microfilled composites. Dent Mater; 2007; 23:51-59.
19. Bona A.D., Benetti P., Borba M., Cecchetti D. Flexural and diametral tensile strength of composite resins. Braz Oral Res; 2008; 22 [1]:84-89.
20. Braem M.J.A., Lambrechts P., Gladys S., Vanherle G. In vitro fatigue behavior of restorative composites and glass-ionomers. Dent Mater; 1995; 11:137-140.
21. Braga R.R., Ferracane J.l. Contraction stress related to degree of conversion and reaction kinetics. J Dent Res ; 2002; 81 [2]:114-118.
22. Burtscher P. Stability of radicals in cured composite materials. Dent Mater; 1993; 9:218-221.
23. Calais J.G., Söderholm K.J.M. Influence of filler type and water exposure on flexural strength of experimental composite resins. J Dent Res; 1988; 67 [5]:836-840.
24. Cattani-Lorente M.-A., Dupuis V., Payan J., Moya F., Meyer J.-M. Effect of water on the physical properties of resin-modified glass-ionomer cements. Dent Mater; 1999; 15:71-78. 25. Cattani-Lorente M.A., Dupuis V., Moya F., Meyer J.M. Comparative study of physical properties of a polyacid-modified composite resin and a resin-modified GIC. Dent Mater; 1999; 15:21-32.
26. Cattani-Lorente M.A., Godin C., Meyer J.M. Early strength of glass-ionomer cements. Dent Mater; 1993; 9 [1]:57-62.
27. Cattani-Lorente M.A., Godin C., Meyer J.M. Mechanical behavior of glass-ionomer cements affected by long term storage in water. Dent Mater; 1994; 10:37-44.
28. Christensen R.G. Building up tooth preparations for full crowns-2000. JADA; 2000; 131:505-506.
29. Chung C.M., Kim J.G., Kim M.S., Kim K.M., Kim K.N. Development of a new photocurable comosite resin with reduced curing shrinkage. Dent Mater; 2002; 18:174-178. 30. Chung K.H. Relationship between composition and properties of posterior resin composites. J Dent Res; 1990; 69 [3]:852-856. 31. Chung K.H., Greener E.H. Correlation between degree of conversion, filler concentration and mechanical properties of posterior composite resins. J Oral Rehabil; 1990; 17:487-494.
32. Chung K., Greener E.H. Degree of conversion of seven visible light-cured posterior composites. J Oral Rehabil; 1988; 15:555-560.
33. Chung S.M., Yap A.U.J., Chandra S.P., Lim C.T. Flexural strength of dental composite restoratives: Comparison of biaxial and 3-point bending test. J Biomed Mater Res; 2004; Part B: Appl Biomater 71 B:278-283. 34. Chutinan S., Platt J.A., Cochran M.A., Moore B.K. Volumetric dimensional change of six direct core materials. Dent Mater; 2004; 20:345-351. 35. Combe E.C., Shaglouf A.M.S., Watts D.C., Wilson N.H.F. Mechanical properties of direct core build-up materials. Dent Mater; 1999; 15:158-165.
References
86
36. Craig R.G., Powers J.M. Restorative Dental Materials. *Restorative Dental Materials Mosby Inc; 11 th ed*2002.
37. Curtis A.R., Palin W.M., Fleming G.J.P., Shortall A.C.C., Maquis P.M. The mechanical properties of nanofilled resin-based composites: The impact of dry and wet cyclic pre-loading on biaxial-flexural strength. Dent Mater; 2009; 25:188-197. 38. Da Silva E.M., Almeida G.S., Poskus L.T., Guimaraes J. G. A. Relationship between the degree of conversion, solubility and salivary sorption of a hybrid and a nanofilled resin composite: Influence of the light-activation mode. J Appl Oral Sci 2008; 16 [2]:161-166.
39. De Gee A.J., Leloup G., Werner A., Vreven J., Davidson C.L. Structural integrity of resin-modified glass-ionomer as affected by the delay or omission of light activation. J Dent Res; 1998; 77 [8]:1658-1663. 40. El-Kallah I.H., Garcia-Godoy F. Mechanical properties of compomer restorative materials. Oper Dent; 1999; 24 [1]:2-8. 41. Eliades G., Vougiouklakis G.J, Cputo A.A. Degree of double bond conversion in light-cured composites. Dent Mater; 1987; 3:19-25. 42. Emami N., Söderholm KJM. How light irradiance and curing time affect monomer conversion in light-cured resin composites. Eur J Oral Sci; 2003; 111:536-542. 43. Emami N., Söderholm K.J.M., Berglund L.A. Effect of light power density variations on bulk curing properties of dental composites. J Dent; 2003; 31:189-196. 44. Ferracane J.L. Correlation between hardness and degree of conversion during the setting reaction of unfilled dental restorative resins. Dent Mater; 1985; 1 [1]:11-14. 45. Ferracane J.L. Current trends in dental composites. Crit Rev Oral Biol Med; 1995; 6 [4]:302-318. 46. Ferracane J.L., Berge H.X., Condon J.R. In vitro aging of dental composites in water- Effect of degree of conversion, filler volume, and filler/ matrix coupling. J Biomed Mater Res; 1998;42:465-472.
47. Ferracane J.L., Greener E.H. The effect of resin formulation on the degree of conversion and mechanical properties of dental restorative resins. J Biomed Mater Res; 1986; 20:121-131. 48. Ferracane J.L., Antonio RC, Matsumoto H. Variables affecting the fracture toughness of dental composites. J Dent Res; 1987; 66 [6]:1140-1145. 49. Ferracane J.L., Berge H.X. Fracture toughness of experimental dental composites aged in ethanol. J Dent Res; 1995; 74 [7]:1418-1423. 50. Ferracane J.L., Condon JR. Post-cure heat treatments for composites: properties and fractography Dent Mater; 1992; 8:290-295. 51. Ferracane J.L., Greener E.H. Fourier Transform Infrared Analysis of degree of polymerization in unfilled resins-Methods comparison. J Dent Res; 1984; 63 [8]:1093-1095.
52. Floyd C.J.E., Dickens S.H. Network structue of Bis-GMA-and UDMA-based resin systems. Dent Mater; 2006; 22:1143-1149.
53. Frankel N., Pearson G.J., Labella R. Long-term strength of aesthetic restoratives. J Oral Rehabil; 1998; 25:89-93.
References
87
54. Guo X., Wang Y., Spencer P., Ye Q., Yao X. Effects of water content and initiator composition on photopolymerization of a model BisGMA/HEMA resin. Dent Mater ; 2008; 24:824-831. 55. Halvorson R.H Erickson R.L., Davidson C.L., The effect of filler and silane content on conversion of resin-based composite Dent Mater; 2003; 19:327-333. 56. Halvorson R.H., Erickson R.L., Davidson C.L. Energy dependent polymerization of resin-based composite. Dent Mater; 2002; 18:463-469. 57 Hickel R., Dash W., Janda R., Tyas M., Anusavice K. New direct restorative materials. Int Dent J; 1998; 48:3-16. 58. Iazzetti G., Dura P.B., Luiz R.R. Effect of time on the flexure strength of four compomers.: In: * IADR *San Diego:*2002 59. Ikejima I., Nomoto R., Mc Cabe J.F. Shear punch strength and FS of model composites with varying filler volume fraction, particle size and silanation. Dent Mater; 2003; 19:206-211.
60. Ilie N., Hickel R. Investigations on mechanical behavior of dental composites. Clin Oral Invest; 2009; 13 [4]:427-438.
61. Imazato S., Mc Cabe J.F., Tarumi H., Ehara A., Ebisu S. Degree of conversion of composites measured by DTA and FTIR. Dent Mater; 2001; 17:178-183.
62. Irie M., Hatanaka K., Suzuki K., Watts D.C. Immediate versus water - storage performance of class V flowable composite restoratives. Dent Mater; 2006; 22:875-883.
63. Irie M., Nakai H. Flexural properties and swelling after storage in water of polyacid-modified composite resin (compomer). Dent Mater J; 1998; 17 [1]:77-82.
64. Jafarzadeh Kashi T.S., Bagheri G.H., Behroozibakhs M., Fatemi S.M., Rezaei Y. Degree of conversion of nano-and micro-hybrid resin composites cured by different light sources. Dent Mater; 2010; 26 S: ei-e84. 65. Jafarzadeh Kashi T.S., Behroozibakhs M., Fatemi S.M., Erfan M., Bagheri G H., The effect of temperature on the efficacy of polymerization of a dental resin composite Dent Mater ; 2010; 26 S e18-e 19
66. Janda R., Roulet J.F., Latta M., Rüttermann S.T. The effects of thermocycling on the flexural strength and flexural modulus of modern resin-based filling materials. Dent Mater; 2006; 22:1103-1108. 67. Kanchanavasita W., Anstice H.M., Peatson G.J., Long-term flexural strength of resin-modified glass-ionomer cements. Biomater; 1998; 19:1703-1713. 68. Kerby R.E., Knobloch L., Schricker S., Gregg B. Synthesis and evaluation of modified urethane dimethacrylate resins with reduced water sorption and solubility. Dent Mater; 2009; 25:302-313.
69. Kim K.H., Ong J.L., Okuno O. The effect of filler loading and morphology on the mechanical properties of contemporary composites. J Prosthet Dent; 2002; 87:642-649.
70. Kovarik R.E., Breeding L.C., Caughman W.F. Fatigue life of 3 core materials under simulated chewing conditions. J Prosthet Dent; 1992; 68:584-590.
71. Leung R.L., Fan P.L., Johnston W.M., Post-irradiation polymerization of visible light-activated composite resin. J Dent Res; 1983; 62 [3]:363-365.
72. Levartovsky S., Kuyinu E., Georgeseco M., Goldstein G.R. A comparison of the diametral tensile strength, the flexural strength, and the compressive strength of two new
References
88
core materials to a silver alloy-reinforced glass-ionomer material. J Prosthet Dent; 1994;72:481-485.
73. Lopez-Suevos F., Dickens S.H. Degree of cure and fracture properties of experimental acid resin-modified composites under wet and dry conditions. Dent Mater; 2008; 24:778-785. 74. Lovell L.G., Berchtold K.A., Elliott J.E., L H., Bowman C.N, Understanding the kinetics and network formation of dimethacrylate dental resins. Polym Adv Technol; 2001;12:335-345.
75. Luiz B.K.M., Amboni R.D.M.C., Prates L.H.M., Bertolino J.R., Pires A.T.N. Influence of drinks on resin composite: Evaluation of degree of cure and color change parameters. J Polymer Testing; 2007; 26 [4]:438-444. 76. Manhart J., Kunzelmann K.H, Chen H.Y., Hickel R. Mechanical properties and wear behavior of light-cured packable composite resins. Dent Mater; 2000; 16:33-40. 77. Masouras K., Silikas N., Watt D.C. Correlation of filler content and elastic properties of resin-composites. Dent Mater; 2008; 24:932-939. 78. Mathis R.S., Ferracane J.L. Properties of a glass-ionomer / resin-composite hybrid material. Dent Mater; 1989; 5:355-358. 79. Mc Cabe J.F. Resin-modified glass-ionomer cements. Biomater; 1998;19:521-527.
80. Mc Cabe J.F.,Walls A. Applied Dental Materials*Blackwell Publishing Limited 2009. 81. Mc Kenzie M.A., Linden R.W.A., Nicholson J.W. The physical properties of conventional and resin-modified glass-ionomer dental cements stored in saliva, proprietary acidic beverages, saline and water. Biomater; 2003; 24:4063-4069.
82. Meyer J.M., Cattani-Lorente M.A., Dupuis V. Compomers: between glass-ionomer cements and composites. Biomater; 1998; 19:529-539.
83. Mitra S.B., Kedrowski B.L. Long-term mechanical properties of glass-ionomers. Dent Mater; 1994; 10:78-82.
84. Momoi Y., Hirosaki K., Kohno A., Mc Cabe J.F. Flexural properties of resin-modified 'hybrid' glass-ionomers in comparison with conventional acid - base glass-ionomers. Dent Mater; 1995; 14 [2]:109-119. 85. Musanje L., Darvell B.W. Effects of strain rate and temperature on the mechanical properties of resin composites. Dent Mater; 2004; 20:750-765. 86. Musanje L., Shu M., Darvell B.W. Water sorption and mechanical behavior of cosmetic direct restorative materials in artificial saliva. Dent Mater; 2001; 17:394-401. 87. Nakajima H., Watkins J.H., Arita K., Hanaoka K., Okabe T. Mechanical properties of glass-ionomers under static and dynamic loading. Dent Mater; 1996; 12:30-37. 88. Nicholson J.W. Chemistry of glass-ionomer cements: a review Biomater; 1998;19:485-494. 89. Nicholson J.W., Anstice H.M., Mc Lean J.W. A preliminary report on the effect of storage in water on the properties of commercial light-cured glass-ionomer cements. Br Dent J; 1992; 173: 98 -101.
90. Nicholson J.W., Asarheed M. Changes on storage of polyacid-modified composite resins. J Oral Rehab; 1998; 25:616-620.
References
89
91. Nicholson J.W., Gjorgievska E., Bajraktarova B. Changes in properties of polyacid-modified composite resins (compomers) following storage in acidic solutions. J Oral Rehab; 2003; 30:601-607. 92. Nomoto R., Asada M., Mc Cabe J.F., Hirano S. Light exposure required for optimum conversion of light activated resin systems. Dent Mater; 2006; 22:1135-1142. 93. O' Mahony A., Spencer P. Core buildup materials and techniques. J Irish Dent Assoc; 1999; 45 [3]:84-90. 94. Ogunyinka A., Palin W.M., Shortall A.C, Marquis P.M. Photoinitiation chemistry affects light transmission and degree of conversion of curing experimental dental resin composites. Dent Mater; 2006; 23:807-813.
95. Oilo G. Characterization of glass-ionomer filling materials. Dent Mater; 1988; 4:129-133.
96. Örtengren U., Elgh U., Spasenoska V., Milleding D., Haasum J., Karlsson S. Water sorption and flexural properties of a composite resin. Int J Prosthodont; 2000; 13:141-147.
97. Ozyesil A.G., Usumez A., Gunduz B. The efficiency of different light sources to polymerize composite beneath a simulated ceramic restoration. J Prosthet Dent; 2004; 91:151-157. 98. Pearson G.J., Atkinson A.S. Long-term flexural strength of glass-ionomer cements. Biomater; 1991; 12:658-660 99. Peez R., Frank S. The physial-mechanical performance of the new Ketac Molar Easymix compared to commercially available glass-ionomer restoratives. J Dent; 2006; 34:582-587.
100. Peutzfedt A. Resin composites in dentistry. Eur J Oral Sci; 1997; 105:97-116. 101. Pfeifer C.S., Silva L.R., Kawano Y., Braga R.R. Bis-GMA co-polymerizations: influence on conversion, flexural properties, fracture toughness and susceptibility to ethanol degradation of experimental composites. Dent Mater; 2009; 25:1136-1141.
102. Pianelli C., Devaux J., Bebelman S., Leloup G. The Micro-Raman spectroscopy, a useful tool to determine the degree of conversion of light-activated composite resins. J Biomed Mater Res ( Appl Biomater); 1999; 48:675-681. 103. Piwowarczyk A., Ottl P., Lauer H-K, Büchler A. Laboratory strength of glass-ionomer cements, compomers, and resin composites. J Prosthodont; 2002; 11:86-91. 104. Ruddell D.E., Maloney M.M., Thompson J.Y. Effect of novel filler particles on the mechanical and wear properties of dental composites. Dent Mater; 2002; 18 [1]:72-80. 105. Rueggeberg F.A., Hashinger D.T., Fairhurst C.W. Calibration of FTIR conversion analysis of contemporary dental resin composites. Dent Mater; 1990; 6:241-249. 106. Ruyter I.E., Oysaed H. Compsites for use in posterior teeth: Composition and conversion. J Biomed Mater Res; 1987; 21:11-23. 107. Ruyter I.E., Svendsen S.A. Remaining methacrylate groups in composite restorative materials. Acta OdontolScand; 1978; 36:75-82. 108. Sakaguchi R.L., Berge H.X. Reduced light energy density decreases post-gel contraction while maintaining DC in composites. J Dent; 1998; 26:695-700. 109. Samuel S.P., Li S., Mukherjee I, Guo Y., Patel A.C., Baran G., Wie Y. Mechanical properties of experimental dental composites containing a combination of mesoporous and nonporous spherical silica as fillers. Dent Mater; 2009; 25:296-301.
References
90
110. Saygili G., Sahmali S., Demirel F. Changes in the mechanical properties of tooth-colored direct restorative materials in relation to time. Poly Adv Technol; 2003; 14:616-622. 111. Shillingburg H.T., Hobo S., Whitsett L.D., Jacobi R., Brackett S.E. Fundamentals of fixed Prosthodontics.*3 rd ed*Quint Publishing Co, Inc*1997. 112. Sideridou I., Tserki V., Papanastasiou G. Effect of chemical structure on degree of conversion in light-cured dimethacrylate -based dental resins. Biomater; 2002; 23:1819-1829.
113. Sideridou I.D., Karabel M.M., Bikiaris D.M. Aging studies of light-cured dimethacrylate-based dental resin composite in water or ethanol/water. Dent Mater; 2007; 23:1142-1149. 114. Silikas N., Eliades G., Watts D.C. Light intensity effects on resin-composite degree of conversion and shrinkage strain. Dent Mater; 2000; 16:292-296. 115. Sindel J., Frankenberger R., Krämer N., Petschelt A. Crack formation of all-ceramic crowns dependent on different core build-up and luting materials. J Dent; 1999; 27:175-181.
116. Tarle Z., Meniga A., Knezevic A., Sutalo J., Ristic M., Pichler G. Composite conversion and temperature rise using a conventional, plasma arc and an experimental blue LED curing unit. J Oral Rehab; 2002; 29 [7]:662-667. 117. Tarle Z., Meniga A., Ristic M., Sutalo J., Pichler G. Possible improvements of clinical properties of dental composite materials with pulsed blue laser curing. CCACAA; 1998; 3:777-787.
118. Tarumi H., Imazato S., Ehara A., Kato S., Ebi N., Ebisu S. Post-irradiation polymerization of composites containing Bis-GMA and TEGDMA. Dent Mater; 1999; 15:238-242. 119. Tjan A.H.L., Morgan D.L. Metal-reinforced glass-ionomers: Their flexural and bond strength to tooth substrates. J Prosthet Dent; 1988; 59:137-141. 120. Toledano M., Torre Dela F.J., Rosales J.L., Osorio R., Garcia Godoy F. Flexural strength evaluation of selected restorative materials. J Dent Res; 1997; 76:422 121. Torabzadeh H., Aboush Y.E.Y. Changes in flexural strength of glass-ionomers and a compomer over time. J Dent Res; 1996; 75 [5]:1177. 122. Tyas M.J. Clinical evaluation of polyacid-modified resin composite (compomer). Oper Dent; 1998; 23:77-80. 123. Van Noort R. Introduction to Dental Materials.*2nd ed*Mosby Inc;*2002.
124. Vijayaraghavan T.V. Hsiao J. Flexural behavior of visible light-cured composites as a function of temperature under water immersion test conditions. Dent Mater; 1994;10:347-352. 125. Viljanen E.K., Lessila L.V.J., Skrifvars M., Vallitu P.K. Degree of conversion and flexural properties of a dendrimer / methylmethacrylate copolymer: design of experiments and statistical screening. Dent Mater; 2005; 21:172-177.
126. Walker M.P., Haj-Ali R., Wang Y., Hunziker D., Williams K.B. Influence of environmental conditions on dental composite flexural properties. Dent Mater; 2006; 22:1002-1007.
References
91
127. Walmsley A., Walsh T., Burke F., Shortall A., Lumley P., Hayes-Hall R. Restoration of teeth (Complex Restorations).*Restorative Dentistry Chicago: Chuchill Livingstone*2002. 128. Wassell R.W., Smart E.R., St George G. Crowns and other extra-coronal restorations: Cores for teeth with vital pulps. Br Dent J; 2002; 192:499-509. 129. Wasson E.A. Reinforced glass-ionmer cements-a review of properties and clinical use. Clinical Materials; 1993; 12:181-190. 130. Wendl B., Droschl H., Kern W. A comparative study of polymerization lamps to determine the degree of cure of composites using infrared spectroscopy. Eur J Orthod; 2004; 26:545-551.
131. Wilson A.D. Resin modified glass-ionomer cements. Int J Prosthodont; 1990; 3:425-429.
132. Wilson P.H.R., Fisher N.L., Bartlett D.W. Direct cores for vital teeth-materials and methods used to retain cores in vital teeth. Eur J Prosthodont Rest Dent; 2002; 10 [4]:157-162. 133. Xie D., Brantley W.A, Culbertson B.M., Wang G. Mechanical properties and microstructures of glass-ionomer cements. Dent Mater; 2000; 16:129-138. 134. Yap A.U.J., Chandra S.P., Chung S.M., Lim C.T. Changes in flexural properties of composite restoratives after aging in water. Oper Dent; 2002; 27:468-474. 135. Yap A.U.J., Tan D.T.T., Goh B.K.C., Kuah H.G., Goh M. Effect of food-simulating liquids on the flexural strength of composite and polyacid-modified composite restoratives. Oper Dent; 2000; 25:202-208.
136. Yoon T.H., Lee Y.K., Lim B.S., Kim C.W. Degree of polymerization of resin composites by different light sources. J Oral Rehab; 2002; 29:1165-1173.
137. Young A.M. FTIR investigation of polymerisation and polyacid neutralization kinetics in resin-modified glass-ionomer dental cements. Biomater; 2002; 23:3289-3295.
138. Zandinejad A.A., Atai M., Pahlevan A. The effect of ceramic and porous fillers on the mechanical properties of experimental dental composites. Dent Mater; 2006; 22:382-387
Declaration
92
12. Declaration
¨I declare that I have written the submitted dissertation independently, without
unauthorized outside help and only with the aids that I have stated in the dissertation.
All text passages which I have quoted word-for word or which I have quoted in an
analogous form have been taken from published or unpublished documents and all
details which are given orally have been identified accordingly. I have followed the
basic principles of good scientific practice as defined in the ¨Statute of the Justus Liebig
University Gießen to secure good scientific practice¨.
Acknowledgment
93
13. Acknowledgment I would like to express my sincere gratitude and appreciation to Prof Dr. Bernd
Wöstmann for his supervision, continuous advice, scientific criticism, valuable guidance
and tireless support throughout performing the tests and formulating my work.
Furthermore, many thanks are directed to Dr. Riehl for his counseling and assistance in
the statistical analysis of the data.
Special thanks also go to Dr Reisenauer, the academic senior counselor and supervisor
of IR-UV- and matrix labs- Institute of Organic Chemistry- JLU, as well as to Dr. Bernd
Dippel, the FTIR-/FTNIR-Raman-Spectroscopy specialist, Perkin-Elmer LAS-
Germany, for offering immediate assistance to solve problems concerning degree of
conversion tests.
My deepest thanks go to the Egyptian Government and the Bureau of Culture and Study
Affairs in Berlin, for giving me the opportunity to get my Doctoral Degree in Germany
with full financial coverage for the whole period of my stay in Germany.