Sorting of membrane proteins - TUprintstuprints.ulb.tu-darmstadt.de/3329/1/2013_03_06.pdf ·...
99
Vom Fachbereich Biologie der Technischen Universität Darmstadt zur Erlangung des akademischen Grades eines Doctor rerum naturalium genehmigte Dissertation von Dipl.-Biol. Charlotte von Chappuis aus Rostock 1. Referent: Prof. Dr. Gerhard Thiel 2. Referent: Prof. Dr. Adam Bertl Tag der Einreichung: 14.12.2012 Tag der mündlichen Prüfung: 08.02.2013 Darmstadt 2013 D17 Sorting of membrane proteins: Influence of N-terminal signals using the example of small viral potassium channels
Transcript of Sorting of membrane proteins - TUprintstuprints.ulb.tu-darmstadt.de/3329/1/2013_03_06.pdf ·...
Vom Fachbereich Biologie der Technischen Universität Darmstadt
zur Erlangung des akademischen Grades
eines Doctor rerum naturalium
genehmigte Dissertation von
Dipl.-Biol. Charlotte von Chappuis
aus Rostock
1. Referent: Prof. Dr. Gerhard Thiel
2. Referent: Prof. Dr. Adam Bertl
Tag der Einreichung: 14.12.2012
Tag der mündlichen Prüfung: 08.02.2013
Darmstadt 2013
D17
Sorting of membrane proteins:
Influence of N-terminal signals using the example of
small viral potassium channels
i
Der häufigste Fehler liegt in der Annahme,
dass die Grenzen unserer Wahrnehmung auch
die Grenzen des Wahrzunehmenden sind.
G.W. Leadbeater
ii
Summary
The sorting of membrane proteins depends on a protein coded signal sequence. For a better
understanding of such signal sequence depending sorting of proteins into different compartments,
we use here the two viral potassium channels PBCV1-Kcv and Kesv as experimental tools. Both
proteins are composed of two transmembrane domains per subunit, which form a functional protein
in a tetrameric arrangement. Despite a high degree of similarities regarding the primary structure
PBCV1-Kcv from Paramecium Bursaria Chlorella Virus 1 and Kesv from Ectocarpus Siliculosus Virus
are sorted in heterologous expression system into different cell compartments. While PBCV1-Kcv
can be localised in the plasma membrane, Kesv can be found in the inner mitochondrial membrane.
To investigate the mechanism of differential sorting I performed localisation studies with the help of
fluorescent labelled PBCV1-Kcv/Kesv chimaeras. The results of these experiments provide the
following conclusions:
The post-translational sorting of Kesv into the inner mitochondrial membrane is very sensitive and
tolerates mutations only on a small scale. Therefore an unerring sorting into the mitochondria
requires nearly the entire Kesv sequence. The post-translational sorting of PBCV1-Kcv into the
plasma membrane via the secretory pathway is more robust. It strongly dependents on a signal
sequence, which can be localised in the last third of the first transmembrane domain. Upon
inserting this signal sequence into the respective position of Kesv, a change of sorting could be
recognised. The corresponding PBCV1-Kcv/Kesv chimaera, called Chim3.3, is no longer sorted to
the mitochondria but into the plasma membrane. This suggests all mitochondrial sorting signals,
which are coded by the flanking Kesv sequence segments, are unable to override of the strong
PBCV1-Kcv sorting signal.
When I replaced this critical signal sequence one by one with the sequence of Kesv, it occurred that
a substitution of the first three amino acids still resulted in a mitochondrial sorting again. Therefore,
the change in sorting is within a region of only 3 amino acids. A test of the relevant chimaeras
indeed reveals that Chim3.3 (M1-L49Kesv+M26-D68Kcv+L92-K124Kesv) is still sorted into the
secretory pathway. Chim3.4 (M1-V50Kesv+I27-D68Kcv+L92-K124Kesv) presents no autonomous
sorting and is distributed throughout the cell. Chim4 (M1-V51Kesv+Y28-D68Kcv+L92-K124Kesv)
can be localised in the mitochondria. In a co-expression the fragile sorting of Chim4 as well as Kesv-
wt into the mitochondria can be stabilised significantly by the presence of the mitochondrial marker
protein COXVIII::mKate2. This so far unknown sorting phenomenon in which a protein assists
another protein in sorting can be further substantiated for the targeting of Chim3.4: The
aforementioned global distribution of Chim3.4 can be affect by a co-expression with the fluorescent
protein mKate2. In the presence of mKate2 the channel protein shows a distinct co-sorting along
with the sorting of mKate2. If mKate2 is fused to an organelle-specific sorting signal sequence, the
fusion protein exhibits a directed sorting into the ER or the mitochondria. In that case Chim3.4
follows the sorting of the reference protein. The results of these experiments suggest that the
iii
sorting of Chim3.4 could be navigated by a protein-protein-interaction between the channel
chimaera and mKate2. Based on the data we can speculate that also small cellular proteins without
a specific sorting signal might be sorted into different compartments with the help of other proteins.
Zusammenfassung
Die Sortierung von Membranproteinen im eukaryotischen Zelltyp ist maßgeblich abhängig von
Protein-codierten Signalsequenzen. Um den Mechanismus der Signalsequenz-abhängigen
Sortierung zu sehr unterschiedlichen Zielen wie der Plasmamembran und den Mitochondrien besser
zu verstehen, wurden in dieser Arbeit die beiden viralen Kalium-Kanäle PBCV1-Kcv und Kesv als
Sortierungswerkzeug eingesetzt. Beide Proteine sind strukturell gekennzeichnet durch zwei
Transmembrandomänen pro Untereinheit, die in einer tetrameren Anordnung ein funktionelles
Protein aufbauen. PBCV1-Kcv aus dem Paramecium Bursaria Chlorella Virus 1und Kesv aus dem
Ectocarpus Siliculosus Virus zeigen trotz eines hohen Grades an Homologie bezüglich Stuktur und
Funktion im heterologen Expressionssystem HEK293 eine unterschiedliche zelluläre Sortierung.
Während PBCV1-Kcv in der Plasmamembran lokalisiert werden konnte, wurde Kesv in der inneren
mitochondrialen Membran lokalisiert (Balss et al. 2008). Um diese unterschiedliche Sortierung
besser zu verstehen, wurden Lokalisationsstudien mit Hilfe von fluoreszenzmarkierten PBCV1-
Kcv/Kesv-Chimären durchgeführt, mit denen folgende Erkenntnisse gewonnen werden konnten:
Die post-translationale Sortierung von Kesv in die innere mitochondriale Membran ist sehr
empfindlich und toleriert Mutationen nur in sehr kleinem Umfang. Daher wird fast die gesamte
Kesv-Sequenz benötigt, um das Protein zielsicher in die Mitochondrien zu transportieren. Dagegen
ist die post-translationale Sortierung von PBCV1-Kcv in die Plasmamembran über den
sekretorischen Weg wenig störanfällig. Die Sortierung von PBCV1-Kcv wird stark geleitet durch die
Signalsequenz M26-D68 Kcv, welche im letzten Drittel der ersten Transmembrandomäne lokalisiert
werden konnte. Wird diese Signalsequenz von PBCV1-Kcv an gleicher Position in Kesv eingesetzt,
erfolgt eine Sortierung dieser PBCV1-Kcv/Kesv Chimäre (hier Chim3.3 genannt) in die
Plasmamembran. Scheinbar können sämtliche noch vorhandene mitochondriale Sortierungssignale,
die durch die flankierenden Kesv-Sequenzabschnitte codiert werden das starke Sortierungssignal
von PBCV1-Kcv in seiner Funktion nicht beeinflussen. Wird diese starke Signalsequenz von PBCV1-
Kcv in einem schrittweisen Aminosäuren-Austausch gegen die Sequenz von Kesv ersetzt kann nach
einem Austausch der ersten drei Aminosäuren wieder eine mitochondriale Sortierung erzielt
werden. Der Wechsel in der Sortierung kann deshalb auf einen Sequenzabschnitt von 3
Aminosäuren eingegrenzt werden. Chim3.3 (M1-L49Kesv+M26-D68Kcv+L92-K124Kesv) wird noch
in den sekretorischen Weg sortiert. Chim3.4 (M1-V50Kesv+I27-D68Kcv+L92-K124Kesv) zeigt keine
eigenständige Sortierung und Chim4 (M1-V51Kesv+Y28-D68Kcv+L92-K124Kesv) kann wieder in
den Mitochondrien lokalisiert werden. Die noch fragile mitochondriale Sortierung von Chim4 sowie
iv
die mitochondriale Sortierung von Kesv-wt können in einer Ko-Expression mit einem
mitochondrialen Referenzprotein COXVIII::mKate2 sichtbar stabilisiert werden.
Ein bisher unbekanntes Sortierungs-Phänomem kann mit der Sortierung von Chim3.4 beschrieben
werden: Wie schon erwähnt verbleibt das Kanal Protein in alleiniger heterologer Expression
unsortiert im Cytosol. Jedoch in Anwesenheit des Fluoreszenzproteins mKate2 zeigt die Chimäre
eine Ko-Sortierung, dem Fluoreszenzprotein mKate2 folgend. Bei einer Fusion von mKate2 mit einer
Kompartment-spezifischen Signalsequenz erfolgt eine gerichtete Sortierung von mKate2 in die
Mitochondrien oder in das ER, der sich die Chimäre 3.4 anschließt. Somit kann die Sortierung des
Proteins beliebig durch die Protein-Protein-Interaktion zwischen Chim3.4 und mKate2 gesteuert
werden. Auf der Basis dieser Daten kann spekuliert werden, dass auch kleine zelluläre Proteine
ohne eigene Sortierungssequenz mittels anderer Proteine in ein definiertes Kompartiment sortiert
werden können.
v
1. Table of contents
1. .... Table of contents v
2. .... Chapter 1 - General Introduction 1
2.1. Intracellular protein-sorting and in eukaryotic cells 1
2.2. Protein-sorting in a different manner 2
2.2.1. Protein-sorting in a post-translational manner 3
2.2.2. Protein-sorting in a co-translational manner 5
2.2.3 Dual targeting of proteins 6
2.3. Protein-insertion into a biological membrane 7
2.4. Ion channels 8
2.4.1. Potassium channels 9
2.4.2. The viral potassium channels PBCV-1Kcv and Kesv 12
2.5. References 15
3. .... Chapter 2 – Optimisation of Protein-Localisation studies with the help of Confocal Laser Scanning Microscopy (CLSM) 18
3.1. Abstract 18
3.2. Introduction 18
3.3. Material and Methods 20
3.3.1. Heterologous Expression in HEK293 20
3.3.2. Compartment labelling 21
3.3.3. Confocal Laser Scanning Microscopy (CLSM) 21
3.3.4. Editing of primary data 22
3.4. Results 22
3.4.1. Localisation of PBCV1-Kcv and Kesv with the help of chemical fluorescent dyes 22
3.4.2. Improvement of primary data based on “Pure Denoise” 28
3.4.3. Improvement of primary data using reference proteins to label different cell compartments30
3.5. Discussion 36
3.6. References 39
4. .... Chapter 3 – PBCV1-Kcv and Kesv as tools for investigating membrane protein sorting 41
4.1. Abstract 41
4.2. Introduction 41
4.3. Material and Methods 43
4.3.1. Heterologous Expression in HEK293 43
4.3.2. Confocal Laser Scanning Microscopy (CLSM) 44
4.3.3. Editing of primary data 44
4.4. Results and Discussion 44
4.4.1. Localisation of Kesv/Kcv chimaeras to identify a sorting signal in the first TMD of PBCV1-Kcv 44
4.4.2. Localisation studies of Chimaera 3.1 – 3.4 to detect a strong N-terminal coded sorting
signal of PBCV1-Kcv 53
4.5. Conclusion 59
4.6. References 61
vi
5. .... Chapter 4 – Localisation of PBCV1-Kcv/Kesv chimaera “Chim3.4” is sorted together with the marker proteins 63
5.1. Abstract 63
5.2. Introduction 63
5.3. Material and Methods 64
5.4. Results and Discussion 64
5.4.1. Localisation of Chim3.4::EGFP in the presence of KDEL::mKate2 or COXVIII::mKate2 64
5.4.2. Localisation of Chim3.4::tagBFP in the presence of KDEL::mKate2 or COXVIII::mKate2 69
5.4.3. Localisation of Chim3.4::EGFP in the presence of KDEL::mKate2 and COXVIII::tagBFP 72
5.5. Conclusion 75
5.6. References 78
6. .... Chapter 5 - The post-translational sorting of Kesv 80
6.1. Abstract 80
6.2. Introduction 80
6.3. Material and Methods 81
6.4. Results and Discussion 81
6.5. References 84
7. .... Appendix 85
7.1. Amino acid sequences of Kcv, Kesv and all PBCV1-Kcv/Kesv chimaeras 85
7.2. Fluorescent proteins 87
7.2.1. General 87
7.2.2. Sequence alignment 88
7.3. List of abbreviations 89
8. .... Danksagung 90
9. .... Eidesstattliche Erklärung 91
10. .. Curriculum Vitae 92
1
2. Chapter 1 - General Introduction
2.1. Intracellular protein-sorting and in eukaryotic cells
A major step in the evolution from prokaryotes to eukaryotes was the development of intracellular
membrane-systems which induced a compartmentalisation of the cell-volume. This fragmentation
allows a task sharing of all biochemical reactions inside the different compartments of a cell.
Examples for this kind of task sharing are the nucleus as the gene bench and the mitochondria as
the energy machine of the cell. As a consequence, the compartmentalisation affords parallel
operations of biochemical reactions, without mutual interfere. This makes the eukaryotic cell more
powerful then a prokaryotic cell. But, a crucial requirement for this eukaryotic arrangement of a cell
is the tended sorting of proteins into the different compartments of the cell. For this purpose cells
developed diverse pathways which allow a differentiated sorting of proteins into the correct target
compartment. The sorting of nascent proteins along such a special pathway depends mostly on a
couple of signals. One of the most prominent signals is an N-terminal encoded signal sequence of a
protein. This signal sequence is recognised by a receptor, and acts as an address for the proper
targeting of a protein. For a better understanding of such specific protein sorting mechanisms and
sorting signals, first we have to focus the attention on transcription and translation of proteins.
Nearly the entire Genome of an eukaryotic cell can be found in the nucleus. The first step is the
transcription of the genomic DNA into mRNA in the nucleus. After this process the mRNA is
transported via the export competent complex, through the nucleus pores, into the cytoplasm. The
export competent complex is composed of a couple of export factors which bind the mRNA. After
reaching the cytoplasm the complex dissociates, and the mRNA is ready to be used for the
translation at the ribosome. The general believe is that a crucial sorting step is associated with the
start of translation. The N-terminus with its targeting signals are the first to emerge with the
beginning of translation; because of their early appearance in a nascent protein, N-terminally
encoded targeting signals have a great influence on the sorting of a protein. These signals decide,
whether a protein is translated either in a co-translational or a post-translational manner. This is the
first incidence in which a targeting signal for the sorting of a protein becomes necessary. But the
sorting of proteins is not controlled by only one signal at the beginning of the translation; it is much
more a combination of several factors which come up in the course of the transcription/translation
machinery and the translocation of an protein. At the time of transcription, alternative splicing and
several transcription initiation sites influence structure, function and localisation of the nascent
protein. As mentioned above, the targeting of a nascent protein is during translation determined
mostly by a potential N-terminally encoded signalling sequence. But also after translation is
completed, there is a series of factors which affect sorting. These factors include signals like the
cytoplasmatic cAMP level, protein phosphorylation, prenylation or N-glycosylation of the protein. In
2
addition external influences such as light can modify the sorting of proteins. All this targeting
signals are described in detail in the course of the following chapters.
2.2. Protein-sorting in a different manner
As a consequence of the compartmentalisation of a eukaryotic cell and the various functions of
proteins, the sorting and transport goes on in a different manner. Generally there are two
possibilities for protein sorting: The sorting in a co-translational or in a post-translational manner.
The first pathway is mainly used by proteins which follow the secretory pathway up to the plasma
membrane. In contrast cytoplasmatic proteins and proteins, which are destined for compartments
like the chloroplasts or the mitochondria, are sorted via the post-translational pathway. In the
context of this work, I will focus on the trafficking of mitochondrial proteins as an example for post-
translational sorting. In addition to these established pathways for protein sorting, there are some
alternative pathways. The latter are less well known but their presence in cells question the rigid
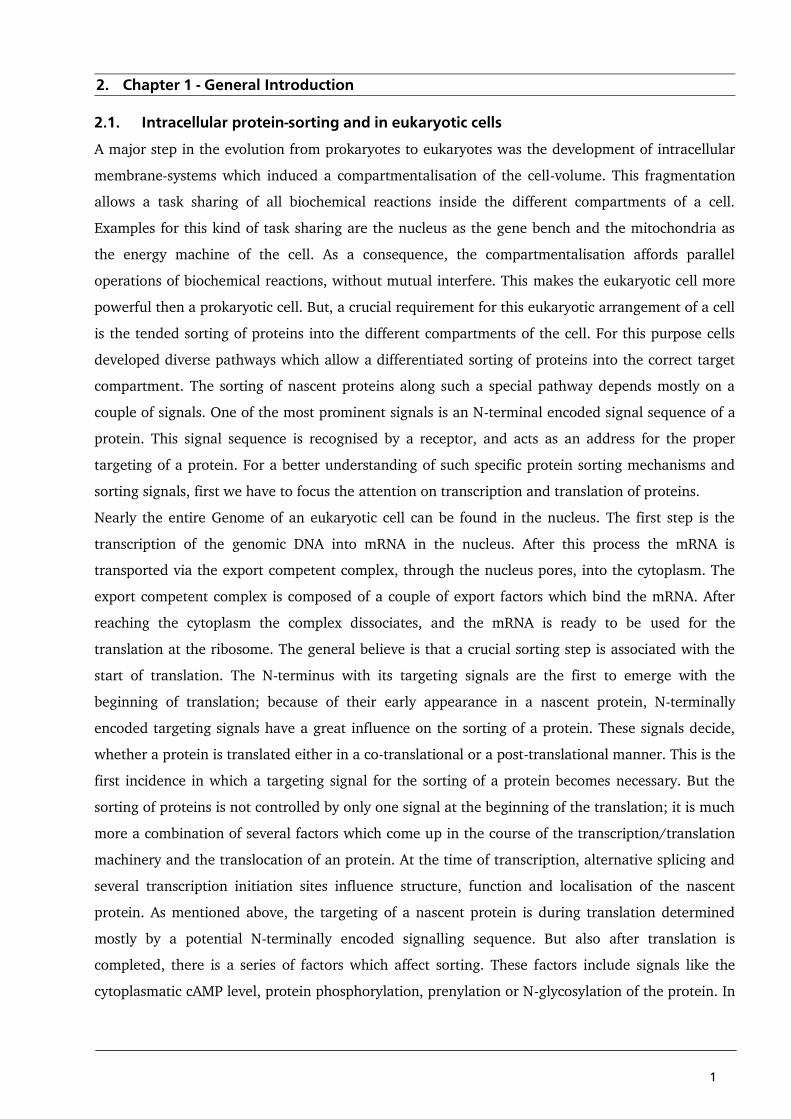
concept namely that protein sorting must either be post-translational or co-translational. Fig.2.2.1.
gives an overview on the potential sorting pathway with the canonical co- and post-translational
pathways and the emerging alternative pathways.
Fig.2.2.1: Sorting of membrane proteins: There are two major pathways for membrane protein sorting. Either
the protein is sorted in a co-translational manner or in a post-translational manner. Most of the plasma
membrane proteins follow a co-translational sorting via the secretory pathway to the plasma membrane. Most
of the mitochondrial proteins follow the post-translational sorting via chaperones to the mitochondrial
membrane. Beside these canonical pathways, there is also the possibility for a co-translational sorting of
mitochondrial membrane proteins via the MAMs to the mitochondrial membrane und a post-translational
sorting of plasma membrane proteins via Get3, Get1-2 into the secretory pathway. (MAM = Mitochondria
Associated Membrane; SRP = Signal Recognition Particle; MSF = Mitochondria Import Stimulation Factor; Get =
Golgi ER Trafficking Complex)
3
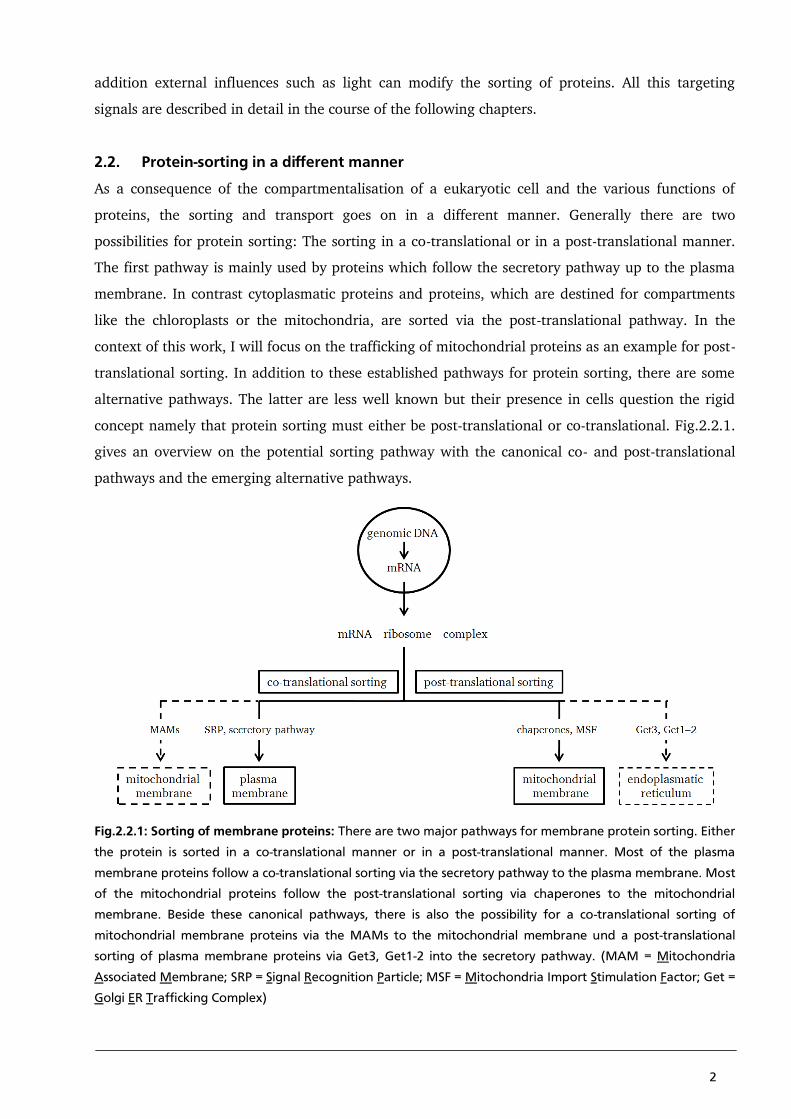
2.2.1. Protein-sorting in a post-translational manner
In the case of sorting in a post-translational manner the mRNA-ribosome-complex stays in the
cytoplasm. The targeting and the insertion into a target compartment occur after terminating of
translation. The sorting signal, usually an N-terminal signal sequence, however becomes already
necessary before the translation is finished. In the following paragraph, I will illustrate the influence
of an N-terminally encoded targeting signal and other targeting signals in the post-translational
protein sorting; this will be illustrated in the context of nucleus encoded mitochondrial proteins:
Usually the N-terminally encoded Mitochondrial Targeting Sequence (MTS) is in a range of 20 to 40
amino acid residues long and contains a lot of positive charged amino acids like arginine, lysine or
histidine (Roise and Schatz 1988). In an early stage of translation the positive charged amino acids
of the MTS interact with the Mitochondrial Import Stimulation Factor (MSF). The MSF itself is a
member of the 14-3-3 protein family. In its function it is an analogue to the Signal Recognition
Particle (SRP) which plays a role in the co-translational pathway. With the help of MSF, the pre-
protein remains in a unfold state and is transported to the Outer Mitochondrial Membrane (OMM)
(Alam et al. 1994). A second possibility for protein transport to the OMM is the use of chaperons.
Therefore, chaperons, like the cytosolic Heat Shock Protein 70 (Hsp70), bind a hydrophobic
sequence of the pre-protein which is usually not the MTS (Omura 1998). The binding of the
chaperone is supported by a preceding labelling of mitochondrial proteins via phosphorylation
(Robin et al. 2003). Again, the native protein has to be protected against a couple of cytosolic
enzymes such as proteases. In the case of hydrophobic proteins, such as membrane proteins, the
unfolded protein also has to be kept in a non-polar environment. For these reasons the native
protein is surrounded by the chaperone. In addition to protection, the chaperones are also
responsible for the transport of the proteins to the OMM. At the OMM the complex, comprising of
protein and chaperones or MSF, dissociates and the protein is translocated with the help of the
TOM-complex (Translocase of the Outer Mitochondrial Membrane) into the inter membrane space
(Athings et al. 1999). The mitochondrion is a compartment which is surrounded by a double
membrane system. So, depending on its function and on the target of the protein, it is sorted by the
Sorting and Assembly Machinery (SAM-complex) into the outer mitochondrial membrane or by the
TIM22-complex (Translocase of the Inner Mitochondrial Membrane) into the Inner Mitochondrial
Membrane (IMM). Mitochondrial matrix proteins are sorted via the TIM23-complex into the matrix
(Rehling, Brandner and Pfanner 2004).
Post-translational targeting is not only relevant for sorting of proteins to the organelles such as the
mitochondria. A post-translational sorting mechanism can also direct certain proteins into the
secretory pathway. The proteins in question are membrane proteins with only one TMD, the so
called Tail Anchored proteins (TA-proteins). Approximately 3-5% of all membrane proteins are
sorted by this little known pathway. An example for this unusually sorting is synaptobrevin which
has a key role in intracellular vesicular trafficking (Kutay et al. 1995). A requirement for this type of
4
sorting is a C-terminally located Trans-Membrane-Domain (TMD) which is recognised by a pre-
targeting-complex. From the pre-targeting complex the protein is handed over to the targeting
protein Get3 (Golgi ER Trafficking Complex). With the help of Get3 the protein is transported to the
surface of the ER membrane. Get3 also binds at the C-terminally located TMD of the TA-protein via
a hydrophobic interaction. After approaching the ER membrane, Get3 interacts with the
transmembrane protein complex Get1-Get2. This complex is posed as a receptor for Get3 and as an
integration-machinery for the TA-protein into the ER membrane (Schuldiner et al. 2008).
The described possibilities for protein sorting in a post-translational manner are summarised in
Fig.2.2.2:
Fig.2.2.2: Protein sorting in a post-translational manner: The majority of mitochondrial proteins, chloroplast
proteins or proteins of the peroxisoms are sorted in a post-translational manner. The protein is transported via
chaperons or MSF to the target compartment (in this case the mitochondrial membrane). The integration of
the proteins occurs by a translocation-complex like the TIM/TOM-complex in the mitochondrial membrane. A
post-translational sorting mechanism is also used by 3-5% proteins of the secretory pathway, the so called tail-
anchored proteins which are recognised by a C-terminal TMD. (MSF = Mitochondrial Import Stimulation
Factor; Get = Golgi ER Trafficking Complex; OMM = Outer Mitochondrial Membrane; IMM = Inner
Mitochondrial Membrane; SAM = Sorting and Assembly Machinery)
5
2.2.2. Protein-sorting in a co-translational manner
The sorting of proteins, which enter the secretory pathway up to the plasma membrane, occurs
mostly in a co-translational manner. If the nascent protein displays in an early stage of translation
an N-terminal signal sequence for this pathway, the ribosome-mRNA-complex associates with the
endoplasmatic reticulum (ER). Therefore, the SRP (Signal Recognition Particle) recognises and
binds the hydrophobic N-terminal TMD at the beginning of the translated protein (Walter and
Blobel 1980). After binding, the translation-complex is targeted by the SRP to the SRP-receptor on
the surface of the ER (Walter and Blobel 1980). During the translation on the surface of the ER
membrane, the nascent protein is integrated into the ER membrane or the ER lumen by the Sec61
translocon (Beckmann et al. 2001). After successfully integration of the protein into the ER
membrane, the protein is further sorted by other signals to its target-compartment via the secretory
pathway up to the plasma membrane. An additional sorting signal for proteins, which follow the
secretory pathway, is the glycolisation of the proteins in the ER (Vagin, Kraut and Sachs 2009).
While, the great majority of co-translational sorted proteins are targeted to the secretory pathway
and finally to the plasma membrane, also some mitochondrial proteins can employ this pathway. In
this case mitochondrial membrane proteins follow the secretory pathway into a sub-compartment of
the ER, the Mitochondrial Associated Membranes (MAMs). In a second step the MAMs physically
interact with the outer mitochondrial membrane (OMM). An example for this kind of transport is
the human cytomegalovirus UL37 exon protein pUL37 (Bozidis et al. 2007). The details for this
process are still mostly unexplored. It is known that the distance between the MAMs and the OMM
amounts to only 10-25 nm. This close distance allows a direct contact between protein complexes of
both membrane systems, namely the MAM and the OMM. Protein complexes, which are already
known to stabilise the interaction between the MAM and the OMM, are the mitofusin-complex and
the Mmm1/Mdm10, 12, 34-complex (Grimm 2012). Another protein, which is already known as a
connection element, is PACS-2 (Simmen et al. 2005)
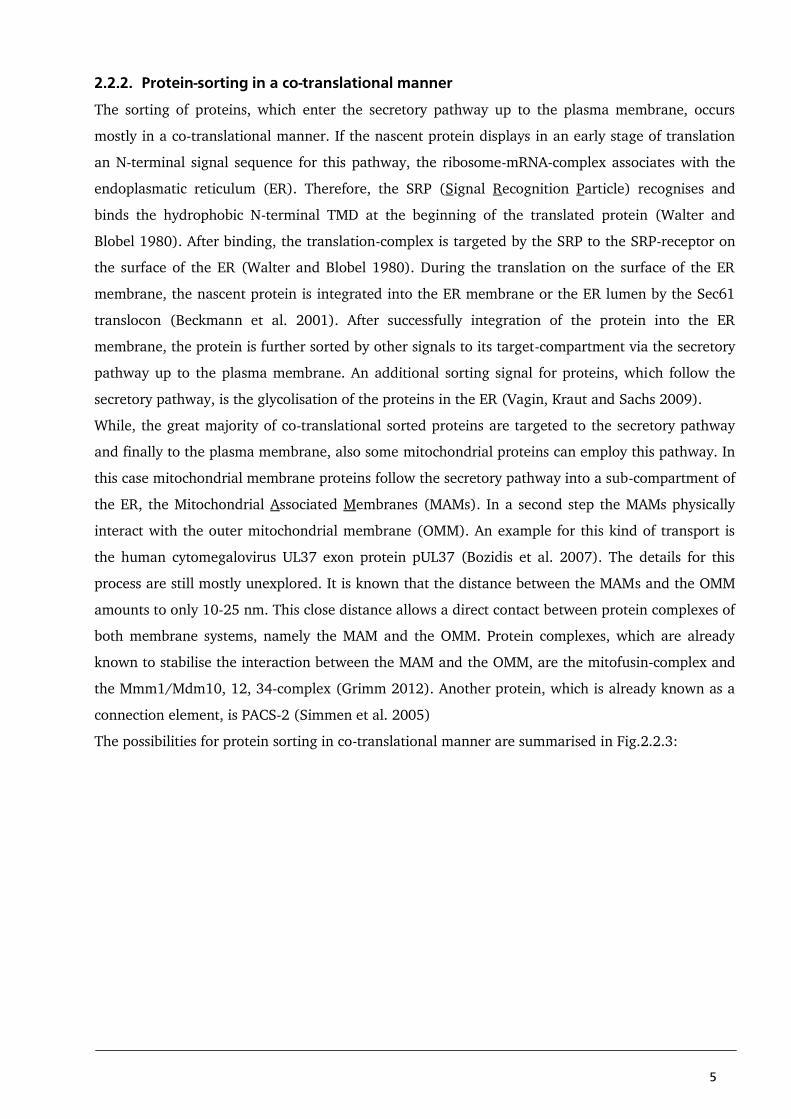
The possibilities for protein sorting in co-translational manner are summarised in Fig.2.2.3:
6
Fig.2.2.3: Protein sorting in a co-translational manner: The sorting in a co-translational manner is mainly used
for proteins of the secretory pathway up to the plasma membrane. The transport and the binding of the
mRNA-ribosome-protein-complex on the surface of the ER are caused by the SRP and the SRP-receptor. A co-
translational pathway is also used by a few mitochondrial membrane proteins. After synthesis in the ER they
are entering the mitochondria via mitochondria associated membrane (MAMs) domains.
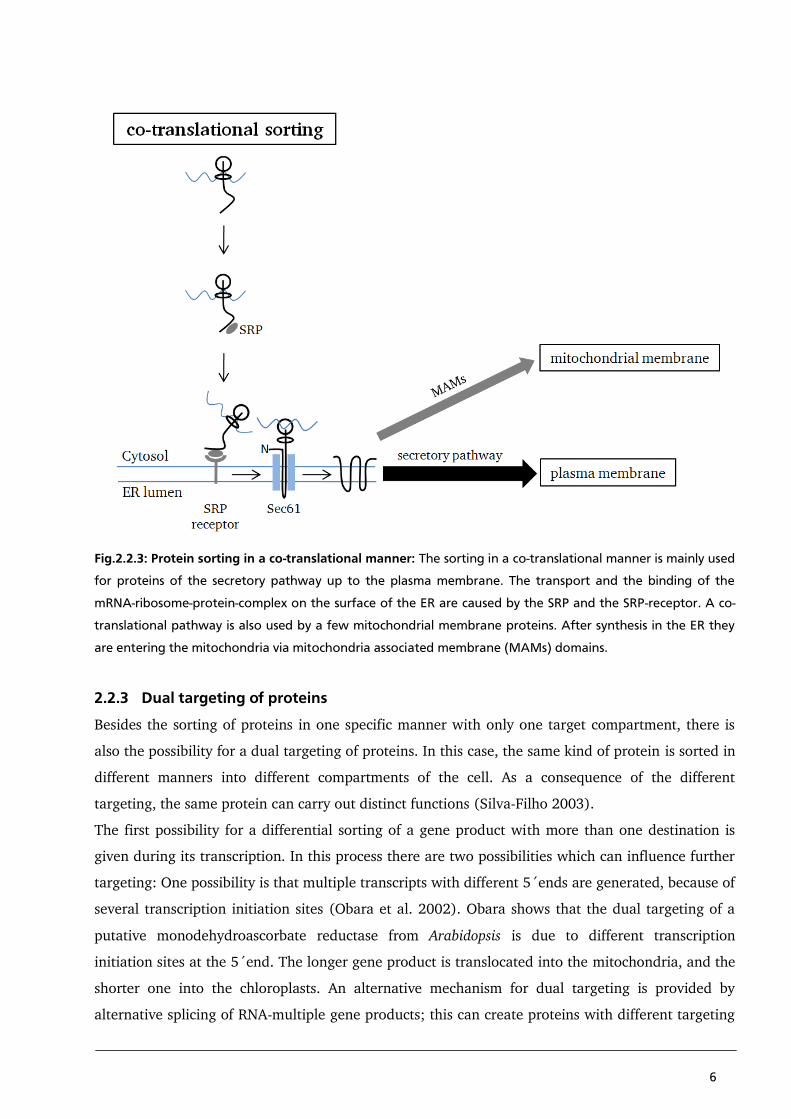
2.2.3 Dual targeting of proteins
Besides the sorting of proteins in one specific manner with only one target compartment, there is
also the possibility for a dual targeting of proteins. In this case, the same kind of protein is sorted in
different manners into different compartments of the cell. As a consequence of the different
targeting, the same protein can carry out distinct functions (Silva-Filho 2003).
The first possibility for a differential sorting of a gene product with more than one destination is
given during its transcription. In this process there are two possibilities which can influence further
targeting: One possibility is that multiple transcripts with different 5´ends are generated, because of
several transcription initiation sites (Obara et al. 2002). Obara shows that the dual targeting of a
putative monodehydroascorbate reductase from Arabidopsis is due to different transcription
initiation sites at the 5´end. The longer gene product is translocated into the mitochondria, and the
shorter one into the chloroplasts. An alternative mechanism for dual targeting is provided by
alternative splicing of RNA-multiple gene products; this can create proteins with different targeting
7
and functional properties. A modification of function and different targeting, as a result of
alternative splicing, has for example been reported in the case of two starch-branching enzyme
isoforms (Hamada 2002). As a consequence of splicing, the enzyme can either be sorted to the
soluble fraction or to the starch-granule of plastids.
A further checkpoint for dual targeting, later in the course of the protein synthesis, is given by the
alternative translation initiation. In this case more than one potential in frame start codon are used
for initiation of translation. One example for dual targeting, caused by alternative translation
initiation, is the spinach protoporphyrinogen oxidase II (Protox II). According to the translation
product, Protox II can be localised in the chloroplasts or the mitochondria (Watanabe et al. 2001).
In addition to a direct modification of a protein, which shows a dual targeting, the sorting can also
depends on post-translational modifications under the influence of factors such as intracellular
cAMP (Anandatheerthavarada et al. 1999), light (Kircher et al. 2002; Sakamoto 2002), prenylation
(Rodríguez-Concepción et al. 1999) or cellular stress. An example for a cAMP dependent sorting is
provided by cytochrome P4502B1. As a function of the cellular cAMP-level and the phosphorylation
level of the protein at position Ser128, the cytochrome is either sorted into the mitochondria or into
the ER (Anandatheerthavarada et al. 1999). In this context it is interesting to note, that the protein
carries a chimeric N-terminal signal sequence, which comprises an ER signal sequence as well as a
mitochondrial signal sequence.
At this point it should be mentioned that the mechanisms of dual targeting, outlined above, are only
the tip of the iceberg in the context of dual targeting of proteins. A lot of factors and signals, which
modify the dual targeting of proteins, are still unexplored.
2.3. Protein-insertion into a biological membrane
The biological membrane is a lipid bilayer with two layers of amphiphilic saturated and unsaturated
phospholipids. The amphiphilic character of the phospholipids is rooted in the components of the
phospholipids. The hydrophilic and polar properties of the phospholipid-head are caused by a
choline coupled with a phosphate-group. The phosphate itself binds to a glycerol backbone. The
hydrophobic and non-polar character of the phospholipid-tail is the result of the saturated and
unsaturated lipids. In consequence of the polar qualities of the aqueous environment, the single
layers of phospholipids follow a special arrangement. The hydrophilic heads are arranged outwards
and the hydrophobic tails of both layers are pointing to each other. According to the composition of
the lipids and the intra-membrane proteins, the character of the bilayer varies, respective the
fluidity and the thickness (5-10 nm) (Pelttari and Helminen 1979). Because of the hydrophobic
character, charged and large molecules, like ions and proteins, cannot pass the membrane by
8
diffusion only; they need transport systems like channels or transporter. In turn these transport
systems are membrane proteins which have to be integrated into the membrane. One possibility to
overcome the barrier between the aqueous environment and the hydrophobic inside of a biological
bilayer is aforementioned protein synthesis in a co-translational manner. The alternative is the post-
translational transport of the protein to the membrane with the help of the targeting proteins like
Get3 or chaperones like Hsp70. On the surface of the membrane, the targeting protein interacts
with an already existing transmembrane protein, which acts as a receptor and a translocase. The
Get1-Get2 or TIM/TOM-complexes are example. The protein of interest is transferred to the
translocase-complex and inserted into the membrane. The insertion requires a sequence of amino
acids with a hydrophobic character which allows an interaction with the hydrophobic tails of the
phospholipids (Schuldiner et al. 2008).
2.4. Ion channels
The main aim of the present work is to understand the sorting of membrane proteins. So ion
channels will here be presented as an example for membrane proteins.
Ion channels are transmembrane proteins, which act as a tunnel for ions to cross the plasma
membrane and all other types of membranes in a cell. Due to the positive or negative charge of the
ions and the hydrophobic and non-polar characteristics of a biological membrane, it is hardly
possible for ions to cross a biological lipid bilayer by diffusion. For this reason transport systems like
channels are essential for the fast exchange of ions across plasma membrane; the same is true for
the transport across all intracellular membrane systems, for instance the mitochondrial membrane.
With the help of an ion channel, the energy barrier for the transport of ions through a biological
membrane can decreases from 50 kcal/mol down to 2 to 3 kcal/mol (Parsegian1969). In addition to
the decrease of the energy barrier, ion channels have two other very important properties: They are
generally highly selective for one type of Ion (Hille 2001), and they are able to regulate the ion flow
across the membrane; the latter is called gating. According to its mode of gating and selectivity, an
ion channel protein is classified into several groups. In relation to the gating mechanism, channels
can for example be classified as voltage-gated channels (Armstrong and Hille 1998), ligand-gated
channels (Barry and Lynch 2005), light gated channels (Nagel 2003) or mechanical-sensitive
channels (Perozo et al. 2002). A further specificity in the nomenclature of channels is given by their
ion selectivity. For instance, the super family of the voltage-gated channels can be subdivided into
voltage-gated sodium channels (Yu and Catterall 2003), voltage-gated calcium channels (Dolphin
2009), voltage-gated proton channels (DeCoursey 2008) and voltage-gated potassium channels
(Stühmer et al. 1989).
Based on the great diversity, the high selectivity and rapid flow rate of 108 ions/s (Lüttge, Kluge and
Thiel 2010), ion channels play an essential role in inter- and intracellular ion transport; and they
are an important tool to keep specific ion-concentrations in all compartments of the cell and to
9
generate large excursions of the membrane potential in a short time. Since the activity of channels
is specific for the membrane in which they operate, they have to be targeted in a proper fashion.
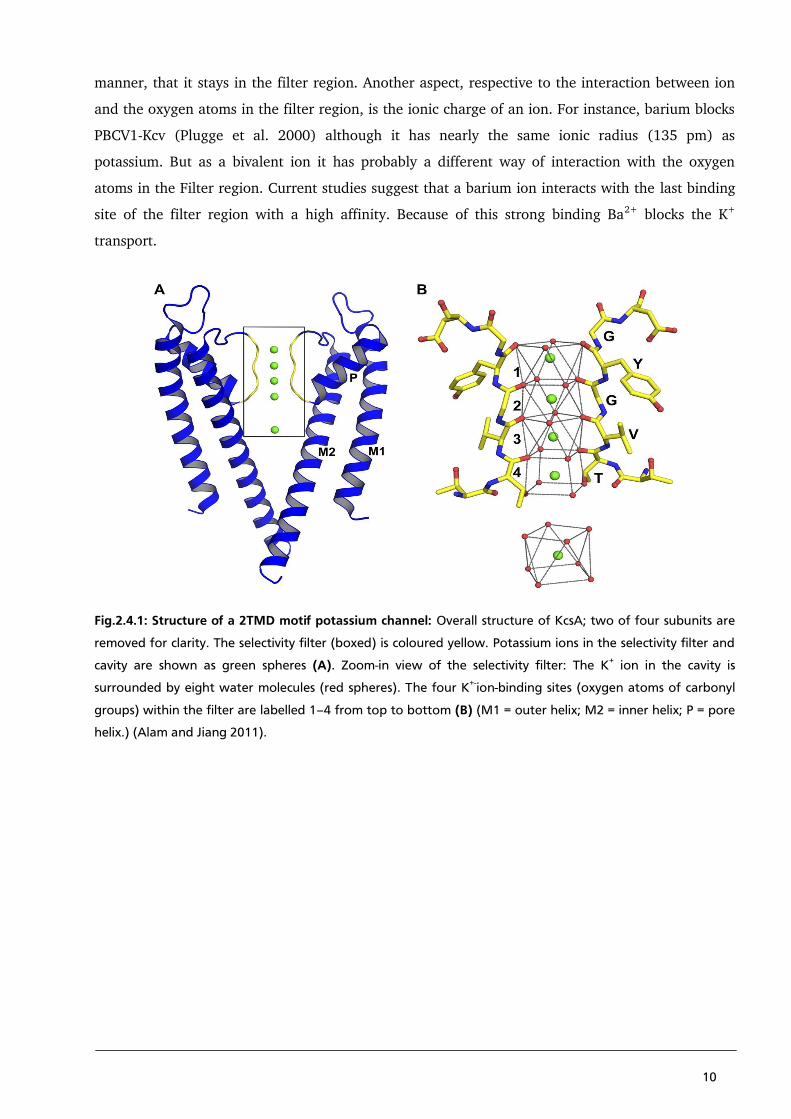
2.4.1. Potassium channels
The super family of potassium channels can also be devised into several groups by the gating
mechanism and the structure. Gating can be voltage dependent (Kv channels, Kir channels), G-
protein coupled (GIRK channels) or calcium activated (BK channels) (Miller 2000, Lewohl et al.
1999, Vergara 2002). A possibility for a structural classification depends on the number of the
transmembrane helices (Tab. 2.2.1.). The 2 transmembrane domain (2TMD) motif channels, like
the viral potassium channels Kcv or Kesv, are composed of only two transmembrane domains per
subunit, and create as a tetramer a functional channel. In addition to the 2TMD motif, there are
channels composed of six transmembrane domains (6TMD) or channels in which a monomer
contains two 2TMD motives in a tandem (two pore channel motif) (Tab.2.2.1.). While the overall
architecture of channels can vary; all of them have the 2TMD motif as a basic component in
common, because it includes the pore and filter region of a potassium channel. Therefore, a detailed
description of the 2TMD motif follows below.
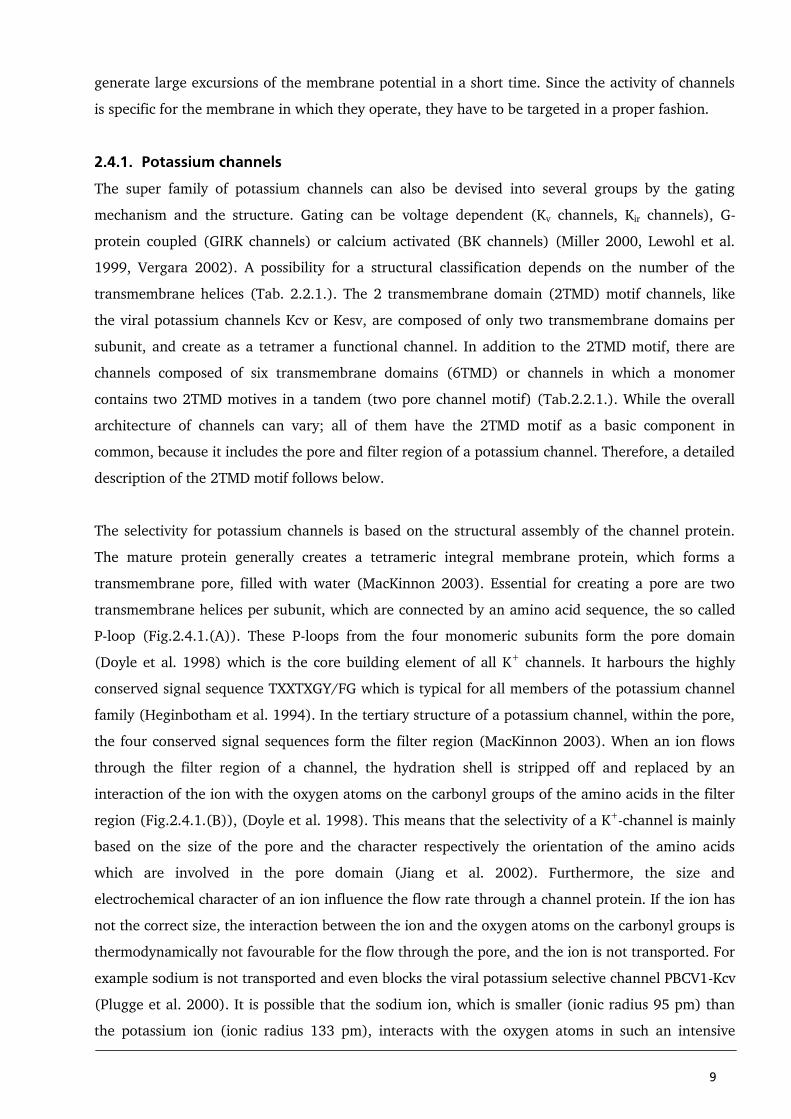
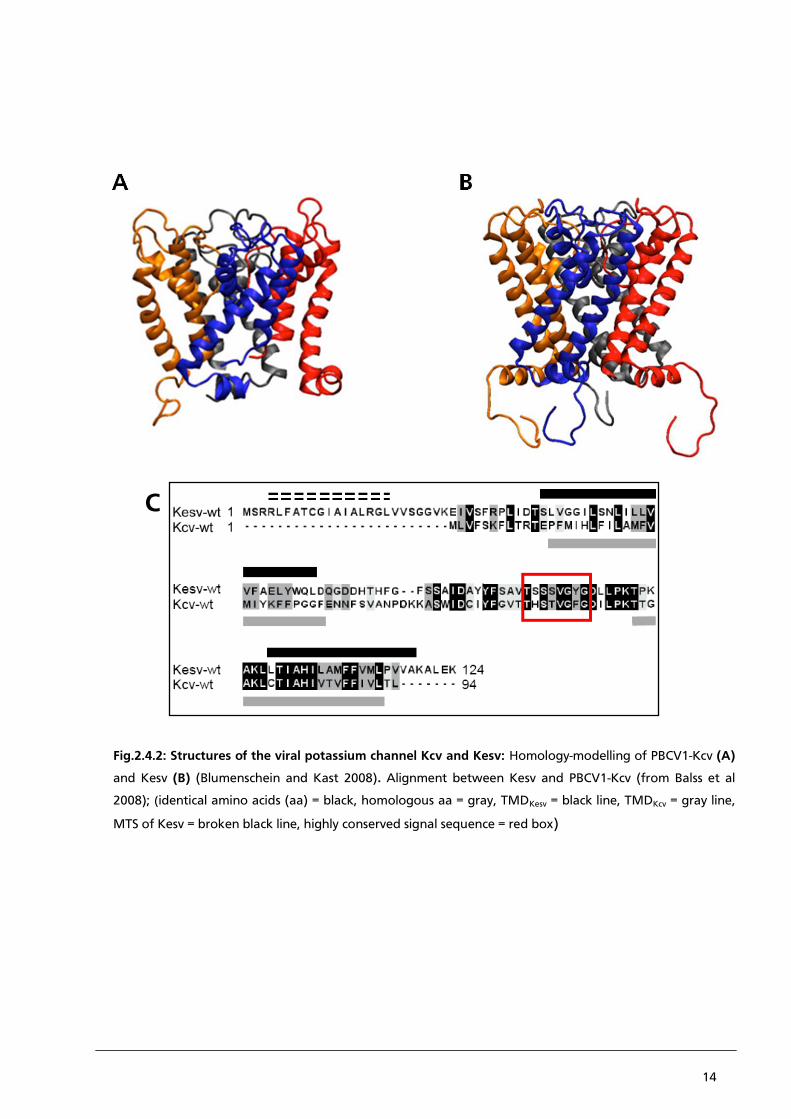
The selectivity for potassium channels is based on the structural assembly of the channel protein.
The mature protein generally creates a tetrameric integral membrane protein, which forms a
transmembrane pore, filled with water (MacKinnon 2003). Essential for creating a pore are two
transmembrane helices per subunit, which are connected by an amino acid sequence, the so called
P-loop (Fig.2.4.1.(A)). These P-loops from the four monomeric subunits form the pore domain
(Doyle et al. 1998) which is the core building element of all K+ channels. It harbours the highly
conserved signal sequence TXXTXGY/FG which is typical for all members of the potassium channel
family (Heginbotham et al. 1994). In the tertiary structure of a potassium channel, within the pore,
the four conserved signal sequences form the filter region (MacKinnon 2003). When an ion flows
through the filter region of a channel, the hydration shell is stripped off and replaced by an
interaction of the ion with the oxygen atoms on the carbonyl groups of the amino acids in the filter
region (Fig.2.4.1.(B)), (Doyle et al. 1998). This means that the selectivity of a K+-channel is mainly
based on the size of the pore and the character respectively the orientation of the amino acids
which are involved in the pore domain (Jiang et al. 2002). Furthermore, the size and
electrochemical character of an ion influence the flow rate through a channel protein. If the ion has
not the correct size, the interaction between the ion and the oxygen atoms on the carbonyl groups is
thermodynamically not favourable for the flow through the pore, and the ion is not transported. For
example sodium is not transported and even blocks the viral potassium selective channel PBCV1-Kcv
(Plugge et al. 2000). It is possible that the sodium ion, which is smaller (ionic radius 95 pm) than
the potassium ion (ionic radius 133 pm), interacts with the oxygen atoms in such an intensive
10
manner, that it stays in the filter region. Another aspect, respective to the interaction between ion
and the oxygen atoms in the filter region, is the ionic charge of an ion. For instance, barium blocks
PBCV1-Kcv (Plugge et al. 2000) although it has nearly the same ionic radius (135 pm) as
potassium. But as a bivalent ion it has probably a different way of interaction with the oxygen
atoms in the Filter region. Current studies suggest that a barium ion interacts with the last binding
site of the filter region with a high affinity. Because of this strong binding Ba2+ blocks the K+
transport.
Fig.2.4.1: Structure of a 2TMD motif potassium channel: Overall structure of KcsA; two of four subunits are
removed for clarity. The selectivity filter (boxed) is coloured yellow. Potassium ions in the selectivity filter and
cavity are shown as green spheres (A). Zoom-in view of the selectivity filter: The K+ ion in the cavity is
surrounded by eight water molecules (red spheres). The four K+-ion-binding sites (oxygen atoms of carbonyl
groups) within the filter are labelled 1–4 from top to bottom (B) (M1 = outer helix; M2 = inner helix; P = pore
helix.) (Alam and Jiang 2011).
11
Tab.2.2.1: Structural classification of potassium channels depending on the number of TMDs (according to
Hertel 2005)
12
2.4.2. The viral potassium channels PBCV-1Kcv and Kesv
With a size of 94 amino acids (aa), the viral potassium channel PBCV1-Kcv is currently one of
smallest identified potassium channels (Plugge et al. 2000). Only another Kcv type channel from
virus ATCV1 is, with a length of only 82 aa (Gazzarrini et al. 2010), even smaller. The channel from
the algae virus Paramecium Bursaria Chlorella Virus (PBCV1) can be expressed heterologously in
several cell systems including mammalian cells (HEK293) (Moroni et al. 2002), xenopus oocytes
(Plugge et al. 2000) and yeast (Balss et al. 2008). In these cells PBCV1-Kcv is co-translationally
sorted into the secretory pathway and finally up to the plasma membrane, where its activity can be
measured (Moroni et al. 2002). The functional protein is based on a tetrameric arrangement, in
which every subunit contains the 2TMD motif with the P-loop in between. In contrast to other
potassium channels, the PBCV1-Kcv exhibits a small cytoplasmatic N-terminus and no cytoplasmatic
C-terminus which is essential for the functional gating mechanism of other potassium channels like
the KscA (Cortes et al. 2001).
Another viral potassium channel, named Kesv, from the Ectocarpus Siliculosus Virus 1 (ESV-1) is
structurally very similar to PBCV1-Kcv. All in all Kesv and PBCV1-Kcv have a protein identity of
29%; in the C-terminal domain the identity reaches a value of 41% (Balss et al. 2008). Supposedly,
the functional protein of Kesv is also based on a tetrameric arrangement within the 2TMD motif and
the P-loop per subunit (Fig.2.4.1. and 2.4.2.). In planar lipid bilayer measurements Kesv shows a
voltage-dependent activity and potassium selectivity similar to that of PBCV1-Kcv (Braun 2011).
The most significant difference between Kesv and PBCV1-Kcv is theirs sorting. Other than PBCV1-
Kcv channel, Kesv is imported in a voltage dependent post-translational manner via the canonical
TOM/TIM complex into the inner mitochondrial membrane (Balss et al. 2008).
The mechanisms, underlying this differential sorting of the similar proteins, is not yet understood.
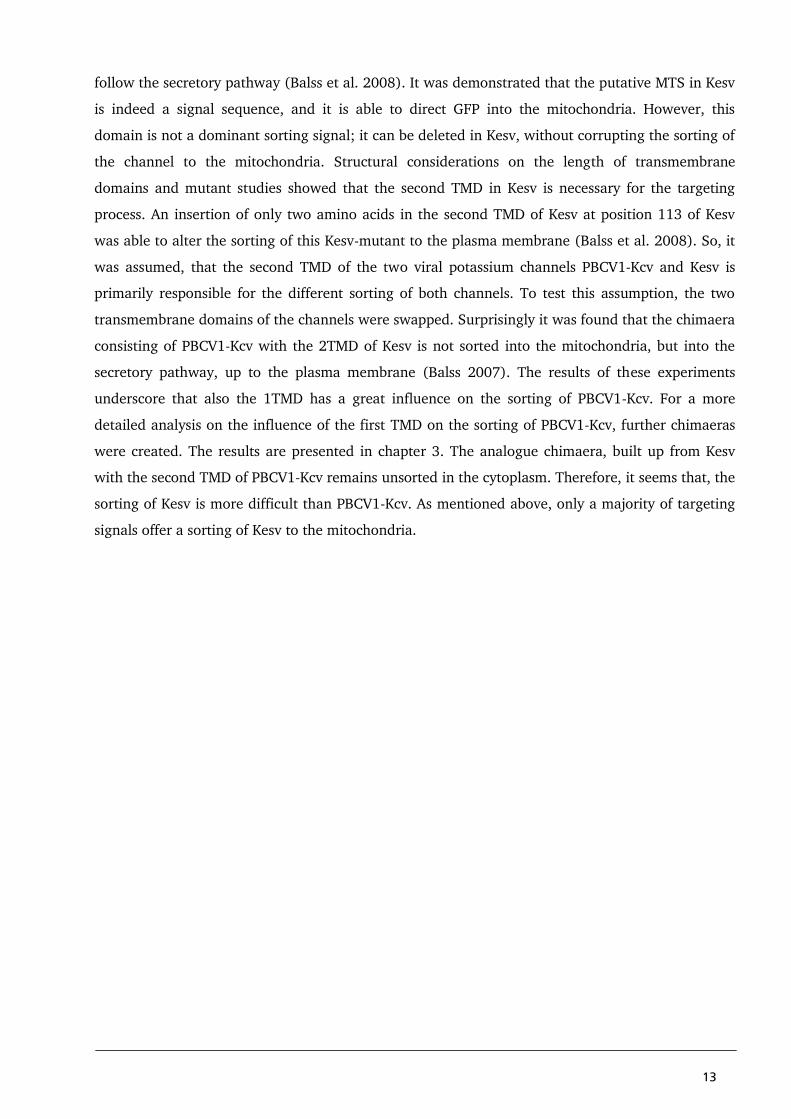
On a structural basis it occurs that Kesv is, with 124 aa, somewhat larger than PBCV1-Kcv. The size
difference is most obviously in the cytoplasmatic domains which are much longer in Kesv
(Fig.2.4.2.(A and B)). Kesv also contains an N-terminal domain with a putative mitochondrial
targeting sequence (MTS). Typical for these signal sequences is richness in positive charged amino
acids (Fig.2.4.2.(C)).
It is generally believed that proteins, such as PBCV1-Kcv, which are targeted to the plasma
membrane, are synthesized in a co-translational manner for sorting to the plasma membrane.
Membrane proteins, like Kesv, which end up in the mitochondria, are thought to be sorted in a post-
translational manner with the help of chaperones. Continuous work on the differential sorting
mechanism of the two channel proteins illustrate that the signalling for the transport into the
mitochondrial membrane is much more sensitive and complex than the signalling for proteins which
13
follow the secretory pathway (Balss et al. 2008). It was demonstrated that the putative MTS in Kesv
is indeed a signal sequence, and it is able to direct GFP into the mitochondria. However, this
domain is not a dominant sorting signal; it can be deleted in Kesv, without corrupting the sorting of
the channel to the mitochondria. Structural considerations on the length of transmembrane
domains and mutant studies showed that the second TMD in Kesv is necessary for the targeting
process. An insertion of only two amino acids in the second TMD of Kesv at position 113 of Kesv
was able to alter the sorting of this Kesv-mutant to the plasma membrane (Balss et al. 2008). So, it
was assumed, that the second TMD of the two viral potassium channels PBCV1-Kcv and Kesv is
primarily responsible for the different sorting of both channels. To test this assumption, the two
transmembrane domains of the channels were swapped. Surprisingly it was found that the chimaera
consisting of PBCV1-Kcv with the 2TMD of Kesv is not sorted into the mitochondria, but into the
secretory pathway, up to the plasma membrane (Balss 2007). The results of these experiments
underscore that also the 1TMD has a great influence on the sorting of PBCV1-Kcv. For a more
detailed analysis on the influence of the first TMD on the sorting of PBCV1-Kcv, further chimaeras
were created. The results are presented in chapter 3. The analogue chimaera, built up from Kesv
with the second TMD of PBCV1-Kcv remains unsorted in the cytoplasm. Therefore, it seems that, the
sorting of Kesv is more difficult than PBCV1-Kcv. As mentioned above, only a majority of targeting
signals offer a sorting of Kesv to the mitochondria.
14
Fig.2.4.2: Structures of the viral potassium channel Kcv and Kesv: Homology-modelling of PBCV1-Kcv (A)
and Kesv (B) (Blumenschein and Kast 2008). Alignment between Kesv and PBCV1-Kcv (from Balss et al
2008); (identical amino acids (aa) = black, homologous aa = gray, TMDKesv = black line, TMDKcv = gray line,
MTS of Kesv = broken black line, highly conserved signal sequence = red box)
C
15
2.5. References
Alam R, Hachiya N, Sakaguchi M, Kawabata S, Iwanaga S, Kitajima M, Mihara K, Omura T
(1994) C-DNA cloning and characterization of mitochondrial import stimulation factor (MSF)
purified from rat liver cytosol. Journal of biochemistry Vol.166: 416-25
Alam R and Jiang Y (2011) Structural studies of ion selectivity in tetrameric cation channels.
Journal of general physiology Vol.137: 397-403
Anandatheerthavarada H, Biswas G, Mullick J, Sepuri N, Otvos L, Pain D, Avadhani N (1999)
Dual targeting of cytochrome P4502B1 to endoplasmic reticulum and mitochondria involves a
novel signal activation by cyclic AMP-dependent phosphorylation at Ser128. EMBO journal
Vol.18: 5494-504
Athing U, Typke D, Nargang F, Neupert W, Nussberger S (1999) The TOM core complex: the
general protein import pore of the outer membrane of mitochondria. JCB Vol.147: 959–68
Balss J, Papatheodorou P, Mehmel M, Baumeister D, Hertel B, Delaroque N, Chatelain F,
Minor D, Van Etten J, Rassow J, Moroni A, Thiel G (2008) Transmembrane domain length
of viral K+channels is a signal for mitochondria targeting. PNAS Vol.105: 12313-8
Beckmann R, Spahn CM, Eswar N, Helmers J, Penczek PA, Sali A, Frank J, Blobel G (2001)
Architecture of the protein-conducting channel associated with the translating 80S ribosome.
Cell Vol.107: 361-72
Bozidis P, Williamson C, Colberg-Poley A (2008) Mitochondrial and secretory human
cytomegalovirus UL37 proteins traffic into mitochondrion-associated membranes of human
cells. JVI Vol.82: 2715-26
Blumenschein and Kast (2008) Homologiemodellierung von Kcv und Kesv und
Molekulardynamische Simulation. TU-Darmstadt
Braun C (2011) Rekonstitution von Kanalproteinen in planaren Lipid Bilayern. TU-Darmstadt
Cortes D, Cuello L, Perozo E (2001) Molecular architecture of full-length KcsA: role of cytoplasmic
domains in ion permeation and activation gating. The Journal of general physiology Vol.117:
165-80
DeCoursey (2008) Voltage-gated proton channels. Cellular and molecular life sciences: CMLS
Vol.65: 2554-73
Dolphin A (2009) Calcium channel diversity: multiple roles of calcium channel subunits. Current
opinion in neurobiology Vol.19: 237-44
Doyle D, Cabral J, Pfuetzner R, Kuo A, Gulbis J, Cohen S, Chait B, MacKinnon R (1998) The
Structure of the Potassium Channel: Molecular Basis of K+ Conduction and Selectivity. Science
Vol.280: 69-77
16
Gazzarrini S, Kang M, Abenavoli A, Romani G, Olivari C, Gaslini D, Ferrara G, Van Etten J,
Kreim M, Kast S, Thiel G, Moroni A (2010) Chlorella virus ATCV-1 encodes a functional
potassium channel of 82 amino acids. Biochemical Journal Vol.420: 295-303
Grimm S (2012) The ER-mitochondria interface: the social network of cell death. Biochemica et
biophysica acta Vol.1823: 327-34
Heginbotham L, Lu Z, Abramson T, MacKinnon R (1994) Mutations in the K+ channel signature
sequence. Biophysical journal Vol.66: 1061-7
Hille B (2001) Ion channels of excitable membranes. 3. Edition, Sinauer Accociates Inc., Sunderland
Jiang Y, Lee A, Chen J, Cadene M, Chait B, MacKinnon R (2002) The open pore conformation of
potassium channels. Nature Vol.417: 523-6
Kircher S, Gil P, Kozma-Bognár L, Fejes E, Speth V, Husselstein-Muller T, Bauer D, Ádám É,
Schäfer E, Nagy F (2002) Nucleo-cytoplasmic partitioning of the plant photoreceptors
phytochrome A, B, C, D, and E is regulated differentially by light and exhibits a diurnal
rhythm. Plant Cell Vol.14: 1541-55
Kutay U, Ahnert-Hilger G, Hartmann E, Wiedenmann B, Rapoport T (1995) Transport route for
synaptobrevin via a novel pathway of insertion into the endoplasmic reticulum membrane.
EMBO journal Vol.14: 217-23
Lewohl J, Wilson W, Mayfield R, Brozowski S, Morrisett R, Harris R (1999) G-protein-coupled
inwardly rectifying potassium channels are targets of alcohol action. Nature neuroscience
Vol.2: 1084-90
Lüttge U, Kluge M, Thiel G (2010) Botanik. Wiley-VCH Verlag GmbH & Co. KGaA
MacKinnon R (2003) Potassium channels. FEBS Letters Vol.555: 62-5
Miller C (2000) An overview of the potassium channel family. Genome biology Vol.1: reviews 0004
Moroni A, Viscomi C, Sangiorgio V, Pagliuca C, Meckel T, Horvath F, Gazzarrini S, Valbuzzi P,
Van Etten J, DiFrancesco D, Thiel G (2002) The short N-terminus is required for functional
expression of the virus-encoded miniature K(+) channel Kcv. FEBS Letters Vol.530: 65-9
Perozo, E, Cortes D M, Sompornpisut P, Kloda A, Martinac B (2002) Open channel structure of
MscL and the gating mechanism of mechanosensitive channels. Nature Vol.418: 942-8
Plugge B, Gazzarrini S, Nelson M, Cerana R, Van Etten J, Derst C, DiFrancesco D, Moroni A,
Thiel G (2000) A Potassium Channel Protein Encoded by Chlorella Virus PBCV-1. Science
Vol.287: 1641-44
Obara K, Sumi K, Fukuda H (2002) The use of multiple transcription starts causes the dual
targeting of Arabidopsis putative monodehydroascorbatereductase to both mitochondria and
chloroplasts. Plant & cell physiology Vol.43: 697-705
Omura T (1998) Mitochondria-targeting sequence, a multi-role sorting sequence recognized at all
steps of protein import into mitochondria. Journal of biochemistry Vol.123: 1010-6
17
Parsegian A (1969) Energy of an ion crossing a low dielectric membrane: Solutions to four
relevant electrostatic problems. Nature Vol.221: 844-6
Pelttari A, Helminen H (1979) The relative thickness of intracellular membranes in epithelial cells
of the ventral lobe of the rat prostate. Histochemical journal Vol.11: 613-24
Rehling P, Brandner K, Pfanner N (2004) Mitochondrial import and the twin-pore translocase.
Nature reviews, Molecular cell biology Vol.5: 519-30
Robin M, Prabu S, Raza H, Anandatheerthavarada H, Avadhani N (2003) Phosphorylation
enhances mitochondrial targeting of GSTA4-4 through increased affinity for binding to
cytoplasmic Hsp70. Journal of biochemistry Vol.278: 18960-70
Rodríguez-Concepción M, Yalovsky S, Zik M, Fromm H, Gruissem W (1999) The prenylation
status of a novel plant calmodulin directs plasma membrane or nuclear localization of the
protein. EMBO journal Vol.18: 1996-2007
Roise D and Schatz G (1988) Mitochondrial presequences. Journal of Biological Chemistry Vol.
263: 4509-4511
Sakamoto K and Briggs W (2002) Cellular and subcellular localization of phototropin 1. Plant Cell
Vol.14: 1723-35
Schuldiner M, Metz J, Schmid V, Denic V, Rakwalska M, Schmitt HD, Schwappach B,
Weissman JS (2008) The GET complex mediates insertion of tail-anchored proteins into the
ER membrane. Cell Vol.134: 634-45
Silva-Filho M (2003) One ticket for multiple destinations: dual targeting of proteins to distinct
subcellular locations. Current Opinion in Plant Biology Vol.6: 589-95
Simmen T, Aslan J, Blagoveshchenskaya A, Thomas L, Wan L, Xiang Y, Feliciangeli S, Hung C,
Crump C, Thomas G (2005) PACS-2 controls endoplasmic reticulum-mitochondria
communication and Bid-mediated apoptosis. EMBO journal Vol.24: 717-29
Stühmer W, Ruppersberg J, Schröter K, Sakmann B, Stocker M, Giese K, Perschke A Baumann
A, Pongs O (1989) Molecular basis of functional diversity of voltage-gated potassium
channels in mammalian brain. EMBO journal Vol.8: 3235-44
Vagin O, Kraut J, and Sachs G (2009) Role of N-glycosylation in trafficking of apical membrane
proteins in epithelia. American journal of physiology, Renal physiology Vol.296: F459-69
Walter P, Blobel G (1980) Purification of a membrane-associated protein complex required for
protein translocation across the endoplasmic reticulum Biochemistry. PNAS Vol.77: 7112-6
Watanabe N, Che F, Iwano M, Takayama S, Yoshida S, Isogai A (2001) Dual targeting of
spinach protoporphyrinogen oxidase II to mitochondria and chloroplasts by alternative use of
two in-frame initiation codons. Journal of biological chemistry Vol.276: 20474-81
Yu F and Catterall (2003) Overview of the voltage-gated sodium channel family. Genome biology
Vol.4: 207
18
3. Chapter 2 – Optimisation of Protein-Localisation studies with the help of Confocal Laser Scanning Microscopy (CLSM)
3.1. Abstract
The following chapter describes experimental attempts to monitor membrane-protein sorting with
the help of confocal laser scanning microscopy. This method was already successfully used in the
past to analyse the different sorting of two small and very similar K+channels. One of these
channels, PBCV1-Kcv, is sorted via the secretory pathway to the plasma membrane. The second one,
Kesv is trafficking to the mitochondria and probably into the inner membrane of this organelle
(Balss et al. 2008). Here I describe strategies, which optimised the microscopically method and
hence improved localisation studies of membrane-proteins. The identification of the target
membrane in the endoplasmic reticulum and in the mitochondria could be greatly improved by
exchanging organelle specific fluorescent dyes with reference proteins fused to a fluorescent
protein. It is reasonable to speculate that reference proteins are superior over dyes because the
activity of the heterologously expressed K+channels under investigation may short circuit the
membrane potential of the target organelle and hence affect the localisation of the respective dyes.
As a side effect the exchange of dyes for proteins also increased the signal to noise ratio since they
reduced the level of unsorted channel proteins; the latter was generally high in combination with
fluorescent dyes. Furthermore, the quality of the primary data could enhanced by the using a
denoise algorithm, which combines the additive white Gaussian noise model with the Poisson
distribution, developed by Luisier (Luisier et al. 2010). With this filter the signal to noise ratio could
increase without loss of information.
3.2. Introduction
There are several possibilities to explore intracellular protein transport and sorting. Frequently
biochemical methods, like western blotting are used to localise a protein in a certain membrane or
organelle. The disadvantage of this technique is that it requires the disruption of a cell and an
isolation and separation of different cell fractions. An alternative often non-invasive experimental
approach is provided by microscopy. With the help of electron or fluorescence microscopy, the
sorting of proteins can be detected via antibody labelling. After fusing a protein of interest with a
fluorescent protein the fusion protein can be localised in cells. Because electron microscopy requires
the fixation of cells, live cell imaging is accomplished with the help of fluorescence microscopy. The
latter method opens the possibilities of exploring inter- and intracellular mass transport in living
cells in a non-invasive manner without an influence of chemicals and without the necessity of
fixation. Because the method uses living cells protein transport and sorting is traceable over a long
period of time. Currently, fluorescence microscopy can be used in several versions to tackle
questions in cell biology. For instance Confocal Laser Scanning Microscopy (CLSM), Total Internal
19
Reflection Fluorescence Microscopy (TIRF), 2 photon microscopy, and Photo Activated Localization
Microscopy (PALM) or STimulated Emission Depletion microscopy (STED) are fluorescent based
methods which allow a localisation of proteins in living cells at different levels of spatial and
temporal resolution. With the latter technique the actual limit of resolving of ca. 250-300 nm, could
be lowered below 50 nm for biological assays (Willig et al. 2006).
The CLSM technique, which is used here for protein sorting studies, is subject to the resolution limit
of about ca. 250-300 nm. According to Abbe (1873), this limit can be calculated with the following
equation:
Δd= λ /(2 sin α)
λ = wavelength
n = index of refraction
α = ½ angle of beam spread
In spite of this resolution limit, the CLSM technique can still be used to study protein sorting in live
cell modus due to a pinhole, which is integrated in the optical path of the detected light. With the
pinhole, photons, which come from the outside of the focal plane, can be blocked. Therefore, the
resolution along the z-axis increases (Semwogerere and Weeks 2005). This allows a 3D
reconstruction with a high spatial resolution.
To examine in this study membrane-protein sorting in living cells with the CLSM technique, the
proteins of interest were tagged with a fluorescent protein. The proteins, which are used in this
context, are the two small viral potassium channels PBCV1-Kcv from the algae virus Paramecium
Bursaria Chlorella Virus (PBCV1) and Kesv from the Ectocarpus Siliculosus Virus 1 (ESV-1). Despite
the different origin, PBCV1-Kcv and Kesv have a protein identity of 29%; in the C-terminal domain
the identity even reaches a value of 41% (Balss et al. 2008). Both channel proteins are very small
(PBVC1-Kcv = 94 aa; Kesv = 124 aa) but exhibit all basic essentials of a potassium channel. The
functional PBCV1-Kcv as well as Kesv is based on a tetrameric arrangement (Gazzarrini et al. 2003).
Per subunit they contain the 2TMD motif with the P-loop in between. In turn the P-loops of all four
subunits form the filter region, which comprise the highly conserved signal sequence TXXTXGY/FG,
typical for all members of the potassium channel family (Heginbotham et al. 1994). In spite of a
high degree of structural similarity, the most significant difference between Kesv and PBCV1-Kcv is
their sorting. When heterologously expressed in HEK293 cells PBCV1-Kcv, tagged with EGFP, could
be localised in the plasma membrane while Kesv is sorted under the same conditions to the
mitochondria (Balss et al. 2008). In agreement with this visual localisation the functionality of
PBCV1-Kcv could be demonstrated in the plasma membrane of various cells including HEK293 cells
with the help of electrophysiological measurements (Plugge et al. 2000, Moroni et al. 2002).
Therefore, it is most likely that PBCV1-Kcv is co-translationally synthesized into the ER, sorted into
20
the secretory pathway and finally inserted into the plasma membrane; this pathway is typical for
plasma membrane proteins (Hedge and Keenan 2011).
In contrast Kesv, tagged with EGFP, is imported in a voltage dependent, post-translational manner
via the canonical TOM/TIM complex into the inner mitochondrial membrane (Balss et al. 2008).
These studies were also accomplished in the heterologously expression system HEK293.
The mechanisms underlying this differential sorting of two similar proteins is not yet understood.
The available data imply that the sorting involves in both channel proteins not only an N-terminal
signal sequence but also signals coded in the two TMDs of the channel proteins (Balss et al. 2008).
More details on the sorting of the two proteins are shown in chapter 3, 4 and 5.
Due to their different sorting PBCV1-Kcv and Kesv can be used as a tool to examine general aspects
of membrane-protein sorting in eukaryotic cells. The current chapter presents methodological steps,
which improved the localisation of fluorescent-tagged proteins in cells, over the method used in
previous work (Balss et al. 2008, Hertel 2005). In the present study the two channel proteins
PBCV1-Kcv::EGFP and Kesv::EGFP were initially localised with the help of fluorescent dyes, which
label defined membranes of cell organelles. To overcome problems of non-specific labelling of these
dyes, I decided to exchange them with fusion proteins, which contain a compartment-specific signal
sequence fused to a fluorescent protein. In the present chapter I describe the general problems of
fluorescent dyes in relation to a defined localisation of PBCV1-Kcv and Kesv. The data show that
protein-based fluorescent markers are much better and more accurate than chemical dyes for
specific labelling of organelle membranes. In addition to this improvement I could further optimise
the quantitative analysis of the optical results by a denoising algorithm, developed by Luisier
(Luisier et al. 2010). This algorithm combines the additive white Gaussian noise model with the
Poisson distribution.
3.3. Material and Methods
3.3.1. Heterologous Expression in HEK293
All localisation studies were realised in human embryonic kidney (HEK) 293 cells (Graham et al.
1977). The cells were grown at 37°C with 5% CO2 for 2 days on a round cover slip in a 35 mm
culture dish until they were 40-50% confluent. After reaching the right confluence, the cells were
transiently transfected with the constructs PBCV1-Kcv and Kesv in pEGFP-N2, using the liposomal
transfection reagent TurbofectTM (Fermentas, St.Leon Rot). After 1 day of incubation the cover slip
was fixed in a ring and filled with phosphate buffered saline (PBS) (8 g/l sodium chloride, 0.2 g/l
potassium chloride, 1.42 g/l disodium hydrogen phosphate, 0.24 g/l potassium hydrogen
phosphate; pH was adjusted with 1M sodium hydroxide up to 7.4. It was necessary to exchange the
cell culture medium with PBS because of the auto-fluorescence of the DMEM cell culture medium.
21
3.3.2. Compartment labelling
After replacement of the cell culture medium with PBS the cell cultures were treated immediately
before starting the CLSM session with MitoTracker® Red CMXRos or ER-TrackerTM Red (BODIPY®
TR Glibenclamide) (Life Technologies GmbH, Frankfurt) to label the mitochondria or the ER
respectively. The working concentration for MitoTracker® Red CMXRos was 25 nM and 1 µM for
ER-TrackerTM Red, as recommended in the manual of Life Technologies GmbH. In the case of
MitoTracker® Red CMXRos, the cell culture was incubated for 5 min and for ER-TrackerTM Red
(BODIPY® TR Glibenclamide) the incubation time was 10 min. After incubation the PBS solution
was exchanged again to wash superfluous dye away.
In the course of the studies the fluorescent dyes were exchanged with reference proteins for the
mitochondrial membrane and the ER. To label the inner mitochondrial membrane the subunit VIII
of human cytochrome C oxidase fused with the fluorescent protein mKate2 (COXVIII::mKate2) was
used. HEK293 cells were double-transfected with the mitochondrial marker together with either
PBCV1-Kcv::pEGFP-N2 or Kesv::pEGFP-N2. In the same way the ER retention sequence KDEL fused
with mKate2 (KDEL::mKate2) was used to visualise the ER. Both constructs are available
commercially (Ervogen, Moscow).
3.3.3. Confocal Laser Scanning Microscopy (CLSM)
The Leica TCS SP microscope (Leica, Heidelberg) was used for all localisation studies. All important
technical settings are listed below:
excitationmax / emission max:
EGFP: 488/509
MitoTracker® Red CMXRos: 579/599
ER-TrackerTM Red (BODIPY® TR Glibenclamide): 587/615
pinhole: 1 airy disc
laser (laser line):
argon laser (488 nm)
helium-neon laser (543 nm)
emission spectra:
GFP: 505 nm- 535 nm
MitoTracker® Red CMXRos: 590 nm – 700 nm
ER-TrackerTM Red (BODIPY® TR Glibenclamide): 600 nm- 700 nm
object lens:
HCX PL APO 63.0x1.20 W CORR UV
PL APO 100.0x1.40 OIL UV
22
3.3.4. Editing of primary data
For an improvement of the qualitative and quantitative analysis the primary data were processed
with an algorithm combining the additive white Gaussian noise model with the Poisson distribution.
In this manner the background noise could be reduced without producing artefacts or lost of
information. The calculation was accomplished with the plugin “Pure denoise” (Poisson unbiased
risk estimate) in the image-analysis program “ImageJ” (Luisier et al. 2010). To improve the denoise
quality the cycle-spin setting was regulated up to 10 cycle spins. The noise estimation was
performed automatically for the whole picture (global).
3.4. Results
3.4.1. Localisation of PBCV1-Kcv and Kesv with the help of chemical fluorescent dyes
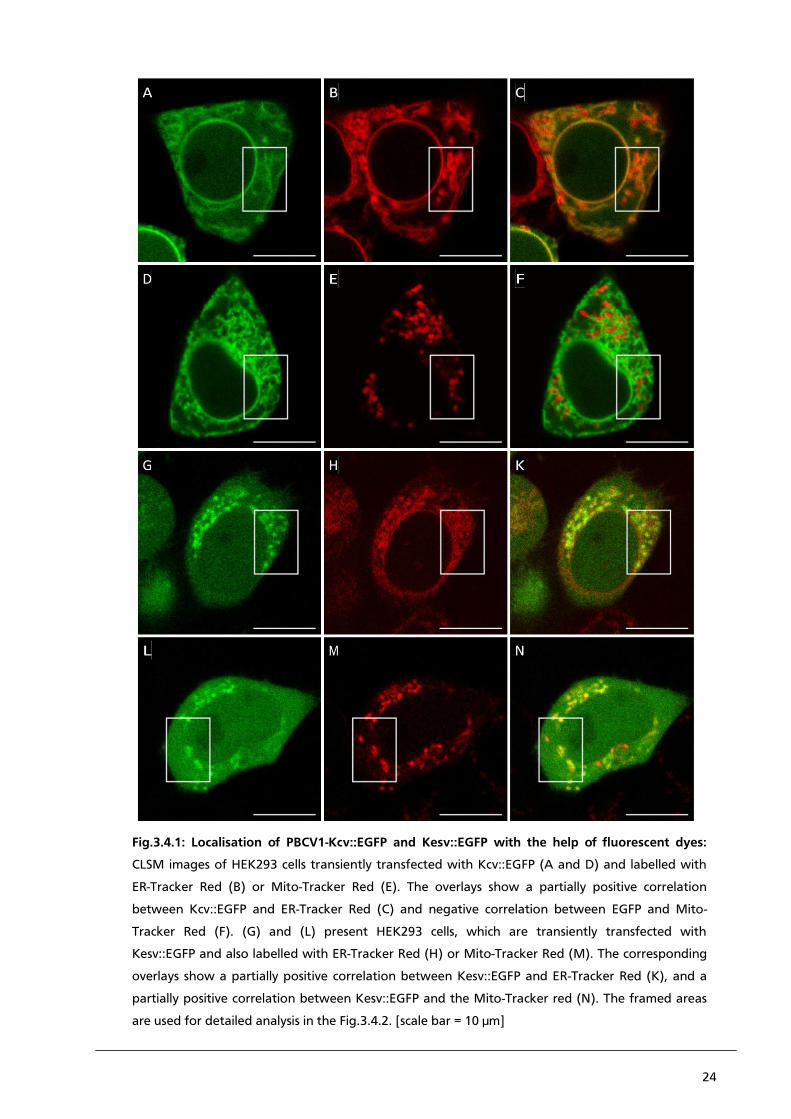
Previous studies have already shown that PBCV1-Kcv and Kesv are differentially sorted in the
heterologously expression system HEK293; PBCV1-Kcv traffics via the secretory pathway to the
plasma membrane, Kesv is imported into the mitochondria (Balss et al. 2008). In this chapter I
focus on measures, which optimise the raw data and improve the qualitative and quantitative
analysis in localisation studies. As starting point I repeat the localisation studies in the same way as
Balss et al. (2008). Therefore PBCV1-Kcv::EGFP and Kesv::EGFP were heterologously expressed in
HEK293 cells. After 1 day of incubation the cells were treated with Mito-Tracker Red or ER-Tracker
Red. Representative results are presented in the following figures Fig.3.4.1. and Fig.3.4.2.. As
expected, PBCV1-Kcv::EGFP can be localised in the ER (Fig.3.4.1. panel A). Most of the synthesised
protein remains in the ER and only a small portion of protein reaches the plasma membrane.
Therefore, the fluorescence signal of the EGFP, localised in the plasma membrane is masked by the
fluorescence signal associated with the ER. In spite of the problem to detect PBCV1-Kcv directly in
the plasma membrane of cells electrophysiological measurements (Moroni et al. 2002) as well as
improved resolution of microscopic techniques on membrane patches of HEK293 cells (Guthmann
(unpublished data)) verify that PBCV1-Kcv is indeed sorted to the plasma membrane. Hence, in the
present live cell microscopy studies of PBCV1-Kcv::EGFP, we consider a localisation of the protein in
the ER as synonymous for a sorting and trafficking of the protein in a co-translational manner from
the ER to the plasma membrane. The ER of HEK293 cells can be labelled with ER-Tracker Red
(Fig.3.4.1. panel B). The overlay of images A and B confirms previous data, which show that
PBCV1-Kcv is co-localised with the ER-Tracker Red. Furthermore, the data also show a negative
correlation between the signal of PBCV1-Kcv::EGFP and Mito-Tracker Red (Fig.3.4.1 panels D-F).
The data imply that PBCV1-Kcv is not entering the mitochondria. A close scrutiny of the co-
localisation between channel and ER-Tracker Red however reveals some surprising details: the data
show that the co-localisation is not hundred percent positive between the fluorescent signal of
PBCV1-Kcv::EGFP and ER-Tracker Red (Fig.3.4.1. panel C). There are also structures, which are
23
only labelled by ER-Tracker Red without revealing a signal of the PBCV1-Kcv::EGFP. This might
indicate that the channel is only present in a sub-domain of the ER.
In contrast to PBCV1-Kcv, Kesv::EGFP shows an entirely different localisation in HEK293. As already
referred by Balss et al. (2008) Kesv::EGFP can be localised in the mitochondrial membrane
(Fig.3.4.1. panel G). To stress the different sorting in contrast to PBCV1-Kcv, the ER was also
labelled with ER-Tracker Red (Fig.3.4.1. panel H). After treating the Kesv::EGFP transfected cells
with ER-Tracker Red, a new problem occurred, which is visible in the overlay in Fig.3.4.1. panel K;
in addition to the ER, the ER-Tracker Red also associates with the mitochondria. This is also well
observable in panel C of Fig.3.4.2.. A description in detail follows below. So instead of a negative
correlation the overlay presents a false positive correlation. The results of these experiments imply
that the ER tracker is not as specific for the endoplasmic reticulum as expected. Another problem,
which we generally encountered with the expression of Kesv::EGFP in HEK293, is the high degree
of background noise all over the cell-volume. The origin of this signal is not clear but it might be
caused by EGFP, which is hydrolytically cut off from the fusion protein Kesv::EGFP (Fig.3.4.1. panel
G and L). This hypothesis is supported by previous data, which detect in a western blot from
Kcv::EGFP expressing HEK293 cells with a GFP antibody the fusion protein but also a signal
corresponding to the molecular size of EGFP (Moroni et al. 2002). As described in the case of
PBCV1-Kcv and ER-Tracker Red, the overlay of Kesv::EGFP and Mito-Tracker Red reveals structures,
which are only labelled by Mito-Tracker Red but do not show a fluorescent signal of Kesv::EGFP
(Fig.3.4.1.(N)).
24
Fig.3.4.1: Localisation of PBCV1-Kcv::EGFP and Kesv::EGFP with the help of fluorescent dyes:
CLSM images of HEK293 cells transiently transfected with Kcv::EGFP (A and D) and labelled with
ER-Tracker Red (B) or Mito-Tracker Red (E). The overlays show a partially positive correlation
between Kcv::EGFP and ER-Tracker Red (C) and negative correlation between EGFP and Mito-
Tracker Red (F). (G) and (L) present HEK293 cells, which are transiently transfected with
Kesv::EGFP and also labelled with ER-Tracker Red (H) or Mito-Tracker Red (M). The corresponding
overlays show a partially positive correlation between Kesv::EGFP and ER-Tracker Red (K), and a
partially positive correlation between Kesv::EGFP and the Mito-Tracker red (N). The framed areas
are used for detailed analysis in the Fig.3.4.2. [scale bar = 10 µm]
25
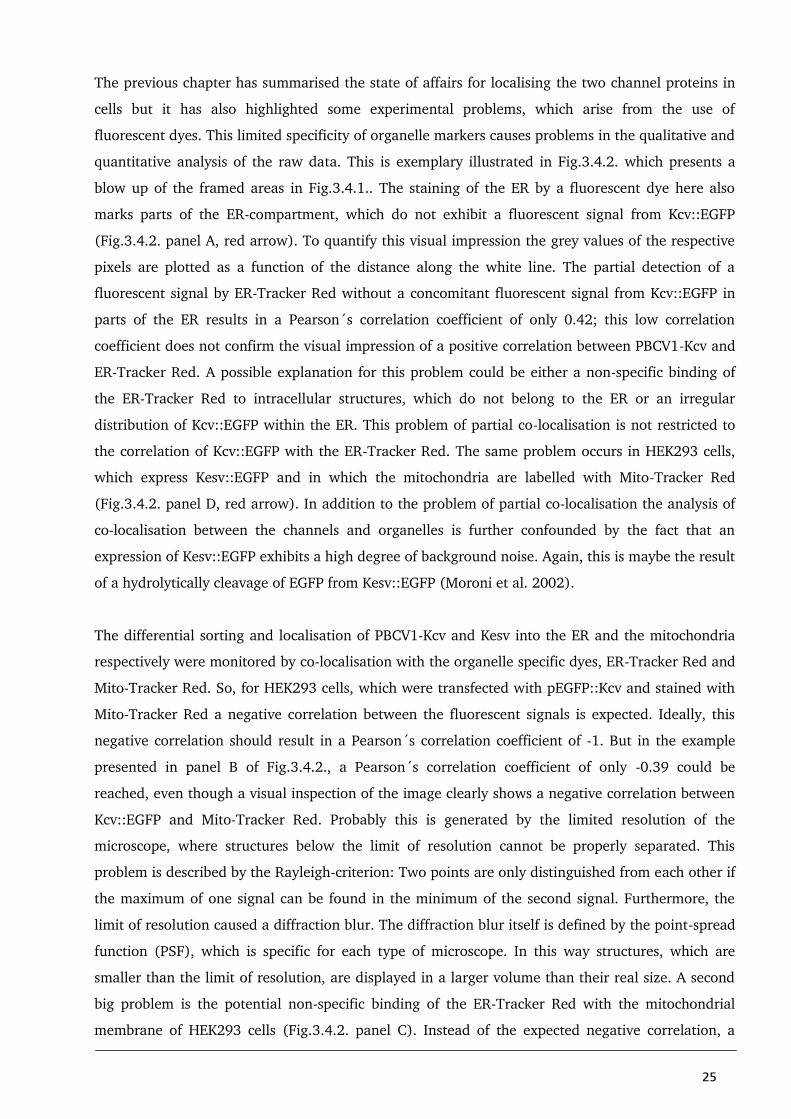
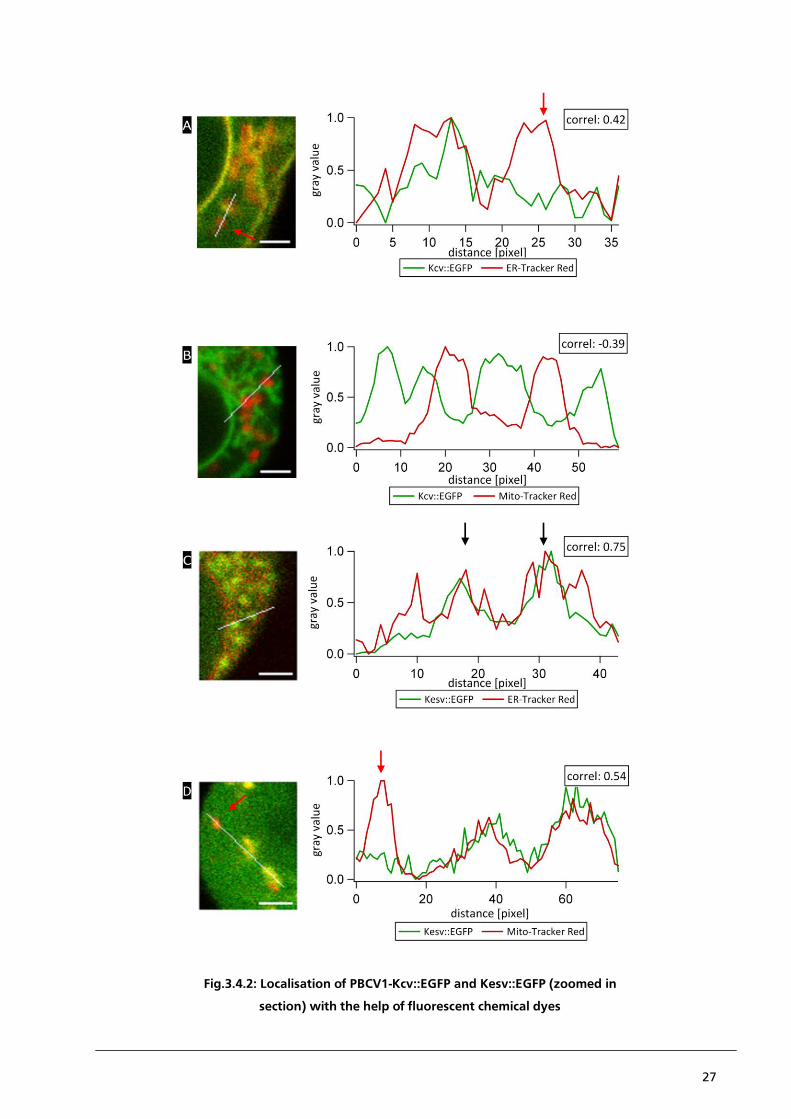
The previous chapter has summarised the state of affairs for localising the two channel proteins in
cells but it has also highlighted some experimental problems, which arise from the use of
fluorescent dyes. This limited specificity of organelle markers causes problems in the qualitative and
quantitative analysis of the raw data. This is exemplary illustrated in Fig.3.4.2. which presents a
blow up of the framed areas in Fig.3.4.1.. The staining of the ER by a fluorescent dye here also
marks parts of the ER-compartment, which do not exhibit a fluorescent signal from Kcv::EGFP
(Fig.3.4.2. panel A, red arrow). To quantify this visual impression the grey values of the respective
pixels are plotted as a function of the distance along the white line. The partial detection of a
fluorescent signal by ER-Tracker Red without a concomitant fluorescent signal from Kcv::EGFP in
parts of the ER results in a Pearson´s correlation coefficient of only 0.42; this low correlation
coefficient does not confirm the visual impression of a positive correlation between PBCV1-Kcv and
ER-Tracker Red. A possible explanation for this problem could be either a non-specific binding of
the ER-Tracker Red to intracellular structures, which do not belong to the ER or an irregular
distribution of Kcv::EGFP within the ER. This problem of partial co-localisation is not restricted to
the correlation of Kcv::EGFP with the ER-Tracker Red. The same problem occurs in HEK293 cells,
which express Kesv::EGFP and in which the mitochondria are labelled with Mito-Tracker Red
(Fig.3.4.2. panel D, red arrow). In addition to the problem of partial co-localisation the analysis of
co-localisation between the channels and organelles is further confounded by the fact that an
expression of Kesv::EGFP exhibits a high degree of background noise. Again, this is maybe the result
of a hydrolytically cleavage of EGFP from Kesv::EGFP (Moroni et al. 2002).
The differential sorting and localisation of PBCV1-Kcv and Kesv into the ER and the mitochondria
respectively were monitored by co-localisation with the organelle specific dyes, ER-Tracker Red and
Mito-Tracker Red. So, for HEK293 cells, which were transfected with pEGFP::Kcv and stained with
Mito-Tracker Red a negative correlation between the fluorescent signals is expected. Ideally, this
negative correlation should result in a Pearson´s correlation coefficient of -1. But in the example
presented in panel B of Fig.3.4.2., a Pearson´s correlation coefficient of only -0.39 could be
reached, even though a visual inspection of the image clearly shows a negative correlation between
Kcv::EGFP and Mito-Tracker Red. Probably this is generated by the limited resolution of the
microscope, where structures below the limit of resolution cannot be properly separated. This
problem is described by the Rayleigh-criterion: Two points are only distinguished from each other if
the maximum of one signal can be found in the minimum of the second signal. Furthermore, the
limit of resolution caused a diffraction blur. The diffraction blur itself is defined by the point-spread
function (PSF), which is specific for each type of microscope. In this way structures, which are
smaller than the limit of resolution, are displayed in a larger volume than their real size. A second
big problem is the potential non-specific binding of the ER-Tracker Red with the mitochondrial
membrane of HEK293 cells (Fig.3.4.2. panel C). Instead of the expected negative correlation, a
26
positive correlation of 0.75 was calculated. The unexpected staining of mitochondria by the ER
marker is maybe the result of the experimental system. It is reasonable to assume that the unspecific
reaction might be caused by a successful integration of functional Kesv channels into the
mitochondrial membrane. This would cause a depolarisation of the mitochondrial membrane
potential, which in turn maybe promotes binding of ER-Tracker Red to the mitochondrial
membrane. This is a reasonable speculation since the difference in membrane potential is an
essential parameter for the organelle specific distribution of the dyes in cells (Jayaraman, 2005).
Following page:
Fig.3.4.2: Localisation of PBCV1-Kcv::EGFP and Kesv::EGFP with the help of fluorescent chemical dyes: Blow
up of CLSM images from Fig.3.4.1. with HEK293 cells transiently transfected with Kcv::EGFP (A and B) and
stained with ER-Tracker Red (A) or Mito-Tracker Red (B). The corresponding intensity profiles and Pearson´s
correlation coefficients moderately confirm the apparent positive correlation between Kcv::EGFP and ER-
Tracker Red and the negative correlation between Kcv::EGFP and Mito-Tracker Red. Areas in which the
fluorescent signals do not co-localise are highlighted (A, red arrow). Panels C and D present HEK293 cells,
which are transiently transfected with Kesv::EGFP and also stained with ER-Tracker Red (C) and Mito-Tracker
Red (D). The corresponding intensity profiles represent the non-specific binding of ER-Tracker Red to the
mitochondrial membrane of HEK293 cells (C, black arrows) and areas with no apparent correlation (D, red
arrow). All intensity profiles represent the gray value of the pixel along the white line in each image. [scale bar
= 2 µm]
27
Fig.3.4.2: Localisation of PBCV1-Kcv::EGFP and Kesv::EGFP (zoomed in
section) with the help of fluorescent chemical dyes
28
3.4.2. Improvement of primary data based on “Pure Denoise”
The following chapter presents analytical tools, which eliminate some of the aforementioned
problems and which improve the signal to noise ratio. Background noise can be reduced with a
minimal loss of signal information when the primary data are appropriately filtered. The algorithm
used for this purpose is a combination of the additive white Gaussian noise model with Poisson
distribution, developed by Luisier et al. (2010). To demonstrate the effect of “Pure Denoise” filtering
Fig.3.4.3. presents a comparison between the raw data, Gauss filtered data and Pure Denoise
processed data using the example of Kcv::EGFP and ER-Tracker Red. The values of the raw data are
hallmarked by a low signal to noise ratio, which makes the identification of local signal maxima and
minima difficult (Fig.3.4.3. panel A). After processing of the raw data with the help of the algorithm
of an additive white Gaussian noise model, the signal to noise ratio increases. But as a negative side
effect the data processing also causes a loss of information (Fig.3.4.3. panel B). This is visible in the
range of 5 to 15 pixels of the plot profiles. The raw data reveal two peaks within the local
maximum. It suggests two structures in this region, which cannot be separated from each other
because of inherent resolution limits. After processing the image with a Gauss filter these two peaks
are no longer identifiable. Also the Pearson´s correlation coefficient increases at the expense of a
loss of signal information. In “Pure Denoise” calculated data the two peaks are also visible. Due to
the background noise, which remains high after Pure Denoise processing, the Pearson´s correlation
coefficient is not as high as the Pearson´s correlation coefficient of the Gauss calculated data. Hence
“Pure Denoise” processed data represent a reasonable compromise between loss of signal
information and a higher signal to noise ratio (Fig.3.4.3. panel C).
For a better understanding the plot profiles are separately presented for the EGFP fluorescent signal
(Fig.3.4.4. panel A) and the ER-Tracker Red fluorescent signal respectively (Fig.3.4.4. panel B).
Both, the fluorescent signal of the ER Tracker Red and the fluorescent signal of Kcv::EGFP, the
“Pure Denoise“ processed data are more similar to the raw data than the Gauss filtered data.
Following page
Fig.3.4.3: Comparison between raw data, Gauss filtered data and Pure Denoise processed data. Exemplary
data show a co-localisation of Kcv::EGFP and ER-Tracker Red. Magnification of 2x with Kcv::EGFP and ER-
Tracker Red and a plot profile represent the gray value of the pixel along the white line in each image. Raw
data (A), Gauss filtered data (B) and “Pure Denoise” processed data (C). [scale bar = 2 µm]
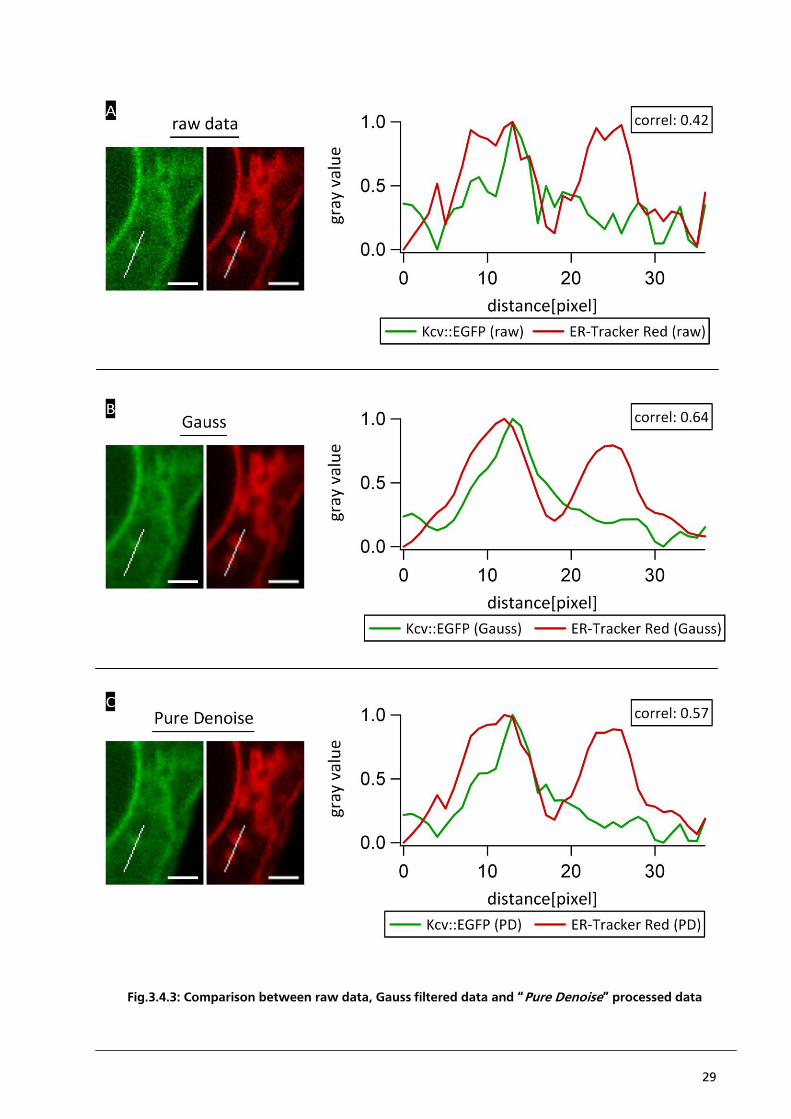
29
Fig.3.4.3: Comparison between raw data, Gauss filtered data and “Pure Denoise” processed data
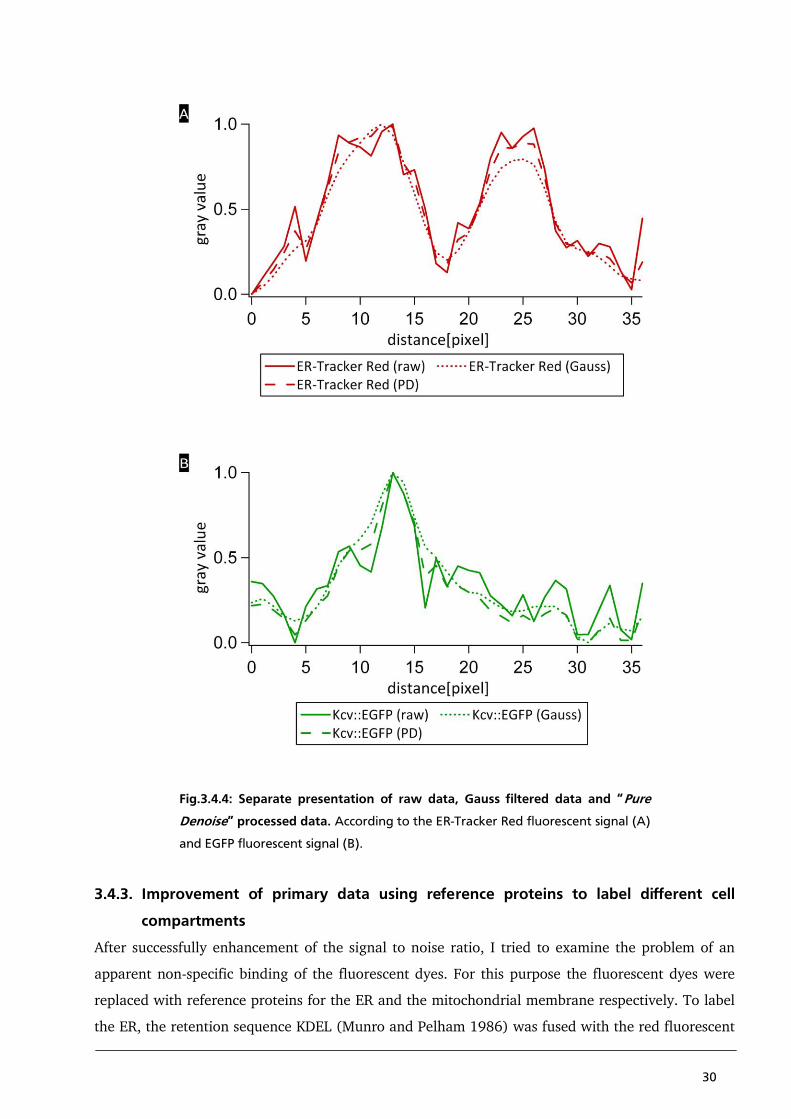
30
Fig.3.4.4: Separate presentation of raw data, Gauss filtered data and “Pure
Denoise” processed data. According to the ER-Tracker Red fluorescent signal (A)
and EGFP fluorescent signal (B).
3.4.3. Improvement of primary data using reference proteins to label different cell
compartments
After successfully enhancement of the signal to noise ratio, I tried to examine the problem of an
apparent non-specific binding of the fluorescent dyes. For this purpose the fluorescent dyes were
replaced with reference proteins for the ER and the mitochondrial membrane respectively. To label
the ER, the retention sequence KDEL (Munro and Pelham 1986) was fused with the red fluorescent
31
protein mKate2. To label the inner mitochondrial membrane a subunit of cytochrome oxidase was
used; in this case the respectively COXVIII protein (Rizutto et al. 1989) was fused with the red
fluorescent protein mKate2. HEK293 cells were transiently double-transfected with the gene of
Kcv::EGFP or Kesv::EGFP and the gene of a reference protein (KDEL::mKate2 or COXVIII::mKate2)
respectively. The corresponding images, presented in Fig.3.4.5., are already Pure Denoise processed.
A visual inspection of the images exhibits a clear positive correlation between Kcv::EGFP and
KDEL::mKate2 (Fig.3.4.5. panel A-C); the localisation of Kcv::EGFP and COXVIII::mKate2 is
negatively correlated (Fig.3.4.5. panel D-F). With the same analysis we find a negative correlation
between Kesv::EGFP and KDEL::mKate2 (Fig.3.4.5. panel G-K), and a positive correlation between
Kesv::EGFP and COXVIII::mkate2 (Fig.3.4.5. panel L-N).
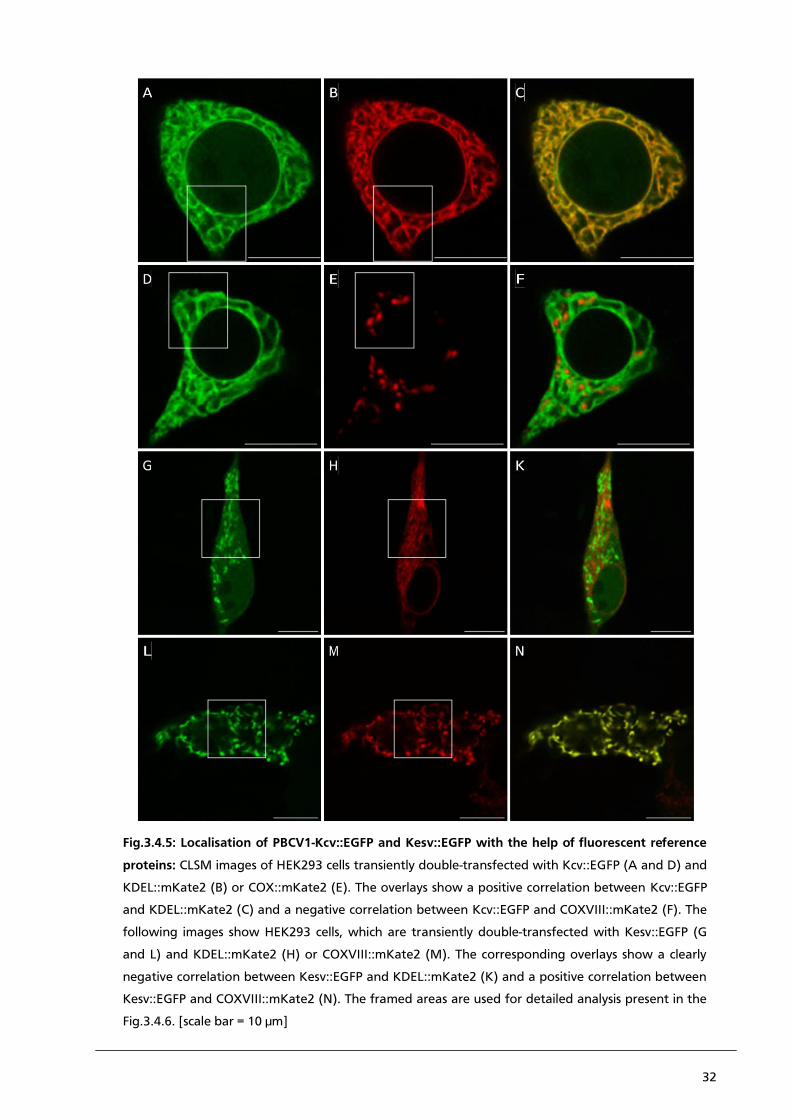
32
Fig.3.4.5: Localisation of PBCV1-Kcv::EGFP and Kesv::EGFP with the help of fluorescent reference
proteins: CLSM images of HEK293 cells transiently double-transfected with Kcv::EGFP (A and D) and
KDEL::mKate2 (B) or COX::mKate2 (E). The overlays show a positive correlation between Kcv::EGFP
and KDEL::mKate2 (C) and a negative correlation between Kcv::EGFP and COXVIII::mKate2 (F). The
following images show HEK293 cells, which are transiently double-transfected with Kesv::EGFP (G
and L) and KDEL::mKate2 (H) or COXVIII::mKate2 (M). The corresponding overlays show a clearly
negative correlation between Kesv::EGFP and KDEL::mKate2 (K) and a positive correlation between
Kesv::EGFP and COXVIII::mKate2 (N). The framed areas are used for detailed analysis present in the
Fig.3.4.6. [scale bar = 10 µm]
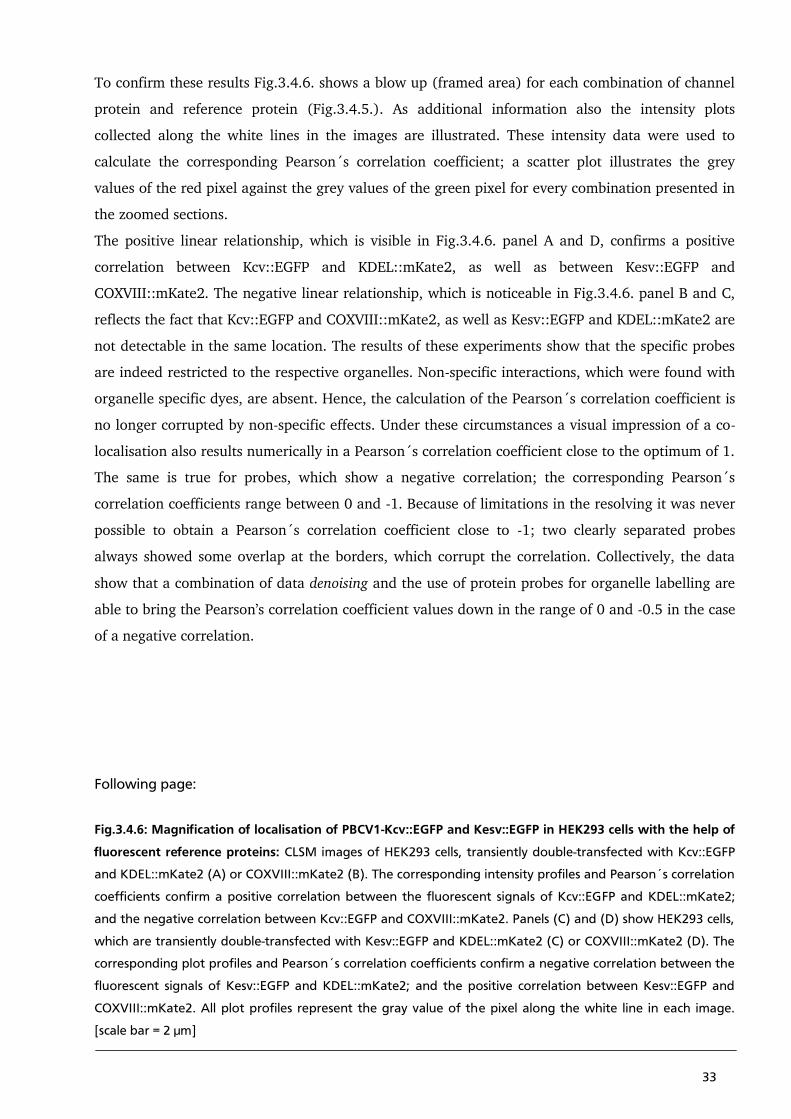
33
To confirm these results Fig.3.4.6. shows a blow up (framed area) for each combination of channel
protein and reference protein (Fig.3.4.5.). As additional information also the intensity plots
collected along the white lines in the images are illustrated. These intensity data were used to
calculate the corresponding Pearson´s correlation coefficient; a scatter plot illustrates the grey
values of the red pixel against the grey values of the green pixel for every combination presented in
the zoomed sections.
The positive linear relationship, which is visible in Fig.3.4.6. panel A and D, confirms a positive
correlation between Kcv::EGFP and KDEL::mKate2, as well as between Kesv::EGFP and
COXVIII::mKate2. The negative linear relationship, which is noticeable in Fig.3.4.6. panel B and C,
reflects the fact that Kcv::EGFP and COXVIII::mKate2, as well as Kesv::EGFP and KDEL::mKate2 are
not detectable in the same location. The results of these experiments show that the specific probes
are indeed restricted to the respective organelles. Non-specific interactions, which were found with
organelle specific dyes, are absent. Hence, the calculation of the Pearson´s correlation coefficient is
no longer corrupted by non-specific effects. Under these circumstances a visual impression of a co-
localisation also results numerically in a Pearson´s correlation coefficient close to the optimum of 1.
The same is true for probes, which show a negative correlation; the corresponding Pearson´s
correlation coefficients range between 0 and -1. Because of limitations in the resolving it was never
possible to obtain a Pearson´s correlation coefficient close to -1; two clearly separated probes
always showed some overlap at the borders, which corrupt the correlation. Collectively, the data
show that a combination of data denoising and the use of protein probes for organelle labelling are
able to bring the Pearson’s correlation coefficient values down in the range of 0 and -0.5 in the case
of a negative correlation.
Following page:
Fig.3.4.6: Magnification of localisation of PBCV1-Kcv::EGFP and Kesv::EGFP in HEK293 cells with the help of
fluorescent reference proteins: CLSM images of HEK293 cells, transiently double-transfected with Kcv::EGFP
and KDEL::mKate2 (A) or COXVIII::mKate2 (B). The corresponding intensity profiles and Pearson´s correlation
coefficients confirm a positive correlation between the fluorescent signals of Kcv::EGFP and KDEL::mKate2;
and the negative correlation between Kcv::EGFP and COXVIII::mKate2. Panels (C) and (D) show HEK293 cells,
which are transiently double-transfected with Kesv::EGFP and KDEL::mKate2 (C) or COXVIII::mKate2 (D). The
corresponding plot profiles and Pearson´s correlation coefficients confirm a negative correlation between the
fluorescent signals of Kesv::EGFP and KDEL::mKate2; and the positive correlation between Kesv::EGFP and
COXVIII::mKate2. All plot profiles represent the gray value of the pixel along the white line in each image.
[scale bar = 2 µm]
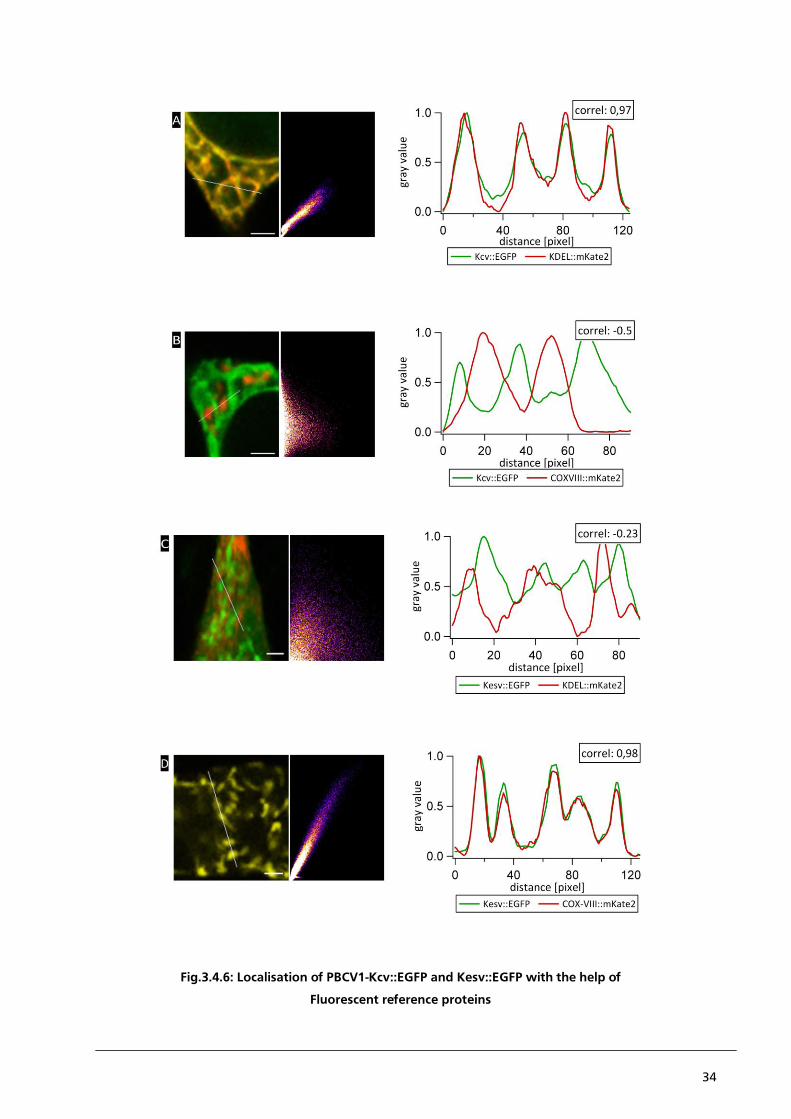
34
Fig.3.4.6: Localisation of PBCV1-Kcv::EGFP and Kesv::EGFP with the help of
Fluorescent reference proteins
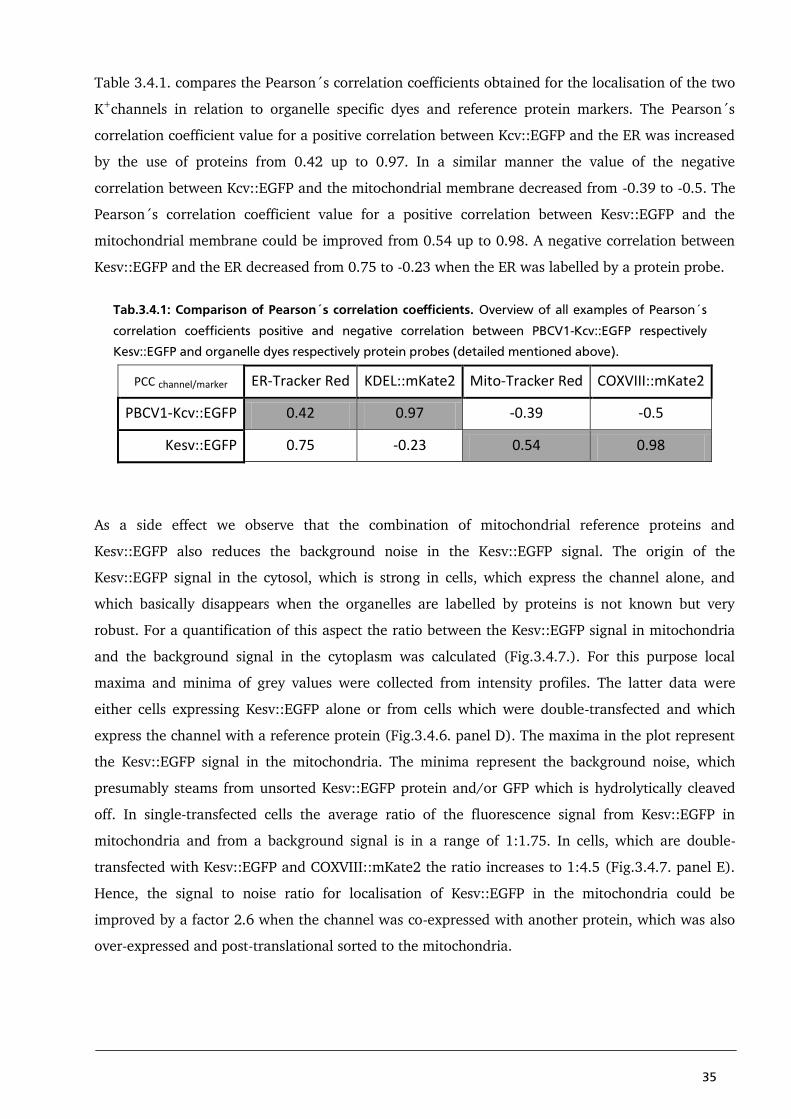
35
Table 3.4.1. compares the Pearson´s correlation coefficients obtained for the localisation of the two
K+channels in relation to organelle specific dyes and reference protein markers. The Pearson´s
correlation coefficient value for a positive correlation between Kcv::EGFP and the ER was increased
by the use of proteins from 0.42 up to 0.97. In a similar manner the value of the negative
correlation between Kcv::EGFP and the mitochondrial membrane decreased from -0.39 to -0.5. The
Pearson´s correlation coefficient value for a positive correlation between Kesv::EGFP and the
mitochondrial membrane could be improved from 0.54 up to 0.98. A negative correlation between
Kesv::EGFP and the ER decreased from 0.75 to -0.23 when the ER was labelled by a protein probe.
Tab.3.4.1: Comparison of Pearson´s correlation coefficients. Overview of all examples of Pearson´s
correlation coefficients positive and negative correlation between PBCV1-Kcv::EGFP respectively
Kesv::EGFP and organelle dyes respectively protein probes (detailed mentioned above).
PCC channel/marker ER-Tracker Red KDEL::mKate2 Mito-Tracker Red COXVIII::mKate2
PBCV1-Kcv::EGFP 0.42 0.97 -0.39 -0.5
Kesv::EGFP 0.75 -0.23 0.54 0.98
As a side effect we observe that the combination of mitochondrial reference proteins and
Kesv::EGFP also reduces the background noise in the Kesv::EGFP signal. The origin of the
Kesv::EGFP signal in the cytosol, which is strong in cells, which express the channel alone, and
which basically disappears when the organelles are labelled by proteins is not known but very
robust. For a quantification of this aspect the ratio between the Kesv::EGFP signal in mitochondria
and the background signal in the cytoplasm was calculated (Fig.3.4.7.). For this purpose local
maxima and minima of grey values were collected from intensity profiles. The latter data were
either cells expressing Kesv::EGFP alone or from cells which were double-transfected and which
express the channel with a reference protein (Fig.3.4.6. panel D). The maxima in the plot represent
the Kesv::EGFP signal in the mitochondria. The minima represent the background noise, which
presumably steams from unsorted Kesv::EGFP protein and/or GFP which is hydrolytically cleaved
off. In single-transfected cells the average ratio of the fluorescence signal from Kesv::EGFP in
mitochondria and from a background signal is in a range of 1:1.75. In cells, which are double-
transfected with Kesv::EGFP and COXVIII::mKate2 the ratio increases to 1:4.5 (Fig.3.4.7. panel E).
Hence, the signal to noise ratio for localisation of Kesv::EGFP in the mitochondria could be
improved by a factor 2.6 when the channel was co-expressed with another protein, which was also
over-expressed and post-translational sorted to the mitochondria.
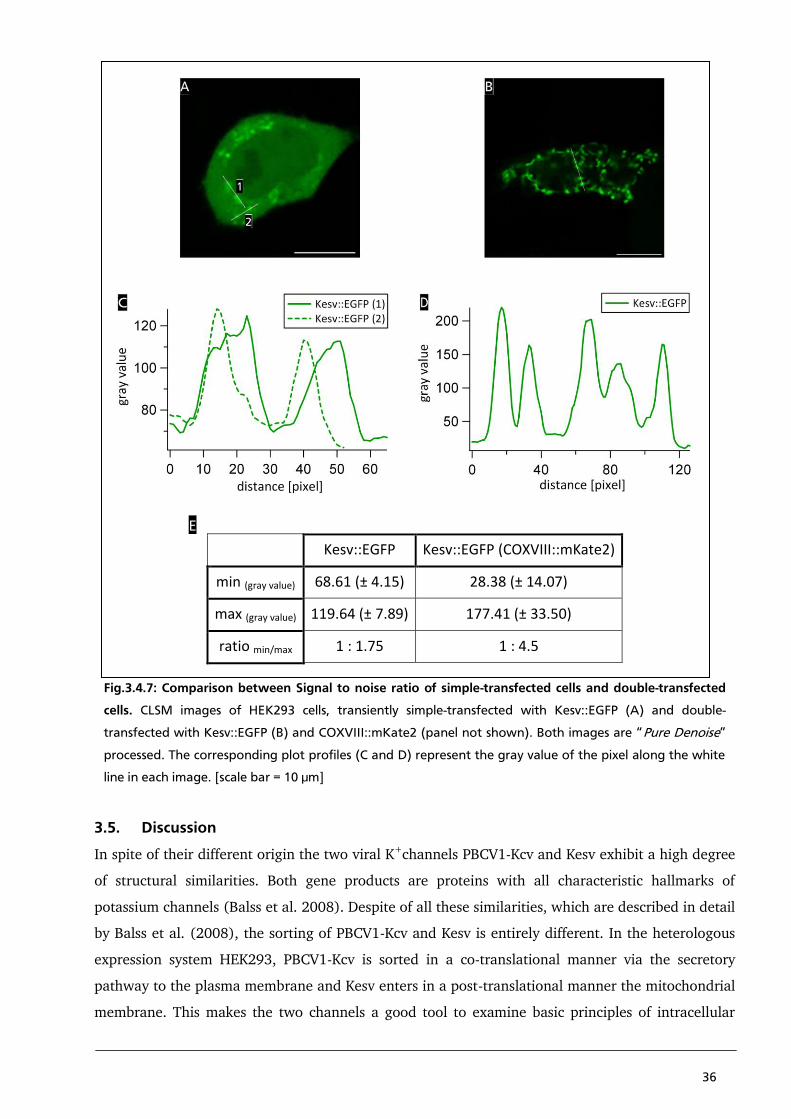
36
Kesv::EGFP Kesv::EGFP (COXVIII::mKate2)
min (gray value) 68.61 (± 4.15) 28.38 (± 14.07)
max (gray value) 119.64 (± 7.89) 177.41 (± 33.50)
ratio min/max 1 : 1.75 1 : 4.5
Fig.3.4.7: Comparison between Signal to noise ratio of simple-transfected cells and double-transfected
cells. CLSM images of HEK293 cells, transiently simple-transfected with Kesv::EGFP (A) and double-
transfected with Kesv::EGFP (B) and COXVIII::mKate2 (panel not shown). Both images are “Pure Denoise”
processed. The corresponding plot profiles (C and D) represent the gray value of the pixel along the white
line in each image. [scale bar = 10 µm]
3.5. Discussion
In spite of their different origin the two viral K+channels PBCV1-Kcv and Kesv exhibit a high degree
of structural similarities. Both gene products are proteins with all characteristic hallmarks of
potassium channels (Balss et al. 2008). Despite of all these similarities, which are described in detail
by Balss et al. (2008), the sorting of PBCV1-Kcv and Kesv is entirely different. In the heterologous
expression system HEK293, PBCV1-Kcv is sorted in a co-translational manner via the secretory
pathway to the plasma membrane and Kesv enters in a post-translational manner the mitochondrial
membrane. This makes the two channels a good tool to examine basic principles of intracellular
E
37
protein sorting. The advantage of fluorescence microscopy, which is used here, over conventional
biochemical methods, is the possibility to investigate protein sorting in a non-invasive manner. But
there are also problems, which are inherent in live cell microscopy. Firstly, the labelling of cell
compartments with fluorescent chemical dyes maybe altered by the protein of interest: If the
protein of interest is an integral membrane protein with channel activity like PBCV1-Kcv or Kesv,
the membrane potential can be affected as a consequence of the channel protein. This can be
important in the case of fluorescent dyes, which label an intracellular membrane according to the
membrane voltage across this membrane (Jayaraman, 2005). This can cause a non specific binding
of the compartment specific markers, as presented in the case of HEK293 cells transiently
transfected with Kesv::EGFP and labelled with ER Tracker Red. It is possible that Kesv affects the
mitochondrial membrane potential with the consequence of a non-specific binding of ER-Tracker
Red to the mitochondrial membrane (Fig.3.4.2. panel C). In some cases a fluorescent signal of
Kesv::EGFP could be observed in the mitochondrial membrane without that the same area was
labelled with Mito-Tracker Red (result are not presented). Such an effect might be caused by the
channel activity of Kesv; a conductance in the inner membrane of the mitochondria will depolarise
this membrane and create a situation, which is unfavourable for the accumulation of Mito-Tracker
Red in this membrane (Jayaraman, 2005).
A discrepancy of apparently positive correlated signals is also visible in the combination with
PBCV1-Kcv and ER-Tracker Red. Either the dye binds non-specific other compartments beside the
ER or PBCV1-Kcv is partially distributed in specific sub-domains of the ER for a tended targeting to
the plasma membrane (Fig.3.4.2.(A)).
The present data show that the exchange of fluorescent dyes for fluorescent reference proteins is a
good improvement for eliminating false positive and negative correlations in co-localisation studies.
Another benefit of the reference proteins was a great reduction in the background noise, e.g. of
fluorescent tagged channel proteins or cleaved GFP, which remained unsorted in the cytosol.
Because of the strong fluorescent signal of Kesv::EGFP and Kcv::EGFP the proteins are easily
localised in cells even with fluorescent markers for the organelles and when channels or the cleaved
GFP remain unsorted in the cytosol. Nonetheless, for a quantitative analysis of co-localisation such a
background noise is unwanted since the fluorescence associated with the organelle markers is often
masked by a large background noise in the cytosol. The reason for the background is not known. It
is worth noting that this background signal is particularly strong in the case of Kesv::EGFP. It might
be speculated that the mitochondrial sorting generates more unsorted protein which remains in the
cytosol (Fig.3.4.2. panel D). Very interesting is the fact that this random noise of Kesv::EGFP in the
cytosol is significantly reduced when the mitochondria are labelled by COXVIII-mKate2 instead of
the fluorescent Mito-Tracker Red dye. (Fig.3.4.7.). The reason for this reduction in cytosolic signal
38
is not known. It occurs as if the mitochondrial sorted reference protein enhances import of the Kesv
channel into the mitochondria.
In addition to the use of organelle specific proteins for labelling the mitochondria or the ER also the
Pure Denoise processing of the raw data improved the signal to noise ratio in the images. This post
imaging processing method helps to increase the signal to noise ratio without a loss of signal
information. With a combination of the additive white Gaussian noise model with the Poisson
distribution the information of the raw data can be reproduced more realistic than by using only a
Gauss filtering of the data.
With all these experimental improvements it is now possible to confirm a visual impression of a
positive correlation between PBCV1-Kcv::EGFP and KDEL::mKate2, and between Kesv::EGFP and
COXVIII::mKate2 respectively with the respective Pearson´s correlation coefficients; in the case of a
co-localisation of a channel with a respective organelle marker the coefficient approaches the
theoretical value of 1. The values for a negative correlation between PBCV1-Kcv::EGFP and
COXVIII::mKate2, and Kesv::EGFP and KDEL::mKate2 is not reaching the theoretical value of-1. The
estimated values of two separate fluorescent labels range between -0.2 and -0.5. These values are
not approaching the expected value of -1 because the inherent limited resolution of the confocal
microscope is not able to fully resolve the position of two very close fluorescent signals. Hence, the
values between -0.2 and -0.5 can be interpreted here as a robust value for a negative correlation
between two fluorescent markers. The limited resolving of a conventional microscope makes it
hardly possible to achieve value near -1; other improved methods like STED microscopy are
required for such an improved separation of adjacent fluorescent signals (Willig et al. 2006).
The methodological considerations, which were presented in this chapter, show that Kesv::EGFP
and Kcv::EGFP can be localised with good confidence in either the ER or the mitochondria. With the
improvements of the method the co-localisation analysis is now robust and the Person´s co-
localisation coefficient can be used as a reliable value for a statistical analysis of positive and
negative co-localisation. With these tools it is now possible to examine the sorting of the two
channels and their mutants in detail.
39
3.6. References
Abbe E (1873) Beiträge zur Theorie des Mikroskops und der mikroskopischen Wahrnehmung.
Balss J, Papatheodorou P, Mehmel M, Baumeister D, Hertel B, Delaroque N, Chatelain F,
Minor D, Van Etten J, Rassow J, Moroni A, Thiel G (2008) Transmembrane domain length
of viral K+ channels is a signal for mitochondria targeting. PNAS Vol.105: 12313-8
Braun C (2011) Rekonstitution von Kanalproteinen in planaren Lipid Bilayern. TU-Darmstadt
Gazzarrini S, Severino M, Lombardi M, Morandi M, DiFrancesco D, Van Etten J, Thiel G,
Moroni A (2003) The viral potassium channel Kcv: structural and functional features. FEBS
Letters Vol. 552: 12-6
Gazzarrini S, Kang M, Abenavoli A, Romani G, Olivari C, Gaslini D, Ferrara G, Van Etten J,
Kreim M, Kast S, Thiel G, Moroni A (2010) Chlorella virus ATCV-1 encodes a functional
potassium channel of 82 amino acids. Biochemical Journal Vol.420: 295-303
Graham F, Smiley J, Russell W, Nairn R (1977) Characteristics of a human cell line transformed
by DNA from human adenovirus type 5. The Journal of general virology Vol.36: 59-74
Hegde R, Keenan R (2011) Tail-anchored membrane protein insertion into the endoplasmic
reticulum. Nature reviews; Molecular cell biology Vol.12: 787-98
Heginbotham L, Lu Z, Abramson T, MacKinnon R (1994) Mutations in the K+ channel signature
sequence. Biophysical journal Vol.66: 1061-7
Hell S, Wichmann J (1994) Breaking the diffraction resolution limit by stimulated emission:
stimulated-emission-depletion fluorescence microscopy. Opticletters Vol.19: 780-2
Hertel B (2005) Struktur-Funktions-Beziehung in dem minimalen viralen K+-Kanal Kcv:
Funktionelle Rolle des N-Terminus bei der Regulation von Kanalaktivität. Landes und
Universitäts Bibliothek Darmstadt
Jayaraman (2005) Flow cytometric determination of mitochondrial membrane potential changes
during apoptosis of T lymphocytic and pancreatic beta cell lines: comparison of
tetramethylrhodamineethylester (TMRE), chloromethyl-X-rosamine (H2-CMX-Ros) and
MitoTracker Red 580 (MTR580). Journal of immunological methods Vol.306: 68-79
Luisier F, Vonesch C, Blu T, Unser M (2010) Fast interscale wavelet denoising of Poisson-
corrupted images. Signal processing Vol.90: 415-427
Miller C (2000) An overview of the potassium channel family. Genome biology Vol.1: reviews0004
Moroni A, Viscomi C, Sangiorgio V, Pagliuca C, Meckel T, Horvath F, Gazzarrini S, Valbuzzi P,
Van Etten J, DiFrancesco D, Thiel G (2002) The short N-terminus is required for functional
expression of the virus-encoded miniature K(+) channel Kcv. FEBS letters Vol.530: 65-9
Munro S and Pelham R (1987) A C-Terminal signal prevents secretion of luminal ER proteins. Cell
Vol.48: 899-907
40
Plugge B, Gazzarrini S, Nelson M, Cerana R, Van Etten J, Derst C, DiFrancesco D, Moroni A,
Thiel G (2000) A Potassium Channel Protein Encoded by Chlorella Virus PBCV-1. Science
Vol.287: 1641-44
Rizzuto R, Nakase H, Darras B, Francke U, Fabrizi G, Mengel T, Walsh F, Kadenbach B,
DiMauro S, Schon E (1989) A gene specifying subunit VIII of human cytochrome c oxidase is
localised to chromosome 11 and is expressed in both muscle and non-muscle tissues. The
Journal of biological chemistry Vol.264: 10595-600
Semwogerere D, Weeks E (2005) Confocal Microscopy. Encyclopedia of Biomaterials and
Biomedical Engineering
Willig K; Rizzoli S, Westphal V, Jahn R, Hell S (2006) STED microscopy reveals that
synaptotagmin remains clustered after synaptic vesicle exocytosis. Nature Vol.440: 935-9
41
4. Chapter 3 – PBCV1-Kcv and Kesv as tools for investigating membrane protein sorting
4.1. Abstract
To investigate non-canonical mechanisms for the sorting of membrane proteins we use two small
potassium channels, PBCV1-Kcv and Kesv. Both channels are structurally very similarity but exhibit
an entirely different sorting. Kesv is post-translationally sorted into the inner mitochondrial
membrane. PBCV1-Kcv on the other hand is targeted in a co-translational manner via the secretory
pathway to the plasma membrane. By creating PBCV1-Kcv/Kesv chimaeras we study here the
sorting signals, which determine the distinct sorting of each protein. Co-localisation studies with
channel chimaeras and fluorescent reference proteins imply that sorting of PBCV1-Kcv only requires
the fold of the first TMD and the P-loop (M26-D68). But the substitution of M26 into a valine causes
a loss of sorting. Whereas, a post-translational sorting of Kesv into the inner mitochondrial
membrane requires nearly the entire Kesv-sequence and seems to be very fragile. In the presents of
over expressed KDEL::mKate2, the targeting of originally mitochondrial localised Kcv/Kesv
chimaeras becomes more diffuse. Equivalent, the mitochondrial sorting is supported in the presents
of over expressed COXVIII::mKate2.
4.2. Introduction
Membrane proteins are sorted by two well-known mechanisms. Nuclear coded proteins, which are
designated for organelles such as the mitochondria, are sorted mostly in a post-translational manner
(Schatz 1996). These proteins generally contain an N-terminal mitochondrial targeting sequence
(MTS) (Roise and Schatz 1988). After translation they are surrounded by chaperones, like the heat
shock protein Hsp70, and transported to the outer mitochondrial membrane (Omura 1998). The
binding of the chaperones is preceded by phosphorylation of the designated mitochondrial proteins
(Robin et al. 2003). The main function of the chaperones is to protect the hydrophobic post-
translationally sorted membrane proteins in their native structure until they are inserted into the
target membrane via the TIM/TOM complex (Hartl 2002). The mechanism for the insertion is
described in detail in chapter 2.2.1.
In contrast to this pathway, plasma membrane proteins are sorted mostly in a co-translational
manner via the secretory pathway to the plasma membrane (Shao and Hedge 2011). Translation
and insertion into the membrane initiate with an interaction between a signal recognition particle
(SRP) and the ribosome-mRNA-complex. If a nascent protein exhibits an N-terminal signal sequence
for the secretory pathway, the SRP binds this sequence and mediates the transport of the ribosome-
mRNA-complex with the nascent protein to a SRP-receptor. The latter receptor is localised on the
surface of the endoplasmatic reticulum (Hedge and Keenan 2011). The insertion of co-
translationally sorted proteins into the secretory pathway is mediated and regulated by the Sec61
42
translocon, a complex, which is functionally analogous to the TIM/TOM complex in the
mitochondrial membrane.
Most of the membrane proteins, which are targeted to the plasma membrane or the organelle
membranes, are sorted according to the two aforementioned processes. But in addition to these
canonical pathways there are also other, largely unknown possibilities for a co-translational protein
sorting for example into the mitochondrial membrane. One of these pathways proceeds via a
recently discovered sub-compartment of the ER, named mitochondrial associated membrane
(Bozidis et al. 2007). Also protein insertion into the ER may occurs in a non-canonical way; tail
anchored proteins for example can be targeted into the ER via a post-translational mechanism using
the TMD-Recognition Complex protein 40 (TRC 40) (Stevanovic and Hedge 2007).
To examine non-canonical pathways of protein sorting two viral K+channels were used. PBCV1-Kcv
and Kesv are two small viral K+channels with a high degree of similarities but with different origins.
With a monomer size of 94 aa, PBCV1-Kcv is one of the smallest known K+-channels; it is coded in
the genome of the algae virus Paramecium Bursaria Chlorella Virus (PBCV1) (Plugge et al. 2000).
Kesv on the other hand is coded by the Ectocarpus Siliculosus Virus 1 (ESV1); this gene product is
slightly longer and comprises 124 aa. From sequence alignments of Kcv, Kesv and the bacterial
potassium channel KcsA, whose crystal structure is already known (Cortes et al. 2001), it is
assumed that functional Kcv and Kesv channels are tetramers with a 2TMD architecture including
one P-loop per subunit (Gazzarrini et al. 2003, Balss et al. 2008). Overall, Kesv and PBCV1-Kcv
have a protein identity of 29%; at the C-terminus this value increases up to 41% (Balss et al. 2008).
Despite this great structural similarity the sorting of PBCV1-Kcv and Kesv is entirely different. In the
heterologous expression system HEK293 it could be shown that PBCV1-Kcv is trafficking to the
plasma membrane via the secretory pathway. Kesv in contrast is not found in the plasma membrane
but in the mitochondria and there most likely in the inner mitochondrial membrane (Balss et al.
2008). Because of the difference in sorting the activity of the PBCV1-Kcv channel could be recorded
in the plasma membrane of various expression systems with electrophysiological methods (Moroni
et al. 2002). The Kesv channel activity reported from the plasma membrane of Xenopus oocytes
(Chen et al. 2005) is probably an artefact and due to an up-regulation of endogenous channels
(Balss et al. 2008). When Kesv is expressed in mammalian cells or Xenopus oocytes it does not
generate any specific activity in the plasma membrane. Still the function of the proteins as an ion
channel remains, because when the purified protein is reconstituted into planar lipid bilayers it
causes single channel fluctuations (Braun 2011).
In search for the mechanisms, which is underlying the differential sorting of the two channels, a
putative mitochondrial targeting sequence (MTS) could be identified in the N-terminal region of
Kesv. Upon fusion to GFP this domain was able to direct the fluorescent protein into the
mitochondria. But when the same domain was fused to PBCV1-Kcv it was not capable to direct the
43
fusion protein (MTS::PBCV1-Kcv::EGFP) to the mitochondria (Balss et al. 2008). The results of
these experiments imply that PBCV1-Kcv contains one or more additional targeting signals, which
ensure a sorting into the secretory pathway and which are stronger than the MTS of Kesv. Further
data show that the sorting of Kesv to the mitochondria is not only depending on the N-terminal
signal domain; sorting can be effectively corrupted by alterations in other parts of the protein. It
was found that an extension of two amino acids at position 113 in the second TMD of Kesv
redirected the sorting of Kesv into the secretory pathway. The results of these experiments suggest
that the second TMD of both channels contains a strong sorting signal, which is responsible for the
differential targeting. Based on this assumption a chimaera was created which comprise the first
TMD of PBCV1-Kcv and the second TMD of Kesv. Surprisingly this chimaera was sorted into the
secretory pathway. This underscores the existence of an additional strong targeting signal in the
first TMD of PBCV1-Kcv. This signal probably overrides the other signals and favours a targeting to
the plasma membrane via the secretory pathway. All these results were published by Balss et al.
(2008). In order to identify this additional putative sorting signal in the first TMD of PBCV1-Kcv
and its importance relative to other signals I created further chimaeras comprising different portions
of Kesv and Kcv. The data assumed a strong signal sequence in the downstream end of the first
TMD for the sorting of PBCV1-Kcv into the secretory pathway. Furthermore, the data confirm the
hypothesis that the post-translational sorting of Kesv to the mitochondria is very fragile and requires
nearly the whole sequence of Kesv.
4.3. Material and Methods
4.3.1. Heterologous Expression in HEK293
All localisation studies were realised in human embryonic kidney (HEK) 293 cells (Graham et al.
1977). The cells were grown at 37°C with 5% CO2 for 2 days on a round cover slip in a 35 mm
culture dish until they were 40-50% confluent. After reaching the right confluence, the cells were
transiently double-transfected with the constructs PBCV1-Kcv,Kesv or Chim1-6 (for nomenclature of
chimaeras see below) in pEGFP-N2 and KDEL::mKate2, COXVIII::mKate2respectively, using the
liposomal transfection reagent TurbofectTM (Fermentas, St.Leon Rot) or Gene Juice (Merck
Millipore, Darmstadt). KDEL::mKate2 and COXVIII::mKate2 were used to visualise the ER and the
inner mitochondrial membrane. Both constructs are commercial available (Ervogen, Moscow).
Chimaeras were obtained by site-directed mutagenesis (Stratagen) and the correctness of the
mutations was checked by DNA sequencing. After 1 day of incubation the cover slip was fixed in a
ring and filled with phosphate buffered saline (PBS) (8 g/l sodium chloride, 0.2 g/l potassium
chloride, 1.42 g/l disodium hydrogen phosphate, 0.24 g/l potassium hydrogen phosphate; pH was
adjusted with 1M sodium hydroxide to 7.4. It was necessary to exchange the cell culture medium
with PBS buffer because of the auto-fluorescence of the DMEM cell culture medium.
44
4.3.2. Confocal Laser Scanning Microscopy (CLSM)
The Leica TCS SP microscope (Leica, Heidelberg) and Leica TCS SP II microscope were used for all
localisation studies. All important technical settings are listed below:
excitationmax / emission max:
EGFP: 488/509
mKate2: 588/633
pinhole: 1 airy disc
laser (laser line):
argon laser (488 nm)
helium-neon laser (543 nm, 561 nm)
emission spectra:
EGFP: 505 nm- 535 nm and 500 nm – 540 nm (for Leica TCS SP II)
mKate2: 615 nm – 800 nm
object lens:
HCX PL APO 63.0x1.20 W CORR UV
PL APO 100.0x1.40 OIL UV
4.3.3. Editing of primary data
For an improvement of the qualitative and quantitative analysis the primary data were processed
with an algorithm, combining the additive white Gaussian noise model with the Poisson
distribution. In this manner the background noise could be reduced without producing artefacts or
loss of information. The calculation was accomplished with the plugin “Pure denoise” (Poisson
unbiased risk estimate) of the image-analysis program “ImageJ” (Luisier et al. 2010). To improve
the denoise quality the cycle-spin setting was regulated up to 10 cycle spins. The noise estimation
was performed automatically for the whole picture (global).
4.4. Results and Discussion
4.4.1. Localisation of Kesv/Kcv chimaeras to identify a sorting signal in the first TMD of
PBCV1-Kcv
To identify a putative sorting signal in the first TMD of PBCV1-Kcv, which directs this protein to the
secretory pathway and further to the plasma membrane I constructed chimaeras of the two
channels. Figure 4.4.1. shows the schematic design of the chimaera monomers. The flanking parts
of the chimaeras comprise the N-terminus and the C-terminus with the second TMD of Kesv
respectively. The central part contains the respective fold of the PBCV-1-Kcv structure. The rational
behind this design is that Chimaera 1 contains the N-terminal MTS and the short 2TMD of Kesv;
both factors should favour sorting to the mitochondria (Balss et al. 2008). The central part contains
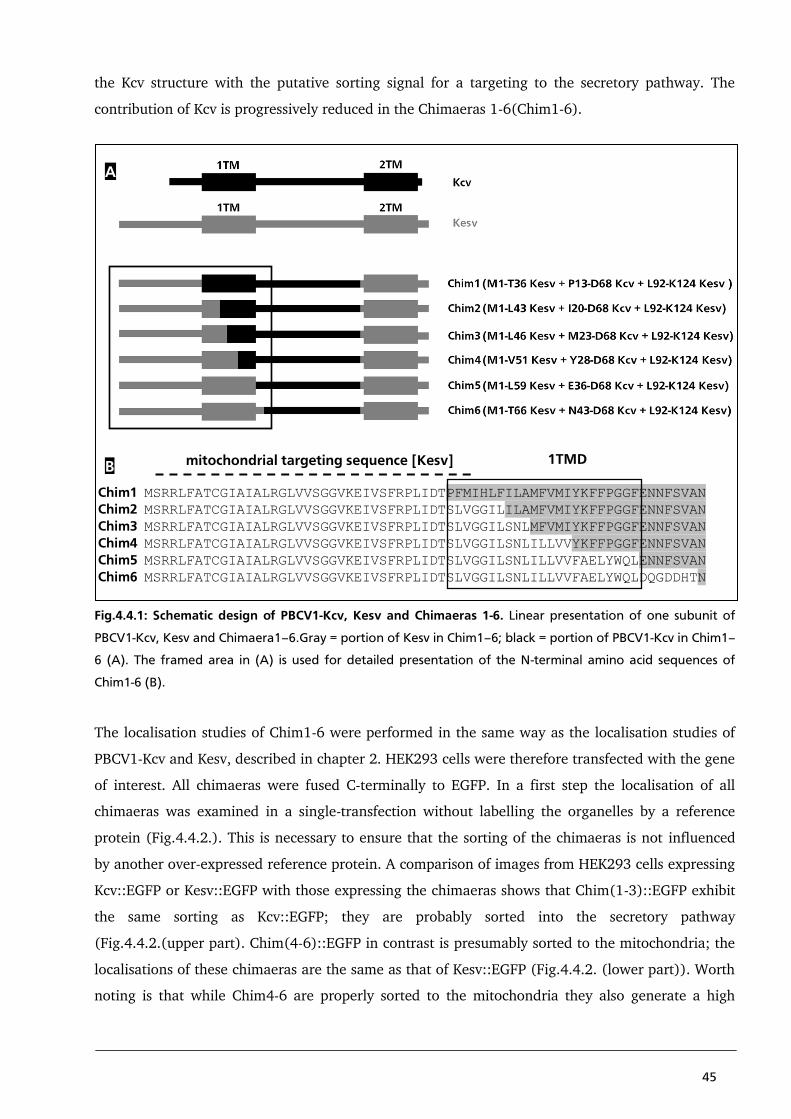
45
the Kcv structure with the putative sorting signal for a targeting to the secretory pathway. The
contribution of Kcv is progressively reduced in the Chimaeras 1-6(Chim1-6).
Chim1 MSRRLFATCGIAIALRGLVVSGGVKEIVSFRPLIDTPFMIHLFILAMFVMIYKFFPGGFENNFSVAN Chim2 MSRRLFATCGIAIALRGLVVSGGVKEIVSFRPLIDTSLVGGILILAMFVMIYKFFPGGFENNFSVAN
Chim3 MSRRLFATCGIAIALRGLVVSGGVKEIVSFRPLIDTSLVGGILSNLMFVMIYKFFPGGFENNFSVAN
Chim4 MSRRLFATCGIAIALRGLVVSGGVKEIVSFRPLIDTSLVGGILSNLILLVVYKFFPGGFENNFSVAN
Chim5 MSRRLFATCGIAIALRGLVVSGGVKEIVSFRPLIDTSLVGGILSNLILLVVFAELYWQLENNFSVAN
Chim6 MSRRLFATCGIAIALRGLVVSGGVKEIVSFRPLIDTSLVGGILSNLILLVVFAELYWQLDQGDDHTN
Fig.4.4.1: Schematic design of PBCV1-Kcv, Kesv and Chimaeras 1-6. Linear presentation of one subunit of
PBCV1-Kcv, Kesv and Chimaera1–6.Gray = portion of Kesv in Chim1–6; black = portion of PBCV1-Kcv in Chim1–
6 (A). The framed area in (A) is used for detailed presentation of the N-terminal amino acid sequences of
Chim1-6 (B).
The localisation studies of Chim1-6 were performed in the same way as the localisation studies of
PBCV1-Kcv and Kesv, described in chapter 2. HEK293 cells were therefore transfected with the gene
of interest. All chimaeras were fused C-terminally to EGFP. In a first step the localisation of all
chimaeras was examined in a single-transfection without labelling the organelles by a reference
protein (Fig.4.4.2.). This is necessary to ensure that the sorting of the chimaeras is not influenced
by another over-expressed reference protein. A comparison of images from HEK293 cells expressing
Kcv::EGFP or Kesv::EGFP with those expressing the chimaeras shows that Chim(1-3)::EGFP exhibit
the same sorting as Kcv::EGFP; they are probably sorted into the secretory pathway
(Fig.4.4.2.(upper part). Chim(4-6)::EGFP in contrast is presumably sorted to the mitochondria; the
localisations of these chimaeras are the same as that of Kesv::EGFP (Fig.4.4.2. (lower part)). Worth
noting is that while Chim4-6 are properly sorted to the mitochondria they also generate a high
mitochondrial targeting sequence [Kesv] 1TMD
A
B
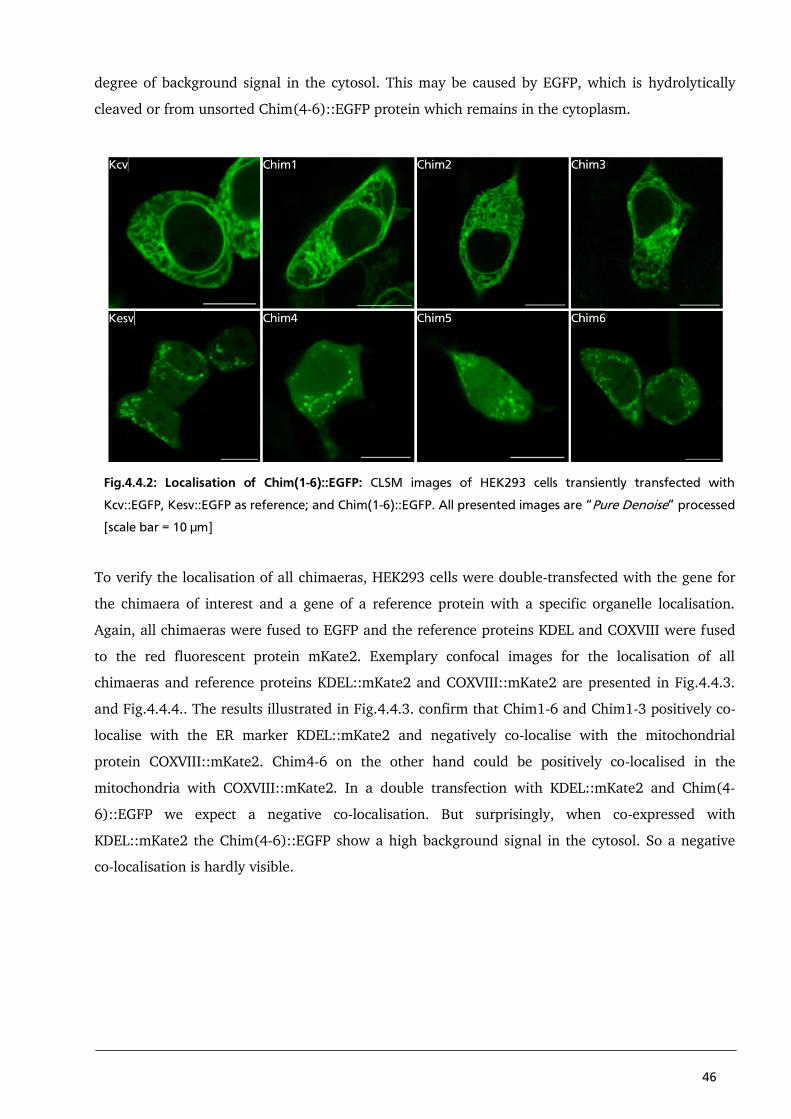
46
degree of background signal in the cytosol. This may be caused by EGFP, which is hydrolytically
cleaved or from unsorted Chim(4-6)::EGFP protein which remains in the cytoplasm.
Fig.4.4.2: Localisation of Chim(1-6)::EGFP: CLSM images of HEK293 cells transiently transfected with
Kcv::EGFP, Kesv::EGFP as reference; and Chim(1-6)::EGFP. All presented images are “Pure Denoise” processed
[scale bar = 10 µm]
To verify the localisation of all chimaeras, HEK293 cells were double-transfected with the gene for
the chimaera of interest and a gene of a reference protein with a specific organelle localisation.
Again, all chimaeras were fused to EGFP and the reference proteins KDEL and COXVIII were fused
to the red fluorescent protein mKate2. Exemplary confocal images for the localisation of all
chimaeras and reference proteins KDEL::mKate2 and COXVIII::mKate2 are presented in Fig.4.4.3.
and Fig.4.4.4.. The results illustrated in Fig.4.4.3. confirm that Chim1-6 and Chim1-3 positively co-
localise with the ER marker KDEL::mKate2 and negatively co-localise with the mitochondrial
protein COXVIII::mKate2. Chim4-6 on the other hand could be positively co-localised in the
mitochondria with COXVIII::mKate2. In a double transfection with KDEL::mKate2 and Chim(4-
6)::EGFP we expect a negative co-localisation. But surprisingly, when co-expressed with
KDEL::mKate2 the Chim(4-6)::EGFP show a high background signal in the cytosol. So a negative
co-localisation is hardly visible.
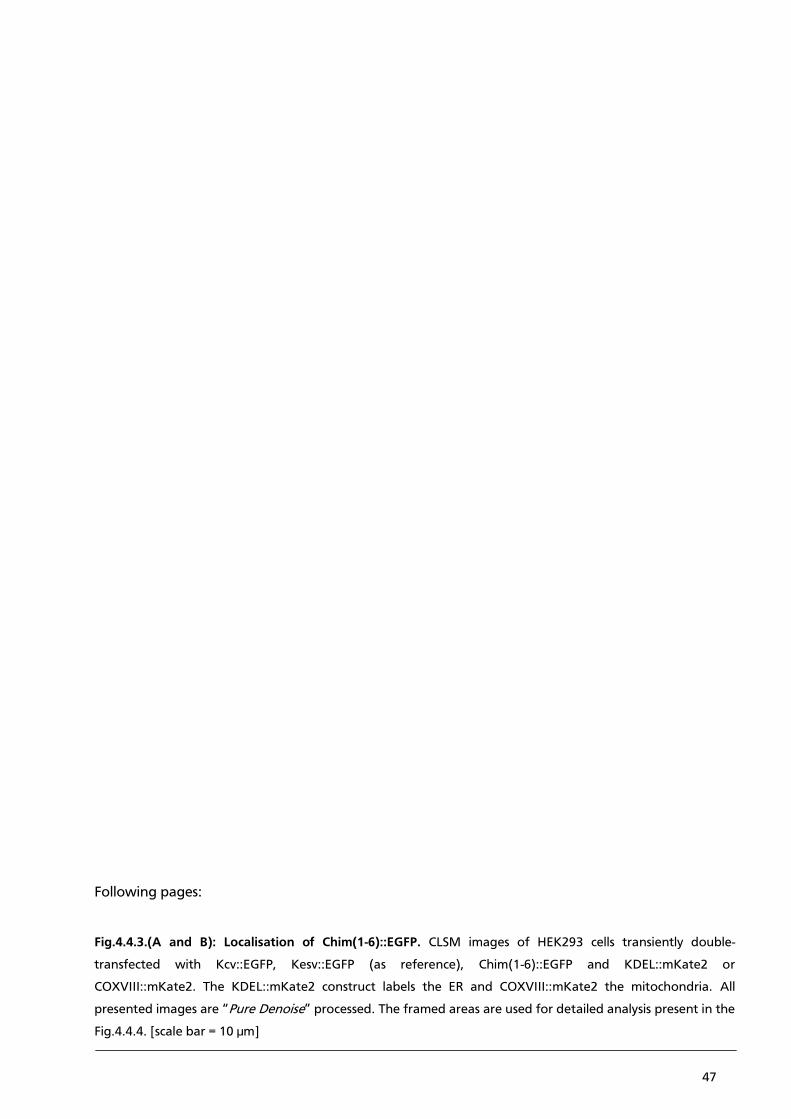
47
Following pages:
Fig.4.4.3.(A and B): Localisation of Chim(1-6)::EGFP. CLSM images of HEK293 cells transiently double-
transfected with Kcv::EGFP, Kesv::EGFP (as reference), Chim(1-6)::EGFP and KDEL::mKate2 or
COXVIII::mKate2. The KDEL::mKate2 construct labels the ER and COXVIII::mKate2 the mitochondria. All
presented images are “Pure Denoise” processed. The framed areas are used for detailed analysis present in the
Fig.4.4.4. [scale bar = 10 µm]
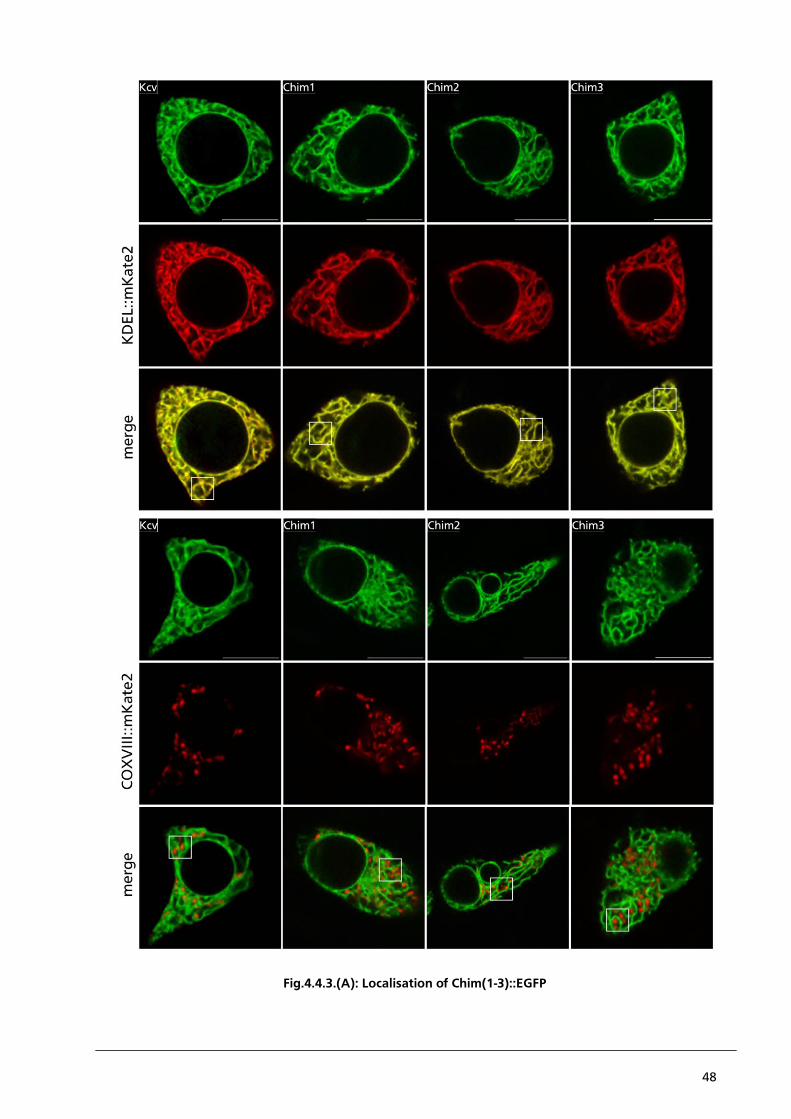
48
Fig.4.4.3.(A): Localisation of Chim(1-3)::EGFP
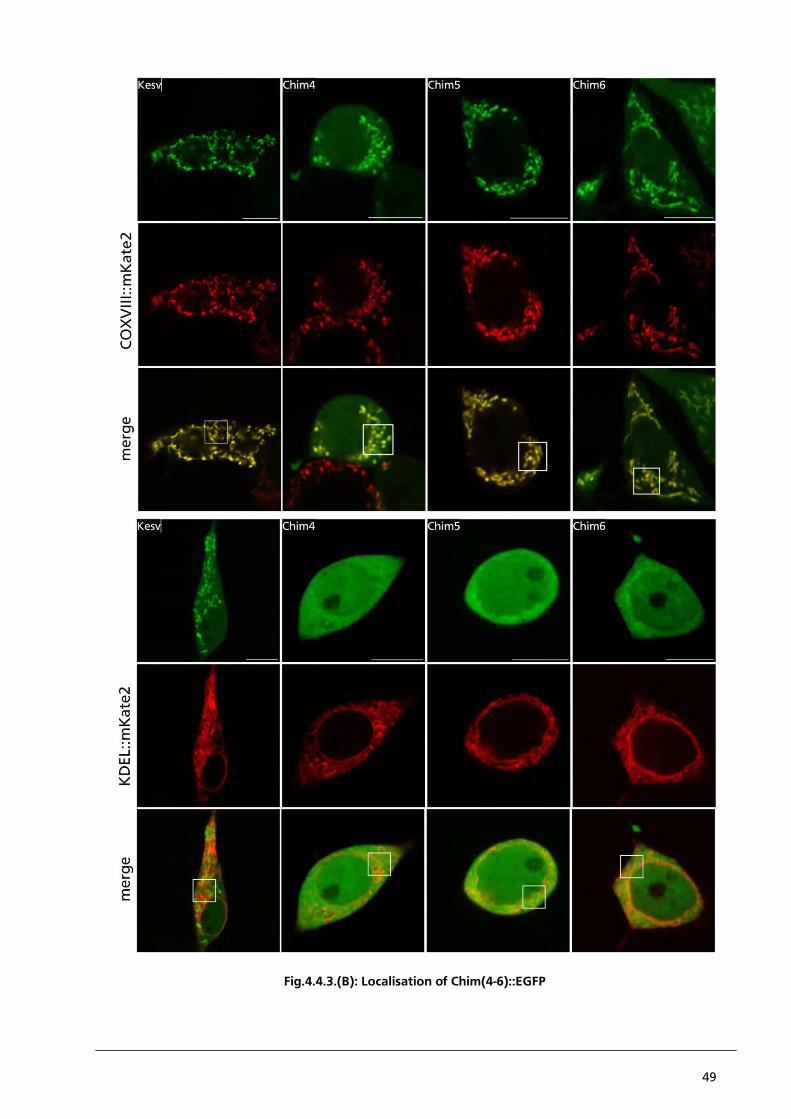
49
Fig.4.4.3.(B): Localisation of Chim(4-6)::EGFP
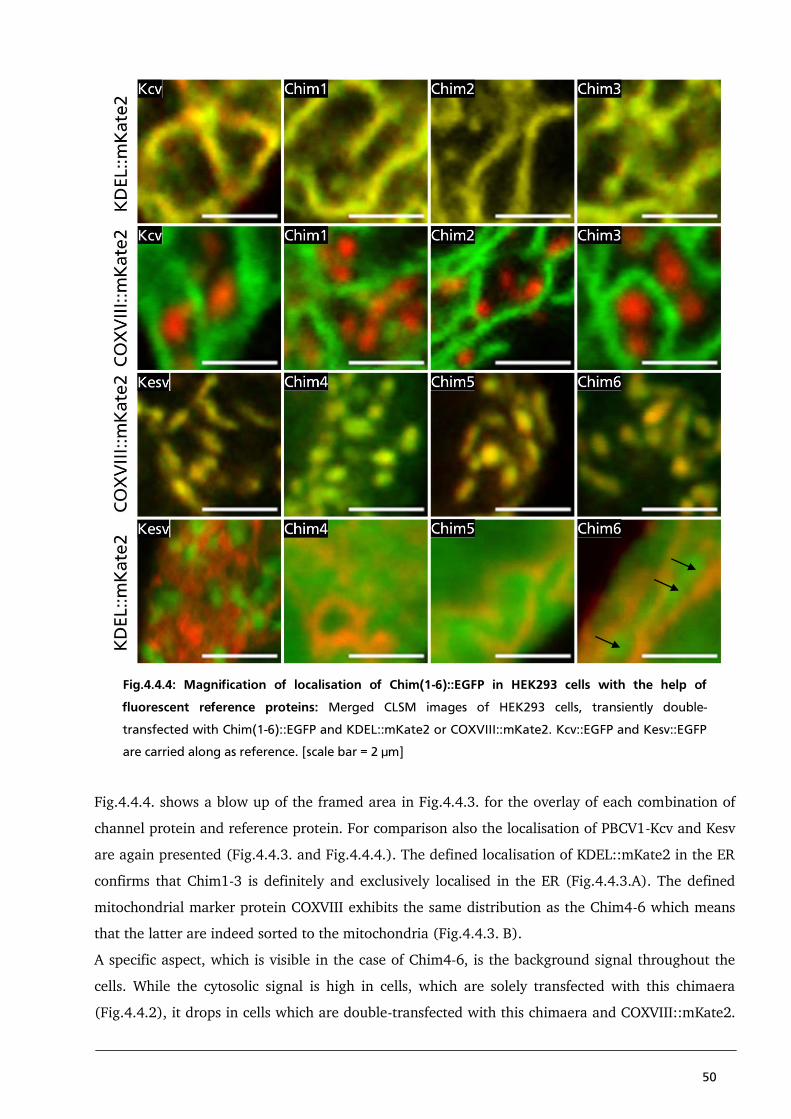
50
Fig.4.4.4: Magnification of localisation of Chim(1-6)::EGFP in HEK293 cells with the help of
fluorescent reference proteins: Merged CLSM images of HEK293 cells, transiently double-
transfected with Chim(1-6)::EGFP and KDEL::mKate2 or COXVIII::mKate2. Kcv::EGFP and Kesv::EGFP
are carried along as reference. [scale bar = 2 µm]
Fig.4.4.4. shows a blow up of the framed area in Fig.4.4.3. for the overlay of each combination of
channel protein and reference protein. For comparison also the localisation of PBCV1-Kcv and Kesv
are again presented (Fig.4.4.3. and Fig.4.4.4.). The defined localisation of KDEL::mKate2 in the ER
confirms that Chim1-3 is definitely and exclusively localised in the ER (Fig.4.4.3.A). The defined
mitochondrial marker protein COXVIII exhibits the same distribution as the Chim4-6 which means
that the latter are indeed sorted to the mitochondria (Fig.4.4.3. B).
A specific aspect, which is visible in the case of Chim4-6, is the background signal throughout the
cells. While the cytosolic signal is high in cells, which are solely transfected with this chimaera
(Fig.4.4.2), it drops in cells which are double-transfected with this chimaera and COXVIII::mKate2.
51
The presence of COXVIII::mKate2 probably causes a more effective sorting of Chim5::EGFP into the
mitochondria. This shift in signal to background ratio is already mentioned in chapter 3.4.3., in the
case of Kesv::EGFP. It is reasonable to speculate that post-translational sorting in these cells is
enhanced by over-expression of COXVIII::mKate2. Hence, the weak sorting of Kesv::EGFP or Chim4-
6::EGFP to the mitochondria could be assisted by a more effective post-translational sorting system.
In contrast Chim(4-6)::EGFP remain largely unsorted in a co-expression with KDEL::mKate2. Only
in the case of Chim6 a mitochondrial sorting is weakly visible (Fig.4.4.4. black arrows). The results
of these experiments suggest that the co-translational sorting of KDEL::mKate2 has a negative
influence on the post-translational sorting of Chim(4-6)::EGFP.
For a quantification of a co-localisation of the Chim1-6 with the reference proteins the Pearson´s
correlation coefficient (PCC) between the respective fluorescent signals was calculated. The
procedure to calculate the PCC from intensity profiles is described in detail in chapter 2. A co-
localisation between a channel protein and a reference protein is expected to give a PCC value close
to 1. To test whether a chimaera is localised exclusively in one organelle I also double-transfected
cells with Kcv::EGFP and Chim(1-3)::EGFP with the mitochondrial reference protein COXVIII-
mKate2. With the same rational Kesv::EGFP and Chim(4-6)::EGFP were expressed with the ER
reference protein KDEL::mKate2. These combinations result in a negative PCC value in the range of
-0.2 to -0.5. It has been mentioned in chapter 2 that the theoretical expected negative PCC value of
-1 cannot be achieved because of limits in optical resolution. The co-localisation analysis of the two
channels Kesv and PBCV-1-Kcv has shown that a negative PCC value in the range of -0.2 and -0.5
reflects the fact that Kesv is not entering the ER and that PBCV-1 Kcv is not sorted to the
mitochondria.
For every combination of channel protein with an organelle specific reference protein the PCCs was
measured for ten randomly chosen cells. The average values are plotted in Fig.4.4.5. in the order of
the chimaeras. The fluorescent signals of Kcv::EGFP and KDEL::mKate2 show a positive correlation
with a PCC value close to 1. A very similar PCC value is obtained with the Chim(1-3)::EGFP in
combination with KDEL::mKate2. This means that these chimaeras are sorted like Kcv::EGFP. The
PCC value obtained for Kcv::EGFP and for the Chim(1-3)::EGFP with the mitochondrial reference
construct COXVIII::mKate2 is negative in the range of -0.2 and -0.45. The results of this analysis
imply that the chimaeras have the same exclusive ER localisation as the Kcv channel.
The same analysis underscores the predominant localisation of Chim(4-6)::EGFP and Kesv::EGFP in
the mitochondria. The fluorescent signals of Kesv::EGFP and of the Chim(4-6)::EGFP show a
negative correlation value in the range of -0.15 and -0.3 with the ER marker KDEL::mKate2. In
contrast the fluorescent signals of Kesv::EGFP and Chim(4-6)::EGFP exhibit a quasi ideal co-
52
localisation with the mitochondrial marker COXVIII::mKate2; the PCC values approach the
theoretical limit of 1.
To test the significance between differences in PCCs values of different chimaeras I performed a
student t-test to compare the individual chimaera with the reference proteins Kesv or Kcv.
In the case that the t-test gives a P value <0.05 for a pair wise comparison the data are labelled (*)
in Fig.4.4.5 and 4.4.9.. In the majority of cases the PCC values are not significantly different from
the reference channels.
The change of sorting between Chim3 and Chim4 implies that PBCV1-Kcv contains in the first TMD
a sorting signal. This signal causes a sorting into the secretory pathway to the plasma membrane.
When this sorting signal is corrupted in the chimaera 4-6 all remaining sorting signals of Kesv
become important. In this situation Chim4-6 are sorted into the mitochondria. This sorting is very
fragile and can be easily destroyed by other influences. A scrutiny to the N-terminal amino acid
sequence of all chimaeras helps to understand the structural difference in the first TMD, which
distinguishes Chim3 from Chim4 (Fig.4.4.1.). Apparently, the amino acid sequence M23-D68 in
PBCV1-Kcvis already sufficient for a successful sorting of Chim3 into the secretory pathway. On the
other hand the aa sequence Y28-D68 is not effective in sorting Chim4 into the secretory pathway.
The results of these experiments imply that an exchange of only 5 aa (MFVMI→ ILLVV) causes the
dramatic switch in protein sorting from the secretory pathway into the mitochondria. Such a short
length of 5 aa for a sorting signal is not surprisingly considering that retention signal sequence
KDEL is only four aa. What remarkable is that the aa sequence MFVMI, which causes a change in
sorting between Chim3 and Chim4, is localised in the centre of the protein. KDEL is generally
known as C-terminal coded retention signal (Munro and Pelham 1986). Furthermore most of the
signals for the sorting of nascent proteins are located in the N-terminus (Walter and Blobel 1980).
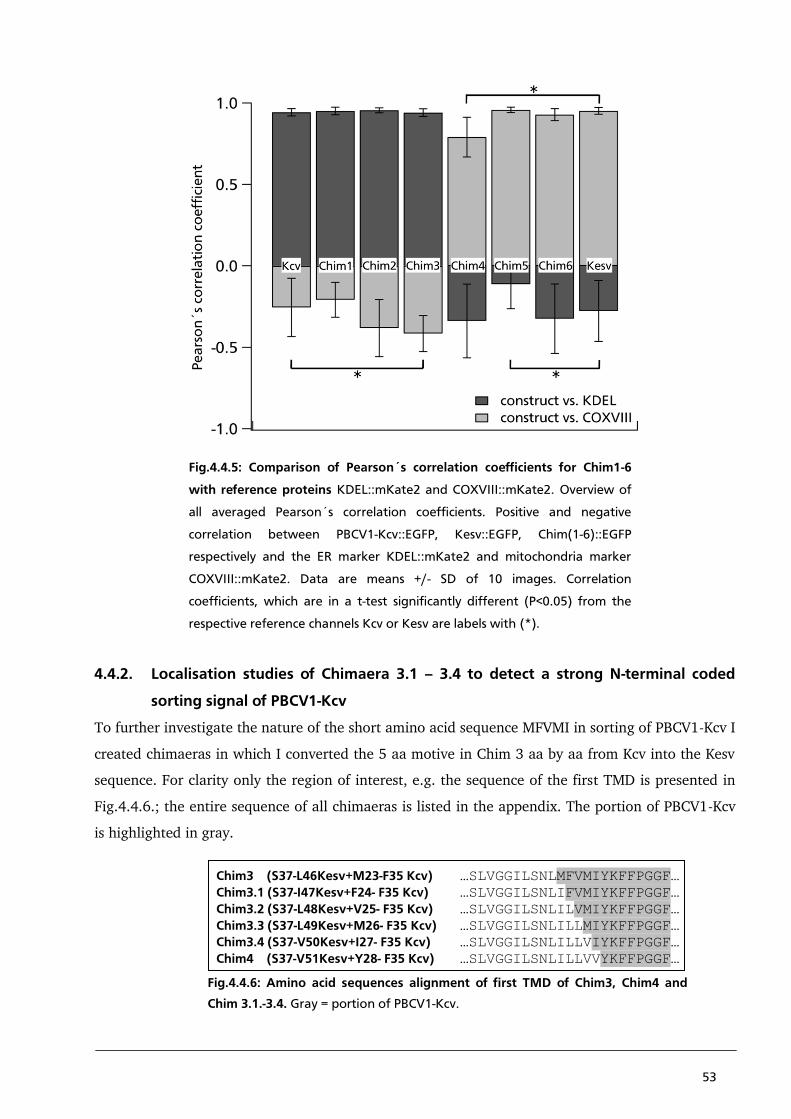
53
Fig.4.4.5: Comparison of Pearson´s correlation coefficients for Chim1-6
with reference proteins KDEL::mKate2 and COXVIII::mKate2. Overview of
all averaged Pearson´s correlation coefficients. Positive and negative
correlation between PBCV1-Kcv::EGFP, Kesv::EGFP, Chim(1-6)::EGFP
respectively and the ER marker KDEL::mKate2 and mitochondria marker
COXVIII::mKate2. Data are means +/- SD of 10 images. Correlation
coefficients, which are in a t-test significantly different (P<0.05) from the
respective reference channels Kcv or Kesv are labels with (*).
4.4.2. Localisation studies of Chimaera 3.1 – 3.4 to detect a strong N-terminal coded
sorting signal of PBCV1-Kcv
To further investigate the nature of the short amino acid sequence MFVMI in sorting of PBCV1-Kcv I
created chimaeras in which I converted the 5 aa motive in Chim 3 aa by aa from Kcv into the Kesv
sequence. For clarity only the region of interest, e.g. the sequence of the first TMD is presented in
Fig.4.4.6.; the entire sequence of all chimaeras is listed in the appendix. The portion of PBCV1-Kcv
is highlighted in gray.
Chim3 (S37-L46Kesv+M23-F35 Kcv) …SLVGGILSNLMFVMIYKFFPGGF… Chim3.1 (S37-I47Kesv+F24- F35 Kcv) …SLVGGILSNLIFVMIYKFFPGGF… Chim3.2 (S37-L48Kesv+V25- F35 Kcv) …SLVGGILSNLILVMIYKFFPGGF…
Chim3.3 (S37-L49Kesv+M26- F35 Kcv) …SLVGGILSNLILLMIYKFFPGGF…
Chim3.4 (S37-V50Kesv+I27- F35 Kcv) …SLVGGILSNLILLVIYKFFPGGF…
Chim4 (S37-V51Kesv+Y28- F35 Kcv) …SLVGGILSNLILLVVYKFFPGGF…
Fig.4.4.6: Amino acid sequences alignment of first TMD of Chim3, Chim4 and
Chim 3.1.-3.4. Gray = portion of PBCV1-Kcv.
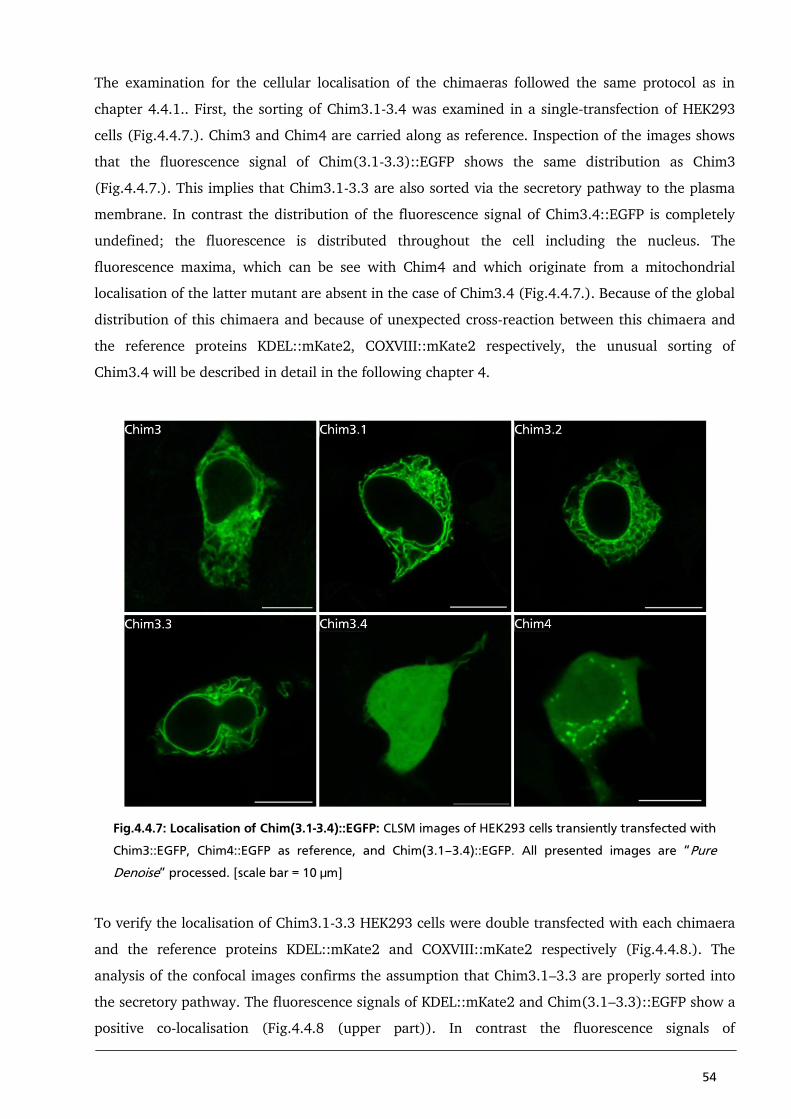
54
The examination for the cellular localisation of the chimaeras followed the same protocol as in
chapter 4.4.1.. First, the sorting of Chim3.1-3.4 was examined in a single-transfection of HEK293
cells (Fig.4.4.7.). Chim3 and Chim4 are carried along as reference. Inspection of the images shows
that the fluorescence signal of Chim(3.1-3.3)::EGFP shows the same distribution as Chim3
(Fig.4.4.7.). This implies that Chim3.1-3.3 are also sorted via the secretory pathway to the plasma
membrane. In contrast the distribution of the fluorescence signal of Chim3.4::EGFP is completely
undefined; the fluorescence is distributed throughout the cell including the nucleus. The
fluorescence maxima, which can be see with Chim4 and which originate from a mitochondrial
localisation of the latter mutant are absent in the case of Chim3.4 (Fig.4.4.7.). Because of the global
distribution of this chimaera and because of unexpected cross-reaction between this chimaera and
the reference proteins KDEL::mKate2, COXVIII::mKate2 respectively, the unusual sorting of
Chim3.4 will be described in detail in the following chapter 4.
Fig.4.4.7: Localisation of Chim(3.1-3.4)::EGFP: CLSM images of HEK293 cells transiently transfected with
Chim3::EGFP, Chim4::EGFP as reference, and Chim(3.1–3.4)::EGFP. All presented images are “Pure
Denoise” processed. [scale bar = 10 µm]
To verify the localisation of Chim3.1-3.3 HEK293 cells were double transfected with each chimaera
and the reference proteins KDEL::mKate2 and COXVIII::mKate2 respectively (Fig.4.4.8.). The
analysis of the confocal images confirms the assumption that Chim3.1–3.3 are properly sorted into
the secretory pathway. The fluorescence signals of KDEL::mKate2 and Chim(3.1–3.3)::EGFP show a
positive co-localisation (Fig.4.4.8 (upper part)). In contrast the fluorescence signals of
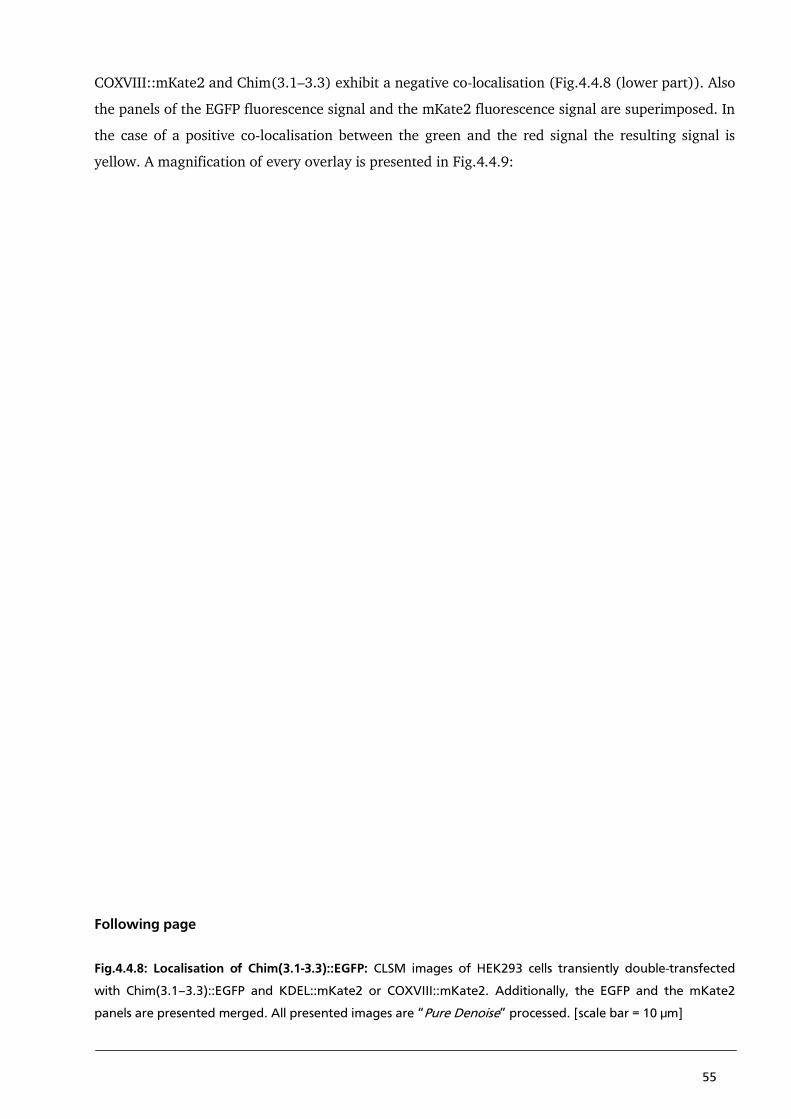
55
COXVIII::mKate2 and Chim(3.1–3.3) exhibit a negative co-localisation (Fig.4.4.8 (lower part)). Also
the panels of the EGFP fluorescence signal and the mKate2 fluorescence signal are superimposed. In
the case of a positive co-localisation between the green and the red signal the resulting signal is
yellow. A magnification of every overlay is presented in Fig.4.4.9:
Following page
Fig.4.4.8: Localisation of Chim(3.1-3.3)::EGFP: CLSM images of HEK293 cells transiently double-transfected
with Chim(3.1–3.3)::EGFP and KDEL::mKate2 or COXVIII::mKate2. Additionally, the EGFP and the mKate2
panels are presented merged. All presented images are “Pure Denoise” processed. [scale bar = 10 µm]
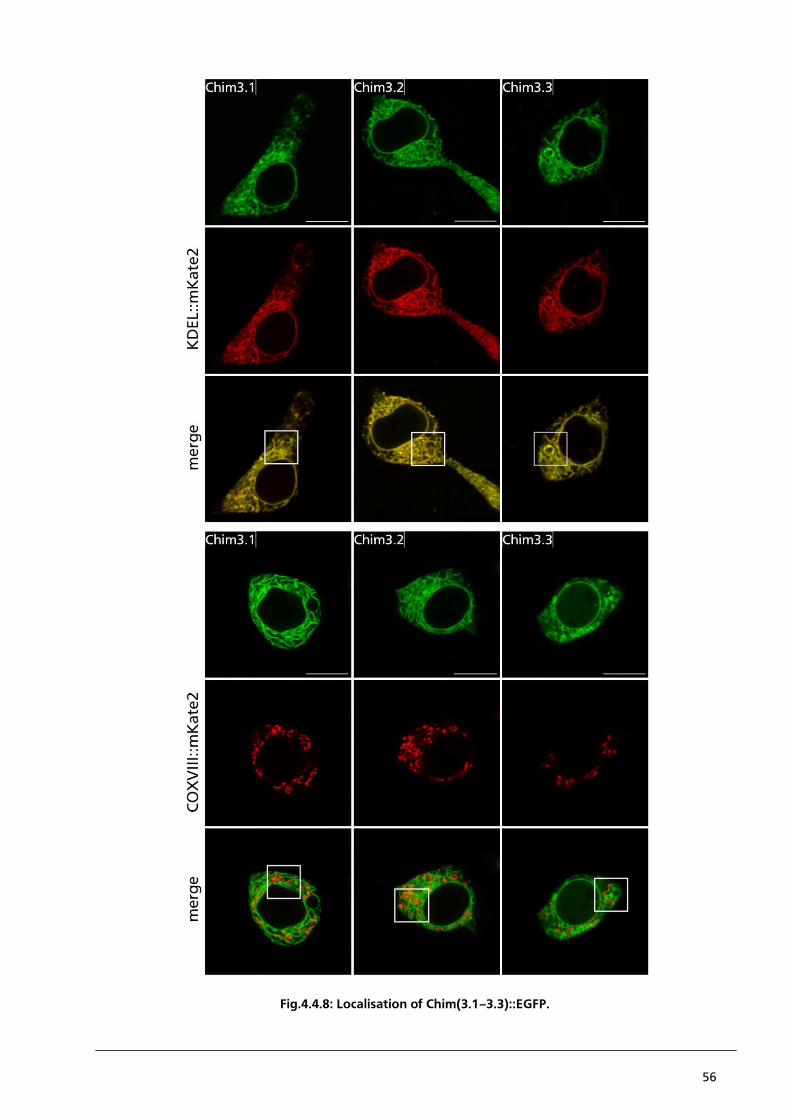
56
Fig.4.4.8: Localisation of Chim(3.1–3.3)::EGFP.
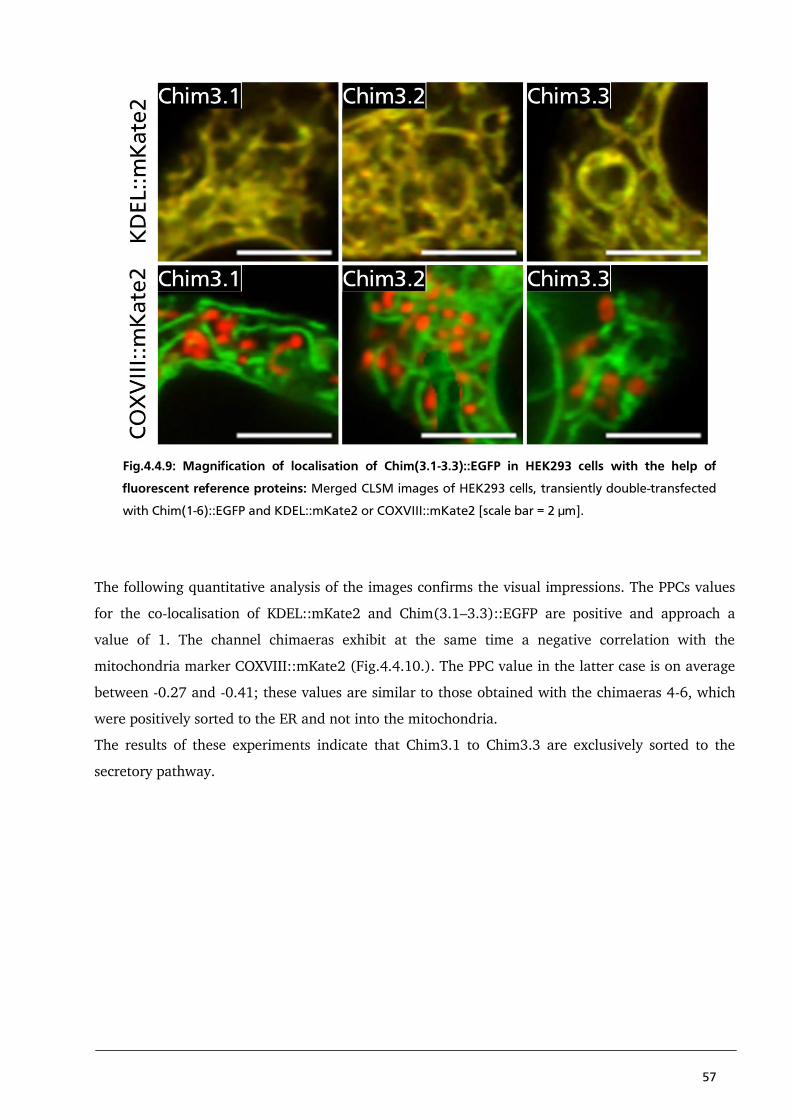
57
Fig.4.4.9: Magnification of localisation of Chim(3.1-3.3)::EGFP in HEK293 cells with the help of
fluorescent reference proteins: Merged CLSM images of HEK293 cells, transiently double-transfected
with Chim(1-6)::EGFP and KDEL::mKate2 or COXVIII::mKate2 [scale bar = 2 µm].
The following quantitative analysis of the images confirms the visual impressions. The PPCs values
for the co-localisation of KDEL::mKate2 and Chim(3.1–3.3)::EGFP are positive and approach a
value of 1. The channel chimaeras exhibit at the same time a negative correlation with the
mitochondria marker COXVIII::mKate2 (Fig.4.4.10.). The PPC value in the latter case is on average
between -0.27 and -0.41; these values are similar to those obtained with the chimaeras 4-6, which
were positively sorted to the ER and not into the mitochondria.
The results of these experiments indicate that Chim3.1 to Chim3.3 are exclusively sorted to the
secretory pathway.
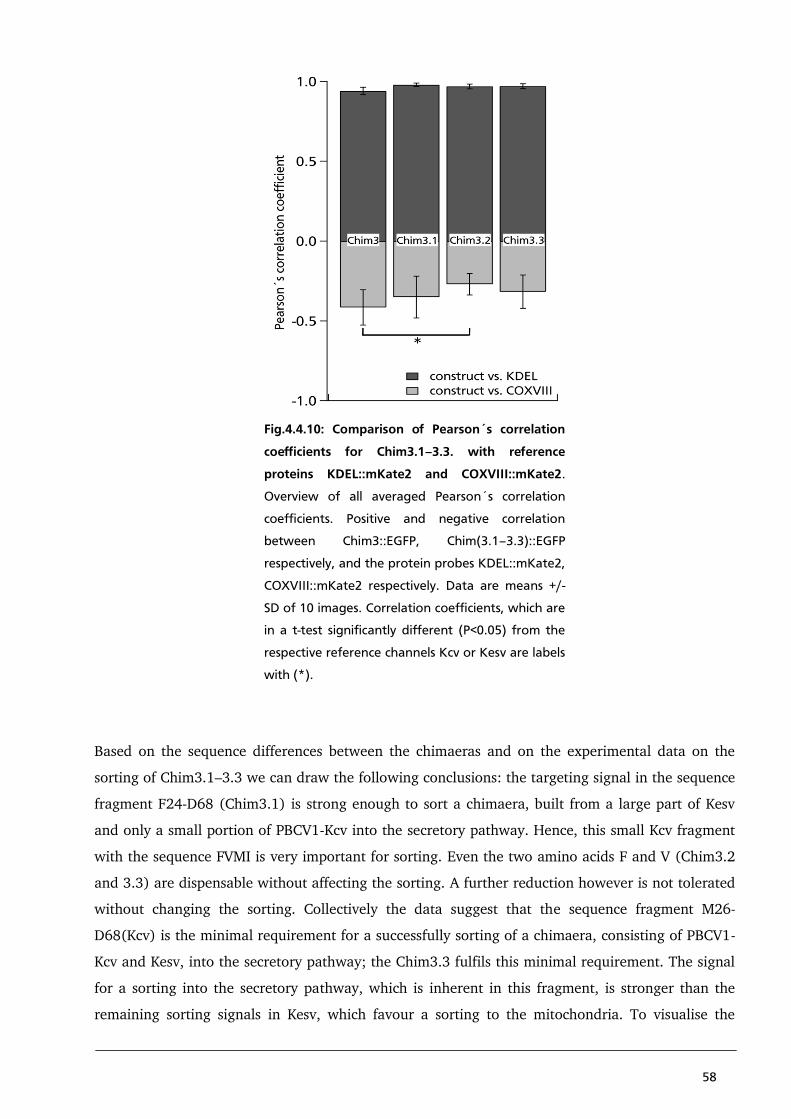
58
Fig.4.4.10: Comparison of Pearson´s correlation
coefficients for Chim3.1–3.3. with reference
proteins KDEL::mKate2 and COXVIII::mKate2.
Overview of all averaged Pearson´s correlation
coefficients. Positive and negative correlation
between Chim3::EGFP, Chim(3.1–3.3)::EGFP
respectively, and the protein probes KDEL::mKate2,
COXVIII::mKate2 respectively. Data are means +/-
SD of 10 images. Correlation coefficients, which are
in a t-test significantly different (P<0.05) from the
respective reference channels Kcv or Kesv are labels
with (*).
Based on the sequence differences between the chimaeras and on the experimental data on the
sorting of Chim3.1–3.3 we can draw the following conclusions: the targeting signal in the sequence
fragment F24-D68 (Chim3.1) is strong enough to sort a chimaera, built from a large part of Kesv
and only a small portion of PBCV1-Kcv into the secretory pathway. Hence, this small Kcv fragment
with the sequence FVMI is very important for sorting. Even the two amino acids F and V (Chim3.2
and 3.3) are dispensable without affecting the sorting. A further reduction however is not tolerated
without changing the sorting. Collectively the data suggest that the sequence fragment M26-
D68(Kcv) is the minimal requirement for a successfully sorting of a chimaera, consisting of PBCV1-
Kcv and Kesv, into the secretory pathway; the Chim3.3 fulfils this minimal requirement. The signal
for a sorting into the secretory pathway, which is inherent in this fragment, is stronger than the
remaining sorting signals in Kesv, which favour a sorting to the mitochondria. To visualise the
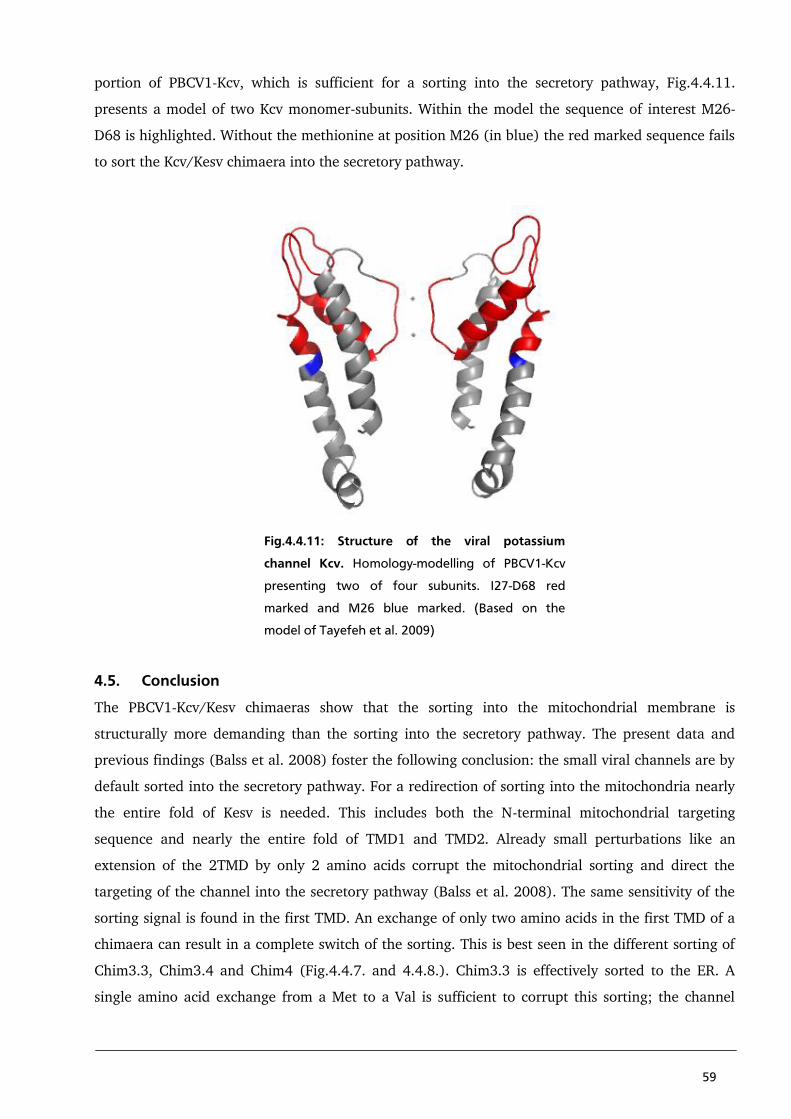
59
portion of PBCV1-Kcv, which is sufficient for a sorting into the secretory pathway, Fig.4.4.11.
presents a model of two Kcv monomer-subunits. Within the model the sequence of interest M26-
D68 is highlighted. Without the methionine at position M26 (in blue) the red marked sequence fails
to sort the Kcv/Kesv chimaera into the secretory pathway.
Fig.4.4.11: Structure of the viral potassium
channel Kcv. Homology-modelling of PBCV1-Kcv
presenting two of four subunits. I27-D68 red
marked and M26 blue marked. (Based on the
model of Tayefeh et al. 2009)
4.5. Conclusion
The PBCV1-Kcv/Kesv chimaeras show that the sorting into the mitochondrial membrane is
structurally more demanding than the sorting into the secretory pathway. The present data and
previous findings (Balss et al. 2008) foster the following conclusion: the small viral channels are by
default sorted into the secretory pathway. For a redirection of sorting into the mitochondria nearly
the entire fold of Kesv is needed. This includes both the N-terminal mitochondrial targeting
sequence and nearly the entire fold of TMD1 and TMD2. Already small perturbations like an
extension of the 2TMD by only 2 amino acids corrupt the mitochondrial sorting and direct the
targeting of the channel into the secretory pathway (Balss et al. 2008). The same sensitivity of the
sorting signal is found in the first TMD. An exchange of only two amino acids in the first TMD of a
chimaera can result in a complete switch of the sorting. This is best seen in the different sorting of
Chim3.3, Chim3.4 and Chim4 (Fig.4.4.7. and 4.4.8.). Chim3.3 is effectively sorted to the ER. A
single amino acid exchange from a Met to a Val is sufficient to corrupt this sorting; the channel
60
chimaera seems to remain unsorted (for further details see chapter 5). One more amino acid
exchange from an Ile to Val generates again a robust sorting but in this case to the mitochondria.
In contrast to the delicate sorting to the mitochondria the sorting of membrane proteins into the
secretory pathway seems to be structurally less demanding. This is well illustrated by the sorting of
Chim3.3 into the ER. This protein contains only 42 aa of PBCV1-Kcv (full length of PBCV1-Kcv: 94
aa); the rest comprises the Kesv sequence. Overall the sorting of Chim1-3.3 into the ER is very
informative. These chimaeras contain the N-terminus of Kesv with the putative mitochondrial
targeting sequence and the short second TMD, which seems to favour mitochondrial targeting. In
spite of this bias for a mitochondrial targeting the chimaeras are effectively sorted into the secretory
pathway. Hence, the sorting signal within the PBCV1-Kcv fragment (M26-D68) is strong enough to
override all peripheral sorting signals for a targeting into the mitochondria. The results of these
experiments suggest that a sorting signal in the centre of the protein is able to determine whether a
membrane protein is sorted into the secretory pathway or other compartments like into the inner
mitochondrial membrane.
A possible scenario which can explain these data involves nascent polypeptide-associated complex
(NAC). In an early stage of translation NAC binds the nascent polypeptide / ribosome complex and
also interacts with the signal recognition particle (SRP) and the ribosome (Powers and Walter
1996). If an N-terminal signal sequence appears in a nascent protein chain for a sorting into the
secretory pathway, the NAC is replaced with the SRP. This initiates the sorting of the polypeptide /
ribosome complex to the surface of the ER and further the sorting of the protein into the secretory
pathway. In the absent of an ER-signal sequence the NAC remains attached to the polypeptide /
ribosome complex and even supports a sorting of the nascent protein into the mitochondria by
binding the TOM-complex on the surface of the mitochondrial membrane (George et al. 1998). sIn
relation to the sorting of PBCV1-Kcv, Kesv and the PBCV1-Kcv/Kesv chimaeras it is reasonable to
speculate that PBCV1-Kcv contains such an N-terminal signal sequence in the first TMD; this causes
an replacement of the NAC with an SRP. Also the Chim1-3.3 comprise this signal sequence, but
starting from Chim4 and any following chimaera with a higher portion of Kesv this signal is
corrupted and exchanged with the sequence of Kesv. In the latter case the NAC can remain with the
polypeptide / ribosome complex and supports the sorting into the mitochondrial membrane.
61
4.6. References
Balss J, Papatheodorou P, Mehmel M, Baumeister D, Hertel B, Delaroque N, Chatelain F,
Minor D, Van Etten J, Rassow J, Moroni A, Thiel G (2008) Transmembrane domain length
of viral K+channels is a signal for mitochondria targeting. PNAS Vol.105: 12313-8
Bozidis P, Williamson C, Colberg-Poley A (2008) Mitochondrial and secretory human
cytomegalovirus UL37 proteins traffic into mitochondrion-associated membranes of human
cells. JVI Vol.82: 2715-26
Braun C (2011) Rekonstitution von Kanalproteinen in planaren Lipid Bilayern. TU-Darmstadt
Chen J, Cassar S, Zhang D, Gopalakrishnan M (2005) A novel potassium channel encoded by
Ectocarpus siliculosus virus. Biochemical and biophysical research communications Vol.326:
887-93
Cortes D, Cuello L, Perozo E (2001) Molecular architecture of full-length KcsA: role of cytoplasmic
domains in ion permeation and activation gating. The Journal of general physiology Vol.117:
165-80
Gazzarrini S, Severino M, Lombardi M, Morandi M, DiFrancesco D, Van Etten J, Thiel G,
Moroni A (2003) The viral potassium channel Kcv: structural and functional features. FEBS
letters Vol.552: 12-6
George R, Beddoe T, Landl K, Lithgow T (1998) The yeast nascent polypeptide-associated
complex initiates protein targeting to mitochondria in vivo. Cell Biology Vol.95: 2296–2301
Graham F, Smiley J, Russell W, Nairn R (1977) Characteristics of a human cell line transformed
by DNA from human adenovirus type 5. The Journal of general virology Vol.36: 59-74
Hartl F, Hayer-Hartl M (2002) Molecular chaperones in the cytosol: from nascent chain to folded
protein. Science Vol.295: 1852-8
Hegde R, Keenan R (2011) Tail-anchored membrane protein insertion into the endoplasmic
reticulum. Nature reviews; Molecular cell biology Vol.12: 787-98
Luisier F, Vonesch C, Blu T, Unser M (2010) Fast interscale wavelet denoising of Poisson-
corrupted images.Signal processing Vol.90: 415-427
Modrek B, Lee C (2002) A genomic view of alternative splicing. Nature genetics Vol.30: 13-9
Moroni A, Viscomi C, Sangiorgio V, Pagliuca C, Meckel T, Horvath F, Gazzarrini S, Valbuzzi P,
Van Etten J, DiFrancesco D, Thiel G (2002) The short N-terminus is required for functional
expression of the virus-encoded miniature K(+) channel Kcv. FEBS letters Vol.530: 65-9
Munro S and Pelham R (1987)A C-Terminal signal prevents secretion of luminal ER proteins. Cell
Vol.48: 899-907
Plugge B, Gazzarrini S, Nelson M, Cerana R, Van Etten J, Derst C, DiFrancesco D, Moroni A,
ThielG (2000) A Potassium Channel Protein Encoded by Chlorella Virus PBCV-1. Science
Vol.287: 1641-44
62
Power and Walter (1996) Nascent polypeptide-associated complex modulates interactions
between the signal recognition particle and the ribosome. Current Biology Vol.6: 331–8
Omura T (1998) Mitochondria-targeting sequence, a multi-role sorting sequence recognized at all
steps of protein import into mitochondria. Journal of biochemistry Vol.123: 1010-6
Robin M, Prabu S, Raza H, Anandatheerthavarada H, Avadhani N (2003) Phosphorylation
enhances mitochondrial targeting of GSTA4-4 through increased affinity for binding to
cytoplasmic Hsp70. Journal of biochemistry Vol.278: 18960-70
Roise D and Schatz G (1988) Mitochondrial presequences. Journal of Biological Chemistry Vol.
263: 4509-4511
Schatz G (1996) The protein import system of mitochondria. Journal of biological
chemistryVol.271:31763-66
Shao S, Hegde R (2011) Membrane protein insertion at the endoplasmic reticulum. Annual review
of cell and developmental biology Vol.27: 25-56
Stevanovic and Hedge (2007) Identification of a targeting factor for post-translational membrane
protein insertion into the ER. Cell Vol.128: 1147-59
Tayefeh S, Kloss T, Kreim M, Gebhardt M, Baumeister D, Hertel B, Richter C, Schwalbe H,
Moroni A, Thiel G, Kast S (2009) Model development for the viral Kcv potassium channel.
Biophysical journal Vol.96: 485-98
Walter P, Blobel G (1980) Purification of a membrane-associated protein complex required for
protein translocation across the endoplasmic reticulum Biochemistry. PNAS Vol.77: 7112-6
63
5. Chapter 4 – Localisation of PBCV1-Kcv/Kesv chimaera “Chim3.4” is sorted together with the marker proteins
5.1. Abstract
The chimaeras flanking Chim3.4 are either sorted to the mitochondria (Chim4) or to the
Endoplasmic Reticulum (Chim 3.3). Chim.34, itself reveals an intriguing sorting; when expressed
alone the chimaera remains un-sorted and it is found over the entire cell volume. But when it is
expressed together with organelle specific marker proteins KDEL::mKate2 (for the ER) and
COXVIII::mkate2 (for the mitochondria) Chim3.4 is co-sorted together with the marker protein into
the organelles. The efficiency of this sorting depends on the strength with which the marker protein
is expressed. By exchanging the fluorescent tags on the channel protein and on the marker proteins
it occurred that the channel protein interacts with the mkate2 tag in this co-sorting process. The
data suggest a novel sorting mechanism in which a protein, which has no inherent sorting signal, is
interacting with another protein, which contains an organelle specific address, and is sorted
together with the latter to a distinct organelle.
5.2. Introduction
By creating PBCV1-Kcv/Kesv chimaeras we could identify in previous experiments a strong sorting
signal in the first TMD of PBCV1-Kcv which directs the protein to the secretory pathway and further
to the plasma membrane. PBCV1-Kcv/Kesv chimaeras, which do not contain this signal sequence,
are sorted like Kesv into the inner mitochondrial membrane. Presumably this sorting mechanism is
due to an interaction between the nascent polypeptide / ribosome complex, the nascent
polypeptide-associated complex (NAC) and the signal recognition particle (SRP). At the beginning
of the translation the NAC binds the nascent polypeptide/ribosome complex (Powers and Walter
1996). With the appearance of an N-terminal signal sequence for a sorting into the secretory
pathway in the sequence of the nascent chain the NAC is exchanged with the SRP. This results in a
sorting into the secretory pathway. In the absence of such a sorting signal the NAC remains
associated with the nascent polypeptide/ribosome complex and supports a sorting to the
mitochondria (Powers and Walter 1996, George et al. 1998).The available data on sorting of
PBCV1-Kcv/Kesv chimaeras can be interpreted in the sense that the N-terminal sorting signal of
PBCV1-Kcv was disrupted in the transition from Chim3.3 and Chim4.
A most interesting phenomenon occurs in the transition between Chim3.3 and Chim 4. This
chimaera is built in the same way as all PBCV1-Kcv/Kesv chimaeras mentioned before in chapter 3.
The flanking parts of Chim3.4 comprise the N-terminus and the C-terminus with the second TMD of
Kesv respectively. The central part contains the respective fold of the PBCV-1-Kcv structure with a
part of the sorting signal for a targeting to the secretory pathway. The critical transition between
64
Kesv and Kcv domains reads in Chim3.4 (M1-V50Kesv + I27-D68Kcv + L92-K124Kesv); the whole
amino acid sequence you can found in the appendix.
When the chimaera is heterologously expressed in HEK293 cells fluorescence signal from
Chim3.4::EGFP is completely undefined; the fluorescence is distributed throughout the cell
including the nucleus. The immediate flanking chimaeras Chim3.3 (M1-L49Kesv + M26-D68Kcv +
L92-K124Kesv) and Chim4 (M1-V51Kesv + Y28-D68Kcv + L92-K124Kesv) on the other hand show
a discrete sorting to either the ER (Chim3.3) or the mitochondria (Chim4) (Fig.5.4.1).
As a surprise we found that a co-expression of this chimaera with the organelle specific reference
proteins KDEL::mKate2 (for ER) and COXVIII::mKate2 (for mitochondria) affected the localisation
of the chimaera. The channel was no longer distributed throughout the cell but co-sorted with the
reference proteins to their destination. To our knowledge such a sorting has not yet been reported
in the literature. The results of the following experiments suggest the presence of further so far
unknown post-translational sorting mechanisms, which are not signal sequence coded. Even a
protein-protein interaction between the fluorescent tags mKate2 and the channel protein Chim3.4
may be involved in this process.
5.3. Material and Methods
All Materials and Methods have been described in chapter 3 with the exception that is Chim3.4
additionally is fused to tagBFP (Subach et at. 2008) and tagGFP2 (Xia et al. 2002.)
5.4. Results and Discussion
5.4.1. Localisation of Chim3.4::EGFP in the presence of KDEL::mKate2 or COXVIII::mKate2
In previous studies on the localisation of PBCV1-Kcv/Kesv all chimaeras showed a distinct sorting
either into the secretory pathway or to the mitochondria. A clear transition in sorting was
determined between Chim3.3 and Chim4 (Fig.5.4.1. upper part, left and right) Chim3.3 is the last
in a series of PBCV1-Kcv/Kesv chimaeras which is clearly sorted into the secretory pathway
(Fig.5.4.1. top-left). Chim4::EGFP on the other side is the first chimaera in the series which is, like
Kesv, sorted into the mitochondria (Fig.5.4.1. top-right). But an intriguing behaviour is obtained
with Chim3.4::EGFP. While the protein reveals in a single transfection an even distribution
throughout the cell (Fig.5.4.1 upper part), it gains in the presence of an organelle specific reference
protein, a distinct localisation: in a co-expression with COXVIII::mKate2 the protein is sorted
together with the mitochondrial marker to the mitochondria. The presence of the ER marker
KDEL::mKate2 promotes a sorting of the chimaera into the secretory pathway (Fig.5.4.1.). The
results of these experiments show a so far unknown mechanism in that membrane protein, which is
by itself not sorted to a membrane but guided by another protein to a distinct destination. This
phenomenon is a function of the reference protein. A labelling of the ER or the mitochondria by
fluorescent dyes has no effect on the localisation of the channel chimaera (data not shown). Further
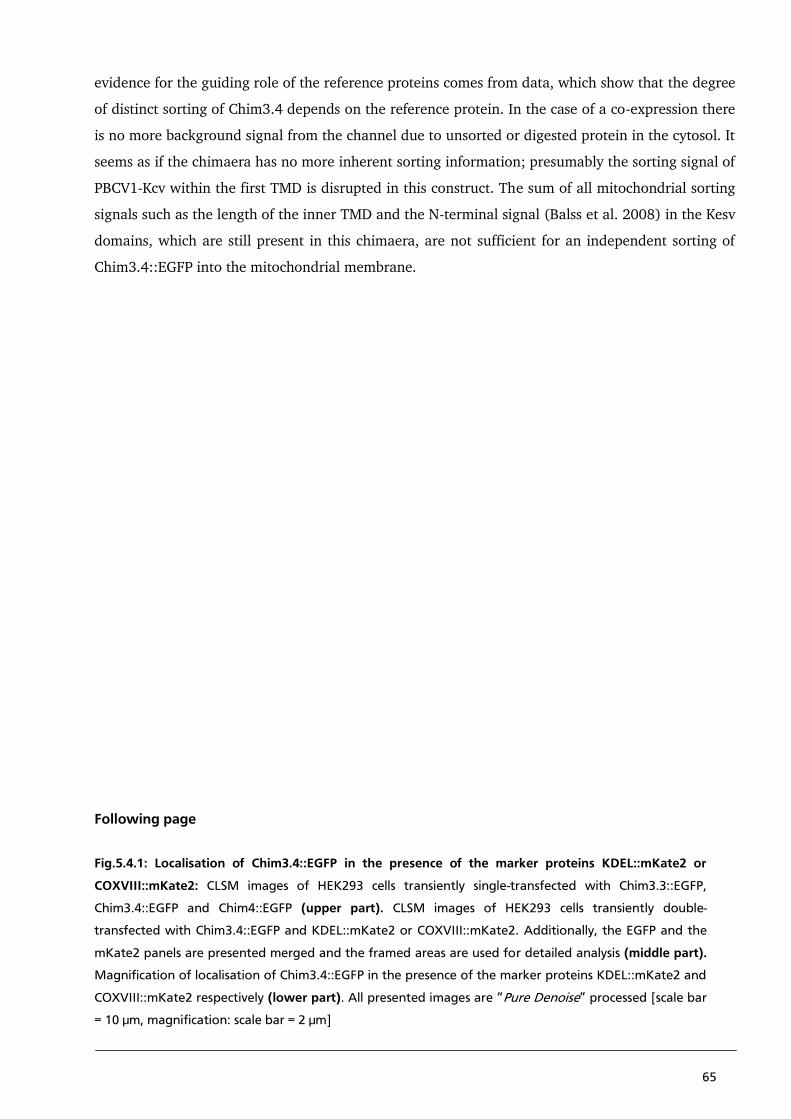
65
evidence for the guiding role of the reference proteins comes from data, which show that the degree
of distinct sorting of Chim3.4 depends on the reference protein. In the case of a co-expression there
is no more background signal from the channel due to unsorted or digested protein in the cytosol. It
seems as if the chimaera has no more inherent sorting information; presumably the sorting signal of
PBCV1-Kcv within the first TMD is disrupted in this construct. The sum of all mitochondrial sorting
signals such as the length of the inner TMD and the N-terminal signal (Balss et al. 2008) in the Kesv
domains, which are still present in this chimaera, are not sufficient for an independent sorting of
Chim3.4::EGFP into the mitochondrial membrane.
Following page
Fig.5.4.1: Localisation of Chim3.4::EGFP in the presence of the marker proteins KDEL::mKate2 or
COXVIII::mKate2: CLSM images of HEK293 cells transiently single-transfected with Chim3.3::EGFP,
Chim3.4::EGFP and Chim4::EGFP (upper part). CLSM images of HEK293 cells transiently double-
transfected with Chim3.4::EGFP and KDEL::mKate2 or COXVIII::mKate2. Additionally, the EGFP and the
mKate2 panels are presented merged and the framed areas are used for detailed analysis (middle part).
Magnification of localisation of Chim3.4::EGFP in the presence of the marker proteins KDEL::mKate2 and
COXVIII::mKate2 respectively (lower part). All presented images are “Pure Denoise” processed [scale bar
= 10 µm, magnification: scale bar = 2 µm]
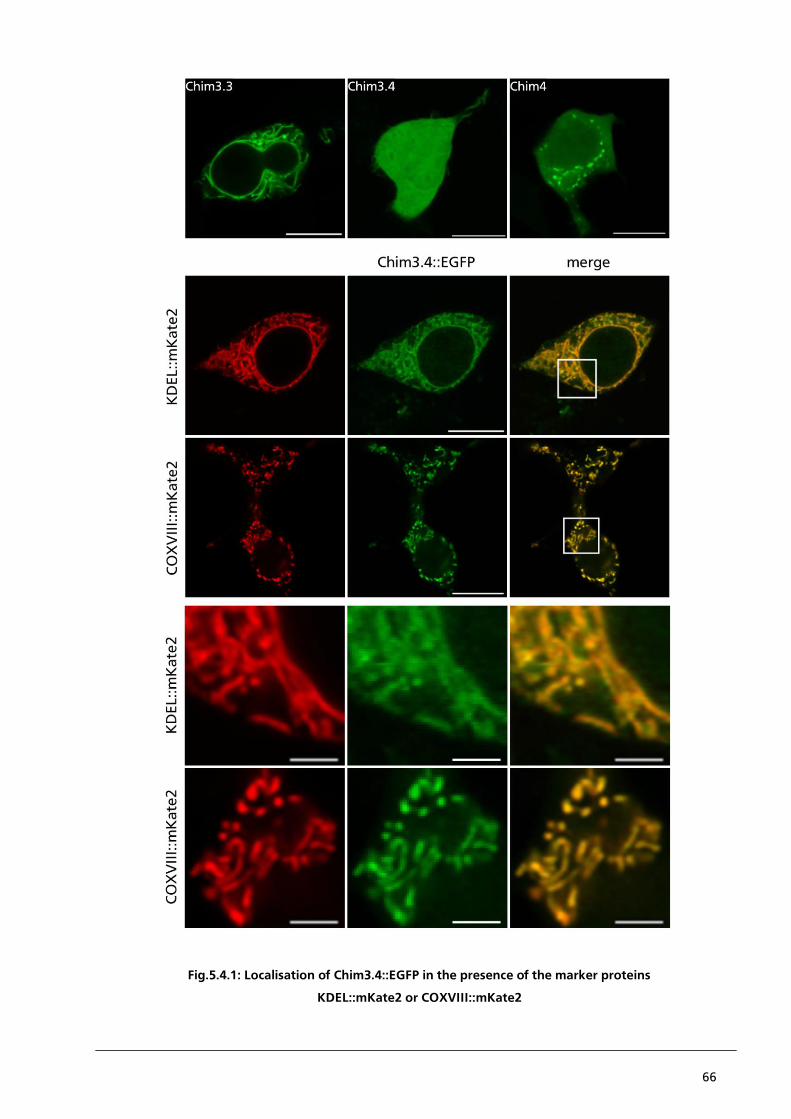
66
Fig.5.4.1: Localisation of Chim3.4::EGFP in the presence of the marker proteins
KDEL::mKate2 or COXVIII::mKate2
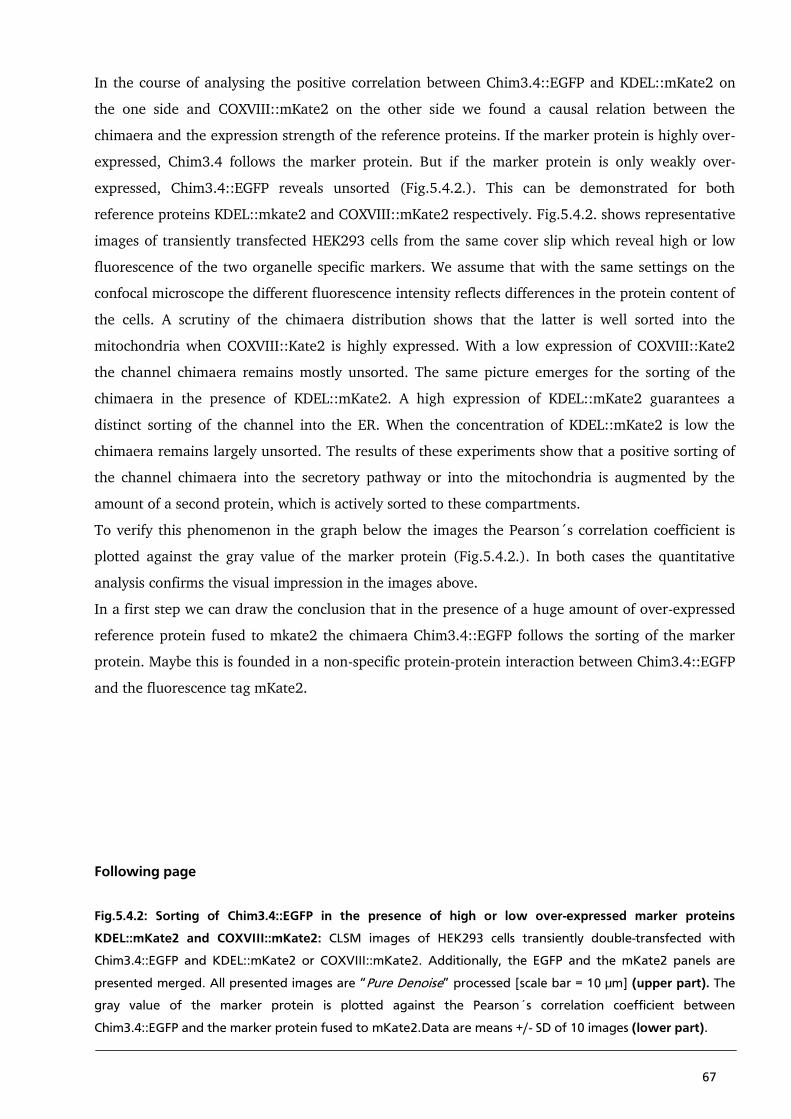
67
In the course of analysing the positive correlation between Chim3.4::EGFP and KDEL::mKate2 on
the one side and COXVIII::mKate2 on the other side we found a causal relation between the
chimaera and the expression strength of the reference proteins. If the marker protein is highly over-
expressed, Chim3.4 follows the marker protein. But if the marker protein is only weakly over-
expressed, Chim3.4::EGFP reveals unsorted (Fig.5.4.2.). This can be demonstrated for both
reference proteins KDEL::mkate2 and COXVIII::mKate2 respectively. Fig.5.4.2. shows representative
images of transiently transfected HEK293 cells from the same cover slip which reveal high or low
fluorescence of the two organelle specific markers. We assume that with the same settings on the
confocal microscope the different fluorescence intensity reflects differences in the protein content of
the cells. A scrutiny of the chimaera distribution shows that the latter is well sorted into the
mitochondria when COXVIII::Kate2 is highly expressed. With a low expression of COXVIII::Kate2
the channel chimaera remains mostly unsorted. The same picture emerges for the sorting of the
chimaera in the presence of KDEL::mKate2. A high expression of KDEL::mKate2 guarantees a
distinct sorting of the channel into the ER. When the concentration of KDEL::mKate2 is low the
chimaera remains largely unsorted. The results of these experiments show that a positive sorting of
the channel chimaera into the secretory pathway or into the mitochondria is augmented by the
amount of a second protein, which is actively sorted to these compartments.
To verify this phenomenon in the graph below the images the Pearson´s correlation coefficient is
plotted against the gray value of the marker protein (Fig.5.4.2.). In both cases the quantitative
analysis confirms the visual impression in the images above.
In a first step we can draw the conclusion that in the presence of a huge amount of over-expressed
reference protein fused to mkate2 the chimaera Chim3.4::EGFP follows the sorting of the marker
protein. Maybe this is founded in a non-specific protein-protein interaction between Chim3.4::EGFP
and the fluorescence tag mKate2.
Following page
Fig.5.4.2: Sorting of Chim3.4::EGFP in the presence of high or low over-expressed marker proteins
KDEL::mKate2 and COXVIII::mKate2: CLSM images of HEK293 cells transiently double-transfected with
Chim3.4::EGFP and KDEL::mKate2 or COXVIII::mKate2. Additionally, the EGFP and the mKate2 panels are
presented merged. All presented images are “Pure Denoise” processed [scale bar = 10 µm] (upper part). The
gray value of the marker protein is plotted against the Pearson´s correlation coefficient between
Chim3.4::EGFP and the marker protein fused to mKate2.Data are means +/- SD of 10 images (lower part).
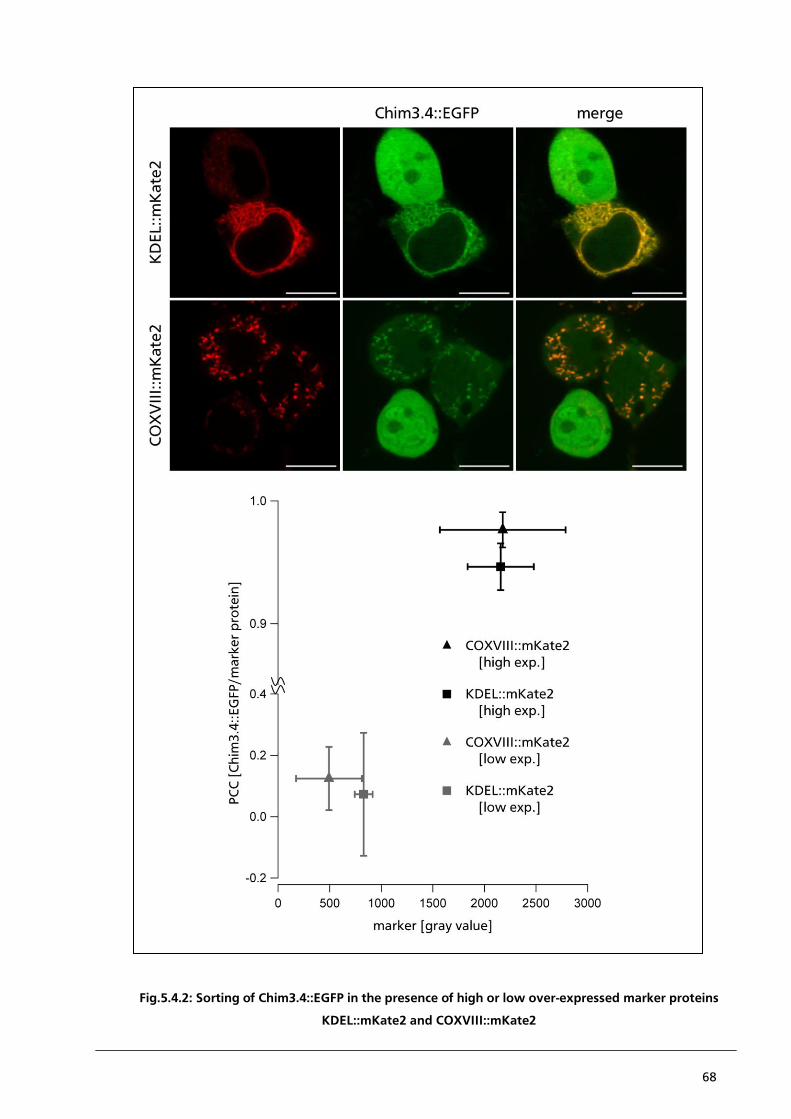
68
Fig.5.4.2: Sorting of Chim3.4::EGFP in the presence of high or low over-expressed marker proteins
KDEL::mKate2 and COXVIII::mKate2
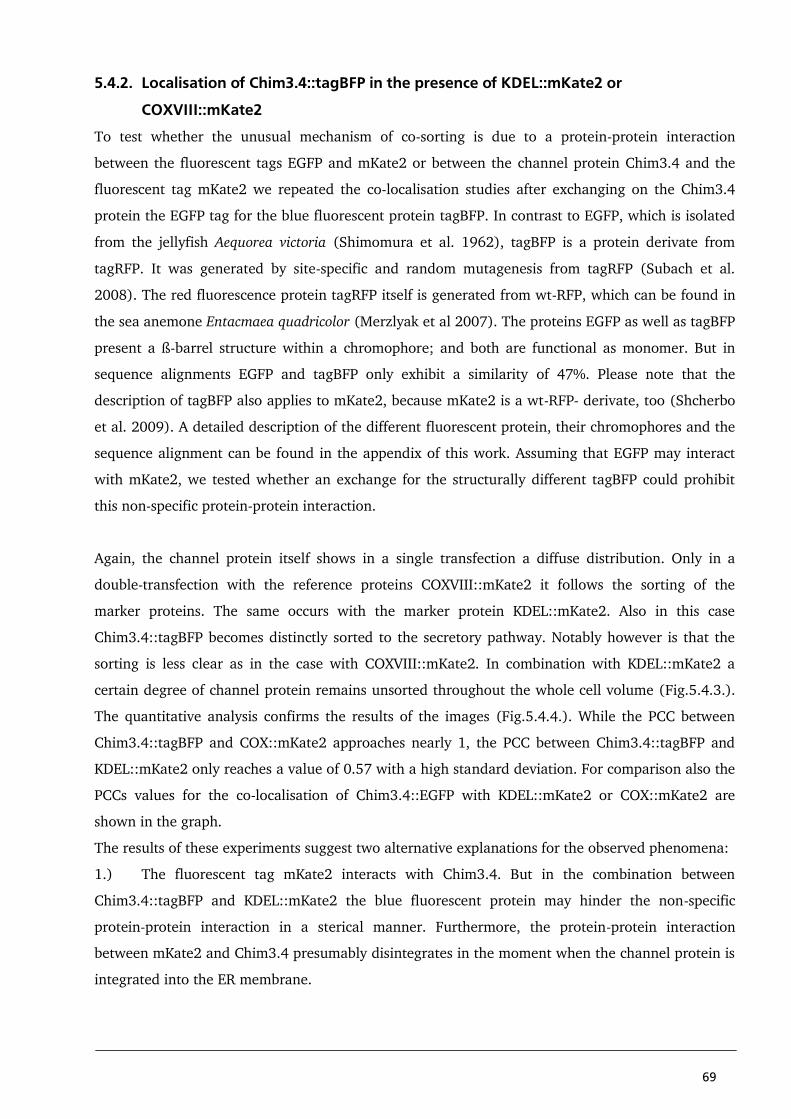
69
5.4.2. Localisation of Chim3.4::tagBFP in the presence of KDEL::mKate2 or
COXVIII::mKate2
To test whether the unusual mechanism of co-sorting is due to a protein-protein interaction
between the fluorescent tags EGFP and mKate2 or between the channel protein Chim3.4 and the
fluorescent tag mKate2 we repeated the co-localisation studies after exchanging on the Chim3.4
protein the EGFP tag for the blue fluorescent protein tagBFP. In contrast to EGFP, which is isolated
from the jellyfish Aequorea victoria (Shimomura et al. 1962), tagBFP is a protein derivate from
tagRFP. It was generated by site-specific and random mutagenesis from tagRFP (Subach et al.
2008). The red fluorescence protein tagRFP itself is generated from wt-RFP, which can be found in
the sea anemone Entacmaea quadricolor (Merzlyak et al 2007). The proteins EGFP as well as tagBFP
present a ß-barrel structure within a chromophore; and both are functional as monomer. But in
sequence alignments EGFP and tagBFP only exhibit a similarity of 47%. Please note that the
description of tagBFP also applies to mKate2, because mKate2 is a wt-RFP- derivate, too (Shcherbo
et al. 2009). A detailed description of the different fluorescent protein, their chromophores and the
sequence alignment can be found in the appendix of this work. Assuming that EGFP may interact
with mKate2, we tested whether an exchange for the structurally different tagBFP could prohibit
this non-specific protein-protein interaction.
Again, the channel protein itself shows in a single transfection a diffuse distribution. Only in a
double-transfection with the reference proteins COXVIII::mKate2 it follows the sorting of the
marker proteins. The same occurs with the marker protein KDEL::mKate2. Also in this case
Chim3.4::tagBFP becomes distinctly sorted to the secretory pathway. Notably however is that the
sorting is less clear as in the case with COXVIII::mKate2. In combination with KDEL::mKate2 a
certain degree of channel protein remains unsorted throughout the whole cell volume (Fig.5.4.3.).
The quantitative analysis confirms the results of the images (Fig.5.4.4.). While the PCC between
Chim3.4::tagBFP and COX::mKate2 approaches nearly 1, the PCC between Chim3.4::tagBFP and
KDEL::mKate2 only reaches a value of 0.57 with a high standard deviation. For comparison also the
PCCs values for the co-localisation of Chim3.4::EGFP with KDEL::mKate2 or COX::mKate2 are
shown in the graph.
The results of these experiments suggest two alternative explanations for the observed phenomena:
1.) The fluorescent tag mKate2 interacts with Chim3.4. But in the combination between
Chim3.4::tagBFP and KDEL::mKate2 the blue fluorescent protein may hinder the non-specific
protein-protein interaction in a sterical manner. Furthermore, the protein-protein interaction
between mKate2 and Chim3.4 presumably disintegrates in the moment when the channel protein is
integrated into the ER membrane.
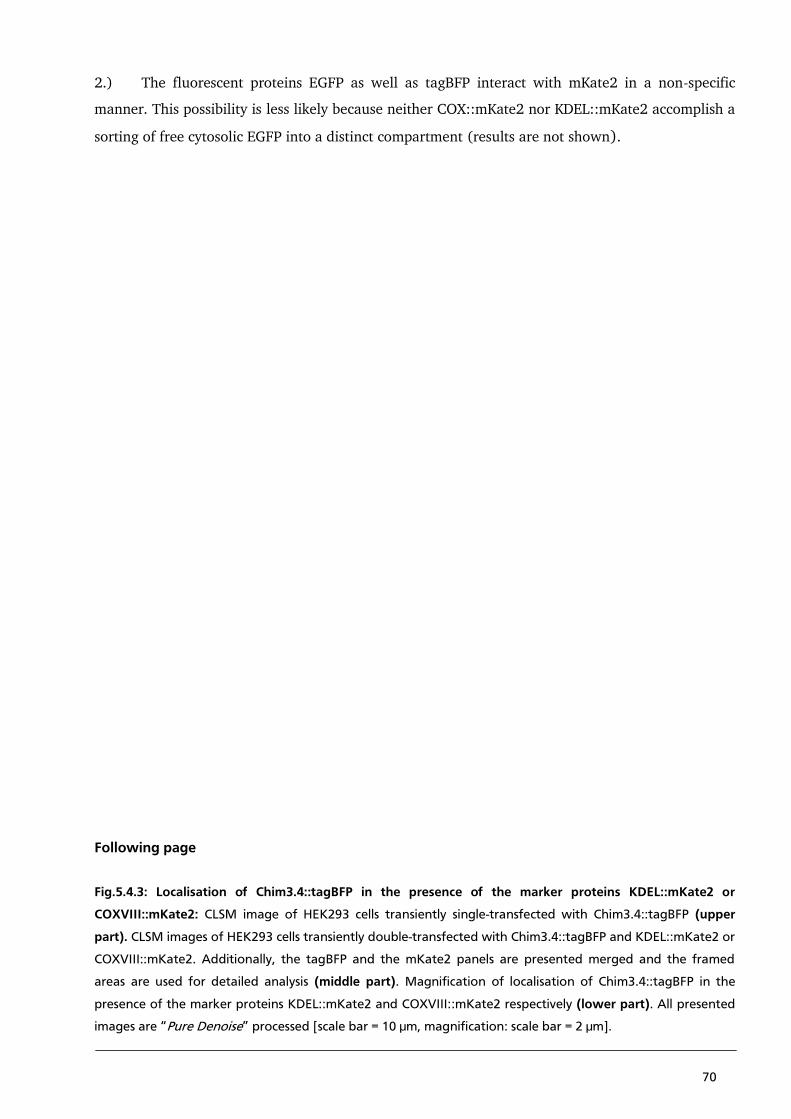
70
2.) The fluorescent proteins EGFP as well as tagBFP interact with mKate2 in a non-specific
manner. This possibility is less likely because neither COX::mKate2 nor KDEL::mKate2 accomplish a
sorting of free cytosolic EGFP into a distinct compartment (results are not shown).
Following page
Fig.5.4.3: Localisation of Chim3.4::tagBFP in the presence of the marker proteins KDEL::mKate2 or
COXVIII::mKate2: CLSM image of HEK293 cells transiently single-transfected with Chim3.4::tagBFP (upper
part). CLSM images of HEK293 cells transiently double-transfected with Chim3.4::tagBFP and KDEL::mKate2 or
COXVIII::mKate2. Additionally, the tagBFP and the mKate2 panels are presented merged and the framed
areas are used for detailed analysis (middle part). Magnification of localisation of Chim3.4::tagBFP in the
presence of the marker proteins KDEL::mKate2 and COXVIII::mKate2 respectively (lower part). All presented
images are “Pure Denoise” processed [scale bar = 10 µm, magnification: scale bar = 2 µm].
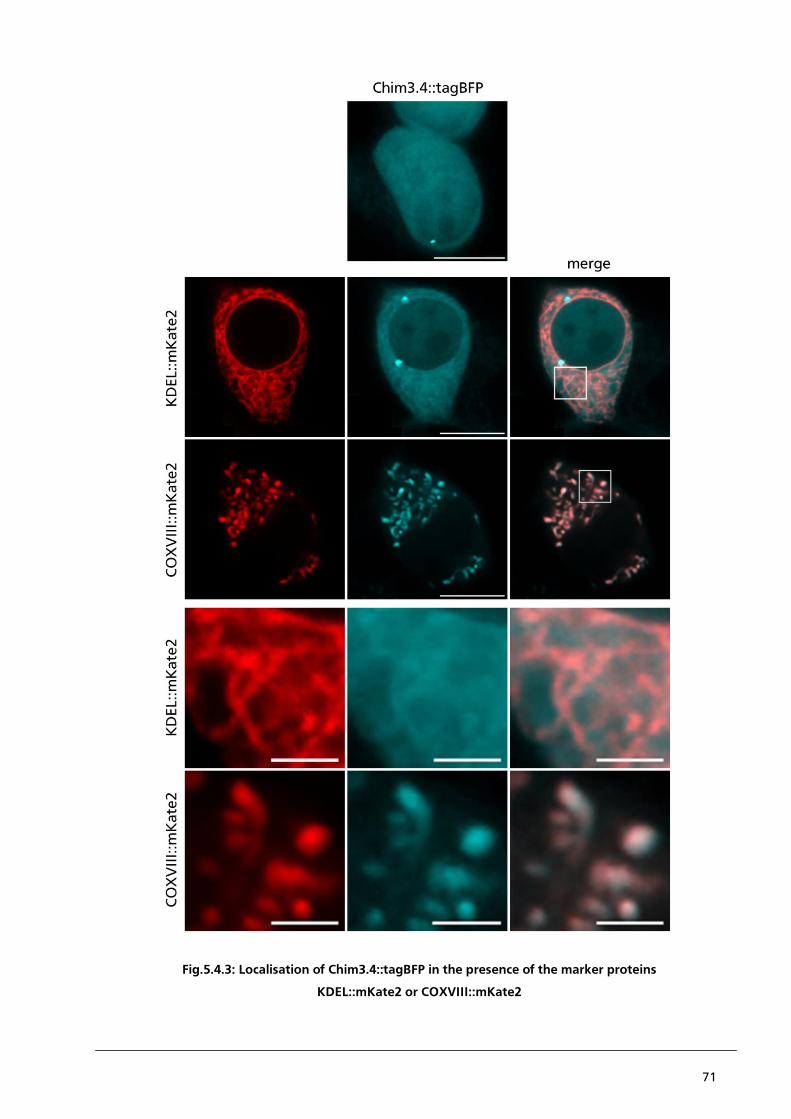
71
Fig.5.4.3: Localisation of Chim3.4::tagBFP in the presence of the marker proteins
KDEL::mKate2 or COXVIII::mKate2
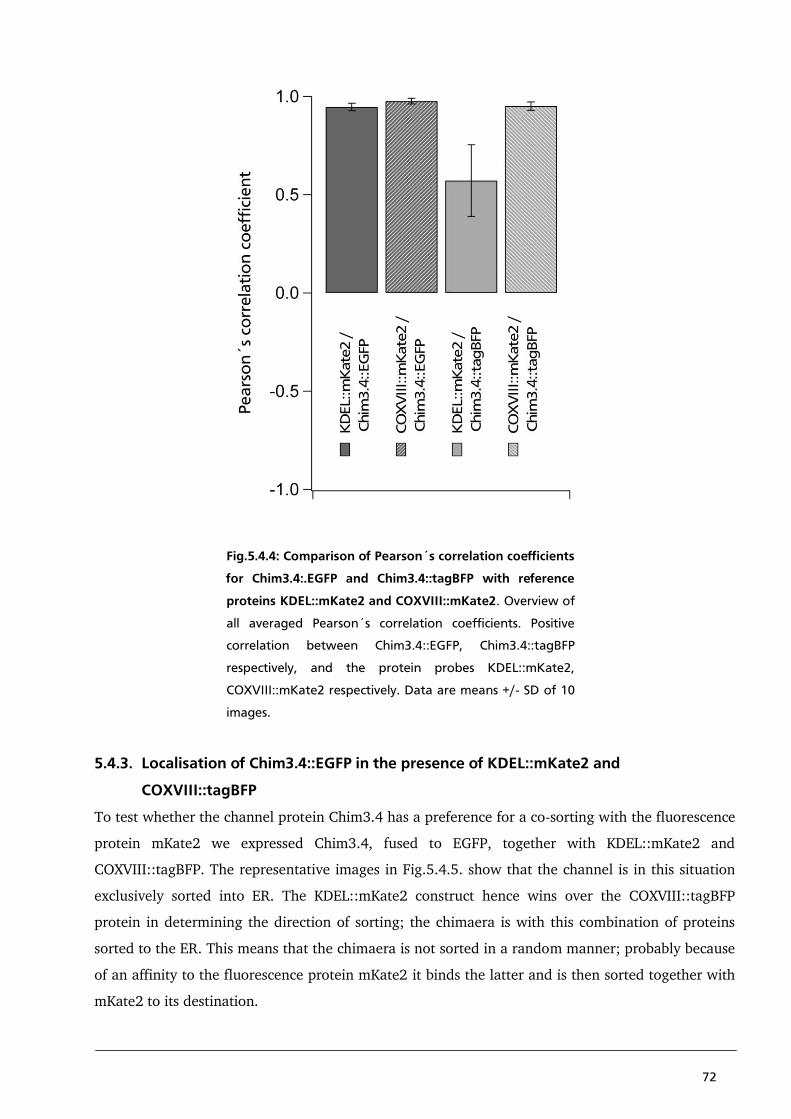
72
Fig.5.4.4: Comparison of Pearson´s correlation coefficients
for Chim3.4:.EGFP and Chim3.4::tagBFP with reference
proteins KDEL::mKate2 and COXVIII::mKate2. Overview of
all averaged Pearson´s correlation coefficients. Positive
correlation between Chim3.4::EGFP, Chim3.4::tagBFP
respectively, and the protein probes KDEL::mKate2,
COXVIII::mKate2 respectively. Data are means +/- SD of 10
images.
5.4.3. Localisation of Chim3.4::EGFP in the presence of KDEL::mKate2 and
COXVIII::tagBFP
To test whether the channel protein Chim3.4 has a preference for a co-sorting with the fluorescence
protein mKate2 we expressed Chim3.4, fused to EGFP, together with KDEL::mKate2 and
COXVIII::tagBFP. The representative images in Fig.5.4.5. show that the channel is in this situation
exclusively sorted into ER. The KDEL::mKate2 construct hence wins over the COXVIII::tagBFP
protein in determining the direction of sorting; the chimaera is with this combination of proteins
sorted to the ER. This means that the chimaera is not sorted in a random manner; probably because
of an affinity to the fluorescence protein mKate2 it binds the latter and is then sorted together with
mKate2 to its destination.
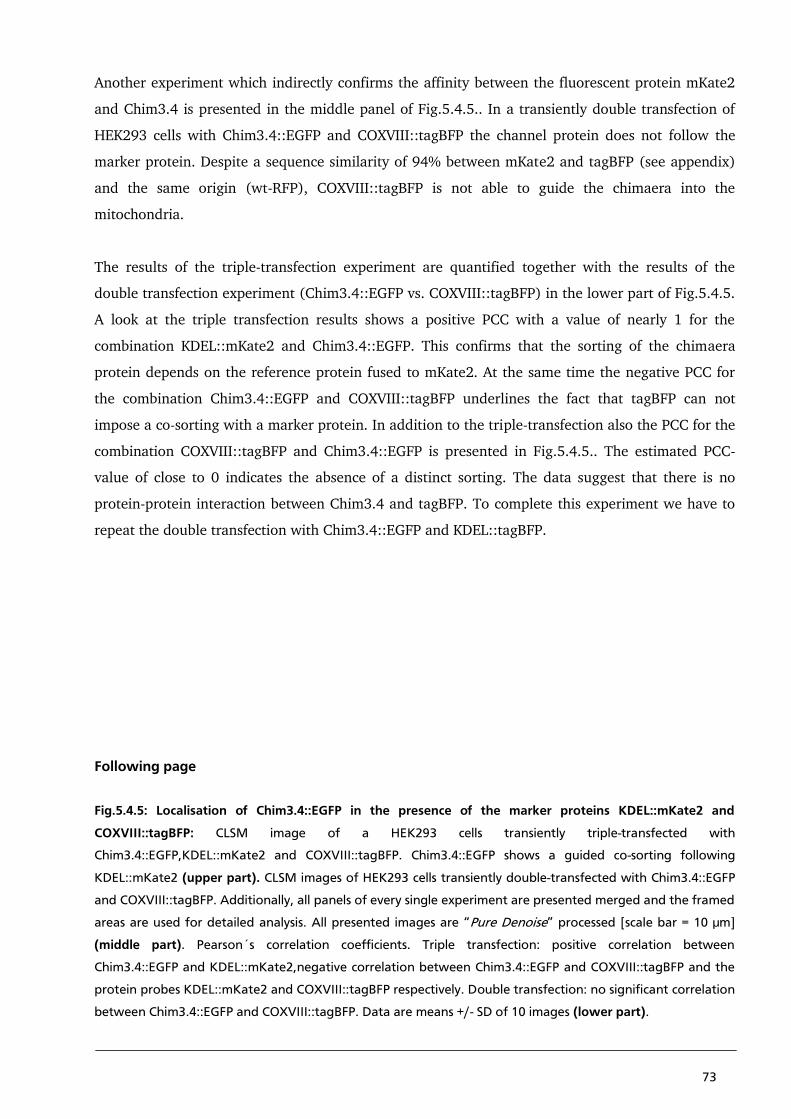
73
Another experiment which indirectly confirms the affinity between the fluorescent protein mKate2
and Chim3.4 is presented in the middle panel of Fig.5.4.5.. In a transiently double transfection of
HEK293 cells with Chim3.4::EGFP and COXVIII::tagBFP the channel protein does not follow the
marker protein. Despite a sequence similarity of 94% between mKate2 and tagBFP (see appendix)
and the same origin (wt-RFP), COXVIII::tagBFP is not able to guide the chimaera into the
mitochondria.
The results of the triple-transfection experiment are quantified together with the results of the
double transfection experiment (Chim3.4::EGFP vs. COXVIII::tagBFP) in the lower part of Fig.5.4.5.
A look at the triple transfection results shows a positive PCC with a value of nearly 1 for the
combination KDEL::mKate2 and Chim3.4::EGFP. This confirms that the sorting of the chimaera
protein depends on the reference protein fused to mKate2. At the same time the negative PCC for
the combination Chim3.4::EGFP and COXVIII::tagBFP underlines the fact that tagBFP can not
impose a co-sorting with a marker protein. In addition to the triple-transfection also the PCC for the
combination COXVIII::tagBFP and Chim3.4::EGFP is presented in Fig.5.4.5.. The estimated PCC-
value of close to 0 indicates the absence of a distinct sorting. The data suggest that there is no
protein-protein interaction between Chim3.4 and tagBFP. To complete this experiment we have to
repeat the double transfection with Chim3.4::EGFP and KDEL::tagBFP.
Following page
Fig.5.4.5: Localisation of Chim3.4::EGFP in the presence of the marker proteins KDEL::mKate2 and
COXVIII::tagBFP: CLSM image of a HEK293 cells transiently triple-transfected with
Chim3.4::EGFP,KDEL::mKate2 and COXVIII::tagBFP. Chim3.4::EGFP shows a guided co-sorting following
KDEL::mKate2 (upper part). CLSM images of HEK293 cells transiently double-transfected with Chim3.4::EGFP
and COXVIII::tagBFP. Additionally, all panels of every single experiment are presented merged and the framed
areas are used for detailed analysis. All presented images are “Pure Denoise” processed [scale bar = 10 µm]
(middle part). Pearson´s correlation coefficients. Triple transfection: positive correlation between
Chim3.4::EGFP and KDEL::mKate2,negative correlation between Chim3.4::EGFP and COXVIII::tagBFP and the
protein probes KDEL::mKate2 and COXVIII::tagBFP respectively. Double transfection: no significant correlation
between Chim3.4::EGFP and COXVIII::tagBFP. Data are means +/- SD of 10 images (lower part).
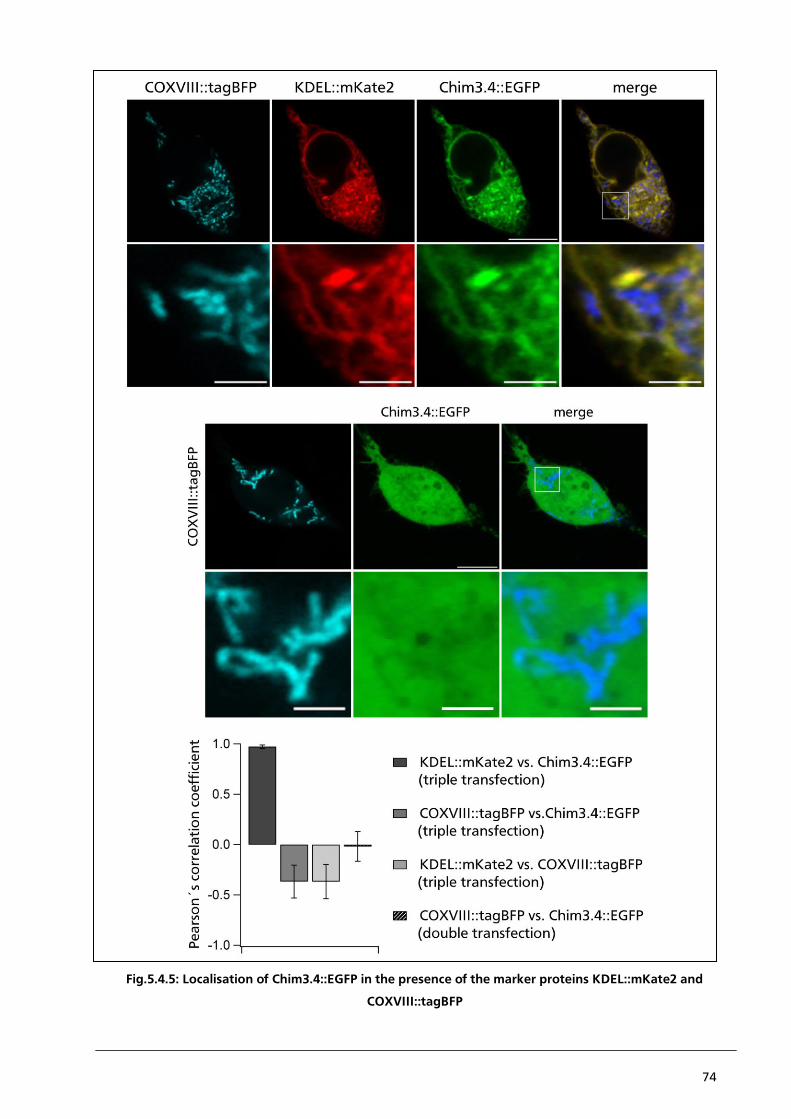
74
Fig.5.4.5: Localisation of Chim3.4::EGFP in the presence of the marker proteins KDEL::mKate2 and
COXVIII::tagBFP
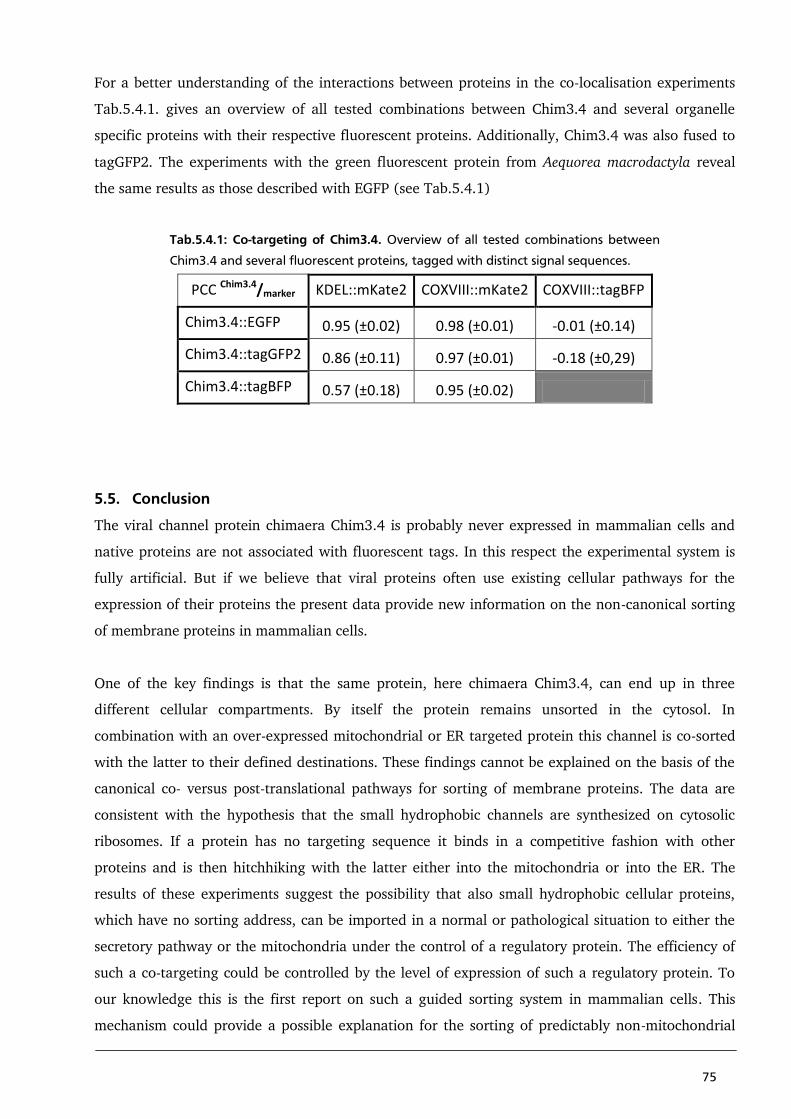
75
For a better understanding of the interactions between proteins in the co-localisation experiments
Tab.5.4.1. gives an overview of all tested combinations between Chim3.4 and several organelle
specific proteins with their respective fluorescent proteins. Additionally, Chim3.4 was also fused to
tagGFP2. The experiments with the green fluorescent protein from Aequorea macrodactyla reveal
the same results as those described with EGFP (see Tab.5.4.1)
Tab.5.4.1: Co-targeting of Chim3.4. Overview of all tested combinations between
Chim3.4 and several fluorescent proteins, tagged with distinct signal sequences.
PCC Chim3.4/marker KDEL::mKate2 COXVIII::mKate2 COXVIII::tagBFP
Chim3.4::EGFP 0.95 (±0.02) 0.98 (±0.01) -0.01 (±0.14)
Chim3.4::tagGFP2 0.86 (±0.11) 0.97 (±0.01) -0.18 (±0,29)
Chim3.4::tagBFP 0.57 (±0.18) 0.95 (±0.02)
5.5. Conclusion
The viral channel protein chimaera Chim3.4 is probably never expressed in mammalian cells and
native proteins are not associated with fluorescent tags. In this respect the experimental system is
fully artificial. But if we believe that viral proteins often use existing cellular pathways for the
expression of their proteins the present data provide new information on the non-canonical sorting
of membrane proteins in mammalian cells.
One of the key findings is that the same protein, here chimaera Chim3.4, can end up in three
different cellular compartments. By itself the protein remains unsorted in the cytosol. In
combination with an over-expressed mitochondrial or ER targeted protein this channel is co-sorted
with the latter to their defined destinations. These findings cannot be explained on the basis of the
canonical co- versus post-translational pathways for sorting of membrane proteins. The data are
consistent with the hypothesis that the small hydrophobic channels are synthesized on cytosolic
ribosomes. If a protein has no targeting sequence it binds in a competitive fashion with other
proteins and is then hitchhiking with the latter either into the mitochondria or into the ER. The
results of these experiments suggest the possibility that also small hydrophobic cellular proteins,
which have no sorting address, can be imported in a normal or pathological situation to either the
secretory pathway or the mitochondria under the control of a regulatory protein. The efficiency of
such a co-targeting could be controlled by the level of expression of such a regulatory protein. To
our knowledge this is the first report on such a guided sorting system in mammalian cells. This
mechanism could provide a possible explanation for the sorting of predictably non-mitochondrial
76
proteins into the mitochondria. Examples for such proteins are the for instance beta-amyloid or the
nuclear transcription factor HMGA1. Both proteins are known as non-mitochondrial protein. But
under certain circumstances beta-amyloid as well as HMGA1 can be localised in the mitochondria,
without revealing a predictable mitochondrial signal sequence (Boncompagni et al. 2012; Dement
et al. 2005)
Another example is the well known p53 tumor suppressor protein, which acts as a transcription
factor induced by DNA-damaging and oxidative stress (Lane et al. 1992). The p53 protein, which
plays a key role in apoptosis is mostly localisation in the nucleus, can also be found in the
mitochondrial membrane. There it causes a membrane depolarisation, which in turn is a key step in
p53 induced apoptosis ( Marchenko et al. 2000).
The presented results are also interesting from an experimental point of view. Organelle specific
fluorescent proteins are frequently used in co-localisation studies. Our data on the sorting of
Chim3.4 now shows that the nature of the fluorescent protein can affect the direction of sorting.
Here the chromophore of mKate2 must be part of the binding motive with which the channel
associates.
The present data also confirm that the two channel proteins Kcv and Kesv have inherent sorting
information, which is sufficient to direct them to either the mitochondria or the ER without the
assistance of a second protein. Previous data have shown that the length of the inner
transmembrane domain of the Kesv channel is important for its targeting to the mitochondria; a
short extension of TMD2 is sufficient to redirect sorting from the mitochondria to the secretory
pathway (Balss et al. 2008). The present data now stress that the fold of TMD2 in Kesv however is
not sufficient for an effective mitochondrial sorting. The chimaeras imply that also the outer
transmembrane domain of Kesv contains a sorting signal. It occurs that the N-terminal end of TMD1
is up to a defined region essential in combination with the flavour of TMD2 for a sorting of the Kesv
channel into the mitochondria. This N-terminal signal is not directly related to the putative
mitochondrial targeting signal at the N-terminus of Kesv. This signal can be cleaved or mutated
without compromising the targeting of the Kesv channel (Balss et al. 2010). This means that the N-
terminal part of TMD1 is the critical fold, which bears the targeting information.
Collectively the data suggest that the default pathway for targeting of small viral channels is the
secretory pathway. The Kesv channel requires the major part of the protein for a successful sorting
to the mitochondria. The critical domain in TMD1 of Kesv, which is required for a mitochondrial
targeting, seems to be very specific. There are many orthologous of the Kcv channel, which are all
sorted to the plasma membrane. An alignment with Kesv and the chimaeras shows that these Kcv
orthologous are rather diverse in the critical region of TMD1 (Hamacher et al. 2012). So it seems as
77
if the motive for sorting the protein to the ER is less critical as that for sorting it to the
mitochondria.
The present data can only be understood under the assumption that the small viral proteins are
sorted in a post translational manner either to the mitochondria or into the secretory pathway. A co-
translational processing of the proteins is unlikely since a combination of signals in the first and the
second transmembrane domain is required for the targeting. Both signals are only present in the
fully synthesized protein.
Nevertheless, we have to consider that the post-translational sorting involves a couple of signal
checkpoints. Also in the beginning of protein processing a sorting station is imaginable when the
polypeptide-associated complex (NAC) binds the nascent polypeptide / ribosome complex. NAC
itself interacts with SRPs, which are well known to support a protein transport and integration into
the ER. The appearance of an N-terminal signal sequence in a nascent protein chain for a sorting
into the secretory pathway causes an replacement of the NAC with the SRP, which triggers a sorting
into the ER (Powers and Walter 1996). In the absent of an ER-signal sequence the NAC remains
attached to the polypeptide / ribosome complex and even supports a sorting of the nascent protein
into the mitochondria by binding the TOM-complex on the surface of the mitochondrial membrane
(George et al. 1998).
Refer to the sorting of Chim3.4 we only can speculate that the N-terminal coded signal sequence in
the PBCV1-Kcv sequence part is too weak for an NAC - SRP exchange. Otherwise, the sum of signals
for a mitochondrial targeting is too fragile for a sorting into the mitochondrial membrane. So, a
binding of NAC is not enough to guarantee protein sorting into the mitochondria. The reference
protein dependent sorting of Chim3.4 points out that at a loss of primary targeting signals protein
sorting becomes very flexible by emerging of secondary environmental impacts like non-specific
protein-protein interaction.
78
5.6. References
Balss J, Papatheodorou P, Mehmel M, Baumeister D, Hertel B, Delaroque N, Chatelain F,
Minor D, Van Etten J, Rassow J, Moroni A, Thiel G (2008) Transmembrane domain length
of viral K+channels is a signal for mitochondria targeting. PNAS Vol.105: 12313-8
Boncompagni S, Moussa CE, Levy E, Pezone MJ, Lopez JR, Protasi F, Shtifman A (2012)
Mitochondrial dysfunction in skeletal muscle of amyloid precursor protein-over-expressing
mice. Journal of Biological Chemistry Vol.287: 20534-44
Dement GA, Treff NR, Magnuson NS, Franceschi V, Reeves R (2005) Dynamic mitochondrial
localization of nuclear transcription factor HMGA1. Exp Cell Res. Vol.307: 388-401
Graham F, Smiley J, Russell W, Nairn R (1977) Characteristics of a human cell line transformed
by DNA from human adenovirus type 5. The Journal of general virology Vol.36: 59-74
Hamacher K, Greiner T, Ogata H, Van Etten J, Gebhardt M, Villareal L, Cosentino C, Moroni A,
Thiel G (2012) Phycodnavirus Potassium Ion Channel Proteins Question the Virus Molecular
Piracy Hypothesis. PLoS ONE Vol.7: e38826
Lane DP (1992) p53, guardian of the genome. Nature Vol.358: 15-6
Luisier F, Vonesch C, Blu T, Unser M (2010) Fast interscale wavelet denoising of Poisson-
corrupted images. Signal processing Vol.90: 415-427
George R, Beddoe T, Landl K, Lithgow T (1998) The yeast nascent polypeptide-associated
complex initiates protein targeting to mitochondria in vivo. Cell Biology Vol.95: 2296–2301
Marchenko ND, Zaika AI, Moll UM (2000) Death signal-induced localization of p53 protein to
mitochondria. A potential role in apoptotic signaling. J Biol Chem Vol.275: 16202-12
Merzlyak E, Goedhart J, Shcherbo D, Bulina M, Shcheglov A, Fradkov A, Gaintzeva A,
Lukyanov K, Lukyanov S, Gadella T, Chudakov D (2007) Bright monomeric red fluorescent
protein with an extended fluorescence lifetime Nature Methods Vol.4: 555-7
Power and Walter (1996) Nascent polypeptide-associated complex modulates interactions
between the signal recognition particle and the ribosome. Current Biology Vol.6: 331–8
Shcherbo D, Murphy CS, Ermakova GV, Solovieva EA, Chepurnykh TV, Shcheglov AS,
Verkhushu VV, Pletnev VZ, Hazelwood KL, Roche PM, Lukyanov S, Zaraisky AG,
Davidson MW, Chudakov DM (2009) Far-red fluorescent tags for protein imaging in living
tissues. Biochem. Journal Vol.418 (3)
Shimomura O, Johnson FH, Saiga Y (1962) Extraction, purification and properties of aequorin, a
bioluminescent protein from the luminous hydromedusan, Aequorea. Journal of Cellular and
Comparative Physiology Vol.59: 223-39
Subach OM, Gundorov IS, Yoshimura M, Subach FV, Zhang J (2008) Conversion of red
fluorescent protein into a bright blue probe. Chem Biol Vol.15: 1116-24
79
Xia NS, Luo WX, Zhang j, Xie XY, Yang Hj, LiSW, Chen M, NgMH (2002) Bioluminescence of
Aequorea macrodactyla, a common jellyfish species in the East China Sea. Mar Biotechnol (NY)
Vol.4: 155-62
80
6. Chapter 5 - The post-translational sorting of Kesv
6.1. Abstract
The two viral K+channel Kcv and Kesv are structurally very similar. Yet one of the channels, PBCV1-
Kcv, is sorted via the secretory pathway to the plasma membrane, the second channel, Kesv, is
targeted to the mitochondria. Since Kesv can be easily redirected into the secretory pathway by
simple mutations we test the possibility that the channels are first co-translationally synthesized
into the ER and that Kesv is only later transferred into the mitochondria. Such a sorting could occur
via a sub-compartment of the ER, the so-called mitochondrial associated membranes (MAMs).
These domains are in close physical proximity with the mitochondria and can presumably transfer
proteins from the ER into the mitochondria. Here we identify the MAM compartment in HEK293
cells on the basis of a localisation of the fluorescent-tagged MAM specific huPSS1 (human
phosphatidyl-serine-synthase 1) protein. A triple transfection of cells with the MAM marker
mEGFP::huPPS1, Kesv::tagRFP and the mitochondrial marker COXVIII::mKate2 shows that Kesv is
exclusively co-localising with the mitochondrial marker and not with the MAM specific protein. The
results of these data suggest that Kesv is not entering the ER and that the MAMs are not involved in
the sorting of the channel.
6.2. Introduction
Sorting of nuclear coded mitochondrial proteins occurs generally in a post-translational manner.
This post-translational sorting is initiated by an N-terminal coded mitochondrial targeting sequence,
which causes a chaperon or MSF (Mitochondrial Import Stimulation Factor) arranged transport of
the pre-protein to the surface of the outer mitochondrial membrane (Roise and Schatz 1988, Alam
et al. 1994, Omura 1998, Robin et al. 2003). Recent data suggest that an additional protein
complex, the nascent polypeptide-associated complex (NAC), supports this post-translational
mitochondrial protein sorting (George et al. 1998).
In addition to the large number of proteins, which use this post-translational pathway some
mitochondrial membrane proteins are sorted in an alternative, co-translational manner into
mitochondrial membrane. In this particular case mitochondrial membrane proteins are synthesized
in a co-translational manner into the ER and follow the secretory pathway into a sub-compartment
of the ER, the Mitochondrial Associated Membranes (MAMs). Because of the small distance of 10-
25 nm between the MAMs and the outer mitochondrial membrane, it is assumed that the MAMs
physically interact with the outer mitochondrial membrane (OMM). As a result of this contact the
membrane proteins may be transmitted from the MAM to the mitochondria. For further information
see chapter 2.2.2.. The human cytomegalovirus UL37 exon protein pUL37 is a known example for
this kind of co-translational sorting (Bozidis et al. 2007).
81
Because of the unusually sorting of the viral potassium channel Kesv into the inner mitochondrial
membrane (Balss et al. 2008) we test here whether the channel protein is sorted in a co-
translational manner via the MAMs from the ER into the mitochondria. To address this question we
performed co-localisation studies of Kesv and huPSS1 (human phosphatidyl-serine-synthase 1); the
latter is known as a protein which can be localised in the MAMs (Bozidis et al. 2007). The results
imply that Kesv is not entering the MAMs and is hence not sorted via this pathway to the
mitochondria.
6.3. Material and Methods
All Materials and Methods have been described in chapter 3 with the exception that
mEGFP::huPSS1is used here as a marker for mitochondrial associated membranes (MAMs) (Bozidis
et al. 2007) and Kesv is linked to the red fluorescent protein tagRFP (Kesv::tagRFP) (Merzlyak et al.
2007).
6.4. Results and Discussion
Here we use the confocal laser scanning microscopy technique (CLSM) to co-localise the viral
channel Kesv with marker proteins of interest. For this purpose the proteins of interest were fused
to different fluorescent tags and heterologously expressed in HEK293 cells. To identify the
mitochondrial associated membranes (MAMs) the reference protein mEGFP::huPSS1, which is
specific for MAMs (Bozidis et al. 2007), was co-localised with the marker proteins KDEL::mKate2
(for ER) and COXVIII::mKate2 (for mitochondria) respectively. The results of transient double-
transfections are presented in Fig.6.4.1: While mEGFP::huPSS1 can be mostly co-localised in a
positive way with the ER reference protein KDEL::mKate2, even sometimes a negative co-
localisation is visible. A representative magnification shows a part of the ER structure where only a
green fluorescence from the mEGFP::huPSS1 can be detected (Fig.6.4.1. red arrow). All in all it is
difficult to distinguish the MAM sub-compartment from the rest of the ER on the basis of a
KDEL::mKate2 labelled ER.
The observation that most of ER, which is labelled with KDEL::mKate2, is also labelled with the
MAM specific marker is in agreement with published results (Rusiňol et al. 1994) in which MAMs
are also considered as a part of the pre-Golgi-compartment. On this background of definition of the
MAMs it is understandable that KDEL::mKate2 and mEGFP::huPSS1 show such a large positive
correlation in our localisation studies.
The images in Fig.6.4.1. show a negative co-localisation between the mitochondrial reference
protein COXVIII::mKate2 and mEGFP::huPSS1. In the magnification it is visible that mitochondria
and ER can lie in very close proximity. Hence, a physical membrane contact between these
compartments is possible; because of the resolution limits it is not possible to identify any further
details.
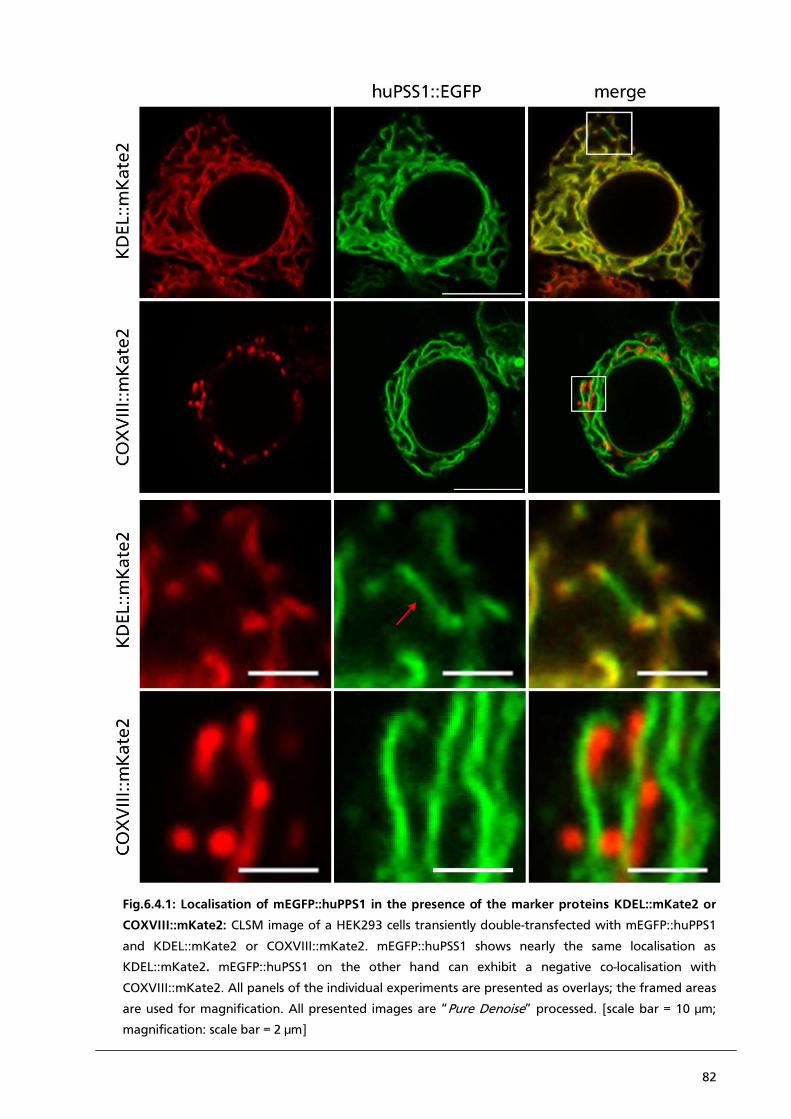
82
Fig.6.4.1: Localisation of mEGFP::huPPS1 in the presence of the marker proteins KDEL::mKate2 or
COXVIII::mKate2: CLSM image of a HEK293 cells transiently double-transfected with mEGFP::huPPS1
and KDEL::mKate2 or COXVIII::mKate2. mEGFP::huPSS1 shows nearly the same localisation as
KDEL::mKate2. mEGFP::huPSS1 on the other hand can exhibit a negative co-localisation with
COXVIII::mKate2. All panels of the individual experiments are presented as overlays; the framed areas
are used for magnification. All presented images are “Pure Denoise” processed. [scale bar = 10 µm;
magnification: scale bar = 2 µm]
83
After identifying the MAMs we test whether there is any indication for a co-translational sorting of
Kesv into the mitochondrial membrane via these structures. Therefore a transiently triple
transfection of HEK293 cells with COXVIII::tagBFP, Kesv::tagRFP and mEGFP::huPSS1 was
accomplished (Fig.6.4.2.). Because of a distinct negative-co-localisation between Kesv::tagRFP and
mEGFP::huPSS1 and the positive co-localisation with COXVIII::mKate2 we conclude that Kesv is not
sorted into the inner mitochondrial membrane via the secretory pathway (Fig.6.4.2.). On the basis
of these data we can exclude that Kesv is sorted in a co-translational manner into the mitochondria;
hence Kesv does not use the same pathway as the human cytomegalovirus UL37 exon protein
pUL37 (Bozidis et al. 2007). The results of the present experiments are in line with a bulk of other
data, which suggest that Kesv is synthesized on cytosolic ribosomes (Balss et al. 2008, chapter 2 and
3 this thesis). The differential sorting of the Kesv protein into the mitochondria or the sorting of
Kesv mutants into the secretory pathway is decided in the cytosol.
Fig.6.4.2: Localisation of Kesv::tagRFP in the presence of the marker proteins mEGFP::huPSS1 and
COXVIII::tagBFP: CLSM image of a HEK293 cells transiently triple-transfected with COXVIII::tagBFP,
Kesv::tagRFP and mEGFP::huPSS1. Kesv::tagRFP shows the same localisation as COXVIII::tagBFP. In contrast
Kesv::tagRFP can negative co-localised with mEGFP::huPSS1. Additionally, all panels of every single experiment
are presented merged and the framed areas are used for magnification. All presented images are “Pure
Denoise” processed [scale bar = 10 µm; magnification: scale bar = 2 µm]
84
6.5. References
Alam R, Hachiya N, Sakaguchi M, Kawabata S, Iwanaga S, Kitajima M, Mihara K, Omura T
(1994) C-DNA cloning and characterization of mitochondrial import stimulation factor (MSF)
purified from rat liver cytosol. Journal of biochemistry Vol.166: 416-25
Balss J, Papatheodorou P, Mehmel M, Baumeister D, Hertel B, Delaroque N, Chatelain F,
Minor D, Van Etten J, Rassow J, Moroni A, Thiel G (2008) Transmembrane domain length
of viral K+channels is a signal for mitochondria targeting. PNAS Vol.105: 12313-8
Bozidis P, Williamson C, Colberg-Poley A (2008) Mitochondrial and secretory human
cytomegalovirus UL37 proteins traffic into mitochondrion-associated membranes of human
cells. JVI Vol.82: 2715-26
George R, Beddoe T, Landl K, Lithgow T (1998) The yeast nascent polypeptide-associated
complex initiates protein targeting to mitochondria in vivo. Cell Biology Vol.95: 2296–2301
Graham F, Smiley J, Russell W, Nairn R (1977) Characteristics of a human cell line transformed
by DNA from human adenovirus type 5. The Journal of general virology Vol.36: 59-74
Luisier F, Vonesch C, Blu T, Unser M (2010) Fast interscale wavelet denoising of Poisson-
corrupted images. Signal processing Vol.90: 415-427
Merzlyak E, Goedhart J, Shcherbo D, Bulina M, Shcheglov A, Fradkov A, Gaintzeva A,
Lukyanov K, Lukyanov S, Gadella T, Chudakov D (2007) Bright monomeric red fluorescent
protein with an extended fluorescence lifetime Nature Methods Vol.4: 555-7
Omura T (1998) Mitochondria-targeting sequence, a multi-role sorting sequence recognized at all
steps of protein import into mitochondria. Journal of biochemistry Vol.123: 1010-6
Roise D and Schatz G (1988) Mitochondrial presequences. Journal of Biological Chemistry Vol.
263: 4509-4511
Robin M, Prabu S, Raza H, Anandatheerthavarada H, Avadhani N (2003) Phosphorylation
enhances mitochondrial targeting of GSTA4-4 through increased affinity for binding to
cytoplasmic Hsp70. Journal of biochemistry Vol.278: 18960-70
Rusiňol A, Cui Z, Chen M, Vance J (1994) A unique mitochondria associated membrane fraction
from rat liver has a high capacity for lipid synthesis and contains pre-Golgi secretory proteins
including nascent lipoproteins. J. Biol. Chem Vol.269: 27494-502
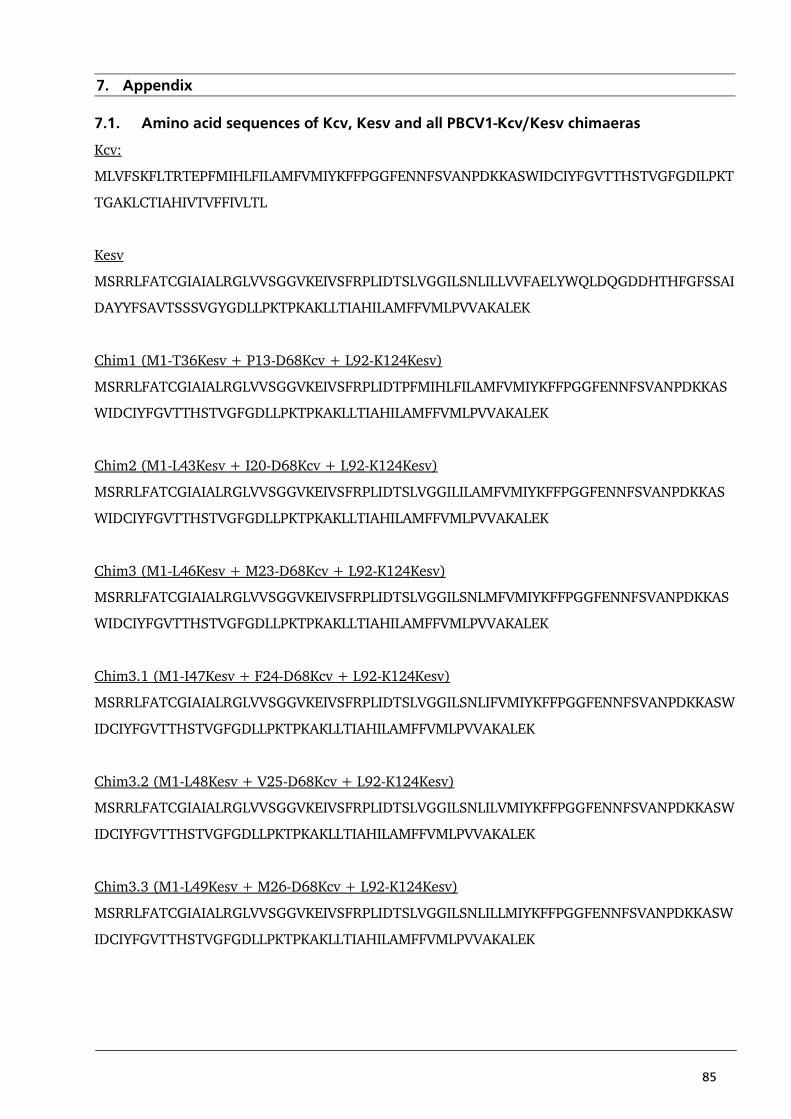
85
7. Appendix
7.1. Amino acid sequences of Kcv, Kesv and all PBCV1-Kcv/Kesv chimaeras
Kcv:
MLVFSKFLTRTEPFMIHLFILAMFVMIYKFFPGGFENNFSVANPDKKASWIDCIYFGVTTHSTVGFGDILPKT
TGAKLCTIAHIVTVFFIVLTL
Kesv
MSRRLFATCGIAIALRGLVVSGGVKEIVSFRPLIDTSLVGGILSNLILLVVFAELYWQLDQGDDHTHFGFSSAI
DAYYFSAVTSSSVGYGDLLPKTPKAKLLTIAHILAMFFVMLPVVAKALEK
Chim1 (M1-T36Kesv + P13-D68Kcv + L92-K124Kesv)
MSRRLFATCGIAIALRGLVVSGGVKEIVSFRPLIDTPFMIHLFILAMFVMIYKFFPGGFENNFSVANPDKKAS
WIDCIYFGVTTHSTVGFGDLLPKTPKAKLLTIAHILAMFFVMLPVVAKALEK
Chim2 (M1-L43Kesv + I20-D68Kcv + L92-K124Kesv)
MSRRLFATCGIAIALRGLVVSGGVKEIVSFRPLIDTSLVGGILILAMFVMIYKFFPGGFENNFSVANPDKKAS
WIDCIYFGVTTHSTVGFGDLLPKTPKAKLLTIAHILAMFFVMLPVVAKALEK
Chim3 (M1-L46Kesv + M23-D68Kcv + L92-K124Kesv)
MSRRLFATCGIAIALRGLVVSGGVKEIVSFRPLIDTSLVGGILSNLMFVMIYKFFPGGFENNFSVANPDKKAS
WIDCIYFGVTTHSTVGFGDLLPKTPKAKLLTIAHILAMFFVMLPVVAKALEK
Chim3.1 (M1-I47Kesv + F24-D68Kcv + L92-K124Kesv)
MSRRLFATCGIAIALRGLVVSGGVKEIVSFRPLIDTSLVGGILSNLIFVMIYKFFPGGFENNFSVANPDKKASW
IDCIYFGVTTHSTVGFGDLLPKTPKAKLLTIAHILAMFFVMLPVVAKALEK
Chim3.2 (M1-L48Kesv + V25-D68Kcv + L92-K124Kesv)
MSRRLFATCGIAIALRGLVVSGGVKEIVSFRPLIDTSLVGGILSNLILVMIYKFFPGGFENNFSVANPDKKASW
IDCIYFGVTTHSTVGFGDLLPKTPKAKLLTIAHILAMFFVMLPVVAKALEK
Chim3.3 (M1-L49Kesv + M26-D68Kcv + L92-K124Kesv)
MSRRLFATCGIAIALRGLVVSGGVKEIVSFRPLIDTSLVGGILSNLILLMIYKFFPGGFENNFSVANPDKKASW
IDCIYFGVTTHSTVGFGDLLPKTPKAKLLTIAHILAMFFVMLPVVAKALEK
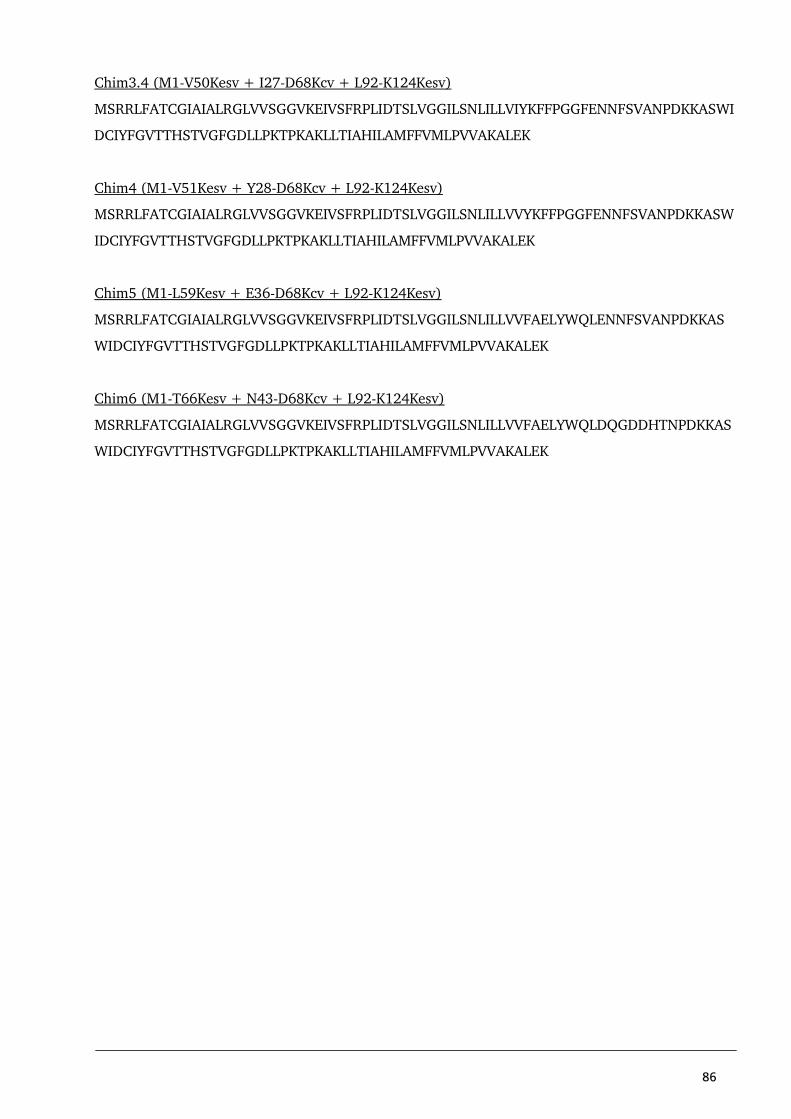
86
Chim3.4 (M1-V50Kesv + I27-D68Kcv + L92-K124Kesv)
MSRRLFATCGIAIALRGLVVSGGVKEIVSFRPLIDTSLVGGILSNLILLVIYKFFPGGFENNFSVANPDKKASWI
DCIYFGVTTHSTVGFGDLLPKTPKAKLLTIAHILAMFFVMLPVVAKALEK
Chim4 (M1-V51Kesv + Y28-D68Kcv + L92-K124Kesv)
MSRRLFATCGIAIALRGLVVSGGVKEIVSFRPLIDTSLVGGILSNLILLVVYKFFPGGFENNFSVANPDKKASW
IDCIYFGVTTHSTVGFGDLLPKTPKAKLLTIAHILAMFFVMLPVVAKALEK
Chim5 (M1-L59Kesv + E36-D68Kcv + L92-K124Kesv)
MSRRLFATCGIAIALRGLVVSGGVKEIVSFRPLIDTSLVGGILSNLILLVVFAELYWQLENNFSVANPDKKAS
WIDCIYFGVTTHSTVGFGDLLPKTPKAKLLTIAHILAMFFVMLPVVAKALEK
Chim6 (M1-T66Kesv + N43-D68Kcv + L92-K124Kesv)
MSRRLFATCGIAIALRGLVVSGGVKEIVSFRPLIDTSLVGGILSNLILLVVFAELYWQLDQGDDHTNPDKKAS
WIDCIYFGVTTHSTVGFGDLLPKTPKAKLLTIAHILAMFFVMLPVVAKALEK
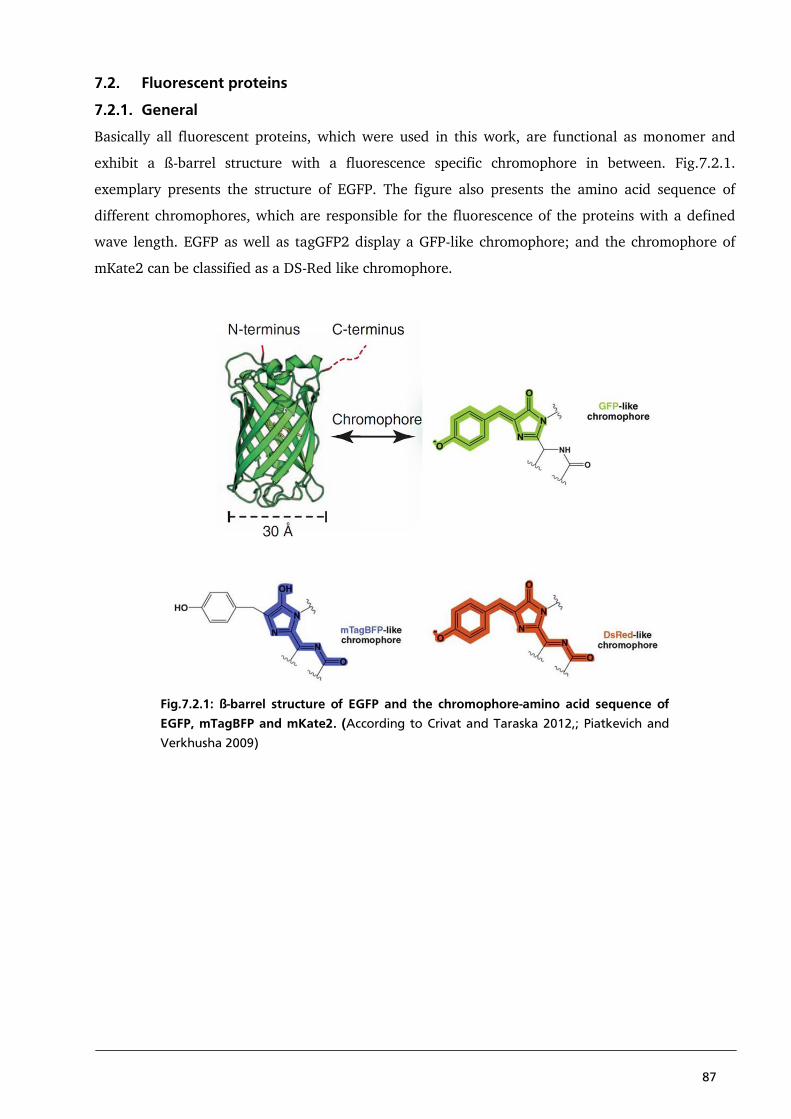
87
7.2. Fluorescent proteins
7.2.1. General
Basically all fluorescent proteins, which were used in this work, are functional as monomer and
exhibit a ß-barrel structure with a fluorescence specific chromophore in between. Fig.7.2.1.
exemplary presents the structure of EGFP. The figure also presents the amino acid sequence of
different chromophores, which are responsible for the fluorescence of the proteins with a defined
wave length. EGFP as well as tagGFP2 display a GFP-like chromophore; and the chromophore of
mKate2 can be classified as a DS-Red like chromophore.
Fig.7.2.1: ß-barrel structure of EGFP and the chromophore-amino acid sequence of
EGFP, mTagBFP and mKate2. (According to Crivat and Taraska 2012,; Piatkevich and
Verkhusha 2009)
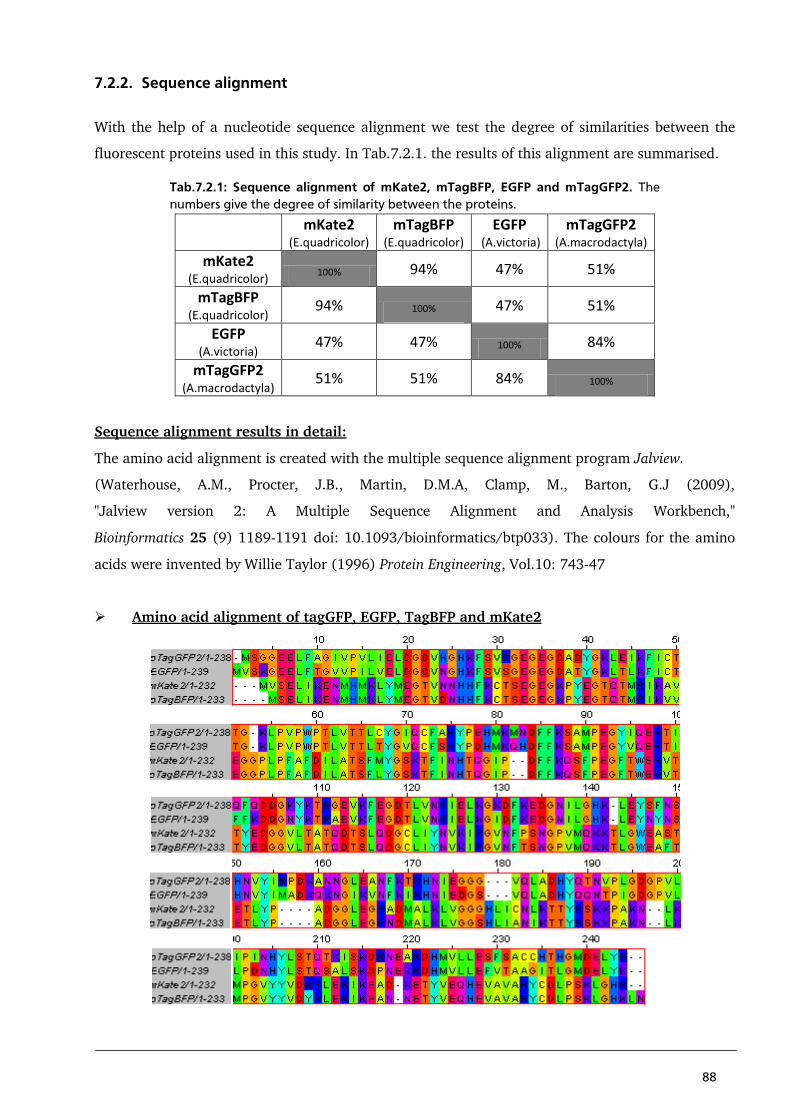
88
7.2.2. Sequence alignment
With the help of a nucleotide sequence alignment we test the degree of similarities between the
fluorescent proteins used in this study. In Tab.7.2.1. the results of this alignment are summarised.
Tab.7.2.1: Sequence alignment of mKate2, mTagBFP, EGFP and mTagGFP2. The
numbers give the degree of similarity between the proteins.
mKate2
(E.quadricolor)
mTagBFP (E.quadricolor)
EGFP (A.victoria)
mTagGFP2 (A.macrodactyla)
mKate2 (E.quadricolor) 100% 94% 47% 51%
mTagBFP (E.quadricolor)
94% 100% 47% 51%
EGFP (A.victoria)
47% 47% 100% 84%
mTagGFP2 (A.macrodactyla)
51% 51% 84% 100%
Sequence alignment results in detail:
The amino acid alignment is created with the multiple sequence alignment program Jalview.
(Waterhouse, A.M., Procter, J.B., Martin, D.M.A, Clamp, M., Barton, G.J (2009),
"Jalview version 2: A Multiple Sequence Alignment and Analysis Workbench,"
Bioinformatics 25 (9) 1189-1191 doi: 10.1093/bioinformatics/btp033). The colours for the amino
acids were invented by Willie Taylor (1996) Protein Engineering, Vol.10: 743-47
Amino acid alignment of tagGFP, EGFP, TagBFP and mKate2
89
7.3. List of abbreviations
aa amino acid
BFP blue fluorescent protein
cAMP cyclic adenosinmonophosphat
Chim chimaera
CLSM confocal laser scanning microscopy
COX cytochrome oxidase
DNA desoxribonucleic acid
ER endoplasmatic reticulum
ESV Ectocarpus siliculosus virus
GET Golgi-ER trafficking complex
GFP green fluorescent protein
HEK human embryonic kidney cells
Hsp heat shock protein
huPPS human phosphatidyl-serine-synthase
IMM inner mitochondrial membrane
KDEL Lysine-Aspartic acid-Glutamic acid-Leucine
Kesv potassium channel from ESV
MAM mitochondria associated membrane
MSF mitochondria import stimulation factor
MTS mitochondrial targeting Sequence
mRNA messenger ribonucleic acid
NAC nascent polypeptide associated complex
OMM outer mitochondrial membrane
PBCV1 Paramecium bursaria Chlorella virus 1
PBCV1-Kcv potassium channel from PBCV1
PCC Pearson´s correlation coefficient
RFP red fluorescent protein
SAM sorting and assembly machinery complex
SRP signal recognition particle
TA tail anchored protein
TIM translocase of the inner mitochondrial membrane
TMD transmembrane domain
TOM translocase of the outer mitochondrial membrane
90
8. Danksagung
An erster Stelle gilt mein Dank Herrn Prof. Dr. Gerhard Thiel für die großartige Betreuung und
Unterstützung meiner Arbeit.
Weiterhin bedanke ich mich bei Herrn Prof. Dr. Adam Bertl für die Übernahme des Koreferats und
Herrn Dr. habil. Tobias Meckel für die umfassende Einweisung und Unterstützung am Mikroskop.
Bastian Roth, Christian Braun, Fenja Siotto, Timo Wulfmeyer, Timo Greiner, Alice Kress und
Manuela Gebhardt möchte ich danken für die fröhliche Zeit im “Kinderzimmer”, in dem, neben
fachlichen Fragen, auch viele philosophische und lebensnahe Themen diskutiert wurden.
Ebenfalls möchte ich mich bei allen weiteren Mitarbeitern der AG Thiel für die herzliche
Unterstützung und die freundliche Zusammenarbeit bedanken.
Darüber hinaus bedanke ich mich ganz herzlich bei meinem Mann Philip von Chappuis für seine
Liebe, Hilfe und Unterstützung in jeder Hinsicht, ohne die vieles nicht möglich gewesen wäre; und
meiner Tochter Theodora von Chappuis für die unendliche Geduld, auf ihre Mutter zu warten.
Meinen Eltern Sabine und Hans-Dieter Neumann, die mir bei allen Problemen und Themen
abseits der Arbeit immer mit Rat und Tat zur Seite standen danke ich ebenfalls ganz herzlich.
91
9. Eidesstattliche Erklärung
"Ich erkläre hiermit ehrenwörtlich, dass ich die vorliegende Arbeit entsprechend den Regeln guter
wissenschaftlicher Praxis selbstständig und ohne unzulässige Hilfe Dritter angefertigt habe.
Sämtliche aus fremden Quellen direkt oder indirekt übernommenen Gedanken sowie sämtliche von
Anderen direkt oder indirekt übernommenen Daten, Techniken und Materialien sind als solche
kenntlich gemacht. Die Arbeit wurde bisher bei keiner anderen Hochschule zu Prüfungszwecken
eingereicht."
Darmstadt, den 11.02.2013
Charlotte von Chappuis
92
10. Curriculum Vitae
Person Charlotte von Chappuis, geborene Neumann,
geboren am 13. Oktober 1983 in Rostock
verheiratet, 1 Tochter (9 Jahre)
Bildung Dez. 2012 - Nov. 2009 wissenschaftliche Mitarbeiterin (Ph.D)
im Fachbereich Biologie (Membranbiophysik),
Technische Universität Darmstadt
Sept. 2009 Diplomarbeit (Zelluläre Lokalisationsstudien über den
viralen Kaliumkanal „Kesv“)
Sept. 2009 - Okt. 2004 Studium der Biologie an der Technischen Universität
Darmstadt
2001 – 2003 Besuch des Fritz-Reuter-Gymnasiums in
Kühlungsborn
1994 – 2001 Besuch des Friderico Francisceum zu Bad Boberan
1990 – 1994 Besuch der Grundschule in Bad Doberan
Weiterbildung
Mai 2011 Besuch der International School of Biophysics,
(Erice, Italien),
41. Kurs „Channels and Transporters“
Sprachen Deutsch (Muttersprache), Englisch, Latinum