
Structure-function relationships of cobalt and manganese ... · Structure-function relationships of...
152
Structure-function relationships of cobalt and manganese oxides as catalysts for (photo-) electrochemical water splitting vorgelegt von Dipl.-Ing. Philipp Hillebrand geb. in Bozen von der Fakultät II – Mathematik und Naturwissenschaften der Technischen Universität Berlin zur Erlangung des akademischen Grades Doktor der Ingenieurwissenschaften - Dr. Ing - genehmigte Dissertation. Promotionsausschuss: Vorsitzender: Prof. Dr. Martin Lerch Gutachter: Prof. Dr. Sebastian Fiechter Gutachter: Prof. Dr. Peter Strasser Gutachter: Dr. Wolfram Calvet Datum der wissenschaftlichen Aussprache: 10. September 2015 Berlin 2015
-
Upload
nguyennguyet -
Category
Documents
-
view
249 -
download
0
Transcript of Structure-function relationships of cobalt and manganese ... · Structure-function relationships of...
Structure-function relationships of
cobalt and manganese oxides as catalysts
for (photo-) electrochemical water splitting
vorgelegt von
Dipl.-Ing.
Philipp Hillebrand
geb. in Bozen
von der Fakultät II – Mathematik und Naturwissenschaften
der Technischen Universität Berlin
zur Erlangung des akademischen Grades
Doktor der Ingenieurwissenschaften
- Dr. Ing -
genehmigte Dissertation.
Promotionsausschuss:
Vorsitzender: Prof. Dr. Martin Lerch
Gutachter: Prof. Dr. Sebastian Fiechter
Gutachter: Prof. Dr. Peter Strasser
Gutachter: Dr. Wolfram Calvet
Datum der wissenschaftlichen Aussprache: 10. September 2015
Berlin 2015

Kurzfassung
Die photoelektrochemische Wasserspaltung ist ein vielversprechendes neuartiges Verfahren zur
Produktion von nachhaltigem und schadstofffreiem Wasserstoff, der als chemischer Energieträger
eingesetzt werden kann. Ein Kernpunkt für die erfolgreiche Entwicklung dieser Technologie ist die
Verfügbarkeit effizienter Katalysatoren bei der Sauerstoffentwicklung (oxygen evolution reaction, OER) an
der Anode des Systems.
In dieser Arbeit werden Kobalt- und Manganoxide als günstige und leicht verfügbare Katalysatoren für die
OER in basischem Ambiente beschrieben. Auf FTO elektrochemisch abgeschiedenes amorphes Kobaltoxid
(CoOx), welches sich einfach herstellen lässt und kein Tempern benötigt, bildete dabei den Schwerpunkt.
Durch Tempern bildet sich kristallines Co3O4, welches jedoch weniger aktiv ist als die amorphe Phase. Bei
Manganoxid ist die kristalline α-Mn2O3 Phase am aktivsten. Sie ist durch zum Teil stark verzerrte [MnO6]-
Koordinationsoktaeder und unterschiedliche interatomare Bindungsabstände gekennzeichnet. Für ihre
Synthese musste die galvanostatisch abgeschiedene Schicht auf 500°C erhitzt werden. Es wird
angenommen, dass die Vielzahl der energetisch leicht unterschiedlichen Bindungszustände an der
Oberfläche für die hohe Aktivität der beiden Phasen verantwortlich ist. Überspannungen von 370 bzw. 360
mV bei 10 mA/cm2 wurden für CoOx und α-Mn2O3 erreicht, was mit den besten Werten aus der Literatur
für diverse Katalysatoren vergleichbar ist1.
Zur Klärung der Fragestellung, ob sich ein Bezug zwischen der Menge an auf der Elektrode
abgeschiedenem Kobaltoxid und der katalytischen Aktivität (Überspannung) herstellen lässt, wurde CoOx
mit unterschiedlichen Ladungsmengen abgeschieden und elektrochemisch charakterisiert. Dabei führte
die systematische Erhöhung der abgeschiedenen Ladung, welche ein Maßstab für die Menge an
Katalysator ist, zu einer steigenden katalytischen Leistung. Dieser Effekt wurde auf Mikroporosität in den
Katalysatorschichten zurückgeführt, welche in elektronenmikroskopischen Abbildungen sichtbar wird.
Differentielle elektrochemische Massenspektroskopie (DEMS) konnte einen klaren Bezug zwischen dem
beobachteten faradayschen Strom bei hohen anodischen Potentialen und der Sauerstoffentwicklung
herstellen. In schlecht gepufferten neutralen Lösungen konnte dagegen mittels DEMS eine Versauerung in
den Poren des Materials nachgewiesen werden, welche die OER behindert. Generell ist die Aktivität in
neutralen Medien deutlich schlechter als in stark basischen.
Mit Hilfe der Methode der in-line Synchrotron-Photoelektronenspektroskopie (SXPS) konnten die
Oberflächenzustände von CoOx- und α-Mn2O3-Elektroden nach Kontakt mit dem Elektrolyten und nach
Polarisation mit verschiedenen anodischen Spannungen untersucht werden. CoOx zeigte dabei eine
partielle Oxidation von Co2+ zu Co3+, überraschenderweise aber kein Co4+, welches durch elektrochemische
Messungen und Literaturangaben zu erwarten gewesen wäre. Durch in-situ UV/Vis Messungen wurde ein
deutlicher elektrochromer Effekt als Funktion der angelegten Spannung beschrieben und Hinweise auf die
Präsenz von Co4+ gefunden. Relaxationsphänomene beweisen die Instabilität der Co4+ Ionen nach
Entfernen der Probe aus dem Elektrolyten, ein Grund für deren Fehlen in den SXPS Spektren. α-Mn2O3
dagegen zeigte einen deutlichen Mn4+ Anteil im SXPS, nachdem die Probe mit einem Potential im OER
Bereich belastet wurde. Dieser Unterschied in der Stabilität des tetravalenten Zustandes könnte ein
Hinweis auf unterschiedliche Reaktionsmechanismen bei der Wasseroxidation an der Phasengrenze
Elektrode/Elektrolyt sein.

Abstract
Photoelectrochemical water splitting represents a promising route for producing sustainable and
potentially cheap hydrogen as an alternative energy carrier to replace fossil fuels. However, several
scientific and technological challenges are still to be solved. One of the key issues is the availability of high
efficient catalysts for the oxygen evolution reaction (OER) at the anode side of the system, to minimize
energetic losses in the process of charge transfer.
In this work cobalt and manganese oxides were investigated as cheap and abundant catalysts for the OER
in alkaline media. The main focus was put on electrochemically deposited cobalt oxide (CoOx) on FTO
substrates, which is easy to fabricate and does not need the application of high temperatures to form the
catalyst. On the contrary, annealing of the as-deposited amorphous thin films has led to the formation of
crystalline spinel phase Co3O4 correlated to a decrease in activity. In the manganese oxide system on the
other hand, crystalline α-Mn2O3, which formed after annealing the galvanostactically deposited film at
500°C in air, showed the best catalytic performance. This material is characterized by (partially) strongly
distorted [MnO6] coordination octahedrons with a wide gamut of different interatomic bonding distances.
It is assumed that the availability of various kinds of energetically slightly different binding sites at the
surface of amorphous CoOx and crystalline α-Mn2O3 is responsible for the high catalytic activity.
Overpotentials of 370 and 360 mV at 10 mA/cm2 have been achieved for CoOx and α-Mn2O3, respectively,
which are comparable to the best catalysts based on abundant transition metal compounds1.
In the synthesis of CoOx electrodes, a systematic increase of the charge during film formation, which is a
measure for the amount of the deposited catalyst, had a pronounced effect on the catalytic performance.
This behavior was attributed to microporosity of the films, which is supported by TEM imaging. Differential
electrochemical mass spectroscopy (DEMS) confirmed that the faradaic current at anodic potentials above
1.5 V (RHE) is related to oxygen evolution. Measurements in buffered aqueous solutions at pH7 revealed
acidification inside the pores, if the buffer concentration is too low. In general, the activity at neutral pH is
significantly lower compared to alkaline media.
In-line synchrotron X-ray photoelectron spectroscopy (SXPS) was applied to study the surface state of CoOx
and α-Mn2O3 after the application of different anodic potentials. CoOx showed a partial oxidation of Co2+
to Co3+ at moderate potentials, but no Co4+ was detected in the OER potential range. This was surprising,
since electrochemical experiments and literature data strongly suggest the formation of Co4+. In-situ
UV/Vis measurements showed a pronounced electrochromic effect and gave further evidence for the
appearance of Co4+ at potentials above 1.5 V. Furthermore, UV/Vis studies provided indications for the
instability of Co4+, if the potential is removed, which is the reason for not appearing in the X-ray spectra.
Instead, α-Mn2O3 showed a clear share of Mn4+ after application of a potential in the OER regime. This
difference in stability of the tetravalent oxidation state is interpreted as a sign for a possible different
oxygen evolution reaction mechanism at the electrode/electrolyte interface.


Danksagung
An dieser Stelle möchte ich mich bei jenen Menschen bedanken, die mich in den letzten Jahren fachlich
und menschlich bei der Erstellung dieser Arbeit unterstützt haben.
Zunächst möchte ich mich herzlich bei Prof. Sebastian Fiechter für die Betreuung meiner Arbeit und die
Unterstützung in allen wissenschaftlichen Belangen bedanken. Er war stets ansprechbar und hilfsbereit.
Durch seinen Enthusiasmus für die Wissenschaft entstanden sehr anregende Diskussionen die oftmals weit
über das wissenschaftliche Thema hinausgingen und mir vielfach neue Blickwinkel eröffneten. Außerdem
bedanke ich mich für seine Verbesserungsvorschläge und die Anfertigung des Gutachtens.
Prof. Peter Strasser von der TU Berlin und Dr. Wolfram Calvet vom Helmholtz-Zentrum Berlin möchte ich
für die Erstellung ihrer Gutachten danken. Außerdem bedanke ich mich bei Prof. Martin Lerch für die
Übernahme des Vorsitzes in der Prüfungskommission.
Für seine Hilfestellung in allen Belangen der Elektrochemie danke ich Peter Bogdanoff, der mit seinem
schier unendlichen Fachwissen so manches Rätsel lösen konnte und immer mit Rat und Tat zur Seite stand.
Alejandra Ramírez danke ich für die Bereitstellung der Syntheseroute für die Manganoxide, sowie für die
gute Zusammenarbeit auf dem Gebiet.
Bei Stefanie Bierwirth, Fatwa Abdi, Matthias May und Michael Kanis möchte ich mich für die Unterstützung
bei den XPS Messungen in Adlershof bedanken. Ein besonderer Dank geht hierbei auch an Dr. Wolfram
Calvet, der mich bei den vielen technischen Problemen mit der SoLIAS sehr unterstützt hat. Bei Fatwa Abdi
möchte ich mich außerdem für die Unterstützung bei den UV/Vis Messungen bedanken.
Für die TEM und REM Querschnittspräparation, sowie für die TEM Bilder bedanke ich mich herzlich bei
Ulrike Bloeck, die das erst möglich gemacht hat. Außerdem geht ein spezieller Dank an Stefanie Bierwirth,
die mit viel Geduld und Hingabe meinen sich ständig ändernden Wünschen bei den REM Aufnahmen
nachkam.
Bei Diana Stellmach bedanke ich mich für die moralische, seelische und leibliche (Schokolade) Fürsorge in
den letzten Jahren. Ihr Weggang riss ein tiefes Loch in die Arbeitsgruppe.
Schließlich geht ein ganz besonderes Dankeschön an Sophie Jancke, die mir in den letzten Monaten der
Arbeit in allen möglichen Belangen sehr geholfen hat. Ohne sie wäre die Arbeit vermutlich nicht rechtzeitig
fertig geworden.
Außerdem danke ich allen Mitgliedern des Instituts für Solare Brennstoffe für das nette und
freundschaftliche Arbeitsklima und auch außerhalb des Instituts haben mich meine Eltern, Brüder und
Freunde immer toll unterstützt und mich durch die Doktorandenzeit begleitet.
Zum Schluss möchte ich mich bei meiner kleinen Familie bedanken, die mich tapfer aushält und mich nach
Kräften unterstützt. Bei meiner Frau Anja dafür, dass sie mir immer gut zuredet, wenn ich Zweifel habe
und meinem Sohn Max für seine bloße Existenz; das allein macht das Leben schon schön.

Table of contents
1. Broader context and motivation ..................................................................... 1
2. Theoretical background ................................................................................... 5
2.1. Electrochemical basics ............................................................................. 5
2.2. The oxygen evolution reaction (OER) ....................................................... 9
2.2.1. Theoretical considerations ..................................................................................... 9
2.2.2. Catalysts for the oxygen evolution reaction .......................................................... 11
2.2.3. Cobalt Oxide ......................................................................................................... 12
2.2.4. Manganese Oxide ................................................................................................. 13
3. Experimental section ..................................................................................... 15
3.1. Sample preparation ............................................................................... 15
3.2. Analysis methods ................................................................................... 17
3.2.1. Electrochemistry .................................................................................................. 17
3.2.1.1. Cyclic voltammetry (CV) ................................................................................ 17
3.2.1.2. Differential electrochemical mass spectroscopy (DEMS) ............................... 20
3.2.2. Spectroscopic methods ........................................................................................ 21
3.2.2.1. In-line synchrotron X-ray photoelectron spectroscopy (SXPS) ....................... 21
3.2.2.2. UV/Vis spectroscopy ..................................................................................... 26
3.2.3. Other methods ..................................................................................................... 27
3.2.3.1. X-ray diffraction (XRD) ................................................................................... 27
3.2.3.2. Scanning electron microscopy (SEM) ............................................................. 27
3.2.3.3. Transmission electron microscopy (TEM) ...................................................... 27
4. Results and discussion ................................................................................... 29
4.1. Cobalt Oxide .......................................................................................... 29

4.1.1. Influence of preparation parameters on the catalytic activity ............................... 29
4.1.1.1. Deposition potential ...................................................................................... 29
4.1.1.2. Composition of the deposition solution ......................................................... 35
4.1.1.3. Substrate ....................................................................................................... 38
4.1.1.4. Temperature ................................................................................................. 45
4.1.2. CoOx films as oxygen evolution catalysts .............................................................. 53
4.1.2.1. Dependence of OER activity on the deposited amount of CoOx ..................... 53
4.1.2.2. Film thickness ................................................................................................ 57
4.1.2.3. Determination of the electrochemically active surface area (ECASA) ............. 60
4.1.2.4. Magnitude of the reduction peaks ................................................................ 65
4.1.2.5. Kinetics.......................................................................................................... 68
4.1.2.6. Influence of the electrolyte ........................................................................... 73
4.1.2.7. Differential electrochemical mass spectroscopy (DEMS) ............................... 78
4.1.2.8. Stability of CoOx electrodes ........................................................................... 81
4.1.3. Spectroscopic analysis .......................................................................................... 87
4.1.3.1. In-line SXPS ................................................................................................... 87
4.1.3.2. In-situ UV/Vis ................................................................................................ 95
4.2. Manganese Oxide ................................................................................ 103
4.2.1. Catalytic activity ................................................................................................. 103
4.2.2. In-line SXPS ........................................................................................................ 105
5. Summary and final remarks ......................................................................... 111
6. Appendix ...................................................................................................... 117
6.1. References ........................................................................................... 117
6.2. List of figures ....................................................................................... 133
6.3. List of tables ......................................................................................... 139
6.4. List of publications ............................................................................... 141
1
1. Broader context and motivation
Sufficient supply of the world’s population with energy is one of the key challenges in the 21st
century. Since the industrial revolution, the demand for energy increased by orders of magnitude
related to a growing world population and its augmented industrial activities. Most scenarios
predict a continuously enhanced energy need in the next decades. In 2010, the primary energy
demand worldwide was in the range of 481-506 EJ (Exa Joule = 1018 Joule)2–4 and assuming
„business as usual“, where no significant political impacts on the energy issue are expected, the
numbers will grow to about 750 EJ in 20355 and 1069 EJ in 20503. Roughly 83% of this enormous
amount of energy is expected to be provided by fossil fuels (coal, natural gas, oil), which
corresponds to burning a lake of oil half the size of Lake Constance (Bodensee) in Germany every
year. Severe and incalculable economic risks are related to this dependence on fossil fuels,
manifested e.g. in the currently extremely underrated oil price of about 60 USD per barrel (April
2015). At the latest when the gigantic speculative bubble6 caused by hydraulic fracturing
(“fracking”) in the United States collapses in a few years, a significant increase of the oil price can
be expected with tremendous consequences for the world economy.
Besides economic issues, strongly increased emissions of CO2, methane, fine dust, mercury and
other heavy metals from producing and burning fossil fuels have affected the global climate and
the health of people living close to power plants. In fact, atmospheric CO2 concentration has never
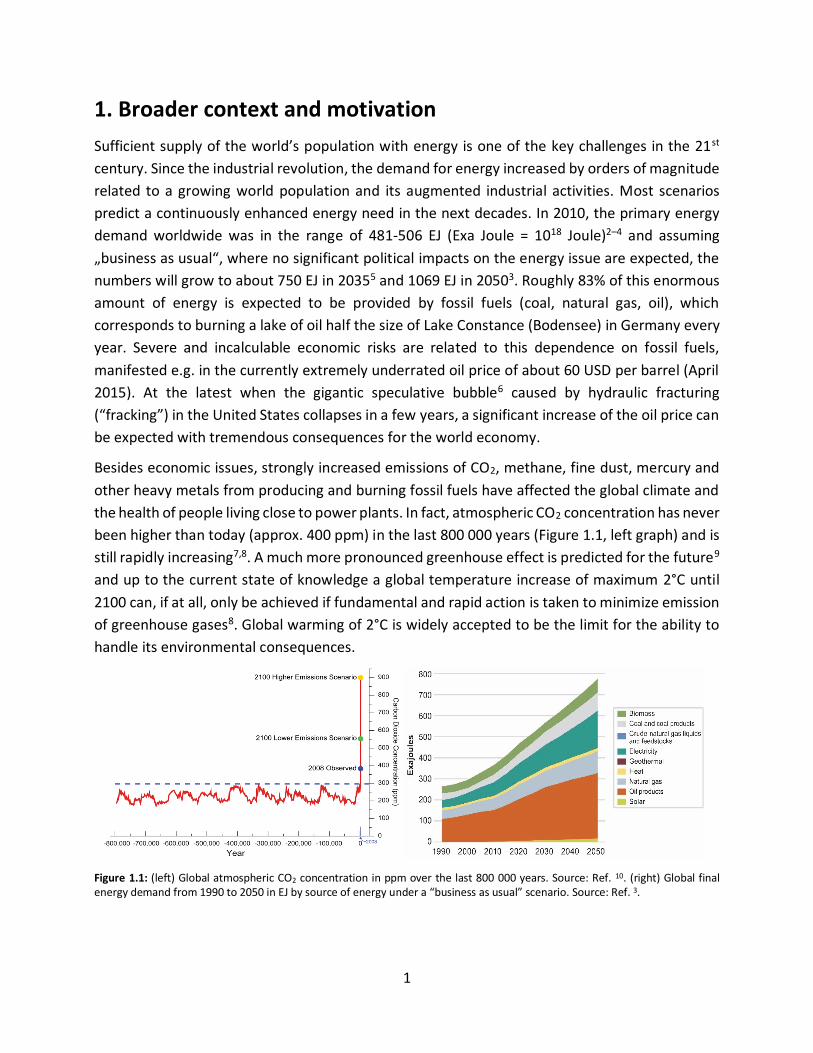
been higher than today (approx. 400 ppm) in the last 800 000 years (Figure 1.1, left graph) and is
still rapidly increasing7,8. A much more pronounced greenhouse effect is predicted for the future9
and up to the current state of knowledge a global temperature increase of maximum 2°C until
2100 can, if at all, only be achieved if fundamental and rapid action is taken to minimize emission
of greenhouse gases8. Global warming of 2°C is widely accepted to be the limit for the ability to
handle its environmental consequences.
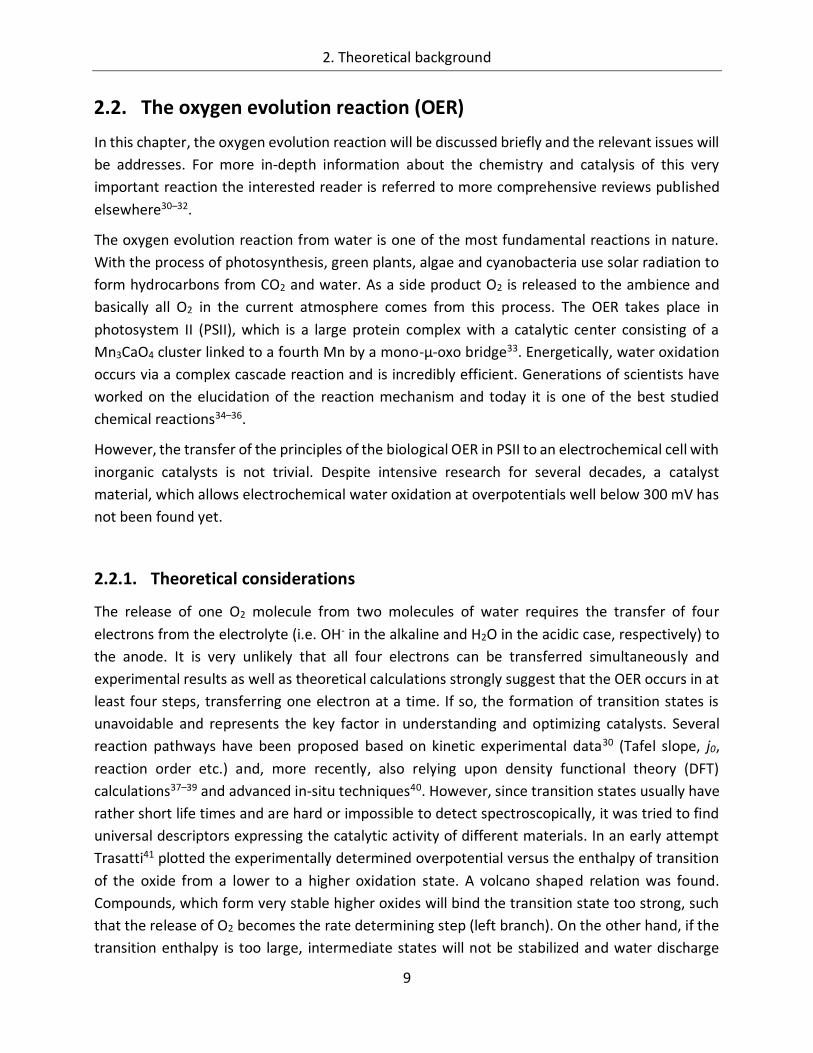
Figure 1.1: (left) Global atmospheric CO2 concentration in ppm over the last 800 000 years. Source: Ref. 10. (right) Global final energy demand from 1990 to 2050 in EJ by source of energy under a “business as usual” scenario. Source: Ref. 3.
1. Broader context and motivation
2
International initiatives have tried to put the problem on the agenda and several governments
have started to pass laws and develop strategies for reducing CO2 emissions, but opposition of
economy and conservative pressure groups is strong. Furthermore, most efforts are focused
mainly on the decarbonization of electricity production, which is reflected by the recent
sensational technological progress in photovoltaics and wind energy systems. However, as the
right diagram in Figure 1.1 shows, less than 20% of the total energy is consumed in form of
electricity. The vast majority consists of fuels for transportation, industry and heating, based on
coal, natural gas and oil products like gasoline. Consequently, even for Germany, who claims to
be a pioneer in climate protection policy, the International Energy Agency (IEA) estimated the
share of carbon free renewable energies on the total primary energy mix in 2011 to be about 3%
only11.
To address the core of the energy problem, an alternative and carbon free chemical fuel has to
be found, which can be stored, transported and converted into heat, motion or electricity on a
large scale and thus replace fossil fuels. It is not surprising, also in consideration of the topic of
this thesis, that the top candidate is molecular hydrogen (H2). This idea is not new. Already in
1874, Jules Verne thought about a society based on “the elements of water, hydrogen and
oxygen”12. In fact, hydrogen brings all qualities to build a whole economy on it. It is one of the
most abundant elements on earth and readily available in form of water. Due to its low molecular
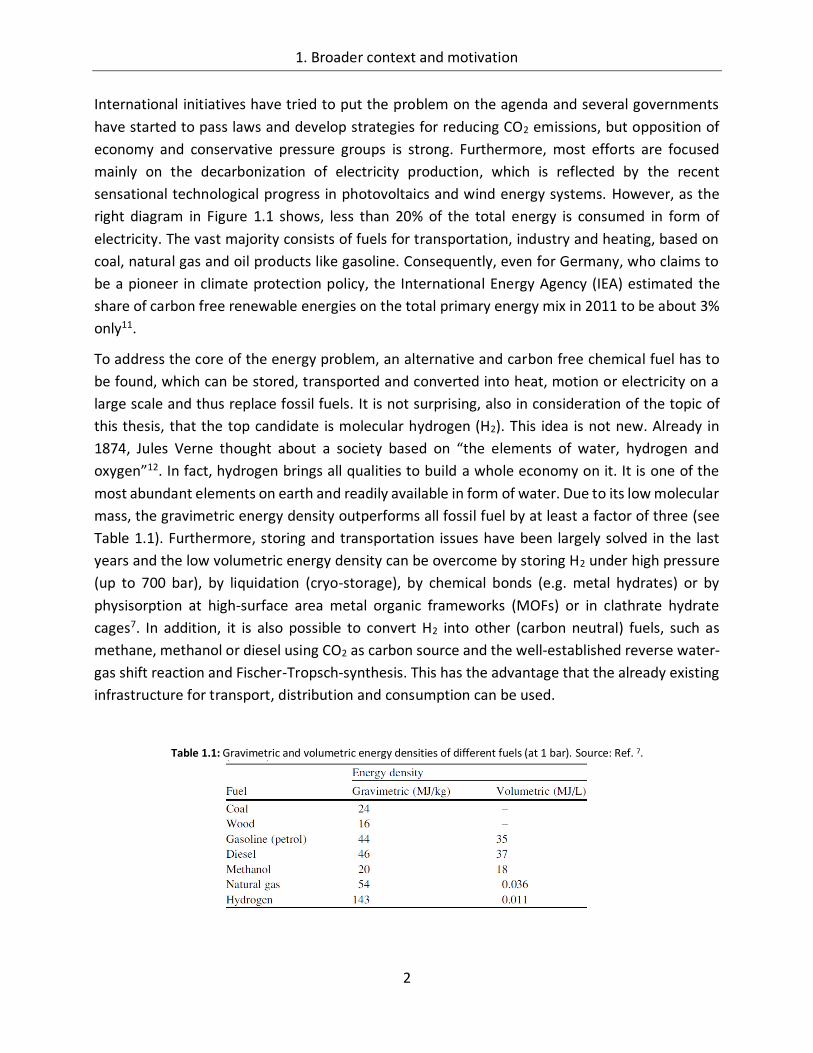
mass, the gravimetric energy density outperforms all fossil fuel by at least a factor of three (see
Table 1.1). Furthermore, storing and transportation issues have been largely solved in the last
years and the low volumetric energy density can be overcome by storing H2 under high pressure
(up to 700 bar), by liquidation (cryo-storage), by chemical bonds (e.g. metal hydrates) or by
physisorption at high-surface area metal organic frameworks (MOFs) or in clathrate hydrate
cages7. In addition, it is also possible to convert H2 into other (carbon neutral) fuels, such as
methane, methanol or diesel using CO2 as carbon source and the well-established reverse water-
gas shift reaction and Fischer-Tropsch-synthesis. This has the advantage that the already existing
infrastructure for transport, distribution and consumption can be used.
Table 1.1: Gravimetric and volumetric energy densities of different fuels (at 1 bar). Source: Ref. 7.
1. Broader context and motivation
3
Even though H2 seems to be the ideal fuel for a sustainable energy supply in the future, there is
still a fundamental problem to be solved. H2 does not appear on earth in its molecular form, it has
to be extracted from compounds. Today, most hydrogen is produced by steam reforming from
natural gas. While this procedure is the most economic one, it does not solve the CO2 problem as
large amounts of CO2 are emitted during the process.
The second main possibility to generate hydrogen is the electrolysis of water13 according to the
reaction:
2 H2O ↔ 2 H2 + O2 ΔG = 237 kJ/mol at RT (1)
Only if the necessary energy comes from renewable energy sources without emission of CO2, the
electrochemical production of H2 makes sense. Attempts have been made to use electricity from
PV or wind power for electrolysis (“power-to-gas”), but up to now this procedure is too expensive
to be competitive.
Another approach is the use of solar radiation energy to directly split water and generate
hydrogen in a photoelectrochemical cell (PEC)7,14. Among others, the so called “artificial leaf”15
represents a possible design for such a photoelectrochemical device. It consists of one or more
PV cells to provide the necessary current and voltage and a set of directly attached electrodes,
where well suited catalysts optimize the electrochemical reaction. In contrast to commercial
electrolyzers, the current densities at such a device would be in the order of ≥10 mA/cm2 (≥ 10%
efficiency of PV * 100 mW/cm2 radiation power), which is a relatively low value, increasing the
needed photoactive area. If one considers the current energy demand of 500 EJ/a an area of at
least 240 000 km2 is needed to be covered with PECs (considering 10 hours of direct sunlight per
day, which is even for deserts a rather optimistic supposition). By 2050, the necessary photoactive
area is expected to increase to a size of more than 500 000 km2. This seems to be far beyond any
realistic feasibility, but on the other hand it is less than 3.5% of the world’s desert area. Still, the
challenge is enormous and there is no alternative to a significant reduction of mankind’s energy
demand to meet the climate goals.
A key issue for developing efficient PECs is the reduction of energy losses at the anode side of the
system, where O2 is released. The so-called oxygen evolution reaction (OER) involves the transfer
of four electrons to produce one O2 molecule, which leads to significant overpotentials to be
applied for achieving acceptable reaction rates. Today, the most efficient OER catalysts are RuO2
and IrO2, which both contain expensive and rare elements. A coating of all the photoactive area
mentioned above with only 100 nm of catalyst would result in the need of over 500 tons of Ir or
260 tons of Ru by 2050. With a current price of 17 600 (Ir)16 and 1 500 €/kg (Ru)17, respectively,
neither of these oxides is applicable for large scales.
1. Broader context and motivation
4
Cobalt and manganese oxides represent two possible alternatives to noble metal oxides. They are
up to four orders of magnitude cheaper (Co: 26.4 €/kg18, Mn: 2 €/kg19), abundant and relatively
easy accessible. But although their high catalytic activity is known for many years, several
questions about the catalytic mechanism are still open.
In this work, cobalt and manganese oxide thin films were synthesized and characterized as
alternative catalysts with a possible application in photoelectrochemical devices with “artificial
leaf” design in superstrate configuration20. The synthesis method of choice was electrochemical
deposition, because it allows in principle to deposit the desired catalyst directly onto the back
contact of the solar cells and is an easy and reliable method, which does not necessarily need the
application of elevated temperatures.
The main focus of the thesis was to understand the relations between composition, crystallinity,
film thickness, surface state and OER activity, respectively. The major part of the experiments was
carried out on amorphous cobalt oxide which was studied intensively using electrochemical
methods to understand its working principles.
In the second part, also spectroscopic analysis methods were applied. By using in-line synchrotron
photoelectron spectroscopy (SXPS) the composition and oxidation states of the surface of cobalt
and manganese oxide, respectively, were investigated in dependence of the applied anodic
potentials and commonalities as well as differences have been evaluated. Furthermore, in-situ
UV/Vis measurements gave direct insights into potential dependent transitions during and after
potential cycling in the anodic regime.
5
2. Theoretical background
2.1. Electrochemical basics
In this chapter the electrochemical background is briefly reviewed regarding electrochemical
water splitting and the oxygen evolution reaction. Much more detailed information can be found
in standard textbooks21–23.
When Alessandro Volta published his invention of the “electric pile” (the first battery) in 1800,
the impact on the scientific community was tremendous. For the first time a steady DC current of
tunable magnitude could be produced and the scientific field of electrochemistry was born.
Despite Volta did not understand the chemistry behind his invention, it pioneered the
development for Ohm’s and Faraday’s laws, the discovery of the relationship between electricity
and magnetism and much more24. While trying to reproduce the “electric pile” W. Nicholson and
A. Carlisle observed the electrochemical splitting of water into hydrogen and oxygen, finding
immediately a first application of Volta’s achievement. However, already in 1789 two Dutchmen,
A. Paets van Troostwijk and J. R. Deiman, were the first to discovered that upon electric discharge
water could be decomposed into “combustible air” and “life-giving air” 25–27. With the
development of the first fuel cell28 in 1838 by W. R. Grove and C. F. Schönbein, respectively, the
energetic cycle was closed and hydrogen as energy carrier started to attract attention.
Energetics
Water splitting is an uphill reaction, which means that it will not occur spontaneously and one has
to introduce energy into the system separate water into its elements. This can be done e.g.
thermally (thermolysis) or by using electric power (electrolysis).
An electrochemical cell for water electrolysis consists of two electrodes immersed into an
aqueous electrolyte. If one applies a potential difference between the two electrodes, which is
high enough to overcome the decomposition voltage Ed and all kinetic barriers, oxygen will be
evolved at the anode, while hydrogen will be produced at the cathode according to:
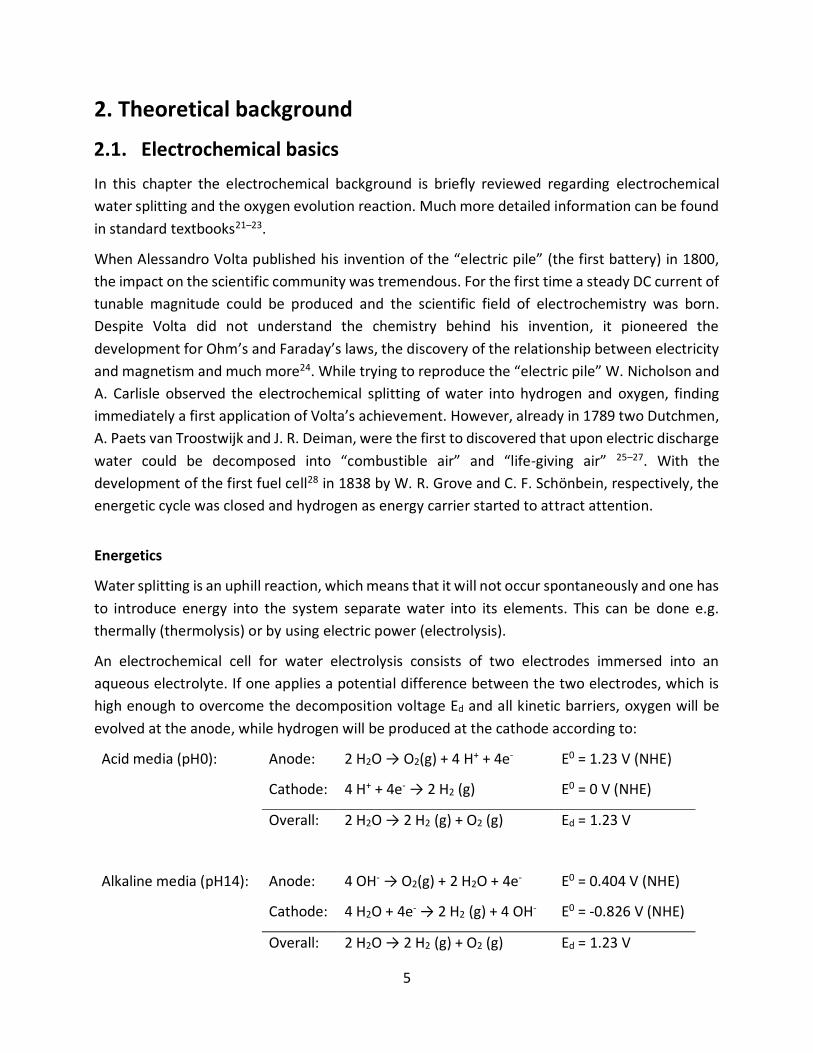
Acid media (pH0): Anode: 2 H2O → O2(g) + 4 H+ + 4e- E0 = 1.23 V (NHE)
Cathode: 4 H+ + 4e- → 2 H2 (g) E0 = 0 V (NHE)
Overall: 2 H2O → 2 H2 (g) + O2 (g) Ed = 1.23 V
Alkaline media (pH14): Anode: 4 OH- → O2(g) + 2 H2O + 4e- E0 = 0.404 V (NHE)
Cathode: 4 H2O + 4e- → 2 H2 (g) + 4 OH- E0 = -0.826 V (NHE)
Overall: 2 H2O → 2 H2 (g) + O2 (g) Ed = 1.23 V
2. Theoretical background
6
The different anodic and cathodic reactions for acid and alkaline media come from the radically
different concentrations (and activities) of H+ and OH- ions by a factor of 1014 for pH0 and pH14,
respectively. At neutral pH7, both pathways can be expected to occur simultaneously but due to
the dissociation constant of water ([H+] * [OH-] = 10-14), the overall concentration of reaction
educts is seven orders of magnitude smaller than in strong acid or alkaline media. This is one of
the reasons, why electrolysis runs best in acid or basic solutions. Furthermore, in neutral
electrolytes the pH value has to be stabilized by a buffering agent to prevent local pH shifts close
to the electrodes (see reaction equations).
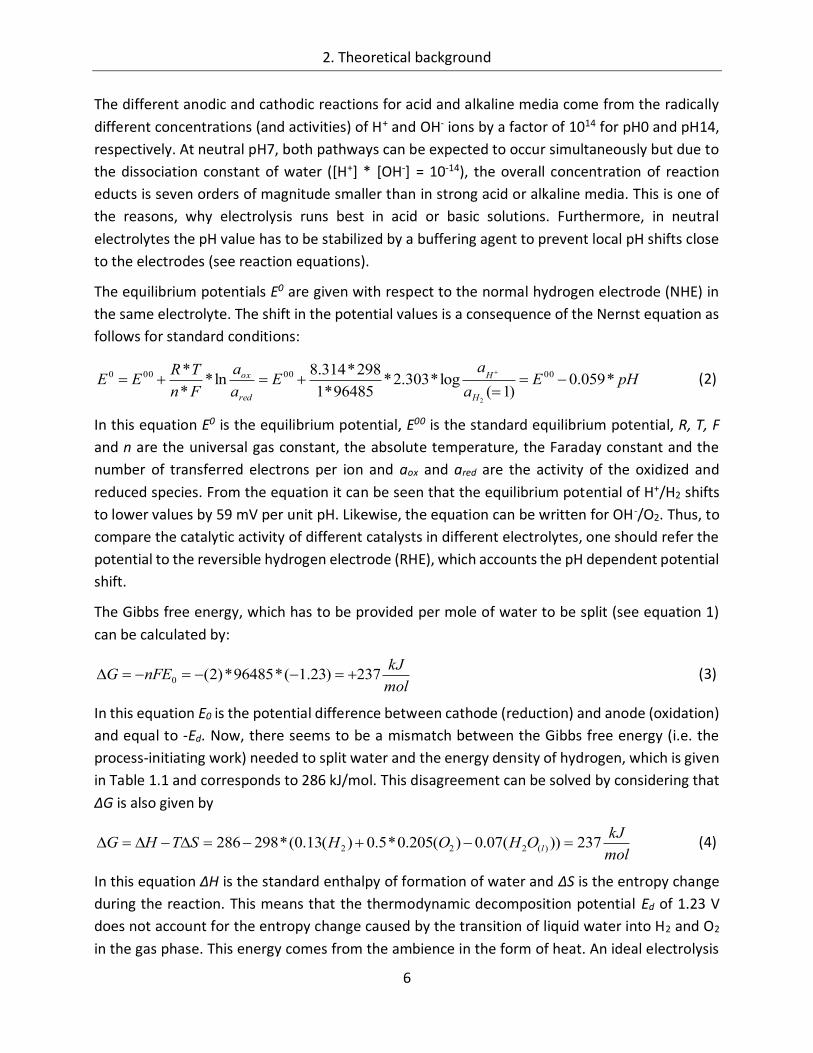
The equilibrium potentials E0 are given with respect to the normal hydrogen electrode (NHE) in
the same electrolyte. The shift in the potential values is a consequence of the Nernst equation as
follows for standard conditions:
pHEa
aE
a
a
Fn
TREE
H
H
red
ox *059.0)1(
log*303.2*96485*1
298*314.8ln*
*
* 0000000
2
(2)
In this equation E0 is the equilibrium potential, E00 is the standard equilibrium potential, R, T, F
and n are the universal gas constant, the absolute temperature, the Faraday constant and the
number of transferred electrons per ion and aox and ared are the activity of the oxidized and
reduced species. From the equation it can be seen that the equilibrium potential of H+/H2 shifts
to lower values by 59 mV per unit pH. Likewise, the equation can be written for OH-/O2. Thus, to
compare the catalytic activity of different catalysts in different electrolytes, one should refer the
potential to the reversible hydrogen electrode (RHE), which accounts the pH dependent potential
shift.
The Gibbs free energy, which has to be provided per mole of water to be split (see equation 1)
can be calculated by:
mol
kJnFEG 237)23.1(*96485*)2(0 (3)
In this equation E0 is the potential difference between cathode (reduction) and anode (oxidation)
and equal to -Ed. Now, there seems to be a mismatch between the Gibbs free energy (i.e. the
process-initiating work) needed to split water and the energy density of hydrogen, which is given
in Table 1.1 and corresponds to 286 kJ/mol. This disagreement can be solved by considering that
ΔG is also given by
mol
kJOHOHSTHG l 237))(07.0)(205.0*5.0)(13.0(*298286 )(222 (4)
In this equation ΔH is the standard enthalpy of formation of water and ΔS is the entropy change
during the reaction. This means that the thermodynamic decomposition potential Ed of 1.23 V
does not account for the entropy change caused by the transition of liquid water into H2 and O2
in the gas phase. This energy comes from the ambience in the form of heat. An ideal electrolysis
2. Theoretical background
7
cell, which runs at 1.23 V would cool down very fast and the reaction would stop. If one takes the
entropy change into account the so called thermoneutral potential of 1.48 V has to be taken to
split water into its elements. However, in a photoelectrochemical cell more than enough heat is
provided by the sun, which can be used by the system, such that for practical use, Ed is the
potential of reference. Nevertheless, the thermoneutral potential is often taken for calculating
solar to hydrogen efficiencies as it leads to higher numbers.
Overpotential
To run an electrochemical reaction into any direction, the equilibrium potential E0 has to be left.
If we consider our water splitting reaction, one can think of an electrochemical cell with two
electrodes, on which H2 and O2 gas are bubbled through the aqueous electrolyte, respectively. If
one connects an electric load in between the electrodes, current will flow from the hydrogen side
to the oxygen side and the equilibrium potential will decrease (this is the case for a fuel cell). But
if one applies an external potential sufficiently higher than the equilibrium potential, current will
flow from the oxygen side to the hydrogen side and water from the electrolyte will be
decomposed into H2 and O2 (electrolysis). Deviation from E0 to either side is called overpotential
η. So, on one hand η is required for electrochemical reactions to occur in the first place, on the
other hand it always represents energy loss, as it diminishes the energy output of a fuel cell and
it increases the energy input for an electrolysis system.
The relation of overpotential η to current density j for an ideal electrochemical cell under standard
conditions is given by the Butler-Volmer equation:
*)*
*
**)1(()*
*
**(
0
TR
Fn
TR
Fn
CA eejjjj
(5)
Here, jA and jC are the anodic and the cathodic current density, j0 is the exchange current density,
α is the charge transfer coefficient and n, F, R and T are the number of electrons involved in the
electrochemical reaction, the Faraday constant, the universal gas constant and the absolute
temperature, respectively. Thus, the current density is always a mixture between anodic and
cathodic reaction currents. However, for a high anodic overpotential the cathodic term becomes
negligible and vice versa. The charge transfer coefficient α is a measure for the effect of anodic
potential change on the activation energy of the reaction. Anodic reactions are most effective if
α is close to 1, cathodic reactions run fastest if α is close to 0. In experiments α values around 0.5
are frequently found.
For overpotentials above ca. 25 mV one can plot the logarithm of the current density versus the
overpotential according to the equation (anodic case):
*1
lg***3.2
**lglg 00
Bj
TR
Fnjj (6)
2. Theoretical background
8
From the linear extrapolation of the curve one can calculate j0 and B (i.e. the Tafel slope, which is
the increase in η per decade of j). Exchange current density and Tafel slope are the two most
important kinetic parameters for characterizing the activity of a catalyst.
The overpotential is composed of three portions. (I) The electron transfer overpotential is related
to the actual electrochemical reaction. It depends on the kind of reaction, activation energies and
number of transferred electrons. (II) The diffusion overpotential is caused by an insufficiently fast
supply of educts (e.g. OH-) to or removal of products (e.g. O2) from the electrode. The formation
of gas bubbles at the surface of the electrode, “blocking” some of the active area is a special case
of diffusion overpotentials. This phenomenon usually occurs at high current densities, when the
reaction rates are very fast. (III) Reaction overpotentials are associated with slow chemical
reactions before or after the charge transfer reaction. This can be e.g. adsorption or desorption
processes.
As will be discussed in the next chapter, the overpotentials required for the OER to run at
satisfying rates are rather large. Big commercial electrolyzers face that problem with harsh
reaction conditions (120°C, 40 wt.% KOH, 30-50 bar)29 to improve kinetics, but for
photoelectrochemical devices (PEC) this is not possible. Understanding, development,
optimization and application of materials catalyzing the OER are therefore indispensable.
2. Theoretical background
9
2.2. The oxygen evolution reaction (OER)
In this chapter, the oxygen evolution reaction will be discussed briefly and the relevant issues will
be addresses. For more in-depth information about the chemistry and catalysis of this very
important reaction the interested reader is referred to more comprehensive reviews published
elsewhere30–32.
The oxygen evolution reaction from water is one of the most fundamental reactions in nature.
With the process of photosynthesis, green plants, algae and cyanobacteria use solar radiation to
form hydrocarbons from CO2 and water. As a side product O2 is released to the ambience and
basically all O2 in the current atmosphere comes from this process. The OER takes place in
photosystem II (PSII), which is a large protein complex with a catalytic center consisting of a
Mn3CaO4 cluster linked to a fourth Mn by a mono-µ-oxo bridge33. Energetically, water oxidation
occurs via a complex cascade reaction and is incredibly efficient. Generations of scientists have
worked on the elucidation of the reaction mechanism and today it is one of the best studied
chemical reactions34–36.
However, the transfer of the principles of the biological OER in PSII to an electrochemical cell with
inorganic catalysts is not trivial. Despite intensive research for several decades, a catalyst
material, which allows electrochemical water oxidation at overpotentials well below 300 mV has
not been found yet.
2.2.1. Theoretical considerations
The release of one O2 molecule from two molecules of water requires the transfer of four
electrons from the electrolyte (i.e. OH- in the alkaline and H2O in the acidic case, respectively) to
the anode. It is very unlikely that all four electrons can be transferred simultaneously and
experimental results as well as theoretical calculations strongly suggest that the OER occurs in at
least four steps, transferring one electron at a time. If so, the formation of transition states is
unavoidable and represents the key factor in understanding and optimizing catalysts. Several
reaction pathways have been proposed based on kinetic experimental data30 (Tafel slope, j0,
reaction order etc.) and, more recently, also relying upon density functional theory (DFT)
calculations37–39 and advanced in-situ techniques40. However, since transition states usually have
rather short life times and are hard or impossible to detect spectroscopically, it was tried to find
universal descriptors expressing the catalytic activity of different materials. In an early attempt
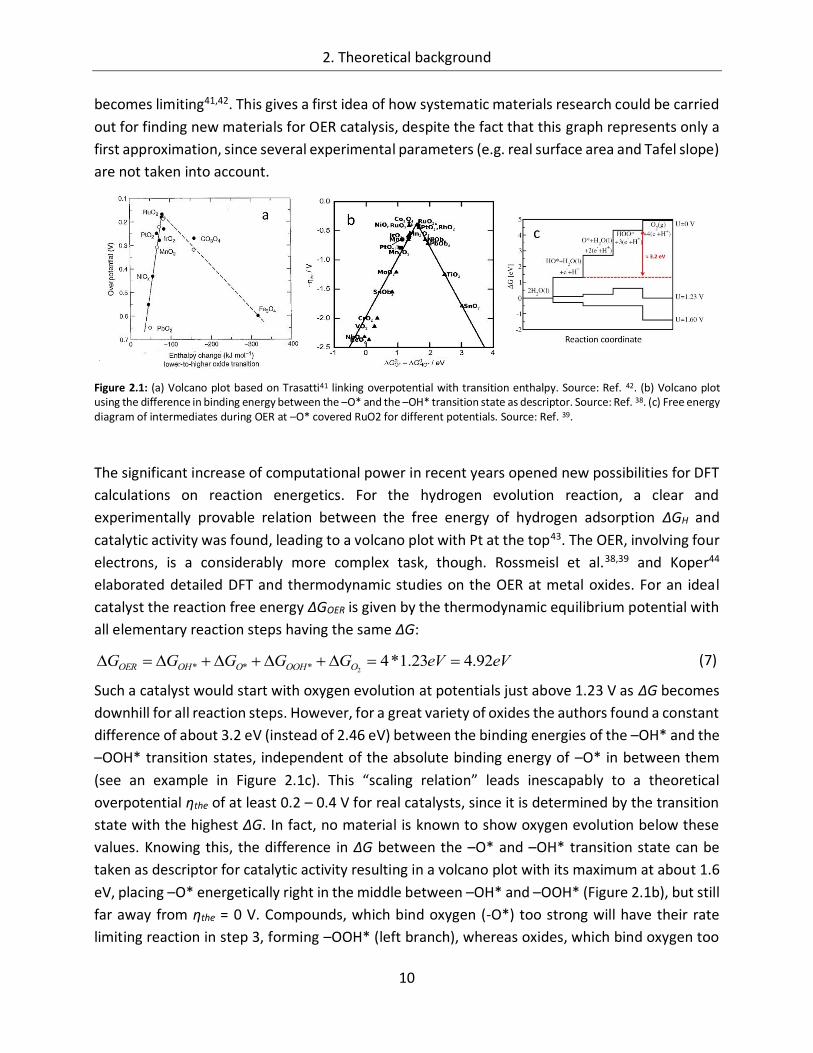
Trasatti41 plotted the experimentally determined overpotential versus the enthalpy of transition
of the oxide from a lower to a higher oxidation state. A volcano shaped relation was found.
Compounds, which form very stable higher oxides will bind the transition state too strong, such
that the release of O2 becomes the rate determining step (left branch). On the other hand, if the
transition enthalpy is too large, intermediate states will not be stabilized and water discharge
2. Theoretical background
10
becomes limiting41,42. This gives a first idea of how systematic materials research could be carried
out for finding new materials for OER catalysis, despite the fact that this graph represents only a
first approximation, since several experimental parameters (e.g. real surface area and Tafel slope)
are not taken into account.
Figure 2.1: (a) Volcano plot based on Trasatti41 linking overpotential with transition enthalpy. Source: Ref. 42. (b) Volcano plot using the difference in binding energy between the –O* and the –OH* transition state as descriptor. Source: Ref. 38. (c) Free energy diagram of intermediates during OER at –O* covered RuO2 for different potentials. Source: Ref. 39.
The significant increase of computational power in recent years opened new possibilities for DFT
calculations on reaction energetics. For the hydrogen evolution reaction, a clear and
experimentally provable relation between the free energy of hydrogen adsorption ΔGH and
catalytic activity was found, leading to a volcano plot with Pt at the top43. The OER, involving four
electrons, is a considerably more complex task, though. Rossmeisl et al.38,39 and Koper44
elaborated detailed DFT and thermodynamic studies on the OER at metal oxides. For an ideal
catalyst the reaction free energy ΔGOER is given by the thermodynamic equilibrium potential with
all elementary reaction steps having the same ΔG:
(7)
Such a catalyst would start with oxygen evolution at potentials just above 1.23 V as ΔG becomes
downhill for all reaction steps. However, for a great variety of oxides the authors found a constant
difference of about 3.2 eV (instead of 2.46 eV) between the binding energies of the –OH* and the
–OOH* transition states, independent of the absolute binding energy of –O* in between them
(see an example in Figure 2.1c). This “scaling relation” leads inescapably to a theoretical
overpotential ηthe of at least 0.2 – 0.4 V for real catalysts, since it is determined by the transition
state with the highest ΔG. In fact, no material is known to show oxygen evolution below these
values. Knowing this, the difference in ΔG between the –O* and –OH* transition state can be
taken as descriptor for catalytic activity resulting in a volcano plot with its maximum at about 1.6
eV, placing –O* energetically right in the middle between –OH* and –OOH* (Figure 2.1b), but still
far away from ηthe = 0 V. Compounds, which bind oxygen (-O*) too strong will have their rate
limiting reaction in step 3, forming –OOH* (left branch), whereas oxides, which bind oxygen too
eVeVGGGGG OOOHOOHOER 92.423.1*42***
2. Theoretical background
11
weakly, have their bottleneck in the formation of –O* (right branch) in step 2. Manganese oxide
is found on the strong binding leg of the volcano plot, while new results placed cobalt oxide on
the weak binding site of the graph37. For significant improvements in OER catalysis this “scaling
relation” has to be overcome. A first effort has been published recently45, where RuO2 has been
modified with Ni and Co.
2.2.2. Catalysts for the oxygen evolution reaction
In contrast to the hydrogen evolution reaction, the OER occurs at potentials where basically all
metals are covered with a thin oxide film and thus the metal oxide is the active phase41,44,46. This
is the reason why e.g. Pt is not a very good OER catalyst even though for the oxygen reduction
reaction it is one of the most active materials. Transition metals are able to readily change their
oxidation state, which is a fundamental property for electrocatalysis, since it always includes
electron transfer from one species to another and charge balance has to be maintained.
Therefore OER catalysts are usually based transition metal oxides. IrO2 and RuO2 have shown the
highest catalytic activity towards OER and especially RuO2 is very well characterized30. However,
both compound consist of very expensive and rare noble metals and are no option for the use in
a large scale application. For classical alkaline electrolysis therefore, steel, Ni or Ni-Co-spinels are
used as anodes and harsh reaction conditions are applied to improve kinetics.
Even though catalysis of OER is one of the bottlenecks for developing photoelectrochemical cells
for solar water splitting, no standards for experimental work, as it is e.g. the case for
photovoltaics, have been established yet. Recently, there has been some effort to introduce a
standard protocol for characterizing HER and OER catalysts for PECs1,47, but still a wide variety of
electrochemical setup parameters and benchmarking characteristics are reported. For instance,
several definitions of turnover frequencies (TOF) are used for the description of a catalysts’
activity. This can defined e.g. as O2 molecules per second and active surface site, per total amount
of catalyst atom47, per gram of catalyst, per surface area unit, per nanocluster48 or also possible
per € of catalyst material. Moreover, the overpotential at which the TOF is measured frequently
varies between different studies, which makes comparison of experimental results challenging.
Furthermore, a crucial parameter, the real surface area, is not easily accessible and no standard
method is available to estimate the roughness of a catalyst. Comparison of the apparent current
density may be interesting considering the application of a catalyst in a device, but for
fundamental research the real current density, which represents the intrinsic activity is of greater
importance. This becomes striking if one takes into account that the preparation parameters can
significantly alter the apparent catalytic activity by e.g. increasing the surface area and/or
porosity, preferring a certain surface modification or improving the contact to the substrate. An
example can be given regarding Ni-Co-oxide, which frequently is described as more active than
cobalt oxide and nickel oxide. A systematic study by Trotochaud et. al49 however, showed that
2. Theoretical background
12
the intrinsic catalytic activity is related to the Ni portion in the compound and the increased
apparent activity most probably related an increased surface area.
In recent years a growing interest in cheap and abundant alternatives for RuO2 and IrO2 emerged
for the application in PECs. The most studied compounds are based on cobalt oxide, manganese
oxide and nickel oxide, but especially iron-nickel-oxide appeared as very highly active towards the
OER49,50. Furthermore, mild synthesis routes51 have been investigated, which is of particular
importance, if the catalyst should be deposited on possibly rather sensitive photoabsorbers or PV
devices.
2.2.3. Cobalt Oxide
Cobalt oxide is a typical first row transition metal oxide. Due to the ability of transition metals to
stabilize more than one oxidation state, several different types of cobalt oxides and cobalt
hydroxides are known. The thermodynamically stable form between room temperature and
900°C is spinel type Co3O452, but also the metastable rock salt CoO compound can be synthesized
relatively easy by annealing in reducing atmosphere53. Co3O4 contains mixed valences of cobalt
ions with Co3+ occupying half of the octahedral sites and Co2+ sitting in one eighth of the
tetrahedral sites of the cubic close-packed oxygen lattice54. The synthesis and/or characterization
of Co2O3 has also been reported sometimes, but Chuang et al.55 showed that nominal Co2O3
shows the same XPS features as Co3O4 and concluded that Co2O3 might not be available under
ambient conditions. Similar information are found elsewhere54. Likewise, the synthesis and
isolation of CoO2 has not been reported yet (to the best of the author’s knowledge).
Besides the oxides also different hydroxides such as Co(OH)2 and Co(OOH) are known. Benson et
al.56 identified in an early work already three different types of cobalt oxyhydroxides. The
complexity of the cobalt oxygen system has later be confirmed by potential cycling experiments
of Co metal in alkaline solutions, showing several transitions within the anodic potential regime
below the onset of the oxygen evolution reaction57,58.
Cobalt oxide, cobalt hydroxide and mixed compounds containing cobalt and oxygen are typically
used as electrochemical supercapacitors59, for electrochromic devices60, in energy storage
systems such as Li-ion batteries61, as gas sensors62 and for heterogeneous catalysis32.
The electrocatalytic activity of cobalt oxide has been known for many decades. Already in 1950
electrochemical experiments on the oxidation of cobalt metal in alkaline solution have been
carried out63 and showed oxygen evolution. Hundreds of papers have been published over the
years reporting the synthesis and electrochemical characterization of active cobalt oxides and
mixed compounds containing Ni, Cu, Li, La and others64–70 to name just a few. The preparation
methods used for fabrication of the OER electrodes were predominantly thermal decomposition
2. Theoretical background
13
of usually Co(NO3)264,71–73, but also sol-gel routes66,68,74–77, spray pyrolysis65,78,79, wet chemical49
and electrodeposition80–83.
With the growing interest in photoelectrochemical application of OER catalysts, mild synthesis
methods, eliminating the need for elevated temperatures became very interesting. In 2008 Kanan
and Nocera84 could synthesize an amorphous, highly active catalyst by simple electrochemical
deposition from a phosphate buffer solution. In numerous studies structure, composition and
working principles were investigated85–89 leading to a comprehensive picture of the catalyst
consisting of octahedrally coordinated Co3+ ions interconnected by di-oxo bridges85,90 and the Co4+
being produced during oxygen evolution88. This catalyst has successfully been applied in several
photoelectrochemical cells to reduce OER overpotentials91–93. Using the right scaffold for the
deposition of this catalyst, tremendous current densities have been achieved at rather low
overpotentials94.
With the new field of application in photoelectrochemical devices or for direct photocatalytic
water splitting95,96 the efforts to develop highly active OER catalysts has increased significantly
and new methods of synthesis51,97 and in-situ investigations40 allowed significant improvements
in activity and understanding of the OER on cobalt oxide based catalysts.
2.2.4. Manganese Oxide
The various available manganese oxides, who comprise e.g. MnO2, Mn3O4 and Mn2O3, are another
group of OER catalysts based transition metal oxides, which attracted much attention in recent
years. Their fundamental activity has been demonstrated very well by nature with the active
center of photosystem II (see above). Several groups have synthesized calcium manganese oxide
powders and thin films to mimic the catalytic center of PS II 98–100. However, it turned out that in
an inorganic approach manganese oxide without the presence of calcium in the investigated
compound are more active towards the OER 101–104,96, stable over a broad pH range105 and also
applicable as bifunctional catalyst for both OER and the oxygen reduction reaction (ORR)101,106.
Intensive structural studies and in-situ investigations have been carried out to elucidate the
working principles of manganese oxide catalysts, finding commonalities with the active center in
PSII103,107–109.
Especially the bixbyite structure of nanostructured α-Mn2O3, which is structurally distinguished by
regular and distorted [MnO6] octahedrons interlinked in a complex network110 as well as
nanostructured β-MnO2 have been described as being extraordinary active binary electrocatalysts
in the process of oxygen evolution101,102. Also in our working group some efforts on manganese
oxide and calcium manganese oxide have been done in the past and showed promising results
concerning activity and stability of thin film electrocatalysts100,111–114.

14
15
3. Experimental section
3.1. Sample preparation
Cobalt Oxide
Cobalt oxide (CoOx) catalyst thin films were prepared via electrochemical deposition following a
modified protocol of Casella and Di Fonzo83. In the standard procedure, 12 mM of CoCl2 * 6 H2O
(Merck, p. A.) and 12 mM of D-gluconic acid sodium salt (Merck, p. S.) as complexing agent were
dissolved in aqueous solution containing 1 M KOH. D-gluconic acid sodium salt is known to be a
very powerful chelating agent for masking metal ions in strongly alkaline solutions and usually
forms dimeric complexes115. The solution has a dark greenish color and is stable for about
12 hours, before Co(OH)2 slowly starts to precipitate as black powder. This precipitation reduces
the concentration of Co2+ ions and consequently deposition rates decrease with time. Therefore,
the deposition solution was freshly prepared for every series of samples.
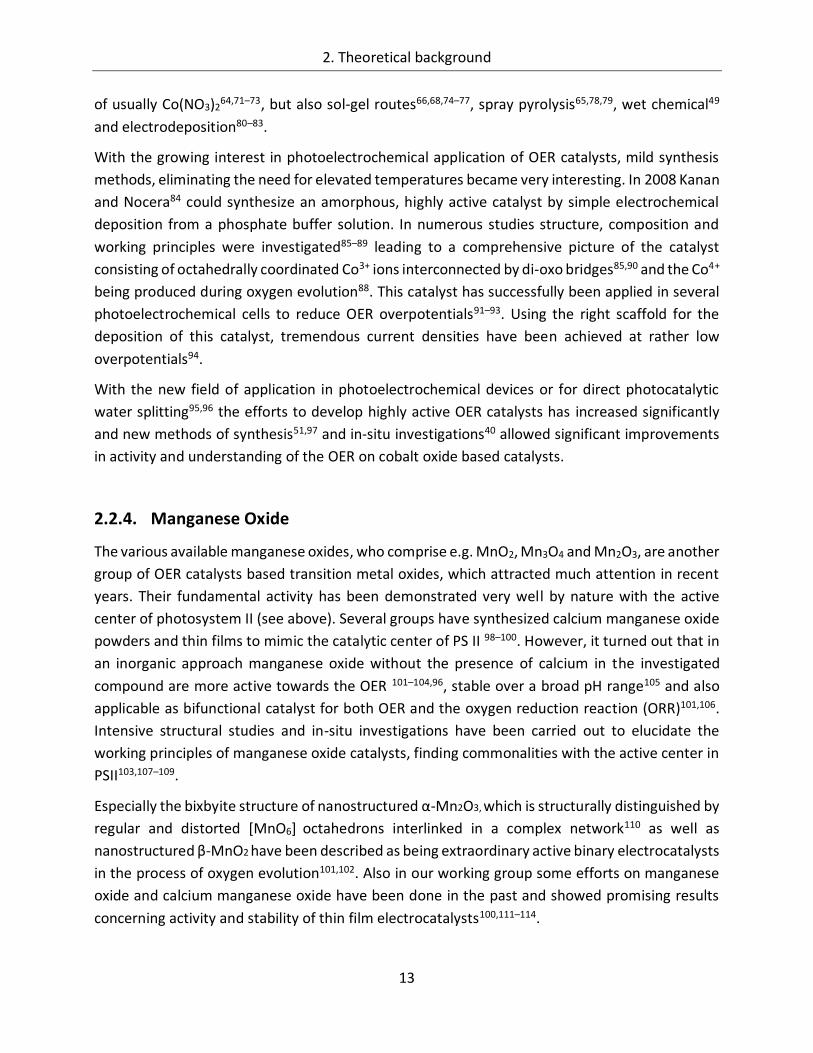
Figure 3.1: Electrochemical cell for sample preparation in operation mode (a) and working (sample) and counter (Pt) electrodes outside the cell (b). WE, CE and RE denote working, counter and reference electrode, respectively.
Electrochemical deposition was carried out in a self-designed three electrode electrochemical cell
(Figure 3.1) with the substrate as working, Pt foil as counter and a commercial Ag/AgCl reference
electrode (Radiometer Analytical, ER = 0.204 V vs. RHE). The standard substrate was FTO coated
glass (Pilkington), but also Au, Ti and Co foils (Goodfellow) were used. For the deposition
procedure a potentiostatic voltage of usually 1.4 V vs. RHE was applied between working and
reference electrode and the resulting deposition current was recorded by the potentiostat
(Versastat 3, Princeton Applied Research). After a defined deposition time or after a particular
charge (usually 1 C/cm2) has passed the electrochemical cell the deposition was stopped and a
homogeneous brownish film was obtained. During the deposition process the solution was
3. Experimental section
16
neither stirred nor bubbled with any gases. Before characterization, the samples were usually
dried in air at room temperature. Some samples were furthermore annealed in air at
temperatures up to 450°C after the deposition. Their color turned into black upon the heat
treatment to form spinel type crystalline Co3O4. Several of the deposition parameters were varied
to find the best preparation conditions. The results are given in chapter 4.1.1.
The following reaction equation has been proposed for the deposition of CoOx83:
eOHLOCoOHLCo 4862163 23
43222 (8)
Co2L22- denotes the dimeric complex formed between the Co2+ ions and the gluconate chelating
agent. It has been further suggested that the deposition of cobalt oxide onto the substrate might
occur in a multistep mechanism116, but the single steps have not been clarified in detail yet.
However, this equation has been used as basis for calculations of film thickness and amount of
deposited Co (see chapter 4.1.2.2).
Manganese Oxide
Manganese oxide films112 were deposited at pH 7 from a 1:1 mixture of two solutions containing
0.5 M MnSO4 (Merck, ACS standard) and 0.5 M Na2SO4 (Sigma Aldrich, 98%), respectively117.
Storing these solutions for long periods of time did not cause any observable changes. For the
electrochemical deposition, FTO/glass was again used as substrate, while a Pt-wire and a
commercial Hg/HgSO4 electrode (Radiometer Analytical, ER = 0.640 V vs. RHE) acted as counter
and reference electrode, respectively. During the deposition N2 was gently bubbled through the
solution. A constant current of 0.25 mA/cm2 was applied for 25 min in order to achieve a brown
homogeneous MnOx film, which was amorphous in its pristine state. After a heat treatment at
500°C for 1 hour in air, the amorphous film converted into crystalline α-Mn2O3, while annealing
at 600°C for 1 hour in N2-atmosphere resulted in the formation of the spinel-type Mn3O4 phase.
3. Experimental section
17
3.2. Analysis methods
3.2.1. Electrochemistry
Electrochemical measurements represent a major tool in this work to characterize the
synthesized catalysts. In this chapter, the applied electrochemical experiments and methods with
the relevant parameters are briefly described. A more detailed description of the techniques can
be found elsewhere22,118,119.
3.2.1.1. Cyclic voltammetry (CV)
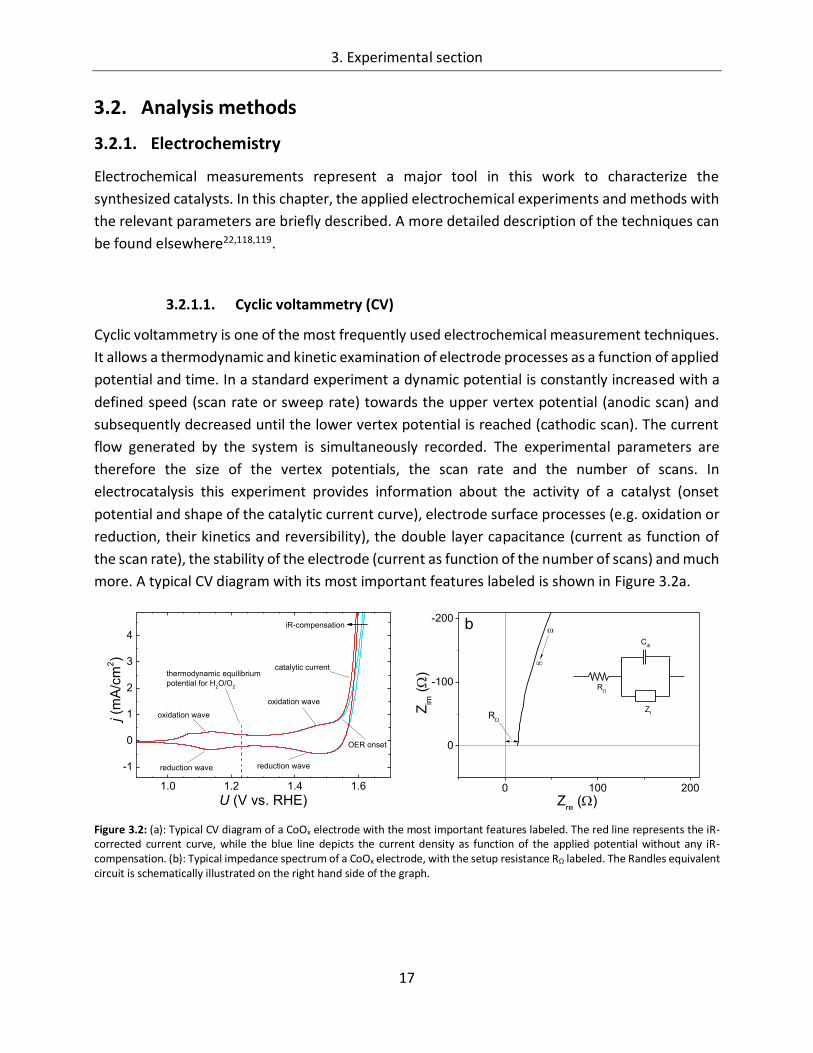
Cyclic voltammetry is one of the most frequently used electrochemical measurement techniques.
It allows a thermodynamic and kinetic examination of electrode processes as a function of applied
potential and time. In a standard experiment a dynamic potential is constantly increased with a
defined speed (scan rate or sweep rate) towards the upper vertex potential (anodic scan) and
subsequently decreased until the lower vertex potential is reached (cathodic scan). The current
flow generated by the system is simultaneously recorded. The experimental parameters are
therefore the size of the vertex potentials, the scan rate and the number of scans. In
electrocatalysis this experiment provides information about the activity of a catalyst (onset
potential and shape of the catalytic current curve), electrode surface processes (e.g. oxidation or
reduction, their kinetics and reversibility), the double layer capacitance (current as function of
the scan rate), the stability of the electrode (current as function of the number of scans) and much
more. A typical CV diagram with its most important features labeled is shown in Figure 3.2a.
Figure 3.2: (a): Typical CV diagram of a CoOx electrode with the most important features labeled. The red line represents the iR-corrected current curve, while the blue line depicts the current density as function of the applied potential without any iR-compensation. (b): Typical impedance spectrum of a CoOx electrode, with the setup resistance RΩ labeled. The Randles equivalent circuit is schematically illustrated on the right hand side of the graph.
1.0 1.2 1.4 1.6
-1
0
1
2
3
4
OER onset
thermodynamic equilibrium
potential for H2O/O
2
reduction wave
oxidation wave
oxidation wave
iR-compensation
j (m
A/c
m2)
U (V vs. RHE)
catalytic current
reduction wave
0 100 200
0
-100
-200
R
Zim
(
)
Zre ()
R
Zf
Cdl
b
3. Experimental section
18
iR- compensation
A very important issue for the characterization of electrocatalysts is the so called compensation
for the iR-drop. The iR-drop is a potential decrease caused by ohmic resistance within the
electrochemical cell (wires, substrate, electrolyte etc.), which leads to the fact that the potential
at the electrode/electrolyte interface is smaller than the applied potential from the potentiostat
and consequently the current response does not correspond exactly to the applied potential. In
order to make the results of an electrochemical measurement independent of the measurement
setup and thus comparable to other results, one should try to eliminate this iR-drop.
The potential drop ΔU can be determined by the following equation:
ΔU = Uapplied – Ureal = i*RΩ (9)
In this equation, Uapplied (V) is the potential applied to the setup by the potentiostat, Ureal (V) is the
actual potential at the sample surface, i (A) is the absolute current at Uapplied and RΩ (Ω) is the
setup resistance. It becomes obvious from the equation that ΔU is directly proportional to the
absolute current i, which is also assigned in Figure 3.1a.
The setup resistance RΩ should be minimized, e.g. by using very conductive substrates and/or by
placing the reference electrode very close to the sample surface. The magnitude of RΩ can be
estimated by impedance spectroscopy. Figure 3.1b shows the high frequency end of a typical
impedance spectrum of a CoOx electrode and the so called Randles equivalent circuit, which
represents the electrochemical half-cell with the sample as working electrode. It consists of the
double layer capacitance Cdl and the general sample impedance Zf of the sample connected in
parallel and furthermore an ohmic series element, which represents the setup resistance RΩ. At
very high frequencies ω the resistance of Cdl becomes zero and the whole impedance signal can
be attributed to RΩ. Thus, the offset of the high frequency end of the impedance spectrum has
been taken for the iR-compensation. Typical values were in the range from 10 to 20 Ω.
Experimental
The CV measurements in this work were, if not mentioned otherwise, conducted in a self-
designed electrochemical cell in a three electrodes arrangement. The samples were mounted into
the cell and contacted as working electrode (WE) with a gold wire. After mounting the top of the
cell, only a defined spot of the film electrode with an area of 0.31 cm2 was in contact with the
electrolyte (measurement spot), which allows the precise calculation of the current density.
About 7 ml of electrolyte, usually 1 M KOH, were added to the cell. A platinum wire acted as
counter electrode (CE), while a commercial Ag/AgCl reference electrode (Radiometer Analytical,
ER = 0.204 V vs. RHE) was used as a point of reference (RE). Potential application with a scan rate
of usually 10 mV/s and current recording were carried out using a Versastat 3 potentiostat
(Princeton Applied Research). All potentials in this work are given with respect to the reversible
3. Experimental section
19
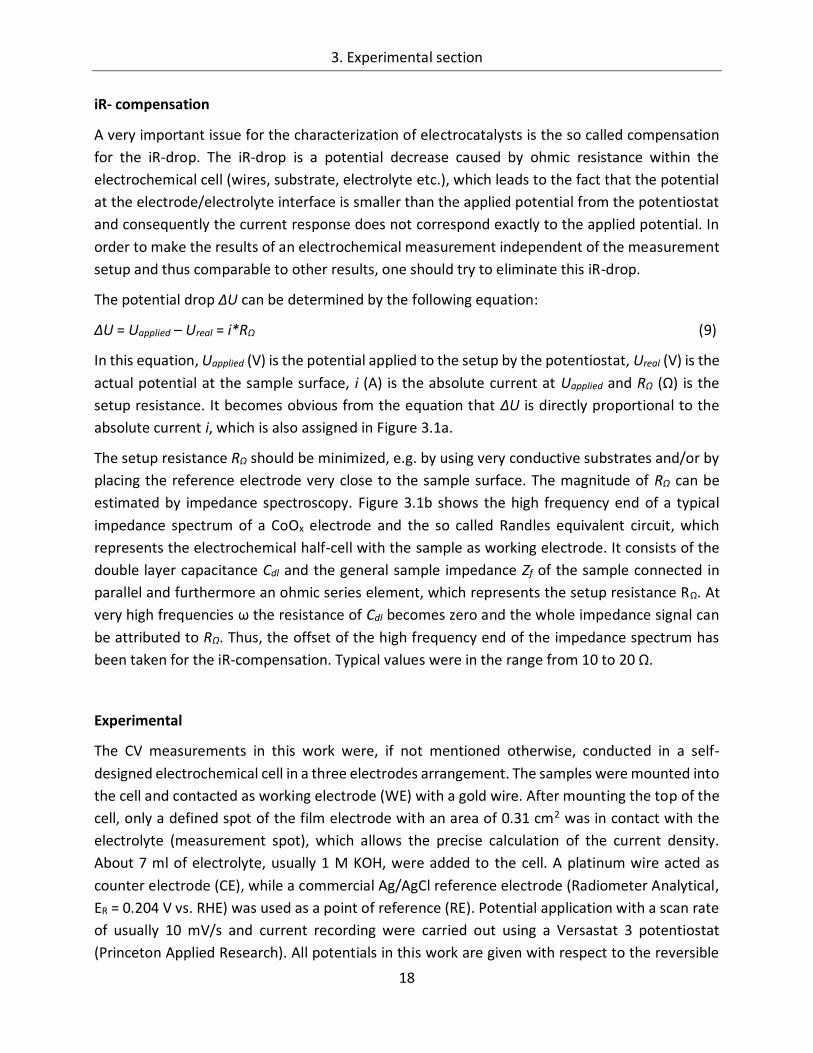
hydrogen electrode (RHE). Figure 3.3 shows two photographs of the unmounted (left) and the
mounted electrochemical cell (right), including the electrodes.
Figure 3.3: Photographs of the unmounted (left) and mounted electrochemical cell (right).
In addition to CV diagrams also potentiostatic and galvanostatic experiments were carried out.
For the former, a constant potential has been applied to the sample and the corresponding
current was recorded as a function of time. This experiment can be used, among others, to gain
information about the stability of the catalyst and for constructing Tafel plots (see 4.1.2.5). In the
latter experiments, a constant current density is set by the potentiostat and the potential
necessary to achieve this current density is recorded over time. These measurements are useful
for benchmarking and stability estimations as well.
3. Experimental section
20
3.2.1.2. Differential electrochemical mass spectroscopy (DEMS)
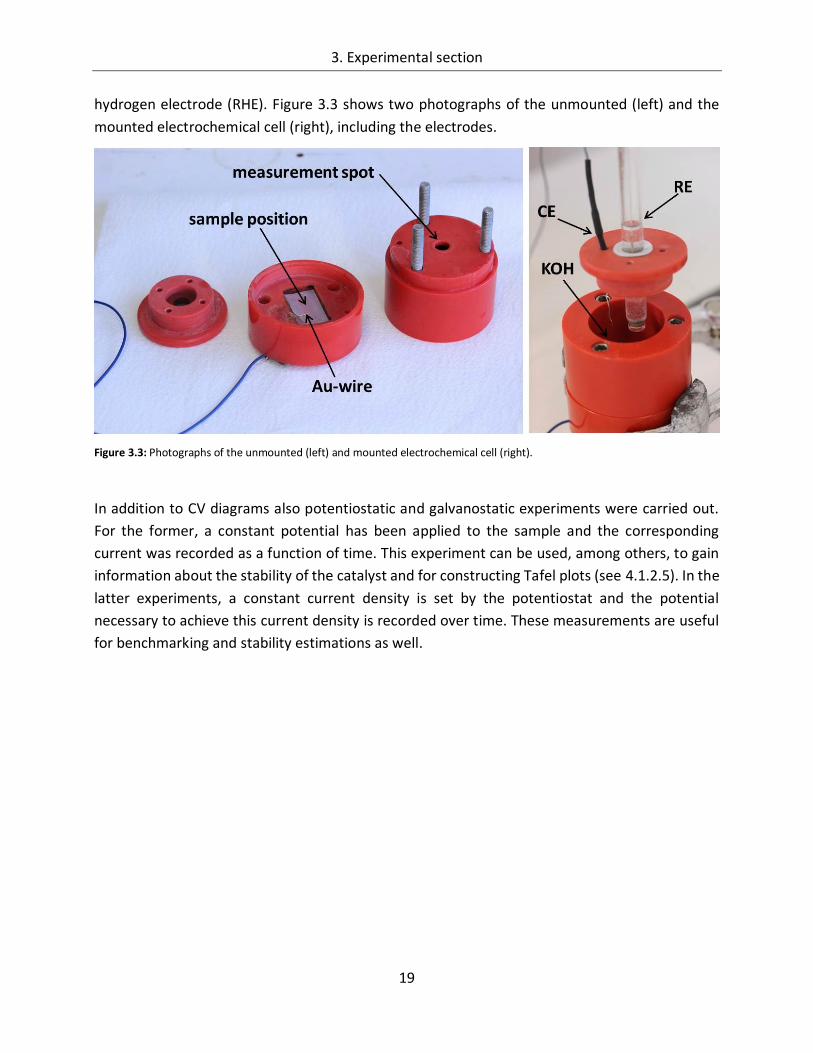
A very special version of CV measurements is known as differential electrochemical mass
spectroscopy (DEMS). The setup consists of an electrochemical cell (three electrode
configuration), which is connected to a mass spectrometer (Balzers; QMI 420, QME 125, QMA
125 with 90° off axis Secondary Electron Multiplier) over a gas permeable hydrophobic membrane
and allows in-situ detection of reaction products like O2, while the applied potential is
cycled120,121. In that way one can test if the exponential current increase after passing a certain
anodic potential (OER onset) actually leads to the production of O2 or if possible corrosion of the
catalyst takes place. A schematic illustration of the setup is given in Figure 3.4. The sample is
placed upside down onto the gas permeable membrane so that an electrolyte film of only a few
hundred µm remains in between the catalyst surface and the membrane. Gases, which are
produced at the surface of the sample, diffuse through the thin electrolyte film, cross to some
extend the membrane and can be detected by the mass spectrometer. To ensure that the gas
signal corresponds to the applied potential the scan rate of the CV measurements was set to
2 mV/s, to give the gas sufficient time to reach the mass spectrometer. Furthermore, the
electrochemical cell was purged with argon to get rid of any residual or dissolved gases in the
electrolyte.
Figure 3.4: Schematic illustration of a DEMS setup. The sample is turned upside down onto the gas permeable membrane where O2 can diffuse through it and be analyzed in the mass spectrometer. The diagram has been taken from Ref. 111.
3. Experimental section
21
3.2.2. Spectroscopic methods
3.2.2.1. In-line synchrotron X-ray photoelectron spectroscopy (SXPS)
Besides electrochemistry the second emphasis of this work lays on photoelectron spectroscopy
(XPS). A very comprehensive textbook about this technique can be found in Ref. 122, a more
compact, but well written overview of the principles and main applications is given by Ref. 123. A
short introduction into the topic will be given in this chapter.
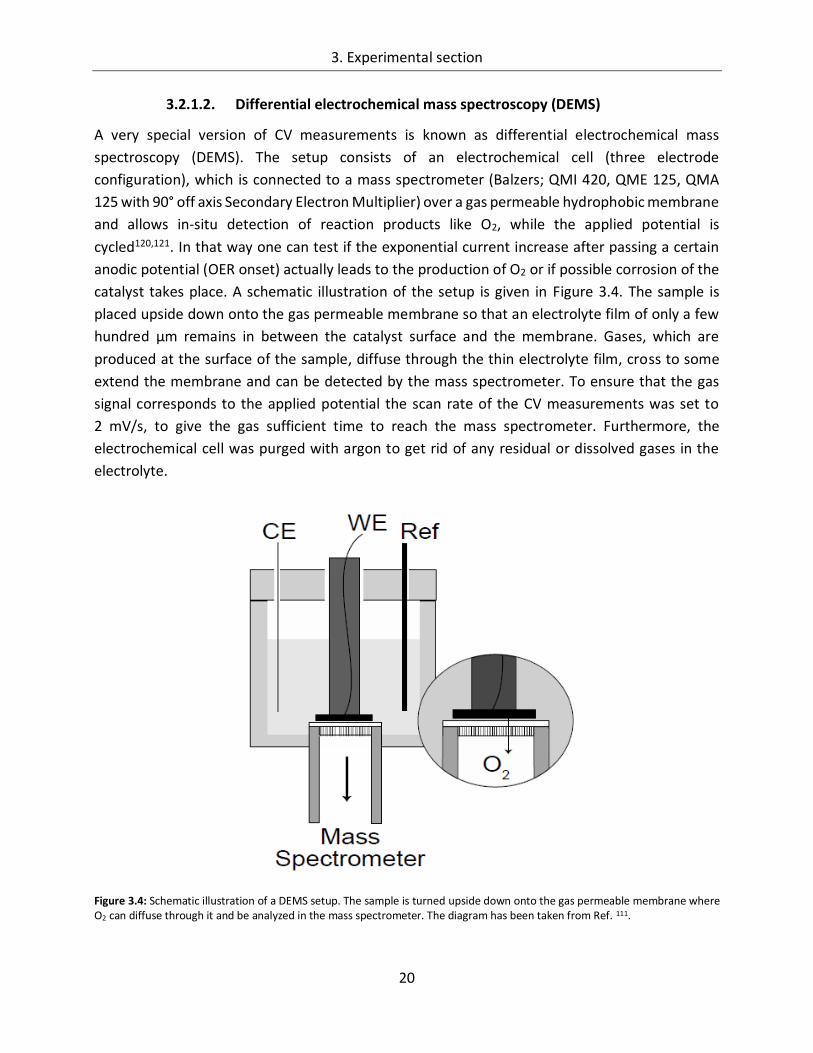
Photoelectron spectroscopy is based on the photoelectric effect, which was discovered by Albert
Einstein, who was rewarded for its correct explanation with the Nobel Prize in 1921. Briefly, an X-
ray photon of known energy hits the sample and interacts with a core electron of one of the
sample’s atoms or ions, which leads to the ejection of this now called photoelectron (see Figure
3.5a). The X-ray photon transfers its energy to the electron, which uses part of the photon energy
to overcome its specific binding energy and converts the rest into kinetic energy. One can write
this relation as:
SBEhKE (10)
where KE is the kinetic energy of the photoelectron, hν is the energy of the X-ray photon, BE is
the binding energy of the photoelectron and φS is the work function of the spectrometer, which
plays a role due to the electrical contact of the sample with the spectrometer and is usually
known. After the photoelectron ejection, the atom/ion is in the (n-1) state and has an electron
hole at its core shell. Accordingly, one electron of an outer shell will drop into that core hole
(Figure 3.5b) to minimize the energy of the system. The energy released by this relaxation process
is either emitted as X-ray photon (X-ray fluorescence) or transferred to another outer electron
leaving the atom/ion as Auger electron (Figure 3.5c). If the X-ray photon energy and the work
function of the spectrometer are known and the kinetic energy is measured by the spectrometer
one can easily calculate the binding energy of the photoelectron.
Figure 3.5: (a): An X-ray photon interacts with a core electron, transfers its energy and leads to the ejection of a photoelectron from the n-electron initial state. (b): The ion, now in the (n-1) state reorganizes its electrons to a lower energy state by dropping an electron from an outer shell into the vacant core hole. (c): The excess energy from the process in (b) is released from the ion either by X-ray photon emission (X-ray fluorescence) or by emission of an Auger electron from an outer shell. Source: Ref. 123
3. Experimental section
22
As every element contains a different number of protons in the atomic nucleus, the binding
energies of the inner electrons (core electrons) are very distinct for every element and can be
used for their identification. Moreover, not only the nature of the element, but also its oxidation
state and/or its binding properties can frequently be detected by analyzing the chemical shift to
higher or lower binding energies. Relaxation processes can influence the binding energy and
cause a shift as well, which is e.g. the case for cobalt. Usually, the binding energy increases with
oxidation state, but because of the higher relaxation energy of the (n-1) state of Co3+, its binding
energy shifts slightly to lower values compared to Co2+. Furthermore, some spectral features, like
shake-up satellites can appear (and be used for analysis), due to interactions of the
photoelectrons with the outer electron shell. Since the kinetic energy of all emitted electrons is
measured by the spectrometer, also Auger electrons are detected and produce peaks in the
spectrum. Their kinetic energy, however, is element specific and independent of the X-ray photon
energy. Thus, in the binding energy scale, the position of the Auger peaks changes for different X-
ray photon energies relative to the photoelectron peaks, according to equation (10). In some
cases, Auger and photoelectron peaks overlap and make analysis difficult or impossible.
Therefore, most laboratory XPS systems contain two or more metallic anodes in the X-ray gun
(usually Al, Mg and/or Ag), to produce X-rays of different energies.
Peak fitting
In many cases the resolution of the spectrometer is not high enough to resolve clear peaks for
every species present in the sample. Then, mathematical peak fitting can be a powerful tool to
gain deeper information about the kind and amount of the contributions building up the
measured peak. However, one has to be careful with the parameters for the fit, as every
measured spectrum can be fitted if enough peaks and degrees of freedom are enabled, even
though there might be no physical justification for the peaks. Further information about the
composition of the sample and spectral features of the elements like reported binding energies,
shake-up satellites, chemical shifts etc. are indispensable for a good peak fit. In this work the
software Unifit 2013 (Unifit Scientific Software GmbH) was used for peak fitting
Surface sensitivity
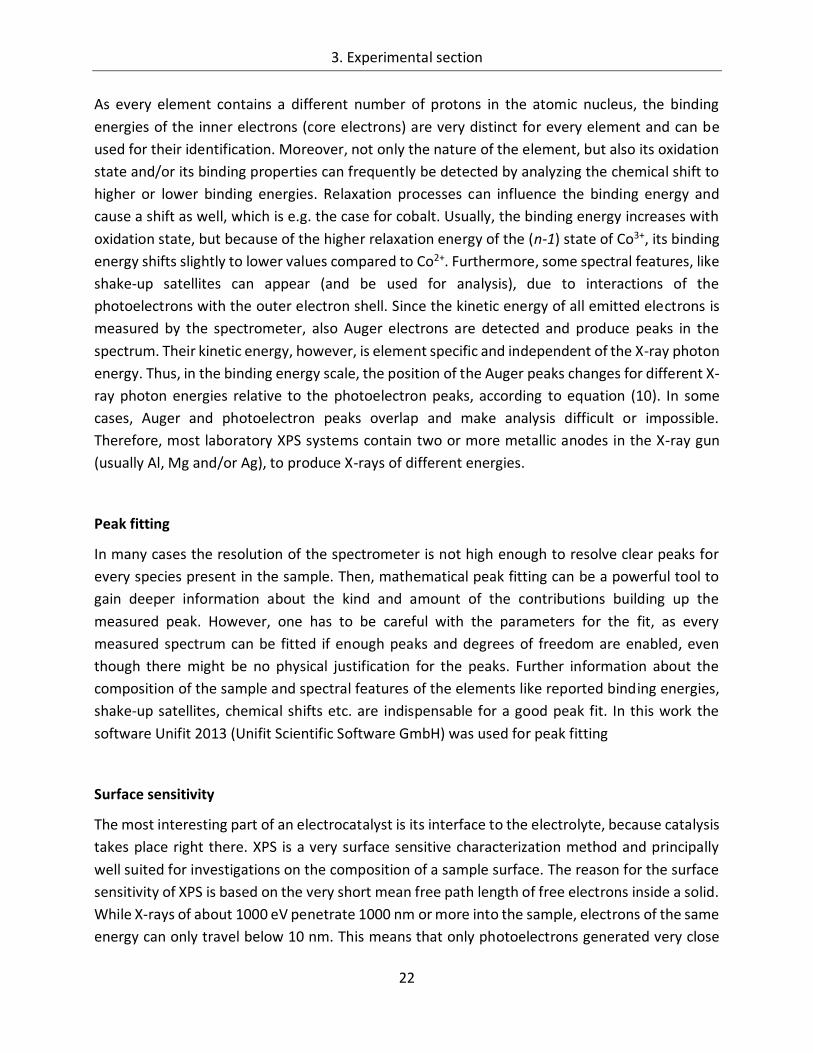
The most interesting part of an electrocatalyst is its interface to the electrolyte, because catalysis
takes place right there. XPS is a very surface sensitive characterization method and principally
well suited for investigations on the composition of a sample surface. The reason for the surface
sensitivity of XPS is based on the very short mean free path length of free electrons inside a solid.
While X-rays of about 1000 eV penetrate 1000 nm or more into the sample, electrons of the same
energy can only travel below 10 nm. This means that only photoelectrons generated very close
3. Experimental section
23
to the surface can escape the solid and contribute to the peak without being scattered or
absorbed. Photoelectrons that lose energy by interacting with other atoms, e.g. by inelastic
scattering, might still be able to leave the sample, but will contribute to the unspecific spectral
background. Figure 3.6 shows the dependence of the mean free path lengths of electrons on their
kinetic energy for different metals. As one can see there is a global minimum at about 50 to 100
eV. The sampling depth is usually said to be three times the mean free path lengths, where 95%
of the signal is generated.
Figure 3.6: Electron mean free path length as function of their kinetic energy for various metals. Source: Ref 122.
Regular laboratory XPS setups contain metal anodes as X-ray source, which produce radiation of
a defined energy. Tuning the surface sensitivity is thus very limited or not possible at all. Besides
its much higher brilliance, synchrotron radiation has a continuous spectrum over several orders
of magnitude and allows adjusting the incident X-ray energy to any desired value. In order to
measure as surface sensitive as possible, one should choose an energy of about 50 eV higher than
the expected binding energy of the peak of interest. The sampling depth should then be around
1 nm only. For many, especially porous samples (like electrocatalysts) a strong secondary electron
tail generated by inelastic scattered photoelectrons becomes striking at low electron kinetic
energies. Peaks in this range therefore might have a very bad signal to noise ratio and a
compromise between surface sensitivity and signal clarity has to be found. The measurements in
this work were conducted with X-ray photon energies about 100 to 150 eV higher than the binding
energy of interest.
3. Experimental section
24
Experimental
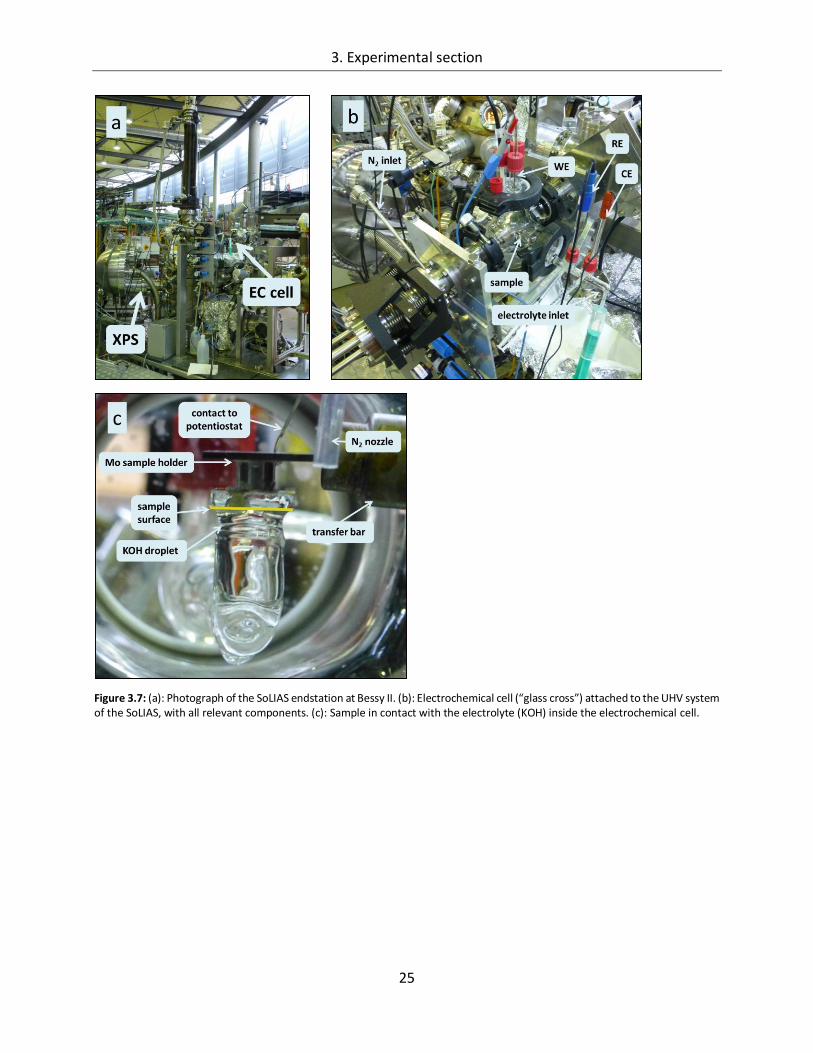
In-line synchrotron X-ray photoelectron spectroscopy experiments were carried out at the U49/2
beamline at Bessy II in Berlin Adlershof using the SoLIAS endstation (Solid-Liquid-Interface-
Analysis-System, provided by the Technical University Darmstadt). The endstation consists of a
photoelectron spectrometer with a Phoibos 150 analyzer (Specs), a large UHV system with
different separable chambers and an attached electrochemical cell (Figure 3.7a). The
electrochemical cell is composed of a three dimensional “glass cross”, which was held under inert
N2 atmosphere. A small glass pipe, which contains the reservoir of the electrolyte (1 M KOH), a
counter (Pt-wire) and a reference electrode (commercial Ag/AgCl) entered the glass cross from
one side (Figure 3.7b). The sample of about 1 cm2 size was mounted onto a molybdenum XPS
sample holder and was electrically contacted using a two component silver filled epoxy adhesive
(Elecolit 323 A+B). On top of the sample the silver adhesive was isolated from the electrolyte with
a nonconductive epoxy adhesive. A molybdenum spacer ensured that the electrolyte did not get
in contact with the sample holder. The sample holder was placed on an UHV transfer bar, turned
upside down and contacted with a platinum wire from the back side (Figure 3.7c). The electrical
circuit was closed by bringing the sample’s surface (i.e. the catalytically active thin film electrode)
in contact with an electrolyte droplet from the glass pipe.
The electrochemical measurements were conducted as follows: First an impedance spectrum was
recorded with a Versastat 3 potentiostat (Princeton Applied Research) to determine the setup
resistance. Typical values were between 150 and 180 Ω. This high resistance was attributed to the
setup geometry with its large distance between the working (sample) and the reference
electrode, the non-ideal electrical contacts and so on. Subsequently, a constant anodic potential
was applied to the sample and after the current had stabilized, which happened typically after 1
to 2 minutes, the electrode film was quickly removed from the electrolyte by pulling back the
transfer bar, while the potential was still kept. Then, residual electrolyte was washed from the
sample surface with deionized water and the electrode was dried in an N2 gas flow using a gas
nozzle. Finally, the electrode was transferred into the UHV system of the SoLIAS for surface
analysis. In that order, the surface of one and the same sample could be studied with XPS after
the application of different potentials and transferred back and forward from the XPS chamber
into the electrochemical environment without contact to the ambient atmosphere.
3. Experimental section
25
Figure 3.7: (a): Photograph of the SoLIAS endstation at Bessy II. (b): Electrochemical cell (“glass cross”) attached to the UHV system of the SoLIAS, with all relevant components. (c): Sample in contact with the electrolyte (KOH) inside the electrochemical cell.
3. Experimental section
26
3.2.2.2. UV/Vis spectroscopy
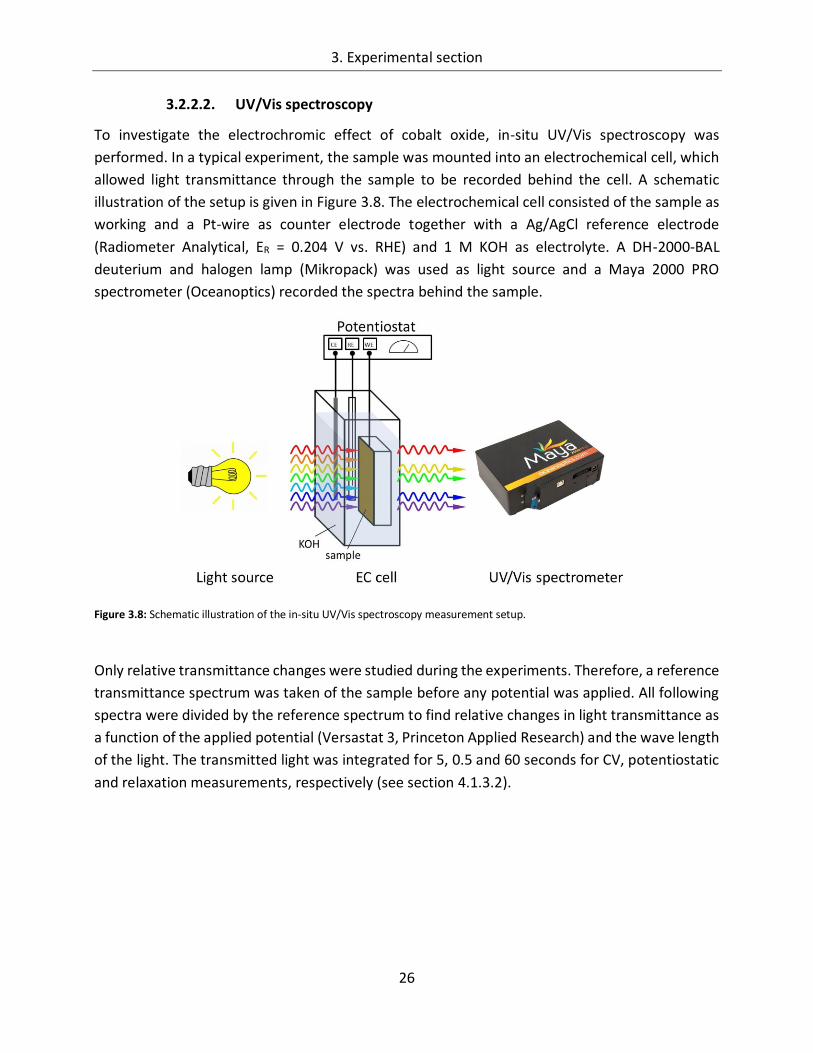
To investigate the electrochromic effect of cobalt oxide, in-situ UV/Vis spectroscopy was
performed. In a typical experiment, the sample was mounted into an electrochemical cell, which
allowed light transmittance through the sample to be recorded behind the cell. A schematic
illustration of the setup is given in Figure 3.8. The electrochemical cell consisted of the sample as
working and a Pt-wire as counter electrode together with a Ag/AgCl reference electrode
(Radiometer Analytical, ER = 0.204 V vs. RHE) and 1 M KOH as electrolyte. A DH-2000-BAL
deuterium and halogen lamp (Mikropack) was used as light source and a Maya 2000 PRO
spectrometer (Oceanoptics) recorded the spectra behind the sample.
Figure 3.8: Schematic illustration of the in-situ UV/Vis spectroscopy measurement setup.
Only relative transmittance changes were studied during the experiments. Therefore, a reference
transmittance spectrum was taken of the sample before any potential was applied. All following
spectra were divided by the reference spectrum to find relative changes in light transmittance as
a function of the applied potential (Versastat 3, Princeton Applied Research) and the wave length
of the light. The transmitted light was integrated for 5, 0.5 and 60 seconds for CV, potentiostatic
and relaxation measurements, respectively (see section 4.1.3.2).
3. Experimental section
27
3.2.3. Other methods
3.2.3.1. X-ray diffraction (XRD)
The crystallinity and crystal structure of some samples was measured using X-ray diffraction. The
thin films were placed in the X-ray diffractometer and measured in gracing incidence mode with
an incident radiation angle of 1°. The X-rays had the wave length of λ = 1.5418 Å (Cu-Kα radiation).
The step size was set to 0.02° and the acquisition time was 10 seconds (manganese oxide samples)
and 25 seconds (cobalt oxide samples) per step, respectively.
X-ray diffraction is based on Bragg’s law:
n * λ = 2d * sinθ (11)
where n is a positive integer, λ is the wave length of the incident radiation (Å), d is the lattice
plane distance (Å) and θ is the angle of the incident radiation based on the considered lattice
plane. Measuring under gracing incident conditions the position of X-ray beam has been kept
constant and the energy dispersive detector has scanned the selected 2θ range. For those angles
θ, where Bragg’s law is fulfilled, a part of the radiation is diffracted and can be detected. In this
geometry diffractograms of thin films can be recorded. A Bruker D8 Advance diffractometer
equipped with a Sol-X detector has been used in this work. To analyze the taken diffractograms,
reference files from the Joint Committee on Powder Diffraction Standards (JCPDS-NBS) have been
used to identify the crystal structure of crystallized parts in the layers.
3.2.3.2. Scanning electron microscopy (SEM)
Scanning electron microscopy was applied to investigate the surface morphology and the
thickness of the catalyst thin films. A LEO Gemini 1530 microscope was used for that purpose. The
electrons were accelerated with 5 kV towards the sample and signals were recorded in the
InLense detector mode. For cross section imaging the samples were cut, glued onto a sample
holder with epoxy resin and polished until a thin and smooth cross section was achieved.
3.2.3.3. Transmission electron microscopy (TEM)
Transmission electron microscopy allows evaluation of thin films on an atomic scale. In this work
cobalt oxide thin films have been examined with a CM 12 microscope (Philips). The system has a
LaB6-cathode as electron source and an acceleration voltage of 120 kV was used. For the
investigations the samples were cut into small pieces, embedded into epoxy resin and again cut
into disks of 0.5 mm thickness. Then, the samples are polished mechanically and in an ion beam
until a film thickness of a few monolayers was obtained in order to allow electrons to pass through
the thinned cross section.

28
29
4. Results and discussion
4.1. Cobalt Oxide
The main part of this work is devoted to the investigation of electrodeposited cobalt oxide thin
films. Special attention is directed to the synthesis of samples avoiding elevated temperatures in
the preparation route, in order to make them suitable for a potential application in a
photoelectrochemical cell (PEC) consisting of a PV device directly connected to highly active and
abundant electrocatalysts for the hydrogen (HER) and oxygen evolution reaction (OER),
respectively. This is necessary, because thin film amorphous/microcrystalline silicon solar cells
may not sustain annealing temperatures above 170°C. The work on such “artificial leaf” type
structures is one focus of the activities in our research group20,124,125.
In the first chapter the influence of different synthesis parameters like deposition potential,
substrate material and annealing temperature, on the activity of the cobalt oxide thin films
towards the OER is described. This is followed by a more detailed view onto the OER itself,
considering, amongst others, stability, the influence of pH and the relation of surface area and
catalyst volume towards the activity of the catalyst, respectively. In the last chapter spectroscopic
methods such as in-line synchrotron radiation photoelectron spectroscopy and in-situ UV/Vis
spectroscopy are applied to gain more insights into the working principles of the cobalt oxide thin
films.
4.1.1. Influence of preparation parameters on the catalytic activity
In this chapter it is investigated how different parameters of the sample preparation process, e.g.
deposition potential, precursor concentration and annealing temperature, influence the activity
of the cobalt oxide catalysts towards the OER. The utilized anodic electrochemical deposition
procedure83 turned out to be a simple, reproducible and very robust method for synthesizing
catalyst thin films on a conductive substrate. If not mentioned otherwise the samples were
deposited at room temperature onto FTO/glass substrates at a potential of 1.4 V vs. RHE from a
solution containing 12 mM CoCl2, 12 mM Na-gluconate and 1 M KOH (standard parameters).
4.1.1.1. Deposition potential
The applied electrical potential is the driving force in the process of electrochemical deposition
and therefore expected to have a major impact on the properties of the deposited films126. To
elucidate the effects of the deposition potential on the cobalt oxide thin films, magnitude and
type of the applied potential were varied in a systematic way.
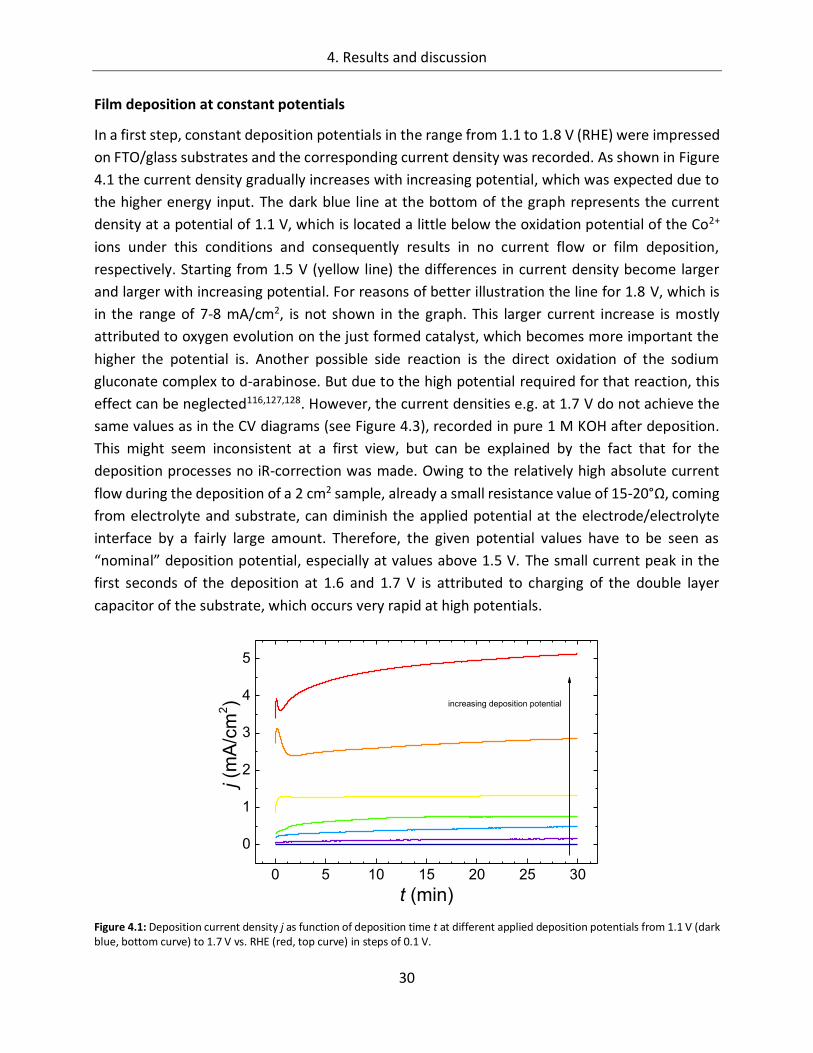
4. Results and discussion
30
Film deposition at constant potentials
In a first step, constant deposition potentials in the range from 1.1 to 1.8 V (RHE) were impressed
on FTO/glass substrates and the corresponding current density was recorded. As shown in Figure
4.1 the current density gradually increases with increasing potential, which was expected due to
the higher energy input. The dark blue line at the bottom of the graph represents the current
density at a potential of 1.1 V, which is located a little below the oxidation potential of the Co2+
ions under this conditions and consequently results in no current flow or film deposition,
respectively. Starting from 1.5 V (yellow line) the differences in current density become larger
and larger with increasing potential. For reasons of better illustration the line for 1.8 V, which is
in the range of 7-8 mA/cm2, is not shown in the graph. This larger current increase is mostly
attributed to oxygen evolution on the just formed catalyst, which becomes more important the
higher the potential is. Another possible side reaction is the direct oxidation of the sodium
gluconate complex to d-arabinose. But due to the high potential required for that reaction, this
effect can be neglected116,127,128. However, the current densities e.g. at 1.7 V do not achieve the
same values as in the CV diagrams (see Figure 4.3), recorded in pure 1 M KOH after deposition.
This might seem inconsistent at a first view, but can be explained by the fact that for the
deposition processes no iR-correction was made. Owing to the relatively high absolute current
flow during the deposition of a 2 cm2 sample, already a small resistance value of 15-20°Ω, coming
from electrolyte and substrate, can diminish the applied potential at the electrode/electrolyte
interface by a fairly large amount. Therefore, the given potential values have to be seen as
“nominal” deposition potential, especially at values above 1.5 V. The small current peak in the
first seconds of the deposition at 1.6 and 1.7 V is attributed to charging of the double layer
capacitor of the substrate, which occurs very rapid at high potentials.
Figure 4.1: Deposition current density j as function of deposition time t at different applied deposition potentials from 1.1 V (dark blue, bottom curve) to 1.7 V vs. RHE (red, top curve) in steps of 0.1 V.
0 5 10 15 20 25 30
0
1
2
3
4
5
j (m
A/c
m2)
t (min)
increasing deposition potential
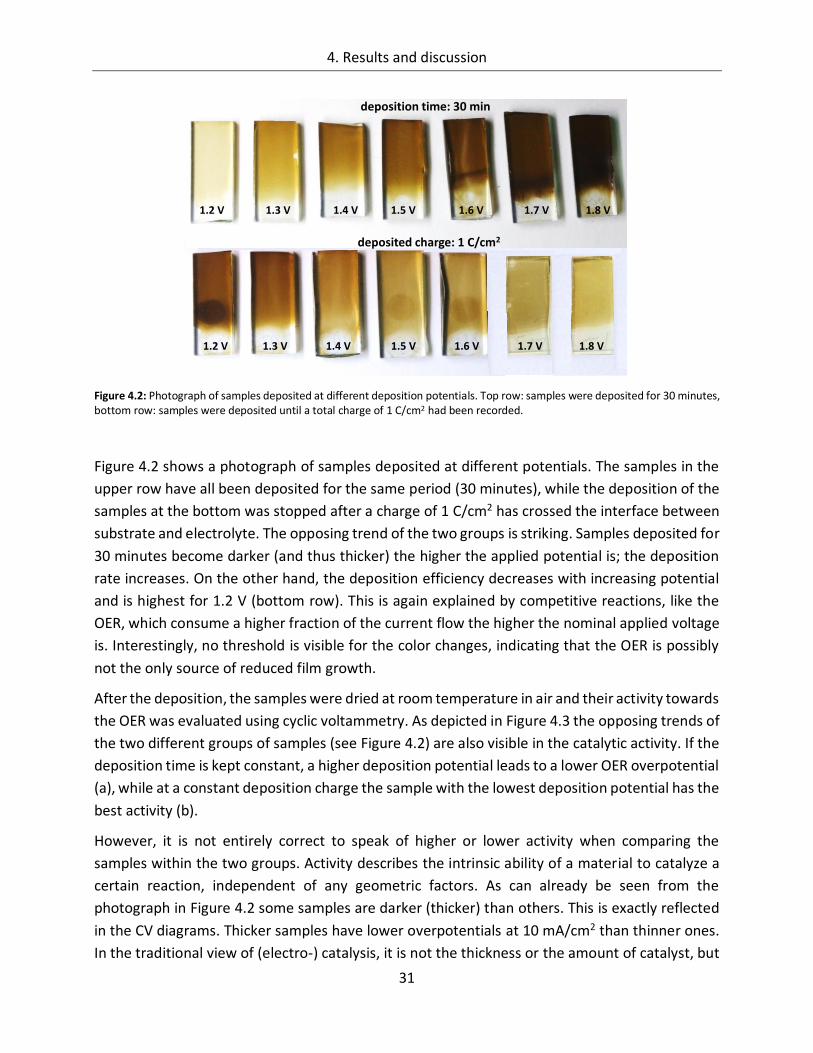
4. Results and discussion
31
Figure 4.2: Photograph of samples deposited at different deposition potentials. Top row: samples were deposited for 30 minutes, bottom row: samples were deposited until a total charge of 1 C/cm2 had been recorded.
Figure 4.2 shows a photograph of samples deposited at different potentials. The samples in the
upper row have all been deposited for the same period (30 minutes), while the deposition of the
samples at the bottom was stopped after a charge of 1 C/cm2 has crossed the interface between
substrate and electrolyte. The opposing trend of the two groups is striking. Samples deposited for
30 minutes become darker (and thus thicker) the higher the applied potential is; the deposition
rate increases. On the other hand, the deposition efficiency decreases with increasing potential
and is highest for 1.2 V (bottom row). This is again explained by competitive reactions, like the
OER, which consume a higher fraction of the current flow the higher the nominal applied voltage
is. Interestingly, no threshold is visible for the color changes, indicating that the OER is possibly
not the only source of reduced film growth.
After the deposition, the samples were dried at room temperature in air and their activity towards
the OER was evaluated using cyclic voltammetry. As depicted in Figure 4.3 the opposing trends of
the two different groups of samples (see Figure 4.2) are also visible in the catalytic activity. If the
deposition time is kept constant, a higher deposition potential leads to a lower OER overpotential
(a), while at a constant deposition charge the sample with the lowest deposition potential has the
best activity (b).
However, it is not entirely correct to speak of higher or lower activity when comparing the
samples within the two groups. Activity describes the intrinsic ability of a material to catalyze a
certain reaction, independent of any geometric factors. As can already be seen from the
photograph in Figure 4.2 some samples are darker (thicker) than others. This is exactly reflected
in the CV diagrams. Thicker samples have lower overpotentials at 10 mA/cm2 than thinner ones.
In the traditional view of (electro-) catalysis, it is not the thickness or the amount of catalyst, but
1.2 V 1.3 V 1.4 V 1.5 V 1.6 V 1.7 V 1.8 V
1.2 V 1.3 V 1.4 V 1.5 V 1.6 V 1.7 V 1.8 V
deposition time: 30 min
deposited charge: 1 C/cm2
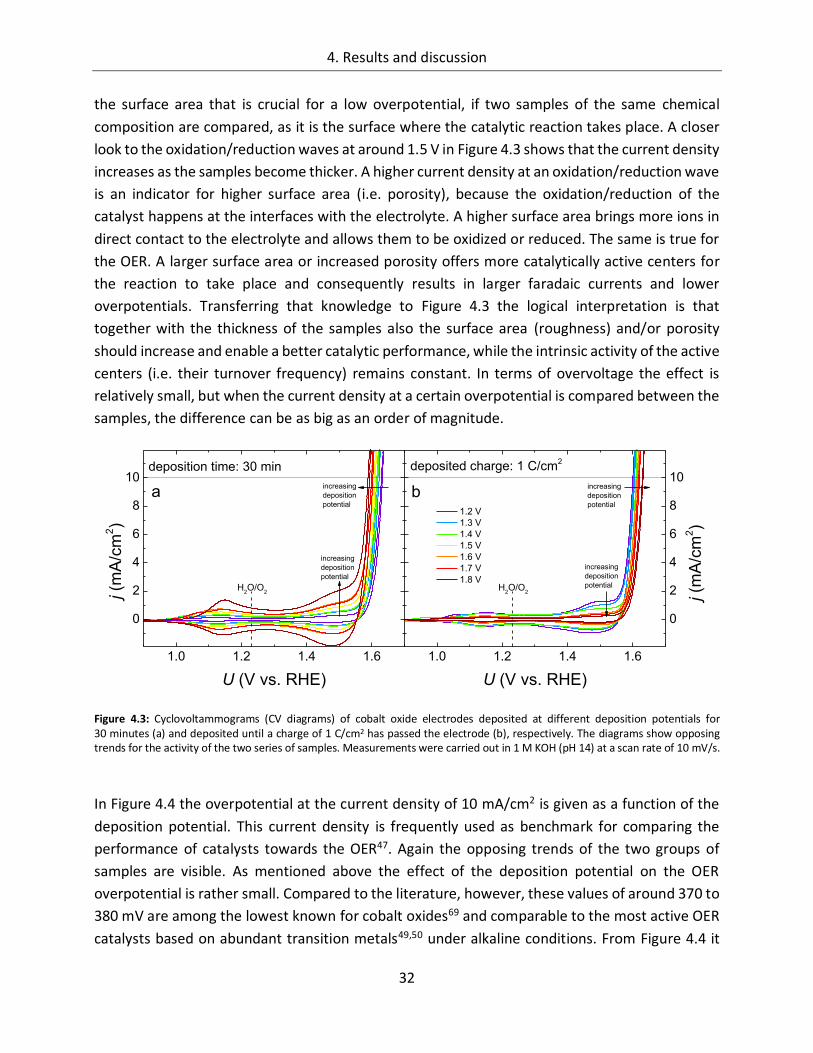
4. Results and discussion
32
the surface area that is crucial for a low overpotential, if two samples of the same chemical
composition are compared, as it is the surface where the catalytic reaction takes place. A closer
look to the oxidation/reduction waves at around 1.5 V in Figure 4.3 shows that the current density
increases as the samples become thicker. A higher current density at an oxidation/reduction wave
is an indicator for higher surface area (i.e. porosity), because the oxidation/reduction of the
catalyst happens at the interfaces with the electrolyte. A higher surface area brings more ions in
direct contact to the electrolyte and allows them to be oxidized or reduced. The same is true for
the OER. A larger surface area or increased porosity offers more catalytically active centers for
the reaction to take place and consequently results in larger faradaic currents and lower
overpotentials. Transferring that knowledge to Figure 4.3 the logical interpretation is that
together with the thickness of the samples also the surface area (roughness) and/or porosity
should increase and enable a better catalytic performance, while the intrinsic activity of the active
centers (i.e. their turnover frequency) remains constant. In terms of overvoltage the effect is
relatively small, but when the current density at a certain overpotential is compared between the
samples, the difference can be as big as an order of magnitude.
Figure 4.3: Cyclovoltammograms (CV diagrams) of cobalt oxide electrodes deposited at different deposition potentials for 30 minutes (a) and deposited until a charge of 1 C/cm2 has passed the electrode (b), respectively. The diagrams show opposing trends for the activity of the two series of samples. Measurements were carried out in 1 M KOH (pH 14) at a scan rate of 10 mV/s.
In Figure 4.4 the overpotential at the current density of 10 mA/cm2 is given as a function of the
deposition potential. This current density is frequently used as benchmark for comparing the
performance of catalysts towards the OER47. Again the opposing trends of the two groups of
samples are visible. As mentioned above the effect of the deposition potential on the OER
overpotential is rather small. Compared to the literature, however, these values of around 370 to
380 mV are among the lowest known for cobalt oxides69 and comparable to the most active OER
catalysts based on abundant transition metals49,50 under alkaline conditions. From Figure 4.4 it
1.0 1.2 1.4 1.6
0
2
4
6
8
10
increasing
deposition
potential
j (m
A/c
m2)
U (V vs. RHE)
H2O/O
2
increasing
deposition
potential
deposition time: 30 min
a
1.0 1.2 1.4 1.6
0
2
4
6
8
10
b
deposited charge: 1 C/cm2
1.2 V
1.3 V
1.4 V
1.5 V
1.6 V
1.7 V
1.8 V
increasing
deposition
potential
increasing
deposition
potentialH2O/O
2
j (
mA
/cm
2)
U (V vs. RHE)
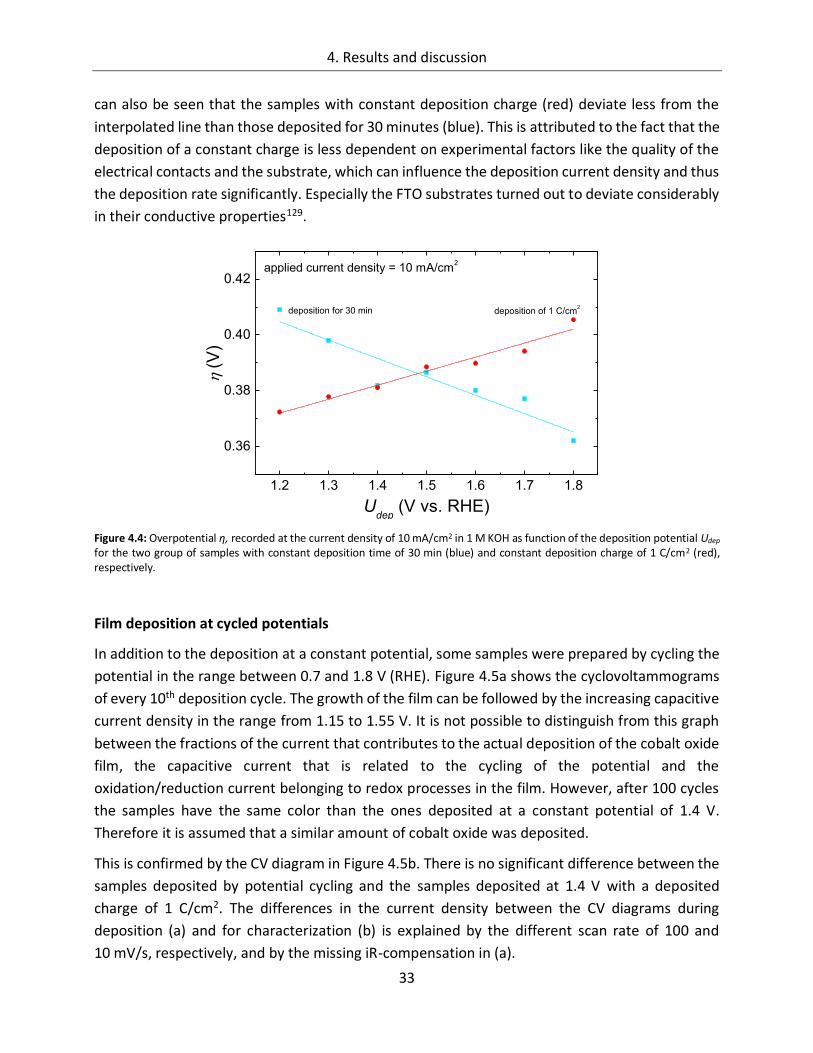
4. Results and discussion
33
can also be seen that the samples with constant deposition charge (red) deviate less from the
interpolated line than those deposited for 30 minutes (blue). This is attributed to the fact that the
deposition of a constant charge is less dependent on experimental factors like the quality of the
electrical contacts and the substrate, which can influence the deposition current density and thus
the deposition rate significantly. Especially the FTO substrates turned out to deviate considerably
in their conductive properties129.
Figure 4.4: Overpotential η, recorded at the current density of 10 mA/cm2 in 1 M KOH as function of the deposition potential Udep for the two group of samples with constant deposition time of 30 min (blue) and constant deposition charge of 1 C/cm2 (red), respectively.
Film deposition at cycled potentials
In addition to the deposition at a constant potential, some samples were prepared by cycling the
potential in the range between 0.7 and 1.8 V (RHE). Figure 4.5a shows the cyclovoltammograms
of every 10th deposition cycle. The growth of the film can be followed by the increasing capacitive
current density in the range from 1.15 to 1.55 V. It is not possible to distinguish from this graph
between the fractions of the current that contributes to the actual deposition of the cobalt oxide
film, the capacitive current that is related to the cycling of the potential and the
oxidation/reduction current belonging to redox processes in the film. However, after 100 cycles
the samples have the same color than the ones deposited at a constant potential of 1.4 V.
Therefore it is assumed that a similar amount of cobalt oxide was deposited.
This is confirmed by the CV diagram in Figure 4.5b. There is no significant difference between the
samples deposited by potential cycling and the samples deposited at 1.4 V with a deposited
charge of 1 C/cm2. The differences in the current density between the CV diagrams during
deposition (a) and for characterization (b) is explained by the different scan rate of 100 and
10 mV/s, respectively, and by the missing iR-compensation in (a).
1.2 1.3 1.4 1.5 1.6 1.7 1.8
0.36
0.38
0.40
0.42
deposition of 1 C/cm2
(
V)
Udep
(V vs. RHE)
deposition for 30 min
applied current density = 10 mA/cm2
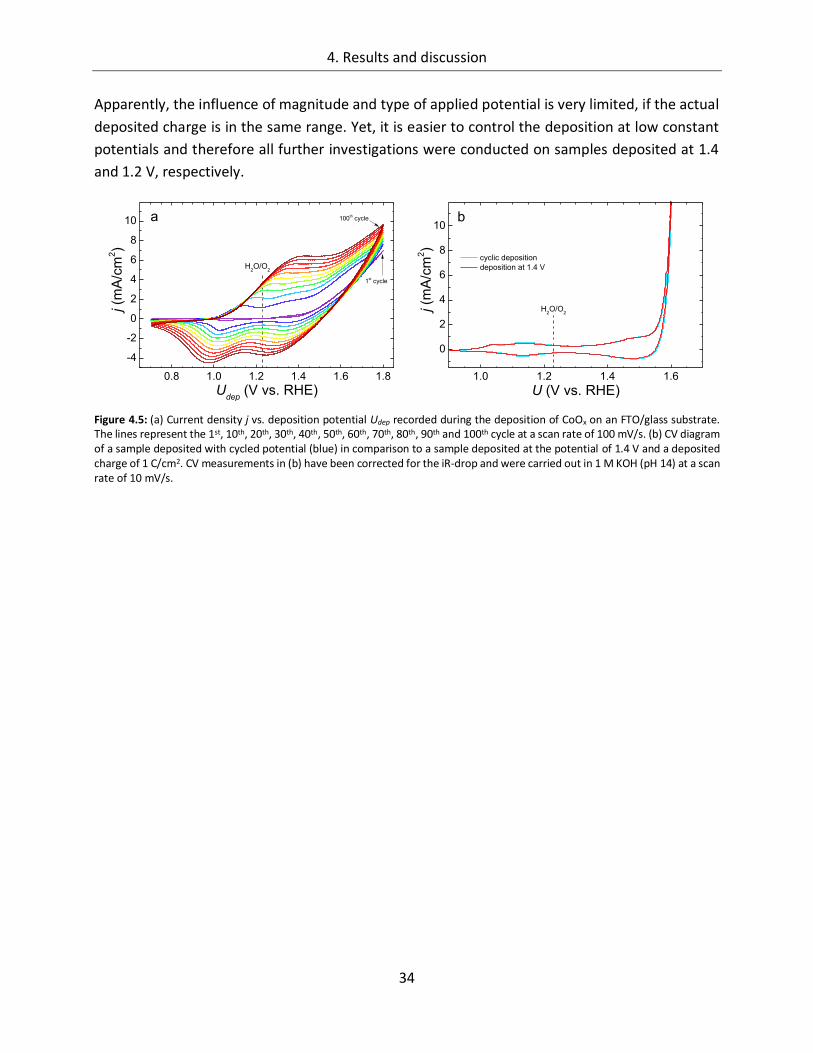
4. Results and discussion
34
Apparently, the influence of magnitude and type of applied potential is very limited, if the actual
deposited charge is in the same range. Yet, it is easier to control the deposition at low constant
potentials and therefore all further investigations were conducted on samples deposited at 1.4
and 1.2 V, respectively.
Figure 4.5: (a) Current density j vs. deposition potential Udep recorded during the deposition of CoOx on an FTO/glass substrate. The lines represent the 1st, 10th, 20th, 30th, 40th, 50th, 60th, 70th, 80th, 90th and 100th cycle at a scan rate of 100 mV/s. (b) CV diagram of a sample deposited with cycled potential (blue) in comparison to a sample deposited at the potential of 1.4 V and a deposited charge of 1 C/cm2. CV measurements in (b) have been corrected for the iR-drop and were carried out in 1 M KOH (pH 14) at a scan rate of 10 mV/s.
0.8 1.0 1.2 1.4 1.6 1.8
-4
-2
0
2
4
6
8
10
1st cycle
j (m
A/c
m2)
Udep
(V vs. RHE)
H2O/O
2
100th cyclea
1.0 1.2 1.4 1.6
0
2
4
6
8
10
cyclic deposition
deposition at 1.4 V
j (m
A/c
m2)
U (V vs. RHE)
H2O/O
2
b
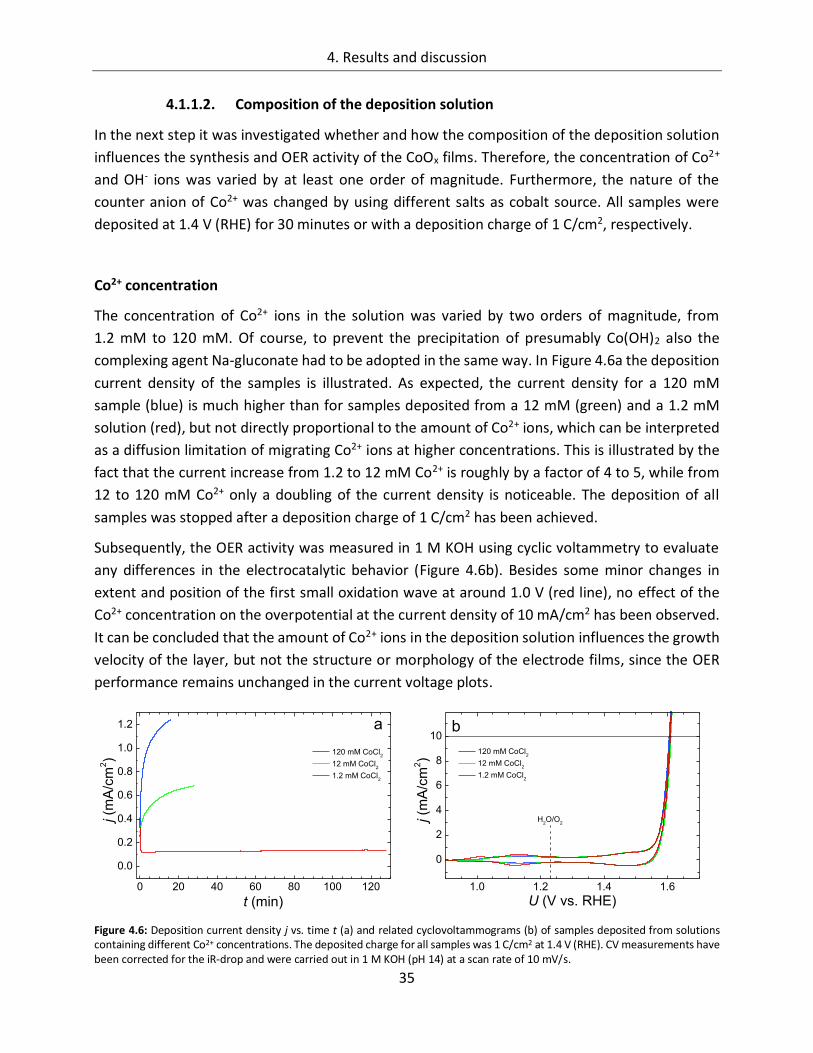
4. Results and discussion
35
4.1.1.2. Composition of the deposition solution
In the next step it was investigated whether and how the composition of the deposition solution
influences the synthesis and OER activity of the CoOx films. Therefore, the concentration of Co2+
and OH- ions was varied by at least one order of magnitude. Furthermore, the nature of the
counter anion of Co2+ was changed by using different salts as cobalt source. All samples were
deposited at 1.4 V (RHE) for 30 minutes or with a deposition charge of 1 C/cm2, respectively.
Co2+ concentration
The concentration of Co2+ ions in the solution was varied by two orders of magnitude, from
1.2 mM to 120 mM. Of course, to prevent the precipitation of presumably Co(OH)2 also the
complexing agent Na-gluconate had to be adopted in the same way. In Figure 4.6a the deposition
current density of the samples is illustrated. As expected, the current density for a 120 mM
sample (blue) is much higher than for samples deposited from a 12 mM (green) and a 1.2 mM
solution (red), but not directly proportional to the amount of Co2+ ions, which can be interpreted
as a diffusion limitation of migrating Co2+ ions at higher concentrations. This is illustrated by the
fact that the current increase from 1.2 to 12 mM Co2+ is roughly by a factor of 4 to 5, while from
12 to 120 mM Co2+ only a doubling of the current density is noticeable. The deposition of all
samples was stopped after a deposition charge of 1 C/cm2 has been achieved.
Subsequently, the OER activity was measured in 1 M KOH using cyclic voltammetry to evaluate
any differences in the electrocatalytic behavior (Figure 4.6b). Besides some minor changes in
extent and position of the first small oxidation wave at around 1.0 V (red line), no effect of the
Co2+ concentration on the overpotential at the current density of 10 mA/cm2 has been observed.
It can be concluded that the amount of Co2+ ions in the deposition solution influences the growth
velocity of the layer, but not the structure or morphology of the electrode films, since the OER
performance remains unchanged in the current voltage plots.
Figure 4.6: Deposition current density j vs. time t (a) and related cyclovoltammograms (b) of samples deposited from solutions containing different Co2+ concentrations. The deposited charge for all samples was 1 C/cm2 at 1.4 V (RHE). CV measurements have been corrected for the iR-drop and were carried out in 1 M KOH (pH 14) at a scan rate of 10 mV/s.
0 20 40 60 80 100 120
0.0
0.2
0.4
0.6
0.8
1.0
1.2
120 mM CoCl2
12 mM CoCl2
1.2 mM CoCl2
j (m
A/c
m2)
t (min)
a
1.0 1.2 1.4 1.6
0
2
4
6
8
10
120 mM CoCl2
12 mM CoCl2
1.2 mM CoCl2
j (m
A/c
m2)
U (V vs. RHE)
H2O/O
2
b
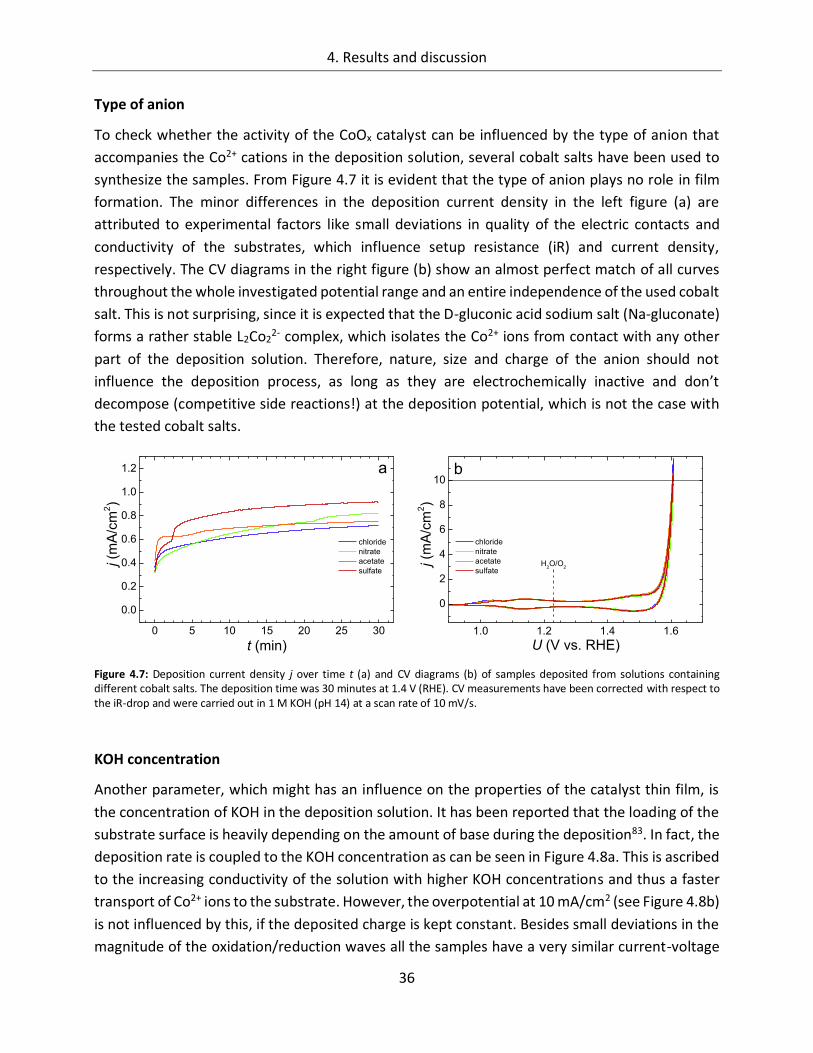
4. Results and discussion
36
Type of anion
To check whether the activity of the CoOx catalyst can be influenced by the type of anion that
accompanies the Co2+ cations in the deposition solution, several cobalt salts have been used to
synthesize the samples. From Figure 4.7 it is evident that the type of anion plays no role in film
formation. The minor differences in the deposition current density in the left figure (a) are
attributed to experimental factors like small deviations in quality of the electric contacts and
conductivity of the substrates, which influence setup resistance (iR) and current density,
respectively. The CV diagrams in the right figure (b) show an almost perfect match of all curves
throughout the whole investigated potential range and an entire independence of the used cobalt
salt. This is not surprising, since it is expected that the D-gluconic acid sodium salt (Na-gluconate)
forms a rather stable L2Co22- complex, which isolates the Co2+ ions from contact with any other
part of the deposition solution. Therefore, nature, size and charge of the anion should not
influence the deposition process, as long as they are electrochemically inactive and don’t
decompose (competitive side reactions!) at the deposition potential, which is not the case with
the tested cobalt salts.
Figure 4.7: Deposition current density j over time t (a) and CV diagrams (b) of samples deposited from solutions containing different cobalt salts. The deposition time was 30 minutes at 1.4 V (RHE). CV measurements have been corrected with respect to the iR-drop and were carried out in 1 M KOH (pH 14) at a scan rate of 10 mV/s.
KOH concentration
Another parameter, which might has an influence on the properties of the catalyst thin film, is
the concentration of KOH in the deposition solution. It has been reported that the loading of the
substrate surface is heavily depending on the amount of base during the deposition83. In fact, the
deposition rate is coupled to the KOH concentration as can be seen in Figure 4.8a. This is ascribed
to the increasing conductivity of the solution with higher KOH concentrations and thus a faster
transport of Co2+ ions to the substrate. However, the overpotential at 10 mA/cm2 (see Figure 4.8b)
is not influenced by this, if the deposited charge is kept constant. Besides small deviations in the
magnitude of the oxidation/reduction waves all the samples have a very similar current-voltage
0 5 10 15 20 25 30
0.0
0.2
0.4
0.6
0.8
1.0
1.2
chloride
nitrate
acetate
sulfate
j (m
A/c
m2)
t (min)
a
1.0 1.2 1.4 1.6
0
2
4
6
8
10
chloride
nitrate
acetate
sulfate
j (m
A/c
m2)
U (V vs. RHE)
H2O/O
2
b
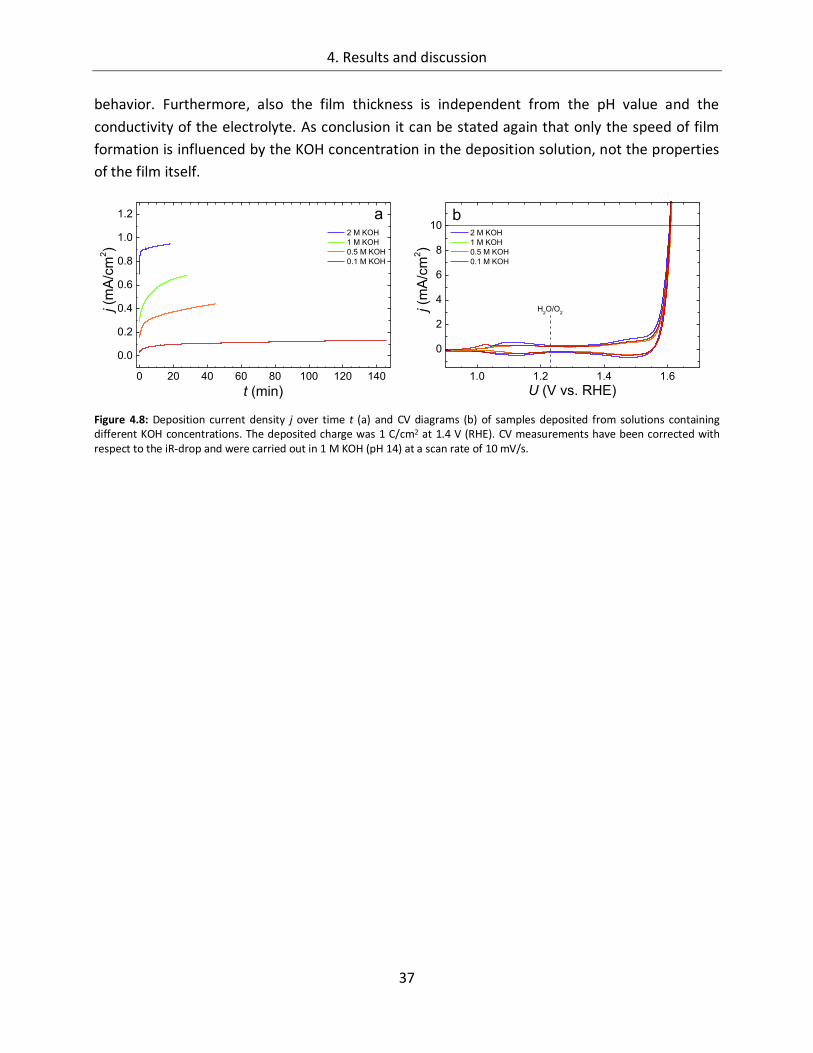
4. Results and discussion
37
behavior. Furthermore, also the film thickness is independent from the pH value and the
conductivity of the electrolyte. As conclusion it can be stated again that only the speed of film
formation is influenced by the KOH concentration in the deposition solution, not the properties
of the film itself.
Figure 4.8: Deposition current density j over time t (a) and CV diagrams (b) of samples deposited from solutions containing different KOH concentrations. The deposited charge was 1 C/cm2 at 1.4 V (RHE). CV measurements have been corrected with respect to the iR-drop and were carried out in 1 M KOH (pH 14) at a scan rate of 10 mV/s.
0 20 40 60 80 100 120 140
0.0
0.2
0.4
0.6
0.8
1.0
1.2
2 M KOH
1 M KOH
0.5 M KOH
0.1 M KOH
j (m
A/c
m2)
t (min)
a
1.0 1.2 1.4 1.6
0
2
4
6
8
10 2 M KOH
1 M KOH
0.5 M KOH
0.1 M KOH
j (m
A/c
m2)
U (V vs. RHE)
H2O/O
2
b
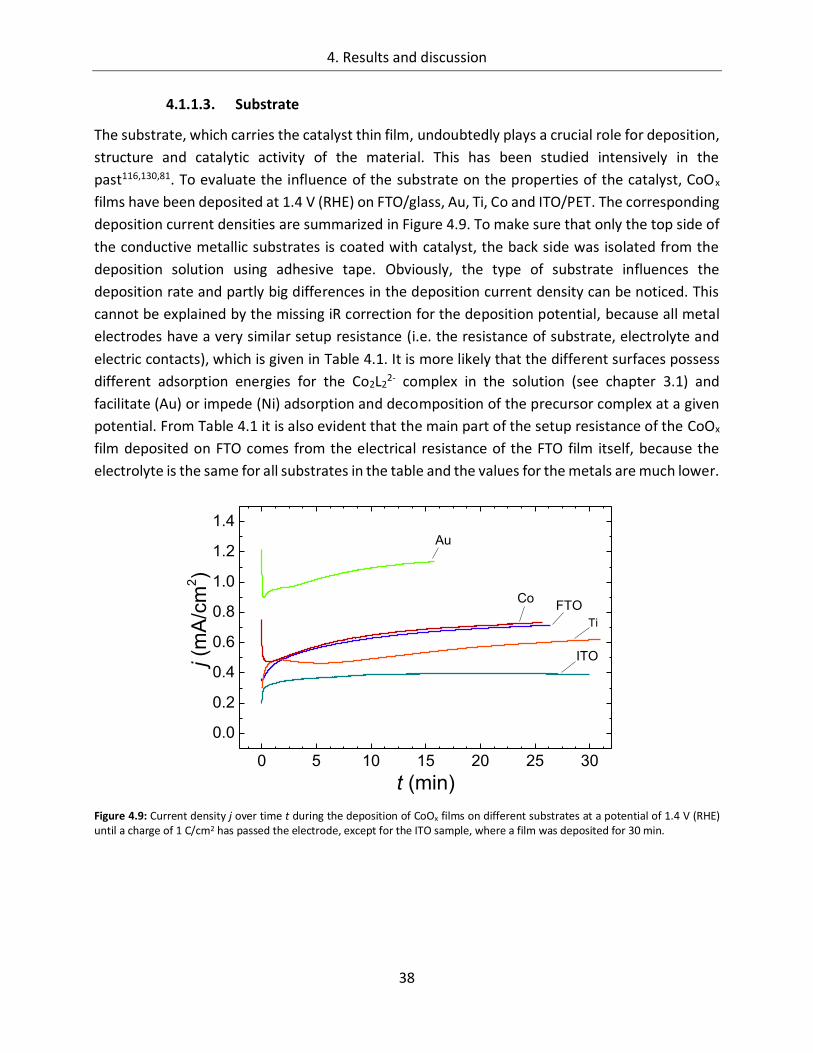
4. Results and discussion
38
4.1.1.3. Substrate
The substrate, which carries the catalyst thin film, undoubtedly plays a crucial role for deposition,
structure and catalytic activity of the material. This has been studied intensively in the
past116,130,81. To evaluate the influence of the substrate on the properties of the catalyst, CoOx
films have been deposited at 1.4 V (RHE) on FTO/glass, Au, Ti, Co and ITO/PET. The corresponding
deposition current densities are summarized in Figure 4.9. To make sure that only the top side of
the conductive metallic substrates is coated with catalyst, the back side was isolated from the
deposition solution using adhesive tape. Obviously, the type of substrate influences the
deposition rate and partly big differences in the deposition current density can be noticed. This
cannot be explained by the missing iR correction for the deposition potential, because all metal
electrodes have a very similar setup resistance (i.e. the resistance of substrate, electrolyte and
electric contacts), which is given in Table 4.1. It is more likely that the different surfaces possess
different adsorption energies for the Co2L22- complex in the solution (see chapter 3.1) and
facilitate (Au) or impede (Ni) adsorption and decomposition of the precursor complex at a given
potential. From Table 4.1 it is also evident that the main part of the setup resistance of the CoOx
film deposited on FTO comes from the electrical resistance of the FTO film itself, because the
electrolyte is the same for all substrates in the table and the values for the metals are much lower.
Figure 4.9: Current density j over time t during the deposition of CoOx films on different substrates at a potential of 1.4 V (RHE) until a charge of 1 C/cm2 has passed the electrode, except for the ITO sample, where a film was deposited for 30 min.
0 5 10 15 20 25 30
0.0
0.2
0.4
0.6
0.8
1.0
1.2
1.4
ITO
Ti
FTOCo
j (m
A/c
m2)
t (min)
Au
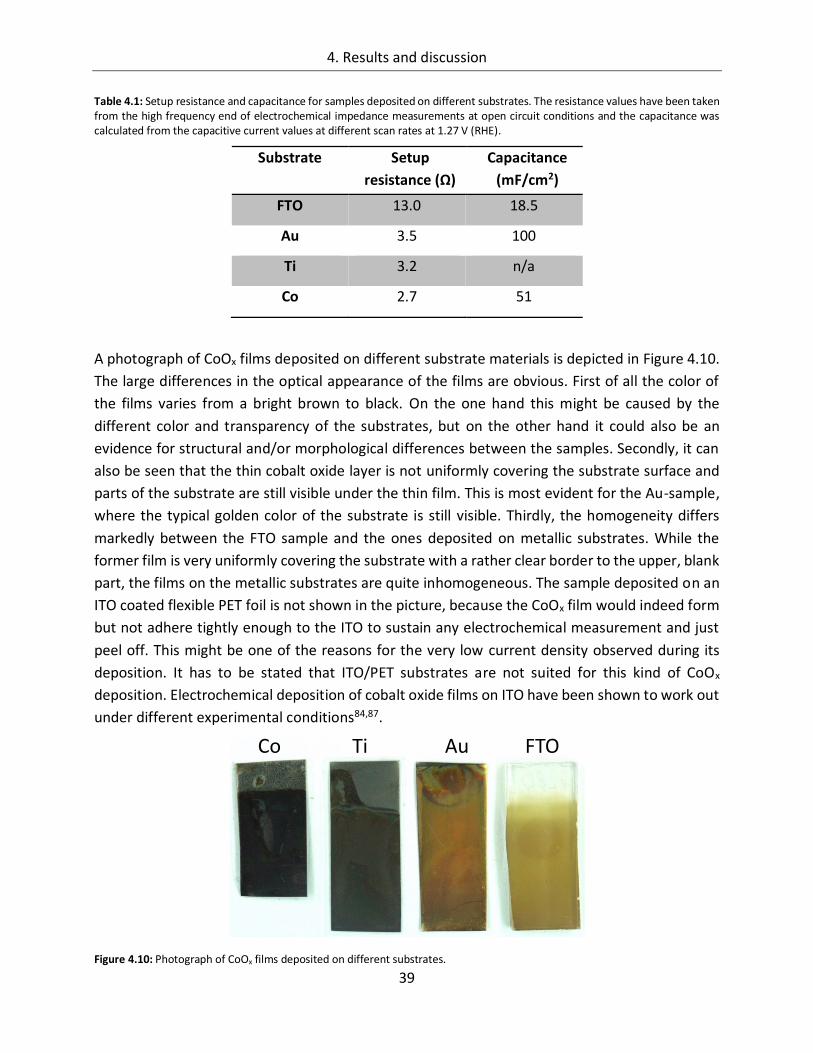
4. Results and discussion
39
Table 4.1: Setup resistance and capacitance for samples deposited on different substrates. The resistance values have been taken from the high frequency end of electrochemical impedance measurements at open circuit conditions and the capacitance was calculated from the capacitive current values at different scan rates at 1.27 V (RHE).
Substrate Setup
resistance (Ω)
Capacitance
(mF/cm2)
FTO 13.0 18.5
Au 3.5 100
Ti 3.2 n/a
Co 2.7 51
A photograph of CoOx films deposited on different substrate materials is depicted in Figure 4.10.
The large differences in the optical appearance of the films are obvious. First of all the color of
the films varies from a bright brown to black. On the one hand this might be caused by the
different color and transparency of the substrates, but on the other hand it could also be an
evidence for structural and/or morphological differences between the samples. Secondly, it can
also be seen that the thin cobalt oxide layer is not uniformly covering the substrate surface and
parts of the substrate are still visible under the thin film. This is most evident for the Au-sample,
where the typical golden color of the substrate is still visible. Thirdly, the homogeneity differs
markedly between the FTO sample and the ones deposited on metallic substrates. While the
former film is very uniformly covering the substrate with a rather clear border to the upper, blank
part, the films on the metallic substrates are quite inhomogeneous. The sample deposited on an
ITO coated flexible PET foil is not shown in the picture, because the CoOx film would indeed form
but not adhere tightly enough to the ITO to sustain any electrochemical measurement and just
peel off. This might be one of the reasons for the very low current density observed during its
deposition. It has to be stated that ITO/PET substrates are not suited for this kind of CoOx
deposition. Electrochemical deposition of cobalt oxide films on ITO have been shown to work out
under different experimental conditions84,87.
Figure 4.10: Photograph of CoOx films deposited on different substrates.
FTOAuTiCo
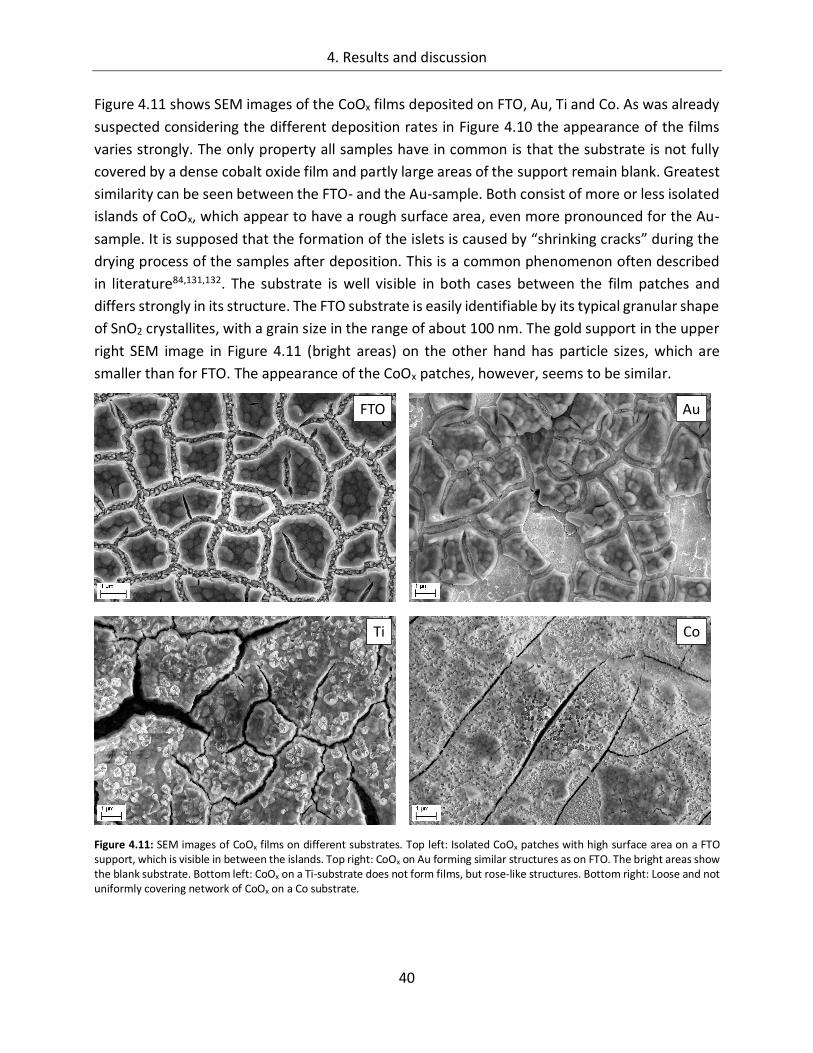
4. Results and discussion
40
Figure 4.11 shows SEM images of the CoOx films deposited on FTO, Au, Ti and Co. As was already
suspected considering the different deposition rates in Figure 4.10 the appearance of the films
varies strongly. The only property all samples have in common is that the substrate is not fully
covered by a dense cobalt oxide film and partly large areas of the support remain blank. Greatest
similarity can be seen between the FTO- and the Au-sample. Both consist of more or less isolated
islands of CoOx, which appear to have a rough surface area, even more pronounced for the Au-
sample. It is supposed that the formation of the islets is caused by “shrinking cracks” during the
drying process of the samples after deposition. This is a common phenomenon often described
in literature84,131,132. The substrate is well visible in both cases between the film patches and
differs strongly in its structure. The FTO substrate is easily identifiable by its typical granular shape
of SnO2 crystallites, with a grain size in the range of about 100 nm. The gold support in the upper
right SEM image in Figure 4.11 (bright areas) on the other hand has particle sizes, which are
smaller than for FTO. The appearance of the CoOx patches, however, seems to be similar.
Figure 4.11: SEM images of CoOx films on different substrates. Top left: Isolated CoOx patches with high surface area on a FTO support, which is visible in between the islands. Top right: CoOx on Au forming similar structures as on FTO. The bright areas show the blank substrate. Bottom left: CoOx on a Ti-substrate does not form films, but rose-like structures. Bottom right: Loose and not uniformly covering network of CoOx on a Co substrate.
FTO Au
Ti Co
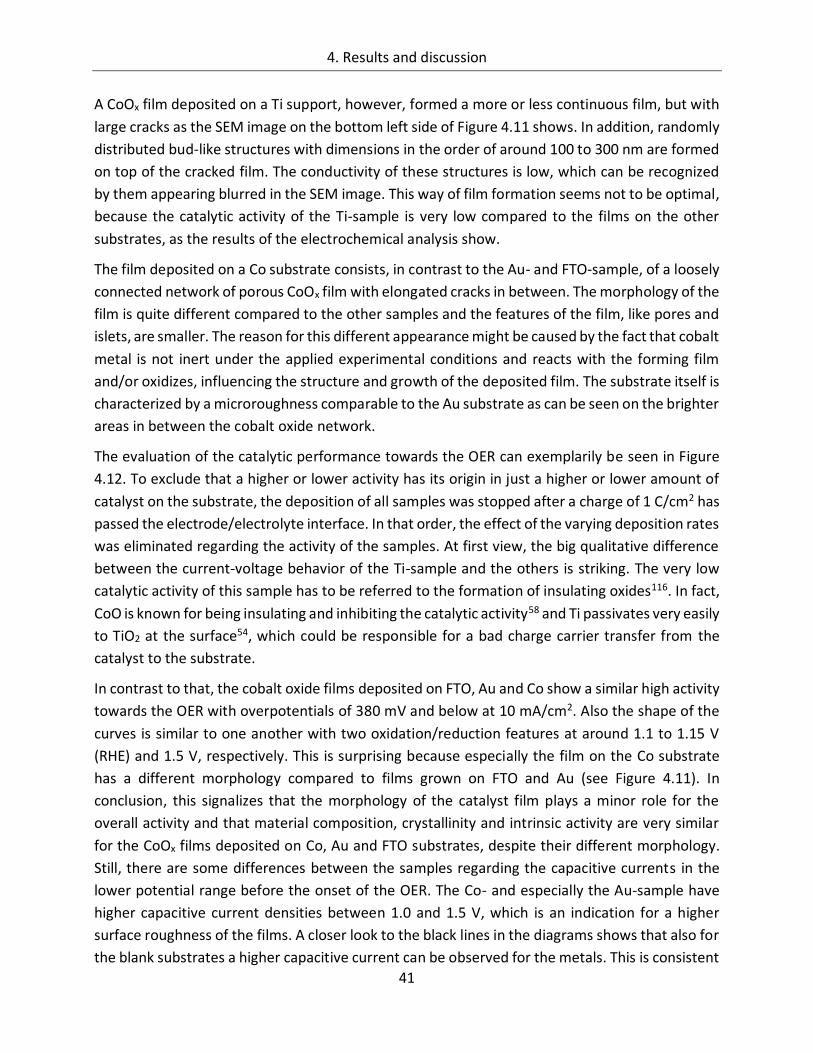
4. Results and discussion
41
A CoOx film deposited on a Ti support, however, formed a more or less continuous film, but with
large cracks as the SEM image on the bottom left side of Figure 4.11 shows. In addition, randomly
distributed bud-like structures with dimensions in the order of around 100 to 300 nm are formed
on top of the cracked film. The conductivity of these structures is low, which can be recognized
by them appearing blurred in the SEM image. This way of film formation seems not to be optimal,
because the catalytic activity of the Ti-sample is very low compared to the films on the other
substrates, as the results of the electrochemical analysis show.
The film deposited on a Co substrate consists, in contrast to the Au- and FTO-sample, of a loosely
connected network of porous CoOx film with elongated cracks in between. The morphology of the
film is quite different compared to the other samples and the features of the film, like pores and
islets, are smaller. The reason for this different appearance might be caused by the fact that cobalt
metal is not inert under the applied experimental conditions and reacts with the forming film
and/or oxidizes, influencing the structure and growth of the deposited film. The substrate itself is
characterized by a microroughness comparable to the Au substrate as can be seen on the brighter
areas in between the cobalt oxide network.
The evaluation of the catalytic performance towards the OER can exemplarily be seen in Figure
4.12. To exclude that a higher or lower activity has its origin in just a higher or lower amount of
catalyst on the substrate, the deposition of all samples was stopped after a charge of 1 C/cm2 has
passed the electrode/electrolyte interface. In that order, the effect of the varying deposition rates
was eliminated regarding the activity of the samples. At first view, the big qualitative difference
between the current-voltage behavior of the Ti-sample and the others is striking. The very low
catalytic activity of this sample has to be referred to the formation of insulating oxides116. In fact,
CoO is known for being insulating and inhibiting the catalytic activity58 and Ti passivates very easily
to TiO2 at the surface54, which could be responsible for a bad charge carrier transfer from the
catalyst to the substrate.
In contrast to that, the cobalt oxide films deposited on FTO, Au and Co show a similar high activity
towards the OER with overpotentials of 380 mV and below at 10 mA/cm2. Also the shape of the
curves is similar to one another with two oxidation/reduction features at around 1.1 to 1.15 V
(RHE) and 1.5 V, respectively. This is surprising because especially the film on the Co substrate
has a different morphology compared to films grown on FTO and Au (see Figure 4.11). In
conclusion, this signalizes that the morphology of the catalyst film plays a minor role for the
overall activity and that material composition, crystallinity and intrinsic activity are very similar
for the CoOx films deposited on Co, Au and FTO substrates, despite their different morphology.
Still, there are some differences between the samples regarding the capacitive currents in the
lower potential range before the onset of the OER. The Co- and especially the Au-sample have
higher capacitive current densities between 1.0 and 1.5 V, which is an indication for a higher
surface roughness of the films. A closer look to the black lines in the diagrams shows that also for
the blank substrates a higher capacitive current can be observed for the metals. This is consistent
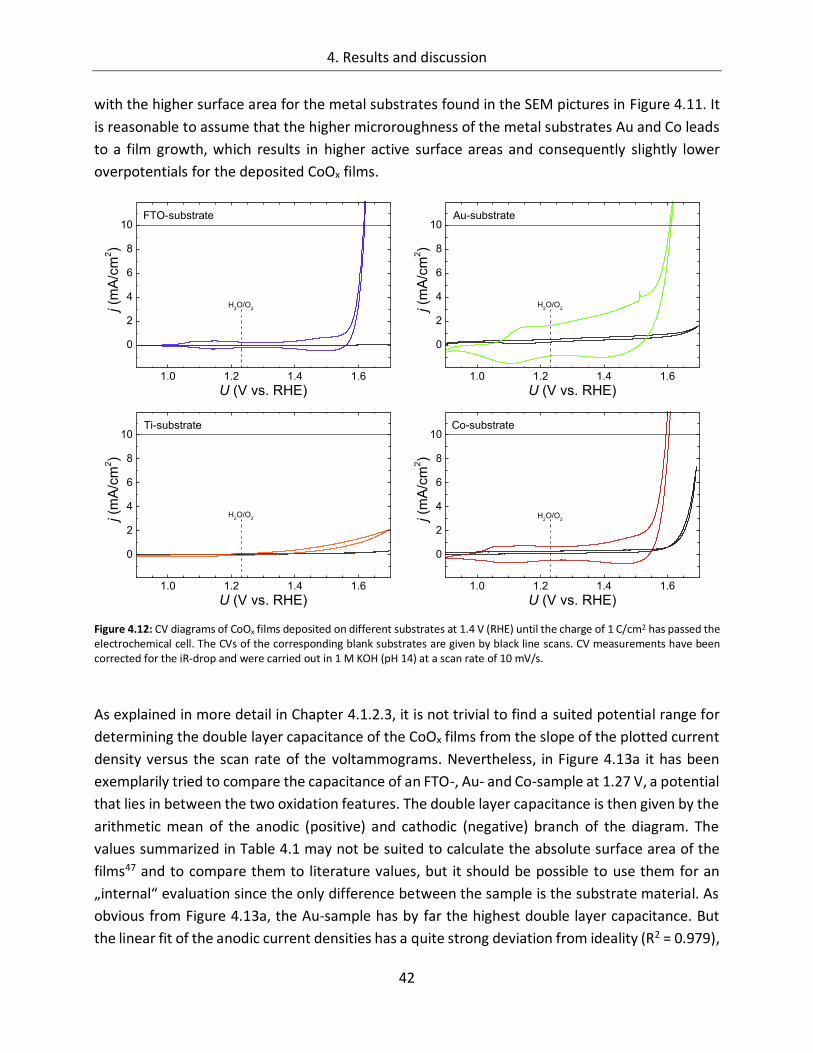
4. Results and discussion
42
with the higher surface area for the metal substrates found in the SEM pictures in Figure 4.11. It
is reasonable to assume that the higher microroughness of the metal substrates Au and Co leads
to a film growth, which results in higher active surface areas and consequently slightly lower
overpotentials for the deposited CoOx films.
Figure 4.12: CV diagrams of CoOx films deposited on different substrates at 1.4 V (RHE) until the charge of 1 C/cm2 has passed the electrochemical cell. The CVs of the corresponding blank substrates are given by black line scans. CV measurements have been corrected for the iR-drop and were carried out in 1 M KOH (pH 14) at a scan rate of 10 mV/s.
As explained in more detail in Chapter 4.1.2.3, it is not trivial to find a suited potential range for
determining the double layer capacitance of the CoOx films from the slope of the plotted current
density versus the scan rate of the voltammograms. Nevertheless, in Figure 4.13a it has been
exemplarily tried to compare the capacitance of an FTO-, Au- and Co-sample at 1.27 V, a potential
that lies in between the two oxidation features. The double layer capacitance is then given by the
arithmetic mean of the anodic (positive) and cathodic (negative) branch of the diagram. The
values summarized in Table 4.1 may not be suited to calculate the absolute surface area of the
films47 and to compare them to literature values, but it should be possible to use them for an
„internal“ evaluation since the only difference between the sample is the substrate material. As
obvious from Figure 4.13a, the Au-sample has by far the highest double layer capacitance. But
the linear fit of the anodic current densities has a quite strong deviation from ideality (R2 = 0.979),
1.0 1.2 1.4 1.6
0
2
4
6
8
10
j (m
A/c
m2)
U (V vs. RHE)
H2O/O
2
FTO-substrate
1.0 1.2 1.4 1.6
0
2
4
6
8
10
j (m
A/c
m2)
U (V vs. RHE)
H2O/O
2
Au-substrate
1.0 1.2 1.4 1.6
0
2
4
6
8
10Ti-substrate
j (m
A/c
m2)
U (V vs. RHE)
H2O/O
2
1.0 1.2 1.4 1.6
0
2
4
6
8
10Co-substrate
j (m
A/c
m2)
U (V vs. RHE)
H2O/O
2
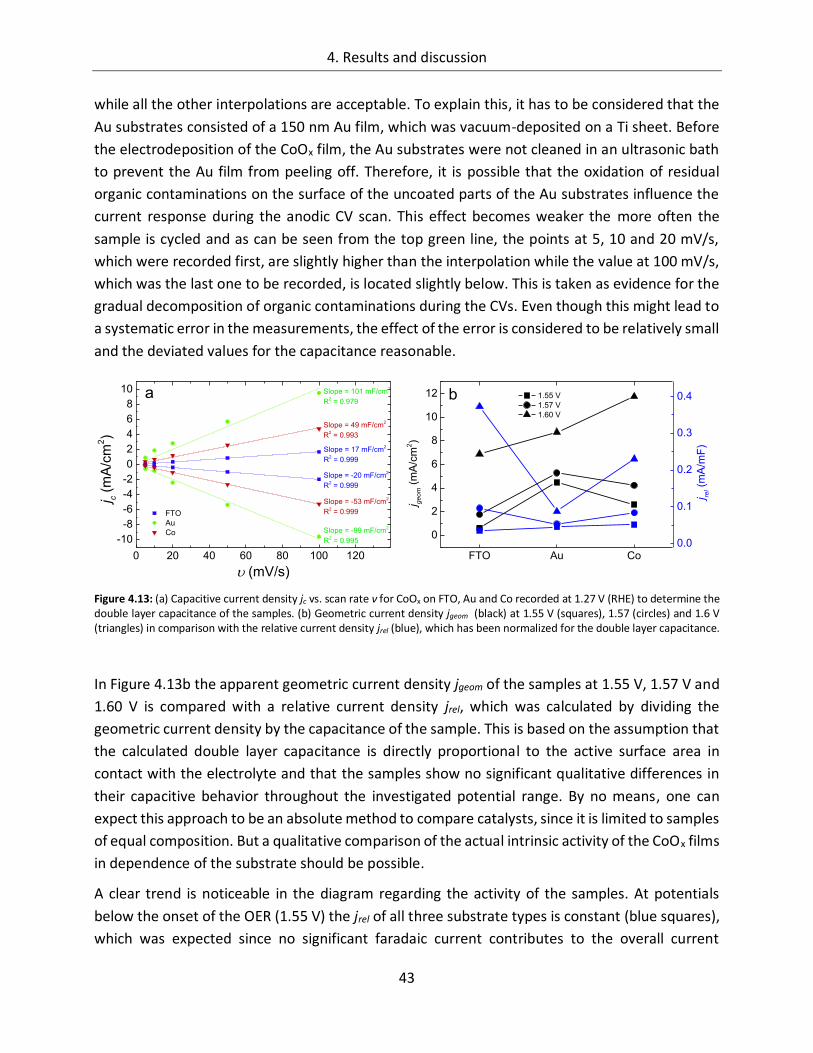
4. Results and discussion
43
while all the other interpolations are acceptable. To explain this, it has to be considered that the
Au substrates consisted of a 150 nm Au film, which was vacuum-deposited on a Ti sheet. Before
the electrodeposition of the CoOx film, the Au substrates were not cleaned in an ultrasonic bath
to prevent the Au film from peeling off. Therefore, it is possible that the oxidation of residual
organic contaminations on the surface of the uncoated parts of the Au substrates influence the
current response during the anodic CV scan. This effect becomes weaker the more often the
sample is cycled and as can be seen from the top green line, the points at 5, 10 and 20 mV/s,
which were recorded first, are slightly higher than the interpolation while the value at 100 mV/s,
which was the last one to be recorded, is located slightly below. This is taken as evidence for the
gradual decomposition of organic contaminations during the CVs. Even though this might lead to
a systematic error in the measurements, the effect of the error is considered to be relatively small
and the deviated values for the capacitance reasonable.
Figure 4.13: (a) Capacitive current density jc vs. scan rate ν for CoOx on FTO, Au and Co recorded at 1.27 V (RHE) to determine the double layer capacitance of the samples. (b) Geometric current density jgeom (black) at 1.55 V (squares), 1.57 (circles) and 1.6 V (triangles) in comparison with the relative current density jrel (blue), which has been normalized for the double layer capacitance.
In Figure 4.13b the apparent geometric current density jgeom of the samples at 1.55 V, 1.57 V and
1.60 V is compared with a relative current density jrel, which was calculated by dividing the
geometric current density by the capacitance of the sample. This is based on the assumption that
the calculated double layer capacitance is directly proportional to the active surface area in
contact with the electrolyte and that the samples show no significant qualitative differences in
their capacitive behavior throughout the investigated potential range. By no means, one can
expect this approach to be an absolute method to compare catalysts, since it is limited to samples
of equal composition. But a qualitative comparison of the actual intrinsic activity of the CoOx films
in dependence of the substrate should be possible.
A clear trend is noticeable in the diagram regarding the activity of the samples. At potentials
below the onset of the OER (1.55 V) the jrel of all three substrate types is constant (blue squares),
which was expected since no significant faradaic current contributes to the overall current
0 20 40 60 80 100 120
-10
-8
-6
-4
-2
0
2
4
6
8
10
FTO
Au
Co
Slope = 49 mF/cm2
R2 = 0.993
Slope = -53 mF/cm2
R2 = 0.999
Slope = -99 mF/cm2
R2 = 0.995
Slope = 101 mF/cm2
R2 = 0.979
Slope = -20 mF/cm2
R2 = 0.999
j c(
mA
/cm
2)
(mV/s)
Slope = 17 mF/cm2
R2 = 0.999
a
FTO Au Co
0
2
4
6
8
10
12 1.55 V
1.57 V
1.60 V
j ge
om (
mA
/cm
2)
b
0.0
0.1
0.2
0.3
0.4
j rel (
mA
/mF
)

4. Results and discussion
44
density. However, if the potential rises above the onset of the OER (1.60 V, blue triangles), jrel of
the FTO-sample increases dramatically compared to the Au- and the Co-sample, while the jgeom
(black lines) is the lowest one. This is interpreted in that way that CoOx on FTO catalyzes the OER
much more efficiently per unit surface area than the same film on Co and especially on Au, which
shows almost no increase in the relative current density despite the higher applied potential. In
contrast to reports on the benefit of Au as substrate130 and as incorporated nanoparticles133 for
the intrinsic activity of cobalt oxide towards the OER, no such effect of the Au support could be
observed here. It has to be stated though that the investigated films in this work were much
thicker compared to the layers from the literature, which possibly superimposes any benefits
from the strong electronegativity of Au. Furthermore, factors like bubble formation and/or
detachment as well as diffusion limitations and surface accessibility are not considered in this
experiments, but they can be seen as inherent film characteristics, which are hard to control in
the deposition process as the results of the former chapters showed.
In conclusion it can be stated that the type of substrate indeed has a strong influence on
deposition rate, morphology and catalytic activity of CoOx electrocatalysts. FTO/glass as substrate
has been identified as the most reliable support, because the CoOx films are formed in a very
homogeneous, stable and reproducible way and due to the transparency of the substrate a first
simple optical quality check is possible. Also, the CV characteristics are reasonably good in
absolute values and the very best of all substrates, when the double layer capacitance is taken
into account to calculate the relative current density per unit surface area. Cobalt oxide films
deposited on Co and Au substrates show similar good catalytic activities but have drawbacks in
film quality (homogeneity) and electrochemical reproducibility. Furthermore, the metallic
substrates, most of all Co, tend to participate in the electrocatalytic reactions, which is not
acceptable for any investigations on the actual cobalt oxide catalyst. Ti would be a very
convenient substrate for the application of cobalt oxide as OER catalyst in a photoelectrochemical
device20, but the electrochemical results in this chapter show that film growth and electrocatalytic
activity are very poor on Ti as substrate. Therefore, all further investigations were conducted on
FTO/glass substrates.
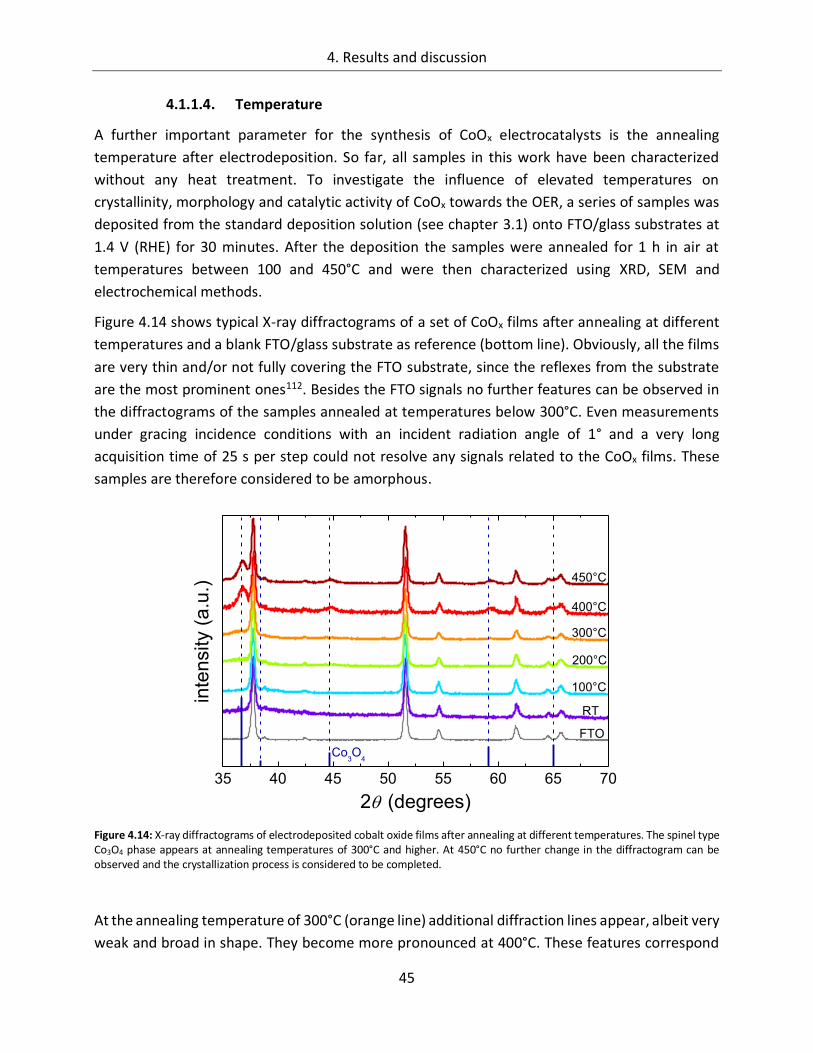
4. Results and discussion
45
4.1.1.4. Temperature
A further important parameter for the synthesis of CoOx electrocatalysts is the annealing
temperature after electrodeposition. So far, all samples in this work have been characterized
without any heat treatment. To investigate the influence of elevated temperatures on
crystallinity, morphology and catalytic activity of CoOx towards the OER, a series of samples was
deposited from the standard deposition solution (see chapter 3.1) onto FTO/glass substrates at
1.4 V (RHE) for 30 minutes. After the deposition the samples were annealed for 1 h in air at
temperatures between 100 and 450°C and were then characterized using XRD, SEM and
electrochemical methods.
Figure 4.14 shows typical X-ray diffractograms of a set of CoOx films after annealing at different
temperatures and a blank FTO/glass substrate as reference (bottom line). Obviously, all the films
are very thin and/or not fully covering the FTO substrate, since the reflexes from the substrate
are the most prominent ones112. Besides the FTO signals no further features can be observed in
the diffractograms of the samples annealed at temperatures below 300°C. Even measurements
under gracing incidence conditions with an incident radiation angle of 1° and a very long
acquisition time of 25 s per step could not resolve any signals related to the CoOx films. These
samples are therefore considered to be amorphous.
Figure 4.14: X-ray diffractograms of electrodeposited cobalt oxide films after annealing at different temperatures. The spinel type Co3O4 phase appears at annealing temperatures of 300°C and higher. At 450°C no further change in the diffractogram can be observed and the crystallization process is considered to be completed.
At the annealing temperature of 300°C (orange line) additional diffraction lines appear, albeit very
weak and broad in shape. They become more pronounced at 400°C. These features correspond
100°C
35 40 45 50 55 60 65 70
FTO
450°C
400°C
300°C
200°C
inte
nsity (
a.u
.)
2 (degrees)
Co3O
4
RT
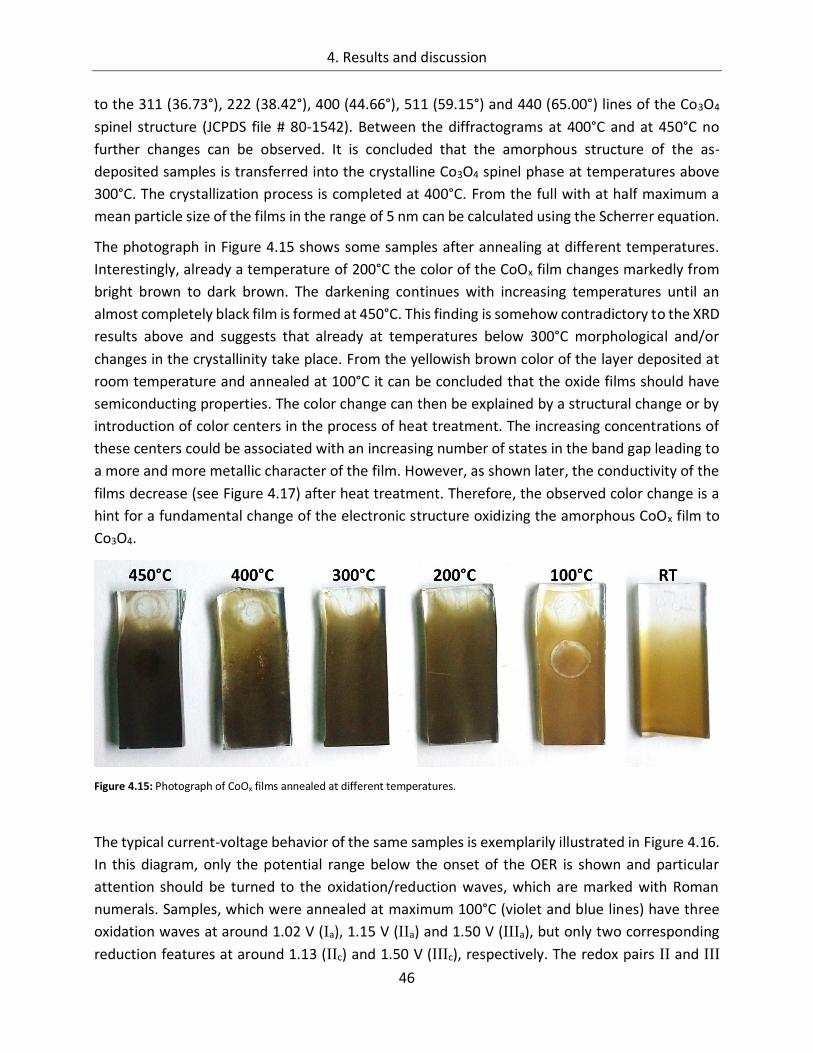
4. Results and discussion
46
to the 311 (36.73°), 222 (38.42°), 400 (44.66°), 511 (59.15°) and 440 (65.00°) lines of the Co3O4
spinel structure (JCPDS file # 80-1542). Between the diffractograms at 400°C and at 450°C no
further changes can be observed. It is concluded that the amorphous structure of the as-
deposited samples is transferred into the crystalline Co3O4 spinel phase at temperatures above
300°C. The crystallization process is completed at 400°C. From the full with at half maximum a
mean particle size of the films in the range of 5 nm can be calculated using the Scherrer equation.
The photograph in Figure 4.15 shows some samples after annealing at different temperatures.
Interestingly, already a temperature of 200°C the color of the CoOx film changes markedly from
bright brown to dark brown. The darkening continues with increasing temperatures until an
almost completely black film is formed at 450°C. This finding is somehow contradictory to the XRD
results above and suggests that already at temperatures below 300°C morphological and/or
changes in the crystallinity take place. From the yellowish brown color of the layer deposited at
room temperature and annealed at 100°C it can be concluded that the oxide films should have
semiconducting properties. The color change can then be explained by a structural change or by
introduction of color centers in the process of heat treatment. The increasing concentrations of
these centers could be associated with an increasing number of states in the band gap leading to
a more and more metallic character of the film. However, as shown later, the conductivity of the
films decrease (see Figure 4.17) after heat treatment. Therefore, the observed color change is a
hint for a fundamental change of the electronic structure oxidizing the amorphous CoOx film to
Co3O4.
Figure 4.15: Photograph of CoOx films annealed at different temperatures.
The typical current-voltage behavior of the same samples is exemplarily illustrated in Figure 4.16.
In this diagram, only the potential range below the onset of the OER is shown and particular
attention should be turned to the oxidation/reduction waves, which are marked with Roman
numerals. Samples, which were annealed at maximum 100°C (violet and blue lines) have three
oxidation waves at around 1.02 V (Ia), 1.15 V (IIa) and 1.50 V (IIIa), but only two corresponding
reduction features at around 1.13 (IIc) and 1.50 V (IIIc), respectively. The redox pairs II and III
4. Results and discussion
47
have been assigned in the literature to the transitions from Co2+ ↔ Co3+ and from Co3+ ↔ Co4+,
respectively112,83,116,81,134,135,80. The third oxidation wave at 1.5 V appears shortly before the onset
of the OER and can therefore be considered as an activation step of the catalyst79,112.
Furthermore, the oxygen evolution reaction is expected to occur on a fully oxidized Co4+
surface136. It is not trivial to identify the species involved in the redox processes because many
different cobalt oxides may appear in the anodic potential range and have to be considered, such
as CoO, Co(OH)2, Co3O4, Co2O3, CoOOH and CoO2. A set of possible redox reaction equations is
summarized in Table 4.2. Some of the depicted reactions have their electrode equilibrium
potentials below the investigated potential range (No. 1-4), but still several redox couples have
to be taken into account and match the observed redox features in the CV diagram very well.
Especially the reactions No. 6 and No. 9 have been considered often in the
literature74,83,116,81,134,136. The high number of possible reactions shows the complexity of the
cobalt oxide/hydroxide system under anodic potential conditions in the alkaline regime.
Table 4.2: Redox couples, half-cell reactions and corresponding electrode equilibrium potentials of cobalt oxide/hydroxide under anodic potential conditions in alkaline solution. Data have been derived from Ref 58.
No. Redox couple Half-cell reaction Electrode potential
(V vs. RHE)
1 CoO/Co3O4 3 CoO + 2 OH- → Co3O4 + H2O + 2 e- 0.555
2 Co(OH)2/Co3O4 3 Co(OH)2 + 2 OH- → Co3O4 + 4 H2O + 2 e- 0.732
3 CoO/CoOOH CoO + OH- → CoOOH + e- 0.752
4 Co(OH)2/CoOOH Co(OH)2 + OH- → CoOOH + H2O + e- 0.870
5 CoO/CoO2 CoO + 2 OH- → CoO2 + H2O + 2 e- 1.119
6 Co3O4/CoOOH Co3O4 + OH- + H2O → 3 CoOOH + e- 1.146
7 Co(OH)2/CoO2 Co(OH)2 + 2 OH- → CoO2 + 2 H2O + 2e- 1.178
8 Co3O4/CoO2 Co3O4 + 4 OH- → 3 CoO2 + 2 H2O + 4 e- 1.401
9 CoOOH/CoO2 CoOOH + OH- → CoO2 + H2O + e- 1.486
The oxidation wave Ia has also been observed previously and was assigned to take part in the Co2+
↔ Co3+ transition135,137, but a few reports also speculate about the origin of this feature to be
the oxidation of adsorbed hydroxyl ions82,138 However, it is remarkable that this wave is
apparently expression of an irreversible process.
The third oxidation feature (IIIa) at around 1.5 V appears as a broad and weak one in the case of
the as-deposited sample and the sample heated at 100°C. This can be interpreted as an overlap
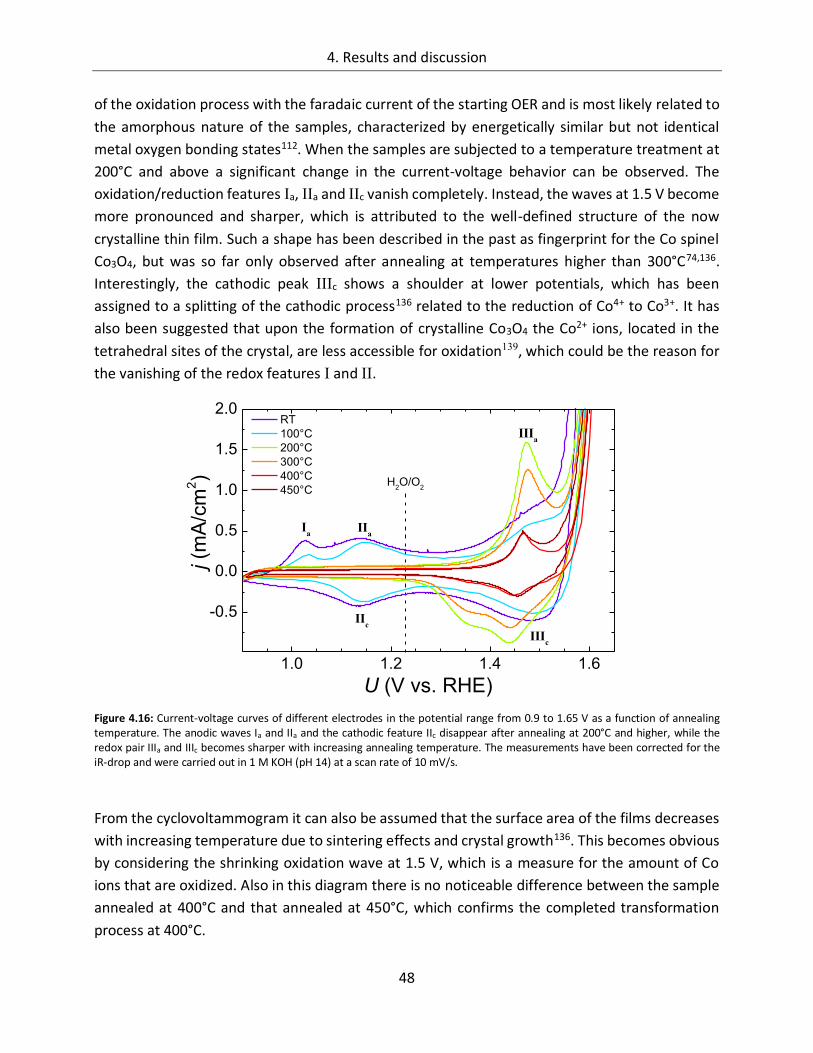
4. Results and discussion
48
of the oxidation process with the faradaic current of the starting OER and is most likely related to
the amorphous nature of the samples, characterized by energetically similar but not identical
metal oxygen bonding states112. When the samples are subjected to a temperature treatment at
200°C and above a significant change in the current-voltage behavior can be observed. The
oxidation/reduction features Ia, IIa and IIc vanish completely. Instead, the waves at 1.5 V become
more pronounced and sharper, which is attributed to the well-defined structure of the now
crystalline thin film. Such a shape has been described in the past as fingerprint for the Co spinel
Co3O4, but was so far only observed after annealing at temperatures higher than 300°C74,136.
Interestingly, the cathodic peak IIIc shows a shoulder at lower potentials, which has been
assigned to a splitting of the cathodic process136 related to the reduction of Co4+ to Co3+. It has
also been suggested that upon the formation of crystalline Co3O4 the Co2+ ions, located in the
tetrahedral sites of the crystal, are less accessible for oxidation139, which could be the reason for
the vanishing of the redox features I and II.
Figure 4.16: Current-voltage curves of different electrodes in the potential range from 0.9 to 1.65 V as a function of annealing temperature. The anodic waves Ia and IIa and the cathodic feature IIc disappear after annealing at 200°C and higher, while the redox pair IIIa and IIIc becomes sharper with increasing annealing temperature. The measurements have been corrected for the iR-drop and were carried out in 1 M KOH (pH 14) at a scan rate of 10 mV/s.
From the cyclovoltammogram it can also be assumed that the surface area of the films decreases
with increasing temperature due to sintering effects and crystal growth136. This becomes obvious
by considering the shrinking oxidation wave at 1.5 V, which is a measure for the amount of Co
ions that are oxidized. Also in this diagram there is no noticeable difference between the sample
annealed at 400°C and that annealed at 450°C, which confirms the completed transformation
process at 400°C.
1.0 1.2 1.4 1.6
-0.5
0.0
0.5
1.0
1.5
2.0
IIc
IIIc
IIa
IIIa
j (m
A/c
m2)
U (V vs. RHE)
H2O/O
2
RT
100°C
200°C
300°C
400°C
450°C
Ia
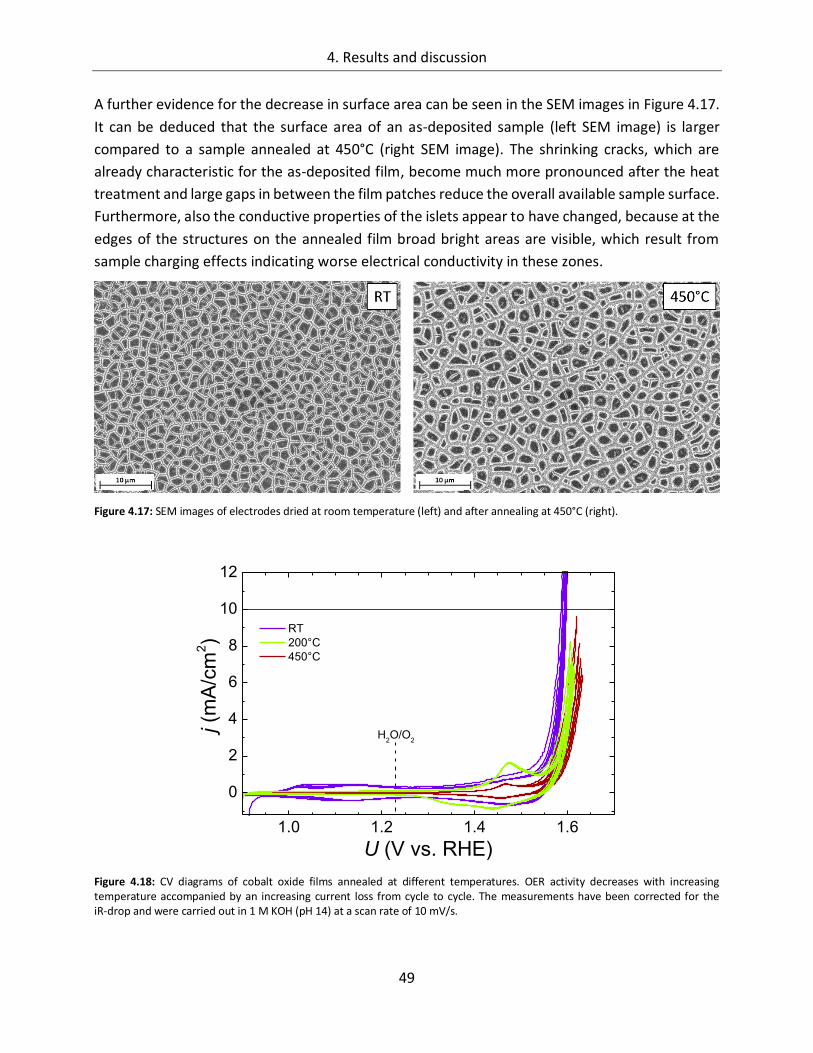
4. Results and discussion
49
A further evidence for the decrease in surface area can be seen in the SEM images in Figure 4.17.
It can be deduced that the surface area of an as-deposited sample (left SEM image) is larger
compared to a sample annealed at 450°C (right SEM image). The shrinking cracks, which are
already characteristic for the as-deposited film, become much more pronounced after the heat
treatment and large gaps in between the film patches reduce the overall available sample surface.
Furthermore, also the conductive properties of the islets appear to have changed, because at the
edges of the structures on the annealed film broad bright areas are visible, which result from
sample charging effects indicating worse electrical conductivity in these zones.
Figure 4.17: SEM images of electrodes dried at room temperature (left) and after annealing at 450°C (right).
Figure 4.18: CV diagrams of cobalt oxide films annealed at different temperatures. OER activity decreases with increasing temperature accompanied by an increasing current loss from cycle to cycle. The measurements have been corrected for the iR-drop and were carried out in 1 M KOH (pH 14) at a scan rate of 10 mV/s.
1.0 1.2 1.4 1.6
0
2
4
6
8
10
12
RT
200°C
450°C
j (m
A/c
m2)
U (V vs. RHE)
H2O/O
2
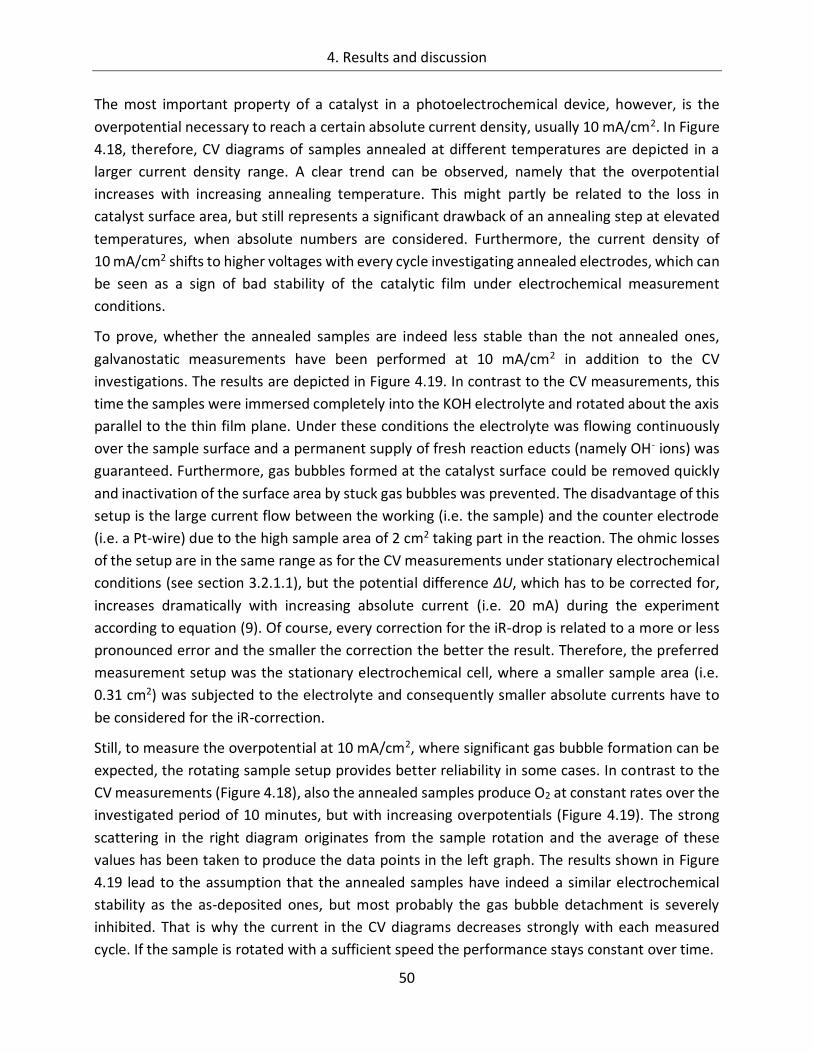
4. Results and discussion
50
The most important property of a catalyst in a photoelectrochemical device, however, is the
overpotential necessary to reach a certain absolute current density, usually 10 mA/cm2. In Figure
4.18, therefore, CV diagrams of samples annealed at different temperatures are depicted in a
larger current density range. A clear trend can be observed, namely that the overpotential
increases with increasing annealing temperature. This might partly be related to the loss in
catalyst surface area, but still represents a significant drawback of an annealing step at elevated
temperatures, when absolute numbers are considered. Furthermore, the current density of
10 mA/cm2 shifts to higher voltages with every cycle investigating annealed electrodes, which can
be seen as a sign of bad stability of the catalytic film under electrochemical measurement
conditions.
To prove, whether the annealed samples are indeed less stable than the not annealed ones,
galvanostatic measurements have been performed at 10 mA/cm2 in addition to the CV
investigations. The results are depicted in Figure 4.19. In contrast to the CV measurements, this
time the samples were immersed completely into the KOH electrolyte and rotated about the axis
parallel to the thin film plane. Under these conditions the electrolyte was flowing continuously
over the sample surface and a permanent supply of fresh reaction educts (namely OH- ions) was
guaranteed. Furthermore, gas bubbles formed at the catalyst surface could be removed quickly
and inactivation of the surface area by stuck gas bubbles was prevented. The disadvantage of this
setup is the large current flow between the working (i.e. the sample) and the counter electrode
(i.e. a Pt-wire) due to the high sample area of 2 cm2 taking part in the reaction. The ohmic losses
of the setup are in the same range as for the CV measurements under stationary electrochemical
conditions (see section 3.2.1.1), but the potential difference ΔU, which has to be corrected for,
increases dramatically with increasing absolute current (i.e. 20 mA) during the experiment
according to equation (9). Of course, every correction for the iR-drop is related to a more or less
pronounced error and the smaller the correction the better the result. Therefore, the preferred
measurement setup was the stationary electrochemical cell, where a smaller sample area (i.e.
0.31 cm2) was subjected to the electrolyte and consequently smaller absolute currents have to
be considered for the iR-correction.
Still, to measure the overpotential at 10 mA/cm2, where significant gas bubble formation can be
expected, the rotating sample setup provides better reliability in some cases. In contrast to the
CV measurements (Figure 4.18), also the annealed samples produce O2 at constant rates over the
investigated period of 10 minutes, but with increasing overpotentials (Figure 4.19). The strong
scattering in the right diagram originates from the sample rotation and the average of these
values has been taken to produce the data points in the left graph. The results shown in Figure
4.19 lead to the assumption that the annealed samples have indeed a similar electrochemical
stability as the as-deposited ones, but most probably the gas bubble detachment is severely
inhibited. That is why the current in the CV diagrams decreases strongly with each measured
cycle. If the sample is rotated with a sufficient speed the performance stays constant over time.
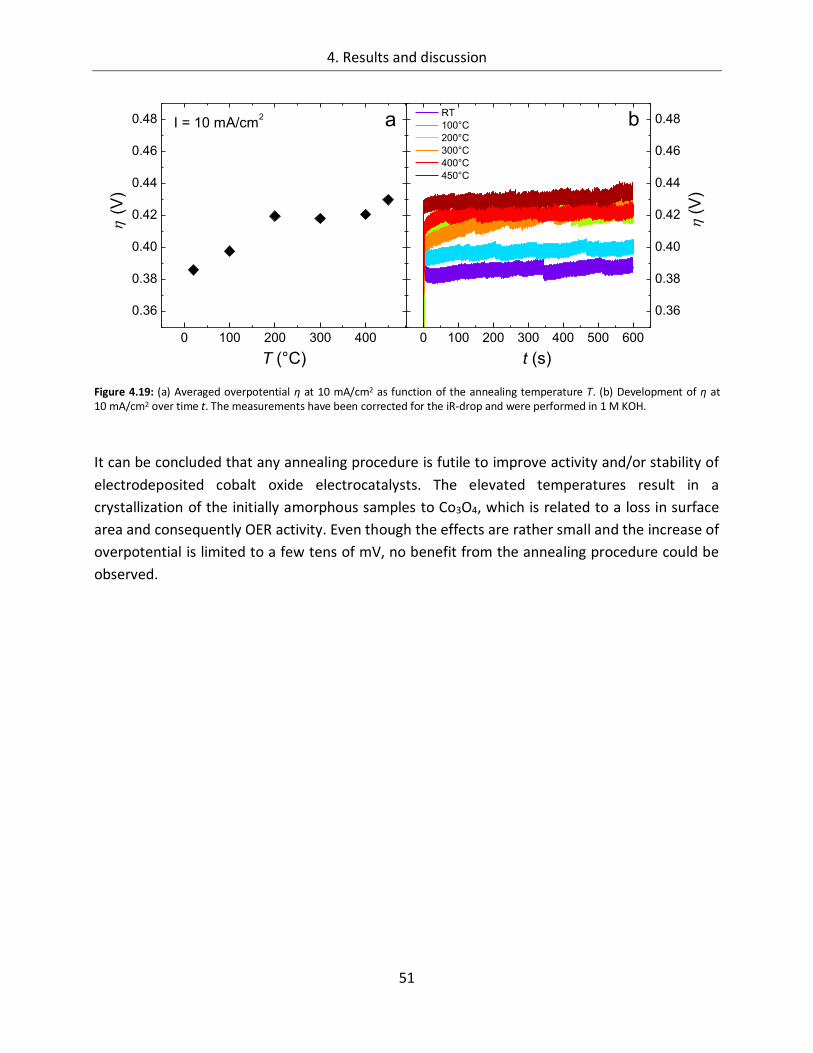
4. Results and discussion
51
Figure 4.19: (a) Averaged overpotential η at 10 mA/cm2 as function of the annealing temperature T. (b) Development of η at 10 mA/cm2 over time t. The measurements have been corrected for the iR-drop and were performed in 1 M KOH.
It can be concluded that any annealing procedure is futile to improve activity and/or stability of
electrodeposited cobalt oxide electrocatalysts. The elevated temperatures result in a
crystallization of the initially amorphous samples to Co3O4, which is related to a loss in surface
area and consequently OER activity. Even though the effects are rather small and the increase of
overpotential is limited to a few tens of mV, no benefit from the annealing procedure could be
observed.
0 100 200 300 400 500 600
0.36
0.38
0.40
0.42
0.44
0.46
0.48 RT
100°C
200°C
300°C
400°C
450°C
(
V)
t (s)
0 100 200 300 400
0.36
0.38
0.40
0.42
0.44
0.46
0.48 I = 10 mA/cm2 b
(
V)
T (°C)
a

4. Results and discussion
52
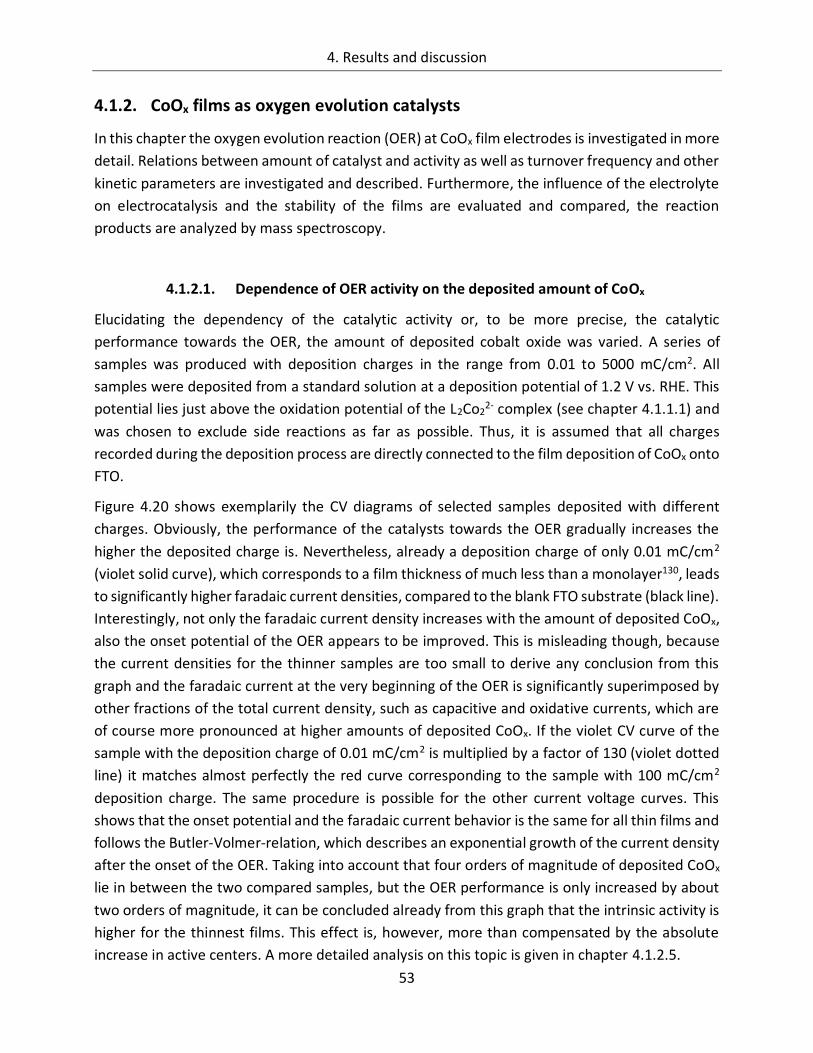
4. Results and discussion
53
4.1.2. CoOx films as oxygen evolution catalysts
In this chapter the oxygen evolution reaction (OER) at CoOx film electrodes is investigated in more
detail. Relations between amount of catalyst and activity as well as turnover frequency and other
kinetic parameters are investigated and described. Furthermore, the influence of the electrolyte
on electrocatalysis and the stability of the films are evaluated and compared, the reaction
products are analyzed by mass spectroscopy.
4.1.2.1. Dependence of OER activity on the deposited amount of CoOx
Elucidating the dependency of the catalytic activity or, to be more precise, the catalytic
performance towards the OER, the amount of deposited cobalt oxide was varied. A series of
samples was produced with deposition charges in the range from 0.01 to 5000 mC/cm2. All
samples were deposited from a standard solution at a deposition potential of 1.2 V vs. RHE. This
potential lies just above the oxidation potential of the L2Co22- complex (see chapter 4.1.1.1) and
was chosen to exclude side reactions as far as possible. Thus, it is assumed that all charges
recorded during the deposition process are directly connected to the film deposition of CoOx onto
FTO.
Figure 4.20 shows exemplarily the CV diagrams of selected samples deposited with different
charges. Obviously, the performance of the catalysts towards the OER gradually increases the
higher the deposited charge is. Nevertheless, already a deposition charge of only 0.01 mC/cm2
(violet solid curve), which corresponds to a film thickness of much less than a monolayer130, leads
to significantly higher faradaic current densities, compared to the blank FTO substrate (black line).
Interestingly, not only the faradaic current density increases with the amount of deposited CoOx,
also the onset potential of the OER appears to be improved. This is misleading though, because
the current densities for the thinner samples are too small to derive any conclusion from this
graph and the faradaic current at the very beginning of the OER is significantly superimposed by
other fractions of the total current density, such as capacitive and oxidative currents, which are
of course more pronounced at higher amounts of deposited CoOx. If the violet CV curve of the
sample with the deposition charge of 0.01 mC/cm2 is multiplied by a factor of 130 (violet dotted
line) it matches almost perfectly the red curve corresponding to the sample with 100 mC/cm2
deposition charge. The same procedure is possible for the other current voltage curves. This
shows that the onset potential and the faradaic current behavior is the same for all thin films and
follows the Butler-Volmer-relation, which describes an exponential growth of the current density
after the onset of the OER. Taking into account that four orders of magnitude of deposited CoOx
lie in between the two compared samples, but the OER performance is only increased by about
two orders of magnitude, it can be concluded already from this graph that the intrinsic activity is
higher for the thinnest films. This effect is, however, more than compensated by the absolute
increase in active centers. A more detailed analysis on this topic is given in chapter 4.1.2.5.
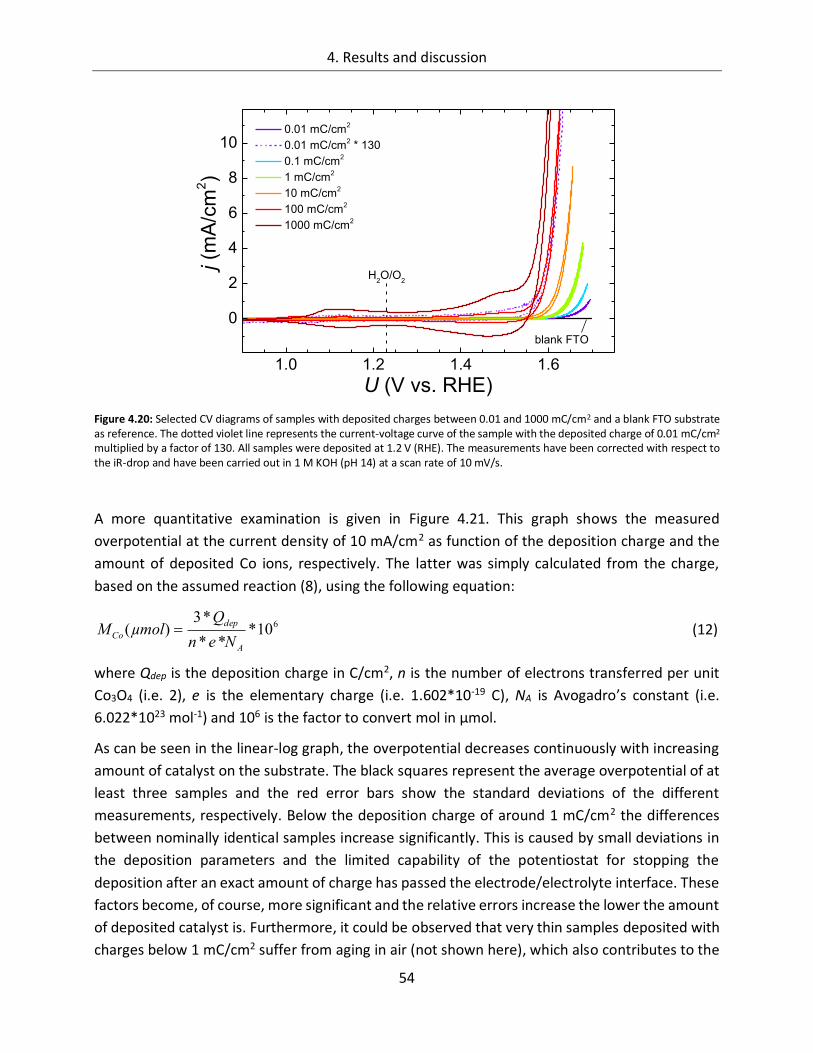
4. Results and discussion
54
Figure 4.20: Selected CV diagrams of samples with deposited charges between 0.01 and 1000 mC/cm2 and a blank FTO substrate as reference. The dotted violet line represents the current-voltage curve of the sample with the deposited charge of 0.01 mC/cm2 multiplied by a factor of 130. All samples were deposited at 1.2 V (RHE). The measurements have been corrected with respect to the iR-drop and have been carried out in 1 M KOH (pH 14) at a scan rate of 10 mV/s.
A more quantitative examination is given in Figure 4.21. This graph shows the measured
overpotential at the current density of 10 mA/cm2 as function of the deposition charge and the
amount of deposited Co ions, respectively. The latter was simply calculated from the charge,
based on the assumed reaction (8), using the following equation:
610***
*3)(
A
dep
CoNen
QµmolM (12)
where Qdep is the deposition charge in C/cm2, n is the number of electrons transferred per unit
Co3O4 (i.e. 2), e is the elementary charge (i.e. 1.602*10-19 C), NA is Avogadro’s constant (i.e.
6.022*1023 mol-1) and 106 is the factor to convert mol in µmol.
As can be seen in the linear-log graph, the overpotential decreases continuously with increasing
amount of catalyst on the substrate. The black squares represent the average overpotential of at
least three samples and the red error bars show the standard deviations of the different
measurements, respectively. Below the deposition charge of around 1 mC/cm2 the differences
between nominally identical samples increase significantly. This is caused by small deviations in
the deposition parameters and the limited capability of the potentiostat for stopping the
deposition after an exact amount of charge has passed the electrode/electrolyte interface. These
factors become, of course, more significant and the relative errors increase the lower the amount
of deposited catalyst is. Furthermore, it could be observed that very thin samples deposited with
charges below 1 mC/cm2 suffer from aging in air (not shown here), which also contributes to the
1.0 1.2 1.4 1.6
0
2
4
6
8
10
blank FTO
0.01 mC/cm2
0.01 mC/cm2 * 130
0.1 mC/cm2
1 mC/cm2
10 mC/cm2
100 mC/cm2
1000 mC/cm2
j (m
A/c
m2)
U (V vs. RHE)
H2O/O
2
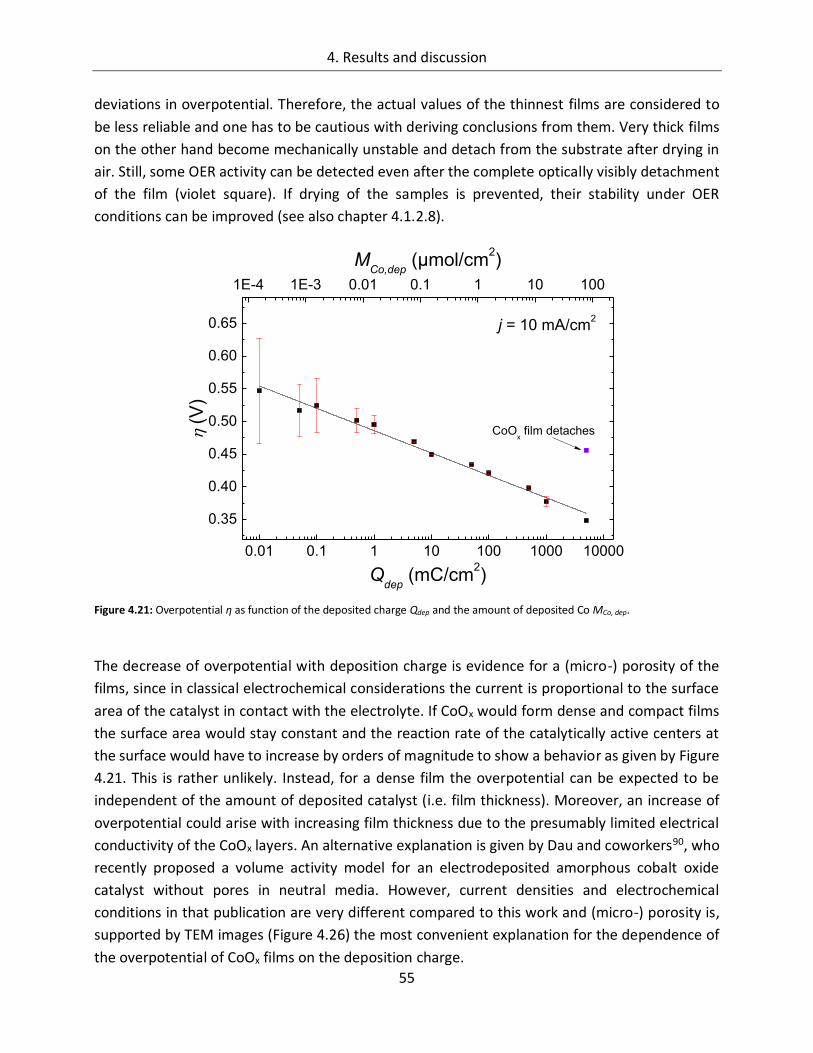
4. Results and discussion
55
deviations in overpotential. Therefore, the actual values of the thinnest films are considered to
be less reliable and one has to be cautious with deriving conclusions from them. Very thick films
on the other hand become mechanically unstable and detach from the substrate after drying in
air. Still, some OER activity can be detected even after the complete optically visibly detachment
of the film (violet square). If drying of the samples is prevented, their stability under OER
conditions can be improved (see also chapter 4.1.2.8).
Figure 4.21: Overpotential η as function of the deposited charge Qdep and the amount of deposited Co MCo, dep.
The decrease of overpotential with deposition charge is evidence for a (micro-) porosity of the
films, since in classical electrochemical considerations the current is proportional to the surface
area of the catalyst in contact with the electrolyte. If CoOx would form dense and compact films
the surface area would stay constant and the reaction rate of the catalytically active centers at
the surface would have to increase by orders of magnitude to show a behavior as given by Figure
4.21. This is rather unlikely. Instead, for a dense film the overpotential can be expected to be
independent of the amount of deposited catalyst (i.e. film thickness). Moreover, an increase of
overpotential could arise with increasing film thickness due to the presumably limited electrical
conductivity of the CoOx layers. An alternative explanation is given by Dau and coworkers90, who
recently proposed a volume activity model for an electrodeposited amorphous cobalt oxide
catalyst without pores in neutral media. However, current densities and electrochemical
conditions in that publication are very different compared to this work and (micro-) porosity is,
supported by TEM images (Figure 4.26) the most convenient explanation for the dependence of
the overpotential of CoOx films on the deposition charge.
0.01 0.1 1 10 100 1000 10000
0.35
0.40
0.45
0.50
0.55
0.60
0.65
(
V)
Qdep
(mC/cm2)
CoOx film detaches
j = 10 mA/cm2
1E-4 1E-3 0.01 0.1 1 10 100
MCo,dep
(µmol/cm2)
4. Results and discussion
56
As already visible from Figure 4.20 also the very thin samples appear to have a significantly
increased activity towards the OER compared to the blank FTO substrate, which has an
overpotential of 1.26 V at 10 mA/cm2 (not shown in the graph). Yeo and Bell130 calculated a film
thickness of about 0.4 monolayers after having deposited 0.095 mC/cm2 of cobalt oxide on Au.
They reported an overpotential (from CV) of around 540 mV at 10 mA/cm2 in 0.1 M KOH, which
is close to the value found in this work and shows that already a sub-monolayer film of cobalt
oxide is capable to oxidize water at relatively high rates.
4. Results and discussion
57
4.1.2.2. Film thickness
The results of the prior chapter have been leading to the assumption that the volume or in other
words the sample thickness plays a role for the OER performance, since the overpotential
decreases continuously with increasing amount of electrochemically deposited cobalt oxide.
Hence, the sample thickness was estimated from SEM cross section and profilometer
investigations. The results are summarized in Figure 4.22 and show the measured film thicknesses
as function of flown charge during electrodeposition. As expected, the sample thickness increases
with increasing deposition charge. However, the measurements with the profilometer did not
always provide reliable results and showed a poor reproducibility as can be seen by the blue
squares and green triangles, respectively. The results generally tend to underestimate the sample
thickness compared to the SEM cross section measurements (cyan diamonds; see also Figure
4.23). Still, it can be noticed that samples deposited at 1.2 V are by trend thicker than samples
deposited at 1.4 V.
Figure 4.22. Sample thickness d as function of the deposition charge Qdep. The blue squares and green triangles represent samples deposited at 1.2 V and 1.4 V (RHE) measured with a profilometer, respectively. The cyan diamonds are the results of cross section SEM investigations on samples deposited at 1.2 V, the black line shows the sample thickness calculated according to equation (13).
The black line in the graph represents the expected film thickness assuming a compound close to
Co3O4 is formed and was calculated according to the equation:
***
10**)(
7
A
dep
Nen
MQnmd (13)
where Qdep is the deposited charge in C/cm2, M is the molar mass of Co3O4 (240.8 g/mol)140, n is
number of transferred electrons per unit Co3O4 (i.e. 2) according to equation (8), ρ is the density
of Co3O4 (6.07 g/cm3)140 and e and NA represent the elementary charge and Avogadro’s constant,
10 100 1000
10
100
1000
1.2 V - profilometer
1.4 V - profilometer
1.2 V- SEM
d(
nm
)
Qdep
(mC/cm2)
theoretical thickness
4. Results and discussion
58
respectively. Comparing the theoretical thickness of a Co3O4 film with the measured SEM cross
section values (cyan line) it can be seen that the film grows slower than expected with respect to
the deposition charge. This shows that the process of film formation is rather complex.
Tentatively, a densification of the film with increasing thickness occurs as the pores far away from
the sample surface become smaller and smaller. The film thickness can be expressed as function
of the deposition charge by:
d = 5.02*Qdep0,76 (14)
Samples with thicknesses below 10 nm could not be resolved neither by SEM nor by profilometer
measurements. Even though, the interpolation from Figure 4.22 is based on only three data
points, the coefficient of determination of R2 = 0.9997 gives reason for the reliability of this fit.
Therefore, for further considerations equation (14) was used for estimating the thicknesses of the
very thin samples.
Cross section SEM images of samples with a deposition charge of 10 (a), 100 (b) and 1000 mC/cm2
(c) can be found in Figure 4.23. They show the typical film thickness and morphology of the
samples in detail. While at 10 mC/cm2 (a) the CoOx film is uniformly distributed over the FTO
substrate and only a few nm thick, the dimension of the film grows to around 170 nm, when 100
mC/cm2 are deposited (b). At this stage the film is still fully covering the substrate. Increasing the
deposition charge by another order of magnitude (c) results in an islet structure, already observed
and described previously (see Figure 4.11). Interestingly, from this images no significant change
in the surface area or any porosity can be observed. Nevertheless, the resolution of the SEM is
not high enough to exclude pores or features in the order of a few nanometers.
4. Results and discussion
59
Figure 4.23: SEM images of samples deposited at 1.2 V (RHE) until 10 (a), 100 (b) and 1000 mC/cm2 have passed the electrode/electrolyte interface. The samples were cut and prepared for cross section analysis in a sandwich alignment.
4. Results and discussion
60
4.1.2.3. Determination of the electrochemically active surface area (ECASA)
In principal all considerations on electrocatalytic reactions are based on the assumption that
charge transfer has to occur at the electrode/electrolyte interface22,141. The electrochemically
active surface area (ECASA) therefore plays a crucial role for characterizing the activity of a
catalyst. This means that at a certain overpotential a catalyst with a weak intrinsic activity (i.e. a
low reaction rate per active center), but a very high ECASA may have a better overall geometric
faradaic current density than a catalyst with a very high intrinsic activity but a smooth surface.
The estimation of the ECASA is one of the most challenging tasks in electrocatalysis, because there
is no established and generally accepted method determining the ECASA of a solid electrode141.
Several techniques have been developed, but they are only physically valid in narrow
confinements or only applicable to allow a comparison within one material system.
In the following, it was tried to estimate the ECASA of the CoOx catalysts by measuring the double
layer capacitance of the films. This can be done by recording current-voltage curves at various
scan rates in a small potential range, where no oxidative/reductive or faradaic current can be
expected and the only contribution to the measured current comes from charging of the double
layer capacitor at the electrode/electrolyte interface47,136,141–143. The current density values of the
anodic and cathodic scan, corresponding to a potential in the middle of the investigated range,
are then plotted against the sweep rate and the mean of the slopes of the best-fit lines gives the
double layer capacitance according to the equation:
32 10*)/(d
djcmmFC c
dl (15)
where jc is the measured capacitive current density in mA/cm2 and ν is the scan rate in mV/s (see
also Figure 4.13). The calculated Cdl has then to be normalized with the Cdl of an “ideal smooth”
film (i.e. real surface area = geometric surface area) of the same electrode material, in order to
receive the roughness factor of the sample. Unfortunately, very few experimental data are
available, describing the nature of “ideal smooth” electrodes, which is the main limitation for this
method. In literature, values ranging from 40 47 to 80 µF/cm2 136 have been used for the
calculation of roughness factors, assuming that the Cdl per unit area is approximately the same
for all oxides. Most authors though refer to Levine and Smith144, who calculated a value of
60 µF/cm2. This approximation has been severely criticized141 and it can be doubted that the
ESCAs of electrodes of different nature can be compared in absolute numbers.
In this work, it was tried, to investigate the relationship between ECASA and the amount of
deposited cobalt oxide. Since all samples nominally consist of the same electrode material and
only the deposition charge was varied, the voltammetric method described above should be
applicable for at least an internal comparison. Figure 4.24a shows the CV diagram of one of the
samples with the regions marked with dotted circles, where the capacitance measurements have
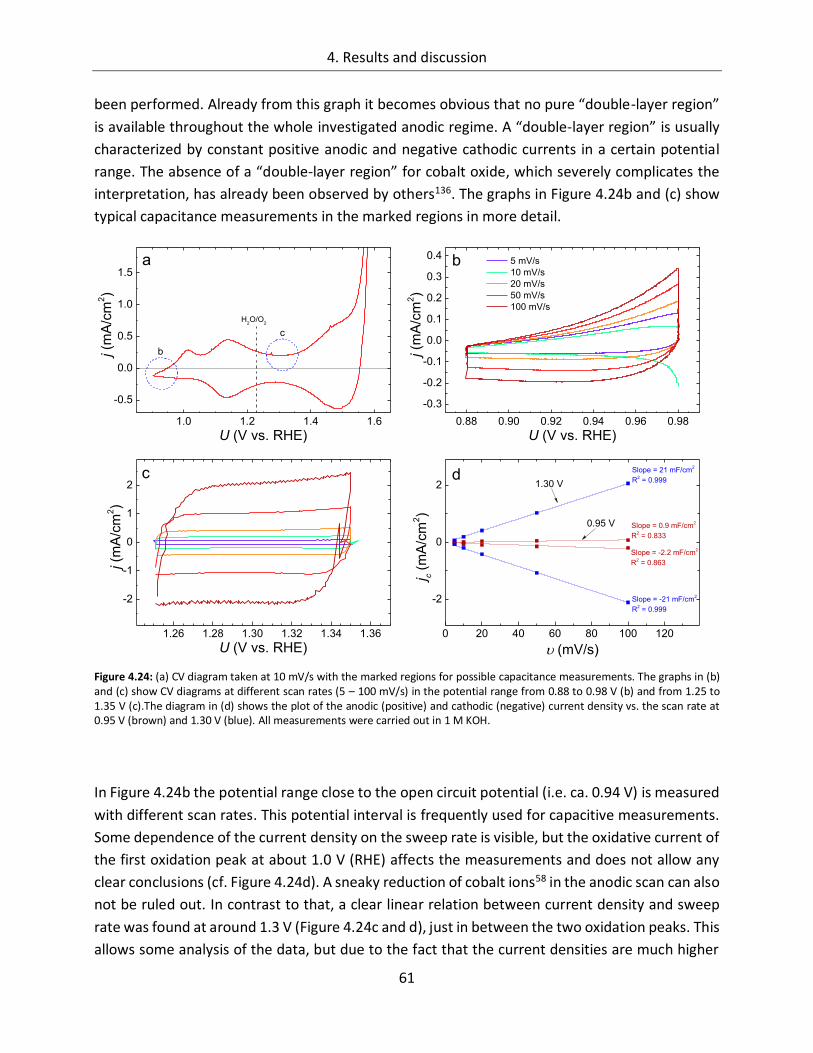
4. Results and discussion
61
been performed. Already from this graph it becomes obvious that no pure “double-layer region”
is available throughout the whole investigated anodic regime. A “double-layer region” is usually
characterized by constant positive anodic and negative cathodic currents in a certain potential
range. The absence of a “double-layer region” for cobalt oxide, which severely complicates the
interpretation, has already been observed by others136. The graphs in Figure 4.24b and (c) show
typical capacitance measurements in the marked regions in more detail.
Figure 4.24: (a) CV diagram taken at 10 mV/s with the marked regions for possible capacitance measurements. The graphs in (b) and (c) show CV diagrams at different scan rates (5 – 100 mV/s) in the potential range from 0.88 to 0.98 V (b) and from 1.25 to 1.35 V (c).The diagram in (d) shows the plot of the anodic (positive) and cathodic (negative) current density vs. the scan rate at 0.95 V (brown) and 1.30 V (blue). All measurements were carried out in 1 M KOH.
In Figure 4.24b the potential range close to the open circuit potential (i.e. ca. 0.94 V) is measured
with different scan rates. This potential interval is frequently used for capacitive measurements.
Some dependence of the current density on the sweep rate is visible, but the oxidative current of
the first oxidation peak at about 1.0 V (RHE) affects the measurements and does not allow any
clear conclusions (cf. Figure 4.24d). A sneaky reduction of cobalt ions58 in the anodic scan can also
not be ruled out. In contrast to that, a clear linear relation between current density and sweep
rate was found at around 1.3 V (Figure 4.24c and d), just in between the two oxidation peaks. This
allows some analysis of the data, but due to the fact that the current densities are much higher
1.0 1.2 1.4 1.6
-0.5
0.0
0.5
1.0
1.5
c
b
j (m
A/c
m2)
U (V vs. RHE)
H2O/O
2
a
0.88 0.90 0.92 0.94 0.96 0.98
-0.3
-0.2
-0.1
0.0
0.1
0.2
0.3
0.4 5 mV/s
10 mV/s
20 mV/s
50 mV/s
100 mV/s
b
j (m
A/c
m2)
U (V vs. RHE)
1.26 1.28 1.30 1.32 1.34 1.36
-2
-1
0
1
2c
j (m
A/c
m2)
U (V vs. RHE)0 20 40 60 80 100 120
-2
0
2d
1.30 V
Slope = -2.2 mF/cm2
R2 = 0.863
Slope = 0.9 mF/cm2
R2 = 0.833
Slope = -21 mF/cm2
R2 = 0.999
Slope = 21 mF/cm2
R2 = 0.999
j c(
mA
/cm
2)
(mV/s)
0.95 V
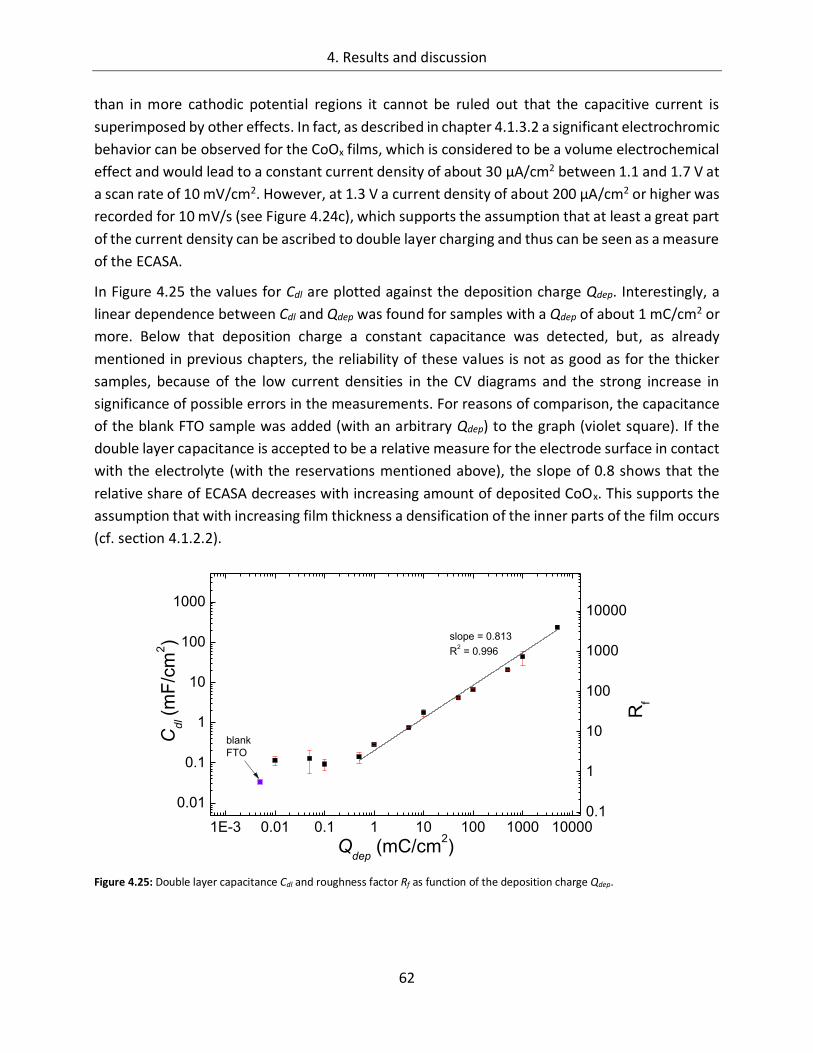
4. Results and discussion
62
than in more cathodic potential regions it cannot be ruled out that the capacitive current is
superimposed by other effects. In fact, as described in chapter 4.1.3.2 a significant electrochromic
behavior can be observed for the CoOx films, which is considered to be a volume electrochemical
effect and would lead to a constant current density of about 30 µA/cm2 between 1.1 and 1.7 V at
a scan rate of 10 mV/cm2. However, at 1.3 V a current density of about 200 µA/cm2 or higher was
recorded for 10 mV/s (see Figure 4.24c), which supports the assumption that at least a great part
of the current density can be ascribed to double layer charging and thus can be seen as a measure
of the ECASA.
In Figure 4.25 the values for Cdl are plotted against the deposition charge Qdep. Interestingly, a
linear dependence between Cdl and Qdep was found for samples with a Qdep of about 1 mC/cm2 or
more. Below that deposition charge a constant capacitance was detected, but, as already
mentioned in previous chapters, the reliability of these values is not as good as for the thicker
samples, because of the low current densities in the CV diagrams and the strong increase in
significance of possible errors in the measurements. For reasons of comparison, the capacitance
of the blank FTO sample was added (with an arbitrary Qdep) to the graph (violet square). If the
double layer capacitance is accepted to be a relative measure for the electrode surface in contact
with the electrolyte (with the reservations mentioned above), the slope of 0.8 shows that the
relative share of ECASA decreases with increasing amount of deposited CoOx. This supports the
assumption that with increasing film thickness a densification of the inner parts of the film occurs
(cf. section 4.1.2.2).
Figure 4.25: Double layer capacitance Cdl and roughness factor Rf as function of the deposition charge Qdep.
1E-3 0.01 0.1 1 10 100 1000 10000
0.01
0.1
1
10
100
1000
slope = 0.813
R2 = 0.996
Cd
l(m
F/c
m2)
Qdep
(mC/cm2)
blank
FTO
0.1
1
10
100
1000
10000
Rf
4. Results and discussion
63
Figure 4.25 also shows the roughness factor (right y-axis), computed by using 60 µF/cm2 as
capacitance per unit real surface area144 and plotted against Qdep. The Rf was found to be between
1 and almost 4000. Depending on the preparation method, Rf values between 10 and several
thousands have been published for cobalt oxides or mixed oxides containing cobalt47,67–
69,72,76,134,136,143,145. Of course, a detailed comparison to differently prepared samples from the
literature is difficult and poorly reliable, but a rough estimation whether the obtained roughness
factors are realistic or not should nevertheless be possible. Except for the thickest samples
(5000 mC/cm2) the order of magnitude fits to the publications, even if an error of about a factor
of two, due to the possible contribution of currents of other origin (see above), is taken into
account.
The supposition that micro- or nanoporosity might be the explanation for the increasing double
layer capacitance with film thickness is supported by TEM cross section images in Figure 4.26. The
left images (a and c) show a sample, which was dried in air at room temperature and has been
considered to be amorphous. The TEM high magnification image (c) shows that the sample
consists of a loosely bound network of tiny grains with a diameter of 2 to 3 nanometers. This
porous network becomes even more obvious from the overview image (a). The distinct particles
do not seem to be of high crystallinity, because almost no lattice plains are visible. It has to be
considered that during the sample preparation for the TEM measurements, the samples have
been heated to 150°C. Therefore, it is thinkable that parts of the porous structures have been
removed by particle movement and growth (see also Figure 4.16, where a dramatic change in the
CV diagram is visible between 100 and 200 °C) and that the original sample has an even higher
internal surface area. It is thinkable that when immersed into the electrolyte, the sample behaves
like a sponge and fills up all the space in between the grains with electrolyte.
In comparison to that the images on the right side (b and d) show a sample, which was tempered
at 400°C. The big difference in grain size and crystallinity is obvious. On several grains in the high
magnification image (d), the lattice planes of the crystallites can be seen. Also, it is apparent that
the internal surface becomes much smaller due to the growth of the grains in the annealing step.
This matches the differences in the CV diagrams between annealed and not annealed samples
(Figure 4.16) very well.
Moreover, in the overview images in (a) and (b) the densification of the inner parts of the thin
films, close to the substrate, can be seen. This is more obvious for the annealed sample in (b),
where the grain size is significantly increased and the pores in between are less. The as-deposited
sample (a) does not show such a clear effect, but still a slightly darker tone can be observed for
areas in the inner part of the film, close to the interface with the substrate.
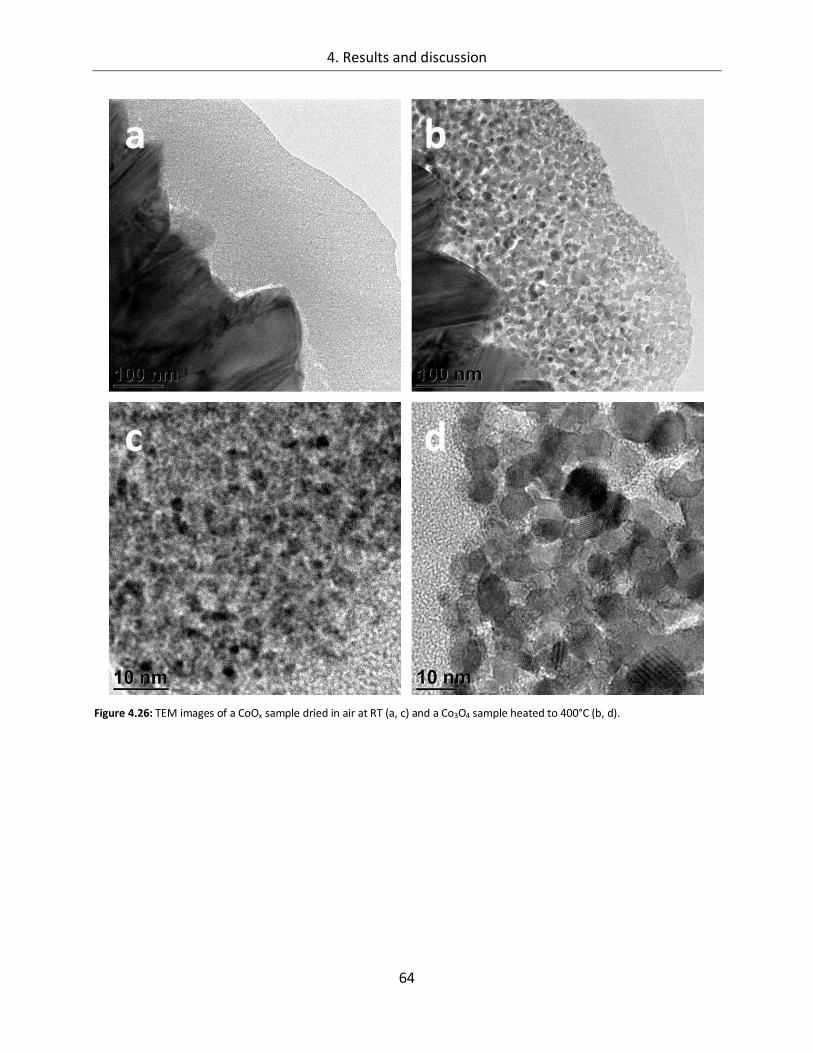
4. Results and discussion
64
Figure 4.26: TEM images of a CoOx sample dried in air at RT (a, c) and a Co3O4 sample heated to 400°C (b, d).
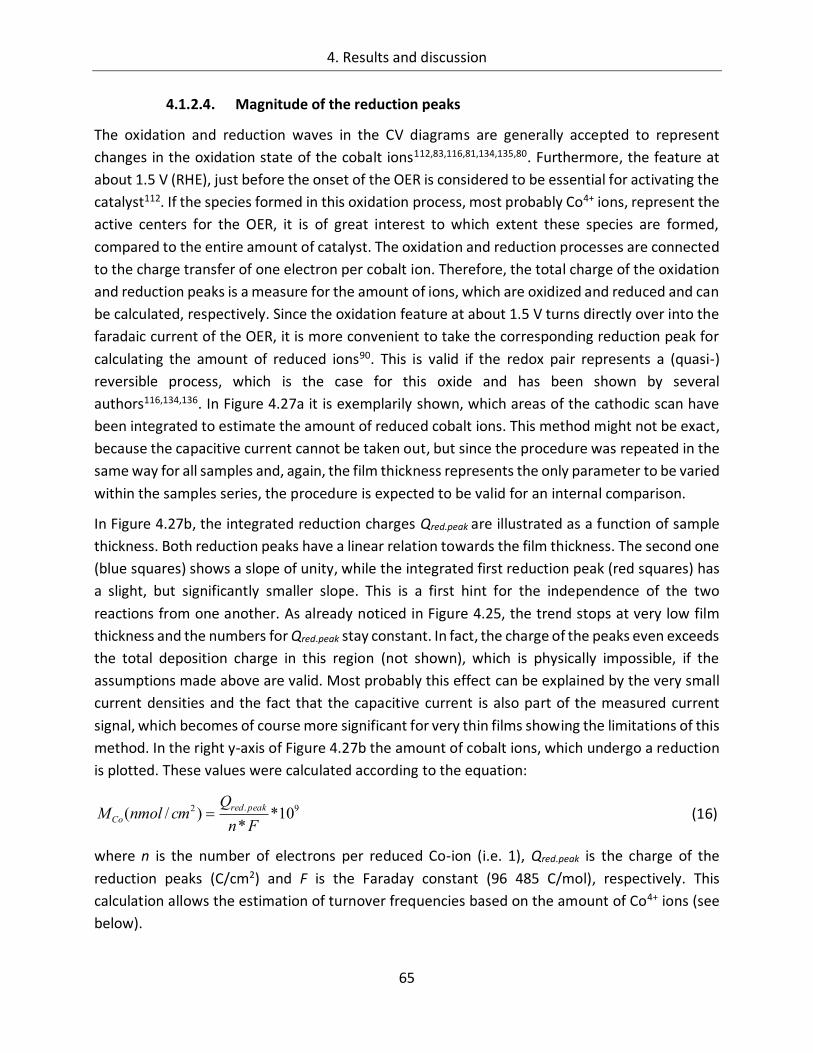
4. Results and discussion
65
4.1.2.4. Magnitude of the reduction peaks
The oxidation and reduction waves in the CV diagrams are generally accepted to represent
changes in the oxidation state of the cobalt ions112,83,116,81,134,135,80. Furthermore, the feature at
about 1.5 V (RHE), just before the onset of the OER is considered to be essential for activating the
catalyst112. If the species formed in this oxidation process, most probably Co4+ ions, represent the
active centers for the OER, it is of great interest to which extent these species are formed,
compared to the entire amount of catalyst. The oxidation and reduction processes are connected
to the charge transfer of one electron per cobalt ion. Therefore, the total charge of the oxidation
and reduction peaks is a measure for the amount of ions, which are oxidized and reduced and can
be calculated, respectively. Since the oxidation feature at about 1.5 V turns directly over into the
faradaic current of the OER, it is more convenient to take the corresponding reduction peak for
calculating the amount of reduced ions90. This is valid if the redox pair represents a (quasi-)
reversible process, which is the case for this oxide and has been shown by several
authors116,134,136. In Figure 4.27a it is exemplarily shown, which areas of the cathodic scan have
been integrated to estimate the amount of reduced cobalt ions. This method might not be exact,
because the capacitive current cannot be taken out, but since the procedure was repeated in the
same way for all samples and, again, the film thickness represents the only parameter to be varied
within the samples series, the procedure is expected to be valid for an internal comparison.
In Figure 4.27b, the integrated reduction charges Qred.peak are illustrated as a function of sample
thickness. Both reduction peaks have a linear relation towards the film thickness. The second one
(blue squares) shows a slope of unity, while the integrated first reduction peak (red squares) has
a slight, but significantly smaller slope. This is a first hint for the independence of the two
reactions from one another. As already noticed in Figure 4.25, the trend stops at very low film
thickness and the numbers for Qred.peak stay constant. In fact, the charge of the peaks even exceeds
the total deposition charge in this region (not shown), which is physically impossible, if the
assumptions made above are valid. Most probably this effect can be explained by the very small
current densities and the fact that the capacitive current is also part of the measured current
signal, which becomes of course more significant for very thin films showing the limitations of this
method. In the right y-axis of Figure 4.27b the amount of cobalt ions, which undergo a reduction
is plotted. These values were calculated according to the equation:
9.2 10**
)/(Fn
QcmnmolM
peakred
Co (16)
where n is the number of electrons per reduced Co-ion (i.e. 1), Qred.peak is the charge of the
reduction peaks (C/cm2) and F is the Faraday constant (96 485 C/mol), respectively. This
calculation allows the estimation of turnover frequencies based on the amount of Co4+ ions (see
below).
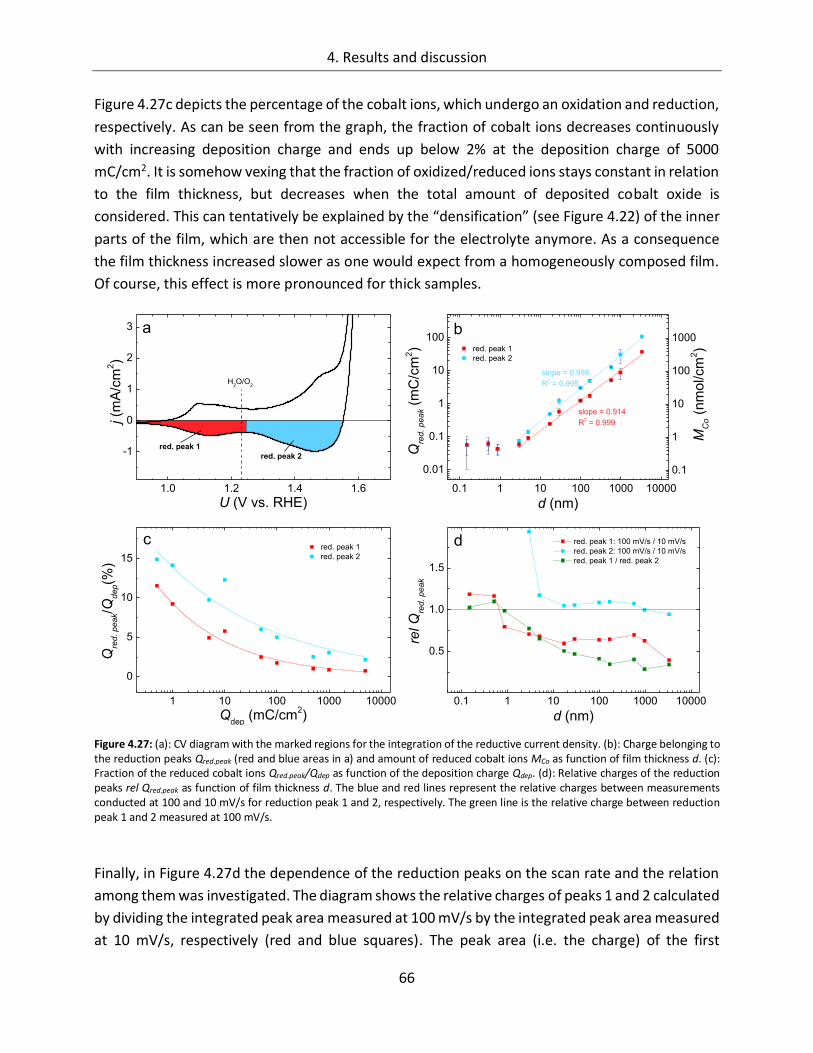
4. Results and discussion
66
Figure 4.27c depicts the percentage of the cobalt ions, which undergo an oxidation and reduction,
respectively. As can be seen from the graph, the fraction of cobalt ions decreases continuously
with increasing deposition charge and ends up below 2% at the deposition charge of 5000
mC/cm2. It is somehow vexing that the fraction of oxidized/reduced ions stays constant in relation
to the film thickness, but decreases when the total amount of deposited cobalt oxide is
considered. This can tentatively be explained by the “densification” (see Figure 4.22) of the inner
parts of the film, which are then not accessible for the electrolyte anymore. As a consequence
the film thickness increased slower as one would expect from a homogeneously composed film.
Of course, this effect is more pronounced for thick samples.
Figure 4.27: (a): CV diagram with the marked regions for the integration of the reductive current density. (b): Charge belonging to the reduction peaks Qred.peak (red and blue areas in a) and amount of reduced cobalt ions MCo as function of film thickness d. (c): Fraction of the reduced cobalt ions Qred.peak/Qdep as function of the deposition charge Qdep. (d): Relative charges of the reduction peaks rel Qred.peak as function of film thickness d. The blue and red lines represent the relative charges between measurements conducted at 100 and 10 mV/s for reduction peak 1 and 2, respectively. The green line is the relative charge between reduction peak 1 and 2 measured at 100 mV/s.
Finally, in Figure 4.27d the dependence of the reduction peaks on the scan rate and the relation
among them was investigated. The diagram shows the relative charges of peaks 1 and 2 calculated
by dividing the integrated peak area measured at 100 mV/s by the integrated peak area measured
at 10 mV/s, respectively (red and blue squares). The peak area (i.e. the charge) of the first
1.0 1.2 1.4 1.6
-1
0
1
2
3
red. peak 1
j (m
A/c
m2)
U (V vs. RHE)
H2O/O
2
red. peak 2
a
0.1 1 10 100 1000 10000
0.01
0.1
1
10
100
slope = 0.914
R2 = 0.999 Q
red. peak(
mC
/cm
2)
d (nm)
red. peak 1
red. peak 2
b
slope = 0.998
R2 = 0.995
0.1
1
10
100
1000
MC
o (
nm
ol/cm
2)
1 10 100 1000 10000
0
5
10
15
c
Qre
d. peak/Q
dep(%
)
Qdep
(mC/cm2)
red. peak 1
red. peak 2
0.1 1 10 100 1000 10000
0.5
1.0
1.5
red. peak 1: 100 mV/s / 10 mV/s
red. peak 2: 100 mV/s / 10 mV/s
red. peak 1 / red. peak 2
rel Q
red. peak
d (nm)
d
4. Results and discussion
67
reduction peak (red) decreases when the sweep rate is increased from 10 to 100 mV/s, which is
why the red curve declines below 1. This can be possibly associated with a slow step in the
oxidation/reduction reaction74,136. Most probably accessibility and/or potential dependent
binding characteristics of OH- ions are responsible for it. Still, it is surprising that the effect can
only be observed on the first reduction peak, while magnitude of the second peak is independent
of the sweep rate and the blue curve stays constant at numbers close to 1. The green line gives
the relation of the charges of the two reduction peak as function of the film thickness. It was
calculated by dividing the peak area of the first reduction peak by the area of the second one and
shows that the first reduction peak becomes smaller relative to the second one as the samples
become thicker. Possibly, the two redox processes are independent from one another and affect
a different amount of cobalt ions. This is important, since the first redox feature is usually
considered to represent the transition from Co2+ to Co3+ (see chapter 4.1.1.4) and could thus
provide the trivalent cobalt ions for the oxidation to Co4+ in the second redox feature. But as the
results from Figure 4.27d show, this is probably not the case and the Co3+ ions have to have their
origin (partly) somewhere else.
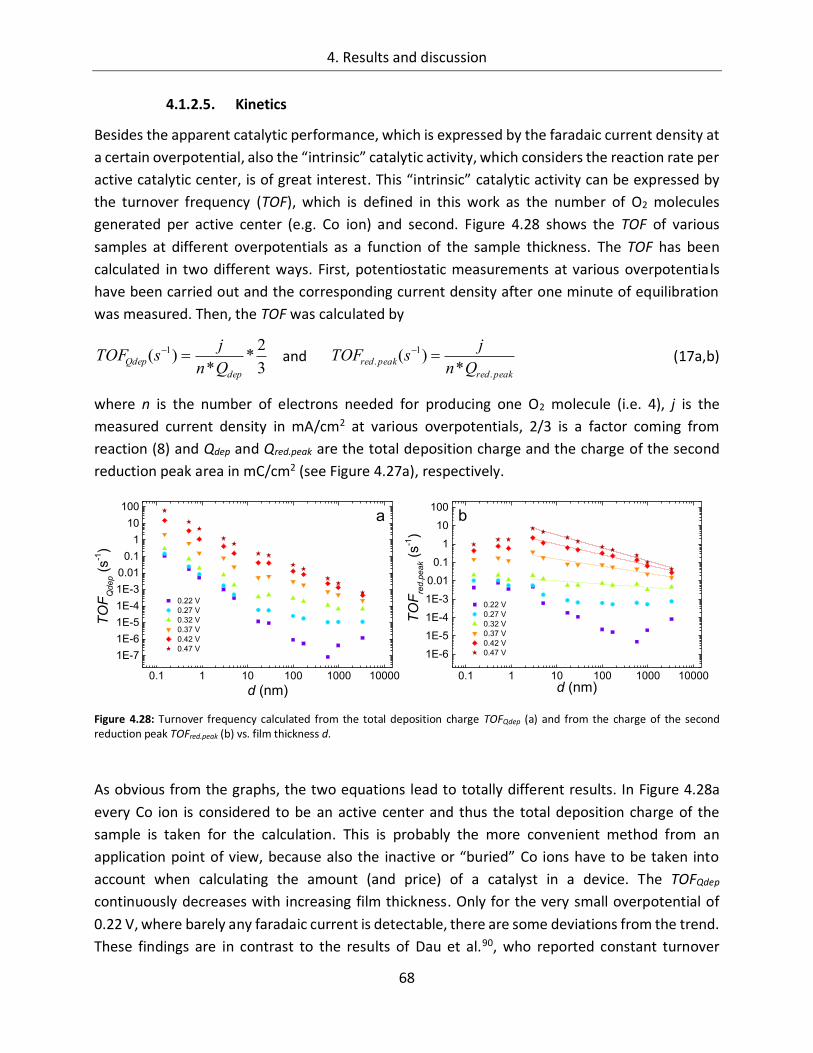
4. Results and discussion
68
4.1.2.5. Kinetics
Besides the apparent catalytic performance, which is expressed by the faradaic current density at
a certain overpotential, also the “intrinsic” catalytic activity, which considers the reaction rate per
active catalytic center, is of great interest. This “intrinsic” catalytic activity can be expressed by
the turnover frequency (TOF), which is defined in this work as the number of O2 molecules
generated per active center (e.g. Co ion) and second. Figure 4.28 shows the TOF of various
samples at different overpotentials as a function of the sample thickness. The TOF has been
calculated in two different ways. First, potentiostatic measurements at various overpotentials
have been carried out and the corresponding current density after one minute of equilibration
was measured. Then, the TOF was calculated by
3
2*
*)( 1
dep
QdepQn
jsTOF
and peakred
peakredQn
jsTOF
.
1
.*
)( (17a,b)
where n is the number of electrons needed for producing one O2 molecule (i.e. 4), j is the
measured current density in mA/cm2 at various overpotentials, 2/3 is a factor coming from
reaction (8) and Qdep and Qred.peak are the total deposition charge and the charge of the second
reduction peak area in mC/cm2 (see Figure 4.27a), respectively.
Figure 4.28: Turnover frequency calculated from the total deposition charge TOFQdep (a) and from the charge of the second reduction peak TOFred.peak (b) vs. film thickness d.
As obvious from the graphs, the two equations lead to totally different results. In Figure 4.28a
every Co ion is considered to be an active center and thus the total deposition charge of the
sample is taken for the calculation. This is probably the more convenient method from an
application point of view, because also the inactive or “buried” Co ions have to be taken into
account when calculating the amount (and price) of a catalyst in a device. The TOFQdep
continuously decreases with increasing film thickness. Only for the very small overpotential of
0.22 V, where barely any faradaic current is detectable, there are some deviations from the trend.
These findings are in contrast to the results of Dau et al.90, who reported constant turnover
0.1 1 10 100 1000 10000
1E-7
1E-6
1E-5
1E-4
1E-3
0.01
0.1
1
10
100a
TO
FQ
dep (
s-1)
d (nm)
0.22 V
0.27 V
0.32 V
0.37 V
0.42 V
0.47 V
0.1 1 10 100 1000 10000
1E-6
1E-5
1E-4
1E-3
0.01
0.1
1
10
100
0.22 V
0.27 V
0.32 V
0.37 V
0.42 V
0.47 V
TO
Fre
d.p
eak (
s-1)
d (nm)
b
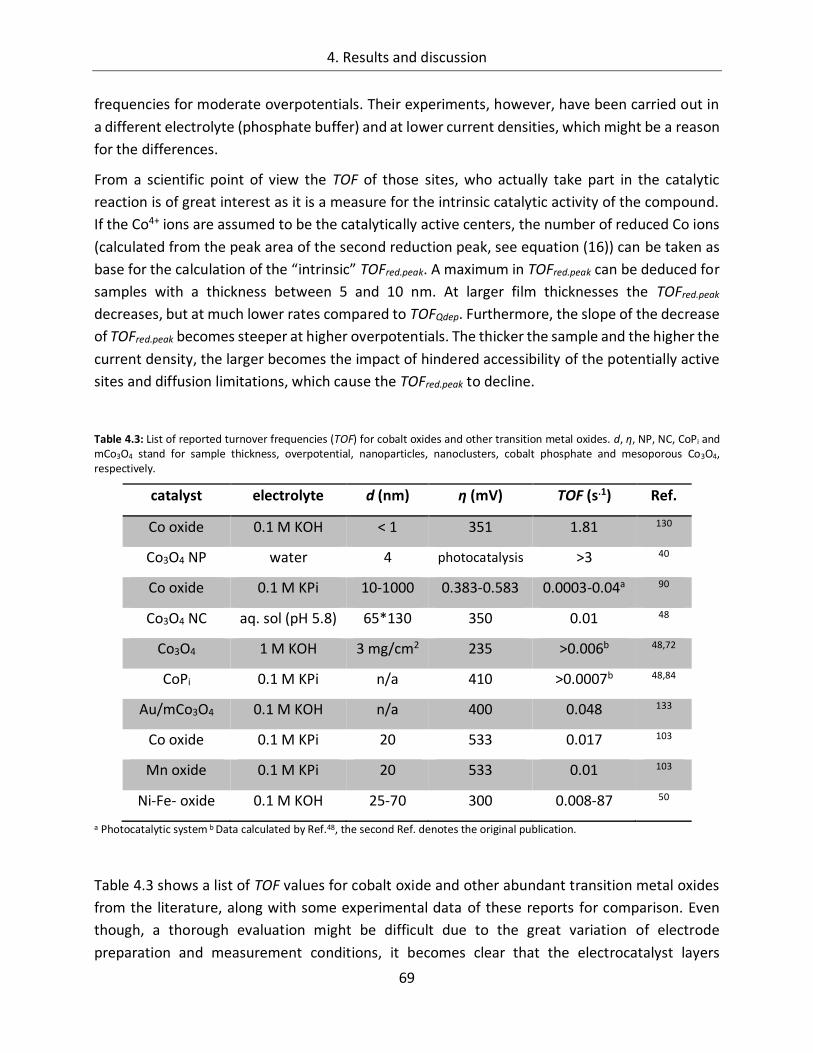
4. Results and discussion
69
frequencies for moderate overpotentials. Their experiments, however, have been carried out in
a different electrolyte (phosphate buffer) and at lower current densities, which might be a reason
for the differences.
From a scientific point of view the TOF of those sites, who actually take part in the catalytic
reaction is of great interest as it is a measure for the intrinsic catalytic activity of the compound.
If the Co4+ ions are assumed to be the catalytically active centers, the number of reduced Co ions
(calculated from the peak area of the second reduction peak, see equation (16)) can be taken as
base for the calculation of the “intrinsic” TOFred.peak. A maximum in TOFred.peak can be deduced for
samples with a thickness between 5 and 10 nm. At larger film thicknesses the TOFred.peak
decreases, but at much lower rates compared to TOFQdep. Furthermore, the slope of the decrease
of TOFred.peak becomes steeper at higher overpotentials. The thicker the sample and the higher the
current density, the larger becomes the impact of hindered accessibility of the potentially active
sites and diffusion limitations, which cause the TOFred.peak to decline.
Table 4.3: List of reported turnover frequencies (TOF) for cobalt oxides and other transition metal oxides. d, η, NP, NC, CoPi and mCo3O4 stand for sample thickness, overpotential, nanoparticles, nanoclusters, cobalt phosphate and mesoporous Co3O4, respectively.
catalyst electrolyte d (nm) η (mV) TOF (s.1) Ref.
Co oxide 0.1 M KOH < 1 351 1.81 130
Co3O4 NP water 4 photocatalysis >3 40
Co oxide 0.1 M KPi 10-1000 0.383-0.583 0.0003-0.04a 90
Co3O4 NC aq. sol (pH 5.8) 65*130 350 0.01 48
Co3O4 1 M KOH 3 mg/cm2 235 >0.006b 48,72
CoPi 0.1 M KPi n/a 410 >0.0007b 48,84
Au/mCo3O4 0.1 M KOH n/a 400 0.048 133
Co oxide 0.1 M KPi 20 533 0.017 103
Mn oxide 0.1 M KPi 20 533 0.01 103
Ni-Fe- oxide 0.1 M KOH 25-70 300 0.008-87 50
a Photocatalytic system b Data calculated by Ref.48, the second Ref. denotes the original publication.
Table 4.3 shows a list of TOF values for cobalt oxide and other abundant transition metal oxides
from the literature, along with some experimental data of these reports for comparison. Even
though, a thorough evaluation might be difficult due to the great variation of electrode
preparation and measurement conditions, it becomes clear that the electrocatalyst layers
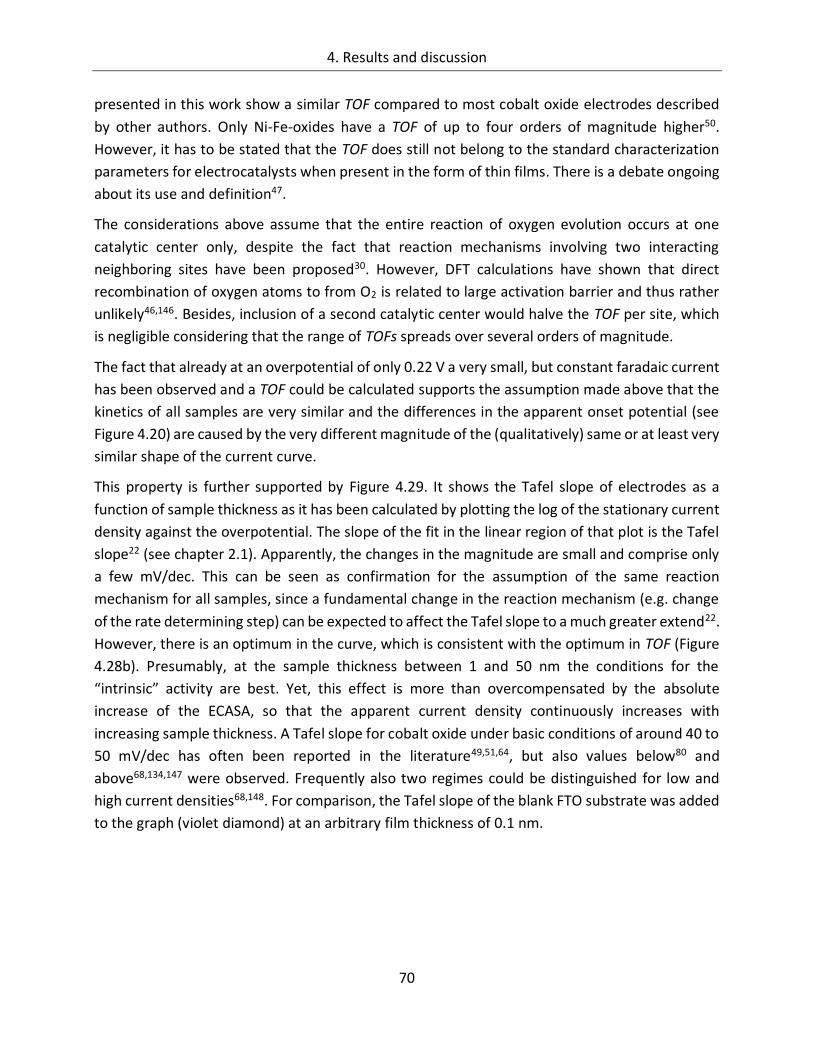
4. Results and discussion
70
presented in this work show a similar TOF compared to most cobalt oxide electrodes described
by other authors. Only Ni-Fe-oxides have a TOF of up to four orders of magnitude higher50.
However, it has to be stated that the TOF does still not belong to the standard characterization
parameters for electrocatalysts when present in the form of thin films. There is a debate ongoing
about its use and definition47.
The considerations above assume that the entire reaction of oxygen evolution occurs at one
catalytic center only, despite the fact that reaction mechanisms involving two interacting
neighboring sites have been proposed30. However, DFT calculations have shown that direct
recombination of oxygen atoms to from O2 is related to large activation barrier and thus rather
unlikely46,146. Besides, inclusion of a second catalytic center would halve the TOF per site, which
is negligible considering that the range of TOFs spreads over several orders of magnitude.
The fact that already at an overpotential of only 0.22 V a very small, but constant faradaic current
has been observed and a TOF could be calculated supports the assumption made above that the
kinetics of all samples are very similar and the differences in the apparent onset potential (see
Figure 4.20) are caused by the very different magnitude of the (qualitatively) same or at least very
similar shape of the current curve.
This property is further supported by Figure 4.29. It shows the Tafel slope of electrodes as a
function of sample thickness as it has been calculated by plotting the log of the stationary current
density against the overpotential. The slope of the fit in the linear region of that plot is the Tafel
slope22 (see chapter 2.1). Apparently, the changes in the magnitude are small and comprise only
a few mV/dec. This can be seen as confirmation for the assumption of the same reaction
mechanism for all samples, since a fundamental change in the reaction mechanism (e.g. change
of the rate determining step) can be expected to affect the Tafel slope to a much greater extend22.
However, there is an optimum in the curve, which is consistent with the optimum in TOF (Figure
4.28b). Presumably, at the sample thickness between 1 and 50 nm the conditions for the
“intrinsic” activity are best. Yet, this effect is more than overcompensated by the absolute
increase of the ECASA, so that the apparent current density continuously increases with
increasing sample thickness. A Tafel slope for cobalt oxide under basic conditions of around 40 to
50 mV/dec has often been reported in the literature49,51,64, but also values below80 and
above68,134,147 were observed. Frequently also two regimes could be distinguished for low and
high current densities68,148. For comparison, the Tafel slope of the blank FTO substrate was added
to the graph (violet diamond) at an arbitrary film thickness of 0.1 nm.
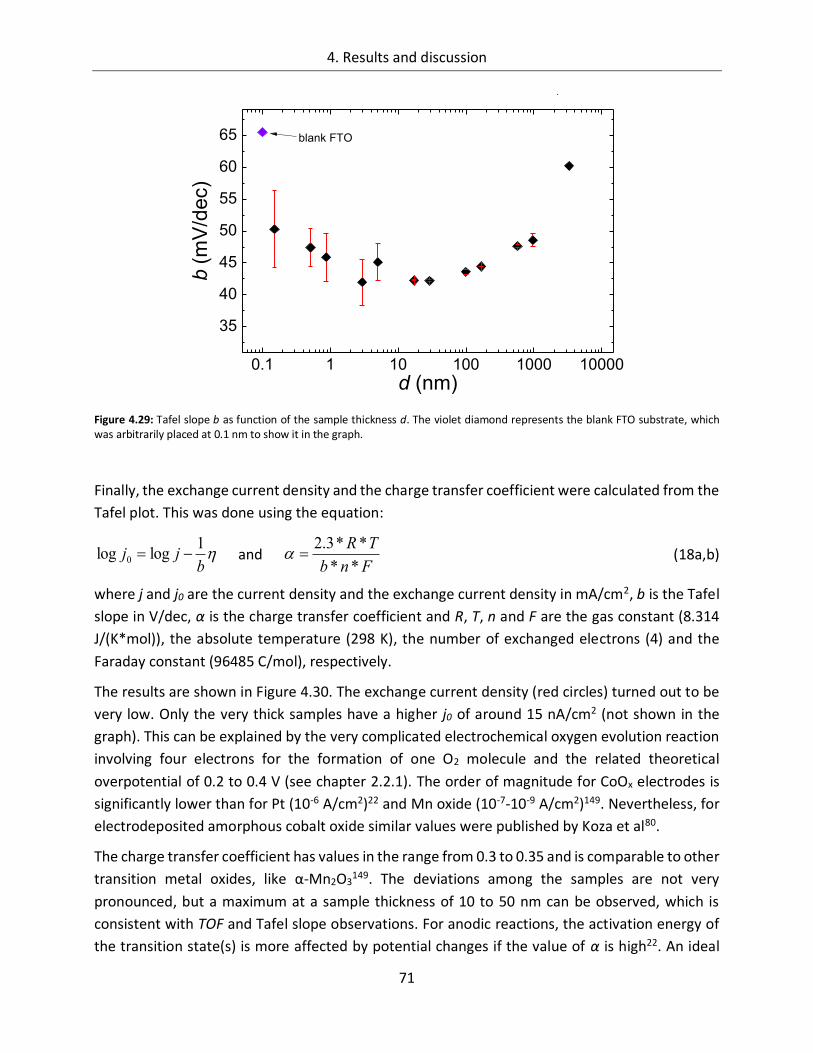
4. Results and discussion
71
Figure 4.29: Tafel slope b as function of the sample thickness d. The violet diamond represents the blank FTO substrate, which was arbitrarily placed at 0.1 nm to show it in the graph.
Finally, the exchange current density and the charge transfer coefficient were calculated from the
Tafel plot. This was done using the equation:
b
jj1
loglog 0 and Fnb
TR
**
**3.2 (18a,b)
where j and j0 are the current density and the exchange current density in mA/cm2, b is the Tafel
slope in V/dec, α is the charge transfer coefficient and R, T, n and F are the gas constant (8.314
J/(K*mol)), the absolute temperature (298 K), the number of exchanged electrons (4) and the
Faraday constant (96485 C/mol), respectively.
The results are shown in Figure 4.30. The exchange current density (red circles) turned out to be
very low. Only the very thick samples have a higher j0 of around 15 nA/cm2 (not shown in the
graph). This can be explained by the very complicated electrochemical oxygen evolution reaction
involving four electrons for the formation of one O2 molecule and the related theoretical
overpotential of 0.2 to 0.4 V (see chapter 2.2.1). The order of magnitude for CoOx electrodes is
significantly lower than for Pt (10-6 A/cm2)22 and Mn oxide (10-7-10-9 A/cm2)149. Nevertheless, for
electrodeposited amorphous cobalt oxide similar values were published by Koza et al80.
The charge transfer coefficient has values in the range from 0.3 to 0.35 and is comparable to other
transition metal oxides, like α-Mn2O3149. The deviations among the samples are not very
pronounced, but a maximum at a sample thickness of 10 to 50 nm can be observed, which is
consistent with TOF and Tafel slope observations. For anodic reactions, the activation energy of
the transition state(s) is more affected by potential changes if the value of α is high22. An ideal
0.1 1 10 100 1000 10000
35
40
45
50
55
60
65
b(
mV
/dec)
d (nm)
Book384
blank FTO
4. Results and discussion
72
catalyst has therefore an α value close to 1. Thus, the results support the assumption that the
best intrinsic catalytic conditions are fulfilled for catalysts with a thickness in the range from 1 to
50 nm (see above).
Figure 4.30: Exchange current density j0 and charge transfer coefficient α versus sample thickness d. The violet diamond and circle represent α and j0 of the blank FTO substrate.
0.1 1 10 100 1000
0.0
2.0x10⁻¹¹
4.0x10⁻¹¹
6.0x10⁻¹¹
8.0x10⁻¹¹
1.0x10⁻¹⁰
1.2x10⁻¹⁰
j 0(
A/c
m2)
d (nm)
blank FTO
0.1
0.2
0.3
0.4
0.5
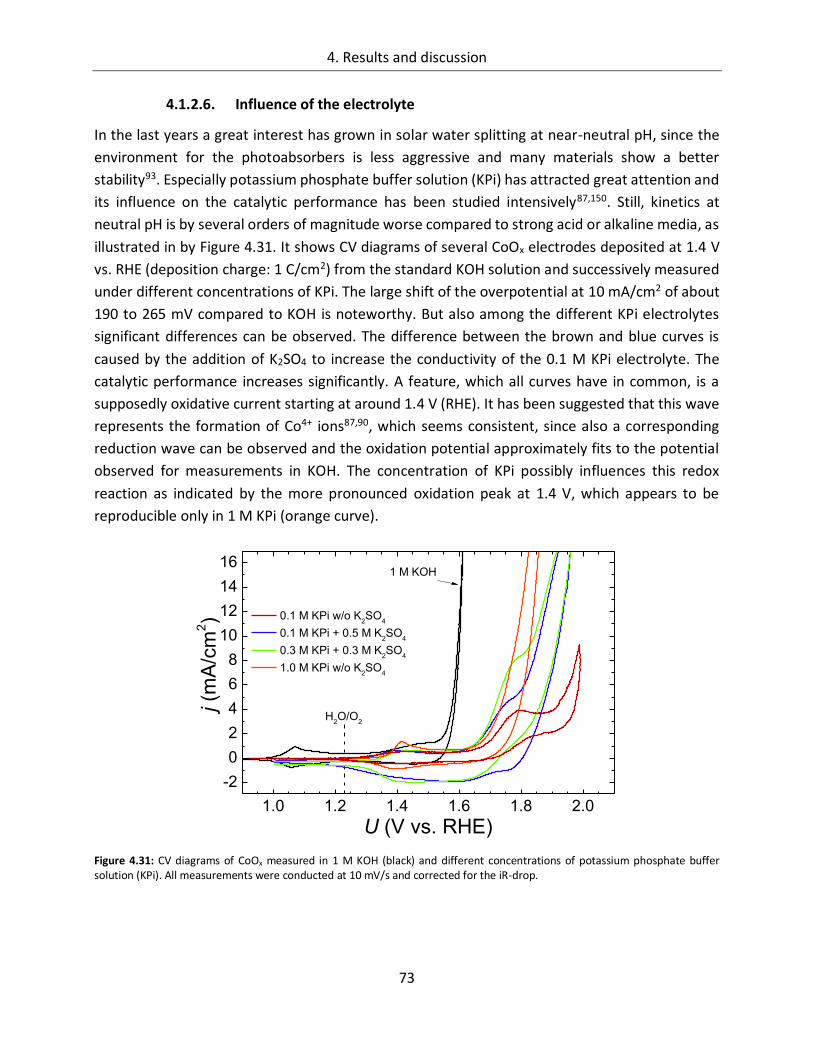
4. Results and discussion
73
4.1.2.6. Influence of the electrolyte
In the last years a great interest has grown in solar water splitting at near-neutral pH, since the
environment for the photoabsorbers is less aggressive and many materials show a better
stability93. Especially potassium phosphate buffer solution (KPi) has attracted great attention and
its influence on the catalytic performance has been studied intensively87,150. Still, kinetics at
neutral pH is by several orders of magnitude worse compared to strong acid or alkaline media, as
illustrated in by Figure 4.31. It shows CV diagrams of several CoOx electrodes deposited at 1.4 V
vs. RHE (deposition charge: 1 C/cm2) from the standard KOH solution and successively measured
under different concentrations of KPi. The large shift of the overpotential at 10 mA/cm2 of about
190 to 265 mV compared to KOH is noteworthy. But also among the different KPi electrolytes
significant differences can be observed. The difference between the brown and blue curves is
caused by the addition of K2SO4 to increase the conductivity of the 0.1 M KPi electrolyte. The
catalytic performance increases significantly. A feature, which all curves have in common, is a
supposedly oxidative current starting at around 1.4 V (RHE). It has been suggested that this wave
represents the formation of Co4+ ions87,90, which seems consistent, since also a corresponding
reduction wave can be observed and the oxidation potential approximately fits to the potential
observed for measurements in KOH. The concentration of KPi possibly influences this redox
reaction as indicated by the more pronounced oxidation peak at 1.4 V, which appears to be
reproducible only in 1 M KPi (orange curve).
Figure 4.31: CV diagrams of CoOx measured in 1 M KOH (black) and different concentrations of potassium phosphate buffer solution (KPi). All measurements were conducted at 10 mV/s and corrected for the iR-drop.
1.0 1.2 1.4 1.6 1.8 2.0
-2
0
2
4
6
8
10
12
14
16
0.1 M KPi w/o K2SO
4
0.1 M KPi + 0.5 M K2SO
4
0.3 M KPi + 0.3 M K2SO
4
1.0 M KPi w/o K2SO
4
j (m
A/c
m2)
U (V vs. RHE)
H2O/O
2
1 M KOH
4. Results and discussion
74
A further wave at about 1.75 V can be observed in all measurements except for the one in 1 M
KPi. This feature is also heavily influenced by the concentration of the KPi electrolyte and its shape
becomes less pronounced with increasing KPi concentration. It is in principle assumable that this
wave represents a further oxidation of the catalyst, but it is rather unlikely, because only very few
compounds containing Co5+ are known and they have to be synthesized under harsh conditions54.
Furthermore, the wave does not show the typical shape expected for redox reactions with a
positive anodic and a negative cathodic current of approximately the same magnitude. Instead,
the cathodic scan reveals a similar course as the anodic scan with a positive current. This can be
seen best in the brown line scan.
Another possible explanation for this behavior is caused by the porous structure of the catalyst.
Initially, at potentials below the onset of the OER, the electrolyte is homogeneously distributed
over the entire ECASA. When the applied potential is increased and oxygen evolution starts, OH -
ions are consumed and H+ ions are produced at the electrode/electrolyte interface due to the
anodic OER reactions in neutral media (see chapter 2.1). Low buffer concentrations might not be
able to stabilize the pH at 7 inside micro- and nanopores or other not very well accessible regions
of the electrode and the pH there drops into the acidic regime. Consequently, the equilibrium
potential of H2O/O2, if measured against the reference electrode, increases according to the
Nernst equation (see equation (2)) and the rate of O2 production (and thus the current) drops.
The outer surface is not affected by this effect, since an “unlimited” amount of buffer molecules
are available from the bulk of the electrolyte. This is why the O2 production rates at the outer
surface continuously grow with increasing potential. At a certain point (at around 1.82 V) the O2
production rates inside the pores become negligible or constant (inactivation) and the only
contribution to the current increase comes from the outer surface area. Therefore, the current
density starts to increase again, but with a different and smaller slope, since the significantly
smaller outer surface area of the catalyst now determines the O2 production rates. This
assumption is supported by the fact that because of the higher buffer capacity, the bending in the
current curve for the measurement in 0.3 M KPi (green line) appears at a higher current density
and after a larger faradaic charge has passed the electrochemical cell (i.e. a larger amount of O2
has been produced). After the inactivation of the pores, the currents of the green and blue curve
are almost the same, because the outer surfaces are nominally identical and the buffer
concentration plays no role for the OER at the outer surface. When the concentration of KPi is
increased to 1 M, the buffer capacity is high enough to compensate all H+ ions produced inside
the pores, at least for the investigated potential range, which is why the red curve does not show
any bending and has a higher slope. It might also be possible that the buffer capacity of the 1 M
KPi is high enough to overcome a “first stage” of the O2 production, where H+ are produced but
mixing and supply of fresh electrolyte caused by O2 bubble formation and release is not sufficient
yet. It could be that at higher O2 production rates an equilibrium between acidification and
electrolyte supply can be formed and continuous OER is possible.
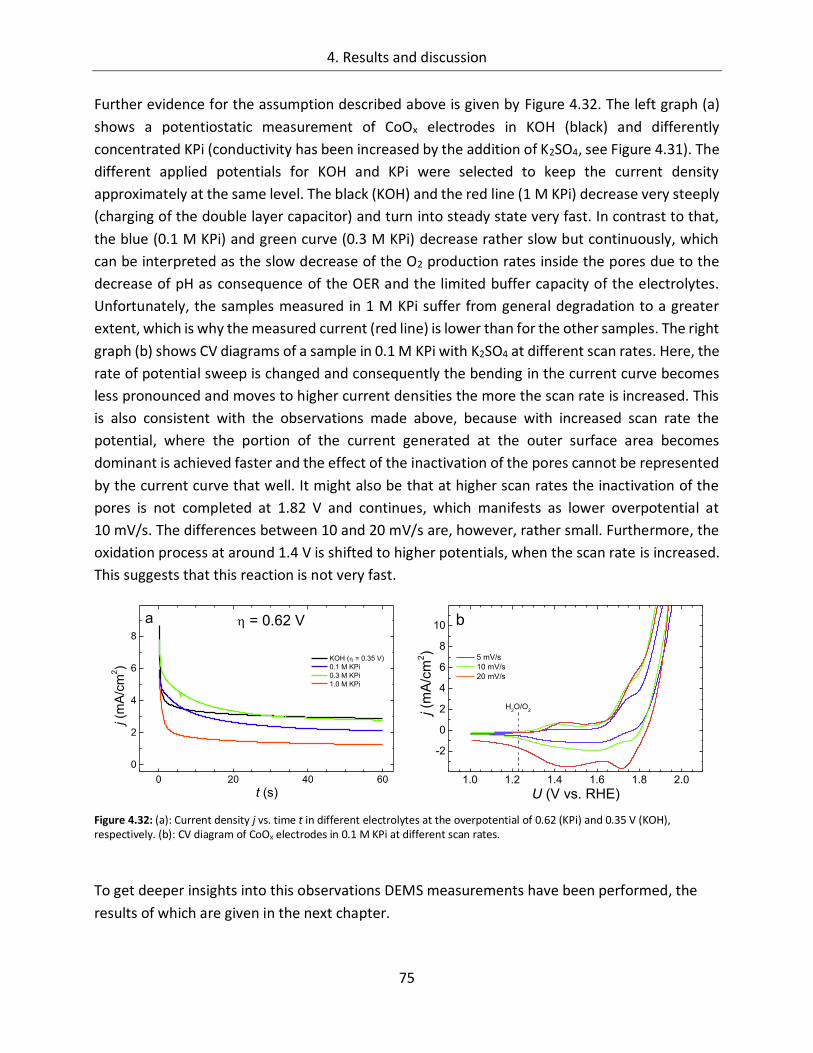
4. Results and discussion
75
Further evidence for the assumption described above is given by Figure 4.32. The left graph (a)
shows a potentiostatic measurement of CoOx electrodes in KOH (black) and differently
concentrated KPi (conductivity has been increased by the addition of K2SO4, see Figure 4.31). The
different applied potentials for KOH and KPi were selected to keep the current density
approximately at the same level. The black (KOH) and the red line (1 M KPi) decrease very steeply
(charging of the double layer capacitor) and turn into steady state very fast. In contrast to that,
the blue (0.1 M KPi) and green curve (0.3 M KPi) decrease rather slow but continuously, which
can be interpreted as the slow decrease of the O2 production rates inside the pores due to the
decrease of pH as consequence of the OER and the limited buffer capacity of the electrolytes.
Unfortunately, the samples measured in 1 M KPi suffer from general degradation to a greater
extent, which is why the measured current (red line) is lower than for the other samples. The right
graph (b) shows CV diagrams of a sample in 0.1 M KPi with K2SO4 at different scan rates. Here, the
rate of potential sweep is changed and consequently the bending in the current curve becomes
less pronounced and moves to higher current densities the more the scan rate is increased. This
is also consistent with the observations made above, because with increased scan rate the
potential, where the portion of the current generated at the outer surface area becomes
dominant is achieved faster and the effect of the inactivation of the pores cannot be represented
by the current curve that well. It might also be that at higher scan rates the inactivation of the
pores is not completed at 1.82 V and continues, which manifests as lower overpotential at
10 mV/s. The differences between 10 and 20 mV/s are, however, rather small. Furthermore, the
oxidation process at around 1.4 V is shifted to higher potentials, when the scan rate is increased.
This suggests that this reaction is not very fast.
Figure 4.32: (a): Current density j vs. time t in different electrolytes at the overpotential of 0.62 (KPi) and 0.35 V (KOH), respectively. (b): CV diagram of CoOx electrodes in 0.1 M KPi at different scan rates.
To get deeper insights into this observations DEMS measurements have been performed, the
results of which are given in the next chapter.
0 20 40 60
0
2
4
6
8
KOH ( = 0.35 V)
0.1 M KPi
0.3 M KPi
1.0 M KPi
j (m
A/c
m2)
t (s)
= 0.62 Va
1.0 1.2 1.4 1.6 1.8 2.0
-2
0
2
4
6
8
10
5 mV/s
10 mV/s
20 mV/s
j (m
A/c
m2)
U (V vs. RHE)
H2O/O
2
b
4. Results and discussion
76
Comparison to CoPi
The work of Kanan and Nocera84, published in 2008, attracted high attention. They reported the
synthesis of a highly active cobalt oxide catalyst by a simple electrochemical deposition from a
phosphate buffer solution. This so called CoPi catalyst has been studied intensively for its
structure and working principles87,86,151 and was applied in several systems to improve
photoanodes in oxidizing water91,92. This catalyst can therefore be used as a benchmark to
estimate the quality of CoOx presented in this work.
CoPi catalysts have been deposited on FTO from a potassium phosphate solution containing
0.5 mM Co(NO3)2, following the proposed protocol84, but the potential to be applied has been
reduced to 1.5 V (RHE), which is significantly below any oxygen evolving current and ensures that
all charge passing the electrode/electrolyte interface is used for film formation87. The deposition
charge was limited to 100 mC/cm2. This limitation was necessary, because a deposition charge of
1000 mC/cm2, as it has been usually used in this work, would require the deposition of almost the
complete amount of Co2+ ions present in the 50 ml of solution used for potentiostatic deposition.
Of course, the CoOx samples for comparison have also been limited to 100 mC/cm2 and were
deposited at 1.2 V.
Figure 4.33 compares the CoOx films from this work with CoPi samples in 1 M KOH (a) and in 0.1 M
KPi with 0.5 M K2SO4 added as conducting salt (b). As can be seen from the right diagram, the CoPi
film (blue) is not stable at all in KOH and significantly loses activity within two scans. In comparison
to that the CoOx film (red) shows a very good chemical stability (see chapter 4.1.2.8). The depicted
red line represents the second cycle.
In neutral electrolyte on the other hand (b) the activity of both catalysts is comparable to one
another and to literature values87,152. Both curves show the same bending at around 1.8 V as it
has been described above. However, kinetics seem to be slightly better for CoPi, because of the
steeper slope of the current after the OER onset, in return CoOx might have a larger ECASA, since
the capacitive portion of the current is higher. Further studies would have to be done to elucidate
these questions, but this was not the scope of this thesis. As a result from this comparison it can
be stated that the CoOx electrodes presented here are far superior to CoPi, when measured in 1
M KOH electrolyte. At neutral pH, their activity is similar.
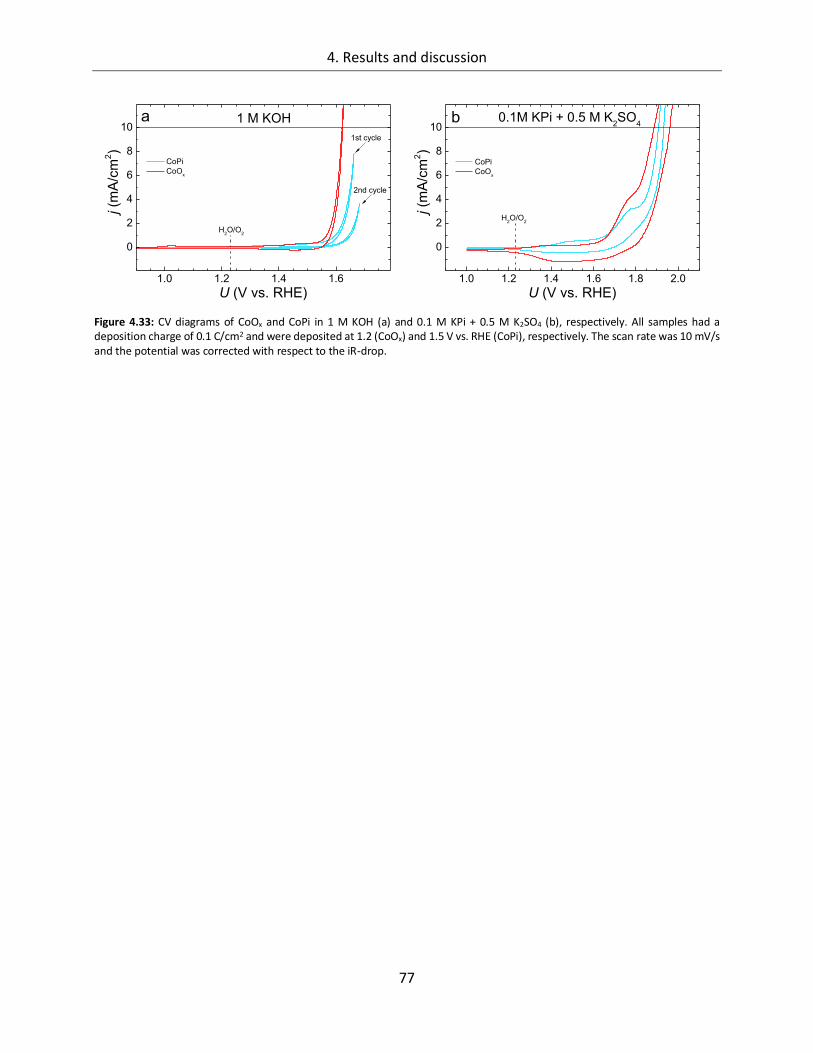
4. Results and discussion
77
Figure 4.33: CV diagrams of CoOx and CoPi in 1 M KOH (a) and 0.1 M KPi + 0.5 M K2SO4 (b), respectively. All samples had a deposition charge of 0.1 C/cm2 and were deposited at 1.2 (CoOx) and 1.5 V vs. RHE (CoPi), respectively. The scan rate was 10 mV/s and the potential was corrected with respect to the iR-drop.
1.0 1.2 1.4 1.6
0
2
4
6
8
10
2nd cycle
CoPi
CoOx
j (m
A/c
m2)
U (V vs. RHE)
H2O/O
2
a 1 M KOH
1st cycle
1.0 1.2 1.4 1.6 1.8 2.0
0
2
4
6
8
10
CoPi
CoOx
j (m
A/c
m2)
U (V vs. RHE)
H2O/O
2
b 0.1M KPi + 0.5 M K2SO
4
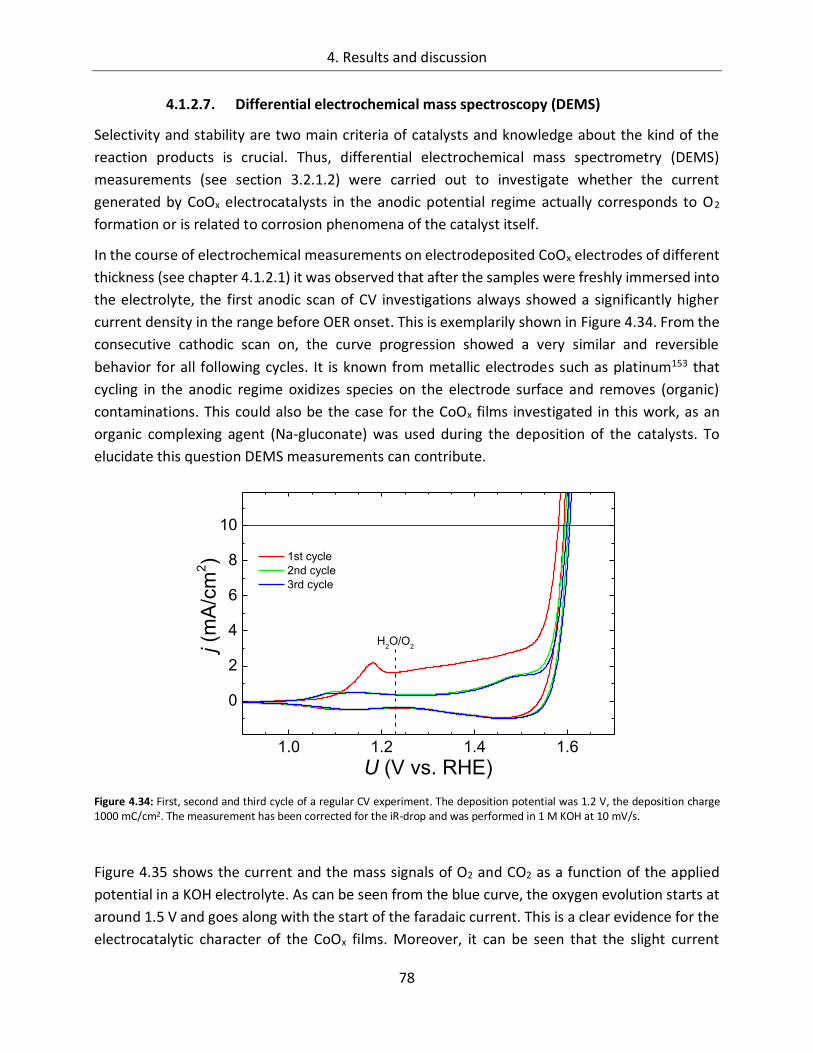
4. Results and discussion
78
4.1.2.7. Differential electrochemical mass spectroscopy (DEMS)
Selectivity and stability are two main criteria of catalysts and knowledge about the kind of the
reaction products is crucial. Thus, differential electrochemical mass spectrometry (DEMS)
measurements (see section 3.2.1.2) were carried out to investigate whether the current
generated by CoOx electrocatalysts in the anodic potential regime actually corresponds to O2
formation or is related to corrosion phenomena of the catalyst itself.
In the course of electrochemical measurements on electrodeposited CoOx electrodes of different
thickness (see chapter 4.1.2.1) it was observed that after the samples were freshly immersed into
the electrolyte, the first anodic scan of CV investigations always showed a significantly higher
current density in the range before OER onset. This is exemplarily shown in Figure 4.34. From the
consecutive cathodic scan on, the curve progression showed a very similar and reversible
behavior for all following cycles. It is known from metallic electrodes such as platinum153 that
cycling in the anodic regime oxidizes species on the electrode surface and removes (organic)
contaminations. This could also be the case for the CoOx films investigated in this work, as an
organic complexing agent (Na-gluconate) was used during the deposition of the catalysts. To
elucidate this question DEMS measurements can contribute.
Figure 4.34: First, second and third cycle of a regular CV experiment. The deposition potential was 1.2 V, the deposition charge 1000 mC/cm2. The measurement has been corrected for the iR-drop and was performed in 1 M KOH at 10 mV/s.
Figure 4.35 shows the current and the mass signals of O2 and CO2 as a function of the applied
potential in a KOH electrolyte. As can be seen from the blue curve, the oxygen evolution starts at
around 1.5 V and goes along with the start of the faradaic current. This is a clear evidence for the
electrocatalytic character of the CoOx films. Moreover, it can be seen that the slight current
1.0 1.2 1.4 1.6
0
2
4
6
8
10
1st cycle
2nd cycle
3rd cycle
j (m
A/c
m2)
U (V vs. RHE)
H2O/O
2
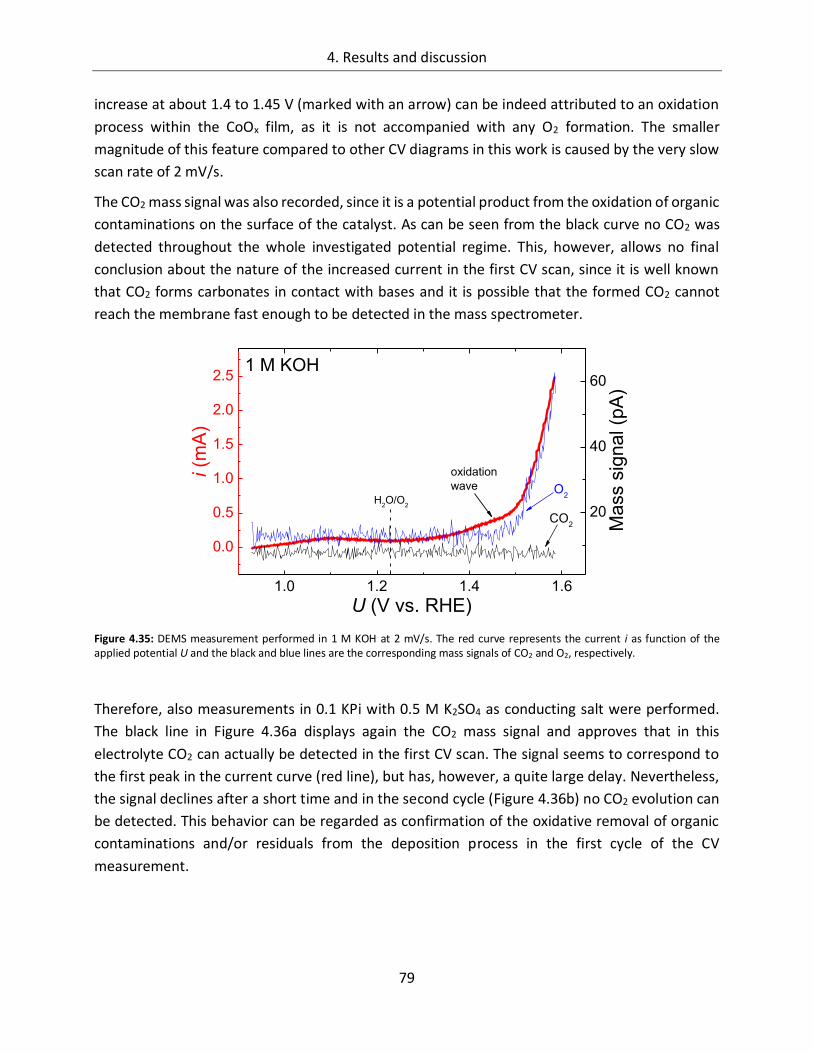
4. Results and discussion
79
increase at about 1.4 to 1.45 V (marked with an arrow) can be indeed attributed to an oxidation
process within the CoOx film, as it is not accompanied with any O2 formation. The smaller
magnitude of this feature compared to other CV diagrams in this work is caused by the very slow
scan rate of 2 mV/s.
The CO2 mass signal was also recorded, since it is a potential product from the oxidation of organic
contaminations on the surface of the catalyst. As can be seen from the black curve no CO2 was
detected throughout the whole investigated potential regime. This, however, allows no final
conclusion about the nature of the increased current in the first CV scan, since it is well known
that CO2 forms carbonates in contact with bases and it is possible that the formed CO2 cannot
reach the membrane fast enough to be detected in the mass spectrometer.
Figure 4.35: DEMS measurement performed in 1 M KOH at 2 mV/s. The red curve represents the current i as function of the applied potential U and the black and blue lines are the corresponding mass signals of CO2 and O2, respectively.
Therefore, also measurements in 0.1 KPi with 0.5 M K2SO4 as conducting salt were performed.
The black line in Figure 4.36a displays again the CO2 mass signal and approves that in this
electrolyte CO2 can actually be detected in the first CV scan. The signal seems to correspond to
the first peak in the current curve (red line), but has, however, a quite large delay. Nevertheless,
the signal declines after a short time and in the second cycle (Figure 4.36b) no CO2 evolution can
be detected. This behavior can be regarded as confirmation of the oxidative removal of organic
contaminations and/or residuals from the deposition process in the first cycle of the CV
measurement.
1.0 1.2 1.4 1.6
0.0
0.5
1.0
1.5
2.0
2.5
O2
CO2
i (m
A)
U (V vs. RHE)
H2O/O
2
1 M KOH
20
40
60
Ma
ss s
ign
al (p
A)
oxidation
wave
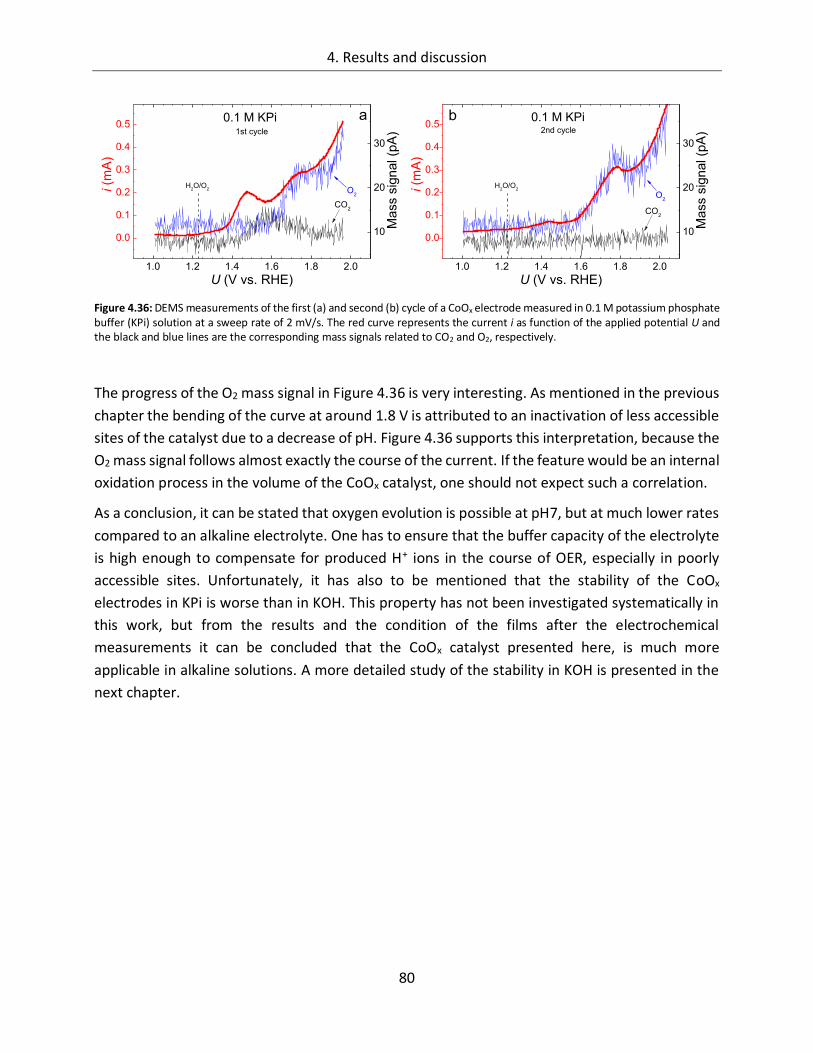
4. Results and discussion
80
Figure 4.36: DEMS measurements of the first (a) and second (b) cycle of a CoOx electrode measured in 0.1 M potassium phosphate buffer (KPi) solution at a sweep rate of 2 mV/s. The red curve represents the current i as function of the applied potential U and the black and blue lines are the corresponding mass signals related to CO2 and O2, respectively.
The progress of the O2 mass signal in Figure 4.36 is very interesting. As mentioned in the previous
chapter the bending of the curve at around 1.8 V is attributed to an inactivation of less accessible
sites of the catalyst due to a decrease of pH. Figure 4.36 supports this interpretation, because the
O2 mass signal follows almost exactly the course of the current. If the feature would be an internal
oxidation process in the volume of the CoOx catalyst, one should not expect such a correlation.
As a conclusion, it can be stated that oxygen evolution is possible at pH7, but at much lower rates
compared to an alkaline electrolyte. One has to ensure that the buffer capacity of the electrolyte
is high enough to compensate for produced H+ ions in the course of OER, especially in poorly
accessible sites. Unfortunately, it has also to be mentioned that the stability of the CoOx
electrodes in KPi is worse than in KOH. This property has not been investigated systematically in
this work, but from the results and the condition of the films after the electrochemical
measurements it can be concluded that the CoOx catalyst presented here, is much more
applicable in alkaline solutions. A more detailed study of the stability in KOH is presented in the
next chapter.
1.0 1.2 1.4 1.6 1.8 2.0
0.0
0.1
0.2
0.3
0.4
0.5
CO2
i (m
A)
U (V vs. RHE)
H2O/O
2 O2
1st cycle
0.1 M KPi a
10
20
30
Mass s
ignal (p
A)
1.0 1.2 1.4 1.6 1.8 2.0
0.0
0.1
0.2
0.3
0.4
0.5
CO2
i (m
A)
U (V vs. RHE)
H2O/O
2
O2
0.1 M KPi2nd cycle
b
10
20
30
Mass s
ignal (p
A)
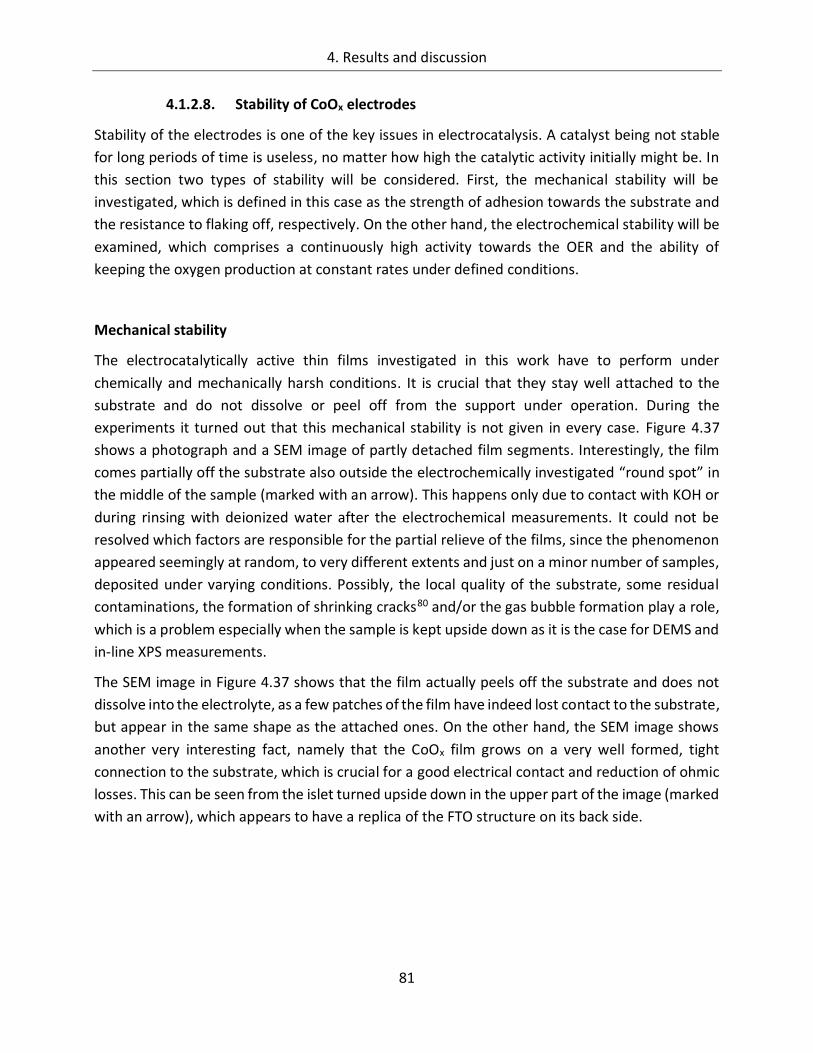
4. Results and discussion
81
4.1.2.8. Stability of CoOx electrodes
Stability of the electrodes is one of the key issues in electrocatalysis. A catalyst being not stable
for long periods of time is useless, no matter how high the catalytic activity initially might be. In
this section two types of stability will be considered. First, the mechanical stability will be
investigated, which is defined in this case as the strength of adhesion towards the substrate and
the resistance to flaking off, respectively. On the other hand, the electrochemical stability will be
examined, which comprises a continuously high activity towards the OER and the ability of
keeping the oxygen production at constant rates under defined conditions.
Mechanical stability
The electrocatalytically active thin films investigated in this work have to perform under
chemically and mechanically harsh conditions. It is crucial that they stay well attached to the
substrate and do not dissolve or peel off from the support under operation. During the
experiments it turned out that this mechanical stability is not given in every case. Figure 4.37
shows a photograph and a SEM image of partly detached film segments. Interestingly, the film
comes partially off the substrate also outside the electrochemically investigated “round spot” in
the middle of the sample (marked with an arrow). This happens only due to contact with KOH or
during rinsing with deionized water after the electrochemical measurements. It could not be
resolved which factors are responsible for the partial relieve of the films, since the phenomenon
appeared seemingly at random, to very different extents and just on a minor number of samples,
deposited under varying conditions. Possibly, the local quality of the substrate, some residual
contaminations, the formation of shrinking cracks80 and/or the gas bubble formation play a role,
which is a problem especially when the sample is kept upside down as it is the case for DEMS and
in-line XPS measurements.
The SEM image in Figure 4.37 shows that the film actually peels off the substrate and does not
dissolve into the electrolyte, as a few patches of the film have indeed lost contact to the substrate,
but appear in the same shape as the attached ones. On the other hand, the SEM image shows
another very interesting fact, namely that the CoOx film grows on a very well formed, tight
connection to the substrate, which is crucial for a good electrical contact and reduction of ohmic
losses. This can be seen from the islet turned upside down in the upper part of the image (marked
with an arrow), which appears to have a replica of the FTO structure on its back side.
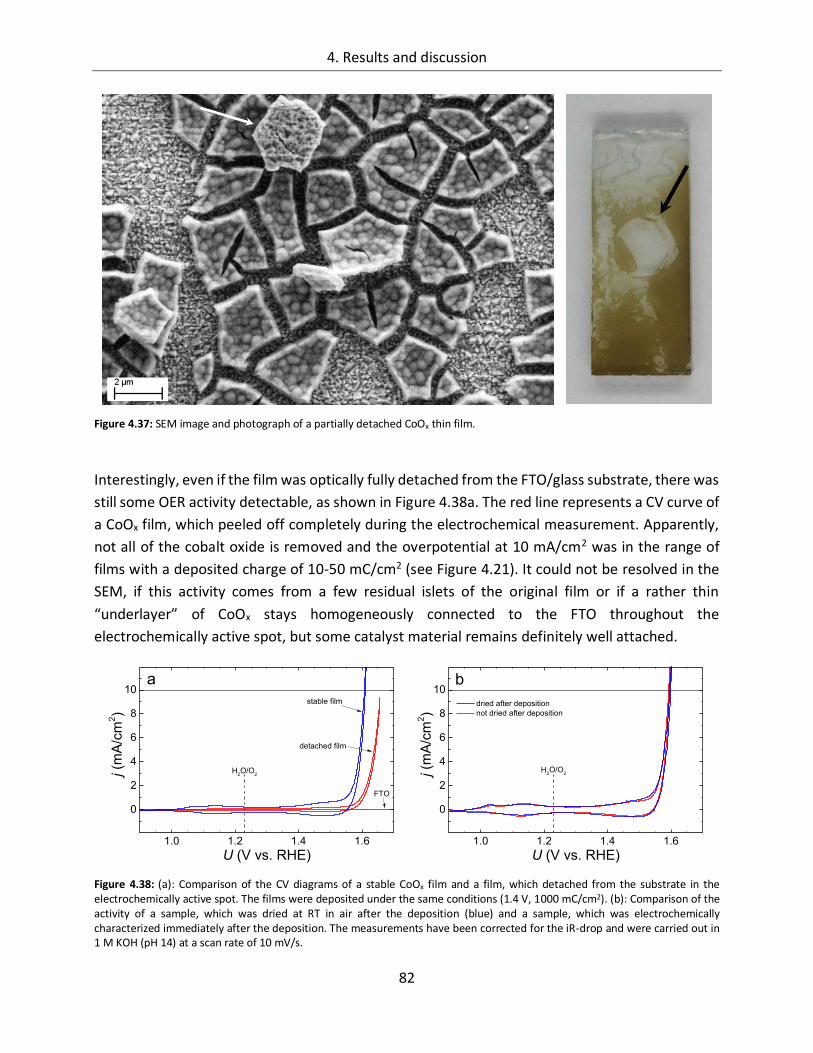
4. Results and discussion
82
Figure 4.37: SEM image and photograph of a partially detached CoOx thin film.
Interestingly, even if the film was optically fully detached from the FTO/glass substrate, there was
still some OER activity detectable, as shown in Figure 4.38a. The red line represents a CV curve of
a CoOx film, which peeled off completely during the electrochemical measurement. Apparently,
not all of the cobalt oxide is removed and the overpotential at 10 mA/cm2 was in the range of
films with a deposited charge of 10-50 mC/cm2 (see Figure 4.21). It could not be resolved in the
SEM, if this activity comes from a few residual islets of the original film or if a rather thin
“underlayer” of CoOx stays homogeneously connected to the FTO throughout the
electrochemically active spot, but some catalyst material remains definitely well attached.
Figure 4.38: (a): Comparison of the CV diagrams of a stable CoOx film and a film, which detached from the substrate in the electrochemically active spot. The films were deposited under the same conditions (1.4 V, 1000 mC/cm2). (b): Comparison of the activity of a sample, which was dried at RT in air after the deposition (blue) and a sample, which was electrochemically characterized immediately after the deposition. The measurements have been corrected for the iR-drop and were carried out in 1 M KOH (pH 14) at a scan rate of 10 mV/s.
1.0 1.2 1.4 1.6
0
2
4
6
8
10
j (m
A/c
m2)
U (V vs. RHE)
H2O/O
2
stable film
detached film
FTO
a
1.0 1.2 1.4 1.6
0
2
4
6
8
10
dried after deposition
not dried after deposition
j (m
A/c
m2)
U (V vs. RHE)
H2O/O
2
b
4. Results and discussion
83
Finally, it was observed that the detachment of the films appeared only on some samples, which
were completely dried between deposition and electrochemical characterization. Thus, the
formation of shrinking cracks (see Figure 4.11) most likely has a strong influence on the adhesion
of the film. Even though the mechanical stability of the thin films is possibly influenced by whether
the sample was dried or not, the electrocatalytic activity is independent of that, as a comparison
of a dried sample with one that was kept in the electrolyte shows (Figure 4.38b). For the
application in a photoelectrochemical device, however, it is recommended to make sure the
sample stays permanently in contact with the electrolyte to avoid film detachment.
Electrochemical stability
For being applicable in a photoelectrochemical device, an electrocatalyst has to keep working at
the same efficiency for a long period of time. Therefore, some long term experiments were
conducted on CoOx electrocatalyst. Figure 4.39 shows a galvanostatic measurement at 10 mA/cm2
for 48 hours. The sample (A = 2 cm2) was fully immersed in the electrolyte and rotated at a speed
of around 400 rpm to prevent surface deactivation by gas bubbles and diffusion limitations. In
addition, the electrolyte was continuously bubbled with N2. As can be seen from the graph the iR-
corrected overpotential decreases slightly from around 400 to 385 mV during the investigated
period of time. The scattering in the curve is attributed to sample rotation. Even though the
activity of the electrode increases over time, the change in overpotential is too small to be a
reliable evidence for a further activation of the catalyst by the ongoing water oxidation process.
Instead, small deviations in the measurement parameters, e.g. in the potential of the reference
electrode, may also play a role. A more detailed study on the long term performance of the
catalysts, including measurements over several thousands of hours, might elucidate if there is a
significant increase of the catalyst’s activity. Such a study, however, is beyond the scope of this
work and hence the CoOx catalysts are considered to be electrochemically stable under alkaline
conditions.
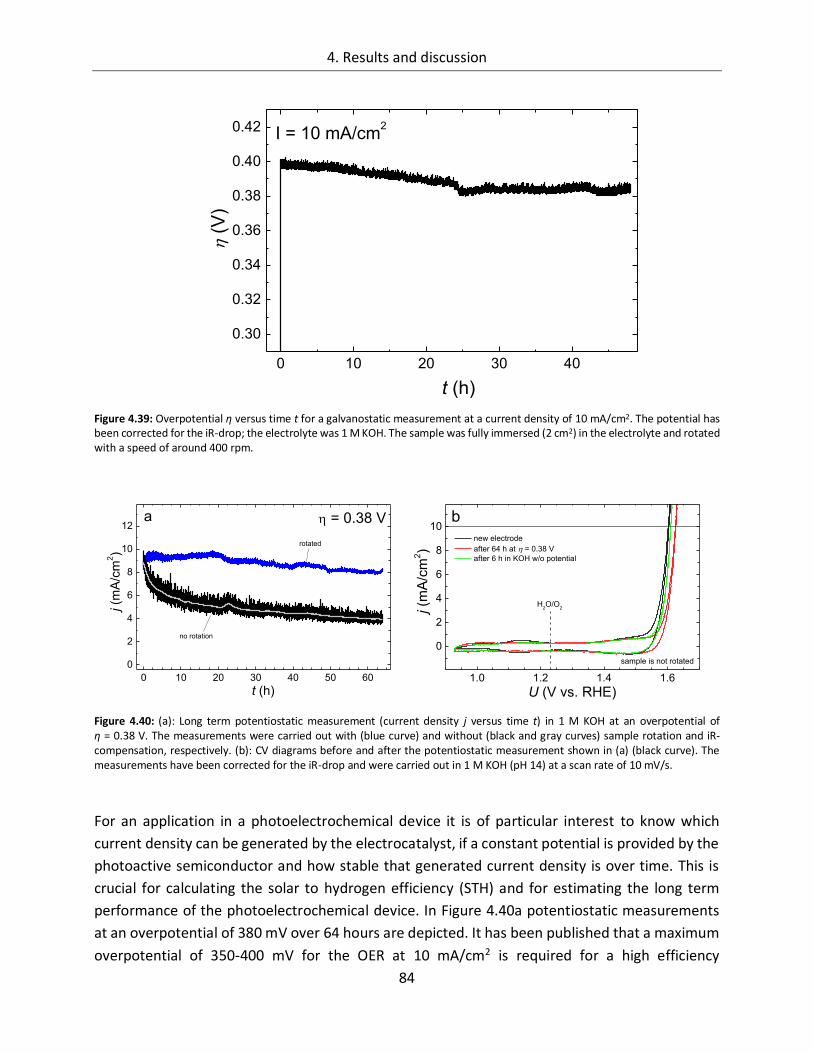
4. Results and discussion
84
Figure 4.39: Overpotential η versus time t for a galvanostatic measurement at a current density of 10 mA/cm2. The potential has been corrected for the iR-drop; the electrolyte was 1 M KOH. The sample was fully immersed (2 cm2) in the electrolyte and rotated with a speed of around 400 rpm.
Figure 4.40: (a): Long term potentiostatic measurement (current density j versus time t) in 1 M KOH at an overpotential of η = 0.38 V. The measurements were carried out with (blue curve) and without (black and gray curves) sample rotation and iR-compensation, respectively. (b): CV diagrams before and after the potentiostatic measurement shown in (a) (black curve). The measurements have been corrected for the iR-drop and were carried out in 1 M KOH (pH 14) at a scan rate of 10 mV/s.
For an application in a photoelectrochemical device it is of particular interest to know which
current density can be generated by the electrocatalyst, if a constant potential is provided by the
photoactive semiconductor and how stable that generated current density is over time. This is
crucial for calculating the solar to hydrogen efficiency (STH) and for estimating the long term
performance of the photoelectrochemical device. In Figure 4.40a potentiostatic measurements
at an overpotential of 380 mV over 64 hours are depicted. It has been published that a maximum
overpotential of 350-400 mV for the OER at 10 mA/cm2 is required for a high efficiency
0 10 20 30 40
0.30
0.32
0.34
0.36
0.38
0.40
0.42
(
V)
t (h)
I = 10 mA/cm2
0 10 20 30 40 50 60
0
2
4
6
8
10
12
j (m
A/c
m2)
t (h)
= 0.38 Va
no rotation
rotated
1.0 1.2 1.4 1.6
0
2
4
6
8
10b
new electrode
after 64 h at = 0.38 V
after 6 h in KOH w/o potential
j (m
A/c
m2)
U (V vs. RHE)
H2O/O
2
sample is not rotated
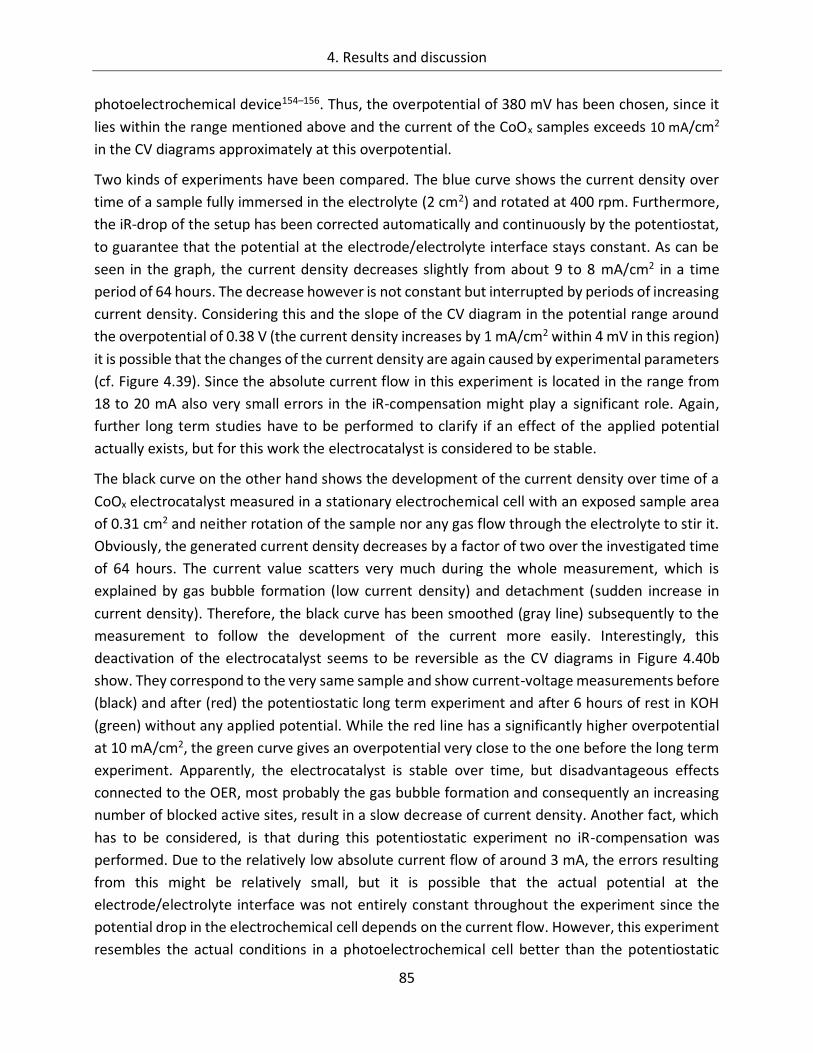
4. Results and discussion
85
photoelectrochemical device154–156. Thus, the overpotential of 380 mV has been chosen, since it
lies within the range mentioned above and the current of the CoOx samples exceeds 10 mA/cm2
in the CV diagrams approximately at this overpotential.
Two kinds of experiments have been compared. The blue curve shows the current density over
time of a sample fully immersed in the electrolyte (2 cm2) and rotated at 400 rpm. Furthermore,
the iR-drop of the setup has been corrected automatically and continuously by the potentiostat,
to guarantee that the potential at the electrode/electrolyte interface stays constant. As can be
seen in the graph, the current density decreases slightly from about 9 to 8 mA/cm2 in a time
period of 64 hours. The decrease however is not constant but interrupted by periods of increasing
current density. Considering this and the slope of the CV diagram in the potential range around
the overpotential of 0.38 V (the current density increases by 1 mA/cm2 within 4 mV in this region)
it is possible that the changes of the current density are again caused by experimental parameters
(cf. Figure 4.39). Since the absolute current flow in this experiment is located in the range from
18 to 20 mA also very small errors in the iR-compensation might play a significant role. Again,
further long term studies have to be performed to clarify if an effect of the applied potential
actually exists, but for this work the electrocatalyst is considered to be stable.
The black curve on the other hand shows the development of the current density over time of a
CoOx electrocatalyst measured in a stationary electrochemical cell with an exposed sample area
of 0.31 cm2 and neither rotation of the sample nor any gas flow through the electrolyte to stir it.
Obviously, the generated current density decreases by a factor of two over the investigated time
of 64 hours. The current value scatters very much during the whole measurement, which is
explained by gas bubble formation (low current density) and detachment (sudden increase in
current density). Therefore, the black curve has been smoothed (gray line) subsequently to the
measurement to follow the development of the current more easily. Interestingly, this
deactivation of the electrocatalyst seems to be reversible as the CV diagrams in Figure 4.40b
show. They correspond to the very same sample and show current-voltage measurements before
(black) and after (red) the potentiostatic long term experiment and after 6 hours of rest in KOH
(green) without any applied potential. While the red line has a significantly higher overpotential
at 10 mA/cm2, the green curve gives an overpotential very close to the one before the long term
experiment. Apparently, the electrocatalyst is stable over time, but disadvantageous effects
connected to the OER, most probably the gas bubble formation and consequently an increasing
number of blocked active sites, result in a slow decrease of current density. Another fact, which
has to be considered, is that during this potentiostatic experiment no iR-compensation was
performed. Due to the relatively low absolute current flow of around 3 mA, the errors resulting
from this might be relatively small, but it is possible that the actual potential at the
electrode/electrolyte interface was not entirely constant throughout the experiment since the
potential drop in the electrochemical cell depends on the current flow. However, this experiment
resembles the actual conditions in a photoelectrochemical cell better than the potentiostatic
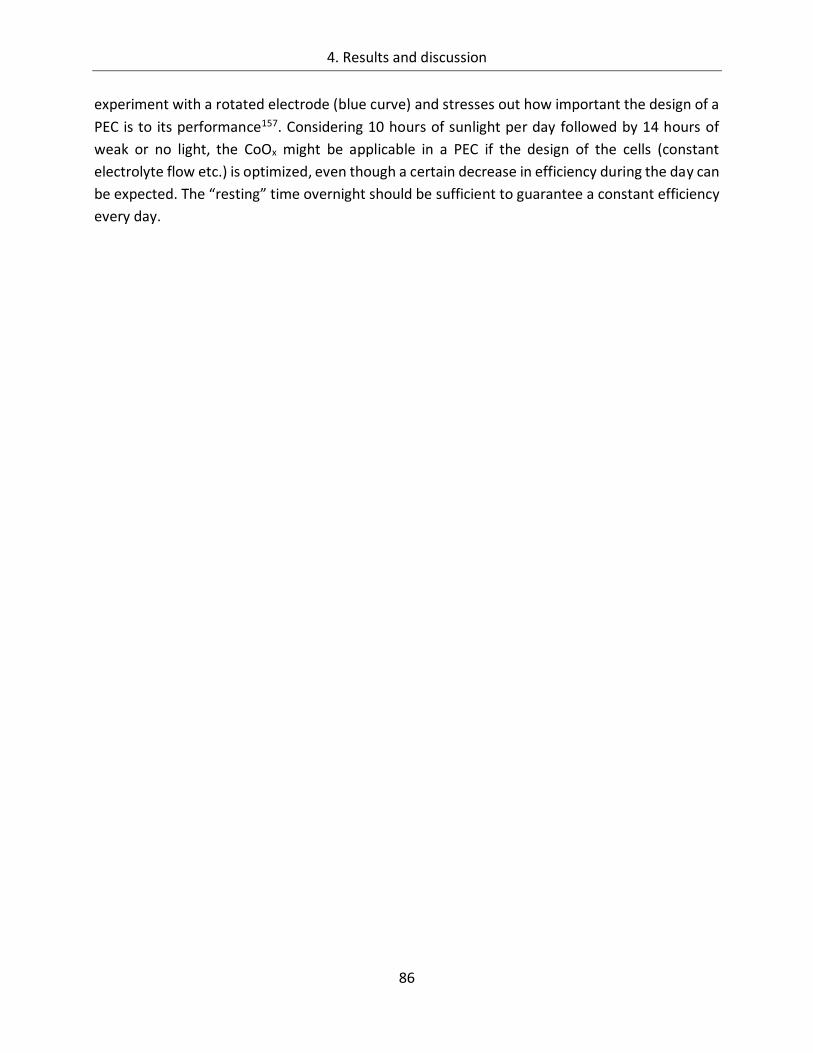
4. Results and discussion
86
experiment with a rotated electrode (blue curve) and stresses out how important the design of a
PEC is to its performance157. Considering 10 hours of sunlight per day followed by 14 hours of
weak or no light, the CoOx might be applicable in a PEC if the design of the cells (constant
electrolyte flow etc.) is optimized, even though a certain decrease in efficiency during the day can
be expected. The “resting” time overnight should be sufficient to guarantee a constant efficiency
every day.
4. Results and discussion
87
4.1.3. Spectroscopic analysis
4.1.3.1. In-line SXPS
As described in more detail in chapter 3.2.2.1, in-line synchrotron XPS measurements were
performed at the U49/2 beamline at Bessy II in Berlin Adlershof, to characterize the catalyst
surface in dependence of the applied potential. The SoLIAS endstation (Technical University
Darmstadt) has been used for the measurements. The samples were subjected to different
constant anodic potentials in an electrochemical cell held under inert N2 atmosphere and after
removal of the electrolyte the samples could be transferred directly into the UHV system of the
SoLIAS for XPS characterization, without any contact to the ambient atmosphere.
Figure 4.41: XPS overview spectra of the pristine CoOx sample (blue) and after the sample has been subjected to a potential of 1.35 V vs. RHE (red). The most important features are marked within the graph. Excitation energy was 900 eV.
Figure 4.41 shows the XPS overview spectra of an as-deposited (pristine) sample and the same
sample after it has been subjected to a potential of 1.35 V vs. RHE. The most prominent features
of the spectra are marked in the graph. Obviously, the signal intensity increases after the
application of 1.35 V, which is attributed to “electrochemical cleaning” of the sample surface (see
also chapter 4.1.2.7). A significant amount of contamination can be expected on the sample
surface, coming from both the deposition process (e.g. residuals of gluconate complexes) and the
storage in air previous to the measurement. The considerably higher C1s and C KLL peaks in the
pristine sample confirm that. Furthermore, small residuals from the KOH electrolyte can be
observed in the K2p peak. Interestingly, chlorine appears after the electrochemical treatment.
The only possible source for this impurity is the reference electrode containing KCl as electrolyte,
800 700 600 500 400 300 200 100 00.0
0.2
0.4
0.6
0.8
VBSn4d
O2s
Co3p
Co3s
Co KLLK2pSn MNN
Sn3d
O KLL
O1s
C1s
C KLL
Cl2p
Cl LMM
pristine
after 1.35 V
inte
nsity (
10
6cp
s)
binding energy (eV)
Co2p
4. Results and discussion
88
which might diffuse through the diaphragm at the tip of the electrode. However, since the
measurement was conducted in 1 M KOH (pH 14) and the thermodynamic equilibrium potential
of Cl-/Cl2 is pH independent at 1.36 V vs. NHE30, compared to 0.404 V vs. NHE for H2O/O2 (cf.
equation (2)), the effect of the chlorine at the sample surface is considered to be negligible.
In all measurements a pronounced Sn3d signal appears which originates from the FTO substrate
indicating that the film is not completely closed. To check whether the FTO is actually inert
towards the OER in the considered potential range, also measurements on a blank substrate have
been performed which did not show any changes in the spectra (not shown).
Figure 4.42 depicts the CV diagram of a sample measured in the electrochemical cell (“glass
cross”) attached to the UHV system of the SoLIAS endstation. The potentials, which were applied
potentiostatically before SXPS investigations are marked with blue bars. The gray curve
represents the actually measured current values as function of the potential, set by the
potentiostat. However, due to the design of the glass cross and the long distance between the
working (sample) and reference electrode a significant setup resistance of about 160 Ω was
determined by impedance spectroscopy. Consequently, the black curve in the diagram represents
the “real” potential values at the electrode/electrolyte interface after the correction for the iR-
drop, according to equation (9). This leads to the fact that the applied potential of 1.9 V appears
as only 1.6 V at the catalyst surface, which it is hence denoted as measurement point in the
graphs.
Figure 4.42: CV diagram of a CoOx electrode recorded inside the glass cross without (grey) and after iR-correction (black). The measured cell resistance was 160 Ω. The position of the investigated potentials are marked with blue bars.
1.0 1.2 1.4 1.6 1.8
0.0
0.5
1.0
1.5
as measured
1.05 V
1.6 V
J (
mA
)
U (V vs. RHE)
1.35 V
iR-corrected
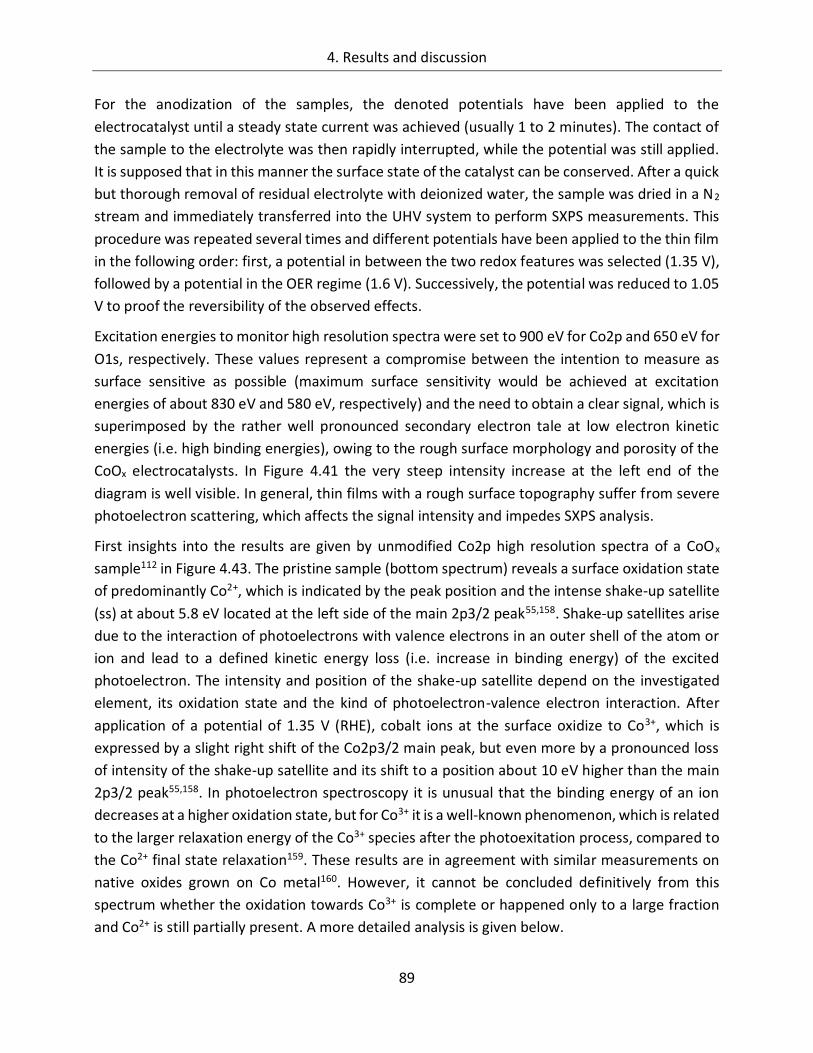
4. Results and discussion
89
For the anodization of the samples, the denoted potentials have been applied to the
electrocatalyst until a steady state current was achieved (usually 1 to 2 minutes). The contact of
the sample to the electrolyte was then rapidly interrupted, while the potential was still applied.
It is supposed that in this manner the surface state of the catalyst can be conserved. After a quick
but thorough removal of residual electrolyte with deionized water, the sample was dried in a N2
stream and immediately transferred into the UHV system to perform SXPS measurements. This
procedure was repeated several times and different potentials have been applied to the thin film
in the following order: first, a potential in between the two redox features was selected (1.35 V),
followed by a potential in the OER regime (1.6 V). Successively, the potential was reduced to 1.05
V to proof the reversibility of the observed effects.
Excitation energies to monitor high resolution spectra were set to 900 eV for Co2p and 650 eV for
O1s, respectively. These values represent a compromise between the intention to measure as
surface sensitive as possible (maximum surface sensitivity would be achieved at excitation
energies of about 830 eV and 580 eV, respectively) and the need to obtain a clear signal, which is
superimposed by the rather well pronounced secondary electron tale at low electron kinetic
energies (i.e. high binding energies), owing to the rough surface morphology and porosity of the
CoOx electrocatalysts. In Figure 4.41 the very steep intensity increase at the left end of the
diagram is well visible. In general, thin films with a rough surface topography suffer from severe
photoelectron scattering, which affects the signal intensity and impedes SXPS analysis.
First insights into the results are given by unmodified Co2p high resolution spectra of a CoOx
sample112 in Figure 4.43. The pristine sample (bottom spectrum) reveals a surface oxidation state
of predominantly Co2+, which is indicated by the peak position and the intense shake-up satellite
(ss) at about 5.8 eV located at the left side of the main 2p3/2 peak55,158. Shake-up satellites arise
due to the interaction of photoelectrons with valence electrons in an outer shell of the atom or
ion and lead to a defined kinetic energy loss (i.e. increase in binding energy) of the excited
photoelectron. The intensity and position of the shake-up satellite depend on the investigated
element, its oxidation state and the kind of photoelectron-valence electron interaction. After
application of a potential of 1.35 V (RHE), cobalt ions at the surface oxidize to Co3+, which is
expressed by a slight right shift of the Co2p3/2 main peak, but even more by a pronounced loss
of intensity of the shake-up satellite and its shift to a position about 10 eV higher than the main
2p3/2 peak55,158. In photoelectron spectroscopy it is unusual that the binding energy of an ion
decreases at a higher oxidation state, but for Co3+ it is a well-known phenomenon, which is related
to the larger relaxation energy of the Co3+ species after the photoexitation process, compared to
the Co2+ final state relaxation159. These results are in agreement with similar measurements on
native oxides grown on Co metal160. However, it cannot be concluded definitively from this
spectrum whether the oxidation towards Co3+ is complete or happened only to a large fraction
and Co2+ is still partially present. A more detailed analysis is given below.
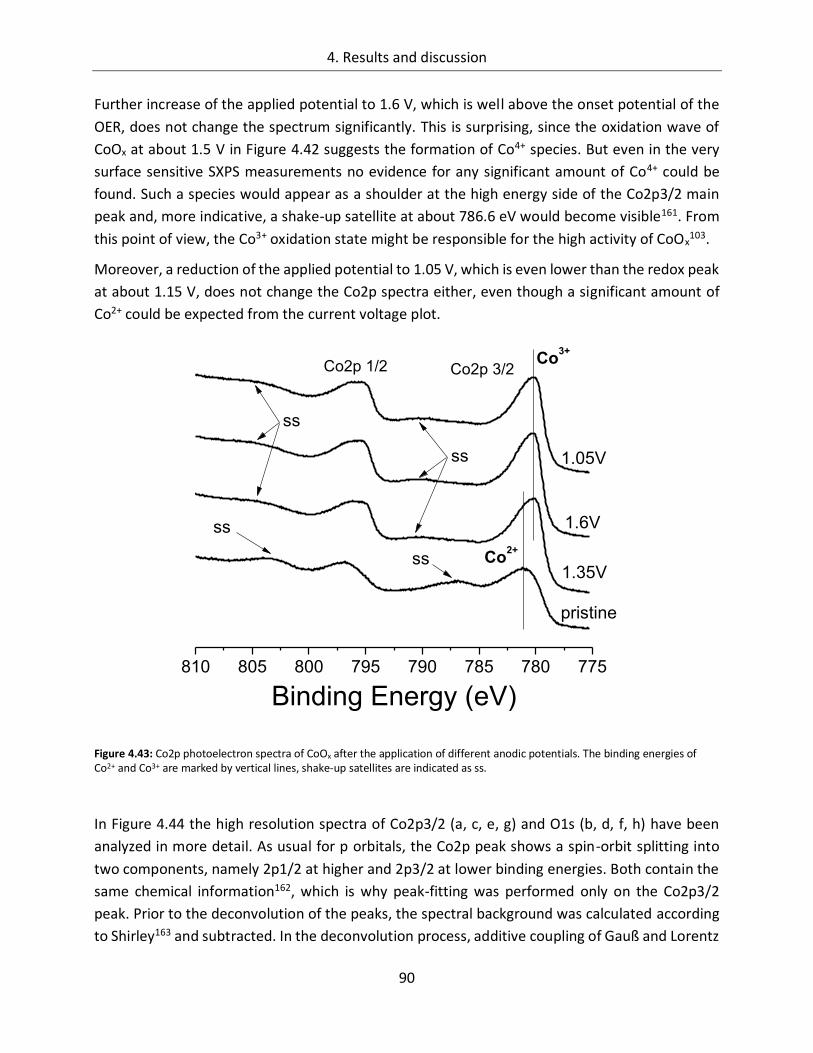
4. Results and discussion
90
Further increase of the applied potential to 1.6 V, which is well above the onset potential of the
OER, does not change the spectrum significantly. This is surprising, since the oxidation wave of
CoOx at about 1.5 V in Figure 4.42 suggests the formation of Co4+ species. But even in the very
surface sensitive SXPS measurements no evidence for any significant amount of Co4+ could be
found. Such a species would appear as a shoulder at the high energy side of the Co2p3/2 main
peak and, more indicative, a shake-up satellite at about 786.6 eV would become visible161. From
this point of view, the Co3+ oxidation state might be responsible for the high activity of CoOx103.
Moreover, a reduction of the applied potential to 1.05 V, which is even lower than the redox peak
at about 1.15 V, does not change the Co2p spectra either, even though a significant amount of
Co2+ could be expected from the current voltage plot.
Figure 4.43: Co2p photoelectron spectra of CoOx after the application of different anodic potentials. The binding energies of Co2+ and Co3+ are marked by vertical lines, shake-up satellites are indicated as ss.
In Figure 4.44 the high resolution spectra of Co2p3/2 (a, c, e, g) and O1s (b, d, f, h) have been
analyzed in more detail. As usual for p orbitals, the Co2p peak shows a spin-orbit splitting into
two components, namely 2p1/2 at higher and 2p3/2 at lower binding energies. Both contain the
same chemical information162, which is why peak-fitting was performed only on the Co2p3/2
peak. Prior to the deconvolution of the peaks, the spectral background was calculated according
to Shirley163 and subtracted. In the deconvolution process, additive coupling of Gauß and Lorentz
810 805 800 795 790 785 780 775
Co2p 3/2
1.05V
1.6V
1.35V
Co3+
ss
Binding Energy (eV)
ss
ss
ss
Co2+
pristine
Co2p 1/2
4. Results and discussion
91
functions was applied. All spectra were charge corrected towards an Au-standard (Au4f5/2 =
84 eV164) measured before and after the measurements on the sample. A comparison with the
position of the C1s peak of the samples, attributed to adventitious hydrocarbons (C-H2 =
284.8 eV), was in good agreement to that. The fitting parameters are summarized in Table 4.4.
As can be seen from Figure 4.44a, four peaks are necessary to deconvolute the pristine Co2p3/2
spectrum. The contributions at 779.7 (orange) and 780.7 eV (cyan) can easily be assigned to lattice
Co3+ and Co2+, respectively55,158,159,165–169. More difficult is the identification of the other two
peaks. The feature at 781.7 (green) was attributed to (surface) Co-OH, even though most
literature values for this peak are found at slightly lower binding energies166,168,170–173. This
assignment is justifiable, because the deconvoluted O1s spectrum in Figure 4.44b gives strong
evidence for OH groups (see below) and a distinction between Co2+ in the lattice of Co3O4 (and
CoO) and Co(OH)2 can be expected from the reported binding energies166. A general shift of about
0.2 eV towards higher binding energies can furthermore be observed for the pristine sample
compared to the other measurements, which might be an explanation for the high binding energy
values of Co(OH)2. The origin of the peak at 783.0 (labeled as A, pink) on the other hand is rather
unclear. The binding energy distance from the well documented Co3+ and Co2+ peaks seems rather
large for being a chemical shift and it is in addition unlikely that further, very distinct chemical
states of cobalt are present in the sample. The peak has previously been observed in Co(OH)2 and
Co3O4 nanoparticles170. A description of its physical nature is missing, though. One can therefore
speculate that some final state effects, probably related to interactions of some photoelectrons
with the outer shell of the Co-ions, are responsible for the appearance of peak A.
However, it is obvious from Figure 4.44a that the pristine sample contains a significant amount of
Co3+. Considering the deposition process at 1.4 V (RHE) one would even expect a much higher
content of Co3+ than it is actually the case. Nevertheless, lattice Co2+ and Co(OH)2 represent the
major part of the peak. A possible explanation for the presence of Co(OH)2 on the surface of the
pristine sample can be given by a dissolution precipitation mechanism160 in the presence of Co2+
ions in solution, which transform from a [Co(OH)4]2- complex to deposited Co(OH)2 on the top of
the catalyst. Another possible reason is related to the multi-step deposition mechanism (see
chapter 3.1). If the decomposition of the Co2L23- complex and the oxidation of the Co2+ ions
happen consecutively and not simultaneously it is possible that a thin layer of not yet oxidized
Co(OH)2 remains at the top of the film, if the deposition potential is turned off rapidly.
The portion of lattice Co2+ is too high for representing only Co3O4, as the relation of Co2+ to Co3+
in this compound is 1:2. As it is not possible to distinguish between Co2+ in the octahedral sites of
CoO and Co2+ in the tetrahedral sites of Co3O4 a certain amount of CoO might be present too.
Moreover, the pronounced shake-up satellite at around 778 eV (see Figure 4.43) is a strong
evidence for the presence of CoO. This is quite surprising and was not expected, since CoO is
known for being insulating and detrimental for the OER activity58. However, as the peak area of
4. Results and discussion
92
Co2+ significantly decreases after potential application, it is likely that CoO simply oxidizes to Co3O4
and plays no role in the OER.
The deconvolution of the O1s peak of the pristine layer in Figure 4.44b shows a strong peak at
531.4 eV (blue), which can be attributed to -OH groups166,170,174,175 and confirms the presence of
Co(OH)2. However, the peak area is too large to represent only Co(OH)2, especially if compared
to the relative fraction of the corresponding Co-OH peak (green) in Figure 4.44a. It is thus assumed
that the –OH peak in Figure 4.44b also comprises some other hydroxides, most probably from
residual gluconic acid and KOH electrolyte from the deposition process164, which both cannot be
resolved as distinct peaks. The other features in the O1s peak are assigned to lattice oxygen of
cobalt oxide (529.5 eV, pink)55,159,166,175, lattice oxygen of the FTO substrate (530.7 eV, gray) and
a broad peak of rather undefined surface oxygen (533.2 eV, yellow), which probably contains
components of water, carbonates, carboxyls164 and other common organic pollutants. A
distinction between differently bonded lattice oxygen is hardly possible for cobalt oxides, because
of the rather small chemical shifts55,166,176 between oxygen bound to Co3+ and Co2+, respectively.
After electrochemical treatment of the sample at 1.35 V, both the Co2p3/2 and the O1s peak
show substantial changes (Figure 4.44c and d). A small shift of all peaks of about 0.1 to 0.2 eV
towards lower binding energies can be observed. The portion of Co3+ significantly increases in
relation to lattice Co2+. Furthermore, the relative amounts of Co-OH and peak A decrease.
However, a complete oxidation to the trivalent state of cobalt does not occur, as Co2+ as well as
–OH groups are still present in the sample. It might be that not all Co-ions at the sample surface
are either accessible or capable for being oxidized to higher valences, but only a limited amount
can take part in the reaction. Evidence for this assumption has already been given in Figure 4.27c
(chapter 4.1.2.4), where it is shown that the overall portion of Co-ions undergoing a transition in
the oxidation state is rather low. The relation of the peak areas of lattice Co3+ (orange) and Co2+
(cyan) is now approximately 2:1, which is a strong evidence for the presence of Co3O4. This
assumption is consistent with results from electrochemical investigations, which suggests an
increased appearance of Co3O4 in the potential region around 1.35 V. The peak representing
surface oxygen (yellow) on the other hand disappears upon electrochemical treatment. This can
be interpreted as a result of the applied potential, “cleaning” the surface from contaminations.
After increasing the potential from 1.35 to 1.6 V (Figure 4.44e and f), both lattice Co oxidation
states and Co-OH are still present in the sample, even in similar quantities. From the CV diagram
(see Figure 4.42), one should expect the appearance of Co4+ ions, but no evidence for the rise of
a new species is recognizable in the spectra. In this respect, it has to be noted that only very few
reports have been published, which show XPS spectra of Co4+ species161 and to the best of the
author’s knowledge no stable CoO2 compound was successfully synthesized so far60. Therefore it
is possible that Co4+ ions are not stable when the applied potential is removed or that they
dissolve into the Helmholtz layer just in front of the electrode/electrolyte interface and are
washed away when the electrolyte is removed after the potentiostatic voltage application.
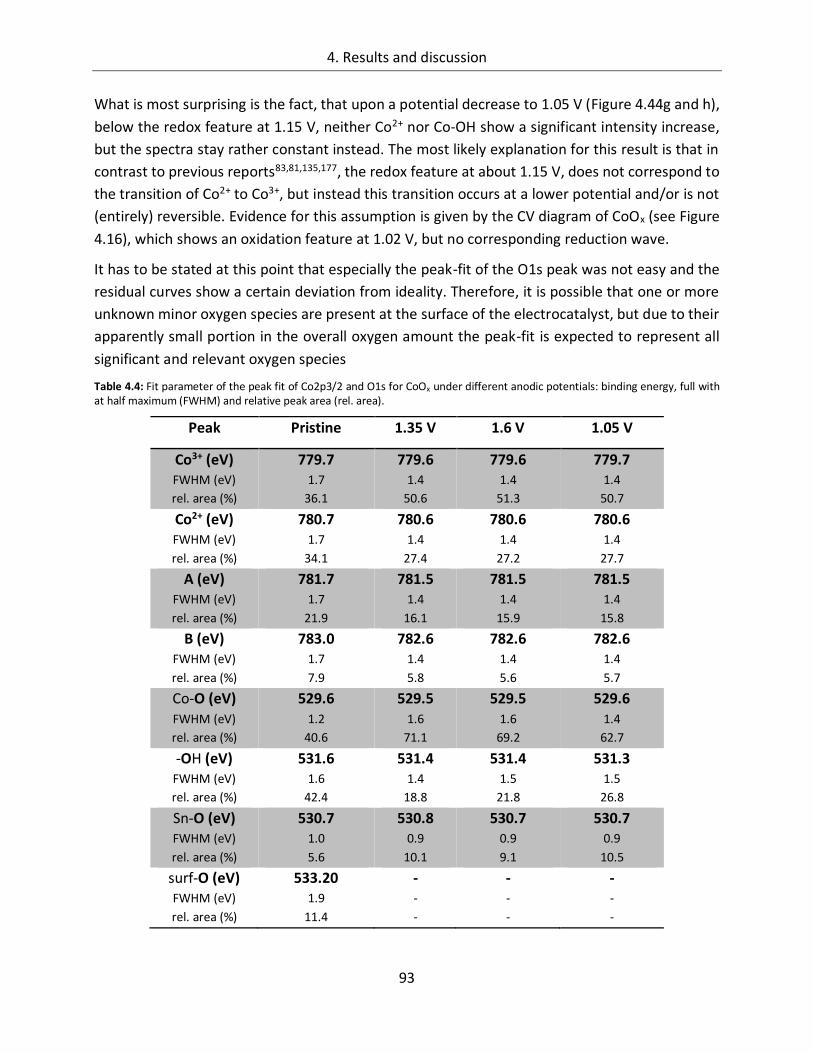
4. Results and discussion
93
What is most surprising is the fact, that upon a potential decrease to 1.05 V (Figure 4.44g and h),
below the redox feature at 1.15 V, neither Co2+ nor Co-OH show a significant intensity increase,
but the spectra stay rather constant instead. The most likely explanation for this result is that in
contrast to previous reports83,81,135,177, the redox feature at about 1.15 V, does not correspond to
the transition of Co2+ to Co3+, but instead this transition occurs at a lower potential and/or is not
(entirely) reversible. Evidence for this assumption is given by the CV diagram of CoOx (see Figure
4.16), which shows an oxidation feature at 1.02 V, but no corresponding reduction wave.
It has to be stated at this point that especially the peak-fit of the O1s peak was not easy and the
residual curves show a certain deviation from ideality. Therefore, it is possible that one or more
unknown minor oxygen species are present at the surface of the electrocatalyst, but due to their
apparently small portion in the overall oxygen amount the peak-fit is expected to represent all
significant and relevant oxygen species
Table 4.4: Fit parameter of the peak fit of Co2p3/2 and O1s for CoOx under different anodic potentials: binding energy, full with at half maximum (FWHM) and relative peak area (rel. area).
Peak Pristine 1.35 V 1.6 V 1.05 V
Co3+ (eV) FWHM (eV)
rel. area (%)
779.7 1.7
36.1
779.6 1.4
50.6
779.6 1.4
51.3
779.7 1.4
50.7
Co2+ (eV) FWHM (eV)
rel. area (%)
780.7 1.7
34.1
780.6 1.4
27.4
780.6 1.4
27.2
780.6 1.4
27.7
A (eV) FWHM (eV)
rel. area (%)
781.7 1.7
21.9
781.5 1.4
16.1
781.5 1.4
15.9
781.5 1.4
15.8
B (eV) FWHM (eV)
rel. area (%)
783.0 1.7
7.9
782.6 1.4
5.8
782.6 1.4
5.6
782.6 1.4
5.7
Co-O (eV) FWHM (eV)
rel. area (%)
529.6 1.2
40.6
529.5 1.6
71.1
529.5 1.6
69.2
529.6 1.4
62.7
-OH (eV) FWHM (eV)
rel. area (%)
531.6 1.6
42.4
531.4 1.4
18.8
531.4 1.5
21.8
531.3 1.5
26.8
Sn-O (eV) FWHM (eV)
rel. area (%)
530.7 1.0
5.6
530.8 0.9
10.1
530.7 0.9
9.1
530.7 0.9
10.5
surf-O (eV) FWHM (eV)
rel. area (%)
533.20 1.9
11.4
- -
-
- -
-
- -
-
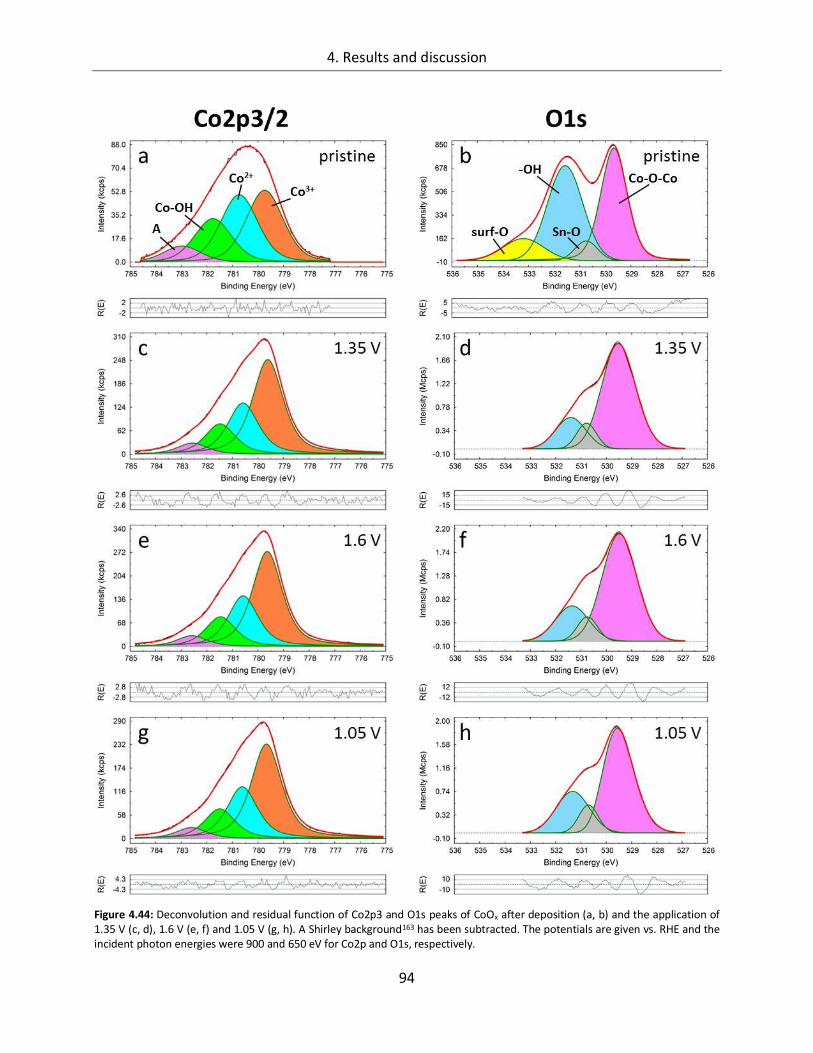
4. Results and discussion
94
Figure 4.44: Deconvolution and residual function of Co2p3 and O1s peaks of CoOx after deposition (a, b) and the application of 1.35 V (c, d), 1.6 V (e, f) and 1.05 V (g, h). A Shirley background163 has been subtracted. The potentials are given vs. RHE and the incident photon energies were 900 and 650 eV for Co2p and O1s, respectively.
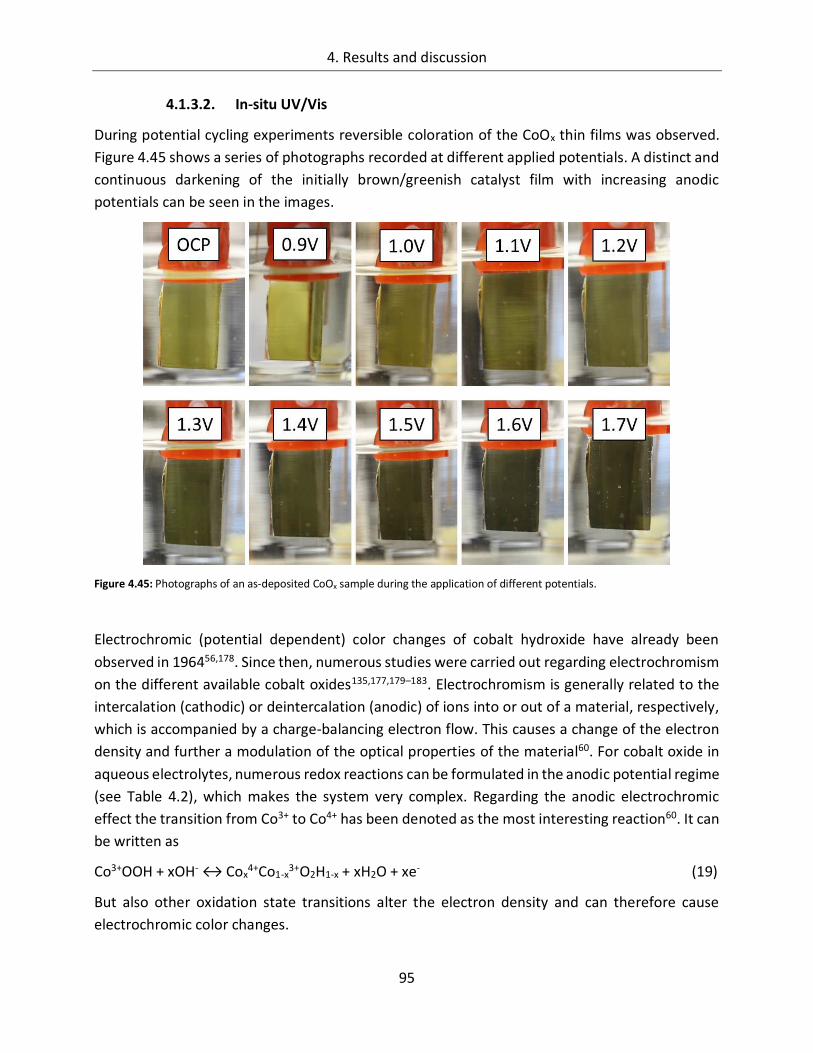
4. Results and discussion
95
4.1.3.2. In-situ UV/Vis
During potential cycling experiments reversible coloration of the CoOx thin films was observed.
Figure 4.45 shows a series of photographs recorded at different applied potentials. A distinct and
continuous darkening of the initially brown/greenish catalyst film with increasing anodic
potentials can be seen in the images.
Figure 4.45: Photographs of an as-deposited CoOx sample during the application of different potentials.
Electrochromic (potential dependent) color changes of cobalt hydroxide have already been
observed in 196456,178. Since then, numerous studies were carried out regarding electrochromism
on the different available cobalt oxides135,177,179–183. Electrochromism is generally related to the
intercalation (cathodic) or deintercalation (anodic) of ions into or out of a material, respectively,
which is accompanied by a charge-balancing electron flow. This causes a change of the electron
density and further a modulation of the optical properties of the material60. For cobalt oxide in
aqueous electrolytes, numerous redox reactions can be formulated in the anodic potential regime
(see Table 4.2), which makes the system very complex. Regarding the anodic electrochromic
effect the transition from Co3+ to Co4+ has been denoted as the most interesting reaction60. It can
be written as
Co3+OOH + xOH- ↔ Cox4+Co1-x
3+O2H1-x + xH2O + xe- (19)
But also other oxidation state transitions alter the electron density and can therefore cause
electrochromic color changes.
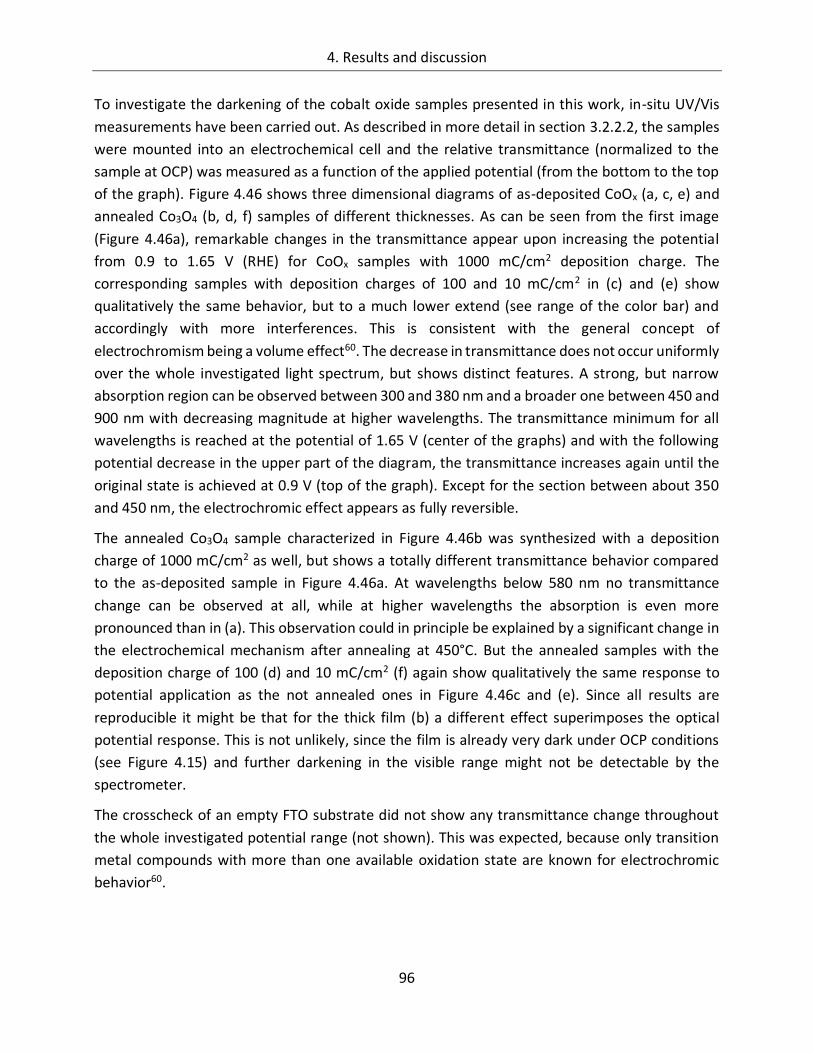
4. Results and discussion
96
To investigate the darkening of the cobalt oxide samples presented in this work, in-situ UV/Vis
measurements have been carried out. As described in more detail in section 3.2.2.2, the samples
were mounted into an electrochemical cell and the relative transmittance (normalized to the
sample at OCP) was measured as a function of the applied potential (from the bottom to the top
of the graph). Figure 4.46 shows three dimensional diagrams of as-deposited CoOx (a, c, e) and
annealed Co3O4 (b, d, f) samples of different thicknesses. As can be seen from the first image
(Figure 4.46a), remarkable changes in the transmittance appear upon increasing the potential
from 0.9 to 1.65 V (RHE) for CoOx samples with 1000 mC/cm2 deposition charge. The
corresponding samples with deposition charges of 100 and 10 mC/cm2 in (c) and (e) show
qualitatively the same behavior, but to a much lower extend (see range of the color bar) and
accordingly with more interferences. This is consistent with the general concept of
electrochromism being a volume effect60. The decrease in transmittance does not occur uniformly
over the whole investigated light spectrum, but shows distinct features. A strong, but narrow
absorption region can be observed between 300 and 380 nm and a broader one between 450 and
900 nm with decreasing magnitude at higher wavelengths. The transmittance minimum for all
wavelengths is reached at the potential of 1.65 V (center of the graphs) and with the following
potential decrease in the upper part of the diagram, the transmittance increases again until the
original state is achieved at 0.9 V (top of the graph). Except for the section between about 350
and 450 nm, the electrochromic effect appears as fully reversible.
The annealed Co3O4 sample characterized in Figure 4.46b was synthesized with a deposition
charge of 1000 mC/cm2 as well, but shows a totally different transmittance behavior compared
to the as-deposited sample in Figure 4.46a. At wavelengths below 580 nm no transmittance
change can be observed at all, while at higher wavelengths the absorption is even more
pronounced than in (a). This observation could in principle be explained by a significant change in
the electrochemical mechanism after annealing at 450°C. But the annealed samples with the
deposition charge of 100 (d) and 10 mC/cm2 (f) again show qualitatively the same response to
potential application as the not annealed ones in Figure 4.46c and (e). Since all results are
reproducible it might be that for the thick film (b) a different effect superimposes the optical
potential response. This is not unlikely, since the film is already very dark under OCP conditions
(see Figure 4.15) and further darkening in the visible range might not be detectable by the
spectrometer.
The crosscheck of an empty FTO substrate did not show any transmittance change throughout
the whole investigated potential range (not shown). This was expected, because only transition
metal compounds with more than one available oxidation state are known for electrochromic
behavior60.
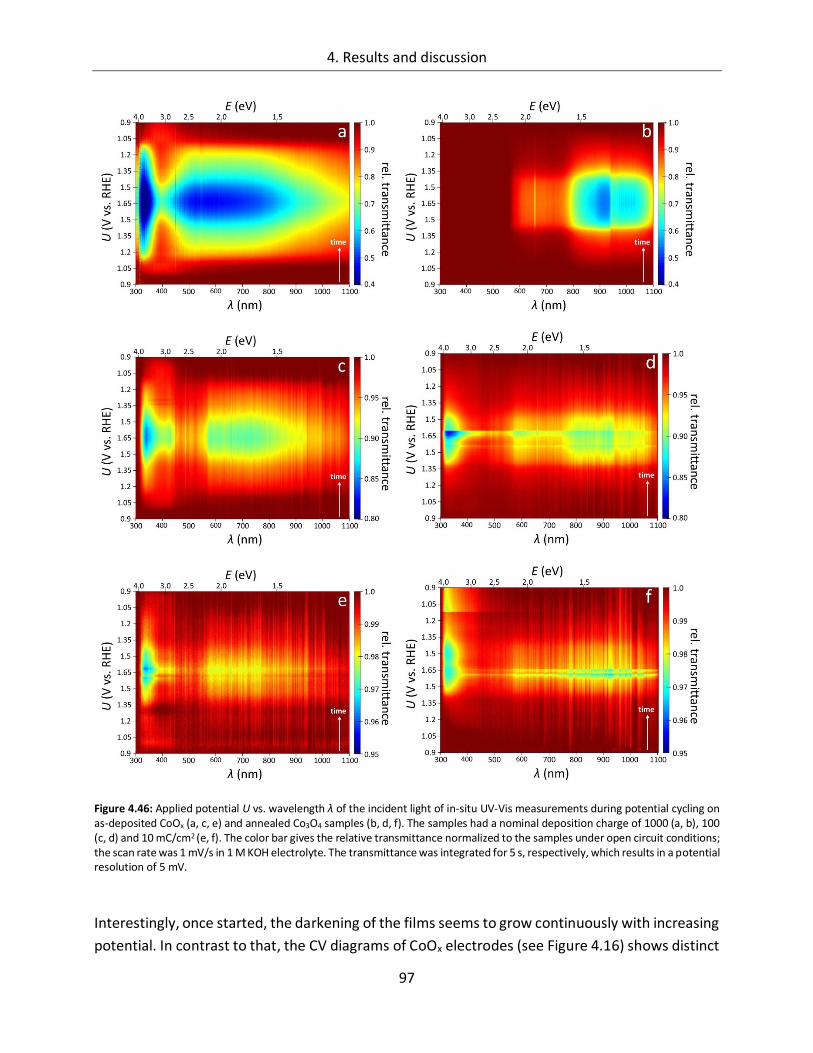
4. Results and discussion
97
Figure 4.46: Applied potential U vs. wavelength λ of the incident light of in-situ UV-Vis measurements during potential cycling on as-deposited CoOx (a, c, e) and annealed Co3O4 samples (b, d, f). The samples had a nominal deposition charge of 1000 (a, b), 100 (c, d) and 10 mC/cm2 (e, f). The color bar gives the relative transmittance normalized to the samples under open circuit conditions; the scan rate was 1 mV/s in 1 M KOH electrolyte. The transmittance was integrated for 5 s, respectively, which results in a potential resolution of 5 mV.
Interestingly, once started, the darkening of the films seems to grow continuously with increasing
potential. In contrast to that, the CV diagrams of CoOx electrodes (see Figure 4.16) shows distinct
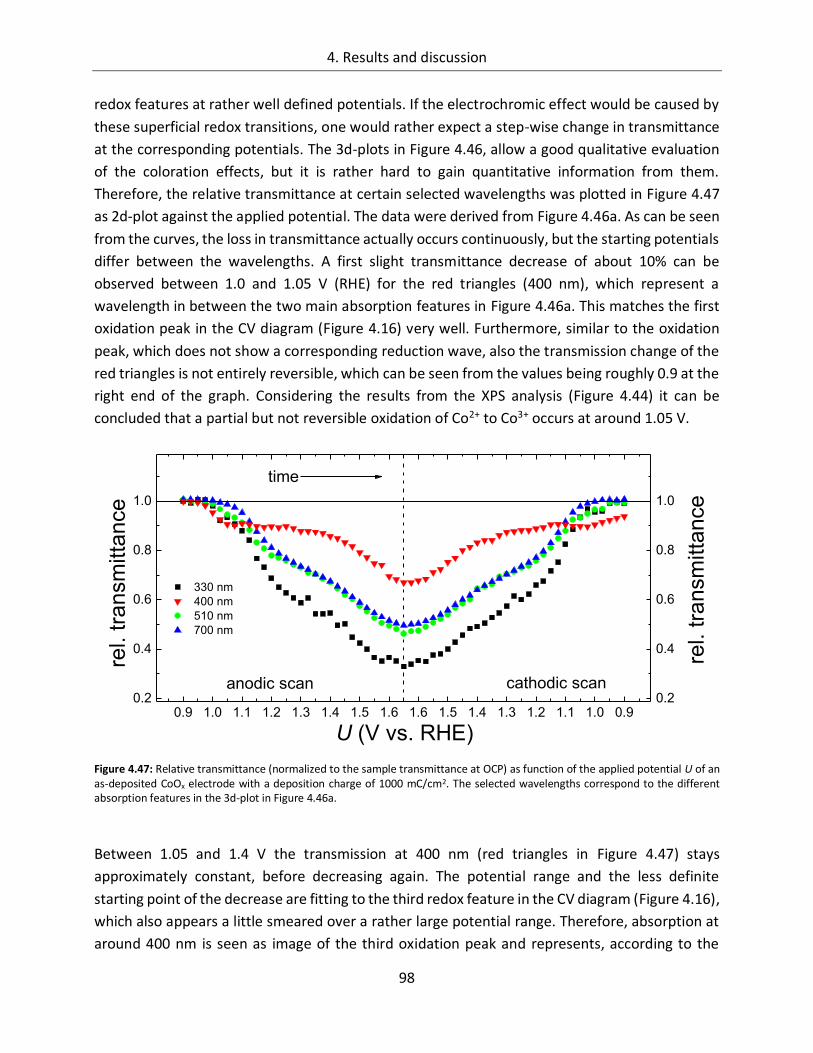
4. Results and discussion
98
redox features at rather well defined potentials. If the electrochromic effect would be caused by
these superficial redox transitions, one would rather expect a step-wise change in transmittance
at the corresponding potentials. The 3d-plots in Figure 4.46, allow a good qualitative evaluation
of the coloration effects, but it is rather hard to gain quantitative information from them.
Therefore, the relative transmittance at certain selected wavelengths was plotted in Figure 4.47
as 2d-plot against the applied potential. The data were derived from Figure 4.46a. As can be seen
from the curves, the loss in transmittance actually occurs continuously, but the starting potentials
differ between the wavelengths. A first slight transmittance decrease of about 10% can be
observed between 1.0 and 1.05 V (RHE) for the red triangles (400 nm), which represent a
wavelength in between the two main absorption features in Figure 4.46a. This matches the first
oxidation peak in the CV diagram (Figure 4.16) very well. Furthermore, similar to the oxidation
peak, which does not show a corresponding reduction wave, also the transmission change of the
red triangles is not entirely reversible, which can be seen from the values being roughly 0.9 at the
right end of the graph. Considering the results from the XPS analysis (Figure 4.44) it can be
concluded that a partial but not reversible oxidation of Co2+ to Co3+ occurs at around 1.05 V.
Figure 4.47: Relative transmittance (normalized to the sample transmittance at OCP) as function of the applied potential U of an as-deposited CoOx electrode with a deposition charge of 1000 mC/cm2. The selected wavelengths correspond to the different absorption features in the 3d-plot in Figure 4.46a.
Between 1.05 and 1.4 V the transmission at 400 nm (red triangles in Figure 4.47) stays
approximately constant, before decreasing again. The potential range and the less definite
starting point of the decrease are fitting to the third redox feature in the CV diagram (Figure 4.16),
which also appears a little smeared over a rather large potential range. Therefore, absorption at
around 400 nm is seen as image of the third oxidation peak and represents, according to the
0.9 1.0 1.1 1.2 1.3 1.4 1.5 1.60.2
0.4
0.6
0.8
1.0
cathodic scan
330 nm
400 nm
510 nm
700 nm
rel. tra
nsm
itta
nce
U (V vs. RHE)
anodic scan
time
1.6 1.5 1.4 1.3 1.2 1.1 1.0 0.90.2
0.4
0.6
0.8
1.0
re
l. tra
nsm
itta
nce
4. Results and discussion
99
literature81,134,135, the appearance of Co4+ due to equation (19). This feature is, in contrast to the
first transmittance decay at 1.0 V, fully reversible and reaches its starting level at about 1.35 V in
the cathodic scan.
The black squares (330 nm), green dots (510 nm) and blue triangles (700 nm) on the other hand
represent the two main absorption features in Figure 4.46a and start decreasing at a potential
between 1.05 and 1.15 V. This can be ascribed to the second redox peak in the CV diagram (Figure
4.16). Consequently, the relative transmittance at these wavelengths is fully reversible and
reaches unity again at about 1.0 V in the cathodic scan. However, the relative transmittance
decreases linearly with increasing potential between 1.1 and 1.65 V and rises again upon
subsequent potential decrease. This is tentatively explained by the electrochromic effect being
volume dependent. Once the oxidation potential for the cobalt ions at the large and rough surface
is reached, the sudden oxidation of a great number of ions occurs, which is expressed by the
oxidation peak centered at around 1.15 V in the CV diagram. However, the potential, which has
to be applied to oxidize cobalt ions in the bulk of the thin film successively increases with distance
of the ions to the surface, because there might be a potential drop inside the thin film and further
the involved ions from the electrolyte (i.e. OH-) have to be transported through the bulk to the
relevant cobalt ions. In that way, the linear decrease of relative transmittance can be seen as
progress of the cobalt oxidation through the bulk of the sample. In the CV diagram this effect is
not visible, since it would result in a small constant current, which is overlapped by other effects.
In the cathodic scan the phenomenon is accordingly reversed. The same model can be applied for
the transmittance at 400 nm (red triangles) between 1.4 and 1.65 V, while the feature between
1.0 and 1.05 V seems to be superficial as it does not proceed at higher potentials.
Unlike the first and third oxidation peak in the CV diagram (Figure 4.16), the assignment of a
particular oxidation reaction for the second peak is not trivial, because conflicting results have
been obtained. From the electrochemical point of view one would expect the transition from Co2+
to Co3+ according to equation No. 6 in Table 4.2. However, XPS measurements (chapter 4.1.3.1)
showed that this oxidation happens only partially and probably already at lower potentials, as a
significant Co2+ portion persists also at potentials far above 1.15 V and an unchanged fraction of
Co3+ can be measured at 1.05 V. It might be that part of the Co2+ ions in the tetrahedral sites of
Co3O4 are not accessible for further oxidation to Co3+ to form CoOOH and that many different
oxides, hydroxides and/or oxyhydroxides exist simultaneously in the sample, but at this point it
has to remain speculation. Nevertheless, it could be shown that also oxidative transitions below
the tetravalent state of Co ions show a considerable electrochromic effect179.
To investigate the kinetics of the electrochromic effect, potential step experiments have been
performed as well. The results are presented in Figure 4.48 for CoOx (a) and annealed Co3O4 layers
(b), both with a deposition charge of 1000 mC/cm2. The electrodes were subjected to different
anodic potentials for 10 seconds each, interrupted by 10 seconds at 0.9 V (dark red areas),
respectively. The coloration of the graphs approximately corresponds to the coloration in Figure
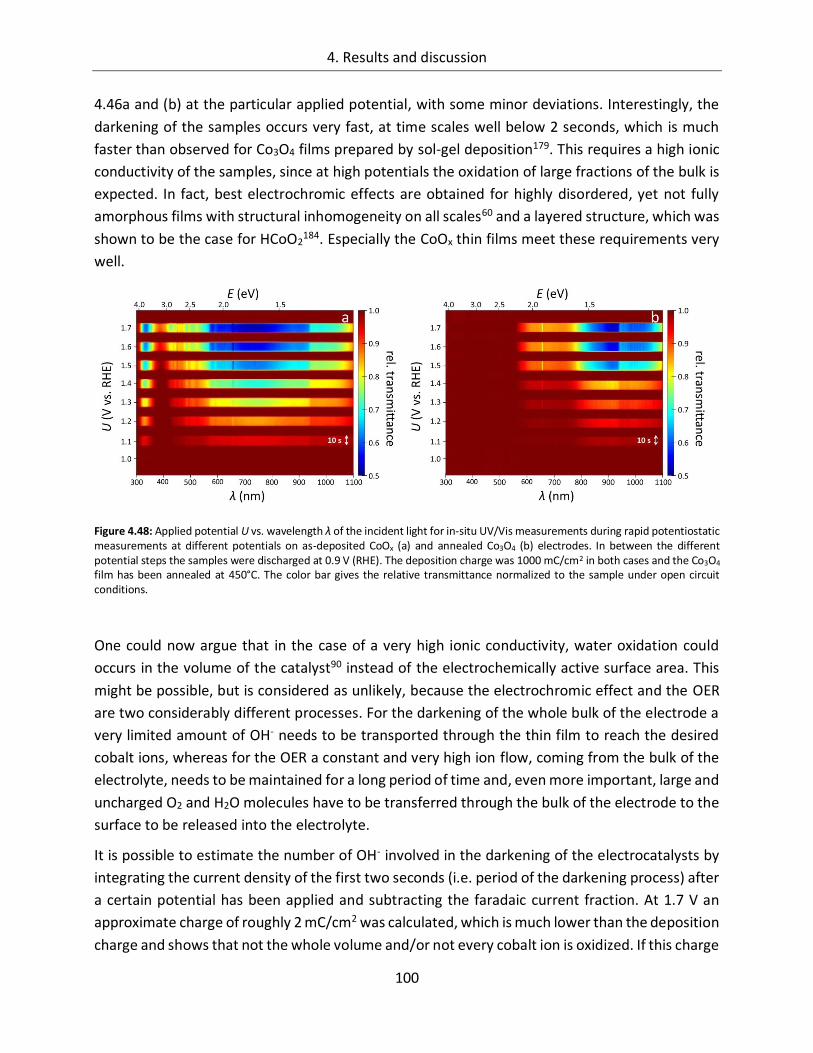
4. Results and discussion
100
4.46a and (b) at the particular applied potential, with some minor deviations. Interestingly, the
darkening of the samples occurs very fast, at time scales well below 2 seconds, which is much
faster than observed for Co3O4 films prepared by sol-gel deposition179. This requires a high ionic
conductivity of the samples, since at high potentials the oxidation of large fractions of the bulk is
expected. In fact, best electrochromic effects are obtained for highly disordered, yet not fully
amorphous films with structural inhomogeneity on all scales60 and a layered structure, which was
shown to be the case for HCoO2184. Especially the CoOx thin films meet these requirements very
well.
Figure 4.48: Applied potential U vs. wavelength λ of the incident light for in-situ UV/Vis measurements during rapid potentiostatic measurements at different potentials on as-deposited CoOx (a) and annealed Co3O4 (b) electrodes. In between the different potential steps the samples were discharged at 0.9 V (RHE). The deposition charge was 1000 mC/cm2 in both cases and the Co3O4 film has been annealed at 450°C. The color bar gives the relative transmittance normalized to the sample under open circuit conditions.
One could now argue that in the case of a very high ionic conductivity, water oxidation could
occurs in the volume of the catalyst90 instead of the electrochemically active surface area. This
might be possible, but is considered as unlikely, because the electrochromic effect and the OER
are two considerably different processes. For the darkening of the whole bulk of the electrode a
very limited amount of OH- needs to be transported through the thin film to reach the desired
cobalt ions, whereas for the OER a constant and very high ion flow, coming from the bulk of the
electrolyte, needs to be maintained for a long period of time and, even more important, large and
uncharged O2 and H2O molecules have to be transferred through the bulk of the electrode to the
surface to be released into the electrolyte.
It is possible to estimate the number of OH- involved in the darkening of the electrocatalysts by
integrating the current density of the first two seconds (i.e. period of the darkening process) after
a certain potential has been applied and subtracting the faradaic current fraction. At 1.7 V an
approximate charge of roughly 2 mC/cm2 was calculated, which is much lower than the deposition
charge and shows that not the whole volume and/or not every cobalt ion is oxidized. If this charge
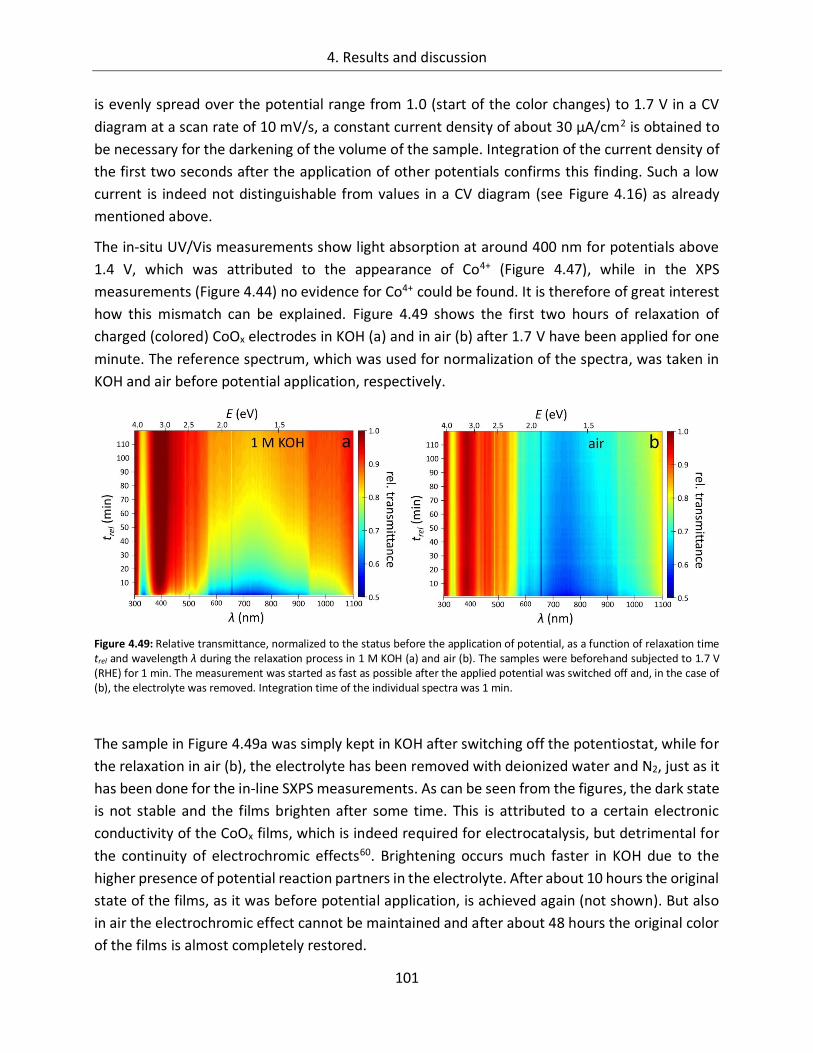
4. Results and discussion
101
is evenly spread over the potential range from 1.0 (start of the color changes) to 1.7 V in a CV
diagram at a scan rate of 10 mV/s, a constant current density of about 30 µA/cm2 is obtained to
be necessary for the darkening of the volume of the sample. Integration of the current density of
the first two seconds after the application of other potentials confirms this finding. Such a low
current is indeed not distinguishable from values in a CV diagram (see Figure 4.16) as already
mentioned above.
The in-situ UV/Vis measurements show light absorption at around 400 nm for potentials above
1.4 V, which was attributed to the appearance of Co4+ (Figure 4.47), while in the XPS
measurements (Figure 4.44) no evidence for Co4+ could be found. It is therefore of great interest
how this mismatch can be explained. Figure 4.49 shows the first two hours of relaxation of
charged (colored) CoOx electrodes in KOH (a) and in air (b) after 1.7 V have been applied for one
minute. The reference spectrum, which was used for normalization of the spectra, was taken in
KOH and air before potential application, respectively.
Figure 4.49: Relative transmittance, normalized to the status before the application of potential, as a function of relaxation time trel and wavelength λ during the relaxation process in 1 M KOH (a) and air (b). The samples were beforehand subjected to 1.7 V (RHE) for 1 min. The measurement was started as fast as possible after the applied potential was switched off and, in the case of (b), the electrolyte was removed. Integration time of the individual spectra was 1 min.
The sample in Figure 4.49a was simply kept in KOH after switching off the potentiostat, while for
the relaxation in air (b), the electrolyte has been removed with deionized water and N2, just as it
has been done for the in-line SXPS measurements. As can be seen from the figures, the dark state
is not stable and the films brighten after some time. This is attributed to a certain electronic
conductivity of the CoOx films, which is indeed required for electrocatalysis, but detrimental for
the continuity of electrochromic effects60. Brightening occurs much faster in KOH due to the
higher presence of potential reaction partners in the electrolyte. After about 10 hours the original
state of the films, as it was before potential application, is achieved again (not shown). But also
in air the electrochromic effect cannot be maintained and after about 48 hours the original color
of the films is almost completely restored.
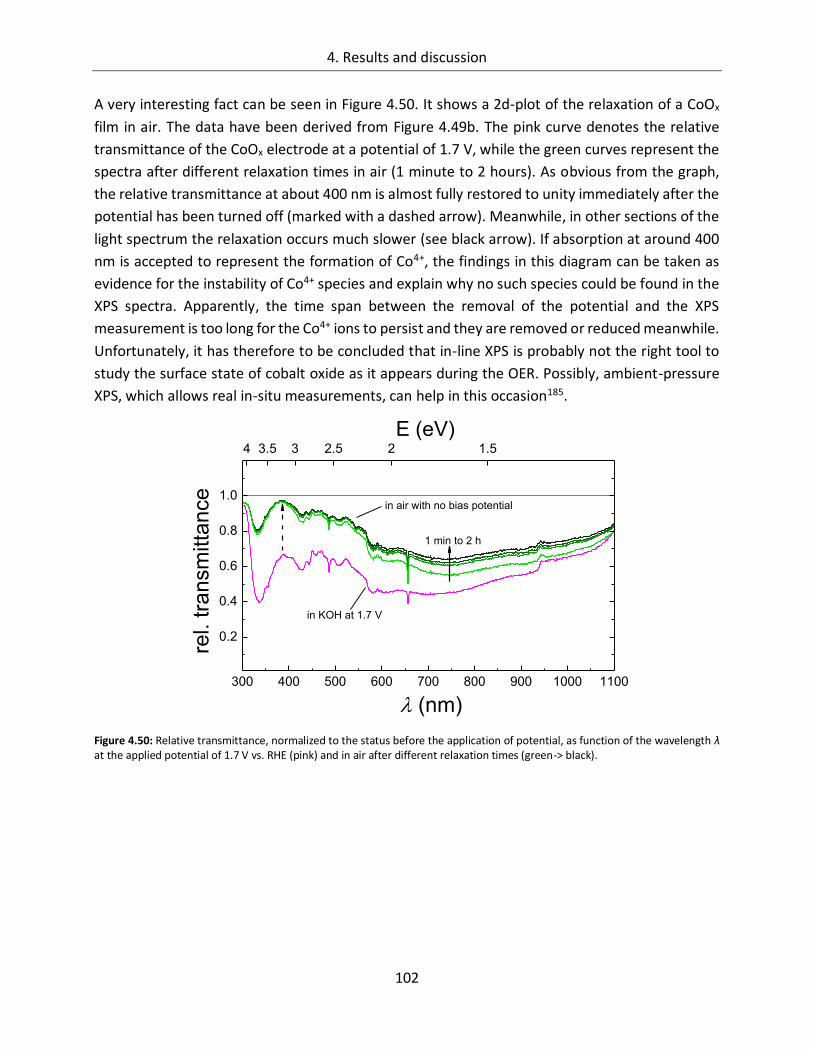
4. Results and discussion
102
A very interesting fact can be seen in Figure 4.50. It shows a 2d-plot of the relaxation of a CoOx
film in air. The data have been derived from Figure 4.49b. The pink curve denotes the relative
transmittance of the CoOx electrode at a potential of 1.7 V, while the green curves represent the
spectra after different relaxation times in air (1 minute to 2 hours). As obvious from the graph,
the relative transmittance at about 400 nm is almost fully restored to unity immediately after the
potential has been turned off (marked with a dashed arrow). Meanwhile, in other sections of the
light spectrum the relaxation occurs much slower (see black arrow). If absorption at around 400
nm is accepted to represent the formation of Co4+, the findings in this diagram can be taken as
evidence for the instability of Co4+ species and explain why no such species could be found in the
XPS spectra. Apparently, the time span between the removal of the potential and the XPS
measurement is too long for the Co4+ ions to persist and they are removed or reduced meanwhile.
Unfortunately, it has therefore to be concluded that in-line XPS is probably not the right tool to
study the surface state of cobalt oxide as it appears during the OER. Possibly, ambient-pressure
XPS, which allows real in-situ measurements, can help in this occasion185.
Figure 4.50: Relative transmittance, normalized to the status before the application of potential, as function of the wavelength λ at the applied potential of 1.7 V vs. RHE (pink) and in air after different relaxation times (green-> black).
300 400 500 600 700 800 900 1000 1100
0.2
0.4
0.6
0.8
1.0
1 min to 2 h
in air with no bias potential
rel. tra
nsm
itta
nce
(nm)
in KOH at 1.7 V
4 3.5 3 2.5 2 1.5
E (eV)
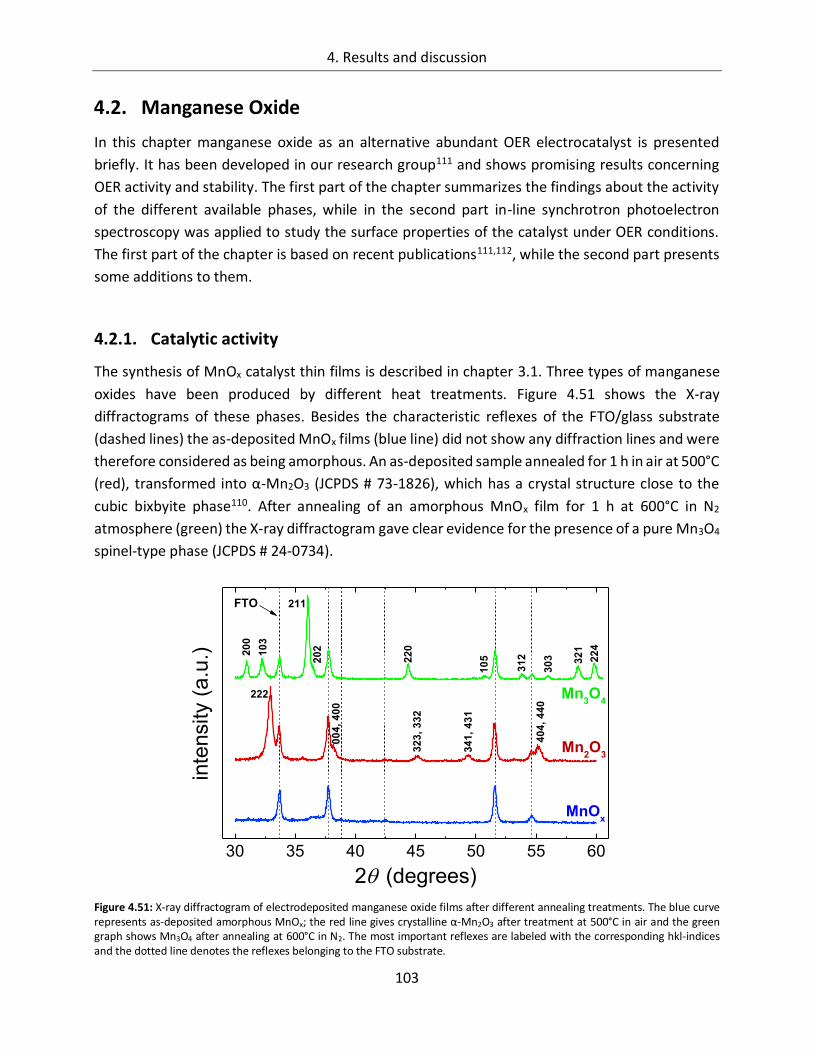
4. Results and discussion
103
4.2. Manganese Oxide
In this chapter manganese oxide as an alternative abundant OER electrocatalyst is presented
briefly. It has been developed in our research group111 and shows promising results concerning
OER activity and stability. The first part of the chapter summarizes the findings about the activity
of the different available phases, while in the second part in-line synchrotron photoelectron
spectroscopy was applied to study the surface properties of the catalyst under OER conditions.
The first part of the chapter is based on recent publications111,112, while the second part presents
some additions to them.
4.2.1. Catalytic activity
The synthesis of MnOx catalyst thin films is described in chapter 3.1. Three types of manganese
oxides have been produced by different heat treatments. Figure 4.51 shows the X-ray
diffractograms of these phases. Besides the characteristic reflexes of the FTO/glass substrate
(dashed lines) the as-deposited MnOx films (blue line) did not show any diffraction lines and were
therefore considered as being amorphous. An as-deposited sample annealed for 1 h in air at 500°C
(red), transformed into α-Mn2O3 (JCPDS # 73-1826), which has a crystal structure close to the
cubic bixbyite phase110. After annealing of an amorphous MnOx film for 1 h at 600°C in N2
atmosphere (green) the X-ray diffractogram gave clear evidence for the presence of a pure Mn3O4
spinel-type phase (JCPDS # 24-0734).
Figure 4.51: X-ray diffractogram of electrodeposited manganese oxide films after different annealing treatments. The blue curve represents as-deposited amorphous MnOx; the red line gives crystalline α-Mn2O3 after treatment at 500°C in air and the green graph shows Mn3O4 after annealing at 600°C in N2. The most important reflexes are labeled with the corresponding hkl-indices and the dotted line denotes the reflexes belonging to the FTO substrate.
30 35 40 45 50 55 60
FTO
MnOx
Mn2O
3
00
4,
40
0
32
3,
33
2
40
4,
44
0
34
1,
43
1
211
inte
nsity (
a.u
.)
2 (degrees)
10
520
2
Mn3O
4222
22
4
32
1
30
3
31
222
0
10
3
20
0
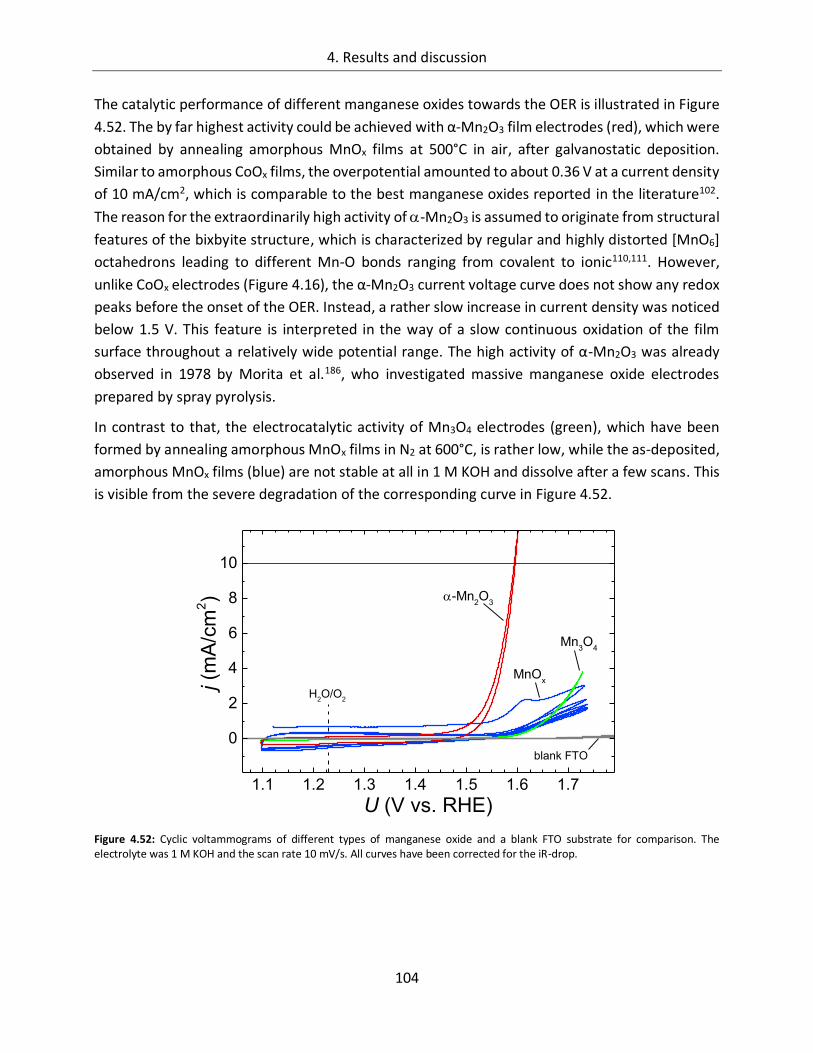
4. Results and discussion
104
The catalytic performance of different manganese oxides towards the OER is illustrated in Figure
4.52. The by far highest activity could be achieved with α-Mn2O3 film electrodes (red), which were
obtained by annealing amorphous MnOx films at 500°C in air, after galvanostatic deposition.
Similar to amorphous CoOx films, the overpotential amounted to about 0.36 V at a current density
of 10 mA/cm2, which is comparable to the best manganese oxides reported in the literature102.
The reason for the extraordinarily high activity of -Mn2O3 is assumed to originate from structural
features of the bixbyite structure, which is characterized by regular and highly distorted [MnO6]
octahedrons leading to different Mn-O bonds ranging from covalent to ionic110,111. However,
unlike CoOx electrodes (Figure 4.16), the α-Mn2O3 current voltage curve does not show any redox
peaks before the onset of the OER. Instead, a rather slow increase in current density was noticed
below 1.5 V. This feature is interpreted in the way of a slow continuous oxidation of the film
surface throughout a relatively wide potential range. The high activity of α-Mn2O3 was already
observed in 1978 by Morita et al.186, who investigated massive manganese oxide electrodes
prepared by spray pyrolysis.
In contrast to that, the electrocatalytic activity of Mn3O4 electrodes (green), which have been
formed by annealing amorphous MnOx films in N2 at 600°C, is rather low, while the as-deposited,
amorphous MnOx films (blue) are not stable at all in 1 M KOH and dissolve after a few scans. This
is visible from the severe degradation of the corresponding curve in Figure 4.52.
Figure 4.52: Cyclic voltammograms of different types of manganese oxide and a blank FTO substrate for comparison. The electrolyte was 1 M KOH and the scan rate 10 mV/s. All curves have been corrected for the iR-drop.
1.1 1.2 1.3 1.4 1.5 1.6 1.7
0
2
4
6
8
10
blank FTO
MnOx
Mn3O
4
j (m
A/c
m2)
U (V vs. RHE)
H2O/O
2
-Mn2O
3
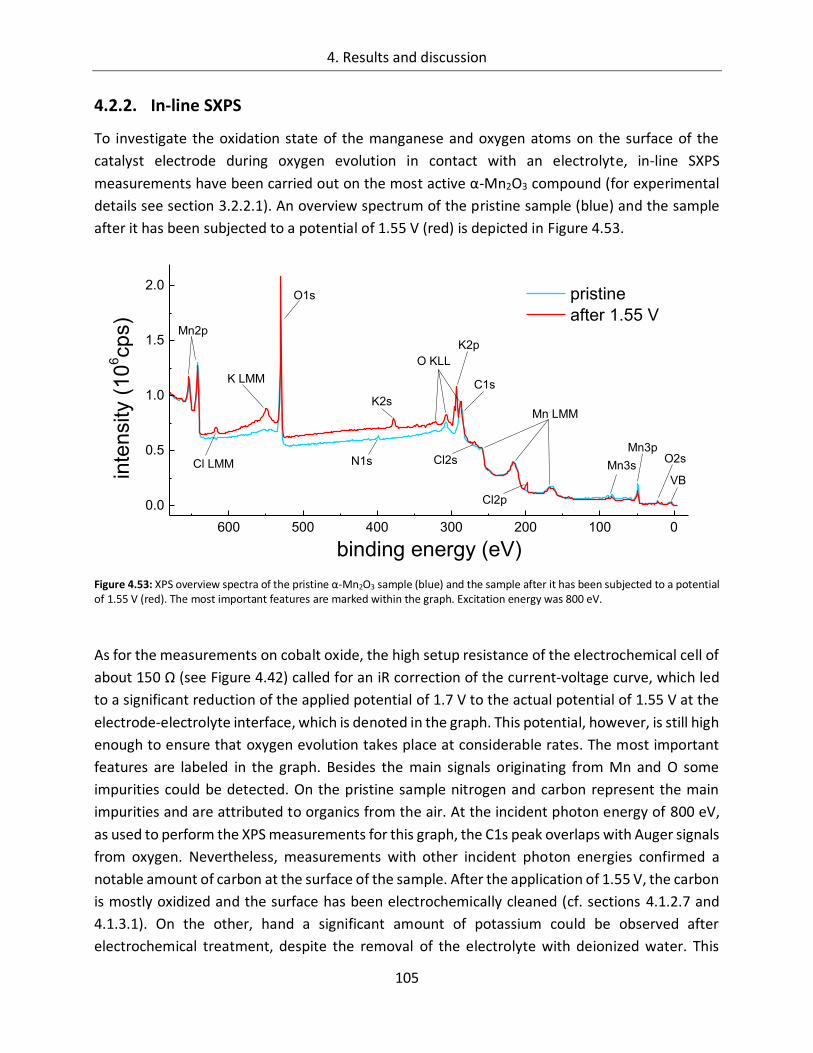
4. Results and discussion
105
4.2.2. In-line SXPS
To investigate the oxidation state of the manganese and oxygen atoms on the surface of the
catalyst electrode during oxygen evolution in contact with an electrolyte, in-line SXPS
measurements have been carried out on the most active α-Mn2O3 compound (for experimental
details see section 3.2.2.1). An overview spectrum of the pristine sample (blue) and the sample
after it has been subjected to a potential of 1.55 V (red) is depicted in Figure 4.53.
Figure 4.53: XPS overview spectra of the pristine α-Mn2O3 sample (blue) and the sample after it has been subjected to a potential of 1.55 V (red). The most important features are marked within the graph. Excitation energy was 800 eV.
As for the measurements on cobalt oxide, the high setup resistance of the electrochemical cell of
about 150 Ω (see Figure 4.42) called for an iR correction of the current-voltage curve, which led
to a significant reduction of the applied potential of 1.7 V to the actual potential of 1.55 V at the
electrode-electrolyte interface, which is denoted in the graph. This potential, however, is still high
enough to ensure that oxygen evolution takes place at considerable rates. The most important
features are labeled in the graph. Besides the main signals originating from Mn and O some
impurities could be detected. On the pristine sample nitrogen and carbon represent the main
impurities and are attributed to organics from the air. At the incident photon energy of 800 eV,
as used to perform the XPS measurements for this graph, the C1s peak overlaps with Auger signals
from oxygen. Nevertheless, measurements with other incident photon energies confirmed a
notable amount of carbon at the surface of the sample. After the application of 1.55 V, the carbon
is mostly oxidized and the surface has been electrochemically cleaned (cf. sections 4.1.2.7 and
4.1.3.1). On the other, hand a significant amount of potassium could be observed after
electrochemical treatment, despite the removal of the electrolyte with deionized water. This
600 500 400 300 200 100 0
0.0
0.5
1.0
1.5
2.0
K2s
Cl2sCl LMM
Cl2p
inte
nsity (
10
6cp
s)
binding energy (eV)
pristine
after 1.55 V
VB
O2sMn3p
Mn3s
Mn LMM
K2p
O KLL
O1s
C1s
N1s
K LMM
Mn2p
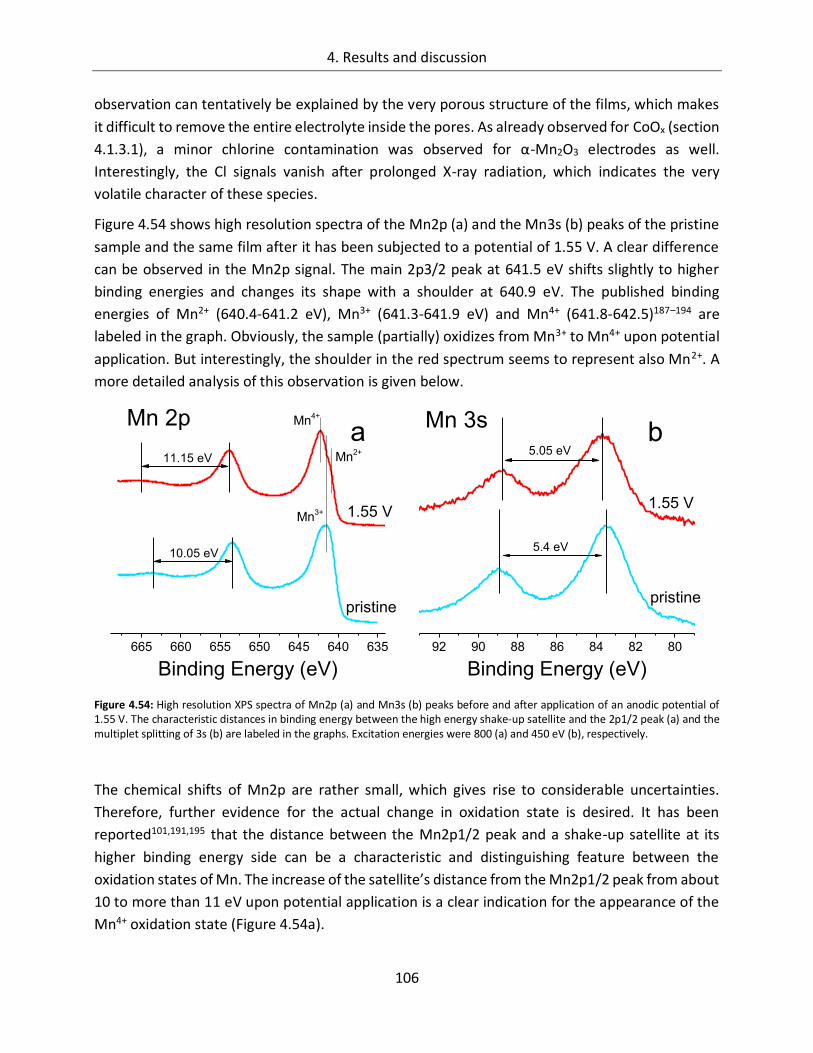
4. Results and discussion
106
observation can tentatively be explained by the very porous structure of the films, which makes
it difficult to remove the entire electrolyte inside the pores. As already observed for CoOx (section
4.1.3.1), a minor chlorine contamination was observed for α-Mn2O3 electrodes as well.
Interestingly, the Cl signals vanish after prolonged X-ray radiation, which indicates the very
volatile character of these species.
Figure 4.54 shows high resolution spectra of the Mn2p (a) and the Mn3s (b) peaks of the pristine
sample and the same film after it has been subjected to a potential of 1.55 V. A clear difference
can be observed in the Mn2p signal. The main 2p3/2 peak at 641.5 eV shifts slightly to higher
binding energies and changes its shape with a shoulder at 640.9 eV. The published binding
energies of Mn2+ (640.4-641.2 eV), Mn3+ (641.3-641.9 eV) and Mn4+ (641.8-642.5)187–194 are
labeled in the graph. Obviously, the sample (partially) oxidizes from Mn3+ to Mn4+ upon potential
application. But interestingly, the shoulder in the red spectrum seems to represent also Mn2+. A
more detailed analysis of this observation is given below.
Figure 4.54: High resolution XPS spectra of Mn2p (a) and Mn3s (b) peaks before and after application of an anodic potential of 1.55 V. The characteristic distances in binding energy between the high energy shake-up satellite and the 2p1/2 peak (a) and the multiplet splitting of 3s (b) are labeled in the graphs. Excitation energies were 800 (a) and 450 eV (b), respectively.
The chemical shifts of Mn2p are rather small, which gives rise to considerable uncertainties.
Therefore, further evidence for the actual change in oxidation state is desired. It has been
reported101,191,195 that the distance between the Mn2p1/2 peak and a shake-up satellite at its
higher binding energy side can be a characteristic and distinguishing feature between the
oxidation states of Mn. The increase of the satellite’s distance from the Mn2p1/2 peak from about
10 to more than 11 eV upon potential application is a clear indication for the appearance of the
Mn4+ oxidation state (Figure 4.54a).
665 660 655 650 645 640 635
Mn2+
Mn4+
Mn3+
Binding Energy (eV)
10.05 eV
1.55 V
pristine
Mn 2p
11.15 eV
a
92 90 88 86 84 82 80
b
5.4 eV
1.55 V
Binding Energy (eV)
pristine
Mn 3s
5.05 eV
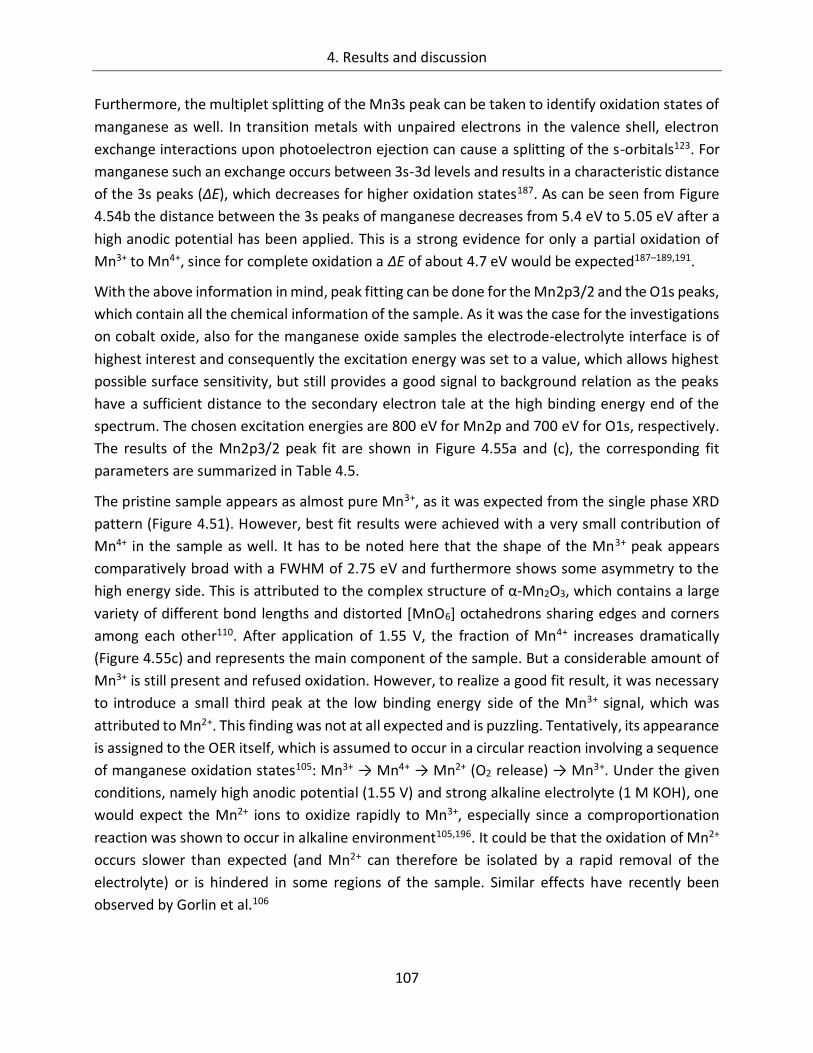
4. Results and discussion
107
Furthermore, the multiplet splitting of the Mn3s peak can be taken to identify oxidation states of
manganese as well. In transition metals with unpaired electrons in the valence shell, electron
exchange interactions upon photoelectron ejection can cause a splitting of the s-orbitals123. For
manganese such an exchange occurs between 3s-3d levels and results in a characteristic distance
of the 3s peaks (ΔE), which decreases for higher oxidation states187. As can be seen from Figure
4.54b the distance between the 3s peaks of manganese decreases from 5.4 eV to 5.05 eV after a
high anodic potential has been applied. This is a strong evidence for only a partial oxidation of
Mn3+ to Mn4+, since for complete oxidation a ΔE of about 4.7 eV would be expected187–189,191.
With the above information in mind, peak fitting can be done for the Mn2p3/2 and the O1s peaks,
which contain all the chemical information of the sample. As it was the case for the investigations
on cobalt oxide, also for the manganese oxide samples the electrode-electrolyte interface is of
highest interest and consequently the excitation energy was set to a value, which allows highest
possible surface sensitivity, but still provides a good signal to background relation as the peaks
have a sufficient distance to the secondary electron tale at the high binding energy end of the
spectrum. The chosen excitation energies are 800 eV for Mn2p and 700 eV for O1s, respectively.
The results of the Mn2p3/2 peak fit are shown in Figure 4.55a and (c), the corresponding fit
parameters are summarized in Table 4.5.
The pristine sample appears as almost pure Mn3+, as it was expected from the single phase XRD
pattern (Figure 4.51). However, best fit results were achieved with a very small contribution of
Mn4+ in the sample as well. It has to be noted here that the shape of the Mn3+ peak appears
comparatively broad with a FWHM of 2.75 eV and furthermore shows some asymmetry to the
high energy side. This is attributed to the complex structure of α-Mn2O3, which contains a large
variety of different bond lengths and distorted [MnO6] octahedrons sharing edges and corners
among each other110. After application of 1.55 V, the fraction of Mn4+ increases dramatically
(Figure 4.55c) and represents the main component of the sample. But a considerable amount of
Mn3+ is still present and refused oxidation. However, to realize a good fit result, it was necessary
to introduce a small third peak at the low binding energy side of the Mn3+ signal, which was
attributed to Mn2+. This finding was not at all expected and is puzzling. Tentatively, its appearance
is assigned to the OER itself, which is assumed to occur in a circular reaction involving a sequence
of manganese oxidation states105: Mn3+ → Mn4+ → Mn2+ (O2 release) → Mn3+. Under the given
conditions, namely high anodic potential (1.55 V) and strong alkaline electrolyte (1 M KOH), one
would expect the Mn2+ ions to oxidize rapidly to Mn3+, especially since a comproportionation
reaction was shown to occur in alkaline environment105,196. It could be that the oxidation of Mn2+
occurs slower than expected (and Mn2+ can therefore be isolated by a rapid removal of the
electrolyte) or is hindered in some regions of the sample. Similar effects have recently been
observed by Gorlin et al.106
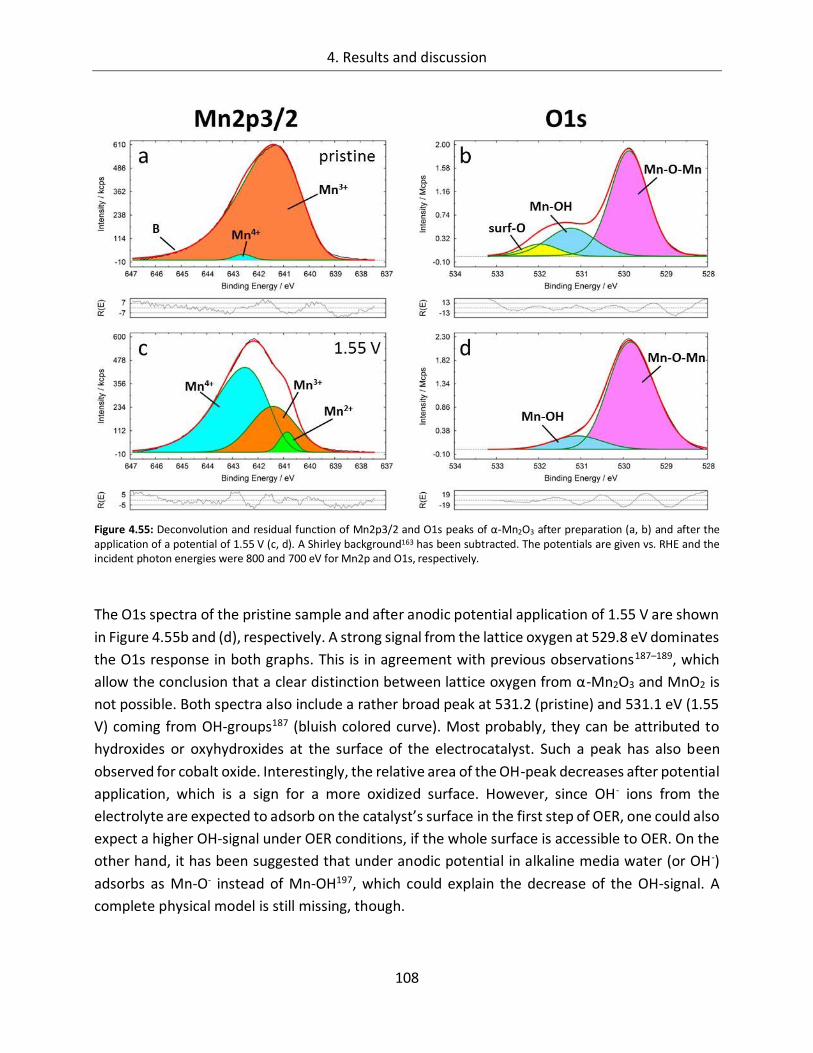
4. Results and discussion
108
Figure 4.55: Deconvolution and residual function of Mn2p3/2 and O1s peaks of α-Mn2O3 after preparation (a, b) and after the application of a potential of 1.55 V (c, d). A Shirley background163 has been subtracted. The potentials are given vs. RHE and the incident photon energies were 800 and 700 eV for Mn2p and O1s, respectively.
The O1s spectra of the pristine sample and after anodic potential application of 1.55 V are shown
in Figure 4.55b and (d), respectively. A strong signal from the lattice oxygen at 529.8 eV dominates
the O1s response in both graphs. This is in agreement with previous observations187–189, which
allow the conclusion that a clear distinction between lattice oxygen from α-Mn2O3 and MnO2 is
not possible. Both spectra also include a rather broad peak at 531.2 (pristine) and 531.1 eV (1.55
V) coming from OH-groups187 (bluish colored curve). Most probably, they can be attributed to
hydroxides or oxyhydroxides at the surface of the electrocatalyst. Such a peak has also been
observed for cobalt oxide. Interestingly, the relative area of the OH-peak decreases after potential
application, which is a sign for a more oxidized surface. However, since OH- ions from the
electrolyte are expected to adsorb on the catalyst’s surface in the first step of OER, one could also
expect a higher OH-signal under OER conditions, if the whole surface is accessible to OER. On the
other hand, it has been suggested that under anodic potential in alkaline media water (or OH-)
adsorbs as Mn-O- instead of Mn-OH197, which could explain the decrease of the OH-signal. A
complete physical model is still missing, though.
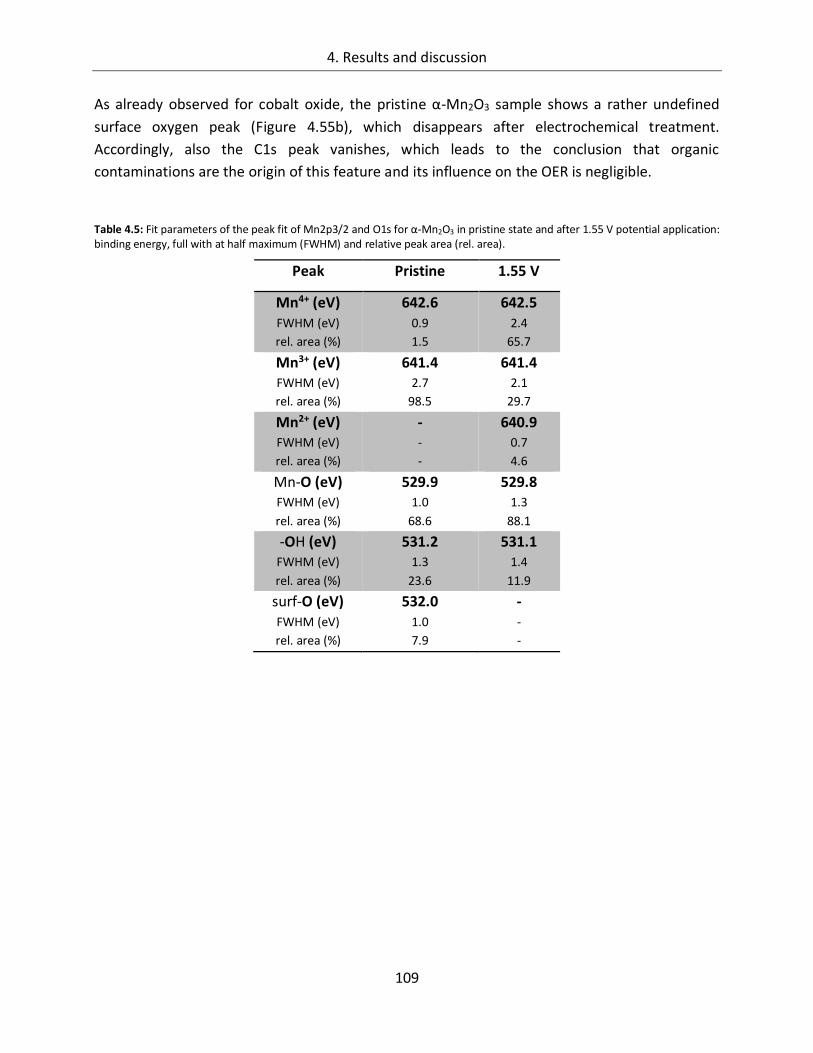
4. Results and discussion
109
As already observed for cobalt oxide, the pristine α-Mn2O3 sample shows a rather undefined
surface oxygen peak (Figure 4.55b), which disappears after electrochemical treatment.
Accordingly, also the C1s peak vanishes, which leads to the conclusion that organic
contaminations are the origin of this feature and its influence on the OER is negligible.
Table 4.5: Fit parameters of the peak fit of Mn2p3/2 and O1s for α-Mn2O3 in pristine state and after 1.55 V potential application: binding energy, full with at half maximum (FWHM) and relative peak area (rel. area).
Peak Pristine 1.55 V
Mn4+ (eV) FWHM (eV)
rel. area (%)
642.6 0.9
1.5
642.5 2.4
65.7
Mn3+ (eV) FWHM (eV)
rel. area (%)
641.4 2.7
98.5
641.4 2.1
29.7
Mn2+ (eV) FWHM (eV)
rel. area (%)
- -
-
640.9 0.7
4.6
Mn-O (eV) FWHM (eV)
rel. area (%)
529.9 1.0
68.6
529.8 1.3
88.1
-OH (eV) FWHM (eV)
rel. area (%)
531.2 1.3
23.6
531.1 1.4
11.9
surf-O (eV) FWHM (eV)
rel. area (%)
532.0 1.0
7.9
- -
-

110
111
5. Summary and final remarks
In this work a systematic study was carried out on the catalytic activity of electrodeposited cobalt
oxide towards the oxygen evolution reaction (OER) in alkaline medium. In a first step (chapter
4.1.1) several deposition parameters were varied and their influence on the performance of the
catalyst was studied. It turned out that using potentiostatic deposition from a solution containing
CoCl2, Na-gluconate and KOH the amount of precursors an OH- in the solution do not affect the
film properties if the deposition charge is kept constant, but had a strong influence on the
deposition rate. The magnitude of the deposition potential had a great influence on the
deposition rate too, as higher anodic potentials increase the driving force and speed up the thin
film formation. However, the “deposition efficiency”, i.e. the portion of the deposition charge
that led to actual film formation, was highest at potentials slightly above the oxidation potential
(> 1.1 V vs. RHE). Therefore, for systematic studies on the activity as function of deposition charge
and film thickness, 1.2 V was the deposition potential of choice.
Film substrate and heat treatment after the electrochemical deposition had a significant influence
on the performance of the catalysts. Despite their distinct morphology, films deposited on FTO,
Au and Co sheets showed a similar OER activity, but on FTO best reproducibility and highest
effective current densities (taking the surface roughness into account) were achieved. Ti is not
suited as substrate, most probably due to insulating TiOx barrier layers at the substrate/catalyst
interface. As-deposited cobalt oxide films showed no XRD patterns beside the characteristic lines
of the substrate and were therefore considered to be amorphous (CoOx). Upon annealing above
300°C, characteristic reflexes of the spinel phase Co3O4 could be found by X-ray diffraction;
crystallization was completed at 450°C. In CV diagrams, however, significant changes in the
potential regime below the OER onset were observed already after annealing at 200°C. While as-
deposited CoOx films showed three characteristic oxidation and two reduction peaks, only one
redox pair at about 1.5 V was observed after heat treatment. Furthermore, the magnitude of the
peak decreased with increasing temperature. SEM images confirmed a significant loss of particle
surface area caused by the annealing process and consequently also the catalytic performance
decreased.
In the second part of the thesis (chapter 0), the OER on CoOx films was investigated in more detail.
Samples with deposition charges ranging from 0.01 to 5000 mC/cm2 were synthesized and
characterized. A logarithmic decrease in overpotential at 10 mA/cm2 as function of the deposition
charge was found. This was in a first moment an unexpected result, since the electrocatalytic
activity is generally considered as a function of the surface area instead of the film thickness.
Therefore, the electrochemically active surface area was evaluated and it could be shown that it
is a function of the deposited charge as well. TEM images supported the suspected micro- and
nanoporosity of the films, which can explain the increase in electrochemically active surface area,
5. Summary and final remarks
112
even though a volume activity of the samples, as proposed recently90, cannot be completely ruled
out at this point.
Oxidation and reduction waves in the CV diagram of CoOx are generally attributed to oxidation
state transitions of the Co ions. As an oxidation peak appears at about 1.5 V, shortly before the
onset of the OER, it is frequently proposed in the literature that it reflects the oxidation from Co3+
to Co4+, which represents a crucial activation step for the cobalt oxide catalyst. The magnitude of
the corresponding reduction wave was evaluated as a function of the film thickness and showed
a 1:1 relation, which supports this statement. In contrast to that, the redox feature at about 1.15
V seems not to be directly related to the OER as it shows different kinetics and decreases in
magnitude compared to the redox feature at 1.5 V as the samples become thicker.
If the Co4+ ions are seen as the active centers for the OER and the activity of the CoOx film is
proportional to their total number at the electrochemically active surface area (i.e. the magnitude
of the reduction wave at 1.5 V), the highest relative activity is found for samples with a thickness
ranging from 3 to 50 nm. Turnover frequencies (TOF) of up to 35 s-1 were derived for moderate
overpotentials (0.42 V) and compared with values found in the literature. Even though values for
TOFs are not easily accessible and/or difficult to compare, the values from this work are rather
high. The maximum relative activity for samples between 3 and 50 nm thickness has been
confirmed by Tafel slopes and charge transfer coefficients, which have their minimum and
maximum in this range, respectively. However, the effect of the high activity per number of Co
ions is more than overcompensated by the increase in absolute amount of catalyst for thicker
samples. If, the whole amount of deposited CoOx is taken as basis for TOF calculations, which is
probably more convenient form an economical point of view, the numbers are significantly lower.
Since in recent years a growing interest for catalysts working under neutral conditions emerged
for their use in photoelectrochemical devices, the activity of the CoOx films towards the OER was
investigated in phosphate buffer at pH7 too. Compared to 1 M KOH a significantly higher
overpotential was found. Furthermore, a strong dependence of the activity on the concentration
of the phosphate buffer appeared, including an interesting wave in the OER regime, which
appeared for low buffer capacities. DEMS measurements showed that the O2 production
coincides with the shape of the wave in the current voltage curve leading to the assumption that
the limited buffer capacity at low PO43- concentrations causes a pH drop inside the nanopores of
the CoOx film electrode, which disables OER in the inner part of the porous film owing to the
hindered diffusion of the electrolyte. At high phosphate concentrations this effect does not
appear. A comparison to the very prominent CoPi catalyst84 showed similar activity at pH7, but a
significantly better performance at pH14.
Furthermore, electrochemical stability of CoOx thin films was studied as a crucial property for a
catalytically active material towards OER. Under optimal experimental conditions (fast removal
of gas bubbles from the surface and rapid supply with fresh electrolyte by rotating the sample)
5. Summary and final remarks
113
no activity loss has been observed for at least 64 hours. However, if the samples suffer from
unfavorable experimental conditions (i.e. no movement of sample and/or electrolyte) as it
probably is the case under photoelectrochemical working conditions in a light-driven electrolyzer,
the catalytic activity decreases significantly over time. But interestingly, if the potential is
removed for several hours, the catalyst can recover and the initial activity is restored. This is a
very appropriate property of CoOx film electrodes having the day and night cycles of such a PEC
device in mind.
In chapter 4.1.3.1, the binding energies and oxidation states of cobalt and oxygen ions on the
surface of CoOx electrodes were investigated as a function of the applied potential using in-line
synchrotron photoelectron spectroscopy (SXPS). Different anodic potentials were applied to the
samples in an electrochemical cell held under inert N2 atmosphere and after removal of the
electrolyte a fast and direct transfer to UHV for surface characterization was possible without any
contact to ambient atmosphere. The thin film showed a superficial partial oxidation of Co2+
species to Co3+ at moderate potentials. This partial oxidation appears to be irreversible even if
the applied potential is decreased again, which gives evidence to doubt the frequently proposed
interpretation of the redox feature at 1.15 V in the CV diagrams to be associated with a transition
from Co2+ to Co3+. Instead, it is proposed that a possible reduction of Co3+ species is occurring in
a sneaky process over an extended potential region which is more cathodic than the investigated
one.
Surprisingly, no Co4+ ions could be found after electrochemical treatment in the OER regime,
although CV diagrams strongly suggested their presence. To evaluate the stability of possible Co4+
species on the surface of the films, in-situ UV/Vis measurements were carried out and clearly
showed a feature, which could be related to Co4+ formation. Relaxation experiments however
revealed that cobalt in the form of Co4+ is not stable in CoOx films as soon as the potential is turned
off and immediate reduction or removal of tetravalent ions from the film surface prevents their
detection with SXPS.
Furthermore, a pronounced color change of the CoOx catalyst films was observed and evaluated
(chapter 4.1.3.2). Over a large range of wavelengths, an absorption increase of the thin film was
monitored as function of the applied potential and a dependence of the darkening on the volume
of the catalyst electrode was found. Even though this electrochromic behavior appears as volume
effect, OER as a volume phenomenon is thought to be very unlikely since both processes are
significantly different and the steady supply of educts (OH-) and especially the release of
uncharged products (H2O and O2) via ionic conduction through the volume of the film in the
necessary rates is difficult to explain because of the large size of the migrating ions. Due to the
pronounced electrochromic effect cobalt oxide is not suited as catalyst placed on the top of
photoabsorbers, since a significant amount of the solar energy would be absorbed by the not
photoactive catalyst. For the “artificial leaf” concept in superstrate configuration though, the
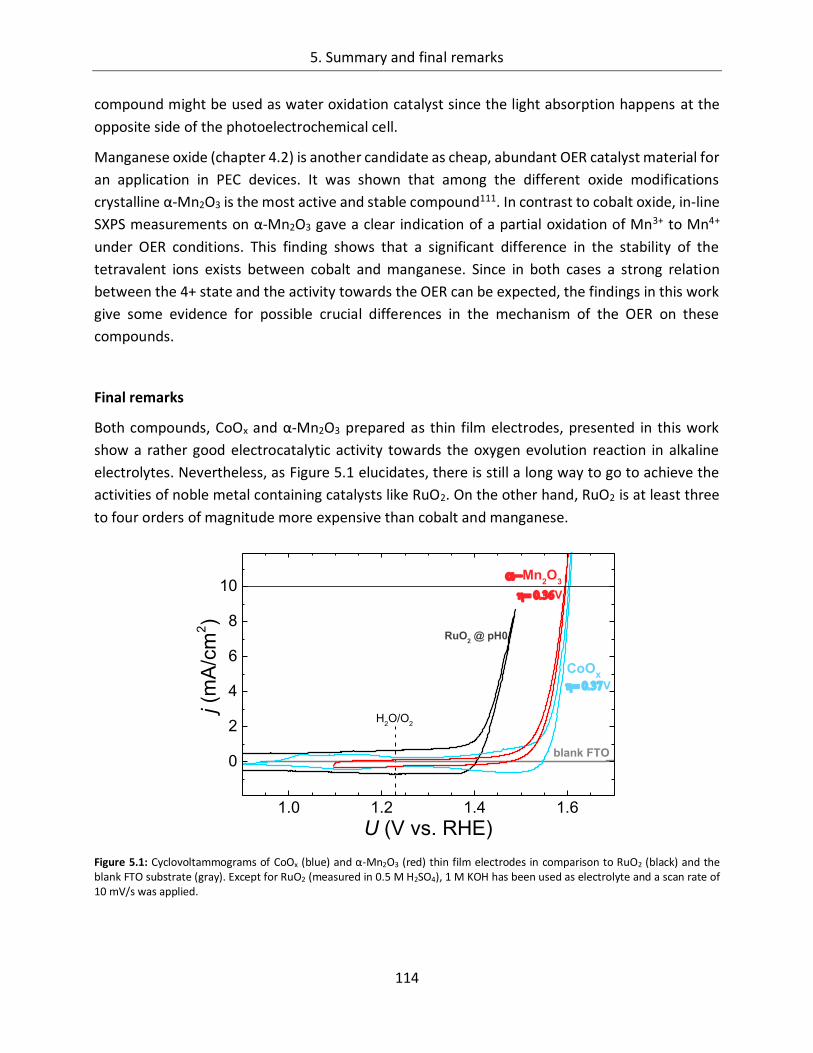
5. Summary and final remarks
114
compound might be used as water oxidation catalyst since the light absorption happens at the
opposite side of the photoelectrochemical cell.
Manganese oxide (chapter 4.2) is another candidate as cheap, abundant OER catalyst material for
an application in PEC devices. It was shown that among the different oxide modifications
crystalline α-Mn2O3 is the most active and stable compound111. In contrast to cobalt oxide, in-line
SXPS measurements on α-Mn2O3 gave a clear indication of a partial oxidation of Mn3+ to Mn4+
under OER conditions. This finding shows that a significant difference in the stability of the
tetravalent ions exists between cobalt and manganese. Since in both cases a strong relation
between the 4+ state and the activity towards the OER can be expected, the findings in this work
give some evidence for possible crucial differences in the mechanism of the OER on these
compounds.
Final remarks
Both compounds, CoOx and α-Mn2O3 prepared as thin film electrodes, presented in this work
show a rather good electrocatalytic activity towards the oxygen evolution reaction in alkaline
electrolytes. Nevertheless, as Figure 5.1 elucidates, there is still a long way to go to achieve the
activities of noble metal containing catalysts like RuO2. On the other hand, RuO2 is at least three
to four orders of magnitude more expensive than cobalt and manganese.
Figure 5.1: Cyclovoltammograms of CoOx (blue) and α-Mn2O3 (red) thin film electrodes in comparison to RuO2 (black) and the blank FTO substrate (gray). Except for RuO2 (measured in 0.5 M H2SO4), 1 M KOH has been used as electrolyte and a scan rate of 10 mV/s was applied.
1.0 1.2 1.4 1.6
0
2
4
6
8
10
j (m
A/c
m2)
U (V vs. RHE)
H2O/O
2
RuO2 @ pH0
Mn2O
3
V
CoOx
V
blank FTO
5. Summary and final remarks
115
The electrochemistry of both metal oxide systems is complex, as several oxide, hydroxide and
oxyhydroxide phases appear in the investigated potential range177,178. In case of cobalt oxide, this
is reflected by a CV diagram, which shows several redox transitions, while oxidation state changes
in manganese oxide occur in a more sneaky way. The large number of compositions and structural
distortions, however, could actually be the key for the catalytic activity. Spectroscopic
investigations may display only half of the truth, since a certain integration of signals and a lower
resolution limit are unavoidable to obtain good signal intensity. Tiny differences in binding energy,
atomic distance or coordination and lattice distortion are not resolvable, but possibly crucial for
a good OER performance. The catalytic center of photosystem II is characterized by is flexibility
and ability to change interionic distances to a large extent35, which allows formation of optimized
binding sites for every transition state during OER. The fact that amorphous CoOx, which offers a
great variety of binding sites, and α-Mn2O3 with its strongly distorted [MnO6] octahedrons, are
the most active compounds fit very well into this picture.
The strongly different stability of the tetravalent oxidation state in CoOx and α-Mn2O3 gives some
evidence for the possibility of different reaction mechanisms for the two oxides with respect to
OER. While it is widely accepted that Co4+ is essential for the catalytic activity of cobalt oxides, the
role of Mn4+ is still under debate102,103,186 and also considered as being detrimental for the
catalytic activity103. Theoretical investigations place Mn2O3 on the strong binding site and Co3O4
and CoOOH on the weak binding side of the volcano activity plot, respectively37,38. A combination
of both transition metals on the atomic scale, might offer a possibility to overcome the scaling
relations of the OER intermediate states, similar to the recently shown modification of RuO2 with
Ni and Co45. Synthesis of mixed Mn-Co-O compounds published some years ago, showed
promising catalytic results198 and call for further investigations. However, catalysis of the oxygen
evolution reaction remains one of the key issues for developing a highly efficient
photoelectrochemical device for solar hydrogen production. Great efforts are currently made in
the community to put this exciting topic onto a new level.

116
117
6. Appendix
6.1. References
(1) McCrory, C. C. L.; Jung, S.; Ferrer, I. M.; Chatman, S.; Peters, J. C.; Jaramillo, T. F. Benchmarking HER and OER Electrocatalysts for Solar Water Splitting Devices. J. Am. Chem. Soc. 2015, 137, 4347–4357.
(2) U.S. eia. International Energy Statistics http://www.eia.gov/cfapps/ipdbproject/iedindex3.cfm?tid=5&pid=62&aid=2&cid=regions&syid=2006&eyid=2010&unit=TBPD.
(3) Nilsson, M.; Heaps, C.; Persson, Å. Energy for a Shared Development Agenda : Global Scenarios and Governance Implications; Stockholm, 2012.
(4) British Petroleum. BP Statistical Review of World Energy, June 2014; 2014.
(5) British Petroleum. BP Energy Outlook 2035; 2015.
(6) Ahmed, N. M. Die Nächste Blase. Le Monde Diplomatique. April 12, 2013, pp 1, 5.
(7) Photoelectrochemical Hydrogen Production; Roel, van de K., Grätzel, M., Eds.; Springer: New York, Dordrecht, Heidelberg, London, 2012.
(8) Pachauri, R. K.; Allen, M. R.; Barros, V. R.; Broome, J.; Cramer, W.; Christ, R.; Church, J. a.; Clarke, L.; Dahe, Q.; Dasgupta, P.; et al. IPCC Climate Change 2014: Synthesis Report; 2014.
(9) Allison, I.; Bindoff, N.; Bindschadler, R.; Cox, P.; de Noblet-Ducoudré, N.; England, M.; Francis, J.; Gruber, N.; Haywood, A.; Karoly, D.; et al. The Copenhagen Diagnosis. Updating the World on the Latest Climate Science; Sydney, 2009.
(10) NOAA. Global Climate Change Indicators https://www.ncdc.noaa.gov/indicators/ (accessed Apr 10, 2015).
(11) International Energy Agency. Energy Policies of IEA Countries: Germany 2013 Review; 2013.
(12) Verne, J. L’Île Mystérieuse; 1874.
(13) Wendt, H.; Vogel, G. H. Die Bedeutung Der Wasserelektrolyse in Zeiten Der Energiewende. Chemie-Ingenieur-Technik 2014, 86 (1-2), 144–148.
6. Appendix
118
(14) Lewis, N. S.; Nocera, D. G. Powering the Planet: Chemical Challenges in Solar Energy Utilization. Proc. Natl. Acad. Sci. U. S. A. 2006, 103 (43), 15729–15735.
(15) Nocera, D. G. The Artificial Leaf. Acc. Chem. Res. 2012, 45 (5), 767–776.
(16) Iridiumpreis in Euro http://www.goldseiten.de/kurse/Iridiumcharts-EUR.php?s=kg (accessed Apr 13, 2015).
(17) Rutheniumpreis in Euro http://www.goldseiten.de/kurse/Rutheniumpreis.php?s=kg (accessed Apr 13, 2015).
(18) Metalprices.com http://www.metalprices.com/dailyexchangedata/Exchange/LME/ALL (accessed Apr 13, 2015).
(19) 1 Year Manganese Prices and Price Charts http://www.infomine.com/investment/metal-prices/manganese/1-year/ (accessed Apr 13, 2015).
(20) Stellmach, D. Molybdänsulfid-Nanopartikel Als Wasserstoffentwickelnder Elektrokatalysator Für Die Lichtinduzierte Wasserspaltung, PhD- thesis, Technische Universität Berlin, 2014.
(21) Hamann, C. H.; Vielstich, W. Elektrochemie I, second edi.; VCH Verlagsgesellschaft mbH: Weinheim, 1985.
(22) Hamann, C. H.; Vielstich, W. Elektrochemie II; Verlag Chemie: Weinheim, 1981.
(23) Atkins, P. W. Physikalische Chemie, first edit.; VCH Verlagsgesellschaft mbH: Weinheim, 1990.
(24) Trasatti, S. 1799–1999: Alessandro Volta’s “Electric Pile.” Journal of Electroanalytical Chemistry, 1999, 460, 1–4.
(25) Trasatti, S. Water Electrolysis: Who First? J. Electroanal. Chem. 1999, 476 (1), 90–91.
(26) De Levie, R. The Electrolysis of Water. J. Electroanal. Chem. 1999, 476, 92–93.
(27) Paets van Troostwijk, A.; Deiman, J. R. No Title. J. Phys. 1790, 2, 130.
(28) Ortiz-Rivera, E. I.; Reyes-Hernandez, A. L.; Febo, R. a. Understanding the History of Fuel Cells. 2007 IEEE Conf. Hist. Electr. Power, HEP 2007 2007, 2 (2), 117–122.
(29) Schmidt, T.; Wendt, H. Electrocatalysis of Cathodic Hydrogen and Anodic Oxygen Evolution in Alkaline Water Electrolysis by in Situ Activation Procedures. Electrochim. Acta 1994, 39 (11-12), 1763–1767.
6. Appendix
119
(30) Trasatti, S.; Lodi, G. Oxygen and Chlorine Evolution at Conductive Metallic Oxide Anodes. In Electrodes of conductive metallic oxides. Part B; Trasatti, S., Ed.; Elsevier: Amsterdam, 1981; pp 521–626.
(31) Matsumoto, Y.; Sato, E. Electrocatalytic Properties of Transition Metal Oxides for Oxygen Evolution Reaction. Mater. Chem. Phys. 1986, 14 (5), 397–426.
(32) Dau, H.; Limberg, C.; Reier, T.; Risch, M.; Roggan, S.; Strasser, P. The Mechanism of Water Oxidation: From Electrolysis via Homogeneous to Biological Catalysis. ChemCatChem 2010, 2 (7), 724–761.
(33) Ferreira, K. N.; Iverson, T. M.; Maghlaoui, K.; Barber, J.; Iwata, S. Architecture of the Photosynthetic Oxygen-Evolving Center. Science (80-. ). 2004, 303, 1831–1839.
(34) Dau, H.; Haumann, M. The Manganese Complex of Photosystem II in Its Reaction cycle—Basic Framework and Possible Realization at the Atomic Level. Coord. Chem. Rev. 2008, 252 (3-4), 273–295.
(35) Siegbahn, P. E. M. Structures and Energetics for O2 Formation in Photosystem II. Acc. Chem. Res. 2009, 42 (12), 1871–1880.
(36) Siegbahn, P. E. M. Water Oxidation Mechanism in Photosystem II, Including Oxidations, Proton Release Pathways, O-O Bond Formation and O2 Release. Biochim. Biophys. Acta - Bioenerg. 2013, 1827 (8-9), 1003–1019.
(37) García-Mota, M.; Bajdich, M.; Viswanathan, V.; Vojvodic, A.; Bell, A. T.; Nørskov, J. K. Importance of Correlation in Determining Electrocatalytic Oxygen Evolution Activity on Cobalt Oxides. J. Phys. Chem. C 2012, 116 (39), 21077–21082.
(38) Man, I. C.; Su, H.-Y.; Calle-Vallejo, F.; Hansen, H. A.; Martínez, J. I.; Inoglu, N. G.; Kitchin, J.; Jaramillo, T. F.; Nørskov, J. K.; Rossmeisl, J. Universality in Oxygen Evolution Electrocatalysis on Oxide Surfaces. ChemCatChem 2011, 3 (7), 1159–1165.
(39) Rossmeisl, J.; Qu, Z. W.; Zhu, H.; Kroes, G. J.; Nørskov, J. K. Electrolysis of Water on Oxide Surfaces. J. Electroanal. Chem. 2007, 607 (1-2), 83–89.
(40) Zhang, M.; de Respinis, M.; Frei, H. Time-Resolved Observations of Water Oxidation Intermediates on a Cobalt Oxide Nanoparticle Catalyst. Nat. Chem. 2014, 6 (4), 362–367.
(41) Trasatti, S. Electrocatalysis in the Anodic Evolution of Oxygen and Chlorine. Electrochim. Acta 1984, 29 (11), 1503–1512.
(42) Gattrell, M.; MacDougall, B. Chapter 30: Reaction Mechanisms of the O2 Reduction/evolution Reaction. In Handbook of Fuel Cells; Vielstich, W., Lamm, A., Gasteiger, H. A., Eds.; John Wiley & Sons: West Sussex, 2003.
6. Appendix
120
(43) Greeley, J.; Jaramillo, T. F.; Bonde, J.; Chorkendorff, I. B.; Nørskov, J. K. Computational High-Throughput Screening of Electrocatalytic Materials for Hydrogen Evolution. Nat. Mater. 2006, 5 (11), 909–913.
(44) Koper, M. T. M. Thermodynamic Theory of Multi-Electron Transfer Reactions: Implications for Electrocatalysis. J. Electroanal. Chem. 2011, 660 (2), 254–260.
(45) Halck, N. B.; Petrykin, V.; Krtil, P.; Rossmeisl, J. Beyond the Volcano Limitations in Electrocatalysis - Oxygen Evolution Reaction. Phys. Chem. Chem. Phys. 2014, 16, 13682–13688.
(46) Rossmeisl, J.; Logadottir, a.; Nørskov, J. K. Electrolysis of Water on (oxidized) Metal Surfaces. Chem. Phys. 2005, 319 (1-3), 178–184.
(47) McCrory, C. C. L.; Jung, S.; Peters, J. C.; Jaramillo, T. F. Benchmarking Heterogeneous Electrocatalysts for the Oxygen Evolution Reaction. J. Am. Chem. Soc. 2013, 135 (45), 16977–16987.
(48) Jiao, F.; Frei, H. Nanostructured Cobalt Oxide Clusters in Mesoporous Silica as Efficient Oxygen-Evolving Catalysts. Angew. Chemie - Int. Ed. 2009, 48, 1841–1844.
(49) Trotochaud, L.; Ranney, J. K.; Williams, K. N.; Boettcher, S. W. Solution-Cast Metal Oxide Thin Film Electrocatalysts for Oxygen Evolution. J. Am. Chem. Soc. 2012, 134 (41), 17253–17261.
(50) Louie, M. W.; Bell, A. T. An Investigation of Thin-Film Ni-Fe Oxide Catalysts for the Electrochemical Evolution of Oxygen. J. Am. Chem. Soc. 2013, 135 (33), 12329–12337.
(51) Smith, R. D. L.; Prévot, M. S.; Fagan, R. D.; Zhang, Z.; Sedach, P. A.; Siu, M. K. J.; Trudel, S.; Berlinguette, C. P. Photochemical Route for Accessing Amorphous Metal Oxide Materials for Water Oxidation Catalysis. Science 2013, 340 (6128), 60–63.
(52) Armelao, L.; Barreca, D.; Gross, S.; Martucci, A.; Tieto, M.; Tondello, E. Cobalt Oxide-Based Films: Sol–gel Synthesis and Characterization. J. Non. Cryst. Solids 2001, 293-295, 477–482.
(53) Armelao, L.; Barreca, D.; Gross, S.; Tondello, E. Nanoscale Cobalt Oxides Thin Films Obtained by CVD and Sol-Gel Routes. J. Phys. IV 2001, 11, Pr3–Pr438.
(54) Riedel, E. Anorganische Chemie, 3rd ed.; de Gruyter: Berlin, New York, 1994.
(55) Chuang, T. J.; Brundle, C. R.; Rice, D. W. Interpretation of the X-Ray Photoemission Spectra of Cobalt Oxides and Cobalt Oxide Surfaces. Surf. Sci. 1976, 59 (2), 413–429.
6. Appendix
121
(56) Benson, P.; Briggs, G. W. D.; Wynne-Jones, W. F. K. The Cobalt Hydroxide electrode—I. Structure and Phase Transitions of the Hydroxides. Electrochim. Acta 1964, 9 (3), 275–280.
(57) Göhr, H. Über Anodisch Gebildete Oxidische Deckschichten Auf Kobalt in Wässeriger Lösung - I. Zur Thermodynamik Des Systems Kobalt - Wässerige Lösung. Electrochim. Acta 1966, 11, 827–834.
(58) Behl, W. K.; Toni, J. E. Anodic Oxidation of Cobalt in Potassium Hydroxide Electrolytes. J. Electroanal. Chem. 1971, 31, 63–75.
(59) Wang, G.; Zhang, L.; Zhang, J. A Review of Electrode Materials for Electrochemical Supercapacitors. Chem. Soc. Rev. 2012, 41 (2), 797.
(60) Granqvist, C. G. Handbook of Inorganic Electrochromic Materials, 2nd ed.; Granqvist, C. G., Ed.; Elsevier: Amsterdam, 1995.
(61) Fergus, J. W. Recent Developments in Cathode Materials for Lithium Ion Batteries. J. Power Sources 2010, 195 (4), 939–954.
(62) Li, W. Y.; Xu, L. N.; Chen, J. Co3O4 Nanomaterials in Lithium-Ion Batteries and Gas Sensors. Adv. Funct. Mater. 2005, 15 (5), 851–857.
(63) El Wakkad, S. E. S.; Hickling, A. The Anodic Behaviour of Metals. Part VI. Cobalt. Trans. Faraday Soc. 1950, 46 (10), 820.
(64) Nikolov, I.; Darkaoui, R.; Zhecheva, E.; Stoyanova, R.; Dimitrov, N.; Vitanov, T. Electrocatalytic Activity of Spinel Related Cobalties MxCo3−xO4 (M = Li, Ni, Cu) in the Oxygen Evolution Reaction. J. Electroanal. Chem. 1997, 429 (1-2), 157–168.
(65) Tiwari, S.; Samuel, S.; Singh, R. N.; Poillerat, G.; Koenig, J. F.; Chartier, P. Active Thin NiCo2O4 Film Prepared on Nickel by Spray Pyrolysis for Oxygen Evolution. Int. J. Hydrogen Energy 1995, 20 (1), 9–15.
(66) De Chialvo, M.; Chialvo, A. Oxygen Evolution Reaction on NixCo(3-x)O4 Electroes with Spinel Structure. Electrochim. Acta 1993, 38 (15), 2247–2252.
(67) Singh, J. P.; Singh, R. N. New Active Spinel-Type MxCO3-xO4 Films for Electro-Catalysis of Oxygen Evolution. J. new Mater. Electrochem. Syst. 2000, 3, 131–139.
(68) Singh, R. N.; Pandey, J. P.; Singh, N. K.; Lal, B.; Chartier, P.; Koenig, J. F. Sol-Gel Derived Spinel MxCo3-xO4 (M = Ni, Cu; 0≤x≤1) Films and Oxygen Evolution. Electrochim. Acta 2000, 45, 1911–1919.
6. Appendix
122
(69) Hamdani, M.; Singh, R. N.; Chartier, P. Co3O4 and Co-Based Spinel Oxides Bifunctional Oxygen Electrodes. Int. J. Electrochem. Sci 2010, 5, 556–577.
(70) Singh, R. N.; Tiwari, S. K.; Singh, S. P.; Singh, N. K.; Poillerat, G.; Chartier, P. Synthesis of (La, Sr)CoO3 Perovskite Films via a Sol-Gel Route and Their Physicochemical and Electrochemical Surface Characterization for Anode Application in Alkaline Water Electrolysis. J. Chem. Soc. Faraday Trans. 1996, 92 (14), 2593.
(71) Rasiyah, P.; Tseung, A. C. C. A Mechanistic Study of Oxygen Evolution on Li-Doped Co3O4. J. Electrochem. Soc. 1983, 130 (2), 365.
(72) Singh, R. N.; Mishra, D.; Sinha, A. S. K.; Singh, A. Novel Electrocatalysts for Generating Oxygen from Alkaline Water Electrolysis. Electrochem. commun. 2007, 9 (6), 1369–1373.
(73) Marsan, B.; Fradette, N.; Beaudoin, G. Physicochemical and Electrochemical Properties of CuCo2O4 Electrodes Prepared by Thermal Decomposition for Oxygen Evolution. J. Electrochem. Soc. 1992, 139 (7), 1889.
(74) Spinolo, G.; Ardizzone, S.; Trasatti, S. Surface Characterization of Co3O4 Electrodes Prepared by the Sol-Gel Method. J. Electroanal. Chem. 1997, 423, 49–57.
(75) El Baydi, M.; Poillerat, G.; Rehspringer, J.-L.; Gautier, J. L.; Koenig, J.-F.; Chartier, P. A Sol-Gel Route for the Preparation of Co3O4 Catalyst for Oxygen Electrocatalysis in Alkaline Medium. Journal of Solid State Chemistry, 1994, 109, 281–288.
(76) Singh, N. K.; Sungh, J. P.; Singh, R. N. Sol–gel-Derived Spinel Co3O4 Films and Oxygen Evolution: Part II. Optimization of Preparation Conditions and Influence of the Nature of the Metal Salt Precursor. Int. J. Hydrogen Energy 2002, 27 (9), 895–903.
(77) Orel, B.; Kauc, V. Characterization of Spinel Co 3 O 4 and Li-Doped Co 3 O 4 Thin Film Electrocatalysts Prepared by the Sol – Gel Route. 2000, 45, 4359–4371.
(78) Poillerat, G.; Chattier, P. Thin Films of Co,O, and NiCo204 Prepared by the Method of Chemical Spray Pyrolysis for Electrocatalysis Part IV. The Electrocatalysis of Oxygen Reduction. Thin Film. 1991, 314, 241–257.
(79) Singh, R. N.; Hamdani, M.; Koenig, J.-F.; Poillerat, G.; Gautier, J. L.; Chartier, P. Thin Films of Co3O4 and NiCo2O4 Obtained by the Method of Chemical Spray Pyrolysis for Electrocatalysis III. The Electrocatalysis of Oxygen Evolution. J. Appl. Electrochem. 1990, 20, 442–446.
(80) Koza, J. A.; He, Z.; Miller, A. S.; Switzer, J. A. Electrodeposition of Crystalline Co 3 O 4 —A Catalyst for the Oxygen Evolution Reaction. Chem. Mater. 2012, 24 (18), 3567–3573.
6. Appendix
123
(81) Castro, E.; Gervasi, C.; Vilche, J. Oxygen Evolution on Electrodeposited Cobalt Oxides. J. Appl. Electrochem. 1998, 28, 835–841.
(82) Casella, I. G. Electrodeposition of Cobalt Oxide Films from Carbonate Solutions Containing Co (II)–tartrate Complexes. J. Electroanal. Chem. 2002, 520, 119–125.
(83) Casella, I. G.; Di Fonzo, D. A. Anodic Electrodeposition of Cobalt Oxides from an Alkaline Bath Containing Co-Gluconate Complexes on Glassy Carbon. An Electroanalytical Investigation. Electrochim. Acta 2011, 56 (22), 7536–7540.
(84) Kanan, M. W.; Nocera, D. G. In Situ Formation of an Oxygen-Evolving Catalyst in Neutral Water Containing Phosphate and Co2+. Science 2008, 321 (5892), 1072–1075.
(85) Risch, M.; Khare, V.; Zaharleva, I.; Gerencser, L.; Chernev, P.; Dau, H. Cobalt-Oxo Core of a Water-Oxidizing Catalyst Film. J. Am. Chem. Soc. 2009, 131 (20), 6936–6937.
(86) Kanan, M. W.; Yano, J.; Surendranath, Y.; Dincă, M.; Yachandra, V. K.; Nocera, D. G. Structure and Valency of a Cobalt-Phosphate Water Oxidation Catalyst Determined by in Situ X-Ray Spectroscopy. J. Am. Chem. Soc. 2010, 132 (39), 13692–13701.
(87) Risch, M.; Klingan, K.; Ringleb, F.; Chernev, P.; Zaharieva, I.; Fischer, A.; Dau, H. Water Oxidation by Electrodeposited Cobalt Oxides--Role of Anions and Redox-Inert Cations in Structure and Function of the Amorphous Catalyst. ChemSusChem 2012, 5 (3), 542–549.
(88) McAlpin, J. G.; Surendranath, Y.; Dincã, M.; Stich, T. a.; Stoian, S. a.; Casey, W. H.; Nocera, D. G.; Britt, R. D. EPR Evidence for Co(IV) Species Produced during Water Oxidation at Neutral pH. J. Am. Chem. Soc. 2010, 132 (20), 6882–6883.
(89) Surendranath, Y.; Lutterman, D. a.; Liu, Y.; Nocera, D. G. Nucleation, Growth, and Repair of a Cobalt-Based Oxygen Evolving Catalyst. J. Am. Chem. Soc. 2012, 134 (14), 6326–6336.
(90) Klingan, K.; Ringleb, F.; Zaharieva, I.; Heidkamp, J.; Chernev, P.; Gonzalez-Flores, D.; Risch, M.; Fischer, A.; Dau, H. Water Oxidation by Amorphous Cobalt-Based Oxides: Volume Activity and Proton Transfer to Electrolyte Bases. ChemSusChem 2014, 7, 1301–1310.
(91) Abdi, F. F.; Han, L.; Smets, A. H. M.; Zeman, M.; Dam, B.; van de Krol, R. Efficient Solar Water Splitting by Enhanced Charge Separation in a Bismuth Vanadate-Silicon Tandem Photoelectrode. Nat. Commun. 2013, 4, 2195.
(92) Zhong, D. K.; Cornuz, M.; Sivula, K.; Grätzel, M.; Gamelin, D. R. Photo-Assisted Electrodeposition of Cobalt–phosphate (Co–Pi) Catalyst on Hematite Photoanodes for Solar Water Oxidation. Energy Environ. Sci. 2011, 4 (5), 1759.
6. Appendix
124
(93) Reece, S. Y.; Hamel, J. A.; Sung, K.; Jarvi, T. D.; Esswein, A. J.; Pijpers, J. J. H.; Nocera, D. G. Wireless Solar Water Splitting Using Silicon-Based Semiconductors and Earth-Abundant Catalysts. Science 2011, 334 (6056), 645–648.
(94) Esswein, A. J.; Surendranath, Y.; Reece, S. Y.; Nocera, D. G. Highly Active Cobalt Phosphate and Borate Based Oxygen Evolving Catalysts Operating in Neutral and Natural Waters. Energy Environ. Sci. 2011, 4 (2), 499.
(95) Jiao, F.; Frei, H. Nanostructured Cobalt Oxide Clusters in Mesoporous Silica as Efficient Oxygen-Evolving Catalysts. Angew. Chemie - Int. Ed. 2009, 48 (10), 1841–1844.
(96) Jiao, F.; Frei, H. Nanostructured Cobalt and Manganese Oxide Clusters as Efficient Water Oxidation Catalysts. Energy Environ. Sci. 2010, 3 (8), 1018.
(97) Sun, Y.; Gao, S.; Lei, F.; Liu, J.; Liang, L.; Xie, Y. Atomically-Thin Non-Layered Cobalt Oxide Porous Sheets for Highly Efficient Oxygen-Evolving Electrocatalysts. Chem. Sci. 2014, 5 (10), 3976.
(98) Najafpour, M. M.; Ehrenberg, T.; Wiechen, M.; Kurz, P. Calcium manganese(III) Oxides (CaMn2O4.xH2O) as Biomimetic Oxygen-Evolving Catalysts. Angew. Chem. Int. Ed. Engl. 2010, 49 (12), 2233–2237.
(99) Wiechen, M.; Zaharieva, I.; Dau, H.; Kurz, P. Layered Manganese Oxides for Water-Oxidation: Alkaline Earth Cations Influence Catalytic Activity in a Photosystem II-like Fashion. Chem. Sci. 2012, 3 (7), 2330.
(100) Ramírez, A.; Bogdanoff, P.; Friedrich, D.; Fiechter, S. Synthesis of Ca2Mn3O8 Films and Their Electrochemical Studies for the Oxygen Evolution Reaction (OER) of Water. Nano Energy 2012, 1 (2), 282–289.
(101) Gorlin, Y.; Jaramillo, T. F. A Bifunctional Nonprecious Metal Catalyst for Oxygen Reduction and Water Oxidation. J. Am. Chem. Soc. 2010, 132 (39), 13612–13614.
(102) Fekete, M.; Hocking, R. K.; Chang, S. L. Y.; Italiano, C.; Patti, A. F.; Arena, F.; Spiccia, L. Highly Active Screen-Printed Electrocatalysts for Water Oxidation Based on Β-Manganese Oxide. Energy Environ. Sci. 2013, 6 (7), 2222.
(103) Zaharieva, I.; Chernev, P.; Risch, M.; Klingan, K.; Kohlhoff, M.; Fischer, A.; Dau, H. Electrosynthesis, Functional, and Structural Characterization of a Water-Oxidizing Manganese Oxide. Energy Environ. Sci. 2012, 5 (5), 7081.
(104) Jiao, F.; Frei, H. Nanostructured Manganese Oxide Clusters Supported on Mesoporous Silica as Efficient Oxygen-Evolving Catalysts. Chem. Commun. 2010, 46 (17), 2920–2922.
6. Appendix
125
(105) Takashima, T.; Hashimoto, K.; Nakamura, R. Mechanisms of pH-Dependent Activity for Water Oxidation to Molecular Oxygen by MnO2 Electrocatalysts. J. Am. Chem. Soc. 2012, 134 (3), 1519–1527.
(106) Gorlin, Y.; Lassalle-Kaiser, B.; Benck, J. D.; Gul, S.; Webb, S. M.; Yachandra, V. K.; Yano, J.; Jaramillo, T. F. In Situ X-Ray Absorption Spectroscopy Investigation of a Bifunctional Manganese Oxide Catalyst with High Activity for Electrochemical Water Oxidation and Oxygen Reduction. J. Am. Chem. Soc. 2013, 135 (23), 8525–8534.
(107) Hocking, R. K.; Brimblecombe, R.; Chang, L.-Y.; Singh, A.; Cheah, M. H.; Glover, C.; Casey, W. H.; Spiccia, L. Water-Oxidation Catalysis by Manganese in a Geochemical-like Cycle. Nat. Chem. 2011, 3 (6), 461–466.
(108) Zaharieva, I.; Najafpour, M. M.; Wiechen, M.; Haumann, M.; Kurz, P.; Dau, H. Synthetic Manganese–calcium Oxides Mimic the Water-Oxidizing Complex of Photosynthesis Functionally and Structurally. Energy Environ. Sci. 2011, 4 (7), 2400.
(109) Shevchenko, D.; Anderlund, M. F.; Styring, S.; Dau, H.; Zaharieva, I.; Thapper, A. Water Oxidation by Manganese Oxides Formed from Tetranuclear Precursor Complexes: The Influence of Phosphate on Structure and Activity. Phys. Chem. Chem. Phys. 2014, 16 (24), 11965.
(110) Norrestam, R. Alpha-Manganese(III) Oxide --- a C-Type Sesquioxide of Orthorhombic Symmetry. Acta Chem. Scand. 1967, 21 (10), 2871–2884.
(111) Ramírez, A.; Hillebrand, P.; Stellmach, D.; May, M. M.; Bogdanoff, P.; Fiechter, S. Evaluation of MnOx, Mn2O3, and Mn3O4 Electrodeposited Films for the Oxygen Evolution Reaction of Water. J. Phys. Chem. C 2014, 118, 14073–14081.
(112) Hillebrand, P.; Ramírez-Caro, A.; Calvet, W.; Bogdanoff, P.; Fiechter, S. On the Structure-Function Relationship of Cobalt and Manganese Oxides as Oxygen Evolving Catalysts for Light-Driven Water Electrolysis: An In-Line Synchrotron Radiation Photoelectron Spectroscopy Study. ECS Trans. 2014, 61 (14), 9–20.
(113) Fiechter, S.; Bogdanoff, P. Oxygen Evolution and Reduction Catalysts: Structural and Electronic Aspects of Transition Metal Based Compounds and Composites. In Photoelectrochemical Water Splitting: Materials, Processes and Architectures; Lewerenz, H. J., Peter, L., Eds.; The Royal Society of Chemistry: Cambridge, 2013; pp 154–192.
(114) Ramírez, a.; Friedrich, D.; Kunst, M.; Fiechter, S. Charge Carrier Kinetics in MnOx, Mn2O3 and Mn3O4 Films for Water Oxidation. Chem. Phys. Lett. 2013, 568-569, 157–160.
(115) Blomqvist, K.; Still, E. R. Solution Studies of Systems with Polynuclear Complex Formation: Copper(II) and Cadmium(II) D-Gluconate Systems. Anal. Chem. 1985, 57, 749–752.
6. Appendix
126
(116) Casella, I. G.; Contursi, M. Cobalt Oxide Electrodeposition on Various Electrode Substrates from Alkaline Medium Containing Co–gluconate Complexes: A Comparative Voltammetric Study. J. Solid State Electrochem. 2012, 16 (12), 3739–3746.
(117) Wu, M.-S.; Chiang, P.-C. J.; Lee, J.-T.; Lin, J.-C. Synthesis of Manganese Oxide Electrodes with Interconnected Nanowire Structure as an Anode Material for Rechargeable Lithium Ion Batteries. J. Phys. Chem. B 2005, 109 (49), 23279–23284.
(118) Bard, A. J.; Faulkner, L. R. Electrochemical Methods. Fundamentals and Applications, second edi.; John Wiley & Sons, 2001.
(119) Heinze, J. Cyclovoltammetrie - Die “Spekroskopie” Des Elektrochemikers. Angew. Chemie 1984, 96 (11), 823–916.
(120) Bogdanoff, P.; Alonso-Vante, N. Online Determination via Differential Electrochemical Mass-Spectroscopy (DEMS) of Chemical-Products Formed in Photoelectrocatalytical Systems. Berichte der Bunsen-Gesellschaft für Phys. Chemie 1993, 97 (7), 940–943.
(121) Bogdanoff, P.; Alonso-Vante, N. A Kinetic Approach of Competitive Photoelectrooxidation of HCOOH and H2O on TiO2 Anatase Thin Layers via on-Line Mass Detection. J. Electroanal. Chem. 1994, 379, 415–421.
(122) Hüfner, S. Photoelectron Spectroscopy. Principles and Applications, Third edit.; Springer-Verlag: Berlin, Heidelberg, 2003.
(123) Ratner, B.; Castner, D. Electron Spectroscopy for Chemical Analysis. In Surface Analysis: The Principal Techniques; Vickerman, J. C., Gilmore, I. S., Eds.; John Wiley & Sons, 2009; pp 43–98.
(124) Kaiser, B.; Jaegermann, W.; Fiechter, S.; Lewerenz, H.-J. Direct Photoelectrochemical Conversion of Sun Light Into Hydrogen for Chemical Energy Storage. Bunsen-Magazin 2011, 4, 104–111.
(125) Stellmach, D.; Bogdanoff, P.; Gabriel, O.; Stannowski, B.; Schlattmann, R.; Krol, R. van de; Fiechter, S. Artificial Leaf for Solar Water Splitting Based on a Triple-Junction a-Si:H/ a-Si:H/ Μc-Si:H Thin Film Solar Cell and a PEDOT:PSS/Catalysts Blend. Prep. 2015.
(126) Djokic (Editor), S. S. Electrodeposition; Djokic, S. S., Ed.; Modern Aspects of Electrochemistry; Springer New York: New York, NY, 2010; Vol. 48.
(127) Pergola, F.; Nucci, L.; Pezzatini, G.; Wei, H.; Guidelli, R. Direct Electro-Oxidation of D-Gluconic Acid to D-Arabinose. Electrochim. Acta 1994, 39 (10), 1415–1417.
(128) Vallieres, C.; Matlosz, M. A Multisectioned Porous Electrode for Synthesis of D-Arabinose. J. Electrochem. Soc. 1999, 146 (8), 2933.
6. Appendix
127
(129) Zachäus, C. Unpublished Results.
(130) Yeo, B. S.; Bell, A. T. Enhanced Activity of Gold-Supported Cobalt Oxide for the Electrochemical Evolution of Oxygen. J. Am. Chem. Soc. 2011, 133 (14), 5587–5593.
(131) Barrera, E. C.; Viveros, T. G.; Morales, U. Preparation of Selective Surfaces of Black Cobalt by the Sol-Gel Process. Renew. Energy 1996, 9 (1-4), 733–736.
(132) Chaudhury, N. K.; Gupta, R.; Gulia, S. Sol-Gel Technology for Sensor Applications. Def. Sci. J. 2007, 57 (3), 241–253.
(133) Lu, X.; Ng, Y. H.; Zhao, C. Gold Nanoparticles Embedded within Mesoporous Cobalt Oxide Enhance Electrochemical Oxygen Evolution. ChemSusChem 2014, 7 (1), 82–86.
(134) Švegl, F.; Orel, B.; Grabec-Švegl, I.; Kaučič, V. Characterization of Spinel Co3O4 and Li-Doped Co3O4 Thin Film Electrocatalysts Prepared by the Sol–gel Route. Electrochim. Acta 2000, 45 (25-26), 4359–4371.
(135) Co, A. C.; Liu, J.; Serebrennikova, I.; Abel, C. M.; Birss, V. I. Structural and Electrochemical Studies of Co Oxide Films Formed by the Sol-Gel Technique. J. Mater. Sci. 2005, 40 (15), 4039–4052.
(136) Boggio, R.; Carugati, A.; Trasatti, S. Electrochemical Surface Properties of Co3O4 Electrodes. J. Appl. Electrochem. 1987, 17 (August 1986), 828–840.
(137) Burke, L. D.; Murphy, M. M. The Electrocatalytic Behavior of Cobalt (and Iron) Electrodes at Low Potential in Base. Journal of The Electrochemical Society, 1991, 138, 88.
(138) Casella, I. G.; Guascito, M. R. Electrochemical Preparation of a Composite Gold–cobalt Electrode and Its Electrocatalytic Activity in Alkaline Medium. Electrochim. Acta 1999, 45, 1113–1120.
(139) Serebrennikova, I. Electrochemical and Structural Studies of Sol-Gel Formed Ni-Co Oxide Films, PhD-thesis, University of Calgary, 1999.
(140) GESTIS-Stoffdatenbank. Cobalt(II,III)-oxid http://gestis.itrust.de/nxt/gateway.dll/gestis_de/500063.xml?f=templates$fn=document-frameset.htm$3.0 (accessed Feb 23, 2015).
(141) Trasatti, S.; Petrii, O. A. Real Surface Area Measurements in Electrochemistry. Pure and Applied Chemistry, 1991, 63, 711–734.
(142) Tilak, B. V; Rader, C. G.; Rangarajan S K. Techniques for Characterizing Porous Electrodes I : Determination of the Double Layer Capacity. J. Electrochem. Soc. 1977, 124 (12), 1879–1886.
6. Appendix
128
(143) Bockris, J. O. M.; Otagawa, T. The Electrocatalysis of Oxygen Evolution on Perovskites. J. Electrochem. Soc. 1984, 131 (2), 290–302.
(144) Levine, S.; Smith, A. L. Theory of the Differential Capacity of the Oxide/Aqueous Electrolyte Interface. Discuss. Faraday Soc. 1971, No. 52, 290–301.
(145) Lal, B.; Singh, N. K.; Samuel, S.; Singh, R. N. Electrocatalytic Propterties of CuxCo(3-x)O4 (0<x<1) Obtained by a New Precipitation Method for Oxygen Evolution. J. New Mater. Electrochem. Syst. 1999, 2, 59–64.
(146) Nørskov, J.; Bligaard, T.; Logadottir, A.; Bahn, S.; Hansen, L. B.; Bollinger, M.; Bengaard, H.; Hammer, B.; Sljivancanin, Z.; Mavrikakis, M.; et al. Universality in Heterogeneous Catalysis. J. Catal. 2002, 209 (2), 275–278.
(147) Singh, S. P.; Samuels, S.; Tiwari, S. K.; Singh, R. N. Preparation of Thin Co3O4 Films on Ni and Their Electrocatalytic Surface Properties towards Oxygen Evolution. Int. J. Hydrogen Energy 1996, 21 (3), 171–178.
(148) Wu, G.; Li, N.; Zhou, D. R.; Mitsuo, K.; Xu, B. Q. Anodically Electrodeposited Co+Ni Mixed Oxide Electrode: Preparation and Electrocatalytic Activity for Oxygen Evolution in Alkaline Media. J. Solid State Chem. 2004, 177, 3682–3692.
(149) Kratzig, A. Strukturelle Und Physikalisch-Chemische Eigenschaften von Übergangsmetallchalkogeniden Als Elektrokatalysatoren Für Die Sauerstoffentwicklung, PhD- thesis, Technische Universität Berlin, 2014.
(150) Surendranath, Y.; Dincǎ, M.; Nocera, D. G. Electrolyte-Dependent Electrosynthesis and Activity of Cobalt-Based Water Oxidation Catalysts. J. Am. Chem. Soc. 2009, 131 (7), 2615–2620.
(151) Surendranath, Y.; Kanan, M. W.; Nocera, D. G. Mechanistic Studies of the Oxygen Evolution Reaction by a Cobalt-Phosphate Catalyst at Neutral pH. J. Am. Chem. Soc. 2010, 132 (46), 16501–16509.
(152) Ringleb, F. Elektrochemische Wasseroxidation an Einer Katalytischen Kobalt-Schicht : Belege Für Protonengekoppelten Elektronentransfer, Diploma thesis, Humbolt Universität zu Berlin, 2009.
(153) Han, K. S.; Han, O. H. Influence of Metal Cleaning on the Particle Size and Surface Morphology of Platinum Black Studied by NMR, TEM and CV Techniques. Electrochim. Acta 2001, 47, 519–523.
(154) Weber, M. F.; Dignam, M. J. Efficiency of Splitting Water with Semiconducting Photoelectrodes. J. Electrochem. Soc. 1984, 131 (June), 1258.
6. Appendix
129
(155) Weber, M. F.; Dignam, M. J. Splitting Water with Semiconducting photoelectrodes—Efficiency Considerations. Int. J. Hydrogen Energy 1986, 11, 225–232.
(156) Walter, M. G.; Warren, E. L.; McKone, J. R.; Boettcher, S. W.; Mi, Q.; Santori, E. a.; Lewis, N. S. Solar Water Splitting Cells. Chem. Rev. 2010, 110, 6446–6473.
(157) Haussener, S.; Xiang, C.; Spurgeon, J. M.; Ardo, S.; Lewis, N. S.; Weber, A. Z. Modeling, Simulation, and Design Criteria for Photoelectrochemical Water-Splitting Systems. Energy Environ. Sci. 2012, 5, 9922–9935.
(158) Langell, M.; Anderson, M.; Carson, G.; Peng, L.; Smith, S. Valence-Band Electronic Structure of Co3O4 Epitaxy on CoO(100). Phys. Rev. B 1999, 59 (7), 4791–4798.
(159) Petitto, S. C.; Langell, M. A. Surface Composition and Structure of Co[sub 3]O[sub 4](110) and the Effect of Impurity Segregation. J. Vac. Sci. Technol. A Vacuum, Surfaces, Film. 2004, 22 (4), 1690.
(160) Foelske, A.; Strehblow, H. H. Structure and Composition of Electrochemically Prepared Oxide Layers on Co in Alkaline Solutions Studied by XPS. Surf. Interface Anal. 2002, 34 (1), 125–129.
(161) Dupin, J. C.; Gonbeau, D.; Benqlilou-Moudden, H.; Vinatier, P.; Levasseur, A. XPS Analysis of New Lithium Cobalt Oxide Thin-Films before and after Lithium Deintercalation. Thin Solid Films 2001, 384 (1), 23–32.
(162) Artyushkova, K.; Levendosky, S.; Atanassov, P.; Fulghum, J. XPS Structural Studies of Nano-Composite Non-Platinum Electrocatalysts for Polymer Electrolyte Fuel Cells. Top. Catal. 2007, 46 (3-4), 263–275.
(163) Shirley, D. A. High-Resolution X-Ray Photoemission Spectrum of the Valence Bands of Gold. Phys. Rev. B 1972, 5 (12), 4709–4714.
(164) Moulder, J. F.; Stickle, W. F.; Sobol, P. E.; Bomben, K. D. Handbook of X-Ray Photoelectron Spectroscopy; Chastain, J., Ed.; Perkin-Elmer Corporation: Eden Prairie, 1992.
(165) Zafeiratos, S.; Dintzer, T.; Teschner, D.; Blume, R.; Hävecker, M.; Knop-Gericke, a.; Schlögl, R. Methanol Oxidation over Model Cobalt Catalysts: Influence of the Cobalt Oxidation State on the Reactivity. J. Catal. 2010, 269 (2), 309–317.
(166) Brundle, C. R.; Chuang, T. J.; Rice, D. W. X- Ray Photoemission Study of the Interaction of Oxygen and Air with Clean Cobalt Surfaces. Surf. Sci. 1976, 60, 286–300.
(167) Haber, J.; Ungier, L. On Chemical Shifts of ESCA and Auger Lines in Cobalt Oxides. J. Electron Spectros. Relat. Phenomena 1977, 12 (3), 305–312.
6. Appendix
130
(168) Tan, B. J.; Klabunde, K. J.; Sherwood, P. M. a. XPS Studies of Solvated Metal Atom Dispersed (SMAD) Catalysts. Evidence for Layered Cobalt-Manganese Particles on Alumina and Silica. J. Am. Chem. Soc. 1991, 113 (3), 855–861.
(169) Carson, G. A.; Nassir, M. H.; Langell, M. A. Epitaxial Growth of Co3O4 on CoO(100). J. Vac. Sci. Technol. A Vacuum, Surfaces, Film. 1996, 14 (3), 1637.
(170) Yang, J.; Liu, H.; Martens, W. N.; Frost, R. L. Synthesis and Characterization of Cobalt Hydroxide, Cobalt Oxyhydroxide, and Cobalt Oxide Nanodiscs. J. Phys. Chem. C 2010, 114 (1), 111–119.
(171) Mclntyre, N. S.; Cook, M. G. X-Ray Photoelectron Studies on Some Oxides and Hydroxides of Cobalt, Nickel, and Copper. Anal. Chem. 1975, 47 (13), 2208–2213.
(172) Hu, C. C.; Hsu, T. Y. Effects of Complex Agents on the Anodic Deposition and Electrochemical Characteristics of Cobalt Oxides. Electrochim. Acta 2008, 53, 2386–2395.
(173) Mattogno, G.; Ferragina, C.; Massucci, M. A.; Patrono, P.; La Ginestra, A. X-RAY PHOTOELECTRON SPECTROSCOPIC EVIDENCE OF INTERLAYER COMPLEX FORMATION BETWEEN Co(II) AND N-HETEROCYCLES IN Alpha-Zr(HPO4)2*H2O. J. Electron Spectros. Relat. Phenomena 1988, 46, 285–295.
(174) Grellner, F.; Klingenberg, B.; Borgmann, D.; Wedler, G. Electron Spectroscopic Study of the Interaction of Oxygen with Co (1120) and of Coadsorption with Water. J. Electron Spectros. Relat. Phenomena 1995, 71, 107–115.
(175) Singh, H.; Sinha, a. K.; Singh, M. N.; Tiwari, P.; Phase, D. M.; Deb, S. K. Spectroscopic and Structural Studies of Isochronally Annealed Cobalt Oxide Nanoparticles. J. Phys. Chem. Solids 2014, 75 (3), 397–402.
(176) Petitto, S. C.; Marsh, E. M.; Carson, G. a.; Langell, M. a. Cobalt Oxide Surface Chemistry: The Interaction of CoO(100), Co3O4(110) and Co3O4(111) with Oxygen and Water. J. Mol. Catal. A Chem. 2008, 281 (1-2), 49–58.
(177) Burke, L. D.; Lyons, M. E.; Murphy, O. J. Formation of Hydrous Oxide Films on Cobalt under Potential Cycling Conditions. J. Electroanal. Chem. 1982, 132 (JAN), 247–261.
(178) Benson, P.; Briggs, G. W. D.; Wynne-Jones, W. F. K. The Cobalt Hydroxide electrode—II. Electrochemical Behaviour. Electrochim. Acta 1964, 9 (3), 281–288.
(179) Švegl, F.; Orel, B.; Hutchins, M. G.; Kalcher, K. Structural and Spectroelectrochemical Investigations of Sol-Gel Derived Electrochromic Spinel Co3O4 Films. Journal of The Electrochemical Society, 1996, 143, 1532.
6. Appendix
131
(180) Burke, L. D.; Murphy, O. J. Electrochromic Behaviour of Oxide Films Grown on Cobalt and Manganese in Base. J. Electroanal. Chem. 1980, 109, 373–377.
(181) Burke, L. D.; Murphy, O. J. Electrochromic Behaviour of Electrodeposited Cobalt Oxide Films. J. Electroanal. Chem. 1980, 112, 379–382.
(182) Trotochaud, L.; Mills, T. J.; Boettcher, S. W. An Optocatalytic Model for Semiconductor-Catalyst Water-Splitting Photoelectrodes Based on in Situ Optical Measurements on Operational Catalysts. J. Phys. Chem. Lett. 2013, 4 (6), 931–935.
(183) Fonseca, C. N. P. da; Paoli, M.-A. De; Gorenstein, A. The Electrochromic Effect in Cobalt Oxide Thin Films. Adv. Mater. 1991, 3 (11), 553–555.
(184) Delaplane, R. G.; Ibers, J. a; Ferraro, J. R.; Rush, J. J. Diffraction and Spectroscopic Studies of the Cobaltic Acid System HCoO2-DCoO2. J. Chem. Phys. 1969, 50 (5), 1920–1927.
(185) Sanchez Casalongue, H. G.; Ng, M. L.; Kaya, S.; Friebel, D.; Ogasawara, H.; Nilsson, A. In Situ Observation of Surface Species on Iridium Oxide Nanoparticles during the Oxygen Evolution Reaction. Angew. Chem. Int. Ed. Engl. 2014, 53 (28), 7169–7172.
(186) Morita, M.; Iwakura, C.; Tamura, H. The Anodic Characteristics of Massive Manganese Oxide Electrode. Electrochim. Acta 1979, 24 (4), 357–362.
(187) Chigane, M.; Ishikawa, M. Manganese Oxide Thin Film Preparation by Potentiostatic Electrolyses and Electrochromism. J. Electrochem. Soc. 2000, 147 (6), 2246.
(188) Audi, A. A.; Sherwood, P. M. a. Valence-Band X-Ray Photoelectron Spectroscopic Studies of Manganese and Its Oxides Interpreted by Cluster and Band Structure Calculations. Surf. Interface Anal. 2002, 33 (3), 274–282.
(189) Oku, M.; Hirokawa, K.; Ikeda, S. X-Ray Photoelectron Spectroscopy of Manganese—oxygen Systems. J. Electron Spectros. Relat. Phenomena 1975, 7 (5), 465–473.
(190) Oku, M.; Hirokawa, K. X-Ray Photoelectron Spectroscopy of Co3O4, Fe3O4, Mn3O4, and Related Compounds. J. Electron Spectros. Relat. Phenomena 1976, 8 (5), 475–481.
(191) Di Castro, V.; Polzonetti, G. XPS Study of MnO Oxidation. J. Electron Spectrosc. Relat. Phenomena1 1989, 48, 117–123.
(192) Foord, J. S.; Jackman, R. B.; Allen, G. C. An X-Ray Photoelectron Spectroscopic Investigation of the Oxidation of Manganese. Philos. Mag. A 1984, 49 (5), 657–663.
(193) Carver, J. C.; Schweitzer, G. K.; Carlson, T. a. Use of X-Ray Photoelectron Spectroscopy to Study Bonding in Cr, Mn, Fe, and Co Compounds. J. Chem. Phys. 1972, 57 (2), 973.
6. Appendix
132
(194) Moses Ezhil Raj, A.; Victoria, S. G.; Jothy, V. B.; Ravidhas, C.; Wollschläger, J.; Suendorf, M.; Neumann, M.; Jayachandran, M.; Sanjeeviraja, C. XRD and XPS Characterization of Mixed Valence Mn3O4 Hausmannite Thin Films Prepared by Chemical Spray Pyrolysis Technique. Appl. Surf. Sci. 2010, 256 (9), 2920–2926.
(195) Hu, H.-K.; Rabalais, J. W. Chemisorption and the Initial Stage of Oxidation on Mn. Surf. Sci. 1981, 107, 376–390.
(196) Lume-Pereira, C.; Baral, S.; Henglein, a; Janata, E. Chemistry of Colloidal Manganese Dioxide. 1. Mechanism of Reduction by an Organic Radical (a Radiation Chemical Study). J. Phys. Chem. 1985, 89 (26), 5772–5778.
(197) Takashima, T.; Yamaguchi, A.; Hashimoto, K.; Irie, H.; Nakamura, R. In Situ UV-Vis Absorption Spectra of Intermediate Species of Oxygen-Evolution Reaction on the Surface of MnO2 in Neutral and Alkaline Media. Electrochemistry 2014, 82 (5), 325–327.
(198) Cheng, F.; Shen, J.; Peng, B.; Pan, Y.; Tao, Z.; Chen, J. Rapid Room-Temperature Synthesis of Nanocrystalline Spinels as Oxygen Reduction and Evolution Electrocatalysts. Nat. Chem. 2011, 3 (1), 79–84.
6. Appendix
133
6.2. List of figures
Figure 1.1: (left) Global atmospheric CO2 concentration in ppm over the last 800 000 years. Source: Ref. 10. (right)
Global final energy demand from 1990 to 2050 in EJ by source of energy under a “business as usual” scenario.
Source: Ref. 3. ................................................................................................................................................ 1
Figure 2.1: (a) Volcano plot based on Trasatti41 linking overpotential with transition enthalpy. Source: Ref. 42. (b)
Volcano plot using the difference in binding energy between the –O* and the –OH* transition state as
descriptor. Source: Ref. 38. (c) Free energy diagram of intermediates during OER at –O* covered RuO2 for
different potentials. Source: Ref. 39. ..............................................................................................................10
Figure 3.1: Electrochemical cell for sample preparation in operation mode (a) and working (sample) and counter
(Pt) electrodes outside the cell (b). WE, CE and RE denote working, counter and reference electrode,
respectively. .................................................................................................................................................15
Figure 3.2: (a): Typical CV diagram of a CoOx electrode with the most important features labeled. The red line
represents the iR-corrected current curve, while the blue line depicts the current density as function of the
applied potential without any iR-compensation. (b): Typical impedance spectrum of a CoOx electrode, with
the setup resistance RΩ labeled. The Randles equivalent circuit is schematically illustrated on the right hand
side of the graph. ..........................................................................................................................................17
Figure 3.3: Photographs of the unmounted (left) and mounted electrochemical cell (right). ...................................19
Figure 3.4: Schematic illustration of a DEMS setup. The sample is turned upside down onto the gas permeable
membrane where O2 can diffuse through it and be analyzed in the mass spectrometer. The diagram has been
taken from Ref. 111. .......................................................................................................................................20
Figure 3.5: (a): An X-ray photon interacts with a core electron, transfers its energy and leads to the ejection of a
photoelectron from the n-electron initial state. (b): The ion, now in the (n-1) state reorganizes its electrons to
a lower energy state by dropping an electron from an outer shell into the vacant core hole. (c): The excess
energy from the process in (b) is released from the ion either by X-ray photon emission (X-ray fluorescence)
or by emission of an Auger electron from an outer shell. Source: Ref. 123 .......................................................21
Figure 3.6: Electron mean free path length as function of their kinetic energy for various metals. Source: Ref 122. ...23
Figure 3.7: (a): Photograph of the SoLIAS endstation at Bessy II. (b): Electrochemical cell (“glass cross”) attached to
the UHV system of the SoLIAS, with all relevant components. (c): Sample in contact with the electrolyte (KOH)
inside the electrochemical cell. .....................................................................................................................25
Figure 3.8: Schematic illustration of the in-situ UV/Vis spectroscopy measurement setup. .....................................26
Figure 4.1: Deposition current density j as function of deposition time t at different applied deposition potentials
from 1.1 V (dark blue, bottom curve) to 1.7 V vs. RHE (red, top curve) in steps of 0.1 V. ................................30
Figure 4.2: Photograph of samples deposited at different deposition potentials. Top row: samples were deposited
for 30 minutes, bottom row: samples were deposited until a total charge of 1 C/cm2 had been recorded. .....31
Figure 4.3: Cyclovoltammograms (CV diagrams) of cobalt oxide electrodes deposited at different deposition
potentials for 30 minutes (a) and deposited until a charge of 1 C/cm2 has passed the electrode (b),
respectively. The diagrams show opposing trends for the activity of the two series of samples. Measurements
were carried out in 1 M KOH (pH 14) at a scan rate of 10 mV/s. ....................................................................32
Figure 4.4: Overpotential η, recorded at the current density of 10 mA/cm2 in 1 M KOH as function of the deposition
potential Udep for the two group of samples with constant deposition time of 30 min (blue) and constant
deposition charge of 1 C/cm2 (red), respectively. ..........................................................................................33
6. Appendix
134
Figure 4.5: (a) Current density j vs. deposition potential Udep recorded during the deposition of CoOx on an
FTO/glass substrate. The lines represent the 1st, 10th, 20th, 30th, 40th, 50th, 60th, 70th, 80th, 90th and 100th cycle
at a scan rate of 100 mV/s. (b) CV diagram of a sample deposited with cycled potential (blue) in comparison
to a sample deposited at the potential of 1.4 V and a deposited charge of 1 C/cm2. CV measurements in (b)
have been corrected for the iR-drop and were carried out in 1 M KOH (pH 14) at a scan rate of 10 mV/s. ......34
Figure 4.6: Deposition current density j vs. time t (a) and related cyclovoltammograms (b) of samples deposited
from solutions containing different Co2+ concentrations. The deposited charge for all samples was 1 C/cm2 at
1.4 V (RHE). CV measurements have been corrected for the iR-drop and were carried out in 1 M KOH (pH 14)
at a scan rate of 10 mV/s. .............................................................................................................................35
Figure 4.7: Deposition current density j over time t (a) and CV diagrams (b) of samples deposited from solutions
containing different cobalt salts. The deposition time was 30 minutes at 1.4 V (RHE). CV measurements have
been corrected with respect to the iR-drop and were carried out in 1 M KOH (pH 14) at a scan rate of 10
mV/s.............................................................................................................................................................36
Figure 4.8: Deposition current density j over time t (a) and CV diagrams (b) of samples deposited from solutions
containing different KOH concentrations. The deposited charge was 1 C/cm2 at 1.4 V (RHE). CV measurements
have been corrected with respect to the iR-drop and were carried out in 1 M KOH (pH 14) at a scan rate of 10
mV/s.............................................................................................................................................................37
Figure 4.9: Current density j over time t during the deposition of CoOx films on different substrates at a potential of
1.4 V (RHE) until a charge of 1 C/cm2 has passed the electrode, except for the ITO sample, where a film was
deposited for 30 min.....................................................................................................................................38
Figure 4.10: Photograph of CoOx films deposited on different substrates. ...............................................................39
Figure 4.11: SEM images of CoOx films on different substrates. Top left: Isolated CoOx patches with high surface
area on a FTO support, which is visible in between the islands. Top right: CoOx on Au forming similar
structures as on FTO. The bright areas show the blank substrate. Bottom left: CoOx on a Ti-substrate does not
form films, but rose-like structures. Bottom right: Loose and not uniformly covering network of CoOx on a Co
substrate. .....................................................................................................................................................40
Figure 4.12: CV diagrams of CoOx films deposited on different substrates at 1.4 V (RHE) until the charge of 1 C/cm2
has passed the electrochemical cell. The CVs of the corresponding blank substrates are given by black line
scans. CV measurements have been corrected for the iR-drop and were carried out in 1 M KOH (pH 14) at a
scan rate of 10 mV/s. ....................................................................................................................................42
Figure 4.13: (a) Capacitive current density jc vs. scan rate ν for CoOx on FTO, Au and Co recorded at 1.27 V (RHE) to
determine the double layer capacitance of the samples. (b) Geometric current density jgeom (black) at 1.55 V
(squares), 1.57 (circles) and 1.6 V (triangles) in comparison with the relative current density jrel (blue), which
has been normalized for the double layer capacitance. .................................................................................43
Figure 4.14: X-ray diffractograms of electrodeposited cobalt oxide films after annealing at different temperatures.
The spinel type Co3O4 phase appears at annealing temperatures of 300°C and higher. At 450°C no further
change in the diffractogram can be observed and the crystallization process is considered to be completed. 45
Figure 4.15: Photograph of CoOx films annealed at different temperatures.............................................................46
Figure 4.16: Current-voltage curves of different electrodes in the potential range from 0.9 to 1.65 V as a function of
annealing temperature. The anodic waves Ia and IIa and the cathodic feature IIc disappear after annealing at
200°C and higher, while the redox pair IIIa and IIIc becomes sharper with increasing annealing temperature.
The measurements have been corrected for the iR-drop and were carried out in 1 M KOH (pH 14) at a scan
rate of 10 mV/s. ............................................................................................................................................48
Figure 4.17: SEM images of electrodes dried at room temperature (left) and after annealing at 450°C (right). ........49
6. Appendix
135
Figure 4.18: CV diagrams of cobalt oxide films annealed at different temperatures. OER activity decreases with
increasing temperature accompanied by an increasing current loss from cycle to cycle. The measurements
have been corrected for the iR-drop and were carried out in 1 M KOH (pH 14) at a scan rate of 10 mV/s. .....49
Figure 4.19: (a) Averaged overpotential η at 10 mA/cm2 as function of the annealing temperature T. (b)
Development of η at 10 mA/cm2 over time t. The measurements have been corrected for the iR-drop and
were performed in 1 M KOH. ........................................................................................................................51
Figure 4.20: Selected CV diagrams of samples with deposited charges between 0.01 and 1000 mC/cm2 and a blank
FTO substrate as reference. The dotted violet line represents the current-voltage curve of the sample with
the deposited charge of 0.01 mC/cm2 multiplied by a factor of 130. All samples were deposited at 1.2 V (RHE).
The measurements have been corrected with respect to the iR-drop and have been carried out in 1 M KOH
(pH 14) at a scan rate of 10 mV/s. .................................................................................................................54
Figure 4.21: Overpotential η as function of the deposited charge Qdep and the amount of deposited Co MCo, dep. .....55
Figure 4.22. Sample thickness d as function of the deposition charge Qdep. The blue squares and green triangles
represent samples deposited at 1.2 V and 1.4 V (RHE) measured with a profilometer, respectively. The cyan
diamonds are the results of cross section SEM investigations on samples deposited at 1.2 V, the black line
shows the sample thickness calculated according to equation (13). ...............................................................57
Figure 4.23: SEM images of samples deposited at 1.2 V (RHE) until 10 (a), 100 (b) and 1000 mC/cm2 have passed the
electrode/electrolyte interface. The samples were cut and prepared for cross section analysis in a sandwich
alignment. ....................................................................................................................................................59
Figure 4.24: (a) CV diagram taken at 10 mV/s with the marked regions for possible capacitance measurements. The
graphs in (b) and (c) show CV diagrams at different scan rates (5 – 100 mV/s) in the potential range from 0.88
to 0.98 V (b) and from 1.25 to 1.35 V (c).The diagram in (d) shows the plot of the anodic (positive) and
cathodic (negative) current density vs. the scan rate at 0.95 V (brown) and 1.30 V (blue). All measurements
were carried out in 1 M KOH. ........................................................................................................................61
Figure 4.25: Double layer capacitance Cdl and roughness factor Rf as function of the deposition charge Qdep. ..........62
Figure 4.26: TEM images of a CoOx sample dried in air at RT (a, c) and a Co3O4 sample heated to 400°C (b, d). ........64
Figure 4.27: (a): CV diagram with the marked regions for the integration of the reductive current density. (b):
Charge belonging to the reduction peaks Qred.peak (red and blue areas in a) and amount of reduced cobalt ions
MCo as function of film thickness d. (c): Fraction of the reduced cobalt ions Qred.peak/Qdep as function of the
deposition charge Qdep. (d): Relative charges of the reduction peaks rel Qred.peak as function of film thickness d.
The blue and red lines represent the relative charges between measurements conducted at 100 and 10 mV/s
for reduction peak 1 and 2, respectively. The green line is the relative charge between reduction peak 1 and 2
measured at 100 mV/s. .................................................................................................................................66
Figure 4.28: Turnover frequency calculated from the total deposition charge TOFQdep (a) and from the charge of the
second reduction peak TOFred.peak (b) vs. film thickness d. ..............................................................................68
Figure 4.29: Tafel slope b as function of the sample thickness d. The violet diamond represents the blank FTO
substrate, which was arbitrarily placed at 0.1 nm to show it in the graph. .....................................................71
Figure 4.30: Exchange current density j0 and charge transfer coefficient α versus sample thickness d. The violet
diamond and circle represent α and j0 of the blank FTO substrate. ................................................................72
Figure 4.31: CV diagrams of CoOx measured in 1 M KOH (black) and different concentrations of potassium
phosphate buffer solution (KPi). All measurements were conducted at 10 mV/s and corrected for the iR-drop.
.....................................................................................................................................................................73
Figure 4.32: (a): Current density j vs. time t in different electrolytes at the overpotential of 0.62 (KPi) and 0.35 V
(KOH), respectively. (b): CV diagram of CoOx electrodes in 0.1 M KPi at different scan rates. .........................75
6. Appendix
136
Figure 4.33: CV diagrams of CoOx and CoPi in 1 M KOH (a) and 0.1 M KPi + 0.5 M K2SO4 (b), respectively. All samples
had a deposition charge of 0.1 C/cm2 and were deposited at 1.2 (CoOx) and 1.5 V vs. RHE (CoPi), respectively.
The scan rate was 10 mV/s and the potential was corrected with respect to the iR-drop. ..............................77
Figure 4.34: First, second and third cycle of a regular CV experiment. The deposition potential was 1.2 V, the
deposition charge 1000 mC/cm2. The measurement has been corrected for the iR-drop and was performed in
1 M KOH at 10 mV/s. ....................................................................................................................................78
Figure 4.35: DEMS measurement performed in 1 M KOH at 2 mV/s. The red curve represents the current i as
function of the applied potential U and the black and blue lines are the corresponding mass signals of CO2 and
O2, respectively. ............................................................................................................................................79
Figure 4.36: DEMS measurements of the first (a) and second (b) cycle of a CoOx electrode measured in 0.1 M
potassium phosphate buffer (KPi) solution at a sweep rate of 2 mV/s. The red curve represents the current i
as function of the applied potential U and the black and blue lines are the corresponding mass signals related
to CO2 and O2, respectively. ..........................................................................................................................80
Figure 4.37: SEM image and photograph of a partially detached CoOx thin film.......................................................82
Figure 4.38: (a): Comparison of the CV diagrams of a stable CoOx film and a film, which detached from the substrate
in the electrochemically active spot. The films were deposited under the same conditions (1.4 V, 1000
mC/cm2). (b): Comparison of the activity of a sample, which was dried at RT in air after the deposition (blue)
and a sample, which was electrochemically characterized immediately after the deposition. The
measurements have been corrected for the iR-drop and were carried out in 1 M KOH (pH 14) at a scan rate of
10 mV/s. .......................................................................................................................................................82
Figure 4.39: Overpotential η versus time t for a galvanostatic measurement at a current density of 10 mA/cm2. The
potential has been corrected for the iR-drop; the electrolyte was 1 M KOH. The sample was fully immersed (2
cm2) in the electrolyte and rotated with a speed of around 400 rpm. ............................................................84
Figure 4.40: (a): Long term potentiostatic measurement (current density j versus time t) in 1 M KOH at an
overpotential of η = 0.38 V. The measurements were carried out with (blue curve) and without (black and
gray curves) sample rotation and iR-compensation, respectively. (b): CV diagrams before and after the
potentiostatic measurement shown in (a) (black curve). The measurements have been corrected for the iR-
drop and were carried out in 1 M KOH (pH 14) at a scan rate of 10 mV/s. ......................................................84
Figure 4.41: XPS overview spectra of the pristine CoOx sample (blue) and after the sample has been subjected to a
potential of 1.35 V vs. RHE (red). The most important features are marked within the graph. Excitation energy
was 900 eV. ..................................................................................................................................................87
Figure 4.42: CV diagram of a CoOx electrode recorded inside the glass cross without (grey) and after iR-correction
(black). The measured cell resistance was 160 Ω. The position of the investigated potentials are marked with
blue bars. .....................................................................................................................................................88
Figure 4.43: Co2p photoelectron spectra of CoOx after the application of different anodic potentials. The binding
energies of Co2+ and Co3+ are marked by vertical lines, shake-up satellites are indicated as ss. .......................90
Figure 4.44: Deconvolution and residual function of Co2p3 and O1s peaks of CoOx after deposition (a, b) and the
application of 1.35 V (c, d), 1.6 V (e, f) and 1.05 V (g, h). A Shirley background163 has been subtracted. The
potentials are given vs. RHE and the incident photon energies were 900 and 650 eV for Co2p and O1s,
respectively. .................................................................................................................................................94
Figure 4.45: Photographs of an as-deposited CoOx sample during the application of different potentials. ...............95
6. Appendix
137
Figure 4.46: Applied potential U vs. wavelength λ of the incident light of in-situ UV-Vis measurements during
potential cycling on as-deposited CoOx (a, c, e) and annealed Co3O4 samples (b, d, f). The samples had a
nominal deposition charge of 1000 (a, b), 100 (c, d) and 10 mC/cm2 (e, f). The color bar gives the relative
transmittance normalized to the samples under open circuit conditions; the scan rate was 1 mV/s in 1 M KOH
electrolyte. The transmittance was integrated for 5 s, respectively, which results in a potential resolution of 5
mV................................................................................................................................................................97
Figure 4.47: Relative transmittance (normalized to the sample transmittance at OCP) as function of the applied
potential U of an as-deposited CoOx electrode with a deposition charge of 1000 mC/cm2. The selected
wavelengths correspond to the different absorption features in the 3d-plot in Figure 4.46a. .........................98
Figure 4.48: Applied potential U vs. wavelength λ of the incident light for in-situ UV/Vis measurements during rapid
potentiostatic measurements at different potentials on as-deposited CoOx (a) and annealed Co3O4 (b)
electrodes. In between the different potential steps the samples were discharged at 0.9 V (RHE). The
deposition charge was 1000 mC/cm2 in both cases and the Co3O4 film has been annealed at 450°C. The color
bar gives the relative transmittance normalized to the sample under open circuit conditions. ..................... 100
Figure 4.49: Relative transmittance, normalized to the status before the application of potential, as a function of
relaxation time trel and wavelength λ during the relaxation process in 1 M KOH (a) and air (b). The samples
were beforehand subjected to 1.7 V (RHE) for 1 min. The measurement was started as fast as possible after
the applied potential was switched off and, in the case of (b), the electrolyte was removed. Integration time
of the individual spectra was 1 min. ............................................................................................................ 101
Figure 4.50: Relative transmittance, normalized to the status before the application of potential, as function of the
wavelength λ at the applied potential of 1.7 V vs. RHE (pink) and in air after different relaxation times (green-
> black). ...................................................................................................................................................... 102
Figure 4.51: X-ray diffractogram of electrodeposited manganese oxide films after different annealing treatments.
The blue curve represents as-deposited amorphous MnOx; the red line gives crystalline α-Mn2O3 after
treatment at 500°C in air and the green graph shows Mn3O4 after annealing at 600°C in N2. The most
important reflexes are labeled with the corresponding hkl-indices and the dotted line denotes the reflexes
belonging to the FTO substrate. .................................................................................................................. 103
Figure 4.52: Cyclic voltammograms of different types of manganese oxide and a blank FTO substrate for
comparison. The electrolyte was 1 M KOH and the scan rate 10 mV/s. All curves have been corrected for the
iR-drop. ...................................................................................................................................................... 104
Figure 4.53: XPS overview spectra of the pristine α-Mn2O3 sample (blue) and the sample after it has been subjected
to a potential of 1.55 V (red). The most important features are marked within the graph. Excitation energy
was 800 eV. ................................................................................................................................................ 105
Figure 4.54: High resolution XPS spectra of Mn2p (a) and Mn3s (b) peaks before and after application of an anodic
potential of 1.55 V. The characteristic distances in binding energy between the high energy shake-up satellite
and the 2p1/2 peak (a) and the multiplet splitting of 3s (b) are labeled in the graphs. Excitation energies were
800 (a) and 450 eV (b), respectively. ........................................................................................................... 106
Figure 4.55: Deconvolution and residual function of Mn2p3/2 and O1s peaks of α-Mn2O3 after preparation (a, b)
and after the application of a potential of 1.55 V (c, d). A Shirley background163 has been subtracted. The
potentials are given vs. RHE and the incident photon energies were 800 and 700 eV for Mn2p and O1s,
respectively. ............................................................................................................................................... 108
Figure 5.1: Cyclovoltammograms of CoOx (blue) and α-Mn2O3 (red) thin film electrodes in comparison to RuO2
(black) and the blank FTO substrate (gray). Except for RuO2 (measured in 0.5 M H2SO4), 1 M KOH has been
used as electrolyte and a scan rate of 10 mV/s was applied. ........................................................................ 114

6. Appendix
138
6. Appendix
139
6.3. List of tables
Table 1.1: Gravimetric and volumetric energy densities of different fuels (at 1 bar). Source: Ref. 7. .......................... 2
Table 4.1: Setup resistance and capacitance for samples deposited on different substrates. The resistance values
have been taken from the high frequency end of electrochemical impedance measurements at open circuit
conditions and the capacitance was calculated from the capacitive current values at different scan rates at
1.27 V (RHE)..................................................................................................................................................39
Table 4.2: Redox couples, half-cell reactions and corresponding electrode equilibrium potentials of cobalt
oxide/hydroxide under anodic potential conditions in alkaline solution. Data have been derived from Ref 58. 47
Table 4.3: List of reported turnover frequencies (TOF) for cobalt oxides and other transition metal oxides. d, η, NP,
NC, CoPi and mCo3O4 stand for sample thickness, overpotential, nanoparticles, nanoclusters, cobalt
phosphate and mesoporous Co3O4, respectively. ..........................................................................................69
Table 4.4: Fit parameter of the peak fit of Co2p3/2 and O1s for CoOx under different anodic potentials: binding
energy, full with at half maximum (FWHM) and relative peak area (rel. area). ...............................................93
Table 4.5: Fit parameters of the peak fit of Mn2p3/2 and O1s for α-Mn2O3 in pristine state and after 1.55 V
potential application: binding energy, full with at half maximum (FWHM) and relative peak area (rel. area).
................................................................................................................................................................... 109

6. Appendix
140
6. Appendix
141
6.4. List of publications
Publications
(1) Didden, A.; Hillebrand, P.; Wollgarten, M.; Dam, B.; van de Krol, R. Deposition of
Conductive TiN Shells on SiO2 Nanoparticles with a Fluidized Bed ALD Reactor. J.
Nanoparticle Res. 2015, (submitted).
(2) Didden, A.; Hillebrand, P.; Dam, B.; van de Krol, R. Photocorrosion Mechanism of TiO2-
Coated Photoanodes. Int. J. Photoenergy 2015, 457980.
(3) Hillebrand, P.; Ramírez-Caro, A.; Calvet, W.; Bogdanoff, P.; Fiechter, S. On the Structure-
Function Relationship of Cobalt and Manganese Oxides as Oxygen Evolving Catalysts for
Light-Driven Water Electrolysis: An In-Line Synchrotron Radiation Photoelectron
Spectroscopy Study. ECS Trans. 2014, 61 (14), 9–20.
(4) Ramírez, A.; Hillebrand, P.; Stellmach, D.; May, M. M.; Bogdanoff, P.; Fiechter, S.
Evaluation of MnOx, Mn2O3, and Mn3O4 Electrodeposited Films for the Oxygen Evolution
Reaction of Water. J. Phys. Chem. C 2014, 118, 14073–14081.
(5) Emmler, T.; Gutzmann, H.; Hillebrand, P.; Schieda, M.; Just, R.; Gärtner, F.; Bogdanoff, P.;
Herrmann-Geppert, I.; Klassen, T. Cold Gas Spraying of Semiconductor Coatings for the
Photooxidation of Water. In Proc. SPIE 8822, Solar Hydrogen and Nanotechnology VIII;
2013; p 88220C.
Conferences
ECS – 225th Meeting, Orlando, FL, May 2014:
On the Structure-function Relationship of Cobalt and Manganese Oxides as Oxygen
Evolving Catalysts for Light-driven Water Electrolysis: An in-line Synchrotron Radiation
Photoelectron Spectroscopy Study
IPS 20, Berlin, DE, July 2014:
On the Relationship between Surface State and Activity of Cobalt and Manganese Oxides
towards the Oxygen Evolution Reaction in Photoelectrochemical Devices
6. Appendix
142
Posters
E-MRS Spring Meeting 2014, Lille, FR, May 2014
In-line Synchrotron Radiation Photoelectron Spectroscopy Study on the Relationships
between structure and function of Cobalt and Manganese Oxides for the oxygen evolution
reaction
Bessy Usermeeting 2013, Berlin, DE, December 2013
On the structure-function relationship between surface chemistry and catalytic activity of
cobalt and manganese oxides towards oxygen evolution reaction (OER)
International Summer School on Basic Concepts and First-Principles Computations for
Surface Science: Applications in Chemical Energy Conversion and Storage, Norderney, DE,
July 2013
Catalytic activity of cobalt oxides and manganese oxides towards the oxygen evolution
reaction


![Tris[tris(ethane-1,2-diamine)cobalt(II)] bis[octacyanidomolybdate(V)] dihydratemypage.just.edu.cn/_upload/article/files/30/fc/684d... · 2017. 6. 8. · Tris[tris(ethane-1,2-diamine)cobalt(II)]](https://static.fdokument.com/doc/165x107/60d9aab9684bc31d7d4fd5e5/tristrisethane-12-diaminecobaltii-bisoctacyanidomolybdatev-2017-6-8.jpg)


![Ruhr-Universität Bochum Fakultät für Sozialwissenschaft ... · Working-out-loud „[…] concept of building relationships through narration and social collaboration“ (Bloomfire](https://static.fdokument.com/doc/165x107/5f01cdac7e708231d4011d48/ruhr-universitt-bochum-fakultt-fr-sozialwissenschaft-working-out-loud.jpg)