Studies on Stable Formulations for a Hydrophobic Cytokine · Dissertation zur Erlangung des...
190
Dissertation zur Erlangung des Doktorgrades der Fakultät für Chemie und Pharmazie der Ludwig-Maximilians-Universität München Studies on Stable Formulations for a Hydrophobic Cytokine Andrea Hawe aus München Juni 2006
Transcript of Studies on Stable Formulations for a Hydrophobic Cytokine · Dissertation zur Erlangung des...
Dissertation zur Erlangung des Doktorgrades
der Fakultät für Chemie und Pharmazie
der Ludwig-Maximilians-Universität München
Studies on Stable Formulations
for a Hydrophobic Cytokine
Andrea Hawe
aus München
Juni 2006
Erklärung
Diese Dissertation wurde im Sinne von § 13 Abs. 3 bzw. 4 der Promotionsordnung vom
29. Januar 1998 von Herrn Prof. Dr. Wolfgang Frieß betreut.
Ehrenwörtliche Versicherung
Diese Dissertation wurde selbstständig, ohne unerlaubte Hilfe erarbeitet.
München, am 26. Juni 2006
(Andrea Hawe)
Dissertation eingereicht am 26. Juni 2006
1. Gutachter: Prof. Dr. Wolfgang Frieß
2. Gutachter: Prof. Dr. Gerhard Winter
Mündliche Prüfung am 21. Juli 2006
Acknowledgements
The presented thesis was written at the Department of Pharmacy, Pharmaceutical
Technology and Biopharmaceutics at the Ludwig-Maximilians-University in Munich under
supervision of Prof. Dr. Wolfgang Frieß.
First of all, I want to express my gratitude to my supervisor Prof. Dr. Wolfgang Frieß for
the possibility to join his research group and especially for his professional and
enthusiastic guidance of my work, as well as all the scientific input and advice he gave
me. Furthermore, I very much appreciate that he offered me great opportunities to
present the work at numerous congresses all over the world. Thank you for the pleasant
working climate that made the development of this thesis not just possible, but a fulfilling
and exciting time.
I want to thank Prof. Dr. Gerhard Winter for his dedicated leadership of the chair, his
commitment to enable us these outstanding working conditions and numerous social
activities, like skiing in winter, barbecue in summer and many more. Thank you a lot for
the scientific and personal advice and taking over the co-referee.
Many thanks to all colleagues from research group Prof. Frieß and from research group
Prof. Winter likewise who shared the time here in Munich with me, for support and
numerous activities in daylight and night time. Special thanks to my direct lab-colleagues
Matthias Ganz and Stefanie Schüle for the overall nice time we had together in our lab.
Thanks also to my indirect lab neighbor Sandra Herrmann for the daily doorway chats.
For all the support by taking over practical work, helping in the student lab and by
literature supply, I want to thank our technical assistants Ingrid Hiltman, Imke Leitner
and Patricia Settele.
I am indebted to Boehringer Ingelheim in Biberach for the general support of the work
with material and the possibility to use their lab equipment. Special thanks to
Dr. Karoline Bechtold-Peters who managed the delicate organization of the material and
to Franz Nothelfer, who advised us in preparative chromatography.
I want to acknowledge the companies Schott AG for providing divers glass vials and
Becton Dickinson GmbH for providing pre-filled syringes for my work.
Many thanks to Prof. Dr. Geoffrey Lee at the Department of Pharmaceutical Technology
at the Friedrich-Alexander University of Erlangen-Nuernberg for the possibility to use the
modulating DSC, Prof. Dr. Udo Bakowsky from the Department of Pharmaceutical
Technology and Biopharmaceutics at the Philipps University in Marburg for performing
the AFM measurements and Dr. Stefan Wittmer form LOT Oriel in Darmstadt for
performing the disc centrifugation experiments.
From the Department of Chemistry and Pharmacy of the LMU in Munich I want to thank
Dr. Svetlana Mintova and Dr. Norbert Stock for taking the SEM pictures. Further,
Wolfgang Wünschheim for his help with the powder diffractometer and Dr. Sascha Correll
for analyzing my samples with the Low Temperature X-ray Diffractometer.
The student assistants Frank Schaubhut, Katja Schmid and Sarah Mikisch are
acknowledged for the good job they have done. It was a pleasure to work with you.
Outside the university I want to thank my flat mates Andrea, Kerstin, Johanna and Seval
for their ongoing friendship, Julia for the great time we had during studying and for all
the advice. Katrin, some special thanks for your friendship over the last years.
My parents, my sister Martina, my brothers Simon and Benno and my grandmother, I
want to thank for all the encouragement and support they gave me in all the years.
Finally, I want to thank Michael for being a great colleague here at the university and for
all your help and for my work, especially the proof-reading of the thesis. Most important I
want to thank you for your love.

For my parents
Table of Contents
Chapter 1
Introduction and Objectives of the Thesis
1. INTRODUCTION ...........................................................................................2
2. FORMULATION OF HYDROPHOBIC PROTEINS ...................................................3
2.1 Hydrophobicity of Proteins ...........................................................................3
2.2 Hydrophobic Proteins used as Pharmaceuticals................................................4
2.3 Solubility of Hydrophobic Proteins .................................................................4
2.4 Protein Adsorption ......................................................................................6
3. HUMAN SERUM ALBUMIN AS STABILIZER FOR PROTEINS ..................................9
3.1 HSA as Excipient in Protein Formulation ....................................................... 11
3.2 Development of HSA-free formulations ........................................................ 13 3.2.1 Lyo- and Cryoprotection ................................................................................................................... 14 3.2.2. Protein Adsorption ............................................................................................................................ 14 3.2.3. Protein Solubility............................................................................................................................... 16
4. CONCLUSIONS .......................................................................................... 17
5. OBJECTIVES OF THE THESIS ....................................................................... 18
6. REFERENCES............................................................................................. 18
Chapter 2
Characterization of Cytokine Solubility and Particle Formation in Presence of
Human Serum Albumin
1. INTRODUCTION ......................................................................................... 26
2. MATERIALS AND METHODS ......................................................................... 27
2.1 Materials ................................................................................................. 27
2.2 Methods .................................................................................................. 27 2.2.1 Turbidity Measurement ..................................................................................................................... 27
2.2.3 Light Obscuration.............................................................................................................................. 27
2.2.4 Dynamic Light Scattering (DLS) ...................................................................................................... 28
2.2.5 Zetapotential...................................................................................................................................... 28
2.2.6 SDS-PAGE........................................................................................................................................ 28
2.2.7 Fluorescence Spectroscopy ............................................................................................................... 28
2.2.8 Attenuated Total Reflection- FTIR Spectroscopy (ATR-FTIR)........................................................ 29
2.2.9 Atomic Force Microscopy (AFM)..................................................................................................... 30
2.2.10 Disc centrifugation ............................................................................................................................ 30
3. RESULTS AND DISCUSSION ....................................................................... 31
3.1 Characterization of Cytokine-HSA Formulations at Different pH and Ionic Strength
Conditions ............................................................................................... 31 3.1.1 Effect of pH and Salt on Turbidity .................................................................................................... 31 3.1.2 SDS-PAGE of the Precipitated Material ........................................................................................... 38 3.1.3 Fluorescence Spectroscopy of Cytokine-HSA Mixtures ................................................................... 39 3.1.4 Particle Size Analysis in Cytokine-HSA Formulations..................................................................... 42
3.2 Studies on HSA-placebo Formulations.......................................................... 49 3.2.1 Batch to Batch Variations of unstabilized-HSA................................................................................ 49 3.2.2 Impact of NaCl, Na-N-Acetyltryptophanate and Na-Octanoate on HSA.......................................... 53
4. CONCLUSIONS .......................................................................................... 56
5. REFERENCES............................................................................................. 57
Chapter 3
Physico-chemical Characterization of the Freezing Behavior of Mannitol-Human
Serum Albumin Formulations
1. INTRODUCTION ......................................................................................... 61
2. MATERIAL AND METHODS ........................................................................... 62
2.1 Materials ................................................................................................. 62
2.2 Methods .................................................................................................. 62 2.2.1 Differential Scanning Calorimetry (DSC)......................................................................................... 62
2.2.2 Cryomicroscopy ................................................................................................................................ 63
2.2.3 Low Temperature X-ray Powder Diffraction (LTXRD) ................................................................... 63
3. RESULTS AND DISCUSSION ........................................................................ 64
3.1 DSC Studies of Stabilized-HSA and Mannitol ................................................. 64
3.2 Impact of HSA-Quality on the Freezing-Behavior of Mannitol........................... 65
3.3 Influence of the Applied Scanning Rate on Thermal Behavior of Mannitol-HSA
Formulations............................................................................................ 68
3.4 Influence of Na-Octanoate, Na-N-Acetyltryptophanate and NaCl on the Freezing
Behavior of Mannitol ................................................................................. 68
3.5 Influence of Na-Octanoate, Na-N-Acetyltryptophanate and NaCl on the Freezing
Behavior of unstabilized-HSA and Mannitol ................................................... 70
3.6 Influence of NaCl on Freezing Behavior of Mannitol with Stabilized-HSA............ 71
3.7 Determination of Tc with Cryomicroscopy..................................................... 72
3.8 Analytics of the Mannitol Freezing Behavior with LTXRD ................................. 73
4. CONCLUSIONS .......................................................................................... 74
5. REFERENCES............................................................................................. 75
Chapter 4
Physico-chemical Lyophilization Behavior of Mannitol-Human Serum Albumin
Formulations
1. INTRODUCTION ......................................................................................... 78
2. MATERIALS AND METHODS ......................................................................... 79
2.1 Materials ................................................................................................. 79
2.2 Methods .................................................................................................. 79 2.2.1 Lyophilization Process ...................................................................................................................... 79
2.2.2 X-ray Powder Diffraction (XRD)...................................................................................................... 80 2.2.3 Differential Scanning Calorimetry (DSC)......................................................................................... 80 2.2.4 Karl-Fischer Titration........................................................................................................................ 80 2.2.5 Turbiditimetry ................................................................................................................................... 80 2.2.6 High Pressure Size Exclustion Chromatography (HP-SEC) ............................................................. 81
3. RESULTS AND DISCUSSION ........................................................................ 82
3.1. Lyophilization of the System Mannitol-HSA-NaCl ........................................... 82 3.1.1 Drying Process .................................................................................................................................. 82 3.1.2 Residual Moisture Content ................................................................................................................ 83 3.1.3 Morphology, Crystallinity and Thermal Properties of Lyophilized Products with Mannitol,
Stabilized-HSA and NaCl ................................................................................................................. 84
3.2. Storage Stability of the Lyophilized Formulations........................................... 88 3.2.1 Changes in the Product Morphology Upon Storage .......................................................................... 88 3.2.2 Stability of HSA during Storage........................................................................................................ 90
4. CONCLUSIONS .......................................................................................... 94
5. REFERENCES............................................................................................. 95
Chapter 5
Impact of Freezing Procedure and Annealing on the Physico-chemical Properties
and the Formation of Mannitol Hydrate in Mannitol-Sucrose-NaCl Formulations
1. INTRODUCTION ......................................................................................... 98
2. MATERIALS AND METHODS ......................................................................... 99
2.1 Materials ................................................................................................. 99
2.2 Methods .................................................................................................. 99 2.2.1 Low Temperature X-ray Powder Diffraction (LTXRD) ................................................................... 99
2.2.2 Differential Scanning Calorimetry (DSC) of the Frozen Solutions................................................. 100
2.2.3 Lyophilization ................................................................................................................................. 100
2.2.4 Differential Scanning Calorimetry (DSC) of Lyophilized Products................................................ 101
2.2.5 Temperature-Modulated-DSC (TMDSC) of Lyophilized Samples................................................. 101
2.2.6 X-ray Powder Diffraction (XRD).................................................................................................... 101
2.2.7 Karl-Fischer Titration...................................................................................................................... 101
3. RESULTS AND DISCUSSION ...................................................................... 102
3.1. Impact of NaCl on the Physico-chemical Properties of Mannitol-Sucrose
Formulations.......................................................................................... 102 3.1.1. DSC of Mannitol-Sucrose-NaCl Formulations in the Frozen State................................................. 102 3.1.2. DSC and XRD of Lyophilized Mannitol-Sucrose Formulations..................................................... 105 3.1.3. Impact of NaCl on Lyophilized Mannitol-Sucrose-Formulations ................................................... 107
3.2. Impact of Annealing on the Formation of Mannitol Hydrate ........................... 109 3.2.1. LTXRD of Mannitol-Sucrose-Formulations at Different Annealing Conditions ............................ 109 3.2.2. XRD of Lyophilized Samples Produced with Different Lyophilization Cycles.............................. 110
4. CONCLUSIONS ........................................................................................ 113
5. REFERENCES........................................................................................... 114
Chapter 6
Development of Stable HSA-free Formulations for a Hydrophobic Cytokine
1. INTRODUCTION ....................................................................................... 117
2. MATERIALS AND METHODS ....................................................................... 118
2.1 Materials ............................................................................................... 118
2.1.1 Proteins and Excipients ................................................................................................................... 118
2.1.2 Containers........................................................................................................................................ 118
2.2 Methods ................................................................................................ 118
2.2.1 Turbiditimetry ................................................................................................................................. 119
2.2.2 UV-Spectroscopy ............................................................................................................................ 120
2.2.3 High Pressure Size Exclusion Chromatography (HP-SEC) ............................................................ 120
2.2.4 Reversed Phase High Pressure Liquid Chromatography (RP-HPLC)............................................. 121
2.2.5 Dynamic Light Scattering (DLS) .................................................................................................... 121
2.2.6 Attenuated Total Reflection-FTIR Spectroscopy (ATR-FTIR)....................................................... 122
2.2.7 Microcalorimetry............................................................................................................................. 123
2.2.8 Lyophilization ................................................................................................................................. 123
2.2.9 Powder X-ray Diffraction (XRD).................................................................................................... 123
2.2.10 Karl-Fischer Titration...................................................................................................................... 123
3. RESULTS AND DISCUSSION ...................................................................... 124
3.1 Impact of pH and Ionic Strength on Cytokine Aggregation ............................ 124 3.1.1 Turbidity and HP-SEC Studies........................................................................................................ 124 3.1.2 Dynamic Light Scattering (DLS) .................................................................................................... 127
3.2 Temperature Induced Changes of the Cytokine ........................................... 130 3.2.1 FTIR-studies.................................................................................................................................... 131 3.2.2 Dynamic Light Scattering Studies................................................................................................... 139
3.3 Cytokine Adsorption to Vials..................................................................... 141 3.3.1 Influence of pH, Glycine Concentration and Container Type on Cytokine Adsorption.................. 142 3.3.2 Influence of Polysorbate 20 on Cytokine Adsorption ..................................................................... 143
3.4 Short-time Cytokine Stability in Solution .................................................... 145 3.4.1 Influence of pH on Cytokine Stability............................................................................................. 145 3.4.2 Influence of Ionic Strength on Cytokine Stability ........................................................................... 148 3.4.3 Influence of Excipients on Cytokine Stability................................................................................. 149
3.5 Freeze-Thaw Stability.............................................................................. 151
3.6 Long-term Stability of Liquid and Lyophilized Formulations ........................... 153 3.6.1 Long-term Stability of Liquid Cytokine Formulations.................................................................... 155 3.6.2 Stability of Lyophilized Formulation .............................................................................................. 158 3.6.3 Comparison of Liquid and Lyophilized Formulation...................................................................... 164
4. CONCLUSIONS ........................................................................................ 165
5. REFERENCES........................................................................................... 167
Chapter 7
Summary of the Thesis 171
List of Abbreviations
ACN Acetonitrile
AFM Atomic Force Microscopy
ATR Attenuated Total Reflection
BSA Bovine Serum Albumin
DCM Dichloromethane
DLS Dynamic Light Scattering
DSC Differential Scanning Calorimetry
FNU Formazine Nephelometric Units
FTIR Fourier Transformation Infrared Spectroscopy
HP-SEC Size Exclusion High Pressure Liquid Chromatography
HSA Human Serum Albumin
LTXRD Low Temperature X-ray Powder Diffraction
Ph. Eur. European Pharmacopoeia
pI Isoelectric point
RP-HPLC Reversed Phase High Pressure Liquid Chromatography
SDS Sodium Dodecyl Sulfate
SEM Scanning Electron Microscopy
Tc Collapse Temperature
Tg Glass Transition
Tg’ Glass Transition of the Maximally Freeze-Concentrated Solution
Tm Denaturation Temperature or Melting Temperature
TMDSC Temperature Modulated Differential Scanning Calorimetry
Trp Tryptophane
XRD X-ray Powder Diffraction

Chapter 1
Introduction and Objectives of the Thesis
Abstract
In the general introduction the formulation development for hydrophobic proteins is
discussed. The low solubility of these proteins often combined with a strong tendency to
adsorb on different materials during processing or storage are the major challenges
during formulation development. Human Serum Albumin (HSA) is frequently used as
excipient to overcome the mentioned problems. As HSA is gained from human plasma,
its use is always related to the risk of blood born pathogens, as well as batch to batch
variations. Furthermore, specific analytics for the active protein are difficult in presence
of an excess of HSA. Therefore, ways need to be found to circumvent the use of HSA in
protein formulations. Possible approaches for the development of HSA-free formulations
for hydrophobic proteins are described in Chapter 1.
Keywords: hydrophobic proteins, solubility, adsorption, HSA

Chapter 1
2
1. Introduction
With the first successful production of recombinant somatostatin, a peptide hormone
consisting of 14 amino acids in 1977 [1] and shortly later the production of recombinant
insulin [2] the starting point for the tremendous increase of biotechnological products on
the pharmaceutical market was set. At about the same time it was accomplished to
produce murine monoclonal [3] and later chimeric and humanized antibodies [4,5].
Approved by the FDA in 1982, human insulin was the first genetically engineered
consumer health product on the market. Since then, numerous products including
recombinantly produced antibodies, proteins and peptides have entered the market and
currently about 225 are under development [6].
One critical step for the production of a protein as pharmaceutical product is the
development of a stable formulation, as proteins are complex molecules which are
susceptible for various degradation mechanisms and instability reactions [7,8]. It is a
great challenge to maintain the native and functional structure of a protein during
pharmaceutical processing, production, storage and the final application at the patient.
The first step is getting insight into the characteristics of the particular protein and
identifying possible instability reactions. To achieve this goal the development of
analytical techniques which are capable to detect and quantify structural and activity
relating changes in the protein is inevitable. In pre-formulation studies the basic
knowledge on the protein is gained and the optimum conditions, concerning pH, buffer
system, ionic strength and protein concentration have to be determined [9]. Based on
this information the further development of a liquid or lyophilized formulation can
proceed. Depending on the protein and the type of formulation the addition of excipients
and stabilizers has to be evaluated. Thereby, it is a general concept to keep the
formulation as simple as possible. The knowledge of the physico-chemical properties of
the selected excipients during freezing and in the dried state if using a solid formulation
is very important. To avoid failures in protein formulations, one has to be aware of the
fact that the physico-chemical properties of excipients can affect protein stability and
activity. Therefore, the focus must not be solely set on the protein alone, but on the
formulation as a complex system. Protein formulation is an interesting and multifarious
field that requires a structured but flexible procedure to achieve the desired goal of a
stable formulation.

Introduction and Objective of the Thesis
3
2. Formulation of Hydrophobic Proteins
2.1 Hydrophobicity of Proteins
Proteins are macromolecules consisting of forty to several hundreds L-amino acids
connected via peptide bonds. Both, the size of the protein and the amino acid
composition govern the characteristics of the particular protein e.g. folding,
hydrophobicity and solubility. When a protein is folded in an aqueous environment about
80% of the hydrophobic amino acids are buried in the interior of the protein without
having contact to the surrounding water molecules [10]. Various scales for the
classification of amino acids according to their hydrophobicity are available. One example
is the scale developed by Cowan and Whittaker (1990) using RP-HPLC which ranges from
0 to 1 (1=high hydrophobicity), with some examples shown in Table 1 [11].
Table 1: Amino acids and hydrophobicity value classified by Cowan and Whittaker (1990) [11].
amino acid value
Alanine 0.660
Leucine 0.988
Isoleucine 1.000
Methionine 0.846
Tryptophane 0.914
Phenylalanine 0.983
Basically, the residues present on the surface of a protein affect the hydrophobicity of the
protein. Each amino acid contributes to the measured surface hydrophobicity in relation
to the protein structure as a whole and the composition of the residues on the protein
surface [12]. Based on this assumption a more sophisticated classification of the
hydrophobicity of amino acids was developed by Berggren et al. (2002), by studying the
partitioning of proteins and peptides in an aqueous two-phase system. Generally, the
classification of the hydrophobicity of amino acids strongly depends on the experimental
setup and therefore the various scales often differ in the prediction of the hydrophobicity
of the different amino acids [13]. A novel approach is the prediction of the average
surface hydrophobicity of a protein by mathematical models which are based on the
amino acid composition and the three-dimensional structure of the protein [14,15].

Chapter 1
4
2.2 Hydrophobic Proteins used as Pharmaceuticals
Many proteins that are used as pharmaceuticals, e.g. interferons, interleukins or growth
factors are considered as hydrophobic. The hydrophobicity of these proteins is further
increased, when they are recombinantly produced in Escherichia coli (E. coli) as host
cells, as glycosilation is not possible in E. coli. Human Interferon beta-1b (INF-ß-1b) for
example is glycosilated at a single site at Asn 80 at the end of helix C [16]. The lack of
glycosilation in the recombinant human INF-ß-1b (rHINF-ß-1b), produced in E. coli
increases the hydrophobicity of the protein, which is reflected in the retention time in
RP-HPLC with a C18 column [17]. Two major issues that have to be overcome during
formulation development for hydrophobic proteins are the low solubility and the
adsorption of the active protein to surfaces, e.g. filters, tubes, pumps or primary
packaging materials.
2.3 Solubility of Hydrophobic Proteins
The low solubility of hydrophobic proteins becomes an issue, when the target
concentration for the formulation cannot be achieved. Already during preformulation
studies the point of solubility needs to be addressed. For a protein it is not possible to
determine one definite solubility value, as solubility is a function of pH, ionic strength and
the presence of further excipients. Generally, solubility is lowest at the isoelectric point
(pI) of a protein, due to the zero net charge of the molecules. Shaw et al. (2002)
produced variants of ribonuclease Sa with isoelectric points from 4.6 to 10.2 (pI of the
wild type: 3.5) by exchanging individual amino acids [18]. They showed that the
minimum solubility of the variants lies within one pH unit around the pI and the solubility
increases at higher and lower pH values [18]. Another example is insulin, with a
maximum solubility below 0.1 mg/ml at its pI at pH 5.4, while the solubility is higher
than 30 mg/ml at pH below 4.0 or above 7.0 [19]. Hydrophobic proteins often show a
solubility below 1.0 mg/ml at physiological pH, e.g. 0.8 mg/ml for G-CSF [20] or 0.05
mg/ml for rhINF-ß-1b [21].
The solubility of a protein needs to be tested as function of the pH, generally in the range
of pH 3.0 to 10.0. However, at the acidic and alkaline end of the pH-range physical and
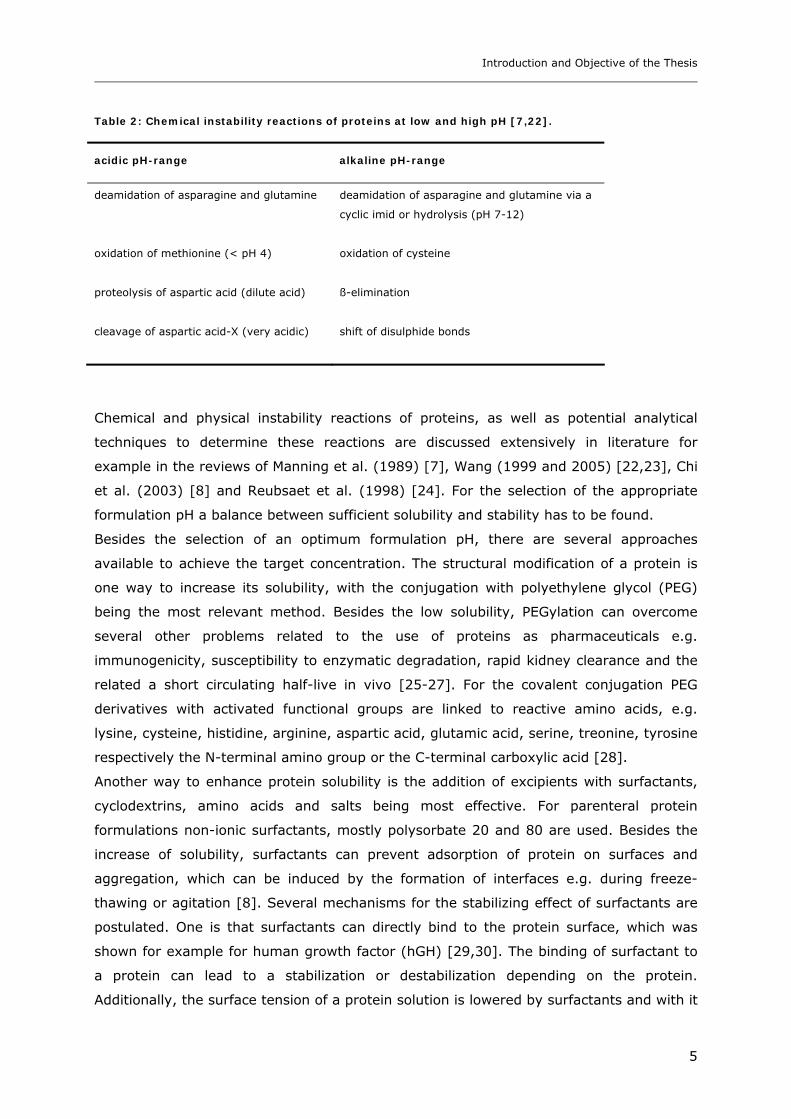
chemical instability reactions are more likely to occur. Table 2 summarizes chemical
instabilities that are characteristic for acidic and alkaline pH conditions.
Introduction and Objective of the Thesis
5
Table 2: Chemical instability reactions of proteins at low and high pH [7,22].
acidic pH-range alkaline pH-range
deamidation of asparagine and glutamine
deamidation of asparagine and glutamine via a
cyclic imid or hydrolysis (pH 7-12)
oxidation of methionine (< pH 4) oxidation of cysteine
proteolysis of aspartic acid (dilute acid) ß-elimination
cleavage of aspartic acid-X (very acidic) shift of disulphide bonds
Chemical and physical instability reactions of proteins, as well as potential analytical
techniques to determine these reactions are discussed extensively in literature for
example in the reviews of Manning et al. (1989) [7], Wang (1999 and 2005) [22,23], Chi
et al. (2003) [8] and Reubsaet et al. (1998) [24]. For the selection of the appropriate
formulation pH a balance between sufficient solubility and stability has to be found.
Besides the selection of an optimum formulation pH, there are several approaches
available to achieve the target concentration. The structural modification of a protein is
one way to increase its solubility, with the conjugation with polyethylene glycol (PEG)
being the most relevant method. Besides the low solubility, PEGylation can overcome
several other problems related to the use of proteins as pharmaceuticals e.g.
immunogenicity, susceptibility to enzymatic degradation, rapid kidney clearance and the
related a short circulating half-live in vivo [25-27]. For the covalent conjugation PEG
derivatives with activated functional groups are linked to reactive amino acids, e.g.
lysine, cysteine, histidine, arginine, aspartic acid, glutamic acid, serine, treonine, tyrosine
respectively the N-terminal amino group or the C-terminal carboxylic acid [28].
Another way to enhance protein solubility is the addition of excipients with surfactants,
cyclodextrins, amino acids and salts being most effective. For parenteral protein
formulations non-ionic surfactants, mostly polysorbate 20 and 80 are used. Besides the
increase of solubility, surfactants can prevent adsorption of protein on surfaces and
aggregation, which can be induced by the formation of interfaces e.g. during freeze-
thawing or agitation [8]. Several mechanisms for the stabilizing effect of surfactants are
postulated. One is that surfactants can directly bind to the protein surface, which was
shown for example for human growth factor (hGH) [29,30]. The binding of surfactant to
a protein can lead to a stabilization or destabilization depending on the protein.
Additionally, the surface tension of a protein solution is lowered by surfactants and with it
Chapter 1
6
the driving force for aggregation and adsorption is decreased [22]. Surfactants compete
with proteins for the adsorption to surfaces, which leads to a stabilization of the protein,
which was shown by Kreilgaard et al. (1998) for recombinant human factor XIII and
polysorbate 20 [31]. Polysorbate 80 protected lactate dehydrogenase (LDH) from
denaturation during freeze-thawing by hindering the interaction of LDH with ice and the
amount of polysorbate 80 required for the protection correlated with the ice crystal
surface area [32].
Cyclodextrins, which are cyclic oligosaccharides composed of six to eight dextrose units,
can be used to enhance the solubility of proteins. For i.v. application chemically modified
ß-cyclodextrins, e.g. 2-hydroxypropyl-ß-cyclodextrins (HPCD) were used to increase the
solubility of Interleukin-2 (IL-2), ovine Growth Factor (O-GH) and Bovine Insulin [33].
Other examples are the use of cyclodextrins for a nasal formulation [34] or a parenteral
formulation of Interferon-ß [35]. Furthermore, cyclodextrins can reduce aggregation and
precipitation of proteins, but on the other hand thermal degradation can be favored
[36,37].
Protein solubility is further a function of the ionic strength and the used salt type. Salts,
respectively anions and cations can be classified by their chaotrope effect (salting in),
respectively cosmotrope (salting out) effect [38]. A stabilizing or salting out effect is
achieved when macromolecules result in preferential hydration of the protein, whereas
binding of salts to the protein surface often leads to a destabilizing, salting in effect
[39,40]. In some cases, the solubility of a protein can be enhanced at its isoelectric
points when low salt concentrations are added [41]. Especially in early developed
formulations, HSA was frequently used to stabilize hydrophobic proteins used in low
concentration, which is further discussed in section 3 of the introduction.
2.4 Protein Adsorption
Hydrophobic proteins, which are often used at low concentration, are susceptible to
surface adsorption resulting in a reduced protein concentration in the final product. For
recombinant human Interleukin-11 (rhIL-11), used at a concentration of 1 µg/ml a
reduction of activity by more than 40% after three hours at room temperature was
caused by the adsorption of the protein on the glass container [42]. Adsorption can occur
on all kinds of surfaces, e.g. filling equipment, tubes, filters or packaging materials.
Especially during filtration processes, when the protein solution gets in contact with large
filter surfaces the risk of protein adsorption is very high. Therefore, protein adsorption
needs to be considered during production and formulation development. The selection of
the container material can also impact the degree of protein adsorption. Schwarzenbach
et al. (2002) demonstrated with atomic force microscopy (AFM) that the adhesion force

Introduction and Objective of the Thesis
7
of Interferon-α-2a (INFα-2a) was reduced by 40% when using glass type I+, which has a
specially treated surface instead of glass type I [43].
Norde (1995) reviewed the principles of protein adsorption on solid surfaces and
described the different stages of the process [44]. The mechanism of adsorption is shown
in Figure 1. Before a protein can adsorb to a surface, it needs to be transported to the
surface (1). The basic mechanisms are diffusion and convective transport by laminar or
turbulent flow. While the velocity of transport is increasing with protein concentration,
the attachment of the protein to the surface is concentration independent. After binding
to the surface (2) the protein can undergo structural reorientations (3). Adsorption is
usually an irreversible process. However, desorption of protein (4) can be achieved by
surface active ingredients [45]. Desorption of lysozyme from a polysulfone (PES)
membrane with surfactants was shown by Kaplan et al. (2002) [46]. Finally the protein is
transported away from the surface again by diffusion or convective transport (5).
Figure 1: Protein adsorption mechanism of a protein on a surface. Psol and Pads are the native state of
the protein in solution and after adsorption. P* are structurally perturbed states of the protein [44].
Numerous factors can impact the kinetics and the degree of adsorption of the particular
protein on surfaces, e.g. protein concentration, temperature, pH, ionic strength and the
presence of further excipients [44,47,48]. The hydrophobic or hydrophilic properties of
the surface further govern the adsorption process. Spontaneous adsorption can occur
when the change in Gibbs Energy (∆adsg ) is negative, by a decrease in enthalpy (∆adsh) or
increase in entropy (∆adss) at a constant temperature as shown in equation (1) [46].
∆adsg = ∆adsh - T∆adss (1)
Chapter 1
8
Generally, the adsorption process is driven by hydrophobic interactions and hydrogen
bonding [49]. In addition, electrostatic interactions between charged surfaces and
proteins, which are surrounded by counter ions to form electrical double layers, play an
important role. The charged surface attraction occurs when protein and surface exhibit
opposite charges. The electrical double layers can overlap and potential differences in net
charge are balanced by the incorporation of counter ions between protein and surface
[50]. The highest affinity of a protein to a surface is achieved, when the opposite charges
of protein and surface result in a net charge of zero.
Adsorption is associated with a structural reorientation of the protein on the surface,
which often leads to irreversible denaturation. Vermeer et al. (1998) identified an
increase in α-helical structures from 0.0% to 17% and a decrease of ß-sheet structure
from 76% to 32% for a mouse monoclonal immunoglobulin (isotype 1) with circular
dichroism (CD) after adsorption to Teflon particles [51]. In a formulation containing 0.05
to 0.2 mg/ml Interleukin-2 (IL-2) more than 97% of the initial activity was lost after
24 hours circulation in silicone rubber tubing, whereas only 20% to 30% of the activity
loss can be attributed to adsorbed protein [52]. This indicates that activity loss is often
more pronounced than the decline of the concentration after adsorption and associated
with structural changes [52]. The tremendous activity loss is especially a problem when
protein solutions are delivered via continuous infusions or when delivery devices e.g.
micro pumps are applied. Tzannis et al. (1997) analyzed the time course of the
adsorption process for IL-2 and found rapid adsorption after 10 minutes combined with a
loss α-helical in favor of ß-sheet structures. After five hours the residual concentration in
solution decreased not significantly anymore. However, the adsorbed molecules undergo
structural changes and the ß-sheet structures disappear in favor of the original α-helix
elements, as well as random structural elements [52]. Jørgensen et al. (1999) showed
that already after 20 minutes the concentration of four peptide epidermal growth factor
(EGF) receptor ligands was reduced to 33% to 73% on polyethylene, 15% to 46% on
polystyrene and 12% to 29% on glass tubes due to adsorption [53].
Protein adsorption can be minimized by the addition of surfactants to the formulation.
Zhang and Ferrari (1999) showed that Albumin adsorption onto silicon surfaces was
reduced by polysorbate 20 [54]. Adsorption of three model proteins (hen egg white
lysozyme, bovine serum albumin and ribonuclease A type IIA) onto different surfaces
was reduced up to 30% by increasing the sugar concentrations, with trisaccharides being
more effective than disaccharides and monosaccharides [48]. The addition of an excess
of Human Serum Albumin to the active protein is another common approach to reduce
the loss of the active protein due to adsorption.
Introduction and Objective of the Thesis
9
3. Human Serum Albumin as Stabilizer for Proteins
Human Serum Albumin is the most abundant protein in human plasma, where it is the
major transport protein for fatty acids, as well as for different metabolites, drugs and
organic compounds. After synthesis in the liver the non-glycosilated HSA is exported into
the blood, where it is present at a concentration of about 0.6 mM. HSA is composed of
585 amino acids and contains 17 disulphide bonds within each molecule. The dominating
secondary structural elements are alpha-helices with about 67%. The heart-shaped
structure consists of three repeating subdomains I-III, which contain two subdomains
each [55]. Several binding sites in the different subdomains of HSA are characterized.
The interaction of HSA with fatty acids and other components is extensively discussed in
literature [56-58].
In the pharmaceutical field HSA is used as drug substance and as excipient for the
stabilization of other proteins. Generally, HSA is extracted from human plasma and
therefore implicates problems associated with human blood derived products like the risk
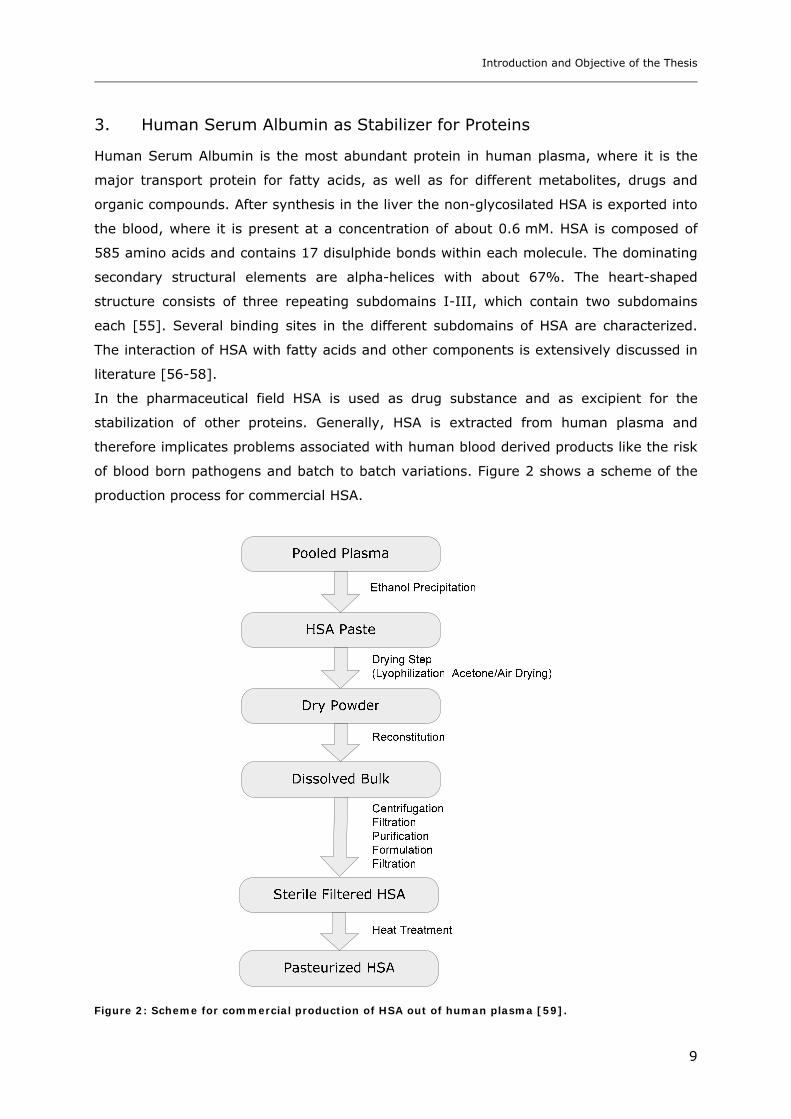
of blood born pathogens and batch to batch variations. Figure 2 shows a scheme of the
production process for commercial HSA.
Figure 2: Scheme for commercial production of HSA out of human plasma [59].
Chapter 1
10
HSA for the application as drug substance or stabilizers in protein formulations is gained
from pooled human plasma using the Cohn fractionation process with HSA precipitating
in the last fraction [60]. After precipitation a wet, crude HSA paste is obtained, which
requires further drying and purification steps. A prerequisite for the use of HSA as drug
substance or excipient is the terminal pasteurization process for 10 hours at 60°C to
guarantee viral inactivation [61].
The pasteurization process imposes an extreme temperature stress for the protein, which
leads to denaturation and aggregation if no further excipients are added. The melting
temperature (Tm) can be used to estimate the thermal stability of a protein. Without
stabilizers the melting temperature of HSA lies at 59.9°C at a formulation pH of 7.4 [62].
The sodium salt of caprylic acid and the sodium salt of the amino acid N-
acetyltryptophanate are used to increase the thermal stability of HSA by increasing
Tm [63,64]. Arakawa and Kita (2002) postulate that the increase in Tm by Na-caprylate
cannot solely explain the stabilizing effect and they assume that Na-caprylate binds to
the denatured form of HSA as well and thereby reduces the tendency of the molecules to
aggregate [65]. Na-N-acetyltryptophanate on the other hand can diminish oxidation, by
protecting the sulfhydryl groups of HSA [62]. The FDA specifies the addition of
0.08 mmol Na-caprylate or a combination of 0.08 mmol Na-caprylate and 0.08 mmol Na-
N-acetyltryptophanate per gram HSA at a formulation pH of 6.9 together with 0.15 M
NaCl [61].
In several approaches recombinant human albumin (rHA) was used to circumvent the
mentioned problems of blood born pathogens and batch to batch variations. Tarelli et al.
(1998) demonstrated that rHA had equal capacity to stabilize thyroid-stimulating
hormone, Interleukin-15 and granulocyte colony-stimulating factor in lyophilized
formulations as plasma derived HSA [66]. Matsushita et al. (2004) offered a functional
analysis of rHA and of different sub domains for pharmaceutical applications [67]. Bosse
et al. (2005) reported equivalent safety and pharmacodynamic behavior of rHA and
plasma derived HSA in a double blind, randomized, phase I trial on 500 volunteers
including three dose levels [68]. However, rHA is not routinely used in the field of protein
formulation, due to the still high material costs.

Introduction and Objective of the Thesis
11
3.1 HSA as Excipient in Protein Formulation
HSA is frequently used as stabilizer in liquid and lyophilized formulations, to prevent
protein adsorption and to stabilize the active protein. Examples for commercial products
that contain HSA as stabilizer are shown in Table 3.
Table 3: Examples for commercial protein formulations with HSA as excipient [69,70].
protein products available
Antithrombin III
Atenativ® (lyophilized)
Botulinum neurotoxin complex BOTOX® (lyophilized), BOTOX® COSMETIC (lyophilized)
Factor VIII Fanhdi® (lyophilized), Haemate®HS (lyophilized), Monoclate-
P® (lyophilized), Recombinate® (lyophilized), Kogenate®
(lyophilized)
Immunoglobulins Gammagard® S/D (lyophilized), Sandoglobulin® (lyophilized),
BabyBIG® (lyophilized), CytoGam® (liquid), RespiGam
(liquid), ZevalinTM (liquid)
Interferons alpha and beta Avonex® (lyophilized), Alferon N Injection® (liquid),
Betaseron® (lyophilized), Rebif® (liquid)
Modified human beta-glucocerebrosidase
Ceredase® (liquid)
Protein C Ceprotin® (lyophilized)
Recombinant alpha-1-proteinase inhibitor
AralastTM (lyophilized)
Streptokinase Streptase® (lyophilized)
Urokinase Abbokinase® (lyophilized)
Fibrinogen (human), thrombin CrossealTM (frozen solution)
For lyophilized formulations it is essential to add stabilizers that protect the active protein
against freezing and drying associated stress. During freezing the low temperature, the
formation of ice crystals, the increasing concentration of protein and excipients in the
remaining amorphous phase, as well as possible phase separations and pH shifts are
displaying stress for the protein. By the addition of cryoprotective excipients the active
protein can be protected against freezing induced damages. Removal of the protein
Chapter 1
12
hydration shell is the major issue during the drying process and lyoprotective excipients
can be applied for stabilization.
An overview and explanation of the stabilization mechanisms of different excipients is
given in the reviews of Wang (2000) [70] and Arakawa et al. (2001) [72]. The
mechanism of preferential exclusion explains the stabilizing effect of many cryoprotectors
[73]. After drying water substitute hypothesis [74] and glass dynamics hypothesis [75]
are important stabilizing mechanisms not only for proteins. Sugars like trehalose or
sucrose, which are amorphous after lyophilization and exhibit a high glass transition
temperature, provide a good stabilization in the dried state. Recently, it was shown by
Cicerone et al. (2003), that the addition of glycerol to trehalose increased protein
stability although the glass transition temperature (Tg) was substantially lowered [76].
Human Serum Albumin can act as lyoprotector and cryoprotector during lyophilization
and can further reduce the loss of active protein due to adsorption [71]. Anchordoquy
and Carpenter (1996) showed that BSA is capable to stabilize Lactate Dehydrogenase
(LDH) during lyophilization and prevent its activity by inhibiting the dissociation of the
tetramer in the frozen state, as well as by preferential exclusion, whereby the stabilizing
effect is increasing with BSA concentration [77].
Because of the unspecifity of protein adsorption on surfaces, the loss of the active protein
can be minimized by the addition of an excess of a second protein e.g. HSA which
saturates the binding sites of a surface. Dawson et al. (1992) describe that the use of
0.05% to 0.1% HSA inhibits protein adsorption and stabilizes different hydrophobic
cytokines (Interleukins IL-1aα, IL-1ß, IL-3, macrophage colony-stimulating factor) during
lyophilization [78]. The addition of 0.1% HSA to formulations of the peptides EGF and
TGF-α can prevent absorption on polyethylene, polystyrene and glass tubes measured
after 24 hours; while for HB-EGF and Betacellulin 0.1% HSA was not sufficient to prevent
adsorption on glass [53].
Development of significant analytical tools to characterize the protein and its degradation
products is a prerequisite for a successful formulation development. In formulation with
HSA as stabilizer, the presence of a second protein often in a 10 to 50 fold surplus
compared to the active protein makes specific analytics difficult. In spectroscopic and
chromatographic methods the signal of the active protein is often superimposed and
disturbed by HSA. To analyze the active protein next to HSA, specific methods like ELISA
[79], selective precipitation [80], western-blot or BIACORE are applied.
Immunogenicity is often associated with the application of protein drugs. The most
prominent example is the incidence of pure red cell aplasia (PRCA) caused by
recombinant human erythropoietin formulations, which coincided with a formulation
change in 1998. Here HSA was substituted by a combination of polysorbate 80 and
glycine for the European market [81]. A controversial discussion on possible reasons for

Introduction and Objective of the Thesis
13
PRCA aroused and two main theories emerged. With the change of the formulation the
prefilled syringes were changed and uncoated rubber stoppers were used. Leachates
from the stopper were made responsible for the immunogenicity reaction [82]. On the
other Hermeling et al. (2003) showed that the presence of micelle-associated epoetin in
the formulations can induce the formation of antibodies against epoetin [83]. The theory
was rebutted by Villalobos et al. (2005) [84]. Structural changes, in particular
aggregation is known to induce the risk of immunogenicity reactions in the patient [85].
HSA itself exhibits a low risk for immunogenicity, however in presence of a second
protein the formation of mixed aggregates can lead to immunogenicity reactions. The
formation of mixed aggregates was shown for rhINFα [86,87] and recombinant
streptokinase [88].
3.2 Development of HSA-free Formulations
HSA is mostly used in low dose formulations of hydrophobic proteins, due to its
solubilizing effect, its ability to reduce protein adsorption and its stabilizing properties. In
the development of new protein formulations HSA is omitted as far as possible, because
of the already discussed disadvantages related to its application. Furthermore, there is
the trend to replace existing formulations which contain HSA as excipient by HSA-free
formulations. For the replacement of HSA, alternative approaches need to be found which
provide sufficient stabilization and solubilization of the protein. Furthermore, the loss of
protein due to adsorption needs to be prevented. Several examples for the replacement
of HSA are available on the market and in literature. In Eprex® (Epoetin-α) HSA was
replaced by polysorbate 80 and glycine as excipients. For the HSA-free formulation of
Avonex® (Interferon-β-1a) arginine and polysorbate 20 were employed. Ruiz et al.
(2003) describe a preformulation study for the development of a HSA-free formulation
for recombinant human Interferon-α-2b (rhINF-α-2b), where they achieved stable
formulations by adding polysorbate 80, EDTA-Na2 and PEG 400 [88]. In a lyophilized
formulation of recombinant streptokinase, HSA was successfully replaced by glycine and
sucrose in a formulation that further contained sodium glutamate and phosphate buffer
at a pH of 7.4 [89]. For recombinant factor VIII SQ, the combination of NaCl as
crystalline bulking agent with L-histidine and sucrose as amorphous stabilizers together
with polysorbate 80 provided a stable lyophilized formulation without HSA [90]. From the
described examples it is obvious that the use of non-ionic surfactants in combination with
sugars and amino acids are common approaches for the development of HSA-free
formulations.
Chapter 1
14
3.2.1 Lyo- and Cryoprotection
In its function as lyo- and cryoprotector HSA can be replaced by sugars, e.g. sucrose,
trehalose, sugar alcohols e.g. mannitol and amino acids e.g. glycine, histidine, arginine.
Thereby, it is important to have sufficient amorphous excipient in the lyophilized product
to stabilize the active protein, by formation of hydrogen bonds and/or providing a glassy
matrix [91]. Mannitol as single component can be dried in rapid processes due to its high
eutectic temperature and thereby forms elegant cakes. However, due to its tendency to
crystallize it is often not able to provide sufficient stabilization for the active protein [92].
Here mixtures of mannitol with sucrose or trehalose, respectively glycine are possible
alternatives [93,94]. For the lyophilization of these mixed systems it is important to
select the optimum ratio of the excipients and to adjust the lyophilization process to
obtain a high degree of crystallization of the bulking agent. A partially crystallized bulking
agent can lead to stability problems, if crystallization occurs upon storage. During
crystallization, hydrate water can be released leading to an increase in residual moisture
of the lyophilized cake. Further the hydrogen bonds between excipient and protein, which
are necessary to stabilize the protein, can no longer be preserved in the crystalline
state [92].
3.2.2 Protein Adsorption
When formulating hydrophobic proteins without HSA protein adsorption needs to be
prevented. A possible approach to overcome protein adsorption is the addition of sugars
to the formulation. Uncharged sugars can be adsorbed to negatively charged surfaces
and can so modify the surface forces. This was shown by Claesson et al. (1996) for the
adsorption of sucrose to an aluminosilicate which reduced the double layer force [95].
However, surface changes by adsorbed sugar molecules were excluded as the prevalent
mechanism, by which sugars can reduce protein adsorption since the described effect
was observed for different proteins independent of the hydrophobic or hydrophilic
properties of the particular surface [48]. Thus, it was concluded that preferential
exclusion of the sugar from the protein surface can explain the effect of a reduced
adsorption in the presence of sugar. Adsorbed, as well as denatured protein molecules
exhibit a larger surface area as compared to the native state, which is thermodynamically
unfavorable and leads to a shift of the equilibrium towards the native state.
An increase in ionic strength can also reduce protein adsorption. This was shown for
human Apotransferrin, whose adsorption onto a silicon titanium dioxide surface at pH 8.0
could be significantly reduced by increasing the NaCl concentrations [96]. Ramsden and
Prenosil (1994) ascribe the reduced adsorption to a lowering of the surface potential
Introduction and Objective of the Thesis
15
which can lead to a higher repulsive energy barrier [96]. By increasing the ionic strength
in the formulations the electrostatic interactions between the protein and the surface can
be weakened. Greene et al. (2005) quantified the adsorption of IgG adsorption onto
chemically modified PPE membranes of different charges. They determined a reduced
adsorption of IgG upon the addition of NaCl independent of the charge of the surface and
concluded that adsorption was driven by unspecific electrostatic interactions [97].
The degree of protein adsorption depends on formulation pH, as the pH strongly affects
the charge of both the protein and in some cases also of the surface. Glass for example
usually exhibits a negative charge in the pH-range feasible for protein formulations. Only
in an extreme acidic environment far below pH 2.0 positively charged sites are present
on the surface of glass [98]. Protein adsorption is typically most pronounced at the pI of
the protein [96]. Maximum adsorption of Human Plasma Albumin was measured close to
its pI at about pH 4.7 on polystyrene latex, silver iodide, polyoxymethylene, hematite
and silica surfaces. As the highest adsorption was measured at the pI of Human Plasma
Albumin independent of the materials, it was assumed the pH dependency of protein
adsorption is rather due to the properties of the protein than to changed surface
conditions at different pH values [99]. Especially for large proteins like ovalbumin and
BSA the highest affinity to polystyrene was determined at their pI and Kondo and
Higashitani (1992) concluded that hydrophobic interactions between the surface and the
protein are most important [100]. On the other hand, high adsorption rates were also
found when the protein and the surface exhibit opposite charges, which was shown for
the IgG adsorption onto chemically modified PPE membranes of different charges [97].
A highly effective approach to prevent protein adsorption is the use of surfactants.
Surfactants can reduce protein adsorption either by having an effect on the surface or by
altering the solution properties. The hydrophobicity of a surfactant appeared to be most
important for the reduction of Salmon Calcitonin (sCT) and BSA adsorption on glass, as
polysorbate 20 was more effective than more hydrophilic poloxamer 188 or ionic
surfactants [101]. Numerous other examples, describing the use of polysorbates to
reduce adsorption are available in literature [54,101]. For example, the adsorption of
HSA to polyethylene sheets was reduced by 35% to 40% when 0.05% polysorbate 20
was added to the formulations [54]. Surfactants can not only prevent protein adsorption.
Already adsorbed protein can as well be desorbed from a surface upon the addition of
surfactants. Feng et al. (1995) showed that polysorbate 20 removed about 40% of
absorbed HSA and 80% of adsorbed High Density Lipoproteins (HDL) from a polyethylene
surface, while only a marginal desorbing effect was achieved for adsorbed IgG and
fibrinogen under similar conditions [102].
Chapter 1
16
Besides the addition of adsorption reducing excipients to the formulation, the issue of
adsorption can be addressed by the selection of the materials which are employed during
processing and storage. During processing especially filter materials, which provide large
surfaces, are critical factors. For the final formulation, special containers with reduced
susceptibility for adsorption like glass type I+ can be employed to minimize protein
adsorption [43].
3.2.3 Protein Solubility
During the development of HSA-free formulations the low solubility of hydrophobic
proteins can become a major problem. Especially at physiological pH, solubility often lies
below 1.0 mg/ml, e.g. 0.8 mg/ml for G-CSF [20] or 0.05 mg/ml for rhINF-ß-1b [21].
Protein solubility is a function of pH; however, the pH of optimum solubility not
necessarily correlates with the pH of optimum stability. Rnase T1 shows the highest
stability, determined by the free energy of unfolding ∆G (H2O) at its isolelectric point at
pH 4.0, at which the protein exhibits the lowest solubility [103]. Therefore, a compromise
between adequate solubility and sufficient stability of the active protein needs to be
found when selecting the formulation pH.
It was already described in 2.3 that protein solubility is a function of the ionic strength
and the type of salt which is added to the formulation. As there is no general rule how
solubility is influenced by the addition of salt, this point needs to be evaluated for the
particular protein. Salts can stabilize proteins, which is for example described by Callahan
et al. (2001) who showed that NaCl increased the thermal stability of brain derived
neurotropic factor (BDNF) and thereby improved the shelf-life stability [104]. On the
other hand, RNase A did not aggregate at pH 3.0 when exposed to 75°C for 24 hours,
unless NaCl was added, which weakened the distinct charge-charge repulsions between
the RNase A monomers that inhibited aggregation without NaCl [105]. Again, the
addition of salt must not affect the stability of the active proteins.
Furthermore, the addition of surfactants can enhance protein solubility and stability.
Surfactants can limit protein degradation during processes in which interfaces are
created, e.g. liquid/air interfaces during filling, liquid/solid interfaces when ice crystals
form during freezing or liquid/air interfaces during reconstitution of lyophilized cakes
[106]. Surfactants accumulate at the particular interfaces, thus the protein concentration
at the interface is reduced and the protein is protected from surface-induced
denaturation [107]. For example polysorbate 80 successfully stabilized lactate
dehydrogenase (LDH) during freeze-thawing [32]. For the development of HSA-free
formulations a combination of various approaches can lead to a successful stabilization of
the active protein.
Introduction and Objective of the Thesis
17
4. Conclusions
Various approaches to overcome the issues of low solubility and the tendency to adsorb
on surfaces arising during the formulation of hydrophobic proteins are available. HSA can
be used to solve these problems as it is an excellent stabilizer and solubility enhancing
excipient. However, its use is related with the concerns of blood born pathogens, batch to
batch variations and immunogenicity when mixed aggregates are formed. Furthermore,
the development of specific analytics for the active protein is often very demanding. By
selecting optimum solution pH, ionic strength, excipients and container materials the
solubility of a protein as well as its tendency to adsorb on surfaces can be influenced. In
numerous cases the development of HSA-free formulations is feasible.
Chapter 1
18
5. Objectives of the Thesis
The goal of the thesis was to analyze the impact of the formulation conditions on the
stabilization of a hydrophobic cytokine. A standard way to formulate the cytokine at
physiological pH is using HSA as excipient. Based on a lyophilized formulation with
mannitol as bulking agent and HSA as stabilizer analogous to commercially available
systems, our intention was to elucidate the impact of HSA-stabilizers, NaCl and pH on
particle formation and stability of the cytokine in the liquid state (Chapter 2). In addition,
we wanted to clarify the role of NaCl on the lyophilization behavior of the system HSA-
mannitol. The goal was to understand how freezing, lyophilization and a subsequent
storage of the formulations are influenced by NaCl and the HSA-stabilizers (Chapter 3
and 4). The use of HSA as excipient is related to the risk of blood born pathogens,
enhanced immunogenicity, as well as to analytical difficulties. Therefore, the second
major objective was to replace HSA in the cytokine formulation and to develop stable
HSA-free formulations. For the lyophilized formulations HSA should be replaced by
sucrose as amorphous stabilizer and the first studies focused on the physico-chemical
properties of the system mannitol–sucrose during lyophilization (Chapter 5). To achieve a
stable HSA-free formulation, cytokine adsorption and solubility needed to be addressed
and optimal formulation conditions had to be found for a liquid as well as a lyophilized
formulation (Chapter 6).
Thus, the main objectives of the thesis were:
1. Characterization of the HSA-containing formulation of the hydrophobic cytokine
with focus on the impact of NaCl and pH on particle formation and protein stability
(Chapter 2).
2. Characterization of the system HSA-mannitol during freezing and lyophilization
with focus on the influence of NaCl and the HSA-stabilizers on the physico-
chemical properties (Chapter 3 and 4).
3. Find the optimum formulation and lyophilization conditions for the system
mannitol-sucrose to achieve a product of crystalline mannitol and amorphous
sucrose, with a reduced content of mannitol hydrate (Chapter 5).
4. Develop a stable HSA-free formulation for the hydrophobic cytokine (Chapter 6).
Introduction and Objective of the Thesis
19
6. References 1. K. Itakura, T. Hirose, R. Crea, A. D. Tiggs, D. Heyneker. Expression in Escherichia coli of a chemically
synthesized gene for the hormone somatostatin. Science 198:1056-1063 (1977).
2. D. V. Goeddel, D. G. Kleid, F. Bolivar, H. L. Heyneker, D. G. Yansura, R. Crea, T. Hirose, A. Kraszewski,
K. Itakura, A. D. Riggs. Expression in Escherichia coli of chemically synthesized genes for human insulin.
Proc. Natl. Acad. of Sci. 76:106-110 (1979).
3. G. Kohler, C. Milstein. Continuous cultures of fused cells secreting antibody of predefined specificity.
Nature 256:495-497 (1975).
4. S. L. Morrison, M. J. Johnson, L. A. Herzenberg, V. T. Oi. Chimeric human antibody molecules: mouse
antigen-binding domains with human constant region domains. Proc. Natl. Acad. of Sci. 81:6851-6855
(1984).
5. P. T. Jones, P. H. Dear, J. Foote, M. S. Neuberger, G. Winter. Replacing the complementarity-
determining regions in a human antibody with those from a mouse. Nature 321:522-525 (1986).
6. “Medicines in Development: Biotechnology, survey 2006”, available at
http://www.phrma.org/files/Biotech%202006.pdf (2006).
7. M. C. Manning, K. Patel, R. T. Borchardt. Stability of Protein Pharmaceuticals. Pharm. Res. 6:903-918
(1989).
8. E. Y. Chi, S. Krishnan, T. W. Randolph, J. F. Carpenter. Physical Stability of Proteins in Aqueous
Solutions: Mechanisms and Driving Forces in Nonnative Protein Aggregation. Pharm. Res. 20:1325-1336
(2003).
9. E. J. McNally, C. E. Lockwood. The Importance of a Thorough Preformulation Study. In “Protein
formulation and Delivery” edited by E. J. McNally, Marcel Dekker Inc., p. 111-139 (2000).
10. J. A. Thomson, B. A. Shriley, G. R. Grimsley, C. N. Pace. Conformational Stability and Mechanism of
folding of Ribonuclease T1. J. Biol. Chem. 264:11614-11620 (1989).
11. R. Cowan, R. G. Whittaker. Hydrophobicity indexes for amino acid residues as determined by high-
performance liquid chromatography. Peptide Res. 3:75-80 (1990).
12. K. Berggren, A. Wolf, J. A. Asenjo, B. A. Andrews, F. Tjerneld. The surface exposed amino acid residues
of monomeric proteins determine the partitioning in aqueous two-phase systems. Biochim. Biophys. Acta
1596:253-268 (2002).
13. V. V. Nauchitel, R. L. Somorjai. Spatial and free energy distribution patterns of amino acid residues in
water soluble proteins. Biophys. Chem. 51:327-336 (1994).
14. S. Moelberg, E. Emberly, C. Tang. Correlation between sequence hydrophobicity and surface-exposure
pattern of database proteins. Protein Sci. 13:752-762 (2004).
15. J. C. Salgado, I. Rapaport, J. A. Asenjo. Is it possible to predict the average surface hydrophobicity of a
protein using only its amino acid composition? J. Chromat. A. 1075:133-143 (2005).
16. M. Karpusas, A. Whitty, L. Runkel, P. Hochman. The structure of human interferon-ß: implications for
activity. Cell. Mol. Life Sci. 54:1203-1216 (1998).
17. J. Utsumi, S. Yamazaki, K. Hosoi, S. Kimura, K. Hanada, T. Shimazu, H. Shimizu. Characterization of
E.coli-Derived Recombinant Human Interferon-ß as Compared with Fibroblast Human Interferon-ß. J.
Biochem. 101:1199-1208 (1987).
18. K. L. Shaw, G. B. Grimsley, G. I. Yakovlev, A. A. Makarov, C. N. Pace. The effect of net charge on the
solubility, activity, and stability of ribonuclease Sa. Protein Sci. 10:1206-1215 (2001).
19. M. J. Akers, M. R. DeFelippis. Peptides and Proteins as Parenteral Solutions. In: Pharmaceutical
Formulation Development of Peptides and Proteins edited by S. Frokjaer and L. Hovgaard, The Taylor
and Francis Series in Pharmaceutical Sciences (2000).
Chapter 1
20
20. C. Gregg, O. Kinstler. Chemical modifications of granulocyte-colony stimulating factor (G-CSF)
bioactivity. United States Patent, US 6,017,876 (2000).
21. L. S. Lin, M. G. Kunitani, M. S. Hora. Interferon-ß-1b (Betaseron®); A Model for Hydrophobic
Therapeutic Proteins. Pharm. Biotechnol. 9:275-301 (1996).
22. W. Wang. Instability, stabilization and formulation of liquid protein pharmaceuticals. Int. J. Pharm.
185:125-188 (1999).
23. W. Wang. Protein Aggregation and its inhibition in biopharmaceutics. Int. J. Pharm. 289:1-30 (2005).
24. J. L. E. Reubsaet, J. H. Beijnen, A. Bult, R. J. van Maanen, J. A. D. Marchal, W. J. M. Underberg.
Analytical techniques used to study the degradation of proteins and peptides: chemical instability. J.
Pharm. Biom. Anal. 17:955-978 (1998).
25. Y. S. Wang, S. Youngster, M. Grace, J. Bausch, R. Bordens, D. F. Wyss. Structural and biological
characterization of pegylated recombinant interferon alpha-2b and its therapeutic implications. Adv. Drug
Del. Rev. 54:547-570 (2002).
26. K. Rajender Reddy, M. W. Modi, S. Pedder. Use of peginterferon alfa-2 (40KD) (Pegasys®) for the
treatment of hepatitis C. Adv. Drug Delivery Rev. 54:571-586 (2002).
27. J. M. Harris, R. B. Chess. Effect of PEGylation on Pharmaceuticals. Nature Rev. 2:214-221 (2002).
28. M. J. Roberts, M. D. Bentley, J. M. Harris. Chemistry for peptide and protein pegylation. Adv. Drug
Delivery Rev. 54:459-476 (2002).
29. M. Katakam, L. N. Bell, A. K. Banga. Effect of surfactant on the physical stability of recombinant human
growth hormone. J. Pharm. Sci. 84:713-716 (1995).
30. N. B. Bam, J. L. Cleland, J. Yang, M. C. Manning, J. F. Carpenter, R. F. Kelley, T. W. Randolph. Tween
Protects Recombinant Human Growth Hormone against agitation-induced Damage via Hydrophobic
Interactions. J. Pharm. Sci. 87:1554-1559 (1998).
31. L. Kreilgaard, L. S. Jones, T. W. Randolph, S. Frokjaer, J. M. Flink, M. C. Manning, J. F. Carpenter. Effect
of Tween 20 on Freeze-Thawing- and Agitation-Induced Aggregation of Recombinant Human Factor XIII.
J. Pharm. Sci. 87:1597-1559 (1998).
32. A. Hillgren, J. Lindgren, M. Aldén. Protection mechanism of Tween 80 during freeze-thawing of a model
protein, LDH. Int. J. Pharm. 237:57-69 (2002).
33. M. Brewster, M. Hora, J. Simpkins, N. Bodor. Use of 2-Hydroxypropyl-ß-cyclodextrin as a Solubilizing and
Stabilizing Excipient for Protein Drugs. Pharm. Res. 8:792-795 (1991).
34. S. C. Quay, H. R. Costantino. Intranasal formulations of interferon beta free of stabilizers that are
proteins or polypeptides. PCT Int. Appl. WO2005120551 (2005).
35. M. D. Del Curto. Stabilized interferon liquid formulations. PCT Int. Appl. WO20055058346 (2005).
36. A. Cooper. Effect of cyclodextrins on the thermal stability of globular proteins. J. Am. Chem. Soc.
114:9208-9209 (1992).
37. S. Branchu, R. T. Forbes, P. York, H. Nyqvist. A central composite design to investigate the thermal
stabilization of lysozyme. Pharm. Res. 16:702-708 (1999).
38. Y. Koga, P. Westh, J. V. Davies, K. Miki, K. Nishikawa, H. Katayanagi. Toward Understanding the
Hofmeister Series. 1. Effect of Sodium Salts of Some Anions on the Molecular Organization of H2O. J.
Phys. Chem. 108:8533-8541 (2004).
39. T. Arakawa, S. N. Timasheff. Preferential Interactions of Proteins with Salts in Concentrated Solutions.
Biochem. 21:6545-6552 (1982).
40 T. Arakawa, S. N. Timasheff. Mechanism of Protein Salting In and Salting Out by Divalent Cation Salts:
Balance between Hydration and Salt Binding. Biochem. 23:5912-5923 (1984).
41. F. Rothstein. Differential precipitation of proteins: science and technology. Bioprocess Technol. 18:115-
208 (1994).
Introduction and Objective of the Thesis
21
42. C. Page, P. Dawson, D. Woolacott, R. Thorpe, An. Mire-Sluis. Development of a Lyophilization
Formulation that Preserves the Biological Activity of the Platelet-inducing Cytokine Interleukin-11 at Low
Concentrations. J. Pharm. Pharmacol. 52:19-26 (2000).
43. M. S. Schwarzenbach, P. Reimann, V. Thommen, M. Hegner, M. Mumenthaler, J. Schwob, H. J.
Güntherodt. Interferon α-2a interactions on Glass Vial Surfaces Measured by Atomic Force Microscopy.
PDA J. Pharm. Sci. Tech., 59:78-89 (2002).
44. W. Norde. Adsorption of Proteins at Solid-Liquid Interfaces. Cells Mat. 5:97-112 (1995).
45. W. Norde, F. MacRitchie, G. Nowicka, J. Lyklema. Protein adsorption at solid-liquid interfaces:
reversibility and conformation aspects. J. Coll. Interf. Sci. 112:447-456 (1986).
46. M. C. Kaplan, A. Jégou, B. Chaufer, M. Rabiller-Baudry, M. C. Michalsky. Adsorption of lysozyme on
membrane material and cleaning with non-ionic surfactant characterized through contact angle
measurements. Desalination 146:149-154 (2002).
47. F. Y. Oliva, L. B. Avalle, O. R. Cámara, C. P. De Pauli. Adsorption of human serum albumin (HSA) onto
colloidal TiO2 particles, Part I. J. Coll. Interf. Sci. 261:299-311 (2003).
48. J. R. Wendorf, C. J. Radke, H. W. Blanch. Reduced Protein Adsorption at Solid Interfaces by Sugar
Excipients. Biotech. Bioeng. 87:565-573 (2004).
49. L. Marchal-Heussler. Adsorption of Drugs. In: Encyclopedia of Surface and Colloidal Science, Marcel
Dekker, New York; pp. 294-306 (2002).
50. W. Norde, J. Lyklema. The adsorption of human plasma albumin and bovine pancreas ribonuclease at
negatively charged polystyrene surfaces. IV: The charge distribution in the adsorbed state. J. Coll. Interf.
Sci. 66:285-294 (1978).
51. A. W. P. Vermeer, M. G. E. G. Bremer, W. Norde. Structural Changes of IgG induced by heat treatment
and by adsorption onto a hydrophobic Teflon surface studied by circular dichroism spectroscopy.
Biochim. Biophys. Acta. 1425:1-12 (1998).
52. S. T. Tzannis, W. J. M. Hrushesky, P. A. Wood, T. M. Przybycien. Adsorption of a Formulated Protein on a
Drug Delivery Device Surface. J. Coll. Interf. Sci. 189:216-228 (1997).
53. P. E. Jørgensen, L. Eskildsen, E. Nexø. Adsorption of EGF receptor ligands to test tubes – a factor with
implications for studies on the potency of these peptides. Scan. J. Clin. Lab. Invest. 59:191-198 (1999).
54. M. Zhang, M. Ferrari. Reduction of Albumin Adsorption onto Silicon Surfaces by Tween 20. Biotechnol.
Bioeng. 56:618-625 (1999).
55. X. M. He, D. C. Carter. Atomic structure and chemistry of human serum albumin. Nature 358:209-215
(1992).
56. J. A. Hamilton. Fatty acid interactions with proteins: what X-ray crystal and NMR solution structures tell
us. Prog. Lipid Res. 43:177-199 (2004).
57. P. A. Zunszain, J. Ghuman, T. Komatsu, E. Tsuchida, S. Curry. Crystal structural analysis of human
serum albumin complexed with hemin and fatty acid. BMC Struct. Biol. 3:no pp given (2003).
58. S. Curry, H. Mandelkow, P. Brick, N. Franks. Crystal structure of human serum albumin complexed with
fatty acid reveals an asymmetric distribution of binding sites. Nat. Struct. Biol. 5:827-835 (1998).
59. J. J. Lin, J. D. Meyer, J. F. Carpenter, M. C. Manning. Stability of Human Serum Albumin During
Bioprocessing: Denaturation and Aggregation During Processing of Albumin Paste. Pharm. Res. 17:391-
396 (2000).
60. E. J. Cohn, L. E. Strong, W. L. Hughes Jr, D. J. Mulford, J. N. Ashworth, M. Melin, H. L. Taylor.
Preparation and properties of serum and plasma proteins. IV. A system for the separation into fractions
of the proteins and lipoprotein components of biological tissues and fluids. J. Am. Chem. Soc. 68:459-
475 (1946).
61. U.S. Food and Drug Administration, Code of Federal Regulations, Title 21, Volume 7: §640.80 Albumin
(Human), revised as on April 1 (2004).
Chapter 1
22
62. M. Anraku, Y. Tsurusaki, H. Watanabe, T. Maruyama, U. Kragh-Hansen, M. Otagiri. Stabilizing
mechanisms in commercial albumin preparations: octanoate and N-acetyl-L-tryptophanate protect
human serum albumin against heat and oxidative stress. Biochim. Biophys. Acta 1702:9-17 (2004).
63. G. Scatchard, L. E. Strong, W. L. Hughes Jr., J. N. Ashworth, A. H. Sparrow. Chemical, clinical, and
immunological studies and the products of human plasma fractionation. XXVI. The properties of human
serum albumin at low salt content. J. Clin. Invest. 24:671-679 (1945).
64. G.A. Ballou, P.D. Boyer, J. M. Luck, G. F. Lum. The heat coagulation of human albumin. J. Biol. Chem.
153:589-605 (1944).
65. T. Arakawa, Y. Kita. Stabilizing effect of caprylate and acetyltryptophanate on heat-induced aggregation
of bovine serum albumin. Biochim. Biophys. Acta, 1479:32-36 (2000).
66. E. Tarelli, A. Mire-Sluis, H. A. Tivnann, B. Bolgiano, D. T. Crane, C. Gee, X. Lemercinier, M. L. Althayde,
N. Sutcliffe, P. H. Corran, B. Rafferty. Recombinant Human Albumin as a Stabilizer for Biological
Materials and for the Preparation of International Reference Reagents. Biologicals 26:331-346 (1998).
67. S. Matsushita, Y. Isima, V. T. G. Chuang, H. Watanabe, S. Tanase, T. Maruyama, M. Otagiri. Functional
Analysis of Recombinant Human Serum Albumin Domains for Pharmaceutical Applications. Pharm. Res.
21:1924-1932 (2004).
68. D. Bosse, M. Praus, P. Kiessling, L. Nyman, C. Andresen, J. Waters, F. Schindel. Phase I Comparability of
Recombinant Human Albumin and Human Serum Albumin. J. Clin. Pharmacol. 45:57-67 (2005).
69. Rote Liste 2005, Arzneimittelverzeichnis für Deutschland (einschließlich EU-Zulassungen und bestimmter
Medizinprodukte). Bundesverband der Pharmazeutischen Industrie (BPI), Verband Forschender
Arzneimittelhersteller (VFA).
70. B. S. Chang, S. Y. Patro. Freeze-drying Process Development for Protein Pharmaceuticals. In:
Lyophilization of Biopharmaceuticals, editors H. R. Costantino, M. J. Pikal, AAPS Press Arlington (2004).
71. W. Wang. Lyophilization and Development of Solid Protein Pharmaceuticals. Int. J. Pharm. 203:1-60
(2000).
72. T. Arakawa, S. J. Prestrelski, W. C. Kenney, J. F. Carpenter. Factors affecting short-term and long-term
stability of proteins. Adv. Drug Del. Rev. 46:307-326 (2001).
73. J. F. Carpenter, J. H. Crowe. The mechanism of cryoprotection of proteins by solutes. Cryobiol. 25:244-
255 (1988).
74. J. H. Crowe, J. F. Carpenter. An infrared spectroscopic study of the interactions of carbohydrates with
dried protein. Biochem. 28:3916-3922 (1989).
75. F. Franks, R. H. M. Hatley, S. F. Mathias. Materials science and the production of shelf-stable biologicals.
Bio. Pharm. 4:38, 40-2, 55 (1991).
76. M. T. Cicerone, A. Tellington, L. Trost, A. Sokolov. Substantially improved stability of biological agents in
the dried form. Bio. Proc. Int. 1:36-47 (2003).
77. T. J. Anchordoquy, J. F. Carpenter. Polymers Protect Lactate Dehydrogenase during Freeze-Drying by
Inhibiting Dissociation in the Frozen State. Arch. Biochem. Biophys. 332:231-238 (1996).
78. P. J. Dawson. Effect of formulation and freeze-drying on the long-term stability of rDNA-derived
cytokines. Dev. Biol. Stand. 74:273-82 (1992).
79. A. Braun, J. Alsenz. Development and Use of Enzyme-Linked Immunosorbent Assays (ELISA) for the
Detection of Protein Aggregates in Interferon Alpha (INFα) Formulations. Pharm. Res. 14:1394-1400
(1997).
80. J. D. Meyer, J. E. Matsuura, J. A. Ruth, E. Shefter, S. T. Patel, J. Bausch, E. Mc Gonigle, M. C. Manning.
Selective Precipitation on Interleukin-4 Using Hydrophobic Ion Pairing: A Method For Improved Analysis
of Proteins Formulated with Large Excesses of Human Serum Albumin. Pharm. Res. 11:1492-1495
(1994).
Introduction and Objective of the Thesis
23
81. A. Haselbeck. Epoetins: differences and their relevance to immunogenicity. Cur. Med. Res. Opin. 19:430-
432 (2003).
82. K. Boven, S. Stryker, J. Knight, A. Thomas, M. van Regenmortel, D. M. Kemeny, D. Power, J. Rossert, N.
Casadevall. The increased incidence of pure red cell aplasia with an Eprex formulation in uncoated rubber
stopper syringes. Kidney Int. 67:2346-2353 (2005).
83. S. Hermeling, H. Schellekens, D. J. A. Crommelin, W. Jiskoot. Micelle-Associated Protein in Epoetin
Formulations: A Risk Factor for Immunogenicity? Pharm. Res. 20:1903-1907 (2003).
84. A. P. Villalobos, S. R. Gunturi, G. A. Heavner. Interaction of Polysorbate 80 with Erythropoietin: A Case
Study in Protein-Surfactant Interactions. Pharm. Res. 22:1186-1194 (2005).
85. S. Hermeling, D. J. A. Crommelin, H. Schellekens, W. Jiskoot. Structure-Immunogenicity Relationships of
Therapeutic Proteins. Pharm. Res. 21:897-903 (2004).
86. A. Braun, L. Kwee, M. A. Labow, J. Alsenz. Protein Aggregates Seem to Play a Key Role Among the
Parameters Influencing the Antigenicity of Interferon Alpha (INF-α) in Normal and Transgenic Mice.
Pharm. Res. 14:1472-1478 (1997).
87. E. Hochuli. Interferon immunogenicity: technical evaluation of interferon-α2a. J. Interf. Cytokine Res.
17(Suppl. 1):15-21 (1997).
88. L. Ruiz, N. Reyes, L. Duany, A. Franco, K. Aroche, E. H. Rando. Long-term stabilization of recombinant
human interferon α 2b in aqueous solution without serum albumin. Int. J. Pharm. 264:57-72 (2003).
89. M. López, L. R. González, N. Reyes, J. Sotolongo, V. Pujol, K. Aroche Tech. Stabilization of a freeze-dried
recombinant streptokinase formulation without serum albumin. J. Clin. Pharm. Therap. 29:367-373
(2004).
90. T. Österberg, A. Fatouros, M. Mikaelsson. Development of a Freeze-Dried Albumin-Free Formulation of
Recombinant Factor VIII SQ. Pharm. Res. 14:892-898 (1997).
91. L. Chang. D. Shepard, J. Sun, D. Ouelette, K. L. Grant, X. Tang, M. J. Pikal. Mechanism of Protein
Stabilization by Sugars During Freeze-Drying and Storage: Native Structure Preservation, Specific
Interaction, and/or Immobilization in a Glassy Matrix. J. Pharm. Sci. 94:1427-1444 (2005).
92. K. Izutsu, S. Kojima. Excipient crystallinity and its protein-structure stabilizing effect during freeze-
drying. J. Pharm. Pharmacol. 54:1033-1039 (2002).
93. R. Johnson, C. Kirchhoff, H. Gaud. Mannitol-Sucrose Mixtures-Versatile Formulations for Protein
Lyophilization. J. Pharm. Sci. 91:914-922 (2002).
94. W. Lei, D. Q. Wang, S. L. Nail. Freeze-Drying of Proteins from a Sucrose-Glycine Excipient System: Effect
of Formulation Composition on the Initial Recovery of Protein Activity. AAPS Pharm. Sci. Tech. 6:150-157
(2005).
95. P. M. Claesson, H. K. Christenson, J. M. Berg, R. D. Neuman. Interaction between Mica Surfaces in the
Presence of Carbohydrates. J. Coll. Interf. Sci. 172:415-424 (1995).
96. J. J. Ramsden, J. E. Prenosil. Effect of Ionic Strength on Protein Adsorption Kinetics. J. Phys. Chem.
98:5376-5381 (1994).
97. G. Greene, H. Radhakrishna, R. Tannenbaum. Protein binding properties of surface-modified porous
polyethylene membranes. Biomat. 26:5972-5982 (2005).
98. S. Sjöberg. Silica in aqueous environment. J. Non-Cryst. Sol. 196:51-57 (1996).
99. W. Norde, F. MacRitichie, G. Nowicka, J. Lyklema. Protein Adsorption at Solid-Liquid interfaces:
Reversibility and Confirmation Aspects. J. Coll. Interf. Sci. 112:447-456 (1985).
100. A. Kondo, K. Higashitani. Adsorption of model proteins with wide variation in molecular properties on
colloidal particles. J. Coll. Interf. Sci. 150:344-351 (1992).
101. M. R. Duncan, J. M. Lee, M. P. Warchol. Influence of surfactants upon protein/peptide adsorption to glass
and polypropylene. Int. J. Pharm. 120:179-88 (1995).
Chapter 1
24
102. M. Feng, A. B. Morales, A. Poot, T. Beugeling, A. Bantjes. Effects of Tween 20 on the desorption of
proteins from polymer surfaces. J. Biom. Sci. Polymer Edition 7:415-425 (1995).
103. C. N. Pace, D. V. Laurents. RNase A and T1: pH dependence and folding. Biochem. 29:2520-2525
(1990).
104. W. J. Callahan, L. O. Narhi, A. A. Kosky, M. J. Treuheit. Sodium Chloride Enhances the Storage and
Conformational Stability of BDNF and PEG-BDNF. Pharm. Res. 18:261-266 (2001).
105. A. M. Tsai, J. H. van Zanten, M. J. Betenbaugh. II. Electrostatic Effect in the Aggregation of Heat
Denatured RNase A and Implications for Protein Additive Design. Biotechnol. Bioeng. 59:281-285
(1998).
106. T. W. Randolph, L. S. Jones. Surfactant-protein interactions. Pharm. Biotechnol. 13:159-175 (2002).
107. P. A. Gunning, A. R. Mackie, A. P. Gunning, N. C. Woodward, P. J. Wilde, V. J. Morris. Effect of Surfactant
Type on Surfactant-Protein Interactions at the Air-Water Interface. Biomacromol. 5:984-991 (2004).
Chapter 2
Characterization of Cytokine Solubility and Particle
Formation in Presences of Human Serum Albumin
Abstract
The impact of pH and NaCl content on particle formation and solubility of the hydrophobic
cytokine in a formulation with Human Serum Albumin (HSA) and mannitol as excipients
was studied. A tremendous increase in turbidity at pH 5.0, close to the isoelectric point of
HSA was observed. Dynamic light scattering (DLS), disc centrifugation, Atomic Force
Microscopy (AFM) and light obscuration were used to characterize the turbidity causing
particle formation process in the formulations. Here the high turbidity values mainly
could be ascribed to particles of 500 to 1000 nm in size. SDS-PAGE showed that most of
the cytokine precipitated at pH 5.0. As HSA used in the formulation further contained Na-
octanoate and Na-N-acetyltryptophante, the impact of these stabilizers on unstabilized-
HSA was evaluated. It could be shown that Na-octanoate and Na-N-acetyltryptophante
were less effective in preventing the turbidity increase of unstabilized-HSA compared to
NaCl. The HSA-cytokine precipitation at pH 5.0 was partially irreversible when the pH
was re-adjusted to 7.0. Furthermore, the interactions between HSA and cytokine were
weakened by NaCl, as determined by fluorescence spectroscopy. The positive effect of
NaCl on the formulation could be attributed to a direct stabilization of HSA, which in
consequence provided an overall stabilization of the cytokine.
Keywords: human serum albumin, cytokine, pH, NaCl, particle formation

Chapter 2
26
1. Introduction
When formulating the hydrophobic cytokine especially the problems of aggregation and
adsorption on containers due to its low solubility need to be overcome. At physiological
pH the solubility of the cytokine is less than 0.05 mg/ml [1]. One possible approach for a
formulation at physiological pH is the use of Human Serum Albumin (HSA) as stabilizing
excipient. Chapter 1 provides a comprehensive discussion on the use of HSA as excipient
for protein formulations. Generally, HSA is extracted from human plasma and therefore
implicates problems associated with human blood derived products like the risk of blood
born pathogens and batch to batch variations. According to the US Food and Drug
Administration, HSA has to undergo pasteurization for ten hours at temperatures of 60°C
at the end of various processing and purification steps [2]. As stabilizing excipients
against heat induced stress Na-octanoate [3] and the amino acid derivative Na-N-
acetyltryptophanate [4] are added. HSA is in addition stabilized by NaCl, which can
inhibit the heat-induced aggregation of HSA [5]. NaCl and the other HSA-stabilizers
brought into the formulations indirectly via HSA may induce problems, e.g. for proteins
which are sensitive to ionic strength. Furthermore, they may impact the physico-chemical
properties of other excipients, e.g. crystallization behavior or glass transitions which is
critical in lyophilized formulations. The impact of the HSA-stabilizers on the physico-
chemical properties of formulations with HSA and mannitol during freezing and
lyophilization is outlined in Chapter 3 and 4. For formulations with HSA limited analytical
methods are available, because HSA, which is often employed in a 10 to 50-fold excess,
interferes with many analytical methods for the active protein.
In this study the hydrophobic model cytokine is used as a lyophilized formulation in
combination with stabilized-HSA and mannitol as excipients in analogy to commercially
available products. To estimate the role of different stabilizers on HSA, studies with
different HSA-types were conducted, as well. The goal was to characterize the physical
stability with special focus on aggregation in HSA–cytokine formulations under different
pH and ionic strength conditions. To get comprehensive insight into the aggregation
phenomena, various methods were used e.g. turbiditimetry, DLS, disc centrifugation,
AFM and light obscuration. We further wanted to analyze possible interactions between
the hydrophobic cytokine and HSA by using fluorescence spectroscopy to understand the
properties of the cytokine–HSA formulation under different pH and ionic strength
conditions.
Characterization of Cytokine Solubility and Particle Formation in Presences of Human Serum Albumin
27
2. Materials and Methods
2.1 Materials
A lyophilized formulation with 0.25 mg/ml cytokine, 12.5 mg/ml mannitol and
12.5 mg/ml stabilized-HSA in analogy to commercially available formulations was used.
This formulation further contained between 0.08% and 0.1% NaCl, deriving from HSA
and from pH-adjustment. Unstabilized-HSA (Fraction V, 96% to 99% purity) from Sigma-
Chemicals (Steinheim, Germany) was solid and contained no further excipients. Four
different batches (072K7600, 072K7601, 033K7600, 033K7601) were used without
further purification. Stabilized-HSA from Grifols (Langen, Germany) was used as 20%
solution and contained 16 mmol Na-octanoate, 16 mmol Na-N-acetyltryptophanate, 130
to 160 mmol/l sodium and max 2 mmol/l potassium. As HSA-free cytokine material a
bulk with 1.2 mg/ml cytokine in 20 mM glycine at pH 3.0 was employed. The production
of this HSA-free cytokine bulk material is described in Chapter 6. NaCl, Na-octanoate and
N-Acetyl-DL-tryptophante were purchased from Sigma (Steinheim, Germany). KCl, LiCl,
NaCH3COO, NH4Cl, KSCN and KI were purchased from Merck (Darmstadt, Germany). All
salts were of reagent grade and used without further purification.
2.2 Methods
2.2.1 Turbidity Measurement
Turbidity measurement was performed with a NEPHLA turbidimeter (Dr. Lange,
Düsseldorf, Germany). Light (λ=860nm) was sent through the samples and the scattered
light was measured at 90° angle. The system was calibrated with formazine as standard
and the results were given in formazine nephelometric units (FNU).
2.2.2 Light Obscuration
Particles ≥1 µm were determined by light obscuration measurement using PAMAS –
SVSS-C Sensor HCB-LD-25/25 (Partikelmess- und Analysensysteme GmbH, Rutesheim,
Germany). Five aliquots of 0.3 ml were analyzed of each sample.
Chapter 2
28
2.2.3 Dynamic Light Scattering (DLS)
DLS, performed on a Zetasizer Nano (Malvern, Herrenberg, Germany) was used to
characterize protein molecules and particles in the range from 1 to 1500 nm. The
Zetasizer Nano is operating with a 4 mM He-Ne-Laser at 633 nm and non invasive back-
scatter technique (NIBS). The size distribution by intensity and volume was calculated
from the correlation function using the multiple narrow mode of the Dispersion
Technology Software from Malvern (version 4.00).
2.2.4 Zetapotential
The zetapotential was determined with the Zetasizer Nano (Malvern, Herrenberg,
Germany). The measurements were performed in the automatic measurement mode
using disposable capillary cells (Malvern DTS 1060).
2.2.5 SDS-PAGE
Non-reducing denaturating SDS-PAGE was used to analyze formulations containing HSA
and the cytokine. NuPAGE® 10% and 12% Bis–Tris gels 1 mm, 10 wells (Invitrogen,
Karlsruhe, Germany) and NuPAGE® MOPS running buffer was used for the separation.
The electrophoresis was performed at a constant current of 0.03 A per gel. NuPAGE® LDS
sample buffer was added to the samples, which were denatured for 10 minutes at 95°C.
20 µl of the solution were loaded to each well. The amount of protein per well ranged
between 0.1 to 0.3 µg cytokine, 5 to 15 µg HSA, or 1 to 5 µg HSA when analyzed as
single component. The gels were stained with SilverXPress® Silver Staining Kit,
respectively Colloidal Blue Staining Kit (Invitrogen, Karlsruhe, Germany).
2.2.6 Fluorescence Spectroscopy
Fluorescence spectroscopy was performed using a Varian Cary Eclipse (Darmstadt,
Germany). The impact of pH on the fluorescence of cytokine, HSA and a combination was
studied. HSA was used in a constant concentration of 0.5 mg/ml, while the cytokine
concentration was varied. HSA-cytokine interactions were studied at pH 3.0 and pH 4.5
with 0.0% and 0.1% NaCl, all buffered with 2 mM glycine. For the first studies the
solutions were measured in 3.0 ml cuvettes at a constant temperature of 20°C with an
excitation wavelength of 280 nm at an excitation slit of 5 nm. The emission was recorded
from 260 to 450 nm at an emission slit of 5 nm and a scanning rate of 120 nm/sec. The
PMT voltage of the detector was set to 400 V. To study protein-protein interactions

Characterization of Cytokine Solubility and Particle Formation in Presences of Human Serum Albumin
29
300 µl of the samples were analyzed in 96-well plates at a constant temperature of 20°C.
Excitation wavelength was 280 nm at an excitation slit of 5 nm and emission was
recorded from 260 to 450 nm at an emission slit of 5 nm and a scanning rate of
30 nm/second. The PMT voltage of the detector was set to 600 V.
Fluorescence quenching was monitored to evaluate the degree of HSA-cytokine
interaction. Therefore, the fluorescence of the individual components, as well as of the
combination was analyzed for the respective conditions. The degree of interaction was
determined using equation (1). A high value for F0/F can be attributed to stronger
interactions between the two proteins [6].
Degree of interaction = F0/F (1)
F0 = calculated sum of the fluorescence intensity (290 to 450nm) of the individual
proteins
F = measured fluorescence intensity (290 to 450 nm) of solution containing both
proteins
2.2.7 Attenuated Total Reflection- FTIR Spectroscopy (ATR-FTIR)
FTIR spectroscopy was performed on a Tensor 27 (Bruker Optics, Ettlingen, Germany)
using the Bio-ATR unit. The spectra were recorded from 4000 to 850 cm-1 wavenumbers
in attenuated total reflectance (ATR) mode at 20°C. Each measurement was the average
of 240 scans. After analysis, the particular buffer spectrum was subtracted from the
protein spectrum. The spectra were further processed by an off-set correction, forming
the second derivative and vector normalization. The structural similarity between the
second derivatives of the spectra was calculated via a spectral correlation coefficient r
according to equation (2) [7,8].
(2)
xi and yi are the corresponding peak intensities of various wave numbers i (second
derivative of amide band I from 1700 to 1600 cm-1) in reference (x) and sample spectra
(y). x* and y* are the average intensities of reference and sample spectra from 1700 to
1600 cm-1.
2/12*2*
**
⎥⎥⎦
⎤
⎢⎢⎣
⎡∑ ∑ ⎟
⎠⎞⎜
⎝⎛ −⎟
⎠⎞⎜
⎝⎛ −
∑ ⎟⎠⎞⎜
⎝⎛ −⎟⎠⎞⎜
⎝⎛ −
=
yiyxix
yiyxixr
Chapter 2
30
2.2.8 Atomic Force Microscopy (AFM)
AFM was conducted by Prof. Dr. U. Bakowsky at the Department of Pharmaceutical
Technology and Biopharmaceutics at the Philipps University, Marburg with a Nanoscope
VI Dimension Bioscope (Veeco Instruments, Santa Barbara, US). As imaging technique
the tapping mode in air was used. Interactions between the sample and the tip were
below 300 pN. Type I cantilevers with a nominal spring constant of 36 nN/nm were
applied. The scanning speed was adjusted to the respective scanned area and ranged
between 0.25 and 2 Hz at a resolution of 512 * 512 pixels, independent of width of the
scanned area. All experiments were performed under atmospheric pressure at
25°C / 60% RH.
2.2.9 Disc centrifugation
The CPS disc centrifugation system (LOT-Oriel GmbH, Damstadt, Germany) was used to
determine the size distribution of the particles in the range of 20 nm to 2 µm. The
measurements were performed by Dr. Stefan Wittmer, LOT Oriel Darmstadt. 200 µl of
the protein solution was applied on the disc, which was rotating with 22000 to
24000 rpm. A density gradient from 7% to 2% sucrose was built up within the disc. At
the edge of the disc the particles were detected with a light source of 470 nm. The time
required for the particles to reach the edge of the disc, as well as the absorption signal
were transformed to a particle size distribution, using Stokes-Law and Mie-theory.
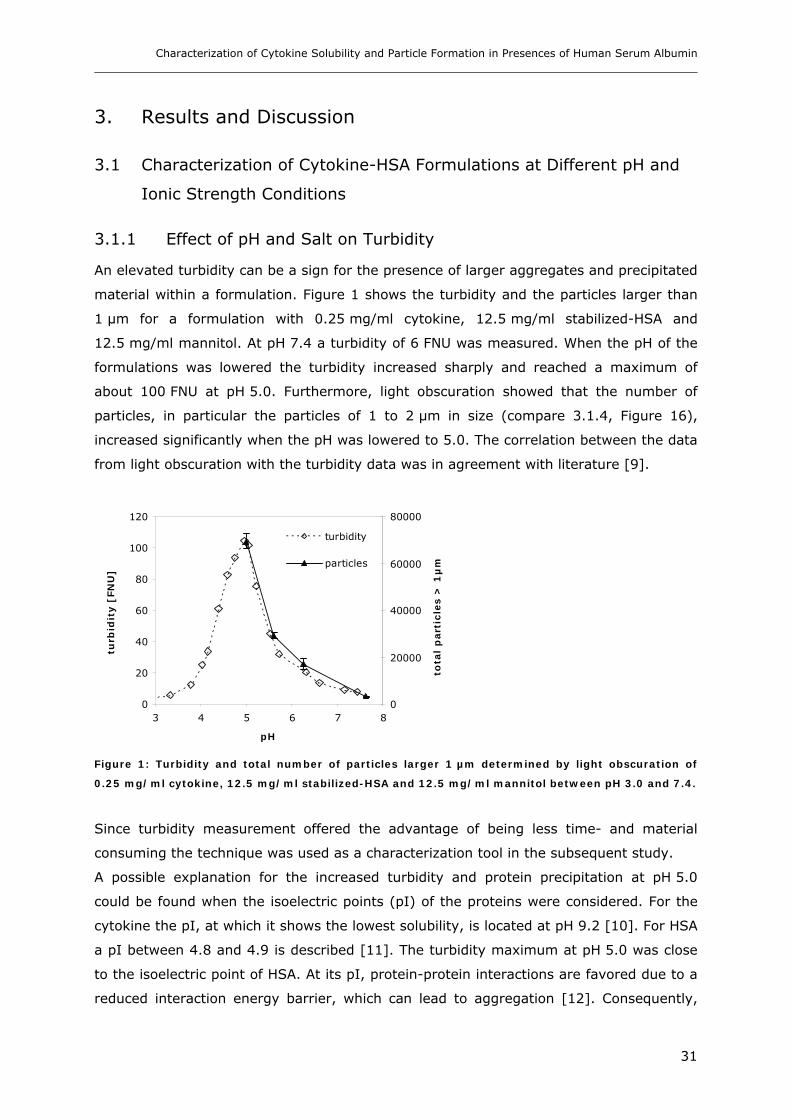
Characterization of Cytokine Solubility and Particle Formation in Presences of Human Serum Albumin
31
3. Results and Discussion
3.1 Characterization of Cytokine-HSA Formulations at Different pH and
Ionic Strength Conditions
3.1.1 Effect of pH and Salt on Turbidity
An elevated turbidity can be a sign for the presence of larger aggregates and precipitated
material within a formulation. Figure 1 shows the turbidity and the particles larger than
1 µm for a formulation with 0.25 mg/ml cytokine, 12.5 mg/ml stabilized-HSA and
12.5 mg/ml mannitol. At pH 7.4 a turbidity of 6 FNU was measured. When the pH of the
formulations was lowered the turbidity increased sharply and reached a maximum of
about 100 FNU at pH 5.0. Furthermore, light obscuration showed that the number of
particles, in particular the particles of 1 to 2 µm in size (compare 3.1.4, Figure 16),
increased significantly when the pH was lowered to 5.0. The correlation between the data
from light obscuration with the turbidity data was in agreement with literature [9].
0
20
40
60
80
100
120
3 4 5 6 7 8
pH
turb
idit
y [
FN
U]
0
20000
40000
60000
80000
tota
l p
art
icle
s >
1µ
m
turbidity
particles
Figure 1: Turbidity and total number of particles larger 1 µm determined by light obscuration of
0.25 mg/ml cytokine, 12.5 mg/ml stabilized-HSA and 12.5 mg/ml mannitol between pH 3.0 and 7.4.
Since turbidity measurement offered the advantage of being less time- and material
consuming the technique was used as a characterization tool in the subsequent study.
A possible explanation for the increased turbidity and protein precipitation at pH 5.0
could be found when the isoelectric points (pI) of the proteins were considered. For the
cytokine the pI, at which it shows the lowest solubility, is located at pH 9.2 [10]. For HSA
a pI between 4.8 and 4.9 is described [11]. The turbidity maximum at pH 5.0 was close
to the isoelectric point of HSA. At its pI, protein-protein interactions are favored due to a
reduced interaction energy barrier, which can lead to aggregation [12]. Consequently,

Chapter 2
32
Saso et al. (1998) described, that HSA showed that highest level of heat-induced
aggregates in the pH range of 4.5 to 5.0 [5]. For the cytokine-HSA formulation the
turbidity increase at pH 5.0 pointed to either a precipitation of HSA itself or a
combination of HSA-cytokine. Furthermore, it could be possible that HSA was no longer
capable to provide sufficient stabilization of the formulation, leading to a precipitation of
the cytokine.
NaCl is known to stabilize HSA against heat-induced aggregation [5] by increasing the
melting temperature (Tm) [13]. As an increase in ionic strength can further impact the
solubility of proteins, the turbidity of the formulation with 0.25 mg/ml cytokine,
12.5 mg/ml stabilized-HSA and 12.5 mg/ml mannitol was studied from pH 7.4 to 3.0
upon the addition of NaCl (Figure 2).
0.00.2
0.4
0.6
0.8
1.0
0
20
40
60
80
100
34
56
78
turb
idit
y [
FN
U]
pH
NaC
l [%]
8.000
10.00
12.00
15.00
20.00
30.00
45.00
75.00
100.0
Figure 2: Turbidity of 0.25 mg/ml cytokine, 12.5 mg/ml stabilized-HSA and 12.5 mg/ml mannitol
with 0.0% to 0.3% NaCl from pH 7.4 to 3.0.
It was obvious that the addition of NaCl could significantly reduce the turbidity increase
at pH 5.0, indicating a stabilizing effect of NaCl on the formulations. For NaCl
concentrations between 0.2% and 0.9% turbidity at pH 5.0 reached a plateau phase of
about 20 FNU. This wide plateau phase pointed at a rather unspecific stabilizing effect of
NaCl, probably induced by electrostatic effects. At pH 7.4, the turbidity was slightly lower
without NaCl, which required further investigations.
To evaluate whether the turbidity preventing effect was specific for NaCl, the influence of
various salts on the turbidity of the cytokine-HSA formulation was evaluated. It is
generally difficult to predict the direct effect of salts on protein stability, as it is
influenced by various factors, e.g. type of protein, pH, ionic strength, mechanism of
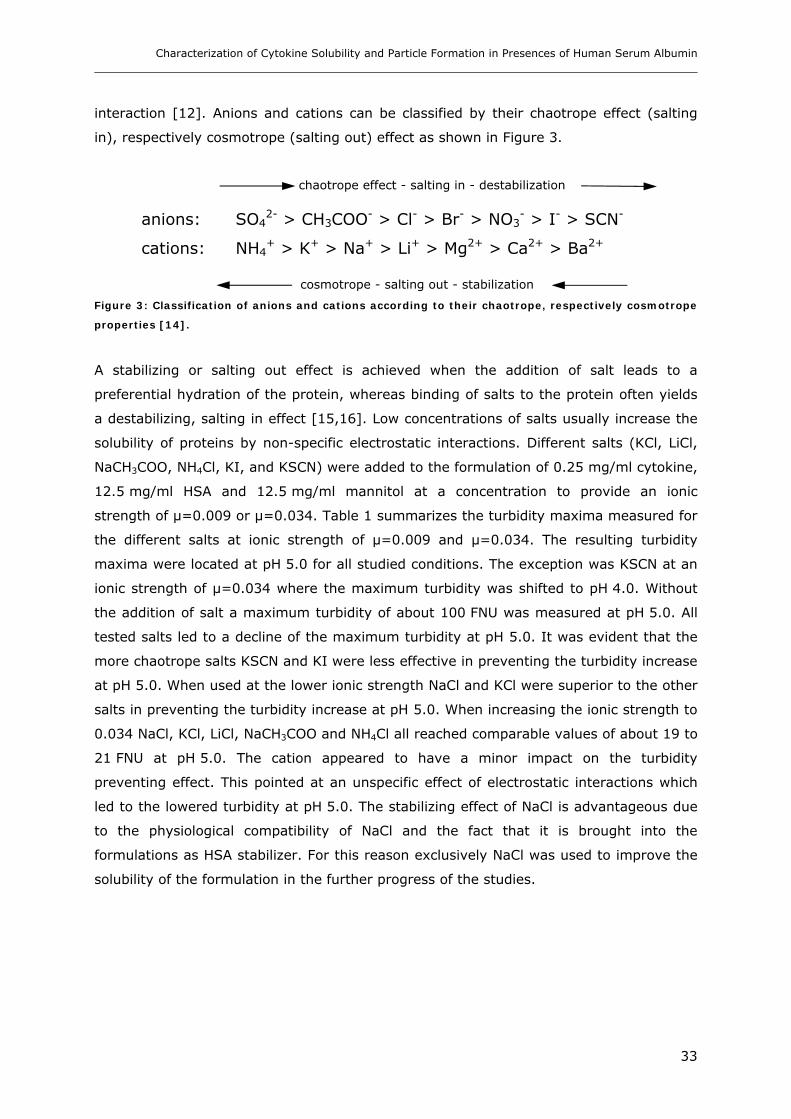
Characterization of Cytokine Solubility and Particle Formation in Presences of Human Serum Albumin
33
interaction [12]. Anions and cations can be classified by their chaotrope effect (salting
in), respectively cosmotrope (salting out) effect as shown in Figure 3.
chaotrope effect - salting in - destabilization
anions: SO42- > CH3COO- > Cl- > Br- > NO3
- > I- > SCN-
cations: NH4+ > K+ > Na+ > Li+ > Mg2+ > Ca2+ > Ba2+
cosmotrope - salting out - stabilization
Figure 3: Classification of anions and cations according to their chaotrope, respectively cosmotrope
properties [14].
A stabilizing or salting out effect is achieved when the addition of salt leads to a
preferential hydration of the protein, whereas binding of salts to the protein often yields
a destabilizing, salting in effect [15,16]. Low concentrations of salts usually increase the
solubility of proteins by non-specific electrostatic interactions. Different salts (KCl, LiCl,
NaCH3COO, NH4Cl, KI, and KSCN) were added to the formulation of 0.25 mg/ml cytokine,
12.5 mg/ml HSA and 12.5 mg/ml mannitol at a concentration to provide an ionic
strength of µ=0.009 or µ=0.034. Table 1 summarizes the turbidity maxima measured for
the different salts at ionic strength of µ=0.009 and µ=0.034. The resulting turbidity
maxima were located at pH 5.0 for all studied conditions. The exception was KSCN at an
ionic strength of µ=0.034 where the maximum turbidity was shifted to pH 4.0. Without
the addition of salt a maximum turbidity of about 100 FNU was measured at pH 5.0. All
tested salts led to a decline of the maximum turbidity at pH 5.0. It was evident that the
more chaotrope salts KSCN and KI were less effective in preventing the turbidity increase
at pH 5.0. When used at the lower ionic strength NaCl and KCl were superior to the other
salts in preventing the turbidity increase at pH 5.0. When increasing the ionic strength to
0.034 NaCl, KCl, LiCl, NaCH3COO and NH4Cl all reached comparable values of about 19 to
21 FNU at pH 5.0. The cation appeared to have a minor impact on the turbidity
preventing effect. This pointed at an unspecific effect of electrostatic interactions which
led to the lowered turbidity at pH 5.0. The stabilizing effect of NaCl is advantageous due
to the physiological compatibility of NaCl and the fact that it is brought into the
formulations as HSA stabilizer. For this reason exclusively NaCl was used to improve the
solubility of the formulation in the further progress of the studies.
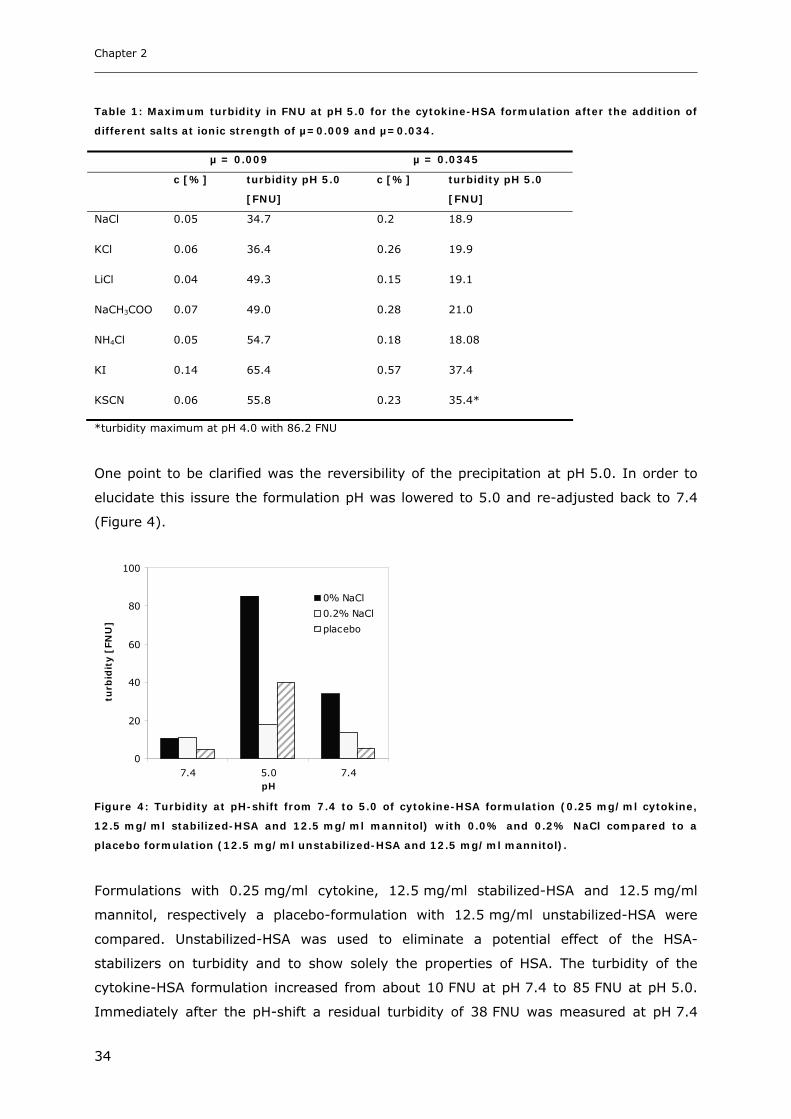
Chapter 2
34
Table 1: Maximum turbidity in FNU at pH 5.0 for the cytokine-HSA formulation after the addition of
different salts at ionic strength of µ=0.009 and µ=0.034.
µ = 0.009 µ = 0.0345
c [%] turbidity pH 5.0
[FNU]
c [%] turbidity pH 5.0
[FNU]
NaCl 0.05 34.7 0.2 18.9
KCl 0.06 36.4 0.26 19.9
LiCl 0.04 49.3 0.15 19.1
NaCH3COO 0.07 49.0 0.28 21.0
NH4Cl 0.05 54.7 0.18 18.08
KI 0.14 65.4 0.57 37.4
KSCN 0.06 55.8 0.23 35.4*
*turbidity maximum at pH 4.0 with 86.2 FNU
One point to be clarified was the reversibility of the precipitation at pH 5.0. In order to
elucidate this issure the formulation pH was lowered to 5.0 and re-adjusted back to 7.4
(Figure 4).
0
20
40
60
80
100
7.4 5.0 7.4pH
turb
idit
y [
FN
U]
0% NaCl
0.2% NaCl
placebo
Figure 4: Turbidity at pH-shift from 7.4 to 5.0 of cytokine-HSA formulation (0.25 mg/ml cytokine,
12.5 mg/ml stabilized-HSA and 12.5 mg/ml mannitol) with 0.0% and 0.2% NaCl compared to a
placebo formulation (12.5 mg/ml unstabilized-HSA and 12.5 mg/ml mannitol).
Formulations with 0.25 mg/ml cytokine, 12.5 mg/ml stabilized-HSA and 12.5 mg/ml
mannitol, respectively a placebo-formulation with 12.5 mg/ml unstabilized-HSA were
compared. Unstabilized-HSA was used to eliminate a potential effect of the HSA-
stabilizers on turbidity and to show solely the properties of HSA. The turbidity of the
cytokine-HSA formulation increased from about 10 FNU at pH 7.4 to 85 FNU at pH 5.0.
Immediately after the pH-shift a residual turbidity of 38 FNU was measured at pH 7.4

Characterization of Cytokine Solubility and Particle Formation in Presences of Human Serum Albumin
35
and a constant level of 33 FNU was reached after approximately 90 minutes. This
indicated that precipitation, triggered by the lowering of the pH, was at least partially
irreversible. When 0.2% NaCl was added to the formulations the turbidity increased from
11 FNU at pH 7.4 to 18 FNU at pH 5.0 and remained with 13 FNU about 2 FNU higher
than initially. For a placebo-formulation with 12.5 mg/ml unstabilized-HSA precipitation
and elevated turbidity levels of about 40 FNU at pH 5.0 were observed as well. In
contrast to the cytokine-HSA formulation the precipitation of unstabilized-HSA was
completely reversible and the turbidity dropped to the initial value of about 4 FNU. This
indicated that the cytokine or a combination of cytokine-HSA were responsible for the
irreversibility of the precipitation.
To further clarify the stabilizing influence of NaCl on the turbidity profile of the cytokine-
HSA formulation, the turbidity of unstabilized-HSA and cytokine as individual components
was studied between pH 3.5 and 7.0 at increasing NaCl concentrations. In a formulation
with 12.5 mg/ml unstabilized-HSA turbidity stepped up at decreasing pH and reached a
maximum at pH 4.5 (Figure 5a). With 0.1% NaCl the turbidity increase was reduced and
at 0.25% and 0.5% NaCl completely inhibited. Thus, it could be stated that NaCl offered
a direct stabilization of HSA against precipitation at pH 5.0. A stabilizing effect of NaCl on
HSA and BSA is also described in literature. Saso et al. (1998) showed a stabilizing effect
of NaCl on heat induced aggregation of HSA [5]. Yamasaki and Yano (1990, 1991)
reported that the denaturation temperature of BSA between pH 4.5 to 9.0 was increased
with rising ionic strength after adding 0.001 to 1.0 M (0.0058% to 5.8%) NaCl. This
stabilizing effect was ascribed to a screening effect of NaCl on the electrostatic forces and
the inhibition of crevice formation within the molecule in the vicinity of 212Trp [17,18].
This screening effect of NaCl on electrostatic forces was as well reflected in the lower
zetapotential values of HSA in presence of NaCl (compare Figure 19, section 3.2.1).
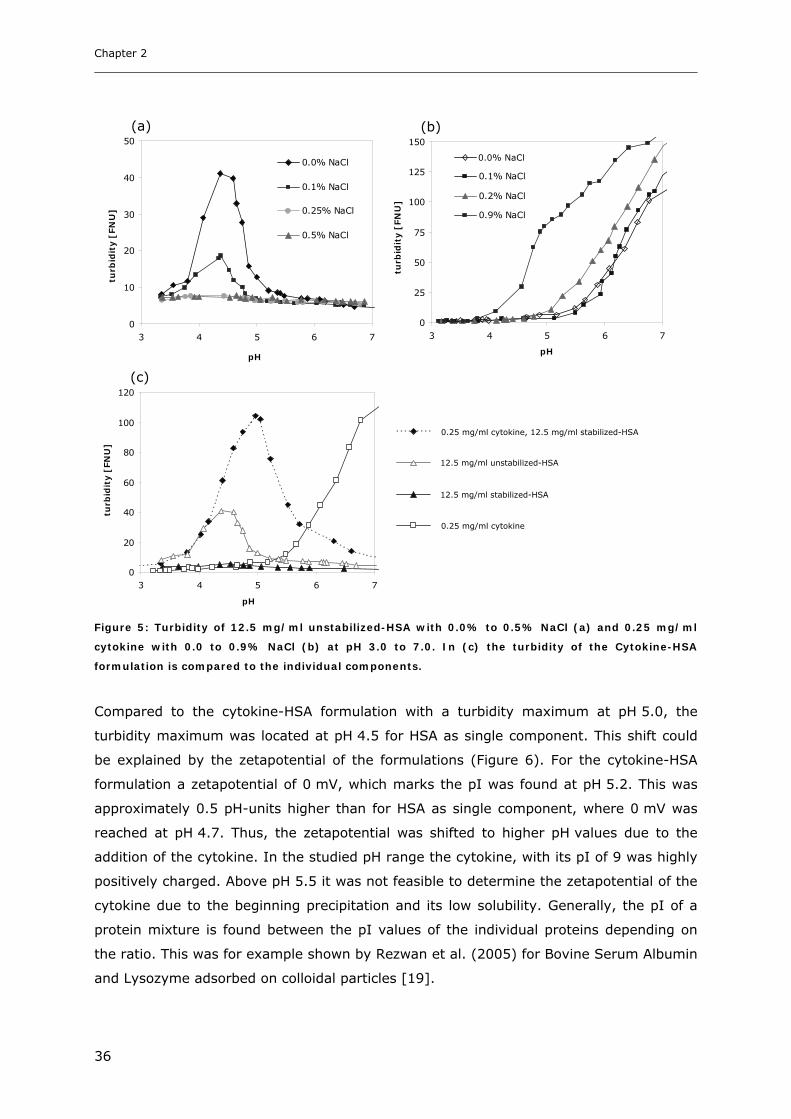
Chapter 2
36
0
10
20
30
40
50
3 4 5 6 7
pH
turb
idit
y [
FN
U]
0.0% NaCl
0.1% NaCl
0.25% NaCl
0.5% NaCl
0
25
50
75
100
125
150
3 4 5 6 7
pH
turb
idit
y [
FN
U]
0% NaCl
0.1% NaCl
0.2% NaCl
0.9% NaCl
0
20
40
60
80
100
120
3 4 5 6 7
pH
turb
idit
y [
FN
U]
0.25 mg/ml cytokine +12.5 mg/ml stab-HSA"
12.5 mg/ml unstab-HSA
12.5 mg/ml stab-HSA
0.25mg/ml cytokine
Figure 5: Turbidity of 12.5 mg/ml unstabilized-HSA with 0.0% to 0.5% NaCl (a) and 0.25 mg/ml
cytokine with 0.0 to 0.9% NaCl (b) at pH 3.0 to 7.0. In (c) the turbidity of the Cytokine-HSA
formulation is compared to the individual components.
Compared to the cytokine-HSA formulation with a turbidity maximum at pH 5.0, the
turbidity maximum was located at pH 4.5 for HSA as single component. This shift could
be explained by the zetapotential of the formulations (Figure 6). For the cytokine-HSA
formulation a zetapotential of 0 mV, which marks the pI was found at pH 5.2. This was
approximately 0.5 pH-units higher than for HSA as single component, where 0 mV was
reached at pH 4.7. Thus, the zetapotential was shifted to higher pH values due to the
addition of the cytokine. In the studied pH range the cytokine, with its pI of 9 was highly
positively charged. Above pH 5.5 it was not feasible to determine the zetapotential of the
cytokine due to the beginning precipitation and its low solubility. Generally, the pI of a
protein mixture is found between the pI values of the individual proteins depending on
the ratio. This was for example shown by Rezwan et al. (2005) for Bovine Serum Albumin
and Lysozyme adsorbed on colloidal particles [19].
(a) (b)
(c)
0.0% NaCl
0.25 mg/ml cytokine, 12.5 mg/ml stabilized-HSA
12.5 mg/ml unstabilized-HSA
12.5 mg/ml stabilized-HSA
0.25 mg/ml cytokine
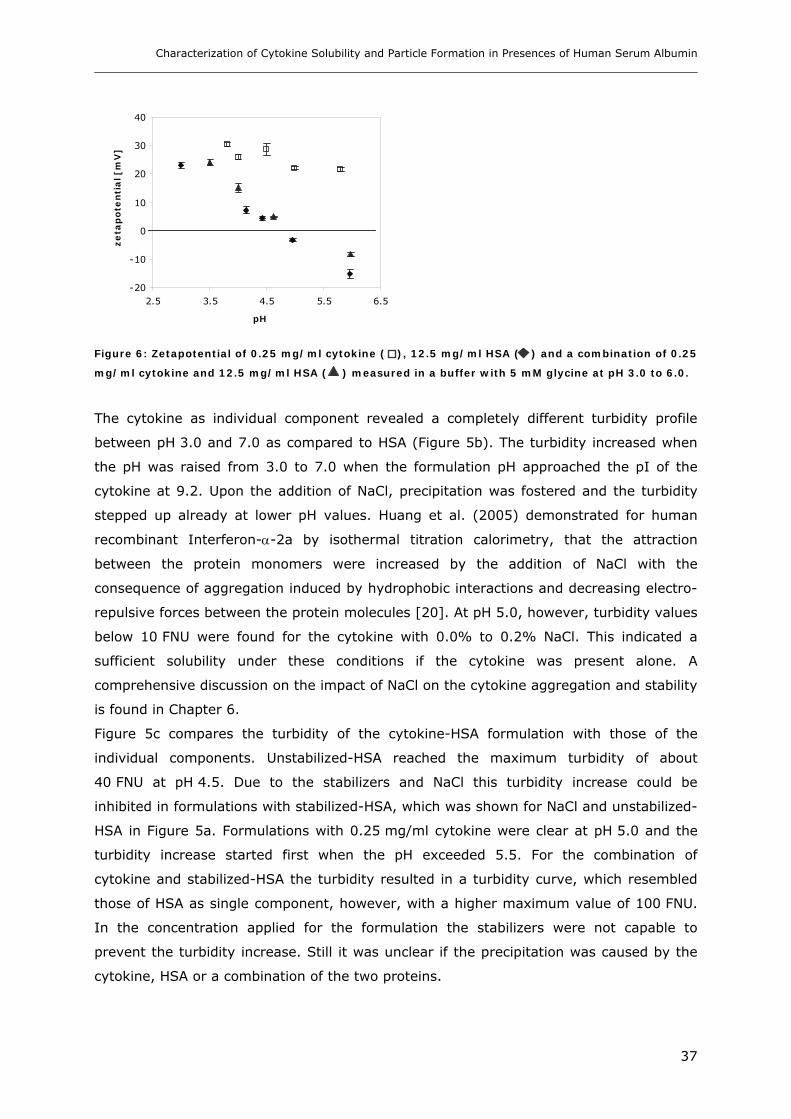
Characterization of Cytokine Solubility and Particle Formation in Presences of Human Serum Albumin
37
-20
-10
0
10
20
30
40
2.5 3.5 4.5 5.5 6.5
pH
ze
tap
ote
nti
al [m
V]
Figure 6: Zetapotential of 0.25 mg/ml cytokine ( ), 12.5 mg/ml HSA ( ) and a combination of 0.25
mg/ml cytokine and 12.5 mg/ml HSA ( ) measured in a buffer with 5 mM glycine at pH 3.0 to 6.0.
The cytokine as individual component revealed a completely different turbidity profile
between pH 3.0 and 7.0 as compared to HSA (Figure 5b). The turbidity increased when
the pH was raised from 3.0 to 7.0 when the formulation pH approached the pI of the
cytokine at 9.2. Upon the addition of NaCl, precipitation was fostered and the turbidity
stepped up already at lower pH values. Huang et al. (2005) demonstrated for human
recombinant Interferon-α-2a by isothermal titration calorimetry, that the attraction
between the protein monomers were increased by the addition of NaCl with the
consequence of aggregation induced by hydrophobic interactions and decreasing electro-
repulsive forces between the protein molecules [20]. At pH 5.0, however, turbidity values
below 10 FNU were found for the cytokine with 0.0% to 0.2% NaCl. This indicated a
sufficient solubility under these conditions if the cytokine was present alone. A
comprehensive discussion on the impact of NaCl on the cytokine aggregation and stability
is found in Chapter 6.
Figure 5c compares the turbidity of the cytokine-HSA formulation with those of the
individual components. Unstabilized-HSA reached the maximum turbidity of about
40 FNU at pH 4.5. Due to the stabilizers and NaCl this turbidity increase could be
inhibited in formulations with stabilized-HSA, which was shown for NaCl and unstabilized-
HSA in Figure 5a. Formulations with 0.25 mg/ml cytokine were clear at pH 5.0 and the
turbidity increase started first when the pH exceeded 5.5. For the combination of
cytokine and stabilized-HSA the turbidity resulted in a turbidity curve, which resembled
those of HSA as single component, however, with a higher maximum value of 100 FNU.
In the concentration applied for the formulation the stabilizers were not capable to
prevent the turbidity increase. Still it was unclear if the precipitation was caused by the
cytokine, HSA or a combination of the two proteins.
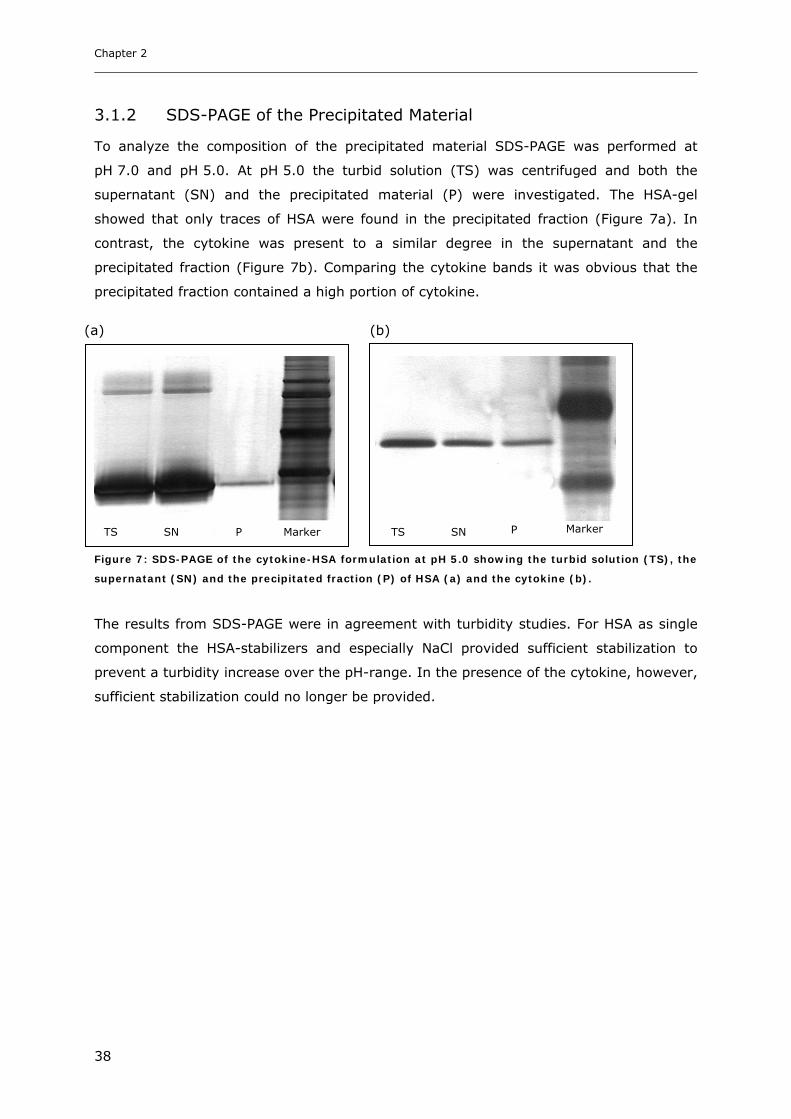
Chapter 2
38
3.1.2 SDS-PAGE of the Precipitated Material
To analyze the composition of the precipitated material SDS-PAGE was performed at
pH 7.0 and pH 5.0. At pH 5.0 the turbid solution (TS) was centrifuged and both the
supernatant (SN) and the precipitated material (P) were investigated. The HSA-gel
showed that only traces of HSA were found in the precipitated fraction (Figure 7a). In
contrast, the cytokine was present to a similar degree in the supernatant and the
precipitated fraction (Figure 7b). Comparing the cytokine bands it was obvious that the
precipitated fraction contained a high portion of cytokine.
Figure 7: SDS-PAGE of the cytokine-HSA formulation at pH 5.0 showing the turbid solution (TS), the
supernatant (SN) and the precipitated fraction (P) of HSA (a) and the cytokine (b).
The results from SDS-PAGE were in agreement with turbidity studies. For HSA as single
component the HSA-stabilizers and especially NaCl provided sufficient stabilization to
prevent a turbidity increase over the pH-range. In the presence of the cytokine, however,
sufficient stabilization could no longer be provided.
TS SN P TS SN P Marker Marker
(a) (b)
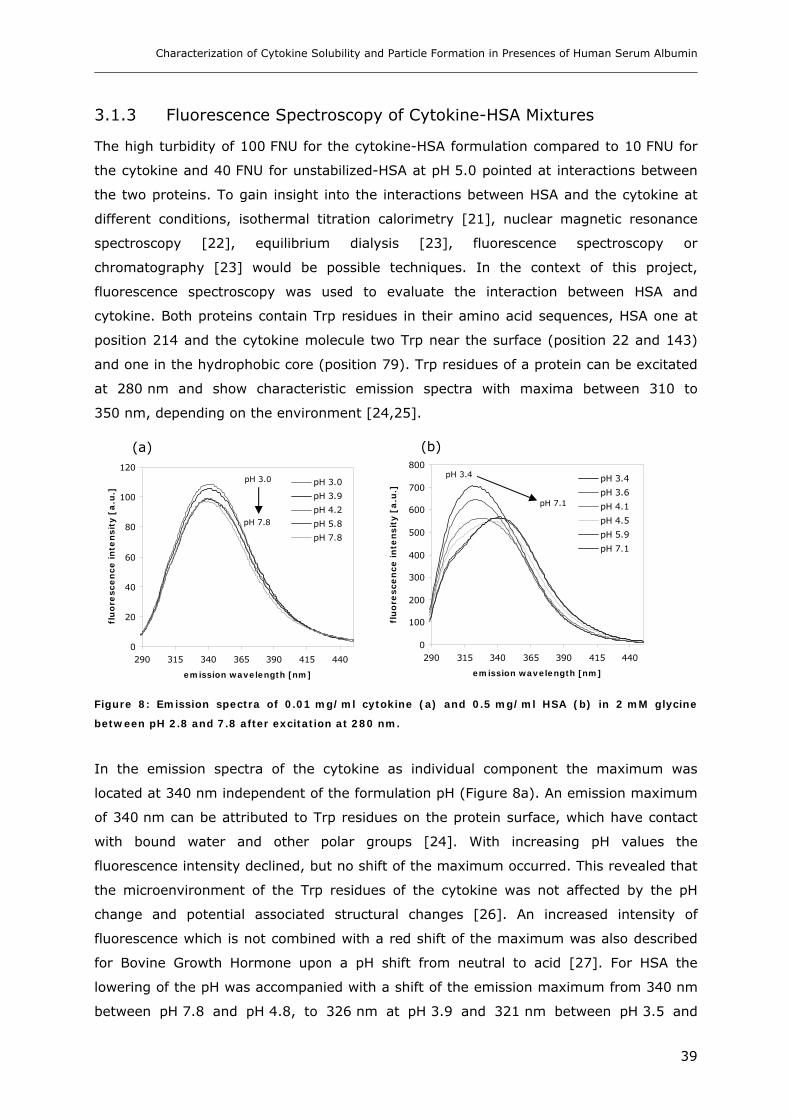
Characterization of Cytokine Solubility and Particle Formation in Presences of Human Serum Albumin
39
3.1.3 Fluorescence Spectroscopy of Cytokine-HSA Mixtures
The high turbidity of 100 FNU for the cytokine-HSA formulation compared to 10 FNU for
the cytokine and 40 FNU for unstabilized-HSA at pH 5.0 pointed at interactions between
the two proteins. To gain insight into the interactions between HSA and the cytokine at
different conditions, isothermal titration calorimetry [21], nuclear magnetic resonance
spectroscopy [22], equilibrium dialysis [23], fluorescence spectroscopy or
chromatography [23] would be possible techniques. In the context of this project,
fluorescence spectroscopy was used to evaluate the interaction between HSA and
cytokine. Both proteins contain Trp residues in their amino acid sequences, HSA one at
position 214 and the cytokine molecule two Trp near the surface (position 22 and 143)
and one in the hydrophobic core (position 79). Trp residues of a protein can be excitated
at 280 nm and show characteristic emission spectra with maxima between 310 to
350 nm, depending on the environment [24,25].
0
20
40
60
80
100
120
290 315 340 365 390 415 440
emission wavelength [nm]
flu
ore
sce
nce
in
ten
sit
y [
a.u
.]
pH 3.0
pH 3.9
pH 4.2
pH 5.8
pH 7.8
0
100
200
300
400
500
600
700
800
290 315 340 365 390 415 440
emission wavelength [nm]
flu
ore
sce
nce
in
ten
sit
y [
a.u
.]
pH 3.4
pH 3.6
pH 4.1
pH 4.5
pH 5.9
pH 7.1
Figure 8: Emission spectra of 0.01 mg/ml cytokine (a) and 0.5 mg/ml HSA (b) in 2 mM glycine
between pH 2.8 and 7.8 after excitation at 280 nm.
In the emission spectra of the cytokine as individual component the maximum was
located at 340 nm independent of the formulation pH (Figure 8a). An emission maximum
of 340 nm can be attributed to Trp residues on the protein surface, which have contact
with bound water and other polar groups [24]. With increasing pH values the
fluorescence intensity declined, but no shift of the maximum occurred. This revealed that
the microenvironment of the Trp residues of the cytokine was not affected by the pH
change and potential associated structural changes [26]. An increased intensity of
fluorescence which is not combined with a red shift of the maximum was also described
for Bovine Growth Hormone upon a pH shift from neutral to acid [27]. For HSA the
lowering of the pH was accompanied with a shift of the emission maximum from 340 nm
between pH 7.8 and pH 4.8, to 326 nm at pH 3.9 and 321 nm between pH 3.5 and
(a) (b)
pH 3.0
pH 7.8
pH 3.4
pH 7.1
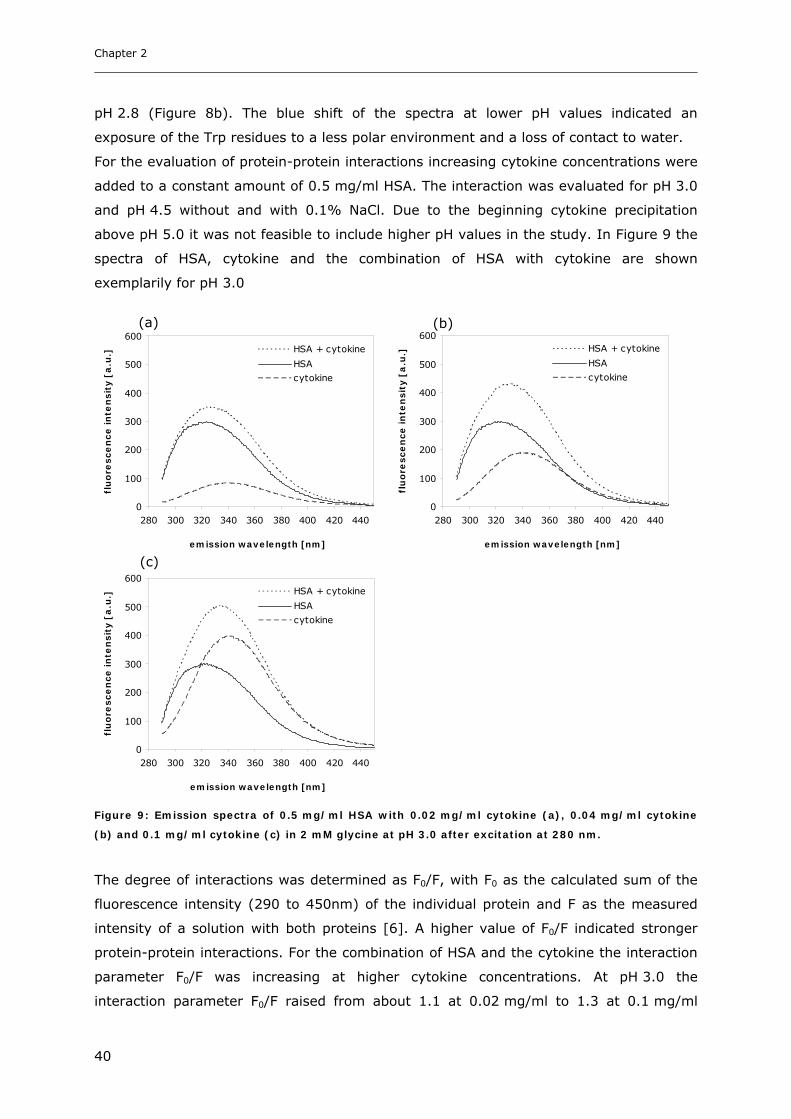
Chapter 2
40
pH 2.8 (Figure 8b). The blue shift of the spectra at lower pH values indicated an
exposure of the Trp residues to a less polar environment and a loss of contact to water.
For the evaluation of protein-protein interactions increasing cytokine concentrations were
added to a constant amount of 0.5 mg/ml HSA. The interaction was evaluated for pH 3.0
and pH 4.5 without and with 0.1% NaCl. Due to the beginning cytokine precipitation
above pH 5.0 it was not feasible to include higher pH values in the study. In Figure 9 the
spectra of HSA, cytokine and the combination of HSA with cytokine are shown
exemplarily for pH 3.0
0
100
200
300
400
500
600
280 300 320 340 360 380 400 420 440
emission wavelength [nm]
flu
ore
sce
nce
in
ten
sit
y [
a.u
.] HSA + cytokine
HSA
cytokine
0
100
200
300
400
500
600
280 300 320 340 360 380 400 420 440
emission wavelength [nm]
flu
ore
sce
nce
in
ten
sit
y [
a.u
.] HSA + cytokine
HSA
cytokine
0
100
200
300
400
500
600
280 300 320 340 360 380 400 420 440
emission wavelength [nm]
flu
ore
sce
nce
in
ten
sit
y [
a.u
.] HSA + cytokine
HSA
cytokine
Figure 9: Emission spectra of 0.5 mg/ml HSA with 0.02 mg/ml cytokine (a), 0.04 mg/ml cytokine
(b) and 0.1 mg/ml cytokine (c) in 2 mM glycine at pH 3.0 after excitation at 280 nm.
The degree of interactions was determined as F0/F, with F0 as the calculated sum of the
fluorescence intensity (290 to 450nm) of the individual protein and F as the measured
intensity of a solution with both proteins [6]. A higher value of F0/F indicated stronger
protein-protein interactions. For the combination of HSA and the cytokine the interaction
parameter F0/F was increasing at higher cytokine concentrations. At pH 3.0 the
interaction parameter F0/F raised from about 1.1 at 0.02 mg/ml to 1.3 at 0.1 mg/ml
(a) (b)
(c)
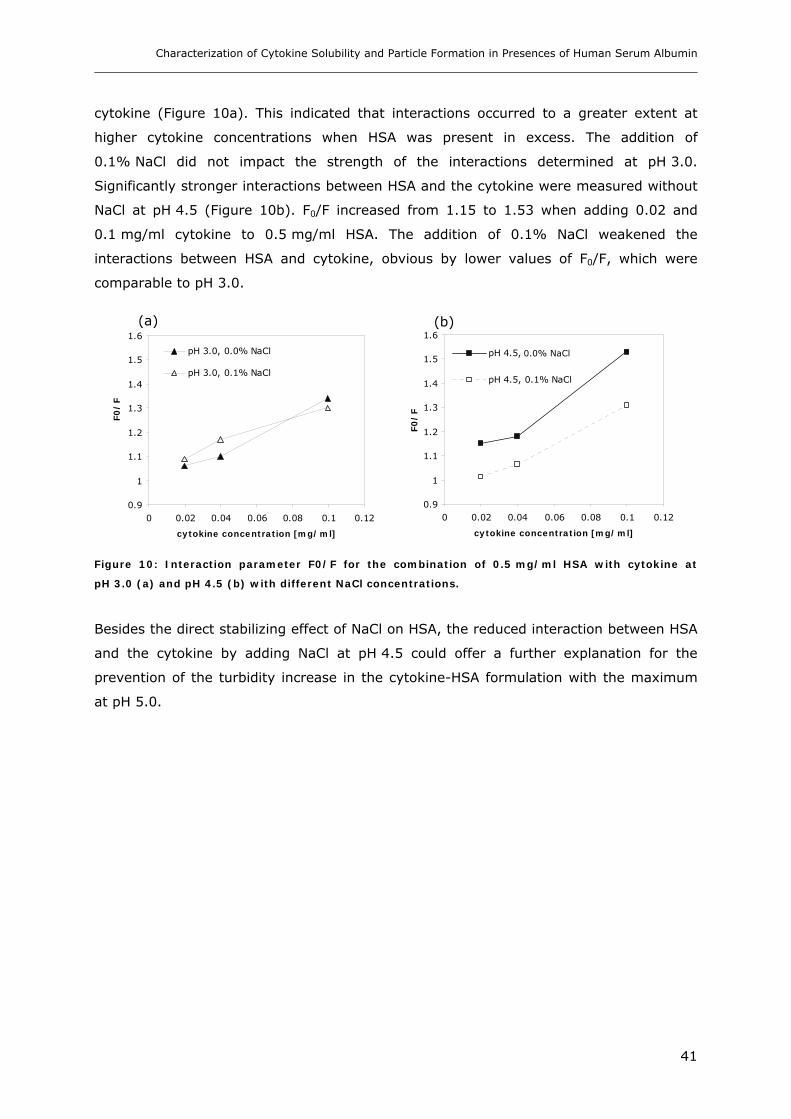
Characterization of Cytokine Solubility and Particle Formation in Presences of Human Serum Albumin
41
cytokine (Figure 10a). This indicated that interactions occurred to a greater extent at
higher cytokine concentrations when HSA was present in excess. The addition of
0.1% NaCl did not impact the strength of the interactions determined at pH 3.0.
Significantly stronger interactions between HSA and the cytokine were measured without
NaCl at pH 4.5 (Figure 10b). F0/F increased from 1.15 to 1.53 when adding 0.02 and
0.1 mg/ml cytokine to 0.5 mg/ml HSA. The addition of 0.1% NaCl weakened the
interactions between HSA and cytokine, obvious by lower values of F0/F, which were
comparable to pH 3.0.
0.9
1
1.1
1.2
1.3
1.4
1.5
1.6
0 0.02 0.04 0.06 0.08 0.1 0.12
cytokine concentration [mg/ml]
F0
/F
pH 3.0, 0.0% NaCl
pH 3.0, 0.1% NaCl
0.9
1
1.1
1.2
1.3
1.4
1.5
1.6
0 0.02 0.04 0.06 0.08 0.1 0.12
cytokine concentration [mg/ml]
F0
/F
pH 4.5, 0% NaCl
pH 4.5, 0.1% NaCl
Figure 10: Interaction parameter F0/F for the combination of 0.5 mg/ml HSA with cytokine at
pH 3.0 (a) and pH 4.5 (b) with different NaCl concentrations.
Besides the direct stabilizing effect of NaCl on HSA, the reduced interaction between HSA
and the cytokine by adding NaCl at pH 4.5 could offer a further explanation for the
prevention of the turbidity increase in the cytokine-HSA formulation with the maximum
at pH 5.0.
0.0% NaCl
(a) (b)
Chapter 2
42
3.1.4 Particle Size Analysis in Cytokine-HSA Formulations
One goal of the study was to characterize the particle formation in cytokine–HSA
formulations depending on pH and NaCl concentration. So far, only turbiditimetry was
used to characterize aggregation and particle formation. However, different particle
fractions especially very small particles below 30 nm, as well as larger particles in the
µm-range may not sufficiently be reflected by turbiditimetry. Therefore, various methods
complementing each other, namely DLS, disc centrifugation and light obscuration were
used to monitor particle formation. For the DLS-measurements the short–term intensity
fluctuations of scattered light, which are caused by random Brownian motion of the
particles are used to calculate the particle size. The measuring range for DLS
experiments is typically 1 nm to 5 µm, in exceptional cases up to 10 µm. The upper limit
depends on particle density and the incipient sedimentation [28]. Particles of 1 µm and
larger can be determined by light obscuration. Disc centrifugation is a method equivalent
to analytical ultracentrifugation that can provide information on particles of 20 nm to
2 µm in size. Furthermore, AFM was utilized to visualize the particles formed with pH-
changes.
The DLS size-distribution by volume showed a peak with a mean diameter of 5 to 9 nm in
the cytokine-HSA formulation without and with 0.2% NaCl between pH 7.0 and 5.0
(Figure 11a,b). This first peak dominated the size distribution by volume with maximum
intensities by volume of about 30% for all studied conditions. The cytokine-HSA
formulation is dominated by the 50-fold excess of HSA compared to the cytokine.
Therefore, the literature values described for HSA can be used as reference values. For
native HSA at neutral pH, a mean diameter of 6 to 7 nm and for aggregated HSA a broad
peak at 30 to 100 nm was described by Sotum and Christiansen (1997) [29]. Lowering
the pH of the cytokine-HSA formulation resulted in a shift of the monomer peak from
4.8 nm at pH 7.0 to 7.5 nm at pH 5.0 without NaCl and from 5.6 nm to 6.5 nm with
0.2% NaCl. A second peak with a maximum between 30 and 60 nm, deriving from
aggregated protein, with an intensity of approximately 0.1% was present in all samples.
In samples without NaCl a third particle class with a maximum of about 500 nm at
pH 5.5 and about 1500 nm at pH 5.0 appeared (Figure 11c,d). The tremendous turbidity
increase below pH 5.5 in NaCl-free samples could essentially be attributed to this third
population.

Characterization of Cytokine Solubility and Particle Formation in Presences of Human Serum Albumin
43
0
5
10
15
20
25
30
35
0 2 4 6 8 10 12 14
size [nm]
inte
nsit
y b
y v
olu
me
[%
]
0
5
10
15
20
25
30
35
0 2 4 6 8 10 12 14
size [nm]
inte
nsit
y b
y v
olu
me
[%
]
0
0.1
0.2
0.3
0.4
0.5
10 100 1000 10000
size [nm]
inte
nsit
y b
y v
olu
me
[%
]
0
0.1
0.2
0.3
0.4
0.5
10 100 1000 10000
size [nm]
inte
nsit
y b
y v
olu
me
[%
]
Figure 11: DLS size-distribution by volume of the cytokine-HSA formulation in water (a,c) and 0.2%
NaCl (b,d) at pH 7.4 ( ), 6.0 ( ), 5.5 ( ) and 5.0 ( ).
Regarding the integrated peak areas of the DLS size-distribution by volume a decline in
the area of the first peak between 0 and 15 nm and the second species between 15 to
120 nm in favor of larger species was obvious when the pH was lowered without NaCl
added (Figure 12a). The fact that the integrated area between 15 and 120 nm declined
at pH 5.5 and 5.0 demonstrated that the turbidity increase could mainly be attributed to
particles larger than 120 nm. The addition of 0.2% NaCl could inhibit the turbidity
increase to a maximum of 20 FNU at pH 5.0 compared to 100 FNU without NaCl. In
samples with 0.2% NaCl less than 1.5% of integrated area of the size distribution by
volume could be attributed to the particles larger than 120 nm (Figure 12b). This further
strengthened the assumption that particles larger than 120 nm were mainly responsible
for the tremendous turbidity increase at pH 5.0. The result were in agreement with
Mahler et al. (2005) who showed for IgG1 formulations that turbidity determined at 350
and 550 nm could be attributed to medium sized aggregates and furthermore was in
correlation with particles of 1 to 2 µm determined by light blockage [9]. In the size
distribution by number more than 99% of the intensity derived from particles smaller
than 10 nm.
(a) (b)
(c) (d)
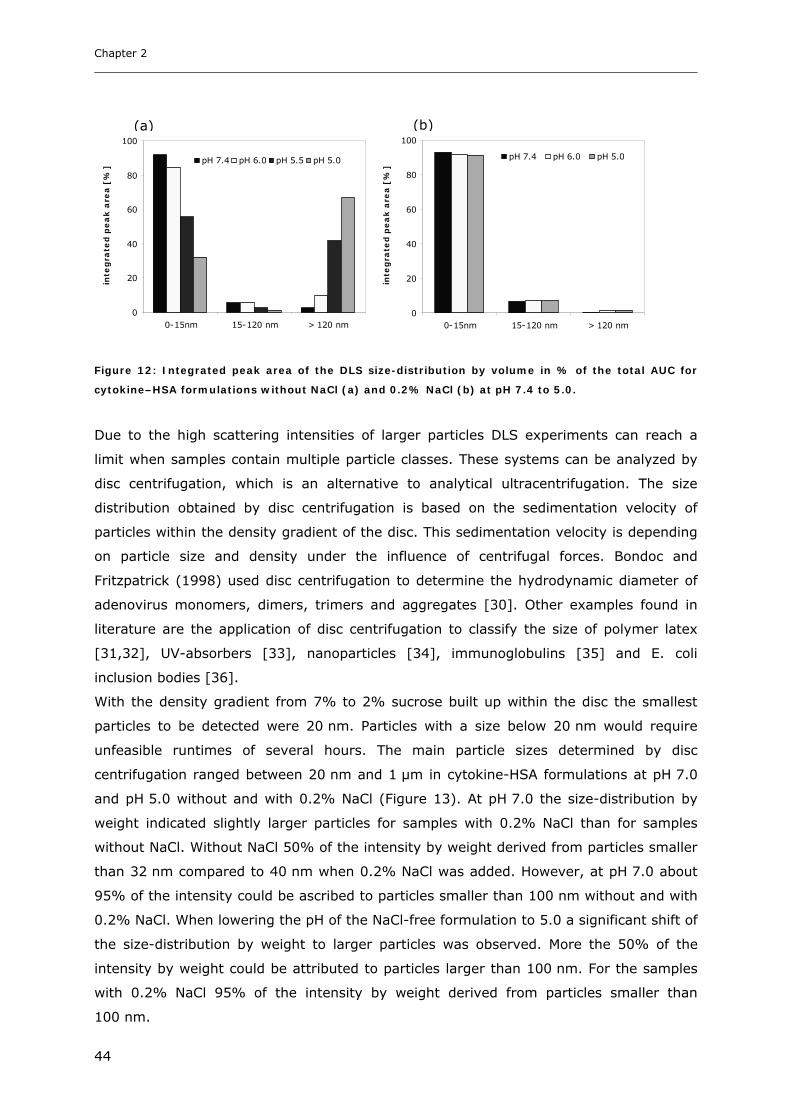
Chapter 2
44
0
20
40
60
80
100
0-15nm 15-120 nm > 120 nm
inte
gra
ted
pe
ak
are
a [
%]
pH 7.4 pH 6.0 pH 5.5 pH 5.0
0
20
40
60
80
100
0-15nm 15-120 nm > 120 nm
inte
gra
ted
pe
ak
are
a [
%]
pH 7.4 pH 6.0 pH 5.0
Figure 12: Integrated peak area of the DLS size-distribution by volume in % of the total AUC for
cytokine–HSA formulations without NaCl (a) and 0.2% NaCl (b) at pH 7.4 to 5.0.
Due to the high scattering intensities of larger particles DLS experiments can reach a
limit when samples contain multiple particle classes. These systems can be analyzed by
disc centrifugation, which is an alternative to analytical ultracentrifugation. The size
distribution obtained by disc centrifugation is based on the sedimentation velocity of
particles within the density gradient of the disc. This sedimentation velocity is depending
on particle size and density under the influence of centrifugal forces. Bondoc and
Fritzpatrick (1998) used disc centrifugation to determine the hydrodynamic diameter of
adenovirus monomers, dimers, trimers and aggregates [30]. Other examples found in
literature are the application of disc centrifugation to classify the size of polymer latex
[31,32], UV-absorbers [33], nanoparticles [34], immunoglobulins [35] and E. coli
inclusion bodies [36].
With the density gradient from 7% to 2% sucrose built up within the disc the smallest
particles to be detected were 20 nm. Particles with a size below 20 nm would require
unfeasible runtimes of several hours. The main particle sizes determined by disc
centrifugation ranged between 20 nm and 1 µm in cytokine-HSA formulations at pH 7.0
and pH 5.0 without and with 0.2% NaCl (Figure 13). At pH 7.0 the size-distribution by
weight indicated slightly larger particles for samples with 0.2% NaCl than for samples
without NaCl. Without NaCl 50% of the intensity by weight derived from particles smaller
than 32 nm compared to 40 nm when 0.2% NaCl was added. However, at pH 7.0 about
95% of the intensity could be ascribed to particles smaller than 100 nm without and with
0.2% NaCl. When lowering the pH of the NaCl-free formulation to 5.0 a significant shift of
the size-distribution by weight to larger particles was observed. More the 50% of the
intensity by weight could be attributed to particles larger than 100 nm. For the samples
with 0.2% NaCl 95% of the intensity by weight derived from particles smaller than
100 nm.
(a) (b)
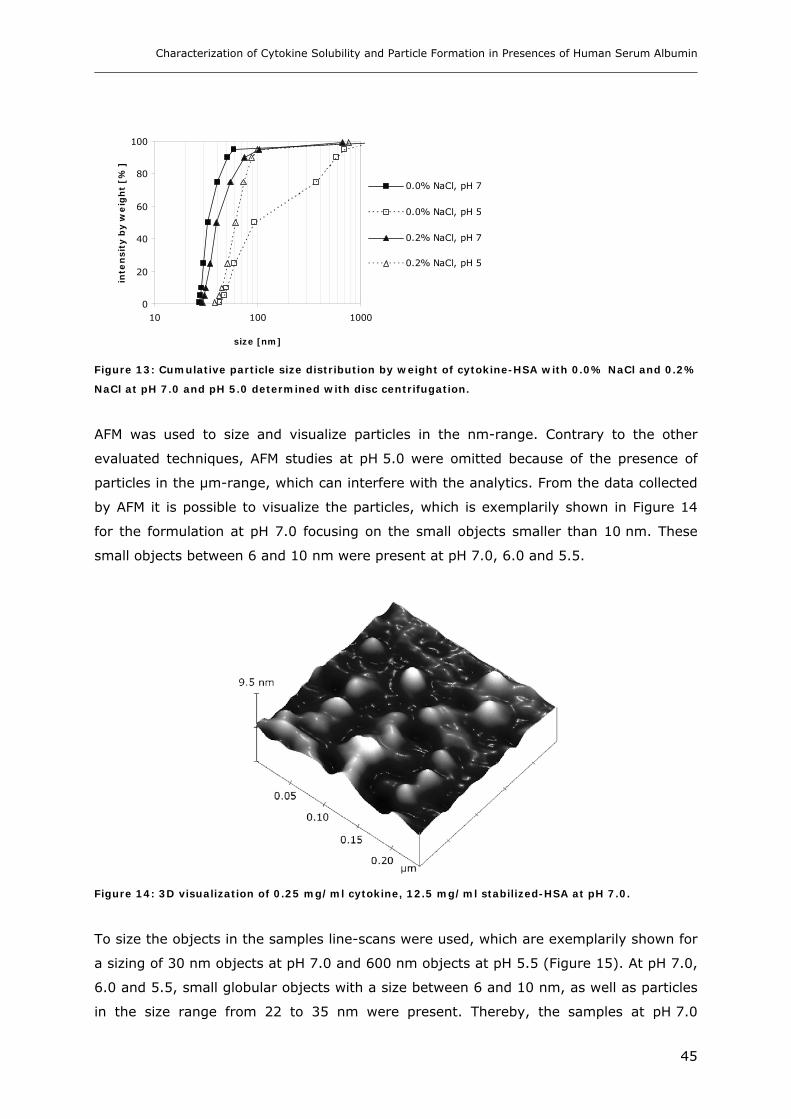
Characterization of Cytokine Solubility and Particle Formation in Presences of Human Serum Albumin
45
0
20
40
60
80
100
10 100 1000
size [nm]
inte
nsit
y b
y w
eig
ht
[%]
0.0% NaCl, pH 7
0.0% NaCl, pH 5
0.2% NaCl, pH 7
0.2% NaCl, pH 5
Figure 13: Cumulative particle size distribution by weight of cytokine-HSA with 0.0% NaCl and 0.2%
NaCl at pH 7.0 and pH 5.0 determined with disc centrifugation.
AFM was used to size and visualize particles in the nm-range. Contrary to the other
evaluated techniques, AFM studies at pH 5.0 were omitted because of the presence of
particles in the µm-range, which can interfere with the analytics. From the data collected
by AFM it is possible to visualize the particles, which is exemplarily shown in Figure 14
for the formulation at pH 7.0 focusing on the small objects smaller than 10 nm. These
small objects between 6 and 10 nm were present at pH 7.0, 6.0 and 5.5.
Figure 14: 3D visualization of 0.25 mg/ml cytokine, 12.5 mg/ml stabilized-HSA at pH 7.0.
To size the objects in the samples line-scans were used, which are exemplarily shown for
a sizing of 30 nm objects at pH 7.0 and 600 nm objects at pH 5.5 (Figure 15). At pH 7.0,
6.0 and 5.5, small globular objects with a size between 6 and 10 nm, as well as particles
in the size range from 22 to 35 nm were present. Thereby, the samples at pH 7.0
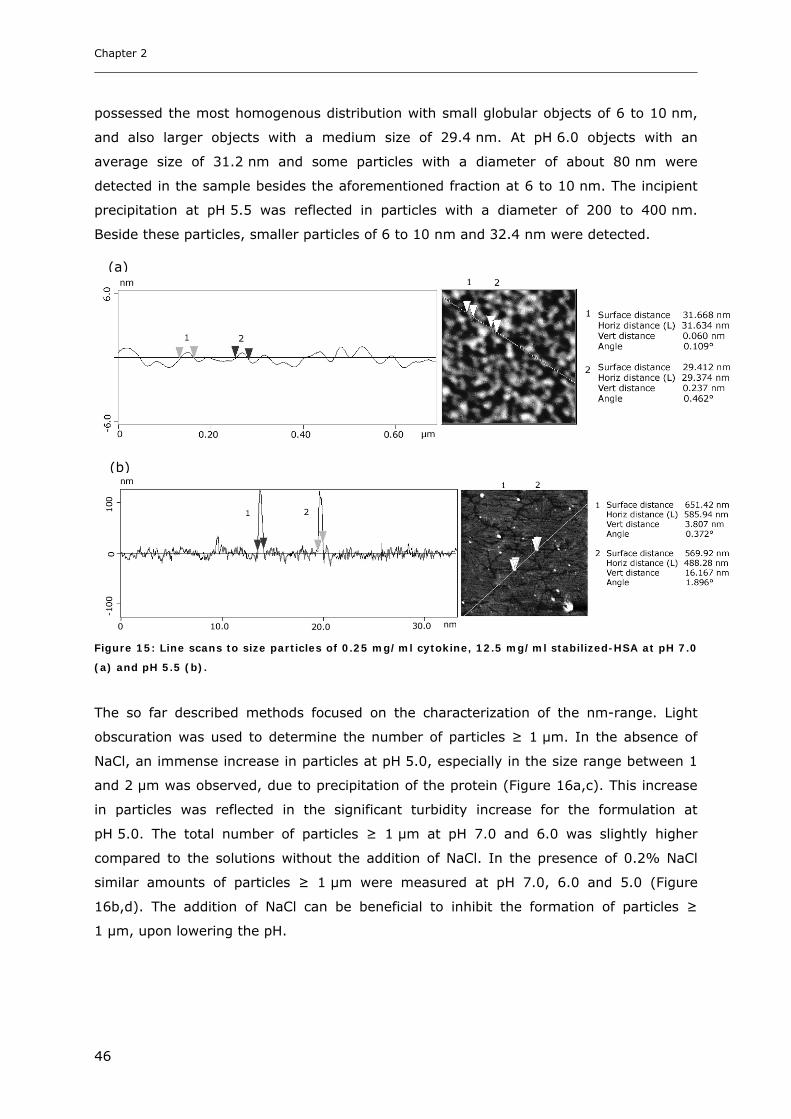
Chapter 2
46
possessed the most homogenous distribution with small globular objects of 6 to 10 nm,
and also larger objects with a medium size of 29.4 nm. At pH 6.0 objects with an
average size of 31.2 nm and some particles with a diameter of about 80 nm were
detected in the sample besides the aforementioned fraction at 6 to 10 nm. The incipient
precipitation at pH 5.5 was reflected in particles with a diameter of 200 to 400 nm.
Beside these particles, smaller particles of 6 to 10 nm and 32.4 nm were detected.
Figure 15: Line scans to size particles of 0.25 mg/ml cytokine, 12.5 mg/ml stabilized-HSA at pH 7.0
(a) and pH 5.5 (b).
The so far described methods focused on the characterization of the nm-range. Light
obscuration was used to determine the number of particles ≥ 1 µm. In the absence of
NaCl, an immense increase in particles at pH 5.0, especially in the size range between 1
and 2 µm was observed, due to precipitation of the protein (Figure 16a,c). This increase
in particles was reflected in the significant turbidity increase for the formulation at
pH 5.0. The total number of particles ≥ 1 µm at pH 7.0 and 6.0 was slightly higher
compared to the solutions without the addition of NaCl. In the presence of 0.2% NaCl
similar amounts of particles ≥ 1 µm were measured at pH 7.0, 6.0 and 5.0 (Figure
16b,d). The addition of NaCl can be beneficial to inhibit the formation of particles ≥
1 µm, upon lowering the pH.
(a)
(b)
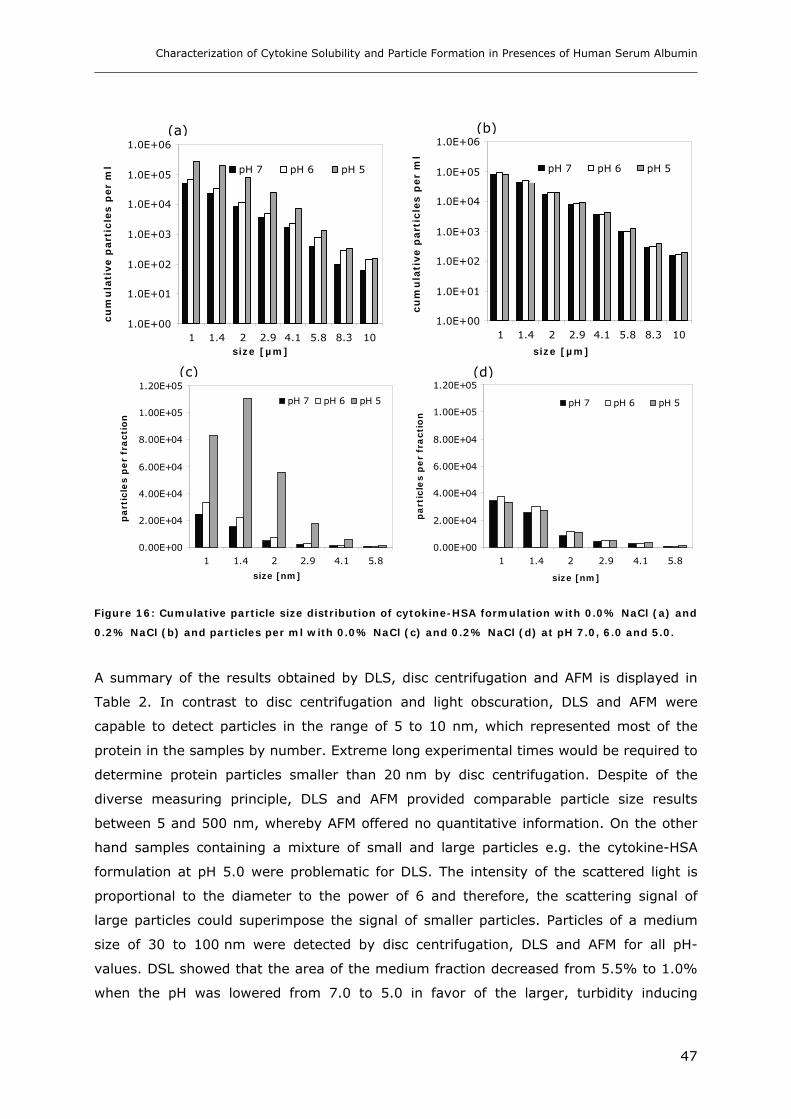
Characterization of Cytokine Solubility and Particle Formation in Presences of Human Serum Albumin
47
1.0E+00
1.0E+01
1.0E+02
1.0E+03
1.0E+04
1.0E+05
1.0E+06
1 1.4 2 2.9 4.1 5.8 8.3 10size [µm]
cu
mu
lati
ve p
art
icle
s p
er
ml pH 7 pH 6 pH 5
1.0E+00
1.0E+01
1.0E+02
1.0E+03
1.0E+04
1.0E+05
1.0E+06
1 1.4 2 2.9 4.1 5.8 8.3 10
size [µm]
cu
mu
lati
ve p
art
icle
s p
er
ml
pH 7 pH 6 pH 5
0.00E+00
2.00E+04
4.00E+04
6.00E+04
8.00E+04
1.00E+05
1.20E+05
1 1.4 2 2.9 4.1 5.8
size [nm]
pa
rtic
les p
er
fra
cti
on
pH 7 pH 6 pH 5
0.00E+00
2.00E+04
4.00E+04
6.00E+04
8.00E+04
1.00E+05
1.20E+05
1 1.4 2 2.9 4.1 5.8
size [nm]
pa
rtic
les p
er
fra
cti
on
pH 7 pH 6 pH 5
Figure 16: Cumulative particle size distribution of cytokine-HSA formulation with 0.0% NaCl (a) and
0.2% NaCl (b) and particles per ml with 0.0% NaCl (c) and 0.2% NaCl (d) at pH 7.0, 6.0 and 5.0.
A summary of the results obtained by DLS, disc centrifugation and AFM is displayed in
Table 2. In contrast to disc centrifugation and light obscuration, DLS and AFM were
capable to detect particles in the range of 5 to 10 nm, which represented most of the
protein in the samples by number. Extreme long experimental times would be required to
determine protein particles smaller than 20 nm by disc centrifugation. Despite of the
diverse measuring principle, DLS and AFM provided comparable particle size results
between 5 and 500 nm, whereby AFM offered no quantitative information. On the other
hand samples containing a mixture of small and large particles e.g. the cytokine-HSA
formulation at pH 5.0 were problematic for DLS. The intensity of the scattered light is
proportional to the diameter to the power of 6 and therefore, the scattering signal of
large particles could superimpose the signal of smaller particles. Particles of a medium
size of 30 to 100 nm were detected by disc centrifugation, DLS and AFM for all pH-
values. DSL showed that the area of the medium fraction decreased from 5.5% to 1.0%
when the pH was lowered from 7.0 to 5.0 in favor of the larger, turbidity inducing
(a) (b)
(c) (d)
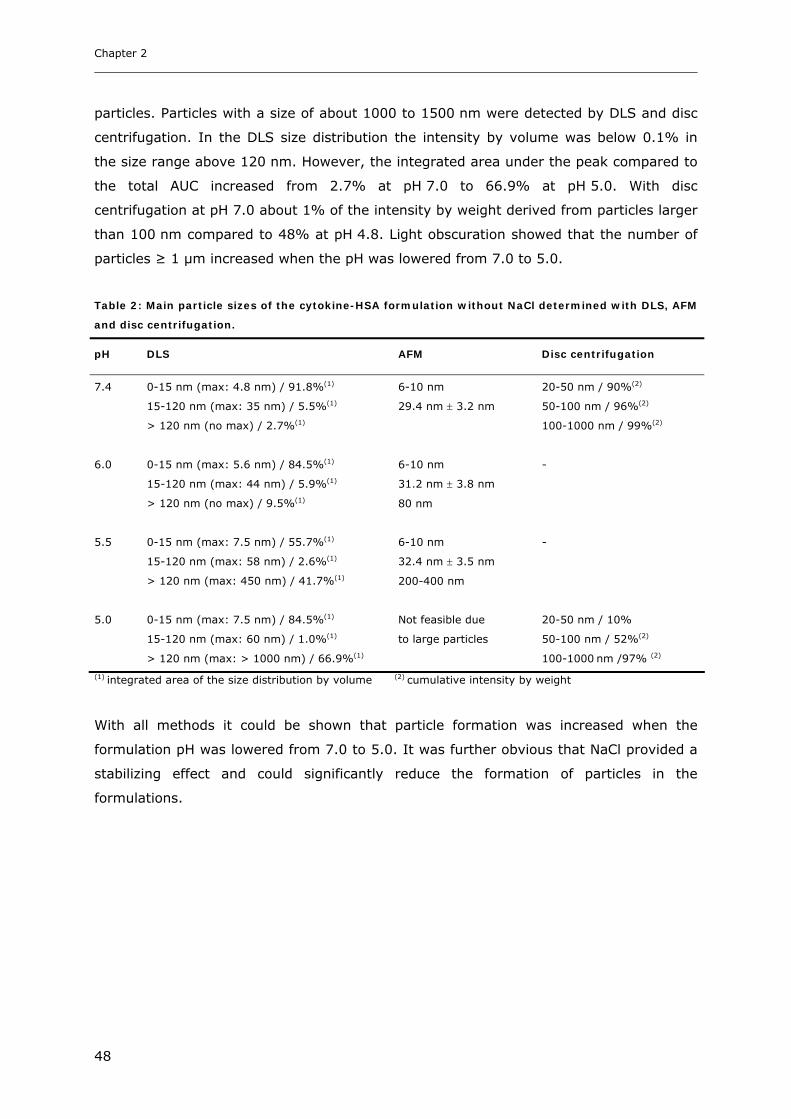
Chapter 2
48
particles. Particles with a size of about 1000 to 1500 nm were detected by DLS and disc
centrifugation. In the DLS size distribution the intensity by volume was below 0.1% in
the size range above 120 nm. However, the integrated area under the peak compared to
the total AUC increased from 2.7% at pH 7.0 to 66.9% at pH 5.0. With disc
centrifugation at pH 7.0 about 1% of the intensity by weight derived from particles larger
than 100 nm compared to 48% at pH 4.8. Light obscuration showed that the number of
particles ≥ 1 µm increased when the pH was lowered from 7.0 to 5.0.
Table 2: Main particle sizes of the cytokine-HSA formulation without NaCl determined with DLS, AFM
and disc centrifugation.
pH DLS AFM Disc centrifugation
7.4
0-15 nm (max: 4.8 nm) / 91.8%(1)
15-120 nm (max: 35 nm) / 5.5%(1)
> 120 nm (no max) / 2.7%(1)
6-10 nm
29.4 nm ± 3.2 nm
20-50 nm / 90%(2)
50-100 nm / 96%(2)
100-1000 nm / 99%(2)
6.0 0-15 nm (max: 5.6 nm) / 84.5%(1)
15-120 nm (max: 44 nm) / 5.9%(1)
> 120 nm (no max) / 9.5%(1)
6-10 nm
31.2 nm ± 3.8 nm
80 nm
-
5.5 0-15 nm (max: 7.5 nm) / 55.7%(1)
15-120 nm (max: 58 nm) / 2.6%(1)
> 120 nm (max: 450 nm) / 41.7%(1)
6-10 nm
32.4 nm ± 3.5 nm
200-400 nm
-
5.0 0-15 nm (max: 7.5 nm) / 84.5%(1)
15-120 nm (max: 60 nm) / 1.0%(1)
> 120 nm (max: > 1000 nm) / 66.9%(1)
Not feasible due
to large particles
20-50 nm / 10%
50-100 nm / 52%(2)
100-1000 nm /97% (2)
(1) integrated area of the size distribution by volume (2) cumulative intensity by weight
With all methods it could be shown that particle formation was increased when the
formulation pH was lowered from 7.0 to 5.0. It was further obvious that NaCl provided a
stabilizing effect and could significantly reduce the formation of particles in the
formulations.

Characterization of Cytokine Solubility and Particle Formation in Presences of Human Serum Albumin
49
3.2 Studies on HSA-Placebo Formulations
Within the progress of the study it was observed that stabilized-HSA behaved
significantly different as compared to unstabilized-HSA. In addition, various batches of
Sigma-HSA showed significant differences in their turbidity profile over the pH-range. To
elaborate these findings two selected batches of unstabilized-HSA were compared by
turbidity measurement, SDS-PAGE, FTIR, zetapotential measurement and DLS. For the
cytokine-HSA formulation stabilized-HSA, which contained the excipients NaCl, Na-
octanoate and Na-N-acetyltryptophanate was used. To clarify the role of these stabilizers
on the behavior of the formulation the impact of the stabilizers on HSA at different pH
and ionic strength conditions was studied.
3.2.1 Batch to Batch Variations of Unstabilized-HSA
Turbidity scans of the analyzed Sigma-batches revealed significant differences in their
profile and turbidity maximum (Figure 17). The turbidity maxima of the four different
batches ranged between 9 and 42 FNU and were located between pH 4.5 and 4.8.
0
10
20
30
40
50
3.0 4.0 5.0 6.0 7.0
pH
turb
idit
y [
FN
U]
072K7600
033K7600
072K7601
033K7601
Figure 17: Turbidity of different batches of 12.5 mg/ml unstabilized-HSA between pH 7.0 and 3.0.
For a more detailed characterization, the batches 033K7600 and 033K7601 were
selected, as they were comparable in shelf-life, time-point of opening and storage
conditions. Although the batches provided a comparable history, the turbidity increase for
batch 033K7600 with a maximum above 40 FNU was more pronounced than for batch
033K7601 (Figure 18a,b). The stabilizing effect of NaCl on the two batches was similar.
The addition of 0.2% NaCl led to a constant low turbidity of about 3 to 4 FNU from
pH 7.0 to 3.5 for both batches.
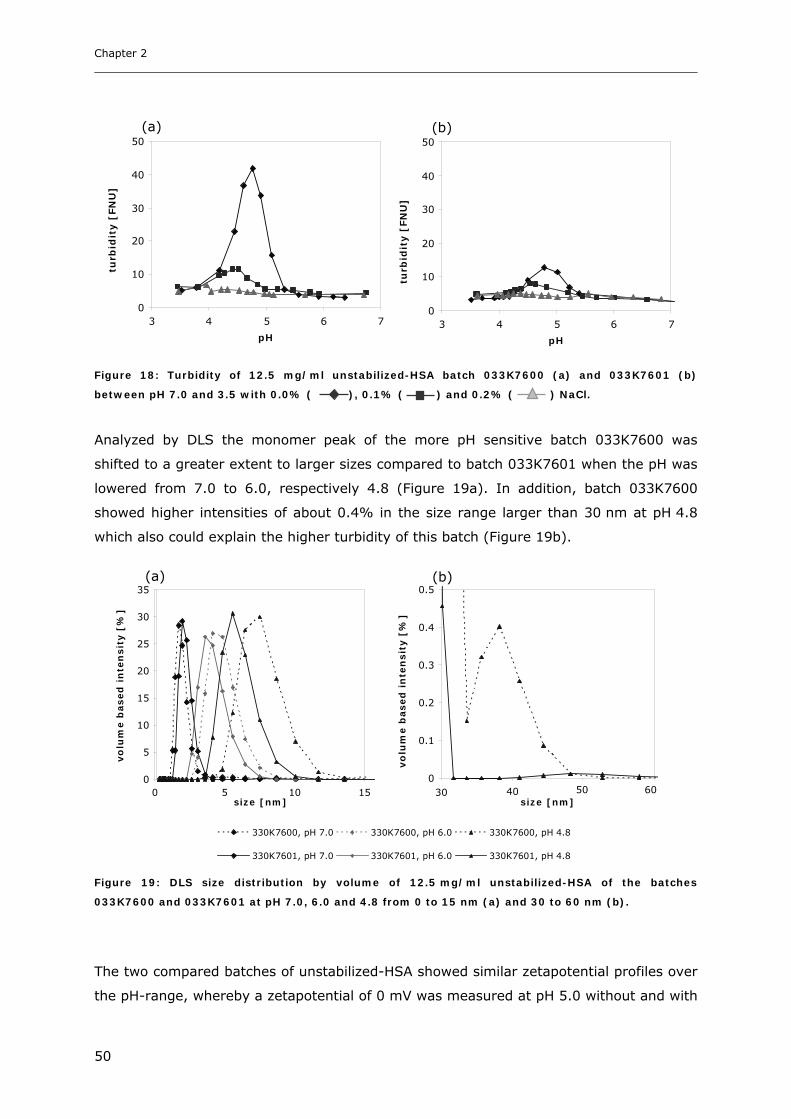
Chapter 2
50
0
10
20
30
40
50
3 4 5 6 7
pH
turb
idit
y [
FN
U]
0
10
20
30
40
50
3 4 5 6 7
pH
turb
idit
y [
FN
U]
Figure 18: Turbidity of 12.5 mg/ml unstabilized-HSA batch 033K7600 (a) and 033K7601 (b)
between pH 7.0 and 3.5 with 0.0% ( ), 0.1% ( ) and 0.2% ( ) NaCl.
Analyzed by DLS the monomer peak of the more pH sensitive batch 033K7600 was
shifted to a greater extent to larger sizes compared to batch 033K7601 when the pH was
lowered from 7.0 to 6.0, respectively 4.8 (Figure 19a). In addition, batch 033K7600
showed higher intensities of about 0.4% in the size range larger than 30 nm at pH 4.8
which also could explain the higher turbidity of this batch (Figure 19b).
0
5
10
15
20
25
30
35
0 5 10 15size [nm]
vo
lum
e b
ased
in
ten
sit
y [
%]
0
0.1
0.2
0.3
0.4
0.5
10 20 30 40size [nm]
vo
lum
e b
ased
in
ten
sit
y [
%]
30 40 50 60
330K7600, pH 7.0 330K7600, pH 6.0 330K7600, pH 4.8
330K7601, pH 7.0 330K7601, pH 6.0 330K7601, pH 4.8
Figure 19: DLS size distribution by volume of 12.5 mg/ml unstabilized-HSA of the batches
033K7600 and 033K7601 at pH 7.0, 6.0 and 4.8 from 0 to 15 nm (a) and 30 to 60 nm (b).
The two compared batches of unstabilized-HSA showed similar zetapotential profiles over
the pH-range, whereby a zetapotential of 0 mV was measured at pH 5.0 without and with
(a) (b)
(a) (b)
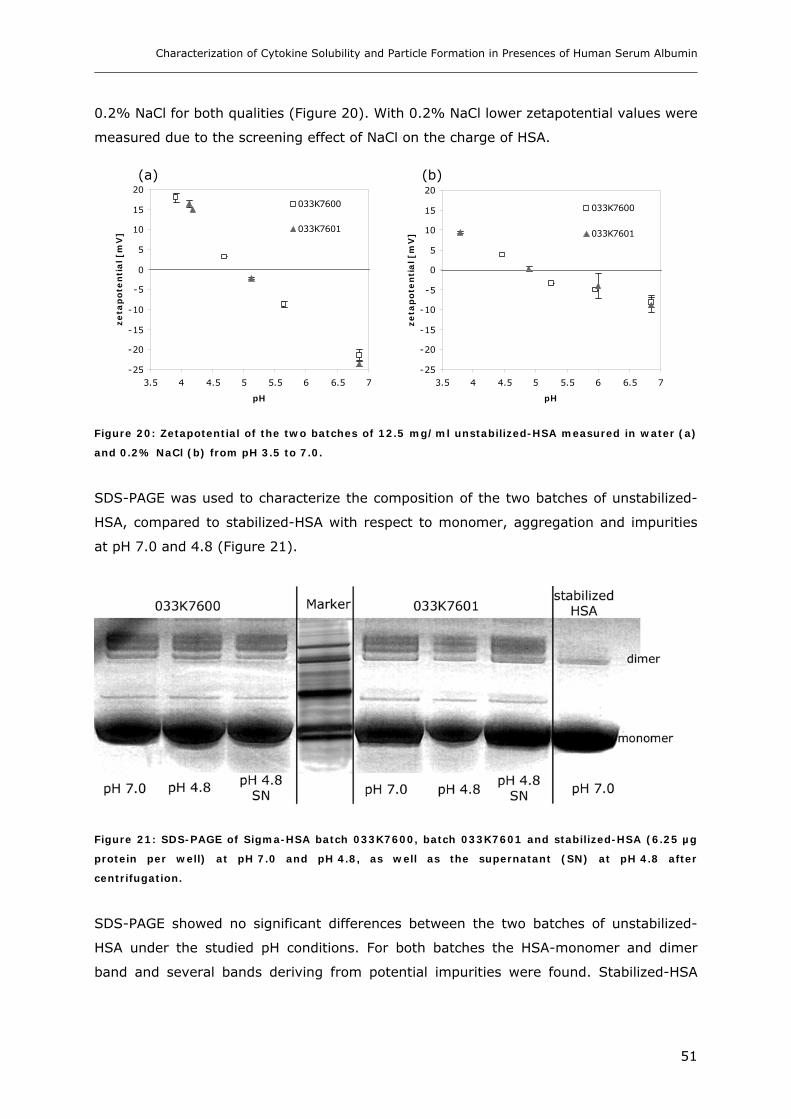
Characterization of Cytokine Solubility and Particle Formation in Presences of Human Serum Albumin
51
0.2% NaCl for both qualities (Figure 20). With 0.2% NaCl lower zetapotential values were
measured due to the screening effect of NaCl on the charge of HSA.
-25
-20
-15
-10
-5
0
5
10
15
20
3.5 4 4.5 5 5.5 6 6.5 7
pH
ze
tap
ote
nti
al [m
V]
033K7600
033K7601
-25
-20
-15
-10
-5
0
5
10
15
20
3.5 4 4.5 5 5.5 6 6.5 7
pHze
tap
ote
nti
al [m
V]
033K7600
033K7601
Figure 20: Zetapotential of the two batches of 12.5 mg/ml unstabilized-HSA measured in water (a)
and 0.2% NaCl (b) from pH 3.5 to 7.0.
SDS-PAGE was used to characterize the composition of the two batches of unstabilized-
HSA, compared to stabilized-HSA with respect to monomer, aggregation and impurities
at pH 7.0 and 4.8 (Figure 21).
Figure 21: SDS-PAGE of Sigma-HSA batch 033K7600, batch 033K7601 and stabilized-HSA (6.25 µg
protein per well) at pH 7.0 and pH 4.8, as well as the supernatant (SN) at pH 4.8 after
centrifugation.
SDS-PAGE showed no significant differences between the two batches of unstabilized-
HSA under the studied pH conditions. For both batches the HSA-monomer and dimer
band and several bands deriving from potential impurities were found. Stabilized-HSA
(a) (b)
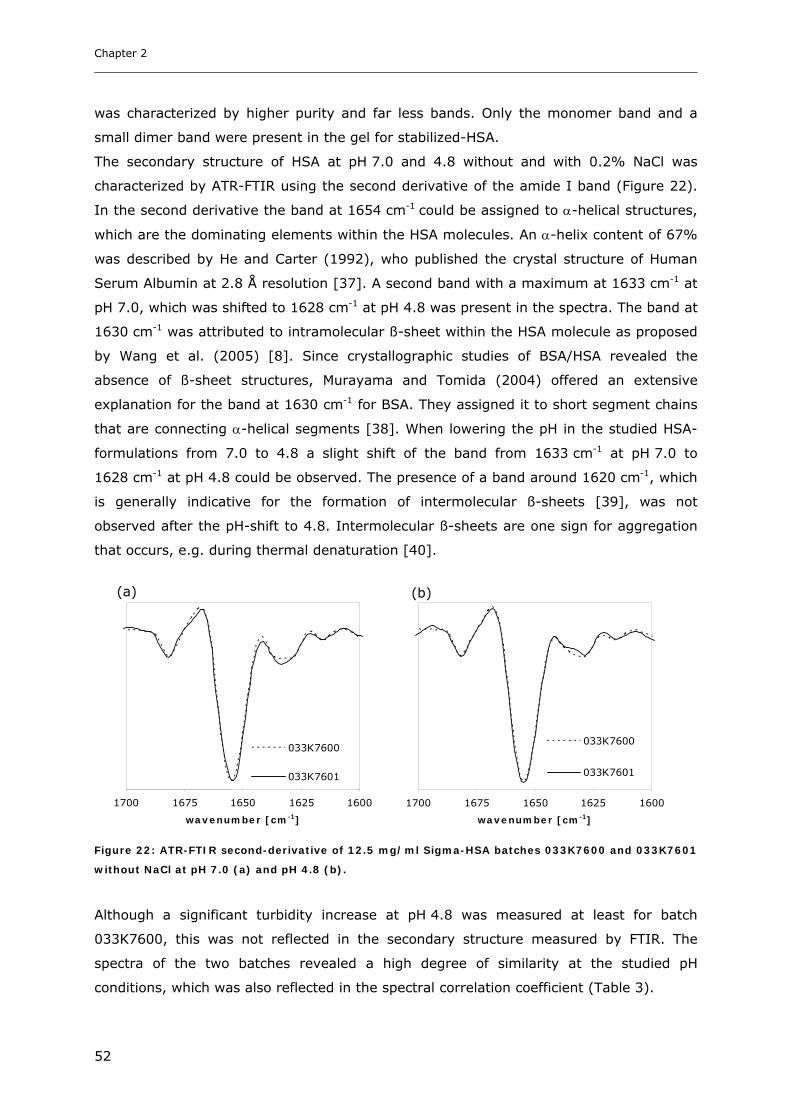
Chapter 2
52
was characterized by higher purity and far less bands. Only the monomer band and a
small dimer band were present in the gel for stabilized-HSA.
The secondary structure of HSA at pH 7.0 and 4.8 without and with 0.2% NaCl was
characterized by ATR-FTIR using the second derivative of the amide I band (Figure 22).
In the second derivative the band at 1654 cm-1 could be assigned to α-helical structures,
which are the dominating elements within the HSA molecules. An α-helix content of 67%
was described by He and Carter (1992), who published the crystal structure of Human
Serum Albumin at 2.8 Å resolution [37]. A second band with a maximum at 1633 cm-1 at
pH 7.0, which was shifted to 1628 cm-1 at pH 4.8 was present in the spectra. The band at
1630 cm-1 was attributed to intramolecular ß-sheet within the HSA molecule as proposed
by Wang et al. (2005) [8]. Since crystallographic studies of BSA/HSA revealed the
absence of ß-sheet structures, Murayama and Tomida (2004) offered an extensive
explanation for the band at 1630 cm-1 for BSA. They assigned it to short segment chains
that are connecting α-helical segments [38]. When lowering the pH in the studied HSA-
formulations from 7.0 to 4.8 a slight shift of the band from 1633 cm-1 at pH 7.0 to
1628 cm-1 at pH 4.8 could be observed. The presence of a band around 1620 cm-1, which
is generally indicative for the formation of intermolecular ß-sheets [39], was not
observed after the pH-shift to 4.8. Intermolecular ß-sheets are one sign for aggregation
that occurs, e.g. during thermal denaturation [40].
16001625165016751700
wavenumber [cm-1]
033K7600
033K7601
16001625165016751700
wavenumber [cm-1]
033K7600
033K7601
Figure 22: ATR-FTIR second-derivative of 12.5 mg/ml Sigma-HSA batches 033K7600 and 033K7601
without NaCl at pH 7.0 (a) and pH 4.8 (b).
Although a significant turbidity increase at pH 4.8 was measured at least for batch
033K7600, this was not reflected in the secondary structure measured by FTIR. The
spectra of the two batches revealed a high degree of similarity at the studied pH
conditions, which was also reflected in the spectral correlation coefficient (Table 3).
(a) (b)

Characterization of Cytokine Solubility and Particle Formation in Presences of Human Serum Albumin
53
Table 3: Spectral correlation coefficient of amide I band (1700 to 1600 cm-1) setting 033K7600 as
sample and 033K7601 as reference.
0.0% NaCl 0.2% NaCl
pH 7.0 99.77% 99.73%
pH 4.8 99.88% 99.86%
Thus, the studies pointed at a difference between the HSA-batches regarding the
precipitation behavior at pH 4.8, close to the pI of the protein, which was monitored by
turbidity measurement and DLS. Despite this behavior, SDS-PAGE and FTIR revealed no
significant differences in aggregation and secondary structure. A possible explanation for
the variations between the batches could be the degree of purity. Batch 033K7600, which
tended to higher turbidity values at pH 4.8 had a purity of 98% according to the
certificate of analysis compared to a purity of 99% for batch 033K7601. Even though no
definite explanation for the different behavior of batches was found, the occurrence of
batch to batch variations needed to be taken into consideration when using the
unstabilized-HSA as raw material.
3.2.2 Impact of NaCl, Na-N-Acetyltryptophanate and Na-Octanoate on
HSA
When used as excipient in the cytokine-HSA formulation, HSA stabilized with Na-
octanoate, Na-N-acetyltryptophanate and NaCl was exclusively used due to regulatory
requirements. The FDA requires the addition of 0.08 mM Na-octanoate and 0.08 mM Na-
N-acetyltryptophanate, respectively 0.16 mM Na-octanoate per gram HSA to stabilize the
protein against heat-induced stress during the pasteurization process [2]. For a solution
with 12.5 mg/ml HSA the addition of 2 mM stabilizers is hence required. Stabilized-HSA
exhibited a constant turbidity below 5 FNU over the pH-range, compared to a significant
increase above 50 FNU at pH 4.8 for some batches of unstabilized-HSA. To elucidate the
differences between stabilized and unstabilized-HSA, the impact of the different
stabilizers on the turbidity of unstabilized-HSA over the pH-range was to be analyzed.
Batch 033K7600 was used, as this batch showed the most pronounced turbidity increase
at pH 4.8 without further stabilization.
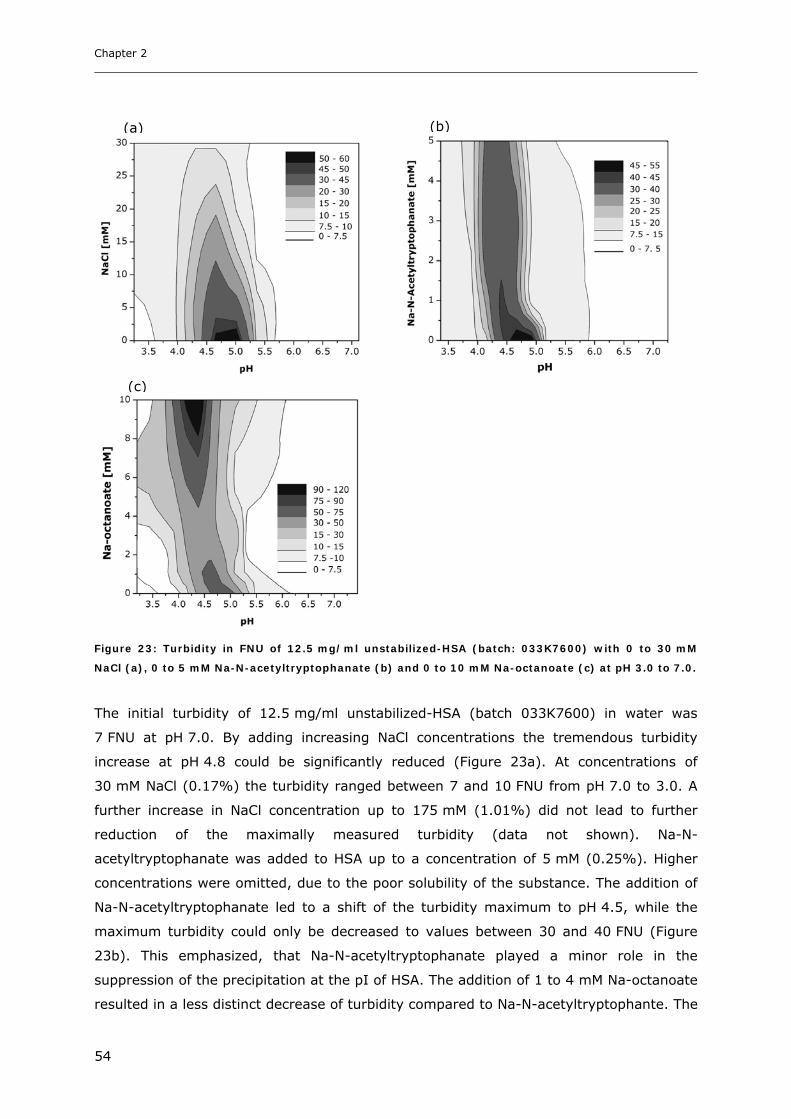
Chapter 2
54
Figure 23: Turbidity in FNU of 12.5 mg/ml unstabilized-HSA (batch: 033K7600) with 0 to 30 mM
NaCl (a), 0 to 5 mM Na-N-acetyltryptophanate (b) and 0 to 10 mM Na-octanoate (c) at pH 3.0 to 7.0.
The initial turbidity of 12.5 mg/ml unstabilized-HSA (batch 033K7600) in water was
7 FNU at pH 7.0. By adding increasing NaCl concentrations the tremendous turbidity
increase at pH 4.8 could be significantly reduced (Figure 23a). At concentrations of
30 mM NaCl (0.17%) the turbidity ranged between 7 and 10 FNU from pH 7.0 to 3.0. A
further increase in NaCl concentration up to 175 mM (1.01%) did not lead to further
reduction of the maximally measured turbidity (data not shown). Na-N-
acetyltryptophanate was added to HSA up to a concentration of 5 mM (0.25%). Higher
concentrations were omitted, due to the poor solubility of the substance. The addition of
Na-N-acetyltryptophanate led to a shift of the turbidity maximum to pH 4.5, while the
maximum turbidity could only be decreased to values between 30 and 40 FNU (Figure
23b). This emphasized, that Na-N-acetyltryptophanate played a minor role in the
suppression of the precipitation at the pI of HSA. The addition of 1 to 4 mM Na-octanoate
resulted in a less distinct decrease of turbidity compared to Na-N-acetyltryptophante. The
(a) (b)
(c)

Characterization of Cytokine Solubility and Particle Formation in Presences of Human Serum Albumin
55
turbidity maximum was shifted to pH 4.5, comparable to Na-N-acetyltryptophante
(Figure 23c). A further increase in Na-octanoate to a concentration between 5 and
10 mM initiated higher turbidities with maximum values above 110 FNU. Na-octanoate
and Na-N-acetyltryptophante are known to bind to the same high affinity site II located
in the subdomain IIIA of HSA [41,42]. The comparable effect on turbidity could therefore
be assigned to the fact that both substances use the same stabilizing binding
mechanism. In Figure 24 the impact of the Na-octanoate and Na-N-acetyltryptophante,
respectively in combination with NaCl on unstabilized is shown.
0
10
20
30
40
50
60
70
3 4 5 6 7
pH
turb
idit
y [
FN
U]
no additives
1 mM AT
10 mM NaCl
1 mM AT +10 mM NaCl
0
10
20
30
40
50
60
70
3 4 5 6 7
pH
turb
idit
y [
FN
U]
no additives
1 mM Oct
10 mM NaCl
1 mM Oct + 10mM NaCl
Figure 24: Impact of Na-N-acetyltryptophanate (AT), Na-octanoate (Oct), NaCl and a combination of
the stabilizers on the turbidity of 12.5 mg/ml unstabilized-HSA from pH 3.5 to 7.2.
Apparently, NaCl played the major role in the prevention of the turbidity increase at
pH 4.8, while the other stabilizers led to a shift of the turbidity maximum to lower pH
values. The slightly better stabilization of Na-N-acetyltryptophanate compared to Na-
octanoate could be assigned to an increased ionic strength in the formulations with Na-N-
acetyltryptophanate. The ionic strength was increased for formulations with Na-N-
acetyltryptophanate, because the poorly soluble compound was dissolved above pH 11
and the pH was adjusted to 7.0 by using HCl/NaOH.
(a) (b)
Chapter 2
56
4. Conclusions
For the studied formulation with 0.25 mg/ml cytokine, 12.5 mg/ml stabilized-HSA and
12.5 mg/ml mannitol a significant increase in turbidity was observed, when the pH was
lowered, reaching a maximum above 100 FNU at pH 5.0. SDS-PAGE revealed that at
pH 5.0 most of the cytokine was found in the precipitate. The particle formation process
was characterized by DLS, disc centrifugation, AFM and light obscuration. The
formulations contained mostly monomers of 5 to 10 nm and a second particle population
at 20 to 50 nm. In highly turbid formulations e.g. when the pH of the cytokine-HSA
formulation was lowered to 5.0 a third population at 500 to 1000 nm emerged. Studies
with HSA placebo formulation made clear that Na-octanoate and Na-N-
acetyltryptophanate used in the concentrations to stabilize HSA only played a minor role
in preventing the turbidity increase at pH 5.0. However, the addition of NaCl provided a
stabilizing effect on the formulation, as the turbidity increase at pH 5.0 could be
significantly reduced. Fluorescence spectroscopy further revealed that the interactions
between HSA and the cytokine were weaker in the presence of NaCl at pH 4.5. The HSA-
cytokine precipitation at pH 5.0 was partly irreversible, when the pH was adjusted back
to 7.4. This irreversibility could become an issue e.g. during pH-adjustment with acid
when the pH drops below 7.4 into the turbidity region at least temporarily in some areas
of a batch. Besides of a reduction of the cytokine-HSA interactions by NaCl, it is essential
to provide sufficient stabilization of HSA by NaCl to achieve an overall stable cytokine-
HSA formulation.
Characterization of Cytokine Solubility and Particle Formation in Presences of Human Serum Albumin
57
5. References
1. L. S. Lin, M. G. Kunitani, M. S. Hora. Interferon-ß-1b (Betaseron®); A Model for Hydrophobic Therapeutic
Proteins. Pharm. Biotechnol. 9:275-301 (1996).
2. U.S. Food and Drug Administration, Code of Federal Regulations, Title 21, Volume 7: §640.80 Albumin
(Human), revised as on April 1, 2004.
3. G. Scatchard, L. E. Strong, W. L. Hughes Jr., J. N. Ashworth, A. H. Sparrow. Chemical, clinical, and
immunological studies and the products of human plasma fractionation. XXVI. The properties of human
serum albumin at low salt content. J. Clin. Invest. 24:671-679 (1945).
4. G. A. Ballou, P. D. Boyer, J. M. Luck, G. F. Lum. The heat coagulation of human albumin. J. Biol. Chem.
153: 589-605 (1944).
5. L. Saso, G. Valentini, E. Grippa, M. G. Leone, B. Silvestrini. Effect of selected substances on heat-induced
aggregation of Albumin, IgG and Lysozyme. Res. Com. Mol. Pathol. Pharmacol. 102:15-28 (1998).
6. M. A. H. Capelle, R. Gurny, T. Avinte. High Throughput Screening of Protein-Protein Interactions. Proc. 5th
World Meeting on Pharm. Biopharm. Pharm. Tech. Geneva (2006).
7. S. L. Wang, S. Y. Lin, M. J. Li, Y. S. Wei, T. F. Hsieh. Temperature effect on the structural stability,
similarity and reversibility of human serum albumin in different states. Biophy. Chem. 114:205-212
(2005).
8. S. L. Wang, Y. S. Wei, S. Y. Lin. Subtractive similarity method used to study the infrared spectra of
proteins in aqueous solution. Vibrat. Spectroscopy 31:313-319 (2003).
9. H. C. Mahler, R. Müller, W. Frieß, A. Delille, S. Matheus. Induction and analysis of aggregates in a liquid
IgG1-antibody formulation. E. J. Pharm. Biopham. 59:407-417 (2005).
10. S. Hershenson, J. Thomson. Isoelectric focusing of recombinant interferon-ß. Appl. Theor. Electrophr.
1:123-124 (1989).
11. M. Houska, E. Brynda. Interactions of proteins with polyelectrolytes at solid/liquid interfaces: sequential
adsorption of albumin and heparin. J. Colloid. Interf. Sci. 188:243-250 (1997).
12. E. Y. Chi, S. Krishnan, T. W. Randolph, J. F. Carpenter. Physical Stability of Proteins in Aqueous Solution:
Mechanism and Driving Forces in Nonnative Protein Aggregation. Pharm. Res. 20:1325-1336 (2003).
13. M. Yamasaki, H. Yano, K. Aoki. Differential scanning calorimetric studies on bovine serum albumin: I
Effects of pH and ionic strength. Int. J. Biol. Macromol. 12:263-268 (1990).
14. Y. Koga, P. Westh, J. V. Davies, K. Miki, K. Nishikawa, H. Katayanagi. Toward Understanding the
Hofmeister Series. 1. Effect of Sodium Salts of Some Anions on the Molecular Organization of H2O. J. Phys.
Chem. 108:8533-8541 (2004).
15. T. Arakawa, S. N. Timasheff. Preferential Interactions of Proteins with Salts in Concentrated Solutions.
Biochem. 21:6545-6552 (1982).
16. T. Arakawa, S. N. Timasheff. Mechanism of Protein Salting In and Salting Out by Divalent Cation Salts:
Balance between Hydration and Salt Binding. Biochem. 23:5912-5923 (1984).
17. M. Yamasaki, H. Yano. Differential scanning calorimetric studies on bovine serum albumin: I. Effects of pH
and ionic strength. Int. J. Bio. Macromol. 12:263-268 (1990).
18. M. Yamasaki, H. Yano. Differential scanning calorimetric studies on bovine serum albumin: II. Effects of
neutral salts and urea. Int. J. Bio. Macromol. 13:322-328 (1991).
19. K. Rezwan, L. P. Meier, L. J. Gauckler. A Prediction Method for the Isoelectric Point of Binary Protein
Mixtures of Bovine Serum Albumin and Lysozyme Adsorbed on Colloidal Titania and Alumina Particles.
Langmuir 21:3493-3497 (2005).
20. S. L. Huang, F. Y. Lin, C. P. Yang. Microcalorimetric studies of the effects on the interactions of human
recombinant interferon-α2a. Eur. J. Pharm. Sci. 24:545-552 (2005).
Chapter 2
58
21. A. Velazquez-Campoy, S. A. Leavitt, E. Freire. Characterization of protein-protein interactions by
isothermal titration calorimetry. Methods in Molec. Biol. 261:35-54 (2004).
22. L. Quin, O. Vinogradova, A. M. Gronenborn. Protein-protein interactions probed by nuclear magnetic
resonance spectroscopy. Meth. in Enzymolog. 339:377-389 (2001).
23. S. Beeckmans. Chromatographic Methods to Study Protein-Protein Interactions. Methods 19:278-305
(1999).
24. A. S. Ladokhin. Fluorescence Spectroscopy in Peptide and Protein Analysis. in Encyclopedia of Analytical
Chemistry. R. A. Meyers (Ed.), 5762-5779 (2000).
25. W. Jiskoot, A. J. W. G. Visser, J. N. Herron, M. Sutter. Fluorescence Spectroscopy. In Methods for
Structural Analysis of Protein Pharmaceuticals. Eds. W. Jiskoot, D. J. A. Crommelin. AAPS Press (2005).
26. V. K. Sharma, D. S. Kalonia. Temperature- and pH-Induced Multiple Partially Unfolded States of
Recombinant Human Interferon-α2a: Possible Implications in Protein Stability. Pharm. Res. 20:1721-1729
(2003).
27. T. H. Holzman, J. J. Dougherty Jr., D. N. Brems, N. E. MacKenzie. pH-Induced Conformational States of
Bovine Growth Hormone. Biochem. 29:1255-1261 (1990).
28. V. M. Gun’ko, A. V. Klyueva, Y. N. Levchuk, R. Leboda. Photon Correlation Spectroscopy investigations of
proteins. Adv. Coll. Interf. Sci. 105:201-238 (2003).
29. P. C. Sontum, C. Christiansen. Photon Correlation Spectroscopy applied to characterisation of denaturation
and thermal stability of human albumin. J. Pharm. Biomed. Anal. 16:295-302 (1997).
30. L. L. Bondoc Jr, S. Fritzpatrick. Size distribution analysis of recombinant adenovirus using disc
centrifugation. J. Indust. Microbiol. Biotechnol. 20:317-322 (1998).
31. E. M. Verdurmen, J. G. Albers, A. L. Geramn. Polybutadiene latex particle size distribution analysis utilizing
a disk centrifuge. Colloid. Polym. Sci. 272:57-63 (1994).
32. P. Navabpour, C. Rega, C. J. Lloyd, D. Attwood, P. A. Lovell, P. Geraghty, D. Clarke. Influence of
concentration on the particle size analysis of polymer latexes using diffusing-wave spectroscopy. Colloid.
Polym. Sci. 283:1025-1032 (2005).
33. B. Herzog, A. Katzenstein, K. Quass, A. Stehlin, H. Luther. Physical properties of organic particulate UV-
absorbers used in sunscreens I. Determination of particle size with fiber-optic quasi-elastic light scattering
(FOQELS), disc centrifugation, and laser diffractometry. J. Coll. Interf. Sci. 271:136-144 (2004).
34. A. Azioune, A. B. Slimane, L. Ait Hamou, A. Pleuvy, M. M. Chehimi, C. Perruchot, S. P. Armes. Synthesis
and Characterization of Active Ester-Functionalized Polypyrrole-Silica Nanoparticles: Application to the
Covalent Attachment of Proteins. Langmuir 20:3350-3356 (2004).
35. G. Neal, E. Keshavarz-Moore, S. P. Ayazi. Ultra scale-down approach for the prediction of full-scale
recovery of ovine polyclonal immunoglobulins used in the manufacture of snake venom specific fab
fragment. Biotechnol. Bioeng. 81:149-157 (2003).
36. H. H. Wong, B. K. O’Neill, A. P. J. Middelberg. Cumulative Sedimentation Analysis of Escherichia coli debris
size. Biotechnol. Bioeng. 55:556-564 (1997).
37. X. M. He, D. C. Carter. Atomic structure and chemistry of human serum albumin. Nature 358:209-215
(1992).
38. K. Murayama, M. Tomida. Heat-Induced Secondary Structure and Conformation Change of Bovine Serum
Albumin Investigated by Fourier Transform Infrared Spectroscopy. Biochem. 43:11526-11532 (2004).
39. A. C. Dong, S. J. Prestrelski, S. D. Allison, J. F. Carpenter. Infrared Spectroscopic studies of lyophilization
induced protein aggregation. J. Pharm. Sci. 84:415-424 (1995).
40. E. Pauthe. J. Pelta, S. Patel, D. Lairez, F. Goubard. Temperature induced ß-aggregation of fibronectin in
aqueous solutions. Biochim. Biophy. Acta 1597:12-21 (2002).

Characterization of Cytokine Solubility and Particle Formation in Presences of Human Serum Albumin
59
41. M. Anraku, Y. Tsurusaki, H. Watanabe, T. Maruyama, U. Kragh-Hansen, M. Otagiri. Stabilizing mechanisms
in commercial albumin preparations: octanoate and N-acetyl-L-tryptophanate protect human serum
albumin against heat and oxidative stress. Biochim. et Biophys. Acta 1702:9-17 (2004).
42. U. Kragh-Hansen, V. T. G. Chuang, M. Otagiri. Practical aspects of the ligand-binding and enzymatic
properties of human serum albumin. Biol. Pharm. Bull. 25:695-704 (2002).
Chapter 3
Physico-chemical Characterization of the Freezing
Behavior of Mannitol-Human Serum Albumin
Formulations
Abstract
The goal of the study was to analyze the impact of the Human Serum Albumin (HSA)
quality (stabilized or non-stabilized HSA), the addition of NaCl and the HSA-stabilizers
Na-octanoate and Na-N-acetyltryptophanate on the freezing behavior of mannitol-HSA
formulations. The focus was set on crystallization, Tg’ (glass transition temperature of
the maximally freeze-concentrated phase) and Tc (collapse temperature). Differential
Scanning Calorimetry (DSC), cryomicroscopy and low temperature X-ray powder
diffraction (LTXRD) were used to study the frozen state. In mannitol-HSA formulations,
mannitol crystallization was inhibited and Tg’ lowered to a greater extend by stabilized-
HSA (containing Na-octanoate, Na-N-acetyltryptophanate and NaCl) than by unstabilized-
HSA. Detailed DSC and LTXRD studies showed that in the concentrations used for the
stabilization of HSA, NaCl led to changes in the freezing-behavior an effect which was
less pronounced for the other stabilizers. NaCl further lowered the Tc which was
determined by cryomicroscopy. As the freezing behavior governs the further
lyophilization process, the changes have to be taken into consideration for the
development of a lyophilization cycle to avoid collapse and instabilities.
Keywords: mannitol, HSA, NaCl, DSC, LTXRD, freezing

Physico-chemical Characterization of the Freezing Behavior of Mannitol-Human Serum Albumin Formulations
61
1. Introduction
Lyophilization is still the most frequently used technique to produce dry and stable
protein formulations. Within the lyophilization process, the applied freezing protocol and
a potential annealing step have a major effect on the subsequent drying procedure
regarding drying-rate and drying-time [1-3]. The freezing process also governs the
structure and morphology of the lyophilized products [4]. Thereby, the physico-chemical
properties of the selected excipients are influenced by the presence of salts, which are
often added as buffer components or stabilizers [5,6]. Salts can further be introduced
into the formulation within the bulk purification process or by pH-adjustment. A slight
increase in salt concentration can lead to significant changes of the physico-chemical
properties of the excipients during freezing and drying [7-10]. Therefore, it is important
to investigate and understand how the freezing step, the low temperature behavior and
the subsequent drying process of a formulation are influenced by the salt concentration.
As model system a formulation with mannitol as crystallizing bulking agent and HSA as
amorphous stabilizer is used. This combination is used to stabilize the cytokine in the
HSA-containing, lyophilized formulation (compare Chapter 2). A combination of the HSA
and mannitol as excipients for the stabilization of proteins is commonly described in
literature and patents, especially for hydrophobic proteins like interleukins and
interferons [11-13]. Mannitol is a standard excipient for lyophilization due to its excellent
cake forming qualities. The nonreducing sugar alcohol can be dried under relatively harsh
conditions, because of its high eutectic temperature of –1.5°C. The crystallization of
mannitol during freezing and drying depends on various factors. Besides the employed
mannitol concentration [4], the lyophilization process, especially the freezing rate
[14,15] has a significant impact on mannitol crystallization and morphology. The
presence of other excipients like lyoprotectants, buffer salts or proteins can promote and
inhibit mannitol crystallization [16-19]. Thus, the crystallization behavior of mannitol in
the frozen state needs to be studied to control the morphology of mannitol upon
lyophilization. HSA is still a widely used excipient in both liquid and lyophilized protein
formulations. Its application as stabilizing excipient in liquid and lyophilized formulations
was already discussed in Chapter 1. According to the US Food and Drug Administration
HSA used in protein formulations or as drug has to be pasteurized for 10 hours at
temperatures up to 60°C [20]. Consequently, stabilization against the heat induced
stress is required. The salt of the fatty acid Na-octanoate [21] and the amino acid
derivative Na-N-acetyltryptophanate [22] protect HSA during the pasteurization process
[23]. HSA is further stabilized by the addition of NaCl [20,21,24]. Thus the ionic strength
in protein formulations stabilized with HSA increases inevitably and the physico-chemical
properties can be affected due to the presence of the different stabilizers. The goal of this
Chapter 3
62
study was to investigate the impact of NaCl and the other HSA-stabilizers on the physico-
chemical properties of formulations containing mannitol and HSA during freezing and at
low temperatures.
2. Material and Methods
2.1 Materials
Different types of HSA were used for the experiments, namely non-stabilized HSA from
Sigma-Chemicals (Steinheim, Germany) and stabilized-HSA from Grifols (Langen,
Germany). Stabilized-HSA from Grifols was used as 20% solution and contained 16 mmol
Na-octanoate, 16 mmol Na-N-acetyltryptophanat and NaCl. For the experiments the
solution was diluted to the desired concentration. Sigma-HSA was provided as a solid
powder which contained 97% HSA according to the specifications and was used without
further purification. Mannitol in the quality of Ph. Eur. was purchased from Caelo (Hilden,
Germany) NaCl, Na-octanoate and N-acetyl-DL-tryptophante from Sigma (Steinheim,
Germany). The pH of the solutions was adjusted to 7.0 ± 0.1 using HCl and NaOH. The
declaration of the used concentrations was given in % [w/v] if not stated otherwise.
2.2 Methods
2.2.1 Differential Scanning Calorimetry (DSC)
DSC was used to study Tg’ and crystallization behavior at low temperatures.
Approximately 20 mg of the solution were analyzed in a crimped Al-crucible. The samples
were frozen from 20°C to -70°C and reheated to 20°C with a standard scanning-rate of
10°C/min in a Netzsch DSC 204 Phoenix® (Selb, Germany), calibrated with Indium. Tg’
(onset, point of inflection) and crystallization (onset, peak, enthalpy) of the excipients
were determined during the heating scan.
2.2.2 Cryomicroscopy
The collapse temperature Tc, which is closely related to Tg’ was determined by
cryomicroscopy. To determine the collapse temperature 5 µl of the solutions were frozen
on a microscopic slide with an average cooling rate of 5°C/min to -50°C on the cooling
stage (Linkman THM 600 S, Surrey, UK) under a microscope (Olympus BX 50, Hamburg,
Germany). After applying vacuum to the system a moving drying front could be
observed, due to the sublimation of ice. Subsequently, the temperature was step-wise
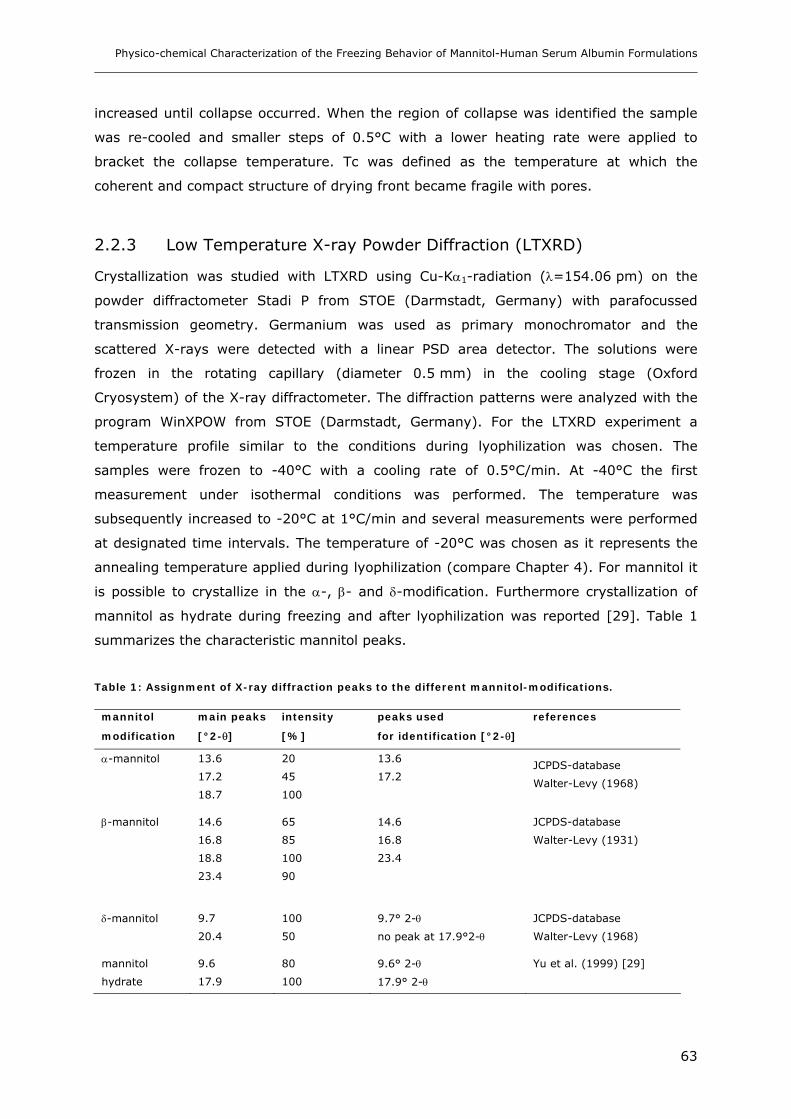
Physico-chemical Characterization of the Freezing Behavior of Mannitol-Human Serum Albumin Formulations
63
increased until collapse occurred. When the region of collapse was identified the sample
was re-cooled and smaller steps of 0.5°C with a lower heating rate were applied to
bracket the collapse temperature. Tc was defined as the temperature at which the
coherent and compact structure of drying front became fragile with pores.
2.2.3 Low Temperature X-ray Powder Diffraction (LTXRD)
Crystallization was studied with LTXRD using Cu-Kα1-radiation (λ=154.06 pm) on the
powder diffractometer Stadi P from STOE (Darmstadt, Germany) with parafocussed
transmission geometry. Germanium was used as primary monochromator and the
scattered X-rays were detected with a linear PSD area detector. The solutions were
frozen in the rotating capillary (diameter 0.5 mm) in the cooling stage (Oxford
Cryosystem) of the X-ray diffractometer. The diffraction patterns were analyzed with the
program WinXPOW from STOE (Darmstadt, Germany). For the LTXRD experiment a
temperature profile similar to the conditions during lyophilization was chosen. The
samples were frozen to -40°C with a cooling rate of 0.5°C/min. At -40°C the first
measurement under isothermal conditions was performed. The temperature was
subsequently increased to -20°C at 1°C/min and several measurements were performed
at designated time intervals. The temperature of -20°C was chosen as it represents the
annealing temperature applied during lyophilization (compare Chapter 4). For mannitol it
is possible to crystallize in the α-, β- and δ-modification. Furthermore crystallization of
mannitol as hydrate during freezing and after lyophilization was reported [29]. Table 1
summarizes the characteristic mannitol peaks.
Table 1: Assignment of X-ray diffraction peaks to the different mannitol-modifications.
mannitol
modification
main peaks
[°2-θ]
intensity
[%]
peaks used
for identification [°2-θ]
references
α-mannitol
13.6
17.2
18.7
20
45
100
13.6
17.2
JCPDS-database
Walter-Levy (1968)
β-mannitol 14.6
16.8
18.8
23.4
65
85
100
90
14.6
16.8
23.4
JCPDS-database
Walter-Levy (1931)
δ-mannitol 9.7
20.4
100
50
9.7° 2-θ
no peak at 17.9°2-θ
JCPDS-database
Walter-Levy (1968)
mannitol
hydrate
9.6
17.9
80
100
9.6° 2-θ
17.9° 2-θ
Yu et al. (1999) [29]
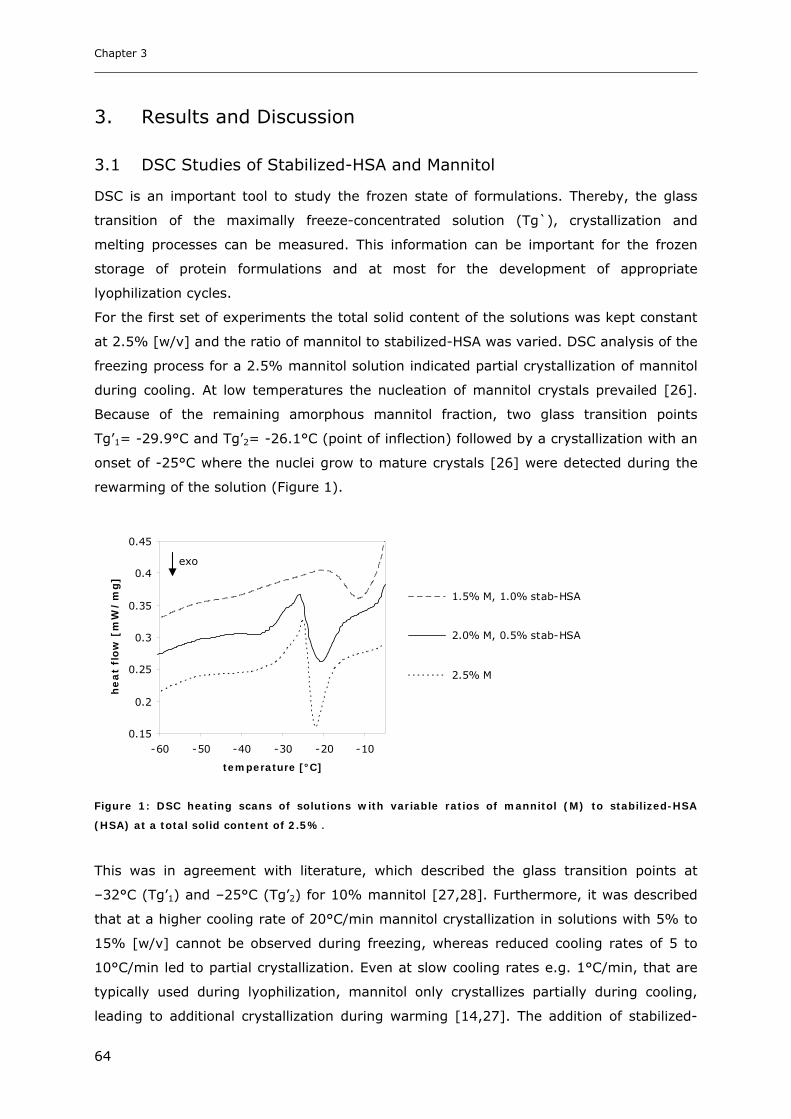
Chapter 3
64
3. Results and Discussion
3.1 DSC Studies of Stabilized-HSA and Mannitol
DSC is an important tool to study the frozen state of formulations. Thereby, the glass
transition of the maximally freeze-concentrated solution (Tg`), crystallization and
melting processes can be measured. This information can be important for the frozen
storage of protein formulations and at most for the development of appropriate
lyophilization cycles.
For the first set of experiments the total solid content of the solutions was kept constant
at 2.5% [w/v] and the ratio of mannitol to stabilized-HSA was varied. DSC analysis of the
freezing process for a 2.5% mannitol solution indicated partial crystallization of mannitol
during cooling. At low temperatures the nucleation of mannitol crystals prevailed [26].
Because of the remaining amorphous mannitol fraction, two glass transition points
Tg’1= -29.9°C and Tg’2= -26.1°C (point of inflection) followed by a crystallization with an
onset of -25°C where the nuclei grow to mature crystals [26] were detected during the
rewarming of the solution (Figure 1).
0.15
0.2
0.25
0.3
0.35
0.4
0.45
-60 -50 -40 -30 -20 -10
temperature [°C]
he
at
flo
w [
mW
/m
g]
1.5% M, 1.0% stab-HSA
2.0% M, 0.5% stab-HSA
2.5% M
Figure 1: DSC heating scans of solutions with variable ratios of mannitol (M) to stabilized-HSA
(HSA) at a total solid content of 2.5%.
This was in agreement with literature, which described the glass transition points at
–32°C (Tg’1) and –25°C (Tg’2) for 10% mannitol [27,28]. Furthermore, it was described
that at a higher cooling rate of 20°C/min mannitol crystallization in solutions with 5% to
15% [w/v] cannot be observed during freezing, whereas reduced cooling rates of 5 to
10°C/min led to partial crystallization. Even at slow cooling rates e.g. 1°C/min, that are
typically used during lyophilization, mannitol only crystallizes partially during cooling,
leading to additional crystallization during warming [14,27]. The addition of stabilized-
exo
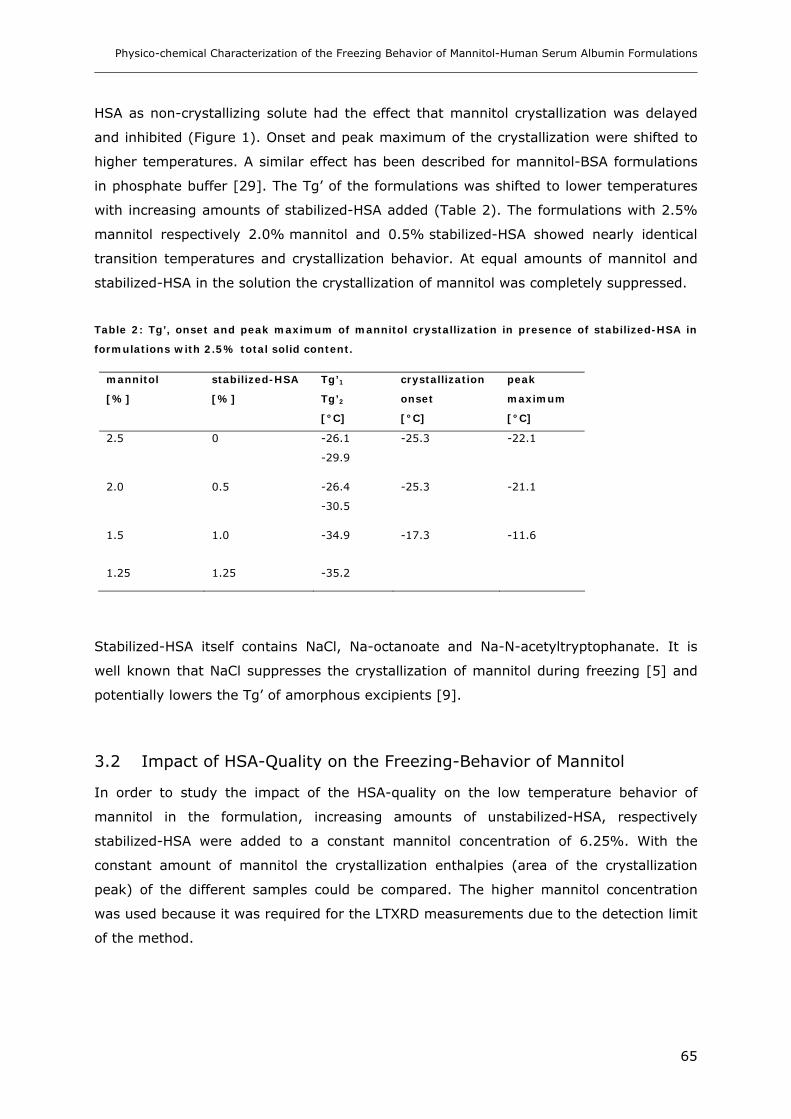
Physico-chemical Characterization of the Freezing Behavior of Mannitol-Human Serum Albumin Formulations
65
HSA as non-crystallizing solute had the effect that mannitol crystallization was delayed
and inhibited (Figure 1). Onset and peak maximum of the crystallization were shifted to
higher temperatures. A similar effect has been described for mannitol-BSA formulations
in phosphate buffer [29]. The Tg’ of the formulations was shifted to lower temperatures
with increasing amounts of stabilized-HSA added (Table 2). The formulations with 2.5%
mannitol respectively 2.0% mannitol and 0.5% stabilized-HSA showed nearly identical
transition temperatures and crystallization behavior. At equal amounts of mannitol and
stabilized-HSA in the solution the crystallization of mannitol was completely suppressed.
Table 2: Tg’, onset and peak maximum of mannitol crystallization in presence of stabilized-HSA in
formulations with 2.5% total solid content.
Stabilized-HSA itself contains NaCl, Na-octanoate and Na-N-acetyltryptophanate. It is
well known that NaCl suppresses the crystallization of mannitol during freezing [5] and
potentially lowers the Tg’ of amorphous excipients [9].
3.2 Impact of HSA-Quality on the Freezing-Behavior of Mannitol
In order to study the impact of the HSA-quality on the low temperature behavior of
mannitol in the formulation, increasing amounts of unstabilized-HSA, respectively
stabilized-HSA were added to a constant mannitol concentration of 6.25%. With the
constant amount of mannitol the crystallization enthalpies (area of the crystallization
peak) of the different samples could be compared. The higher mannitol concentration
was used because it was required for the LTXRD measurements due to the detection limit
of the method.
mannitol
[%]
stabilized-HSA
[%]
Tg’1
Tg’2
[°C]
crystallization
onset
[°C]
peak
maximum
[°C]
2.5 0 -26.1
-29.9
-25.3 -22.1
2.0 0.5 -26.4
-30.5
-25.3 -21.1
1.5 1.0 -34.9
-17.3 -11.6
1.25 1.25 -35.2

Chapter 3
66
-0.4
-0.2
0
0.2
0.4
0.6
0.8
1
1.2
1.4
1.6
-50 -40 -30 -20 -10
temperature [°C]
he
at
flo
w [
mW
/m
g]
-0.6
-0.4
-0.2
0
0.2
0.4
0.6
0.8
1
1.2
1.4
-50 -40 -30 -20 -10
temperature [°C]
he
at
flo
w [
mW
/m
g]
Figure 2: DSC heating scan of 6.25% mannitol with 0.0% to 6.25% stabilized-HSA (a) and 0.0% to
6.25% unstabilized-HSA (b) at 10°C/min.
In the DSC, mannitol crystallization was delayed and finally completely suppressed with
increasing amounts of stabilized-HSA at a scanning rate of 10°C/min (Figure 2a and
Table 3). In addition, stabilized-HSA influenced the Tg’ of the formulations during
freezing. Two Tg’ values were detected up to a concentration of 3.125% stabilized-HSA,
whereas only one Tg’ was left at higher concentrations. The position of the Tg’ was
shifted to lower temperatures. Both results were in agreement with the studies
conducted with 2.5% total solid content (compare 3.1). The same set of experiments was
performed with unstabilized-HSA. By the addition of 3.125% to 6.25% unstabilized-HSA
the crystallization of mannitol was delayed to higher temperatures and the crystallization
enthalpy was decreasing (Figure 2b). This showed that HSA itself inhibited and delayed
the crystallization of mannitol. However, Tg’ was unaffected when adding unstabilized-
HSA to the formulations. In the range of 1.25% to 6.25% unstabilized-HSA Tg’1 was
found at -31.5°C and Tg’2 around -26°C. Both HSA-qualities had a significant impact on
the crystallization behavior of mannitol during the heating scan of the DSC. At a
concentration of 1.25% HSA, the onset of mannitol crystallization (-24.5°C) was
unaffected by the addition of both, unstabilized and stabilized HSA (Figure 2). The peak
maximum of the crystallization was located at -23.4°C for pure mannitol and was shifted
to -22.5°C with the addition of 1.25% unstabilized-HSA, respectively to -20.9°C for
stabilized-HSA. However, a higher crystallization enthalpy in the heating-scan was
measured for 1.25% unstabilized-HSA containing mannitol solutions (-26.8 J/g)
compared to 6.25% pure mannitol (17.1 J/g) or 6.25% mannitol with 1.25% stabilized-
HSA (-17.0 J/g). The inhibitory effect of unstabilized-HSA on mannitol crystallization was
less pronounced than that of stabilized-HSA, resulting in the increased crystallization
6.25% 6.25%
5.0%
3.125%
3.125%
1.25%
1.25%
0.0%
0.0%
exo exo
(a) (b)

Physico-chemical Characterization of the Freezing Behavior of Mannitol-Human Serum Albumin Formulations
67
enthalpy during the rewarming for unstabilized-HSA. The lower crystallization enthalpy
for mannitol as single component could be explained by the fact that mannitol had the
chance to crystallize during the cooling scan, seen by an exothermal peak at -40°C (data
not shown). A complete inhibition of mannitol crystallization was achieved by adding
6.25% stabilized-HSA, but not with 6.25% unstabilized-HSA. The DSC-data suggested
that the studied HSA-qualities both had the ability to inhibit mannitol crystallization, with
a stronger inhibitory effect seen for stabilized-HSA. Stabilized-HSA contained further
additives, presumably NaCl which is known to inhibit mannitol crystallization.
Table 3: Tg’1, Tg’2 and crystallization (onset, peak maximum and enthalpy) of 6.25% mannitol with
unstabilized-HSA and stabilized-HSA measured with DSC at 1°C/min, 5°C/min and 10°C/min.
UNSTABILIZED-HSA STABILIZED-HSA
10°C/min 10°C/min 5°C/min 1°C/min
HSA
[%]
Tg’1
Tg’2
crystalli-
zation
Tg’1
Tg’2
crystalli-
zation
Tg’1
Tg’2
crystalli-
zation
Tg’1
Tg’2
crystalli-
zation
0
(5:0)*
-31.2°C
-27.1°C
-25.4°C(1)
-23.1°C(2)
-17.1 J/g(3)
-31.2°C
-27.1°C
-25.4°C(1)
-23.1°C(2)
-17.0 J/g(3)
-34.0°C
-29.4°C
-27.2°C(1)
-25.3°C(2)
-10.4 J/g(3)
-34.2°C
-31.6°C
-28.9°C(1)
-27.9°C(2)
-5.0 J/g(3)
1.25
(5:1)*
-32.0°C
-27.2°C
-24.6°C(1)
-22.6°C(2)
-26.8 J/g(3)
-32.9°C
-28.1°C
-25.1°C(1)
-21.0°C(2)
-17.0 J/g(3)
-34.1°C
-29.4°C
-27.9°C(1)
-26.5°C(2)
-12.9 J/g(3)
-35.1°C
-31.8°C
-30.0°C(1)
-28.7°C(2)
-5.3 J/g(3)
3.125
(5:3)*
-31.4°C
-25.0°C
-20.2°C(1)
-14.6°C(2)
-12.5 J/g(3)
-39.5°C
-32.7°C
-22.5°C(1)
-18.4°C(2)
-11.4 J/g(3)
-34.6°C -26.9°C(1)
-24.0°C(2)
-8.8 J/g(3)
-36.1°C -31.4°C(1)
-29.6°C(2)
-6.3 J/g(3)
6.25
(5:5)*
-31.4°C
-25.0°C
-20.2°C(1)
-14.6°C(2)
-12.5 J/g(3)
-37.7°C no
cryst.
-39.0°C -14.6°C(1)
-11.3°C(2)
-1.1 J/g(3)
-40.4°C -29.0°C(1)
-25.0°C(2)
-6.6 J/g(3)
* ratio of mannitol : HSA (1) onset (2) peak maximum (3) enthalpy of crystallization

Chapter 3
68
3.3 Influence of the Applied Scanning Rate on Thermal Behavior of
Mannitol-HSA Formulations
In order to reflect the conditions predominating during lyophilization and to investigate
how the scanning rate influences Tg’ and the crystallization behavior of mannitol, the
DSC was operated at 1°C/min, 5°C/min and 10°C/min for the heating and cooling-scans.
At the scanning rates 1°C/min and 5°C/min 6.25% mannitol in a solution with
6.25% stabilized-HSA had the chance to crystallize during the cooling scan. As a
consequence less material crystallized during heating resulting in a lowered
crystallization enthalpy of -5.0 J/g at 1°C/min and -10.4 J/g at 5°C/min compared to
-17.1 J/g at 10°C/min (Figure 4). It was already shown that mannitol crystallization was
completely suppressed by the addition of more than 3.125% stabilized-HSA to 6.25%
mannitol at a scanning rate of 10°C/min. At a scanning rate of 1°C/min and 5°C/min
mannitol crystallization was detected up to a concentration 6.25% stabilized-HSA.
Comparing the results obtained with the different scanning rates it became obvious that
the thermal events occurred at lower temperatures, when 1°C/min, respectively 5°C/min
were used (Table 3). Tg’ is a kinetic parameter and therefore depends on the applied
scanning rate [26] with a shift to lower temperatures at reduced scanning rates [30].
This has to be considered for the development of a lyophilization cycle due to the lower
cooling rates that are frequently used.
3.4 Influence of Na-Octanoate, Na-N-Acetyltryptophanate and NaCl on
the Freezing Behavior of Mannitol
A more pronounced inhibitory effect on crystallization and the lowering of Tg’ was
noticeable for stabilized-HSA compared to unstabilized-HAS (compare 3.2). The solution
of 6.25% stabilized-HSA used for the DSC experiments contained 5 mM (0.08%)
Na-octanoate and 5 mM (0.13%) Na-N-acetyltryptophanate and at least 31.5 mM
(0.19%) NaCl. In the concentrations actually used for stabilizing HSA,
Na-N-actyltryptophanate and Na-octanoate showed no significant inhibition of mannitol
crystallization (Figure 3). Whereas 5 mM Na-octanoate showed no impact on Tg’, Tg’1
was lowered by 1.0°C and Tg’2 by 1.5°C in the presence of 5 mM
Na-N-actyltryptophanate. In contrast NaCl had a major influence on the low temperature
behavior of mannitol. At a concentration of 0.19% NaCl the suppression of mannitol
crystallization and the decrease of Tg’1 by 3.9°C and Tg’2 by 2.8°C. The HSA-stabilizers,
principally NaCl were responsible for the differences in the low-temperature behavior in
formulations with stabilized and unstabilized-HSA
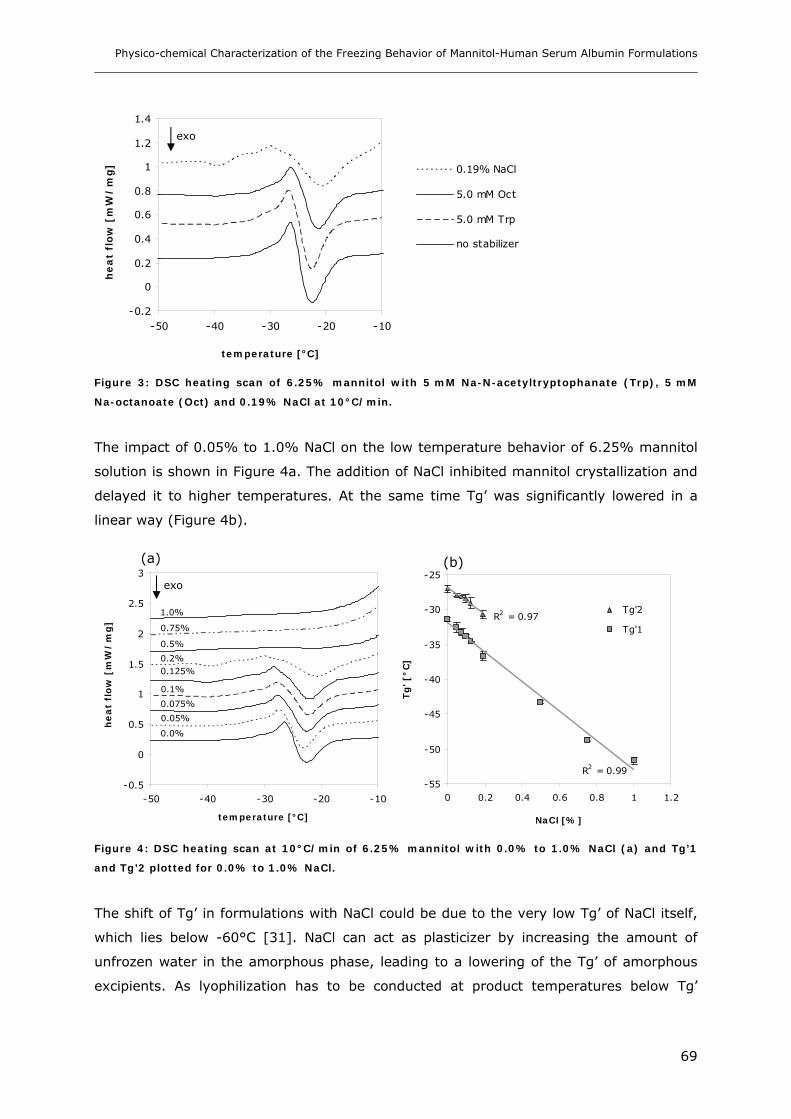
Physico-chemical Characterization of the Freezing Behavior of Mannitol-Human Serum Albumin Formulations
69
-0.2
0
0.2
0.4
0.6
0.8
1
1.2
1.4
-50 -40 -30 -20 -10
temperature [°C]
he
at
flo
w [
mW
/m
g] 0.19% NaCl
5.0 mM Oct
5.0 mM Trp
no stabilizer
Figure 3: DSC heating scan of 6.25% mannitol with 5 mM Na-N-acetyltryptophanate (Trp), 5 mM
Na-octanoate (Oct) and 0.19% NaCl at 10°C/min.
The impact of 0.05% to 1.0% NaCl on the low temperature behavior of 6.25% mannitol
solution is shown in Figure 4a. The addition of NaCl inhibited mannitol crystallization and
delayed it to higher temperatures. At the same time Tg’ was significantly lowered in a
linear way (Figure 4b).
-0.5
0
0.5
1
1.5
2
2.5
3
-50 -40 -30 -20 -10
temperature [°C]
he
at
flo
w [
mW
/m
g]
R2 = 0.99
R2 = 0.97
-55
-50
-45
-40
-35
-30
-25
0 0.2 0.4 0.6 0.8 1 1.2
NaCl [%]
Tg
' [°
C]
Tg'2
Tg'1
Figure 4: DSC heating scan at 10°C/min of 6.25% mannitol with 0.0% to 1.0% NaCl (a) and Tg’1
and Tg’2 plotted for 0.0% to 1.0% NaCl.
The shift of Tg’ in formulations with NaCl could be due to the very low Tg’ of NaCl itself,
which lies below -60°C [31]. NaCl can act as plasticizer by increasing the amount of
unfrozen water in the amorphous phase, leading to a lowering of the Tg’ of amorphous
excipients. As lyophilization has to be conducted at product temperatures below Tg’
exo
exo
1.0%
0.75%
0.5%
0.2% 0.125%
0.1%
0.075%
0.05%
0.0%
(a) (b)
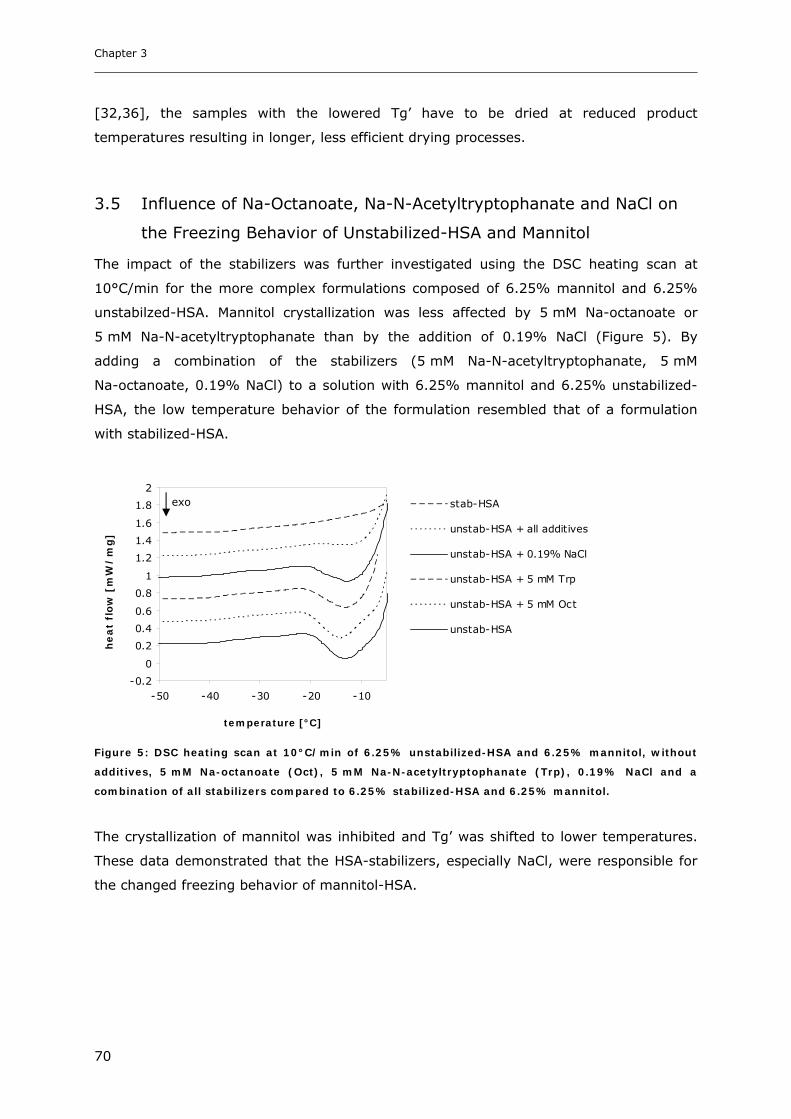
Chapter 3
70
[32,36], the samples with the lowered Tg’ have to be dried at reduced product
temperatures resulting in longer, less efficient drying processes.
3.5 Influence of Na-Octanoate, Na-N-Acetyltryptophanate and NaCl on
the Freezing Behavior of Unstabilized-HSA and Mannitol
The impact of the stabilizers was further investigated using the DSC heating scan at
10°C/min for the more complex formulations composed of 6.25% mannitol and 6.25%
unstabilzed-HSA. Mannitol crystallization was less affected by 5 mM Na-octanoate or
5 mM Na-N-acetyltryptophanate than by the addition of 0.19% NaCl (Figure 5). By
adding a combination of the stabilizers (5 mM Na-N-acetyltryptophanate, 5 mM
Na-octanoate, 0.19% NaCl) to a solution with 6.25% mannitol and 6.25% unstabilized-
HSA, the low temperature behavior of the formulation resembled that of a formulation
with stabilized-HSA.
-0.2
0
0.2
0.4
0.6
0.8
1
1.2
1.4
1.6
1.8
2
-50 -40 -30 -20 -10
temperature [°C]
he
at
flo
w [
mW
/m
g]
stab-HSA
unstab-HSA + all additives
unstab-HSA + 0.19% NaCl
unstab-HSA + 5 mM Trp
unstab-HSA + 5 mM Oct
unstab-HSA
Figure 5: DSC heating scan at 10°C/min of 6.25% unstabilized-HSA and 6.25% mannitol, without
additives, 5 mM Na-octanoate (Oct), 5 mM Na-N-acetyltryptophanate (Trp), 0.19% NaCl and a
combination of all stabilizers compared to 6.25% stabilized-HSA and 6.25% mannitol.
The crystallization of mannitol was inhibited and Tg’ was shifted to lower temperatures.
These data demonstrated that the HSA-stabilizers, especially NaCl, were responsible for
the changed freezing behavior of mannitol-HSA.
exo
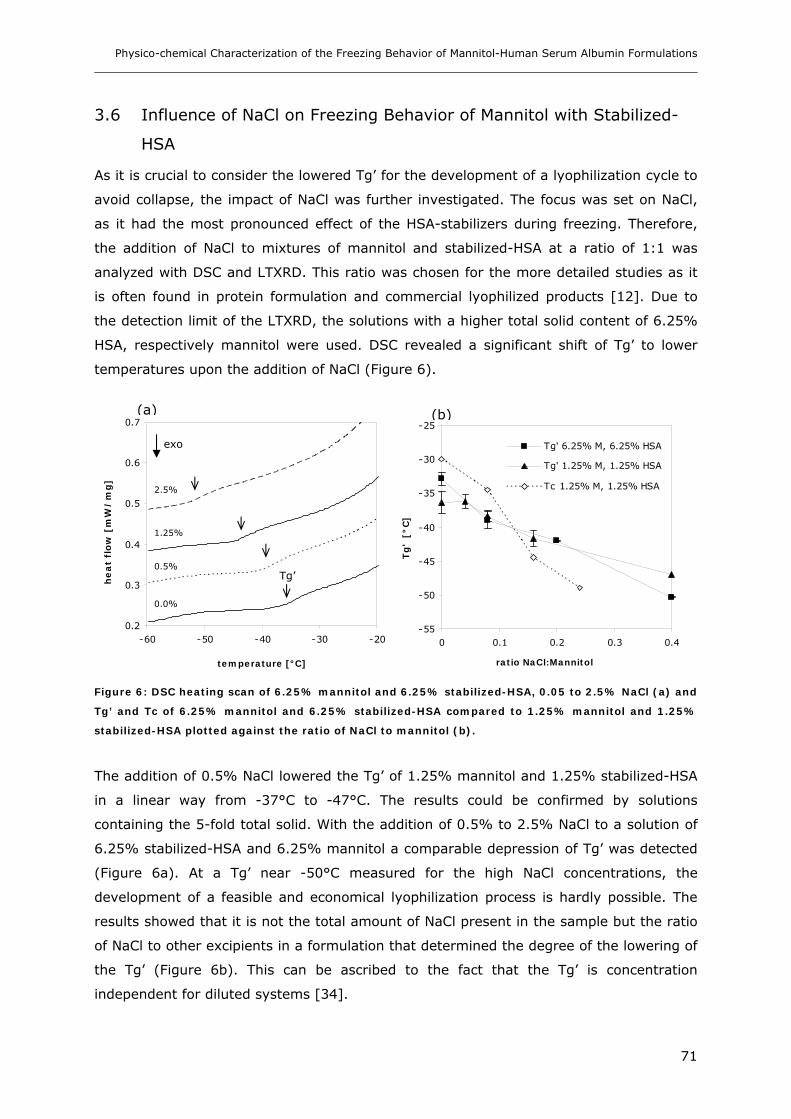
Physico-chemical Characterization of the Freezing Behavior of Mannitol-Human Serum Albumin Formulations
71
3.6 Influence of NaCl on Freezing Behavior of Mannitol with Stabilized-
HSA
As it is crucial to consider the lowered Tg’ for the development of a lyophilization cycle to
avoid collapse, the impact of NaCl was further investigated. The focus was set on NaCl,
as it had the most pronounced effect of the HSA-stabilizers during freezing. Therefore,
the addition of NaCl to mixtures of mannitol and stabilized-HSA at a ratio of 1:1 was
analyzed with DSC and LTXRD. This ratio was chosen for the more detailed studies as it
is often found in protein formulation and commercial lyophilized products [12]. Due to
the detection limit of the LTXRD, the solutions with a higher total solid content of 6.25%
HSA, respectively mannitol were used. DSC revealed a significant shift of Tg’ to lower
temperatures upon the addition of NaCl (Figure 6).
0.2
0.3
0.4
0.5
0.6
0.7
-60 -50 -40 -30 -20
temperature [°C]
he
at
flo
w [
mW
/m
g]
-55
-50
-45
-40
-35
-30
-25
0 0.1 0.2 0.3 0.4
ratio NaCl:Mannitol
Tg
' [
°C
]
Tg' 6.25% M, 6.25% HSA
Tg' 1.25% M, 1.25% HSA
Tc 1.25% M, 1.25% HSA
Figure 6: DSC heating scan of 6.25% mannitol and 6.25% stabilized-HSA, 0.05 to 2.5% NaCl (a) and
Tg’ and Tc of 6.25% mannitol and 6.25% stabilized-HSA compared to 1.25% mannitol and 1.25%
stabilized-HSA plotted against the ratio of NaCl to mannitol (b).
The addition of 0.5% NaCl lowered the Tg’ of 1.25% mannitol and 1.25% stabilized-HSA
in a linear way from -37°C to -47°C. The results could be confirmed by solutions
containing the 5-fold total solid. With the addition of 0.5% to 2.5% NaCl to a solution of
6.25% stabilized-HSA and 6.25% mannitol a comparable depression of Tg’ was detected
(Figure 6a). At a Tg’ near -50°C measured for the high NaCl concentrations, the
development of a feasible and economical lyophilization process is hardly possible. The
results showed that it is not the total amount of NaCl present in the sample but the ratio
of NaCl to other excipients in a formulation that determined the degree of the lowering of
the Tg’ (Figure 6b). This can be ascribed to the fact that the Tg’ is concentration
independent for diluted systems [34].
exo
0.0%
0.5%
1.25%
2.5%
Tg’
(a) (b)
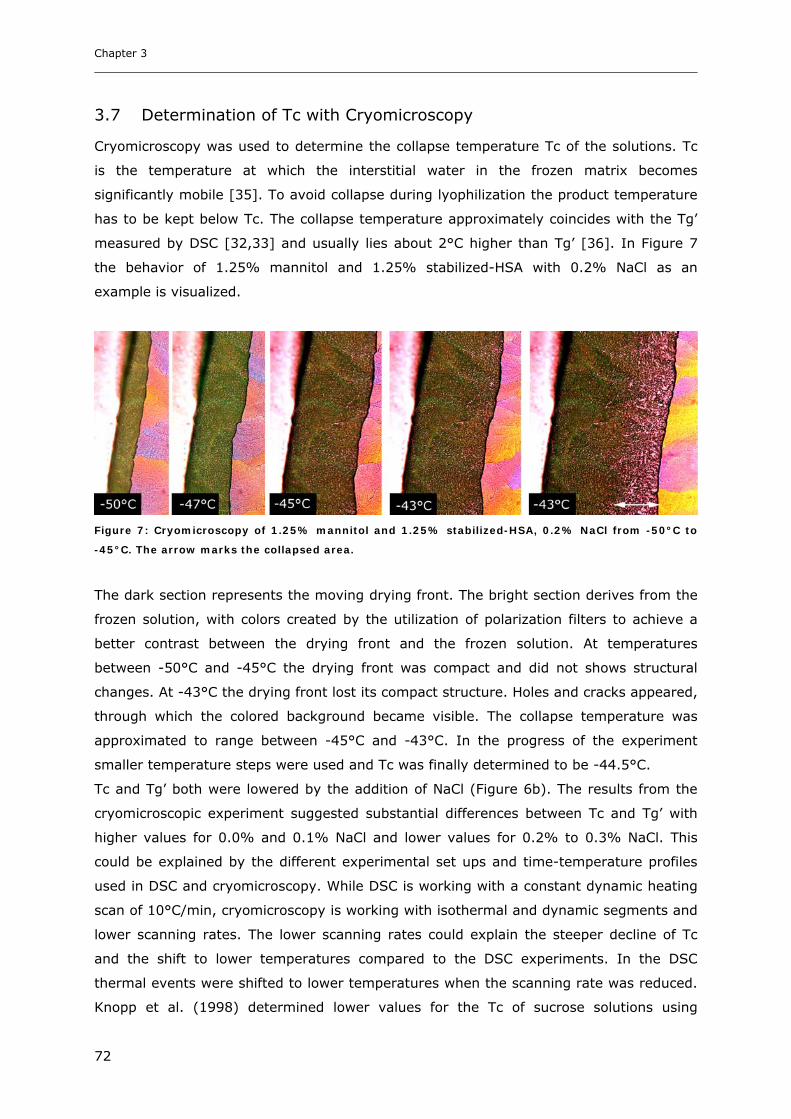
Chapter 3
72
3.7 Determination of Tc with Cryomicroscopy
Cryomicroscopy was used to determine the collapse temperature Tc of the solutions. Tc
is the temperature at which the interstitial water in the frozen matrix becomes
significantly mobile [35]. To avoid collapse during lyophilization the product temperature
has to be kept below Tc. The collapse temperature approximately coincides with the Tg’
measured by DSC [32,33] and usually lies about 2°C higher than Tg’ [36]. In Figure 7
the behavior of 1.25% mannitol and 1.25% stabilized-HSA with 0.2% NaCl as an
example is visualized.
Figure 7: Cryomicroscopy of 1.25% mannitol and 1.25% stabilized-HSA, 0.2% NaCl from -50°C to
-45°C. The arrow marks the collapsed area.
The dark section represents the moving drying front. The bright section derives from the
frozen solution, with colors created by the utilization of polarization filters to achieve a
better contrast between the drying front and the frozen solution. At temperatures
between -50°C and -45°C the drying front was compact and did not shows structural
changes. At -43°C the drying front lost its compact structure. Holes and cracks appeared,
through which the colored background became visible. The collapse temperature was
approximated to range between -45°C and -43°C. In the progress of the experiment
smaller temperature steps were used and Tc was finally determined to be -44.5°C.
Tc and Tg’ both were lowered by the addition of NaCl (Figure 6b). The results from the
cryomicroscopic experiment suggested substantial differences between Tc and Tg’ with
higher values for 0.0% and 0.1% NaCl and lower values for 0.2% to 0.3% NaCl. This
could be explained by the different experimental set ups and time-temperature profiles
used in DSC and cryomicroscopy. While DSC is working with a constant dynamic heating
scan of 10°C/min, cryomicroscopy is working with isothermal and dynamic segments and
lower scanning rates. The lower scanning rates could explain the steeper decline of Tc
and the shift to lower temperatures compared to the DSC experiments. In the DSC
thermal events were shifted to lower temperatures when the scanning rate was reduced.
Knopp et al. (1998) determined lower values for the Tc of sucrose solutions using

Physico-chemical Characterization of the Freezing Behavior of Mannitol-Human Serum Albumin Formulations
73
cryomicroscopy compared to Tg’ with a Tc of -37.7°C measured for 5% and 10%
sucrose, while the Tg’ lies at -32.0°C [37]. However, sucrose solutions at higher
concentrations (above 40%) can exhibit two transitions. The transition at -40°C is usually
assigned to the real glass transition, while the transition at -32°C is due to the onset of
melting of ice crystals [38]. The Tc below -45°C for mannitol stabilized-HSA formulations
with 0.2% and 0.3% NaCl could become critical during lyophilization.
3.8 Analytics of the Mannitol Freezing Behavior with LTXRD
DSC offers information on crystalline and amorphous phases in the frozen state.
However, it is not possible to identify and characterize the crystalline phases according to
their composition and modifications [39]. With LTXRD it is possible to identify and
characterize multiple crystalline phases [40,41]. Because of the detection limit of LTXRD
the higher mannitol concentration of 6.25% had to be used.
Figure 8: LTXRD of 6.25% mannitol and 6.25% stabilized-HSA with 0.0% NaCl (a), 1.25% NaCl (b)
and 2.5% NaCl (c) after cooling to -40°C and during the 3 scans of the annealing phase at -20°C.
Chapter 3
74
After freezing a solution with 6.25% mannitol and 6.25% stabilized-HSA to -40°C in the
LTXRD no peaks of crystalline material could be detected besides the peaks of ice. After
the temperature was increased to -20°C mannitol crystallized in the δ-modification, as
could be seen by the peak at 9.7° 2-θ and 20.4° 2-θ and the absence of a signal at 17.9°
2-θ (Figure 8a). The addition of 1.25% NaCl delayed the crystallization of mannitol. Here
at the end of the first scan at -20°C after approximately 20 minutes a peak at 20.4° 2-θ
appeared. In the further course of the annealing phase the peaks gained in intensity
(Figure 8b). Increasing the NaCl concentration to 2.5% led to a complete inhibition of
crystallization and no crystalline material was detected with the LTXRD (Figure 8c).
Unlike in LTXRD, no crystallization was measured in the heating scan of the DSC for
solutions with 6.25% mannitol and 6.25% stabilized-HSA. Generally, the kinetic
mechanism of crystallization is influenced by temperature [42]. During the dynamic
heating scan of the DSC at 10°C/min mannitol did not have the chance to crystallize,
while the isothermal steps in the LTXRD provided enough time for crystallization.
4. Conclusions
DSC showed that unstabilized-HSA, stabilized-HSA and NaCl can delay and inhibit the
crystallization of mannitol, which was confirmed by LTXRD. Thereby, stabilized-HSA
showed a different behavior than unstabilized-HSA because of the presence of NaCl, Na-
octanoate and Na-N-acetyltryptophanate. In the particular concentration used for the
stabilization of HSA, NaCl had the most distinct impact on the low temperature behavior
of mannitol. Already the addition of small quantities of NaCl shifted Tg’ and Tc of
mannitol formulations to lower temperatures, which could become critical for a freeze-
drying process with respect to collapse. The study showed that the freezing step had a
significant effect on the physico-chemical properties of mannitol–HSA formulations, which
can affect the subsequent drying process and the physico-chemical properties of the
lyophilized products. The study demonstrated that already the freezing step has a
significant effect on the behavior of the formulations with mannitol and HSA. It can be
assumed that this affect the subsequent drying process and the physico-chemical
properties of the lyophilized products. The lyophilization behavior of the formulations with
stabilized-HSA and mannitol are described in Chapter 4 of the thesis.

Physico-chemical Characterization of the Freezing Behavior of Mannitol-Human Serum Albumin Formulations
75
5. References
1. L. Jingsong, T. Viverette, M. Virgin, M. Anderson, P. Dalal. A study of the impact of freezing on the
lyophilization of a concentrated formulation with a high fill depth. Pharm. Dev. Technol. 10:261-272
(2005).
2. J. A. Searles, J. F. Carpenter, T. W. Randolph. Annealing to Optimize the Primary Drying Rate, Reduce
Freezing-Induced Drying Rate Heterogeneity, and Determine Tg’ in Pharmaceutical Lyophilization. J.
Pharm. Sci. 90:872-887 (2001).
3. X. Lu, M. Pikal. Freeze-Drying of Mannitol-Trehalose-Sodium Chloride-Based Formulations: The impact of
Annealing on Dry Layer Resistance to Mass Transfer and Cake Structure. Pharm Dev. Technol. 9:85-95
(2004).
4. A. Cannon, E. Trappler. The influence of Lyophilization on the Polymorphic Behavior of Mannitol. PDA J.
Pharm. Sci. Technol. 54:13-22 (2000).
5. C. Telang, L. Yu, R. Suryanararyanan. Effective Inhibition of Mannitol Crystallization in Frozen Solutions by
Sodium Chloride. Pharm. Res. 20:660-667 (2003).
6. M. F. Mazzobre, M. P. Longinotti, H. R. Corti, M. P. Buera. Effect of Salts on the Properties of Aqueous
Sugar Systems, in Relation to Biomaterial Stabilization. 1. Water Sorption Behavior and Ice
Crystallization/Melting. Cryobiol. 43:199-210 (2001).
7. L. M. Her, M. Deras, S. L. Nail. Electrolyte-Induced Changes in Glass Transition Temperatures of Freeze-
Concentrated Solutes. Pharm. Res. 12:768-772 (1995).
8. M. J. Akers, N. Milton, S. R. Byrn, S. L. Nail. Glycine Crystallization During Freezing: The Effect of Salt
Form, pH, and Ionic Strength. Pharm. Res. 12:1455-1461 (1995).
9. E. Y. Shalaev, F. Franks. Crystalline and Amorphous Phases in the Ternary System Water-Sucrose-Sodium
Chloride. J. Phys. Chem. 100:1144-1152 (1996).
10. H. Nicolajsen, A. Hvidt. Phase Behavior of the System Trehalose-NaCl-Water. Cryobiol. 31:199-205
(1994).
11. W. H. Hanish, P. M. Fernandes, T. Taforo. Stable formulations for lipophilic IL-2 proteins. United States
Patent 4,992,271 (1991).
12. N. Zander. Ready-to-use prothrombin time reagent containing recombinant tissue factor, antioxidant and
human serum albumin. Eur. Pat. Appl. EP 942,284 A (1992).
13. R. M. Platz, N. Kimura, O. Satoh, L. C. Foster. Dry powder formulations of interferons. PCT Int. Appl, WO
953,1479 A1 (1995).
14. A. Pyne, R. Surana, R. Suryanararyanan. Crystallization of Mannitol below Tg’ during Freeze-Drying in
Binary and Ternary Aqueous Systems. Pharm. Res. 19:901-908 (2002).
15. B. Lyuet, D. Rasmussen. Study by differential thermal analysis of the temperature of instability of rapidly
cooled solutions of glycerol, ethylene glycol, sucrose and glucose. Biodyn. 10:1167-1191 (1968).
16. M. J. Pikal, K. M. Dellermann, M. L. Roy, R. M. Riggin. The Effects of Formulation Variables on the Stability
of Freeze-Dried Human Growth Hormone. Pharm. Res. 8:427-436 (1991).
17. A. Kim, M. Akers, S. Nail. The Physical State of Mannitol after Freeze-Drying: Effect of Mannitol
Concentration, Freezing Rate and a Noncrystallizing Cosolute. J. Pharm. Sci. 87:931-935 (1998).
18. B. Lueckel, D. Bodmer, B. Helk, H. Leuenberger. Formulations of Sugars with Amino Acids or Mannitol-
Influence of Concentration Ratio on Properties of the Freeze-Concentrate and the Lyophilisate. Pharm. Dev.
Technol. 3:325-336 (1998).
19. X. Liao, R. Krishnamurthy, R. Suryanarayanan. Influence of the Active Pharmaceutical Ingredient
Concentration on the Physical State of Manntiol- Implications in Freeze-Drying. Pharm. Res. 22:1978-1985
(2005).
Chapter 3
76
20. U.S. Food and Drug Administration, Code of Federal Regulations, Title 21, Volume 7: §640.80 Albumin
(Human), revised as on April 1 (2004).
21. G. Scatchard, L. E. Strong, W. L. Hughes Jr., J. N. Ashworth, A. H. Sparrow. Chemical, clinical, and
Immunological studies and the products of human plasma fractionation. XXVI. The properties of human
serum albumin at low salt content. J. Clin. Invest. 24:671-679 (1945).
22. G. A. Ballou, P. D. Boyer, J. M. Luck, G. F. Lum. The heat coagulation of human albumin. J. Biol. Chem.
153: 589-605 (1944).
23. T. Arakawa, Y. Kita. Stabilizing effect effect of caprylate and acetyltryptophanate on heat-induced
aggregation of bovine serum albumin. Bioch. et Bioph. Acta. 1479:32-36 (2000).
24. L. Saso, G. Valentini, E. Grippa, M. G. Leone, B. Silvestrini. Effect of selected substances on heat-induced
aggregation of Albumin, IgG and Lysozyme. Res. Com. Mol. Pathol. Pharmacol. 102:15-28 (1998).
25. L. Yu, N. Milton, E. Groleau, D. Mishra, R. Vansickle. Existence of a Manniol Hydrate during Freeze-Drying
and Practical Implications. J. Pharm. Sci. 88:196-198 (1999).
26. L. Yu. Amorphous pharmaceutical solids: preparation, characterization and stabilization. Adv. Drug Del.
Rev. 48:27-42 (2001).
27. R. Cavatur, N. Vemuri, A. Pyne, Z. Chrzan, D. Toledo-Velasquez, R. Suryanararyanan. Crystallization
Behavior of Mannitol in Frozen Aqueous Solutions. Pharm. Res. 19:894-900 (2002).
28. P. Meredith, A. Donald, R. Pyne. Freeze-Drying: In Situ Observations Using Cryoenvironmental Scanning
Electron Microscopy and Differential Scanning Calorimetry. J. Pharm. Sci. 85:631-637 (1996).
29. K. Izutsu, S. Kojima. Excipient crystallinity and its protein-structure-stabilizing effect during freeze-drying.
J. Pharm. Pharmacol. 54:1033-1039 (2002).
30. D. Q. M. Craig, P. G. Royall, V. L. Kett, M. L. Hopton. The relevance of the amorphous state to
pharmaceutical dosage forms: glassy drugs and freeze-dried systems. Int. J. Pharm. 179:179-207 (1999).
31. F. Franks. Solid Aqueous solution. Pure Appl. Chem. 65:2527-2537 (1993)
32. M. J. Pikal. Freeze-drying of proteins: Part I: Process design. Biopharm. 3:18-26 (1990).
33. M. J. Pikal. Freeze-drying of proteins: Part II: formulation selection. Biopharm. 3:26-30 (1990).
34. T. Chen, D. M. Oakley. Thermal analysis of proteins of pharmaceutical interest. Thermochim. Acta
248:229-244 (1995).
35. T. A. Jennings. Lyophilization: Introduction and Basic Principles. Interpharm Press, Colorado, USA (1999).
36. M. J. Pikal, S. Shah. The collapse temperature in freeze drying: dependence on measurement methodology
and rate of water removal from the glassy phase. Int. J. Pharm. 62:165-186 (1990).
37. S. A. Knopp, S. Chongprasert, S. L. Nail. The relationship between the TMDSC Curve of Frozen Sucrose
Solutions and Collapse during Freeze-Drying. J. Therm. Anal. 54:659-672 (1998).
38. E. Y. Shalaev, F. Franks. Structural Glass Transition and Thermophysical Processes in Amorphous
Carbohydrates and their Supersaturated Solutions. J. Chem. Soc. Faraday Trans. 91:1511-1517 (1995).
39. A. Pyne, R. Suryanarayanan. Phase Transitions of Glycine in Frozen Aqueous Solutions and during Freeze-
Drying. Pharm. Res. 18:1448-1454 (2001).
40. R. Cavatur, R. Suryanarayanan. Characterization of phase transition during freeze-drying by in situ X-ray
powder diffractometry. Pharm. Dev. Tech. 3:579-586 (1998).
41. R. Cavatur, R. Suryanarayanan. Characterization of frozen aqueous solutions by low temperature X-ray
powder diffractometry. Pharm. Res. 15:193-198 (1998).
42. N. Rodríguez-Hornedo, D. Murphy. Significance of Controlling Crystallization Mechanisms and Kinetics in
Pharmaceutical Systems. J. Pharm. Sci. 88:651-660 (1999).
Chapter 4
Physico-chemical Lyophilization Behavior of Mannitol-
Human Serum Albumin Formulations
Abstract
The lyophilization behavior is influenced by the presence of salts. The impact of NaCl on
drying-time and the morphology after lyophilization was studied for formulations with
mannitol and HSA, using different freezing-protocols. The drying-process was monitored
by thermocouples and microbalance technique. Karl-Fischer titration, DSC, XRD and SEM
were used to study the products after lyophilization and 6 months storage at 2-8°C,
25°C / 60% RH and 40°C / 75% RH.
NaCl decreased the drying-time of mannitol-HSA formulations, indicating morphological
changes, which was confirmed by XRD and SEM. Without NaCl exclusively δ-mannitol was
formed, which remained physico-chemically stable upon storage for 6 months. With
increasing NaCl concentrations more β-mannitol and finally amorphous products were
formed, whereby the freezing-protocol determined how much NaCl was needed to
achieve an amorphous product. Upon storage, the amorphous state could not be
preserved and mannitol and NaCl crystallized, which could damage proteins in the
formulations. However, regarding the stability of HSA in the lyophilized products,
monitored by turbidimetry and HP-SEC, the addition of NaCl could prevent increases in
turbidity and the loss of HSA-monomers upon storage. Here the benefit of NaCl on HSA
stability outbalanced the potential drawbacks that morphological changes, like
crystallization impose on protein stability in the lyophilized products.
Keywords: lyophilization, mannitol, HSA, morphology, storage stability
Chapter 4
78
1. Introduction
For the development of lyophilized formulations it is essential to add excipients that
stabilize proteins against stress and damage during freezing, drying and upon storage.
One common way to achieve elegant and stable lyophilized products is combining a
crystalline bulking agent, e.g. mannitol or glycine with a second excipient that remains
amorphous and acts as lyoprotector e.g. sucrose, trehalose or human serum albumin
(HSA) [1-4]. Morphology and physico-chemical properties of the selected excipients used
to stabilize the active protein can be influenced by the presence of salts [5,6]. Therefore,
it is important to investigate and understand how the lyophilization process and the
lyophilized products are influenced by the salt concentration. As model system a
formulation with mannitol as cake forming agent and HSA as amorphous stabilizer is
used, based on the formulation of the hydrophobic cytokine. For mannitol it is described
in literature, that both the applied lyophilization process [7,8] and the presence of other
excipients like lyoprotectants, buffer salts or proteins have an impact on the morphology
of mannitol and can both promote and inhibit mannitol crystallization [1,9,10]. HSA is
used as cyro- and lyoprotector for lyophilization, especially in older formulations. HSA is
stabilized against the heat induced stress during the required pasteurization process by
Na-octanoate [11] and Na-N-acetyltryptophanate [12]. Further, HSA is stabilized by NaCl
[12-15] with the consequence that the ionic strength in protein formulations stabilized
with HSA is inevitably increased and the physico-chemical properties can be affected due
to the presence of NaCl brought into the formulation.
Detailed studies of the low temperature behavior of formulations with mannitol and HSA
are described in Chapter 3. It could be shown that mannitol crystallization was inhibited
by the addition of HSA and NaCl. Comparing the different HSA-stabilizers, NaCl had the
most pronounced effect on the low temperature behavior of the formulations. NaCl
further led to a significant depression of the collapse temperature (Tc) and the glass
transition of the maximally freeze-concentrated solutions (Tg’) of the formulations. The
outcome of the freezing-studies has to be taken into consideration for the development
of the lyophilization process, as freezing governs the physico-chemical properties of the
excipients during and after lyophilization. To avoid collapse for example the product
temperature during the process has to be kept below the collapse temperature [16,17].
The focus of Chapter 4 was set on the impact of NaCl on the lyophilization process of
mannitol-HSA-based formulations and the physico-chemical properties of the lyophilized
products. Stabilized-HSA, which enhances the complexity of the formulations, was
selected as excipient as it was the exclusively used HSA-quality in the lyophilized
cytokine formulation.
Physico-chemical Lyophilization Behavior of Mannitol-Human Serum Albumin Formulations
79
2. Materials and Methods
2.1 Materials
Stabilized-HSA from Grifols (Langen, Germany) was used as 20% solution and further
contained 16 mmol Na-octanoate, 16 mmol Na-N-acetyltryptophanate and 3.0% NaCl as
stabilizers. For the experiments the solution was diluted to the desired concentration.
Mannitol was purchased from Caelo (Hilden, Germany) and NaCl from Sigma (Steinheim,
Germany). The basic formulation contained 1.25% mannitol and 1.25% stabilized-HSA.
Based on this formulation the fraction of the excipients, the total solid concentration and
the NaCl concentration was varied. The pH of the solution was adjusted to 7.0 ± 0.1
using NaOH or HCl.
2.2 Methods
2.2.1 Lyophilization Process
1.2 ml of the solution were dried in 2 R vials from Schott (Mainz, Germany) in the Epsilon
2-12 D freeze-drier from Christ (Osterrode, Germany). Four different freezing-protocols I
to IV were used for the production of the samples (Table 1). Primary drying was
conducted at a shelf-temperature of -5°C and a pressure of 0.1 mbar. For secondary
drying the shelf-temperature was increased to 30°C, while the pressure was kept
constant at 0.1 mbar.
Table 1: Lyophilization programs I-IV used for the studies.
program freezing-protocol freezing-rate
I within 2 h to -50°C 0.46°C/min
II within 2 h to -50°C
Annealing at -20°C for 2 h
0.46°C/min
III within 1 h to -50°C 0.92°C/min
IV freezing on pre-cooled shelves (-50°C) 2.3°C/min
The lyophilization process was monitored by measuring the product temperature of
selected vials with thermocouples [18]. The end point of primary-drying was reached
when the temperature in the vial was exceeding the shelf-temperature. As second tool to
monitor the drying process, a microbalance type CWS-40 (Christ, Osterrode, Germany)
was used. With the microbalance it is possible to determine the actual drying-rate during
the process. The end of the primary drying is reached when the drying rate falls below
Chapter 4
80
3 mg/h [19]. The thermocouples were placed into vials on a completely filled shelf as
well as in vials, which were located on an extra shelf in a distance of 5 cm to each other.
The vials were placed separately to assure the comparability of the results with the data
form the microbalance. The microbalance was also placed separately on an extra shelf in
the freeze-drier.
2.2.2 X-ray Powder Diffraction (XRD)
The morphology of the lyophilized products was analyzed with X-ray powder diffraction
(XRD) from 5-40° 2-Θ, with steps of 0.05° 2-Θ and a duration of 2 seconds per step on
the X-ray diffractometer XRD 3000 TT (Seifert, Ahrenburg, Germany), equipped with a
copper anode (40 kV, 30 mA, wavelength 154.17 pm).
2.2.3 Differential Scanning Calorimetry (DSC)
The samples were analyzed with the Netzsch DSC 204 Phoenix® (Selb, Germany),
calibrated with indium from 0°C to 150°C with a rate of 10°C/min. Approximately 10 mg
of the lyophilized samples were analyzed in sealed Al-crucibles. The thermal events were
analyzed in the heating scan of the DSC.
2.2.4 Karl-Fischer Titration
The residual moisture of the samples was analyzed by coulometric Karl-Fischer titration
using the Aqua 40.00 titrator with a headspace module (Analytik Jena AG, Halle,
Germany). For the measurement at least 10 mg of the lyophilized sample was heated to
80°C. The evaporated water was transferred into the titration solution and the amount of
H2O was determined.
2.2.5 Turbiditimetry
The turbidity of the samples in formazine nephelometric units (FNU) was measured by
90° light scattering at λ=860 nm with the NEPHLA turbidimeter (Dr. Lange, Düsseldorf,
Germany) calibrated with formazine as standard. To evaluate the degree of turbidity the
reference solutions I-IV of the European Pharmacopoeia method 2.2.1 (clarity and
degree of opalescence of liquids) were used [20]. A stock solution was prepared by
mixing hydrazine-sulfate (10 mg/ml) and hexamethylenetetramine (100 mg/ml) at a
ratio of 1:1. After 24 hours the stock solution was further diluted with water to
concentrations of 0.075 mg/ml hydrazine sulfate and 0.75 mg/ml
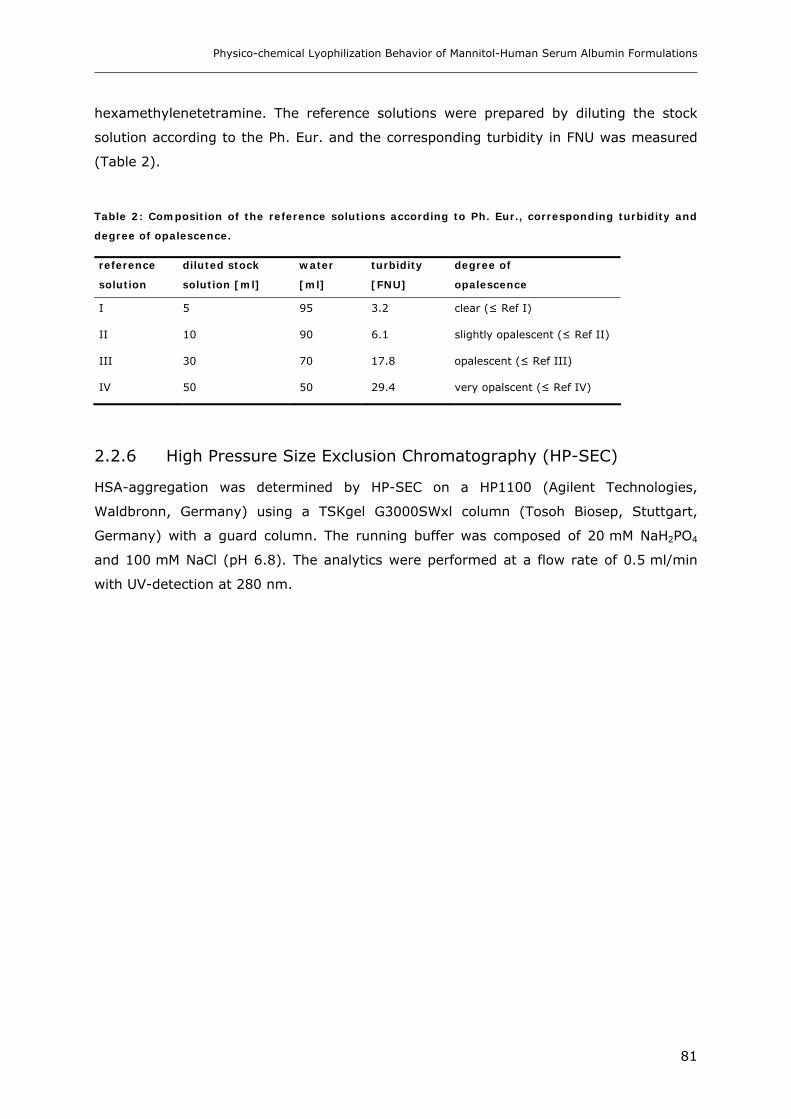
Physico-chemical Lyophilization Behavior of Mannitol-Human Serum Albumin Formulations
81
hexamethylenetetramine. The reference solutions were prepared by diluting the stock
solution according to the Ph. Eur. and the corresponding turbidity in FNU was measured
(Table 2).
Table 2: Composition of the reference solutions according to Ph. Eur., corresponding turbidity and
degree of opalescence.
reference
solution
diluted stock
solution [ml]
water
[ml]
turbidity
[FNU]
degree of
opalescence
I 5 95 3.2 clear (≤ Ref I)
II 10 90 6.1 slightly opalescent (≤ Ref II)
III 30 70 17.8 opalescent (≤ Ref III)
IV 50 50 29.4 very opalscent (≤ Ref IV)
2.2.6 High Pressure Size Exclusion Chromatography (HP-SEC)
HSA-aggregation was determined by HP-SEC on a HP1100 (Agilent Technologies,
Waldbronn, Germany) using a TSKgel G3000SWxl column (Tosoh Biosep, Stuttgart,
Germany) with a guard column. The running buffer was composed of 20 mM NaH2PO4
and 100 mM NaCl (pH 6.8). The analytics were performed at a flow rate of 0.5 ml/min
with UV-detection at 280 nm.

Chapter 4
82
3. Results and Discussion
3.1. Lyophilization of the System Mannitol-HSA-NaCl
3.1.1 Drying Process
The drying process, basically the length of primary drying is depending on the structure
of the frozen matrix and with it the dry layer resistance. Thereby, the composition of the
formulation and the applied freezing procedure, which determines the size of the ice
crystals can influence the duration of primary drying [21,22]. The impact of the freezing
protocol and the addition of NaCl to formulations with 1.25% mannitol and 1.25%
stabilized-HSA on primary drying time were investigated using thermocouples and the
microbalance technique. Samples dried after a regular freezing with 0.45°C/min
(program I) exhibited the shortest primary drying time (7.6 h ± 0.3 h, n=3) after vacuum
was applied. Longer primary drying times were observed when the vials were frozen with
a higher freezing-rate by placing them on pre-cooled shelves (8.9 h ± 0.7 h, n=3) and
after freezing with an annealing step (9.9 h ± 0.1 h, n=3). Annealing can both increase
and decrease the drying-rate. Searles et al. (2001) showed that annealing at a
temperature above Tg’ leads to a 3.5 fold increase in the primary-drying rate of sucrose-
hydroxyethyl starch formulations, due to increased ice-crystal size and simplified
amorphous structures [23]. On the other hand, Pikal et al. (2004) determined prolonged
primary drying times for mannitol-trehalose-NaCl based formulations after annealing, as
partial collapse was inhibited by the highly crystallized mannitol, leading to a more
compact structure that offers a higher dry-layer resistance [24].
4
6
8
10
12
14
0 0.1 0.2
NaCl [%]
du
rati
on
of
pri
mary
dry
ing
[h
]
single vial
microbalance
vial on filled shelf
Figure 1: Primary drying time of 1.25% mannitol and 1.25% stabilized-HSA dried with program I.
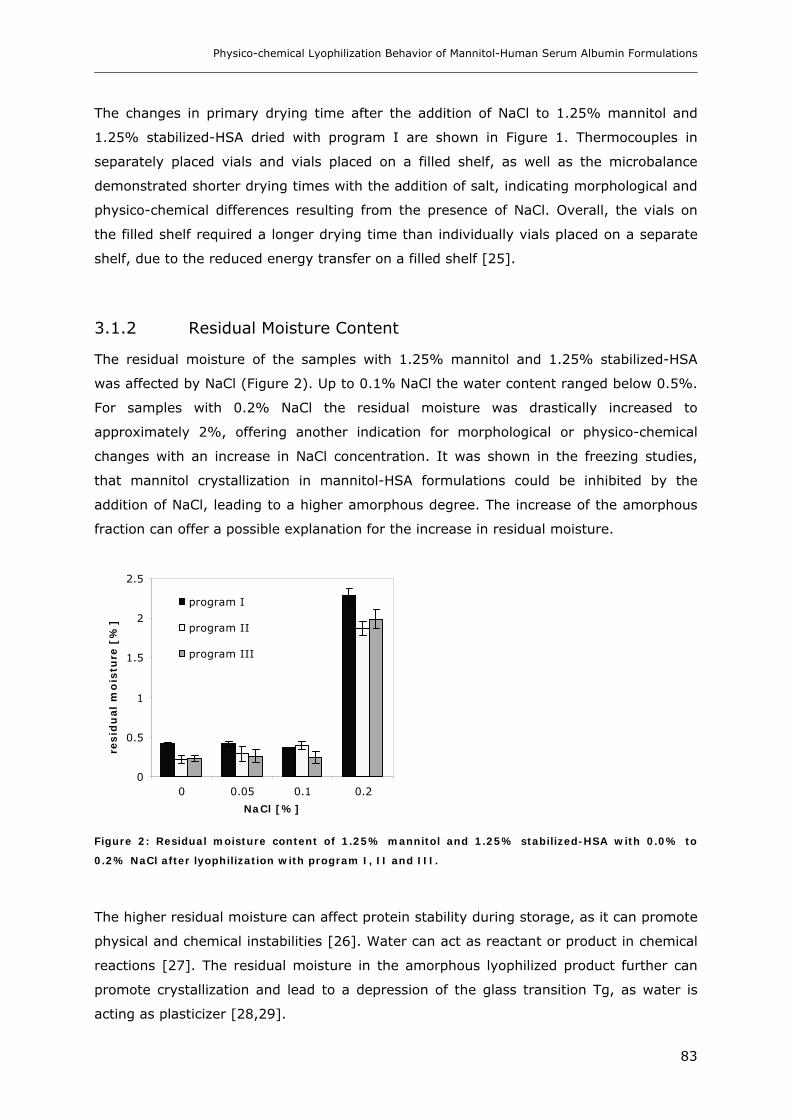
Physico-chemical Lyophilization Behavior of Mannitol-Human Serum Albumin Formulations
83
The changes in primary drying time after the addition of NaCl to 1.25% mannitol and
1.25% stabilized-HSA dried with program I are shown in Figure 1. Thermocouples in
separately placed vials and vials placed on a filled shelf, as well as the microbalance
demonstrated shorter drying times with the addition of salt, indicating morphological and
physico-chemical differences resulting from the presence of NaCl. Overall, the vials on
the filled shelf required a longer drying time than individually vials placed on a separate
shelf, due to the reduced energy transfer on a filled shelf [25].
3.1.2 Residual Moisture Content
The residual moisture of the samples with 1.25% mannitol and 1.25% stabilized-HSA
was affected by NaCl (Figure 2). Up to 0.1% NaCl the water content ranged below 0.5%.
For samples with 0.2% NaCl the residual moisture was drastically increased to
approximately 2%, offering another indication for morphological or physico-chemical
changes with an increase in NaCl concentration. It was shown in the freezing studies,
that mannitol crystallization in mannitol-HSA formulations could be inhibited by the
addition of NaCl, leading to a higher amorphous degree. The increase of the amorphous
fraction can offer a possible explanation for the increase in residual moisture.
0
0.5
1
1.5
2
2.5
0 0.05 0.1 0.2
NaCl [%]
resid
ual
mo
istu
re [
%]
program I
program II
program III
Figure 2: Residual moisture content of 1.25% mannitol and 1.25% stabilized-HSA with 0.0% to
0.2% NaCl after lyophilization with program I, II and III.
The higher residual moisture can affect protein stability during storage, as it can promote
physical and chemical instabilities [26]. Water can act as reactant or product in chemical
reactions [27]. The residual moisture in the amorphous lyophilized product further can
promote crystallization and lead to a depression of the glass transition Tg, as water is
acting as plasticizer [28,29].

Chapter 4
84
3.1.3 Morphology, Crystallinity and Thermal Properties of Lyophilized
Products with Mannitol, Stabilized-HSA and NaCl
Previous freezing studies had shown that mannitol crystallization could be inhibited by
the addition of NaCl or HSA. This can affect the drying process and the physico-chemical
properties of the lyophilized products. To explain the shorter primary drying time and
higher residual moisture content for increasing NaCl concentrations, the morphology of
lyophilized products with mannitol, HSA and NaCl was analyzed with XRD, DSC and SEM.
After freeze-drying a 2.5% mannitol solution, peaks of all modifications (α-, β- and δ-
mannitol) were found in the XRD pattern (Figure 3).
5 10 15 20 25 30 35 40
° 2-Theta
Figure 3: XRD diffraction pattern of variable ratios of mannitol (M) to stabilized HSA (HSA)
lyophilized with program I from solutions with a total solid content of 2.5%.
With increasing amounts of stabilized-HSA, the α-modification disappeared first when
0.5% stabilized-HSA was added to the formulations. This was followed by a
disappearance of the β-modification at 1.0% stabilized-HSA, leaving solely
δ-mannitol. The critical ratio of mannitol to stabilized-HSA was 1:1, as the products were
partially crystalline comprising δ-mannitol independent of the lyophilization program. The
products were amorphous according to XRD when more than 50% of the lyophilized
product was composed of HSA. For formulation with 1.25% mannitol and 1.25%
stabilized-HSA the impact of NaCl and the applied freezing process on the morphology of
the lyophilized products were studied with XRD. After lyophilization with program I,
mannitol was present in the δ-modification for 0.0% to 0.1% NaCl (Figure 4a). By
increasing the NaCl concentration to 0.15% the β-modification augmented. 0.2% NaCl
led to pure β-mannitol and amorphous mannitol was found for 0.3% NaCl. Peaks of
2.5% M
1.5% M, 1.0% HSA
1.25% M, 1.25% HSA
1.0% M, 1.5% HSA
δ ß
ß
2.0% M, 0.5% HSA
α
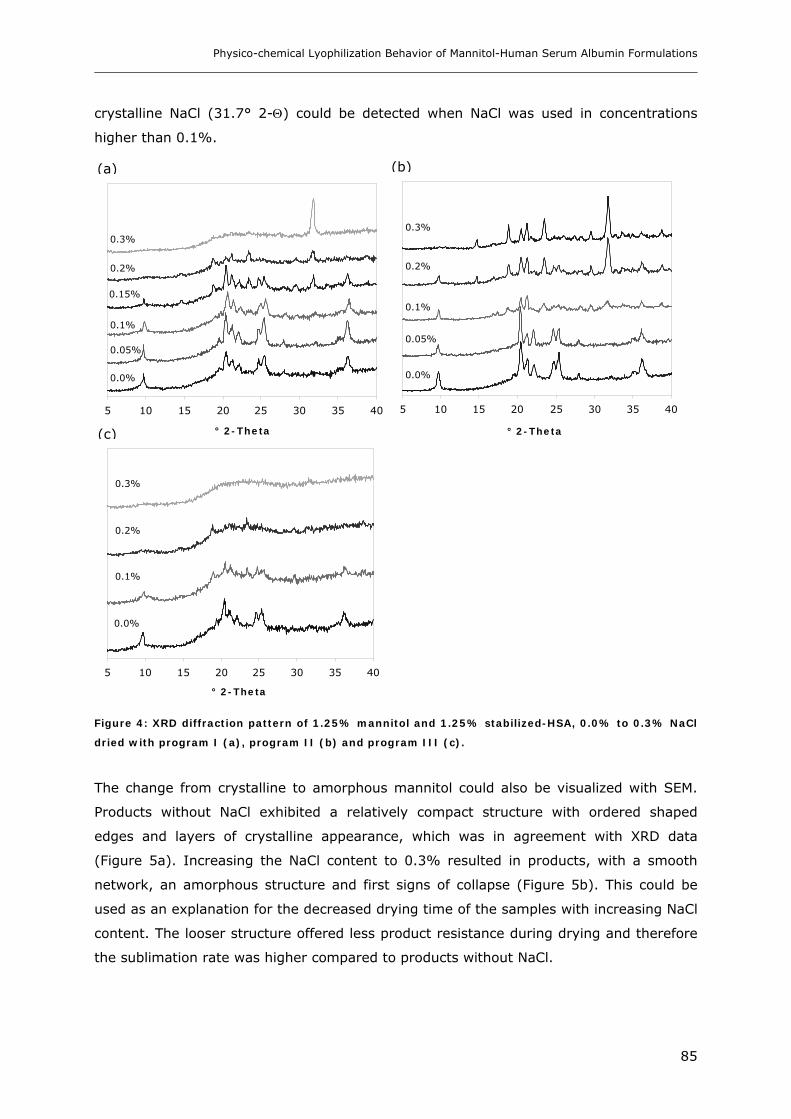
Physico-chemical Lyophilization Behavior of Mannitol-Human Serum Albumin Formulations
85
crystalline NaCl (31.7° 2-Θ) could be detected when NaCl was used in concentrations
higher than 0.1%.
5 10 15 20 25 30 35 40
° 2-Theta
5 10 15 20 25 30 35 40
° 2-Theta
5 10 15 20 25 30 35 40
° 2-Theta
Figure 4: XRD diffraction pattern of 1.25% mannitol and 1.25% stabilized-HSA, 0.0% to 0.3% NaCl
dried with program I (a), program II (b) and program III (c).
The change from crystalline to amorphous mannitol could also be visualized with SEM.
Products without NaCl exhibited a relatively compact structure with ordered shaped
edges and layers of crystalline appearance, which was in agreement with XRD data
(Figure 5a). Increasing the NaCl content to 0.3% resulted in products, with a smooth
network, an amorphous structure and first signs of collapse (Figure 5b). This could be
used as an explanation for the decreased drying time of the samples with increasing NaCl
content. The looser structure offered less product resistance during drying and therefore
the sublimation rate was higher compared to products without NaCl.
0.0% 0.0%
0.0%
0.1%
0.2%
0.3%
0.05%
0.1%
0.15%
0.2%
0.3%
0.05%
0.1%
0.2%
0.3%
(a) (b)
(c)
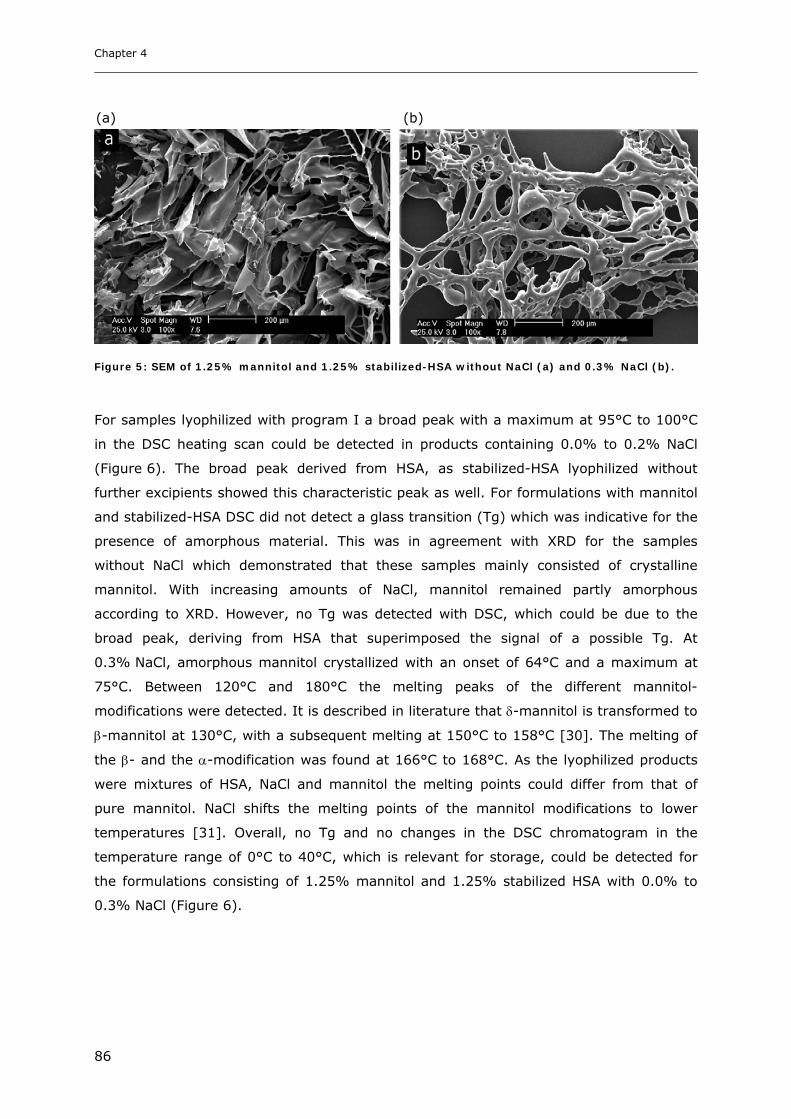
Chapter 4
86
Figure 5: SEM of 1.25% mannitol and 1.25% stabilized-HSA without NaCl (a) and 0.3% NaCl (b).
For samples lyophilized with program I a broad peak with a maximum at 95°C to 100°C
in the DSC heating scan could be detected in products containing 0.0% to 0.2% NaCl
(Figure 6). The broad peak derived from HSA, as stabilized-HSA lyophilized without
further excipients showed this characteristic peak as well. For formulations with mannitol
and stabilized-HSA DSC did not detect a glass transition (Tg) which was indicative for the
presence of amorphous material. This was in agreement with XRD for the samples
without NaCl which demonstrated that these samples mainly consisted of crystalline
mannitol. With increasing amounts of NaCl, mannitol remained partly amorphous
according to XRD. However, no Tg was detected with DSC, which could be due to the
broad peak, deriving from HSA that superimposed the signal of a possible Tg. At
0.3% NaCl, amorphous mannitol crystallized with an onset of 64°C and a maximum at
75°C. Between 120°C and 180°C the melting peaks of the different mannitol-
modifications were detected. It is described in literature that δ-mannitol is transformed to
β-mannitol at 130°C, with a subsequent melting at 150°C to 158°C [30]. The melting of
the β- and the α-modification was found at 166°C to 168°C. As the lyophilized products
were mixtures of HSA, NaCl and mannitol the melting points could differ from that of
pure mannitol. NaCl shifts the melting points of the mannitol modifications to lower
temperatures [31]. Overall, no Tg and no changes in the DSC chromatogram in the
temperature range of 0°C to 40°C, which is relevant for storage, could be detected for
the formulations consisting of 1.25% mannitol and 1.25% stabilized HSA with 0.0% to
0.3% NaCl (Figure 6).
(a) (b)
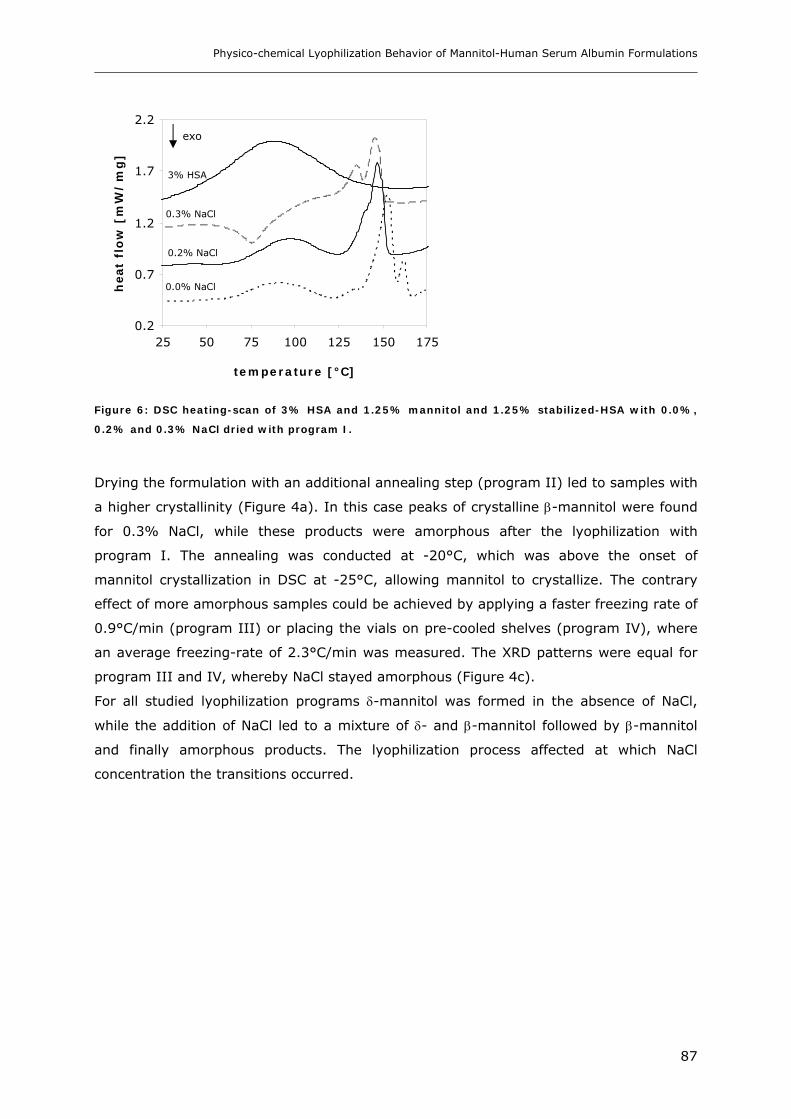
Physico-chemical Lyophilization Behavior of Mannitol-Human Serum Albumin Formulations
87
0.2
0.7
1.2
1.7
2.2
25 50 75 100 125 150 175
temperature [°C]
heat
flo
w [
mW
/m
g]
Figure 6: DSC heating-scan of 3% HSA and 1.25% mannitol and 1.25% stabilized-HSA with 0.0%,
0.2% and 0.3% NaCl dried with program I.
Drying the formulation with an additional annealing step (program II) led to samples with
a higher crystallinity (Figure 4a). In this case peaks of crystalline β-mannitol were found
for 0.3% NaCl, while these products were amorphous after the lyophilization with
program I. The annealing was conducted at -20°C, which was above the onset of
mannitol crystallization in DSC at -25°C, allowing mannitol to crystallize. The contrary
effect of more amorphous samples could be achieved by applying a faster freezing rate of
0.9°C/min (program III) or placing the vials on pre-cooled shelves (program IV), where
an average freezing-rate of 2.3°C/min was measured. The XRD patterns were equal for
program III and IV, whereby NaCl stayed amorphous (Figure 4c).
For all studied lyophilization programs δ-mannitol was formed in the absence of NaCl,
while the addition of NaCl led to a mixture of δ- and β-mannitol followed by β-mannitol
and finally amorphous products. The lyophilization process affected at which NaCl
concentration the transitions occurred.
0.0% NaCl
0.2% NaCl
0.3% NaCl
3% HSA
exo
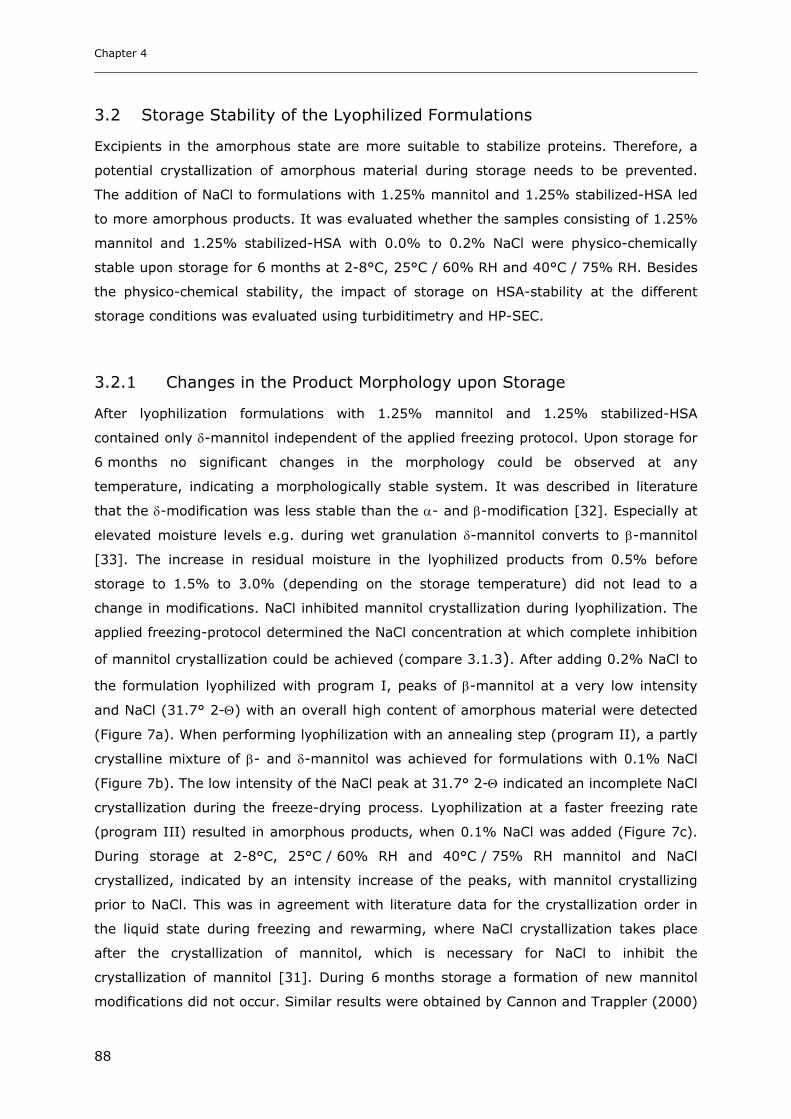
Chapter 4
88
3.2 Storage Stability of the Lyophilized Formulations
Excipients in the amorphous state are more suitable to stabilize proteins. Therefore, a
potential crystallization of amorphous material during storage needs to be prevented.
The addition of NaCl to formulations with 1.25% mannitol and 1.25% stabilized-HSA led
to more amorphous products. It was evaluated whether the samples consisting of 1.25%
mannitol and 1.25% stabilized-HSA with 0.0% to 0.2% NaCl were physico-chemically
stable upon storage for 6 months at 2-8°C, 25°C / 60% RH and 40°C / 75% RH. Besides
the physico-chemical stability, the impact of storage on HSA-stability at the different
storage conditions was evaluated using turbiditimetry and HP-SEC.
3.2.1 Changes in the Product Morphology upon Storage
After lyophilization formulations with 1.25% mannitol and 1.25% stabilized-HSA
contained only δ-mannitol independent of the applied freezing protocol. Upon storage for
6 months no significant changes in the morphology could be observed at any
temperature, indicating a morphologically stable system. It was described in literature
that the δ-modification was less stable than the α- and β-modification [32]. Especially at
elevated moisture levels e.g. during wet granulation δ-mannitol converts to β-mannitol
[33]. The increase in residual moisture in the lyophilized products from 0.5% before
storage to 1.5% to 3.0% (depending on the storage temperature) did not lead to a
change in modifications. NaCl inhibited mannitol crystallization during lyophilization. The
applied freezing-protocol determined the NaCl concentration at which complete inhibition
of mannitol crystallization could be achieved (compare 3.1.3). After adding 0.2% NaCl to
the formulation lyophilized with program I, peaks of β-mannitol at a very low intensity
and NaCl (31.7° 2-Θ) with an overall high content of amorphous material were detected
(Figure 7a). When performing lyophilization with an annealing step (program II), a partly
crystalline mixture of β- and δ-mannitol was achieved for formulations with 0.1% NaCl
(Figure 7b). The low intensity of the NaCl peak at 31.7° 2-Θ indicated an incomplete NaCl
crystallization during the freeze-drying process. Lyophilization at a faster freezing rate
(program III) resulted in amorphous products, when 0.1% NaCl was added (Figure 7c).
During storage at 2-8°C, 25°C / 60% RH and 40°C / 75% RH mannitol and NaCl
crystallized, indicated by an intensity increase of the peaks, with mannitol crystallizing
prior to NaCl. This was in agreement with literature data for the crystallization order in
the liquid state during freezing and rewarming, where NaCl crystallization takes place
after the crystallization of mannitol, which is necessary for NaCl to inhibit the
crystallization of mannitol [31]. During 6 months storage a formation of new mannitol
modifications did not occur. Similar results were obtained by Cannon and Trappler (2000)
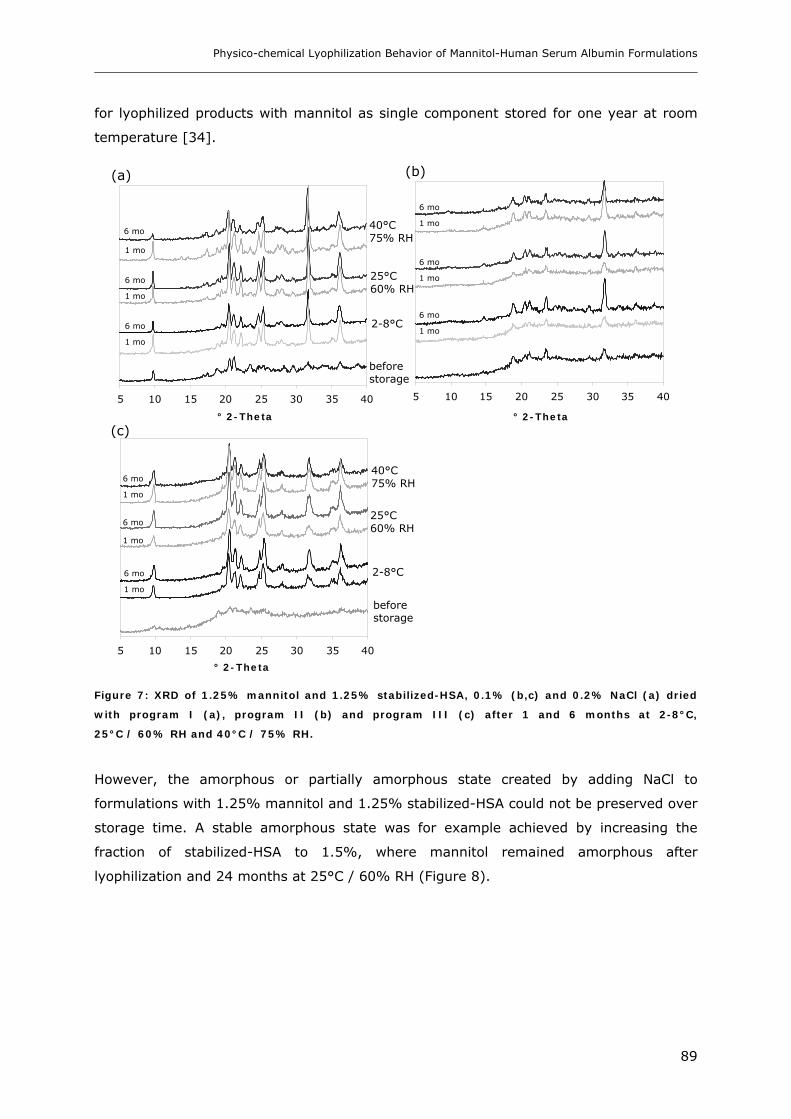
Physico-chemical Lyophilization Behavior of Mannitol-Human Serum Albumin Formulations
89
for lyophilized products with mannitol as single component stored for one year at room
temperature [34].
5 10 15 20 25 30 35 40
° 2-Theta
5 10 15 20 25 30 35 40
° 2-Theta
5 10 15 20 25 30 35 40
° 2-Theta
Figure 7: XRD of 1.25% mannitol and 1.25% stabilized-HSA, 0.1% (b,c) and 0.2% NaCl (a) dried
with program I (a), program II (b) and program III (c) after 1 and 6 months at 2-8°C,
25°C / 60% RH and 40°C / 75% RH.
However, the amorphous or partially amorphous state created by adding NaCl to
formulations with 1.25% mannitol and 1.25% stabilized-HSA could not be preserved over
storage time. A stable amorphous state was for example achieved by increasing the
fraction of stabilized-HSA to 1.5%, where mannitol remained amorphous after
lyophilization and 24 months at 25°C / 60% RH (Figure 8).
before storage
before storage
2-8°C
25°C 60% RH
40°C 75% RH
2-8°C
25°C 60% RH
40°C 75% RH
1 mo
6 mo
6 mo
6 mo
1 mo
1 mo
6 mo
1 mo
6 mo
1 mo
6 mo
1 mo
6 mo
1 mo
6 mo
1 mo
6 mo
1 mo
(a) (b)
(c)

Chapter 4
90
5 10 15 20 25 30 35 40
° 2-Theta
Figure 8: XRD of 1.5% stabilized-HSA and 1.0% mannitol without and with 0.1% NaCl, lyophilized
with program I after lyophilization and 24 months at 25°C / 60% RH.
When adding 0.1% NaCl, the peak at 31.7° 2-Θ was present and increased in intensity
over time, while mannitol remained amorphous. It could be shown that the amorphous
state created by NaCl was not stable upon storage. If NaCl is required e.g. as stabilizer
for the active ingredient the fact that it crystallizes upon storage needs to be considered.
3.2.2 Stability of HSA during Storage
More important than the physico-chemical stability of the lyophilized product is the
stability of a protein upon storage. To evaluate the stability of HSA over time, turbidity in
FNU was monitored over the pH range from 7.5 to 3.0 and compared to the reference
solutions I-IV of the European Pharmacopoeia method 2.2.1 [20]. By the pH scan the
differences between the formulations became more obvious, as the increase in turbidity
at pH 4.5 to 5.0 was more pronounced for stressed products. Additionally, aggregation
was monitored with HP-SEC. Here the samples lyophilized with program I after 24
months at 25°C / 60% RH are shown exemplarily. Independent of the applied
lyophilization process, clear solutions (turbidity < Ref I of Ph. Eur.) were obtained after
reconstitution with water. The pH turbidity profile did not change after 6 months at 2-8°C
(Figure 9a). After storage at 25°C / 60% RH and 40°C / 75% RH the turbidity increase at
pH 5.0 was more obvious (Figure 9b-e). After 6 months at 25°C / 60% RH, respectively
40°C / 75% RH turbidities of 25-30 FNU, respectively 45-55 FNU were measured at pH
5.0, indicating damage of the protein at elevated temperatures. Furthermore, the
turbidity of samples lyophilized with program II was about 4 FNU (25°C / 60% RH) and
10 FNU (40°C / 75% RH) higher compared to preparations dried with the other
0.1% NaCl
0.0% NaCl
before storage
before storage
24 mo 25°C / 60% RH
24 mo 25°C / 60% RH
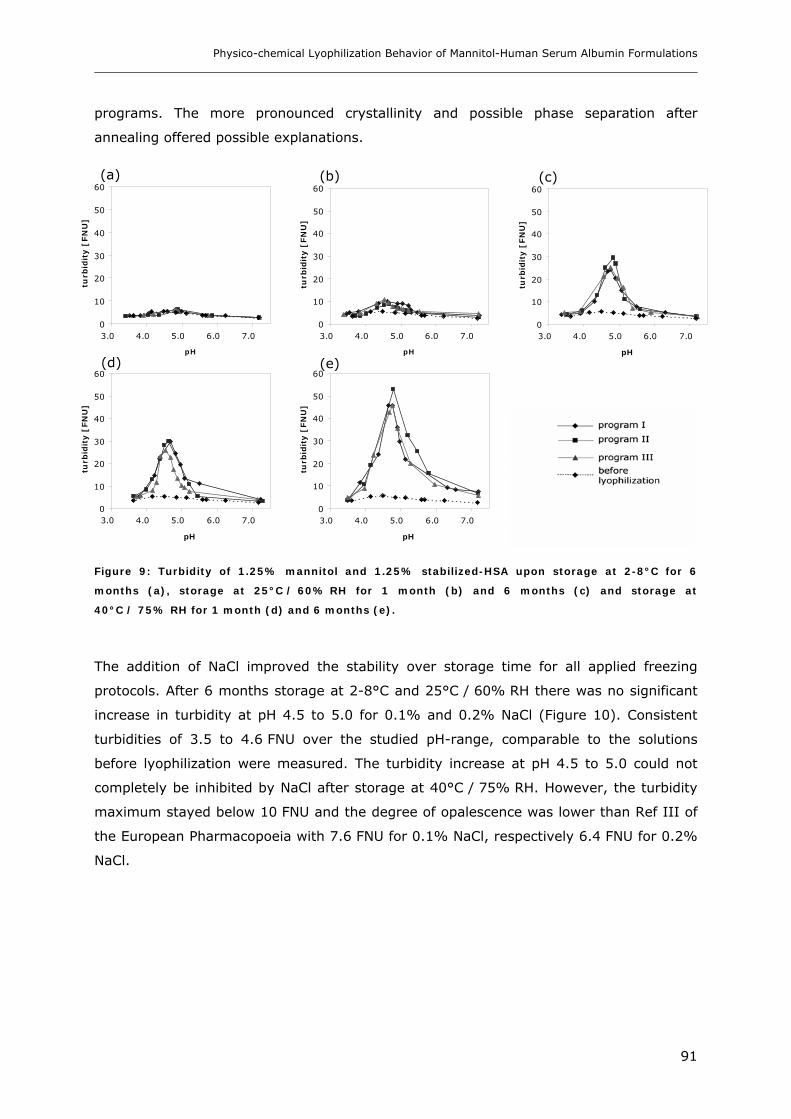
Physico-chemical Lyophilization Behavior of Mannitol-Human Serum Albumin Formulations
91
programs. The more pronounced crystallinity and possible phase separation after
annealing offered possible explanations.
0
10
20
30
40
50
60
3.0 4.0 5.0 6.0 7.0
pH
turb
idit
y [
FN
U]
0
10
20
30
40
50
60
3.0 4.0 5.0 6.0 7.0
pH
turb
idit
y [
FN
U]
0
10
20
30
40
50
60
3.0 4.0 5.0 6.0 7.0
pH
turb
idit
y [
FN
U]
0
10
20
30
40
50
60
3.0 4.0 5.0 6.0 7.0
pH
turb
idit
y [
FN
U]
0
10
20
30
40
50
60
3.0 4.0 5.0 6.0 7.0
pH
turb
idit
y [
FN
U]
Figure 9: Turbidity of 1.25% mannitol and 1.25% stabilized-HSA upon storage at 2-8°C for 6
months (a), storage at 25°C / 60% RH for 1 month (b) and 6 months (c) and storage at
40°C / 75% RH for 1 month (d) and 6 months (e).
The addition of NaCl improved the stability over storage time for all applied freezing
protocols. After 6 months storage at 2-8°C and 25°C / 60% RH there was no significant
increase in turbidity at pH 4.5 to 5.0 for 0.1% and 0.2% NaCl (Figure 10). Consistent
turbidities of 3.5 to 4.6 FNU over the studied pH-range, comparable to the solutions
before lyophilization were measured. The turbidity increase at pH 4.5 to 5.0 could not
completely be inhibited by NaCl after storage at 40°C / 75% RH. However, the turbidity
maximum stayed below 10 FNU and the degree of opalescence was lower than Ref III of
the European Pharmacopoeia with 7.6 FNU for 0.1% NaCl, respectively 6.4 FNU for 0.2%
NaCl.
(a) (b) (c)
(d) (e)

Chapter 4
92
0
2
4
6
8
10
3 4 5 6 7
pH
turb
idit
y [
FN
U]
40°C/75% RH25°C/60% RH2-8°Cbefore lyophilization
0
2
4
6
8
10
3 4 5 6 7
pH
turb
idit
y [
FN
U]
40°C/75% RH25°C/60% RH2-8°Cbefore lyophilization
Figure 10: Turbidity of 1.25% mannitol and 1.25% stabilized-HSA with 0.1% NaCl (a) and
0.2% NaCl (b) dried with program I after 6 months storage at 2-8°C, 25°C / 60% RH and
40°C / 75% RH.
The stabilizing effect of NaCl on HSA seen in the turbidity data was further confirmed
with HP-SEC. It was shown by HP-SEC for samples lyophilized with program I after 24
months storage at 25°C / 60% RH that higher monomer contents were found with
increasing NaCl concentrations (Figure 11). The monomer content after lyophilization was
93% ± 0.5% independent of the NaCl concentration.
84
86
88
90
92
94
0 0.05 0.1 0.15 0.2
NaCl [%]
HS
A m
on
om
er
co
nte
nt
[%]
Figure 11: HSA-monomer content after reconstitution of 1.25% mannitol and 1.25% stabilized-HSA
formulation with 0.0% to 0.2% NaCl, lyophilized with program I and 24 months storage at
25°C / 60% RH.
A stabilizing effect of NaCl on HSA, respectively BSA is also described in literature. In the
solid state HSA generally exhibits a good thermo-reversible structural stability, which was
(a) (b)
Physico-chemical Lyophilization Behavior of Mannitol-Human Serum Albumin Formulations
93
determined by FTIR from Wang et al. (2005) [35]. Higher melting temperatures (Tm) are
detected by DSC with increasing NaCl concentrations in HSA solutions in the pH range
from 5.6 to 7.0 [36]. Costantino et al. (1995a) showed for lyophilized recombinant
human albumin (rHA) that aggregation upon high humidity incubation was reduced by
NaCl due to the uptake of water in the vicinity of rHA by NaCl [37]. The secondary
structure of rHA, was not significantly affected by the addition of NaCl [38]. Structural
changes, in particular aggregation is known to induce the risk of immunogenicity
reactions in the patient [39]. HSA itself exhibits a low risk for immunogenicity, however
in presence of a second protein the formation of mixed aggregates can lead to
immunogenicity reactions, which was e.g. shown for rhINFα [40,41].
Overall, the turbidity data showed a good stability of stabilized-HSA upon storage at
2-8°C for all studied lyophilization programs. At higher storage temperatures the samples
produced with annealing (program II) exhibited higher turbidity values at pH 5.0,
indicating destabilization. By NaCl addition, mannitol remained amorphous after
lyophilization, but crystallized upon storage. Crystallization is known for its potential
negative impact on protein integrity [3]. However, the addition of NaCl enhanced the
stability of HSA independent of the applied freeze-drying program and the crystallization
of mannitol upon storage. This indicated that the stabilizing effect of NaCl on HSA
prevailed over a possible detrimental effect of mannitol crystallization upon storage.
Chapter 4
94
4. Conclusions
The lyophilization behavior and the physico-chemical properties of the dried products are
influenced by the presence of salts in the formulations. Therefore, the impact of NaCl on
drying-time, crystallization and morphology was studied for formulations with mannitol
and stabilized-HSA, using different freezing-protocols. A shorter drying-time for
formulations with 1.25% mannitol and 1.25% stabilized-HSA was observed for three
different lyophilization programs with increasing amounts of NaCl, due to morphological
changes and a less compact cake structure. It could be shown by DSC, XRD and SEM
that both NaCl-concentration and applied freezing-protocol had a significant impact on
the physico-chemical properties of the formulations after lyophilization with differences in
crystallinity and existing modifications. Without NaCl the lyophilized samples contained
exclusively δ-mannitol for all studied freezing-protocols and remained physico-chemically
stable upon storage for 6 months at 2-8°C, 25°C / 60% RH and 40°C / 75% RH. With
increasing NaCl concentrations a larger fraction of β-mannitol was detected and finally
amorphous products were formed. The applied freezing-protocol determined how much
NaCl was needed to achieve an amorphous product. However, upon storage the
amorphous state could not be preserved with the consequence that mannitol and NaCl
crystallized. The data indicated that products without NaCl were more stable in their
modifications. However, regarding the stability of HSA in the lyophilized products,
monitored by a turbidity scan from pH 3.0 to 7.0 and HP-SEC, the addition of NaCl
improved the stability of HSA upon storage. This could be referred to a direct stabilizing
effect of NaCl on HSA upon storage, which is described in literature. For the studied
systems the benefit of NaCl on protein stability outbalanced the potential drawbacks that
morphological changes, like crystallization imposed on lyophilized products. Concluding,
it can be stated that it is important to understand how NaCl is affecting the morphology
and the protein in the formulation during lyophilization.
Physico-chemical Lyophilization Behavior of Mannitol-Human Serum Albumin Formulations
95
5. References
1. M. J. Pikal, K. M. Dellermann, M. L. Roy, R. M. Riggin. The Effects of Formulation Variables on the Stability
of Freeze-Dried Human Growth Hormone. Pharm. Res. 8:427-436 (1991).
2. R. Johnson, C. Kirchhoff, H. Gaud. Mannitol-Sucrose Mixtures-Versatile Formulations for Protein
Lyophilization. J. Pharm. Sci. 91:914-922 (2002).
3 K. Izutsu, S. Kojima. Excipient crystallinity and its protein-structure-stabilizing effect druing freeze-drying.
J. Pharm. Pharmacol. 54:1033-1039 (2002).
4. K. Kasraian, T. M. Spitznagel, J. A. Juneau, K. Yim. Characterization of the Sucrose/Glycine/Water System
by Differential Scanning Calorimetry and Freeze-Drying Microscopy. Pharm. Dev. Technology. 3:233-239
(1998).
5. C. Telang, L. Yu, R. Suryanararyanan. Effective Inhibition of Mannitol Crystallization in Frozen Solutions by
Sodium Chloride. Pharm. Res. 20:660-667 (2003).
6. M. F. Mazzobre, M. P. Longinotti, H. R. Corti, M. P. Buera. Effect of Salts on the Properties of Aqueous
Sugar Systems, in Relation to Biomaterial Stabilization. 1. Water Sorption Behavior and Ice
Crystallization/Melting. Cryobiol. 43:199-210 (2001).
7. A. Pyne, R. Surana, R. Suryanararyanan. Crystallization of Mannitol below Tg’ during Freeze-Drying in
Binary and Ternary Aqueous Systems. Pharm. Res. 19:901-908 (2002).
8. B. Lyuet, D. Rasmussen. Study by differential thermal analysis of the temperature of instability of rapidly
cooled solutions of glycerol, ethylene glycol, sucrose and glucose. Biodyn. 10:1167-1191 (1968).
9. A. Kim, M. Akers, S. Nail. The Physical State of Mannitol after Freeze-Drying. Effect of Mannitol
Concentration, Freezing Rate and a Noncrystallizing Cosolute. J. Pharm. Sci. 87:931-935 (1998).
10. B. Lueckel, D. Bodmer, B. Helk, H. Leuenberger. Formulations of Sugars with Amino Acids or Mannitol-
Influence of Concentration Ratio on Properties of the Freeze-Concentrate and the Lyophilizate. Pharm. Dev.
Technol. 3:325-336 (1998).
11. G. Scatchard, L. E. Strong, W. L. Hughes Jr., J. N. Ashworth, A. H. Sparrow. Chemical, clinical, and
immunological studies and the products of human plasma fractionation. XXVI. The properties of human
serum albumin at low salt content. J. Clinical Invest. 24:671-679 (1945).
12. G. A. Ballou, P. D. Boyer, J. M. Luck, G. F. Lum. The heat coagulation of human albumin. J. Biol. Chem.
153:589-605 (1944).
13. U.S. Food and Drug Administration, Code of Federal Regulations, Title 21, Volume 7: §640.80 Albumin
(Human), revised as on April 1, 2004.
14. T. Arakawa, Y. Kita. Stabilizing effect effect of octanoate and adetyltryptophanate on heat-induced
aggregation of bovine serum albumin. Biochim. Biophys. Acta 1479:32-36 (2000).
15. L. Saso, G. Valentini, E. Grippa, M. G. Leone, B. Silvestrini. Effect of selected substances on heat-induced
aggregation of Albumin, IgG and Lysozyme. Res. Com. in Mol. Pathology Pharmacol. 102:15-28 (1998).
16. M. J. Pikal. Freeze-drying of proteins: Part I: Process design. Biopharm. 3: 17-26 (1990).
17. M. J. Pikal, S. Shah. The collapse temperature in freeze drying: dependence on measurement methodology
and rate of water removal from the glassy phase. Int. J. Pharm. 62:165-186 (1990).
18. S. Nail, L. Gatlin. Freeze-drying: Principles and practice. In K. E. Avis, H. A. Lieberman, L. Lachman
(editors). Pharmaceutical Dosage Forms: Parenteral Medications, Vol. 2. New York: Marcel Dekker; pp 163-
333 (1986).
19. C. Roth, G. Winter, G. Lee. Continous Measurement of Drying Rate of Crystalline and Amorphous Systems
during Freeze-Drying Using a In Situ Microbalance Technique. J. Pharm. Sci. 90:1345-1355 (2001).
20. Clarity and degree of opalescence of liquids. European Pharmacopoeia p. 27-29 (2005).
21. D. E. Overcashier, T. W. Patapoff, C. C. Hsu. Lyophilization of Protein Formulations in Vials: Investigation
on the Relationship between Resistance to Vapor Flow during Primary Drying and Small Scale Collapse. J.
Pharm. Sci. 88:688-695 (1999).
22. J. A. Searles, J. F. Carpenter, T. W. Randolph. The Ice Nucleation Temperature Determines the Primary
Drying Rate of Lyophilization for Samples Frozen on a Temperature-Controlled Shelf. J. Pharm. Sci.
90:860-871 (2001).
Chapter 4
96
23. J. A. Searles, J. F. Carpenter, T. W. Randolph. Annealing to Optimize the Primary Drying Rate
Heterogeneity, and Determine Tg’ in Pharmaceutical Compositions. J. Pharm. Sci. 90:872-887 (2001).
24. X. Lu, M. Pikal. Freeze-Drying of Mannitol-Trehalose-Sodium Chloride-Based Formulations: The Impact of
Annealing on Dry Layer Resistance to Mass Transfer and Cake Structure. Pharm. Tech. Dev. 9:85-95
(2004).
25. I. Presser. Innovative Online Messverfahren zur Optimierung von Gefriertrocknungsprozessen. Dissertation
(2003).
26. E. D. Breen, J. G. Curley, D. E. Overcashier, C. C. Hsu, S. J. Shire. Effect of moisture on the stability of a
lyophilized humanized monoclonal antibody formulation. Pharm. Res. 18:1345-53 (2001).
27. E. Y. Shalaev, G. Zografi. How Does Residual Water Affect the Solid-State Degradation of Drugs in the
Amorphous State? J. Pharm. Sci. 85:1137-1141 (1996).
28. D. J. Burnett, F. Thielmann, J. Booth. Determining the critical relative humidity for moisture-induced phase
transitions. Int. J. Pharm. 287:123-133 (2004).
29. Y. K. Roos, M. Cook. Plasticizing effect of water on thermal behavior and crystallization of amorphous food
models. J. Food Sci. 56:38-43 (1991).
30. A. Burger, J. Henck, S. Hetz, J. Rollinger, A. Weissnicht, H. Stottner. Energy/Temperature Diagram and
Compression Behavior of the Polymorphs of D-Mannitol. J. Pharm. Sci. 89:4 (2000).
31. C. Telang, R. Suryanarayanan, L. Yiu. Crystallization of D-Mannitol in Binary Mixtures with NaCl: Phase
Diagram and Polymorphism. Pharm. Res. 20:1939-1945 (2003).
32. L. Yu. Nucleation of One Polymorph by Another. J. Am. Chem. Soc. 125:6380-6381 (2003).
33. T. Yoshinari, R. T. Forbes, P. York, Y. Kawashima. Moisture induced polymorphic transition of Mannitol and
its morphological transformation. Int. J. Pharm. 247:69-77 (2002).
34. A. Cannon, E. Trappler. The influence of Lyophilization on the Polymorphic Behavior of Mannitol. PDA J.
Pharm. Sci. Technol. 54:13-22 (2000).
35. S. L. Wang, S.Y. Lin, M. J. Li, Y. S. Wie, T. F. Hsieh. Temperature effect on the structural stability,
similarity, and reversibility of human serum albumin in different states. Bioph. Chem. 114:205-212
(2005).
36. M. Yamasaki, H. Yano, K. Aoki. Differential scanning calorimetric studies on bovine serum albumin: I.
Effects of pH and ionic strength. Int. J. Biol. Macromol. 12:263-268 (1990).
37. H. R. Costantino, K. Griebenow, P. Mishra, R. Langer, A. M. Klibanov. Fourier-transform infrared
spectroscopic investigation of protein stability in the lyophilized form. Biochim. Biophy. Acta 1253:69-74
(1995).
38. H. R. Costantino, R. Langer, A. M. Klibanov. Aggregation of a lyophilized pharmaceutical protein,
recombinant human albumin: effect of moisture and stabilization by excipients. Bio/Technol. 13:493-496
(1995).
39. S. Hermeling, D. J. A. Crommelin, H. Schellekens, W. Jiskoot. Structure-Immunogenicity Relationships of
Therapeutic Proteins. Pharm. Res. 21:897-903 (2004).
40. A. Braun, L. Kwee, M. A. Labow, J. Alsenz. Protein Aggregates Seem to Play a Key Role Among the
Parameters Influencing the Antigenicity of Interferon Alpha (INF-α) in Normal and Transgenic Mice. Pharm.
Res. 14:1472-1478 (1997).
41. E. Hochuli. Interferon immunogenicity: technical evaluation of interferon-α2a. J. Interferon Cytokine Res.
17 (Suppl. 1):15-21 (1997).
Chapter 5
Impact of Freezing Procedure and Annealing on the Physico-
chemical Properties and the Formation of Mannitol Hydrate in
Mannitol-Sucrose-NaCl Formulations
Abstract
The goal was to investigate the excipient system mannitol-sucrose as alternative HSA-
free lyophilized formulations for the cytokine. Thereby, the impact of NaCl on the
physico-chemical properties of mannitol-sucrose formulations during freezing and drying,
with special focus on mannitol hydrate formation was investigated. Differential Scanning
Calorimetry (DSC) and Low-temperature X-ray Powder Diffraction (LTXRD) were used to
study the frozen solutions. After lyophilization the products were analyzed with DSC,
Temperature-modulated DSC (TMDSC), X-ray Powder Diffraction (XRD) and Karl-Fischer
titration. DSC showed an inhibition of mannitol crystallization by sucrose and NaCl during
freezing. Tg’ was lowered by both mannitol and NaCl. By the application of an annealing
step during lyophilization mannitol crystallinity could be increased. However,
lyophilization with an annealing step promoted the formation of mannitol hydrate.
Mannitol hydrate is known to undergo conversion into the anhydrous polymorphs of
mannitol upon storage with the consequence that the hydrate water is released. LTXRD
revealed that mannitol hydrate was formed at temperatures below -30°C, but not at
-27°C. The tendency that mannitol hydrate is predominantly formed at lower
temperature was confirmed by XRD of lyophilized products, produced at different
annealing temperatures.
Keywords: freezing, lyophilization, annealing, NaCl, mannitol hydrate
Chapter 5
98
1. Introduction
In the HSA-containing cytokine formulation, mannitol was used as crystalline bulking
agent and HSA as lyo- and cryoprotector. This combination of a crystalline bulking agent,
e.g. mannitol or glycine with a second excipient that remains amorphous e.g. sucrose,
trehalose or human serum albumin is a common way to achieve elegant lyophilized
products [1-3]. Combinations of glycine with sucrose, respectively mannitol with sucrose
are often employed. Johnson et al. (2002), as well as Passot et al. (2005) used a
combination of 4% mannitol and 1% sucrose to successfully stabilize different proteins
[4,5]. Liao et al. (2005) have studied the impact of an incooperated protein on the
physical state of mannitol in formulations with mannitol and sucrose [6]. During
lyophilization mannitol can crystallize in the α- β- or δ-modification or as mannitol
hydrate depending on the applied freezing protocol, a potential annealing step and the
process conditions during primary and secondary drying [7-9]. The presence of other
excipients like buffer components, lyoprotectants or proteins can both inhibit and
promote mannitol crystallization [10-12]. Especially salts, that are added as buffer
components, isotonicity agents or stabilizers can have a major impact on the physico-
chemical properties of mannitol and other excipients [13,14]. A slight increase in salt
concentration can lead to significant changes of the physico-chemical properties of the
excipients during freezing and drying [15-18]. The impact of NaCl on the system
mannitol-HSA during freezing and lyophilization is subject of Chapter 3 and 4. Besides
the anhydrous modifications, mannitol can exist as a metastable crystalline hydrate after
lyophilization [19]. The presence of mannitol hydrate can lead to stability problems
during storage due to the release of hydrate water upon its conversion into the
anhydrous crystal forms. Therefore, it is important to develop lyophilization cycles that
result in products free of mannitol hydrate. Johnson et al. (2002) showed that mannitol
hydrate content can be reduced when performing the secondary drying at temperatures
above 40°C [4]. Little is known about how an annealing procedure influences the
formation of mannitol hydrate during lyophilization. Annealing is often applied for
formulations with mannitol as bulking agent to maximize mannitol crystallization during
the freezing-step. On the other hand, several approaches are described to produce
amorphous mannitol as lyoprotector, e.g. by adding NaCl, boric acid or sodium
tetraborate [13,20,21]. Only in the amorphous state mannitol is able to adequately
stabilize the active protein via molecular interactions [22,23]. However, amorphous
mannitol tends to crystallize upon storage and thereby looses its ability to stabilize the
protein [2]. Therefore, the employment of mannitol as crystalline bulking agent in
combination with an amorphous lyoprotector is the more promising approach. Thereby, it
is essential to ensure mannitol crystallization during lyophilization. The crystallization of
Impact of Freezing Procedure and Annealing on the Physico-chemical Properties and the Formation of Mannitol
Hydrate in Mannitol-Sucrose-NaCl Formulations
99
an excipient upon storage can reduce storage stability. This was described by Kreilgaard
et al. (1999) for Humicola languinosa Lipase formulated with sucrose, who attributed the
reduced stability after crystallization to an increase in moisture content and a reduced
glass transition (Tg) value of the remaining amorphous phase [24].
With respect to the planned development of HSA-free formulations for the cytokine, HSA
was replaced by sucrose in its function as lyo- and cryoprotector. Different combinations
of mannitol, sucrose and NaCl were used as model formulations for the studies. The
impact of NaCl on the physico-chemical properties of the formulation during freezing,
annealing and drying was investigated. For the frozen state the glass transition of the
maximally freeze-concentrated solution (Tg’) of the formulations and the crystallization of
mannitol were monitored. The lyophilized products were analyzed regarding mannitol
modifications, Tg and residual moisture. Special focus was set on the presence of
mannitol hydrate in relation to the applied annealing steps, to find the optimum
lyophilization conditions for the formulations.
2. Materials and Methods
2.1 Materials
Mannitol was obtained from Caelo (Hilden, Germany), sucrose from Suedzucker
(Mannheim, Germany) and NaCl from Sigma (Steinheim, Germany).
2.2 Methods
2.2.1 Low Temperature X-ray Powder Diffraction (LTXRD)
Crystallization was studied with LTXRD using Cu-Kα1-radiation (λ=154.06 pm) on the
powder diffractometer Stadi P from STOE (Darmstadt, Germany) with parafocussed
transmission geometry. Germanium was used as primary monochromator and the
scattered X-rays were detected with a linear PSD area detector. The sterile filtrated
solutions were frozen in the rotating capillary (diameter 0.5 mm) in the cooling stage
(Oxford Cryosystem) of the X-ray diffractometer. For the LTXRD experiment a
temperature profile similar to the conditions during lyophilization was chosen. The
samples were frozen to -50°C with a cooling rate of 0.5°C/min. At -50°C the first
measurement under isothermal conditions was performed. The temperature was
subsequently increased to the different annealing temperatures at 1°C/min and several
measurements were performed at designated time intervals. The diffraction patterns
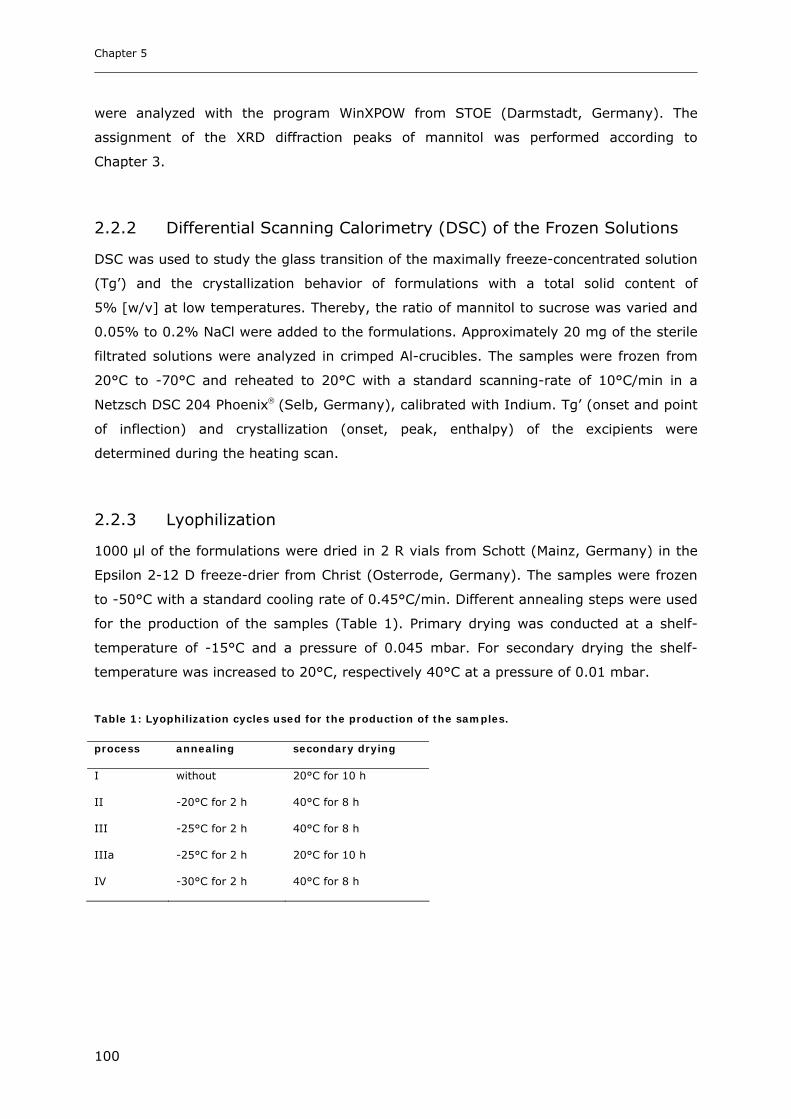
Chapter 5
100
were analyzed with the program WinXPOW from STOE (Darmstadt, Germany). The
assignment of the XRD diffraction peaks of mannitol was performed according to
Chapter 3.
2.2.2 Differential Scanning Calorimetry (DSC) of the Frozen Solutions
DSC was used to study the glass transition of the maximally freeze-concentrated solution
(Tg’) and the crystallization behavior of formulations with a total solid content of
5% [w/v] at low temperatures. Thereby, the ratio of mannitol to sucrose was varied and
0.05% to 0.2% NaCl were added to the formulations. Approximately 20 mg of the sterile
filtrated solutions were analyzed in crimped Al-crucibles. The samples were frozen from
20°C to -70°C and reheated to 20°C with a standard scanning-rate of 10°C/min in a
Netzsch DSC 204 Phoenix® (Selb, Germany), calibrated with Indium. Tg’ (onset and point
of inflection) and crystallization (onset, peak, enthalpy) of the excipients were
determined during the heating scan.
2.2.3 Lyophilization
1000 µl of the formulations were dried in 2 R vials from Schott (Mainz, Germany) in the
Epsilon 2-12 D freeze-drier from Christ (Osterrode, Germany). The samples were frozen
to -50°C with a standard cooling rate of 0.45°C/min. Different annealing steps were used
for the production of the samples (Table 1). Primary drying was conducted at a shelf-
temperature of -15°C and a pressure of 0.045 mbar. For secondary drying the shelf-
temperature was increased to 20°C, respectively 40°C at a pressure of 0.01 mbar.
Table 1: Lyophilization cycles used for the production of the samples.
process annealing secondary drying
I without 20°C for 10 h
II -20°C for 2 h 40°C for 8 h
III -25°C for 2 h 40°C for 8 h
IIIa -25°C for 2 h 20°C for 10 h
IV -30°C for 2 h 40°C for 8 h
Impact of Freezing Procedure and Annealing on the Physico-chemical Properties and the Formation of Mannitol
Hydrate in Mannitol-Sucrose-NaCl Formulations
101
2.2.4 Differential Scanning Calorimetry (DSC) of Lyophilized Products
The lyophilized samples were analyzed with the Netzsch DSC 204 Phoenix® (Selb,
Germany) from 0 to 150°C using scanning rates of 10°C/min. Approximately 10 mg of
the lyophilized samples were analyzed in sealed Al-crucibles. The thermal events were
analyzed in the heating scan of the DSC.
2.2.5 Temperature-Modulated-DSC (TMDSC) of Lyophilized Samples
The lyophilized samples were further analyzed with the Mettler Toledo DSC 822e
(Giessen, Germany) in the modulating mode using 40 µl Al crucibles with Pin (ME
27331). The samples were scanned from 0 to 80°C at an average heating rate of
1.0°C/min at an amplitude of 0.5°C and a period of 0.8 minutes. The glass transitions
were detected in the reversing heat curve.
2.2.6 X-ray Powder Diffraction (XRD)
The morphology of the lyophilized products was analyzed by X-ray powder diffraction
(XRD) from 5-40° 2-Θ, with steps of 0.05° 2-Θ and a duration of 2 seconds per step on
the X-ray diffractometer XRD 3000 TT (Seifert, Ahrenburg, Germany), equipped with a
copper anode (40 kV, 30 mA, wavelength 154.17 pm).
2.2.7 Karl-Fischer Titration
The residual moisture of the samples was determined by coulometric Karl-Fischer
titration using the Aqua 40.00 titrator with a headspace module (Analytik Jena AG, Halle,
Germany). For the measurement at least 10 mg of the lyophilized sample was heated to
80°C for 10 minutes. The evaporated water was transferred into the titration solution and
the amount of H2O was determined. As reference material Apura Water Standard Oven
1% (Merck, Darmstadt Germany) was used and the recovery was considered for the
calculation of the residual moisture of the samples.
To determine the amount of mannitol hydrate in the lyophilized sample Karl-Fischer was
performed in the dynamic mode. The sample was heated with a heating rate of 5°C/min
from 30 to 90°C and the water was simultaneously titrated.
Chapter 5
102
3. Results and Discussion
3.1 Impact of NaCl on the Physico-chemical Properties of Mannitol-
Sucrose Formulations
For the HSA-free formulations of the cytokine a total solid content of 5.0% [w/v] was
planned, with mannitol as crystalline bulking agent and sucrose as amorphous stabilizer.
The optimum ratio of mannitol to sucrose to produce formulations with crystalline
mannitol and amorphous sucrose had to be found. The ratio of mannitol to sucrose was
varied and 0.0% to 0.2% NaCl were added to the formulations. Before performing
lyophilization, the physico-chemical properties of the formulations regarding Tg` and
crystallization were studied in the frozen state.
3.1.1 DSC of Mannitol-Sucrose-NaCl Formulations in the Frozen State
DSC indicated partial crystallization of mannitol during cooling for a 5.0% mannitol
solution at scanning rates of 10°C/min. During the cooling scan the nucleation of
mannitol crystals prevailed [25]. Because of the remaining amorphous mannitol fraction,
two glass transitions Tg’1 at -29.8°C and Tg’2 at -25.5°C were measured, which were in
agreement with literature [26,27]. The glass transition events were followed by mannitol
crystallization with a peak maximum at -19.3°C during the rewarming of the sample.
Here the nuclei, formed at low temperatures grow to mature crystals [25]. The addition
of sucrose inhibited mannitol crystallization in the heating scan, indicated by a decreased
enthalpy of crystallization and a shift of the peak maximum to higher temperatures
(Figure 1a, b). When the sucrose fraction in the formulation exceeded 50%, mannitol
crystallization was completely suppressed in the heating scan. In formulations with 4.0%
mannitol and 1.0% sucrose three glass transition events Tg’1 at -41.5°C, Tg’2 at -32.2°C
and Tg’3 at -27.8°C could be detected. For a similar formulation with 4.0% mannitol,
1.0% sucrose in 10 mM Tris buffer Passot et al. (2005) described two glass transitions
Tg’1 at -41°C and Tg’2 at -31°C, while Tg’3 was not measured [5]. However, it is often
difficult to detect the Tg’ which is close to the onset of mannitol crystallization, even in
solutions with mannitol as single component, as it can overlap with the subsequent
mannitol crystallization [26]. The origin of multiple glass transition processes was
discussed by Liao et al. (2005) who focused on the lowest Tg’ for their studies [6]. With
increasing amounts of sucrose, the two glass transitions at higher temperatures were no
longer present, with only the glass transition at lower temperature remaining. The glass
transition at lower temperatures was raised from -41.8°C for 4.0% mannitol and 1.0%
sucrose to -33°C for 5.0% sucrose (Figure 1c).
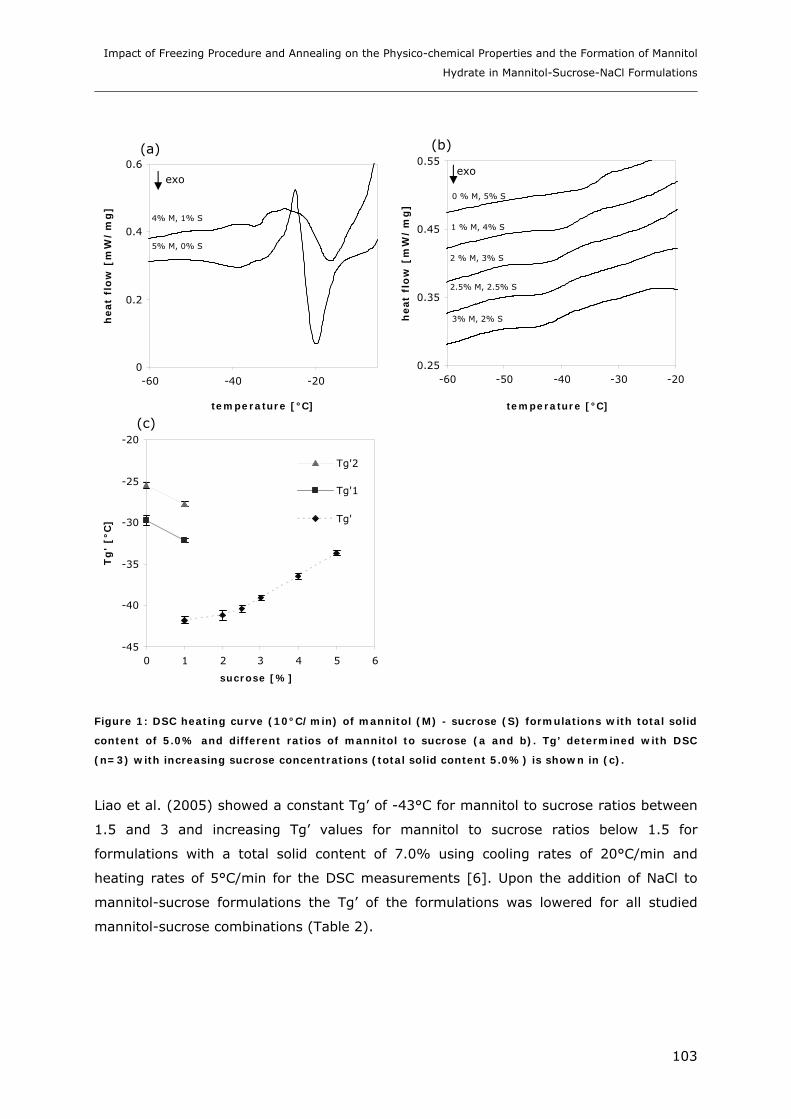
Impact of Freezing Procedure and Annealing on the Physico-chemical Properties and the Formation of Mannitol
Hydrate in Mannitol-Sucrose-NaCl Formulations
103
0
0.2
0.4
0.6
-60 -40 -20
temperature [°C]
heat
flo
w [
mW
/m
g]
0.25
0.35
0.45
0.55
-60 -50 -40 -30 -20
temperature [°C]h
eat
flo
w [
mW
/m
g]
-45
-40
-35
-30
-25
-20
0 1 2 3 4 5 6
sucrose [%]
Tg
' [°
C]
Tg'2
Tg'1
Tg'
Figure 1: DSC heating curve (10°C/min) of mannitol (M) - sucrose (S) formulations with total solid
content of 5.0% and different ratios of mannitol to sucrose (a and b). Tg’ determined with DSC
(n=3) with increasing sucrose concentrations (total solid content 5.0%) is shown in (c).
Liao et al. (2005) showed a constant Tg’ of -43°C for mannitol to sucrose ratios between
1.5 and 3 and increasing Tg’ values for mannitol to sucrose ratios below 1.5 for
formulations with a total solid content of 7.0% using cooling rates of 20°C/min and
heating rates of 5°C/min for the DSC measurements [6]. Upon the addition of NaCl to
mannitol-sucrose formulations the Tg’ of the formulations was lowered for all studied
mannitol-sucrose combinations (Table 2).
(a) (b)
exo exo
5% M, 0% S
4% M, 1% S
3% M, 2% S
2.5% M, 2.5% S
2 % M, 3% S
1 % M, 4% S
0 % M, 5% S
(c)
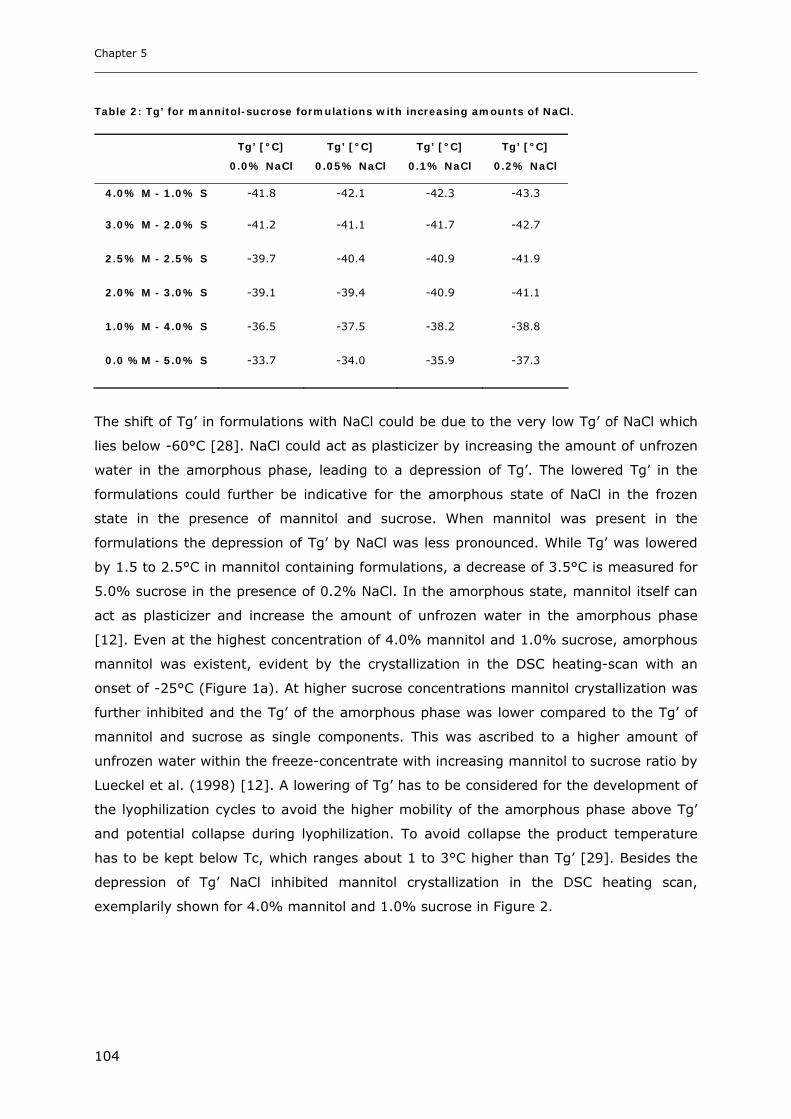
Chapter 5
104
Table 2: Tg’ for mannitol-sucrose formulations with increasing amounts of NaCl.
Tg’ [°C]
0.0% NaCl
Tg’ [°C]
0.05% NaCl
Tg’ [°C]
0.1% NaCl
Tg’ [°C]
0.2% NaCl
4.0% M - 1.0% S
-41.8
-42.1
-42.3
-43.3
3.0% M - 2.0% S -41.2 -41.1 -41.7 -42.7
2.5% M - 2.5% S -39.7 -40.4 -40.9 -41.9
2.0% M - 3.0% S -39.1 -39.4 -40.9 -41.1
1.0% M - 4.0% S -36.5 -37.5 -38.2 -38.8
0.0 %M - 5.0% S -33.7 -34.0 -35.9 -37.3
The shift of Tg’ in formulations with NaCl could be due to the very low Tg’ of NaCl which
lies below -60°C [28]. NaCl could act as plasticizer by increasing the amount of unfrozen
water in the amorphous phase, leading to a depression of Tg’. The lowered Tg’ in the
formulations could further be indicative for the amorphous state of NaCl in the frozen
state in the presence of mannitol and sucrose. When mannitol was present in the
formulations the depression of Tg’ by NaCl was less pronounced. While Tg’ was lowered
by 1.5 to 2.5°C in mannitol containing formulations, a decrease of 3.5°C is measured for
5.0% sucrose in the presence of 0.2% NaCl. In the amorphous state, mannitol itself can
act as plasticizer and increase the amount of unfrozen water in the amorphous phase
[12]. Even at the highest concentration of 4.0% mannitol and 1.0% sucrose, amorphous
mannitol was existent, evident by the crystallization in the DSC heating-scan with an
onset of -25°C (Figure 1a). At higher sucrose concentrations mannitol crystallization was
further inhibited and the Tg’ of the amorphous phase was lower compared to the Tg’ of
mannitol and sucrose as single components. This was ascribed to a higher amount of
unfrozen water within the freeze-concentrate with increasing mannitol to sucrose ratio by
Lueckel et al. (1998) [12]. A lowering of Tg’ has to be considered for the development of
the lyophilization cycles to avoid the higher mobility of the amorphous phase above Tg’
and potential collapse during lyophilization. To avoid collapse the product temperature
has to be kept below Tc, which ranges about 1 to 3°C higher than Tg’ [29]. Besides the
depression of Tg’ NaCl inhibited mannitol crystallization in the DSC heating scan,
exemplarily shown for 4.0% mannitol and 1.0% sucrose in Figure 2.
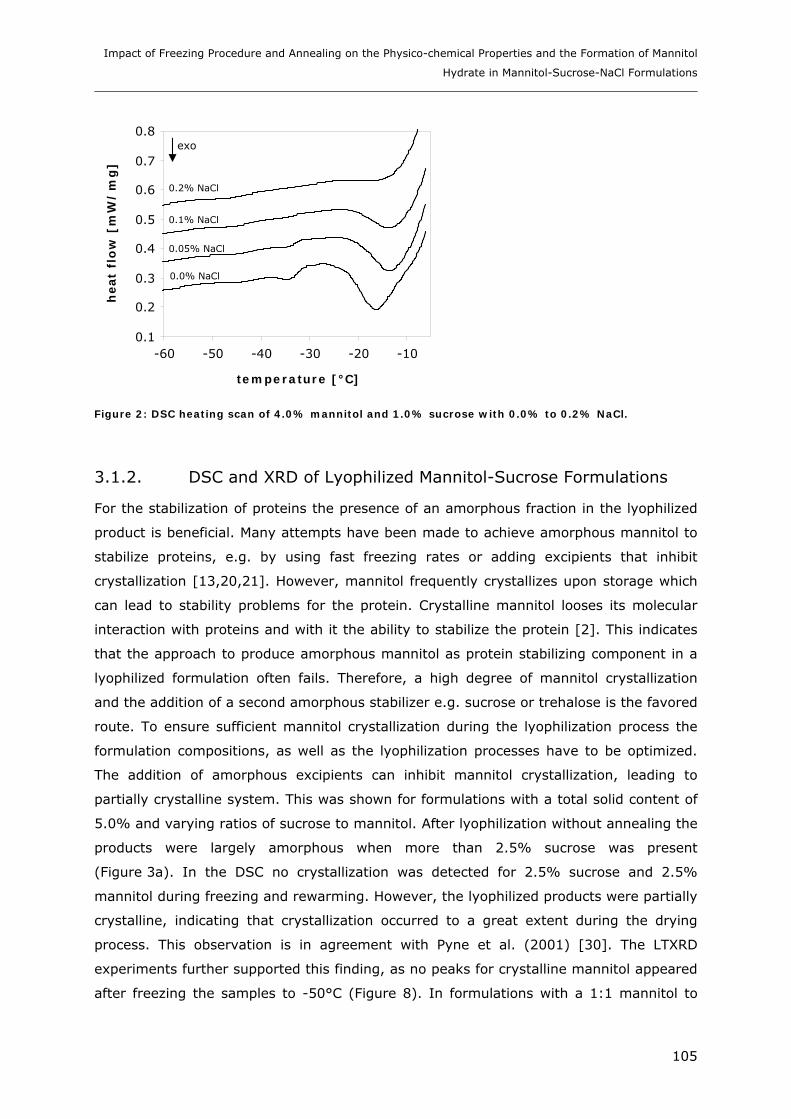
Impact of Freezing Procedure and Annealing on the Physico-chemical Properties and the Formation of Mannitol
Hydrate in Mannitol-Sucrose-NaCl Formulations
105
0.1
0.2
0.3
0.4
0.5
0.6
0.7
0.8
-60 -50 -40 -30 -20 -10
temperature [°C]
heat
flo
w [
mW
/m
g]
Figure 2: DSC heating scan of 4.0% mannitol and 1.0% sucrose with 0.0% to 0.2% NaCl.
3.1.2. DSC and XRD of Lyophilized Mannitol-Sucrose Formulations
For the stabilization of proteins the presence of an amorphous fraction in the lyophilized
product is beneficial. Many attempts have been made to achieve amorphous mannitol to
stabilize proteins, e.g. by using fast freezing rates or adding excipients that inhibit
crystallization [13,20,21]. However, mannitol frequently crystallizes upon storage which
can lead to stability problems for the protein. Crystalline mannitol looses its molecular
interaction with proteins and with it the ability to stabilize the protein [2]. This indicates
that the approach to produce amorphous mannitol as protein stabilizing component in a
lyophilized formulation often fails. Therefore, a high degree of mannitol crystallization
and the addition of a second amorphous stabilizer e.g. sucrose or trehalose is the favored
route. To ensure sufficient mannitol crystallization during the lyophilization process the
formulation compositions, as well as the lyophilization processes have to be optimized.
The addition of amorphous excipients can inhibit mannitol crystallization, leading to
partially crystalline system. This was shown for formulations with a total solid content of
5.0% and varying ratios of sucrose to mannitol. After lyophilization without annealing the
products were largely amorphous when more than 2.5% sucrose was present
(Figure 3a). In the DSC no crystallization was detected for 2.5% sucrose and 2.5%
mannitol during freezing and rewarming. However, the lyophilized products were partially
crystalline, indicating that crystallization occurred to a great extent during the drying
process. This observation is in agreement with Pyne et al. (2001) [30]. The LTXRD
experiments further supported this finding, as no peaks for crystalline mannitol appeared
after freezing the samples to -50°C (Figure 8). In formulations with a 1:1 mannitol to
0.0% NaCl
0.05% NaCl
0.1% NaCl
0.2% NaCl
exo

Chapter 5
106
sucrose ratio, peaks of δ-mannitol (9.7° 2-Θ) and β-mannitol (23.4° 2-Θ) were detected.
Furthermore, mannitol hydrate indicated by the peak at 17.9° 2-Θ was present.
5 10 15 20 25 30 35 40
° 2-Theta
5 10 15 20 25 30 35 40
° 2-Theta
Figure 3: XRD of mannitol (M) - sucrose (S) formulations after lyophilization with process I (a) and
with process IIIa which included an annealing step at -25°C for 2 hours (b).
In the first DSC heating scan of 2.5% mannitol and 2.5% sucrose, lyophilized with
program I two glass transitions (Tg) at 12°C and 36°C followed by mannitol
crystallization with an onset of 43.3°C and a peak maximum of 55.5°C were detected
(Figure 4).
0
0.1
0.2
0.3
0.4
0.5
-20 0 20 40 60 80 100
temperature [°C]
heat
flo
w [
mW
/m
g]
Figure 4: DSC heating scans of 2.5% mannitol and 2.5% sucrose lyophilized with program I.
(a) (b)
4% M, 1% S
3% M, 2% S
2.5% M, 2.5% S
2% M, 3% S 2% M, 3% S
3% M, 2% S
4% M, 1% S
exo
1st scan
2nd scan
crystallization
Tg
Tg
Tg
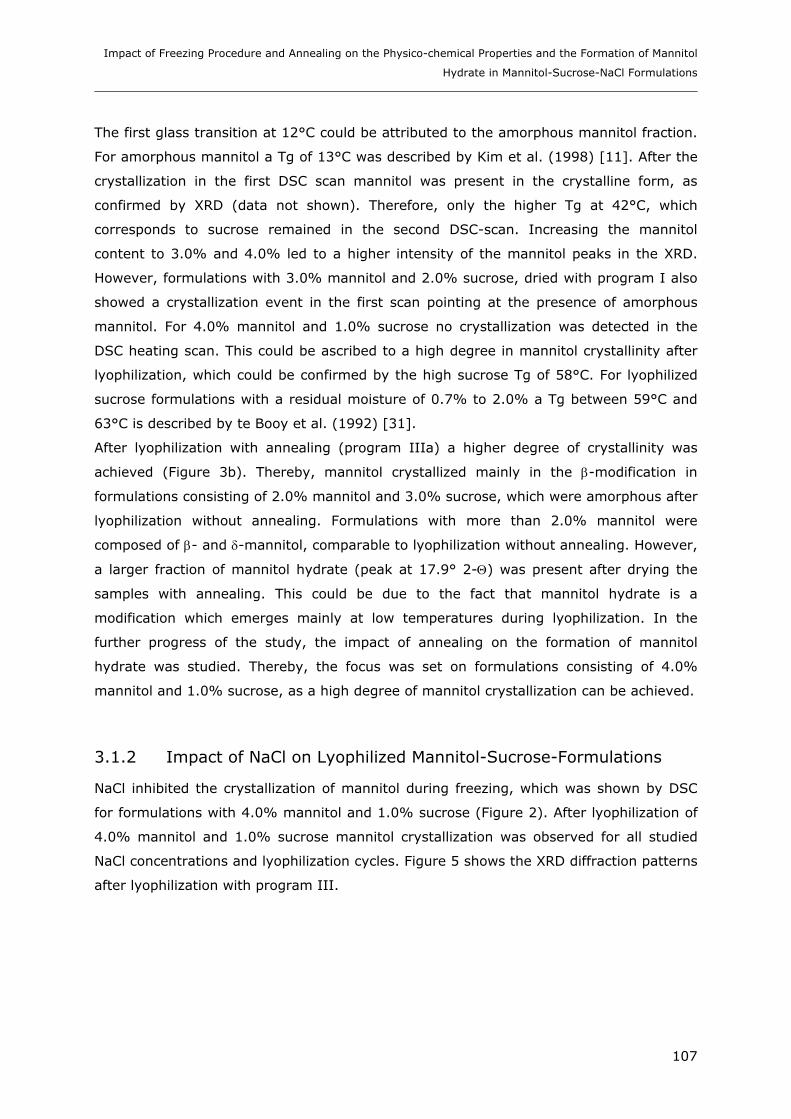
Impact of Freezing Procedure and Annealing on the Physico-chemical Properties and the Formation of Mannitol
Hydrate in Mannitol-Sucrose-NaCl Formulations
107
The first glass transition at 12°C could be attributed to the amorphous mannitol fraction.
For amorphous mannitol a Tg of 13°C was described by Kim et al. (1998) [11]. After the
crystallization in the first DSC scan mannitol was present in the crystalline form, as
confirmed by XRD (data not shown). Therefore, only the higher Tg at 42°C, which
corresponds to sucrose remained in the second DSC-scan. Increasing the mannitol
content to 3.0% and 4.0% led to a higher intensity of the mannitol peaks in the XRD.
However, formulations with 3.0% mannitol and 2.0% sucrose, dried with program I also
showed a crystallization event in the first scan pointing at the presence of amorphous
mannitol. For 4.0% mannitol and 1.0% sucrose no crystallization was detected in the
DSC heating scan. This could be ascribed to a high degree in mannitol crystallinity after
lyophilization, which could be confirmed by the high sucrose Tg of 58°C. For lyophilized
sucrose formulations with a residual moisture of 0.7% to 2.0% a Tg between 59°C and
63°C is described by te Booy et al. (1992) [31].
After lyophilization with annealing (program IIIa) a higher degree of crystallinity was
achieved (Figure 3b). Thereby, mannitol crystallized mainly in the β-modification in
formulations consisting of 2.0% mannitol and 3.0% sucrose, which were amorphous after
lyophilization without annealing. Formulations with more than 2.0% mannitol were
composed of β- and δ-mannitol, comparable to lyophilization without annealing. However,
a larger fraction of mannitol hydrate (peak at 17.9° 2-Θ) was present after drying the
samples with annealing. This could be due to the fact that mannitol hydrate is a
modification which emerges mainly at low temperatures during lyophilization. In the
further progress of the study, the impact of annealing on the formation of mannitol
hydrate was studied. Thereby, the focus was set on formulations consisting of 4.0%
mannitol and 1.0% sucrose, as a high degree of mannitol crystallization can be achieved.
3.1.2 Impact of NaCl on Lyophilized Mannitol-Sucrose-Formulations
NaCl inhibited the crystallization of mannitol during freezing, which was shown by DSC
for formulations with 4.0% mannitol and 1.0% sucrose (Figure 2). After lyophilization of
4.0% mannitol and 1.0% sucrose mannitol crystallization was observed for all studied
NaCl concentrations and lyophilization cycles. Figure 5 shows the XRD diffraction patterns
after lyophilization with program III.
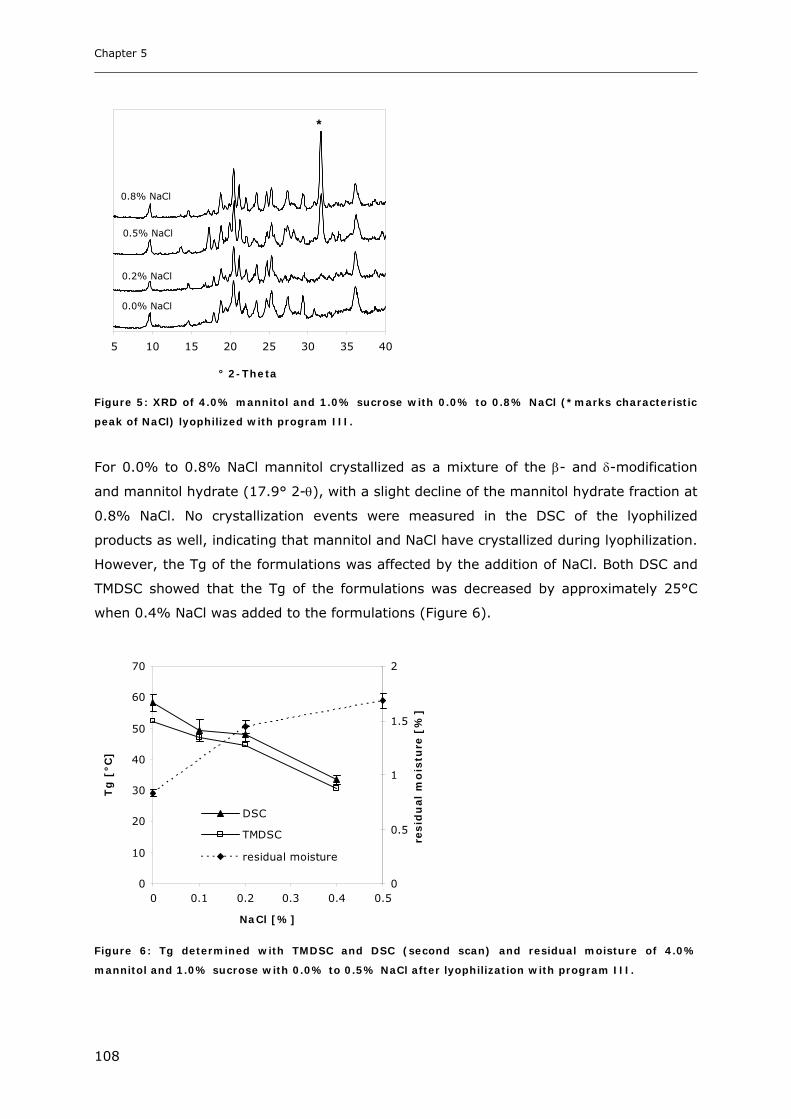
Chapter 5
108
5 10 15 20 25 30 35 40
° 2-Theta
Figure 5: XRD of 4.0% mannitol and 1.0% sucrose with 0.0% to 0.8% NaCl (*marks characteristic
peak of NaCl) lyophilized with program III.
For 0.0% to 0.8% NaCl mannitol crystallized as a mixture of the β- and δ-modification
and mannitol hydrate (17.9° 2-θ), with a slight decline of the mannitol hydrate fraction at
0.8% NaCl. No crystallization events were measured in the DSC of the lyophilized
products as well, indicating that mannitol and NaCl have crystallized during lyophilization.
However, the Tg of the formulations was affected by the addition of NaCl. Both DSC and
TMDSC showed that the Tg of the formulations was decreased by approximately 25°C
when 0.4% NaCl was added to the formulations (Figure 6).
0
10
20
30
40
50
60
70
0 0.1 0.2 0.3 0.4 0.5
NaCl [%]
Tg
[°C
]
0
0.5
1
1.5
2
resid
ual
mo
istu
re [
%]
DSC
TMDSC
residual moisture
Figure 6: Tg determined with TMDSC and DSC (second scan) and residual moisture of 4.0%
mannitol and 1.0% sucrose with 0.0% to 0.5% NaCl after lyophilization with program III.
0.8% NaCl
0.5% NaCl
0.2% NaCl
0.0% NaCl
*

Impact of Freezing Procedure and Annealing on the Physico-chemical Properties and the Formation of Mannitol
Hydrate in Mannitol-Sucrose-NaCl Formulations
109
The residual moisture increased from 0.8% without NaCl to 1.7% with 0.5% NaCl. This
could explain the lowered glass transitions as water acts as plasticizer for the amorphous
phase. Although mannitol crystallization was not affected by increasing NaCl
concentrations, the lowered glass transition temperatures of the lyophilized products
needs to be considered for the storage stability of a protein. A higher Tg is often
beneficial for protein stability upon storage which was for example shown by Prestrelski
et al. (1995) for Interleukin-2 [32]. However, Chang et al. (1996) demonstrated that
storage of lyophilized recombinant human interleukin-1 receptor antagonist formulations
below Tg was necessary, but not always sufficient to ensure long-term stability e.g. when
the protein was already damaged during lyophilization process [33]. On the other hand,
Davidson and Sun (2001) demonstrated for sucrose–raffinose formulations that an
increase in Tg of the lyophilized samples was not related to a higher recovery of Glucose-
6-phosphate Dehydrogenase activity after reconstitution when stored above Tg [34].
3.2 Impact of Annealing on the Formation of Mannitol Hydrate
To study the impact of annealing on the formation of mannitol hydrate, formulations with
4.0% mannitol and 1.0% sucrose were lyophilized with different lyophilization cycles.
Furthermore, LTXRD was used to monitor crystallization of mannitol during an annealing
step at low temperatures. For the LTXRD experiments solutions with higher
concentrations (8.0% mannitol and 2.0% sucrose) were used, due to the detection limit
of the method.
3.2.1 LTXRD of Mannitol-Sucrose-Formulations at Different Annealing
Conditions
DSC offers information on crystalline and amorphous phases in the frozen state.
However, with DSC it is not possible to identify and characterize the composition and
modifications of the crystalline phase [35], which is on the other hand possible with
LTXRD [36,37]. After freezing a formulation of 8.0% mannitol and 2.0% sucrose to -50°C
with a cooling rate of 0.5°C/min no peaks of crystalline mannitol were detected
(Figure 7). The cooling rate of 0.5°C/min was chosen as it is comparable to the cooling
rate used during lyophilization. After an isothermal phase of one hour at -50°C the
temperature was increased with 1.0°C/min to the annealing temperatures of -23°C,
-27°C and -32°C, where three measurements were performed under isothermal
conditions. After heating the samples to the annealing temperatures peaks of crystalline
mannitol were detected. At -23°C and -27°C mannitol crystallized in the δ-modification,
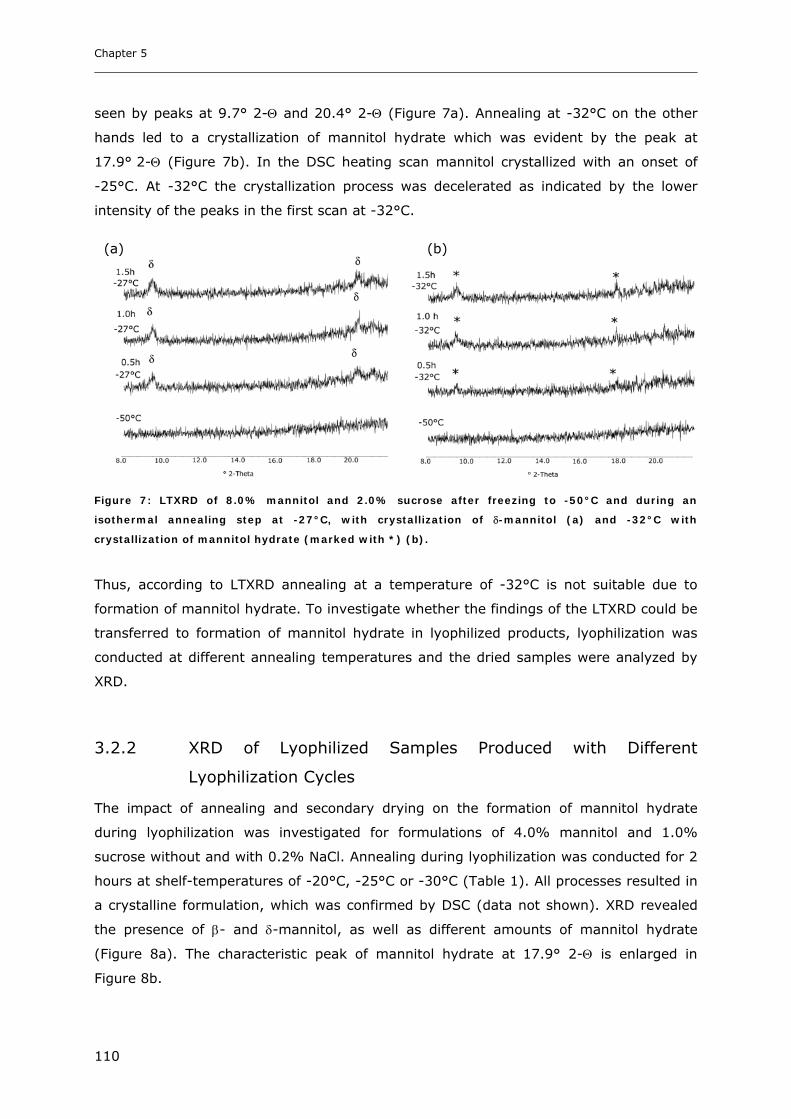
Chapter 5
110
seen by peaks at 9.7° 2-Θ and 20.4° 2-Θ (Figure 7a). Annealing at -32°C on the other
hands led to a crystallization of mannitol hydrate which was evident by the peak at
17.9° 2-Θ (Figure 7b). In the DSC heating scan mannitol crystallized with an onset of
-25°C. At -32°C the crystallization process was decelerated as indicated by the lower
intensity of the peaks in the first scan at -32°C.
Figure 7: LTXRD of 8.0% mannitol and 2.0% sucrose after freezing to -50°C and during an
isothermal annealing step at -27°C, with crystallization of δ-mannitol (a) and -32°C with
crystallization of mannitol hydrate (marked with *) (b).
Thus, according to LTXRD annealing at a temperature of -32°C is not suitable due to
formation of mannitol hydrate. To investigate whether the findings of the LTXRD could be
transferred to formation of mannitol hydrate in lyophilized products, lyophilization was
conducted at different annealing temperatures and the dried samples were analyzed by
XRD.
3.2.2 XRD of Lyophilized Samples Produced with Different
Lyophilization Cycles
The impact of annealing and secondary drying on the formation of mannitol hydrate
during lyophilization was investigated for formulations of 4.0% mannitol and 1.0%
sucrose without and with 0.2% NaCl. Annealing during lyophilization was conducted for 2
hours at shelf-temperatures of -20°C, -25°C or -30°C (Table 1). All processes resulted in
a crystalline formulation, which was confirmed by DSC (data not shown). XRD revealed
the presence of β- and δ-mannitol, as well as different amounts of mannitol hydrate
(Figure 8a). The characteristic peak of mannitol hydrate at 17.9° 2-Θ is enlarged in
Figure 8b.
(a) (b)
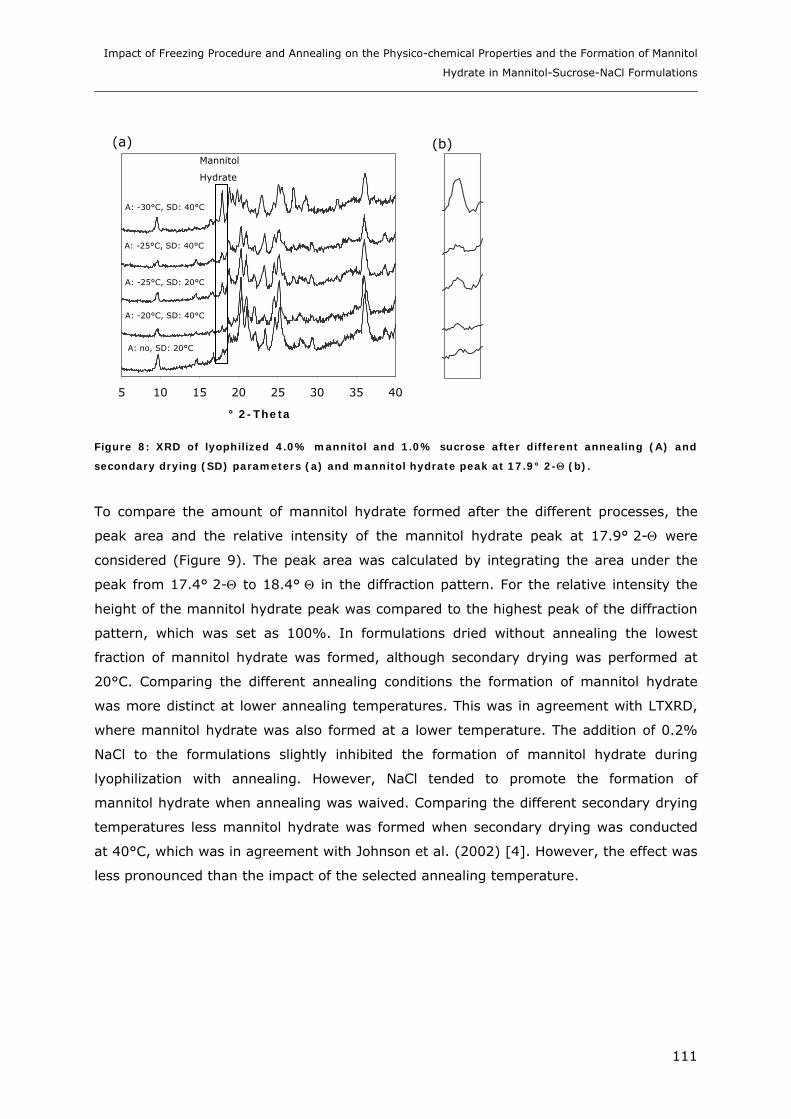
Impact of Freezing Procedure and Annealing on the Physico-chemical Properties and the Formation of Mannitol
Hydrate in Mannitol-Sucrose-NaCl Formulations
111
5 10 15 20 25 30 35 40
° 2-Theta
Figure 8: XRD of lyophilized 4.0% mannitol and 1.0% sucrose after different annealing (A) and
secondary drying (SD) parameters (a) and mannitol hydrate peak at 17.9° 2-Θ (b).
To compare the amount of mannitol hydrate formed after the different processes, the
peak area and the relative intensity of the mannitol hydrate peak at 17.9° 2-Θ were
considered (Figure 9). The peak area was calculated by integrating the area under the
peak from 17.4° 2-Θ to 18.4° Θ in the diffraction pattern. For the relative intensity the
height of the mannitol hydrate peak was compared to the highest peak of the diffraction
pattern, which was set as 100%. In formulations dried without annealing the lowest
fraction of mannitol hydrate was formed, although secondary drying was performed at
20°C. Comparing the different annealing conditions the formation of mannitol hydrate
was more distinct at lower annealing temperatures. This was in agreement with LTXRD,
where mannitol hydrate was also formed at a lower temperature. The addition of 0.2%
NaCl to the formulations slightly inhibited the formation of mannitol hydrate during
lyophilization with annealing. However, NaCl tended to promote the formation of
mannitol hydrate when annealing was waived. Comparing the different secondary drying
temperatures less mannitol hydrate was formed when secondary drying was conducted
at 40°C, which was in agreement with Johnson et al. (2002) [4]. However, the effect was
less pronounced than the impact of the selected annealing temperature.
Mannitol
Hydrate
A: no, SD: 20°C
A: -30°C, SD: 40°C
A: -25°C, SD: 40°C
A: -25°C, SD: 20°C
A: -20°C, SD: 40°C
(a) (b)
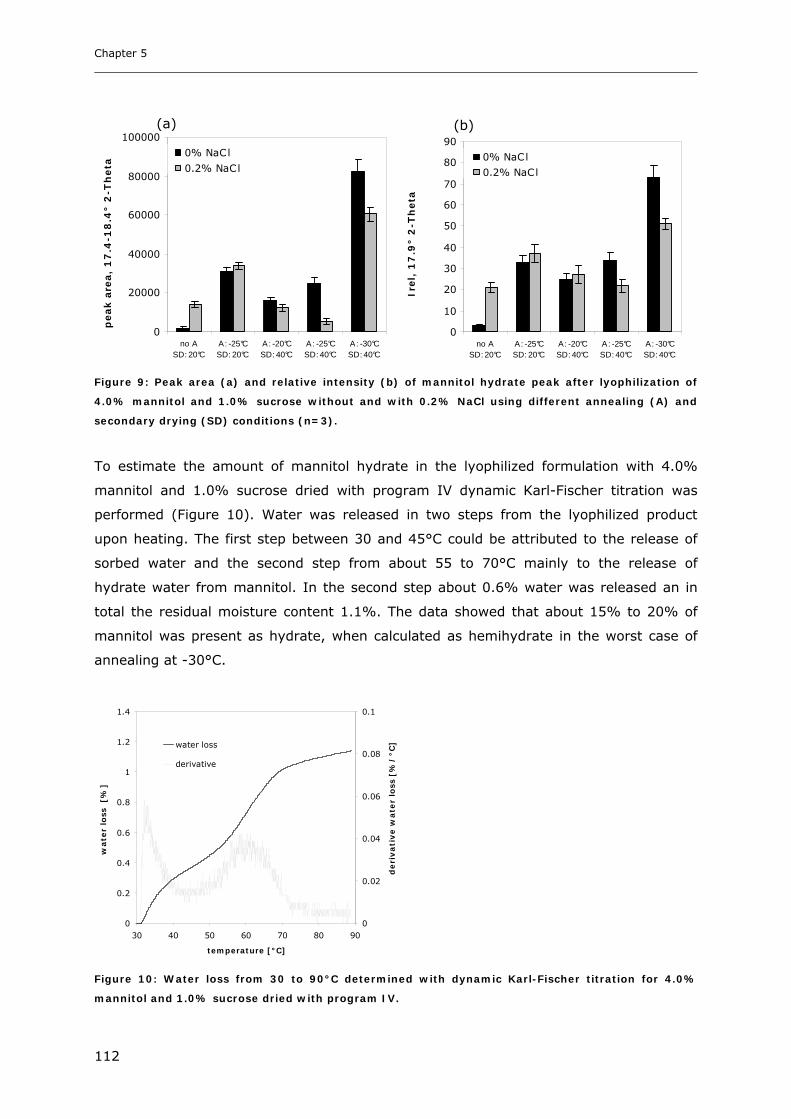
Chapter 5
112
0
20000
40000
60000
80000
100000
no ASD: 20°C
A: -25°CSD: 20°C
A: -20°CSD: 40°C
A: -25°CSD: 40°C
A: -30°CSD: 40°C
peak a
rea,
17
.4-1
8.4
° 2
-Th
eta
0% NaCl
0.2% NaCl
0
10
20
30
40
50
60
70
80
90
no ASD: 20°C
A: -25°CSD: 20°C
A: -20°CSD: 40°C
A: -25°CSD: 40°C
A: -30°CSD: 40°C
Irel,
17
.9°
2-T
heta
0% NaCl
0.2% NaCl
Figure 9: Peak area (a) and relative intensity (b) of mannitol hydrate peak after lyophilization of
4.0% mannitol and 1.0% sucrose without and with 0.2% NaCl using different annealing (A) and
secondary drying (SD) conditions (n=3).
To estimate the amount of mannitol hydrate in the lyophilized formulation with 4.0%
mannitol and 1.0% sucrose dried with program IV dynamic Karl-Fischer titration was
performed (Figure 10). Water was released in two steps from the lyophilized product
upon heating. The first step between 30 and 45°C could be attributed to the release of
sorbed water and the second step from about 55 to 70°C mainly to the release of
hydrate water from mannitol. In the second step about 0.6% water was released an in
total the residual moisture content 1.1%. The data showed that about 15% to 20% of
mannitol was present as hydrate, when calculated as hemihydrate in the worst case of
annealing at -30°C.
0
0.2
0.4
0.6
0.8
1
1.2
1.4
30 40 50 60 70 80 90
temperature [°C]
wate
r lo
ss [%
]
0
0.02
0.04
0.06
0.08
0.1
deri
vati
ve w
ate
r lo
ss [
%/
°C]water loss
derivative
Figure 10: Water loss from 30 to 90°C determined with dynamic Karl-Fischer titration for 4.0%
mannitol and 1.0% sucrose dried with program IV.
(a) (b)
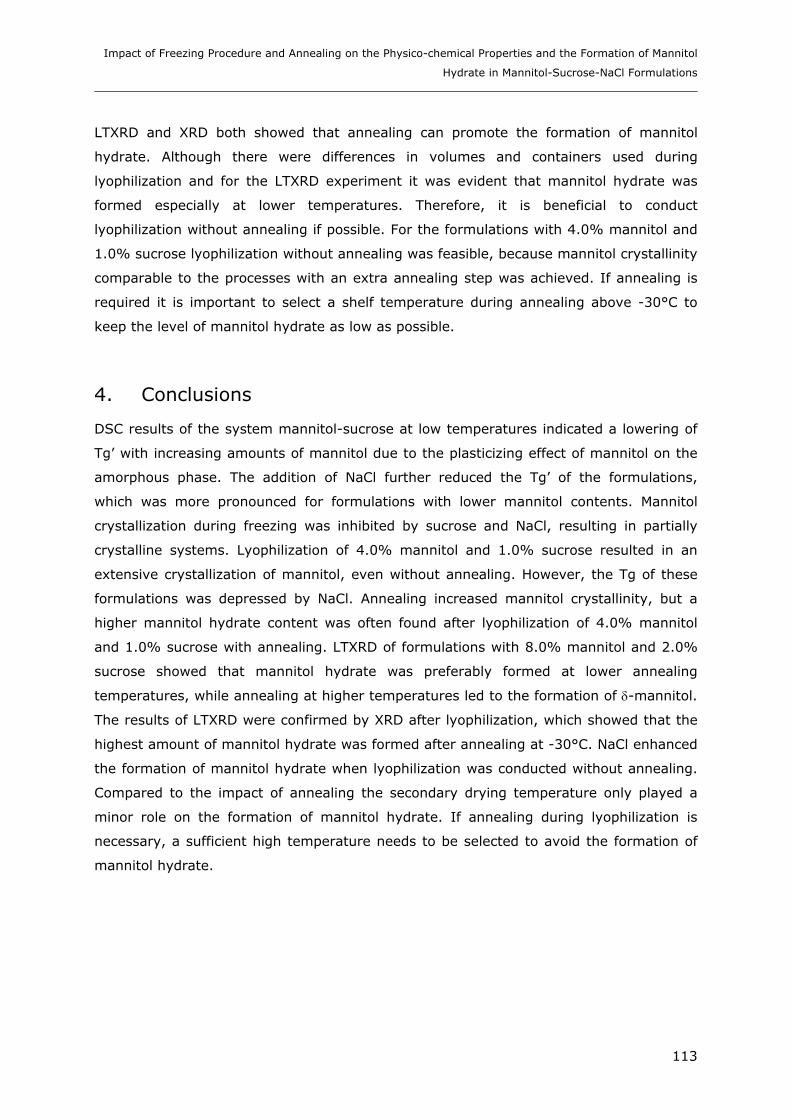
Impact of Freezing Procedure and Annealing on the Physico-chemical Properties and the Formation of Mannitol
Hydrate in Mannitol-Sucrose-NaCl Formulations
113
LTXRD and XRD both showed that annealing can promote the formation of mannitol
hydrate. Although there were differences in volumes and containers used during
lyophilization and for the LTXRD experiment it was evident that mannitol hydrate was
formed especially at lower temperatures. Therefore, it is beneficial to conduct
lyophilization without annealing if possible. For the formulations with 4.0% mannitol and
1.0% sucrose lyophilization without annealing was feasible, because mannitol crystallinity
comparable to the processes with an extra annealing step was achieved. If annealing is
required it is important to select a shelf temperature during annealing above -30°C to
keep the level of mannitol hydrate as low as possible.
4. Conclusions
DSC results of the system mannitol-sucrose at low temperatures indicated a lowering of
Tg’ with increasing amounts of mannitol due to the plasticizing effect of mannitol on the
amorphous phase. The addition of NaCl further reduced the Tg’ of the formulations,
which was more pronounced for formulations with lower mannitol contents. Mannitol
crystallization during freezing was inhibited by sucrose and NaCl, resulting in partially
crystalline systems. Lyophilization of 4.0% mannitol and 1.0% sucrose resulted in an
extensive crystallization of mannitol, even without annealing. However, the Tg of these
formulations was depressed by NaCl. Annealing increased mannitol crystallinity, but a
higher mannitol hydrate content was often found after lyophilization of 4.0% mannitol
and 1.0% sucrose with annealing. LTXRD of formulations with 8.0% mannitol and 2.0%
sucrose showed that mannitol hydrate was preferably formed at lower annealing
temperatures, while annealing at higher temperatures led to the formation of δ-mannitol.
The results of LTXRD were confirmed by XRD after lyophilization, which showed that the
highest amount of mannitol hydrate was formed after annealing at -30°C. NaCl enhanced
the formation of mannitol hydrate when lyophilization was conducted without annealing.
Compared to the impact of annealing the secondary drying temperature only played a
minor role on the formation of mannitol hydrate. If annealing during lyophilization is
necessary, a sufficient high temperature needs to be selected to avoid the formation of
mannitol hydrate.
Chapter 5
114
5. References
1. M. J. Pikal, K. M. Dellermann, M. L. Roy and R. M. Riggin. The Effects of Formulation Variables on the
Stability of Freeze-Dried Human Growth Hormone. Pharm. Res. 8:427-436 (1991).
2. K. Izutsu, S. Kojima. Excipient crystallinity and its protein-structure-stabilizing effect during freeze-drying.
J. Pharm. Pharmacol. 54:1033-1039 (2002).
3. K. Kasraian, T. M. Spitznagel, J. A. Juneau, K. Yim. Characterization of the Sucrose/Glycine/Water System
by Differential Scanning Calorimetry and Freeze-Drying Microscopy. Pharm. Dev. Technol. 3:233-239
(1998).
4. R. Johnson, C. Kirchhoff, H. Gaud. Mannitol-Sucrose Mixtures-Versatile Formulations for Protein
Lyophilization. J. Pharm. Sci. 91:914-922 (2002).
5. S. Passot, F. Fonseca, M. Alarcon-Lorca, D. Rolland, M. Marin. Physical characterization of formulations for
the development of two stable freeze-dried proteins during both dried and liquid storage. Eur. J. Pharm.
Biopham. 60:335-348 (2005).
6. X. Liao, R. Krishnamurthy, R. Suryanarayanan. Influence of the Active Pharmaceutical Ingredient
Concentration on the Physical State of Mannitol-Implications in Freeze-Drying. Pharm. Res. 22:1978-1985
(2005).
7. A. Cannon, E. Trappler. The influence of Lyophilization on the Polymorphic Behavior of Mannitol. PDA J.
Pharm. Sci. Technol. 54:13-22 (2000).
8. A. Pyne, R. Surana, R. Suryanararyanan. Crystallization of Mannitol below Tg’ during Freeze-Drying in
Binary and Ternary Aqueous Systems. Pharm. Res. 19:901-908 (2002).
9. X. Lu, M. Pikal. Freeze-Drying of Mannitol-Trehalose-Sodium Chloride-Based Formulations: The impact of
Annealing on Dry Layer Resistance to Mass Transfer and Cake Structure. Pharm Dev. Technol. 9:85-95
(2004).
10. M. J. Pikal, K. M. Dellermann, M. L. Roy, R. M. Riggin. The Effects of Formulation Variables on the Stability
of Freeze-Dried Human Growth Hormone. Pharm. Res. 8:427-436 (1991).
11. A. Kim, M. Akers, S. Nail. The Physical State of Mannitol after Freeze-Drying: Effect of Mannitol
Concentration, Freezing Rate and a Noncrystallizing Cosolute. J. Pharm. Sci. 87:931-935 (1998).
12. B. Lueckel, D. Bodmer, B. Helk, H. Leuenberger. Formulations of Sugars with Amino Acids or Mannitol-
Influence of Concentration Ratio on Properties of the Freeze-Concentrate and the Lyophilisate. Pharm. Dev.
Technol. 3:325-336 (1998).
13. C. Telang, L. Yu, R. Suryanararyanan. Effective Inhibition of Mannitol Crystallization in Frozen Solutions by
Sodium Chloride. Pharm. Res. 20:660-667 (2003).
14. M. F. Mazzobre, M. P. Longinotti, H. R. Corti, M. P. Buera. Effect of Salts on the Properties of Aqueous
Sugar Systems, in Relation to Biomaterial Stabilization. 1. Water Sorption Behavior and Ice
Crystallization/Melting. Cryobiol. 43:199-210 (2001).
15. A. Hawe, W. Frieß, Physico-chemical Lyophilization Behavior of Mannitol, Human Serum Albumin
Formulations. Eur. J. Pharm. Sci. 28:224-232 (2006).
16. M. J. Akers, N. Milton, S. R. Byrn, S. L. Nail. Glycine Crystallization During Freezing: The Effect of Salt
Form, pH, and Ionic Strength. Pharm. Res. 12:1455-1461 (1995).
17. E. Y. Shalaev, F. Franks. Crystalline and Amorphous Phases in the Ternary System Water-Sucrose-Sodium
Chloride. J. Phys. Chem. 100:1144-1152 (1996).
18. H. Nicolajsen, A. Hvidt. Phase Behavior of the System Trehalose-NaCl-Water. Cryobiol. 31:199-205
(1994).
19. L. Yu, N. Milton, E. Groleau, D. Mishra, R. Vansickle. Existence of a Mannitol Hydrate during Freeze-Drying
and Practical Implications. J. Pharm. Sci. 88:196-198 (1999).
Impact of Freezing Procedure and Annealing on the Physico-chemical Properties and the Formation of Mannitol
Hydrate in Mannitol-Sucrose-NaCl Formulations
115
20. K. Izutsu, S. O. Ocheda, N. Aoyagi, S. Kojima. Effect of sodium tetraborate and boric acid on
nonisothermal mannitol crystallization in frozen solutions and freeze-dried solids. Int. J. Pharm. 273:85-93
(2004).
21. T. Yoshinari, R. T. Forbes, P. York, Y. Kawashima. Crystallisation of amorphous mannitol is retarded using
boric acid. Int. J. Pharm. 258:109-120 (2003).
22. K. K. Izutsu, S. Yoshioka, T. Terao. Effect of Mannitol Crystallinity on the Stabilization of Enzymes during
Freeze-Drying. Chem. Pharm. Bull. 42:5-8 (1994).
23. H. R. Costantino, J. D. Andya, P. A. Nguyen, N. Dasovich, T. D. Sweeney, S. J. Shire, C. C. Hsu, Y. F. Maa.
Effect of Mannitol Crystallization on the Stability and Aerosol Performance of a Spray-Dried Pharmaceutical
Protein, Recombinant Humanized Anti-IgE Monoclonal Antibody. J. Pharm. Sci. 87:1406-1411 (1998).
24. L. Kreilgaard, S. Frokjaer, J. M. Flink, T. W. Randolph, J. F. Carpenter. Effects of Additives on the Stability
of Humicola lanuginosa Lipase during Freeze-Drying and in the Dried Solid. J. Pham. Sci. 88:281-290
(1999).
25. L. Yu. Amorphous pharmaceutical solids: preparation, characterization and stabilization. Adv. Drug Deli.
Rev. 48:27-42 (2001).
26 R. Cavatur, N. Vemuri, A. Pyne, Z. Chrzan, D. Toledo-Velasquez, R. Suryanararyanan. Crystallization
Behavior of Mannitol in Frozen Aqueous Solutions. Pharm. Res. 19:894-900 (2002).
27. P. Meredith, A. Donald, R. Payne. Freeze-Drying: In Situ Observations Using Cryoenvironmental Scanning
Electron Microscopy and Differential Scanning Calorimetry. J. Pharm. Sci. 85:631-637 (1996).
28 F. Franks. Solid Aqueous solution. Pure Appl. Chem. 65:2527-2537 (1993).
29. M. J. Pikal, S. Shah. The collapse temperature in freeze drying: dependence on measurement methodology
and rate of water removal from the glassy phase. Int. J. Pharm. 62:165-186 (1990).
30. A. Pyne, K. Chatterjee, T. Suryanarayanan. Solute Crystallization in Mannitol-Glycine Systems –
Implications on Protein Stabilization in Freeze-Dried Formulations. J. Pharm. Sci. 92:2272-2282 (2003).
31. M. P. W. M. te Booy, R. A. de Ruiter, A. L. J. de Meere. Evaluation of the Physical Stability of Freeze-Dried
Sucrose-Containing Formulations by Differential Scanning Calorimetry. Pharm. Res. 9:109-114 (1992).
32. S. J. Prestrelski, K. A. Pikal, T. Arakawa. Optimization of lyophilization conditions for recombinant human
interleukin-2 by dried-state conformational analysis using Fourier-transform infrared spectroscopy. Pharm.
Res. 12:1250-1259 (1995).
33. B. S. Chang, R. M. Beauvais, A. Dong, J. F. Carpenter. Physical Factors Affecting the Storage Stability of
Freeze-Dried Interleukin-1 Receptor Antagonist: Glass Transition and Protein Confirmation. Arch. Biochem.
Bioph. 331:249-258 (1996).
34. P. Davidson, W. Q. Sun. Effect of Sucrose/Raffinose Mass Ratios on the Stability of Co-Lyophilized Protein
During Storage above Tg. Pharm. Res. 19:474-479 (2001).
35. A. Pyne, R. Suryanarayanan. Phase Transitions of Glycine in Frozen Aqueous Solutions and during Freeze-
Drying. Pharm. Res. 18:1448-1454 (2001).
36. R. Cavatur, R. Suryanarayanan. Characterization of phase transition during freeze-drying by in situ X-ray
powder diffractometry. Pharm. Dev. Tech. 3:579-586 (1998).
37. R. Cavatur, R. Suryanarayanan. Characterization of frozen aqueous solutions by low temperature X-ray
powder diffractometry. Pharm. Res. 15:193-198 (1998).
Chapter 6
Development of Stable, HSA-free Formulations for a
Hydrophobic Cytokine
Abstract
Chapter 6 describes the characterization of the hydrophobic cytokine with respect to the
influence of pH and ionic strength on aggregate formation and the thermal stability of the
cytokine, as well as the development of HSA-free formulations. When the formulation pH
exceeded 5.5 a precipitation of the cytokine led to a significant turbidity increase.
Thereby, the increase in aggregates and turbidity determined by HP-SEC and DLS were
more pronounced at a higher ionic strength. Especially at higher pH values protein
adsorption was more distinct compared to pH 3.0. Protein adsorption could be minimized
by the addition of polysorbate 20 or the use of glass type I+. FTIR showed that the
denaturation temperature was decreased when the formulation pH was raised, indicating
enhanced stability at lower pH values, which was confirmed by DLS.
Five liquid formulations in the pH range 3.5 to 4.5 and five lyophilized formulations in the
pH range 4.0 to 5.0 were stored for 6 months at 2-8°C, 25°C / 60% RH and
40°C / 75% RH. The stability of these formulations was evaluated regarding aggregation
and chemical modification. The stability was in each case better at lower pH values,
which was in agreement with the higher denaturation temperatures measured by FTIR
for the cytokine formulated at lower pH. For the lyophilized formulation at pH 4.0 stored
at 40°C / 75% RH a discoloration of the reconstituted solutions was observable, which
could be ascribed to an inversion of sucrose. Both liquid formulations at pH 3.5 and 4.0
and lyophilized formulations at pH 4.0 to 5.0 showed good stability when stored at
2-8°C. Thus, freeze-drying allowed formulating the cytokine at significantly higher pH. To
avoid protein adsorption the addition of polysorbate 20 and the use of glass type I+ were
feasible.
Keywords: hydrophobic cytokine, HSA-free formulation, protein adsorption, stability
Development of Stable, HSA-free Formulations for a Hydrophobic Cytokine
117
1. Introduction
The model protein for the studies was a recombinant human cytokine with a molecular
weight of about 20 kDa, which can be specified as very hydrophobic. The cytokine is
produced in E. coli and therefore non-glycosilated [1]. During formulation development
the hydrophobicity and the corresponding low solubility and adsorption phenomena were
the major concerns that had to be overcome. One possible way is a formulation of the
cytokine with HSA, which is an excellent stabilizer in liquid and lyophilized formulations.
The properties of a HSA-containing formulation of the cytokine were characterized and
discussed in Chapter 2. HSA can act as lyoprotector and cryoprotector during
lyophilization [2]. Moreover, it reduces the loss of active protein due to adsorption, which
poses a problem especially for low dose formulations of hydrophobic proteins [3,4].
However, HSA as excipient is generally extracted from human plasma and implicates the
problems associated with human blood derived products. Besides the risk of blood born
pathogens, batch to batch variations can occur. HSA itself exhibits a low risk of
immunogenicity, whereas in presence of a second protein the formation of mixed
aggregates can lead to immunogenicity reactions, which was e.g. shown for rhINFα [5,6].
Other issues emerging for HSA-containing formulations are the difficulties that occur
during the development of analytical methods for the active protein in the formulations.
With HSA, a second protein often present in a 10 to 50 fold excess compared to the
active protein is brought into the formulation. This makes selective analytics of the active
protein, as well as its aggregates and degradation products difficult and often impossible.
Specific methods like ELISA [7], selective precipitation [8], western-blot or BIACORE are
required to solve this analytical problem. For these reasons, HSA is avoided in the
development of new formulations as far as possible. In its function as lyo- and
cryoprotector, HSA can be replaced by other excipients e.g. sugars, sugar alcohols or
amino acids. The concern of protein adsorption can be overcome by the addition of
sugars [9] and most important by surfactants [10,11], e.g. poloxamer 188 or
polysorbate 20 and 80. Another approach to minimize protein adsorption is the use of
special containers with reduced susceptibility for adsorption, like glass type I+ [12].
The first studies focused on the optimization of formulation buffer and pH. Changes of
the cytokine in relation to pH, ionic strength and temperature were evaluated using
different analytical techniques to get an understanding of its structural characteristics.
For selected pH and buffer conditions short-term stability studies over two weeks were
conducted. In this context, the impact of NaCl and glycine concentration and the addition
of further excipients (mannitol, trehalose, polysorbate 20) on the formation of
aggregates were evaluated. Furthermore, the problem of protein adsorption needed to be
considered, when selecting the containers and the constituents of the formulation. The
Chapter 6
118
impact of pH, ionic strength and the presence of surfactants on the degree of protein
adsorption were rated for different container materials. Besides these studies the freeze-
thaw stability of the cytokine was tested, which was important for the subsequent
development of lyophilized formulations. For the lyophilized cytokine formulations a
combination of mannitol with sucrose was selected based on the results of the studies
described in Chapter 5. Depending on the results of the preliminary studies five liquid
formulations and five lyophilized formulations were to be selected. The stability of the
formulations was evaluated over 6 months at 2-8°C, 25°C / 60% RH and
40°C / 75% RH.
2. Materials and Methods
2.1 Materials
2.1.1 Proteins and Excipients
The starting material contained 1.0 mg/ml cytokine formulated with 0.1% sodium
dodecyl sulfate (SDS) at pH 5.5. Preparative size-exclusion chromatography was used to
remove SDS using Sephadex G-25 columns (Amersham Biosciences, Uppsala, Sweden)
equilibrated with 10mM NaOH (pH 12) as eluting buffer. The protein content of the
fractions was determined with UV-spectroscopy at 280 nm. The fractions were further
analyzed for the presence of SDS according to the European Pharmacopoeia. Therefore,
0.1 ml of the fraction was mixed with 0.1 ml 0.1% methylene blue solution and 2.0 ml
diluted H2SO4 (5.5 ml concentrated H2SO4 in 100 ml H2O). The aqueous solution was
shaken out with 2.0 ml dichloromethane (DCM), whereby the ionic pair of methylene blue
(Sigma, Steinheim, Germany) and SDS colored the DCM-phase blue. The samples were
evaluated visually by means of reference solutions with known SDS contents. SDS from
Merck (Hohenbrunn, Germany) was used for the reference solutions. After the buffer
exchange with Sephadex-G25 column, the cytokine was intermediately formulated in
10 mM NaOH at pH 12. A concentrated stock solution of the particular buffer (200 mM)
was added to the formulations and the pH was instantly adjusted with HCl.
As excipients for formulation development sucrose from Suedzucker (Mannheim,
Germany), mannitol from Caelo (Hilden, Germany), polysorbate 20 from Serva
(Heidelberg, Germany) and glycine and NaCl from Sigma (Steinheim, Germany) were
employed without further purification.

Development of Stable, HSA-free Formulations for a Hydrophobic Cytokine
119
2.1.2 Containers
2 R glass vials were a donation of Schott AG (Mainz, Germany). Two qualities of glass
were employed, standard borosilicate glass type I and SCHOTT type I plus®, which are
based on standard type I glass. An additional layer of 0.1 to 0.2 µm of SiO2 is coated
onto the inner surface using the Plasma Impulse Chemical Vapor Deposition (PICVD)
process. The vials were closed with unsiliconized butyl-lyophilization stoppers (Firma
West, Eschweiler, Germany). BD Hypak SCFTM glass prefilled 1 ml syringes were a
donation of Becton Dickinson GmbH (Heidelberg, Germany). The prefilled syringes were
used for the stability study of the liquid cytokine formulation. For the stability study
1.0 ml of the particular formulation was filled into the syringe barrel and subsequently
the plunger, consisting of a stopper and a rod, was attached to the barrel from the back.
2.2 Methods
2.2.1 Turbiditimetry
The NEPHLA turbidimeter (Dr. Lange, Düsseldorf, Germany) was used for turbidity
measurements. The principle of turbidity measurement is 90° scattered light photometry.
Light (λ=860 nm) is sent through the samples and the scattered light is measured at 90°
angle. The system is calibrated with formazine as standard and the results are given in
formazine nephelometric units (FNU). To evaluate the degree of turbidity the reference
solutions I-IV of the European Pharmacopoeia method 2.2.1 (clarity and degree of
opalescence of liquids) were used [13]. A stock solution was prepared by mixing
hydrazine sulfate (10 mg/ml) and hexamethylenetetramine (100 mg/ml) at a ratio of
1:1. After 24 hours the stock solution was diluted with water to concentrations of
0.075 mg/ml hydrazine sulfate and 0.75 mg/ml hexamethylenetetramine (both from
Sigma-Aldrich, Steinheim, Germany). The reference solutions were prepared with the
diluted solution according to Table 1 and the turbidity in FNU was measured.
Table 1: Composition of the opalescence reference solutions and turbidity.
reference
solution
diluted stock
solution [ml]
water R
[ml]
turbidity
[FNU]
degree of
opalescence
I 5 95 3.2 clear (≤ Ref I)
II 10 90 6.1 slightly opalescent (≤ Ref II)
III 30 70 17.8 opalescent (≤ Ref III)
IV 50 50 29.4 very opalescent (≤ Ref IV)
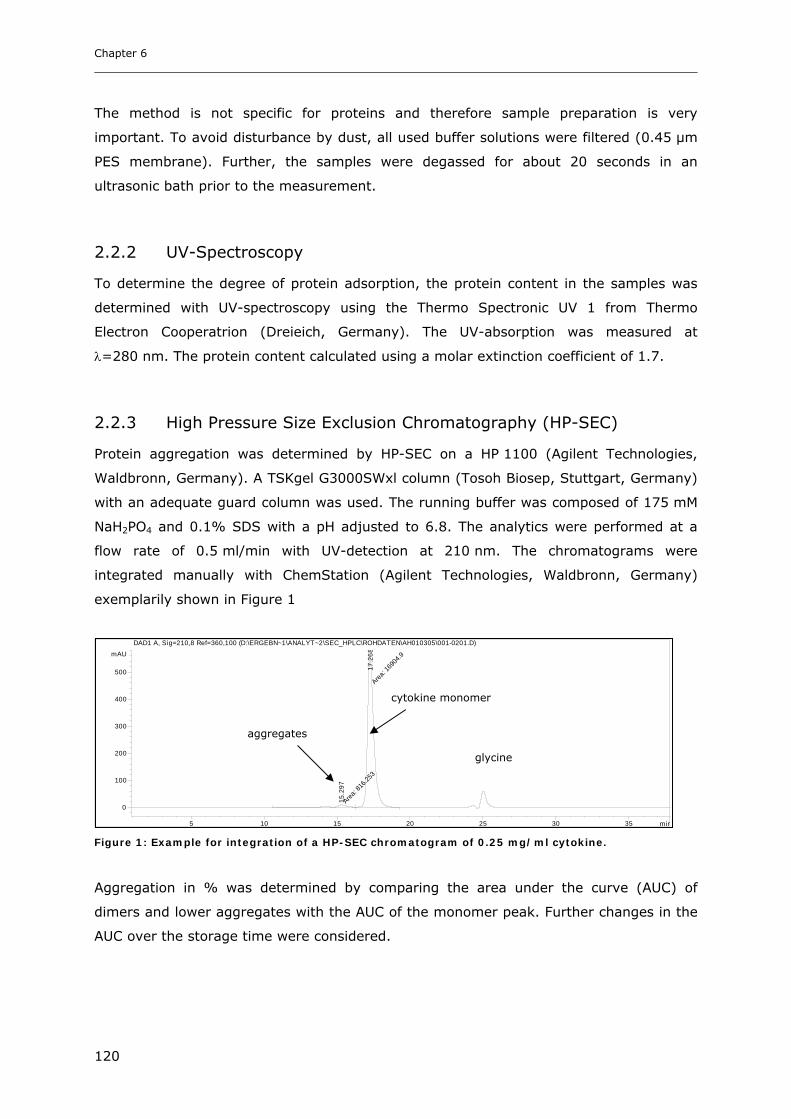
Chapter 6
120
The method is not specific for proteins and therefore sample preparation is very
important. To avoid disturbance by dust, all used buffer solutions were filtered (0.45 µm
PES membrane). Further, the samples were degassed for about 20 seconds in an
ultrasonic bath prior to the measurement.
2.2.2 UV-Spectroscopy
To determine the degree of protein adsorption, the protein content in the samples was
determined with UV-spectroscopy using the Thermo Spectronic UV 1 from Thermo
Electron Cooperatrion (Dreieich, Germany). The UV-absorption was measured at
λ=280 nm. The protein content calculated using a molar extinction coefficient of 1.7.
2.2.3 High Pressure Size Exclusion Chromatography (HP-SEC)
Protein aggregation was determined by HP-SEC on a HP 1100 (Agilent Technologies,
Waldbronn, Germany). A TSKgel G3000SWxl column (Tosoh Biosep, Stuttgart, Germany)
with an adequate guard column was used. The running buffer was composed of 175 mM
NaH2PO4 and 0.1% SDS with a pH adjusted to 6.8. The analytics were performed at a
flow rate of 0.5 ml/min with UV-detection at 210 nm. The chromatograms were
integrated manually with ChemStation (Agilent Technologies, Waldbronn, Germany)
exemplarily shown in Figure 1
min5 10 15 20 25 30 35
mAU
0
100
200
300
400
500
DAD1 A, Sig=210,8 Ref=360,100 (D:\ERGEBN~1\ANALYT~2\SEC_HPLC\ROHDATEN\AH010305\001-0201.D)
Area
: 816
.253
15.
297
Area
: 169
04.9
17.
268
Figure 1: Example for integration of a HP-SEC chromatogram of 0.25 mg/ml cytokine.
Aggregation in % was determined by comparing the area under the curve (AUC) of
dimers and lower aggregates with the AUC of the monomer peak. Further changes in the
AUC over the storage time were considered.
glycine
cytokine monomer
aggregates
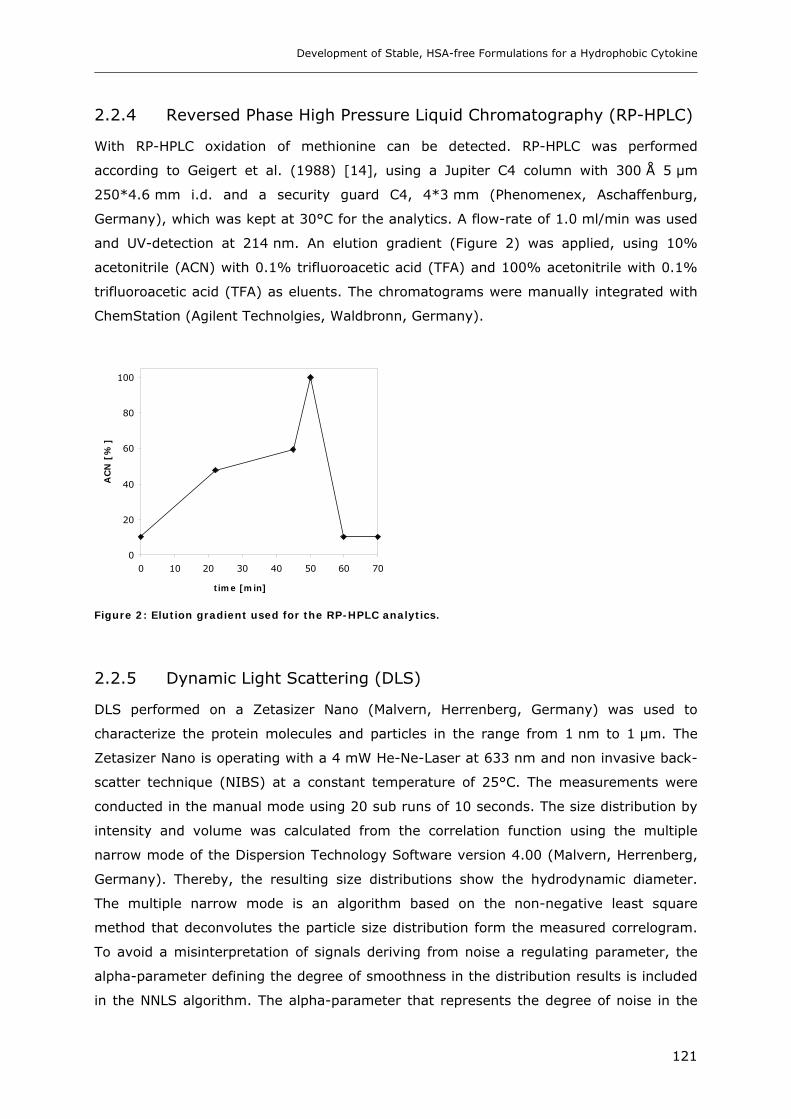
Development of Stable, HSA-free Formulations for a Hydrophobic Cytokine
121
2.2.4 Reversed Phase High Pressure Liquid Chromatography (RP-HPLC)
With RP-HPLC oxidation of methionine can be detected. RP-HPLC was performed
according to Geigert et al. (1988) [14], using a Jupiter C4 column with 300 Å 5 µm
250*4.6 mm i.d. and a security guard C4, 4*3 mm (Phenomenex, Aschaffenburg,
Germany), which was kept at 30°C for the analytics. A flow-rate of 1.0 ml/min was used
and UV-detection at 214 nm. An elution gradient (Figure 2) was applied, using 10%
acetonitrile (ACN) with 0.1% trifluoroacetic acid (TFA) and 100% acetonitrile with 0.1%
trifluoroacetic acid (TFA) as eluents. The chromatograms were manually integrated with
ChemStation (Agilent Technolgies, Waldbronn, Germany).
0
20
40
60
80
100
0 10 20 30 40 50 60 70
time [min]
AC
N [
%]
Figure 2: Elution gradient used for the RP-HPLC analytics.
2.2.5 Dynamic Light Scattering (DLS)
DLS performed on a Zetasizer Nano (Malvern, Herrenberg, Germany) was used to
characterize the protein molecules and particles in the range from 1 nm to 1 µm. The
Zetasizer Nano is operating with a 4 mW He-Ne-Laser at 633 nm and non invasive back-
scatter technique (NIBS) at a constant temperature of 25°C. The measurements were
conducted in the manual mode using 20 sub runs of 10 seconds. The size distribution by
intensity and volume was calculated from the correlation function using the multiple
narrow mode of the Dispersion Technology Software version 4.00 (Malvern, Herrenberg,
Germany). Thereby, the resulting size distributions show the hydrodynamic diameter.
The multiple narrow mode is an algorithm based on the non-negative least square
method that deconvolutes the particle size distribution form the measured correlogram.
To avoid a misinterpretation of signals deriving from noise a regulating parameter, the
alpha-parameter defining the degree of smoothness in the distribution results is included
in the NNLS algorithm. The alpha-parameter that represents the degree of noise in the
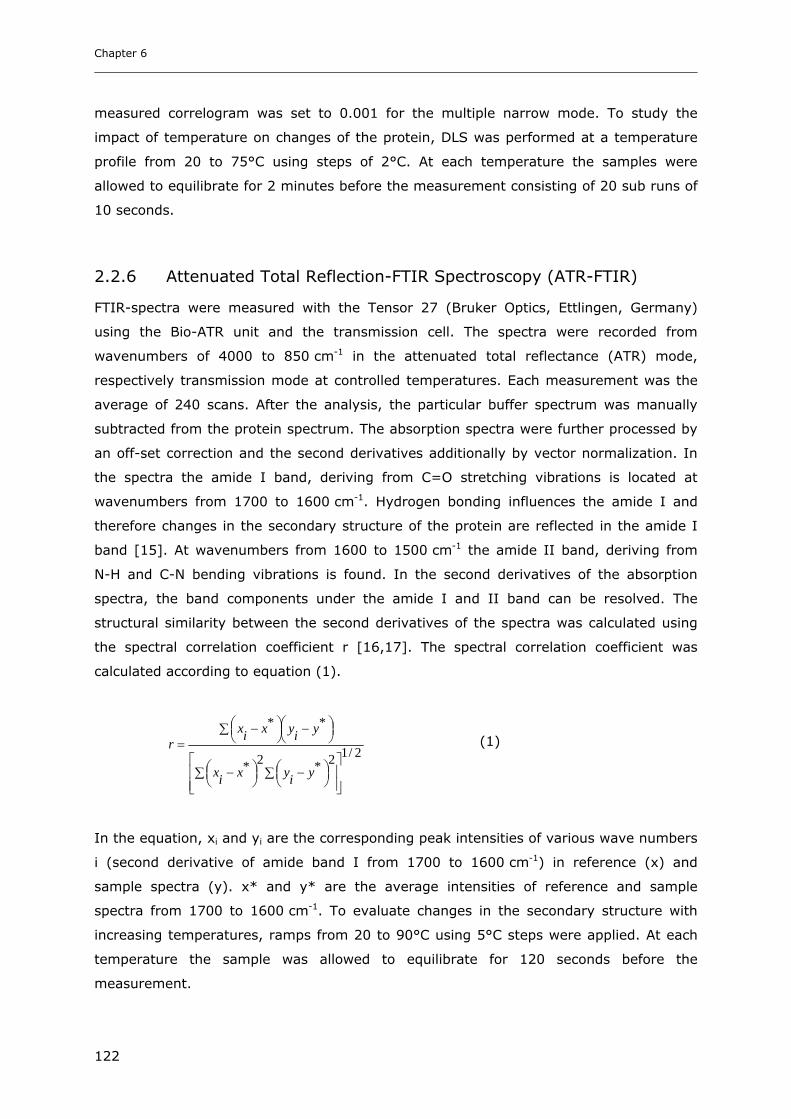
Chapter 6
122
measured correlogram was set to 0.001 for the multiple narrow mode. To study the
impact of temperature on changes of the protein, DLS was performed at a temperature
profile from 20 to 75°C using steps of 2°C. At each temperature the samples were
allowed to equilibrate for 2 minutes before the measurement consisting of 20 sub runs of
10 seconds.
2.2.6 Attenuated Total Reflection-FTIR Spectroscopy (ATR-FTIR)
FTIR-spectra were measured with the Tensor 27 (Bruker Optics, Ettlingen, Germany)
using the Bio-ATR unit and the transmission cell. The spectra were recorded from
wavenumbers of 4000 to 850 cm-1 in the attenuated total reflectance (ATR) mode,
respectively transmission mode at controlled temperatures. Each measurement was the
average of 240 scans. After the analysis, the particular buffer spectrum was manually
subtracted from the protein spectrum. The absorption spectra were further processed by
an off-set correction and the second derivatives additionally by vector normalization. In
the spectra the amide I band, deriving from C=O stretching vibrations is located at
wavenumbers from 1700 to 1600 cm-1. Hydrogen bonding influences the amide I and
therefore changes in the secondary structure of the protein are reflected in the amide I
band [15]. At wavenumbers from 1600 to 1500 cm-1 the amide II band, deriving from
N-H and C-N bending vibrations is found. In the second derivatives of the absorption
spectra, the band components under the amide I and II band can be resolved. The
structural similarity between the second derivatives of the spectra was calculated using
the spectral correlation coefficient r [16,17]. The spectral correlation coefficient was
calculated according to equation (1).
2/12*2*
**
⎥⎥⎦
⎤
⎢⎢⎣
⎡∑ ∑ ⎟
⎠⎞⎜
⎝⎛ −⎟
⎠⎞⎜
⎝⎛ −
∑ ⎟⎠⎞⎜
⎝⎛ −⎟⎠⎞⎜
⎝⎛ −
=
yiyxix
yiyxixr
In the equation, xi and yi are the corresponding peak intensities of various wave numbers
i (second derivative of amide band I from 1700 to 1600 cm-1) in reference (x) and
sample spectra (y). x* and y* are the average intensities of reference and sample
spectra from 1700 to 1600 cm-1. To evaluate changes in the secondary structure with
increasing temperatures, ramps from 20 to 90°C using 5°C steps were applied. At each
temperature the sample was allowed to equilibrate for 120 seconds before the
measurement.
(1)
Development of Stable, HSA-free Formulations for a Hydrophobic Cytokine
123
2.2.7 Microcalorimetry
Microcalorimetry was performed with a VP-DSC (MicroCal®, Milton Keynes, United
Kingdom). All solutions with a protein concentration of 1 mg/ml were degassed for
5 minutes prior to the measurement. The scans were recorded from 20 to 90°C at a
scanning rate of 1.0°C/min. Each measurement consisted of three scans: water against
water, buffer against buffer and protein against buffer scan. The buffer scan was
subtracted from the protein scan by the Origin® software.
2.2.8 Lyophilization
1000 µl of the formulations were dried in 2 R vials in the Epsilon 2-12 D freeze-drier from
Christ (Osterrode, Germany). The samples were frozen to -50°C with a standard cooling
rate of 0.45°C/min and kept at -50°C for 2 hours. Primary drying was conducted at a
shelf-temperature of -15°C with a pressure of 0.045 mbar for 20 hours. For secondary
drying the shelf-temperature was increased to 40°C for 10 hours. The vials were closed
under N2 atmosphere at a pressure of 800 mbar.
2.2.9 Powder X-ray Diffraction (XRD)
The morphology of the lyophilized products was analyzed with X-ray powder diffraction
(XRD) from 5-40° 2-Θ, with steps of 0.05° 2-Θ and a duration of 2 seconds per step on
the X-ray diffractometer XRD 3000 TT (Seifert, Ahrenburg, Germany), equipped with a
copper anode (40 kV, 30 mA, wavelength 154.17 pm).
2.2.10 Karl-Fischer Titration
The residual moisture of the samples was analyzed by coloumetric Karl-Fischer titration
using the Aqua 40.00 titrator with a headspace module (Analytik Jena AG, Halle,
Germany). The headspace method was validated against conventional Karl-Fischer
titration, where anhydrous methanol was used to extract water from the lyophilized
products. For the measurement at least 10 mg of the lyophilized sample was heated to
80°C for 10 minutes. The evaporated water was transferred into the titration solution and
the amount of H2O was determined. As reference material apura Water Standard Oven
1% (Merck, Darmstadt Germany) was used.

Chapter 6
124
3. Results and Discussion
3.1 Impact of pH and Ionic Strength on Cytokine Aggregation
3.1.1 Turbidity and HP-SEC Studies
The selection of the optimum buffer composition and formulation pH is a prerequisite for
the subsequent formulation development. According to literature a low pH combined with
a low ionic strength is beneficial for the stability and the solubility of the used cytokine
[18]. Thereby, glycine is suggested as appropriate buffering substance [18]. Based on
this information the cytokine was formulated in 20 mM glycine at pH 3.0 as starting
material for further studies. To investigate the impact of ionic strength and buffer
concentration, glycine and NaCl concentrations were varied at a constant cytokine
concentration of 0.25 mg/ml. The formulation pH was step-wise increased by adding
NaOH and the corresponding turbidity was monitored from pH 3.0 to pH 9.0 (Figure 3).
010
2030
40
50
0
50
100
150
200
34
56
78
9
tu
rbid
ity [
FN
U]
pHglycine [mM]
0.000.05
0.10
0.15
0.20
0
50
100
150
200
34
56
78
9
tu
rbid
ity [
FN
U]
NaCl [%]
pH
Figure 3: Turbidity of 0.25 mg/ml cytokine with 5 to 50 mM glycine (a) and with 20 mM glycine and
0.0% to 0.2% NaCl (b) form pH 3.0 to 9.0.
From 5 to 20 mM glycine turbidity ranged from 1 to 3 FNU at a pH between 3.0 and 5.0.
The solutions were less turbid than reference solution I (3.2 FNU) of the European
Pharmacopoeia and the degree of opalescence could be evaluated as clear. At these
conditions the cytokine exhibited an adequate good solubility. A precipitation of the
cytokine, noticeable by a steep increase in turbidity was measured when the pH was
raised above 5.5 for all studied formulations. The turbidity increase could be ascribed to
the declining solubility of the cytokine, as the pH approached the protein pI. A pI of 9.2
(a) (b)
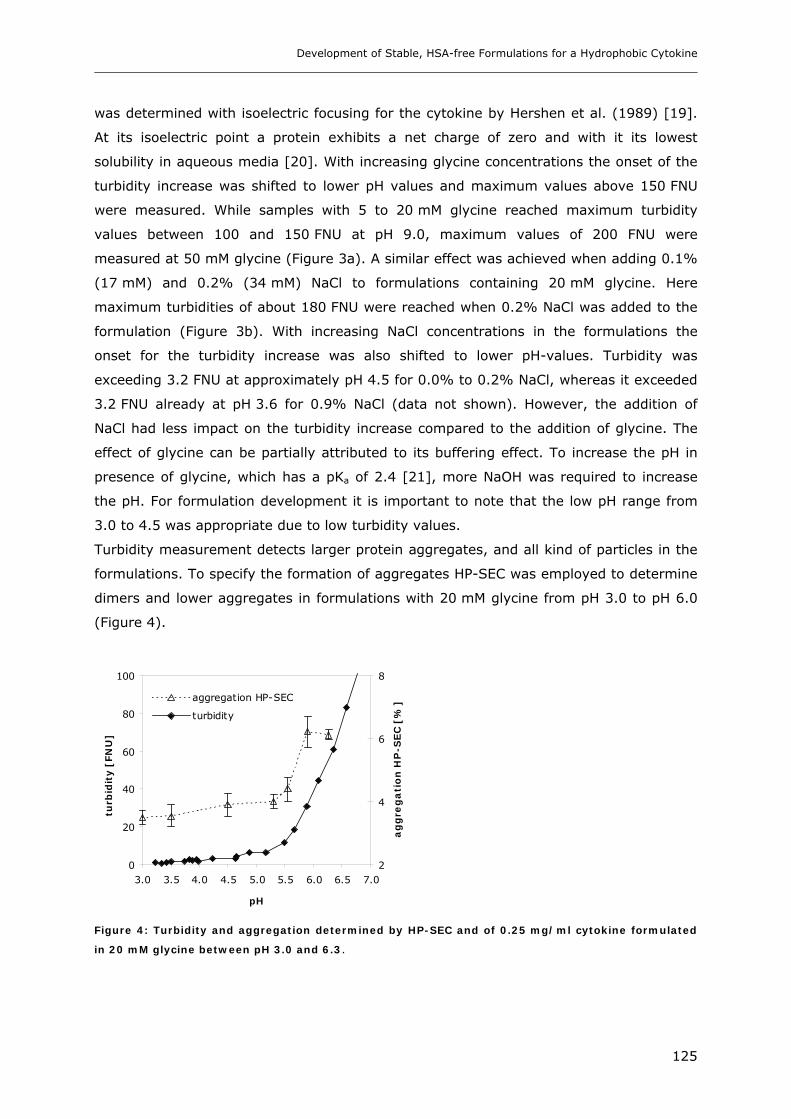
Development of Stable, HSA-free Formulations for a Hydrophobic Cytokine
125
was determined with isoelectric focusing for the cytokine by Hershen et al. (1989) [19].
At its isoelectric point a protein exhibits a net charge of zero and with it its lowest
solubility in aqueous media [20]. With increasing glycine concentrations the onset of the
turbidity increase was shifted to lower pH values and maximum values above 150 FNU
were measured. While samples with 5 to 20 mM glycine reached maximum turbidity
values between 100 and 150 FNU at pH 9.0, maximum values of 200 FNU were
measured at 50 mM glycine (Figure 3a). A similar effect was achieved when adding 0.1%
(17 mM) and 0.2% (34 mM) NaCl to formulations containing 20 mM glycine. Here
maximum turbidities of about 180 FNU were reached when 0.2% NaCl was added to the
formulation (Figure 3b). With increasing NaCl concentrations in the formulations the
onset for the turbidity increase was also shifted to lower pH-values. Turbidity was
exceeding 3.2 FNU at approximately pH 4.5 for 0.0% to 0.2% NaCl, whereas it exceeded
3.2 FNU already at pH 3.6 for 0.9% NaCl (data not shown). However, the addition of
NaCl had less impact on the turbidity increase compared to the addition of glycine. The
effect of glycine can be partially attributed to its buffering effect. To increase the pH in
presence of glycine, which has a pKa of 2.4 [21], more NaOH was required to increase
the pH. For formulation development it is important to note that the low pH range from
3.0 to 4.5 was appropriate due to low turbidity values.
Turbidity measurement detects larger protein aggregates, and all kind of particles in the
formulations. To specify the formation of aggregates HP-SEC was employed to determine
dimers and lower aggregates in formulations with 20 mM glycine from pH 3.0 to pH 6.0
(Figure 4).
0
20
40
60
80
100
3.0 3.5 4.0 4.5 5.0 5.5 6.0 6.5 7.0
pH
turb
idit
y [
FN
U]
2
4
6
8
ag
gre
ga
tio
n H
P-S
EC
[%
]aggregation HP-SEC
turbidity
Figure 4: Turbidity and aggregation determined by HP-SEC and of 0.25 mg/ml cytokine formulated
in 20 mM glycine between pH 3.0 and 6.3.

Chapter 6
126
The starting material at pH 3.0 already contained about 3.5% aggregates, which
probably can be assigned to the complex preparation method of the SDS-free bulk
material which was described in point 2.1 of this chapter. However, no reference values
concerning dimers and small aggregates in the HSA-containing formulation were
available. Due to the 50-fold excess of HSA in the formulation it was not possible to
separate the cytokine and its aggregated species from HSA by HP-SEC. In the HSA-free
formulation, aggregation ranged from 3.6% to 4.4% between pH 3.0 and 5.5. Above
pH 5.5 the area of the peaks of aggregated protein relative to area of the monomer peak
significantly stepped up to 6.0%. The presence of larger aggregates, indicated by the
high turbidity values above pH 5.5 was reflected in a substantial decrease of the total
AUC of monomer and aggregates in the HP-SEC chromatograms. Larger aggregates, as
well as precipitated protein were retained by the guard column and therefore not
detected, but reflected in the decline of the AUC. Thus, HP-SEC revealed that the
turbidity increase was associated with an aggregation of the cytokine at increasing pH
values. For the formulations at pH 3.0 and pH 4.5 the aggregate content in presence of
0.2%, 0.5% and 0.9% NaCl was determined by HP-SEC. HP-SEC indicated an average
increase in aggregates by 0.4% in samples with 0.0% to 0.9% NaCl when the pH was
changed from pH 3.0 to 4.5 (Figure 5).
3
3.5
4
4.5
0 0.2 0.5 0.9
NaCl [%]
ag
gre
ga
tio
n H
P-S
EC
[%
]
pH 3.0 pH 4.5
Figure 5: Aggregation determined by HP-SEC of 0.25 mg/ml cytokine in 20 mM glycine with 0.0% to
0.9% NaCl at pH 3.0 and 4.5.
For the samples with 0.9% NaCl, particularly at pH 4.5 the AUC of the chromatograms
was slightly decreased. Here again precipitation of the cytokine occurred and was
confirmed by the increased turbidity of about 20 FNU. To further clarify the impact of
NaCl on cytokine formulations short-time stability studies are necessary, because a
possible detrimental effect of an increased ionic strength can be amplified during storage.
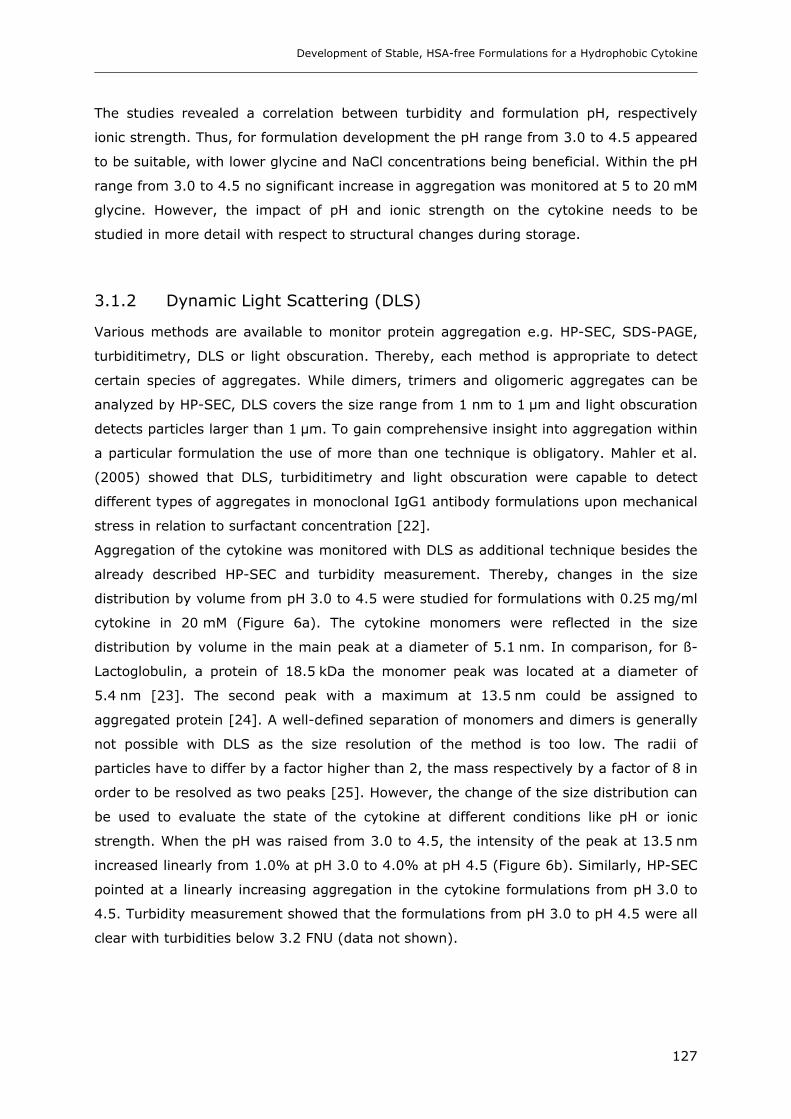
Development of Stable, HSA-free Formulations for a Hydrophobic Cytokine
127
The studies revealed a correlation between turbidity and formulation pH, respectively
ionic strength. Thus, for formulation development the pH range from 3.0 to 4.5 appeared
to be suitable, with lower glycine and NaCl concentrations being beneficial. Within the pH
range from 3.0 to 4.5 no significant increase in aggregation was monitored at 5 to 20 mM
glycine. However, the impact of pH and ionic strength on the cytokine needs to be
studied in more detail with respect to structural changes during storage.
3.1.2 Dynamic Light Scattering (DLS)
Various methods are available to monitor protein aggregation e.g. HP-SEC, SDS-PAGE,
turbiditimetry, DLS or light obscuration. Thereby, each method is appropriate to detect
certain species of aggregates. While dimers, trimers and oligomeric aggregates can be
analyzed by HP-SEC, DLS covers the size range from 1 nm to 1 µm and light obscuration
detects particles larger than 1 µm. To gain comprehensive insight into aggregation within
a particular formulation the use of more than one technique is obligatory. Mahler et al.
(2005) showed that DLS, turbiditimetry and light obscuration were capable to detect
different types of aggregates in monoclonal IgG1 antibody formulations upon mechanical
stress in relation to surfactant concentration [22].
Aggregation of the cytokine was monitored with DLS as additional technique besides the
already described HP-SEC and turbidity measurement. Thereby, changes in the size
distribution by volume from pH 3.0 to 4.5 were studied for formulations with 0.25 mg/ml
cytokine in 20 mM (Figure 6a). The cytokine monomers were reflected in the size
distribution by volume in the main peak at a diameter of 5.1 nm. In comparison, for ß-
Lactoglobulin, a protein of 18.5 kDa the monomer peak was located at a diameter of
5.4 nm [23]. The second peak with a maximum at 13.5 nm could be assigned to
aggregated protein [24]. A well-defined separation of monomers and dimers is generally
not possible with DLS as the size resolution of the method is too low. The radii of
particles have to differ by a factor higher than 2, the mass respectively by a factor of 8 in
order to be resolved as two peaks [25]. However, the change of the size distribution can
be used to evaluate the state of the cytokine at different conditions like pH or ionic
strength. When the pH was raised from 3.0 to 4.5, the intensity of the peak at 13.5 nm
increased linearly from 1.0% at pH 3.0 to 4.0% at pH 4.5 (Figure 6b). Similarly, HP-SEC
pointed at a linearly increasing aggregation in the cytokine formulations from pH 3.0 to
4.5. Turbidity measurement showed that the formulations from pH 3.0 to pH 4.5 were all
clear with turbidities below 3.2 FNU (data not shown).
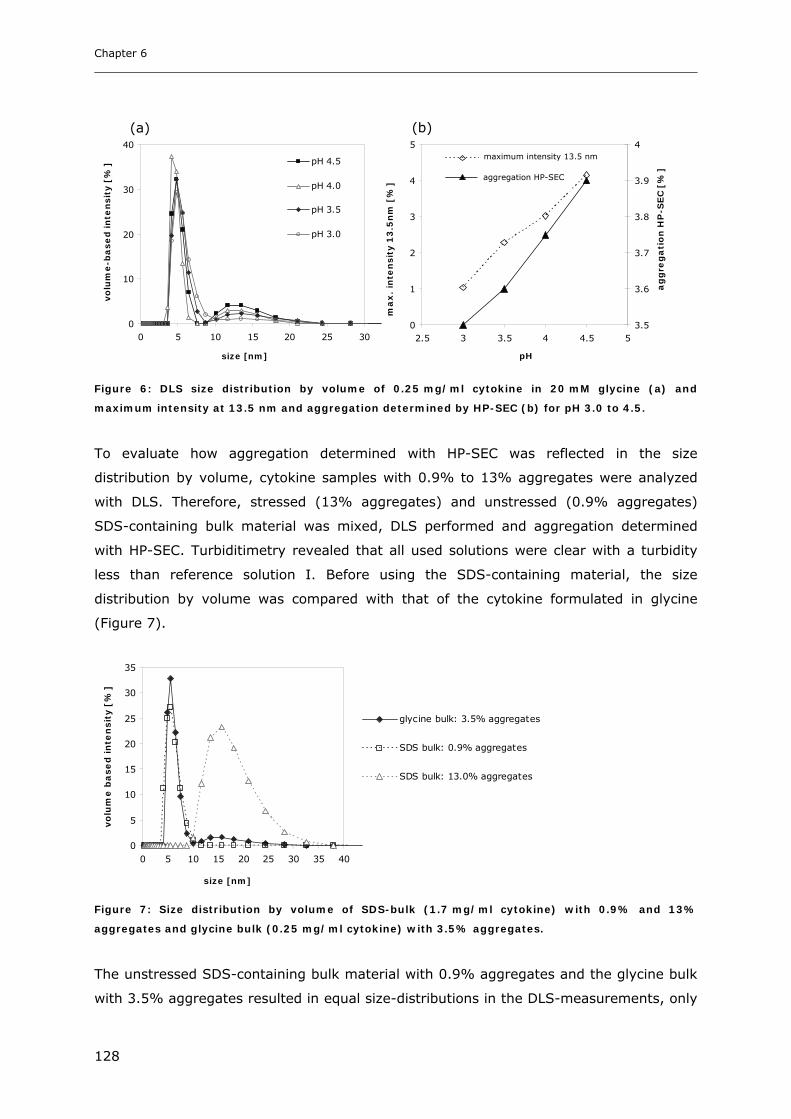
Chapter 6
128
0
10
20
30
40
0 5 10 15 20 25 30
size [nm]
vo
lum
e-b
ase
d in
ten
sit
y [
%] pH 4.5
pH 4.0
pH 3.5
pH 3.0
0
1
2
3
4
5
2.5 3 3.5 4 4.5 5
pH
ma
x.
inte
nsit
y 1
3.5
nm
[%
]
3.5
3.6
3.7
3.8
3.9
4
ag
gre
ga
tio
n H
P-S
EC
[%
]
aggregtion HP-SEC
maximum intensity13.5 nm
Figure 6: DLS size distribution by volume of 0.25 mg/ml cytokine in 20 mM glycine (a) and
maximum intensity at 13.5 nm and aggregation determined by HP-SEC (b) for pH 3.0 to 4.5.
To evaluate how aggregation determined with HP-SEC was reflected in the size
distribution by volume, cytokine samples with 0.9% to 13% aggregates were analyzed
with DLS. Therefore, stressed (13% aggregates) and unstressed (0.9% aggregates)
SDS-containing bulk material was mixed, DLS performed and aggregation determined
with HP-SEC. Turbiditimetry revealed that all used solutions were clear with a turbidity
less than reference solution I. Before using the SDS-containing material, the size
distribution by volume was compared with that of the cytokine formulated in glycine
(Figure 7).
0
5
10
15
20
25
30
35
0 5 10 15 20 25 30 35 40
size [nm]
vo
lum
e b
ase
d in
ten
sit
y [
%]
glycine bulk: 3.5% aggregates
SDS bulk: 0.9% aggregates
SDS bulk: 13.0% aggregates
Figure 7: Size distribution by volume of SDS-bulk (1.7 mg/ml cytokine) with 0.9% and 13%
aggregates and glycine bulk (0.25 mg/ml cytokine) with 3.5% aggregates.
The unstressed SDS-containing bulk material with 0.9% aggregates and the glycine bulk
with 3.5% aggregates resulted in equal size-distributions in the DLS-measurements, only
(a) (b)
maximum intensity 13.5 nm
aggregation HP-SEC
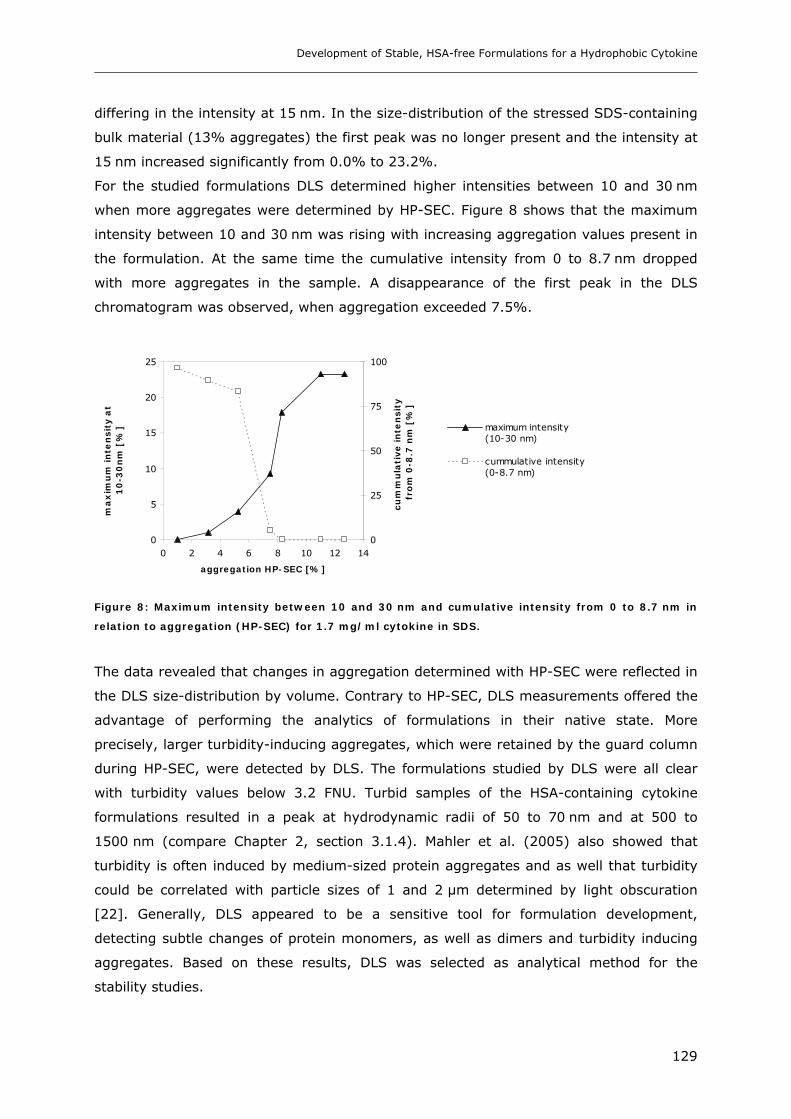
Development of Stable, HSA-free Formulations for a Hydrophobic Cytokine
129
differing in the intensity at 15 nm. In the size-distribution of the stressed SDS-containing
bulk material (13% aggregates) the first peak was no longer present and the intensity at
15 nm increased significantly from 0.0% to 23.2%.
For the studied formulations DLS determined higher intensities between 10 and 30 nm
when more aggregates were determined by HP-SEC. Figure 8 shows that the maximum
intensity between 10 and 30 nm was rising with increasing aggregation values present in
the formulation. At the same time the cumulative intensity from 0 to 8.7 nm dropped
with more aggregates in the sample. A disappearance of the first peak in the DLS
chromatogram was observed, when aggregation exceeded 7.5%.
0
5
10
15
20
25
0 2 4 6 8 10 12 14
aggregation HP-SEC [%]
ma
xim
um
in
ten
sit
y a
t 1
0-3
0n
m [
%]
0
25
50
75
100
cu
mm
ula
tive
in
ten
sit
y f
rom
0-8
.7 n
m [
%]
maximum intensity(10-30 nm)
cummulative intensity(0-8.7 nm)
Figure 8: Maximum intensity between 10 and 30 nm and cumulative intensity from 0 to 8.7 nm in
relation to aggregation (HP-SEC) for 1.7 mg/ml cytokine in SDS.
The data revealed that changes in aggregation determined with HP-SEC were reflected in
the DLS size-distribution by volume. Contrary to HP-SEC, DLS measurements offered the
advantage of performing the analytics of formulations in their native state. More
precisely, larger turbidity-inducing aggregates, which were retained by the guard column
during HP-SEC, were detected by DLS. The formulations studied by DLS were all clear
with turbidity values below 3.2 FNU. Turbid samples of the HSA-containing cytokine
formulations resulted in a peak at hydrodynamic radii of 50 to 70 nm and at 500 to
1500 nm (compare Chapter 2, section 3.1.4). Mahler et al. (2005) also showed that
turbidity is often induced by medium-sized protein aggregates and as well that turbidity
could be correlated with particle sizes of 1 and 2 µm determined by light obscuration
[22]. Generally, DLS appeared to be a sensitive tool for formulation development,
detecting subtle changes of protein monomers, as well as dimers and turbidity inducing
aggregates. Based on these results, DLS was selected as analytical method for the
stability studies.

Chapter 6
130
3.2 Temperature Induced Changes of the Cytokine
Microcalorimetry is typically used to determine the melting temperature (Tm) of proteins.
In the Differential Scanning Calorimentry (DSC) measurement the heat capacity of a
protein solution is measured as function of temperature [26]. With increasing
temperature, proteins begin to loose their native confirmation and undergo unfolding,
which is reflected by an endothermic transition in the DSC chromatograms [27]. The
midpoint of the denaturation transition is defined as melting temperature or denaturation
temperature [26]. This can be used to predict protein stability at different formulation
conditions e.g. pH or excipients. A decreasing Tm is often correlated with an inferior
thermal stability, which was for example shown by Remmele et al. (1998) for
Interleukin-1 Receptor upon the addition of different preservatives [28]. However, an
exception from this case is for example the lowering of Tm by PEG, although PEG is
known to increase the stability of formulations at room temperature [29].
The DSC-scans of 1.0 mg/ml cytokine in 20 mM glycine at pH 3.0 and 5.0 are shown in
Figure 9. At pH 3.0 no clear transition was detected. At pH 5.0 an exothermic shift of the
baseline starting at approximately 57°C was found which could be attributed to
aggregation occurring at higher temperatures [26].
20 40 60 80 100
-0.0005
-0.0004
-0.0003
-0.0002
-0.0001
0.0000
0.0001
Cp
[ca
l/°C
]
temperature [°C]
pH 3.0
pH 5.0
Figure 9: DSC-scan (protein scan minus buffer scan) of 1.0 mg/ml cytokine in 20 mM glycine at pH
3.0 and pH 5.0 from 20 to 100°C at 1.0°C/min.
Thus, microcalorimetry was not suitable to determine the melting temperature of the
cytokine between pH 3.0 and 5.0, which would be important for formulation
development. Therefore, the use of FTIR and DLS as alternative methods to determine
the denaturation temperature for the cytokine was evaluated.
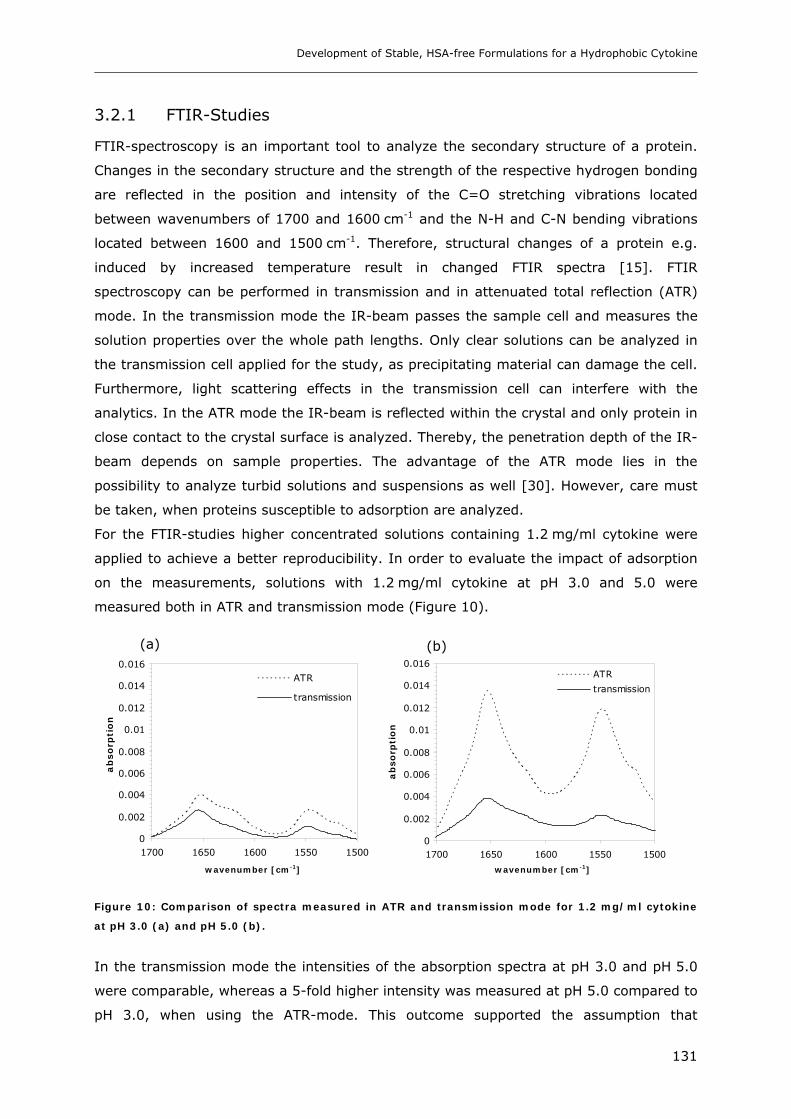
Development of Stable, HSA-free Formulations for a Hydrophobic Cytokine
131
3.2.1 FTIR-Studies
FTIR-spectroscopy is an important tool to analyze the secondary structure of a protein.
Changes in the secondary structure and the strength of the respective hydrogen bonding
are reflected in the position and intensity of the C=O stretching vibrations located
between wavenumbers of 1700 and 1600 cm-1 and the N-H and C-N bending vibrations
located between 1600 and 1500 cm-1. Therefore, structural changes of a protein e.g.
induced by increased temperature result in changed FTIR spectra [15]. FTIR
spectroscopy can be performed in transmission and in attenuated total reflection (ATR)
mode. In the transmission mode the IR-beam passes the sample cell and measures the
solution properties over the whole path lengths. Only clear solutions can be analyzed in
the transmission cell applied for the study, as precipitating material can damage the cell.
Furthermore, light scattering effects in the transmission cell can interfere with the
analytics. In the ATR mode the IR-beam is reflected within the crystal and only protein in
close contact to the crystal surface is analyzed. Thereby, the penetration depth of the IR-
beam depends on sample properties. The advantage of the ATR mode lies in the
possibility to analyze turbid solutions and suspensions as well [30]. However, care must
be taken, when proteins susceptible to adsorption are analyzed.
For the FTIR-studies higher concentrated solutions containing 1.2 mg/ml cytokine were
applied to achieve a better reproducibility. In order to evaluate the impact of adsorption
on the measurements, solutions with 1.2 mg/ml cytokine at pH 3.0 and 5.0 were
measured both in ATR and transmission mode (Figure 10).
0
0.002
0.004
0.006
0.008
0.01
0.012
0.014
0.016
15001550160016501700
wavenumber [cm-1]
ab
so
rpti
on
ATR
transmission
0
0.002
0.004
0.006
0.008
0.01
0.012
0.014
0.016
15001550160016501700
wavenumber [cm-1]
ab
so
rpti
on
ATR
transmission
Figure 10: Comparison of spectra measured in ATR and transmission mode for 1.2 mg/ml cytokine
at pH 3.0 (a) and pH 5.0 (b).
In the transmission mode the intensities of the absorption spectra at pH 3.0 and pH 5.0
were comparable, whereas a 5-fold higher intensity was measured at pH 5.0 compared to
pH 3.0, when using the ATR-mode. This outcome supported the assumption that
(a) (b)
wavenumber [cm-1] wavenumber [cm-1]
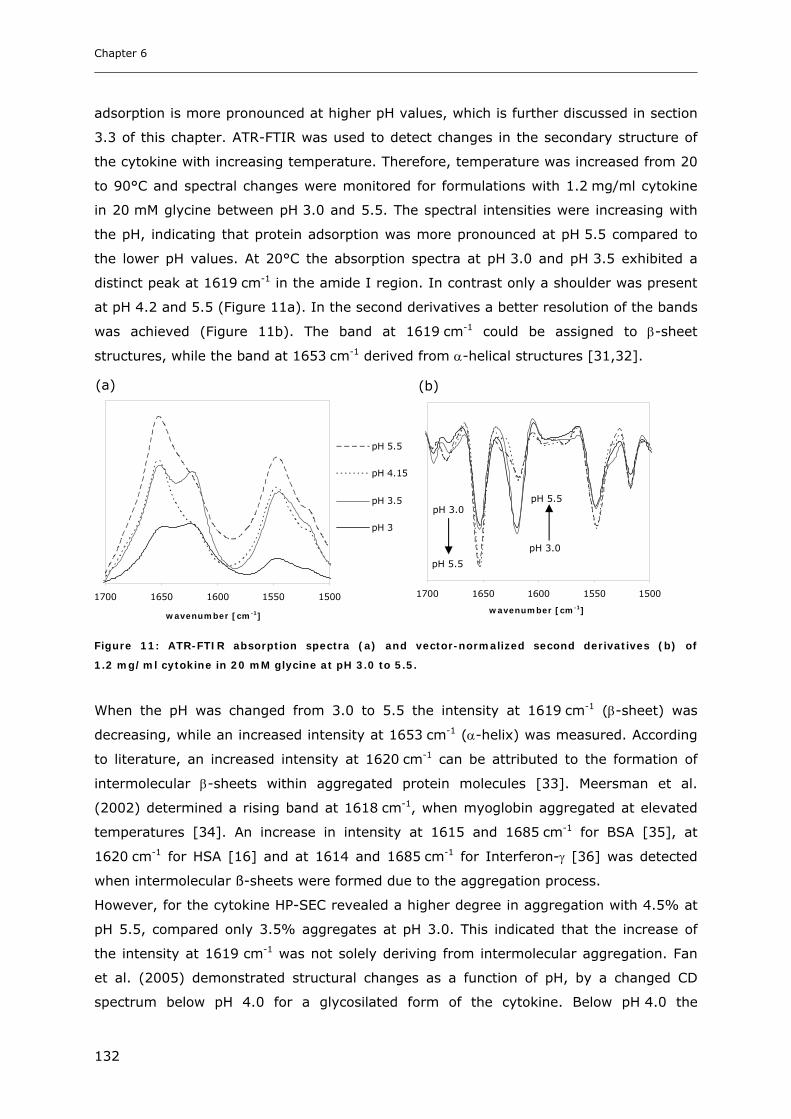
Chapter 6
132
adsorption is more pronounced at higher pH values, which is further discussed in section
3.3 of this chapter. ATR-FTIR was used to detect changes in the secondary structure of
the cytokine with increasing temperature. Therefore, temperature was increased from 20
to 90°C and spectral changes were monitored for formulations with 1.2 mg/ml cytokine
in 20 mM glycine between pH 3.0 and 5.5. The spectral intensities were increasing with
the pH, indicating that protein adsorption was more pronounced at pH 5.5 compared to
the lower pH values. At 20°C the absorption spectra at pH 3.0 and pH 3.5 exhibited a
distinct peak at 1619 cm-1 in the amide I region. In contrast only a shoulder was present
at pH 4.2 and 5.5 (Figure 11a). In the second derivatives a better resolution of the bands
was achieved (Figure 11b). The band at 1619 cm-1 could be assigned to β-sheet
structures, while the band at 1653 cm-1 derived from α-helical structures [31,32].
15001550160016501700
wavenumber [cm-1]
pH 5.5
pH 4.15
pH 3.5
pH 3
15001550160016501700
wavenumber [cm-1]
Figure 11: ATR-FTIR absorption spectra (a) and vector-normalized second derivatives (b) of
1.2 mg/ml cytokine in 20 mM glycine at pH 3.0 to 5.5.
When the pH was changed from 3.0 to 5.5 the intensity at 1619 cm-1 (β-sheet) was
decreasing, while an increased intensity at 1653 cm-1 (α-helix) was measured. According
to literature, an increased intensity at 1620 cm-1 can be attributed to the formation of
intermolecular β-sheets within aggregated protein molecules [33]. Meersman et al.
(2002) determined a rising band at 1618 cm-1, when myoglobin aggregated at elevated
temperatures [34]. An increase in intensity at 1615 and 1685 cm-1 for BSA [35], at
1620 cm-1 for HSA [16] and at 1614 and 1685 cm-1 for Interferon-γ [36] was detected
when intermolecular ß-sheets were formed due to the aggregation process.
However, for the cytokine HP-SEC revealed a higher degree in aggregation with 4.5% at
pH 5.5, compared only 3.5% aggregates at pH 3.0. This indicated that the increase of
the intensity at 1619 cm-1 was not solely deriving from intermolecular aggregation. Fan
et al. (2005) demonstrated structural changes as a function of pH, by a changed CD
spectrum below pH 4.0 for a glycosilated form of the cytokine. Below pH 4.0 the
pH 5.5
pH 3.0
pH 5.5
pH 3.0
wavenumber [cm-1] wavenumber [cm-1]
(a) (b)
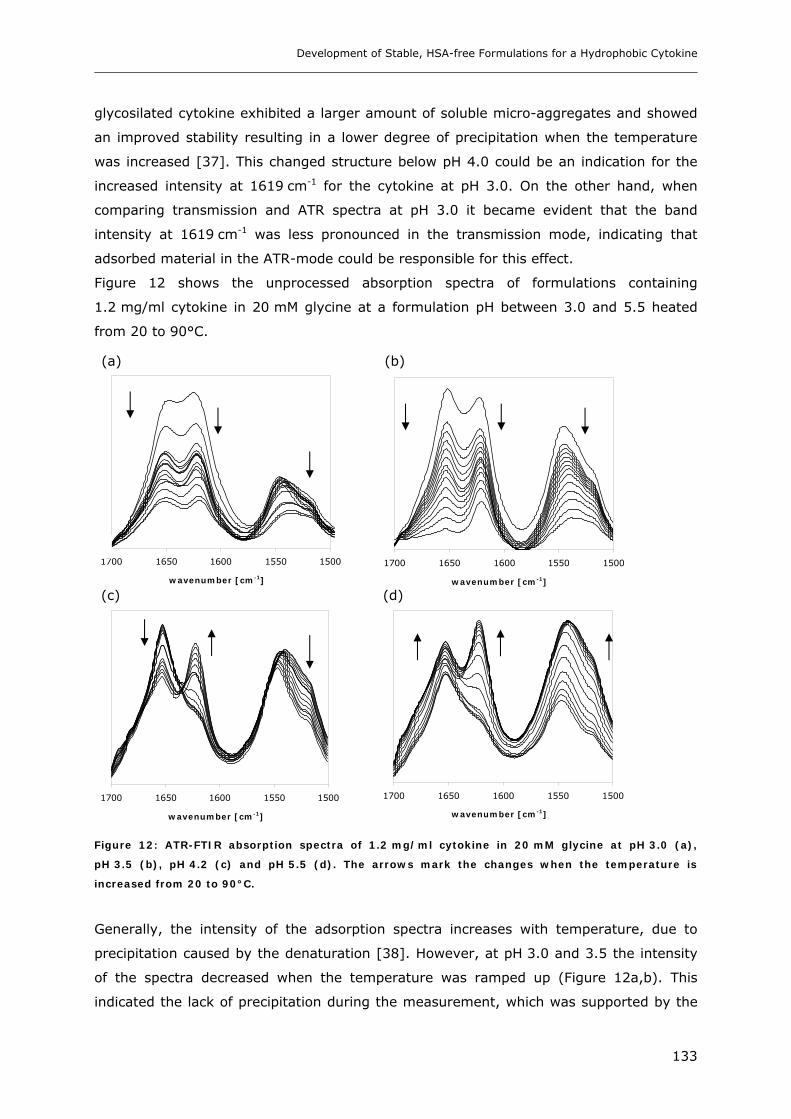
Development of Stable, HSA-free Formulations for a Hydrophobic Cytokine
133
glycosilated cytokine exhibited a larger amount of soluble micro-aggregates and showed
an improved stability resulting in a lower degree of precipitation when the temperature
was increased [37]. This changed structure below pH 4.0 could be an indication for the
increased intensity at 1619 cm-1 for the cytokine at pH 3.0. On the other hand, when
comparing transmission and ATR spectra at pH 3.0 it became evident that the band
intensity at 1619 cm-1 was less pronounced in the transmission mode, indicating that
adsorbed material in the ATR-mode could be responsible for this effect.
Figure 12 shows the unprocessed absorption spectra of formulations containing
1.2 mg/ml cytokine in 20 mM glycine at a formulation pH between 3.0 and 5.5 heated
from 20 to 90°C.
15001550160016501700
wavenumber [cm-1]
15001550160016501700
wavenumber [cm-1]
15001550160016501700
wavenumber [cm-1]
15001550160016501700
wavenumber [cm-1]
Figure 12: ATR-FTIR absorption spectra of 1.2 mg/ml cytokine in 20 mM glycine at pH 3.0 (a),
pH 3.5 (b), pH 4.2 (c) and pH 5.5 (d). The arrows mark the changes when the temperature is
increased from 20 to 90°C.
Generally, the intensity of the adsorption spectra increases with temperature, due to
precipitation caused by the denaturation [38]. However, at pH 3.0 and 3.5 the intensity
of the spectra decreased when the temperature was ramped up (Figure 12a,b). This
indicated the lack of precipitation during the measurement, which was supported by the
wavenumber [cm-1] wavenumber [cm-1]
wavenumber [cm-1] wavenumber [cm-1]
(c) (d)
(a) (b)
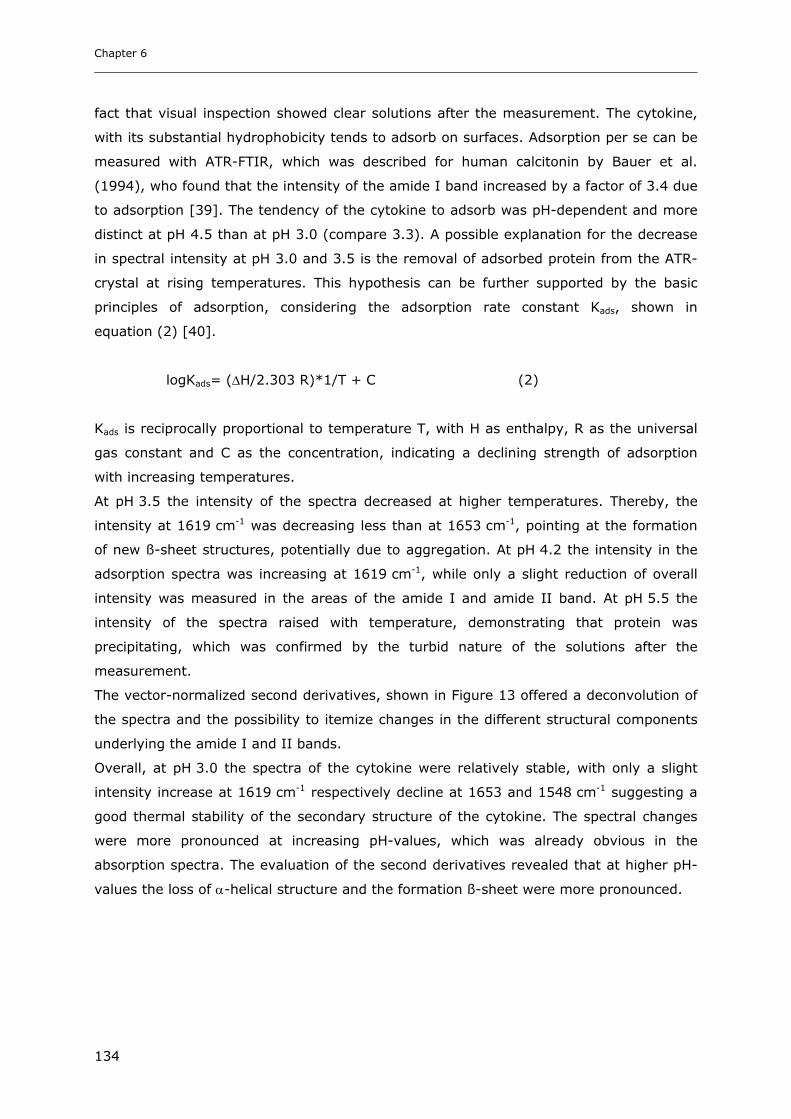
Chapter 6
134
fact that visual inspection showed clear solutions after the measurement. The cytokine,
with its substantial hydrophobicity tends to adsorb on surfaces. Adsorption per se can be
measured with ATR-FTIR, which was described for human calcitonin by Bauer et al.
(1994), who found that the intensity of the amide I band increased by a factor of 3.4 due
to adsorption [39]. The tendency of the cytokine to adsorb was pH-dependent and more
distinct at pH 4.5 than at pH 3.0 (compare 3.3). A possible explanation for the decrease
in spectral intensity at pH 3.0 and 3.5 is the removal of adsorbed protein from the ATR-
crystal at rising temperatures. This hypothesis can be further supported by the basic
principles of adsorption, considering the adsorption rate constant Kads, shown in
equation (2) [40].
logKads= (∆H/2.303 R)*1/T + C (2)
Kads is reciprocally proportional to temperature T, with H as enthalpy, R as the universal
gas constant and C as the concentration, indicating a declining strength of adsorption
with increasing temperatures.
At pH 3.5 the intensity of the spectra decreased at higher temperatures. Thereby, the
intensity at 1619 cm-1 was decreasing less than at 1653 cm-1, pointing at the formation
of new ß-sheet structures, potentially due to aggregation. At pH 4.2 the intensity in the
adsorption spectra was increasing at 1619 cm-1, while only a slight reduction of overall
intensity was measured in the areas of the amide I and amide II band. At pH 5.5 the
intensity of the spectra raised with temperature, demonstrating that protein was
precipitating, which was confirmed by the turbid nature of the solutions after the
measurement.
The vector-normalized second derivatives, shown in Figure 13 offered a deconvolution of
the spectra and the possibility to itemize changes in the different structural components
underlying the amide I and II bands.
Overall, at pH 3.0 the spectra of the cytokine were relatively stable, with only a slight
intensity increase at 1619 cm-1 respectively decline at 1653 and 1548 cm-1 suggesting a
good thermal stability of the secondary structure of the cytokine. The spectral changes
were more pronounced at increasing pH-values, which was already obvious in the
absorption spectra. The evaluation of the second derivatives revealed that at higher pH-
values the loss of α-helical structure and the formation ß-sheet were more pronounced.
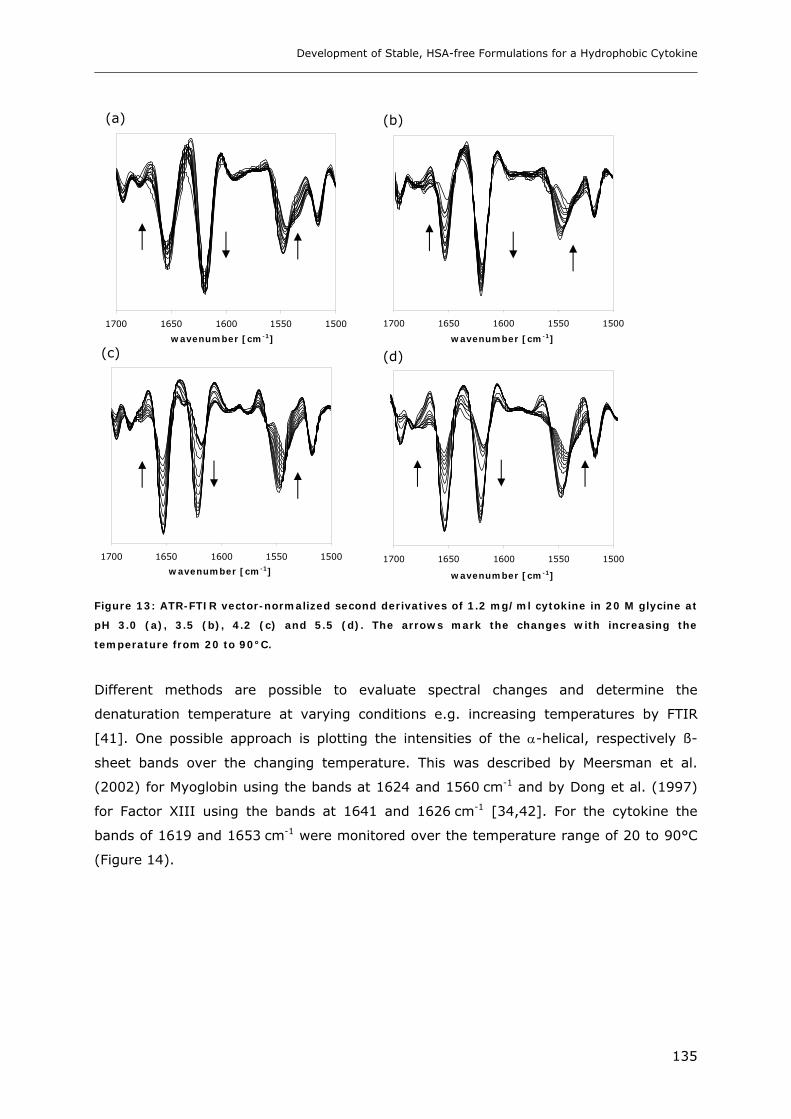
Development of Stable, HSA-free Formulations for a Hydrophobic Cytokine
135
15001550160016501700
wavenumber [cm-1]
15001550160016501700
wavenumber [cm-1]
15001550160016501700
wavenumber [cm-1]
15001550160016501700
wavenumber [cm-1]
Figure 13: ATR-FTIR vector-normalized second derivatives of 1.2 mg/ml cytokine in 20 M glycine at
pH 3.0 (a), 3.5 (b), 4.2 (c) and 5.5 (d). The arrows mark the changes with increasing the
temperature from 20 to 90°C.
Different methods are possible to evaluate spectral changes and determine the
denaturation temperature at varying conditions e.g. increasing temperatures by FTIR
[41]. One possible approach is plotting the intensities of the α-helical, respectively ß-
sheet bands over the changing temperature. This was described by Meersman et al.
(2002) for Myoglobin using the bands at 1624 and 1560 cm-1 and by Dong et al. (1997)
for Factor XIII using the bands at 1641 and 1626 cm-1 [34,42]. For the cytokine the
bands of 1619 and 1653 cm-1 were monitored over the temperature range of 20 to 90°C
(Figure 14).
(a) (b)
(c) (d) wavenumber [cm-1] wavenumber [cm-1]
wavenumber [cm-1] wavenumber [cm-1]
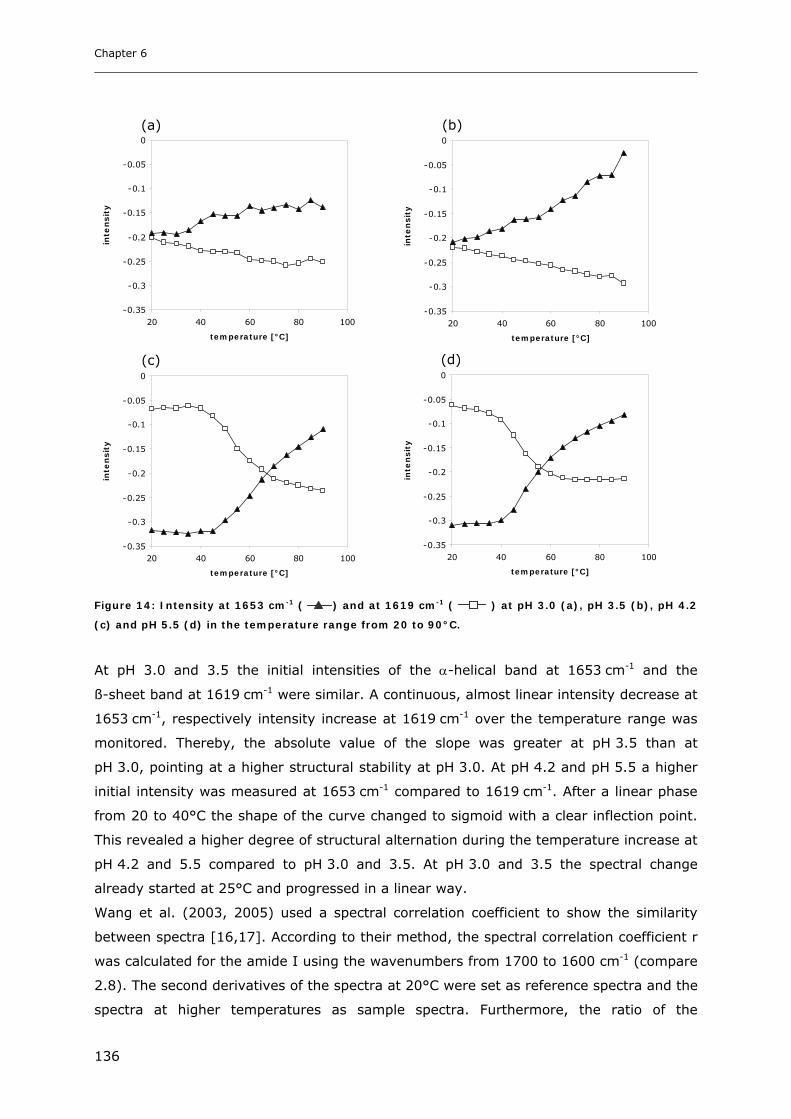
Chapter 6
136
-0.35
-0.3
-0.25
-0.2
-0.15
-0.1
-0.05
0
20 40 60 80 100
temperature [°C]
inte
nsit
y
-0.35
-0.3
-0.25
-0.2
-0.15
-0.1
-0.05
0
20 40 60 80 100
temperature [°C]
inte
nsit
y
-0.35
-0.3
-0.25
-0.2
-0.15
-0.1
-0.05
0
20 40 60 80 100
temperature [°C]
inte
nsit
y
-0.35
-0.3
-0.25
-0.2
-0.15
-0.1
-0.05
0
20 40 60 80 100
temperature [°C]
inte
nsit
y
Figure 14: Intensity at 1653 cm-1 ( ) and at 1619 cm-1 ( ) at pH 3.0 (a), pH 3.5 (b), pH 4.2
(c) and pH 5.5 (d) in the temperature range from 20 to 90°C.
At pH 3.0 and 3.5 the initial intensities of the α-helical band at 1653 cm-1 and the
ß-sheet band at 1619 cm-1 were similar. A continuous, almost linear intensity decrease at
1653 cm-1, respectively intensity increase at 1619 cm-1 over the temperature range was
monitored. Thereby, the absolute value of the slope was greater at pH 3.5 than at
pH 3.0, pointing at a higher structural stability at pH 3.0. At pH 4.2 and pH 5.5 a higher
initial intensity was measured at 1653 cm-1 compared to 1619 cm-1. After a linear phase
from 20 to 40°C the shape of the curve changed to sigmoid with a clear inflection point.
This revealed a higher degree of structural alternation during the temperature increase at
pH 4.2 and 5.5 compared to pH 3.0 and 3.5. At pH 3.0 and 3.5 the spectral change
already started at 25°C and progressed in a linear way.
Wang et al. (2003, 2005) used a spectral correlation coefficient to show the similarity
between spectra [16,17]. According to their method, the spectral correlation coefficient r
was calculated for the amide I using the wavenumbers from 1700 to 1600 cm-1 (compare
2.8). The second derivatives of the spectra at 20°C were set as reference spectra and the
spectra at higher temperatures as sample spectra. Furthermore, the ratio of the
(a) (b)
(c) (d)

Development of Stable, HSA-free Formulations for a Hydrophobic Cytokine
137
intensities at 1619 and 1653 cm-1, comparable to Goosens et al. (2003) [36] were
plotted over the temperature range between 20 to 90°C and compared to the spectral
correlation coefficient (Figure 15).
0
0.2
0.4
0.6
0.8
1
0 20 40 60 80 100
temperature [°C]
sp
ectr
al co
rre
lati
on
co
eff
icie
nt
0
1
2
3
4
inte
nsit
y r
ati
o
0
0.2
0.4
0.6
0.8
1
0 20 40 60 80 100
temperature [°C]sp
ectr
al co
rre
lati
on
co
eff
icie
nt
0
1
2
3
4
inte
nsit
y r
ati
o
0
0.2
0.4
0.6
0.8
1
0 20 40 60 80 100
temperature [°C]
sp
ectr
al co
rre
lati
on
co
eff
icie
nt
0
1
2
3
4
inte
nsit
y r
ati
o
0
0.2
0.4
0.6
0.8
1
0 20 40 60 80 100
temperature [°C]
sp
ectr
al co
rre
lati
on
co
eff
icie
nt
0
1
2
3
4
inte
nsit
y r
ati
o
Figure 15: Spectral correlation coefficient ( ) and intensity ratio of 1619 cm-1 to 1653 cm-1
( ) at pH 3.0 (a), 3.5 (b), 4.2 (c) and 5.5 (d) in the temperature range from 20 to 90°C.
At pH 3.0 both the intensity ratio and the spectral correlation coefficient showed a linear
change in intensities. Here, the alternations were obvious already at temperatures above
25°C. First at pH 3.5 it was possible to detect an inflection point for the intensity ratio
offering a value of 74°C as denaturation temperature. For pH 4.2 and pH 5.5 on the
other hand constant spectral correlation coefficients, respectively intensity ratios were
existent from 20 to 45°C, which is relevant for the storage of the formulations. For the
higher pH-values the spectral correlation coefficient and the intensity ratio began to
change at temperatures above 40 to 45°C.
For the cytokine the denaturation temperatures calculated from the intensities at 1619
and 1653 cm-1, respectively the intensity ratio and the spectral correlation coefficient r
are compared in Table 2.
(a) (b)
(c) (d)

Chapter 6
138
Table 2: Denaturation temperatures (Tm) of the formulations determined from the ATR-FTIR
spectra.
intensity
1619cm-1
intensity
1653cm-1
ratio
1619cm-1/1653cm-1
Spectral correlation
coefficient r
Tm
(average)
pH 3.0 - - - -
pH 3.5 - - 74°C - 74°C
pH 4.2 53°C 60°C 55°C 60°C 57°C
pH 5.5 50°C 47.5°C 50°C 50°C 49°C
At pH 3.0 it was not possible to determine an accurately defined transition temperature
with the four different approaches. The spectra changed already above 25°C. Especially
the spectral correlation coefficient and the intensity ratio revealed a linear change with
increasing temperatures. At pH 3.5 only the intensity ratio of 1619 to 1653 cm-1 offered a
value of 74°C for Tm. The structural changes with increasing temperatures were still not
pronounced enough to get results from the other methods. The transition temperature
was shifted from of 57°C at pH 4.2 to 49°C at pH 5.5, indicating a decreased thermal
stability.
Besides the evaluation of changes at increasing temperature, the application of FTIR-
spectroscopy as tool to monitor structural changes of proteins upon storage is often
found in literature. For example Kerwin et al. (1998) used FTIR spectroscopy to monitor
the stability of recombinant haemoglobin upon long term storage at -20°C [43]. The
application of FTIR as technique to monitor changes of the secondary structure of the
cytokine was evaluated for a concentration of 1.0 mg/ml in 20 mM glycine at pH 4.0
(Figure 16). After 2 weeks storage at 2-8°C and 40°C aggregation was determined with
HP-SEC and secondary structure monitored with FTIR spectroscopy. Aggregation
measured by HP-SEC increased from 4.0% before storage to 4.3% after 2 weeks at
2-8°C respectively 12% at 40°C. In the FTIR spectra no significant changes were visible
after 2 weeks at 2-8°C. Upon storage at 40°C on the other hand a second peak with a
maximum at 1619 cm-1, deriving from intermolecular ß-sheet structures emerged. This
experiment showed the ability of FTIR-spectroscopy to detect changes in the protein
structure during storage, when using formulations with 1.0 mg/ml cytokine. As routine
tool for the planned stability studies with 0.25 mg/ml cytokine on the other hand, FTIR
was not suitable. The more complex formulations containing 0.25 mg/ml cytokine and
further stabilizers (sugars, surfactants) showed only poor reproducibility of the spectra
due to the low cytokine concentrations (data not shown).
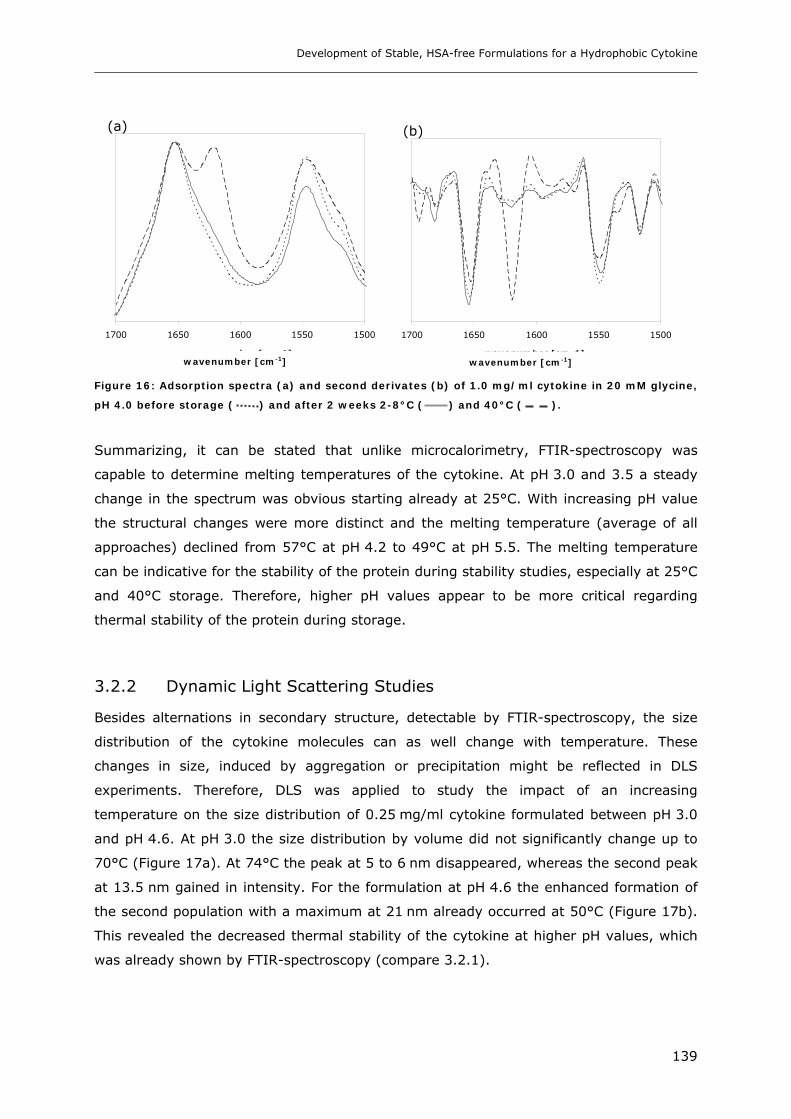
Development of Stable, HSA-free Formulations for a Hydrophobic Cytokine
139
15001550160016501700
wavenumber [cm-1]
15001550160016501700
wavenumber [cm-1]
Figure 16: Adsorption spectra (a) and second derivates (b) of 1.0 mg/ml cytokine in 20 mM glycine,
pH 4.0 before storage ( ) and after 2 weeks 2-8°C ( ) and 40°C ( ).
Summarizing, it can be stated that unlike microcalorimetry, FTIR-spectroscopy was
capable to determine melting temperatures of the cytokine. At pH 3.0 and 3.5 a steady
change in the spectrum was obvious starting already at 25°C. With increasing pH value
the structural changes were more distinct and the melting temperature (average of all
approaches) declined from 57°C at pH 4.2 to 49°C at pH 5.5. The melting temperature
can be indicative for the stability of the protein during stability studies, especially at 25°C
and 40°C storage. Therefore, higher pH values appear to be more critical regarding
thermal stability of the protein during storage.
3.2.2 Dynamic Light Scattering Studies
Besides alternations in secondary structure, detectable by FTIR-spectroscopy, the size
distribution of the cytokine molecules can as well change with temperature. These
changes in size, induced by aggregation or precipitation might be reflected in DLS
experiments. Therefore, DLS was applied to study the impact of an increasing
temperature on the size distribution of 0.25 mg/ml cytokine formulated between pH 3.0
and pH 4.6. At pH 3.0 the size distribution by volume did not significantly change up to
70°C (Figure 17a). At 74°C the peak at 5 to 6 nm disappeared, whereas the second peak
at 13.5 nm gained in intensity. For the formulation at pH 4.6 the enhanced formation of
the second population with a maximum at 21 nm already occurred at 50°C (Figure 17b).
This revealed the decreased thermal stability of the cytokine at higher pH values, which
was already shown by FTIR-spectroscopy (compare 3.2.1).
(a) (b)
wavenumber [cm-1] wavenumber [cm-1]

Chapter 6
140
1 10 100
size [nm]
1 10 100
size [nm]
12
14
16
18
20
22
24
20 30 40 50 60 70 80
temperature [°C]
Za
ve
rag
e [
nm
]
pH 4.0
pH 3.5
pH 3.0
10
15
20
25
30
35
40
20 30 40 50 60
temperature [°C]
Za
ve
rag
e [
nm
]
Figure 17: Size distribution by volume of 0.25 mg/ml cytokine in 20 mM glycine at pH 3.0 (a) and
pH 4.6 (b) with increasing temperatures. Change in z-average of 0.25 mg/ml cytokine in 20 mM
glycine at pH 3.0, 3.5 and 4.0 (c) and pH 4.6 (d) with increasing temperature.
As a method to determine the melting temperature of a protein, the z-average can be
plotted as function of the temperature [44]. The use of z-average as parameter for
protein solutions needs to be considered as critical, as protein solutions generally show a
multimodal distribution. Z-avarage as the medium intensity weighted average of the
correlation function offers a value for the protein size in a formulation, which is not
necessarily reflecting the genuine size. However, changes of z-average with temperature
can be considered to visualize changes of a protein at different conditions e.g.
formulation composition or temperature [24]. To make significant statements about the
size of a protein, respectively its multimeric forms, the hydrodynamic radius or diameter
can be considered. Petsev et al. (2000) determined a hydrodynamic diameter using
CONTIN algorithm for Apoferritin monomers at 11.4 nm, for dimers at 17.1 nm and
higher aggregate at 30.0 nm after separating the fractions with size exclusion
chromatography [45]. For HSA, Lin et al. (2000) measured a hydrodynamic radius of 2 to
(a) (b)
(c) (d)
20°C
30°C
40°C
50°C
60°C
70°C
74°C
24°C
30°C
40°C
46°C
50°C
56°C
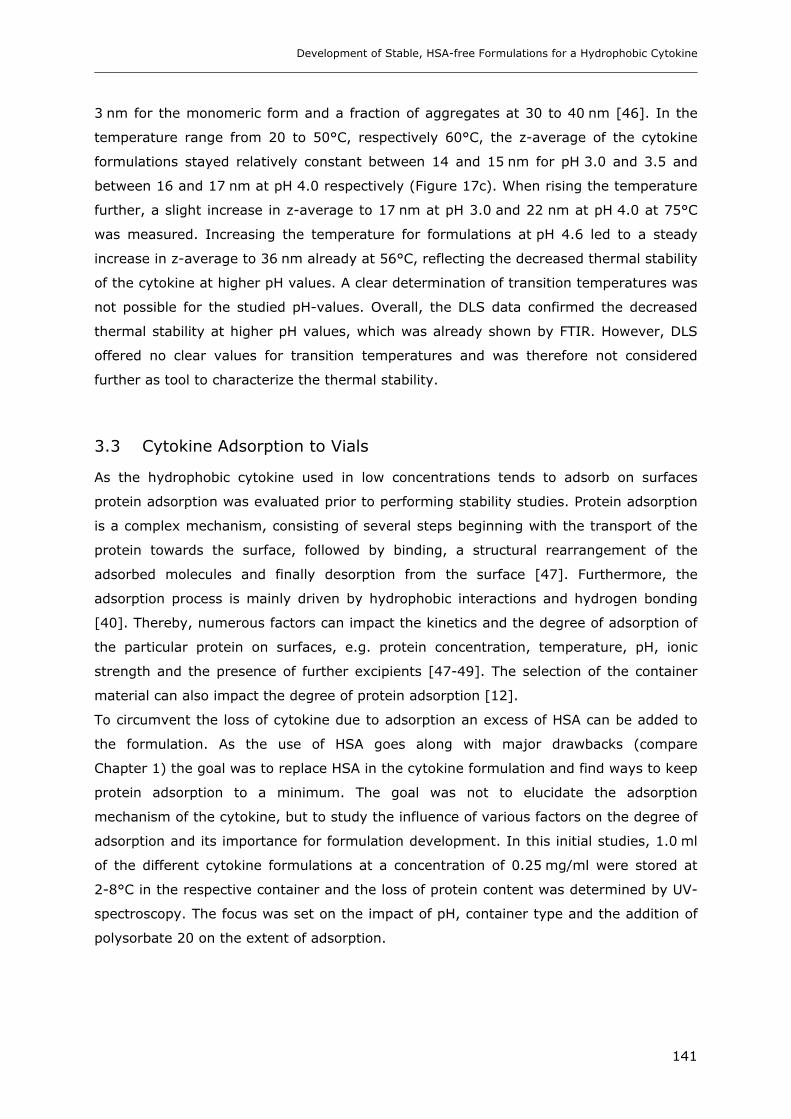
Development of Stable, HSA-free Formulations for a Hydrophobic Cytokine
141
3 nm for the monomeric form and a fraction of aggregates at 30 to 40 nm [46]. In the
temperature range from 20 to 50°C, respectively 60°C, the z-average of the cytokine
formulations stayed relatively constant between 14 and 15 nm for pH 3.0 and 3.5 and
between 16 and 17 nm at pH 4.0 respectively (Figure 17c). When rising the temperature
further, a slight increase in z-average to 17 nm at pH 3.0 and 22 nm at pH 4.0 at 75°C
was measured. Increasing the temperature for formulations at pH 4.6 led to a steady
increase in z-average to 36 nm already at 56°C, reflecting the decreased thermal stability
of the cytokine at higher pH values. A clear determination of transition temperatures was
not possible for the studied pH-values. Overall, the DLS data confirmed the decreased
thermal stability at higher pH values, which was already shown by FTIR. However, DLS
offered no clear values for transition temperatures and was therefore not considered
further as tool to characterize the thermal stability.
3.3 Cytokine Adsorption to Vials
As the hydrophobic cytokine used in low concentrations tends to adsorb on surfaces
protein adsorption was evaluated prior to performing stability studies. Protein adsorption
is a complex mechanism, consisting of several steps beginning with the transport of the
protein towards the surface, followed by binding, a structural rearrangement of the
adsorbed molecules and finally desorption from the surface [47]. Furthermore, the
adsorption process is mainly driven by hydrophobic interactions and hydrogen bonding
[40]. Thereby, numerous factors can impact the kinetics and the degree of adsorption of
the particular protein on surfaces, e.g. protein concentration, temperature, pH, ionic
strength and the presence of further excipients [47-49]. The selection of the container
material can also impact the degree of protein adsorption [12].
To circumvent the loss of cytokine due to adsorption an excess of HSA can be added to
the formulation. As the use of HSA goes along with major drawbacks (compare
Chapter 1) the goal was to replace HSA in the cytokine formulation and find ways to keep
protein adsorption to a minimum. The goal was not to elucidate the adsorption
mechanism of the cytokine, but to study the influence of various factors on the degree of
adsorption and its importance for formulation development. In this initial studies, 1.0 ml
of the different cytokine formulations at a concentration of 0.25 mg/ml were stored at
2-8°C in the respective container and the loss of protein content was determined by UV-
spectroscopy. The focus was set on the impact of pH, container type and the addition of
polysorbate 20 on the extent of adsorption.
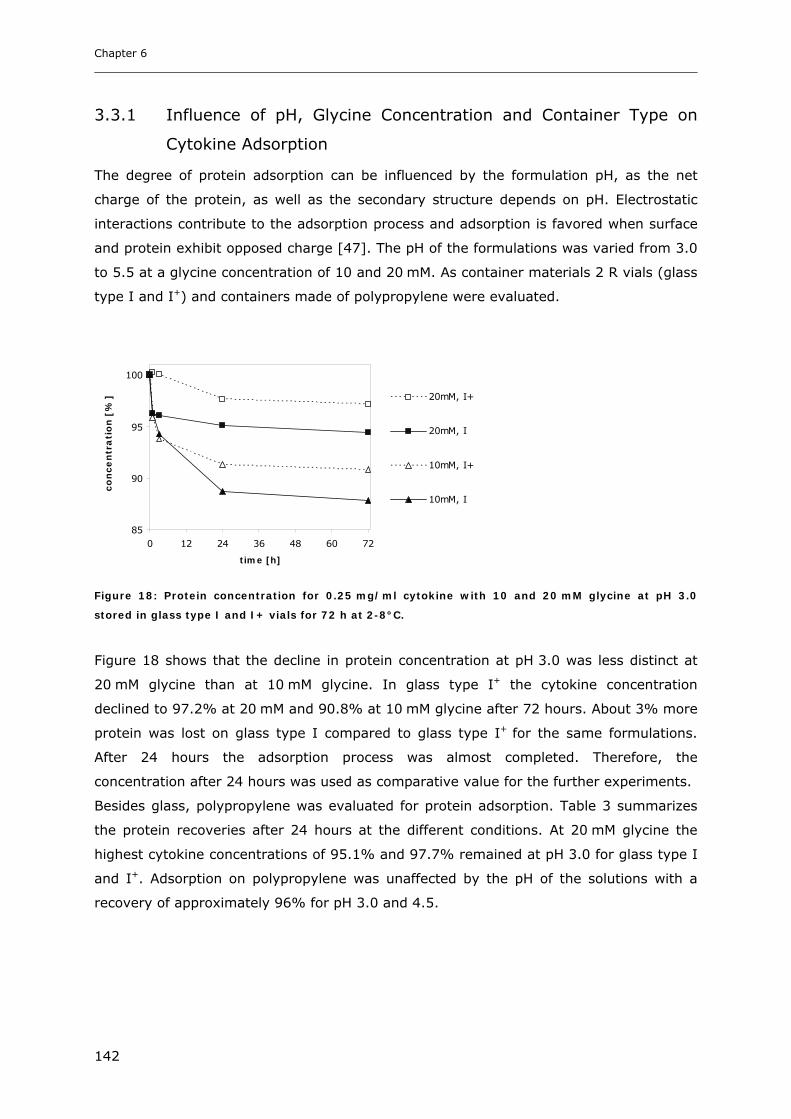
Chapter 6
142
3.3.1 Influence of pH, Glycine Concentration and Container Type on
Cytokine Adsorption
The degree of protein adsorption can be influenced by the formulation pH, as the net
charge of the protein, as well as the secondary structure depends on pH. Electrostatic
interactions contribute to the adsorption process and adsorption is favored when surface
and protein exhibit opposed charge [47]. The pH of the formulations was varied from 3.0
to 5.5 at a glycine concentration of 10 and 20 mM. As container materials 2 R vials (glass
type I and I+) and containers made of polypropylene were evaluated.
85
90
95
100
0 12 24 36 48 60 72
time [h]
co
nce
ntr
ati
on
[%
] 20mM, I+
20mM, I
10mM, I+
10mM, I
Figure 18: Protein concentration for 0.25 mg/ml cytokine with 10 and 20 mM glycine at pH 3.0
stored in glass type I and I+ vials for 72 h at 2-8°C.
Figure 18 shows that the decline in protein concentration at pH 3.0 was less distinct at
20 mM glycine than at 10 mM glycine. In glass type I+ the cytokine concentration
declined to 97.2% at 20 mM and 90.8% at 10 mM glycine after 72 hours. About 3% more
protein was lost on glass type I compared to glass type I+ for the same formulations.
After 24 hours the adsorption process was almost completed. Therefore, the
concentration after 24 hours was used as comparative value for the further experiments.
Besides glass, polypropylene was evaluated for protein adsorption. Table 3 summarizes
the protein recoveries after 24 hours at the different conditions. At 20 mM glycine the
highest cytokine concentrations of 95.1% and 97.7% remained at pH 3.0 for glass type I
and I+. Adsorption on polypropylene was unaffected by the pH of the solutions with a
recovery of approximately 96% for pH 3.0 and 4.5.
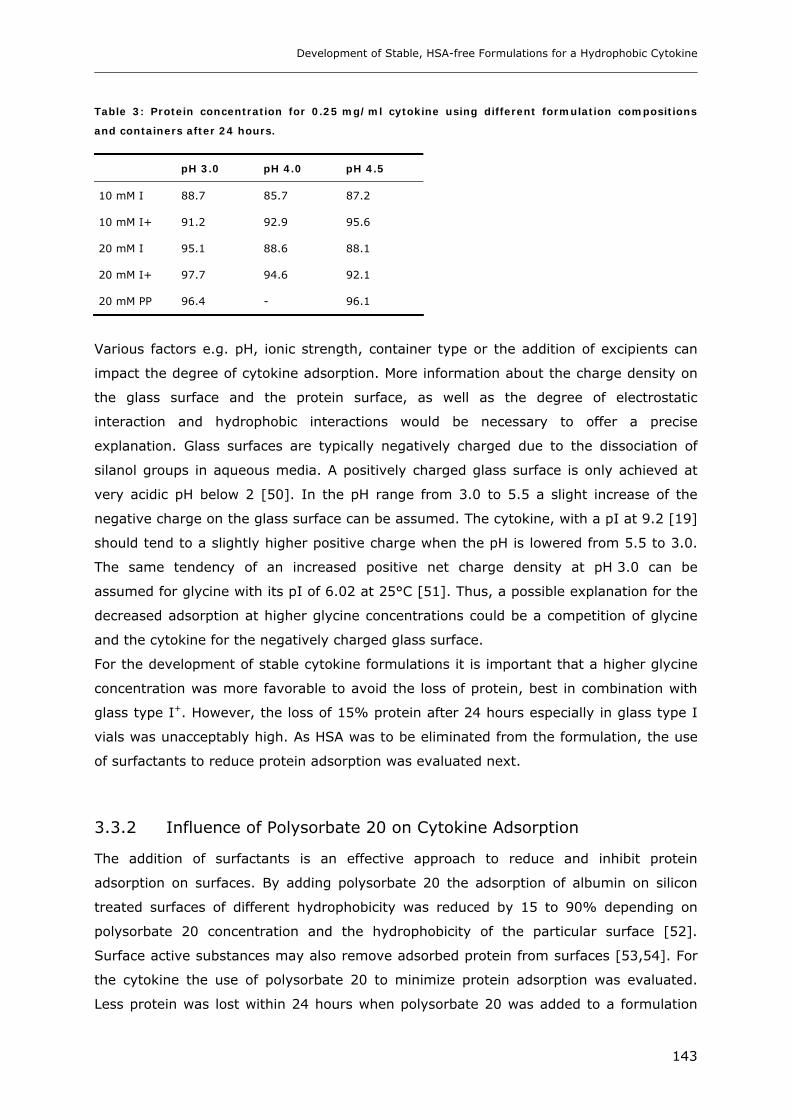
Development of Stable, HSA-free Formulations for a Hydrophobic Cytokine
143
Table 3: Protein concentration for 0.25 mg/ml cytokine using different formulation compositions
and containers after 24 hours.
pH 3.0 pH 4.0 pH 4.5
10 mM I 88.7 85.7 87.2
10 mM I+ 91.2 92.9 95.6
20 mM I 95.1 88.6 88.1
20 mM I+ 97.7 94.6 92.1
20 mM PP 96.4 - 96.1
Various factors e.g. pH, ionic strength, container type or the addition of excipients can
impact the degree of cytokine adsorption. More information about the charge density on
the glass surface and the protein surface, as well as the degree of electrostatic
interaction and hydrophobic interactions would be necessary to offer a precise
explanation. Glass surfaces are typically negatively charged due to the dissociation of
silanol groups in aqueous media. A positively charged glass surface is only achieved at
very acidic pH below 2 [50]. In the pH range from 3.0 to 5.5 a slight increase of the
negative charge on the glass surface can be assumed. The cytokine, with a pI at 9.2 [19]
should tend to a slightly higher positive charge when the pH is lowered from 5.5 to 3.0.
The same tendency of an increased positive net charge density at pH 3.0 can be
assumed for glycine with its pI of 6.02 at 25°C [51]. Thus, a possible explanation for the
decreased adsorption at higher glycine concentrations could be a competition of glycine
and the cytokine for the negatively charged glass surface.
For the development of stable cytokine formulations it is important that a higher glycine
concentration was more favorable to avoid the loss of protein, best in combination with
glass type I+. However, the loss of 15% protein after 24 hours especially in glass type I
vials was unacceptably high. As HSA was to be eliminated from the formulation, the use
of surfactants to reduce protein adsorption was evaluated next.
3.3.2 Influence of Polysorbate 20 on Cytokine Adsorption
The addition of surfactants is an effective approach to reduce and inhibit protein
adsorption on surfaces. By adding polysorbate 20 the adsorption of albumin on silicon
treated surfaces of different hydrophobicity was reduced by 15 to 90% depending on
polysorbate 20 concentration and the hydrophobicity of the particular surface [52].
Surface active substances may also remove adsorbed protein from surfaces [53,54]. For
the cytokine the use of polysorbate 20 to minimize protein adsorption was evaluated.
Less protein was lost within 24 hours when polysorbate 20 was added to a formulation
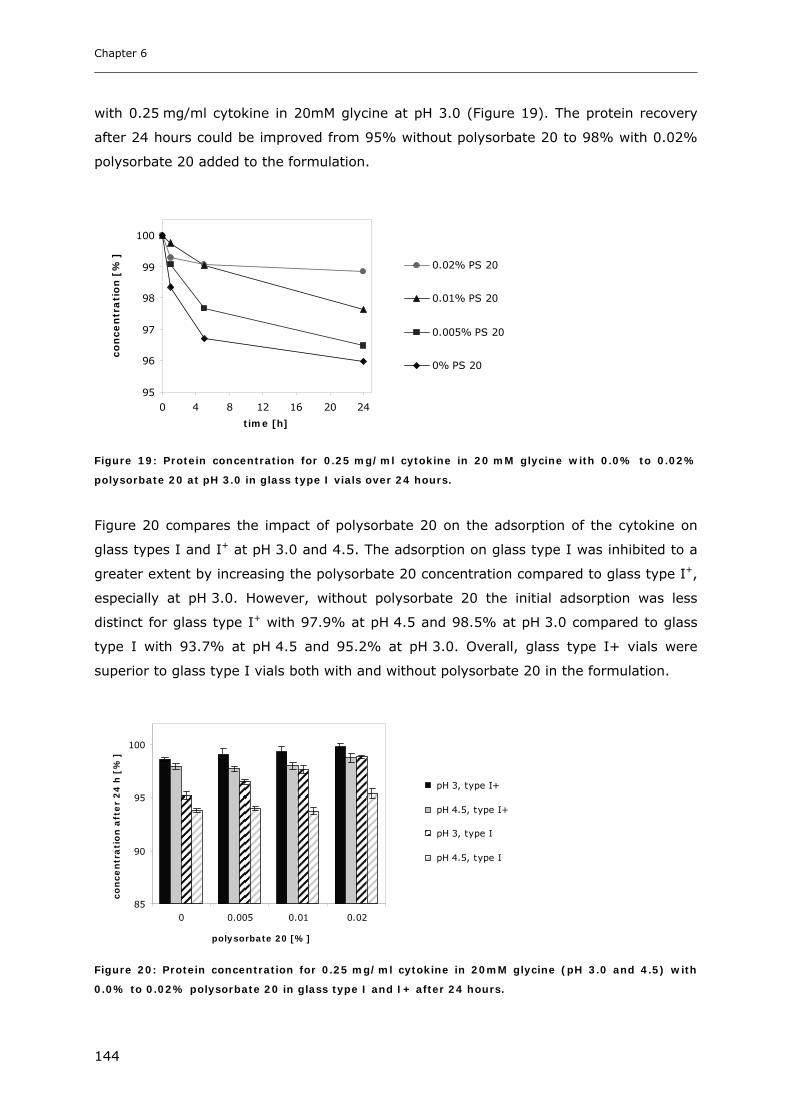
Chapter 6
144
with 0.25 mg/ml cytokine in 20mM glycine at pH 3.0 (Figure 19). The protein recovery
after 24 hours could be improved from 95% without polysorbate 20 to 98% with 0.02%
polysorbate 20 added to the formulation.
95
96
97
98
99
100
0 4 8 12 16 20 24
time [h]
co
nce
ntr
ati
on
[%
]
0.02% PS 20
0.01% PS 20
0.005% PS 20
0% PS 20
Figure 19: Protein concentration for 0.25 mg/ml cytokine in 20 mM glycine with 0.0% to 0.02%
polysorbate 20 at pH 3.0 in glass type I vials over 24 hours.
Figure 20 compares the impact of polysorbate 20 on the adsorption of the cytokine on
glass types I and I+ at pH 3.0 and 4.5. The adsorption on glass type I was inhibited to a
greater extent by increasing the polysorbate 20 concentration compared to glass type I+,
especially at pH 3.0. However, without polysorbate 20 the initial adsorption was less
distinct for glass type I+ with 97.9% at pH 4.5 and 98.5% at pH 3.0 compared to glass
type I with 93.7% at pH 4.5 and 95.2% at pH 3.0. Overall, glass type I+ vials were
superior to glass type I vials both with and without polysorbate 20 in the formulation.
85
90
95
100
0 0.005 0.01 0.02
polysorbate 20 [%]
co
nce
ntr
ati
on
aft
er
24
h [
%]
pH 3, type I+
pH 4.5, type I+
pH 3, type I
pH 4.5, type I
Figure 20: Protein concentration for 0.25 mg/ml cytokine in 20mM glycine (pH 3.0 and 4.5) with
0.0% to 0.02% polysorbate 20 in glass type I and I+ after 24 hours.
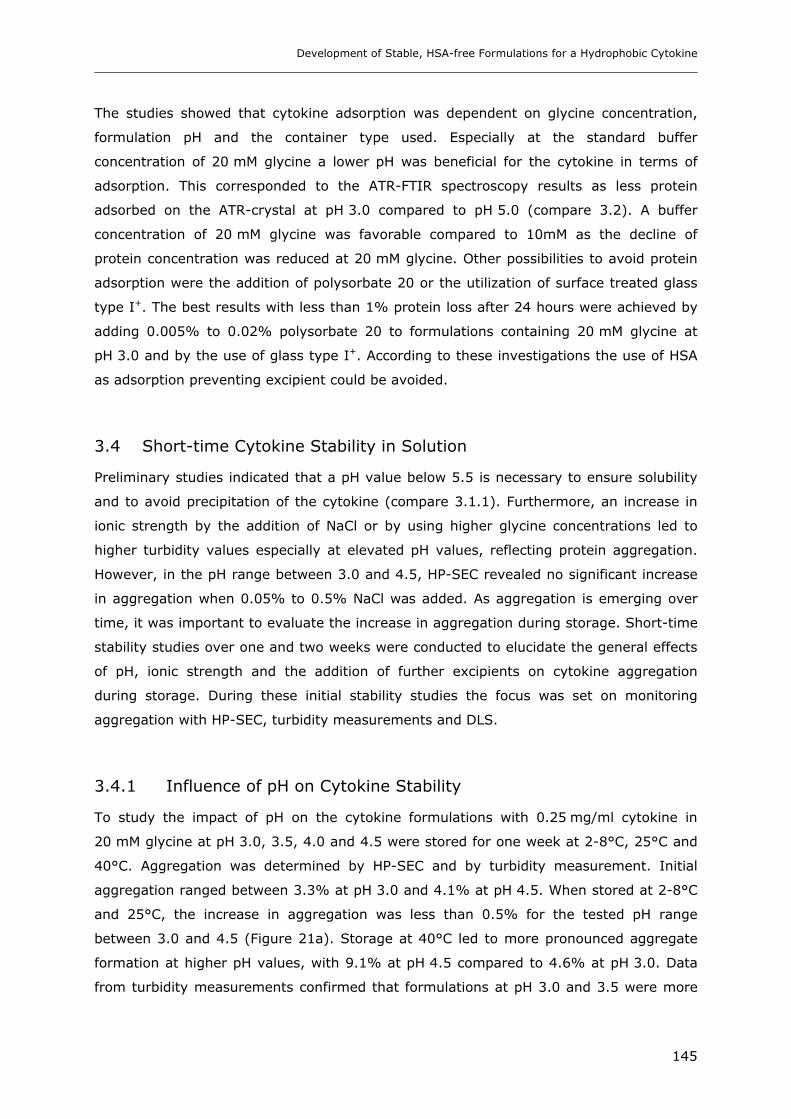
Development of Stable, HSA-free Formulations for a Hydrophobic Cytokine
145
The studies showed that cytokine adsorption was dependent on glycine concentration,
formulation pH and the container type used. Especially at the standard buffer
concentration of 20 mM glycine a lower pH was beneficial for the cytokine in terms of
adsorption. This corresponded to the ATR-FTIR spectroscopy results as less protein
adsorbed on the ATR-crystal at pH 3.0 compared to pH 5.0 (compare 3.2). A buffer
concentration of 20 mM glycine was favorable compared to 10mM as the decline of
protein concentration was reduced at 20 mM glycine. Other possibilities to avoid protein
adsorption were the addition of polysorbate 20 or the utilization of surface treated glass
type I+. The best results with less than 1% protein loss after 24 hours were achieved by
adding 0.005% to 0.02% polysorbate 20 to formulations containing 20 mM glycine at
pH 3.0 and by the use of glass type I+. According to these investigations the use of HSA
as adsorption preventing excipient could be avoided.
3.4 Short-time Cytokine Stability in Solution
Preliminary studies indicated that a pH value below 5.5 is necessary to ensure solubility
and to avoid precipitation of the cytokine (compare 3.1.1). Furthermore, an increase in
ionic strength by the addition of NaCl or by using higher glycine concentrations led to
higher turbidity values especially at elevated pH values, reflecting protein aggregation.
However, in the pH range between 3.0 and 4.5, HP-SEC revealed no significant increase
in aggregation when 0.05% to 0.5% NaCl was added. As aggregation is emerging over
time, it was important to evaluate the increase in aggregation during storage. Short-time
stability studies over one and two weeks were conducted to elucidate the general effects
of pH, ionic strength and the addition of further excipients on cytokine aggregation
during storage. During these initial stability studies the focus was set on monitoring
aggregation with HP-SEC, turbidity measurements and DLS.
3.4.1 Influence of pH on Cytokine Stability
To study the impact of pH on the cytokine formulations with 0.25 mg/ml cytokine in
20 mM glycine at pH 3.0, 3.5, 4.0 and 4.5 were stored for one week at 2-8°C, 25°C and
40°C. Aggregation was determined by HP-SEC and by turbidity measurement. Initial
aggregation ranged between 3.3% at pH 3.0 and 4.1% at pH 4.5. When stored at 2-8°C
and 25°C, the increase in aggregation was less than 0.5% for the tested pH range
between 3.0 and 4.5 (Figure 21a). Storage at 40°C led to more pronounced aggregate
formation at higher pH values, with 9.1% at pH 4.5 compared to 4.6% at pH 3.0. Data
from turbidity measurements confirmed that formulations at pH 3.0 and 3.5 were more
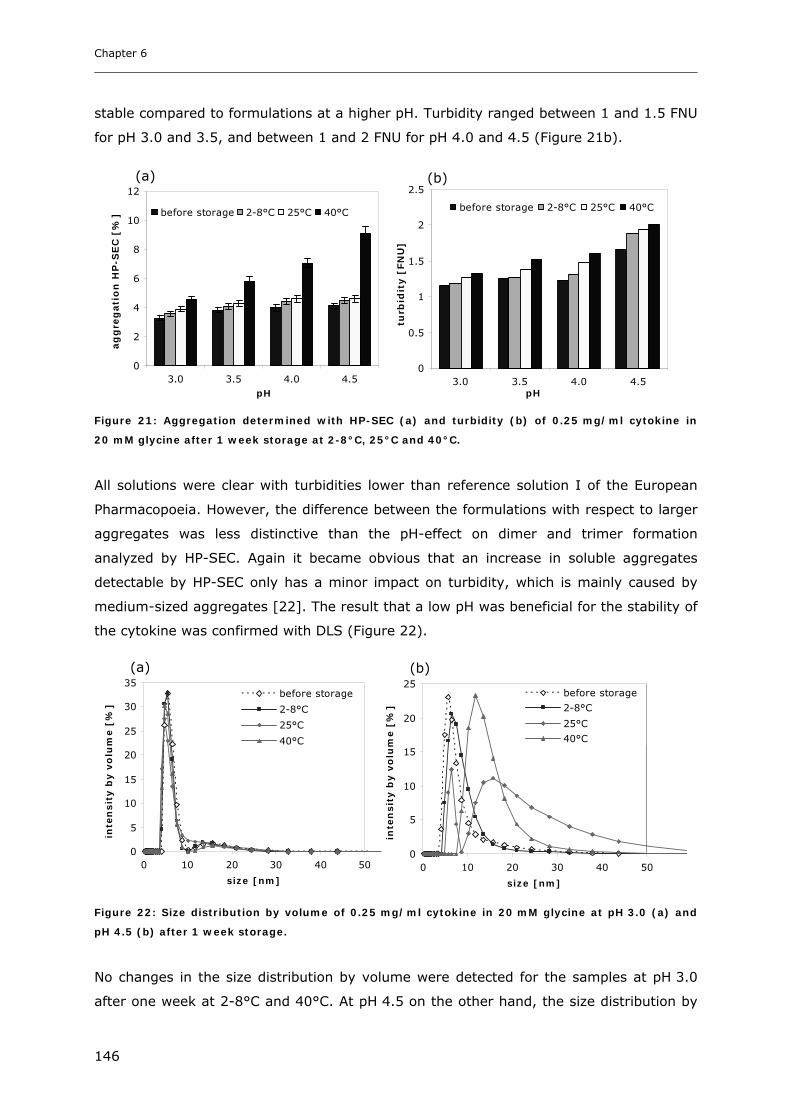
Chapter 6
146
stable compared to formulations at a higher pH. Turbidity ranged between 1 and 1.5 FNU
for pH 3.0 and 3.5, and between 1 and 2 FNU for pH 4.0 and 4.5 (Figure 21b).
0
2
4
6
8
10
12
3.0 3.5 4.0 4.5pH
ag
gre
gati
on
HP
-SE
C [
%] before storage 2-8°C 25°C 40°C
0
0.5
1
1.5
2
2.5
3.0 3.5 4.0 4.5pH
turb
idit
y [
FN
U]
before storage 2-8°C 25°C 40°C
Figure 21: Aggregation determined with HP-SEC (a) and turbidity (b) of 0.25 mg/ml cytokine in
20 mM glycine after 1 week storage at 2-8°C, 25°C and 40°C.
All solutions were clear with turbidities lower than reference solution I of the European
Pharmacopoeia. However, the difference between the formulations with respect to larger
aggregates was less distinctive than the pH-effect on dimer and trimer formation
analyzed by HP-SEC. Again it became obvious that an increase in soluble aggregates
detectable by HP-SEC only has a minor impact on turbidity, which is mainly caused by
medium-sized aggregates [22]. The result that a low pH was beneficial for the stability of
the cytokine was confirmed with DLS (Figure 22).
0
5
10
15
20
25
30
35
0 10 20 30 40 50
size [nm]
inte
nsit
y b
y v
olu
me [
%]
before storage
2-8°C
25°C
40°C
0
5
10
15
20
25
0 10 20 30 40 50
size [nm]
inte
nsit
y b
y v
olu
me [
%]
before storage
2-8°C
25°C
40°C
Figure 22: Size distribution by volume of 0.25 mg/ml cytokine in 20 mM glycine at pH 3.0 (a) and
pH 4.5 (b) after 1 week storage.
No changes in the size distribution by volume were detected for the samples at pH 3.0
after one week at 2-8°C and 40°C. At pH 4.5 on the other hand, the size distribution by
(a) (b)
(a) (b)
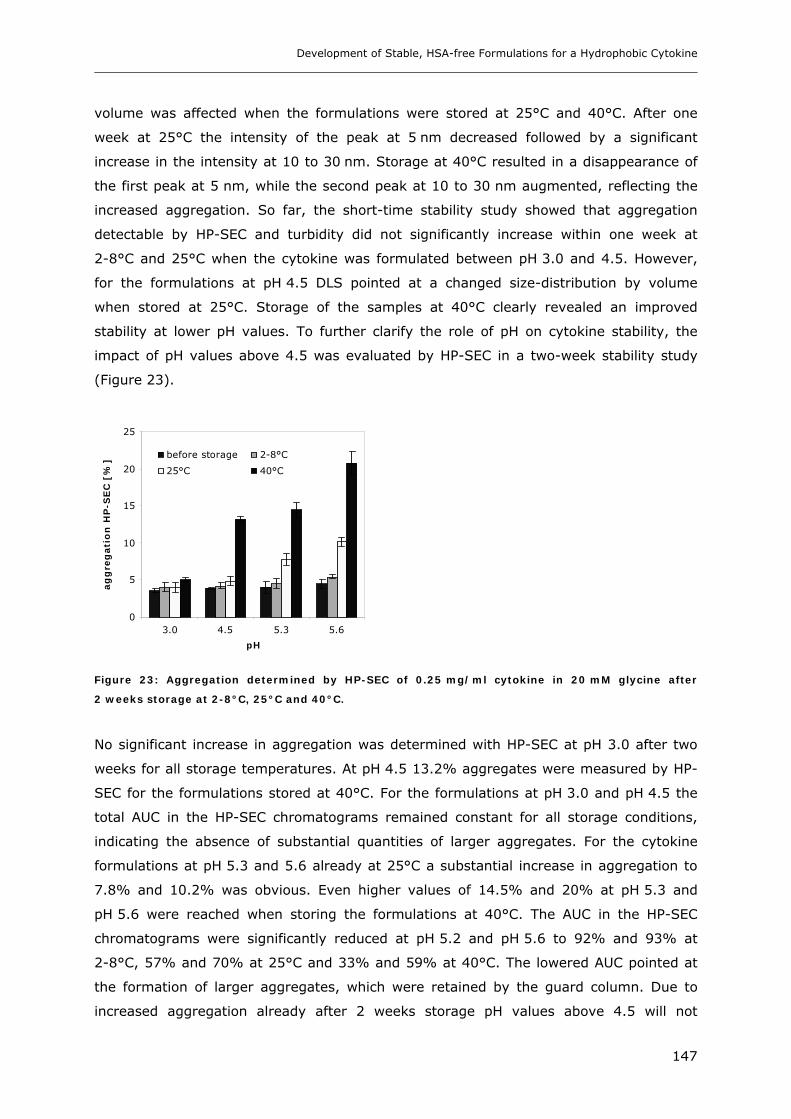
Development of Stable, HSA-free Formulations for a Hydrophobic Cytokine
147
volume was affected when the formulations were stored at 25°C and 40°C. After one
week at 25°C the intensity of the peak at 5 nm decreased followed by a significant
increase in the intensity at 10 to 30 nm. Storage at 40°C resulted in a disappearance of
the first peak at 5 nm, while the second peak at 10 to 30 nm augmented, reflecting the
increased aggregation. So far, the short-time stability study showed that aggregation
detectable by HP-SEC and turbidity did not significantly increase within one week at
2-8°C and 25°C when the cytokine was formulated between pH 3.0 and 4.5. However,
for the formulations at pH 4.5 DLS pointed at a changed size-distribution by volume
when stored at 25°C. Storage of the samples at 40°C clearly revealed an improved
stability at lower pH values. To further clarify the role of pH on cytokine stability, the
impact of pH values above 4.5 was evaluated by HP-SEC in a two-week stability study
(Figure 23).
0
5
10
15
20
25
3.0 4.5 5.3 5.6
pH
ag
gre
gati
on
HP
-SE
C [
%] before storage 2-8°C
25°C 40°C
Figure 23: Aggregation determined by HP-SEC of 0.25 mg/ml cytokine in 20 mM glycine after
2 weeks storage at 2-8°C, 25°C and 40°C.
No significant increase in aggregation was determined with HP-SEC at pH 3.0 after two
weeks for all storage temperatures. At pH 4.5 13.2% aggregates were measured by HP-
SEC for the formulations stored at 40°C. For the formulations at pH 3.0 and pH 4.5 the
total AUC in the HP-SEC chromatograms remained constant for all storage conditions,
indicating the absence of substantial quantities of larger aggregates. For the cytokine
formulations at pH 5.3 and 5.6 already at 25°C a substantial increase in aggregation to
7.8% and 10.2% was obvious. Even higher values of 14.5% and 20% at pH 5.3 and
pH 5.6 were reached when storing the formulations at 40°C. The AUC in the HP-SEC
chromatograms were significantly reduced at pH 5.2 and pH 5.6 to 92% and 93% at
2-8°C, 57% and 70% at 25°C and 33% and 59% at 40°C. The lowered AUC pointed at
the formation of larger aggregates, which were retained by the guard column. Due to
increased aggregation already after 2 weeks storage pH values above 4.5 will not
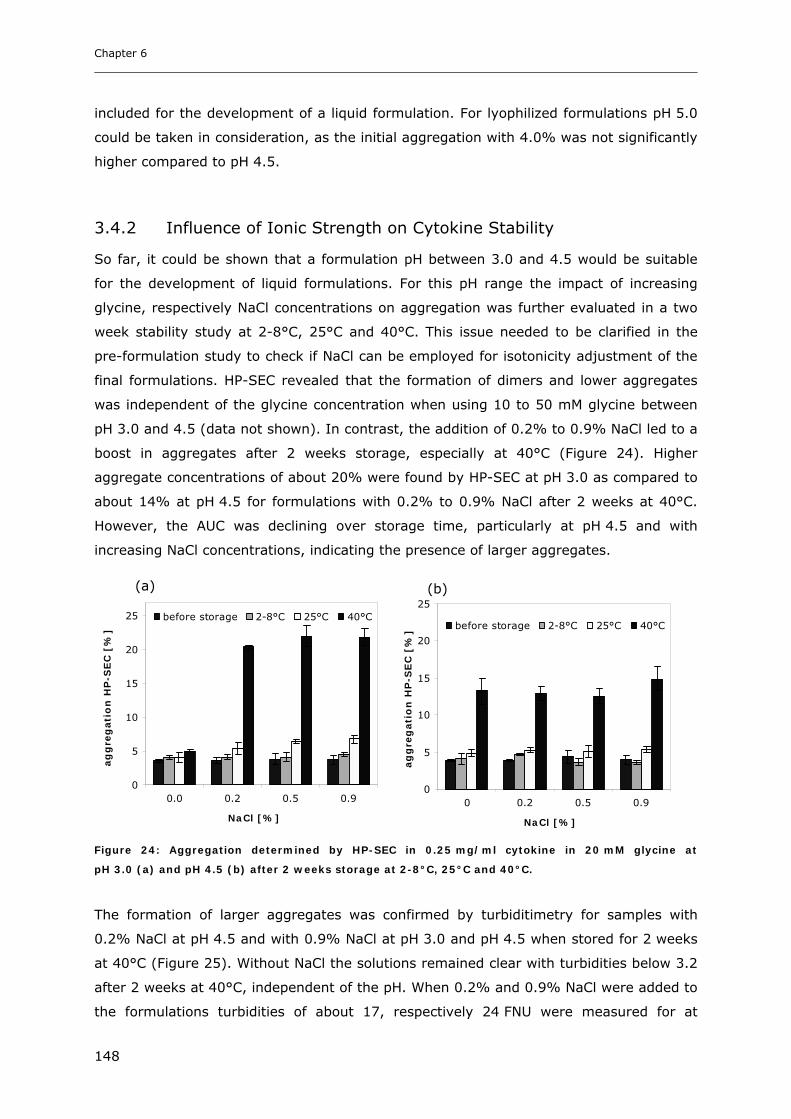
Chapter 6
148
included for the development of a liquid formulation. For lyophilized formulations pH 5.0
could be taken in consideration, as the initial aggregation with 4.0% was not significantly
higher compared to pH 4.5.
3.4.2 Influence of Ionic Strength on Cytokine Stability
So far, it could be shown that a formulation pH between 3.0 and 4.5 would be suitable
for the development of liquid formulations. For this pH range the impact of increasing
glycine, respectively NaCl concentrations on aggregation was further evaluated in a two
week stability study at 2-8°C, 25°C and 40°C. This issue needed to be clarified in the
pre-formulation study to check if NaCl can be employed for isotonicity adjustment of the
final formulations. HP-SEC revealed that the formation of dimers and lower aggregates
was independent of the glycine concentration when using 10 to 50 mM glycine between
pH 3.0 and 4.5 (data not shown). In contrast, the addition of 0.2% to 0.9% NaCl led to a
boost in aggregates after 2 weeks storage, especially at 40°C (Figure 24). Higher
aggregate concentrations of about 20% were found by HP-SEC at pH 3.0 as compared to
about 14% at pH 4.5 for formulations with 0.2% to 0.9% NaCl after 2 weeks at 40°C.
However, the AUC was declining over storage time, particularly at pH 4.5 and with
increasing NaCl concentrations, indicating the presence of larger aggregates.
0
5
10
15
20
25
0.0 0.2 0.5 0.9
NaCl [%]
ag
gre
gati
on
HP
-SE
C [
%]
before storage 2-8°C 25°C 40°C
0
5
10
15
20
25
0 0.2 0.5 0.9
NaCl [%]
ag
gre
gati
on
HP
-SE
C [
%] before storage 2-8°C 25°C 40°C
Figure 24: Aggregation determined by HP-SEC in 0.25 mg/ml cytokine in 20 mM glycine at
pH 3.0 (a) and pH 4.5 (b) after 2 weeks storage at 2-8°C, 25°C and 40°C.
The formation of larger aggregates was confirmed by turbiditimetry for samples with
0.2% NaCl at pH 4.5 and with 0.9% NaCl at pH 3.0 and pH 4.5 when stored for 2 weeks
at 40°C (Figure 25). Without NaCl the solutions remained clear with turbidities below 3.2
after 2 weeks at 40°C, independent of the pH. When 0.2% and 0.9% NaCl were added to
the formulations turbidities of about 17, respectively 24 FNU were measured for at
(a) (b)
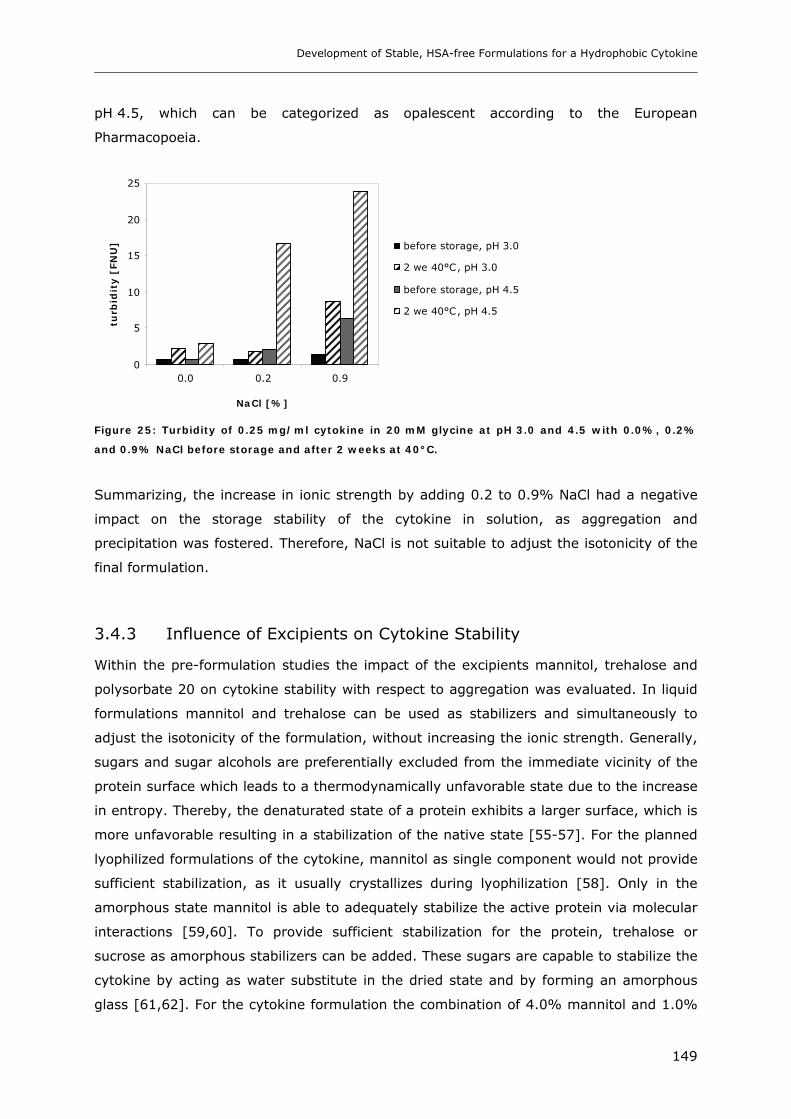
Development of Stable, HSA-free Formulations for a Hydrophobic Cytokine
149
pH 4.5, which can be categorized as opalescent according to the European
Pharmacopoeia.
0
5
10
15
20
25
0.0 0.2 0.9
NaCl [%]
turb
idit
y [
FN
U] before storage, pH 3.0
2 we 40°C, pH 3.0
before storage, pH 4.5
2 we 40°C, pH 4.5
Figure 25: Turbidity of 0.25 mg/ml cytokine in 20 mM glycine at pH 3.0 and 4.5 with 0.0%, 0.2%
and 0.9% NaCl before storage and after 2 weeks at 40°C.
Summarizing, the increase in ionic strength by adding 0.2 to 0.9% NaCl had a negative
impact on the storage stability of the cytokine in solution, as aggregation and
precipitation was fostered. Therefore, NaCl is not suitable to adjust the isotonicity of the
final formulation.
3.4.3 Influence of Excipients on Cytokine Stability
Within the pre-formulation studies the impact of the excipients mannitol, trehalose and
polysorbate 20 on cytokine stability with respect to aggregation was evaluated. In liquid
formulations mannitol and trehalose can be used as stabilizers and simultaneously to
adjust the isotonicity of the formulation, without increasing the ionic strength. Generally,
sugars and sugar alcohols are preferentially excluded from the immediate vicinity of the
protein surface which leads to a thermodynamically unfavorable state due to the increase
in entropy. Thereby, the denaturated state of a protein exhibits a larger surface, which is
more unfavorable resulting in a stabilization of the native state [55-57]. For the planned
lyophilized formulations of the cytokine, mannitol as single component would not provide
sufficient stabilization, as it usually crystallizes during lyophilization [58]. Only in the
amorphous state mannitol is able to adequately stabilize the active protein via molecular
interactions [59,60]. To provide sufficient stabilization for the protein, trehalose or
sucrose as amorphous stabilizers can be added. These sugars are capable to stabilize the
cytokine by acting as water substitute in the dried state and by forming an amorphous
glass [61,62]. For the cytokine formulation the combination of 4.0% mannitol and 1.0%
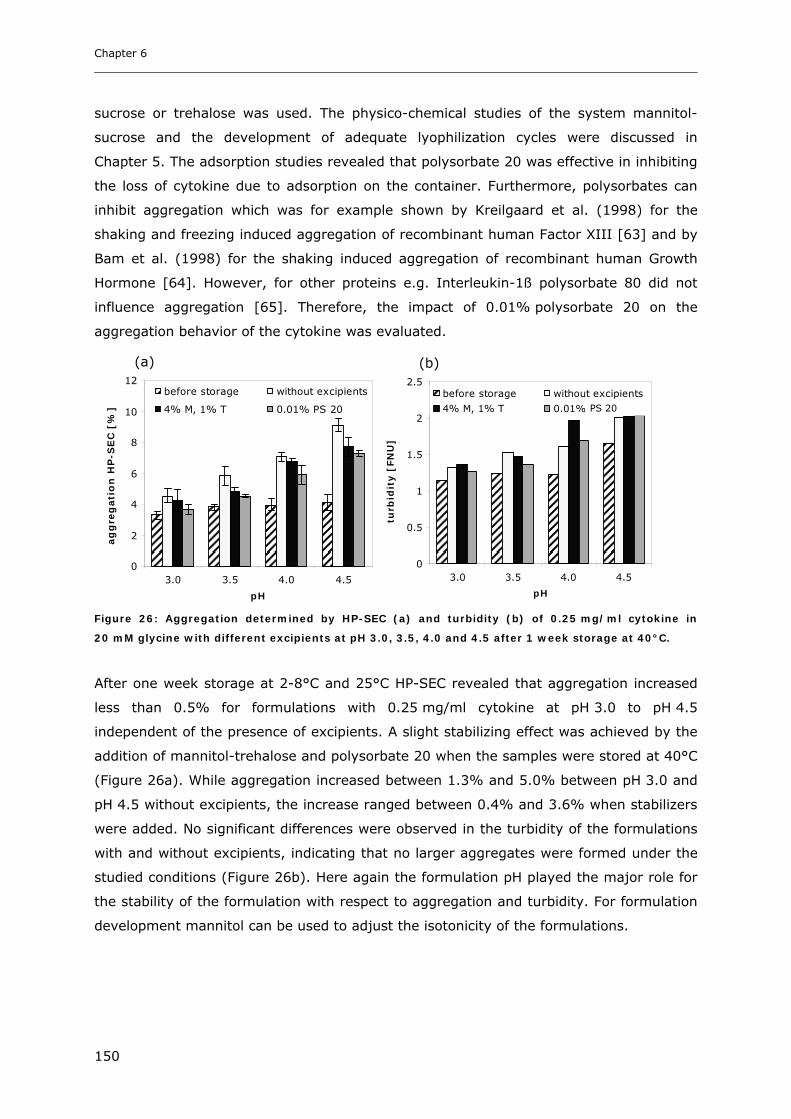
Chapter 6
150
sucrose or trehalose was used. The physico-chemical studies of the system mannitol-
sucrose and the development of adequate lyophilization cycles were discussed in
Chapter 5. The adsorption studies revealed that polysorbate 20 was effective in inhibiting
the loss of cytokine due to adsorption on the container. Furthermore, polysorbates can
inhibit aggregation which was for example shown by Kreilgaard et al. (1998) for the
shaking and freezing induced aggregation of recombinant human Factor XIII [63] and by
Bam et al. (1998) for the shaking induced aggregation of recombinant human Growth
Hormone [64]. However, for other proteins e.g. Interleukin-1ß polysorbate 80 did not
influence aggregation [65]. Therefore, the impact of 0.01% polysorbate 20 on the
aggregation behavior of the cytokine was evaluated.
0
2
4
6
8
10
12
3.0 3.5 4.0 4.5
pH
ag
gre
gati
on
HP
-SE
C [
%]
before storage without excipients
4% M, 1% T 0.01% PS 20
0
0.5
1
1.5
2
2.5
3.0 3.5 4.0 4.5
pH
turb
idit
y [
FN
U]
before storage without excipients
4% M, 1% T 0.01% Tween 20
Figure 26: Aggregation determined by HP-SEC (a) and turbidity (b) of 0.25 mg/ml cytokine in
20 mM glycine with different excipients at pH 3.0, 3.5, 4.0 and 4.5 after 1 week storage at 40°C.
After one week storage at 2-8°C and 25°C HP-SEC revealed that aggregation increased
less than 0.5% for formulations with 0.25 mg/ml cytokine at pH 3.0 to pH 4.5
independent of the presence of excipients. A slight stabilizing effect was achieved by the
addition of mannitol-trehalose and polysorbate 20 when the samples were stored at 40°C
(Figure 26a). While aggregation increased between 1.3% and 5.0% between pH 3.0 and
pH 4.5 without excipients, the increase ranged between 0.4% and 3.6% when stabilizers
were added. No significant differences were observed in the turbidity of the formulations
with and without excipients, indicating that no larger aggregates were formed under the
studied conditions (Figure 26b). Here again the formulation pH played the major role for
the stability of the formulation with respect to aggregation and turbidity. For formulation
development mannitol can be used to adjust the isotonicity of the formulations.
(a) (b)
PS 20
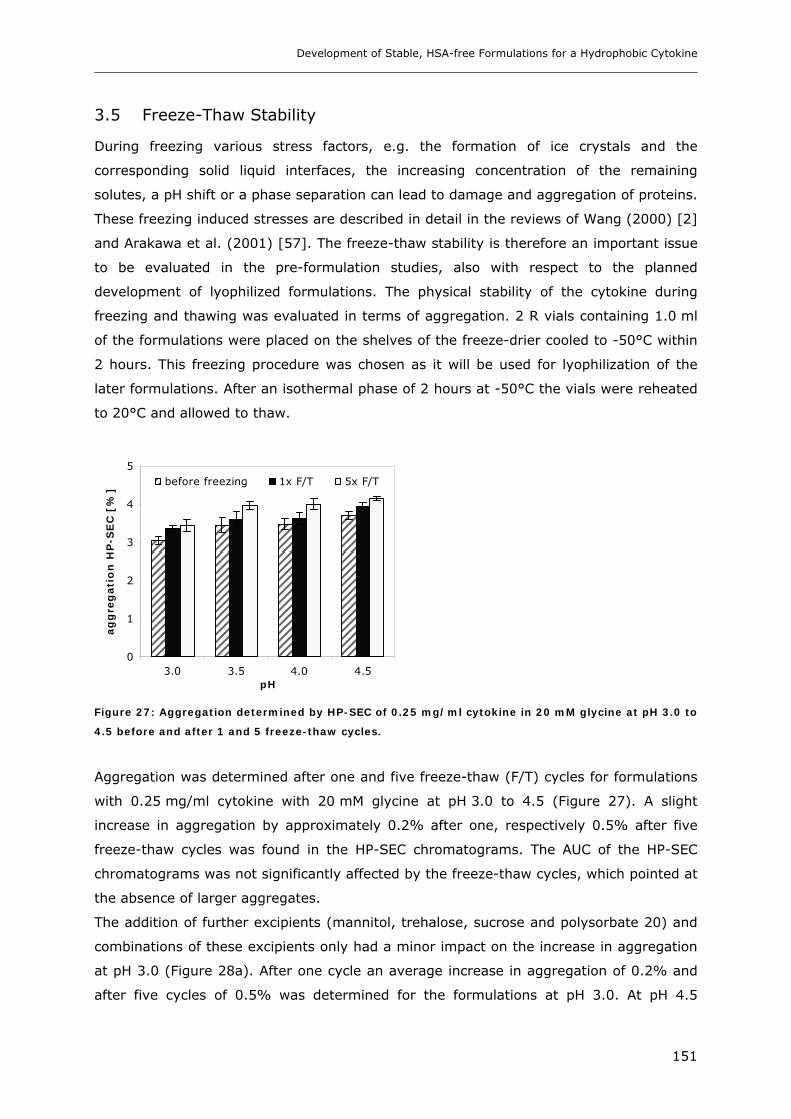
Development of Stable, HSA-free Formulations for a Hydrophobic Cytokine
151
3.5 Freeze-Thaw Stability
During freezing various stress factors, e.g. the formation of ice crystals and the
corresponding solid liquid interfaces, the increasing concentration of the remaining
solutes, a pH shift or a phase separation can lead to damage and aggregation of proteins.
These freezing induced stresses are described in detail in the reviews of Wang (2000) [2]
and Arakawa et al. (2001) [57]. The freeze-thaw stability is therefore an important issue
to be evaluated in the pre-formulation studies, also with respect to the planned
development of lyophilized formulations. The physical stability of the cytokine during
freezing and thawing was evaluated in terms of aggregation. 2 R vials containing 1.0 ml
of the formulations were placed on the shelves of the freeze-drier cooled to -50°C within
2 hours. This freezing procedure was chosen as it will be used for lyophilization of the
later formulations. After an isothermal phase of 2 hours at -50°C the vials were reheated
to 20°C and allowed to thaw.
0
1
2
3
4
5
3.0 3.5 4.0 4.5pH
ag
gre
gati
on
HP
-SE
C [
%]
before freezing 1x F/T 5x F/T
Figure 27: Aggregation determined by HP-SEC of 0.25 mg/ml cytokine in 20 mM glycine at pH 3.0 to
4.5 before and after 1 and 5 freeze-thaw cycles.
Aggregation was determined after one and five freeze-thaw (F/T) cycles for formulations
with 0.25 mg/ml cytokine with 20 mM glycine at pH 3.0 to 4.5 (Figure 27). A slight
increase in aggregation by approximately 0.2% after one, respectively 0.5% after five
freeze-thaw cycles was found in the HP-SEC chromatograms. The AUC of the HP-SEC
chromatograms was not significantly affected by the freeze-thaw cycles, which pointed at
the absence of larger aggregates.
The addition of further excipients (mannitol, trehalose, sucrose and polysorbate 20) and
combinations of these excipients only had a minor impact on the increase in aggregation
at pH 3.0 (Figure 28a). After one cycle an average increase in aggregation of 0.2% and
after five cycles of 0.5% was determined for the formulations at pH 3.0. At pH 4.5

Chapter 6
152
aggregation increased by 0.25% after one freeze-thaw cycle (Figure 28b). After five
cycles the formulations with 4.0% mannitol and 1.0% sucrose respectively 4.0%
mannitol and 1.0% trehalose and 0.01% polysorbate 20 showed an increase in
aggregation by 0.2%, compared to an increase between 0.4% to 0.8% for the other
formulations.
0
1
2
3
4
5
no excipients 4% M , 1% T 5% T 4% M , 1% T0.01% PS20
ag
gre
gati
on
HP
-SE
C [
%]
before freezing 1x F/T 5x F/T
0
1
2
3
4
5
noexcipients
4% M , 1% T 4% M , 1% S 5% T 5% S 4% M , 1% T0.01% PS20
ag
gre
gati
on
HP
-SE
C [
%]
before freezing 1x F/T 5x F/T
Figure 28: Aggregation determined by HP-SEC of 0.25 mg/ml cytokine in 20 mM glycine at pH 3.0
(a) and pH 4.5 (b) with combinations of mannitol (M), sucrose (S), trehalose (T) and polysorbate 20
(PS20) before and after 1 and 5 freeze-thaw cycles.
Thus, the cytokine showed an overall good stability against stresses induced by freezing
and thawing, even without further excipients beside the buffering glycine. Due to this
good stability the freezing step during lyophilization is not expected to cause major
physico-chemical alternations of the cytokine.
(a) (b)
Development of Stable, HSA-free Formulations for a Hydrophobic Cytokine
153
3.6 Long-term Stability of Liquid and Lyophilized Formulations
The goal of the study was the development of stable, HSA-free formulations of the
cytokine, as an alternative to the existing HSA-containing lyophilized formulation. Based
on the results of the preformulation study, which pointed at the structural characteristics
of the cytokine (compare 3.2), protein adsorption (compare 3.3) and the effect of pH,
ionic strength and the addition of excipients (compare 3.4) on cytokine stability, the
most promising conditions were selected. It was shown that the physical stability of the
cytokine was improved at low pH between 3.0 and 3.5. A glycine concentration of 20 mM
turned out to be beneficial regarding aggregation and loss of protein due to adsorption.
FTIR revealed a higher fraction of ß-sheet structure at pH 3.0 and 3.5, but also an
increased stability against structural changes with increasing temperature. The changed
secondary structure at pH 3.0 and 3.5 could be regarded as critical, as the activity of the
cytokine might be changed. However, it was not an irreversible change as the amount of
ß-sheet was reduced in favor of α-helical structure when the pH was increased. In
literature an increased thermal stability for the cytokine determined by circular dichroism
and a protection of its activity at pH 2.9 was described by Boublik et al. (1990) [66]. To
clarify the question how activity and secondary structure are correlated, in vitro assays
for antiviral activity, e.g. antiviral yield reduction assays or cytopathic effect bioassays
[67] would be necessary to quantify the biological activity of the cytokine. The first short-
time stability studies indicated that storage at 2-8°C and 25°C may allow formulating the
cytokine at pH 4.0 and possibly at pH 4.5. To minimize protein adsorption the addition of
0.005% to 0.02% polysorbate 20 is reasonable. For the lyophilized formulations glass
type I+ vials could be used. For the liquid formulation the utilization of pre-filled syringes
was planned, which were not available in glass type I+ quality. In this case the addition
of polysorbate 20 could minimize protein adsorption. The addition of salt or the use of
higher buffer concentrations needs to be avoided, as aggregation and precipitation were
favored at higher ionic strength. In the further studies, the isotonicity of the solutions
was therefore adjusted with mannitol in the liquid or with combinations of mannitol with
sucrose in the lyophilized formulation. The 6 months stability study of the liquid
formulations was performed in glass prefilled syringes BD Hypak SCF®. All liquid
formulations contained 0.25 mg/ml cytokine, 20 mM glycine and 4.8% mannitol, whereas
pH and polysorbate 20 concentrations were varied (Table 4).
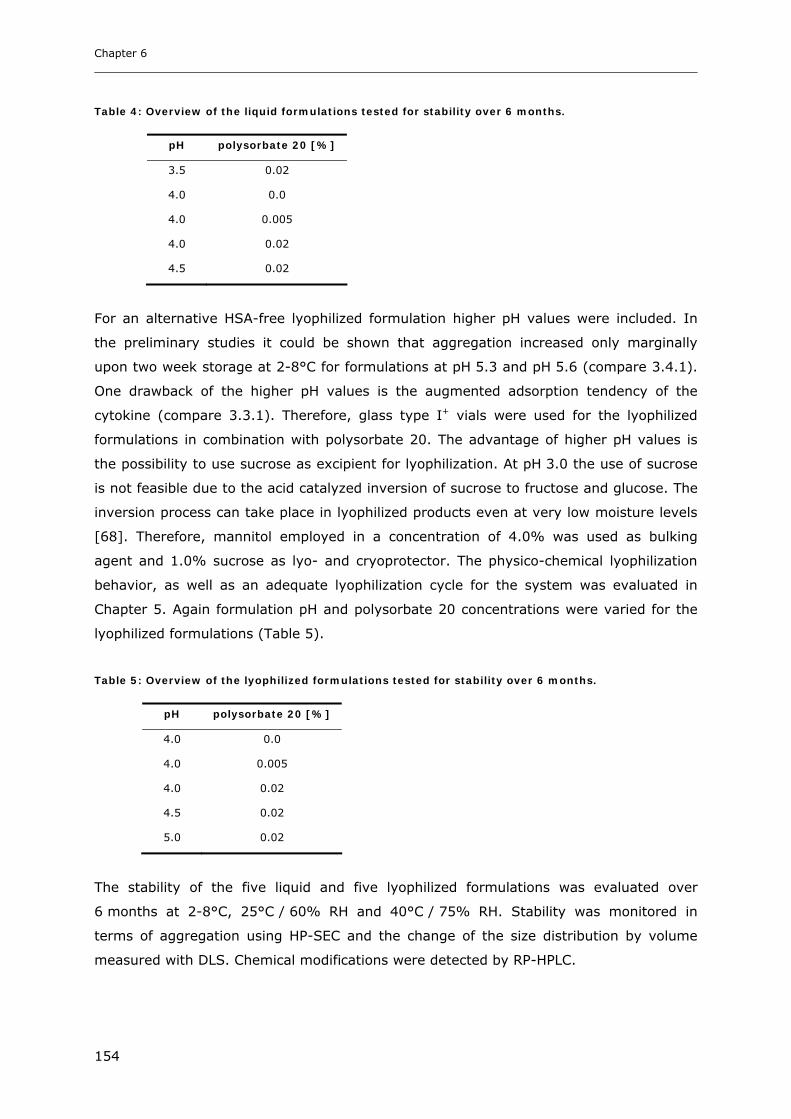
Chapter 6
154
Table 4: Overview of the liquid formulations tested for stability over 6 months.
pH polysorbate 20 [%]
3.5 0.02
4.0 0.0
4.0 0.005
4.0 0.02
4.5 0.02
For an alternative HSA-free lyophilized formulation higher pH values were included. In
the preliminary studies it could be shown that aggregation increased only marginally
upon two week storage at 2-8°C for formulations at pH 5.3 and pH 5.6 (compare 3.4.1).
One drawback of the higher pH values is the augmented adsorption tendency of the
cytokine (compare 3.3.1). Therefore, glass type I+ vials were used for the lyophilized
formulations in combination with polysorbate 20. The advantage of higher pH values is
the possibility to use sucrose as excipient for lyophilization. At pH 3.0 the use of sucrose
is not feasible due to the acid catalyzed inversion of sucrose to fructose and glucose. The
inversion process can take place in lyophilized products even at very low moisture levels
[68]. Therefore, mannitol employed in a concentration of 4.0% was used as bulking
agent and 1.0% sucrose as lyo- and cryoprotector. The physico-chemical lyophilization
behavior, as well as an adequate lyophilization cycle for the system was evaluated in
Chapter 5. Again formulation pH and polysorbate 20 concentrations were varied for the
lyophilized formulations (Table 5).
Table 5: Overview of the lyophilized formulations tested for stability over 6 months.
pH polysorbate 20 [%]
4.0 0.0
4.0 0.005
4.0 0.02
4.5 0.02
5.0 0.02
The stability of the five liquid and five lyophilized formulations was evaluated over
6 months at 2-8°C, 25°C / 60% RH and 40°C / 75% RH. Stability was monitored in
terms of aggregation using HP-SEC and the change of the size distribution by volume
measured with DLS. Chemical modifications were detected by RP-HPLC.

Development of Stable, HSA-free Formulations for a Hydrophobic Cytokine
155
3.6.1 Long-term Stability of Liquid Cytokine Formulations
The formation of dimers and lower aggregates was determined by HP-SEC after 1, 3 and
6 months storage period at 2-8°C, 25°C and 40°C (Figure 29). After 6 months storage
the level of dimers and lower aggregates was increased by 0.6% at 2-8°C and by 1.4%
at 25°C for formulations at pH 3.5. The most significant rise by 1.6% at
2-8°C and by 5.2% at 25°C was determined at the highest tested pH of 4.5. Aggregation
stepped up drastically, when the liquid cytokine formulations were stored at 40°C. At
pH 4.0 more than 40% and at pH 4.5 more than 50% dimers lower aggregates were
formed, whereas only 11.5% dimers and trimers were detected at pH 3.5.
0
2
4
6
8
10
pH 3.50.02% PS20
pH 40% PS20
pH 40.005% PS20
pH 40.02% PS20
pH 4.50.02% PS20
aggre
gati
on
HP
-SEC
[%
]
before storage 1 mo 3 mo 6 mo
0
2
4
6
8
10
12
pH 3.50.02% PS20
pH 40% PS20
pH 40.005% PS20
pH 40.02% PS20
pH 4.50.02% PS20
aggre
gati
on
HP
-SEC
[%
]
before storage 1 mo 3 mo 6 mo
0
10
20
30
40
50
60
pH 3.50.02% PS20
pH 40% PS20
pH 40.005% PS20
pH 40.02% PS20
pH 4.50.02% PS20
aggre
gati
on
HP
-SEC
[%
]
before storage 1 mo 3 mo 6 mo
Figure 29: Aggregation determined by HP-SEC of the cytokine in the liquid formulations over
6 months during storage at 2-8°C (a), 25°C (b) and 40°C (c).
The pH-dependency of the formulation stability was in agreement with the results of the
FTIR-studies (compare 3.2.1). For the cytokine formulated at pH 3.5 a denaturation
temperature Tm of 74°C was determined, while pH 4.2 resulted in a Tm of 57°C. FTIR
had shown that significant structural changes at pH 4.2 already started at a temperature
(a) (b)
(c)
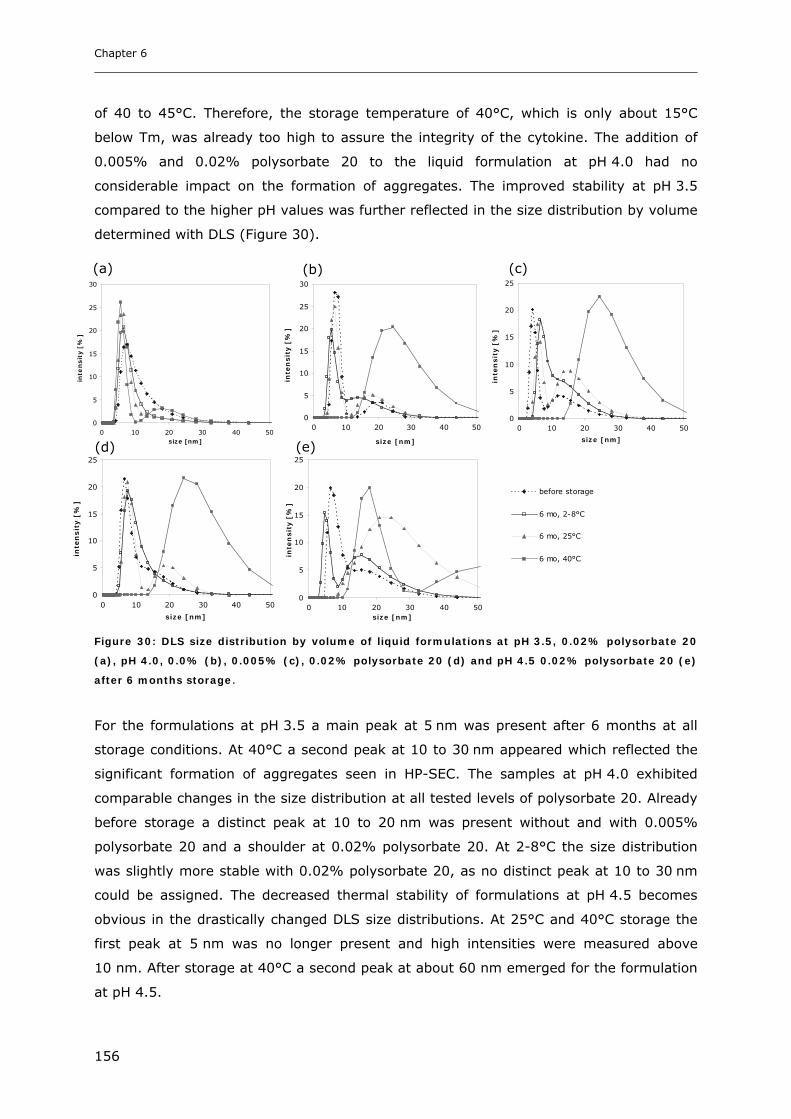
Chapter 6
156
of 40 to 45°C. Therefore, the storage temperature of 40°C, which is only about 15°C
below Tm, was already too high to assure the integrity of the cytokine. The addition of
0.005% and 0.02% polysorbate 20 to the liquid formulation at pH 4.0 had no
considerable impact on the formation of aggregates. The improved stability at pH 3.5
compared to the higher pH values was further reflected in the size distribution by volume
determined with DLS (Figure 30).
0
5
10
15
20
25
30
0 10 20 30 40 50size [nm]
inte
nsit
y [
%]
0
5
10
15
20
25
30
0 10 20 30 40 50
size [nm]
inte
nsit
y [
%]
0
5
10
15
20
25
0 10 20 30 40 50
size [nm]
inte
nsit
y [
%]
0
5
10
15
20
25
0 10 20 30 40 50
size [nm]
inte
nsit
y [
%]
0
5
10
15
20
25
0 10 20 30 40 50size [nm]
inte
nsit
y [
%]
before storage
6 mo, 2-8°C
6 mo, 25°C
6 mo, 40°C
Figure 30: DLS size distribution by volume of liquid formulations at pH 3.5, 0.02% polysorbate 20
(a), pH 4.0, 0.0% (b), 0.005% (c), 0.02% polysorbate 20 (d) and pH 4.5 0.02% polysorbate 20 (e)
after 6 months storage.
For the formulations at pH 3.5 a main peak at 5 nm was present after 6 months at all
storage conditions. At 40°C a second peak at 10 to 30 nm appeared which reflected the
significant formation of aggregates seen in HP-SEC. The samples at pH 4.0 exhibited
comparable changes in the size distribution at all tested levels of polysorbate 20. Already
before storage a distinct peak at 10 to 20 nm was present without and with 0.005%
polysorbate 20 and a shoulder at 0.02% polysorbate 20. At 2-8°C the size distribution
was slightly more stable with 0.02% polysorbate 20, as no distinct peak at 10 to 30 nm
could be assigned. The decreased thermal stability of formulations at pH 4.5 becomes
obvious in the drastically changed DLS size distributions. At 25°C and 40°C storage the
first peak at 5 nm was no longer present and high intensities were measured above
10 nm. After storage at 40°C a second peak at about 60 nm emerged for the formulation
at pH 4.5.
(a) (b) (c)
(e) (d)
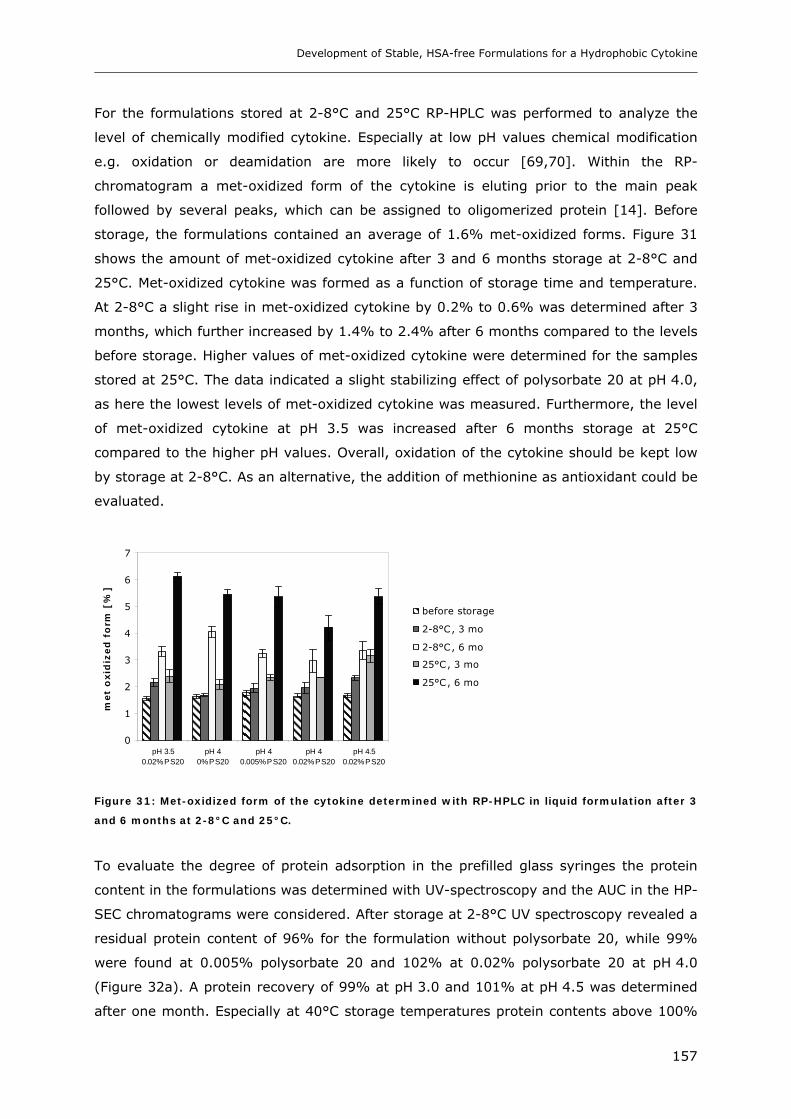
Development of Stable, HSA-free Formulations for a Hydrophobic Cytokine
157
For the formulations stored at 2-8°C and 25°C RP-HPLC was performed to analyze the
level of chemically modified cytokine. Especially at low pH values chemical modification
e.g. oxidation or deamidation are more likely to occur [69,70]. Within the RP-
chromatogram a met-oxidized form of the cytokine is eluting prior to the main peak
followed by several peaks, which can be assigned to oligomerized protein [14]. Before
storage, the formulations contained an average of 1.6% met-oxidized forms. Figure 31
shows the amount of met-oxidized cytokine after 3 and 6 months storage at 2-8°C and
25°C. Met-oxidized cytokine was formed as a function of storage time and temperature.
At 2-8°C a slight rise in met-oxidized cytokine by 0.2% to 0.6% was determined after 3
months, which further increased by 1.4% to 2.4% after 6 months compared to the levels
before storage. Higher values of met-oxidized cytokine were determined for the samples
stored at 25°C. The data indicated a slight stabilizing effect of polysorbate 20 at pH 4.0,
as here the lowest levels of met-oxidized cytokine was measured. Furthermore, the level
of met-oxidized cytokine at pH 3.5 was increased after 6 months storage at 25°C
compared to the higher pH values. Overall, oxidation of the cytokine should be kept low
by storage at 2-8°C. As an alternative, the addition of methionine as antioxidant could be
evaluated.
0
1
2
3
4
5
6
7
pH 3.50.02% PS20
pH 40% PS20
pH 40.005% PS20
pH 40.02% PS20
pH 4.50.02% PS20
met
oxid
ized
fo
rm [
%]
before storage
2-8°C, 3 mo
2-8°C, 6 mo
25°C, 3 mo
25°C, 6 mo
Figure 31: Met-oxidized form of the cytokine determined with RP-HPLC in liquid formulation after 3
and 6 months at 2-8°C and 25°C.
To evaluate the degree of protein adsorption in the prefilled glass syringes the protein
content in the formulations was determined with UV-spectroscopy and the AUC in the HP-
SEC chromatograms were considered. After storage at 2-8°C UV spectroscopy revealed a
residual protein content of 96% for the formulation without polysorbate 20, while 99%
were found at 0.005% polysorbate 20 and 102% at 0.02% polysorbate 20 at pH 4.0
(Figure 32a). A protein recovery of 99% at pH 3.0 and 101% at pH 4.5 was determined
after one month. Especially at 40°C storage temperatures protein contents above 100%

Chapter 6
158
were determined. This could be explained by light scattering effects of aggregated
proteins, also evident by an increased UV-absorption at 350 nm and 550 nm. This trend
was confirmed by the AUCs of the HP-SEC chromatograms (Figure 32b).
90
95
100
105
110
pH 3.50.02% PS20
pH 40% PS20
pH 40.005% PS20
pH 40.02% PS20
pH 4.50.02% PS20
pro
tein
co
nte
nt
[%]
2-8°C 25°C 40°C
1.5
1.55
1.6
1.65
1.7
1.75
pH 3.50.02% PS20
pH 40% PS20
pH 40.005% PS20
pH 40.02% PS20
pH 4.50.02% PS20
AU
C [
mA
U]
before storage 2-8°C 25°C 40°C
Figure 32: Protein content determined by UV-spectroscopy (a) and AUC in the HP-SEC
chromatograms (b) of the liquid formulations after 1 month storage at 2-8°, 25°C and 40°C.
Summing up, the development of a liquid HSA-free formulation for the cytokine was
feasible. Most suitable with respect to aggregation and formation of met-oxidized
cytokine were the formulations at pH 3.5 and pH 4.0, stored at 2-8°C. Storage at 40°C
facilitated the aggregation process, which was confirmed by HP-SEC and DLS. While
aggregation was only slightly increased at 25°C, the formation of met-oxidized cytokine
augmented significantly. To avoid adsorption of the cytokine to the glass syringes the
addition of at least 0.005% polysorbate 20 was necessary. Furthermore, polysorbate 20
had a slight stabilizing effect with respect to the DLS size distribution at 2-8°C and the
formation of met-oxidized cytokine.
3.6.2 Stability of Lyophilized Formulation
To stabilize the cytokine in lyophilized form pH values of 4.0 to 5.0 were selected.
Mannitol was used as crystalline bulking agent and sucrose as amorphous stabilizer.
Thereby, a lyophilization cycle optimized to avoid the formation of mannitol hydrate and
to ensure mannitol crystallization as far as possible was used (compare Chapter 5). After
lyophilization mainly δ-mannitol (peak at 9.7° 2-Θ) with a smaller fraction of β-mannitol
(peaks at 14.6 and 23.5° 2-Θ) was present in all formulations. Figure 33 shows
exemplarily the XRD patterns of the formulations at pH 4.0 without and with 0.02%
polysorbate 20. In lyophilized formulation without polysorbate 20 a larger fraction of β-
(a) (b)

Development of Stable, HSA-free Formulations for a Hydrophobic Cytokine
159
mannitol is present compared to the formulations with 0.02% polysorbate 20.
Polysorbate is known to influence the morphology of mannitol after lyophilization [71].
5 10 15 20 25 30 35
° 2-Theta
5 10 15 20 25 30 35
° 2-Theta
Figure 33: XRD diffraction pattern of lyophilized formulation at pH 4.0 without (a) and with 0.02%
polysorbate 20 (b) after lyophilization and 6 months storage at 2-8°C, 25°C / 60% RH and
40°C / 75% RH.
Changes in the physico-chemical properties of the lyophilized products were evaluated as
they may influence protein stability. However, for formulations with mannitol and HSA it
could be shown in Chapter 3 that a change in the mannitol modifications and crystallinity
did not affect the integrity and stability of HSA. Upon storage, slight changes could be
detected in the XRD-diffraction patterns of the polysorbate 20 free samples (Figure 33a).
After 6 months storage at 25°C / 60% RH and 40°C / 75% RH peaks of α-mannitol
appeared at 13.6° 2-Θ and 17.2° 2-Θ. It was further evident that the intensity of the
δ-mannitol peak at 9.7° 2-Θ decreased during 6 months at 40°C / 75% RH. This could be
ascribed to the fact that the δ-modification is the least stable modification of mannitol
[72]. Samples with 0.02% polysorbate 20 were more stable regarding mannitol
modifications with only a slight decrease in ß-mannitol (Figure 33b).
After lyophilization all formulations exhibited low residual moisture levels between 0.5%
and 1.0% (Table 6). This low water contents could be attributed to the high content of
crystalline mannitol in the formulations. Over 6 months only a slight increase in residual
moisture up to maximally 1.2% at 2-8°C and 25°C / 60% RH and maximally 1.4% at
40°C / 75% RH was measured. Water can act as reactant in chemical reactions within
the lyophilized sample and as plasticizer with the consequence that the molecular
mobility of the system is altered [73]. Generally, residual moisture levels of about 1%
are suggested for lyophilized protein formulations [74]. However, Chang et al. (2005)
showed that water in lyophilized IgG1-sucrose increased the molecular mobility in the
glassy matrix, while the lowest aggregation rate was measured at intermediate water
(a) (b)
40°C
25°C
after
lyo
2-8°C
40°C
25°C
2-8°C
after
lyo
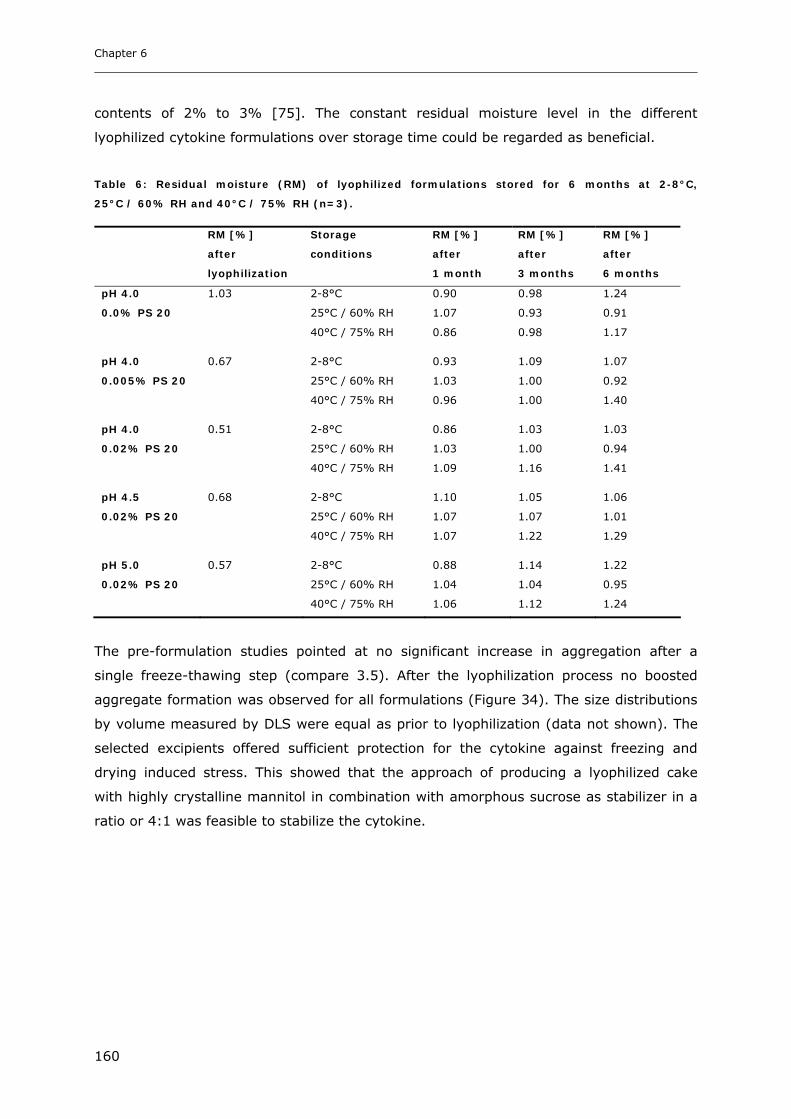
Chapter 6
160
contents of 2% to 3% [75]. The constant residual moisture level in the different
lyophilized cytokine formulations over storage time could be regarded as beneficial.
Table 6: Residual moisture (RM) of lyophilized formulations stored for 6 months at 2-8°C,
25°C / 60% RH and 40°C / 75% RH (n=3).
RM [%]
after
lyophilization
Storage
conditions
RM [%]
after
1 month
RM [%]
after
3 months
RM [%]
after
6 months
pH 4.0
0.0% PS 20
1.03 2-8°C
25°C / 60% RH
40°C / 75% RH
0.90
1.07
0.86
0.98
0.93
0.98
1.24
0.91
1.17
pH 4.0
0.005% PS 20
0.67 2-8°C
25°C / 60% RH
40°C / 75% RH
0.93
1.03
0.96
1.09
1.00
1.00
1.07
0.92
1.40
pH 4.0
0.02% PS 20
0.51 2-8°C
25°C / 60% RH
40°C / 75% RH
0.86
1.03
1.09
1.03
1.00
1.16
1.03
0.94
1.41
pH 4.5
0.02% PS 20
0.68 2-8°C
25°C / 60% RH
40°C / 75% RH
1.10
1.07
1.07
1.05
1.07
1.22
1.06
1.01
1.29
pH 5.0
0.02% PS 20
0.57 2-8°C
25°C / 60% RH
40°C / 75% RH
0.88
1.04
1.06
1.14
1.04
1.12
1.22
0.95
1.24
The pre-formulation studies pointed at no significant increase in aggregation after a
single freeze-thawing step (compare 3.5). After the lyophilization process no boosted
aggregate formation was observed for all formulations (Figure 34). The size distributions
by volume measured by DLS were equal as prior to lyophilization (data not shown). The
selected excipients offered sufficient protection for the cytokine against freezing and
drying induced stress. This showed that the approach of producing a lyophilized cake
with highly crystalline mannitol in combination with amorphous sucrose as stabilizer in a
ratio or 4:1 was feasible to stabilize the cytokine.

Development of Stable, HSA-free Formulations for a Hydrophobic Cytokine
161
3.0
3.5
4.0
4.5
5.0
5.5
0% PS20pH 4
0.005% PS20pH 4
0.02% PS20pH 4
0.02% PS20pH 4.5
0.02% PS20pH 5
ag
gre
gati
on
HP
-SE
C [
%] before lyophilization after lyophilization
Figure 34: Aggregation determined by HP-SEC of the formulations before and after lyophilization.
The stability of the lyophilized cytokine formulations was further evaluated over 6 months
at 2-8°C, 25°C / 60% RH and 40°C / 75% RH, with respect to the formation of
aggregates and a met-oxidized form of the cytokine. After 6 months at 2-8°C the level of
dimers and lower aggregates increased between 0.3% and 0.7% for all studied
formulations, independent of formulation pH and the addition of polysorbate 20 (Figure
35a). Storage at 25°C / 60% RH and 40°C / 75% RH resulted in higher contents of
dimers and lower aggregates, especially at the presence of 0.02% polysorbate 20 (Figure
35 b,c). XRD revealed that the formulations at pH 4.0 without polysorbate 20 were
physico-chemically less stable and underwent morphological changes during storage
(Figure 33a). Regarding aggregation on the other hand the formulations at pH 4.0 with
0.0% and 0.005% polysorbate provided an improved stability compared to the
formulations with 0.02% polysorbate 20 after 6 months storage at 25°C / 60% RH and
40°C / 75% RH. The improved stabilizing conditions without or with lower polysorbate 20
concentrations outbalanced a potential detrimental effect of the change in modifications
during storage (compare Chapter 4). During storage at 40°C / 75% RH the highest
aggregation values were measured at pH 4.0, when comparing the formulations with
0.02% polysorbate 20 at the different pH values. For sucrose containing formulations a
pH of 4.0 is critical due to the risk of the inversion of sucrose at low pH [68]. This was
confirmed by the slightly brownish color of the reconstituted formulations stored at 40°C,
which was distinct at pH 4.0. The discoloration induced by the Maillard reaction, occurs
when sucrose undergoes inversion to fructose and glucose. The use of trehalose instead
of sucrose would be an alternative approach to improve the stability of the lyophilized
formulation, by avoiding the inversion of sucrose. The AUC of the HP-SEC remained at a
constant level for the samples stored at 2-8°C and 25°C / 60% RH indicating that no
significant loss of protein due to adsorption or precipitation occurred, which could be
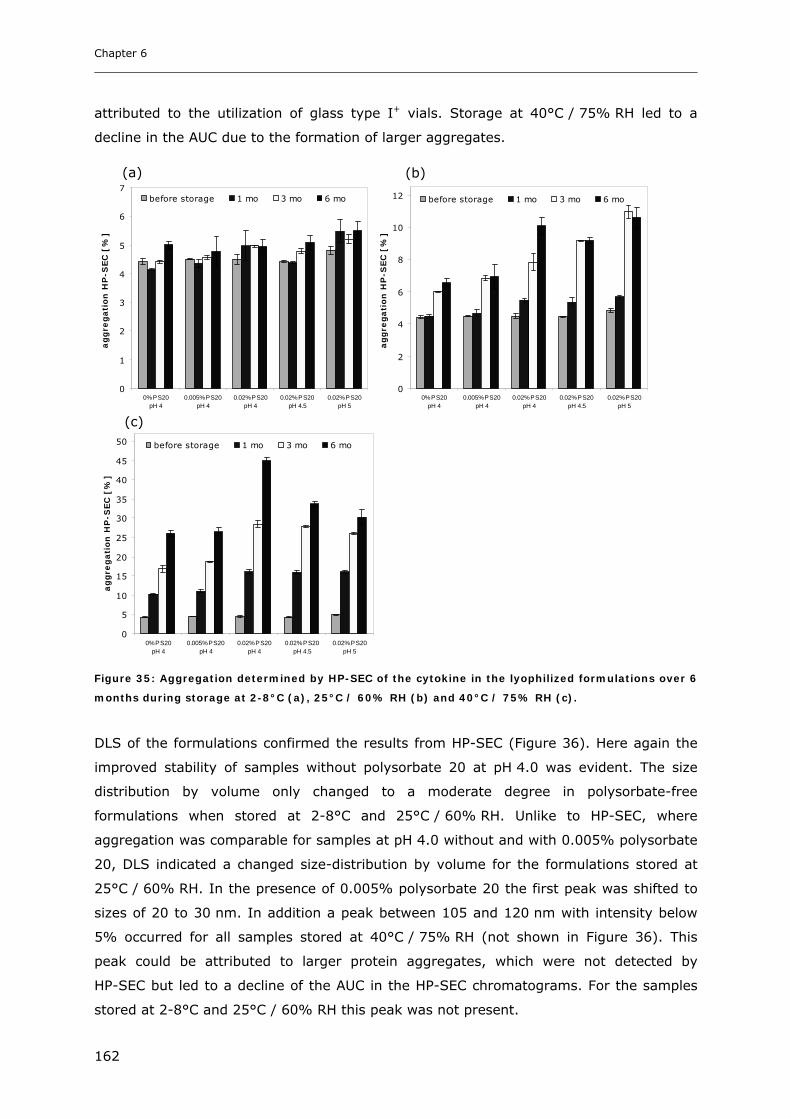
Chapter 6
162
attributed to the utilization of glass type I+ vials. Storage at 40°C / 75% RH led to a
decline in the AUC due to the formation of larger aggregates.
0
1
2
3
4
5
6
7
0% PS20pH 4
0.005% PS20pH 4
0.02% PS20pH 4
0.02% PS20pH 4.5
0.02% PS20pH 5
aggre
gati
on
HP
-SEC
[%
]
before storage 1 mo 3 mo 6 mo
0
2
4
6
8
10
12
0% PS20pH 4
0.005% PS20pH 4
0.02% PS20pH 4
0.02% PS20pH 4.5
0.02% PS20pH 5
aggre
gati
on
HP
-SEC
[%
]
before storage 1 mo 3 mo 6 mo
0
5
10
15
20
25
30
35
40
45
50
0% PS20pH 4
0.005% PS20pH 4
0.02% PS20pH 4
0.02% PS20pH 4.5
0.02% PS20pH 5
aggre
gati
on
HP
-SEC
[%
]
before storage 1 mo 3 mo 6 mo
Figure 35: Aggregation determined by HP-SEC of the cytokine in the lyophilized formulations over 6
months during storage at 2-8°C (a), 25°C / 60% RH (b) and 40°C / 75% RH (c).
DLS of the formulations confirmed the results from HP-SEC (Figure 36). Here again the
improved stability of samples without polysorbate 20 at pH 4.0 was evident. The size
distribution by volume only changed to a moderate degree in polysorbate-free
formulations when stored at 2-8°C and 25°C / 60% RH. Unlike to HP-SEC, where
aggregation was comparable for samples at pH 4.0 without and with 0.005% polysorbate
20, DLS indicated a changed size-distribution by volume for the formulations stored at
25°C / 60% RH. In the presence of 0.005% polysorbate 20 the first peak was shifted to
sizes of 20 to 30 nm. In addition a peak between 105 and 120 nm with intensity below
5% occurred for all samples stored at 40°C / 75% RH (not shown in Figure 36). This
peak could be attributed to larger protein aggregates, which were not detected by
HP-SEC but led to a decline of the AUC in the HP-SEC chromatograms. For the samples
stored at 2-8°C and 25°C / 60% RH this peak was not present.
(b)
(c)
(a)
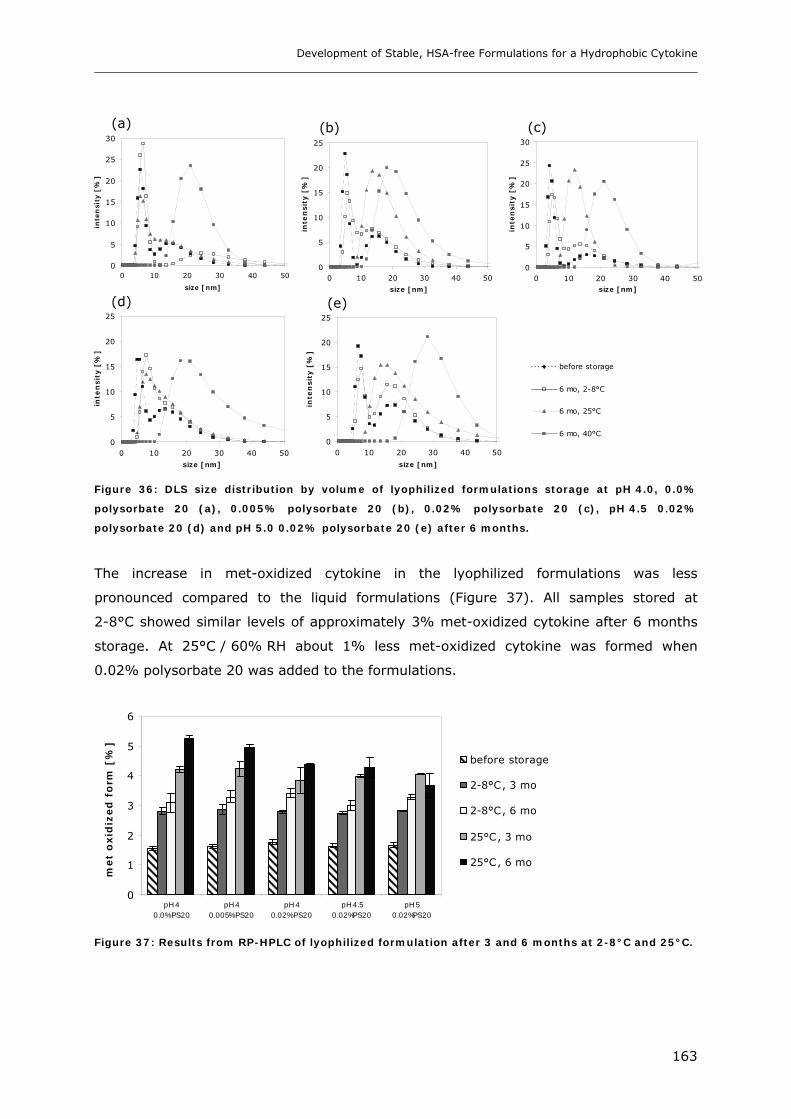
Development of Stable, HSA-free Formulations for a Hydrophobic Cytokine
163
0
5
10
15
20
25
30
0 10 20 30 40 50
size [nm]
inte
nsi
ty [
%]
0
5
10
15
20
25
0 10 20 30 40 50
size [nm]
inte
nsi
ty [
%]
0
5
10
15
20
25
30
0 10 20 30 40 50size [nm]
inte
nsi
ty [
%]
0
5
10
15
20
25
0 10 20 30 40 50
size [nm]
inte
nsi
ty [
%]
0
5
10
15
20
25
0 10 20 30 40 50
size [nm]
inte
nsi
ty [
%]
before storage
6 mo, 2-8°C
6 mo, 25°C
6 mo, 40°C
Figure 36: DLS size distribution by volume of lyophilized formulations storage at pH 4.0, 0.0%
polysorbate 20 (a), 0.005% polysorbate 20 (b), 0.02% polysorbate 20 (c), pH 4.5 0.02%
polysorbate 20 (d) and pH 5.0 0.02% polysorbate 20 (e) after 6 months.
The increase in met-oxidized cytokine in the lyophilized formulations was less
pronounced compared to the liquid formulations (Figure 37). All samples stored at
2-8°C showed similar levels of approximately 3% met-oxidized cytokine after 6 months
storage. At 25°C / 60% RH about 1% less met-oxidized cytokine was formed when
0.02% polysorbate 20 was added to the formulations.
0
1
2
3
4
5
6
pH 40.0% PS20
pH 40.005% PS20
pH 40.02% PS20
pH 4.50.02%PS20
pH 50.02%PS20
met
oxid
ized
fo
rm [
%]
before storage
2-8°C, 3 mo
2-8°C, 6 mo
25°C, 3 mo
25°C, 6 mo
Figure 37: Results from RP-HPLC of lyophilized formulation after 3 and 6 months at 2-8°C and 25°C.
(b)
(d) (e)
(a) (c)
Chapter 6
164
Thus, the used lyophilization cycle resulted in elegant cakes consisting of crystalline
mannitol and amorphous sucrose. Low aggregation levels could be preserved upon
storage at 2-8°C. The addition of 0.02% polysorbate 20 fostered aggregate formation at
25°C / 60% RH and 40°C / 75% RH, but decreased the formation of met-oxidized
cytokine at 25°C / 60% RH. However, the mechanism by which polysorbate 20 increased
aggregate formation in the lyophilized product during storage at 25°C / 60% RH and
40°C / 75% RH is unclear. The increased formation of aggregates induced by polysorbate
20 was not observed in the liquid formulation. The optimum stability for the lyophilized
cytokine formulation could be achieved at pH 4.0 without polysorbate 20 and storage at
2-8°C.
3.6.3 Comparison of Liquid and Lyophilized Formulation
In the stability study of the liquid formulation, pH 3.5 and 4.0 turned out to be most
stable regarding aggregation. The formation of the met-oxidized cytokine was
independent of the pH but increased with storage time and temperature. Lyophilized
formulations were stable form pH 4.0 to 5.0, when stored at 2-8°C. Again the formation
of met-oxidized cytokine was independent of the formulation pH. In order to avoid
protein adsorption the addition of polysorbate 20 to the liquid formulation was necessary,
as the pre-filled syringes were manufactured of glass type I. Furthermore, in liquid
formulation, polysorbate 20 was beneficial with respect to DLS-size distribution by
volume and the formation of met-oxidized cytokine. The reduced formation of met-
oxidized cytokine in presence of polysorbate 20 was as well seen for the lyophilized
formulations. However, here polysorbate 20 fostered the formation of aggregates. As
glass type I+ vials were employed for the lyophilized formulation, polysorbate 20 could
be omitted with respect to adsorption.
Development of Stable, HSA-free Formulations for a Hydrophobic Cytokine
165
4. Conclusions
The goal of the studies was to develop stable, HSA-free formulations for the cytokine as
an alternative to the HSA-containing formulation. For formulation development the focus
was set on the pH range between 3.0 and 5.5 in which an initial solubility of the cytokine
at a constant aggregation level of about 3% to 4% was given. Above pH 5.5 precipitation
of the cytokine indicated by an increased turbidity impeded a feasible formulation
development. Initial characterization of the cytokine at different pH and ionic strength
conditions revealed an improved stability with respect to aggregation and turbidity at a
pH below 4.5 and low ionic strength. Furthermore, an improved thermal stability for
lower pH values could be demonstrated by FTIR. At pH 3.0 and pH 3.5 a steady change
of the FTIR-spectra with an onset above 25°C was observed. First at pH 3.5 a Tm of
74°C could be determined. With increasing pH the Tm values were lowered to 57°C at
pH 4.2 and 49°C at pH 5.5. The improved thermal stability at lower pH values was also
confirmed by DLS. A concentration of 20 mM glycine was selected as appropriate because
the tendency of the cytokine to adsorb on glass was reduced compared to lower glycine
concentration. Protein adsorption was found to be minimal at pH 3.0 using 20 mM glycine
as buffer. Possible approaches to further reduce the loss of protein by adsorption were
the use of glass type I+ and the addition of polysorbate 20 to the formulations, where
more than 97% of the protein content could be recovered after 24 hours at pH 3.0 and
4.5. First short time stability studies had shown that an increase in ionic strength by
adding NaCl led to a tremendous increase in aggregates and turbidity already after one
week especially at 40°C. The addition of mannitol and trehalose on the other hand
slightly improved the stability, with respect to aggregation.
For the storage stability study five liquid and five lyophilized formulations were selected,
which contained 0.25 mg/ml cytokine, 20 mM glycine at different pH-values and
polysorbate 20 concentrations. The isotonicity was adjusted with mannitol in the liquid
formulation, due to the increased aggregation in presence of NaCl. For the lyophilized
formulation sucrose was added as amorphous lyoprotector. Generally, aggregation levels
and the formation of a met-oxidized form of the cytokine were increasing with higher
storage temperature. The use of methionine as antioxidant could be an approach to
reduce oxidation. For the liquid formulation aggregation increased by 0.5% for
formulations with 0.02% polysorbate 20 independent of the pH. Polysorbate 20 could
further reduce the loss of protein due to adsorption on the pre-filled glass syringes and
the formation of met-oxidized cytokine. At pH 4.5 higher aggregation levels and a
significantly changed DLS size-distribution by volume were obtained when the samples
were stored at 25°C.

Chapter 6
166
For the lyophilized formulations aggregation increased by 0.2% to 0.7% for all studied
pH-values after 6 months at 2-8°C. Best stability with respect to aggregation was
achieved for the lyophilized formulations at pH 4.0 with 0.0% and 0.005% polysorbate
20. The formation of met-oxidized cytokine on the other hand was lower in presence of
polysorbate 20. For the lyophilized formulations a discoloration of the solutions after
reconstitution was observed after storage at 40°C / 75% RH for pH 4.0 and pH 4.5 and
at 25°C / 60% RH also for pH 4.0. The effect can be ascribed to the inversion of sucrose
to the reducing sugars fructose and glucose, which is accelerated with temperature,
residual moisture and lower pH. To achieve stable lyophilized formulations also at pH 4.0
and higher storage temperatures, the use of trehalose instead of sucrose could be a
possible approach as trehalose shows a higher chemical stability. With lyophilization it
was possible to use a higher pH of 5.0, which was not possible for the liquid formulations.
When storing the liquid and lyophilized formulations for 6 months at 2-8°C good results
could be achieved with all formulations. Within the studied formulations the liquid
formulations at pH 3.5 and 4.0 with 0.02% polysorbate 20, as well as the lyophilized
formulations at pH 4.0 with 0 and 0.005% polysorbate 20 offered the best stability at
higher storage temperatures. Summarizing, it can be concluded that it is possible to
stabilize the cytokine without the use of HSA as stabilizer at low pH. Aggregation and
oxidation is critical at higher storage temperatures which required storage at 2-8°C. The
issue of protein adsorption can be overcome by using polysorbate 20 as excipients, as
well as by glass type I+ vials.

Development of Stable, HSA-free Formulations for a Hydrophobic Cytokine
167
5. References
1. L. S. Lin, M. G. Kunitani, M. S. Hora. Interferon-ß-1b (Betaseron®). A Model for Hydrophobic Therapeutic
Proteins. Pharm. Biotechnol. 9:275-301 (1996).
2. W. Wang. Lyophilization and Development of Solid Protein Pharmaceuticals. Int. J. Pharm. 203:1-60
(2000).
3. P. McGoff, D. S. Scher. Solution formulation of Proteins/Peptides. 139-158 In E. J. McNally (eds) Protein
formulation and Delivery; Drugs and the Pharmaceutical Science Volume 99, Marcel Dekker Inc, New York
pp. 139-158 (2000).
4. P. J. Dawson. Effect of formulation and freeze-drying on the long-term stability of r-DNA-derived cytokines.
Dev. Biol. Stand. 74:273-282 (1992).
5. A. Braun, L. Kwee, M. A. Labow, J. Alsenz. Protein Aggregates Seem to Play a Key Role Among the
Parameters Influencing the Antigenicity of Interferon Alpha (INF-α) in Normal and Transgenic Mice. Pharm.
Res. 14:1472-1478 (1997).
6. E. Hochuli. Interferon immunogenicity: technical evaluation of interferon-α2a. J. Interferon Cytokine Res.
17 (Suppl. 1): 15-21 (1997).
7. A. Braun, J. Alsenz. Development and Use of Enzyme-Linked Immunosorbent Assays (ELISA) for the
Detection of Protein Aggregates in Interferon Alpha (INFα) Formulations. Pharm. Res. 14:1394-1400
(1997).
8. J. D. Meyer, J. E. Matsuura, J. A. Ruth, E. Shefter, S. T. Patel, J. Bausch, E. Mc Gonigle, M. C. Manning.
Selective Precipitation on Interleukin-4 Using Hydrophobic Ion Pairing: A Method For Improved Analysis of
Proteins Formulated with Large Excesses of Human Serum Albumin. Pharm. Res. 11:1492-1495 (1994).
9. J. R. Wendorf, C. J. Radke, H. W. Blanch. Reduced Protein Adsorption at Solid Interfaces by Sugar
Excipients. Biotech. Bioeng. 87:565-573 (2004).
10. F. Samaritani, A. Del Rio. Human serum albumin (HSA)-free stabilized interferon liquid formulations, WO
2004096263 A2, PCT Int. Appl. (2004).
11. M. R. Duncan, J. M. Lee, M. P. Warchol. Influence of surfactants upon protein/peptide adsorption to glass
and polypropylene. Int. J. Pharm. 120:179-88 (1995).
12. M. S. Schwarzenbach, P. Reimann, V. Thommen, M. Hegner, M. Mumenthaler, J. Schwob, H. J. Güntherodt.
Interferon α-2a interactions on Glass Vial Surfaces Measured by Atomic Force Microscopy. PDA J. Pharm.
Sci. Tech. 59:78-89 (2002).
13. Clarity and degree of opalescence of liquids; European Pharmacopoeia p. 27-29 (2005).
14. J. Geigert, B. A. Panschar, S. Fong, H. N. Huston, D. E. Wong, D. Y. Wong, C. Taforo, M. Pemberton. The
Long-Term Stability of Recombinant (Serine-17) Human Interferon-ß. J. Interferon Res. 8:539-547 (1988).
15. E. A. Cooper, K. Knutson. Fourier Transform Infrared Spectroscopy Investigations of Protein Structure. in
Physical Methods to Characterize Pharmaceutical Proteins. edited by J.N. Herron, Plenum Press New York
101-143 (1995).
16. S. L. Wang, S. Y. Lin, M. J. Li, Y. S. Wei, T. F. Hsieh. Temperature effect on the structural stability,
similarity and reversibility of human serum albumin in different states. Biophys. Chem. 114:205-212
(2005).
17. S. L. Wang, Y. S. Wei, S. Y. Lin. Subtractive similarity method used to study the infrared spectra of
proteins in aqueous solution. Vibrat. Spect. 31:313-319 (2003).
18. B. A. Shirley, M. Choe, M. Tellers, S. Babuka. Solubility of INF-Beta-1b in Sodium Chloride Solutions. PCT
Int. Appl. WO 02/080976 A2 (2002).
19. S. Hershenson, J. Thomson. Isoelectric focusing of recombinant interferon-ß. Appl. Theor. Electrophr.
1:123-124 (1989).
Chapter 6
168
20. K. L. Shaw, G. B. Grimsley, G. I. Yakovlev, A. A. Makarov, C. N. Pace. The effect of net charge on the
solubility, activity, and stability of ribonuclease Sa. Protein Sci. 10:1206-1215 (2001).
21. K. P. C. Vollhardt, N. E. Schore. Organische Chemie. Ed. H. Butenschön. VCH Verlagsgesellschaft mbH,
Weinheim (1995).
22. H. C. Mahler, R. Müller, W. Frieß, A. Delille, S. Matheus. Induction of aggregates in a liquid IgG1-antibody
formulation. Eur. J. Pharm. Biopharm. 59:407-417 (2005).
23. D. Shaw, P. Dubin. Aggregation of ß-Lactoglobulin. Malvern Application notes. www.malvern.co.uk. (2005).
24. P. C. Sontum, C. Christiansen. Photon Correlation Spectroscopy applied to characterisation of denaturation
and thermal stability of human albumin. J. Pharm. Biomed. Anal. 16:295-302 (1997).
25. J. Demeester, S. S. de Smedt, N. N. Sanders, J. Haustraete. Light Scattering. in Methods for Structural
Analysis of Protein Pharmaceuticals, edited by W. Jiskoot and D. J. A. Cormmelin, AAPS Press p. 245-277
(2005).
26. A. Schön, A. Veláquez-Compoy. Calorimetry in Methods for Structural Analysis of Protein Pharmaceuticals.
Eds. W. Jiskoot, D. J. A. Crommelin, AAPS Press, Arlington VA, 573-591 (2005).
27. A. Cooper, M. A. Nutley, A. Wadood. Differential scanning microcalorimetry. Protein-Ligand Interactions:
Hydrodynamics and Calorimetry, Oxford University Press. 287-318 (2001).
28. R. L. Remmele, N. S. Nightlinger, S. Srinivasan, W. R. Gombotz. Interleukin-1 Receptor (IL-1R) Liquid
Formulation Development Using Differential Scanning Calorimetry. Pharm. Res. 15:200-208 (1998).
29. L. L. Y. Lee, J. C. Lee. Thermal stability of proteins in the presence of poly (ethylene glycols). Biochem.
26:7813-7819 (1987).
30. M. van de Weert, J. A. Hering, P. I. Haris. Fourier Transform Infrared spectroscopy. In Methods for
Structural Analysis of Protein Pharmaceuticals. Eds. W. Jiskoot, D. J. A. Crommelin. AAPS Press Arlington
131-167 (2005).
31. D. M. Byler, H. Susi. Examination of the secondary structure of proteins by deconvolved FTIR spectra.
Biopolym. 25:469-487 (1986).
32. A. C. Dong, P. Huang; W. S. Caughey. Protein secondary structures in water from second-derivative amide
I infrared spectra. Biochem. 29:3303-3308 (1990).
33. A. C. Dong, S. J. Prestrelski, S. D. Allison, J. F. Carpenter. Infrared Spectroscopic studies of lyophilization
induced protein aggregation. J. Pharm. Sci. 84:415-424 (1995).
34. F. Meersman, L. Smeller, K. Heremans. Comparative Fourier Transform Infrared Spectroscopy Study of
Cold-, Pressure-, and Heat-Induced Unfolding and Aggregation of Myoglobin. Biophys. J. 82:2635-2644
(2002).
35. K. Murayama, M. Tomida. Head-Induced Secondary Structure and Confomration Change of Bovien Serum
Albumin investigated by Fourier Transform Infrared Spectroscopy. Biochem. 43:11526-11532 (2004).
36. K. Goossens, J. Helewyn, F. Meersman, M. De Ley, K. Heremans. Pressure- and temperature- Induced
unfolding and aggregation of recombinant human interferon-γ: a Fourier transform infrared spectroscopy
study. Biochem. J. 370:529-535 (2003).
37. H. Fan, J. Ralston, M. Dibiase, E. Faulkner, C. Russel Middaugh. Solution behavior of INF-ß-1a: An
Empirical Phase Diagram Based Approach. J. Pharm. Sci. 94:1893-1911 (2005).
38. Bruker Optics. IR-Spektroskopische Quantifizierung von Strukturänderungen in Proteinlösungen.
Application Note.
39. H. H. Bauer, M. Müller, J. Goette, H. P. Merkle, U. P. Fringeli. Interfacial Adsorption and Aggregation
Associated Changes in Secondary Structure of Human Calcitonin Monitored by ATR-FTIR Spectroscopy.
Biochem. 33:12276-12282 (1994).
40. L. Marchal-Heussler. Asorption of Drugs. in Ecyclopeida of Surface and Colloidal Science, Marcel Dekker,
New York; pp. 294-306 (2002).
Development of Stable, HSA-free Formulations for a Hydrophobic Cytokine
169
41. S. Matheus, W. Friess, H. C. Mahler. FTIR and n-DSC as analytical tools for high concentration protein
formulations. Pharm. Res.23:1350-1363 (2006).
42. A. Dong, B. Kendrick, L. Kreilgaard, J. Matsuura, M. C. Manning, J. F. Carpenter. Spectroscopic Study of
the Secondary Structure and Thermal Denaturation of Recombinant Human Factor XIII in Aqueous
Solution. Archives Biochem. Biophys. 347:213-220 (1997).
43. B. A. Kerwin, M. C. Heller, S. H. Levin, T. W. Randolph. Effects of Tween 80 and Sucrose on Acute Short-
Term Stability and Long-Term Storage at -20°C of a Recombinant Hemoglobin. J. Pharm. Sci. 87:1062-
1068 (1998).
44. Malvern Application note: Characterization of protein melting point, www.malvern.co.uk.
45. D. M. Petsev, B. R. Thomas, S. T. Yau, P. G. Vekilov. Interaction and Aggregation of Apoferritin Molecules
in Solution: Effect of Added Electrolytes. Biophys. J. 78:2060-2069 (2000).
46. J. J. Lin, J. D. Meyer, J. F. Carpenter, M. C. Manning. Stability of Human Serum Albumin During
Bioprocessing: Denaturation and Aggregation During Processing of Albumin Paste. Pharm. Res. 17:391-
396 (2000).
47. W. Norde. Adsorption of Proteins at Solid-Liquid Interfaces. Cells Mat. 5:97-112 (1995).
48. F. Y. Oliva, L. B. Avalle, O. R. Cámara, C. P. De Pauli. Adsorption of human serum albumin (HSA) onto
colloidal TiO2 particles, Part I. J. Coll. Interf. Sci. 261:299-311 (2003).
49. J. R. Wendorf, C. J. Radke, H. W. Blanch. Reduced Protein Adsorption at Solid Interfaces by Sugar
Excipients. Biotech. Bioeng. 87:565-573 (2004).
50. S. Sjöberg. Silica in aqueous Environments. J. Non-crystall. Sol. 196:51-57 (1995).
51. M. Hiraki. Isoelectric point of glycine and α-alanine. J. Biochem. 15:345-357 (1932).
52. M. Zhang, M. Ferrari. Reduction of Albumin Adsorption onto Silicon Surfaces by Tween 20. Biotech. Bioeng.
56:618-625 (1997).
53. W. Norde, F. MackRitchie, G. Nowicka, J. Lyklema. Protein adsorption at solid-liquid interfaces: reversibility
and conformation aspects. J. Coll. Interf. Sci. 112:447-456 (1986).
54. M. C. Kaplan, A. Jégou, B. Chaufer, M. Rabiller-Baudry, M. C. Michalsky. Adsorption of lysozyme on
membrane material and cleaning with non-ionic surfactant characterized through contact angle
measurements. Desal. 146:149-154 (2002).
55. T. Arakawa, S. N. Timasheff. Preferential Interactions of Proteins with Salts in Concentrated Solutions.
Biochem. 21:6545-6552 (1982).
56. T. Arakawa, S. N. Timasheff. Mechanism of Protein Salting In and Salting Out by Divalent Cation Salts:
Balance between Hydration and Salt Binding. Biochem. 23:5912-5923 (1984).
57. T. Arakawa, S. J. Prestrelski, W. C. Kenney, J. F. Carpenter. Factors affecting short-term and long-term
stability of proteins. Adv. Drug Del. Rev. 46:307-326 (2001).
58. A. Kim, M. Akers and S. Nail. The Physical State of Mannitol after Freeze-Drying: Effect of Mannitol
Concentration, Freezing Rate and a Noncrystallizing Cosolute. J. Pharm. Sci. 87:931-935 (1998).
59. K. Izutsu, S. Yoshioka, T. Terao. Effect of Mannitol Crystallinity on the Stabilization of Enzymes during
Freeze-Drying. Chem. Pharm. Bull. 42:5-8 (1994).
60. H. R. Costantino, J. D. Andya, P. A. Nguyen, N. Dasovich, T. D. Sweeney, S. J. Shire, C. C. Hsu, Y. F. Maa.
Effect of Mannitol Crystallization on the Stability and Aerosol Performance of a Spray-Dried Pharmaceutical
Protein, Recombinant Humanized Anti-IgE Monoclonal Antibody. J. Pharm. Sci. 87:1406-1411 (1998).
61. J. H. Crowe, J. F. Carpenter. An infrared spectroscopic study of the interactions of carbohydrates with dried
protein. Biochem. 28:3916-3922 (1989).
62. F. Franks, R. H. M. Hatley, S. F. Mathias. Materials science and the production of shelf-stable biologicals.
Bio. Pharm. 4:38-55 (1991).

Chapter 6
170
63. L. Kreilgaard, L. S. Jones, T. W. Randolph, S. Frokjoer, J. M. Flink, M. C. Manning, J. F. Carpenter. Effect of
Tween 20 on Freeze-Thawing- and Agitation-Induced Aggregation of Recombinant Human Factor XIII. J.
Pharm. Sci. 87:1597-1603 (1998).
64. N. B. Bam, J. L. Cleland, J. Yang, M. C. Manning, J. F. Carpenter, R. F. Kelley, T. W. Randolph. Tween
Protects Recombinant Human Growth Hormone against Agitation-Induced Damage via Hydrophobic
Interactions. J. Pharm. Sci. 87:1554-1559 (1998).
65. L. C. Gu, E. A. Erdos, H. S. Chiang, T. Calderwood, K. Tsai, G. C. Visor, J. Duffy, W. C. Hsu, L. C. Foster.
Stability of Interleukin 1.beta. (IL-1.beta.) in aqueous solution: analytical methods, kinetics, products, and
solution formulation implications. Pharm. Res. 8:485-490 (1991).
66. M. Boublik, J. A. Moschera, C. Wei, H-F. Kung. Conformation and Activity of Recombinant Human Fibroblas
Interferon-ß. J. Interferon Res. 10:213-213 (1990).
67. S. E. Grossberg, J. L. Taylor, R. E. Seibenlist, P. Jameson. Biological and immunological assays of human
interferons. in Manual of Clinical Immunology, Editors: N. R. Rose, H. Friedman, J. L. Fahey, Am. Soc. of
Microbiol. 295-299 (1985).
68. E. Y. Shalaev, Q. Lun, M. Shalaeva, G. Zografi. Acid-Catalyzed Inversion of Sucrose in the Amorphous
State at Very Low Levels of Residual Water. Pharm. Res. 17:366-370 (2000).
69. M. C. Manning, K. Patel, R. T. Borchardt. Stability of Protein Pharmaceuticals. Pharm. Res. 6:903-918
(1989).
70. W. Wang. Instability, stabilization and formulation of liquid protein pharmaceuticals. Int. J. Pharm.
185:125-188 (1999).
71. R. Haikala, R. Eerola, V. P. Tanninen, J. Yliruusi. Polymorphic changes of mannitol durino freeze-drying:
effect of surface active agents. PDA J. Pharm. Sci. Tech. 51:96-101 (1997).
72. L. Yu. Nucleation of One Polymorph by Another. J. Am. Chem. Soc. 125:6380-6381 (2003).
73. E. Y. Shalaev, G. Zografi. How Does Residual Moisture Affect the Solid-State Degradation of Drugs in the
Amorphous State. J. Pharm. Sci. 85:1137-1141 (1996).
74. M. J. Pikal. Freeze-drying of Proteins. Part I: process design. Biopharm. 3:18-27 (1990).
75. L. Chang, D. Shepherd, J. Sun, X. Tang, M. J. Pikal. Effect of Sorbitol and Residual Moisture on the Stabiliy
of Lyophilized Antibodies: Implications for the Mechanism of Protein Stabilization in the Solid State. J.
Pharm. Sci. 94:1445-1455 (2005).
171
Chapter 7: Summary of the Thesis
1. General Introduction
The goal of the thesis was to study the impact of formulation conditions on the stability
of a hydrophobic cytokine. Chapter 1 provides a general introduction into the formulation
of hydrophobic proteins. Poor solubility and the tendency of hydrophobic proteins to
adsorb on surfaces are the major challenges. To circumvent these problems Human
Serum Albumin (HSA) is frequently used as excipient, however, its use is related to the
risk of blood born pathogens and enhanced immunogenicity. Possible approaches for the
development of HSA-free formulations for hydrophobic proteins are discussed. In its
function as cryo- and lyoprotector HSA can be replaced by sugars, sugar alcohols or
amino acids. By adjusting the formulation pH and ionic strength protein solubility can be
optimized and adsorption reduced. Protein adsorption is most effectively addressed by
the addition of surfactants and can be solved by the use of container materials which are
less prone to adsorption e.g. glass type I+.
2. Characterization of Cytokine Solubility and Particle Formation in
Presence of Human Serum Albumin
Based on commercially available formulations a hydrophobic recombinant human
cytokine lyophilized with HSA and mannitol was used for the studies. In Chapter 2 the
HSA-cytokine formulation was characterized with respect to turbidity, particle formation
and protein-protein interactions. The impact of NaCl, the HSA-stabilizers Na-octanoate
and Na-N-acetyltryptophanate, as well as formulation pH on the HSA-cytokine
formulation was elucidated. When lowering the pH, a significant increase in turbidity with
maximum values close to the isoelectric point of HSA around pH 5.0 was observed which
was partially irreversible mainly due to the cytokine. The precipitated fraction was
characterized by Dynamic Light Scattering, Atomic Force Microscopy, disc centrifugation
and light obscuration. The main particle classes ranged between 4 to 10 nm, 20 to 50 nm
and 500 to 1000 nm. A shift from smaller to larger particles was found when the pH was
lowered from 7.4 to 5.0. By the addition of NaCl to the formulation the turbidity increase
at pH 5.0 could be prevented. Fluorescence spectroscopy revealed weaker interactions
between HSA and the cytokine at pH 4.5 in the presence of NaCl. Furthermore, studies
with HSA placebo formulation demonstrated a direct stabilizing effect of NaCl on HSA,
with respect to the turbidity increase at pH 5.0. At concentrations applied for the
stabilization of HSA, Na-octanoate and Na-N-acetyltryptophanate only played a minor
Chapter 7
172
role for the prevention of the turbidity increase at pH 5.0. Thus, it could be shown in
Chapter 2 that NaCl was essential for the overall stability of the HSA-cytokine
formulation.
3. Characterization of the Lyophilization Behavior of Mannitol-Human
Serum Albumin-NaCl Formulations
As NaCl can impact the freezing and lyophilization behavior, the impact of NaCl on the
behavior of mannitol-HSA placebo mixtures based on the cytokine-HSA formulations was
studied. The freezing process of mannitol–HSA-NaCl formulations was subject of
Chapter 3. Two different HSA-qualities, unstabilized-HSA and stabilized-HSA containing
NaCl, Na-octanoate and Na-N-acetyltryptophanate were used. Differential Scanning
Calorimetry and Low Temperature X-ray Diffraction showed that both HSA-types and
NaCl could delay and inhibit the crystallization of mannitol. This effect has to be taken in
consideration, as it is possible that mannitol crystallizes in an uncontrolled way upon
storage. Due to the presence of the stabilizers, formulations with stabilized-HSA differed
in their freezing behavior as compared to those containing unstabilized-HSA. In the
particular concentration used for the stabilization of HSA, NaCl had the most distinct
impact on the low temperature behavior of mannitol. Already small quantities of NaCl
shifted Tg’ and Tc of mannitol formulations to lower temperatures. The study
demonstrated that the freezing step had a significant effect on the physico-chemical
properties of the formulations which can affect the subsequent drying process and the
lyophilized products.
The effect of NaCl on the overall lyophilization processes, as well as the resulting
lyophilized products of mannitol-HSA-NaCl formulations was described in Chapter 4.
Increasing NaCl-concentrations led to products with a lower degree of crystallinity and
less compact cake structures. In the presence of NaCl the drying time was shorter due to
the changed cake structure. Differential Scanning Calorimetry, X-ray Powder Diffraction
and Scanning Electron Microscopy showed that NaCl-concentration and applied freezing-
protocol governed the morphology of the formulations after lyophilization. Increasing
NaCl concentration led to partially amorphous products. However, upon storage the
amorphous state could not be preserved, with the consequence that mannitol and NaCl
crystallized. The data indicated that products without NaCl were more stable in their
modifications. However, the stability of HSA upon storage in the lyophilized products,
monitored by a turbidity scan from pH 3.0 to 7.0 and size exclusion chromatography was
improved by the addition of NaCl. This could be referred to the direct stabilizing effect of
NaCl on HSA. For the studied systems the benefit of NaCl on protein stability outbalanced
the observed potential drawbacks. Consequently, Chapter 3 and 4 showed the
Summary of the Thesis
173
importance of the physico-chemical characterization of the formulations used for
lyophilization, when NaCl is part of the formulation. The lowering of Tg’ and the inhibition
of mannitol crystallization are the most distinct effects of NaCl.
4. Development of a Human Serum Albumin-free formulation for the
Cytokine
One goal of the thesis was to develop a HSA-free formulation for the cytokine. In
Chapter 5 the system mannitol–sucrose was evaluated as possible excipient combination
for the cytokine during lyophilization. The optimum ratio of mannitol to sucrose and
appropriate lyophilization cycles were evaluated with the objective to achieve a product
consisting of highly crystalline mannitol in combination with amorphous sucrose. Special
focus was set on the formation of the metastable mannitol hydrate, as it can cause
stability problems due to the release of hydrate water. NaCl lowered the Tg’ of mannitol-
sucrose formulations, as it acts as plasticizer for the amorphous phase which needs to be
considered to avoid collapse. Mannitol crystallization during freezing was inhibited by
sucrose and NaCl. This results in partially crystalline systems which come along with the
disadvantage of potential crystallization upon storage that can be detrimental for the
stability of the active protein. In addition, an increased content of mannitol hydrate was
found after lyophilization with annealing, which was applied to maximize mannitol
crystallization. Low Temperature X-ray Diffraction experiments with 8.0% mannitol and
2.0% sucrose showed that mannitol hydrate was preferably formed at lower annealing
temperatures, which was confirmed by Powder X-ray Diffraction after lyophilization.
Thus, if annealing during lyophilization is necessary, a sufficiently high temperature
needs to be selected. Adequate crystallization of mannitol was achieved in formulations
with 4.0% mannitol and 1.0% sucrose in processes without annealing. Therefore, this
system was selected for a HSA-free lyophilized formulation of the cytokine.
The development of stable, HSA-free formulations for the cytokine was outlined in
Chapter 6. Pre-formulation studies revealed that sufficient cytokine solubility was given
in the pH-range from 3.0 to 5.5. Above pH 5.5 a turbidity increase caused by the
precipitation of the cytokine was observed. Below pH 4.5 at a low ionic strength the best
stability of the cytokine with respect to aggregation and turbidity was achieved. As buffer
system 20 mM glycine was selected, since lower glycine concentrations favored protein
adsorption to the container and higher glycine concentrations led to an increased
aggregation tendency. Protein adsorption could be minimized by the utilization of glass
type I+ and the addition of polysorbate 20 to the formulations. The thermal stability of
the cytokine, monitored by the denaturation temperature determined with Fourier
Transform Infrared Spectroscopy, decreased at higher pH values.

Chapter 7
174
The stability of five liquid formulations at pH 3.5 to 4.5 with 4.8% mannitol and five
lyophilized formulations at pH 4.0 to 5.0 with 4% mannitol and 1% sucrose was
evaluated over 6 months at 2-8°C, 25°C / 60% RH and 40°C / 75% RH. For both, liquid
and lyophilized formulations the formation of met-oxidized cytokine was independent of
the pH but increased with storage time and temperature. In the liquid formulations the
level of met-oxidized cytokine was slightly higher compared to the lyophilized
formulation. The liquid formulation at pH 3.5 and 4.0 and the lyophilized formulations
between pH 4.0 and 5.0 turned out to be most stable regarding aggregation, when
stored at 2-8°C. To avoid protein adsorption the addition of polysorbate 20 to the liquid
formulation was necessary, as the pre-filled syringes were manufactured of glass type I.
In the liquid formulation polysorbate 20 further had a slight protective effect with respect
to the formation of larger protein aggregate populations detectable by Dynamic Light
Scattering and the formation of met-oxidized cytokine. However, in the freeze-dried
formulation polysorbate 20 fostered the formation of aggregates. As glass type I+ vials
were employed for lyophilization adsorption was minimal and one could omit
polysorbate 20. Overall, it was possible to stabilize the cytokine without the use of HSA
at low pH.
Thus, the studies provided an extensive characterization of the hydrophobic cytokine, its
stabilization with HSA and the pH dependent instability of HSA-containing systems. As an
alternative a stable HSA-free formulation for the cytokine could be presented. Especially
for the lyophilized formulations it could be shown that subtle changes of excipients e.g. in
the NaCl content can have a detrimental impact.
Presentations and Publications associated with this Thesis
Articles
A. Hawe, W. Frieß. Physico-chemical Behavior of Mannitol, Human Serum Albumin
Formulations during Lyophilization. Eur. J. Pharm. Sci. 28:224-232 (2006).
A. Hawe, W. Frieß. Impact of Freezing Procedure and Annealing on the Physico-chemical
Properties and the Formation of Mannitol Hydrate in Mannitol-Sucrose-NaCl Formulations.
Eur. J. Pharm. Biopharm. 64:316-325 (2006).
A. Hawe, W. Frieß. Freezing Behavior of Mannitol, HSA Formulations. AAPS Pharm. Sci.
Tech. accepted (2006).
Oral Presentations
A. Hawe, W. Frieß. Development of a Formulation for a Hydrophobic Cytokine.
5th Worldmeeting on Pharmaceutics, Biopharmaceutics and Pharmaceutical Technology,
Geneva, Switzerland (2006).
A.Hawe, W. Frieß. Human Serum Albumin as Stabilizing Carrier for Cytokines.
Local Chapter Germany of the Controlled Release Society, Marburg, Germany (2005).
Posters
A. Hawe, W. Frieß. Human Serum Albumin as Stabilizing Excipient for Cytokines. AAPS
Annual Meeting and Exposition, Nashville, USA (2005).
A. Hawe, W. Frieß. Impact of NaCl on the Physico-chemical Properties of Formulations
with Mannitol and HSA during Freezing and Lyophilization.
AAPS Annual Meeting and Exposition, Nashville, USA (2005).
A. Hawe, W. Frieß. Development of a Formulation for a Hydrophobic Cytokine.
AAPS National Biotechnology Conference, San Fransisco, USA (2005).
A. Hawe, W. Frieß. Influence of NaCl on the Crystallization Behavior of Mannitol in the
System Mannitol-HSA-NaCl during Lyophilization.
European Conference on Drug Delivery and Pharmaceutical Technology, Sevilla, Spain,
(2004).
A. Hawe, W. Frieß. Influence of NaCl on Excipients used for Lyophilization of Proteins.
Protein Stability Conference, Breckenridge, USA, (2003).
Curriculum Vitae
ANDREA HAWE
PERSONAL DETAILS
Date of birth: August 09, 1977
Place of birth: Munich, Germany
Nationality: German
EDUCATION
08/2002 – 07/2006 PhD Thesis
Department for Pharmacy, Pharmaceutical Technology and
Biopharmaceutics Ludwig-Maximilians-University, Munich
Supervisor: Prof. Dr. Wolfgang Friess
05/2002 Licence to practice as pharmacist
11/2001-05/2002 Internship at Roche GmbH, Penzberg
05/2001-10/2001 Internship in public pharmacy, Sonnenapotheke, Munich
1997-2001 Study of Pharmacy at the Ludwig-Maximilians University,
Munich
08/1996 – 02/1997 Exchange student at the Georgia Southwestern State
University, Americus, GA, USA
1987-1996 High School, Gymnasium Penzberg
graduation with ‘Abitur’