![LNCCrogerio/poo2/Apoio/Arrays-LNCC.pdf · Em Java, construímos o array bidimensional consumo[ ][ ] e o array unidimensional preço[ ]. A solução é dada pelo array unidimensional](https://static.fdokument.com/doc/165x107/5ed03dc07d4cb6261160d441/rogeriopoo2apoioarrays-lnccpdf-em-java-construmos-o-array-bidimensional.jpg)
Submillimeter array observation of the proto-planetary ... · SUBMILLIMETER ARRAY OBSERVATION OF...
12
Title Submillimeter array observation of the proto-planetary nebula CRL 618 in the CO J = 6-5 line Author(s) Nakashima, JI; Fong, D; Hasegawa, T; Hirano, N; Koning, N; Kwok, S; Lim, J; DinhVanTrung; Young, K Citation Astronomical Journal, 2007, v. 134 n. 5, p. 2035-2045 Issued Date 2007 URL http://hdl.handle.net/10722/57330 Rights Creative Commons: Attribution 3.0 Hong Kong License
Transcript of Submillimeter array observation of the proto-planetary ... · SUBMILLIMETER ARRAY OBSERVATION OF...
Title Submillimeter array observation of the proto-planetary nebulaCRL 618 in the CO J = 6-5 line
Author(s) Nakashima, JI; Fong, D; Hasegawa, T; Hirano, N; Koning, N;Kwok, S; Lim, J; DinhVanTrung; Young, K
Citation Astronomical Journal, 2007, v. 134 n. 5, p. 2035-2045
Issued Date 2007
URL http://hdl.handle.net/10722/57330
Rights Creative Commons: Attribution 3.0 Hong Kong License
SUBMILLIMETER ARRAY OBSERVATION OF THE PROTOYPLANETARYNEBULA CRL 618 IN THE CO J = 6Y5 LINE
Jun-ichi Nakashima,1David Fong,
2Tatsuhiko Hasegawa,
1Naomi Hirano,
1Nico Koning,
3
Sun Kwok,1,4
Jeremy Lim,1Dinh-Van-Trung,
1and Ken Young
5
Received 2007 June 20; accepted 2007 July 26
ABSTRACT
We report on the results of a Submillimeter Array (SMA) interferometric observation of the protoYplanetary nebulaCRL 618 in the 12CO J ¼ 6Y5 line.With the new capability of the SMA enabling us to use two receivers at a time, wealso observed simultaneously in the 12CO J ¼ 2Y1 and 13CO J ¼ 2Y1 lines. The 12CO J ¼ 6Y5 and 13CO J ¼ 2Y1lines were interferometrically observed for the first time toward CRL 618. The flux of the high-velocity componentof the 12CO J ¼ 6Y5 line is almost fully recovered, while roughly 80% of the flux of the low-velocity component isresolved out. The low recovery rate suggests that the emission region of the low-velocity component of the 12COJ ¼ 6Y5 line is largely extended. Continuum emission is detected at both 230 and 690 GHz. The flux of the 690 GHzcontinuum emission seems to be partially resolved out, suggesting that dust emission partly contaminates the 690GHzcontinuumflux. The cavity structure, which has been confirmed in a previous observation in the 12CO J ¼ 2Y1 line, isnot clearly detected in the 12CO J ¼ 6Y5 line, and only the south wall of the cavity is detected. This result suggeststhat the physical condition of the molecular envelope of CRL 618 is not exactly axially symmetric.
Key words: stars: AGB and post-AGB — stars: carbon — stars: imaging — stars: individual (CRL 618) —stars: kinematics — stars: winds, outflows
1. INTRODUCTION
Stellar evolution from the asymptotic giant branch (AGB)phase to the planetary nebula (PN) phase is very rapid. This tran-sient phase between the AGB and PN phases is often called theprotoYplanetary nebula (PPN) phase and /or post-AGB phase(Kwok 1993; van Winckel 2003). PPNe are considered to playan important role in a wide variety of astrophysical problems: forexample, the shape and shaping of PNe, the chemical evolutionof the evolved stars, and the synthesis of organic matter in space(Balick & Frank 2002; Kwok 2004). Unfortunately, however,the number of PPNe identified is rather limited, mainly due totheir transient existence (see, e.g., Szczerba et al. 2007).
In the last few decades, the well-known example of a PPN,CRL 618 (= RAFGL 618 = IRAS 04395+3601 = WestbrookNebula), has provided a unique opportunity to investigate the na-ture of at least one particular case of PPNe. CRL 618 entered itsPPN phase about 100 yr ago (Kwok & Bignell 1984), and thecentral B0 star is surrounded by a compact H ii region (its angu-lar size is roughly 0:200 ; 0:400) visible through centimeter- andmillimeter-wave continuum emission (Wynn-Williams 1977;Kwok & Feldman 1981; Kwok & Bignell 1984; Martın-Pintado1993). The flux of the free-free emission at k ¼ 1:3 and 3mmhasbeen continuously changing over the last 25 yr (see, e.g., SanchezContreras et al. 2004), implying the rapid evolution of this ob-ject. The envelope of CRL 618 includes a rich set of molecu-lar species (e.g., Bujarrabal et al. 1988; Cernicharo et al. 1989,
2001a, 2001b; Fukasaku et al. 1994; Remijan et al. 2005), andhas been repeatedly observed in molecular radio lines, especiallythat of CO (e.g., Shibata et al. 1993; Yamamura et al. 1994;Hajian et al. 1996; Sanchez Contreras et al. 2004).
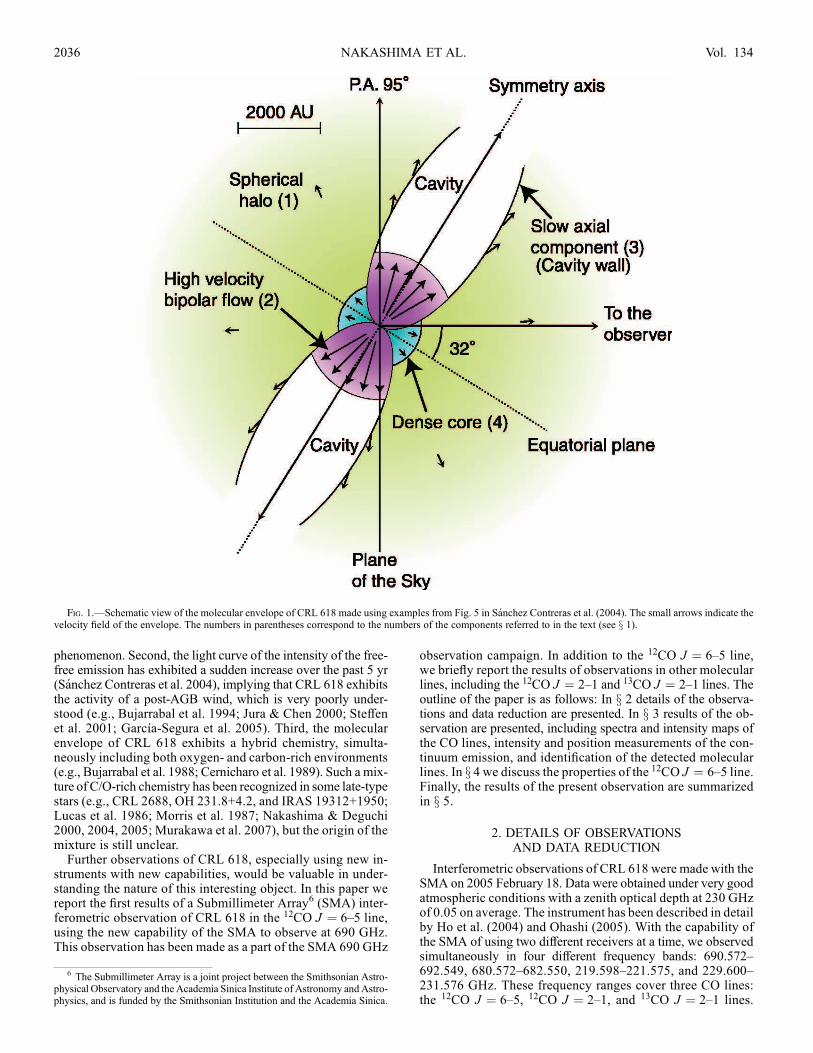
Through radio observations in molecular rotational lines, fourdifferent kinematical components have been identified in themo-lecular envelope of CRL 618. In Figure 1 we present a schematicview of themolecular envelope of CRL 618. The first component[corresponding to (1) in Fig. 1] exhibits an almost round shape inCO maps, and its angular size is larger than 2000. The expandingvelocity of this spherical component is roughly 17.5 km s�1, andit is interpreted as the remnant of the spherical mass-loss processof the central star during the AGB phase. The second component[corresponding to (2) in Fig. 1] exhibits a bipolar flow observedup to axial distances of�2.500 from the nebula center. The expan-sion velocity of this component reaches up to 350 km s�1. In-cidentally, the proper motion of this high-velocity bipolar flowhas been measured by Sanchez Contreras & Sahai (2004), andthe value is�0.04500 yr�1, corresponding to a distance of 900 pcif we assume the inclination angle of the polar axis is 30�; thisdistance is consistent with that estimated by an independentmethod (Goodrich 1991). An additional two kinematical com-ponents were recently found by Sanchez Contreras et al. (2004)in their high-resolution (�100) interferometric radio observation:an extended structure elongated in the polar direction up to anaxial distance of�600 from the nebula center, which is expandingat a velocity of about 22 km s�1 [corresponding to (3) in Fig. 1],and a dense, inner torus-like core expanding at a velocity of lessthan 12 km s�1 [corresponding to (4) in Fig. 1].
Although numerous observational and theoretical effortshave beenmade for CRL 618, several interesting puzzles remain.First, the largely extended torus-like structure is detectable in theHCO+ J ¼ 1Y0 line, but not in the CO J ¼ 2Y1 line (SanchezContreras et al. 2004; Sanchez Contreras & Sahai 2004). SanchezContreras et al. (2004) suggested that a passage of a shock acrossthe torus-like structure plays an important role in explaining this
1 Academia Sinica Institute of Astronomy andAstrophysics, P.O. Box 23-141,Taipei 106, Taiwan; [email protected].
2 Submillimeter Array, Harvard-Smithsonian Center for Astrophysics, 645NorthA’ohoku Place, Hilo, HI 96720, USA.
3 Department of Physics andAstronomy, University of Calgary, Calgary, ABT2N 1N4, Canada.
4 Faculty of Science, University of Hong Kong, Chong Yuet Ming PhysicsBuilding, Hong Kong, China.
5 Harvard-Smithsonian Center for Astrophysics, 60 Garden Street, Cambridge,MA 02138, USA.
2035
The Astronomical Journal, 134:2035Y2045, 2007 November
# 2007. The American Astronomical Society. All rights reserved. Printed in U.S.A.
phenomenon. Second, the light curve of the intensity of the free-free emission has exhibited a sudden increase over the past 5 yr(Sanchez Contreras et al. 2004), implying that CRL 618 exhibitsthe activity of a post-AGB wind, which is very poorly under-stood (e.g., Bujarrabal et al. 1994; Jura & Chen 2000; Steffenet al. 2001; Garcıa-Segura et al. 2005). Third, the molecularenvelope of CRL 618 exhibits a hybrid chemistry, simulta-neously including both oxygen- and carbon-rich environments(e.g., Bujarrabal et al. 1988; Cernicharo et al. 1989). Such a mix-ture of C/O-rich chemistry has been recognized in some late-typestars (e.g., CRL 2688, OH 231.8+4.2, and IRAS 19312+1950;Lucas et al. 1986; Morris et al. 1987; Nakashima & Deguchi2000, 2004, 2005; Murakawa et al. 2007), but the origin of themixture is still unclear.
Further observations of CRL 618, especially using new in-struments with new capabilities, would be valuable in under-standing the nature of this interesting object. In this paper wereport the first results of a Submillimeter Array6 (SMA) inter-ferometric observation of CRL 618 in the 12CO J ¼ 6Y5 line,using the new capability of the SMA to observe at 690 GHz.This observation has been made as a part of the SMA 690 GHz
observation campaign. In addition to the 12CO J ¼ 6Y5 line,we briefly report the results of observations in other molecularlines, including the 12CO J ¼ 2Y1 and 13CO J ¼ 2Y1 lines. Theoutline of the paper is as follows: In x 2 details of the observa-tions and data reduction are presented. In x 3 results of the ob-servation are presented, including spectra and intensity maps ofthe CO lines, intensity and position measurements of the con-tinuum emission, and identification of the detected molecularlines. In x 4 we discuss the properties of the 12CO J ¼ 6Y5 line.Finally, the results of the present observation are summarizedin x 5.
2. DETAILS OF OBSERVATIONSAND DATA REDUCTION
Interferometric observations of CRL 618 were made with theSMA on 2005 February 18. Data were obtained under very goodatmospheric conditions with a zenith optical depth at 230 GHzof 0.05 on average. The instrument has been described in detailby Ho et al. (2004) and Ohashi (2005). With the capability ofthe SMA of using two different receivers at a time, we observedsimultaneously in four different frequency bands: 690.572Y692.549, 680.572Y682.550, 219.598Y221.575, and 229.600Y231.576 GHz. These frequency ranges cover three CO lines:the 12CO J ¼ 6Y5, 12CO J ¼ 2Y1, and 13CO J ¼ 2Y1 lines.
Fig. 1.—Schematic view of the molecular envelope of CRL 618 made using examples from Fig. 5 in Sanchez Contreras et al. (2004). The small arrows indicate thevelocity field of the envelope. The numbers in parentheses correspond to the numbers of the components referred to in the text (see x 1).
6 The Submillimeter Array is a joint project between the Smithsonian Astro-physical Observatory and the Academia Sinica Institute of Astronomy andAstro-physics, and is funded by the Smithsonian Institution and the Academia Sinica.
NAKASHIMA ET AL.2036 Vol. 134
The array used six elements (with a diameter of 6 m) in thecompact array configuration. The baseline length ranged from10 to 70 m. The field of view of a single antenna was 1800 and5400 at 690 and 230 GHz, respectively. The observation wasinterleaved every 15 minutes with nearby gain calibrators, 3C111 and Titan, to track the phase variations over time. Becausethe angular size of Titan was roughly 0:8800 ; 0:6800, Titan wasnot an ideal point source compared with the small size of thebeam (�100Y300) of the present observations. Therefore, in thegain calibration we used the non-point flag of the gain-calcommand in the IDL-MIR package, which enabled us to usea planet /satellite as a calibrator ( IDL-MIR is data reductionsoftware developed by the SMA project). The non-point flagfunction assumes the calibrator is a uniform disk; the size andflux of the calibrator are automatically retrieved and calcu-lated by the internal theoretical calculation. The absolute fluxcalibration was determined from observations of Ganymede,and was approximately accurate to within 15%. We adopted theantenna-based solution in the passband calibration of the 690GHzdata. With enough signal-to-noise ratio in each channel, theantenna-based bandpass solution is robust and consistent withbaseline-based calibration results. For the 230 GHz data weadopted a standard calibration method using the baseline-basedsolution. The final map has an accumulated on-source observ-ing time of about 4 hr. The single-sideband system temperatureranged from 2000 to 3000 K at 690 GHz and from 150 to 200 Kat 230 GHz, depending on the atmospheric conditions and thetelescope direction. The SMA correlator had a bandwidth of2 GHz with a resolution of 0.812 MHz. The velocity resolutionwas 0.35 km s�1 at 690 GHz and 1.0 km s�1 at 230 GHz. Thephase center of the map was taken at R:A: ¼ 04h42m53:67s,decl: ¼ 36
�06053:200 (J2000.0). Image processing of the data
was performed with the MIRIAD software package (Sault et al.1995). We used robust weighting for the 690 GHz data. The ro-bust weighting of the visibility data, which is an optimizedcompromise between natural and uniform weighting, gave a1:000 ; 0:800 CLEAN beam at 690 GHz with a position angleof �12
�. For the 12CO and 13CO J ¼ 2Y1 lines, a superuni-
form weighting of visibility data (with a suppression region of800 ; 800) was adopted to enhance the angular resolution, andthis weighting gave a 2:600 ; 2:400 CLEAN beam with a posi-tion angle of +11.2
�. The widths of the bands for the contin-
uum maps at 690 and 230 GHz were roughly 1.5 and 1.9 GHz,respectively.
3. RESULTS
3.1. Spectra of the CO Lines
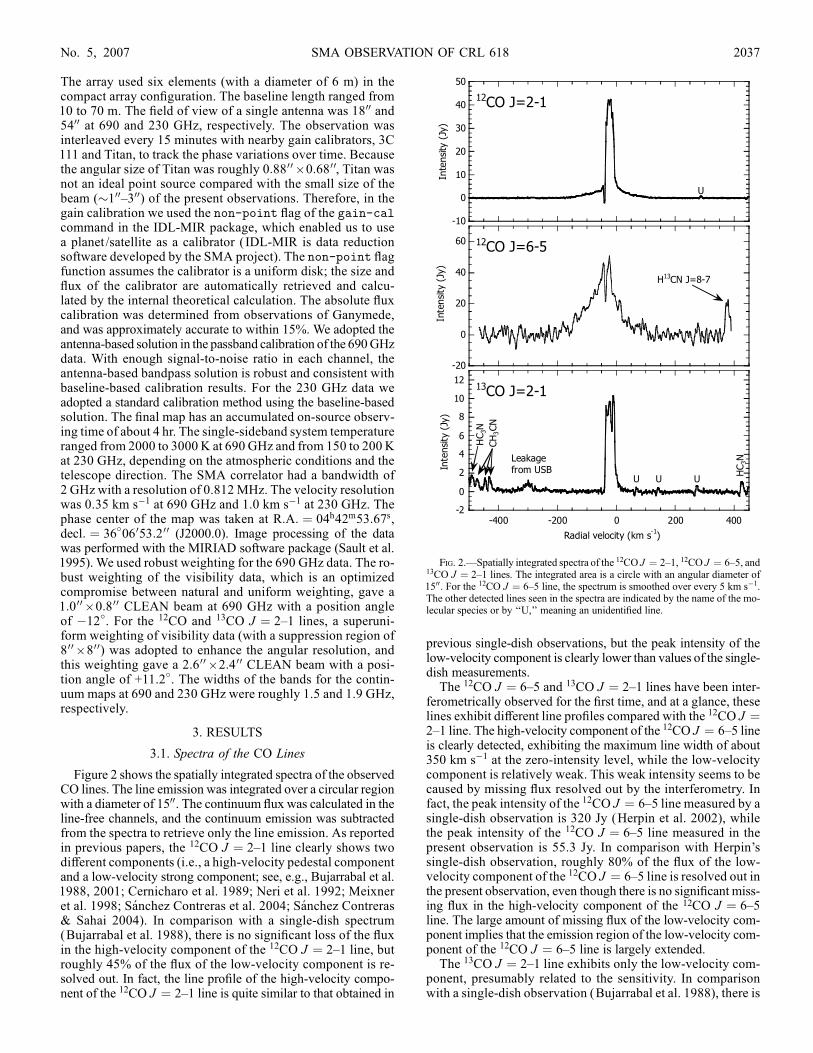
Figure 2 shows the spatially integrated spectra of the observedCO lines. The line emission was integrated over a circular regionwith a diameter of 1500. The continuum flux was calculated in theline-free channels, and the continuum emission was subtractedfrom the spectra to retrieve only the line emission. As reportedin previous papers, the 12CO J ¼ 2Y1 line clearly shows twodifferent components (i.e., a high-velocity pedestal componentand a low-velocity strong component; see, e.g., Bujarrabal et al.1988, 2001; Cernicharo et al. 1989; Neri et al. 1992; Meixneret al. 1998; Sanchez Contreras et al. 2004; Sanchez Contreras& Sahai 2004). In comparison with a single-dish spectrum(Bujarrabal et al. 1988), there is no significant loss of the fluxin the high-velocity component of the 12CO J ¼ 2Y1 line, butroughly 45% of the flux of the low-velocity component is re-solved out. In fact, the line profile of the high-velocity compo-nent of the 12CO J ¼ 2Y1 line is quite similar to that obtained in
previous single-dish observations, but the peak intensity of thelow-velocity component is clearly lower than values of the single-dish measurements.
The 12CO J ¼ 6Y5 and 13CO J ¼ 2Y1 lines have been inter-ferometrically observed for the first time, and at a glance, theselines exhibit different line profiles compared with the 12CO J ¼2Y1 line. The high-velocity component of the 12CO J ¼ 6Y5 lineis clearly detected, exhibiting the maximum line width of about350 km s�1 at the zero-intensity level, while the low-velocitycomponent is relatively weak. This weak intensity seems to becaused by missing flux resolved out by the interferometry. Infact, the peak intensity of the 12CO J ¼ 6Y5 line measured by asingle-dish observation is 320 Jy (Herpin et al. 2002), whilethe peak intensity of the 12CO J ¼ 6Y5 line measured in thepresent observation is 55.3 Jy. In comparison with Herpin’ssingle-dish observation, roughly 80% of the flux of the low-velocity component of the 12CO J ¼ 6Y5 line is resolved out inthe present observation, even though there is no significant miss-ing flux in the high-velocity component of the 12CO J ¼ 6Y5line. The large amount of missing flux of the low-velocity com-ponent implies that the emission region of the low-velocity com-ponent of the 12CO J ¼ 6Y5 line is largely extended.
The 13CO J ¼ 2Y1 line exhibits only the low-velocity com-ponent, presumably related to the sensitivity. In comparisonwith a single-dish observation (Bujarrabal et al. 1988), there is
Fig. 2.—Spatially integrated spectra of the 12CO J ¼ 2Y1, 12CO J ¼ 6Y5, and13CO J ¼ 2Y1 lines. The integrated area is a circle with an angular diameter of1500. For the 12CO J ¼ 6Y5 line, the spectrum is smoothed over every 5 km s�1.The other detected lines seen in the spectra are indicated by the name of the mo-lecular species or by ‘‘U,’’ meaning an unidentified line.
SMA OBSERVATION OF CRL 618 2037No. 5, 2007
no significant flux loss in the low-velocity component of the13CO J ¼ 2Y1 line. In all three spectra of the CO lines, we cansee an absorption feature at Vlsr � �40 km s�1. Although it issomewhat difficult to see the absorption feature in the 13CO J ¼2Y1 line (at least, there is no absorption below the continuum
level), the line profile of the 13CO J ¼ 2Y1 line is certainlyasymmetric: it shows a weaker blue side compared with the redone (this is clearly seen in the p-v diagram given in a later section;see Fig. 8). Therefore, there is in fact absorption of the blue sideof the low-velocity component in the 13CO J ¼ 2Y1 line. The
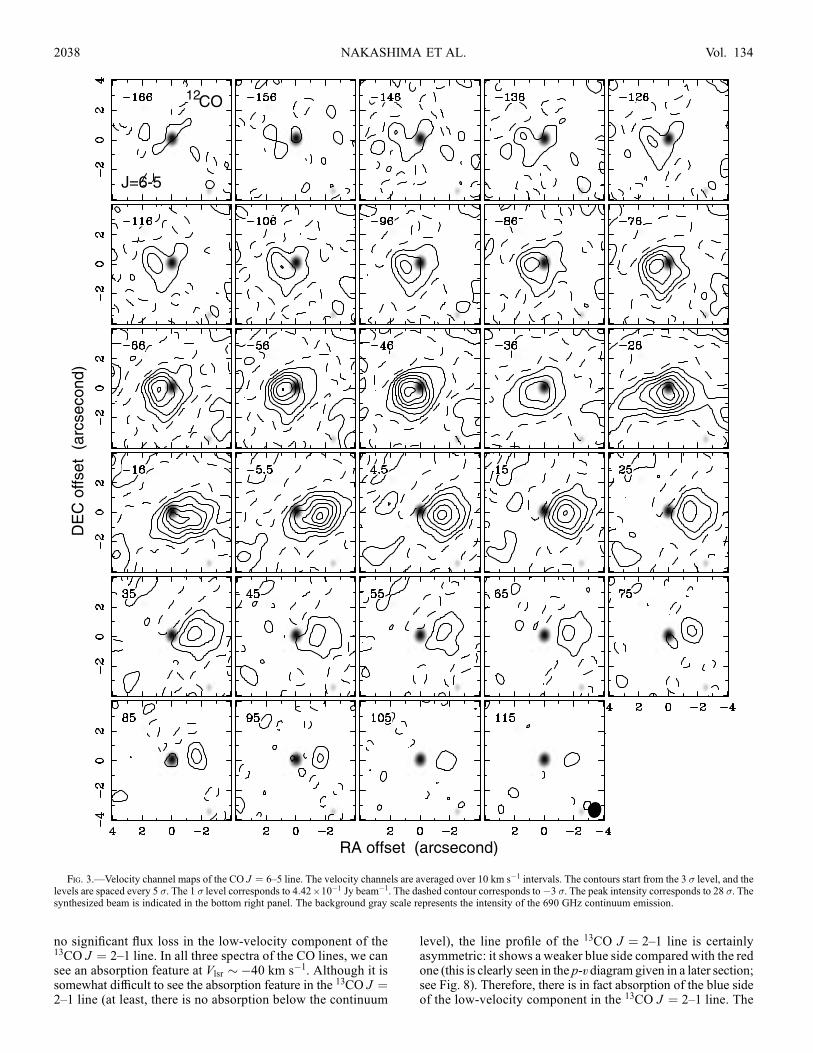
Fig. 3.—Velocity channel maps of the CO J ¼ 6Y5 line. The velocity channels are averaged over 10 km s�1 intervals. The contours start from the 3 � level, and thelevels are spaced every 5 �. The 1 � level corresponds to 4:42 ; 10�1 Jy beam�1. The dashed contour corresponds to�3 �. The peak intensity corresponds to 28 �. Thesynthesized beam is indicated in the bottom right panel. The background gray scale represents the intensity of the 690 GHz continuum emission.
NAKASHIMA ET AL.2038 Vol. 134
profile of the low-velocity component, showing a spiky feature,is somewhat different from that of the 12CO J ¼ 2Y1 line, show-ing a parabolic profile. This difference is presumably due to therelatively thin optical depth of the 13CO J ¼ 2Y1 line. The spikyprofile suggests a complex kinematics in the inner part the mo-lecular envelope. In Figure 2 (bottom) we can see a broad emis-sion feature at Vlsr � �300 km s�1, which can be explainedby leakage of the strong 12CO J ¼ 2Y1 line lying in the othersideband. This conclusion is based on the fact that the peak ve-locity of this feature exactly corresponds to the backside of the12CO J ¼ 2Y1 line, the line profile is very similar to that of the12CO J ¼ 2Y1 line, and also because no possible lines are foundin molecular line catalogs. (Note that this leakage problem hasalready been fixed, and the current SMA system has no problemseven in the case of very strong lines such as CO lines.)
3.2. Intensity Maps of CO Lines
Figure 3 shows the velocity channel maps of the 12CO J ¼6Y5 line. The background gray scale represents the continuumemission at 690 GHz, and the origin of the map is taken atthe intensity peak of the continuum emission. In Figure 3 wecan clearly see a velocity gradient in the east-west direction, aswell as in the 12CO J ¼ 2Y1 map by Sanchez Contreras et al.(2004). Interestingly, we cannot see the cavity structure foundby Sanchez Contreras et al. (2004) in the 12CO J ¼ 2Y1 line, al-though the angular resolution of the present observation in the12CO J ¼ 6Y5 line roughly equals that of Sanchez Contreras’sobservation in the 12CO J ¼ 2Y1 line. Both ends of the high-velocity component (i.e., from�166 to�116 km s�1 and from35 to 115 km s�1) are clearly extended in the east-west direc-tion up to roughly�2.500 from the nebula center. This size of theextension in the east-west direction is the same as that seen in the12CO J ¼ 2Y1 line.
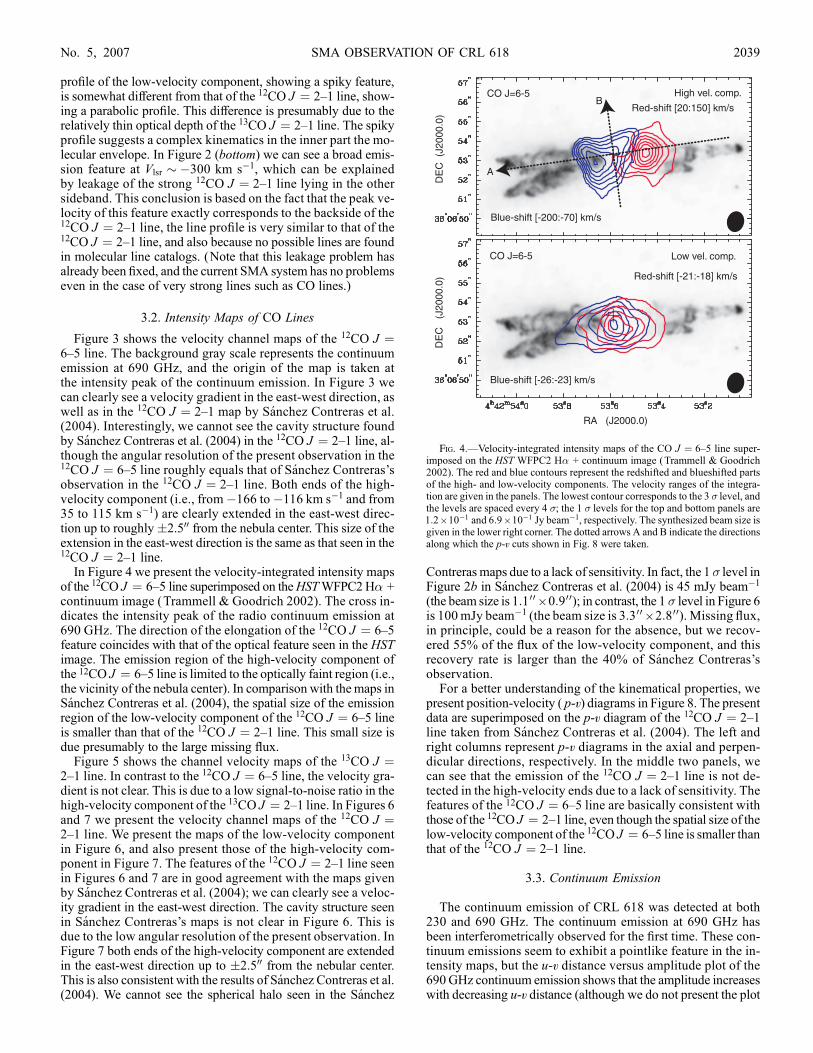
In Figure 4 we present the velocity-integrated intensity mapsof the 12CO J ¼ 6Y5 line superimposed on theHSTWFPC2H� +continuum image (Trammell & Goodrich 2002). The cross in-dicates the intensity peak of the radio continuum emission at690 GHz. The direction of the elongation of the 12CO J ¼ 6Y5feature coincides with that of the optical feature seen in the HSTimage. The emission region of the high-velocity component ofthe 12CO J ¼ 6Y5 line is limited to the optically faint region (i.e.,the vicinity of the nebula center). In comparison with the maps inSanchez Contreras et al. (2004), the spatial size of the emissionregion of the low-velocity component of the 12CO J ¼ 6Y5 lineis smaller than that of the 12CO J ¼ 2Y1 line. This small size isdue presumably to the large missing flux.
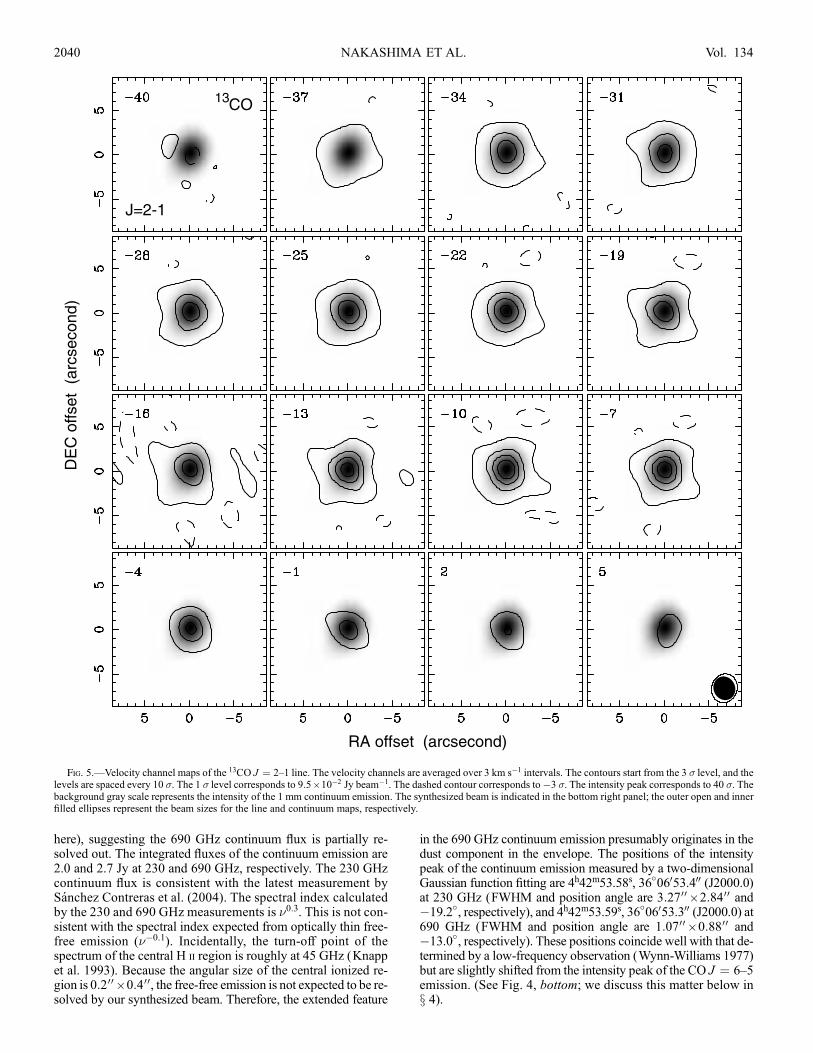
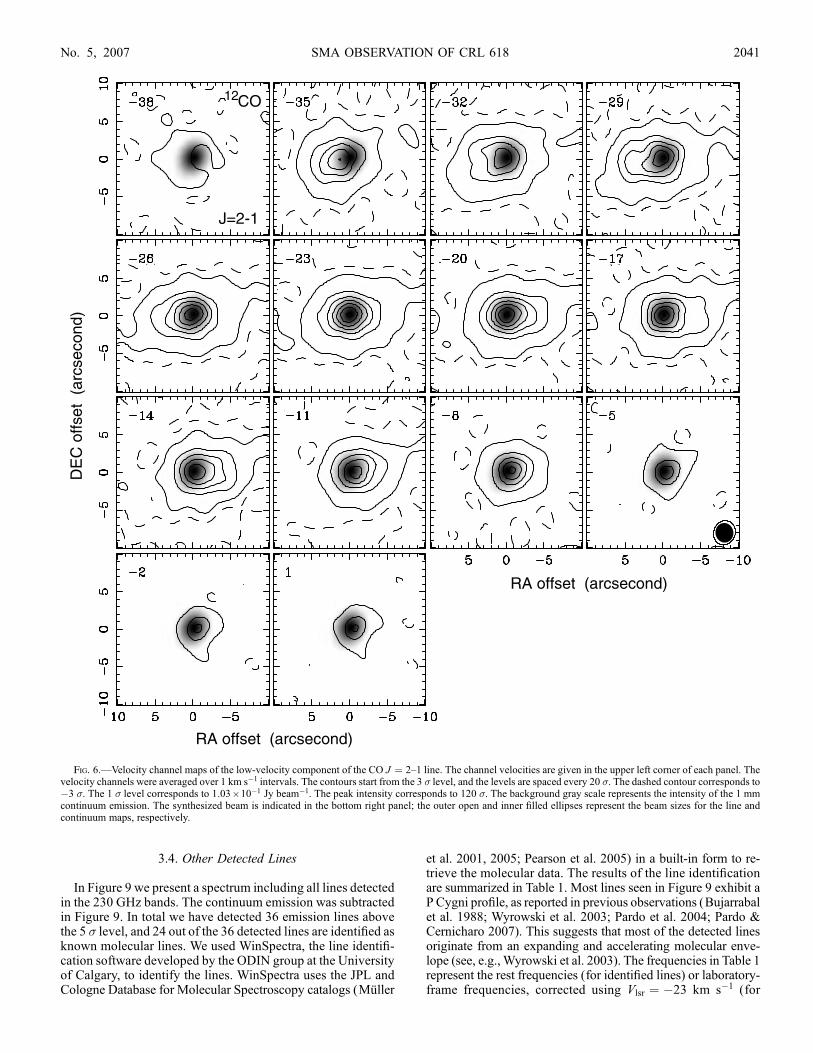
Figure 5 shows the channel velocity maps of the 13CO J ¼2Y1 line. In contrast to the 12CO J ¼ 6Y5 line, the velocity gra-dient is not clear. This is due to a low signal-to-noise ratio in thehigh-velocity component of the 13CO J ¼ 2Y1 line. In Figures 6and 7 we present the velocity channel maps of the 12CO J ¼2Y1 line. We present the maps of the low-velocity componentin Figure 6, and also present those of the high-velocity com-ponent in Figure 7. The features of the 12CO J ¼ 2Y1 line seenin Figures 6 and 7 are in good agreement with the maps givenby Sanchez Contreras et al. (2004); we can clearly see a veloc-ity gradient in the east-west direction. The cavity structure seenin Sanchez Contreras’s maps is not clear in Figure 6. This isdue to the low angular resolution of the present observation. InFigure 7 both ends of the high-velocity component are extendedin the east-west direction up to �2.500 from the nebular center.This is also consistent with the results of Sanchez Contreras et al.(2004). We cannot see the spherical halo seen in the Sanchez
Contreras maps due to a lack of sensitivity. In fact, the 1 � level inFigure 2b in Sanchez Contreras et al. (2004) is 45 mJy beam�1
(the beam size is 1:100 ; 0:900); in contrast, the 1 � level in Figure 6is 100 mJy beam�1 (the beam size is 3:300 ; 2:800). Missing flux,in principle, could be a reason for the absence, but we recov-ered 55% of the flux of the low-velocity component, and thisrecovery rate is larger than the 40% of Sanchez Contreras’sobservation.
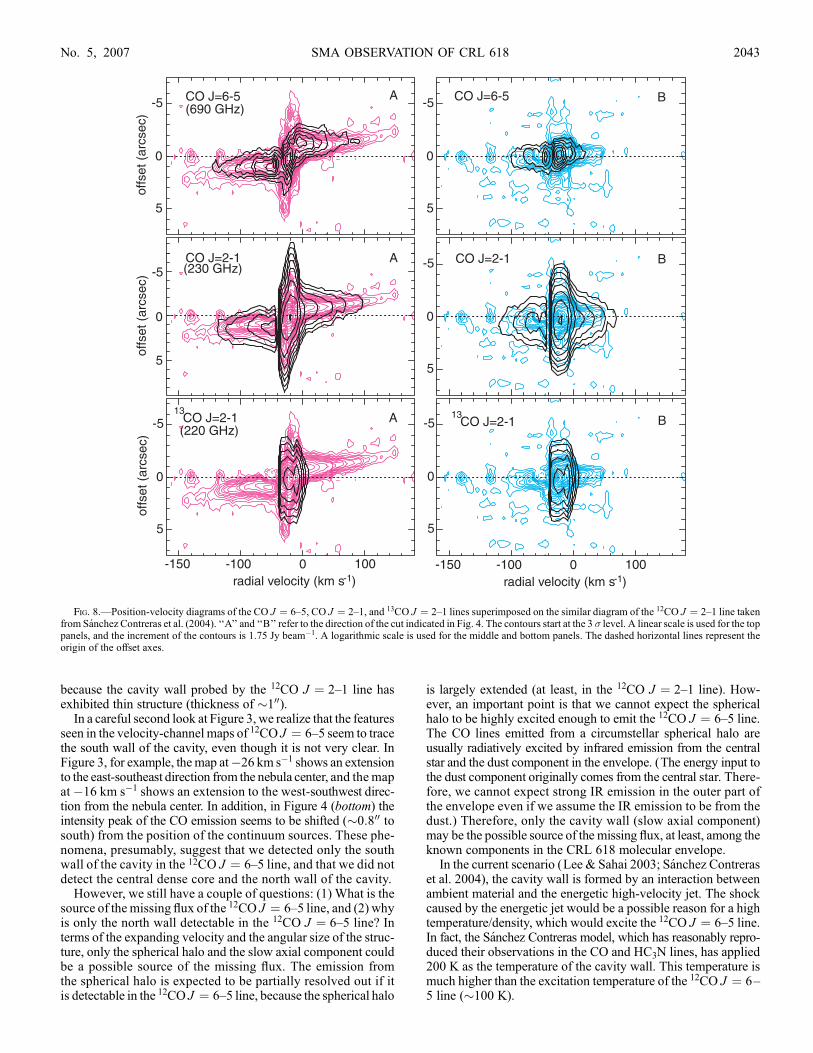
For a better understanding of the kinematical properties, wepresent position-velocity ( p-v) diagrams in Figure 8. The presentdata are superimposed on the p-v diagram of the 12CO J ¼ 2Y1line taken from Sanchez Contreras et al. (2004). The left andright columns represent p-v diagrams in the axial and perpen-dicular directions, respectively. In the middle two panels, wecan see that the emission of the 12CO J ¼ 2Y1 line is not de-tected in the high-velocity ends due to a lack of sensitivity. Thefeatures of the 12CO J ¼ 6Y5 line are basically consistent withthose of the 12CO J ¼ 2Y1 line, even though the spatial size of thelow-velocity component of the 12CO J ¼ 6Y5 line is smaller thanthat of the 12CO J ¼ 2Y1 line.
3.3. Continuum Emission
The continuum emission of CRL 618 was detected at both230 and 690 GHz. The continuum emission at 690 GHz hasbeen interferometrically observed for the first time. These con-tinuum emissions seem to exhibit a pointlike feature in the in-tensity maps, but the u-v distance versus amplitude plot of the690GHz continuum emission shows that the amplitude increaseswith decreasing u-v distance (although we do not present the plot
Fig. 4.—Velocity-integrated intensity maps of the CO J ¼ 6Y5 line super-imposed on the HST WFPC2 H� + continuum image (Trammell & Goodrich2002). The red and blue contours represent the redshifted and blueshifted partsof the high- and low-velocity components. The velocity ranges of the integra-tion are given in the panels. The lowest contour corresponds to the 3 � level, andthe levels are spaced every 4 �; the 1 � levels for the top and bottom panels are1:2 ; 10�1 and 6:9 ; 10�1 Jy beam�1, respectively. The synthesized beam size isgiven in the lower right corner. The dotted arrows A and B indicate the directionsalong which the p-v cuts shown in Fig. 8 were taken.
SMA OBSERVATION OF CRL 618 2039No. 5, 2007
here), suggesting the 690 GHz continuum flux is partially re-solved out. The integrated fluxes of the continuum emission are2.0 and 2.7 Jy at 230 and 690 GHz, respectively. The 230 GHzcontinuum flux is consistent with the latest measurement bySanchez Contreras et al. (2004). The spectral index calculatedby the 230 and 690 GHz measurements is �0.3. This is not con-sistent with the spectral index expected from optically thin free-free emission (��0.1). Incidentally, the turn-off point of thespectrum of the central H ii region is roughly at 45 GHz (Knappet al. 1993). Because the angular size of the central ionized re-gion is 0:200 ; 0:400, the free-free emission is not expected to be re-solved by our synthesized beam. Therefore, the extended feature
in the 690 GHz continuum emission presumably originates in thedust component in the envelope. The positions of the intensitypeak of the continuum emission measured by a two-dimensionalGaussian function fitting are 4h42m53.58s, 36�06053.400 (J2000.0)at 230 GHz (FWHM and position angle are 3:2700 ; 2:8400 and�19.2�, respectively), and 4h42m53.59s, 36�06053.300 (J2000.0) at690 GHz (FWHM and position angle are 1:0700 ; 0:8800 and�13.0�, respectively). These positions coincide well with that de-termined by a low-frequency observation (Wynn-Williams 1977)but are slightly shifted from the intensity peak of the CO J ¼ 6Y5emission. (See Fig. 4, bottom; we discuss this matter below inx 4).
Fig. 5.—Velocity channel maps of the 13CO J ¼ 2Y1 line. The velocity channels are averaged over 3 km s�1 intervals. The contours start from the 3 � level, and thelevels are spaced every 10 �. The 1 � level corresponds to 9:5 ; 10�2 Jy beam�1. The dashed contour corresponds to�3 �. The intensity peak corresponds to 40 �. Thebackground gray scale represents the intensity of the 1 mm continuum emission. The synthesized beam is indicated in the bottom right panel; the outer open and innerfilled ellipses represent the beam sizes for the line and continuum maps, respectively.
NAKASHIMA ET AL.2040 Vol. 134
3.4. Other Detected Lines
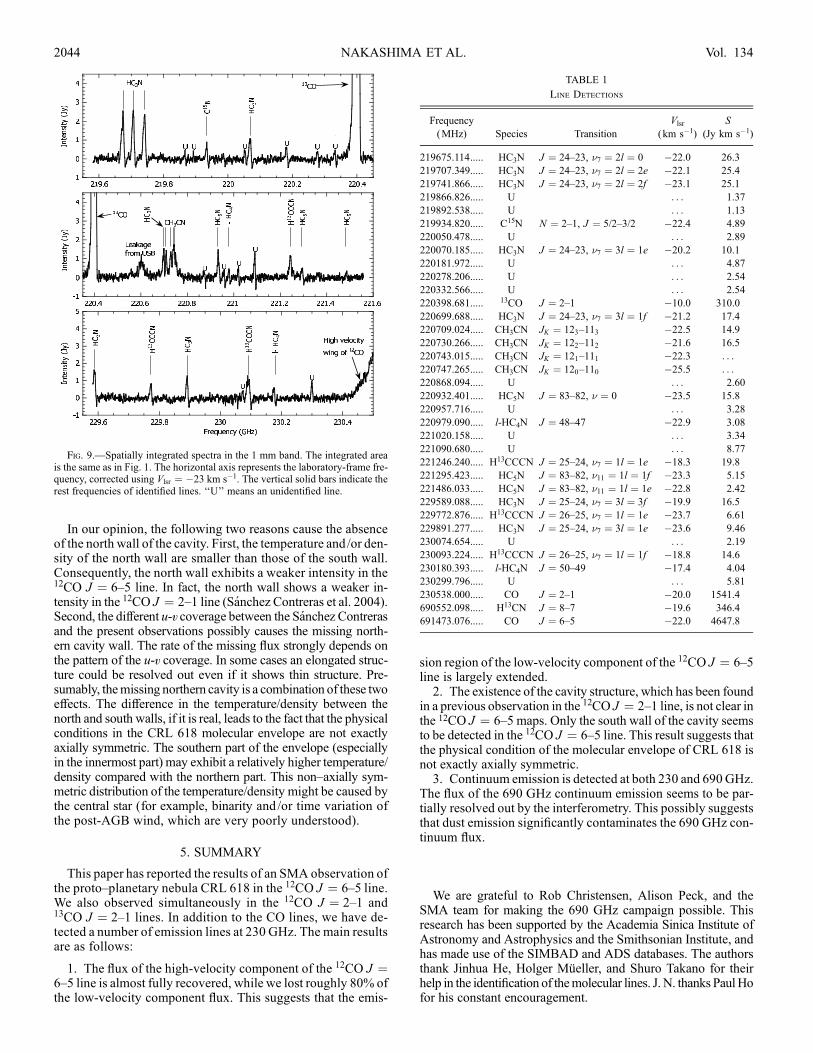
In Figure 9 we present a spectrum including all lines detectedin the 230 GHz bands. The continuum emission was subtractedin Figure 9. In total we have detected 36 emission lines abovethe 5 � level, and 24 out of the 36 detected lines are identified asknown molecular lines. We used WinSpectra, the line identifi-cation software developed by the ODIN group at the Universityof Calgary, to identify the lines. WinSpectra uses the JPL andCologne Database for Molecular Spectroscopy catalogs (Muller
et al. 2001, 2005; Pearson et al. 2005) in a built-in form to re-trieve the molecular data. The results of the line identificationare summarized in Table 1. Most lines seen in Figure 9 exhibit aP Cygni profile, as reported in previous observations (Bujarrabalet al. 1988; Wyrowski et al. 2003; Pardo et al. 2004; Pardo &Cernicharo 2007). This suggests that most of the detected linesoriginate from an expanding and accelerating molecular enve-lope (see, e.g., Wyrowski et al. 2003). The frequencies in Table 1represent the rest frequencies (for identified lines) or laboratory-frame frequencies, corrected using Vlsr ¼ �23 km s�1 (for
Fig. 6.—Velocity channel maps of the low-velocity component of the CO J ¼ 2Y1 line. The channel velocities are given in the upper left corner of each panel. Thevelocity channels were averaged over 1 km s�1 intervals. The contours start from the 3 � level, and the levels are spaced every 20 �. The dashed contour corresponds to�3 �. The 1 � level corresponds to 1:03 ; 10�1 Jy beam�1. The peak intensity corresponds to 120 �. The background gray scale represents the intensity of the 1 mmcontinuum emission. The synthesized beam is indicated in the bottom right panel; the outer open and inner filled ellipses represent the beam sizes for the line andcontinuum maps, respectively.
SMA OBSERVATION OF CRL 618 2041No. 5, 2007
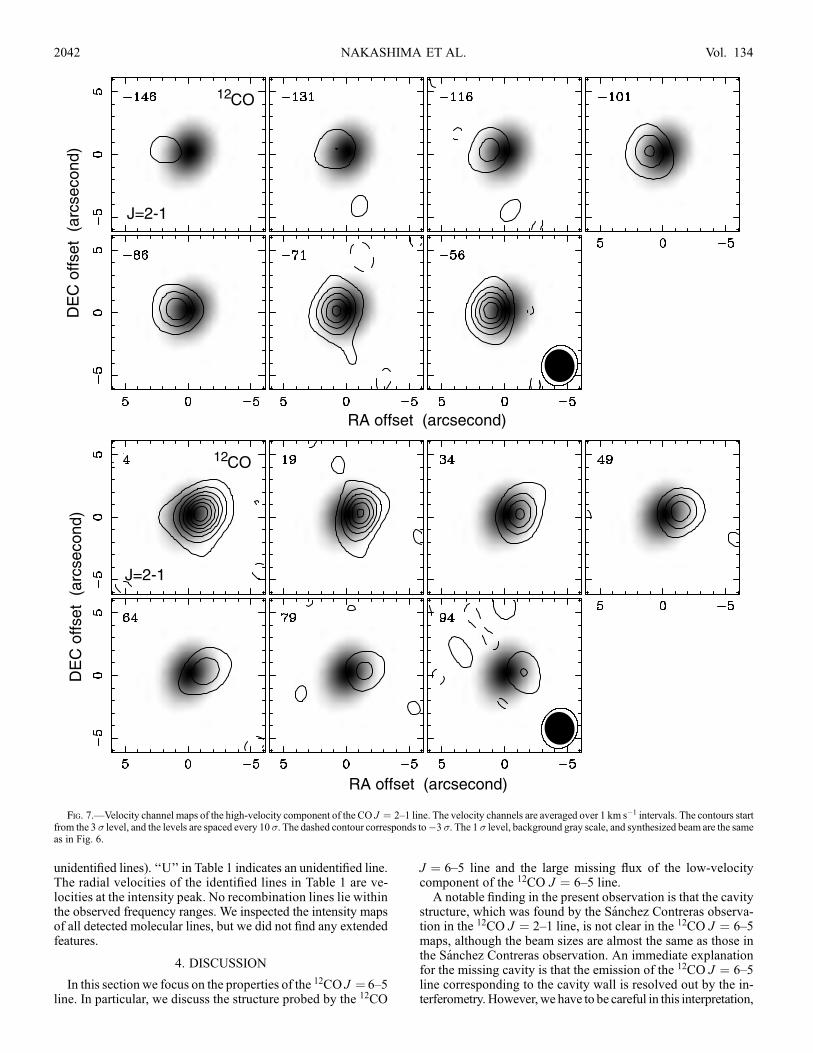
unidentified lines). ‘‘U’’ in Table 1 indicates an unidentified line.The radial velocities of the identified lines in Table 1 are ve-locities at the intensity peak. No recombination lines lie withinthe observed frequency ranges. We inspected the intensity mapsof all detected molecular lines, but we did not find any extendedfeatures.
4. DISCUSSION
In this section we focus on the properties of the 12CO J ¼ 6Y5line. In particular, we discuss the structure probed by the 12CO
J ¼ 6Y5 line and the large missing flux of the low-velocitycomponent of the 12CO J ¼ 6Y5 line.A notable finding in the present observation is that the cavity
structure, which was found by the Sanchez Contreras observa-tion in the 12CO J ¼ 2Y1 line, is not clear in the 12CO J ¼ 6Y5maps, although the beam sizes are almost the same as those inthe Sanchez Contreras observation. An immediate explanationfor the missing cavity is that the emission of the 12CO J ¼ 6Y5line corresponding to the cavity wall is resolved out by the in-terferometry. However, we have to be careful in this interpretation,
Fig. 7.—Velocity channel maps of the high-velocity component of the CO J ¼ 2Y1 line. The velocity channels are averaged over 1 km s�1 intervals. The contours startfrom the 3 � level, and the levels are spaced every 10 �. The dashed contour corresponds to�3 �. The 1 � level, background gray scale, and synthesized beam are the sameas in Fig. 6.
NAKASHIMA ET AL.2042 Vol. 134
because the cavity wall probed by the 12CO J ¼ 2Y1 line hasexhibited thin structure (thickness of �100).
In a careful second look at Figure 3, we realize that the featuresseen in the velocity-channel maps of 12CO J ¼ 6Y5 seem to tracethe south wall of the cavity, even though it is not very clear. InFigure 3, for example, themap at�26 km s�1 shows an extensionto the east-southeast direction from the nebula center, and the mapat�16 km s�1 shows an extension to the west-southwest direc-tion from the nebula center. In addition, in Figure 4 (bottom) theintensity peak of the CO emission seems to be shifted (�0.800 tosouth) from the position of the continuum sources. These phe-nomena, presumably, suggest that we detected only the southwall of the cavity in the 12CO J ¼ 6Y5 line, and that we did notdetect the central dense core and the north wall of the cavity.
However, we still have a couple of questions: (1) What is thesource of the missing flux of the 12CO J ¼ 6Y5 line, and (2) whyis only the north wall detectable in the 12CO J ¼ 6Y5 line? Interms of the expanding velocity and the angular size of the struc-ture, only the spherical halo and the slow axial component couldbe a possible source of the missing flux. The emission fromthe spherical halo is expected to be partially resolved out if itis detectable in the 12CO J ¼ 6Y5 line, because the spherical halo
is largely extended (at least, in the 12CO J ¼ 2Y1 line). How-ever, an important point is that we cannot expect the sphericalhalo to be highly excited enough to emit the 12CO J ¼ 6Y5 line.The CO lines emitted from a circumstellar spherical halo areusually radiatively excited by infrared emission from the centralstar and the dust component in the envelope. (The energy input tothe dust component originally comes from the central star. There-fore, we cannot expect strong IR emission in the outer part ofthe envelope even if we assume the IR emission to be from thedust.) Therefore, only the cavity wall (slow axial component)may be the possible source of the missing flux, at least, among theknown components in the CRL 618 molecular envelope.
In the current scenario (Lee & Sahai 2003; Sanchez Contreraset al. 2004), the cavity wall is formed by an interaction betweenambient material and the energetic high-velocity jet. The shockcaused by the energetic jet would be a possible reason for a hightemperature/density, which would excite the 12CO J ¼ 6Y5 line.In fact, the Sanchez Contreras model, which has reasonably repro-duced their observations in the CO and HC3N lines, has applied200 K as the temperature of the cavity wall. This temperature ismuch higher than the excitation temperature of the 12CO J ¼ 6Y5 line (�100 K).
Fig. 8.—Position-velocity diagrams of the CO J ¼ 6Y5, CO J ¼ 2Y1, and 13CO J ¼ 2Y1 lines superimposed on the similar diagram of the 12CO J ¼ 2Y1 line takenfrom Sanchez Contreras et al. (2004). ‘‘A’’ and ‘‘B’’ refer to the direction of the cut indicated in Fig. 4. The contours start at the 3 � level. A linear scale is used for the toppanels, and the increment of the contours is 1.75 Jy beam�1. A logarithmic scale is used for the middle and bottom panels. The dashed horizontal lines represent theorigin of the offset axes.
SMA OBSERVATION OF CRL 618 2043No. 5, 2007
In our opinion, the following two reasons cause the absenceof the north wall of the cavity. First, the temperature and/or den-sity of the north wall are smaller than those of the south wall.Consequently, the north wall exhibits a weaker intensity in the12CO J ¼ 6Y5 line. In fact, the north wall shows a weaker in-tensity in the 12CO J ¼ 2Y1 line (Sanchez Contreras et al. 2004).Second, the different u-v coverage between the Sanchez Contrerasand the present observations possibly causes the missing north-ern cavity wall. The rate of the missing flux strongly depends onthe pattern of the u-v coverage. In some cases an elongated struc-ture could be resolved out even if it shows thin structure. Pre-sumably, themissing northern cavity is a combination of these twoeffects. The difference in the temperature/density between thenorth and south walls, if it is real, leads to the fact that the physicalconditions in the CRL 618 molecular envelope are not exactlyaxially symmetric. The southern part of the envelope (especiallyin the innermost part) may exhibit a relatively higher temperature/density compared with the northern part. This nonYaxially sym-metric distribution of the temperature/density might be caused bythe central star (for example, binarity and /or time variation ofthe post-AGB wind, which are very poorly understood).
5. SUMMARY
This paper has reported the results of an SMA observation ofthe protoYplanetary nebula CRL 618 in the 12CO J ¼ 6Y5 line.We also observed simultaneously in the 12CO J ¼ 2Y1 and13CO J ¼ 2Y1 lines. In addition to the CO lines, we have de-tected a number of emission lines at 230 GHz. The main resultsare as follows:
1. The flux of the high-velocity component of the 12CO J ¼6Y5 line is almost fully recovered, while we lost roughly 80% ofthe low-velocity component flux. This suggests that the emis-
sion region of the low-velocity component of the 12CO J ¼ 6Y5line is largely extended.2. The existence of the cavity structure, which has been found
in a previous observation in the 12CO J ¼ 2Y1 line, is not clear inthe 12CO J ¼ 6Y5 maps. Only the south wall of the cavity seemsto be detected in the 12CO J ¼ 6Y5 line. This result suggests thatthe physical condition of the molecular envelope of CRL 618 isnot exactly axially symmetric.3. Continuum emission is detected at both 230 and 690 GHz.
The flux of the 690 GHz continuum emission seems to be par-tially resolved out by the interferometry. This possibly suggeststhat dust emission significantly contaminates the 690 GHz con-tinuum flux.
We are grateful to Rob Christensen, Alison Peck, and theSMA team for making the 690 GHz campaign possible. Thisresearch has been supported by the Academia Sinica Institute ofAstronomy and Astrophysics and the Smithsonian Institute, andhas made use of the SIMBAD and ADS databases. The authorsthank Jinhua He, Holger Mueller, and Shuro Takano for theirhelp in the identification of themolecular lines. J. N. thanks PaulHofor his constant encouragement.
Fig. 9.—Spatially integrated spectra in the 1 mm band. The integrated areais the same as in Fig. 1. The horizontal axis represents the laboratory-frame fre-quency, corrected using Vlsr ¼ �23 km s�1. The vertical solid bars indicate therest frequencies of identified lines. ‘‘U’’ means an unidentified line.
TABLE 1
Line Detections
Frequency
(MHz) Species Transition
Vlsr
( km s�1)
S
(Jy km s�1)
219675.114..... HC3N J ¼ 24Y23, �7 ¼ 2l ¼ 0 �22.0 26.3
219707.349..... HC3N J ¼ 24Y23, �7 ¼ 2l ¼ 2e �22.1 25.4
219741.866..... HC3N J ¼ 24Y23, �7 ¼ 2l ¼ 2f �23.1 25.1
219866.826..... U . . . 1.37
219892.538..... U . . . 1.13
219934.820..... C15N N ¼ 2Y1, J ¼ 5/2Y3/2 �22.4 4.89
220050.478..... U . . . 2.89
220070.185..... HC3N J ¼ 24Y23, �7 ¼ 3l ¼ 1e �20.2 10.1
220181.972..... U . . . 4.87
220278.206..... U . . . 2.54
220332.566..... U . . . 2.54
220398.681..... 13CO J ¼ 2Y1 �10.0 310.0
220699.688..... HC3N J ¼ 24Y23, �7 ¼ 3l ¼ 1f �21.2 17.4
220709.024..... CH3CN JK ¼ 123Y113 �22.5 14.9
220730.266..... CH3CN JK ¼ 122Y112 �21.6 16.5
220743.015..... CH3CN JK ¼ 121Y111 �22.3 . . .
220747.265..... CH3CN JK ¼ 120Y110 �25.5 . . .220868.094..... U . . . 2.60
220932.401..... HC5N J ¼ 83Y82, � ¼ 0 �23.5 15.8
220957.716..... U . . . 3.28
220979.090..... l-HC4N J ¼ 48Y47 �22.9 3.08
221020.158..... U . . . 3.34
221090.680..... U . . . 8.77
221246.240..... H13CCCN J ¼ 25Y24, �7 ¼ 1l ¼ 1e �18.3 19.8
221295.423..... HC5N J ¼ 83Y82, �11 ¼ 1l ¼ 1f �23.3 5.15
221486.033..... HC5N J ¼ 83Y82, �11 ¼ 1l ¼ 1e �22.8 2.42
229589.088..... HC3N J ¼ 25Y24, �7 ¼ 3l ¼ 3f �19.9 16.5
229772.876..... H13CCCN J ¼ 26Y25, �7 ¼ 1l ¼ 1e �23.7 6.61
229891.277..... HC3N J ¼ 25Y24, �7 ¼ 3l ¼ 1e �23.6 9.46
230074.654..... U . . . 2.19
230093.224..... H13CCCN J ¼ 26Y25, �7 ¼ 1l ¼ 1f �18.8 14.6
230180.393..... l-HC4N J ¼ 50Y49 �17.4 4.04
230299.796..... U . . . 5.81
230538.000..... CO J ¼ 2Y1 �20.0 1541.4
690552.098..... H13CN J ¼ 8Y7 �19.6 346.4
691473.076..... CO J ¼ 6Y5 �22.0 4647.8
NAKASHIMA ET AL.2044 Vol. 134
REFERENCES
Balick, B., & Frank, A. 2002, ARA&A, 40, 439Bujarrabal, V., Alcolea, J., Neri, R., & Grewing, M. 1994, ApJ, 436, L169Bujarrabal, V., Castro-Carrizo, A., Alcolea, J., & Sanchez Contreras, C. 2001,A&A, 377, 868
Bujarrabal, V., Gomez-Gonzalez, J., Bachiller, R., & Martın-Pintado, J. 1988,A&A, 204, 242
Cernicharo, J., Guelin, M., Martın-Pintado, J., Penalver, J., & Mauersberger, R.1989, A&A, 222, L1
Cernicharo, J., Heras, A. M., Tielens, A. G. G. M., Pardo, J. R., Herpin, F.,Guelin, M., & Waters, L. B. F. M. 2001a, ApJ, 546, L123
Cernicharo, J., et al. 2001b, ApJ, 546, L127Fukasaku, S., Hirahara, Y., Masuda, A., Kawaguchi, K., Ishikawa, S., & Kaifu,N. 1994, ApJ, 437, 410
Garcıa-Segura, G., Lopez, J. A., & Franco, J. 2005, ApJ, 618, 919Goodrich, R. W. 1991, ApJ, 376, 654Hajian, A. R., Phillips, J. A., & Terzian, Y. 1996, ApJ, 467, 341Herpin, F., Goicoechea, J. R., Pardo, J. R., & Cernicharo, J. 2002, ApJ, 577,961
Ho, P., Moran, J. M., & Lo, K. Y. 2004, ApJ, 616, L1Jura, M., & Chen, C. 2000, ApJ, 544, L141Knapp, G. R., Sandell, G., & Robson, E. I. 1993, ApJS, 88, 173Kwok, S. 1993, ARA&A, 31, 63———. 2004, Nature, 430, 985Kwok, S., & Bignell, R. C. 1984, ApJ, 276, 544Kwok, S., & Feldman, P. A. 1981, ApJ, 247, L67Lee, C., & Sahai, R. 2003, ApJ, 586, 319Lucas, R., Omont, A., Guilloteau, S., & Nguyen-Q-Rieu. 1986, A&A, 154, L12Martın-Pintado, J., Gaume, R., Bachiller, R., & Johnson, K. 1993, ApJ, 419,725
Meixner, M., Campbell, M. T., Welch, W. J., & Likkel, L. 1998, ApJ, 509, 392Morris, M., Guilloteau, S., Lucas, R., & Omont, A. 1987, ApJ, 321, 888Muller, H. S. P., Schloder, F., Stutzki, J., & Winnewisser, G. 2005, J. MolecularStructure, 742, 215
Muller, H. S. P., Thorwirth, S., Roth, D. A., & Winnewisser, G. 2001, A&A,370, L49
Murakawa, K., Nakashima, J., Ohnaka, K., & Deguchi, S. 2007, A&A, 470,957
Nakashima, J., & Deguchi, S. 2000, PASJ, 52, L43———. 2004, ApJ, 610, L41———. 2005, ApJ, 633, 282Neri, R., Garcia-Burillo, S., Guelin, M., Guilloteau, S., & Lucas, R. 1992,A&A, 262, 544
Ohashi, N. 2005, J. Korean Astron. Soc., 38, 103Pardo, J. R., & Cernicharo, J. 2007, ApJ, 654, 978Pardo, J. R., Cernicharo, J., Goicoechea, J. R., & Phillips, T. G. 2004, ApJ, 615,495
Pearson, J. C., Drouin, B. J., & Pickett, H. M. 2005, in IAU Symp. 235, GalaxyEvolution across the Hubble Time, ed. F. Combes & J. Palous (New York:Cambridge Univ. Press), 270
Remijan, A., Wyrowsky, F., Friedel, D. N., Meier, D. S., & Snyder, L. E. 2005,ApJ, 626, 233
SanchezContreras, C., Bujarrabal, V., Castro-Carrizo, A.,Alcolea, J.,& Sargent, A.2004, ApJ, 617, 1142
Sanchez Contreras, C., & Sahai, R. 2004, ApJ, 602, 960Sault, R. J., Teuben, P. J., & Wright, M. C. H. 1995, in ASP Conf. Ser. 77,Astronomical Data Analysis Software and Systems IV, ed. R. A. Shaw, H. E.Payne, & J. J. E. Hayes (San Francisco: ASP), 433
Shibata, K. M., Deguchi, S., Hirano, N., Kameya, O., & Tamura, S. 1993, ApJ,415, 708
Steffen, W., Lopez, J. A., & Lim, A. 2001, ApJ, 556, 823Szczerba, R., Siodmiak, N., Stasinska, G., & Borkowski, J. 2007, A&A, 469,799
Trammell, S. R., & Goodrich, R. W. 2002, ApJ, 579, 688van Winckel, H. 2003, ARA&A, 41, 391Wynn-Williams, C. G. 1977, MNRAS, 181, P61Wyrowski, F., Schilke, P., Thorwirth, S., Menten, K. M., & Winnewisser, G.2003, ApJ, 586, 344
Yamamura, I., Shibata, K. M., Kasuga, T., & Deguchi, S. 1994, ApJ, 427, 406
SMA OBSERVATION OF CRL 618 2045No. 5, 2007