
Light Harvesting using Metal-Organic and Organic Sensitizers in Hybrid Solar Cells

Supporting Information
Metal Organic Framework Derived Copper Catalysts for CO2 to Ethylene
Conversion
Kaili Yao,a,b Yujian Xia,c Jun Li, d Ning Wang,a Jingrui Han,a Congcong Gao,a Mei Han,a Guoqiang
Shen,e Yongchang Liu,a Ali Seifitokaldani,f Xuhui Sun,c and Hongyan Lianga,b,*
aSchool of Materials Science and Engineering, Tianjin University, Tianjin 300350, P. R. China
bKey Laboratory of Efficient Utilization of Low and Medium Grade Energy, Ministry of Education,
Tianjin University, Tianjin 300350, P. R. China
cInstitute of Functional Nano & Soft Materials (FUNSOM), Jiangsu Key Laboratory for Carbon-Based
Materials and Devices, Soochow University, Suzhou, Jiangsu, 215123, P.R. China
dInstitute of Chemical Sciences and Engineering, École polytechnique fédérale de Lausanne,
Lausanne 1015, Switzerland
eSchool of Chemical Engineering and Technology, Tianjin University, Tianjin 300350, P. R. ChinafDepartment of Chemical Engineering, McGill University, Montreal, H3A 0C5, Canada
* E-mail: [email protected]
Electronic Supplementary Material (ESI) for Journal of Materials Chemistry A.This journal is © The Royal Society of Chemistry 2020

1 Experimental section
1.1 MOF-derived electrocatalyst preparation
HKUST-1 (denoted as H-0) was used as a precursor for preparing oxide-copper/carbon catalysts which was fabricated by following method: 8.14 mmol Cu nitrate (Cu (NO3)2·2H2O) and 4.16 mmol trimesic acid (C9H6O6, benzene-1,3,5-tricarboxylic acid) were dissolved in 50 mL methanol, respectively. After stirring to produce a homogeneous solution, Cu nitrate solution was transferred to the trimesic acid solution. The mixed solution was stirred for 2 h at room temperature. Then, the obtained blue solution containing HKUST-1 was washed by centrifugation with methanol and vacuum-dried.
Subsequently, the oxide-copper/carbon electrocatalysts were produced by calcination of HKUST-1 at the furnace under ambient air. The temperature was chosen according to the phase state change. The temperature of thermal treatment was conducted at 230, 265, and 500℃ for 3 h with a heating rate of 5℃/min, and the obtained catalysts were denoted as H-230, H-265 and H-500, respectively.
1.2 Material Characterization
Thermal behavior of HKUST-1 according to the temperature was investigated by TG/DSC with a simultaneous thermal analyzer (METTLER TOLEDO), the experiment was carried out in air flow (50 mL/min) at a heating rate of 10℃/min using an initial HKUST-1 mass of 1.326 mg. The phase of catalysts powder was verified by XRD with a Bruker D8 Advanced diffractometer using Cu Kα radiation (λ = 1.5406 Å). The surface morphology and composition of the catalysts were characterized by scanning electron microscopy (SEM, JEOL JSM-7800F) instruments with energy dispersive X-ray spectroscopy (EDX). Transmission electron microscope (TEM), high-resolution TEM (HRTEM), and TEM-mapping images were performed on a JEOL JEM-2100F operated at 200 kV. XPS for Cu oxidation state investigation before and after CO2RR was carried out by using a Thermo Scientific K-Alpha+ source XPS system. HAADF-STEM images were collected using a JEOL ARM200F microscope with the STEM aberration corrector operated at 200 kV.
1.3 Soft x-ray absorption spectroscopy (XAS) and extended x-ray absorption fine structure (EXAFS) measurements
The soft x-ray absorption spectroscopy measurements were carried out at beamline 20A1 of Taiwan Light Source. The energy scales of all Cu L3-edge XAS were calibrated by CuO standard reference sample. All the sample signals were collected simultaneously with the reference signal to ensure the accuracy of energy calibration. TEY signals were recorded by measuring the sample drain current. All spectra were normalized to the incoming photon flux monitored by the drain current of gold mesh located upstream of the end-station. Linear background was subtracted by fitting the slop in the pre-edge region of the spectrum into a straight line.
The extended x-ray absorption fine structure (EXAFS) measurements were conducted at beamline 17C1 and beamline 44A1 of Taiwan Light Source. The monochromator was operated with two flat Si (111) crystal. The calculated monochromator resolution at the Cu K-edge is about 0.45 eV. Cu metal foil was used as reference sample and were collected simultaneously with the sample to accurately determine the position of the absorption edge in X-ray absorption near edge structure (XANES) spectra of the sample. All EXAFS data were recorded in fluorescent mode using Lytle detector, ionization chambers were used to measure the incident intensity and the intensity transmitted through the Cu reference foil.
1.4 Electrochemical CO2 Reduction
The CO2RR activity of the catalysts was investigated by performing electrolysis in a two-compartment H-cell in CO2 saturated 0.1 M potassium bicarbonate (KHCO3) electrolyte. The three-electrode set-up was connected to a potentiostat (Autolab 204). Ag/AgCl was used as the reference electrode and graphite was used as the counter electrode, ion exchange membrane was Nafion 117. During electrolysis, CO2 gas was delivered into the cathodic compartment at a rate of 30 standard cubic centimeters per minute and was routed into a gas chromatograph with a thermal conductivity detector and a flame ionization detector (GC-2060A). Nitrogen (99.999%) was used as the carrier gas. The products were taken after 1 h of continuous run time. Reaction products were quantitatively determined using gas chromatography and nuclear magnetic resonance for gas and liquid products, respectively. Electrode potentials were converted to RHE using the following equation:ERHE = EAg/AgCl + 0.197 V + 0.0591 × pH
The number of moles of gas product were calculated from gas chromatography peak areas with conversion factors for gas products based on calibration with standard samples at 1.013 bar and 298.15 K. The Faradaic efficiency (FE) were calculated on the basis of the following equation:
FE% =
Peak area × FCO2× α × Z × 96485 × 101300 × 10 - 9
8.314 × 298.15 × j × 60× 100%
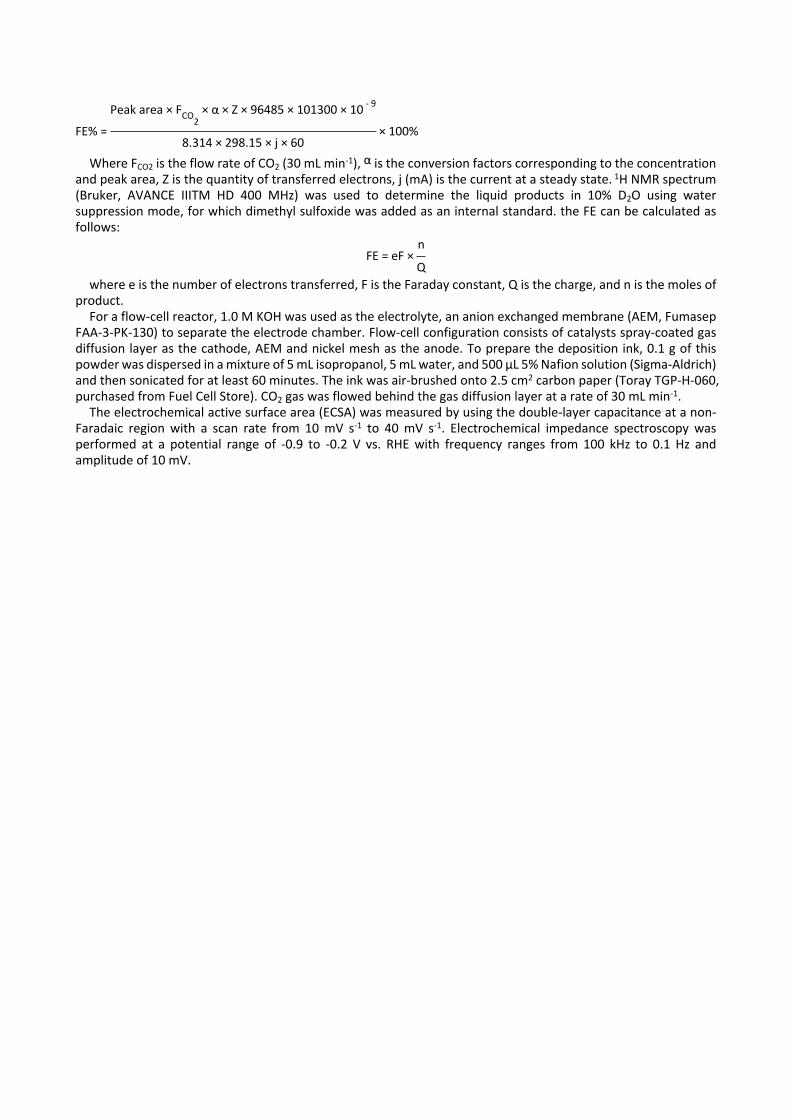
Where FCO2 is the flow rate of CO2 (30 mL min-1), is the conversion factors corresponding to the concentration αand peak area, Z is the quantity of transferred electrons, j (mA) is the current at a steady state. 1H NMR spectrum (Bruker, AVANCE IIITM HD 400 MHz) was used to determine the liquid products in 10% D2O using water suppression mode, for which dimethyl sulfoxide was added as an internal standard. the FE can be calculated as follows:
FE = eF ×n
Qwhere e is the number of electrons transferred, F is the Faraday constant, Q is the charge, and n is the moles of
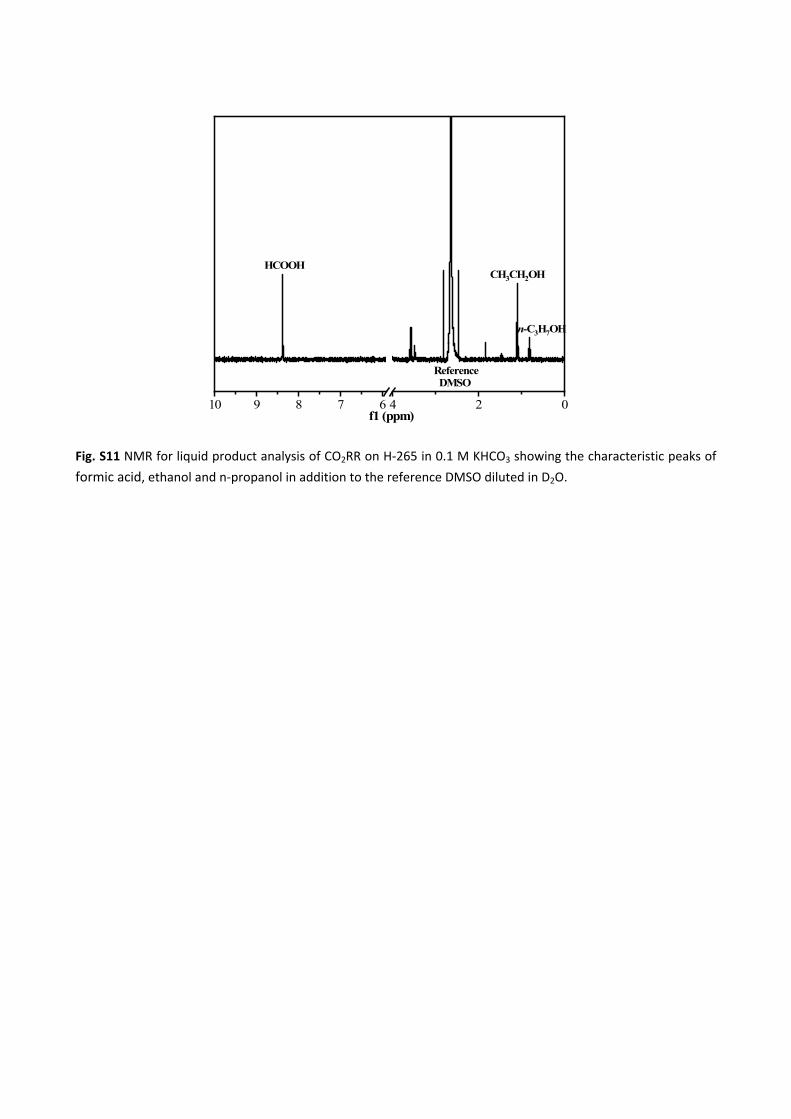
product. For a flow-cell reactor, 1.0 M KOH was used as the electrolyte, an anion exchanged membrane (AEM, Fumasep
FAA-3-PK-130) to separate the electrode chamber. Flow-cell configuration consists of catalysts spray-coated gas diffusion layer as the cathode, AEM and nickel mesh as the anode. To prepare the deposition ink, 0.1 g of this powder was dispersed in a mixture of 5 mL isopropanol, 5 mL water, and 500 μL 5% Nafion solution (Sigma-Aldrich) and then sonicated for at least 60 minutes. The ink was air-brushed onto 2.5 cm2 carbon paper (Toray TGP-H-060, purchased from Fuel Cell Store). CO2 gas was flowed behind the gas diffusion layer at a rate of 30 mL min-1.
The electrochemical active surface area (ECSA) was measured by using the double-layer capacitance at a non-Faradaic region with a scan rate from 10 mV s-1 to 40 mV s-1. Electrochemical impedance spectroscopy was performed at a potential range of -0.9 to -0.2 V vs. RHE with frequency ranges from 100 kHz to 0.1 Hz and amplitude of 10 mV.

Fig. S1 The crystal structure of pristine HKUST-1 (H-0). Grey atoms refer to carbon, red atoms refer to oxygen, brown atoms refer to copper, white atoms refer to hydrogen. HKUST-1 is a metal organic framework (MOF) comprised of copper dimer with benzene-1,3,5-tricarboxylic acid frames between them to form a 3D structure with open pores and periodic arrangement of Cu cations.1

0 100 200 300 400 500 600 700 8000
20
40
60
80
100
Mainframe disappear
Temperature (C)
Weig
ht p
erce
nt (%
)
265C: oxidation state
Fig. S2 Thermogravimetric analysis (TGA) curves of pristine HKUST-1 in air atmosphere. The first weight decrease
of HKUST-1 to 63% at 210℃ is due to the removal of adsorbed water and partial evaporation of organic ligands in the Cu dimer. Then increasing the temperature to 265℃, all HKUST-1 is completely converted to an oxidation state (dash line), which can be confirmed by XRD pattern in Fig. S3 below. The second abrupt mass loss occurred
at 310℃ is attribute to combustion of organic components in pristine HKUST-1.2

10 20 30 40 50 60
36.5
Inte
nsity
(a.u
.)
2 (degree)
1
H-500
H-300
H-280
H-265
H-250
H-230H-0
Fig. S3 XRD patterns for as-prepared H-0, H-230, H-265 and H-500 samples (Adding H-250, H-280 and H-300 samples). The XRD patterns presented the distinctive peaks at 2θ = 35.5°, 38.8° and 48.7°, which could be assigned to CuO (black lines, JCPDS card No. 48-1548).3 The diffraction peak of H-265 at 2θ = 36.5° belonged to the Cu2O (red line, JCPDS card No. 78-2076),4 which was close to the peak of CuO, but it can be seen more clearly in Fig. 1b.
It can be obviously observed that when the calcination temperature was 265℃ or above 265℃, HKUST-1 was completely converted to inorganic copper oxide.

Fig. S4 SEM and TEM images for as-prepared (a, d) H-0, (b, e) H-230, and (c, f) H-500 samples. The inset images were the color of H-0, H-230, and H-500 powders, H-0 was blue, H-230 was dark green and H-500 was dark.

Fig. S5 TEM image and the corresponding element mapping images for H-265 catalysts: (a) TEM image; EDS mapping of (b) Cu element, (c) O element and (d) C element. Noted that, after calcination, there are retained carbon elements in the catalysts, same as reported previously.5, 6

Fig. S6 SEM image and the corresponding element mapping images for H-500: (a) SEM image; EDS mapping of (b) Cu element, (c) O element and (d) C element. Noted that, after calcination, there are retained carbon elements in the catalysts, same as reported previously.5, 6

Fig. S7 GC calibration curves for (a) H2, (b) CO, (c) CH4, and (d) C2H4 measured with TCD and FID.

-0.78-0.98-1.18-1.38-1.58-1.78 -0.78-0.98-1.18-1.38-1.58-1.78 -0.78-0.98-1.18-1.38-1.58-1.780
20
40
60
80
100
H-500H-230
H-0
Fara
daic
eff
icie
ncy
(%)
E vs. RHE
H2 CO CH4 C2H4
Fig. S8 Faradaic efficiencies of gas products at various potential of CO2RR on H-0, H-230, and H-500 samples.

Fig. S9 (a) SEM image of Cu foil, and (b) Faradaic efficiencies of gas products at various potential of CO2RR on Cu foil control sample.

Fig. S10 (a) SEM image of Cu2O. (b) Faradaic efficiencies of gas products at various potential of CO2RR on Cu2O.
10 9 8 7 6 4 2 0
n-C3H7OH
CH3CH2OH
Reference DMSO
HCOOH
f1 (ppm)
Fig. S11 NMR for liquid product analysis of CO2RR on H-265 in 0.1 M KHCO3 showing the characteristic peaks of formic acid, ethanol and n-propanol in addition to the reference DMSO diluted in D2O.
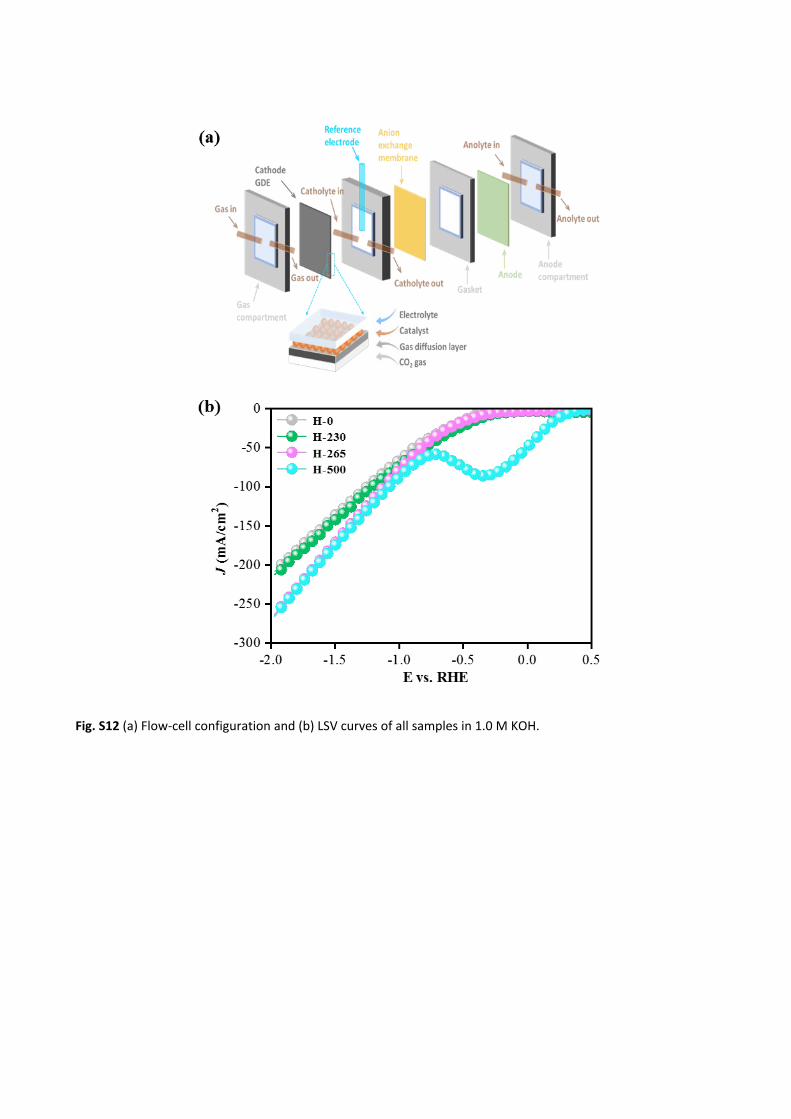
Fig. S12 (a) Flow-cell configuration and (b) LSV curves of all samples in 1.0 M KOH.

Fig. S13 Faraday efficiency stability of (a) H-265, (b) H-500, and (H-0) at a fixed potential of -1.58 V vs. RHE.

Fig. S14 Cyclic voltammograms of (a) as-prepared H-0, (b) H-230, (c) H-265, and (d) H-500 over a range of scan rates of 0.01 to 0.04 V/s. (e) Electrochemical double-layer capacitance plot for all samples coated on glassy carbon with Nafion. (f) LSV curves of all samples in an H-cell configuration.

30 35 40 45 50 55 60
CuCu2O
CuO1 h post
0.5 h post
0 h post
Inte
nsity
(a.u
.)
2 (degree)
Fig. S15 XRD analysis of H-265 measured before, after 0.5 h and 1 h of CO2RR in a flow-cell configuration with 1.0 M KOH electrolyte. After 0.5 h operation, Cu2+ was reduced to low valent state (Cu2O and Cu), and after 1 h operation, Cu2O was reduced to Cu but a small part of Cu2O still retained.7
0 1 2 3 4 5 6 7 8 9 10 11
k3 (k
) (Å
-3)
k (Å-1)
0 h post 1 h post 10 h post Cu foil standard Cu2O standard CuO standard
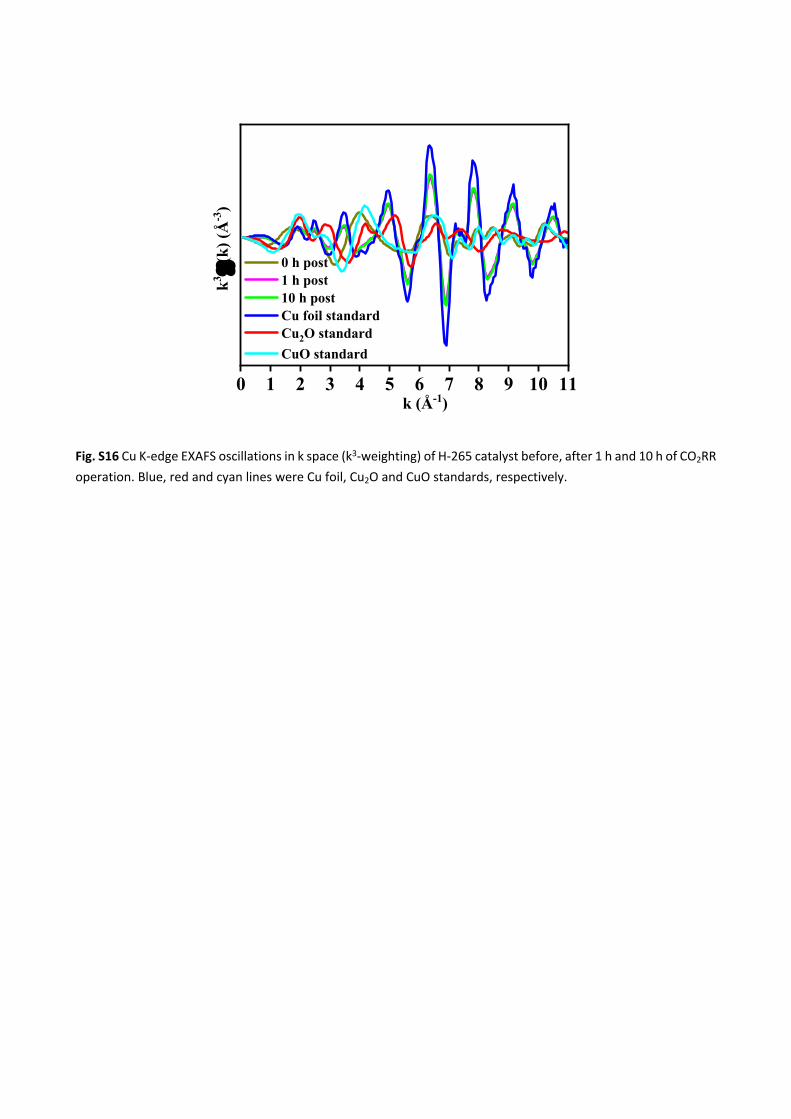
Fig. S16 Cu K-edge EXAFS oscillations in k space (k3-weighting) of H-265 catalyst before, after 1 h and 10 h of CO2RR operation. Blue, red and cyan lines were Cu foil, Cu2O and CuO standards, respectively.

Fig. S17 XANES fitting of Fig. 3e for H-265 catalyst: (a) 1 h post and (b) 10 h post; (c) Calculated ratio of Cu oxidation states with respect to time before and after CO2RR.

Fig. S18 EXAFS fitting of Fig. 3f for H-265 samples after CO2RR: (a) 1 h post and (b) 10 h post.

Fig. S19 (a) XPS O 1s spectra of H-265 measured before, after 1 h and 10 h of CO2RR, respectively, and (b) XPS O 1s spectra of H-500 measured before, after 1 h of CO2RR, respectively. (CuO: 529.8 eV, Cu2O: 530.5 eV, C related oxygen: 531.9 eV, and H2O: 533.5 eV).8

30 35 40 45 50 55 60
In
tens
ity (a
.u.)
2 (degree)
0.5 h post
0 h post
1 h post
CuCu2O
CuO
1
Fig. S20 XRD analysis of H-500 measured before, after 0.5 h and 1 h of CO2RR. Red lines refer to CuO, green lines refer to Cu2O and blue lines refer to Cu.

Fig. S21 (a) XPS Cu 2p spectra, and (b) Auger spectra of Cu LMM of H-500 measured before, and after 1 h of CO2RR, respectively.
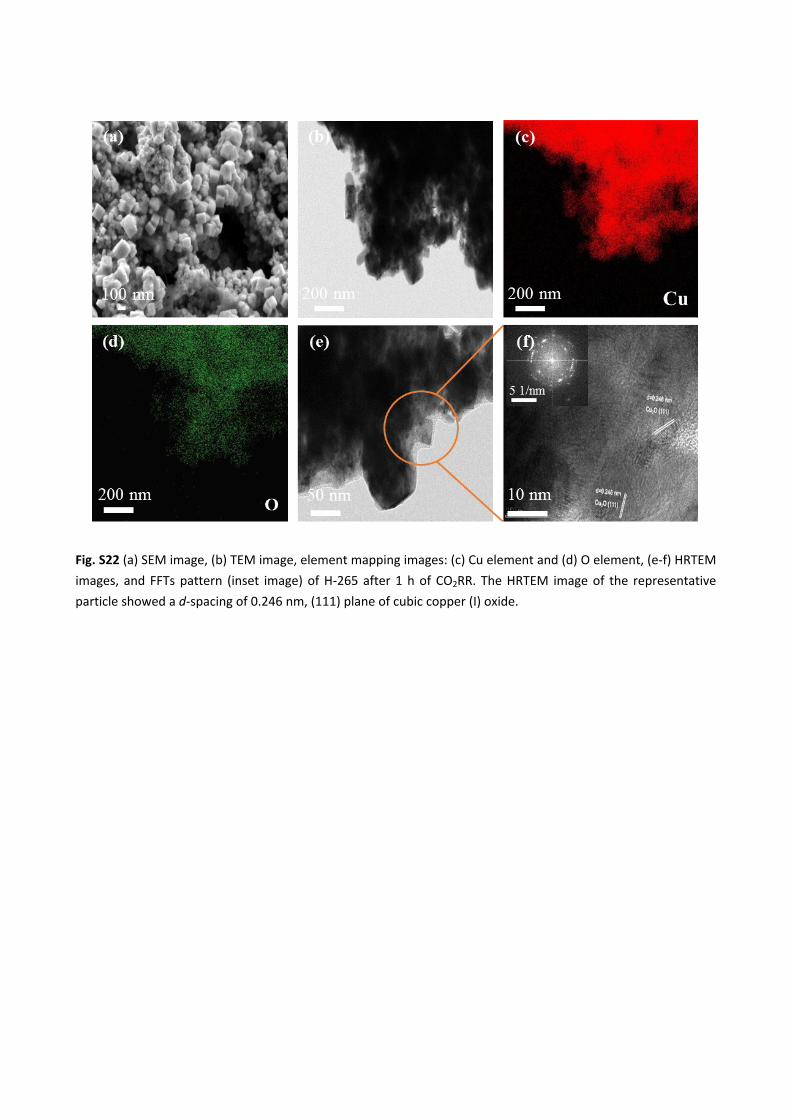
Fig. S22 (a) SEM image, (b) TEM image, element mapping images: (c) Cu element and (d) O element, (e-f) HRTEM images, and FFTs pattern (inset image) of H-265 after 1 h of CO2RR. The HRTEM image of the representative particle showed a d-spacing of 0.246 nm, (111) plane of cubic copper (I) oxide.
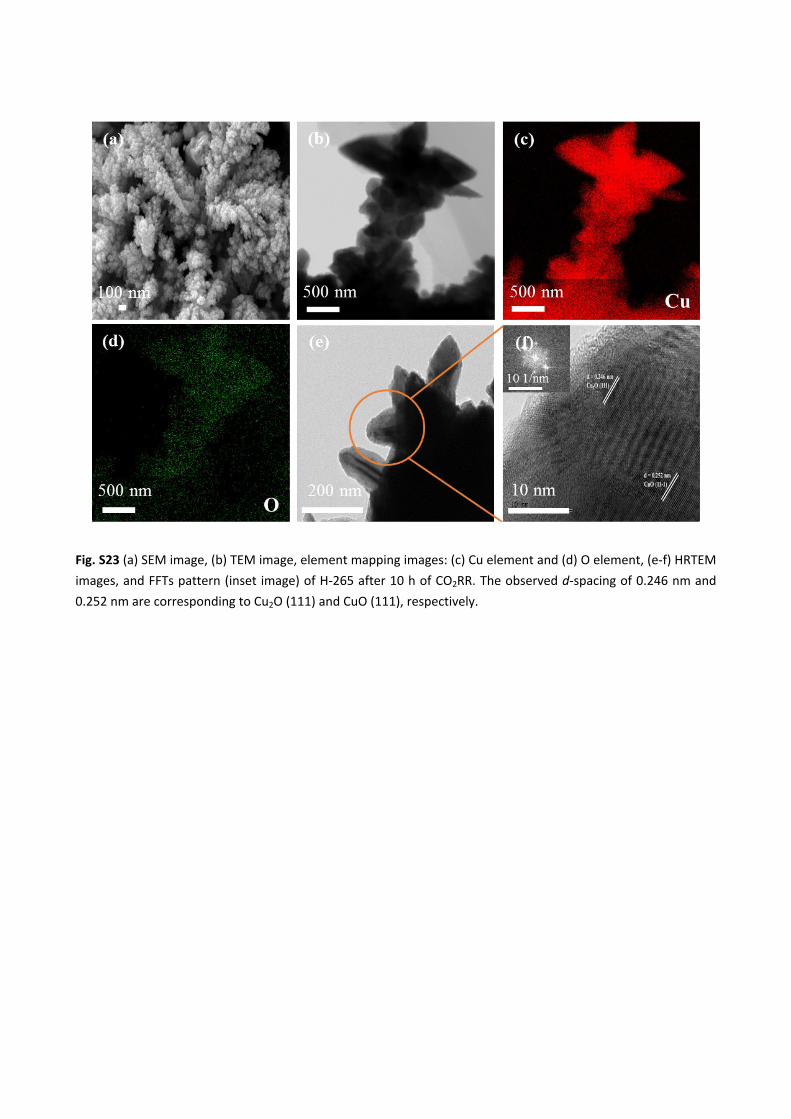
Fig. S23 (a) SEM image, (b) TEM image, element mapping images: (c) Cu element and (d) O element, (e-f) HRTEM images, and FFTs pattern (inset image) of H-265 after 10 h of CO2RR. The observed d-spacing of 0.246 nm and 0.252 nm are corresponding to Cu2O (111) and CuO (111), respectively.
10 nm

Fig. S24 SEM images for investigating the structure change for H-500 sample at -1.58 V vs. RHE: (a) before and (b) after 1 h of CO2RR. H-500 sample presents a bulk agglomeration before and after 1 h CO2RR.

-1.2 -0.8 -0.4 0.0 0.40.0
0.1
0.2
0.3
0.4
0.5
Log(-JCO) (mA/cm2)
Ove
r po
tent
ia (V
)Tafel slope=170.6
Tafel slope=224.3
Tafel slope=119.5
Tafel slope=260.1
H-0 H-230 H-265 H-500
Fig. S25 Tafel plot of CO2 saturated 0.1 M KHCO3 aqueous electrolyte. Theoretically, for CO2 reduction, a Tafel slope of 118 mV dec-1 means that the rate-limiting step is the initial one-electron reduction of CO2 to CO2·-, while a Tafel slope of 59 mV dec-1 implies that the rate-determining step (RDS) is a chemical reaction occurring after the one-electron activation of an inert CO2 molecule.9 According to Fig. S25, the Tafel slope of H-0, H-230, H-265, and H-500 samples were 260.1, 224.3, 119.5, and 170.6 mV dec-1, respectively, which were close to 118 mV dec-1, implying that the RDS is the activate of CO2. This proves that the H-265 catalyst is able to activate CO2 to CO2·- intermediate with a lower energy barrier compared to the other catalysts.
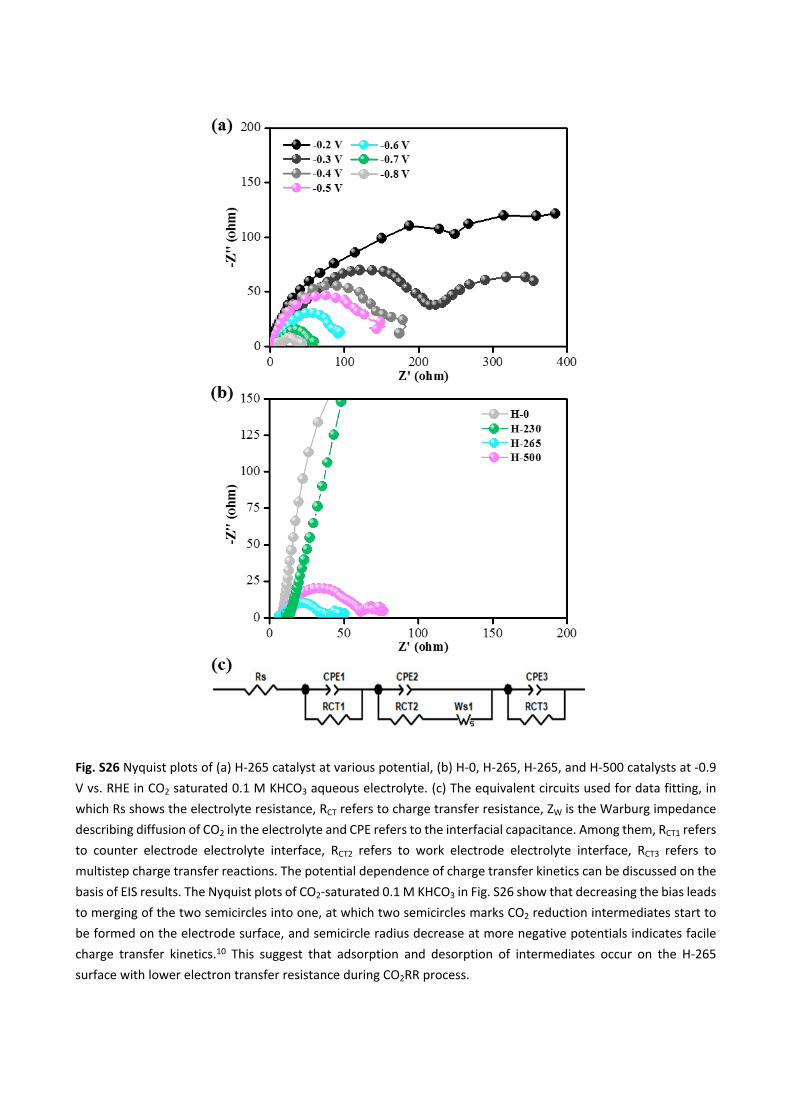
Fig. S26 Nyquist plots of (a) H-265 catalyst at various potential, (b) H-0, H-265, H-265, and H-500 catalysts at -0.9 V vs. RHE in CO2 saturated 0.1 M KHCO3 aqueous electrolyte. (c) The equivalent circuits used for data fitting, in which Rs shows the electrolyte resistance, RCT refers to charge transfer resistance, ZW is the Warburg impedance describing diffusion of CO2 in the electrolyte and CPE refers to the interfacial capacitance. Among them, RCT1 refers to counter electrode electrolyte interface, RCT2 refers to work electrode electrolyte interface, RCT3 refers to multistep charge transfer reactions. The potential dependence of charge transfer kinetics can be discussed on the basis of EIS results. The Nyquist plots of CO2-saturated 0.1 M KHCO3 in Fig. S26 show that decreasing the bias leads to merging of the two semicircles into one, at which two semicircles marks CO2 reduction intermediates start to be formed on the electrode surface, and semicircle radius decrease at more negative potentials indicates facile charge transfer kinetics.10 This suggest that adsorption and desorption of intermediates occur on the H-265 surface with lower electron transfer resistance during CO2RR process.
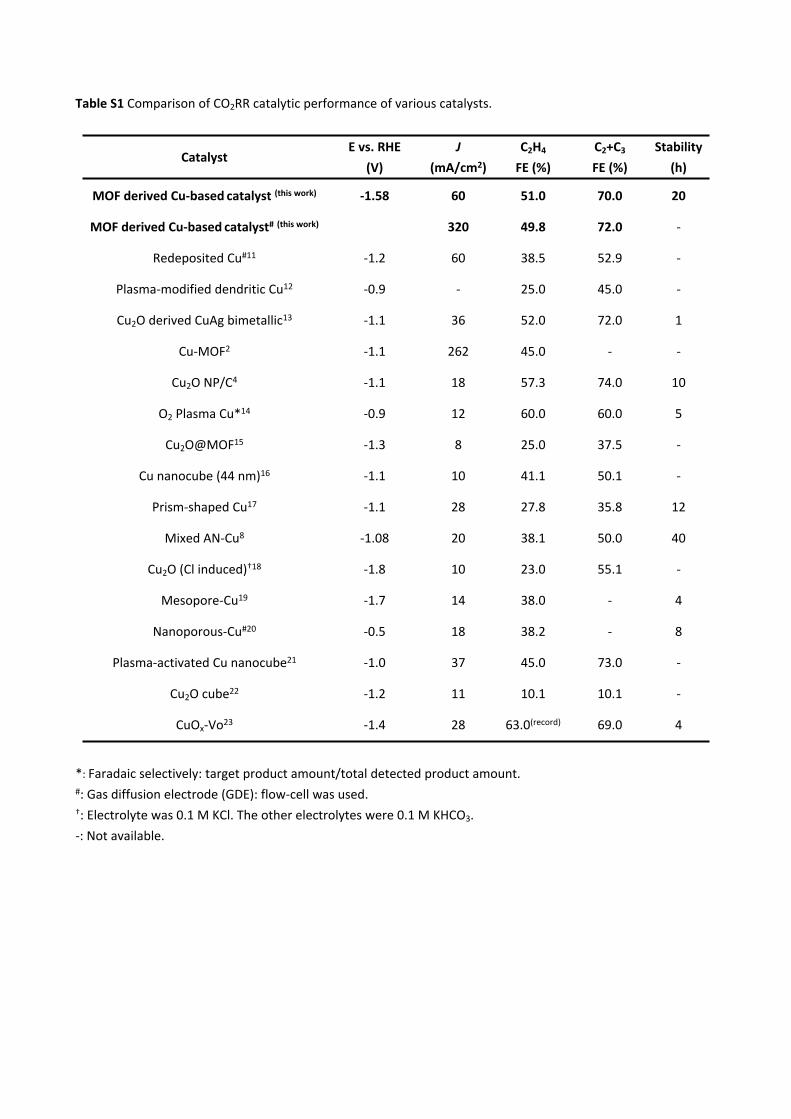
Table S1 Comparison of CO2RR catalytic performance of various catalysts.
CatalystE vs. RHE
(V)J
(mA/cm2)C2H4
FE (%)C2+C3 FE (%)
Stability (h)
MOF derived Cu-based catalyst (this work) -1.58 60 51.0 70.0 20
MOF derived Cu-based catalyst# (this work) 320 49.8 72.0 -
Redeposited Cu#11 -1.2 60 38.5 52.9 -
Plasma-modified dendritic Cu12 -0.9 - 25.0 45.0 -
Cu2O derived CuAg bimetallic13 -1.1 36 52.0 72.0 1
Cu-MOF2 -1.1 262 45.0 - -
Cu2O NP/C4 -1.1 18 57.3 74.0 10
O2 Plasma Cu*14 -0.9 12 60.0 60.0 5
Cu2O@MOF15 -1.3 8 25.0 37.5 -
Cu nanocube (44 nm)16 -1.1 10 41.1 50.1 -
Prism-shaped Cu17 -1.1 28 27.8 35.8 12
Mixed AN-Cu8 -1.08 20 38.1 50.0 40
Cu2O (Cl induced)†18 -1.8 10 23.0 55.1 -
Mesopore-Cu19 -1.7 14 38.0 - 4
Nanoporous-Cu#20 -0.5 18 38.2 - 8
Plasma-activated Cu nanocube21 -1.0 37 45.0 73.0 -
Cu2O cube22 -1.2 11 10.1 10.1 -
CuOx-Vo23 -1.4 28 63.0(record) 69.0 4
*: Faradaic selectively: target product amount/total detected product amount. #: Gas diffusion electrode (GDE): flow-cell was used. †: Electrolyte was 0.1 M KCl. The other electrolytes were 0.1 M KHCO3.-: Not available.

Table S2 FEs of all the products on all catalysts during potentiostatic electrolysis at -1.58 V vs. RHE in CO2-saturated 0.1 M KHCO3 in H-cell.
Table S3 FEs of all the products on H-265 catalyst during potentiostatic electrolysis at various potential in CO2-
saturated 0.1 M KHCO3 in H-cell.
Table S4 FEs of all the products on H-265 catalyst during galvanostatic electrolysis in flow-cell.
FEs (%)Potential
(RHE) H2 CO CH4 C2H4 HCOO
H
C2H5OH CH3COO
H
C3H7OH C1 C2+C3 Total
H-0 27.20 1.24 35.07 13.41 12.89 4.21 1.25 0 76.40 18.87 95.28
H-230 20.83 1.85 21.34 39.39 10.66 6.29 2.37 0 54.68 48.05 102.7
H-265 20.83 4.01 0.85 51.02 2.28 16.40 0.20 3.05 27.97 70.67 98.64
H-500 37.92 3.75 0.84 37.02 3.27 12.59 0.84 1.37 45.78 51.82 97.59
Cu foil 44.67 4.16 33.56 13.31 1.10 2.20 0 0 83.49 15.51 98.99
FEs (%)Potential
(RHE) H2 CO CH4 C2H4 HCOOH C2H5OH CH3COO
H
C3H7OH C1 C2+C3 Total
-0.78 25.37 22.17 3.82 20.04 8.29 10.09 5.21 1.32 56.65 39.67 96.32
-0.98 21.37 18.17 2.50 29.04 7.84 12.13 4.31 1.53 46.88 50.02 96.90
-1.18 17.05 13.55 2.77 38.66 5.69 13.23 3.09 1.96 34.07 58.95 96.02
-1.38 20.72 9.75 0.96 43.03 3.72 15.16 2.13 2.02 35.16 62.34 97.49
-1.58 20.83 4.01 0.85 51.02 2.28 16.40 0.20 3.05 27.97 70.68 98.64
-1.78 25.26 7.63 1.12 45.08 3.44 10.41 2.08 2.16 37.44 59.73 97.17
FEs (%)Current
density H2 CO CH4 C2H4 HCOOH C2H5OH CH3COOH C3H7OH Total
120 11.09 17.71 0.13 24.20 10.23 28.02 2.13 4.14 97.65220 9.44 16.28 0.11 37.12 8.99 23.96 1.93 4.02 101.85

Table S5 ECSA= Roughness factor (SRF)*geometric area,24 and the geometric area is 0.071 cm2. SRF of the samples can be determined by comparing the measured capacitance of the sample (CDL_Sample) with that of a blank reference surface (CDL_Reference), namely, SRF=CDL_Sample/CDL_Reference, the CDL refers to the double-layer capacitance, which can be seen in Fig. S15e. Therefore, all the samples’ ECSA can be seen in the table below.
Sample ECSA (cm2)
Glassy carbon 0.071H-0 0.142H-230 0.533H-265 0.343H-500 0.249
Table S6 XANES Linear combination fitting.
Cu foil Cu2O CuO
0 h post 0 0 11 h post 0.696 0.304 010 h post 0.719 0.281 0
Table S7 First shell EXAFS fitting results of Fig. 3f for standard Cu foil and H-265 samples after CO2RR.
Scatter CN R (Å) σ2 (Å2) ∆E (eV)
Cu foil Cu-Cu 12 2.55 0.00871 3.8Cu-Cu 8.2 2.54 0.00859 7.4
1 h postCu-O 0.4 1.83 0.00293 7.4Cu-Cu 8.2 2.54 0.00831 5.2
10 h postCu-O 0.3 1.84 0.00249 5.2
320 13.64 13.33 0.08 49.88 3.13 20.09 0.19 2.02 102.36420 14.50 15.71 0.11 26.44 7.08 25.01 1.07 3.94 93.86


Table S8 Oxygen and copper atomic concentration and ratio compared by SEM-EDS.
Sample C (At%) O (At%) Cu (At%) O/Cu ratio
H-265 Before reaction 17.02 45.03 37.95 1.19
H-265 After 30 min reaction 17.15 26.88 55.97 0.48
H-265 After 1 h reaction 17.38 26.26 56.36 0.46
H-265 After 10 h reaction 17.59 11.76 70.65 0.17
H-500 Before reaction 21.22 36.68 42.10 0.87
H-265 After 30 min reaction 22.63 16.80 60.57 0.28
H-500 After 1 h reaction 24.09 5.03 70.88 0.07
References
1 L. D. Ji, J. Wang, K. B. Wu and N. J. Yang, Adv. Funct. Mater., 2018, 28, 8.2 D.-H. Acs Central ScienceNam, O. S. Bushuyev, J. Li, P. De Luna, A. Seifitokaldani, C.-T. Dinh, F. P. García de Arquer, Y. Wang, Z. Liang and A. H. Proppe, J. Am. Chem. Soc., 2018, 140, 11378-11386.3 X. Duan, H. Huang, S. Xiao, J. Deng, G. Zhou, Q. Li and T. Wang, J. Mater. Chem. A, 2016, 4, 8402-8411.4 H. Jung, S. Y. Lee, C. W. Lee, M. K. Cho, D. H. Won, C. Kim, H.-S. Oh, B. K. Min and Y. J. Hwang, J. Am. Chem. Soc., 2019, 141, 4624-4633.5 K. Zhao, Y. M. Liu, X. Quan, S. Chen and H. T. Yu, ACS Appl. Mater. Interfaces, 2017, 9, 5302-5311.6 E. Zhang, T. Wang, K. Yu, J. Liu, W. Chen, A. Li, H. Rong, R. Lin, S. Ji, X. Zhene, Y. Wang, L. Zheng, C. Chen, D. Wang, J. Zhang and Y. Li, J. Am. Chem. Soc., 2019, 141, 16569-16573.7 M. G. Kibria, C. T. Dinh, A. Seifitokaldani, P. De Luna, T. Burdyny, R. Quintero-Bermudez, M. B. Ross, O. S. Bushuyev, F. P. García de Arquer and P. Yang, Adv. Mater., 2018, 1804867, 1-7.8 S. Y. Lee, H. Jung, N.-K. Kim, H.-S. Oh, B. K. Min and Y. J. Hwang, J. Am. Chem. Soc., 2018, 140, 8681-8689.9 Z. Sun, T. Ma, H. Tao, Q. Fan and B. Han, Chem, 2017, 3, 560-587.10 A. H. Shah, Y. Wang, A. R. Woldu, L. Lin, M. Iqbal, D. Cahen and T. He, J. Phys. Chem. C, 2018, 122, 18528-18536.11 P. D. Luna, R. Quinterobermudez, C. T. Dinh, M. B. Ross, O. S. Bushuyev, P. Todorović, T. Regier, S. O. Kelley, P. Yang and E. H. Sargent, Nat. Catal., 2018, 1, 103-110.12 F. Scholten, I. Sinev, M. Bernal and B. R. Cuenya, ACS Catal., 2019, 9, 5496-5502.13 J. Gao, H. Zhang, X. Guo, J. Luo, S. M. Zakeeruddin, D. Ren and M. Gratzel, J. Am. Chem. Soc., 2019, 141, 18704-18714.14 H. Mistry, A. S. Varela, C. S. Bonifacio, I. Zegkinoglou, I. Sinev, Y.-W. Choi, K. Kisslinger, E. A. Stach, J. C. Yang, P. Strasser and B. Roldan Cuenya, Nat. Commun., 2016, 7, 12123.15 X. Tan, C. Yu, C. Zhao, H. Huang, X. Yao, X. Han, W. Guo, S. Cui, H. Huang and J. Qiu, ACS Appl. Mater. Interfaces, 2019, 11, 9904-9910.16 A. Loiudice, P. Lobaccaro, E. A. Kamali, T. Thao, B. H. Huang, J. W. Ager and R. Buonsanti, Angew. Chem., Int. Ed., 2016, 55, 5789-5792.17 H. S. Jeon, S. Kunze, F. Scholten and B. Roldan Cuenya, ACS Catal., 2018, 8, 531-535.18 L. Mandal, K. R. Yang, M. R. Motapothula, D. Ren, P. Lobaccaro, A. Patra, M. Sherburne, V. S. Batista, B. S. Yeo, J. W. Ager, J. Martin and T. Venkatesan, ACS Appl. Mater. Interfaces, 2018, 10, 8574-8584.19 K. D. Yang, W. R. Ko, J. H. Lee, S. J. Kim, H. Lee, M. H. Lee and K. T. Nam, Angew. Chem., Int. Ed., 2017, 56, 796-800.20 T. T. Hoang, S. Ma, J. I. Gold, P. J. Kenis and A. A. Gewirth, ACS Catal., 2017, 7, 3313-3321.21 D. Gao, I. Zegkinoglou, N. J. Divins, F. Scholten, I. Sinev, P. Grosse and B. Roldan Cuenya, Acs Nano, 2017, 11, 4825-4831.22 W. Tan, B. Cao, W. Xiao, M. Zhang, S. Wang, S. Xie, D. Xie, F. Cheng, Q. Guo and P. Liu, Nanoscale Research Letters, 2019, 14.23 Z. Gu, N. Yang, P. Han, M. Kuang, B. Mei, Z. Jiang, J. Zhong, L. Li and G. Zheng, Small Methods, 2018, 3, 1800449.24 J. Huang, M. Mensi, E. Oveisi, V. Mantella and R. Buonsanti, J. Am. Chem. Soc., 2019, 141, 2490-2499.